UNITED STATES
SECURITIES AND EXCHANGE COMMISSION
Washington, D.C. 20549
FORM N-CSR
CERTIFIED SHAREHOLDER REPORT OF REGISTERED
MANAGEMENT INVESTMENT COMPANIES
Investment Company Act file number 811-03221
Fidelity Charles Street Trust
(Exact name of registrant as specified in charter)
245 Summer St., Boston, Massachusetts 02210
(Address of principal executive offices) (Zip code)
Margaret Carey, Secretary
245 Summer St.
Boston, Massachusetts 02210
(Name and address of agent for service)
Registrant's telephone number, including area code:
617-563-7000
| |
Date of fiscal year end: | September 30 |
|
|
Date of reporting period: | September 30, 2023 |
Item 1.
Reports to Stockholders
Fidelity Asset Manager® Funds
Fidelity Asset Manager® 20%
Fidelity Asset Manager® 30%
Fidelity Asset Manager® 40%
Fidelity Asset Manager® 50%
Fidelity Asset Manager® 60%
Fidelity Asset Manager® 70%
Fidelity Asset Manager® 85%
Annual Report
September 30, 2023
Includes Fidelity and Fidelity Advisor share classes
Contents
To view a fund's proxy voting guidelines and proxy voting record for the 12-month period ended June 30, visit http://www.fidelity.com/proxyvotingresults or visit the Securities and Exchange Commission's (SEC) web site at http://www.sec.gov.
You may also call 1-800-544-8544 if you're an individual investing directly with Fidelity, call 1-800-835-5092 if you're a plan sponsor or participant with Fidelity as your recordkeeper or call 1-877-208-0098 on institutional accounts or if you're an advisor or invest through one to request a free copy of the proxy voting guidelines.
Standard & Poor's, S&P and S&P 500 are registered service marks of The McGraw-Hill Companies, Inc. and have been licensed for use by Fidelity Distributors Corporation.
Other third-party marks appearing herein are the property of their respective owners.
All other marks appearing herein are registered or unregistered trademarks or service marks of FMR LLC or an affiliated company. © 2023 FMR LLC. All rights reserved.
This report and the financial statements contained herein are submitted for the general information of the shareholders of the Funds. This report is not authorized for distribution to prospective investors in the Funds unless preceded or accompanied by an effective prospectus.
A fund files its complete schedule of portfolio holdings with the SEC for the first and third quarters of each fiscal year on Form N-PORT. Forms N-PORT are available on the SEC's web site at http://www.sec.gov. A fund's Forms N-PORT may be reviewed and copied at the SEC's Public Reference Room in Washington, DC. Information regarding the operation of the SEC's Public Reference Room may be obtained by calling 1-800-SEC-0330.
For a complete list of a fund's portfolio holdings, view the most recent holdings listing, semiannual report, or annual report on Fidelity's web site at http://www.fidelity.com, http://www.institutional.fidelity.com, or http://www.401k.com, as applicable.
NOT FDIC INSURED •MAY LOSE VALUE •NO BANK GUARANTEE
Neither the Funds nor Fidelity Distributors Corporation is a bank.
Fidelity Asset Manager® 20%
Average annual total return reflects the change in the value of an investment, assuming reinvestment of distributions from dividend income and capital gains (the profits earned upon the sale of securities that have grown in value, if any) and assuming a constant rate of performance each year. The hypothetical investment and the average annual total returns do not reflect the deduction of taxes that a shareholder would pay on fund distributions or the redemption of fund shares. During periods of reimbursement by Fidelity, a fund's total return will be greater than it would be had the reimbursement not occurred. How a fund did yesterday is no guarantee of how it will do tomorrow.
| Average Annual Total Returns |
| | | | |
Periods ended September 30, 2023 | Past 1 year | Past 5 years | Past 10 years |
Class A (incl. 5.75% sales charge) | -1.92% | 0.58% | 1.95% |
Class M (incl. 3.50% sales charge) | 0.20% | 0.80% | 1.93% |
Class C (incl. contingent deferred sales charge) | 2.36% | 1.01% | 1.94% |
| Fidelity Asset Manager® 20% | 4.40% | 2.10% | 2.88% |
| Class I | 4.33% | 2.04% | 2.82% |
| Class Z | 4.42% | 2.13% | 2.86% |
Class C shares' contingent deferred sales charges included in the past one year, past five years and past ten years total return figures are 1%, 0% and 0%, respectively.
The initial offering of Class Z shares took place on October 2, 2018. Returns prior to October 2, 2018, are those of Class I.
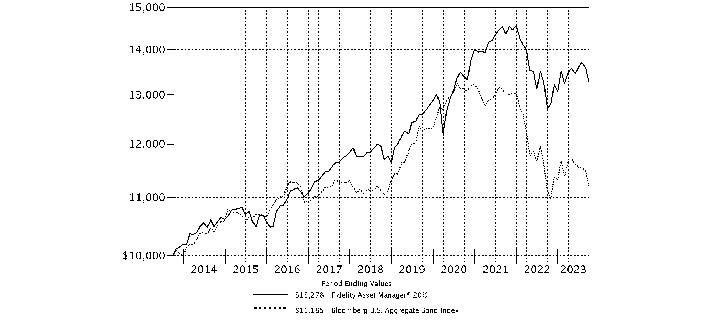
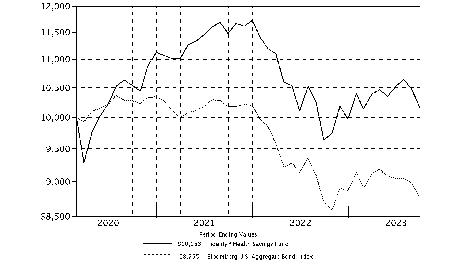
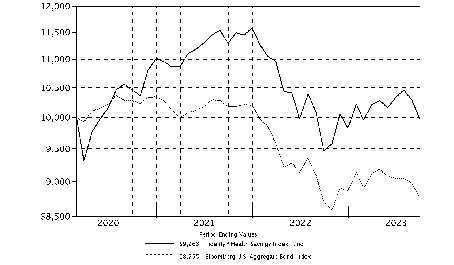
| $10,000 Over 10 Years |
| |
Let's say hypothetically that $10,000 was invested in Fidelity Asset Manager® 20%, a class of the fund, on September 30, 2013. The chart shows how the value of your investment would have changed, and also shows how the Bloomberg U.S. Aggregate Bond Index performed over the same period. |
|
|
Fidelity Asset Manager® 30%
Average annual total return reflects the change in the value of an investment, assuming reinvestment of distributions from dividend income and capital gains (the profits earned upon the sale of securities that have grown in value, if any) and assuming a constant rate of performance each year. The hypothetical investment and the average annual total returns do not reflect the deduction of taxes that a shareholder would pay on fund distributions or the redemption of fund shares. During periods of reimbursement by Fidelity, a fund's total return will be greater than it would be had the reimbursement not occurred. How a fund did yesterday is no guarantee of how it will do tomorrow.
| Average Annual Total Returns |
| | | | |
Periods ended September 30, 2023 | Past 1 year | Past 5 years | Past 10 years |
Class A (incl. 5.75% sales charge) | -0.34% | 1.25% | 2.80% |
Class M (incl. 3.50% sales charge) | 1.80% | 1.46% | 2.77% |
Class C (incl. contingent deferred sales charge) | 4.00% | 1.67% | 2.79% |
| Fidelity Asset Manager® 30% | 6.07% | 2.75% | 3.73% |
| Class I | 6.10% | 2.72% | 3.68% |
| Class Z | 6.10% | 2.78% | 3.71% |
Class C shares' contingent deferred sales charges included in the past one year, past five years and past ten years total return figures are 1%, 0% and 0%, respectively.
The initial offering of Class Z shares took place on October 2, 2018. Returns prior to October 2, 2018, are those of Class I.
| $10,000 Over 10 Years |
| |
Let's say hypothetically that $10,000 was invested in Fidelity Asset Manager® 30%, a class of the fund, on September 30, 2013. The chart shows how the value of your investment would have changed, and also shows how the Bloomberg U.S. Aggregate Bond Index performed over the same period. |
|
|
Fidelity Asset Manager® 40%
Average annual total return reflects the change in the value of an investment, assuming reinvestment of distributions from dividend income and capital gains (the profits earned upon the sale of securities that have grown in value, if any) and assuming a constant rate of performance each year. The hypothetical investment and the average annual total returns do not reflect the deduction of taxes that a shareholder would pay on fund distributions or the redemption of fund shares. During periods of reimbursement by Fidelity, a fund's total return will be greater than it would be had the reimbursement not occurred. How a fund did yesterday is no guarantee of how it will do tomorrow.
| Average Annual Total Returns |
| | | | |
Periods ended September 30, 2023 | Past 1 year | Past 5 years | Past 10 years |
Class A (incl. 5.75% sales charge) | 1.41% | 1.89% | 3.59% |
Class M (incl. 3.50% sales charge) | 3.52% | 2.12% | 3.57% |
Class C (incl. contingent deferred sales charge) | 5.70% | 2.33% | 3.57% |
| Fidelity Asset Manager® 40% | 7.95% | 3.43% | 4.52% |
| Class I | 7.79% | 3.37% | 4.48% |
| Class Z | 7.89% | 3.46% | 4.52% |
Class C shares' contingent deferred sales charges included in the past one year, past five years and past ten years total return figures are 1%, 0% and 0%, respectively.
The initial offering of Class Z shares took place on October 2, 2018. Returns prior to October 2, 2018, are those of Class I.
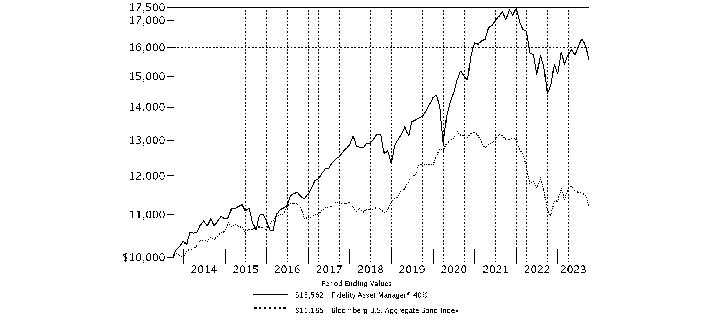
| $10,000 Over 10 Years |
| |
Let's say hypothetically that $10,000 was invested in Fidelity Asset Manager® 40%, a class of the fund, on September 30, 2013. The chart shows how the value of your investment would have changed, and also shows how the Bloomberg U.S. Aggregate Bond Index performed over the same period. |
|
|
Fidelity Asset Manager® 50%
Average annual total return reflects the change in the value of an investment, assuming reinvestment of distributions from dividend income and capital gains (the profits earned upon the sale of securities that have grown in value, if any) and assuming a constant rate of performance each year. The hypothetical investment and the average annual total returns do not reflect the deduction of taxes that a shareholder would pay on fund distributions or the redemption of fund shares. During periods of reimbursement by Fidelity, a fund's total return will be greater than it would be had the reimbursement not occurred. How a fund did yesterday is no guarantee of how it will do tomorrow.
| Average Annual Total Returns |
| | | | |
Periods ended September 30, 2023 | Past 1 year | Past 5 years | Past 10 years |
Class A (incl. 5.75% sales charge) | 3.01% | 2.39% | 4.25% |
Class M (incl. 3.50% sales charge) | 5.22% | 2.64% | 4.24% |
Class C (incl. contingent deferred sales charge) | 7.47% | 2.84% | 4.23% |
| Fidelity Asset Manager® 50% | 9.59% | 3.92% | 5.18% |
| Class I | 9.63% | 3.91% | 5.15% |
| Class Z | 9.71% | 4.00% | 5.20% |
Class C shares' contingent deferred sales charges included in the past one year, past five years and past ten years total return figures are 1%, 0% and 0%, respectively.
The initial offering of Class Z shares took place on October 2, 2018. Returns prior to October 2, 2018, are those of Class I.
| $10,000 Over 10 Years |
| |
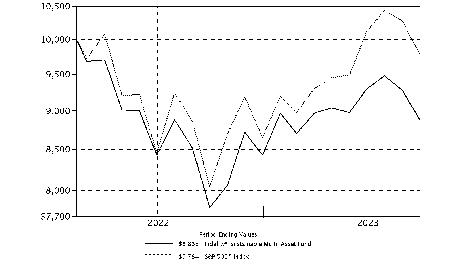
Let's say hypothetically that $10,000 was invested in Fidelity Asset Manager® 50%, a class of the fund, on September 30, 2013. The chart shows how the value of your investment would have changed, and also shows how the S&P 500® Index performed over the same period. |
|
|
Fidelity Asset Manager® 60%
Average annual total return reflects the change in the value of an investment, assuming reinvestment of distributions from dividend income and capital gains (the profits earned upon the sale of securities that have grown in value, if any) and assuming a constant rate of performance each year. The hypothetical investment and the average annual total returns do not reflect the deduction of taxes that a shareholder would pay on fund distributions or the redemption of fund shares. During periods of reimbursement by Fidelity, a fund's total return will be greater than it would be had the reimbursement not occurred. How a fund did yesterday is no guarantee of how it will do tomorrow.
| Average Annual Total Returns |
| | | | |
Periods ended September 30, 2023 | Past 1 year | Past 5 years | Past 10 years |
Class A (incl. 5.75% sales charge) | 4.70% | 2.89% | 4.89% |
Class M (incl. 3.50% sales charge) | 6.91% | 3.13% | 4.88% |
Class C (incl. contingent deferred sales charge) | 9.30% | 3.33% | 4.88% |
| Fidelity Asset Manager® 60% | 11.38% | 4.45% | 5.85% |
| Class I | 11.39% | 4.40% | 5.80% |
| Class Z | 11.56% | 4.53% | 5.87% |
Class C shares' contingent deferred sales charges included in the past one year, past five years and past ten years total return figures are 1%, 0% and 0%, respectively.
The initial offering of Class Z shares took place on October 2, 2018. Returns prior to October 2, 2018, are those of Class I.
| $10,000 Over 10 Years |
| |
Let's say hypothetically that $10,000 was invested in Fidelity Asset Manager® 60%, a class of the fund, on September 30, 2013. The chart shows how the value of your investment would have changed, and also shows how the S&P 500® Index performed over the same period. |
|
|
Fidelity Asset Manager® 70%
Average annual total return reflects the change in the value of an investment, assuming reinvestment of distributions from dividend income and capital gains (the profits earned upon the sale of securities that have grown in value, if any) and assuming a constant rate of performance each year. The hypothetical investment and the average annual total returns do not reflect the deduction of taxes that a shareholder would pay on fund distributions or the redemption of fund shares. During periods of reimbursement by Fidelity, a fund's total return will be greater than it would be had the reimbursement not occurred. How a fund did yesterday is no guarantee of how it will do tomorrow.
| Average Annual Total Returns |
| | | | |
Periods ended September 30, 2023 | Past 1 year | Past 5 years | Past 10 years |
Class A (incl. 5.75% sales charge) | 6.62% | 3.51% | 5.60% |
Class M (incl. 3.50% sales charge) | 8.91% | 3.75% | 5.58% |
Class C (incl. contingent deferred sales charge) | 11.25% | 3.96% | 5.59% |
| Fidelity Asset Manager® 70% | 13.46% | 5.07% | 6.55% |
| Class I | 13.43% | 5.04% | 6.52% |
| Class Z | 13.58% | 5.15% | 6.58% |
Class C shares' contingent deferred sales charges included in the past one year, past five years and past ten years total return figures are 1%, 0% and 0%, respectively.
The initial offering of Class Z shares took place on October 2, 2018. Returns prior to October 2, 2018, are those of Class I.
| $10,000 Over 10 Years |
| |
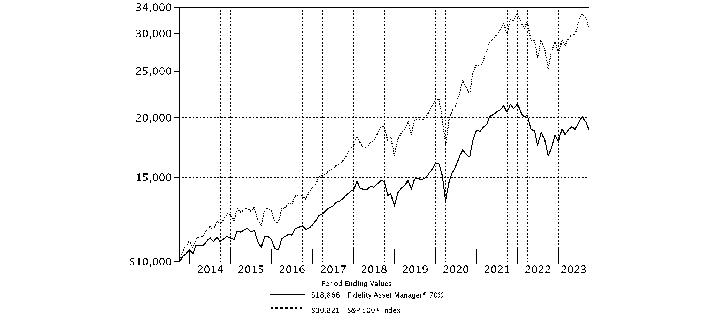
Let's say hypothetically that $10,000 was invested in Fidelity Asset Manager® 70%, a class of the fund, on September 30, 2013. The chart shows how the value of your investment would have changed, and also shows how the S&P 500® Index performed over the same period. |
|
|
Fidelity Asset Manager® 85%
Average annual total return reflects the change in the value of an investment, assuming reinvestment of distributions from dividend income and capital gains (the profits earned upon the sale of securities that have grown in value, if any) and assuming a constant rate of performance each year. The hypothetical investment and the average annual total returns do not reflect the deduction of taxes that a shareholder would pay on fund distributions or the redemption of fund shares. During periods of reimbursement by Fidelity, a fund's total return will be greater than it would be had the reimbursement not occurred. How a fund did yesterday is no guarantee of how it will do tomorrow.
| Average Annual Total Returns |
| | | | |
Periods ended September 30, 2023 | Past 1 year | Past 5 years | Past 10 years |
Class A (incl. 5.75% sales charge) | 9.28% | 4.31% | 6.62% |
Class M (incl. 3.50% sales charge) | 11.58% | 4.53% | 6.58% |
Class C (incl. contingent deferred sales charge) | 14.00% | 4.74% | 6.61% |
| Fidelity Asset Manager® 85% | 16.21% | 5.86% | 7.57% |
| Class I | 16.19% | 5.82% | 7.55% |
| Class Z | 16.31% | 5.94% | 7.61% |
Class C shares' contingent deferred sales charges included in the past one year, past five years and past ten years total return figures are 1%, 0% and 0%, respectively.
The initial offering of Class Z shares took place on October 2, 2018. Returns prior to October 2, 2018, are those of Class I.
| $10,000 Over 10 Years |
| |
Let's say hypothetically that $10,000 was invested in Fidelity Asset Manager® 85%, a class of the fund, on September 30, 2013. The chart shows how the value of your investment would have changed, and also shows how the S&P 500® Index performed over the same period. |
|
|
Market Recap:
For the 12 months ending September 30, 2023, continued global economic expansion and a slowing in the pace of inflation contributed to a favorable backdrop for risk assets. After struggling throughout much of 2022, risk assets strongly rebounded the past 12 months, with U.S. large-cap stocks leading the way. In the U.S., the upturn was driven partly by a narrow set of companies in the information technology and communication services sectors amid excitement for generative artificial intelligence. Meanwhile, monetary tightening by the U.S. Federal Reserve and other central banks continued amid elevated inflation. U.S. stocks gained 20.49% for the 12 months, as measured by the Dow Jones U.S. Total Stock Market Index, as all but two sectors rose. Information technology (+41%), communication services (+35%) and energy (+29%) led by the widest margin. Conversely, utilities (-7%) and real estate (-1%) lagged most. Growth stocks broadly outpaced value, while larger-caps topped small-caps. Commodities returned -1.30%, according to the Bloomberg Commodity Index Total Return. Looking abroad, international equities rose 20.60% for the 12 months, according to the MSCI ACWI (All Country World Index) ex USA Index. All regions gained, with Europe ex U.K. (+31%) leading the way. Japan (+26%) and the U.K. (+25%) also outperformed, whereas Asia Pacific ex Japan (+11%) lagged by the widest margin. Each of the 11 sectors advanced, with information technology (+30%), industrials (+29%) and energy (+28%) being the top performers. Conversely, real estate (+5%) lagged most, followed by consumer staples (+9%). As for fixed income, U.S. taxable investment-grade bonds returned 0.64% for the 12 months, per the Bloomberg U.S. Aggregate Bond Index, amid elevated inflation and rising interest rates. Since March 2022, the Fed has hiked its benchmark interest rate 11 times, by 5.25 percentage points, while allowing up to billions in bonds to mature each month without investing the proceeds. Short-term U.S. Treasuries (+4.58%) topped U.S. investment-grade corporate bonds (+3.47%), while commercial mortgage-backed securities returned (+1.19%) and agencies gained (+2.10%). Outside the index, leveraged loans (+13.39%), U.S. high-yield bonds (+8.24%) and emerging-markets debt (+8.61%) rose, whereas Treasury Inflation-Protected Securities (+1.25%) experienced a modest gain.
Comments from Co-Managers Geoff Stein and Avishek Hazrachoudhury:
For the fiscal year ending September 30, 2023, the Funds' share classes (excluding sales charges, if applicable) posted gains ranging from about 3% to 16%, with each trailing its respective Composite Index. Looking back over the past 12 months, security selection aided relative performance whereas asset class positioning detracted. The timing of adjustments to the Funds' international developed-markets (DM) allocation was the primary factor that worked against its core equity allocation strategy. Out-of-benchmark exposure to commodity-related securities also hampered the portfolios' relative results. Fixed-income positioning also detracted from returns versus Composites. Although underweight stakes in investment-grade (IG) bonds and cash helped, a non-benchmark stake in long-term U.S. Treasuries hurt. On the plus side, security selection drove strong relative performance for most of the Funds' key underlying portfolios. The biggest being among IG bonds and stock picks in international markets. As of period end, the Funds were moderately underweight large-cap U.S. stocks and neutral to slightly underweight international DM and emerging-markets equities. In fixed income, the allocation to IG bonds was moderately below the Funds' target weightings. Cash was increased to near neutral during the period to help the Funds' capture higher yields.
Note to shareholders:
On November 1, 2023, Katie Shaw succeeded Geoff Stein as Co-Manager of the Fund.
In June 2022, the funds began adjusting the neutral mix within their equity allocations, moving from a 60%/40% split between domestic and international to 70%/30%, in an effort to increase diversification. The funds reached their new target exposures in August 2022.
The views expressed above reflect those of the portfolio manager(s) only through the end of the period as stated on the cover of this report and do not necessarily represent the views of Fidelity or any other person in the Fidelity organization. Any such views are subject to change at any time based upon market or other conditions and Fidelity disclaims any responsibility to update such views. These views may not be relied on as investment advice and, because investment decisions for a Fidelity fund are based on numerous factors, may not be relied on as an indication of trading intent on behalf of any Fidelity fund.
The information in the following tables is based on the combined Investments of the Fund and it's pro-rata share of investments in Fidelity's Central Funds, other than the Commodity Strategy and Money Market Central Funds.
Top Holdings (% of Fund's net assets) |
| |
| iShares MSCI USA Minimum Volatility ETF | 1.3 | |
| Microsoft Corp. | 1.1 | |
| Apple, Inc. | 0.9 | |
| Alphabet, Inc. Class A | 0.7 | |
| iShares 20+ Year Treasury Bond ETF | 0.6 | |
| Amazon.com, Inc. | 0.6 | |
| Exxon Mobil Corp. | 0.4 | |
| NVIDIA Corp. | 0.4 | |
| Meta Platforms, Inc. Class A | 0.4 | |
| JPMorgan Chase & Co. | 0.4 | |
| | 6.8 | |
| |
| Top Bond Issuers (% of Fund's net assets) |
(with maturities greater than one year) |
| U.S. Treasury Obligations | 20.1 | |
| Fannie Mae | 3.6 | |
| Freddie Mac | 3.4 | |
| Ginnie Mae | 1.8 | |
| Uniform Mortgage Backed Securities | 1.7 | |
| JPMorgan Chase & Co. | 0.7 | |
| Morgan Stanley | 0.6 | |
| Citigroup, Inc. | 0.6 | |
| Bank of America Corp. | 0.4 | |
| Petroleos Mexicanos | 0.4 | |
| | 33.3 | |
| |
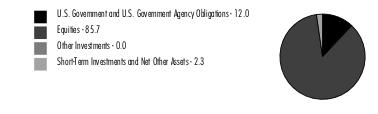
| Market Sectors (% of Fund's net assets) |
| |
| Financials | 31.1 | |
| Information Technology | 6.2 | |
| Health Care | 3.8 | |
| Consumer Discretionary | 3.6 | |
| Industrials | 3.6 | |
| Communication Services | 3.3 | |
| Energy | 2.7 | |
| Consumer Staples | 2.2 | |
| Real Estate | 2.1 | |
| Materials | 0.9 | |
| Utilities | 0.8 | |
| |
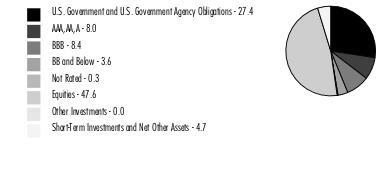
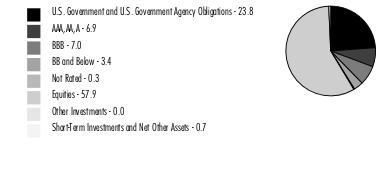
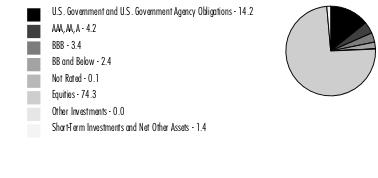
Quality Diversification (% of Fund's net assets) |
|
Percentages shown as 0.0% may reflect amounts less than 0.05%. |
| |
| We have used ratings from Moody's Investors Service, Inc. Where Moody's® ratings are not available, we have used S&P® ratings. All ratings are as of the date indicated and do not reflect subsequent changes. |
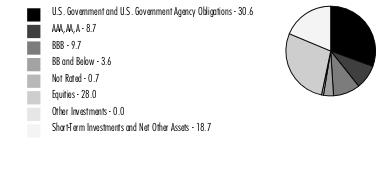
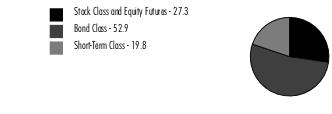
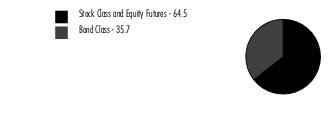
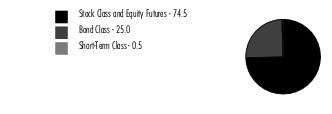
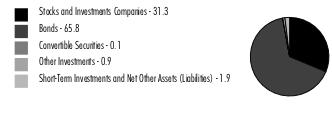
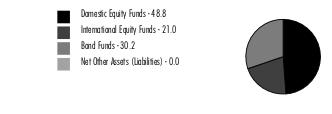
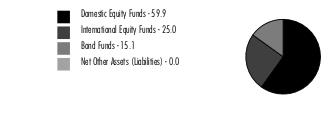
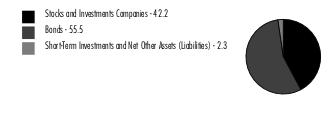
Asset Allocation (% of Fund's net assets) |
|
|
Asset allocations in the pie charts reflect the categorization of assets as defined in the Fund's prospectus in effect as of the time periods indicated above. Percentages are adjusted for the effect of future contracts and swap contracts, if applicable.
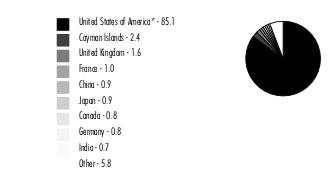
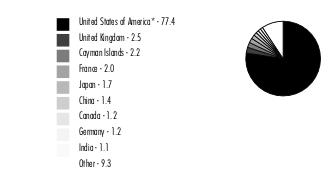
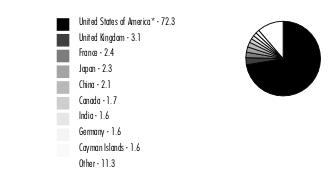
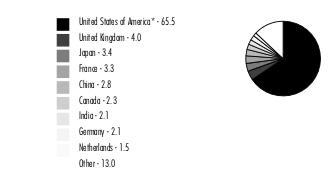
Geographic Diversification (% of Fund's net assets) |
|
* Includes Short-Term investments and Net Other Assets (Liabilities). Percentages are adjusted for the effect of derivatives, if applicable. |
| |
Percentages in the above tables are adjusted for the effect of TBA sale Commitments.
Equities and Stock Class and Equity Futures percentages above include Fidelity Commodity Strategy Central Fund of 0.2%.
At period end, foreign investments including the Fund's pro-rata share of the underlying Central Funds, other than the Commodity Strategy Central and Money Market Funds, was 14.6% of net assets.
An unaudited holdings list for the Fund, which presents direct holdings as well as the pro-rata share of any securities and other investments held indirectly through its investment in underlying Fidelity Central Funds, other than the Commodity Strategy and Money Market Central Funds, is available at fidelity.com and/or institutional.fidelity.com, as applicable.
Fidelity Asset Manager® 20%
Showing Percentage of Net Assets
| Equity Central Funds - 26.1% |
| | | Shares | Value ($) |
| Fidelity Commodity Strategy Central Fund (a) | | 128,588 | 12,138,671 |
| Fidelity Emerging Markets Equity Central Fund (a) | | 845,304 | 158,756,478 |
| Fidelity Hedged Equity Central Fund (a) | | 659,343 | 68,400,292 |
| Fidelity International Equity Central Fund (a) | | 3,379,541 | 298,819,024 |
| Fidelity Real Estate Equity Central Fund (a) | | 200,818 | 22,499,701 |
| Fidelity U.S. Equity Central Fund (a) | | 6,904,480 | 802,922,024 |
| TOTAL EQUITY CENTRAL FUNDS (Cost $854,077,067) | | | 1,363,536,190 |
| | | | |
| Fixed-Income Central Funds - 51.4% |
| | | Shares | Value ($) |
| High Yield Fixed-Income Funds - 2.8% | | | |
| Fidelity Emerging Markets Debt Central Fund (a) | | 886,286 | 6,505,336 |
| Fidelity Emerging Markets Debt Local Currency Central Fund (a) | | 492,900 | 43,626,574 |
| Fidelity Floating Rate Central Fund (a) | | 717,029 | 70,283,198 |
| Fidelity High Income Central Fund (a) | | 265,595 | 26,862,290 |
TOTAL HIGH YIELD FIXED-INCOME FUNDS | | | 147,277,398 |
| Investment Grade Fixed-Income Funds - 48.6% | | | |
| Fidelity Inflation-Protected Bond Index Central Fund (a) | | 449,988 | 39,598,919 |
| Fidelity International Credit Central Fund (a) | | 176,453 | 13,426,284 |
| Fidelity Investment Grade Bond Central Fund (a) | | 26,579,633 | 2,488,119,466 |
TOTAL INVESTMENT GRADE FIXED-INCOME FUNDS | | | 2,541,144,669 |
| TOTAL FIXED-INCOME CENTRAL FUNDS (Cost $2,942,496,062) | | | 2,688,422,067 |
| | | | |
| Money Market Central Funds - 20.4% |
| | | Shares | Value ($) |
| Fidelity Cash Central Fund 5.39% (b) | | 93,462,174 | 93,480,867 |
| Fidelity Money Market Central Fund 5.51% (b) | | 963,040,273 | 962,943,969 |
| Fidelity Securities Lending Cash Central Fund 5.39% (b)(c) | | 13,103,090 | 13,104,400 |
| TOTAL MONEY MARKET CENTRAL FUNDS (Cost $1,069,603,525) | | | 1,069,529,236 |
| | | | |
| U.S. Treasury Obligations - 0.4% |
| | | Principal Amount (d) | Value ($) |
U.S. Treasury Bills, yield at date of purchase 5.37% to 5.39% 12/7/23 to 12/21/23 (e) (Cost $23,807,294) | | 24,060,000 | 23,810,491 |
| | | | |
| Investment Companies - 1.9% |
| | | Shares | Value ($) |
| iShares 20+ Year Treasury Bond ETF (f) | | 358,087 | 31,758,736 |
| iShares MSCI USA Minimum Volatility ETF | | 945,873 | 68,462,289 |
| TOTAL INVESTMENT COMPANIES (Cost $103,181,333) | | | 100,221,025 |
| | | | |
| TOTAL INVESTMENT IN SECURITIES - 100.2% (Cost $4,993,165,281) | 5,245,519,009 |
NET OTHER ASSETS (LIABILITIES) - (0.2)% | (12,450,355) |
| NET ASSETS - 100.0% | 5,233,068,654 |
| | |
| Futures Contracts |
| | Number of contracts | Expiration Date | Notional Amount ($) | Value ($) | Unrealized Appreciation/ (Depreciation) ($) |
| Sold | | | | | |
| | | | | | |
| Equity Index Contracts | | | | | |
| CME E-mini S&P 500 Index Contracts (United States) | 1,803 | Dec 2023 | 389,943,825 | 12,476,228 | 12,476,228 |
| ICE MSCI Emerging Markets Index Contracts (United States) | 1,014 | Dec 2023 | 48,443,850 | 1,613,078 | 1,613,078 |
| | | | | | |
| TOTAL FUTURES CONTRACTS | | | | | 14,089,306 |
| The notional amount of futures sold as a percentage of Net Assets is 8.4% |
For the period, the average monthly notional amount at value for futures contracts in the aggregate was $447,376,811.
Security Type Abbreviations
Legend
| (a) | Affiliated fund that is generally available only to investment companies and other accounts managed by Fidelity Investments. A complete unaudited schedule of portfolio holdings for each Fidelity Central Fund is filed with the SEC for the first and third quarters of each fiscal year on Form N-PORT and is available upon request or at the SEC's website at www.sec.gov. An unaudited holdings listing for the Fund, which presents direct holdings as well as the pro-rata share of securities and other investments held indirectly through its investment in underlying non-money market Fidelity Central Funds, other than the Commodity Strategy Central Fund, is available at fidelity.com and/or institutional.fidelity.com, as applicable. In addition, each Fidelity Central Fund's financial statements,which are not covered by the Fund's Report of Independent Registered Public Accounting Firm, are available on the SEC's website or upon request. |
| (b) | Affiliated fund that is generally available only to investment companies and other accounts managed by Fidelity Investments. The rate quoted is the annualized seven-day yield of the fund at period end. A complete unaudited listing of the fund's holdings as of its most recent quarter end is available upon request. In addition, each Fidelity Central Fund's financial statements, which are not covered by the Fund's Report of Independent Registered Public Accounting Firm, are available on the SEC's website or upon request. |
| (c) | Investment made with cash collateral received from securities on loan. |
| (d) | Amount is stated in United States dollars unless otherwise noted. |
| (e) | Security or a portion of the security was pledged to cover margin requirements for futures contracts. At period end, the value of securities pledged amounted to $22,820,235. |
| (f) | Security or a portion of the security is on loan at period end. |
Affiliated Central Funds
Fiscal year to date information regarding the Fund's investments in Fidelity Central Funds, including the ownership percentage, is presented below.
| Affiliate | Value, beginning of period ($) | Purchases ($) | Sales Proceeds ($) | Dividend Income ($) | Realized Gain (loss) ($) | Change in Unrealized appreciation (depreciation) ($) | Value, end of period ($) | % ownership, end of period |
| Fidelity Cash Central Fund 5.39% | 59,228,042 | 733,821,597 | 699,568,772 | 2,143,614 | - | - | 93,480,867 | 0.2% |
| Fidelity Commodity Strategy Central Fund | 106,709,912 | 6,623,410 | 96,900,410 | 1,679,441 | (24,082,434) | 19,788,193 | 12,138,671 | 5.3% |
| Fidelity Emerging Markets Debt Central Fund | 10,372,630 | 3,045,472 | 7,302,695 | 575,340 | (1,243,611) | 1,633,540 | 6,505,336 | 0.3% |
| Fidelity Emerging Markets Debt Local Currency Central Fund | 11,242,314 | 30,501,876 | 142 | 34,438 | 44,842 | 1,837,684 | 43,626,574 | 15.9% |
| Fidelity Emerging Markets Equity Central Fund | 117,545,795 | 100,971,896 | 66,667,360 | 4,092,138 | (28,326,045) | 35,232,192 | 158,756,478 | 7.4% |
| Fidelity Floating Rate Central Fund | 159,044,039 | 19,096,852 | 113,190,729 | 10,898,952 | (3,696,092) | 9,029,128 | 70,283,198 | 4.8% |
| Fidelity Hedged Equity Central Fund | - | 68,532,049 | - | 9,146 | - | (131,757) | 68,400,292 | 15.9% |
| Fidelity High Income Central Fund | 42,203,666 | 5,941,721 | 22,861,196 | 2,972,394 | 424,500 | 1,153,599 | 26,862,290 | 1.9% |
| Fidelity Inflation-Protected Bond Index Central Fund | 68,571,060 | 11,996,892 | 35,253,319 | 7,584,653 | (3,327,125) | (2,388,589) | 39,598,919 | 9.3% |
| Fidelity International Credit Central Fund | 51,773,273 | 5,124,703 | 41,458,267 | 2,406,057 | (11,877,942) | 10,158,952 | 13,426,284 | 6.8% |
| Fidelity International Equity Central Fund | 172,519,871 | 192,774,995 | 105,898,739 | 6,772,993 | (4,044,590) | 43,467,487 | 298,819,024 | 6.4% |
| Fidelity Investment Grade Bond Central Fund | 2,397,843,318 | 540,842,062 | 389,577,842 | 97,293,040 | (16,270,433) | (44,717,639) | 2,488,119,466 | 6.7% |
| Fidelity Money Market Central Fund 0.45% | 1,111,446,680 | 119,641,742 | 268,146,571 | 49,891,844 | (19,771) | 21,889 | 962,943,969 | 82.5% |
| Fidelity Real Estate Equity Central Fund | 36,620,079 | 3,266,235 | 18,940,046 | 920,912 | (908,440) | 2,461,873 | 22,499,701 | 2.4% |
| Fidelity Securities Lending Cash Central Fund 5.39% | - | 269,887,682 | 256,783,282 | 2,105 | - | - | 13,104,400 | 0.0% |
| Fidelity U.S. Equity Central Fund | 858,863,446 | 69,894,001 | 272,585,479 | 24,138,228 | 2,717,335 | 144,032,721 | 802,922,024 | 5.1% |
| Total | 5,203,984,125 | 2,181,963,185 | 2,395,134,849 | 211,415,295 | (90,609,806) | 221,579,273 | 5,121,487,493 | |
| | | | | | | | | |
Amounts in the dividend income column in the above table include any capital gain distributions from underlying funds, which are presented in the corresponding line item in the Statement of Operations, if applicable.
Amounts in the dividend income column for Fidelity Securities Lending Cash Central Fund represents the income earned on investing cash collateral, less rebates paid to borrowers and any lending agent fees associated with the loan, plus any premium payments received for lending certain types of securities.
Amounts included in the purchases and sales proceeds columns may include in-kind transactions, if applicable.
Investment Valuation
The following is a summary of the inputs used, as of September 30, 2023, involving the Fund's assets and liabilities carried at fair value. The inputs or methodology used for valuing securities may not be an indication of the risk associated with investing in those securities. For more information on valuation inputs, and their aggregation into the levels used below, please refer to the Investment Valuation section in the accompanying Notes to Financial Statements.
| Valuation Inputs at Reporting Date: |
| Description | Total ($) | Level 1 ($) | Level 2 ($) | Level 3 ($) |
Investments in Securities: | | | | |
|
| Equity Central Funds | 1,363,536,190 | 1,363,536,190 | - | - |
|
| Fixed-Income Central Funds | 2,688,422,067 | 2,688,422,067 | - | - |
|
| Money Market Central Funds | 1,069,529,236 | 1,069,529,236 | - | - |
|
| U.S Treasury Obligations | 23,810,491 | - | 23,810,491 | - |
|
| Investment Companies | 100,221,025 | 100,221,025 | - | - |
| Total Investments in Securities: | 5,245,519,009 | 5,221,708,518 | 23,810,491 | - |
Derivative Instruments: Assets | | | | |
Futures Contracts | 14,089,306 | 14,089,306 | - | - |
| Total Assets | 14,089,306 | 14,089,306 | - | - |
| Total Derivative Instruments: | 14,089,306 | 14,089,306 | - | - |
Value of Derivative Instruments
The following table is a summary of the Fund's value of derivative instruments by primary risk exposure as of September 30, 2023. For additional information on derivative instruments, please refer to the Derivative Instruments section in the accompanying Notes to Financial Statements.
Primary Risk Exposure / Derivative Type | Value |
| Asset ($) | Liability ($) |
| Equity Risk | | |
Futures Contracts (a) | 14,089,306 | 0 |
| Total Equity Risk | 14,089,306 | 0 |
| Total Value of Derivatives | 14,089,306 | 0 |
(a)Reflects gross cumulative appreciation (depreciation) on futures contracts as presented in the Schedule of Investments. In the Statement of Assets and Liabilities, the period end daily variation margin is included in receivable or payable for daily variation margin on futures contracts, and the net cumulative appreciation (depreciation) is included in Total accumulated earnings (loss).
Fidelity Asset Manager® 20%
| Statement of Assets and Liabilities |
| | | | September 30, 2023 |
| | | | | |
| Assets | | | | |
| Investment in securities, at value (including securities loaned of $12,842,312) - See accompanying schedule: | | | | |
Unaffiliated issuers (cost $126,988,627) | $ | 124,031,516 | | |
Fidelity Central Funds (cost $4,866,176,654) | | 5,121,487,493 | | |
| | | | | |
| | | | | |
| Total Investment in Securities (cost $4,993,165,281) | | | $ | 5,245,519,009 |
| Receivable for investments sold | | | | 3,422,778 |
| Receivable for fund shares sold | | | | 415,419 |
| Dividends receivable | | | | 378,288 |
| Distributions receivable from Fidelity Central Funds | | | | 142,151 |
| Receivable for daily variation margin on futures contracts | | | | 1,081,800 |
| Prepaid expenses | | | | 7,614 |
Total assets | | | | 5,250,967,059 |
| Liabilities | | | | |
| Payable for investments purchased | $ | 473,722 | | |
| Payable for fund shares redeemed | | 2,031,662 | | |
| Accrued management fee | | 1,757,599 | | |
| Distribution and service plan fees payable | | 37,770 | | |
| Other affiliated payables | | 435,435 | | |
| Other payables and accrued expenses | | 57,817 | | |
| Collateral on securities loaned | | 13,104,400 | | |
| Total Liabilities | | | | 17,898,405 |
| Net Assets | | | $ | 5,233,068,654 |
| Net Assets consist of: | | | | |
| Paid in capital | | | $ | 5,391,581,660 |
| Total accumulated earnings (loss) | | | | (158,513,006) |
| Net Assets | | | $ | 5,233,068,654 |
| | | | | |
| Net Asset Value and Maximum Offering Price | | | | |
| Class A : | | | | |
Net Asset Value and redemption price per share ($53,118,627 ÷ 4,193,134 shares)(a) | | | $ | 12.67 |
| Maximum offering price per share (100/94.25 of $12.67) | | | $ | 13.44 |
| Class M : | | | | |
Net Asset Value and redemption price per share ($28,202,425 ÷ 2,232,896 shares)(a) | | | $ | 12.63 |
| Maximum offering price per share (100/96.50 of $12.63) | | | $ | 13.09 |
| Class C : | | | | |
Net Asset Value and offering price per share ($16,530,874 ÷ 1,319,730 shares)(a) | | | $ | 12.53 |
| Asset Manager 20% : | | | | |
Net Asset Value, offering price and redemption price per share ($3,329,197,031 ÷ 262,338,992 shares) | | | $ | 12.69 |
| Class I : | | | | |
Net Asset Value, offering price and redemption price per share ($20,593,713 ÷ 1,622,324 shares) | | | $ | 12.69 |
| Class Z : | | | | |
Net Asset Value, offering price and redemption price per share ($1,785,425,984 ÷ 140,756,628 shares) | | | $ | 12.68 |
(a)Redemption price per share is equal to net asset value less any applicable contingent deferred sales charge. |
| Statement of Operations |
| | | | Year ended September 30, 2023 |
| Investment Income | | | | |
| Dividends | | | $ | 2,458,088 |
| Interest | | | | 1,018,217 |
| Income from Fidelity Central Funds (including $2,105 from security lending) | | | | 197,119,448 |
| Total Income | | | | 200,595,753 |
| Expenses | | | | |
| Management fee | $ | 22,063,558 | | |
| Transfer agent fees | | 4,154,845 | | |
| Distribution and service plan fees | | 472,269 | | |
| Accounting fees | | 1,194,719 | | |
| Custodian fees and expenses | | 36,352 | | |
| Independent trustees' fees and expenses | | 20,557 | | |
| Registration fees | | 117,816 | | |
| Audit | | 47,602 | | |
| Legal | | 11,753 | | |
| Miscellaneous | | 48,842 | | |
| Total expenses before reductions | | 28,168,313 | | |
| Expense reductions | | (150,095) | | |
| Total expenses after reductions | | | | 28,018,218 |
| Net Investment income (loss) | | | | 172,577,535 |
| Realized and Unrealized Gain (Loss) | | | | |
| Net realized gain (loss) on: | | | | |
| Investment Securities: | | | | |
| Unaffiliated issuers | | (40,130,860) | | |
| Fidelity Central Funds | | (90,609,806) | | |
| Futures contracts | | (35,303,036) | | |
| Capital gain distributions from Fidelity Central Funds | | 14,590,285 | | |
| Total net realized gain (loss) | | | | (151,453,417) |
| Change in net unrealized appreciation (depreciation) on: | | | | |
| Investment Securities: | | | | |
| Unaffiliated issuers | | 27,324,803 | | |
| Fidelity Central Funds | | 221,579,273 | | |
| Futures contracts | | (23,126,930) | | |
| Total change in net unrealized appreciation (depreciation) | | | | 225,777,146 |
| Net gain (loss) | | | | 74,323,729 |
| Net increase (decrease) in net assets resulting from operations | | | $ | 246,901,264 |
| Statement of Changes in Net Assets |
| |
| | Year ended September 30, 2023 | | Year ended September 30, 2022 |
| Increase (Decrease) in Net Assets | | | | |
| Operations | | | | |
| Net investment income (loss) | $ | 172,577,535 | $ | 120,665,591 |
| Net realized gain (loss) | | (151,453,417) | | 141,315,034 |
| Change in net unrealized appreciation (depreciation) | | 225,777,146 | | (1,018,435,410) |
| Net increase (decrease) in net assets resulting from operations | | 246,901,264 | | (756,454,785) |
| Distributions to shareholders | | (298,570,191) | | (122,000,836) |
| | | | | |
| Share transactions - net increase (decrease) | | (148,513,918) | | (49,428,139) |
| Total increase (decrease) in net assets | | (200,182,845) | | (927,883,760) |
| | | | | |
| Net Assets | | | | |
| Beginning of period | | 5,433,251,499 | | 6,361,135,259 |
| End of period | $ | 5,233,068,654 | $ | 5,433,251,499 |
| | | | | |
| | | | | |
Financial Highlights
| Fidelity Advisor Asset Manager® 20% Class A |
| |
| Years ended September 30, | | 2023 | | 2022 | | 2021 | | 2020 | | 2019 |
Selected Per-Share Data | | | | | | | | | | |
| Net asset value, beginning of period | $ | 12.81 | $ | 14.74 | $ | 14.00 | $ | 13.51 | $ | 13.40 |
| Income from Investment Operations | | | | | | | | | | |
Net investment income (loss) A,B | | .36 | | .23 | | .14 | | .18 | | .26 |
| Net realized and unrealized gain (loss) | | .16 | | (1.93) | | .82 | | .62 | | .36 |
| Total from investment operations | | .52 | | (1.70) | | .96 | | .80 | | .62 |
| Distributions from net investment income | | (.40) | | (.19) | | (.11) | | (.19) | | (.26) |
| Distributions from net realized gain | | (.26) | | (.03) | | (.12) | | (.13) | | (.24) |
| Total distributions | | (.66) | | (.23) C | | (.22) C | | (.31) C | | (.51) C |
| Net asset value, end of period | $ | 12.67 | $ | 12.81 | $ | 14.74 | $ | 14.00 | $ | 13.51 |
Total Return D,E | | 4.07% | | (11.71)% | | 6.91% | | 6.04% | | 4.85% |
Ratios to Average Net Assets B,F,G | | | | | | | | | | |
| Expenses before reductions | | .82% | | .81% | | .81% | | .82% | | .83% |
| Expenses net of fee waivers, if any | | .81% | | .81% | | .81% | | .82% | | .83% |
| Expenses net of all reductions | | .81% | | .81% | | .81% | | .82% | | .83% |
| Net investment income (loss) | | 2.80% | | 1.61% | | .97% | | 1.34% | | 1.97% |
| Supplemental Data | | | | | | | | | | |
| Net assets, end of period (000 omitted) | $ | 53,119 | $ | 56,979 | $ | 62,957 | $ | 50,633 | $ | 45,153 |
Portfolio turnover rate H | | 28% | | 22% | | 25% | | 25% | | 41% |
ACalculated based on average shares outstanding during the period.
BNet investment income (loss) is affected by the timing of the declaration of dividends by any underlying mutual funds or exchange-traded funds (ETFs). Net investment income (loss) of any mutual funds or ETFs is not included in the Fund's net investment income (loss) ratio.
CTotal distributions per share do not sum due to rounding.
DTotal returns would have been lower if certain expenses had not been reduced during the applicable periods shown.
ETotal returns do not include the effect of the sales charges.
FFees and expenses of any underlying mutual funds or exchange-traded funds (ETFs) are not included in the Fund's expense ratio. The Fund indirectly bears its proportionate share of these expenses. For additional expense information related to investments in Fidelity Central Funds, please refer to the "Investments in Fidelity Central Funds" note found in the Notes to Financial Statements section of the most recent Annual or Semi-Annual report.
GExpense ratios reflect operating expenses of the class. Expenses before reductions do not reflect amounts reimbursed, waived, or reduced through arrangements with the investment adviser, brokerage services, or other offset arrangements, if applicable, and do not represent the amount paid by the class during periods when reimbursements, waivers or reductions occur.
HAmount does not include the portfolio activity of any underlying mutual funds or exchange-traded funds (ETFs).
| Fidelity Advisor Asset Manager® 20% Class M |
| |
| Years ended September 30, | | 2023 | | 2022 | | 2021 | | 2020 | | 2019 |
Selected Per-Share Data | | | | | | | | | | |
| Net asset value, beginning of period | $ | 12.77 | $ | 14.70 | $ | 13.97 | $ | 13.48 | $ | 13.37 |
| Income from Investment Operations | | | | | | | | | | |
Net investment income (loss) A,B | | .33 | | .19 | | .10 | | .15 | | .23 |
| Net realized and unrealized gain (loss) | | .16 | | (1.92) | | .82 | | .62 | | .35 |
| Total from investment operations | | .49 | | (1.73) | | .92 | | .77 | | .58 |
| Distributions from net investment income | | (.37) | | (.16) | | (.07) | | (.15) | | (.23) |
| Distributions from net realized gain | | (.26) | | (.03) | | (.12) | | (.13) | | (.24) |
| Total distributions | | (.63) | | (.20) C | | (.19) | | (.28) | | (.47) |
| Net asset value, end of period | $ | 12.63 | $ | 12.77 | $ | 14.70 | $ | 13.97 | $ | 13.48 |
Total Return D,E | | 3.84% | | (11.94)% | | 6.60% | | 5.79% | | 4.58% |
Ratios to Average Net Assets B,F,G | | | | | | | | | | |
| Expenses before reductions | | 1.06% | | 1.06% | | 1.07% | | 1.08% | | 1.08% |
| Expenses net of fee waivers, if any | | 1.06% | | 1.06% | | 1.07% | | 1.07% | | 1.08% |
| Expenses net of all reductions | | 1.06% | | 1.06% | | 1.07% | | 1.07% | | 1.08% |
| Net investment income (loss) | | 2.55% | | 1.36% | | .72% | | 1.09% | | 1.72% |
| Supplemental Data | | | | | | | | | | |
| Net assets, end of period (000 omitted) | $ | 28,202 | $ | 27,193 | $ | 31,762 | $ | 27,366 | $ | 25,696 |
Portfolio turnover rate H | | 28% | | 22% | | 25% | | 25% | | 41% |
ACalculated based on average shares outstanding during the period.
BNet investment income (loss) is affected by the timing of the declaration of dividends by any underlying mutual funds or exchange-traded funds (ETFs). Net investment income (loss) of any mutual funds or ETFs is not included in the Fund's net investment income (loss) ratio.
CTotal distributions per share do not sum due to rounding.
DTotal returns would have been lower if certain expenses had not been reduced during the applicable periods shown.
ETotal returns do not include the effect of the sales charges.
FFees and expenses of any underlying mutual funds or exchange-traded funds (ETFs) are not included in the Fund's expense ratio. The Fund indirectly bears its proportionate share of these expenses. For additional expense information related to investments in Fidelity Central Funds, please refer to the "Investments in Fidelity Central Funds" note found in the Notes to Financial Statements section of the most recent Annual or Semi-Annual report.
GExpense ratios reflect operating expenses of the class. Expenses before reductions do not reflect amounts reimbursed, waived, or reduced through arrangements with the investment adviser, brokerage services, or other offset arrangements, if applicable, and do not represent the amount paid by the class during periods when reimbursements, waivers or reductions occur.
HAmount does not include the portfolio activity of any underlying mutual funds or exchange-traded funds (ETFs).
| Fidelity Advisor Asset Manager® 20% Class C |
| |
| Years ended September 30, | | 2023 | | 2022 | | 2021 | | 2020 | | 2019 |
Selected Per-Share Data | | | | | | | | | | |
| Net asset value, beginning of period | $ | 12.67 | $ | 14.61 | $ | 13.91 | $ | 13.43 | $ | 13.32 |
| Income from Investment Operations | | | | | | | | | | |
Net investment income (loss) A,B | | .26 | | .12 | | .03 | | .08 | | .16 |
| Net realized and unrealized gain (loss) | | .16 | | (1.92) | | .82 | | .61 | | .36 |
| Total from investment operations | | .42 | | (1.80) | | .85 | | .69 | | .52 |
| Distributions from net investment income | | (.30) | | (.11) | | (.03) | | (.09) | | (.16) |
| Distributions from net realized gain | | (.26) | | (.03) | | (.12) | | (.13) | | (.24) |
| Total distributions | | (.56) | | (.14) | | (.15) | | (.21) C | | (.41) C |
| Net asset value, end of period | $ | 12.53 | $ | 12.67 | $ | 14.61 | $ | 13.91 | $ | 13.43 |
Total Return D,E | | 3.35% | | (12.41)% | | 6.10% | | 5.22% | | 4.06% |
Ratios to Average Net Assets B,F,G | | | | | | | | | | |
| Expenses before reductions | | 1.57% | | 1.57% | | 1.57% | | 1.58% | | 1.59% |
| Expenses net of fee waivers, if any | | 1.57% | | 1.57% | | 1.57% | | 1.58% | | 1.59% |
| Expenses net of all reductions | | 1.57% | | 1.57% | | 1.57% | | 1.58% | | 1.59% |
| Net investment income (loss) | | 2.05% | | .85% | | .22% | | .59% | | 1.21% |
| Supplemental Data | | | | | | | | | | |
| Net assets, end of period (000 omitted) | $ | 16,531 | $ | 19,557 | $ | 25,804 | $ | 24,940 | $ | 21,588 |
Portfolio turnover rate H | | 28% | | 22% | | 25% | | 25% | | 41% |
ACalculated based on average shares outstanding during the period.
BNet investment income (loss) is affected by the timing of the declaration of dividends by any underlying mutual funds or exchange-traded funds (ETFs). Net investment income (loss) of any mutual funds or ETFs is not included in the Fund's net investment income (loss) ratio.
CTotal distributions per share do not sum due to rounding.
DTotal returns would have been lower if certain expenses had not been reduced during the applicable periods shown.
ETotal returns do not include the effect of the contingent deferred sales charge.
FFees and expenses of any underlying mutual funds or exchange-traded funds (ETFs) are not included in the Fund's expense ratio. The Fund indirectly bears its proportionate share of these expenses. For additional expense information related to investments in Fidelity Central Funds, please refer to the "Investments in Fidelity Central Funds" note found in the Notes to Financial Statements section of the most recent Annual or Semi-Annual report.
GExpense ratios reflect operating expenses of the class. Expenses before reductions do not reflect amounts reimbursed, waived, or reduced through arrangements with the investment adviser, brokerage services, or other offset arrangements, if applicable, and do not represent the amount paid by the class during periods when reimbursements, waivers or reductions occur.
HAmount does not include the portfolio activity of any underlying mutual funds or exchange-traded funds (ETFs).
| Fidelity Asset Manager® 20% |
| |
| Years ended September 30, | | 2023 | | 2022 | | 2021 | | 2020 | | 2019 |
Selected Per-Share Data | | | | | | | | | | |
| Net asset value, beginning of period | $ | 12.83 | $ | 14.76 | $ | 14.02 | $ | 13.54 | $ | 13.42 |
| Income from Investment Operations | | | | | | | | | | |
Net investment income (loss) A,B | | .40 | | .27 | | .19 | | .23 | | .30 |
| Net realized and unrealized gain (loss) | | .16 | | (1.93) | | .82 | | .61 | | .37 |
| Total from investment operations | | .56 | | (1.66) | | 1.01 | | .84 | | .67 |
| Distributions from net investment income | | (.44) | | (.24) | | (.15) | | (.23) | | (.31) |
| Distributions from net realized gain | | (.26) | | (.03) | | (.12) | | (.13) | | (.24) |
| Total distributions | | (.70) | | (.27) | | (.27) | | (.36) | | (.55) |
| Net asset value, end of period | $ | 12.69 | $ | 12.83 | $ | 14.76 | $ | 14.02 | $ | 13.54 |
Total Return C | | 4.40% | | (11.41)% | | 7.24% | | 6.29% | | 5.24% |
Ratios to Average Net Assets B,D,E | | | | | | | | | | |
| Expenses before reductions | | .51% | | .50% | | .50% | | .51% | | .51% |
| Expenses net of fee waivers, if any | | .51% | | .50% | | .50% | | .50% | | .51% |
| Expenses net of all reductions | | .51% | | .50% | | .50% | | .50% | | .51% |
| Net investment income (loss) | | 3.11% | | 1.92% | | 1.29% | | 1.66% | | 2.29% |
| Supplemental Data | | | | | | | | | | |
| Net assets, end of period (000 omitted) | $ | 3,329,197 | $ | 3,734,894 | $ | 4,723,410 | $ | 5,377,374 | $ | 4,990,188 |
Portfolio turnover rate F | | 28% | | 22% | | 25% | | 25% | | 41% |
ACalculated based on average shares outstanding during the period.
BNet investment income (loss) is affected by the timing of the declaration of dividends by any underlying mutual funds or exchange-traded funds (ETFs). Net investment income (loss) of any mutual funds or ETFs is not included in the Fund's net investment income (loss) ratio.
CTotal returns would have been lower if certain expenses had not been reduced during the applicable periods shown.
DFees and expenses of any underlying mutual funds or exchange-traded funds (ETFs) are not included in the Fund's expense ratio. The Fund indirectly bears its proportionate share of these expenses. For additional expense information related to investments in Fidelity Central Funds, please refer to the "Investments in Fidelity Central Funds" note found in the Notes to Financial Statements section of the most recent Annual or Semi-Annual report.
EExpense ratios reflect operating expenses of the class. Expenses before reductions do not reflect amounts reimbursed, waived, or reduced through arrangements with the investment adviser, brokerage services, or other offset arrangements, if applicable, and do not represent the amount paid by the class during periods when reimbursements, waivers or reductions occur.
FAmount does not include the portfolio activity of any underlying mutual funds or exchange-traded funds (ETFs).
| Fidelity Advisor Asset Manager® 20% Class I |
| |
| Years ended September 30, | | 2023 | | 2022 | | 2021 | | 2020 | | 2019 |
Selected Per-Share Data | | | | | | | | | | |
| Net asset value, beginning of period | $ | 12.83 | $ | 14.76 | $ | 14.02 | $ | 13.53 | $ | 13.41 |
| Income from Investment Operations | | | | | | | | | | |
Net investment income (loss) A,B | | .40 | | .26 | | .18 | | .22 | | .30 |
| Net realized and unrealized gain (loss) | | .15 | | (1.93) | | .82 | | .61 | | .36 |
| Total from investment operations | | .55 | | (1.67) | | 1.00 | | .83 | | .66 |
| Distributions from net investment income | | (.43) | | (.23) | | (.14) | | (.22) | | (.30) |
| Distributions from net realized gain | | (.26) | | (.03) | | (.12) | | (.13) | | (.24) |
| Total distributions | | (.69) | | (.26) | | (.26) | | (.34) C | | (.54) |
| Net asset value, end of period | $ | 12.69 | $ | 12.83 | $ | 14.76 | $ | 14.02 | $ | 13.53 |
Total Return D | | 4.33% | | (11.46)% | | 7.17% | | 6.27% | | 5.18% |
Ratios to Average Net Assets B,E,F | | | | | | | | | | |
| Expenses before reductions | | .55% | | .55% | | .55% | | .58% | | .56% |
| Expenses net of fee waivers, if any | | .55% | | .55% | | .55% | | .57% | | .56% |
| Expenses net of all reductions | | .55% | | .55% | | .55% | | .57% | | .56% |
| Net investment income (loss) | | 3.06% | | 1.87% | | 1.24% | | 1.59% | | 2.24% |
| Supplemental Data | | | | | | | | | | |
| Net assets, end of period (000 omitted) | $ | 20,594 | $ | 28,182 | $ | 31,374 | $ | 32,445 | $ | 25,577 |
Portfolio turnover rate G | | 28% | | 22% | | 25% | | 25% | | 41% |
ACalculated based on average shares outstanding during the period.
BNet investment income (loss) is affected by the timing of the declaration of dividends by any underlying mutual funds or exchange-traded funds (ETFs). Net investment income (loss) of any mutual funds or ETFs is not included in the Fund's net investment income (loss) ratio.
CTotal distributions per share do not sum due to rounding.
DTotal returns would have been lower if certain expenses had not been reduced during the applicable periods shown.
EFees and expenses of any underlying mutual funds or exchange-traded funds (ETFs) are not included in the Fund's expense ratio. The Fund indirectly bears its proportionate share of these expenses. For additional expense information related to investments in Fidelity Central Funds, please refer to the "Investments in Fidelity Central Funds" note found in the Notes to Financial Statements section of the most recent Annual or Semi-Annual report.
FExpense ratios reflect operating expenses of the class. Expenses before reductions do not reflect amounts reimbursed, waived, or reduced through arrangements with the investment adviser, brokerage services, or other offset arrangements, if applicable, and do not represent the amount paid by the class during periods when reimbursements, waivers or reductions occur.
GAmount does not include the portfolio activity of any underlying mutual funds or exchange-traded funds (ETFs).
| Fidelity Advisor Asset Manager® 20% Class Z |
| |
| Years ended September 30, | | 2023 | | 2022 | | 2021 | | 2020 | | 2019 A |
Selected Per-Share Data | | | | | | | | | | |
| Net asset value, beginning of period | $ | 12.82 | $ | 14.76 | $ | 14.02 | $ | 13.53 | $ | 13.41 |
| Income from Investment Operations | | | | | | | | | | |
Net investment income (loss) B,C | | .41 | | .27 | | .19 | | .23 | | .30 |
| Net realized and unrealized gain (loss) | | .15 | | (1.93) | | .82 | | .62 | | .37 |
| Total from investment operations | | .56 | | (1.66) | | 1.01 | | .85 | | .67 |
| Distributions from net investment income | | (.44) | | (.24) | | (.16) | | (.24) | | (.31) |
| Distributions from net realized gain | | (.26) | | (.03) | | (.12) | | (.13) | | (.24) |
| Total distributions | | (.70) | | (.28) D | | (.27) D | | (.36) D | | (.55) |
| Net asset value, end of period | $ | 12.68 | $ | 12.82 | $ | 14.76 | $ | 14.02 | $ | 13.53 |
Total Return E,F | | 4.42% | | (11.45)% | | 7.27% | | 6.41% | | 5.27% |
Ratios to Average Net Assets C,G,H | | | | | | | | | | |
| Expenses before reductions | | .47% | | .47% | | .47% | | .48% | | .48% I |
| Expenses net of fee waivers, if any | | .47% | | .47% | | .47% | | .48% | | .48% I |
| Expenses net of all reductions | | .47% | | .47% | | .47% | | .48% | | .48% I |
| Net investment income (loss) | | 3.14% | | 1.95% | | 1.31% | | 1.69% | | 2.32% I |
| Supplemental Data | | | | | | | | | | |
| Net assets, end of period (000 omitted) | $ | 1,785,426 | $ | 1,566,447 | $ | 1,485,829 | $ | 18,177 | $ | 14,613 |
Portfolio turnover rate J | | 28% | | 22% | | 25% | | 25% | | 41% |
AFor the period October 2, 2018 (commencement of sale of shares) through September 30, 2019.
BCalculated based on average shares outstanding during the period.
CNet investment income (loss) is affected by the timing of the declaration of dividends by any underlying mutual funds or exchange-traded funds (ETFs). Net investment income (loss) of any mutual funds or ETFs is not included in the Fund's net investment income (loss) ratio.
DTotal distributions per share do not sum due to rounding.
ETotal returns for periods of less than one year are not annualized.
FTotal returns would have been lower if certain expenses had not been reduced during the applicable periods shown.
GFees and expenses of any underlying mutual funds or exchange-traded funds (ETFs) are not included in the Fund's expense ratio. The Fund indirectly bears its proportionate share of these expenses. For additional expense information related to investments in Fidelity Central Funds, please refer to the "Investments in Fidelity Central Funds" note found in the Notes to Financial Statements section of the most recent Annual or Semi-Annual report.
HExpense ratios reflect operating expenses of the class. Expenses before reductions do not reflect amounts reimbursed, waived, or reduced through arrangements with the investment adviser, brokerage services, or other offset arrangements, if applicable, and do not represent the amount paid by the class during periods when reimbursements, waivers or reductions occur.
IAnnualized.
JAmount does not include the portfolio activity of any underlying mutual funds or exchange-traded funds (ETFs).
The information in the following tables is based on the combined Investments of the Fund and it's pro-rata share of investments in Fidelity's Central Funds, other than the Commodity Strategy and Money Market Central Funds.
Top Holdings (% of Fund's net assets) |
| |
| Microsoft Corp. | 1.5 | |
| iShares MSCI USA Minimum Volatility ETF | 1.3 | |
| Apple, Inc. | 1.2 | |
| Alphabet, Inc. Class A | 0.9 | |
| Amazon.com, Inc. | 0.8 | |
| iShares 20+ Year Treasury Bond ETF | 0.6 | |
| Exxon Mobil Corp. | 0.5 | |
| NVIDIA Corp. | 0.5 | |
| Meta Platforms, Inc. Class A | 0.5 | |
| JPMorgan Chase & Co. | 0.5 | |
| | 8.3 | |
| |
| Top Bond Issuers (% of Fund's net assets) |
(with maturities greater than one year) |
| U.S. Treasury Obligations | 20.0 | |
| Fannie Mae | 3.5 | |
| Freddie Mac | 3.3 | |
| Ginnie Mae | 1.8 | |
| Uniform Mortgage Backed Securities | 1.7 | |
| JPMorgan Chase & Co. | 0.7 | |
| Morgan Stanley | 0.6 | |
| Citigroup, Inc. | 0.6 | |
| Bank of America Corp. | 0.4 | |
| Petroleos Mexicanos | 0.4 | |
| | 33.0 | |
| |
| Market Sectors (% of Fund's net assets) |
| |
| Financials | 21.4 | |
| Information Technology | 8.2 | |
| Health Care | 5.2 | |
| Industrials | 4.7 | |
| Consumer Discretionary | 4.7 | |
| Communication Services | 3.8 | |
| Energy | 3.1 | |
| Consumer Staples | 3.1 | |
| Real Estate | 2.1 | |
| Materials | 1.7 | |
| Utilities | 1.0 | |
| |
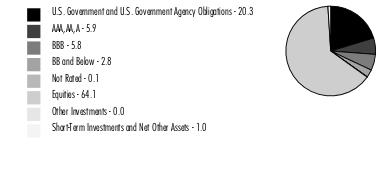
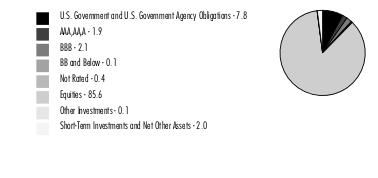
Quality Diversification (% of Fund's net assets) |
|
Percentages shown as 0.0% may reflect amounts less than 0.05%. |
| |
| We have used ratings from Moody's Investors Service, Inc. Where Moody's® ratings are not available, we have used S&P® ratings. All ratings are as of the date indicated and do not reflect subsequent changes. |
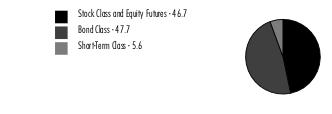
Asset Allocation (% of Fund's net assets) |
|
|
Asset allocations in the pie charts reflect the categorization of assets as defined in the Fund's prospectus in effect as of the time periods indicated above. Percentages are adjusted for the effect of future contracts and swap contracts, if applicable.
Geographic Diversification (% of Fund's net assets) |
|
* Includes Short-Term investments and Net Other Assets (Liabilities). Percentages are adjusted for the effect of derivatives, if applicable. |
| |
Percentages in the above tables are adjusted for the effect of TBA sale Commitments.
Equities and Stock Class and Equity Futures percentages above include Fidelity Commodity Strategy Central Fund of 0.2%.
At period end, foreign investments including the Fund's pro-rata share of the underlying Central Funds, other than the Commodity Strategy Central and Money Market Funds, was 18.8% of net assets.
An unaudited holdings list for the Fund, which presents direct holdings as well as the pro-rata share of any securities and other investments held indirectly through its investment in underlying Fidelity Central Funds, other than the Commodity Strategy and Money Market Central Funds, is available at fidelity.com and/or institutional.fidelity.com, as applicable.
Fidelity Asset Manager® 30%
Showing Percentage of Net Assets
| Equity Central Funds - 35.9% |
| | | Shares | Value ($) |
| Fidelity Commodity Strategy Central Fund (a) | | 48,891 | 4,615,345 |
| Fidelity Emerging Markets Equity Central Fund (a) | | 465,186 | 87,366,529 |
| Fidelity Hedged Equity Central Fund (a) | | 254,029 | 26,352,919 |
| Fidelity International Equity Central Fund (a) | | 1,923,147 | 170,044,678 |
| Fidelity Real Estate Equity Central Fund (a) | | 71,458 | 8,006,189 |
| Fidelity U.S. Equity Central Fund (a) | | 3,584,945 | 416,893,259 |
| TOTAL EQUITY CENTRAL FUNDS (Cost $500,388,731) | | | 713,278,919 |
| | | | |
| Fixed-Income Central Funds - 51.0% |
| | | Shares | Value ($) |
| High Yield Fixed-Income Funds - 2.8% | | | |
| Fidelity Emerging Markets Debt Central Fund (a) | | 240,680 | 1,766,594 |
| Fidelity Emerging Markets Debt Local Currency Central Fund (a) | | 191,309 | 16,932,788 |
| Fidelity Floating Rate Central Fund (a) | | 273,882 | 26,845,875 |
| Fidelity High Income Central Fund (a) | | 101,463 | 10,261,998 |
TOTAL HIGH YIELD FIXED-INCOME FUNDS | | | 55,807,255 |
| Investment Grade Fixed-Income Funds - 48.2% | | | |
| Fidelity Inflation-Protected Bond Index Central Fund (a) | | 229,196 | 20,169,277 |
| Fidelity International Credit Central Fund (a) | | 67,403 | 5,128,668 |
| Fidelity Investment Grade Bond Central Fund (a) | | 9,964,329 | 932,760,855 |
TOTAL INVESTMENT GRADE FIXED-INCOME FUNDS | | | 958,058,800 |
| TOTAL FIXED-INCOME CENTRAL FUNDS (Cost $1,155,674,181) | | | 1,013,866,055 |
| | | | |
| Money Market Central Funds - 11.3% |
| | | Shares | Value ($) |
| Fidelity Cash Central Fund 5.39% (b) | | 63,649,521 | 63,662,251 |
| Fidelity Money Market Central Fund 5.51% (b) | | 149,082,715 | 149,067,807 |
| Fidelity Securities Lending Cash Central Fund 5.39% (b)(c) | | 12,342,966 | 12,344,200 |
| TOTAL MONEY MARKET CENTRAL FUNDS (Cost $225,084,012) | | | 225,074,258 |
| | | | |
| U.S. Treasury Obligations - 0.5% |
| | | Principal Amount (d) | Value ($) |
U.S. Treasury Bills, yield at date of purchase 5.37% to 5.39% 12/7/23 to 12/21/23 (e) (Cost $9,817,693) | | 9,920,000 | 9,818,984 |
| | | | |
| Investment Companies - 1.9% |
| | | Shares | Value ($) |
| iShares 20+ Year Treasury Bond ETF (f) | | 141,386 | 12,539,524 |
| iShares MSCI USA Minimum Volatility ETF | | 364,422 | 26,376,863 |
| TOTAL INVESTMENT COMPANIES (Cost $40,060,553) | | | 38,916,387 |
| | | | |
| TOTAL INVESTMENT IN SECURITIES - 100.6% (Cost $1,931,025,170) | 2,000,954,603 |
NET OTHER ASSETS (LIABILITIES) - (0.6)% | (12,149,774) |
| NET ASSETS - 100.0% | 1,988,804,829 |
| | |
| Futures Contracts |
| | Number of contracts | Expiration Date | Notional Amount ($) | Value ($) | Unrealized Appreciation/ (Depreciation) ($) |
| Sold | | | | | |
| | | | | | |
| Equity Index Contracts | | | | | |
| CME E-mini S&P 500 Index Contracts (United States) | 661 | Dec 2023 | 142,957,775 | 4,921,341 | 4,921,341 |
| ICE MSCI Emerging Markets Index Contracts (United States) | 503 | Dec 2023 | 24,030,825 | 800,176 | 800,176 |
| | | | | | |
| TOTAL FUTURES CONTRACTS | | | | | 5,721,517 |
| The notional amount of futures sold as a percentage of Net Assets is 8.4% |
For the period, the average monthly notional amount at value for futures contracts in the aggregate was $177,484,750.
Security Type Abbreviations
Legend
| (a) | Affiliated fund that is generally available only to investment companies and other accounts managed by Fidelity Investments. A complete unaudited schedule of portfolio holdings for each Fidelity Central Fund is filed with the SEC for the first and third quarters of each fiscal year on Form N-PORT and is available upon request or at the SEC's website at www.sec.gov. An unaudited holdings listing for the Fund, which presents direct holdings as well as the pro-rata share of securities and other investments held indirectly through its investment in underlying non-money market Fidelity Central Funds, other than the Commodity Strategy Central Fund, is available at fidelity.com and/or institutional.fidelity.com, as applicable. In addition, each Fidelity Central Fund's financial statements,which are not covered by the Fund's Report of Independent Registered Public Accounting Firm, are available on the SEC's website or upon request. |
| (b) | Affiliated fund that is generally available only to investment companies and other accounts managed by Fidelity Investments. The rate quoted is the annualized seven-day yield of the fund at period end. A complete unaudited listing of the fund's holdings as of its most recent quarter end is available upon request. In addition, each Fidelity Central Fund's financial statements, which are not covered by the Fund's Report of Independent Registered Public Accounting Firm, are available on the SEC's website or upon request. |
| (c) | Investment made with cash collateral received from securities on loan. |
| (d) | Amount is stated in United States dollars unless otherwise noted. |
| (e) | Security or a portion of the security was pledged to cover margin requirements for futures contracts. At period end, the value of securities pledged amounted to $9,432,784. |
| (f) | Security or a portion of the security is on loan at period end. |
Affiliated Central Funds
Fiscal year to date information regarding the Fund's investments in Fidelity Central Funds, including the ownership percentage, is presented below.
| Affiliate | Value, beginning of period ($) | Purchases ($) | Sales Proceeds ($) | Dividend Income ($) | Realized Gain (loss) ($) | Change in Unrealized appreciation (depreciation) ($) | Value, end of period ($) | % ownership, end of period |
| Fidelity Cash Central Fund 5.39% | 26,304,484 | 312,228,658 | 274,870,891 | 1,133,084 | - | - | 63,662,251 | 0.2% |
| Fidelity Commodity Strategy Central Fund | 43,032,802 | 1,223,014 | 37,994,053 | 665,812 | (9,373,983) | 7,727,565 | 4,615,345 | 2.0% |
| Fidelity Emerging Markets Debt Central Fund | 4,177,203 | 437,149 | 3,027,133 | 200,976 | (576,093) | 755,468 | 1,766,594 | 0.1% |
| Fidelity Emerging Markets Debt Local Currency Central Fund | 5,164,720 | 10,949,901 | 40 | 14,496 | 16,884 | 801,323 | 16,932,788 | 6.2% |
| Fidelity Emerging Markets Equity Central Fund | 71,327,680 | 35,106,434 | 25,457,769 | 2,525,783 | (8,163,191) | 14,553,375 | 87,366,529 | 4.1% |
| Fidelity Floating Rate Central Fund | 64,573,399 | 5,119,785 | 44,937,871 | 4,259,740 | (1,527,054) | 3,617,616 | 26,845,875 | 1.8% |
| Fidelity Hedged Equity Central Fund | - | 26,401,838 | - | 3,543 | - | (48,919) | 26,352,919 | 6.1% |
| Fidelity High Income Central Fund | 17,488,385 | 1,568,946 | 9,448,897 | 1,186,077 | 410,236 | 243,328 | 10,261,998 | 0.7% |
| Fidelity Inflation-Protected Bond Index Central Fund | 33,761,713 | 4,225,992 | 14,984,760 | 3,712,593 | (1,463,442) | (1,370,226) | 20,169,277 | 4.8% |
| Fidelity International Credit Central Fund | 20,783,361 | 1,301,338 | 16,168,228 | 1,063,697 | (4,692,959) | 3,905,156 | 5,128,668 | 2.6% |
| Fidelity International Equity Central Fund | 121,113,145 | 78,933,602 | 59,046,755 | 4,086,847 | (2,388,833) | 31,433,519 | 170,044,678 | 3.6% |
| Fidelity Investment Grade Bond Central Fund | 958,225,809 | 163,595,839 | 166,965,978 | 37,378,653 | (15,585,053) | (6,509,762) | 932,760,855 | 2.5% |
| Fidelity Money Market Central Fund 0.45% | 198,931,024 | 11,271,787 | 61,136,308 | 8,284,267 | (4,604) | 5,908 | 149,067,807 | 12.8% |
| Fidelity Real Estate Equity Central Fund | 14,434,007 | 585,865 | 7,643,570 | 347,521 | 35,685 | 594,202 | 8,006,189 | 0.9% |
| Fidelity Securities Lending Cash Central Fund 5.39% | - | 116,495,929 | 104,151,729 | 1,708 | - | - | 12,344,200 | 0.0% |
| Fidelity U.S. Equity Central Fund | 493,161,621 | 19,418,826 | 175,890,227 | 13,102,130 | 3,375,042 | 76,827,997 | 416,893,259 | 2.6% |
| Total | 2,072,479,353 | 788,864,903 | 1,001,724,209 | 77,966,927 | (39,937,365) | 132,536,550 | 1,952,219,232 | |
| | | | | | | | | |
Amounts in the dividend income column in the above table include any capital gain distributions from underlying funds, which are presented in the corresponding line item in the Statement of Operations, if applicable.
Amounts in the dividend income column for Fidelity Securities Lending Cash Central Fund represents the income earned on investing cash collateral, less rebates paid to borrowers and any lending agent fees associated with the loan, plus any premium payments received for lending certain types of securities.
Amounts included in the purchases and sales proceeds columns may include in-kind transactions, if applicable.
Investment Valuation
The following is a summary of the inputs used, as of September 30, 2023, involving the Fund's assets and liabilities carried at fair value. The inputs or methodology used for valuing securities may not be an indication of the risk associated with investing in those securities. For more information on valuation inputs, and their aggregation into the levels used below, please refer to the Investment Valuation section in the accompanying Notes to Financial Statements.
| Valuation Inputs at Reporting Date: |
| Description | Total ($) | Level 1 ($) | Level 2 ($) | Level 3 ($) |
Investments in Securities: | | | | |
|
| Equity Central Funds | 713,278,919 | 713,278,919 | - | - |
|
| Fixed-Income Central Funds | 1,013,866,055 | 1,013,866,055 | - | - |
|
| Money Market Central Funds | 225,074,258 | 225,074,258 | - | - |
|
| U.S Treasury Obligations | 9,818,984 | - | 9,818,984 | - |
|
| Investment Companies | 38,916,387 | 38,916,387 | - | - |
| Total Investments in Securities: | 2,000,954,603 | 1,991,135,619 | 9,818,984 | - |
Derivative Instruments: Assets | | | | |
Futures Contracts | 5,721,517 | 5,721,517 | - | - |
| Total Assets | 5,721,517 | 5,721,517 | - | - |
| Total Derivative Instruments: | 5,721,517 | 5,721,517 | - | - |
Value of Derivative Instruments
The following table is a summary of the Fund's value of derivative instruments by primary risk exposure as of September 30, 2023. For additional information on derivative instruments, please refer to the Derivative Instruments section in the accompanying Notes to Financial Statements.
Primary Risk Exposure / Derivative Type | Value |
| Asset ($) | Liability ($) |
| Equity Risk | | |
Futures Contracts (a) | 5,721,517 | 0 |
| Total Equity Risk | 5,721,517 | 0 |
| Total Value of Derivatives | 5,721,517 | 0 |
(a)Reflects gross cumulative appreciation (depreciation) on futures contracts as presented in the Schedule of Investments. In the Statement of Assets and Liabilities, the period end daily variation margin is included in receivable or payable for daily variation margin on futures contracts, and the net cumulative appreciation (depreciation) is included in Total accumulated earnings (loss).
Fidelity Asset Manager® 30%
| Statement of Assets and Liabilities |
| | | | September 30, 2023 |
| | | | | |
| Assets | | | | |
| Investment in securities, at value (including securities loaned of $12,097,316) - See accompanying schedule: | | | | |
Unaffiliated issuers (cost $49,878,246) | $ | 48,735,371 | | |
Fidelity Central Funds (cost $1,881,146,924) | | 1,952,219,232 | | |
| | | | | |
| | | | | |
| Total Investment in Securities (cost $1,931,025,170) | | | $ | 2,000,954,603 |
| Receivable for investments sold | | | | 2,778,416 |
| Receivable for fund shares sold | | | | 148,860 |
| Dividends receivable | | | | 141,043 |
| Distributions receivable from Fidelity Central Funds | | | | 113,029 |
| Receivable for daily variation margin on futures contracts | | | | 396,600 |
| Prepaid expenses | | | | 2,926 |
Total assets | | | | 2,004,535,477 |
| Liabilities | | | | |
| Payable for investments purchased | $ | 143,024 | | |
| Payable for fund shares redeemed | | 2,290,633 | | |
| Accrued management fee | | 672,339 | | |
| Distribution and service plan fees payable | | 41,212 | | |
| Other affiliated payables | | 194,267 | | |
| Other payables and accrued expenses | | 44,973 | | |
| Collateral on securities loaned | | 12,344,200 | | |
| Total Liabilities | | | | 15,730,648 |
| Net Assets | | | $ | 1,988,804,829 |
| Net Assets consist of: | | | | |
| Paid in capital | | | $ | 2,042,888,679 |
| Total accumulated earnings (loss) | | | | (54,083,850) |
| Net Assets | | | $ | 1,988,804,829 |
| | | | | |
| Net Asset Value and Maximum Offering Price | | | | |
| Class A : | | | | |
Net Asset Value and redemption price per share ($69,350,304 ÷ 6,397,215 shares)(a) | | | $ | 10.84 |
| Maximum offering price per share (100/94.25 of $10.84) | | | $ | 11.50 |
| Class M : | | | | |
Net Asset Value and redemption price per share ($21,273,917 ÷ 1,967,367 shares)(a) | | | $ | 10.81 |
| Maximum offering price per share (100/96.50 of $10.81) | | | $ | 11.20 |
| Class C : | | | | |
Net Asset Value and offering price per share ($20,534,106 ÷ 1,918,502 shares)(a) | | | $ | 10.70 |
| Asset Manager 30% : | | | | |
Net Asset Value, offering price and redemption price per share ($1,418,965,860 ÷ 130,968,783 shares) | | | $ | 10.83 |
| Class I : | | | | |
Net Asset Value, offering price and redemption price per share ($24,321,756 ÷ 2,244,623 shares) | | | $ | 10.84 |
| Class Z : | | | | |
Net Asset Value, offering price and redemption price per share ($434,358,886 ÷ 40,094,247 shares) | | | $ | 10.83 |
(a)Redemption price per share is equal to net asset value less any applicable contingent deferred sales charge. |
| Statement of Operations |
| | | | Year ended September 30, 2023 |
| Investment Income | | | | |
| Dividends | | | $ | 1,125,020 |
| Interest | | | | 441,404 |
| Income from Fidelity Central Funds (including $1,708 from security lending) | | | | 70,140,558 |
| Total Income | | | | 71,706,982 |
| Expenses | | | | |
| Management fee | $ | 8,574,473 | | |
| Transfer agent fees | | 1,715,977 | | |
| Distribution and service plan fees | | 526,803 | | |
| Accounting fees | | 706,673 | | |
| Custodian fees and expenses | | 32,111 | | |
| Independent trustees' fees and expenses | | 8,080 | | |
| Registration fees | | 98,949 | | |
| Audit | | 38,997 | | |
| Legal | | 4,709 | | |
| Miscellaneous | | 21,871 | | |
| Total expenses before reductions | | 11,728,643 | | |
| Expense reductions | | (59,046) | | |
| Total expenses after reductions | | | | 11,669,597 |
| Net Investment income (loss) | | | | 60,037,385 |
| Realized and Unrealized Gain (Loss) | | | | |
| Net realized gain (loss) on: | | | | |
| Investment Securities: | | | | |
| Unaffiliated issuers | | (18,717,071) | | |
| Fidelity Central Funds | | (39,937,365) | | |
| Futures contracts | | (11,676,170) | | |
| Capital gain distributions from Fidelity Central Funds | | 7,826,369 | | |
| Total net realized gain (loss) | | | | (62,504,237) |
| Change in net unrealized appreciation (depreciation) on: | | | | |
| Investment Securities: | | | | |
| Unaffiliated issuers | | 14,438,992 | | |
| Fidelity Central Funds | | 132,536,550 | | |
| Futures contracts | | (11,394,821) | | |
| Total change in net unrealized appreciation (depreciation) | | | | 135,580,721 |
| Net gain (loss) | | | | 73,076,484 |
| Net increase (decrease) in net assets resulting from operations | | | $ | 133,113,869 |
| Statement of Changes in Net Assets |
| |
| | Year ended September 30, 2023 | | Year ended September 30, 2022 |
| Increase (Decrease) in Net Assets | | | | |
| Operations | | | | |
| Net investment income (loss) | $ | 60,037,385 | $ | 52,128,543 |
| Net realized gain (loss) | | (62,504,237) | | 71,770,963 |
| Change in net unrealized appreciation (depreciation) | | 135,580,721 | | (500,477,751) |
| Net increase (decrease) in net assets resulting from operations | | 133,113,869 | | (376,578,245) |
| Distributions to shareholders | | (118,388,775) | | (58,123,685) |
| | | | | |
| Share transactions - net increase (decrease) | | (199,275,265) | | (274,428,795) |
| Total increase (decrease) in net assets | | (184,550,171) | | (709,130,725) |
| | | | | |
| Net Assets | | | | |
| Beginning of period | | 2,173,355,000 | | 2,882,485,725 |
| End of period | $ | 1,988,804,829 | $ | 2,173,355,000 |
| | | | | |
| | | | | |
Financial Highlights
| Fidelity Advisor Asset Manager® 30% Class A |
| |
| Years ended September 30, | | 2023 | | 2022 | | 2021 | | 2020 | | 2019 |
Selected Per-Share Data | | | | | | | | | | |
| Net asset value, beginning of period | $ | 10.80 | $ | 12.77 | $ | 11.80 | $ | 11.24 | $ | 11.15 |
| Income from Investment Operations | | | | | | | | | | |
Net investment income (loss) A,B | | .28 | | .20 | | .14 | | .16 | | .21 |
| Net realized and unrealized gain (loss) | | .33 | | (1.95) | | 1.03 | | .71 | | .27 |
| Total from investment operations | | .61 | | (1.75) | | 1.17 | | .87 | | .48 |
| Distributions from net investment income | | (.31) | | (.18) | | (.09) | | (.17) | | (.21) |
| Distributions from net realized gain | | (.26) | | (.04) | | (.11) | | (.14) | | (.18) |
| Total distributions | | (.57) | | (.22) | | (.20) | | (.31) | | (.39) |
| Net asset value, end of period | $ | 10.84 | $ | 10.80 | $ | 12.77 | $ | 11.80 | $ | 11.24 |
Total Return C,D | | 5.74% | | (13.89)% | | 9.98% | | 7.83% | | 4.54% |
Ratios to Average Net Assets B,E,F | | | | | | | | | | |
| Expenses before reductions | | .82% | | .82% | | .82% | | .82% | | .82% |
| Expenses net of fee waivers, if any | | .82% | | .82% | | .82% | | .82% | | .82% |
| Expenses net of all reductions | | .82% | | .82% | | .82% | | .82% | | .82% |
| Net investment income (loss) | | 2.51% | | 1.66% | | 1.10% | | 1.43% | | 1.91% |
| Supplemental Data | | | | | | | | | | |
| Net assets, end of period (000 omitted) | $ | 69,350 | $ | 71,633 | $ | 77,502 | $ | 50,625 | $ | 36,978 |
Portfolio turnover rate G | | 22% | | 23% | | 18% | | 23% | | 34% |
ACalculated based on average shares outstanding during the period.
BNet investment income (loss) is affected by the timing of the declaration of dividends by any underlying mutual funds or exchange-traded funds (ETFs). Net investment income (loss) of any mutual funds or ETFs is not included in the Fund's net investment income (loss) ratio.
CTotal returns would have been lower if certain expenses had not been reduced during the applicable periods shown.
DTotal returns do not include the effect of the sales charges.
EFees and expenses of any underlying mutual funds or exchange-traded funds (ETFs) are not included in the Fund's expense ratio. The Fund indirectly bears its proportionate share of these expenses.
FExpense ratios reflect operating expenses of the class. Expenses before reductions do not reflect amounts reimbursed, waived, or reduced through arrangements with the investment adviser, brokerage services, or other offset arrangements, if applicable, and do not represent the amount paid by the class during periods when reimbursements, waivers or reductions occur.
GAmount does not include the portfolio activity of any underlying mutual funds or exchange-traded funds (ETFs).
| Fidelity Advisor Asset Manager® 30% Class M |
| |
| Years ended September 30, | | 2023 | | 2022 | | 2021 | | 2020 | | 2019 |
Selected Per-Share Data | | | | | | | | | | |
| Net asset value, beginning of period | $ | 10.77 | $ | 12.75 | $ | 11.77 | $ | 11.22 | $ | 11.13 |
| Income from Investment Operations | | | | | | | | | | |
Net investment income (loss) A,B | | .25 | | .17 | | .11 | | .13 | | .18 |
| Net realized and unrealized gain (loss) | | .34 | | (1.95) | | 1.04 | | .70 | | .27 |
| Total from investment operations | | .59 | | (1.78) | | 1.15 | | .83 | | .45 |
| Distributions from net investment income | | (.29) | | (.15) | | (.07) | | (.14) | | (.18) |
| Distributions from net realized gain | | (.26) | | (.04) | | (.11) | | (.14) | | (.18) |
| Total distributions | | (.55) | | (.20) C | | (.17) C | | (.28) | | (.36) |
| Net asset value, end of period | $ | 10.81 | $ | 10.77 | $ | 12.75 | $ | 11.77 | $ | 11.22 |
Total Return D,E | | 5.49% | | (14.20)% | | 9.84% | | 7.49% | | 4.28% |
Ratios to Average Net Assets B,F,G | | | | | | | | | | |
| Expenses before reductions | | 1.07% | | 1.08% | | 1.08% | | 1.08% | | 1.09% |
| Expenses net of fee waivers, if any | | 1.07% | | 1.08% | | 1.08% | | 1.08% | | 1.09% |
| Expenses net of all reductions | | 1.07% | | 1.08% | | 1.08% | | 1.08% | | 1.09% |
| Net investment income (loss) | | 2.26% | | 1.41% | | .84% | | 1.17% | | 1.64% |
| Supplemental Data | | | | | | | | | | |
| Net assets, end of period (000 omitted) | $ | 21,274 | $ | 22,364 | $ | 26,218 | $ | 20,329 | $ | 16,252 |
Portfolio turnover rate H | | 22% | | 23% | | 18% | | 23% | | 34% |
ACalculated based on average shares outstanding during the period.
BNet investment income (loss) is affected by the timing of the declaration of dividends by any underlying mutual funds or exchange-traded funds (ETFs). Net investment income (loss) of any mutual funds or ETFs is not included in the Fund's net investment income (loss) ratio.
CTotal distributions per share do not sum due to rounding.
DTotal returns would have been lower if certain expenses had not been reduced during the applicable periods shown.
ETotal returns do not include the effect of the sales charges.
FFees and expenses of any underlying mutual funds or exchange-traded funds (ETFs) are not included in the Fund's expense ratio. The Fund indirectly bears its proportionate share of these expenses.
GExpense ratios reflect operating expenses of the class. Expenses before reductions do not reflect amounts reimbursed, waived, or reduced through arrangements with the investment adviser, brokerage services, or other offset arrangements, if applicable, and do not represent the amount paid by the class during periods when reimbursements, waivers or reductions occur.
HAmount does not include the portfolio activity of any underlying mutual funds or exchange-traded funds (ETFs).
| Fidelity Advisor Asset Manager® 30% Class C |
| |
| Years ended September 30, | | 2023 | | 2022 | | 2021 | | 2020 | | 2019 |
Selected Per-Share Data | | | | | | | | | | |
| Net asset value, beginning of period | $ | 10.66 | $ | 12.64 | $ | 11.71 | $ | 11.16 | $ | 11.07 |
| Income from Investment Operations | | | | | | | | | | |
Net investment income (loss) A,B | | .19 | | .11 | | .04 | | .07 | | .12 |
| Net realized and unrealized gain (loss) | | .34 | | (1.94) | | 1.03 | | .70 | | .28 |
| Total from investment operations | | .53 | | (1.83) | | 1.07 | | .77 | | .40 |
| Distributions from net investment income | | (.23) | | (.11) | | (.03) | | (.08) | | (.12) |
| Distributions from net realized gain | | (.26) | | (.04) | | (.11) | | (.14) | | (.18) |
| Total distributions | | (.49) | | (.15) | | (.14) | | (.22) | | (.31) C |
| Net asset value, end of period | $ | 10.70 | $ | 10.66 | $ | 12.64 | $ | 11.71 | $ | 11.16 |
Total Return D,E | | 5.00% | | (14.62)% | | 9.17% | | 7.00% | | 3.77% |
Ratios to Average Net Assets B,F,G | | | | | | | | | | |
| Expenses before reductions | | 1.58% | | 1.58% | | 1.59% | | 1.59% | | 1.60% |
| Expenses net of fee waivers, if any | | 1.58% | | 1.58% | | 1.59% | | 1.59% | | 1.60% |
| Expenses net of all reductions | | 1.58% | | 1.58% | | 1.59% | | 1.59% | | 1.60% |
| Net investment income (loss) | | 1.74% | | .90% | | .33% | | .66% | | 1.13% |
| Supplemental Data | | | | | | | | | | |
| Net assets, end of period (000 omitted) | $ | 20,534 | $ | 24,169 | $ | 31,949 | $ | 27,496 | $ | 24,224 |
Portfolio turnover rate H | | 22% | | 23% | | 18% | | 23% | | 34% |
ACalculated based on average shares outstanding during the period.
BNet investment income (loss) is affected by the timing of the declaration of dividends by any underlying mutual funds or exchange-traded funds (ETFs). Net investment income (loss) of any mutual funds or ETFs is not included in the Fund's net investment income (loss) ratio.
CTotal distributions per share do not sum due to rounding.
DTotal returns would have been lower if certain expenses had not been reduced during the applicable periods shown.
ETotal returns do not include the effect of the contingent deferred sales charge.
FFees and expenses of any underlying mutual funds or exchange-traded funds (ETFs) are not included in the Fund's expense ratio. The Fund indirectly bears its proportionate share of these expenses.
GExpense ratios reflect operating expenses of the class. Expenses before reductions do not reflect amounts reimbursed, waived, or reduced through arrangements with the investment adviser, brokerage services, or other offset arrangements, if applicable, and do not represent the amount paid by the class during periods when reimbursements, waivers or reductions occur.
HAmount does not include the portfolio activity of any underlying mutual funds or exchange-traded funds (ETFs).
| Fidelity Asset Manager® 30% |
| |
| Years ended September 30, | | 2023 | | 2022 | | 2021 | | 2020 | | 2019 |
Selected Per-Share Data | | | | | | | | | | |
| Net asset value, beginning of period | $ | 10.79 | $ | 12.77 | $ | 11.79 | $ | 11.24 | $ | 11.15 |
| Income from Investment Operations | | | | | | | | | | |
Net investment income (loss) A,B | | .31 | | .24 | | .18 | | .20 | | .24 |
| Net realized and unrealized gain (loss) | | .34 | | (1.96) | | 1.04 | | .69 | | .27 |
| Total from investment operations | | .65 | | (1.72) | | 1.22 | | .89 | | .51 |
| Distributions from net investment income | | (.35) | | (.22) | | (.14) | | (.20) | | (.24) |
| Distributions from net realized gain | | (.26) | | (.04) | | (.11) | | (.14) | | (.18) |
| Total distributions | | (.61) | | (.26) | | (.24) C | | (.34) | | (.42) |
| Net asset value, end of period | $ | 10.83 | $ | 10.79 | $ | 12.77 | $ | 11.79 | $ | 11.24 |
Total Return D | | 6.07% | | (13.71)% | | 10.43% | | 8.05% | | 4.87% |
Ratios to Average Net Assets B,E,F | | | | | | | | | | |
| Expenses before reductions | | .52% | | .52% | | .52% | | .52% | | .53% |
| Expenses net of fee waivers, if any | | .52% | | .51% | | .52% | | .52% | | .52% |
| Expenses net of all reductions | | .52% | | .51% | | .52% | | .52% | | .52% |
| Net investment income (loss) | | 2.80% | | 1.97% | | 1.40% | | 1.74% | | 2.21% |
| Supplemental Data | | | | | | | | | | |
| Net assets, end of period (000 omitted) | $ | 1,418,966 | $ | 1,625,346 | $ | 2,196,582 | $ | 1,935,863 | $ | 1,661,192 |
Portfolio turnover rate G | | 22% | | 23% | | 18% | | 23% | | 34% |
ACalculated based on average shares outstanding during the period.
BNet investment income (loss) is affected by the timing of the declaration of dividends by any underlying mutual funds or exchange-traded funds (ETFs). Net investment income (loss) of any mutual funds or ETFs is not included in the Fund's net investment income (loss) ratio.
CTotal distributions per share do not sum due to rounding.
DTotal returns would have been lower if certain expenses had not been reduced during the applicable periods shown.
EFees and expenses of any underlying mutual funds or exchange-traded funds (ETFs) are not included in the Fund's expense ratio. The Fund indirectly bears its proportionate share of these expenses.
FExpense ratios reflect operating expenses of the class. Expenses before reductions do not reflect amounts reimbursed, waived, or reduced through arrangements with the investment adviser, brokerage services, or other offset arrangements, if applicable, and do not represent the amount paid by the class during periods when reimbursements, waivers or reductions occur.
GAmount does not include the portfolio activity of any underlying mutual funds or exchange-traded funds (ETFs).
| Fidelity Advisor Asset Manager® 30% Class I |
| |
| Years ended September 30, | | 2023 | | 2022 | | 2021 | | 2020 | | 2019 |
Selected Per-Share Data | | | | | | | | | | |
| Net asset value, beginning of period | $ | 10.79 | $ | 12.77 | $ | 11.79 | $ | 11.24 | $ | 11.15 |
| Income from Investment Operations | | | | | | | | | | |
Net investment income (loss) A,B | | .30 | | .24 | | .17 | | .19 | | .23 |
| Net realized and unrealized gain (loss) | | .35 | | (1.96) | | 1.05 | | .69 | | .28 |
| Total from investment operations | | .65 | | (1.72) | | 1.22 | | .88 | | .51 |
| Distributions from net investment income | | (.34) | | (.21) | | (.13) | | (.19) | | (.23) |
| Distributions from net realized gain | | (.26) | | (.04) | | (.11) | | (.14) | | (.18) |
| Total distributions | | (.60) | | (.26) C | | (.24) | | (.33) | | (.42) C |
| Net asset value, end of period | $ | 10.84 | $ | 10.79 | $ | 12.77 | $ | 11.79 | $ | 11.24 |
Total Return D | | 6.10% | | (13.75)% | | 10.41% | | 8.00% | | 4.80% |
Ratios to Average Net Assets B,E,F | | | | | | | | | | |
| Expenses before reductions | | .58% | | .54% | | .55% | | .59% | | .59% |
| Expenses net of fee waivers, if any | | .58% | | .54% | | .54% | | .59% | | .59% |
| Expenses net of all reductions | | .58% | | .54% | | .54% | | .59% | | .59% |
| Net investment income (loss) | | 2.75% | | 1.94% | | 1.37% | | 1.67% | | 2.14% |
| Supplemental Data | | | | | | | | | | |
| Net assets, end of period (000 omitted) | $ | 24,322 | $ | 30,027 | $ | 76,079 | $ | 19,225 | $ | 19,014 |
Portfolio turnover rate G | | 22% | | 23% | | 18% | | 23% | | 34% |
ACalculated based on average shares outstanding during the period.
BNet investment income (loss) is affected by the timing of the declaration of dividends by any underlying mutual funds or exchange-traded funds (ETFs). Net investment income (loss) of any mutual funds or ETFs is not included in the Fund's net investment income (loss) ratio.
CTotal distributions per share do not sum due to rounding.
DTotal returns would have been lower if certain expenses had not been reduced during the applicable periods shown.
EFees and expenses of any underlying mutual funds or exchange-traded funds (ETFs) are not included in the Fund's expense ratio. The Fund indirectly bears its proportionate share of these expenses.
FExpense ratios reflect operating expenses of the class. Expenses before reductions do not reflect amounts reimbursed, waived, or reduced through arrangements with the investment adviser, brokerage services, or other offset arrangements, if applicable, and do not represent the amount paid by the class during periods when reimbursements, waivers or reductions occur.
GAmount does not include the portfolio activity of any underlying mutual funds or exchange-traded funds (ETFs).
| Fidelity Advisor Asset Manager® 30% Class Z |
| |
| Years ended September 30, | | 2023 | | 2022 | | 2021 | | 2020 | | 2019 A |
Selected Per-Share Data | | | | | | | | | | |
| Net asset value, beginning of period | $ | 10.79 | $ | 12.77 | $ | 11.79 | $ | 11.24 | $ | 11.14 |
| Income from Investment Operations | | | | | | | | | | |
Net investment income (loss) B,C | | .31 | | .24 | | .18 | | .20 | | .24 |
| Net realized and unrealized gain (loss) | | .34 | | (1.96) | | 1.04 | | .69 | | .29 |
| Total from investment operations | | .65 | | (1.72) | | 1.22 | | .89 | | .53 |
| Distributions from net investment income | | (.35) | | (.22) | | (.14) | | (.20) | | (.25) |
| Distributions from net realized gain | | (.26) | | (.04) | | (.11) | | (.14) | | (.18) |
| Total distributions | | (.61) | | (.26) | | (.24) D | | (.34) | | (.43) |
| Net asset value, end of period | $ | 10.83 | $ | 10.79 | $ | 12.77 | $ | 11.79 | $ | 11.24 |
Total Return E,F | | 6.10% | | (13.69)% | | 10.44% | | 8.10% | | 5.01% |
Ratios to Average Net Assets C,G,H | | | | | | | | | | |
| Expenses before reductions | | .49% | | .49% | | .49% | | .50% | | .50% I |
| Expenses net of fee waivers, if any | | .49% | | .49% | | .49% | | .49% | | .50% I |
| Expenses net of all reductions | | .49% | | .49% | | .49% | | .49% | | .50% I |
| Net investment income (loss) | | 2.84% | | 2.00% | | 1.43% | | 1.76% | | 2.23% I |
| Supplemental Data | | | | | | | | | | |
| Net assets, end of period (000 omitted) | $ | 434,359 | $ | 399,817 | $ | 474,155 | $ | 9,698 | $ | 7,353 |
Portfolio turnover rate J | | 22% | | 23% | | 18% | | 23% | | 34% |
AFor the period October 2, 2018 (commencement of sale of shares) through September 30, 2019.
BCalculated based on average shares outstanding during the period.
CNet investment income (loss) is affected by the timing of the declaration of dividends by any underlying mutual funds or exchange-traded funds (ETFs). Net investment income (loss) of any mutual funds or ETFs is not included in the Fund's net investment income (loss) ratio.
DTotal distributions per share do not sum due to rounding.
ETotal returns for periods of less than one year are not annualized.
FTotal returns would have been lower if certain expenses had not been reduced during the applicable periods shown.
GFees and expenses of any underlying mutual funds or exchange-traded funds (ETFs) are not included in the Fund's expense ratio. The Fund indirectly bears its proportionate share of these expenses.
HExpense ratios reflect operating expenses of the class. Expenses before reductions do not reflect amounts reimbursed, waived, or reduced through arrangements with the investment adviser, brokerage services, or other offset arrangements, if applicable, and do not represent the amount paid by the class during periods when reimbursements, waivers or reductions occur.
IAnnualized.
JAmount does not include the portfolio activity of any underlying mutual funds or exchange-traded funds (ETFs).
The information in the following tables is based on the combined Investments of the Fund and it's pro-rata share of investments in Fidelity's Central Funds, other than the Commodity Strategy and Money Market Central Funds.
Top Holdings (% of Fund's net assets) |
| |
| Microsoft Corp. | 1.9 | |
| Apple, Inc. | 1.6 | |
| iShares MSCI USA Minimum Volatility ETF | 1.3 | |
| Alphabet, Inc. Class A | 1.1 | |
| Amazon.com, Inc. | 1.0 | |
| iShares 20+ Year Treasury Bond ETF | 0.6 | |
| Exxon Mobil Corp. | 0.6 | |
| NVIDIA Corp. | 0.6 | |
| Meta Platforms, Inc. Class A | 0.6 | |
| JPMorgan Chase & Co. | 0.6 | |
| | 9.9 | |
| |
| Top Bond Issuers (% of Fund's net assets) |
(with maturities greater than one year) |
| U.S. Treasury Obligations | 18.1 | |
| Fannie Mae | 3.2 | |
| Freddie Mac | 3.0 | |
| Ginnie Mae | 1.6 | |
| Uniform Mortgage Backed Securities | 1.5 | |
| JPMorgan Chase & Co. | 0.7 | |
| Morgan Stanley | 0.6 | |
| Citigroup, Inc. | 0.5 | |
| Bank of America Corp. | 0.4 | |
| Petroleos Mexicanos | 0.3 | |
| | 29.9 | |
| |
| Market Sectors (% of Fund's net assets) |
| |
| Financials | 17.5 | |
| Information Technology | 10.2 | |
| Health Care | 6.4 | |
| Industrials | 6.3 | |
| Consumer Discretionary | 6.0 | |
| Communication Services | 4.4 | |
| Consumer Staples | 3.6 | |
| Energy | 3.6 | |
| Real Estate | 2.4 | |
| Materials | 1.5 | |
| Utilities | 1.1 | |
| |
Quality Diversification (% of Fund's net assets) |
|
Percentages shown as 0.0% may reflect amounts less than 0.05%. |
| |
| We have used ratings from Moody's Investors Service, Inc. Where Moody's® ratings are not available, we have used S&P® ratings. All ratings are as of the date indicated and do not reflect subsequent changes. |
Asset Allocation (% of Fund's net assets) |
|
|
Asset allocations in the pie charts reflect the categorization of assets as defined in the Fund's prospectus in effect as of the time periods indicated above. Percentages are adjusted for the effect of future contracts and swap contracts, if applicable.
Geographic Diversification (% of Fund's net assets) |
|
* Includes Short-Term investments and Net Other Assets (Liabilities). Percentages are adjusted for the effect of derivatives, if applicable. |
| |
Percentages in the above tables are adjusted for the effect of TBA sale Commitments.
Equities and Stock Class and Equity Futures percentages above include Fidelity Commodity Strategy Central Fund of 0.2%.
At period end, foreign investments including the Fund's pro-rata share of the underlying Central Funds, other than the Commodity Strategy Central and Money Market Funds, was 22.6% of net assets.
An unaudited holdings list for the Fund, which presents direct holdings as well as the pro-rata share of any securities and other investments held indirectly through its investment in underlying Fidelity Central Funds, other than the Commodity Strategy and Money Market Central Funds, is available at fidelity.com and/or institutional.fidelity.com, as applicable.
Fidelity Asset Manager® 40%
Showing Percentage of Net Assets
| Equity Central Funds - 45.7% |
| | | Shares | Value ($) |
| Fidelity Commodity Strategy Central Fund (a) | | 49,146 | 4,639,420 |
| Fidelity Emerging Markets Equity Central Fund (a) | | 582,103 | 109,324,803 |
| Fidelity Hedged Equity Central Fund (a) | | 262,991 | 27,282,644 |
| Fidelity International Equity Central Fund (a) | | 2,712,407 | 239,831,032 |
| Fidelity Real Estate Equity Central Fund (a) | | 75,657 | 8,476,564 |
| Fidelity U.S. Equity Central Fund (a) | | 4,892,250 | 568,919,790 |
| TOTAL EQUITY CENTRAL FUNDS (Cost $651,471,315) | | | 958,474,253 |
| | | | |
| Fixed-Income Central Funds - 46.3% |
| | | Shares | Value ($) |
| High Yield Fixed-Income Funds - 2.9% | | | |
| Fidelity Emerging Markets Debt Central Fund (a) | | 484,922 | 3,559,328 |
| Fidelity Emerging Markets Debt Local Currency Central Fund (a) | | 195,094 | 17,267,812 |
| Fidelity Floating Rate Central Fund (a) | | 289,114 | 28,338,924 |
| Fidelity High Income Central Fund (a) | | 107,214 | 10,843,591 |
TOTAL HIGH YIELD FIXED-INCOME FUNDS | | | 60,009,655 |
| Investment Grade Fixed-Income Funds - 43.4% | | | |
| Fidelity Inflation-Protected Bond Index Central Fund (a) | | 242,367 | 21,328,261 |
| Fidelity International Credit Central Fund (a) | | 71,224 | 5,419,421 |
| Fidelity Investment Grade Bond Central Fund (a) | | 9,431,500 | 882,882,693 |
TOTAL INVESTMENT GRADE FIXED-INCOME FUNDS | | | 909,630,375 |
| TOTAL FIXED-INCOME CENTRAL FUNDS (Cost $1,097,577,078) | | | 969,640,030 |
| | | | |
| Money Market Central Funds - 6.2% |
| | | Shares | Value ($) |
| Fidelity Cash Central Fund 5.39% (b) | | 61,315,952 | 61,328,215 |
| Fidelity Money Market Central Fund 5.51% (b) | | 55,383,241 | 55,377,703 |
| Fidelity Securities Lending Cash Central Fund 5.39% (b)(c) | | 12,750,175 | 12,751,450 |
| TOTAL MONEY MARKET CENTRAL FUNDS (Cost $129,458,836) | | | 129,457,368 |
| | | | |
| U.S. Treasury Obligations - 0.5% |
| | | Principal Amount (d) | Value ($) |
U.S. Treasury Bills, yield at date of purchase 5.37% to 5.39% 12/7/23 to 12/21/23 (e) (Cost $10,500,360) | | 10,610,000 | 10,501,744 |
| | | | |
| Investment Companies - 1.9% |
| | | Shares | Value ($) |
| iShares 20+ Year Treasury Bond ETF (f) | | 140,911 | 12,497,397 |
| iShares MSCI USA Minimum Volatility ETF | | 377,297 | 27,308,757 |
| TOTAL INVESTMENT COMPANIES (Cost $40,974,040) | | | 39,806,154 |
| | | | |
| TOTAL INVESTMENT IN SECURITIES - 100.6% (Cost $1,929,981,629) | 2,107,879,549 |
NET OTHER ASSETS (LIABILITIES) - (0.6)% | (12,636,205) |
| NET ASSETS - 100.0% | 2,095,243,344 |
| | |
| Futures Contracts |
| | Number of contracts | Expiration Date | Notional Amount ($) | Value ($) | Unrealized Appreciation/ (Depreciation) ($) |
| Sold | | | | | |
| | | | | | |
| Equity Index Contracts | | | | | |
| CME E-mini S&P 500 Index Contracts (United States) | 723 | Dec 2023 | 156,366,825 | 5,373,319 | 5,373,319 |
| ICE MSCI Emerging Markets Index Contracts (United States) | 413 | Dec 2023 | 19,731,075 | 657,003 | 657,003 |
| | | | | | |
| TOTAL FUTURES CONTRACTS | | | | | 6,030,322 |
| The notional amount of futures sold as a percentage of Net Assets is 8.4% |
For the period, the average monthly notional amount at value for futures contracts in the aggregate was $180,708,584.
Security Type Abbreviations
Legend
| (a) | Affiliated fund that is generally available only to investment companies and other accounts managed by Fidelity Investments. A complete unaudited schedule of portfolio holdings for each Fidelity Central Fund is filed with the SEC for the first and third quarters of each fiscal year on Form N-PORT and is available upon request or at the SEC's website at www.sec.gov. An unaudited holdings listing for the Fund, which presents direct holdings as well as the pro-rata share of securities and other investments held indirectly through its investment in underlying non-money market Fidelity Central Funds, other than the Commodity Strategy Central Fund, is available at fidelity.com and/or institutional.fidelity.com, as applicable. In addition, each Fidelity Central Fund's financial statements,which are not covered by the Fund's Report of Independent Registered Public Accounting Firm, are available on the SEC's website or upon request. |
| (b) | Affiliated fund that is generally available only to investment companies and other accounts managed by Fidelity Investments. The rate quoted is the annualized seven-day yield of the fund at period end. A complete unaudited listing of the fund's holdings as of its most recent quarter end is available upon request. In addition, each Fidelity Central Fund's financial statements, which are not covered by the Fund's Report of Independent Registered Public Accounting Firm, are available on the SEC's website or upon request. |
| (c) | Investment made with cash collateral received from securities on loan. |
| (d) | Amount is stated in United States dollars unless otherwise noted. |
| (e) | Security or a portion of the security was pledged to cover margin requirements for futures contracts. At period end, the value of securities pledged amounted to $10,095,739. |
| (f) | Security or a portion of the security is on loan at period end. |
Affiliated Central Funds
Fiscal year to date information regarding the Fund's investments in Fidelity Central Funds, including the ownership percentage, is presented below.
| Affiliate | Value, beginning of period ($) | Purchases ($) | Sales Proceeds ($) | Dividend Income ($) | Realized Gain (loss) ($) | Change in Unrealized appreciation (depreciation) ($) | Value, end of period ($) | % ownership, end of period |
| Fidelity Cash Central Fund 5.39% | 25,779,181 | 315,812,745 | 280,263,711 | 1,056,184 | - | - | 61,328,215 | 0.1% |
| Fidelity Commodity Strategy Central Fund | 48,250,509 | 1,183,927 | 42,657,880 | 718,683 | (10,589,326) | 8,452,190 | 4,639,420 | 2.0% |
| Fidelity Emerging Markets Debt Central Fund | 5,115,458 | 527,340 | 2,267,347 | 276,297 | (448,041) | 631,918 | 3,559,328 | 0.2% |
| Fidelity Emerging Markets Debt Local Currency Central Fund | 4,816,726 | 11,664,536 | 50 | 14,076 | 16,617 | 769,983 | 17,267,812 | 6.3% |
| Fidelity Emerging Markets Equity Central Fund | 95,037,432 | 35,052,084 | 30,220,591 | 3,329,594 | (7,849,440) | 17,305,318 | 109,324,803 | 5.1% |
| Fidelity Floating Rate Central Fund | 64,536,473 | 5,203,500 | 43,519,881 | 4,331,351 | (1,478,273) | 3,597,105 | 28,338,924 | 1.9% |
| Fidelity Hedged Equity Central Fund | - | 27,339,785 | - | 3,600 | - | (57,141) | 27,282,644 | 6.3% |
| Fidelity High Income Central Fund | 17,596,056 | 1,547,073 | 8,954,003 | 1,209,729 | 259,573 | 394,892 | 10,843,591 | 0.8% |
| Fidelity Inflation-Protected Bond Index Central Fund | 33,934,556 | 4,238,299 | 14,001,703 | 3,723,010 | (1,401,934) | (1,440,957) | 21,328,261 | 5.0% |
| Fidelity International Credit Central Fund | 20,394,314 | 1,306,051 | 15,495,530 | 1,065,650 | (4,601,882) | 3,816,468 | 5,419,421 | 2.7% |
| Fidelity International Equity Central Fund | 175,490,724 | 76,684,087 | 54,256,770 | 5,569,119 | (3,971,783) | 45,884,774 | 239,831,032 | 5.1% |
| Fidelity Investment Grade Bond Central Fund | 844,746,742 | 173,542,970 | 113,777,733 | 33,975,041 | (6,813,180) | (14,816,106) | 882,882,693 | 2.4% |
| Fidelity Money Market Central Fund 0.45% | 87,063,754 | 4,423,086 | 36,109,761 | 3,270,597 | (2,868) | 3,492 | 55,377,703 | 4.7% |
| Fidelity Real Estate Equity Central Fund | 14,451,672 | 591,582 | 7,179,487 | 352,624 | 45,083 | 567,714 | 8,476,564 | 0.9% |
| Fidelity Securities Lending Cash Central Fund 5.39% | - | 241,181,886 | 228,430,436 | 2,054 | - | - | 12,751,450 | 0.0% |
| Fidelity U.S. Equity Central Fund | 617,394,236 | 24,864,786 | 176,145,967 | 16,833,778 | 2,783,874 | 100,022,861 | 568,919,790 | 3.6% |
| Total | 2,054,607,833 | 925,163,737 | 1,053,280,850 | 75,731,387 | (34,051,580) | 165,132,511 | 2,057,571,651 | |
| | | | | | | | | |
Amounts in the dividend income column in the above table include any capital gain distributions from underlying funds, which are presented in the corresponding line item in the Statement of Operations, if applicable.
Amounts in the dividend income column for Fidelity Securities Lending Cash Central Fund represents the income earned on investing cash collateral, less rebates paid to borrowers and any lending agent fees associated with the loan, plus any premium payments received for lending certain types of securities.
Amounts included in the purchases and sales proceeds columns may include in-kind transactions, if applicable.
Investment Valuation
The following is a summary of the inputs used, as of September 30, 2023, involving the Fund's assets and liabilities carried at fair value. The inputs or methodology used for valuing securities may not be an indication of the risk associated with investing in those securities. For more information on valuation inputs, and their aggregation into the levels used below, please refer to the Investment Valuation section in the accompanying Notes to Financial Statements.
| Valuation Inputs at Reporting Date: |
| Description | Total ($) | Level 1 ($) | Level 2 ($) | Level 3 ($) |
Investments in Securities: | | | | |
|
| Equity Central Funds | 958,474,253 | 958,474,253 | - | - |
|
| Fixed-Income Central Funds | 969,640,030 | 969,640,030 | - | - |
|
| Money Market Central Funds | 129,457,368 | 129,457,368 | - | - |
|
| U.S Treasury Obligations | 10,501,744 | - | 10,501,744 | - |
|
| Investment Companies | 39,806,154 | 39,806,154 | - | - |
| Total Investments in Securities: | 2,107,879,549 | 2,097,377,805 | 10,501,744 | - |
Derivative Instruments: Assets | | | | |
Futures Contracts | 6,030,322 | 6,030,322 | - | - |
| Total Assets | 6,030,322 | 6,030,322 | - | - |
| Total Derivative Instruments: | 6,030,322 | 6,030,322 | - | - |
Value of Derivative Instruments
The following table is a summary of the Fund's value of derivative instruments by primary risk exposure as of September 30, 2023. For additional information on derivative instruments, please refer to the Derivative Instruments section in the accompanying Notes to Financial Statements.
Primary Risk Exposure / Derivative Type | Value |
| Asset ($) | Liability ($) |
| Equity Risk | | |
Futures Contracts (a) | 6,030,322 | 0 |
| Total Equity Risk | 6,030,322 | 0 |
| Total Value of Derivatives | 6,030,322 | 0 |
(a)Reflects gross cumulative appreciation (depreciation) on futures contracts as presented in the Schedule of Investments. In the Statement of Assets and Liabilities, the period end daily variation margin is included in receivable or payable for daily variation margin on futures contracts, and the net cumulative appreciation (depreciation) is included in Total accumulated earnings (loss).
Fidelity Asset Manager® 40%
| Statement of Assets and Liabilities |
| | | | September 30, 2023 |
| | | | | |
| Assets | | | | |
| Investment in securities, at value (including securities loaned of $12,496,421) - See accompanying schedule: | | | | |
Unaffiliated issuers (cost $51,474,400) | $ | 50,307,898 | | |
Fidelity Central Funds (cost $1,878,507,229) | | 2,057,571,651 | | |
| | | | | |
| | | | | |
| Total Investment in Securities (cost $1,929,981,629) | | | $ | 2,107,879,549 |
| Receivable for investments sold | | | | 2,839,747 |
| Receivable for fund shares sold | | | | 227,182 |
| Dividends receivable | | | | 146,026 |
| Distributions receivable from Fidelity Central Funds | | | | 99,380 |
| Receivable for daily variation margin on futures contracts | | | | 433,800 |
| Prepaid expenses | | | | 3,020 |
Total assets | | | | 2,111,628,704 |
| Liabilities | | | | |
| Payable for investments purchased | $ | 125,873 | | |
| Payable for fund shares redeemed | | 2,515,968 | | |
| Accrued management fee | | 706,886 | | |
| Distribution and service plan fees payable | | 35,489 | | |
| Other affiliated payables | | 203,666 | | |
| Other payables and accrued expenses | | 46,028 | | |
| Collateral on securities loaned | | 12,751,450 | | |
| Total Liabilities | | | | 16,385,360 |
| Net Assets | | | $ | 2,095,243,344 |
| Net Assets consist of: | | | | |
| Paid in capital | | | $ | 2,028,951,937 |
| Total accumulated earnings (loss) | | | | 66,291,407 |
| Net Assets | | | $ | 2,095,243,344 |
| | | | | |
| Net Asset Value and Maximum Offering Price | | | | |
| Class A : | | | | |
Net Asset Value and redemption price per share ($69,847,992 ÷ 5,999,834 shares)(a) | | | $ | 11.64 |
| Maximum offering price per share (100/94.25 of $11.64) | | | $ | 12.35 |
| Class M : | | | | |
Net Asset Value and redemption price per share ($13,019,957 ÷ 1,120,454 shares)(a) | | | $ | 11.62 |
| Maximum offering price per share (100/96.50 of $11.62) | | | $ | 12.04 |
| Class C : | | | | |
Net Asset Value and offering price per share ($17,575,866 ÷ 1,519,881 shares)(a) | | | $ | 11.56 |
| Asset Manager 40% : | | | | |
Net Asset Value, offering price and redemption price per share ($1,427,453,460 ÷ 122,633,441 shares) | | | $ | 11.64 |
| Class I : | | | | |
Net Asset Value, offering price and redemption price per share ($36,450,581 ÷ 3,130,207 shares) | | | $ | 11.64 |
| Class Z : | | | | |
Net Asset Value, offering price and redemption price per share ($530,895,488 ÷ 45,607,014 shares) | | | $ | 11.64 |
(a)Redemption price per share is equal to net asset value less any applicable contingent deferred sales charge. |
| Statement of Operations |
| | | | Year ended September 30, 2023 |
| Investment Income | | | | |
| Dividends | | | $ | 1,125,147 |
| Interest | | | | 450,257 |
| Income from Fidelity Central Funds (including $2,054 from security lending) | | | | 66,060,043 |
| Total Income | | | | 67,635,447 |
| Expenses | | | | |
| Management fee | $ | 8,758,520 | | |
| Transfer agent fees | | 1,768,622 | | |
| Distribution and service plan fees | | 437,740 | | |
| Accounting fees | | 720,650 | | |
| Custodian fees and expenses | | 40,127 | | |
| Independent trustees' fees and expenses | | 8,161 | | |
| Registration fees | | 106,309 | | |
| Audit | | 39,000 | | |
| Legal | | 4,711 | | |
| Miscellaneous | | 21,321 | | |
| Total expenses before reductions | | 11,905,161 | | |
| Expense reductions | | (59,553) | | |
| Total expenses after reductions | | | | 11,845,608 |
| Net Investment income (loss) | | | | 55,789,839 |
| Realized and Unrealized Gain (Loss) | | | | |
| Net realized gain (loss) on: | | | | |
| Investment Securities: | | | | |
| Unaffiliated issuers | | (17,518,279) | | |
| Fidelity Central Funds | | (34,051,580) | | |
| Futures contracts | | (11,887,553) | | |
| Capital gain distributions from Fidelity Central Funds | | 9,671,344 | | |
| Total net realized gain (loss) | | | | (53,786,068) |
| Change in net unrealized appreciation (depreciation) on: | | | | |
| Investment Securities: | | | | |
| Unaffiliated issuers | | 12,949,068 | | |
| Fidelity Central Funds | | 165,132,511 | | |
| Futures contracts | | (10,445,310) | | |
| Total change in net unrealized appreciation (depreciation) | | | | 167,636,269 |
| Net gain (loss) | | | | 113,850,201 |
| Net increase (decrease) in net assets resulting from operations | | | $ | 169,640,040 |
| Statement of Changes in Net Assets |
| |
| | Year ended September 30, 2023 | | Year ended September 30, 2022 |
| Increase (Decrease) in Net Assets | | | | |
| Operations | | | | |
| Net investment income (loss) | $ | 55,789,839 | $ | 50,128,286 |
| Net realized gain (loss) | | (53,786,068) | | 83,390,599 |
| Change in net unrealized appreciation (depreciation) | | 167,636,269 | | (535,548,491) |
| Net increase (decrease) in net assets resulting from operations | | 169,640,040 | | (402,029,606) |
| Distributions to shareholders | | (131,471,885) | | (63,105,930) |
| | | | | |
| Share transactions - net increase (decrease) | | (94,597,313) | | 72,581,869 |
| Total increase (decrease) in net assets | | (56,429,158) | | (392,553,667) |
| | | | | |
| Net Assets | | | | |
| Beginning of period | | 2,151,672,502 | | 2,544,226,169 |
| End of period | $ | 2,095,243,344 | $ | 2,151,672,502 |
| | | | | |
| | | | | |
Financial Highlights
| Fidelity Advisor Asset Manager® 40% Class A |
| |
| Years ended September 30, | | 2023 | | 2022 | | 2021 | | 2020 | | 2019 |
Selected Per-Share Data | | | | | | | | | | |
| Net asset value, beginning of period | $ | 11.46 | $ | 13.85 | $ | 12.49 | $ | 11.82 | $ | 11.87 |
| Income from Investment Operations | | | | | | | | | | |
Net investment income (loss) A,B | | .27 | | .22 | | .15 | | .17 | | .21 |
| Net realized and unrealized gain (loss) | | .58 | | (2.32) | | 1.47 | | .88 | | .21 |
| Total from investment operations | | .85 | | (2.10) | | 1.62 | | 1.05 | | .42 |
| Distributions from net investment income | | (.30) | | (.18) | | (.12) | | (.17) | | (.21) |
| Distributions from net realized gain | | (.37) | | (.11) | | (.13) | | (.21) | | (.27) |
| Total distributions | | (.67) | | (.29) | | (.26) C | | (.38) | | (.47) C |
| Net asset value, end of period | $ | 11.64 | $ | 11.46 | $ | 13.85 | $ | 12.49 | $ | 11.82 |
Total Return D,E | | 7.60% | | (15.47)% | | 13.06% | | 9.06% | | 3.90% |
Ratios to Average Net Assets B,F,G | | | | | | | | | | |
| Expenses before reductions | | .83% | | .82% | | .82% | | .83% | | .83% |
| Expenses net of fee waivers, if any | | .82% | | .82% | | .82% | | .83% | | .83% |
| Expenses net of all reductions | | .82% | | .82% | | .82% | | .83% | | .83% |
| Net investment income (loss) | | 2.24% | | 1.72% | | 1.08% | | 1.43% | | 1.79% |
| Supplemental Data | | | | | | | | | | |
| Net assets, end of period (000 omitted) | $ | 69,848 | $ | 69,848 | $ | 74,272 | $ | 48,985 | $ | 42,490 |
Portfolio turnover rate H | | 21% | | 16% | | 22% | | 24% | | 36% |
ACalculated based on average shares outstanding during the period.
BNet investment income (loss) is affected by the timing of the declaration of dividends by any underlying mutual funds or exchange-traded funds (ETFs). Net investment income (loss) of any mutual funds or ETFs is not included in the Fund's net investment income (loss) ratio.
CTotal distributions per share do not sum due to rounding.
DTotal returns would have been lower if certain expenses had not been reduced during the applicable periods shown.
ETotal returns do not include the effect of the sales charges.
FFees and expenses of any underlying mutual funds or exchange-traded funds (ETFs) are not included in the Fund's expense ratio. The Fund indirectly bears its proportionate share of these expenses. For additional expense information related to investments in Fidelity Central Funds, please refer to the "Investments in Fidelity Central Funds" note found in the Notes to Financial Statements section of the most recent Annual or Semi-Annual report.
GExpense ratios reflect operating expenses of the class. Expenses before reductions do not reflect amounts reimbursed, waived, or reduced through arrangements with the investment adviser, brokerage services, or other offset arrangements, if applicable, and do not represent the amount paid by the class during periods when reimbursements, waivers or reductions occur.
HAmount does not include the portfolio activity of any underlying mutual funds or exchange-traded funds (ETFs).
| Fidelity Advisor Asset Manager® 40% Class M |
| |
| Years ended September 30, | | 2023 | | 2022 | | 2021 | | 2020 | | 2019 |
Selected Per-Share Data | | | | | | | | | | |
| Net asset value, beginning of period | $ | 11.45 | $ | 13.83 | $ | 12.47 | $ | 11.80 | $ | 11.85 |
| Income from Investment Operations | | | | | | | | | | |
Net investment income (loss) A,B | | .24 | | .19 | | .11 | | .14 | | .18 |
| Net realized and unrealized gain (loss) | | .58 | | (2.31) | | 1.47 | | .88 | | .21 |
| Total from investment operations | | .82 | | (2.12) | | 1.58 | | 1.02 | | .39 |
| Distributions from net investment income | | (.28) | | (.15) | | (.09) | | (.14) | | (.17) |
| Distributions from net realized gain | | (.37) | | (.11) | | (.13) | | (.21) | | (.27) |
| Total distributions | | (.65) | | (.26) | | (.22) | | (.35) | | (.44) |
| Net asset value, end of period | $ | 11.62 | $ | 11.45 | $ | 13.83 | $ | 12.47 | $ | 11.80 |
Total Return C,D | | 7.28% | | (15.63)% | | 12.80% | | 8.80% | | 3.61% |
Ratios to Average Net Assets B,E,F | | | | | | | | | | |
| Expenses before reductions | | 1.07% | | 1.06% | | 1.06% | | 1.08% | | 1.09% |
| Expenses net of fee waivers, if any | | 1.06% | | 1.06% | | 1.06% | | 1.08% | | 1.09% |
| Expenses net of all reductions | | 1.06% | | 1.06% | | 1.06% | | 1.08% | | 1.09% |
| Net investment income (loss) | | 2.01% | | 1.48% | | .84% | | 1.17% | | 1.53% |
| Supplemental Data | | | | | | | | | | |
| Net assets, end of period (000 omitted) | $ | 13,020 | $ | 12,231 | $ | 14,809 | $ | 11,898 | $ | 10,913 |
Portfolio turnover rate G | | 21% | | 16% | | 22% | | 24% | | 36% |
ACalculated based on average shares outstanding during the period.
BNet investment income (loss) is affected by the timing of the declaration of dividends by any underlying mutual funds or exchange-traded funds (ETFs). Net investment income (loss) of any mutual funds or ETFs is not included in the Fund's net investment income (loss) ratio.
CTotal returns would have been lower if certain expenses had not been reduced during the applicable periods shown.
DTotal returns do not include the effect of the sales charges.
EFees and expenses of any underlying mutual funds or exchange-traded funds (ETFs) are not included in the Fund's expense ratio. The Fund indirectly bears its proportionate share of these expenses. For additional expense information related to investments in Fidelity Central Funds, please refer to the "Investments in Fidelity Central Funds" note found in the Notes to Financial Statements section of the most recent Annual or Semi-Annual report.
FExpense ratios reflect operating expenses of the class. Expenses before reductions do not reflect amounts reimbursed, waived, or reduced through arrangements with the investment adviser, brokerage services, or other offset arrangements, if applicable, and do not represent the amount paid by the class during periods when reimbursements, waivers or reductions occur.
GAmount does not include the portfolio activity of any underlying mutual funds or exchange-traded funds (ETFs).
| Fidelity Advisor Asset Manager® 40% Class C |
| |
| Years ended September 30, | | 2023 | | 2022 | | 2021 | | 2020 | | 2019 |
Selected Per-Share Data | | | | | | | | | | |
| Net asset value, beginning of period | $ | 11.39 | $ | 13.77 | $ | 12.42 | $ | 11.75 | $ | 11.80 |
| Income from Investment Operations | | | | | | | | | | |
Net investment income (loss) A,B | | .17 | | .12 | | .04 | | .08 | | .12 |
| Net realized and unrealized gain (loss) | | .58 | | (2.30) | | 1.47 | | .88 | | .21 |
| Total from investment operations | | .75 | | (2.18) | | 1.51 | | .96 | | .33 |
| Distributions from net investment income | | (.21) | | (.09) | | (.03) | | (.08) | | (.12) |
| Distributions from net realized gain | | (.37) | | (.11) | | (.13) | | (.21) | | (.27) |
| Total distributions | | (.58) | | (.20) | | (.16) | | (.29) | | (.38) C |
| Net asset value, end of period | $ | 11.56 | $ | 11.39 | $ | 13.77 | $ | 12.42 | $ | 11.75 |
Total Return D,E | | 6.70% | | (16.07)% | | 12.24% | | 8.25% | | 3.11% |
Ratios to Average Net Assets B,F,G | | | | | | | | | | |
| Expenses before reductions | | 1.59% | | 1.59% | | 1.59% | | 1.59% | | 1.60% |
| Expenses net of fee waivers, if any | | 1.59% | | 1.59% | | 1.59% | | 1.59% | | 1.60% |
| Expenses net of all reductions | | 1.59% | | 1.59% | | 1.59% | | 1.59% | | 1.60% |
| Net investment income (loss) | | 1.48% | | .95% | | .31% | | .66% | | 1.03% |
| Supplemental Data | | | | | | | | | | |
| Net assets, end of period (000 omitted) | $ | 17,576 | $ | 19,517 | $ | 26,841 | $ | 23,974 | $ | 24,834 |
Portfolio turnover rate H | | 21% | | 16% | | 22% | | 24% | | 36% |
ACalculated based on average shares outstanding during the period.
BNet investment income (loss) is affected by the timing of the declaration of dividends by any underlying mutual funds or exchange-traded funds (ETFs). Net investment income (loss) of any mutual funds or ETFs is not included in the Fund's net investment income (loss) ratio.
CTotal distributions per share do not sum due to rounding.
DTotal returns would have been lower if certain expenses had not been reduced during the applicable periods shown.
ETotal returns do not include the effect of the contingent deferred sales charge.
FFees and expenses of any underlying mutual funds or exchange-traded funds (ETFs) are not included in the Fund's expense ratio. The Fund indirectly bears its proportionate share of these expenses. For additional expense information related to investments in Fidelity Central Funds, please refer to the "Investments in Fidelity Central Funds" note found in the Notes to Financial Statements section of the most recent Annual or Semi-Annual report.
GExpense ratios reflect operating expenses of the class. Expenses before reductions do not reflect amounts reimbursed, waived, or reduced through arrangements with the investment adviser, brokerage services, or other offset arrangements, if applicable, and do not represent the amount paid by the class during periods when reimbursements, waivers or reductions occur.
HAmount does not include the portfolio activity of any underlying mutual funds or exchange-traded funds (ETFs).
| Fidelity Asset Manager® 40% |
| |
| Years ended September 30, | | 2023 | | 2022 | | 2021 | | 2020 | | 2019 |
Selected Per-Share Data | | | | | | | | | | |
| Net asset value, beginning of period | $ | 11.46 | $ | 13.85 | $ | 12.49 | $ | 11.82 | $ | 11.87 |
| Income from Investment Operations | | | | | | | | | | |
Net investment income (loss) A,B | | .30 | | .26 | | .19 | | .21 | | .24 |
| Net realized and unrealized gain (loss) | | .59 | | (2.32) | | 1.46 | | .88 | | .22 |
| Total from investment operations | | .89 | | (2.06) | | 1.65 | | 1.09 | | .46 |
| Distributions from net investment income | | (.34) | | (.22) | | (.16) | | (.21) | | (.24) |
| Distributions from net realized gain | | (.37) | | (.11) | | (.13) | | (.21) | | (.27) |
| Total distributions | | (.71) | | (.33) | | (.29) | | (.42) | | (.51) |
| Net asset value, end of period | $ | 11.64 | $ | 11.46 | $ | 13.85 | $ | 12.49 | $ | 11.82 |
Total Return C | | 7.95% | | (15.21)% | | 13.38% | | 9.41% | | 4.23% |
Ratios to Average Net Assets B,D,E | | | | | | | | | | |
| Expenses before reductions | | .53% | | .52% | | .52% | | .52% | | .52% |
| Expenses net of fee waivers, if any | | .52% | | .52% | | .51% | | .52% | | .52% |
| Expenses net of all reductions | | .52% | | .52% | | .51% | | .52% | | .52% |
| Net investment income (loss) | | 2.55% | | 2.02% | | 1.39% | | 1.73% | | 2.10% |
| Supplemental Data | | | | | | | | | | |
| Net assets, end of period (000 omitted) | $ | 1,427,453 | $ | 1,515,043 | $ | 1,829,755 | $ | 1,911,787 | $ | 1,704,998 |
Portfolio turnover rate F | | 21% | | 16% | | 22% | | 24% | | 36% |
ACalculated based on average shares outstanding during the period.
BNet investment income (loss) is affected by the timing of the declaration of dividends by any underlying mutual funds or exchange-traded funds (ETFs). Net investment income (loss) of any mutual funds or ETFs is not included in the Fund's net investment income (loss) ratio.
CTotal returns would have been lower if certain expenses had not been reduced during the applicable periods shown.
DFees and expenses of any underlying mutual funds or exchange-traded funds (ETFs) are not included in the Fund's expense ratio. The Fund indirectly bears its proportionate share of these expenses. For additional expense information related to investments in Fidelity Central Funds, please refer to the "Investments in Fidelity Central Funds" note found in the Notes to Financial Statements section of the most recent Annual or Semi-Annual report.
EExpense ratios reflect operating expenses of the class. Expenses before reductions do not reflect amounts reimbursed, waived, or reduced through arrangements with the investment adviser, brokerage services, or other offset arrangements, if applicable, and do not represent the amount paid by the class during periods when reimbursements, waivers or reductions occur.
FAmount does not include the portfolio activity of any underlying mutual funds or exchange-traded funds (ETFs).
| Fidelity Advisor Asset Manager® 40% Class I |
| |
| Years ended September 30, | | 2023 | | 2022 | | 2021 | | 2020 | | 2019 |
Selected Per-Share Data | | | | | | | | | | |
| Net asset value, beginning of period | $ | 11.47 | $ | 13.86 | $ | 12.49 | $ | 11.82 | $ | 11.87 |
| Income from Investment Operations | | | | | | | | | | |
Net investment income (loss) A,B | | .30 | | .26 | | .18 | | .20 | | .24 |
| Net realized and unrealized gain (loss) | | .58 | | (2.32) | | 1.48 | | .88 | | .21 |
| Total from investment operations | | .88 | | (2.06) | | 1.66 | | 1.08 | | .45 |
| Distributions from net investment income | | (.33) | | (.21) | | (.16) | | (.20) | | (.24) |
| Distributions from net realized gain | | (.37) | | (.11) | | (.13) | | (.21) | | (.27) |
| Total distributions | | (.71) C | | (.33) C | | (.29) | | (.41) | | (.50) C |
| Net asset value, end of period | $ | 11.64 | $ | 11.47 | $ | 13.86 | $ | 12.49 | $ | 11.82 |
Total Return D | | 7.79% | | (15.24)% | | 13.42% | | 9.35% | | 4.18% |
Ratios to Average Net Assets B,E,F | | | | | | | | | | |
| Expenses before reductions | | .57% | | .57% | | .57% | | .56% | | .56% |
| Expenses net of fee waivers, if any | | .57% | | .57% | | .56% | | .56% | | .56% |
| Expenses net of all reductions | | .57% | | .57% | | .56% | | .56% | | .56% |
| Net investment income (loss) | | 2.50% | | 1.97% | | 1.34% | | 1.69% | | 2.06% |
| Supplemental Data | | | | | | | | | | |
| Net assets, end of period (000 omitted) | $ | 36,451 | $ | 34,286 | $ | 42,310 | $ | 28,708 | $ | 25,014 |
Portfolio turnover rate G | | 21% | | 16% | | 22% | | 24% | | 36% |
ACalculated based on average shares outstanding during the period.
BNet investment income (loss) is affected by the timing of the declaration of dividends by any underlying mutual funds or exchange-traded funds (ETFs). Net investment income (loss) of any mutual funds or ETFs is not included in the Fund's net investment income (loss) ratio.
CTotal distributions per share do not sum due to rounding.
DTotal returns would have been lower if certain expenses had not been reduced during the applicable periods shown.
EFees and expenses of any underlying mutual funds or exchange-traded funds (ETFs) are not included in the Fund's expense ratio. The Fund indirectly bears its proportionate share of these expenses. For additional expense information related to investments in Fidelity Central Funds, please refer to the "Investments in Fidelity Central Funds" note found in the Notes to Financial Statements section of the most recent Annual or Semi-Annual report.
FExpense ratios reflect operating expenses of the class. Expenses before reductions do not reflect amounts reimbursed, waived, or reduced through arrangements with the investment adviser, brokerage services, or other offset arrangements, if applicable, and do not represent the amount paid by the class during periods when reimbursements, waivers or reductions occur.
GAmount does not include the portfolio activity of any underlying mutual funds or exchange-traded funds (ETFs).
| Fidelity Advisor Asset Manager® 40% Class Z |
| |
| Years ended September 30, | | 2023 | | 2022 | | 2021 | | 2020 | | 2019 A |
Selected Per-Share Data | | | | | | | | | | |
| Net asset value, beginning of period | $ | 11.47 | $ | 13.86 | $ | 12.49 | $ | 11.82 | $ | 11.86 |
| Income from Investment Operations | | | | | | | | | | |
Net investment income (loss) B,C | | .31 | | .27 | | .19 | | .21 | | .24 |
| Net realized and unrealized gain (loss) | | .58 | | (2.32) | | 1.48 | | .88 | | .23 |
| Total from investment operations | | .89 | | (2.05) | | 1.67 | | 1.09 | | .47 |
| Distributions from net investment income | | (.34) | | (.23) | | (.17) | | (.22) | | (.24) |
| Distributions from net realized gain | | (.37) | | (.11) | | (.13) | | (.21) | | (.27) |
| Total distributions | | (.72) D | | (.34) | | (.30) | | (.42) D | | (.51) |
| Net asset value, end of period | $ | 11.64 | $ | 11.47 | $ | 13.86 | $ | 12.49 | $ | 11.82 |
Total Return E,F | | 7.89% | | (15.16)% | | 13.49% | | 9.45% | | 4.34% |
Ratios to Average Net Assets C,G,H | | | | | | | | | | |
| Expenses before reductions | | .49% | | .49% | | .49% | | .50% | | .50% I |
| Expenses net of fee waivers, if any | | .49% | | .49% | | .49% | | .49% | | .50% I |
| Expenses net of all reductions | | .49% | | .49% | | .49% | | .49% | | .50% I |
| Net investment income (loss) | | 2.58% | | 2.05% | | 1.41% | | 1.76% | | 2.12% I |
| Supplemental Data | | | | | | | | | | |
| Net assets, end of period (000 omitted) | $ | 530,895 | $ | 500,747 | $ | 556,238 | $ | 12,416 | $ | 6,431 |
Portfolio turnover rate J | | 21% | | 16% | | 22% | | 24% | | 36% |
AFor the period October 2, 2018 (commencement of sale of shares) through September 30, 2019.
BCalculated based on average shares outstanding during the period.
CNet investment income (loss) is affected by the timing of the declaration of dividends by any underlying mutual funds or exchange-traded funds (ETFs). Net investment income (loss) of any mutual funds or ETFs is not included in the Fund's net investment income (loss) ratio.
DTotal distributions per share do not sum due to rounding.
ETotal returns for periods of less than one year are not annualized.
FTotal returns would have been lower if certain expenses had not been reduced during the applicable periods shown.
GFees and expenses of any underlying mutual funds or exchange-traded funds (ETFs) are not included in the Fund's expense ratio. The Fund indirectly bears its proportionate share of these expenses. For additional expense information related to investments in Fidelity Central Funds, please refer to the "Investments in Fidelity Central Funds" note found in the Notes to Financial Statements section of the most recent Annual or Semi-Annual report.
HExpense ratios reflect operating expenses of the class. Expenses before reductions do not reflect amounts reimbursed, waived, or reduced through arrangements with the investment adviser, brokerage services, or other offset arrangements, if applicable, and do not represent the amount paid by the class during periods when reimbursements, waivers or reductions occur.
IAnnualized.
JAmount does not include the portfolio activity of any underlying mutual funds or exchange-traded funds (ETFs).
The information in the following tables is based on the combined Investments of the Fund and it's pro-rata share of investments in Fidelity's Central Funds, other than the Commodity Strategy and Money Market Central Funds.
Top Holdings (% of Fund's net assets) |
| |
| Microsoft Corp. | 2.3 | |
| Apple, Inc. | 1.8 | |
| iShares MSCI USA Minimum Volatility ETF | 1.3 | |
| Alphabet, Inc. Class A | 1.3 | |
| Amazon.com, Inc. | 1.2 | |
| iShares 20+ Year Treasury Bond ETF | 0.8 | |
| Exxon Mobil Corp. | 0.7 | |
| NVIDIA Corp. | 0.7 | |
| Meta Platforms, Inc. Class A | 0.7 | |
| JPMorgan Chase & Co. | 0.7 | |
| | 11.5 | |
| |
| Top Bond Issuers (% of Fund's net assets) |
(with maturities greater than one year) |
| U.S. Treasury Obligations | 15.8 | |
| Fannie Mae | 2.7 | |
| Freddie Mac | 2.5 | |
| Ginnie Mae | 1.5 | |
| Uniform Mortgage Backed Securities | 1.3 | |
| JPMorgan Chase & Co. | 0.6 | |
| Morgan Stanley | 0.5 | |
| Citigroup, Inc. | 0.3 | |
| Bank of America Corp. | 0.3 | |
| Petroleos Mexicanos | 0.3 | |
| | 25.8 | |
| |
| Market Sectors (% of Fund's net assets) |
| |
| Financials | 16.2 | |
| Information Technology | 11.9 | |
| Health Care | 7.2 | |
| Industrials | 7.0 | |
| Consumer Discretionary | 6.9 | |
| Communication Services | 4.7 | |
| Consumer Staples | 4.3 | |
| Energy | 4.1 | |
| Real Estate | 2.8 | |
| Materials | 2.3 | |
| Utilities | 1.0 | |
| |
Quality Diversification (% of Fund's net assets) |
|
Percentages shown as 0.0% may reflect amounts less than 0.05%. |
| |
| We have used ratings from Moody's Investors Service, Inc. Where Moody's® ratings are not available, we have used S&P® ratings. All ratings are as of the date indicated and do not reflect subsequent changes. |
Asset Allocation (% of Fund's net assets) |
|
|
Asset allocations in the pie charts reflect the categorization of assets as defined in the Fund's prospectus in effect as of the time periods indicated above. Percentages are adjusted for the effect of future contracts and swap contracts, if applicable.
Geographic Diversification (% of Fund's net assets) |
|
* Includes Short-Term investments and Net Other Assets (Liabilities). Percentages are adjusted for the effect of derivatives, if applicable. |
| |
Percentages in the above tables are adjusted for the effect of TBA sale Commitments.
Equities and Stock Class and Equity Futures percentages above include Fidelity Commodity Strategy Central Fund of 0.5%.
At period end, foreign investments including the Fund's pro-rata share of the underlying Central Funds, other than the Commodity Strategy Central and Money Market Funds, was 26.3% of net assets.
An unaudited holdings list for the Fund, which presents direct holdings as well as the pro-rata share of any securities and other investments held indirectly through its investment in underlying Fidelity Central Funds, other than the Commodity Strategy and Money Market Central Funds, is available at fidelity.com and/or institutional.fidelity.com, as applicable.
Fidelity Asset Manager® 50%
Showing Percentage of Net Assets
| Equity Central Funds - 55.8% |
| | | Shares | Value ($) |
| Fidelity Commodity Strategy Central Fund (a) | | 478,748 | 45,193,778 |
| Fidelity Emerging Markets Equity Central Fund (a) | | 3,061,651 | 575,008,680 |
| Fidelity Hedged Equity Central Fund (a) | | 1,142,415 | 118,514,113 |
| Fidelity International Equity Central Fund (a) | | 15,214,433 | 1,345,260,183 |
| Fidelity Real Estate Equity Central Fund (a) | | 326,057 | 36,531,465 |
| Fidelity U.S. Equity Central Fund (a) | | 25,144,974 | 2,924,109,056 |
| TOTAL EQUITY CENTRAL FUNDS (Cost $2,776,023,134) | | | 5,044,617,275 |
| | | | |
| Fixed-Income Central Funds - 40.3% |
| | | Shares | Value ($) |
| High Yield Fixed-Income Funds - 2.9% | | | |
| Fidelity Emerging Markets Debt Central Fund (a) | | 2,027,460 | 14,881,559 |
| Fidelity Emerging Markets Debt Local Currency Central Fund (a) | | 834,538 | 73,864,985 |
| Fidelity Floating Rate Central Fund (a) | | 1,250,727 | 122,596,300 |
| Fidelity High Income Central Fund (a) | | 463,956 | 46,924,476 |
TOTAL HIGH YIELD FIXED-INCOME FUNDS | | | 258,267,320 |
| Investment Grade Fixed-Income Funds - 37.4% | | | |
| Fidelity Inflation-Protected Bond Index Central Fund (a) | | 1,311,450 | 115,407,562 |
| Fidelity International Credit Central Fund (a) | | 615,627 | 46,843,042 |
| Fidelity Investment Grade Bond Central Fund (a) | | 34,406,579 | 3,220,799,898 |
TOTAL INVESTMENT GRADE FIXED-INCOME FUNDS | | | 3,383,050,502 |
| TOTAL FIXED-INCOME CENTRAL FUNDS (Cost $3,955,882,561) | | | 3,641,317,822 |
| | | | |
| Money Market Central Funds - 1.4% |
| | | Shares | Value ($) |
| Fidelity Cash Central Fund 5.39% (b) | | 122,215,177 | 122,239,620 |
| Fidelity Securities Lending Cash Central Fund 5.39% (b)(c) | | 751,075 | 751,150 |
| TOTAL MONEY MARKET CENTRAL FUNDS (Cost $122,990,770) | | | 122,990,770 |
| | | | |
| U.S. Treasury Obligations - 0.4% |
| | | Principal Amount (d) | Value ($) |
U.S. Treasury Bills, yield at date of purchase 5.35% to 5.39% 10/26/23 to 12/21/23 (e) (Cost $34,979,199) | | 35,270,000 | 34,984,170 |
| | | | |
| Investment Companies - 2.1% |
| | | Shares | Value ($) |
| iShares 20+ Year Treasury Bond ETF (f) | | 856,816 | 75,991,011 |
| iShares MSCI USA Minimum Volatility ETF | | 1,639,008 | 118,631,396 |
| TOTAL INVESTMENT COMPANIES (Cost $202,985,257) | | | 194,622,407 |
| | | | |
| TOTAL INVESTMENT IN SECURITIES - 100.0% (Cost $7,092,860,921) | 9,038,532,444 |
NET OTHER ASSETS (LIABILITIES) - 0.0% | (278,719) |
| NET ASSETS - 100.0% | 9,038,253,725 |
| | |
| Futures Contracts |
| | Number of contracts | Expiration Date | Notional Amount ($) | Value ($) | Unrealized Appreciation/ (Depreciation) ($) |
| Sold | | | | | |
| | | | | | |
| Equity Index Contracts | | | | | |
| CME E-mini S&P 500 Index Contracts (United States) | 2,493 | Dec 2023 | 539,173,575 | 16,681,630 | 16,681,630 |
| ICE MSCI EAFE Index Contracts (United States) | 470 | Dec 2023 | 47,975,250 | 1,011,116 | 1,011,116 |
| ICE MSCI Emerging Markets Index Contracts (United States) | 1,863 | Dec 2023 | 89,004,825 | 2,963,674 | 2,963,674 |
| | | | | | |
| TOTAL FUTURES CONTRACTS | | | | | 20,656,420 |
| The notional amount of futures sold as a percentage of Net Assets is 7.5% |
For the period, the average monthly notional amount at value for futures contracts in the aggregate was $737,736,834.
Security Type Abbreviations
Legend
| (a) | Affiliated fund that is generally available only to investment companies and other accounts managed by Fidelity Investments. A complete unaudited schedule of portfolio holdings for each Fidelity Central Fund is filed with the SEC for the first and third quarters of each fiscal year on Form N-PORT and is available upon request or at the SEC's website at www.sec.gov. An unaudited holdings listing for the Fund, which presents direct holdings as well as the pro-rata share of securities and other investments held indirectly through its investment in underlying non-money market Fidelity Central Funds, other than the Commodity Strategy Central Fund, is available at fidelity.com and/or institutional.fidelity.com, as applicable. In addition, each Fidelity Central Fund's financial statements,which are not covered by the Fund's Report of Independent Registered Public Accounting Firm, are available on the SEC's website or upon request. |
| (b) | Affiliated fund that is generally available only to investment companies and other accounts managed by Fidelity Investments. The rate quoted is the annualized seven-day yield of the fund at period end. A complete unaudited listing of the fund's holdings as of its most recent quarter end is available upon request. In addition, each Fidelity Central Fund's financial statements, which are not covered by the Fund's Report of Independent Registered Public Accounting Firm, are available on the SEC's website or upon request. |
| (c) | Investment made with cash collateral received from securities on loan. |
| (d) | Amount is stated in United States dollars unless otherwise noted. |
| (e) | Security or a portion of the security was pledged to cover margin requirements for futures contracts. At period end, the value of securities pledged amounted to $33,315,361. |
| (f) | Security or a portion of the security is on loan at period end. |
Affiliated Central Funds
Fiscal year to date information regarding the Fund's investments in Fidelity Central Funds, including the ownership percentage, is presented below.
| Affiliate | Value, beginning of period ($) | Purchases ($) | Sales Proceeds ($) | Dividend Income ($) | Realized Gain (loss) ($) | Change in Unrealized appreciation (depreciation) ($) | Value, end of period ($) | % ownership, end of period |
| Fidelity Cash Central Fund 5.39% | 91,967,268 | 1,115,299,031 | 1,085,026,679 | 2,614,806 | - | - | 122,239,620 | 0.3% |
| Fidelity Commodity Strategy Central Fund | 203,314,745 | 5,842,664 | 155,302,897 | 4,197,778 | (39,581,199) | 30,920,465 | 45,193,778 | 19.9% |
| Fidelity Emerging Markets Debt Central Fund | 20,685,617 | 1,959,079 | 8,482,629 | 1,142,465 | (2,031,567) | 2,751,059 | 14,881,559 | 0.7% |
| Fidelity Emerging Markets Debt Local Currency Central Fund | 23,176,447 | 47,040,114 | 199 | 63,539 | 78,895 | 3,569,728 | 73,864,985 | 26.9% |
| Fidelity Emerging Markets Equity Central Fund | 486,823,346 | 149,200,667 | 115,074,770 | 18,236,167 | (23,527,749) | 77,587,186 | 575,008,680 | 26.7% |
| Fidelity Floating Rate Central Fund | 273,001,460 | 21,111,607 | 180,527,100 | 18,520,253 | (6,056,308) | 15,066,641 | 122,596,300 | 8.3% |
| Fidelity Hedged Equity Central Fund | - | 118,792,271 | - | 15,326 | - | (278,158) | 118,514,113 | 27.5% |
| Fidelity High Income Central Fund | 75,459,699 | 6,066,787 | 37,393,213 | 5,225,324 | 1,423,556 | 1,367,647 | 46,924,476 | 3.3% |
| Fidelity Inflation-Protected Bond Index Central Fund | 186,198,174 | 22,641,860 | 77,774,714 | 20,516,490 | (7,803,224) | (7,854,534) | 115,407,562 | 27.2% |
| Fidelity International Credit Central Fund | 108,800,355 | 7,107,247 | 64,506,435 | 6,152,210 | (19,612,186) | 15,054,061 | 46,843,042 | 23.6% |
| Fidelity International Equity Central Fund | 941,361,876 | 322,805,441 | 141,125,686 | 29,748,400 | (8,992,676) | 231,211,228 | 1,345,260,183 | 28.7% |
| Fidelity Investment Grade Bond Central Fund | 2,986,555,177 | 721,489,766 | 405,763,480 | 123,343,275 | (15,209,448) | (66,272,117) | 3,220,799,898 | 8.7% |
| Fidelity Real Estate Equity Central Fund | 61,134,245 | 2,204,856 | 29,350,109 | 1,507,994 | 202,420 | 2,340,053 | 36,531,465 | 3.9% |
| Fidelity Securities Lending Cash Central Fund 5.39% | - | 361,494,268 | 360,743,118 | 8,116 | - | - | 751,150 | 0.0% |
| Fidelity U.S. Equity Central Fund | 3,121,072,050 | 115,226,981 | 837,908,911 | 84,619,601 | 189,206,087 | 336,512,849 | 2,924,109,056 | 18.6% |
| Total | 8,579,550,459 | 3,018,282,639 | 3,498,979,940 | 315,911,744 | 68,096,601 | 641,976,108 | 8,808,925,867 | |
| | | | | | | | | |
Amounts in the dividend income column in the above table include any capital gain distributions from underlying funds, which are presented in the corresponding line item in the Statement of Operations, if applicable.
Amounts in the dividend income column for Fidelity Securities Lending Cash Central Fund represents the income earned on investing cash collateral, less rebates paid to borrowers and any lending agent fees associated with the loan, plus any premium payments received for lending certain types of securities.
Amounts included in the purchases and sales proceeds columns may include in-kind transactions, if applicable.
Investment Valuation
The following is a summary of the inputs used, as of September 30, 2023, involving the Fund's assets and liabilities carried at fair value. The inputs or methodology used for valuing securities may not be an indication of the risk associated with investing in those securities. For more information on valuation inputs, and their aggregation into the levels used below, please refer to the Investment Valuation section in the accompanying Notes to Financial Statements.
| Valuation Inputs at Reporting Date: |
| Description | Total ($) | Level 1 ($) | Level 2 ($) | Level 3 ($) |
Investments in Securities: | | | | |
|
| Equity Central Funds | 5,044,617,275 | 5,044,617,275 | - | - |
|
| Fixed-Income Central Funds | 3,641,317,822 | 3,641,317,822 | - | - |
|
| Money Market Central Funds | 122,990,770 | 122,990,770 | - | - |
|
| U.S Treasury Obligations | 34,984,170 | - | 34,984,170 | - |
|
| Investment Companies | 194,622,407 | 194,622,407 | - | - |
| Total Investments in Securities: | 9,038,532,444 | 9,003,548,274 | 34,984,170 | - |
Derivative Instruments: Assets | | | | |
Futures Contracts | 20,656,420 | 20,656,420 | - | - |
| Total Assets | 20,656,420 | 20,656,420 | - | - |
| Total Derivative Instruments: | 20,656,420 | 20,656,420 | - | - |
Value of Derivative Instruments
The following table is a summary of the Fund's value of derivative instruments by primary risk exposure as of September 30, 2023. For additional information on derivative instruments, please refer to the Derivative Instruments section in the accompanying Notes to Financial Statements.
Primary Risk Exposure / Derivative Type | Value |
| Asset ($) | Liability ($) |
| Equity Risk | | |
Futures Contracts (a) | 20,656,420 | 0 |
| Total Equity Risk | 20,656,420 | 0 |
| Total Value of Derivatives | 20,656,420 | 0 |
(a)Reflects gross cumulative appreciation (depreciation) on futures contracts as presented in the Schedule of Investments. In the Statement of Assets and Liabilities, the period end daily variation margin is included in receivable or payable for daily variation margin on futures contracts, and the net cumulative appreciation (depreciation) is included in Total accumulated earnings (loss).
Fidelity Asset Manager® 50%
| Statement of Assets and Liabilities |
| | | | September 30, 2023 |
| | | | | |
| Assets | | | | |
| Investment in securities, at value (including securities loaned of $736,127) - See accompanying schedule: | | | | |
Unaffiliated issuers (cost $237,964,456) | $ | 229,606,577 | | |
Fidelity Central Funds (cost $6,854,896,465) | | 8,808,925,867 | | |
| | | | | |
| | | | | |
| Total Investment in Securities (cost $7,092,860,921) | | | $ | 9,038,532,444 |
| Receivable for investments sold | | | | 8,269,371 |
| Receivable for fund shares sold | | | | 721,601 |
| Dividends receivable | | | | 634,348 |
| Distributions receivable from Fidelity Central Funds | | | | 157,372 |
| Receivable for daily variation margin on futures contracts | | | | 1,662,650 |
| Prepaid expenses | | | | 13,083 |
| Other receivables | | | | 162,874 |
Total assets | | | | 9,050,153,743 |
| Liabilities | | | | |
| Payable for investments purchased | $ | 427,389 | | |
| Payable for fund shares redeemed | | 5,808,495 | | |
| Accrued management fee | | 3,648,343 | | |
| Transfer agent fee payable | | 821,517 | | |
| Distribution and service plan fees payable | | 71,340 | | |
| Other affiliated payables | | 122,576 | | |
| Other payables and accrued expenses | | 249,208 | | |
| Collateral on securities loaned | | 751,150 | | |
| Total Liabilities | | | | 11,900,018 |
| Net Assets | | | $ | 9,038,253,725 |
| Net Assets consist of: | | | | |
| Paid in capital | | | $ | 7,901,671,497 |
| Total accumulated earnings (loss) | | | | 1,136,582,228 |
| Net Assets | | | $ | 9,038,253,725 |
| | | | | |
| Net Asset Value and Maximum Offering Price | | | | |
| Class A : | | | | |
Net Asset Value and redemption price per share ($116,526,372 ÷ 6,423,601 shares)(a) | | | $ | 18.14 |
| Maximum offering price per share (100/94.25 of $18.14) | | | $ | 19.25 |
| Class M : | | | | |
Net Asset Value and redemption price per share ($48,133,911 ÷ 2,657,112 shares)(a) | | | $ | 18.12 |
| Maximum offering price per share (100/96.50 of $18.12) | | | $ | 18.78 |
| Class C : | | | | |
Net Asset Value and offering price per share ($29,985,656 ÷ 1,672,755 shares)(a) | | | $ | 17.93 |
| Asset Manager 50% : | | | | |
Net Asset Value, offering price and redemption price per share ($6,958,278,365 ÷ 381,594,339 shares) | | | $ | 18.23 |
| Class I : | | | | |
Net Asset Value, offering price and redemption price per share ($50,985,563 ÷ 2,802,018 shares) | | | $ | 18.20 |
| Class Z : | | | | |
Net Asset Value, offering price and redemption price per share ($1,834,343,858 ÷ 100,897,305 shares) | | | $ | 18.18 |
(a)Redemption price per share is equal to net asset value less any applicable contingent deferred sales charge. |
| Statement of Operations |
| | | | Year ended September 30, 2023 |
| Investment Income | | | | |
| Dividends | | | $ | 5,414,500 |
| Interest | | | | 1,608,922 |
| Income from Fidelity Central Funds (including $8,116 from security lending) | | | | 266,910,938 |
| Total Income | | | | 273,934,360 |
| Expenses | | | | |
| Management fee | $ | 44,897,686 | | |
| Transfer agent fees | | 9,948,133 | | |
| Distribution and service plan fees | | 870,740 | | |
| Accounting fees | | 1,478,777 | | |
| Custodian fees and expenses | | 32,305 | | |
| Independent trustees' fees and expenses | | 34,815 | | |
| Registration fees | | 119,007 | | |
| Audit | | 47,816 | | |
| Legal | | 19,955 | | |
| Miscellaneous | | 96,342 | | |
| Total expenses before reductions | | 57,545,576 | | |
| Expense reductions | | (475,796) | | |
| Total expenses after reductions | | | | 57,069,780 |
| Net Investment income (loss) | | | | 216,864,580 |
| Realized and Unrealized Gain (Loss) | | | | |
| Net realized gain (loss) on: | | | | |
| Investment Securities: | | | | |
| Unaffiliated issuers | | (86,428,374) | | |
| Fidelity Central Funds | | 68,096,601 | | |
| Futures contracts | | (46,068,460) | | |
| Capital gain distributions from Fidelity Central Funds | | 49,000,806 | | |
| Total net realized gain (loss) | | | | (15,399,427) |
| Change in net unrealized appreciation (depreciation) on: | | | | |
| Investment Securities: | | | | |
| Unaffiliated issuers | | 64,775,518 | | |
| Fidelity Central Funds | | 641,976,108 | | |
| Futures contracts | | (44,882,363) | | |
| Total change in net unrealized appreciation (depreciation) | | | | 661,869,263 |
| Net gain (loss) | | | | 646,469,836 |
| Net increase (decrease) in net assets resulting from operations | | | $ | 863,334,416 |
| Statement of Changes in Net Assets |
| |
| | Year ended September 30, 2023 | | Year ended September 30, 2022 |
| Increase (Decrease) in Net Assets | | | | |
| Operations | | | | |
| Net investment income (loss) | $ | 216,864,580 | $ | 208,898,662 |
| Net realized gain (loss) | | (15,399,427) | | 465,207,708 |
| Change in net unrealized appreciation (depreciation) | | 661,869,263 | | (2,558,606,467) |
| Net increase (decrease) in net assets resulting from operations | | 863,334,416 | | (1,884,500,097) |
| Distributions to shareholders | | (639,672,674) | | (345,832,994) |
| | | | | |
| Share transactions - net increase (decrease) | | (196,061,966) | | (312,881,619) |
| Total increase (decrease) in net assets | | 27,599,776 | | (2,543,214,710) |
| | | | | |
| Net Assets | | | | |
| Beginning of period | | 9,010,653,949 | | 11,553,868,659 |
| End of period | $ | 9,038,253,725 | $ | 9,010,653,949 |
| | | | | |
| | | | | |
Financial Highlights
| Fidelity Advisor Asset Manager® 50% Class A |
| |
| Years ended September 30, | | 2023 | | 2022 | | 2021 | | 2020 | | 2019 |
Selected Per-Share Data | | | | | | | | | | |
| Net asset value, beginning of period | $ | 17.75 | $ | 21.98 | $ | 19.33 | $ | 18.22 | $ | 18.58 |
| Income from Investment Operations | | | | | | | | | | |
Net investment income (loss) A,B | | .37 | | .33 | | .20 | | .24 | | .28 |
| Net realized and unrealized gain (loss) | | 1.24 | | (3.97) | | 2.86 | | 1.57 | | .20 |
| Total from investment operations | | 1.61 | | (3.64) | | 3.06 | | 1.81 | | .48 |
| Distributions from net investment income | | (.44) | | (.28) | | (.17) | | (.25) | | (.29) |
| Distributions from net realized gain | | (.78) | | (.31) | | (.24) | | (.45) | | (.55) |
| Total distributions | | (1.22) | | (.59) | | (.41) | | (.70) | | (.84) |
| Net asset value, end of period | $ | 18.14 | $ | 17.75 | $ | 21.98 | $ | 19.33 | $ | 18.22 |
Total Return C,D | | 9.29% | | (17.02)% | | 15.99% | | 10.15% | | 3.07% |
Ratios to Average Net Assets B,E,F | | | | | | | | | | |
| Expenses before reductions | | .91% | | .91% | | .91% | | .93% | | .94% |
| Expenses net of fee waivers, if any | | .91% | | .90% | | .91% | | .92% | | .94% |
| Expenses net of all reductions | | .91% | | .90% | | .91% | | .92% | | .94% |
| Net investment income (loss) | | 2.00% | | 1.63% | | .94% | | 1.32% | | 1.57% |
| Supplemental Data | | | | | | | | | | |
| Net assets, end of period (000 omitted) | $ | 116,526 | $ | 110,693 | $ | 134,052 | $ | 106,339 | $ | 95,542 |
Portfolio turnover rate G | | 20% | | 20% | | 17% | | 24% | | 37% |
ACalculated based on average shares outstanding during the period.
BNet investment income (loss) is affected by the timing of the declaration of dividends by any underlying mutual funds or exchange-traded funds (ETFs). Net investment income (loss) of any mutual funds or ETFs is not included in the Fund's net investment income (loss) ratio.
CTotal returns would have been lower if certain expenses had not been reduced during the applicable periods shown.
DTotal returns do not include the effect of the sales charges.
EFees and expenses of any underlying mutual funds or exchange-traded funds (ETFs) are not included in the Fund's expense ratio. The Fund indirectly bears its proportionate share of these expenses. For additional expense information related to investments in Fidelity Central Funds, please refer to the "Investments in Fidelity Central Funds" note found in the Notes to Financial Statements section of the most recent Annual or Semi-Annual report.
FExpense ratios reflect operating expenses of the class. Expenses before reductions do not reflect amounts reimbursed, waived, or reduced through arrangements with the investment adviser, brokerage services, or other offset arrangements, if applicable, and do not represent the amount paid by the class during periods when reimbursements, waivers or reductions occur.
GAmount does not include the portfolio activity of any underlying mutual funds or exchange-traded funds (ETFs).
| Fidelity Advisor Asset Manager® 50% Class M |
| |
| Years ended September 30, | | 2023 | | 2022 | | 2021 | | 2020 | | 2019 |
Selected Per-Share Data | | | | | | | | | | |
| Net asset value, beginning of period | $ | 17.73 | $ | 21.95 | $ | 19.31 | $ | 18.20 | $ | 18.56 |
| Income from Investment Operations | | | | | | | | | | |
Net investment income (loss) A,B | | .32 | | .28 | | .15 | | .20 | | .23 |
| Net realized and unrealized gain (loss) | | 1.24 | | (3.95) | | 2.85 | | 1.57 | | .21 |
| Total from investment operations | | 1.56 | | (3.67) | | 3.00 | | 1.77 | | .44 |
| Distributions from net investment income | | (.39) | | (.24) | | (.12) | | (.20) | | (.25) |
| Distributions from net realized gain | | (.78) | | (.31) | | (.24) | | (.45) | | (.55) |
| Total distributions | | (1.17) | | (.55) | | (.36) | | (.66) C | | (.80) |
| Net asset value, end of period | $ | 18.12 | $ | 17.73 | $ | 21.95 | $ | 19.31 | $ | 18.20 |
Total Return D,E | | 9.03% | | (17.18)% | | 15.69% | | 9.89% | | 2.81% |
Ratios to Average Net Assets B,F,G | | | | | | | | | | |
| Expenses before reductions | | 1.15% | | 1.15% | | 1.15% | | 1.17% | | 1.18% |
| Expenses net of fee waivers, if any | | 1.15% | | 1.15% | | 1.15% | | 1.16% | | 1.18% |
| Expenses net of all reductions | | 1.15% | | 1.15% | | 1.15% | | 1.16% | | 1.18% |
| Net investment income (loss) | | 1.76% | | 1.39% | | .70% | | 1.08% | | 1.33% |
| Supplemental Data | | | | | | | | | | |
| Net assets, end of period (000 omitted) | $ | 48,134 | $ | 47,759 | $ | 57,507 | $ | 45,076 | $ | 42,658 |
Portfolio turnover rate H | | 20% | | 20% | | 17% | | 24% | | 37% |
ACalculated based on average shares outstanding during the period.
BNet investment income (loss) is affected by the timing of the declaration of dividends by any underlying mutual funds or exchange-traded funds (ETFs). Net investment income (loss) of any mutual funds or ETFs is not included in the Fund's net investment income (loss) ratio.
CTotal distributions per share do not sum due to rounding.
DTotal returns would have been lower if certain expenses had not been reduced during the applicable periods shown.
ETotal returns do not include the effect of the sales charges.
FFees and expenses of any underlying mutual funds or exchange-traded funds (ETFs) are not included in the Fund's expense ratio. The Fund indirectly bears its proportionate share of these expenses. For additional expense information related to investments in Fidelity Central Funds, please refer to the "Investments in Fidelity Central Funds" note found in the Notes to Financial Statements section of the most recent Annual or Semi-Annual report.
GExpense ratios reflect operating expenses of the class. Expenses before reductions do not reflect amounts reimbursed, waived, or reduced through arrangements with the investment adviser, brokerage services, or other offset arrangements, if applicable, and do not represent the amount paid by the class during periods when reimbursements, waivers or reductions occur.
HAmount does not include the portfolio activity of any underlying mutual funds or exchange-traded funds (ETFs).
| Fidelity Advisor Asset Manager® 50% Class C |
| |
| Years ended September 30, | | 2023 | | 2022 | | 2021 | | 2020 | | 2019 |
Selected Per-Share Data | | | | | | | | | | |
| Net asset value, beginning of period | $ | 17.55 | $ | 21.76 | $ | 19.16 | $ | 18.05 | $ | 18.42 |
| Income from Investment Operations | | | | | | | | | | |
Net investment income (loss) A,B | | .23 | | .18 | | .04 | | .10 | | .14 |
| Net realized and unrealized gain (loss) | | 1.23 | | (3.93) | | 2.84 | | 1.57 | | .20 |
| Total from investment operations | | 1.46 | | (3.75) | | 2.88 | | 1.67 | | .34 |
| Distributions from net investment income | | (.29) | | (.15) | | (.04) | | (.11) | | (.16) |
| Distributions from net realized gain | | (.78) | | (.31) | | (.24) | | (.45) | | (.55) |
| Total distributions | | (1.08) C | | (.46) | | (.28) | | (.56) | | (.71) |
| Net asset value, end of period | $ | 17.93 | $ | 17.55 | $ | 21.76 | $ | 19.16 | $ | 18.05 |
Total Return D,E | | 8.47% | | (17.64)% | | 15.12% | | 9.38% | | 2.25% |
Ratios to Average Net Assets B,F,G | | | | | | | | | | |
| Expenses before reductions | | 1.66% | | 1.66% | | 1.67% | | 1.68% | | 1.69% |
| Expenses net of fee waivers, if any | | 1.66% | | 1.66% | | 1.67% | | 1.68% | | 1.69% |
| Expenses net of all reductions | | 1.66% | | 1.66% | | 1.67% | | 1.68% | | 1.69% |
| Net investment income (loss) | | 1.24% | | .87% | | .18% | | .56% | | .82% |
| Supplemental Data | | | | | | | | | | |
| Net assets, end of period (000 omitted) | $ | 29,986 | $ | 31,796 | $ | 51,226 | $ | 44,990 | $ | 46,487 |
Portfolio turnover rate H | | 20% | | 20% | | 17% | | 24% | | 37% |
ACalculated based on average shares outstanding during the period.
BNet investment income (loss) is affected by the timing of the declaration of dividends by any underlying mutual funds or exchange-traded funds (ETFs). Net investment income (loss) of any mutual funds or ETFs is not included in the Fund's net investment income (loss) ratio.
CTotal distributions per share do not sum due to rounding.
DTotal returns would have been lower if certain expenses had not been reduced during the applicable periods shown.
ETotal returns do not include the effect of the contingent deferred sales charge.
FFees and expenses of any underlying mutual funds or exchange-traded funds (ETFs) are not included in the Fund's expense ratio. The Fund indirectly bears its proportionate share of these expenses. For additional expense information related to investments in Fidelity Central Funds, please refer to the "Investments in Fidelity Central Funds" note found in the Notes to Financial Statements section of the most recent Annual or Semi-Annual report.
GExpense ratios reflect operating expenses of the class. Expenses before reductions do not reflect amounts reimbursed, waived, or reduced through arrangements with the investment adviser, brokerage services, or other offset arrangements, if applicable, and do not represent the amount paid by the class during periods when reimbursements, waivers or reductions occur.
HAmount does not include the portfolio activity of any underlying mutual funds or exchange-traded funds (ETFs).
| Fidelity Asset Manager® 50% |
| |
| Years ended September 30, | | 2023 | | 2022 | | 2021 | | 2020 | | 2019 |
Selected Per-Share Data | | | | | | | | | | |
| Net asset value, beginning of period | $ | 17.84 | $ | 22.09 | $ | 19.42 | $ | 18.30 | $ | 18.66 |
| Income from Investment Operations | | | | | | | | | | |
Net investment income (loss) A,B | | .43 | | .40 | | .27 | | .30 | | .33 |
| Net realized and unrealized gain (loss) | | 1.24 | | (3.99) | | 2.87 | | 1.58 | | .21 |
| Total from investment operations | | 1.67 | | (3.59) | | 3.14 | | 1.88 | | .54 |
| Distributions from net investment income | | (.49) | | (.35) | | (.23) | | (.30) | | (.35) |
| Distributions from net realized gain | | (.78) | | (.31) | | (.24) | | (.45) | | (.55) |
| Total distributions | | (1.28) C | | (.66) | | (.47) | | (.76) C | | (.90) |
| Net asset value, end of period | $ | 18.23 | $ | 17.84 | $ | 22.09 | $ | 19.42 | $ | 18.30 |
Total Return D | | 9.59% | | (16.79)% | | 16.36% | | 10.51% | | 3.37% |
Ratios to Average Net Assets B,E,F | | | | | | | | | | |
| Expenses before reductions | | .61% | | .61% | | .61% | | .62% | | .63% |
| Expenses net of fee waivers, if any | | .61% | | .60% | | .60% | | .62% | | .63% |
| Expenses net of all reductions | | .61% | | .60% | | .60% | | .62% | | .63% |
| Net investment income (loss) | | 2.29% | | 1.93% | | 1.25% | | 1.63% | | 1.88% |
| Supplemental Data | | | | | | | | | | |
| Net assets, end of period (000 omitted) | $ | 6,958,278 | $ | 7,094,870 | $ | 9,274,634 | $ | 9,387,915 | $ | 9,026,444 |
Portfolio turnover rate G | | 20% | | 20% | | 17% | | 24% | | 37% |
ACalculated based on average shares outstanding during the period.
BNet investment income (loss) is affected by the timing of the declaration of dividends by any underlying mutual funds or exchange-traded funds (ETFs). Net investment income (loss) of any mutual funds or ETFs is not included in the Fund's net investment income (loss) ratio.
CTotal distributions per share do not sum due to rounding.
DTotal returns would have been lower if certain expenses had not been reduced during the applicable periods shown.
EFees and expenses of any underlying mutual funds or exchange-traded funds (ETFs) are not included in the Fund's expense ratio. The Fund indirectly bears its proportionate share of these expenses. For additional expense information related to investments in Fidelity Central Funds, please refer to the "Investments in Fidelity Central Funds" note found in the Notes to Financial Statements section of the most recent Annual or Semi-Annual report.
FExpense ratios reflect operating expenses of the class. Expenses before reductions do not reflect amounts reimbursed, waived, or reduced through arrangements with the investment adviser, brokerage services, or other offset arrangements, if applicable, and do not represent the amount paid by the class during periods when reimbursements, waivers or reductions occur.
GAmount does not include the portfolio activity of any underlying mutual funds or exchange-traded funds (ETFs).
| Fidelity Advisor Asset Manager® 50% Class I |
| |
| Years ended September 30, | | 2023 | | 2022 | | 2021 | | 2020 | | 2019 |
Selected Per-Share Data | | | | | | | | | | |
| Net asset value, beginning of period | $ | 17.80 | $ | 22.04 | $ | 19.38 | $ | 18.26 | $ | 18.62 |
| Income from Investment Operations | | | | | | | | | | |
Net investment income (loss) A,B | | .42 | | .39 | | .26 | | .29 | | .33 |
| Net realized and unrealized gain (loss) | | 1.25 | | (3.98) | | 2.87 | | 1.58 | | .20 |
| Total from investment operations | | 1.67 | | (3.59) | | 3.13 | | 1.87 | | .53 |
| Distributions from net investment income | | (.49) | | (.34) | | (.23) | | (.30) | | (.34) |
| Distributions from net realized gain | | (.78) | | (.31) | | (.24) | | (.45) | | (.55) |
| Total distributions | | (1.27) | | (.65) | | (.47) | | (.75) | | (.89) |
| Net asset value, end of period | $ | 18.20 | $ | 17.80 | $ | 22.04 | $ | 19.38 | $ | 18.26 |
Total Return C | | 9.63% | | (16.80)% | | 16.30% | | 10.49% | | 3.33% |
Ratios to Average Net Assets B,D,E | | | | | | | | | | |
| Expenses before reductions | | .64% | | .64% | | .64% | | .65% | | .66% |
| Expenses net of fee waivers, if any | | .63% | | .64% | | .64% | | .65% | | .66% |
| Expenses net of all reductions | | .63% | | .64% | | .64% | | .65% | | .66% |
| Net investment income (loss) | | 2.27% | | 1.90% | | 1.21% | | 1.59% | | 1.85% |
| Supplemental Data | | | | | | | | | | |
| Net assets, end of period (000 omitted) | $ | 50,986 | $ | 60,352 | $ | 81,320 | $ | 55,021 | $ | 62,141 |
Portfolio turnover rate F | | 20% | | 20% | | 17% | | 24% | | 37% |
ACalculated based on average shares outstanding during the period.
BNet investment income (loss) is affected by the timing of the declaration of dividends by any underlying mutual funds or exchange-traded funds (ETFs). Net investment income (loss) of any mutual funds or ETFs is not included in the Fund's net investment income (loss) ratio.
CTotal returns would have been lower if certain expenses had not been reduced during the applicable periods shown.
DFees and expenses of any underlying mutual funds or exchange-traded funds (ETFs) are not included in the Fund's expense ratio. The Fund indirectly bears its proportionate share of these expenses. For additional expense information related to investments in Fidelity Central Funds, please refer to the "Investments in Fidelity Central Funds" note found in the Notes to Financial Statements section of the most recent Annual or Semi-Annual report.
EExpense ratios reflect operating expenses of the class. Expenses before reductions do not reflect amounts reimbursed, waived, or reduced through arrangements with the investment adviser, brokerage services, or other offset arrangements, if applicable, and do not represent the amount paid by the class during periods when reimbursements, waivers or reductions occur.
FAmount does not include the portfolio activity of any underlying mutual funds or exchange-traded funds (ETFs).
| Fidelity Advisor Asset Manager® 50% Class Z |
| |
| Years ended September 30, | | 2023 | | 2022 | | 2021 | | 2020 | | 2019 A |
Selected Per-Share Data | | | | | | | | | | |
| Net asset value, beginning of period | $ | 17.79 | $ | 22.03 | $ | 19.37 | $ | 18.26 | $ | 18.59 |
| Income from Investment Operations | | | | | | | | | | |
Net investment income (loss) B,C | | .44 | | .41 | | .28 | | .31 | | .35 |
| Net realized and unrealized gain (loss) | | 1.24 | | (3.98) | | 2.87 | | 1.57 | | .23 |
| Total from investment operations | | 1.68 | | (3.57) | | 3.15 | | 1.88 | | .58 |
| Distributions from net investment income | | (.51) | | (.36) | | (.25) | | (.32) | | (.36) |
| Distributions from net realized gain | | (.78) | | (.31) | | (.24) | | (.45) | | (.55) |
| Total distributions | | (1.29) | | (.67) | | (.49) | | (.77) | | (.91) |
| Net asset value, end of period | $ | 18.18 | $ | 17.79 | $ | 22.03 | $ | 19.37 | $ | 18.26 |
Total Return D,E | | 9.71% | | (16.71)% | | 16.43% | | 10.56% | | 3.61% |
Ratios to Average Net Assets C,F,G | | | | | | | | | | |
| Expenses before reductions | | .54% | | .53% | | .54% | | .55% | | .55% H |
| Expenses net of fee waivers, if any | | .53% | | .53% | | .54% | | .54% | | .55% H |
| Expenses net of all reductions | | .53% | | .53% | | .54% | | .54% | | .55% H |
| Net investment income (loss) | | 2.37% | | 2.00% | | 1.32% | | 1.70% | | 1.96% H |
| Supplemental Data | | | | | | | | | | |
| Net assets, end of period (000 omitted) | $ | 1,834,344 | $ | 1,665,184 | $ | 1,955,130 | $ | 26,638 | $ | 20,968 |
Portfolio turnover rate I | | 20% | | 20% | | 17% | | 24% | | 37% |
AFor the period October 2, 2018 (commencement of sale of shares) through September 30, 2019.
BCalculated based on average shares outstanding during the period.
CNet investment income (loss) is affected by the timing of the declaration of dividends by any underlying mutual funds or exchange-traded funds (ETFs). Net investment income (loss) of any mutual funds or ETFs is not included in the Fund's net investment income (loss) ratio.
DTotal returns for periods of less than one year are not annualized.
ETotal returns would have been lower if certain expenses had not been reduced during the applicable periods shown.
FFees and expenses of any underlying mutual funds or exchange-traded funds (ETFs) are not included in the Fund's expense ratio. The Fund indirectly bears its proportionate share of these expenses. For additional expense information related to investments in Fidelity Central Funds, please refer to the "Investments in Fidelity Central Funds" note found in the Notes to Financial Statements section of the most recent Annual or Semi-Annual report.
GExpense ratios reflect operating expenses of the class. Expenses before reductions do not reflect amounts reimbursed, waived, or reduced through arrangements with the investment adviser, brokerage services, or other offset arrangements, if applicable, and do not represent the amount paid by the class during periods when reimbursements, waivers or reductions occur.
HAnnualized.
IAmount does not include the portfolio activity of any underlying mutual funds or exchange-traded funds (ETFs).
The information in the following tables is based on the combined Investments of the Fund and it's pro-rata share of investments in Fidelity's Central Funds, other than the Commodity Strategy and Money Market Central Funds.
Top Holdings (% of Fund's net assets) |
| |
| Microsoft Corp. | 2.6 | |
| Apple, Inc. | 2.1 | |
| Alphabet, Inc. Class A | 1.5 | |
| iShares MSCI USA Minimum Volatility ETF | 1.3 | |
| Amazon.com, Inc. | 1.3 | |
| Exxon Mobil Corp. | 0.8 | |
| iShares 20+ Year Treasury Bond ETF | 0.6 | |
| NVIDIA Corp. | 0.7 | |
| Meta Platforms, Inc. Class A | 0.7 | |
| JPMorgan Chase & Co. | 0.7 | |
| | 12.3 | |
| |
| Market Sectors (% of Fund's net assets) |
| |
| Financials | 15.8 | |
| Information Technology | 13.3 | |
| Health Care | 7.9 | |
| Industrials | 7.9 | |
| Consumer Discretionary | 7.3 | |
| Communication Services | 5.2 | |
| Consumer Staples | 4.6 | |
| Energy | 4.4 | |
| Materials | 2.9 | |
| Real Estate | 2.4 | |
| Utilities | 1.0 | |
| |
Quality Diversification (% of Fund's net assets) |
|
Percentages shown as 0.0% may reflect amounts less than 0.05%. |
| |
| We have used ratings from Moody's Investors Service, Inc. Where Moody's® ratings are not available, we have used S&P® ratings. All ratings are as of the date indicated and do not reflect subsequent changes. |
Asset Allocation (% of Fund's net assets) |
|
Short-Term Class - (0.2)% |
|
Asset allocations in the pie charts reflect the categorization of assets as defined in the Fund's prospectus in effect as of the time periods indicated above. Percentages are adjusted for the effect of future contracts and swap contracts, if applicable.
Geographic Diversification (% of Fund's net assets) |
|
* Includes Short-Term investments and Net Other Assets (Liabilities). Percentages are adjusted for the effect of derivatives, if applicable. |
| |
Percentages in the above tables are adjusted for the effect of TBA sale Commitments.
Equities and Stock Class and Equity Futures percentages above include Fidelity Commodity Strategy Central Fund of 0.5%.
At period end, foreign investments including the Fund's pro-rata share of the underlying Central Funds, other than the Commodity Strategy Central and Money Market Funds, was 27.7% of net assets.
An unaudited holdings list for the Fund, which presents direct holdings as well as the pro-rata share of any securities and other investments held indirectly through its investment in underlying Fidelity Central Funds, other than the Commodity Strategy and Money Market Central Funds, is available at fidelity.com and/or institutional.fidelity.com, as applicable.
Fidelity Asset Manager® 60%
Showing Percentage of Net Assets
| Equity Central Funds - 62.2% |
| | | Shares | Value ($) |
| Fidelity Commodity Strategy Central Fund (a) | | 196,910 | 18,588,270 |
| Fidelity Emerging Markets Equity Central Fund (a) | | 1,477,424 | 277,474,909 |
| Fidelity Hedged Equity Central Fund (a) | | 463,063 | 48,038,169 |
| Fidelity International Equity Central Fund (a) | | 6,552,501 | 579,372,171 |
| Fidelity Real Estate Equity Central Fund (a) | | 133,812 | 14,992,261 |
| Fidelity U.S. Equity Central Fund (a) | | 11,779,057 | 1,369,786,584 |
| TOTAL EQUITY CENTRAL FUNDS (Cost $1,566,446,292) | | | 2,308,252,364 |
| | | | |
| Fixed-Income Central Funds - 34.5% |
| | | Shares | Value ($) |
| High Yield Fixed-Income Funds - 2.6% | | | |
| Fidelity Emerging Markets Debt Central Fund (a) | | 1,161,348 | 8,524,296 |
| Fidelity Emerging Markets Debt Local Currency Central Fund (a) | | 333,064 | 29,479,528 |
| Fidelity Floating Rate Central Fund (a) | | 413,401 | 40,521,596 |
| Fidelity High Income Central Fund (a) | | 191,031 | 19,320,907 |
TOTAL HIGH YIELD FIXED-INCOME FUNDS | | | 97,846,327 |
| Investment Grade Fixed-Income Funds - 31.9% | | | |
| Fidelity Inflation-Protected Bond Index Central Fund (a) | | 648,217 | 57,043,055 |
| Fidelity International Credit Central Fund (a) | | 253,481 | 19,287,389 |
| Fidelity Investment Grade Bond Central Fund (a) | | 11,810,440 | 1,105,575,307 |
TOTAL INVESTMENT GRADE FIXED-INCOME FUNDS | | | 1,181,905,751 |
| TOTAL FIXED-INCOME CENTRAL FUNDS (Cost $1,433,258,702) | | | 1,279,752,078 |
| | | | |
| Money Market Central Funds - 1.7% |
| | | Shares | Value ($) |
| Fidelity Cash Central Fund 5.39% (b) | | 40,378,444 | 40,386,520 |
| Fidelity Securities Lending Cash Central Fund 5.39% (b)(c) | | 22,269,823 | 22,272,050 |
| TOTAL MONEY MARKET CENTRAL FUNDS (Cost $62,658,570) | | | 62,658,570 |
| | | | |
| U.S. Treasury Obligations - 0.3% |
| | | Principal Amount (d) | Value ($) |
U.S. Treasury Bills, yield at date of purchase 5.33% to 5.39% 10/26/23 to 12/21/23 (e) (Cost $11,196,240) | | 11,300,000 | 11,197,820 |
| | | | |
| Investment Companies - 1.9% |
| | | Shares | Value ($) |
| iShares 20+ Year Treasury Bond ETF (f) | | 282,047 | 25,014,748 |
| iShares MSCI USA Minimum Volatility ETF | | 664,385 | 48,088,188 |
| TOTAL INVESTMENT COMPANIES (Cost $75,813,150) | | | 73,102,936 |
| | | | |
| TOTAL INVESTMENT IN SECURITIES - 100.6% (Cost $3,149,372,954) | 3,734,963,768 |
NET OTHER ASSETS (LIABILITIES) - (0.6)% | (22,481,745) |
| NET ASSETS - 100.0% | 3,712,482,023 |
| | |
| Futures Contracts |
| | Number of contracts | Expiration Date | Notional Amount ($) | Value ($) | Unrealized Appreciation/ (Depreciation) ($) |
| Purchased | | | | | |
| | | | | | |
| Equity Index Contracts | | | | | |
| ICE MSCI EAFE Index Contracts (United States) | 609 | Dec 2023 | 62,163,675 | (2,126,524) | (2,126,524) |
| | | | | | |
| Sold | | | | | |
| | | | | | |
| Equity Index Contracts | | | | | |
| CME E-mini S&P 500 Index Contracts (United States) | 776 | Dec 2023 | 167,829,400 | 4,386,663 | 4,386,663 |
| ICE MSCI Emerging Markets Index Contracts (United States) | 763 | Dec 2023 | 36,452,325 | 1,213,786 | 1,213,786 |
| | | | | | |
| TOTAL SOLD | | | | | 5,600,449 |
| | | | | | |
| TOTAL FUTURES CONTRACTS | | | | | 3,473,925 |
| The notional amount of futures purchased as a percentage of Net Assets is 1.7% |
| The notional amount of futures sold as a percentage of Net Assets is 5.5% |
Security Type Abbreviations
Legend
| (a) | Affiliated fund that is generally available only to investment companies and other accounts managed by Fidelity Investments. A complete unaudited schedule of portfolio holdings for each Fidelity Central Fund is filed with the SEC for the first and third quarters of each fiscal year on Form N-PORT and is available upon request or at the SEC's website at www.sec.gov. An unaudited holdings listing for the Fund, which presents direct holdings as well as the pro-rata share of securities and other investments held indirectly through its investment in underlying non-money market Fidelity Central Funds, other than the Commodity Strategy Central Fund, is available at fidelity.com and/or institutional.fidelity.com, as applicable. In addition, each Fidelity Central Fund's financial statements,which are not covered by the Fund's Report of Independent Registered Public Accounting Firm, are available on the SEC's website or upon request. |
| (b) | Affiliated fund that is generally available only to investment companies and other accounts managed by Fidelity Investments. The rate quoted is the annualized seven-day yield of the fund at period end. A complete unaudited listing of the fund's holdings as of its most recent quarter end is available upon request. In addition, each Fidelity Central Fund's financial statements, which are not covered by the Fund's Report of Independent Registered Public Accounting Firm, are available on the SEC's website or upon request. |
| (c) | Investment made with cash collateral received from securities on loan. |
| (d) | Amount is stated in United States dollars unless otherwise noted. |
| (e) | Security or a portion of the security was pledged to cover margin requirements for futures contracts. At period end, the value of securities pledged amounted to $10,482,981. |
| (f) | Security or a portion of the security is on loan at period end. |
Affiliated Central Funds
Fiscal year to date information regarding the Fund's investments in Fidelity Central Funds, including the ownership percentage, is presented below.
| Affiliate | Value, beginning of period ($) | Purchases ($) | Sales Proceeds ($) | Dividend Income ($) | Realized Gain (loss) ($) | Change in Unrealized appreciation (depreciation) ($) | Value, end of period ($) | % ownership, end of period |
| Fidelity Cash Central Fund 5.39% | 19,144,438 | 352,056,819 | 330,814,737 | 965,641 | - | - | 40,386,520 | 0.1% |
| Fidelity Commodity Strategy Central Fund | 87,982,827 | 3,487,807 | 69,213,615 | 1,775,744 | (12,349,086) | 8,680,337 | 18,588,270 | 8.2% |
| Fidelity Emerging Markets Debt Central Fund | 9,389,231 | 1,461,089 | 2,615,465 | 561,401 | (489,179) | 778,620 | 8,524,296 | 0.4% |
| Fidelity Emerging Markets Debt Local Currency Central Fund | 8,782,496 | 19,289,867 | 55 | 24,638 | 26,874 | 1,380,346 | 29,479,528 | 10.7% |
| Fidelity Emerging Markets Equity Central Fund | 224,652,096 | 62,471,835 | 35,071,199 | 8,687,456 | (9,373,432) | 34,795,609 | 277,474,909 | 12.9% |
| Fidelity Floating Rate Central Fund | 106,769,688 | 8,355,372 | 77,874,768 | 6,583,887 | (2,836,392) | 6,107,696 | 40,521,596 | 2.7% |
| Fidelity Hedged Equity Central Fund | - | 48,163,347 | - | 6,083 | - | (125,178) | 48,038,169 | 11.1% |
| Fidelity High Income Central Fund | 29,754,467 | 2,911,007 | 14,442,945 | 2,095,172 | 386,034 | 712,344 | 19,320,907 | 1.3% |
| Fidelity Inflation-Protected Bond Index Central Fund | 75,762,196 | 10,608,889 | 22,766,546 | 8,434,347 | (2,313,275) | (4,248,209) | 57,043,055 | 13.5% |
| Fidelity International Credit Central Fund | 44,027,858 | 3,424,099 | 26,323,821 | 2,442,313 | (7,993,155) | 6,152,408 | 19,287,389 | 9.7% |
| Fidelity International Equity Central Fund | 393,745,617 | 148,538,136 | 55,095,899 | 12,649,495 | (2,379,564) | 94,563,881 | 579,372,171 | 12.3% |
| Fidelity Investment Grade Bond Central Fund | 969,331,203 | 260,599,528 | 96,408,593 | 41,164,986 | (1,057,288) | (26,889,543) | 1,105,575,307 | 3.0% |
| Fidelity Real Estate Equity Central Fund | 23,887,449 | 1,290,050 | 11,146,673 | 602,093 | 94,096 | 867,339 | 14,992,261 | 1.6% |
| Fidelity Securities Lending Cash Central Fund 5.39% | 21,668,650 | 709,997,335 | 709,393,935 | 6,820 | - | - | 22,272,050 | 0.1% |
| Fidelity U.S. Equity Central Fund | 1,329,560,304 | 77,075,695 | 265,278,317 | 37,760,085 | 12,728,903 | 215,699,999 | 1,369,786,584 | 8.7% |
| Total | 3,344,458,520 | 1,709,730,875 | 1,716,446,568 | 123,760,161 | (25,555,464) | 338,475,649 | 3,650,663,012 | |
| | | | | | | | | |
Amounts in the dividend income column in the above table include any capital gain distributions from underlying funds, which are presented in the corresponding line item in the Statement of Operations, if applicable.
Amounts in the dividend income column for Fidelity Securities Lending Cash Central Fund represents the income earned on investing cash collateral, less rebates paid to borrowers and any lending agent fees associated with the loan, plus any premium payments received for lending certain types of securities.
Amounts included in the purchases and sales proceeds columns may include in-kind transactions, if applicable.
Investment Valuation
The following is a summary of the inputs used, as of September 30, 2023, involving the Fund's assets and liabilities carried at fair value. The inputs or methodology used for valuing securities may not be an indication of the risk associated with investing in those securities. For more information on valuation inputs, and their aggregation into the levels used below, please refer to the Investment Valuation section in the accompanying Notes to Financial Statements.
| Valuation Inputs at Reporting Date: |
| Description | Total ($) | Level 1 ($) | Level 2 ($) | Level 3 ($) |
Investments in Securities: | | | | |
|
| Equity Central Funds | 2,308,252,364 | 2,308,252,364 | - | - |
|
| Fixed-Income Central Funds | 1,279,752,078 | 1,279,752,078 | - | - |
|
| Money Market Central Funds | 62,658,570 | 62,658,570 | - | - |
|
| U.S Treasury Obligations | 11,197,820 | - | 11,197,820 | - |
|
| Investment Companies | 73,102,936 | 73,102,936 | - | - |
| Total Investments in Securities: | 3,734,963,768 | 3,723,765,948 | 11,197,820 | - |
Derivative Instruments: Assets | | | | |
Futures Contracts | 5,600,449 | 5,600,449 | - | - |
| Total Assets | 5,600,449 | 5,600,449 | - | - |
| Liabilities | | | | |
Futures Contracts | (2,126,524) | (2,126,524) | - | - |
| Total Liabilities | (2,126,524) | (2,126,524) | - | - |
| Total Derivative Instruments: | 3,473,925 | 3,473,925 | - | - |
Value of Derivative Instruments
The following table is a summary of the Fund's value of derivative instruments by primary risk exposure as of September 30, 2023. For additional information on derivative instruments, please refer to the Derivative Instruments section in the accompanying Notes to Financial Statements.
Primary Risk Exposure / Derivative Type | Value |
| Asset ($) | Liability ($) |
| Equity Risk | | |
Futures Contracts (a) | 5,600,449 | (2,126,524) |
| Total Equity Risk | 5,600,449 | (2,126,524) |
| Total Value of Derivatives | 5,600,449 | (2,126,524) |
(a)Reflects gross cumulative appreciation (depreciation) on futures contracts as presented in the Schedule of Investments. In the Statement of Assets and Liabilities, the period end daily variation margin is included in receivable or payable for daily variation margin on futures contracts, and the net cumulative appreciation (depreciation) is included in Total accumulated earnings (loss).
Fidelity Asset Manager® 60%
| Statement of Assets and Liabilities |
| | | | September 30, 2023 |
| | | | | |
| Assets | | | | |
| Investment in securities, at value (including securities loaned of $21,826,609) - See accompanying schedule: | | | | |
Unaffiliated issuers (cost $87,009,390) | $ | 84,300,756 | | |
Fidelity Central Funds (cost $3,062,363,564) | | 3,650,663,012 | | |
| | | | | |
| | | | | |
| Total Investment in Securities (cost $3,149,372,954) | | | $ | 3,734,963,768 |
| Foreign currency held at value (cost $266) | | | | 255 |
| Receivable for investments sold | | | | 2,719,392 |
| Receivable for fund shares sold | | | | 2,269,396 |
| Dividends receivable | | | | 275,795 |
| Distributions receivable from Fidelity Central Funds | | | | 35,934 |
| Receivable for daily variation margin on futures contracts | | | | 249,405 |
| Prepaid expenses | | | | 5,287 |
| Other receivables | | | | 2,355 |
Total assets | | | | 3,740,521,587 |
| Liabilities | | | | |
| Payable for investments purchased | $ | 162,497 | | |
| Payable for fund shares redeemed | | 3,403,360 | | |
| Accrued management fee | | 1,656,836 | | |
| Distribution and service plan fees payable | | 78,000 | | |
| Other affiliated payables | | 412,572 | | |
| Other payables and accrued expenses | | 54,249 | | |
| Collateral on securities loaned | | 22,272,050 | | |
| Total Liabilities | | | | 28,039,564 |
| Net Assets | | | $ | 3,712,482,023 |
| Net Assets consist of: | | | | |
| Paid in capital | | | $ | 3,277,266,540 |
| Total accumulated earnings (loss) | | | | 435,215,483 |
| Net Assets | | | $ | 3,712,482,023 |
| | | | | |
| Net Asset Value and Maximum Offering Price | | | | |
| Class A : | | | | |
Net Asset Value and redemption price per share ($149,984,926 ÷ 11,101,917 shares)(a) | | | $ | 13.51 |
| Maximum offering price per share (100/94.25 of $13.51) | | | $ | 14.33 |
| Class M : | | | | |
Net Asset Value and redemption price per share ($45,642,165 ÷ 3,400,692 shares)(a) | | | $ | 13.42 |
| Maximum offering price per share (100/96.50 of $13.42) | | | $ | 13.91 |
| Class C : | | | | |
Net Asset Value and offering price per share ($30,785,835 ÷ 2,323,884 shares)(a) | | | $ | 13.25 |
| Asset Manager 60% : | | | | |
Net Asset Value, offering price and redemption price per share ($2,043,413,861 ÷ 150,210,344 shares) | | | $ | 13.60 |
| Class I : | | | | |
Net Asset Value, offering price and redemption price per share ($101,803,309 ÷ 7,482,284 shares) | | | $ | 13.61 |
| Class Z : | | | | |
Net Asset Value, offering price and redemption price per share ($1,340,851,927 ÷ 98,605,616 shares) | | | $ | 13.60 |
(a)Redemption price per share is equal to net asset value less any applicable contingent deferred sales charge. |
| Statement of Operations |
| | | | Year ended September 30, 2023 |
| Investment Income | | | | |
| Dividends | | | $ | 2,294,301 |
| Interest | | | | 576,506 |
| Income from Fidelity Central Funds (including $6,820 from security lending) | | | | 102,273,209 |
| Total Income | | | | 105,144,016 |
| Expenses | | | | |
| Management fee | $ | 19,865,688 | | |
| Transfer agent fees | | 3,652,755 | | |
| Distribution and service plan fees | | 947,309 | | |
| Accounting fees | | 1,246,556 | | |
| Custodian fees and expenses | | 34,774 | | |
| Independent trustees' fees and expenses | | 13,838 | | |
| Registration fees | | 117,756 | | |
| Audit | | 39,088 | | |
| Legal | | 16,103 | | |
| Miscellaneous | | 37,192 | | |
| Total expenses before reductions | | 25,971,059 | | |
| Expense reductions | | (189,408) | | |
| Total expenses after reductions | | | | 25,781,651 |
| Net Investment income (loss) | | | | 79,362,365 |
| Realized and Unrealized Gain (Loss) | | | | |
| Net realized gain (loss) on: | | | | |
| Investment Securities: | | | | |
| Unaffiliated issuers | | (35,014,099) | | |
| Fidelity Central Funds | | (25,555,464) | | |
| Foreign currency transactions | | 1 | | |
| Futures contracts | | (5,467,353) | | |
| Capital gain distributions from Fidelity Central Funds | | 21,486,952 | | |
| Total net realized gain (loss) | | | | (44,549,963) |
| Change in net unrealized appreciation (depreciation) on: | | | | |
| Investment Securities: | | | | |
| Unaffiliated issuers | | 26,166,521 | | |
| Fidelity Central Funds | | 338,475,649 | | |
| Assets and liabilities in foreign currencies | | 1,394 | | |
| Futures contracts | | (1,963,555) | | |
| Total change in net unrealized appreciation (depreciation) | | | | 362,680,009 |
| Net gain (loss) | | | | 318,130,046 |
| Net increase (decrease) in net assets resulting from operations | | | $ | 397,492,411 |
| Statement of Changes in Net Assets |
| |
| | Year ended September 30, 2023 | | Year ended September 30, 2022 |
| Increase (Decrease) in Net Assets | | | | |
| Operations | | | | |
| Net investment income (loss) | $ | 79,362,365 | $ | 77,394,423 |
| Net realized gain (loss) | | (44,549,963) | | 135,782,767 |
| Change in net unrealized appreciation (depreciation) | | 362,680,009 | | (1,021,962,706) |
| Net increase (decrease) in net assets resulting from operations | | 397,492,411 | | (808,785,516) |
| Distributions to shareholders | | (156,194,680) | | (114,158,802) |
| | | | | |
| Share transactions - net increase (decrease) | | (14,706,584) | | 176,306,744 |
| Total increase (decrease) in net assets | | 226,591,147 | | (746,637,574) |
| | | | | |
| Net Assets | | | | |
| Beginning of period | | 3,485,890,876 | | 4,232,528,450 |
| End of period | $ | 3,712,482,023 | $ | 3,485,890,876 |
| | | | | |
| | | | | |
Financial Highlights
| Fidelity Advisor Asset Manager® 60% Class A |
| |
| Years ended September 30, | | 2023 | | 2022 | | 2021 | | 2020 | | 2019 |
Selected Per-Share Data | | | | | | | | | | |
| Net asset value, beginning of period | $ | 12.66 | $ | 15.88 | $ | 13.57 | $ | 12.68 | $ | 12.92 |
| Income from Investment Operations | | | | | | | | | | |
Net investment income (loss) A,B | | .24 | | .23 | | .13 | | .15 | | .17 |
| Net realized and unrealized gain (loss) | | 1.14 | | (3.08) | | 2.42 | | 1.24 | | .06 |
| Total from investment operations | | 1.38 | | (2.85) | | 2.55 | | 1.39 | | .23 |
| Distributions from net investment income | | (.25) | | (.18) | | (.12) | | (.17) | | (.15) |
| Distributions from net realized gain | | (.28) | | (.19) | | (.12) | | (.33) | | (.32) |
| Total distributions | | (.53) | | (.37) | | (.24) | | (.50) | | (.47) |
| Net asset value, end of period | $ | 13.51 | $ | 12.66 | $ | 15.88 | $ | 13.57 | $ | 12.68 |
Total Return C,D | | 11.09% | | (18.47)% | | 18.90% | | 11.13% | | 2.24% |
Ratios to Average Net Assets B,E,F | | | | | | | | | | |
| Expenses before reductions | | .99% | | .99% | | .99% | | 1.00% | | 1.02% |
| Expenses net of fee waivers, if any | | .99% | | .99% | | .99% | | 1.00% | | 1.01% |
| Expenses net of all reductions | | .99% | | .99% | | .99% | | 1.00% | | 1.01% |
| Net investment income (loss) | | 1.79% | | 1.55% | | .84% | | 1.19% | | 1.40% |
| Supplemental Data | | | | | | | | | | |
| Net assets, end of period (000 omitted) | $ | 149,985 | $ | 138,958 | $ | 167,442 | $ | 129,967 | $ | 128,269 |
Portfolio turnover rate G | | 21% | | 23% | | 19% | | 29% | | 39% |
ACalculated based on average shares outstanding during the period.
BNet investment income (loss) is affected by the timing of the declaration of dividends by any underlying mutual funds or exchange-traded funds (ETFs). Net investment income (loss) of any mutual funds or ETFs is not included in the Fund's net investment income (loss) ratio.
CTotal returns would have been lower if certain expenses had not been reduced during the applicable periods shown.
DTotal returns do not include the effect of the sales charges.
EFees and expenses of any underlying mutual funds or exchange-traded funds (ETFs) are not included in the Fund's expense ratio. The Fund indirectly bears its proportionate share of these expenses.
FExpense ratios reflect operating expenses of the class. Expenses before reductions do not reflect amounts reimbursed, waived, or reduced through arrangements with the investment adviser, brokerage services, or other offset arrangements, if applicable, and do not represent the amount paid by the class during periods when reimbursements, waivers or reductions occur.
GAmount does not include the portfolio activity of any underlying mutual funds or exchange-traded funds (ETFs).
| Fidelity Advisor Asset Manager® 60% Class M |
| |
| Years ended September 30, | | 2023 | | 2022 | | 2021 | | 2020 | | 2019 |
Selected Per-Share Data | | | | | | | | | | |
| Net asset value, beginning of period | $ | 12.58 | $ | 15.78 | $ | 13.48 | $ | 12.60 | $ | 12.84 |
| Income from Investment Operations | | | | | | | | | | |
Net investment income (loss) A,B | | .21 | | .19 | | .09 | | .12 | | .14 |
| Net realized and unrealized gain (loss) | | 1.13 | | (3.07) | | 2.41 | | 1.22 | | .06 |
| Total from investment operations | | 1.34 | | (2.88) | | 2.50 | | 1.34 | | .20 |
| Distributions from net investment income | | (.22) | | (.13) | | (.08) | | (.13) | | (.12) |
| Distributions from net realized gain | | (.28) | | (.19) | | (.12) | | (.33) | | (.32) |
| Total distributions | | (.50) | | (.32) | | (.20) | | (.46) | | (.44) |
| Net asset value, end of period | $ | 13.42 | $ | 12.58 | $ | 15.78 | $ | 13.48 | $ | 12.60 |
Total Return C,D | | 10.79% | | (18.67)% | | 18.67% | | 10.83% | | 2.01% |
Ratios to Average Net Assets B,E,F | | | | | | | | | | |
| Expenses before reductions | | 1.23% | | 1.23% | | 1.24% | | 1.26% | | 1.28% |
| Expenses net of fee waivers, if any | | 1.23% | | 1.23% | | 1.24% | | 1.25% | | 1.25% |
| Expenses net of all reductions | | 1.23% | | 1.23% | | 1.24% | | 1.25% | | 1.25% |
| Net investment income (loss) | | 1.55% | | 1.31% | | .59% | | .94% | | 1.15% |
| Supplemental Data | | | | | | | | | | |
| Net assets, end of period (000 omitted) | $ | 45,642 | $ | 43,630 | $ | 54,174 | $ | 49,060 | $ | 49,997 |
Portfolio turnover rate G | | 21% | | 23% | | 19% | | 29% | | 39% |
ACalculated based on average shares outstanding during the period.
BNet investment income (loss) is affected by the timing of the declaration of dividends by any underlying mutual funds or exchange-traded funds (ETFs). Net investment income (loss) of any mutual funds or ETFs is not included in the Fund's net investment income (loss) ratio.
CTotal returns would have been lower if certain expenses had not been reduced during the applicable periods shown.
DTotal returns do not include the effect of the sales charges.
EFees and expenses of any underlying mutual funds or exchange-traded funds (ETFs) are not included in the Fund's expense ratio. The Fund indirectly bears its proportionate share of these expenses.
FExpense ratios reflect operating expenses of the class. Expenses before reductions do not reflect amounts reimbursed, waived, or reduced through arrangements with the investment adviser, brokerage services, or other offset arrangements, if applicable, and do not represent the amount paid by the class during periods when reimbursements, waivers or reductions occur.
GAmount does not include the portfolio activity of any underlying mutual funds or exchange-traded funds (ETFs).
| Fidelity Advisor Asset Manager® 60% Class C |
| |
| Years ended September 30, | | 2023 | | 2022 | | 2021 | | 2020 | | 2019 |
Selected Per-Share Data | | | | | | | | | | |
| Net asset value, beginning of period | $ | 12.39 | $ | 15.55 | $ | 13.29 | $ | 12.42 | $ | 12.67 |
| Income from Investment Operations | | | | | | | | | | |
Net investment income (loss) A,B | | .14 | | .12 | | .01 | | .05 | | .08 |
| Net realized and unrealized gain (loss) | | 1.12 | | (3.05) | | 2.38 | | 1.21 | | .06 |
| Total from investment operations | | 1.26 | | (2.93) | | 2.39 | | 1.26 | | .14 |
| Distributions from net investment income | | (.12) | | (.04) | | - C | | (.06) | | (.07) |
| Distributions from net realized gain | | (.28) | | (.19) | | (.12) | | (.33) | | (.32) |
| Total distributions | | (.40) | | (.23) | | (.13) D | | (.39) | | (.39) |
| Net asset value, end of period | $ | 13.25 | $ | 12.39 | $ | 15.55 | $ | 13.29 | $ | 12.42 |
Total Return E,F | | 10.30% | | (19.15)% | | 18.02% | | 10.29% | | 1.47% |
Ratios to Average Net Assets B,G,H | | | | | | | | | | |
| Expenses before reductions | | 1.76% | | 1.75% | | 1.77% | | 1.79% | | 1.81% |
| Expenses net of fee waivers, if any | | 1.76% | | 1.75% | | 1.77% | | 1.76% | | 1.76% |
| Expenses net of all reductions | | 1.76% | | 1.75% | | 1.77% | | 1.76% | | 1.76% |
| Net investment income (loss) | | 1.03% | | .79% | | .06% | | .42% | | .64% |
| Supplemental Data | | | | | | | | | | |
| Net assets, end of period (000 omitted) | $ | 30,786 | $ | 32,289 | $ | 55,262 | $ | 61,950 | $ | 67,955 |
Portfolio turnover rate I | | 21% | | 23% | | 19% | | 29% | | 39% |
ACalculated based on average shares outstanding during the period.
BNet investment income (loss) is affected by the timing of the declaration of dividends by any underlying mutual funds or exchange-traded funds (ETFs). Net investment income (loss) of any mutual funds or ETFs is not included in the Fund's net investment income (loss) ratio.
CAmount represents less than $.005 per share.
DTotal distributions per share do not sum due to rounding.
ETotal returns would have been lower if certain expenses had not been reduced during the applicable periods shown.
FTotal returns do not include the effect of the contingent deferred sales charge.
GFees and expenses of any underlying mutual funds or exchange-traded funds (ETFs) are not included in the Fund's expense ratio. The Fund indirectly bears its proportionate share of these expenses.
HExpense ratios reflect operating expenses of the class. Expenses before reductions do not reflect amounts reimbursed, waived, or reduced through arrangements with the investment adviser, brokerage services, or other offset arrangements, if applicable, and do not represent the amount paid by the class during periods when reimbursements, waivers or reductions occur.
IAmount does not include the portfolio activity of any underlying mutual funds or exchange-traded funds (ETFs).
| Fidelity Asset Manager® 60% |
| |
| Years ended September 30, | | 2023 | | 2022 | | 2021 | | 2020 | | 2019 |
Selected Per-Share Data | | | | | | | | | | |
| Net asset value, beginning of period | $ | 12.75 | $ | 15.98 | $ | 13.65 | $ | 12.75 | $ | 12.98 |
| Income from Investment Operations | | | | | | | | | | |
Net investment income (loss) A,B | | .29 | | .28 | | .18 | | .19 | | .21 |
| Net realized and unrealized gain (loss) | | 1.14 | | (3.10) | | 2.43 | | 1.25 | | .06 |
| Total from investment operations | | 1.43 | | (2.82) | | 2.61 | | 1.44 | | .27 |
| Distributions from net investment income | | (.29) | | (.22) | | (.16) | | (.21) | | (.18) |
| Distributions from net realized gain | | (.28) | | (.19) | | (.12) | | (.33) | | (.32) |
| Total distributions | | (.58) C | | (.41) | | (.28) | | (.54) | | (.50) |
| Net asset value, end of period | $ | 13.60 | $ | 12.75 | $ | 15.98 | $ | 13.65 | $ | 12.75 |
Total Return D | | 11.38% | | (18.20)% | | 19.28% | | 11.50% | | 2.60% |
Ratios to Average Net Assets B,E,F | | | | | | | | | | |
| Expenses before reductions | | .68% | | .67% | | .67% | | .69% | | .70% |
| Expenses net of fee waivers, if any | | .68% | | .67% | | .67% | | .68% | | .69% |
| Expenses net of all reductions | | .68% | | .67% | | .67% | | .68% | | .69% |
| Net investment income (loss) | | 2.10% | | 1.87% | | 1.15% | | 1.51% | | 1.71% |
| Supplemental Data | | | | | | | | | | |
| Net assets, end of period (000 omitted) | $ | 2,043,414 | $ | 1,935,217 | $ | 2,427,382 | $ | 2,950,010 | $ | 2,727,092 |
Portfolio turnover rate G | | 21% | | 23% | | 19% | | 29% | | 39% |
ACalculated based on average shares outstanding during the period.
BNet investment income (loss) is affected by the timing of the declaration of dividends by any underlying mutual funds or exchange-traded funds (ETFs). Net investment income (loss) of any mutual funds or ETFs is not included in the Fund's net investment income (loss) ratio.
CTotal distributions per share do not sum due to rounding.
DTotal returns would have been lower if certain expenses had not been reduced during the applicable periods shown.
EFees and expenses of any underlying mutual funds or exchange-traded funds (ETFs) are not included in the Fund's expense ratio. The Fund indirectly bears its proportionate share of these expenses.
FExpense ratios reflect operating expenses of the class. Expenses before reductions do not reflect amounts reimbursed, waived, or reduced through arrangements with the investment adviser, brokerage services, or other offset arrangements, if applicable, and do not represent the amount paid by the class during periods when reimbursements, waivers or reductions occur.
GAmount does not include the portfolio activity of any underlying mutual funds or exchange-traded funds (ETFs).
| Fidelity Advisor Asset Manager® 60% Class I |
| |
| Years ended September 30, | | 2023 | | 2022 | | 2021 | | 2020 | | 2019 |
Selected Per-Share Data | | | | | | | | | | |
| Net asset value, beginning of period | $ | 12.75 | $ | 15.99 | $ | 13.66 | $ | 12.76 | $ | 12.99 |
| Income from Investment Operations | | | | | | | | | | |
Net investment income (loss) A,B | | .28 | | .27 | | .17 | | .19 | | .21 |
| Net realized and unrealized gain (loss) | | 1.15 | | (3.10) | | 2.43 | | 1.24 | | .05 |
| Total from investment operations | | 1.43 | | (2.83) | | 2.60 | | 1.43 | | .26 |
| Distributions from net investment income | | (.29) | | (.22) | | (.15) | | (.20) | | (.17) |
| Distributions from net realized gain | | (.28) | | (.19) | | (.12) | | (.33) | | (.32) |
| Total distributions | | (.57) | | (.41) | | (.27) | | (.53) | | (.49) |
| Net asset value, end of period | $ | 13.61 | $ | 12.75 | $ | 15.99 | $ | 13.66 | $ | 12.76 |
Total Return C | | 11.39% | | (18.27)% | | 19.20% | | 11.44% | | 2.56% |
Ratios to Average Net Assets B,D,E | | | | | | | | | | |
| Expenses before reductions | | .74% | | .74% | | .74% | | .74% | | .75% |
| Expenses net of fee waivers, if any | | .74% | | .73% | | .74% | | .73% | | .73% |
| Expenses net of all reductions | | .74% | | .73% | | .74% | | .73% | | .73% |
| Net investment income (loss) | | 2.04% | | 1.81% | | 1.09% | | 1.46% | | 1.67% |
| Supplemental Data | | | | | | | | | | |
| Net assets, end of period (000 omitted) | $ | 101,803 | $ | 95,499 | $ | 115,782 | $ | 51,429 | $ | 55,379 |
Portfolio turnover rate F | | 21% | | 23% | | 19% | | 29% | | 39% |
ACalculated based on average shares outstanding during the period.
BNet investment income (loss) is affected by the timing of the declaration of dividends by any underlying mutual funds or exchange-traded funds (ETFs). Net investment income (loss) of any mutual funds or ETFs is not included in the Fund's net investment income (loss) ratio.
CTotal returns would have been lower if certain expenses had not been reduced during the applicable periods shown.
DFees and expenses of any underlying mutual funds or exchange-traded funds (ETFs) are not included in the Fund's expense ratio. The Fund indirectly bears its proportionate share of these expenses.
EExpense ratios reflect operating expenses of the class. Expenses before reductions do not reflect amounts reimbursed, waived, or reduced through arrangements with the investment adviser, brokerage services, or other offset arrangements, if applicable, and do not represent the amount paid by the class during periods when reimbursements, waivers or reductions occur.
FAmount does not include the portfolio activity of any underlying mutual funds or exchange-traded funds (ETFs).
| Fidelity Advisor Asset Manager® 60% Class Z |
| |
| Years ended September 30, | | 2023 | | 2022 | | 2021 | | 2020 | | 2019 A |
Selected Per-Share Data | | | | | | | | | | |
| Net asset value, beginning of period | $ | 12.74 | $ | 15.98 | $ | 13.65 | $ | 12.76 | $ | 12.97 |
| Income from Investment Operations | | | | | | | | | | |
Net investment income (loss) B,C | | .30 | | .29 | | .19 | | .20 | | .22 |
| Net realized and unrealized gain (loss) | | 1.15 | | (3.10) | | 2.43 | | 1.24 | | .08 |
| Total from investment operations | | 1.45 | | (2.81) | | 2.62 | | 1.44 | | .30 |
| Distributions from net investment income | | (.31) | | (.24) | | (.17) | | (.22) | | (.19) |
| Distributions from net realized gain | | (.28) | | (.19) | | (.12) | | (.33) | | (.32) |
| Total distributions | | (.59) | | (.43) | | (.29) | | (.55) | | (.51) |
| Net asset value, end of period | $ | 13.60 | $ | 12.74 | $ | 15.98 | $ | 13.65 | $ | 12.76 |
Total Return D,E | | 11.56% | | (18.17)% | | 19.35% | | 11.50% | | 2.86% |
Ratios to Average Net Assets C,F,G | | | | | | | | | | |
| Expenses before reductions | | .61% | | .60% | | .61% | | .62% | | .63% H |
| Expenses net of fee waivers, if any | | .60% | | .60% | | .61% | | .62% | | .63% H |
| Expenses net of all reductions | | .60% | | .60% | | .61% | | .62% | | .63% H |
| Net investment income (loss) | | 2.18% | | 1.94% | | 1.22% | | 1.57% | | 1.77% H |
| Supplemental Data | | | | | | | | | | |
| Net assets, end of period (000 omitted) | $ | 1,340,852 | $ | 1,240,298 | $ | 1,412,486 | $ | 22,117 | $ | 19,124 |
Portfolio turnover rate I | | 21% | | 23% | | 19% | | 29% | | 39% |
AFor the period October 2, 2018 (commencement of sale of shares) through September 30, 2019.
BCalculated based on average shares outstanding during the period.
CNet investment income (loss) is affected by the timing of the declaration of dividends by any underlying mutual funds or exchange-traded funds (ETFs). Net investment income (loss) of any mutual funds or ETFs is not included in the Fund's net investment income (loss) ratio.
DTotal returns for periods of less than one year are not annualized.
ETotal returns would have been lower if certain expenses had not been reduced during the applicable periods shown.
FFees and expenses of any underlying mutual funds or exchange-traded funds (ETFs) are not included in the Fund's expense ratio. The Fund indirectly bears its proportionate share of these expenses.
GExpense ratios reflect operating expenses of the class. Expenses before reductions do not reflect amounts reimbursed, waived, or reduced through arrangements with the investment adviser, brokerage services, or other offset arrangements, if applicable, and do not represent the amount paid by the class during periods when reimbursements, waivers or reductions occur.
HAnnualized.
IAmount does not include the portfolio activity of any underlying mutual funds or exchange-traded funds (ETFs).
The information in the following tables is based on the combined Investments of the Fund and it's pro-rata share of investments in Fidelity's Central Funds, other than the Commodity Strategy and Money Market Central Funds.
Top Holdings (% of Fund's net assets) |
| |
| Microsoft Corp. | 3.0 | |
| Apple, Inc. | 2.4 | |
| Alphabet, Inc. Class A | 1.7 | |
| Amazon.com, Inc. | 1.5 | |
| iShares MSCI USA Minimum Volatility ETF | 1.3 | |
| Exxon Mobil Corp. | 1.0 | |
| NVIDIA Corp. | 0.8 | |
| JPMorgan Chase & Co. | 0.8 | |
| Meta Platforms, Inc. Class A | 0.8 | |
| Taiwan Semiconductor Manufacturing Co. Ltd. | 0.7 | |
| | 14.0 | |
| |
| Market Sectors (% of Fund's net assets) |
| |
| Financials | 16.3 | |
| Information Technology | 14.9 | |
| Health Care | 8.6 | |
| Industrials | 8.6 | |
| Consumer Discretionary | 8.5 | |
| Communication Services | 5.8 | |
| Consumer Staples | 4.8 | |
| Energy | 4.4 | |
| Materials | 3.1 | |
| Real Estate | 2.4 | |
| Utilities | 1.0 | |
| |
Quality Diversification (% of Fund's net assets) |
|
Percentages shown as 0.0% may reflect amounts less than 0.05%. |
| |
| We have used ratings from Moody's Investors Service, Inc. Where Moody's® ratings are not available, we have used S&P® ratings. All ratings are as of the date indicated and do not reflect subsequent changes. |
Asset Allocation (% of Fund's net assets) |
|
|
Asset allocations in the pie charts reflect the categorization of assets as defined in the Fund's prospectus in effect as of the time periods indicated above. Percentages are adjusted for the effect of future contracts and swap contracts, if applicable.
Geographic Diversification (% of Fund's net assets) |
|
* Includes Short-Term investments and Net Other Assets (Liabilities). Percentages are adjusted for the effect of derivatives, if applicable. |
| |
Percentages in the above tables are adjusted for the effect of TBA sale Commitments.
Equities and Stock Class and Equity Futures percentages above include Fidelity Commodity Strategy Central Fund of 0.5%.
At period end, foreign investments including the Fund's pro-rata share of the underlying Central Funds, other than the Commodity Strategy Central and Money Market Funds, was 30.9% of net assets.
An unaudited holdings list for the Fund, which presents direct holdings as well as the pro-rata share of any securities and other investments held indirectly through its investment in underlying Fidelity Central Funds, other than the Commodity Strategy and Money Market Central Funds, is available at fidelity.com and/or institutional.fidelity.com, as applicable.
Fidelity Asset Manager® 70%
Showing Percentage of Net Assets
| Equity Central Funds - 72.3% |
| | | Shares | Value ($) |
| Fidelity Commodity Strategy Central Fund (a) | | 312,409 | 29,491,374 |
| Fidelity Emerging Markets Equity Central Fund (a) | | 2,750,965 | 516,658,666 |
| Fidelity Hedged Equity Central Fund (a) | | 750,545 | 77,861,533 |
| Fidelity International Equity Central Fund (a) | | 12,518,676 | 1,106,901,331 |
| Fidelity Real Estate Equity Central Fund (a) | | 214,154 | 23,993,826 |
| Fidelity U.S. Equity Central Fund (a) | | 22,278,371 | 2,590,751,814 |
| TOTAL EQUITY CENTRAL FUNDS (Cost $2,471,475,553) | | | 4,345,658,544 |
| | | | |
| Fixed-Income Central Funds - 24.0% |
| | | Shares | Value ($) |
| High Yield Fixed-Income Funds - 2.4% | | | |
| Fidelity Emerging Markets Debt Central Fund (a) | | 1,858,389 | 13,640,575 |
| Fidelity Emerging Markets Debt Local Currency Central Fund (a) | | 537,516 | 47,575,499 |
| Fidelity Floating Rate Central Fund (a) | | 505,866 | 49,584,956 |
| Fidelity High Income Central Fund (a) | | 309,634 | 31,316,361 |
TOTAL HIGH YIELD FIXED-INCOME FUNDS | | | 142,117,391 |
| Investment Grade Fixed-Income Funds - 21.6% | | | |
| Fidelity Inflation-Protected Bond Index Central Fund (a) | | 1,050,982 | 92,486,409 |
| Fidelity International Credit Central Fund (a) | | 410,851 | 31,261,654 |
| Fidelity Investment Grade Bond Central Fund (a) | | 12,572,881 | 1,176,947,370 |
TOTAL INVESTMENT GRADE FIXED-INCOME FUNDS | | | 1,300,695,433 |
| TOTAL FIXED-INCOME CENTRAL FUNDS (Cost $1,574,877,130) | | | 1,442,812,824 |
| | | | |
| Money Market Central Funds - 2.1% |
| | | Shares | Value ($) |
| Fidelity Cash Central Fund 5.39% (b) | | 86,757,732 | 86,775,084 |
| Fidelity Securities Lending Cash Central Fund 5.39% (b)(c) | | 40,340,866 | 40,344,900 |
| TOTAL MONEY MARKET CENTRAL FUNDS (Cost $127,119,983) | | | 127,119,984 |
| | | | |
| U.S. Treasury Obligations - 0.3% |
| | | Principal Amount (d) | Value ($) |
U.S. Treasury Bills, yield at date of purchase 5.33% to 5.39% 10/26/23 to 12/21/23 (e) (Cost $19,019,364) | | 19,200,000 | 19,022,030 |
| | | | |
| Investment Companies - 2.0% |
| | | Shares | Value ($) |
| iShares 20+ Year Treasury Bond ETF (f) | | 445,815 | 39,539,332 |
| iShares MSCI USA Minimum Volatility ETF | | 1,076,821 | 77,940,303 |
| TOTAL INVESTMENT COMPANIES (Cost $122,008,357) | | | 117,479,635 |
| | | | |
| TOTAL INVESTMENT IN SECURITIES - 100.7% (Cost $4,314,500,387) | 6,052,093,017 |
NET OTHER ASSETS (LIABILITIES) - (0.7)% | (40,431,845) |
| NET ASSETS - 100.0% | 6,011,661,172 |
| | |
| Futures Contracts |
| | Number of contracts | Expiration Date | Notional Amount ($) | Value ($) | Unrealized Appreciation/ (Depreciation) ($) |
| Purchased | | | | | |
| | | | | | |
| Equity Index Contracts | | | | | |
| ICE MSCI EAFE Index Contracts (United States) | 1,048 | Dec 2023 | 106,974,600 | (3,659,438) | (3,659,438) |
| | | | | | |
| Sold | | | | | |
| | | | | | |
| Equity Index Contracts | | | | | |
| CME E-mini S&P 500 Index Contracts (United States) | 1,320 | Dec 2023 | 285,483,000 | 7,446,604 | 7,446,604 |
| ICE MSCI Emerging Markets Index Contracts (United States) | 1,246 | Dec 2023 | 59,527,650 | 1,982,146 | 1,982,146 |
| | | | | | |
| TOTAL SOLD | | | | | 9,428,750 |
| | | | | | |
| TOTAL FUTURES CONTRACTS | | | | | 5,769,312 |
| The notional amount of futures purchased as a percentage of Net Assets is 1.8% |
| The notional amount of futures sold as a percentage of Net Assets is 5.7% |
Security Type Abbreviations
Legend
| (a) | Affiliated fund that is generally available only to investment companies and other accounts managed by Fidelity Investments. A complete unaudited schedule of portfolio holdings for each Fidelity Central Fund is filed with the SEC for the first and third quarters of each fiscal year on Form N-PORT and is available upon request or at the SEC's website at www.sec.gov. An unaudited holdings listing for the Fund, which presents direct holdings as well as the pro-rata share of securities and other investments held indirectly through its investment in underlying non-money market Fidelity Central Funds, other than the Commodity Strategy Central Fund, is available at fidelity.com and/or institutional.fidelity.com, as applicable. In addition, each Fidelity Central Fund's financial statements,which are not covered by the Fund's Report of Independent Registered Public Accounting Firm, are available on the SEC's website or upon request. |
| (b) | Affiliated fund that is generally available only to investment companies and other accounts managed by Fidelity Investments. The rate quoted is the annualized seven-day yield of the fund at period end. A complete unaudited listing of the fund's holdings as of its most recent quarter end is available upon request. In addition, each Fidelity Central Fund's financial statements, which are not covered by the Fund's Report of Independent Registered Public Accounting Firm, are available on the SEC's website or upon request. |
| (c) | Investment made with cash collateral received from securities on loan. |
| (d) | Amount is stated in United States dollars unless otherwise noted. |
| (e) | Security or a portion of the security was pledged to cover margin requirements for futures contracts. At period end, the value of securities pledged amounted to $17,861,829. |
| (f) | Security or a portion of the security is on loan at period end. |
Affiliated Central Funds
Fiscal year to date information regarding the Fund's investments in Fidelity Central Funds, including the ownership percentage, is presented below.
| Affiliate | Value, beginning of period ($) | Purchases ($) | Sales Proceeds ($) | Dividend Income ($) | Realized Gain (loss) ($) | Change in Unrealized appreciation (depreciation) ($) | Value, end of period ($) | % ownership, end of period |
| Fidelity Cash Central Fund 5.39% | 31,878,883 | 579,450,935 | 524,554,734 | 1,944,004 | - | - | 86,775,084 | 0.2% |
| Fidelity Commodity Strategy Central Fund | 140,326,756 | 4,874,607 | 108,833,382 | 2,828,295 | (19,594,689) | 12,718,082 | 29,491,374 | 13.0% |
| Fidelity Emerging Markets Debt Central Fund | 28,301,729 | 2,385,009 | 18,376,814 | 1,350,830 | (4,461,696) | 5,792,347 | 13,640,575 | 0.7% |
| Fidelity Emerging Markets Debt Local Currency Central Fund | 14,887,808 | 30,337,378 | 93 | 40,651 | 45,648 | 2,304,758 | 47,575,499 | 17.3% |
| Fidelity Emerging Markets Equity Central Fund | 418,358,762 | 102,304,402 | 51,909,566 | 16,237,716 | (10,293,411) | 58,198,479 | 516,658,666 | 24.0% |
| Fidelity Floating Rate Central Fund | 155,147,748 | 11,765,619 | 122,129,661 | 9,510,338 | (4,173,213) | 8,974,463 | 49,584,956 | 3.4% |
| Fidelity Hedged Equity Central Fund | - | 78,071,850 | - | 9,782 | - | (210,317) | 77,861,533 | 18.1% |
| Fidelity High Income Central Fund | 47,825,594 | 4,213,408 | 22,482,227 | 3,378,336 | 904,477 | 855,109 | 31,316,361 | 2.2% |
| Fidelity Inflation-Protected Bond Index Central Fund | 121,276,414 | 15,758,528 | 33,976,469 | 13,558,250 | (4,065,368) | (6,506,696) | 92,486,409 | 21.8% |
| Fidelity International Credit Central Fund | 72,088,262 | 4,942,150 | 42,766,125 | 3,930,781 | (13,060,474) | 10,057,841 | 31,261,654 | 15.8% |
| Fidelity International Equity Central Fund | 787,786,717 | 212,494,476 | 79,653,237 | 24,278,161 | (3,310,988) | 189,584,363 | 1,106,901,331 | 23.6% |
| Fidelity Investment Grade Bond Central Fund | 920,418,876 | 380,130,521 | 90,808,798 | 42,608,846 | (1,292,497) | (31,500,732) | 1,176,947,370 | 3.2% |
| Fidelity Real Estate Equity Central Fund | 38,168,175 | 1,678,978 | 17,383,197 | 965,180 | 146,239 | 1,383,631 | 23,993,826 | 2.6% |
| Fidelity Securities Lending Cash Central Fund 5.39% | 63,992,200 | 1,616,493,134 | 1,640,140,434 | 18,719 | - | - | 40,344,900 | 0.1% |
| Fidelity U.S. Equity Central Fund | 2,468,179,513 | 116,869,902 | 419,522,713 | 70,686,752 | 25,674,793 | 399,550,319 | 2,590,751,814 | 16.5% |
| Total | 5,308,637,437 | 3,161,770,897 | 3,172,537,450 | 191,346,641 | (33,481,179) | 651,201,647 | 5,915,591,352 | |
| | | | | | | | | |
Amounts in the dividend income column in the above table include any capital gain distributions from underlying funds, which are presented in the corresponding line item in the Statement of Operations, if applicable.
Amounts in the dividend income column for Fidelity Securities Lending Cash Central Fund represents the income earned on investing cash collateral, less rebates paid to borrowers and any lending agent fees associated with the loan, plus any premium payments received for lending certain types of securities.
Amounts included in the purchases and sales proceeds columns may include in-kind transactions, if applicable.
Investment Valuation
The following is a summary of the inputs used, as of September 30, 2023, involving the Fund's assets and liabilities carried at fair value. The inputs or methodology used for valuing securities may not be an indication of the risk associated with investing in those securities. For more information on valuation inputs, and their aggregation into the levels used below, please refer to the Investment Valuation section in the accompanying Notes to Financial Statements.
| Valuation Inputs at Reporting Date: |
| Description | Total ($) | Level 1 ($) | Level 2 ($) | Level 3 ($) |
Investments in Securities: | | | | |
|
| Equity Central Funds | 4,345,658,544 | 4,345,658,544 | - | - |
|
| Fixed-Income Central Funds | 1,442,812,824 | 1,442,812,824 | - | - |
|
| Money Market Central Funds | 127,119,984 | 127,119,984 | - | - |
|
| U.S Treasury Obligations | 19,022,030 | - | 19,022,030 | - |
|
| Investment Companies | 117,479,635 | 117,479,635 | - | - |
| Total Investments in Securities: | 6,052,093,017 | 6,033,070,987 | 19,022,030 | - |
Derivative Instruments: Assets | | | | |
Futures Contracts | 9,428,750 | 9,428,750 | - | - |
| Total Assets | 9,428,750 | 9,428,750 | - | - |
| Liabilities | | | | |
Futures Contracts | (3,659,438) | (3,659,438) | - | - |
| Total Liabilities | (3,659,438) | (3,659,438) | - | - |
| Total Derivative Instruments: | 5,769,312 | 5,769,312 | - | - |
Value of Derivative Instruments
The following table is a summary of the Fund's value of derivative instruments by primary risk exposure as of September 30, 2023. For additional information on derivative instruments, please refer to the Derivative Instruments section in the accompanying Notes to Financial Statements.
Primary Risk Exposure / Derivative Type | Value |
| Asset ($) | Liability ($) |
| Equity Risk | | |
Futures Contracts (a) | 9,428,750 | (3,659,438) |
| Total Equity Risk | 9,428,750 | (3,659,438) |
| Total Value of Derivatives | 9,428,750 | (3,659,438) |
(a)Reflects gross cumulative appreciation (depreciation) on futures contracts as presented in the Schedule of Investments. In the Statement of Assets and Liabilities, the period end daily variation margin is included in receivable or payable for daily variation margin on futures contracts, and the net cumulative appreciation (depreciation) is included in Total accumulated earnings (loss).
Fidelity Asset Manager® 70%
| Statement of Assets and Liabilities |
| | | | September 30, 2023 |
| | | | | |
| Assets | | | | |
| Investment in securities, at value (including securities loaned of $39,538,002) - See accompanying schedule: | | | | |
Unaffiliated issuers (cost $141,027,721) | $ | 136,501,665 | | |
Fidelity Central Funds (cost $4,173,472,666) | | 5,915,591,352 | | |
| | | | | |
| | | | | |
| Total Investment in Securities (cost $4,314,500,387) | | | $ | 6,052,093,017 |
| Receivable for investments sold | | | | 3,707,616 |
| Receivable for fund shares sold | | | | 1,290,751 |
| Dividends receivable | | | | 416,764 |
| Distributions receivable from Fidelity Central Funds | | | | 154,641 |
| Receivable for daily variation margin on futures contracts | | | | 419,960 |
| Prepaid expenses | | | | 8,554 |
| Other receivables | | | | 4,405 |
Total assets | | | | 6,058,095,708 |
| Liabilities | | | | |
| Payable for investments purchased | $ | 168,944 | | |
| Payable for fund shares redeemed | | 2,441,983 | | |
| Accrued management fee | | 2,682,997 | | |
| Distribution and service plan fees payable | | 98,861 | | |
| Other affiliated payables | | 623,420 | | |
| Other payables and accrued expenses | | 73,431 | | |
| Collateral on securities loaned | | 40,344,900 | | |
| Total Liabilities | | | | 46,434,536 |
| Net Assets | | | $ | 6,011,661,172 |
| Net Assets consist of: | | | | |
| Paid in capital | | | $ | 4,735,678,353 |
| Total accumulated earnings (loss) | | | | 1,275,982,819 |
| Net Assets | | | $ | 6,011,661,172 |
| | | | | |
| Net Asset Value and Maximum Offering Price | | | | |
| Class A : | | | | |
Net Asset Value and redemption price per share ($204,081,867 ÷ 8,591,751 shares)(a) | | | $ | 23.75 |
| Maximum offering price per share (100/94.25 of $23.75) | | | $ | 25.20 |
| Class M : | | | | |
Net Asset Value and redemption price per share ($66,988,166 ÷ 2,822,647 shares)(a) | | | $ | 23.73 |
| Maximum offering price per share (100/96.50 of $23.73) | | | $ | 24.59 |
| Class C : | | | | |
Net Asset Value and offering price per share ($31,474,107 ÷ 1,333,596 shares)(a) | | | $ | 23.60 |
| Asset Manager 70% : | | | | |
Net Asset Value, offering price and redemption price per share ($3,733,444,716 ÷ 156,560,754 shares) | | | $ | 23.85 |
| Class I : | | | | |
Net Asset Value, offering price and redemption price per share ($46,254,264 ÷ 1,938,534 shares) | | | $ | 23.86 |
| Class Z : | | | | |
Net Asset Value, offering price and redemption price per share ($1,929,418,052 ÷ 81,011,876 shares) | | | $ | 23.82 |
(a)Redemption price per share is equal to net asset value less any applicable contingent deferred sales charge. |
| Statement of Operations |
| | | | Year ended September 30, 2023 |
| Investment Income | | | | |
| Dividends | | | $ | 3,935,674 |
| Interest | | | | 928,002 |
| Income from Fidelity Central Funds (including $18,719 from security lending) | | | | 151,830,155 |
| Total Income | | | | 156,693,831 |
| Expenses | | | | |
| Management fee | $ | 32,012,554 | | |
| Transfer agent fees | | 6,030,647 | | |
| Distribution and service plan fees | | 1,166,519 | | |
| Accounting fees | | 1,341,369 | | |
| Custodian fees and expenses | | 32,917 | | |
| Independent trustees' fees and expenses | | 22,235 | | |
| Registration fees | | 108,124 | | |
| Audit | | 47,631 | | |
| Legal | | 12,566 | | |
| Miscellaneous | | 62,678 | | |
| Total expenses before reductions | | 40,837,240 | | |
| Expense reductions | | (306,021) | | |
| Total expenses after reductions | | | | 40,531,219 |
| Net Investment income (loss) | | | | 116,162,612 |
| Realized and Unrealized Gain (Loss) | | | | |
| Net realized gain (loss) on: | | | | |
| Investment Securities: | | | | |
| Unaffiliated issuers | | (62,903,007) | | |
| Fidelity Central Funds | | (33,481,179) | | |
| Futures contracts | | (11,401,889) | | |
| Capital gain distributions from Fidelity Central Funds | | 39,516,486 | | |
| Total net realized gain (loss) | | | | (68,269,589) |
| Change in net unrealized appreciation (depreciation) on: | | | | |
| Investment Securities: | | | | |
| Unaffiliated issuers | | 49,495,132 | | |
| Fidelity Central Funds | | 651,201,647 | | |
| Futures contracts | | (5,772,221) | | |
| Total change in net unrealized appreciation (depreciation) | | | | 694,924,558 |
| Net gain (loss) | | | | 626,654,969 |
| Net increase (decrease) in net assets resulting from operations | | | $ | 742,817,581 |
| Statement of Changes in Net Assets |
| |
| | Year ended September 30, 2023 | | Year ended September 30, 2022 |
| Increase (Decrease) in Net Assets | | | | |
| Operations | | | | |
| Net investment income (loss) | $ | 116,162,612 | $ | 118,820,892 |
| Net realized gain (loss) | | (68,269,589) | | 351,046,181 |
| Change in net unrealized appreciation (depreciation) | | 694,924,558 | | (1,801,796,030) |
| Net increase (decrease) in net assets resulting from operations | | 742,817,581 | | (1,331,928,957) |
| Distributions to shareholders | | (369,551,550) | | (197,081,541) |
| | | | | |
| Share transactions - net increase (decrease) | | 106,335,076 | | 166,143,423 |
| Total increase (decrease) in net assets | | 479,601,107 | | (1,362,867,075) |
| | | | | |
| Net Assets | | | | |
| Beginning of period | | 5,532,060,065 | | 6,894,927,140 |
| End of period | $ | 6,011,661,172 | $ | 5,532,060,065 |
| | | | | |
| | | | | |
Financial Highlights
| Fidelity Advisor Asset Manager® 70% Class A |
| |
| Years ended September 30, | | 2023 | | 2022 | | 2021 | | 2020 | | 2019 |
Selected Per-Share Data | | | | | | | | | | |
| Net asset value, beginning of period | $ | 22.33 | $ | 28.33 | $ | 23.67 | $ | 22.21 | $ | 23.27 |
| Income from Investment Operations | | | | | | | | | | |
Net investment income (loss) A,B | | .39 | | .40 | | .21 | | .25 | | .27 |
| Net realized and unrealized gain (loss) | | 2.47 | | (5.69) | | 4.95 | | 2.32 | | (.17) |
| Total from investment operations | | 2.86 | | (5.29) | | 5.16 | | 2.57 | | .10 |
| Distributions from net investment income | | (.42) | | (.31) | | (.18) | | (.28) | | (.25) |
| Distributions from net realized gain | | (1.02) | | (.40) | | (.32) | | (.83) | | (.91) |
| Total distributions | | (1.44) | | (.71) | | (.50) | | (1.11) | | (1.16) |
| Net asset value, end of period | $ | 23.75 | $ | 22.33 | $ | 28.33 | $ | 23.67 | $ | 22.21 |
Total Return C,D | | 13.13% | | (19.23)% | | 21.99% | | 11.81% | | 1.16% |
Ratios to Average Net Assets B,E,F | | | | | | | | | | |
| Expenses before reductions | | .97% | | .96% | | .96% | | .99% | | 1.00% |
| Expenses net of fee waivers, if any | | .96% | | .96% | | .96% | | .98% | | 1.00% |
| Expenses net of all reductions | | .96% | | .96% | | .96% | | .98% | | 1.00% |
| Net investment income (loss) | | 1.61% | | 1.50% | | .76% | | 1.11% | | 1.25% |
| Supplemental Data | | | | | | | | | | |
| Net assets, end of period (000 omitted) | $ | 204,082 | $ | 179,830 | $ | 219,595 | $ | 179,404 | $ | 166,280 |
Portfolio turnover rate G | | 19% | | 23% | | 20% | | 27% | | 41% |
ACalculated based on average shares outstanding during the period.
BNet investment income (loss) is affected by the timing of the declaration of dividends by any underlying mutual funds or exchange-traded funds (ETFs). Net investment income (loss) of any mutual funds or ETFs is not included in the Fund's net investment income (loss) ratio.
CTotal returns would have been lower if certain expenses had not been reduced during the applicable periods shown.
DTotal returns do not include the effect of the sales charges.
EFees and expenses of any underlying mutual funds or exchange-traded funds (ETFs) are not included in the Fund's expense ratio. The Fund indirectly bears its proportionate share of these expenses. For additional expense information related to investments in Fidelity Central Funds, please refer to the "Investments in Fidelity Central Funds" note found in the Notes to Financial Statements section of the most recent Annual or Semi-Annual report.
FExpense ratios reflect operating expenses of the class. Expenses before reductions do not reflect amounts reimbursed, waived, or reduced through arrangements with the investment adviser, brokerage services, or other offset arrangements, if applicable, and do not represent the amount paid by the class during periods when reimbursements, waivers or reductions occur.
GAmount does not include the portfolio activity of any underlying mutual funds or exchange-traded funds (ETFs).
| Fidelity Advisor Asset Manager® 70% Class M |
| |
| Years ended September 30, | | 2023 | | 2022 | | 2021 | | 2020 | | 2019 |
Selected Per-Share Data | | | | | | | | | | |
| Net asset value, beginning of period | $ | 22.30 | $ | 28.30 | $ | 23.65 | $ | 22.19 | $ | 23.24 |
| Income from Investment Operations | | | | | | | | | | |
Net investment income (loss) A,B | | .33 | | .33 | | .14 | | .19 | | .22 |
| Net realized and unrealized gain (loss) | | 2.47 | | (5.69) | | 4.96 | | 2.33 | | (.17) |
| Total from investment operations | | 2.80 | | (5.36) | | 5.10 | | 2.52 | | .05 |
| Distributions from net investment income | | (.35) | | (.24) | | (.13) | | (.23) | | (.19) |
| Distributions from net realized gain | | (1.02) | | (.40) | | (.32) | | (.83) | | (.91) |
| Total distributions | | (1.37) | | (.64) | | (.45) | | (1.06) | | (1.10) |
| Net asset value, end of period | $ | 23.73 | $ | 22.30 | $ | 28.30 | $ | 23.65 | $ | 22.19 |
Total Return C,D | | 12.86% | | (19.45)% | | 21.71% | | 11.56% | | .90% |
Ratios to Average Net Assets B,E,F | | | | | | | | | | |
| Expenses before reductions | | 1.21% | | 1.21% | | 1.21% | | 1.23% | | 1.24% |
| Expenses net of fee waivers, if any | | 1.21% | | 1.20% | | 1.21% | | 1.23% | | 1.24% |
| Expenses net of all reductions | | 1.21% | | 1.20% | | 1.21% | | 1.23% | | 1.24% |
| Net investment income (loss) | | 1.37% | | 1.25% | | .51% | | .87% | | 1.01% |
| Supplemental Data | | | | | | | | | | |
| Net assets, end of period (000 omitted) | $ | 66,988 | $ | 62,915 | $ | 80,784 | $ | 69,250 | $ | 63,064 |
Portfolio turnover rate G | | 19% | | 23% | | 20% | | 27% | | 41% |
ACalculated based on average shares outstanding during the period.
BNet investment income (loss) is affected by the timing of the declaration of dividends by any underlying mutual funds or exchange-traded funds (ETFs). Net investment income (loss) of any mutual funds or ETFs is not included in the Fund's net investment income (loss) ratio.
CTotal returns would have been lower if certain expenses had not been reduced during the applicable periods shown.
DTotal returns do not include the effect of the sales charges.
EFees and expenses of any underlying mutual funds or exchange-traded funds (ETFs) are not included in the Fund's expense ratio. The Fund indirectly bears its proportionate share of these expenses. For additional expense information related to investments in Fidelity Central Funds, please refer to the "Investments in Fidelity Central Funds" note found in the Notes to Financial Statements section of the most recent Annual or Semi-Annual report.
FExpense ratios reflect operating expenses of the class. Expenses before reductions do not reflect amounts reimbursed, waived, or reduced through arrangements with the investment adviser, brokerage services, or other offset arrangements, if applicable, and do not represent the amount paid by the class during periods when reimbursements, waivers or reductions occur.
GAmount does not include the portfolio activity of any underlying mutual funds or exchange-traded funds (ETFs).
| Fidelity Advisor Asset Manager® 70% Class C |
| |
| Years ended September 30, | | 2023 | | 2022 | | 2021 | | 2020 | | 2019 |
Selected Per-Share Data | | | | | | | | | | |
| Net asset value, beginning of period | $ | 22.18 | $ | 28.12 | $ | 23.50 | $ | 22.03 | $ | 23.06 |
| Income from Investment Operations | | | | | | | | | | |
Net investment income (loss) A,B | | .20 | | .19 | | - C | | .08 | | .11 |
| Net realized and unrealized gain (loss) | | 2.46 | | (5.66) | | 4.94 | | 2.30 | | (.15) |
| Total from investment operations | | 2.66 | | (5.47) | | 4.94 | | 2.38 | | (.04) |
| Distributions from net investment income | | (.22) | | (.07) | | - | | (.08) | | (.07) |
| Distributions from net realized gain | | (1.02) | | (.40) | | (.32) | | (.83) | | (.91) |
| Total distributions | | (1.24) | | (.47) | | (.32) | | (.91) | | (.99) D |
| Net asset value, end of period | $ | 23.60 | $ | 22.18 | $ | 28.12 | $ | 23.50 | $ | 22.03 |
Total Return E,F | | 12.25% | | (19.84)% | | 21.12% | | 10.98% | | .42% |
Ratios to Average Net Assets B,G,H | | | | | | | | | | |
| Expenses before reductions | | 1.72% | | 1.72% | | 1.72% | | 1.74% | | 1.75% |
| Expenses net of fee waivers, if any | | 1.72% | | 1.72% | | 1.72% | | 1.74% | | 1.75% |
| Expenses net of all reductions | | 1.72% | | 1.72% | | 1.72% | | 1.74% | | 1.75% |
| Net investment income (loss) | | .85% | | .74% | | -% I | | .36% | | .50% |
| Supplemental Data | | | | | | | | | | |
| Net assets, end of period (000 omitted) | $ | 31,474 | $ | 29,116 | $ | 44,170 | $ | 40,240 | $ | 42,547 |
Portfolio turnover rate J | | 19% | | 23% | | 20% | | 27% | | 41% |
ACalculated based on average shares outstanding during the period.
BNet investment income (loss) is affected by the timing of the declaration of dividends by any underlying mutual funds or exchange-traded funds (ETFs). Net investment income (loss) of any mutual funds or ETFs is not included in the Fund's net investment income (loss) ratio.
CAmount represents less than $.005 per share.
DTotal distributions per share do not sum due to rounding.
ETotal returns would have been lower if certain expenses had not been reduced during the applicable periods shown.
FTotal returns do not include the effect of the contingent deferred sales charge.
GFees and expenses of any underlying mutual funds or exchange-traded funds (ETFs) are not included in the Fund's expense ratio. The Fund indirectly bears its proportionate share of these expenses. For additional expense information related to investments in Fidelity Central Funds, please refer to the "Investments in Fidelity Central Funds" note found in the Notes to Financial Statements section of the most recent Annual or Semi-Annual report.
HExpense ratios reflect operating expenses of the class. Expenses before reductions do not reflect amounts reimbursed, waived, or reduced through arrangements with the investment adviser, brokerage services, or other offset arrangements, if applicable, and do not represent the amount paid by the class during periods when reimbursements, waivers or reductions occur.
IAmount represents less than .005%.
JAmount does not include the portfolio activity of any underlying mutual funds or exchange-traded funds (ETFs).
| Fidelity Asset Manager® 70% |
| |
| Years ended September 30, | | 2023 | | 2022 | | 2021 | | 2020 | | 2019 |
Selected Per-Share Data | | | | | | | | | | |
| Net asset value, beginning of period | $ | 22.42 | $ | 28.43 | $ | 23.74 | $ | 22.27 | $ | 23.33 |
| Income from Investment Operations | | | | | | | | | | |
Net investment income (loss) A,B | | .46 | | .48 | | .29 | | .32 | | .34 |
| Net realized and unrealized gain (loss) | | 2.48 | | (5.70) | | 4.97 | | 2.33 | | (.17) |
| Total from investment operations | | 2.94 | | (5.22) | | 5.26 | | 2.65 | | .17 |
| Distributions from net investment income | | (.48) | | (.39) | | (.26) | | (.35) | | (.31) |
| Distributions from net realized gain | | (1.02) | | (.40) | | (.32) | | (.83) | | (.91) |
| Total distributions | | (1.51) C | | (.79) | | (.57) C | | (1.18) | | (1.23) C |
| Net asset value, end of period | $ | 23.85 | $ | 22.42 | $ | 28.43 | $ | 23.74 | $ | 22.27 |
Total Return D | | 13.46% | | (18.98)% | | 22.39% | | 12.14% | | 1.51% |
Ratios to Average Net Assets A,E,F | | | | | | | | | | |
| Expenses before reductions | | .67% | | .67% | | .66% | | .68% | | .69% |
| Expenses net of fee waivers, if any | | .67% | | .66% | | .66% | | .68% | | .69% |
| Expenses net of all reductions | | .67% | | .66% | | .66% | | .68% | | .69% |
| Net investment income (loss) | | 1.90% | | 1.79% | | 1.06% | | 1.42% | | 1.56% |
| Supplemental Data | | | | | | | | | | |
| Net assets, end of period (000 omitted) | $ | 3,733,445 | $ | 3,518,486 | $ | 4,523,497 | $ | 5,203,794 | $ | 4,893,270 |
Portfolio turnover rate G | | 19% | | 23% | | 20% | | 27% | | 41% |
ANet investment income (loss) is affected by the timing of the declaration of dividends by any underlying mutual funds or exchange-traded funds (ETFs). Net investment income (loss) of any mutual funds or ETFs is not included in the Fund's net investment income (loss) ratio.
BCalculated based on average shares outstanding during the period.
CTotal distributions per share do not sum due to rounding.
DTotal returns would have been lower if certain expenses had not been reduced during the applicable periods shown.
EFees and expenses of any underlying mutual funds or exchange-traded funds (ETFs) are not included in the Fund's expense ratio. The Fund indirectly bears its proportionate share of these expenses. For additional expense information related to investments in Fidelity Central Funds, please refer to the "Investments in Fidelity Central Funds" note found in the Notes to Financial Statements section of the most recent Annual or Semi-Annual report.
FExpense ratios reflect operating expenses of the class. Expenses before reductions do not reflect amounts reimbursed, waived, or reduced through arrangements with the investment adviser, brokerage services, or other offset arrangements, if applicable, and do not represent the amount paid by the class during periods when reimbursements, waivers or reductions occur.
GAmount does not include the portfolio activity of any underlying mutual funds or exchange-traded funds (ETFs).
| Fidelity Advisor Asset Manager® 70% Class I |
| |
| Years ended September 30, | | 2023 | | 2022 | | 2021 | | 2020 | | 2019 |
Selected Per-Share Data | | | | | | | | | | |
| Net asset value, beginning of period | $ | 22.43 | $ | 28.46 | $ | 23.75 | $ | 22.27 | $ | 23.33 |
| Income from Investment Operations | | | | | | | | | | |
Net investment income (loss) A,B | | .45 | | .47 | | .28 | | .31 | | .33 |
| Net realized and unrealized gain (loss) | | 2.48 | | (5.71) | | 4.98 | | 2.34 | | (.17) |
| Total from investment operations | | 2.93 | | (5.24) | | 5.26 | | 2.65 | | .16 |
| Distributions from net investment income | | (.48) | | (.39) | | (.24) | | (.34) | | (.30) |
| Distributions from net realized gain | | (1.02) | | (.40) | | (.32) | | (.83) | | (.91) |
| Total distributions | | (1.50) | | (.79) | | (.55) C | | (1.17) | | (1.22) C |
| Net asset value, end of period | $ | 23.86 | $ | 22.43 | $ | 28.46 | $ | 23.75 | $ | 22.27 |
Total Return D | | 13.43% | | (19.03)% | | 22.37% | | 12.14% | | 1.46% |
Ratios to Average Net Assets B,E,F | | | | | | | | | | |
| Expenses before reductions | | .70% | | .69% | | .69% | | .71% | | .72% |
| Expenses net of fee waivers, if any | | .69% | | .69% | | .69% | | .71% | | .72% |
| Expenses net of all reductions | | .69% | | .69% | | .69% | | .71% | | .72% |
| Net investment income (loss) | | 1.88% | | 1.76% | | 1.03% | | 1.39% | | 1.53% |
| Supplemental Data | | | | | | | | | | |
| Net assets, end of period (000 omitted) | $ | 46,254 | $ | 43,240 | $ | 54,440 | $ | 38,396 | $ | 68,475 |
Portfolio turnover rate G | | 19% | | 23% | | 20% | | 27% | | 41% |
ACalculated based on average shares outstanding during the period.
BNet investment income (loss) is affected by the timing of the declaration of dividends by any underlying mutual funds or exchange-traded funds (ETFs). Net investment income (loss) of any mutual funds or ETFs is not included in the Fund's net investment income (loss) ratio.
CTotal distributions per share do not sum due to rounding.
DTotal returns would have been lower if certain expenses had not been reduced during the applicable periods shown.
EFees and expenses of any underlying mutual funds or exchange-traded funds (ETFs) are not included in the Fund's expense ratio. The Fund indirectly bears its proportionate share of these expenses. For additional expense information related to investments in Fidelity Central Funds, please refer to the "Investments in Fidelity Central Funds" note found in the Notes to Financial Statements section of the most recent Annual or Semi-Annual report.
FExpense ratios reflect operating expenses of the class. Expenses before reductions do not reflect amounts reimbursed, waived, or reduced through arrangements with the investment adviser, brokerage services, or other offset arrangements, if applicable, and do not represent the amount paid by the class during periods when reimbursements, waivers or reductions occur.
GAmount does not include the portfolio activity of any underlying mutual funds or exchange-traded funds (ETFs).
| Fidelity Advisor Asset Manager® 70% Class Z |
| |
| Years ended September 30, | | 2023 | | 2022 | | 2021 | | 2020 | | 2019 A |
Selected Per-Share Data | | | | | | | | | | |
| Net asset value, beginning of period | $ | 22.39 | $ | 28.41 | $ | 23.72 | $ | 22.26 | $ | 23.29 |
| Income from Investment Operations | | | | | | | | | | |
Net investment income (loss) B,C | | .48 | | .49 | | .32 | | .33 | | .35 |
| Net realized and unrealized gain (loss) | | 2.48 | | (5.68) | | 4.96 | | 2.33 | | (.13) |
| Total from investment operations | | 2.96 | | (5.19) | | 5.28 | | 2.66 | | .22 |
| Distributions from net investment income | | (.50) | | (.42) | | (.27) | | (.37) | | (.34) |
| Distributions from net realized gain | | (1.02) | | (.40) | | (.32) | | (.83) | | (.91) |
| Total distributions | | (1.53) D | | (.83) D | | (.59) | | (1.20) | | (1.25) |
| Net asset value, end of period | $ | 23.82 | $ | 22.39 | $ | 28.41 | $ | 23.72 | $ | 22.26 |
Total Return E,F | | 13.58% | | (18.94)% | | 22.48% | | 12.21% | | 1.78% |
Ratios to Average Net Assets C,G,H | | | | | | | | | | |
| Expenses before reductions | | .59% | | .59% | | .59% | | .61% | | .62% I |
| Expenses net of fee waivers, if any | | .59% | | .59% | | .59% | | .60% | | .61% I |
| Expenses net of all reductions | | .59% | | .59% | | .59% | | .60% | | .61% I |
| Net investment income (loss) | | 1.98% | | 1.86% | | 1.13% | | 1.49% | | 1.64% I |
| Supplemental Data | | | | | | | | | | |
| Net assets, end of period (000 omitted) | $ | 1,929,418 | $ | 1,698,474 | $ | 1,972,441 | $ | 28,723 | $ | 24,876 |
Portfolio turnover rate J | | 19% | | 23% | | 20% | | 27% | | 41% |
AFor the period October 2, 2018 (commencement of sale of shares) through September 30, 2019.
BCalculated based on average shares outstanding during the period.
CNet investment income (loss) is affected by the timing of the declaration of dividends by any underlying mutual funds or exchange-traded funds (ETFs). Net investment income (loss) of any mutual funds or ETFs is not included in the Fund's net investment income (loss) ratio.
DTotal distributions per share do not sum due to rounding.
ETotal returns for periods of less than one year are not annualized.
FTotal returns would have been lower if certain expenses had not been reduced during the applicable periods shown.
GFees and expenses of any underlying mutual funds or exchange-traded funds (ETFs) are not included in the Fund's expense ratio. The Fund indirectly bears its proportionate share of these expenses. For additional expense information related to investments in Fidelity Central Funds, please refer to the "Investments in Fidelity Central Funds" note found in the Notes to Financial Statements section of the most recent Annual or Semi-Annual report.
HExpense ratios reflect operating expenses of the class. Expenses before reductions do not reflect amounts reimbursed, waived, or reduced through arrangements with the investment adviser, brokerage services, or other offset arrangements, if applicable, and do not represent the amount paid by the class during periods when reimbursements, waivers or reductions occur.
IAnnualized.
JAmount does not include the portfolio activity of any underlying mutual funds or exchange-traded funds (ETFs).
The information in the following tables is based on the combined Investments of the Fund and it's pro-rata share of investments in Fidelity's Central Funds, other than the Commodity Strategy and Money Market Central Funds.
Top Holdings (% of Fund's net assets) |
| |
| Microsoft Corp. | 3.3 | |
| Apple, Inc. | 2.7 | |
| Alphabet, Inc. Class A | 1.9 | |
| Amazon.com, Inc. | 1.7 | |
| iShares MSCI USA Minimum Volatility ETF | 1.3 | |
| Exxon Mobil Corp. | 1.1 | |
| NVIDIA Corp. | 0.9 | |
| JPMorgan Chase & Co. | 0.9 | |
| Meta Platforms, Inc. Class A | 0.9 | |
| Taiwan Semiconductor Manufacturing Co. Ltd. | 0.9 | |
| | 15.6 | |
| |
| Market Sectors (% of Fund's net assets) |
| |
| Information Technology | 16.9 | |
| Financials | 16.6 | |
| Health Care | 9.9 | |
| Industrials | 9.7 | |
| Consumer Discretionary | 9.4 | |
| Communication Services | 6.0 | |
| Consumer Staples | 5.5 | |
| Energy | 4.6 | |
| Materials | 3.6 | |
| Real Estate | 2.3 | |
| Utilities | 1.3 | |
| |
Quality Diversification (% of Fund's net assets) |
|
| |
| We have used ratings from Moody's Investors Service, Inc. Where Moody's® ratings are not available, we have used S&P® ratings. All ratings are as of the date indicated and do not reflect subsequent changes. |
Asset Allocation (% of Fund's net assets) |
|
Short-Term Class - (0.1)% |
|
Asset allocations in the pie charts reflect the categorization of assets as defined in the Fund's prospectus in effect as of the time periods indicated above. Percentages are adjusted for the effect of future contracts and swap contracts, if applicable.
Geographic Diversification (% of Fund's net assets) |
|
* Includes Short-Term investments and Net Other Assets (Liabilities). Percentages are adjusted for the effect of derivatives, if applicable. |
| |
Percentages in the above tables are adjusted for the effect of TBA sale Commitments.
Equities and Stock Class and Equity Futures percentages above include Fidelity Commodity Strategy Central Fund of 0.8%.
At period end, foreign investments including the Fund's pro-rata share of the underlying Central Funds, other than the Commodity Strategy Central and Money Market Funds, was 34.5% of net assets.
An unaudited holdings list for the Fund, which presents direct holdings as well as the pro-rata share of any securities and other investments held indirectly through its investment in underlying Fidelity Central Funds, other than the Commodity Strategy and Money Market Central Funds, is available at fidelity.com and/or institutional.fidelity.com, as applicable.
Fidelity Asset Manager® 85%
Showing Percentage of Net Assets
| Equity Central Funds - 83.6% |
| | | Shares | Value ($) |
| Fidelity Commodity Strategy Central Fund (a) | | 283,999 | 26,809,484 |
| Fidelity Emerging Markets Equity Central Fund (a) | | 1,874,898 | 352,124,631 |
| Fidelity Hedged Equity Central Fund (a) | | 426,580 | 44,253,429 |
| Fidelity International Equity Central Fund (a) | | 8,726,844 | 771,627,509 |
| Fidelity Real Estate Equity Central Fund (a) | | 145,330 | 16,282,735 |
| Fidelity U.S. Equity Central Fund (a) | | 14,465,244 | 1,682,163,181 |
| TOTAL EQUITY CENTRAL FUNDS (Cost $1,897,722,517) | | | 2,893,260,969 |
| | | | |
| Fixed-Income Central Funds - 13.1% |
| | | Shares | Value ($) |
| High Yield Fixed-Income Funds - 1.6% | | | |
| Fidelity Emerging Markets Debt Central Fund (a) | | 1,129,923 | 8,293,636 |
| Fidelity Emerging Markets Debt Local Currency Central Fund (a) | | 408,791 | 36,182,100 |
| Fidelity Floating Rate Central Fund (a) | | 93,466 | 9,161,547 |
TOTAL HIGH YIELD FIXED-INCOME FUNDS | | | 53,637,283 |
| Investment Grade Fixed-Income Funds - 11.5% | | | |
| Fidelity Inflation-Protected Bond Index Central Fund (a) | | 607,518 | 53,461,590 |
| Fidelity International Credit Central Fund (a) | | 232,185 | 17,666,979 |
| Fidelity Investment Grade Bond Central Fund (a) | | 3,489,723 | 326,672,938 |
TOTAL INVESTMENT GRADE FIXED-INCOME FUNDS | | | 397,801,507 |
| TOTAL FIXED-INCOME CENTRAL FUNDS (Cost $482,793,130) | | | 451,438,790 |
| | | | |
| Money Market Central Funds - 1.9% |
| | | Shares | Value ($) |
| Fidelity Cash Central Fund 5.39% (b) | | 38,167,670 | 38,175,304 |
| Fidelity Securities Lending Cash Central Fund 5.39% (b)(c) | | 26,126,728 | 26,129,341 |
| TOTAL MONEY MARKET CENTRAL FUNDS (Cost $64,304,645) | | | 64,304,645 |
| | | | |
| U.S. Treasury Obligations - 0.2% |
| | | Principal Amount (d) | Value ($) |
U.S. Treasury Bills, yield at date of purchase 5.35% to 5.39% 10/26/23 to 12/21/23 (e) (Cost $7,416,598) | | 7,490,000 | 7,417,581 |
| | | | |
| Investment Companies - 2.0% |
| | | Shares | Value ($) |
| iShares 20+ Year Treasury Bond ETF (f) | | 288,809 | 25,614,470 |
| iShares MSCI USA Minimum Volatility ETF | | 612,024 | 44,298,297 |
| TOTAL INVESTMENT COMPANIES (Cost $73,359,547) | | | 69,912,767 |
| | | | |
| TOTAL INVESTMENT IN SECURITIES - 100.8% (Cost $2,525,596,437) | 3,486,334,752 |
NET OTHER ASSETS (LIABILITIES) - (0.8)% | (26,629,148) |
| NET ASSETS - 100.0% | 3,459,705,604 |
| | |
| Futures Contracts |
| | Number of contracts | Expiration Date | Notional Amount ($) | Value ($) | Unrealized Appreciation/ (Depreciation) ($) |
| Purchased | | | | | |
| | | | | | |
| Equity Index Contracts | | | | | |
| ICE MSCI EAFE Index Contracts (United States) | 790 | Dec 2023 | 80,639,250 | (2,758,546) | (2,758,546) |
| | | | | | |
| Sold | | | | | |
| | | | | | |
| Equity Index Contracts | | | | | |
| CME E-mini S&P 500 Index Contracts (United States) | 194 | Dec 2023 | 41,957,350 | 1,672,013 | 1,672,013 |
| ICE MSCI Emerging Markets Index Contracts (United States) | 624 | Dec 2023 | 29,811,600 | 992,664 | 992,664 |
| | | | | | |
| TOTAL SOLD | | | | | 2,664,677 |
| | | | | | |
| TOTAL FUTURES CONTRACTS | | | | | (93,869) |
| The notional amount of futures purchased as a percentage of Net Assets is 2.3% |
| The notional amount of futures sold as a percentage of Net Assets is 2.1% |
Security Type Abbreviations
Legend
| (a) | Affiliated fund that is generally available only to investment companies and other accounts managed by Fidelity Investments. A complete unaudited schedule of portfolio holdings for each Fidelity Central Fund is filed with the SEC for the first and third quarters of each fiscal year on Form N-PORT and is available upon request or at the SEC's website at www.sec.gov. An unaudited holdings listing for the Fund, which presents direct holdings as well as the pro-rata share of securities and other investments held indirectly through its investment in underlying non-money market Fidelity Central Funds, other than the Commodity Strategy Central Fund, is available at fidelity.com and/or institutional.fidelity.com, as applicable. In addition, each Fidelity Central Fund's financial statements,which are not covered by the Fund's Report of Independent Registered Public Accounting Firm, are available on the SEC's website or upon request. |
| (b) | Affiliated fund that is generally available only to investment companies and other accounts managed by Fidelity Investments. The rate quoted is the annualized seven-day yield of the fund at period end. A complete unaudited listing of the fund's holdings as of its most recent quarter end is available upon request. In addition, each Fidelity Central Fund's financial statements, which are not covered by the Fund's Report of Independent Registered Public Accounting Firm, are available on the SEC's website or upon request. |
| (c) | Investment made with cash collateral received from securities on loan. |
| (d) | Amount is stated in United States dollars unless otherwise noted. |
| (e) | Security or a portion of the security was pledged to cover margin requirements for futures contracts. At period end, the value of securities pledged amounted to $4,252,503. |
| (f) | Security or a portion of the security is on loan at period end. |
Affiliated Central Funds
Fiscal year to date information regarding the Fund's investments in Fidelity Central Funds, including the ownership percentage, is presented below.
| Affiliate | Value, beginning of period ($) | Purchases ($) | Sales Proceeds ($) | Dividend Income ($) | Realized Gain (loss) ($) | Change in Unrealized appreciation (depreciation) ($) | Value, end of period ($) | % ownership, end of period |
| Fidelity Cash Central Fund 5.39% | 13,400,862 | 266,236,545 | 241,462,103 | 559,347 | - | - | 38,175,304 | 0.1% |
| Fidelity Commodity Strategy Central Fund | 78,940,714 | 4,377,092 | 52,834,611 | 2,049,232 | (8,627,449) | 4,953,738 | 26,809,484 | 11.8% |
| Fidelity Emerging Markets Debt Central Fund | 12,999,589 | 2,413,697 | 7,640,619 | 661,113 | (1,234,190) | 1,755,159 | 8,293,636 | 0.4% |
| Fidelity Emerging Markets Debt Local Currency Central Fund | 8,467,097 | 26,172,671 | 33 | 23,020 | 23,123 | 1,519,242 | 36,182,100 | 13.2% |
| Fidelity Emerging Markets Equity Central Fund | 292,726,440 | 87,926,502 | 60,174,535 | 11,057,604 | (16,303,411) | 47,949,635 | 352,124,631 | 16.3% |
| Fidelity Floating Rate Central Fund | 26,789,150 | 2,205,399 | 20,669,292 | 1,432,443 | (814,510) | 1,650,800 | 9,161,547 | 0.6% |
| Fidelity Hedged Equity Central Fund | - | 44,376,348 | - | 5,524 | - | (122,919) | 44,253,429 | 10.3% |
| Fidelity High Income Central Fund | - | 28 | 4,821 | 45 | 4,793 | - | - | 0.0% |
| Fidelity Inflation-Protected Bond Index Central Fund | 63,761,519 | 16,756,353 | 21,594,184 | 7,066,562 | (2,218,142) | (3,243,956) | 53,461,590 | 12.6% |
| Fidelity International Credit Central Fund | 42,225,958 | 3,430,555 | 26,336,599 | 2,155,281 | (7,756,457) | 6,103,522 | 17,666,979 | 8.9% |
| Fidelity International Equity Central Fund | 580,772,173 | 126,335,372 | 66,758,927 | 16,788,227 | (4,712,317) | 135,991,208 | 771,627,509 | 16.4% |
| Fidelity Investment Grade Bond Central Fund | 146,696,239 | 253,906,381 | 66,053,325 | 8,167,577 | (4,602,646) | (3,273,711) | 326,672,938 | 0.9% |
| Fidelity Real Estate Equity Central Fund | 28,721,218 | 1,847,954 | 15,611,182 | 689,751 | 57,085 | 1,267,660 | 16,282,735 | 1.8% |
| Fidelity Securities Lending Cash Central Fund 5.39% | 16,469,750 | 1,608,179,009 | 1,598,519,418 | 24,747 | - | - | 26,129,341 | 0.1% |
| Fidelity U.S. Equity Central Fund | 1,623,482,375 | 159,382,389 | 385,685,425 | 48,067,591 | 23,143,500 | 261,840,342 | 1,682,163,181 | 10.7% |
| Total | 2,935,453,084 | 2,603,546,295 | 2,563,345,074 | 98,748,064 | (23,040,621) | 456,390,720 | 3,409,004,404 | |
| | | | | | | | | |
Amounts in the dividend income column in the above table include any capital gain distributions from underlying funds, which are presented in the corresponding line item in the Statement of Operations, if applicable.
Amounts in the dividend income column for Fidelity Securities Lending Cash Central Fund represents the income earned on investing cash collateral, less rebates paid to borrowers and any lending agent fees associated with the loan, plus any premium payments received for lending certain types of securities.
Amounts included in the purchases and sales proceeds columns may include in-kind transactions, if applicable.
Investment Valuation
The following is a summary of the inputs used, as of September 30, 2023, involving the Fund's assets and liabilities carried at fair value. The inputs or methodology used for valuing securities may not be an indication of the risk associated with investing in those securities. For more information on valuation inputs, and their aggregation into the levels used below, please refer to the Investment Valuation section in the accompanying Notes to Financial Statements.
| Valuation Inputs at Reporting Date: |
| Description | Total ($) | Level 1 ($) | Level 2 ($) | Level 3 ($) |
Investments in Securities: | | | | |
|
| Equity Central Funds | 2,893,260,969 | 2,893,260,969 | - | - |
|
| Fixed-Income Central Funds | 451,438,790 | 451,438,790 | - | - |
|
| Money Market Central Funds | 64,304,645 | 64,304,645 | - | - |
|
| U.S Treasury Obligations | 7,417,581 | - | 7,417,581 | - |
|
| Investment Companies | 69,912,767 | 69,912,767 | - | - |
| Total Investments in Securities: | 3,486,334,752 | 3,478,917,171 | 7,417,581 | - |
Derivative Instruments: Assets | | | | |
Futures Contracts | 2,664,677 | 2,664,677 | - | - |
| Total Assets | 2,664,677 | 2,664,677 | - | - |
| Liabilities | | | | |
Futures Contracts | (2,758,546) | (2,758,546) | - | - |
| Total Liabilities | (2,758,546) | (2,758,546) | - | - |
| Total Derivative Instruments: | (93,869) | (93,869) | - | - |
Value of Derivative Instruments
The following table is a summary of the Fund's value of derivative instruments by primary risk exposure as of September 30, 2023. For additional information on derivative instruments, please refer to the Derivative Instruments section in the accompanying Notes to Financial Statements.
Primary Risk Exposure / Derivative Type | Value |
| Asset ($) | Liability ($) |
| Equity Risk | | |
Futures Contracts (a) | 2,664,677 | (2,758,546) |
| Total Equity Risk | 2,664,677 | (2,758,546) |
| Total Value of Derivatives | 2,664,677 | (2,758,546) |
(a)Reflects gross cumulative appreciation (depreciation) on futures contracts as presented in the Schedule of Investments. In the Statement of Assets and Liabilities, the period end daily variation margin is included in receivable or payable for daily variation margin on futures contracts, and the net cumulative appreciation (depreciation) is included in Total accumulated earnings (loss).
Fidelity Asset Manager® 85%
| Statement of Assets and Liabilities |
| | | | September 30, 2023 |
| | | | | |
| Assets | | | | |
| Investment in securities, at value (including securities loaned of $25,606,754) - See accompanying schedule: | | | | |
Unaffiliated issuers (cost $80,776,145) | $ | 77,330,348 | | |
Fidelity Central Funds (cost $2,444,820,292) | | 3,409,004,404 | | |
| | | | | |
| | | | | |
| Total Investment in Securities (cost $2,525,596,437) | | | $ | 3,486,334,752 |
| Receivable for investments sold | | | | 3,098,048 |
| Receivable for fund shares sold | | | | 1,666,877 |
| Dividends receivable | | | | 236,873 |
| Distributions receivable from Fidelity Central Funds | | | | 33,533 |
| Prepaid expenses | | | | 4,851 |
Total assets | | | | 3,491,374,934 |
| Liabilities | | | | |
| Payable for investments purchased | $ | 33,141 | | |
| Payable for fund shares redeemed | | 3,231,606 | | |
| Accrued management fee | | 1,549,180 | | |
| Distribution and service plan fees payable | | 96,145 | | |
| Payable for daily variation margin on futures contracts | | 164,050 | | |
| Other affiliated payables | | 401,716 | | |
| Other payables and accrued expenses | | 64,151 | | |
| Collateral on securities loaned | | 26,129,341 | | |
| Total Liabilities | | | | 31,669,330 |
| Net Assets | | | $ | 3,459,705,604 |
| Net Assets consist of: | | | | |
| Paid in capital | | | $ | 2,732,964,918 |
| Total accumulated earnings (loss) | | | | 726,740,686 |
| Net Assets | | | $ | 3,459,705,604 |
| | | | | |
| Net Asset Value and Maximum Offering Price | | | | |
| Class A : | | | | |
Net Asset Value and redemption price per share ($202,553,604 ÷ 9,255,086 shares)(a) | | | $ | 21.89 |
| Maximum offering price per share (100/94.25 of $21.89) | | | $ | 23.23 |
| Class M : | | | | |
Net Asset Value and redemption price per share ($46,122,583 ÷ 2,125,430 shares)(a) | | | $ | 21.70 |
| Maximum offering price per share (100/96.50 of $21.70) | | | $ | 22.49 |
| Class C : | | | | |
Net Asset Value and offering price per share ($39,038,183 ÷ 1,823,944 shares)(a) | | | $ | 21.40 |
| Asset Manager 85% : | | | | |
Net Asset Value, offering price and redemption price per share ($1,892,890,171 ÷ 85,331,378 shares) | | | $ | 22.18 |
| Class I : | | | | |
Net Asset Value, offering price and redemption price per share ($58,137,312 ÷ 2,629,541 shares) | | | $ | 22.11 |
| Class Z : | | | | |
Net Asset Value, offering price and redemption price per share ($1,220,963,751 ÷ 55,338,735 shares) | | | $ | 22.06 |
(a)Redemption price per share is equal to net asset value less any applicable contingent deferred sales charge. |
| Statement of Operations |
| | | | Year ended September 30, 2023 |
| Investment Income | | | | |
| Dividends | | | $ | 2,614,964 |
| Interest | | | | 499,289 |
| Income from Fidelity Central Funds (including $24,747 from security lending) | | | | 72,460,577 |
| Total Income | | | | 75,574,830 |
| Expenses | | | | |
| Management fee | $ | 18,124,254 | | |
| Transfer agent fees | | 3,706,071 | | |
| Distribution and service plan fees | | 1,116,157 | | |
| Accounting fees | | 879,326 | | |
| Custodian fees and expenses | | 27,561 | | |
| Independent trustees' fees and expenses | | 12,547 | | |
| Registration fees | | 114,489 | | |
| Audit | | 47,484 | | |
| Legal | | 7,081 | | |
| Interest | | 1,696 | | |
| Miscellaneous | | 47,671 | | |
| Total expenses before reductions | | 24,084,337 | | |
| Expense reductions | | (171,281) | | |
| Total expenses after reductions | | | | 23,913,056 |
| Net Investment income (loss) | | | | 51,661,774 |
| Realized and Unrealized Gain (Loss) | | | | |
| Net realized gain (loss) on: | | | | |
| Investment Securities: | | | | |
| Unaffiliated issuers | | (41,778,208) | | |
| Fidelity Central Funds | | (23,040,621) | | |
| Futures contracts | | (7,200,627) | | |
| Capital gain distributions from Fidelity Central Funds | | 26,287,487 | | |
| Total net realized gain (loss) | | | | (45,731,969) |
| Change in net unrealized appreciation (depreciation) on: | | | | |
| Investment Securities: | | | | |
| Unaffiliated issuers | | 32,622,093 | | |
| Fidelity Central Funds | | 456,390,719 | | |
| Futures contracts | | (1,019,052) | | |
| Total change in net unrealized appreciation (depreciation) | | | | 487,993,760 |
| Net gain (loss) | | | | 442,261,791 |
| Net increase (decrease) in net assets resulting from operations | | | $ | 493,923,565 |
| Statement of Changes in Net Assets |
| |
| | Year ended September 30, 2023 | | Year ended September 30, 2022 |
| Increase (Decrease) in Net Assets | | | | |
| Operations | | | | |
| Net investment income (loss) | $ | 51,661,774 | $ | 57,022,306 |
| Net realized gain (loss) | | (45,731,969) | | 172,237,074 |
| Change in net unrealized appreciation (depreciation) | | 487,993,760 | | (1,059,883,711) |
| Net increase (decrease) in net assets resulting from operations | | 493,923,565 | | (830,624,331) |
| Distributions to shareholders | | (159,424,192) | | (128,057,101) |
| | | | | |
| Share transactions - net increase (decrease) | | 39,116,407 | | 242,638,642 |
| Total increase (decrease) in net assets | | 373,615,780 | | (716,042,790) |
| | | | | |
| Net Assets | | | | |
| Beginning of period | | 3,086,089,824 | | 3,802,132,614 |
| End of period | $ | 3,459,705,604 | $ | 3,086,089,824 |
| | | | | |
| | | | | |
Financial Highlights
| Fidelity Advisor Asset Manager® 85% Class A |
| |
| Years ended September 30, | | 2023 | | 2022 | | 2021 | | 2020 | | 2019 |
Selected Per-Share Data | | | | | | | | | | |
| Net asset value, beginning of period | $ | 19.79 | $ | 25.79 | $ | 20.73 | $ | 19.30 | $ | 20.36 |
| Income from Investment Operations | | | | | | | | | | |
Net investment income (loss) A,B | | .27 | | .30 | | .16 | | .19 | | .20 |
| Net realized and unrealized gain (loss) | | 2.82 | | (5.52) | | 5.31 | | 2.29 | | (.37) |
| Total from investment operations | | 3.09 | | (5.22) | | 5.47 | | 2.48 | | (.17) |
| Distributions from net investment income | | (.32) | | (.24) | | (.13) | | (.22) | | (.17) |
| Distributions from net realized gain | | (.67) | | (.54) | | (.28) | | (.84) | | (.72) |
| Total distributions | | (.99) | | (.78) | | (.41) | | (1.05) C | | (.89) |
| Net asset value, end of period | $ | 21.89 | $ | 19.79 | $ | 25.79 | $ | 20.73 | $ | 19.30 |
Total Return D,E | | 15.95% | | (21.00)% | | 26.59% | | 13.11% | | (.11)% |
Ratios to Average Net Assets B,F,G | | | | | | | | | | |
| Expenses before reductions | | .98% | | .97% | | .98% | | 1.00% | | 1.01% |
| Expenses net of fee waivers, if any | | .97% | | .97% | | .98% | | .99% | | 1.01% |
| Expenses net of all reductions | | .97% | | .97% | | .98% | | .99% | | 1.01% |
| Net investment income (loss) | | 1.22% | | 1.24% | | .64% | | .97% | | 1.06% |
| Supplemental Data | | | | | | | | | | |
| Net assets, end of period (000 omitted) | $ | 202,554 | $ | 165,075 | $ | 191,715 | $ | 143,117 | $ | 125,168 |
Portfolio turnover rate H | | 24% | | 27% | | 18% | | 41% | | 47% |
ACalculated based on average shares outstanding during the period.
BNet investment income (loss) is affected by the timing of the declaration of dividends by any underlying mutual funds or exchange-traded funds (ETFs). Net investment income (loss) of any mutual funds or ETFs is not included in the Fund's net investment income (loss) ratio.
CTotal distributions per share do not sum due to rounding.
DTotal returns would have been lower if certain expenses had not been reduced during the applicable periods shown.
ETotal returns do not include the effect of the sales charges.
FFees and expenses of any underlying mutual funds or exchange-traded funds (ETFs) are not included in the Fund's expense ratio. The Fund indirectly bears its proportionate share of these expenses.
GExpense ratios reflect operating expenses of the class. Expenses before reductions do not reflect amounts reimbursed, waived, or reduced through arrangements with the investment adviser, brokerage services, or other offset arrangements, if applicable, and do not represent the amount paid by the class during periods when reimbursements, waivers or reductions occur.
HAmount does not include the portfolio activity of any underlying mutual funds or exchange-traded funds (ETFs).
| Fidelity Advisor Asset Manager® 85% Class M |
| |
| Years ended September 30, | | 2023 | | 2022 | | 2021 | | 2020 | | 2019 |
Selected Per-Share Data | | | | | | | | | | |
| Net asset value, beginning of period | $ | 19.62 | $ | 25.58 | $ | 20.57 | $ | 19.17 | $ | 20.22 |
| Income from Investment Operations | | | | | | | | | | |
Net investment income (loss) A,B | | .21 | | .24 | | .09 | | .14 | | .15 |
| Net realized and unrealized gain (loss) | | 2.80 | | (5.48) | | 5.28 | | 2.27 | | (.36) |
| Total from investment operations | | 3.01 | | (5.24) | | 5.37 | | 2.41 | | (.21) |
| Distributions from net investment income | | (.26) | | (.18) | | (.08) | | (.18) | | (.13) |
| Distributions from net realized gain | | (.67) | | (.54) | | (.28) | | (.84) | | (.72) |
| Total distributions | | (.93) | | (.72) | | (.36) | | (1.01) C | | (.84) C |
| Net asset value, end of period | $ | 21.70 | $ | 19.62 | $ | 25.58 | $ | 20.57 | $ | 19.17 |
Total Return D,E | | 15.62% | | (21.21)% | | 26.30% | | 12.81% | | (.35)% |
Ratios to Average Net Assets B,F,G | | | | | | | | | | |
| Expenses before reductions | | 1.23% | | 1.22% | | 1.23% | | 1.25% | | 1.27% |
| Expenses net of fee waivers, if any | | 1.22% | | 1.22% | | 1.23% | | 1.25% | | 1.27% |
| Expenses net of all reductions | | 1.22% | | 1.22% | | 1.23% | | 1.25% | | 1.27% |
| Net investment income (loss) | | .97% | | 1.00% | | .39% | | .72% | | .80% |
| Supplemental Data | | | | | | | | | | |
| Net assets, end of period (000 omitted) | $ | 46,123 | $ | 42,034 | $ | 54,864 | $ | 40,604 | $ | 33,611 |
Portfolio turnover rate H | | 24% | | 27% | | 18% | | 41% | | 47% |
ACalculated based on average shares outstanding during the period.
BNet investment income (loss) is affected by the timing of the declaration of dividends by any underlying mutual funds or exchange-traded funds (ETFs). Net investment income (loss) of any mutual funds or ETFs is not included in the Fund's net investment income (loss) ratio.
CTotal distributions per share do not sum due to rounding.
DTotal returns would have been lower if certain expenses had not been reduced during the applicable periods shown.
ETotal returns do not include the effect of the sales charges.
FFees and expenses of any underlying mutual funds or exchange-traded funds (ETFs) are not included in the Fund's expense ratio. The Fund indirectly bears its proportionate share of these expenses.
GExpense ratios reflect operating expenses of the class. Expenses before reductions do not reflect amounts reimbursed, waived, or reduced through arrangements with the investment adviser, brokerage services, or other offset arrangements, if applicable, and do not represent the amount paid by the class during periods when reimbursements, waivers or reductions occur.
HAmount does not include the portfolio activity of any underlying mutual funds or exchange-traded funds (ETFs).
| Fidelity Advisor Asset Manager® 85% Class C |
| |
| Years ended September 30, | | 2023 | | 2022 | | 2021 | | 2020 | | 2019 |
Selected Per-Share Data | | | | | | | | | | |
| Net asset value, beginning of period | $ | 19.36 | $ | 25.24 | $ | 20.31 | $ | 18.92 | $ | 19.95 |
| Income from Investment Operations | | | | | | | | | | |
Net investment income (loss) A,B | | .10 | | .11 | | (.03) | | .04 | | .06 |
| Net realized and unrealized gain (loss) | | 2.76 | | (5.42) | | 5.21 | | 2.24 | | (.35) |
| Total from investment operations | | 2.86 | | (5.31) | | 5.18 | | 2.28 | | (.29) |
| Distributions from net investment income | | (.15) | | (.03) | | - | | (.06) | | (.02) |
| Distributions from net realized gain | | (.67) | | (.54) | | (.25) | | (.84) | | (.72) |
| Total distributions | | (.82) | | (.57) | | (.25) | | (.89) C | | (.74) |
| Net asset value, end of period | $ | 21.40 | $ | 19.36 | $ | 25.24 | $ | 20.31 | $ | 18.92 |
Total Return D,E | | 15.00% | | (21.61)% | | 25.65% | | 12.25% | | (.88)% |
Ratios to Average Net Assets B,F,G | | | | | | | | | | |
| Expenses before reductions | | 1.74% | | 1.74% | | 1.74% | | 1.76% | | 1.77% |
| Expenses net of fee waivers, if any | | 1.74% | | 1.73% | | 1.74% | | 1.76% | | 1.77% |
| Expenses net of all reductions | | 1.74% | | 1.73% | | 1.74% | | 1.76% | | 1.77% |
| Net investment income (loss) | | .46% | | .48% | | (.13)% | | .21% | | .30% |
| Supplemental Data | | | | | | | | | | |
| Net assets, end of period (000 omitted) | $ | 39,038 | $ | 36,141 | $ | 49,896 | $ | 44,510 | $ | 40,909 |
Portfolio turnover rate H | | 24% | | 27% | | 18% | | 41% | | 47% |
ACalculated based on average shares outstanding during the period.
BNet investment income (loss) is affected by the timing of the declaration of dividends by any underlying mutual funds or exchange-traded funds (ETFs). Net investment income (loss) of any mutual funds or ETFs is not included in the Fund's net investment income (loss) ratio.
CTotal distributions per share do not sum due to rounding.
DTotal returns would have been lower if certain expenses had not been reduced during the applicable periods shown.
ETotal returns do not include the effect of the contingent deferred sales charge.
FFees and expenses of any underlying mutual funds or exchange-traded funds (ETFs) are not included in the Fund's expense ratio. The Fund indirectly bears its proportionate share of these expenses.
GExpense ratios reflect operating expenses of the class. Expenses before reductions do not reflect amounts reimbursed, waived, or reduced through arrangements with the investment adviser, brokerage services, or other offset arrangements, if applicable, and do not represent the amount paid by the class during periods when reimbursements, waivers or reductions occur.
HAmount does not include the portfolio activity of any underlying mutual funds or exchange-traded funds (ETFs).
| Fidelity Asset Manager® 85% |
| |
| Years ended September 30, | | 2023 | | 2022 | | 2021 | | 2020 | | 2019 |
Selected Per-Share Data | | | | | | | | | | |
| Net asset value, beginning of period | $ | 20.05 | $ | 26.10 | $ | 20.96 | $ | 19.50 | $ | 20.56 |
| Income from Investment Operations | | | | | | | | | | |
Net investment income (loss) A,B | | .33 | | .37 | | .23 | | .25 | | .26 |
| Net realized and unrealized gain (loss) | | 2.85 | | (5.58) | | 5.38 | | 2.32 | | (.38) |
| Total from investment operations | | 3.18 | | (5.21) | | 5.61 | | 2.57 | | (.12) |
| Distributions from net investment income | | (.38) | | (.30) | | (.19) | | (.27) | | (.23) |
| Distributions from net realized gain | | (.67) | | (.54) | | (.28) | | (.84) | | (.72) |
| Total distributions | | (1.05) | | (.84) | | (.47) | | (1.11) | | (.94) C |
| Net asset value, end of period | $ | 22.18 | $ | 20.05 | $ | 26.10 | $ | 20.96 | $ | 19.50 |
Total Return D | | 16.21% | | (20.76)% | | 27.00% | | 13.44% | | .21% |
Ratios to Average Net Assets B,E,F | | | | | | | | | | |
| Expenses before reductions | | .70% | | .69% | | .68% | | .69% | | .71% |
| Expenses net of fee waivers, if any | | .69% | | .68% | | .68% | | .69% | | .71% |
| Expenses net of all reductions | | .69% | | .68% | | .68% | | .69% | | .71% |
| Net investment income (loss) | | 1.50% | | 1.53% | | .94% | | 1.28% | | 1.36% |
| Supplemental Data | | | | | | | | | | |
| Net assets, end of period (000 omitted) | $ | 1,892,890 | $ | 1,697,192 | $ | 2,185,948 | $ | 2,520,790 | $ | 2,278,919 |
Portfolio turnover rate G | | 24% | | 27% | | 18% | | 41% | | 47% |
ACalculated based on average shares outstanding during the period.
BNet investment income (loss) is affected by the timing of the declaration of dividends by any underlying mutual funds or exchange-traded funds (ETFs). Net investment income (loss) of any mutual funds or ETFs is not included in the Fund's net investment income (loss) ratio.
CTotal distributions per share do not sum due to rounding.
DTotal returns would have been lower if certain expenses had not been reduced during the applicable periods shown.
EFees and expenses of any underlying mutual funds or exchange-traded funds (ETFs) are not included in the Fund's expense ratio. The Fund indirectly bears its proportionate share of these expenses.
FExpense ratios reflect operating expenses of the class. Expenses before reductions do not reflect amounts reimbursed, waived, or reduced through arrangements with the investment adviser, brokerage services, or other offset arrangements, if applicable, and do not represent the amount paid by the class during periods when reimbursements, waivers or reductions occur.
GAmount does not include the portfolio activity of any underlying mutual funds or exchange-traded funds (ETFs).
| Fidelity Advisor Asset Manager® 85% Class I |
| |
| Years ended September 30, | | 2023 | | 2022 | | 2021 | | 2020 | | 2019 |
Selected Per-Share Data | | | | | | | | | | |
| Net asset value, beginning of period | $ | 19.99 | $ | 26.03 | $ | 20.91 | $ | 19.45 | $ | 20.50 |
| Income from Investment Operations | | | | | | | | | | |
Net investment income (loss) A,B | | .33 | | .36 | | .22 | | .24 | | .25 |
| Net realized and unrealized gain (loss) | | 2.84 | | (5.56) | | 5.36 | | 2.32 | | (.37) |
| Total from investment operations | | 3.17 | | (5.20) | | 5.58 | | 2.56 | | (.12) |
| Distributions from net investment income | | (.38) | | (.30) | | (.18) | | (.26) | | (.21) |
| Distributions from net realized gain | | (.67) | | (.54) | | (.28) | | (.84) | | (.72) |
| Total distributions | | (1.05) | | (.84) | | (.46) | | (1.10) | | (.93) |
| Net asset value, end of period | $ | 22.11 | $ | 19.99 | $ | 26.03 | $ | 20.91 | $ | 19.45 |
Total Return C | | 16.19% | | (20.78)% | | 26.93% | | 13.40% | | .15% |
Ratios to Average Net Assets B,D,E | | | | | | | | | | |
| Expenses before reductions | | .72% | | .71% | | .71% | | .73% | | .74% |
| Expenses net of fee waivers, if any | | .71% | | .71% | | .71% | | .72% | | .74% |
| Expenses net of all reductions | | .71% | | .71% | | .71% | | .72% | | .74% |
| Net investment income (loss) | | 1.48% | | 1.50% | | .90% | | 1.25% | | 1.33% |
| Supplemental Data | | | | | | | | | | |
| Net assets, end of period (000 omitted) | $ | 58,137 | $ | 51,528 | $ | 60,989 | $ | 31,606 | $ | 39,115 |
Portfolio turnover rate F | | 24% | | 27% | | 18% | | 41% | | 47% |
ACalculated based on average shares outstanding during the period.
BNet investment income (loss) is affected by the timing of the declaration of dividends by any underlying mutual funds or exchange-traded funds (ETFs). Net investment income (loss) of any mutual funds or ETFs is not included in the Fund's net investment income (loss) ratio.
CTotal returns would have been lower if certain expenses had not been reduced during the applicable periods shown.
DFees and expenses of any underlying mutual funds or exchange-traded funds (ETFs) are not included in the Fund's expense ratio. The Fund indirectly bears its proportionate share of these expenses.
EExpense ratios reflect operating expenses of the class. Expenses before reductions do not reflect amounts reimbursed, waived, or reduced through arrangements with the investment adviser, brokerage services, or other offset arrangements, if applicable, and do not represent the amount paid by the class during periods when reimbursements, waivers or reductions occur.
FAmount does not include the portfolio activity of any underlying mutual funds or exchange-traded funds (ETFs).
| Fidelity Advisor Asset Manager® 85% Class Z |
| |
| Years ended September 30, | | 2023 | | 2022 | | 2021 | | 2020 | | 2019 A |
Selected Per-Share Data | | | | | | | | | | |
| Net asset value, beginning of period | $ | 19.95 | $ | 25.99 | $ | 20.87 | $ | 19.43 | $ | 20.45 |
| Income from Investment Operations | | | | | | | | | | |
Net investment income (loss) B,C | | .35 | | .39 | | .26 | | .26 | | .27 |
| Net realized and unrealized gain (loss) | | 2.83 | | (5.55) | | 5.34 | | 2.31 | | (.32) |
| Total from investment operations | | 3.18 | | (5.16) | | 5.60 | | 2.57 | | (.05) |
| Distributions from net investment income | | (.40) | | (.34) | | (.21) | | (.30) | | (.25) |
| Distributions from net realized gain | | (.67) | | (.54) | | (.28) | | (.84) | | (.72) |
| Total distributions | | (1.07) | | (.88) | | (.48) D | | (1.13) D | | (.97) |
| Net asset value, end of period | $ | 22.06 | $ | 19.95 | $ | 25.99 | $ | 20.87 | $ | 19.43 |
Total Return E,F | | 16.31% | | (20.71)% | | 27.11% | | 13.50% | | .54% |
Ratios to Average Net Assets C,G,H | | | | | | | | | | |
| Expenses before reductions | | .60% | | .60% | | .60% | | .61% | | .62% I |
| Expenses net of fee waivers, if any | | .60% | | .59% | | .60% | | .61% | | .62% I |
| Expenses net of all reductions | | .60% | | .59% | | .60% | | .61% | | .62% I |
| Net investment income (loss) | | 1.60% | | 1.62% | | 1.01% | | 1.36% | | 1.45% I |
| Supplemental Data | | | | | | | | | | |
| Net assets, end of period (000 omitted) | $ | 1,220,964 | $ | 1,094,119 | $ | 1,258,721 | $ | 24,683 | $ | 23,286 |
Portfolio turnover rate J | | 24% | | 27% | | 18% | | 41% | | 47% |
AFor the period October 2, 2018 (commencement of sale of shares) through September 30, 2019.
BCalculated based on average shares outstanding during the period.
CNet investment income (loss) is affected by the timing of the declaration of dividends by any underlying mutual funds or exchange-traded funds (ETFs). Net investment income (loss) of any mutual funds or ETFs is not included in the Fund's net investment income (loss) ratio.
DTotal distributions per share do not sum due to rounding.
ETotal returns for periods of less than one year are not annualized.
FTotal returns would have been lower if certain expenses had not been reduced during the applicable periods shown.
GFees and expenses of any underlying mutual funds or exchange-traded funds (ETFs) are not included in the Fund's expense ratio. The Fund indirectly bears its proportionate share of these expenses.
HExpense ratios reflect operating expenses of the class. Expenses before reductions do not reflect amounts reimbursed, waived, or reduced through arrangements with the investment adviser, brokerage services, or other offset arrangements, if applicable, and do not represent the amount paid by the class during periods when reimbursements, waivers or reductions occur.
IAnnualized.
JAmount does not include the portfolio activity of any underlying mutual funds or exchange-traded funds (ETFs).
For the period ended September 30, 2023
1. Organization.
Fidelity Asset Manager 20%, Fidelity Asset Manager 30%, Fidelity Asset Manager 40%, Fidelity Asset Manager 50%, Fidelity Asset Manager 60%, Fidelity Asset Manager 70% and Fidelity Asset Manager 85% (the Funds) are funds of Fidelity Charles Street Trust (the Trust). The Trust is registered under the Investment Company Act of 1940, as amended (the 1940 Act), as an open-end management investment company organized as a Massachusetts business trust. Each Fund is authorized to issue an unlimited number of shares. Each Fund offers Class A, Class M, Class C, Asset Manager, Class I and Class Z shares, each of which has equal rights as to assets and voting privileges. Class A, Class M, Class C, Class I and Class Z are Fidelity Advisor classes. Each class has exclusive voting rights with respect to matters that affect that class. Class C shares will automatically convert to Class A shares after a holding period of eight years from the initial date of purchase, with certain exceptions.
2. Investments in Fidelity Central Funds.
Funds may invest in Fidelity Central Funds, which are open-end investment companies generally available only to other investment companies and accounts managed by the investment adviser and its affiliates. The Schedule of Investments lists any Fidelity Central Funds held as an investment as of period end, but does not include the underlying holdings of each Fidelity Central Fund. An investing fund indirectly bears its proportionate share of the expenses of the underlying Fidelity Central Funds.
Based on its investment objective, each Fidelity Central Fund may invest or participate in various investment vehicles or strategies that are similar to those of the investing fund. These strategies are consistent with the investment objectives of the investing fund and may involve certain economic risks which may cause a decline in value of each of the Fidelity Central Funds and thus a decline in the value of the investing fund.
| Fidelity Central Fund | Investment Manager | Investment Objective | Investment Practices | Expense RatioA |
| Fidelity Commodity Strategy Central Fund | Geode Capital Management, LLC (Geode) | Seeks to provide investment returns that correspond to the performance of the commodities market. | Investment in commodity-related investments through a wholly-owned subsidiary organized under the laws of the Cayman Islands Futures | Less than .005% |
| Fidelity Emerging Markets Debt Central Fund | Fidelity Management & Research Company LLC (FMR) | Seeks high total return by normally investing in debt securities of issuers in emerging markets and other debt investments that are tied economically to emerging markets. | Foreign Securities Restricted Securities | Less than .005% |
| Fidelity Emerging Markets Equity Central Fund | Fidelity Management & Research Company LLC (FMR) | Seeks capital appreciation by investing primarily in equity securities of issuers in emerging markets. | Foreign Securities Futures Loans & Direct Debt Instruments | .02% |
| Fidelity International Equity Central Fund | Fidelity Management & Research Company LLC (FMR) | Seeks capital appreciation by investing primarily in non-U.S. based common stocks, including securities of issuers located in emerging markets. | Delayed Delivery & When Issued Securities Foreign Securities Futures Loans & Direct Debt Instruments | .01% |
| Fidelity Floating Rate Central Fund | Fidelity Management & Research Company LLC (FMR) | Seeks a high level of income by normally investing in floating rate loans and other floating rate securities. | Loans & Direct Debt Instruments Restricted Securities | Less than .005% |
| Fidelity High Income Central Fund | Fidelity Management & Research Company LLC (FMR) | Seeks a high level of income and may also seek capital appreciation by investing primarily in debt securities, preferred stocks, and convertible securities, with an emphasis on lower-quality debt securities. | Delayed Delivery & When Issued Securities Loans & Direct Debt Instruments Restricted Securities | .03% |
| Fidelity Inflation-Protected Bond Index Central Fund | Fidelity Management & Research Company LLC (FMR) | Seeks to provide investment results that correspond to the performance of the inflation-protected United States Treasury market, and may invest in derivatives. | | Less than .005% |
| Fidelity Investment Grade Bond Central Fund | Fidelity Management & Research Company LLC (FMR) | Seeks a high level of income by normally investing in investment-grade debt securities. | Delayed Delivery & When Issued Securities Futures Options Restricted Securities Swaps | Less than .005% |
| Fidelity Real Estate Equity Central Fund | Fidelity Management & Research Company LLC (FMR) | Seeks above-average income and long-term capital growth by investing primarily in equity securities of issuers in the real estate industry. | Loans & Direct Debt Instruments | Less than .005% |
| Fidelity International Credit Central Fund | Fidelity Management & Research Company LLC (FMR) | Seeks a high level of current income by normally investing in debt securities of foreign issuers, including debt securities of issuers located in emerging markets. Foreign currency exposure is hedged utilizing foreign currency contracts. | Delayed Delivery & When Issued Securities Foreign Securities Loans & Direct Debt Instruments Options | Less than .005% |
| Fidelity U.S. Equity Central Fund | Fidelity Management & Research Company LLC (FMR) | Seeks capital appreciation by investing primarily in common stocks, allocated across different market sectors. | Foreign Securities Futures Loans & Direct Debt Instruments Restricted Securities | Less than .005% |
| Fidelity Emerging Markets Debt Local Currency Central Fund | Fidelity Management & Research Company LLC (FMR) | Seeks high total return by normally investing in debt securities of issuers in emerging markets and other debt investments that are tied economically to emerging markets and denominated in the local currency of the issuer. | Foreign Securities Futures Restricted Securities | .01% |
| Fidelity Hedged Equity Central Fund | Fidelity Diversifying Solutions LLC (FDS) | Seeks capital appreciation by investing primarily in common stocks of companies with market capitalizations generally similar to companies in the S&P 500® Index. | Options | .01% |
| Fidelity Money Market Central Funds | Fidelity Management & Research Company LLC (FMR) | Each fund seeks to obtain a high level of current income consistent with the preservation of capital and liquidity. | Short-term Investments | Less than .005% |
A Expenses expressed as a percentage of average net assets and are as of each underlying Central Fund's most recent annual or semi-annual shareholder report.
An unaudited holdings listing for the investing fund, which presents direct holdings as well as the pro-rata share of any securities and other investments held indirectly through its investment in underlying non-money market Fidelity Central Funds, is available at fidelity.com and/or institutional.fidelity.com, as applicable. A complete unaudited list of holdings for each Fidelity Central Fund is available upon request or at the Securities and Exchange Commission website at www.sec.gov. In addition, the financial statements of the Fidelity Central Funds which contain the significant accounting policies (including investment valuation policies) of those funds, and are not covered by the Report of Independent Registered Public Accounting Firm, are available on the Securities and Exchange Commission website or upon request.
3. Significant Accounting Policies.
Each Fund is an investment company and applies the accounting and reporting guidance of the Financial Accounting Standards Board (FASB) Accounting Standards Codification Topic 946 Financial Services - Investment Companies. The financial statements have been prepared in conformity with accounting principles generally accepted in the United States of America (GAAP), which require management to make certain estimates and assumptions at the date of the financial statements. Actual results could differ from those estimates. Subsequent events, if any, through the date that the financial statements were issued have been evaluated in the preparation of the financial statements. Each Fund's Schedule of Investments lists any underlying mutual funds or exchange-traded funds (ETFs) but does not include the underlying holdings of these funds. The following summarizes the significant accounting policies of each Fund:
Investment Valuation. Investments are valued as of 4:00 p.m. Eastern time on the last calendar day of the period. The Board of Trustees (the Board) has designated each Fund's investment adviser as the valuation designee responsible for the fair valuation function and performing fair value determinations as needed. The investment adviser has established a Fair Value Committee (the Committee) to carry out the day-to-day fair valuation responsibilities and has adopted policies and procedures to govern the fair valuation process and the activities of the Committee. In accordance with these fair valuation policies and procedures, which have been approved by the Board, each Fund attempts to obtain prices from one or more third party pricing services or brokers to value its investments. When current market prices, quotations or currency exchange rates are not readily available or reliable, investments will be fair valued in good faith by the Committee, in accordance with the policies and procedures. Factors used in determining fair value vary by investment type and may include market or investment specific events, transaction data, estimated cash flows, and market observations of comparable investments. The frequency that the fair valuation procedures are used cannot be predicted and they may be utilized to a significant extent. The Committee manages each Fund's fair valuation practices and maintains the fair valuation policies and procedures. Each Fund's investment adviser reports to the Board information regarding the fair valuation process and related material matters.
Each Fund categorizes the inputs to valuation techniques used to value its investments into a disclosure hierarchy consisting of three levels as shown below:
Level 1 - unadjusted quoted prices in active markets for identical investments
Level 2 - other significant observable inputs (including quoted prices for similar investments, interest rates, prepayment speeds, etc.)
Level 3 - unobservable inputs (including the Fund's own assumptions based on the best information available)
Valuation techniques used to value each Fund's investments by major category are as follows. Debt securities, including restricted securities, are valued based on evaluated prices received from third party pricing services or from brokers who make markets in such securities. U.S. government and government agency obligations are valued by pricing services who utilize matrix pricing which considers yield or price of bonds of comparable quality, coupon, maturity and type or by broker-supplied prices. When independent prices are unavailable or unreliable, debt securities may be valued utilizing pricing methodologies which consider similar factors that would be used by third party pricing services. Debt securities are generally categorized as Level 2 in the hierarchy but may be Level 3 depending on the circumstances.
ETFs are valued at their last sale price or official closing price as reported by a third party pricing service on the primary market or exchange on which they are traded and are categorized as Level 1 in the hierarchy. In the event there were no sales during the day but the exchange reports a closing bid level, ETFs are valued at the closing bid and would be categorized as Level 1 in the hierarchy. In the event there was no closing bid, ETFs may be valued by another method that the Board believes reflects fair value in accordance with the Board's fair value pricing policies and may be categorized as Level 2 in the hierarchy.
Futures contracts are valued at the settlement price established each day by the board of trade or exchange on which they are traded and are categorized as Level 1 in the hierarchy. Investments in open-end mutual funds, including the Fidelity Central Funds, are valued at their closing net asset value (NAV) each business day and are categorized as Level 1 in the hierarchy.
Changes in valuation techniques may result in transfers in or out of an assigned level within the disclosure hierarchy. The aggregate value of investments by input level, as of September 30, 2023, is included at the end of each Fund's Schedule of Investments.
Foreign Currency. Certain Funds may use foreign currency contracts to facilitate transactions in foreign-denominated securities. Gains and losses from these transactions may arise from changes in the value of the foreign currency or if the counterparties do not perform under the contracts' terms.
Foreign-denominated assets, including investment securities, and liabilities are translated into U.S. dollars at the exchange rates at period end. Purchases and sales of investment securities, income and dividends received, and expenses denominated in foreign currencies are translated into U.S. dollars at the exchange rate in effect on the transaction date.
The effects of exchange rate fluctuations on investments are included with the net realized and unrealized gain (loss) on investment securities. Other foreign currency transactions resulting in realized and unrealized gain (loss) are disclosed separately.
Investment Transactions and Income. For financial reporting purposes, the Funds' investment holdings and NAV include trades executed through the end of the last business day of the period. The NAV per share for processing shareholder transactions is calculated as of the close of business of the New York Stock Exchange (NYSE), normally 4:00 p.m. Eastern time and includes trades executed through the end of the prior business day. Gains and losses on securities sold are determined on the basis of identified cost and for certain Funds include proceeds received from litigation. Commissions paid to certain brokers with whom the investment adviser, or its affiliates, places trades on behalf of a fund include an amount in addition to trade execution, which may be rebated back to a fund. Any such rebates are included in net realized gain (loss) on investments in the Statement of Operations. Dividend income is recorded on the ex-dividend date, except for certain dividends from foreign securities where the ex-dividend date may have passed, which are recorded as soon as the Funds are informed of the ex-dividend date. Non-cash dividends included in dividend income, if any, are recorded at the fair market value of the securities received. Income and capital gain distributions from Fidelity Central Funds, if any, are recorded on the ex-dividend date. Certain distributions received by the Funds represent a return of capital or capital gain. The Funds determine the components of these distributions subsequent to the ex-dividend date, based upon receipt of tax filings or other correspondence relating to the underlying investment. These distributions are recorded as a reduction of cost of investments and/or as a realized gain. Interest income is accrued as earned and includes coupon interest and amortization of premium and accretion of discount on debt securities as applicable. Investment income is recorded net of foreign taxes withheld where recovery of such taxes is uncertain. Funds may file withholding tax reclaims in certain jurisdictions to recover a portion of amounts previously withheld. Any withholding tax reclaims income is included in the Statement of Operations in dividends. Any receivables for withholding tax reclaims are included in the Statement of Assets and Liabilities in dividends receivable.
Class Allocations and Expenses. Investment income, realized and unrealized capital gains and losses, common expenses of a fund, and certain fund-level expense reductions, if any, are allocated daily on a pro-rata basis to each class based on the relative net assets of each class to the total net assets of a fund. Each class differs with respect to transfer agent and distribution and service plan fees incurred, as applicable. Certain expense reductions may also differ by class, if applicable. For the reporting period, the allocated portion of income and expenses to each class as a percent of its average net assets may vary due to the timing of recording these transactions in relation to fluctuating net assets of the classes. Expenses directly attributable to a fund are charged to that fund. Expenses attributable to more than one fund are allocated among the respective funds on the basis of relative net assets or other appropriate methods. Expenses included in the accompanying financial statements reflect the expenses of that fund and do not include any expenses associated with any underlying mutual funds or exchange-traded funds (ETFs). Although not included in a fund's expenses, a fund indirectly bears its proportionate share of these expenses through the net asset value of each underlying mutual fund or exchange-traded fund (ETF). Expense estimates are accrued in the period to which they relate and adjustments are made when actual amounts are known.
Deferred Trustee Compensation. Under a Deferred Compensation Plan (the Plan) for certain Funds, certain independent Trustees have elected to defer receipt of a portion of their annual compensation. Deferred amounts are invested in affiliated mutual funds, are marked-to-market and remain in a fund until distributed in accordance with the Plan. The investment of deferred amounts and the offsetting payable to the Trustees presented below are included in the accompanying Statement of Assets and Liabilities in other receivables and other payables and accrued expenses, as applicable.
| Fidelity Asset Manager 50% | 162,874 |
| Fidelity Asset Manager 70% | 4,405 |
Income Tax Information and Distributions to Shareholders. Each year, each Fund intends to qualify as a regulated investment company under Subchapter M of the Internal Revenue Code, including distributing substantially all of its taxable income and realized gains. As a result, no provision for U.S. Federal income taxes is required. As of September 30, 2023, each Fund did not have any unrecognized tax benefits in the financial statements; nor is each Fund aware of any tax positions for which it is reasonably possible that the total amounts of unrecognized tax benefits will significantly change in the next twelve months. Each Fund files a U.S. federal tax return, in addition to state and local tax returns as required. Each Fund's federal income tax returns are subject to examination by the Internal Revenue Service (IRS) for a period of three fiscal years after they are filed. State and local tax returns may be subject to examination for an additional fiscal year depending on the jurisdiction. Foreign taxes are provided for based on each Fund's understanding of the tax rules and rates that exist in the foreign markets in which it invests.
Distributions are declared and recorded on the ex-dividend date. Income and capital gain distributions are declared separately for each class. Income and capital gain distributions are determined in accordance with income tax regulations, which may differ from GAAP. In addition, certain Funds claimed a portion of the payment made to redeeming shareholders as a distribution for income tax purposes.
Capital accounts within the financial statements are adjusted for permanent book-tax differences. These adjustments have no impact on net assets or the results of operations. Capital accounts are not adjusted for temporary book-tax differences which will reverse in a subsequent period.
Book-tax differences are primarily due to the short-term gain distributions from the underlying mutual funds or exchange-traded funds (ETFs), futures contracts, foreign currency transactions, capital loss carryforwards, and losses deferred due to wash sales and excise tax regulations.
As of period end, the cost and unrealized appreciation (depreciation) in securities, and derivatives if applicable, for federal income tax purposes were as follows for each Fund:
| | Tax cost | Gross unrealized appreciation | Gross unrealized depreciation | Net unrealized appreciation (depreciation) |
| Fidelity Asset Manager 20% | $5,257,781,557 | $406,072,800 | $ (418,335,348) | $ (12,262,548) |
| Fidelity Asset Manager 30% | 1,988,566,575 | 187,085,205 | (174,697,177) | 12,388,028 |
| Fidelity Asset Manager 40% | 1,993,495,077 | 272,106,642 | (157,722,170) | 114,384,472 |
| Fidelity Asset Manager 50% | 7,901,839,955 | 1,715,533,031 | (578,840,542) | 1,136,692,489 |
| Fidelity Asset Manager 60% | 3,307,019,177 | 646,193,720 | (218,249,129) | 427,944,591 |
| Fidelity Asset Manager 70% | 4,831,970,818 | 1,457,601,027 | (237,478,828) | 1,220,122,199 |
| Fidelity Asset Manager 85% | 2,742,044,925 | 844,056,829 | (99,767,002) | 744,289,827 |
The tax-based components of distributable earnings as of period end were as follows for each Fund:
| | Undistributed ordinary income | Capital loss carryforward | Net unrealized appreciation (depreciation) on securities and other investments |
| Fidelity Asset Manager 20% | $22,890,783 | $ (169,141,242) | $ (12,262,548) |
| Fidelity Asset Manager 30% | 8,668,912 | (75,140,787) | 12,388,028 |
| Fidelity Asset Manager 40% | 14,434,019 | (62,527,085) | 114,384,472 |
| Fidelity Asset Manager 50% | 52,889,556 | (52,999,817) | 1,136,692,489 |
| Fidelity Asset Manager 60% | 49,211,007 | (41,937,520) | 427,941,994 |
| Fidelity Asset Manager 70% | 70,850,438 | - | 1,220,122,199 |
| Fidelity Asset Manager 85% | 29,369,402 | (46,918,543) | 744,289,827 |
Capital loss carryforwards are only available to offset future capital gains of the Funds to the extent provided by regulations and may be limited. The capital loss carryforward information presented below, including any applicable limitation, is estimated as of fiscal period end and is subject to adjustment.
| | Short-term | Long-term | Total capital loss carryforward |
| Fidelity Asset Manager 20% | $ (75,348,017) | $ (93,793,225) | $ (169,141,242) |
| Fidelity Asset Manager 30% | (26,816,217) | (48,324,570) | (75,140,787) |
| Fidelity Asset Manager 40% | (38,616,887) | (23,910,198) | (62,527,085) |
| Fidelity Asset Manager 50% | (52,999,817) | - | (52,999,817) |
| Fidelity Asset Manager 60% | (22,795,001) | (19,142,519) | (41,937,520) |
| Fidelity Asset Manager 85% | (32,741,746) | (14,176,797) | (46,918,543) |
| | | | |
| | | | |
| | | | |
Certain of the Funds intend to elect to defer to the next fiscal year capital losses recognized during the period November 1, 2022 to September 30, 2023. Loss deferrals were as follows:
| | Capital losses |
| | |
| Fidelity Asset Manager 70% | (14,989,821) |
| | |
The tax character of distributions paid was as follows:
| September 30, 2023 | | | |
| | Ordinary Income | Long-term Capital Gains | Total |
| Fidelity Asset Manager 20% | $187,362,931 | $111,207,260 | $298,570,191 |
| Fidelity Asset Manager 30% | 67,537,920 | 50,850,855 | 118,388,775 |
| Fidelity Asset Manager 40% | 62,665,528 | 68,806,357 | 131,471,885 |
| Fidelity Asset Manager 50% | 248,903,495 | 390,769,179 | 639,672,674 |
| Fidelity Asset Manager 60% | 79,634,831 | 76,559,849 | 156,194,680 |
| Fidelity Asset Manager 70% | 119,011,572 | 250,539,978 | 369,551,550 |
| Fidelity Asset Manager 85% | 58,047,423 | 101,376,769 | 159,424,192 |
| September 30, 2022 | | | |
| | Ordinary Income | Long-term Capital Gains | Total |
| Fidelity Asset Manager 20% | $122,000,836 | $ - | $122,000,836 |
| Fidelity Asset Manager 30% | 58,123,685 | - | 58,123,685 |
| Fidelity Asset Manager 40% | 53,291,395 | 9,814,535 | 63,105,930 |
| Fidelity Asset Manager 50% | 246,217,527 | 99,615,467 | 345,832,994 |
| Fidelity Asset Manager 60% | 89,380,774 | 24,778,028 | 114,158,802 |
| Fidelity Asset Manager 70% | 162,606,338 | 34,475,203 | 197,081,541 |
| Fidelity Asset Manager 85% | 93,631,050 | 34,426,051 | 128,057,101 |
4. Derivative Instruments.
Risk Exposures and the Use of Derivative Instruments. Each Fund's investment objectives allow for various types of derivative instruments, including futures contracts. Derivatives are investments whose value is primarily derived from underlying assets, indices or reference rates and may be transacted on an exchange or over-the-counter (OTC). Derivatives may involve a future commitment to buy or sell a specified asset based on specified terms, to exchange future cash flows at periodic intervals based on a notional principal amount, or for one party to make one or more payments upon the occurrence of specified events in exchange for periodic payments from the other party.
Derivatives were used to increase returns and to manage exposure to certain risks as defined below. The success of any strategy involving derivatives depends on analysis of numerous economic factors, and if the strategies for investment do not work as intended, the objectives may not be achieved.
Derivatives were used to increase or decrease exposure to the following risk(s):
| | |
| Equity Risk | Equity risk relates to the fluctuations in the value of financial instruments as a result of changes in market prices (other than those arising from interest rate risk or foreign exchange risk), whether caused by factors specific to an individual investment, its issuer, or all factors affecting all instruments traded in a market or market segment. |
| Interest Rate Risk | Interest rate risk relates to the fluctuations in the value of interest-bearing securities due to changes in the prevailing levels of market interest rates. |
Funds are also exposed to additional risks from investing in derivatives, such as liquidity risk and counterparty credit risk. Liquidity risk is the risk that a fund will be unable to close out the derivative in the open market in a timely manner. Counterparty credit risk is the risk that the counterparty will not be able to fulfill its obligation to a fund. Counterparty credit risk related to exchange-traded contracts may be mitigated by the protection provided by the exchange on which they trade.
Investing in derivatives may involve greater risks than investing in the underlying assets directly and, to varying degrees, may involve risk of loss in excess of any initial investment and collateral received and amounts recognized in the Statement of Assets and Liabilities. In addition, there may be the risk that the change in value of the derivative contract does not correspond to the change in value of the underlying instrument.
Net Realized Gain (Loss) and Change in Net Unrealized Appreciation (Depreciation) on Derivatives. The table below, which reflects the impacts of derivatives on the financial performance, summarizes the net realized gain (loss) and change in net unrealized appreciation (depreciation) for derivatives during the period as presented in the Statement of Operations.
| Primary Risk Exposure / Derivative Type | Net Realized Gain (Loss)($) | Change in Net Unrealized Appreciation (Depreciation)($) |
| Fidelity Asset Manager 20% | | |
| Equity Risk | | |
| Futures Contracts | (33,362,589) | (23,221,810) |
| Total Equity Risk | (33,362,589) | (23,221,810) |
| Interest Rate Risk | | |
| Futures Contracts | (1,940,447) | 94,879 |
| Total Interest Rate Risk | (1,940,447) | 94,879 |
| Totals | (35,303,036) | (23,126,931) |
| Fidelity Asset Manager 30% | | |
| Equity Risk | | |
| Futures Contracts | (10,907,161) | (11,432,738) |
| Total Equity Risk | (10,907,161) | (11,432,738) |
| Interest Rate Risk | | |
| Futures Contracts | (769,009) | 37,917 |
| Total Interest Rate Risk | (769,009) | 37,917 |
| Totals | (11,676,170) | (11,394,821) |
| Fidelity Asset Manager 40% | | |
| Equity Risk | | |
| Futures Contracts | (11,112,073) | (10,482,850) |
| Total Equity Risk | (11,112,073) | (10,482,850) |
| Interest Rate Risk | | |
| Futures Contracts | (775,480) | 37,540 |
| Total Interest Rate Risk | (775,480) | 37,540 |
| Totals | (11,887,553) | (10,445,310) |
| Fidelity Asset Manager 50% | | |
| Equity Risk | | |
| Futures Contracts | (42,799,969) | (45,039,763) |
| Total Equity Risk | (42,799,969) | (45,039,763) |
| Interest Rate Risk | | |
| Futures Contracts | (3,268,491) | 157,401 |
| Total Interest Rate Risk | (3,268,491) | 157,401 |
| Totals | (46,068,460) | (44,882,362) |
| Fidelity Asset Manager 60% | | |
| Equity Risk | | |
| Futures Contracts | (4,176,186) | (2,024,609) |
| Total Equity Risk | (4,176,186) | (2,024,609) |
| Interest Rate Risk | | |
| Futures Contracts | (1,291,167) | 61,054 |
| Total Interest Rate Risk | (1,291,167) | 61,054 |
| Totals | (5,467,353) | (1,963,555) |
| Fidelity Asset Manager 70% | | |
| Equity Risk | | |
| Futures Contracts | (9,340,324) | (5,868,945) |
| Total Equity Risk | (9,340,324) | (5,868,945) |
| Interest Rate Risk | | |
| Futures Contracts | (2,061,565) | 96,724 |
| Total Interest Rate Risk | (2,061,565) | 96,724 |
| Totals | (11,401,889) | (5,772,221) |
| Fidelity Asset Manager 85% | | |
| Equity Risk | | |
| Futures Contracts | (6,038,317) | (1,073,107) |
| Total Equity Risk | (6,038,317) | (1,073,107) |
| Interest Rate Risk | | |
| Futures Contracts | (1,162,310) | 54,055 |
| Total Interest Rate Risk | (1,162,310) | 54,055 |
| Totals | (7,200,627) | (1,019,052) |
If there are any open positions at period end, a summary of the value of derivatives by primary risk exposure is included at the end of the Schedule of Investments.
Futures Contracts. A futures contract is an agreement between two parties to buy or sell a specified underlying instrument for a fixed price at a specified future date. Futures contracts were used to manage exposure to the stock market, bond market and fluctuations in interest rates.
Upon entering into a futures contract, a fund is required to deposit either cash or securities (initial margin) with a clearing broker in an amount equal to a certain percentage of the face value of the contract. Futures contracts are marked-to-market daily and subsequent daily payments are made or received by a fund depending on the daily fluctuations in the value of the futures contracts and are recorded as unrealized appreciation or (depreciation). This receivable and/or payable, if any, is included in daily variation margin on futures contracts in the Statement of Assets and Liabilities. Realized gain or (loss) is recorded upon the expiration or closing of a futures contract. The net realized gain (loss) and change in net unrealized appreciation (depreciation) on futures contracts during the period is presented in the Statement of Operations.
Any open futures contracts at period end are presented in the Schedule of Investments under the caption "Futures Contracts". The notional amount at value reflects each contract's exposure to the underlying instrument or index at period end, and is representative of volume of activity during the period unless an average notional amount is presented. Any securities deposited to meet initial margin requirements are identified in the Schedule of Investments. Any cash deposited to meet initial margin requirements is presented as segregated cash with brokers for derivative instruments in the Statement of Assets and Liabilities.
5. Purchases and Sales of Investments.
Purchases and sales of securities, other than short-term securities, U.S. government securities and in-kind transactions, as applicable, are noted in the table below.
| | Purchases ($) | Sales ($) |
| Fidelity Asset Manager 20% | 1,241,476,720 | 1,421,975,231 |
| Fidelity Asset Manager 30% | 419,153,408 | 668,130,323 |
| Fidelity Asset Manager 40% | 436,258,301 | 612,486,824 |
| Fidelity Asset Manager 50% | 1,879,543,306 | 2,513,791,265 |
| Fidelity Asset Manager 60% | 769,401,076 | 850,023,081 |
| Fidelity Asset Manager 70% | 1,146,797,145 | 1,298,372,197 |
| Fidelity Asset Manager 85% | 827,877,741 | 884,924,938 |
6. Fees and Other Transactions with Affiliates.
Management Fee. Fidelity Management & Research Company LLC (the investment adviser) and its affiliates provide the Funds with investment management related services for which the Funds pay a monthly management fee. The management fee is the sum of an individual fund fee rate and an annualized group fee rate. The individual fund fee rate is applied to each Fund's average net assets. The group fee rate is based upon the monthly average net assets of a group of registered investment companies with which the investment adviser has management contracts. The group fee rate decreases as assets under management increase and increases as assets under management decrease. For the reporting period, each Fund's annual management fee rate expressed as a percentage of each Fund's average net assets was as follows:
| | Individual Rate | Group Rate | Total |
| Fidelity Asset Manager 20% | .30% | .10% | .40% |
| Fidelity Asset Manager 30% | .30% | .10% | .40% |
| Fidelity Asset Manager 40% | .30% | .10% | .40% |
| Fidelity Asset Manager 50% | .25% | .23% | .48% |
| Fidelity Asset Manager 60% | .30% | .23% | .53% |
| Fidelity Asset Manager 70% | .30% | .23% | .53% |
| Fidelity Asset Manager 85% | .30% | .23% | .53% |
The investment adviser pays a portion of the management fees received from the Fund to the Fidelity Central Funds' investment advisers, who are also affiliates, for managing the assets of the Fidelity Central Funds.
Distribution and Service Plan Fees. In accordance with Rule 12b-1 of the 1940 Act, each Fund has adopted separate Distribution and Service Plans for each class of shares. Certain classes pay Fidelity Distributors Company LLC (FDC), an affiliate of the investment adviser, separate Distribution and Service Fees, each of which is based on an annual percentage of each class' average net assets. In addition, FDC may pay financial intermediaries for selling shares of each Fund and providing shareholder support services. For the period, the Distribution and Service Fee rates, total fees and amounts retained by FDC were as follows:
| | Distribution Fee | Service Fee | Total Fees | Retained by FDC |
| Fidelity Asset Manager 20% | | | | |
| Class A | - % | .25% | $141,356 | $4,619 |
| Class M | .25% | .25% | 142,936 | 511 |
Class C | .75% | .25% | 187,977 | 21,241 |
| | | | $472,269 | $26,371 |
| Fidelity Asset Manager 30% | | | | |
Class A | - % | .25% | $181,312 | $4,982 |
Class M | .25% | .25% | 112,560 | 230 |
Class C | .75% | .25% | 232,931 | 22,865 |
| | | | $526,803 | $28,077 |
| Fidelity Asset Manager 40% | | | | |
Class A | - % | .25% | $181,423 | $1,519 |
Class M | .25% | .25% | 67,010 | 237 |
Class C | .75% | .25% | 189,307 | 22,313 |
| | | | $437,740 | $24,069 |
| Fidelity Asset Manager 50% | | | | |
Class A | - % | .25% | $299,012 | $10,379 |
Class M | .25% | .25% | 254,876 | 782 |
Class C | .75% | .25% | 316,852 | 31,225 |
| | | | $870,740 | $42,386 |
| Fidelity Asset Manager 60% | | | | |
Class A | - % | .25% | $380,610 | $4,977 |
Class M | .25% | .25% | 235,514 | 663 |
Class C | .75% | .25% | 331,185 | 33,700 |
| | | | $947,309 | $39,340 |
| Fidelity Asset Manager 70% | | | | |
Class A | - % | .25% | $505,807 | $5,671 |
Class M | .25% | .25% | 343,032 | 888 |
Class C | .75% | .25% | 317,680 | 46,739 |
| | | | $1,166,519 | $53,298 |
| Fidelity Asset Manager 85% | | | | |
Class A | - % | .25% | $488,761 | $2,632 |
Class M | .25% | .25% | 230,344 | 869 |
Class C | .75% | .25% | 397,052 | 66,481 |
| | | | $1,116,157 | $69,982 |
| | | | | |
Sales Load. FDC may receive a front-end sales charge of up to 5.75% for selling Class A shares and 3.50% for selling Class M shares, some of which is paid to financial intermediaries for selling shares of each Fund. Depending on the holding period, FDC may receive contingent deferred sales charges levied on Class A, Class M and Class C redemptions. The deferred sales charges are 1.00% for Class C shares, 1.00% for certain purchases of Class A shares and .25% for certain purchases of Class M shares.
For the period, sales charge amounts retained by FDC were as follows:
| | Retained by FDC |
| Fidelity Asset Manager 20% | |
| Class A | $12,028 |
| Class M | 2,929 |
Class C A | 1,020 |
| | $15,977 |
| Fidelity Asset Manager 30% | |
Class A | $12,913 |
Class M | 1,501 |
Class C A | 362 |
| | $14,776 |
| Fidelity Asset Manager 40% | |
Class A | $16,915 |
Class M | 2,603 |
Class C A | 460 |
| | $19,978 |
| Fidelity Asset Manager 50% | |
Class A | $27,381 |
Class M | 5,307 |
Class C A | 850 |
| | $33,538 |
| Fidelity Asset Manager 60% | |
Class A | $37,939 |
Class M | 4,979 |
Class C A | 823 |
| | $43,741 |
| Fidelity Asset Manager 70% | |
Class A | $91,415 |
Class M | 8,326 |
Class C A | 900 |
| | $100,641 |
| Fidelity Asset Manager 85% | |
Class A | $184,560 |
Class M | 6,924 |
Class C A | 957 |
| | $192,441 |
| | |
A When Class C shares are initially sold, FDC pays commissions from its own resources to financial intermediaries through which the sales are made.
Transfer Agent Fees. Fidelity Investments Institutional Operations Company LLC (FIIOC), an affiliate of the investment adviser, is the transfer, dividend disbursing and shareholder servicing agent for each class of the Funds. FIIOC receives account fees and asset-based fees that vary according to the account size and type of account of the shareholders of the respective classes of each Fund, except for Class Z. FIIOC receives an asset-based fee of Class Z's average net assets. FIIOC pays for typesetting, printing and mailing of shareholder reports, except proxy statements. For the period, transfer agent fees for each class were as follows:
| | Amount | % of Class-Level Average Net Assets |
| Fidelity Asset Manager 20% | | |
Class A | $80,679 | .14 |
Class M | 40,131 | .14 |
Class C | 26,987 | .14 |
Asset Manager 20% | 3,072,494 | .08 |
Class I | 33,501 | .13 |
Class Z | 901,053 | .05 |
| | $4,154,845 | |
| Fidelity Asset Manager 30% | | |
Class A | $93,928 | .13 |
Class M | 29,495 | .13 |
Class C | 33,296 | .14 |
Asset Manager 30% | 1,299,933 | .08 |
Class I | 38,781 | .14 |
Class Z | 220,544 | .05 |
| | $1,715,977 | |
| Fidelity Asset Manager 40% | | |
Class A | $98,888 | .14 |
Class M | 16,929 | .13 |
Class C | 28,008 | .15 |
Asset Manager 40% | 1,301,788 | .09 |
Class I | 48,659 | .13 |
Class Z | 274,350 | .05 |
| | $1,768,622 | |
| Fidelity Asset Manager 50% | | |
Class A | $197,970 | .17 |
Class M | 79,621 | .16 |
Class C | 53,527 | .17 |
Asset Manager 50% | 8,753,785 | .12 |
Class I | 79,893 | .14 |
Class Z | 783,337 | .04 |
| | $9,948,133 | |
| Fidelity Asset Manager 60% | | |
Class A | $273,499 | .18 |
Class M | 79,841 | .17 |
Class C | 64,510 | .19 |
Asset Manager 60% | 2,482,306 | .12 |
Class I | 183,992 | .18 |
Class Z | 568,607 | .04 |
| | $3,652,755 | |
| Fidelity Asset Manager 70% | | |
Class A | $331,393 | .16 |
Class M | 108,265 | .16 |
Class C | 54,670 | .17 |
Asset Manager 70% | 4,656,368 | .12 |
Class I | 70,619 | .15 |
Class Z | 809,332 | .04 |
| | $6,030,647 | |
| Fidelity Asset Manager 85% | | |
Class A | $331,336 | .17 |
Class M | 76,828 | .17 |
Class C | 72,065 | .18 |
Asset Manager 85% | 2,620,691 | .14 |
Class I | 95,286 | .16 |
Class Z | 509,865 | .04 |
| | $3,706,071 | |
Accounting Fees. Fidelity Service Company, Inc. (FSC), an affiliate of the investment adviser, maintains each Fund's accounting records. The accounting fee is based on the level of average net assets for each month. For the period, the fees were equivalent to the following annual rates:
| | % of Average Net Assets |
| Fidelity Asset Manager 20% | .02 |
| Fidelity Asset Manager 30% | .03 |
| Fidelity Asset Manager 40% | .03 |
| Fidelity Asset Manager 50% | .02 |
| Fidelity Asset Manager 60% | .03 |
| Fidelity Asset Manager 70% | .02 |
| Fidelity Asset Manager 85% | .03 |
Brokerage Commissions. A portion of portfolio transactions were placed with brokerage firms which are affiliates of the investment adviser. Brokerage commissions are included in net realized gain (loss) and change in net unrealized appreciation (depreciation) in the Statement of Operations. The commissions paid to these affiliated firms were as follows:
| | Amount |
| Fidelity Asset Manager 20% | $4 |
| Fidelity Asset Manager 30% | 2 |
| Fidelity Asset Manager 40% | 2 |
| Fidelity Asset Manager 50% | 7 |
| Fidelity Asset Manager 60% | 3 |
| Fidelity Asset Manager 70% | 4 |
| Fidelity Asset Manager 85% | 2 |
| | |
Interfund Lending Program. Pursuant to an Exemptive Order issued by the Securities and Exchange Commission (the SEC), each Fund, along with other registered investment companies having management contracts with Fidelity Management & Research Company LLC (FMR), or other affiliated entities of FMR, may participate in an interfund lending program. This program provides an alternative credit facility allowing each Fund to borrow from, or lend money to, other participating affiliated funds. At period end, there were no interfund loans outstanding. Activity in this program during the period for which loans were outstanding was as follows:
| | Borrower or Lender | Average Loan Balance | Weighted Average Interest Rate | Interest Expense |
| Fidelity Asset Manager 85% | Borrower | $5,008,000 | 4.07% | $1,696 |
Interfund Trades. Funds may purchase from or sell securities to other Fidelity Funds under procedures adopted by the Board. The procedures have been designed to ensure these interfund trades are executed in accordance with Rule 17a-7 of the 1940 Act. Any interfund trades are included within the respective purchases and sales amounts shown in the Purchases and Sales of Investments note. During the period, there were no interfund trades.
7. Committed Line of Credit.
Certain Funds participate with other funds managed by the investment adviser or an affiliate in a $4.25 billion credit facility (the "line of credit") to be utilized for temporary or emergency purposes to fund shareholder redemptions or for other short-term liquidity purposes. The participating funds have agreed to pay commitment fees on their pro-rata portion of the line of credit, which are reflected in Miscellaneous expenses on the Statement of Operations, and are listed below. During the period, there were no borrowings on this line of credit.
| | Amount |
| Fidelity Asset Manager 20% | $10,507 |
| Fidelity Asset Manager 30% | 4,156 |
| Fidelity Asset Manager 40% | 4,169 |
| Fidelity Asset Manager 50% | 17,734 |
| Fidelity Asset Manager 60% | 7,013 |
| Fidelity Asset Manager 70% | 11,250 |
| Fidelity Asset Manager 85% | 6,339 |
8. Security Lending.
Funds lend portfolio securities from time to time in order to earn additional income. Lending agents are used, including National Financial Services (NFS), an affiliate of the investment adviser. Pursuant to a securities lending agreement, NFS will receive a fee, which is capped at 9.9% of a fund's daily lending revenue, for its services as lending agent. A fund may lend securities to certain qualified borrowers, including NFS. On the settlement date of the loan, a fund receives collateral (in the form of U.S. Treasury obligations, letters of credit and/or cash) against the loaned securities and maintains collateral in an amount not less than 100% of the market value of the loaned securities during the period of the loan. The market value of the loaned securities is determined at the close of business of a fund and any additional required collateral is delivered to a fund on the next business day. A fund or borrower may terminate the loan at any time, and if the borrower defaults on its obligation to return the securities loaned because of insolvency or other reasons, a fund may apply collateral received from the borrower against the obligation. A fund may experience delays and costs in recovering the securities loaned. Any cash collateral received is invested in the Fidelity Securities Lending Cash Central Fund. Any loaned securities are identified as such in the Schedule of Investments, and the value of loaned securities and cash collateral at period end, as applicable, are presented in the Statement of Assets and Liabilities. Security lending income represents the income earned on investing cash collateral, less rebates paid to borrowers and any lending agent fees associated with the loan, plus any premium payments received for lending certain types of securities. Security lending income is presented in the Statement of Operations as a component of income from Fidelity Central Funds. Affiliated security lending activity, if any, was as follows:
| | Total Security Lending Fees Paid to NFS | Security Lending Income From Securities Loaned to NFS | Value of Securities Loaned to NFS at Period End |
| Fidelity Asset Manager 20% | $235 | $- | $- |
| Fidelity Asset Manager 30% | $190 | $- | $- |
| Fidelity Asset Manager 40% | $229 | $- | $- |
| Fidelity Asset Manager 50% | $876 | $- | $- |
| Fidelity Asset Manager 60% | $732 | $- | $- |
| Fidelity Asset Manager 70% | $2,022 | $- | $- |
| Fidelity Asset Manager 85% | $2,687 | $- | $- |
9. Expense Reductions.
Through arrangements with each applicable Fund's custodian and each class' transfer agent, credits realized as a result of certain uninvested cash balances were used to reduce each applicable Fund's or class' expenses. All of the applicable expense reductions are noted in the table below.
| | Custodian credits | Transfer Agent credits |
| Fidelity Asset Manager 20% | $31 | $- |
| Class A | - | 38 |
| Class M | - | 538 |
| Class C | - | 33 |
| Fidelity Asset Manager 30% | 204 | - |
| Class M | - | 199 |
| Class C | - | 18 |
| Fidelity Asset Manager 40% | 258 | - |
| Class M | - | 49 |
| Fidelity Asset Manager 50% | - | - |
| Class M | - | 372 |
| Fidelity Asset Manager 60% | - | - |
| Class M | - | 243 |
| Fidelity Asset Manager 70% | 1,767 | - |
| Class M | - | 9 |
| Fidelity Asset Manager 85% | - | - |
| Class M | - | 105 |
In addition, during the period the investment adviser or an affiliate reimbursed and/or waived a portion of fund-level operating expenses as follows:
| | Fund-Level Amount |
| Fidelity Asset Manager 20% | $149,455 |
| Fidelity Asset Manager 30% | 58,625 |
| Fidelity Asset Manager 40% | 59,246 |
| Fidelity Asset Manager 50% | 475,424 |
| Fidelity Asset Manager 60% | 189,165 |
| Fidelity Asset Manager 70% | 304,245 |
| Fidelity Asset Manager 85% | 171,176 |
10. Distributions to Shareholders.
Distributions to shareholders of each class were as follows:
| | Year ended September 30, 2023 | Year ended September 30, 2022 |
| Fidelity Asset Manager 20% | | |
| Distributions to shareholders | | |
| Class A | $2,872,185 | $991,390 |
| Class M | 1,348,563 | 421,840 |
| Class C | 835,007 | 250,693 |
| Asset Manager 20% | 195,919,341 | 85,201,958 |
| Class I | 1,439,959 | 564,762 |
| Class Z | 96,155,136 | 34,570,193 |
Total | $298,570,191 | $122,000,836 |
| Fidelity Asset Manager 30% | | |
| Distributions to shareholders | | |
| Class A | $3,712,002 | $1,450,459 |
| Class M | 1,115,340 | 413,081 |
| Class C | 1,057,329 | 398,808 |
| Asset Manager 30% | 87,216,487 | 44,055,920 |
| Class I | 1,456,615 | 1,487,743 |
| Class Z | 23,831,002 | 10,317,674 |
Total | $118,388,775 | $58,123,685 |
| Fidelity Asset Manager 40% | | |
| Distributions to shareholders | | |
| Class A | $ 4,061,015 | $ 1,639,380 |
| Class M | 717,718 | 277,419 |
| Class C | 952,604 | 395,975 |
| Asset Manager 40% | 91,378,261 | 45,248,272 |
| Class I | 2,096,562 | 1,013,722 |
| Class Z | 32,265,725 | 14,531,162 |
Total | $131,471,885 | $63,105,930 |
| Fidelity Asset Manager 50% | | |
| Distributions to shareholders | | |
| Class A | $7,725,964 | $ 3,721,847 |
| Class M | 3,172,590 | 1,484,787 |
| Class C | 1,858,800 | 1,078,039 |
| Asset Manager 50% | 498,002,312 | 273,464,153 |
| Class I | 3,864,843 | 2,421,243 |
| Class Z | 125,048,165 | 63,662,925 |
Total | $639,672,674 | $345,832,994 |
| Fidelity Asset Manager 60% | | |
| Distributions to shareholders | | |
| Class A | $5,829,870 | $3,902,281 |
| Class M | 1,719,076 | 1,101,083 |
| Class C | 1,017,325 | 858,414 |
| Asset Manager 60% | 86,418,079 | 63,251,257 |
| Class I | 4,209,470 | 2,945,047 |
| Class Z | 57,000,860 | 42,100,720 |
Total | $156,194,680 | $114,158,802 |
| Fidelity Asset Manager 70% | | |
| Distributions to shareholders | | |
| Class A | $11,630,377 | $5,556,535 |
| Class M | 3,792,389 | 1,832,295 |
| Class C | 1,619,138 | 693,159 |
| Asset Manager 70% | 232,428,831 | 125,547,326 |
| Class I | 2,972,044 | 1,586,971 |
| Class Z | 117,108,771 | 61,865,255 |
Total | $369,551,550 | $197,081,541 |
| Fidelity Asset Manager 85% | | |
| Distributions to shareholders | | |
| Class A | $8,386,555 | $5,950,158 |
| Class M | 1,930,817 | 1,556,477 |
| Class C | 1,489,984 | 1,116,460 |
| Asset Manager 85% | 87,417,456 | 70,669,724 |
| Class I | 2,665,270 | 1,988,931 |
| Class Z | 57,534,110 | 46,775,351 |
Total | $159,424,192 | $128,057,101 |
11. Share Transactions.
Share transactions for each class were as follows and may contain in-kind transactions, automatic conversions between classes or exchanges between affiliated funds:
| | Shares | Shares | Dollars | Dollars |
| | Year ended September 30, 2023 | Year ended September 30, 2022 | Year ended September 30, 2023 | Year ended September 30, 2022 |
| Fidelity Asset Manager 20% | | | | |
| Class A | | | | |
| Shares sold | 747,930 | 1,213,628 | $9,713,539 | $17,161,109 |
| Reinvestment of distributions | 217,307 | 67,107 | 2,784,288 | 958,183 |
| Shares redeemed | (1,221,697) | (1,102,850) | (15,835,637) | (15,442,378) |
| Net increase (decrease) | (256,460) | 177,885 | $(3,337,810) | $2,676,914 |
| Class M | | | | |
| Shares sold | 308,015 | 260,742 | $3,986,588 | $3,700,387 |
| Reinvestment of distributions | 104,944 | 29,459 | 1,340,835 | 421,152 |
| Shares redeemed | (309,409) | (321,181) | (4,003,754) | (4,514,288) |
| Net increase (decrease) | 103,550 | (30,980) | $1,323,669 | $(392,749) |
| Class C | | | | |
| Shares sold | 209,118 | 781,490 | $2,688,974 | $11,016,567 |
| Reinvestment of distributions | 65,337 | 17,269 | 827,517 | 247,715 |
| Shares redeemed | (498,144) | (1,021,837) | (6,386,213) | (13,973,536) |
| Net increase (decrease) | (223,689) | (223,078) | $(2,869,722) | $(2,709,254) |
| Asset Manager 20% | | | | |
| Shares sold | 13,116,861 | 34,537,085 | $170,315,586 | $493,333,788 |
| Reinvestment of distributions | 14,397,795 | 5,685,424 | 184,830,124 | 81,364,653 |
| Shares redeemed | (56,301,179) | (69,009,967) | (731,267,083) | (964,227,064) |
| Net increase (decrease) | (28,786,523) | (28,787,458) | $(376,121,373) | $(389,528,623) |
| Class I | | | | |
| Shares sold | 751,231 | 1,039,602 | $9,753,797 | $14,594,278 |
| Reinvestment of distributions | 106,997 | 36,840 | 1,373,332 | 525,188 |
| Shares redeemed | (1,432,497) | (1,004,799) | (18,650,066) | (14,055,036) |
| Net increase (decrease) | (574,269) | 71,643 | $(7,522,937) | $1,064,430 |
| Class Z | | | | |
| Shares sold | 41,778,309 | 58,153,285 | $542,899,885 | $852,912,615 |
| Reinvestment of distributions | 7,479,736 | 2,420,374 | 95,991,524 | 34,545,167 |
| Shares redeemed | (30,676,184) | (39,079,978) | (398,877,154) | (547,996,639) |
| Net increase (decrease) | 18,581,861 | 21,493,681 | $240,014,255 | $339,461,143 |
| Fidelity Asset Manager 30% | | | | |
| Class A | | | | |
| Shares sold | 803,385 | 1,638,808 | $8,869,002 | $20,111,023 |
| Reinvestment of distributions | 335,928 | 114,874 | 3,652,477 | 1,424,987 |
| Shares redeemed | (1,377,556) | (1,185,055) | (15,252,349) | (14,197,922) |
| Net increase (decrease) | (238,243) | 568,627 | $(2,730,870) | $7,338,088 |
| Class M | | | | |
| Shares sold | 267,816 | 492,689 | $2,968,427 | $6,024,847 |
| Reinvestment of distributions | 102,780 | 33,190 | 1,114,632 | 412,720 |
| Shares redeemed | (479,687) | (506,164) | (5,308,302) | (6,083,193) |
| Net increase (decrease) | (109,091) | 19,715 | $(1,225,243) | $354,374 |
| Class C | | | | |
| Shares sold | 198,376 | 621,466 | $2,154,101 | $7,670,984 |
| Reinvestment of distributions | 98,581 | 31,982 | 1,057,182 | 398,765 |
| Shares redeemed | (644,843) | (913,951) | (7,047,003) | (10,932,489) |
| Net increase (decrease) | (347,886) | (260,503) | $(3,835,720) | $(2,862,740) |
| Asset Manager 30% | | | | |
| Shares sold | 8,152,829 | 25,304,829 | $90,263,762 | $313,879,604 |
| Reinvestment of distributions | 7,493,533 | 3,362,693 | 81,428,212 | 41,729,028 |
| Shares redeemed | (35,306,472) | (50,063,881) | (390,638,128) | (603,305,981) |
| Net increase (decrease) | (19,660,110) | (21,396,359) | $(218,946,154) | $(247,697,349) |
| Class I | | | | |
| Shares sold | 2,583,395 | 927,221 | $28,952,448 | $11,540,764 |
| Reinvestment of distributions | 128,358 | 115,131 | 1,394,770 | 1,427,504 |
| Shares redeemed | (3,249,621) | (4,219,686) | (36,009,329) | (48,105,245) |
| Net increase (decrease) | (537,868) | (3,177,334) | $(5,662,111) | $(35,136,977) |
| Class Z | | | | |
| Shares sold | 7,577,570 | 9,286,612 | $83,915,317 | $116,583,512 |
| Reinvestment of distributions | 2,183,026 | 829,481 | 23,736,270 | 10,268,903 |
| Shares redeemed | (6,721,782) | (10,199,285) | (74,526,754) | (123,276,606) |
| Net increase (decrease) | 3,038,814 | (83,192) | $33,124,833 | $3,575,809 |
| Fidelity Asset Manager 40% | | | | |
| Class A | | | | |
| Shares sold | 884,362 | 1,624,250 | $10,483,915 | $21,547,853 |
| Reinvestment of distributions | 352,160 | 120,588 | 4,057,526 | 1,637,134 |
| Shares redeemed | (1,329,805) | (1,013,908) | (15,729,162) | (13,044,713) |
| Net increase (decrease) | (93,283) | 730,930 | $(1,187,721) | $10,140,274 |
| Class M | | | | |
| Shares sold | 159,494 | 141,483 | $1,897,889 | $1,854,906 |
| Reinvestment of distributions | 61,249 | 19,968 | 704,834 | 272,231 |
| Shares redeemed | (168,980) | (163,695) | (2,003,338) | (2,112,478) |
| Net increase (decrease) | 51,763 | (2,244) | $599,385 | $14,659 |
| Class C | | | | |
| Shares sold | 224,416 | 445,803 | $2,650,340 | $5,889,712 |
| Reinvestment of distributions | 82,940 | 28,802 | 949,184 | 395,493 |
| Shares redeemed | (501,532) | (709,727) | (5,901,268) | (9,131,451) |
| Net increase (decrease) | (194,176) | (235,122) | $(2,301,744) | $(2,846,246) |
| Asset Manager 40% | | | | |
| Shares sold | 11,052,633 | 30,122,919 | $131,183,147 | $400,913,648 |
| Reinvestment of distributions | 7,318,660 | 3,151,983 | 84,284,822 | 42,769,069 |
| Shares redeemed | (27,887,233) | (33,206,313) | (329,996,011) | (429,561,437) |
| Net increase (decrease) | (9,515,940) | 68,589 | $(114,528,042) | $14,121,280 |
| Class I | | | | |
| Shares sold | 853,834 | 833,599 | $10,102,646 | $10,882,785 |
| Reinvestment of distributions | 153,641 | 60,145 | 1,770,765 | 815,909 |
| Shares redeemed | (867,039) | (957,436) | (10,244,014) | (12,321,248) |
| Net increase (decrease) | 140,436 | (63,692) | $1,629,397 | $(622,554) |
| Class Z | | | | |
| Shares sold | 6,284,539 | 8,734,021 | $73,845,714 | $118,135,811 |
| Reinvestment of distributions | 2,795,482 | 1,070,159 | 32,210,077 | 14,495,871 |
| Shares redeemed | (7,148,927) | (6,274,751) | (84,864,379) | (80,857,226) |
| Net increase (decrease) | 1,931,094 | 3,529,429 | $21,191,412 | $51,774,456 |
| Fidelity Asset Manager 50% | | | | |
| Class A | | | | |
| Shares sold | 968,649 | 1,097,694 | $17,835,233 | $22,893,055 |
| Reinvestment of distributions | 421,565 | 166,313 | 7,504,919 | 3,608,779 |
| Shares redeemed | (1,202,574) | (1,126,804) | (22,213,419) | (22,919,785) |
| Net increase (decrease) | 187,640 | 137,203 | $3,126,733 | $3,582,049 |
| Class M | | | | |
| Shares sold | 265,642 | 406,424 | $4,885,043 | $8,571,943 |
| Reinvestment of distributions | 178,242 | 68,192 | 3,168,893 | 1,483,171 |
| Shares redeemed | (481,078) | (399,715) | (8,894,168) | (8,135,490) |
| Net increase (decrease) | (37,194) | 74,901 | $(840,232) | $1,919,624 |
| Class C | | | | |
| Shares sold | 297,400 | 356,481 | $5,471,240 | $7,555,005 |
| Reinvestment of distributions | 104,429 | 48,862 | 1,836,994 | 1,064,828 |
| Shares redeemed | (541,145) | (947,734) | (9,877,578) | (19,409,950) |
| Net increase (decrease) | (139,316) | (542,391) | $(2,569,344) | $(10,790,117) |
| Asset Manager 50% | | | | |
| Shares sold | 15,925,415 | 27,309,440 | $296,093,223 | $577,432,799 |
| Reinvestment of distributions | 26,236,917 | 11,987,047 | 469,456,625 | 260,572,763 |
| Shares redeemed | (58,256,227) | (61,543,211) | (1,080,821,978) | (1,266,134,074) |
| Net increase (decrease) | (16,093,895) | (22,246,724) | $(315,272,130) | $(428,128,512) |
| Class I | | | | |
| Shares sold | 489,704 | 643,396 | $9,044,818 | $13,349,939 |
| Reinvestment of distributions | 200,468 | 102,735 | 3,577,872 | 2,227,359 |
| Shares redeemed | (1,278,236) | (1,045,348) | (23,632,045) | (20,852,276) |
| Net increase (decrease) | (588,064) | (299,217) | $(11,009,355) | $(5,274,978) |
| Class Z | | | | |
| Shares sold | 14,377,254 | 14,429,540 | $265,269,375 | $317,156,617 |
| Reinvestment of distributions | 7,003,999 | 2,940,624 | 124,981,916 | 63,625,470 |
| Shares redeemed | (14,076,380) | (12,520,527) | (259,748,929) | (254,971,772) |
| Net increase (decrease) | 7,304,873 | 4,849,637 | $130,502,362 | $125,810,315 |
| Fidelity Asset Manager 60% | | | | |
| Class A | | | | |
| Shares sold | 1,291,616 | 1,933,013 | $17,577,208 | $28,794,422 |
| Reinvestment of distributions | 442,750 | 238,708 | 5,742,465 | 3,845,582 |
| Shares redeemed | (1,607,777) | (1,739,346) | (21,900,881) | (25,611,081) |
| Net increase (decrease) | 126,589 | 432,375 | $1,418,792 | $7,028,923 |
| Class M | | | | |
| Shares sold | 183,978 | 404,590 | $2,468,297 | $5,941,698 |
| Reinvestment of distributions | 132,108 | 68,230 | 1,705,515 | 1,094,411 |
| Shares redeemed | (383,998) | (437,923) | (5,194,019) | (6,435,330) |
| Net increase (decrease) | (67,912) | 34,897 | $(1,020,207) | $600,779 |
| Class C | | | | |
| Shares sold | 398,666 | 761,108 | $5,301,650 | $11,638,028 |
| Reinvestment of distributions | 79,236 | 53,957 | 1,013,431 | 856,301 |
| Shares redeemed | (759,021) | (1,764,942) | (10,054,751) | (25,816,724) |
| Net increase (decrease) | (281,119) | (949,877) | $(3,739,670) | $(13,322,395) |
| Asset Manager 60% | | | | |
| Shares sold | 19,688,961 | 24,399,337 | $269,133,298 | $372,698,318 |
| Reinvestment of distributions | 6,154,563 | 3,711,829 | 80,193,953 | 60,094,504 |
| Shares redeemed | (27,437,050) | (28,208,147) | (375,308,414) | (417,194,958) |
| Net increase (decrease) | (1,593,526) | (96,981) | $(25,981,163) | $15,597,864 |
| Class I | | | | |
| Shares sold | 936,886 | 1,457,978 | $12,827,045 | $21,857,509 |
| Reinvestment of distributions | 316,435 | 178,293 | 4,126,312 | 2,888,342 |
| Shares redeemed | (1,261,060) | (1,387,591) | (17,305,847) | (20,572,676) |
| Net increase (decrease) | (7,739) | 248,680 | $(352,490) | $4,173,175 |
| Class Z | | | | |
| Shares sold | 8,916,420 | 20,950,179 | $121,471,479 | $332,907,746 |
| Reinvestment of distributions | 4,361,118 | 2,601,636 | 56,781,753 | 42,068,451 |
| Shares redeemed | (11,992,984) | (14,604,794) | (163,285,078) | (212,747,799) |
| Net increase (decrease) | 1,284,554 | 8,947,021 | $14,968,154 | $162,228,398 |
| Fidelity Asset Manager 70% | | | | |
| Class A | | | | |
| Shares sold | 1,132,350 | 1,232,167 | $27,070,987 | $32,684,583 |
| Reinvestment of distributions | 497,456 | 185,884 | 11,227,584 | 5,366,481 |
| Shares redeemed | (1,090,699) | (1,115,506) | (26,022,775) | (29,516,026) |
| Net increase (decrease) | 539,107 | 302,545 | $12,275,796 | $8,535,038 |
| Class M | | | | |
| Shares sold | 270,196 | 365,881 | $6,476,400 | $9,976,911 |
| Reinvestment of distributions | 166,294 | 62,819 | 3,756,587 | 1,814,208 |
| Shares redeemed | (434,796) | (462,420) | (10,337,019) | (12,080,636) |
| Net increase (decrease) | 1,694 | (33,720) | $(104,032) | $(289,517) |
| Class C | | | | |
| Shares sold | 315,611 | 244,063 | $7,566,188 | $6,432,819 |
| Reinvestment of distributions | 71,764 | 24,031 | 1,618,279 | 692,811 |
| Shares redeemed | (366,730) | (526,175) | (8,731,748) | (14,054,121) |
| Net increase (decrease) | 20,645 | (258,081) | $452,719 | $(6,928,491) |
| Asset Manager 70% | | | | |
| Shares sold | 10,874,313 | 13,461,929 | $261,535,858 | $363,284,018 |
| Reinvestment of distributions | 9,702,666 | 4,176,392 | 219,377,281 | 120,739,485 |
| Shares redeemed | (20,978,824) | (19,789,580) | (502,758,161) | (523,368,127) |
| Net increase (decrease) | (401,845) | (2,151,259) | $(21,845,022) | $(39,344,624) |
| Class I | | | | |
| Shares sold | 512,304 | 611,462 | $12,263,683 | $16,733,716 |
| Reinvestment of distributions | 123,913 | 52,797 | 2,804,156 | 1,527,414 |
| Shares redeemed | (625,523) | (649,608) | (15,009,057) | (17,306,780) |
| Net increase (decrease) | 10,694 | 14,651 | $58,782 | $954,350 |
| Class Z | | | | |
| Shares sold | 7,207,888 | 11,306,690 | $171,717,576 | $323,885,349 |
| Reinvestment of distributions | 5,183,731 | 2,141,090 | 116,996,811 | 61,791,848 |
| Shares redeemed | (7,234,949) | (7,017,762) | (173,217,554) | (182,460,530) |
| Net increase (decrease) | 5,156,670 | 6,430,018 | $115,496,833 | $203,216,667 |
| Fidelity Asset Manager 85% | | | | |
| Class A | | | | |
| Shares sold | 1,680,039 | 1,954,912 | $36,637,506 | $46,844,607 |
| Reinvestment of distributions | 406,694 | 223,610 | 8,349,442 | 5,909,999 |
| Shares redeemed | (1,171,777) | (1,270,677) | (25,636,095) | (30,396,928) |
| Net increase (decrease) | 914,956 | 907,845 | $19,350,853 | $22,357,678 |
| Class M | | | | |
| Shares sold | 228,141 | 294,786 | $4,975,206 | $7,228,937 |
| Reinvestment of distributions | 94,377 | 59,085 | 1,924,349 | 1,550,980 |
| Shares redeemed | (339,417) | (356,369) | (7,349,555) | (8,566,938) |
| Net increase (decrease) | (16,899) | (2,498) | $(450,000) | $212,979 |
| Class C | | | | |
| Shares sold | 374,319 | 372,668 | $8,048,298 | $8,760,605 |
| Reinvestment of distributions | 73,597 | 42,825 | 1,485,932 | 1,113,453 |
| Shares redeemed | (490,917) | (525,731) | (10,504,586) | (12,376,554) |
| Net increase (decrease) | (43,001) | (110,238) | $(970,356) | $(2,502,496) |
| Asset Manager 85% | | | | |
| Shares sold | 8,202,359 | 10,443,635 | $182,700,183 | $258,814,937 |
| Reinvestment of distributions | 4,009,724 | 2,550,056 | 83,241,869 | 68,112,000 |
| Shares redeemed | (11,532,481) | (12,083,008) | (254,741,572) | (291,630,863) |
| Net increase (decrease) | 679,602 | 910,683 | $11,200,480 | $35,296,074 |
| Class I | | | | |
| Shares sold | 823,798 | 636,693 | $18,218,557 | $15,242,748 |
| Reinvestment of distributions | 122,678 | 73,939 | 2,539,426 | 1,969,001 |
| Shares redeemed | (895,092) | (475,195) | (19,928,329) | (11,332,371) |
| Net increase (decrease) | 51,384 | 235,437 | $829,654 | $5,879,378 |
| Class Z | | | | |
| Shares sold | 8,552,138 | 13,530,246 | $188,206,301 | $344,125,128 |
| Reinvestment of distributions | 2,786,073 | 1,760,616 | 57,504,545 | 46,761,952 |
| Shares redeemed | (10,847,796) | (8,877,361) | (236,555,070) | (209,492,051) |
| Net increase (decrease) | 490,415 | 6,413,501 | $9,155,776 | $181,395,029 |
12. Other.
A fund's organizational documents provide former and current trustees and officers with a limited indemnification against liabilities arising in connection with the performance of their duties to the fund. In the normal course of business, a fund may also enter into contracts that provide general indemnifications. A fund's maximum exposure under these arrangements is unknown as this would be dependent on future claims that may be made against a fund. The risk of material loss from such claims is considered remote.
At the end of the period, a shareholder of record owned more than 25% of the total outstanding shares as follows:
| Fund | Affiliated % |
| Fidelity Asset Manager 20% | 34% |
| Fidelity Asset Manager 60% | 35% |
| Fidelity Asset Manager 70% | 31% |
| Fidelity Asset Manager 85% | 33% |
13. Risk and Uncertainties.
Many factors affect a fund's performance. Developments that disrupt global economies and financial markets, such as pandemics, epidemics, outbreaks of infectious diseases, war, terrorism, and environmental disasters, may significantly affect a fund's investment performance. The effects of these developments to a fund will be impacted by the types of securities in which a fund invests, the financial condition, industry, economic sector, and geographic location of an issuer, and a fund's level of investment in the securities of that issuer. Significant concentrations in security types, issuers, industries, sectors, and geographic locations may magnify the factors that affect a fund's performance.
To the Board of Trustees of Fidelity Charles Street Trust and the Shareholders of Fidelity Asset Manager 20%, Fidelity Asset Manager 30%, Fidelity Asset Manager 40%, Fidelity Asset Manager 50%, Fidelity Asset Manager 60%, Fidelity Asset Manager 70% and Fidelity Asset Manager 85%:
Opinion on the Financial Statements and Financial Highlights
We have audited the accompanying statements of assets and liabilities of Fidelity Asset Manager 20%, Fidelity Asset Manager 30%, Fidelity Asset Manager 40%, Fidelity Asset Manager 50%, Fidelity Asset Manager 60%, Fidelity Asset Manager 70% and Fidelity Asset Manager 85% (the "Funds"), each a fund of Fidelity Charles Street Trust, including the schedules of investments, as of September 30, 2023, the related statements of operations for the year then ended, the statements of changes in net assets for each of the two years in the period then ended, the financial highlights for each of the five years in the period then ended, and the related notes. In our opinion, the financial statements and financial highlights present fairly, in all material respects, the financial position of each of the Funds as of September 30, 2023, and the results of their operations for the year then ended, the changes in their net assets for each of the two years in the period then ended, and the financial highlights for each of the five years in the period then ended in conformity with accounting principles generally accepted in the United States of America.
Basis for Opinion
These financial statements and financial highlights are the responsibility of the Funds' management. Our responsibility is to express an opinion on the Funds' financial statements and financial highlights based on our audits. We are a public accounting firm registered with the Public Company Accounting Oversight Board (United States) (PCAOB) and are required to be independent with respect to the Funds in accordance with the U.S. federal securities laws and the applicable rules and regulations of the Securities and Exchange Commission and the PCAOB.
We conducted our audits in accordance with the standards of the PCAOB. Those standards require that we plan and perform the audit to obtain reasonable assurance about whether the financial statements and financial highlights are free of material misstatement, whether due to error or fraud. The Funds are not required to have, nor were we engaged to perform, an audit of its internal control over financial reporting. As part of our audits we are required to obtain an understanding of internal control over financial reporting but not for the purpose of expressing an opinion on the effectiveness of the Funds' internal control over financial reporting. Accordingly, we express no such opinion.
Our audits included performing procedures to assess the risks of material misstatement of the financial statements and financial highlights, whether due to error or fraud, and performing procedures that respond to those risks. Such procedures included examining, on a test basis, evidence regarding the amounts and disclosures in the financial statements and financial highlights. Our audits also included evaluating the accounting principles used and significant estimates made by management, as well as evaluating the overall presentation of the financial statements and financial highlights. Our procedures included confirmation of securities owned as of September 30, 2023, by correspondence with the custodian and brokers; when replies were not received from brokers, we performed other auditing procedures. We believe that our audits provide a reasonable basis for our opinion.
/s/ Deloitte & Touche LLP
Boston, Massachusetts
November 14, 2023
We have served as the auditor of one or more of the Fidelity investment companies since 1999.
The Trustees, Members of the Advisory Board (if any), and officers of the trust and funds, as applicable, are listed below. The Board of Trustees governs each fund and is responsible for protecting the interests of shareholders. The Trustees are experienced executives who meet periodically throughout the year to oversee each fund's activities, review contractual arrangements with companies that provide services to each fund, oversee management of the risks associated with such activities and contractual arrangements, and review each fund's performance. If the interests of a fund and an underlying Fidelity® fund were to diverge, a conflict of interest could arise and affect how the Trustees and Members of the Advisory Board fulfill their fiduciary duties to the affected funds. FMR has structured the funds to avoid these potential conflicts, although there may be situations where a conflict of interest is unavoidable. In such instances, FMR, the Trustees, and Members of the Advisory Board would take reasonable steps to minimize and, if possible, eliminate the conflict. As of September 30, 2023, except for Laura M. Bishop, Robert W. Helm, Christine J. Thompson, and Carol J. Zierhoffer, each of the Trustees oversees 313 funds. As of October 18, 2023, the date of their election as Trustee, Ms. Bishop, Mr. Helm, Ms. Thompson, and Ms. Zierhoffer each oversees 229 funds.
The Trustees hold office without limit in time except that (a) any Trustee may resign; (b) any Trustee may be removed by written instrument, signed by at least two-thirds of the number of Trustees prior to such removal; (c) any Trustee who requests to be retired or who has become incapacitated by illness or injury may be retired by written instrument signed by a majority of the other Trustees; and (d) any Trustee may be removed at any special meeting of shareholders by a two-thirds vote of the outstanding voting securities of the trust. Each Trustee who is not an interested person (as defined in the 1940 Act) of the trust and the funds is referred to herein as an Independent Trustee. Each Independent Trustee shall retire not later than the last day of the calendar year in which his or her 75th birthday occurs. The Independent Trustees may waive this mandatory retirement age policy with respect to individual Trustees. Officers and Advisory Board Members hold office without limit in time, except that any officer or Advisory Board Member may resign or may be removed by a vote of a majority of the Trustees at any regular meeting or any special meeting of the Trustees. Except as indicated, each individual has held the office shown or other offices in the same company for the past five years.
The funds' Statement of Additional Information (SAI) includes more information about the Trustees. To request a free copy, call Fidelity at 1-800-544-8544 if you're an individual investing directly with Fidelity, call 1-800-835-5092 if you're a plan sponsor or participant with Fidelity as your recordkeeper or call 1-877-208-0098 on institutional accounts or if you're an advisor or invest through one.
Experience, Skills, Attributes, and Qualifications of the Trustees. The Governance and Nominating Committee has adopted a statement of policy that describes the experience, qualifications, attributes, and skills that are necessary and desirable for potential Independent Trustee candidates (Statement of Policy). The Board believes that each Trustee satisfied at the time he or she was initially elected or appointed a Trustee, and continues to satisfy, the standards contemplated by the Statement of Policy. The Governance and Nominating Committee also engages professional search firms to help identify potential Independent Trustee candidates who have the experience, qualifications, attributes, and skills consistent with the Statement of Policy. From time to time, additional criteria based on the composition and skills of the current Independent Trustees, as well as experience or skills that may be appropriate in light of future changes to board composition, business conditions, and regulatory or other developments, have also been considered by the professional search firms and the Governance and Nominating Committee. In addition, the Board takes into account the Trustees' commitment and participation in Board and committee meetings, as well as their leadership of standing and ad hoc committees throughout their tenure.
In determining that a particular Trustee was and continues to be qualified to serve as a Trustee, the Board has considered a variety of criteria, none of which, in isolation, was controlling. The Board believes that, collectively, the Trustees have balanced and diverse experience, qualifications, attributes, and skills, which allow the Board to operate effectively in governing each fund and protecting the interests of shareholders. Information about the specific experience, skills, attributes, and qualifications of each Trustee, which in each case led to the Board's conclusion that the Trustee should serve (or continue to serve) as a trustee of the funds, is provided below.
Board Structure and Oversight Function. Abigail P. Johnson is an interested person and currently serves as Chairman. The Trustees have determined that an interested Chairman is appropriate and benefits shareholders because an interested Chairman has a personal and professional stake in the quality and continuity of services provided to the funds. Independent Trustees exercise their informed business judgment to appoint an individual of their choosing to serve as Chairman, regardless of whether the Trustee happens to be independent or a member of management. The Independent Trustees have determined that they can act independently and effectively without having an Independent Trustee serve as Chairman and that a key structural component for assuring that they are in a position to do so is for the Independent Trustees to constitute a substantial majority for the Board. The Independent Trustees also regularly meet in executive session. Michael E. Kenneally serves as Chairman of the Independent Trustees and as such (i) acts as a liaison between the Independent Trustees and management with respect to matters important to the Independent Trustees and (ii) with management prepares agendas for Board meetings.
Fidelity® funds are overseen by different Boards of Trustees. The funds' Board oversees Fidelity's investment-grade bond, money market, asset allocation and certain equity funds, and other Boards oversee Fidelity's alternative investment, high income and other equity funds. The asset allocation funds may invest in Fidelity® funds that are overseen by such other Boards. The use of separate Boards, each with its own committee structure, allows the Trustees of each group of Fidelity® funds to focus on the unique issues of the funds they oversee, including common research, investment, and operational issues. On occasion, the separate Boards establish joint committees to address issues of overlapping consequences for the Fidelity® funds overseen by each Board.
The Trustees operate using a system of committees to facilitate the timely and efficient consideration of all matters of importance to the Trustees, each fund, and fund shareholders and to facilitate compliance with legal and regulatory requirements and oversight of the funds' activities and associated risks. The Board, acting through its committees, has charged FMR and its affiliates with (i) identifying events or circumstances the occurrence of which could have demonstrably adverse effects on the funds' business and/or reputation; (ii) implementing processes and controls to lessen the possibility that such events or circumstances occur or to mitigate the effects of such events or circumstances if they do occur; and (iii) creating and maintaining a system designed to evaluate continuously business and market conditions in order to facilitate the identification and implementation processes described in (i) and (ii) above. Because the day-to-day operations and activities of the funds are carried out by or through FMR, its affiliates, and other service providers, the funds' exposure to risks is mitigated but not eliminated by the processes overseen by the Trustees. While each of the Board's committees has responsibility for overseeing different aspects of the funds' activities, oversight is exercised primarily through the Operations and Audit Committees. In addition, an ad hoc Board committee of Independent Trustees has worked with FMR to enhance the Board's oversight of investment and financial risks, legal and regulatory risks, technology risks, and operational risks, including the development of additional risk reporting to the Board. Appropriate personnel, including but not limited to the funds' Chief Compliance Officer (CCO), FMR's internal auditor, the independent accountants, the funds' Treasurer and portfolio management personnel, make periodic reports to the Board's committees, as appropriate, including an annual review of Fidelity's risk management program for the Fidelity® funds. The responsibilities of each standing committee, including their oversight responsibilities, are described further under "Standing Committees of the Trustees."
Interested Trustees*:
Correspondence intended for a Trustee who is an interested person may be sent to Fidelity Investments, 245 Summer Street, Boston, Massachusetts 02210.
Name, Year of Birth; Principal Occupations and Other Relevant Experience+
Abigail P. Johnson (1961)
Year of Election or Appointment: 2009
Trustee
Chairman of the Board of Trustees
Ms. Johnson also serves as Trustee of other Fidelity® funds. Ms. Johnson serves as Chairman (2016-present), Chief Executive Officer (2014-present), and Director (2007-present) of FMR LLC (diversified financial services company), President of Fidelity Financial Services (2012-present) and President of Personal, Workplace and Institutional Services (2005-present). Ms. Johnson is Chairman and Director of Fidelity Management & Research Company LLC (investment adviser firm, 2011-present). Previously, Ms. Johnson served as Chairman and Director of FMR Co., Inc. (investment adviser firm, 2011-2019), Vice Chairman (2007-2016) and President (2013-2016) of FMR LLC, President and a Director of Fidelity Management & Research Company (2001-2005), a Trustee of other investment companies advised by Fidelity Management & Research Company, Fidelity Investments Money Management, Inc. (investment adviser firm), and FMR Co., Inc. (2001-2005), Senior Vice President of the Fidelity® funds (2001-2005), and managed a number of Fidelity® funds. Ms. Abigail P. Johnson and Mr. Arthur E. Johnson are not related.
Jennifer Toolin McAuliffe (1959)
Year of Election or Appointment: 2016
Trustee
Ms. McAuliffe also serves as Trustee of other Fidelity® funds and as Trustee of Fidelity Charitable (2020-present). Previously, Ms. McAuliffe served as Co-Head of Fixed Income of Fidelity Investments Limited (now known as FIL Limited (FIL)) (diversified financial services company), Director of Research for FIL's credit and quantitative teams in London, Hong Kong and Tokyo and Director of Research for taxable and municipal bonds at Fidelity Investments Money Management, Inc. Ms. McAuliffe previously served as a member of the Advisory Board of certain Fidelity® funds (2016). Ms. McAuliffe was previously a lawyer at Ropes & Gray LLP and an international banker at Chemical Bank NA (now JPMorgan Chase & Co.). Ms. McAuliffe also currently serves as director or trustee of several not-for-profit entities.
Christine J. Thompson (1958)
Year of Election or Appointment: 2023
Trustee
Ms. Thompson also serves as a Trustee of other Fidelity® funds. Ms. Thompson serves as Leader of Advanced Technologies for Investment Management at Fidelity Investments (2018-present). Previously, Ms. Thompson served as Chief Investment Officer in the Bond group at Fidelity Management & Research Company (2010-2018) and held various other roles including Director of municipal bond portfolio managers and Portfolio Manager of certain Fidelity® funds.
* Determined to be an "Interested Trustee" by virtue of, among other things, his or her affiliation with the trust or various entities under common control with FMR.
+ The information includes the Trustee's principal occupation during the last five years and other information relating to the experience, attributes, and skills relevant to the Trustee's qualifications to serve as a Trustee, which led to the conclusion that the Trustee should serve as a Trustee for each fund.
Independent Trustees:
Correspondence intended for an Independent Trustee may be sent to Fidelity Investments, P.O. Box 55235, Boston, Massachusetts 02205-5235.
Name, Year of Birth; Principal Occupations and Other Relevant Experience+
Elizabeth S. Acton (1951)
Year of Election or Appointment: 2013
Trustee
Ms. Acton also serves as Trustee of other Fidelity® funds. Prior to her retirement, Ms. Acton served as Executive Vice President, Finance (2011-2012), Executive Vice President, Chief Financial Officer (2002-2011) and Treasurer (2004-2005) of Comerica Incorporated (financial services). Prior to joining Comerica, Ms. Acton held a variety of positions at Ford Motor Company (1983-2002), including Vice President and Treasurer (2000-2002) and Executive Vice President and Chief Financial Officer of Ford Motor Credit Company (1998-2000). Ms. Acton currently serves as a member of the Board and Audit and Finance Committees of Beazer Homes USA, Inc. (homebuilding, 2012-present). Ms. Acton previously served as a member of the Advisory Board of certain Fidelity® funds (2013-2016).
Laura M. Bishop (1961)
Year of Election or Appointment: 2023
Trustee
Ms. Bishop also serves as Trustee or Member of the Advisory Board of other Fidelity® funds. Prior to her retirement, Ms. Bishop held a variety of positions at United Services Automobile Association (2001-2020), including Executive Vice President and Chief Financial Officer (2014-2020) and Senior Vice President and Deputy Chief Financial Officer (2012-2014). Ms. Bishop currently serves as a member of the Audit Committee and Compensation and Personnel Committee (2021-present) of the Board of Directors of Korn Ferry (global organizational consulting). Previously, Ms. Bishop served as a Member of the Advisory Board of certain Fidelity® funds (2022-2023).
Ann E. Dunwoody (1953)
Year of Election or Appointment: 2018
Trustee
General Dunwoody also serves as Trustee of other Fidelity® funds. General Dunwoody (United States Army, Retired) was the first woman in U.S. military history to achieve the rank of four-star general and prior to her retirement in 2012 held a variety of positions within the U.S. Army, including Commanding General, U.S. Army Material Command (2008-2012). General Dunwoody currently serves as a member of the Board, Chair of Nomination Committee and a member of the Corporate Governance Committee of Kforce Inc. (professional staffing services, 2016-present) and a member of the Board of Automattic Inc. (software engineering, 2018-present). Previously, General Dunwoody served as President of First to Four LLC (leadership and mentoring services, 2012-2022), a member of the Advisory Board and Nominating and Corporate Governance Committee of L3 Technologies, Inc. (communication, electronic, sensor and aerospace systems, 2013-2019) and a member of the Board and Audit and Sustainability and Corporate Responsibility Committees of Republic Services, Inc. (waste collection, disposal and recycling, 2013-2016). General Dunwoody also serves on several boards for non-profit organizations, including as a member of the Board, Chair of the Nomination and Governance Committee and a member of the Audit Committee of the Noble Reach Foundation (formerly Logistics Management Institute) (consulting non-profit, 2012-present) and a member of the Board of ThanksUSA (military family education non-profit, 2014-present). Previously, General Dunwoody served as a member of the Board of Florida Institute of Technology (2015-2022) and a member of the Council of Trustees for the Association of the United States Army (advocacy non-profit, 2013-2021). General Dunwoody previously served as a member of the Advisory Board of certain Fidelity® funds (2018).
John Engler (1948)
Year of Election or Appointment: 2014
Trustee
Mr. Engler also serves as Trustee of other Fidelity® funds. Previously, Mr. Engler served as Governor of Michigan (1991-2003), President of the Business Roundtable (2011-2017) and interim President of Michigan State University (2018-2019). Previously, Mr. Engler served as a member of the Board of Stride, Inc. (formerly K12 Inc.) (technology-based education company, 2012-2022), a member of the Board of Universal Forest Products (manufacturer and distributor of wood and wood-alternative products, 2003-2019) and Trustee of The Munder Funds (2003-2014). Mr. Engler previously served as a member of the Advisory Board of certain Fidelity® funds (2014-2016).
Robert F. Gartland (1951)
Year of Election or Appointment: 2010
Trustee
Mr. Gartland also serves as Trustee of other Fidelity® funds. Prior to his retirement, Mr. Gartland held a variety of positions at Morgan Stanley (financial services, 1979-2007), including Managing Director (1987-2007) and Chase Manhattan Bank (1975-1978). Mr. Gartland previously served as Chairman and an investor in Gartland & Mellina Group Corp. (consulting, 2009-2019), as a member of the Board of National Securities Clearing Corporation (1993-1996) and as Chairman of TradeWeb (2003-2004).
Robert W. Helm (1957)
Year of Election or Appointment: 2023
Trustee
Mr. Helm also serves as Trustee or Member of the Advisory Board of other Fidelity® funds. Mr. Helm was formerly Deputy Chairman (2003-2020), partner (1991-2020) and an associate (1984-1991) of Dechert LLP (formerly Dechert Price & Rhoads). Mr. Helm currently serves on boards and committees of several not-for-profit organizations, including as a Trustee and member of the Executive Committee of the Baltimore Council on Foreign Affairs, a member of the Board of Directors of the St. Vincent de Paul Society of Baltimore and a member of the Life Guard Society of Mt. Vernon. Previously, Mr. Helm served as a Member of the Advisory Board of certain Fidelity® funds (2021-2023).
Arthur E. Johnson (1947)
Year of Election or Appointment: 2008
Trustee
Mr. Johnson also serves as Trustee of other Fidelity® funds. Prior to his retirement, Mr. Johnson served as Senior Vice President of Corporate Strategic Development of Lockheed Martin Corporation (defense contractor, 1999-2009). Mr. Johnson currently serves as a member of the Board of Booz Allen Hamilton (management consulting, 2011-present). Mr. Johnson previously served as a member of the Board of Eaton Corporation plc (diversified power management, 2009-2019) and a member of the Board of AGL Resources, Inc. (holding company, 2002-2016). Mr. Johnson previously served as Chairman (2018-2021) and Vice Chairman (2015-2018) of the Independent Trustees of certain Fidelity® funds. Mr. Arthur E. Johnson is not related to Ms. Abigail P. Johnson.
Michael E. Kenneally (1954)
Year of Election or Appointment: 2009
Trustee
Chairman of the Independent Trustees
Mr. Kenneally also serves as Trustee of other Fidelity® funds and was Vice Chairman (2018-2021) of the Independent Trustees of certain Fidelity® funds. Prior to retirement in 2005, he was Chairman and Global Chief Executive Officer of Credit Suisse Asset Management, the worldwide fund management and institutional investment business of Credit Suisse Group. Previously, Mr. Kenneally was an Executive Vice President and the Chief Investment Officer for Bank of America. In this role, he was responsible for the investment management, strategy and products delivered to the bank's institutional, high-net-worth and retail clients. Earlier, Mr. Kenneally directed the organization's equity and quantitative research groups. He began his career as a research analyst and then spent more than a dozen years as a portfolio manager for endowments, pension plans and mutual funds. He earned the Chartered Financial Analyst (CFA) designation in 1991.
Mark A. Murray (1954)
Year of Election or Appointment: 2016
Trustee
Mr. Murray also serves as Trustee of other Fidelity® funds. Previously, Mr. Murray served as Co-Chief Executive Officer (2013-2016), President (2006-2013) and Vice Chairman (2013-2020) of Meijer, Inc. Mr. Murray serves as a member of the Board (2009-present) and Public Policy and Responsibility Committee (2009-present) and Chair of the Nuclear Review Committee (2019-present) of DTE Energy Company (diversified energy company). Mr. Murray previously served as a member of the Board of Spectrum Health (not-for-profit health system, 2015-2019) and as a member of the Board and Audit Committee and Chairman of the Nominating and Corporate Governance Committee of Universal Forest Products, Inc. (manufacturer and distributor of wood and wood-alternative products, 2004-2016). Mr. Murray also serves as a member of the Board of many community and professional organizations. Mr. Murray previously served as a member of the Advisory Board of certain Fidelity® funds (2016).
Carol J. Zierhoffer (1960)
Year of Election or Appointment: 2023
Trustee
Ms. Zierhoffer also serves as Trustee or Member of the Advisory Board of other Fidelity® funds. Prior to her retirement, Ms. Zierhoffer held a variety of positions at Bechtel Corporation (engineering company, 2013-2019), including Principal Vice President and Chief Information Officer (2013-2016) and Senior Vice President and Chief Information Officer (2016-2019). Ms. Zierhoffer currently serves as a member of the Board of Directors, Audit Committee and Compensation Committee of Allscripts Healthcare Solutions, Inc. (healthcare technology, 2020-present) and as a member of the Board of Directors, Audit and Finance Committee and Nominating and Governance Committee of Atlas Air Worldwide Holdings, Inc. (aviation operating services, 2021-present). Previously, Ms. Zierhoffer served as a member of the Board of Directors and Audit Committee and as the founding Chair of the Information Technology Committee of MedAssets, Inc. (healthcare technology, 2013-2016), and as a Member of the Advisory Board of certain Fidelity® funds (2023).
+ The information includes the Trustee's principal occupation during the last five years and other information relating to the experience, attributes, and skills relevant to the Trustee's qualifications to serve as a Trustee, which led to the conclusion that the Trustee should serve as a Trustee for each fund.
Advisory Board Members and Officers:
Correspondence intended for a Member of the Advisory Board (if any) may be sent to Fidelity Investments, P.O. Box 55235, Boston, Massachusetts 02205-5235. Correspondence intended for an officer may be sent to Fidelity Investments, 245 Summer Street, Boston, Massachusetts 02210.
Name, Year of Birth; Principal Occupation
Heather Bonner (1977)
Year of Election or Appointment: 2023
Assistant Treasurer
Ms. Bonner also serves as an officer of other funds. Ms. Bonner is a Senior Vice President (2022-present) and is an employee of Fidelity Investments (2022-present). Ms. Bonner serves as Assistant Treasurer of Fidelity CRET Trustee LLC (2022-present). Prior to joining Fidelity, Ms. Bonner served as Managing Director at AQR Capital Management (2013-2022) and was the Treasurer and Principal Financial Officer of the AQR Funds (2013-2022).
Craig S. Brown (1977)
Year of Election or Appointment: 2019
Assistant Treasurer
Mr. Brown also serves as an officer of other funds. Mr. Brown is a Vice President (2015-present) and is an employee of Fidelity Investments. Mr. Brown serves as Assistant Treasurer of FIMM, LLC (2021-present). Previously, Mr. Brown served as Assistant Treasurer of certain Fidelity® funds (2019-2022).
John J. Burke III (1964)
Year of Election or Appointment: 2018
Chief Financial Officer
Mr. Burke also serves as Chief Financial Officer of other funds. Mr. Burke is Head of Fidelity Fund and Investment Operations (2018-present) and is an employee of Fidelity Investments. Mr. Burke serves as President, Executive Vice President, or Director of certain Fidelity entities. Previously Mr. Burke served as head of Asset Management Investment Operations (2012-2018).
Margaret Carey (1973)
Year of Election or Appointment: 2023
Secretary and Chief Legal Officer (CLO)
Ms. Carey also serves as an officer of other funds and as CLO of certain Fidelity entities. Ms. Carey is a Senior Vice President, Deputy General Counsel (2019-present) and is an employee of Fidelity Investments.
David J. Carter (1973)
Year of Election or Appointment: 2020
Assistant Secretary
Mr. Carter also serves as Assistant Secretary of other funds. Mr. Carter is a Senior Vice President, Deputy General Counsel (2022-present) and is an employee of Fidelity Investments. Mr. Carter serves as Chief Legal Officer of Fidelity Investments Institutional Operations Company LLC - Shareholder Division (transfer agent, 2020-present).
Jonathan Davis (1968)
Year of Election or Appointment: 2010
Assistant Treasurer
Mr. Davis also serves as an officer of other funds. Mr. Davis is a Vice President (2006-present) and is an employee of Fidelity Investments. Mr. Davis serves as Assistant Treasurer of certain Fidelity entities.
Laura M. Del Prato (1964)
Year of Election or Appointment: 2018
President and Treasurer
Ms. Del Prato also serves as an officer of other funds. Ms. Del Prato is a Senior Vice President (2017-present) and is an employee of Fidelity Investments. Ms. Del Prato serves as Vice President or Assistant Treasurer of certain Fidelity entities. Previously, Ms. Del Prato served as President and Treasurer of The North Carolina Capital Management Trust: Cash Portfolio and Term Portfolio (2018-2020).
Christopher M. Gouveia (1973)
Year of Election or Appointment: 2023
Chief Compliance Officer
Mr. Gouveia also serves as Chief Compliance Officer of other funds. Mr. Gouveia is a Senior Vice President of Asset Management Compliance (2019-present) and is an employee of Fidelity Investments. Mr. Gouveia serves as Compliance Officer of Fidelity Management Trust Company (2023-present). Previously, Mr. Gouveia served as Chief Compliance Officer of the North Carolina Capital Management Trust (2016-2019).
Colm A. Hogan (1973)
Year of Election or Appointment: 2016
Assistant Treasurer
Mr. Hogan also serves as an officer of other funds. Mr. Hogan is a Vice President (2016-present) and is an employee of Fidelity Investments. Mr. Hogan serves as Assistant Treasurer of certain Fidelity entities. Previously, Mr. Hogan served as Deputy Treasurer of certain Fidelity® funds (2016-2020) and Assistant Treasurer of certain Fidelity® funds (2016-2018).
William Irving (1964)
Year of Election or Appointment: 2023
Vice President
Mr. Irving also serves as Vice President of other funds. Mr. Irving is Head of Fidelity Asset Management Solutions (2022-present) and is an employee of Fidelity Investments. Mr. Irving serves as President and Director of Fidelity Diversifying Solutions LLC (investment adviser firm, 2023-present) and President or Director of certain other Fidelity entities. Previously, Mr. Irving served as Chief Investment Officer (CIO) in the Global Asset Allocation division (2020-2022). Prior to that, he was Managing Director of Research in the Global Asset Allocation division (2018-2020) and portfolio manager of certain Fidelity® funds (2004-2018).
Chris Maher (1972)
Year of Election or Appointment: 2013
Assistant Treasurer
Mr. Maher also serves as an officer of other funds. Mr. Maher is a Vice President (2008-present) and is an employee of Fidelity Investments. Mr. Maher serves as Assistant Treasurer of certain Fidelity entities. Previously, Mr. Maher served as Assistant Treasurer of certain funds (2013-2020).
Brett Segaloff (1972)
Year of Election or Appointment: 2021
Anti-Money Laundering (AML) Officer
Mr. Segaloff also serves as AML Officer of other funds. Mr. Segaloff is a Vice President (2022-present) and is an employee of Fidelity Investments. Mr. Segaloff serves as Anti Money Laundering Compliance Officer or Anti Money Laundering/Bank Secrecy Act Compliance Officer of certain Fidelity entities.
Stacie M. Smith (1974)
Year of Election or Appointment: 2013
Assistant Treasurer
Ms. Smith also serves as an officer of other funds. Ms. Smith is a Senior Vice President (2016-present) and is an employee of Fidelity Investments. Ms. Smith serves as Assistant Treasurer of certain Fidelity entities and has served in other fund officer roles.
Jim Wegmann (1979)
Year of Election or Appointment: 2021
Deputy Treasurer
Mr. Wegmann also serves as an officer of other funds. Mr. Wegmann is a Vice President (2016-present) and is an employee of Fidelity Investments. Mr. Wegmann serves as Assistant Treasurer of FIMM, LLC (2021-present). Previously, Mr. Wegmann served as Assistant Treasurer of certain Fidelity® funds (2019-2021).
As a shareholder, you incur two types of costs: (1) transaction costs, which may include sales charges (loads) on purchase payments or redemption proceeds, as applicable and (2) ongoing costs, which generally include management fees, distribution and/or service (12b-1) fees and other Fund expenses. This Example is intended to help you understand your ongoing costs (in dollars) of investing in a fund and to compare these costs with the ongoing costs of investing in other mutual funds.
| The Example is based on an investment of $1,000 invested at the beginning of the period and held for the entire period (April 1, 2023 to September 30, 2023). |
Actual Expenses
The first line of the accompanying table provides information about actual account values and actual expenses. You may use the information in this line, together with the amount you invested, to estimate the expenses that you paid over the period. Simply divide your account value by $1,000.00 (for example, an $8,600 account value divided by $1,000.00 = 8.6), then multiply the result by the number in the first line for a class/Fund under the heading entitled "Expenses Paid During Period" to estimate the expenses you paid on your account during this period. If any fund is a shareholder of any underlying mutual funds or exchange-traded funds (ETFs) (the Underlying Funds), such fund indirectly bears its proportional share of the expenses of the Underlying Funds in addition to the direct expenses incurred presented in the table. These fees and expenses are not included in the annualized expense ratio used to calculate the expense estimate in the table below.
Hypothetical Example for Comparison Purposes
The second line of the accompanying table provides information about hypothetical account values and hypothetical expenses based on the actual expense ratio and an assumed rate of return of 5% per year before expenses, which is not the actual return. The hypothetical account values and expenses may not be used to estimate the actual ending account balance or expenses you paid for the period. You may use this information to compare the ongoing costs of investing in the Fund and other funds. To do so, compare this 5% hypothetical example with the 5% hypothetical examples that appear in the shareholder reports of the other funds. If any fund is a shareholder of any Underlying Funds, such fund indirectly bears its proportional share of the expenses of the Underlying Funds in addition to the direct expenses as presented in the table. These fees and expenses are not included in the annualized expense ratio used to calculate the expense estimate in the table below.
Please note that the expenses shown in the table are meant to highlight your ongoing costs only and do not reflect any transaction costs. Therefore, the second line of the table is useful in comparing ongoing costs only, and will not help you determine the relative total costs of owning different funds. In addition, if these transactional costs were included, your costs would have been higher.
| | | | | Annualized Expense Ratio- A | | Beginning Account Value April 1, 2023 | | Ending Account Value September 30, 2023 | | Expenses Paid During Period- C April 1, 2023 to September 30, 2023 |
| Fidelity Asset Manager® 20% | | | | | | | | | | |
| Class A | | | | .81% | | | | | | |
| Actual | | | | | | $ 1,000 | | $ 983.40 | | $ 4.03 |
Hypothetical-B | | | | | | $ 1,000 | | $ 1,021.01 | | $ 4.10 |
| Class M | | | | 1.06% | | | | | | |
| Actual | | | | | | $ 1,000 | | $ 982.30 | | $ 5.27 |
Hypothetical-B | | | | | | $ 1,000 | | $ 1,019.75 | | $ 5.37 |
| Class C | | | | 1.56% | | | | | | |
| Actual | | | | | | $ 1,000 | | $ 980.40 | | $ 7.74 |
Hypothetical-B | | | | | | $ 1,000 | | $ 1,017.25 | | $ 7.89 |
| Fidelity Asset Manager® 20% | | | | .50% | | | | | | |
| Actual | | | | | | $ 1,000 | | $ 985.00 | | $ 2.49 |
Hypothetical-B | | | | | | $ 1,000 | | $ 1,022.56 | | $ 2.54 |
| Class I | | | | .54% | | | | | | |
| Actual | | | | | | $ 1,000 | | $ 984.70 | | $ 2.69 |
Hypothetical-B | | | | | | $ 1,000 | | $ 1,022.36 | | $ 2.74 |
| Class Z | | | | .47% | | | | | | |
| Actual | | | | | | $ 1,000 | | $ 985.20 | | $ 2.34 |
Hypothetical-B | | | | | | $ 1,000 | | $ 1,022.71 | | $ 2.38 |
| Fidelity Asset Manager® 30% | | | | | | | | | | |
| Class A | | | | .82% | | | | | | |
| Actual | | | | | | $ 1,000 | | $ 983.40 | | $ 4.08 |
Hypothetical-B | | | | | | $ 1,000 | | $ 1,020.96 | | $ 4.15 |
| Class M | | | | 1.07% | | | | | | |
| Actual | | | | | | $ 1,000 | | $ 982.20 | | $ 5.32 |
Hypothetical-B | | | | | | $ 1,000 | | $ 1,019.70 | | $ 5.42 |
| Class C | | | | 1.58% | | | | | | |
| Actual | | | | | | $ 1,000 | | $ 979.50 | | $ 7.84 |
Hypothetical-B | | | | | | $ 1,000 | | $ 1,017.15 | | $ 7.99 |
| Fidelity Asset Manager® 30% | | | | .52% | | | | | | |
| Actual | | | | | | $ 1,000 | | $ 984.90 | | $ 2.59 |
Hypothetical-B | | | | | | $ 1,000 | | $ 1,022.46 | | $ 2.64 |
| Class I | | | | .58% | | | | | | |
| Actual | | | | | | $ 1,000 | | $ 984.80 | | $ 2.89 |
Hypothetical-B | | | | | | $ 1,000 | | $ 1,022.16 | | $ 2.94 |
| Class Z | | | | .49% | | | | | | |
| Actual | | | | | | $ 1,000 | | $ 985.00 | | $ 2.44 |
Hypothetical-B | | | | | | $ 1,000 | | $ 1,022.61 | | $ 2.48 |
| Fidelity Asset Manager® 40% | | | | | | | | | | |
| Class A | | | | .82% | | | | | | |
| Actual | | | | | | $ 1,000 | | $ 986.40 | | $ 4.08 |
Hypothetical-B | | | | | | $ 1,000 | | $ 1,020.96 | | $ 4.15 |
| Class M | | | | 1.07% | | | | | | |
| Actual | | | | | | $ 1,000 | | $ 985.30 | | $ 5.33 |
Hypothetical-B | | | | | | $ 1,000 | | $ 1,019.70 | | $ 5.42 |
| Class C | | | | 1.58% | | | | | | |
| Actual | | | | | | $ 1,000 | | $ 981.80 | | $ 7.85 |
Hypothetical-B | | | | | | $ 1,000 | | $ 1,017.15 | | $ 7.99 |
| Fidelity Asset Manager® 40% | | | | .52% | | | | | | |
| Actual | | | | | | $ 1,000 | | $ 987.90 | | $ 2.59 |
Hypothetical-B | | | | | | $ 1,000 | | $ 1,022.46 | | $ 2.64 |
| Class I | | | | .57% | | | | | | |
| Actual | | | | | | $ 1,000 | | $ 986.80 | | $ 2.84 |
Hypothetical-B | | | | | | $ 1,000 | | $ 1,022.21 | | $ 2.89 |
| Class Z | | | | .49% | | | | | | |
| Actual | | | | | | $ 1,000 | | $ 988.10 | | $ 2.44 |
Hypothetical-B | | | | | | $ 1,000 | | $ 1,022.61 | | $ 2.48 |
| Fidelity Asset Manager® 50% | | | | | | | | | | |
| Class A | | | | .90% | | | | | | |
| Actual | | | | | | $ 1,000 | | $ 988.40 | | $ 4.49 |
Hypothetical-B | | | | | | $ 1,000 | | $ 1,020.56 | | $ 4.56 |
| Class M | | | | 1.14% | | | | | | |
| Actual | | | | | | $ 1,000 | | $ 987.20 | | $ 5.68 |
Hypothetical-B | | | | | | $ 1,000 | | $ 1,019.35 | | $ 5.77 |
| Class C | | | | 1.66% | | | | | | |
| Actual | | | | | | $ 1,000 | | $ 984.60 | | $ 8.26 |
Hypothetical-B | | | | | | $ 1,000 | | $ 1,016.75 | | $ 8.39 |
| Fidelity Asset Manager® 50% | | | | .61% | | | | | | |
| Actual | | | | | | $ 1,000 | | $ 989.40 | | $ 3.04 |
Hypothetical-B | | | | | | $ 1,000 | | $ 1,022.01 | | $ 3.09 |
| Class I | | | | .63% | | | | | | |
| Actual | | | | | | $ 1,000 | | $ 989.80 | | $ 3.14 |
Hypothetical-B | | | | | | $ 1,000 | | $ 1,021.91 | | $ 3.19 |
| Class Z | | | | .53% | | | | | | |
| Actual | | | | | | $ 1,000 | | $ 990.30 | | $ 2.64 |
Hypothetical-B | | | | | | $ 1,000 | | $ 1,022.41 | | $ 2.69 |
| Fidelity Asset Manager® 60% | | | | | | | | | | |
| Class A | | | | .99% | | | | | | |
| Actual | | | | | | $ 1,000 | | $ 991.20 | | $ 4.94 |
Hypothetical-B | | | | | | $ 1,000 | | $ 1,020.10 | | $ 5.01 |
| Class M | | | | 1.22% | | | | | | |
| Actual | | | | | | $ 1,000 | | $ 989.70 | | $ 6.09 |
Hypothetical-B | | | | | | $ 1,000 | | $ 1,018.95 | | $ 6.17 |
| Class C | | | | 1.75% | | | | | | |
| Actual | | | | | | $ 1,000 | | $ 987.30 | | $ 8.72 |
Hypothetical-B | | | | | | $ 1,000 | | $ 1,016.29 | | $ 8.85 |
| Fidelity Asset Manager® 60% | | | | .68% | | | | | | |
| Actual | | | | | | $ 1,000 | | $ 992.70 | | $ 3.40 |
Hypothetical-B | | | | | | $ 1,000 | | $ 1,021.66 | | $ 3.45 |
| Class I | | | | .73% | | | | | | |
| Actual | | | | | | $ 1,000 | | $ 992.70 | | $ 3.65 |
Hypothetical-B | | | | | | $ 1,000 | | $ 1,021.41 | | $ 3.70 |
| Class Z | | | | .60% | | | | | | |
| Actual | | | | | | $ 1,000 | | $ 993.40 | | $ 3.00 |
Hypothetical-B | | | | | | $ 1,000 | | $ 1,022.06 | | $ 3.04 |
| Fidelity Asset Manager® 70% | | | | | | | | | | |
| Class A | | | | .96% | | | | | | |
| Actual | | | | | | $ 1,000 | | $ 996.60 | | $ 4.80 |
Hypothetical-B | | | | | | $ 1,000 | | $ 1,020.26 | | $ 4.86 |
| Class M | | | | 1.20% | | | | | | |
| Actual | | | | | | $ 1,000 | | $ 995.40 | | $ 6.00 |
Hypothetical-B | | | | | | $ 1,000 | | $ 1,019.05 | | $ 6.07 |
| Class C | | | | 1.72% | | | | | | |
| Actual | | | | | | $ 1,000 | | $ 992.80 | | $ 8.59 |
Hypothetical-B | | | | | | $ 1,000 | | $ 1,016.44 | | $ 8.69 |
| Fidelity Asset Manager® 70% | | | | .67% | | | | | | |
| Actual | | | | | | $ 1,000 | | $ 998.30 | | $ 3.36 |
Hypothetical-B | | | | | | $ 1,000 | | $ 1,021.71 | | $ 3.40 |
| Class I | | | | .69% | | | | | | |
| Actual | | | | | | $ 1,000 | | $ 998.30 | | $ 3.46 |
Hypothetical-B | | | | | | $ 1,000 | | $ 1,021.61 | | $ 3.50 |
| Class Z | | | | .59% | | | | | | |
| Actual | | | | | | $ 1,000 | | $ 998.70 | | $ 2.96 |
Hypothetical-B | | | | | | $ 1,000 | | $ 1,022.11 | | $ 2.99 |
| Fidelity Asset Manager® 85% | | | | | | | | | | |
| Class A | | | | .97% | | | | | | |
| Actual | | | | | | $ 1,000 | | $ 1,002.70 | | $ 4.87 |
Hypothetical-B | | | | | | $ 1,000 | | $ 1,020.21 | | $ 4.91 |
| Class M | | | | 1.22% | | | | | | |
| Actual | | | | | | $ 1,000 | | $ 1,001.40 | | $ 6.12 |
Hypothetical-B | | | | | | $ 1,000 | | $ 1,018.95 | | $ 6.17 |
| Class C | | | | 1.73% | | | | | | |
| Actual | | | | | | $ 1,000 | | $ 998.60 | | $ 8.67 |
Hypothetical-B | | | | | | $ 1,000 | | $ 1,016.39 | | $ 8.74 |
| Fidelity Asset Manager® 85% | | | | .69% | | | | | | |
| Actual | | | | | | $ 1,000 | | $ 1,003.60 | | $ 3.47 |
Hypothetical-B | | | | | | $ 1,000 | | $ 1,021.61 | | $ 3.50 |
| Class I | | | | .71% | | | | | | |
| Actual | | | | | | $ 1,000 | | $ 1,004.10 | | $ 3.57 |
Hypothetical-B | | | | | | $ 1,000 | | $ 1,021.51 | | $ 3.60 |
| Class Z | | | | .59% | | | | | | |
| Actual | | | | | | $ 1,000 | | $ 1,004.10 | | $ 2.96 |
Hypothetical-B | | | | | | $ 1,000 | | $ 1,022.11 | | $ 2.99 |
| |
A Annualized expense ratio reflects expenses net of applicable fee waivers.
B 5% return per year before expenses
C Expenses are equal to the annualized expense ratio, multiplied by the average account value over the period, multiplied by 183/ 365 (to reflect the one-half year period). The fees and expenses of any Underlying Funds are not included in each annualized expense ratio.
The dividend and capital gains distributions for the fund(s) are available on Fidelity.com or Institutional.Fidelity.com
The funds hereby designate as capital gain dividend the amounts noted below for the taxable year ended September 30, 2023, or, if subsequently determined to be different, the net capital gain of such year.
| Fidelity Asset Manager 70% | $1,645,937 |
A percentage of the dividends distributed during the fiscal year for the following funds were derived from interest on U.S. Government securities which is generally exempt from state income tax:
| Fidelity Asset Manager 20% | 18.09% |
| Fidelity Asset Manager 30% | 19.48% |
| Fidelity Asset Manager 40% | 18.66% |
| Fidelity Asset Manager 50% | 18.63% |
| Fidelity Asset Manager 60% | 17.44% |
| Fidelity Asset Manager 70% | 14.90% |
| Fidelity Asset Manager 85% | 11.66% |
| | |
The funds hereby designate the amounts noted below as distributions paid in the calendar year 2022 as qualifying to be taxed as interest-related dividends for nonresident alien shareholders:
| Fidelity Asset Manager 20% | $79,654,620 |
| Fidelity Asset Manager 30% | $29,820,431 |
| Fidelity Asset Manager 40% | $25,579,666 |
| Fidelity Asset Manager 50% | $91,881,995 |
| Fidelity Asset Manager 60% | $30,349,709 |
| Fidelity Asset Manager 70% | $35,378,737 |
| Fidelity Asset Manager 85% | $8,858,818 |
The funds hereby designate the amounts noted below as distributions paid during the fiscal year ended 2023 as qualifying to be taxed as section 163(j) interest dividends:
| Fidelity Asset Manager 20% | $164,301,387 |
| Fidelity Asset Manager 30% | $51,140,067 |
| Fidelity Asset Manager 40% | $36,614,415 |
| Fidelity Asset Manager 50% | $121,241,665 |
| Fidelity Asset Manager 60% | $33,080,268 |
| Fidelity Asset Manager 70% | $37,007,592 |
| Fidelity Asset Manager 85% | $7,648,979 |
A percentage of the dividends distributed during the fiscal year for the following funds qualify for the dividends-received deduction for corporate shareholders:
| | Class A | Class M | Class C | Retail | Class I | Class Z |
| Fidelity Asset Manager 20% | | | | | | |
| October 2022 | 0% | 0% | 0% | 0% | 0% | 0% |
| November 2022 | 7% | 8% | 11% | 6% | 6% | 6% |
| December 2022 | 9% | 10% | 11% | 8% | 9% | 8% |
| February 2023 | 8% | 11% | 32% | 6% | 7% | 6% |
| March 2023 | 8% | 9% | 12% | 6% | 7% | 6% |
| April 2023 | 7% | 8% | 10% | 6% | 6% | 6% |
| May 2023 | 7% | 8% | 11% | 6% | 7% | 6% |
| June 2023 | 8% | 8% | 11% | 6% | 7% | 6% |
| July 2023 | 7% | 7% | 8% | 6% | 7% | 6% |
| August 2023 | 7% | 8% | 11% | 6% | 6% | 6% |
| September 2023 | 7% | 8% | 10% | 6% | 7% | 6% |
| Fidelity Asset Manager 30% | | | | | | |
| October 2022 | 0% | 0% | 0% | 0% | 0% | 0% |
| November 2022 | 10% | 13% | 20% | 8% | 9% | 8% |
| December 2022 | 12% | 13% | 16% | 12% | 12% | 11% |
| February 2023 | 13% | 16% | 40% | 10% | 10% | 10% |
| March 2023 | 12% | 14% | 25% | 10% | 12% | 10% |
| April 2023 | 12% | 13% | 18% | 10% | 10% | 10% |
| May 2023 | 12% | 14% | 21% | 10% | 10% | 10% |
| June 2023 | 12% | 14% | 23% | 10% | 11% | 10% |
| July 2023 | 11% | 12% | 13% | 10% | 10% | 10% |
| August 2023 | 12% | 14% | 22% | 10% | 10% | 10% |
| September 2023 | 12% | 14% | 20% | 10% | 10% | 10% |
| Fidelity Asset Manager 40% | | | | | | |
| October 2022 | 0% | 0% | 0% | 0% | 0% | 0% |
| December 2022 | 16% | 17% | 22% | 15% | 15% | 14% |
| April 2023 | 23% | 27% | 52% | 18% | 19% | 18% |
| July 2023 | 21% | 23% | 30% | 18% | 19% | 18% |
| Fidelity Asset Manager 50% | | | | | | |
| October 2022 | 0% | 0% | 0% | 0% | 0% | 0% |
| December 2022 | 19% | 21% | 26% | 18% | 18% | 17% |
| April 2023 | 32% | 41% | 100% | 24% | 25% | 23% |
| July 2023 | 28% | 32% | 42% | 24% | 25% | 24% |
| Fidelity Asset Manager 60% | | | | | | |
| December 2022 | 25% | 28% | 50% | 21% | 22% | 20% |
| Fidelity Asset Manager 70% | | | | | | |
| December 2022 | 30% | 36% | 55% | 26% | 26% | 25% |
| Fidelity Asset Manager 85% | | | | | | |
| December 2022 | 40% | 50% | 83% | 34% | 35% | 33% |
A percentage of the dividends distributed during the fiscal year for the following funds may be taken into account as a dividend for purposes of the maximum rate under section 1(h)(11) of the Internal Revenue Code.
| | Class A | Class M | Class C | Retail | Class I | Class Z |
| Fidelity Asset Manager 20% | | | | | | |
| October 2022 | 0.00% | 0.00% | 0.00% | 0.00% | 0.00% | 0.00% |
| November 2022 | 10.00% | 11.65% | 16.08% | 8.76% | 9.13% | 8.76% |
| December 2022 | 13.24% | 14.15% | 16.43% | 12.31% | 12.43% | 12.19% |
| February 2023 | 18.72% | 24.96% | 74.87% | 14.98% | 16.64% | 14.98% |
| March 2023 | 17.87% | 20.85% | 28.87% | 15.01% | 15.64% | 15.01% |
| April 2023 | 16.66% | 17.81% | 22.45% | 15.19% | 15.19% | 14.76% |
| May 2023 | 17.52% | 19.12% | 26.28% | 15.02% | 15.58% | 15.02% |
| June 2023 | 17.75% | 19.52% | 26.03% | 15.02% | 15.62% | 15.02% |
| July 2023 | 16.31% | 17.01% | 19.57% | 15.05% | 15.35% | 15.05% |
| August 2023 | 17.04% | 19.36% | 25.05% | 15.21% | 15.21% | 14.69% |
| September 2023 | 17.34% | 18.78% | 23.73% | 15.03% | 15.55% | 15.03% |
| Fidelity Asset Manager 30% | | | | | | |
| October 2022 | 0.00% | 0.00% | 0.00% | 0.00% | 0.00% | 0.00% |
| November 2022 | 16.28% | 20.64% | 32.11% | 13.44% | 15.20% | 13.44% |
| December 2022 | 20.26% | 21.63% | 25.41% | 18.83% | 18.83% | 18.61% |
| February 2023 | 33.47% | 40.16% | 100% | 25.10% | 25.10% | 25.10% |
| March 2023 | 30.59% | 35.69% | 61.17% | 25.19% | 28.55% | 25.19% |
| April 2023 | 28.66% | 31.39% | 43.94% | 25.35% | 25.35% | 25.35% |
| May 2023 | 28.81% | 35.46% | 51.21% | 25.61% | 25.61% | 24.26% |
| June 2023 | 30.28% | 34.94% | 56.77% | 25.23% | 26.72% | 25.23% |
| July 2023 | 27.25% | 28.57% | 32.54% | 25.47% | 26.04% | 25.47% |
| August 2023 | 30.01% | 34.29% | 53.34% | 25.27% | 25.27% | 25.27% |
| September 2023 | 30.32% | 34.98% | 50.53% | 25.27% | 25.27% | 25.27% |
| Fidelity Asset Manager 40% | | | | | | |
| October 2022 | 0.00% | 0.00% | 0.00% | 0.00% | 0.00% | 0.00% |
| December 2022 | 27.89% | 29.87% | 37.93% | 25.12% | 25.63% | 24.87% |
| April 2023 | 57.17% | 67.56% | 100% | 46.45% | 47.44% | 45.50% |
| July 2023 | 52.40% | 58.13% | 75.92% | 46.50% | 47.69% | 45.93% |
| Fidelity Asset Manager 50% | | | | | | |
| October 2022 | 0.00% | 0.00% | 0.00% | 0.00% | 0.00% | 0.00% |
| December 2022 | 34.55% | 37.51% | 47.03% | 31.40% | 31.82% | 30.60% |
| April 2023 | 82.92% | 100% | 100% | 64.01% | 65.15% | 60.81% |
| July 2023 | 73.07% | 82.60% | 100% | 63.86% | 64.95% | 61.78% |
| Fidelity Asset Manager 60% | | | | | | |
| December 2022 | 46.35% | 53.37% | 93.36% | 39.60% | 40.67% | 38.20% |
| Fidelity Asset Manager 70% | | | | | | |
| December 2022 | 57.38% | 67.91% | 100% | 49.48% | 49.98% | 47.59% |
| Fidelity Asset Manager 85% | | | | | | |
| December 2022 | 79.18% | 97.39% | 100% | 67.54% | 68.22% | 64.03% |
A percentage of the dividends distributed during the fiscal year for the following funds qualify as a Section 199A dividend:
| | Class A | Class M | Class C | Retail | Class I | Class Z |
| Fidelity Asset Manager 20% | | | | | | |
| October 2022 | 0.00% | 0.00% | 0.00% | 0.00% | 0.00% | 0.00% |
| November 2022 | 1.14% | 1.33% | 1.84% | 1.00% | 1.04% | 1.00% |
| December 2022 | 1.51% | 1.62% | 1.88% | 1.41% | 1.42% | 1.39% |
| February 2023 | 0.74% | 0.98% | 2.93% | 0.59% | 0.66% | 0.59% |
| March 2023 | 0.70% | 0.82% | 1.13% | 0.59% | 0.62% | 0.59% |
| April 2023 | 0.66% | 0.70% | 0.88% | 0.60% | 0.60% | 0.58% |
| May 2023 | 0.69% | 0.75% | 1.03% | 0.59% | 0.61% | 0.59% |
| June 2023 | 0.70% | 0.77% | 1.02% | 0.59% | 0.62% | 0.59% |
| July 2023 | 0.64% | 0.67% | 0.77% | 0.59% | 0.61% | 0.59% |
| August 2023 | 0.67% | 0.76% | 0.98% | 0.60% | 0.60% | 0.58% |
| September 2023 | 0.68% | 0.74% | 0.93% | 0.59% | 0.61% | 0.59% |
| Fidelity Asset Manager 30% | | | | | | |
| October 2022 | 0.00% | 0.00% | 0.00% | 0.00% | 0.00% | 0.00% |
| November 2022 | 1.42% | 1.81% | 2.81% | 1.18% | 1.33% | 1.18% |
| December 2022 | 1.77% | 1.89% | 2.22% | 1.65% | 1.65% | 1.63% |
| February 2023 | 1.00% | 1.19% | 0.00% | 0.75% | 0.75% | 0.75% |
| March 2023 | 0.90% | 1.05% | 1.80% | 0.74% | 0.84% | 0.74% |
| April 2023 | 0.84% | 0.92% | 1.29% | 0.75% | 0.75% | 0.75% |
| May 2023 | 0.85% | 1.04% | 1.50% | 0.75% | 0.75% | 0.72% |
| June 2023 | 0.89% | 1.03% | 1.67% | 0.74% | 0.79% | 0.74% |
| July 2023 | 0.80% | 0.84% | 0.96% | 0.75% | 0.77% | 0.75% |
| August 2023 | 0.88% | 1.01% | 1.57% | 0.74% | 0.74% | 0.74% |
| September 2023 | 0.89% | 1.03% | 1.48% | 0.74% | 0.74% | 0.74% |
| Fidelity Asset Manager 40% | | | | | | |
| October 2022 | 0.00% | 0.00% | 0.00% | 0.00% | 0.00% | 0.00% |
| December 2022 | 2.13% | 2.28% | 2.89% | 1.92% | 1.96% | 1.90% |
| April 2023 | 1.48% | 1.75% | 0.00% | 1.20% | 1.23% | 1.18% |
| July 2023 | 1.35% | 1.50% | 1.95% | 1.20% | 1.23% | 1.18% |
| Fidelity Asset Manager 50% | | | | | | |
| October 2022 | 0.00% | 0.00% | 0.00% | 0.00% | 0.00% | 0.00% |
| December 2022 | 2.35% | 2.55% | 3.20% | 2.14% | 2.17% | 2.08% |
| April 2023 | 1.80% | 0.00% | 0.00% | 1.39% | 1.42% | 1.32% |
| July 2023 | 1.58% | 1.79% | 0.00% | 1.38% | 1.41% | 1.34% |
| Fidelity Asset Manager 60% | | | | | | |
| December 2022 | 1.53% | 1.76% | 3.08% | 1.31% | 1.35% | 1.26% |
| Fidelity Asset Manager 70% | | | | | | |
| December 2022 | 1.74% | 2.06% | 0.00% | 1.50% | 1.52% | 1.45% |
| Fidelity Asset Manager 85% | | | | | | |
| December 2022 | 2.40% | 2.62% | 0.00% | 2.05% | 2.07% | 1.94% |
The amounts per share which represent income derived from sources within, and taxes paid to, foreign countries or possessions of the United States are as follows:
| | Pay Date | Income | Taxes |
| Fidelity Asset Manager 20% | | | |
| Class A | 02/07/22 | $0.0001 | $0.0000 |
| Class M | 02/07/22 | $0.0000 | $0.0000 |
| Class C | 02/07/22 | $0.0000 | $0.0000 |
| Asset Manager 20% | 02/07/22 | $0.0003 | $0.0000 |
| Class I | 02/07/22 | $0.0002 | $0.0000 |
| Class Z | 02/07/22 | $0.0003 | $0.0000 |
| | | | |
| Class A | 03/07/22 | $0.0002 | $0.0000 |
| Class M | 03/07/22 | $0.0000 | $0.0000 |
| Class C | 03/07/22 | $0.0000 | $0.0000 |
| Asset Manager 20% | 03/07/22 | $0.0004 | $0.0000 |
| Class I | 03/07/22 | $0.0003 | $0.0000 |
| Class Z | 03/07/22 | $0.0004 | $0.0000 |
| | | | |
| Class A | 04/04/22 | $0.0004 | $0.0001 |
| Class M | 04/04/22 | $0.0003 | $0.0001 |
| Class C | 04/04/22 | $0.0001 | $0.0001 |
| Asset Manager 20% | 04/04/22 | $0.0006 | $0.0001 |
| Class I | 04/04/22 | $0.0006 | $0.0001 |
| Class Z | 04/04/22 | $0.0006 | $0.0001 |
| | | | |
| Class A | 05/09/22 | $0.0005 | $0.0001 |
| Class M | 05/09/22 | $0.0004 | $0.0001 |
| Class C | 05/09/22 | $0.0000 | $0.0000 |
| Asset Manager 20% | 05/09/22 | $0.0008 | $0.0001 |
| Class I | 05/09/22 | $0.0007 | $0.0001 |
| Class Z | 05/09/22 | $0.0008 | $0.0001 |
| | | | |
| Class A | 06/06/22 | $0.0003 | $0.0001 |
| Class M | 06/06/22 | $0.0002 | $0.0001 |
| Class C | 06/06/22 | $0.0000 | $0.0000 |
| Asset Manager 20% | 06/06/22 | $0.0005 | $0.0001 |
| Class I | 06/06/22 | $0.0004 | $0.0001 |
| Class Z | 06/06/22 | $0.0005 | $0.0001 |
| | | | |
| Class A | 07/05/22 | $0.0012 | $0.0002 |
| Class M | 07/05/22 | $0.0011 | $0.0002 |
| Class C | 07/05/22 | $0.0008 | $0.0002 |
| Asset Manager 20% | 07/05/22 | $0.0014 | $0.0002 |
| Class I | 07/05/22 | $0.0014 | $0.0002 |
| Class Z | 07/05/22 | $0.0014 | $0.0002 |
| | | | |
| Class A | 08/08/22 | $0.0008 | $0.0001 |
| Class M | 08/08/22 | $0.0007 | $0.0001 |
| Class C | 08/08/22 | $0.0003 | $0.0001 |
| Asset Manager 20% | 08/08/22 | $0.0010 | $0.0001 |
| Class I | 08/08/22 | $0.0010 | $0.0001 |
| Class Z | 08/08/22 | $0.0010 | $0.0001 |
| | | | |
| Class A | 09/06/22 | $0.0008 | $0.0001 |
| Class M | 09/06/22 | $0.0007 | $0.0001 |
| Class C | 09/06/22 | $0.0004 | $0.0001 |
| Asset Manager 20% | 09/06/22 | $0.0010 | $0.0001 |
| Class I | 09/06/22 | $0.0010 | $0.0001 |
| Class Z | 09/06/22 | $0.0010 | $0.0001 |
| | | | |
| Class A | 10/10/22 | $0.0041 | $0.0005 |
| Class M | 10/10/22 | $0.0039 | $0.0005 |
| Class C | 10/10/22 | $0.0037 | $0.0005 |
| Asset Manager 20% | 10/10/22 | $0.0043 | $0.0005 |
| Class I | 10/10/22 | $0.0042 | $0.0005 |
| Class Z | 10/10/22 | $0.0043 | $0.0005 |
| | | | |
| Class A | 11/07/22 | $0.0011 | $0.0001 |
| Class M | 11/07/22 | $0.0009 | $0.0001 |
| Class C | 11/07/22 | $0.0007 | $0.0001 |
| Asset Manager 20% | 11/07/22 | $0.0012 | $0.0001 |
| Class I | 11/07/22 | $0.0012 | $0.0001 |
| Class Z | 11/07/22 | $0.0012 | $0.0001 |
| | | | |
| Class A | 12/30/22 | $0.0047 | $0.0006 |
| Class M | 12/30/22 | $0.0044 | $0.0006 |
| Class C | 12/30/22 | $0.0038 | $0.0006 |
| Asset Manager 20% | 12/30/22 | $0.0050 | $0.0006 |
| Class I | 12/30/22 | $0.0050 | $0.0006 |
| Class Z | 12/30/22 | $0.0051 | $0.0006 |
| | | | |
| Fidelity Asset Manager 30% | | | |
| Class A | 02/07/22 | $0.0001 | $0.0000 |
| Class M | 02/07/22 | $0.0000 | $0.0000 |
| Class C | 02/07/22 | $0.0000 | $0.0000 |
| Asset Manager 30% | 02/07/22 | $0.0004 | $0.0000 |
| Class I | 02/07/22 | $0.0003 | $0.0000 |
| Class Z | 02/07/22 | $0.0004 | $0.0000 |
| | | | |
| Class A | 03/07/22 | $0.0002 | $0.0001 |
| Class M | 03/07/22 | $0.0000 | $0.0000 |
| Class C | 03/07/22 | $0.0000 | $0.0000 |
| Asset Manager 30% | 03/07/22 | $0.0005 | $0.0001 |
| Class I | 03/07/22 | $0.0005 | $0.0001 |
| Class Z | 03/07/22 | $0.0005 | $0.0001 |
| | | | |
| Class A | 04/04/22 | $0.0006 | $0.0001 |
| Class M | 04/04/22 | $0.0005 | $0.0001 |
| Class C | 04/04/22 | $0.0000 | $0.0000 |
| Asset Manager 30% | 04/04/22 | $0.0009 | $0.0001 |
| Class I | 04/04/22 | $0.0008 | $0.0001 |
| Class Z | 04/04/22 | $0.0009 | $0.0001 |
| | | | |
| Class A | 05/09/22 | $0.0006 | $0.0001 |
| Class M | 05/09/22 | $0.0004 | $0.0001 |
| Class C | 05/09/22 | $0.0000 | $0.0000 |
| Asset Manager 30% | 05/09/22 | $0.0009 | $0.0001 |
| Class I | 05/09/22 | $0.0009 | $0.0001 |
| Class Z | 05/09/22 | $0.0009 | $0.0001 |
| | | | |
| Class A | 06/06/22 | $0.0005 | $0.0001 |
| Class M | 06/06/22 | $0.0003 | $0.0001 |
| Class C | 06/06/22 | $0.0000 | $0.0000 |
| Asset Manager 30% | 06/06/22 | $0.0008 | $0.0001 |
| Class I | 06/06/22 | $0.0007 | $0.0001 |
| Class Z | 06/06/22 | $0.0008 | $0.0001 |
| | | | |
| Class A | 07/05/22 | $0.0024 | $0.0003 |
| Class M | 07/05/22 | $0.0022 | $0.0003 |
| Class C | 07/05/22 | $0.0018 | $0.0003 |
| Asset Manager 30% | 07/05/22 | $0.0027 | $0.0003 |
| Class I | 07/05/22 | $0.0026 | $0.0003 |
| Class Z | 07/05/22 | $0.0027 | $0.0003 |
| | | | |
| Class A | 08/08/22 | $0.0008 | $0.0001 |
| Class M | 08/08/22 | $0.0006 | $0.0001 |
| Class C | 08/08/22 | $0.0002 | $0.0001 |
| Asset Manager 30% | 08/08/22 | $0.0011 | $0.0001 |
| Class I | 08/08/22 | $0.0011 | $0.0001 |
| Class Z | 08/08/22 | $0.0012 | $0.0001 |
| | | | |
| Class A | 09/06/22 | $0.0009 | $0.0001 |
| Class M | 09/06/22 | $0.0006 | $0.0001 |
| Class C | 09/06/22 | $0.0003 | $0.0001 |
| Asset Manager 30% | 09/06/22 | $0.0011 | $0.0001 |
| Class I | 09/06/22 | $0.0011 | $0.0001 |
| Class Z | 09/06/22 | $0.0011 | $0.0001 |
| | | | |
| Class A | 10/10/22 | $0.0066 | $0.0009 |
| Class M | 10/10/22 | $0.0064 | $0.0009 |
| Class C | 10/10/22 | $0.0059 | $0.0009 |
| Asset Manager 30% | 10/10/22 | $0.0069 | $0.0009 |
| Class I | 10/10/22 | $0.0068 | $0.0009 |
| Class Z | 10/10/22 | $0.0070 | $0.0009 |
| | | | |
| Class A | 11/07/22 | $0.0013 | $0.0002 |
| Class M | 11/07/22 | $0.0010 | $0.0002 |
| Class C | 11/07/22 | $0.0006 | $0.0002 |
| Asset Manager 30% | 11/07/22 | $0.0015 | $0.0002 |
| Class I | 11/07/22 | $0.0013 | $0.0002 |
| Class Z | 11/07/22 | $0.0015 | $0.0002 |
| | | | |
| Class A | 12/30/22 | $0.0070 | $0.0010 |
| Class M | 12/30/22 | $0.0066 | $0.0010 |
| Class C | 12/30/22 | $0.0056 | $0.0010 |
| Asset Manager 30% | 12/30/22 | $0.0075 | $0.0010 |
| Class I | 12/30/22 | $0.0075 | $0.0010 |
| Class Z | 12/30/22 | $0.0076 | $0.0010 |
| | | | |
| Fidelity Asset Manager 40% | | | |
| Class A | 04/04/22 | $0.0013 | $0.0003 |
| Class M | 04/04/22 | $0.0004 | $0.0003 |
| Class C | 04/04/22 | $0.0000 | $0.0000 |
| Asset Manager 40% | 04/04/22 | $0.0024 | $0.0003 |
| Class I | 04/04/22 | $0.0021 | $0.0003 |
| Class Z | 04/04/22 | $0.0025 | $0.0003 |
| | | | |
| Class A | 07/05/22 | $0.0053 | $0.0009 |
| Class M | 07/05/22 | $0.0043 | $0.0009 |
| Class C | 07/05/22 | $0.0021 | $0.0009 |
| Asset Manager 40% | 07/05/22 | $0.0066 | $0.0009 |
| Class I | 07/05/22 | $0.0063 | $0.0009 |
| Class Z | 07/05/22 | $0.0067 | $0.0009 |
| | | | |
| Class A | 10/10/22 | $0.0130 | $0.0019 |
| Class M | 10/10/22 | $0.0122 | $0.0019 |
| Class C | 10/10/22 | $0.0099 | $0.0019 |
| Asset Manager 40% | 10/10/22 | $0.0143 | $0.0019 |
| Class I | 10/10/22 | $0.0140 | $0.0019 |
| Class Z | 10/10/22 | $0.0144 | $0.0019 |
| | | | |
| Class A | 12/30/22 | $0.0113 | $0.0017 |
| Class M | 12/30/22 | $0.0105 | $0.0017 |
| Class C | 12/30/22 | $0.0083 | $0.0017 |
| Asset Manager 40% | 12/30/22 | $0.0125 | $0.0017 |
| Class I | 12/30/22 | $0.0123 | $0.0017 |
| Class Z | 12/30/22 | $0.0126 | $0.0017 |
| Fidelity Asset Manager 50% | | | |
| Class A | 04/04/22 | $0.0016 | $0.0005 |
| Class M | 04/04/22 | $0.0000 | $0.0000 |
| Class C | 04/04/22 | $0.0000 | $0.0000 |
| Asset Manager 50% | 04/04/22 | $0.0039 | $0.0005 |
| Class I | 04/04/22 | $0.0038 | $0.0005 |
| Class Z | 04/04/22 | $0.0046 | $0.0005 |
| | | | |
| Class A | 07/05/22 | $0.0109 | $0.0018 |
| Class M | 07/05/22 | $0.0089 | $0.0018 |
| Class C | 07/05/22 | $0.0042 | $0.0018 |
| Asset Manager 50% | 07/05/22 | $0.0132 | $0.0018 |
| Class I | 07/05/22 | $0.0131 | $0.0018 |
| Class Z | 07/05/22 | $0.0139 | $0.0018 |
| | | | |
| Class A | 10/10/22 | $0.0262 | $0.0038 |
| Class M | 10/10/22 | $0.0241 | $0.0038 |
| Class C | 10/10/22 | $0.0196 | $0.0038 |
| Asset Manager 50% | 10/10/22 | $0.0287 | $0.0038 |
| Class I | 10/10/22 | $0.0283 | $0.0038 |
| Class Z | 10/10/22 | $0.0295 | $0.0038 |
| | | | |
| Class A | 12/30/22 | $0.0234 | $0.0035 |
| Class M | 12/30/22 | $0.0216 | $0.0035 |
| Class C | 12/30/22 | $0.0172 | $0.0035 |
| Asset Manager 50% | 12/30/22 | $0.0258 | $0.0035 |
| Class I | 12/30/22 | $0.0254 | $0.0035 |
| Class Z | 12/30/22 | $0.0264 | $0.0035 |
| Fidelity Asset Manager 60% | | | |
| Class A | 12/30/22 | $0.0524 | $0.0081 |
| Class M | 12/30/22 | $0.0455 | $0.0081 |
| Class C | 12/30/22 | $0.0260 | $0.0081 |
| Asset Manager 60% | 12/30/22 | $0.0614 | $0.0081 |
| Class I | 12/30/22 | $0.0597 | $0.0081 |
| Class Z | 12/30/22 | $0.0636 | $0.0081 |
| Fidelity Asset Manager 70% | | | |
| Class A | 12/30/22 | $0.1114 | $0.0173 |
| Class M | 12/30/22 | $0.0942 | $0.0173 |
| Class C | 12/30/22 | $0.0609 | $0.0173 |
| Asset Manager 70% | 12/30/22 | $0.1292 | $0.0173 |
| Class I | 12/30/22 | $0.1279 | $0.0173 |
| Class Z | 12/30/22 | $0.1344 | $0.0173 |
| Fidelity Asset Manager 85% | | | |
| Class A | 12/30/22 | $0.1239 | $0.0193 |
| Class M | 12/30/22 | $0.1007 | $0.0193 |
| Class C | 12/30/22 | $0.0605 | $0.0193 |
| Asset Manager 85% | 12/30/22 | $0.1452 | $0.0193 |
| Class I | 12/30/22 | $0.1438 | $0.0193 |
| Class Z | 12/30/22 | $0.1532 | $0.0193 |
The funds will notify shareholders in January 2024 of amounts for use in preparing 2023 income tax returns.
Board Approval of Investment Advisory Contracts and Management Fees
Fidelity Asset Manager 20%
Fidelity Asset Manager 30%
Fidelity Asset Manager 40%
Fidelity Asset Manager 50%
Fidelity Asset Manager 60%
Fidelity Asset Manager 70%
Fidelity Asset Manager 85%
Each year, the Board of Trustees, including the Independent Trustees (together, the Board), considers the renewal of each fund's management contract with Fidelity Management & Research Company LLC (FMR) and the sub-advisory agreements (together, the Advisory Contracts) for each fund. FMR and the sub-advisers are referred to herein as the Investment Advisers. The Board, assisted by the advice of fund counsel and Independent Trustees' counsel, requests and considers a broad range of information relevant to the renewal of the Advisory Contracts throughout the year.
The Board meets regularly and, at each of its meetings, covers an extensive agenda of topics and materials and considers factors that are relevant to its annual consideration of the renewal of each fund's Advisory Contracts, including the services and support provided to each fund and its shareholders. The Board's Operations Committee, of which all the Independent Trustees are members, meets regularly throughout the year and requests, receives and considers, among other matters, information related to the annual consideration of the renewal of each fund's Advisory Contracts before making its recommendation to the Board. The Board also meets as needed to review matters specifically related to the Board's annual consideration of the renewal of the Advisory Contracts. Members of the Board may also meet from time to time with trustees of other Fidelity funds through joint ad hoc committees to discuss certain matters relevant to all of the Fidelity funds.
At its September 2023 meeting, the Board unanimously determined to renew each fund's Advisory Contracts. In reaching its determination, the Board considered all factors it believed relevant, including (i) the nature, extent, and quality of the services provided to each fund and its shareholders (including the investment performance of each fund); (ii) the competitiveness relative to peer funds of each fund's management fee and the total expense ratio of a representative class (the retail class, which was selected because it was the largest class without 12b-1 fees in 2022); (iii) the total costs of the services provided by and the profits realized by FMR and its affiliates (Fidelity) from its relationships with each fund; and (iv) the extent to which, if any, economies of scale exist and are realized as each fund grows, and whether any economies of scale are appropriately shared with fund shareholders. The Board also considered the broad range of investment choices available to shareholders from FMR's competitors and that each fund's shareholders have chosen to invest in that fund, which is part of the Fidelity family of funds. The Board's decision to renew the Advisory Contracts was not based on any single factor.
The Board reached a determination, with the assistance of fund counsel and Independent Trustees' counsel and through the exercise of its business judgment, that the renewal of the Advisory Contracts was in the best interests of each fund and its shareholders and that the compensation payable under the Advisory Contracts was fair and reasonable in light of all of the surrounding circumstances.
Nature, Extent, and Quality of Services Provided. The Board considered the Investment Advisers' staffing as it relates to the funds, including the backgrounds and experience of investment personnel, and also considered the Investment Advisers' implementation of each fund's investment program. The Independent Trustees also had discussions with senior management of Fidelity's investment operations and investment groups. The Board considered the structure of the investment personnel compensation program and whether this structure provides appropriate incentives to act in the best interests of each fund. Additionally, the Board considered the portfolio managers' investments, if any, in the funds that they manage.
Resources Dedicated to Investment Management and Support Services. The Board reviewed the general qualifications and capabilities of Fidelity's investment staff, including its size, education, experience, and resources, as well as Fidelity's approach to recruiting, training, managing, and compensating investment personnel. The Board noted the resources devoted to Fidelity's global investment organization, and that Fidelity's analysts have extensive resources, tools and capabilities that allow them to conduct quantitative and fundamental analysis, as well as credit analysis of issuers, counterparties and guarantors. Further, the Board considered that Fidelity's investment professionals have sufficient access to global information and data so as to provide competitive investment results over time, and that those professionals also have access to sophisticated tools that permit them to assess portfolio construction and risk and performance attribution characteristics continuously, as well as to transmit new information and research conclusions rapidly around the world. Additionally, in its deliberations, the Board considered Fidelity's trading, risk management, compliance, cybersecurity, and technology and operations capabilities and resources, which are integral parts of the investment management process.
Shareholder and Administrative Services. The Board considered (i) the nature, extent, quality, and cost of advisory, administrative, and shareholder services performed by the Investment Advisers and their affiliates under the Advisory Contracts and under separate agreements covering transfer agency, pricing and bookkeeping, and securities lending services for each fund; (ii) the nature and extent of Fidelity's supervision of third party service providers, principally custodians, subcustodians, and pricing vendors; and (iii) the resources devoted by Fidelity to, and the record of compliance with, each fund's compliance policies and procedures. The Board also reviewed the allocation of fund brokerage, including allocations to brokers affiliated with the Investment Advisers, the use of brokerage commissions to pay fund expenses, and the use of "soft" commission dollars to pay for research services. The Board also considered each fund's securities lending activities and any payments made to Fidelity relating to securities lending.
The Board noted that the growth of fund assets over time across the complex allows Fidelity to reinvest in the development of services designed to enhance the value and convenience of the Fidelity funds as investment vehicles. These services include 24-hour access to account information and market information over the Internet and through telephone representatives, investor education materials and asset allocation tools. The Board also considered that it reviews customer service metrics such as telephone response times, continuity of services on the website and metrics addressing services at Fidelity Investor Centers.
Investment in a Large Fund Family. The Board considered the benefits to shareholders of investing in a fund that is part of a large family of funds offering a variety of investment disciplines and providing a large variety of fund investor services. The Board noted that Fidelity had taken, or had made recommendations to the Board that resulted in the Fidelity funds taking, a number of actions over the previous year that benefited particular funds and/or the Fidelity funds in general.
Investment Performance. The Board took into account discussions that occur with representatives of the Investment Advisers, and reports that it receives, at Board meetings throughout the year relating to fund investment performance. In this regard the Board noted that as part of regularly scheduled fund reviews and other reports to the Board on fund performance, the Board considered annualized return information for each fund for different time periods, measured against one or more appropriate securities market indices, including a customized blended index that reflects the respective weights of the fund's asset classes (each a benchmark index) and an appropriate peer group of funds with similar objectives (peer group). The Board also considered information about performance attribution. In its evaluation of fund investment performance at meetings throughout the year, the Board gave particular attention to information indicating underperformance of certain Fidelity funds over different time periods and discussed with the Investment Advisers the reasons for such underperformance.
In addition to reviewing absolute and relative fund performance, the Independent Trustees periodically consider the appropriateness of fund performance metrics in evaluating the results achieved. The Independent Trustees generally give greater weight to fund performance over longer time periods than over shorter time periods. Depending on the circumstances, the Independent Trustees may be satisfied with a fund's performance notwithstanding that it lags its benchmark index or peer group for certain periods.
Based on its review, the Board concluded that the nature, extent, and quality of services provided to each fund under the Advisory Contracts should continue to benefit the shareholders of each fund.
Competitiveness of Management Fee and Total Expense Ratio. The Board was provided with information regarding industry trends in management fees and expenses. In its review of each fund's management fee and total expense ratio of the retail class of each fund, the Board considered each fund's management fee rate as well as other fund or class expenses, as applicable, such as transfer agent fees, pricing and bookkeeping fees, fund-paid 12b-1 fees, and custodial, legal, and audit fees. The Board also noted that Fidelity may agree to waive fees or reimburse expenses from time to time, and the extent to which, if any, it has done so for each fund.
Comparisons of Management Fees and Total Expense Ratios. Among other things, the Board reviewed data for selected groups of competitive funds and classes (referred to as "mapped groups") that were compiled by Fidelity based on combining similar investment objective categories (as classified by Lipper) that have comparable investment mandates. The data reviewed by the Board included (i) gross management fee comparisons (before taking into account expense reimbursements or caps) relative to the total universe of funds within the mapped group; (ii) gross management fee comparisons relative to a subset of non-Fidelity funds in the mapped group that are similar in size and management fee structure to each fund (referred to as the "asset size peer group"); (iii) total expense comparisons of the retail class of each fund relative to funds and classes in the mapped group that have a similar sales load structure to the retail class of each fund (referred to as the "similar sales load structure group"); and (iv) total expense comparisons of the retail class of each fund relative to funds and classes in the similar sales load structure group that are similar in size and management fee structure to each fund (referred to as the "total expense asset size peer group").
The information provided to the Board indicated that each fund's management fee rate ranked below the competitive median of the mapped group for 2022 and below the competitive median of the asset size peer group for 2022. Further, the information provided to the Board indicated that the total expense ratio of each fund's retail class ranked below or equal to the competitive median of the similar sales load structure group for 2022 and below the competitive median of the total expense asset size peer group for 2022.
The Board considered information about the reasons that Class M of certain funds was in the 4th quartile for total expense ratio comparisons. The Board also considered that the total expenses for Class M of each fund (except Fidelity Asset Manager 50%) ranked in the 4th quartile of the similar sales load structure group. The Board noted that Class M has a 0.50% 12b-1 fee, which is higher than the 12b-1 fee for most front-end load classes. The Board further noted that Class M shares, purchasers of which may be subject to a front-end sales load, are primarily distributed on a load-waived basis through retirement plans and intermediary wrap products that qualify for a sales charge waiver. The Board also noted that, in the retirement plan market, Class M's 0.50% 12b-1 fee is comparable to competing Class R shares, which Lipper classifies as institutional load. The Board considered that, when compared against classes with a 0.50% 12b-1 fee, regardless of load, the total expenses ratios of Class M shares of each fund ranked below or equal to its respective competitive median.
Fees Charged to Other Fidelity Clients. The Board also considered Fidelity fee structures and other information with respect to clients of Fidelity, such as other funds advised or subadvised by Fidelity, pension plan clients, and other institutional clients with similar mandates. The Board noted that a joint ad hoc committee created by it and the boards of other Fidelity funds periodically reviews and compares Fidelity's institutional investment advisory business with its business of providing services to the Fidelity funds and also noted the most recent findings of the committee. The Board noted that the committee's review included a consideration of the differences in services provided, fees charged, and costs incurred, as well as competition in the markets serving the different categories of clients.
Based on its review, the Board concluded that each fund's management fee is fair and reasonable in light of the services that the fund receives and the other factors considered. Further, based on its review of total expense ratios and fees charged to other Fidelity clients, the Board concluded that the total expense ratio of each class of each fund was reasonable in light of the services that the fund and its shareholders receive and the other factors considered.
Costs of the Services and Profitability. The Board considered the revenues earned and the expenses incurred by Fidelity in conducting the business of developing, marketing, distributing, managing, administering and servicing each fund and servicing each fund's shareholders. The Board also considered the level of Fidelity's profits in respect of all the Fidelity funds.
On an annual basis, Fidelity presents to the Board information about the profitability of its relationships with each fund. Fidelity calculates profitability information for each fund, as well as aggregate profitability information for groups of Fidelity funds and all Fidelity funds, using a series of detailed revenue and cost allocation methodologies which originate with the books and records of Fidelity on which Fidelity's audited financial statements are based. The Audit Committee of the Board reviews any significant changes from the prior year's methodologies and the full Board approves such changes.
A public accounting firm has been engaged annually by the Board as part of the Board's assessment of Fidelity's profitability analysis. The engagement includes the review and assessment of the methodologies used by Fidelity in determining the revenues and expenses attributable to Fidelity's fund business, and completion of agreed-upon procedures in respect of the mathematical accuracy of certain fund profitability information and its conformity to established allocation methodologies. After considering the reports issued under the engagement and information provided by Fidelity, the Board concluded that while other allocation methods may also be reasonable, Fidelity's profitability methodologies are reasonable in all material respects.
The Board also reviewed Fidelity's non-fund businesses and potential indirect benefits such businesses may have received as a result of their association with Fidelity's fund business (i.e., fall-out benefits) as well as cases where Fidelity's affiliates may benefit from the funds' business. The Board considered areas where potential indirect benefits to the Fidelity funds from their relationships with Fidelity may exist. The Board's consideration of these matters was informed by the findings of a joint ad hoc committee created by it and the boards of other Fidelity funds to evaluate potential fall-out benefits.
The Board considered the costs of the services provided by and the profits realized by Fidelity in connection with the operation of each fund and was satisfied that the profitability was not excessive.
Economies of Scale. The Board considered whether there have been economies of scale in respect of the management of the Fidelity funds, whether the Fidelity funds (including each fund) have appropriately benefited from any such economies of scale, and whether there is potential for realization of any further economies of scale. The Board considered the extent to which each fund will benefit from economies of scale as assets grow through increased services to the fund, through waivers or reimbursements, or through fee or expense ratio reductions. The Board also noted that a committee created by it and the boards of other Fidelity funds periodically analyzes whether Fidelity attains economies of scale in respect of the management and servicing of the Fidelity funds, whether the Fidelity funds have appropriately benefited from such economies of scale, and whether there is potential for realization of any further economies of scale.
The Board recognized that each fund's management contract incorporates a "group fee" structure, which provides for lower group fee rates as total "group assets" increase, and for higher group fee rates as total "group assets" decrease ("group assets" as defined in the management contract). FMR calculates the group fee rates based on a tiered asset "breakpoint" schedule that varies based on asset class. The Board considered that the group fee is designed to deliver the benefits of economies of scale to fund shareholders when total Fidelity fund assets increase, even if assets of any particular fund are unchanged or have declined, because some portion of Fidelity's costs are attributable to services provided to all Fidelity funds, and all funds benefit if those costs can be allocated among more assets. The Board also considered that Fidelity agreed to impose a temporary fee waiver in the form of additional breakpoints to the current breakpoint schedule. The Board concluded that, given the group fee structure, fund shareholders will benefit from lower management fees as "group assets" increase at the fund complex level, regardless of whether Fidelity achieves any such economies of scale.
The Board concluded, taking into account the analysis of the committee, that economies of scale, if any, are being appropriately shared between fund shareholders and Fidelity.
Additional Information Requested by the Board. In order to develop fully the factual basis for consideration of the Fidelity funds' advisory contracts, the Board requested and received additional information on certain topics, including: (i) Fidelity's fund profitability methodology, profitability trends for certain funds, the allocation of various costs to different funds, and the impact of certain factors on fund profitability results; (ii) portfolio manager changes that have occurred during the past year and Fidelity's views regarding portfolio manager investment in the Fidelity funds that they manage; (iii) hiring, training, and retaining personnel; (iv) the arrangements with and compensation paid to certain fund sub-advisers and the treatment of such compensation within Fidelity's fund profitability methodology; (v) the terms of the funds' various management fee structures, including the basic group fee and the terms of Fidelity's voluntary expense limitation arrangements; (vi) Fidelity's transfer agent, pricing and bookkeeping fees, expense and service structures for different funds and classes relative to competitive trends and market conditions; (vii) the impact on fund profitability of recent industry trends, such as the growth in passively managed funds and the changes in flows for different types of funds; (viii) the types of management fee and total expense comparisons provided, and the challenges and limitations associated with such information; (ix) explanations regarding the relative total expense ratios and management fees of certain funds and classes, total expense and management fee competitive trends, and methodologies for total expense and management fee competitive comparisons; (x) information concerning expense limitations applicable to certain funds; and (xi) matters related to money market funds, exchange-traded funds, and target date funds.
Conclusion. Based on its evaluation of all of the conclusions noted above, and after considering all factors it believed relevant, the Board, including the Independent Trustees, concluded that the advisory and sub-advisory fee arrangements are fair and reasonable in light of all of the surrounding circumstances and that each fund's Advisory Contracts should be renewed through September 30, 2024.
1.878277.115
AR-ANN-1123
Fidelity® Health Savings Fund
Annual Report
September 30, 2023
Contents
To view a fund's proxy voting guidelines and proxy voting record for the 12-month period ended June 30, visit http://www.fidelity.com/proxyvotingresults or visit the Securities and Exchange Commission's (SEC) web site at http://www.sec.gov.
You may also call 1-800-544-8544 if you're an individual investing directly with Fidelity, call 1-800-835-5092 if you're a plan sponsor or participant with Fidelity as your recordkeeper or call 1-877-208-0098 on institutional accounts or if you're an advisor or invest through one to request a free copy of the proxy voting guidelines.
Standard & Poor's, S&P and S&P 500 are registered service marks of The McGraw-Hill Companies, Inc. and have been licensed for use by Fidelity Distributors Corporation.
Other third-party marks appearing herein are the property of their respective owners.
All other marks appearing herein are registered or unregistered trademarks or service marks of FMR LLC or an affiliated company. © 2023 FMR LLC. All rights reserved.
This report and the financial statements contained herein are submitted for the general information of the shareholders of the Fund. This report is not authorized for distribution to prospective investors in the Fund unless preceded or accompanied by an effective prospectus.
A fund files its complete schedule of portfolio holdings with the SEC for the first and third quarters of each fiscal year on Form N-PORT. Forms N-PORT are available on the SEC's web site at http://www.sec.gov. A fund's Forms N-PORT may be reviewed and copied at the SEC's Public Reference Room in Washington, DC. Information regarding the operation of the SEC's Public Reference Room may be obtained by calling 1-800-SEC-0330.
For a complete list of a fund's portfolio holdings, view the most recent holdings listing, semiannual report, or annual report on Fidelity's web site at http://www.fidelity.com, http://www.institutional.fidelity.com, or http://www.401k.com, as applicable.
NOT FDIC INSURED •MAY LOSE VALUE •NO BANK GUARANTEE
Neither the Fund nor Fidelity Distributors Corporation is a bank.
Average annual total return reflects the change in the value of an investment, assuming reinvestment of distributions from dividend income and capital gains (the profits earned upon the sale of securities that have grown in value, if any) and assuming a constant rate of performance each year. The hypothetical investment and the average annual total returns do not reflect the deduction of taxes that a shareholder would pay on fund distributions or the redemption of fund shares. During periods of reimbursement by Fidelity, a fund's total return will be greater than it would be had the reimbursement not occurred. How a fund did yesterday is no guarantee of how it will do tomorrow.
| Average Annual Total Returns |
| | | | |
Periods ended September 30, 2023 | Past 1 year | Life of Fund A |
| Fidelity® Health Savings Fund | 5.36% | 0.43% |
| Class K | 5.36% | 0.50% |
A From March 2, 2020
| $10,000 Over Life of Fund |
| |
Let's say hypothetically that $10,000 was invested in Fidelity® Health Savings Fund, a class of the fund, on March 2, 2020, when the fund started. The chart shows how the value of your investment would have changed, and also shows how the Bloomberg U.S. Aggregate Bond Index performed over the same period. |
|
|
Market Recap:
For the 12 months ending September 30, 2023, continued global economic expansion and a slowing in the pace of inflation contributed to a favorable backdrop for risk assets. After struggling throughout much of 2022, risk assets strongly rebounded the past 12 months, with U.S. large-cap stocks leading the way. In the U.S., the upturn was driven partly by a narrow set of companies in the information technology and communication services sectors amid excitement for generative artificial intelligence. Meanwhile, monetary tightening by the U.S. Federal Reserve and other central banks continued amid elevated inflation. U.S. stocks gained 20.49% for the 12 months, as measured by the Dow Jones U.S. Total Stock Market Index, as all but two sectors rose. Information technology (+41%), communication services (+35%) and energy (+29%) led by the widest margin. Conversely, utilities (-7%) and real estate (-1%) lagged most. Growth stocks broadly outpaced value, while larger-caps topped small-caps. Commodities returned -1.30%, according to the Bloomberg Commodity Index Total Return. Looking abroad, international equities rose 20.60% for the 12 months, according to the MSCI ACWI (All Country World Index) ex USA Index. All regions gained, with Europe ex U.K. (+31%) leading the way. Japan (+26%) and the U.K. (+25%) also outperformed, whereas Asia Pacific ex Japan (+11%) lagged by the widest margin. Each of the 11 sectors advanced, with information technology (+30%), industrials (+29%) and energy (+28%) being the top performers. Conversely, real estate (+5%) lagged most, followed by consumer staples (+9%). As for fixed income, U.S. taxable investment-grade bonds returned 0.64% for the 12 months, per the Bloomberg U.S. Aggregate Bond Index, amid elevated inflation and rising interest rates. Since March 2022, the Fed has hiked its benchmark interest rate 11 times, by 5.25 percentage points, while allowing up to billions in bonds to mature each month without investing the proceeds. Short-term U.S. Treasuries (+4.58%) topped U.S. investment-grade corporate bonds (+3.47%), while commercial mortgage-backed securities returned (+1.19%) and agencies gained (+2.10%). Outside the index, leveraged loans (+13.39%), U.S. high-yield bonds (+8.24%) and emerging-markets debt (+8.61%) rose, whereas Treasury Inflation-Protected Securities (+1.25%) experienced a modest gain.
Comments from Co-Managers Avishek Hazrachoudhury and Hongshu Chen:
For the fiscal year ending September 30, 2023, the fund's share classes (excluding sales charges, if applicable) rose about 5%, trailing both the 7.35% gain of the benchmark Fidelity Health Savings Composite Index and the 6.69% return of the Fidelity Health Savings Extended Composite Index. (The Extended Composite Index represents the fund's strategic allocation.) Looking back over the past 12 months, security selection aided relative performance while asset class positioning detracted. The fund's core equity allocation strategy hampered performance versus the Extended Composite benchmark. Underweighting U.S. equities hurt due to the strong performance of domestic stocks. Additionally, the timing of adjustments made during the year worked against the fund's overweight in international developed-markets (DM) stocks. Out-of-benchmark exposure to commodity-related securities also hampered the portfolio's relative result. Fixed-income allocations substantially contributed on a relative basis. Underweighting investment-grade (IG) bonds and cash proved advantageous and more than offset a poor result from the fund's allocation to long-term U.S. Treasuries. As for security selection, IG bonds and emerging-markets (EM) debt added the most value for the period. As of period end, the fund was underweight large-cap U.S. stocks and overweight international DM and EM equities. In fixed income, the fund's allocations to U.S. and international IG bonds were notably below the portfolio's target weightings. The fund was slightly overweight in EM debt.
Note to shareholders: On May 1, 2023, Hongshu Chen assumed co-management responsibilities for the fund, succeeding Geoff Stein.
The views expressed above reflect those of the portfolio manager(s) only through the end of the period as stated on the cover of this report and do not necessarily represent the views of Fidelity or any other person in the Fidelity organization. Any such views are subject to change at any time based upon market or other conditions and Fidelity disclaims any responsibility to update such views. These views may not be relied on as investment advice and, because investment decisions for a Fidelity fund are based on numerous factors, may not be relied on as an indication of trading intent on behalf of any Fidelity fund.
The information in the following tables is based on the combined Investments of the Fund and it's pro-rata share of investments in Fidelity's Central Funds, other than the Commodity Strategy and Money Market Central Funds.
Top Holdings (% of Fund's net assets) |
| |
| Fidelity International Bond Index Fund | 18.3 | |
| Fidelity Long-Term Treasury Bond Index Fund | 9.9 | |
| Microsoft Corp. | 1.1 | |
| Apple, Inc. | 0.9 | |
| iShares MSCI USA Minimum Volatility ETF | 0.8 | |
| Alphabet, Inc. Class A | 0.7 | |
| Amazon.com, Inc. | 0.6 | |
| Taiwan Semiconductor Manufacturing Co. Ltd. | 0.4 | |
| Exxon Mobil Corp. | 0.3 | |
| AstraZeneca PLC (United Kingdom) | 0.3 | |
| | 33.3 | |
| |
| Market Sectors (% of Fund's net assets) |
| |
| Financials | 9.7 | |
| Information Technology | 6.4 | |
| Industrials | 4.9 | |
| Consumer Discretionary | 3.8 | |
| Health Care | 3.4 | |
| Energy | 3.4 | |
| Communication Services | 3.1 | |
| Consumer Staples | 1.9 | |
| Materials | 1.6 | |
| Real Estate | 0.9 | |
| Utilities | 0.8 | |
| |
Quality Diversification (% of Fund's net assets) |
|
Equities percentage includes investment in Fidelity Commodity Strategy Central Fund - 0.3% |
Percentages shown as 0.0% may reflect amounts less than 0.05%. |
| |
| We have used ratings from Moody's Investors Service, Inc. Where Moody's® ratings are not available, we have used S&P® ratings. All ratings are as of the date indicated and do not reflect subsequent changes. |
Asset Allocation (% of Fund's net assets) |
|
Written options - (0.1)% |
Futures and Swaps - 0.8% |
|
Geographic Diversification (% of Fund's net assets) |
|
* Includes Short-Term investments and Net Other Assets (Liabilities). Percentages are adjusted for the effect of derivatives, if applicable. |
| |
An unaudited holdings list for the Fund, which presents direct holdings as well as the pro-rata share of any securities and other investments held indirectly through its investment in underlying Fidelity Central Funds, other than the Commodity Strategy and Money Market Central Funds, is available at fidelity.com and/or institutional.fidelity.com, as applicable.
Showing Percentage of Net Assets
| Equity Central Funds - 31.1% |
| | | Shares | Value ($) |
| Fidelity Commodity Strategy Central Fund (a) | | 1,468 | 138,602 |
| Fidelity Emerging Markets Equity Central Fund (a) | | 13,699 | 2,572,834 |
| Fidelity Hedged Equity Central Fund (a) | | 3,852 | 399,573 |
| Fidelity International Equity Central Fund (a) | | 62,683 | 5,542,430 |
| Fidelity Real Estate Equity Central Fund (a) | | 1,150 | 128,807 |
| Fidelity U.S. Equity Central Fund (a) | | 68,207 | 7,931,771 |
| TOTAL EQUITY CENTRAL FUNDS (Cost $16,818,140) | | | 16,714,017 |
| | | | |
| Fixed-Income Central Funds - 37.7% |
| | | Shares | Value ($) |
| High Yield Fixed-Income Funds - 10.4% | | | |
| Fidelity Emerging Markets Debt Central Fund (a) | | 663,642 | 4,871,134 |
| Fidelity Emerging Markets Debt Local Currency Central Fund (a) | | 3,053 | 270,192 |
| Fidelity Floating Rate Central Fund (a) | | 2,868 | 281,092 |
| Fidelity High Income Central Fund (a) | | 1,372 | 138,719 |
TOTAL HIGH YIELD FIXED-INCOME FUNDS | | | 5,561,137 |
| Investment Grade Fixed-Income Funds - 27.3% | | | |
| Fidelity Inflation-Protected Bond Index Central Fund (a) | | 73,240 | 6,445,140 |
| Fidelity Investment Grade Bond Central Fund (a) | | 87,905 | 8,228,829 |
TOTAL INVESTMENT GRADE FIXED-INCOME FUNDS | | | 14,673,969 |
| TOTAL FIXED-INCOME CENTRAL FUNDS (Cost $22,389,088) | | | 20,235,106 |
| | | | |
| Money Market Central Funds - 2.2% |
| | | Shares | Value ($) |
Fidelity Cash Central Fund 5.39% (b) (Cost $1,202,805) | | 1,202,564 | 1,202,805 |
| | | | |
| U.S. Treasury Obligations - 0.0% |
| | | Principal Amount (c) | Value ($) |
U.S. Treasury Bills, yield at date of purchase 5.35% 10/26/23 (d) (Cost $19,927) | | 20,000 | 19,930 |
| | | | |
| Investment Companies - 0.8% |
| | | Shares | Value ($) |
iShares MSCI USA Minimum Volatility ETF (Cost $409,643) | | 5,542 | 401,130 |
| | | | |
| Fixed-Income Funds - 28.2% |
| | | Shares | Value ($) |
| Fidelity International Bond Index Fund (e) | | 1,107,643 | 9,835,871 |
| Fidelity Long-Term Treasury Bond Index Fund (e) | | 580,629 | 5,289,526 |
| TOTAL FIXED-INCOME FUNDS (Cost $17,205,769) | | | 15,125,397 |
| | | | |
| TOTAL INVESTMENT IN SECURITIES - 100.0% (Cost $58,045,372) | 53,698,385 |
NET OTHER ASSETS (LIABILITIES) - 0.0% | (1,885) |
| NET ASSETS - 100.0% | 53,696,500 |
| | |
| Futures Contracts |
| | Number of contracts | Expiration Date | Notional Amount ($) | Value ($) | Unrealized Appreciation/ (Depreciation) ($) |
| Purchased | | | | | |
| | | | | | |
| Treasury Contracts | | | | | |
| CBOT 5-Year U.S. Treasury Note Contracts (United States) | 3 | Dec 2023 | 316,078 | (2,020) | (2,020) |
| | | | | | |
| The notional amount of futures purchased as a percentage of Net Assets is 0.6% |
Security Type Abbreviations
Legend
| (a) | Affiliated fund that is generally available only to investment companies and other accounts managed by Fidelity Investments. A complete unaudited schedule of portfolio holdings for each Fidelity Central Fund is filed with the SEC for the first and third quarters of each fiscal year on Form N-PORT and is available upon request or at the SEC's website at www.sec.gov. An unaudited holdings listing for the Fund, which presents direct holdings as well as the pro-rata share of securities and other investments held indirectly through its investment in underlying non-money market Fidelity Central Funds, other than the Commodity Strategy Central Fund, is available at fidelity.com and/or institutional.fidelity.com, as applicable. In addition, each Fidelity Central Fund's financial statements,which are not covered by the Fund's Report of Independent Registered Public Accounting Firm, are available on the SEC's website or upon request. |
| (b) | Affiliated fund that is generally available only to investment companies and other accounts managed by Fidelity Investments. The rate quoted is the annualized seven-day yield of the fund at period end. A complete unaudited listing of the fund's holdings as of its most recent quarter end is available upon request. In addition, each Fidelity Central Fund's financial statements, which are not covered by the Fund's Report of Independent Registered Public Accounting Firm, are available on the SEC's website or upon request. |
| (c) | Amount is stated in United States dollars unless otherwise noted. |
| (d) | Security or a portion of the security was pledged to cover margin requirements for futures contracts. At period end, the value of securities pledged amounted to $19,930. |
Affiliated Central Funds
Fiscal year to date information regarding the Fund's investments in Fidelity Central Funds, including the ownership percentage, is presented below.
| Affiliate | Value, beginning of period ($) | Purchases ($) | Sales Proceeds ($) | Dividend Income ($) | Realized Gain (loss) ($) | Change in Unrealized appreciation (depreciation) ($) | Value, end of period ($) | % ownership, end of period |
| Fidelity Cash Central Fund 5.39% | 11,079 | 3,815,576 | 2,623,850 | 15,507 | - | - | 1,202,805 | 0.0% |
| Fidelity Commodity Strategy Central Fund | 908,745 | 336,720 | 1,047,024 | 16,309 | (249,200) | 189,361 | 138,602 | 0.1% |
| Fidelity Emerging Markets Debt Central Fund | 3,768,817 | 1,484,661 | 460,508 | 271,686 | (47,742) | 125,906 | 4,871,134 | 0.2% |
| Fidelity Emerging Markets Debt Local Currency Central Fund | 93,400 | 527,309 | 372,000 | 309 | (1,818) | 23,301 | 270,192 | 0.1% |
| Fidelity Emerging Markets Equity Central Fund | 1,110,376 | 1,852,341 | 458,992 | 61,056 | (82,723) | 151,832 | 2,572,834 | 0.1% |
| Fidelity Floating Rate Central Fund | 1,232,257 | 579,011 | 1,557,292 | 76,990 | (50,224) | 77,340 | 281,092 | 0.0% |
| Fidelity Hedged Equity Central Fund | - | 429,958 | 31,000 | 72 | 472 | 143 | 399,573 | 0.1% |
| Fidelity High Income Central Fund | 463,947 | 282,842 | 626,835 | 27,838 | (25,994) | 44,759 | 138,719 | 0.0% |
| Fidelity Inflation-Protected Bond Index Central Fund | 5,315,270 | 3,722,837 | 2,073,291 | 641,523 | (438,516) | (81,160) | 6,445,140 | 1.5% |
| Fidelity International Equity Central Fund | 1,556,314 | 4,551,570 | 888,589 | 95,408 | 14,565 | 308,570 | 5,542,430 | 0.1% |
| Fidelity Investment Grade Bond Central Fund | 5,612,806 | 6,448,343 | 3,544,863 | 303,794 | (436,452) | 148,995 | 8,228,829 | 0.0% |
| Fidelity Real Estate Equity Central Fund | 273,025 | 197,958 | 353,745 | 7,040 | (6,260) | 17,829 | 128,807 | 0.0% |
| Fidelity Securities Lending Cash Central Fund 5.39% | - | 1,496,971 | 1,496,971 | 30 | - | - | - | 0.0% |
| Fidelity U.S. Equity Central Fund | 6,922,099 | 3,474,774 | 3,624,746 | 191,205 | (247,590) | 1,407,234 | 7,931,771 | 0.1% |
| Total | 27,268,135 | 29,200,871 | 19,159,706 | 1,708,767 | (1,571,482) | 2,414,110 | 38,151,928 | |
| | | | | | | | | |
Amounts in the dividend income column in the above table include any capital gain distributions from underlying funds, which are presented in the corresponding line item in the Statement of Operations, if applicable.
Amounts in the dividend income column for Fidelity Securities Lending Cash Central Fund represents the income earned on investing cash collateral, less rebates paid to borrowers and any lending agent fees associated with the loan, plus any premium payments received for lending certain types of securities.
Amounts included in the purchases and sales proceeds columns may include in-kind transactions, if applicable.
Affiliated Underlying Funds
Fiscal year to date information regarding the Fund's investments in affiliated Underlying Funds is presented below. Exchanges between classes of the same affiliated Underlying Funds may occur. If an Underlying Funds changes its name, the name presented below is the name in effect at period end.
| Affiliate | Value, beginning of period ($) | Purchases ($) | Sales Proceeds ($) | Dividend Income ($) | Realized Gain (loss) ($) | Change in Unrealized appreciation (depreciation) ($) | Value, end of period ($) |
| Fidelity International Bond Index Fund | 8,047,697 | 4,966,926 | 3,210,849 | 166,101 | (255,357) | 287,454 | 9,835,871 |
| Fidelity Long-Term Treasury Bond Index Fund | 4,381,151 | 4,386,951 | 2,850,003 | 151,329 | (738,897) | 110,324 | 5,289,526 |
| | 12,428,848 | 9,353,877 | 6,060,852 | 317,430 | (994,254) | 397,778 | 15,125,397 |
Amounts in the dividend income column in the above table include any capital gain distributions from underlying funds, which are presented in the corresponding line item in the Statement of Operations, if applicable.
Amounts included in the purchases and sales proceeds columns may include in-kind transactions, if applicable.
Investment Valuation
The following is a summary of the inputs used, as of September 30, 2023, involving the Fund's assets and liabilities carried at fair value. The inputs or methodology used for valuing securities may not be an indication of the risk associated with investing in those securities. For more information on valuation inputs, and their aggregation into the levels used below, please refer to the Investment Valuation section in the accompanying Notes to Financial Statements.
| Valuation Inputs at Reporting Date: |
| Description | Total ($) | Level 1 ($) | Level 2 ($) | Level 3 ($) |
Investments in Securities: | | | | |
|
| Equity Central Funds | 16,714,017 | 16,714,017 | - | - |
|
| Fixed-Income Central Funds | 20,235,106 | 20,235,106 | - | - |
|
| Money Market Central Funds | 1,202,805 | 1,202,805 | - | - |
|
| Other Short-Term Investments | 19,930 | - | 19,930 | - |
|
| Investment Companies | 401,130 | 401,130 | - | - |
|
| Fixed-Income Funds | 15,125,397 | 15,125,397 | - | - |
| Total Investments in Securities: | 53,698,385 | 53,678,455 | 19,930 | - |
Derivative Instruments: Liabilities | | | | |
Futures Contracts | (2,020) | (2,020) | - | - |
| Total Liabilities | (2,020) | (2,020) | - | - |
| Total Derivative Instruments: | (2,020) | (2,020) | - | - |
Value of Derivative Instruments
The following table is a summary of the Fund's value of derivative instruments by primary risk exposure as of September 30, 2023. For additional information on derivative instruments, please refer to the Derivative Instruments section in the accompanying Notes to Financial Statements.
Primary Risk Exposure / Derivative Type | Value |
| Asset ($) | Liability ($) |
| Interest Rate Risk | | |
Futures Contracts (a) | 0 | (2,020) |
| Total Interest Rate Risk | 0 | (2,020) |
| Total Value of Derivatives | 0 | (2,020) |
(a)Reflects gross cumulative appreciation (depreciation) on futures contracts as presented in the Schedule of Investments. In the Statement of Assets and Liabilities, the period end daily variation margin is included in receivable or payable for daily variation margin on futures contracts, and the net cumulative appreciation (depreciation) is included in Total accumulated earnings (loss).
| Statement of Assets and Liabilities |
| | | | September 30, 2023 |
| | | | | |
| Assets | | | | |
| Investment in securities, at value - See accompanying schedule: | | | | |
Unaffiliated issuers (cost $429,570) | $ | 421,060 | | |
Fidelity Central Funds (cost $40,410,033) | | 38,151,928 | | |
Other affiliated issuers (cost $17,205,769) | | 15,125,397 | | |
| | | | | |
| | | | | |
| Total Investment in Securities (cost $58,045,372) | | | $ | 53,698,385 |
| Cash | | | | 1,102 |
| Receivable for investments sold | | | | 45,956 |
| Receivable for fund shares sold | | | | 36,854 |
| Dividends receivable | | | | 1,104 |
| Distributions receivable from Fidelity Central Funds | | | | 425 |
| Receivable for daily variation margin on futures contracts | | | | 469 |
Total assets | | | | 53,784,295 |
| Liabilities | | | | |
| Payable for fund shares redeemed | $ | 66,820 | | |
| Accrued management fee | | 17,693 | | |
| Other payables and accrued expenses | | 3,282 | | |
| Total Liabilities | | | | 87,795 |
| Net Assets | | | $ | 53,696,500 |
| Net Assets consist of: | | | | |
| Paid in capital | | | $ | 60,967,639 |
| Total accumulated earnings (loss) | | | | (7,271,139) |
| Net Assets | | | $ | 53,696,500 |
| | | | | |
| Net Asset Value and Maximum Offering Price | | | | |
| Fidelity Health Savings Fund : | | | | |
Net Asset Value, offering price and redemption price per share ($20,513,085 ÷ 2,218,815 shares) | | | $ | 9.25 |
| Class K : | | | | |
Net Asset Value, offering price and redemption price per share ($33,183,415 ÷ 3,589,771 shares) | | | $ | 9.24 |
| Statement of Operations |
| | | | Year ended September 30, 2023 |
| Investment Income | | | | |
| Dividends: | | | | |
| Unaffiliated issuers | | | $ | 9,053 |
| Affiliated issuers | | | | 61,387 |
| Interest | | | | 837 |
| Income from Fidelity Central Funds (including $30 from security lending) | | | | 1,708,767 |
| Total Income | | | | 1,780,044 |
| Expenses | | | | |
| Management fee | $ | 195,365 | | |
| Independent trustees' fees and expenses | | 176 | | |
| Miscellaneous | | 3,283 | | |
| Total expenses before reductions | | 198,824 | | |
| Expense reductions | | (469) | | |
| Total expenses after reductions | | | | 198,355 |
| Net Investment income (loss) | | | | 1,581,689 |
| Realized and Unrealized Gain (Loss) | | | | |
| Net realized gain (loss) on: | | | | |
| Investment Securities: | | | | |
| Unaffiliated issuers | | (62,037) | | |
| Fidelity Central Funds | | (1,571,482) | | |
| Other affiliated issuers | | (994,254) | | |
| Futures contracts | | (15,931) | | |
| Capital gain distributions from underlying funds: | | | | |
| Affiliated issuers | | 256,043 | | |
| Total net realized gain (loss) | | | | (2,387,661) |
| Change in net unrealized appreciation (depreciation) on: | | | | |
| Investment Securities: | | | | |
| Unaffiliated issuers | | 76,491 | | |
| Fidelity Central Funds | | 2,414,110 | | |
| Other affiliated issuers | | 397,778 | | |
| Futures contracts | | (370) | | |
| Total change in net unrealized appreciation (depreciation) | | | | 2,888,009 |
| Net gain (loss) | | | | 500,348 |
| Net increase (decrease) in net assets resulting from operations | | | $ | 2,082,037 |
| Statement of Changes in Net Assets |
| |
| | Year ended September 30, 2023 | | Year ended September 30, 2022 |
| Increase (Decrease) in Net Assets | | | | |
| Operations | | | | |
| Net investment income (loss) | $ | 1,581,689 | $ | 1,099,098 |
| Net realized gain (loss) | | (2,387,661) | | (210,536) |
| Change in net unrealized appreciation (depreciation) | | 2,888,009 | | (8,250,369) |
| Net increase (decrease) in net assets resulting from operations | | 2,082,037 | | (7,361,807) |
| Distributions to shareholders | | (1,929,841) | | (1,166,276) |
| | | | | |
| Share transactions - net increase (decrease) | | 12,860,633 | | 15,716,403 |
| Total increase (decrease) in net assets | | 13,012,829 | | 7,188,320 |
| | | | | |
| Net Assets | | | | |
| Beginning of period | | 40,683,671 | | 33,495,351 |
| End of period | $ | 53,696,500 | $ | 40,683,671 |
| | | | | |
| | | | | |
Financial Highlights
| Fidelity® Health Savings Fund |
| |
| Years ended September 30, | | 2023 | | 2022 | | 2021 | | 2020 A |
Selected Per-Share Data | | | | | | | | |
| Net asset value, beginning of period | $ | 9.15 | $ | 11.21 | $ | 10.48 | $ | 10.00 |
| Income from Investment Operations | | | | | | | | |
Net investment income (loss) B,C | | .29 | | .28 | | .16 | | .08 |
| Net realized and unrealized gain (loss) | | .20 | | (2.02) | | .76 | | .46 |
| Total from investment operations | | .49 | | (1.74) | | .92 | | .54 |
| Distributions from net investment income | | (.34) | | (.25) | | (.11) | | (.06) |
| Distributions from net realized gain | | (.05) | | (.07) | | (.08) | | - |
| Total distributions | | (.39) | | (.32) | | (.19) | | (.06) |
| Net asset value, end of period | $ | 9.25 | $ | 9.15 | $ | 11.21 | $ | 10.48 |
Total Return D,E | | 5.36% | | (15.98)% | | 8.81% | | 5.41% |
Ratios to Average Net Assets C,F,G | | | | | | | | |
| Expenses before reductions | | .46% | | .45% | | .45% | | .45% H |
| Expenses net of fee waivers, if any | | .46% | | .45% | | .45% | | .45% H |
| Expenses net of all reductions | | .46% | | .45% | | .45% | | .45% H |
| Net investment income (loss) | | 3.11% | | 2.66% | | 1.48% | | 1.36% H |
| Supplemental Data | | | | | | | | |
| Net assets, end of period (000 omitted) | $ | 20,513 | $ | 18,399 | $ | 16,668 | $ | 4,324 |
Portfolio turnover rate I | | 46% | | 29% | | 31% | | 43% H |
AFor the period March 2, 2020 (commencement of operations) through September 30, 2020.
BCalculated based on average shares outstanding during the period.
CNet investment income (loss) is affected by the timing of the declaration of dividends by any underlying mutual funds or exchange-traded funds (ETFs). Net investment income (loss) of any mutual funds or ETFs is not included in the Fund's net investment income (loss) ratio.
DTotal returns for periods of less than one year are not annualized.
ETotal returns would have been lower if certain expenses had not been reduced during the applicable periods shown.
FFees and expenses of any underlying mutual funds or exchange-traded funds (ETFs) are not included in the Fund's expense ratio. The Fund indirectly bears its proportionate share of these expenses. For additional expense information related to investments in Fidelity Central Funds, please refer to the "Investments in Fidelity Central Funds" note found in the Notes to Financial Statements section of the most recent Annual or Semi-Annual report.
GExpense ratios reflect operating expenses of the class. Expenses before reductions do not reflect amounts reimbursed, waived, or reduced through arrangements with the investment adviser, brokerage services, or other offset arrangements, if applicable, and do not represent the amount paid by the class during periods when reimbursements, waivers or reductions occur.
HAnnualized.
IAmount does not include the portfolio activity of any underlying mutual funds or exchange-traded funds (ETFs).
| Fidelity® Health Savings Fund Class K |
| |
| Years ended September 30, | | 2023 | | 2022 | | 2021 | | 2020 A |
Selected Per-Share Data | | | | | | | | |
| Net asset value, beginning of period | $ | 9.15 | $ | 11.21 | $ | 10.48 | $ | 10.00 |
| Income from Investment Operations | | | | | | | | |
Net investment income (loss) B,C | | .30 | | .29 | | .18 | | .09 |
| Net realized and unrealized gain (loss) | | .19 | | (2.02) | | .75 | | .45 |
| Total from investment operations | | .49 | | (1.73) | | .93 | | .54 |
| Distributions from net investment income | | (.35) | | (.27) | | (.12) | | (.06) |
| Distributions from net realized gain | | (.05) | | (.07) | | (.08) | | - |
| Total distributions | | (.40) | | (.33) D | | (.20) | | (.06) |
| Net asset value, end of period | $ | 9.24 | $ | 9.15 | $ | 11.21 | $ | 10.48 |
Total Return E,F | | 5.36% | | (15.88)% | | 8.92% | | 5.45% |
Ratios to Average Net Assets C,G,H | | | | | | | | |
| Expenses before reductions | | .36% | | .35% | | .35% | | .35% I |
| Expenses net of fee waivers, if any | | .36% | | .35% | | .35% | | .35% I |
| Expenses net of all reductions | | .36% | | .35% | | .35% | | .35% I |
| Net investment income (loss) | | 3.21% | | 2.76% | | 1.58% | | 1.46% I |
| Supplemental Data | | | | | | | | |
| Net assets, end of period (000 omitted) | $ | 33,183 | $ | 22,284 | $ | 16,827 | $ | 3,308 |
Portfolio turnover rate J | | 46% | | 29% | | 31% | | 43% I |
AFor the period March 2, 2020 (commencement of operations) through September 30, 2020.
BCalculated based on average shares outstanding during the period.
CNet investment income (loss) is affected by the timing of the declaration of dividends by any underlying mutual funds or exchange-traded funds (ETFs). Net investment income (loss) of any mutual funds or ETFs is not included in the Fund's net investment income (loss) ratio.
DTotal distributions per share do not sum due to rounding.
ETotal returns for periods of less than one year are not annualized.
FTotal returns would have been lower if certain expenses had not been reduced during the applicable periods shown.
GFees and expenses of any underlying mutual funds or exchange-traded funds (ETFs) are not included in the Fund's expense ratio. The Fund indirectly bears its proportionate share of these expenses. For additional expense information related to investments in Fidelity Central Funds, please refer to the "Investments in Fidelity Central Funds" note found in the Notes to Financial Statements section of the most recent Annual or Semi-Annual report.
HExpense ratios reflect operating expenses of the class. Expenses before reductions do not reflect amounts reimbursed, waived, or reduced through arrangements with the investment adviser, brokerage services, or other offset arrangements, if applicable, and do not represent the amount paid by the class during periods when reimbursements, waivers or reductions occur.
IAnnualized.
JAmount does not include the portfolio activity of any underlying mutual funds or exchange-traded funds (ETFs).
For the period ended September 30, 2023
1. Organization.
Fidelity Health Savings Fund (the Fund) is a fund of Fidelity Charles Street Trust (the Trust) and is authorized to issue an unlimited number of shares. The Trust is registered under the Investment Company Act of 1940, as amended (the 1940 Act), as an open-end management investment company organized as a Massachusetts business trust. The Fund offers Health Savings Fund and Class K shares, each of which has equal rights as to assets and voting privileges. Shares are available only to certain Fidelity health savings accounts.
2. Investments in Fidelity Central Funds.
Funds may invest in Fidelity Central Funds, which are open-end investment companies generally available only to other investment companies and accounts managed by the investment adviser and its affiliates. The Schedule of Investments lists any Fidelity Central Funds held as an investment as of period end, but does not include the underlying holdings of each Fidelity Central Fund. An investing fund indirectly bears its proportionate share of the expenses of the underlying Fidelity Central Funds.
Based on its investment objective, each Fidelity Central Fund may invest or participate in various investment vehicles or strategies that are similar to those of the investing fund. These strategies are consistent with the investment objectives of the investing fund and may involve certain economic risks which may cause a decline in value of each of the Fidelity Central Funds and thus a decline in the value of the investing fund.
| Fidelity Central Fund | Investment Manager | Investment Objective | Investment Practices | Expense RatioA |
| Fidelity Commodity Strategy Central Fund | Geode Capital Management, LLC (Geode) | Seeks to provide investment returns that correspond to the performance of the commodities market. | Investment in commodity-related investments through a wholly-owned subsidiary organized under the laws of the Cayman Islands Futures | Less than .005% |
| Fidelity Emerging Markets Debt Central Fund | Fidelity Management & Research Company LLC (FMR) | Seeks high total return by normally investing in debt securities of issuers in emerging markets and other debt investments that are tied economically to emerging markets. | Foreign Securities Restricted Securities | Less than .005% |
| Fidelity Emerging Markets Equity Central Fund | Fidelity Management & Research Company LLC (FMR) | Seeks capital appreciation by investing primarily in equity securities of issuers in emerging markets. | Foreign Securities Futures Loans & Direct Debt Instruments | 0.02% |
| Fidelity International Equity Central Fund | Fidelity Management & Research Company LLC (FMR) | Seeks capital appreciation by investing primarily in non-U.S. based common stocks, including securities of issuers located in emerging markets. | Delayed Delivery & When Issued Securities Foreign Securities Futures Loans & Direct Debt Instruments | 0.01% |
| Fidelity Floating Rate Central Fund | Fidelity Management & Research Company LLC (FMR) | Seeks a high level of income by normally investing in floating rate loans and other floating rate securities. | Loans & Direct Debt Instruments Restricted Securities | Less than .005% |
| Fidelity High Income Central Fund | Fidelity Management & Research Company LLC (FMR) | Seeks a high level of income and may also seek capital appreciation by investing primarily in debt securities, preferred stocks, and convertible securities, with an emphasis on lower-quality debt securities. | Delayed Delivery & When Issued Securities Loans & Direct Debt Instruments Restricted Securities | 0.03% |
| Fidelity Inflation-Protected Bond Index Central Fund | Fidelity Management & Research Company LLC (FMR) | Seeks to provide investment results that correspond to the performance of the inflation-protected United States Treasury market, and may invest in derivatives. | | Less than .005% |
| Fidelity Investment Grade Bond Central Fund | Fidelity Management & Research Company LLC (FMR) | Seeks a high level of income by normally investing in investment-grade debt securities. | Delayed Delivery & When Issued Securities Futures Options Restricted Securities Swaps | Less than .005% |
| Fidelity Real Estate Equity Central Fund | Fidelity Management & Research Company LLC (FMR) | Seeks above-average income and long-term capital growth by investing primarily in equity securities of issuers in the real estate industry. | Loans & Direct Debt Instruments | Less than .005% |
| Fidelity U.S. Equity Central Fund | Fidelity Management & Research Company LLC (FMR) | Seeks capital appreciation by investing primarily in common stocks, allocated across different market sectors. | Foreign Securities Futures Loans & Direct Debt Instruments Restricted Securities | Less than .005% |
| Fidelity Emerging Markets Debt Local Currency Central Fund | Fidelity Management & Research Company LLC (FMR) | Seeks high total return by normally investing in debt securities of issuers in emerging markets and other debt investments that are tied economically to emerging markets and denominated in the local currency of the issuer. | Foreign Securities Futures Restricted Securities | 0.01% |
| Fidelity Hedged Equity Central Fund | Fidelity Diversifying Solutions LLC (FDS) | Seeks capital appreciation by investing primarily in common stocks of companies with market capitalizations generally similar to companies in the S&P 500® Index. | Options | 0.01% |
| Fidelity Money Market Central Funds | Fidelity Management & Research Company LLC (FMR) | Each fund seeks to obtain a high level of current income consistent with the preservation of capital and liquidity. | Short-term Investments | Less than .005% |
A Expenses expressed as a percentage of average net assets and are as of each underlying Central Fund's most recent annual or semi-annual shareholder report.
An unaudited holdings listing for the investing fund, which presents direct holdings as well as the pro-rata share of any securities and other investments held indirectly through its investment in underlying non-money market Fidelity Central Funds, is available at fidelity.com and/or institutional.fidelity.com, as applicable. A complete unaudited list of holdings for each Fidelity Central Fund is available upon request or at the Securities and Exchange Commission website at www.sec.gov. In addition, the financial statements of the Fidelity Central Funds which contain the significant accounting policies (including investment valuation policies) of those funds, and are not covered by the Report of Independent Registered Public Accounting Firm, are available on the Securities and Exchange Commission website or upon request.
3. Significant Accounting Policies.
The Fund is an investment company and applies the accounting and reporting guidance of the Financial Accounting Standards Board (FASB) Accounting Standards Codification Topic 946 Financial Services - Investment Companies. The financial statements have been prepared in conformity with accounting principles generally accepted in the United States of America (GAAP), which require management to make certain estimates and assumptions at the date of the financial statements. Actual results could differ from those estimates. Subsequent events, if any, through the date that the financial statements were issued have been evaluated in the preparation of the financial statements. The Fund's Schedule of Investments lists any underlying mutual funds or exchange-traded funds (ETFs) but does not include the underlying holdings of these funds. The following summarizes the significant accounting policies of the Fund:
Investment Valuation. Investments are valued as of 4:00 p.m. Eastern time on the last calendar day of the period. The Fund uses a third party pricing service approved by the Board of Trustees (the Board) to value its investments. The Board of Trustees (the Board) has designated the Fund's investment adviser as the valuation designee responsible for the fair valuation function and performing fair value determinations as needed. The investment adviser has established a Fair Value Committee (the Committee) to carry out the day-to-day fair valuation responsibilities and has adopted policies and procedures to govern the fair valuation process and the activities of the Committee. In accordance with these fair valuation policies and procedures, which have been approved by the Board, the Fund attempts to obtain prices from one or more third party pricing services or brokers to value its investments. When current market prices, quotations or currency exchange rates are not readily available or reliable, investments will be fair valued in good faith by the Committee, in accordance with the policies and procedures. Factors used in determining fair value vary by investment type and may include market or investment specific events, transaction data, estimated cash flows, and market observations of comparable investments. The frequency that the fair valuation procedures are used cannot be predicted and they may be utilized to a significant extent. The Committee manages the Fund's fair valuation practices and maintains the fair valuation policies and procedures. The Fund's investment adviser reports to the Board information regarding the fair valuation process and related material matters. The Fund categorizes the inputs to valuation techniques used to value its investments into a disclosure hierarchy consisting of three levels as shown below:
Level 1 - unadjusted quoted prices in active markets for identical investments
Level 2 - other significant observable inputs (including quoted prices for similar investments, interest rates, prepayment speeds, etc.)
Level 3 - unobservable inputs (including the Fund's own assumptions based on the best information available)
Valuation techniques used to value the Fund's investments by major category are as follows. Investments in open-end mutual funds are valued at their closing net asset value (NAV) each business day and are categorized as Level 1 in the hierarchy. Debt securities, including restricted securities, are valued based on evaluated prices received from third party pricing services or from brokers who make markets in such securities. U.S. government and government agency obligations are valued by pricing services who utilize matrix pricing which considers yield or price of bonds of comparable quality, coupon, maturity and type or by broker-supplied prices. When independent prices are unavailable or unreliable, debt securities may be valued utilizing pricing methodologies which consider similar factors that would be used by third party pricing services. Debt securities are generally categorized as Level 2 in the hierarchy but may be Level 3 depending on the circumstances. ETFs are valued at their last sale price or official closing price as reported by a third party pricing service on the primary market or exchange on which they are traded and are categorized as Level 1 in the hierarchy. In the event there were no sales during the day but the exchange reports a closing bid level, ETFs are valued at the closing bid and would be categorized as Level 1 in the hierarchy. In the event there was no closing bid, ETFs may be valued by another method that the Board believes reflects fair value in accordance with the Board's fair value pricing policies and may be categorized as Level 2 in the hierarchy. The aggregate value of investments by input level as of September 30, 2023 is included at the end of the Fund's Schedule of Investments.
Futures contracts are valued at the settlement price established each day by the board of trade or exchange on which they are traded and are categorized as Level 1 in the hierarchy.
Investment Transactions and Income. For financial reporting purposes, the Fund's investment holdings and NAV include trades executed through the end of the last business day of the period. The NAV per share for processing shareholder transactions is calculated as of the close of business of the New York Stock Exchange (NYSE), normally 4:00 p.m. Eastern time and includes trades executed through the end of the prior business day. Gains and losses on securities sold are determined on the basis of identified cost. Income and capital gain distributions from any underlying mutual funds or exchange-traded funds (ETFs) are recorded on the ex-dividend date. Interest income is accrued as earned. Interest income includes coupon interest and amortization of premium and accretion of discount on debt securities as applicable.
Class Allocations and Expenses. Investment income, realized and unrealized capital gains and losses, common expenses of a fund, and certain fund-level expense reductions, if any, are allocated daily on a pro-rata basis to each class based on the relative net assets of each class to the total net assets of a fund. Each class differs with respect to transfer agent and distribution and service plan fees incurred, as applicable. Certain expense reductions may also differ by class, if applicable. For the reporting period, the allocated portion of income and expenses to each class as a percent of its average net assets may vary due to the timing of recording these transactions in relation to fluctuating net assets of the classes. Expenses directly attributable to a fund are charged to that fund. Expenses attributable to more than one fund are allocated among the respective funds on the basis of relative net assets or other appropriate methods. Expenses included in the accompanying financial statements reflect the expenses of that fund and do not include any expenses associated with any underlying mutual funds or exchange-traded funds (ETFs). Although not included in a fund's expenses, a fund indirectly bears its proportionate share of these expenses through the net asset value of each underlying mutual fund or exchange-traded fund (ETF). Expense estimates are accrued in the period to which they relate and adjustments are made when actual amounts are known.
Income Tax Information and Distributions to Shareholders. Each year, the Fund intends to qualify as a regulated investment company under Subchapter M of the Internal Revenue Code, including distributing substantially all of its taxable income and realized gains. As a result, no provision for U.S. Federal income taxes is required. As of September 30, 2023, the Fund did not have any unrecognized tax benefits in the financial statements; nor is the Fund aware of any tax positions for which it is reasonably possible that the total amounts of unrecognized tax benefits will significantly change in the next twelve months. The Fund files a U.S. federal tax return, in addition to state and local tax returns as required. The Fund's federal income tax returns are subject to examination by the Internal Revenue Service (IRS) for a period of three fiscal years after they are filed. State and local tax returns may be subject to examination for an additional fiscal year depending on the jurisdiction.
Distributions are declared and recorded on the ex-dividend date. Income and capital gain distributions are declared separately for each class. Income and capital gain distributions are determined in accordance with income tax regulations, which may differ from GAAP.
Capital accounts within the financial statements are adjusted for permanent book-tax differences. These adjustments have no impact on net assets or the results of operations. Capital accounts are not adjusted for temporary book-tax differences which will reverse in a subsequent period.
Book-tax differences are primarily due to the short-term gain distributions from the underlying mutual funds or exchange-traded funds (ETFs), futures contracts, capital loss carryforwards and losses deferred due to wash sales.
As of period end, the cost and unrealized appreciation (depreciation) in securities, and derivatives if applicable, for federal income tax purposes were as follows:
| Gross unrealized appreciation | $440,419 |
| Gross unrealized depreciation | (5,712,912) |
| Net unrealized appreciation (depreciation) | $(5,272,493) |
| Tax Cost | $58,970,878 |
The tax-based components of distributable earnings as of period end were as follows:
| Undistributed ordinary income | $174,594 |
| Capital loss carryforward | $(2,173,241) |
| Net unrealized appreciation (depreciation) on securities and other investments | $(5,272,493) |
Capital loss carryforwards are only available to offset future capital gains of the Fund to the extent provided by regulations and may be limited. The capital loss carryforward information presented below, including any applicable limitation, is estimated as of fiscal period end and is subject to adjustment.
Short-term | $(420,457) |
Long-term | (1,752,784) |
| Total capital loss carryforward | $(2,173,241) |
The tax character of distributions paid was as follows:
| | September 30, 2023 | September 30, 2022 |
| Ordinary Income | $1,701,090 | $1,092,363 |
| Long-term Capital Gains | 228,751 | 73,913 |
| Total | $1,929,841 | $ 1,166,276 |
4. Derivative Instruments.
Risk Exposures and the Use of Derivative Instruments. The Fund's investment objectives allow for various types of derivative instruments, including futures contracts. Derivatives are investments whose value is primarily derived from underlying assets, indices or reference rates and may be transacted on an exchange or over-the-counter (OTC). Derivatives may involve a future commitment to buy or sell a specified asset based on specified terms, to exchange future cash flows at periodic intervals based on a notional principal amount, or for one party to make one or more payments upon the occurrence of specified events in exchange for periodic payments from the other party.
Derivatives were used to increase returns and to manage exposure to certain risks as defined below. The success of any strategy involving derivatives depends on analysis of numerous economic factors, and if the strategies for investment do not work as intended, the objectives may not be achieved.
Derivatives were used to increase or decrease exposure to the following risk(s):
| Interest Rate Risk | Interest rate risk relates to the fluctuations in the value of interest-bearing securities due to changes in the prevailing levels of market interest rates. |
Funds are also exposed to additional risks from investing in derivatives, such as liquidity risk and counterparty credit risk. Liquidity risk is the risk that a fund will be unable to close out the derivative in the open market in a timely manner. Counterparty credit risk is the risk that the counterparty will not be able to fulfill its obligation to a fund. Counterparty credit risk related to exchange-traded contracts may be mitigated by the protection provided by the exchange on which they trade.
Investing in derivatives may involve greater risks than investing in the underlying assets directly and, to varying degrees, may involve risk of loss in excess of any initial investment and collateral received and amounts recognized in the Statement of Assets and Liabilities. In addition, there may be the risk that the change in value of the derivative contract does not correspond to the change in value of the underlying instrument.
Futures Contracts. A futures contract is an agreement between two parties to buy or sell a specified underlying instrument for a fixed price at a specified future date. Futures contracts were used to manage exposure to the bond market and fluctuations in interest rates.
Upon entering into a futures contract, a fund is required to deposit either cash or securities (initial margin) with a clearing broker in an amount equal to a certain percentage of the face value of the contract. Futures contracts are marked-to-market daily and subsequent daily payments are made or received by a fund depending on the daily fluctuations in the value of the futures contracts and are recorded as unrealized appreciation or (depreciation). This receivable and/or payable, if any, is included in daily variation margin on futures contracts in the Statement of Assets and Liabilities. Realized gain or (loss) is recorded upon the expiration or closing of a futures contract. The net realized gain (loss) and change in net unrealized appreciation (depreciation) on futures contracts during the period is presented in the Statement of Operations.
Any open futures contracts at period end are presented in the Schedule of Investments under the caption "Futures Contracts". The notional amount at value reflects each contract's exposure to the underlying instrument or index at period end, and is representative of volume of activity during the period unless an average notional amount is presented. Any securities deposited to meet initial margin requirements are identified in the Schedule of Investments. Any cash deposited to meet initial margin requirements is presented as segregated cash with brokers for derivative instruments in the Statement of Assets and Liabilities.
5. Purchases and Sales of Investments.
Purchases and sales of securities, other than short-term securities and in-kind transactions, as applicable, are noted in the table below.
| | Purchases ($) | Sales ($) |
| Fidelity Health Savings Fund | 34,478,129 | 22,923,084 |
6. Fees and Other Transactions with Affiliates.
Management Fee. Fidelity Management & Research Company LLC (the investment adviser) and its affiliates provide the Fund with investment management related services for which each class of the Fund pays a monthly management fee. Under the management contract, the investment adviser pays all other operating expenses, except the compensation of the independent Trustees and certain miscellaneous expenses such as proxy and shareholder meeting expenses. During the period, the management fee for each class of the Fund was as follows:
| | Annual % of Class-Level Average Net Assets |
| Fidelity Health Savings Fund | .45% |
| Class K | .35% |
Brokerage Commissions. A portion of portfolio transactions were placed with brokerage firms which are affiliates of the investment adviser. Brokerage commissions are included in net realized gain (loss) and change in net unrealized appreciation (depreciation) in the Statement of Operations. The commissions paid to these affiliated firms were as follows:
| | Amount |
| Fidelity Health Savings Fund | $9 |
Interfund Trades. Funds may purchase from or sell securities to other Fidelity Funds under procedures adopted by the Board. The procedures have been designed to ensure these interfund trades are executed in accordance with Rule 17a-7 of the 1940 Act. Any interfund trades are included within the respective purchases and sales amounts shown in the Purchases and Sales of Investments note. During the period, there were no interfund trades.
7. Committed Line of Credit.
Certain Funds participate with other funds managed by the investment adviser or an affiliate in a $4.25 billion credit facility (the "line of credit") to be utilized for temporary or emergency purposes to fund shareholder redemptions or for other short-term liquidity purposes. The commitment fees on the pro-rata portion of the line of credit are borne by the investment adviser. During the period, there were no borrowings on this line of credit.
8. Security Lending.
Funds lend portfolio securities from time to time in order to earn additional income. Lending agents are used, including National Financial Services (NFS), an affiliate of the investment adviser. Pursuant to a securities lending agreement, NFS will receive a fee, which is capped at 9.9% of a fund's daily lending revenue, for its services as lending agent. A fund may lend securities to certain qualified borrowers, including NFS. On the settlement date of the loan, a fund receives collateral (in the form of U.S. Treasury obligations, letters of credit and/or cash) against the loaned securities and maintains collateral in an amount not less than 100% of the market value of the loaned securities during the period of the loan. The market value of the loaned securities is determined at the close of business of a fund and any additional required collateral is delivered to a fund on the next business day. A fund or borrower may terminate the loan at any time, and if the borrower defaults on its obligation to return the securities loaned because of insolvency or other reasons, a fund may apply collateral received from the borrower against the obligation. A fund may experience delays and costs in recovering the securities loaned. Any cash collateral received is invested in the Fidelity Securities Lending Cash Central Fund. Any loaned securities are identified as such in the Schedule of Investments, and the value of loaned securities and cash collateral at period end, as applicable, are presented in the Statement of Assets and Liabilities. Security lending income represents the income earned on investing cash collateral, less rebates paid to borrowers and any lending agent fees associated with the loan, plus any premium payments received for lending certain types of securities. Security lending income is presented in the Statement of Operations as a component of income from Fidelity Central Funds. Affiliated security lending activity, if any, was as follows:
| | Total Security Lending Fees Paid to NFS | Security Lending Income From Securities Loaned to NFS | Value of Securities Loaned to NFS at Period End |
| Fidelity Health Savings Fund | $3 | $ - | $- |
9. Expense Reductions.
Through arrangements with the Fund's custodian, credits realized as a result of certain uninvested cash balances were used to reduce the Fund's expenses. During the period, custodian credits reduced the Fund's expenses by $469.
10. Distributions to Shareholders.
Distributions to shareholders of each class were as follows:
| | Year ended September 30, 2023 | Year ended September 30, 2022 |
| Fidelity Health Savings Fund | | |
| Distributions to shareholders | | |
| Fidelity Health Savings Fund | $816,880 | $553,514 |
| Class K | 1,112,961 | 612,762 |
Total | $ 1,929,841 | $ 1,166,276 |
11. Share Transactions.
Share transactions for each class were as follows and may contain in-kind transactions, automatic conversions between classes or exchanges between affiliated funds:
| | Shares | Shares | Dollars | Dollars |
| | Year ended September 30, 2023 | Year ended September 30, 2022 | Year ended September 30, 2023 | Year ended September 30, 2022 |
| Fidelity Health Savings Fund | | | | |
| Fidelity Health Savings Fund | | | | |
| Shares sold | 540,289 | 741,885 | $5,127,504 | $7,995,080 |
| Reinvestment of distributions | 84,506 | 50,079 | 786,375 | 545,571 |
| Shares redeemed | (416,682) | (268,130) | (3,956,063) | (2,817,885) |
| Net increase (decrease) | 208,113 | 523,834 | $1,957,816 | $5,722,766 |
| Class K | | | | |
| Shares sold | 1,435,056 | 1,121,709 | $13,586,075 | $11,928,637 |
| Reinvestment of distributions | 118,108 | 56,311 | 1,100,944 | 610,743 |
| Shares redeemed | (398,766) | (243,420) | (3,784,202) | (2,545,743) |
| Net increase (decrease) | 1,154,398 | 934,600 | $10,902,817 | $9,993,637 |
12. Other.
A fund's organizational documents provide former and current trustees and officers with a limited indemnification against liabilities arising in connection with the performance of their duties to the fund. In the normal course of business, a fund may also enter into contracts that provide general indemnifications. A fund's maximum exposure under these arrangements is unknown as this would be dependent on future claims that may be made against a fund. The risk of material loss from such claims is considered remote.
13. Risk and Uncertainties.
Many factors affect a fund's performance. Developments that disrupt global economies and financial markets, such as pandemics, epidemics, outbreaks of infectious diseases, war, terrorism, and environmental disasters, may significantly affect a fund's investment performance. The effects of these developments to a fund will be impacted by the types of securities in which a fund invests, the financial condition, industry, economic sector, and geographic location of an issuer, and a fund's level of investment in the securities of that issuer. Significant concentrations in security types, issuers, industries, sectors, and geographic locations may magnify the factors that affect a fund's performance.
To the Board of Trustees of Fidelity Charles Street Trust and the Shareholders of Fidelity Health Savings Fund:
Opinion on the Financial Statements and Financial Highlights
We have audited the accompanying statement of assets and liabilities of Fidelity Health Savings Fund (the "Fund"), a fund of Fidelity Charles Street Trust, including the schedule of investments, as of September 30, 2023, the related statement of operations for the year then ended, the statement of changes in net assets for each of the two years in the period then ended, the financial highlights for each of three years in the period then ended and for the period from March 2, 2020 (commencement of operations) through September 30, 2020, and the related notes. In our opinion, the financial statements and financial highlights present fairly, in all material respects, the financial position of the Fund as of September 30, 2023, and the results of its operations for the year then ended, the changes in its net assets for each of the two years in the period then ended, and the financial highlights for each of the three years in the period then ended and for the period from March 2, 2020 (commencement of operations) through September 30, 2020, in conformity with accounting principles generally accepted in the United States of America.
Basis for Opinion
These financial statements and financial highlights are the responsibility of the Fund's management. Our responsibility is to express an opinion on the Fund's financial statements and financial highlights based on our audits. We are a public accounting firm registered with the Public Company Accounting Oversight Board (United States) (PCAOB) and are required to be independent with respect to the Fund in accordance with the U.S. federal securities laws and the applicable rules and regulations of the Securities and Exchange Commission and the PCAOB.
We conducted our audits in accordance with the standards of the PCAOB. Those standards require that we plan and perform the audit to obtain reasonable assurance about whether the financial statements and financial highlights are free of material misstatement, whether due to error or fraud. The Fund is not required to have, nor were we engaged to perform, an audit of its internal control over financial reporting. As part of our audits we are required to obtain an understanding of internal control over financial reporting but not for the purpose of expressing an opinion on the effectiveness of the Fund's internal control over financial reporting. Accordingly, we express no such opinion.
Our audits included performing procedures to assess the risks of material misstatement of the financial statements and financial highlights, whether due to error or fraud, and performing procedures that respond to those risks. Such procedures included examining, on a test basis, evidence regarding the amounts and disclosures in the financial statements and financial highlights. Our audits also included evaluating the accounting principles used and significant estimates made by management, as well as evaluating the overall presentation of the financial statements and financial highlights. Our procedures included confirmation of securities owned as of September 30, 2023, by correspondence with the custodian and brokers; when replies were not received from brokers, we performed other auditing procedures. We believe that our audits provide a reasonable basis for our opinion.
/s/ Deloitte & Touche LLP
Boston, Massachusetts
November 15, 2023
We have served as the auditor of one or more of the Fidelity investment companies since 1999.
The Trustees, Members of the Advisory Board (if any), and officers of the trust and fund, as applicable, are listed below. The Board of Trustees governs the fund and is responsible for protecting the interests of shareholders. The Trustees are experienced executives who meet periodically throughout the year to oversee the fund's activities, review contractual arrangements with companies that provide services to the fund, oversee management of the risks associated with such activities and contractual arrangements, and review the fund's performance. If the interests of the fund and an underlying Fidelity® fund were to diverge, a conflict of interest could arise and affect how the Trustees and Members of the Advisory Board fulfill their fiduciary duties to the affected funds. FMR has structured the fund to avoid these potential conflicts, although there may be situations where a conflict of interest is unavoidable. In such instances, FMR, the Trustees, and Members of the Advisory Board would take reasonable steps to minimize and, if possible, eliminate the conflict. As of September 30, 2023, except for Laura M. Bishop, Robert W. Helm, Christine J. Thompson, and Carol J. Zierhoffer, each of the Trustees oversees 313 funds. As of October 18, 2023, the date of their election as Trustee, Ms. Bishop, Mr. Helm, Ms. Thompson, and Ms. Zierhoffer each oversees 229 funds.
The Trustees hold office without limit in time except that (a) any Trustee may resign; (b) any Trustee may be removed by written instrument, signed by at least two-thirds of the number of Trustees prior to such removal; (c) any Trustee who requests to be retired or who has become incapacitated by illness or injury may be retired by written instrument signed by a majority of the other Trustees; and (d) any Trustee may be removed at any special meeting of shareholders by a two-thirds vote of the outstanding voting securities of the trust. Each Trustee who is not an interested person (as defined in the 1940 Act) of the trust and the fund is referred to herein as an Independent Trustee. Each Independent Trustee shall retire not later than the last day of the calendar year in which his or her 75th birthday occurs. The Independent Trustees may waive this mandatory retirement age policy with respect to individual Trustees. Officers and Advisory Board Members hold office without limit in time, except that any officer or Advisory Board Member may resign or may be removed by a vote of a majority of the Trustees at any regular meeting or any special meeting of the Trustees. Except as indicated, each individual has held the office shown or other offices in the same company for the past five years.
The fund's Statement of Additional Information (SAI) includes more information about the Trustees. To request a free copy, call Fidelity at 1-800-544-8544 if you're an individual investing directly with Fidelity, call 1-800-835-5092 if you're a plan sponsor or participant with Fidelity as your recordkeeper or call 1-877-208-0098 on institutional accounts or if you're an advisor or invest through one.
Experience, Skills, Attributes, and Qualifications of the Trustees. The Governance and Nominating Committee has adopted a statement of policy that describes the experience, qualifications, attributes, and skills that are necessary and desirable for potential Independent Trustee candidates (Statement of Policy). The Board believes that each Trustee satisfied at the time he or she was initially elected or appointed a Trustee, and continues to satisfy, the standards contemplated by the Statement of Policy. The Governance and Nominating Committee also engages professional search firms to help identify potential Independent Trustee candidates who have the experience, qualifications, attributes, and skills consistent with the Statement of Policy. From time to time, additional criteria based on the composition and skills of the current Independent Trustees, as well as experience or skills that may be appropriate in light of future changes to board composition, business conditions, and regulatory or other developments, have also been considered by the professional search firms and the Governance and Nominating Committee. In addition, the Board takes into account the Trustees' commitment and participation in Board and committee meetings, as well as their leadership of standing and ad hoc committees throughout their tenure.
In determining that a particular Trustee was and continues to be qualified to serve as a Trustee, the Board has considered a variety of criteria, none of which, in isolation, was controlling. The Board believes that, collectively, the Trustees have balanced and diverse experience, qualifications, attributes, and skills, which allow the Board to operate effectively in governing the fund and protecting the interests of shareholders. Information about the specific experience, skills, attributes, and qualifications of each Trustee, which in each case led to the Board's conclusion that the Trustee should serve (or continue to serve) as a trustee of the fund, is provided below.
Board Structure and Oversight Function. Abigail P. Johnson is an interested person and currently serves as Chairman. The Trustees have determined that an interested Chairman is appropriate and benefits shareholders because an interested Chairman has a personal and professional stake in the quality and continuity of services provided to the fund. Independent Trustees exercise their informed business judgment to appoint an individual of their choosing to serve as Chairman, regardless of whether the Trustee happens to be independent or a member of management. The Independent Trustees have determined that they can act independently and effectively without having an Independent Trustee serve as Chairman and that a key structural component for assuring that they are in a position to do so is for the Independent Trustees to constitute a substantial majority for the Board. The Independent Trustees also regularly meet in executive session. Michael E. Kenneally serves as Chairman of the Independent Trustees and as such (i) acts as a liaison between the Independent Trustees and management with respect to matters important to the Independent Trustees and (ii) with management prepares agendas for Board meetings.
Fidelity® funds are overseen by different Boards of Trustees. The fund's Board oversees Fidelity's investment-grade bond, money market, asset allocation and certain equity funds, and other Boards oversee Fidelity's alternative investment, high income and other equity funds. The asset allocation funds may invest in Fidelity® funds that are overseen by such other Boards. The use of separate Boards, each with its own committee structure, allows the Trustees of each group of Fidelity® funds to focus on the unique issues of the funds they oversee, including common research, investment, and operational issues. On occasion, the separate Boards establish joint committees to address issues of overlapping consequences for the Fidelity® funds overseen by each Board.
The Trustees operate using a system of committees to facilitate the timely and efficient consideration of all matters of importance to the Trustees, the fund, and fund shareholders and to facilitate compliance with legal and regulatory requirements and oversight of the fund's activities and associated risks. The Board, acting through its committees, has charged FMR and its affiliates with (i) identifying events or circumstances the occurrence of which could have demonstrably adverse effects on the fund's business and/or reputation; (ii) implementing processes and controls to lessen the possibility that such events or circumstances occur or to mitigate the effects of such events or circumstances if they do occur; and (iii) creating and maintaining a system designed to evaluate continuously business and market conditions in order to facilitate the identification and implementation processes described in (i) and (ii) above. Because the day-to-day operations and activities of the fund are carried out by or through FMR, its affiliates, and other service providers, the fund's exposure to risks is mitigated but not eliminated by the processes overseen by the Trustees. While each of the Board's committees has responsibility for overseeing different aspects of the fund's activities, oversight is exercised primarily through the Operations and Audit Committees. In addition, an ad hoc Board committee of Independent Trustees has worked with FMR to enhance the Board's oversight of investment and financial risks, legal and regulatory risks, technology risks, and operational risks, including the development of additional risk reporting to the Board. Appropriate personnel, including but not limited to the fund's Chief Compliance Officer (CCO), FMR's internal auditor, the independent accountants, the fund's Treasurer and portfolio management personnel, make periodic reports to the Board's committees, as appropriate, including an annual review of Fidelity's risk management program for the Fidelity® funds. The responsibilities of each standing committee, including their oversight responsibilities, are described further under "Standing Committees of the Trustees."
Interested Trustees*:
Correspondence intended for a Trustee who is an interested person may be sent to Fidelity Investments, 245 Summer Street, Boston, Massachusetts 02210.
Name, Year of Birth; Principal Occupations and Other Relevant Experience+
Abigail P. Johnson (1961)
Year of Election or Appointment: 2009
Trustee
Chairman of the Board of Trustees
Ms. Johnson also serves as Trustee of other Fidelity® funds. Ms. Johnson serves as Chairman (2016-present), Chief Executive Officer (2014-present), and Director (2007-present) of FMR LLC (diversified financial services company), President of Fidelity Financial Services (2012-present) and President of Personal, Workplace and Institutional Services (2005-present). Ms. Johnson is Chairman and Director of Fidelity Management & Research Company LLC (investment adviser firm, 2011-present). Previously, Ms. Johnson served as Chairman and Director of FMR Co., Inc. (investment adviser firm, 2011-2019), Vice Chairman (2007-2016) and President (2013-2016) of FMR LLC, President and a Director of Fidelity Management & Research Company (2001-2005), a Trustee of other investment companies advised by Fidelity Management & Research Company, Fidelity Investments Money Management, Inc. (investment adviser firm), and FMR Co., Inc. (2001-2005), Senior Vice President of the Fidelity® funds (2001-2005), and managed a number of Fidelity® funds. Ms. Abigail P. Johnson and Mr. Arthur E. Johnson are not related.
Jennifer Toolin McAuliffe (1959)
Year of Election or Appointment: 2016
Trustee
Ms. McAuliffe also serves as Trustee of other Fidelity® funds and as Trustee of Fidelity Charitable (2020-present). Previously, Ms. McAuliffe served as Co-Head of Fixed Income of Fidelity Investments Limited (now known as FIL Limited (FIL)) (diversified financial services company), Director of Research for FIL's credit and quantitative teams in London, Hong Kong and Tokyo and Director of Research for taxable and municipal bonds at Fidelity Investments Money Management, Inc. Ms. McAuliffe previously served as a member of the Advisory Board of certain Fidelity® funds (2016). Ms. McAuliffe was previously a lawyer at Ropes & Gray LLP and an international banker at Chemical Bank NA (now JPMorgan Chase & Co.). Ms. McAuliffe also currently serves as director or trustee of several not-for-profit entities.
Christine J. Thompson (1958)
Year of Election or Appointment: 2023
Trustee
Ms. Thompson also serves as a Trustee of other Fidelity® funds. Ms. Thompson serves as Leader of Advanced Technologies for Investment Management at Fidelity Investments (2018-present). Previously, Ms. Thompson served as Chief Investment Officer in the Bond group at Fidelity Management & Research Company (2010-2018) and held various other roles including Director of municipal bond portfolio managers and Portfolio Manager of certain Fidelity® funds.
* Determined to be an "Interested Trustee" by virtue of, among other things, his or her affiliation with the trust or various entities under common control with FMR.
+ The information includes the Trustee's principal occupation during the last five years and other information relating to the experience, attributes, and skills relevant to the Trustee's qualifications to serve as a Trustee, which led to the conclusion that the Trustee should serve as a Trustee for the fund.
Independent Trustees:
Correspondence intended for an Independent Trustee may be sent to Fidelity Investments, P.O. Box 55235, Boston, Massachusetts 02205-5235.
Name, Year of Birth; Principal Occupations and Other Relevant Experience+
Elizabeth S. Acton (1951)
Year of Election or Appointment: 2013
Trustee
Ms. Acton also serves as Trustee of other Fidelity® funds. Prior to her retirement, Ms. Acton served as Executive Vice President, Finance (2011-2012), Executive Vice President, Chief Financial Officer (2002-2011) and Treasurer (2004-2005) of Comerica Incorporated (financial services). Prior to joining Comerica, Ms. Acton held a variety of positions at Ford Motor Company (1983-2002), including Vice President and Treasurer (2000-2002) and Executive Vice President and Chief Financial Officer of Ford Motor Credit Company (1998-2000). Ms. Acton currently serves as a member of the Board and Audit and Finance Committees of Beazer Homes USA, Inc. (homebuilding, 2012-present). Ms. Acton previously served as a member of the Advisory Board of certain Fidelity® funds (2013-2016).
Laura M. Bishop (1961)
Year of Election or Appointment: 2023
Trustee
Ms. Bishop also serves as Trustee or Member of the Advisory Board of other Fidelity® funds. Prior to her retirement, Ms. Bishop held a variety of positions at United Services Automobile Association (2001-2020), including Executive Vice President and Chief Financial Officer (2014-2020) and Senior Vice President and Deputy Chief Financial Officer (2012-2014). Ms. Bishop currently serves as a member of the Audit Committee and Compensation and Personnel Committee (2021-present) of the Board of Directors of Korn Ferry (global organizational consulting). Previously, Ms. Bishop served as a Member of the Advisory Board of certain Fidelity® funds (2022-2023).
Ann E. Dunwoody (1953)
Year of Election or Appointment: 2018
Trustee
General Dunwoody also serves as Trustee of other Fidelity® funds. General Dunwoody (United States Army, Retired) was the first woman in U.S. military history to achieve the rank of four-star general and prior to her retirement in 2012 held a variety of positions within the U.S. Army, including Commanding General, U.S. Army Material Command (2008-2012). General Dunwoody currently serves as a member of the Board, Chair of Nomination Committee and a member of the Corporate Governance Committee of Kforce Inc. (professional staffing services, 2016-present) and a member of the Board of Automattic Inc. (software engineering, 2018-present). Previously, General Dunwoody served as President of First to Four LLC (leadership and mentoring services, 2012-2022), a member of the Advisory Board and Nominating and Corporate Governance Committee of L3 Technologies, Inc. (communication, electronic, sensor and aerospace systems, 2013-2019) and a member of the Board and Audit and Sustainability and Corporate Responsibility Committees of Republic Services, Inc. (waste collection, disposal and recycling, 2013-2016). General Dunwoody also serves on several boards for non-profit organizations, including as a member of the Board, Chair of the Nomination and Governance Committee and a member of the Audit Committee of the Noble Reach Foundation (formerly Logistics Management Institute) (consulting non-profit, 2012-present) and a member of the Board of ThanksUSA (military family education non-profit, 2014-present). Previously, General Dunwoody served as a member of the Board of Florida Institute of Technology (2015-2022) and a member of the Council of Trustees for the Association of the United States Army (advocacy non-profit, 2013-2021). General Dunwoody previously served as a member of the Advisory Board of certain Fidelity® funds (2018).
John Engler (1948)
Year of Election or Appointment: 2014
Trustee
Mr. Engler also serves as Trustee of other Fidelity® funds. Previously, Mr. Engler served as Governor of Michigan (1991-2003), President of the Business Roundtable (2011-2017) and interim President of Michigan State University (2018-2019). Previously, Mr. Engler served as a member of the Board of Stride, Inc. (formerly K12 Inc.) (technology-based education company, 2012-2022), a member of the Board of Universal Forest Products (manufacturer and distributor of wood and wood-alternative products, 2003-2019) and Trustee of The Munder Funds (2003-2014). Mr. Engler previously served as a member of the Advisory Board of certain Fidelity® funds (2014-2016).
Robert F. Gartland (1951)
Year of Election or Appointment: 2010
Trustee
Mr. Gartland also serves as Trustee of other Fidelity® funds. Prior to his retirement, Mr. Gartland held a variety of positions at Morgan Stanley (financial services, 1979-2007), including Managing Director (1987-2007) and Chase Manhattan Bank (1975-1978). Mr. Gartland previously served as Chairman and an investor in Gartland & Mellina Group Corp. (consulting, 2009-2019), as a member of the Board of National Securities Clearing Corporation (1993-1996) and as Chairman of TradeWeb (2003-2004).
Robert W. Helm (1957)
Year of Election or Appointment: 2023
Trustee
Mr. Helm also serves as Trustee or Member of the Advisory Board of other Fidelity® funds. Mr. Helm was formerly Deputy Chairman (2003-2020), partner (1991-2020) and an associate (1984-1991) of Dechert LLP (formerly Dechert Price & Rhoads). Mr. Helm currently serves on boards and committees of several not-for-profit organizations, including as a Trustee and member of the Executive Committee of the Baltimore Council on Foreign Affairs, a member of the Board of Directors of the St. Vincent de Paul Society of Baltimore and a member of the Life Guard Society of Mt. Vernon. Previously, Mr. Helm served as a Member of the Advisory Board of certain Fidelity® funds (2021-2023).
Arthur E. Johnson (1947)
Year of Election or Appointment: 2008
Trustee
Mr. Johnson also serves as Trustee of other Fidelity® funds. Prior to his retirement, Mr. Johnson served as Senior Vice President of Corporate Strategic Development of Lockheed Martin Corporation (defense contractor, 1999-2009). Mr. Johnson currently serves as a member of the Board of Booz Allen Hamilton (management consulting, 2011-present). Mr. Johnson previously served as a member of the Board of Eaton Corporation plc (diversified power management, 2009-2019) and a member of the Board of AGL Resources, Inc. (holding company, 2002-2016). Mr. Johnson previously served as Chairman (2018-2021) and Vice Chairman (2015-2018) of the Independent Trustees of certain Fidelity® funds. Mr. Arthur E. Johnson is not related to Ms. Abigail P. Johnson.
Michael E. Kenneally (1954)
Year of Election or Appointment: 2009
Trustee
Chairman of the Independent Trustees
Mr. Kenneally also serves as Trustee of other Fidelity® funds and was Vice Chairman (2018-2021) of the Independent Trustees of certain Fidelity® funds. Prior to retirement in 2005, he was Chairman and Global Chief Executive Officer of Credit Suisse Asset Management, the worldwide fund management and institutional investment business of Credit Suisse Group. Previously, Mr. Kenneally was an Executive Vice President and the Chief Investment Officer for Bank of America. In this role, he was responsible for the investment management, strategy and products delivered to the bank's institutional, high-net-worth and retail clients. Earlier, Mr. Kenneally directed the organization's equity and quantitative research groups. He began his career as a research analyst and then spent more than a dozen years as a portfolio manager for endowments, pension plans and mutual funds. He earned the Chartered Financial Analyst (CFA) designation in 1991.
Mark A. Murray (1954)
Year of Election or Appointment: 2016
Trustee
Mr. Murray also serves as Trustee of other Fidelity® funds. Previously, Mr. Murray served as Co-Chief Executive Officer (2013-2016), President (2006-2013) and Vice Chairman (2013-2020) of Meijer, Inc. Mr. Murray serves as a member of the Board (2009-present) and Public Policy and Responsibility Committee (2009-present) and Chair of the Nuclear Review Committee (2019-present) of DTE Energy Company (diversified energy company). Mr. Murray previously served as a member of the Board of Spectrum Health (not-for-profit health system, 2015-2019) and as a member of the Board and Audit Committee and Chairman of the Nominating and Corporate Governance Committee of Universal Forest Products, Inc. (manufacturer and distributor of wood and wood-alternative products, 2004-2016). Mr. Murray also serves as a member of the Board of many community and professional organizations. Mr. Murray previously served as a member of the Advisory Board of certain Fidelity® funds (2016).
Carol J. Zierhoffer (1960)
Year of Election or Appointment: 2023
Trustee
Ms. Zierhoffer also serves as Trustee or Member of the Advisory Board of other Fidelity® funds. Prior to her retirement, Ms. Zierhoffer held a variety of positions at Bechtel Corporation (engineering company, 2013-2019), including Principal Vice President and Chief Information Officer (2013-2016) and Senior Vice President and Chief Information Officer (2016-2019). Ms. Zierhoffer currently serves as a member of the Board of Directors, Audit Committee and Compensation Committee of Allscripts Healthcare Solutions, Inc. (healthcare technology, 2020-present) and as a member of the Board of Directors, Audit and Finance Committee and Nominating and Governance Committee of Atlas Air Worldwide Holdings, Inc. (aviation operating services, 2021-present). Previously, Ms. Zierhoffer served as a member of the Board of Directors and Audit Committee and as the founding Chair of the Information Technology Committee of MedAssets, Inc. (healthcare technology, 2013-2016), and as a Member of the Advisory Board of certain Fidelity® funds (2023).
+ The information includes the Trustee's principal occupation during the last five years and other information relating to the experience, attributes, and skills relevant to the Trustee's qualifications to serve as a Trustee, which led to the conclusion that the Trustee should serve as a Trustee for the fund.
Advisory Board Members and Officers:
Correspondence intended for a Member of the Advisory Board (if any) may be sent to Fidelity Investments, P.O. Box 55235, Boston, Massachusetts 02205-5235. Correspondence intended for an officer may be sent to Fidelity Investments, 245 Summer Street, Boston, Massachusetts 02210.
Name, Year of Birth; Principal Occupation
Heather Bonner (1977)
Year of Election or Appointment: 2023
Assistant Treasurer
Ms. Bonner also serves as an officer of other funds. Ms. Bonner is a Senior Vice President (2022-present) and is an employee of Fidelity Investments (2022-present). Ms. Bonner serves as Assistant Treasurer of Fidelity CRET Trustee LLC (2022-present). Prior to joining Fidelity, Ms. Bonner served as Managing Director at AQR Capital Management (2013-2022) and was the Treasurer and Principal Financial Officer of the AQR Funds (2013-2022).
Craig S. Brown (1977)
Year of Election or Appointment: 2019
Assistant Treasurer
Mr. Brown also serves as an officer of other funds. Mr. Brown is a Vice President (2015-present) and is an employee of Fidelity Investments. Mr. Brown serves as Assistant Treasurer of FIMM, LLC (2021-present). Previously, Mr. Brown served as Assistant Treasurer of certain Fidelity® funds (2019-2022).
John J. Burke III (1964)
Year of Election or Appointment: 2018
Chief Financial Officer
Mr. Burke also serves as Chief Financial Officer of other funds. Mr. Burke is Head of Fidelity Fund and Investment Operations (2018-present) and is an employee of Fidelity Investments. Mr. Burke serves as President, Executive Vice President, or Director of certain Fidelity entities. Previously Mr. Burke served as head of Asset Management Investment Operations (2012-2018).
Margaret Carey (1973)
Year of Election or Appointment: 2023
Secretary and Chief Legal Officer (CLO)
Ms. Carey also serves as an officer of other funds and as CLO of certain Fidelity entities. Ms. Carey is a Senior Vice President, Deputy General Counsel (2019-present) and is an employee of Fidelity Investments.
David J. Carter (1973)
Year of Election or Appointment: 2020
Assistant Secretary
Mr. Carter also serves as Assistant Secretary of other funds. Mr. Carter is a Senior Vice President, Deputy General Counsel (2022-present) and is an employee of Fidelity Investments. Mr. Carter serves as Chief Legal Officer of Fidelity Investments Institutional Operations Company LLC - Shareholder Division (transfer agent, 2020-present).
Jonathan Davis (1968)
Year of Election or Appointment: 2010
Assistant Treasurer
Mr. Davis also serves as an officer of other funds. Mr. Davis is a Vice President (2006-present) and is an employee of Fidelity Investments. Mr. Davis serves as Assistant Treasurer of certain Fidelity entities.
Laura M. Del Prato (1964)
Year of Election or Appointment: 2018
President and Treasurer
Ms. Del Prato also serves as an officer of other funds. Ms. Del Prato is a Senior Vice President (2017-present) and is an employee of Fidelity Investments. Ms. Del Prato serves as Vice President or Assistant Treasurer of certain Fidelity entities. Previously, Ms. Del Prato served as President and Treasurer of The North Carolina Capital Management Trust: Cash Portfolio and Term Portfolio (2018-2020).
Christopher M. Gouveia (1973)
Year of Election or Appointment: 2023
Chief Compliance Officer
Mr. Gouveia also serves as Chief Compliance Officer of other funds. Mr. Gouveia is a Senior Vice President of Asset Management Compliance (2019-present) and is an employee of Fidelity Investments. Mr. Gouveia serves as Compliance Officer of Fidelity Management Trust Company (2023-present). Previously, Mr. Gouveia served as Chief Compliance Officer of the North Carolina Capital Management Trust (2016-2019).
Colm A. Hogan (1973)
Year of Election or Appointment: 2016
Assistant Treasurer
Mr. Hogan also serves as an officer of other funds. Mr. Hogan is a Vice President (2016-present) and is an employee of Fidelity Investments. Mr. Hogan serves as Assistant Treasurer of certain Fidelity entities. Previously, Mr. Hogan served as Deputy Treasurer of certain Fidelity® funds (2016-2020) and Assistant Treasurer of certain Fidelity® funds (2016-2018).
William Irving (1964)
Year of Election or Appointment: 2023
Vice President
Mr. Irving also serves as Vice President of other funds. Mr. Irving is Head of Fidelity Asset Management Solutions (2022-present) and is an employee of Fidelity Investments. Mr. Irving serves as President and Director of Fidelity Diversifying Solutions LLC (investment adviser firm, 2023-present) and President or Director of certain other Fidelity entities. Previously, Mr. Irving served as Chief Investment Officer (CIO) in the Global Asset Allocation division (2020-2022). Prior to that, he was Managing Director of Research in the Global Asset Allocation division (2018-2020) and portfolio manager of certain Fidelity® funds (2004-2018).
Chris Maher (1972)
Year of Election or Appointment: 2013
Assistant Treasurer
Mr. Maher also serves as an officer of other funds. Mr. Maher is a Vice President (2008-present) and is an employee of Fidelity Investments. Mr. Maher serves as Assistant Treasurer of certain Fidelity entities. Previously, Mr. Maher served as Assistant Treasurer of certain funds (2013-2020).
Brett Segaloff (1972)
Year of Election or Appointment: 2021
Anti-Money Laundering (AML) Officer
Mr. Segaloff also serves as AML Officer of other funds. Mr. Segaloff is a Vice President (2022-present) and is an employee of Fidelity Investments. Mr. Segaloff serves as Anti Money Laundering Compliance Officer or Anti Money Laundering/Bank Secrecy Act Compliance Officer of certain Fidelity entities.
Stacie M. Smith (1974)
Year of Election or Appointment: 2013
Assistant Treasurer
Ms. Smith also serves as an officer of other funds. Ms. Smith is a Senior Vice President (2016-present) and is an employee of Fidelity Investments. Ms. Smith serves as Assistant Treasurer of certain Fidelity entities and has served in other fund officer roles.
Jim Wegmann (1979)
Year of Election or Appointment: 2021
Deputy Treasurer
Mr. Wegmann also serves as an officer of other funds. Mr. Wegmann is a Vice President (2016-present) and is an employee of Fidelity Investments. Mr. Wegmann serves as Assistant Treasurer of FIMM, LLC (2021-present). Previously, Mr. Wegmann served as Assistant Treasurer of certain Fidelity® funds (2019-2021).
As a shareholder, you incur two types of costs: (1) transaction costs, which may include sales charges (loads) on purchase payments or redemption proceeds, as applicable and (2) ongoing costs, which generally include management fees, distribution and/or service (12b-1) fees and other Fund expenses. This Example is intended to help you understand your ongoing costs (in dollars) of investing in a fund and to compare these costs with the ongoing costs of investing in other mutual funds.
| The Example is based on an investment of $1,000 invested at the beginning of the period and held for the entire period (April 1, 2023 to September 30, 2023). |
Actual Expenses
The first line of the accompanying table provides information about actual account values and actual expenses. You may use the information in this line, together with the amount you invested, to estimate the expenses that you paid over the period. Simply divide your account value by $1,000.00 (for example, an $8,600 account value divided by $1,000.00 = 8.6), then multiply the result by the number in the first line for a class/Fund under the heading entitled "Expenses Paid During Period" to estimate the expenses you paid on your account during this period. If any fund is a shareholder of any underlying mutual funds or exchange-traded funds (ETFs) (the Underlying Funds), such fund indirectly bears its proportional share of the expenses of the Underlying Funds in addition to the direct expenses incurred presented in the table. These fees and expenses are not included in the annualized expense ratio used to calculate the expense estimate in the table below.
Hypothetical Example for Comparison Purposes
The second line of the accompanying table provides information about hypothetical account values and hypothetical expenses based on the actual expense ratio and an assumed rate of return of 5% per year before expenses, which is not the actual return. The hypothetical account values and expenses may not be used to estimate the actual ending account balance or expenses you paid for the period. You may use this information to compare the ongoing costs of investing in the Fund and other funds. To do so, compare this 5% hypothetical example with the 5% hypothetical examples that appear in the shareholder reports of the other funds. If any fund is a shareholder of any Underlying Funds, such fund indirectly bears its proportional share of the expenses of the Underlying Funds in addition to the direct expenses as presented in the table. These fees and expenses are not included in the annualized expense ratio used to calculate the expense estimate in the table below.
Please note that the expenses shown in the table are meant to highlight your ongoing costs only and do not reflect any transaction costs. Therefore, the second line of the table is useful in comparing ongoing costs only, and will not help you determine the relative total costs of owning different funds. In addition, if these transactional costs were included, your costs would have been higher.
| | | | | Annualized Expense Ratio- A | | Beginning Account Value April 1, 2023 | | Ending Account Value September 30, 2023 | | Expenses Paid During Period- C April 1, 2023 to September 30, 2023 |
| Fidelity® Health Savings Fund | | | | | | | | | | |
| Fidelity® Health Savings Fund | | | | .46% | | | | | | |
| Actual | | | | | | $ 1,000 | | $ 976.90 | | $ 2.28 |
Hypothetical-B | | | | | | $ 1,000 | | $ 1,022.76 | | $ 2.33 |
| Class K | | | | .36% | | | | | | |
| Actual | | | | | | $ 1,000 | | $ 976.30 | | $ 1.78 |
Hypothetical-B | | | | | | $ 1,000 | | $ 1,023.26 | | $ 1.83 |
| |
A Annualized expense ratio reflects expenses net of applicable fee waivers.
B 5% return per year before expenses
C Expenses are equal to the annualized expense ratio, multiplied by the average account value over the period, multiplied by 183/ 365 (to reflect the one-half year period). The fees and expenses of any Underlying Funds are not included in each annualized expense ratio.
The dividend and capital gains distributions for the fund(s) are available on Fidelity.com or Institutional.Fidelity.com.
A total of 43.54% of the dividends distributed during the fiscal year was derived from interest on U.S. Government securities which is generally exempt from state income tax.
The fund designates $1,002,577 of distributions paid during the fiscal year ended 2023 as qualifying to be taxed as section 163(j) interest dividends.
A percentage of the dividends distributed during the fiscal year for the following funds qualify for the dividends-received deduction for corporate shareholders:
| | Fidelity Health Savings Fund | Class K |
| | | |
| November, 2022 | 4% | 4% |
| December, 2022 | 4% | 4% |
| February, 2023 | 9% | 7% |
| March, 2023 | 9% | 7% |
| April, 2023 | 8% | 8% |
| May, 2023 | 8% | 8% |
| June, 2023 | 8% | 8% |
| July, 2023 | 8% | 8% |
| August, 2023 | 8% | 8% |
| September, 2023 | 8% | 8% |
A percentage of the dividends distributed during the fiscal year for the following funds may be taken into account as a dividend for purposes of the maximum rate under section 1(h)(11) of the Internal Revenue Code.
| | Fidelity Health Savings Fund | Class K |
| | | |
| November, 2022 | 6.95% | 6.46% |
| December, 2022 | 7.49% | 7.39% |
| February, 2023 | 28.65% | 24.56% |
| March, 2023 | 28.36% | 24.81% |
| April, 2023 | 27.22% | 25.52% |
| May, 2023 | 26.84% | 25.76% |
| June, 2023 | 26.19% | 26.19% |
| July, 2023 | 26.75% | 25.83% |
| August, 2023 | 27.19% | 25.59% |
| September, 2023 | 26.19% | 26.19% |
A percentage of the dividends distributed during the fiscal year for the following funds qualify as a section 199A dividend:
| | Fidelity Health Savings Fund | Class K |
| | | |
| November, 2022 | 0.74% | 0.69% |
| December, 2022 | 0.80% | 0.79% |
| February, 2023 | 0.78% | 0.67% |
| March, 2023 | 0.77% | 0.68% |
| April, 2023 | 0.74% | 0.70% |
| May, 2023 | 0.73% | 0.70% |
| June, 2023 | 0.71% | 0.71% |
| July, 2023 | 0.73% | 0.71% |
| August, 2023 | 0.74% | 0.70% |
| September, 2023 | 0.71% | 0.71% |
The amounts per share which represent income derived from sources within, and taxes paid to, foreign countries or possessions of the United States are as follows:
| | Pay Date | Income | Taxes |
| | | | |
| Fidelity Health Savings Fund | 10/10/2022 | $0.0017 | $0.0005 |
| Class K | 10/10/2022 | $0.0017 | $0.0005 |
| Fidelity Health Savings Fund | 11/07/2022 | $0.0003 | $0.0001 |
| Class K | 11/07/2022 | $0.0004 | $0.0001 |
| Fidelity Health Savings Fund | 12/30/2022 | $0.0038 | $0.0012 |
| Class K | 12/30/2022 | $0.0038 | $0.0012 |
The fund will notify shareholders in January 2024 of amounts for use in preparing 2023 income tax returns.
Board Approval of Investment Advisory Contracts and Management Fees
Fidelity Health Savings Fund
Each year, the Board of Trustees, including the Independent Trustees (together, the Board), considers the renewal of the fund's management contract with Fidelity Management & Research Company LLC (FMR) and the sub-advisory agreements (together, the Advisory Contracts) for the fund. FMR and the sub-advisers are referred to herein as the Investment Advisers. The Board, assisted by the advice of fund counsel and Independent Trustees' counsel, requests and considers a broad range of information relevant to the renewal of the Advisory Contracts throughout the year.
The Board meets regularly and, at each of its meetings, covers an extensive agenda of topics and materials and considers factors that are relevant to its annual consideration of the renewal of the fund's Advisory Contracts, including the services and support provided to the fund and its shareholders. The Board's Operations Committee, of which all the Independent Trustees are members, meets regularly throughout the year and requests, receives and considers, among other matters, information related to the annual consideration of the renewal of the fund's Advisory Contracts before making its recommendation to the Board. The Board also meets as needed to review matters specifically related to the Board's annual consideration of the renewal of the Advisory Contracts. Members of the Board may also meet from time to time with trustees of other Fidelity funds through joint ad hoc committees to discuss certain matters relevant to all of the Fidelity funds.
At its September 2023 meeting, the Board unanimously determined to renew the fund's Advisory Contracts. In reaching its determination, the Board considered all factors it believed relevant, including (i) the nature, extent, and quality of the services provided to the fund and its shareholders (including the investment performance of the fund); (ii) the competitiveness relative to peer funds of the fund's management fee and the total expense ratio of a representative class (the retail class, which was selected because it was the largest class in 2022); (iii) the total costs of the services provided by and the profits realized by FMR and its affiliates (Fidelity) from its relationships with the fund; and (iv) the extent to which, if any, economies of scale exist and are realized as the fund grows, and whether any economies of scale are appropriately shared with fund shareholders. The Board also considered the broad range of investment choices available to shareholders from FMR's competitors and that the fund's shareholders have chosen to invest in the fund, which is part of the Fidelity family of funds. The Board's decision to renew the Advisory Contracts was not based on any single factor.
The Board reached a determination, with the assistance of fund counsel and Independent Trustees' counsel and through the exercise of its business judgment, that the renewal of the Advisory Contracts was in the best interests of the fund and its shareholders and that the compensation payable under the Advisory Contracts was fair and reasonable in light of all of the surrounding circumstances.
Nature, Extent, and Quality of Services Provided. The Board considered the Investment Advisers' staffing as it relates to the fund, including the backgrounds and experience of investment personnel, and also considered the Investment Advisers' implementation of the fund's investment program. The Independent Trustees also had discussions with senior management of Fidelity's investment operations and investment groups with responsibility for the underlying Fidelity funds in which the fund invests. The Board considered the structure of the investment personnel compensation program and whether this structure provides appropriate incentives to act in the best interests of the fund. Additionally, the Board considered the portfolio managers' investments, if any, in the funds that they manage.
Resources Dedicated to Investment Management and Support Services. The Board reviewed the general qualifications and capabilities of Fidelity's investment staff, including its size, education, experience, and resources, as well as Fidelity's approach to recruiting, training, managing, and compensating investment personnel. The Board noted the resources devoted to Fidelity's global investment organization, and that Fidelity's analysts have extensive resources, tools, and capabilities that allow them to conduct quantitative and fundamental analysis, as well as credit analysis of issuers, counterparties, and guarantors. Further, the Board considered that Fidelity's investment professionals have sufficient access to global information and data so as to provide competitive investment results over time, and that those professionals also have access to sophisticated tools that permit them to assess portfolio construction and risk and performance attribution characteristics continuously, as well as to transmit new information and research conclusions rapidly around the world. Additionally, in its deliberations, the Board considered Fidelity's trading, risk management, compliance, cybersecurity, and technology and operations capabilities and resources, which are integral parts of the investment management process.
Shareholder and Administrative Services. The Board considered (i) the nature, extent, quality, and cost of advisory, administrative, and shareholder services performed by the Investment Advisers and their affiliates under the Advisory Contracts and under separate agreements covering transfer agency, pricing and bookkeeping, and securities lending services for the fund; (ii) the nature and extent of Fidelity's supervision of third party service providers, principally custodians, subcustodians, and pricing vendors; and (iii) the resources devoted by Fidelity to, and the record of compliance with, the fund's compliance policies and procedures. The Board also reviewed the allocation of fund brokerage, including allocations to brokers affiliated with the Investment Advisers, the use of brokerage commissions to pay fund expenses, and the use of "soft" commission dollars to pay for research services. The Board also considered the fund's securities lending activities and any payments made to Fidelity relating to securities lending.
The Board noted that the growth of fund assets over time across the complex allows Fidelity to reinvest in the development of services designed to enhance the value and convenience of the Fidelity funds as investment vehicles. These services include 24-hour access to account information and market information over the Internet and through telephone representatives, investor education materials and asset allocation tools. The Board also considered that it reviews customer service metrics such as telephone response times, continuity of services on the website and metrics addressing services at Fidelity Investor Centers.
Investment in a Large Fund Family. The Board considered the benefits to shareholders of investing in a fund that is part of a large family of funds offering a variety of investment disciplines and providing a large variety of fund investor services. The Board noted that Fidelity had taken, or had made recommendations to the Board that resulted in the Fidelity funds taking, a number of actions over the previous year that benefited particular funds and/or the Fidelity funds in general.
Investment Performance. The Board took into account discussions that occur with representatives of the Investment Advisers, and reports that it receives, at Board meetings throughout the year relating to fund investment performance. In this regard the Board noted that as part of regularly scheduled fund reviews and other reports to the Board on fund performance, the Board considered annualized return information for the fund for different time periods, measured against one or more appropriate securities market indices, including a customized blended index that reflects the respective weights of the fund's asset classes (each a benchmark index). The Board also considered information about performance attribution. In its evaluation of fund investment performance at meetings throughout the year, the Board gave particular attention to information indicating underperformance of certain Fidelity funds over different time periods and discussed with the Investment Advisers the reasons for such underperformance.
In addition to reviewing absolute and relative fund performance, the Independent Trustees periodically consider the appropriateness of fund performance metrics in evaluating the results achieved. The Independent Trustees generally give greater weight to fund performance over longer time periods than over shorter time periods. Depending on the circumstances, the Independent Trustees may be satisfied with a fund's performance notwithstanding that it lags its benchmark index or peer group for certain periods.
Based on its review, the Board concluded that the nature, extent, and quality of services provided to the fund under the Advisory Contracts should continue to benefit the shareholders of the fund.
Competitiveness of Management Fee and Total Expense Ratio. The Board was provided with information regarding industry trends in management fees and expenses. In its review of the fund's management fee and total expense ratio of the retail class, the Board considered the fund's unitary (subject to limited exceptions) fee rate as well as other fund or class expenses paid by FMR under the fund's management contract, such as transfer agent fees, pricing and bookkeeping fees, and custodial, legal and audit fees. The Board also noted that Fidelity may agree to waive fees or reimburse expenses from time to time, and the extent to which, if any, it has done so for the fund.
Comparisons of Management Fees and Total Expense Ratios. Among other things, the Board reviewed data for selected groups of competitive funds and classes (referred to as "mapped groups") that were compiled by Fidelity based on combining similar investment objective categories (as classified by Lipper) that have comparable investment mandates. The data reviewed by the Board included (i) gross management fee comparisons (before taking into account expense reimbursements or caps) relative to the total universe of funds within the mapped group; (ii) gross management fee comparisons relative to a subset of non-Fidelity funds in the mapped group that are similar in size and management fee structure to the fund (referred to as the "asset size peer group"); (iii) total expense comparisons of the retail class of the fund relative to funds and classes in the mapped group that have a similar sales load structure to the retail class of the fund (referred to as the "similar sales load structure group"); and (iv) total expense comparisons of the retail class of the fund relative to funds and classes in the similar sales load structure group that are similar in size and management fee structure to the fund (referred to as the "total expense asset size peer group").
The information provided to the Board indicated that the fund's management fee rate ranked below the competitive median of the mapped group for 2022 and below the competitive median of the asset size peer group for 2022. Further, the information provided to the Board indicated that the total expense ratio of the retail class ranked below the competitive median of the similar sales load structure group for 2022 and below the competitive median of the total expense asset size peer group for 2022.
Fees Charged to Other Fidelity Clients. The Board also considered Fidelity fee structures and other information with respect to clients of Fidelity, such as other funds advised or subadvised by Fidelity, pension plan clients, and other institutional clients with similar mandates. The Board noted that a joint ad hoc committee created by it and the boards of other Fidelity funds periodically reviews and compares Fidelity's institutional investment advisory business with its business of providing services to the Fidelity funds and also noted the most recent findings of the committee. The Board noted that the committee's review included a consideration of the differences in services provided, fees charged, and costs incurred, as well as competition in the markets serving the different categories of clients.
Based on its review, the Board concluded that the fund's management fee is fair and reasonable in light of the services that the fund receives and the other factors considered. Further, based on its review of total expense ratios and fees charged to other Fidelity clients, the Board concluded that the total expense ratio of each class of the fund was reasonable in light of the services that the fund and its shareholders receive and the other factors considered.
Costs of the Services and Profitability. The Board considered the revenues earned and the expenses incurred by Fidelity in conducting the business of developing, marketing, distributing, managing, administering and servicing the fund and servicing the fund's shareholders. The Board also considered the level of Fidelity's profits in respect of all the Fidelity funds, including the Fidelity funds in which the fund invests.
On an annual basis, Fidelity presents to the Board information about the profitability of its relationships with the fund. Fidelity calculates profitability information for each fund, as well as aggregate profitability information for groups of Fidelity funds and all Fidelity funds, using a series of detailed revenue and cost allocation methodologies which originate with the books and records of Fidelity on which Fidelity's audited financial statements are based. The Audit Committee of the Board reviews any significant changes from the prior year's methodologies and the full Board approves such changes.
A public accounting firm has been engaged annually by the Board as part of the Board's assessment of Fidelity's profitability analysis. The engagement includes the review and assessment of the methodologies used by Fidelity in determining the revenues and expenses attributable to Fidelity's fund business, and completion of agreed-upon procedures in respect of the mathematical accuracy of certain fund profitability information and its conformity to established allocation methodologies. After considering the reports issued under the engagement and information provided by Fidelity, the Board concluded that while other allocation methods may also be reasonable, Fidelity's profitability methodologies are reasonable in all material respects.
The Board also reviewed Fidelity's non-fund businesses and potential indirect benefits such businesses may have received as a result of their association with Fidelity's fund business (i.e., fall-out benefits) as well as cases where Fidelity's affiliates may benefit from the funds' business. The Board considered areas where potential indirect benefits to the Fidelity funds from their relationships with Fidelity may exist. The Board's consideration of these matters was informed by the findings of a joint ad hoc committee created by it and the boards of other Fidelity funds to evaluate potential fall-out benefits.
The Board considered the costs of the services provided by and the profits realized by Fidelity in connection with the operation of the fund and was satisfied that the profitability was not excessive.
Economies of Scale. The Board considered whether there have been economies of scale in respect of the management of the Fidelity funds, whether the Fidelity funds (including the fund) have appropriately benefited from any such economies of scale, and whether there is potential for realization of any further economies of scale. The Board considered the extent to which the fund will benefit from economies of scale as assets grow through increased services to the fund, through waivers or reimbursements, or through fee or expense ratio reductions. The Board recognized that, due to the fund's current contractual arrangements, its expense ratio will not decline if the fund's operating costs decrease as assets grow, or rise as assets decrease. The Board also noted that a committee created by it and the boards of other Fidelity funds periodically analyzes whether Fidelity attains economies of scale in respect of the management and servicing of the Fidelity funds, whether the Fidelity funds have appropriately benefited from such economies of scale, and whether there is potential for realization of any further economies of scale.
The Board concluded, taking into account the analysis of the committee, that economies of scale, if any, are being appropriately shared between fund shareholders and Fidelity.
Additional Information Requested by the Board. In order to develop fully the factual basis for consideration of the Fidelity funds' advisory contracts, the Board requested and received additional information on certain topics, including: (i) Fidelity's fund profitability methodology, profitability trends for certain funds, the allocation of various costs to different funds, and the impact of certain factors on fund profitability results; (ii) portfolio manager changes that have occurred during the past year and Fidelity's views regarding portfolio manager investment in the Fidelity funds that they manage; (iii) hiring, training, and retaining personnel; (iv) the arrangements with and compensation paid to certain fund sub-advisers and the treatment of such compensation within Fidelity's fund profitability methodology; (v) the terms of the funds' various management fee structures, including the basic group fee and the terms of Fidelity's voluntary expense limitation arrangements; (vi) Fidelity's transfer agent, pricing and bookkeeping fees, expense and service structures for different funds and classes relative to competitive trends and market conditions; (vii) the impact on fund profitability of recent industry trends, such as the growth in passively managed funds and the changes in flows for different types of funds; (viii) the types of management fee and total expense comparisons provided, and the challenges and limitations associated with such information; (ix) explanations regarding the relative total expense ratios and management fees of certain funds and classes, total expense and management fee competitive trends, and methodologies for total expense and management fee competitive comparisons; (x) information concerning expense limitations applicable to certain funds; and (xi) matters related to money market funds, exchange-traded funds, and target date funds.
Conclusion. Based on its evaluation of all of the conclusions noted above, and after considering all factors it believed relevant, the Board, including the Independent Trustees, concluded that the advisory and sub-advisory fee arrangements are fair and reasonable in light of all of the surrounding circumstances and that the fund's Advisory Contracts should be renewed through September 30, 2024.
1.9897530.103
HSF-ANN-1123
Fidelity® Sustainable Multi-Asset Fund
Annual Report
September 30, 2023
Includes Fidelity and Fidelity Advisor share classes
Contents
To view a fund's proxy voting guidelines and proxy voting record for the 12-month period ended June 30, visit http://www.fidelity.com/proxyvotingresults or visit the Securities and Exchange Commission's (SEC) web site at http://www.sec.gov.
You may also call 1-800-544-8544 if you're an individual investing directly with Fidelity, call 1-800-835-5092 if you're a plan sponsor or participant with Fidelity as your recordkeeper or call 1-877-208-0098 on institutional accounts or if you're an advisor or invest through one to request a free copy of the proxy voting guidelines.
Standard & Poor's, S&P and S&P 500 are registered service marks of The McGraw-Hill Companies, Inc. and have been licensed for use by Fidelity Distributors Corporation.
Other third-party marks appearing herein are the property of their respective owners.
All other marks appearing herein are registered or unregistered trademarks or service marks of FMR LLC or an affiliated company. © 2023 FMR LLC. All rights reserved.
This report and the financial statements contained herein are submitted for the general information of the shareholders of the Fund. This report is not authorized for distribution to prospective investors in the Fund unless preceded or accompanied by an effective prospectus.
A fund files its complete schedule of portfolio holdings with the SEC for the first and third quarters of each fiscal year on Form N-PORT. Forms N-PORT are available on the SEC's web site at http://www.sec.gov. A fund's Forms N-PORT may be reviewed and copied at the SEC's Public Reference Room in Washington, DC. Information regarding the operation of the SEC's Public Reference Room may be obtained by calling 1-800-SEC-0330.
For a complete list of a fund's portfolio holdings, view the most recent holdings listing, semiannual report, or annual report on Fidelity's web site at http://www.fidelity.com, http://www.institutional.fidelity.com, or http://www.401k.com, as applicable.
NOT FDIC INSURED •MAY LOSE VALUE •NO BANK GUARANTEE
Neither the Fund nor Fidelity Distributors Corporation is a bank.
Average annual total return reflects the change in the value of an investment, assuming reinvestment of distributions from dividend income and capital gains (the profits earned upon the sale of securities that have grown in value, if any) and assuming a constant rate of performance each year. The hypothetical investment and the average annual total returns do not reflect the deduction of taxes that a shareholder would pay on fund distributions or the redemption of fund shares. During periods of reimbursement by Fidelity, a fund's total return will be greater than it would be had the reimbursement not occurred. How a fund did yesterday is no guarantee of how it will do tomorrow.
| Average Annual Total Returns |
| | | | |
Periods ended September 30, 2023 | Past 1 year | Life of Fund A |
Class A (incl. 5.75% sales charge) | 7.03% | -10.52% |
Class M (incl. 3.50% sales charge) | 9.49% | -9.41% |
Class C (incl. contingent deferred sales charge) | 11.80% | -7.89% |
| Fidelity® Sustainable Multi-Asset Fund | 13.91% | -6.97% |
| Class I | 13.91% | -6.97% |
A From February 10, 2022
Class C shares' contingent deferred sales charges included in the past one year and life of fund total return figures are 1% and 0%, respectively.
| $10,000 Over Life of Fund |
| |
Let's say hypothetically that $10,000 was invested in Fidelity® Sustainable Multi-Asset Fund, a class of the fund, on February 10, 2022, when the fund started. The chart shows how the value of your investment would have changed, and also shows how the S&P 500® Index performed over the same period. |
|
|
Market Recap:
For the 12 months ending September 30, 2023, continued global economic expansion and a slowing in the pace of inflation contributed to a favorable backdrop for risk assets. After struggling throughout much of 2022, risk assets strongly rebounded the past 12 months, with U.S. large-cap stocks leading the way. In the U.S., the upturn was driven partly by a narrow set of companies in the information technology and communication services sectors amid excitement for generative artificial intelligence applications. Meanwhile, monetary tightening by the U.S. Federal Reserve and other central banks continued amid elevated inflation.
International equities rose 20.60% for the 12 months, according to the MSCI ACWI (All Country World Index) ex USA Index. All regions gained, with Europe ex U.K. (+31%) leading the way. Japan (+26%) and the U.K. (+25%) also outperformed, whereas Asia Pacific ex Japan (+11%) lagged by the widest margin. Each of the 11 sectors also advanced, with information technology (+30%), industrials (+29%) and energy (+28%) being the top performers. Conversely, real estate (+5%) lagged the most, followed by consumer staples (+9%).
U.S. stocks gained 20.49% for the 12 months, as measured by the Dow Jones U.S. Total Stock Market Index, as all but two sectors rose. Information technology (+41%), communication services (+35%) and energy (+29%) led by the widest margins. Conversely, utilities (-7%) and real estate (-1%) lagged most. Growth stocks broadly outpaced value, while larger-caps topped small-caps. Commodities returned -1.30%, according to the Bloomberg Commodity Index Total Return.
U.S. taxable investment-grade bonds returned 0.64% for the 12 months, per the Bloomberg U.S. Aggregate Bond Index, amid elevated inflation and rising interest rates. Since March 2022, the Fed has hiked its benchmark interest rate 11 times, by 5.25 percentage points, while allowing up to billions in bonds to mature each month without investing the proceeds. Short-term U.S. Treasuries (+4.58%) topped U.S. investment-grade corporate bonds (+3.47%), while commercial mortgage-backed securities returned (+1.19%) and agencies gained (+2.10%). Outside the index, leveraged loans (+13.39%), U.S. high-yield bonds (+8.24%) and emerging-markets debt (+8.61%) rose, whereas Treasury Inflation-Protected Securities (+1.25%) experienced a modest gain.
Comments from Co-Portfolio Managers Bruno Weinberg Crocco and Finola McGuire Foley:
For the fiscal year, the fund's share classes gained roughly 13% to 14%, compared with a 15.24% advance for the Fidelity® Sustainable Multi-Asset Composite Index. The performance of the underlying investment portfolios was the primary reason for the Fund's underperformance of the Composite index, especially among the non-U.S. equity portfolios. More specifically, Fidelity® Sustainable International Equity Fund returned 16.25% for the 12 months, trailing the 25.73% gain of its benchmark, the MSCI EAFE ESG Leaders Index. Modestly offsetting that weak relative performance was an investment in Fidelity® Sustainable Emerging Markets Equity Fund (+12.62%), which outpaced its benchmark, the MSCI Emerging Markets ESG Leaders Index (+10.47%). Elsewhere, the Fund's allocation to Fidelity® Sustainable Core Investment Grade Bond Fund (+1.32%) added relative value, topping the 0.64% result of the Bloomberg U.S. Aggregate Bond Index. Meanwhile, active asset allocation contributed to the Fund's relative result this period. In particular, an underweight in U.S. investment-grade bonds was helpful, as was an overweight in non-U.S. equities. Conversely, an overweight in U.S. Treasury Inflation-Protected Securities detracted from the Fund's relative performance.
Note to shareholders: Application of FMR's environmental, social and governance (ESG) ratings process and/or its sustainable investing exclusion criteria may affect the Fund's exposure to certain issuers, sectors, regions and countries, and may affect the portfolios' performance.
The views expressed above reflect those of the portfolio manager(s) only through the end of the period as stated on the cover of this report and do not necessarily represent the views of Fidelity or any other person in the Fidelity organization. Any such views are subject to change at any time based upon market or other conditions and Fidelity disclaims any responsibility to update such views. These views may not be relied on as investment advice and, because investment decisions for a Fidelity fund are based on numerous factors, may not be relied on as an indication of trading intent on behalf of any Fidelity fund.
The information in the following tables is based on the direct Investments of the Fund.
Top Holdings (% of Fund's net assets) |
| |
| Fidelity U.S. Sustainability Index Fund | 25.9 | |
| Fidelity Sustainable International Equity Fund | 17.9 | |
| Fidelity Sustainable Core Plus Bond Fund | 12.3 | |
| Fidelity Sustainable U.S. Equity ETF | 10.9 | |
| Fidelity International Sustainability Index Fund | 7.0 | |
| Fidelity Sustainable Emerging Markets Equity Fund | 6.8 | |
| Fidelity Inflation-Protected Bond Index Fund | 6.1 | |
| Fidelity Long-Term Treasury Bond Index Fund | 5.0 | |
| Fidelity Sustainability Bond Index Fund | 4.1 | |
| Fidelity Sustainable Low Duration Bond Fund | 4.0 | |
| | 100.0 | |
| |
Asset Allocation (% of Fund's net assets) |
|
Percentages shown as 0.0% may reflect amounts less than 0.05%. |
|
Showing Percentage of Net Assets
| Domestic Equity Funds - 36.8% |
| | | Shares | Value ($) |
| Fidelity Sustainable U.S. Equity ETF (a) | | 72,676 | 1,461,100 |
| Fidelity U.S. Sustainability Index Fund (a) | | 181,902 | 3,485,249 |
| TOTAL DOMESTIC EQUITY FUNDS (Cost $4,587,541) | | | 4,946,349 |
| | | | |
| International Equity Funds - 31.7% |
| | | Shares | Value ($) |
| Fidelity International Sustainability Index Fund (a) | | 85,736 | 935,377 |
| Fidelity Sustainable Emerging Markets Equity Fund (a) | | 120,290 | 920,216 |
| Fidelity Sustainable International Equity Fund (a) | | 298,346 | 2,404,669 |
| TOTAL INTERNATIONAL EQUITY FUNDS (Cost $4,320,985) | | | 4,260,262 |
| | | | |
| Bond Funds - 31.5% |
| | | Shares | Value ($) |
| Fidelity Inflation-Protected Bond Index Fund (a) | | 91,631 | 820,095 |
| Fidelity Long-Term Treasury Bond Index Fund (a) | | 73,938 | 673,572 |
| Fidelity Sustainability Bond Index Fund (a) | | 62,705 | 554,310 |
| Fidelity Sustainable Core Plus Bond Fund (a) | | 186,829 | 1,653,438 |
| Fidelity Sustainable Low Duration Bond Fund (a) | | 53,090 | 538,331 |
| TOTAL BOND FUNDS (Cost $4,506,332) | | | 4,239,746 |
| | | | |
| Short-Term Funds - 0.0% |
| | | Shares | Value ($) |
Fidelity Cash Central Fund 5.39% (b) (Cost $348) | | 348 | 348 |
| | | | |
| TOTAL INVESTMENT IN SECURITIES - 100.0% (Cost $13,415,206) | 13,446,705 |
NET OTHER ASSETS (LIABILITIES) - 0.0% | 2,205 |
| NET ASSETS - 100.0% | 13,448,910 |
| | |
Security Type Abbreviations
Legend
| (b) | Affiliated fund that is generally available only to investment companies and other accounts managed by Fidelity Investments. The rate quoted is the annualized seven-day yield of the fund at period end. A complete unaudited listing of the fund's holdings as of its most recent quarter end is available upon request. In addition, each Fidelity Central Fund's financial statements, which are not covered by the Fund's Report of Independent Registered Public Accounting Firm, are available on the SEC's website or upon request. |
Affiliated Central Funds
Fiscal year to date information regarding the Fund's investments in Fidelity Central Funds, including the ownership percentage, is presented below.
| Affiliate | Value, beginning of period ($) | Purchases ($) | Sales Proceeds ($) | Dividend Income ($) | Realized Gain (loss) ($) | Change in Unrealized appreciation (depreciation) ($) | Value, end of period ($) | % ownership, end of period |
| Fidelity Cash Central Fund 5.39% | 464 | 288,676 | 288,792 | 121 | - | - | 348 | 0.0% |
| Total | 464 | 288,676 | 288,792 | 121 | - | - | 348 | |
| | | | | | | | | |
Amounts in the dividend income column in the above table include any capital gain distributions from underlying funds, which are presented in the corresponding line item in the Statement of Operations, if applicable.
Amounts included in the purchases and sales proceeds columns may include in-kind transactions, if applicable.
Affiliated Underlying Funds
Fiscal year to date information regarding the Fund's investments in affiliated Underlying Funds is presented below. Exchanges between classes of the same affiliated Underlying Funds may occur. If an Underlying Funds changes its name, the name presented below is the name in effect at period end.
| Affiliate | Value, beginning of period ($) | Purchases ($) | Sales Proceeds ($) | Dividend Income ($) | Realized Gain (loss) ($) | Change in Unrealized appreciation (depreciation) ($) | Value, end of period ($) |
| Fidelity Inflation-Protected Bond Index Fund | 442,310 | 905,510 | 475,153 | 54,755 | (27,060) | (25,512) | 820,095 |
| Fidelity International Sustainability Index Fund | 330,703 | 747,070 | 199,166 | 11,780 | (7,788) | 64,558 | 935,377 |
| Fidelity Long-Term Treasury Bond Index Fund | 247,345 | 762,563 | 251,353 | 14,685 | (20,662) | (64,321) | 673,572 |
| Fidelity Sustainability Bond Index Fund | 165,311 | 542,841 | 134,519 | 10,890 | (1,648) | (17,675) | 554,310 |
| Fidelity Sustainable Core Plus Bond Fund | 497,093 | 1,627,468 | 407,730 | 44,821 | (7,476) | (55,917) | 1,653,438 |
| Fidelity Sustainable Emerging Markets Equity Fund | 319,811 | 891,403 | 322,324 | 3,459 | (1,341) | 32,667 | 920,216 |
| Fidelity Sustainable International Equity Fund | 876,458 | 1,921,866 | 502,259 | 7,257 | (22,323) | 130,927 | 2,404,669 |
| Fidelity Sustainable Low Duration Bond Fund | 70,084 | 668,660 | 206,442 | 7,552 | 241 | 5,788 | 538,331 |
| Fidelity Sustainable U.S. Equity ETF | 569,900 | 790,318 | 48,882 | 10,862 | (389) | 150,153 | 1,461,100 |
| Fidelity U.S. Sustainability Index Fund | 1,349,419 | 3,624,748 | 1,929,313 | 27,537 | (43,768) | 484,163 | 3,485,249 |
| | 4,868,434 | 12,482,447 | 4,477,141 | 193,598 | (132,214) | 704,831 | 13,446,357 |
Amounts in the dividend income column in the above table include any capital gain distributions from underlying funds, which are presented in the corresponding line item in the Statement of Operations, if applicable.
Amounts included in the purchases and sales proceeds columns may include in-kind transactions, if applicable.
Investment Valuation
The following is a summary of the inputs used, as of September 30, 2023, involving the Fund's assets and liabilities carried at fair value. The inputs or methodology used for valuing securities may not be an indication of the risk associated with investing in those securities. For more information on valuation inputs, and their aggregation into the levels used below, please refer to the Investment Valuation section in the accompanying Notes to Financial Statements.
| Valuation Inputs at Reporting Date: |
| Description | Total ($) | Level 1 ($) | Level 2 ($) | Level 3 ($) |
Investments in Securities: | | | | |
|
| Domestic Equity Funds | 4,946,349 | 4,946,349 | - | - |
|
| International Equity Funds | 4,260,262 | 4,260,262 | - | - |
|
| Bond Funds | 4,239,746 | 4,239,746 | - | - |
|
| Short-Term Funds | 348 | 348 | - | - |
| Total Investments in Securities: | 13,446,705 | 13,446,705 | - | - |
| Statement of Assets and Liabilities |
| | | | September 30, 2023 |
| | | | | |
| Assets | | | | |
| Investment in securities, at value - See accompanying schedule: | | | | |
Fidelity Central Funds (cost $348) | $ | 348 | | |
Other affiliated issuers (cost $13,414,858) | | 13,446,357 | | |
| | | | | |
| | | | | |
| Total Investment in Securities (cost $13,415,206) | | | $ | 13,446,705 |
| Cash | | | | 2,689 |
| Receivable for investments sold | | | | 977 |
| Receivable for fund shares sold | | | | 72,375 |
| Distributions receivable from Fidelity Central Funds | | | | 2 |
| Receivable from investment adviser for expense reductions | | | | 575 |
Total assets | | | | 13,523,323 |
| Liabilities | | | | |
| Payable for investments purchased | $ | 72,724 | | |
| Accrued management fee | | 1,133 | | |
| Distribution and service plan fees payable | | 416 | | |
| Other payables and accrued expenses | | 140 | | |
| Total Liabilities | | | | 74,413 |
| Net Assets | | | $ | 13,448,910 |
| Net Assets consist of: | | | | |
| Paid in capital | | | $ | 13,605,864 |
| Total accumulated earnings (loss) | | | | (156,954) |
| Net Assets | | | $ | 13,448,910 |
| | | | | |
| Net Asset Value and Maximum Offering Price | | | | |
| Class A : | | | | |
Net Asset Value and redemption price per share ($284,969 ÷ 32,707 shares)(a) | | | $ | 8.71 |
| Maximum offering price per share (100/94.25 of $8.71) | | | $ | 9.24 |
| Class M : | | | | |
Net Asset Value and redemption price per share ($205,772 ÷ 23,660 shares)(a) | | | $ | 8.70 |
| Maximum offering price per share (100/96.50 of $8.70) | | | $ | 9.02 |
| Class C : | | | | |
Net Asset Value and offering price per share ($311,990 ÷ 36,033 shares)(a) | | | $ | 8.66 |
| Fidelity Sustainable Multi-Asset Fund : | | | | |
Net Asset Value, offering price and redemption price per share ($11,866,246 ÷ 1,359,279 shares) | | | $ | 8.73 |
| Class I : | | | | |
Net Asset Value, offering price and redemption price per share ($779,933 ÷ 89,342 shares) | | | $ | 8.73 |
(a)Redemption price per share is equal to net asset value less any applicable contingent deferred sales charge. |
| Statement of Operations |
| | | | Year ended September 30, 2023 |
| Investment Income | | | | |
| Dividends: | | | | |
| Affiliated issuers | | | $ | 193,598 |
| Income from Fidelity Central Funds | | | | 121 |
| Total Income | | | | 193,719 |
| Expenses | | | | |
| Management fee | $ | 9,902 | | |
| Distribution and service plan fees | | 4,386 | | |
| Independent trustees' fees and expenses | | 32 | | |
| Miscellaneous | | 141 | | |
| Total expenses before reductions | | 14,461 | | |
| Expense reductions | | (5,197) | | |
| Total expenses after reductions | | | | 9,264 |
| Net Investment income (loss) | | | | 184,455 |
| Realized and Unrealized Gain (Loss) | | | | |
| Net realized gain (loss) on: | | | | |
| Investment Securities: | | | | |
| Affiliated issuers | | (132,214) | | |
| Total net realized gain (loss) | | | | (132,214) |
| Change in net unrealized appreciation (depreciation) on: | | | | |
| Investment Securities: | | | | |
| Affiliated issuers | | 704,831 | | |
| Total change in net unrealized appreciation (depreciation) | | | | 704,831 |
| Net gain (loss) | | | | 572,617 |
| Net increase (decrease) in net assets resulting from operations | | | $ | 757,072 |
| Statement of Changes in Net Assets |
| |
| | Year ended September 30, 2023 | | For the period February 10, 2022 (commencement of operations) through September 30, 2022 |
| Increase (Decrease) in Net Assets | | | | |
| Operations | | | | |
| Net investment income (loss) | $ | 184,455 | $ | 7,371 |
| Net realized gain (loss) | | (132,214) | | (120,181) |
| Change in net unrealized appreciation (depreciation) | | 704,831 | | (673,332) |
| Net increase (decrease) in net assets resulting from operations | | 757,072 | | (786,142) |
| Distributions to shareholders | | (127,886) | | - |
| | | | | |
| Share transactions - net increase (decrease) | | 7,949,542 | | 5,656,324 |
| Total increase (decrease) in net assets | | 8,578,728 | | 4,870,182 |
| | | | | |
| Net Assets | | | | |
| Beginning of period | | 4,870,182 | | - |
| End of period | $ | 13,448,910 | $ | 4,870,182 |
| | | | | |
| | | | | |
Financial Highlights
| Fidelity Advisor® Sustainable Multi-Asset Fund Class A |
| |
| Years ended September 30, | | 2023 | | 2022 A |
Selected Per-Share Data | | | | |
| Net asset value, beginning of period | $ | 7.79 | $ | 10.00 |
| Income from Investment Operations | | | | |
Net investment income (loss) B,C | | .14 | | .02 |
| Net realized and unrealized gain (loss) | | .91 | | (2.23) |
| Total from investment operations | | 1.05 | | (2.21) |
| Distributions from net investment income | | (.13) | | - |
| Total distributions | | (.13) | | - |
| Net asset value, end of period | $ | 8.71 | $ | 7.79 |
Total Return D,E,F | | 13.56% | | (22.10)% |
Ratios to Average Net Assets C,G,H | | | | |
| Expenses before reductions | | .35% | | .35% I |
| Expenses net of fee waivers, if any | | .30% | | .30% I |
| Expenses net of all reductions | | .30% | | .30% I |
| Net investment income (loss) | | 1.66% | | .30% I |
| Supplemental Data | | | | |
| Net assets, end of period (000 omitted) | $ | 285 | $ | 163 |
Portfolio turnover rate J | | 45% | | 111% I |
AFor the period February 10, 2022 (commencement of operations) through September 30, 2022
BCalculated based on average shares outstanding during the period.
CNet investment income (loss) is affected by the timing of the declaration of dividends by any underlying mutual funds or exchange-traded funds (ETFs). Net investment income (loss) of any mutual funds or ETFs is not included in the Fund's net investment income (loss) ratio.
DTotal returns for periods of less than one year are not annualized.
ETotal returns would have been lower if certain expenses had not been reduced during the applicable periods shown.
FTotal returns do not include the effect of the sales charges.
GFees and expenses of any underlying mutual funds or exchange-traded funds (ETFs) are not included in the Fund's expense ratio. The Fund indirectly bears its proportionate share of these expenses. For additional expense information related to investments in Fidelity Central Funds, please refer to the "Investments in Fidelity Central Funds" note found in the Notes to Financial Statements section of the most recent Annual or Semi-Annual report.
HExpense ratios reflect operating expenses of the class. Expenses before reductions do not reflect amounts reimbursed, waived, or reduced through arrangements with the investment adviser, brokerage services, or other offset arrangements, if applicable, and do not represent the amount paid by the class during periods when reimbursements, waivers or reductions occur.
IAnnualized.
JAmount does not include the portfolio activity of any underlying mutual funds or exchange-traded funds (ETFs).
| Fidelity Advisor® Sustainable Multi-Asset Fund Class M |
| |
| Years ended September 30, | | 2023 | | 2022 A |
Selected Per-Share Data | | | | |
| Net asset value, beginning of period | $ | 7.77 | $ | 10.00 |
| Income from Investment Operations | | | | |
Net investment income (loss) B,C | | .12 | | - D |
| Net realized and unrealized gain (loss) | | .92 | | (2.23) |
| Total from investment operations | | 1.04 | | (2.23) |
| Distributions from net investment income | | (.11) | | - |
| Total distributions | | (.11) | | - |
| Net asset value, end of period | $ | 8.70 | $ | 7.77 |
Total Return E,F,G | | 13.46% | | (22.30)% |
Ratios to Average Net Assets C,H,I | | | | |
| Expenses before reductions | | .60% | | .60% J |
| Expenses net of fee waivers, if any | | .55% | | .55% J |
| Expenses net of all reductions | | .55% | | .55% J |
| Net investment income (loss) | | 1.41% | | .05% J |
| Supplemental Data | | | | |
| Net assets, end of period (000 omitted) | $ | 206 | $ | 169 |
Portfolio turnover rate K | | 45% | | 111% J |
AFor the period February 10, 2022 (commencement of operations) through September 30, 2022
BCalculated based on average shares outstanding during the period.
CNet investment income (loss) is affected by the timing of the declaration of dividends by any underlying mutual funds or exchange-traded funds (ETFs). Net investment income (loss) of any mutual funds or ETFs is not included in the Fund's net investment income (loss) ratio.
DAmount represents less than $.005 per share.
ETotal returns for periods of less than one year are not annualized.
FTotal returns would have been lower if certain expenses had not been reduced during the applicable periods shown.
GTotal returns do not include the effect of the sales charges.
HFees and expenses of any underlying mutual funds or exchange-traded funds (ETFs) are not included in the Fund's expense ratio. The Fund indirectly bears its proportionate share of these expenses. For additional expense information related to investments in Fidelity Central Funds, please refer to the "Investments in Fidelity Central Funds" note found in the Notes to Financial Statements section of the most recent Annual or Semi-Annual report.
IExpense ratios reflect operating expenses of the class. Expenses before reductions do not reflect amounts reimbursed, waived, or reduced through arrangements with the investment adviser, brokerage services, or other offset arrangements, if applicable, and do not represent the amount paid by the class during periods when reimbursements, waivers or reductions occur.
JAnnualized.
KAmount does not include the portfolio activity of any underlying mutual funds or exchange-traded funds (ETFs).
| Fidelity Advisor® Sustainable Multi-Asset Fund Class C |
| |
| Years ended September 30, | | 2023 | | 2022 A |
Selected Per-Share Data | | | | |
| Net asset value, beginning of period | $ | 7.75 | $ | 10.00 |
| Income from Investment Operations | | | | |
Net investment income (loss) B,C | | .08 | | (.03) |
| Net realized and unrealized gain (loss) | | .91 | | (2.22) |
| Total from investment operations | | .99 | | (2.25) |
| Distributions from net investment income | | (.08) | | - |
| Total distributions | | (.08) | | - |
| Net asset value, end of period | $ | 8.66 | $ | 7.75 |
Total Return D,E,F | | 12.80% | | (22.50)% |
Ratios to Average Net Assets C,G,H | | | | |
| Expenses before reductions | | 1.10% | | 1.10% I |
| Expenses net of fee waivers, if any | | 1.05% | | 1.05% I |
| Expenses net of all reductions | | 1.05% | | 1.05% I |
| Net investment income (loss) | | .91% | | (.45)% I |
| Supplemental Data | | | | |
| Net assets, end of period (000 omitted) | $ | 312 | $ | 229 |
Portfolio turnover rate J | | 45% | | 111% I |
AFor the period February 10, 2022 (commencement of operations) through September 30, 2022
BCalculated based on average shares outstanding during the period.
CNet investment income (loss) is affected by the timing of the declaration of dividends by any underlying mutual funds or exchange-traded funds (ETFs). Net investment income (loss) of any mutual funds or ETFs is not included in the Fund's net investment income (loss) ratio.
DTotal returns for periods of less than one year are not annualized.
ETotal returns would have been lower if certain expenses had not been reduced during the applicable periods shown.
FTotal returns do not include the effect of the contingent deferred sales charge.
GFees and expenses of any underlying mutual funds or exchange-traded funds (ETFs) are not included in the Fund's expense ratio. The Fund indirectly bears its proportionate share of these expenses. For additional expense information related to investments in Fidelity Central Funds, please refer to the "Investments in Fidelity Central Funds" note found in the Notes to Financial Statements section of the most recent Annual or Semi-Annual report.
HExpense ratios reflect operating expenses of the class. Expenses before reductions do not reflect amounts reimbursed, waived, or reduced through arrangements with the investment adviser, brokerage services, or other offset arrangements, if applicable, and do not represent the amount paid by the class during periods when reimbursements, waivers or reductions occur.
IAnnualized.
JAmount does not include the portfolio activity of any underlying mutual funds or exchange-traded funds (ETFs).
| Fidelity® Sustainable Multi-Asset Fund |
| |
| Years ended September 30, | | 2023 | | 2022 A |
Selected Per-Share Data | | | | |
| Net asset value, beginning of period | $ | 7.80 | $ | 10.00 |
| Income from Investment Operations | | | | |
Net investment income (loss) B,C | | .17 | | .03 |
| Net realized and unrealized gain (loss) | | .91 | | (2.23) |
| Total from investment operations | | 1.08 | | (2.20) |
| Distributions from net investment income | | (.15) | | - |
| Total distributions | | (.15) | | - |
| Net asset value, end of period | $ | 8.73 | $ | 7.80 |
Total Return D,E | | 13.91% | | (22.00)% |
Ratios to Average Net Assets B,F,G | | | | |
| Expenses before reductions | | .10% | | .10% H |
| Expenses net of fee waivers, if any | | .05% | | .05% H |
| Expenses net of all reductions | | .05% | | .05% H |
| Net investment income (loss) | | 1.91% | | .55% H |
| Supplemental Data | | | | |
| Net assets, end of period (000 omitted) | $ | 11,866 | $ | 4,010 |
Portfolio turnover rate I | | 45% | | 111% H |
AFor the period February 10, 2022 (commencement of operations) through September 30, 2022
BNet investment income (loss) is affected by the timing of the declaration of dividends by any underlying mutual funds or exchange-traded funds (ETFs). Net investment income (loss) of any mutual funds or ETFs is not included in the Fund's net investment income (loss) ratio.
CCalculated based on average shares outstanding during the period.
DTotal returns for periods of less than one year are not annualized.
ETotal returns would have been lower if certain expenses had not been reduced during the applicable periods shown.
FFees and expenses of any underlying mutual funds or exchange-traded funds (ETFs) are not included in the Fund's expense ratio. The Fund indirectly bears its proportionate share of these expenses. For additional expense information related to investments in Fidelity Central Funds, please refer to the "Investments in Fidelity Central Funds" note found in the Notes to Financial Statements section of the most recent Annual or Semi-Annual report.
GExpense ratios reflect operating expenses of the class. Expenses before reductions do not reflect amounts reimbursed, waived, or reduced through arrangements with the investment adviser, brokerage services, or other offset arrangements, if applicable, and do not represent the amount paid by the class during periods when reimbursements, waivers or reductions occur.
HAnnualized.
IAmount does not include the portfolio activity of any underlying mutual funds or exchange-traded funds (ETFs).
| Fidelity Advisor® Sustainable Multi-Asset Fund Class I |
| |
| Years ended September 30, | | 2023 | | 2022 A |
Selected Per-Share Data | | | | |
| Net asset value, beginning of period | $ | 7.80 | $ | 10.00 |
| Income from Investment Operations | | | | |
Net investment income (loss) B,C | | .17 | | .03 |
| Net realized and unrealized gain (loss) | | .91 | | (2.23) |
| Total from investment operations | | 1.08 | | (2.20) |
| Distributions from net investment income | | (.15) | | - |
| Total distributions | | (.15) | | - |
| Net asset value, end of period | $ | 8.73 | $ | 7.80 |
Total Return D,E | | 13.91% | | (22.00)% |
Ratios to Average Net Assets C,F,G | | | | |
| Expenses before reductions | | .10% | | .10% H |
| Expenses net of fee waivers, if any | | .05% | | .05% H |
| Expenses net of all reductions | | .05% | | .05% H |
| Net investment income (loss) | | 1.91% | | .55% H |
| Supplemental Data | | | | |
| Net assets, end of period (000 omitted) | $ | 780 | $ | 300 |
Portfolio turnover rate I | | 45% | | 111% H |
AFor the period February 10, 2022 (commencement of operations) through September 30, 2022
BCalculated based on average shares outstanding during the period.
CNet investment income (loss) is affected by the timing of the declaration of dividends by any underlying mutual funds or exchange-traded funds (ETFs). Net investment income (loss) of any mutual funds or ETFs is not included in the Fund's net investment income (loss) ratio.
DTotal returns for periods of less than one year are not annualized.
ETotal returns would have been lower if certain expenses had not been reduced during the applicable periods shown.
FFees and expenses of any underlying mutual funds or exchange-traded funds (ETFs) are not included in the Fund's expense ratio. The Fund indirectly bears its proportionate share of these expenses. For additional expense information related to investments in Fidelity Central Funds, please refer to the "Investments in Fidelity Central Funds" note found in the Notes to Financial Statements section of the most recent Annual or Semi-Annual report.
GExpense ratios reflect operating expenses of the class. Expenses before reductions do not reflect amounts reimbursed, waived, or reduced through arrangements with the investment adviser, brokerage services, or other offset arrangements, if applicable, and do not represent the amount paid by the class during periods when reimbursements, waivers or reductions occur.
HAnnualized.
IAmount does not include the portfolio activity of any underlying mutual funds or exchange-traded funds (ETFs).
For the period ended September 30, 2023
1. Organization.
Fidelity Sustainable Multi-Asset Fund (the Fund) is a fund of Fidelity Charles Street Trust (the Trust) and is authorized to issue an unlimited number of shares. The Trust is registered under the Investment Company Act of 1940, as amended (the 1940 Act), as an open-end management investment company organized as a Massachusetts business trust. The Fund offers Class A, Class M, Class C, Sustainable Multi-Asset Fund and Class I shares, each of which has equal rights as to assets and voting privileges. Class A, Class M, Class C, and Class I are Fidelity Advisor classes. Each class has exclusive voting rights with respect to matters that affect that class. Class C shares will automatically convert to Class A shares after a holding period of eight years from the initial date of purchase, with certain exceptions.
2. Investments in Fidelity Central Funds.
Funds may invest in Fidelity Central Funds, which are open-end investment companies generally available only to other investment companies and accounts managed by the investment adviser and its affiliates. The Schedule of Investments lists any Fidelity Central Funds held as an investment as of period end, but does not include the underlying holdings of each Fidelity Central Fund. An investing fund indirectly bears its proportionate share of the expenses of the underlying Fidelity Central Funds.
Based on its investment objective, each Fidelity Central Fund may invest or participate in various investment vehicles or strategies that are similar to those of the investing fund. These strategies are consistent with the investment objectives of the investing fund and may involve certain economic risks which may cause a decline in value of each of the Fidelity Central Funds and thus a decline in the value of the investing fund.
| Fidelity Central Fund | Investment Manager | Investment Objective | Investment Practices | Expense RatioA |
| Fidelity Money Market Central Funds | Fidelity Management & Research Company LLC (FMR) | Each fund seeks to obtain a high level of current income consistent with the preservation of capital and liquidity. | Short-term Investments | Less than .005% |
A Expenses expressed as a percentage of average net assets and are as of each underlying Central Fund's most recent annual or semi-annual shareholder report.
A complete unaudited list of holdings for each Fidelity Central Fund is available upon request or at the Securities and Exchange Commission website at www.sec.gov. In addition, the financial statements of the Fidelity Central Funds which contain the significant accounting policies (including investment valuation policies) of those funds, and are not covered by the Report of Independent Registered Public Accounting Firm, are available on the Securities and Exchange Commission website or upon request.
3. Significant Accounting Policies.
The Fund is an investment company and applies the accounting and reporting guidance of the Financial Accounting Standards Board (FASB) Accounting Standards Codification Topic 946 Financial Services - Investment Companies. The financial statements have been prepared in conformity with accounting principles generally accepted in the United States of America (GAAP), which require management to make certain estimates and assumptions at the date of the financial statements. Actual results could differ from those estimates. Subsequent events, if any, through the date that the financial statements were issued have been evaluated in the preparation of the financial statements. The Fund's Schedule of Investments lists any underlying mutual funds or exchange-traded funds (ETFs) but does not include the underlying holdings of these funds. The following summarizes the significant accounting policies of the Fund:
Investment Valuation. Investments are valued as of 4:00 p.m. Eastern time on the last calendar day of the period. The Board of Trustees (the Board) has designated the Fund's investment adviser as the valuation designee responsible for the fair valuation function and performing fair value determinations as needed. The investment adviser has established a Fair Value Committee (the Committee) to carry out the day-to-day fair valuation responsibilities and has adopted policies and procedures to govern the fair valuation process and the activities of the Committee. In accordance with these fair valuation policies and procedures, which have been approved by the Board, the Fund attempts to obtain prices from one or more third party pricing services or brokers to value its investments. When current market prices, quotations or currency exchange rates are not readily available or reliable, investments will be fair valued in good faith by the Committee, in accordance with the policies and procedures. Factors used in determining fair value vary by investment type and may include market or investment specific events, transaction data, estimated cash flows, and market observations of comparable investments. The frequency that the fair valuation procedures are used cannot be predicted and they may be utilized to a significant extent. The Committee manages the Fund's fair valuation practices and maintains the fair valuation policies and procedures. The Fund's investment adviser reports to the Board information regarding the fair valuation process and related material matters. The Fund categorizes the inputs to valuation techniques used to value its investments into a disclosure hierarchy consisting of three levels as shown below:
Level 1 - unadjusted quoted prices in active markets for identical investments
Level 2 - other significant observable inputs (including quoted prices for similar investments, interest rates, prepayment speeds, etc.)
Level 3 - unobservable inputs (including the Fund's own assumptions based on the best information available)
Valuation techniques used to value the Fund's investments by major category are as follows. Investments in open-end mutual funds are valued at their closing net asset value (NAV) each business day and are categorized as Level 1 in the hierarchy. ETFs are valued at their last sale price or official closing price as reported by a third party pricing service on the primary market or exchange on which they are traded and are categorized as Level 1 in the hierarchy. In the event there were no sales during the day but the exchange reports a closing bid level, ETFs are valued at the closing bid and would be categorized as Level 1 in the hierarchy. In the event there was no closing bid, ETFs may be valued by another method that the Board believes reflects fair value in accordance with the Board's fair value pricing policies and may be categorized as Level 2 in the hierarchy. The aggregate value of investments by input level as of September 30, 2023 is included at the end of the Fund's Schedule of Investments.
Investment Transactions and Income. For financial reporting purposes, the Fund's investment holdings and NAV include trades executed through the end of the last business day of the period. The NAV per share for processing shareholder transactions is calculated as of the close of business of the New York Stock Exchange (NYSE), normally 4:00 p.m. Eastern time and includes trades executed through the end of the prior business day. Gains and losses on securities sold are determined on the basis of identified cost. Income and capital gain distributions from any underlying mutual funds or exchange-traded funds (ETFs) are recorded on the ex-dividend date.
Class Allocations and Expenses. Investment income, realized and unrealized capital gains and losses, common expenses of a fund, and certain fund-level expense reductions, if any, are allocated daily on a pro-rata basis to each class based on the relative net assets of each class to the total net assets of a fund. Each class differs with respect to transfer agent and distribution and service plan fees incurred, as applicable. Certain expense reductions may also differ by class, if applicable. For the reporting period, the allocated portion of income and expenses to each class as a percent of its average net assets may vary due to the timing of recording these transactions in relation to fluctuating net assets of the classes. Expenses directly attributable to a fund are charged to that fund. Expenses attributable to more than one fund are allocated among the respective funds on the basis of relative net assets or other appropriate methods. Expenses included in the accompanying financial statements reflect the expenses of that fund and do not include any expenses associated with any underlying mutual funds or exchange-traded funds (ETFs). Although not included in a fund's expenses, a fund indirectly bears its proportionate share of these expenses through the net asset value of each underlying mutual fund or exchange-traded fund (ETF). Expense estimates are accrued in the period to which they relate and adjustments are made when actual amounts are known.
Income Tax Information and Distributions to Shareholders. Each year, the Fund intends to qualify as a regulated investment company under Subchapter M of the Internal Revenue Code, including distributing substantially all of its taxable income and realized gains. As a result, no provision for U.S. Federal income taxes is required. As of September 30, 2023, the Fund did not have any unrecognized tax benefits in the financial statements; nor is the Fund aware of any tax positions for which it is reasonably possible that the total amounts of unrecognized tax benefits will significantly change in the next twelve months. The Fund files a U.S. federal tax return, in addition to state and local tax returns as required. The Fund's federal income tax returns are subject to examination by the Internal Revenue Service (IRS) for a period of three fiscal years after they are filed. State and local tax returns may be subject to examination for an additional fiscal year depending on the jurisdiction.
Distributions are declared and recorded on the ex-dividend date. Income and capital gain distributions are declared separately for each class. Income and capital gain distributions are determined in accordance with income tax regulations, which may differ from GAAP.
Capital accounts within the financial statements are adjusted for permanent book-tax differences. These adjustments have no impact on net assets or the results of operations. Capital accounts are not adjusted for temporary book-tax differences which will reverse in a subsequent period.
Book-tax differences are primarily due to capital loss carryforwards and losses deferred due to wash sales.
As of period end, the cost and unrealized appreciation (depreciation) in securities, and derivatives if applicable, for federal income tax purposes were as follows:
| Gross unrealized appreciation | $422,716 |
| Gross unrealized depreciation | (589,221) |
| Net unrealized appreciation (depreciation) | $(166,505) |
| Tax Cost | $13,613,210 |
The tax-based components of distributable earnings as of period end were as follows:
| Undistributed ordinary income | $63,942 |
| Capital loss carryforward | $(54,390) |
| Net unrealized appreciation (depreciation) on securities and other investments | $(166,505) |
Capital loss carryforwards are only available to offset future capital gains of the Fund to the extent provided by regulations and may be limited. The capital loss carryforward information presented below, including any applicable limitation, is estimated as of fiscal period end and is subject to adjustment.
Short-term | $(44,302) |
Long-term | (10,088) |
| Total capital loss carryforward | $(54,390) |
The tax character of distributions paid was as follows:
| | September 30, 2023 |
| Ordinary Income | $127,886 |
4. Purchases and Sales of Investments.
Purchases and sales of securities, other than short-term securities and in-kind transactions, as applicable, are noted in the table below.
| | Purchases ($) | Sales ($) |
| Fidelity Sustainable Multi-Asset Fund | 12,482,447 | 4,477,141 |
5. Fees and Other Transactions with Affiliates.
Management Fee. Fidelity Management & Research Company LLC (the investment adviser) and its affiliates provide the Fund with investment management related services for which each class of the Fund pays a monthly management fee. Under the management contract, the investment adviser pays all other operating expenses, except the compensation of the independent Trustees and certain miscellaneous expenses such as proxy and shareholder meeting expenses. During the period, the management fee for each class of the Fund was as follows:
| | Annual % of Class-Level Average Net Assets |
| Class A | .10% |
| Class M | .10% |
| Class C | .10% |
| Fidelity Sustainable Multi-Asset Fund | .10% |
| Class I | .10% |
Distribution and Service Plan Fees. In accordance with Rule 12b-1 of the 1940 Act, the Fund has adopted separate Distribution and Service Plans for each class of shares. Certain classes pay Fidelity Distributors Company LLC (FDC), an affiliate of the investment adviser, separate Distribution and Service Fees, each of which is based on an annual percentage of each class' average net assets. In addition, FDC may pay financial intermediaries for selling shares of the Fund and providing shareholder support services. For the period, the Distribution and Service Fee rates, total fees and amounts retained by FDC were as follows:
| | Distribution Fee | Service Fee | Total Fees | Retained by FDC |
| Class A | - % | .25% | $560 | $441 |
| Class M | .25% | .25% | 986 | 878 |
| Class C | .75% | .25% | 2,840 | 2,307 |
| | | | $4,386 | $ 3,626 |
Sales Load. FDC may receive a front-end sales charge of up to 5.75% for selling Class A shares and 3.50% for selling Class M shares, some of which is paid to financial intermediaries for selling shares of the Fund. Depending on the holding period, FDC may receive contingent deferred sales charges levied on Class A, Class M and Class C redemptions. The deferred sales charges are 1.00% for Class C shares, 1.00% for certain purchases of Class A shares and .25% for certain purchases of Class M shares.
For the period, sales charge amounts retained by FDC were as follows:
| | Retained by FDC |
| Class A | $28 |
| Class M | 4 |
| | $32 |
Brokerage Commissions. A portion of portfolio transactions were placed with brokerage firms which are affiliates of the investment adviser. Brokerage commissions are included in net realized gain (loss) and change in net unrealized appreciation (depreciation) in the Statement of Operations. The commissions paid to these affiliated firms were as follows:
| | Amount |
| Fidelity Sustainable Multi-Asset Fund | $ 4 |
Interfund Trades. Funds may purchase from or sell securities to other Fidelity Funds under procedures adopted by the Board. The procedures have been designed to ensure these interfund trades are executed in accordance with Rule 17a-7 of the 1940 Act. Any interfund trades are included within the respective purchases and sales amounts shown in the Purchases and Sales of Investments note. During the period, there were no interfund trades.
6. Expense Reductions.
The investment adviser contractually agreed to reimburse expenses of each class to the extent annual operating expenses exceeded certain levels of class-level average net assets as noted in the table below. This reimbursement will remain in place through January 31, 2025. Some expenses, for example the compensation of the independent Trustees, and certain miscellaneous expenses such as proxy and shareholder meeting expenses, are excluded from this reimbursement.
The following classes were in reimbursement during the period:
| | Expense Limitations | Reimbursement |
| Class A | .30% | $112 |
| Class M | .55% | 99 |
| Class C | 1.05% | 141 |
| Fidelity Sustainable Multi-Asset Fund | .05% | 4,258 |
| Class I | .05% | 344 |
| | | $4,954 |
Through arrangements with the Fund's custodian and each class' transfer agent, credits realized as a result of certain uninvested cash balances were used to reduce the Fund's expenses. During the period, custodian credits reduced the Fund's expenses by $195. During the period, transfer agent credits reduced each class' expenses as noted in the table below.
| | Expense reduction |
| Class A | $3 |
| Class M | 3 |
| Class C | 4 |
| Fidelity Sustainable Multi-Asset Fund | 38 |
| | $48 |
7. Distributions to Shareholders.
Distributions to shareholders of each class were as follows:
| | Year ended September 30, 2023 | Year ended September 30, 2022 |
| Fidelity Sustainable Multi-Asset Fund | | |
| Distributions to shareholders | | |
| Class A | $2,921 | $ - |
| Class M | 2,413 | - |
| Class C | 2,356 | - |
| Fidelity Sustainable Multi-Asset Fund | 111,228 | - |
| Class I | 8,968 | - |
Total | $127,886 | $- |
8. Share Transactions.
Share transactions for each class were as follows and may contain in-kind transactions, automatic conversions between classes or exchanges between affiliated funds:
| | Shares | Shares | Dollars | Dollars |
| | Year ended September 30, 2023 | Year ended September 30, 2022 A | Year ended September 30, 2023 | Year ended September 30, 2022 A |
| Fidelity Sustainable Multi-Asset Fund | | | | |
| Class A | | | | |
| Shares sold | 11,609 | 21,029 | $102,638 | $209,320 |
| Reinvestment of distributions | 351 | - | 3,088 | - |
| Shares redeemed | (227) | (55) | (1,972) | (462) |
| Net increase (decrease) | 11,733 | 20,974 | $103,754 | $208,858 |
| Class M | | | | |
| Shares sold | 1,680 | 21,690 | $14,859 | $214,500 |
| Reinvestment of distributions | 290 | - | 2,413 | - |
| Net increase (decrease) | 1,970 | 21,690 | $17,272 | $214,500 |
| Class C | | | | |
| Shares sold | 6,801 | 29,553 | $59,944 | $287,500 |
| Reinvestment of distributions | 283 | - | 2,356 | - |
| Shares redeemed | (604) | - | (5,396) | - |
| Net increase (decrease) | 6,480 | 29,553 | $56,904 | $287,500 |
| Fidelity Sustainable Multi-Asset Fund | | | | |
| Shares sold | 1,087,736 | 577,511 | $9,492,988 | $5,157,892 |
| Reinvestment of distributions | 9,927 | - | 82,677 | - |
| Shares redeemed | (252,506) | (63,389) | (2,227,321) | (568,256) |
| Net increase (decrease) | 845,157 | 514,122 | $7,348,344 | $4,589,636 |
| Class I | | | | |
| Shares sold | 71,544 | 39,415 | $609,786 | $364,524 |
| Reinvestment of distributions | 983 | - | 8,185 | - |
| Shares redeemed | (21,589) | (1,011) | (194,703) | (8,694) |
| Net increase (decrease) | 50,938 | 38,404 | $423,268 | $355,830 |
A For the period February 10, 2022 (commencement of operations) through September 30, 2022.
9. Other.
A fund's organizational documents provide former and current trustees and officers with a limited indemnification against liabilities arising in connection with the performance of their duties to the fund. In the normal course of business, a fund may also enter into contracts that provide general indemnifications. A fund's maximum exposure under these arrangements is unknown as this would be dependent on future claims that may be made against a fund. The risk of material loss from such claims is considered remote.
Funds do not invest in underlying mutual funds for the purpose of exercising management or control; however, investments by funds within their principal investment strategies may represent a significant portion of the underlying mutual fund's net assets. At the end of the period, certain Funds were the owners of record of 10% or more of the total outstanding shares of the following underlying mutual funds as shown below.
| Fund | Fidelity Sustainable Multi-Asset Fund |
| Fidelity Sustainable Emerging Markets Equity Fund | 20% |
| Fidelity Sustainable International Equity Fund | 33% |
10. Risk and Uncertainties.
Many factors affect a fund's performance. Developments that disrupt global economies and financial markets, such as pandemics, epidemics, outbreaks of infectious diseases, war, terrorism, and environmental disasters, may significantly affect a fund's investment performance. The effects of these developments to a fund will be impacted by the types of securities in which a fund invests, the financial condition, industry, economic sector, and geographic location of an issuer, and a fund's level of investment in the securities of that issuer. Significant concentrations in security types, issuers, industries, sectors, and geographic locations may magnify the factors that affect a fund's performance.
To the Board of Trustees of Fidelity Charles Street Trust and the Shareholders of Fidelity Sustainable Multi-Asset Fund:
Opinion on the Financial Statements and Financial Highlights
We have audited the accompanying statement of assets and liabilities of Fidelity Sustainable Multi-Asset Fund (the "Fund"), a fund of Fidelity Charles Street Trust, including the schedule of investments, as of September 30, 2023, the related statement of operations for the year then ended, and the statement of changes in net assets and the financial highlights for the year then ended and for the period from February 10, 2022 (commencement of operations) through September 30, 2022, and the related notes. In our opinion, the financial statements and financial highlights present fairly, in all material respects, the financial position of the Fund as of September 30, 2023, and the results of its operations for the year then ended, and the changes in its net assets and the financial highlights for the year then ended and for the period from February 10, 2022 (commencement of operations) through September 30, 2022, in conformity with accounting principles generally accepted in the United States of America.
Basis for Opinion
These financial statements and financial highlights are the responsibility of the Fund's management. Our responsibility is to express an opinion on the Fund's financial statements and financial highlights based on our audits. We are a public accounting firm registered with the Public Company Accounting Oversight Board (United States) (PCAOB) and are required to be independent with respect to the Fund in accordance with the U.S. federal securities laws and the applicable rules and regulations of the Securities and Exchange Commission and the PCAOB.
We conducted our audits in accordance with the standards of the PCAOB. Those standards require that we plan and perform the audit to obtain reasonable assurance about whether the financial statements and financial highlights are free of material misstatement, whether due to error or fraud. The Fund is not required to have, nor were we engaged to perform, an audit of its internal control over financial reporting. As part of our audits we are required to obtain an understanding of internal control over financial reporting but not for the purpose of expressing an opinion on the effectiveness of the Fund's internal control over financial reporting. Accordingly, we express no such opinion.
Our audits included performing procedures to assess the risks of material misstatement of the financial statements and financial highlights, whether due to error or fraud, and performing procedures that respond to those risks. Such procedures included examining, on a test basis, evidence regarding the amounts and disclosures in the financial statements and financial highlights. Our audits also included evaluating the accounting principles used and significant estimates made by management, as well as evaluating the overall presentation of the financial statements and financial highlights. Our procedures included confirmation of securities owned as of September 30, 2023, by correspondence with the custodian and brokers; when replies were not received from brokers, we performed other auditing procedures. We believe that our audits provide a reasonable basis for our opinion.
/s/ Deloitte & Touche LLP
Boston, Massachusetts
November 13, 2023
We have served as the auditor of one or more of the Fidelity investment companies since 1999.
The Trustees, Members of the Advisory Board (if any), and officers of the trust and fund, as applicable, are listed below. The Board of Trustees governs the fund and is responsible for protecting the interests of shareholders. The Trustees are experienced executives who meet periodically throughout the year to oversee the fund's activities, review contractual arrangements with companies that provide services to the fund, oversee management of the risks associated with such activities and contractual arrangements, and review the fund's performance. If the interests of the fund and an underlying Fidelity® fund were to diverge, a conflict of interest could arise and affect how the Trustees and Members of the Advisory Board fulfill their fiduciary duties to the affected funds. FMR has structured the fund to avoid these potential conflicts, although there may be situations where a conflict of interest is unavoidable. In such instances, FMR, the Trustees, and Members of the Advisory Board would take reasonable steps to minimize and, if possible, eliminate the conflict. As of September 30, 2023, except for Laura M. Bishop, Robert W. Helm, Christine J. Thompson, and Carol J. Zierhoffer, each of the Trustees oversees 313 funds. As of October 18, 2023, the date of their election as Trustee, Ms. Bishop, Mr. Helm, Ms. Thompson, and Ms. Zierhoffer each oversees 229 funds.
The Trustees hold office without limit in time except that (a) any Trustee may resign; (b) any Trustee may be removed by written instrument, signed by at least two-thirds of the number of Trustees prior to such removal; (c) any Trustee who requests to be retired or who has become incapacitated by illness or injury may be retired by written instrument signed by a majority of the other Trustees; and (d) any Trustee may be removed at any special meeting of shareholders by a two-thirds vote of the outstanding voting securities of the trust. Each Trustee who is not an interested person (as defined in the 1940 Act) of the trust and the fund is referred to herein as an Independent Trustee. Each Independent Trustee shall retire not later than the last day of the calendar year in which his or her 75th birthday occurs. The Independent Trustees may waive this mandatory retirement age policy with respect to individual Trustees. Officers and Advisory Board Members hold office without limit in time, except that any officer or Advisory Board Member may resign or may be removed by a vote of a majority of the Trustees at any regular meeting or any special meeting of the Trustees. Except as indicated, each individual has held the office shown or other offices in the same company for the past five years.
The fund's Statement of Additional Information (SAI) includes more information about the Trustees. To request a free copy, call Fidelity at 1-800-544-8544 if you're an individual investing directly with Fidelity, call 1-800-835-5092 if you're a plan sponsor or participant with Fidelity as your recordkeeper or call 1-877-208-0098 on institutional accounts or if you're an advisor or invest through one.
Experience, Skills, Attributes, and Qualifications of the Trustees. The Governance and Nominating Committee has adopted a statement of policy that describes the experience, qualifications, attributes, and skills that are necessary and desirable for potential Independent Trustee candidates (Statement of Policy). The Board believes that each Trustee satisfied at the time he or she was initially elected or appointed a Trustee, and continues to satisfy, the standards contemplated by the Statement of Policy. The Governance and Nominating Committee also engages professional search firms to help identify potential Independent Trustee candidates who have the experience, qualifications, attributes, and skills consistent with the Statement of Policy. From time to time, additional criteria based on the composition and skills of the current Independent Trustees, as well as experience or skills that may be appropriate in light of future changes to board composition, business conditions, and regulatory or other developments, have also been considered by the professional search firms and the Governance and Nominating Committee. In addition, the Board takes into account the Trustees' commitment and participation in Board and committee meetings, as well as their leadership of standing and ad hoc committees throughout their tenure.
In determining that a particular Trustee was and continues to be qualified to serve as a Trustee, the Board has considered a variety of criteria, none of which, in isolation, was controlling. The Board believes that, collectively, the Trustees have balanced and diverse experience, qualifications, attributes, and skills, which allow the Board to operate effectively in governing the fund and protecting the interests of shareholders. Information about the specific experience, skills, attributes, and qualifications of each Trustee, which in each case led to the Board's conclusion that the Trustee should serve (or continue to serve) as a trustee of the fund, is provided below.
Board Structure and Oversight Function. Abigail P. Johnson is an interested person and currently serves as Chairman. The Trustees have determined that an interested Chairman is appropriate and benefits shareholders because an interested Chairman has a personal and professional stake in the quality and continuity of services provided to the fund. Independent Trustees exercise their informed business judgment to appoint an individual of their choosing to serve as Chairman, regardless of whether the Trustee happens to be independent or a member of management. The Independent Trustees have determined that they can act independently and effectively without having an Independent Trustee serve as Chairman and that a key structural component for assuring that they are in a position to do so is for the Independent Trustees to constitute a substantial majority for the Board. The Independent Trustees also regularly meet in executive session. Michael E. Kenneally serves as Chairman of the Independent Trustees and as such (i) acts as a liaison between the Independent Trustees and management with respect to matters important to the Independent Trustees and (ii) with management prepares agendas for Board meetings.
Fidelity® funds are overseen by different Boards of Trustees. The fund's Board oversees Fidelity's investment-grade bond, money market, asset allocation and certain equity funds, and other Boards oversee Fidelity's alternative investment, high income and other equity funds. The asset allocation funds may invest in Fidelity® funds that are overseen by such other Boards. The use of separate Boards, each with its own committee structure, allows the Trustees of each group of Fidelity® funds to focus on the unique issues of the funds they oversee, including common research, investment, and operational issues. On occasion, the separate Boards establish joint committees to address issues of overlapping consequences for the Fidelity® funds overseen by each Board.
The Trustees operate using a system of committees to facilitate the timely and efficient consideration of all matters of importance to the Trustees, the fund, and fund shareholders and to facilitate compliance with legal and regulatory requirements and oversight of the fund's activities and associated risks. The Board, acting through its committees, has charged FMR and its affiliates with (i) identifying events or circumstances the occurrence of which could have demonstrably adverse effects on the fund's business and/or reputation; (ii) implementing processes and controls to lessen the possibility that such events or circumstances occur or to mitigate the effects of such events or circumstances if they do occur; and (iii) creating and maintaining a system designed to evaluate continuously business and market conditions in order to facilitate the identification and implementation processes described in (i) and (ii) above. Because the day-to-day operations and activities of the fund are carried out by or through FMR, its affiliates, and other service providers, the fund's exposure to risks is mitigated but not eliminated by the processes overseen by the Trustees. While each of the Board's committees has responsibility for overseeing different aspects of the fund's activities, oversight is exercised primarily through the Operations and Audit Committees. In addition, an ad hoc Board committee of Independent Trustees has worked with FMR to enhance the Board's oversight of investment and financial risks, legal and regulatory risks, technology risks, and operational risks, including the development of additional risk reporting to the Board. Appropriate personnel, including but not limited to the fund's Chief Compliance Officer (CCO), FMR's internal auditor, the independent accountants, the fund's Treasurer and portfolio management personnel, make periodic reports to the Board's committees, as appropriate, including an annual review of Fidelity's risk management program for the Fidelity® funds. The responsibilities of each standing committee, including their oversight responsibilities, are described further under "Standing Committees of the Trustees."
Interested Trustees*:
Correspondence intended for a Trustee who is an interested person may be sent to Fidelity Investments, 245 Summer Street, Boston, Massachusetts 02210.
Name, Year of Birth; Principal Occupations and Other Relevant Experience+
Abigail P. Johnson (1961)
Year of Election or Appointment: 2009
Trustee
Chairman of the Board of Trustees
Ms. Johnson also serves as Trustee of other Fidelity® funds. Ms. Johnson serves as Chairman (2016-present), Chief Executive Officer (2014-present), and Director (2007-present) of FMR LLC (diversified financial services company), President of Fidelity Financial Services (2012-present) and President of Personal, Workplace and Institutional Services (2005-present). Ms. Johnson is Chairman and Director of Fidelity Management & Research Company LLC (investment adviser firm, 2011-present). Previously, Ms. Johnson served as Chairman and Director of FMR Co., Inc. (investment adviser firm, 2011-2019), Vice Chairman (2007-2016) and President (2013-2016) of FMR LLC, President and a Director of Fidelity Management & Research Company (2001-2005), a Trustee of other investment companies advised by Fidelity Management & Research Company, Fidelity Investments Money Management, Inc. (investment adviser firm), and FMR Co., Inc. (2001-2005), Senior Vice President of the Fidelity® funds (2001-2005), and managed a number of Fidelity® funds. Ms. Abigail P. Johnson and Mr. Arthur E. Johnson are not related.
Jennifer Toolin McAuliffe (1959)
Year of Election or Appointment: 2016
Trustee
Ms. McAuliffe also serves as Trustee of other Fidelity® funds and as Trustee of Fidelity Charitable (2020-present). Previously, Ms. McAuliffe served as Co-Head of Fixed Income of Fidelity Investments Limited (now known as FIL Limited (FIL)) (diversified financial services company), Director of Research for FIL's credit and quantitative teams in London, Hong Kong and Tokyo and Director of Research for taxable and municipal bonds at Fidelity Investments Money Management, Inc. Ms. McAuliffe previously served as a member of the Advisory Board of certain Fidelity® funds (2016). Ms. McAuliffe was previously a lawyer at Ropes & Gray LLP and an international banker at Chemical Bank NA (now JPMorgan Chase & Co.). Ms. McAuliffe also currently serves as director or trustee of several not-for-profit entities.
Christine J. Thompson (1958)
Year of Election or Appointment: 2023
Trustee
Ms. Thompson also serves as a Trustee of other Fidelity® funds. Ms. Thompson serves as Leader of Advanced Technologies for Investment Management at Fidelity Investments (2018-present). Previously, Ms. Thompson served as Chief Investment Officer in the Bond group at Fidelity Management & Research Company (2010-2018) and held various other roles including Director of municipal bond portfolio managers and Portfolio Manager of certain Fidelity® funds.
* Determined to be an "Interested Trustee" by virtue of, among other things, his or her affiliation with the trust or various entities under common control with FMR.
+ The information includes the Trustee's principal occupation during the last five years and other information relating to the experience, attributes, and skills relevant to the Trustee's qualifications to serve as a Trustee, which led to the conclusion that the Trustee should serve as a Trustee for the fund.
Independent Trustees:
Correspondence intended for an Independent Trustee may be sent to Fidelity Investments, P.O. Box 55235, Boston, Massachusetts 02205-5235.
Name, Year of Birth; Principal Occupations and Other Relevant Experience+
Elizabeth S. Acton (1951)
Year of Election or Appointment: 2013
Trustee
Ms. Acton also serves as Trustee of other Fidelity® funds. Prior to her retirement, Ms. Acton served as Executive Vice President, Finance (2011-2012), Executive Vice President, Chief Financial Officer (2002-2011) and Treasurer (2004-2005) of Comerica Incorporated (financial services). Prior to joining Comerica, Ms. Acton held a variety of positions at Ford Motor Company (1983-2002), including Vice President and Treasurer (2000-2002) and Executive Vice President and Chief Financial Officer of Ford Motor Credit Company (1998-2000). Ms. Acton currently serves as a member of the Board and Audit and Finance Committees of Beazer Homes USA, Inc. (homebuilding, 2012-present). Ms. Acton previously served as a member of the Advisory Board of certain Fidelity® funds (2013-2016).
Laura M. Bishop (1961)
Year of Election or Appointment: 2023
Trustee
Ms. Bishop also serves as Trustee or Member of the Advisory Board of other Fidelity® funds. Prior to her retirement, Ms. Bishop held a variety of positions at United Services Automobile Association (2001-2020), including Executive Vice President and Chief Financial Officer (2014-2020) and Senior Vice President and Deputy Chief Financial Officer (2012-2014). Ms. Bishop currently serves as a member of the Audit Committee and Compensation and Personnel Committee (2021-present) of the Board of Directors of Korn Ferry (global organizational consulting). Previously, Ms. Bishop served as a Member of the Advisory Board of certain Fidelity® funds (2022-2023).
Ann E. Dunwoody (1953)
Year of Election or Appointment: 2018
Trustee
General Dunwoody also serves as Trustee of other Fidelity® funds. General Dunwoody (United States Army, Retired) was the first woman in U.S. military history to achieve the rank of four-star general and prior to her retirement in 2012 held a variety of positions within the U.S. Army, including Commanding General, U.S. Army Material Command (2008-2012). General Dunwoody currently serves as a member of the Board, Chair of Nomination Committee and a member of the Corporate Governance Committee of Kforce Inc. (professional staffing services, 2016-present) and a member of the Board of Automattic Inc. (software engineering, 2018-present). Previously, General Dunwoody served as President of First to Four LLC (leadership and mentoring services, 2012-2022), a member of the Advisory Board and Nominating and Corporate Governance Committee of L3 Technologies, Inc. (communication, electronic, sensor and aerospace systems, 2013-2019) and a member of the Board and Audit and Sustainability and Corporate Responsibility Committees of Republic Services, Inc. (waste collection, disposal and recycling, 2013-2016). General Dunwoody also serves on several boards for non-profit organizations, including as a member of the Board, Chair of the Nomination and Governance Committee and a member of the Audit Committee of the Noble Reach Foundation (formerly Logistics Management Institute) (consulting non-profit, 2012-present) and a member of the Board of ThanksUSA (military family education non-profit, 2014-present). Previously, General Dunwoody served as a member of the Board of Florida Institute of Technology (2015-2022) and a member of the Council of Trustees for the Association of the United States Army (advocacy non-profit, 2013-2021). General Dunwoody previously served as a member of the Advisory Board of certain Fidelity® funds (2018).
John Engler (1948)
Year of Election or Appointment: 2014
Trustee
Mr. Engler also serves as Trustee of other Fidelity® funds. Previously, Mr. Engler served as Governor of Michigan (1991-2003), President of the Business Roundtable (2011-2017) and interim President of Michigan State University (2018-2019). Previously, Mr. Engler served as a member of the Board of Stride, Inc. (formerly K12 Inc.) (technology-based education company, 2012-2022), a member of the Board of Universal Forest Products (manufacturer and distributor of wood and wood-alternative products, 2003-2019) and Trustee of The Munder Funds (2003-2014). Mr. Engler previously served as a member of the Advisory Board of certain Fidelity® funds (2014-2016).
Robert F. Gartland (1951)
Year of Election or Appointment: 2010
Trustee
Mr. Gartland also serves as Trustee of other Fidelity® funds. Prior to his retirement, Mr. Gartland held a variety of positions at Morgan Stanley (financial services, 1979-2007), including Managing Director (1987-2007) and Chase Manhattan Bank (1975-1978). Mr. Gartland previously served as Chairman and an investor in Gartland & Mellina Group Corp. (consulting, 2009-2019), as a member of the Board of National Securities Clearing Corporation (1993-1996) and as Chairman of TradeWeb (2003-2004).
Robert W. Helm (1957)
Year of Election or Appointment: 2023
Trustee
Mr. Helm also serves as Trustee or Member of the Advisory Board of other Fidelity® funds. Mr. Helm was formerly Deputy Chairman (2003-2020), partner (1991-2020) and an associate (1984-1991) of Dechert LLP (formerly Dechert Price & Rhoads). Mr. Helm currently serves on boards and committees of several not-for-profit organizations, including as a Trustee and member of the Executive Committee of the Baltimore Council on Foreign Affairs, a member of the Board of Directors of the St. Vincent de Paul Society of Baltimore and a member of the Life Guard Society of Mt. Vernon. Previously, Mr. Helm served as a Member of the Advisory Board of certain Fidelity® funds (2021-2023).
Arthur E. Johnson (1947)
Year of Election or Appointment: 2008
Trustee
Mr. Johnson also serves as Trustee of other Fidelity® funds. Prior to his retirement, Mr. Johnson served as Senior Vice President of Corporate Strategic Development of Lockheed Martin Corporation (defense contractor, 1999-2009). Mr. Johnson currently serves as a member of the Board of Booz Allen Hamilton (management consulting, 2011-present). Mr. Johnson previously served as a member of the Board of Eaton Corporation plc (diversified power management, 2009-2019) and a member of the Board of AGL Resources, Inc. (holding company, 2002-2016). Mr. Johnson previously served as Chairman (2018-2021) and Vice Chairman (2015-2018) of the Independent Trustees of certain Fidelity® funds. Mr. Arthur E. Johnson is not related to Ms. Abigail P. Johnson.
Michael E. Kenneally (1954)
Year of Election or Appointment: 2009
Trustee
Chairman of the Independent Trustees
Mr. Kenneally also serves as Trustee of other Fidelity® funds and was Vice Chairman (2018-2021) of the Independent Trustees of certain Fidelity® funds. Prior to retirement in 2005, he was Chairman and Global Chief Executive Officer of Credit Suisse Asset Management, the worldwide fund management and institutional investment business of Credit Suisse Group. Previously, Mr. Kenneally was an Executive Vice President and the Chief Investment Officer for Bank of America. In this role, he was responsible for the investment management, strategy and products delivered to the bank's institutional, high-net-worth and retail clients. Earlier, Mr. Kenneally directed the organization's equity and quantitative research groups. He began his career as a research analyst and then spent more than a dozen years as a portfolio manager for endowments, pension plans and mutual funds. He earned the Chartered Financial Analyst (CFA) designation in 1991.
Mark A. Murray (1954)
Year of Election or Appointment: 2016
Trustee
Mr. Murray also serves as Trustee of other Fidelity® funds. Previously, Mr. Murray served as Co-Chief Executive Officer (2013-2016), President (2006-2013) and Vice Chairman (2013-2020) of Meijer, Inc. Mr. Murray serves as a member of the Board (2009-present) and Public Policy and Responsibility Committee (2009-present) and Chair of the Nuclear Review Committee (2019-present) of DTE Energy Company (diversified energy company). Mr. Murray previously served as a member of the Board of Spectrum Health (not-for-profit health system, 2015-2019) and as a member of the Board and Audit Committee and Chairman of the Nominating and Corporate Governance Committee of Universal Forest Products, Inc. (manufacturer and distributor of wood and wood-alternative products, 2004-2016). Mr. Murray also serves as a member of the Board of many community and professional organizations. Mr. Murray previously served as a member of the Advisory Board of certain Fidelity® funds (2016).
Carol J. Zierhoffer (1960)
Year of Election or Appointment: 2023
Trustee
Ms. Zierhoffer also serves as Trustee or Member of the Advisory Board of other Fidelity® funds. Prior to her retirement, Ms. Zierhoffer held a variety of positions at Bechtel Corporation (engineering company, 2013-2019), including Principal Vice President and Chief Information Officer (2013-2016) and Senior Vice President and Chief Information Officer (2016-2019). Ms. Zierhoffer currently serves as a member of the Board of Directors, Audit Committee and Compensation Committee of Allscripts Healthcare Solutions, Inc. (healthcare technology, 2020-present) and as a member of the Board of Directors, Audit and Finance Committee and Nominating and Governance Committee of Atlas Air Worldwide Holdings, Inc. (aviation operating services, 2021-present). Previously, Ms. Zierhoffer served as a member of the Board of Directors and Audit Committee and as the founding Chair of the Information Technology Committee of MedAssets, Inc. (healthcare technology, 2013-2016), and as a Member of the Advisory Board of certain Fidelity® funds (2023).
+ The information includes the Trustee's principal occupation during the last five years and other information relating to the experience, attributes, and skills relevant to the Trustee's qualifications to serve as a Trustee, which led to the conclusion that the Trustee should serve as a Trustee for the fund.
Advisory Board Members and Officers:
Correspondence intended for a Member of the Advisory Board (if any) may be sent to Fidelity Investments, P.O. Box 55235, Boston, Massachusetts 02205-5235. Correspondence intended for an officer may be sent to Fidelity Investments, 245 Summer Street, Boston, Massachusetts 02210.
Name, Year of Birth; Principal Occupation
Heather Bonner (1977)
Year of Election or Appointment: 2023
Assistant Treasurer
Ms. Bonner also serves as an officer of other funds. Ms. Bonner is a Senior Vice President (2022-present) and is an employee of Fidelity Investments (2022-present). Ms. Bonner serves as Assistant Treasurer of Fidelity CRET Trustee LLC (2022-present). Prior to joining Fidelity, Ms. Bonner served as Managing Director at AQR Capital Management (2013-2022) and was the Treasurer and Principal Financial Officer of the AQR Funds (2013-2022).
Craig S. Brown (1977)
Year of Election or Appointment: 2019
Assistant Treasurer
Mr. Brown also serves as an officer of other funds. Mr. Brown is a Vice President (2015-present) and is an employee of Fidelity Investments. Mr. Brown serves as Assistant Treasurer of FIMM, LLC (2021-present). Previously, Mr. Brown served as Assistant Treasurer of certain Fidelity® funds (2019-2022).
John J. Burke III (1964)
Year of Election or Appointment: 2018
Chief Financial Officer
Mr. Burke also serves as Chief Financial Officer of other funds. Mr. Burke is Head of Fidelity Fund and Investment Operations (2018-present) and is an employee of Fidelity Investments. Mr. Burke serves as President, Executive Vice President, or Director of certain Fidelity entities. Previously Mr. Burke served as head of Asset Management Investment Operations (2012-2018).
Margaret Carey (1973)
Year of Election or Appointment: 2023
Secretary and Chief Legal Officer (CLO)
Ms. Carey also serves as an officer of other funds and as CLO of certain Fidelity entities. Ms. Carey is a Senior Vice President, Deputy General Counsel (2019-present) and is an employee of Fidelity Investments.
David J. Carter (1973)
Year of Election or Appointment: 2020
Assistant Secretary
Mr. Carter also serves as Assistant Secretary of other funds. Mr. Carter is a Senior Vice President, Deputy General Counsel (2022-present) and is an employee of Fidelity Investments. Mr. Carter serves as Chief Legal Officer of Fidelity Investments Institutional Operations Company LLC - Shareholder Division (transfer agent, 2020-present).
Jonathan Davis (1968)
Year of Election or Appointment: 2010
Assistant Treasurer
Mr. Davis also serves as an officer of other funds. Mr. Davis is a Vice President (2006-present) and is an employee of Fidelity Investments. Mr. Davis serves as Assistant Treasurer of certain Fidelity entities.
Laura M. Del Prato (1964)
Year of Election or Appointment: 2018
President and Treasurer
Ms. Del Prato also serves as an officer of other funds. Ms. Del Prato is a Senior Vice President (2017-present) and is an employee of Fidelity Investments. Ms. Del Prato serves as Vice President or Assistant Treasurer of certain Fidelity entities. Previously, Ms. Del Prato served as President and Treasurer of The North Carolina Capital Management Trust: Cash Portfolio and Term Portfolio (2018-2020).
Christopher M. Gouveia (1973)
Year of Election or Appointment: 2023
Chief Compliance Officer
Mr. Gouveia also serves as Chief Compliance Officer of other funds. Mr. Gouveia is a Senior Vice President of Asset Management Compliance (2019-present) and is an employee of Fidelity Investments. Mr. Gouveia serves as Compliance Officer of Fidelity Management Trust Company (2023-present). Previously, Mr. Gouveia served as Chief Compliance Officer of the North Carolina Capital Management Trust (2016-2019).
Colm A. Hogan (1973)
Year of Election or Appointment: 2016
Assistant Treasurer
Mr. Hogan also serves as an officer of other funds. Mr. Hogan is a Vice President (2016-present) and is an employee of Fidelity Investments. Mr. Hogan serves as Assistant Treasurer of certain Fidelity entities. Previously, Mr. Hogan served as Deputy Treasurer of certain Fidelity® funds (2016-2020) and Assistant Treasurer of certain Fidelity® funds (2016-2018).
William Irving (1964)
Year of Election or Appointment: 2023
Vice President
Mr. Irving also serves as Vice President of other funds. Mr. Irving is Head of Fidelity Asset Management Solutions (2022-present) and is an employee of Fidelity Investments. Mr. Irving serves as President and Director of Fidelity Diversifying Solutions LLC (investment adviser firm, 2023-present) and President or Director of certain other Fidelity entities. Previously, Mr. Irving served as Chief Investment Officer (CIO) in the Global Asset Allocation division (2020-2022). Prior to that, he was Managing Director of Research in the Global Asset Allocation division (2018-2020) and portfolio manager of certain Fidelity® funds (2004-2018).
Chris Maher (1972)
Year of Election or Appointment: 2013
Assistant Treasurer
Mr. Maher also serves as an officer of other funds. Mr. Maher is a Vice President (2008-present) and is an employee of Fidelity Investments. Mr. Maher serves as Assistant Treasurer of certain Fidelity entities. Previously, Mr. Maher served as Assistant Treasurer of certain funds (2013-2020).
Brett Segaloff (1972)
Year of Election or Appointment: 2021
Anti-Money Laundering (AML) Officer
Mr. Segaloff also serves as AML Officer of other funds. Mr. Segaloff is a Vice President (2022-present) and is an employee of Fidelity Investments. Mr. Segaloff serves as Anti Money Laundering Compliance Officer or Anti Money Laundering/Bank Secrecy Act Compliance Officer of certain Fidelity entities.
Stacie M. Smith (1974)
Year of Election or Appointment: 2013
Assistant Treasurer
Ms. Smith also serves as an officer of other funds. Ms. Smith is a Senior Vice President (2016-present) and is an employee of Fidelity Investments. Ms. Smith serves as Assistant Treasurer of certain Fidelity entities and has served in other fund officer roles.
Jim Wegmann (1979)
Year of Election or Appointment: 2021
Deputy Treasurer
Mr. Wegmann also serves as an officer of other funds. Mr. Wegmann is a Vice President (2016-present) and is an employee of Fidelity Investments. Mr. Wegmann serves as Assistant Treasurer of FIMM, LLC (2021-present). Previously, Mr. Wegmann served as Assistant Treasurer of certain Fidelity® funds (2019-2021).
As a shareholder, you incur two types of costs: (1) transaction costs, which may include sales charges (loads) on purchase payments or redemption proceeds, as applicable and (2) ongoing costs, which generally include management fees, distribution and/or service (12b-1) fees and other Fund expenses. This Example is intended to help you understand your ongoing costs (in dollars) of investing in a fund and to compare these costs with the ongoing costs of investing in other mutual funds.
| The Example is based on an investment of $1,000 invested at the beginning of the period and held for the entire period (April 1, 2023 to September 30, 2023). |
Actual Expenses
The first line of the accompanying table provides information about actual account values and actual expenses. You may use the information in this line, together with the amount you invested, to estimate the expenses that you paid over the period. Simply divide your account value by $1,000.00 (for example, an $8,600 account value divided by $1,000.00 = 8.6), then multiply the result by the number in the first line for a class/Fund under the heading entitled "Expenses Paid During Period" to estimate the expenses you paid on your account during this period. If any fund is a shareholder of any underlying mutual funds or exchange-traded funds (ETFs) (the Underlying Funds), such fund indirectly bears its proportional share of the expenses of the Underlying Funds in addition to the direct expenses incurred presented in the table. These fees and expenses are not included in the annualized expense ratio used to calculate the expense estimate in the table below.
Hypothetical Example for Comparison Purposes
The second line of the accompanying table provides information about hypothetical account values and hypothetical expenses based on the actual expense ratio and an assumed rate of return of 5% per year before expenses, which is not the actual return. The hypothetical account values and expenses may not be used to estimate the actual ending account balance or expenses you paid for the period. You may use this information to compare the ongoing costs of investing in the Fund and other funds. To do so, compare this 5% hypothetical example with the 5% hypothetical examples that appear in the shareholder reports of the other funds. If any fund is a shareholder of any Underlying Funds, such fund indirectly bears its proportional share of the expenses of the Underlying Funds in addition to the direct expenses as presented in the table. These fees and expenses are not included in the annualized expense ratio used to calculate the expense estimate in the table below.
Please note that the expenses shown in the table are meant to highlight your ongoing costs only and do not reflect any transaction costs. Therefore, the second line of the table is useful in comparing ongoing costs only, and will not help you determine the relative total costs of owning different funds. In addition, if these transactional costs were included, your costs would have been higher.
| | | | | Annualized Expense Ratio- A | | Beginning Account Value April 1, 2023 | | Ending Account Value September 30, 2023 | | Expenses Paid During Period- C April 1, 2023 to September 30, 2023 |
| Fidelity® Sustainable Multi-Asset Fund | | | | | | | | | | |
| Class A | | | | .30% | | | | | | |
| Actual | | | | | | $ 1,000 | | $ 988.60 | | $ 1.50 |
Hypothetical-B | | | | | | $ 1,000 | | $ 1,023.56 | | $ 1.52 |
| Class M | | | | .55% | | | | | | |
| Actual | | | | | | $ 1,000 | | $ 988.60 | | $ 2.74 |
Hypothetical-B | | | | | | $ 1,000 | | $ 1,022.31 | | $ 2.79 |
| Class C | | | | 1.05% | | | | | | |
| Actual | | | | | | $ 1,000 | | $ 986.30 | | $ 5.23 |
Hypothetical-B | | | | | | $ 1,000 | | $ 1,019.80 | | $ 5.32 |
| Fidelity® Sustainable Multi-Asset Fund | | | | .05% | | | | | | |
| Actual | | | | | | $ 1,000 | | $ 990.90 | | $ .25 |
Hypothetical-B | | | | | | $ 1,000 | | $ 1,024.82 | | $ .25 |
| Class I | | | | .05% | | | | | | |
| Actual | | | | | | $ 1,000 | | $ 990.90 | | $ .25 |
Hypothetical-B | | | | | | $ 1,000 | | $ 1,024.82 | | $ .25 |
| |
A Annualized expense ratio reflects expenses net of applicable fee waivers.
B 5% return per year before expenses
C Expenses are equal to the annualized expense ratio, multiplied by the average account value over the period, multiplied by 183/ 365 (to reflect the one-half year period). The fees and expenses of any Underlying Funds are not included in each annualized expense ratio.
The dividend and capital gains distributions for the fund(s) are available on Fidelity.com or Institutional.Fidelity.com.
A total of 44.74% of the dividends distributed during the fiscal year was derived from interest on U.S. Government securities which is generally exempt from state income tax.
The fund designates $70,015 of distributions paid in the calendar year 2022 as qualifying to be taxed as interest-related dividends for nonresident alien shareholders.
The fund designates $4,758 of distributions paid during the fiscal year ended 2023 as qualifying to be taxed as section 163(j) interest dividends.
Class A designates 27% and 24%; Class M designates 31% and 24%; Class C designates 44% and 24%; Fidelity Sustainable Multi-Asset Fund designates 24% and 24%; and Class I designates 24% and 24%; of the dividends distributed December 29th and 30th, respectively during the fiscal year as qualifying for the dividends-received deduction for corporate shareholders.
Class A designates 45.55% and 42.43%; Class M designates 53.25% and 42.43%; Class C designates 74.46% and 42.43%; Fidelity Sustainable Multi-Asset Fund designates 40.06% and 42.43%; and Class I designates 40.06% and 42.43%; of the dividends distributed December 29th and 30th, respectively during the fiscal year as amounts which may be taken into account as a dividend for purposes of the maximum rate under section 1(h)(11) of the Internal Revenue Code.
Class A designates 0.34% and 0.32%; Class M designates 0.40% and 0.32%; Class C designates 0.55% and 0.32%; Fidelity Sustainable Multi-Asset Fund designates 0.30% and 0.32%; and Class I designates 0.30% and 0.32%; of the dividends distributed December 29th and 30th, respectively during the fiscal year as a section 199A dividend.
The amounts per share which represent income derived from sources within, and taxes paid to, foreign countries or possessions of the United States are as follows:
| | Pay Date | Income | Taxes |
| Insert Fund Name | | | |
| Class A | 12/30/22 | $0.0277 | $0.0053 |
| Class M | 12/30/22 | $0.0237 | $0.0053 |
| Class C | 12/30/22 | $0.0169 | $0.0053 |
| Fidelity Sustainable Multi-Asset Fund | 12/30/22 | $0.0315 | $0.0053 |
| Class I | 12/30/22 | $0.0315 | $0.0053 |
The fund will notify shareholders in January 2024 of amounts for use in preparing 2023 income tax returns.
Board Approval of Investment Advisory Contracts and Management Fees
Fidelity Sustainable Multi-Asset Income Fund
Each year, the Board of Trustees, including the Independent Trustees (together, the Board), considers the renewal of the fund's management contract (the Advisory Contract) with Fidelity Management & Research Company LLC (FMR). The Board, assisted by the advice of fund counsel and Independent Trustees' counsel, requests and considers a broad range of information relevant to the renewal of the Advisory Contract throughout the year.
The Board meets regularly and, at each of its meetings, covers an extensive agenda of topics and materials and considers factors that are relevant to its annual consideration of the renewal of the fund's Advisory Contract, including the services and support provided to the fund and its shareholders. The Board's Operations Committee, of which all the Independent Trustees are members, meets regularly throughout the year and requests, receives and considers, among other matters, information related to the annual consideration of the renewal of the fund's Advisory Contract before making its recommendation to the Board. The Board also meets as needed to review matters specifically related to the Board's annual consideration of the renewal of the Advisory Contract. Members of the Board may also meet from time to time with trustees of other Fidelity funds through joint ad hoc committees to discuss certain matters relevant to all of the Fidelity funds.
At its September 2023 meeting, the Board unanimously determined to renew the fund's Advisory Contract. In reaching its determination, the Board considered all factors it believed relevant, including (i) the nature, extent, and quality of the services provided to the fund and its shareholders (including the investment performance of the fund); (ii) the competitiveness relative to peer funds of the fund's management fee and the total expense ratio of a representative class (the retail class, which was selected because it was the largest class without 12b-1 fees in 2022); (iii) the total costs of the services provided by and the profits realized by FMR and its affiliates (Fidelity) from its relationships with the fund; and (iv) the extent to which, if any, economies of scale exist and are realized as the fund grows, and whether any economies of scale are appropriately shared with fund shareholders. The Board also considered the broad range of investment choices available to shareholders from FMR's competitors and that the fund's shareholders have chosen to invest in the fund, which is part of the Fidelity family of funds. The Board's decision to renew the Advisory Contract was not based on any single factor.
The Board reached a determination, with the assistance of fund counsel and Independent Trustees' counsel and through the exercise of its business judgment, that the renewal of the Advisory Contract was in the best interests of the fund and its shareholders and that the compensation payable under the Advisory Contract was fair and reasonable in light of all of the surrounding circumstances.
Nature, Extent, and Quality of Services Provided. The Board considered FMR's staffing as it relates to the fund, including the backgrounds and experience of investment personnel and also considered FMR's implementation of the fund's investment program. The Independent Trustees also had discussions with senior management of Fidelity's investment operations and investment groups with responsibility for the underlying Fidelity funds in which the fund invests. The Board considered the structure of the investment personnel compensation program and whether this structure provides appropriate incentives to act in the best interests of the fund. Additionally, the Board considered the portfolio managers' investments, if any, in the funds that they manage.
Resources Dedicated to Investment Management and Support Services. The Board reviewed the general qualifications and capabilities of Fidelity's investment staff, including its size, education, experience, and resources, as well as Fidelity's approach to recruiting, training, managing, and compensating investment personnel. The Board noted the resources devoted to Fidelity's global investment organization, and that Fidelity's analysts have extensive resources, tools and capabilities that allow them to conduct quantitative and fundamental analysis, as well as credit analysis of issuers, counterparties and guarantors. Further, the Board considered that Fidelity's investment professionals have sufficient access to global information and data so as to provide competitive investment results over time, and that those professionals also have access to sophisticated tools that permit them to assess portfolio construction and risk and performance attribution characteristics continuously, as well as to transmit new information and research conclusions rapidly around the world. Additionally, in its deliberations, the Board considered Fidelity's trading, risk management, compliance, cybersecurity, and technology and operations capabilities and resources, which are integral parts of the investment management process.
Shareholder and Administrative Services. The Board considered (i) the nature, extent, quality, and cost of advisory, administrative, and shareholder services performed by Fidelity under the Advisory Contract and under separate agreements covering transfer agency, pricing and bookkeeping, and securities lending services for the fund; (ii) the nature and extent of Fidelity's supervision of third party service providers, principally custodians, subcustodians, and pricing vendors; and (iii) the resources devoted by Fidelity to, and the record of compliance with, the fund's compliance policies and procedures. The Board also reviewed the allocation of fund brokerage, including allocations to brokers affiliated with Fidelity, the use of brokerage commissions to pay fund expenses, and the use of "soft" commission dollars to pay for research services. The Board also considered the fund's securities lending activities and any payments made to Fidelity relating to securities lending.
The Board noted that the growth of fund assets over time across the complex allows Fidelity to reinvest in the development of services designed to enhance the value and convenience of the Fidelity funds as investment vehicles. These services include 24-hour access to account information and market information over the Internet and through telephone representatives, investor education materials and asset allocation tools. The Board also considered that it reviews customer service metrics such as telephone response times, continuity of services on the website and metrics addressing services at Fidelity Investor Centers.
Investment in a Large Fund Family. The Board considered the benefits to shareholders of investing in a fund that is part of a large family of funds offering a variety of investment disciplines and providing a large variety of fund investor services. The Board noted that Fidelity had taken, or had made recommendations to the Board that resulted in the Fidelity funds taking, a number of actions over the previous year that benefited particular funds and/or the Fidelity funds in general.
Investment Performance. The Board took into account discussions that occur with representatives of the investment adviser, and reports that it receives, at Board meetings throughout the year relating to fund investment performance. In this regard the Board noted that as part of regularly scheduled fund reviews and other reports to the Board on fund performance, the Board considered annualized return information for the fund for different time periods, measured against one or more appropriate securities market indices, including a customized blended index that reflects the respective weights of the fund's asset classes (each a benchmark index). The Board also considered information about performance attribution. In its evaluation of fund investment performance at meetings throughout the year, the Board gave particular attention to information indicating underperformance of certain Fidelity funds over different time periods and discussed with the investment adviser the reasons for such underperformance.
In addition to reviewing absolute and relative fund performance, the Independent Trustees periodically consider the appropriateness of fund performance metrics in evaluating the results achieved. The Independent Trustees generally give greater weight to fund performance over longer time periods than over shorter time periods. Depending on the circumstances, the Independent Trustees may be satisfied with a fund's performance notwithstanding that it lags its benchmark index for certain periods.
Based on its review, the Board concluded that the nature, extent, and quality of services provided to the fund under the Advisory Contract should continue to benefit the shareholders of the fund.
Competitiveness of Management Fee and Total Expense Ratio. The Board was provided with information regarding industry trends in management fees and expenses. In its review of the fund's management fee and total expense ratio of the retail class, the Board considered the fund's unitary (subject to limited exceptions) fee rate as well as other fund or class expenses paid by FMR under the fund's management contract, such as transfer agent fees, fund-paid 12b-1 fees, pricing and bookkeeping fees, and custodial, legal and audit fees. The Board also noted that Fidelity may agree to waive fees or reimburse expenses from time to time, and the extent to which, if any, it has done so for the fund.
Comparisons of Management Fees and Total Expense Ratios. Among other things, the Board reviewed data for selected groups of competitive funds and classes (referred to as "mapped groups") that were compiled by Fidelity based on combining similar investment objective categories (as classified by Lipper) that have comparable investment mandates. The data reviewed by the Board included (i) gross management fee comparisons (before taking into account expense reimbursements or caps) relative to the total universe of funds within the mapped group; (ii) gross management fee comparisons relative to a subset of non-Fidelity funds in the mapped group that are similar in size and management fee structure to the fund (referred to as the "asset size peer group"); (iii) total expense comparisons of the retail class of the fund relative to funds and classes in the mapped group that have a similar sales load structure to the retail class of the fund (referred to as the "similar sales load structure group"); and (iv) total expense comparisons of the retail class of the fund relative to funds and classes in the similar sales load structure group that are similar in size and management fee structure to the fund (referred to as the "total expense asset size peer group").
The information provided to the Board indicated that the fund's management fee rate ranked above the competitive median of the mapped group for 2022 and above the competitive median of the asset size peer group for 2022. Further, the information provided to the Board indicated that the total expense ratio of the retail class ranked below the competitive median of the similar sales load structure group for 2022 and below the competitive median of the total expense asset size peer group for 2022. The fund has a unitary fee that covers services and fees beyond those related to portfolio management services, unlike the majority of funds within its mapped group. The Board noted that when compared to competitors based on total expenses, the total expense ratio of the retail class ranked below the competitive median.
Other Contractual Arrangements. The Board further considered that FMR has contractually agreed to reimburse Class A, Class M, Class C, Class I, and the retail class of the fund to the extent that total operating expenses, with certain exceptions, as a percentage of their respective average net assets, exceed 0.30%, 0.55%, 1.05%, 0.05%, and 0.05% through January 31, 2024.
Fees Charged to Other Fidelity Clients. The Board also considered Fidelity fee structures and other information with respect to clients of Fidelity, such as other funds advised or subadvised by Fidelity, pension plan clients, and other institutional clients with similar mandates. The Board noted that a joint ad hoc committee created by it and the boards of other Fidelity funds periodically reviews and compares Fidelity's institutional investment advisory business with its business of providing services to the Fidelity funds and also noted the most recent findings of the committee. The Board noted that the committee's review included a consideration of the differences in services provided, fees charged, and costs incurred, as well as competition in the markets serving the different categories of clients.
Based on its review, the Board concluded that the fund's management fee is fair and reasonable in light of the services that the fund receives and the other factors considered. Further, based on its review of total expense ratios and fees charged to other Fidelity clients, the Board concluded that the total expense ratio of each class of the fund was reasonable in light of the services that the fund and its shareholders receive and the other factors considered.
Costs of the Services and Profitability. The Board considered the revenues earned and the expenses incurred by Fidelity in conducting the business of developing, marketing, distributing, managing, administering and servicing the fund and servicing the fund's shareholders. The Board also considered the level of Fidelity's profits in respect of all the Fidelity funds, including the Fidelity funds in which the fund invests.
On an annual basis, Fidelity presents to the Board information about the profitability of its relationships with the fund. Fidelity calculates profitability information for each fund, as well as aggregate profitability information for groups of Fidelity funds and all Fidelity funds, using a series of detailed revenue and cost allocation methodologies which originate with the books and records of Fidelity on which Fidelity's audited financial statements are based. The Audit Committee of the Board reviews any significant changes from the prior year's methodologies and the full Board approves such changes.
A public accounting firm has been engaged annually by the Board as part of the Board's assessment of Fidelity's profitability analysis. The engagement includes the review and assessment of the methodologies used by Fidelity in determining the revenues and expenses attributable to Fidelity's fund business, and completion of agreed-upon procedures in respect of the mathematical accuracy of certain fund profitability information and its conformity to established allocation methodologies. After considering the reports issued under the engagement and information provided by Fidelity, the Board concluded that while other allocation methods may also be reasonable, Fidelity's profitability methodologies are reasonable in all material respects.
The Board also reviewed Fidelity's non-fund businesses and potential indirect benefits such businesses may have received as a result of their association with Fidelity's fund business (i.e., fall-out benefits) as well as cases where Fidelity's affiliates may benefit from the funds' business. The Board considered areas where potential indirect benefits to the Fidelity funds from their relationships with Fidelity may exist. The Board's consideration of these matters was informed by the findings of a joint ad hoc committee created by it and the boards of other Fidelity funds to evaluate potential fall-out benefits.
The Board considered the costs of the services provided by and the profits realized by Fidelity in connection with the operation of the fund and was satisfied that the profitability was not excessive.
Economies of Scale. The Board considered whether there have been economies of scale in respect of the management of the Fidelity funds, whether the Fidelity funds (including the fund) have appropriately benefited from any such economies of scale, and whether there is potential for realization of any further economies of scale. The Board considered the extent to which the fund will benefit from economies of scale as assets grow through increased services to the fund, through waivers or reimbursements, or through fee or expense ratio reductions. The Board recognized that, due to the fund's current contractual arrangements, its expense ratio will not decline if the fund's operating costs decrease as assets grow, or rise as assets decrease. The Board also noted that a committee created by it and the boards of other Fidelity funds periodically analyzes whether Fidelity attains economies of scale in respect of the management and servicing of the Fidelity funds, whether the Fidelity funds have appropriately benefited from such economies of scale, and whether there is potential for realization of any further economies of scale.
The Board concluded, taking into account the analysis of the committee, that economies of scale, if any, are being appropriately shared between fund shareholders and Fidelity.
Additional Information Requested by the Board. In order to develop fully the factual basis for consideration of the Fidelity funds' advisory contracts, the Board requested and received additional information on certain topics, including: (i) Fidelity's fund profitability methodology, profitability trends for certain funds, the allocation of various costs to different funds, and the impact of certain factors on fund profitability results; (ii) portfolio manager changes that have occurred during the past year and Fidelity's views regarding portfolio manager investment in the Fidelity funds that they manage; (iii) hiring, training, and retaining personnel; (iv) the arrangements with and compensation paid to certain fund sub-advisers and the treatment of such compensation within Fidelity's fund profitability methodology; (v) the terms of the funds' various management fee structures, including the basic group fee and the terms of Fidelity's voluntary expense limitation arrangements; (vi) Fidelity's transfer agent, pricing and bookkeeping fees, expense and service structures for different funds and classes relative to competitive trends and market conditions; (vii) the impact on fund profitability of recent industry trends, such as the growth in passively managed funds and the changes in flows for different types of funds; (viii) the types of management fee and total expense comparisons provided, and the challenges and limitations associated with such information; (ix) explanations regarding the relative total expense ratios and management fees of certain funds and classes, total expense and management fee competitive trends, and methodologies for total expense and management fee competitive comparisons; (x) information concerning expense limitations applicable to certain funds; and (xi) matters related to money market funds, exchange-traded funds, and target date funds.
Conclusion. Based on its evaluation of all of the conclusions noted above, and after considering all factors it believed relevant, the Board, including the Independent Trustees, concluded that the advisory fee arrangements are fair and reasonable in light of all of the surrounding circumstances and that the fund's Advisory Contract should be renewed through September 30, 2024.
1.9904616.101
MAF-ANN-1123
Moderate with Income Allocation Fund
Balanced Allocation Fund
Growth Allocation Fund
Aggressive Growth Allocation Fund
Annual Report
September 30, 2023
Contents
To view a fund's proxy voting guidelines and proxy voting record for the 12-month period ended June 30, visit http://www.fidelity.com/proxyvotingresults or visit the Securities and Exchange Commission's (SEC) web site at http://www.sec.gov.
You may also call 1-800-544-8544 to request a free copy of the proxy voting guidelines.
BLOOMBERG ® is a trademark and service mark of Bloomberg Finance L.P. and its affiliates (collectively "Bloomberg"). Bloomberg or Bloomberg's licensors own all proprietary rights in the Bloomberg Indices. Neither Bloomberg nor Bloomberg's licensors approves or endorses this material, or guarantees the accuracy or completeness of any information herein, or makes any warranty, express or implied, as to the results to be obtained therefrom and, to the maximum extent allowed by law, neither shall have any liability or responsibility for injury or damages arising in connection therewith.
Standard & Poor's®; and S&P®; are registered trademarks of Standard & Poor's Financial Services LLC ("S&P") and Dow Jones®; is a registered trademark of Dow Jones Trademark Holdings LLC ("Dow Jones"). The fund is not sponsored, endorsed, sold or promoted by SPDJI, Dow Jones, S&P, or their respective affiliates and none of such parties make any representation regarding the advisability of investing in such product(s) nor do they have any liability for any errors, omissions, or interruptions of the index or indices.
Standard & Poor's, S&P and S&P 500 are registered service marks of The McGraw-Hill Companies, Inc. and have been licensed for use by Fidelity Distributors Corporation.
Other third-party marks appearing herein are the property of their respective owners.
All other marks appearing herein are registered or unregistered trademarks or service marks of FMR LLC or an affiliated company. © 2023 FMR LLC. All rights reserved.
This report and the financial statements contained herein are submitted for the general information of the shareholders of the Funds. This report is not authorized for distribution to prospective investors in the Funds unless preceded or accompanied by an effective prospectus.
A fund files its complete schedule of portfolio holdings with the SEC for the first and third quarters of each fiscal year on Form N-PORT. Forms N-PORT are available on the SEC's web site at http://www.sec.gov. A fund's Forms N-PORT may be reviewed and copied at the SEC's Public Reference Room in Washington, DC. Information regarding the operation of the SEC's Public Reference Room may be obtained by calling 1-800-SEC-0330.
For a complete list of a fund's portfolio holdings, view the most recent holdings listing, semiannual report, or annual report on Fidelity's web site at http://www.fidelity.com, http://www.institutional.fidelity.com, or http://www.401k.com, as applicable.
NOT FDIC INSURED •MAY LOSE VALUE •NO BANK GUARANTEE
Neither the Funds nor Fidelity Distributors Corporation is a bank.
Moderate with Income Allocation Fund
Average annual total return reflects the change in the value of an investment, assuming reinvestment of distributions from dividend income and capital gains (the profits earned upon the sale of securities that have grown in value, if any) and assuming a constant rate of performance each year. The hypothetical investment and the average annual total returns do not reflect the deduction of taxes that a shareholder would pay on fund distributions or the redemption of fund shares. During periods of reimbursement by Fidelity, a fund's total return will be greater than it would be had the reimbursement not occurred. How a fund did yesterday is no guarantee of how it will do tomorrow.
| Average Annual Total Returns |
| | | | |
Periods ended September 30, 2023 | Past 1 year | Life of Fund A |
| Moderate with Income Allocation Fund | 6.90% | -4.96% |
A From February 9, 2022
| $10,000 Over Life of Fund |
| |
Let's say hypothetically that $10,000 was invested in Moderate with Income Allocation Fund, on February 9, 2022, when the fund started. The chart shows how the value of your investment would have changed, and also shows how the Bloomberg U.S. Aggregate Bond Index performed over the same period. |
|
|
Balanced Allocation Fund
Average annual total return reflects the change in the value of an investment, assuming reinvestment of distributions from dividend income and capital gains (the profits earned upon the sale of securities that have grown in value, if any) and assuming a constant rate of performance each year. The hypothetical investment and the average annual total returns do not reflect the deduction of taxes that a shareholder would pay on fund distributions or the redemption of fund shares. During periods of reimbursement by Fidelity, a fund's total return will be greater than it would be had the reimbursement not occurred. How a fund did yesterday is no guarantee of how it will do tomorrow.
| Average Annual Total Returns |
| | | | |
Periods ended September 30, 2023 | Past 1 year | Life of Fund A |
| Balanced Allocation Fund | 10.62% | -4.95% |
A From February 9, 2022
| $10,000 Over Life of Fund |
| |
Let's say hypothetically that $10,000 was invested in Balanced Allocation Fund, on February 9, 2022, when the fund started. The chart shows how the value of your investment would have changed, and also shows how the S&P 500® Index performed over the same period. |
|
|
Growth Allocation Fund
Average annual total return reflects the change in the value of an investment, assuming reinvestment of distributions from dividend income and capital gains (the profits earned upon the sale of securities that have grown in value, if any) and assuming a constant rate of performance each year. The hypothetical investment and the average annual total returns do not reflect the deduction of taxes that a shareholder would pay on fund distributions or the redemption of fund shares. During periods of reimbursement by Fidelity, a fund's total return will be greater than it would be had the reimbursement not occurred. How a fund did yesterday is no guarantee of how it will do tomorrow.
| Average Annual Total Returns |
| | | | |
Periods ended September 30, 2023 | Past 1 year | Life of Fund A |
| Growth Allocation Fund | 14.55% | -4.68% |
A From February 9, 2022
| $10,000 Over Life of Fund |
| |
Let's say hypothetically that $10,000 was invested in Growth Allocation Fund, on February 9, 2022, when the fund started. The chart shows how the value of your investment would have changed, and also shows how the S&P 500® Index performed over the same period. |
|
|
Aggressive Growth Allocation Fund
Average annual total return reflects the change in the value of an investment, assuming reinvestment of distributions from dividend income and capital gains (the profits earned upon the sale of securities that have grown in value, if any) and assuming a constant rate of performance each year. The hypothetical investment and the average annual total returns do not reflect the deduction of taxes that a shareholder would pay on fund distributions or the redemption of fund shares. During periods of reimbursement by Fidelity, a fund's total return will be greater than it would be had the reimbursement not occurred. How a fund did yesterday is no guarantee of how it will do tomorrow.
| Average Annual Total Returns |
| | | | |
Periods ended September 30, 2023 | Past 1 year | Life of Fund A |
| Aggressive Growth Allocation Fund | 17.49% | -4.67% |
A From February 9, 2022
| $10,000 Over Life of Fund |
| |
Let's say hypothetically that $10,000 was invested in Aggressive Growth Allocation Fund, on February 9, 2022, when the fund started. The chart shows how the value of your investment would have changed, and also shows how the S&P 500® Index performed over the same period. |
|
|
Market Recap:
For the 12 months ending September 30, 2023, continued global economic expansion and a slowing in the pace of inflation contributed to a favorable backdrop for risk assets. After struggling throughout much of 2022, risk assets strongly rebounded the past 12 months, with U.S. large-cap stocks leading the way. In the U.S., the upturn was driven partly by a narrow set of companies in the information technology and communication services sectors amid excitement for generative artificial intelligence applications. Meanwhile, monetary tightening by the U.S. Federal Reserve and other central banks continued amid elevated inflation. Against this backdrop, U.S. stocks gained 20.49% for the 12 months, as measured by the Dow Jones U.S. Total Stock Market Index, as all but two sectors rose. Information technology (+41%), communication services (+35%) and energy (+29%) led by the widest margins. Conversely, utilities (-7%) and real estate (-1%) lagged most. Growth stocks broadly outpaced value, while larger-caps topped small-caps. Commodities returned -1.30%, according to the Bloomberg Commodity Index Total Return. Overseas, international equities rose 20.60% for the 12 months, according to the MSCI ACWI (All Country World Index) ex USA Index. All regions gained, with Europe ex U.K. (+31%) leading the way. Japan (+26%) and the U.K. (+25%) also outperformed, whereas Asia Pacific ex Japan (+11%) lagged by the widest margin. Each of the 11 sectors also advanced, with information technology (+30%), industrials (+29%) and energy (+28%) being the top performers. Conversely, real estate (+5%) lagged the most, followed by consumer staples (+9%). Turning to fixed income, U.S. taxable investment-grade bonds returned 0.64% for the 12 months, per the Bloomberg U.S. Aggregate Bond Index, amid elevated inflation and rising interest rates. Since March 2022, the Fed has hiked its benchmark interest rate 11 times, by 5.25 percentage points, while allowing up to billions in bonds to mature each month without investing the proceeds. Short-term U.S. Treasuries (+4.58%) topped U.S. investment-grade corporate bonds (+3.47%), while commercial mortgage-backed securities returned (+1.19%) and agencies gained (+2.10%). Outside the index, leveraged loans (+13.39%), U.S. high-yield bonds (+8.24%) and emerging-markets debt (+8.61%) rose, whereas Treasury Inflation-Protected Securities (+1.25%) experienced a modest gain.
Comments from Co-Portfolio Managers Sharon Dolan and Kristina Stookey:
For the fiscal year ending September 30, 2023, the four index-based asset allocation funds posted gains ranging from about 7% to 17%, closely tracking their respective Composite benchmarks. During the 12-month period, each of the portfolios' major asset classes - domestic equities, international stocks, U.S. investment-grade bonds and short-term debt - generated positive performance. The Dow Jones U.S. Total Stock Market Index rose 20.49%, driven higher by the growth-oriented information technology (+41%) and communication services (+35%) sectors. Also within the index, energy (+29%) and industrials (+24%) stocks fared quite well. On the other hand, utilities (-7%), real estate (-1%), health care (+6%) and consumer staples (+7%) notably underperformed the broader equity market. Outside the U.S., stock performance was comparable, as measured by the 20.40% increase in the MSCI ACWI ex USA Index (Net MA). Developed-market economies in Europe (+31%) posted strong results, led by Italy, Denmark (+55% each) and Ireland (+47%). The U.K. and Japan also outperformed, rising 25% and 26% respectively. In contrast, equity markets in Finland (+2%), Portugal (+11%) and Switzerland (+17%) lagged. Emerging-markets (+12%) were unable to keep pace with their developed-market counterparts, though Hungary, Turkey (+76% each) and Greece (+71%) stood out to the upside. Meanwhile, several Middle East economies came under pressure during the period, particularly Qatar (-18%), Saudi Arabia (-6%) and Kuwait (-2%). Other major EM economies like China (+5%) and India (+11%) underperformed as well. As it relates to U.S. investment-grade bonds, the Bloomberg U.S. Aggregate Bond Index gained 0.64% as short-term bonds outperformed long-term issues, while lower-quality bonds bettered higher-quality debt, and risk assets like corporate bonds and asset-backed securities outpaced U.S. Treasuries and Treasury Inflation-Protected Securities. Conversely, U.S. mortgage-backed securities lagged. Policy action by the Fed also was a factor driving the performance of short-term bonds (+2.62%), as measured by the Bloomberg U.S. 1-5 Year Government/Credit Bond Index.
The views expressed above reflect those of the portfolio manager(s) only through the end of the period as stated on the cover of this report and do not necessarily represent the views of Fidelity or any other person in the Fidelity organization. Any such views are subject to change at any time based upon market or other conditions and Fidelity disclaims any responsibility to update such views. These views may not be relied on as investment advice and, because investment decisions for a Fidelity fund are based on numerous factors, may not be relied on as an indication of trading intent on behalf of any Fidelity fund.
The information in the following tables is based on the direct Investments of the Fund.
Top Holdings (% of Fund's net assets) |
| |
| Fidelity U.S. Bond Index Fund | 50.2 | |
| Fidelity Total Market Index Fund | 20.8 | |
| Fidelity Short-Term Bond Index Fund | 20.1 | |
| Fidelity Total International Index Fund | 8.9 | |
| | 100.0 | |
| |
Asset Allocation (% of Fund's net assets) |
|
Percentages shown as 0.0% may reflect amounts less than 0.05%. |
|
Moderate with Income Allocation Fund
Showing Percentage of Net Assets
| Domestic Equity Funds - 20.8% |
| | | Shares | Value ($) |
Fidelity Total Market Index Fund (a) (Cost $44,243) | | 383 | 45,508 |
| | | | |
| International Equity Funds - 8.9% |
| | | Shares | Value ($) |
Fidelity Total International Index Fund (a) (Cost $20,203) | | 1,584 | 19,483 |
| | | | |
| Bond Funds - 70.3% |
| | | Shares | Value ($) |
| Fidelity Short-Term Bond Index Fund (a) | | 4,625 | 43,933 |
| Fidelity U.S. Bond Index Fund (a) | | 11,106 | 109,509 |
| TOTAL BOND FUNDS (Cost $165,831) | | | 153,442 |
| | | | |
| TOTAL INVESTMENT IN SECURITIES - 100.0% (Cost $230,277) | 218,433 |
NET OTHER ASSETS (LIABILITIES) - 0.0% | (6) |
| NET ASSETS - 100.0% | 218,427 |
| | |
Legend
Affiliated Underlying Funds
Fiscal year to date information regarding the Fund's investments in affiliated Underlying Funds is presented below. Exchanges between classes of the same affiliated Underlying Funds may occur. If an Underlying Funds changes its name, the name presented below is the name in effect at period end.
| Affiliate | Value, beginning of period ($) | Purchases ($) | Sales Proceeds ($) | Dividend Income ($) | Realized Gain (loss) ($) | Change in Unrealized appreciation (depreciation) ($) | Value, end of period ($) |
| Fidelity Short-Term Bond Index Fund | 31,835 | 18,639 | 6,855 | 614 | (111) | 425 | 43,933 |
| Fidelity Total International Index Fund | 14,076 | 7,671 | 4,826 | 380 | (534) | 3,096 | 19,483 |
| Fidelity Total Market Index Fund | 32,681 | 18,263 | 12,373 | 583 | (915) | 7,852 | 45,508 |
| Fidelity U.S. Bond Index Fund | 79,280 | 46,850 | 13,619 | 2,852 | (1,233) | (1,769) | 109,509 |
| | 157,872 | 91,423 | 37,673 | 4,429 | (2,793) | 9,604 | 218,433 |
Amounts in the dividend income column in the above table include any capital gain distributions from underlying funds, which are presented in the corresponding line item in the Statement of Operations, if applicable.
Amounts included in the purchases and sales proceeds columns may include in-kind transactions, if applicable.
Investment Valuation
The following is a summary of the inputs used, as of September 30, 2023, involving the Fund's assets and liabilities carried at fair value. The inputs or methodology used for valuing securities may not be an indication of the risk associated with investing in those securities. For more information on valuation inputs, and their aggregation into the levels used below, please refer to the Investment Valuation section in the accompanying Notes to Financial Statements.
| Valuation Inputs at Reporting Date: |
| Description | Total ($) | Level 1 ($) | Level 2 ($) | Level 3 ($) |
Investments in Securities: | | | | |
|
| Domestic Equity Funds | 45,508 | 45,508 | - | - |
|
| International Equity Funds | 19,483 | 19,483 | - | - |
|
| Bond Funds | 153,442 | 153,442 | - | - |
| Total Investments in Securities: | 218,433 | 218,433 | - | - |
Moderate with Income Allocation Fund
| Statement of Assets and Liabilities |
| | | | September 30, 2023 |
| | | | | |
| Assets | | | | |
| Investment in securities, at value - See accompanying schedule: | | | | |
Affiliated issuers (cost $230,277) | $ | 218,433 | | |
| | | | | |
| | | | | |
| Total Investment in Securities (cost $230,277) | | | $ | 218,433 |
| Receivable for investments sold | | | | 843 |
| Receivable for fund shares sold | | | | 151 |
| Receivable from investment adviser for expense reductions | | | | 6 |
Total assets | | | | 219,433 |
| Liabilities | | | | |
| Payable for investments purchased | $ | 994 | | |
| Other payables and accrued expenses | | 12 | | |
| Total Liabilities | | | | 1,006 |
| Net Assets | | | $ | 218,427 |
| Net Assets consist of: | | | | |
| Paid in capital | | | $ | 233,094 |
| Total accumulated earnings (loss) | | | | (14,667) |
| Net Assets | | | $ | 218,427 |
Net Asset Value, offering price and redemption price per share ($218,427 ÷ 24,421 shares) | | | $ | 8.94 |
| Statement of Operations |
| | | | Year ended September 30, 2023 |
| Investment Income | | | | |
| Dividends: | | | | |
| Affiliated issuers | | | $ | 4,429 |
| Expenses | | | | |
| Management fee | $ | 200 | | |
| Proxy | | 12 | | |
| Total expenses before reductions | | 212 | | |
| Expense reductions | | (206) | | |
| Total expenses after reductions | | | | 6 |
| Net Investment income (loss) | | | | 4,423 |
| Realized and Unrealized Gain (Loss) | | | | |
| Net realized gain (loss) on: | | | | |
| Investment Securities: | | | | |
| Affiliated issuers | | (2,793) | | |
| Total net realized gain (loss) | | | | (2,793) |
| Change in net unrealized appreciation (depreciation) on: | | | | |
| Investment Securities: | | | | |
| Affiliated issuers | | 9,604 | | |
| Total change in net unrealized appreciation (depreciation) | | | | 9,604 |
| Net gain (loss) | | | | 6,811 |
| Net increase (decrease) in net assets resulting from operations | | | $ | 11,234 |
| Statement of Changes in Net Assets |
| |
| | Year ended September 30, 2023 | | For the period February 9, 2022 (commencement of operations) through September 30, 2022 |
| Increase (Decrease) in Net Assets | | | | |
| Operations | | | | |
| Net investment income (loss) | $ | 4,423 | $ | 1,215 |
| Net realized gain (loss) | | (2,793) | | (508) |
| Change in net unrealized appreciation (depreciation) | | 9,604 | | (21,448) |
| Net increase (decrease) in net assets resulting from operations | | 11,234 | | (20,741) |
| Distributions to shareholders | | (4,231) | | (927) |
| | | | | |
| Share transactions | | | | |
| Proceeds from sales of shares | | 97,410 | | 178,618 |
| Reinvestment of distributions | | 4,231 | | 927 |
| Cost of shares redeemed | | (48,089) | | (5) |
| | | | | |
Net increase (decrease) in net assets resulting from share transactions | | 53,552 | | 179,540 |
| Total increase (decrease) in net assets | | 60,555 | | 157,872 |
| | | | | |
| Net Assets | | | | |
| Beginning of period | | 157,872 | | - |
| End of period | $ | 218,427 | $ | 157,872 |
| | | | | |
| Other Information | | | | |
| Shares | | | | |
| Sold | | 10,755 | | 18,354 |
| Issued in reinvestment of distributions | | 472 | | 101 |
| Redeemed | | (5,260) | | (1) |
| Net increase (decrease) | | 5,967 | | 18,454 |
| | | | | |
Financial Highlights
| Moderate with Income Allocation Fund |
| |
| Years ended September 30, | | 2023 | | 2022 A |
Selected Per-Share Data | | | | |
| Net asset value, beginning of period | $ | 8.55 | $ | 10.00 |
| Income from Investment Operations | | | | |
Net investment income (loss) B,C | | .20 | | .08 |
| Net realized and unrealized gain (loss) | | .39 | | (1.47) |
| Total from investment operations | | .59 | | (1.39) |
| Distributions from net investment income | | (.20) | | (.06) |
| Total distributions | | (.20) | | (.06) |
| Net asset value, end of period | $ | 8.94 | $ | 8.55 |
Total Return D,E | | 6.90% | | (13.93)% |
Ratios to Average Net Assets C,F,G | | | | |
| Expenses before reductions | | .11% | | .10% H |
| Expenses net of fee waivers, if any | | -% | | -% H |
| Expenses net of all reductions | | -% | | -% H |
| Net investment income (loss) | | 2.21% | | 1.36% H |
| Supplemental Data | | | | |
| Net assets, end of period (000 omitted) | $ | 218 | $ | 158 |
Portfolio turnover rate I | | 19% | | 11% H |
AFor the period February 9, 2022 (commencement of operations) through September 30, 2022.
BCalculated based on average shares outstanding during the period.
CNet investment income (loss) is affected by the timing of the declaration of dividends by any underlying mutual funds or exchange-traded funds (ETFs). Net investment income (loss) of any mutual funds or ETFs is not included in the Fund's net investment income (loss) ratio.
DTotal returns for periods of less than one year are not annualized.
ETotal returns would have been lower if certain expenses had not been reduced during the applicable periods shown.
FFees and expenses of any underlying mutual funds or exchange-traded funds (ETFs) are not included in the Fund's expense ratio. The Fund indirectly bears its proportionate share of these expenses.
GExpense ratios reflect operating expenses of the class. Expenses before reductions do not reflect amounts reimbursed, waived, or reduced through arrangements with the investment adviser, brokerage services, or other offset arrangements, if applicable, and do not represent the amount paid by the class during periods when reimbursements, waivers or reductions occur.
HAnnualized.
IAmount does not include the portfolio activity of any underlying mutual funds or exchange-traded funds (ETFs).
The information in the following tables is based on the direct Investments of the Fund.
Top Holdings (% of Fund's net assets) |
| |
| Fidelity U.S. Bond Index Fund | 40.2 | |
| Fidelity Total Market Index Fund | 34.8 | |
| Fidelity Total International Index Fund | 14.9 | |
| Fidelity Short-Term Bond Index Fund | 10.1 | |
| | 100.0 | |
| |
Asset Allocation (% of Fund's net assets) |
|
Percentages shown as 0.0% may reflect amounts less than 0.05%. |
|
Balanced Allocation Fund
Showing Percentage of Net Assets
| Domestic Equity Funds - 34.8% |
| | | Shares | Value ($) |
Fidelity Total Market Index Fund (a) ��(Cost $151,361) | | 1,286 | 153,027 |
| | | | |
| International Equity Funds - 14.9% |
| | | Shares | Value ($) |
Fidelity Total International Index Fund (a) (Cost $67,663) | | 5,330 | 65,563 |
| | | | |
| Bond Funds - 50.3% |
| | | Shares | Value ($) |
| Fidelity Short-Term Bond Index Fund (a) | | 4,674 | 44,406 |
| Fidelity U.S. Bond Index Fund (a) | | 17,927 | 176,761 |
| TOTAL BOND FUNDS (Cost $238,068) | | | 221,167 |
| | | | |
| TOTAL INVESTMENT IN SECURITIES - 100.0% (Cost $457,092) | 439,757 |
NET OTHER ASSETS (LIABILITIES) - 0.0% | (25) |
| NET ASSETS - 100.0% | 439,732 |
| | |
Legend
Affiliated Underlying Funds
Fiscal year to date information regarding the Fund's investments in affiliated Underlying Funds is presented below. Exchanges between classes of the same affiliated Underlying Funds may occur. If an Underlying Funds changes its name, the name presented below is the name in effect at period end.
| Affiliate | Value, beginning of period ($) | Purchases ($) | Sales Proceeds ($) | Dividend Income ($) | Realized Gain (loss) ($) | Change in Unrealized appreciation (depreciation) ($) | Value, end of period ($) |
| Fidelity Short-Term Bond Index Fund | 25,588 | 25,084 | 6,524 | 536 | (85) | 343 | 44,406 |
| Fidelity Total International Index Fund | 37,701 | 34,580 | 13,280 | 1,053 | (1,041) | 7,603 | 65,563 |
| Fidelity Total Market Index Fund | 87,411 | 78,888 | 31,527 | 1,612 | (1,643) | 19,898 | 153,027 |
| Fidelity U.S. Bond Index Fund | 101,723 | 101,131 | 21,219 | 3,965 | (630) | (4,244) | 176,761 |
| | 252,423 | 239,683 | 72,550 | 7,166 | (3,399) | 23,600 | 439,757 |
Amounts in the dividend income column in the above table include any capital gain distributions from underlying funds, which are presented in the corresponding line item in the Statement of Operations, if applicable.
Amounts included in the purchases and sales proceeds columns may include in-kind transactions, if applicable.
Investment Valuation
The following is a summary of the inputs used, as of September 30, 2023, involving the Fund's assets and liabilities carried at fair value. The inputs or methodology used for valuing securities may not be an indication of the risk associated with investing in those securities. For more information on valuation inputs, and their aggregation into the levels used below, please refer to the Investment Valuation section in the accompanying Notes to Financial Statements.
| Valuation Inputs at Reporting Date: |
| Description | Total ($) | Level 1 ($) | Level 2 ($) | Level 3 ($) |
Investments in Securities: | | | | |
|
| Domestic Equity Funds | 153,027 | 153,027 | - | - |
|
| International Equity Funds | 65,563 | 65,563 | - | - |
|
| Bond Funds | 221,167 | 221,167 | - | - |
| Total Investments in Securities: | 439,757 | 439,757 | - | - |
Balanced Allocation Fund
| Statement of Assets and Liabilities |
| | | | September 30, 2023 |
| | | | | |
| Assets | | | | |
| Investment in securities, at value - See accompanying schedule: | | | | |
Affiliated issuers (cost $457,092) | $ | 439,757 | | |
| | | | | |
| | | | | |
| Total Investment in Securities (cost $457,092) | | | $ | 439,757 |
| Receivable for investments sold | | | | 1,240 |
| Receivable for fund shares sold | | | | 1,149 |
| Receivable from investment adviser for expense reductions | | | | 11 |
Total assets | | | | 442,157 |
| Liabilities | | | | |
| Payable for investments purchased | $ | 2,404 | | |
| Other payables and accrued expenses | | 21 | | |
| Total Liabilities | | | | 2,425 |
| Net Assets | | | $ | 439,732 |
| Net Assets consist of: | | | | |
| Paid in capital | | | $ | 459,623 |
| Total accumulated earnings (loss) | | | | (19,891) |
| Net Assets | | | $ | 439,732 |
Net Asset Value, offering price and redemption price per share ($439,732 ÷ 48,945 shares) | | | $ | 8.98 |
| Statement of Operations |
| | | | Year ended September 30, 2023 |
| Investment Income | | | | |
| Dividends: | | | | |
| Affiliated issuers | | | $ | 7,166 |
| Expenses | | | | |
| Management fee | $ | 349 | | |
| Independent trustees' fees and expenses | | 1 | | |
| Proxy | | 22 | | |
| Total expenses before reductions | | 372 | | |
| Expense reductions | | (360) | | |
| Total expenses after reductions | | | | 12 |
| Net Investment income (loss) | | | | 7,154 |
| Realized and Unrealized Gain (Loss) | | | | |
| Net realized gain (loss) on: | | | | |
| Investment Securities: | | | | |
| Affiliated issuers | | (3,399) | | |
| Total net realized gain (loss) | | | | (3,399) |
| Change in net unrealized appreciation (depreciation) on: | | | | |
| Investment Securities: | | | | |
| Affiliated issuers | | 23,600 | | |
| Total change in net unrealized appreciation (depreciation) | | | | 23,600 |
| Net gain (loss) | | | | 20,201 |
| Net increase (decrease) in net assets resulting from operations | | | $ | 27,355 |
| Statement of Changes in Net Assets |
| |
| | Year ended September 30, 2023 | | For the period February 9, 2022 (commencement of operations) through September 30, 2022 |
| Increase (Decrease) in Net Assets | | | | |
| Operations | | | | |
| Net investment income (loss) | $ | 7,154 | $ | 1,452 |
| Net realized gain (loss) | | (3,399) | | (684) |
| Change in net unrealized appreciation (depreciation) | | 23,600 | | (40,935) |
| Net increase (decrease) in net assets resulting from operations | | 27,355 | | (40,167) |
| Distributions to shareholders | | (6,373) | | (706) |
| | | | | |
| Share transactions | | | | |
| Proceeds from sales of shares | | 260,248 | | 296,747 |
| Reinvestment of distributions | | 6,373 | | 706 |
| Cost of shares redeemed | | (100,294) | | (4,157) |
| | | | | |
Net increase (decrease) in net assets resulting from share transactions | | 166,327 | | 293,296 |
| Total increase (decrease) in net assets | | 187,309 | | 252,423 |
| | | | | |
| Net Assets | | | | |
| Beginning of period | | 252,423 | | - |
| End of period | $ | 439,732 | $ | 252,423 |
| | | | | |
| Other Information | | | | |
| Shares | | | | |
| Sold | | 28,900 | | 30,805 |
| Issued in reinvestment of distributions | | 726 | | 79 |
| Redeemed | | (11,125) | | (440) |
| Net increase (decrease) | | 18,501 | | 30,444 |
| | | | | |
Financial Highlights
| Years ended September 30, | | 2023 | | 2022 A |
Selected Per-Share Data | | | | |
| Net asset value, beginning of period | $ | 8.29 | $ | 10.00 |
| Income from Investment Operations | | | | |
Net investment income (loss) B,C | | .18 | | .06 |
| Net realized and unrealized gain (loss) | | .69 | | (1.74) |
| Total from investment operations | | .87 | | (1.68) |
| Distributions from net investment income | | (.18) | | (.03) |
| Total distributions | | (.18) | | (.03) |
| Net asset value, end of period | $ | 8.98 | $ | 8.29 |
Total Return D,E | | 10.62% | | (16.81)% |
Ratios to Average Net Assets C,F,G | | | | |
| Expenses before reductions | | .11% | | .10% H |
| Expenses net of fee waivers, if any | | -% | | -% H |
| Expenses net of all reductions | | -% | | -% H |
| Net investment income (loss) | | 2.05% | | 1.07% H |
| Supplemental Data | | | | |
| Net assets, end of period (000 omitted) | $ | 440 | $ | 252 |
Portfolio turnover rate I | | 21% | | 12% H |
AFor the period February 9, 2022 (commencement of operations) through September 30, 2022.
BCalculated based on average shares outstanding during the period.
CNet investment income (loss) is affected by the timing of the declaration of dividends by any underlying mutual funds or exchange-traded funds (ETFs). Net investment income (loss) of any mutual funds or ETFs is not included in the Fund's net investment income (loss) ratio.
DTotal returns for periods of less than one year are not annualized.
ETotal returns would have been lower if certain expenses had not been reduced during the applicable periods shown.
FFees and expenses of any underlying mutual funds or exchange-traded funds (ETFs) are not included in the Fund's expense ratio. The Fund indirectly bears its proportionate share of these expenses.
GExpense ratios reflect operating expenses of the class. Expenses before reductions do not reflect amounts reimbursed, waived, or reduced through arrangements with the investment adviser, brokerage services, or other offset arrangements, if applicable, and do not represent the amount paid by the class during periods when reimbursements, waivers or reductions occur.
HAnnualized.
IAmount does not include the portfolio activity of any underlying mutual funds or exchange-traded funds (ETFs).
The information in the following tables is based on the direct Investments of the Fund.
Top Holdings (% of Fund's net assets) |
| |
| Fidelity Total Market Index Fund | 48.8 | |
| Fidelity U.S. Bond Index Fund | 25.1 | |
| Fidelity Total International Index Fund | 21.0 | |
| Fidelity Short-Term Bond Index Fund | 5.1 | |
| | 100.0 | |
| |
Asset Allocation (% of Fund's net assets) |
|
Percentages shown as 0.0% may reflect amounts less than 0.05%. |
|
Growth Allocation Fund
Showing Percentage of Net Assets
| Domestic Equity Funds - 48.8% |
| | | Shares | Value ($) |
Fidelity Total Market Index Fund (a) (Cost $257,816) | | 2,216 | 263,577 |
| | | | |
| International Equity Funds - 21.0% |
| | | Shares | Value ($) |
Fidelity Total International Index Fund (a) (Cost $115,068) | | 9,211 | 113,293 |
| | | | |
| Bond Funds - 30.2% |
| | | Shares | Value ($) |
| Fidelity Short-Term Bond Index Fund (a) | | 2,873 | 27,290 |
| Fidelity U.S. Bond Index Fund (a) | | 13,775 | 135,819 |
| TOTAL BOND FUNDS (Cost $176,637) | | | 163,109 |
| | | | |
| TOTAL INVESTMENT IN SECURITIES - 100.0% (Cost $549,521) | 539,979 |
NET OTHER ASSETS (LIABILITIES) - 0.0% | (25) |
| NET ASSETS - 100.0% | 539,954 |
| | |
Legend
Affiliated Underlying Funds
Fiscal year to date information regarding the Fund's investments in affiliated Underlying Funds is presented below. Exchanges between classes of the same affiliated Underlying Funds may occur. If an Underlying Funds changes its name, the name presented below is the name in effect at period end.
| Affiliate | Value, beginning of period ($) | Purchases ($) | Sales Proceeds ($) | Dividend Income ($) | Realized Gain (loss) ($) | Change in Unrealized appreciation (depreciation) ($) | Value, end of period ($) |
| Fidelity Short-Term Bond Index Fund | 17,365 | 15,594 | 5,884 | 362 | (7) | 222 | 27,290 |
| Fidelity Total International Index Fund | 71,347 | 56,632 | 28,229 | 2,169 | (1,192) | 14,735 | 113,293 |
| Fidelity Total Market Index Fund | 165,312 | 125,689 | 62,817 | 3,287 | (346) | 35,739 | 263,577 |
| Fidelity U.S. Bond Index Fund | 85,923 | 79,822 | 26,381 | 3,354 | (354) | (3,191) | 135,819 |
| | 339,947 | 277,737 | 123,311 | 9,172 | (1,899) | 47,505 | 539,979 |
Amounts in the dividend income column in the above table include any capital gain distributions from underlying funds, which are presented in the corresponding line item in the Statement of Operations, if applicable.
Amounts included in the purchases and sales proceeds columns may include in-kind transactions, if applicable.
Investment Valuation
The following is a summary of the inputs used, as of September 30, 2023, involving the Fund's assets and liabilities carried at fair value. The inputs or methodology used for valuing securities may not be an indication of the risk associated with investing in those securities. For more information on valuation inputs, and their aggregation into the levels used below, please refer to the Investment Valuation section in the accompanying Notes to Financial Statements.
| Valuation Inputs at Reporting Date: |
| Description | Total ($) | Level 1 ($) | Level 2 ($) | Level 3 ($) |
Investments in Securities: | | | | |
|
| Domestic Equity Funds | 263,577 | 263,577 | - | - |
|
| International Equity Funds | 113,293 | 113,293 | - | - |
|
| Bond Funds | 163,109 | 163,109 | - | - |
| Total Investments in Securities: | 539,979 | 539,979 | - | - |
Growth Allocation Fund
| Statement of Assets and Liabilities |
| | | | September 30, 2023 |
| | | | | |
| Assets | | | | |
| Investment in securities, at value - See accompanying schedule: | | | | |
Affiliated issuers (cost $549,521) | $ | 539,979 | | |
| | | | | |
| | | | | |
| Total Investment in Securities (cost $549,521) | | | $ | 539,979 |
| Receivable for investments sold | | | | 1,551 |
| Receivable for fund shares sold | | | | 1,487 |
| Receivable from investment adviser for expense reductions | | | | 18 |
Total assets | | | | 543,035 |
| Liabilities | | | | |
| Payable for investments purchased | $ | 3,050 | | |
| Other payables and accrued expenses | | 31 | | |
| Total Liabilities | | | | 3,081 |
| Net Assets | | | $ | 539,954 |
| Net Assets consist of: | | | | |
| Paid in capital | | | $ | 554,742 |
| Total accumulated earnings (loss) | | | | (14,788) |
| Net Assets | | | $ | 539,954 |
Net Asset Value, offering price and redemption price per share ($539,954 ÷ 59,390 shares) | | | $ | 9.09 |
| Statement of Operations |
| | | | Year ended September 30, 2023 |
| Investment Income | | | | |
| Dividends: | | | | |
| Affiliated issuers | | | $ | 9,172 |
| Expenses | | | | |
| Management fee | $ | 473 | | |
| Independent trustees' fees and expenses | | 2 | | |
| Proxy | | 32 | | |
| Total expenses before reductions | | 507 | | |
| Expense reductions | | (491) | | |
| Total expenses after reductions | | | | 16 |
| Net Investment income (loss) | | | | 9,156 |
| Realized and Unrealized Gain (Loss) | | | | |
| Net realized gain (loss) on: | | | | |
| Investment Securities: | | | | |
| Affiliated issuers | | (1,899) | | |
| Total net realized gain (loss) | | | | (1,899) |
| Change in net unrealized appreciation (depreciation) on: | | | | |
| Investment Securities: | | | | |
| Affiliated issuers | | 47,505 | | |
| Total change in net unrealized appreciation (depreciation) | | | | 47,505 |
| Net gain (loss) | | | | 45,606 |
| Net increase (decrease) in net assets resulting from operations | | | $ | 54,762 |
| Statement of Changes in Net Assets |
| |
| | Year ended September 30, 2023 | | For the period February 9, 2022 (commencement of operations) through September 30, 2022 |
| Increase (Decrease) in Net Assets | | | | |
| Operations | | | | |
| Net investment income (loss) | $ | 9,156 | $ | 1,350 |
| Net realized gain (loss) | | (1,899) | | (6,503) |
| Change in net unrealized appreciation (depreciation) | | 47,505 | | (57,047) |
| Net increase (decrease) in net assets resulting from operations | | 54,762 | | (62,200) |
| Distributions to shareholders | | (7,126) | | - |
| | | | | |
| Share transactions | | | | |
| Proceeds from sales of shares | | 257,090 | | 445,709 |
| Reinvestment of distributions | | 7,126 | | - |
| Cost of shares redeemed | | (111,845) | | (43,562) |
| | | | | |
Net increase (decrease) in net assets resulting from share transactions | | 152,371 | | 402,147 |
| Total increase (decrease) in net assets | | 200,007 | | 339,947 |
| | | | | |
| Net Assets | | | | |
| Beginning of period | | 339,947 | | - |
| End of period | $ | 539,954 | $ | 339,947 |
| | | | | |
| Other Information | | | | |
| Shares | | | | |
| Sold | | 28,875 | | 47,105 |
| Issued in reinvestment of distributions | | 835 | | - |
| Redeemed | | (12,450) | | (4,975) |
| Net increase (decrease) | | 17,260 | | 42,130 |
| | | | | |
Financial Highlights
| Years ended September 30, | | 2023 | | 2022 A |
Selected Per-Share Data | | | | |
| Net asset value, beginning of period | $ | 8.07 | $ | 10.00 |
| Income from Investment Operations | | | | |
Net investment income (loss) B,C | | .17 | | .04 |
| Net realized and unrealized gain (loss) | | 1.00 | | (1.97) |
| Total from investment operations | | 1.17 | | (1.93) |
| Distributions from net investment income | | (.15) | | - |
| Total distributions | | (.15) | | - |
| Net asset value, end of period | $ | 9.09 | $ | 8.07 |
Total Return D,E | | 14.55% | | (19.30)% |
Ratios to Average Net Assets C,F,G | | | | |
| Expenses before reductions | | .11% | | .10% H |
| Expenses net of fee waivers, if any | | -% | | -% H |
| Expenses net of all reductions | | -% | | -% H |
| Net investment income (loss) | | 1.94% | | .73% H |
| Supplemental Data | | | | |
| Net assets, end of period (000 omitted) | $ | 540 | $ | 340 |
Portfolio turnover rate I | | 26% | | 34% H |
AFor the period February 9, 2022 (commencement of operations) through September 30, 2022.
BCalculated based on average shares outstanding during the period.
CNet investment income (loss) is affected by the timing of the declaration of dividends by any underlying mutual funds or exchange-traded funds (ETFs). Net investment income (loss) of any mutual funds or ETFs is not included in the Fund's net investment income (loss) ratio.
DTotal returns for periods of less than one year are not annualized.
ETotal returns would have been lower if certain expenses had not been reduced during the applicable periods shown.
FFees and expenses of any underlying mutual funds or exchange-traded funds (ETFs) are not included in the Fund's expense ratio. The Fund indirectly bears its proportionate share of these expenses.
GExpense ratios reflect operating expenses of the class. Expenses before reductions do not reflect amounts reimbursed, waived, or reduced through arrangements with the investment adviser, brokerage services, or other offset arrangements, if applicable, and do not represent the amount paid by the class during periods when reimbursements, waivers or reductions occur.
HAnnualized.
IAmount does not include the portfolio activity of any underlying mutual funds or exchange-traded funds (ETFs).
The information in the following tables is based on the direct Investments of the Fund.
Top Holdings (% of Fund's net assets) |
| |
| Fidelity Total Market Index Fund | 59.9 | |
| Fidelity Total International Index Fund | 25.0 | |
| Fidelity U.S. Bond Index Fund | 15.1 | |
| | 100.0 | |
| |
Asset Allocation (% of Fund's net assets) |
|
Percentages shown as 0.0% may reflect amounts less than 0.05%. |
|
Aggressive Growth Allocation Fund
Showing Percentage of Net Assets
| Domestic Equity Funds - 59.9% |
| | | Shares | Value ($) |
Fidelity Total Market Index Fund (a) (Cost $432,436) | | 3,730 | 443,650 |
| | | | |
| International Equity Funds - 25.0% |
| | | Shares | Value ($) |
Fidelity Total International Index Fund (a) (Cost $188,157) | | 15,081 | 185,495 |
| | | | |
| Bond Funds - 15.1% |
| | | Shares | Value ($) |
Fidelity U.S. Bond Index Fund (a) (Cost $120,924) | | 11,368 | 112,091 |
| | | | |
| TOTAL INVESTMENT IN SECURITIES - 100.0% (Cost $741,517) | 741,236 |
NET OTHER ASSETS (LIABILITIES) - 0.0% | (19) |
| NET ASSETS - 100.0% | 741,217 |
| | |
Legend
Affiliated Underlying Funds
Fiscal year to date information regarding the Fund's investments in affiliated Underlying Funds is presented below. Exchanges between classes of the same affiliated Underlying Funds may occur. If an Underlying Funds changes its name, the name presented below is the name in effect at period end.
| Affiliate | Value, beginning of period ($) | Purchases ($) | Sales Proceeds ($) | Dividend Income ($) | Realized Gain (loss) ($) | Change in Unrealized appreciation (depreciation) ($) | Value, end of period ($) |
| Fidelity Total International Index Fund | 88,592 | 110,327 | 29,205 | 2,808 | (2,160) | 17,941 | 185,495 |
| Fidelity Total Market Index Fund | 210,960 | 253,786 | 69,788 | 4,378 | (1,155) | 49,847 | 443,650 |
| Fidelity U.S. Bond Index Fund | 53,774 | 78,119 | 16,309 | 2,462 | (463) | (3,030) | 112,091 |
| | 353,326 | 442,232 | 115,302 | 9,648 | (3,778) | 64,758 | 741,236 |
Amounts in the dividend income column in the above table include any capital gain distributions from underlying funds, which are presented in the corresponding line item in the Statement of Operations, if applicable.
Amounts included in the purchases and sales proceeds columns may include in-kind transactions, if applicable.
Investment Valuation
The following is a summary of the inputs used, as of September 30, 2023, involving the Fund's assets and liabilities carried at fair value. The inputs or methodology used for valuing securities may not be an indication of the risk associated with investing in those securities. For more information on valuation inputs, and their aggregation into the levels used below, please refer to the Investment Valuation section in the accompanying Notes to Financial Statements.
| Valuation Inputs at Reporting Date: |
| Description | Total ($) | Level 1 ($) | Level 2 ($) | Level 3 ($) |
Investments in Securities: | | | | |
|
| Domestic Equity Funds | 443,650 | 443,650 | - | - |
|
| International Equity Funds | 185,495 | 185,495 | - | - |
|
| Bond Funds | 112,091 | 112,091 | - | - |
| Total Investments in Securities: | 741,236 | 741,236 | - | - |
Aggressive Growth Allocation Fund
| Statement of Assets and Liabilities |
| | | | September 30, 2023 |
| | | | | |
| Assets | | | | |
| Investment in securities, at value - See accompanying schedule: | | | | |
Affiliated issuers (cost $741,517) | $ | 741,236 | | |
| | | | | |
| | | | | |
| Total Investment in Securities (cost $741,517) | | | $ | 741,236 |
| Receivable for investments sold | | | | 1,032 |
| Receivable for fund shares sold | | | | 2,373 |
| Receivable from investment adviser for expense reductions | | | | 21 |
Total assets | | | | 744,662 |
| Liabilities | | | | |
| Payable for investments purchased | $ | 3,405 | | |
| Other payables and accrued expenses | | 40 | | |
| Total Liabilities | | | | 3,445 |
| Net Assets | | | $ | 741,217 |
| Net Assets consist of: | | | | |
| Paid in capital | | | $ | 745,578 |
| Total accumulated earnings (loss) | | | | (4,361) |
| Net Assets | | | $ | 741,217 |
Net Asset Value, offering price and redemption price per share ($741,217 ÷ 81,609 shares) | | | $ | 9.08 |
| Statement of Operations |
| | | | Year ended September 30, 2023 |
| Investment Income | | | | |
| Dividends: | | | | |
| Affiliated issuers | | | $ | 9,648 |
| Expenses | | | | |
| Management fee | $ | 574 | | |
| Independent trustees' fees and expenses | | 2 | | |
| Proxy | | 38 | | |
| Total expenses before reductions | | 614 | | |
| Expense reductions | | (595) | | |
| Total expenses after reductions | | | | 19 |
| Net Investment income (loss) | | | | 9,629 |
| Realized and Unrealized Gain (Loss) | | | | |
| Net realized gain (loss) on: | | | | |
| Investment Securities: | | | | |
| Affiliated issuers | | (3,778) | | |
| Total net realized gain (loss) | | | | (3,778) |
| Change in net unrealized appreciation (depreciation) on: | | | | |
| Investment Securities: | | | | |
| Affiliated issuers | | 64,758 | | |
| Total change in net unrealized appreciation (depreciation) | | | | 64,758 |
| Net gain (loss) | | | | 60,980 |
| Net increase (decrease) in net assets resulting from operations | | | $ | 70,609 |
| Statement of Changes in Net Assets |
| |
| | Year ended September 30, 2023 | | For the period February 9, 2022 (commencement of operations) through September 30, 2022 |
| Increase (Decrease) in Net Assets | | | | |
| Operations | | | | |
| Net investment income (loss) | $ | 9,629 | $ | 880 |
| Net realized gain (loss) | | (3,778) | | (2,613) |
| Change in net unrealized appreciation (depreciation) | | 64,758 | | (65,039) |
| Net increase (decrease) in net assets resulting from operations | | 70,609 | | (66,772) |
| Distributions to shareholders | | (8,054) | | - |
| | | | | |
| Share transactions | | | | |
| Proceeds from sales of shares | | 439,935 | | 437,529 |
| Reinvestment of distributions | | 8,054 | | - |
| Cost of shares redeemed | | (122,652) | | (17,432) |
| | | | | |
Net increase (decrease) in net assets resulting from share transactions | | 325,337 | | 420,097 |
| Total increase (decrease) in net assets | | 387,892 | | 353,325 |
| | | | | |
| Net Assets | | | | |
| Beginning of period | | 353,325 | | - |
| End of period | $ | 741,217 | $ | 353,325 |
| | | | | |
| Other Information | | | | |
| Shares | | | | |
| Sold | | 49,552 | | 46,920 |
| Issued in reinvestment of distributions | | 959 | | - |
| Redeemed | | (13,810) | | (2,012) |
| Net increase (decrease) | | 36,701 | | 44,908 |
| | | | | |
Financial Highlights
| Aggressive Growth Allocation Fund |
| |
| Years ended September 30, | | 2023 | | 2022 A |
Selected Per-Share Data | | | | |
| Net asset value, beginning of period | $ | 7.87 | $ | 10.00 |
| Income from Investment Operations | | | | |
Net investment income (loss) B,C | | .15 | | .03 |
| Net realized and unrealized gain (loss) | | 1.21 | | (2.16) |
| Total from investment operations | | 1.36 | | (2.13) |
| Distributions from net investment income | | (.15) | | - |
| Distributions from net realized gain | | - D | | - |
| Total distributions | | (.15) | | - |
| Net asset value, end of period | $ | 9.08 | $ | 7.87 |
Total Return E,F | | 17.49% | | (21.30)% |
Ratios to Average Net Assets B,G,H | | | | |
| Expenses before reductions | | .11% | | .10% I |
| Expenses net of fee waivers, if any | | -% | | -% I |
| Expenses net of all reductions | | -% | | -% I |
| Net investment income (loss) | | 1.68% | | .46% I |
| Supplemental Data | | | | |
| Net assets, end of period (000 omitted) | $ | 741 | $ | 353 |
Portfolio turnover rate J | | 20% | | 14% I |
AFor the period February 9, 2022 (commencement of operations) through September 30, 2022.
BNet investment income (loss) is affected by the timing of the declaration of dividends by any underlying mutual funds or exchange-traded funds (ETFs). Net investment income (loss) of any mutual funds or ETFs is not included in the Fund's net investment income (loss) ratio.
CCalculated based on average shares outstanding during the period.
DAmount represents less than $.005 per share.
ETotal returns for periods of less than one year are not annualized.
FTotal returns would have been lower if certain expenses had not been reduced during the applicable periods shown.
GFees and expenses of any underlying mutual funds or exchange-traded funds (ETFs) are not included in the Fund's expense ratio. The Fund indirectly bears its proportionate share of these expenses.
HExpense ratios reflect operating expenses of the class. Expenses before reductions do not reflect amounts reimbursed, waived, or reduced through arrangements with the investment adviser, brokerage services, or other offset arrangements, if applicable, and do not represent the amount paid by the class during periods when reimbursements, waivers or reductions occur.
IAnnualized.
JAmount does not include the portfolio activity of any underlying mutual funds or exchange-traded funds (ETFs).
For the period ended September 30, 2023
1. Organization.
Moderate with Income Allocation Fund, Balanced Allocation Fund, Growth Allocation Fund and Aggressive Growth Allocation Fund (the Funds) are funds of Fidelity Charles Street Trust (the Trust). Each Fund is authorized to issue an unlimited number of shares. Shares are available only to certain health savings accounts that are made available through Raytheon. Share transactions on the Statement of Changes in Net Assets may contain exchanges between affiliated funds. The Trust is registered under the Investment Company Act of 1940, as amended (the 1940 Act), as an open-end management investment company organized as a Massachusetts business trust.
2. Significant Accounting Policies.
Each Fund is an investment company and applies the accounting and reporting guidance of the Financial Accounting Standards Board (FASB) Accounting Standards Codification Topic 946 Financial Services - Investment Companies. The financial statements have been prepared in conformity with accounting principles generally accepted in the United States of America (GAAP), which require management to make certain estimates and assumptions at the date of the financial statements. Actual results could differ from those estimates. Subsequent events, if any, through the date that the financial statements were issued have been evaluated in the preparation of the financial statements. Each Fund's Schedule of Investments lists any underlying mutual funds or exchange-traded funds (ETFs) but does not include the underlying holdings of these funds. The following summarizes the significant accounting policies of each Fund:
Investment Valuation. Investments are valued as of 4:00 p.m. Eastern time on the last calendar day of the period. Each Fund categorizes the inputs to valuation techniques used to value its investments into a disclosure hierarchy consisting of three levels as shown below:
Level 1 - unadjusted quoted prices in active markets for identical investments
Level 2 - other significant observable inputs (including quoted prices for similar investments, interest rates, prepayment speeds, etc.)
Level 3 - unobservable inputs (including the Fund's own assumptions based on the best information available)
Valuation techniques used to value each Fund's investments by major category are as follows. Investments in open-end mutual funds are valued at their closing net asset value (NAV) each business day and are categorized as Level 1 in the hierarchy. The aggregate value of investments by input level as of September 30, 2023 is included at the end of each Fund's Schedule of Investments.
Investment Transactions and Income. For financial reporting purposes, the Funds' investment holdings and NAV include trades executed through the end of the last business day of the period. The NAV per share for processing shareholder transactions is calculated as of the close of business of the New York Stock Exchange (NYSE), normally 4:00 p.m. Eastern time and includes trades executed through the end of the prior business day. Gains and losses on securities sold are determined on the basis of identified cost. Income and capital gain distributions from any underlying mutual funds or exchange-traded funds (ETFs) are recorded on the ex-dividend date.
Expenses. Expenses directly attributable to a fund are charged to that fund. Expenses attributable to more than one fund are allocated among the respective funds on the basis of relative net assets or other appropriate methods. Expenses included in the accompanying financial statements reflect the expenses of that fund and do not include any expenses associated with any underlying mutual funds or exchange-traded funds. Although not included in a fund's expenses, a fund indirectly bears its proportionate share of these expenses through the net asset value of each underlying mutual fund or exchange-traded fund. Expense estimates are accrued in the period to which they relate and adjustments are made when actual amounts are known.
Income Tax Information and Distributions to Shareholders. Each year, each Fund intends to qualify as a regulated investment company under Subchapter M of the Internal Revenue Code, including distributing substantially all of its taxable income and realized gains. As a result, no provision for U.S. Federal income taxes is required. As of September 30, 2023, each Fund did not have any unrecognized tax benefits in the financial statements; nor is each Fund aware of any tax positions for which it is reasonably possible that the total amounts of unrecognized tax benefits will significantly change in the next twelve months. Each Fund files a U.S. federal tax return, in addition to state and local tax returns as required. Each Fund's federal income tax returns are subject to examination by the Internal Revenue Service (IRS) for a period of three fiscal years after they are filed. State and local tax returns may be subject to examination for an additional fiscal year depending on the jurisdiction.
Distributions are declared and recorded on the ex-dividend date. Income and capital gain distributions are determined in accordance with income tax regulations, which may differ from GAAP. In addition, certain Funds claimed a portion of the payment made to redeeming shareholders as a distribution for income tax purposes.
Capital accounts within the financial statements are adjusted for permanent book-tax differences. These adjustments have no impact on net assets or the results of operations. Capital accounts are not adjusted for temporary book-tax differences which will reverse in a subsequent period.
Book-tax differences are primarily due to capital loss carryforwards and losses deferred due to wash sales.
As of period end, the cost and unrealized appreciation (depreciation) in securities, and derivatives if applicable, for federal income tax purposes were as follows for each Fund:
| | Tax cost | Gross unrealized appreciation | Gross unrealized depreciation | Net unrealized appreciation (depreciation) |
| Moderate with Income Allocation Fund | $233,009 | $1,903 | $(16,479) | $(14,576) |
| Balanced Allocation Fund | 461,196 | 5,315 | (26,754) | (21,439) |
| Growth Allocation Fund | 555,885 | 11,873 | (27,779) | (15,906) |
| Aggressive Growth Allocation Fund | 748,002 | 19,531 | (26,297) | (6,766) |
The tax-based components of distributable earnings as of period end were as follows for each Fund:
| | Undistributed ordinary income | Capital loss carryforward | Net unrealized appreciation (depreciation) on securities and other investments |
| Moderate with Income Allocation Fund | $479 | $(569) | $(14,576) |
| Balanced Allocation Fund | 1,548 | - | (21,439) |
| Growth Allocation Fund | 3,157 | (2,038) | (15,906) |
| Aggressive Growth Allocation Fund | 2,428 | (23) | (6,766) |
Capital loss carryforwards are only available to offset future capital gains of the Funds to the extent provided by regulations and may be limited. The capital loss carryforward information presented below, including any applicable limitation, is estimated as of fiscal period end and is subject to adjustment.
| | Short-term | Long-term | Total capital loss carryforward |
| Moderate with Income Allocation Fund | $ (197) | $ (372) | $ (569) |
| Growth Allocation Fund | (1,655) | (383) | (2,038) |
| Aggressive Growth Allocation Fund | - | (23) | (23) |
Due to large subscriptions in a prior period, Balanced Allocation Fund and Aggressive Growth Allocation Fund are subject to annual limits on their use of some of their unrealized capital losses to offset capital gains in future periods. If those capital losses are realized and the limitation prevents the Funds from using any of those capital losses in a future period, those capital losses will be available to offset capital gains in subsequent periods.
The tax character of distributions paid was as follows:
| September 30, 2023 | |
| | Ordinary Income |
| Moderate with Income Allocation Fund | $4,231 |
| Balanced Allocation Fund | 6,373 |
| Growth Allocation Fund | 7,126 |
| Aggressive Growth Allocation Fund | 8,054 |
| September 30, 2022 | |
| | Ordinary Income |
| Moderate with Income Allocation Fund | $927 |
| Balanced Allocation Fund | 706 |
3. Purchases and Sales of Investments.
Purchases and sales of securities, other than short-term securities and in-kind transactions, as applicable, are noted in the table below.
| | Purchases ($) | Sales ($) |
| Moderate with Income Allocation Fund | 91,423 | 37,673 |
| Balanced Allocation Fund | 239,683 | 72,550 |
| Growth Allocation Fund | 277,737 | 123,311 |
| Aggressive Growth Allocation Fund | 442,232 | 115,302 |
4. Fees and Other Transactions with Affiliates.
Management Fee. Fidelity Management & Research Company LLC (the investment adviser) provides the Funds with investment management related services. For these services each Fund pays a monthly management fee to the investment adviser. The management fee is based on an annual rate of .10% of each Fund's average net assets. Under the management contract, the investment adviser pays all other operating expenses, except the compensation of the independent Trustees and certain miscellaneous expenses such as proxy and shareholder meeting expenses.
During the period, the investment adviser waived its management fee as described in the Expense Reductions note.
Interfund Trades. Funds may purchase from or sell securities to other Fidelity Funds under procedures adopted by the Board. The procedures have been designed to ensure these interfund trades are executed in accordance with Rule 17a-7 of the 1940 Act. Any interfund trades are included within the respective purchases and sales amounts shown in the Purchases and Sales of Investments note. During the period, there were no interfund trades.
5. Expense Reductions.
The investment adviser contractually agreed to waive each Fund's management fee in an amount equal to .10% of average net assets until January 31, 2027. For the period, management fees were reduced by the following amounts:
| | Management Fee Waiver |
| Moderate with Income Allocation Fund | $200 |
| Balanced Allocation Fund | $349 |
| Growth Allocation Fund | $473 |
| Aggressive Growth Allocation Fund | $574 |
The investment adviser contractually agreed to reimburse certain Funds to the extent proxy and shareholder meeting expenses exceeded .003% of average net assets on an annual basis. This reimbursement will remain in place through January 31, 2025. During the period this reimbursement reduced each applicable Fund's expenses as follows:
| | Reimbursement |
| Moderate with Income Allocation Fund | $6 |
| Balanced Allocation Fund | $11 |
| Growth Allocation Fund | $18 |
| Aggressive Growth Allocation Fund | $21 |
6. Other.
A fund's organizational documents provide former and current trustees and officers with a limited indemnification against liabilities arising in connection with the performance of their duties to the fund. In the normal course of business, a fund may also enter into contracts that provide general indemnifications. A fund's maximum exposure under these arrangements is unknown as this would be dependent on future claims that may be made against a fund. The risk of material loss from such claims is considered remote.
At the end of the period, the investment adviser or its affiliates were owners of record of more than 10% of the outstanding shares as follows:
| Fund | Affiliated % |
| Moderate with Income Allocation Fund | 28% |
7. Risk and Uncertainties.
Many factors affect a fund's performance. Developments that disrupt global economies and financial markets, such as pandemics, epidemics, outbreaks of infectious diseases, war, terrorism, and environmental disasters, may significantly affect a fund's investment performance. The effects of these developments to a fund will be impacted by the types of securities in which a fund invests, the financial condition, industry, economic sector, and geographic location of an issuer, and a fund's level of investment in the securities of that issuer. Significant concentrations in security types, issuers, industries, sectors, and geographic locations may magnify the factors that affect a fund's performance.
To the Board of Trustees of Fidelity Charles Street Trust and Shareholders of Moderate with Income Allocation Fund, Balanced Allocation Fund, Growth Allocation Fund, and Aggressive Growth Allocation Fund
Opinions on the Financial Statements
We have audited the accompanying statements of assets and liabilities, including the schedules of investments, of Moderate with Income Allocation Fund, Balanced Allocation Fund, Growth Allocation Fund, and Aggressive Growth Allocation Fund (four of the funds constituting Fidelity Charles Street Trust, hereafter collectively referred to as the "Funds") as of September 30, 2023, the related statements of operations for the year ended September 30, 2023, and the statements of changes in net assets and the financial highlights for the year ended September 30, 2023 and for the period February 9, 2022 (commencement of operations) through September 30, 2022, including the related notes (collectively referred to as the "financial statements"). In our opinion, the financial statements present fairly, in all material respects, the financial position of each of the Funds as of September 30, 2023, the results of each of their operations for the year ended September 30, 2023 and the changes in their net assets and each of the financial highlights for the year ended September 30, 2023 and for the period February 9, 2022 (commencement of operations) through September 30, 2022 in conformity with accounting principles generally accepted in the United States of America.
Basis for Opinions
These financial statements are the responsibility of the Funds' management. Our responsibility is to express an opinion on the Funds' financial statements based on our audits. We are a public accounting firm registered with the Public Company Accounting Oversight Board (United States) (PCAOB) and are required to be independent with respect to the Funds in accordance with the U.S. federal securities laws and the applicable rules and regulations of the Securities and Exchange Commission and the PCAOB.
We conducted our audits of these financial statements in accordance with the standards of the PCAOB. Those standards require that we plan and perform the audit to obtain reasonable assurance about whether the financial statements are free of material misstatement, whether due to error or fraud.
Our audits included performing procedures to assess the risks of material misstatement of the financial statements, whether due to error or fraud, and performing procedures that respond to those risks. Such procedures included examining, on a test basis, evidence regarding the amounts and disclosures in the financial statements. Our audits also included evaluating the accounting principles used and significant estimates made by management, as well as evaluating the overall presentation of the financial statements. Our procedures included confirmation of securities owned as of September 30, 2023 by correspondence with the custodian and broker. We believe that our audits provide a reasonable basis for our opinions.
/s/ PricewaterhouseCoopers LLP
Boston, Massachusetts
November 10, 2023
We have served as the auditor of one or more investment companies in the Fidelity group of funds since 1932.
The Trustees, Members of the Advisory Board (if any), and officers of the trust and funds, as applicable, are listed below. The Board of Trustees governs each fund and is responsible for protecting the interests of shareholders. The Trustees are experienced executives who meet periodically throughout the year to oversee each fund's activities, review contractual arrangements with companies that provide services to each fund, oversee management of the risks associated with such activities and contractual arrangements, and review each fund's performance. If the interests of a fund and an underlying Fidelity® fund were to diverge, a conflict of interest could arise and affect how the Trustees and Members of the Advisory Board fulfill their fiduciary duties to the affected funds. FMR has structured the funds to avoid these potential conflicts, although there may be situations where a conflict of interest is unavoidable. In such instances, FMR, the Trustees, and Members of the Advisory Board would take reasonable steps to minimize and, if possible, eliminate the conflict. As of September 30, 2023, except for Laura M. Bishop, Robert W. Helm, Christine J. Thompson, and Carol J. Zierhoffer, each of the Trustees oversees 313 funds. As of October 18, 2023, the date of their election as Trustee, Ms. Bishop, Mr. Helm, Ms. Thompson, and Ms. Zierhoffer each oversees 229 funds.
The Trustees hold office without limit in time except that (a) any Trustee may resign; (b) any Trustee may be removed by written instrument, signed by at least two-thirds of the number of Trustees prior to such removal; (c) any Trustee who requests to be retired or who has become incapacitated by illness or injury may be retired by written instrument signed by a majority of the other Trustees; and (d) any Trustee may be removed at any special meeting of shareholders by a two-thirds vote of the outstanding voting securities of the trust. Each Trustee who is not an interested person (as defined in the 1940 Act) of the trust and the funds is referred to herein as an Independent Trustee. Each Independent Trustee shall retire not later than the last day of the calendar year in which his or her 75th birthday occurs. The Independent Trustees may waive this mandatory retirement age policy with respect to individual Trustees. Officers and Advisory Board Members hold office without limit in time, except that any officer or Advisory Board Member may resign or may be removed by a vote of a majority of the Trustees at any regular meeting or any special meeting of the Trustees. Except as indicated, each individual has held the office shown or other offices in the same company for the past five years.
The funds' Statement of Additional Information (SAI) includes more information about the Trustees. To request a free copy, call Fidelity at 1-800-544-8544.
Experience, Skills, Attributes, and Qualifications of the Trustees. The Governance and Nominating Committee has adopted a statement of policy that describes the experience, qualifications, attributes, and skills that are necessary and desirable for potential Independent Trustee candidates (Statement of Policy). The Board believes that each Trustee satisfied at the time he or she was initially elected or appointed a Trustee, and continues to satisfy, the standards contemplated by the Statement of Policy. The Governance and Nominating Committee also engages professional search firms to help identify potential Independent Trustee candidates who have the experience, qualifications, attributes, and skills consistent with the Statement of Policy. From time to time, additional criteria based on the composition and skills of the current Independent Trustees, as well as experience or skills that may be appropriate in light of future changes to board composition, business conditions, and regulatory or other developments, have also been considered by the professional search firms and the Governance and Nominating Committee. In addition, the Board takes into account the Trustees' commitment and participation in Board and committee meetings, as well as their leadership of standing and ad hoc committees throughout their tenure.
In determining that a particular Trustee was and continues to be qualified to serve as a Trustee, the Board has considered a variety of criteria, none of which, in isolation, was controlling. The Board believes that, collectively, the Trustees have balanced and diverse experience, qualifications, attributes, and skills, which allow the Board to operate effectively in governing each fund and protecting the interests of shareholders. Information about the specific experience, skills, attributes, and qualifications of each Trustee, which in each case led to the Board's conclusion that the Trustee should serve (or continue to serve) as a trustee of the funds, is provided below.
Board Structure and Oversight Function. Abigail P. Johnson is an interested person and currently serves as Chairman. The Trustees have determined that an interested Chairman is appropriate and benefits shareholders because an interested Chairman has a personal and professional stake in the quality and continuity of services provided to the funds. Independent Trustees exercise their informed business judgment to appoint an individual of their choosing to serve as Chairman, regardless of whether the Trustee happens to be independent or a member of management. The Independent Trustees have determined that they can act independently and effectively without having an Independent Trustee serve as Chairman and that a key structural component for assuring that they are in a position to do so is for the Independent Trustees to constitute a substantial majority for the Board. The Independent Trustees also regularly meet in executive session. Michael E. Kenneally serves as Chairman of the Independent Trustees and as such (i) acts as a liaison between the Independent Trustees and management with respect to matters important to the Independent Trustees and (ii) with management prepares agendas for Board meetings.
Fidelity® funds are overseen by different Boards of Trustees. The funds' Board oversees Fidelity's investment-grade bond, money market, asset allocation and certain equity funds, and other Boards oversee Fidelity's alternative investment, high income and other equity funds. The asset allocation funds may invest in Fidelity® funds that are overseen by such other Boards. The use of separate Boards, each with its own committee structure, allows the Trustees of each group of Fidelity® funds to focus on the unique issues of the funds they oversee, including common research, investment, and operational issues. On occasion, the separate Boards establish joint committees to address issues of overlapping consequences for the Fidelity® funds overseen by each Board.
The Trustees operate using a system of committees to facilitate the timely and efficient consideration of all matters of importance to the Trustees, each fund, and fund shareholders and to facilitate compliance with legal and regulatory requirements and oversight of the funds' activities and associated risks. The Board, acting through its committees, has charged FMR and its affiliates with (i) identifying events or circumstances the occurrence of which could have demonstrably adverse effects on the funds' business and/or reputation; (ii) implementing processes and controls to lessen the possibility that such events or circumstances occur or to mitigate the effects of such events or circumstances if they do occur; and (iii) creating and maintaining a system designed to evaluate continuously business and market conditions in order to facilitate the identification and implementation processes described in (i) and (ii) above. Because the day-to-day operations and activities of the funds are carried out by or through FMR, its affiliates, and other service providers, the funds' exposure to risks is mitigated but not eliminated by the processes overseen by the Trustees. While each of the Board's committees has responsibility for overseeing different aspects of the funds' activities, oversight is exercised primarily through the Operations and Audit Committees. In addition, an ad hoc Board committee of Independent Trustees has worked with FMR to enhance the Board's oversight of investment and financial risks, legal and regulatory risks, technology risks, and operational risks, including the development of additional risk reporting to the Board. Appropriate personnel, including but not limited to the funds' Chief Compliance Officer (CCO), FMR's internal auditor, the independent accountants, the funds' Treasurer and portfolio management personnel, make periodic reports to the Board's committees, as appropriate, including an annual review of Fidelity's risk management program for the Fidelity® funds. The responsibilities of each standing committee, including their oversight responsibilities, are described further under "Standing Committees of the Trustees."
Interested Trustees*:
Correspondence intended for a Trustee who is an interested person may be sent to Fidelity Investments, 245 Summer Street, Boston, Massachusetts 02210.
Name, Year of Birth; Principal Occupations and Other Relevant Experience+
Abigail P. Johnson (1961)
Year of Election or Appointment: 2009
Trustee
Chairman of the Board of Trustees
Ms. Johnson also serves as Trustee of other Fidelity® funds. Ms. Johnson serves as Chairman (2016-present), Chief Executive Officer (2014-present), and Director (2007-present) of FMR LLC (diversified financial services company), President of Fidelity Financial Services (2012-present) and President of Personal, Workplace and Institutional Services (2005-present). Ms. Johnson is Chairman and Director of Fidelity Management & Research Company LLC (investment adviser firm, 2011-present). Previously, Ms. Johnson served as Chairman and Director of FMR Co., Inc. (investment adviser firm, 2011-2019), Vice Chairman (2007-2016) and President (2013-2016) of FMR LLC, President and a Director of Fidelity Management & Research Company (2001-2005), a Trustee of other investment companies advised by Fidelity Management & Research Company, Fidelity Investments Money Management, Inc. (investment adviser firm), and FMR Co., Inc. (2001-2005), Senior Vice President of the Fidelity® funds (2001-2005), and managed a number of Fidelity® funds. Ms. Abigail P. Johnson and Mr. Arthur E. Johnson are not related.
Jennifer Toolin McAuliffe (1959)
Year of Election or Appointment: 2016
Trustee
Ms. McAuliffe also serves as Trustee of other Fidelity® funds and as Trustee of Fidelity Charitable (2020-present). Previously, Ms. McAuliffe served as Co-Head of Fixed Income of Fidelity Investments Limited (now known as FIL Limited (FIL)) (diversified financial services company), Director of Research for FIL's credit and quantitative teams in London, Hong Kong and Tokyo and Director of Research for taxable and municipal bonds at Fidelity Investments Money Management, Inc. Ms. McAuliffe previously served as a member of the Advisory Board of certain Fidelity® funds (2016). Ms. McAuliffe was previously a lawyer at Ropes & Gray LLP and an international banker at Chemical Bank NA (now JPMorgan Chase & Co.). Ms. McAuliffe also currently serves as director or trustee of several not-for-profit entities.
Christine J. Thompson (1958)
Year of Election or Appointment: 2023
Trustee
Ms. Thompson also serves as a Trustee of other Fidelity® funds. Ms. Thompson serves as Leader of Advanced Technologies for Investment Management at Fidelity Investments (2018-present). Previously, Ms. Thompson served as Chief Investment Officer in the Bond group at Fidelity Management & Research Company (2010-2018) and held various other roles including Director of municipal bond portfolio managers and Portfolio Manager of certain Fidelity® funds.
* Determined to be an "Interested Trustee" by virtue of, among other things, his or her affiliation with the trust or various entities under common control with FMR.
+ The information includes the Trustee's principal occupation during the last five years and other information relating to the experience, attributes, and skills relevant to the Trustee's qualifications to serve as a Trustee, which led to the conclusion that the Trustee should serve as a Trustee for each fund.
Independent Trustees:
Correspondence intended for an Independent Trustee may be sent to Fidelity Investments, P.O. Box 55235, Boston, Massachusetts 02205-5235.
Name, Year of Birth; Principal Occupations and Other Relevant Experience+
Elizabeth S. Acton (1951)
Year of Election or Appointment: 2013
Trustee
Ms. Acton also serves as Trustee of other Fidelity® funds. Prior to her retirement, Ms. Acton served as Executive Vice President, Finance (2011-2012), Executive Vice President, Chief Financial Officer (2002-2011) and Treasurer (2004-2005) of Comerica Incorporated (financial services). Prior to joining Comerica, Ms. Acton held a variety of positions at Ford Motor Company (1983-2002), including Vice President and Treasurer (2000-2002) and Executive Vice President and Chief Financial Officer of Ford Motor Credit Company (1998-2000). Ms. Acton currently serves as a member of the Board and Audit and Finance Committees of Beazer Homes USA, Inc. (homebuilding, 2012-present). Ms. Acton previously served as a member of the Advisory Board of certain Fidelity® funds (2013-2016).
Laura M. Bishop (1961)
Year of Election or Appointment: 2023
Trustee
Ms. Bishop also serves as Trustee or Member of the Advisory Board of other Fidelity® funds. Prior to her retirement, Ms. Bishop held a variety of positions at United Services Automobile Association (2001-2020), including Executive Vice President and Chief Financial Officer (2014-2020) and Senior Vice President and Deputy Chief Financial Officer (2012-2014). Ms. Bishop currently serves as a member of the Audit Committee and Compensation and Personnel Committee (2021-present) of the Board of Directors of Korn Ferry (global organizational consulting). Previously, Ms. Bishop served as a Member of the Advisory Board of certain Fidelity® funds (2022-2023).
Ann E. Dunwoody (1953)
Year of Election or Appointment: 2018
Trustee
General Dunwoody also serves as Trustee of other Fidelity® funds. General Dunwoody (United States Army, Retired) was the first woman in U.S. military history to achieve the rank of four-star general and prior to her retirement in 2012 held a variety of positions within the U.S. Army, including Commanding General, U.S. Army Material Command (2008-2012). General Dunwoody currently serves as a member of the Board, Chair of Nomination Committee and a member of the Corporate Governance Committee of Kforce Inc. (professional staffing services, 2016-present) and a member of the Board of Automattic Inc. (software engineering, 2018-present). Previously, General Dunwoody served as President of First to Four LLC (leadership and mentoring services, 2012-2022), a member of the Advisory Board and Nominating and Corporate Governance Committee of L3 Technologies, Inc. (communication, electronic, sensor and aerospace systems, 2013-2019) and a member of the Board and Audit and Sustainability and Corporate Responsibility Committees of Republic Services, Inc. (waste collection, disposal and recycling, 2013-2016). General Dunwoody also serves on several boards for non-profit organizations, including as a member of the Board, Chair of the Nomination and Governance Committee and a member of the Audit Committee of the Noble Reach Foundation (formerly Logistics Management Institute) (consulting non-profit, 2012-present) and a member of the Board of ThanksUSA (military family education non-profit, 2014-present). Previously, General Dunwoody served as a member of the Board of Florida Institute of Technology (2015-2022) and a member of the Council of Trustees for the Association of the United States Army (advocacy non-profit, 2013-2021). General Dunwoody previously served as a member of the Advisory Board of certain Fidelity® funds (2018).
John Engler (1948)
Year of Election or Appointment: 2014
Trustee
Mr. Engler also serves as Trustee of other Fidelity® funds. Previously, Mr. Engler served as Governor of Michigan (1991-2003), President of the Business Roundtable (2011-2017) and interim President of Michigan State University (2018-2019). Previously, Mr. Engler served as a member of the Board of Stride, Inc. (formerly K12 Inc.) (technology-based education company, 2012-2022), a member of the Board of Universal Forest Products (manufacturer and distributor of wood and wood-alternative products, 2003-2019) and Trustee of The Munder Funds (2003-2014). Mr. Engler previously served as a member of the Advisory Board of certain Fidelity® funds (2014-2016).
Robert F. Gartland (1951)
Year of Election or Appointment: 2010
Trustee
Mr. Gartland also serves as Trustee of other Fidelity® funds. Prior to his retirement, Mr. Gartland held a variety of positions at Morgan Stanley (financial services, 1979-2007), including Managing Director (1987-2007) and Chase Manhattan Bank (1975-1978). Mr. Gartland previously served as Chairman and an investor in Gartland & Mellina Group Corp. (consulting, 2009-2019), as a member of the Board of National Securities Clearing Corporation (1993-1996) and as Chairman of TradeWeb (2003-2004).
Robert W. Helm (1957)
Year of Election or Appointment: 2023
Trustee
Mr. Helm also serves as Trustee or Member of the Advisory Board of other Fidelity® funds. Mr. Helm was formerly Deputy Chairman (2003-2020), partner (1991-2020) and an associate (1984-1991) of Dechert LLP (formerly Dechert Price & Rhoads). Mr. Helm currently serves on boards and committees of several not-for-profit organizations, including as a Trustee and member of the Executive Committee of the Baltimore Council on Foreign Affairs, a member of the Board of Directors of the St. Vincent de Paul Society of Baltimore and a member of the Life Guard Society of Mt. Vernon. Previously, Mr. Helm served as a Member of the Advisory Board of certain Fidelity® funds (2021-2023).
Arthur E. Johnson (1947)
Year of Election or Appointment: 2008
Trustee
Mr. Johnson also serves as Trustee of other Fidelity® funds. Prior to his retirement, Mr. Johnson served as Senior Vice President of Corporate Strategic Development of Lockheed Martin Corporation (defense contractor, 1999-2009). Mr. Johnson currently serves as a member of the Board of Booz Allen Hamilton (management consulting, 2011-present). Mr. Johnson previously served as a member of the Board of Eaton Corporation plc (diversified power management, 2009-2019) and a member of the Board of AGL Resources, Inc. (holding company, 2002-2016). Mr. Johnson previously served as Chairman (2018-2021) and Vice Chairman (2015-2018) of the Independent Trustees of certain Fidelity® funds. Mr. Arthur E. Johnson is not related to Ms. Abigail P. Johnson.
Michael E. Kenneally (1954)
Year of Election or Appointment: 2009
Trustee
Chairman of the Independent Trustees
Mr. Kenneally also serves as Trustee of other Fidelity® funds and was Vice Chairman (2018-2021) of the Independent Trustees of certain Fidelity® funds. Prior to retirement in 2005, he was Chairman and Global Chief Executive Officer of Credit Suisse Asset Management, the worldwide fund management and institutional investment business of Credit Suisse Group. Previously, Mr. Kenneally was an Executive Vice President and the Chief Investment Officer for Bank of America. In this role, he was responsible for the investment management, strategy and products delivered to the bank's institutional, high-net-worth and retail clients. Earlier, Mr. Kenneally directed the organization's equity and quantitative research groups. He began his career as a research analyst and then spent more than a dozen years as a portfolio manager for endowments, pension plans and mutual funds. He earned the Chartered Financial Analyst (CFA) designation in 1991.
Mark A. Murray (1954)
Year of Election or Appointment: 2016
Trustee
Mr. Murray also serves as Trustee of other Fidelity® funds. Previously, Mr. Murray served as Co-Chief Executive Officer (2013-2016), President (2006-2013) and Vice Chairman (2013-2020) of Meijer, Inc. Mr. Murray serves as a member of the Board (2009-present) and Public Policy and Responsibility Committee (2009-present) and Chair of the Nuclear Review Committee (2019-present) of DTE Energy Company (diversified energy company). Mr. Murray previously served as a member of the Board of Spectrum Health (not-for-profit health system, 2015-2019) and as a member of the Board and Audit Committee and Chairman of the Nominating and Corporate Governance Committee of Universal Forest Products, Inc. (manufacturer and distributor of wood and wood-alternative products, 2004-2016). Mr. Murray also serves as a member of the Board of many community and professional organizations. Mr. Murray previously served as a member of the Advisory Board of certain Fidelity® funds (2016).
Carol J. Zierhoffer (1960)
Year of Election or Appointment: 2023
Trustee
Ms. Zierhoffer also serves as Trustee or Member of the Advisory Board of other Fidelity® funds. Prior to her retirement, Ms. Zierhoffer held a variety of positions at Bechtel Corporation (engineering company, 2013-2019), including Principal Vice President and Chief Information Officer (2013-2016) and Senior Vice President and Chief Information Officer (2016-2019). Ms. Zierhoffer currently serves as a member of the Board of Directors, Audit Committee and Compensation Committee of Allscripts Healthcare Solutions, Inc. (healthcare technology, 2020-present) and as a member of the Board of Directors, Audit and Finance Committee and Nominating and Governance Committee of Atlas Air Worldwide Holdings, Inc. (aviation operating services, 2021-present). Previously, Ms. Zierhoffer served as a member of the Board of Directors and Audit Committee and as the founding Chair of the Information Technology Committee of MedAssets, Inc. (healthcare technology, 2013-2016), and as a Member of the Advisory Board of certain Fidelity® funds (2023).
+ The information includes the Trustee's principal occupation during the last five years and other information relating to the experience, attributes, and skills relevant to the Trustee's qualifications to serve as a Trustee, which led to the conclusion that the Trustee should serve as a Trustee for each fund.
Advisory Board Members and Officers:
Correspondence intended for a Member of the Advisory Board (if any) may be sent to Fidelity Investments, P.O. Box 55235, Boston, Massachusetts 02205-5235. Correspondence intended for an officer may be sent to Fidelity Investments, 245 Summer Street, Boston, Massachusetts 02210.
Name, Year of Birth; Principal Occupation
Heather Bonner (1977)
Year of Election or Appointment: 2023
Assistant Treasurer
Ms. Bonner also serves as an officer of other funds. Ms. Bonner is a Senior Vice President (2022-present) and is an employee of Fidelity Investments (2022-present). Ms. Bonner serves as Assistant Treasurer of Fidelity CRET Trustee LLC (2022-present). Prior to joining Fidelity, Ms. Bonner served as Managing Director at AQR Capital Management (2013-2022) and was the Treasurer and Principal Financial Officer of the AQR Funds (2013-2022).
Craig S. Brown (1977)
Year of Election or Appointment: 2019
Assistant Treasurer
Mr. Brown also serves as an officer of other funds. Mr. Brown is a Vice President (2015-present) and is an employee of Fidelity Investments. Mr. Brown serves as Assistant Treasurer of FIMM, LLC (2021-present). Previously, Mr. Brown served as Assistant Treasurer of certain Fidelity® funds (2019-2022).
John J. Burke III (1964)
Year of Election or Appointment: 2018
Chief Financial Officer
Mr. Burke also serves as Chief Financial Officer of other funds. Mr. Burke is Head of Fidelity Fund and Investment Operations (2018-present) and is an employee of Fidelity Investments. Mr. Burke serves as President, Executive Vice President, or Director of certain Fidelity entities. Previously Mr. Burke served as head of Asset Management Investment Operations (2012-2018).
Margaret Carey (1973)
Year of Election or Appointment: 2023
Secretary and Chief Legal Officer (CLO)
Ms. Carey also serves as an officer of other funds and as CLO of certain Fidelity entities. Ms. Carey is a Senior Vice President, Deputy General Counsel (2019-present) and is an employee of Fidelity Investments.
David J. Carter (1973)
Year of Election or Appointment: 2020
Assistant Secretary
Mr. Carter also serves as Assistant Secretary of other funds. Mr. Carter is a Senior Vice President, Deputy General Counsel (2022-present) and is an employee of Fidelity Investments. Mr. Carter serves as Chief Legal Officer of Fidelity Investments Institutional Operations Company LLC - Shareholder Division (transfer agent, 2020-present).
Jonathan Davis (1968)
Year of Election or Appointment: 2010
Assistant Treasurer
Mr. Davis also serves as an officer of other funds. Mr. Davis is a Vice President (2006-present) and is an employee of Fidelity Investments. Mr. Davis serves as Assistant Treasurer of certain Fidelity entities.
Laura M. Del Prato (1964)
Year of Election or Appointment: 2018
President and Treasurer
Ms. Del Prato also serves as an officer of other funds. Ms. Del Prato is a Senior Vice President (2017-present) and is an employee of Fidelity Investments. Ms. Del Prato serves as Vice President or Assistant Treasurer of certain Fidelity entities. Previously, Ms. Del Prato served as President and Treasurer of The North Carolina Capital Management Trust: Cash Portfolio and Term Portfolio (2018-2020).
Christopher M. Gouveia (1973)
Year of Election or Appointment: 2023
Chief Compliance Officer
Mr. Gouveia also serves as Chief Compliance Officer of other funds. Mr. Gouveia is a Senior Vice President of Asset Management Compliance (2019-present) and is an employee of Fidelity Investments. Mr. Gouveia serves as Compliance Officer of Fidelity Management Trust Company (2023-present). Previously, Mr. Gouveia served as Chief Compliance Officer of the North Carolina Capital Management Trust (2016-2019).
Colm A. Hogan (1973)
Year of Election or Appointment: 2016
Assistant Treasurer
Mr. Hogan also serves as an officer of other funds. Mr. Hogan is a Vice President (2016-present) and is an employee of Fidelity Investments. Mr. Hogan serves as Assistant Treasurer of certain Fidelity entities. Previously, Mr. Hogan served as Deputy Treasurer of certain Fidelity® funds (2016-2020) and Assistant Treasurer of certain Fidelity® funds (2016-2018).
William Irving (1964)
Year of Election or Appointment: 2023
Vice President
Mr. Irving also serves as Vice President of other funds. Mr. Irving is Head of Fidelity Asset Management Solutions (2022-present) and is an employee of Fidelity Investments. Mr. Irving serves as President and Director of Fidelity Diversifying Solutions LLC (investment adviser firm, 2023-present) and President or Director of certain other Fidelity entities. Previously, Mr. Irving served as Chief Investment Officer (CIO) in the Global Asset Allocation division (2020-2022). Prior to that, he was Managing Director of Research in the Global Asset Allocation division (2018-2020) and portfolio manager of certain Fidelity® funds (2004-2018).
Chris Maher (1972)
Year of Election or Appointment: 2013
Assistant Treasurer
Mr. Maher also serves as an officer of other funds. Mr. Maher is a Vice President (2008-present) and is an employee of Fidelity Investments. Mr. Maher serves as Assistant Treasurer of certain Fidelity entities. Previously, Mr. Maher served as Assistant Treasurer of certain funds (2013-2020).
Brett Segaloff (1972)
Year of Election or Appointment: 2021
Anti-Money Laundering (AML) Officer
Mr. Segaloff also serves as AML Officer of other funds. Mr. Segaloff is a Vice President (2022-present) and is an employee of Fidelity Investments. Mr. Segaloff serves as Anti Money Laundering Compliance Officer or Anti Money Laundering/Bank Secrecy Act Compliance Officer of certain Fidelity entities.
Stacie M. Smith (1974)
Year of Election or Appointment: 2013
Assistant Treasurer
Ms. Smith also serves as an officer of other funds. Ms. Smith is a Senior Vice President (2016-present) and is an employee of Fidelity Investments. Ms. Smith serves as Assistant Treasurer of certain Fidelity entities and has served in other fund officer roles.
Jim Wegmann (1979)
Year of Election or Appointment: 2021
Deputy Treasurer
Mr. Wegmann also serves as an officer of other funds. Mr. Wegmann is a Vice President (2016-present) and is an employee of Fidelity Investments. Mr. Wegmann serves as Assistant Treasurer of FIMM, LLC (2021-present). Previously, Mr. Wegmann served as Assistant Treasurer of certain Fidelity® funds (2019-2021).
As a shareholder, you incur two types of costs: (1) transaction costs, which may include sales charges (loads) on purchase payments or redemption proceeds, as applicable and (2) ongoing costs, which generally include management fees, distribution and/or service (12b-1) fees and other Fund expenses. This Example is intended to help you understand your ongoing costs (in dollars) of investing in a fund and to compare these costs with the ongoing costs of investing in other mutual funds.
| The Example is based on an investment of $1,000 invested at the beginning of the period and held for the entire period (April 1, 2023 to September 30, 2023). |
Actual Expenses
The first line of the accompanying table provides information about actual account values and actual expenses. You may use the information in this line, together with the amount you invested, to estimate the expenses that you paid over the period. Simply divide your account value by $1,000.00 (for example, an $8,600 account value divided by $1,000.00 = 8.6), then multiply the result by the number in the first line for a class/Fund under the heading entitled "Expenses Paid During Period" to estimate the expenses you paid on your account during this period. If any fund is a shareholder of any underlying mutual funds or exchange-traded funds (ETFs) (the Underlying Funds), such fund indirectly bears its proportional share of the expenses of the Underlying Funds in addition to the direct expenses incurred presented in the table. These fees and expenses are not included in the annualized expense ratio used to calculate the expense estimate in the table below.
Hypothetical Example for Comparison Purposes
The second line of the accompanying table provides information about hypothetical account values and hypothetical expenses based on the actual expense ratio and an assumed rate of return of 5% per year before expenses, which is not the actual return. The hypothetical account values and expenses may not be used to estimate the actual ending account balance or expenses you paid for the period. You may use this information to compare the ongoing costs of investing in the Fund and other funds. To do so, compare this 5% hypothetical example with the 5% hypothetical examples that appear in the shareholder reports of the other funds. If any fund is a shareholder of any Underlying Funds, such fund indirectly bears its proportional share of the expenses of the Underlying Funds in addition to the direct expenses as presented in the table. These fees and expenses are not included in the annualized expense ratio used to calculate the expense estimate in the table below.
Please note that the expenses shown in the table are meant to highlight your ongoing costs only and do not reflect any transaction costs. Therefore, the second line of the table is useful in comparing ongoing costs only, and will not help you determine the relative total costs of owning different funds. In addition, if these transactional costs were included, your costs would have been higher.
| | | | | Annualized Expense Ratio- A | | Beginning Account Value April 1, 2023 | | Ending Account Value September 30, 2023 | | Expenses Paid During Period- C April 1, 2023 to September 30, 2023 |
| | | | | | | | | | |
| Moderate with Income Allocation Fund | | | | .01% | | | | | | |
| Actual | | | | | | $ 1,000 | | $ 988.20 | | $ .05 |
Hypothetical-B | | | | | | $ 1,000 | | $ 1,025.02 | | $ .05 |
| | | | | | | | | | |
| Balanced Allocation Fund | | | | .01% | | | | | | |
| Actual | | | | | | $ 1,000 | | $ 998.50 | | $ .05 |
Hypothetical-B | | | | | | $ 1,000 | | $ 1,025.02 | | $ .05 |
| | | | | | | | | | |
| Growth Allocation Fund | | | | .01% | | | | | | |
| Actual | | | | | | $ 1,000 | | $ 1,010.00 | | $ .05 |
Hypothetical-B | | | | | | $ 1,000 | | $ 1,025.02 | | $ .05 |
| | | | | | | | | | |
| Aggressive Growth Allocation Fund | | | | .01% | | | | | | |
| Actual | | | | | | $ 1,000 | | $ 1,019.10 | | $ .05 |
Hypothetical-B | | | | | | $ 1,000 | | $ 1,025.02 | | $ .05 |
| |
A Annualized expense ratio reflects expenses net of applicable fee waivers.
B 5% return per year before expenses
C Expenses are equal to the annualized expense ratio, multiplied by the average account value over the period, multiplied by 183/ 365 (to reflect the one-half year period). The fees and expenses of any Underlying Funds are not included in each annualized expense ratio.
The dividend and capital gains distributions for the fund(s) are available on Fidelity.com or Institutional.Fidelity.com.
A percentage of the dividends distributed during the fiscal year for the following funds were derived from interest on U.S. Government securities which is generally exempt from state income tax:
| Moderate with Income Allocation Fund | 32.61% |
| Balanced Allocation Fund | 24.99% |
| Growth Allocation Fund | 15.83% |
| Aggressive Growth Allocation Fund | 9.17% |
A percentage of the dividends distributed during the fiscal year for the following funds qualify for the dividends-received deduction for corporate shareholders:
| Moderate with Income Allocation Fund | |
| October 2022 | 0% |
| November 2022 | 18% |
| December 2022 | 27% |
| February 2023 | 4% |
| March 2023 | 4% |
| April 2023 | 4% |
| May 2023 | 4% |
| June 2023 | 4% |
| July 2023 | 4% |
| August 2023 | 4% |
| September 2023 | 4% |
| Balanced Allocation Fund | |
| October 2022 | 0% |
| December 2022 | 35% |
| April 2023 | 10% |
| July 2023 | 10% |
| Growth Allocation Fund | |
| December 2022 | 36% |
| Aggressive Growth Allocation Fund | |
| December 2022 | 42% |
A percentage of the dividends distributed during the fiscal year for the following funds may be taken into account as a dividend for purposes of the maximum rate under section 1(h)(11) of the Internal Revenue Code.
| Moderate with Income Allocation Fund | |
| October 2022 | 0% |
| November 2022 | 35.25% |
| December 2022 | 51.65% |
| February 2023 | 3.98% |
| March 2023 | 3.98% |
| April 2023 | 3.98% |
| May 2023 | 3.98% |
| June 2023 | 3.98% |
| July 2023 | 3.98% |
| August 2023 | 3.98% |
| September 2023 | 3.98% |
| Balanced Allocation Fund | |
| October 2022 | 0% |
| December 2022 | 66.22% |
| April 2023 | 9.69% |
| July 2023 | 9.69% |
| Growth Allocation Fund | |
| December 2022 | 66.86% |
| Aggressive Growth Allocation Fund | |
| December 2022 | 76.65% |
A percentage of the dividends distributed during the fiscal year for the following funds qualify as a section 199A dividend:
| Moderate with Income Allocation Fund | |
| November 2022 | 1.69% |
| December 2022 | 2.47% |
| Balanced Allocation Fund | |
| December 2022 | 3.17% |
| Growth Allocation Fund | |
| December 2022 | 3.05% |
| Aggressive Growth Allocation Fund | |
| December 2022 | 3.58% |
The funds hereby designate the amounts noted below as distributions paid in the calendar 2022 as qualifying to be taxed as interest-related dividends for nonresident alien shareholders:
| Moderate with Income Allocation Fund | $1,778 |
| Balanced Allocation Fund | $2,098 |
| Growth Allocation Fund | $1,792 |
| Aggressive Growth Allocation Fund | $1,039 |
The funds hereby designate the percentages noted below of the short-term capital gain dividends distributed during the fiscal year as qualifying to be taxed as short-term capital gain dividends for nonresident alien shareholders:
| | December 2022 |
| Aggressive Growth Allocation Fund | 74.57% |
The funds hereby designate the amounts noted below as distributions paid during the fiscal year ended 2023 as qualifying to be taxed as section 163(j) interest dividends:
| Moderate with Income Allocation Fund | $3,208 |
| Balanced Allocation Fund | $3,491 |
| Growth Allocation Fund | $758 |
| Aggressive Growth Allocation Fund | $457 |
The amounts per share which represent income derived from sources within, and taxes paid to, foreign countries or possessions of the United States are as follows:
| | Pay Date | Income | Taxes |
| Moderate with Income Allocation Fund | 03/07/2022 | $0.0005 | $0.0000 |
| | 04/04/2022 | $0.0011 | $0.0001 |
| | 05/09/2022 | $0.0020 | $0.0002 |
| | 06/06/2022 | $0.0014 | $0.0001 |
| | 07/05/2022 | $0.0014 | $0.0001 |
| | 08/08/2022 | $0.0015 | $0.0002 |
| | 09/06/2022 | $0.0015 | $0.0002 |
| | 10/10/2022 | $0.0018 | $0.0002 |
| | 11/07/2022 | $0.0017 | $0.0002 |
| | 12/30/2022 | $0.0113 | $0.0012 |
| Balanced Allocation Fund | 04/04/2022 | $0.0017 | $0.0002 |
| | 07/05/2022 | $0.0059 | $0.0006 |
| | 10/10/2022 | $0.0057 | $0.0006 |
| | 12/30/2022 | $0.0257 | $0.0027 |
| Growth Allocation Fund | 12/30/2022 | $0.0494 | $0.0052 |
| Aggressive Growth Allocation Fund | 12/30/2022 | $0.0601 | $0.0064 |
The funds will notify shareholders in January 2024 of amounts for use in preparing 2023 income tax returns.
Board Approval of Investment Advisory Contracts and Management Fees
Moderate with Income Allocation Fund
Balanced Allocation Fund
Growth Allocation Fund
Aggressive Growth Allocation Fund
Each year, the Board of Trustees, including the Independent Trustees (together, the Board), considers the renewal of each fund's management contract (together, the Advisory Contracts) with Fidelity Management & Research Company LLC (FMR). The Board, assisted by the advice of fund counsel and Independent Trustees' counsel, requests and considers a broad range of information relevant to the renewal of the Advisory Contracts throughout the year.
The Board meets regularly and, at each of its meetings, covers an extensive agenda of topics and materials and considers factors that are relevant to its annual consideration of the renewal of each fund's Advisory Contract, including the services and support provided to each fund and its shareholders. The Board's Operations Committee, of which all the Independent Trustees are members, meets regularly throughout the year and requests, receives and considers, among other matters, information related to the annual consideration of the renewal of each fund's Advisory Contract before making its recommendation to the Board. The Board also meets as needed to review matters specifically related to the Board's annual consideration of the renewal of the Advisory Contracts. Members of the Board may also meet from time to time with trustees of other Fidelity funds through joint ad hoc committees to discuss certain matters relevant to all of the Fidelity funds.
At its September 2023 meeting, the Board unanimously determined to renew each fund's Advisory Contract. In reaching its determination, the Board considered all factors it believed relevant, including (i) the nature, extent, and quality of the services provided to each fund and its shareholders (including the investment performance of each fund); (ii) the competitiveness relative to peer funds of each fund's management fee and total expense ratio; (iii) the total costs of the services provided by and the profits realized by FMR and its affiliates (Fidelity) from its relationships with each fund; and (iv) the extent to which, if any, economies of scale exist and are realized as each fund grows, and whether any economies of scale are appropriately shared with fund shareholders. The Board also considered the broad range of investment choices available to shareholders from FMR's competitors and that each fund's shareholders have chosen to invest in that fund, which is part of the Fidelity family of funds. The Board's decision to renew the Advisory Contracts was not based on any single factor.
The Board reached a determination, with the assistance of fund counsel and Independent Trustees' counsel and through the exercise of its business judgment, that the renewal of the Advisory Contracts was in the best interests of each fund and its shareholders and that the compensation payable under the Advisory Contracts was fair and reasonable in light of all of the surrounding circumstances.
Nature, Extent, and Quality of Services Provided. The Board considered Fidelity's staffing as it relates to the funds, including the backgrounds and experience of investment personnel, and also considered FMR's implementation of each fund's investment program. The Independent Trustees also had discussions with senior management of Fidelity's investment operations and investment groups with responsibility for the underlying Fidelity funds in which the fund invests. The Board considered the structure of the investment personnel compensation program and whether this structure provides appropriate incentives to act in the best interests of each fund. Additionally, the Board considered the portfolio managers' investments, if any, in the funds that they manage.
Resources Dedicated to Investment Management and Support Services. The Board reviewed the general qualifications and capabilities of Fidelity's investment staff, including its size, education, experience, and resources, as well as Fidelity's approach to recruiting, training, managing, and compensating investment personnel. The Board noted the resources devoted to Fidelity's global investment organization, and that Fidelity's analysts have extensive resources, tools and capabilities that allow them to conduct quantitative and fundamental analysis, as well as credit analysis of issuers, counterparties and guarantors. Further, the Board considered that Fidelity's investment professionals have sufficient access to global information and data so as to provide competitive investment results over time, and that those professionals also have access to sophisticated tools that permit them to assess portfolio construction and risk and performance attribution characteristics continuously, as well as to transmit new information and research conclusions rapidly around the world. Additionally, in its deliberations, the Board considered Fidelity's trading, risk management, compliance, cybersecurity, and technology and operations capabilities and resources, which are integral parts of the investment management process.
Shareholder and Administrative Services. The Board considered (i) the nature, extent, quality, and cost of advisory, administrative, and shareholder services performed by Fidelity under the Advisory Contracts and under separate agreements covering transfer agency, pricing and bookkeeping, and securities lending services for each fund; (ii) the nature and extent of Fidelity's supervision of third party service providers, principally custodians, subcustodians, and pricing vendors; and (iii) the resources devoted by Fidelity to, and the record of compliance with, each fund's compliance policies and procedures. The Board also reviewed the allocation of fund brokerage, including allocations to brokers affiliated with Fidelity, the use of brokerage commissions to pay fund expenses, and the use of "soft" commission dollars to pay for research services. The Board also considered each fund's securities lending activities and any payments made to Fidelity relating to securities lending.
The Board noted that the growth of fund assets over time across the complex allows Fidelity to reinvest in the development of services designed to enhance the value and convenience of the Fidelity funds as investment vehicles. These services include 24-hour access to account information and market information over the Internet and through telephone representatives, investor education materials and asset allocation tools. The Board also considered that it reviews customer service metrics such as telephone response times, continuity of services on the website and metrics addressing services at Fidelity Investor Centers.
Investment in a Large Fund Family. The Board considered the benefits to shareholders of investing in a fund that is part of a large family of funds offering a variety of investment disciplines and providing a large variety of fund investor services. The Board noted that Fidelity had taken, or had made recommendations to the Board that resulted in the Fidelity funds taking, a number of actions over the previous year that benefited particular funds and/or the Fidelity funds in general.
Investment Performance. The Board took into account discussions that occur with representatives of the investment adviser, and reports that it receives, at Board meetings throughout the year relating to fund investment performance. In this regard the Board noted that as part of regularly scheduled fund reviews and other reports to the Board on fund performance, the Board considered annualized return information for each fund for different time periods, measured against one or more appropriate securities market indices, including a customized blended index that reflects the respective weights of the fund's asset classes (each a benchmark index). The Board also considered information about performance attribution. In its evaluation of fund investment performance at meetings throughout the year, the Board gave particular attention to information indicating underperformance of certain Fidelity funds over different time periods and discussed with the investment adviser the reasons for such underperformance.
In addition to reviewing absolute and relative fund performance, the Independent Trustees periodically consider the appropriateness of fund performance metrics in evaluating the results achieved. The Independent Trustees generally give greater weight to fund performance over longer time periods than over shorter time periods. Depending on the circumstances, the Independent Trustees may be satisfied with a fund's performance notwithstanding that it lags its benchmark index for certain periods.
Based on its review, the Board concluded that the nature, extent, and quality of services provided to each fund under the Advisory Contracts should continue to benefit the shareholders of each fund.
Competitiveness of Management Fee and Total Expense Ratio. The Board was provided with information regarding industry trends in management fees and expenses. In its review of each fund's management fee and total expense ratio, the Board considered each fund's unitary (subject to limited exceptions) fee rate as well as other fund expenses paid by FMR under the fund's management contract, such as transfer agent fees, pricing and bookkeeping fees, and custodial, legal and audit fees. The Board also noted that Fidelity may agree to waive fees or reimburse expenses from time to time, and the extent to which, if any, it has done so for each fund.
Comparisons of Management Fees and Total Expense Ratios. Among other things, the Board reviewed data for selected groups of competitive funds and classes (referred to as "mapped groups") that were compiled by Fidelity based on combining similar investment objective categories (as classified by Lipper) that have comparable investment mandates. The data reviewed by the Board included (i) gross management fee comparisons (before taking into account expense reimbursements or caps) relative to the total universe of funds within the mapped group; (ii) gross management fee comparisons relative to a subset of non-Fidelity funds in the mapped group that are similar in size and management fee structure to each fund (referred to as the "asset size peer group"); (iii) total expense comparisons of each fund relative to funds and classes in the mapped group that have a similar sales load structure to each fund (referred to as the "similar sales load structure group"); and (iv) total expense comparisons of each fund relative to funds and classes in the similar sales load structure group that are similar in size and management fee structure to each fund (referred to as the "total expense asset size peer group").
The information provided to the Board indicated that each fund's management fee rate ranked below the competitive median of the mapped group for 2022 and below the competitive median of the asset size peer group for 2022. Further, the information provided to the Board indicated that the total expense ratio of each fund ranked below the competitive median of the similar sales load structure group for 2022 and below the competitive median of the total expense asset size peer group for 2022.
Other Contractual Arrangements. The Board further considered that FMR has contractually agreed to waive 0.10% of the fund's management fee through January 31, 2026.
Fees Charged to Other Fidelity Clients. The Board also considered Fidelity fee structures and other information with respect to clients of Fidelity, such as other funds advised or subadvised by Fidelity, pension plan clients, and other institutional clients with similar mandates. The Board noted that a joint ad hoc committee created by it and the boards of other Fidelity funds periodically reviews and compares Fidelity's institutional investment advisory business with its business of providing services to the Fidelity funds and also noted the most recent findings of the committee. The Board noted that the committee's review included a consideration of the differences in services provided, fees charged, and costs incurred, as well as competition in the markets serving the different categories of clients.
Based on its review, the Board concluded that each fund's management fee is fair and reasonable in light of the services that the fund receives and the other factors considered. Further, based on its review of total expense ratios and fees charged to other Fidelity clients, the Board concluded that the total expense ratio of each fund was reasonable in light of the services that the fund and its shareholders receive and the other factors considered.
Costs of the Services and Profitability. The Board considered the revenues earned and the expenses incurred by Fidelity in conducting the business of developing, marketing, distributing, managing, administering and servicing each fund and servicing each fund's shareholders. The Board also considered the level of Fidelity's profits in respect of all the Fidelity funds, including the Fidelity funds in which the fund invests.
On an annual basis, Fidelity presents to the Board information about the profitability of its relationships with each fund. Fidelity calculates profitability information for each fund, as well as aggregate profitability information for groups of Fidelity funds and all Fidelity funds, using a series of detailed revenue and cost allocation methodologies which originate with the books and records of Fidelity on which Fidelity's audited financial statements are based. The Audit Committee of the Board reviews any significant changes from the prior year's methodologies and the full Board approves such changes.
A public accounting firm has been engaged annually by the Board as part of the Board's assessment of Fidelity's profitability analysis. The engagement includes the review and assessment of the methodologies used by Fidelity in determining the revenues and expenses attributable to Fidelity's fund business, and completion of agreed-upon procedures in respect of the mathematical accuracy of certain fund profitability information and its conformity to established allocation methodologies. After considering the reports issued under the engagement and information provided by Fidelity, the Board concluded that while other allocation methods may also be reasonable, Fidelity's profitability methodologies are reasonable in all material respects.
The Board also reviewed Fidelity's non-fund businesses and potential indirect benefits such businesses may have received as a result of their association with Fidelity's fund business (i.e., fall-out benefits) as well as cases where Fidelity's affiliates may benefit from the funds' business. The Board considered areas where potential indirect benefits to the Fidelity funds from their relationships with Fidelity may exist. The Board's consideration of these matters was informed by the findings of a joint ad hoc committee created by it and the boards of other Fidelity funds to evaluate potential fall-out benefits.
The Board considered the costs of the services provided by and the profits realized by Fidelity in connection with the operation of each fund and was satisfied that the profitability was not excessive.
Economies of Scale. The Board considered whether there have been economies of scale in respect of the management of the Fidelity funds, whether the Fidelity funds (including each fund) have appropriately benefited from any such economies of scale, and whether there is potential for realization of any further economies of scale. The Board considered the extent to which each fund will benefit from economies of scale as assets grow through increased services to the fund, through waivers or reimbursements, or through fee or expense ratio reductions. The Board recognized that, due to each fund's current contractual arrangements, its expense ratio will not decline if the fund's operating costs decrease as assets grow, or rise as assets decrease. The Board also noted that a committee created by it and the boards of other Fidelity funds periodically analyzes whether Fidelity attains economies of scale in respect of the management and servicing of the Fidelity funds, whether the Fidelity funds have appropriately benefited from such economies of scale, and whether there is potential for realization of any further economies of scale.
The Board concluded, taking into account the analysis of the committee, that economies of scale, if any, are being appropriately shared between fund shareholders and Fidelity.
Additional Information Requested by the Board. In order to develop fully the factual basis for consideration of the Fidelity funds' advisory contracts, the Board requested and received additional information on certain topics, including: (i) Fidelity's fund profitability methodology, profitability trends for certain funds, the allocation of various costs to different funds, and the impact of certain factors on fund profitability results; (ii) portfolio manager changes that have occurred during the past year and Fidelity's views regarding portfolio manager investment in the Fidelity funds that they manage; (iii) hiring, training, and retaining personnel; (iv) the arrangements with and compensation paid to certain fund sub-advisers and the treatment of such compensation within Fidelity's fund profitability methodology; (v) the terms of the funds' various management fee structures, including the basic group fee and the terms of Fidelity's voluntary expense limitation arrangements; (vi) Fidelity's transfer agent, pricing and bookkeeping fees, expense and service structures for different funds and classes relative to competitive trends and market conditions; (vii) the impact on fund profitability of recent industry trends, such as the growth in passively managed funds and the changes in flows for different types of funds; (viii) the types of management fee and total expense comparisons provided, and the challenges and limitations associated with such information; (ix) explanations regarding the relative total expense ratios and management fees of certain funds and classes, total expense and management fee competitive trends, and methodologies for total expense and management fee competitive comparisons; (x) information concerning expense limitations applicable to certain funds; and (xi) matters related to money market funds, exchange-traded funds, and target date funds.
Conclusion. Based on its evaluation of all of the conclusions noted above, and after considering all factors it believed relevant, the Board, including the Independent Trustees, concluded that the advisory fee arrangements are fair and reasonable in light of all of the surrounding circumstances and that each fund's Advisory Contract should be renewed through September 30, 2024.
1.9904652.101
HSA-ANN-1123
Fidelity® Health Savings Index Fund
Annual Report
September 30, 2023
Contents
To view a fund's proxy voting guidelines and proxy voting record for the 12-month period ended June 30, visit http://www.fidelity.com/proxyvotingresults or visit the Securities and Exchange Commission's (SEC) web site at http://www.sec.gov.
You may also call 1-800-544-8544 to request a free copy of the proxy voting guidelines.
BLOOMBERG ® is a trademark and service mark of Bloomberg Finance L.P. and its affiliates (collectively "Bloomberg"). Bloomberg or Bloomberg's licensors own all proprietary rights in the Bloomberg Indices. Neither Bloomberg nor Bloomberg's licensors approves or endorses this material, or guarantees the accuracy or completeness of any information herein, or makes any warranty, express or implied, as to the results to be obtained therefrom and, to the maximum extent allowed by law, neither shall have any liability or responsibility for injury or damages arising in connection therewith.
Standard & Poor's, S&P and S&P 500 are registered service marks of The McGraw-Hill Companies, Inc. and have been licensed for use by Fidelity Distributors Corporation.
Other third-party marks appearing herein are the property of their respective owners.
All other marks appearing herein are registered or unregistered trademarks or service marks of FMR LLC or an affiliated company. © 2023 FMR LLC. All rights reserved.
This report and the financial statements contained herein are submitted for the general information of the shareholders of the Fund. This report is not authorized for distribution to prospective investors in the Fund unless preceded or accompanied by an effective prospectus.
A fund files its complete schedule of portfolio holdings with the SEC for the first and third quarters of each fiscal year on Form N-PORT. Forms N-PORT are available on the SEC's web site at http://www.sec.gov. A fund's Forms N-PORT may be reviewed and copied at the SEC's Public Reference Room in Washington, DC. Information regarding the operation of the SEC's Public Reference Room may be obtained by calling 1-800-SEC-0330.
For a complete list of a fund's portfolio holdings, view the most recent holdings listing, semiannual report, or annual report on Fidelity's web site at http://www.fidelity.com, http://www.institutional.fidelity.com, or http://www.401k.com, as applicable.
NOT FDIC INSURED •MAY LOSE VALUE •NO BANK GUARANTEE
Neither the Fund nor Fidelity Distributors Corporation is a bank.
Average annual total return reflects the change in the value of an investment, assuming reinvestment of distributions from dividend income and capital gains (the profits earned upon the sale of securities that have grown in value, if any) and assuming a constant rate of performance each year. The hypothetical investment and the average annual total returns do not reflect the deduction of taxes that a shareholder would pay on fund distributions or the redemption of fund shares. During periods of reimbursement by Fidelity, a fund's total return will be greater than it would be had the reimbursement not occurred. How a fund did yesterday is no guarantee of how it will do tomorrow.
| Average Annual Total Returns |
| | | | |
Periods ended September 30, 2023 | Past 1 year | Life of Fund A |
| Fidelity® Health Savings Index Fund | 5.30% | -0.10% |
A From March 2, 2020
| $10,000 Over Life of Fund |
| |
Let's say hypothetically that $10,000 was invested in Fidelity® Health Savings Index Fund, on March 2, 2020, when the fund started. The chart shows how the value of your investment would have changed, and also shows how the Bloomberg U.S. Aggregate Bond Index performed over the same period. |
|
|
Market Recap:
For the 12 months ending September 30, 2023, continued global economic expansion and a slowing in the pace of inflation contributed to a favorable backdrop for risk assets. After struggling throughout much of 2022, risk assets strongly rebounded the past 12 months, with U.S. large-cap stocks leading the way. In the U.S., the upturn was driven partly by a narrow set of companies in the information technology and communication services sectors amid excitement for generative artificial intelligence. Meanwhile, monetary tightening by the U.S. Federal Reserve and other central banks continued amid elevated inflation. U.S. stocks gained 20.49% for the 12 months, as measured by the Dow Jones U.S. Total Stock Market Index, as all but two sectors rose. Information technology (+41%), communication services (+35%) and energy (+29%) led by the widest margin. Conversely, utilities (-7%) and real estate (-1%) lagged most. Growth stocks broadly outpaced value, while larger-caps topped small-caps. Commodities returned -1.30%, according to the Bloomberg Commodity Index Total Return. Looking abroad, international equities rose 20.60% for the 12 months, according to the MSCI ACWI (All Country World Index) ex USA Index. All regions gained, with Europe ex U.K. (+31%) leading the way. Japan (+26%) and the U.K. (+25%) also outperformed, whereas Asia Pacific ex Japan (+11%) lagged by the widest margin. Each of the 11 sectors advanced, with information technology (+30%), industrials (+29%) and energy (+28%) being the top performers. Conversely, real estate (+5%) lagged most, followed by consumer staples (+9%). As for fixed income, U.S. taxable investment-grade bonds returned 0.64% for the 12 months, per the Bloomberg U.S. Aggregate Bond Index, amid elevated inflation and rising interest rates. Since March 2022, the Fed has hiked its benchmark interest rate 11 times, by 5.25 percentage points, while allowing up to billions in bonds to mature each month without investing the proceeds. Short-term U.S. Treasuries (+4.58%) topped U.S. investment-grade corporate bonds (+3.47%), while commercial mortgage-backed securities returned (+1.19%) and agencies gained (+2.10%). Outside the index, leveraged loans (+13.39%), U.S. high-yield bonds (+8.24%) and emerging-markets debt (+8.61%) rose, whereas Treasury Inflation-Protected Securities (+1.25%) experienced a modest gain.
Comments from Co-Managers Avishek Hazrachoudhury and Hongshu Chen:
For the fiscal year ending September 30, 2023, the fund gained 5.30%, trailing the 7.35% return of the benchmark Fidelity Health Savings Composite Index. Looking back over the past 12 months, both asset class positioning and security selection detracted. The fund's core equity allocation strategy hampered performance versus the Composite benchmark. Underweighting U.S. equities hurt due to the strong performance of domestic stocks. Additionally, the timing of adjustments made during the year worked against the fund's overweight in international developed-markets (DM) stocks. Out-of-benchmark exposure to commodity-related securities also hampered the portfolio's relative result. Fixed-income allocations contributed on a relative basis. Underweighting investment-grade (IG) bonds and cash proved advantageous and more than offset a poor result from the fund's allocation to long-term U.S. Treasuries. An overweight stake in emerging-markets (EM) debt also added value. As for security selection, our international government bond exposure was the primary detractor this period. As of period end, the fund was underweight large-cap U.S. stocks and overweight international DM and EM equities. In fixed income, the fund's allocations to U.S. and international IG bonds were notably below the portfolio's target weightings. The fund remained slightly overweight in EM debt.
Note to shareholders: On May 1, 2023, Hongshu Chen assumed co-management responsibilities for the fund, succeeding Geoff Stein.
The views expressed above reflect those of the portfolio manager(s) only through the end of the period as stated on the cover of this report and do not necessarily represent the views of Fidelity or any other person in the Fidelity organization. Any such views are subject to change at any time based upon market or other conditions and Fidelity disclaims any responsibility to update such views. These views may not be relied on as investment advice and, because investment decisions for a Fidelity fund are based on numerous factors, may not be relied on as an indication of trading intent on behalf of any Fidelity fund.
The information in the following tables is based on the combined Investments of the Fund and its pro-rata share of investments in Fidelity's Central Funds, other than the Money Market Central Funds.
Top Holdings (% of Fund's net assets) |
| |
| Fidelity International Bond Index Fund | 18.3 | |
| Fidelity U.S. Bond Index Fund | 15.4 | |
| Fidelity Total Market Index Fund | 14.7 | |
| Fidelity International Index Fund | 10.4 | |
| Fidelity Long-Term Treasury Bond Index Fund | 9.8 | |
| iShares JPMorgan USD Emerging Markets Bond ETF | 9.0 | |
| Fidelity Emerging Markets Index Fund | 4.8 | |
| iShares MSCI USA Minimum Volatility ETF | 0.7 | |
| Invesco Senior Loan ETF | 0.5 | |
| VanEck JP Morgan EM Local Currency Bond ETF | 0.5 | |
| | 84.1 | |
| |
Quality Diversification (% of Fund's net assets) |
|
Percentages shown as 0.0% may reflect amounts less than 0.05%. |
| |
| We have used ratings from Moody's Investors Service, Inc. Where Moody's® ratings are not available, we have used S&P® ratings. All ratings are as of the date indicated and do not reflect subsequent changes. |
Percentages are adjusted for the effect of futures contracts, if applicable.
Asset Allocation (% of Fund's net assets) |
|
Futures - 0.4% |
|
An unaudited holdings listing for the Fund, which presents direct holdings as well as the pro-rata share of any securities and other investments held indirectly through its investment in underlying non-money market Fidelity Central Funds, is available at fidelity.com and/or institutional. fidelity.com, as applicable.
Showing Percentage of Net Assets
| Equity Central Funds - 0.8% |
| | | Shares | Value ($) |
Fidelity Hedged Equity Central Fund (a) (Cost $177,104) | | 1,708 | 177,145 |
| | | | |
| Equity Funds - 30.4% |
| | | Shares | Value ($) |
| Fidelity Commodity Strategy Fund (b) | | 638 | 61,833 |
| Fidelity Emerging Markets Index Fund (b) | | 119,661 | 1,147,545 |
| Fidelity International Index Fund (b) | | 56,430 | 2,482,920 |
| Fidelity Real Estate Index Fund (b) | | 4,205 | 57,059 |
| Fidelity Total Market Index Fund (b) | | 29,641 | 3,525,792 |
| TOTAL EQUITY FUNDS (Cost $6,986,828) | | | 7,275,149 |
| | | | |
| Fixed-Income Central Funds - 12.0% |
| | | Shares | Value ($) |
| Investment Grade Fixed-Income Funds - 12.0% | | | |
Fidelity Inflation-Protected Bond Index Central Fund (a) (Cost $3,222,319) | | 32,586 | 2,867,552 |
| | | | |
| Money Market Central Funds - 2.2% |
| | | Shares | Value ($) |
Fidelity Cash Central Fund 5.39% (c) (Cost $529,971) | | 529,865 | 529,971 |
| | | | |
| U.S. Treasury Obligations - 0.1% |
| | | Principal Amount (d) | Value ($) |
U.S. Treasury Bills, yield at date of purchase 5.35% 10/26/23 (e) (Cost $19,927) | | 20,000 | 19,930 |
| | | | |
| Investment Companies - 11.0% |
| | | Shares | Value ($) |
| Invesco Senior Loan ETF | | 5,856 | 122,917 |
| iShares iBoxx $ High Yield Corporate Bond ETF | | 828 | 61,040 |
| iShares JPMorgan USD Emerging Markets Bond ETF | | 26,058 | 2,150,306 |
| iShares MSCI USA Minimum Volatility ETF | | 2,467 | 178,561 |
| VanEck JP Morgan EM Local Currency Bond ETF | | 4,977 | 118,801 |
| TOTAL INVESTMENT COMPANIES (Cost $3,160,304) | | | 2,631,625 |
| | | | |
| Fixed-Income Funds - 43.5% |
| | | Shares | Value ($) |
| Fidelity International Bond Index Fund (b) | | 492,810 | 4,376,158 |
| Fidelity Long-Term Treasury Bond Index Fund (b) | | 258,383 | 2,353,871 |
| Fidelity U.S. Bond Index Fund (b) | | 372,061 | 3,668,520 |
| TOTAL FIXED-INCOME FUNDS (Cost $11,704,782) | | | 10,398,549 |
| | | | |
| TOTAL INVESTMENT IN SECURITIES - 100.0% (Cost $25,801,235) | 23,899,921 |
NET OTHER ASSETS (LIABILITIES) - 0.0% | (196) |
| NET ASSETS - 100.0% | 23,899,725 |
| | |
| Futures Contracts |
| | Number of contracts | Expiration Date | Notional Amount ($) | Value ($) | Unrealized Appreciation/ (Depreciation) ($) |
| Purchased | | | | | |
| | | | | | |
| Treasury Contracts | | | | | |
| CBOT 5-Year U.S. Treasury Note Contracts (United States) | 1 | Dec 2023 | 105,359 | (673) | (673) |
| | | | | | |
| The notional amount of futures purchased as a percentage of Net Assets is 0.4% |
Security Type Abbreviations
Legend
| (a) | Affiliated fund that is generally available only to investment companies and other accounts managed by Fidelity Investments. A complete unaudited schedule of portfolio holdings for each Fidelity Central Fund is filed with the SEC for the first and third quarters of each fiscal year on Form N-PORT and is available upon request or at the SEC's website at www.sec.gov. An unaudited holdings listing for the Fund, which presents direct holdings as well as the pro-rata share of securities and other investments held indirectly through its investment in underlying non-money market Fidelity Central Funds, is available at fidelity.com and/or institutional.fidelity.com, as applicable. In addition, each Fidelity Central Fund's financial statements,which are not covered by the Fund's Report of Independent Registered Public Accounting Firm, are available on the SEC's website or upon request. |
| (c) | Affiliated fund that is generally available only to investment companies and other accounts managed by Fidelity Investments. The rate quoted is the annualized seven-day yield of the fund at period end. A complete unaudited listing of the fund's holdings as of its most recent quarter end is available upon request. In addition, each Fidelity Central Fund's financial statements, which are not covered by the Fund's Report of Independent Registered Public Accounting Firm, are available on the SEC's website or upon request. |
| (d) | Amount is stated in United States dollars unless otherwise noted. |
| (e) | Security or a portion of the security was pledged to cover margin requirements for futures contracts. At period end, the value of securities pledged amounted to $9,965. |
Affiliated Central Funds
Fiscal year to date information regarding the Fund's investments in Fidelity Central Funds, including the ownership percentage, is presented below.
| Affiliate | Value, beginning of period ($) | Purchases ($) | Sales Proceeds ($) | Dividend Income ($) | Realized Gain (loss) ($) | Change in Unrealized appreciation (depreciation) ($) | Value, end of period ($) | % ownership, end of period |
| Fidelity Cash Central Fund 5.39% | 1,849 | 2,203,625 | 1,675,503 | 7,453 | - | - | 529,971 | 0.0% |
| Fidelity Hedged Equity Central Fund | - | 191,876 | 15,000 | 35 | 228 | 41 | 177,145 | 0.0% |
| Fidelity Inflation-Protected Bond Index Central Fund | 2,537,896 | 1,574,256 | 1,001,067 | 302,160 | (193,715) | (49,818) | 2,867,552 | 0.7% |
| Total | 2,539,745 | 3,969,757 | 2,691,570 | 309,648 | (193,487) | (49,777) | 3,574,668 | |
| | | | | | | | | |
Amounts in the dividend income column in the above table include any capital gain distributions from underlying funds, which are presented in the corresponding line item in the Statement of Operations, if applicable.
Amounts included in the purchases and sales proceeds columns may include in-kind transactions, if applicable.
Affiliated Underlying Funds
Fiscal year to date information regarding the Fund's investments in affiliated Underlying Funds is presented below. Exchanges between classes of the same affiliated Underlying Funds may occur. If an Underlying Funds changes its name, the name presented below is the name in effect at period end.
| Affiliate | Value, beginning of period ($) | Purchases ($) | Sales Proceeds ($) | Dividend Income ($) | Realized Gain (loss) ($) | Change in Unrealized appreciation (depreciation) ($) | Value, end of period ($) |
| Fidelity Commodity Strategy Fund | 436,441 | 131,819 | 481,036 | 5,233 | (168,698) | 143,307 | 61,833 |
| Fidelity Emerging Markets Index Fund | 529,810 | 854,567 | 261,497 | 13,108 | (44,822) | 69,487 | 1,147,545 |
| Fidelity International Bond Index Fund | 3,841,487 | 2,111,052 | 1,593,786 | 75,811 | (112,980) | 130,385 | 4,376,158 |
| Fidelity International Index Fund | 741,301 | 2,042,849 | 477,345 | 30,215 | (4,052) | 180,167 | 2,482,920 |
| Fidelity Long-Term Treasury Bond Index Fund | 2,091,132 | 1,912,274 | 1,370,210 | 69,272 | (344,912) | 65,587 | 2,353,871 |
| Fidelity Real Estate Index Fund | 131,617 | 85,037 | 159,376 | 3,104 | (7,482) | 7,263 | 57,059 |
| Fidelity Total Market Index Fund | 3,301,986 | 1,396,069 | 1,733,988 | 50,343 | (84,009) | 645,734 | 3,525,792 |
| Fidelity U.S. Bond Index Fund | 2,677,964 | 3,058,637 | 1,949,455 | 104,938 | (182,456) | 63,830 | 3,668,520 |
| | 13,751,738 | 11,592,304 | 8,026,693 | 352,024 | (949,411) | 1,305,760 | 17,673,698 |
Amounts in the dividend income column in the above table include any capital gain distributions from underlying funds, which are presented in the corresponding line item in the Statement of Operations, if applicable.
Amounts included in the purchases and sales proceeds columns may include in-kind transactions, if applicable.
Investment Valuation
The following is a summary of the inputs used, as of September 30, 2023, involving the Fund's assets and liabilities carried at fair value. The inputs or methodology used for valuing securities may not be an indication of the risk associated with investing in those securities. For more information on valuation inputs, and their aggregation into the levels used below, please refer to the Investment Valuation section in the accompanying Notes to Financial Statements.
| Valuation Inputs at Reporting Date: |
| Description | Total ($) | Level 1 ($) | Level 2 ($) | Level 3 ($) |
Investments in Securities: | | | | |
|
| Equity Central Funds | 177,145 | 177,145 | - | - |
|
| Equity Funds | 7,275,149 | 7,275,149 | - | - |
|
| Fixed-Income Central Funds | 2,867,552 | 2,867,552 | - | - |
|
| Money Market Central Funds | 529,971 | 529,971 | - | - |
|
| Other Short-Term Investments | 19,930 | - | 19,930 | - |
|
| Investment Companies | 2,631,625 | 2,631,625 | - | - |
|
| Fixed-Income Funds | 10,398,549 | 10,398,549 | - | - |
| Total Investments in Securities: | 23,899,921 | 23,879,991 | 19,930 | - |
Derivative Instruments: Liabilities | | | | |
Futures Contracts | (673) | (673) | - | - |
| Total Liabilities | (673) | (673) | - | - |
| Total Derivative Instruments: | (673) | (673) | - | - |
Value of Derivative Instruments
The following table is a summary of the Fund's value of derivative instruments by primary risk exposure as of September 30, 2023. For additional information on derivative instruments, please refer to the Derivative Instruments section in the accompanying Notes to Financial Statements.
Primary Risk Exposure / Derivative Type | Value |
| Asset ($) | Liability ($) |
| Interest Rate Risk | | |
Futures Contracts (a) | 0 | (673) |
| Total Interest Rate Risk | 0 | (673) |
| Total Value of Derivatives | 0 | (673) |
(a)Reflects gross cumulative appreciation (depreciation) on futures contracts as presented in the Schedule of Investments. In the Statement of Assets and Liabilities, the period end daily variation margin is included in receivable or payable for daily variation margin on futures contracts, and the net cumulative appreciation (depreciation) is included in Total accumulated earnings (loss).
| Statement of Assets and Liabilities |
| | | | September 30, 2023 |
| | | | | |
| Assets | | | | |
| Investment in securities, at value - See accompanying schedule: | | | | |
Unaffiliated issuers (cost $3,180,231) | $ | 2,651,555 | | |
Fidelity Central Funds (cost $3,929,394) | | 3,574,668 | | |
Other affiliated issuers (cost $18,691,610) | | 17,673,698 | | |
| | | | | |
| | | | | |
| Total Investment in Securities (cost $25,801,235) | | | $ | 23,899,921 |
| Cash | | | | 1,196 |
| Receivable for investments sold | | | | 21,105 |
| Receivable for fund shares sold | | | | 11,509 |
| Dividends receivable | | | | 176 |
| Distributions receivable from Fidelity Central Funds | | | | 1,842 |
| Receivable for daily variation margin on futures contracts | | | | 156 |
Total assets | | | | 23,935,905 |
| Liabilities | | | | |
| Payable for fund shares redeemed | $ | 32,990 | | |
| Accrued management fee | | 2,023 | | |
| Other payables and accrued expenses | | 1,167 | | |
| Total Liabilities | | | | 36,180 |
| Net Assets | | | $ | 23,899,725 |
| Net Assets consist of: | | | | |
| Paid in capital | | | $ | 27,392,333 |
| Total accumulated earnings (loss) | | | | (3,492,608) |
| Net Assets | | | $ | 23,899,725 |
Net Asset Value, offering price and redemption price per share ($23,899,725 ÷ 2,620,230 shares) | | | $ | 9.12 |
| Statement of Operations |
| | | | Year ended September 30, 2023 |
| Investment Income | | | | |
| Dividends: | | | | |
| Unaffiliated issuers | | | $ | 153,591 |
| Affiliated issuers | | | | 276,703 |
| Interest | | | | 541 |
| Income from Fidelity Central Funds | | | | 309,648 |
| Total Income | | | | 740,483 |
| Expenses | | | | |
| Management fee | $ | 34,221 | | |
| Independent trustees' fees and expenses | | 82 | | |
| Miscellaneous | | 1,169 | | |
| Total expenses before reductions | | 35,472 | | |
| Expense reductions | | (11,830) | | |
| Total expenses after reductions | | | | 23,642 |
| Net Investment income (loss) | | | | 716,841 |
| Realized and Unrealized Gain (Loss) | | | | |
| Net realized gain (loss) on: | | | | |
| Investment Securities: | | | | |
| Unaffiliated issuers | | (126,372) | | |
| Fidelity Central Funds | | (193,487) | | |
| Other affiliated issuers | | (949,411) | | |
| Futures contracts | | (7,609) | | |
| Capital gain distributions from underlying funds: | | | | |
| Affiliated issuers | | 75,321 | | |
| Total net realized gain (loss) | | | | (1,201,558) |
| Change in net unrealized appreciation (depreciation) on: | | | | |
| Investment Securities: | | | | |
| Unaffiliated issuers | | 225,164 | | |
| Fidelity Central Funds | | (49,777) | | |
| Other affiliated issuers | | 1,305,760 | | |
| Futures contracts | | 152 | | |
| Total change in net unrealized appreciation (depreciation) | | | | 1,481,299 |
| Net gain (loss) | | | | 279,741 |
| Net increase (decrease) in net assets resulting from operations | | | $ | 996,582 |
| Statement of Changes in Net Assets |
| |
| | Year ended September 30, 2023 | | Year ended September 30, 2022 |
| Increase (Decrease) in Net Assets | | | | |
| Operations | | | | |
| Net investment income (loss) | $ | 716,841 | $ | 605,114 |
| Net realized gain (loss) | | (1,201,558) | | (383,544) |
| Change in net unrealized appreciation (depreciation) | | 1,481,299 | | (3,838,318) |
| Net increase (decrease) in net assets resulting from operations | | 996,582 | | (3,616,748) |
| Distributions to shareholders | | (840,168) | | (537,680) |
| | | | | |
| Share transactions | | | | |
| Proceeds from sales of shares | | 6,744,977 | | 9,482,212 |
| Reinvestment of distributions | | 820,452 | | 534,480 |
| Cost of shares redeemed | | (3,231,067) | | (3,317,424) |
| | | | | |
Net increase (decrease) in net assets resulting from share transactions | | 4,334,362 | | 6,699,268 |
| Total increase (decrease) in net assets | | 4,490,776 | | 2,544,840 |
| | | | | |
| Net Assets | | | | |
| Beginning of period | | 19,408,949 | | 16,864,109 |
| End of period | $ | 23,899,725 | $ | 19,408,949 |
| | | | | |
| Other Information | | | | |
| Shares | | | | |
| Sold | | 721,609 | | 895,231 |
| Issued in reinvestment of distributions | | 89,465 | | 49,657 |
| Redeemed | | (345,817) | | (314,380) |
| Net increase (decrease) | | 465,257 | | 630,508 |
| | | | | |
Financial Highlights
| Fidelity® Health Savings Index Fund |
| |
| Years ended September 30, | | 2023 | | 2022 | | 2021 | | 2020 A |
Selected Per-Share Data | | | | | | | | |
| Net asset value, beginning of period | $ | 9.01 | $ | 11.06 | $ | 10.41 | $ | 10.00 |
| Income from Investment Operations | | | | | | | | |
Net investment income (loss) B,C | | .29 | | .32 | | .17 | | .06 |
| Net realized and unrealized gain (loss) | | .18 | | (2.06) | | .66 | | .40 |
| Total from investment operations | | .47 | | (1.74) | | .83 | | .46 |
| Distributions from net investment income | | (.36) | | (.28) | | (.14) | | (.05) |
| Distributions from net realized gain | | - | | (.03) | | (.04) | | - |
| Total distributions | | (.36) | | (.31) | | (.18) | | (.05) |
| Net asset value, end of period | $ | 9.12 | $ | 9.01 | $ | 11.06 | $ | 10.41 |
Total Return D,E | | 5.30% | | (16.22)% | | 7.99% | | 4.58% |
Ratios to Average Net Assets C,F,G | | | | | | | | |
| Expenses before reductions | | .16% | | .15% | | .15% | | .15% H |
| Expenses net of fee waivers, if any | | .11% | | .10% | | .10% | | .10% H |
| Expenses net of all reductions | | .10% | | .10% | | .10% | | .10% H |
| Net investment income (loss) | | 3.14% | | 3.08% | | 1.51% | | .97% H |
| Supplemental Data | | | | | | | | |
| Net assets, end of period (000 omitted) | $ | 23,900 | $ | 19,409 | $ | 16,864 | $ | 3,609 |
Portfolio turnover rate I | | 49% | | 32% | | 42% | | 71% H |
AFor the period March 2, 2020 (commencement of operations) through September 30, 2020.
BCalculated based on average shares outstanding during the period.
CNet investment income (loss) is affected by the timing of the declaration of dividends by any underlying mutual funds or exchange-traded funds (ETFs). Net investment income (loss) of any mutual funds or ETFs is not included in the Fund's net investment income (loss) ratio.
DTotal returns for periods of less than one year are not annualized.
ETotal returns would have been lower if certain expenses had not been reduced during the applicable periods shown.
FFees and expenses of any underlying mutual funds or exchange-traded funds (ETFs) are not included in the Fund's expense ratio. The Fund indirectly bears its proportionate share of these expenses. For additional expense information related to investments in Fidelity Central Funds, please refer to the "Investments in Fidelity Central Funds" note found in the Notes to Financial Statements section of the most recent Annual or Semi-Annual report.
GExpense ratios reflect operating expenses of the class. Expenses before reductions do not reflect amounts reimbursed, waived, or reduced through arrangements with the investment adviser, brokerage services, or other offset arrangements, if applicable, and do not represent the amount paid by the class during periods when reimbursements, waivers or reductions occur.
HAnnualized.
IAmount does not include the portfolio activity of any underlying mutual funds or exchange-traded funds (ETFs).
For the period ended September 30, 2023
1. Organization.
Fidelity Health Savings Index Fund (the Fund) is a fund of Fidelity Charles Street Trust (the Trust) and is authorized to issue an unlimited number of shares. Share transactions on the Statement of Changes in Net Assets may contain exchanges between affiliated funds. The Trust is registered under the Investment Company Act of 1940, as amended (the 1940 Act), as an open-end management investment company organized as a Massachusetts business trust. Shares are available only to certain Fidelity health savings accounts.
2. Investments in Fidelity Central Funds.
Funds may invest in Fidelity Central Funds, which are open-end investment companies generally available only to other investment companies and accounts managed by the investment adviser and its affiliates. The Schedule of Investments lists any Fidelity Central Funds held as an investment as of period end, but does not include the underlying holdings of each Fidelity Central Fund. An investing fund indirectly bears its proportionate share of the expenses of the underlying Fidelity Central Funds.
Based on its investment objective, each Fidelity Central Fund may invest or participate in various investment vehicles or strategies that are similar to those of the investing fund. These strategies are consistent with the investment objectives of the investing fund and may involve certain economic risks which may cause a decline in value of each of the Fidelity Central Funds and thus a decline in the value of the investing fund.
| Fidelity Central Fund | Investment Manager | Investment Objective | Investment Practices | Expense RatioA |
| Fidelity Inflation-Protected Bond Index Central Fund | Fidelity Management & Research Company LLC (FMR) | Seeks to provide investment results that correspond to the performance of the inflation-protected United States Treasury market, and may invest in derivatives. | | Less than .005% |
| Fidelity Hedged Equity Central Fund | Fidelity Diversifying Solutions LLC (FDS) | Seeks capital appreciation by investing primarily in common stocks of companies with market capitalizations generally similar to companies in the S&P 500® Index. | Options | 0.01% |
| Fidelity Money Market Central Funds | Fidelity Management & Research Company LLC (FMR) | Each fund seeks to obtain a high level of current income consistent with the preservation of capital and liquidity. | Short-term Investments | Less than .005% |
A Expenses expressed as a percentage of average net assets and are as of each underlying Central Fund's most recent annual or semi-annual shareholder report.
An unaudited holdings listing for the investing fund, which presents direct holdings as well as the pro-rata share of any securities and other investments held indirectly through its investment in underlying non-money market Fidelity Central Funds, is available at fidelity.com and/or institutional.fidelity.com, as applicable. A complete unaudited list of holdings for each Fidelity Central Fund is available upon request or at the Securities and Exchange Commission website at www.sec.gov. In addition, the financial statements of the Fidelity Central Funds which contain the significant accounting policies (including investment valuation policies) of those funds, and are not covered by the Report of Independent Registered Public Accounting Firm, are available on the Securities and Exchange Commission website or upon request.
3. Significant Accounting Policies.
The Fund is an investment company and applies the accounting and reporting guidance of the Financial Accounting Standards Board (FASB) Accounting Standards Codification Topic 946 Financial Services - Investment Companies. The financial statements have been prepared in conformity with accounting principles generally accepted in the United States of America (GAAP), which require management to make certain estimates and assumptions at the date of the financial statements. Actual results could differ from those estimates. Subsequent events, if any, through the date that the financial statements were issued have been evaluated in the preparation of the financial statements. The Fund's Schedule of Investments lists any underlying mutual funds or exchange-traded funds (ETFs) but does not include the underlying holdings of these funds. The following summarizes the significant accounting policies of the Fund:
Investment Valuation. Investments are valued as of 4:00 p.m. Eastern time on the last calendar day of the period. The Fund uses a third party pricing service approved by the Board of Trustees (the Board) to value its investments. The Board of Trustees (the Board) has designated the Fund's investment adviser as the valuation designee responsible for the fair valuation function and performing fair value determinations as needed. The investment adviser has established a Fair Value Committee (the Committee) to carry out the day-to-day fair valuation responsibilities and has adopted policies and procedures to govern the fair valuation process and the activities of the Committee. In accordance with these fair valuation policies and procedures, which have been approved by the Board, the Fund attempts to obtain prices from one or more third party pricing services or brokers to value its investments. When current market prices, quotations or currency exchange rates are not readily available or reliable, investments will be fair valued in good faith by the Committee, in accordance with the policies and procedures. Factors used in determining fair value vary by investment type and may include market or investment specific events, transaction data, estimated cash flows, and market observations of comparable investments. The frequency that the fair valuation procedures are used cannot be predicted and they may be utilized to a significant extent. The Committee manages the Fund's fair valuation practices and maintains the fair valuation policies and procedures. The Fund's investment adviser reports to the Board information regarding the fair valuation process and related material matters. The Fund categorizes the inputs to valuation techniques used to value its investments into a disclosure hierarchy consisting of three levels as shown below:
Level 1 - unadjusted quoted prices in active markets for identical investments
Level 2 - other significant observable inputs (including quoted prices for similar investments, interest rates, prepayment speeds, etc.)
Level 3 - unobservable inputs (including the Fund's own assumptions based on the best information available)
Valuation techniques used to value the Fund's investments by major category are as follows. Investments in open-end mutual funds are valued at their closing net asset value (NAV) each business day and are categorized as Level 1 in the hierarchy. Debt securities, including restricted securities, are valued based on evaluated prices received from third party pricing services or from brokers who make markets in such securities. U.S. government and government agency obligations are valued by pricing services who utilize matrix pricing which considers yield or price of bonds of comparable quality, coupon, maturity and type or by broker-supplied prices. When independent prices are unavailable or unreliable, debt securities may be valued utilizing pricing methodologies which consider similar factors that would be used by third party pricing services. Debt securities are generally categorized as Level 2 in the hierarchy but may be Level 3 depending on the circumstances. ETFs are valued at their last sale price or official closing price as reported by a third party pricing service on the primary market or exchange on which they are traded and are categorized as Level 1 in the hierarchy. In the event there were no sales during the day but the exchange reports a closing bid level, ETFs are valued at the closing bid and would be categorized as Level 1 in the hierarchy. In the event there was no closing bid, ETFs may be valued by another method that the Board believes reflects fair value in accordance with the Board's fair value pricing policies and may be categorized as Level 2 in the hierarchy. The aggregate value of investments by input level as of September 30, 2023 is included at the end of the Fund's Schedule of Investments.
Futures contracts are valued at the settlement price established each day by the board of trade or exchange on which they are traded and are categorized as Level 1 in the hierarchy.
Investment Transactions and Income. For financial reporting purposes, the Fund's investment holdings and NAV include trades executed through the end of the last business day of the period. The NAV per share for processing shareholder transactions is calculated as of the close of business of the New York Stock Exchange (NYSE), normally 4:00 p.m. Eastern time and includes trades executed through the end of the prior business day. Gains and losses on securities sold are determined on the basis of identified cost. Income and capital gain distributions from any underlying mutual funds or exchange-traded funds (ETFs) are recorded on the ex-dividend date. Interest income is accrued as earned. Interest income includes coupon interest and amortization of premium and accretion of discount on debt securities as applicable.
Expenses. Expenses directly attributable to a fund are charged to that fund. Expenses attributable to more than one fund are allocated among the respective funds on the basis of relative net assets or other appropriate methods. Expenses included in the accompanying financial statements reflect the expenses of that fund and do not include any expenses associated with any underlying mutual funds or exchange-traded funds. Although not included in a fund's expenses, a fund indirectly bears its proportionate share of these expenses through the net asset value of each underlying mutual fund or exchange-traded fund. Expense estimates are accrued in the period to which they relate and adjustments are made when actual amounts are known.
Income Tax Information and Distributions to Shareholders. Each year, the Fund intends to qualify as a regulated investment company under Subchapter M of the Internal Revenue Code, including distributing substantially all of its taxable income and realized gains. As a result, no provision for U.S. Federal income taxes is required. As of September 30, 2023, the Fund did not have any unrecognized tax benefits in the financial statements; nor is the Fund aware of any tax positions for which it is reasonably possible that the total amounts of unrecognized tax benefits will significantly change in the next twelve months. The Fund files a U.S. federal tax return, in addition to state and local tax returns as required. The Fund's federal income tax returns are subject to examination by the Internal Revenue Service (IRS) for a period of three fiscal years after they are filed. State and local tax returns may be subject to examination for an additional fiscal year depending on the jurisdiction.
Distributions are declared and recorded on the ex-dividend date. Income and capital gain distributions are determined in accordance with income tax regulations, which may differ from GAAP.
Capital accounts within the financial statements are adjusted for permanent book-tax differences. These adjustments have no impact on net assets or the results of operations. Capital accounts are not adjusted for temporary book-tax differences which will reverse in a subsequent period.
Book-tax differences are primarily due to futures contracts, capital loss carryforwards and losses deferred due to wash sales.
As of period end, the cost and unrealized appreciation (depreciation) in securities, and derivatives if applicable, for federal income tax purposes were as follows:
| Gross unrealized appreciation | $347,766 |
| Gross unrealized depreciation | (2,640,094) |
| Net unrealized appreciation (depreciation) | $(2,292,328) |
| Tax Cost | $26,192,249 |
The tax-based components of distributable earnings as of period end were as follows:
| Undistributed ordinary income | $39,674 |
| Capital loss carryforward | $(1,239,952) |
| Net unrealized appreciation (depreciation) on securities and other investments | $(2,292,328) |
Capital loss carryforwards are only available to offset future capital gains of the Fund to the extent provided by regulations and may be limited. The capital loss carryforward information presented below, including any applicable limitation, is estimated as of fiscal period end and is subject to adjustment.
Short-term | $(388,756) |
Long-term | (851,196) |
| Total capital loss carryforward | $(1,239,952) |
The tax character of distributions paid was as follows:
| | September 30, 2023 | September 30, 2022 |
| Ordinary Income | $840,168 | $512,170 |
| Long-term Capital Gains | - | 25,510 |
| Total | $840,168 | $ 537,680 |
4. Derivative Instruments.
Risk Exposures and the Use of Derivative Instruments. The Fund's investment objectives allow for various types of derivative instruments, including futures contracts. Derivatives are investments whose value is primarily derived from underlying assets, indices or reference rates and may be transacted on an exchange or over-the-counter (OTC). Derivatives may involve a future commitment to buy or sell a specified asset based on specified terms, to exchange future cash flows at periodic intervals based on a notional principal amount, or for one party to make one or more payments upon the occurrence of specified events in exchange for periodic payments from the other party.
Derivatives were used to increase returns and to manage exposure to certain risks as defined below. The success of any strategy involving derivatives depends on analysis of numerous economic factors, and if the strategies for investment do not work as intended, the objectives may not be achieved.
Derivatives were used to increase or decrease exposure to the following risk(s):
| Interest Rate Risk | Interest rate risk relates to the fluctuations in the value of interest-bearing securities due to changes in the prevailing levels of market interest rates. |
Funds are also exposed to additional risks from investing in derivatives, such as liquidity risk and counterparty credit risk. Liquidity risk is the risk that a fund will be unable to close out the derivative in the open market in a timely manner. Counterparty credit risk is the risk that the counterparty will not be able to fulfill its obligation to a fund. Counterparty credit risk related to exchange-traded contracts may be mitigated by the protection provided by the exchange on which they trade.
Investing in derivatives may involve greater risks than investing in the underlying assets directly and, to varying degrees, may involve risk of loss in excess of any initial investment and collateral received and amounts recognized in the Statement of Assets and Liabilities. In addition, there may be the risk that the change in value of the derivative contract does not correspond to the change in value of the underlying instrument.
Futures Contracts. A futures contract is an agreement between two parties to buy or sell a specified underlying instrument for a fixed price at a specified future date. Futures contracts were used to manage exposure to the bond market and fluctuations in interest rates.
Upon entering into a futures contract, a fund is required to deposit either cash or securities (initial margin) with a clearing broker in an amount equal to a certain percentage of the face value of the contract. Futures contracts are marked-to-market daily and subsequent daily payments are made or received by a fund depending on the daily fluctuations in the value of the futures contracts and are recorded as unrealized appreciation or (depreciation). This receivable and/or payable, if any, is included in daily variation margin on futures contracts in the Statement of Assets and Liabilities. Realized gain or (loss) is recorded upon the expiration or closing of a futures contract. The net realized gain (loss) and change in net unrealized appreciation (depreciation) on futures contracts during the period is presented in the Statement of Operations.
Any open futures contracts at period end are presented in the Schedule of Investments under the caption "Futures Contracts". The notional amount at value reflects each contract's exposure to the underlying instrument or index at period end, and is representative of volume of activity during the period unless an average notional amount is presented. Any securities deposited to meet initial margin requirements are identified in the Schedule of Investments. Any cash deposited to meet initial margin requirements is presented as segregated cash with brokers for derivative instruments in the Statement of Assets and Liabilities.
5. Purchases and Sales of Investments.
Purchases and sales of securities, other than short-term securities and in-kind transactions, as applicable, are noted in the table below.
| | Purchases ($) | Sales ($) |
| Fidelity Health Savings Index Fund | 14,780,388 | 11,032,744 |
6. Fees and Other Transactions with Affiliates.
Management Fee. Fidelity Management & Research Company LLC (the investment adviser) and its affiliates provide the Fund with investment management related services for which the Fund pays a monthly management fee. The management fee is based on an annual rate of .15% of the Fund's average net assets. Under the management contract, the investment adviser pays all other operating expenses, except the compensation of the independent Trustees and certain miscellaneous expenses such as proxy and shareholder meeting expenses.
During the period, the investment adviser waived a portion of its management fee as described in the Expense Reductions note.
Brokerage Commissions. A portion of portfolio transactions were placed with brokerage firms which are affiliates of the investment adviser. Brokerage commissions are included in net realized gain (loss) and change in net unrealized appreciation (depreciation) in the Statement of Operations. The commissions paid to these affiliated firms were as follows:
| | Amount |
| Fidelity Health Savings Index Fund | $65 |
Interfund Trades. Funds may purchase from or sell securities to other Fidelity Funds under procedures adopted by the Board. The procedures have been designed to ensure these interfund trades are executed in accordance with Rule 17a-7 of the 1940 Act. Any interfund trades are included within the respective purchases and sales amounts shown in the Purchases and Sales of Investments note. During the period, there were no interfund trades.
7. Committed Line of Credit.
Certain Funds participate with other funds managed by the investment adviser or an affiliate in a $4.25 billion credit facility (the "line of credit") to be utilized for temporary or emergency purposes to fund shareholder redemptions or for other short-term liquidity purposes. The commitment fees on the pro-rata portion of the line of credit are borne by the investment adviser. During the period, there were no borrowings on this line of credit.
8. Expense Reductions.
The investment adviser contractually agreed to waive the Fund's management fee in an amount equal to .05% of average net assets until January 31, 2025. For the period, management fees were reduced by $11,407.
Through arrangements with the Fund's custodian, credits realized as a result of certain uninvested cash balances were used to reduce the Fund's expenses by $423.
9. Other.
A fund's organizational documents provide former and current trustees and officers with a limited indemnification against liabilities arising in connection with the performance of their duties to the fund. In the normal course of business, a fund may also enter into contracts that provide general indemnifications. A fund's maximum exposure under these arrangements is unknown as this would be dependent on future claims that may be made against a fund. The risk of material loss from such claims is considered remote.
10. Risk and Uncertainties.
Many factors affect a fund's performance. Developments that disrupt global economies and financial markets, such as pandemics, epidemics, outbreaks of infectious diseases, war, terrorism, and environmental disasters, may significantly affect a fund's investment performance. The effects of these developments to a fund will be impacted by the types of securities in which a fund invests, the financial condition, industry, economic sector, and geographic location of an issuer, and a fund's level of investment in the securities of that issuer. Significant concentrations in security types, issuers, industries, sectors, and geographic locations may magnify the factors that affect a fund's performance.
To the Board of Trustees of Fidelity Charles Street Trust and the Shareholders of Fidelity Health Savings Index Fund:
Opinion on the Financial Statements and Financial Highlights
We have audited the accompanying statement of assets and liabilities of Fidelity Health Savings Index Fund (the "Fund"), a fund of Fidelity Charles Street Trust, including the schedule of investments, as of September 30, 2023, the related statement of operations for the year then ended, the statement of changes in net assets for each of the two years in the period then ended, the financial highlights for each of three years in the period then ended and for the period from March 2, 2020 (commencement of operations) through September 30, 2020, and the related notes. In our opinion, the financial statements and financial highlights present fairly, in all material respects, the financial position of the Fund as of September 30, 2023, and the results of its operations for the year then ended, the changes in its net assets for each of the two years in the period then ended, and the financial highlights for each of the three years in the period then ended and for the period from March 2, 2020 (commencement of operations) through September 30, 2020, in conformity with accounting principles generally accepted in the United States of America.
Basis for Opinion
These financial statements and financial highlights are the responsibility of the Fund's management. Our responsibility is to express an opinion on the Fund's financial statements and financial highlights based on our audits. We are a public accounting firm registered with the Public Company Accounting Oversight Board (United States) (PCAOB) and are required to be independent with respect to the Fund in accordance with the U.S. federal securities laws and the applicable rules and regulations of the Securities and Exchange Commission and the PCAOB.
We conducted our audits in accordance with the standards of the PCAOB. Those standards require that we plan and perform the audit to obtain reasonable assurance about whether the financial statements and financial highlights are free of material misstatement, whether due to error or fraud. The Fund is not required to have, nor were we engaged to perform, an audit of its internal control over financial reporting. As part of our audits we are required to obtain an understanding of internal control over financial reporting but not for the purpose of expressing an opinion on the effectiveness of the Fund's internal control over financial reporting. Accordingly, we express no such opinion.
Our audits included performing procedures to assess the risks of material misstatement of the financial statements and financial highlights, whether due to error or fraud, and performing procedures that respond to those risks. Such procedures included examining, on a test basis, evidence regarding the amounts and disclosures in the financial statements and financial highlights. Our audits also included evaluating the accounting principles used and significant estimates made by management, as well as evaluating the overall presentation of the financial statements and financial highlights. Our procedures included confirmation of securities owned as of September 30, 2023, by correspondence with the custodian and brokers; when replies were not received from brokers, we performed other auditing procedures. We believe that our audits provide a reasonable basis for our opinion.
/s/ Deloitte & Touche LLP
Boston, Massachusetts
November 15, 2023
We have served as the auditor of one or more of the Fidelity investment companies since 1999.
The Trustees, Members of the Advisory Board (if any), and officers of the trust and fund, as applicable, are listed below. The Board of Trustees governs the fund and is responsible for protecting the interests of shareholders. The Trustees are experienced executives who meet periodically throughout the year to oversee the fund's activities, review contractual arrangements with companies that provide services to the fund, oversee management of the risks associated with such activities and contractual arrangements, and review the fund's performance. If the interests of the fund and an underlying Fidelity® fund were to diverge, a conflict of interest could arise and affect how the Trustees and Members of the Advisory Board fulfill their fiduciary duties to the affected funds. FMR has structured the fund to avoid these potential conflicts, although there may be situations where a conflict of interest is unavoidable. In such instances, FMR, the Trustees, and Members of the Advisory Board would take reasonable steps to minimize and, if possible, eliminate the conflict. As of September 30, 2023, except for Laura M. Bishop, Robert W. Helm, Christine J. Thompson, and Carol J. Zierhoffer, each of the Trustees oversees 313 funds. As of October 18, 2023, the date of their election as Trustee, Ms. Bishop, Mr. Helm, Ms. Thompson, and Ms. Zierhoffer each oversees 229 funds.
The Trustees hold office without limit in time except that (a) any Trustee may resign; (b) any Trustee may be removed by written instrument, signed by at least two-thirds of the number of Trustees prior to such removal; (c) any Trustee who requests to be retired or who has become incapacitated by illness or injury may be retired by written instrument signed by a majority of the other Trustees; and (d) any Trustee may be removed at any special meeting of shareholders by a two-thirds vote of the outstanding voting securities of the trust. Each Trustee who is not an interested person (as defined in the 1940 Act) of the trust and the fund is referred to herein as an Independent Trustee. Each Independent Trustee shall retire not later than the last day of the calendar year in which his or her 75th birthday occurs. The Independent Trustees may waive this mandatory retirement age policy with respect to individual Trustees. Officers and Advisory Board Members hold office without limit in time, except that any officer or Advisory Board Member may resign or may be removed by a vote of a majority of the Trustees at any regular meeting or any special meeting of the Trustees. Except as indicated, each individual has held the office shown or other offices in the same company for the past five years.
The fund's Statement of Additional Information (SAI) includes more information about the Trustees. To request a free copy, call Fidelity at 1-800-544-8544.
Experience, Skills, Attributes, and Qualifications of the Trustees. The Governance and Nominating Committee has adopted a statement of policy that describes the experience, qualifications, attributes, and skills that are necessary and desirable for potential Independent Trustee candidates (Statement of Policy). The Board believes that each Trustee satisfied at the time he or she was initially elected or appointed a Trustee, and continues to satisfy, the standards contemplated by the Statement of Policy. The Governance and Nominating Committee also engages professional search firms to help identify potential Independent Trustee candidates who have the experience, qualifications, attributes, and skills consistent with the Statement of Policy. From time to time, additional criteria based on the composition and skills of the current Independent Trustees, as well as experience or skills that may be appropriate in light of future changes to board composition, business conditions, and regulatory or other developments, have also been considered by the professional search firms and the Governance and Nominating Committee. In addition, the Board takes into account the Trustees' commitment and participation in Board and committee meetings, as well as their leadership of standing and ad hoc committees throughout their tenure.
In determining that a particular Trustee was and continues to be qualified to serve as a Trustee, the Board has considered a variety of criteria, none of which, in isolation, was controlling. The Board believes that, collectively, the Trustees have balanced and diverse experience, qualifications, attributes, and skills, which allow the Board to operate effectively in governing the fund and protecting the interests of shareholders. Information about the specific experience, skills, attributes, and qualifications of each Trustee, which in each case led to the Board's conclusion that the Trustee should serve (or continue to serve) as a trustee of the fund, is provided below.
Board Structure and Oversight Function. Abigail P. Johnson is an interested person and currently serves as Chairman. The Trustees have determined that an interested Chairman is appropriate and benefits shareholders because an interested Chairman has a personal and professional stake in the quality and continuity of services provided to the fund. Independent Trustees exercise their informed business judgment to appoint an individual of their choosing to serve as Chairman, regardless of whether the Trustee happens to be independent or a member of management. The Independent Trustees have determined that they can act independently and effectively without having an Independent Trustee serve as Chairman and that a key structural component for assuring that they are in a position to do so is for the Independent Trustees to constitute a substantial majority for the Board. The Independent Trustees also regularly meet in executive session. Michael E. Kenneally serves as Chairman of the Independent Trustees and as such (i) acts as a liaison between the Independent Trustees and management with respect to matters important to the Independent Trustees and (ii) with management prepares agendas for Board meetings.
Fidelity® funds are overseen by different Boards of Trustees. The fund's Board oversees Fidelity's investment-grade bond, money market, asset allocation and certain equity funds, and other Boards oversee Fidelity's alternative investment, high income and other equity funds. The asset allocation funds may invest in Fidelity® funds that are overseen by such other Boards. The use of separate Boards, each with its own committee structure, allows the Trustees of each group of Fidelity® funds to focus on the unique issues of the funds they oversee, including common research, investment, and operational issues. On occasion, the separate Boards establish joint committees to address issues of overlapping consequences for the Fidelity® funds overseen by each Board.
The Trustees operate using a system of committees to facilitate the timely and efficient consideration of all matters of importance to the Trustees, the fund, and fund shareholders and to facilitate compliance with legal and regulatory requirements and oversight of the fund's activities and associated risks. The Board, acting through its committees, has charged FMR and its affiliates with (i) identifying events or circumstances the occurrence of which could have demonstrably adverse effects on the fund's business and/or reputation; (ii) implementing processes and controls to lessen the possibility that such events or circumstances occur or to mitigate the effects of such events or circumstances if they do occur; and (iii) creating and maintaining a system designed to evaluate continuously business and market conditions in order to facilitate the identification and implementation processes described in (i) and (ii) above. Because the day-to-day operations and activities of the fund are carried out by or through FMR, its affiliates, and other service providers, the fund's exposure to risks is mitigated but not eliminated by the processes overseen by the Trustees. While each of the Board's committees has responsibility for overseeing different aspects of the fund's activities, oversight is exercised primarily through the Operations and Audit Committees. In addition, an ad hoc Board committee of Independent Trustees has worked with FMR to enhance the Board's oversight of investment and financial risks, legal and regulatory risks, technology risks, and operational risks, including the development of additional risk reporting to the Board. Appropriate personnel, including but not limited to the fund's Chief Compliance Officer (CCO), FMR's internal auditor, the independent accountants, the fund's Treasurer and portfolio management personnel, make periodic reports to the Board's committees, as appropriate, including an annual review of Fidelity's risk management program for the Fidelity® funds. The responsibilities of each standing committee, including their oversight responsibilities, are described further under "Standing Committees of the Trustees."
Interested Trustees*:
Correspondence intended for a Trustee who is an interested person may be sent to Fidelity Investments, 245 Summer Street, Boston, Massachusetts 02210.
Name, Year of Birth; Principal Occupations and Other Relevant Experience+
Abigail P. Johnson (1961)
Year of Election or Appointment: 2009
Trustee
Chairman of the Board of Trustees
Ms. Johnson also serves as Trustee of other Fidelity® funds. Ms. Johnson serves as Chairman (2016-present), Chief Executive Officer (2014-present), and Director (2007-present) of FMR LLC (diversified financial services company), President of Fidelity Financial Services (2012-present) and President of Personal, Workplace and Institutional Services (2005-present). Ms. Johnson is Chairman and Director of Fidelity Management & Research Company LLC (investment adviser firm, 2011-present). Previously, Ms. Johnson served as Chairman and Director of FMR Co., Inc. (investment adviser firm, 2011-2019), Vice Chairman (2007-2016) and President (2013-2016) of FMR LLC, President and a Director of Fidelity Management & Research Company (2001-2005), a Trustee of other investment companies advised by Fidelity Management & Research Company, Fidelity Investments Money Management, Inc. (investment adviser firm), and FMR Co., Inc. (2001-2005), Senior Vice President of the Fidelity® funds (2001-2005), and managed a number of Fidelity® funds. Ms. Abigail P. Johnson and Mr. Arthur E. Johnson are not related.
Jennifer Toolin McAuliffe (1959)
Year of Election or Appointment: 2016
Trustee
Ms. McAuliffe also serves as Trustee of other Fidelity® funds and as Trustee of Fidelity Charitable (2020-present). Previously, Ms. McAuliffe served as Co-Head of Fixed Income of Fidelity Investments Limited (now known as FIL Limited (FIL)) (diversified financial services company), Director of Research for FIL's credit and quantitative teams in London, Hong Kong and Tokyo and Director of Research for taxable and municipal bonds at Fidelity Investments Money Management, Inc. Ms. McAuliffe previously served as a member of the Advisory Board of certain Fidelity® funds (2016). Ms. McAuliffe was previously a lawyer at Ropes & Gray LLP and an international banker at Chemical Bank NA (now JPMorgan Chase & Co.). Ms. McAuliffe also currently serves as director or trustee of several not-for-profit entities.
Christine J. Thompson (1958)
Year of Election or Appointment: 2023
Trustee
Ms. Thompson also serves as a Trustee of other Fidelity® funds. Ms. Thompson serves as Leader of Advanced Technologies for Investment Management at Fidelity Investments (2018-present). Previously, Ms. Thompson served as Chief Investment Officer in the Bond group at Fidelity Management & Research Company (2010-2018) and held various other roles including Director of municipal bond portfolio managers and Portfolio Manager of certain Fidelity® funds.
* Determined to be an "Interested Trustee" by virtue of, among other things, his or her affiliation with the trust or various entities under common control with FMR.
+ The information includes the Trustee's principal occupation during the last five years and other information relating to the experience, attributes, and skills relevant to the Trustee's qualifications to serve as a Trustee, which led to the conclusion that the Trustee should serve as a Trustee for the fund.
Independent Trustees:
Correspondence intended for an Independent Trustee may be sent to Fidelity Investments, P.O. Box 55235, Boston, Massachusetts 02205-5235.
Name, Year of Birth; Principal Occupations and Other Relevant Experience+
Elizabeth S. Acton (1951)
Year of Election or Appointment: 2013
Trustee
Ms. Acton also serves as Trustee of other Fidelity® funds. Prior to her retirement, Ms. Acton served as Executive Vice President, Finance (2011-2012), Executive Vice President, Chief Financial Officer (2002-2011) and Treasurer (2004-2005) of Comerica Incorporated (financial services). Prior to joining Comerica, Ms. Acton held a variety of positions at Ford Motor Company (1983-2002), including Vice President and Treasurer (2000-2002) and Executive Vice President and Chief Financial Officer of Ford Motor Credit Company (1998-2000). Ms. Acton currently serves as a member of the Board and Audit and Finance Committees of Beazer Homes USA, Inc. (homebuilding, 2012-present). Ms. Acton previously served as a member of the Advisory Board of certain Fidelity® funds (2013-2016).
Laura M. Bishop (1961)
Year of Election or Appointment: 2023
Trustee
Ms. Bishop also serves as Trustee or Member of the Advisory Board of other Fidelity® funds. Prior to her retirement, Ms. Bishop held a variety of positions at United Services Automobile Association (2001-2020), including Executive Vice President and Chief Financial Officer (2014-2020) and Senior Vice President and Deputy Chief Financial Officer (2012-2014). Ms. Bishop currently serves as a member of the Audit Committee and Compensation and Personnel Committee (2021-present) of the Board of Directors of Korn Ferry (global organizational consulting). Previously, Ms. Bishop served as a Member of the Advisory Board of certain Fidelity® funds (2022-2023).
Ann E. Dunwoody (1953)
Year of Election or Appointment: 2018
Trustee
General Dunwoody also serves as Trustee of other Fidelity® funds. General Dunwoody (United States Army, Retired) was the first woman in U.S. military history to achieve the rank of four-star general and prior to her retirement in 2012 held a variety of positions within the U.S. Army, including Commanding General, U.S. Army Material Command (2008-2012). General Dunwoody currently serves as a member of the Board, Chair of Nomination Committee and a member of the Corporate Governance Committee of Kforce Inc. (professional staffing services, 2016-present) and a member of the Board of Automattic Inc. (software engineering, 2018-present). Previously, General Dunwoody served as President of First to Four LLC (leadership and mentoring services, 2012-2022), a member of the Advisory Board and Nominating and Corporate Governance Committee of L3 Technologies, Inc. (communication, electronic, sensor and aerospace systems, 2013-2019) and a member of the Board and Audit and Sustainability and Corporate Responsibility Committees of Republic Services, Inc. (waste collection, disposal and recycling, 2013-2016). General Dunwoody also serves on several boards for non-profit organizations, including as a member of the Board, Chair of the Nomination and Governance Committee and a member of the Audit Committee of the Noble Reach Foundation (formerly Logistics Management Institute) (consulting non-profit, 2012-present) and a member of the Board of ThanksUSA (military family education non-profit, 2014-present). Previously, General Dunwoody served as a member of the Board of Florida Institute of Technology (2015-2022) and a member of the Council of Trustees for the Association of the United States Army (advocacy non-profit, 2013-2021). General Dunwoody previously served as a member of the Advisory Board of certain Fidelity® funds (2018).
John Engler (1948)
Year of Election or Appointment: 2014
Trustee
Mr. Engler also serves as Trustee of other Fidelity® funds. Previously, Mr. Engler served as Governor of Michigan (1991-2003), President of the Business Roundtable (2011-2017) and interim President of Michigan State University (2018-2019). Previously, Mr. Engler served as a member of the Board of Stride, Inc. (formerly K12 Inc.) (technology-based education company, 2012-2022), a member of the Board of Universal Forest Products (manufacturer and distributor of wood and wood-alternative products, 2003-2019) and Trustee of The Munder Funds (2003-2014). Mr. Engler previously served as a member of the Advisory Board of certain Fidelity® funds (2014-2016).
Robert F. Gartland (1951)
Year of Election or Appointment: 2010
Trustee
Mr. Gartland also serves as Trustee of other Fidelity® funds. Prior to his retirement, Mr. Gartland held a variety of positions at Morgan Stanley (financial services, 1979-2007), including Managing Director (1987-2007) and Chase Manhattan Bank (1975-1978). Mr. Gartland previously served as Chairman and an investor in Gartland & Mellina Group Corp. (consulting, 2009-2019), as a member of the Board of National Securities Clearing Corporation (1993-1996) and as Chairman of TradeWeb (2003-2004).
Robert W. Helm (1957)
Year of Election or Appointment: 2023
Trustee
Mr. Helm also serves as Trustee or Member of the Advisory Board of other Fidelity® funds. Mr. Helm was formerly Deputy Chairman (2003-2020), partner (1991-2020) and an associate (1984-1991) of Dechert LLP (formerly Dechert Price & Rhoads). Mr. Helm currently serves on boards and committees of several not-for-profit organizations, including as a Trustee and member of the Executive Committee of the Baltimore Council on Foreign Affairs, a member of the Board of Directors of the St. Vincent de Paul Society of Baltimore and a member of the Life Guard Society of Mt. Vernon. Previously, Mr. Helm served as a Member of the Advisory Board of certain Fidelity® funds (2021-2023).
Arthur E. Johnson (1947)
Year of Election or Appointment: 2008
Trustee
Mr. Johnson also serves as Trustee of other Fidelity® funds. Prior to his retirement, Mr. Johnson served as Senior Vice President of Corporate Strategic Development of Lockheed Martin Corporation (defense contractor, 1999-2009). Mr. Johnson currently serves as a member of the Board of Booz Allen Hamilton (management consulting, 2011-present). Mr. Johnson previously served as a member of the Board of Eaton Corporation plc (diversified power management, 2009-2019) and a member of the Board of AGL Resources, Inc. (holding company, 2002-2016). Mr. Johnson previously served as Chairman (2018-2021) and Vice Chairman (2015-2018) of the Independent Trustees of certain Fidelity® funds. Mr. Arthur E. Johnson is not related to Ms. Abigail P. Johnson.
Michael E. Kenneally (1954)
Year of Election or Appointment: 2009
Trustee
Chairman of the Independent Trustees
Mr. Kenneally also serves as Trustee of other Fidelity® funds and was Vice Chairman (2018-2021) of the Independent Trustees of certain Fidelity® funds. Prior to retirement in 2005, he was Chairman and Global Chief Executive Officer of Credit Suisse Asset Management, the worldwide fund management and institutional investment business of Credit Suisse Group. Previously, Mr. Kenneally was an Executive Vice President and the Chief Investment Officer for Bank of America. In this role, he was responsible for the investment management, strategy and products delivered to the bank's institutional, high-net-worth and retail clients. Earlier, Mr. Kenneally directed the organization's equity and quantitative research groups. He began his career as a research analyst and then spent more than a dozen years as a portfolio manager for endowments, pension plans and mutual funds. He earned the Chartered Financial Analyst (CFA) designation in 1991.
Mark A. Murray (1954)
Year of Election or Appointment: 2016
Trustee
Mr. Murray also serves as Trustee of other Fidelity® funds. Previously, Mr. Murray served as Co-Chief Executive Officer (2013-2016), President (2006-2013) and Vice Chairman (2013-2020) of Meijer, Inc. Mr. Murray serves as a member of the Board (2009-present) and Public Policy and Responsibility Committee (2009-present) and Chair of the Nuclear Review Committee (2019-present) of DTE Energy Company (diversified energy company). Mr. Murray previously served as a member of the Board of Spectrum Health (not-for-profit health system, 2015-2019) and as a member of the Board and Audit Committee and Chairman of the Nominating and Corporate Governance Committee of Universal Forest Products, Inc. (manufacturer and distributor of wood and wood-alternative products, 2004-2016). Mr. Murray also serves as a member of the Board of many community and professional organizations. Mr. Murray previously served as a member of the Advisory Board of certain Fidelity® funds (2016).
Carol J. Zierhoffer (1960)
Year of Election or Appointment: 2023
Trustee
Ms. Zierhoffer also serves as Trustee or Member of the Advisory Board of other Fidelity® funds. Prior to her retirement, Ms. Zierhoffer held a variety of positions at Bechtel Corporation (engineering company, 2013-2019), including Principal Vice President and Chief Information Officer (2013-2016) and Senior Vice President and Chief Information Officer (2016-2019). Ms. Zierhoffer currently serves as a member of the Board of Directors, Audit Committee and Compensation Committee of Allscripts Healthcare Solutions, Inc. (healthcare technology, 2020-present) and as a member of the Board of Directors, Audit and Finance Committee and Nominating and Governance Committee of Atlas Air Worldwide Holdings, Inc. (aviation operating services, 2021-present). Previously, Ms. Zierhoffer served as a member of the Board of Directors and Audit Committee and as the founding Chair of the Information Technology Committee of MedAssets, Inc. (healthcare technology, 2013-2016), and as a Member of the Advisory Board of certain Fidelity® funds (2023).
+ The information includes the Trustee's principal occupation during the last five years and other information relating to the experience, attributes, and skills relevant to the Trustee's qualifications to serve as a Trustee, which led to the conclusion that the Trustee should serve as a Trustee for the fund.
Advisory Board Members and Officers:
Correspondence intended for a Member of the Advisory Board (if any) may be sent to Fidelity Investments, P.O. Box 55235, Boston, Massachusetts 02205-5235. Correspondence intended for an officer may be sent to Fidelity Investments, 245 Summer Street, Boston, Massachusetts 02210.
Name, Year of Birth; Principal Occupation
Heather Bonner (1977)
Year of Election or Appointment: 2023
Assistant Treasurer
Ms. Bonner also serves as an officer of other funds. Ms. Bonner is a Senior Vice President (2022-present) and is an employee of Fidelity Investments (2022-present). Ms. Bonner serves as Assistant Treasurer of Fidelity CRET Trustee LLC (2022-present). Prior to joining Fidelity, Ms. Bonner served as Managing Director at AQR Capital Management (2013-2022) and was the Treasurer and Principal Financial Officer of the AQR Funds (2013-2022).
Craig S. Brown (1977)
Year of Election or Appointment: 2019
Assistant Treasurer
Mr. Brown also serves as an officer of other funds. Mr. Brown is a Vice President (2015-present) and is an employee of Fidelity Investments. Mr. Brown serves as Assistant Treasurer of FIMM, LLC (2021-present). Previously, Mr. Brown served as Assistant Treasurer of certain Fidelity® funds (2019-2022).
John J. Burke III (1964)
Year of Election or Appointment: 2018
Chief Financial Officer
Mr. Burke also serves as Chief Financial Officer of other funds. Mr. Burke is Head of Fidelity Fund and Investment Operations (2018-present) and is an employee of Fidelity Investments. Mr. Burke serves as President, Executive Vice President, or Director of certain Fidelity entities. Previously Mr. Burke served as head of Asset Management Investment Operations (2012-2018).
Margaret Carey (1973)
Year of Election or Appointment: 2023
Secretary and Chief Legal Officer (CLO)
Ms. Carey also serves as an officer of other funds and as CLO of certain Fidelity entities. Ms. Carey is a Senior Vice President, Deputy General Counsel (2019-present) and is an employee of Fidelity Investments.
David J. Carter (1973)
Year of Election or Appointment: 2020
Assistant Secretary
Mr. Carter also serves as Assistant Secretary of other funds. Mr. Carter is a Senior Vice President, Deputy General Counsel (2022-present) and is an employee of Fidelity Investments. Mr. Carter serves as Chief Legal Officer of Fidelity Investments Institutional Operations Company LLC - Shareholder Division (transfer agent, 2020-present).
Jonathan Davis (1968)
Year of Election or Appointment: 2010
Assistant Treasurer
Mr. Davis also serves as an officer of other funds. Mr. Davis is a Vice President (2006-present) and is an employee of Fidelity Investments. Mr. Davis serves as Assistant Treasurer of certain Fidelity entities.
Laura M. Del Prato (1964)
Year of Election or Appointment: 2018
President and Treasurer
Ms. Del Prato also serves as an officer of other funds. Ms. Del Prato is a Senior Vice President (2017-present) and is an employee of Fidelity Investments. Ms. Del Prato serves as Vice President or Assistant Treasurer of certain Fidelity entities. Previously, Ms. Del Prato served as President and Treasurer of The North Carolina Capital Management Trust: Cash Portfolio and Term Portfolio (2018-2020).
Christopher M. Gouveia (1973)
Year of Election or Appointment: 2023
Chief Compliance Officer
Mr. Gouveia also serves as Chief Compliance Officer of other funds. Mr. Gouveia is a Senior Vice President of Asset Management Compliance (2019-present) and is an employee of Fidelity Investments. Mr. Gouveia serves as Compliance Officer of Fidelity Management Trust Company (2023-present). Previously, Mr. Gouveia served as Chief Compliance Officer of the North Carolina Capital Management Trust (2016-2019).
Colm A. Hogan (1973)
Year of Election or Appointment: 2016
Assistant Treasurer
Mr. Hogan also serves as an officer of other funds. Mr. Hogan is a Vice President (2016-present) and is an employee of Fidelity Investments. Mr. Hogan serves as Assistant Treasurer of certain Fidelity entities. Previously, Mr. Hogan served as Deputy Treasurer of certain Fidelity® funds (2016-2020) and Assistant Treasurer of certain Fidelity® funds (2016-2018).
William Irving (1964)
Year of Election or Appointment: 2023
Vice President
Mr. Irving also serves as Vice President of other funds. Mr. Irving is Head of Fidelity Asset Management Solutions (2022-present) and is an employee of Fidelity Investments. Mr. Irving serves as President and Director of Fidelity Diversifying Solutions LLC (investment adviser firm, 2023-present) and President or Director of certain other Fidelity entities. Previously, Mr. Irving served as Chief Investment Officer (CIO) in the Global Asset Allocation division (2020-2022). Prior to that, he was Managing Director of Research in the Global Asset Allocation division (2018-2020) and portfolio manager of certain Fidelity® funds (2004-2018).
Chris Maher (1972)
Year of Election or Appointment: 2013
Assistant Treasurer
Mr. Maher also serves as an officer of other funds. Mr. Maher is a Vice President (2008-present) and is an employee of Fidelity Investments. Mr. Maher serves as Assistant Treasurer of certain Fidelity entities. Previously, Mr. Maher served as Assistant Treasurer of certain funds (2013-2020).
Brett Segaloff (1972)
Year of Election or Appointment: 2021
Anti-Money Laundering (AML) Officer
Mr. Segaloff also serves as AML Officer of other funds. Mr. Segaloff is a Vice President (2022-present) and is an employee of Fidelity Investments. Mr. Segaloff serves as Anti Money Laundering Compliance Officer or Anti Money Laundering/Bank Secrecy Act Compliance Officer of certain Fidelity entities.
Stacie M. Smith (1974)
Year of Election or Appointment: 2013
Assistant Treasurer
Ms. Smith also serves as an officer of other funds. Ms. Smith is a Senior Vice President (2016-present) and is an employee of Fidelity Investments. Ms. Smith serves as Assistant Treasurer of certain Fidelity entities and has served in other fund officer roles.
Jim Wegmann (1979)
Year of Election or Appointment: 2021
Deputy Treasurer
Mr. Wegmann also serves as an officer of other funds. Mr. Wegmann is a Vice President (2016-present) and is an employee of Fidelity Investments. Mr. Wegmann serves as Assistant Treasurer of FIMM, LLC (2021-present). Previously, Mr. Wegmann served as Assistant Treasurer of certain Fidelity® funds (2019-2021).
As a shareholder, you incur two types of costs: (1) transaction costs, which may include sales charges (loads) on purchase payments or redemption proceeds, as applicable and (2) ongoing costs, which generally include management fees, distribution and/or service (12b-1) fees and other Fund expenses. This Example is intended to help you understand your ongoing costs (in dollars) of investing in a fund and to compare these costs with the ongoing costs of investing in other mutual funds.
| The Example is based on an investment of $1,000 invested at the beginning of the period and held for the entire period (April 1, 2023 to September 30, 2023). |
Actual Expenses
The first line of the accompanying table provides information about actual account values and actual expenses. You may use the information in this line, together with the amount you invested, to estimate the expenses that you paid over the period. Simply divide your account value by $1,000.00 (for example, an $8,600 account value divided by $1,000.00 = 8.6), then multiply the result by the number in the first line for a class/Fund under the heading entitled "Expenses Paid During Period" to estimate the expenses you paid on your account during this period. If any fund is a shareholder of any underlying mutual funds or exchange-traded funds (ETFs) (the Underlying Funds), such fund indirectly bears its proportional share of the expenses of the Underlying Funds in addition to the direct expenses incurred presented in the table. These fees and expenses are not included in the annualized expense ratio used to calculate the expense estimate in the table below.
Hypothetical Example for Comparison Purposes
The second line of the accompanying table provides information about hypothetical account values and hypothetical expenses based on the actual expense ratio and an assumed rate of return of 5% per year before expenses, which is not the actual return. The hypothetical account values and expenses may not be used to estimate the actual ending account balance or expenses you paid for the period. You may use this information to compare the ongoing costs of investing in the Fund and other funds. To do so, compare this 5% hypothetical example with the 5% hypothetical examples that appear in the shareholder reports of the other funds. If any fund is a shareholder of any Underlying Funds, such fund indirectly bears its proportional share of the expenses of the Underlying Funds in addition to the direct expenses as presented in the table. These fees and expenses are not included in the annualized expense ratio used to calculate the expense estimate in the table below.
Please note that the expenses shown in the table are meant to highlight your ongoing costs only and do not reflect any transaction costs. Therefore, the second line of the table is useful in comparing ongoing costs only, and will not help you determine the relative total costs of owning different funds. In addition, if these transactional costs were included, your costs would have been higher.
| | | | | Annualized Expense Ratio- A | | Beginning Account Value April 1, 2023 | | Ending Account Value September 30, 2023 | | Expenses Paid During Period- C April 1, 2023 to September 30, 2023 |
| | | | | | | | | | |
| Fidelity® Health Savings Index Fund | | | | .11% | | | | | | |
| Actual | | | | | | $ 1,000 | | $ 975.50 | | $ .54 |
Hypothetical-B | | | | | | $ 1,000 | | $ 1,024.52 | | $ .56 |
| |
A Annualized expense ratio reflects expenses net of applicable fee waivers.
B 5% return per year before expenses
C Expenses are equal to the annualized expense ratio, multiplied by the average account value over the period, multiplied by 183/ 365 (to reflect the one-half year period). The fees and expenses of any Underlying Funds are not included in each annualized expense ratio.
The dividend and capital gains distributions for the fund(s) are available on Fidelity.com or Institutional.Fidelity.com.
A total of 50.02% of the dividends distributed during the fiscal year was derived from interest on U.S. Government securities which is generally exempt from state income tax.
The fund designates $216,879 of distributions paid during the fiscal year ended 2023 as qualifying to be taxed as section 163(j) interest dividends.
A percentage of the dividends distributed during the fiscal year for the fund qualify for the dividends-received deduction for corporate shareholders:
| November | 10% |
| December | 10% |
| February | 3% |
| March | 3% |
| April | 3% |
| May | 3% |
| June | 3% |
| July | 3% |
| August | 3% |
| September | 3% |
| | |
A percentage of the dividends distributed during the fiscal year for the fund may be taken into account as a dividend for purposes of the maximum rate under section 1(h)(11) of the Internal Revenue Code:
| October | 13.92% |
| November | 13.92% |
| December | 13.92% |
| February | 2.75% |
| March | 2.75% |
| April | 2.75% |
| May | 2.75% |
| June | 2.75% |
| July | 2.75% |
| August | 2.75% |
| September | 2.75% |
| | |
A percentage of the dividends distributed during the fiscal year for the fund are section 199A dividends:
| October | 0.93% |
| November | 0.93% |
| December | 0.93% |
| | |
The amounts per share which represent income derived from sources within, and taxes paid to, foreign countries or possessions of the United States are as follows:
| | Pay Date | Income | Taxes |
| Fidelity Health Savings Index Fund | | | |
| | 10/10/22 | $0.0049 | $0.0005 |
| | 11/07/22 | $0.0009 | $0.0001 |
| | 12/30/22 | $0.0115 | $0.0011 |
The fund will notify shareholders in January 2024 of amounts for use in preparing 2023 income tax returns.
Board Approval of Investment Advisory Contracts and Management Fees
Fidelity Health Savings Index Fund
Each year, the Board of Trustees, including the Independent Trustees (together, the Board), considers the renewal of the fund's management contract with Fidelity Management & Research Company LLC (FMR) and the sub-advisory agreements (together, the Advisory Contracts) for the fund. FMR and the sub-advisers are referred to herein as the Investment Advisers. The Board, assisted by the advice of fund counsel and Independent Trustees' counsel, requests and considers a broad range of information relevant to the renewal of the Advisory Contracts throughout the year.
The Board meets regularly and, at each of its meetings, covers an extensive agenda of topics and materials and considers factors that are relevant to its annual consideration of the renewal of the fund's Advisory Contracts, including the services and support provided to the fund and its shareholders. The Board's Operations Committee, of which all the Independent Trustees are members, meets regularly throughout the year and requests, receives and considers, among other matters, information related to the annual consideration of the renewal of the fund's Advisory Contracts before making its recommendation to the Board. The Board also meets as needed to review matters specifically related to the Board's annual consideration of the renewal of the Advisory Contracts. Members of the Board may also meet from time to time with trustees of other Fidelity funds through joint ad hoc committees to discuss certain matters relevant to all of the Fidelity funds.
At its September 2023 meeting, the Board unanimously determined to renew the fund's Advisory Contracts. In reaching its determination, the Board considered all factors it believed relevant, including (i) the nature, extent, and quality of the services provided to the fund and its shareholders (including the investment performance of the fund); (ii) the competitiveness relative to peer funds of the fund's management fee and total expense ratio; (iii) the total costs of the services provided by and the profits realized by FMR and its affiliates (Fidelity) from its relationships with the fund; and (iv) the extent to which, if any, economies of scale exist and are realized as the fund grows, and whether any economies of scale are appropriately shared with fund shareholders. The Board also considered the broad range of investment choices available to shareholders from FMR's competitors and that the fund's shareholders have chosen to invest in the fund, which is part of the Fidelity family of funds. The Board's decision to renew the Advisory Contracts was not based on any single factor.
The Board reached a determination, with the assistance of fund counsel and Independent Trustees' counsel and through the exercise of its business judgment, that the renewal of the Advisory Contracts was in the best interests of the fund and its shareholders and that the compensation payable under the Advisory Contracts was fair and reasonable in light of all of the surrounding circumstances.
Nature, Extent, and Quality of Services Provided. The Board considered the Investment Advisers' staffing as it relates to the fund, including the backgrounds and experience of investment personnel, and also considered the Investment Advisers' implementation of the fund's investment program. The Independent Trustees also had discussions with senior management of Fidelity's investment operations and investment groups with responsibility for the underlying Fidelity funds in which the fund invests. The Board considered the structure of the investment personnel compensation program and whether this structure provides appropriate incentives to act in the best interests of the fund. Additionally, the Board considered the portfolio managers' investments, if any, in the funds that they manage.
Resources Dedicated to Investment Management and Support Services. The Board reviewed the general qualifications and capabilities of Fidelity's investment staff, including its size, education, experience, and resources, as well as Fidelity's approach to recruiting, training, managing, and compensating investment personnel. The Board noted the resources devoted to Fidelity's global investment organization, and that Fidelity's analysts have extensive resources, tools, and capabilities that allow them to conduct quantitative and fundamental analysis, as well as credit analysis of issuers, counterparties, and guarantors. Further, the Board considered that Fidelity's investment professionals have sufficient access to global information and data so as to provide competitive investment results over time, and that those professionals also have access to sophisticated tools that permit them to assess portfolio construction and risk and performance attribution characteristics continuously, as well as to transmit new information and research conclusions rapidly around the world. Additionally, in its deliberations, the Board considered Fidelity's trading, risk management, compliance, cybersecurity, and technology and operations capabilities and resources, which are integral parts of the investment management process.
Shareholder and Administrative Services. The Board considered (i) the nature, extent, quality, and cost of advisory, administrative, and shareholder services performed by the Investment Advisers and their affiliates under the Advisory Contracts and under separate agreements covering transfer agency, pricing and bookkeeping, and securities lending services for the fund; (ii) the nature and extent of Fidelity's supervision of third party service providers, principally custodians, subcustodians, and pricing vendors; and (iii) the resources devoted by Fidelity to, and the record of compliance with, the fund's compliance policies and procedures. The Board also reviewed the allocation of fund brokerage, including allocations to brokers affiliated with the Investment Advisers, the use of brokerage commissions to pay fund expenses, and the use of "soft" commission dollars to pay for research services. The Board also considered the fund's securities lending activities and any payments made to Fidelity relating to securities lending.
The Board noted that the growth of fund assets over time across the complex allows Fidelity to reinvest in the development of services designed to enhance the value and convenience of the Fidelity funds as investment vehicles. These services include 24-hour access to account information and market information over the Internet and through telephone representatives, investor education materials and asset allocation tools. The Board also considered that it reviews customer service metrics such as telephone response times, continuity of services on the website and metrics addressing services at Fidelity Investor Centers.
Investment in a Large Fund Family. The Board considered the benefits to shareholders of investing in a fund that is part of a large family of funds offering a variety of investment disciplines and providing a large variety of fund investor services. The Board noted that Fidelity had taken, or had made recommendations to the Board that resulted in the Fidelity funds taking, a number of actions over the previous year that benefited particular funds and/or the Fidelity funds in general.
Investment Performance. The Board took into account discussions that occur with representatives of the Investment Advisers, and reports that it receives, at Board meetings throughout the year relating to fund investment performance. In this regard the Board noted that as part of regularly scheduled fund reviews and other reports to the Board on fund performance, the Board considered annualized return information for the fund for different time periods, measured against one or more appropriate securities market indices, including a customized blended index that reflects the respective weights of the fund's asset classes (each a benchmark index). The Board also considered information about performance attribution. In its evaluation of fund investment performance at meetings throughout the year, the Board gave particular attention to information indicating underperformance of certain Fidelity funds over different time periods and discussed with the Investment Advisers the reasons for such underperformance.
In addition to reviewing absolute and relative fund performance, the Independent Trustees periodically consider the appropriateness of fund performance metrics in evaluating the results achieved. The Independent Trustees generally give greater weight to fund performance over longer time periods than over shorter time periods. Depending on the circumstances, the Independent Trustees may be satisfied with a fund's performance notwithstanding that it lags its benchmark index or peer group for certain periods.
Based on its review, the Board concluded that the nature, extent, and quality of services provided to the fund under the Advisory Contracts should continue to benefit the shareholders of the fund.
Competitiveness of Management Fee and Total Expense Ratio. The Board was provided with information regarding industry trends in management fees and expenses. In its review of the fund's management fee and total expense ratio, the Board considered the fund's unitary (subject to limited exceptions) fee rate as well as other fund expenses paid by FMR under the fund's management contract, such as transfer agent fees, pricing and bookkeeping fees, and custodial, legal and audit fees. The Board also noted that Fidelity may agree to waive fees or reimburse expenses from time to time, and the extent to which, if any, it has done so for the fund.
Comparisons of Management Fees and Total Expense Ratios. Among other things, the Board reviewed data for selected groups of competitive funds and classes (referred to as "mapped groups") that were compiled by Fidelity based on combining similar investment objective categories (as classified by Lipper) that have comparable investment mandates. The data reviewed by the Board included (i) gross management fee comparisons (before taking into account expense reimbursements or caps) relative to the total universe of funds within the mapped group; (ii) gross management fee comparisons relative to a subset of non-Fidelity funds in the mapped group that are similar in size and management fee structure to the fund (referred to as the "asset size peer group"); (iii) total expense comparisons of the fund relative to funds and classes in the mapped group that have a similar sales load structure to the fund (referred to as the "similar sales load structure group"); and (iv) total expense comparisons of the fund relative to funds and classes in the similar sales load structure group that are similar in size and management fee structure to the fund (referred to as the "total expense asset size peer group").
The information provided to the Board indicated that the fund's management fee rate ranked above the competitive median of the mapped group for 2022 and above the competitive median of the asset size peer group for 2022. Further, the information provided to the Board indicated that the total expense ratio of the fund ranked below the competitive median of the similar sales load structure group for 2022 and below the competitive median of the total expense asset size peer group for 2022. The fund has a unitary fee that covers services and fees beyond those related to portfolio management services, unlike the majority of funds within its mapped group. The Board noted that when compared to competitors based on total expenses, the total expense ratio of the fund ranked below the competitive median.
Fees Charged to Other Fidelity Clients. The Board also considered Fidelity fee structures and other information with respect to clients of Fidelity, such as other funds advised or subadvised by Fidelity, pension plan clients, and other institutional clients with similar mandates. The Board noted that a joint ad hoc committee created by it and the boards of other Fidelity funds periodically reviews and compares Fidelity's institutional investment advisory business with its business of providing services to the Fidelity funds and also noted the most recent findings of the committee. The Board noted that the committee's review included a consideration of the differences in services provided, fees charged, and costs incurred, as well as competition in the markets serving the different categories of clients.
Based on its review, the Board concluded that the fund's management fee is fair and reasonable in light of the services that the fund receives and the other factors considered. Further, based on its review of total expense ratios and fees charged to other Fidelity clients, the Board concluded that the total expense ratio of the fund was reasonable in light of the services that the fund and its shareholders receive and the other factors considered.
Costs of the Services and Profitability. The Board considered the revenues earned and the expenses incurred by Fidelity in conducting the business of developing, marketing, distributing, managing, administering and servicing the fund and servicing the fund's shareholders. The Board also considered the level of Fidelity's profits in respect of all the Fidelity funds, including the Fidelity funds in which the fund invests.
On an annual basis, Fidelity presents to the Board information about the profitability of its relationships with the fund. Fidelity calculates profitability information for each fund, as well as aggregate profitability information for groups of Fidelity funds and all Fidelity funds, using a series of detailed revenue and cost allocation methodologies which originate with the books and records of Fidelity on which Fidelity's audited financial statements are based. The Audit Committee of the Board reviews any significant changes from the prior year's methodologies and the full Board approves such changes.
A public accounting firm has been engaged annually by the Board as part of the Board's assessment of Fidelity's profitability analysis. The engagement includes the review and assessment of the methodologies used by Fidelity in determining the revenues and expenses attributable to Fidelity's fund business, and completion of agreed-upon procedures in respect of the mathematical accuracy of certain fund profitability information and its conformity to established allocation methodologies. After considering the reports issued under the engagement and information provided by Fidelity, the Board concluded that while other allocation methods may also be reasonable, Fidelity's profitability methodologies are reasonable in all material respects.
The Board also reviewed Fidelity's non-fund businesses and potential indirect benefits such businesses may have received as a result of their association with Fidelity's fund business (i.e., fall-out benefits) as well as cases where Fidelity's affiliates may benefit from the funds' business. The Board considered areas where potential indirect benefits to the Fidelity funds from their relationships with Fidelity may exist. The Board's consideration of these matters was informed by the findings of a joint ad hoc committee created by it and the boards of other Fidelity funds to evaluate potential fall-out benefits.
The Board considered the costs of the services provided by and the profits realized by Fidelity in connection with the operation of the fund and was satisfied that the profitability was not excessive.
Economies of Scale. The Board considered whether there have been economies of scale in respect of the management of the Fidelity funds, whether the Fidelity funds (including the fund) have appropriately benefited from any such economies of scale, and whether there is potential for realization of any further economies of scale. The Board considered the extent to which the fund will benefit from economies of scale as assets grow through increased services to the fund, through waivers or reimbursements, or through fee or expense ratio reductions. The Board recognized that, due to the fund's current contractual arrangements, its expense ratio will not decline if the fund's operating costs decrease as assets grow, or rise as assets decrease. The Board also noted that a committee created by it and the boards of other Fidelity funds periodically analyzes whether Fidelity attains economies of scale in respect of the management and servicing of the Fidelity funds, whether the Fidelity funds have appropriately benefited from such economies of scale, and whether there is potential for realization of any further economies of scale.
The Board concluded, taking into account the analysis of the committee, that economies of scale, if any, are being appropriately shared between fund shareholders and Fidelity.
Additional Information Requested by the Board. In order to develop fully the factual basis for consideration of the Fidelity funds' advisory contracts, the Board requested and received additional information on certain topics, including: (i) Fidelity's fund profitability methodology, profitability trends for certain funds, the allocation of various costs to different funds, and the impact of certain factors on fund profitability results; (ii) portfolio manager changes that have occurred during the past year and Fidelity's views regarding portfolio manager investment in the Fidelity funds that they manage; (iii) hiring, training, and retaining personnel; (iv) the arrangements with and compensation paid to certain fund sub-advisers and the treatment of such compensation within Fidelity's fund profitability methodology; (v) the terms of the funds' various management fee structures, including the basic group fee and the terms of Fidelity's voluntary expense limitation arrangements; (vi) Fidelity's transfer agent, pricing and bookkeeping fees, expense and service structures for different funds and classes relative to competitive trends and market conditions; (vii) the impact on fund profitability of recent industry trends, such as the growth in passively managed funds and the changes in flows for different types of funds; (viii) the types of management fee and total expense comparisons provided, and the challenges and limitations associated with such information; (ix) explanations regarding the relative total expense ratios and management fees of certain funds and classes, total expense and management fee competitive trends, and methodologies for total expense and management fee competitive comparisons; (x) information concerning expense limitations applicable to certain funds; and (xi) matters related to money market funds, exchange-traded funds, and target date funds.
Conclusion. Based on its evaluation of all of the conclusions noted above, and after considering all factors it believed relevant, the Board, including the Independent Trustees, concluded that the advisory and sub-advisory fee arrangements are fair and reasonable in light of all of the surrounding circumstances and that the fund's Advisory Contracts should be renewed through September 30, 2024.
1.9897521.103
HSI-ANN-1123
Item 2.
Code of Ethics
As of the end of the period, September 30, 2023, Fidelity Charles Street Trust (the trust) has adopted a code of ethics, as defined in Item 2 of Form N-CSR, that applies to its President and Treasurer and its Chief Financial Officer. A copy of the code of ethics is filed as an exhibit to this Form N-CSR.
Item 3.
Audit Committee Financial Expert
The Board of Trustees of the trust has determined that Elizabeth S. Acton is an audit committee financial expert, as defined in Item 3 of Form N-CSR. Ms. Acton is independent for purposes of Item 3 of Form N-CSR.
Item 4.
Principal Accountant Fees and Services
Fees and Services
The following table presents fees billed by Deloitte & Touche LLP, the member firms of Deloitte Touche Tohmatsu, and their respective affiliates (collectively, “Deloitte Entities”) in each of the last two fiscal years for services rendered to Fidelity Asset Manager 20%, Fidelity Asset Manager 30%, Fidelity Asset Manager 40%, Fidelity Asset Manager 50%, Fidelity Asset Manager 60%, Fidelity Asset Manager 70%, Fidelity Asset Manager 85%, Fidelity Health Savings Fund, Fidelity Health Savings Index Fund, and Fidelity Sustainable Multi-Asset Fund for services rendered to (the “Fund(s)”):
Services Billed by Deloitte Entities
September 30, 2023 FeesA
| | | | |
| Audit Fees | Audit-Related Fees | Tax Fees | All Other Fees |
Fidelity Asset Manager 20% | $21,000 | $- | $8,100 | $600 |
Fidelity Asset Manager 30% | $20,900 | $- | $8,100 | $600 |
Fidelity Asset Manager 40% | $20,900 | $- | $8,100 | $600 |
Fidelity Asset Manager 50% | $21,100 | $- | $8,100 | $600 |
Fidelity Asset Manager 60% | $21,000 | $- | $8,100 | $600 |
Fidelity Asset Manager 70% | $21,000 | $- | $8,100 | $600 |
Fidelity Asset Manager 85% | $21,000 | $- | $8,100 | $600 |
Fidelity Health Savings Fund | $16,200 | $- | $8,100 | $500 |
Fidelity Health Savings Index Fund | $15,600 | $- | $8,100 | $500 |
Fidelity Sustainable Multi-Asset Fund | $22,000 | $- | $8,100 | $600 |
September 30, 2022 FeesA,B
| | | | |
| Audit Fees | Audit-Related Fees | Tax Fees | All Other Fees |
|
|
|
|
|
|
|
|
|
|
Fidelity Asset Manager 20% | $20,500 | $- | $7,800 | $500 |
Fidelity Asset Manager 30% | $20,500 | $- | $7,800 | $500 |
Fidelity Asset Manager 40% | $20,500 | $- | $7,800 | $500 |
Fidelity Asset Manager 50% | $20,500 | $- | $7,800 | $500 |
Fidelity Asset Manager 60% | $20,500 | $- | $7,800 | $500 |
Fidelity Asset Manager 70% | $20,500 | $- | $7,800 | $500 |
Fidelity Asset Manager 85% | $20,500 | $- | $7,800 | $500 |
Fidelity Health Savings Fund | $15,800 | $- | $7,600 | $500 |
Fidelity Health Savings Index Fund | $15,200 | $- | $7,600 | $400 |
Fidelity Sustainable Multi-Asset Fund | $18,000 | $- | $7,100 | $300 |
A Amounts may reflect rounding.
B Fidelity Sustainable Multi-Asset Fund commenced operations on February 10, 2022.
The following table presents fees billed by PricewaterhouseCoopers LLP (“PwC”) in each of the last two fiscal years for services rendered to Aggressive Growth Allocation Fund, Balanced Allocation Fund, Growth Allocation Fund, and Moderate with Income Allocation Fund (the “Funds”):
Services Billed by PwC
September 30, 2023 FeesA
| | | | |
| Audit Fees | Audit-Related Fees | Tax Fees | All Other Fees |
Aggressive Growth Allocation Fund | $14,700 | $1,400 | $7,600 | $600 |
Balanced Allocation Fund | $14,700 | $1,400 | $7,600 | $600 |
Growth Allocation Fund | $14,700 | $1,400 | $7,600 | $600 |
Moderate with Income Allocation Fund | $14,700 | $1,400 | $6,000 | $600 |
September 30, 2022 FeesA,B
| | | | |
| Audit Fees | Audit-Related Fees | Tax Fees | All Other Fees |
Aggressive Growth Allocation Fund | $11,900 | $800 | $5,000 | $400 |
Balanced Allocation Fund | $11,900 | $800 | $5,000 | $400 |
Growth Allocation Fund | $11,900 | $800 | $5,000 | $400 |
Moderate with Income Allocation Fund | $11,900 | $800 | $5,000 | $400 |
A Amounts may reflect rounding.
B Aggressive Growth Allocation Fund, Balanced Allocation Fund, Growth Allocation Fund, and Moderate with Income Allocation Fund commenced operations on February 9, 2022.
The following table(s) present(s) fees billed by Deloitte Entities and PwC that were required to be approved by the Audit Committee for services that relate directly to the operations and financial reporting of the Fund(s) and that are rendered on behalf of Fidelity Management & Research Company LLC ("FMR") and entities controlling, controlled by, or under common control with FMR (not including any sub-adviser whose role is primarily portfolio management and is subcontracted with or overseen by another investment adviser) that provide ongoing services to the Fund(s) (“Fund Service Providers”):
Services Billed by Deloitte Entities
| | |
| September 30, 2023A | September 30, 2022A,B |
Audit-Related Fees | $- | $- |
Tax Fees | $- | $- |
All Other Fees | $- | $- |
A Amounts may reflect rounding.
B May include amounts billed prior to the Fidelity Sustainable Multi-Asset Fund’s commencement of operations.
Services Billed by PwC
| | |
| September 30, 2023A | September 30, 2022A,B |
Audit-Related Fees | $8,284,200 | $7,914,600 |
Tax Fees | $1,000 | $1,000 |
All Other Fees | $- | $- |
A Amounts may reflect rounding.
B May include amounts billed prior to the Aggressive Growth Allocation Fund, Balanced Allocation Fund, Growth Allocation Fund, and Moderate with Income Allocation Funds’ commencement of operations.
“Audit-Related Fees” represent fees billed for assurance and related services that are reasonably related to the performance of the fund audit or the review of the fund's financial statements and that are not reported under Audit Fees.
“Tax Fees” represent fees billed for tax compliance, tax advice or tax planning that relate directly to the operations and financial reporting of the fund.
“All Other Fees” represent fees billed for services provided to the fund or Fund Service Provider, a significant portion of which are assurance related, that relate directly to the operations and financial reporting of the fund, excluding those services that are reported under Audit Fees, Audit-Related Fees or Tax Fees.
Assurance services must be performed by an independent public accountant.
* * *
The aggregate non-audit fees billed by Deloitte Entities and PwC for services rendered to the Fund(s), FMR (not including any sub-adviser whose role is primarily portfolio management and is subcontracted with or overseen by another investment adviser), and any Fund Service Provider for each of the last two fiscal years of the Fund(s) are as follows:
| | | | | |
Billed By | September 30, 2023A | September 30, 2022A,B |
Deloitte Entities | $329,400 | $539,200 | |
PwC | $13,624,600 | $12,907,800 | |
A Amounts may reflect rounding.
B May include amounts billed prior to the Aggressive Growth Allocation Fund, Balanced Allocation Fund, Fidelity Sustainable Multi-Asset Fund, Growth Allocation Fund, and Moderate with Income Allocation Funds’ commencement of operations.
The trust's Audit Committee has considered non-audit services that were not pre-approved that were provided by Deloitte Entities and PwC to Fund Service Providers to be compatible with maintaining the independence of Deloitte Entities and PwC in its(their) audit of the Fund(s), taking into account representations from Deloitte Entities and PwC, in accordance with Public Company Accounting Oversight Board rules, regarding its independence from the Fund(s) and its(their) related entities and FMR’s review of the appropriateness and permissibility under applicable law of such non-audit services prior to their provision to the Fund(s) Service Providers.
Audit Committee Pre-Approval Policies and Procedures
The trust’s Audit Committee must pre-approve all audit and non-audit services provided by a fund’s independent registered public accounting firm relating to the operations or financial reporting of the fund. Prior to the commencement of any audit or non-audit services to a fund, the Audit Committee reviews the services to determine whether they are appropriate and permissible under applicable law.
The Audit Committee has adopted policies and procedures to, among other purposes, provide a framework for the Committee’s consideration of non-audit services by the audit firms that audit the Fidelity funds. The policies and procedures require that any non-audit service provided by a fund audit firm to a Fidelity fund and any non-audit service provided by a fund auditor to a Fund Service Provider that relates directly to the operations and financial reporting of a Fidelity fund (“Covered Service”) are subject to approval by the Audit Committee before such service is provided.
All Covered Services must be approved in advance of provision of the service either: (i) by formal resolution of the Audit Committee, or (ii) by oral or written approval of the service by the Chair of the Audit Committee (or if the Chair is unavailable, such other member of the Audit Committee as may be designated by the Chair to act in the Chair’s absence). The approval contemplated by (ii) above is permitted where the Treasurer determines that action on such an engagement is necessary before the next meeting of the Audit Committee.
Non-audit services provided by a fund audit firm to a Fund Service Provider that do not relate directly to the operations and financial reporting of a Fidelity fund are reported to the Audit Committee periodically.
Non-Audit Services Approved Pursuant to Rule 2-01(c)(7)(i)(C) and (ii) of Regulation S-X (“De Minimis Exception”)
There were no non-audit services approved or required to be approved by the Audit Committee pursuant to the De Minimis Exception during the Fund’s(s’) last two fiscal years relating to services provided to (i) the Fund(s) or (ii) any Fund Service Provider that relate directly to the operations and financial reporting of the Fund(s).
The Registrant has not retained, for the preparation of the audit report on the financial statements included in the Form N-CSR, a registered public accounting firm that has a branch or office that is located in a foreign jurisdiction and that the Public Company Accounting Oversight Board (the “PCAOB”) has determined that the PCAOB is unable to inspect or investigate completely because of a position taken by an authority in the foreign jurisdiction.
The Registrant is not a “foreign issuer,” as defined in 17 CFR 240.3b-4.
Item 5.
Audit Committee of Listed Registrants
Not applicable.
Item 6.
Investments
(a)
Not applicable.
(b)
Not applicable.
Item 7.
Disclosure of Proxy Voting Policies and Procedures for Closed-End Management Investment Companies
Not applicable.
Item 8.
Portfolio Managers of Closed-End Management Investment Companies
Not applicable.
Item 9.
Purchase of Equity Securities by Closed-End Management Investment Company and Affiliated Purchasers
Not applicable.
Item 10.
Submission of Matters to a Vote of Security Holders
There were no material changes to the procedures by which shareholders may recommend nominees to the trust’s Board of Trustees.
Item 11.
Controls and Procedures
(a)(i) The President and Treasurer and the Chief Financial Officer have concluded that the trust’s disclosure controls and procedures (as defined in Rule 30a-3(c) under the Investment Company Act) provide reasonable assurances that material information relating to the trust is made known to them by the appropriate persons, based on their evaluation of these controls and procedures as of a date within 90 days of the filing date of this report.
(a)(ii) There was no change in the trust’s internal control over financial reporting (as defined in Rule 30a-3(d) under the Investment Company Act) that occurred during the period covered by this report that has materially affected, or is reasonably likely to materially affect, the trust’s internal control over financial reporting.
Item 12.
Disclosure of Securities Lending Activities for Closed-End Management
Investment Companies
Not applicable.
Item 13.
Exhibits
SIGNATURES
Pursuant to the requirements of the Securities Exchange Act of 1934 and the Investment Company Act of 1940, the registrant has duly caused this report to be signed on its behalf by the undersigned, thereunto duly authorized.
Fidelity Charles Street Trust
| |
By: | /s/Laura M. Del Prato |
| Laura M. Del Prato |
| President and Treasurer |
|
|
Date: | November 21, 2023 |
Pursuant to the requirements of the Securities Exchange Act of 1934 and the Investment Company Act of 1940, this report has been signed below by the following persons on behalf of the registrant and in the capacities and on the dates indicated.
| |
By: | /s/Laura M. Del Prato |
| Laura M. Del Prato |
| President and Treasurer |
|
|
Date: | November 21, 2023 |
| |
By: | /s/John J. Burke III |
| John J. Burke III |
| Chief Financial Officer |
|
|
Date: | November 21, 2023 |