Fidelity Asset Manager® Funds - 20%, 30%, 40%, 50%, 60%, 70%, 85%
Fidelity Advisor Asset Manager® 20%
Fidelity Advisor Asset Manager® 30%
Fidelity Advisor Asset Manager® 40%
Fidelity Advisor Asset Manager® 50%
Fidelity Advisor Asset Manager® 60%
Fidelity Advisor Asset Manager® 70%
Fidelity Advisor Asset Manager® 85%
Annual Report
September 30, 2020
Includes Fidelity and Fidelity Advisor share classes

See the inside front cover for important information about access to your fund’s shareholder reports.

Beginning on January 1, 2021, as permitted by regulations adopted by the Securities and Exchange Commission, paper copies of a fund’s shareholder reports will no longer be sent by mail, unless you specifically request paper copies of the reports from the fund or from your financial intermediary, such as a financial advisor, broker-dealer or bank. Instead, the reports will be made available on a website, and you will be notified by mail each time a report is posted and provided with a website link to access the report.
If you already elected to receive shareholder reports electronically, you will not be affected by this change and you need not take any action. You may elect to receive shareholder reports and other communications from a fund electronically, by contacting your financial intermediary. For Fidelity customers, visit Fidelity's web site or call Fidelity using the contact information listed below.
You may elect to receive all future reports in paper free of charge. If you wish to continue receiving paper copies of your shareholder reports, you may contact your financial intermediary or, if you are a Fidelity customer, visit Fidelity’s website, or call Fidelity at the applicable toll-free number listed below. Your election to receive reports in paper will apply to all funds held with the fund complex/your financial intermediary.
| Account Type | Website | Phone Number |
| Brokerage, Mutual Fund, or Annuity Contracts: | fidelity.com/mailpreferences | 1-800-343-3548 |
| Employer Provided Retirement Accounts: | netbenefits.fidelity.com/preferences (choose 'no' under Required Disclosures to continue to print) | 1-800-343-0860 |
| Advisor Sold Accounts Serviced Through Your Financial Intermediary: | Contact Your Financial Intermediary | Your Financial Intermediary's phone number |
| Advisor Sold Accounts Serviced by Fidelity: | institutional.fidelity.com | 1-877-208-0098 |
Contents
To view a fund's proxy voting guidelines and proxy voting record for the 12-month period ended June 30, visit http://www.fidelity.com/proxyvotingresults or visit the Securities and Exchange Commission's (SEC) web site at http://www.sec.gov.
You may also call 1-800-544-8544 if you’re an individual investing directly with Fidelity, call 1-800-835-5092 if you’re a plan sponsor or participant with Fidelity as your recordkeeper or call 1-877-208-0098 on institutional accounts or if you’re an advisor or invest through one to request a free copy of the proxy voting guidelines.
Standard & Poor's, S&P and S&P 500 are registered service marks of The McGraw-Hill Companies, Inc. and have been licensed for use by Fidelity Distributors Corporation.
Other third-party marks appearing herein are the property of their respective owners.
All other marks appearing herein are registered or unregistered trademarks or service marks of FMR LLC or an affiliated company. © 2020 FMR LLC. All rights reserved.
This report and the financial statements contained herein are submitted for the general information of the shareholders of the Funds. This report is not authorized for distribution to prospective investors in the Funds unless preceded or accompanied by an effective prospectus.
A fund files its complete schedule of portfolio holdings with the SEC for the first and third quarters of each fiscal year on Form N-PORT. Forms N-PORT are available on the SEC’s web site at http://www.sec.gov. A fund's Forms N-PORT may be reviewed and copied at the SEC’s Public Reference Room in Washington, DC. Information regarding the operation of the SEC's Public Reference Room may be obtained by calling 1-800-SEC-0330.
For a complete list of a fund's portfolio holdings, view the most recent holdings listing, semiannual report, or annual report on Fidelity's web site at http://www.fidelity.com, http://www.institutional.fidelity.com, or http://www.401k.com, as applicable.
NOT FDIC INSURED •MAY LOSE VALUE •NO BANK GUARANTEE
Neither the Funds nor Fidelity Distributors Corporation is a bank.
Notes to Shareholders:
Early in 2020, the outbreak and spread of a new coronavirus emerged as a public health emergency that had a major influence on financial markets, primarily based on its impact on the global economy and the outlook for corporate earnings. The virus causes a respiratory disease known as COVID-19. On March 11, the World Health Organization declared the COVID-19 outbreak a pandemic, citing sustained risk of further global spread.
In the weeks following, as the crisis worsened, we witnessed an escalating human tragedy with wide-scale social and economic consequences from coronavirus-containment measures. The outbreak of COVID-19 prompted a number of measures to limit the spread, including travel and border restrictions, quarantines, and restrictions on large gatherings. In turn, these resulted in lower consumer activity, diminished demand for a wide range of products and services, disruption in manufacturing and supply chains, and – given the wide variability in outcomes regarding the outbreak – significant market uncertainty and volatility. Amid the turmoil, the U.S. government took unprecedented action – in concert with the U.S. Federal Reserve and central banks around the world – to help support consumers, businesses, and the broader economy, and to limit disruption to the financial system.
The situation continues to unfold, and the extent and duration of its impact on financial markets and the economy remain highly uncertain. Extreme events such as the coronavirus crisis are “exogenous shocks” that can have significant adverse effects on mutual funds and their investments. Although multiple asset classes may be affected by market disruption, the duration and impact may not be the same for all types of assets.
Fidelity is committed to helping you stay informed amid news about COVID-19 and during increased market volatility, and we’re taking extra steps to be responsive to customer needs. We encourage you to visit our websites, where we offer ongoing updates, commentary, and analysis on the markets and our funds.
In September 2020, Fidelity Asset Manager® Funds changed the means by which they attain their U.S. equity exposure, from 10 individual Fidelity sector central funds to one consolidated, multisector portfolio (Fidelity U.S. Equity Central Fund). This new, broad-based investment vehicle provides additional tax efficiencies and more flexibility for the sector specialists to express their convictions, advantages that should serve shareholders well.
Fidelity Asset Manager® 20%
Performance: The Bottom Line
Average annual total return reflects the change in the value of an investment, assuming reinvestment of distributions from dividend income and capital gains (the profits earned upon the sale of securities that have grown in value, if any) and assuming a constant rate of performance each year. The hypothetical investment and the average annual total returns do not reflect the deduction of taxes that a shareholder would pay on fund distributions or the redemption of fund shares. During periods of reimbursement by Fidelity, a fund’s total return will be greater than it would be had the reimbursement not occurred. How a fund did yesterday is no guarantee of how it will do tomorrow.
Average Annual Total Returns
| Periods ended September 30, 2020 | Past 1 year | Past 5 years | Past 10 years |
| Class A (incl. 5.75% sales charge) | (0.06)% | 3.46% | 3.57% |
| Class M (incl. 3.50% sales charge) | 2.09% | 3.69% | 3.55% |
| Class C (incl. contingent deferred sales charge) | 4.22% | 3.91% | 3.40% |
| Fidelity Asset Manager® 20% | 6.29% | 5.03% | 4.50% |
| Class I | 6.27% | 4.97% | 4.46% |
| Class Z | 6.41% | 5.02% | 4.49% |
Class C shares' contingent deferred sales charges included in the past one year, past five years and past ten years total return figures are 1%, 0% and 0%, respectively.
The initial offering of Class Z shares took place on October 2, 2018. Returns prior to October 2, 2018, are those of Class I.
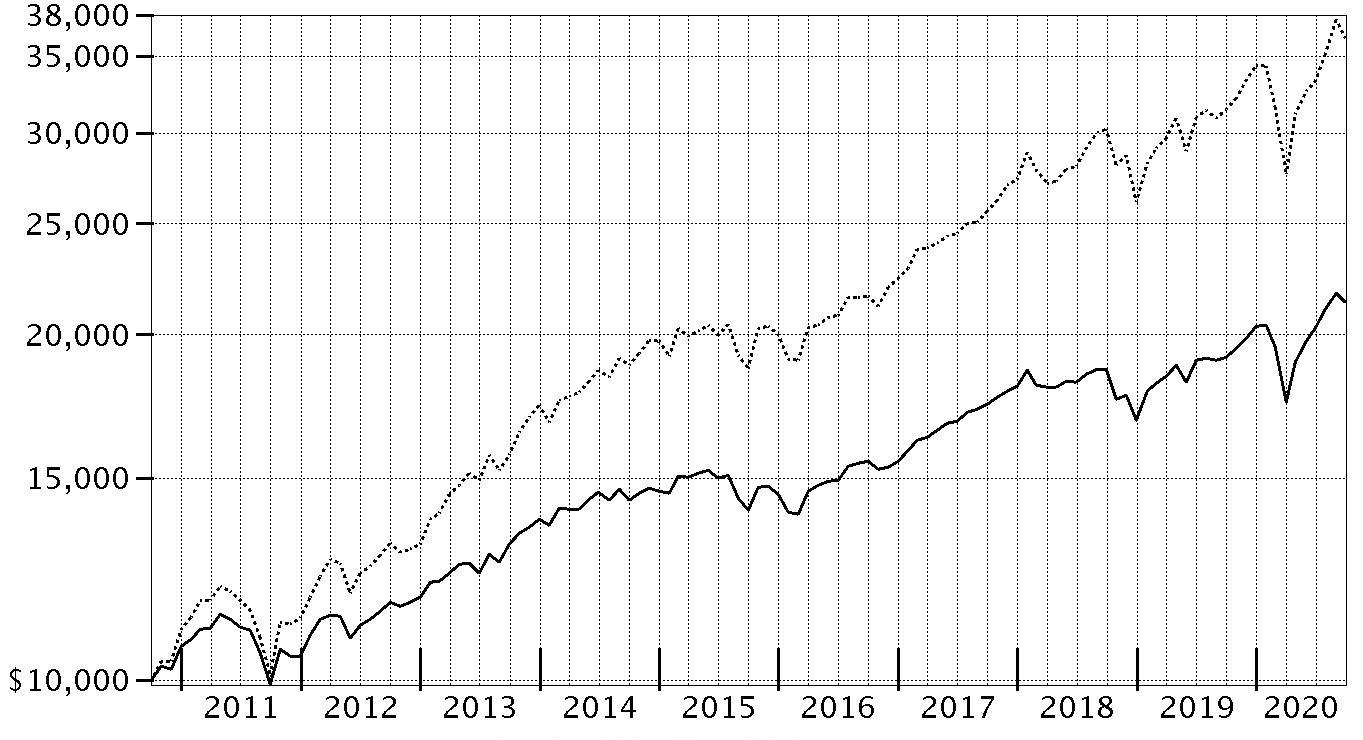
$10,000 Over 10 Years
Let's say hypothetically that $10,000 was invested in Fidelity Asset Manager® 20%, a class of the fund, on September 30, 2010.
The chart shows how the value of your investment would have changed, and also shows how the Bloomberg Barclays U.S. Aggregate Bond Index performed over the same period.
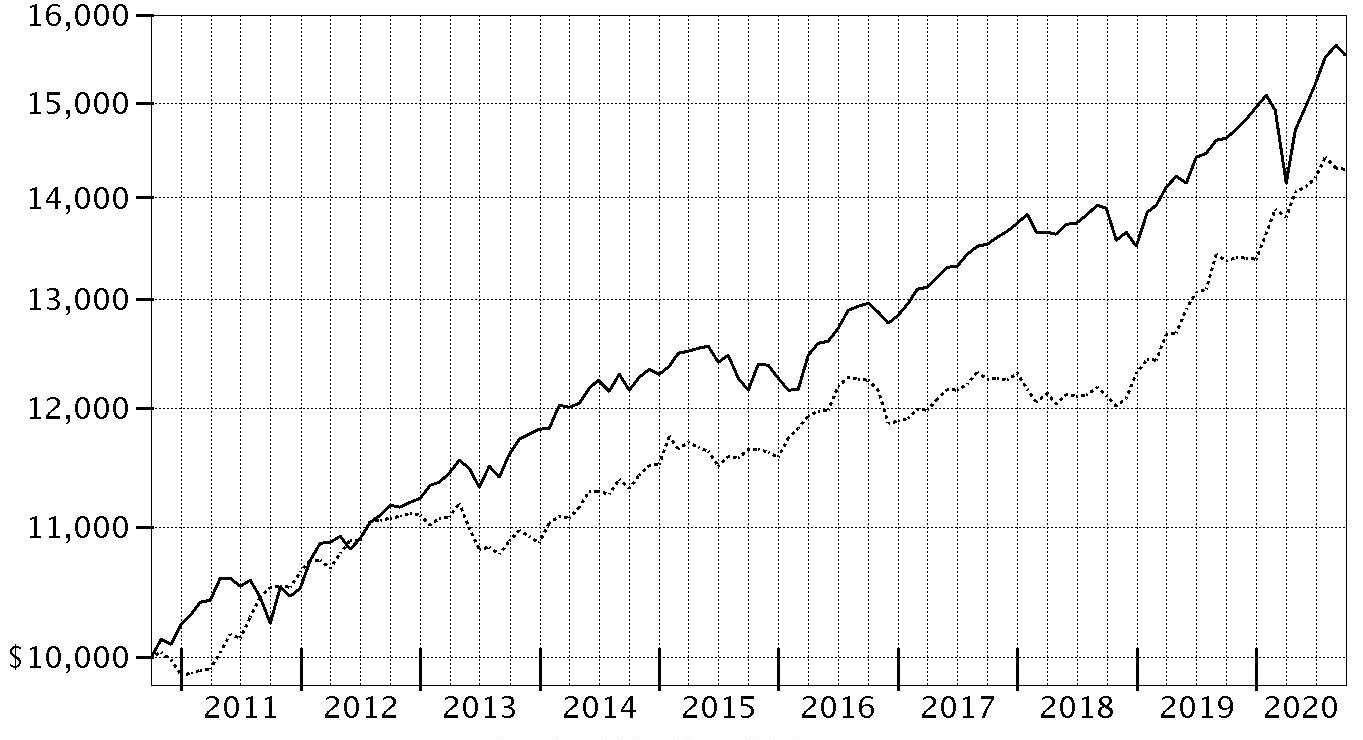
| Period Ending Values |
| $15,537 | Fidelity Asset Manager® 20% |
| $14,291 | Bloomberg Barclays U.S. Aggregate Bond Index |
Fidelity Asset Manager® 30%
Performance: The Bottom Line
Average annual total return reflects the change in the value of an investment, assuming reinvestment of distributions from dividend income and capital gains (the profits earned upon the sale of securities that have grown in value, if any) and assuming a constant rate of performance each year. The hypothetical investment and the average annual total returns do not reflect the deduction of taxes that a shareholder would pay on fund distributions or the redemption of fund shares. During periods of reimbursement by Fidelity, a fund’s total return will be greater than it would be had the reimbursement not occurred. How a fund did yesterday is no guarantee of how it will do tomorrow.
Average Annual Total Returns
| Periods ended September 30, 2020 | Past 1 year | Past 5 years | Past 10 years |
| Class A (incl. 5.75% sales charge) | 1.63% | 4.63% | 4.63% |
| Class M (incl. 3.50% sales charge) | 3.72% | 4.83% | 4.60% |
| Class C (incl. contingent deferred sales charge) | 6.00% | 5.06% | 4.45% |
| Fidelity Asset Manager® 30% | 8.05% | 6.17% | 5.57% |
| Class I | 8.00% | 6.10% | 5.51% |
| Class Z | 8.10% | 6.14% | 5.53% |
Class C shares' contingent deferred sales charges included in the past one year, past five years and past ten years total return figures are 1%, 0% and 0%, respectively.
The initial offering of Class Z shares took place on October 2, 2018. Returns prior to October 2, 2018, are those of Class I.
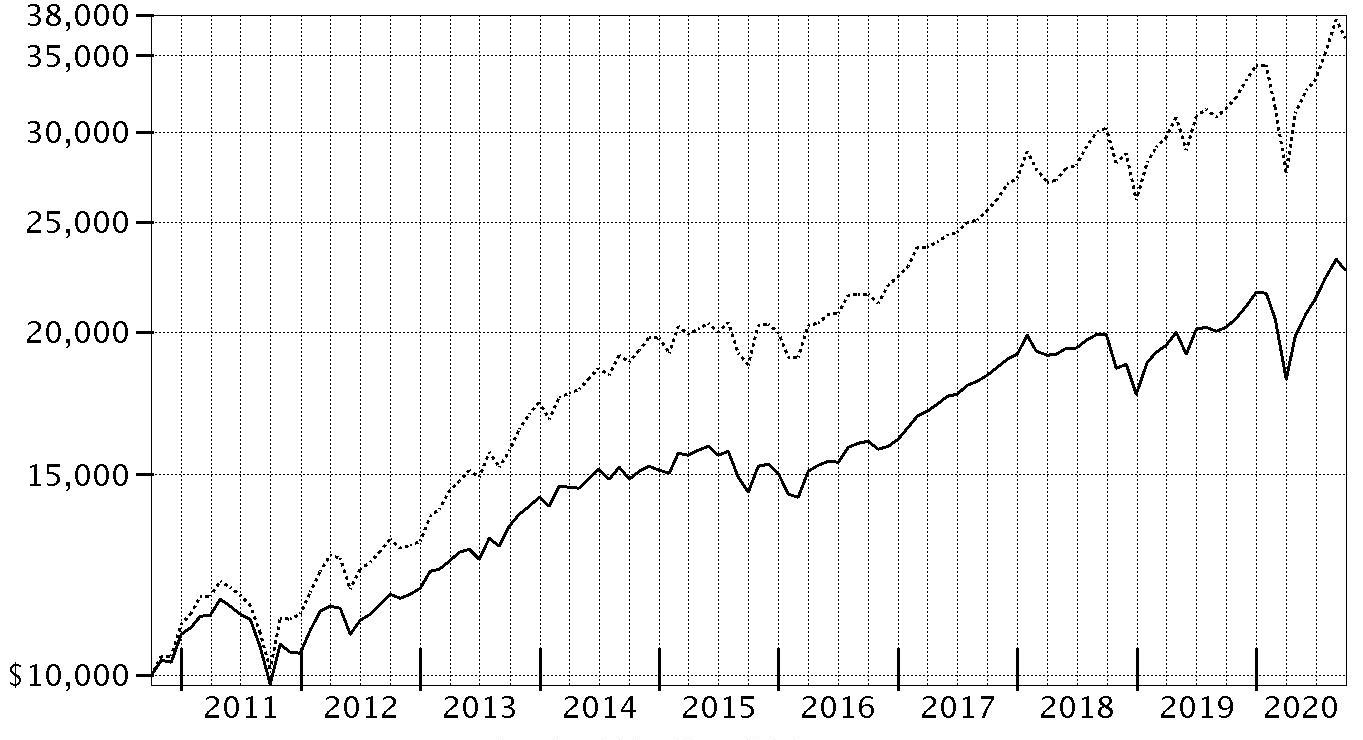
$10,000 Over 10 Years
Let's say hypothetically that $10,000 was invested in Fidelity Asset Manager® 30%, a class of the fund, on September 30, 2010.
The chart shows how the value of your investment would have changed, and also shows how the Bloomberg Barclays U.S. Aggregate Bond Index performed over the same period.
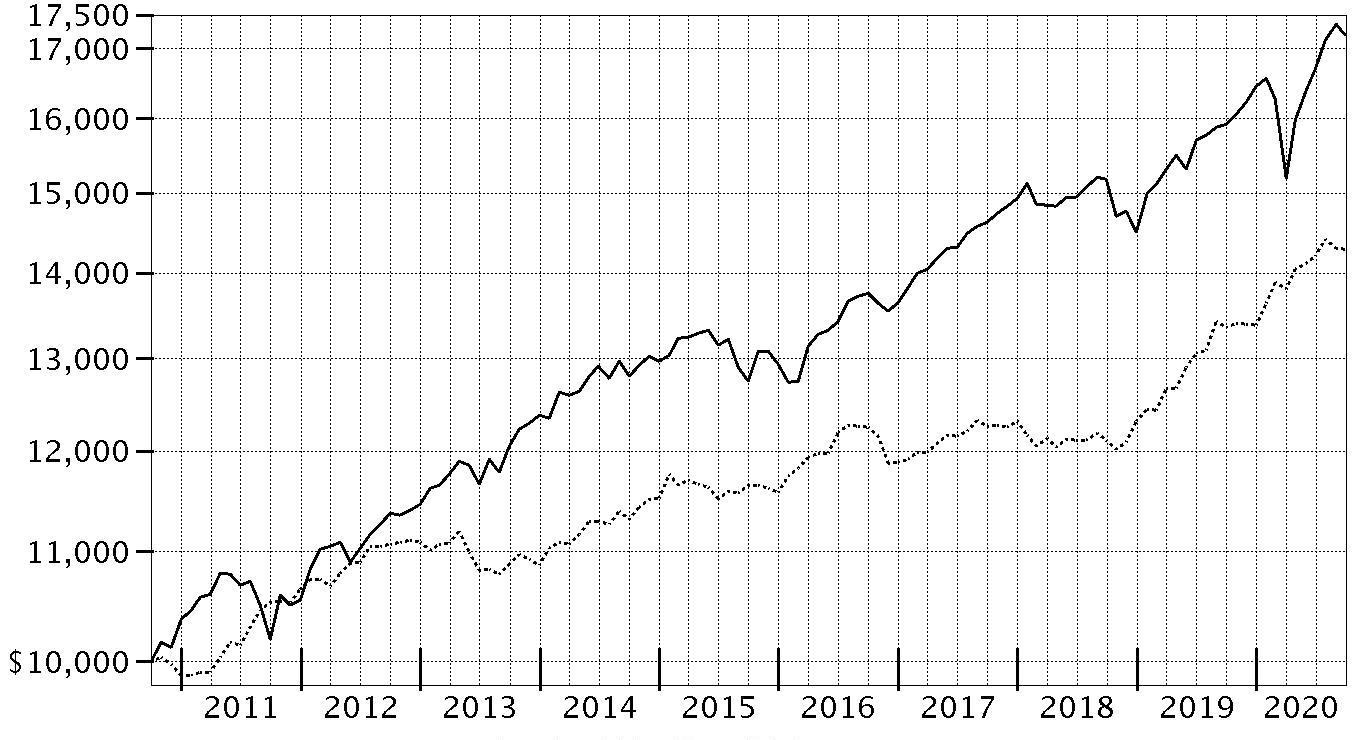
| Period Ending Values |
| $17,199 | Fidelity Asset Manager® 30% |
| $14,291 | Bloomberg Barclays U.S. Aggregate Bond Index |
Fidelity Asset Manager® 40%
Performance: The Bottom Line
Average annual total return reflects the change in the value of an investment, assuming reinvestment of distributions from dividend income and capital gains (the profits earned upon the sale of securities that have grown in value, if any) and assuming a constant rate of performance each year. The hypothetical investment and the average annual total returns do not reflect the deduction of taxes that a shareholder would pay on fund distributions or the redemption of fund shares. During periods of reimbursement by Fidelity, a fund’s total return will be greater than it would be had the reimbursement not occurred. How a fund did yesterday is no guarantee of how it will do tomorrow.
Average Annual Total Returns
| Periods ended September 30, 2020 | Past 1 year | Past 5 years | Past 10 years |
| Class A (incl. 5.75% sales charge) | 2.79% | 5.53% | 5.50% |
| Class M (incl. 3.50% sales charge) | 4.99% | 5.75% | 5.48% |
| Class C (incl. contingent deferred sales charge) | 7.25% | 5.96% | 5.32% |
| Fidelity Asset Manager® 40% | 9.41% | 7.12% | 6.45% |
| Class I | 9.35% | 7.07% | 6.41% |
| Class Z | 9.45% | 7.10% | 6.42% |
Class C shares' contingent deferred sales charges included in the past one year, past five years and past ten years total return figures are 1%, 0% and 0%, respectively.
The initial offering of Class Z shares took place on October 2, 2018. Returns prior to October 2, 2018, are those of Class I.
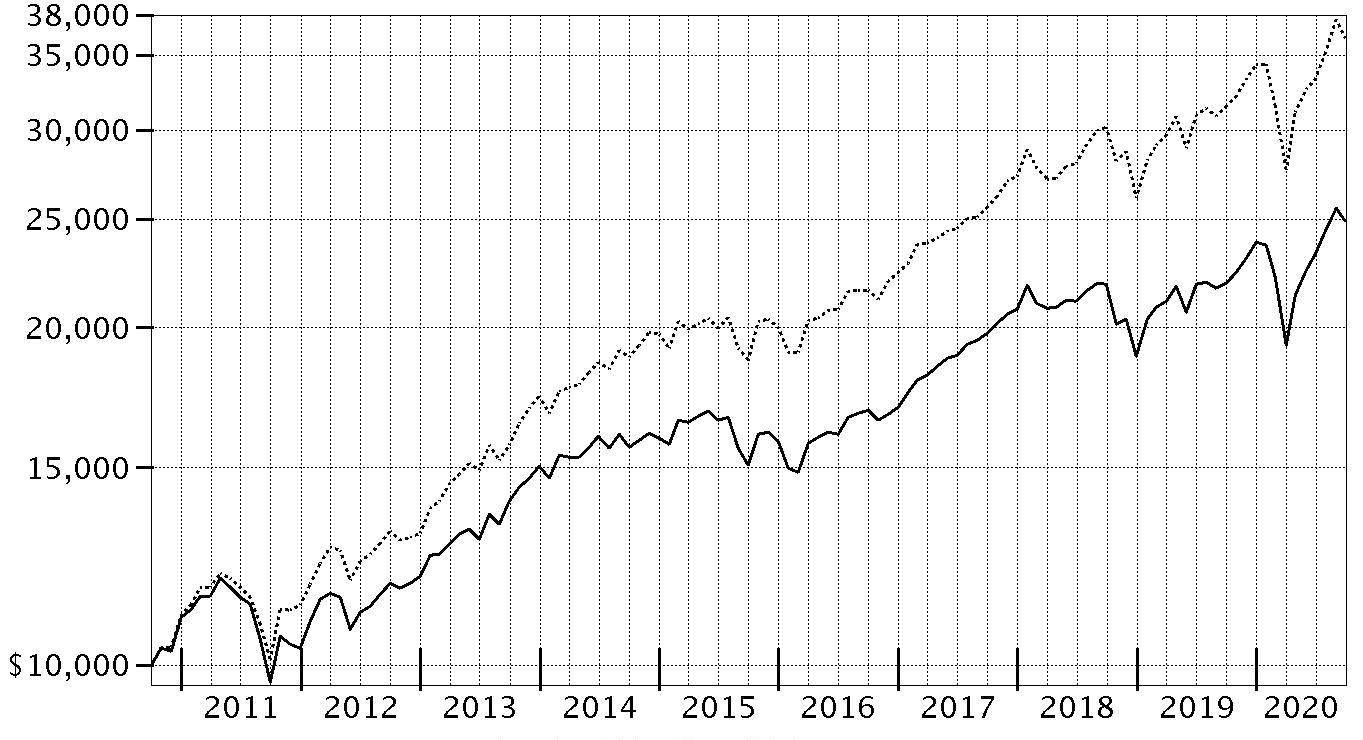
$10,000 Over 10 Years
Let's say hypothetically that $10,000 was invested in Fidelity Asset Manager® 40%, a class of the fund, on September 30, 2010.
The chart shows how the value of your investment would have changed, and also shows how the Bloomberg Barclays U.S. Aggregate Bond Index performed over the same period.
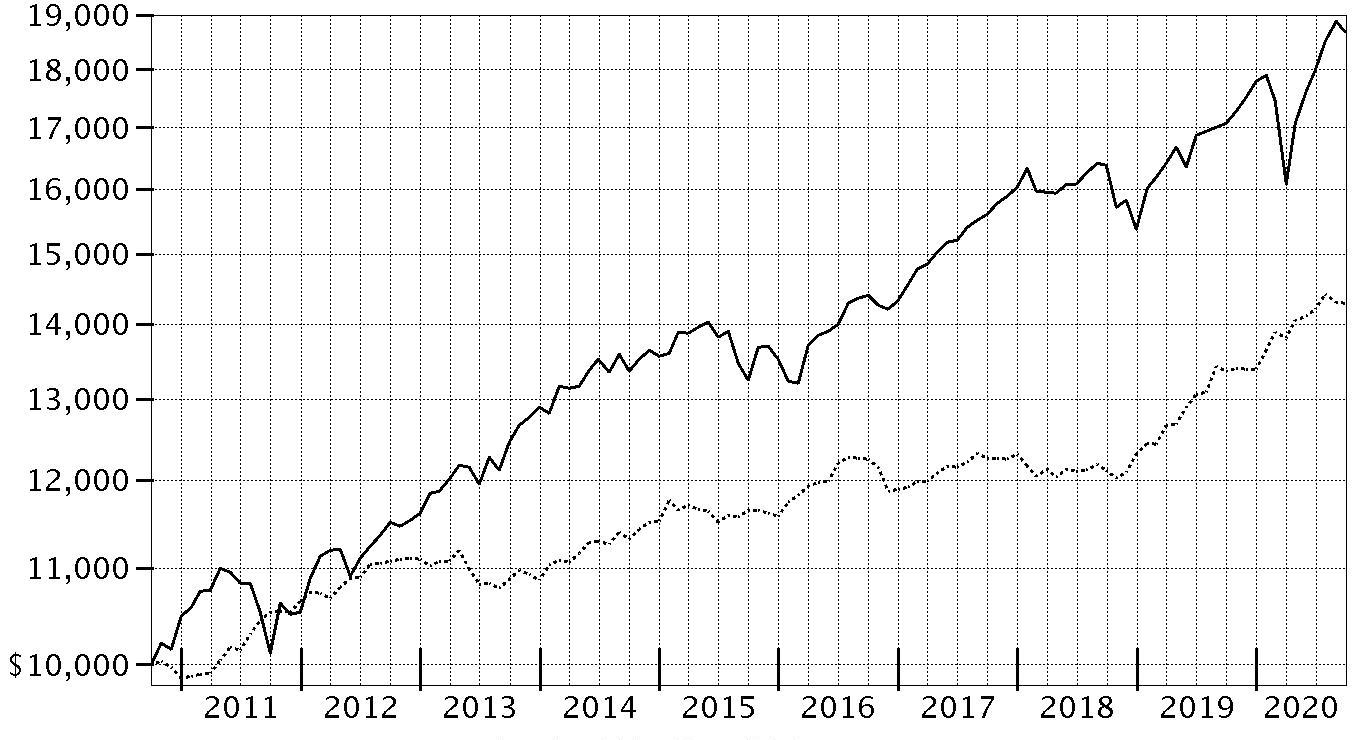
| Period Ending Values |
| $18,680 | Fidelity Asset Manager® 40% |
| $14,291 | Bloomberg Barclays U.S. Aggregate Bond Index |
Fidelity Asset Manager® 50%
Performance: The Bottom Line
Average annual total return reflects the change in the value of an investment, assuming reinvestment of distributions from dividend income and capital gains (the profits earned upon the sale of securities that have grown in value, if any) and assuming a constant rate of performance each year. The hypothetical investment and the average annual total returns do not reflect the deduction of taxes that a shareholder would pay on fund distributions or the redemption of fund shares. During periods of reimbursement by Fidelity, a fund’s total return will be greater than it would be had the reimbursement not occurred. How a fund did yesterday is no guarantee of how it will do tomorrow.
Average Annual Total Returns
| Periods ended September 30, 2020 | Past 1 year | Past 5 years | Past 10 years |
| Class A (incl. 5.75% sales charge) | 3.82% | 6.31% | 6.23% |
| Class M (incl. 3.50% sales charge) | 6.05% | 6.55% | 6.22% |
| Class C (incl. contingent deferred sales charge) | 8.38% | 6.77% | 6.06% |
| Fidelity Asset Manager® 50% | 10.51% | 7.91% | 7.20% |
| Class I | 10.49% | 7.87% | 7.14% |
| Class Z | 10.56% | 7.91% | 7.16% |
Class C shares' contingent deferred sales charges included in the past one year, past five years and past ten years total return figures are 1%, 0% and 0%, respectively.
The initial offering of Class Z shares took place on October 2, 2018. Returns prior to October 2, 2018, are those of Class I.
$10,000 Over 10 Years
Let's say hypothetically that $10,000 was invested in Fidelity Asset Manager® 50%, a class of the fund, on September 30, 2010.
The chart shows how the value of your investment would have changed, and also shows how the S&P 500® Index performed over the same period.
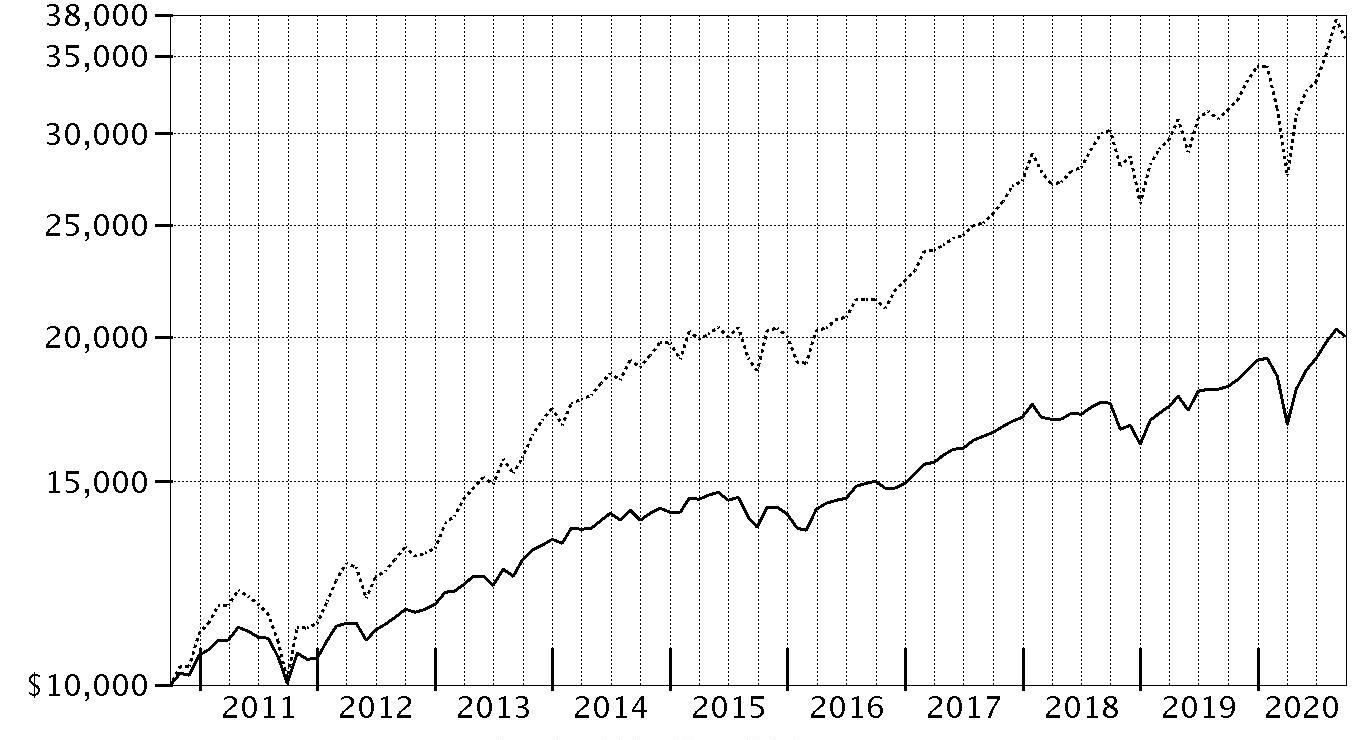
| Period Ending Values |
| $20,033 | Fidelity Asset Manager® 50% |
| $36,244 | S&P 500® Index |
Fidelity Asset Manager® 60%
Performance: The Bottom Line
Average annual total return reflects the change in the value of an investment, assuming reinvestment of distributions from dividend income and capital gains (the profits earned upon the sale of securities that have grown in value, if any) and assuming a constant rate of performance each year. The hypothetical investment and the average annual total returns do not reflect the deduction of taxes that a shareholder would pay on fund distributions or the redemption of fund shares. During periods of reimbursement by Fidelity, a fund’s total return will be greater than it would be had the reimbursement not occurred. How a fund did yesterday is no guarantee of how it will do tomorrow.
Average Annual Total Returns
| Periods ended September 30, 2020 | Past 1 year | Past 5 years | Past 10 years |
| Class A (incl. 5.75% sales charge) | 4.74% | 7.09% | 6.90% |
| Class M (incl. 3.50% sales charge) | 6.95% | 7.32% | 6.88% |
| Class C (incl. contingent deferred sales charge) | 9.29% | 7.56% | 6.73% |
| Fidelity Asset Manager® 60% | 11.50% | 8.70% | 7.87% |
| Class I | 11.44% | 8.67% | 7.82% |
| Class Z | 11.50% | 8.71% | 7.84% |
Class C shares' contingent deferred sales charges included in the past one year, past five years and past ten years total return figures are 1%, 0% and 0%, respectively.
The initial offering of Class Z shares took place on October 2, 2018. Returns prior to October 2, 2018, are those of Class I.
$10,000 Over 10 Years
Let's say hypothetically that $10,000 was invested in Fidelity Asset Manager® 60%, a class of the fund, on September 30, 2010.
The chart shows how the value of your investment would have changed, and also shows how the S&P 500® Index performed over the same period.
| Period Ending Values |
| $21,334 | Fidelity Asset Manager® 60% |
| $36,244 | S&P 500® Index |
Fidelity Asset Manager® 70%
Performance: The Bottom Line
Average annual total return reflects the change in the value of an investment, assuming reinvestment of distributions from dividend income and capital gains (the profits earned upon the sale of securities that have grown in value, if any) and assuming a constant rate of performance each year. The hypothetical investment and the average annual total returns do not reflect the deduction of taxes that a shareholder would pay on fund distributions or the redemption of fund shares. During periods of reimbursement by Fidelity, a fund’s total return will be greater than it would be had the reimbursement not occurred. How a fund did yesterday is no guarantee of how it will do tomorrow.
Average Annual Total Returns
| Periods ended September 30, 2020 | Past 1 year | Past 5 years | Past 10 years |
| Class A (incl. 5.75% sales charge) | 5.38% | 7.77% | 7.55% |
| Class M (incl. 3.50% sales charge) | 7.65% | 8.02% | 7.53% |
| Class C (incl. contingent deferred sales charge) | 9.98% | 8.24% | 7.38% |
| Fidelity Asset Manager® 70% | 12.14% | 9.40% | 8.53% |
| Class I | 12.14% | 9.36% | 8.49% |
| Class Z | 12.21% | 9.41% | 8.51% |
Class C shares' contingent deferred sales charges included in the past one year, past five years and past ten years total return figures are 1%, 0% and 0%, respectively.
The initial offering of Class Z shares took place on October 2, 2018. Returns prior to October 2, 2018, are those of Class I.
$10,000 Over 10 Years
Let's say hypothetically that $10,000 was invested in Fidelity Asset Manager® 70%, a class of the fund, on September 30, 2010.
The chart shows how the value of your investment would have changed, and also shows how the S&P 500® Index performed over the same period.
| Period Ending Values |
| $22,676 | Fidelity Asset Manager® 70% |
| $36,244 | S&P 500® Index |
Fidelity Asset Manager® 85%
Performance: The Bottom Line
Average annual total return reflects the change in the value of an investment, assuming reinvestment of distributions from dividend income and capital gains (the profits earned upon the sale of securities that have grown in value, if any) and assuming a constant rate of performance each year. The hypothetical investment and the average annual total returns do not reflect the deduction of taxes that a shareholder would pay on fund distributions or the redemption of fund shares. During periods of reimbursement by Fidelity, a fund’s total return will be greater than it would be had the reimbursement not occurred. How a fund did yesterday is no guarantee of how it will do tomorrow.
Average Annual Total Returns
| Periods ended September 30, 2020 | Past 1 year | Past 5 years | Past 10 years |
| Class A (incl. 5.75% sales charge) | 6.61% | 8.90% | 8.57% |
| Class M (incl. 3.50% sales charge) | 8.86% | 9.12% | 8.52% |
| Class C (incl. contingent deferred sales charge) | 11.25% | 9.37% | 8.38% |
| Fidelity Asset Manager® 85% | 13.44% | 10.53% | 9.54% |
| Class I | 13.40% | 10.49% | 9.51% |
| Class Z | 13.50% | 10.54% | 9.54% |
Class C shares' contingent deferred sales charges included in the past one year, past five years and past ten years total return figures are 1%, 0% and 0%, respectively.
The initial offering of Class Z shares took place on October 2, 2018. Returns prior to October 2, 2018, are those of Class I.
$10,000 Over 10 Years
Let's say hypothetically that $10,000 was invested in Fidelity Asset Manager® 85%, a class of the fund, on September 30, 2010.
The chart shows how the value of your investment would have changed, and also shows how the S&P 500® Index performed over the same period.
| Period Ending Values |
| $24,865 | Fidelity Asset Manager® 85% |
| $36,244 | S&P 500® Index |
Management's Discussion of Fund Performance
Market Recap: For the 12 months ending September 30, 2020, financial markets were influenced by the global outbreak and spread of the coronavirus, which resulted in a shutdown of business activity in many local and foreign economies. Declared a pandemic on March 11, the crisis and containment efforts led to increased uncertainty, broad-based contraction in economic activity, elevated volatility and dislocation in financial markets. Rapid and expansive monetary- and fiscal-policy responses partially offset the economic disruption and fueled an uptrend for many assets from March 24 through the end of September.
Non-U.S. equities gained 3.16% for the 12 months, according to the MSCI ACWI (All Country World Index) ex USA Index, reflecting significant ups and downs related to the pandemic. From a regional perspective, emerging markets (+11%), Japan (+7%) and Europe ex U.K. (+5%) outperformed the broader index. Conversely, the U.K. (-16%), Asia Pacific ex Japan (-5%) and Canada (-2%) lagged. By sector, information technology (+35%) and health care (+22%) led. On the other end of the spectrum, the energy sector (-33%) underperformed by the widest margin, while financials (-17%) and real estate (-14%) also notably trailed the index.
The Dow Jones U.S. Total Stock Market Index gained 14.77% for the 12 months. After a sharp decline in the first quarter of 2020 (-20.96%) due to the coronavirus outbreak, U.S. equities rebounded with a 22.09% advance in the second quarter and gained 33.17% for the second half of the year. Among sectors, information technology (+46%) and consumer discretionary (+36%) stood out, whereas energy (-46%) fared worst, followed by financials (-14%). Large-cap stocks handily topped smaller-caps, while growth significantly outpaced value. Elsewhere, commodities notably lagged equities.
Turning to fixed income, U.S. taxable investment-grade bonds (the Bloomberg Barclays U.S. Aggregate Bond Index) rose 6.98%, as investors generally sought assets with greater perceived safety and yields plunged. Treasury securities (+8.04%) and U.S. corporate bonds (+7.50%) led the way, while government agency and mortgage-backed securities (+5.34% and +4.36%, respectively) had shallower gains. Extended (non-core) categories outside the index were mixed, with Treasury Inflation-Protected Securities performing strongly, but floating-rate bank loans, emerging-markets debt and high-yield bonds turning in weaker advances.
Comments from Portfolio Manager Avishek Hazrachoudhury: For the fiscal year, the share classes of the seven Asset Manager Funds (excluding sales charges, if applicable) posted gains ranging from about 6% to 13%, with all but the Asset Manager 20% Fund outpacing their respective Composite benchmarks. (The 20% Fund performed roughly in line.) Overall, asset allocation hampered relative performance, whereas security selection fueled the Funds’ results versus Composites. Stock picks in the U.S., as well as in international developed and emerging markets (DM and EM), added considerable value, as did security selection among investment-grade (IG) bonds. Strong investment choices across a number of sectors, most notably health care, information technology and communication services drove the performance of our U.S. equity portfolio. Within foreign DM equities, picks in Europe ex U.K. and Japan added the most value. In EM, choices in China and to a lesser extent, Taiwan, provided the biggest boost. Our IG bond portfolio benefited from corporate bonds issued by banks and companies in consumer-focused sectors. Outside of corporates, an underweighting in U.S. Treasuries and exposure to long-term, government-agency mortgage-backed securities further aided the Funds’ relative results. Turning to asset allocation, the Funds’ core equity strategy of maintaining a roughly neutral weighting in U.S. stocks, slightly underweighting international DM equities and overweighting EM stocks, on average, hampered relative performance. However, an out-of-benchmark position in REITs (real estate investment trusts) was the primary detractor from the Funds’ equity positioning. Exposure to the stocks of gold mining companies via Van Eck Vectors
® Gold Miners exchange-traded fund boosted performance in the 60%, 70% and 85% Funds. As for fixed income, underweighting cash and IG bonds in order to fund out-of-benchmark allocations in riskier market sectors aided performance versus Composite benchmarks. Positions in long-term U.S. Treasuries and Treasury Inflation-Protected Securities (TIPS) helped the most. Looking ahead, we have a cautiously optimistic outlook, but believe continued fiscal and monetary stimulus is critical to supporting the economic recovery.
The views expressed above reflect those of the portfolio manager(s) only through the end of the period as stated on the cover of this report and do not necessarily represent the views of Fidelity or any other person in the Fidelity organization. Any such views are subject to change at any time based upon market or other conditions and Fidelity disclaims any responsibility to update such views. These views may not be relied on as investment advice and, because investment decisions for a Fidelity fund are based on numerous factors, may not be relied on as an indication of trading intent on behalf of any Fidelity fund.
Fidelity Asset Manager® 20%
Investment Summary (Unaudited)
The information in the following tables is based on the combined investments of the Fund and its pro-rata share of the investments of Fidelity's Central Funds, other than the Money Market Central Funds.
Top Five Bond Issuers as of September 30, 2020
| (with maturities greater than one year) | % of fund's net assets |
| U.S. Treasury Obligations | 13.7 |
| Fannie Mae | 4.6 |
| Freddie Mac | 2.6 |
| Ginnie Mae | 2.1 |
| Uniform Mortgage Backed Securities | 1.6 |
| | 24.6 |
Quality Diversification (% of fund's net assets)
| As of September 30, 2020 |
| | U.S. Government and U.S. Government Agency Obligations | 25.0% |
| | AAA,AA,A | 9.2% |
| | BBB | 14.2% |
| | BB and Below | 6.0% |
| | Not Rated | 1.3% |
| | Equities | 22.5% |
| | Short-Term Investments and Net Other Assets | 21.8% |

We have used ratings from Moody's Investors Service, Inc. Where Moody's® ratings are not available, we have used S&P® ratings. All ratings are as of the date indicated and do not reflect subsequent changes.
Top Five Stocks as of September 30, 2020
| | % of fund's net assets |
| Apple, Inc. | 1.0 |
| Microsoft Corp. | 0.9 |
| Alphabet, Inc. Class A | 0.5 |
| Amazon.com, Inc. | 0.4 |
| Alibaba Group Holding Ltd. sponsored ADR | 0.3 |
| | 3.1 |
Top Five Market Sectors as of September 30, 2020
| | % of fund's net assets |
| Financials | 33.9 |
| Information Technology | 6.4 |
| Communication Services | 4.2 |
| Health Care | 4.0 |
| Consumer Discretionary | 3.8 |
Asset Allocation (% of fund's net assets)
| As of September 30, 2020 |
| | Stock Class and Equity Futures | 22.6% |
| | Bond Class | 54.7% |
| | Short-Term Class | 22.7% |

Asset allocations in the pie charts reflect the categorization of assets as defined in the Fund's prospectus in effect as of the time periods indicated above. Percentages are adjusted for the effect of future contracts and swap contracts, if applicable.
At period end, foreign investments including the Fund's pro-rata share of the underlying Central Funds, other than the Money Market Funds, was 16.2% of net assets.
Percentages in the above tables are adjusted for the effect of TBA Sale Commitments.
An unaudited holdings listing for the Fund, which presents direct holdings as well as the pro-rata share of any securities and other investments held indirectly through its investment in underlying Fidelity Central Funds, other than the Money Market Central Funds, is available at fidelity.com and/or institutional.fidelity.com, as applicable.
Fidelity Asset Manager® 20%
Schedule of Investments September 30, 2020
Showing Percentage of Net Assets
| Equity Central Funds - 22.5% | | | |
| | | Shares | Value |
| Fidelity Emerging Markets Equity Central Fund (a) | | 811,512 | $192,441,857 |
| Fidelity International Equity Central Fund (a) | | 2,172,444 | 183,832,195 |
| Fidelity Real Estate Equity Central Fund (a) | | 244,014 | 26,375,490 |
| Fidelity U.S. Equity Central Fund (a) | | 8,391,732 | 845,131,290 |
| TOTAL EQUITY CENTRAL FUNDS | | | |
| (Cost $846,337,454) | | | 1,247,780,832 |
|
| Fixed-Income Central Funds - 56.4% | | | |
| High Yield Fixed-Income Funds - 3.6% | | | |
| Fidelity Emerging Markets Debt Central Fund (a) | | 5,703,907 | 51,221,082 |
| Fidelity Emerging Markets Debt Local Currency Central Fund (a) | | 258,540 | 25,892,781 |
| Fidelity Floating Rate Central Fund (a) | | 266,370 | 25,670,044 |
| Fidelity High Income Central Fund (a) | | 946,711 | 98,921,826 |
|
| TOTAL HIGH YIELD FIXED-INCOME FUNDS | | | 201,705,733 |
|
| Investment Grade Fixed-Income Funds - 52.8% | | | |
| Fidelity Inflation-Protected Bond Index Central Fund (a) | | 3,044,641 | 331,652,697 |
| Fidelity International Credit Central Fund (a) | | 795,298 | 83,267,677 |
| Fidelity Investment Grade Bond Central Fund (a) | | 21,145,205 | 2,503,803,771 |
|
| TOTAL INVESTMENT GRADE FIXED-INCOME FUNDS | | | 2,918,724,145 |
|
| TOTAL FIXED-INCOME CENTRAL FUNDS | | | |
| (Cost $2,753,943,868) | | | 3,120,429,878 |
|
| Money Market Central Funds - 20.5% | | | |
| Fidelity Cash Central Fund 0.10% (b) | | 44,507,875 | 44,516,777 |
| Fidelity Money Market Central Fund 0.20% (b) | | 1,087,204,479 | 1,087,204,479 |
| TOTAL MONEY MARKET CENTRAL FUNDS | | | |
| (Cost $1,131,720,987) | | | 1,131,721,256 |
| | | Principal Amount | Value |
|
| U.S. Treasury Obligations - 0.3% | | | |
| U.S. Treasury Bills, yield at date of purchase 0.1% to 0.13% 10/8/20 to 12/10/20 (c) | | | |
| (Cost $18,006,688) | | 18,010,000 | 18,007,047 |
| | | Shares | Value |
|
| Investment Companies - 0.3% | | | |
| iShares MSCI Japan ETF | | | |
| (Cost $12,887,395) | | 245,398 | 14,495,660 |
| TOTAL INVESTMENT IN SECURITIES - 100.0% | | | |
| (Cost $4,762,896,392) | | | 5,532,434,673 |
| NET OTHER ASSETS (LIABILITIES) - 0.0% | | | (1,499,862) |
| NET ASSETS - 100% | | | $5,530,934,811 |
| Futures Contracts | | | | | |
| | Number of contracts | Expiration Date | Notional Amount | Value | Unrealized Appreciation/(Depreciation) |
| Sold | | | | | |
| Equity Index Contracts | | | | | |
| CME E-mini S&P 500 Index Contracts (United States) | 766 | Dec. 2020 | $128,381,600 | $(838,104) | $(838,104) |
The notional amount of futures sold as a percentage of Net Assets is 2.3%
For the period, the average monthly notional amount at value for futures contracts in the aggregate was $95,917,617.
Security Type Abbreviations
ETF – Exchange-Traded Fund
Legend
(a) Affiliated fund that is generally available only to investment companies and other accounts managed by Fidelity Investments. A complete unaudited schedule of portfolio holdings for each Fidelity Central Fund is filed with the SEC for the first and third quarters of each fiscal year on Form N-PORT and is available upon request or at the SEC's website at www.sec.gov. An unaudited holdings listing for the Fund, which presents direct holdings as well as the pro-rata share of securities and other investments held indirectly through its investment in underlying non-money market Fidelity Central Funds, is available at fidelity.com and/or institutional.fidelity.com, as applicable. In addition, each Fidelity Central Fund's financial statements, which are not covered by the Fund's Report of Independent Registered Public Accounting Firm, are available on the SEC's website or upon request.
(b) Affiliated fund that is generally available only to investment companies and other accounts managed by Fidelity Investments. The rate quoted is the annualized seven-day yield of the fund at period end. A complete unaudited listing of the fund's holdings as of its most recent quarter end is available upon request. In addition, each Fidelity Central Fund's financial statements, which are not covered by the Fund's Report of Independent Registered Public Accounting Firm, are available on the SEC's website or upon request.
(c) Security or a portion of the security was pledged to cover margin requirements for futures contracts. At period end, the value of securities pledged amounted to $12,430,825.
Affiliated Central Funds
Information regarding fiscal year to date income earned by the Fund from investments in Fidelity Central Funds is as follows:
| Fund | Income earned |
| Fidelity Cash Central Fund | $821,784 |
| Fidelity Communication Services Central Fund | 3,902,855 |
| Fidelity Consumer Discretionary Central Fund | 2,350,868 |
| Fidelity Consumer Staples Central Fund | 1,338,764 |
| Fidelity Emerging Markets Debt Central Fund | 2,980,233 |
| Fidelity Emerging Markets Equity Central Fund | 4,712,541 |
| Fidelity Energy Central Fund | 745,582 |
| Fidelity Financials Central Fund | 7,577,055 |
| Fidelity Floating Rate Central Fund | 1,339,914 |
| Fidelity Health Care Central Fund | 11,906,704 |
| Fidelity High Income Central Fund | 3,385,771 |
| Fidelity Industrials Central Fund | 1,108,574 |
| Fidelity Inflation-Protected Bond Index Central Fund | 5,071,158 |
| Fidelity Information Technology Central Fund | 25,298,500 |
| Fidelity International Credit Central Fund | 2,838,103 |
| Fidelity International Equity Central Fund | 2,899,600 |
| Fidelity Investment Grade Bond Central Fund | 66,968,309 |
| Fidelity Materials Central Fund | 280,117 |
| Fidelity Money Market Central Fund | 13,329,569 |
| Fidelity Real Estate Equity Central Fund | 1,411,699 |
| Fidelity Securities Lending Cash Central Fund | 8,158 |
| Fidelity Utilities Central Fund | 1,381,537 |
| Total | $161,657,395 |
Amounts in the income column in the above table include any capital gain distributions from underlying funds, which are presented in the corresponding line-item in the Statement of Operations, if applicable. Amount for Fidelity Securities Lending Cash Central Fund represents the income earned on investing cash collateral, less rebates paid to borrowers and any lending agent fees associated with the loan, plus any premium payments received for lending certain types of securities.
The value, beginning of period, for the Fidelity Money Market Central Fund was $1,170,784,267. Net realized gain (loss) and change in net unrealized appreciation (depreciation) on Fidelity Money Market Central Fund is presented in the Statement of Operations, if applicable. Purchases and sales of the Fidelity Money Market Central Fund were $134,588,120 and $218,175,556, respectively, during the period.
Fiscal year to date information regarding the Fund’s investments in non-Money Market Central Funds, including the ownership percentage, is presented below.
| Affiliate | Value, beginning of period | Purchases(a) | Sales Proceeds(a) | Realized Gain (loss) | Change in Unrealized appreciation (depreciation) | Value, end of period | % ownership, end of period |
| Fidelity Commodity Strategy Central Fund | $8,758,848 | $28,732 | $8,981,966 | $(963,555) | $1,157,941 | $-- | 0.0 |
| Fidelity Communication Services Central Fund | 54,167,072 | 23,295,015 | 5,807,125 | (339,291) | (9,875,911) | -- | 0.0 |
| Fidelity Consumer Discretionary Central Fund | 65,548,171 | 18,785,840 | 7,992,530 | (232,430) | (41,297,409) | -- | 0.0 |
| Fidelity Consumer Staples Central Fund | 42,517,048 | 13,464,950 | 4,349,145 | (216,320) | (14,939,081) | -- | 0.0 |
| Fidelity Emerging Markets Debt Central Fund | 49,626,992 | 8,695,363 | 4,984,324 | (324,113) | (1,792,836) | 51,221,082 | 1.9 |
| Fidelity Emerging Markets Debt Local Currency Central Fund | -- | 25,854,000 | -- | -- | 38,781 | 25,892,781 | 17.2 |
| Fidelity Emerging Markets Equity Central Fund | 167,530,840 | 16,937,131 | 11,908,048 | (1,389,624) | 21,271,558 | 192,441,857 | 9.7 |
| Fidelity Energy Central Fund | 26,810,221 | 5,490,999 | 1,978,580 | (460,056) | 1,339,414 | -- | 0.0 |
| Fidelity Financials Central Fund | 118,672,976 | 29,128,386 | 14,150,662 | (1,773,002) | (40,010,550) | -- | 0.0 |
| Fidelity Floating Rate Central Fund | 25,374,512 | 4,160,696 | 2,460,129 | (134,672) | (1,270,363) | 25,670,044 | 1.3 |
| Fidelity Health Care Central Fund | 87,505,894 | 29,930,359 | 9,531,031 | (236,541) | (51,483,974) | -- | 0.0 |
| Fidelity High Income Central Fund | 51,567,906 | 73,568,006 | 29,562,234 | 1,743,510 | 1,604,638 | 98,921,826 | 3.7 |
| Fidelity Industrials Central Fund | 62,265,617 | 13,099,783 | 7,451,684 | (555,026) | (29,954,855) | -- | 0.0 |
| Fidelity Inflation-Protected Bond Index Central Fund | 267,701,164 | 88,682,202 | 42,733,754 | (26,513) | 18,029,598 | 331,652,697 | 20.8 |
| Fidelity Information Technology Central Fund | 148,255,196 | 55,430,552 | 18,977,293 | 6,876,839 | (70,460,748) | -- | 0.0 |
| Fidelity International Credit Central Fund | 52,008,454 | 35,848,019 | 5,255,355 | (103,444) | 770,003 | 83,267,677 | 17.8 |
| Fidelity International Equity Central Fund | 126,984,865 | 64,240,867 | 19,783,174 | (2,717,799) | 15,107,436 | 183,832,195 | 6.1 |
| Fidelity Investment Grade Bond Central Fund | 2,123,133,926 | 562,511,253 | 293,965,439 | (3,924,349) | 116,048,380 | 2,503,803,771 | 8.6 |
| Fidelity Materials Central Fund | 15,515,826 | 5,317,115 | 2,579,071 | (297,816) | (3,713,806) | -- | 0.0 |
| Fidelity Real Estate Equity Central Fund | 77,481,500 | 7,966,186 | 39,583,961 | (13,896,932) | (5,591,303) | 26,375,490 | 3.8 |
| Fidelity U.S. Equity Central Fund | -- | 1,794,908 | 1,577,712 | (452,360) | 344,247,664 | 845,131,290 | 3.9 |
| Fidelity Utilities Central Fund | 22,779,522 | 5,609,850 | 2,411,444 | (195,801) | (9,416,673) | -- | 0.0 |
| | 3,594,206,550 | 1,089,840,212 | 536,024,661 | (19,619,295) | 239,807,904 | 4,368,210,710 | |
(a) Excludes the value of securities received and delivered through merger transactions, if applicable.
Investment Valuation
The following is a summary of the inputs used, as of September 30, 2020, involving the Fund's assets and liabilities carried at fair value. The inputs or methodology used for valuing securities may not be an indication of the risk associated with investing in those securities. For more information on valuation inputs, and their aggregation into the levels used below, please refer to the Investment Valuation section in the accompanying Notes to Financial Statements.
| | Valuation Inputs at Reporting Date: |
| Description | Total | Level 1 | Level 2 | Level 3 |
| Investments in Securities: | | | | |
| Equity Central Funds | $1,247,780,832 | $1,247,780,832 | $-- | $-- |
| Fixed-Income Central Funds | 3,120,429,878 | 3,120,429,878 | -- | -- |
| Money Market Central Funds | 1,131,721,256 | 1,131,721,256 | -- | -- |
| Other Short-Term Investments | 18,007,047 | -- | 18,007,047 | -- |
| Investment Companies | 14,495,660 | 14,495,660 | -- | -- |
| Total Investments in Securities: | $5,532,434,673 | $5,514,427,626 | $18,007,047 | $-- |
| Derivative Instruments: | | | | |
| Liabilities | | | | |
| Futures Contracts | $(838,104) | $(838,104) | $-- | $-- |
| Total Liabilities | $(838,104) | $(838,104) | $-- | $-- |
| Total Derivative Instruments: | $(838,104) | $(838,104) | $-- | $-- |
Value of Derivative Instruments
The following table is a summary of the Fund's value of derivative instruments by primary risk exposure as of September 30, 2020. For additional information on derivative instruments, please refer to the Derivative Instruments section in the accompanying Notes to Financial Statements.
| Primary Risk Exposure / Derivative Type | Value |
| | Asset | Liability |
| Equity Risk | | |
| Futures Contracts(a) | $0 | $(838,104) |
| Total Equity Risk | 0 | (838,104) |
| Total Value of Derivatives | $0 | $(838,104) |
(a) Reflects gross cumulative appreciation (depreciation) on futures contracts as presented in the Schedule of Investments. In the Statement of Assets and Liabilities, the period end daily variation margin is included in receivable or payable for daily variation margin on futures contracts, and the net cumulative appreciation (depreciation) is included in Total accumulated earnings (loss).
Other Information
Distribution of investments by country or territory of incorporation, as a percentage of Total Net Assets, is as follows (Unaudited):
| United States of America | 83.8% |
| Cayman Islands | 3.2% |
| United Kingdom | 2.5% |
| Netherlands | 1.2% |
| Others (Individually Less Than 1%) | 9.3% |
| | 100.0% |
The information in the above table is based on the combined investments of the Fund and its pro-rata share of the investments of Fidelity's Central Funds, other than the Money Market Central Funds.
See accompanying notes which are an integral part of the financial statements.
Fidelity Asset Manager® 20%
Financial Statements
Statement of Assets and Liabilities
| | | September 30, 2020 |
| Assets | | |
Investment in securities, at value — See accompanying schedule:
Unaffiliated issuers (cost $30,894,083) | $32,502,707 | |
| Fidelity Central Funds (cost $4,732,002,309) | 5,499,931,966 | |
| Total Investment in Securities (cost $4,762,896,392) | | $5,532,434,673 |
| Receivable for investments sold | | 1,757,319 |
| Receivable for fund shares sold | | 4,102,466 |
| Distributions receivable from Fidelity Central Funds | | 5,137 |
| Prepaid expenses | | 8,633 |
| Total assets | | 5,538,308,228 |
| Liabilities | | |
| Payable for investments purchased | $2,174,887 | |
| Payable for fund shares redeemed | 2,010,287 | |
| Accrued management fee | 1,844,456 | |
| Distribution and service plan fees payable | 42,194 | |
| Payable for daily variation margin on futures contracts | 823,969 | |
| Other affiliated payables | 453,885 | |
| Other payables and accrued expenses | 23,739 | |
| Total liabilities | | 7,373,417 |
| Net Assets | | $5,530,934,811 |
| Net Assets consist of: | | |
| Paid in capital | | $5,037,192,648 |
| Total accumulated earnings (loss) | | 493,742,163 |
| Net Assets | | $5,530,934,811 |
| Net Asset Value and Maximum Offering Price | | |
| Class A: | | |
| Net Asset Value and redemption price per share ($50,633,169 ÷ 3,616,720 shares)(a) | | $14.00 |
| Maximum offering price per share (100/94.25 of $14.00) | | $14.85 |
| Class M: | | |
| Net Asset Value and redemption price per share ($27,366,198 ÷ 1,959,281 shares)(a) | | $13.97 |
| Maximum offering price per share (100/96.50 of $13.97) | | $14.48 |
| Class C: | | |
| Net Asset Value and offering price per share ($24,939,998 ÷ 1,793,149 shares)(a) | | $13.91 |
| Asset Manager 20%: | | |
| Net Asset Value, offering price and redemption price per share ($5,377,373,701 ÷ 383,426,440 shares) | | $14.02 |
| Class I: | | |
| Net Asset Value, offering price and redemption price per share ($32,445,028 ÷ 2,313,686 shares) | | $14.02 |
| Class Z: | | |
| Net Asset Value, offering price and redemption price per share ($18,176,717 ÷ 1,296,647 shares) | | $14.02 |
(a) Redemption price per share is equal to net asset value less any applicable contingent deferred sales charge.
See accompanying notes which are an integral part of the financial statements.
Statement of Operations
| | | Year ended September 30, 2020 |
| Investment Income | | |
| Dividends | | $4,028,835 |
| Interest | | 43,940 |
| Income from Fidelity Central Funds (including $8,158 from security lending) | | 110,952,498 |
| Total income | | 115,025,273 |
| Expenses | | |
| Management fee | $21,301,463 | |
| Transfer agent fees | 4,137,616 | |
| Distribution and service plan fees | 466,274 | |
| Accounting fees | 1,184,791 | |
| Custodian fees and expenses | 4,611 | |
| Independent trustees' fees and expenses | 16,953 | |
| Registration fees | 190,004 | |
| Audit | 48,340 | |
| Legal | 8,317 | |
| Interest | 2,313 | |
| Miscellaneous | 31,046 | |
| Total expenses before reductions | 27,391,728 | |
| Expense reductions | (65,202) | |
| Total expenses after reductions | | 27,326,526 |
| Net investment income (loss) | | 87,698,747 |
| Realized and Unrealized Gain (Loss) | | |
| Net realized gain (loss) on: | | |
| Investment securities: | | |
| Unaffiliated issuers | (7,349,095) | |
| Fidelity Central Funds | (19,610,907) | |
| Futures contracts | (23,553,753) | |
| Capital gain distributions from Fidelity Central Funds | 50,704,897 | |
| Total net realized gain (loss) | | 191,142 |
| Change in net unrealized appreciation (depreciation) on: | | |
| Investment securities: | | |
| Unaffiliated issuers | (12,793,129) | |
| Fidelity Central Funds | 239,802,964 | |
| Futures contracts | (2,296,353) | |
| Total change in net unrealized appreciation (depreciation) | | 224,713,482 |
| Net gain (loss) | | 224,904,624 |
| Net increase (decrease) in net assets resulting from operations | | $312,603,371 |
See accompanying notes which are an integral part of the financial statements.
Statement of Changes in Net Assets
| | Year ended September 30, 2020 | Year ended September 30, 2019 |
| Increase (Decrease) in Net Assets | | |
| Operations | | |
| Net investment income (loss) | $87,698,747 | $112,781,149 |
| Net realized gain (loss) | 191,142 | 64,437,384 |
| Change in net unrealized appreciation (depreciation) | 224,713,482 | 76,415,010 |
| Net increase (decrease) in net assets resulting from operations | 312,603,371 | 253,633,543 |
| Distributions to shareholders | (138,422,178) | (203,283,861) |
| Share transactions - net increase (decrease) | 233,939,412 | 116,857,755 |
| Total increase (decrease) in net assets | 408,120,605 | 167,207,437 |
| Net Assets | | |
| Beginning of period | 5,122,814,206 | 4,955,606,769 |
| End of period | $5,530,934,811 | $5,122,814,206 |
See accompanying notes which are an integral part of the financial statements.
Financial Highlights
Fidelity Asset Manager 20% Class A
| Years ended September 30, | 2020 | 2019 | 2018 | 2017 | 2016 |
| Selected Per–Share Data | | | | | |
| Net asset value, beginning of period | $13.51 | $13.40 | $13.55 | $13.24 | $12.93 |
| Income from Investment Operations | | | | | |
| Net investment income (loss)A | .18 | .26 | .20 | .16 | .19 |
| Net realized and unrealized gain (loss) | .62 | .36 | .11 | .37 | .59 |
| Total from investment operations | .80 | .62 | .31 | .53 | .78 |
| Distributions from net investment income | (.19) | (.26) | (.19) | (.16) | (.20) |
| Distributions from net realized gain | (.13) | (.24) | (.27) | (.07) | (.27) |
| Total distributions | (.31)B | (.51)B | (.46) | (.22)B | (.47) |
| Net asset value, end of period | $14.00 | $13.51 | $13.40 | $13.55 | $13.24 |
| Total ReturnC,D | 6.04% | 4.85% | 2.36% | 4.08% | 6.18% |
| Ratios to Average Net AssetsE,F | | | | | |
| Expenses before reductions | .82% | .83% | .84% | .84% | .83% |
| Expenses net of fee waivers, if any | .82% | .83% | .84% | .84% | .83% |
| Expenses net of all reductions | .82% | .83% | .84% | .83% | .83% |
| Net investment income (loss) | 1.34% | 1.97% | 1.49% | 1.21% | 1.47% |
| Supplemental Data | | | | | |
| Net assets, end of period (000 omitted) | $50,633 | $45,153 | $39,089 | $39,787 | $42,221 |
| Portfolio turnover rateG | 25% | 41% | 24% | 22% | 19% |
A Calculated based on average shares outstanding during the period.
B Total distributions per share do not sum due to rounding.
C Total returns would have been lower if certain expenses had not been reduced during the applicable periods shown.
D Total returns do not include the effect of the sales charges.
E Fees and expenses of any underlying mutual funds or exchange-traded funds (ETFs) are not included in the Fund's expense ratio. The Fund indirectly bears its proportionate share of these expenses. For additional expense information related to investments in Fidelity Central Funds, please refer to the "Investments in Fidelity Central Funds" note found in the Notes to Financial Statements section of the most recent Annual or Semi-Annual report.
F Expense ratios reflect operating expenses of the class. Expenses before reductions do not reflect amounts reimbursed, waived, or reduced through arrangements with the investment adviser, brokerage services, or other offset arrangements, if applicable, and do not represent the amount paid by the class during periods when reimbursements, waivers or reductions occur.
G Amount does not include the portfolio activity of any underlying mutual funds or exchange-traded funds (ETFs).
See accompanying notes which are an integral part of the financial statements.
Fidelity Asset Manager 20% Class M
| Years ended September 30, | 2020 | 2019 | 2018 | 2017 | 2016 |
| Selected Per–Share Data | | | | | |
| Net asset value, beginning of period | $13.48 | $13.37 | $13.52 | $13.21 | $12.90 |
| Income from Investment Operations | | | | | |
| Net investment income (loss)A | .15 | .23 | .16 | .13 | .16 |
| Net realized and unrealized gain (loss) | .62 | .35 | .12 | .37 | .58 |
| Total from investment operations | .77 | .58 | .28 | .50 | .74 |
| Distributions from net investment income | (.15) | (.23) | (.16) | (.12) | (.17) |
| Distributions from net realized gain | (.13) | (.24) | (.27) | (.07) | (.27) |
| Total distributions | (.28) | (.47) | (.43) | (.19) | (.43)B |
| Net asset value, end of period | $13.97 | $13.48 | $13.37 | $13.52 | $13.21 |
| Total ReturnC,D | 5.79% | 4.58% | 2.10% | 3.81% | 5.93% |
| Ratios to Average Net AssetsE,F | | | | | |
| Expenses before reductions | 1.08% | 1.08% | 1.10% | 1.10% | 1.09% |
| Expenses net of fee waivers, if any | 1.07% | 1.08% | 1.10% | 1.10% | 1.09% |
| Expenses net of all reductions | 1.07% | 1.08% | 1.10% | 1.10% | 1.09% |
| Net investment income (loss) | 1.09% | 1.72% | 1.23% | .95% | 1.21% |
| Supplemental Data | | | | | |
| Net assets, end of period (000 omitted) | $27,366 | $25,696 | $22,133 | $22,474 | $25,052 |
| Portfolio turnover rateG | 25% | 41% | 24% | 22% | 19% |
A Calculated based on average shares outstanding during the period.
B Total distributions per share do not sum due to rounding.
C Total returns would have been lower if certain expenses had not been reduced during the applicable periods shown.
D Total returns do not include the effect of the sales charges.
E Fees and expenses of any underlying mutual funds or exchange-traded funds (ETFs) are not included in the Fund's expense ratio. The Fund indirectly bears its proportionate share of these expenses. For additional expense information related to investments in Fidelity Central Funds, please refer to the "Investments in Fidelity Central Funds" note found in the Notes to Financial Statements section of the most recent Annual or Semi-Annual report.
F Expense ratios reflect operating expenses of the class. Expenses before reductions do not reflect amounts reimbursed, waived, or reduced through arrangements with the investment adviser, brokerage services, or other offset arrangements, if applicable, and do not represent the amount paid by the class during periods when reimbursements, waivers or reductions occur.
G Amount does not include the portfolio activity of any underlying mutual funds or exchange-traded funds (ETFs).
See accompanying notes which are an integral part of the financial statements.
Fidelity Asset Manager 20% Class C
| Years ended September 30, | 2020 | 2019 | 2018 | 2017 | 2016 |
| Selected Per–Share Data | | | | | |
| Net asset value, beginning of period | $13.43 | $13.32 | $13.47 | $13.17 | $12.85 |
| Income from Investment Operations | | | | | |
| Net investment income (loss)A | .08 | .16 | .10 | .06 | .09 |
| Net realized and unrealized gain (loss) | .61 | .36 | .11 | .36 | .60 |
| Total from investment operations | .69 | .52 | .21 | .42 | .69 |
| Distributions from net investment income | (.09) | (.16) | (.09) | (.06) | (.10) |
| Distributions from net realized gain | (.13) | (.24) | (.27) | (.07) | (.27) |
| Total distributions | (.21)B | (.41)B | (.36) | (.12)B | (.37) |
| Net asset value, end of period | $13.91 | $13.43 | $13.32 | $13.47 | $13.17 |
| Total ReturnC,D | 5.22% | 4.06% | 1.59% | 3.25% | 5.49% |
| Ratios to Average Net AssetsE,F | | | | | |
| Expenses before reductions | 1.58% | 1.59% | 1.59% | 1.59% | 1.59% |
| Expenses net of fee waivers, if any | 1.58% | 1.59% | 1.59% | 1.59% | 1.59% |
| Expenses net of all reductions | 1.58% | 1.59% | 1.59% | 1.59% | 1.59% |
| Net investment income (loss) | .59% | 1.21% | .74% | .45% | .71% |
| Supplemental Data | | | | | |
| Net assets, end of period (000 omitted) | $24,940 | $21,588 | $26,000 | $28,217 | $29,337 |
| Portfolio turnover rateG | 25% | 41% | 24% | 22% | 19% |
A Calculated based on average shares outstanding during the period.
B Total distributions per share do not sum due to rounding.
C Total returns would have been lower if certain expenses had not been reduced during the applicable periods shown.
D Total returns do not include the effect of the contingent deferred sales charge.
E Fees and expenses of any underlying mutual funds or exchange-traded funds (ETFs) are not included in the Fund's expense ratio. The Fund indirectly bears its proportionate share of these expenses. For additional expense information related to investments in Fidelity Central Funds, please refer to the "Investments in Fidelity Central Funds" note found in the Notes to Financial Statements section of the most recent Annual or Semi-Annual report.
F Expense ratios reflect operating expenses of the class. Expenses before reductions do not reflect amounts reimbursed, waived, or reduced through arrangements with the investment adviser, brokerage services, or other offset arrangements, if applicable, and do not represent the amount paid by the class during periods when reimbursements, waivers or reductions occur.
G Amount does not include the portfolio activity of any underlying mutual funds or exchange-traded funds (ETFs).
See accompanying notes which are an integral part of the financial statements.
Fidelity Asset Manager 20%
| Years ended September 30, | 2020 | 2019 | 2018 | 2017 | 2016 |
| Selected Per–Share Data | | | | | |
| Net asset value, beginning of period | $13.54 | $13.42 | $13.57 | $13.26 | $12.94 |
| Income from Investment Operations | | | | | |
| Net investment income (loss)A | .23 | .30 | .24 | .20 | .23 |
| Net realized and unrealized gain (loss) | .61 | .37 | .12 | .37 | .60 |
| Total from investment operations | .84 | .67 | .36 | .57 | .83 |
| Distributions from net investment income | (.23) | (.31) | (.24) | (.20) | (.24) |
| Distributions from net realized gain | (.13) | (.24) | (.27) | (.07) | (.27) |
| Total distributions | (.36) | (.55) | (.51) | (.26)B | (.51) |
| Net asset value, end of period | $14.02 | $13.54 | $13.42 | $13.57 | $13.26 |
| Total ReturnC | 6.29% | 5.24% | 2.68% | 4.40% | 6.58% |
| Ratios to Average Net AssetsD,E | | | | | |
| Expenses before reductions | .51% | .51% | .52% | .52% | .52% |
| Expenses net of fee waivers, if any | .50% | .51% | .52% | .52% | .52% |
| Expenses net of all reductions | .50% | .51% | .51% | .52% | .52% |
| Net investment income (loss) | 1.66% | 2.29% | 1.81% | 1.52% | 1.78% |
| Supplemental Data | | | | | |
| Net assets, end of period (000 omitted) | $5,377,374 | $4,990,188 | $4,819,671 | $4,880,833 | $4,802,797 |
| Portfolio turnover rateF | 25% | 41% | 24% | 22% | 19% |
A Calculated based on average shares outstanding during the period.
B Total distributions per share do not sum due to rounding.
C Total returns would have been lower if certain expenses had not been reduced during the applicable periods shown.
D Fees and expenses of any underlying mutual funds or exchange-traded funds (ETFs) are not included in the Fund's expense ratio. The Fund indirectly bears its proportionate share of these expenses. For additional expense information related to investments in Fidelity Central Funds, please refer to the "Investments in Fidelity Central Funds" note found in the Notes to Financial Statements section of the most recent Annual or Semi-Annual report.
E Expense ratios reflect operating expenses of the class. Expenses before reductions do not reflect amounts reimbursed, waived, or reduced through arrangements with the investment adviser, brokerage services, or other offset arrangements, if applicable, and do not represent the amount paid by the class during periods when reimbursements, waivers or reductions occur.
F Amount does not include the portfolio activity of any underlying mutual funds or exchange-traded funds (ETFs).
See accompanying notes which are an integral part of the financial statements.
Fidelity Asset Manager 20% Class I
| Years ended September 30, | 2020 | 2019 | 2018 | 2017 | 2016 |
| Selected Per–Share Data | | | | | |
| Net asset value, beginning of period | $13.53 | $13.41 | $13.57 | $13.26 | $12.94 |
| Income from Investment Operations | | | | | |
| Net investment income (loss)A | .22 | .30 | .24 | .20 | .22 |
| Net realized and unrealized gain (loss) | .61 | .36 | .10 | .37 | .60 |
| Total from investment operations | .83 | .66 | .34 | .57 | .82 |
| Distributions from net investment income | (.22) | (.30) | (.23) | (.19) | (.24) |
| Distributions from net realized gain | (.13) | (.24) | (.27) | (.07) | (.27) |
| Total distributions | (.34)B | (.54) | (.50) | (.26) | (.50)B |
| Net asset value, end of period | $14.02 | $13.53 | $13.41 | $13.57 | $13.26 |
| Total ReturnC | 6.27% | 5.18% | 2.57% | 4.35% | 6.56% |
| Ratios to Average Net AssetsD,E | | | | | |
| Expenses before reductions | .58% | .56% | .55% | .56% | .57% |
| Expenses net of fee waivers, if any | .57% | .56% | .55% | .56% | .57% |
| Expenses net of all reductions | .57% | .56% | .55% | .56% | .57% |
| Net investment income (loss) | 1.59% | 2.24% | 1.78% | 1.48% | 1.73% |
| Supplemental Data | | | | | |
| Net assets, end of period (000 omitted) | $32,445 | $25,577 | $48,713 | $50,272 | $27,315 |
| Portfolio turnover rateF | 25% | 41% | 24% | 22% | 19% |
A Calculated based on average shares outstanding during the period.
B Total distributions per share do not sum due to rounding.
C Total returns would have been lower if certain expenses had not been reduced during the applicable periods shown.
D Fees and expenses of any underlying mutual funds or exchange-traded funds (ETFs) are not included in the Fund's expense ratio. The Fund indirectly bears its proportionate share of these expenses. For additional expense information related to investments in Fidelity Central Funds, please refer to the "Investments in Fidelity Central Funds" note found in the Notes to Financial Statements section of the most recent Annual or Semi-Annual report.
E Expense ratios reflect operating expenses of the class. Expenses before reductions do not reflect amounts reimbursed, waived, or reduced through arrangements with the investment adviser, brokerage services, or other offset arrangements, if applicable, and do not represent the amount paid by the class during periods when reimbursements, waivers or reductions occur.
F Amount does not include the portfolio activity of any underlying mutual funds or exchange-traded funds (ETFs).
See accompanying notes which are an integral part of the financial statements.
Fidelity Asset Manager 20% Class Z
| Years ended September 30, | 2020 | 2019 A |
| Selected Per–Share Data | | |
| Net asset value, beginning of period | $13.53 | $13.41 |
| Income from Investment Operations | | |
| Net investment income (loss)B | .23 | .30 |
| Net realized and unrealized gain (loss) | .62 | .37 |
| Total from investment operations | .85 | .67 |
| Distributions from net investment income | (.24) | (.31) |
| Distributions from net realized gain | (.13) | (.24) |
| Total distributions | (.36)C | (.55) |
| Net asset value, end of period | $14.02 | $13.53 |
| Total ReturnD,E | 6.41% | 5.27% |
| Ratios to Average Net AssetsF,G | | |
| Expenses before reductions | .48% | .48%H |
| Expenses net of fee waivers, if any | .48% | .48%H |
| Expenses net of all reductions | .48% | .48%H |
| Net investment income (loss) | 1.69% | 2.32%H |
| Supplemental Data | | |
| Net assets, end of period (000 omitted) | $18,177 | $14,613 |
| Portfolio turnover rateI | 25% | 41% |
A For the period October 2, 2018 (commencement of sale of shares) to September 30, 2019.
B Calculated based on average shares outstanding during the period.
C Total distributions per share do not sum due to rounding.
D Total returns for periods of less than one year are not annualized.
E Total returns would have been lower if certain expenses had not been reduced during the applicable periods shown.
F Fees and expenses of any underlying mutual funds or exchange-traded funds (ETFs) are not included in the Fund's expense ratio. The Fund indirectly bears its proportionate share of these expenses. For additional expense information related to investments in Fidelity Central Funds, please refer to the "Investments in Fidelity Central Funds" note found in the Notes to Financial Statements section of the most recent Annual or Semi-Annual report.
G Expense ratios reflect operating expenses of the class. Expenses before reductions do not reflect amounts reimbursed, waived, or reduced through arrangements with the investment adviser, brokerage services, or other offset arrangements, if applicable, and do not represent the amount paid by the class during periods when reimbursements, waivers or reductions occur.
H Annualized
I Amount does not include the portfolio activity of any underlying mutual funds or exchange-traded funds (ETFs).
See accompanying notes which are an integral part of the financial statements.
Fidelity Asset Manager® 30%
Investment Summary (Unaudited)
The information in the following tables is based on the combined investments of the Fund and its pro-rata share of the investments of Fidelity's Central Funds, other than the Money Market Central Funds.
Top Five Bond Issuers as of September 30, 2020
| (with maturities greater than one year) | % of fund's net assets |
| U.S. Treasury Obligations | 13.7 |
| Fannie Mae | 4.6 |
| Freddie Mac | 2.6 |
| Ginnie Mae | 2.1 |
| Uniform Mortgage Backed Securities | 1.6 |
| | 24.6 |
Quality Diversification (% of fund's net assets)
| As of September 30, 2020 |
| | U.S. Government and U.S. Government Agency Obligations | 25.0% |
| | AAA,AA,A | 9.0% |
| | BBB | 14.1% |
| | BB and Below | 6.0% |
| | Not Rated | 1.3% |
| | Equities | 33.9% |
| | Short-Term Investments and Net Other Assets | 10.7% |

We have used ratings from Moody's Investors Service, Inc. Where Moody's® ratings are not available, we have used S&P® ratings. All ratings are as of the date indicated and do not reflect subsequent changes.
Top Five Stocks as of September 30, 2020
| | % of fund's net assets |
| Apple, Inc. | 1.5 |
| Microsoft Corp. | 1.4 |
| Alphabet, Inc. Class A | 0.7 |
| Amazon.com, Inc. | 0.6 |
| Facebook, Inc. Class A | 0.4 |
| | 4.6 |
Top Five Market Sectors as of September 30, 2020
| | % of fund's net assets |
| Financials | 23.1 |
| Information Technology | 9.3 |
| Health Care | 5.6 |
| Communication Services | 5.1 |
| Consumer Discretionary | 4.6 |
Asset Allocation (% of fund's net assets)
| As of September 30, 2020 |
| | Stock Class and Equity Futures | 34.1% |
| | Bond Class | 54.5% |
| | Short-Term Class | 11.4% |

Asset allocations in the pie charts reflect the categorization of assets as defined in the Fund's prospectus in effect as of the time periods indicated above. Percentages are adjusted for the effect of future contracts and swap contracts, if applicable.
At period end, foreign investments including the Fund's pro-rata share of the underlying Central Funds, other than the Money Market Funds, was 19.5% of net assets.
Percentages in the above tables are adjusted for the effect of TBA Sale Commitments.
An unaudited holdings listing for the Fund, which presents direct holdings as well as the pro-rata share of any securities and other investments held indirectly through its investment in underlying Fidelity Central Funds, other than the Money Market Central Funds, is available at fidelity.com and/or institutional.fidelity.com, as applicable.
Fidelity Asset Manager® 30%
Schedule of Investments September 30, 2020
Showing Percentage of Net Assets
| Equity Central Funds - 33.1% | | | |
| | | Shares | Value |
| Fidelity Emerging Markets Equity Central Fund (a) | | 406,768 | $96,461,082 |
| Fidelity International Equity Central Fund (a) | | 1,208,373 | 102,252,557 |
| Fidelity Real Estate Equity Central Fund (a) | | 86,772 | 9,379,156 |
| Fidelity U.S. Equity Central Fund (a) | | 4,712,385 | 474,584,245 |
| TOTAL EQUITY CENTRAL FUNDS | | | |
| (Cost $527,033,470) | | | 682,677,040 |
|
| Fixed-Income Central Funds - 56.2% | | | |
| High Yield Fixed-Income Funds - 3.6% | | | |
| Fidelity Emerging Markets Debt Central Fund (a) | | 2,107,007 | 18,920,927 |
| Fidelity Emerging Markets Debt Local Currency Central Fund (a) | | 95,990 | 9,613,399 |
| Fidelity Floating Rate Central Fund (a) | | 97,853 | 9,430,122 |
| Fidelity High Income Central Fund (a) | | 345,253 | 36,075,535 |
|
| TOTAL HIGH YIELD FIXED-INCOME FUNDS | | | 74,039,983 |
|
| Investment Grade Fixed-Income Funds - 52.6% | | | |
| Fidelity Inflation-Protected Bond Index Central Fund (a) | | 1,138,466 | 124,013,147 |
| Fidelity International Credit Central Fund (a) | | 293,524 | 30,732,001 |
| Fidelity Investment Grade Bond Central Fund (a) | | 7,856,046 | 930,234,358 |
|
| TOTAL INVESTMENT GRADE FIXED-INCOME FUNDS | | | 1,084,979,506 |
|
| TOTAL FIXED-INCOME CENTRAL FUNDS | | | |
| (Cost $1,064,849,295) | | | 1,159,019,489 |
|
| Money Market Central Funds - 9.0% | | | |
| Fidelity Cash Central Fund 0.10% (b) | | 19,438,505 | 19,442,393 |
| Fidelity Money Market Central Fund 0.20% (b) | | 165,551,348 | 165,551,348 |
| TOTAL MONEY MARKET CENTRAL FUNDS | | | |
| (Cost $184,995,671) | | | 184,993,741 |
| | | Principal Amount | Value |
|
| U.S. Treasury Obligations - 0.4% | | | |
| U.S. Treasury Bills, yield at date of purchase 0.1% to 0.13% 10/8/20 to 12/10/20 (c) | | | |
| (Cost $9,278,295) | | 9,280,000 | 9,278,488 |
| | | Shares | Value |
|
| Investment Companies - 1.3% | | | |
| iShares MSCI Japan ETF | | | |
| (Cost $24,705,707) | | 472,219 | 27,893,976 |
| TOTAL INVESTMENT IN SECURITIES - 100.0% | | | |
| (Cost $1,810,862,438) | | | 2,063,862,734 |
| NET OTHER ASSETS (LIABILITIES) - 0.0% | | | (626,309) |
| NET ASSETS - 100% | | | $2,063,236,425 |
| Futures Contracts | | | | | |
| | Number of contracts | Expiration Date | Notional Amount | Value | Unrealized Appreciation/(Depreciation) |
| Sold | | | | | |
| Equity Index Contracts | | | | | |
| CME E-mini S&P 500 Index Contracts (United States) | 402 | Dec. 2020 | $67,375,200 | $(439,840) | $(439,840) |
The notional amount of futures sold as a percentage of Net Assets is 3.3%
For the period, the average monthly notional amount at value for futures contracts in the aggregate was $47,538,753.
Security Type Abbreviations
ETF – Exchange-Traded Fund
Legend
(a) Affiliated fund that is generally available only to investment companies and other accounts managed by Fidelity Investments. A complete unaudited schedule of portfolio holdings for each Fidelity Central Fund is filed with the SEC for the first and third quarters of each fiscal year on Form N-PORT and is available upon request or at the SEC's website at www.sec.gov. An unaudited holdings listing for the Fund, which presents direct holdings as well as the pro-rata share of securities and other investments held indirectly through its investment in underlying non-money market Fidelity Central Funds, is available at fidelity.com and/or institutional.fidelity.com, as applicable. In addition, each Fidelity Central Fund's financial statements, which are not covered by the Fund's Report of Independent Registered Public Accounting Firm, are available on the SEC's website or upon request.
(b) Affiliated fund that is generally available only to investment companies and other accounts managed by Fidelity Investments. The rate quoted is the annualized seven-day yield of the fund at period end. A complete unaudited listing of the fund's holdings as of its most recent quarter end is available upon request. In addition, each Fidelity Central Fund's financial statements, which are not covered by the Fund's Report of Independent Registered Public Accounting Firm, are available on the SEC's website or upon request.
(c) Security or a portion of the security was pledged to cover margin requirements for futures contracts. At period end, the value of securities pledged amounted to $6,724,819.
Affiliated Central Funds
Information regarding fiscal year to date income earned by the Fund from investments in Fidelity Central Funds is as follows:
| Fund | Income earned |
| Fidelity Cash Central Fund | $244,178 |
| Fidelity Communication Services Central Fund | 2,202,266 |
| Fidelity Consumer Discretionary Central Fund | 1,323,176 |
| Fidelity Consumer Staples Central Fund | 743,884 |
| Fidelity Emerging Markets Debt Central Fund | 1,060,295 |
| Fidelity Emerging Markets Equity Central Fund | 2,304,639 |
| Fidelity Energy Central Fund | 412,561 |
| Fidelity Financials Central Fund | 4,233,770 |
| Fidelity Floating Rate Central Fund | 474,789 |
| Fidelity Health Care Central Fund | 6,650,090 |
| Fidelity High Income Central Fund | 1,200,361 |
| Fidelity Industrials Central Fund | 616,658 |
| Fidelity Inflation-Protected Bond Index Central Fund | 1,750,775 |
| Fidelity Information Technology Central Fund | 14,176,379 |
| Fidelity International Credit Central Fund | 1,003,354 |
| Fidelity International Equity Central Fund | 1,750,815 |
| Fidelity Investment Grade Bond Central Fund | 23,731,746 |
| Fidelity Materials Central Fund | 156,734 |
| Fidelity Money Market Central Fund | 2,452,106 |
| Fidelity Real Estate Equity Central Fund | 494,476 |
| Fidelity Securities Lending Cash Central Fund | 2,799 |
| Fidelity Utilities Central Fund | 776,683 |
| Total | $67,762,534 |
Amounts in the income column in the above table include any capital gain distributions from underlying funds, which are presented in the corresponding line-item in the Statement of Operations, if applicable. Amount for Fidelity Securities Lending Cash Central Fund represents the income earned on investing cash collateral, less rebates paid to borrowers and any lending agent fees associated with the loan, plus any premium payments received for lending certain types of securities.
The value, beginning of period, for the Fidelity Money Market Central Fund was $216,629,176. Net realized gain (loss) and change in net unrealized appreciation (depreciation) on Fidelity Money Market Central Fund is presented in the Statement of Operations, if applicable. Purchases and sales of the Fidelity Money Market Central Fund were $39,280,291 and $90,363,515, respectively, during the period.
Fiscal year to date information regarding the Fund’s investments in non-Money Market Central Funds, including the ownership percentage, is presented below.
| Affiliate | Value, beginning of period | Purchases(a) | Sales Proceeds(a) | Realized Gain (loss) | Change in Unrealized appreciation (depreciation) | Value, end of period | % ownership, end of period |
| Fidelity Commodity Strategy Central Fund | $4,421,320 | $43,236 | $4,563,105 | $(467,783) | $566,332 | $-- | 0.0 |
| Fidelity Communication Services Central Fund | 29,849,679 | 13,923,422 | 2,949,972 | (361,464) | (4,188,940) | -- | 0.0 |
| Fidelity Consumer Discretionary Central Fund | 35,863,420 | 11,897,276 | 4,119,955 | (259,312) | (15,317,913) | -- | 0.0 |
| Fidelity Consumer Staples Central Fund | 23,209,376 | 8,171,025 | 2,201,106 | (186,467) | (3,411,958) | -- | 0.0 |
| Fidelity Emerging Markets Debt Central Fund | 17,118,699 | 4,518,953 | 1,860,153 | (311,643) | (544,929) | 18,920,927 | 0.7 |
| Fidelity Emerging Markets Debt Local Currency Central Fund | -- | 9,599,000 | -- | -- | 14,399 | 9,613,399 | 6.4 |
| Fidelity Emerging Markets Equity Central Fund | 80,958,483 | 13,436,491 | 6,832,027 | (1,511,992) | 10,410,127 | 96,461,082 | 4.9 |
| Fidelity Energy Central Fund | 14,611,117 | 3,531,823 | 888,528 | (418,603) | 3,172,787 | -- | 0.0 |
| Fidelity Financials Central Fund | 64,908,991 | 18,187,345 | 7,112,429 | (1,207,533) | (14,491,889) | -- | 0.0 |
| Fidelity Floating Rate Central Fund | 8,713,247 | 2,181,319 | 924,119 | (103,919) | (436,406) | 9,430,122 | 0.5 |
| Fidelity Health Care Central Fund | 47,748,854 | 18,581,889 | 4,910,971 | (432,712) | (17,756,472) | -- | 0.0 |
| Fidelity High Income Central Fund | 17,698,975 | 27,445,830 | 10,177,245 | (334,260) | 1,442,235 | 36,075,535 | 1.4 |
| Fidelity Industrials Central Fund | 34,129,524 | 8,379,133 | 3,818,029 | (438,280) | (9,158,032) | -- | 0.0 |
| Fidelity Inflation-Protected Bond Index Central Fund | 84,966,620 | 49,557,104 | 16,729,266 | (91,545) | 6,310,234 | 124,013,147 | 7.8 |
| Fidelity Information Technology Central Fund | 81,039,910 | 34,532,422 | 9,834,495 | (407,488) | (25,151,057) | -- | 0.0 |
| Fidelity International Credit Central Fund | 17,922,469 | 14,544,666 | 1,938,225 | (87,715) | 290,806 | 30,732,001 | 6.6 |
| Fidelity International Equity Central Fund | 77,119,279 | 31,744,291 | 11,462,799 | (2,856,893) | 7,708,679 | 102,252,557 | 3.4 |
| Fidelity Investment Grade Bond Central Fund | 729,326,223 | 272,598,566 | 109,941,025 | (2,518,538) | 40,769,132 | 930,234,358 | 3.2 |
| Fidelity Materials Central Fund | 8,631,520 | 3,182,522 | 1,338,400 | (204,827) | 30,126 | -- | 0.0 |
| Fidelity Real Estate Equity Central Fund | 26,648,248 | 4,044,529 | 14,115,116 | (5,291,744) | (1,906,761) | 9,379,156 | 1.3 |
| Fidelity U.S. Equity Central Fund | -- | 1,520,518 | 478,833 | 7,078 | 129,746,620 | 474,584,245 | 2.2 |
| Fidelity Utilities Central Fund | 12,503,906 | 3,465,918 | 1,269,716 | (162,098) | (3,764,477) | -- | 0.0 |
| | 1,417,389,860 | 555,087,278 | 217,465,514 | (17,647,738) | 104,332,643 | 1,841,696,529 | |
(a) Excludes the value of securities received and delivered through merger transactions, if applicable.
Investment Valuation
The following is a summary of the inputs used, as of September 30, 2020, involving the Fund's assets and liabilities carried at fair value. The inputs or methodology used for valuing securities may not be an indication of the risk associated with investing in those securities. For more information on valuation inputs, and their aggregation into the levels used below, please refer to the Investment Valuation section in the accompanying Notes to Financial Statements.
| | Valuation Inputs at Reporting Date: |
| Description | Total | Level 1 | Level 2 | Level 3 |
| Investments in Securities: | | | | |
| Equity Central Funds | $682,677,040 | $682,677,040 | $-- | $-- |
| Fixed-Income Central Funds | 1,159,019,489 | 1,159,019,489 | -- | -- |
| Money Market Central Funds | 184,993,741 | 184,993,741 | -- | -- |
| Other Short-Term Investments | 9,278,488 | -- | 9,278,488 | -- |
| Investment Companies | 27,893,976 | 27,893,976 | -- | -- |
| Total Investments in Securities: | $2,063,862,734 | $2,054,584,246 | $9,278,488 | $-- |
| Derivative Instruments: | | | | |
| Liabilities | | | | |
| Futures Contracts | $(439,840) | $(439,840) | $-- | $-- |
| Total Liabilities | $(439,840) | $(439,840) | $-- | $-- |
| Total Derivative Instruments: | $(439,840) | $(439,840) | $-- | $-- |
Value of Derivative Instruments
The following table is a summary of the Fund's value of derivative instruments by primary risk exposure as of September 30, 2020. For additional information on derivative instruments, please refer to the Derivative Instruments section in the accompanying Notes to Financial Statements.
| Primary Risk Exposure / Derivative Type | Value |
| | Asset | Liability |
| Equity Risk | | |
| Futures Contracts(a) | $0 | $(439,840) |
| Total Equity Risk | 0 | (439,840) |
| Total Value of Derivatives | $0 | $(439,840) |
(a) Reflects gross cumulative appreciation (depreciation) on futures contracts as presented in the Schedule of Investments. In the Statement of Assets and Liabilities, the period end daily variation margin is included in receivable or payable for daily variation margin on futures contracts, and the net cumulative appreciation (depreciation) is included in Total accumulated earnings (loss).
Other Information
Distribution of investments by country or territory of incorporation, as a percentage of Total Net Assets, is as follows (Unaudited):
| United States of America | 80.5% |
| Cayman Islands | 3.7% |
| United Kingdom | 2.8% |
| Netherlands | 1.4% |
| Switzerland | 1.2% |
| Japan | 1.0% |
| France | 1.0% |
| Others (Individually Less Than 1%) | 8.4% |
| | 100.0% |
The information in the above table is based on the combined investments of the Fund and its pro-rata share of the investments of Fidelity's Central Funds, other than the Money Market Central Funds.
See accompanying notes which are an integral part of the financial statements.
Fidelity Asset Manager® 30%
Financial Statements
Statement of Assets and Liabilities
| | | September 30, 2020 |
| Assets | | |
Investment in securities, at value — See accompanying schedule:
Unaffiliated issuers (cost $33,984,002) | $37,172,464 | |
| Fidelity Central Funds (cost $1,776,878,436) | 2,026,690,270 | |
| Total Investment in Securities (cost $1,810,862,438) | | $2,063,862,734 |
| Receivable for investments sold | | 662,089 |
| Receivable for fund shares sold | | 1,796,348 |
| Distributions receivable from Fidelity Central Funds | | 2,385 |
| Prepaid expenses | | 3,084 |
| Total assets | | 2,066,326,640 |
| Liabilities | | |
| Payable for investments purchased | $1,048,668 | |
| Payable for fund shares redeemed | 696,655 | |
| Accrued management fee | 685,167 | |
| Distribution and service plan fees payable | 41,581 | |
| Payable for daily variation margin on futures contracts | 413,811 | |
| Other affiliated payables | 184,616 | |
| Other payables and accrued expenses | 19,717 | |
| Total liabilities | | 3,090,215 |
| Net Assets | | $2,063,236,425 |
| Net Assets consist of: | | |
| Paid in capital | | $1,867,878,271 |
| Total accumulated earnings (loss) | | 195,358,154 |
| Net Assets | | $2,063,236,425 |
| Net Asset Value and Maximum Offering Price | | |
| Class A: | | |
| Net Asset Value and redemption price per share ($50,625,152 ÷ 4,291,754 shares)(a) | | $11.80 |
| Maximum offering price per share (100/94.25 of $11.80) | | $12.52 |
| Class M: | | |
| Net Asset Value and redemption price per share ($20,329,322 ÷ 1,726,533 shares)(a) | | $11.77 |
| Maximum offering price per share (100/96.50 of $11.77) | | $12.20 |
| Class C: | | |
| Net Asset Value and offering price per share ($27,495,944 ÷ 2,348,508 shares)(a) | | $11.71 |
| Asset Manager 30%: | | |
| Net Asset Value, offering price and redemption price per share ($1,935,862,603 ÷ 164,152,014 shares) | | $11.79 |
| Class I: | | |
| Net Asset Value, offering price and redemption price per share ($19,225,112 ÷ 1,630,487 shares) | | $11.79 |
| Class Z: | | |
| Net Asset Value, offering price and redemption price per share ($9,698,292 ÷ 822,620 shares) | | $11.79 |
(a) Redemption price per share is equal to net asset value less any applicable contingent deferred sales charge.
See accompanying notes which are an integral part of the financial statements.
Statement of Operations
| | | Year ended September 30, 2020 |
| Investment Income | | |
| Dividends | | $1,730,485 |
| Interest | | 33,907 |
| Income from Fidelity Central Funds (including $2,799 from security lending) | | 41,002,832 |
| Total income | | 42,767,224 |
| Expenses | | |
| Management fee | $7,617,933 | |
| Transfer agent fees | 1,447,648 | |
| Distribution and service plan fees | 452,886 | |
| Accounting fees | 628,829 | |
| Custodian fees and expenses | 4,848 | |
| Independent trustees' fees and expenses | 6,002 | |
| Registration fees | 146,627 | |
| Audit | 39,740 | |
| Legal | 2,894 | |
| Interest | 839 | |
| Miscellaneous | 10,668 | |
| Total expenses before reductions | 10,358,914 | |
| Expense reductions | (19,533) | |
| Total expenses after reductions | | 10,339,381 |
| Net investment income (loss) | | 32,427,843 |
| Realized and Unrealized Gain (Loss) | | |
| Net realized gain (loss) on: | | |
| Investment securities: | | |
| Unaffiliated issuers | 2,037,902 | |
| Fidelity Central Funds | (17,646,339) | |
| Futures contracts | (11,560,886) | |
| Capital gain distributions from Fidelity Central Funds | 26,759,702 | |
| Total net realized gain (loss) | | (409,621) |
| Change in net unrealized appreciation (depreciation) on: | | |
| Investment securities: | | |
| Unaffiliated issuers | (2,963,469) | |
| Fidelity Central Funds | 104,337,240 | |
| Futures contracts | (1,444,771) | |
| Total change in net unrealized appreciation (depreciation) | | 99,929,000 |
| Net gain (loss) | | 99,519,379 |
| Net increase (decrease) in net assets resulting from operations | | $131,947,222 |
See accompanying notes which are an integral part of the financial statements.
Statement of Changes in Net Assets
| | Year ended September 30, 2020 | Year ended September 30, 2019 |
| Increase (Decrease) in Net Assets | | |
| Operations | | |
| Net investment income (loss) | $32,427,843 | $35,074,863 |
| Net realized gain (loss) | (409,621) | 23,057,740 |
| Change in net unrealized appreciation (depreciation) | 99,929,000 | 20,382,445 |
| Net increase (decrease) in net assets resulting from operations | 131,947,222 | 78,515,048 |
| Distributions to shareholders | (55,398,929) | (60,202,108) |
| Share transactions - net increase (decrease) | 221,675,535 | 173,802,985 |
| Total increase (decrease) in net assets | 298,223,828 | 192,115,925 |
| Net Assets | | |
| Beginning of period | 1,765,012,597 | 1,572,896,672 |
| End of period | $2,063,236,425 | $1,765,012,597 |
See accompanying notes which are an integral part of the financial statements.
Financial Highlights
Fidelity Asset Manager 30% Class A
| Years ended September 30, | 2020 | 2019 | 2018 | 2017 | 2016 |
| Selected Per–Share Data | | | | | |
| Net asset value, beginning of period | $11.24 | $11.15 | $11.11 | $10.62 | $10.19 |
| Income from Investment Operations | | | | | |
| Net investment income (loss)A | .16 | .21 | .16 | .13 | .16 |
| Net realized and unrealized gain (loss) | .71 | .27 | .21 | .51 | .60 |
| Total from investment operations | .87 | .48 | .37 | .64 | .76 |
| Distributions from net investment income | (.17) | (.21) | (.15) | (.13) | (.17) |
| Distributions from net realized gain | (.14) | (.18) | (.18) | (.02) | (.16) |
| Total distributions | (.31) | (.39) | (.33) | (.15) | (.33) |
| Net asset value, end of period | $11.80 | $11.24 | $11.15 | $11.11 | $10.62 |
| Total ReturnB,C | 7.83% | 4.54% | 3.40% | 6.06% | 7.61% |
| Ratios to Average Net AssetsD,E | | | | | |
| Expenses before reductions | .82% | .82% | .84% | .85% | .85% |
| Expenses net of fee waivers, if any | .82% | .82% | .84% | .85% | .85% |
| Expenses net of all reductions | .82% | .82% | .84% | .85% | .85% |
| Net investment income (loss) | 1.43% | 1.91% | 1.47% | 1.24% | 1.58% |
| Supplemental Data | | | | | |
| Net assets, end of period (000 omitted) | $50,625 | $36,978 | $28,713 | $22,457 | $23,868 |
| Portfolio turnover rateF | 23% | 34% | 18% | 24% | 24% |
A Calculated based on average shares outstanding during the period.
B Total returns would have been lower if certain expenses had not been reduced during the applicable periods shown.
C Total returns do not include the effect of the sales charges.
D Fees and expenses of any underlying mutual funds or exchange-traded funds (ETFs) are not included in the Fund's expense ratio. The Fund indirectly bears its proportionate share of these expenses. For additional expense information related to investments in Fidelity Central Funds, please refer to the "Investments in Fidelity Central Funds" note found in the Notes to Financial Statements section of the most recent Annual or Semi-Annual report.
E Expense ratios reflect operating expenses of the class. Expenses before reductions do not reflect amounts reimbursed, waived, or reduced through arrangements with the investment adviser, brokerage services, or other offset arrangements, if applicable, and do not represent the amount paid by the class during periods when reimbursements, waivers or reductions occur.
F Amount does not include the portfolio activity of any underlying mutual funds or exchange-traded funds (ETFs).
See accompanying notes which are an integral part of the financial statements.
Fidelity Asset Manager 30% Class M
| Years ended September 30, | 2020 | 2019 | 2018 | 2017 | 2016 |
| Selected Per–Share Data | | | | | |
| Net asset value, beginning of period | $11.22 | $11.13 | $11.10 | $10.61 | $10.18 |
| Income from Investment Operations | | | | | |
| Net investment income (loss)A | .13 | .18 | .13 | .11 | .14 |
| Net realized and unrealized gain (loss) | .70 | .27 | .21 | .50 | .59 |
| Total from investment operations | .83 | .45 | .34 | .61 | .73 |
| Distributions from net investment income | (.14) | (.18) | (.13) | (.10) | (.14) |
| Distributions from net realized gain | (.14) | (.18) | (.18) | (.02) | (.16) |
| Total distributions | (.28) | (.36) | (.31) | (.12) | (.30) |
| Net asset value, end of period | $11.77 | $11.22 | $11.13 | $11.10 | $10.61 |
| Total ReturnB,C | 7.49% | 4.28% | 3.08% | 5.81% | 7.33% |
| Ratios to Average Net AssetsD,E | | | | | |
| Expenses before reductions | 1.08% | 1.09% | 1.10% | 1.11% | 1.11% |
| Expenses net of fee waivers, if any | 1.08% | 1.09% | 1.09% | 1.11% | 1.11% |
| Expenses net of all reductions | 1.08% | 1.09% | 1.09% | 1.11% | 1.11% |
| Net investment income (loss) | 1.17% | 1.64% | 1.21% | .98% | 1.32% |
| Supplemental Data | | | | | |
| Net assets, end of period (000 omitted) | $20,329 | $16,252 | $14,473 | $13,023 | $11,834 |
| Portfolio turnover rateF | 23% | 34% | 18% | 24% | 24% |
A Calculated based on average shares outstanding during the period.
B Total returns would have been lower if certain expenses had not been reduced during the applicable periods shown.
C Total returns do not include the effect of the sales charges.
D Fees and expenses of any underlying mutual funds or exchange-traded funds (ETFs) are not included in the Fund's expense ratio. The Fund indirectly bears its proportionate share of these expenses. For additional expense information related to investments in Fidelity Central Funds, please refer to the "Investments in Fidelity Central Funds" note found in the Notes to Financial Statements section of the most recent Annual or Semi-Annual report.
E Expense ratios reflect operating expenses of the class. Expenses before reductions do not reflect amounts reimbursed, waived, or reduced through arrangements with the investment adviser, brokerage services, or other offset arrangements, if applicable, and do not represent the amount paid by the class during periods when reimbursements, waivers or reductions occur.
F Amount does not include the portfolio activity of any underlying mutual funds or exchange-traded funds (ETFs).
See accompanying notes which are an integral part of the financial statements.
Fidelity Asset Manager 30% Class C
| Years ended September 30, | 2020 | 2019 | 2018 | 2017 | 2016 |
| Selected Per–Share Data | | | | | |
| Net asset value, beginning of period | $11.16 | $11.07 | $11.04 | $10.57 | $10.14 |
| Income from Investment Operations | | | | | |
| Net investment income (loss)A | .07 | .12 | .08 | .05 | .08 |
| Net realized and unrealized gain (loss) | .70 | .28 | .20 | .49 | .60 |
| Total from investment operations | .77 | .40 | .28 | .54 | .68 |
| Distributions from net investment income | (.08) | (.12) | (.07) | (.05) | (.09) |
| Distributions from net realized gain | (.14) | (.18) | (.18) | (.02) | (.16) |
| Total distributions | (.22) | (.31)B | (.25) | (.07) | (.25) |
| Net asset value, end of period | $11.71 | $11.16 | $11.07 | $11.04 | $10.57 |
| Total ReturnC,D | 7.00% | 3.77% | 2.59% | 5.16% | 6.85% |
| Ratios to Average Net AssetsE,F | | | | | |
| Expenses before reductions | 1.59% | 1.60% | 1.61% | 1.61% | 1.61% |
| Expenses net of fee waivers, if any | 1.59% | 1.60% | 1.61% | 1.61% | 1.61% |
| Expenses net of all reductions | 1.59% | 1.60% | 1.61% | 1.61% | 1.61% |
| Net investment income (loss) | .66% | 1.13% | .70% | .47% | .82% |
| Supplemental Data | | | | | |
| Net assets, end of period (000 omitted) | $27,496 | $24,224 | $24,911 | $20,979 | $21,579 |
| Portfolio turnover rateG | 23% | 34% | 18% | 24% | 24% |
A Calculated based on average shares outstanding during the period.
B Total distributions per share do not sum due to rounding.
C Total returns would have been lower if certain expenses had not been reduced during the applicable periods shown.
D Total returns do not include the effect of the contingent deferred sales charge.
E Fees and expenses of any underlying mutual funds or exchange-traded funds (ETFs) are not included in the Fund's expense ratio. The Fund indirectly bears its proportionate share of these expenses. For additional expense information related to investments in Fidelity Central Funds, please refer to the "Investments in Fidelity Central Funds" note found in the Notes to Financial Statements section of the most recent Annual or Semi-Annual report.
F Expense ratios reflect operating expenses of the class. Expenses before reductions do not reflect amounts reimbursed, waived, or reduced through arrangements with the investment adviser, brokerage services, or other offset arrangements, if applicable, and do not represent the amount paid by the class during periods when reimbursements, waivers or reductions occur.
G Amount does not include the portfolio activity of any underlying mutual funds or exchange-traded funds (ETFs).
See accompanying notes which are an integral part of the financial statements.
Fidelity Asset Manager 30%
| Years ended September 30, | 2020 | 2019 | 2018 | 2017 | 2016 |
| Selected Per–Share Data | | | | | |
| Net asset value, beginning of period | $11.24 | $11.15 | $11.11 | $10.63 | $10.20 |
| Income from Investment Operations | | | | | |
| Net investment income (loss)A | .20 | .24 | .20 | .17 | .20 |
| Net realized and unrealized gain (loss) | .69 | .27 | .21 | .49 | .59 |
| Total from investment operations | .89 | .51 | .41 | .66 | .79 |
| Distributions from net investment income | (.20) | (.24) | (.19) | (.16) | (.20) |
| Distributions from net realized gain | (.14) | (.18) | (.18) | (.02) | (.16) |
| Total distributions | (.34) | (.42) | (.37) | (.18) | (.36) |
| Net asset value, end of period | $11.79 | $11.24 | $11.15 | $11.11 | $10.63 |
| Total ReturnB | 8.05% | 4.87% | 3.75% | 6.32% | 7.94% |
| Ratios to Average Net AssetsC,D | | | | | |
| Expenses before reductions | .52% | .53% | .53% | .54% | .54% |
| Expenses net of fee waivers, if any | .52% | .52% | .53% | .54% | .54% |
| Expenses net of all reductions | .52% | .52% | .53% | .53% | .53% |
| Net investment income (loss) | 1.74% | 2.21% | 1.78% | 1.55% | 1.90% |
| Supplemental Data | | | | | |
| Net assets, end of period (000 omitted) | $1,935,863 | $1,661,192 | $1,480,983 | $1,139,197 | $937,285 |
| Portfolio turnover rateE | 23% | 34% | 18% | 24% | 24% |
A Calculated based on average shares outstanding during the period.
B Total returns would have been lower if certain expenses had not been reduced during the applicable periods shown.
C Fees and expenses of any underlying mutual funds or exchange-traded funds (ETFs) are not included in the Fund's expense ratio. The Fund indirectly bears its proportionate share of these expenses. For additional expense information related to investments in Fidelity Central Funds, please refer to the "Investments in Fidelity Central Funds" note found in the Notes to Financial Statements section of the most recent Annual or Semi-Annual report.
D Expense ratios reflect operating expenses of the class. Expenses before reductions do not reflect amounts reimbursed, waived, or reduced through arrangements with the investment adviser, brokerage services, or other offset arrangements, if applicable, and do not represent the amount paid by the class during periods when reimbursements, waivers or reductions occur.
E Amount does not include the portfolio activity of any underlying mutual funds or exchange-traded funds (ETFs).
See accompanying notes which are an integral part of the financial statements.
Fidelity Asset Manager 30% Class I
| Years ended September 30, | 2020 | 2019 | 2018 | 2017 | 2016 |
| Selected Per–Share Data | | | | | |
| Net asset value, beginning of period | $11.24 | $11.15 | $11.11 | $10.62 | $10.20 |
| Income from Investment Operations | | | | | |
| Net investment income (loss)A | .19 | .23 | .19 | .16 | .19 |
| Net realized and unrealized gain (loss) | .69 | .28 | .21 | .50 | .59 |
| Total from investment operations | .88 | .51 | .40 | .66 | .78 |
| Distributions from net investment income | (.19) | (.23) | (.18) | (.15) | (.20) |
| Distributions from net realized gain | (.14) | (.18) | (.18) | (.02) | (.16) |
| Total distributions | (.33) | (.42)B | (.36) | (.17) | (.36) |
| Net asset value, end of period | $11.79 | $11.24 | $11.15 | $11.11 | $10.62 |
| Total ReturnC | 8.00% | 4.80% | 3.66% | 6.32% | 7.80% |
| Ratios to Average Net AssetsD,E | | | | | |
| Expenses before reductions | .59% | .59% | .61% | .62% | .60% |
| Expenses net of fee waivers, if any | .59% | .59% | .61% | .62% | .60% |
| Expenses net of all reductions | .59% | .59% | .61% | .62% | .60% |
| Net investment income (loss) | 1.67% | 2.14% | 1.70% | 1.46% | 1.84% |
| Supplemental Data | | | | | |
| Net assets, end of period (000 omitted) | $19,225 | $19,014 | $23,818 | $20,500 | $11,501 |
| Portfolio turnover rateF | 23% | 34% | 18% | 24% | 24% |
A Calculated based on average shares outstanding during the period.
B Total distributions per share do not sum due to rounding.
C Total returns would have been lower if certain expenses had not been reduced during the applicable periods shown.
D Fees and expenses of any underlying mutual funds or exchange-traded funds (ETFs) are not included in the Fund's expense ratio. The Fund indirectly bears its proportionate share of these expenses. For additional expense information related to investments in Fidelity Central Funds, please refer to the "Investments in Fidelity Central Funds" note found in the Notes to Financial Statements section of the most recent Annual or Semi-Annual report.
E Expense ratios reflect operating expenses of the class. Expenses before reductions do not reflect amounts reimbursed, waived, or reduced through arrangements with the investment adviser, brokerage services, or other offset arrangements, if applicable, and do not represent the amount paid by the class during periods when reimbursements, waivers or reductions occur.
F Amount does not include the portfolio activity of any underlying mutual funds or exchange-traded funds (ETFs).
See accompanying notes which are an integral part of the financial statements.
Fidelity Asset Manager 30% Class Z
| Years ended September 30, | 2020 | 2019 A |
| Selected Per–Share Data | | |
| Net asset value, beginning of period | $11.24 | $11.14 |
| Income from Investment Operations | | |
| Net investment income (loss)B | .20 | .24 |
| Net realized and unrealized gain (loss) | .69 | .29 |
| Total from investment operations | .89 | .53 |
| Distributions from net investment income | (.20) | (.25) |
| Distributions from net realized gain | (.14) | (.18) |
| Total distributions | (.34) | (.43) |
| Net asset value, end of period | $11.79 | $11.24 |
| Total ReturnC,D | 8.10% | 5.01% |
| Ratios to Average Net AssetsE,F | | |
| Expenses before reductions | .50% | .50%G |
| Expenses net of fee waivers, if any | .49% | .50%G |
| Expenses net of all reductions | .49% | .50%G |
| Net investment income (loss) | 1.76% | 2.23%G |
| Supplemental Data | | |
| Net assets, end of period (000 omitted) | $9,698 | $7,353 |
| Portfolio turnover rateH | 23% | 34% |
A For the period October 2, 2018 (commencement of sale of shares) to September 30, 2019.
B Calculated based on average shares outstanding during the period.
C Total returns for periods of less than one year are not annualized.
D Total returns would have been lower if certain expenses had not been reduced during the applicable periods shown.
E Fees and expenses of any underlying mutual funds or exchange-traded funds (ETFs) are not included in the Fund's expense ratio. The Fund indirectly bears its proportionate share of these expenses. For additional expense information related to investments in Fidelity Central Funds, please refer to the "Investments in Fidelity Central Funds" note found in the Notes to Financial Statements section of the most recent Annual or Semi-Annual report.
F Expense ratios reflect operating expenses of the class. Expenses before reductions do not reflect amounts reimbursed, waived, or reduced through arrangements with the investment adviser, brokerage services, or other offset arrangements, if applicable, and do not represent the amount paid by the class during periods when reimbursements, waivers or reductions occur.
G Annualized
H Amount does not include the portfolio activity of any underlying mutual funds or exchange-traded funds (ETFs).
See accompanying notes which are an integral part of the financial statements.
Fidelity Asset Manager® 40%
Investment Summary (Unaudited)
The information in the following tables is based on the combined investments of the Fund and its pro-rata share of the investments of Fidelity's Central Funds, other than the Money Market Central Funds.
Top Five Bond Issuers as of September 30, 2020
| (with maturities greater than one year) | % of fund's net assets |
| U.S. Treasury Obligations | 12.3 |
| Fannie Mae | 4.0 |
| Freddie Mac | 2.3 |
| Ginnie Mae | 1.8 |
| Uniform Mortgage Backed Securities | 1.3 |
| | 21.7 |
Quality Diversification (% of fund's net assets)
| As of September 30, 2020 |
| | U.S. Government and U.S. Government Agency Obligations | 22.1% |
| | AAA,AA,A | 7.8% |
| | BBB | 12.7% |
| | BB and Below | 5.7% |
| | Not Rated | 1.2% |
| | Equities | 44.0% |
| | Short-Term Investments and Net Other Assets | 6.5% |

We have used ratings from Moody's Investors Service, Inc. Where Moody's® ratings are not available, we have used S&P® ratings. All ratings are as of the date indicated and do not reflect subsequent changes.
Top Five Stocks as of September 30, 2020
| | % of fund's net assets |
| Apple, Inc. | 1.9 |
| Microsoft Corp. | 1.8 |
| Alphabet, Inc. Class A | 1.0 |
| Amazon.com, Inc. | 0.8 |
| Facebook, Inc. Class A | 0.6 |
| | 6.1 |
Top Five Market Sectors as of September 30, 2020
| | % of fund's net assets |
| Financials | 18.4 |
| Information Technology | 11.6 |
| Health Care | 6.8 |
| Consumer Discretionary | 5.8 |
| Communication Services | 5.8 |
Asset Allocation (% of fund's net assets)
| As of September 30, 2020 |
| | Stock Class and Equity Futures | 44.3% |
| | Bond Class | 48.9% |
| | Short-Term Class | 6.8% |

Asset allocations in the pie charts reflect the categorization of assets as defined in the Fund's prospectus in effect as of the time periods indicated above. Percentages are adjusted for the effect of future contracts and swap contracts, if applicable.
At period end, foreign investments including the Fund's pro-rata share of the underlying Central Funds, other than the Money Market Funds, was 22.1% of net assets.
Percentages in the above tables are adjusted for the effect of TBA Sale Commitments.
An unaudited holdings listing for the Fund, which presents direct holdings as well as the pro-rata share of any securities and other investments held indirectly through its investment in underlying Fidelity Central Funds, other than the Money Market Central Funds, is available at fidelity.com and/or institutional.fidelity.com, as applicable.
Fidelity Asset Manager® 40%
Schedule of Investments September 30, 2020
Showing Percentage of Net Assets
| Equity Central Funds - 43.2% | | | |
| | | Shares | Value |
| Fidelity Emerging Markets Equity Central Fund (a) | | 476,495 | $112,996,139 |
| Fidelity International Equity Central Fund (a) | | 1,678,077 | 141,998,853 |
| Fidelity Real Estate Equity Central Fund (a) | | 84,171 | 9,098,043 |
| Fidelity U.S. Equity Central Fund (a) | | 6,121,623 | 616,508,652 |
| TOTAL EQUITY CENTRAL FUNDS | | | |
| (Cost $651,839,857) | | | 880,601,687 |
|
| Fixed-Income Central Funds - 50.4% | | | |
| High Yield Fixed-Income Funds - 3.5% | | | |
| Fidelity Emerging Markets Debt Central Fund (a) | | 2,054,058 | 18,445,441 |
| Fidelity Emerging Markets Debt Local Currency Central Fund (a) | | 94,870 | 9,501,231 |
| Fidelity Floating Rate Central Fund (a) | | 94,945 | 9,149,841 |
| Fidelity High Income Central Fund (a) | | 334,628 | 34,965,272 |
|
| TOTAL HIGH YIELD FIXED-INCOME FUNDS | | | 72,061,785 |
|
| Investment Grade Fixed-Income Funds - 46.9% | | | |
| Fidelity Inflation-Protected Bond Index Central Fund (a) | | 1,025,742 | 111,734,069 |
| Fidelity International Credit Central Fund (a) | | 286,944 | 30,043,011 |
| Fidelity Investment Grade Bond Central Fund (a) | | 6,866,954 | 813,115,991 |
|
| TOTAL INVESTMENT GRADE FIXED-INCOME FUNDS | | | 954,893,071 |
|
| TOTAL FIXED-INCOME CENTRAL FUNDS | | | |
| (Cost $942,596,094) | | | 1,026,954,856 |
|
| Money Market Central Funds - 4.4% | | | |
| Fidelity Cash Central Fund 0.10% (b) | | 34,360,191 | 34,367,063 |
| Fidelity Money Market Central Fund 0.20% (b) | | 55,942,692 | 55,942,692 |
| TOTAL MONEY MARKET CENTRAL FUNDS | | | |
| (Cost $90,309,255) | | | 90,309,755 |
| | | Principal Amount | Value |
|
| U.S. Treasury Obligations - 0.5% | | | |
| U.S. Treasury Bills, yield at date of purchase 0.11% to 0.13% 10/8/20 to 12/10/20 (c) | | | |
| (Cost $9,538,084) | | 9,540,000 | 9,538,314 |
| | | Shares | Value |
|
| Investment Companies - 1.5% | | | |
| iShares MSCI Japan ETF | | | |
| (Cost $27,284,621) | | 526,060 | 31,074,364 |
| TOTAL INVESTMENT IN SECURITIES - 100.0% | | | |
| (Cost $1,721,567,911) | | | 2,038,478,976 |
| NET OTHER ASSETS (LIABILITIES) - 0.0% | | | (710,657) |
| NET ASSETS - 100% | | | $2,037,768,319 |
| Futures Contracts | | | | | |
| | Number of contracts | Expiration Date | Notional Amount | Value | Unrealized Appreciation/(Depreciation) |
| Sold | | | | | |
| Equity Index Contracts | | | | | |
| CME E-mini S&P 500 Index Contracts (United States)�� | 415 | Dec. 2020 | $69,554,000 | $(454,064) | $(454,064) |
The notional amount of futures sold as a percentage of Net Assets is 3.4%
For the period, the average monthly notional amount at value for futures contracts in the aggregate was $52,828,918.
Security Type Abbreviations
ETF – Exchange-Traded Fund
Legend
(a) Affiliated fund that is generally available only to investment companies and other accounts managed by Fidelity Investments. A complete unaudited schedule of portfolio holdings for each Fidelity Central Fund is filed with the SEC for the first and third quarters of each fiscal year on Form N-PORT and is available upon request or at the SEC's website at www.sec.gov. An unaudited holdings listing for the Fund, which presents direct holdings as well as the pro-rata share of securities and other investments held indirectly through its investment in underlying non-money market Fidelity Central Funds, is available at fidelity.com and/or institutional.fidelity.com, as applicable. In addition, each Fidelity Central Fund's financial statements, which are not covered by the Fund's Report of Independent Registered Public Accounting Firm, are available on the SEC's website or upon request.
(b) Affiliated fund that is generally available only to investment companies and other accounts managed by Fidelity Investments. The rate quoted is the annualized seven-day yield of the fund at period end. A complete unaudited listing of the fund's holdings as of its most recent quarter end is available upon request. In addition, each Fidelity Central Fund's financial statements, which are not covered by the Fund's Report of Independent Registered Public Accounting Firm, are available on the SEC's website or upon request.
(c) Security or a portion of the security was pledged to cover margin requirements for futures contracts. At period end, the value of securities pledged amounted to $6,888,671.
Affiliated Central Funds
Information regarding fiscal year to date income earned by the Fund from investments in Fidelity Central Funds is as follows:
| Fund | Income earned |
| Fidelity Cash Central Fund | $252,176 |
| Fidelity Communication Services Central Fund | 3,002,550 |
| Fidelity Consumer Discretionary Central Fund | 1,827,584 |
| Fidelity Consumer Staples Central Fund | 1,021,945 |
| Fidelity Emerging Markets Debt Central Fund | 1,072,109 |
| Fidelity Emerging Markets Equity Central Fund | 2,745,411 |
| Fidelity Energy Central Fund | 566,948 |
| Fidelity Financials Central Fund | 5,796,015 |
| Fidelity Floating Rate Central Fund | 476,626 |
| Fidelity Health Care Central Fund | 8,982,215 |
| Fidelity High Income Central Fund | 1,198,284 |
| Fidelity Industrials Central Fund | 847,586 |
| Fidelity Inflation-Protected Bond Index Central Fund | 1,676,526 |
| Fidelity Information Technology Central Fund | 17,579,241 |
| Fidelity International Credit Central Fund | 1,026,903 |
| Fidelity International Equity Central Fund | 2,511,575 |
| Fidelity Investment Grade Bond Central Fund | 21,108,284 |
| Fidelity Materials Central Fund | 214,658 |
| Fidelity Money Market Central Fund | 1,424,406 |
| Fidelity Real Estate Equity Central Fund | 499,971 |
| Fidelity Securities Lending Cash Central Fund | 2,894 |
| Fidelity Utilities Central Fund | 1,064,688 |
| Total | $74,898,595 |
Amounts in the income column in the above table include any capital gain distributions from underlying funds, which are presented in the corresponding line-item in the Statement of Operations, if applicable. Amount for Fidelity Securities Lending Cash Central Fund represents the income earned on investing cash collateral, less rebates paid to borrowers and any lending agent fees associated with the loan, plus any premium payments received for lending certain types of securities.
Fiscal year to date information regarding the Fund’s investments in non-Money Market Central Funds, including the ownership percentage, is presented below.
| Affiliate | Value, beginning of period | Purchases(a) | Sales Proceeds(a) | Realized Gain (loss) | Change in Unrealized appreciation (depreciation) | Value, end of period | % ownership, end of period |
| Fidelity Commodity Strategy Central Fund | $7,756,437 | $67,506 | $8,004,539 | $(901,449) | $1,082,045 | $-- | 0.0 |
| Fidelity Communication Services Central Fund | 42,062,287 | 14,313,383 | 4,457,247 | (144,901) | (6,097,232) | -- | 0.0 |
| Fidelity Consumer Discretionary Central Fund | 50,685,069 | 12,799,870 | 8,155,380 | 378,395 | (22,973,575) | -- | 0.0 |
| Fidelity Consumer Staples Central Fund | 32,787,164 | 8,068,592 | 3,319,745 | (49,324) | (4,428,975) | -- | 0.0 |
| Fidelity Emerging Markets Debt Central Fund | 17,653,749 | 3,396,988 | 1,868,757 | (138,386) | (598,153) | 18,445,441 | 0.7 |
| Fidelity Emerging Markets Debt Local Currency Central Fund | -- | 9,487,000 | -- | -- | 14,231 | 9,501,231 | 6.3 |
| Fidelity Emerging Markets Equity Central Fund | 96,588,206 | 12,208,086 | 7,693,075 | (678,880) | 12,571,802 | 112,996,139 | 5.7 |
| Fidelity Energy Central Fund | 20,599,920 | 3,258,646 | 1,446,079 | (274,819) | 4,742,353 | -- | 0.0 |
| Fidelity Financials Central Fund | 91,402,608 | 19,887,225 | 13,313,564 | (1,255,699) | (21,811,347) | -- | 0.0 |
| Fidelity Floating Rate Central Fund | 8,920,661 | 1,628,363 | 921,875 | (38,839) | (438,469) | 9,149,841 | 0.5 |
| Fidelity Health Care Central Fund | 67,320,251 | 20,927,487 | 10,363,783 | (121,530) | (26,814,334) | -- | 0.0 |
| Fidelity High Income Central Fund | 18,158,108 | 26,217,341 | 10,598,161 | (240,509) | 1,428,493 | 34,965,272 | 1.3 |
| Fidelity Industrials Central Fund | 48,127,043 | 8,721,779 | 7,317,162 | (124,590) | (13,900,182) | -- | 0.0 |
| Fidelity Inflation-Protected Bond Index Central Fund | 84,969,155 | 37,703,961 | 16,901,360 | 62,359 | 5,899,954 | 111,734,069 | 7.0 |
| Fidelity Information Technology Central Fund | 114,160,697 | 51,537,936 | 33,295,629 | 5,144,970 | (39,639,019) | -- | 0.0 |
| Fidelity International Credit Central Fund | 18,490,955 | 13,263,582 | 1,960,537 | (40,596) | 289,607 | 30,043,011 | 6.4 |
| Fidelity International Equity Central Fund | 112,273,224 | 34,596,066 | 15,132,775 | (1,772,551) | 12,034,889 | 141,998,853 | 4.7 |
| Fidelity Investment Grade Bond Central Fund | 656,574,363 | 222,982,445 | 102,040,056 | (887,521) | 36,486,760 | 813,115,991 | 2.8 |
| Fidelity Materials Central Fund | 12,030,347 | 3,677,925 | 2,394,919 | (323,188) | 95,642 | -- | 0.0 |
| Fidelity Real Estate Equity Central Fund | 27,379,308 | 2,920,221 | 14,208,335 | (5,047,276) | (1,945,875) | 9,098,043 | 1.3 |
| Fidelity U.S. Equity Central Fund | -- | 1,112,820 | 1,194,300 | (496,287) | 193,155,117 | 616,508,652 | 2.8 |
| Fidelity Utilities Central Fund | 17,552,733 | 3,855,723 | 2,327,793 | (172,951) | (5,683,776) | -- | 0.0 |
| | 1,545,492,285 | 512,632,945 | 266,915,071 | (7,123,572) | 123,469,956 | 1,907,556,543 | |
(a) Excludes the value of securities received and delivered through merger transactions, if applicable.
Investment Valuation
The following is a summary of the inputs used, as of September 30, 2020, involving the Fund's assets and liabilities carried at fair value. The inputs or methodology used for valuing securities may not be an indication of the risk associated with investing in those securities. For more information on valuation inputs, and their aggregation into the levels used below, please refer to the Investment Valuation section in the accompanying Notes to Financial Statements.
| | Valuation Inputs at Reporting Date: |
| Description | Total | Level 1 | Level 2 | Level 3 |
| Investments in Securities: | | | | |
| Equity Central Funds | $880,601,687 | $880,601,687 | $-- | $-- |
| Fixed-Income Central Funds | 1,026,954,856 | 1,026,954,856 | -- | -- |
| Money Market Central Funds | 90,309,755 | 90,309,755 | -- | -- |
| Other Short-Term Investments | 9,538,314 | -- | 9,538,314 | -- |
| Investment Companies | 31,074,364 | 31,074,364 | -- | -- |
| Total Investments in Securities: | $2,038,478,976 | $2,028,940,662 | $9,538,314 | $-- |
| Derivative Instruments: | | | | |
| Liabilities | | | | |
| Futures Contracts | $(454,064) | $(454,064) | $-- | $-- |
| Total Liabilities | $(454,064) | $(454,064) | $-- | $-- |
| Total Derivative Instruments: | $(454,064) | $(454,064) | $-- | $-- |
Value of Derivative Instruments
The following table is a summary of the Fund's value of derivative instruments by primary risk exposure as of September 30, 2020. For additional information on derivative instruments, please refer to the Derivative Instruments section in the accompanying Notes to Financial Statements.
| Primary Risk Exposure / Derivative Type | Value |
| | Asset | Liability |
| Equity Risk | | |
| Futures Contracts(a) | $0 | $(454,064) |
| Total Equity Risk | 0 | (454,064) |
| Total Value of Derivatives | $0 | $(454,064) |
(a) Reflects gross cumulative appreciation (depreciation) on futures contracts as presented in the Schedule of Investments. In the Statement of Assets and Liabilities, the period end daily variation margin is included in receivable or payable for daily variation margin on futures contracts, and the net cumulative appreciation (depreciation) is included in Total accumulated earnings (loss).
Other Information
Distribution of investments by country or territory of incorporation, as a percentage of Total Net Assets, is as follows (Unaudited):
| United States of America | 77.9% |
| Cayman Islands | 3.8% |
| United Kingdom | 3.0% |
| Switzerland | 1.5% |
| Netherlands | 1.5% |
| Japan | 1.3% |
| France | 1.3% |
| Others (Individually Less Than 1%) | 9.7% |
| | 100.0% |
The information in the above table is based on the combined investments of the Fund and its pro-rata share of the investments of Fidelity's Central Funds, other than the Money Market Central Funds.
See accompanying notes which are an integral part of the financial statements.
Fidelity Asset Manager® 40%
Financial Statements
Statement of Assets and Liabilities
| | | September 30, 2020 |
| Assets | | |
Investment in securities, at value — See accompanying schedule:
Unaffiliated issuers (cost $36,822,705) | $40,612,678 | |
| Fidelity Central Funds (cost $1,684,745,206) | 1,997,866,298 | |
| Total Investment in Securities (cost $1,721,567,911) | | $2,038,478,976 |
| Receivable for investments sold | | 647,801 |
| Receivable for fund shares sold | | 1,312,304 |
| Distributions receivable from Fidelity Central Funds | | 4,077 |
| Prepaid expenses | | 3,127 |
| Total assets | | 2,040,446,285 |
| Liabilities | | |
| Payable for investments purchased | $660,834 | |
| Payable for fund shares redeemed | 674,899 | |
| Accrued management fee | 679,698 | |
| Distribution and service plan fees payable | 35,025 | |
| Payable for daily variation margin on futures contracts | 424,889 | |
| Other affiliated payables | 184,549 | |
| Other payables and accrued expenses | 18,072 | |
| Total liabilities | | 2,677,966 |
| Net Assets | | $2,037,768,319 |
| Net Assets consist of: | | |
| Paid in capital | | $1,764,122,878 |
| Total accumulated earnings (loss) | | 273,645,441 |
| Net Assets | | $2,037,768,319 |
| Net Asset Value and Maximum Offering Price | | |
| Class A: | | |
| Net Asset Value and redemption price per share ($48,985,341 ÷ 3,922,254 shares)(a) | | $12.49 |
| Maximum offering price per share (100/94.25 of $12.49) | | $13.25 |
| Class M: | | |
| Net Asset Value and redemption price per share ($11,897,761 ÷ 954,285 shares)(a) | | $12.47 |
| Maximum offering price per share (100/96.50 of $12.47) | | $12.92 |
| Class C: | | |
| Net Asset Value and offering price per share ($23,974,248 ÷ 1,929,813 shares)(a) | | $12.42 |
| Asset Manager 40%: | | |
| Net Asset Value, offering price and redemption price per share ($1,911,787,111 ÷ 153,098,958 shares) | | $12.49 |
| Class I: | | |
| Net Asset Value, offering price and redemption price per share ($28,707,837 ÷ 2,298,160 shares) | | $12.49 |
| Class Z: | | |
| Net Asset Value, offering price and redemption price per share ($12,416,021 ÷ 994,106 shares) | | $12.49 |
(a) Redemption price per share is equal to net asset value less any applicable contingent deferred sales charge.
See accompanying notes which are an integral part of the financial statements.
Statement of Operations
| | | Year ended September 30, 2020 |
| Investment Income | | |
| Dividends | | $1,858,694 |
| Interest | | 37,142 |
| Income from Fidelity Central Funds (including $2,894 from security lending) | | 41,280,122 |
| Total income | | 43,175,958 |
| Expenses | | |
| Management fee | $7,697,667 | |
| Transfer agent fees | 1,468,323 | |
| Distribution and service plan fees | 400,846 | |
| Accounting fees | 634,811 | |
| Custodian fees and expenses | 4,874 | |
| Independent trustees' fees and expenses | 6,094 | |
| Registration fees | 145,105 | |
| Audit | 39,740 | |
| Legal | 2,976 | |
| Interest | 472 | |
| Miscellaneous | 10,996 | |
| Total expenses before reductions | 10,411,904 | |
| Expense reductions | (16,611) | |
| Total expenses after reductions | | 10,395,293 |
| Net investment income (loss) | | 32,780,665 |
| Realized and Unrealized Gain (Loss) | | |
| Net realized gain (loss) on: | | |
| Investment securities: | | |
| Unaffiliated issuers | 2,599,220 | |
| Fidelity Central Funds | (7,108,121) | |
| Futures contracts | (13,732,996) | |
| Capital gain distributions from Fidelity Central Funds | 33,618,473 | |
| Total net realized gain (loss) | | 15,376,576 |
| Change in net unrealized appreciation (depreciation) on: | | |
| Investment securities: | | |
| Unaffiliated issuers | (2,504,223) | |
| Fidelity Central Funds | 123,471,503 | |
| Futures contracts | (1,501,480) | |
| Total change in net unrealized appreciation (depreciation) | | 119,465,800 |
| Net gain (loss) | | 134,842,376 |
| Net increase (decrease) in net assets resulting from operations | | $167,623,041 |
See accompanying notes which are an integral part of the financial statements.
Statement of Changes in Net Assets
| | Year ended September 30, 2020 | Year ended September 30, 2019 |
| Increase (Decrease) in Net Assets | | |
| Operations | | |
| Net investment income (loss) | $32,780,665 | $35,405,005 |
| Net realized gain (loss) | 15,376,576 | 36,829,918 |
| Change in net unrealized appreciation (depreciation) | 119,465,800 | 1,121,911 |
| Net increase (decrease) in net assets resulting from operations | 167,623,041 | 73,356,834 |
| Distributions to shareholders | (65,997,525) | (72,896,387) |
| Share transactions - net increase (decrease) | 121,462,067 | 131,600,043 |
| Total increase (decrease) in net assets | 223,087,583 | 132,060,490 |
| Net Assets | | |
| Beginning of period | 1,814,680,736 | 1,682,620,246 |
| End of period | $2,037,768,319 | $1,814,680,736 |
See accompanying notes which are an integral part of the financial statements.
Financial Highlights
Fidelity Asset Manager 40% Class A
| Years ended September 30, | 2020 | 2019 | 2018 | 2017 | 2016 |
| Selected Per–Share Data | | | | | |
| Net asset value, beginning of period | $11.82 | $11.87 | $11.67 | $10.95 | $10.39 |
| Income from Investment Operations | | | | | |
| Net investment income (loss)A | .17 | .21 | .17 | .14 | .16 |
| Net realized and unrealized gain (loss) | .88 | .21 | .36 | .73 | .70 |
| Total from investment operations | 1.05 | .42 | .53 | .87 | .86 |
| Distributions from net investment income | (.17) | (.21) | (.15) | (.13) | (.17) |
| Distributions from net realized gain | (.21) | (.27) | (.18) | (.02) | (.13) |
| Total distributions | (.38) | (.47)B | (.33) | (.15) | (.30) |
| Net asset value, end of period | $12.49 | $11.82 | $11.87 | $11.67 | $10.95 |
| Total ReturnC,D | 9.06% | 3.90% | 4.62% | 8.01% | 8.44% |
| Ratios to Average Net AssetsE,F | | | | | |
| Expenses before reductions | .83% | .83% | .84% | .84% | .84% |
| Expenses net of fee waivers, if any | .83% | .83% | .84% | .84% | .84% |
| Expenses net of all reductions | .83% | .83% | .84% | .84% | .84% |
| Net investment income (loss) | 1.43% | 1.79% | 1.41% | 1.21% | 1.53% |
| Supplemental Data | | | | | |
| Net assets, end of period (000 omitted) | $48,985 | $42,490 | $38,073 | $36,200 | $40,046 |
| Portfolio turnover rateG | 24% | 36% | 17% | 20% | 22% |
A Calculated based on average shares outstanding during the period.
B Total distributions per share do not sum due to rounding.
C Total returns would have been lower if certain expenses had not been reduced during the applicable periods shown.
D Total returns do not include the effect of the sales charges.
E Fees and expenses of any underlying mutual funds or exchange-traded funds (ETFs) are not included in the Fund's expense ratio. The Fund indirectly bears its proportionate share of these expenses. For additional expense information related to investments in Fidelity Central Funds, please refer to the "Investments in Fidelity Central Funds" note found in the Notes to Financial Statements section of the most recent Annual or Semi-Annual report.
F Expense ratios reflect operating expenses of the class. Expenses before reductions do not reflect amounts reimbursed, waived, or reduced through arrangements with the investment adviser, brokerage services, or other offset arrangements, if applicable, and do not represent the amount paid by the class during periods when reimbursements, waivers or reductions occur.
G Amount does not include the portfolio activity of any underlying mutual funds or exchange-traded funds (ETFs).
See accompanying notes which are an integral part of the financial statements.
Fidelity Asset Manager 40% Class M
| Years ended September 30, | 2020 | 2019 | 2018 | 2017 | 2016 |
| Selected Per–Share Data | | | | | |
| Net asset value, beginning of period | $11.80 | $11.85 | $11.65 | $10.93 | $10.37 |
| Income from Investment Operations | | | | | |
| Net investment income (loss)A | .14 | .18 | .13 | .11 | .13 |
| Net realized and unrealized gain (loss) | .88 | .21 | .37 | .73 | .70 |
| Total from investment operations | 1.02 | .39 | .50 | .84 | .83 |
| Distributions from net investment income | (.14) | (.17) | (.12) | (.10) | (.14) |
| Distributions from net realized gain | (.21) | (.27) | (.18) | (.02) | (.13) |
| Total distributions | (.35) | (.44) | (.30) | (.12) | (.27) |
| Net asset value, end of period | $12.47 | $11.80 | $11.85 | $11.65 | $10.93 |
| Total ReturnB,C | 8.80% | 3.61% | 4.35% | 7.75% | 8.12% |
| Ratios to Average Net AssetsD,E | | | | | |
| Expenses before reductions | 1.08% | 1.09% | 1.10% | 1.12% | 1.12% |
| Expenses net of fee waivers, if any | 1.08% | 1.09% | 1.10% | 1.11% | 1.12% |
| Expenses net of all reductions | 1.08% | 1.09% | 1.10% | 1.11% | 1.12% |
| Net investment income (loss) | 1.17% | 1.53% | 1.14% | .94% | 1.25% |
| Supplemental Data | | | | | |
| Net assets, end of period (000 omitted) | $11,898 | $10,913 | $12,318 | $11,665 | $10,297 |
| Portfolio turnover rateF | 24% | 36% | 17% | 20% | 22% |
A Calculated based on average shares outstanding during the period.
B Total returns would have been lower if certain expenses had not been reduced during the applicable periods shown.
C Total returns do not include the effect of the sales charges.
D Fees and expenses of any underlying mutual funds or exchange-traded funds (ETFs) are not included in the Fund's expense ratio. The Fund indirectly bears its proportionate share of these expenses. For additional expense information related to investments in Fidelity Central Funds, please refer to the "Investments in Fidelity Central Funds" note found in the Notes to Financial Statements section of the most recent Annual or Semi-Annual report.
E Expense ratios reflect operating expenses of the class. Expenses before reductions do not reflect amounts reimbursed, waived, or reduced through arrangements with the investment adviser, brokerage services, or other offset arrangements, if applicable, and do not represent the amount paid by the class during periods when reimbursements, waivers or reductions occur.
F Amount does not include the portfolio activity of any underlying mutual funds or exchange-traded funds (ETFs).
See accompanying notes which are an integral part of the financial statements.
Fidelity Asset Manager 40% Class C
| Years ended September 30, | 2020 | 2019 | 2018 | 2017 | 2016 |
| Selected Per–Share Data | | | | | |
| Net asset value, beginning of period | $11.75 | $11.80 | $11.61 | $10.90 | $10.34 |
| Income from Investment Operations | | | | | |
| Net investment income (loss)A | .08 | .12 | .08 | .05 | .08 |
| Net realized and unrealized gain (loss) | .88 | .21 | .35 | .73 | .70 |
| Total from investment operations | .96 | .33 | .43 | .78 | .78 |
| Distributions from net investment income | (.08) | (.12) | (.06) | (.05) | (.09) |
| Distributions from net realized gain | (.21) | (.27) | (.18) | (.02) | (.13) |
| Total distributions | (.29) | (.38)B | (.24) | (.07) | (.22) |
| Net asset value, end of period | $12.42 | $11.75 | $11.80 | $11.61 | $10.90 |
| Total ReturnC,D | 8.25% | 3.11% | 3.77% | 7.16% | 7.62% |
| Ratios to Average Net AssetsE,F | | | | | |
| Expenses before reductions | 1.59% | 1.60% | 1.60% | 1.61% | 1.61% |
| Expenses net of fee waivers, if any | 1.59% | 1.60% | 1.60% | 1.61% | 1.61% |
| Expenses net of all reductions | 1.59% | 1.60% | 1.60% | 1.61% | 1.61% |
| Net investment income (loss) | .66% | 1.03% | .64% | .45% | .76% |
| Supplemental Data | | | | | |
| Net assets, end of period (000 omitted) | $23,974 | $24,834 | $25,656 | $23,354 | $22,064 |
| Portfolio turnover rateG | 24% | 36% | 17% | 20% | 22% |
A Calculated based on average shares outstanding during the period.
B Total distributions per share do not sum due to rounding.
C Total returns would have been lower if certain expenses had not been reduced during the applicable periods shown.
D Total returns do not include the effect of the contingent deferred sales charge.
E Fees and expenses of any underlying mutual funds or exchange-traded funds (ETFs) are not included in the Fund's expense ratio. The Fund indirectly bears its proportionate share of these expenses. For additional expense information related to investments in Fidelity Central Funds, please refer to the "Investments in Fidelity Central Funds" note found in the Notes to Financial Statements section of the most recent Annual or Semi-Annual report.
F Expense ratios reflect operating expenses of the class. Expenses before reductions do not reflect amounts reimbursed, waived, or reduced through arrangements with the investment adviser, brokerage services, or other offset arrangements, if applicable, and do not represent the amount paid by the class during periods when reimbursements, waivers or reductions occur.
G Amount does not include the portfolio activity of any underlying mutual funds or exchange-traded funds (ETFs).
See accompanying notes which are an integral part of the financial statements.
Fidelity Asset Manager 40%
| Years ended September 30, | 2020 | 2019 | 2018 | 2017 | 2016 |
| Selected Per–Share Data | | | | | |
| Net asset value, beginning of period | $11.82 | $11.87 | $11.67 | $10.95 | $10.39 |
| Income from Investment Operations | | | | | |
| Net investment income (loss)A | .21 | .24 | .20 | .17 | .19 |
| Net realized and unrealized gain (loss) | .88 | .22 | .37 | .73 | .70 |
| Total from investment operations | 1.09 | .46 | .57 | .90 | .89 |
| Distributions from net investment income | (.21) | (.24) | (.19) | (.16) | (.20) |
| Distributions from net realized gain | (.21) | (.27) | (.18) | (.02) | (.13) |
| Total distributions | (.42) | (.51) | (.37) | (.18) | (.33) |
| Net asset value, end of period | $12.49 | $11.82 | $11.87 | $11.67 | $10.95 |
| Total ReturnB | 9.41% | 4.23% | 4.95% | 8.35% | 8.76% |
| Ratios to Average Net AssetsC,D | | | | | |
| Expenses before reductions | .52% | .52% | .53% | .54% | .54% |
| Expenses net of fee waivers, if any | .52% | .52% | .53% | .54% | .54% |
| Expenses net of all reductions | .52% | .52% | .53% | .53% | .54% |
| Net investment income (loss) | 1.73% | 2.10% | 1.71% | 1.52% | 1.83% |
| Supplemental Data | | | | | |
| Net assets, end of period (000 omitted) | $1,911,787 | $1,704,998 | $1,577,393 | $1,344,514 | $1,084,411 |
| Portfolio turnover rateE | 24% | 36% | 17% | 20% | 22% |
A Calculated based on average shares outstanding during the period.
B Total returns would have been lower if certain expenses had not been reduced during the applicable periods shown.
C Fees and expenses of any underlying mutual funds or exchange-traded funds (ETFs) are not included in the Fund's expense ratio. The Fund indirectly bears its proportionate share of these expenses. For additional expense information related to investments in Fidelity Central Funds, please refer to the "Investments in Fidelity Central Funds" note found in the Notes to Financial Statements section of the most recent Annual or Semi-Annual report.
D Expense ratios reflect operating expenses of the class. Expenses before reductions do not reflect amounts reimbursed, waived, or reduced through arrangements with the investment adviser, brokerage services, or other offset arrangements, if applicable, and do not represent the amount paid by the class during periods when reimbursements, waivers or reductions occur.
E Amount does not include the portfolio activity of any underlying mutual funds or exchange-traded funds (ETFs).
See accompanying notes which are an integral part of the financial statements.
Fidelity Asset Manager 40% Class I
| Years ended September 30, | 2020 | 2019 | 2018 | 2017 | 2016 |
| Selected Per–Share Data | | | | | |
| Net asset value, beginning of period | $11.82 | $11.87 | $11.67 | $10.95 | $10.39 |
| Income from Investment Operations | | | | | |
| Net investment income (loss)A | .20 | .24 | .20 | .17 | .19 |
| Net realized and unrealized gain (loss) | .88 | .21 | .36 | .73 | .69 |
| Total from investment operations | 1.08 | .45 | .56 | .90 | .88 |
| Distributions from net investment income | (.20) | (.24) | (.18) | (.16) | (.19) |
| Distributions from net realized gain | (.21) | (.27) | (.18) | (.02) | (.13) |
| Total distributions | (.41) | (.50)B | (.36) | (.18) | (.32) |
| Net asset value, end of period | $12.49 | $11.82 | $11.87 | $11.67 | $10.95 |
| Total ReturnC | 9.35% | 4.18% | 4.91% | 8.32% | 8.67% |
| Ratios to Average Net AssetsD,E | | | | | |
| Expenses before reductions | .56% | .56% | .56% | .56% | .58% |
| Expenses net of fee waivers, if any | .56% | .56% | .56% | .56% | .58% |
| Expenses net of all reductions | .56% | .56% | .56% | .56% | .58% |
| Net investment income (loss) | 1.69% | 2.06% | 1.68% | 1.49% | 1.79% |
| Supplemental Data | | | | | |
| Net assets, end of period (000 omitted) | $28,708 | $25,014 | $29,180 | $20,025 | $15,525 |
| Portfolio turnover rateF | 24% | 36% | 17% | 20% | 22% |
A Calculated based on average shares outstanding during the period.
B Total distributions per share do not sum due to rounding.
C Total returns would have been lower if certain expenses had not been reduced during the applicable periods shown.
D Fees and expenses of any underlying mutual funds or exchange-traded funds (ETFs) are not included in the Fund's expense ratio. The Fund indirectly bears its proportionate share of these expenses. For additional expense information related to investments in Fidelity Central Funds, please refer to the "Investments in Fidelity Central Funds" note found in the Notes to Financial Statements section of the most recent Annual or Semi-Annual report.
E Expense ratios reflect operating expenses of the class. Expenses before reductions do not reflect amounts reimbursed, waived, or reduced through arrangements with the investment adviser, brokerage services, or other offset arrangements, if applicable, and do not represent the amount paid by the class during periods when reimbursements, waivers or reductions occur.
F Amount does not include the portfolio activity of any underlying mutual funds or exchange-traded funds (ETFs).
See accompanying notes which are an integral part of the financial statements.
Fidelity Asset Manager 40% Class Z
| Years ended September 30, | 2020 | 2019 A |
| Selected Per–Share Data | | |
| Net asset value, beginning of period | $11.82 | $11.86 |
| Income from Investment Operations | | |
| Net investment income (loss)B | .21 | .24 |
| Net realized and unrealized gain (loss) | .88 | .23 |
| Total from investment operations | 1.09 | .47 |
| Distributions from net investment income | (.22) | (.24) |
| Distributions from net realized gain | (.21) | (.27) |
| Total distributions | (.42)C | (.51) |
| Net asset value, end of period | $12.49 | $11.82 |
| Total ReturnD,E | 9.45% | 4.34% |
| Ratios to Average Net AssetsF,G | | |
| Expenses before reductions | .50% | .50%H |
| Expenses net of fee waivers, if any | .49% | .50%H |
| Expenses net of all reductions | .49% | .50%H |
| Net investment income (loss) | 1.76% | 2.12%H |
| Supplemental Data | | |
| Net assets, end of period (000 omitted) | $12,416 | $6,431 |
| Portfolio turnover rateI | 24% | 36% |
A For the period October 2, 2018 (commencement of sale of shares) to September 30, 2019.
B Calculated based on average shares outstanding during the period.
C Total distributions per share do not sum due to rounding.
D Total returns for periods of less than one year are not annualized.
E Total returns would have been lower if certain expenses had not been reduced during the applicable periods shown.
F Fees and expenses of any underlying mutual funds or exchange-traded funds (ETFs) are not included in the Fund's expense ratio. The Fund indirectly bears its proportionate share of these expenses. For additional expense information related to investments in Fidelity Central Funds, please refer to the "Investments in Fidelity Central Funds" note found in the Notes to Financial Statements section of the most recent Annual or Semi-Annual report.
G Expense ratios reflect operating expenses of the class. Expenses before reductions do not reflect amounts reimbursed, waived, or reduced through arrangements with the investment adviser, brokerage services, or other offset arrangements, if applicable, and do not represent the amount paid by the class during periods when reimbursements, waivers or reductions occur.
H Annualized
I Amount does not include the portfolio activity of any underlying mutual funds or exchange-traded funds (ETFs).
See accompanying notes which are an integral part of the financial statements.
Fidelity Asset Manager® 50%
Investment Summary (Unaudited)
The information in the following tables is based on the combined investments of the Fund and its pro-rata share of the investments of Fidelity's Central Funds, other than the Money Market Central Funds.
Top Ten Stocks as of September 30, 2020
| | % of fund's net assets |
| Apple, Inc. | 2.4 |
| Microsoft Corp. | 2.3 |
| Alphabet, Inc. Class A | 1.2 |
| Amazon.com, Inc. | 1.0 |
| Facebook, Inc. Class A | 0.7 |
| Roche Holding AG (participation certificate) | 0.5 |
| Alibaba Group Holding Ltd. sponsored ADR | 0.5 |
| Tencent Holdings Ltd. | 0.5 |
| UnitedHealth Group, Inc. | 0.5 |
| Salesforce.com, Inc. | 0.5 |
| | 10.1 |
Top Five Market Sectors as of September 30, 2020
| | % of fund's net assets |
| Financials | 15.3 |
| Information Technology | 14.2 |
| Health Care | 7.7 |
| Consumer Discretionary | 7.2 |
| Communication Services | 6.4 |
Top Five Bond Issuers as of September 30, 2020
| (with maturities greater than one year) | % of fund's net assets |
| U.S. Treasury Obligations | 10.8 |
| Fannie Mae | 3.4 |
| Freddie Mac | 1.9 |
| Ginnie Mae | 1.5 |
| Uniform Mortgage Backed Securities | 1.3 |
| | 18.9 |
Quality Diversification (% of fund's net assets)
| As of September 30, 2020 |
| | U.S. Government and U.S. Government Agency Obligations | 19.2% |
| | AAA,AA,A | 6.8% |
| | BBB | 10.6% |
| | BB and Below | 5.2% |
| | Not Rated | 1.2% |
| | Equities | 54.4% |
| | Short-Term Investments and Net Other Assets | 2.6% |

We have used ratings from Moody's Investors Service, Inc. Where Moody's® ratings are not available, we have used S&P® ratings. All ratings are as of the date indicated and do not reflect subsequent changes.
Asset Allocation (% of fund's net assets)
| As of September 30, 2020 |
| | Stock Class and Equity Futures | 54.7% |
| | Bond Class | 42.4% |
| | Short-Term Class | 2.9% |

Asset allocations in the pie charts reflect the categorization of assets as defined in the Fund's prospectus in effect as of the time periods indicated above. Percentages are adjusted for the effect of future contracts and swap contracts, if applicable.
At period end, foreign investments including the Fund's pro-rata share of the underlying Central Funds, other than the Money Market Funds, was 24.9% of net assets.
Percentages in the above tables are adjusted for the effect of TBA Sale Commitments.
An unaudited holdings listing for the Fund, which presents direct holdings as well as the pro-rata share of any securities and other investments held indirectly through its investment in underlying Fidelity Central Funds, other than the Money Market Central Funds, is available at fidelity.com and/or institutional.fidelity.com, as applicable.
Fidelity Asset Manager® 50%
Schedule of Investments September 30, 2020
Showing Percentage of Net Assets
| Equity Central Funds - 53.7% | | | |
| | | Shares | Value |
| Fidelity Emerging Markets Equity Central Fund (a) | | 2,556,146 | $606,164,356 |
| Fidelity International Equity Central Fund (a) | | 10,723,996 | 907,464,541 |
| Fidelity Real Estate Equity Central Fund (a) | | 123,710 | 13,371,801 |
| Fidelity U.S. Equity Central Fund (a) | | 36,403,268 | 3,666,173,116 |
| TOTAL EQUITY CENTRAL FUNDS | | | |
| (Cost $3,142,293,093) | | | 5,193,173,814 |
|
| Fixed-Income Central Funds - 43.7% | | | |
| High Yield Fixed-Income Funds - 3.5% | | | |
| Fidelity Emerging Markets Debt Central Fund (a) | | 9,607,893 | 86,278,875 |
| Fidelity Emerging Markets Debt Local Currency Central Fund (a) | | 449,940 | 45,061,491 |
| Fidelity Floating Rate Central Fund (a) | | 440,802 | 42,480,052 |
| Fidelity High Income Central Fund (a) | | 1,548,405 | 161,792,884 |
|
| TOTAL HIGH YIELD FIXED-INCOME FUNDS | | | 335,613,302 |
|
| Investment Grade Fixed-Income Funds - 40.2% | | | |
| Fidelity Inflation-Protected Bond Index Central Fund (a) | | 4,436,207 | 483,236,022 |
| Fidelity International Credit Central Fund (a) | | 1,351,812 | 141,534,724 |
| Fidelity Investment Grade Bond Central Fund (a) | | 27,556,565 | 3,262,972,826 |
|
| TOTAL INVESTMENT GRADE FIXED-INCOME FUNDS | | | 3,887,743,572 |
|
| TOTAL FIXED-INCOME CENTRAL FUNDS | | | |
| (Cost $3,735,549,434) | | | 4,223,356,874 |
|
| Money Market Central Funds - 2.3% | | | |
| Fidelity Cash Central Fund 0.10% (b) | | 63,507,740 | 63,520,441 |
| Fidelity Securities Lending Cash Central Fund 0.10% (b)(c) | | 155,139,986 | 155,155,500 |
| TOTAL MONEY MARKET CENTRAL FUNDS | | | |
| (Cost $218,675,845) | | | 218,675,941 |
| | | Principal Amount | Value |
|
| U.S. Treasury Obligations - 0.4% | | | |
| U.S. Treasury Bills, yield at date of purchase 0.09% to 0.13% 10/8/20 to 12/10/20 (d) | | | |
| (Cost $38,424,416) | | 38,430,000 | 38,424,380 |
| | | Shares | Value |
|
| Investment Companies - 1.5% | | | |
| iShares MSCI Japan ETF (e) | | | |
| (Cost $131,550,288) | | 2,554,039 | 150,867,084 |
| TOTAL INVESTMENT IN SECURITIES - 101.6% | | | |
| (Cost $7,266,493,076) | | | 9,824,498,093 |
| NET OTHER ASSETS (LIABILITIES) - (1.6)% | | | (158,519,593) |
| NET ASSETS - 100% | | | $9,665,978,500 |
| Futures Contracts | | | | | |
| | Number of contracts | Expiration Date | Notional Amount | Value | Unrealized Appreciation/(Depreciation) |
| Sold | | | | | |
| Equity Index Contracts | | | | | |
| CME E-mini S&P 500 Index Contracts (United States) | 2,018 | Dec. 2020 | $338,216,800 | $(2,207,955) | $(2,207,955) |
The notional amount of futures sold as a percentage of Net Assets is 3.5%
For the period, the average monthly notional amount at value for futures contracts in the aggregate was $245,027,650.
Security Type Abbreviations
ETF – Exchange-Traded Fund
Legend
(a) Affiliated fund that is generally available only to investment companies and other accounts managed by Fidelity Investments. A complete unaudited schedule of portfolio holdings for each Fidelity Central Fund is filed with the SEC for the first and third quarters of each fiscal year on Form N-PORT and is available upon request or at the SEC's website at www.sec.gov. An unaudited holdings listing for the Fund, which presents direct holdings as well as the pro-rata share of securities and other investments held indirectly through its investment in underlying non-money market Fidelity Central Funds, is available at fidelity.com and/or institutional.fidelity.com, as applicable. In addition, each Fidelity Central Fund's financial statements, which are not covered by the Fund's Report of Independent Registered Public Accounting Firm, are available on the SEC's website or upon request.
(b) Affiliated fund that is generally available only to investment companies and other accounts managed by Fidelity Investments. The rate quoted is the annualized seven-day yield of the fund at period end. A complete unaudited listing of the fund's holdings as of its most recent quarter end is available upon request. In addition, each Fidelity Central Fund's financial statements, which are not covered by the Fund's Report of Independent Registered Public Accounting Firm, are available on the SEC's website or upon request.
(c) Investment made with cash collateral received from securities on loan.
(d) Security or a portion of the security was pledged to cover margin requirements for futures contracts. At period end, the value of securities pledged amounted to $30,266,469.
(e) Security or a portion of the security is on loan at period end.
Affiliated Central Funds
Information regarding fiscal year to date income earned by the Fund from investments in Fidelity Central Funds is as follows:
| Fund | Income earned |
| Fidelity Cash Central Fund | $1,230,944 |
| Fidelity Communication Services Central Fund | 18,240,642 |
| Fidelity Consumer Discretionary Central Fund | 11,355,968 |
| Fidelity Consumer Staples Central Fund | 6,252,878 |
| Fidelity Emerging Markets Debt Central Fund | 5,275,252 |
| Fidelity Emerging Markets Equity Central Fund | 15,438,289 |
| Fidelity Energy Central Fund | 3,458,111 |
| Fidelity Financials Central Fund | 35,349,585 |
| Fidelity Floating Rate Central Fund | 2,325,955 |
| Fidelity Health Care Central Fund | 53,004,401 |
| Fidelity High Income Central Fund | 5,758,853 |
| Fidelity Industrials Central Fund | 5,155,443 |
| Fidelity Inflation-Protected Bond Index Central Fund | 7,560,145 |
| Fidelity Information Technology Central Fund | 110,297,230 |
| Fidelity International Credit Central Fund | 5,080,796 |
| Fidelity International Equity Central Fund | 16,544,747 |
| Fidelity Investment Grade Bond Central Fund | 88,955,436 |
| Fidelity Materials Central Fund | 1,301,375 |
| Fidelity Money Market Central Fund | 2,232,054 |
| Fidelity Real Estate Equity Central Fund | 2,274,942 |
| Fidelity Securities Lending Cash Central Fund | 21,536 |
| Fidelity Utilities Central Fund | 6,629,365 |
| Total | $403,743,947 |
Amounts in the income column in the above table include any capital gain distributions from underlying funds, which are presented in the corresponding line-item in the Statement of Operations, if applicable. Amount for Fidelity Securities Lending Cash Central Fund represents the income earned on investing cash collateral, less rebates paid to borrowers and any lending agent fees associated with the loan, plus any premium payments received for lending certain types of securities.
Fiscal year to date information regarding the Fund’s investments in non-Money Market Central Funds, including the ownership percentage, is presented below.
| Affiliate | Value, beginning of period | Purchases(a) | Sales Proceeds(a) | Realized Gain (loss) | Change in Unrealized appreciation (depreciation) | Value, end of period | % ownership, end of period |
| Fidelity Commodity Strategy Central Fund | $48,821,485 | $38,559 | $50,109,387 | $(5,632,044) | $6,881,387 | $-- | 0.0 |
| Fidelity Communication Services Central Fund | 270,962,401 | 63,400,160 | 24,949,488 | (186,928) | (57,704,182) | -- | 0.0 |
| Fidelity Consumer Discretionary Central Fund | 325,603,934 | 43,689,172 | 37,576,438 | 1,560,745 | (222,930,744) | -- | 0.0 |
| Fidelity Consumer Staples Central Fund | 211,715,427 | 30,476,122 | 18,074,846 | (505,816) | (93,020,894) | -- | 0.0 |
| Fidelity Emerging Markets Debt Central Fund | 90,593,706 | 7,720,464 | 8,351,212 | (711,428) | (2,972,655) | 86,278,875 | 3.2 |
| Fidelity Emerging Markets Debt Local Currency Central Fund | -- | 44,994,000 | -- | -- | 67,491 | 45,061,491 | 30.0 |
| Fidelity Emerging Markets Equity Central Fund | 556,651,884 | 26,866,786 | 41,858,969 | (4,439,574) | 68,944,229 | 606,164,356 | 30.5 |
| Fidelity Energy Central Fund | 132,855,984 | 10,557,938 | 7,957,892 | (1,652,341) | 9,639,826 | -- | 0.0 |
| Fidelity Financials Central Fund | 588,924,022 | 63,873,711 | 64,569,970 | (7,174,800) | (125,276,143) | -- | 0.0 |
| Fidelity Floating Rate Central Fund | 45,518,177 | 3,536,219 | 4,122,682 | (265,637) | (2,186,025) | 42,480,052 | 2.2 |
| Fidelity Health Care Central Fund | 434,669,997 | 73,835,436 | 49,342,113 | 2,630,425 | (280,380,025) | -- | 0.0 |
| Fidelity High Income Central Fund | 92,722,467 | 118,989,657 | 55,447,929 | (1,144,654) | 6,673,343 | 161,792,884 | 6.1 |
| Fidelity Industrials Central Fund | 309,350,734 | 21,759,572 | 33,945,308 | (1,543,218) | (163,867,943) | -- | 0.0 |
| Fidelity Inflation-Protected Bond Index Central Fund | 421,991,665 | 100,274,047 | 65,604,822 | 289,577 | 26,285,555 | 483,236,022 | 30.3 |
| Fidelity Information Technology Central Fund | 736,651,164 | 170,736,051 | 122,341,800 | 20,115,102 | (434,177,255) | -- | 0.0 |
| Fidelity International Credit Central Fund | 94,953,312 | 55,064,950 | 9,558,906 | (119,300) | 1,194,668 | 141,534,724 | 30.3 |
| Fidelity International Equity Central Fund | 785,158,315 | 143,096,329 | 83,027,352 | (4,859,481) | 67,096,730 | 907,464,541 | 30.0 |
| Fidelity Investment Grade Bond Central Fund | 2,880,244,015 | 711,446,123 | 475,564,959 | (677,322) | 147,524,969 | 3,262,972,826 | 11.2 |
| Fidelity Materials Central Fund | 76,769,511 | 14,333,829 | 11,549,427 | (1,816,844) | (25,705,297) | -- | 0.0 |
| Fidelity Real Estate Equity Central Fund | 140,113,734 | 5,306,862 | 96,499,141 | (24,014,389) | (11,535,265) | 13,371,801 | 1.9 |
| Fidelity U.S. Equity Central Fund | -- | 1,508,858 | 6,195,317 | (4,430,820) | 1,784,019,621 | 3,666,173,116 | 16.8 |
| Fidelity Utilities Central Fund | 113,626,444 | 12,582,167 | 11,473,619 | (780,829) | (50,544,940) | -- | 0.0 |
| | 8,357,898,378 | 1,724,087,012 | 1,278,121,577 | (35,359,576) | 648,026,451 | 9,416,530,688 | |
(a) Excludes the value of securities received and delivered through merger transactions, if applicable.
Investment Valuation
The following is a summary of the inputs used, as of September 30, 2020, involving the Fund's assets and liabilities carried at fair value. The inputs or methodology used for valuing securities may not be an indication of the risk associated with investing in those securities. For more information on valuation inputs, and their aggregation into the levels used below, please refer to the Investment Valuation section in the accompanying Notes to Financial Statements.
| | Valuation Inputs at Reporting Date: |
| Description | Total | Level 1 | Level 2 | Level 3 |
| Investments in Securities: | | | | |
| Equity Central Funds | $5,193,173,814 | $5,193,173,814 | $-- | $-- |
| Fixed-Income Central Funds | 4,223,356,874 | 4,223,356,874 | -- | -- |
| Money Market Central Funds | 218,675,941 | 218,675,941 | -- | -- |
| Other Short-Term Investments | 38,424,380 | -- | 38,424,380 | -- |
| Investment Companies | 150,867,084 | 150,867,084 | -- | -- |
| Total Investments in Securities: | $9,824,498,093 | $9,786,073,713 | $38,424,380 | $-- |
| Derivative Instruments: | | | | |
| Liabilities | | | | |
| Futures Contracts | $(2,207,955) | $(2,207,955) | $-- | $-- |
| Total Liabilities | $(2,207,955) | $(2,207,955) | $-- | $-- |
| Total Derivative Instruments: | $(2,207,955) | $(2,207,955) | $-- | $-- |
Value of Derivative Instruments
The following table is a summary of the Fund's value of derivative instruments by primary risk exposure as of September 30, 2020. For additional information on derivative instruments, please refer to the Derivative Instruments section in the accompanying Notes to Financial Statements.
| Primary Risk Exposure / Derivative Type | Value |
| | Asset | Liability |
| Equity Risk | | |
| Futures Contracts(a) | $0 | $(2,207,955) |
| Total Equity Risk | 0 | (2,207,955) |
| Total Value of Derivatives | $0 | $(2,207,955) |
(a) Reflects gross cumulative appreciation (depreciation) on futures contracts as presented in the Schedule of Investments. In the Statement of Assets and Liabilities, the period end daily variation margin is included in receivable or payable for daily variation margin on futures contracts, and the net cumulative appreciation (depreciation) is included in Total accumulated earnings (loss).
Other Information
Distribution of investments by country or territory of incorporation, as a percentage of Total Net Assets, is as follows (Unaudited):
| United States of America | 75.1% |
| Cayman Islands | 3.7% |
| United Kingdom | 3.1% |
| Japan | 1.9% |
| Switzerland | 1.8% |
| Netherlands | 1.6% |
| France | 1.5% |
| Germany | 1.1% |
| Canada | 1.0% |
| Others (Individually Less Than 1%) | 9.2% |
| | 100.0% |
The information in the above table is based on the combined investments of the Fund and its pro-rata share of the investments of Fidelity's Central Funds, other than the Money Market Central Funds.
See accompanying notes which are an integral part of the financial statements.
Fidelity Asset Manager® 50%
Financial Statements
Statement of Assets and Liabilities
| | | September 30, 2020 |
| Assets | | |
Investment in securities, at value (including securities loaned of $150,864,780) — See accompanying schedule:
Unaffiliated issuers (cost $169,974,704) | $189,291,464 | |
| Fidelity Central Funds (cost $7,096,518,372) | 9,635,206,629 | |
| Total Investment in Securities (cost $7,266,493,076) | | $9,824,498,093 |
| Receivable for investments sold | | 3,693,427 |
| Receivable for fund shares sold | | 3,296,962 |
| Distributions receivable from Fidelity Central Funds | | 10,001 |
| Prepaid expenses | | 15,270 |
| Other receivables | | 204,006 |
| Total assets | | 9,831,717,759 |
| Liabilities | | |
| Payable for investments purchased | $59,664 | |
| Payable for fund shares redeemed | 3,227,007 | |
| Accrued management fee | 3,876,028 | |
| Distribution and service plan fees payable | 79,076 | |
| Payable for daily variation margin on futures contracts | 2,060,941 | |
| Other affiliated payables | 1,070,282 | |
| Other payables and accrued expenses | 210,761 | |
| Collateral on securities loaned | 155,155,500 | |
| Total liabilities | | 165,739,259 |
| Net Assets | | $9,665,978,500 |
| Net Assets consist of: | | |
| Paid in capital | | $7,824,897,067 |
| Total accumulated earnings (loss) | | 1,841,081,433 |
| Net Assets | | $9,665,978,500 |
| Net Asset Value and Maximum Offering Price | | |
| Class A: | | |
| Net Asset Value and redemption price per share ($106,338,742 ÷ 5,501,778 shares)(a) | | $19.33 |
| Maximum offering price per share (100/94.25 of $19.33) | | $20.51 |
| Class M: | | |
| Net Asset Value and redemption price per share ($45,075,762 ÷ 2,334,686 shares)(a) | | $19.31 |
| Maximum offering price per share (100/96.50 of $19.31) | | $20.01 |
| Class C: | | |
| Net Asset Value and offering price per share ($44,989,969 ÷ 2,348,694 shares)(a) | | $19.16 |
| Asset Manager 50%: | | |
| Net Asset Value, offering price and redemption price per share ($9,387,914,687 ÷ 483,495,468 shares) | | $19.42 |
| Class I: | | |
| Net Asset Value, offering price and redemption price per share ($55,021,143 ÷ 2,839,101 shares) | | $19.38 |
| Class Z: | | |
| Net Asset Value, offering price and redemption price per share ($26,638,197 ÷ 1,375,259 shares) | | $19.37 |
(a) Redemption price per share is equal to net asset value less any applicable contingent deferred sales charge.
See accompanying notes which are an integral part of the financial statements.
Statement of Operations
| | | Year ended September 30, 2020 |
| Investment Income | | |
| Dividends | | $9,947,971 |
| Interest | | 168,495 |
| Income from Fidelity Central Funds (including $21,536 from security lending) | | 201,155,871 |
| Total income | | 211,272,337 |
| Expenses | | |
| Management fee | $45,444,221 | |
| Transfer agent fees | 10,960,287 | |
| Distribution and service plan fees | 921,883 | |
| Accounting fees | 1,548,022 | |
| Custodian fees and expenses | 7,617 | |
| Independent trustees' fees and expenses | 30,267 | |
| Registration fees | 174,842 | |
| Audit | 39,509 | |
| Legal | 15,371 | |
| Interest | 2,718 | |
| Miscellaneous | 56,329 | |
| Total expenses before reductions | 59,201,066 | |
| Expense reductions | (96,513) | |
| Total expenses after reductions | | 59,104,553 |
| Net investment income (loss) | | 152,167,784 |
| Realized and Unrealized Gain (Loss) | | |
| Net realized gain (loss) on: | | |
| Investment securities: | | |
| Unaffiliated issuers | 14,281,802 | |
| Fidelity Central Funds | (35,325,327) | |
| Futures contracts | (61,881,295) | |
| Capital gain distributions from Fidelity Central Funds | 202,588,076 | |
| Total net realized gain (loss) | | 119,663,256 |
| Change in net unrealized appreciation (depreciation) on: | | |
| Investment securities: | | |
| Unaffiliated issuers | (13,021,062) | |
| Fidelity Central Funds | 648,033,461 | |
| Futures contracts | (7,615,062) | |
| Total change in net unrealized appreciation (depreciation) | | 627,397,337 |
| Net gain (loss) | | 747,060,593 |
| Net increase (decrease) in net assets resulting from operations | | $899,228,377 |
See accompanying notes which are an integral part of the financial statements.
Statement of Changes in Net Assets
| | Year ended September 30, 2020 | Year ended September 30, 2019 |
| Increase (Decrease) in Net Assets | | |
| Operations | | |
| Net investment income (loss) | $152,167,784 | $169,711,971 |
| Net realized gain (loss) | 119,663,256 | 270,636,372 |
| Change in net unrealized appreciation (depreciation) | 627,397,337 | (140,953,006) |
| Net increase (decrease) in net assets resulting from operations | 899,228,377 | 299,395,337 |
| Distributions to shareholders | (384,474,225) | (448,986,882) |
| Share transactions - net increase (decrease) | (143,015,947) | 48,306,274 |
| Total increase (decrease) in net assets | 371,738,205 | (101,285,271) |
| Net Assets | | |
| Beginning of period | 9,294,240,295 | 9,395,525,566 |
| End of period | $9,665,978,500 | $9,294,240,295 |
See accompanying notes which are an integral part of the financial statements.
Financial Highlights
Fidelity Asset Manager 50% Class A
| Years ended September 30, | 2020 | 2019 | 2018 | 2017 | 2016 |
| Selected Per–Share Data | | | | | |
| Net asset value, beginning of period | $18.22 | $18.58 | $18.29 | $16.91 | $16.33 |
| Income from Investment Operations | | | | | |
| Net investment income (loss)A | .24 | .28 | .23 | .19 | .23 |
| Net realized and unrealized gain (loss) | 1.57 | .20 | .80 | 1.46 | 1.21 |
| Total from investment operations | 1.81 | .48 | 1.03 | 1.65 | 1.44 |
| Distributions from net investment income | (.25) | (.29) | (.21) | (.18) | (.25) |
| Distributions from net realized gain | (.45) | (.55) | (.53) | (.09) | (.62) |
| Total distributions | (.70) | (.84) | (.74) | (.27) | (.86)B |
| Net asset value, end of period | $19.33 | $18.22 | $18.58 | $18.29 | $16.91 |
| Total ReturnC,D | 10.15% | 3.07% | 5.74% | 9.90% | 9.19% |
| Ratios to Average Net AssetsE,F | | | | | |
| Expenses before reductions | .93% | .94% | .94% | .96% | .96% |
| Expenses net of fee waivers, if any | .92% | .94% | .94% | .96% | .96% |
| Expenses net of all reductions | .92% | .94% | .94% | .95% | .96% |
| Net investment income (loss) | 1.32% | 1.57% | 1.24% | 1.08% | 1.42% |
| Supplemental Data | | | | | |
| Net assets, end of period (000 omitted) | $106,339 | $95,542 | $86,252 | $75,623 | $77,724 |
| Portfolio turnover rateG | 24% | 37% | 15% | 20% | 19% |
A Calculated based on average shares outstanding during the period.
B Total distributions per share do not sum due to rounding.
C Total returns would have been lower if certain expenses had not been reduced during the applicable periods shown.
D Total returns do not include the effect of the sales charges.
E Fees and expenses of any underlying mutual funds or exchange-traded funds (ETFs) are not included in the Fund's expense ratio. The Fund indirectly bears its proportionate share of these expenses. For additional expense information related to investments in Fidelity Central Funds, please refer to the "Investments in Fidelity Central Funds" note found in the Notes to Financial Statements section of the most recent Annual or Semi-Annual report.
F Expense ratios reflect operating expenses of the class. Expenses before reductions do not reflect amounts reimbursed, waived, or reduced through arrangements with the investment adviser, brokerage services, or other offset arrangements, if applicable, and do not represent the amount paid by the class during periods when reimbursements, waivers or reductions occur.
G Amount does not include the portfolio activity of any underlying mutual funds or exchange-traded funds (ETFs).
See accompanying notes which are an integral part of the financial statements.
Fidelity Asset Manager 50% Class M
| Years ended September 30, | 2020 | 2019 | 2018 | 2017 | 2016 |
| Selected Per–Share Data | | | | | |
| Net asset value, beginning of period | $18.20 | $18.56 | $18.27 | $16.90 | $16.31 |
| Income from Investment Operations | | | | | |
| Net investment income (loss)A | .20 | .23 | .18 | .14 | .19 |
| Net realized and unrealized gain (loss) | 1.57 | .21 | .80 | 1.46 | 1.22 |
| Total from investment operations | 1.77 | .44 | .98 | 1.60 | 1.41 |
| Distributions from net investment income | (.20) | (.25) | (.16) | (.14) | (.20) |
| Distributions from net realized gain | (.45) | (.55) | (.53) | (.09) | (.62) |
| Total distributions | (.66)B | (.80) | (.69) | (.23) | (.82) |
| Net asset value, end of period | $19.31 | $18.20 | $18.56 | $18.27 | $16.90 |
| Total ReturnC,D | 9.89% | 2.81% | 5.48% | 9.57% | 8.97% |
| Ratios to Average Net AssetsE,F | | | | | |
| Expenses before reductions | 1.17% | 1.18% | 1.19% | 1.21% | 1.22% |
| Expenses net of fee waivers, if any | 1.16% | 1.18% | 1.19% | 1.21% | 1.22% |
| Expenses net of all reductions | 1.16% | 1.18% | 1.19% | 1.21% | 1.22% |
| Net investment income (loss) | 1.08% | 1.33% | .99% | .83% | 1.15% |
| Supplemental Data | | | | | |
| Net assets, end of period (000 omitted) | $45,076 | $42,658 | $41,222 | $36,209 | $32,431 |
| Portfolio turnover rateG | 24% | 37% | 15% | 20% | 19% |
A Calculated based on average shares outstanding during the period.
B Total distributions per share do not sum due to rounding.
C Total returns would have been lower if certain expenses had not been reduced during the applicable periods shown.
D Total returns do not include the effect of the sales charges.
E Fees and expenses of any underlying mutual funds or exchange-traded funds (ETFs) are not included in the Fund's expense ratio. The Fund indirectly bears its proportionate share of these expenses. For additional expense information related to investments in Fidelity Central Funds, please refer to the "Investments in Fidelity Central Funds" note found in the Notes to Financial Statements section of the most recent Annual or Semi-Annual report.
F Expense ratios reflect operating expenses of the class. Expenses before reductions do not reflect amounts reimbursed, waived, or reduced through arrangements with the investment adviser, brokerage services, or other offset arrangements, if applicable, and do not represent the amount paid by the class during periods when reimbursements, waivers or reductions occur.
G Amount does not include the portfolio activity of any underlying mutual funds or exchange-traded funds (ETFs).
See accompanying notes which are an integral part of the financial statements.
Fidelity Asset Manager 50% Class C
| Years ended September 30, | 2020 | 2019 | 2018 | 2017 | 2016 |
| Selected Per–Share Data | | | | | |
| Net asset value, beginning of period | $18.05 | $18.42 | $18.15 | $16.79 | $16.21 |
| Income from Investment Operations | | | | | |
| Net investment income (loss)A | .10 | .14 | .09 | .05 | .11 |
| Net realized and unrealized gain (loss) | 1.57 | .20 | .79 | 1.46 | 1.21 |
| Total from investment operations | 1.67 | .34 | .88 | 1.51 | 1.32 |
| Distributions from net investment income | (.11) | (.16) | (.08) | (.06) | (.12) |
| Distributions from net realized gain | (.45) | (.55) | (.53) | (.09) | (.62) |
| Total distributions | (.56) | (.71) | (.61) | (.15) | (.74) |
| Net asset value, end of period | $19.16 | $18.05 | $18.42 | $18.15 | $16.79 |
| Total ReturnB,C | 9.38% | 2.25% | 4.93% | 9.07% | 8.42% |
| Ratios to Average Net AssetsD,E | | | | | |
| Expenses before reductions | 1.68% | 1.69% | 1.70% | 1.72% | 1.72% |
| Expenses net of fee waivers, if any | 1.68% | 1.69% | 1.70% | 1.72% | 1.72% |
| Expenses net of all reductions | 1.68% | 1.69% | 1.70% | 1.71% | 1.72% |
| Net investment income (loss) | .56% | .82% | .49% | .32% | .66% |
| Supplemental Data | | | | | |
| Net assets, end of period (000 omitted) | $44,990 | $46,487 | $51,337 | $41,900 | $42,706 |
| Portfolio turnover rateF | 24% | 37% | 15% | 20% | 19% |
A Calculated based on average shares outstanding during the period.
B Total returns would have been lower if certain expenses had not been reduced during the applicable periods shown.
C Total returns do not include the effect of the contingent deferred sales charge.
D Fees and expenses of any underlying mutual funds or exchange-traded funds (ETFs) are not included in the Fund's expense ratio. The Fund indirectly bears its proportionate share of these expenses. For additional expense information related to investments in Fidelity Central Funds, please refer to the "Investments in Fidelity Central Funds" note found in the Notes to Financial Statements section of the most recent Annual or Semi-Annual report.
E Expense ratios reflect operating expenses of the class. Expenses before reductions do not reflect amounts reimbursed, waived, or reduced through arrangements with the investment adviser, brokerage services, or other offset arrangements, if applicable, and do not represent the amount paid by the class during periods when reimbursements, waivers or reductions occur.
F Amount does not include the portfolio activity of any underlying mutual funds or exchange-traded funds (ETFs).
See accompanying notes which are an integral part of the financial statements.
Fidelity Asset Manager 50%
| Years ended September 30, | 2020 | 2019 | 2018 | 2017 | 2016 |
| Selected Per–Share Data | | | | | |
| Net asset value, beginning of period | $18.30 | $18.66 | $18.37 | $16.98 | $16.39 |
| Income from Investment Operations | | | | | |
| Net investment income (loss)A | .30 | .33 | .29 | .24 | .28 |
| Net realized and unrealized gain (loss) | 1.58 | .21 | .80 | 1.47 | 1.22 |
| Total from investment operations | 1.88 | .54 | 1.09 | 1.71 | 1.50 |
| Distributions from net investment income | (.30) | (.35) | (.26) | (.24) | (.30) |
| Distributions from net realized gain | (.45) | (.55) | (.53) | (.09) | (.62) |
| Total distributions | (.76)B | (.90) | (.80)B | (.32)B | (.91)B |
| Net asset value, end of period | $19.42 | $18.30 | $18.66 | $18.37 | $16.98 |
| Total ReturnC | 10.51% | 3.37% | 6.05% | 10.26% | 9.56% |
| Ratios to Average Net AssetsD,E | | | | | |
| Expenses before reductions | .62% | .63% | .63% | .65% | .65% |
| Expenses net of fee waivers, if any | .62% | .63% | .63% | .64% | .65% |
| Expenses net of all reductions | .62% | .63% | .63% | .64% | .65% |
| Net investment income (loss) | 1.63% | 1.88% | 1.55% | 1.39% | 1.72% |
| Supplemental Data | | | | | |
| Net assets, end of period (000 omitted) | $9,387,915 | $9,026,444 | $9,140,811 | $8,324,452 | $7,566,062 |
| Portfolio turnover rateF | 24% | 37% | 15% | 20% | 19% |
A Calculated based on average shares outstanding during the period.
B Total distributions per share do not sum due to rounding.
C Total returns would have been lower if certain expenses had not been reduced during the applicable periods shown.
D Fees and expenses of any underlying mutual funds or exchange-traded funds (ETFs) are not included in the Fund's expense ratio. The Fund indirectly bears its proportionate share of these expenses. For additional expense information related to investments in Fidelity Central Funds, please refer to the "Investments in Fidelity Central Funds" note found in the Notes to Financial Statements section of the most recent Annual or Semi-Annual report.
E Expense ratios reflect operating expenses of the class. Expenses before reductions do not reflect amounts reimbursed, waived, or reduced through arrangements with the investment adviser, brokerage services, or other offset arrangements, if applicable, and do not represent the amount paid by the class during periods when reimbursements, waivers or reductions occur.
F Amount does not include the portfolio activity of any underlying mutual funds or exchange-traded funds (ETFs).
See accompanying notes which are an integral part of the financial statements.
Fidelity Asset Manager 50% Class I
| Years ended September 30, | 2020 | 2019 | 2018 | 2017 | 2016 |
| Selected Per–Share Data | | | | | |
| Net asset value, beginning of period | $18.26 | $18.62 | $18.33 | $16.95 | $16.36 |
| Income from Investment Operations | | | | | |
| Net investment income (loss)A | .29 | .33 | .28 | .24 | .27 |
| Net realized and unrealized gain (loss) | 1.58 | .20 | .80 | 1.46 | 1.23 |
| Total from investment operations | 1.87 | .53 | 1.08 | 1.70 | 1.50 |
| Distributions from net investment income | (.30) | (.34) | (.26) | (.23) | (.29) |
| Distributions from net realized gain | (.45) | (.55) | (.53) | (.09) | (.62) |
| Total distributions | (.75) | (.89) | (.79) | (.32) | (.91) |
| Net asset value, end of period | $19.38 | $18.26 | $18.62 | $18.33 | $16.95 |
| Total ReturnB | 10.49% | 3.33% | 6.02% | 10.17% | 9.53% |
| Ratios to Average Net AssetsC,D | | | | | |
| Expenses before reductions | .65% | .66% | .67% | .68% | .70% |
| Expenses net of fee waivers, if any | .65% | .66% | .67% | .68% | .70% |
| Expenses net of all reductions | .65% | .66% | .67% | .68% | .70% |
| Net investment income (loss) | 1.59% | 1.85% | 1.52% | 1.35% | 1.68% |
| Supplemental Data | | | | | |
| Net assets, end of period (000 omitted) | $55,021 | $62,141 | $75,904 | $42,497 | $39,673 |
| Portfolio turnover rateE | 24% | 37% | 15% | 20% | 19% |
A Calculated based on average shares outstanding during the period.
B Total returns would have been lower if certain expenses had not been reduced during the applicable periods shown.
C Fees and expenses of any underlying mutual funds or exchange-traded funds (ETFs) are not included in the Fund's expense ratio. The Fund indirectly bears its proportionate share of these expenses. For additional expense information related to investments in Fidelity Central Funds, please refer to the "Investments in Fidelity Central Funds" note found in the Notes to Financial Statements section of the most recent Annual or Semi-Annual report.
D Expense ratios reflect operating expenses of the class. Expenses before reductions do not reflect amounts reimbursed, waived, or reduced through arrangements with the investment adviser, brokerage services, or other offset arrangements, if applicable, and do not represent the amount paid by the class during periods when reimbursements, waivers or reductions occur.
E Amount does not include the portfolio activity of any underlying mutual funds or exchange-traded funds (ETFs).
See accompanying notes which are an integral part of the financial statements.
Fidelity Asset Manager 50% Class Z
| Years ended September 30, | 2020 | 2019 A |
| Selected Per–Share Data | | |
| Net asset value, beginning of period | $18.26 | $18.59 |
| Income from Investment Operations | | |
| Net investment income (loss)B | .31 | .35 |
| Net realized and unrealized gain (loss) | 1.57 | .23 |
| Total from investment operations | 1.88 | .58 |
| Distributions from net investment income | (.32) | (.36) |
| Distributions from net realized gain | (.45) | (.55) |
| Total distributions | (.77) | (.91) |
| Net asset value, end of period | $19.37 | $18.26 |
| Total ReturnC,D | 10.56% | 3.61% |
| Ratios to Average Net AssetsE,F | | |
| Expenses before reductions | .55% | .55%G |
| Expenses net of fee waivers, if any | .54% | .55%G |
| Expenses net of all reductions | .54% | .55%G |
| Net investment income (loss) | 1.70% | 1.96%G |
| Supplemental Data | | |
| Net assets, end of period (000 omitted) | $26,638 | $20,968 |
| Portfolio turnover rateH | 24% | 37% |
A For the period October 2, 2018 (commencement of sale of shares) to September 30, 2019.
B Calculated based on average shares outstanding during the period.
C Total returns for periods of less than one year are not annualized.
D Total returns would have been lower if certain expenses had not been reduced during the applicable periods shown.
E Fees and expenses of any underlying mutual funds or exchange-traded funds (ETFs) are not included in the Fund's expense ratio. The Fund indirectly bears its proportionate share of these expenses. For additional expense information related to investments in Fidelity Central Funds, please refer to the "Investments in Fidelity Central Funds" note found in the Notes to Financial Statements section of the most recent Annual or Semi-Annual report.
F Expense ratios reflect operating expenses of the class. Expenses before reductions do not reflect amounts reimbursed, waived, or reduced through arrangements with the investment adviser, brokerage services, or other offset arrangements, if applicable, and do not represent the amount paid by the class during periods when reimbursements, waivers or reductions occur.
G Annualized
H Amount does not include the portfolio activity of any underlying mutual funds or exchange-traded funds (ETFs).
See accompanying notes which are an integral part of the financial statements.
Fidelity Asset Manager® 60%
Investment Summary (Unaudited)
The information in the following tables is based on the combined investments of the Fund and its pro-rata share of the investments of Fidelity's Central Funds, other than the Money Market Central Funds.
Top Ten Stocks as of September 30, 2020
| | % of fund's net assets |
| Apple, Inc. | 2.8 |
| Microsoft Corp. | 2.6 |
| Alphabet, Inc. Class A | 1.4 |
| Amazon.com, Inc. | 1.2 |
| Facebook, Inc. Class A | 0.9 |
| Roche Holding AG (participation certificate) | 0.7 |
| Alibaba Group Holding Ltd. sponsored ADR | 0.7 |
| UnitedHealth Group, Inc. | 0.6 |
| Salesforce.com, Inc. | 0.6 |
| Tencent Holdings Ltd | 0.5 |
| | 12.0 |
Top Five Market Sectors as of September 30, 2020
| | % of fund's net assets |
| Information Technology | 15.4 |
| Financials | 14.6 |
| Health Care | 8.7 |
| Consumer Discretionary | 8.0 |
| Communication Services | 6.9 |
Quality Diversification (% of fund's net assets)
| As of September 30, 2020 |
| | U.S. Government and U.S. Government Agency Obligations | 15.6% |
| | AAA,AA,A | 5.2% |
| | BBB | 8.0% |
| | BB and Below | 4.2% |
| | Not Rated | 1.2% |
| | Equities | 63.8% |
| | Short-Term Investments and Net Other Assets | 2.0% |

We have used ratings from Moody's Investors Service, Inc. Where Moody's® ratings are not available, we have used S&P® ratings. All ratings are as of the date indicated and do not reflect subsequent changes.
Asset Allocation (% of fund's net assets)
| As of September 30, 2020 |
| | Stock Class and Equity Futures | 64.6% |
| | Bond Class | 33.3% |
| | Short-Term Class | 2.1% |

Asset allocations in the pie charts reflect the categorization of assets as defined in the Fund's prospectus in effect as of the time periods indicated above. Percentages are adjusted for the effect of future contracts and swap contracts, if applicable.
At period end, foreign investments including the Fund's pro-rata share of the underlying Central Funds, other than the Market Funds, was 26.3% of net assets.
Percentages in the above tables are adjusted for the effect of TBA Sale Commitments.
An unaudited holdings listing for the Fund, which presents direct holdings as well as the pro-rata share of any securities and other investments held indirectly through its investment in underlying Fidelity Central Funds, other than the Money Market Central Funds, is available at fidelity.com and/or institutional.fidelity.com, as applicable.
Fidelity Asset Manager® 60%
Schedule of Investments September 30, 2020
Showing Percentage of Net Assets
| Equity Central Funds - 61.9% | | | |
| | | Shares | Value |
| Fidelity Emerging Markets Equity Central Fund (a) | | 942,935 | $223,607,673 |
| Fidelity International Equity Central Fund (a) | | 4,264,738 | 360,882,090 |
| Fidelity Real Estate Equity Central Fund (a) | | 41,684 | 4,505,615 |
| Fidelity U.S. Equity Central Fund (a) | | 14,204,981 | 1,430,583,670 |
| TOTAL EQUITY CENTRAL FUNDS | | | |
| (Cost $1,465,405,085) | | | 2,019,579,048 |
|
| Fixed-Income Central Funds - 34.3% | | | |
| High Yield Fixed-Income Funds - 3.4% | | | |
| Fidelity Emerging Markets Debt Central Fund (a) | | 3,104,583 | 27,879,158 |
| Fidelity Emerging Markets Debt Local Currency Central Fund (a) | | 151,970 | 15,219,796 |
| Fidelity Floating Rate Central Fund (a) | | 147,427 | 14,207,510 |
| Fidelity High Income Central Fund (a) | | 513,980 | 53,705,739 |
|
| TOTAL HIGH YIELD FIXED-INCOME FUNDS | | | 111,012,203 |
|
| Investment Grade Fixed-Income Funds - 30.9% | | | |
| Fidelity Inflation-Protected Bond Index Central Fund (a) | | 1,407,025 | 153,267,204 |
| Fidelity International Credit Central Fund (a) | | 438,899 | 45,952,687 |
| Fidelity Investment Grade Bond Central Fund (a) | | 6,841,965 | 810,157,055 |
|
| TOTAL INVESTMENT GRADE FIXED-INCOME FUNDS | | | 1,009,376,946 |
|
| TOTAL FIXED-INCOME CENTRAL FUNDS | | | |
| (Cost $1,018,745,468) | | | 1,120,389,149 |
|
| Money Market Central Funds - 2.0% | | | |
| Fidelity Cash Central Fund 0.10% (b) | | 20,918,113 | 20,922,296 |
| Fidelity Securities Lending Cash Central Fund 0.10% (b)(c) | | 45,205,629 | 45,210,150 |
| TOTAL MONEY MARKET CENTRAL FUNDS | | | |
| (Cost $66,132,446) | | | 66,132,446 |
| | | Principal Amount | Value |
|
| U.S. Treasury Obligations - 0.3% | | | |
| U.S. Treasury Bills, yield at date of purchase 0.08% to 0.14% 10/1/20 to 12/24/20 (d) | | | |
| (Cost $10,518,552) | | 10,520,000 | 10,518,435 |
| | | Shares | Value |
|
| Investment Companies - 2.9% | | | |
| iShares MSCI Japan ETF (e) | | 855,231 | $50,518,495 |
| Market Vectors Gold Miners ETF | | 1,120,340 | 43,872,514 |
| TOTAL INVESTMENT COMPANIES | | | |
| (Cost $83,299,362) | | | 94,391,009 |
| TOTAL INVESTMENT IN SECURITIES - 101.4% | | | |
| (Cost $2,644,100,913) | | | 3,311,010,087 |
| NET OTHER ASSETS (LIABILITIES) - (1.4)% | | | (46,477,117) |
| NET ASSETS - 100% | | | $3,264,532,970 |
| Futures Contracts | | | | | |
| | Number of contracts | Expiration Date | Notional Amount | Value | Unrealized Appreciation/(Depreciation) |
| Purchased | | | | | |
| Equity Index Contracts | | | | | |
| ICE E-mini MSCI EAFE Index Contracts (United States) | 184 | Dec. 2020 | $17,049,440 | $(337,999) | $(337,999) |
| Sold | | | | | |
| Equity Index Contracts | | | | | |
| CME E-mini S&P 500 Index Contracts (United States) | 403 | Dec. 2020 | 67,542,800 | (440,935) | (440,935) |
| TOTAL FUTURES CONTRACTS | | | | | $(778,934) |
The notional amount of futures purchased as a percentage of Net Assets is .5%
The notional amount of futures sold as a percentage of Net Assets is 2.1%
For the period, the average monthly notional amount at value for futures contracts in the aggregate was $71,383,079.
Security Type Abbreviations
ETF – Exchange-Traded Fund
Legend
(a) Affiliated fund that is generally available only to investment companies and other accounts managed by Fidelity Investments. A complete unaudited schedule of portfolio holdings for each Fidelity Central Fund is filed with the SEC for the first and third quarters of each fiscal year on Form N-PORT and is available upon request or at the SEC's website at www.sec.gov. An unaudited holdings listing for the Fund, which presents direct holdings as well as the pro-rata share of securities and other investments held indirectly through its investment in underlying non-money market Fidelity Central Funds, is available at fidelity.com and/or institutional.fidelity.com, as applicable. In addition, each Fidelity Central Fund's financial statements, which are not covered by the Fund's Report of Independent Registered Public Accounting Firm, are available on the SEC's website or upon request.
(b) Affiliated fund that is generally available only to investment companies and other accounts managed by Fidelity Investments. The rate quoted is the annualized seven-day yield of the fund at period end. A complete unaudited listing of the fund's holdings as of its most recent quarter end is available upon request. In addition, each Fidelity Central Fund's financial statements, which are not covered by the Fund's Report of Independent Registered Public Accounting Firm, are available on the SEC's website or upon request.
(c) Investment made with cash collateral received from securities on loan.
(d) Security or a portion of the security was pledged to cover margin requirements for futures contracts. At period end, the value of securities pledged amounted to $8,424,554.
(e) Security or a portion of the security is on loan at period end.
Affiliated Central Funds
Information regarding fiscal year to date income earned by the Fund from investments in Fidelity Central Funds is as follows:
| Fund | Income earned |
| Fidelity Cash Central Fund | $237,367 |
| Fidelity Communication Services Central Fund | 7,171,273 |
| Fidelity Consumer Discretionary Central Fund | 4,531,273 |
| Fidelity Consumer Staples Central Fund | 2,465,473 |
| Fidelity Emerging Markets Debt Central Fund | 1,701,975 |
| Fidelity Emerging Markets Equity Central Fund | 5,669,726 |
| Fidelity Energy Central Fund | 1,351,010 |
| Fidelity Financials Central Fund | 13,953,603 |
| Fidelity Floating Rate Central Fund | 775,328 |
| Fidelity Health Care Central Fund | 20,596,450 |
| Fidelity High Income Central Fund | 1,912,020 |
| Fidelity Industrials Central Fund | 2,041,661 |
| Fidelity Inflation-Protected Bond Index Central Fund | 2,399,724 |
| Fidelity Information Technology Central Fund | 44,327,277 |
| Fidelity International Credit Central Fund | 1,620,512 |
| Fidelity International Equity Central Fund | 6,280,780 |
| Fidelity Investment Grade Bond Central Fund | 23,493,025 |
| Fidelity Materials Central Fund | 514,529 |
| Fidelity Real Estate Equity Central Fund | 751,114 |
| Fidelity Securities Lending Cash Central Fund | 22,280 |
| Fidelity Utilities Central Fund | 2,612,076 |
| Total | $144,428,476 |
Amounts in the income column in the above table include any capital gain distributions from underlying funds, which are presented in the corresponding line-item in the Statement of Operations, if applicable. Amount for Fidelity Securities Lending Cash Central Fund represents the income earned on investing cash collateral, less rebates paid to borrowers and any lending agent fees associated with the loan, plus any premium payments received for lending certain types of securities.
Fiscal year to date information regarding the Fund’s investments in non-Money Market Central Funds, including the ownership percentage, is presented below.
| Affiliate | Value, beginning of period | Purchases(a) | Sales Proceeds(a) | Realized Gain (loss) | Change in Unrealized appreciation (depreciation) | Value, end of period | % ownership, end of period |
| Fidelity Commodity Strategy Central Fund | $15,917,632 | $67,730 | $16,390,279 | $(1,819,164) | $2,224,081 | $-- | 0.0 |
| Fidelity Communication Services Central Fund | 106,167,767 | 30,015,555 | 14,703,669 | 49,974 | (16,083,935) | -- | 0.0 |
| Fidelity Consumer Discretionary Central Fund | 128,356,170 | 20,888,972 | 18,862,381 | 663,641 | (56,804,655) | -- | 0.0 |
| Fidelity Consumer Staples Central Fund | 83,499,614 | 15,871,170 | 11,231,233 | (483,207) | (13,520,656) | -- | 0.0 |
| Fidelity Emerging Markets Debt Central Fund | 28,733,528 | 3,941,434 | 3,507,439 | (296,152) | (992,213) | 27,879,158 | 1.0 |
| Fidelity Emerging Markets Debt Local Currency Central Fund | -- | 15,197,000 | -- | -- | 22,796 | 15,219,796 | 10.1 |
| Fidelity Emerging Markets Equity Central Fund | 202,689,185 | 18,634,151 | 20,357,968 | (3,108,511) | 25,750,816 | 223,607,673 | 11.3 |
| Fidelity Energy Central Fund | 51,781,439 | 6,512,671 | 4,560,245 | (2,403,660) | 12,736,620 | -- | 0.0 |
| Fidelity Financials Central Fund | 232,025,574 | 33,566,805 | 32,465,580 | (5,760,653) | (54,618,106) | -- | 0.0 |
| Fidelity Floating Rate Central Fund | 14,893,624 | 1,892,676 | 1,724,779 | (121,441) | (732,570) | 14,207,510 | 0.7 |
| Fidelity Health Care Central Fund | 171,030,936 | 35,317,066 | 26,892,405 | 1,085,755 | (65,679,309) | -- | 0.0 |
| Fidelity High Income Central Fund | 30,335,088 | 40,144,500 | 18,547,147 | (218,544) | 1,991,842 | 53,705,739 | 2.0 |
| Fidelity Industrials Central Fund | 121,938,637 | 12,838,022 | 17,191,593 | (1,995,995) | (34,402,499) | -- | 0.0 |
| Fidelity Inflation-Protected Bond Index Central Fund | 132,243,107 | 46,316,484 | 33,505,258 | 146,255 | 8,066,616 | 153,267,204 | 9.6 |
| Fidelity Information Technology Central Fund | 289,704,552 | 69,107,892 | 50,801,665 | 855,916 | (91,981,585) | -- | 0.0 |
| Fidelity International Credit Central Fund | 29,711,418 | 19,771,031 | 3,852,538 | (84,714) | 407,490 | 45,952,687 | 9.8 |
| Fidelity International Equity Central Fund | 285,691,604 | 103,976,716 | 54,146,474 | (5,906,150) | 31,266,394 | 360,882,090 | 11.9 |
| Fidelity Investment Grade Bond Central Fund | 790,581,145 | 197,980,301 | 216,101,673 | (2,899) | 37,700,181 | 810,157,055 | 2.8 |
| Fidelity Materials Central Fund | 30,269,377 | 6,622,058 | 5,402,111 | (629,277) | 744,966 | -- | 0.0 |
| Fidelity Real Estate Equity Central Fund | 45,907,288 | 3,553,597 | 32,799,328 | (8,495,190) | (3,660,752) | 4,505,615 | 0.6 |
| Fidelity U.S. Equity Central Fund | -- | 735,508 | 4,763,341 | (5,279,956) | 474,485,515 | 1,430,583,670 | 6.6 |
| Fidelity Utilities Central Fund | 44,309,417 | 6,624,148 | 5,789,035 | (592,697) | (14,322,619) | -- | 0.0 |
| | 2,835,787,102 | 689,575,487 | 593,596,141 | (34,396,669) | 242,598,418 | 3,139,968,197 | |
(a) Excludes the value of securities received and delivered through merger transactions, if applicable.
Investment Valuation
The following is a summary of the inputs used, as of September 30, 2020, involving the Fund's assets and liabilities carried at fair value. The inputs or methodology used for valuing securities may not be an indication of the risk associated with investing in those securities. For more information on valuation inputs, and their aggregation into the levels used below, please refer to the Investment Valuation section in the accompanying Notes to Financial Statements.
| | Valuation Inputs at Reporting Date: |
| Description | Total | Level 1 | Level 2 | Level 3 |
| Investments in Securities: | | | | |
| Equity Central Funds | $2,019,579,048 | $2,019,579,048 | $-- | $-- |
| Fixed-Income Central Funds | 1,120,389,149 | 1,120,389,149 | -- | -- |
| Money Market Central Funds | 66,132,446 | 66,132,446 | -- | -- |
| Other Short-Term Investments | 10,518,435 | -- | 10,518,435 | -- |
| Investment Companies | 94,391,009 | 94,391,009 | -- | -- |
| Total Investments in Securities: | $3,311,010,087 | $3,300,491,652 | $10,518,435 | $-- |
| Derivative Instruments: | | | | |
| Liabilities | | | | |
| Futures Contracts | $(778,934) | $(778,934) | $-- | $-- |
| Total Liabilities | $(778,934) | $(778,934) | $-- | $-- |
| Total Derivative Instruments: | $(778,934) | $(778,934) | $-- | $-- |
Value of Derivative Instruments
The following table is a summary of the Fund's value of derivative instruments by primary risk exposure as of September 30, 2020. For additional information on derivative instruments, please refer to the Derivative Instruments section in the accompanying Notes to Financial Statements.
| Primary Risk Exposure / Derivative Type | Value |
| | Asset | Liability |
| Equity Risk | | |
| Futures Contracts(a) | $0 | $(778,934) |
| Total Equity Risk | 0 | (778,934) |
| Total Value of Derivatives | $0 | $(778,934) |
(a) Reflects gross cumulative appreciation (depreciation) on futures contracts as presented in the Schedule of Investments. In the Statement of Assets and Liabilities, the period end daily variation margin is included in receivable or payable for daily variation margin on futures contracts, and the net cumulative appreciation (depreciation) is included in Total accumulated earnings (loss).
Other Information
Distribution of investments by country or territory of incorporation, as a percentage of Total Net Assets, is as follows (Unaudited):
| United States of America | 73.7% |
| Cayman Islands | 3.6% |
| United Kingdom | 3.2% |
| Japan | 2.1% |
| Switzerland | 2.0% |
| France | 1.7% |
| Netherlands | 1.7% |
| Germany | 1.1% |
| Canada | 1.1% |
| Others (Individually Less Than 1%) | 9.8% |
| | 100.0% |
The information in the above table is based on the combined investments of the Fund and its pro-rata share of the investments of Fidelity's Central Funds, other than the Money Market Central Funds.
See accompanying notes which are an integral part of the financial statements.
Fidelity Asset Manager® 60%
Financial Statements
Statement of Assets and Liabilities
| | | September 30, 2020 |
| Assets | | |
Investment in securities, at value (including securities loaned of $43,959,894) — See accompanying schedule:
Unaffiliated issuers (cost $93,817,914) | $104,909,444 | |
| Fidelity Central Funds (cost $2,550,282,999) | 3,206,100,643 | |
| Total Investment in Securities (cost $2,644,100,913) | | $3,311,010,087 |
| Receivable for investments sold | | 2,234,518 |
| Receivable for fund shares sold | | 1,055,213 |
| Dividends receivable | | 61,740 |
| Distributions receivable from Fidelity Central Funds | | 3,804 |
| Prepaid expenses | | 5,088 |
| Other receivables | | 2,659 |
| Total assets | | 3,314,373,109 |
| Liabilities | | |
| Payable for investments purchased | $25,942 | |
| Payable for fund shares redeemed | 2,076,516 | |
| Accrued management fee | 1,449,432 | |
| Distribution and service plan fees payable | 99,995 | |
| Payable for daily variation margin on futures contracts | 538,032 | |
| Other affiliated payables | 416,361 | |
| Other payables and accrued expenses | 23,711 | |
| Collateral on securities loaned | 45,210,150 | |
| Total liabilities | | 49,840,139 |
| Net Assets | | $3,264,532,970 |
| Net Assets consist of: | | |
| Paid in capital | | $2,702,643,282 |
| Total accumulated earnings (loss) | | 561,889,688 |
| Net Assets | | $3,264,532,970 |
| Net Asset Value and Maximum Offering Price | | |
| Class A: | | |
| Net Asset Value and redemption price per share ($129,966,721 ÷ 9,578,172 shares)(a) | | $13.57 |
| Maximum offering price per share (100/94.25 of $13.57) | | $14.40 |
| Class M: | | |
| Net Asset Value and redemption price per share ($49,060,374 ÷ 3,639,153 shares)(a) | | $13.48 |
| Maximum offering price per share (100/96.50 of $13.48) | | $13.97 |
| Class C: | | |
| Net Asset Value and offering price per share ($61,950,258 ÷ 4,662,096 shares)(a) | | $13.29 |
| Asset Manager 60%: | | |
| Net Asset Value, offering price and redemption price per share ($2,950,009,908 ÷ 216,154,225 shares) | | $13.65 |
| Class I: | | |
| Net Asset Value, offering price and redemption price per share ($51,428,607 ÷ 3,765,853 shares) | | $13.66 |
| Class Z: | | |
| Net Asset Value, offering price and redemption price per share ($22,117,102 ÷ 1,620,419 shares) | | $13.65 |
(a) Redemption price per share is equal to net asset value less any applicable contingent deferred sales charge.
See accompanying notes which are an integral part of the financial statements.
Statement of Operations
| | | Year ended September 30, 2020 |
| Investment Income | | |
| Dividends | | $3,602,070 |
| Interest | | 48,332 |
| Income from Fidelity Central Funds (including $22,280 from security lending) | | 65,315,110 |
| Total income | | 68,965,512 |
| Expenses | | |
| Management fee | $16,795,031 | |
| Transfer agent fees | 3,614,531 | |
| Distribution and service plan fees | 1,202,428 | |
| Accounting fees | 1,183,840 | |
| Custodian fees and expenses | 8,815 | |
| Independent trustees' fees and expenses | 10,088 | |
| Registration fees | 133,608 | |
| Audit | 41,152 | |
| Legal | 10,367 | |
| Interest | 787 | |
| Miscellaneous | 18,641 | |
| Total expenses before reductions | 23,019,288 | |
| Expense reductions | (199,780) | |
| Total expenses after reductions | | 22,819,508 |
| Net investment income (loss) | | 46,146,004 |
| Realized and Unrealized Gain (Loss) | | |
| Net realized gain (loss) on: | | |
| Investment securities: | | |
| Unaffiliated issuers | 1,790,827 | |
| Fidelity Central Funds | (34,393,962) | |
| Foreign currency transactions | 26 | |
| Futures contracts | (20,816,984) | |
| Capital gain distributions from Fidelity Central Funds | 79,113,366 | |
| Total net realized gain (loss) | | 25,693,273 |
| Change in net unrealized appreciation (depreciation) on: | | |
| Investment securities: | | |
| Unaffiliated issuers | 1,369,007 | |
| Fidelity Central Funds | 242,598,412 | |
| Assets and liabilities in foreign currencies | 4,385 | |
| Futures contracts | (2,106,038) | |
| Total change in net unrealized appreciation (depreciation) | | 241,865,766 |
| Net gain (loss) | | 267,559,039 |
| Net increase (decrease) in net assets resulting from operations | | $313,705,043 |
See accompanying notes which are an integral part of the financial statements.
Statement of Changes in Net Assets
| | Year ended September 30, 2020 | Year ended September 30, 2019 |
| Increase (Decrease) in Net Assets | | |
| Operations | | |
| Net investment income (loss) | $46,146,004 | $49,033,979 |
| Net realized gain (loss) | 25,693,273 | 92,559,135 |
| Change in net unrealized appreciation (depreciation) | 241,865,766 | (63,422,390) |
| Net increase (decrease) in net assets resulting from operations | 313,705,043 | 78,170,724 |
| Distributions to shareholders | (130,212,248) | (115,058,389) |
| Share transactions - net increase (decrease) | 33,223,905 | 68,787,056 |
| Total increase (decrease) in net assets | 216,716,700 | 31,899,391 |
| Net Assets | | |
| Beginning of period | 3,047,816,270 | 3,015,916,879 |
| End of period | $3,264,532,970 | $3,047,816,270 |
See accompanying notes which are an integral part of the financial statements.
Financial Highlights
Fidelity Asset Manager 60% Class A
| Years ended September 30, | 2020 | 2019 | 2018 | 2017 | 2016 |
| Selected Per–Share Data | | | | | |
| Net asset value, beginning of period | $12.68 | $12.92 | $12.42 | $11.24 | $10.60 |
| Income from Investment Operations | | | | | |
| Net investment income (loss)A | .15 | .17 | .14 | .11 | .14 |
| Net realized and unrealized gain (loss) | 1.24 | .06 | .69 | 1.21 | .90 |
| Total from investment operations | 1.39 | .23 | .83 | 1.32 | 1.04 |
| Distributions from net investment income | (.17) | (.15) | (.11) | (.12) | (.15) |
| Distributions from net realized gain | (.33) | (.32) | (.22) | (.02) | (.25) |
| Total distributions | (.50) | (.47) | (.33) | (.14) | (.40) |
| Net asset value, end of period | $13.57 | $12.68 | $12.92 | $12.42 | $11.24 |
| Total ReturnB,C | 11.13% | 2.24% | 6.80% | 11.86% | 10.10% |
| Ratios to Average Net AssetsD,E | | | | | |
| Expenses before reductions | 1.00% | 1.02% | 1.02% | 1.03% | 1.03% |
| Expenses net of fee waivers, if any | 1.00% | 1.01% | 1.01% | 1.03% | 1.03% |
| Expenses net of all reductions | 1.00% | 1.01% | 1.01% | 1.02% | 1.03% |
| Net investment income (loss) | 1.19% | 1.40% | 1.12% | .98% | 1.30% |
| Supplemental Data | | | | | |
| Net assets, end of period (000 omitted) | $129,967 | $128,269 | $130,729 | $59,049 | $59,027 |
| Portfolio turnover rateF | 29% | 39% | 18%G | 18% | 21% |
A Calculated based on average shares outstanding during the period.
B Total returns would have been lower if certain expenses had not been reduced during the applicable periods shown.
C Total returns do not include the effect of the sales charges.
D Fees and expenses of any underlying mutual funds or exchange-traded funds (ETFs) are not included in the Fund's expense ratio. The Fund indirectly bears its proportionate share of these expenses. For additional expense information related to investments in Fidelity Central Funds, please refer to the "Investments in Fidelity Central Funds" note found in the Notes to Financial Statements section of the most recent Annual or Semi-Annual report.
E Expense ratios reflect operating expenses of the class. Expenses before reductions do not reflect amounts reimbursed, waived, or reduced through arrangements with the investment adviser, brokerage services, or other offset arrangements, if applicable, and do not represent the amount paid by the class during periods when reimbursements, waivers or reductions occur.
F Amount does not include the portfolio activity of any underlying mutual funds or exchange-traded funds (ETFs).
G The portfolio turnover rate does not include the assets acquired in the merger.
See accompanying notes which are an integral part of the financial statements.
Fidelity Asset Manager 60% Class M
| Years ended September 30, | 2020 | 2019 | 2018 | 2017 | 2016 |
| Selected Per–Share Data | | | | | |
| Net asset value, beginning of period | $12.60 | $12.84 | $12.34 | $11.17 | $10.55 |
| Income from Investment Operations | | | | | |
| Net investment income (loss)A | .12 | .14 | .11 | .09 | .11 |
| Net realized and unrealized gain (loss) | 1.22 | .06 | .70 | 1.19 | .88 |
| Total from investment operations | 1.34 | .20 | .81 | 1.28 | .99 |
| Distributions from net investment income | (.13) | (.12) | (.08) | (.09) | (.13) |
| Distributions from net realized gain | (.33) | (.32) | (.22) | (.02) | (.25) |
| Total distributions | (.46) | (.44) | (.31)B | (.11) | (.37)B |
| Net asset value, end of period | $13.48 | $12.60 | $12.84 | $12.34 | $11.17 |
| Total ReturnC,D | 10.83% | 2.01% | 6.60% | 11.58% | 9.68% |
| Ratios to Average Net AssetsE,F | | | | | |
| Expenses before reductions | 1.26% | 1.28% | 1.28% | 1.28% | 1.29% |
| Expenses net of fee waivers, if any | 1.25% | 1.25% | 1.26% | 1.28% | 1.29% |
| Expenses net of all reductions | 1.25% | 1.25% | 1.26% | 1.27% | 1.28% |
| Net investment income (loss) | .94% | 1.15% | .87% | .73% | 1.04% |
| Supplemental Data | | | | | |
| Net assets, end of period (000 omitted) | $49,060 | $49,997 | $55,343 | $20,860 | $16,763 |
| Portfolio turnover rateG | 29% | 39% | 18%H | 18% | 21% |
A Calculated based on average shares outstanding during the period.
B Total distributions per share do not sum due to rounding.
C Total returns would have been lower if certain expenses had not been reduced during the applicable periods shown.
D Total returns do not include the effect of the sales charges.
E Fees and expenses of any underlying mutual funds or exchange-traded funds (ETFs) are not included in the Fund's expense ratio. The Fund indirectly bears its proportionate share of these expenses. For additional expense information related to investments in Fidelity Central Funds, please refer to the "Investments in Fidelity Central Funds" note found in the Notes to Financial Statements section of the most recent Annual or Semi-Annual report.
F Expense ratios reflect operating expenses of the class. Expenses before reductions do not reflect amounts reimbursed, waived, or reduced through arrangements with the investment adviser, brokerage services, or other offset arrangements, if applicable, and do not represent the amount paid by the class during periods when reimbursements, waivers or reductions occur.
G Amount does not include the portfolio activity of any underlying mutual funds or exchange-traded funds (ETFs).
H The portfolio turnover rate does not include the assets acquired in the merger.
See accompanying notes which are an integral part of the financial statements.
Fidelity Asset Manager 60% Class C
| Years ended September 30, | 2020 | 2019 | 2018 | 2017 | 2016 |
| Selected Per–Share Data | | | | | |
| Net asset value, beginning of period | $12.42 | $12.67 | $12.18 | $11.04 | $10.42 |
| Income from Investment Operations | | | | | |
| Net investment income (loss)A | .05 | .08 | .05 | .03 | .06 |
| Net realized and unrealized gain (loss) | 1.21 | .06 | .69 | 1.17 | .88 |
| Total from investment operations | 1.26 | .14 | .74 | 1.20 | .94 |
| Distributions from net investment income | (.06) | (.07) | (.02) | (.04) | (.08) |
| Distributions from net realized gain | (.33) | (.32) | (.22) | (.02) | (.25) |
| Total distributions | (.39) | (.39) | (.25)B | (.06) | (.32)B |
| Net asset value, end of period | $13.29 | $12.42 | $12.67 | $12.18 | $11.04 |
| Total ReturnC,D | 10.29% | 1.47% | 6.09% | 10.94% | 9.27% |
| Ratios to Average Net AssetsE,F | | | | | |
| Expenses before reductions | 1.79% | 1.81% | 1.79% | 1.78% | 1.78% |
| Expenses net of fee waivers, if any | 1.76% | 1.76% | 1.76% | 1.78% | 1.78% |
| Expenses net of all reductions | 1.76% | 1.76% | 1.76% | 1.78% | 1.78% |
| Net investment income (loss) | .42% | .64% | .37% | .23% | .54% |
| Supplemental Data | | | | | |
| Net assets, end of period (000 omitted) | $61,950 | $67,955 | $86,887 | $37,384 | $34,037 |
| Portfolio turnover rateG | 29% | 39% | 18%H | 18% | 21% |
A Calculated based on average shares outstanding during the period.
B Total distributions per share do not sum due to rounding.
C Total returns would have been lower if certain expenses had not been reduced during the applicable periods shown.
D Total returns do not include the effect of the contingent deferred sales charge.
E Fees and expenses of any underlying mutual funds or exchange-traded funds (ETFs) are not included in the Fund's expense ratio. The Fund indirectly bears its proportionate share of these expenses. For additional expense information related to investments in Fidelity Central Funds, please refer to the "Investments in Fidelity Central Funds" note found in the Notes to Financial Statements section of the most recent Annual or Semi-Annual report.
F Expense ratios reflect operating expenses of the class. Expenses before reductions do not reflect amounts reimbursed, waived, or reduced through arrangements with the investment adviser, brokerage services, or other offset arrangements, if applicable, and do not represent the amount paid by the class during periods when reimbursements, waivers or reductions occur.
G Amount does not include the portfolio activity of any underlying mutual funds or exchange-traded funds (ETFs).
H The portfolio turnover rate does not include the assets acquired in the merger.
See accompanying notes which are an integral part of the financial statements.
Fidelity Asset Manager 60%
| Years ended September 30, | 2020 | 2019 | 2018 | 2017 | 2016 |
| Selected Per–Share Data | | | | | |
| Net asset value, beginning of period | $12.75 | $12.98 | $12.47 | $11.29 | $10.66 |
| Income from Investment Operations | | | | | |
| Net investment income (loss)A | .19 | .21 | .18 | .15 | .17 |
| Net realized and unrealized gain (loss) | 1.25 | .06 | .70 | 1.21 | .90 |
| Total from investment operations | 1.44 | .27 | .88 | 1.36 | 1.07 |
| Distributions from net investment income | (.21) | (.18) | (.15) | (.15) | (.19) |
| Distributions from net realized gain | (.33) | (.32) | (.22) | (.02) | (.25) |
| Total distributions | (.54) | (.50) | (.37) | (.18)B | (.44) |
| Net asset value, end of period | $13.65 | $12.75 | $12.98 | $12.47 | $11.29 |
| Total ReturnC | 11.50% | 2.60% | 7.17% | 12.19% | 10.31% |
| Ratios to Average Net AssetsD,E | | | | | |
| Expenses before reductions | .69% | .70% | .70% | .71% | .71% |
| Expenses net of fee waivers, if any | .68% | .69% | .70% | .71% | .71% |
| Expenses net of all reductions | .68% | .69% | .70% | .71% | .71% |
| Net investment income (loss) | 1.51% | 1.71% | 1.44% | 1.30% | 1.61% |
| Supplemental Data | | | | | |
| Net assets, end of period (000 omitted) | $2,950,010 | $2,727,092 | $2,679,353 | $1,821,025 | $1,426,502 |
| Portfolio turnover rateF | 29% | 39% | 18%G | 18% | 21% |
A Calculated based on average shares outstanding during the period.
B Total distributions per share do not sum due to rounding.
C Total returns would have been lower if certain expenses had not been reduced during the applicable periods shown.
D Fees and expenses of any underlying mutual funds or exchange-traded funds (ETFs) are not included in the Fund's expense ratio. The Fund indirectly bears its proportionate share of these expenses. For additional expense information related to investments in Fidelity Central Funds, please refer to the "Investments in Fidelity Central Funds" note found in the Notes to Financial Statements section of the most recent Annual or Semi-Annual report.
E Expense ratios reflect operating expenses of the class. Expenses before reductions do not reflect amounts reimbursed, waived, or reduced through arrangements with the investment adviser, brokerage services, or other offset arrangements, if applicable, and do not represent the amount paid by the class during periods when reimbursements, waivers or reductions occur.
F Amount does not include the portfolio activity of any underlying mutual funds or exchange-traded funds (ETFs).
G The portfolio turnover rate does not include the assets acquired in the merger.
See accompanying notes which are an integral part of the financial statements.
Fidelity Asset Manager 60% Class I
| Years ended September 30, | 2020 | 2019 | 2018 | 2017 | 2016 |
| Selected Per–Share Data | | | | | |
| Net asset value, beginning of period | $12.76 | $12.99 | $12.48 | $11.30 | $10.66 |
| Income from Investment Operations | | | | | |
| Net investment income (loss)A | .19 | .21 | .18 | .15 | .17 |
| Net realized and unrealized gain (loss) | 1.24 | .05 | .70 | 1.20 | .90 |
| Total from investment operations | 1.43 | .26 | .88 | 1.35 | 1.07 |
| Distributions from net investment income | (.20) | (.17) | (.14) | (.15) | (.18) |
| Distributions from net realized gain | (.33) | (.32) | (.22) | (.02) | (.25) |
| Total distributions | (.53) | (.49) | (.37)B | (.17) | (.43) |
| Net asset value, end of period | $13.66 | $12.76 | $12.99 | $12.48 | $11.30 |
| Total ReturnC | 11.44% | 2.56% | 7.12% | 12.16% | 10.37% |
| Ratios to Average Net AssetsD,E | | | | | |
| Expenses before reductions | .74% | .75% | .75% | .75% | .75% |
| Expenses net of fee waivers, if any | .73% | .73% | .74% | .74% | .74% |
| Expenses net of all reductions | .73% | .73% | .74% | .74% | .74% |
| Net investment income (loss) | 1.46% | 1.67% | 1.39% | 1.26% | 1.58% |
| Supplemental Data | | | | | |
| Net assets, end of period (000 omitted) | $51,429 | $55,379 | $63,604 | $26,423 | $18,651 |
| Portfolio turnover rateF | 29% | 39% | 18%G | 18% | 21% |
A Calculated based on average shares outstanding during the period.
B Total distributions per share do not sum due to rounding.
C Total returns would have been lower if certain expenses had not been reduced during the applicable periods shown.
D Fees and expenses of any underlying mutual funds or exchange-traded funds (ETFs) are not included in the Fund's expense ratio. The Fund indirectly bears its proportionate share of these expenses. For additional expense information related to investments in Fidelity Central Funds, please refer to the "Investments in Fidelity Central Funds" note found in the Notes to Financial Statements section of the most recent Annual or Semi-Annual report.
E Expense ratios reflect operating expenses of the class. Expenses before reductions do not reflect amounts reimbursed, waived, or reduced through arrangements with the investment adviser, brokerage services, or other offset arrangements, if applicable, and do not represent the amount paid by the class during periods when reimbursements, waivers or reductions occur.
F Amount does not include the portfolio activity of any underlying mutual funds or exchange-traded funds (ETFs).
G The portfolio turnover rate does not include the assets acquired in the merger.
See accompanying notes which are an integral part of the financial statements.
Fidelity Asset Manager 60% Class Z
| Years ended September 30, | 2020 | 2019 A |
| Selected Per–Share Data | | |
| Net asset value, beginning of period | $12.76 | $12.97 |
| Income from Investment Operations | | |
| Net investment income (loss)B | .20 | .22 |
| Net realized and unrealized gain (loss) | 1.24 | .08 |
| Total from investment operations | 1.44 | .30 |
| Distributions from net investment income | (.22) | (.19) |
| Distributions from net realized gain | (.33) | (.32) |
| Total distributions | (.55) | (.51) |
| Net asset value, end of period | $13.65 | $12.76 |
| Total ReturnC,D | 11.50% | 2.86% |
| Ratios to Average Net AssetsE,F | | |
| Expenses before reductions | .62% | .63%G |
| Expenses net of fee waivers, if any | .62% | .63%G |
| Expenses net of all reductions | .62% | .63%G |
| Net investment income (loss) | 1.57% | 1.77%G |
| Supplemental Data | | |
| Net assets, end of period (000 omitted) | $22,117 | $19,124 |
| Portfolio turnover rateH | 29% | 39% |
A For the period October 2, 2018 (commencement of sale of shares) to September 30, 2019.
B Calculated based on average shares outstanding during the period.
C Total returns for periods of less than one year are not annualized.
D Total returns would have been lower if certain expenses had not been reduced during the applicable periods shown.
E Fees and expenses of any underlying mutual funds or exchange-traded funds (ETFs) are not included in the Fund's expense ratio. The Fund indirectly bears its proportionate share of these expenses. For additional expense information related to investments in Fidelity Central Funds, please refer to the "Investments in Fidelity Central Funds" note found in the Notes to Financial Statements section of the most recent Annual or Semi-Annual report.
F Expense ratios reflect operating expenses of the class. Expenses before reductions do not reflect amounts reimbursed, waived, or reduced through arrangements with the investment adviser, brokerage services, or other offset arrangements, if applicable, and do not represent the amount paid by the class during periods when reimbursements, waivers or reductions occur.
G Annualized
H Amount does not include the portfolio activity of any underlying mutual funds or exchange-traded funds (ETFs).
See accompanying notes which are an integral part of the financial statements.
Fidelity Asset Manager® 70%
Investment Summary (Unaudited)
The information in the following tables is based on the combined investments of the Fund and its pro-rata share of the investments of Fidelity's Central Funds, other than the Money Market Central Funds.
Top Ten Stocks as of September 30, 2020
| | % of fund's net assets |
| Apple, Inc. | 3.3 |
| Microsoft Corp. | 3.1 |
| Alphabet, Inc. Class A | 1.6 |
| Amazon.com, Inc. | 1.4 |
| Facebook, Inc. Class A | 1.0 |
| Roche Holding AG (participation certificate) | 0.8 |
| Alibaba Group Holding Ltd. sponsored ADR | 0.8 |
| Salesforce.com, Inc. | 0.7 |
| Adobe, Inc. | 0.7 |
| UnitedHealth Group, Inc. | 0.7 |
| | 14.1 |
Top Five Market Sectors as of September 30, 2020
| | % of fund's net assets |
| Information Technology | 18.1 |
| Financials | 13.1 |
| Health Care | 9.9 |
| Consumer Discretionary | 9.3 |
| Communication Services | 7.3 |
Quality Diversification (% of fund's net assets)
| As of September 30, 2020 |
| | U.S. Government and U.S. Government Agency Obligations | 10.3% |
| | AAA,AA,A | 3.1% |
| | BBB | 4.5% |
| | BB and Below | 3.9% |
| | Not Rated | 0.8% |
| | Equities | 75.2% |
| | Short-Term Investments and Net Other Assets | 2.2% |

We have used ratings from Moody's Investors Service, Inc. Where Moody's® ratings are not available, we have used S&P® ratings. All ratings are as of the date indicated and do not reflect subsequent changes.
Asset Allocation (% of fund's net assets)
| As of September 30, 2020 |
| | Stock Class and Equity Futures | 75.7% |
| | Bond Class | 22.1% |
| | Short-Term Class | 2.2% |

Asset allocations in the pie charts reflect the categorization of assets as defined in the Fund's prospectus in effect as of the time periods indicated above. Percentages are adjusted for the effect of future contracts and swap contracts, if applicable.
At period end, foreign investments including the Fund's pro-rata share of the underlying Central Funds, other than the Money Market Funds, was 28.6% of net assets.
Percentages in the above tables are adjusted for the effect of TBA Sale Commitments.
An unaudited holdings listing for the Fund, which presents direct holdings as well as the pro-rata share of any securities and other investments held indirectly through its investment in underlying Fidelity Central Funds, other than the Money Market Central Funds, is available at fidelity.com and/or institutional.fidelity.com, as applicable.
Fidelity Asset Manager® 70%
Schedule of Investments September 30, 2020
Showing Percentage of Net Assets
| Equity Central Funds - 72.9% | | | |
| | | Shares | Value |
| Fidelity Emerging Markets Equity Central Fund (a) | | 1,776,593 | $421,301,253 |
| Fidelity International Equity Central Fund (a) | | 8,910,548 | 754,010,575 |
| Fidelity Real Estate Equity Central Fund (a) | | 70,543 | 7,624,993 |
| Fidelity U.S. Equity Central Fund (a) | | 28,527,083 | 2,872,962,504 |
| TOTAL EQUITY CENTRAL FUNDS | | | |
| (Cost $2,479,232,192) | | | 4,055,899,325 |
|
| Fixed-Income Central Funds - 22.8% | | | |
| High Yield Fixed-Income Funds - 3.4% | | | |
| Fidelity Emerging Markets Debt Central Fund (a) | | 5,325,093 | 47,819,338 |
| Fidelity Emerging Markets Debt Local Currency Central Fund (a) | | 258,180 | 25,856,727 |
| Fidelity Floating Rate Central Fund (a) | | 248,626 | 23,960,132 |
| Fidelity High Income Central Fund (a) | | 857,044 | 89,552,559 |
|
| TOTAL HIGH YIELD FIXED-INCOME FUNDS | | | 187,188,756 |
|
| Investment Grade Fixed-Income Funds - 19.4% | | | |
| Fidelity Inflation-Protected Bond Index Central Fund (a) | | 2,047,378 | 223,020,904 |
| Fidelity International Credit Central Fund (a) | | 739,475 | 77,423,084 |
| Fidelity Investment Grade Bond Central Fund (a) | | 6,580,925 | 779,247,359 |
|
| TOTAL INVESTMENT GRADE FIXED-INCOME FUNDS | | | 1,079,691,347 |
|
| TOTAL FIXED-INCOME CENTRAL FUNDS | | | |
| (Cost $1,147,450,460) | | | 1,266,880,103 |
|
| Money Market Central Funds - 2.2% | | | |
| Fidelity Cash Central Fund 0.10% (b) | | 32,707,406 | 32,713,948 |
| Fidelity Securities Lending Cash Central Fund 0.10% (b)(c) | | 88,807,619 | 88,816,500 |
| TOTAL MONEY MARKET CENTRAL FUNDS | | | |
| (Cost $121,530,448) | | | 121,530,448 |
| | | Principal Amount | Value |
|
| U.S. Treasury Obligations - 0.3% | | | |
| U.S. Treasury Bills, yield at date of purchase 0.09% to 0.14% 10/1/20 to 11/27/20 (d) | | | |
| (Cost $19,397,208) | | 19,400,000 | 19,397,064 |
| | | Shares | Value |
|
| Investment Companies - 3.4% | | | |
| iShares MSCI Japan ETF (e) | | 1,462,015 | $86,361,226 |
| Market Vectors Gold Miners ETF | | 2,566,077 | 100,487,575 |
| TOTAL INVESTMENT COMPANIES | | | |
| (Cost $161,313,067) | | | 186,848,801 |
| TOTAL INVESTMENT IN SECURITIES - 101.6% | | | |
| (Cost $3,928,923,375) | | | 5,650,555,741 |
| NET OTHER ASSETS (LIABILITIES) - (1.6)% | | | (90,749,024) |
| NET ASSETS - 100% | | | $5,559,806,717 |
| Futures Contracts | | | | | |
| | Number of contracts | Expiration Date | Notional Amount | Value | Unrealized Appreciation/(Depreciation) |
| Purchased | | | | | |
| Equity Index Contracts | | | | | |
| ICE E-mini MSCI EAFE Index Contracts (United States) | 84 | Dec. 2020 | $7,783,440 | $(154,116) | $(154,116) |
| Sold | | | | | |
| Equity Index Contracts | | | | | |
| CME E-mini S&P 500 Index Contracts (United States) | 944 | Dec. 2020 | 158,214,400 | (1,032,859) | (1,032,859) |
| TOTAL FUTURES CONTRACTS | | | | | $(1,186,975) |
The notional amount of futures purchased as a percentage of Net Assets is 0.1%
The notional amount of futures sold as a percentage of Net Assets is 2.8%
For the period, the average monthly notional amount at value for futures contracts in the aggregate was $134,550,665.
Security Type Abbreviations
ETF – Exchange-Traded Fund
Legend
(a) Affiliated fund that is generally available only to investment companies and other accounts managed by Fidelity Investments. A complete unaudited schedule of portfolio holdings for each Fidelity Central Fund is filed with the SEC for the first and third quarters of each fiscal year on Form N-PORT and is available upon request or at the SEC's website at www.sec.gov. An unaudited holdings listing for the Fund, which presents direct holdings as well as the pro-rata share of securities and other investments held indirectly through its investment in underlying non-money market Fidelity Central Funds, is available at fidelity.com and/or institutional.fidelity.com, as applicable. In addition, each Fidelity Central Fund's financial statements, which are not covered by the Fund's Report of Independent Registered Public Accounting Firm, are available on the SEC's website or upon request.
(b) Affiliated fund that is generally available only to investment companies and other accounts managed by Fidelity Investments. The rate quoted is the annualized seven-day yield of the fund at period end. A complete unaudited listing of the fund's holdings as of its most recent quarter end is available upon request. In addition, each Fidelity Central Fund's financial statements, which are not covered by the Fund's Report of Independent Registered Public Accounting Firm, are available on the SEC's website or upon request.
(c) Investment made with cash collateral received from securities on loan.
(d) Security or a portion of the security was pledged to cover margin requirements for futures contracts. At period end, the value of securities pledged amounted to $15,455,593.
(e) Security or a portion of the security is on loan at period end.
Affiliated Central Funds
Information regarding fiscal year to date income earned by the Fund from investments in Fidelity Central Funds is as follows:
| Fund | Income earned |
| Fidelity Cash Central Fund | $470,740 |
| Fidelity Communication Services Central Fund | 14,384,210 |
| Fidelity Consumer Discretionary Central Fund | 9,064,311 |
| Fidelity Consumer Staples Central Fund | 4,922,911 |
| Fidelity Emerging Markets Debt Central Fund | 2,925,337 |
| Fidelity Emerging Markets Equity Central Fund | 10,774,032 |
| Fidelity Energy Central Fund | 2,715,686 |
| Fidelity Financials Central Fund | 27,937,471 |
| Fidelity Floating Rate Central Fund | 1,313,104 |
| Fidelity Health Care Central Fund | 41,317,907 |
| Fidelity High Income Central Fund | 3,213,284 |
| Fidelity Industrials Central Fund | 4,075,181 |
| Fidelity Inflation-Protected Bond Index Central Fund | 4,074,331 |
| Fidelity Information Technology Central Fund | 88,696,153 |
| Fidelity International Credit Central Fund | 2,747,472 |
| Fidelity International Equity Central Fund | 12,848,539 |
| Fidelity Investment Grade Bond Central Fund | 23,617,850 |
| Fidelity Materials Central Fund | 1,020,603 |
| Fidelity Money Market Central Fund | 8,796 |
| Fidelity Real Estate Equity Central Fund | 1,278,439 |
| Fidelity Securities Lending Cash Central Fund | 23,068 |
| Fidelity Utilities Central Fund | 5,236,048 |
| Total | $262,665,473 |
Amounts in the income column in the above table include any capital gain distributions from underlying funds, which are presented in the corresponding line-item in the Statement of Operations, if applicable. Amount for Fidelity Securities Lending Cash Central Fund represents the income earned on investing cash collateral, less rebates paid to borrowers and any lending agent fees associated with the loan, plus any premium payments received for lending certain types of securities.
Fiscal year to date information regarding the Fund’s investments in non-Money Market Central Funds, including the ownership percentage, is presented below.
| Affiliate | Value, beginning of period | Purchases(a) | Sales Proceeds(a) | Realized Gain (loss) | Change in Unrealized appreciation (depreciation) | Value, end of period | % ownership, end of period |
| Fidelity Commodity Strategy Central Fund | $32,647,589 | $117,371 | $33,651,238 | $(3,678,143) | $4,564,421 | $-- | 0.0 |
| Fidelity Communication Services Central Fund | 214,706,153 | 52,584,087 | 24,538,807 | 886,088 | (38,830,783) | -- | 0.0 |
| Fidelity Consumer Discretionary Central Fund | 259,168,069 | 33,835,609 | 32,141,288 | 1,862,495 | (177,833,958) | -- | 0.0 |
| Fidelity Consumer Staples Central Fund | 167,998,481 | 25,654,516 | 17,559,043 | (349,551) | (67,905,828) | -- | 0.0 |
| Fidelity Emerging Markets Debt Central Fund | 50,124,298 | 4,737,975 | 5,044,076 | (308,092) | (1,690,767) | 47,819,338 | 1.8 |
| Fidelity Emerging Markets Debt Local Currency Central Fund | -- | 25,818,000 | -- | -- | 38,727 | 25,856,727 | 17.2 |
| Fidelity Emerging Markets Equity Central Fund | 387,591,447 | 22,667,557 | 34,594,248 | (2,351,298) | 47,987,795 | 421,301,253 | 21.2 |
| Fidelity Energy Central Fund | 105,217,969 | 8,986,361 | 7,553,738 | (2,423,365) | 12,996,162 | -- | 0.0 |
| Fidelity Financials Central Fund | 468,510,330 | 49,401,551 | 54,855,457 | (6,634,232) | (73,722,941) | -- | 0.0 |
| Fidelity Floating Rate Central Fund | 25,630,848 | 2,233,476 | 2,550,654 | (164,725) | (1,188,813) | 23,960,132 | 1.3 |
| Fidelity Health Care Central Fund | 345,447,334 | 55,949,744 | 42,238,995 | 3,970,075 | (224,052,139) | -- | 0.0 |
| Fidelity High Income Central Fund | 52,270,910 | 65,921,180 | 31,705,138 | (719,861) | 3,785,468 | 89,552,559 | 3.4 |
| Fidelity Industrials Central Fund | 246,122,879 | 16,510,391 | 28,933,525 | (1,311,003) | (132,694,199) | -- | 0.0 |
| Fidelity Inflation-Protected Bond Index Central Fund | 228,872,976 | 59,225,633 | 78,536,004 | 1,400,557 | 12,057,742 | 223,020,904 | 14.0 |
| Fidelity Information Technology Central Fund | 585,401,625 | 112,766,709 | 82,159,521 | 13,543,426 | (355,286,097) | -- | 0.0 |
| Fidelity International Credit Central Fund | 51,087,935 | 31,533,518 | 5,819,874 | (29,299) | 650,804 | 77,423,084 | 16.6 |
| Fidelity International Equity Central Fund | 594,388,542 | 175,591,362 | 73,460,600 | (2,694,359) | 60,185,630 | 754,010,575 | 25.0 |
| Fidelity Investment Grade Bond Central Fund | 828,735,842 | 172,400,705 | 258,106,186 | 1,800,931 | 34,416,067 | 779,247,359 | 2.7 |
| Fidelity Materials Central Fund | 60,235,086 | 11,652,965 | 9,425,603 | (676,994) | (21,068,201) | -- | 0.0 |
| Fidelity Real Estate Equity Central Fund | 79,036,568 | 3,347,238 | 54,573,435 | (13,757,931) | (6,427,447) | 7,624,993 | 1.1 |
| Fidelity U.S. Equity Central Fund | -- | 130,217 | 7,448,758 | (5,766,603) | 1,387,104,250 | 2,872,962,504 | 13.2 |
| Fidelity Utilities Central Fund | 89,802,096 | 9,687,172 | 9,405,013 | (528,901) | (41,824,793) | -- | 0.0 |
| | 4,872,996,977 | 940,753,337 | 894,301,201 | (17,930,785) | 421,261,100 | 5,322,779,428 | |
(a) Excludes the value of securities received and delivered through merger transactions, if applicable.
Investment Valuation
The following is a summary of the inputs used, as of September 30, 2020, involving the Fund's assets and liabilities carried at fair value. The inputs or methodology used for valuing securities may not be an indication of the risk associated with investing in those securities. For more information on valuation inputs, and their aggregation into the levels used below, please refer to the Investment Valuation section in the accompanying Notes to Financial Statements.
| | Valuation Inputs at Reporting Date: |
| Description | Total | Level 1 | Level 2 | Level 3 |
| Investments in Securities: | | | | |
| Equity Central Funds | $4,055,899,325 | $4,055,899,325 | $-- | $-- |
| Fixed-Income Central Funds | 1,266,880,103 | 1,266,880,103 | -- | -- |
| Money Market Central Funds | 121,530,448 | 121,530,448 | -- | -- |
| Other Short-Term Investments | 19,397,064 | -- | 19,397,064 | -- |
| Investment Companies | 186,848,801 | 186,848,801 | -- | -- |
| Total Investments in Securities: | $5,650,555,741 | $5,631,158,677 | $19,397,064 | $-- |
| Derivative Instruments: | | | | |
| Liabilities | | | | |
| Futures Contracts | $(1,186,975) | $(1,186,975) | $-- | $-- |
| Total Liabilities | $(1,186,975) | $(1,186,975) | $-- | $-- |
| Total Derivative Instruments: | $(1,186,975) | $(1,186,975) | $-- | $-- |
Value of Derivative Instruments
The following table is a summary of the Fund's value of derivative instruments by primary risk exposure as of September 30, 2020. For additional information on derivative instruments, please refer to the Derivative Instruments section in the accompanying Notes to Financial Statements.
| Primary Risk Exposure / Derivative Type | Value |
| | Asset | Liability |
| Equity Risk | | |
| Futures Contracts(a) | $0 | $(1,186,975) |
| Total Equity Risk | 0 | (1,186,975) |
| Total Value of Derivatives | $0 | $(1,186,975) |
(a) Reflects gross cumulative appreciation (depreciation) on futures contracts as presented in the Schedule of Investments. In the Statement of Assets and Liabilities, the period end daily variation margin is included in receivable or payable for daily variation margin on futures contracts, and the net cumulative appreciation (depreciation) is included in Total accumulated earnings (loss).
Other Information
Distribution of investments by country or territory of incorporation, as a percentage of Total Net Assets, is as follows (Unaudited):
| United States of America | 71.4% |
| Cayman Islands | 3.3% |
| United Kingdom | 3.3% |
| Japan | 2.6% |
| Switzerland | 2.3% |
| France | 1.9% |
| Netherlands | 1.7% |
| Canada | 1.4% |
| Germany | 1.3% |
| Korea (South) | 1.0% |
| Others (Individually Less Than 1%) | 9.8% |
| | 100.0% |
The information in the above table is based on the combined investments of the Fund and its pro-rata share of the investments of Fidelity's Central Funds, other than the Money Market Central Funds.
See accompanying notes which are an integral part of the financial statements.
Fidelity Asset Manager® 70%
Financial Statements
Statement of Assets and Liabilities
| | | September 30, 2020 |
| Assets | | |
Investment in securities, at value (including securities loaned of $86,360,340) — See accompanying schedule:
Unaffiliated issuers (cost $180,710,275) | $206,245,865 | |
| Fidelity Central Funds (cost $3,748,213,100) | 5,444,309,876 | |
| Total Investment in Securities (cost $3,928,923,375) | | $5,650,555,741 |
| Receivable for investments sold | | 5,363,861 |
| Receivable for fund shares sold | | 1,243,424 |
| Distributions receivable from Fidelity Central Funds | | 6,835 |
| Prepaid expenses | | 8,629 |
| Other receivables | | 32,755 |
| Total assets | | 5,657,211,245 |
| Liabilities | | |
| Payable for investments purchased | $5,529 | |
| Payable for fund shares redeemed | 4,285,039 | |
| Accrued management fee | 2,467,613 | |
| Distribution and service plan fees payable | 100,159 | |
| Payable for daily variation margin on futures contracts | 1,030,939 | |
| Other affiliated payables | 658,486 | |
| Other payables and accrued expenses | 40,263 | |
| Collateral on securities loaned | 88,816,500 | |
| Total liabilities | | 97,404,528 |
| Net Assets | | $5,559,806,717 |
| Net Assets consist of: | | |
| Paid in capital | | $4,207,269,407 |
| Total accumulated earnings (loss) | | 1,352,537,310 |
| Net Assets | | $5,559,806,717 |
| Net Asset Value and Maximum Offering Price | | |
| Class A: | | |
| Net Asset Value and redemption price per share ($179,403,990 ÷ 7,580,335 shares)(a) | | $23.67 |
| Maximum offering price per share (100/94.25 of $23.67) | | $25.11 |
| Class M: | | |
| Net Asset Value and redemption price per share ($69,249,606 ÷ 2,928,610 shares)(a) | | $23.65 |
| Maximum offering price per share (100/96.50 of $23.65) | | $24.51 |
| Class C: | | |
| Net Asset Value and offering price per share ($40,240,498 ÷ 1,712,462 shares)(a) | | $23.50 |
| Asset Manager 70%: | | |
| Net Asset Value, offering price and redemption price per share ($5,203,793,730 ÷ 219,215,932 shares) | | $23.74 |
| Class I: | | |
| Net Asset Value, offering price and redemption price per share ($38,396,388 ÷ 1,616,868 shares) | | $23.75 |
| Class Z: | | |
| Net Asset Value, offering price and redemption price per share ($28,722,505 ÷ 1,210,803 shares) | | $23.72 |
(a) Redemption price per share is equal to net asset value less any applicable contingent deferred sales charge.
See accompanying notes which are an integral part of the financial statements.
Statement of Operations
| | | Year ended September 30, 2020 |
| Investment Income | | |
| Dividends | | $6,733,242 |
| Interest | | 77,832 |
| Income from Fidelity Central Funds (including $23,068 from security lending) | | 105,707,645 |
| Total income | | 112,518,719 |
| Expenses | | |
| Management fee | $28,558,408 | |
| Transfer agent fees | 6,279,986 | |
| Distribution and service plan fees | 1,153,544 | |
| Accounting fees | 1,381,582 | |
| Custodian fees and expenses | 6,633 | |
| Independent trustees' fees and expenses | 17,189 | |
| Registration fees | 131,964 | |
| Audit | 39,740 | |
| Legal | 9,033 | |
| Interest | 1,440 | |
| Miscellaneous | 32,004 | |
| Total expenses before reductions | 37,611,523 | |
| Expense reductions | (82,179) | |
| Total expenses after reductions | | 37,529,344 |
| Net investment income (loss) | | 74,989,375 |
| Realized and Unrealized Gain (Loss) | | |
| Net realized gain (loss) on: | | |
| Investment securities: | | |
| Unaffiliated issuers | (1,884,958) | |
| Fidelity Central Funds | (17,930,576) | |
| Futures contracts | (44,311,442) | |
| Capital gain distributions from Fidelity Central Funds | 156,957,828 | |
| Total net realized gain (loss) | | 92,830,852 |
| Change in net unrealized appreciation (depreciation) on: | | |
| Investment securities: | | |
| Unaffiliated issuers | 7,736,336 | |
| Fidelity Central Funds | 421,261,059 | |
| Futures contracts | (3,299,409) | |
| Total change in net unrealized appreciation (depreciation) | | 425,697,986 |
| Net gain (loss) | | 518,528,838 |
| Net increase (decrease) in net assets resulting from operations | | $593,518,213 |
See accompanying notes which are an integral part of the financial statements.
Statement of Changes in Net Assets
| | Year ended September 30, 2020 | Year ended September 30, 2019 |
| Increase (Decrease) in Net Assets | | |
| Operations | | |
| Net investment income (loss) | $74,989,375 | $79,323,993 |
| Net realized gain (loss) | 92,830,852 | 225,584,843 |
| Change in net unrealized appreciation (depreciation) | 425,697,986 | (235,858,957) |
| Net increase (decrease) in net assets resulting from operations | 593,518,213 | 69,049,879 |
| Distributions to shareholders | (278,845,625) | (282,804,003) |
| Share transactions - net increase (decrease) | (13,377,148) | 28,857,702 |
| Total increase (decrease) in net assets | 301,295,440 | (184,896,422) |
| Net Assets | | |
| Beginning of period | 5,258,511,277 | 5,443,407,699 |
| End of period | $5,559,806,717 | $5,258,511,277 |
See accompanying notes which are an integral part of the financial statements.
Financial Highlights
Fidelity Asset Manager 70% Class A
| Years ended September 30, | 2020 | 2019 | 2018 | 2017 | 2016 |
| Selected Per–Share Data | | | | | |
| Net asset value, beginning of period | $22.21 | $23.27 | $22.26 | $19.78 | $18.84 |
| Income from Investment Operations | | | | | |
| Net investment income (loss)A | .25 | .27 | .23 | .19 | .22 |
| Net realized and unrealized gain (loss) | 2.32 | (.17) | 1.59 | 2.53 | 1.70 |
| Total from investment operations | 2.57 | .10 | 1.82 | 2.72 | 1.92 |
| Distributions from net investment income | (.28) | (.25) | (.19) | (.20) | (.25) |
| Distributions from net realized gain | (.83) | (.91) | (.62) | (.04) | (.73) |
| Total distributions | (1.11) | (1.16) | (.81) | (.24) | (.98) |
| Net asset value, end of period | $23.67 | $22.21 | $23.27 | $22.26 | $19.78 |
| Total ReturnB,C | 11.81% | 1.16% | 8.31% | 13.89% | 10.57% |
| Ratios to Average Net AssetsD,E | | | | | |
| Expenses before reductions | .99% | 1.00% | 1.00% | 1.02% | 1.02% |
| Expenses net of fee waivers, if any | .98% | 1.00% | 1.00% | 1.01% | 1.02% |
| Expenses net of all reductions | .98% | 1.00% | 1.00% | 1.01% | 1.02% |
| Net investment income (loss) | 1.11% | 1.25% | .99% | .90% | 1.17% |
| Supplemental Data | | | | | |
| Net assets, end of period (000 omitted) | $179,404 | $166,280 | $155,622 | $146,562 | $146,585 |
| Portfolio turnover rateF | 27% | 41% | 21% | 19% | 21% |
A Calculated based on average shares outstanding during the period.
B Total returns would have been lower if certain expenses had not been reduced during the applicable periods shown.
C Total returns do not include the effect of the sales charges.
D Fees and expenses of any underlying mutual funds or exchange-traded funds (ETFs) are not included in the Fund's expense ratio. The Fund indirectly bears its proportionate share of these expenses. For additional expense information related to investments in Fidelity Central Funds, please refer to the "Investments in Fidelity Central Funds" note found in the Notes to Financial Statements section of the most recent Annual or Semi-Annual report.
E Expense ratios reflect operating expenses of the class. Expenses before reductions do not reflect amounts reimbursed, waived, or reduced through arrangements with the investment adviser, brokerage services, or other offset arrangements, if applicable, and do not represent the amount paid by the class during periods when reimbursements, waivers or reductions occur.
F Amount does not include the portfolio activity of any underlying mutual funds or exchange-traded funds (ETFs).
See accompanying notes which are an integral part of the financial statements.
Fidelity Asset Manager 70% Class M
| Years ended September 30, | 2020 | 2019 | 2018 | 2017 | 2016 |
| Selected Per–Share Data | | | | | |
| Net asset value, beginning of period | $22.19 | $23.24 | $22.25 | $19.77 | $18.82 |
| Income from Investment Operations | | | | | |
| Net investment income (loss)A | .19 | .22 | .17 | .13 | .17 |
| Net realized and unrealized gain (loss) | 2.33 | (.17) | 1.58 | 2.54 | 1.70 |
| Total from investment operations | 2.52 | .05 | 1.75 | 2.67 | 1.87 |
| Distributions from net investment income | (.23) | (.19) | (.14) | (.15) | (.20) |
| Distributions from net realized gain | (.83) | (.91) | (.62) | (.04) | (.73) |
| Total distributions | (1.06) | (1.10) | (.76) | (.19) | (.92)B |
| Net asset value, end of period | $23.65 | $22.19 | $23.24 | $22.25 | $19.77 |
| Total ReturnC,D | 11.56% | .90% | 7.99% | 13.63% | 10.31% |
| Ratios to Average Net AssetsE,F | | | | | |
| Expenses before reductions | 1.23% | 1.24% | 1.25% | 1.27% | 1.28% |
| Expenses net of fee waivers, if any | 1.23% | 1.24% | 1.25% | 1.27% | 1.28% |
| Expenses net of all reductions | 1.23% | 1.24% | 1.25% | 1.27% | 1.28% |
| Net investment income (loss) | .87% | 1.01% | .74% | .64% | .91% |
| Supplemental Data | | | | | |
| Net assets, end of period (000 omitted) | $69,250 | $63,064 | $61,587 | $53,245 | $48,149 |
| Portfolio turnover rateG | 27% | 41% | 21% | 19% | 21% |
A Calculated based on average shares outstanding during the period.
B Total distributions per share do not sum due to rounding.
C Total returns would have been lower if certain expenses had not been reduced during the applicable periods shown.
D Total returns do not include the effect of the sales charges.
E Fees and expenses of any underlying mutual funds or exchange-traded funds (ETFs) are not included in the Fund's expense ratio. The Fund indirectly bears its proportionate share of these expenses. For additional expense information related to investments in Fidelity Central Funds, please refer to the "Investments in Fidelity Central Funds" note found in the Notes to Financial Statements section of the most recent Annual or Semi-Annual report.
F Expense ratios reflect operating expenses of the class. Expenses before reductions do not reflect amounts reimbursed, waived, or reduced through arrangements with the investment adviser, brokerage services, or other offset arrangements, if applicable, and do not represent the amount paid by the class during periods when reimbursements, waivers or reductions occur.
G Amount does not include the portfolio activity of any underlying mutual funds or exchange-traded funds (ETFs).
See accompanying notes which are an integral part of the financial statements.
Fidelity Asset Manager 70% Class C
| Years ended September 30, | 2020 | 2019 | 2018 | 2017 | 2016 |
| Selected Per–Share Data | | | | | |
| Net asset value, beginning of period | $22.03 | $23.06 | $22.08 | $19.63 | $18.69 |
| Income from Investment Operations | | | | | |
| Net investment income (loss)A | .08 | .11 | .05 | .03 | .08 |
| Net realized and unrealized gain (loss) | 2.30 | (.15) | 1.57 | 2.51 | 1.69 |
| Total from investment operations | 2.38 | (.04) | 1.62 | 2.54 | 1.77 |
| Distributions from net investment income | (.08) | (.07) | (.03) | (.05) | (.10) |
| Distributions from net realized gain | (.83) | (.91) | (.62) | (.04) | (.73) |
| Total distributions | (.91) | (.99)B | (.64)B | (.09) | (.83) |
| Net asset value, end of period | $23.50 | $22.03 | $23.06 | $22.08 | $19.63 |
| Total ReturnC,D | 10.98% | .42% | 7.46% | 13.00% | 9.78% |
| Ratios to Average Net AssetsE,F | | | | | |
| Expenses before reductions | 1.74% | 1.75% | 1.75% | 1.77% | 1.78% |
| Expenses net of fee waivers, if any | 1.74% | 1.75% | 1.75% | 1.77% | 1.78% |
| Expenses net of all reductions | 1.74% | 1.75% | 1.75% | 1.77% | 1.78% |
| Net investment income (loss) | .36% | .50% | .24% | .14% | .41% |
| Supplemental Data | | | | | |
| Net assets, end of period (000 omitted) | $40,240 | $42,547 | $63,398 | $59,046 | $56,605 |
| Portfolio turnover rateG | 27% | 41% | 21% | 19% | 21% |
A Calculated based on average shares outstanding during the period.
B Total distributions per share do not sum due to rounding.
C Total returns would have been lower if certain expenses had not been reduced during the applicable periods shown.
D Total returns do not include the effect of the contingent deferred sales charge.
E Fees and expenses of any underlying mutual funds or exchange-traded funds (ETFs) are not included in the Fund's expense ratio. The Fund indirectly bears its proportionate share of these expenses. For additional expense information related to investments in Fidelity Central Funds, please refer to the "Investments in Fidelity Central Funds" note found in the Notes to Financial Statements section of the most recent Annual or Semi-Annual report.
F Expense ratios reflect operating expenses of the class. Expenses before reductions do not reflect amounts reimbursed, waived, or reduced through arrangements with the investment adviser, brokerage services, or other offset arrangements, if applicable, and do not represent the amount paid by the class during periods when reimbursements, waivers or reductions occur.
G Amount does not include the portfolio activity of any underlying mutual funds or exchange-traded funds (ETFs).
See accompanying notes which are an integral part of the financial statements.
Fidelity Asset Manager 70%
| Years ended September 30, | 2020 | 2019 | 2018 | 2017 | 2016 |
| Selected Per–Share Data | | | | | |
| Net asset value, beginning of period | $22.27 | $23.33 | $22.33 | $19.84 | $18.89 |
| Income from Investment Operations | | | | | |
| Net investment income (loss)A | .32 | .34 | .30 | .25 | .28 |
| Net realized and unrealized gain (loss) | 2.33 | (.17) | 1.58 | 2.54 | 1.71 |
| Total from investment operations | 2.65 | .17 | 1.88 | 2.79 | 1.99 |
| Distributions from net investment income | (.35) | (.31) | (.26) | (.26) | (.31) |
| Distributions from net realized gain | (.83) | (.91) | (.62) | (.04) | (.73) |
| Total distributions | (1.18) | (1.23)B | (.88) | (.30) | (1.04) |
| Net asset value, end of period | $23.74 | $22.27 | $23.33 | $22.33 | $19.84 |
| Total ReturnC | 12.14% | 1.51% | 8.57% | 14.25% | 10.97% |
| Ratios to Average Net AssetsD,E | | | | | |
| Expenses before reductions | .68% | .69% | .69% | .71% | .72% |
| Expenses net of fee waivers, if any | .68% | .69% | .69% | .71% | .71% |
| Expenses net of all reductions | .68% | .69% | .69% | .70% | .71% |
| Net investment income (loss) | 1.42% | 1.56% | 1.30% | 1.20% | 1.48% |
| Supplemental Data | | | | | |
| Net assets, end of period (000 omitted) | $5,203,794 | $4,893,270 | $5,088,118 | $4,673,798 | $3,996,905 |
| Portfolio turnover rateF | 27% | 41% | 21% | 19% | 21% |
A Calculated based on average shares outstanding during the period.
B Total distributions per share do not sum due to rounding.
C Total returns would have been lower if certain expenses had not been reduced during the applicable periods shown.
D Fees and expenses of any underlying mutual funds or exchange-traded funds (ETFs) are not included in the Fund's expense ratio. The Fund indirectly bears its proportionate share of these expenses. For additional expense information related to investments in Fidelity Central Funds, please refer to the "Investments in Fidelity Central Funds" note found in the Notes to Financial Statements section of the most recent Annual or Semi-Annual report.
E Expense ratios reflect operating expenses of the class. Expenses before reductions do not reflect amounts reimbursed, waived, or reduced through arrangements with the investment adviser, brokerage services, or other offset arrangements, if applicable, and do not represent the amount paid by the class during periods when reimbursements, waivers or reductions occur.
F Amount does not include the portfolio activity of any underlying mutual funds or exchange-traded funds (ETFs).
See accompanying notes which are an integral part of the financial statements.
Fidelity Asset Manager 70% Class I
| Years ended September 30, | 2020 | 2019 | 2018 | 2017 | 2016 |
| Selected Per–Share Data | | | | | |
| Net asset value, beginning of period | $22.27 | $23.33 | $22.33 | $19.85 | $18.90 |
| Income from Investment Operations | | | | | |
| Net investment income (loss)A | .31 | .33 | .29 | .24 | .28 |
| Net realized and unrealized gain (loss) | 2.34 | (.17) | 1.58 | 2.54 | 1.70 |
| Total from investment operations | 2.65 | .16 | 1.87 | 2.78 | 1.98 |
| Distributions from net investment income | (.34) | (.30) | (.25) | (.26) | (.30) |
| Distributions from net realized gain | (.83) | (.91) | (.62) | (.04) | (.73) |
| Total distributions | (1.17) | (1.22)B | (.87) | (.30) | (1.03) |
| Net asset value, end of period | $23.75 | $22.27 | $23.33 | $22.33 | $19.85 |
| Total ReturnC | 12.14% | 1.46% | 8.53% | 14.22% | 10.92% |
| Ratios to Average Net AssetsD,E | | | | | |
| Expenses before reductions | .71% | .72% | .72% | .74% | .74% |
| Expenses net of fee waivers, if any | .71% | .72% | .72% | .74% | .74% |
| Expenses net of all reductions | .71% | .72% | .72% | .73% | .74% |
| Net investment income (loss) | 1.39% | 1.53% | 1.27% | 1.17% | 1.45% |
| Supplemental Data | | | | | |
| Net assets, end of period (000 omitted) | $38,396 | $68,475 | $74,682 | $79,461 | $42,321 |
| Portfolio turnover rateF | 27% | 41% | 21% | 19% | 21% |
A Calculated based on average shares outstanding during the period.
B Total distributions per share do not sum due to rounding.
C Total returns would have been lower if certain expenses had not been reduced during the applicable periods shown.
D Fees and expenses of any underlying mutual funds or exchange-traded funds (ETFs) are not included in the Fund's expense ratio. The Fund indirectly bears its proportionate share of these expenses. For additional expense information related to investments in Fidelity Central Funds, please refer to the "Investments in Fidelity Central Funds" note found in the Notes to Financial Statements section of the most recent Annual or Semi-Annual report.
E Expense ratios reflect operating expenses of the class. Expenses before reductions do not reflect amounts reimbursed, waived, or reduced through arrangements with the investment adviser, brokerage services, or other offset arrangements, if applicable, and do not represent the amount paid by the class during periods when reimbursements, waivers or reductions occur.
F Amount does not include the portfolio activity of any underlying mutual funds or exchange-traded funds (ETFs).
See accompanying notes which are an integral part of the financial statements.
Fidelity Asset Manager 70% Class Z
| Years ended September 30, | 2020 | 2019 A |
| Selected Per–Share Data | | |
| Net asset value, beginning of period | $22.26 | $23.29 |
| Income from Investment Operations | | |
| Net investment income (loss)B | .33 | .35 |
| Net realized and unrealized gain (loss) | 2.33 | (.13) |
| Total from investment operations | 2.66 | .22 |
| Distributions from net investment income | (.37) | (.34) |
| Distributions from net realized gain | (.83) | (.91) |
| Total distributions | (1.20) | (1.25) |
| Net asset value, end of period | $23.72 | $22.26 |
| Total ReturnC,D | 12.21% | 1.78% |
| Ratios to Average Net AssetsE,F | | |
| Expenses before reductions | .61% | .62%G |
| Expenses net of fee waivers, if any | .60% | .61%G |
| Expenses net of all reductions | .60% | .61%G |
| Net investment income (loss) | 1.49% | 1.64%G |
| Supplemental Data | | |
| Net assets, end of period (000 omitted) | $28,723 | $24,876 |
| Portfolio turnover rateH | 27% | 41% |
A For the period October 2, 2018 (commencement of sale of shares) to September 30, 2019.
B Calculated based on average shares outstanding during the period.
C Total returns for periods of less than one year are not annualized.
D Total returns would have been lower if certain expenses had not been reduced during the applicable periods shown.
E Fees and expenses of any underlying mutual funds or exchange-traded funds (ETFs) are not included in the Fund's expense ratio. The Fund indirectly bears its proportionate share of these expenses. For additional expense information related to investments in Fidelity Central Funds, please refer to the "Investments in Fidelity Central Funds" note found in the Notes to Financial Statements section of the most recent Annual or Semi-Annual report.
F Expense ratios reflect operating expenses of the class. Expenses before reductions do not reflect amounts reimbursed, waived, or reduced through arrangements with the investment adviser, brokerage services, or other offset arrangements, if applicable, and do not represent the amount paid by the class during periods when reimbursements, waivers or reductions occur.
G Annualized
H Amount does not include the portfolio activity of any underlying mutual funds or exchange-traded funds (ETFs).
See accompanying notes which are an integral part of the financial statements.
Fidelity Asset Manager® 85%
Investment Summary (Unaudited)
The information in the following tables is based on the combined investments of the Fund and its pro-rata share of the investments of Fidelity's Central Funds, other than the Money Market Central Funds.
Top Ten Stocks as of September 30, 2020
| | % of fund's net assets |
| Apple, Inc. | 3.8 |
| Microsoft Corp. | 3.6 |
| Alphabet, Inc. Class A | 1.9 |
| Amazon.com, Inc. | 1.6 |
| Facebook, Inc. Class A | 1.2 |
| Roche Holding AG (participation certificate) | 1.0 |
| Alibaba Group Holding Ltd. sponsored ADR | 0.9 |
| UnitedHealth Group, Inc. | 0.8 |
| Salesforce.com, Inc. | 0.8 |
| Adobe, Inc. | 0.7 |
| | 16.3 |
Top Five Market Sectors as of September 30, 2020
| | % of fund's net assets |
| Information Technology | 20.5 |
| Financials | 12.3 |
| Health Care | 11.1 |
| Consumer Discretionary | 10.7 |
| Communication Services | 8.3 |
Quality Diversification (% of fund's net assets)
| As of September 30, 2020 |
| | U.S. Government and U.S. Government Agency Obligations | 5.2% |
| | AAA,AA,A | 1.2% |
| | BBB | 1.2% |
| | BB and Below | 2.6% |
| | Not Rated | 0.2% |
| | Equities | 87.6% |
| | Short-Term Investments and Net Other Assets | 2.0% |

We have used ratings from Moody's Investors Service, Inc. Where Moody's® ratings are not available, we have used S&P® ratings. All ratings are as of the date indicated and do not reflect subsequent changes.
Asset Allocation (% of fund's net assets)
| As of September 30, 2020 |
| | Stock Class and Equity Futures | 89.4% |
| | Bond Class | 10.5% |
| | Short-Term Class | 0.1% |

Asset allocations in the pie charts reflect the categorization of assets as defined in the Fund's prospectus in effect as of the time periods indicated above. Percentages are adjusted for the effect of future contracts and swap contracts, if applicable.
At period end, foreign investments including the Fund's pro-rata share of the underlying Central Funds, other than the Money Market Funds, was 39.1% of net assets.
Percentages in the above tables are adjusted for the effect of TBA Sale Commitments.
An unaudited holdings listing for the Fund, which presents direct holdings as well as the pro-rata share of any securities and other investments held indirectly through its investment in underlying Fidelity Central Funds, other than the Money Market Central Funds, is available at fidelity.com and/or institutional.fidelity.com, as applicable.
Fidelity Asset Manager® 85%
Schedule of Investments September 30, 2020
Showing Percentage of Net Assets
| Equity Central Funds - 85.1% | | | |
| | | Shares | Value |
| Fidelity Emerging Markets Equity Central Fund (a) | | 1,049,521 | $248,883,467 |
| Fidelity International Equity Central Fund (a) | | 5,182,118 | 438,510,847 |
| Fidelity Real Estate Equity Central Fund (a) | | 35,519 | 3,839,228 |
| Fidelity U.S. Equity Central Fund (a) | | 16,849,458 | 1,696,908,927 |
| TOTAL EQUITY CENTRAL FUNDS | | | |
| (Cost $1,584,797,311) | | | 2,388,142,469 |
|
| Fixed-Income Central Funds - 10.8% | | | |
| High Yield Fixed-Income Funds - 2.6% | | | |
| Fidelity Emerging Markets Debt Central Fund (a) | | 1,398,993 | 12,562,957 |
| Fidelity Emerging Markets Debt Local Currency Central Fund (a) | | 129,440 | 12,963,416 |
| Fidelity High Income Central Fund (a) | | 451,728 | 47,201,042 |
|
| TOTAL HIGH YIELD FIXED-INCOME FUNDS | | | 72,727,415 |
|
| Investment Grade Fixed-Income Funds - 8.2% | | | |
| Fidelity Inflation-Protected Bond Index Central Fund (a) | | 960,178 | 104,592,243 |
| Fidelity International Credit Central Fund (a) | | 373,500 | 39,105,459 |
| Fidelity Investment Grade Bond Central Fund (a) | | 722,769 | 85,583,038 |
|
| TOTAL INVESTMENT GRADE FIXED-INCOME FUNDS | | | 229,280,740 |
|
| TOTAL FIXED-INCOME CENTRAL FUNDS | | | |
| (Cost $284,668,910) | | | 302,008,155 |
|
| Money Market Central Funds - 0.7% | | | |
| Fidelity Cash Central Fund 0.10% (b) | | 1,274,829 | 1,275,084 |
| Fidelity Securities Lending Cash Central Fund 0.10% (b)(c) | | 17,214,829 | 17,216,550 |
| TOTAL MONEY MARKET CENTRAL FUNDS | | | |
| (Cost $18,491,634) | | | 18,491,634 |
| | | Principal Amount | Value |
|
| U.S. Treasury Obligations - 0.3% | | | |
| U.S. Treasury Bills, yield at date of purchase 0.09% to 0.13% 10/8/20 to 12/3/20 (d) | | | |
| (Cost $9,448,796) | | 9,450,000 | 9,448,826 |
| | | Shares | Value |
|
| Investment Companies - 3.7% | | | |
| iShares MSCI Japan ETF (e) | | 724,970 | $42,823,978 |
| Market Vectors Gold Miners ETF | | 1,597,609 | 62,562,368 |
| TOTAL INVESTMENT COMPANIES | | | |
| (Cost $90,826,377) | | | 105,386,346 |
| TOTAL INVESTMENT IN SECURITIES - 100.6% | | | |
| (Cost $1,988,233,028) | | | 2,823,477,430 |
| NET OTHER ASSETS (LIABILITIES) - (0.6)% | | | (18,167,532) |
| NET ASSETS - 100% | | | $2,805,309,898 |
| Futures Contracts | | | | | |
| | Number of contracts | Expiration Date | Notional Amount | Value | Unrealized Appreciation/(Depreciation) |
| Purchased | | | | | |
| Equity Index Contracts | | | | | |
| ICE E-mini MSCI EAFE Index Contracts (United States) | 438 | Dec. 2020 | $40,585,080 | $(804,286) | $(804,286) |
| Sold | | | | | |
| Equity Index Contracts | | | | | |
| CME E-mini S&P 500 Index Contracts (United States) | 164 | Dec. 2020 | 27,486,400 | (179,437) | (179,437) |
| TOTAL FUTURES CONTRACTS | | | | | $(983,723) |
The notional amount of futures purchased as a percentage of Net Assets is 1.4%
The notional amount of futures sold as a percentage of Net Assets is 1.0%
For the period, the average monthly notional amount at value for futures contracts in the aggregate was $60,062,691.
Security Type Abbreviations
ETF – Exchange-Traded Fund
Legend
(a) Affiliated fund that is generally available only to investment companies and other accounts managed by Fidelity Investments. A complete unaudited schedule of portfolio holdings for each Fidelity Central Fund is filed with the SEC for the first and third quarters of each fiscal year on Form N-PORT and is available upon request or at the SEC's website at www.sec.gov. An unaudited holdings listing for the Fund, which presents direct holdings as well as the pro-rata share of securities and other investments held indirectly through its investment in underlying non-money market Fidelity Central Funds, is available at fidelity.com and/or institutional.fidelity.com, as applicable. In addition, each Fidelity Central Fund's financial statements, which are not covered by the Fund's Report of Independent Registered Public Accounting Firm, are available on the SEC's website or upon request.
(b) Affiliated fund that is generally available only to investment companies and other accounts managed by Fidelity Investments. The rate quoted is the annualized seven-day yield of the fund at period end. A complete unaudited listing of the fund's holdings as of its most recent quarter end is available upon request. In addition, each Fidelity Central Fund's financial statements, which are not covered by the Fund's Report of Independent Registered Public Accounting Firm, are available on the SEC's website or upon request.
(c) Investment made with cash collateral received from securities on loan.
(d) Security or a portion of the security was pledged to cover margin requirements for futures contracts. At period end, the value of securities pledged amounted to $7,529,044.
(e) Security or a portion of the security is on loan at period end.
Affiliated Central Funds
Information regarding fiscal year to date income earned by the Fund from investments in Fidelity Central Funds is as follows:
| Fund | Income earned |
| Fidelity Cash Central Fund | $536,215 |
| Fidelity Communication Services Central Fund | 8,389,463 |
| Fidelity Consumer Discretionary Central Fund | 5,214,169 |
| Fidelity Consumer Staples Central Fund | 2,872,966 |
| Fidelity Emerging Markets Debt Central Fund | 302,120 |
| Fidelity Emerging Markets Equity Central Fund | 5,856,697 |
| Fidelity Energy Central Fund | 1,576,175 |
| Fidelity Financials Central Fund | 16,287,315 |
| Fidelity Floating Rate Central Fund | 125,271 |
| Fidelity Health Care Central Fund | 24,423,458 |
| Fidelity High Income Central Fund | 1,027,737 |
| Fidelity Industrials Central Fund | 2,366,677 |
| Fidelity Inflation-Protected Bond Index Central Fund | 545,416 |
| Fidelity Information Technology Central Fund | 52,286,029 |
| Fidelity International Credit Central Fund | 1,353,887 |
| Fidelity International Equity Central Fund | 7,578,185 |
| Fidelity Investment Grade Bond Central Fund | 3,036,408 |
| Fidelity Materials Central Fund | 597,112 |
| Fidelity Real Estate Equity Central Fund | 615,141 |
| Fidelity Securities Lending Cash Central Fund | 21,667 |
| Fidelity Utilities Central Fund | 3,034,749 |
| Total | $138,046,857 |
Amounts in the income column in the above table include any capital gain distributions from underlying funds, which are presented in the corresponding line-item in the Statement of Operations, if applicable. Amount for Fidelity Securities Lending Cash Central Fund represents the income earned on investing cash collateral, less rebates paid to borrowers and any lending agent fees associated with the loan, plus any premium payments received for lending certain types of securities.
Fiscal year to date information regarding the Fund’s investments in non-Money Market Central Funds, including the ownership percentage, is presented below.
| Affiliate | Value, beginning of period | Purchases(a) | Sales Proceeds(a) | Realized Gain (loss) | Change in Unrealized appreciation (depreciation) | Value, end of period | % ownership, end of period |
| Fidelity Commodity Strategy Central Fund | $18,010,309 | $8,827 | $18,524,615 | $(2,005,483) | $2,510,962 | $-- | 0.0 |
| Fidelity Communication Services Central Fund | 121,146,428 | 38,579,341 | 15,099,432 | 138,556 | (19,306,134) | -- | 0.0 |
| Fidelity Consumer Discretionary Central Fund | 145,851,157 | 29,200,070 | 19,939,062 | 696,615 | (86,084,411) | -- | 0.0 |
| Fidelity Consumer Staples Central Fund | 94,912,045 | 20,548,211 | 10,818,934 | (200,372) | (24,088,927) | -- | 0.0 |
| Fidelity Emerging Markets Debt Central Fund | 23,998,807 | 13,362,396 | 24,599,801 | (314,019) | 115,574 | 12,562,957 | 0.5 |
| Fidelity Emerging Markets Debt Local Currency Central Fund | -- | 12,944,000 | -- | -- | 19,416 | 12,963,416 | 8.6 |
| Fidelity Emerging Markets Equity Central Fund | 209,258,176 | 36,394,553 | 21,696,826 | (2,305,403) | 27,232,967 | 248,883,467 | 12.5 |
| Fidelity Energy Central Fund | 59,111,288 | 8,627,733 | 4,813,540 | (1,345,420) | 12,459,799 | -- | 0.0 |
| Fidelity Financials Central Fund | 264,480,828 | 44,396,305 | 34,241,471 | (3,758,891) | (63,984,377) | -- | 0.0 |
| Fidelity Floating Rate Central Fund | 12,352,802 | 209,941 | 12,470,417 | (175,177) | 82,851 | -- | 0.0 |
| Fidelity Health Care Central Fund | 195,374,361 | 46,341,267 | 26,248,359 | (12,070) | (105,256,450) | -- | 0.0 |
| Fidelity High Income Central Fund | 25,117,089 | 47,828,623 | 27,816,828 | 663,386 | 1,408,772 | 47,201,042 | 1.8 |
| Fidelity Industrials Central Fund | 138,134,573 | 18,255,817 | 17,694,496 | (819,430) | (59,159,227) | -- | 0.0 |
| Fidelity Inflation-Protected Bond Index Central Fund | 103,551,980 | 100,400,350 | 103,485,226 | 2,009,158 | 2,115,981 | 104,592,243 | 6.6 |
| Fidelity Information Technology Central Fund | 330,757,551 | 88,844,078 | 50,927,995 | 1,565,489 | (158,963,247) | -- | 0.0 |
| Fidelity International Credit Central Fund | 25,069,783 | 16,767,002 | 3,069,157 | (15,577) | 353,408 | 39,105,459 | 8.4 |
| Fidelity International Equity Central Fund | 337,777,369 | 113,444,291 | 49,710,629 | (2,766,888) | 39,766,704 | 438,510,847 | 14.5 |
| Fidelity Investment Grade Bond Central Fund | 166,457,516 | 60,255,452 | 144,918,002 | 553,567 | 3,234,505 | 85,583,038 | 0.3 |
| Fidelity Materials Central Fund | 34,050,837 | 9,121,352 | 6,064,913 | (773,330) | (5,264,405) | -- | 0.0 |
| Fidelity Real Estate Equity Central Fund | 38,179,205 | 2,703,756 | 27,071,397 | (7,076,325) | (2,896,011) | 3,839,228 | 0.5 |
| Fidelity U.S. Equity Central Fund | -- | 5,655,933 | 17,377,967 | (14,775,587) | 702,915,980 | 1,696,908,927 | 7.8 |
| Fidelity Utilities Central Fund | 50,854,081 | 8,409,038 | 5,941,855 | (264,288) | (20,295,216) | -- | 0.0 |
| | 2,394,446,185 | 722,298,336 | 642,530,922 | (30,981,489) | 246,918,514 | 2,690,150,624 | |
(a) Excludes the value of securities received and delivered through merger transactions, if applicable.
Investment Valuation
The following is a summary of the inputs used, as of September 30, 2020, involving the Fund's assets and liabilities carried at fair value. The inputs or methodology used for valuing securities may not be an indication of the risk associated with investing in those securities. For more information on valuation inputs, and their aggregation into the levels used below, please refer to the Investment Valuation section in the accompanying Notes to Financial Statements.
| | Valuation Inputs at Reporting Date: |
| Description | Total | Level 1 | Level 2 | Level 3 |
| Investments in Securities: | | | | |
| Equity Central Funds | $2,388,142,469 | $2,388,142,469 | $-- | $-- |
| Fixed-Income Central Funds | 302,008,155 | 302,008,155 | -- | -- |
| Money Market Central Funds | 18,491,634 | 18,491,634 | -- | -- |
| Other Short-Term Investments | 9,448,826 | -- | 9,448,826 | -- |
| Investment Companies | 105,386,346 | 105,386,346 | -- | -- |
| Total Investments in Securities: | $2,823,477,430 | $2,814,028,604 | $9,448,826 | $-- |
| Derivative Instruments: | | | | |
| Liabilities | | | | |
| Futures Contracts | $(983,723) | $(983,723) | $-- | $-- |
| Total Liabilities | $(983,723) | $(983,723) | $-- | $-- |
| Total Derivative Instruments: | $(983,723) | $(983,723) | $-- | $-- |
Value of Derivative Instruments
The following table is a summary of the Fund's value of derivative instruments by primary risk exposure as of September 30, 2020. For additional information on derivative instruments, please refer to the Derivative Instruments section in the accompanying Notes to Financial Statements.
| Primary Risk Exposure / Derivative Type | Value |
| | Asset | Liability |
| Equity Risk | | |
| Futures Contracts(a) | $0 | $(983,723) |
| Total Equity Risk | 0 | (983,723) |
| Total Value of Derivatives | $0 | $(983,723) |
(a) Reflects gross cumulative appreciation (depreciation) on futures contracts as presented in the Schedule of Investments. In the Statement of Assets and Liabilities, the period end daily variation margin is included in receivable or payable for daily variation margin on futures contracts, and the net cumulative appreciation (depreciation) is included in Total accumulated earnings (loss).
Other Information
Distribution of investments by country or territory of incorporation, as a percentage of Total Net Assets, is as follows (Unaudited):
| United States of America | 68.9% |
| United Kingdom | 3.3% |
| Cayman Islands | 3.2% |
| Japan | 3.0% |
| Switzerland | 2.6% |
| France | 2.3% |
| Netherlands | 2.0% |
| Canada | 1.6% |
| Germany | 1.5% |
| Korea (South) | 1.2% |
| India | 1.0% |
| Others (Individually Less Than 1%) | 9.4% |
| | 100.0% |
The information in the above table is based on the combined investments of the Fund and its pro-rata share of the investments of Fidelity's Central Funds, other than the Money Market Central Funds.
See accompanying notes which are an integral part of the financial statements.
Fidelity Asset Manager® 85%
Financial Statements
Statement of Assets and Liabilities
| | | September 30, 2020 |
| Assets | | |
Investment in securities, at value (including securities loaned of $16,740,438) — See accompanying schedule:
Unaffiliated issuers (cost $100,275,173) | $114,835,172 | |
| Fidelity Central Funds (cost $1,887,957,855) | 2,708,642,258 | |
| Total Investment in Securities (cost $1,988,233,028) | | $2,823,477,430 |
| Receivable for investments sold | | 1,183,451 |
| Receivable for fund shares sold | | 6,137,431 |
| Distributions receivable from Fidelity Central Funds | | 1,358 |
| Prepaid expenses | | 4,291 |
| Total assets | | 2,830,803,961 |
| Liabilities | | |
| Payable for investments purchased | $5,377,950 | |
| Payable for fund shares redeemed | 751,981 | |
| Accrued management fee | 1,241,182 | |
| Distribution and service plan fees payable | 84,265 | |
| Payable for daily variation margin on futures contracts | 442,243 | |
| Other affiliated payables | 363,712 | |
| Other payables and accrued expenses | 16,180 | |
| Collateral on securities loaned | 17,216,550 | |
| Total liabilities | | 25,494,063 |
| Net Assets | | $2,805,309,898 |
| Net Assets consist of: | | |
| Paid in capital | | $2,134,561,282 |
| Total accumulated earnings (loss) | | 670,748,616 |
| Net Assets | | $2,805,309,898 |
| Net Asset Value and Maximum Offering Price | | |
| Class A: | | |
| Net Asset Value and redemption price per share ($143,117,096 ÷ 6,903,799 shares)(a) | | $20.73 |
| Maximum offering price per share (100/94.25 of $20.73) | | $21.99 |
| Class M: | | |
| Net Asset Value and redemption price per share ($40,603,958 ÷ 1,973,901 shares)(a) | | $20.57 |
| Maximum offering price per share (100/96.50 of $20.57) | | $21.32 |
| Class C: | | |
| Net Asset Value and offering price per share ($44,510,398 ÷ 2,191,840 shares)(a) | | $20.31 |
| Asset Manager 85%: | | |
| Net Asset Value, offering price and redemption price per share ($2,520,790,349 ÷ 120,240,484 shares) | | $20.96 |
| Class I: | | |
| Net Asset Value, offering price and redemption price per share ($31,605,558 ÷ 1,511,444 shares) | | $20.91 |
| Class Z: | | |
| Net Asset Value, offering price and redemption price per share ($24,682,539 ÷ 1,182,512 shares) | | $20.87 |
(a) Redemption price per share is equal to net asset value less any applicable contingent deferred sales charge.
See accompanying notes which are an integral part of the financial statements.
Statement of Operations
| | | Year ended September 30, 2020 |
| Investment Income | | |
| Dividends | | $3,801,563 |
| Interest | | 36,257 |
| Income from Fidelity Central Funds (including $21,667 from security lending) | | 48,089,087 |
| Total income | | 51,926,907 |
| Expenses | | |
| Management fee | $14,049,614 | |
| Transfer agent fees | 3,362,765 | |
| Distribution and service plan fees | 934,613 | |
| Accounting fees | 783,245 | |
| Custodian fees and expenses | 5,999 | |
| Independent trustees' fees and expenses | 8,408 | |
| Registration fees | 116,657 | |
| Audit | 39,740 | |
| Legal | 4,603 | |
| Interest | 367 | |
| Miscellaneous | 15,622 | |
| Total expenses before reductions | 19,321,633 | |
| Expense reductions | (75,287) | |
| Total expenses after reductions | | 19,246,346 |
| Net investment income (loss) | | 32,680,561 |
| Realized and Unrealized Gain (Loss) | | |
| Net realized gain (loss) on: | | |
| Investment securities: | | |
| Unaffiliated issuers | (2,208,122) | |
| Fidelity Central Funds | (30,984,725) | |
| Futures contracts | (21,445,562) | |
| Capital gain distributions from Fidelity Central Funds | 89,957,770 | |
| Total net realized gain (loss) | | 35,319,361 |
| Change in net unrealized appreciation (depreciation) on: | | |
| Investment securities: | | |
| Unaffiliated issuers | 5,747,621 | |
| Fidelity Central Funds | 246,918,515 | |
| Futures contracts | (950,619) | |
| Total change in net unrealized appreciation (depreciation) | | 251,715,517 |
| Net gain (loss) | | 287,034,878 |
| Net increase (decrease) in net assets resulting from operations | | $319,715,439 |
See accompanying notes which are an integral part of the financial statements.
Statement of Changes in Net Assets
| | Year ended September 30, 2020 | Year ended September 30, 2019 |
| Increase (Decrease) in Net Assets | | |
| Operations | | |
| Net investment income (loss) | $32,680,561 | $32,979,401 |
| Net realized gain (loss) | 35,319,361 | 113,853,957 |
| Change in net unrealized appreciation (depreciation) | 251,715,517 | (144,599,362) |
| Net increase (decrease) in net assets resulting from operations | 319,715,439 | 2,233,996 |
| Distributions to shareholders | (144,716,033) | (118,486,707) |
| Share transactions - net increase (decrease) | 89,303,172 | 28,013,859 |
| Total increase (decrease) in net assets | 264,302,578 | (88,238,852) |
| Net Assets | | |
| Beginning of period | 2,541,007,320 | 2,629,246,172 |
| End of period | $2,805,309,898 | $2,541,007,320 |
See accompanying notes which are an integral part of the financial statements.
Financial Highlights
Fidelity Asset Manager 85% Class A
| Years ended September 30, | 2020 | 2019 | 2018 | 2017 | 2016 |
| Selected Per–Share Data | | | | | |
| Net asset value, beginning of period | $19.30 | $20.36 | $19.02 | $16.45 | $15.42 |
| Income from Investment Operations | | | | | |
| Net investment income (loss)A | .19 | .20 | .16 | .13 | .14 |
| Net realized and unrealized gain (loss) | 2.29 | (.37) | 1.77 | 2.61 | 1.59 |
| Total from investment operations | 2.48 | (.17) | 1.93 | 2.74 | 1.73 |
| Distributions from net investment income | (.22) | (.17) | (.14) | (.13) | (.17) |
| Distributions from net realized gain | (.84) | (.72) | (.45) | (.05) | (.53) |
| Total distributions | (1.05)B | (.89) | (.59) | (.17)B | (.70) |
| Net asset value, end of period | $20.73 | $19.30 | $20.36 | $19.02 | $16.45 |
| Total ReturnC,D | 13.11% | (.11)% | 10.29% | 16.83% | 11.62% |
| Ratios to Average Net AssetsE,F | | | | | |
| Expenses before reductions | 1.00% | 1.01% | 1.02% | 1.04% | 1.05% |
| Expenses net of fee waivers, if any | .99% | 1.01% | 1.02% | 1.04% | 1.05% |
| Expenses net of all reductions | .99% | 1.01% | 1.02% | 1.03% | 1.05% |
| Net investment income (loss) | .97% | 1.06% | .80% | .74% | .90% |
| Supplemental Data | | | | | |
| Net assets, end of period (000 omitted) | $143,117 | $125,168 | $115,447 | $92,868 | $78,147 |
| Portfolio turnover rateG | 41% | 47% | 24% | 23% | 22% |
A Calculated based on average shares outstanding during the period.
B Total distributions per share do not sum due to rounding.
C Total returns would have been lower if certain expenses had not been reduced during the applicable periods shown.
D Total returns do not include the effect of the sales charges.
E Fees and expenses of any underlying mutual funds or exchange-traded funds (ETFs) are not included in the Fund's expense ratio. The Fund indirectly bears its proportionate share of these expenses. For additional expense information related to investments in Fidelity Central Funds, please refer to the "Investments in Fidelity Central Funds" note found in the Notes to Financial Statements section of the most recent Annual or Semi-Annual report.
F Expense ratios reflect operating expenses of the class. Expenses before reductions do not reflect amounts reimbursed, waived, or reduced through arrangements with the investment adviser, brokerage services, or other offset arrangements, if applicable, and do not represent the amount paid by the class during periods when reimbursements, waivers or reductions occur.
G Amount does not include the portfolio activity of any underlying mutual funds or exchange-traded funds (ETFs).
See accompanying notes which are an integral part of the financial statements.
Fidelity Asset Manager 85% Class M
| Years ended September 30, | 2020 | 2019 | 2018 | 2017 | 2016 |
| Selected Per–Share Data | | | | | |
| Net asset value, beginning of period | $19.17 | $20.22 | $18.91 | $16.34 | $15.32 |
| Income from Investment Operations | | | | | |
| Net investment income (loss)A | .14 | .15 | .10 | .08 | .10 |
| Net realized and unrealized gain (loss) | 2.27 | (.36) | 1.75 | 2.61 | 1.58 |
| Total from investment operations | 2.41 | (.21) | 1.85 | 2.69 | 1.68 |
| Distributions from net investment income | (.18) | (.13) | (.09) | (.07) | (.13) |
| Distributions from net realized gain | (.84) | (.72) | (.45) | (.05) | (.53) |
| Total distributions | (1.01)B | (.84)B | (.54) | (.12) | (.66) |
| Net asset value, end of period | $20.57 | $19.17 | $20.22 | $18.91 | $16.34 |
| Total ReturnC,D | 12.81% | (.35)% | 9.94% | 16.54% | 11.31% |
| Ratios to Average Net AssetsE,F | | | | | |
| Expenses before reductions | 1.25% | 1.27% | 1.29% | 1.31% | 1.32% |
| Expenses net of fee waivers, if any | 1.25% | 1.27% | 1.29% | 1.31% | 1.32% |
| Expenses net of all reductions | 1.25% | 1.27% | 1.29% | 1.31% | 1.32% |
| Net investment income (loss) | .72% | .80% | .53% | .46% | .63% |
| Supplemental Data | | | | | |
| Net assets, end of period (000 omitted) | $40,604 | $33,611 | $31,371 | $24,207 | $19,582 |
| Portfolio turnover rateG | 41% | 47% | 24% | 23% | 22% |
A Calculated based on average shares outstanding during the period.
B Total distributions per share do not sum due to rounding.
C Total returns would have been lower if certain expenses had not been reduced during the applicable periods shown.
D Total returns do not include the effect of the sales charges.
E Fees and expenses of any underlying mutual funds or exchange-traded funds (ETFs) are not included in the Fund's expense ratio. The Fund indirectly bears its proportionate share of these expenses. For additional expense information related to investments in Fidelity Central Funds, please refer to the "Investments in Fidelity Central Funds" note found in the Notes to Financial Statements section of the most recent Annual or Semi-Annual report.
F Expense ratios reflect operating expenses of the class. Expenses before reductions do not reflect amounts reimbursed, waived, or reduced through arrangements with the investment adviser, brokerage services, or other offset arrangements, if applicable, and do not represent the amount paid by the class during periods when reimbursements, waivers or reductions occur.
G Amount does not include the portfolio activity of any underlying mutual funds or exchange-traded funds (ETFs).
See accompanying notes which are an integral part of the financial statements.
Fidelity Asset Manager 85% Class C
| Years ended September 30, | 2020 | 2019 | 2018 | 2017 | 2016 |
| Selected Per–Share Data | | | | | |
| Net asset value, beginning of period | $18.92 | $19.95 | $18.65 | $16.14 | $15.14 |
| Income from Investment Operations | | | | | |
| Net investment income (loss)A | .04 | .06 | .01 | –B | .02 |
| Net realized and unrealized gain (loss) | 2.24 | (.35) | 1.74 | 2.56 | 1.57 |
| Total from investment operations | 2.28 | (.29) | 1.75 | 2.56 | 1.59 |
| Distributions from net investment income | (.06) | (.02) | –B | (.01) | (.06) |
| Distributions from net realized gain | (.84) | (.72) | (.45) | (.05) | (.53) |
| Total distributions | (.89)C | (.74) | (.45) | (.05)C | (.59) |
| Net asset value, end of period | $20.31 | $18.92 | $19.95 | $18.65 | $16.14 |
| Total ReturnD,E | 12.25% | (.88)% | 9.51% | 15.94% | 10.80% |
| Ratios to Average Net AssetsF,G | | | | | |
| Expenses before reductions | 1.76% | 1.77% | 1.77% | 1.79% | 1.80% |
| Expenses net of fee waivers, if any | 1.76% | 1.77% | 1.77% | 1.79% | 1.80% |
| Expenses net of all reductions | 1.76% | 1.77% | 1.77% | 1.78% | 1.80% |
| Net investment income (loss) | .21% | .30% | .05% | (.01)% | .15% |
| Supplemental Data | | | | | |
| Net assets, end of period (000 omitted) | $44,510 | $40,909 | $50,588 | $44,313 | $38,916 |
| Portfolio turnover rateH | 41% | 47% | 24% | 23% | 22% |
A Calculated based on average shares outstanding during the period.
B Amount represents less than $.005 per share.
C Total distributions per share do not sum due to rounding.
D Total returns would have been lower if certain expenses had not been reduced during the applicable periods shown.
E Total returns do not include the effect of the contingent deferred sales charge.
F Fees and expenses of any underlying mutual funds or exchange-traded funds (ETFs) are not included in the Fund's expense ratio. The Fund indirectly bears its proportionate share of these expenses. For additional expense information related to investments in Fidelity Central Funds, please refer to the "Investments in Fidelity Central Funds" note found in the Notes to Financial Statements section of the most recent Annual or Semi-Annual report.
G Expense ratios reflect operating expenses of the class. Expenses before reductions do not reflect amounts reimbursed, waived, or reduced through arrangements with the investment adviser, brokerage services, or other offset arrangements, if applicable, and do not represent the amount paid by the class during periods when reimbursements, waivers or reductions occur.
H Amount does not include the portfolio activity of any underlying mutual funds or exchange-traded funds (ETFs).
See accompanying notes which are an integral part of the financial statements.
Fidelity Asset Manager 85%
| Years ended September 30, | 2020 | 2019 | 2018 | 2017 | 2016 |
| Selected Per–Share Data | | | | | |
| Net asset value, beginning of period | $19.50 | $20.56 | $19.20 | $16.60 | $15.56 |
| Income from Investment Operations | | | | | |
| Net investment income (loss)A | .25 | .26 | .22 | .19 | .19 |
| Net realized and unrealized gain (loss) | 2.32 | (.38) | 1.78 | 2.63 | 1.60 |
| Total from investment operations | 2.57 | (.12) | 2.00 | 2.82 | 1.79 |
| Distributions from net investment income | (.27) | (.23) | (.19) | (.17) | (.22) |
| Distributions from net realized gain | (.84) | (.72) | (.45) | (.05) | (.53) |
| Total distributions | (1.11) | (.94)B | (.64) | (.22) | (.75) |
| Net asset value, end of period | $20.96 | $19.50 | $20.56 | $19.20 | $16.60 |
| Total ReturnC | 13.44% | .21% | 10.62% | 17.20% | 11.92% |
| Ratios to Average Net AssetsD,E | | | | | |
| Expenses before reductions | .69% | .71% | .71% | .73% | .74% |
| Expenses net of fee waivers, if any | .69% | .71% | .71% | .73% | .74% |
| Expenses net of all reductions | .69% | .71% | .71% | .73% | .74% |
| Net investment income (loss) | 1.28% | 1.36% | 1.11% | 1.05% | 1.21% |
| Supplemental Data | | | | | |
| Net assets, end of period (000 omitted) | $2,520,790 | $2,278,919 | $2,377,705 | $1,832,601 | $1,454,033 |
| Portfolio turnover rateF | 41% | 47% | 24% | 23% | 22% |
A Calculated based on average shares outstanding during the period.
B Total distributions per share do not sum due to rounding.
C Total returns would have been lower if certain expenses had not been reduced during the applicable periods shown.
D Fees and expenses of any underlying mutual funds or exchange-traded funds (ETFs) are not included in the Fund's expense ratio. The Fund indirectly bears its proportionate share of these expenses. For additional expense information related to investments in Fidelity Central Funds, please refer to the "Investments in Fidelity Central Funds" note found in the Notes to Financial Statements section of the most recent Annual or Semi-Annual report.
E Expense ratios reflect operating expenses of the class. Expenses before reductions do not reflect amounts reimbursed, waived, or reduced through arrangements with the investment adviser, brokerage services, or other offset arrangements, if applicable, and do not represent the amount paid by the class during periods when reimbursements, waivers or reductions occur.
F Amount does not include the portfolio activity of any underlying mutual funds or exchange-traded funds (ETFs).
See accompanying notes which are an integral part of the financial statements.
Fidelity Asset Manager 85% Class I
| Years ended September 30, | 2020 | 2019 | 2018 | 2017 | 2016 |
| Selected Per–Share Data | | | | | |
| Net asset value, beginning of period | $19.45 | $20.50 | $19.15 | $16.55 | $15.51 |
| Income from Investment Operations | | | | | |
| Net investment income (loss)A | .24 | .25 | .21 | .18 | .19 |
| Net realized and unrealized gain (loss) | 2.32 | (.37) | 1.78 | 2.63 | 1.60 |
| Total from investment operations | 2.56 | (.12) | 1.99 | 2.81 | 1.79 |
| Distributions from net investment income | (.26) | (.21) | (.19) | (.16) | (.21) |
| Distributions from net realized gain | (.84) | (.72) | (.45) | (.05) | (.53) |
| Total distributions | (1.10) | (.93) | (.64) | (.21) | (.75)B |
| Net asset value, end of period | $20.91 | $19.45 | $20.50 | $19.15 | $16.55 |
| Total ReturnC | 13.40% | .15% | 10.58% | 17.16% | 11.93% |
| Ratios to Average Net AssetsD,E | | | | | |
| Expenses before reductions | .73% | .74% | .75% | .76% | .75% |
| Expenses net of fee waivers, if any | .72% | .74% | .75% | .76% | .75% |
| Expenses net of all reductions | .72% | .74% | .75% | .75% | .75% |
| Net investment income (loss) | 1.25% | 1.33% | 1.07% | 1.02% | 1.20% |
| Supplemental Data | | | | | |
| Net assets, end of period (000 omitted) | $31,606 | $39,115 | $54,135 | $38,765 | $40,747 |
| Portfolio turnover rateF | 41% | 47% | 24% | 23% | 22% |
A Calculated based on average shares outstanding during the period.
B Total distributions per share do not sum due to rounding.
C Total returns would have been lower if certain expenses had not been reduced during the applicable periods shown.
D Fees and expenses of any underlying mutual funds or exchange-traded funds (ETFs) are not included in the Fund's expense ratio. The Fund indirectly bears its proportionate share of these expenses. For additional expense information related to investments in Fidelity Central Funds, please refer to the "Investments in Fidelity Central Funds" note found in the Notes to Financial Statements section of the most recent Annual or Semi-Annual report.
E Expense ratios reflect operating expenses of the class. Expenses before reductions do not reflect amounts reimbursed, waived, or reduced through arrangements with the investment adviser, brokerage services, or other offset arrangements, if applicable, and do not represent the amount paid by the class during periods when reimbursements, waivers or reductions occur.
F Amount does not include the portfolio activity of any underlying mutual funds or exchange-traded funds (ETFs).
See accompanying notes which are an integral part of the financial statements.
Fidelity Asset Manager 85% Class Z
| Years ended September 30, | 2020 | 2019 A |
| Selected Per–Share Data | | |
| Net asset value, beginning of period | $19.43 | $20.45 |
| Income from Investment Operations | | |
| Net investment income (loss)B | .26 | .27 |
| Net realized and unrealized gain (loss) | 2.31 | (.32) |
| Total from investment operations | 2.57 | (.05) |
| Distributions from net investment income | (.30) | (.25) |
| Distributions from net realized gain | (.84) | (.72) |
| Total distributions | (1.13)C | (.97) |
| Net asset value, end of period | $20.87 | $19.43 |
| Total ReturnD,E | 13.50% | .54% |
| Ratios to Average Net AssetsF,G | | |
| Expenses before reductions | .61% | .62%H |
| Expenses net of fee waivers, if any | .61% | .62%H |
| Expenses net of all reductions | .61% | .62%H |
| Net investment income (loss) | 1.36% | 1.45%H |
| Supplemental Data | | |
| Net assets, end of period (000 omitted) | $24,683 | $23,286 |
| Portfolio turnover rateI | 41% | 47% |
A For the period October 2, 2018 (commencement of sale of shares) to September 30, 2019.
B Calculated based on average shares outstanding during the period.
C Total distributions per share do not sum due to rounding.
D Total returns for periods of less than one year are not annualized.
E Total returns would have been lower if certain expenses had not been reduced during the applicable periods shown.
F Fees and expenses of any underlying mutual funds or exchange-traded funds (ETFs) are not included in the Fund's expense ratio. The Fund indirectly bears its proportionate share of these expenses. For additional expense information related to investments in Fidelity Central Funds, please refer to the "Investments in Fidelity Central Funds" note found in the Notes to Financial Statements section of the most recent Annual or Semi-Annual report.
G Expense ratios reflect operating expenses of the class. Expenses before reductions do not reflect amounts reimbursed, waived, or reduced through arrangements with the investment adviser, brokerage services, or other offset arrangements, if applicable, and do not represent the amount paid by the class during periods when reimbursements, waivers or reductions occur.
H Annualized
I Amount does not include the portfolio activity of any underlying mutual funds or exchange-traded funds (ETFs).
See accompanying notes which are an integral part of the financial statements.
Notes to Financial Statements
For the period ended September 30, 2020
1. Organization.
Fidelity Asset Manager 20%, Fidelity Asset Manager 30%, Fidelity Asset Manager 40%, Fidelity Asset Manager 50%, Fidelity Asset Manager 60%, Fidelity Asset Manager 70% and Fidelity Asset Manager 85% (the Funds) are funds of Fidelity Charles Street Trust (the Trust). The Trust is registered under the Investment Company Act of 1940, as amended (the 1940 Act), as an open-end management investment company organized as a Massachusetts business trust. Each Fund is authorized to issue an unlimited number of shares. Each Fund offers Class A, Class M, Class C, Asset Manager, Class I and Class Z shares, each of which has equal rights as to assets and voting privileges. Each class has exclusive voting rights with respect to matters that affect that class. Each Fund commenced sale of Class Z shares on October 2, 2018. Class C shares will automatically convert to Class A shares after a holding period of ten years from the initial date of purchase, with certain exceptions.
Effective January 1, 2020:
Investment advisers Fidelity Investments Money Management, Inc., FMR Co., Inc., and Fidelity SelectCo, LLC, merged with and into Fidelity Management & Research Company. In connection with the merger transactions, the resulting, merged investment adviser was then redomiciled from Massachusetts to Delaware, changed its corporate structure from a corporation to a limited liability company, and changed its name to "Fidelity Management & Research Company LLC".
Broker-dealer Fidelity Distributors Corporation merged with and into Fidelity Investments Institutional Services Company, Inc. ("FIISC"). FIISC was then redomiciled from Massachusetts to Delaware, changed its corporate structure from a corporation to a limited liability company, and changed its name to "Fidelity Distributors Company LLC".
Fidelity Investments Institutional Operations Company, Inc. converted from a Massachusetts corporation to a Massachusetts LLC, and changed its name to "Fidelity Investments Institutional Operations Company LLC".
2. Investments in Fidelity Central Funds.
The Funds invest in Fidelity Central Funds, which are open-end investment companies generally available only to other investment companies and accounts managed by the investment adviser and its affiliates. The Funds' Schedules of Investments list each of the Fidelity Central Funds held as of period end as an investment of each Fund, but do not include the underlying holdings of each Fidelity Central Fund. As an Investing Fund, each Fund indirectly bears its proportionate share of the expenses of the underlying Fidelity Central Funds.
Based on its investment objective, each Fidelity Central Fund may invest or participate in various investment vehicles or strategies that are similar to those of each Fund. These strategies are consistent with the investment objectives of each Fund and may involve certain economic risks which may cause a decline in value of each of the Fidelity Central Funds and thus a decline in the value of each Fund. The following summarizes the Funds' investment in each Fidelity Central Fund.
| Fidelity Central Fund(a) | Investment Manager | Investment Objective | Investment Practices | Expense Ratio (b),(c),(d) |
| Fidelity Emerging Markets Debt Central Fund | FMR | Seeks high total return by normally investing in debt securities of issuers in emerging markets and other debt investments that are tied economically to emerging markets. | Foreign Securities
Restricted Securities
| Less than .005% |
| Fidelity Emerging Markets Equity Central Fund | FMR | Seeks capital appreciation by investing primarily in equity securities of issuers in emerging markets. | Foreign Securities
Futures
| .05% |
| Fidelity International Equity Central Fund | FMR | Seeks capital appreciation by investing primarily in non-U.S. based common stocks, including securities of issuers located in emerging markets. | Delayed Delivery & When Issued Securities
Foreign Securities
Futures
| .01% |
| Fidelity Floating Rate Central Fund | FMR | Seeks a high level of income by normally investing in floating rate loans and other floating rate securities. | Loans & Direct Debt Instruments
Restricted Securities
| Less than .005% |
| Fidelity High Income Central Fund | FMR | Seeks a high level of income and may also seek capital appreciation by investing primarily in debt securities, preferred stocks, and convertible securities, with an emphasis on lower-quality debt securities. | Delayed Delivery & When Issued Securities
Loans & Direct Debt Instruments
Restricted Securities
| Less than .005% |
| Fidelity Inflation-Protected Bond Index Central Fund | FMR | Seeks to provide investment results that correspond to the performance of the inflation-protected United States Treasury market, and may invest in derivatives. | | Less than .005% |
| Fidelity Investment Grade Bond Central Fund | FMR | Seeks a high level of income by normally investing in investment–grade debt securities. | Delayed Delivery & When Issued Securities
Restricted Securities
| Less than .005% |
| Fidelity Real Estate Equity Central Fund | FMR | Seeks above-average income and long-term capital growth by investing primarily in equity securities of issuers in the real estate industry. | | Less than .005% |
| Fidelity International Credit Central Fund | FMR | Seeks a high level of current income by normally investing in debt securities of foreign issuers, including debt securities of issuers located in emerging markets. Foreign currency exposure is hedged utilizing foreign currency contracts. | Foreign Securities
Foreign Forward Currency Contracts
Futures
Options
Restricted Securities
Swaps | .01% |
| Fidelity U.S. Equity Central Fund | FMR | Seeks capital appreciation by investing primarily in common stocks, allocated across different market sectors. | Foreign Securities
Futures
| .01% |
| Fidelity Emerging Markets Debt Local Currency Central Fund | FMR | Seeks high total return by normally
investing in debt securities of issuers in emerging markets and other debt investments that are tied economically to emerging markets and denominated in the local currency of the issuer. | Foreign Securities
| .01% |
(a) The Fidelity Equity Central Funds merged into Fidelity U.S. Equity Central Fund on September 18, 2020.
(b) Expenses expressed as a percentage of average net assets and are as of each underlying Central Fund's most recent annual or semi-annual shareholder report.
(c) For Fidelity U.S. Equity Central Fund, percentage is based on estimated amounts for the current fiscal year. Fund commenced operations on September 18, 2020.
(d) For Fidelity Emerging Markets Debt Local Currency Central Fund, percentage is based on estimated amounts for the current fiscal year. Fund commenced operations on September 23, 2020.
An unaudited holdings listing for each Fund, which presents direct holdings as well as the pro-rata share of any securities and other investments held indirectly through each fund's investment in underlying Fidelity Central Funds, other than the Money Market Central Funds, is available at fidelity.com and/or institutional.fidelity.com, as applicable. A complete unaudited list of holdings for each Fidelity Central Fund is available upon request or at the Securities and Exchange Commission (the SEC) website at www.sec.gov. In addition, the financial statements of the Fidelity Central Funds which contain the significant accounting policies (including investment valuation policies) of those funds, which are not covered by the Funds' Report of Independent Registered Public Accounting Firm, are available on the SEC website or upon request.
3. Significant Accounting Policies.
Each Fund is an investment company and applies the accounting and reporting guidance of the Financial Accounting Standards Board (FASB) Accounting Standards Codification Topic 946 Financial Services – Investment Companies. The financial statements have been prepared in conformity with accounting principles generally accepted in the United States of America (GAAP), which require management to make certain estimates and assumptions at the date of the financial statements. Actual results could differ from those estimates. Subsequent events, if any, through the date that the financial statements were issued have been evaluated in the preparation of the financial statements. The following summarizes the significant accounting policies of the Funds:
Investment Valuation. Investments are valued as of 4:00 p.m. Eastern time on the last calendar day of the period. The Board of Trustees (the Board) has delegated the day to day responsibility for the valuation of each Fund's investments to the Fair Value Committee (the Committee) established by each Fund's investment adviser. In accordance with valuation policies and procedures approved by the Board, each Fund attempts to obtain prices from one or more third party pricing vendors or brokers to value its investments. When current market prices, quotations or currency exchange rates are not readily available or reliable, investments will be fair valued in good faith by the Committee, in accordance with procedures adopted by the Board. Factors used in determining fair value vary by investment type and may include market or investment specific events, changes in interest rates and credit quality. The frequency with which these procedures are used cannot be predicted and they may be utilized to a significant extent. The Committee oversees each Fund's valuation policies and procedures and reports to the Board on the Committee's activities and fair value determinations. The Board monitors the appropriateness of the procedures used in valuing each Fund's investments and ratifies the fair value determinations of the Committee. Each Fund categorizes the inputs to valuation techniques used to value its investments into a disclosure hierarchy consisting of three levels as shown below:
- Level 1 – quoted prices in active markets for identical investments
- Level 2 – other significant observable inputs (including quoted prices for similar investments, interest rates, prepayment speeds, etc.)
- Level 3 – unobservable inputs (including the Fund's own assumptions based on the best information available)
Valuation techniques used to value each Fund's investments by major category are as follows. Debt securities, including restricted securities, are valued based on evaluated prices received from third party pricing vendors or from brokers who make markets in such securities. U.S. government and government agency obligations are valued by pricing vendors who utilize matrix pricing which considers yield or price of bonds of comparable quality, coupon, maturity and type or by broker-supplied prices. When independent prices are unavailable or unreliable, debt securities may be valued utilizing pricing methodologies which consider similar factors that would be used by third party pricing vendors. Debt securities are generally categorized as Level 2 in the hierarchy but may be Level 3 depending on the circumstances.
Exchange-Traded Funds (ETFs) are valued at their last sale price or official closing price as reported by a third party pricing vendor on the primary market or exchange on which they are traded and are categorized as Level 1 in the hierarchy. In the event there were no sales during the day but the exchange reports a closing bid level, ETFs are valued at the closing bid and would be categorized as Level 1 in the hierarchy. In the event there was no closing bid, ETFs may be valued by another method that the Board believes reflects fair value in accordance with the Board's fair value pricing policies and may be categorized as Level 2 in the hierarchy.
Futures contracts are valued at the settlement price established each day by the board of trade or exchange on which they are traded and are categorized as Level 1 in the hierarchy. Investments in open-end mutual funds, including the Fidelity Central Funds, are valued at their closing net asset value (NAV) each business day and are categorized as Level 1 in the hierarchy.
Changes in valuation techniques may result in transfers in or out of an assigned level within the disclosure hierarchy. The aggregate value of investments by input level, as of September 30, 2020, is included at the end of each Fund's Schedule of Investments.
Foreign Currency. Certain Funds may use foreign currency contracts to facilitate transactions in foreign-denominated securities. Gains and losses from these transactions may arise from changes in the value of the foreign currency or if the counterparties do not perform under the contracts' terms.
Foreign-denominated assets, including investment securities, and liabilities are translated into U.S. dollars at the exchange rates at period end. Purchases and sales of investment securities, income and dividends received, and expenses denominated in foreign currencies are translated into U.S. dollars at the exchange rate in effect on the transaction date.
The effects of exchange rate fluctuations on investments are included with the net realized and unrealized gain (loss) on investment securities. Other foreign currency transactions resulting in realized and unrealized gain (loss) are disclosed separately.
Investment Transactions and Income. For financial reporting purposes, the Funds' investment holdings and NAV include trades executed through the end of the last business day of the period. The NAV per share for processing shareholder transactions is calculated as of the close of business of the New York Stock Exchange (NYSE), normally 4:00 p.m. Eastern time and includes trades executed through the end of the prior business day. Gains and losses on securities sold are determined on the basis of identified cost and for certain Funds include proceeds received from litigation. Dividend income is recorded on the ex-dividend date, except for certain dividends from foreign securities where the ex-dividend date may have passed, which are recorded as soon as the Funds are informed of the ex-dividend date. Non-cash dividends included in dividend income, if any, are recorded at the fair market value of the securities received. Income and capital gain distributions from Fidelity Central Funds, if any, are recorded on the ex-dividend date. Certain distributions received by the Funds represent a return of capital or capital gain. The Funds determine the components of these distributions subsequent to the ex-dividend date, based upon receipt of tax filings or other correspondence relating to the underlying investment. These distributions are recorded as a reduction of cost of investments and/or as a realized gain. Interest income is accrued as earned and includes coupon interest and amortization of premium and accretion of discount on debt securities as applicable. Investment income is recorded net of foreign taxes withheld where recovery of such taxes is uncertain. Debt obligations may be placed on non-accrual status and related interest income may be reduced by ceasing current accruals and writing off interest receivables when the collection of all or a portion of interest has become doubtful based on consistently applied procedures. A debt obligation is removed from non-accrual status when the issuer resumes interest payments or when collectability of interest is reasonably assured.
Class Allocations and Expenses. Investment income, realized and unrealized capital gains and losses, common expenses of each Fund, and certain fund-level expense reductions, if any, are allocated daily on a pro-rata basis to each class based on the relative net assets of each class to the total net assets of each Fund. Each class differs with respect to transfer agent and distribution and service plan fees incurred. Certain expense reductions may also differ by class. For the reporting period, the allocated portion of income and expenses to each class as a percent of its average net assets may vary due to the timing of recording these transactions in relation to fluctuating net assets of the classes. Expenses directly attributable to a fund are charged to that fund. Expenses attributable to more than one fund are allocated among the respective funds on the basis of relative net assets or other appropriate methods. Expense estimates are accrued in the period to which they relate and adjustments are made when actual amounts are known. Expenses included in the accompanying financial statements reflect the expenses of each Fund and do not include any expenses of the Fidelity Central Funds. Although not included in each Fund's expenses, each Fund indirectly bears its proportionate share of the Fidelity Central Funds' expenses through the impact of these expenses on each Fidelity Central Fund's NAV.
Deferred Trustee Compensation. Under a Deferred Compensation Plan (the Plan) for the Funds, certain independent Trustees have elected to defer receipt of a portion of their annual compensation. Deferred amounts are invested in a cross-section of Fidelity funds, are marked-to-market and remain in each Fund until distributed in accordance with the Plan. The investment of deferred amounts and the offsetting payable to the Trustees presented below are included in each accompanying Statement of Assets and Liabilities in other receivables and other payables and accrued expenses, respectively.
| Fidelity Asset Manager 50% | $204,006 |
| Fidelity Asset Manager 70% | 32,755 |
Income Tax Information and Distributions to Shareholders. Each year, each Fund intends to qualify as a regulated investment company under Subchapter M of the Internal Revenue Code, including distributing substantially all of its taxable income and realized gains. As a result, no provision for U.S. Federal income taxes is required. As of September 30, 2020, each Fund did not have any unrecognized tax benefits in the financial statements; nor is each Fund aware of any tax positions for which it is reasonably possible that the total amounts of unrecognized tax benefits will significantly change in the next twelve months. Each Fund files a U.S. federal tax return, in addition to state and local tax returns as required. Each Fund's federal income tax returns are subject to examination by the Internal Revenue Service (IRS) for a period of three fiscal years after they are filed. State and local tax returns may be subject to examination for an additional fiscal year depending on the jurisdiction. Foreign taxes are provided for based on each Fund's understanding of the tax rules and rates that exist in the foreign markets in which it invests.
Distributions are declared and recorded on the ex-dividend date. Income and capital gain distributions are declared separately for each class. Income and capital gain distributions are determined in accordance with income tax regulations, which may differ from GAAP. In addition, the Funds claimed a portion of the payment made to redeeming shareholders as a distribution for income tax purposes.
Capital accounts within the financial statements are adjusted for permanent book-tax differences. These adjustments have no impact on net assets or the results of operations. Capital accounts are not adjusted for temporary book-tax differences which will reverse in a subsequent period.
Book-tax differences are primarily due to the short-term gain distributions from the underlying mutual funds or exchange-traded funds (ETFs), futures contracts, foreign currency transactions, market discount, partnerships (including allocations from Fidelity Central Funds), deferred trustees compensation and losses deferred due to wash sales and excise tax regulations.
As of period end, the cost and unrealized appreciation (depreciation) in securities, and derivatives if applicable, for federal income tax purposes were as follows for each Fund:
| | Tax cost | Gross unrealized appreciation | Gross unrealized depreciation | Net unrealized appreciation (depreciation) |
| Fidelity Asset Manager 20% | $5,017,213,539 | $546,456,895 | $(31,235,761) | $515,221,134 |
| Fidelity Asset Manager 30% | 1,864,576,537 | 219,630,057 | (20,343,860) | 199,286,197 |
| Fidelity Asset Manager 40% | 1,780,430,660 | 278,033,465 | (19,985,149) | 258,048,316 |
| Fidelity Asset Manager 50% | 8,088,207,966 | 1,826,542,640 | (90,252,513) | 1,736,290,127 |
| Fidelity Asset Manager 60% | 2,792,764,261 | 563,659,946 | (45,414,120) | 518,245,826 |
| Fidelity Asset Manager 70% | 4,403,414,130 | 1,304,191,271 | (57,049,660) | 1,247,141,611 |
| Fidelity Asset Manager 85% | 2,207,138,087 | 647,798,217 | (31,458,874) | 616,339,343 |
The tax-based components of distributable earnings as of period end were as follows for each Fund:
| | Undistributed ordinary income | Undistributed long-term capital gain | Capital loss carryforward | Net unrealized appreciation (depreciation) on securities and other investments |
| Fidelity Asset Manager 20% | $15,475,722 | $– | $(36,954,698) | $515,221,134 |
| Fidelity Asset Manager 30% | 7,428,440 | – | (11,356,484) | 199,286,197 |
| Fidelity Asset Manager 40% | 12,647,197 | 2,949,926 | – | 258,048,316 |
| Fidelity Asset Manager 50% | 67,437,959 | 37,557,355 | – | 1,736,290,127 |
| Fidelity Asset Manager 60% | 39,872,636 | 3,769,079 | – | 518,247,975 |
| Fidelity Asset Manager 70% | 68,230,160 | 37,198,294 | – | 1,247,141,611 |
| Fidelity Asset Manager 85% | 32,056,972 | 22,352,300 | – | 616,339,343 |
Capital loss carryforwards are only available to offset future capital gains of the Funds to the extent provided by regulations and may be limited. The capital loss carryforward information presented below, including any applicable limitation, is estimated as of fiscal period end and is subject to adjustment.
| | No expiration |
| | Short-term |
| Fidelity Asset Manager 20% | $(36,954,698) |
| Fidelity Asset Manager 30% | (11,356,484) |
The tax character of distributions paid was as follows:
| September 30, 2020 | | | |
| | Ordinary Income | Long-term Capital Gains | Total |
| Fidelity Asset Manager 20% | $98,542,571 | $39,879,607 | $138,422,178 |
| Fidelity Asset Manager 30% | 36,396,995 | 19,001,934 | 55,398,929 |
| Fidelity Asset Manager 40% | 37,424,506 | 28,573,019 | 65,997,525 |
| Fidelity Asset Manager 50% | 176,420,606 | 208,053,619 | 384,474,225 |
| Fidelity Asset Manager 60% | 58,133,683 | 72,078,565 | 130,212,248 |
| Fidelity Asset Manager 70% | 96,895,748 | 181,949,877 | 278,845,625 |
| Fidelity Asset Manager 85% | 41,972,994 | 102,743,039 | 144,716,033 |
| September 30, 2019 | | | |
| | Ordinary Income | Long-term Capital Gains | Total |
| Fidelity Asset Manager 20% | $130,920,095 | $72,363,766 | $203,283,861 |
| Fidelity Asset Manager 30% | 38,252,717 | 21,949,391 | 60,202,108 |
| Fidelity Asset Manager 40% | 39,796,298 | 33,100,089 | 72,896,387 |
| Fidelity Asset Manager 50% | 202,678,869 | 246,308,013 | 448,986,882 |
| Fidelity Asset Manager 60% | 49,847,816 | 65,210,573 | 115,058,389 |
| Fidelity Asset Manager 70% | 92,973,804 | 189,830,199 | 282,804,003 |
| Fidelity Asset Manager 85% | 33,450,643 | 85,036,064 | 118,486,707 |
4. Derivative Instruments.
Risk Exposures and the Use of Derivative Instruments. The Funds' investment objective allows the Funds to enter into various types of derivative contracts, including futures contracts. Derivatives are investments whose value is primarily derived from underlying assets, indices or reference rates and may be transacted on an exchange or over-the-counter (OTC). Derivatives may involve a future commitment to buy or sell a specified asset based on specified terms, to exchange future cash flows at periodic intervals based on a notional principal amount, or for one party to make one or more payments upon the occurrence of specified events in exchange for periodic payments from the other party.
The Funds used derivatives to increase returns and to manage exposure to certain risks as defined below. The success of any strategy involving derivatives depends on analysis of numerous economic factors, and if the strategies for investment do not work as intended, the Funds may not achieve their objectives.
The Funds' use of derivatives increased or decreased their exposure to the following risk:
| Equity Risk | Equity risk relates to the fluctuations in the value of financial instruments as a result of changes in market prices (other than those arising from interest rate risk or foreign exchange risk), whether caused by factors specific to an individual investment, its issuer, or all factors affecting all instruments traded in a market or market segment.
|
The Funds are also exposed to additional risks from investing in derivatives, such as liquidity risk and counterparty credit risk. Liquidity risk is the risk that the Funds will be unable to close out the derivative in the open market in a timely manner. Counterparty credit risk is the risk that the counterparty will not be able to fulfill its obligation to the Funds. Counterparty credit risk related to exchange-traded futures contracts may be mitigated by the protection provided by the exchange on which they trade.
Investing in derivatives may involve greater risks than investing in the underlying assets directly and, to varying degrees, may involve risk of loss in excess of any initial investment and collateral received and amounts recognized in the Statement of Assets and Liabilities. In addition, there may be the risk that the change in value of the derivative contract does not correspond to the change in value of the underlying instrument.
Futures Contracts. A futures contract is an agreement between two parties to buy or sell a specified underlying instrument for a fixed price at a specified future date. The Funds used futures contracts to manage their exposure to the stock market.
Upon entering into a futures contract, a fund is required to deposit either cash or securities (initial margin) with a clearing broker in an amount equal to a certain percentage of the face value of the contract. Futures contracts are marked-to-market daily and subsequent daily payments (variation margin) are made or received by a fund depending on the daily fluctuations in the value of the futures contracts and are recorded as unrealized appreciation or (depreciation). This receivable and/or payable, if any, is included in daily variation margin on futures contracts in the Statement of Assets and Liabilities. Realized gain or (loss) is recorded upon the expiration or closing of a futures contract. The net realized gain (loss) and change in net unrealized appreciation (depreciation) on futures contracts during the period is presented in the Statement of Operations.
Any open futures contracts at period end are presented in the Schedule of Investments under the caption "Futures Contracts". The notional amount at value reflects each contract's exposure to the underlying instrument or index at period end and is representative of volume of activity during the period. Securities deposited to meet initial margin requirements are identified in the Schedule of Investments.
5. Purchases and Sales of Investments.
Purchases and sales of securities, other than short-term securities, are noted in the table below.
| | Purchases ($) | Sales ($) |
| Fidelity Asset Manager 20% | 1,408,049,079 | 1,010,782,869 |
| Fidelity Asset Manager 30% | 659,416,487 | 381,202,745 |
| Fidelity Asset Manager 40% | 608,379,044 | 423,061,200 |
| Fidelity Asset Manager 50% | 2,282,301,134 | 2,160,837,949 |
| Fidelity Asset Manager 60% | 937,315,872 | 912,858,004 |
| Fidelity Asset Manager 70% | 1,434,646,351 | 1,486,871,444 |
| Fidelity Asset Manager 85% | 1,103,695,039 | 1,062,847,171 |
6. Fees and Other Transactions with Affiliates.
Management Fee. Fidelity Management & Research Company LLC (the investment adviser) and its affiliates provide the Funds with investment management related services for which the Funds pay a monthly management fee. The management fee is the sum of an individual fund fee rate and an annualized group fee rate. The individual fund fee rate is applied to each Fund's average net assets. The group fee rate is based upon the monthly average net assets of a group of registered investment companies with which the investment adviser has management contracts. The group fee rate decreases as assets under management increase and increases as assets under management decrease. For the reporting period, each Fund's annual management fee rate expressed as a percentage of each Fund's average net assets was as follows:
| | Individual Rate | Group Rate | Total |
| Fidelity Asset Manager 20% | .30% | .10% | .40% |
| Fidelity Asset Manager 30% | .30% | .10% | .40% |
| Fidelity Asset Manager 40% | .30% | .10% | .40% |
| Fidelity Asset Manager 50% | .25% | .23% | .48% |
| Fidelity Asset Manager 60% | .30% | .23% | .53% |
| Fidelity Asset Manager 70% | .30% | .23% | .53% |
| Fidelity Asset Manager 85% | .30% | .23% | .53% |
The investment adviser pays a portion of the management fees received from the Fund to the Fidelity Central Funds' investment advisers, who are also affiliates, for managing the assets of the Fidelity Central Funds.
Distribution and Service Plan Fees. In accordance with Rule 12b-1 of the 1940 Act, each Fund has adopted separate Distribution and Service Plans for each class of shares. Certain classes pay Fidelity Distributors Company LLC (FDC), an affiliate of the investment adviser, separate Distribution and Service Fees, each of which is based on an annual percentage of each class' average net assets. In addition, FDC may pay financial intermediaries for selling shares of each Fund and providing shareholder support services. For the period, the Distribution and Service Fee rates, total fees and amounts retained by FDC were as follows:
| | Distribution Fee | Service Fee | Total Fees | Retained by FDC |
| Fidelity Asset Manager 20% | | | | |
| Class A | -% | .25% | $113,383 | $3,970 |
| Class M | .25% | .25% | 129,090 | 648 |
| Class C | .75% | .25% | 223,801 | 30,937 |
| | | | $466,274 | $35,555 |
| Fidelity Asset Manager 30% | | | | |
| Class A | -% | .25% | $108,085 | $7,244 |
| Class M | .25% | .25% | 88,134 | 124 |
| Class C | .75% | .25% | 256,667 | 43,211 |
| | | | $452,886 | $50,579 |
| Fidelity Asset Manager 40% | | | | |
| Class A | -% | .25% | $109,027 | $3,763 |
| Class M | .25% | .25% | 55,112 | 217 |
| Class C | .75% | .25% | 236,707 | 28,401 |
| | | | $400,846 | $32,381 |
| Fidelity Asset Manager 50% | | | | |
| Class A | -% | .25% | $249,282 | $7,966 |
| Class M | .25% | .25% | 221,396 | 292 |
| Class C | .75% | .25% | 451,205 | 65,687 |
| | | | $921,883 | $73,945 |
| Fidelity Asset Manager 60% | | | | |
| Class A | -% | .25% | $315,065 | $4,041 |
| Class M | .25% | .25% | 249,746 | 503 |
| Class C | .75% | .25% | 637,617 | 53,553 |
| | | | $1,202,428 | $58,097 |
| Fidelity Asset Manager 70% | | | | |
| Class A | -% | .25% | $423,253 | $4,940 |
| Class M | .25% | .25% | 324,866 | 2,843 |
| Class C | .75% | .25% | 405,425 | 49,407 |
| | | | $1,153,544 | $57,190 |
| Fidelity Asset Manager 85% | | | | |
| Class A | -% | .25% | $329,798 | $3,061 |
| Class M | .25% | .25% | 183,624 | 281 |
| Class C | .75% | .25% | 421,191 | 75,602 |
| | | | $934,613 | $78,944 |
Sales Load. FDC may receive a front-end sales charge of up to 5.75% for selling Class A shares and 3.50% for selling Class M shares, some of which is paid to financial intermediaries for selling shares of each Fund. Depending on the holding period, FDC may receive contingent deferred sales charges levied on Class A, Class M and Class C redemptions. The deferred sales charges are 1.00% for Class C shares, 1.00% for certain purchases of Class A shares and .25% for certain purchases of Class M shares.
For the period, sales charge amounts retained by FDC were as follows:
| | Retained by FDC |
| Fidelity Asset Manager 20% | |
| Class A | $22,066 |
| Class M | 8,250 |
| Class C(a) | 4,907 |
| | $35,223 |
| Fidelity Asset Manager 30% | |
| Class A | $25,758 |
| Class M | 2,410 |
| Class C(a) | 2,626 |
| | $30,794 |
| Fidelity Asset Manager 40% | |
| Class A | $34,380 |
| Class M | 3,411 |
| Class C(a) | 1,409 |
| | $39,200 |
| Fidelity Asset Manager 50% | |
| Class A | $23,555 |
| Class M | 10,111 |
| Class C(a) | 4,798 |
| | $38,464 |
| Fidelity Asset Manager 60% | |
| Class A | $46,612 |
| Class M | 7,527 |
| Class C(a) | 4,502 |
| | $58,641 |
| Fidelity Asset Manager 70% | |
| Class A | $76,073 |
| Class M | 10,401 |
| Class C(a) | 5,062 |
| | $91,536 |
| Fidelity Asset Manager 85% | |
| Class A | $132,326 |
| Class M | 9,090 |
| Class C(a) | 6,972 |
| | $148,388 |
(a) When Class C shares are initially sold, FDC pays commissions from its own resources to financial intermediaries through which the sales are made.
Transfer Agent Fees. Fidelity Investments Institutional Operations Company LLC (FIIOC), an affiliate of the investment adviser, is the transfer, dividend disbursing and shareholder servicing agent for each class of the Funds. FIIOC receives account fees and asset-based fees that vary according to the account size and type of account of the shareholders of the respective classes of each Fund, except for Class Z. FIIOC receives an asset-based fee of Class Z's average net assets. FIIOC pays for typesetting, printing and mailing of shareholder reports, except proxy statements. Effective February 1, 2020, the Board approved to change the fee for Class Z from .046% to .044% for Fidelity Asset Manager 50%, Fidelity Asset Manager 60%, Fidelity Asset Manager 70% and Fidelity Asset Manager 85%.For the period, transfer agent fees for each class were as follows:
| | Amount | % of Class-Level Average Net Assets |
| Fidelity Asset Manager 20% | | |
| Class A | $65,537 | .14 |
| Class M | 37,845 | .15 |
| Class C | 34,286 | .15 |
| Asset Manager 20% | 3,942,103 | .08 |
| Class I | 50,363 | .15 |
| Class Z | 7,482 | .05 |
| | $4,137,616 | |
| Fidelity Asset Manager 30% | | |
| Class A | $53,871 | .12 |
| Class M | 23,611 | .13 |
| Class C | 37,593 | .15 |
| Asset Manager 30% | 1,303,360 | .07 |
| Class I | 24,922 | .14 |
| Class Z | 4,291 | .05 |
| | $1,447,648 | |
| Fidelity Asset Manager 40% | | |
| Class A | $57,069 | .13 |
| Class M | 15,115 | .14 |
| Class C | 34,804 | .15 |
| Asset Manager 40% | 1,326,378 | .07 |
| Class I | 31,255 | .12 |
| Class Z | 3,702 | .05 |
| | $1,468,323 | |
| Fidelity Asset Manager 50% | | |
| Class A | $172,217 | .17 |
| Class M | 72,056 | .16 |
| Class C | 80,664 | .18 |
| Asset Manager 50% | 10,544,089 | .12 |
| Class I | 81,474 | .15 |
| Class Z | 9,787 | .04 |
| | $10,960,287 | |
| Fidelity Asset Manager 60% | | |
| Class A | $223,136 | .18 |
| Class M | 90,481 | .18 |
| Class C | 137,520 | .22 |
| Asset Manager 60% | 3,069,826 | .11 |
| Class I | 85,204 | .16 |
| Class Z | 8,364 | .04 |
| | $3,614,531 | |
| Fidelity Asset Manager 70% | | |
| Class A | $291,650 | .17 |
| Class M | 108,452 | .17 |
| Class C | 72,355 | .18 |
| Asset Manager 70% | 5,706,618 | .11 |
| Class I | 89,721 | .14 |
| Class Z | 11,190 | .04 |
| | $6,279,986 | |
| Fidelity Asset Manager 85% | | |
| Class A | $233,398 | .18 |
| Class M | 67,145 | .18 |
| Class C | 79,906 | .19 |
| Asset Manager 85% | 2,921,588 | .12 |
| Class I | 50,036 | .16 |
| Class Z | 10,692 | .04 |
| | $3,362,765 | |
Accounting Fees. Fidelity Service Company, Inc. (FSC), an affiliate of the investment adviser, maintains each Fund's accounting records. The accounting fee is based on the level of average net assets for each month. For the period, the fees were equivalent to the following annual rates:
| | % of Average Net Assets |
| Fidelity Asset Manager 20% | .02 |
| Fidelity Asset Manager 30% | .03 |
| Fidelity Asset Manager 40% | .03 |
| Fidelity Asset Manager 50% | .02 |
| Fidelity Asset Manager 60% | .04 |
| Fidelity Asset Manager 70% | .03 |
| Fidelity Asset Manager 85% | .03 |
Brokerage Commissions. A portion of portfolio transactions were placed with brokerage firms which are affiliates of the investment adviser. Brokerage commissions are included in net realized gain (loss) and change in net unrealized appreciation (depreciation) in the Statement of Operations. The commissions paid to these affiliated firms were as follows:
| | Amount |
| Fidelity Asset Manager 20% | $1,677 |
| Fidelity Asset Manager 30% | 143 |
| Fidelity Asset Manager 40% | 146 |
| Fidelity Asset Manager 50% | 1,086 |
| Fidelity Asset Manager 60% | 1,245 |
| Fidelity Asset Manager 70% | 2,080 |
| Fidelity Asset Manager 85% | 1,486 |
Interfund Lending Program. Pursuant to an Exemptive Order issued by the SEC, each Fund, along with other registered investment companies having management contracts with Fidelity Management & Research Company LLC (FMR), or other affiliated entities of FMR, may participate in an interfund lending program. This program provides an alternative credit facility allowing each Fund to borrow from, or lend money to, other participating affiliated funds. At period end, there were no interfund loans outstanding. Activity in this program during the period for which loans were outstanding was as follows:
| | Borrower or Lender | Average Loan Balance | Weighted Average Interest Rate | Interest Expense |
| Fidelity Asset Manager 20% | Borrower | $46,929,000 | 1.77% | $2,313 |
| Fidelity Asset Manager 30% | Borrower | $17,028,000 | 1.77% | $839 |
| Fidelity Asset Manager 40% | Borrower | $9,567,000 | 1.77% | $472 |
| Fidelity Asset Manager 50% | Borrower | $55,146,000 | 1.77% | $2,718 |
| Fidelity Asset Manager 60% | Borrower | $7,696,000 | 1.23% | $787 |
| Fidelity Asset Manager 70% | Borrower | $9,219,800 | 1.12% | $1,440 |
| Fidelity Asset Manager 85% | Borrower | $40,616,000 | .33% | $367 |
Interfund Trades. Funds may purchase from or sell securities to other Fidelity Funds under procedures adopted by the Board. The procedures have been designed to ensure these interfund trades are executed in accordance with Rule 17a-7 of the 1940 Act. Interfund trades are included within the respective purchases and sales amounts shown in the Purchases and Sales of Investments note.
Prior Fiscal Year Reallocation of Underlying Fund Investments. During the prior period, the investment adviser reallocated portions of investments of the Funds. This involved taxable redemptions of Fidelity Consumer Discretionary Central Fund and Fidelity Information Technology Central Fund for investments and non-taxable exchanges of those investments for shares of Fidelity Communication Services Central Fund. Fidelity Communication Services Central Fund, Fidelity Consumer Discretionary Central Fund and Fidelity Information Technology Central Fund are affiliated investment companies managed by FMR. Details of the transactions are presented in the accompanying table:
| Fund | Value of Investments Delivered – Consumer Discretionary Central Fund | Value of Investments Delivered – Information Technology Central Fund | Net Realized Gain (Loss) - Consumer Discretionary Central Fund | Net Realized Gain (Loss) - Information Technology Central Fund | Shares of Fidelity Communication Services Central Fund |
| Fidelity Asset Manager 20% | $8,287,816 | $22,064,168 | $143,269 | $(1,834,288) | 165,244 |
| Fidelity Asset Manager 30% | 4,191,630 | 11,133,993 | 40,707 | (1,174,655) | 83,437 |
| Fidelity Asset Manager 40% | 6,157,563 | 16,324,048 | 61,120 | (1,575,905) | 122,396 |
| Fidelity Asset Manager 50% | 42,393,850 | 112,638,454 | 2,128,212 | (7,094,704) | 844,035 |
| Fidelity Asset Manager 60% | 16,483,005 | 43,767,522 | 346,948 | (3,599,296) | 328,019 |
| Fidelity Asset Manager 70% | 34,458,735 | 91,443,178 | 4,889,713 | (3,189,830) | 685,442 |
| Fidelity Asset Manager 85% | 20,203,488 | 53,640,310 | 379,073 | (4,871,123) | 402,024 |
7. Committed Line of Credit.
Certain Funds participate with other funds managed by the investment adviser or an affiliate in a $4.25 billion credit facility (the "line of credit") to be utilized for temporary or emergency purposes to fund shareholder redemptions or for other short-term liquidity purposes. The participating funds have agreed to pay commitment fees on their pro-rata portion of the line of credit, which are reflected in Miscellaneous expenses on the Statement of Operations, and are as follows:
| | Amount |
| Fidelity Asset Manager 20% | $12,684 |
| Fidelity Asset Manager 30% | 4,452 |
| Fidelity Asset Manager 40% | 4,539 |
| Fidelity Asset Manager 50% | 22,768 |
| Fidelity Asset Manager 60% | 7,567 |
| Fidelity Asset Manager 70% | 12,916 |
| Fidelity Asset Manager 85% | 6,309 |
During the period, there were no borrowings on this line of credit.
8. Security Lending.
Certain Funds lend portfolio securities from time to time in order to earn additional income. Lending agents are used, including National Financial Services (NFS), an affiliate of the Funds. Pursuant to a securities lending agreement, NFS will receive a fee, which is capped at 9.9% of a Fund's daily lending revenue, for its services as lending agent. The Funds may lend securities to certain qualified borrowers, including NFS. On the settlement date of the loan, each applicable Fund receives collateral (in the form of U.S. Treasury obligations, letters of credit and/or cash) against the loaned securities and maintains collateral in an amount not less than 100% of the market value of the loaned securities during the period of the loan. The market value of the loaned securities is determined at the close of business of the Funds and any additional required collateral is delivered to the Funds on the next business day. The Funds or borrower may terminate the loan at any time, and if the borrower defaults on its obligation to return the securities loaned because of insolvency or other reasons, the Funds may apply collateral received from the borrower against the obligation. The Funds may experience delays and costs in recovering the securities loaned. Any cash collateral received is invested in the Fidelity Securities Lending Cash Central Fund. The value of loaned securities and cash collateral at period end are disclosed on each applicable Fund's Statement of Assets and Liabilities. Security lending income represents the income earned on investing cash collateral, less rebates paid to borrowers and any lending agent fees associated with the loan, plus any premium payments received for lending certain types of securities. Total security lending income is presented on each applicable Fund's Statement of Operations as a component of interest income. Net income from Fidelity Central Funds is presented in the Statement of Operations as a component of income from Fidelity Central Funds. During the period, there were no securities loaned to NFS. Affiliated security lending activity was as follows:
| | Total Security Lending Income Fees Paid to NFS |
| Fidelity Asset Manager 20% | $880 |
| Fidelity Asset Manager 30% | $304 |
| Fidelity Asset Manager 40% | $316 |
| Fidelity Asset Manager 50% | $2,739 |
| Fidelity Asset Manager 60% | $2,477 |
| Fidelity Asset Manager 70% | $2,709 |
| Fidelity Asset Manager 85% | $2,382 |
9. Expense Reductions.
The investment adviser voluntarily agreed to reimburse expenses of each class of each Fund to the extent annual operating expenses exceeded certain levels of class-level average net assets as noted in the table below. Some expenses, for example the compensation of the independent Trustees, and certain miscellaneous expenses such as proxy and shareholder meeting expenses, are excluded from this reimbursement.
Commissions paid to certain brokers with whom the investment adviser, or its affiliates, places trades on behalf of certain Funds and certain Central Funds include an amount in addition to trade execution, which may be rebated back to the Funds to offset certain expenses. Through arrangements with each applicable Fund's custodian and each class' transfer agent, credits realized as a result of certain uninvested cash balances were used to reduce each applicable Fund's or class' expenses. All of the applicable expense reductions are noted in the table below.
| | Custodian credits | Transfer Agent credits |
| Fidelity Asset Manager 30% | $105 | $– |
| Fidelity Asset Manager 50%- Class C | – | 6 |
| Fidelity Asset Manager 60% | 17 | – |
| Fidelity Asset Manager 60%- Class C | – | 107 |
| Fidelity Asset Manager 70% | 24 | – |
| Fidelity Asset Manager 70%- Class C | – | 51 |
During the period the investment adviser or an affiliate reimbursed and/or waived a portion of fund-level operating expenses as follows:
| | Fund-Level Amount |
| Fidelity Asset Manager 20% | $10,502 |
| Fidelity Asset Manager 30% | 3,744 |
| Fidelity Asset Manager 40% | 3,831 |
| Fidelity Asset Manager 50% | 38,626 |
| Fidelity Asset Manager 60% | 13,209 |
| Fidelity Asset Manager 70% | 22,187 |
| Fidelity Asset Manager 85% | 10,773 |
In addition, during the period the investment advisor reimbursed and/or waived a portion of class-level operating expenses for Fidelity Asset Manager 60% as follows:
| Class A | $6,913 |
| Class M | 6,280 |
| Class C | 18,191 |
| Asset Manager 60% | 129,169 |
| Class I | 6,013 |
In addition, during the period the investment adviser or an affiliate reimbursed certain Funds for an operational error which is included in the accompanying Statements of Operations as follows:
| | Amount |
| Fidelity Asset Manager 20% | $54,700 |
| Fidelity Asset Manager 30% | 15,684 |
| Fidelity Asset Manager 40% | 12,780 |
| Fidelity Asset Manager 50% | 57,881 |
| Fidelity Asset Manager 60% | 19,881 |
| Fidelity Asset Manager 70% | 59,917 |
| Fidelity Asset Manager 85% | 64,514 |
10. Distributions to Shareholders.
Distributions to shareholders of each class were as follows:
| | Year ended
September 30, 2020 | Year ended
September 30, 2019(a) |
| Fidelity Asset Manager 20% | | |
| Distributions to shareholders | | |
| Class A | $1,047,253 | $1,570,089 |
| Class M | 544,284 | 853,990 |
| Class C | 341,314 | 750,350 |
| Asset Manager 20% | 135,291,379 | 197,910,628 |
| Class I | 805,412 | 2,102,579 |
| Class Z | 392,536 | 96,225 |
| Total | $138,422,178 | $203,283,861 |
| Fidelity Asset Manager 30% | | |
| Distributions to shareholders | | |
| Class A | $1,114,224 | $1,064,432 |
| Class M | 404,331 | 465,273 |
| Class C | 496,433 | 649,283 |
| Asset Manager 30% | 52,618,026 | 57,158,889 |
| Class I | 531,363 | 838,803 |
| Class Z | 234,552 | 25,428 |
| Total | $55,398,929 | $60,202,108 |
| Fidelity Asset Manager 40% | | |
| Distributions to shareholders | | |
| Class A | $1,365,211 | $1,545,456 |
| Class M | 321,540 | 435,794 |
| Class C | 584,935 | 842,658 |
| Asset Manager 40% | 62,567,740 | 68,760,660 |
| Class I | 900,071 | 1,275,964 |
| Class Z | 258,028 | 35,855 |
| Total | $65,997,525 | $72,896,387 |
| Fidelity Asset Manager 50% | | |
| Distributions to shareholders | | |
| Class A | $3,722,876 | $3,996,439 |
| Class M | 1,560,275 | 1,784,787 |
| Class C | 1,430,031 | 1,996,139 |
| Asset Manager 50% | 374,544,054 | 438,008,262 |
| Class I | 2,307,393 | 3,132,584 |
| Class Z | 909,596 | 68,671 |
| Total | $384,474,225 | $448,986,882 |
| Fidelity Asset Manager 60% | | |
| Distributions to shareholders | | |
| Class A | $4,887,126 | $4,620,358 |
| Class M | 1,798,452 | 1,832,629 |
| Class C | 2,040,018 | 2,563,749 |
| Asset Manager 60% | 118,388,823 | 103,779,288 |
| Class I | 2,275,067 | 2,198,007 |
| Class Z | 822,762 | 64,358 |
| Total | $130,212,248 | $115,058,389 |
| Fidelity Asset Manager 70% | | |
| Distributions to shareholders | | |
| Class A | $8,330,466 | $7,809,044 |
| Class M | 3,020,563 | 2,855,665 |
| Class C | 1,699,457 | 2,669,934 |
| Asset Manager 70% | 260,996,019 | 265,505,010 |
| Class I | 3,504,873 | 3,847,572 |
| Class Z | 1,294,247 | 116,778 |
| Total | $278,845,625 | $282,804,003 |
| Fidelity Asset Manager 85% | | |
| Distributions to shareholders | | |
| Class A | $6,897,564 | $5,200,546 |
| Class M | 1,918,803 | 1,347,043 |
| Class C | 1,881,183 | 1,821,178 |
| Asset Manager 85% | 130,727,910 | 108,378,709 |
| Class I | 1,813,683 | 1,684,051 |
| Class Z | 1,476,890 | 55,180 |
| Total | $144,716,033 | $118,486,707 |
(a) Distributions for Class Z are for the period October 2, 2018 (commencement of sale of shares) to September 30, 2019.
11. Share Transactions.
Share transactions for each class were as follows and may contain automatic conversions between classes or exchanges between affiliated funds:
| | Shares | Shares | Dollars | Dollars |
| | Year ended September 30, 2020 | Year ended September 30, 2019 (a) | Year ended September 30, 2020 | Year ended September 30, 2019 (a) |
| Fidelity Asset Manager 20% | | | | |
| Class A | | | | |
| Shares sold | 1,236,570 | 1,076,995 | $16,874,456 | $14,164,488 |
| Reinvestment of distributions | 74,594 | 119,700 | 1,013,447 | 1,541,758 |
| Shares redeemed | (1,035,946) | (772,609) | (13,890,115) | (10,227,558) |
| Net increase (decrease) | 275,218 | 424,086 | $3,997,788 | $5,478,688 |
| Class M | | | | |
| Shares sold | 507,392 | 525,062 | $6,933,662 | $6,854,314 |
| Reinvestment of distributions | 40,146 | 66,514 | 544,277 | 853,929 |
| Shares redeemed | (494,146) | (341,369) | (6,557,902) | (4,504,638) |
| Net increase (decrease) | 53,392 | 250,207 | $920,037 | $3,203,605 |
| Class C | | | | |
| Shares sold | 673,653 | 402,887 | $9,061,855 | $5,242,455 |
| Reinvestment of distributions | 24,917 | 58,472 | 336,063 | 743,631 |
| Shares redeemed | (512,971) | (806,464) | (6,888,316) | (10,531,960) |
| Net increase (decrease) | 185,599 | (345,105) | $2,509,602 | $(4,545,874) |
| Asset Manager 20% | | | | |
| Shares sold | 94,790,013 | 66,149,537 | $1,292,345,919 | $871,652,401 |
| Reinvestment of distributions | 9,663,111 | 14,872,126 | 131,460,543 | 191,983,773 |
| Shares redeemed | (89,697,201) | (71,506,369) | (1,205,331,923) | (941,269,313) |
| Net increase (decrease) | 14,755,923 | 9,515,294 | $218,474,539 | $122,366,861 |
| Class I | | | | |
| Shares sold | 2,086,707 | 2,345,273 | $28,024,629 | $30,866,592 |
| Reinvestment of distributions | 55,012 | 155,469 | 748,319 | 2,005,770 |
| Shares redeemed | (1,718,223) | (4,242,395) | (23,646,385) | (56,989,755) |
| Net increase (decrease) | 423,496 | (1,741,653) | $5,126,563 | $(24,117,393) |
| Class Z | | | | |
| Shares sold | 907,294 | 1,171,455 | $12,210,909 | $15,700,808 |
| Reinvestment of distributions | 26,316 | 6,689 | 357,878 | 87,392 |
| Shares redeemed | (716,902) | (98,205) | (9,657,904) | (1,316,332) |
| Net increase (decrease) | 216,708 | 1,079,939 | $2,910,883 | $14,471,868 |
| Fidelity Asset Manager 30% | | | | |
| Class A | | | | |
| Shares sold | 1,613,727 | 1,220,772 | $18,316,059 | $13,341,328 |
| Reinvestment of distributions | 96,160 | 98,431 | 1,090,503 | 1,045,047 |
| Shares redeemed | (707,003) | (605,637) | (7,868,741) | (6,632,447) |
| Net increase (decrease) | 1,002,884 | 713,566 | $11,537,821 | $7,753,928 |
| Class M | | | | |
| Shares sold | 827,922 | 543,815 | $9,402,242 | $5,910,874 |
| Reinvestment of distributions | 35,669 | 43,923 | 404,000 | 464,829 |
| Shares redeemed | (584,915) | (439,927) | (6,631,605) | (4,775,700) |
| Net increase (decrease) | 278,676 | 147,811 | $3,174,637 | $1,600,003 |
| Class C | | | | |
| Shares sold | 678,550 | 592,679 | $7,593,623 | $6,424,554 |
| Reinvestment of distributions | 44,056 | 61,860 | 496,412 | 647,237 |
| Shares redeemed | (543,827) | (734,303) | (6,089,829) | (7,898,531) |
| Net increase (decrease) | 178,779 | (79,764) | $2,000,206 | $(826,740) |
| Asset Manager 30% | | | | |
| Shares sold | 57,264,105 | 40,462,622 | $653,842,994 | $441,835,826 |
| Reinvestment of distributions | 4,542,192 | 5,259,826 | 51,497,537 | 55,858,340 |
| Shares redeemed | (45,455,537) | (30,790,576) | (501,921,164) | (334,859,982) |
| Net increase (decrease) | 16,350,760 | 14,931,872 | $203,419,367 | $162,834,184 |
| Class I | | | | |
| Shares sold | 795,002 | 739,663 | $9,016,722 | $7,965,553 |
| Reinvestment of distributions | 42,944 | 73,108 | 487,262 | 773,701 |
| Shares redeemed | (899,210) | (1,257,954) | (9,836,835) | (13,589,898) |
| Net increase (decrease) | (61,264) | (445,183) | $(332,851) | $(4,850,644) |
| Class Z | | | | |
| Shares sold | 907,601 | 700,893 | $10,097,987 | $7,806,101 |
| Reinvestment of distributions | 19,079 | 2,177 | 216,026 | 23,697 |
| Shares redeemed | (758,348) | (48,782) | (8,437,658) | (537,544) |
| Net increase (decrease) | 168,332 | 654,288 | $1,876,355 | $7,292,254 |
| Fidelity Asset Manager 40% | | | | |
| Class A | | | | |
| Shares sold | 1,186,058 | 880,005 | $14,340,167 | $10,047,509 |
| Reinvestment of distributions | 114,622 | 140,646 | 1,363,886 | 1,544,493 |
| Shares redeemed | (974,515) | (632,691) | (11,290,067) | (7,230,104) |
| Net increase (decrease) | 326,165 | 387,960 | $4,413,986 | $4,361,898 |
| Class M | | | | |
| Shares sold | 208,441 | 150,421 | $2,493,352 | $1,707,007 |
| Reinvestment of distributions | 26,676 | 39,754 | 317,668 | 434,340 |
| Shares redeemed | (205,948) | (304,960) | (2,387,718) | (3,473,210) |
| Net increase (decrease) | 29,169 | (114,785) | $423,302 | $(1,331,863) |
| Class C | | | | |
| Shares sold | 537,448 | 750,123 | $6,458,877 | $8,467,907 |
| Reinvestment of distributions | 48,933 | 77,656 | 584,086 | 840,965 |
| Shares redeemed | (769,766) | (888,099) | (9,007,800) | (10,095,911) |
| Net increase (decrease) | (183,385) | (60,320) | $(1,964,837) | $(787,039) |
| Asset Manager 40% | | | | |
| Shares sold | 45,690,343 | 35,364,642 | $537,500,435 | $403,093,364 |
| Reinvestment of distributions | 5,159,338 | 6,109,794 | 61,202,157 | 67,189,214 |
| Shares redeemed | (42,055,405) | (30,082,193) | (488,076,595) | (343,351,558) |
| Net increase (decrease) | 8,794,276 | 11,392,243 | $110,625,997 | $126,931,020 |
| Class I | | | | |
| Shares sold | 911,020 | 1,403,118 | $10,724,320 | $16,068,114 |
| Reinvestment of distributions | 54,373 | 107,467 | 645,573 | 1,176,252 |
| Shares redeemed | (783,686) | (1,852,592) | (9,055,527) | (21,121,738) |
| Net increase (decrease) | 181,707 | (342,007) | $2,314,366 | $(3,877,372) |
| Class Z | | | | |
| Shares sold | 1,018,164 | 645,200 | $12,385,997 | $7,464,738 |
| Reinvestment of distributions | 19,635 | 2,221 | 233,117 | 24,784 |
| Shares redeemed | (587,778) | (103,336) | (6,969,861) | (1,186,123) |
| Net increase (decrease) | 450,021 | 544,085 | $5,649,253 | $6,303,399 |
| Fidelity Asset Manager 50% | | | | |
| Class A | | | | |
| Shares sold | 1,272,915 | 1,443,505 | $23,232,597 | $25,457,008 |
| Reinvestment of distributions | 196,552 | 231,706 | 3,615,572 | 3,872,049 |
| Shares redeemed | (1,212,215) | (1,073,579) | (21,831,524) | (18,901,055) |
| Net increase (decrease) | 257,252 | 601,632 | $5,016,645 | $10,428,002 |
| Class M | | | | |
| Shares sold | 763,612 | 667,143 | $13,614,291 | $11,752,837 |
| Reinvestment of distributions | 84,512 | 107,157 | 1,556,386 | 1,783,386 |
| Shares redeemed | (857,625) | (651,653) | (15,596,163) | (11,566,385) |
| Net increase (decrease) | (9,501) | 122,647 | $(425,486) | $1,969,838 |
| Class C | | | | |
| Shares sold | 663,600 | 1,305,395 | $12,089,845 | $22,806,142 |
| Reinvestment of distributions | 75,298 | 117,916 | 1,385,535 | 1,935,521 |
| Shares redeemed | (965,044) | (1,636,010) | (17,295,838) | (28,595,591) |
| Net increase (decrease) | (226,146) | (212,699) | $(3,820,458) | $(3,853,928) |
| Asset Manager 50% | | | | |
| Shares sold | 60,849,973 | 54,785,784 | $1,127,833,325 | $966,130,506 |
| Reinvestment of distributions | 19,718,538 | 25,288,314 | 363,251,514 | 425,023,390 |
| Shares redeemed | (90,358,681) | (76,778,644) | (1,630,112,305) | (1,359,748,171) |
| Net increase (decrease) | (9,790,170) | 3,295,454 | $(139,027,466) | $31,405,725 |
| Class I | | | | |
| Shares sold | 886,404 | 1,454,781 | $16,201,813 | $25,370,030 |
| Reinvestment of distributions | 119,334 | 167,220 | 2,196,933 | 2,808,958 |
| Shares redeemed | (1,569,039) | (2,296,004) | (27,649,699) | (40,444,579) |
| Net increase (decrease) | (563,301) | (674,003) | $(9,250,953) | $(12,265,591) |
| Class Z | | | | |
| Shares sold | 626,408 | 1,281,072 | $11,604,899 | $22,995,157 |
| Reinvestment of distributions | 48,080 | 2,953 | 883,181 | 49,780 |
| Shares redeemed | (447,751) | (135,503) | (7,996,309) | (2,422,709) |
| Net increase (decrease) | 226,737 | 1,148,522 | $4,491,771 | $20,622,228 |
| Fidelity Asset Manager 60% | | | | |
| Class A | | | | |
| Shares sold | 1,519,736 | 1,961,876 | $19,407,817 | $23,979,037 |
| Reinvestment of distributions | 373,649 | 411,701 | 4,838,750 | 4,590,464 |
| Shares redeemed | (2,428,371) | (2,380,876) | (30,337,949) | (29,058,912) |
| Net increase (decrease) | (534,986) | (7,299) | $(6,091,382) | $(489,411) |
| Class M | | | | |
| Shares sold | 738,905 | 500,974 | $8,900,392 | $6,117,219 |
| Reinvestment of distributions | 139,189 | 164,098 | 1,794,101 | 1,821,484 |
| Shares redeemed | (1,206,119) | (1,008,020) | (15,280,343) | (12,281,935) |
| Net increase (decrease) | (328,025) | (342,948) | $(4,585,850) | $(4,343,232) |
| Class C | | | | |
| Shares sold | 603,810 | 941,240 | $7,537,745 | $11,217,922 |
| Reinvestment of distributions | 158,223 | 231,593 | 2,018,918 | 2,542,893 |
| Shares redeemed | (1,569,592) | (2,562,163) | (19,411,347) | (30,607,485) |
| Net increase (decrease) | (807,559) | (1,389,330) | $(9,854,684) | $(16,846,670) |
| Asset Manager 60% | | | | |
| Shares sold | 43,543,753 | 40,571,133 | $564,708,397 | $494,494,742 |
| Reinvestment of distributions | 8,944,044 | 9,083,022 | 116,272,570 | 101,548,182 |
| Shares redeemed | (50,151,526) | (42,208,495) | (622,178,796) | (517,322,203) |
| Net increase (decrease) | 2,336,271 | 7,445,660 | $58,802,171 | $78,720,721 |
| Class I | | | | |
| Shares sold | 904,234 | 1,213,753 | $11,703,079 | $14,876,598 |
| Reinvestment of distributions | 168,860 | 190,817 | 2,196,874 | 2,135,246 |
| Shares redeemed | (1,646,479) | (1,961,572) | (20,798,251) | (23,947,526) |
| Net increase (decrease) | (573,385) | (557,002) | $(6,898,298) | $(6,935,682) |
| Class Z | | | | |
| Shares sold | 539,929 | 1,643,355 | $6,989,509 | $20,494,674 |
| Reinvestment of distributions | 62,040 | 5,016 | 805,905 | 56,082 |
| Shares redeemed | (480,572) | (149,349) | (5,943,466) | (1,869,426) |
| Net increase (decrease) | 121,397 | 1,499,022 | $1,851,948 | $18,681,330 |
| Fidelity Asset Manager 70% | | | | |
| Class A | | | | |
| Shares sold | 1,141,883 | 1,662,490 | $24,918,970 | $35,520,153 |
| Reinvestment of distributions | 355,332 | 388,496 | 8,048,258 | 7,517,406 |
| Shares redeemed | (1,404,623) | (1,251,913) | (30,763,764) | (26,764,008) |
| Net increase (decrease) | 92,592 | 799,073 | $2,203,464 | $16,273,551 |
| Class M | | | | |
| Shares sold | 460,603 | 455,301 | $10,225,927 | $9,738,075 |
| Reinvestment of distributions | 132,379 | 146,493 | 3,001,040 | 2,837,567 |
| Shares redeemed | (506,272) | (410,098) | (11,008,175) | (8,759,862) |
| Net increase (decrease) | 86,710 | 191,696 | $2,218,792 | $3,815,780 |
| Class C | | | | |
| Shares sold | 211,446 | 376,088 | $4,647,063 | $7,978,727 |
| Reinvestment of distributions | 73,995 | 136,642 | 1,673,759 | 2,637,190 |
| Shares redeemed | (504,181) | (1,330,309) | (10,840,748) | (28,228,288) |
| Net increase (decrease) | (218,740) | (817,579) | $(4,519,926) | $(17,612,371) |
| Asset Manager 70% | | | | |
| Shares sold | 26,345,068 | 22,236,481 | $589,948,425 | $476,736,763 |
| Reinvestment of distributions | 11,312,502 | 13,471,969 | 256,341,296 | 260,682,604 |
| Shares redeemed | (38,207,267) | (34,001,960) | (827,857,092) | (732,088,853) |
| Net increase (decrease) | (549,697) | 1,706,490 | $18,432,629 | $5,330,514 |
| Class I | | | | |
| Shares sold | 491,055 | 570,797 | $10,371,232 | $12,336,527 |
| Reinvestment of distributions | 149,933 | 193,412 | 3,400,479 | 3,744,456 |
| Shares redeemed | (2,098,785) | (890,092) | (47,556,690) | (19,414,041) |
| Net increase (decrease) | (1,457,797) | (125,883) | $(33,784,979) | $(3,333,058) |
| Class Z | | | | |
| Shares sold | 340,136 | 1,173,781 | $7,453,305 | $25,619,376 |
| Reinvestment of distributions | 56,034 | 4,742 | 1,268,608 | 91,659 |
| Shares redeemed | (303,064) | (60,826) | (6,649,041) | (1,327,749) |
| Net increase (decrease) | 93,106 | 1,117,697 | $2,072,872 | $24,383,286 |
| Fidelity Asset Manager 85% | | | | |
| Class A | | | | |
| Shares sold | 1,356,661 | 1,539,093 | $25,433,750 | $28,651,994 |
| Reinvestment of distributions | 345,662 | 312,814 | 6,864,842 | 5,177,085 |
| Shares redeemed | (1,283,567) | (1,036,785) | (24,654,272) | (19,361,909) |
| Net increase (decrease) | 418,756 | 815,122 | $7,644,320 | $14,467,170 |
| Class M | | | | |
| Shares sold | 530,547 | 408,976 | $10,264,160 | $7,515,511 |
| Reinvestment of distributions | 96,860 | 81,489 | 1,912,018 | 1,342,127 |
| Shares redeemed | (406,879) | (288,263) | (7,319,857) | (5,324,572) |
| Net increase (decrease) | 220,528 | 202,202 | $4,856,321 | $3,533,066 |
| Class C | | | | |
| Shares sold | 522,589 | 399,353 | $9,739,367 | $7,283,539 |
| Reinvestment of distributions | 95,347 | 110,678 | 1,864,988 | 1,805,155 |
| Shares redeemed | (588,556) | (883,911) | (11,008,225) | (16,190,058) |
| Net increase (decrease) | 29,380 | (373,880) | $596,130 | $(7,101,364) |
| Asset Manager 85% | | | | |
| Shares sold | 21,647,655 | 16,410,898 | $424,199,489 | $305,856,561 |
| Reinvestment of distributions | 6,423,778 | 6,405,540 | 128,732,513 | 106,844,397 |
| Shares redeemed | (24,686,554) | (21,581,610) | (467,426,526) | (405,780,272) |
| Net increase (decrease) | 3,384,879 | 1,234,828 | $85,505,476 | $6,920,686 |
| Class I | | | | |
| Shares sold | 490,352 | 639,230 | $9,391,597 | $11,730,512 |
| Reinvestment of distributions | 88,373 | 98,286 | 1,766,573 | 1,635,471 |
| Shares redeemed | (1,078,449) | (1,367,138) | (20,506,055) | (25,901,193) |
| Net increase (decrease) | (499,724) | (629,622) | $(9,347,885) | $(12,535,210) |
| Class Z | | | | |
| Shares sold | 639,664 | 1,244,769 | $12,234,121 | $23,601,000 |
| Reinvestment of distributions | 72,240 | 1,771 | 1,440,458 | 29,410 |
| Shares redeemed | (728,045) | (47,887) | (13,625,769) | (900,899) |
| Net increase (decrease) | (16,141) | 1,198,653 | $48,810 | $22,729,511 |
(a) Share transactions for Class Z are for the period October 2, 2018 (commencement of sale of shares) to September 30, 2019.
12. Other.
The Funds' organizational documents provide former and current trustees and officers with a limited indemnification against liabilities arising in connection with the performance of their duties to the Funds. In the normal course of business, the Funds may also enter into contracts that provide general indemnifications. The Funds' maximum exposure under these arrangements is unknown as this would be dependent on future claims that may be made against the Funds. The risk of material loss from such claims is considered remote.
At the end of the period, a shareholder of record owned more than 25% of the total outstanding shares of the following Fund:
| Fund | % of shares held |
| Fidelity Asset Manager 60% | 31% |
| Fidelity Asset Manager 70% | 26% |
| Fidelity Asset Manager 85% | 29% |
13. Coronavirus (COVID-19) Pandemic.
An outbreak of COVID-19 first detected in China during December 2019 has since spread globally and was declared a pandemic by the World Health Organization during March 2020. Developments that disrupt global economies and financial markets, such as the COVID-19 pandemic, may magnify factors that affect the Funds' performance.
Report of Independent Registered Public Accounting Firm
To the Board of Trustees of Fidelity Charles Street Trust and the Shareholders of Fidelity Asset Manager 20%, Fidelity Asset Manager 30%, Fidelity Asset Manager 40%, Fidelity Asset Manager 50%, Fidelity Asset Manager 60%, Fidelity Asset Manager 70% and Fidelity Asset Manager 85%:
Opinion on the Financial Statements and Financial Highlights
We have audited the accompanying statements of assets and liabilities of Fidelity Asset Manager 20%, Fidelity Asset Manager 30%, Fidelity Asset Manager 40%, Fidelity Asset Manager 50%, Fidelity Asset Manager 60%, Fidelity Asset Manager 70% and Fidelity Asset Manager 85% (the "Funds"), each a fund of Fidelity Charles Street Trust, including the schedules of investments, as of September 30, 2020, the related statements of operations for the year then ended, the statements of changes in net assets for each of the two years in the period then ended, the financial highlights for each of the five years in the period then ended, and the related notes. In our opinion, the financial statements and financial highlights present fairly, in all material respects, the financial position of each of the Funds as of September 30, 2020, and the results of their operations for the year then ended, the changes in their net assets for each of the two years in the period then ended, and the financial highlights for each of the five years in the period then ended in conformity with accounting principles generally accepted in the United States of America.
Basis for Opinion
These financial statements and financial highlights are the responsibility of the Funds’ management. Our responsibility is to express an opinion on the Funds’ financial statements and financial highlights based on our audits. We are a public accounting firm registered with the Public Company Accounting Oversight Board (United States) (PCAOB) and are required to be independent with respect to the Funds in accordance with the U.S. federal securities laws and the applicable rules and regulations of the Securities and Exchange Commission and the PCAOB.
We conducted our audits in accordance with the standards of the PCAOB. Those standards require that we plan and perform the audit to obtain reasonable assurance about whether the financial statements and financial highlights are free of material misstatement, whether due to error or fraud. The Funds are not required to have, nor were we engaged to perform, an audit of their internal control over financial reporting. As part of our audits we are required to obtain an understanding of internal control over financial reporting but not for the purpose of expressing an opinion on the effectiveness of the Funds’ internal control over financial reporting. Accordingly, we express no such opinion.
Our audits included performing procedures to assess the risks of material misstatement of the financial statements and financial highlights, whether due to error or fraud, and performing procedures that respond to those risks. Such procedures included examining, on a test basis, evidence regarding the amounts and disclosures in the financial statements and financial highlights. Our audits also included evaluating the accounting principles used and significant estimates made by management, as well as evaluating the overall presentation of the financial statements and financial highlights. Our procedures included confirmation of securities owned as of September 30, 2020, by correspondence with the custodian and brokers; when replies were not received from brokers, we performed other auditing procedures. We believe that our audits provide a reasonable basis for our opinion.
/s/ Deloitte & Touche LLP
Boston, Massachusetts
November 13, 2020
We have served as the auditor of one or more of the Fidelity investment companies since 1999.
Trustees and Officers
The Trustees, Members of the Advisory Board (if any), and officers of the trust and funds, as applicable, are listed below. The Board of Trustees governs each fund and is responsible for protecting the interests of shareholders. The Trustees are experienced executives who meet periodically throughout the year to oversee each fund's activities, review contractual arrangements with companies that provide services to each fund, oversee management of the risks associated with such activities and contractual arrangements, and review each fund's performance. Each of the Trustees oversees 280 funds.
The Trustees hold office without limit in time except that (a) any Trustee may resign; (b) any Trustee may be removed by written instrument, signed by at least two-thirds of the number of Trustees prior to such removal; (c) any Trustee who requests to be retired or who has become incapacitated by illness or injury may be retired by written instrument signed by a majority of the other Trustees; and (d) any Trustee may be removed at any special meeting of shareholders by a two-thirds vote of the outstanding voting securities of the trust. Each Trustee who is not an interested person (as defined in the 1940 Act) of the trust and the funds is referred to herein as an Independent Trustee. Each Independent Trustee shall retire not later than the last day of the calendar year in which his or her 75th birthday occurs. The Independent Trustees may waive this mandatory retirement age policy with respect to individual Trustees. Officers and Advisory Board Members hold office without limit in time, except that any officer or Advisory Board Member may resign or may be removed by a vote of a majority of the Trustees at any regular meeting or any special meeting of the Trustees. Except as indicated, each individual has held the office shown or other offices in the same company for the past five years.
Each fund's Statement of Additional Information (SAI) includes more information about the Trustees. To request a free copy, call Fidelity at 1-800-544-8544 if you’re an individual investing directly with Fidelity, call 1-800-835-5092 if you’re a plan sponsor or participant with Fidelity as your recordkeeper or call 1-877-208-0098 on institutional accounts or if you’re an advisor or invest through one.
Experience, Skills, Attributes, and Qualifications of the Trustees. The Governance and Nominating Committee has adopted a statement of policy that describes the experience, qualifications, attributes, and skills that are necessary and desirable for potential Independent Trustee candidates (Statement of Policy). The Board believes that each Trustee satisfied at the time he or she was initially elected or appointed a Trustee, and continues to satisfy, the standards contemplated by the Statement of Policy. The Governance and Nominating Committee also engages professional search firms to help identify potential Independent Trustee candidates who have the experience, qualifications, attributes, and skills consistent with the Statement of Policy. From time to time, additional criteria based on the composition and skills of the current Independent Trustees, as well as experience or skills that may be appropriate in light of future changes to board composition, business conditions, and regulatory or other developments, have also been considered by the professional search firms and the Governance and Nominating Committee. In addition, the Board takes into account the Trustees' commitment and participation in Board and committee meetings, as well as their leadership of standing and ad hoc committees throughout their tenure.
In determining that a particular Trustee was and continues to be qualified to serve as a Trustee, the Board has considered a variety of criteria, none of which, in isolation, was controlling. The Board believes that, collectively, the Trustees have balanced and diverse experience, qualifications, attributes, and skills, which allow the Board to operate effectively in governing each fund and protecting the interests of shareholders. Information about the specific experience, skills, attributes, and qualifications of each Trustee, which in each case led to the Board's conclusion that the Trustee should serve (or continue to serve) as a trustee of the funds, is provided below.
Board Structure and Oversight Function. Abigail P. Johnson is an interested person and currently serves as Chairman. The Trustees have determined that an interested Chairman is appropriate and benefits shareholders because an interested Chairman has a personal and professional stake in the quality and continuity of services provided to the funds. Independent Trustees exercise their informed business judgment to appoint an individual of their choosing to serve as Chairman, regardless of whether the Trustee happens to be independent or a member of management. The Independent Trustees have determined that they can act independently and effectively without having an Independent Trustee serve as Chairman and that a key structural component for assuring that they are in a position to do so is for the Independent Trustees to constitute a substantial majority for the Board. The Independent Trustees also regularly meet in executive session. Arthur E. Johnson serves as Chairman of the Independent Trustees and as such (i) acts as a liaison between the Independent Trustees and management with respect to matters important to the Independent Trustees and (ii) with management prepares agendas for Board meetings.
Fidelity® funds are overseen by different Boards of Trustees. The funds' Board oversees Fidelity's investment-grade bond, money market, asset allocation and certain equity funds, and other Boards oversee Fidelity's high income and other equity funds. The asset allocation funds may invest in Fidelity® funds that are overseen by such other Boards. The use of separate Boards, each with its own committee structure, allows the Trustees of each group of Fidelity® funds to focus on the unique issues of the funds they oversee, including common research, investment, and operational issues. On occasion, the separate Boards establish joint committees to address issues of overlapping consequences for the Fidelity® funds overseen by each Board.
The Trustees operate using a system of committees to facilitate the timely and efficient consideration of all matters of importance to the Trustees, each fund, and fund shareholders and to facilitate compliance with legal and regulatory requirements and oversight of the funds' activities and associated risks. The Board, acting through its committees, has charged FMR and its affiliates with (i) identifying events or circumstances the occurrence of which could have demonstrably adverse effects on the funds' business and/or reputation; (ii) implementing processes and controls to lessen the possibility that such events or circumstances occur or to mitigate the effects of such events or circumstances if they do occur; and (iii) creating and maintaining a system designed to evaluate continuously business and market conditions in order to facilitate the identification and implementation processes described in (i) and (ii) above. Because the day-to-day operations and activities of the funds are carried out by or through FMR, its affiliates, and other service providers, the funds' exposure to risks is mitigated but not eliminated by the processes overseen by the Trustees. While each of the Board's committees has responsibility for overseeing different aspects of the funds' activities, oversight is exercised primarily through the Operations and Audit Committees. In addition, an ad hoc Board committee of Independent Trustees has worked with FMR to enhance the Board's oversight of investment and financial risks, legal and regulatory risks, technology risks, and operational risks, including the development of additional risk reporting to the Board. Appropriate personnel, including but not limited to the funds' Chief Compliance Officer (CCO), FMR's internal auditor, the independent accountants, the funds' Treasurer and portfolio management personnel, make periodic reports to the Board's committees, as appropriate, including an annual review of Fidelity's risk management program for the Fidelity® funds. The responsibilities of each standing committee, including their oversight responsibilities, are described further under "Standing Committees of the Trustees."
Interested Trustees*:
Correspondence intended for a Trustee who is an interested person may be sent to Fidelity Investments, 245 Summer Street, Boston, Massachusetts 02210.
Name, Year of Birth; Principal Occupations and Other Relevant Experience+
Abigail P. Johnson (1961)
Year of Election or Appointment: 2009
Trustee
Chairman of the Board of Trustees
Ms. Johnson also serves as Trustee of other Fidelity® funds. Ms. Johnson serves as Chairman (2016-present), Chief Executive Officer (2014-present), and Director (2007-present) of FMR LLC (diversified financial services company), President of Fidelity Financial Services (2012-present) and President of Personal, Workplace and Institutional Services (2005-present). Ms. Johnson is Chairman and Director of Fidelity Management & Research Company LLC (investment adviser firm, 2011-present). Previously, Ms. Johnson served as Chairman and Director of FMR Co., Inc. (investment adviser firm, 2011-2019), Vice Chairman (2007-2016) and President (2013-2016) of FMR LLC, President and a Director of Fidelity Management & Research Company (2001-2005), a Trustee of other investment companies advised by Fidelity Management & Research Company, Fidelity Investments Money Management, Inc. (investment adviser firm), and FMR Co., Inc. (2001-2005), Senior Vice President of the Fidelity® funds (2001-2005), and managed a number of Fidelity® funds. Ms. Abigail P. Johnson and Mr. Arthur E. Johnson are not related.
Jennifer Toolin McAuliffe (1959)
Year of Election or Appointment: 2016
Trustee
Ms. McAuliffe also serves as Trustee of other Fidelity® funds. Previously, Ms. McAuliffe served as Co-Head of Fixed Income of Fidelity Investments Limited (now known as FIL Limited (FIL)) (diversified financial services company), Director of Research for FIL’s credit and quantitative teams in London, Hong Kong and Tokyo and Director of Research for taxable and municipal bonds at Fidelity Investments Money Management, Inc. Ms. McAuliffe previously served as a member of the Advisory Board of certain Fidelity® funds (2016). Ms. McAuliffe was previously a lawyer at Ropes & Gray LLP and currently serves as director or trustee of several not-for-profit entities.
* Determined to be an “Interested Trustee” by virtue of, among other things, his or her affiliation with the trust or various entities under common control with FMR.
+ The information includes the Trustee's principal occupation during the last five years and other information relating to the experience, attributes, and skills relevant to the Trustee's qualifications to serve as a Trustee, which led to the conclusion that the Trustee should serve as a Trustee for each fund.
Independent Trustees:
Correspondence intended for an Independent Trustee may be sent to Fidelity Investments, P.O. Box 55235, Boston, Massachusetts 02205-5235.
Name, Year of Birth; Principal Occupations and Other Relevant Experience+
Elizabeth S. Acton (1951)
Year of Election or Appointment: 2013
Trustee
Ms. Acton also serves as Trustee of other Fidelity® funds. Prior to her retirement, Ms. Acton served as Executive Vice President, Finance (2011-2012), Executive Vice President, Chief Financial Officer (2002-2011) and Treasurer (2004-2005) of Comerica Incorporated (financial services). Prior to joining Comerica, Ms. Acton held a variety of positions at Ford Motor Company (1983-2002), including Vice President and Treasurer (2000-2002) and Executive Vice President and Chief Financial Officer of Ford Motor Credit Company (1998-2000). Ms. Acton currently serves as a member of the Board and Audit and Finance Committees of Beazer Homes USA, Inc. (homebuilding, 2012-present). Ms. Acton previously served as a member of the Advisory Board of certain Fidelity® funds (2013-2016).
Ann E. Dunwoody (1953)
Year of Election or Appointment: 2018
Trustee
General Dunwoody also serves as Trustee of other Fidelity® funds. General Dunwoody (United States Army, Retired) was the first woman in U.S. military history to achieve the rank of four-star general and prior to her retirement in 2012 held a variety of positions within the U.S. Army, including Commanding General, U.S. Army Material Command (2008-2012). General Dunwoody currently serves as President of First to Four LLC (leadership and mentoring services, 2012-present), a member of the Board and Nomination and Corporate Governance Committees of Kforce Inc. (professional staffing services, 2016-present) and a member of the Board of Automattic Inc. (software engineering, 2018-present). Previously, General Dunwoody served as a member of the Advisory Board and Nominating and Corporate Governance Committee of L3 Technologies, Inc. (communication, electronic, sensor and aerospace systems, 2013-2019) and a member of the Board and Audit and Sustainability and Corporate Responsibility Committees of Republic Services, Inc. (waste collection, disposal and recycling, 2013-2016). Ms. Dunwoody also serves on several boards for non-profit organizations, including as a member of the Board, Chair of the Nomination and Governance Committee and a member of the Audit Committee of Logistics Management Institute (consulting non-profit, 2012-present), a member of the Council of Trustees for the Association of the United States Army (advocacy non-profit, 2013-present), a member of the Board of Florida Institute of Technology (2015-present) and a member of the Board of ThanksUSA (military family education non-profit, 2014-present). General Dunwoody previously served as a member of the Advisory Board of certain Fidelity® funds (2018).
John Engler (1948)
Year of Election or Appointment: 2014
Trustee
Mr. Engler also serves as Trustee of other Fidelity® funds. Previously, Mr. Engler served as Governor of Michigan (1991-2003), President of the Business Roundtable (2011-2017) and interim President of Michigan State University (2018-2019). Mr. Engler currently serves as a member of the Board of K12 Inc. (technology-based education company, 2012-present). Previously, Mr. Engler served as a member of the Board of Universal Forest Products (manufacturer and distributor of wood and wood-alternative products, 2003-2019) and Trustee of The Munder Funds (2003-2014). Mr. Engler previously served as a member of the Advisory Board of certain Fidelity® funds (2014-2016).
Robert F. Gartland (1951)
Year of Election or Appointment: 2010
Trustee
Mr. Gartland also serves as Trustee of other Fidelity® funds. Prior to his retirement, Mr. Gartland held a variety of positions at Morgan Stanley (financial services, 1979-2007), including Managing Director (1987-2007) and Chase Manhattan Bank (1975-1978). Mr. Gartland previously served as Chairman and an investor in Gartland & Mellina Group Corp. (consulting, 2009-2019), as a member of the Board of National Securities Clearing Corporation (1993-1996) and as Chairman of TradeWeb (2003-2004).
Arthur E. Johnson (1947)
Year of Election or Appointment: 2008
Trustee
Chairman of the Independent Trustees
Mr. Johnson also serves as Trustee of other Fidelity® funds. Prior to his retirement, Mr. Johnson served as Senior Vice President of Corporate Strategic Development of Lockheed Martin Corporation (defense contractor, 1999-2009). Mr. Johnson currently serves as a member of the Board of Booz Allen Hamilton (management consulting, 2011-present). Mr. Johnson previously served as a member of the Board of Eaton Corporation plc (diversified power management, 2009-2019) and a member of the Board of AGL Resources, Inc. (holding company, 2002-2016). Mr. Johnson previously served as Vice Chairman (2015-2018) of the Independent Trustees of certain Fidelity® funds. Mr. Arthur E. Johnson is not related to Ms. Abigail P. Johnson.
Michael E. Kenneally (1954)
Year of Election or Appointment: 2009
Trustee
Vice Chairman of the Independent Trustees
Mr. Kenneally also serves as Trustee of other Fidelity® funds. Prior to his retirement, Mr. Kenneally served as Chairman and Global Chief Executive Officer of Credit Suisse Asset Management and Executive Vice President and Chief Investment Officer of Bank of America Corporation. Earlier roles at Bank of America included Director of Research, Senior Portfolio Manager for various institutional equity accounts and mutual funds and Portfolio Manager for a number of institutional fixed-income clients. Mr. Kenneally began his career as a Research Analyst in 1983 and was awarded the Chartered Financial Analyst (CFA) designation in 1991.
Marie L. Knowles (1946)
Year of Election or Appointment: 2001
Trustee
Ms. Knowles also serves as Trustee of other Fidelity® funds. Prior to her retirement, Ms. Knowles held several positions at Atlantic Richfield Company (diversified energy), including Executive Vice President and Chief Financial Officer (1996-2000), Senior Vice President (1993-1996) and President of ARCO Transportation Company (pipeline and tanker operations, 1993-1996). Ms. Knowles currently serves as a member of the Board of McKesson Corporation (healthcare service, since 2002), a member of the Board of the Santa Catalina Island Company (real estate, 2009-present), a member of the Investment Company Institute Board of Governors and a member of the Governing Council of the Independent Directors Council (2014-present). Ms. Knowles also serves as a member of the Advisory Board for the School of Engineering of the University of Southern California. Ms. Knowles previously served as Chairman (2015-2018) and Vice Chairman (2012-2015) of the Independent Trustees of certain Fidelity® funds.
Mark A. Murray (1954)
Year of Election or Appointment: 2016
Trustee
Mr. Murray also serves as Trustee of other Fidelity® funds. Previously, Mr. Murray served as Co-Chief Executive Officer (2013-2016), President (2006-2013) and Vice Chairman (2013-2020) of Meijer, Inc. Mr. Murray serves as a member of the Board and Nuclear Review and Public Policy and Responsibility Committees of DTE Energy Company (diversified energy company, 2009-present) and a member of the Board and Audit Committee and Chairman of the Nominating and Corporate Governance Committee of Universal Forest Products, Inc. (manufacturer and distributor of wood and wood-alternative products, 2004-2016). Mr. Murray previously served as a member of the Board of Spectrum Health (not-for-profit health system, 2015-2019). Mr. Murray also serves as a member of the Board of many community and professional organizations. Mr. Murray previously served as a member of the Advisory Board of certain Fidelity® funds (2016).
+ The information includes the Trustee's principal occupation during the last five years and other information relating to the experience, attributes, and skills relevant to the Trustee's qualifications to serve as a Trustee, which led to the conclusion that the Trustee should serve as a Trustee for each fund.
Advisory Board Members and Officers:
Correspondence intended for an officer may be sent to Fidelity Investments, 245 Summer Street, Boston, Massachusetts 02210. Officers appear below in alphabetical order.
Name, Year of Birth; Principal Occupation
Elizabeth Paige Baumann (1968)
Year of Election or Appointment: 2017
Anti-Money Laundering (AML) Officer
Ms. Baumann also serves as AML Officer of other funds. She is Chief AML Officer (2012-present) and Senior Vice President (2014-present) of FMR LLC (diversified financial services company) and is an employee of Fidelity Investments. Previously, Ms. Baumann served as AML Officer of certain funds (2017-2019), as AML Officer of the funds (2012-2016), and Vice President (2007-2014) and Deputy Anti-Money Laundering Officer (2007-2012) of FMR LLC.
Craig S. Brown (1977)
Year of Election or Appointment: 2019
Assistant Treasurer
Mr. Brown also serves as Assistant Treasurer of other funds. Mr. Brown is an employee of Fidelity Investments (2013-present).
John J. Burke III (1964)
Year of Election or Appointment: 2018
Chief Financial Officer
Mr. Burke also serves as Chief Financial Officer of other funds. Mr. Burke serves as Head of Investment Operations for Fidelity Fund and Investment Operations (2018-present) and is an employee of Fidelity Investments (1998-present). Previously Mr. Burke served as head of Asset Management Investment Operations (2012-2018).
David J. Carter (1973)
Year of Election or Appointment: 2020
Assistant Secretary
Mr. Carter also serves as Assistant Secretary of other funds. Mr. Carter serves as Vice President, Associate General Counsel (2010-present) and is an employee of Fidelity Investments (2005-present).
Jonathan Davis (1968)
Year of Election or Appointment: 2010
Assistant Treasurer
Mr. Davis also serves as Assistant Treasurer of other funds. Mr. Davis serves as Assistant Treasurer of FMR Capital, Inc. (2017-present) and is an employee of Fidelity Investments. Previously, Mr. Davis served as Vice President and Associate General Counsel of FMR LLC (diversified financial services company, 2003-2010).
Laura M. Del Prato (1964)
Year of Election or Appointment: 2018
President and Treasurer
Ms. Del Prato also serves as an officer of other funds. Ms. Del Prato is an employee of Fidelity Investments (2017-present). Previously, Ms. Del Prato served as President and Treasurer of The North Carolina Capital Management Trust: Cash Portfolio and Term Portfolio (2018-2020). Prior to joining Fidelity Investments, Ms. Del Prato served as a Managing Director and Treasurer of the JPMorgan Mutual Funds (2014-2017). Prior to JPMorgan, Ms. Del Prato served as a partner at Cohen Fund Audit Services (accounting firm, 2012-2013) and KPMG LLP (accounting firm, 2004-2012).
Colm A. Hogan (1973)
Year of Election or Appointment: 2016
Assistant Treasurer
Mr. Hogan also serves as an officer of other funds. Mr. Hogan serves as Assistant Treasurer of FMR Capital, Inc. (2017-present) and is an employee of Fidelity Investments (2005-present). Previously, Mr. Hogan served as Deputy Treasurer of certain Fidelity® funds (2016-2020) and Assistant Treasurer of certain Fidelity® funds (2016-2018).
Cynthia Lo Bessette (1969)
Year of Election or Appointment: 2019
Secretary and Chief Legal Officer (CLO)
Ms. Lo Bessette also serves as an officer of other funds. Ms. Lo Bessette serves as CLO, Secretary, and Senior Vice President of Fidelity Management & Research Company LLC (investment adviser firm, 2019-present); and CLO of Fidelity Management & Research (Hong Kong) Limited, FMR Investment Management (UK) Limited, and Fidelity Management & Research (Japan) Limited (investment adviser firms, 2019-present). She is a Senior Vice President and Deputy General Counsel of FMR LLC (diversified financial services company, 2019-present), and is an employee of Fidelity Investments. Previously, Ms. Lo Bessette served as CLO, Secretary, and Senior Vice President of FMR Co., Inc. (investment adviser firm, 2019); Secretary of Fidelity SelectCo, LLC and Fidelity Investments Money Management, Inc. (investment adviser firms, 2019). Prior to joining Fidelity Investments, Ms. Lo Bessette was Executive Vice President, General Counsel (2016-2019) and Senior Vice President, Deputy General Counsel (2015-2016) of OppenheimerFunds (investment management company) and Deputy Chief Legal Officer (2013-2015) of Jennison Associates LLC (investment adviser firm).
Chris Maher (1972)
Year of Election or Appointment: 2013
Assistant Treasurer
Mr. Maher also serves as an officer of other funds. Mr. Maher serves as Assistant Treasurer of FMR Capital, Inc. (2017-present), and is an employee of Fidelity Investments (2008-present). Previously, Mr. Maher served as Assistant Treasurer of certain funds (2013-2020); Vice President of Asset Management Compliance (2013), Vice President of the Program Management Group of FMR (investment adviser firm, 2010-2013), and Vice President of Valuation Oversight (2008-2010).
Kenneth B. Robins (1969)
Year of Election or Appointment: 2020
Chief Compliance Officer
Mr. Robins also serves as an officer of other funds. Mr. Robins serves as Compliance Officer of Fidelity Management & Research Company LLC (investment adviser firm, 2016-present) and is an employee of Fidelity Investments (2004-present). Previously, Mr. Robins served as Compliance Officer of FMR Co., Inc. (investment adviser firm, 2016-2019), as Executive Vice President of Fidelity Investments Money Management, Inc. (investment adviser firm, 2013-2016) and served in other fund officer roles.
Stacie M. Smith (1974)
Year of Election or Appointment: 2013
Assistant Treasurer
Ms. Smith also serves as an officer of other funds. Ms. Smith serves as Assistant Treasurer of FMR Capital, Inc. (2017-present), is an employee of Fidelity Investments (2009-present), and has served in other fund officer roles. Prior to joining Fidelity Investments, Ms. Smith served as Senior Audit Manager of Ernst & Young LLP (accounting firm, 1996-2009). Previously, Ms. Smith served as Assistant Treasurer (2013-2019) and Deputy Treasurer (2013-2016) of certain Fidelity® funds.
Marc L. Spector (1972)
Year of Election or Appointment: 2016
Deputy Treasurer
Mr. Spector also serves as an officer of other funds. Mr. Spector serves as Assistant Treasurer of FMR Capital, Inc. (2017-present) and is an employee of Fidelity Investments (2016-present). Prior to joining Fidelity Investments, Mr. Spector served as Director at the Siegfried Group (accounting firm, 2013-2016), and prior to Siegfried Group as audit senior manager at Deloitte & Touche LLP (accounting firm, 2005-2013).
Jim Wegmann (1979)
Year of Election or Appointment: 2019
Assistant Treasurer
Mr. Wegmann also serves as Assistant Treasurer of other funds. Mr. Wegmann is an employee of Fidelity Investments (2011-present).
Vadim Zlotnikov (1962)
Year of Election or Appointment: 2019
Vice President
Mr. Zlotnikov also serves as Vice President of other funds. Mr. Zlotnikov serves as President of FIAM (Fidelity Institutional Asset Management) and is an employee of Fidelity Investments (2018-present). Previously, Mr. Zlotnikov served as President and Chief Investment Officer of Global Asset Allocation (2018-2020). Prior to joining Fidelity Investments, Mr. Zlotnikov served as Co-Head of Multi-Asset Solutions, Chief Market Strategist, and CIO of Systematic Strategies with AllianceBernstein (investment adviser firm, 2002-2018).
Shareholder Expense Example
As a shareholder, you incur two types of costs: (1) transaction costs, which may include sales charges (loads) on purchase payments or redemption proceeds, as applicable and (2) ongoing costs, which generally include management fees, distribution and/or service (12b-1) fees and other Fund expenses. This Example is intended to help you understand your ongoing costs (in dollars) of investing in a fund and to compare these costs with the ongoing costs of investing in other mutual funds.
The Example is based on an investment of $1,000 invested at the beginning of the period and held for the entire period (April 1, 2020 to September 30, 2020).
Actual Expenses
The first line of the accompanying table provides information about actual account values and actual expenses. You may use the information in this line, together with the amount you invested, to estimate the expenses that you paid over the period. Simply divide your account value by $1,000.00 (for example, an $8,600 account value divided by $1,000.00 = 8.6), then multiply the result by the number in the first line for a class/Fund under the heading entitled "Expenses Paid During Period" to estimate the expenses you paid on your account during this period. If any fund is a shareholder of any underlying mutual funds or exchange-traded funds (ETFs) (the Underlying Funds), such fund indirectly bears its proportional share of the expenses of the Underlying Funds in addition to the direct expenses incurred presented in the table. These fees and expenses are not included in the annualized expense ratio used to calculate the expense estimate in the table below.
Hypothetical Example for Comparison Purposes
The second line of the accompanying table provides information about hypothetical account values and hypothetical expenses based on the actual expense ratio and an assumed rate of return of 5% per year before expenses, which is not the actual return. The hypothetical account values and expenses may not be used to estimate the actual ending account balance or expenses you paid for the period. You may use this information to compare the ongoing costs of investing in the Fund and other funds. To do so, compare this 5% hypothetical example with the 5% hypothetical examples that appear in the shareholder reports of the other funds. If any fund is a shareholder of any Underlying Funds, such fund indirectly bears its proportional share of the expenses of the Underlying Funds in addition to the direct expenses as presented in the table. These fees and expenses are not included in the annualized expense ratio used to calculate the expense estimate in the table below.
Please note that the expenses shown in the table are meant to highlight your ongoing costs only and do not reflect any transaction costs. Therefore, the second line of the table is useful in comparing ongoing costs only, and will not help you determine the relative total costs of owning different funds. In addition, if these transactional costs were included, your costs would have been higher.
| | Annualized Expense Ratio-A | Beginning
Account Value
April 1, 2020 | Ending
Account Value
September 30, 2020 | Expenses Paid
During Period-B
April 1, 2020
to September 30, 2020 |
| Fidelity Asset Manager 20% | | | | |
| Class A | .82% | | | |
| Actual | | $1,000.00 | $1,096.90 | $4.30 |
| Hypothetical-C | | $1,000.00 | $1,020.90 | $4.14 |
| Class M | 1.07% | | | |
| Actual | | $1,000.00 | $1,095.70 | $5.61 |
| Hypothetical-C | | $1,000.00 | $1,019.65 | $5.40 |
| Class C | 1.58% | | | |
| Actual | | $1,000.00 | $1,093.50 | $8.27 |
| Hypothetical-C | | $1,000.00 | $1,017.10 | $7.97 |
| Asset Manager 20% | .50% | | | |
| Actual | | $1,000.00 | $1,098.50 | $2.62 |
| Hypothetical-C | | $1,000.00 | $1,022.50 | $2.53 |
| Class I | .58% | | | |
| Actual | | $1,000.00 | $1,097.90 | $3.04 |
| Hypothetical-C | | $1,000.00 | $1,022.10 | $2.93 |
| Class Z | .48% | | | |
| Actual | | $1,000.00 | $1,099.50 | $2.52 |
| Hypothetical-C | | $1,000.00 | $1,022.60 | $2.43 |
| Fidelity Asset Manager 30% | | | | |
| Class A | .82% | | | |
| Actual | | $1,000.00 | $1,131.40 | $4.37 |
| Hypothetical-C | | $1,000.00 | $1,020.90 | $4.14 |
| Class M | 1.08% | | | |
| Actual | | $1,000.00 | $1,128.30 | $5.75 |
| Hypothetical-C | | $1,000.00 | $1,019.60 | $5.45 |
| Class C | 1.59% | | | |
| Actual | | $1,000.00 | $1,126.10 | $8.45 |
| Hypothetical-C | | $1,000.00 | $1,017.05 | $8.02 |
| Asset Manager 30% | .52% | | | |
| Actual | | $1,000.00 | $1,132.10 | $2.77 |
| Hypothetical-C | | $1,000.00 | $1,022.40 | $2.63 |
| Class I | .58% | | | |
| Actual | | $1,000.00 | $1,131.80 | $3.09 |
| Hypothetical-C | | $1,000.00 | $1,022.10 | $2.93 |
| Class Z | .49% | | | |
| Actual | | $1,000.00 | $1,132.40 | $2.61 |
| Hypothetical-C | | $1,000.00 | $1,022.55 | $2.48 |
| Fidelity Asset Manager 40% | | | | |
| Class A | .82% | | | |
| Actual | | $1,000.00 | $1,159.90 | $4.43 |
| Hypothetical-C | | $1,000.00 | $1,020.90 | $4.14 |
| Class M | 1.08% | | | |
| Actual | | $1,000.00 | $1,158.80 | $5.83 |
| Hypothetical-C | | $1,000.00 | $1,019.60 | $5.45 |
| Class C | 1.59% | | | |
| Actual | | $1,000.00 | $1,155.20 | $8.57 |
| Hypothetical-C | | $1,000.00 | $1,017.05 | $8.02 |
| Asset Manager 40% | .52% | | | |
| Actual | | $1,000.00 | $1,161.70 | $2.81 |
| Hypothetical-C | | $1,000.00 | $1,022.40 | $2.63 |
| Class I | .56% | | | |
| Actual | | $1,000.00 | $1,161.40 | $3.03 |
| Hypothetical-C | | $1,000.00 | $1,022.20 | $2.83 |
| Class Z | .49% | | | |
| Actual | | $1,000.00 | $1,161.90 | $2.65 |
| Hypothetical-C | | $1,000.00 | $1,022.55 | $2.48 |
| Fidelity Asset Manager 50% | | | | |
| Class A | .92% | | | |
| Actual | | $1,000.00 | $1,188.40 | $5.03 |
| Hypothetical-C | | $1,000.00 | $1,020.40 | $4.65 |
| Class M | 1.16% | | | |
| Actual | | $1,000.00 | $1,187.20 | $6.34 |
| Hypothetical-C | | $1,000.00 | $1,019.20 | $5.86 |
| Class C | 1.68% | | | |
| Actual | | $1,000.00 | $1,184.20 | $9.17 |
| Hypothetical-C | | $1,000.00 | $1,016.60 | $8.47 |
| Asset Manager 50% | .61% | | | |
| Actual | | $1,000.00 | $1,190.70 | $3.34 |
| Hypothetical-C | | $1,000.00 | $1,021.95 | $3.08 |
| Class I | .64% | | | |
| Actual | | $1,000.00 | $1,190.20 | $3.50 |
| Hypothetical-C | | $1,000.00 | $1,021.80 | $3.23 |
| Class Z | .54% | | | |
| Actual | | $1,000.00 | $1,191.00 | $2.96 |
| Hypothetical-C | | $1,000.00 | $1,022.30 | $2.73 |
| Fidelity Asset Manager 60% | | | | |
| Class A | 1.00% | | | |
| Actual | | $1,000.00 | $1,218.10 | $5.55 |
| Hypothetical-C | | $1,000.00 | $1,020.00 | $5.05 |
| Class M | 1.25% | | | |
| Actual | | $1,000.00 | $1,216.60 | $6.93 |
| Hypothetical-C | | $1,000.00 | $1,018.75 | $6.31 |
| Class C | 1.78% | | | |
| Actual | | $1,000.00 | $1,213.70 | $9.85 |
| Hypothetical-C | | $1,000.00 | $1,016.10 | $8.97 |
| Asset Manager 60% | .68% | | | |
| Actual | | $1,000.00 | $1,220.90 | $3.78 |
| Hypothetical-C | | $1,000.00 | $1,021.60 | $3.44 |
| Class I | .73% | | | |
| Actual | | $1,000.00 | $1,220.70 | $4.05 |
| Hypothetical-C | | $1,000.00 | $1,021.35 | $3.69 |
| Class Z | .62% | | | |
| Actual | | $1,000.00 | $1,220.90 | $3.44 |
| Hypothetical-C | | $1,000.00 | $1,021.90 | $3.13 |
| Fidelity Asset Manager 70% | | | | |
| Class A | .98% | | | |
| Actual | | $1,000.00 | $1,245.80 | $5.50 |
| Hypothetical-C | | $1,000.00 | $1,020.10 | $4.95 |
| Class M | 1.22% | | | |
| Actual | | $1,000.00 | $1,244.10 | $6.84 |
| Hypothetical-C | | $1,000.00 | $1,018.90 | $6.16 |
| Class C | 1.74% | | | |
| Actual | | $1,000.00 | $1,240.80 | $9.75 |
| Hypothetical-C | | $1,000.00 | $1,016.30 | $8.77 |
| Asset Manager 70% | .67% | | | |
| Actual | | $1,000.00 | $1,247.50 | $3.76 |
| Hypothetical-C | | $1,000.00 | $1,021.65 | $3.39 |
| Class I | .69% | | | |
| Actual | | $1,000.00 | $1,247.40 | $3.88 |
| Hypothetical-C | | $1,000.00 | $1,021.55 | $3.49 |
| Class Z | .60% | | | |
| Actual | | $1,000.00 | $1,247.80 | $3.37 |
| Hypothetical-C | | $1,000.00 | $1,022.00 | $3.03 |
| Fidelity Asset Manager 85% | | | | |
| Class A | .99% | | | |
| Actual | | $1,000.00 | $1,286.80 | $5.66 |
| Hypothetical-C | | $1,000.00 | $1,020.05 | $5.00 |
| Class M | 1.25% | | | |
| Actual | | $1,000.00 | $1,284.80 | $7.14 |
| Hypothetical-C | | $1,000.00 | $1,018.75 | $6.31 |
| Class C | 1.75% | | | |
| Actual | | $1,000.00 | $1,282.20 | $9.98 |
| Hypothetical-C | | $1,000.00 | $1,016.25 | $8.82 |
| Asset Manager 85% | .69% | | | |
| Actual | | $1,000.00 | $1,288.30 | $3.95 |
| Hypothetical-C | | $1,000.00 | $1,021.55 | $3.49 |
| Class I | .72% | | | |
| Actual | | $1,000.00 | $1,288.40 | $4.12 |
| Hypothetical-C | | $1,000.00 | $1,021.40 | $3.64 |
| Class Z | .61% | | | |
| Actual | | $1,000.00 | $1,289.10 | $3.49 |
| Hypothetical-C | | $1,000.00 | $1,021.95 | $3.08 |
A Annualized expense ratio reflects expenses net of applicable fee waivers.
B Expenses are equal to the annualized expense ratio, multiplied by the average account value over the period, multiplied by 183/ 366 (to reflect the one-half year period). The fees and expenses of any Underlying Funds are not included in each annualized expense ratio.
C 5% return per year before expenses
Distributions (Unaudited)
The funds hereby designate as capital gain dividend the amounts noted below for the taxable year ended September 30, 2020, or, if subsequently determined to be different, the net capital gain of such year.
| Fidelity Asset Manager 40% | $2,984,911 |
| Fidelity Asset Manager 50% | $37,984,949 |
| Fidelity Asset Manager 60% | $3,783,753 |
| Fidelity Asset Manager 70% | $37,263,450 |
| Fidelity Asset Manager 85% | $22,473,701 |
|
A percentage of the dividends distributed during the fiscal year for the following funds were derived from interest on U.S. Government securities which is generally exempt from state income tax
| Fidelity Asset Manager 20% | |
| Class A | 9.41% |
| Class M | 9.41% |
| Class C | 9.41% |
| Asset Manager 20% | 9.41% |
| Class I | 9.41% |
| Class Z | 9.41% |
| Fidelity Asset Manager 30% | |
| Class A | 7.80% |
| Class M | 7.80% |
| Class C | 7.80% |
| Asset Manager 30% | 7.80% |
| Class I | 7.80% |
| Class Z | 7.80% |
| Fidelity Asset Manager 40% | |
| Class A | 6.53% |
| Class M | 6.53% |
| Class C | 6.53% |
| Asset Manager 40% | 6.53% |
| Class I | 6.53% |
| Class Z | 6.53% |
| Fidelity Asset Manager 50% | |
| Class A | 5.37% |
| Class M | 5.37% |
| Class C | 5.37% |
| Asset Manager 50% | 5.37% |
| Class I | 5.37% |
| Class Z | 5.37% |
| Fidelity Asset Manager 60% | |
| Class A | 4.35% |
| Class M | 4.35% |
| Class C | 4.35% |
| Asset Manager 60% | 4.35% |
| Class I | 4.35% |
| Class Z | 4.35% |
| Fidelity Asset Manager 70% | |
| Class A | 3.26% |
| Class M | 3.26% |
| Class C | 3.26% |
| Asset Manager 70% | 3.26% |
| Class I | 3.26% |
| Class Z | 3.26% |
| Fidelity Asset Manager 85% | |
| Class A | 1.39% |
| Class M | 1.39% |
| Class C | 1.39% |
| Asset Manager 85% | 1.39% |
| Class I | 1.39% |
| Class Z | 1.39% |
|
The funds hereby designate the amounts noted below as distributions paid during the period January 1, 2020 to September 30, 2020 as qualifying to be taxed as interest-related dividends for nonresident alien shareholders:
| Fidelity Asset Manager 20% | $ 49,658,852 |
| Fidelity Asset Manager 30% | $ 18,192,405 |
| Fidelity Asset Manager 40% | $ 13,326,090 |
| Fidelity Asset Manager 50% | $ 59,458,712 |
|
A percentage of the dividends distributed during the fiscal year for the following funds qualify for the dividends–received deduction for corporate shareholders:
| | Class A | Class M | Class C | Retail | Class I | Class Z |
| Fidelity Asset Manager 20% | | | | | | |
| October 2019 | 0% | 0% | 0% | 0% | 0% | 0% |
| November 2019 | 7% | 8% | 11% | 6% | 6% | 6% |
| December 2019 | 8% | 9% | 11% | 7% | 7% | 7% |
| February 2020 | 21% | 27% | 100% | 16% | 16% | 15% |
| March 2020 | 22% | 31% | 82% | 16% | 18% | 16% |
| April 2020 | 20% | 25% | 37% | 16% | 17% | 16% |
| May 2020 | 20% | 24% | 36% | 16% | 17% | 16% |
| June 2020 | 21% | 28% | 93% | 16% | 17% | 16% |
| July 2020 | 22% | 29% | 87% | 16% | 17% | 16% |
| August 2020 | 21% | 25% | 49% | 16% | 17% | 16% |
| September 2020 | 22% | 33% | 100% | 16% | 20% | 16% |
| Fidelity Asset Manager 30% | | | | | | |
| October 2019 | 0% | 0% | 0% | 0% | 0% | 0% |
| November 2019 | 8% | 10% | 14% | 7% | 7% | 7% |
| December 2019 | 10% | 11% | 13% | 10% | 10% | 9% |
| February 2020 | 24% | 37% | 0% | 18% | 18% | 18% |
| March 2020 | 26% | 36% | 100% | 18% | 20% | 18% |
| April 2020 | 21% | 24% | 39% | 18% | 19% | 17% |
| May 2020 | 20% | 25% | 39% | 18% | 18% | 17% |
| June 2020 | 24% | 30% | 79% | 18% | 18% | 18% |
| July 2020 | 22% | 26% | 52% | 18% | 19% | 18% |
| August 2020 | 23% | 27% | 55% | 18% | 18% | 17% |
| September 2020 | 25% | 33% | 100% | 18% | 20% | 18% |
| Fidelity Asset Manager 40% | | | | | | |
| October 2019 | 0% | 0% | 0% | 0% | 0% | 0% |
| December 2019 | 12% | 14% | 17% | 11% | 12% | 11% |
| April 2020 | 36% | 48% | 100% | 26% | 27% | 26% |
| July 2020 | 32% | 38% | 74% | 26% | 27% | 26% |
| Fidelity Asset Manager 50% | | | | | | |
| October 2019 | 0% | 0% | 0% | 0% | 0% | 0% |
| December 2019 | 16% | 17% | 21% | 14% | 15% | 14% |
| April 2020 | 84% | 100% | –% | 59% | 62% | 55% |
| July 2020 | 72% | 90% | 100% | 59% | 60% | 56% |
| Fidelity Asset Manager 60% | | | | | | |
| December 2019 | 33% | 39% | 67% | 27% | 28% | 26% |
| Fidelity Asset Manager 70% | | | | | | |
| December 2019 | 39% | 46% | 89% | 33% | 34% | 32% |
| Fidelity Asset Manager 85% | | | | | | |
| December 2019 | 52% | 60% | 100% | 43% | 45% | 41% |
|
A percentage of the dividends distributed during the fiscal year for the following funds may be taken into account as a dividend for purposes of the maximum rate under section 1(h)(11) of the Internal Revenue Code.
| | Class A | Class M | Class C | Retail | Class I | Class Z |
| Fidelity Asset Manager 20% | | | | | | |
| October 2019 | 0% | 0% | 0% | 0% | 0% | 0% |
| November 2019 | 13% | 15% | 22% | 11% | 12% | 11% |
| December 2019 | 16% | 17% | 20% | 14% | 14% | 14% |
| February 2020 | 31% | 41% | 100% | 25% | 25% | 23% |
| March 2020 | 34% | 46% | 100% | 25% | 27% | 25% |
| April 2020 | 30% | 37% | 55% | 25% | 26% | 24% |
| May 2020 | 30% | 36% | 54% | 25% | 26% | 24% |
| June 2020 | 32% | 42% | 100% | 25% | 26% | 25% |
| July 2020 | 33% | 44% | 100% | 25% | 26% | 25% |
| August 2020 | 32% | 37% | 73% | 25% | 26% | 25% |
| September 2020 | 33% | 49% | 100% | 25% | 30% | 25% |
| Fidelity Asset Manager 30% | | | | | | |
| October 2019 | 0% | 0% | 0% | 0% | 0% | 0% |
| November 2019 | 18% | 20% | 28% | 15% | 15% | 15% |
| December 2019 | 21% | 23% | 27% | 20% | 20% | 19% |
| February 2020 | 39% | 58% | 0% | 29% | 29% | 29% |
| March 2020 | 41% | 57% | 100% | 29% | 32% | 29% |
| April 2020 | 33% | 38% | 61% | 29% | 31% | 27% |
| May 2020 | 32% | 39% | 61% | 29% | 29% | 28% |
| June 2020 | 37% | 47% | 100% | 29% | 29% | 29% |
| July 2020 | 35% | 41% | 81% | 29% | 31% | 29% |
| August 2020 | 36% | 43% | 86% | 29% | 29% | 27% |
| September 2020 | 40% | 53% | 100% | 29% | 32% | 29% |
| Fidelity Asset Manager 40% | | | | | | |
| October 2019 | 0% | 0% | 0% | 0% | 0% | 0% |
| December 2019 | 25% | 28% | 34% | 23% | 23% | 23% |
| April 2020 | 63% | 84% | 100% | 46% | 47% | 45% |
| July 2020 | 56% | 67% | 100% | 46% | 48% | 45% |
| Fidelity Asset Manager 50% | | | | | | |
| October 2019 | 0% | 0% | 0% | 0% | 0% | 0% |
| December 2019 | 31% | 34% | 40% | 28% | 28% | 27% |
| April 2020 | 100% | 100% | –% | 90% | 94% | 84% |
| July 2020 | 100% | 100% | 100% | 90% | 91% | 86% |
| Fidelity Asset Manager 60% | | | | | | |
| December 2019 | 64% | 76% | 100% | 53% | 54% | 51% |
| Fidelity Asset Manager 70% | | | | | | |
| December 2019 | 76% | 90% | 100% | 65% | 66% | 61% |
| Fidelity Asset Manager 85% | | | | | | |
| December 2019 | 88% | 100% | 100% | 74% | 77% | 69% |
|
A percentage of the dividends distributed during the fiscal year for the following funds qualify as a section 199A dividend:
| | Class A | Class M | Class C | Retail | Class I | Class Z |
| Fidelity Asset Manager 20% | | | | | | |
| October 2019 | 0% | 0% | 0% | 0% | 0% | 0% |
| November 2019 | 2% | 2% | 2% | 1% | 1% | 1% |
| December 2019 | 2% | 2% | 2% | 2% | 2% | 2% |
| February 2020 | 4% | 5% | 0% | 3% | 3% | 3% |
| March 2020 | 4% | 6% | 0% | 3% | 3% | 3% |
| April 2020 | 4% | 5% | 7% | 3% | 3% | 3% |
| May 2020 | 4% | 4% | 6% | 3% | 3% | 3% |
| June 2020 | 4% | 5% | 0% | 3% | 3% | 3% |
| July 2020 | 4% | 5% | 0% | 3% | 3% | 3% |
| August 2020 | 4% | 5% | 9% | 3% | 3% | 3% |
| September 2020 | 4% | 6% | 0% | 3% | 4% | 3% |
| Fidelity Asset Manager 30% | | | | | | |
| October 2019 | 0% | 0% | 0% | 0% | 0% | 0% |
| November 2019 | 2% | 2% | 3% | 2% | 2% | 2% |
| December 2019 | 2% | 3% | 3% | 2% | 2% | 2% |
| February 2020 | 4% | 5% | 0% | 3% | 3% | 3% |
| March 2020 | 4% | 5% | 0% | 3% | 3% | 3% |
| April 2020 | 3% | 4% | 6% | 3% | 3% | 3% |
| May 2020 | 3% | 4% | 5% | 3% | 3% | 3% |
| June 2020 | 4% | 4% | 0% | 3% | 3% | 3% |
| July 2020 | 3% | 4% | 7% | 3% | 3% | 3% |
| August 2020 | 3% | 4% | 8% | 3% | 3% | 3% |
| September 2020 | 4% | 5% | 0% | 3% | 3% | 3% |
| | | | | | | |
| Fidelity Asset Manager 40% | | | | | | |
| October 2019 | 0% | 0% | 0% | 0% | 0% | 0% |
| December 2019 | 3% | 3% | 4% | 3% | 3% | 3% |
| April 2020 | 5% | 7% | 0% | 4% | 4% | 4% |
| July 2020 | 5% | 6% | 0% | 4% | 4% | 4% |
| Fidelity Asset Manager 50% | | | | | | |
| October 2019 | 0% | 0% | 0% | 0% | 0% | 0% |
| December 2019 | 3% | 4% | 4% | 3% | 3% | 3% |
| April 2020 | 0% | 0% | –% | 5% | 6% | 5% |
| July 2020 | 0% | 0% | 0% | 5% | 5% | 5% |
| Fidelity Asset Manager 60% | | | | | | |
| December 2019 | 3% | 3% | 0% | 3% | 3% | 3% |
| Fidelity Asset Manager 70% | | | | | | |
| December 2019 | 3% | 3% | 0% | 3% | 3% | 2% |
| Fidelity Asset Manager 85% | | | | | | |
| December 2019 | 3% | 0% | 0% | 3% | 3% | 3% |
|
The amounts per share which represent income derived from sources within, and taxes paid to, foreign countries or possessions of the United States are as follows:
| | Pay Date | Income | Taxes |
| Fidelity Asset Manager 20% | | | |
| Class A | 12/31/19 | $0.0265 | $0.0023 |
| Class M | 12/31/19 | $0.0244 | $0.0023 |
| Class C | 12/31/19 | $0.0201 | $0.0023 |
| Asset Manager 20% | 12/31/19 | $0.0293 | $0.0023 |
| Class I | 12/31/19 | $0.0290 | $0.0023 |
| Class Z | 12/31/19 | $0.0297 | $0.0023 |
| Fidelity Asset Manager 30% | | | |
| Class A | 12/31/19 | $0.0328 | $0.0029 |
| Class M | 12/31/19 | $0.0299 | $0.0029 |
| Class C | 12/31/19 | $0.0255 | $0.0029 |
| Asset Manager 30% | 12/31/19 | $0.0357 | $0.0029 |
| Class I | 12/31/19 | $0.0352 | $0.0029 |
| Class Z | 12/31/19 | $0.0362 | $0.0029 |
| Fidelity Asset Manager 40% | | | |
| Class A | 12/31/19 | $0.0436 | $0.0038 |
| Class M | 12/31/19 | $0.0394 | $0.0038 |
| Class C | 12/31/19 | $0.0320 | $0.0038 |
| Asset Manager 40% | 12/31/19 | $0.0482 | $0.0038 |
| Class I | 12/31/19 | $0.0473 | $0.0038 |
| Class Z | 12/31/19 | $0.0487 | $0.0038 |
| Fidelity Asset Manager 50% | | | |
| Class A | 12/31/19 | $0.0839 | $0.0072 |
| Class M | 12/31/19 | $0.0765 | $0.0072 |
| Class C | 12/31/19 | $0.0633 | $0.0072 |
| Asset Manager 50% | 12/31/19 | $0.0926 | $0.0072 |
| Class I | 12/31/19 | $0.0914 | $0.0072 |
| Class Z | 12/31/19 | $0.0943 | $0.0072 |
| Fidelity Asset Manager 60% | | | |
| Class A | 12/31/19 | $0.0615 | $0.0056 |
| Class M | 12/31/19 | $0.0514 | $0.0056 |
| Class C | 12/31/19 | $0.0304 | $0.0056 |
| Asset Manager 60% | 12/31/19 | $0.0740 | $0.0056 |
| Class I | 12/31/19 | $0.0722 | $0.0056 |
| Class Z | 12/31/19 | $0.0769 | $0.0056 |
| Fidelity Asset Manager 70% | | | |
| Class A | 12/31/19 | $0.1272 | $0.0112 |
| Class M | 12/31/19 | $0.1083 | $0.0112 |
| Class C | 12/31/19 | $0.0565 | $0.0112 |
| Asset Manager 70% | 12/31/19 | $0.1506 | $0.0112 |
| Class I | 12/31/19 | $0.1470 | $0.0112 |
| Class Z | 12/31/19 | $0.1584 | $0.0112 |
| Fidelity Asset Manager 85% | | | |
| Class A | 12/31/19 | $0.1235 | $0.0107 |
| Class M | 12/31/19 | $0.1056 | $0.0107 |
| Class C | 12/31/19 | $0.0532 | $0.0107 |
| Asset Manager 85% | 12/31/19 | $0.1475 | $0.0107 |
| Class I | 12/31/19 | $0.1418 | $0.0107 |
| Class Z | 12/31/19 | $0.1571 | $0.0107 |
|
The funds will notify shareholders in January 2021 of amounts for use in preparing 2020 income tax returns.
Board Approval of Investment Advisory Contracts and Management Fees
Fidelity Asset Manager 20%
Fidelity Asset Manager 30%
Fidelity Asset Manager 40%
Fidelity Asset Manager 50%
Fidelity Asset Manager 60%
Fidelity Asset Manager 70%
Fidelity Asset Manager 85%
Each year, the Board of Trustees, including the Independent Trustees (together, the Board), votes on the renewal of the management contract with Fidelity Management & Research Company LLC (FMR) and the sub-advisory agreements (together, the Advisory Contracts) for each fund. FMR and the sub-advisers are referred to herein as the Investment Advisers. The Board, assisted by the advice of fund counsel and Independent Trustees' counsel, requests and considers a broad range of information relevant to the renewal of the Advisory Contracts throughout the year.
The Board meets regularly and, at each of its meetings, covers an extensive agenda of topics and materials and considers factors that are relevant to its annual consideration of the renewal of each fund's Advisory Contracts, including the services and support provided to each fund and its shareholders. The Board has established four standing committees (Committees) — Operations, Audit, Fair Valuation, and Governance and Nominating — each composed of and chaired by Independent Trustees with varying backgrounds, to which the Board has assigned specific subject matter responsibilities in order to enhance effective decision-making by the Board. The Operations Committee, of which all of the Independent Trustees are members, meets regularly throughout the year and considers, among other matters, information specifically related to the annual consideration of the renewal of each fund's Advisory Contracts. The Board, acting directly and through its Committees, requests and receives information concerning the annual consideration of the renewal of each fund's Advisory Contracts. The Board also meets as needed to review matters specifically related to the Board's annual consideration of the renewal of the Advisory Contracts. Members of the Board may also meet with trustees of other Fidelity funds through joint ad hoc committees to discuss certain matters relevant to all of the Fidelity funds.
At its September 2020 meeting, the Board unanimously determined to renew each fund's Advisory Contracts. In reaching its determination, the Board considered all factors it believed relevant, including (i) the nature, extent, and quality of the services provided to each fund and its shareholders (including the investment performance of each fund); (ii) the competitiveness of each fund's management fee and total expense ratio relative to peer funds; (iii) the total costs of the services provided by and the profits realized by Fidelity from its relationships with each fund; and (iv) the extent to which, if any, economies of scale exist and are realized as each fund grows, and whether any economies of scale are appropriately shared with fund shareholders.
In considering whether to renew the Advisory Contracts for each fund, the Board reached a determination, with the assistance of fund counsel and Independent Trustees' counsel and through the exercise of its business judgment, that the renewal of the Advisory Contracts was in the best interests of each fund and its shareholders and that the compensation payable under the Advisory Contracts was fair and reasonable. The Board's decision to renew the Advisory Contracts was not based on any single factor, but rather was based on a comprehensive consideration of all the information provided to the Board at its meetings throughout the year. The Board, in reaching its determination to renew the Advisory Contracts, was aware that shareholders of each fund have a broad range of investment choices available to them, including a wide choice among funds offered by Fidelity's competitors, and that each fund's shareholders, who have the opportunity to review and weigh the disclosure provided by the fund in its prospectus and other public disclosures, have chosen to invest in that fund, which is part of the Fidelity family of funds.
Nature, Extent, and Quality of Services Provided. The Board considered Fidelity's staffing as it relates to the funds, including the backgrounds of investment personnel of Fidelity, and also considered the funds' investment objectives, strategies, and related investment philosophies. The Independent Trustees also had discussions with senior management of Fidelity's investment operations and investment groups. The Board considered the structure of the investment personnel compensation program and whether this structure provides appropriate incentives to act in the best interests of each fund. Additionally, the Board considered the portfolio managers' investments, if any, in the funds that they manage.
Resources Dedicated to Investment Management and Support Services. The Board reviewed the general qualifications and capabilities of Fidelity's investment staff, including its size, education, experience, and resources, as well as Fidelity's approach to recruiting, managing, and compensating investment personnel. The Board noted that Fidelity has continued to increase the resources devoted to non-U.S. offices, including expansion of Fidelity's global investment organization. The Board also noted that Fidelity's analysts have extensive resources, tools and capabilities that allow them to conduct sophisticated quantitative and fundamental analysis, as well as credit analysis of issuers, counterparties and guarantors. Further, the Board considered that Fidelity's investment professionals have sufficient access to global information and data so as to provide competitive investment results over time, and that those professionals also have access to sophisticated tools that permit them to assess portfolio construction and risk and performance attribution characteristics continuously, as well as to transmit new information and research conclusions rapidly around the world. Additionally, in its deliberations, the Board considered Fidelity's trading, risk management, compliance, and technology and operations capabilities and resources, which are integral parts of the investment management process. The Board also considered Fidelity's investments in business continuity planning, and its success in continuously providing services to the fund notwithstanding the severe disruptions caused by the COVID-19 pandemic.
Shareholder and Administrative Services. The Board considered (i) the nature, extent, quality, and cost of advisory, administrative, and shareholder services performed by the Investment Advisers and their affiliates under the Advisory Contracts and under separate agreements covering transfer agency, pricing and bookkeeping, and securities lending services for each fund; (ii) the nature and extent of the supervision of third party service providers, principally custodians, subcustodians, and pricing vendors; and (iii) the resources devoted to, and the record of compliance with, each fund's compliance policies and procedures. The Board also reviewed the allocation of fund brokerage, including allocations to brokers affiliated with the Investment Advisers, the use of brokerage commissions to pay fund expenses, and the use of "soft" commission dollars to pay for research services.
The Board noted that the growth of fund assets over time across the complex allows Fidelity to reinvest in the development of services designed to enhance the value and convenience of the Fidelity funds as investment vehicles. These services include 24-hour access to account information and market information over the Internet and through telephone representatives, investor education materials and asset allocation tools, and the expanded availability of Fidelity Investor Centers.
Investment in a Large Fund Family. The Board considered the benefits to shareholders of investing in a Fidelity fund, including the benefits of investing in a fund that is part of a large family of funds offering a variety of investment disciplines and providing a large variety of mutual fund investor services. The Board noted that Fidelity had taken, or had made recommendations that resulted in the Fidelity funds taking, a number of actions over the previous year that benefited particular funds, including: (i) continuing to dedicate additional resources to Fidelity's investment research process, which includes meetings with management of issuers of securities in which the funds invest, and to the support of the senior management team that oversees asset management; (ii) continuing efforts to enhance Fidelity's global research capabilities; (iii) launching new funds and ETFs with innovative structures, strategies and pricing and making other enhancements to meet client needs; (iv) launching new share classes of existing funds; (v) eliminating purchase minimums and broadening eligibility requirements for certain funds and share classes; (vi) reducing management fees and total expenses for certain target date funds or classes and index funds; (vii) lowering expenses for certain funds and classes by implementing or lowering expense caps; (viii) rationalizing product lines and gaining increased efficiencies from fund mergers, liquidations, and share class consolidations; (ix) continuing to develop, acquire and implement systems and technology to improve services to the funds and shareholders, strengthen information security, and increase efficiency; and (x) continuing to implement enhancements to further strengthen Fidelity's product line to increase investors' probability of success in achieving their investment goals, including retirement income goals.
Investment Performance. The Board considered whether each fund has operated in accordance with its investment objective, as well as its record of compliance with its investment restrictions and its performance history.
The Board took into account discussions that occur at Board meetings throughout the year with representatives of the Investment Advisers about fund investment performance. In this regard the Board noted that as part of regularly scheduled fund reviews and other reports to the Board on fund performance, the Board considers annualized return information for each fund for different time periods, measured against one or more appropriate securities market indices, including a customized blended index that reflects the respective weights of the fund's asset classes (each a benchmark index) and an appropriate peer group of funds with similar objectives (peer group). In its evaluation of fund investment performance at meetings throughout the year, the Board gave particular attention to information indicating underperformance of certain Fidelity funds for specific time periods and discussed with the Investment Advisers the reasons for such underperformance.
In addition to reviewing absolute and relative fund performance, the Independent Trustees periodically consider the appropriateness of fund performance metrics in evaluating the results achieved. In general, the Independent Trustees believe that fund performance should be evaluated based on gross performance (before fees and expenses but after transaction costs) compared to appropriate benchmark indices, over appropriate time periods that may include full market cycles, and on net performance (after fees and expenses) compared to appropriate peer groups, as applicable, over the same periods, taking into account relevant factors including the following: general market conditions; expectations for interest rate levels and credit conditions; issuer-specific information including credit quality; and fund cash flows and other factors. The Independent Trustees generally give greater weight to fund performance over longer time periods than over shorter time periods. Depending on the circumstances, the Independent Trustees may be satisfied with a fund's performance notwithstanding that it lags its benchmark index or peer group for certain periods.
The Independent Trustees recognize that shareholders evaluate performance on a net basis over their own holding periods, for which one-, three-, and five-year periods are often used as a proxy. For this reason, the performance information reviewed by the Board also included net cumulative calendar year total return information for each fund and an appropriate benchmark index and peer group for the most recent one-, three-, and five-year periods. The Independent Trustees recognize that shareholders who are not investing through a tax-advantaged retirement account also consider tax consequences in evaluating performance.
Based on its review, the Board concluded that the nature, extent, and quality of services provided to each fund under the Advisory Contracts should continue to benefit the shareholders of each fund.
Competitiveness of Management Fee and Total Expense Ratio. The Board considered each fund's management fee and total expense ratio compared to "mapped groups" of competitive funds and classes created for the purpose of facilitating the Trustees' competitive analysis of management fees and total expenses. Fidelity creates "mapped groups" by combining similar Lipper investment objective categories that have comparable investment mandates. Combining Lipper investment objective categories aids the Board's management fee and total expense ratio comparisons by broadening the competitive group used for comparison.
Management Fee. The Board considered two proprietary management fee comparisons for the 12-month periods shown in basis points (BP) in the charts below. The group of Lipper funds used by the Board for management fee comparisons is referred to below as the "Total Mapped Group." The Total Mapped Group comparison focuses on a fund's standing in terms of gross management fees before expense reimbursements or caps relative to the total universe of funds with comparable investment mandates, regardless of whether their management fee structures also are comparable. Funds with comparable investment mandates offer exposure to similar types of securities. Funds with comparable management fee structures have similar management fee contractual arrangements (
e.g., flat rate charged for advisory services, all-inclusive fee rate,
etc.). "TMG %" represents the percentage of funds in the Total Mapped Group that had management fees that were lower than a fund's. For example, a hypothetical TMG % of 20% would mean that 80% of the funds in the Total Mapped Group had higher, and 20% had lower, management fees than a fund. The funds' actual TMG %s and the number of funds in the Total Mapped Group are in the charts below. The "Asset-Sized Peer Group" (ASPG) comparison focuses on a fund's standing relative to a subset of non-Fidelity funds within the Total Mapped Group that are similar in size and management fee structure. For example, if a fund is in the first quartile of the ASPG, the fund's management fee ranks in the least expensive or lowest 25% of funds in the ASPG. The ASPG represents at least 15% of the funds in the Total Mapped Group with comparable asset size and management fee structures, subject to a minimum of 50 funds (or all funds in the Total Mapped Group if fewer than 50). Additional information, such as the ASPG quartile in which a fund's management fee rate ranked, is also included in the charts and was considered by the Board.
Fidelity Asset Manager 20%
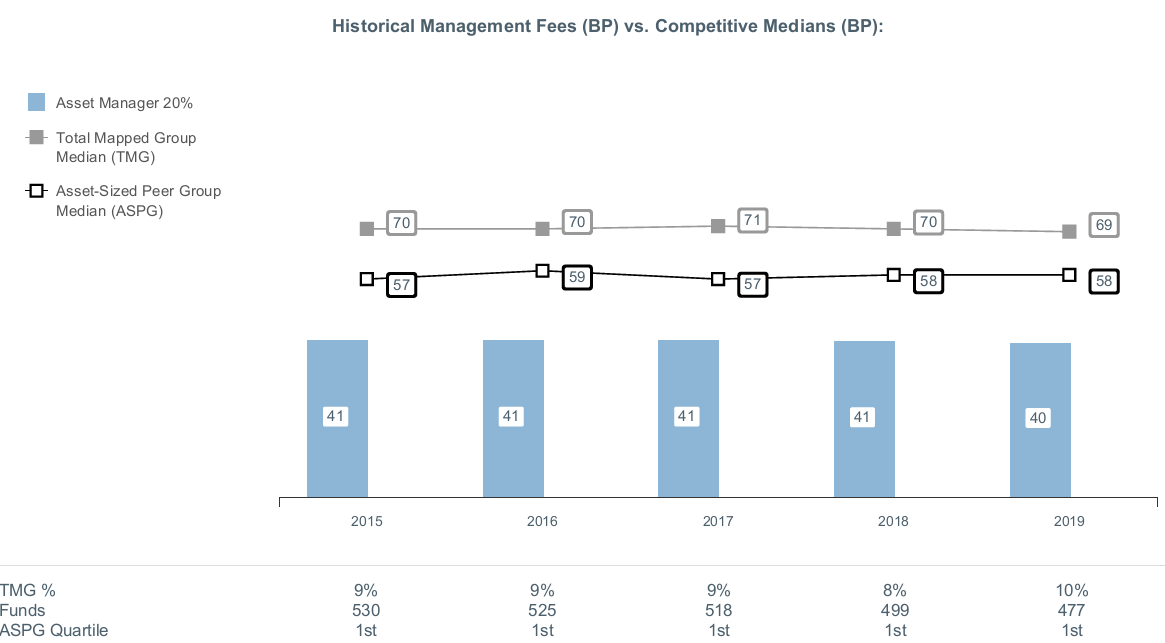
Fidelity Asset Manager 30%
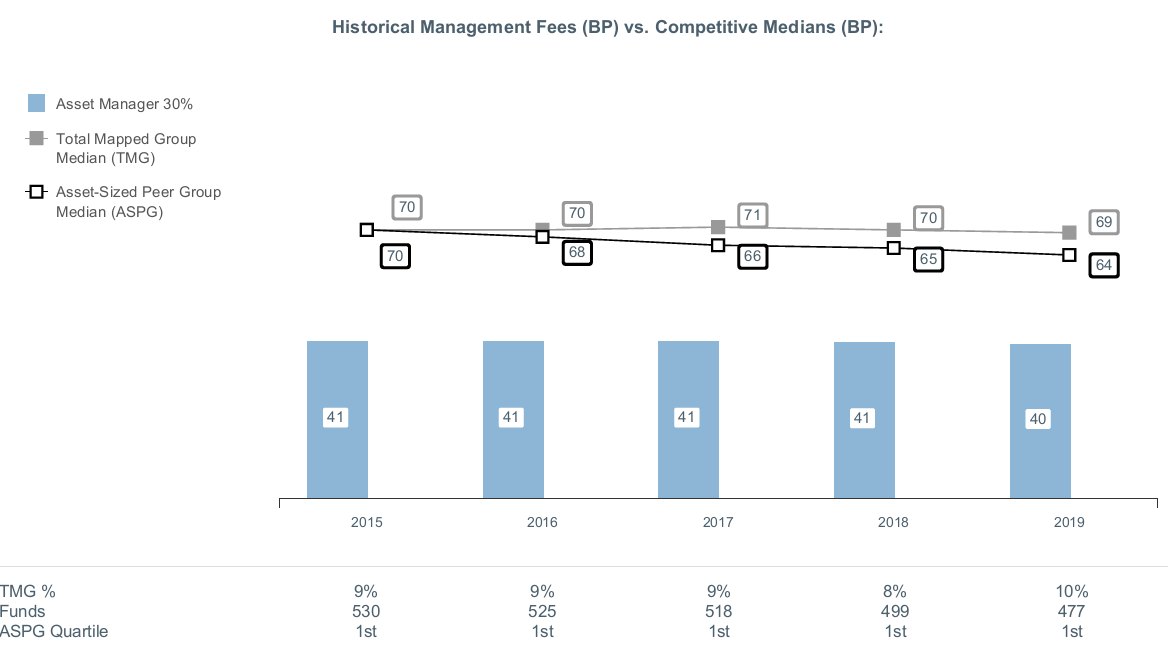
Fidelity Asset Manager 40%
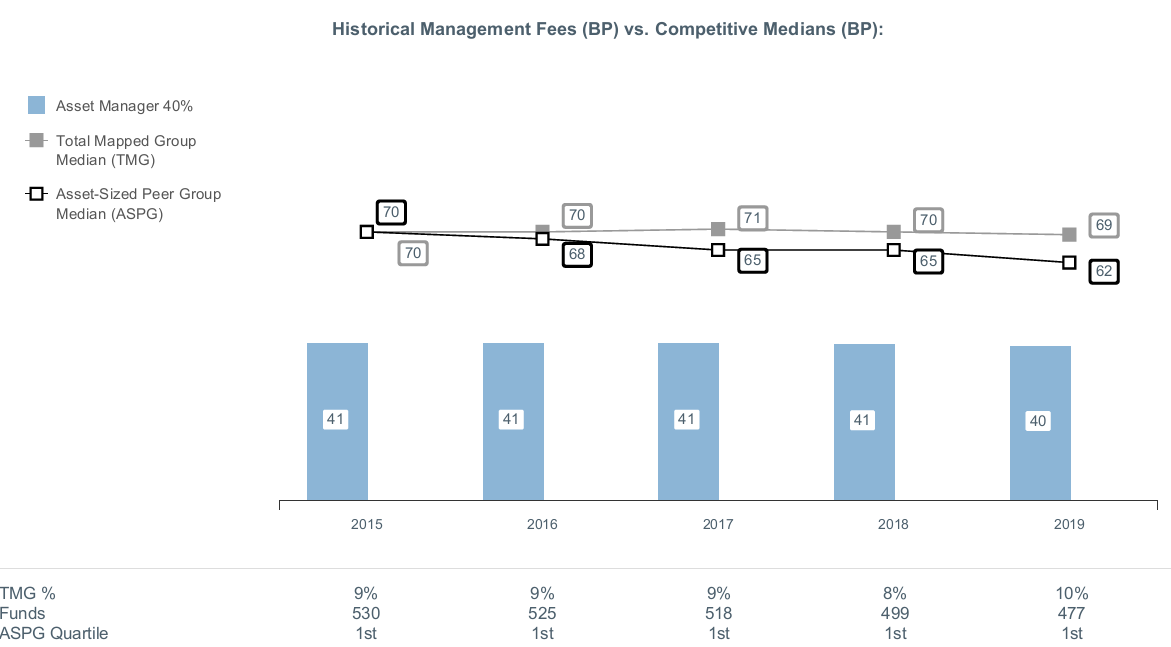
Fidelity Asset Manager 50%
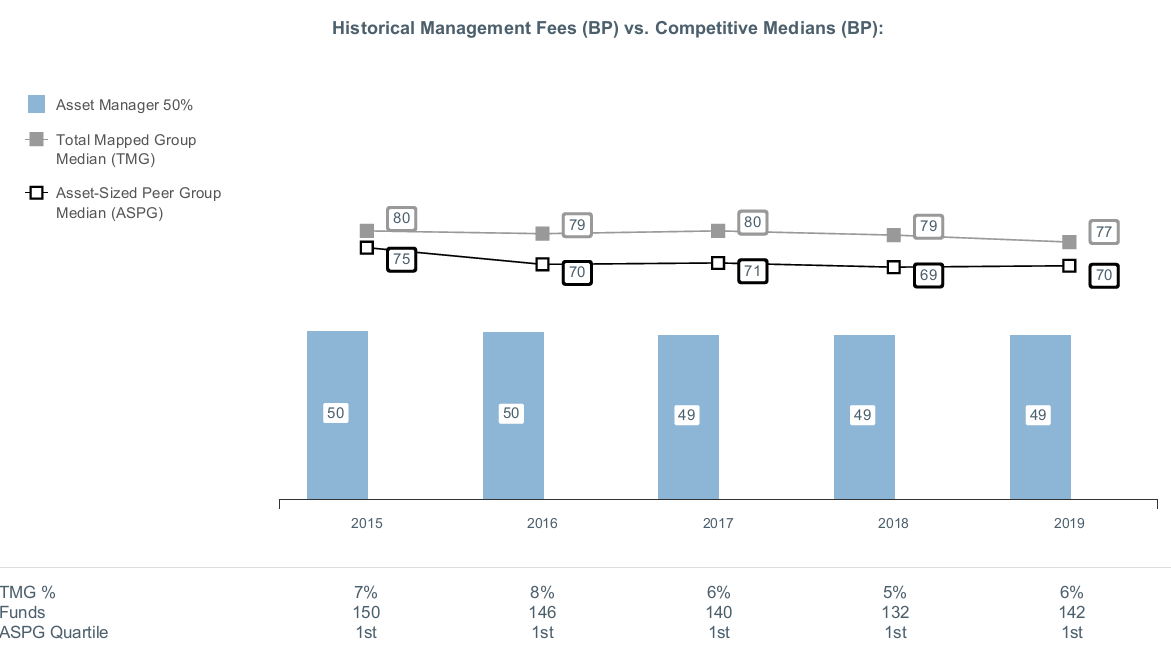
Fidelity Asset Manager 60%
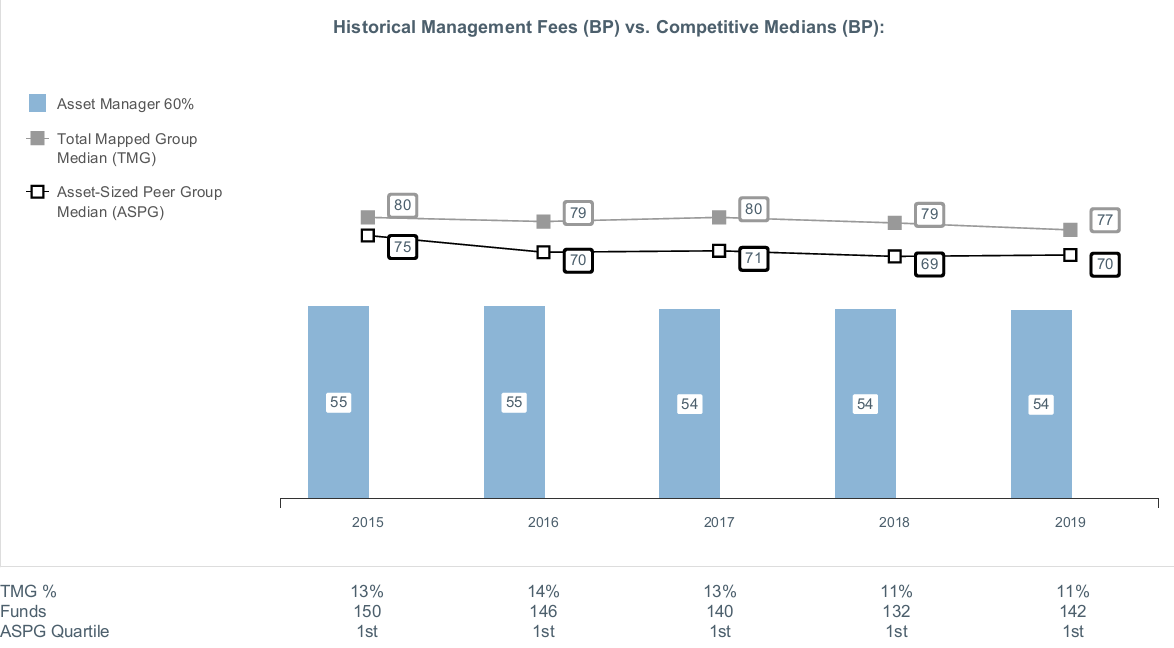
Fidelity Asset Manager 70%
Fidelity Asset Manager 85%
The Board noted that each fund's management fee rate ranked below the median of its Total Mapped Group and below the median of its ASPG for 2019.
The Board noted that it and the boards of other Fidelity funds formed an ad hoc Committee on Group Fee, which meets periodically, to conduct an in-depth review of the "group fee" component of the management fee of funds with such management fee structures. The Committee's focus included the mechanics of the group fee, the competitive landscape of group fee structures, Fidelity funds with no group fee component and investment products not included in group fee assets. The Board also considered that, for funds subject to the group fee, FMR agreed to voluntarily waive fees over a specified period of time in amounts designed to account for assets converted from certain funds to certain collective investment trusts.
Based on its review, the Board concluded that each fund's management fee is fair and reasonable in light of the services that the fund receives and the other factors considered.
Total Expense Ratio. In its review of the total expense ratio of each class of each fund, the Board considered the fund's management fee rate as well as other fund or class expenses, as applicable, such as transfer agent fees, pricing and bookkeeping fees, fund-paid 12b-1 fees, and custodial, legal, and audit fees. The Board also noted that Fidelity may agree to waive fees or reimburse expenses from time to time, and the extent to which, if any, it has done so for each fund. As part of its review, the Board also considered the current and historical total expense ratios of each class of each fund compared to competitive fund median expenses. Each class of each fund is compared to those funds and classes in the Total Mapped Group (used by the Board for management fee comparisons) that have a similar sales load structure.
The Board noted that the total expense ratio of each of Class A, Class C, Class I, Class Z, and the retail class of each fund ranked below the competitive median for 2019 and the total expense ratio of Class M of each fund ranked above the competitive median for 2019. The Board considered that, in general, various factors can affect total expense ratios. The Board noted that the total expense ratio of Class M was above the competitive median primarily because of higher 12b-1 fees on Class M as compared to most competitor funds. Class M has a higher 12b-1 fee, but a lower front-end sales charge, than traditionally priced front-end sales charge classes. The Board considered that Class M is primarily sold load-waived to retirement plans and intermediary wrap programs where its 0.50% 12b-1 fee is comparable to competing no-load, higher 12b-1 fee classes designed specifically for retirement plans and wrap programs. The Board noted that, when compared with competitor funds that charge a 0.50% 12b-1 fee, the total expense ratio of Class M of each fund is at or below median. The Board noted that each fund offers multiple classes, each of which has a different sales load and 12b-1 fee structure, and that the multiple structures are intended to offer a range of pricing options for the intermediary market. The Board also noted that the total expense ratios of the classes of each fund vary primarily by the level of their 12b-1 fees, although differences in transfer agent fees may also cause expenses to vary from class to class.
The Board further considered that FMR has contractually agreed to reimburse the following classes of each of the funds listed below to the extent that total operating expenses, with certain exceptions, as a percentage of their respective average net assets, exceed the amounts listed below through January 31, 2021:
Fees Charged to Other Fidelity Clients. The Board also considered Fidelity fee structures and other information with respect to clients of Fidelity, such as other funds advised or subadvised by Fidelity, pension plan clients, and other institutional clients with similar mandates. The Board noted that a joint ad hoc committee created by it and the boards of other Fidelity funds periodically reviews and compares Fidelity's institutional investment advisory business with its business of providing services to the Fidelity funds and also noted the most recent findings of the committee. The Board noted that the committee's review included a consideration of the differences in services provided, fees charged, and costs incurred, as well as competition in the markets serving the different categories of clients.
Based on its review of total expense ratios and fees charged to other Fidelity clients, the Board concluded that the total expense ratio of each class of each fund was reasonable in light of the services that the fund and its shareholders receive and the other factors considered.
Costs of the Services and Profitability. The Board considered the revenues earned and the expenses incurred by Fidelity in conducting the business of developing, marketing, distributing, managing, administering and servicing each fund and servicing each fund's shareholders. The Board also considered the level of Fidelity's profits in respect of all the Fidelity funds.
On an annual basis, Fidelity presents to the Board information about the profitability of its relationships with each fund. Fidelity calculates profitability information for each fund, as well as aggregate profitability information for groups of Fidelity funds and all Fidelity funds, using a series of detailed revenue and cost allocation methodologies which originate with the books and records of Fidelity on which Fidelity's audited financial statements are based. The Audit Committee of the Board reviews any significant changes from the prior year's methodologies and the full Board approves such changes.
A public accounting firm has been engaged annually by the Board as part of the Board's assessment of Fidelity's profitability analysis. The engagement includes the review and assessment of the methodologies used by Fidelity in determining the revenues and expenses attributable to Fidelity's mutual fund business, and completion of agreed-upon procedures in respect of the mathematical accuracy of certain fund profitability information and its conformity to established allocation methodologies. After considering the reports issued under the engagement and information provided by Fidelity, the Board concluded that while other allocation methods may also be reasonable, Fidelity's profitability methodologies are reasonable in all material respects.
The Board also reviewed Fidelity's non-fund businesses and potential indirect benefits such businesses may have received as a result of their association with Fidelity's mutual fund business (i.e., fall-out benefits) as well as cases where Fidelity's affiliates may benefit from the funds' business. The Board considered areas where potential indirect benefits to the Fidelity funds from their relationships with Fidelity may exist. The Board also considered that in 2019 a joint ad hoc committee created by it and the boards of other Fidelity funds evaluated potential fall-out benefits (PFOB Committee). The Board noted that it considered the PFOB Committee's findings in connection with its consideration of the renewal of the Advisory Contracts.
The Board considered the costs of the services provided by and the profits realized by Fidelity in connection with the operation of each fund, including the conclusions of the PFOB Committee, and was satisfied that the profitability was not excessive.
Economies of Scale. The Board considered whether there have been economies of scale in respect of the management of the Fidelity funds, whether the Fidelity funds (including each fund) have appropriately benefited from any such economies of scale, and whether there is potential for realization of any further economies of scale. The Board considered the extent to which each fund will benefit from economies of scale as assets grow through increased services to the fund, through waivers or reimbursements, or through fee or expense ratio reductions. The Board also noted that a committee (the Economies of Scale Committee) created by it and the boards of other Fidelity funds periodically analyzes whether Fidelity attains economies of scale in respect of the management and servicing of the Fidelity funds, whether the Fidelity funds have appropriately benefited from such economies of scale, and whether there is potential for realization of any further economies of scale.
The Board recognized that each fund's management contract incorporates a "group fee" structure, which provides for lower group fee rates as total "group assets" increase, and for higher group fee rates as total "group assets" decrease ("group assets" as defined in the management contract). FMR calculates the group fee rates based on a tiered asset "breakpoint" schedule that varies based on asset class. The Board considered that the group fee is designed to deliver the benefits of economies of scale to fund shareholders when total Fidelity fund assets increase, even if assets of any particular fund are unchanged or have declined, because some portion of Fidelity's costs are attributable to services provided to all Fidelity funds, and all funds benefit if those costs can be allocated among more assets. The Board concluded that, given the group fee structure, fund shareholders will benefit from lower management fees as "group assets" increase at the fund complex level, regardless of whether Fidelity achieves any such economies of scale.
The Board concluded, taking into account the analysis of the Economies of Scale Committee, that economies of scale, if any, are being appropriately shared between fund shareholders and Fidelity.
Additional Information Requested by the Board. In order to develop fully the factual basis for consideration of the Fidelity funds' advisory contracts, the Board requested and received additional information on certain topics, including: (i) Fidelity's fund profitability methodology, profitability trends for certain funds, the allocation of various costs to different funds, and the impact of certain factors on fund profitability results; (ii) portfolio manager changes that have occurred during the past year and the amount of the investment that each portfolio manager has made in the Fidelity fund(s) that he or she manages; (iii) Fidelity's compensation structure for portfolio managers, research analysts, and other key personnel, including its effects on fund profitability, the rationale for the compensation structure, and the extent to which current market conditions have affected retention and recruitment; (iv) the arrangements with and compensation paid to certain fund sub-advisers on behalf of the Fidelity funds and the treatment of such compensation within Fidelity's fund profitability methodology; (v) the terms of the funds' various management fee structures, including the basic group fee and the terms of Fidelity's voluntary expense limitation agreements; (vi) Fidelity's transfer agent fee, expense, and service structures for different funds and classes relative to competitive trends; (vii) the impact on fund profitability of recent industry trends, such as the growth in passively managed funds and outflows from actively managed equity funds; and (viii) explanations regarding the relative total expense ratios of certain funds and classes, total expense competitive trends and methodologies for total expense competitive comparisons, and actions that might be taken by Fidelity to reduce total expense ratios for certain classes. In addition, the Board considered its discussions with Fidelity regarding Fidelity's efforts to maintain the continuous investment and shareholder services necessary for the funds during the current pandemic and economic circumstances.
Based on its evaluation of all of the conclusions noted above, and after considering all factors it believed relevant, the Board concluded that the advisory fee arrangements are fair and reasonable, and that each fund's Advisory Contracts should be renewed.

AR-ANN-1120
1.878277.112
Fidelity® Health Savings Fund
Annual Report
September 30, 2020
See the inside front cover for important information about access to your fund’s shareholder reports.
Beginning on January 1, 2021, as permitted by regulations adopted by the Securities and Exchange Commission, paper copies of a fund’s shareholder reports will no longer be sent by mail, unless you specifically request paper copies of the reports from the fund or from your financial intermediary, such as a financial advisor, broker-dealer or bank. Instead, the reports will be made available on a website, and you will be notified by mail each time a report is posted and provided with a website link to access the report.
If you already elected to receive shareholder reports electronically, you will not be affected by this change and you need not take any action. You may elect to receive shareholder reports and other communications from a fund electronically, by contacting your financial intermediary. For Fidelity customers, visit Fidelity's web site or call Fidelity using the contact information listed below.
You may elect to receive all future reports in paper free of charge. If you wish to continue receiving paper copies of your shareholder reports, you may contact your financial intermediary or, if you are a Fidelity customer, visit Fidelity’s website, or call Fidelity at the applicable toll-free number listed below. Your election to receive reports in paper will apply to all funds held with the fund complex/your financial intermediary.
| Account Type | Website | Phone Number |
| Brokerage, Mutual Fund, or Annuity Contracts: | fidelity.com/mailpreferences | 1-800-343-3548 |
| Employer Provided Retirement Accounts: | netbenefits.fidelity.com/preferences (choose 'no' under Required Disclosures to continue to print) | 1-800-343-0860 |
| Advisor Sold Accounts Serviced Through Your Financial Intermediary: | Contact Your Financial Intermediary | Your Financial Intermediary's phone number |
| Advisor Sold Accounts Serviced by Fidelity: | institutional.fidelity.com | 1-877-208-0098 |
Contents
To view a fund's proxy voting guidelines and proxy voting record for the 12-month period ended June 30, visit http://www.fidelity.com/proxyvotingresults or visit the Securities and Exchange Commission's (SEC) web site at http://www.sec.gov.
You may also call 1-800-544-8544 if you’re an individual investing directly with Fidelity, call 1-800-835-5092 if you’re a plan sponsor or participant with Fidelity as your recordkeeper or call 1-877-208-0098 on institutional accounts or if you’re an advisor or invest through one to request a free copy of the proxy voting guidelines.
Standard & Poor's, S&P and S&P 500 are registered service marks of The McGraw-Hill Companies, Inc. and have been licensed for use by Fidelity Distributors Corporation.
Other third-party marks appearing herein are the property of their respective owners.
All other marks appearing herein are registered or unregistered trademarks or service marks of FMR LLC or an affiliated company. © 2020 FMR LLC. All rights reserved.
This report and the financial statements contained herein are submitted for the general information of the shareholders of the Fund. This report is not authorized for distribution to prospective investors in the Fund unless preceded or accompanied by an effective prospectus.
A fund files its complete schedule of portfolio holdings with the SEC for the first and third quarters of each fiscal year on Form N-PORT. Forms N-PORT are available on the SEC’s web site at http://www.sec.gov. A fund's Forms N-PORT may be reviewed and copied at the SEC’s Public Reference Room in Washington, DC. Information regarding the operation of the SEC's Public Reference Room may be obtained by calling 1-800-SEC-0330.
For a complete list of a fund's portfolio holdings, view the most recent holdings listing, semiannual report, or annual report on Fidelity's web site at http://www.fidelity.com, http://www.institutional.fidelity.com, or http://www.401k.com, as applicable.
NOT FDIC INSURED •MAY LOSE VALUE •NO BANK GUARANTEE
Neither the Fund nor Fidelity Distributors Corporation is a bank.
Note to Shareholders:
Early in 2020, the outbreak and spread of a new coronavirus emerged as a public health emergency that had a major influence on financial markets, primarily based on its impact on the global economy and the outlook for corporate earnings. The virus causes a respiratory disease known as COVID-19. On March 11, the World Health Organization declared the COVID-19 outbreak a pandemic, citing sustained risk of further global spread.
In the weeks following, as the crisis worsened, we witnessed an escalating human tragedy with wide-scale social and economic consequences from coronavirus-containment measures. The outbreak of COVID-19 prompted a number of measures to limit the spread, including travel and border restrictions, quarantines, and restrictions on large gatherings. In turn, these resulted in lower consumer activity, diminished demand for a wide range of products and services, disruption in manufacturing and supply chains, and – given the wide variability in outcomes regarding the outbreak – significant market uncertainty and volatility. Amid the turmoil, the U.S. government took unprecedented action – in concert with the U.S. Federal Reserve and central banks around the world – to help support consumers, businesses, and the broader economy, and to limit disruption to the financial system.
The situation continues to unfold, and the extent and duration of its impact on financial markets and the economy remain highly uncertain. Extreme events such as the coronavirus crisis are “exogenous shocks” that can have significant adverse effects on mutual funds and their investments. Although multiple asset classes may be affected by market disruption, the duration and impact may not be the same for all types of assets.
Fidelity is committed to helping you stay informed amid news about COVID-19 and during increased market volatility, and we’re taking extra steps to be responsive to customer needs. We encourage you to visit our websites, where we offer ongoing updates, commentary, and analysis on the markets and our funds.
Performance: The Bottom Line
Average annual total return reflects the change in the value of an investment, assuming reinvestment of distributions from dividend income and capital gains (the profits earned upon the sale of securities that have grown in value, if any) and assuming a constant rate of performance each year. The hypothetical investment and the average annual total returns do not reflect the deduction of taxes that a shareholder would pay on fund distributions or the redemption of fund shares. During periods of reimbursement by Fidelity, a fund’s total return will be greater than it would be had the reimbursement not occurred. How a fund did yesterday is no guarantee of how it will do tomorrow.
Average annual total returns for Fidelity® Health Savings Fund will be reported once the fund is a year old.
$10,000 Over Life of Fund
Let's say hypothetically that $10,000 was invested in Fidelity® Health Savings Fund , a class of the fund, on March 2, 2020, when the fund started.
The chart shows how the value of your investment would have changed, and also shows how the Bloomberg Barclays U.S. Aggregate Bond Index performed over the same period.
| Period Ending Values |
| $10,541 | Fidelity® Health Savings Fund |
| $10,278 | Bloomberg Barclays U.S. Aggregate Bond Index |
Management's Discussion of Fund Performance
Market Recap: The S&P 500
® index gained 15.15% for the 12 months ending September 30, 2020, in what was a bumpy ride for U.S. equity investors, marked by a steep but brief decline due to the early-2020 outbreak and spread of the coronavirus, followed by a historic rebound. Declared a pandemic on March 11, the COVID-19 crisis and containment efforts caused broad contraction in economic activity, along with extreme uncertainty, volatility and dislocation in financial markets. By mid-March, U.S. stocks had entered bear-market territory less than a month after hitting an all-time high and extending the longest-running bull market in American history. Stocks slid in late February, following a surge in COVID-19 cases outside China. The downtrend continued in March (-12%), capping the index’s worst quarter since 2008. A historically rapid and expansive U.S. monetary/fiscal-policy response provided a partial offset to the economic disruption and fueled a sharp uptrend beginning March 24, with recent strength supported by near-term potential for a COVID-19 vaccine breakthrough and signs of an early recovery in economic activity. The historic rally continued until September 2, when the S&P 500 achieved an all-time high, before retreating and returning -3.80% for the month, partly due to the inability of Congress to reach a deal on additional stimulus funding. Growth stocks dominated value shares for the year. By sector, information technology (+47%) led. In contrast, energy (-45%) fell hard along with the price of crude oil.
Comments from Co-Portfolio Manager Avishek Hazrachoudhury: From commencement of operations on March 2, 2020, to September 30, 2020, the fund gained 5.41%, outpacing the 4.35% advance of its benchmark, the Fidelity Health Savings Composite Index. Security selection added the most value versus the benchmark, fueled by stock picks in international developed markets (DM) and in the U.S. Picks among investment-grade bonds also contributed. In terms of overall asset allocation, fixed-income positioning meaningfully aided relative performance, while equity allocation was marginally beneficial. Within fixed income, our strategy entailed underweighting investment-grade bonds in favor of out-of-benchmark positions in long-term U.S. Treasuries, Treasury Inflation-Protected Securities (TIPS), high-yield corporate bonds, bank loans, emerging-markets (EM) debt and international corporate credit. Long-term Treasuries helped the most, as the asset class benefited from increased demand for the relative safety of U.S. Treasuries during March’s extreme market volatility. The fund’s core equity allocation strategy – underweighting U.S. and international DM stocks, while overweighting EM stocks – detracted versus the benchmark, primarily due to our U.S. positioning. A small, out-of-benchmark stake in REITs (real estate investment trusts) also hurt, mainly due to weakness in commercial real estate. On the plus side, commodities exposure – which is also outside the Composite benchmark – via the Van Eck Vectors
® Gold Miners ETF (+56%), provided a major boost for the period and brought the fund’s total equity contribution slightly into positive territory.
The views expressed above reflect those of the portfolio manager(s) only through the end of the period as stated on the cover of this report and do not necessarily represent the views of Fidelity or any other person in the Fidelity organization. Any such views are subject to change at any time based upon market or other conditions and Fidelity disclaims any responsibility to update such views. These views may not be relied on as investment advice and, because investment decisions for a Fidelity fund are based on numerous factors, may not be relied on as an indication of trading intent on behalf of any Fidelity fund.
Investment Summary (Unaudited)
The information in the following tables is based on the combined investments of the Fund and its pro-rata share of the investments of Fidelity's Central Funds, other than the Money Market Central Funds.Top Ten Holdings as of September 30, 2020
| | % of fund's net assets |
| Fidelity International Bond Index Fund | 18.6 |
| Fidelity Long-Term Treasury Bond Index Fund | 7.2 |
| Market Vectors Gold Miners ETF | 2.8 |
| JPMorgan BetaBuilders Japan ETF | 1.3 |
| Apple, Inc. | 1.0 |
| Microsoft Corp. | 0.9 |
| Alphabet, Inc. Class A | 0.5 |
| Alibaba Group Holding Ltd. sponsored ADR | 0.5 |
| Amazon.com, Inc. | 0.4 |
| Tencent Holdings Ltd. | 0.4 |
| | 33.6 |
Top Five Market Sectors as of September 30, 2020
| | % of fund's net assets |
| Financials | 8.2 |
| Information Technology | 6.7 |
| Consumer Discretionary | 3.7 |
| Communication Services | 3.5 |
| Health Care | 3.3 |
Quality Diversification (% of fund's net assets)
| As of September 30, 2020 |
| | U.S. Government and U.S. Government Agency Obligations | 23.5% |
| | AAA,AA,A | 4.7% |
| | BBB | 5.1% |
| | BB and Below | 8.2% |
| | Not Rated | 1.5% |
| | Equities | 55.0% |
| | Short-Term Investments and Net Other Assets | 2.0% |

We have used ratings from Moody's Investors Service, Inc. Where Moody's® ratings are not available, we have used S&P® ratings. All ratings are as of the date indicated and do not reflect subsequent changes.
Asset Allocation (% of fund's net assets)
| As of September 30, 2020 |
| | Stocks, Investment Companies and Equity Futures | 26.4% |
| | Bonds | 67.9% |
| | Other Investments | 3.7% |
| | Short-Term Investments and Net Other Assets (Liabilities) | 2.0% |

An unaudited holdings listing for the Fund, which presents direct holdings as well as the pro-rata share of any securities and other investments held indirectly through its investment in underlying non-money market Fidelity Central Funds, is available at fidelity.com and/or institutional.fidelity.com, as applicable.
At period end, foreign investments including the Fund's pro-rata share of the underlying Central Funds, other than the Money Market Funds, was 21.2% of net assets.
Schedule of Investments September 30, 2020
Showing Percentage of Net Assets
| Equity Central Funds - 25.6% | | | |
| | | Shares | Value |
| Fidelity Emerging Markets Equity Central Fund (a) | | 1,456 | $345,376 |
| Fidelity International Equity Central Fund (a) | | 5,062 | 428,306 |
| Fidelity Real Estate Equity Central Fund (a) | | 101 | 10,874 |
| Fidelity U.S. Equity Central Fund (a) | | 11,586 | 1,166,794 |
| TOTAL EQUITY CENTRAL FUNDS | | | |
| (Cost $1,838,053) | | | 1,951,350 |
|
| Fixed-Income Central Funds - 44.5% | | | |
| High Yield Fixed-Income Funds - 12.5% | | | |
| Fidelity Emerging Markets Debt Central Fund (a) | | 83,990 | 754,232 |
| Fidelity Emerging Markets Debt Local Currency Central Fund (a) | | 340 | 34,051 |
| Fidelity Floating Rate Central Fund (a) | | 355 | 34,237 |
| Fidelity High Income Central Fund (a) | | 1,241 | 129,693 |
|
| TOTAL HIGH YIELD FIXED-INCOME FUNDS | | | 952,213 |
|
| Investment Grade Fixed-Income Funds - 32.0% | | | |
| Fidelity Inflation-Protected Bond Index Central Fund (a) | | 11,248 | 1,225,239 |
| Fidelity Investment Grade Bond Central Fund (a) | | 10,292 | 1,218,676 |
|
| TOTAL INVESTMENT GRADE FIXED-INCOME FUNDS | | | 2,443,915 |
|
| TOTAL FIXED-INCOME CENTRAL FUNDS | | | |
| (Cost $3,338,436) | | | 3,396,128 |
|
| Money Market Central Funds - 0.0% | | | |
| Fidelity Cash Central Fund 0.10% (b) | | | |
| (Cost $886) | | 886 | 886 |
|
| Investment Companies - 4.1% | | | |
| JPMorgan BetaBuilders Japan ETF | | 3,938 | 97,150 |
| Market Vectors Gold Miners ETF | | 5,423 | 212,365 |
| TOTAL INVESTMENT COMPANIES | | | |
| (Cost $262,564) | | | 309,515 |
|
| Fixed-Income Funds - 25.8% | | | |
| Fidelity International Bond Index Fund (c) | | 140,020 | 1,422,603 |
| Fidelity Long-Term Treasury Bond Index Fund (c) | | 32,512 | 548,472 |
| TOTAL FIXED-INCOME FUNDS | | | |
| (Cost $1,947,479) | | | 1,971,075 |
| TOTAL INVESTMENT IN SECURITIES - 100.0% | | | |
| (Cost $7,387,418) | | | 7,628,954 |
| NET OTHER ASSETS (LIABILITIES) - 0.0% | | | 2,644 |
| NET ASSETS - 100% | | | $7,631,598 |
Security Type Abbreviations
ETF – Exchange-Traded Fund
Legend
(a) Affiliated fund that is generally available only to investment companies and other accounts managed by Fidelity Investments. A complete unaudited schedule of portfolio holdings for each Fidelity Central Fund is filed with the SEC for the first and third quarters of each fiscal year on Form N-PORT and is available upon request or at the SEC's website at www.sec.gov. An unaudited holdings listing for the Fund, which presents direct holdings as well as the pro-rata share of securities and other investments held indirectly through its investment in underlying non-money market Fidelity Central Funds, is available at fidelity.com and/or institutional.fidelity.com, as applicable. In addition, each Fidelity Central Fund's financial statements, which are not covered by the Fund's Report of Independent Registered Public Accounting Firm, are available on the SEC's website or upon request.
(b) Affiliated fund that is generally available only to investment companies and other accounts managed by Fidelity Investments. The rate quoted is the annualized seven-day yield of the fund at period end. A complete unaudited listing of the fund's holdings as of its most recent quarter end is available upon request. In addition, each Fidelity Central Fund's financial statements, which are not covered by the Fund's Report of Independent Registered Public Accounting Firm, are available on the SEC's website or upon request.
(c) Affiliated Fund
Affiliated Central Funds
Information regarding fiscal year to date income earned by the Fund from investments in Fidelity Central Funds is as follows:
| Fund | Income earned |
| Fidelity Communication Services Central Fund | $2,059 |
| Fidelity Consumer Discretionary Central Fund | 363 |
| Fidelity Consumer Staples Central Fund | 782 |
| Fidelity Emerging Markets Debt Central Fund | 12,493 |
| Fidelity Emerging Markets Equity Central Fund | 1,640 |
| Fidelity Energy Central Fund | 556 |
| Fidelity Financials Central Fund | 5,031 |
| Fidelity Floating Rate Central Fund | 544 |
| Fidelity Health Care Central Fund | 12,732 |
| Fidelity High Income Central Fund | 2,289 |
| Fidelity Industrials Central Fund | 678 |
| Fidelity Inflation-Protected Bond Index Central Fund | 1,251 |
| Fidelity Information Technology Central Fund | 23,811 |
| Fidelity International Equity Central Fund | 2,212 |
| Fidelity Investment Grade Bond Central Fund | 11,066 |
| Fidelity Materials Central Fund | 133 |
| Fidelity Real Estate Equity Central Fund | 185 |
| Fidelity Utilities Central Fund | 499 |
| Total | $78,324 |
Amounts in the income column in the above table include any capital gain distributions from underlying funds, which are presented in the corresponding line-item in the Statement of Operations, if applicable.
Fiscal year to date information regarding the Fund’s investments in non-Money Market Central Funds, including the ownership percentage, is presented below.
| Affiliate | Value, beginning of period | Purchases(a) | Sales Proceeds(a) | Realized Gain (loss) | Change in Unrealized appreciation (depreciation) | Value, end of period | % ownership, end of period |
| Fidelity Communication Services Central Fund | $-- | $127,473 | $26,427 | $(598) | $-- | $-- | 0.0 |
| Fidelity Consumer Discretionary Central Fund | -- | 137,777 | 32,248 | (779) | -- | -- | 0.0 |
| Fidelity Consumer Staples Central Fund | -- | 83,769 | 17,265 | (424) | -- | -- | 0.0 |
| Fidelity Emerging Markets Debt Central Fund | -- | 759,189 | 6,192 | (559) | 1,794 | 754,232 | 0.0 |
| Fidelity Emerging Markets Debt Local Currency Central Fund | -- | 34,000 | -- | -- | 51 | 34,051 | 0.0 |
| Fidelity Emerging Markets Equity Central Fund | -- | 360,606 | 30,254 | (5,065) | 20,089 | 345,376 | 0.0 |
| Fidelity Energy Central Fund | -- | 41,481 | 12,701 | (2,550) | -- | -- | 0.0 |
| Fidelity Financials Central Fund | -- | 220,468 | 70,207 | (6,063) | -- | -- | 0.0 |
| Fidelity Floating Rate Central Fund | -- | 34,070 | 45 | (1) | 213 | 34,237 | 0.0 |
| Fidelity Health Care Central Fund | -- | 204,129 | 38,160 | (889) | -- | -- | 0.0 |
| Fidelity High Income Central Fund | -- | 126,587 | 157 | (7) | 3,270 | 129,693 | 0.0 |
| Fidelity Industrials Central Fund | -- | 114,583 | 34,087 | (1,751) | -- | -- | 0.0 |
| Fidelity Inflation-Protected Bond Index Central Fund | -- | 1,203,738 | 11,795 | (123) | 33,419 | 1,225,239 | 0.1 |
| Fidelity Information Technology Central Fund | -- | 379,673 | 86,580 | (1,025) | -- | -- | 0.0 |
| Fidelity International Equity Central Fund | -- | 486,290 | 76,437 | (2,255) | 20,708 | 428,306 | 0.0 |
| Fidelity Investment Grade Bond Central Fund | -- | 1,440,320 | 239,486 | (1,102) | 18,944 | 1,218,676 | 0.0 |
| Fidelity Materials Central Fund | -- | 30,272 | 7,463 | (349) | -- | -- | 0.0 |
| Fidelity Real Estate Equity Central Fund | -- | 46,581 | 29,222 | (6,725) | 240 | 10,874 | 0.0 |
| Fidelity U.S. Equity Central Fund | -- | 125,024 | 50,976 | (7,511) | 72,261 | 1,166,794 | 0.0 |
| Fidelity Utilities Central Fund | -- | 43,526 | 13,804 | (1,785) | -- | -- | 0.0 |
| Total | $-- | $5,999,556 | $783,506 | $(39,561) | $170,989 | $5,347,478 | |
(a) Excludes the value of securities received and delivered through merger transactions, if applicable.
Affiliated Underlying Funds
Fiscal year to date information regarding the Fund's investments in affiliated Underlying Funds, excluding any Money Market Central Funds, is presented below. Exchanges between classes of the same affiliated Underlying Funds may occur.
| Affiliate | Value, beginning of period | Purchases | Sales Proceeds | Dividend Income | Realized Gain (loss) | Change in Unrealized appreciation (depreciation) | Value, end of period |
| Fidelity International Bond Index Fund | $-- | $1,561,633 | $155,186 | $1,107 | $(602) | $16,758 | $1,422,603 |
| Fidelity Long-Term Treasury Bond Index Fund | -- | 773,506 | 236,956 | 3,841 | 5,082 | 6,840 | 548,472 |
| Total | $-- | $2,335,139 | $392,142 | $4,948 | $4,480 | $23,598 | $1,971,075 |
Amounts in the income column in the above table include any capital gain distributions from underlying funds, which are presented in the corresponding line-item in the Statement of Operations, if applicable.
Investment Valuation
The following is a summary of the inputs used, as of September 30, 2020, involving the Fund's assets and liabilities carried at fair value. The inputs or methodology used for valuing securities may not be an indication of the risk associated with investing in those securities. For more information on valuation inputs, and their aggregation into the levels used below, please refer to the Investment Valuation section in the accompanying Notes to Financial Statements.
| | Valuation Inputs at Reporting Date: |
| Description | Total | Level 1 | Level 2 | Level 3 |
| Investments in Securities: | | | | |
| Equity Central Funds | $1,951,350 | $1,951,350 | $-- | $-- |
| Fixed-Income Central Funds | 3,396,128 | 3,396,128 | -- | -- |
| Money Market Central Funds | 886 | 886 | -- | -- |
| Investment Companies | 309,515 | 309,515 | -- | -- |
| Fixed-Income Funds | 1,971,075 | 1,971,075 | -- | -- |
| Total Investments in Securities: | $7,628,954 | $7,628,954 | $-- | $-- |
Other Information
Distribution of investments by country or territory of incorporation, as a percentage of Total Net Assets, is as follows (Unaudited):
| United States of America | 78.9% |
| Cayman Islands | 2.4% |
| United Kingdom | 1.8% |
| France | 1.5% |
| Netherlands | 1.4% |
| Japan | 1.1% |
| Others (Individually Less Than 1%) | 12.9% |
| | 100.0% |
The information in the above table is based on the combined investments of the Fund and its pro-rata share of the investments of Fidelity's Central Funds, other than the Money Market Central Funds.
See accompanying notes which are an integral part of the financial statements.
Financial Statements
Statement of Assets and Liabilities
| | | September 30, 2020 |
| Assets | | |
Investment in securities, at value — See accompanying schedule:
Unaffiliated issuers (cost $262,564) | $309,515 | |
| Fidelity Central Funds (cost $5,177,375) | 5,348,364 | |
| Other affiliated issuers (cost $1,947,479) | 1,971,075 | |
| Total Investment in Securities (cost $7,387,418) | | $7,628,954 |
| Cash | | 2,761 |
| Receivable for investments sold | | 40,409 |
| Receivable for fund shares sold | | 30,527 |
| Dividends receivable | | 743 |
| Total assets | | 7,703,394 |
| Liabilities | | |
| Payable for investments purchased | $69,013 | |
| Payable for fund shares redeemed | 325 | |
| Accrued management fee | 2,458 | |
| Total liabilities | | 71,796 |
| Net Assets | | $7,631,598 |
| Net Assets consist of: | | |
| Paid in capital | | $7,375,210 |
| Total accumulated earnings (loss) | | 256,388 |
| Net Assets | | $7,631,598 |
| Net Asset Value and Maximum Offering Price | | |
| Fidelity Health Savings Fund: | | |
| Net Asset Value, offering price and redemption price per share ($4,323,968 ÷ 412,663 shares) | | $10.48 |
| Class K: | | |
| Net Asset Value, offering price and redemption price per share ($3,307,630 ÷ 315,606 shares) | | $10.48 |
See accompanying notes which are an integral part of the financial statements.
Statement of Operations
| | | For the period
March 2, 2020 (commencement of operations) to
September 30, 2020 |
| Investment Income | | |
| Dividends (including $4,948 earned from other affiliated issuers) | | $4,948 |
| Income from Fidelity Central Funds | | 40,883 |
| Total income | | 45,831 |
| Expenses | | |
| Management fee | $10,206 | |
| Independent trustees' fees and expenses | 5 | |
| Commitment fees | 17 | |
| Total expenses before reductions | 10,228 | |
| Expense reductions | (22) | |
| Total expenses after reductions | | 10,206 |
| Net investment income (loss) | | 35,625 |
| Realized and Unrealized Gain (Loss) | | |
| Net realized gain (loss) on: | | |
| Investment securities: | | |
| Unaffiliated issuers | 2,263 | |
| Fidelity Central Funds | (39,561) | |
| Other affiliated issuers | 4,480 | |
| Capital gain distributions from Fidelity Central Funds | 37,441 | |
| Total net realized gain (loss) | | 4,623 |
| Change in net unrealized appreciation (depreciation) on: | | |
| Investment securities: | | |
| Unaffiliated issuers | 46,951 | |
| Fidelity Central Funds | 170,989 | |
| Other affiliated issuers | 23,596 | |
| Total change in net unrealized appreciation (depreciation) | | 241,536 |
| Net gain (loss) | | 246,159 |
| Net increase (decrease) in net assets resulting from operations | | $281,784 |
See accompanying notes which are an integral part of the financial statements.
Statement of Changes in Net Assets
| | For the period
March 2, 2020 (commencement of operations) to
September 30, 2020 |
| Increase (Decrease) in Net Assets | |
| Operations | |
| Net investment income (loss) | $35,625 |
| Net realized gain (loss) | 4,623 |
| Change in net unrealized appreciation (depreciation) | 241,536 |
| Net increase (decrease) in net assets resulting from operations | 281,784 |
| Distributions to shareholders | (25,412) |
| Share transactions - net increase (decrease) | 7,375,226 |
| Total increase (decrease) in net assets | 7,631,598 |
| Net Assets | |
| Beginning of period | – |
| End of period | $7,631,598 |
See accompanying notes which are an integral part of the financial statements.
Financial Highlights
Fidelity Health Savings Fund
| Years ended September 30, | 2020 A |
| Selected Per–Share Data | |
| Net asset value, beginning of period | $10.00 |
| Income from Investment Operations | |
| Net investment income (loss)B | .08 |
| Net realized and unrealized gain (loss) | .46 |
| Total from investment operations | .54 |
| Distributions from net investment income | (.06) |
| Total distributions | (.06) |
| Net asset value, end of period | $10.48 |
| Total ReturnC,D | 5.41% |
| Ratios to Average Net AssetsE,F | |
| Expenses before reductions | .45%G |
| Expenses net of fee waivers, if any | .45%G |
| Expenses net of all reductions | .45%G |
| Net investment income (loss) | 1.36%G |
| Supplemental Data | |
| Net assets, end of period (000 omitted) | $4,324 |
| Portfolio turnover rateH | 43%G |
A For the period March 2, 2020 (commencement of operations) to September 30, 2020.
B Calculated based on average shares outstanding during the period.
C Total returns for periods of less than one year are not annualized.
D Total returns would have been lower if certain expenses had not been reduced during the applicable periods shown.
E Fees and expenses of any underlying mutual funds or exchange-traded funds (ETFs) are not included in the Fund's expense ratio. The Fund indirectly bears its proportionate share of these expenses. For additional expense information related to investments in Fidelity Central Funds, please refer to the "Investments in Fidelity Central Funds" note found in the Notes to Financial Statements section of the most recent Annual or Semi-Annual report.
F Expense ratios reflect operating expenses of the class. Expenses before reductions do not reflect amounts reimbursed, waived, or reduced through arrangements with the investment adviser, brokerage services, or other offset arrangements, if applicable, and do not represent the amount paid by the class during periods when reimbursements, waivers or reductions occur.
G Annualized
H Amount does not include the portfolio activity of any underlying mutual funds or exchange-traded funds (ETFs).
See accompanying notes which are an integral part of the financial statements.
Fidelity Health Savings Fund Class K
| Years ended September 30, | 2020 A |
| Selected Per–Share Data | |
| Net asset value, beginning of period | $10.00 |
| Income from Investment Operations | |
| Net investment income (loss)B | .09 |
| Net realized and unrealized gain (loss) | .45 |
| Total from investment operations | .54 |
| Distributions from net investment income | (.06) |
| Total distributions | (.06) |
| Net asset value, end of period | $10.48 |
| Total ReturnC,D | 5.45% |
| Ratios to Average Net AssetsE,F | |
| Expenses before reductions | .35%G |
| Expenses net of fee waivers, if any | .35%G |
| Expenses net of all reductions | .35%G |
| Net investment income (loss) | 1.46%G |
| Supplemental Data | |
| Net assets, end of period (000 omitted) | $3,308 |
| Portfolio turnover rateH | 43%G |
A For the period March 2, 2020 (commencement of operations) to September 30, 2020.
B Calculated based on average shares outstanding during the period.
C Total returns for periods of less than one year are not annualized.
D Total returns would have been lower if certain expenses had not been reduced during the applicable periods shown.
E Fees and expenses of any underlying mutual funds or exchange-traded funds (ETFs) are not included in the Fund's expense ratio. The Fund indirectly bears its proportionate share of these expenses. For additional expense information related to investments in Fidelity Central Funds, please refer to the "Investments in Fidelity Central Funds" note found in the Notes to Financial Statements section of the most recent Annual or Semi-Annual report.
F Expense ratios reflect operating expenses of the class. Expenses before reductions do not reflect amounts reimbursed, waived, or reduced through arrangements with the investment adviser, brokerage services, or other offset arrangements, if applicable, and do not represent the amount paid by the class during periods when reimbursements, waivers or reductions occur.
G Annualized
H Amount does not include the portfolio activity of any underlying mutual funds or exchange-traded funds (ETFs).
See accompanying notes which are an integral part of the financial statements.
Notes to Financial Statements
For the period ended September 30, 2020
1. Organization.
Fidelity Health Savings Fund (the Fund) is a fund of Fidelity Charles Street Trust (the Trust) and is authorized to issue an unlimited number of shares. The Trust is registered under the Investment Company Act of 1940, as amended (the 1940 Act), as an open-end management investment company organized as a Massachusetts business trust. The Fund offers Fidelity Health Savings Fund and Class K shares, each of which has equal rights as to assets and voting privileges. Each class has exclusive voting rights with respect to matters that affect that class.
2. Investments in Fidelity Central Funds.
The Fund invests in Fidelity Central Funds, which are open-end investment companies generally available only to other investment companies and accounts managed by the investment adviser and its affiliates. The Fund's Schedule of Investments lists each of the Fidelity Central Funds held as of period end, if any, as an investment of the Fund, but does not include the underlying holdings of each Fidelity Central Fund. As an Investing Fund, the Fund indirectly bears its proportionate share of the expenses of the underlying Fidelity Central Funds.
Based on its investment objective, each Fidelity Central Fund may invest or participate in various investment vehicles or strategies that are similar to those of the Fund. These strategies are consistent with the investment objectives of the Fund and may involve certain economic risks which may cause a decline in value of each of the Fidelity Central Funds and thus a decline in the value of the Fund. The following summarizes the Fund's investment in each non-money market Fidelity Central Fund.
| Fidelity Central Fund(a) | Investment Manager | Investment Objective | Investment Practices | Expense Ratio(b),(c),(d) |
| Fidelity Emerging Markets Debt Central Fund | FMR | Seeks high total return by normally investing in debt securities of issuers in emerging markets and other debt investments that are tied economically to emerging markets. | Foreign Securities
Restricted Securities
| Less than .005% |
| Fidelity Emerging Markets Equity Central Fund | FMR | Seeks capital appreciation by investing primarily in equity securities of issuers in emerging markets. | Foreign Securities
Futures
| .05% |
| Fidelity International Equity Central Fund | FMR | Seeks capital appreciation by investing primarily in non-U.S. based common stocks, including securities of issuers located in emerging markets. | Delayed Delivery & When Issued Securities
Foreign Securities
Futures
| .01% |
| Fidelity Floating Rate Central Fund | FMR | Seeks a high level of income by normally investing in floating rate loans and other floating rate securities. | Loans & Direct Debt Instruments
Restricted Securities
| Less than .005% |
| Fidelity High Income Central Fund | FMR | Seeks a high level of income and may also seek capital appreciation by investing primarily in debt securities, preferred stocks, and convertible securities, with an emphasis on lower-quality debt securities. | Delayed Delivery & When Issued Securities
Loans & Direct Debt Instruments
Restricted Securities
| Less than .005% |
| Fidelity Inflation-Protected Bond Index Central Fund | FMR | Seeks to provide investment results that correspond to the performance of the inflation-protected United States Treasury market, and may invest in derivatives. | - | Less than .005% |
| Fidelity Investment Grade Bond Central Fund | FMR | Seeks a high level of income by normally investing in investment–grade debt securities. | Delayed Delivery & When Issued Securities
Restricted Securities
| Less than .005% |
| Fidelity Real Estate Equity Central Fund | FMR | Seeks above-average income and long-term capital growth by investing primarily in equity securities of issuers in the real estate industry. | - | Less than .005% |
| Fidelity U.S. Equity Central Fund | FMR | Seeks capital appreciation by investing primarily in common stocks, allocated across different market sectors. | Foreign Securities
Futures
| .01% |
| Fidelity Emerging Markets Debt Local Currency Central Fund | FMR | Seeks high total return by normally
investing in debt securities of issuers in emerging markets and other debt investments that are tied economically to emerging markets and denominated in the local currency of the issuer.
| Foreign Securities
| .01% |
(a) The Fidelity Equity Central Funds merged into Fidelity U.S. Equity Central Fund on September 18, 2020.
(b) Expenses expressed as a percentage of average net assets and are as of each underlying Central Fund's most recent annual or semi-annual shareholder report.
(c) For Fidelity U.S. Equity Central Fund, percentage is based on estimated amounts for the current fiscal year. Fund commenced operations on September 18, 2020.
(d) For Fidelity Emerging Markets Debt Local Currency Central Fund, percentage is based on estimated amounts for the current fiscal year. Fund commenced operations on September 23, 2020.
An unaudited holdings listing for the Fund, which presents direct holdings as well as the pro-rata share of any securities and other investments held indirectly through its investment in underlying non-money market Fidelity Central Funds, is available at fidelity.com. A complete unaudited list of holdings for each Fidelity Central Fund is available upon request or at the Securities and Exchange Commission (the SEC) website at www.sec.gov. In addition, the financial statements of the Fidelity Central Funds which contain the significant accounting policies (including investment valuation policies) of those funds, which are not covered by the Fund's Report of Independent Registered Public Accounting Firm, are available on the SEC website or upon request.
3. Significant Accounting Policies.
The Fund is an investment company and applies the accounting and reporting guidance of the Financial Accounting Standards Board (FASB) Accounting Standards Codification Topic 946 Financial Services – Investment Companies. The financial statements have been prepared in conformity with accounting principles generally accepted in the United States of America (GAAP), which require management to make certain estimates and assumptions at the date of the financial statements. Actual results could differ from those estimates. Subsequent events, if any, through the date that the financial statements were issued have been evaluated in the preparation of the financial statements. The following summarizes the significant accounting policies of the Fund:
Investment Valuation. Investments are valued as of 4:00 p.m. Eastern time on the last calendar day of the period. The Board of Trustees (the Board) has delegated the day to day responsibility for the valuation of the Fund's investments to the Fair Value Committee (the Committee) established by the Fund's investment adviser. In accordance with valuation policies and procedures approved by the Board, the Fund attempts to obtain prices from one or more third party pricing vendors or brokers to value its investments. When current market prices, quotations or currency exchange rates are not readily available or reliable, investments will be fair valued in good faith by the Committee, in accordance with procedures adopted by the Board. Factors used in determining fair value vary by investment type and may include market or investment specific events. The frequency with which these procedures are used cannot be predicted and they may be utilized to a significant extent. The Committee oversees the Fund's valuation policies and procedures and reports to the Board on the Committee's activities and fair value determinations. The Board monitors the appropriateness of the procedures used in valuing the Fund's investments and ratifies the fair value determinations of the Committee. The Fund categorizes the inputs to valuation techniques used to value its investments into a disclosure hierarchy consisting of three levels as shown below:
- Level 1 – quoted prices in active markets for identical investments
- Level 2 – other significant observable inputs (including quoted prices for similar investments, interest rates, prepayment speeds, etc.)
- Level 3 – unobservable inputs (including the Fund's own assumptions based on the best information available)
Valuation techniques used to value the Fund's investments by major category are as follows. Investments in open-end mutual funds are valued at their closing net asset value (NAV) each business day and are categorized as Level 1 in the hierarchy.
Exchange-Traded Funds (ETFs) are valued at their last sale price or official closing price as reported by a third party pricing vendor on the primary market or exchange on which they are traded and are categorized as Level 1 in the hierarchy. In the event there were no sales during the day but the exchange reports a closing bid level, ETFs are valued at the closing bid and would be categorized as Level 1 in the hierarchy. In the event there was no closing bid, ETFs may be valued by another method that the Board believes reflects fair value in accordance with the Board's fair value pricing policies and may be categorized as Level 2 in the hierarchy. The aggregate value of investments by input level as of September 30, 2020 is included at the end of the Fund's Schedule of Investments.
Investment Transactions and Income. For financial reporting purposes, the Fund's investment holdings and NAV include trades executed through the end of the last business day of the period. The NAV per share for processing shareholder transactions is calculated as of the close of business of the New York Stock Exchange (NYSE), normally 4:00 p.m. Eastern time and includes trades executed through the end of the prior business day. Gains and losses on securities sold are determined on the basis of identified cost. Dividend income is recorded on the ex-dividend date, except for certain dividends from foreign securities where the ex-dividend date may have passed, which are recorded as soon as the Fund is informed of the ex-dividend date. Non-cash dividends included in dividend income, if any, are recorded at the fair market value of the securities received. Income and capital gain distributions from any underlying mutual funds or exchange traded funds (ETF) are recorded on the ex-dividend date.
Class Allocations and Expenses. Investment income, realized and unrealized capital gains and losses, common expenses of the Fund, and certain fund-level expense reductions, if any, are allocated daily on a pro-rata basis to each class based on the relative net assets of each class to the total net assets of the Fund. Each class differs with respect to fees incurred. Certain expense reductions may also differ by class. For the reporting period, the allocated portion of income and expenses to each class as a percent of its average net assets may vary due to the timing of recording these transactions in relation to fluctuating net assets of the classes. Expenses directly attributable to a fund are charged to that fund. Expenses attributable to more than one fund are allocated among the respective funds on the basis of relative net assets or other appropriate methods. Expense estimates are accrued in the period to which they relate and adjustments are made when actual amounts are known. Expenses included in the accompanying financial statements reflect the expenses of the Fund and do not include any expenses associated with any underlying mutual funds or exchange traded funds (ETFs). Although not included, in the Fund's expenses, the Fund indirectly bears its proportionate share of any underlying mutual funds or exchange traded funds (ETFs) expenses through the impact of these expenses on each underlying mutual funds or exchange traded funds (ETFs) NAV.
Income Tax Information and Distributions to Shareholders. Each year, the Fund intends to qualify as a regulated investment company under Subchapter M of the Internal Revenue Code, including distributing substantially all of its taxable income and realized gains. As a result, no provision for U.S. Federal income taxes is required. As of September 30, 2020, the Fund did not have any unrecognized tax benefits in the financial statements; nor is the Fund aware of any tax positions for which it is reasonably possible that the total amounts of unrecognized tax benefits will significantly change in the next twelve months. The Fund files a U.S. federal tax return, in addition to state and local tax returns as required. The Fund's federal income tax returns are subject to examination by the Internal Revenue Service (IRS) for a period of three fiscal years after they are filed. State and local tax returns may be subject to examination for an additional fiscal year depending on the jurisdiction.
Distributions are declared and recorded on the ex-dividend date. Income and capital gain distributions are declared separately for each class. Income and capital gain distributions are determined in accordance with income tax regulations, which may differ from GAAP.
Capital accounts within the financial statements are adjusted for permanent book-tax differences. These adjustments have no impact on net assets or the results of operations. Capital accounts are not adjusted for temporary book-tax differences which will reverse in a subsequent period.
Book-tax differences are primarily due to the short-term gain distributions from the Underlying Funds and losses deferred due to wash sales.
As of period end, the cost and unrealized appreciation (depreciation) in securities, and derivatives if applicable, for federal income tax purposes were as follows:
| Gross unrealized appreciation | $253,487 |
| Gross unrealized depreciation | (48,125) |
| Net unrealized appreciation (depreciation) | $205,362 |
| Tax Cost | $7,423,592 |
The tax-based components of distributable earnings as of period end were as follows:
| Undistributed ordinary income | $22,209 |
| Undistributed long-term capital gain | $28,818 |
| Net unrealized appreciation (depreciation) on securities and other investments | $205,362 |
The tax character of distributions paid was as follows:
| | September 30, 2020(a) |
| Ordinary Income | $25,412 |
(a) For the period March 2, 2020 (commencement of operations) to September 30, 2020.
4. Purchases and Sales of Investments.
Purchases and sales of securities, other than short-term securities, are noted in the table below.
| | Purchases ($) | Sales ($) |
| Fidelity Health Savings Fund | 8,605,184 | 1,185,742 |
5. Fees and Other Transactions with Affiliates.
Management Fee. Fidelity Management & Research Company LLC (the investment adviser) and its affiliates provide the Fund with investment management related services for which each class of the Fund pays a monthly management fee. Under the management contract, the investment adviser pays all other operating expenses, except the compensation of the independent Trustees and certain miscellaneous expenses such as proxy and shareholder meeting expenses. During the period, the management fee for each class of the Fund was as follows:
| | Annual % of Class-Level Average Net Assets |
| Fidelity Health Savings Fund | .45% |
| Class K | .35% |
Interfund Trades. Funds may purchase from or sell securities to other Fidelity Funds under procedures adopted by the Board. The procedures have been designed to ensure these interfund trades are executed in accordance with Rule 17a-7 of the 1940 Act. Interfund trades are included within the respective purchases and sales amounts shown in the Purchases and Sales of Investments note.
6. Committed Line of Credit.
Certain Funds participate with other funds managed by the investment adviser or an affiliate in a $4.25 billion credit facility (the "line of credit") to be utilized for temporary or emergency purposes to fund shareholder redemptions or for other short-term liquidity purposes. The participating funds have agreed to pay commitment fees on their pro-rata portion of the line of credit, which are reflected in Commitment fees on the Statement of Operations, and are as follows:
| | Amount |
| Fidelity Health Savings Fund | $17 |
During the period, there were no borrowings on this line of credit.
7. Expense Reductions.
Through arrangements with the Fund's custodian, credits realized as a result of certain uninvested cash balances were used to reduce the Fund's expenses. During the period, custodian credits reduced the Fund's expenses by $22.
8. Distributions to Shareholders.
Distributions to shareholders of each class were as follows:
| | Year ended
September 30, 2020(a) |
| Distributions to shareholders | |
| Fidelity Health Savings Fund | $12,961 |
| Class K | 12,451 |
| Total | $25,412 |
(a) For the period March 2, 2020 (commencement of operations) to September 30, 2020.
9. Share Transactions.
Share transactions for each class were as follows and may contain automatic conversions between classes or exchanges between affiliated funds:
| | Shares | Dollars |
| | Year ended September 30, 2020(a) | Year ended September 30, 2020(a) |
| Fidelity Health Savings Fund | | |
| Shares sold | 414,555 | $4,210,858 |
| Reinvestment of distributions | 1,266 | 12,925 |
| Shares redeemed | (3,158) | (32,523) |
| Net increase (decrease) | 412,663 | $4,191,260 |
| Class K | | |
| Shares sold | 317,469 | $3,203,596 |
| Reinvestment of distributions | 1,226 | 12,451 |
| Shares redeemed | (3,089) | (32,081) |
| Net increase (decrease) | 315,606 | $3,183,966 |
(a) For the period March 2, 2020 (commencement of operations) to September 30, 2020.
10. Other.
The Fund's organizational documents provide former and current trustees and officers with a limited indemnification against liabilities arising in connection with the performance of their duties to the Fund. In the normal course of business, the Fund may also enter into contracts that provide general indemnifications. The Fund's maximum exposure under these arrangements is unknown as this would be dependent on future claims that may be made against the Fund. The risk of material loss from such claims is considered remote.
At the end of the period, the investment adviser or its affiliates were the owners of record of approximately 28% of the total outstanding shares of the Fund.
11. Coronavirus (COVID-19) Pandemic.
An outbreak of COVID-19 first detected in China during December 2019 has since spread globally and was declared a pandemic by the World Health Organization during March 2020. Developments that disrupt global economies and financial markets, such as the COVID-19 pandemic, may magnify factors that affect the Fund's performance.
Report of Independent Registered Public Accounting Firm
To the Board of Trustees of Fidelity Charles Street Trust and Shareholders of Fidelity Health Savings Fund:
Opinion on the Financial Statements and Financial Highlights
We have audited the accompanying statement of assets and liabilities of Fidelity Health Savings Fund (the "Fund"), a fund of Fidelity Charles Street Trust, including the schedule of investments, as of September 30, 2020, the related statement of operations, the statement of changes in net assets and the financial highlights for the period from March 2, 2020 (commencement of operations) through September 30, 2020, and the related notes. In our opinion, the financial statements and financial highlights present fairly, in all material respects, the financial position of the Fund as of September 30, 2020, and the results of its operations, the changes in its net assets and the financial highlights for the period from March 2, 2020 (commencement of operations) through September 30, 2020 in conformity with accounting principles generally accepted in the United States of America.
Basis for Opinion
These financial statements and financial highlights are the responsibility of the Fund's management. Our responsibility is to express an opinion on the Fund's financial statements and financial highlights based on our audits. We are a public accounting firm registered with the Public Company Accounting Oversight Board (United States) (PCAOB) and are required to be independent with respect to the Fund in accordance with the U.S. federal securities laws and the applicable rules and regulations of the Securities and Exchange Commission and the PCAOB.
We conducted our audits in accordance with the standards of the PCAOB. Those standards require that we plan and perform the audit to obtain reasonable assurance about whether the financial statements and financial highlights are free of material misstatement, whether due to error or fraud. The Fund is not required to have, nor were we engaged to perform, an audit of its internal control over financial reporting. As part of our audits we are required to obtain an understanding of internal control over financial reporting but not for the purpose of expressing an opinion on the effectiveness of the Fund’s internal control over financial reporting. Accordingly, we express no such opinion.
Our audits included performing procedures to assess the risks of material misstatement of the financial statements and financial highlights, whether due to error or fraud, and performing procedures that respond to those risks. Such procedures included examining, on a test basis, evidence regarding the amounts and disclosures in the financial statements and financial highlights. Our audits also included evaluating the accounting principles used and significant estimates made by management, as well as evaluating the overall presentation of the financial statements and financial highlights. Our procedures included confirmation of securities owned as of September 30, 2020, by correspondence with the custodian and brokers; when replies were not received from brokers, we performed other auditing procedures. We believe that our audits provide a reasonable basis for our opinion.
/s/ Deloitte & Touche LLP
Boston, Massachusetts
November 13, 2020
We have served as the auditor of one or more of the Fidelity investment companies since 1999.
Trustees and Officers
The Trustees, Members of the Advisory Board (if any), and officers of the trust and fund, as applicable, are listed below. The Board of Trustees governs the fund and is responsible for protecting the interests of shareholders. The Trustees are experienced executives who meet periodically throughout the year to oversee the fund's activities, review contractual arrangements with companies that provide services to the fund, oversee management of the risks associated with such activities and contractual arrangements, and review the fund's performance. Each of the Trustees oversees 280 funds.
The Trustees hold office without limit in time except that (a) any Trustee may resign; (b) any Trustee may be removed by written instrument, signed by at least two-thirds of the number of Trustees prior to such removal; (c) any Trustee who requests to be retired or who has become incapacitated by illness or injury may be retired by written instrument signed by a majority of the other Trustees; and (d) any Trustee may be removed at any special meeting of shareholders by a two-thirds vote of the outstanding voting securities of the trust. Each Trustee who is not an interested person (as defined in the 1940 Act) of the trust and the fund is referred to herein as an Independent Trustee. Each Independent Trustee shall retire not later than the last day of the calendar year in which his or her 75th birthday occurs. The Independent Trustees may waive this mandatory retirement age policy with respect to individual Trustees. Officers and Advisory Board Members hold office without limit in time, except that any officer or Advisory Board Member may resign or may be removed by a vote of a majority of the Trustees at any regular meeting or any special meeting of the Trustees. Except as indicated, each individual has held the office shown or other offices in the same company for the past five years.
The fund's Statement of Additional Information (SAI) includes more information about the Trustees. To request a free copy, call Fidelity at 1-800-544-8544 if you’re an individual investing directly with Fidelity, call 1-800-835-5092 if you’re a plan sponsor or participant with Fidelity as your recordkeeper or call 1-877-208-0098 on institutional accounts or if you’re an advisor or invest through one.
Experience, Skills, Attributes, and Qualifications of the Trustees. The Governance and Nominating Committee has adopted a statement of policy that describes the experience, qualifications, attributes, and skills that are necessary and desirable for potential Independent Trustee candidates (Statement of Policy). The Board believes that each Trustee satisfied at the time he or she was initially elected or appointed a Trustee, and continues to satisfy, the standards contemplated by the Statement of Policy. The Governance and Nominating Committee also engages professional search firms to help identify potential Independent Trustee candidates who have the experience, qualifications, attributes, and skills consistent with the Statement of Policy. From time to time, additional criteria based on the composition and skills of the current Independent Trustees, as well as experience or skills that may be appropriate in light of future changes to board composition, business conditions, and regulatory or other developments, have also been considered by the professional search firms and the Governance and Nominating Committee. In addition, the Board takes into account the Trustees' commitment and participation in Board and committee meetings, as well as their leadership of standing and ad hoc committees throughout their tenure.
In determining that a particular Trustee was and continues to be qualified to serve as a Trustee, the Board has considered a variety of criteria, none of which, in isolation, was controlling. The Board believes that, collectively, the Trustees have balanced and diverse experience, qualifications, attributes, and skills, which allow the Board to operate effectively in governing the fund and protecting the interests of shareholders. Information about the specific experience, skills, attributes, and qualifications of each Trustee, which in each case led to the Board's conclusion that the Trustee should serve (or continue to serve) as a trustee of the fund, is provided below.
Board Structure and Oversight Function. Abigail P. Johnson is an interested person and currently serves as Chairman. The Trustees have determined that an interested Chairman is appropriate and benefits shareholders because an interested Chairman has a personal and professional stake in the quality and continuity of services provided to the fund. Independent Trustees exercise their informed business judgment to appoint an individual of their choosing to serve as Chairman, regardless of whether the Trustee happens to be independent or a member of management. The Independent Trustees have determined that they can act independently and effectively without having an Independent Trustee serve as Chairman and that a key structural component for assuring that they are in a position to do so is for the Independent Trustees to constitute a substantial majority for the Board. The Independent Trustees also regularly meet in executive session. Arthur E. Johnson serves as Chairman of the Independent Trustees and as such (i) acts as a liaison between the Independent Trustees and management with respect to matters important to the Independent Trustees and (ii) with management prepares agendas for Board meetings.
Fidelity® funds are overseen by different Boards of Trustees. The fund's Board oversees Fidelity's investment-grade bond, money market, asset allocation and certain equity funds, and other Boards oversee Fidelity's high income and other equity funds. The asset allocation funds may invest in Fidelity® funds that are overseen by such other Boards. The use of separate Boards, each with its own committee structure, allows the Trustees of each group of Fidelity® funds to focus on the unique issues of the funds they oversee, including common research, investment, and operational issues. On occasion, the separate Boards establish joint committees to address issues of overlapping consequences for the Fidelity® funds overseen by each Board.
The Trustees operate using a system of committees to facilitate the timely and efficient consideration of all matters of importance to the Trustees, the fund, and fund shareholders and to facilitate compliance with legal and regulatory requirements and oversight of the fund's activities and associated risks. The Board, acting through its committees, has charged FMR and its affiliates with (i) identifying events or circumstances the occurrence of which could have demonstrably adverse effects on the fund's business and/or reputation; (ii) implementing processes and controls to lessen the possibility that such events or circumstances occur or to mitigate the effects of such events or circumstances if they do occur; and (iii) creating and maintaining a system designed to evaluate continuously business and market conditions in order to facilitate the identification and implementation processes described in (i) and (ii) above. Because the day-to-day operations and activities of the fund are carried out by or through FMR, its affiliates, and other service providers, the fund's exposure to risks is mitigated but not eliminated by the processes overseen by the Trustees. While each of the Board's committees has responsibility for overseeing different aspects of the fund's activities, oversight is exercised primarily through the Operations and Audit Committees. In addition, an ad hoc Board committee of Independent Trustees has worked with FMR to enhance the Board's oversight of investment and financial risks, legal and regulatory risks, technology risks, and operational risks, including the development of additional risk reporting to the Board. Appropriate personnel, including but not limited to the fund's Chief Compliance Officer (CCO), FMR's internal auditor, the independent accountants, the fund's Treasurer and portfolio management personnel, make periodic reports to the Board's committees, as appropriate, including an annual review of Fidelity's risk management program for the Fidelity® funds. The responsibilities of each standing committee, including their oversight responsibilities, are described further under "Standing Committees of the Trustees."
Interested Trustees*:
Correspondence intended for a Trustee who is an interested person may be sent to Fidelity Investments, 245 Summer Street, Boston, Massachusetts 02210.
Name, Year of Birth; Principal Occupations and Other Relevant Experience+
Abigail P. Johnson (1961)
Year of Election or Appointment: 2009
Trustee
Chairman of the Board of Trustees
Ms. Johnson also serves as Trustee of other Fidelity® funds. Ms. Johnson serves as Chairman (2016-present), Chief Executive Officer (2014-present), and Director (2007-present) of FMR LLC (diversified financial services company), President of Fidelity Financial Services (2012-present) and President of Personal, Workplace and Institutional Services (2005-present). Ms. Johnson is Chairman and Director of Fidelity Management & Research Company LLC (investment adviser firm, 2011-present). Previously, Ms. Johnson served as Chairman and Director of FMR Co., Inc. (investment adviser firm, 2011-2019), Vice Chairman (2007-2016) and President (2013-2016) of FMR LLC, President and a Director of Fidelity Management & Research Company (2001-2005), a Trustee of other investment companies advised by Fidelity Management & Research Company, Fidelity Investments Money Management, Inc. (investment adviser firm), and FMR Co., Inc. (2001-2005), Senior Vice President of the Fidelity® funds (2001-2005), and managed a number of Fidelity® funds. Ms. Abigail P. Johnson and Mr. Arthur E. Johnson are not related.
Jennifer Toolin McAuliffe (1959)
Year of Election or Appointment: 2016
Trustee
Ms. McAuliffe also serves as Trustee of other Fidelity® funds. Previously, Ms. McAuliffe served as Co-Head of Fixed Income of Fidelity Investments Limited (now known as FIL Limited (FIL)) (diversified financial services company), Director of Research for FIL’s credit and quantitative teams in London, Hong Kong and Tokyo and Director of Research for taxable and municipal bonds at Fidelity Investments Money Management, Inc. Ms. McAuliffe previously served as a member of the Advisory Board of certain Fidelity® funds (2016). Ms. McAuliffe was previously a lawyer at Ropes & Gray LLP and currently serves as director or trustee of several not-for-profit entities.
* Determined to be an “Interested Trustee” by virtue of, among other things, his or her affiliation with the trust or various entities under common control with FMR.
+ The information includes the Trustee's principal occupation during the last five years and other information relating to the experience, attributes, and skills relevant to the Trustee's qualifications to serve as a Trustee, which led to the conclusion that the Trustee should serve as a Trustee for the fund.
Independent Trustees:
Correspondence intended for an Independent Trustee may be sent to Fidelity Investments, P.O. Box 55235, Boston, Massachusetts 02205-5235.
Name, Year of Birth; Principal Occupations and Other Relevant Experience+
Elizabeth S. Acton (1951)
Year of Election or Appointment: 2013
Trustee
Ms. Acton also serves as Trustee of other Fidelity® funds. Prior to her retirement, Ms. Acton served as Executive Vice President, Finance (2011-2012), Executive Vice President, Chief Financial Officer (2002-2011) and Treasurer (2004-2005) of Comerica Incorporated (financial services). Prior to joining Comerica, Ms. Acton held a variety of positions at Ford Motor Company (1983-2002), including Vice President and Treasurer (2000-2002) and Executive Vice President and Chief Financial Officer of Ford Motor Credit Company (1998-2000). Ms. Acton currently serves as a member of the Board and Audit and Finance Committees of Beazer Homes USA, Inc. (homebuilding, 2012-present). Ms. Acton previously served as a member of the Advisory Board of certain Fidelity® funds (2013-2016).
Ann E. Dunwoody (1953)
Year of Election or Appointment: 2018
Trustee
General Dunwoody also serves as Trustee of other Fidelity® funds. General Dunwoody (United States Army, Retired) was the first woman in U.S. military history to achieve the rank of four-star general and prior to her retirement in 2012 held a variety of positions within the U.S. Army, including Commanding General, U.S. Army Material Command (2008-2012). General Dunwoody currently serves as President of First to Four LLC (leadership and mentoring services, 2012-present), a member of the Board and Nomination and Corporate Governance Committees of Kforce Inc. (professional staffing services, 2016-present) and a member of the Board of Automattic Inc. (software engineering, 2018-present). Previously, General Dunwoody served as a member of the Advisory Board and Nominating and Corporate Governance Committee of L3 Technologies, Inc. (communication, electronic, sensor and aerospace systems, 2013-2019) and a member of the Board and Audit and Sustainability and Corporate Responsibility Committees of Republic Services, Inc. (waste collection, disposal and recycling, 2013-2016). Ms. Dunwoody also serves on several boards for non-profit organizations, including as a member of the Board, Chair of the Nomination and Governance Committee and a member of the Audit Committee of Logistics Management Institute (consulting non-profit, 2012-present), a member of the Council of Trustees for the Association of the United States Army (advocacy non-profit, 2013-present), a member of the Board of Florida Institute of Technology (2015-present) and a member of the Board of ThanksUSA (military family education non-profit, 2014-present). General Dunwoody previously served as a member of the Advisory Board of certain Fidelity® funds (2018).
John Engler (1948)
Year of Election or Appointment: 2014
Trustee
Mr. Engler also serves as Trustee of other Fidelity® funds. Previously, Mr. Engler served as Governor of Michigan (1991-2003), President of the Business Roundtable (2011-2017) and interim President of Michigan State University (2018-2019). Mr. Engler currently serves as a member of the Board of K12 Inc. (technology-based education company, 2012-present). Previously, Mr. Engler served as a member of the Board of Universal Forest Products (manufacturer and distributor of wood and wood-alternative products, 2003-2019) and Trustee of The Munder Funds (2003-2014). Mr. Engler previously served as a member of the Advisory Board of certain Fidelity® funds (2014-2016).
Robert F. Gartland (1951)
Year of Election or Appointment: 2010
Trustee
Mr. Gartland also serves as Trustee of other Fidelity® funds. Prior to his retirement, Mr. Gartland held a variety of positions at Morgan Stanley (financial services, 1979-2007), including Managing Director (1987-2007) and Chase Manhattan Bank (1975-1978). Mr. Gartland previously served as Chairman and an investor in Gartland & Mellina Group Corp. (consulting, 2009-2019), as a member of the Board of National Securities Clearing Corporation (1993-1996) and as Chairman of TradeWeb (2003-2004).
Arthur E. Johnson (1947)
Year of Election or Appointment: 2008
Trustee
Chairman of the Independent Trustees
Mr. Johnson also serves as Trustee of other Fidelity® funds. Prior to his retirement, Mr. Johnson served as Senior Vice President of Corporate Strategic Development of Lockheed Martin Corporation (defense contractor, 1999-2009). Mr. Johnson currently serves as a member of the Board of Booz Allen Hamilton (management consulting, 2011-present). Mr. Johnson previously served as a member of the Board of Eaton Corporation plc (diversified power management, 2009-2019) and a member of the Board of AGL Resources, Inc. (holding company, 2002-2016). Mr. Johnson previously served as Vice Chairman (2015-2018) of the Independent Trustees of certain Fidelity® funds. Mr. Arthur E. Johnson is not related to Ms. Abigail P. Johnson.
Michael E. Kenneally (1954)
Year of Election or Appointment: 2009
Trustee
Vice Chairman of the Independent Trustees
Mr. Kenneally also serves as Trustee of other Fidelity® funds. Prior to his retirement, Mr. Kenneally served as Chairman and Global Chief Executive Officer of Credit Suisse Asset Management and Executive Vice President and Chief Investment Officer of Bank of America Corporation. Earlier roles at Bank of America included Director of Research, Senior Portfolio Manager for various institutional equity accounts and mutual funds and Portfolio Manager for a number of institutional fixed-income clients. Mr. Kenneally began his career as a Research Analyst in 1983 and was awarded the Chartered Financial Analyst (CFA) designation in 1991.
Marie L. Knowles (1946)
Year of Election or Appointment: 2001
Trustee
Ms. Knowles also serves as Trustee of other Fidelity® funds. Prior to her retirement, Ms. Knowles held several positions at Atlantic Richfield Company (diversified energy), including Executive Vice President and Chief Financial Officer (1996-2000), Senior Vice President (1993-1996) and President of ARCO Transportation Company (pipeline and tanker operations, 1993-1996). Ms. Knowles currently serves as a member of the Board of McKesson Corporation (healthcare service, since 2002), a member of the Board of the Santa Catalina Island Company (real estate, 2009-present), a member of the Investment Company Institute Board of Governors and a member of the Governing Council of the Independent Directors Council (2014-present). Ms. Knowles also serves as a member of the Advisory Board for the School of Engineering of the University of Southern California. Ms. Knowles previously served as Chairman (2015-2018) and Vice Chairman (2012-2015) of the Independent Trustees of certain Fidelity® funds.
Mark A. Murray (1954)
Year of Election or Appointment: 2016
Trustee
Mr. Murray also serves as Trustee of other Fidelity® funds. Previously, Mr. Murray served as Co-Chief Executive Officer (2013-2016), President (2006-2013) and Vice Chairman (2013-2020) of Meijer, Inc. Mr. Murray serves as a member of the Board and Nuclear Review and Public Policy and Responsibility Committees of DTE Energy Company (diversified energy company, 2009-present) and a member of the Board and Audit Committee and Chairman of the Nominating and Corporate Governance Committee of Universal Forest Products, Inc. (manufacturer and distributor of wood and wood-alternative products, 2004-2016). Mr. Murray previously served as a member of the Board of Spectrum Health (not-for-profit health system, 2015-2019). Mr. Murray also serves as a member of the Board of many community and professional organizations. Mr. Murray previously served as a member of the Advisory Board of certain Fidelity® funds (2016).
+ The information includes the Trustee's principal occupation during the last five years and other information relating to the experience, attributes, and skills relevant to the Trustee's qualifications to serve as a Trustee, which led to the conclusion that the Trustee should serve as a Trustee for the fund.
Advisory Board Members and Officers:
Correspondence intended for an officer may be sent to Fidelity Investments, 245 Summer Street, Boston, Massachusetts 02210. Officers appear below in alphabetical order.
Name, Year of Birth; Principal Occupation
Elizabeth Paige Baumann (1968)
Year of Election or Appointment: 2017
Anti-Money Laundering (AML) Officer
Ms. Baumann also serves as AML Officer of other funds. She is Chief AML Officer (2012-present) and Senior Vice President (2014-present) of FMR LLC (diversified financial services company) and is an employee of Fidelity Investments. Previously, Ms. Baumann served as AML Officer of certain funds (2017-2019), as AML Officer of the funds (2012-2016), and Vice President (2007-2014) and Deputy Anti-Money Laundering Officer (2007-2012) of FMR LLC.
Craig S. Brown (1977)
Year of Election or Appointment: 2019
Assistant Treasurer
Mr. Brown also serves as Assistant Treasurer of other funds. Mr. Brown is an employee of Fidelity Investments (2013-present).
John J. Burke III (1964)
Year of Election or Appointment: 2018
Chief Financial Officer
Mr. Burke also serves as Chief Financial Officer of other funds. Mr. Burke serves as Head of Investment Operations for Fidelity Fund and Investment Operations (2018-present) and is an employee of Fidelity Investments (1998-present). Previously Mr. Burke served as head of Asset Management Investment Operations (2012-2018).
David J. Carter (1973)
Year of Election or Appointment: 2020
Assistant Secretary
Mr. Carter also serves as Assistant Secretary of other funds. Mr. Carter serves as Vice President, Associate General Counsel (2010-present) and is an employee of Fidelity Investments (2005-present).
Jonathan Davis (1968)
Year of Election or Appointment: 2010
Assistant Treasurer
Mr. Davis also serves as Assistant Treasurer of other funds. Mr. Davis serves as Assistant Treasurer of FMR Capital, Inc. (2017-present) and is an employee of Fidelity Investments. Previously, Mr. Davis served as Vice President and Associate General Counsel of FMR LLC (diversified financial services company, 2003-2010).
Laura M. Del Prato (1964)
Year of Election or Appointment: 2018
President and Treasurer
Ms. Del Prato also serves as an officer of other funds. Ms. Del Prato is an employee of Fidelity Investments (2017-present). Previously, Ms. Del Prato served as President and Treasurer of The North Carolina Capital Management Trust: Cash Portfolio and Term Portfolio (2018-2020). Prior to joining Fidelity Investments, Ms. Del Prato served as a Managing Director and Treasurer of the JPMorgan Mutual Funds (2014-2017). Prior to JPMorgan, Ms. Del Prato served as a partner at Cohen Fund Audit Services (accounting firm, 2012-2013) and KPMG LLP (accounting firm, 2004-2012).
Colm A. Hogan (1973)
Year of Election or Appointment: 2016
Assistant Treasurer
Mr. Hogan also serves as an officer of other funds. Mr. Hogan serves as Assistant Treasurer of FMR Capital, Inc. (2017-present) and is an employee of Fidelity Investments (2005-present). Previously, Mr. Hogan served as Deputy Treasurer of certain Fidelity® funds (2016-2020) and Assistant Treasurer of certain Fidelity® funds (2016-2018).
Cynthia Lo Bessette (1969)
Year of Election or Appointment: 2019
Secretary and Chief Legal Officer (CLO)
Ms. Lo Bessette also serves as an officer of other funds. Ms. Lo Bessette serves as CLO, Secretary, and Senior Vice President of Fidelity Management & Research Company LLC (investment adviser firm, 2019-present); and CLO of Fidelity Management & Research (Hong Kong) Limited, FMR Investment Management (UK) Limited, and Fidelity Management & Research (Japan) Limited (investment adviser firms, 2019-present). She is a Senior Vice President and Deputy General Counsel of FMR LLC (diversified financial services company, 2019-present), and is an employee of Fidelity Investments. Previously, Ms. Lo Bessette served as CLO, Secretary, and Senior Vice President of FMR Co., Inc. (investment adviser firm, 2019); Secretary of Fidelity SelectCo, LLC and Fidelity Investments Money Management, Inc. (investment adviser firms, 2019). Prior to joining Fidelity Investments, Ms. Lo Bessette was Executive Vice President, General Counsel (2016-2019) and Senior Vice President, Deputy General Counsel (2015-2016) of OppenheimerFunds (investment management company) and Deputy Chief Legal Officer (2013-2015) of Jennison Associates LLC (investment adviser firm).
Chris Maher (1972)
Year of Election or Appointment: 2013
Assistant Treasurer
Mr. Maher also serves as an officer of other funds. Mr. Maher serves as Assistant Treasurer of FMR Capital, Inc. (2017-present), and is an employee of Fidelity Investments (2008-present). Previously, Mr. Maher served as Assistant Treasurer of certain funds (2013-2020); Vice President of Asset Management Compliance (2013), Vice President of the Program Management Group of FMR (investment adviser firm, 2010-2013), and Vice President of Valuation Oversight (2008-2010).
Kenneth B. Robins (1969)
Year of Election or Appointment: 2020
Chief Compliance Officer
Mr. Robins also serves as an officer of other funds. Mr. Robins serves as Compliance Officer of Fidelity Management & Research Company LLC (investment adviser firm, 2016-present) and is an employee of Fidelity Investments (2004-present). Previously, Mr. Robins served as Compliance Officer of FMR Co., Inc. (investment adviser firm, 2016-2019), as Executive Vice President of Fidelity Investments Money Management, Inc. (investment adviser firm, 2013-2016) and served in other fund officer roles.
Stacie M. Smith (1974)
Year of Election or Appointment: 2013
Assistant Treasurer
Ms. Smith also serves as an officer of other funds. Ms. Smith serves as Assistant Treasurer of FMR Capital, Inc. (2017-present), is an employee of Fidelity Investments (2009-present), and has served in other fund officer roles. Prior to joining Fidelity Investments, Ms. Smith served as Senior Audit Manager of Ernst & Young LLP (accounting firm, 1996-2009). Previously, Ms. Smith served as Assistant Treasurer (2013-2019) and Deputy Treasurer (2013-2016) of certain Fidelity® funds.
Marc L. Spector (1972)
Year of Election or Appointment: 2016
Deputy Treasurer
Mr. Spector also serves as an officer of other funds. Mr. Spector serves as Assistant Treasurer of FMR Capital, Inc. (2017-present) and is an employee of Fidelity Investments (2016-present). Prior to joining Fidelity Investments, Mr. Spector served as Director at the Siegfried Group (accounting firm, 2013-2016), and prior to Siegfried Group as audit senior manager at Deloitte & Touche LLP (accounting firm, 2005-2013).
Jim Wegmann (1979)
Year of Election or Appointment: 2019
Assistant Treasurer
Mr. Wegmann also serves as Assistant Treasurer of other funds. Mr. Wegmann is an employee of Fidelity Investments (2011-present).
Vadim Zlotnikov (1962)
Year of Election or Appointment: 2019
Vice President
Mr. Zlotnikov also serves as Vice President of other funds. Mr. Zlotnikov serves as President of FIAM (Fidelity Institutional Asset Management) and is an employee of Fidelity Investments (2018-present). Previously, Mr. Zlotnikov served as President and Chief Investment Officer of Global Asset Allocation (2018-2020). Prior to joining Fidelity Investments, Mr. Zlotnikov served as Co-Head of Multi-Asset Solutions, Chief Market Strategist, and CIO of Systematic Strategies with AllianceBernstein (investment adviser firm, 2002-2018).
Shareholder Expense Example
As a shareholder, you incur two types of costs: (1) transaction costs, which may include sales charges (loads) on purchase payments or redemption proceeds, as applicable and (2) ongoing costs, which generally include management fees, distribution and/or service (12b-1) fees and other Fund expenses. This Example is intended to help you understand your ongoing costs (in dollars) of investing in a fund and to compare these costs with the ongoing costs of investing in other mutual funds.
The Example is based on an investment of $1,000 invested at the beginning of the period and held for the entire period (April 1, 2020 to September 30, 2020).
Actual Expenses
The first line of the accompanying table provides information about actual account values and actual expenses. You may use the information in this line, together with the amount you invested, to estimate the expenses that you paid over the period. Simply divide your account value by $1,000.00 (for example, an $8,600 account value divided by $1,000.00 = 8.6), then multiply the result by the number in the first line for a class/Fund under the heading entitled "Expenses Paid During Period" to estimate the expenses you paid on your account during this period. If any fund is a shareholder of any underlying mutual funds or exchange-traded funds (ETFs) (the Underlying Funds), such fund indirectly bears its proportional share of the expenses of the Underlying Funds in addition to the direct expenses incurred presented in the table. These fees and expenses are not included in the annualized expense ratio used to calculate the expense estimate in the table below.
Hypothetical Example for Comparison Purposes
The second line of the accompanying table provides information about hypothetical account values and hypothetical expenses based on the actual expense ratio and an assumed rate of return of 5% per year before expenses, which is not the actual return. The hypothetical account values and expenses may not be used to estimate the actual ending account balance or expenses you paid for the period. You may use this information to compare the ongoing costs of investing in the Fund and other funds. To do so, compare this 5% hypothetical example with the 5% hypothetical examples that appear in the shareholder reports of the other funds. If any fund is a shareholder of any Underlying Funds, such fund indirectly bears its proportional share of the expenses of the Underlying Funds in addition to the direct expenses as presented in the table. These fees and expenses are not included in the annualized expense ratio used to calculate the expense estimate in the table below.
Please note that the expenses shown in the table are meant to highlight your ongoing costs only and do not reflect any transaction costs. Therefore, the second line of the table is useful in comparing ongoing costs only, and will not help you determine the relative total costs of owning different funds.
| | Annualized Expense Ratio-A | Beginning
Account Value
April 1, 2020 | Ending
Account Value
September 30, 2020 | Expenses Paid
During Period-B
April 1, 2020
to September 30, 2020 |
| Fidelity Health Savings Fund | | | | |
| Fidelity Health Savings Fund | .45% | | | |
| Actual | | $1,000.00 | $1,135.90 | $2.40 |
| Hypothetical-C | | $1,000.00 | $1,022.75 | $2.28 |
| Class K | .35% | | | |
| Actual | | $1,000.00 | $1,136.30 | $1.87 |
| Hypothetical-C | | $1,000.00 | $1,023.25 | $1.77 |
A Annualized expense ratio reflects expenses net of applicable fee waivers.
B Expenses are equal to the annualized expense ratio, multiplied by the average account value over the period, multiplied by 183/ 366 (to reflect the one-half year period). The fees and expenses of any Underlying Funds are not included in each annualized expense ratio.
C 5% return per year before expenses
Distributions (Unaudited)
The fund hereby designates as a capital gain dividend with respect to the taxable year ended September, $28,818, or, if subsequently determined to be different, the net capital gain of such year.
A total of 7.56% of the dividends distributed during the fiscal year was derived from interest on U.S. Government securities which is generally exempt from state income tax.
Fidelity Health Savings Fund designates 27%, 28%, 29%, 27%, 28% and 28%; Class K designates 27%, 26%, 25%, 27%, 26% and 25% of the dividends distributed in April, May, June, July, August and September, respectively during the fiscal year as qualifying for the dividends–received deduction for corporate shareholders.
Fidelity Health Savings Fund designates 41%, 43%, 44%, 41%, 43%, and 43%; Class K designates 41%, 40%, 39%, 41%, 39% and 39% of dividends distributed in April, May, June, July, August and September respectively during the fiscal year as amounts which may be taken into account as a dividend for purposes of the maximum rate under section 1(h)(11) of the Internal Revenue Code.
Fidelity Health Savings Fund, and Class K designates 2% of the dividends distributed during the fiscal year as a section 199A dividend.
The fund will notify shareholders in January 2021 of amounts for use in preparing 2020 income tax returns.
HSF-ANN-1120
1.9897530.100
Fidelity® Health Savings Index Fund
Annual Report
September 30, 2020
See the inside front cover for important information about access to your fund’s shareholder reports.
Beginning on January 1, 2021, as permitted by regulations adopted by the Securities and Exchange Commission, paper copies of a fund’s shareholder reports will no longer be sent by mail, unless you specifically request paper copies of the reports from the fund or from your financial intermediary, such as a financial advisor, broker-dealer or bank. Instead, the reports will be made available on a website, and you will be notified by mail each time a report is posted and provided with a website link to access the report.
If you already elected to receive shareholder reports electronically, you will not be affected by this change and you need not take any action. You may elect to receive shareholder reports and other communications from a fund electronically, by contacting your financial intermediary. For Fidelity customers, visit Fidelity's web site or call Fidelity using the contact information listed below.
You may elect to receive all future reports in paper free of charge. If you wish to continue receiving paper copies of your shareholder reports, you may contact your financial intermediary or, if you are a Fidelity customer, visit Fidelity’s website, or call Fidelity at the applicable toll-free number listed below. Your election to receive reports in paper will apply to all funds held with the fund complex/your financial intermediary.
| Account Type | Website | Phone Number |
| Brokerage, Mutual Fund, or Annuity Contracts: | fidelity.com/mailpreferences | 1-800-343-3548 |
| Employer Provided Retirement Accounts: | netbenefits.fidelity.com/preferences (choose 'no' under Required Disclosures to continue to print) | 1-800-343-0860 |
| Advisor Sold Accounts Serviced Through Your Financial Intermediary: | Contact Your Financial Intermediary | Your Financial Intermediary's phone number |
| Advisor Sold Accounts Serviced by Fidelity: | institutional.fidelity.com | 1-877-208-0098 |
Contents
To view a fund's proxy voting guidelines and proxy voting record for the 12-month period ended June 30, visit http://www.fidelity.com/proxyvotingresults or visit the Securities and Exchange Commission's (SEC) web site at http://www.sec.gov.
You may also call 1-800-544-8544 to request a free copy of the proxy voting guidelines.
Standard & Poor's, S&P and S&P 500 are registered service marks of The McGraw-Hill Companies, Inc. and have been licensed for use by Fidelity Distributors Corporation.
Other third-party marks appearing herein are the property of their respective owners.
All other marks appearing herein are registered or unregistered trademarks or service marks of FMR LLC or an affiliated company. © 2020 FMR LLC. All rights reserved.
This report and the financial statements contained herein are submitted for the general information of the shareholders of the Fund. This report is not authorized for distribution to prospective investors in the Fund unless preceded or accompanied by an effective prospectus.
A fund files its complete schedule of portfolio holdings with the SEC for the first and third quarters of each fiscal year on Form N-PORT. Forms N-PORT are available on the SEC’s web site at http://www.sec.gov. A fund's Forms N-PORT may be reviewed and copied at the SEC’s Public Reference Room in Washington, DC. Information regarding the operation of the SEC's Public Reference Room may be obtained by calling 1-800-SEC-0330.
For a complete list of a fund's portfolio holdings, view the most recent holdings listing, semiannual report, or annual report on Fidelity's web site at http://www.fidelity.com, http://www.institutional.fidelity.com, or http://www.401k.com, as applicable.
NOT FDIC INSURED •MAY LOSE VALUE •NO BANK GUARANTEE
Neither the Fund nor Fidelity Distributors Corporation is a bank.
Note to Shareholders:
Early in 2020, the outbreak and spread of a new coronavirus emerged as a public health emergency that had a major influence on financial markets, primarily based on its impact on the global economy and the outlook for corporate earnings. The virus causes a respiratory disease known as COVID-19. On March 11, the World Health Organization declared the COVID-19 outbreak a pandemic, citing sustained risk of further global spread.
In the weeks following, as the crisis worsened, we witnessed an escalating human tragedy with wide-scale social and economic consequences from coronavirus-containment measures. The outbreak of COVID-19 prompted a number of measures to limit the spread, including travel and border restrictions, quarantines, and restrictions on large gatherings. In turn, these resulted in lower consumer activity, diminished demand for a wide range of products and services, disruption in manufacturing and supply chains, and – given the wide variability in outcomes regarding the outbreak – significant market uncertainty and volatility. Amid the turmoil, the U.S. government took unprecedented action – in concert with the U.S. Federal Reserve and central banks around the world – to help support consumers, businesses, and the broader economy, and to limit disruption to the financial system.
The situation continues to unfold, and the extent and duration of its impact on financial markets and the economy remain highly uncertain. Extreme events such as the coronavirus crisis are “exogenous shocks” that can have significant adverse effects on mutual funds and their investments. Although multiple asset classes may be affected by market disruption, the duration and impact may not be the same for all types of assets.
Fidelity is committed to helping you stay informed amid news about COVID-19 and during increased market volatility, and we’re taking extra steps to be responsive to customer needs. We encourage you to visit our websites, where we offer ongoing updates, commentary, and analysis on the markets and our funds.
Performance: The Bottom Line
Average annual total return reflects the change in the value of an investment, assuming reinvestment of distributions from dividend income and capital gains (the profits earned upon the sale of securities that have grown in value, if any) and assuming a constant rate of performance each year. The hypothetical investment and the average annual total returns do not reflect the deduction of taxes that a shareholder would pay on fund distributions or the redemption of fund shares. During periods of reimbursement by Fidelity, a fund’s total return will be greater than it would be had the reimbursement not occurred. How a fund did yesterday is no guarantee of how it will do tomorrow.
Average annual total returns for Fidelity® Health Savings Index Fund will be reported once the fund is a year old.
$10,000 Over Life of Fund
Let's say hypothetically that $10,000 was invested in Fidelity® Health Savings Index Fund on March 2, 2020, when the fund started.
The chart shows how the value of your investment would have changed, and also shows how the Bloomberg Barclays U.S. Aggregate Bond Index performed over the same period.
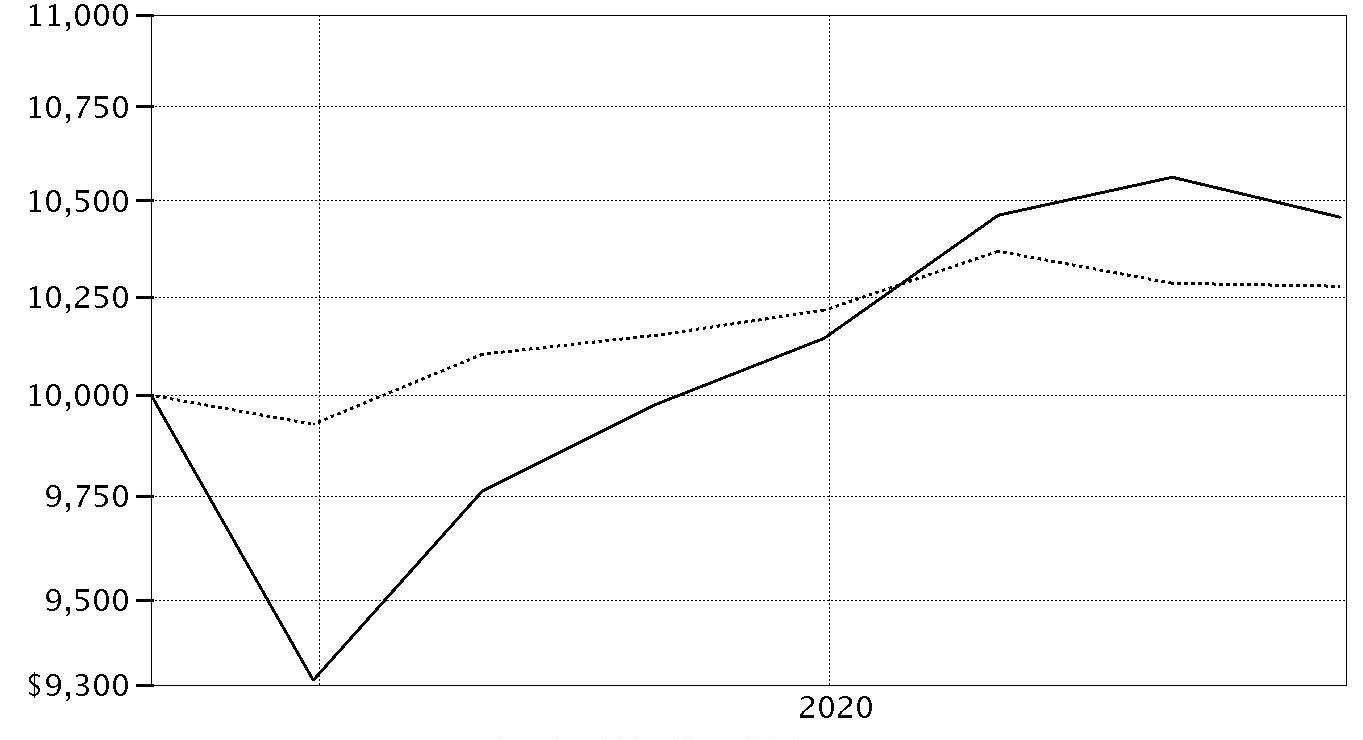
| Period Ending Values |
| $10,458 | Fidelity® Health Savings Index Fund |
| $10,278 | Bloomberg Barclays U.S. Aggregate Bond Index |
Management's Discussion of Fund Performance
Market Recap: The S&P 500
® index gained 15.15% for the 12 months ending September 30, 2020, in what was a bumpy ride for U.S. equity investors, marked by a steep but brief decline due to the early-2020 outbreak and spread of the coronavirus, followed by a historic rebound. Declared a pandemic on March 11, the COVID-19 crisis and containment efforts caused broad contraction in economic activity, along with extreme uncertainty, volatility and dislocation in financial markets. By mid-March, U.S. stocks had entered bear-market territory less than a month after hitting an all-time high and extending the longest-running bull market in American history. Stocks slid in late February, following a surge in COVID-19 cases outside China. The downtrend continued in March (-12%), capping the index’s worst quarter since 2008. A historically rapid and expansive U.S. monetary/fiscal-policy response provided a partial offset to the economic disruption and fueled a sharp uptrend beginning March 24, with recent strength supported by near-term potential for a COVID-19 vaccine breakthrough and signs of an early recovery in economic activity. The historic rally continued until September 2, when the S&P 500 achieved an all-time high, before retreating and returning -3.80% for the month, partly due to the inability of Congress to reach a deal on additional stimulus funding. Growth stocks dominated value shares for the year. By sector, information technology (+47%) led. In contrast, energy (-45%) fell hard along with the price of crude oil.
Comments from Co-Portfolio Manager Avishek Hazrachoudhury: From commencement of operations on March 2, 2020, to September 30, 2020, the fund gained 4.58%, outpacing the 4.35% advance of its benchmark, the Fidelity Health Savings Composite Index. Overall, the fund’s asset allocation among equity and fixed-income equity investments aided relative performance during this inaugural reporting period. The fund’s core equity allocation strategy – underweighting U.S. and foreign developed-markets stocks, while overweighting emerging-markets (EM) stocks – detracted versus the benchmark, primarily due to our U.S. positioning. A small, out-of-benchmark stake in REITs (real estate investment trusts) also hurt, mainly due to weakness in commercial real estate. On the plus side, commodities exposure – which is also outside the Composite benchmark – via the Van Eck Vectors
® Gold Miners ETF (+56%), provided a major boost for the period and brought the fund’s total equity contribution into positive territory. The fund’s fixed-income allocation strategy added the most value this period. Specifically, our positioning entailed underweighting investment-grade bonds in favor of out-of-benchmark positions in long-term U.S. Treasuries, Treasury Inflation-Protected Securities (TIPS), high-yield corporate bonds, bank loans, EM debt and international corporate credit. Long-term Treasuries helped the most, as the asset class benefited from a demand for the relative safety of Treasuries during March’s extreme market volatility.
The views expressed above reflect those of the portfolio manager(s) only through the end of the period as stated on the cover of this report and do not necessarily represent the views of Fidelity or any other person in the Fidelity organization. Any such views are subject to change at any time based upon market or other conditions and Fidelity disclaims any responsibility to update such views. These views may not be relied on as investment advice and, because investment decisions for a Fidelity fund are based on numerous factors, may not be relied on as an indication of trading intent on behalf of any Fidelity fund.
Investment Summary (Unaudited)
The information in the following tables is based on the combined investments of the Fund and its pro-rata share of the investments of Fidelity's Central Funds, other than the Money Market Central Funds.
Top Ten Holdings as of September 30, 2020
| | % of fund's net assets |
| Fidelity International Bond Index Fund | 18.6 |
| Fidelity U.S. Bond Index Fund | 16.0 |
| Fidelity Total Market Index Fund | 15.3 |
| iShares JPMorgan USD Emerging Markets Bond ETF | 9.8 |
| Fidelity Long-Term Treasury Bond Index Fund | 7.2 |
| Fidelity International Index Fund | 5.5 |
| Fidelity Emerging Markets Index Fund | 4.6 |
| Market Vectors Gold Miners ETF | 2.8 |
| iShares iBoxx $ High Yield Corporate Bond ETF | 1.6 |
| JPMorgan BetaBuilders Japan ETF | 1.4 |
| | 82.8 |
Quality Diversification (% of fund's net assets)
| As of September 30, 2020 |
| | U.S. Government and U.S. Government Agency Obligations | 16.1% |
| | Equities | 83.7% |
| | Short-Term Investments and Net Other Assets | 0.2% |

We have used ratings from Moody's Investors Service, Inc. Where Moody's® ratings are not available, we have used S&P® ratings. All ratings are as of the date indicated and do not reflect subsequent changes.
Asset Allocation (% of fund's net assets)
| As of September 30, 2020 |
| | Stocks, Investment Companies and Equity Futures | 41.9% |
| | Bonds | 57.9% |
| | Short-Term Investments and Net Other Assets (Liabilities) | 0.2% |

An unaudited holdings listing for the Fund, which presents direct holdings as well as the pro-rata share of any securities and other investments held indirectly through its investment in underlying non-money market Fidelity Central Funds, is available at fidelity.com and/or institutional.fidelity.com, as applicable.
At period end, foreign investments including the Fund's pro-rata share of the underlying Central Funds, other than the Money Market Funds, was 0.0% of net assets.
Schedule of Investments September 30, 2020
Showing Percentage of Net Assets
| Equity Funds - 25.5% | | | |
| | | Shares | Value |
| Fidelity Emerging Markets Index Fund (a) | | 15,088 | $164,311 |
| Fidelity International Index Fund (a) | | 4,909 | 196,940 |
| Fidelity Real Estate Index Fund (a) | | 385 | 5,060 |
| Fidelity Total Market Index Fund (a) | | 5,807 | 551,957 |
| TOTAL EQUITY FUNDS | | | |
| (Cost $850,963) | | | 918,268 |
|
| Fixed-Income Central Funds - 16.2% | | | |
| Investment Grade Fixed-Income Funds - 16.2% | | | |
| Fidelity Inflation-Protected Bond Index Central Fund (b) | | | |
| (Cost $563,131) | | 5,352 | 583,019 |
|
| Money Market Central Funds - 0.0% | | | |
| Fidelity Cash Central Fund 0.10% (c) | | | |
| (Cost $1,072) | | 1,072 | 1,072 |
|
| Investment Companies - 16.4% | | | |
| Invesco Senior Loan ETF | | 624 | 13,566 |
| iShares iBoxx $ High Yield Corporate Bond ETF | | 690 | 57,891 |
| iShares JPMorgan USD Emerging Markets Bond ETF | | 3,202 | 355,070 |
| JPMorgan BetaBuilders Japan ETF | | 1,989 | 49,069 |
| Market Vectors Emerging Markets Local Currency Bond ETF | | 530 | 16,345 |
| Market Vectors Gold Miners ETF | | 2,566 | 100,485 |
| TOTAL INVESTMENT COMPANIES | | | |
| (Cost $554,601) | | | 592,426 |
|
| Fixed-Income Funds - 41.8% | | | |
| Fidelity International Bond Index Fund (a) | | 66,183 | 672,423 |
| Fidelity Long-Term Treasury Bond Index Fund (a) | | 15,448 | 260,614 |
| Fidelity U.S. Bond Index Fund (a) | | 45,991 | 576,729 |
| TOTAL FIXED-INCOME FUNDS | | | |
| (Cost $1,486,557) | | | 1,509,766 |
| TOTAL INVESTMENT IN SECURITIES - 99.9% | | | |
| (Cost $3,456,324) | | | 3,604,551 |
| NET OTHER ASSETS (LIABILITIES) - 0.1% | | | 4,487 |
| NET ASSETS - 100% | | | $3,609,038 |
Security Type Abbreviations
ETF – Exchange-Traded Fund
Legend
(a) Affiliated Fund
(b) Affiliated fund that is generally available only to investment companies and other accounts managed by Fidelity Investments. A complete unaudited schedule of portfolio holdings for each Fidelity Central Fund is filed with the SEC for the first and third quarters of each fiscal year on Form N-PORT and is available upon request or at the SEC's website at www.sec.gov. An unaudited holdings listing for the Fund, which presents direct holdings as well as the pro-rata share of securities and other investments held indirectly through its investment in underlying non-money market Fidelity Central Funds, is available at fidelity.com and/or institutional.fidelity.com, as applicable. In addition, each Fidelity Central Fund's financial statements, which are not covered by the Fund's Report of Independent Registered Public Accounting Firm, are available on the SEC's website or upon request.
(c) Affiliated fund that is generally available only to investment companies and other accounts managed by Fidelity Investments. The rate quoted is the annualized seven-day yield of the fund at period end. A complete unaudited listing of the fund's holdings as of its most recent quarter end is available upon request. In addition, each Fidelity Central Fund's financial statements, which are not covered by the Fund's Report of Independent Registered Public Accounting Firm, are available on the SEC's website or upon request.
Affiliated Central Funds
Information regarding fiscal year to date income earned by the Fund from investments in Fidelity Central Funds is as follows:
| Fund | Income earned |
| Fidelity Cash Central Fund | $9 |
| Fidelity Inflation-Protected Bond Index Central Fund | 805 |
| Total | $814 |
Amounts in the income column in the above table include any capital gain distributions from underlying funds, which are presented in the corresponding line-item in the Statement of Operations, if applicable.
Fiscal year to date information regarding the Fund’s investments in non-Money Market Central Funds, including the ownership percentage, is presented below.
| Fund | Value, beginning of period | Purchases | Sales Proceeds | Realized Gain/Loss | Change in Unrealized appreciation (depreciation) | Value, end of period | % ownership, end of period |
| Fidelity Inflation-Protected Bond Index Central Fund | $-- | $582,746 | $19,583 | $(32) | $19,888 | $583,019 | 0.0% |
| Total | $-- | $582,746 | $19,583 | $(32) | $19,888 | $583,019 | |
Affiliated Underlying Funds
Fiscal year to date information regarding the Fund's investments in affiliated Underlying Funds, excluding any Money Market Central Funds, is presented below. Exchanges between classes of the same affiliated Underlying Funds may occur.
| Affiliate | Value, beginning of period | Purchases | Sales Proceeds | Dividend Income | Realized Gain (loss) | Change in Unrealized appreciation (depreciation) | Value, end of period |
| Fidelity Emerging Markets Index Fund | $-- | $212,529 | $53,622 | $-- | $(4,070) | $9,474 | $164,311 |
| Fidelity International Bond Index Fund | -- | 767,899 | 103,443 | 756 | (595) | 8,562 | 672,423 |
| Fidelity International Index Fund | -- | 254,679 | 58,837 | -- | (3,992 ) | 5,090 | 196,940 |
| Fidelity Long-Term Treasury Bond Index Fund | -- | 433,763 | 187,713 | 2,482 | 7,034 | 7,530 | 260,614 |
| Fidelity Real Estate Index Fund | -- | 35,326 | 22,177 | 120 | (7,995) | (94) | 5,060 |
| Fidelity Total Market Index Fund | -- | 743,049 | 235,702 | 1,063 | (8,225) | 52,835 | 551,957 |
| Fidelity U.S. Bond Index Fund | -- | 1,020,246 | 451,472 | 5,163 | 838 | 7,117 | 576,729 |
| Total | $-- | $3,467,491 | $1,112,966 | $9,584 | $(17,005 ) | $90,514 | $2,428,034 |
Amounts in the income column in the above table include any capital gain distributions from underlying funds, which are presented in the corresponding line-item in the Statement of Operations, if applicable.
Investment Valuation
The following is a summary of the inputs used, as of September 30, 2020, involving the Fund's assets and liabilities carried at fair value. The inputs or methodology used for valuing securities may not be an indication of the risk associated with investing in those securities. For more information on valuation inputs, and their aggregation into the levels used below, please refer to the Investment Valuation section in the accompanying Notes to Financial Statements.
| | Valuation Inputs at Reporting Date: |
| Description | Total | Level 1 | Level 2 | Level 3 |
| Investments in Securities: | | | | |
| Equity Funds | $918,268 | $918,268 | $-- | $-- |
| Fixed-Income Central Funds | 583,019 | 583,019 | -- | -- |
| Money Market Central Funds | 1,072 | 1,072 | -- | -- |
| Investment Companies | 592,426 | 592,426 | -- | -- |
| Fixed-Income Funds | 1,509,766 | 1,509,766 | -- | -- |
| Total Investments in Securities: | $3,604,551 | $3,604,551 | $-- | $-- |
See accompanying notes which are an integral part of the financial statements.
Financial Statements
Statement of Assets and Liabilities
| | | September 30, 2020 |
| Assets | | |
Investment in securities, at value — See accompanying schedule:
Unaffiliated issuers (cost $554,601) | $592,426 | |
| Fidelity Central Funds (cost $564,203) | 584,091 | |
| Other affiliated issuers (cost $2,337,520) | 2,428,034 | |
| Total Investment in Securities (cost $3,456,324) | | $3,604,551 |
| Cash | | 14,759 |
| Receivable for investments sold | | 20,071 |
| Receivable for fund shares sold | | 9,276 |
| Dividends receivable | | 1,316 |
| Total assets | | 3,649,973 |
| Liabilities | | |
| Payable for investments purchased | $40,647 | |
| Accrued management fee | 288 | |
| Total liabilities | | 40,935 |
| Net Assets | | $3,609,038 |
| Net Assets consist of: | | |
| Paid in capital | | $3,472,848 |
| Total accumulated earnings (loss) | | 136,190 |
| Net Assets | | $3,609,038 |
| Net Asset Value, offering price and redemption price per share ($3,609,038 ÷ 346,580 shares) | | $10.41 |
See accompanying notes which are an integral part of the financial statements.
Statement of Operations
| | | For the period
March 2, 2020 (commencement of operations) to
September 30, 2020 |
| Investment Income | | |
| Dividends (including $9,584 earned from other affiliated issuers) | | $15,820 |
| Income from Fidelity Central Funds | | 814 |
| Total income | | 16,634 |
| Expenses | | |
| Management fee | $2,351 | |
| Independent trustees' fees and expenses | 3 | |
| Commitment fees | 17 | |
| Total expenses before reductions | 2,371 | |
| Expense reductions | (860) | |
| Total expenses after reductions | | 1,511 |
| Net investment income (loss) | | 15,123 |
| Realized and Unrealized Gain (Loss) | | |
| Net realized gain (loss) on: | | |
| Investment securities: | | |
| Unaffiliated issuers | 2,273 | |
| Fidelity Central Funds | (32) | |
| Other affiliated issuers | (17,005) | |
| Total net realized gain (loss) | | (14,764) |
| Change in net unrealized appreciation (depreciation) on: | | |
| Investment securities: | | |
| Unaffiliated issuers | 37,825 | |
| Fidelity Central Funds | 19,888 | |
| Other affiliated issuers | 90,514 | |
| Total change in net unrealized appreciation (depreciation) | | 148,227 |
| Net gain (loss) | | 133,463 |
| Net increase (decrease) in net assets resulting from operations | | $148,586 |
See accompanying notes which are an integral part of the financial statements.
Statement of Changes in Net Assets
| | For the period
March 2, 2020 (commencement of operations) to
September 30, 2020 |
| Increase (Decrease) in Net Assets | |
| Operations | |
| Net investment income (loss) | $15,123 |
| Net realized gain (loss) | (14,764) |
| Change in net unrealized appreciation (depreciation) | 148,227 |
| Net increase (decrease) in net assets resulting from operations | 148,586 |
| Distributions to shareholders | (12,396) |
| Share transactions | |
| Proceeds from sales of shares | 3,548,797 |
| Reinvestment of distributions | 12,392 |
| Cost of shares redeemed | (88,341) |
| Net increase (decrease) in net assets resulting from share transactions | 3,472,848 |
| Total increase (decrease) in net assets | 3,609,038 |
| Net Assets | |
| Beginning of period | – |
| End of period | $3,609,038 |
| Other Information | |
| Shares | |
| Sold | 353,945 |
| Issued in reinvestment of distributions | 1,228 |
| Redeemed | (8,593) |
| Net increase (decrease) | 346,580 |
See accompanying notes which are an integral part of the financial statements.
Financial Highlights
Fidelity Health Savings Index Fund
| | |
| Year ended September 30, | 2020 A |
| Selected Per–Share Data | |
| Net asset value, beginning of period | $10.00 |
| Income from Investment Operations | |
| Net investment income (loss)B | .06 |
| Net realized and unrealized gain (loss) | .40 |
| Total from investment operations | .46 |
| Distributions from net investment income | (.05) |
| Total distributions | (.05) |
| Net asset value, end of period | $10.41 |
| Total ReturnC,D | 4.58% |
| Ratios to Average Net AssetsE,F | |
| Expenses before reductions | .15%G |
| Expenses net of fee waivers, if any | .10%G |
| Expenses net of all reductions | .10%G |
| Net investment income (loss) | .97%G |
| Supplemental Data | |
| Net assets, end of period (000 omitted) | $3,609 |
| Portfolio turnover rateH | 71%G |
A For the period March 2, 2020 (commencement of operations) to September 30, 2020.
B Calculated based on average shares outstanding during the period.
C Total returns for periods of less than one year are not annualized.
D Total returns would have been lower if certain expenses had not been reduced during the applicable periods shown.
E Fees and expenses of any underlying mutual funds or exchange-traded funds (ETFs) are not included in the Fund's expense ratio. The Fund indirectly bears its proportionate share of these expenses. For additional expense information related to investments in Fidelity Central Funds, please refer to the "Investments in Fidelity Central Funds" note found in the Notes to Financial Statements section of the most recent Annual or Semi-Annual report.
F Expense ratios reflect operating expenses of the class. Expenses before reductions do not reflect amounts reimbursed, waived, or reduced through arrangements with the investment advisor, brokerage services, or other offset arrangements, if applicable, and do not represent the amount paid by the class during periods when reimbursements, waivers or reductions occur.
G Annualized
H Amount does not include the portfolio activity of any underlying mutual funds or exchange-traded funds (ETFs).
See accompanying notes which are an integral part of the financial statements.
Notes to Financial Statements
For the period ended September 30, 2020
1. Organization.
Fidelity Health Savings Index Fund (the Fund) is a fund of Fidelity Charles Street Trust (the Trust) and is authorized to issue an unlimited number of shares. Share transactions on the Statement of Changes in Net Assets may contain exchanges between affiliated funds. The Trust is registered under the Investment Company Act of 1940, as amended (the 1940 Act), as an open-end management investment company organized as a Massachusetts business trust.
2. Investments in Fidelity Central Funds.
The Fund invests in Fidelity Central Funds, which are open-end investment companies generally available only to other investment companies and accounts managed by the investment adviser and its affiliates. The Fund's Schedule of Investments lists each of the Fidelity Central Funds held as of period end, if any, as an investment of the Fund, but does not include the underlying holdings of each Fidelity Central Fund. As an Investing Fund, the Fund indirectly bears its proportionate share of the expenses of the underlying Fidelity Central Funds.
Based on its investment objective, each Fidelity Central Fund may invest or participate in various investment vehicles or strategies that are similar to those of the Fund. These strategies are consistent with the investment objectives of the Fund and may involve certain economic risks which may cause a decline in value of each of the Fidelity Central Funds and thus a decline in the value of the Fund. The Money Market Central Funds seek preservation of capital and current income and are managed by the investment adviser. Annualized expenses of the Money Market Central Funds as of their most recent shareholder report date ranged from less than .005% to .01%. The following summarizes the Fund's investment in each non-money market Fidelity Central Fund.
| Fidelity Central Fund | Investment Manager | Investment Objective | Investment Practices | Expense Ratio(a) |
| Fidelity Inflation-Protected Bond Index Central Fund | FMR | Seeks to provide investment results that correspond to the performance of the inflation-protected United States Treasury market, and may invest in derivatives. | | Less than .005% |
(a) Expenses expressed as a percentage of average net assets and are as of each underlying Central Fund's most recent annual or semi-annual shareholder report.
An unaudited holdings listing for the Fund, which presents direct holdings as well as the pro-rata share of any securities and other investments held indirectly through its investment in underlying non-money market Fidelity Central Funds, is available at fidelity.com. A complete unaudited list of holdings for each Fidelity Central Fund is available upon request or at the Securities and Exchange Commission (the SEC) website at www.sec.gov. In addition, the financial statements of the Fidelity Central Funds which contain the significant accounting policies (including investment valuation policies) of those funds, which are not covered by the Fund's Report of Independent Registered Public Accounting Firm, are available on the SEC website or upon request.
3. Significant Accounting Policies.
The Fund is an investment company and applies the accounting and reporting guidance of the Financial Accounting Standards Board (FASB) Accounting Standards Codification Topic 946 Financial Services – Investment Companies. The financial statements have been prepared in conformity with accounting principles generally accepted in the United States of America (GAAP), which require management to make certain estimates and assumptions at the date of the financial statements. Actual results could differ from those estimates. Subsequent events, if any, through the date that the financial statements were issued have been evaluated in the preparation of the financial statements. The following summarizes the significant accounting policies of the Fund:
Investment Valuation. Investments are valued as of 4:00 p.m. Eastern time on the last calendar day of the period. The Board of Trustees (the Board) has delegated the day to day responsibility for the valuation of the Fund's investments to the Fair Value Committee (the Committee) established by the the Fund's investment adviser. In accordance with valuation policies and procedures approved by the Board, the Fund attempts to obtain prices from one or more third party pricing vendors or brokers to value its investments. When current market prices, quotations or currency exchange rates are not readily available or reliable, investments will be fair valued in good faith by the Committee, in accordance with procedures adopted by the Board. Factors used in determining fair value vary by investment type and may include market or investment specific events. The frequency with which these procedures are used cannot be predicted and they may be utilized to a significant extent. The Committee oversees the Fund's valuation policies and procedures and reports to the Board on the Committee's activities and fair value determinations. The Board monitors the appropriateness of the procedures used in valuing the Fund's investments and ratifies the fair value determinations of the Committee. The Fund categorizes the inputs to valuation techniques used to value its investments into a disclosure hierarchy consisting of three levels as shown below:
- Level 1 – quoted prices in active markets for identical investments
- Level 2 – other significant observable inputs (including quoted prices for similar investments, interest rates, prepayment speeds, etc.)
- Level 3 – unobservable inputs (including the Fund's own assumptions based on the best information available)
Valuation techniques used to value the Fund's investments by major category are as follows. Investments in open-end mutual funds are valued at their closing net asset value (NAV) each business day and are categorized as Level 1 in the hierarchy.
Exchange-Traded Funds (ETFs) are valued at their last sale price or official closing price as reported by a third party pricing vendor on the primary market or exchange on which they are traded and are categorized as Level 1 in the hierarchy. In the event there were no sales during the day but the exchange reports a closing bid level, ETFs are valued at the closing bid and would be categorized as Level 1 in the hierarchy. In the event there was no closing bid, ETFs may be valued by another method that the Board believes reflects fair value in accordance with the Board's fair value pricing policies and may be categorized as Level 2 in the hierarchy. The aggregate value of investments by input level as of September 30, 2020 is included at the end of the Fund's Schedule of Investments.
Investment Transactions and Income. For financial reporting purposes, the Fund's investment holdings and NAV include trades executed through the end of the last business day of the period. The NAV per share for processing shareholder transactions is calculated as of the close of business of the New York Stock Exchange (NYSE), normally 4:00 p.m. Eastern time and includes trades executed through the end of the prior business day. Gains and losses on securities sold are determined on the basis of identified cost. Dividend income is recorded on the ex-dividend date. Income and capital gain distributions from any underlying mutual funds or exchange traded funds (ETF), are recorded on the ex-dividend date, except for certain dividends from foreign securities where the ex-dividend date may have passed, which are recorded as soon as the Fund is informed of the ex-dividend date. Non-cash dividends included in dividend income, if any, are recorded at the fair market value of the securities received.
Expenses. Expenses directly attributable to a fund are charged to that fund. Expenses attributable to more than one fund are allocated among the respective funds on the basis of relative net assets or other appropriate methods. Expense estimates are accrued in the period to which they relate and adjustments are made when actual amounts are known. Expenses included in the accompanying financial statements reflect the expenses of the Fund and do not include any expenses associated with any underlying mutual funds or exchange traded funds (ETFs). Although not included, in the Fund's expenses, the Fund indirectly bears its proportionate share of any underlying mutual funds or exchange traded funds (ETFs) expenses through the impact of these expenses on each underlying mutual funds or exchange traded funds (ETFs) NAV.
Income Tax Information and Distributions to Shareholders. Each year, the Fund intends to qualify as a regulated investment company under Subchapter M of the Internal Revenue Code, including distributing substantially all of its taxable income and realized gains. As a result, no provision for U.S. Federal income taxes is required. As of September 30, 2020, the Fund did not have any unrecognized tax benefits in the financial statements; nor is the Fund aware of any tax positions for which it is reasonably possible that the total amounts of unrecognized tax benefits will significantly change in the next twelve months. The Fund files a U.S. federal tax return, in addition to state and local tax returns as required. The Fund's federal income tax returns are subject to examination by the Internal Revenue Service (IRS) for a period of three fiscal years after they are filed. State and local tax returns may be subject to examination for an additional fiscal year depending on the jurisdiction.
Distributions are declared and recorded on the ex-dividend date. Income and capital gain distributions are determined in accordance with income tax regulations, which may differ from GAAP.
Capital accounts within the financial statements are adjusted for permanent book-tax differences. These adjustments have no impact on net assets or the results of operations. Capital accounts are not adjusted for temporary book-tax differences which will reverse in a subsequent period.
Book-tax differences are primarily due to wash sales.
As of period end, the cost and unrealized appreciation (depreciation) in securities, and derivatives if applicable, for federal income tax purposes were as follows:
| Gross unrealized appreciation | $149,081 |
| Gross unrealized depreciation | (18,771) |
| Net unrealized appreciation (depreciation) | $130,310 |
| Tax Cost | $3,474,241 |
The tax-based components of distributable earnings as of period end were as follows:
| Undistributed ordinary income | $5,868 |
| Undistributed long-term capital gain | $13 |
| Net unrealized appreciation (depreciation) on securities and other investments | $130,310 |
The tax character of distributions paid was as follows:
| | September 30, 2020(a) |
| Ordinary Income | $12,396 |
| Total | $12,396 |
(a) For the period March 2, 2020 (commencement of operations) to September 30, 2020.
4. Purchases and Sales of Investments.
Purchases and sales of securities, other than short-term securities, are noted in the table below.
| | Purchases ($) | Sales ($) |
| Fidelity Health Savings Index Fund | 4,636,996 | 1,166,887 |
5. Fees and Other Transactions with Affiliates.
Management Fee. Fidelity Management & Research Company LLC (the investment adviser) and its affiliates provide the Fund with investment management related services for which the Fund pays a monthly management fee. The management fee is based on an annual rate of .15% of the Fund's average net assets. Under the management contract, the investment adviser pays all other operating expenses, except the compensation of the independent Trustees and certain miscellaneous expenses such as proxy and shareholder meeting expenses.
During the period, the investment adviser waived a portion of its management fee as described in the Expense Reductions note.
Interfund Trades. Funds may purchase from or sell securities to other Fidelity Funds under procedures adopted by the Board. The procedures have been designed to ensure these interfund trades are executed in accordance with Rule 17a-7 of the 1940 Act. Interfund trades are included within the respective purchases and sales amounts shown in the Purchases and Sales of Investments note.
6. Committed Line of Credit.
Certain Funds participate with other funds managed by the investment adviser or an affiliate in a $4.25 billion credit facility (the "line of credit") to be utilized for temporary or emergency purposes to fund shareholder redemptions or for other short-term liquidity purposes. The participating funds have agreed to pay commitment fees on their pro-rata portion of the line of credit, which are reflected in Commitment fees on the Statement of Operations, and are as follows:
| | Amount |
| Fidelity Health Savings Index Fund | $17 |
During the period, there were no borrowings on this line of credit.
7. Expense Reductions.
The investment adviser contractually agreed to waive the Fund's management fee in an amount equal to .05% of average net assets until January 31, 2022. For the period, management fees were reduced by $784.
In addition, through arrangements with the Fund's custodian, credits realized as a result of certain uninvested cash balances were used to reduce the Fund's expenses by $76.
8. Other.
The Fund's organizational documents provide former and current trustees and officers with a limited indemnification against liabilities arising in connection with the performance of their duties to the Fund. In the normal course of business, the Fund may also enter into contracts that provide general indemnifications. The Fund's maximum exposure under these arrangements is unknown as this would be dependent on future claims that may be made against the Fund. The risk of material loss from such claims is considered remote.
At the end of the period, the investment adviser or its affiliates were the owners of record of approximately 58% of the total outstanding shares of the Fund.
9. Coronavirus (COVID-19) Pandemic.
An outbreak of COVID-19 first detected in China during December 2019 has since spread globally and was declared a pandemic by the World Health Organization during March 2020. Developments that disrupt global economies and financial markets, such as the COVID-19 pandemic, may magnify factors that affect the Fund's performance.
Report of Independent Registered Public Accounting Firm
To the Board of Trustees of Fidelity Charles Street Trust and Shareholders of Fidelity Health Savings Index Fund
Opinion on the Financial Statements and Financial Highlights
We have audited the accompanying statement of assets and liabilities of Fidelity Health Savings Index Fund (the "Fund"), a fund of Fidelity Charles Street Trust, including the schedule of investments, as of September 30, 2020, the related statement of operations, the statement of changes in net assets and the financial highlights for the period from March 2, 2020 (commencement of operations) through September 30, 2020, and the related notes. In our opinion, the financial statements and financial highlights present fairly, in all material respects, the financial position of the Fund as of September 30, 2020, and the results of its operations, the changes in its net assets and the financial highlights for the period from March 2, 2020 (commencement of operations) through September 30, 2020 in conformity with accounting principles generally accepted in the United States of America.
Basis for Opinion
These financial statements and financial highlights are the responsibility of the Fund's management. Our responsibility is to express an opinion on the Fund's financial statements and financial highlights based on our audits. We are a public accounting firm registered with the Public Company Accounting Oversight Board (United States) (PCAOB) and are required to be independent with respect to the Fund in accordance with the U.S. federal securities laws and the applicable rules and regulations of the Securities and Exchange Commission and the PCAOB.
We conducted our audits in accordance with the standards of the PCAOB. Those standards require that we plan and perform the audit to obtain reasonable assurance about whether the financial statements and financial highlights are free of material misstatement, whether due to error or fraud. The Fund is not required to have, nor were we engaged to perform, an audit of its internal control over financial reporting. As part of our audits we are required to obtain an understanding of internal control over financial reporting but not for the purpose of expressing an opinion on the effectiveness of the Fund’s internal control over financial reporting. Accordingly, we express no such opinion.
Our audits included performing procedures to assess the risks of material misstatement of the financial statements and financial highlights, whether due to error or fraud, and performing procedures that respond to those risks. Such procedures included examining, on a test basis, evidence regarding the amounts and disclosures in the financial statements and financial highlights. Our audits also included evaluating the accounting principles used and significant estimates made by management, as well as evaluating the overall presentation of the financial statements and financial highlights. Our procedures included confirmation of securities owned as of September 30, 2020, by correspondence with the custodian and brokers; when replies were not received from brokers, we performed other auditing procedures. We believe that our audits provide a reasonable basis for our opinion.
/s/ Deloitte & Touche LLP
Boston, Massachusetts
November 13, 2020
We have served as the auditor of one or more of the Fidelity investment companies since 1999.
Trustees and Officers
The Trustees, Members of the Advisory Board (if any), and officers of the trust and fund, as applicable, are listed below. The Board of Trustees governs the fund and is responsible for protecting the interests of shareholders. The Trustees are experienced executives who meet periodically throughout the year to oversee the fund's activities, review contractual arrangements with companies that provide services to the fund, oversee management of the risks associated with such activities and contractual arrangements, and review the fund's performance. Each of the Trustees oversees 280 funds.
The Trustees hold office without limit in time except that (a) any Trustee may resign; (b) any Trustee may be removed by written instrument, signed by at least two-thirds of the number of Trustees prior to such removal; (c) any Trustee who requests to be retired or who has become incapacitated by illness or injury may be retired by written instrument signed by a majority of the other Trustees; and (d) any Trustee may be removed at any special meeting of shareholders by a two-thirds vote of the outstanding voting securities of the trust. Each Trustee who is not an interested person (as defined in the 1940 Act) of the trust and the fund is referred to herein as an Independent Trustee. Each Independent Trustee shall retire not later than the last day of the calendar year in which his or her 75th birthday occurs. The Independent Trustees may waive this mandatory retirement age policy with respect to individual Trustees. Officers and Advisory Board Members hold office without limit in time, except that any officer or Advisory Board Member may resign or may be removed by a vote of a majority of the Trustees at any regular meeting or any special meeting of the Trustees. Except as indicated, each individual has held the office shown or other offices in the same company for the past five years.
The fund’s Statement of Additional Information (SAI) includes more information about the Trustees. To request a free copy, call Fidelity at 1-800-544-8544.
Experience, Skills, Attributes, and Qualifications of the Trustees. The Governance and Nominating Committee has adopted a statement of policy that describes the experience, qualifications, attributes, and skills that are necessary and desirable for potential Independent Trustee candidates (Statement of Policy). The Board believes that each Trustee satisfied at the time he or she was initially elected or appointed a Trustee, and continues to satisfy, the standards contemplated by the Statement of Policy. The Governance and Nominating Committee also engages professional search firms to help identify potential Independent Trustee candidates who have the experience, qualifications, attributes, and skills consistent with the Statement of Policy. From time to time, additional criteria based on the composition and skills of the current Independent Trustees, as well as experience or skills that may be appropriate in light of future changes to board composition, business conditions, and regulatory or other developments, have also been considered by the professional search firms and the Governance and Nominating Committee. In addition, the Board takes into account the Trustees' commitment and participation in Board and committee meetings, as well as their leadership of standing and ad hoc committees throughout their tenure.
In determining that a particular Trustee was and continues to be qualified to serve as a Trustee, the Board has considered a variety of criteria, none of which, in isolation, was controlling. The Board believes that, collectively, the Trustees have balanced and diverse experience, qualifications, attributes, and skills, which allow the Board to operate effectively in governing the fund and protecting the interests of shareholders. Information about the specific experience, skills, attributes, and qualifications of each Trustee, which in each case led to the Board's conclusion that the Trustee should serve (or continue to serve) as a trustee of the fund, is provided below.
Board Structure and Oversight Function. Abigail P. Johnson is an interested person and currently serves as Chairman. The Trustees have determined that an interested Chairman is appropriate and benefits shareholders because an interested Chairman has a personal and professional stake in the quality and continuity of services provided to the fund. Independent Trustees exercise their informed business judgment to appoint an individual of their choosing to serve as Chairman, regardless of whether the Trustee happens to be independent or a member of management. The Independent Trustees have determined that they can act independently and effectively without having an Independent Trustee serve as Chairman and that a key structural component for assuring that they are in a position to do so is for the Independent Trustees to constitute a substantial majority for the Board. The Independent Trustees also regularly meet in executive session. Arthur E. Johnson serves as Chairman of the Independent Trustees and as such (i) acts as a liaison between the Independent Trustees and management with respect to matters important to the Independent Trustees and (ii) with management prepares agendas for Board meetings.
Fidelity® funds are overseen by different Boards of Trustees. The fund's Board oversees Fidelity's investment-grade bond, money market, asset allocation and certain equity funds, and other Boards oversee Fidelity's high income and other equity funds. The asset allocation funds may invest in Fidelity® funds that are overseen by such other Boards. The use of separate Boards, each with its own committee structure, allows the Trustees of each group of Fidelity® funds to focus on the unique issues of the funds they oversee, including common research, investment, and operational issues. On occasion, the separate Boards establish joint committees to address issues of overlapping consequences for the Fidelity® funds overseen by each Board.
The Trustees operate using a system of committees to facilitate the timely and efficient consideration of all matters of importance to the Trustees, the fund, and fund shareholders and to facilitate compliance with legal and regulatory requirements and oversight of the fund's activities and associated risks. The Board, acting through its committees, has charged FMR and its affiliates with (i) identifying events or circumstances the occurrence of which could have demonstrably adverse effects on the fund's business and/or reputation; (ii) implementing processes and controls to lessen the possibility that such events or circumstances occur or to mitigate the effects of such events or circumstances if they do occur; and (iii) creating and maintaining a system designed to evaluate continuously business and market conditions in order to facilitate the identification and implementation processes described in (i) and (ii) above. Because the day-to-day operations and activities of the fund are carried out by or through FMR, its affiliates, and other service providers, the fund's exposure to risks is mitigated but not eliminated by the processes overseen by the Trustees. While each of the Board's committees has responsibility for overseeing different aspects of the fund's activities, oversight is exercised primarily through the Operations and Audit Committees. In addition, an ad hoc Board committee of Independent Trustees has worked with FMR to enhance the Board's oversight of investment and financial risks, legal and regulatory risks, technology risks, and operational risks, including the development of additional risk reporting to the Board. Appropriate personnel, including but not limited to the fund's Chief Compliance Officer (CCO), FMR's internal auditor, the independent accountants, the fund's Treasurer and portfolio management personnel, make periodic reports to the Board's committees, as appropriate, including an annual review of Fidelity's risk management program for the Fidelity® funds. The responsibilities of each standing committee, including their oversight responsibilities, are described further under "Standing Committees of the Trustees."
Interested Trustees*:
Correspondence intended for a Trustee who is an interested person may be sent to Fidelity Investments, 245 Summer Street, Boston, Massachusetts 02210.
Name, Year of Birth; Principal Occupations and Other Relevant Experience+
Abigail P. Johnson (1961)
Year of Election or Appointment: 2009
Trustee
Chairman of the Board of Trustees
Ms. Johnson also serves as Trustee of other Fidelity® funds. Ms. Johnson serves as Chairman (2016-present), Chief Executive Officer (2014-present), and Director (2007-present) of FMR LLC (diversified financial services company), President of Fidelity Financial Services (2012-present) and President of Personal, Workplace and Institutional Services (2005-present). Ms. Johnson is Chairman and Director of Fidelity Management & Research Company LLC (investment adviser firm, 2011-present). Previously, Ms. Johnson served as Chairman and Director of FMR Co., Inc. (investment adviser firm, 2011-2019), Vice Chairman (2007-2016) and President (2013-2016) of FMR LLC, President and a Director of Fidelity Management & Research Company (2001-2005), a Trustee of other investment companies advised by Fidelity Management & Research Company, Fidelity Investments Money Management, Inc. (investment adviser firm), and FMR Co., Inc. (2001-2005), Senior Vice President of the Fidelity® funds (2001-2005), and managed a number of Fidelity® funds. Ms. Abigail P. Johnson and Mr. Arthur E. Johnson are not related.
Jennifer Toolin McAuliffe (1959)
Year of Election or Appointment: 2016
Trustee
Ms. McAuliffe also serves as Trustee of other Fidelity® funds. Previously, Ms. McAuliffe served as Co-Head of Fixed Income of Fidelity Investments Limited (now known as FIL Limited (FIL)) (diversified financial services company), Director of Research for FIL’s credit and quantitative teams in London, Hong Kong and Tokyo and Director of Research for taxable and municipal bonds at Fidelity Investments Money Management, Inc. Ms. McAuliffe previously served as a member of the Advisory Board of certain Fidelity® funds (2016). Ms. McAuliffe was previously a lawyer at Ropes & Gray LLP and currently serves as director or trustee of several not-for-profit entities.
* Determined to be an “Interested Trustee” by virtue of, among other things, his or her affiliation with the trust or various entities under common control with FMR.
+ The information includes the Trustee's principal occupation during the last five years and other information relating to the experience, attributes, and skills relevant to the Trustee's qualifications to serve as a Trustee, which led to the conclusion that the Trustee should serve as a Trustee for the fund.
Independent Trustees:
Correspondence intended for an Independent Trustee may be sent to Fidelity Investments, P.O. Box 55235, Boston, Massachusetts 02205-5235.
Name, Year of Birth; Principal Occupations and Other Relevant Experience+
Elizabeth S. Acton (1951)
Year of Election or Appointment: 2013
Trustee
Ms. Acton also serves as Trustee of other Fidelity® funds. Prior to her retirement, Ms. Acton served as Executive Vice President, Finance (2011-2012), Executive Vice President, Chief Financial Officer (2002-2011) and Treasurer (2004-2005) of Comerica Incorporated (financial services). Prior to joining Comerica, Ms. Acton held a variety of positions at Ford Motor Company (1983-2002), including Vice President and Treasurer (2000-2002) and Executive Vice President and Chief Financial Officer of Ford Motor Credit Company (1998-2000). Ms. Acton currently serves as a member of the Board and Audit and Finance Committees of Beazer Homes USA, Inc. (homebuilding, 2012-present). Ms. Acton previously served as a member of the Advisory Board of certain Fidelity® funds (2013-2016).
Ann E. Dunwoody (1953)
Year of Election or Appointment: 2018
Trustee
General Dunwoody also serves as Trustee of other Fidelity® funds. General Dunwoody (United States Army, Retired) was the first woman in U.S. military history to achieve the rank of four-star general and prior to her retirement in 2012 held a variety of positions within the U.S. Army, including Commanding General, U.S. Army Material Command (2008-2012). General Dunwoody currently serves as President of First to Four LLC (leadership and mentoring services, 2012-present), a member of the Board and Nomination and Corporate Governance Committees of Kforce Inc. (professional staffing services, 2016-present) and a member of the Board of Automattic Inc. (software engineering, 2018-present). Previously, General Dunwoody served as a member of the Advisory Board and Nominating and Corporate Governance Committee of L3 Technologies, Inc. (communication, electronic, sensor and aerospace systems, 2013-2019) and a member of the Board and Audit and Sustainability and Corporate Responsibility Committees of Republic Services, Inc. (waste collection, disposal and recycling, 2013-2016). Ms. Dunwoody also serves on several boards for non-profit organizations, including as a member of the Board, Chair of the Nomination and Governance Committee and a member of the Audit Committee of Logistics Management Institute (consulting non-profit, 2012-present), a member of the Council of Trustees for the Association of the United States Army (advocacy non-profit, 2013-present), a member of the Board of Florida Institute of Technology (2015-present) and a member of the Board of ThanksUSA (military family education non-profit, 2014-present). General Dunwoody previously served as a member of the Advisory Board of certain Fidelity® funds (2018).
John Engler (1948)
Year of Election or Appointment: 2014
Trustee
Mr. Engler also serves as Trustee of other Fidelity® funds. Previously, Mr. Engler served as Governor of Michigan (1991-2003), President of the Business Roundtable (2011-2017) and interim President of Michigan State University (2018-2019). Mr. Engler currently serves as a member of the Board of K12 Inc. (technology-based education company, 2012-present). Previously, Mr. Engler served as a member of the Board of Universal Forest Products (manufacturer and distributor of wood and wood-alternative products, 2003-2019) and Trustee of The Munder Funds (2003-2014). Mr. Engler previously served as a member of the Advisory Board of certain Fidelity® funds (2014-2016).
Robert F. Gartland (1951)
Year of Election or Appointment: 2010
Trustee
Mr. Gartland also serves as Trustee of other Fidelity® funds. Prior to his retirement, Mr. Gartland held a variety of positions at Morgan Stanley (financial services, 1979-2007), including Managing Director (1987-2007) and Chase Manhattan Bank (1975-1978). Mr. Gartland previously served as Chairman and an investor in Gartland & Mellina Group Corp. (consulting, 2009-2019), as a member of the Board of National Securities Clearing Corporation (1993-1996) and as Chairman of TradeWeb (2003-2004).
Arthur E. Johnson (1947)
Year of Election or Appointment: 2008
Trustee
Chairman of the Independent Trustees
Mr. Johnson also serves as Trustee of other Fidelity® funds. Prior to his retirement, Mr. Johnson served as Senior Vice President of Corporate Strategic Development of Lockheed Martin Corporation (defense contractor, 1999-2009). Mr. Johnson currently serves as a member of the Board of Booz Allen Hamilton (management consulting, 2011-present). Mr. Johnson previously served as a member of the Board of Eaton Corporation plc (diversified power management, 2009-2019) and a member of the Board of AGL Resources, Inc. (holding company, 2002-2016). Mr. Johnson previously served as Vice Chairman (2015-2018) of the Independent Trustees of certain Fidelity® funds. Mr. Arthur E. Johnson is not related to Ms. Abigail P. Johnson.
Michael E. Kenneally (1954)
Year of Election or Appointment: 2009
Trustee
Vice Chairman of the Independent Trustees
Mr. Kenneally also serves as Trustee of other Fidelity® funds. Prior to his retirement, Mr. Kenneally served as Chairman and Global Chief Executive Officer of Credit Suisse Asset Management and Executive Vice President and Chief Investment Officer of Bank of America Corporation. Earlier roles at Bank of America included Director of Research, Senior Portfolio Manager for various institutional equity accounts and mutual funds and Portfolio Manager for a number of institutional fixed-income clients. Mr. Kenneally began his career as a Research Analyst in 1983 and was awarded the Chartered Financial Analyst (CFA) designation in 1991.
Marie L. Knowles (1946)
Year of Election or Appointment: 2001
Trustee
Ms. Knowles also serves as Trustee of other Fidelity® funds. Prior to her retirement, Ms. Knowles held several positions at Atlantic Richfield Company (diversified energy), including Executive Vice President and Chief Financial Officer (1996-2000), Senior Vice President (1993-1996) and President of ARCO Transportation Company (pipeline and tanker operations, 1993-1996). Ms. Knowles currently serves as a member of the Board of McKesson Corporation (healthcare service, since 2002), a member of the Board of the Santa Catalina Island Company (real estate, 2009-present), a member of the Investment Company Institute Board of Governors and a member of the Governing Council of the Independent Directors Council (2014-present). Ms. Knowles also serves as a member of the Advisory Board for the School of Engineering of the University of Southern California. Ms. Knowles previously served as Chairman (2015-2018) and Vice Chairman (2012-2015) of the Independent Trustees of certain Fidelity® funds.
Mark A. Murray (1954)
Year of Election or Appointment: 2016
Trustee
Mr. Murray also serves as Trustee of other Fidelity® funds. Previously, Mr. Murray served as Co-Chief Executive Officer (2013-2016), President (2006-2013) and Vice Chairman (2013-2020) of Meijer, Inc. Mr. Murray serves as a member of the Board and Nuclear Review and Public Policy and Responsibility Committees of DTE Energy Company (diversified energy company, 2009-present) and a member of the Board and Audit Committee and Chairman of the Nominating and Corporate Governance Committee of Universal Forest Products, Inc. (manufacturer and distributor of wood and wood-alternative products, 2004-2016). Mr. Murray previously served as a member of the Board of Spectrum Health (not-for-profit health system, 2015-2019). Mr. Murray also serves as a member of the Board of many community and professional organizations. Mr. Murray previously served as a member of the Advisory Board of certain Fidelity® funds (2016).
+ The information includes the Trustee's principal occupation during the last five years and other information relating to the experience, attributes, and skills relevant to the Trustee's qualifications to serve as a Trustee, which led to the conclusion that the Trustee should serve as a Trustee for the fund.
Advisory Board Members and Officers:
Correspondence intended for an officer may be sent to Fidelity Investments, 245 Summer Street, Boston, Massachusetts 02210. Officers appear below in alphabetical order.
Name, Year of Birth; Principal Occupation
Elizabeth Paige Baumann (1968)
Year of Election or Appointment: 2017
Anti-Money Laundering (AML) Officer
Ms. Baumann also serves as AML Officer of other funds. She is Chief AML Officer (2012-present) and Senior Vice President (2014-present) of FMR LLC (diversified financial services company) and is an employee of Fidelity Investments. Previously, Ms. Baumann served as AML Officer of certain funds (2017-2019), as AML Officer of the funds (2012-2016), and Vice President (2007-2014) and Deputy Anti-Money Laundering Officer (2007-2012) of FMR LLC.
Craig S. Brown (1977)
Year of Election or Appointment: 2019
Assistant Treasurer
Mr. Brown also serves as Assistant Treasurer of other funds. Mr. Brown is an employee of Fidelity Investments (2013-present).
John J. Burke III (1964)
Year of Election or Appointment: 2018
Chief Financial Officer
Mr. Burke also serves as Chief Financial Officer of other funds. Mr. Burke serves as Head of Investment Operations for Fidelity Fund and Investment Operations (2018-present) and is an employee of Fidelity Investments (1998-present). Previously Mr. Burke served as head of Asset Management Investment Operations (2012-2018).
David J. Carter (1973)
Year of Election or Appointment: 2020
Assistant Secretary
Mr. Carter also serves as Assistant Secretary of other funds. Mr. Carter serves as Vice President, Associate General Counsel (2010-present) and is an employee of Fidelity Investments (2005-present).
Jonathan Davis (1968)
Year of Election or Appointment: 2010
Assistant Treasurer
Mr. Davis also serves as Assistant Treasurer of other funds. Mr. Davis serves as Assistant Treasurer of FMR Capital, Inc. (2017-present) and is an employee of Fidelity Investments. Previously, Mr. Davis served as Vice President and Associate General Counsel of FMR LLC (diversified financial services company, 2003-2010).
Laura M. Del Prato (1964)
Year of Election or Appointment: 2018
President and Treasurer
Ms. Del Prato also serves as an officer of other funds. Ms. Del Prato is an employee of Fidelity Investments (2017-present). Previously, Ms. Del Prato served as President and Treasurer of The North Carolina Capital Management Trust: Cash Portfolio and Term Portfolio (2018-2020). Prior to joining Fidelity Investments, Ms. Del Prato served as a Managing Director and Treasurer of the JPMorgan Mutual Funds (2014-2017). Prior to JPMorgan, Ms. Del Prato served as a partner at Cohen Fund Audit Services (accounting firm, 2012-2013) and KPMG LLP (accounting firm, 2004-2012).
Colm A. Hogan (1973)
Year of Election or Appointment: 2016
Assistant Treasurer
Mr. Hogan also serves as an officer of other funds. Mr. Hogan serves as Assistant Treasurer of FMR Capital, Inc. (2017-present) and is an employee of Fidelity Investments (2005-present). Previously, Mr. Hogan served as Deputy Treasurer of certain Fidelity® funds (2016-2020) and Assistant Treasurer of certain Fidelity® funds (2016-2018).
Cynthia Lo Bessette (1969)
Year of Election or Appointment: 2019
Secretary and Chief Legal Officer (CLO)
Ms. Lo Bessette also serves as an officer of other funds. Ms. Lo Bessette serves as CLO, Secretary, and Senior Vice President of Fidelity Management & Research Company LLC (investment adviser firm, 2019-present); and CLO of Fidelity Management & Research (Hong Kong) Limited, FMR Investment Management (UK) Limited, and Fidelity Management & Research (Japan) Limited (investment adviser firms, 2019-present). She is a Senior Vice President and Deputy General Counsel of FMR LLC (diversified financial services company, 2019-present), and is an employee of Fidelity Investments. Previously, Ms. Lo Bessette served as CLO, Secretary, and Senior Vice President of FMR Co., Inc. (investment adviser firm, 2019); Secretary of Fidelity SelectCo, LLC and Fidelity Investments Money Management, Inc. (investment adviser firms, 2019). Prior to joining Fidelity Investments, Ms. Lo Bessette was Executive Vice President, General Counsel (2016-2019) and Senior Vice President, Deputy General Counsel (2015-2016) of OppenheimerFunds (investment management company) and Deputy Chief Legal Officer (2013-2015) of Jennison Associates LLC (investment adviser firm).
Chris Maher (1972)
Year of Election or Appointment: 2013
Assistant Treasurer
Mr. Maher also serves as an officer of other funds. Mr. Maher serves as Assistant Treasurer of FMR Capital, Inc. (2017-present), and is an employee of Fidelity Investments (2008-present). Previously, Mr. Maher served as Assistant Treasurer of certain funds (2013-2020); Vice President of Asset Management Compliance (2013), Vice President of the Program Management Group of FMR (investment adviser firm, 2010-2013), and Vice President of Valuation Oversight (2008-2010).
Kenneth B. Robins (1969)
Year of Election or Appointment: 2020
Chief Compliance Officer
Mr. Robins also serves as an officer of other funds. Mr. Robins serves as Compliance Officer of Fidelity Management & Research Company LLC (investment adviser firm, 2016-present) and is an employee of Fidelity Investments (2004-present). Previously, Mr. Robins served as Compliance Officer of FMR Co., Inc. (investment adviser firm, 2016-2019), as Executive Vice President of Fidelity Investments Money Management, Inc. (investment adviser firm, 2013-2016) and served in other fund officer roles.
Stacie M. Smith (1974)
Year of Election or Appointment: 2013
Assistant Treasurer
Ms. Smith also serves as an officer of other funds. Ms. Smith serves as Assistant Treasurer of FMR Capital, Inc. (2017-present), is an employee of Fidelity Investments (2009-present), and has served in other fund officer roles. Prior to joining Fidelity Investments, Ms. Smith served as Senior Audit Manager of Ernst & Young LLP (accounting firm, 1996-2009). Previously, Ms. Smith served as Assistant Treasurer (2013-2019) and Deputy Treasurer (2013-2016) of certain Fidelity® funds.
Marc L. Spector (1972)
Year of Election or Appointment: 2016
Deputy Treasurer
Mr. Spector also serves as an officer of other funds. Mr. Spector serves as Assistant Treasurer of FMR Capital, Inc. (2017-present) and is an employee of Fidelity Investments (2016-present). Prior to joining Fidelity Investments, Mr. Spector served as Director at the Siegfried Group (accounting firm, 2013-2016), and prior to Siegfried Group as audit senior manager at Deloitte & Touche LLP (accounting firm, 2005-2013).
Jim Wegmann (1979)
Year of Election or Appointment: 2019
Assistant Treasurer
Mr. Wegmann also serves as Assistant Treasurer of other funds. Mr. Wegmann is an employee of Fidelity Investments (2011-present).
Shareholder Expense Example
As a shareholder, you incur two types of costs: (1) transaction costs, which may include sales charges (loads) on purchase payments or redemption proceeds, as applicable and (2) ongoing costs, which generally include management fees, distribution and/or service (12b-1) fees and other Fund expenses. This Example is intended to help you understand your ongoing costs (in dollars) of investing in a fund and to compare these costs with the ongoing costs of investing in other mutual funds.
The Example is based on an investment of $1,000 invested at the beginning of the period and held for the entire period (April 1, 2020 to September 30, 2020).
Actual Expenses
The first line of the accompanying table provides information about actual account values and actual expenses. You may use the information in this line, together with the amount you invested, to estimate the expenses that you paid over the period. Simply divide your account value by $1,000.00 (for example, an $8,600 account value divided by $1,000.00 = 8.6), then multiply the result by the number in the first line for a class/Fund under the heading entitled "Expenses Paid During Period" to estimate the expenses you paid on your account during this period. If any fund is a shareholder of any underlying mutual funds or exchange-traded funds (ETFs) (the Underlying Funds), such fund indirectly bears its proportional share of the expenses of the Underlying Funds in addition to the direct expenses incurred presented in the table. These fees and expenses are not included in the annualized expense ratio used to calculate the expense estimate in the table below.
Hypothetical Example for Comparison Purposes
The second line of the accompanying table provides information about hypothetical account values and hypothetical expenses based on the actual expense ratio and an assumed rate of return of 5% per year before expenses, which is not the actual return. The hypothetical account values and expenses may not be used to estimate the actual ending account balance or expenses you paid for the period. You may use this information to compare the ongoing costs of investing in the Fund and other funds. To do so, compare this 5% hypothetical example with the 5% hypothetical examples that appear in the shareholder reports of the other funds. If any fund is a shareholder of any Underlying Funds, such fund indirectly bears its proportional share of the expenses of the Underlying Funds in addition to the direct expenses as presented in the table. These fees and expenses are not included in the annualized expense ratio used to calculate the expense estimate in the table below.
Please note that the expenses shown in the table are meant to highlight your ongoing costs only and do not reflect any transaction costs. Therefore, the second line of the table is useful in comparing ongoing costs only, and will not help you determine the relative total costs of owning different funds.
| | Annualized Expense Ratio-A | Beginning
Account Value
April 1, 2020 | Ending
Account Value
September 30, 2020 | Expenses Paid
During Period-B
April 1, 2020
to September 30, 2020 |
| Fidelity Health Savings Index Fund | .10% | | | |
| Actual | | $1,000.00 | $1,123.30 | $.53 |
| Hypothetical-C | | $1,000.00 | $1,024.50 | $.51 |
A Annualized expense ratio reflects expenses net of applicable fee waivers.
B Expenses are equal to the annualized expense ratio, multiplied by the average account value over the period, multiplied by 183/ 366 (to reflect the one-half year period). The fees and expenses of any Underlying Funds are not included in each annualized expense ratio.
C 5% return per year before expenses
Distributions (Unaudited)
The fund hereby designates as a capital gain dividend with respect to the taxable year ended September, 2020, $13, or, if subsequently determined to be different, the net capital gain of such year.
A total of 29.19% of the dividends distributed during the fiscal year was derived from interest on U.S. Government securities which is generally exempt from state income tax.
The fund designates 8% of the dividends distributed during the fiscal year as qualifying for the dividends–received deduction for corporate shareholders.
The fund designates 8% of the dividends distributed during the fiscal year as amounts which may be taken into account as a dividend for the purposes of the maximum rate under section 1(h)(11) of the Internal Revenue Code.
The fund designates 1% of the dividends distributed during the fiscal year as a section 199A dividend.
The fund will notify shareholders in January 2021 of amounts for use in preparing 2020 income tax returns.
HSI-ANN-1120
1.9897521.100