Exhibit 99.1
Exhibit 99.1
Arthur J. Gallagher & Co.
September 2008
Safe Harbor Statement
Except for the historical information and discussions, certain statements contained herein relating to future results may constitute “forward-looking statements” within the meaning of the Private Securities Litigation Reform Act of 1995. These statements involve a number of risks, uncertainties and other factors that could cause actual results to differ materially from those expected, as discussed in Gallagher’s filings with the U.S. Securities and Exchange Commission, including but not limited to the following: Gallagher’s commission revenues are highly dependent on premiums charged by insurers, which are subject to fluctuation; lower interest rates reduce Gallagher’s income earned on invested funds; alternative insurance markets continue to grow which could unfavorably impact commission and favorably impact fee revenue, though not necessarily to the same extent; Gallagher’s revenues vary significantly from period-to-period as a result of the timing of policy inception dates and the net effect of new and lost business production; the insurance brokerage industry is subject to a great deal of uncertainty due to investigations into its business practices by various governmental authorities and related private litigation; the general level of economic activity can have a substantial impact on Gallagher’s renewal business; Gallagher’s operating results, returns on investments and financial position may be adversely impacted by exposure to various market risks such as interest rate, equity pricing, foreign exchange rates and the competitive environment; Gallagher’s revenues and net earnings will continue to be subject to reduction due to the elimination of certain contingent commission arrangements on January 1, 2005 and related developments in the insurance industry; and Gallagher’s effective income tax rate may be subject to increase as a result of changes in income tax laws, unfavorable interpretations of past, current or future tax laws or changes in crude oil prices or developments resulting in the loss or unavailability of IRC Section 29-related Syn/Coal Credits. Gallagher’s ability to grow has been enhanced through acquisitions, which may or may not be available on acceptable terms in the future and which, if consummated, may or may not be advantageous to Gallagher. Accordingly, actual results may differ materially from those set forth in the forward-looking statements. For a further discussion of certain of the matters described above see Item 1A, “Risk Factors” in Gallagher’s Annual Report on Form 10K for the year ended December 31, 2007.
Arthur J. Gallagher & Co.
Certain Non-GAAP Financial Measures
• This presentation includes certain information that may be considered “non-GAAP financial measures” within the meaning of SEC regulations because it is derived from Gallagher’s consolidated financial information but is not required to be presented in financial statements that are prepared in conformity with U.S. generally accepted accounting principles (GAAP). Consistent with SEC regulations, a description of such information is provided below and a reconciliation of certain of such items to GAAP is provided on our web-site at www.ajg.com.
• Pretax earnings from continuing operations for 2006 and 2005 were adjusted in this presentation to add back charges related to litigation and contingent commission matters and claims handling obligations and to eliminate the impact of medical and pension plan changes. Charges in 2006 related to retail contingent commission related matters and medical plan changes totaled $9.0 million (or $5.4 million after tax) and $7.5 million (or $4.5 million after tax), respectively. Charges in 2005 related to retail contingent commission matters and claims handling obligations totaled $73.6 million (or $44.2 million after tax) and $5.2 million (or $3.6 million after tax), respectively. In addition, Gallagher recognized a pension curtailment gain of $10.0 million (or $6.0 million after tax) in 2005. There were no such charges or gains in 2001 to 2004. These adjustments, which Gallagher believes are for non-recurring items, were made to GAAP earnings from continuing operations in 2006 and 2005 in order to calculate earnings from continuing operations before litigation and contingent commission related matters, claims handling obligations and medical and pension plan changes. In addition, total revenues and pretax earnings from continuing operations exclude retail contingent commissions and are on an as originally reported basis for all periods presented in this presentation. The term EBITDA used herein represents pretax earnings from continuing operations (excluding the impact of the non-recurring items discussed above and retail contingent commissions) before interest, depreciation and amortization expenses.
• Gallagher believes the “non-GAAP financial measures” included in this presentation provide meaningful additional information, which may be helpful to investors in assessing certain aspects of Gallagher’s operating performance and financial condition that may not be otherwise apparent from GAAP. Industry peers provide similar supplemental information, although they may not use the same or comparable terminology and may not make identical adjustments. This non-GAAP information should be used in addition to, but not as a substitute for, the GAAP information.
Arthur J. Gallagher & Co.
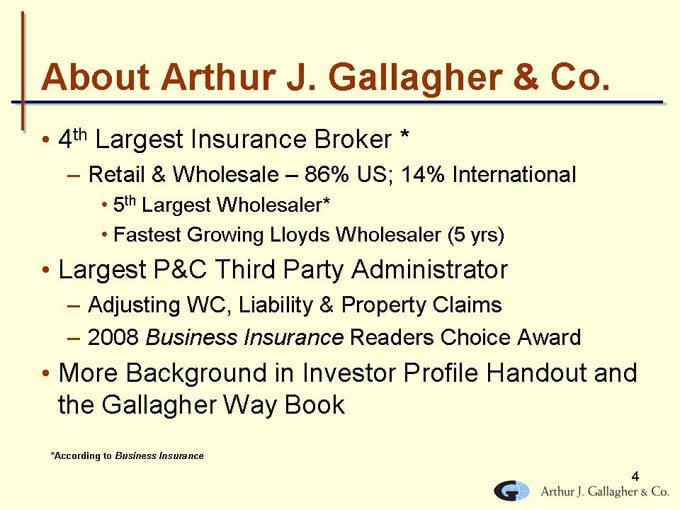
About Arthur J. Gallagher & Co.
• 4th Largest Insurance Broker *
– Retail & Wholesale – 86% US; 14% International
• 5th Largest Wholesaler*
• Fastest Growing Lloyds Wholesaler (5 yrs)
• Largest P&C Third Party Administrator
– Adjusting WC, Liability & Property Claims
– 2008 Business Insurance Readers Choice Award
• More Background in Investor Profile Handout and the Gallagher Way Book
*According to Business Insurance
Arthur J. Gallagher & Co.
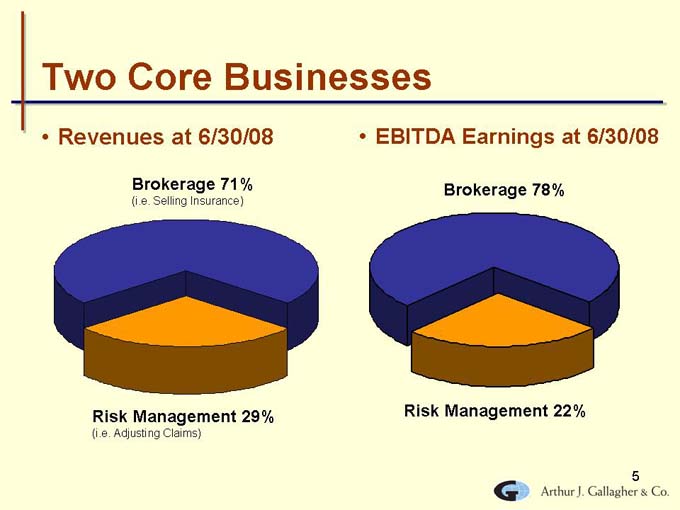
Two Core Businesses
• Revenues at 6/30/08 • EBITDA Earnings at 6/30/08
Brokerage 71% Brokerage 78%
(i.e. Selling Insurance)
Risk Management 29% Risk Management 22%
(i.e. Adjusting Claims)
Arthur J. Gallagher & Co.
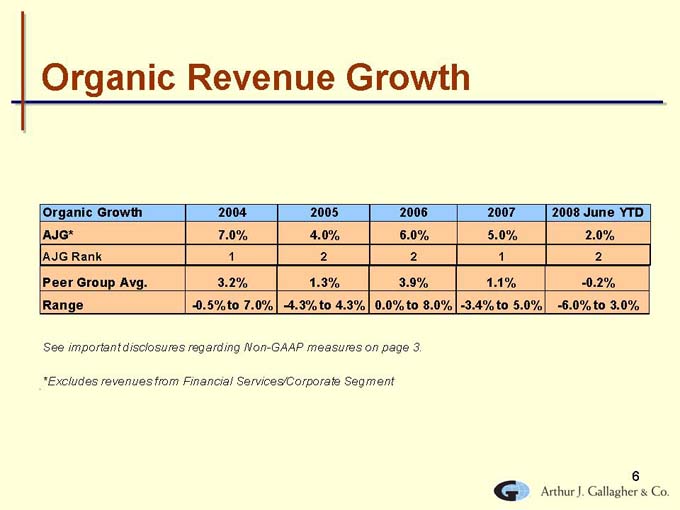
Organic Revenue Growth
Organic Growth 2004 2005 2006 2007 2008 June YTD
AJG* 7.0% 4.0% 6.0% 5.0% 2.0%
AJG Rank 1 2 2 1 2
Peer Group Avg. 3.2% 1.3% 3.9% 1.1% -0.2%
Range -0.5% to 7.0% -4.3% to 4.3% 0.0% to 8.0% -3.4% to 5.0% -6.0% to 3.0%
See important disclosures regarding Non-GAAP measures on page 3.
*Excludes revenues from Financial Services/Corporate Segment
Arthur J. Gallagher & Co.
Current Environment
• Fighting a Headwind
– Soft P&C Market (i.e. too much supply)
• Some predict another 2+ years
– Teetering Economy (i.e. slowing demand)
• Business cutbacks
• Slowing employee counts
• Energy and wage inflation
• U.S. and Even Global Recession
Arthur J. Gallagher & Co.
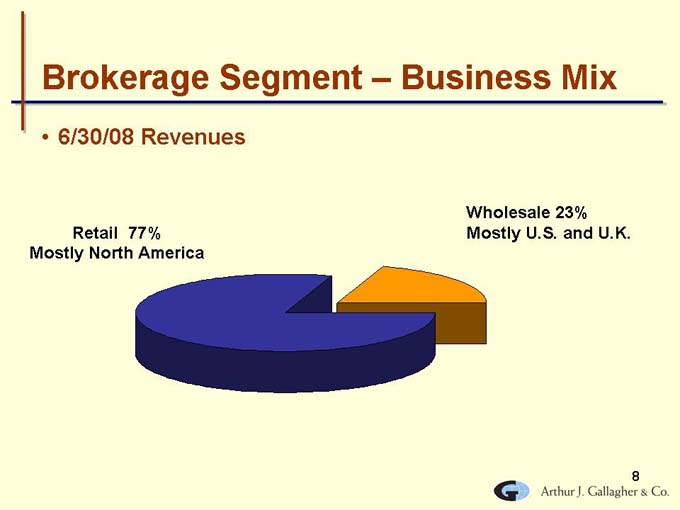
Brokerage Segment – Business Mix
• 6/30/08 Revenues
Wholesale 23%
Mostly U.S. and U.K.
Retail 77% Mostly North America
Arthur J. Gallagher & Co.
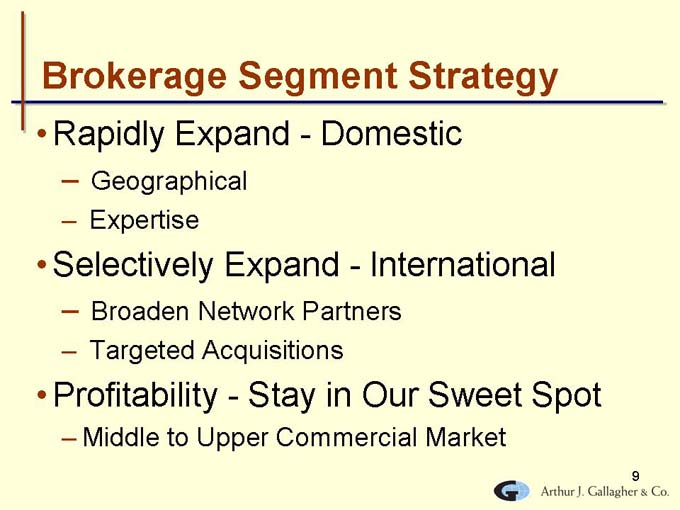
Brokerage Segment Strategy
• Rapidly Expand – Domestic
– Geographical
– Expertise
• Selectively Expand – International
– Broaden Network Partners
– Targeted Acquisitions
• Profitability—Stay in Our Sweet Spot
– Middle to Upper Commercial Market
9
Arthur J. Gallagher & Co.
Domestic Brokerage Expansion
•Sell
•Hire
•Develop
•Acquire
10
Arthur J. Gallagher & Co.
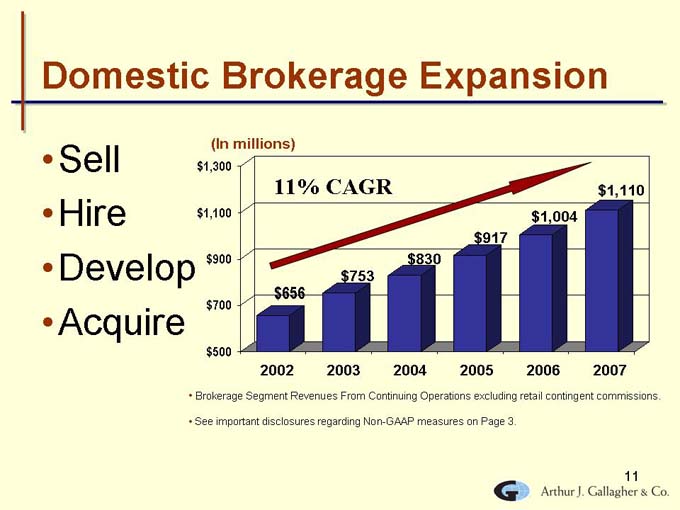
Domestic Brokerage Expansion
•Sell
•Hire
•Develop
•Acquire
(In millions)
$1,300
$1,100
$900
$700
$500
11% CAGR
$656
2002
$753
2003
$830
2004
$917
2005
$1,004
2006
$1,110
2007
• Brokerage Segment Revenues From Continuing Operations excluding retail contingent commissions.
• See important disclosures regarding Non-GAAP measures on Page 3.
11
Arthur J. Gallagher & Co.

Domestic Expansion – Hire
•Producers that want to sell
•Producers that want access to our network, expertise and niches
•Producers that want to be supported by our infrastructure
•Must fit into our culture!
12
Arthur J. Gallagher & Co.
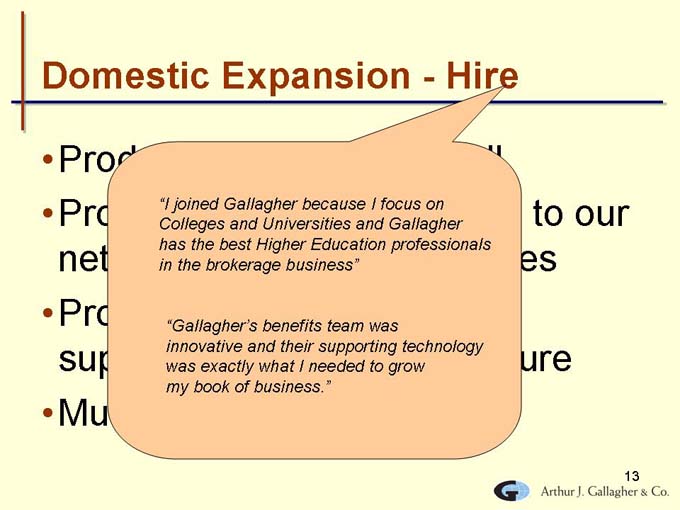
Domestic Expansion—Hire
•Producers that want to sell
•Producers that want access to our network, expertise and niches
•Producers that want to be supported by our infrastructure
•Must fit into our culture!
“I joined Gallagher because I focus on Colleges and Universities and Gallagher has the best Higher Education professionals in the brokerage business”
“Gallagher’s benefits team was innovative and their supporting technology was exactly what I needed to grow my book of business.”
13
Arthur J. Gallagher & Co.

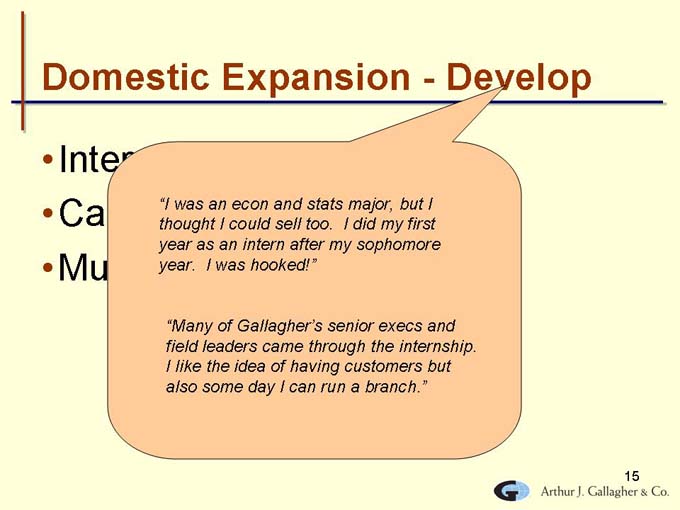
Domestic Expansion – Develop
•Internships
•Career Launch
•Must fit into our culture!
14
Arthur J. Gallagher & Co.
Domestic Expansion—Develop
•Internships
•Career Launch
•Must fit into our culture!
“I was an econ and stats major, but I thought I could sell too. I did my first year as an intern after my sophomore year. I was hooked!”
“Many of Gallagher’s senior execs and field leaders came through the internship. I like the idea of having customers but also some day I can run a branch.”
15
Arthur J. Gallagher & Co.
Domestic Expansion – Acquire
•About 18,000 retail and wholesale brokerages and agencies* (P&C and Benefits)
•Most owned by baby boomers
•Small number of consolidators
*According to Hales & Co, Inc.
16
Arthur J. Gallagher & Co.
Domestic Expansion – Acquire
•Gallagher has done over 200 deals in the last 23 years
•Typical deal is $2 to $10 million in revenues
•2 | | to 5 producers supported by a professional staff of 10 to 20 |
•Must fit into our culture!
17
Arthur J. Gallagher & Co.

Domestic Expansion – Acquire
•Gallagher has done over 180 deals in the last 20 years
•Typical deal is $2 to $10 million in revenues
•2 | | to 5 producers supported by a professional staff of 10 to 20 |
•Must fit into our culture!
“I had the relationships with many larger prospects, but I didn’t have the resources to get their business. Sold to Gallagher, brought in the experts and now they are my client!”
“It was simple – my son and I wanted to be a part of a global player. My son wanted to be part of a team and I thought I was going to slow down. Ha, I’m rejuvenated and I’m having a blast!”
18
Arthur J. Gallagher & Co.

Mergers & Acquisitions
• 2007 was a record year for acquisitions
• 2008 acquisition pace continues
– Growth led by retail operations
Annualized Revenue Acquired (in millions)
$100
$80
$60
$40
$20
$0
$23
$38
$83
$52
Retail
$10
$16
$16
$6
Wholesale
• 2005 • 2006 • 2007 • 2008 June YTD
Number of Acquisitions Closed
20
15
10
0
9
18
19
Retail
Wholesale
• 2005 • 2006 • 2007 • 2008 June YTD
19
Arthur J. Gallagher & Co.
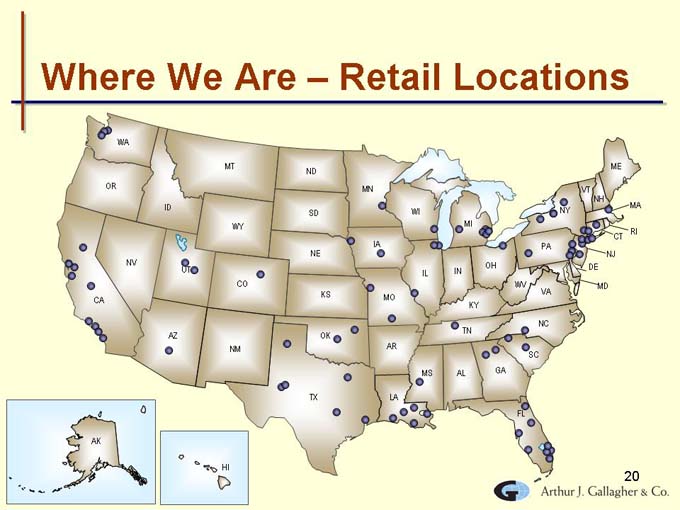
Where We Are – Retail Locations
20
Arthur J. Gallagher & Co.
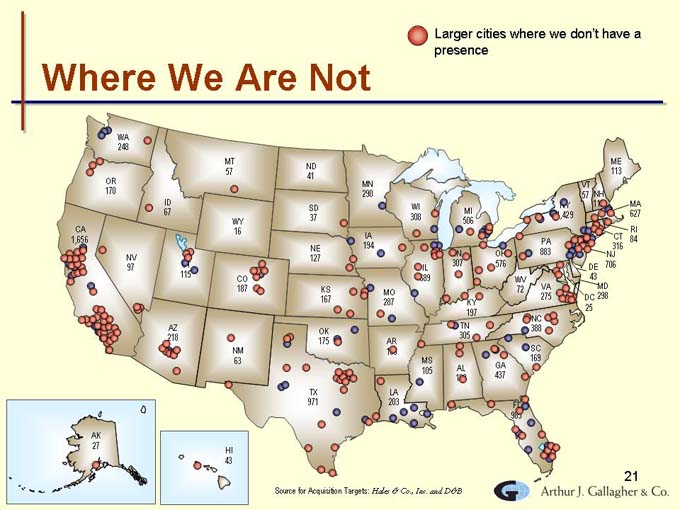
Where We Are Not
• Larger cities where we don’t have a presence
Source for Acquisition Targets: Hales & Co., Inc. and D&B
21
Arthur J. Gallagher & Co.

International Expansion
• Substantial London operation
• Attract experienced teams
• Opportunistic with acquisitions and joint ventures
• Network of independent brokers in over 100 countries
22
Arthur J. Gallagher & Co.
Brokerage – Supporting the Growth
Field
•Full-time training & career development teams
•Full-time M&A teams
•Full-time niche & product support teams
23
Arthur J. Gallagher & Co.
Brokerage – Supporting the Growth
Back Office
• Centralized corporate systems
– General Ledger, T&E, HR, Real Estate and Planning
• Created supporting service centers
– However, NOT client facing
24
Arthur J. Gallagher & Co.
Brokerage – Supporting the Growth
• Branch manager now can focus on:
– Selling
– Developing
– Client service
– Hiring
– Acquiring
– Strategy
25
Arthur J. Gallagher & Co.
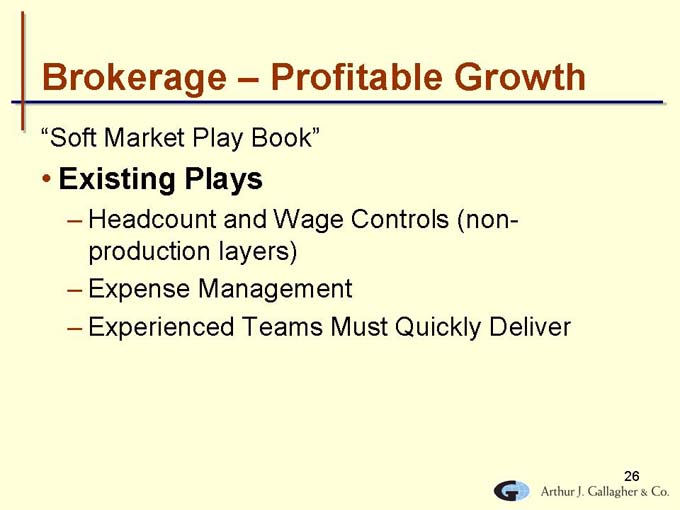
Brokerage – Profitable Growth
“Soft Market Play Book”
• Existing Plays
– Headcount and Wage Controls (non-production layers)
– Expense Management
– Experienced Teams Must Quickly Deliver
26
Arthur J. Gallagher & Co.
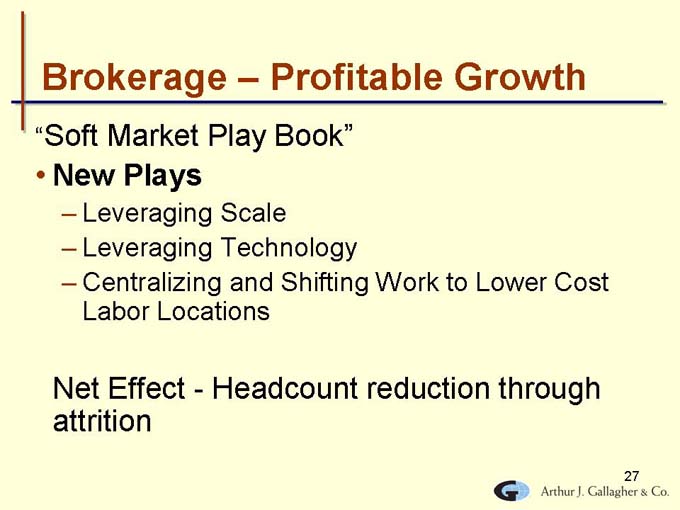
Brokerage – Profitable Growth
“Soft Market Play Book”
• New Plays
– Leveraging Scale
– Leveraging Technology
– Centralizing and Shifting Work to Lower Cost Labor Locations
Net Effect—Headcount reduction through attrition
27
Arthur J. Gallagher & Co.
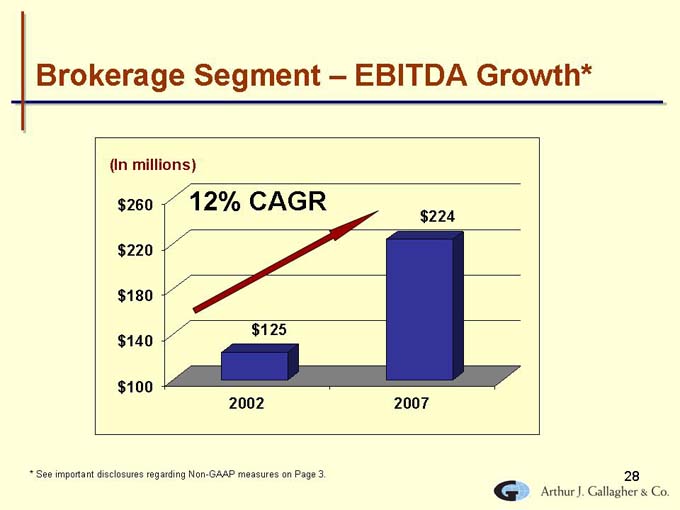
Brokerage Segment – EBITDA Growth*
(In millions)
$260
$220
$180
$140
$100
12% CAGR
$125
2002
$224
2007
* | | See important disclosures regarding Non-GAAP measures on Page 3. |
28
Arthur J. Gallagher & Co.
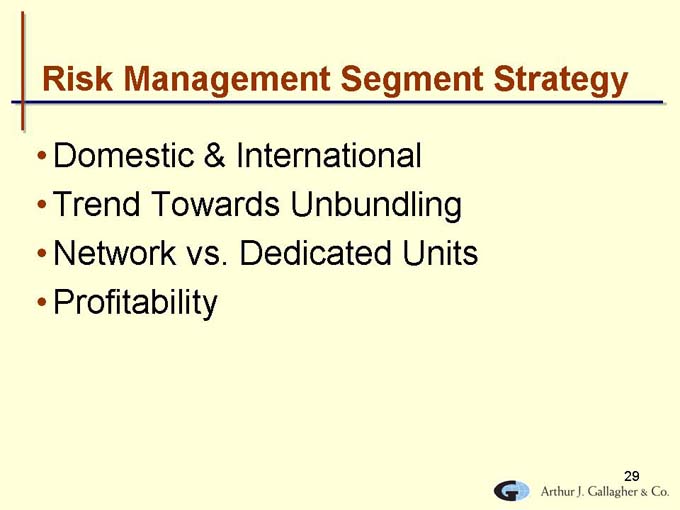
Risk Management Segment Strategy
• Domestic & International
• Trend Towards Unbundling
• Network vs. Dedicated Units
• Profitability
29
Arthur J. Gallagher & Co.
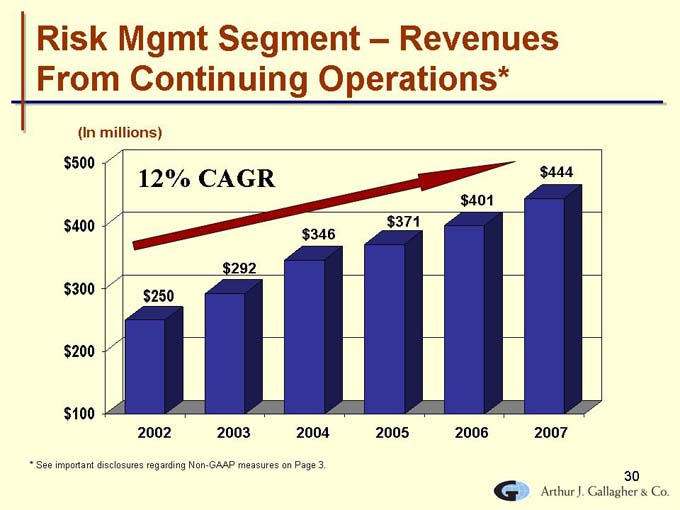
Risk Mgmt Segment – Revenues From Continuing Operations*
(In millions)
$500
$400
$300
$200
$100
12% CAGR
$250
2002
$292
2003
$346
2004
$371
2005
$401
2006
$444
2007
* | | See important disclosures regarding Non-GAAP measures on Page 3. |
30
Arthur J. Gallagher & Co.
Risk Mgmt – Domestic & International
• Revenue growth is all organic
• Targeting Fortune 1000 but standard platform enables profitable service to much smaller accounts as well
• Differentiate through client intimacy, commitment to quality and technology
• International presence largely public entity but leveraging US expertise to penetrate commercial clients
31
Arthur J. Gallagher & Co.
Risk Mgmt – Unbundling Trend
• A growing company has needs that can often best be met in alternative markets
• We can tailor service to clients needs
• Include on-site when appropriate
• Hard markets accelerate the drive to alternative markets
• Soft market has slowed pace but opportunities still exist
32
Arthur J. Gallagher & Co.

Risk Mgmt – Network Philosophy
• Leverage global technology and standard processes to provide service anywhere in the country
• Broaden market opportunity to smaller clients where we don’t need to be on-site
• Move to regional operations and to lower cost locations where possible
33
Arthur J. Gallagher & Co.
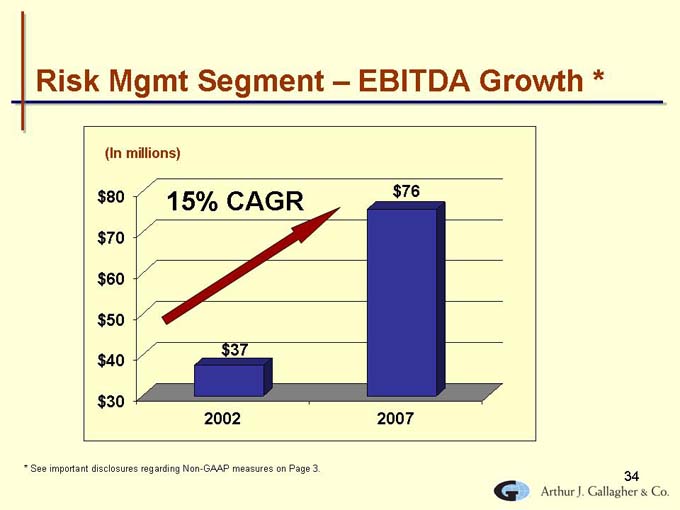
Risk Mgmt Segment – EBITDA Growth *
(In millions)
$80
$70
$60
$50
$40
$30
15% CAGR
$37
2002
$76
2007
* | | See important disclosures regarding Non-GAAP measures on Page 3. |
34
Arthur J. Gallagher & Co.
Cash, Cash & Cash
• Both Brokerage & Risk Management Businesses Generate Substantial Cash Flow
• Neither Need Substantial Capital or Cap Ex
35
Arthur J. Gallagher & Co.
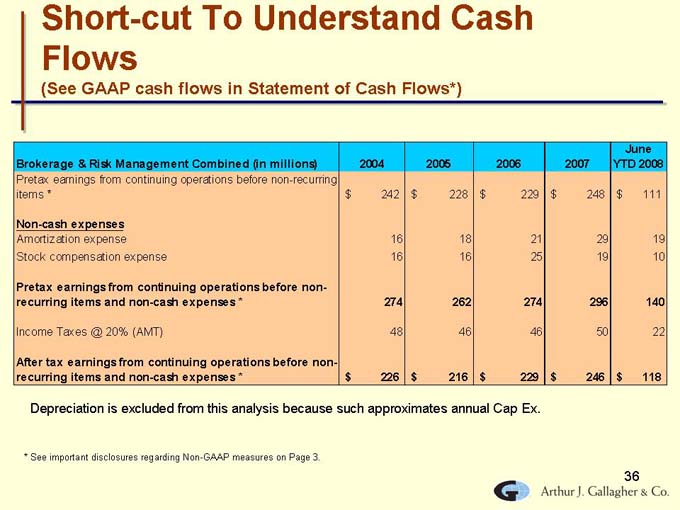
Short-cut To Understand Cash Flows
(See GAAP cash flows in Statement of Cash Flows*)
Brokerage & Risk Management Combined (in millions) 2004 2005 2006 2007 June YTD 2008
Pretax earnings from continuing operations before non-recurring items * $ 242 $ 228 $ 229 $ 248 $ 111
Non-cash expenses
Amortization expense 16 18 21 29 19
Stock compensation expense 16 16 25 19 10
Pretax earnings from continuing operations before non- recurring items and non-cash expenses * 274 262 274 296 140
Income Taxes @ 20% (AMT) 48 46 46 50 22
After tax earnings from continuing operations before non- recurring items and non-cash expenses * $ 226 $ 216 $ 229 $ 246 $ 118
Depreciation is excluded from this analysis because such approximates annual Cap Ex.
* | | See important disclosures regarding Non-GAAP measures on Page 3. |
36
Arthur J. Gallagher & Co.
Cash, Cash & Cash
• Pay Dividend
– Long-cycle Industry
– Shareholders need returns while holding
• Buy Brokers
• Repurchase Shares
• Appropriate Debt Levels
37
Arthur J. Gallagher & Co.
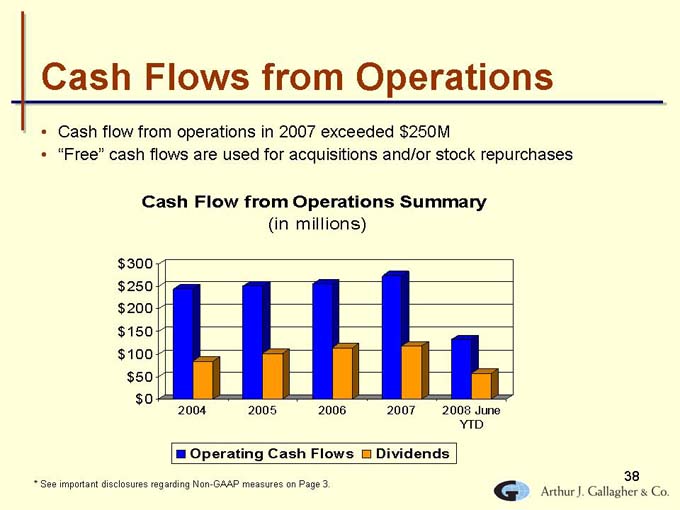
Cash Flows from Operations
• Cash flow from operations in 2007 exceeded $250M
• “Free” cash flows are used for acquisitions and/or stock repurchases
Cash Flow from Operations Summary
(in millions)
$300
$250
$200
$150
$100
$50
$0
2004
2005
2006
2007
2008 June YTD
• Operating Cash Flows • Dividends
* | | See important disclosures regarding Non-GAAP measures on Page 3. |
38
Arthur J. Gallagher & Co.
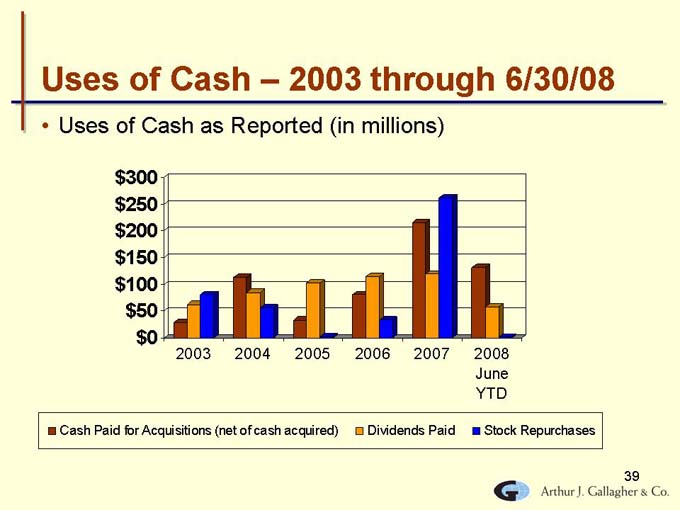
Uses of Cash – 2003 through 6/30/08
• Uses of Cash as Reported (in millions)
$300
$250
$200
$150
$100
$50
$0
2003
2004
2005
2006
2007
2008 June YTD
• Cash Paid for Acquisitions (net of cash acquired) • Dividends Paid •Stock Repurchases
39
Arthur J. Gallagher & Co.
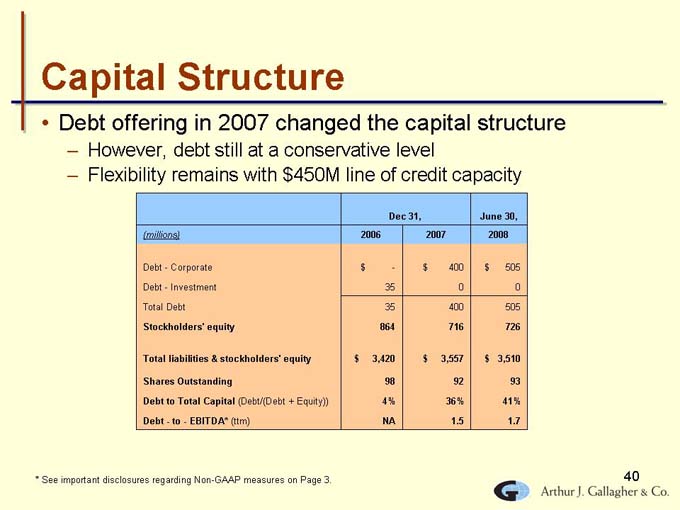
Capital Structure
• Debt offering in 2007 changed the capital structure
– However, debt still at a conservative level
– Flexibility remains with $450M line of credit capacity
Dec 31, June 30,
(millions) 2006 2007 2008
Debt—Corporate $—$ 400 $ 505
Debt—Investment 35 0 0
Total Debt 35 400 505
Stockholders’ equity 864 716 726
Total liabilities & stockholders’ equity $ 3,420 $ 3,557 $ 3,510
Shares Outstanding 98 92 93
Debt to Total Capital (Debt/(Debt + Equity)) 4% 36% 41%
Debt—to—EBITDA* (ttm) NA 1.5 1.7
* | | See important disclosures regarding Non-GAAP measures on Page 3. |
40
Arthur J. Gallagher & Co.
Our Goals are Simple
• Here’s how we all win:
– Target Revenue & EBITDA Growth of 15%/yr
– Push Brokerage & Risk Mgmt margins to 20%
– Control share count growth
– Return cash to shareholders
• Result—Stock price growth
41
Arthur J. Gallagher & Co.

Conclusion
Questions & Answers
42
Arthur J. Gallagher & Co.
Arthur J. Gallagher & Co.
For Additional Information
Website: www.ajg.com
Email: investor_relations@ajg.com Marsha_Akin@ajg.com
Phone: 630-773-3800
43