Exhibit 99.4
Exhibit 99.4
GROWING VALUE
Arthur J. Gallagher & Co. is one of the world’s largest insurance brokers and the world’s largest third-party property/casualty (P/C) claims administrator.* Gallagher generates approximately 87% of its revenues in the United States, with the remaining 13% derived primarily in Australia, Bermuda, Canada, New Zealand and the United Kingdom.
*According to Business Insurance magazine.
FEBRUARY 2011
Brokerage Segment 2
Brokerage Acquisition Strategy 4
Risk Management Segment 4
Corporate Segment 5
Insurance Market Overview 6
Condensed Financial Information 7
Why Invest? 8
www.ajg.com
As of December 31, 2010 (unless otherwise indicated)
Price $29.08
52-week high/low $29.80 - $21.90
Trailing 12-mos. revenues $1.9 billion
Market cap $3.2 billion
Indicated annual dividend $1.32*
Yield 4.5%
Shares outstanding 108.4 million
End of fiscal year December 31
Number of employees 10,736
* On January 27, 2011, Gallagher’s Board of Directors declared a $0.33 per share first-quarter dividend.
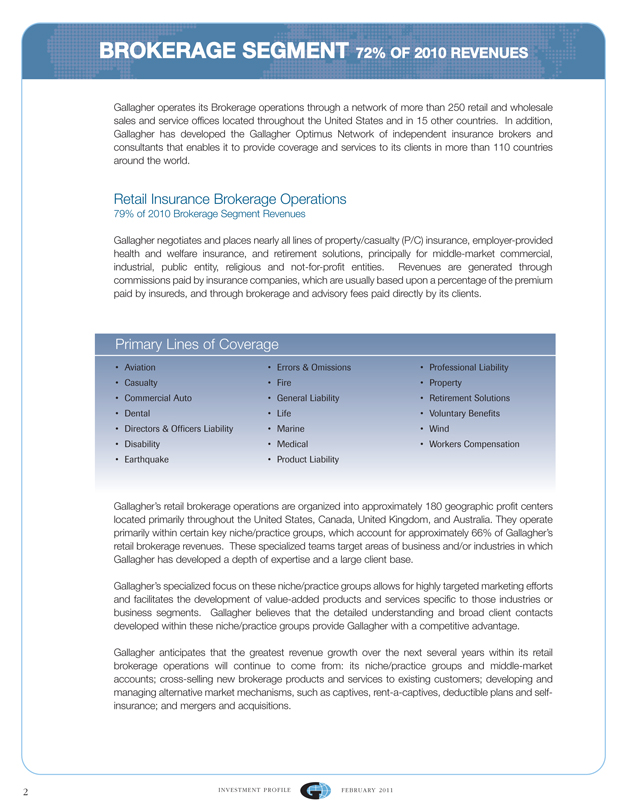
GALLAGHER 3-YEAR STOCK PERFORMANCE
TOTAL RETURNS JANUARY 1, 2008 - DECEMBER 31, 2010
50%
40% AJG 41%
30% 20% 10%
0%
S&P 500
-10% -8% -20%
-30%
-40%
-50%
Mar.-08 Jun.-08 Sept.-08 Dec.-08 Mar.-09 Jun.-09 Sept.-09 Dec.-09 Mar.-10 Jun-10 Sept.-10 Dec.-10
Source for data: BloombergTotal Returns assume dividend reinvestment
AJG S&P 500
Brokerage Risk Corporate
Segment Management Segment
Segment
BROKERAGE SEGMENT 72% OF 2010 REVENUES
Gallagher operates its Brokerage operations through a network of more than 250 retail and wholesale sales and service offices located throughout the United States and in 15 other countries. In addition, Gallagher has developed the Gallagher Optimus Network of independent insurance brokers and consultants that enables it to provide coverage and services to its clients in more than 110 countries around the world.
Retail Insurance Brokerage Operations
79% of 2010 Brokerage Segment Revenues
Gallagher negotiates and places nearly all lines of property/casualty (P/C) insurance, employer-provided health and welfare insurance, and retirement solutions, principally for middle-market commercial, industrial, public entity, religious and not-for-profit entities. Revenues are generated through commissions paid by insurance companies, which are usually based upon a percentage of the premium paid by insureds, and through brokerage and advisory fees paid directly by its clients.
Primary Lines of Coverage
• Aviation • Errors & Omissions • Professional Liability
• Casualty • Fire • Property
• Commercial Auto • General Liability • Retirement Solutions
• Dental • Life • Voluntary Benefits
• Directors & Officers Liability • Marine • Wind
• Disability • Medical • Workers Compensation
• Earthquake • Product Liability
Gallagher’s retail brokerage operations are organized into approximately 180 geographic profit centers located primarily throughout the United States, Canada, United Kingdom, and Australia. They operate primarily within certain key niche/practice groups, which account for approximately 66% of Gallagher’s retail brokerage revenues. These specialized teams target areas of business and/or industries in which Gallagher has developed a depth of expertise and a large client base.
Gallagher’s specialized focus on these niche/practice groups allows for highly targeted marketing efforts and facilitates the development of value-added products and services specific to those industries or business segments. Gallagher believes that the detailed understanding and broad client contacts developed within these niche/practice groups provide Gallagher with a competitive advantage.
Gallagher anticipates that the greatest revenue growth over the next several years within its retail brokerage operations will continue to come from: its niche/practice groups and middle-market accounts; cross-selling new brokerage products and services to existing customers; developing and managing alternative market mechanisms, such as captives, rent-a-captives, deductible plans and self-insurance; and mergers and acquisitions.
2
Niche/Practice Groups
• Agribusiness • Habitational • Private Equity
• Aviation & Aerospace • Healthcare • Public Entity
• Captive Consulting • Higher Education • Real Estate
• Construction • Hospitality • Religious/Not-for-Profit
• Cyber Risk • Marine • Restaurant
• Energy • Manufacturing • Scholastic
• Entertainment • Personal • Technology/Telecom
• Global Risks • Professional Groups • Transportation
Wholesale Insurance Brokerage Operations
21% of 2010 Brokerage Segment Revenues
Gallagher’s wholesale brokerage operations assist retail brokers and agents in the placement of specialized, unique and hard-to-place insurance programs. Wholesale revenues are generated from sharing the commissions paid to the retail broker by the insurance carrier.
Gallagher’s wholesale brokerage operations are organized into more than 60 geographic profit centers located primarily in the United States and Bermuda, and through its approved Lloyd’s of London broker. In certain cases Gallagher acts as a brokerage wholesaler and in other cases Gallagher acts as a managing general agent, handling specialized insurance coverages for insurance carriers.
More than 75% of Gallagher’s wholesale brokerage revenues come from retail brokers and agents who are not affiliated with Gallagher. Based on wholesale premium volume from P/C risks, Gallagher’s U.S. wholesale brokerage operation currently ranks as the largest domestic managing general agency, according to Business Insurance magazine.
Gallagher anticipates growing its wholesale brokerage operations by increasing its number of agent and broker clients, by developing new managing general agency programs and through mergers and acquisitions.
Gallagher Optimus Network
The Gallagher Optimus Network is a global alliance of independent broker partners. Optimus Network partners are selected by Gallagher based upon common business philosophies and the partners’ strengths and service capabilities within their respective countries. Through the Gallagher Optimus Network and its own international operations, Gallagher offers client-service capabilities in more than 110 countries around the world.
3
Brokerage Segment Acquisition Strategy
Gallagher is highly growth-oriented. Its Brokerage Segment growth strategy has two primary components: organic growth through new business production and the strategic acquisition of complementary businesses. Gallagher completed and integrated approximately 254 acquisitions from 1985 through 2010, substantially all within the Brokerage Segment. Most were regional or local retail or wholesale brokers possessing a strong middle-market focus or significant expertise in a desirable market niche. Gallagher typically acquires companies that generate between $1 million and $10 million in annual revenues. In addition, Gallagher is focused on international expansion through acquisitions and joint ventures, where the company begins its relationship with an equity position.
Gallagher is highly selective. An acquisition must offer significant benefits, such as expanding the company’s talent pool, enhancing its geographic presence and service capabilities, and/or broadening and further diversifying its business mix. In selecting acquisition candidates, Gallagher also focuses on:
• |
| a corporate culture that matches Gallagher’s sales-oriented culture |
• |
| a profitable, growing business that could further enhance its ability to compete by gaining access to Gallagher’s greater resources |
• |
| clearly defined financial criteria. |
Contributing to the company’s success as an acquirer is its attractiveness as a merger partner. Gallagher believes that growth-oriented independent brokers and consultants are attracted by its aggressive, sales-oriented culture, team-based approach and depth of resources.
RISK MANAGEMENT SEGMENT
25% OF 2010 REVENUES
Based on revenues, Gallagher’s Risk Management operation currently ranks as the world’s largest third-party P/C claims administrator, according to Business Insurance magazine. Gallagher provides contract claims settlement and administration services for entities that choose to self-insure and insurance companies that choose to outsource their claims-handling services.
Expertise
• Real-time Claims Management • Managed Care Services
• Recoveries (subrogation, salvage, etc.) • Risk Control Services
• Appraisal Services • Safety Programs
• Litigation Management • Settlement Management
• Information Management • Education & Training
4
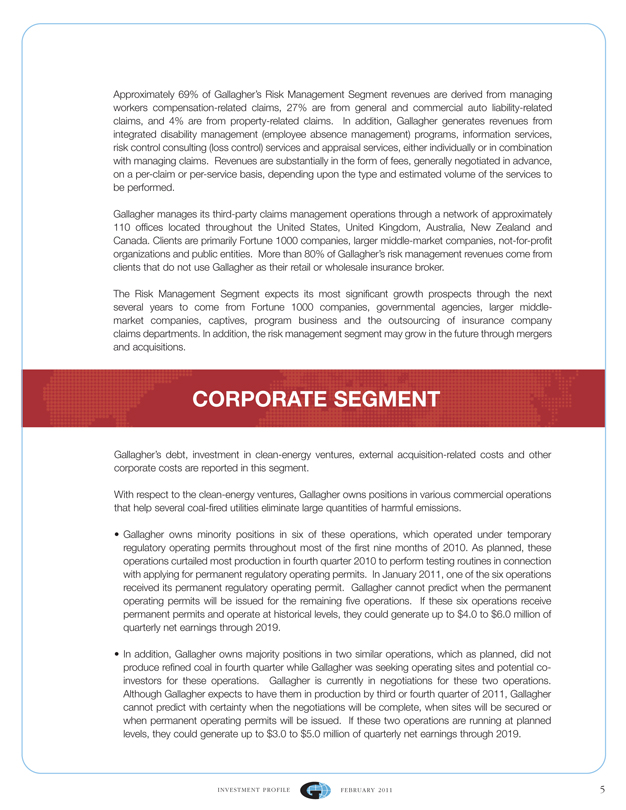
Approximately 69% of Gallagher’s Risk Management Segment revenues are derived from managing workers compensation-related claims, 27% are from general and commercial auto liability-related claims, and 4% are from property-related claims. In addition, Gallagher generates revenues from integrated disability management (employee absence management) programs, information services, risk control consulting (loss control) services and appraisal services, either individually or in combination with managing claims. Revenues are substantially in the form of fees, generally negotiated in advance, on a per-claim or per-service basis, depending upon the type and estimated volume of the services to be performed.
Gallagher manages its third-party claims management operations through a network of approximately 110 offices located throughout the United States, United Kingdom, Australia, New Zealand and Canada. Clients are primarily Fortune 1000 companies, larger middle-market companies, not-for-profit organizations and public entities. More than 80% of Gallagher’s risk management revenues come from clients that do not use Gallagher as their retail or wholesale insurance broker.
The Risk Management Segment expects its most significant growth prospects through the next several years to come from Fortune 1000 companies, governmental agencies, larger middle-market companies, captives, program business and the outsourcing of insurance company claims departments. In addition, the risk management segment may grow in the future through mergers and acquisitions.
CORPORATE SEGMENT
Gallagher’s debt, investment in clean-energy ventures, external acquisition-related costs and other corporate costs are reported in this segment.
With respect to the clean-energy ventures, Gallagher owns positions in various commercial operations that help several coal-fired utilities eliminate large quantities of harmful emissions.
• |
| Gallagher owns minority positions in six of these operations, which operated under temporary regulatory operating permits throughout most of the first nine months of 2010. As planned, these operations curtailed most production in fourth quarter 2010 to perform testing routines in connection with applying for permanent regulatory operating permits. In January 2011, one of the six operations received its permanent regulatory operating permit. Gallagher cannot predict when the permanent operating permits will be issued for the remaining five operations. If these six operations receive permanent permits and operate at historical levels, they could generate up to $4.0 to $6.0 million of quarterly net earnings through 2019. |
• |
| In addition, Gallagher owns majority positions in two similar operations, which as planned, did not produce refined coal in fourth quarter while Gallagher was seeking operating sites and potential co- investors for these operations. Gallagher is currently in negotiations for these two operations. |
Although Gallagher expects to have them in production by third or fourth quarter of 2011, Gallagher cannot predict with certainty when the negotiations will be complete, when sites will be secured or when permanent operating permits will be issued. If these two operations are running at planned levels, they could generate up to $3.0 to $5.0 million of quarterly net earnings through 2019.
5
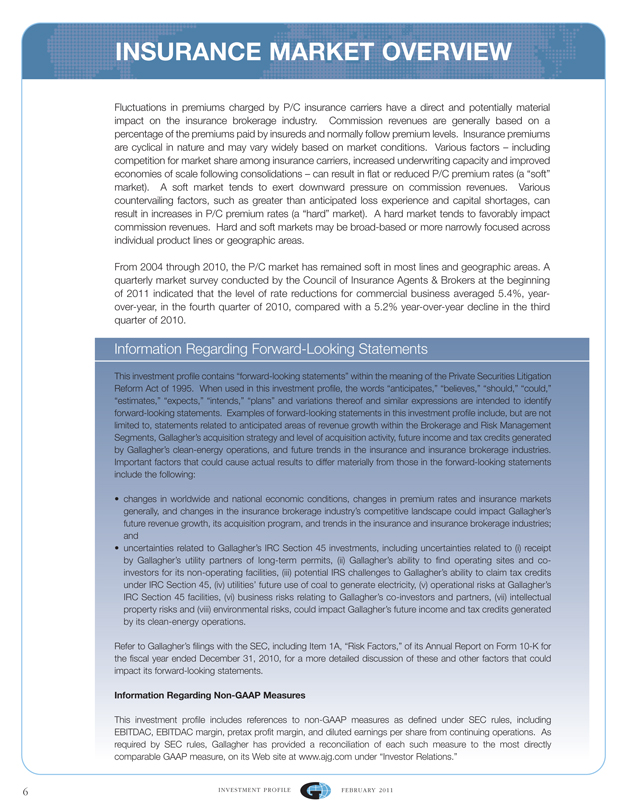
INSURANCE MARKET OVERVIEW
Fluctuations in premiums charged by P/C insurance carriers have a direct and potentially material impact on the insurance brokerage industry. Commission revenues are generally based on a percentage of the premiums paid by insureds and normally follow premium levels. Insurance premiums are cyclical in nature and may vary widely based on market conditions. Various factors – including competition for market share among insurance carriers, increased underwriting capacity and improved economies of scale following consolidations – can result in flat or reduced P/C premium rates (a “soft” market). A soft market tends to exert downward pressure on commission revenues. Various countervailing factors, such as greater than anticipated loss experience and capital shortages, can result in increases in P/C premium rates (a “hard” market). A hard market tends to favorably impact commission revenues. Hard and soft markets may be broad-based or more narrowly focused across individual product lines or geographic areas.
From 2004 through 2010, the P/C market has remained soft in most lines and geographic areas. A quarterly market survey conducted by the Council of Insurance Agents & Brokers at the beginning of 2011 indicated that the level of rate reductions for commercial business averaged 5.4%, year-over-year, in the fourth quarter of 2010, compared with a 5.2% year-over-year decline in the third quarter of 2010.
Information Regarding Forward-Looking Statements
This investment profile contains “forward-looking statements” within the meaning of the Private Securities Litigation Reform Act of 1995. When used in this investment profile, the words “anticipates,” “believes,” “should,” “could,” “estimates,” “expects,” “intends,” “plans” and variations thereof and similar expressions are intended to identify forward-looking statements. Examples of forward-looking statements in this investment profile include, but are not limited to, statements related to anticipated areas of revenue growth within the Brokerage and Risk Management Segments, Gallagher’s acquisition strategy and level of acquisition activity, future income and tax credits generated by Gallagher’s clean-energy operations, and future trends in the insurance and insurance brokerage industries. Important factors that could cause actual results to differ materially from those in the forward-looking statements include the following:
• |
| changes in worldwide and national economic conditions, changes in premium rates and insurance markets generally, and changes in the insurance brokerage industry’s competitive landscape could impact Gallagher’s future revenue growth, its acquisition program, and trends in the insurance and insurance brokerage industries; and |
• |
| uncertainties related to Gallagher’s IRC Section 45 investments, including uncertainties related to (i) receipt by Gallagher’s utility partners of long-term permits, (ii) Gallagher’s ability to find operating sites and co- investors for its non-operating facilities, (iii) potential IRS challenges to Gallagher’s ability to claim tax credits under IRC Section 45, (iv) utilities’ future use of coal to generate electricity, (v) operational risks at Gallagher’s IRC Section 45 facilities, (vi) business risks relating to Gallagher’s co-investors and partners, (vii) intellectual property risks and (viii) environmental risks, could impact Gallagher’s future income and tax credits generated by its clean-energy operations. |
Refer to Gallagher’s filings with the SEC, including Item 1A, “Risk Factors,” of its Annual Report on Form 10-K for the fiscal year ended December 31, 2010, for a more detailed discussion of these and other factors that could impact its forward-looking statements.
Information Regarding Non-GAAP Measures
This investment profile includes references to non-GAAP measures as defined under SEC rules, including EBITDAC, EBITDAC margin, pretax profit margin, and diluted earnings per share from continuing operations. As required by SEC rules, Gallagher has provided a reconciliation of each such measure to the most directly comparable GAAP measure, on its Web site at www.ajg.com under “Investor Relations.”
6
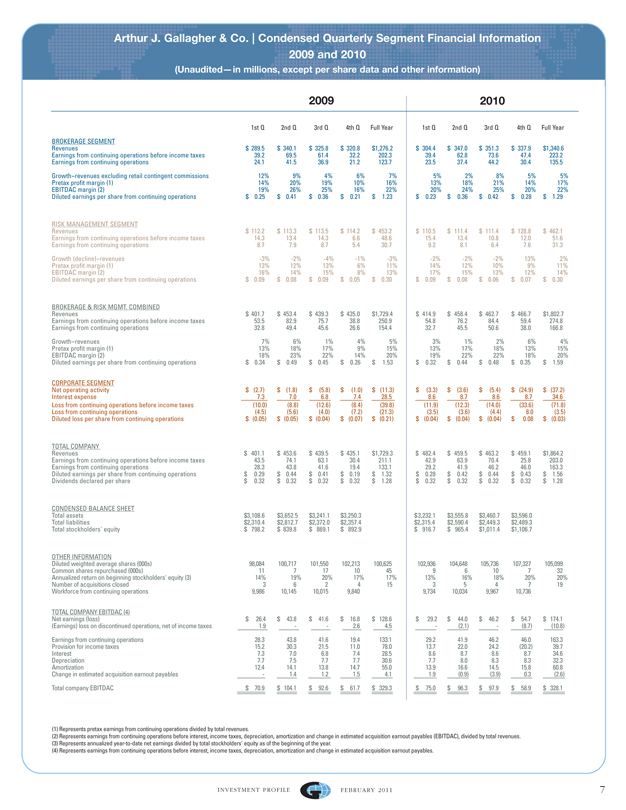
Arthur J. Gallagher & Co. | Condensed Quarterly Segment Financial Information 2009 and 2010
(Unaudited-– in millions, except per share data and other information)
2009
2010
1st Q
2nd Q
3rd Q
4th Q
Full Year
1st Q
2nd Q
3rd Q
4th Q
Full Year
BROKERAGE SEGMENT
Revenues
$289.5
$340.1
$325.8
$320.8
$1,276.2
$304.4
$347.0
$351.3
$337.9
$1,340.6
Earnings from continuing operations before income taxes
39.2
69.5
61.4
32.2
202.3
39.4
62.8
73.6
47.4
223.2
Earnings from continuing operations
24.1
41.5
36.9
21.2
123.7
23.5
37.4
44.2
30.4
135.5
Growth-revenues excluding retail contingent commissions
12%
9%
4%
6%
7%
5%
2%
8%
5%
5%
Pretax profit margin (1)
14%
20%
19%
10%
16%
13%
18%
21%
14%
17%
EBITDAC margin (2)
19%
26%
25%
16%
22%
20%
24%
25%
20%
22%
Diluted earnings per share from continuing operations
$0.25
$0.41
$0.36
$0.21
$1.23
$0.23
$0.36
$0.42
$0.28
$1.29
RISK MANAGEMENT SEGMENT
Revenues
$112.2
$113.3
$113.5
$114.2
$453.2
$110.5
$111.4
$111.4
$128.8
$462.1
Earnings from continuing operations before income taxes
14.3
13.4
14.3
6.6
48.6
15.4
13.4
10.8
12.0
51.6
Earnings from continuing operations
8.7
7.9
8.7
5.4
30.7
9.2
8.1
6.4
7.6
31.3
Growth (decline)-revenues
-3%
-2%
-4%
-1%
-3%
-2%
-2%
-2%
13%
2%
Pretax profit margin (1)
13%
12%
13%
6%
11%
14%
12%
10%
9%
11%
EBITDAC margin (2)
16%
14%
15%
8%
13%
17%
15%
13%
12%
14%
Diluted earnings per share from continuing operations
$0.09
$0.08
$0.09
$0.05
$0.30
$0.09
$0.08
$0.06
$0.07
$0.30
BROKERAGE & RISK MGMT. COMBINED
Revenues
$401.7
$453.4
$439.3
$435.0
$1,729.4
$414.9
$458.4
$462.7
$466.7
$1,802.7
Earnings from continuing operations before income taxes
53.5
82.9
75.7
38.8
250.9
54.8
76.2
84.4
59.4
274.8
Earnings from continuing operations
32.8
49.4
45.6
26.6
154.4
32.7
45.5
50.6
38.0
166.8
Growth-revenues
7%
6%
1%
4%
5%
3%
1%
2%
6%
4%
Pretax profit margin (1)
13%
18%
17%
9%
15%
13%
17%
18%
13%
15%
EBITDAC margin (2)
18%
23%
22%
14%
20%
19%
22%
22%
18%
20%
Diluted earnings per share from continuing operations
$0.34
$0.49
$0.45
$0.26
$1.53
$0.32
$0.44
$0.48
$0.35
$1.59
CORPORATE SEGMENT
Net operating activity
$(2.7)
$(1.8)
$(5.8)
$(1.0)
$(11.3)
$(3.3)
$(3.6)
$(5.4)
$(24.9)
$(37.2)
Interest expense
7.3
7.0
6.8
7.4
28.5
8.6
8.7
8.6
8.7
34.6
Loss from continuing operations before income taxes
(10.0)
(8.8)
(12.6)
(8.4)
(39.8)
(11.9)
(12.3)
(14.0)
(33.6)
(71.8)
Loss from continuing operations
(4.5)
(5.6)
(4.0)
(7.2)
(21.3)
(3.5)
(3.6)
(4.4)
8.0
(3.5)
Diluted loss per share from continuing operations
$(0.05)
$(0.05)
$(0.04)
$(0.07)
$(0.21)
$(0.04)
$(0.04)
$(0.04)
$0.08
$(0.03)
TOTAL COMPANY
Revenues
$401.1
$453.6
$439.5
$435.1
$1,729.3
$482.4
$459.5
$463.2
$459.1
$1,864.2
Earnings from continuing operations before income taxes
43.5
74.1
63.1
30.4
211.1
42.9
63.9
70.4
25.8
203.0
Earnings from continuing operations
28.3
43.8
41.6
19.4
133.1
29.2
41.9
46.2
46.0
163.3
Diluted earnings per share from continuing operations
$0.29
$0.44
$0.41
$0.19
$1.32
$0.28
$0.42
$0.44
$0.43
$1.56
Dividends declared per share
$0.32
$0.32
$0.32
$0.32
$1.28
$0.32
$0.32
$0.32
$0.32
$1.28
CONDENSED BALANCE SHEET
Total assets
$3,108.6
$3,652.5
$3,241.1
$3,250.3
$3,232.1
$3,555.8
$3,460.7
$3,596.0
Total liabilities
$2,310.4
$2,812.7
$2,372.0
$2,357.4
$2,315.4
$2,590.4
$2,449.3
$2,489.3
Total stockholders’ equity
$798.2
$839.8
$869.1
$892.9
$916.7
$965.4
$1,011.4
$1,106.7
OTHER INFORMATION
Diluted weighted average shares (000s)
98,084
100,717
101,550
102,213
100,625
102,936
104,648
105,736
107,327
105,099
Common shares repurchased (000s)
11
7
17
10
45
9
6
10
7
32
Annualized return on beginning stockholders’ equity (3)
14%
19%
20%
17%
17%
13%
16%
18%
20%
20%
Number of acquisitions closed
3
6
2
4
15
3
5
4
7
19
Workforce from continuing operations
9,986
10,145
10,015
9,840
9,734
10,034
9,967
10,736
TOTAL COMPANY EBITDAC (4)
Net earnings (loss)
$26.4
$43.8
$41.6
$16.8
$128.6
$29.2
$44.0
$46.2
$54.7
$174.1
(Earnings) loss on discontinued operations, net of income taxes
1.9
—
—
2.6
4.5
—
(2.1)
—
(8.7)
(10.8)
Earnings from continuing operations
28.3
43.8
41.6
19.4
133.1
29.2
41.9
46.2
46.0
163.3
Provision for income taxes
15.2
30.3
21.5
11.0
78.0
13.7
22.0
24.2
(20.2)
39.7
Interest
7.3
7.0
6.8
7.4
28.5
8.6
8.7
8.6
8.7
34.6
Depreciation
7.7
7.5
7.7
7.7
30.6
7.7
8.0
8.3
8.3
32.3
Amortization
12.4
14.1
13.8
14.7
55.0
13.9
16.6
14.5
15.8
60.8
Change in estimated acquisition earnout payables
—
1.4
1.2
1.5
4.1
1.9
(0.9)
(3.9)
0.3
(2.6)
Total company EBITDAC
$70.9
$104.1
$92.6
$61.7
$329.3
$75.0
$96.3
$97.9
$58.9
$328.1
(1) |
| Represents pretax earnings from continuing operations divided by total revenues. |
(2) |
| Represents earnings from continuing operations before interest, income taxes, depreciation, amortization and change in estimated acquisition earnout payables (EBITDAC), divided by total revenues. |
(3) |
| Represents annualized year-to-date net earnings divided by total stockholders’ equity as of the beginning of the year. |
(4) |
| Represents earnings from continuing operations before interest, income taxes, depreciation, amortization and change in estimated acquisition earnout payables. |
7 |
|
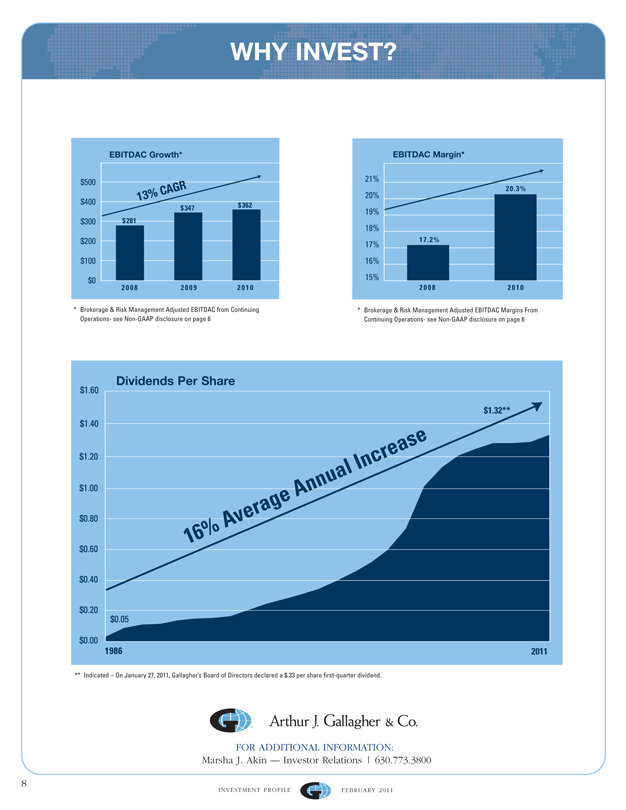
WHY INVEST?
EBITDAC Growth*
$500
AGR
%C
13
$400 $362
$34 7 $300 $281
$200
$100
$0
2008 2009 2010
* Brokerage & Risk Management Adjusted EBITDAC from Continuing Operations- see Non-GAAP disclosure on page 6
EBITDAC Margin*
21%
20 .3%
20%
19%
18%
17% 17 .2%
16%
15%
2008 2010
* Brokerage & Risk Management Adjusted EBITDAC Margins From Continuing Operations- see Non-GAAP disclosure on page 6
Dividends Per Share
$1.60
$1.40
$1.20
$1.00
$0.80
$0.60
$0.40
$0.20
$0.00
$0.05
1986
2011
$1.32**
16% Average Annual Increase
** Indicated – On January 27, 2011, Gallagher’s Board of Directors declared a $.33 per share first-quarter dividend.
FOR ADDITIONAL INFORMATION: Marsha J. Akin –– Investor Relations | 630.773.3800
8