Table of Contents
| þ | ANNUAL REPORT PURSUANT TO SECTION 13 OR 15(d) OF THE SECURITIES EXCHANGE ACT OF 1934 |
| o | TRANSITION REPORT PURSUANT TO SECTION 13 OR 15(d) OF THE SECURITIES EXCHANGE ACT OF 1934 |
| Florida (State or other jurisdiction of incorporation or organization) | 59-0906081 (IRS Employer identification number) | |
| P.O. Box 338, La Belle, Florida (Address of principal executive offices) | 33975 (Zip code) |
| Name of each exchange | ||
| Title of class: | on which registered: | |
| COMMON CAPITAL STOCK, $1.00 Par value, Non-cumulative | NASDAQ |
| Large accelerated filero | Accelerated filerþ | Non-accelerated filero | Smaller Reporting Companyo |
ALICO, INC.
FORM 10-K
For the year ended September 30, 2008
| 3 | ||||||||
| 10 | ||||||||
| 15 | ||||||||
| 16 | ||||||||
| 17 | ||||||||
| 18 | ||||||||
| 18 | ||||||||
| 22 | ||||||||
| 23 | ||||||||
| 40 | ||||||||
| 42 | ||||||||
| 83 | ||||||||
| 83 | ||||||||
| 84 | ||||||||
| 85 | ||||||||
| 88 | ||||||||
| Exhibit 10.6 | ||||||||
| Exhibit 14.1 | ||||||||
| Exhibit 14.2 | ||||||||
| Exhibit 31.1 | ||||||||
| Exhibit 31.2 | ||||||||
| Exhibit 32.1 | ||||||||
| Exhibit 32.2 | ||||||||
2
Table of Contents
3
Table of Contents
4
Table of Contents
| Year ended | One month | Fiscal years ended | ||||||||||||||
| Sept. 30, | Sept. 30, | Aug. 31, | Aug. 31, | |||||||||||||
| 2008 | 2007 (1) | 2007 | 2006 | |||||||||||||
Revenues | ||||||||||||||||
Agriculture: | ||||||||||||||||
| Bowen | $ | 45,499 | $ | 143 | $ | 52,716 | $ | 30,869 | ||||||||
| Citrus groves | 41,167 | 5 | 47,484 | 22,188 | ||||||||||||
| Sugarcane | 9,671 | — | 9,432 | 8,926 | ||||||||||||
| Cattle | 6,793 | 330 | 9,977 | 5,700 | ||||||||||||
| Vegetables | 5,460 | — | 3,803 | 2,389 | ||||||||||||
| Sod | 1,118 | 92 | 2,180 | 1,528 | ||||||||||||
| Native trees and shrubs | 125 | — | 249 | 142 | ||||||||||||
| Agriculture operations revenue | 109,833 | 570 | 125,841 | 71,742 | ||||||||||||
| Real estate activities | 3,870 | — | 3,329 | 113 | ||||||||||||
| Land leasing and rentals | 2,276 | 141 | 1,495 | 1,369 | ||||||||||||
| Mining royalties | 403 | 47 | 1,340 | 940 | ||||||||||||
Total operating revenue | $ | 116,382 | $ | 758 | $ | 132,005 | $ | 74,164 | ||||||||
| Year ended | One month | Fiscal years ended | ||||||||||||||
| Sept. 30, | Sept. 30, | Aug. 31, | Aug. 31, | |||||||||||||
| 2008 | 2007 (1) | 2007 | 2006 | |||||||||||||
Gross profit (loss): | ||||||||||||||||
Agriculture: | ||||||||||||||||
| Bowen | $ | 1,470 | $ | (79 | ) | $ | 930 | $ | (268 | ) | ||||||
| Citrus groves | 13,530 | 2 | 24,057 | 7,614 | ||||||||||||
| Sugarcane | 421 | — | 599 | 360 | ||||||||||||
| Cattle | (2,127 | ) | 41 | 255 | 786 | |||||||||||
| Vegetables | (141 | ) | — | 496 | 985 | |||||||||||
| Sod | (1,535 | ) | (116 | ) | 862 | 688 | ||||||||||
| Native trees and shrubs | 125 | — | 249 | 142 | ||||||||||||
| Gross profit from agricultural operations | 11,743 | (152 | ) | 27,448 | 10,307 | |||||||||||
| Real estate activities | 341 | (59 | ) | (79 | ) | 52 | ||||||||||
| Land leasing and rentals | 1,668 | 105 | 1,102 | 917 | ||||||||||||
| Mining royalties | 305 | 37 | 1,214 | 940 | ||||||||||||
| Net casualty (recovery) | — | — | — | 4,036 | ||||||||||||
| Subtotal | 14,057 | (69 | ) | 29,685 | 16,252 | |||||||||||
| Profits from the sale of bulk real estate | 817 | — | 1,257 | 4,369 | ||||||||||||
| Net interest and investment income | 1,180 | (137 | ) | 1,685 | 5,092 | |||||||||||
| Corporate general and administrative and other | (11,216 | ) | (819 | ) | (12,502 | ) | (10,533 | ) | ||||||||
| Income from operations before income taxes | 4,838 | (1,025 | ) | 20,125 | 15,180 | |||||||||||
| Provision for income taxes | (765 | ) | 176 | 33,520 | 7,159 | |||||||||||
| Net income (loss) from continuing operations | $ | 5,603 | $ | (849 | ) | $ | (13,395 | ) | $ | 8,021 | ||||||
| (1) | Alico changed its fiscal year end from August 31 to September 30. The year ended September 30, 2008 was the first full year on the new fiscal year. Results for September 30, 2007 are for the one month transition period. |
5
Table of Contents
| Sept. 30, | Sept. 30, | |||||||
| 2008 | 2007 | |||||||
Total Assets: | ||||||||
Agriculture: | ||||||||
| Bowen | $ | 2,581 | $ | 2,891 | ||||
| Citrus groves | 49,201 | 53,339 | ||||||
| Sugarcane | 43,525 | 45,128 | ||||||
| Cattle | 18,343 | 20,837 | ||||||
| Vegetables | 4,213 | 3,238 | ||||||
| Sod | 3,906 | 5,400 | ||||||
| Subtotal Agriculture | 121,769 | 130,833 | ||||||
| Other Corporate assets | 152,163 | 154,516 | ||||||
Total assets | $ | 273,932 | $ | 285,349 | ||||
6
Table of Contents
7
Table of Contents
8
Table of Contents
9
Table of Contents
| • | population migration; | ||
| • | national, regional and local economic conditions; |
10
Table of Contents
| • | conditions in local real estate markets (e.g., supply of land versus demand); | ||
| • | competition from other available property; | ||
| • | current level of, or potential availability of roads and utilities; | ||
| • | availability of governmental entitlements; | ||
| • | government regulation and changes in real estate, zoning, land use, environmental or tax laws; | ||
| • | interest rates and the availability of financing, and; | ||
| • | potential liability under environmental and other laws. |
11
Table of Contents
12
Table of Contents
13
Table of Contents
14
Table of Contents
15
Table of Contents
Land Use Summary
September 30, 2008
| Total | Hendry | Polk | Collier | Glades | Lee | |||||||||||||||||||
Citrus: | ||||||||||||||||||||||||
| Producing acres | 10,582 | 3,048 | 3,405 | 4,129 | — | — | ||||||||||||||||||
| Support and nonproductive* | 6,303 | 2,317 | 789 | 3,197 | — | — | ||||||||||||||||||
Total Citrus | 16,885 | 5,365 | 4,194 | 7,326 | — | — | ||||||||||||||||||
Sugarcane: | ||||||||||||||||||||||||
| Producing acres | 9,110 | 9,110 | — | — | — | — | ||||||||||||||||||
| Support and nonproductive* | 6,912 | 6,912 | — | — | — | — | ||||||||||||||||||
Total Sugarcane | 16,022 | 16,022 | — | — | — | — | ||||||||||||||||||
Ranch: | ||||||||||||||||||||||||
| Improved pasture | 21,201 | 20,906 | 295 | — | — | — | ||||||||||||||||||
| Semi-improved pasture | 21,752 | 20,038 | 602 | 1,112 | — | — | ||||||||||||||||||
| Native pasture | 19,513 | 11,846 | 5,949 | 1,718 | — | — | ||||||||||||||||||
| Support and nonproductive* | 13,583 | 12,527 | 376 | 680 | — | — | ||||||||||||||||||
Total Ranch | 76,049 | 65,317 | 7,222 | 3,510 | — | — | ||||||||||||||||||
Farming: | ||||||||||||||||||||||||
| Productive acres | 5,521 | 5,521 | — | — | — | — | ||||||||||||||||||
| Support and nonproductive* | 17,479 | 17,479 | — | — | — | — | ||||||||||||||||||
Total farming | 23,000 | 23,000 | — | — | — | — | ||||||||||||||||||
Sod: | ||||||||||||||||||||||||
| Producing acres | 1,540 | 1,540 | — | — | — | — | ||||||||||||||||||
| Support and nonproductive* | 363 | 363 | — | — | — | — | ||||||||||||||||||
Total sod | 1,903 | 1,903 | — | — | — | — | ||||||||||||||||||
Rock and Sand Mining | 526 | — | — | — | 526 | — | ||||||||||||||||||
Commercial & Residential | 1,081 | 54 | 66 | — | — | 961 | ||||||||||||||||||
Total | 135,466 | 111,661 | 11,482 | 10,836 | 526 | 961 | ||||||||||||||||||
| * | Includes buildings, roads, water management systems, fallow lands and wetlands. |
16
Table of Contents
17
Table of Contents
| 2008 | 2007 | |||||||||||||||
| Price | Price | |||||||||||||||
| High | Low | High | Low | |||||||||||||
| First Quarter | $ | 51.13 | $ | 35.35 | $ | 62.92 | $ | 48.50 | ||||||||
| Second Quarter | $ | 45.62 | $ | 35.44 | $ | 60.45 | $ | 46.25 | ||||||||
| Third Quarter | $ | 45.48 | $ | 33.14 | $ | 62.24 | $ | 54.97 | ||||||||
| Fourth Quarter | $ | 50.32 | $ | 33.90 | $ | 65.00 | $ | 43.29 | ||||||||
| Record Date | Payment Date | Amount Paid Per Share | ||||
| December 29, 2006 | January 15, 2007 | $ | 0.275 | |||
| March 30, 2007 | April 16, 2007 | $ | 0.275 | |||
| June 29, 2007 | July 16, 2007 | $ | 0.275 | |||
| September 28, 2007 | October 15, 2007 | $ | 0.275 | |||
| December 29, 2007 | January 15, 2008 | $ | 0.275 | |||
| April 30, 2008 | May 16, 2008 | $ | 0.275 | |||
| July 31, 2008 | August 15, 2008 | $ | 0.275 | |||
18
Table of Contents
19
Table of Contents
| Number of securities | ||||||||||||
| remaining available | ||||||||||||
| for future issuance | ||||||||||||
| Number of securities | under equity | |||||||||||
| to be issued upon | Weighted average | compensation plans | ||||||||||
| exercise of | exercise price of | (excluding securities | ||||||||||
| outstanding options, | outstanding options, | reflected in | ||||||||||
| Plan category | warrants and rights | warrants and rights | column (a)) | |||||||||
| (a) | (b) | (c) | ||||||||||
| Equity compensation plans approved by security holders | 6,158 | $ | 16.84 | 231,600 | ||||||||
| Equity compensation plans not approved by security holders | — | — | — | |||||||||
| Total | 6,158 | $ | 16.84 | 231,600 | ||||||||
| Total Shares | ||||||||||||||||
| Purchased as Part of | ||||||||||||||||
| Total Number of | Average price | Publicly Announced | Total Dollar value of | |||||||||||||
| Date | Shares Purchased | paid per share | Plans or Programs(1) | shares purchased | ||||||||||||
| January 2007 | 9,927 | $ | 48.72 | 25,927 | $ | 483,597 | ||||||||||
| March 2007 | 843 | $ | 47.69 | 26,770 | $ | 40,199 | ||||||||||
| May 2007 | 10,000 | $ | 59.67 | 36,770 | $ | 596,654 | ||||||||||
| August 2007 | 7,000 | $ | 51.98 | 43,770 | $ | 363,841 | ||||||||||
| November 2007 | 12,000 | $ | 43.97 | 55,770 | $ | 527,699 | ||||||||||
| March 2008 | 6,200 | $ | 44.24 | 61,970 | $ | 274,268 | ||||||||||
| May 2008 | 9,768 | $ | 40.32 | 71,738 | $ | 393,851 | ||||||||||
20
Table of Contents
21
Table of Contents
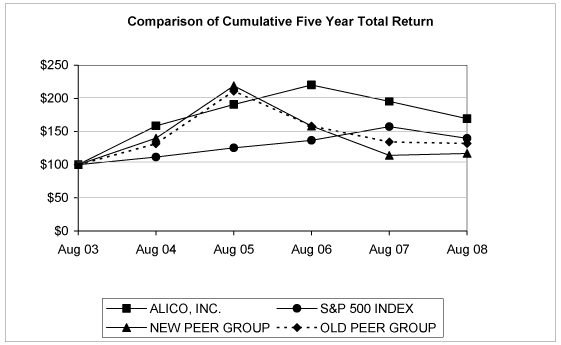
| Years Ending | ||||||||||||||||||||
| Company Name / Index | Aug 04 | Aug 05 | Aug 06 | Aug 07 | Aug 08 | |||||||||||||||
ALICO, INC. | 58.48 | 20.40 | 15.39 | -11.28 | -13.32 | |||||||||||||||
S&P 500 INDEX | 11.46 | 12.56 | 8.88 | 15.13 | -11.14 | |||||||||||||||
NEW PEER GROUP | 39.85 | 56.59 | -27.71 | -27.92 | 2.34 | |||||||||||||||
OLD PEER GROUP | 31.36 | 60.44 | -24.86 | -15.21 | -1.80 | |||||||||||||||
| Base | ||||||||||||||||||||||||
| Period | Years Ending | |||||||||||||||||||||||
| Company Name / Index | Aug 03 | Aug 04 | Aug 05 | Aug 06 | Aug 07 | Aug 08 | ||||||||||||||||||
ALICO, INC. | 100 | 158.48 | 190.82 | 220.18 | 195.35 | 169.33 | ||||||||||||||||||
S&P 500 INDEX | 100 | 111.46 | 125.45 | 136.59 | 157.27 | 139.75 | ||||||||||||||||||
NEW PEER GROUP | 100 | 139.85 | 218.99 | 158.30 | 114.10 | 116.77 | ||||||||||||||||||
OLD PEER GROUP | 100 | 131.36 | 210.75 | 158.35 | 134.27 | 131.85 | ||||||||||||||||||
| New Peer Group | Old Peer Group Companies | |
CONSOLIDATED TOMOKA LAND CO | ALEXANDER & BALDWIN INC | |
ST JOE CO | CONSOLIDATED TOMOKA LAND CO | |
TEJON RANCH CO | ST JOE CO | |
THOMAS PROPERTIES GROUP | TEJON RANCH CO |
| September 30, | Years Ended August 31, | |||||||||||||||||||||||
| Description | 2008 | 2007 (1) | 2007 | 2006 | 2005 | 2004 | ||||||||||||||||||
| (In Thousands, Except Per Share Amounts) | ||||||||||||||||||||||||
| Operating revenue | $ | 116,382 | $ | 758 | $ | 132,005 | $ | 74,164 | $ | 52,938 | $ | 52,057 | ||||||||||||
| Income (loss) from continuing operations | 5,603 | (849 | ) | (13,395 | ) | 8,021 | 6,260 | 17,813 | ||||||||||||||||
| Income (loss) from continuing operations per weighted average common share | $ | 0.76 | $ | (0.12 | ) | $ | (1.82 | ) | $ | 1.09 | $ | 0.85 | $ | 2.47 | ||||||||||
| Average Number of Shares Outstanding | 7,367 | 7,358 | 7,369 | 7,368 | 7,331 | 7,219 | ||||||||||||||||||
| Cash Dividend Declared Per Share | 1.10 | 0.28 | 1.10 | 1.03 | 1.25 | 0.60 | ||||||||||||||||||
| Total Assets | 273,932 | 285,349 | 281,206 | 263,579 | 248,306 | 238,242 | ||||||||||||||||||
| Long-Term Obligations | 140,239 | 143,265 | 143,790 | 103,601 | 85,826 | 82,908 | ||||||||||||||||||
| (1) | Beginning with fiscal 2008, Alico changed its year end from August 31 to September 30. The year ended September 30, 2008 was the first full year on the new fiscal year. Results for September 30, 2007 are for the one month transition period. |
22
Table of Contents
23
Table of Contents
| 9/30/08 | 9/30/07 | 8/31/07 | ||||||||||
| Cash & liquid investments | $ | 78,637 | $ | 78,110 | $ | 81,067 | ||||||
| Total current assets | 123,130 | 135,376 | 127,494 | |||||||||
| Current liabilities | 18,200 | 25,138 | 17,519 | |||||||||
| Working capital | 104,930 | 110,238 | 109,975 | |||||||||
| Total assets | 273,932 | 285,349 | 281,206 | |||||||||
| Notes payable | $ | 137,758 | $ | 135,884 | $ | 136,889 | ||||||
| Current ratio | 6.77 | 5.39 | 7.28 | |||||||||
| Due Date | Due before restructure | Due after restructure | ||||||
| 9/28/08 | $ | 3,980 | $ | 1,787 | ||||
| 9/28/09 | 12,000 | 1,000 | ||||||
| 9/28/10 | 12,000 | 1,000 | ||||||
| 9/28/11 | 26,128 | 4,000 | ||||||
| 9/28/12 | -0- | 8,000 | ||||||
| 9/28/13 | -0- | 12,000 | ||||||
| 9/28/14 | $ | -0- | $ | 26,321 | ||||
24
Table of Contents
25
Table of Contents
26
Table of Contents
| Year Ended | Month Ended | Year Ended | ||||||||||||||
| September 30, | September 30, | August 31, | ||||||||||||||
| 2008 | 2007 | 2007 | 2006 | |||||||||||||
| Operating revenue | $ | 116,382 | $ | 758 | $ | 132,005 | $ | 74,164 | ||||||||
| Gross profit (loss) | 14,057 | (69 | ) | 29,685 | 16,252 | |||||||||||
| General & administrative expenses | 11,478 | 815 | 12,727 | 10,901 | ||||||||||||
| Profit (loss) from continuing operations | 2,579 | (884 | ) | 16,958 | 5,351 | |||||||||||
| Profit on sale of real estate | 817 | — | 1,257 | 4,369 | ||||||||||||
| Interest and investment income | 7,745 | 683 | 7,337 | 8,944 | ||||||||||||
| Interest expense | 6,565 | 820 | 5,652 | 3,852 | ||||||||||||
| Other income (expense) | 262 | (4 | ) | 225 | 368 | |||||||||||
| Income tax provision | $ | (765 | ) | $ | (176 | ) | $ | 33,520 | $ | 7,159 | ||||||
| Effective income tax rate | (15.8 | )% | 17.2 | % | 166.6 | % | 47.2 | % | ||||||||
| Net income (loss) from continuing operations | $ | 5,603 | $ | (849 | ) | $ | (13,395 | ) | $ | 8,021 | ||||||
27
Table of Contents
28
Table of Contents
29
Table of Contents
| Year ended | One month | Fiscal years ended | ||||||||||||||
| Sept. 30, | Sept. 30, | Aug. 31, | Aug. 31, | |||||||||||||
| 2008 | 2007 (1) | 2007 | 2006 | |||||||||||||
Revenues | ||||||||||||||||
Agriculture: | ||||||||||||||||
| Bowen | $ | 45,499 | $ | 143 | $ | 52,716 | $ | 30,869 | ||||||||
| Citrus groves | 41,167 | 5 | 47,484 | 22,188 | ||||||||||||
| Sugarcane | 9,671 | — | 9,432 | 8,926 | ||||||||||||
| Cattle | 6,793 | 330 | 9,977 | 5,700 | ||||||||||||
| Vegetables | 5,460 | — | 3,803 | 2,389 | ||||||||||||
| Sod | 1,118 | 92 | 2,180 | 1,528 | ||||||||||||
| Native trees and shrubs | 125 | — | 249 | 142 | ||||||||||||
| Agriculture operations revenue | 109,833 | 570 | 125,841 | 71,742 | ||||||||||||
| Real estate activities | 3,870 | — | 3,329 | 113 | ||||||||||||
| Land leasing and rentals | 2,276 | 141 | 1,495 | 1,369 | ||||||||||||
| Mining royalties | 403 | 47 | 1,340 | 940 | ||||||||||||
Total operating revenue | $ | 116,382 | $ | 758 | $ | 132,005 | $ | 74,164 | ||||||||
| (1) | Alico changed its fiscal year end from August 31 to September 30. The year ended September 30, 2008 was the first full year on the new fiscal year. Results for September 30, 2007 are for the one month transition period. |
30
Table of Contents
| Year ended | One month | Fiscal years ended | ||||||||||||||
| Sept. 30, | Sept. 30, | Aug. 31, | Aug. 31, | |||||||||||||
| 2008 | 2007 (1) | 2007 | 2006 | |||||||||||||
Gross profit (loss): | ||||||||||||||||
Agriculture: | ||||||||||||||||
| Bowen | $ | 1,470 | $ | (79 | ) | $ | 930 | $ | (268 | ) | ||||||
| Citrus groves | 13,530 | 2 | 24,057 | 7,614 | ||||||||||||
| Sugarcane | 421 | — | 599 | 360 | ||||||||||||
| Cattle | (2,127 | ) | 41 | 255 | 786 | |||||||||||
| Vegetables | (141 | ) | — | 496 | 985 | |||||||||||
| Sod | (1,535 | ) | (116 | ) | 862 | 688 | ||||||||||
| Native trees and shrubs | 125 | — | 249 | 142 | ||||||||||||
| Gross profit from agricultural operations | 11,743 | (152 | ) | 27,448 | 10,307 | |||||||||||
| Real estate activities | 341 | (59 | ) | (79 | ) | 52 | ||||||||||
| Land leasing and rentals | 1,668 | 105 | 1,102 | 917 | ||||||||||||
| Mining royalties | 305 | 37 | 1,214 | 940 | ||||||||||||
| Net casualty (recovery) | — | — | — | 4,036 | ||||||||||||
| Gross Profit (loss) | 14,057 | (69 | ) | 29,685 | 16,252 | |||||||||||
| (1) | Alico changed its fiscal year end from August 31 to September 30. The year ended September 30, 2008 was the first full year on the new fiscal year. Results for September 30, 2007 are for the one month transition period. |
31
Table of Contents
32
Table of Contents
33
Table of Contents
34
Table of Contents
35
Table of Contents
36
Table of Contents
| Payments due by Period | ||||||||||||||||||||
| Less than | 1 - 3 | 3 - 5 | 5 + | |||||||||||||||||
| Contractual obligations | Total | 1 year | years | years | years | |||||||||||||||
| Long-term debt | $ | 137,758 | $ | 5,470 | $ | 91,222 | $ | 11,614 | $ | 29,452 | ||||||||||
| Expected interest on debt | 29,394 | 7,109 | 12,578 | 4,794 | 4,913 | |||||||||||||||
| Commissions | 2,705 | 139 | 250 | 1,000 | 1,316 | |||||||||||||||
| Citrus purchase contracts | 10,901 | 8,855 | 2,046 | — | — | |||||||||||||||
| Retirement benefits | 4,532 | 381 | 792 | 779 | 2,580 | |||||||||||||||
| Equipment additions | 99 | 99 | — | — | — | |||||||||||||||
| Consulting contracts | 1,043 | 638 | 405 | — | — | |||||||||||||||
| Leases — operating | 457 | 207 | 250 | — | — | |||||||||||||||
| Total | $ | 186,889 | $ | 22,898 | $ | 107,543 | $ | 18,187 | $ | 38,261 | ||||||||||
37
Table of Contents
38
Table of Contents
39
Table of Contents
| Estimated | ||||||||
| Cost | Fair Value | |||||||
| Marketable Securities and Short-term Investments (1) | ||||||||
| Fixed Rate | $ | 18,922 | $ | 18,902 | ||||
| Variable Rate | $ | 9,575 | $ | 9,445 | ||||
| (1) | See definition in Notes 1 and 2 in Notes to Consolidated Financial Statements. |
40
Table of Contents
| Aggregate | ||||
| Fair | ||||
| Values | ||||
| Due in one year or less | $ | 15,227 | ||
| Due between one and five years | 4,815 | |||
| Due between five and ten years | 1,000 | |||
| Due thereafter | 5,980 | |||
| Total | $ | 27,022 | ||
41
Table of Contents
Alico, Inc.
December 15, 2008
42
Table of Contents
REPORT OF INDEPENDENT REGISTERED CERTIFIED PUBLIC ACCOUNTING FIRM
To the Board of Directors and Stockholders
Alico, Inc.
We have audited Alico, Inc. and Subsidiaries internal control over financial reporting as of September 30, 2008, based on criteria established inInternal Control — Integrated Frameworkissued by the Committee of Sponsoring Organizations of the Treadway Commission. Alico, Inc. and Subsidiaries’ management is responsible for maintaining effective internal control over financial reporting and for its assessment of the effectiveness of internal control over financial reporting included in the accompanying Management’s Annual Report on Internal Control Over Financial Reporting. Our responsibility is to express an opinion on the company’s internal control over financial reporting based on our audit.
We conducted our audit in accordance with the standards of the Public Company Accounting Oversight Board (United States). Those standards require that we plan and perform the audit to obtain reasonable assurance about whether effective internal control over financial reporting was maintained in all material respects. Our audit included obtaining an understanding of internal control over financial reporting, assessing the risk that a material weakness exists, and testing and evaluating the design and operating effectiveness of internal control based on the assessed risk. Our audit also included performing such other procedures as we considered necessary in the circumstances. We believe that our audit provides a reasonable basis for our opinion.
A company’s internal control over financial reporting is a process designed to provide reasonable assurance regarding the reliability of financial reporting and the preparation of financial statements for external purposes in accordance with generally accepted accounting principles. A company’s internal control over financial reporting includes those policies and procedures that(a)pertain to the maintenance of records that, in reasonable detail, accurately and fairly reflect the transactions and dispositions of the assets of the company;(b)provide reasonable assurance that transactions are recorded as necessary to permit preparation of financial statements in accordance with generally accepted accounting principles, and that receipts and expenditures of the company are being made only in accordance with authorizations of management and directors of the company; and(c)provide reasonable assurance regarding prevention or timely detection of unauthorized acquisition, use, or disposition of the company’s assets that could have a material effect on the financial statements.
Because of its inherent limitations, internal control over financial reporting may not prevent or detect misstatements. Also, projections of any evaluation of effectiveness to future periods are subject to the risk that controls may become inadequate because of changes in conditions, or that the degree of compliance with the policies or procedures may deteriorate.
In our opinion, Alico, Inc. and Subsidiaries maintained, in all material respects, effective internal control over financial reporting as of September 30, 2008, based on criteria established inInternal Control — Integrated Framework issued by the Committee of Sponsoring Organizations of the Treadway Commission.
We have also audited, in accordance with the standards of the Public Company Accounting Oversight Board (United States), the consolidated balance sheets of Alico, Inc. and Subsidiaries as of September 30, 2008 and 2007 and the related consolidated statements of operations, stockholders’ equity and comprehensive income (loss), and cash flows for the years ended September 30, 2008 and August 31, 2007 and for the one month transitional period ended September 30, 2007 and our report dated December 15, 2008 expressed an unqualified opinion.
/s/ McGladrey & Pullen, LLP
Orlando, Florida
December 15, 2008
43
Table of Contents
Alico, Inc. and Subsidiaries
November 17, 2006
44
Table of Contents
(in thousands)
| September 30, | ||||||||
| 2008 | 2007 | |||||||
ASSETS | ||||||||
| Current assets: | ||||||||
| Cash and cash equivalents | $ | 54,370 | $ | 31,599 | ||||
| Marketable securities available for sale | 24,267 | 46,511 | ||||||
| Accounts receivable, net | 5,394 | 15,126 | ||||||
| Federal income tax receivable | 6,388 | 5,696 | ||||||
| Mortgages and notes receivable | 2,830 | 3,832 | ||||||
| Inventories | 27,451 | 27,232 | ||||||
| Deferred tax asset | 1,507 | 2,661 | ||||||
| Other current assets | 923 | 2,719 | ||||||
| Total current assets | 123,130 | 135,376 | ||||||
| Other assets: | ||||||||
| Mortgages and notes receivable, net of current portion | 4,774 | 6,688 | ||||||
| Investments, marketable securities available for sale and deposits | 6,975 | 3,875 | ||||||
| Deferred tax asset | 6,056 | 3,208 | ||||||
| Cash surrender value of life insurance, designated | 7,585 | 7,656 | ||||||
| Total other assets | 25,390 | 21,427 | ||||||
| Property, buildings and equipment | 181,429 | 178,968 | ||||||
| Less accumulated depreciation | (56,017 | ) | (50,422 | ) | ||||
| Net property, buildings and equipment | 125,412 | 128,546 | ||||||
| Total assets | $ | 273,932 | $ | 285,349 | ||||
45
Table of Contents
(in thousands)
| September 30, | ||||||||
| 2008 | 2007 | |||||||
LIABILITIES & STOCKHOLDERS’ EQUITY | ||||||||
| Current liabilities: | ||||||||
| Accounts payable | $ | 1,847 | $ | 1,943 | ||||
| State income taxes payable | 281 | 9,114 | ||||||
| Current portion of notes payable | 5,470 | 1,350 | ||||||
| Accrued expenses | 3,372 | 4,425 | ||||||
| Dividends payable | 2,027 | 4,048 | ||||||
| Accrued ad valorem taxes | 2,270 | 2,105 | ||||||
| Other current liabilities | 2,933 | 2,153 | ||||||
| Total current liabilities | 18,200 | 25,138 | ||||||
| Notes payable, net of current portion | 132,288 | 134,534 | ||||||
| Deferred retirement benefits, net of current portion | 4,151 | 4,466 | ||||||
| Commissions and deposits payable | 3,800 | 4,265 | ||||||
| Total liabilities | 158,439 | 168,403 | ||||||
Stockholders’ equity: | ||||||||
| Preferred stock, no par value. Authorized 1,000 shares; issued, none | — | — | ||||||
| Common stock, $1 par value. Authorized 15,000 shares; issued 7,376 shares; outstanding 7,374 in 2008 and 7,357 in 2007 | 7,376 | 7,376 | ||||||
| Additional paid in capital | 9,474 | 10,199 | ||||||
| Treasury stock, at cost | (64 | ) | (891 | ) | ||||
| Accumulated other comprehensive (loss) income | (92 | ) | 49 | |||||
| Retained earnings | 98,799 | 100,213 | ||||||
| Total stockholders’ equity | 115,493 | 116,946 | ||||||
| Total liabilities and stockholders’ equity | $ | 273,932 | $ | 285,349 | ||||
46
Table of Contents
(in thousands except per share data)
| One Month | ||||||||||||||||
| Year Ended | Ended | Year Ended | Year Ended | |||||||||||||
| Sept. 30, 2008 | Sept. 30, 2007 | Aug. 31, 2007 | Aug. 31, 2006 | |||||||||||||
Operating revenue | ||||||||||||||||
| Agricultural operations | $ | 109,833 | $ | 570 | $ | 125,841 | $ | 71,742 | ||||||||
| Non-agricultural operations | 2,679 | 188 | 2,835 | 2,309 | ||||||||||||
| Real estate operations | 3,870 | — | 3,329 | 113 | ||||||||||||
Total operating revenue | 116,382 | 758 | 132,005 | 74,164 | ||||||||||||
Operating expenses | ||||||||||||||||
| Agricultural operations | 98,090 | 722 | 98,393 | 61,435 | ||||||||||||
| Non-agricultural operations | 706 | 46 | 519 | 452 | ||||||||||||
| Real estate operations | 3,529 | 59 | 3,408 | 61 | ||||||||||||
| Net casualty (recovery) | — | — | — | (4,036 | ) | |||||||||||
| Total operating expenses | 102,325 | 827 | 102,320 | 57,912 | ||||||||||||
| Gross profit (loss) | 14,057 | (69 | ) | 29,685 | 16,252 | |||||||||||
| Corporate general and administrative | 11,478 | 815 | 12,727 | 10,901 | ||||||||||||
Profit (loss) from continuing operations | 2,579 | (884 | ) | 16,958 | 5,351 | |||||||||||
Other income (expenses): | ||||||||||||||||
| Profit on sales of bulk real estate: | ||||||||||||||||
| Sales | 817 | — | 1,434 | 5,761 | ||||||||||||
| Cost of sales | — | — | (177 | ) | (1,392 | ) | ||||||||||
| Profit on sales of bulk real estate, net | 817 | — | 1,257 | 4,369 | ||||||||||||
| Interest & investment income | 7,745 | 683 | 7,337 | 8,944 | ||||||||||||
| Interest expense | (6,565 | ) | (820 | ) | (5,652 | ) | (3,852 | ) | ||||||||
| Other | 262 | (4 | ) | 225 | 368 | |||||||||||
Total other income, (expense) net | 2,259 | (141 | ) | 3,167 | 9,829 | |||||||||||
| Income (loss) from continuing operations before income taxes | 4,838 | (1,025 | ) | 20,125 | 15,180 | |||||||||||
| (Benefit from) Provisions for income taxes | (765 | ) | (176 | ) | 33,520 | 7,159 | ||||||||||
Income (loss) from continuing operations | 5,603 | (849 | ) | (13,395 | ) | 8,021 | ||||||||||
| (Loss) income from discontinued operations, net of taxes | (890 | ) | 169 | (295 | ) | (1,230 | ) | |||||||||
Net (loss) income | $ | 4,713 | $ | (680 | ) | $ | (13,690 | ) | $ | 6,791 | ||||||
| Weighted-average number of shares outstanding | 7,367 | 7,358 | 7,369 | 7,368 | ||||||||||||
| Weighted-average number of shares outstanding assuming dilution | 7,385 | 7,358 | 7,369 | 7,379 | ||||||||||||
| Per share amounts- income (loss) from continuing operations: | ||||||||||||||||
| Basic | $ | 0.76 | $ | (0.12 | ) | $ | (1.82 | ) | $ | 1.09 | ||||||
| Diluted | $ | 0.76 | $ | (0.12 | ) | $ | (1.82 | ) | $ | 1.09 | ||||||
| Per share amounts- net income (loss) | ||||||||||||||||
| Basic | $ | 0.64 | $ | (0.09 | ) | $ | (1.86 | ) | $ | 0.92 | ||||||
| Diluted | $ | 0.64 | $ | (0.09 | ) | $ | (1.86 | ) | $ | 0.92 | ||||||
| Dividends | $ | 1.10 | $ | 0.28 | $ | 1.10 | $ | 1.03 | ||||||||
47
Table of Contents
(in thousands)
| Accumulated | ||||||||||||||||||||||||||||
| Common Stock | Additional | Treasury | Other | |||||||||||||||||||||||||
| Shares | Paid in | Stock | Comprehensive | Retained | ||||||||||||||||||||||||
| Issued | Amount | Capital | at cost | Income (loss) | Earnings | Total | ||||||||||||||||||||||
| Restated Balances, August 31, 2005 | 7,369 | 7,369 | 9,183 | 2,195 | 125,914 | 144,661 | ||||||||||||||||||||||
| Comprehensive income: | ||||||||||||||||||||||||||||
| Net income | — | — | — | — | — | 6,791 | 6,791 | |||||||||||||||||||||
| Unrealized losses on securities, net of taxes of $408 and reclassification adjustment | — | — | — | — | (2,224 | ) | — | (2,224 | ) | |||||||||||||||||||
| Total comprehensive income: | 4,567 | |||||||||||||||||||||||||||
| Dividends | — | — | — | — | — | (7,556 | ) | (7,556 | ) | |||||||||||||||||||
| Treasury Stock Purchased | — | — | — | (763 | ) | — | — | (763 | ) | |||||||||||||||||||
| Stock based compensation | ||||||||||||||||||||||||||||
| - Directors | — | — | 52 | 476 | — | — | 528 | |||||||||||||||||||||
| Employee: | ||||||||||||||||||||||||||||
| Stock options exercised | 7 | 7 | 127 | — | — | — | 134 | |||||||||||||||||||||
| Stock based compensation | — | — | 329 | — | — | — | 329 | |||||||||||||||||||||
| Balances, August 31, 2006 | 7,376 | $ | 7,376 | $ | 9,691 | $ | (287 | ) | $ | (29 | ) | $ | 125,149 | $ | 141,900 | |||||||||||||
| Comprehensive income: | ||||||||||||||||||||||||||||
| Net loss | — | — | — | — | (13,690 | ) | (13,690 | ) | ||||||||||||||||||||
| Unrealized losses on securities, net of taxes of $39 and reclassification adjustment | — | — | — | — | 74 | — | 74 | |||||||||||||||||||||
| Total comprehensive income: | (13,616 | ) | ||||||||||||||||||||||||||
| Dividends | — | — | — | — | — | (8,106 | ) | (8,106 | ) | |||||||||||||||||||
| Treasury Stock Purchased | — | — | — | (1,484 | ) | — | — | (1,484 | ) | |||||||||||||||||||
| Stock based compensation | ||||||||||||||||||||||||||||
| - Directors | — | — | 37 | 478 | — | — | 515 | |||||||||||||||||||||
| Employee: | ||||||||||||||||||||||||||||
| Stock options exercised | — | — | (39 | ) | 55 | — | — | 16 | ||||||||||||||||||||
| Stock based compensation | — | — | 480 | 192 | — | — | 672 | |||||||||||||||||||||
| Balances, August 31, 2007 | 7,376 | $ | 7,376 | $ | 10,169 | $ | (1,046 | ) | $ | 45 | $ | 103,353 | $ | 119,897 | ||||||||||||||
| Comprehensive income: | ||||||||||||||||||||||||||||
| Net loss | — | — | — | — | (680 | ) | (680 | ) | ||||||||||||||||||||
| Liability- Uncertain Tax Positions | — | — | — | — | — | (436 | ) | (436 | ) | |||||||||||||||||||
| Unrealized gain on securities, net of taxes of $1 and reclassification adjustment | — | — | — | — | 4 | — | 4 | |||||||||||||||||||||
| Total comprehensive loss: | (1,112 | ) | ||||||||||||||||||||||||||
| Dividends | — | — | — | — | — | (2,024 | ) | (2,024 | ) | |||||||||||||||||||
| Treasury Stock Purchased | ||||||||||||||||||||||||||||
| Stock based compensation | ||||||||||||||||||||||||||||
| - Directors | — | — | (6 | ) | 155 | — | — | 149 | ||||||||||||||||||||
| Employee: | ||||||||||||||||||||||||||||
| Stock options exercised | — | — | — | — | — | — | — | |||||||||||||||||||||
| Stock based compensation | — | — | 36 | — | — | — | 36 | |||||||||||||||||||||
| Balances, September 30, 2007 | 7,376 | $ | 7,376 | $ | 10,199 | $ | (891 | ) | $ | 49 | $ | 100,213 | $ | 116,946 | ||||||||||||||
| Comprehensive income: | ||||||||||||||||||||||||||||
| Net income | — | — | — | — | — | 4,713 | 4,713 | |||||||||||||||||||||
| Unrealized losses on securities, net of taxes of $87 and reclassification adjustment | — | — | — | — | (141 | ) | — | (141 | ) | |||||||||||||||||||
| 4,572 | ||||||||||||||||||||||||||||
| Total comprehensive income: | ||||||||||||||||||||||||||||
| Dividends | — | — | — | — | — | (6,127 | ) | (6,127 | ) | |||||||||||||||||||
| Treasury Stock Purchased | — | — | — | (1,196 | ) | — | (1,196 | ) | ||||||||||||||||||||
| Stock based compensation | ||||||||||||||||||||||||||||
| - Directors | — | — | (114 | ) | 567 | — | 453 | |||||||||||||||||||||
| Employee: | ||||||||||||||||||||||||||||
| Stock options exercised | — | — | (80 | ) | 111 | — | — | 31 | ||||||||||||||||||||
| Stock based compensation | — | — | (531 | ) | 1,345 | — | — | 814 | ||||||||||||||||||||
| Balances, September 30, 2008 | 7,376 | $ | 7,376 | $ | 9,474 | $ | (64 | ) | $ | (92 | ) | $ | 98,799 | $ | 115,493 | |||||||||||||
| One Month | ||||||||||||||||
| Fiscal Year | Sept. 30, | Fiscal Year | ||||||||||||||
| 2008 | 2007 | 2007 | 2006 | |||||||||||||
| Disclosure of reclassification amount: | ||||||||||||||||
| Unrealized holding (losses) gains arising during the period | (209 | ) | 27 | 62 | (29 | ) | ||||||||||
| Less: reclassification adjustment for realized gain (loss) included in net income | (68 | ) | 23 | (12 | ) | 2,195 | ||||||||||
| Net unrealized (losses) gains on securities | (141 | ) | 4 | 74 | (2,224 | ) | ||||||||||
48
Table of Contents
(in thousands)
| One Month | ||||||||||||||||
| Year Ended | Ended | Year Ended | ||||||||||||||
| Sept. 30, | Sept. 30, | August 31, | ||||||||||||||
| 2008 | 2007 | 2007 | 2006 | |||||||||||||
| Increase (Decrease) in Cash and Cash equivalents: | ||||||||||||||||
| Cash flows from operating activities: | ||||||||||||||||
| Net income (loss) | $ | 4,713 | $ | (680 | ) | $ | (13,690 | ) | $ | 6,791 | ||||||
| Adjustments to reconcile net income (loss) to cash (used for) provided by operating activities: | ||||||||||||||||
| Depreciation & amortization | 8,317 | 707 | 8,770 | 8,590 | ||||||||||||
| Gain on breeding herd sales | (38 | ) | (36 | ) | (529 | ) | (162 | ) | ||||||||
| Deferred income tax expense, net | (1,694 | ) | (204 | ) | (21,255 | ) | 883 | |||||||||
| Deferred retirement benefits | (276 | ) | (74 | ) | (1,186 | ) | 245 | |||||||||
| Net gain on sale of marketable securities | (63 | ) | — | (31 | ) | (3,254 | ) | |||||||||
| Loss on sale of property and equipment | 668 | — | (20 | ) | 861 | |||||||||||
| Fixed asset impairments | 1,599 | — | 2,028 | — | ||||||||||||
| Loss from non consolidated joint venture | 653 | — | 57 | — | ||||||||||||
| Gain on real estate sales | (817 | ) | (93 | ) | (1,257 | ) | (4,369 | ) | ||||||||
| Stock based compensation | 1,267 | 185 | 1,187 | 857 | ||||||||||||
| Imputed interest on mortgage note receivable | — | — | — | (2,891 | ) | |||||||||||
| Cash provided by (used for) changes in: | ||||||||||||||||
| Accounts receivable | 8,809 | 890 | (7,149 | ) | 2,323 | |||||||||||
| Inventories | (219 | ) | (2,018 | ) | (669 | ) | (4,159 | ) | ||||||||
| Other assets | 547 | (321 | ) | (163 | ) | (1,585 | ) | |||||||||
| Accounts payable & accrued expenses | (169 | ) | (192 | ) | (756 | ) | 719 | |||||||||
| Income taxes payable/receivable | (9,525 | ) | 83 | 2,031 | 1,304 | |||||||||||
| Other non-current liability | — | — | (20,293 | ) | 3,339 | |||||||||||
| Net cash provided by (used for) operating activities | 13,772 | (1,753 | ) | (52,925 | ) | 9,492 | ||||||||||
| Cash flows from investing activities: | ||||||||||||||||
| Increase in land inventories | — | — | — | (793 | ) | |||||||||||
| Real Estate deposits and accrued commissions | 100 | — | 1,622 | 6,811 | ||||||||||||
| Purchases of property and equipment | (6,130 | ) | (293 | ) | (9,138 | ) | (33,172 | ) | ||||||||
| Sale (purchase) of other investments | 37 | — | (878 | ) | — | |||||||||||
| Proceeds from disposals of property and equipment | 1,511 | 90 | 1,652 | 1,092 | ||||||||||||
| Proceeds from sale of real estate | — | — | — | 5,555 | ||||||||||||
| Purchases of marketable securities and investments | (46,863 | ) | (1,574 | ) | (54,882 | ) | (92,583 | ) | ||||||||
| Proceeds from sales of marketable securities | 64,949 | 1,309 | 58,823 | 109,992 | ||||||||||||
| Collection of mortgages and notes receivable | 2,830 | — | 2,173 | 632 | ||||||||||||
| Net cash provided by (used for) investing activities | $ | 16,434 | $ | (468 | ) | $ | (628 | ) | $ | (2,466 | ) | |||||
(continued)
49
Table of Contents
(in thousands)
| One Month | ||||||||||||||||
| Year Ended | Ended | Year Ended | ||||||||||||||
| Sept. 30, | Sept. 30, | August 31, | ||||||||||||||
| 2008 | 2007 | 2007 | 2006 | |||||||||||||
| Cash flows from financing activities: | ||||||||||||||||
| Proceeds from exercise of stock options | $ | 31 | $ | — | $ | 16 | $ | 134 | ||||||||
| Treasury stock purchases | (1,196 | ) | — | (1,484 | ) | (763 | ) | |||||||||
| Proceeds from notes payable | 42,040 | 1,101 | 95,959 | 65,814 | ||||||||||||
| Principal payment of notes payable | (40,166 | ) | (2,106 | ) | (23,072 | ) | (53,160 | ) | ||||||||
| Dividends paid | (8,144 | ) | — | (8,106 | ) | (7,370 | ) | |||||||||
| Net cash provided by (used for) financing activities | (7,435 | ) | (1,005 | ) | 63,313 | 4,655 | ||||||||||
| Net increase (decrease) in cash and cash equivalents | 22,771 | (3,226 | ) | 9,760 | 11,681 | |||||||||||
| Cash and cash equivalents: | ||||||||||||||||
| At beginning of year | 31,599 | 34,825 | 25,065 | 13,384 | ||||||||||||
| At end of year | $ | 54,370 | $ | 31,599 | $ | 34,825 | $ | 25,065 | ||||||||
| Supplemental disclosures of cash flow information: | ||||||||||||||||
| Cash paid for interest, net of amount capitalized | $ | 8,182 | $ | 43 | $ | 5,077 | $ | 3,576 | ||||||||
| Cash paid for income taxes, including related interest | $ | 10,579 | $ | — | $ | 72,818 | $ | 1,803 | ||||||||
| Non-cash investing activities: | ||||||||||||||||
| Reclassification of breeding herd to Property & Equipment | $ | 458 | $ | — | $ | 594 | $ | 516 | ||||||||
50
Table of Contents
As of September 30, 2008 and 2007,
and for the years ended September 30, 2008, August 31, 2007 and 2006
and the one month transition period ended September 30, 2007
(in thousands except for unit data)
51
Table of Contents
52
Table of Contents
53
Table of Contents
54
Table of Contents
55
Table of Contents
56
Table of Contents
| Accounts receivable | Revenues | |||||||||||||||||||
| Sept 30, 2008 | Sept 30, 2007 | Sept 30, 2008 | Aug 31, 2007 | Aug 31, 2006 | ||||||||||||||||
| USSC | $ | 2,373 | $ | 1,497 | $ | 9,671 | $ | 9,432 | $ | 8,926 | ||||||||||
| Southern Garndens | $ | 2,373 | $ | 4,288 | $ | 15,041 | $ | 19,517 | $ | 2,133 | ||||||||||
| Cutrale Citurs Juices | $ | — | $ | — | $ | 21,162 | $ | 6,345 | $ | 1,748 | ||||||||||
| Florida Orange Marketers | $ | — | $ | — | $ | 13,396 | $ | 7,305 | $ | 1,394 | ||||||||||
| Citrosuco North American, Inc. | $ | — | $ | — | $ | 13,336 | $ | 8,297 | $ | 1,451 | ||||||||||
57
Table of Contents
| 2008 | 2007 | |||||||||||||||||||||||||||||||
| Gross | Estimated | Gross | Estimated | |||||||||||||||||||||||||||||
| Unrealized | Fair | Unrealized | Fair | |||||||||||||||||||||||||||||
| Cost | Gains | Losses | Value | Cost | Gains | Losses | Value | |||||||||||||||||||||||||
Debt securities | ||||||||||||||||||||||||||||||||
| Municipal bonds | $ | 23,493 | $ | 3 | $ | (150 | ) | $ | 23,346 | $ | 29,213 | $ | 23 | $ | (2 | ) | $ | 29,234 | ||||||||||||||
| Mutual funds | 1,325 | — | — | 1,325 | 2,000 | — | — | 2,000 | ||||||||||||||||||||||||
| Fixed maturity funds | 3,529 | 7 | — | 3,536 | 12,569 | 49 | (2 | ) | 12,616 | |||||||||||||||||||||||
| Corporate bonds | 150 | — | (10 | ) | 140 | 2,670 | — | (9 | ) | 2,661 | ||||||||||||||||||||||
| Total | $ | 28,497 | $ | 10 | $ | (160 | ) | $ | 28,347 | $ | 46,452 | $ | 72 | $ | (13 | ) | $ | 46,511 | ||||||||||||||
| Marketable securities available for sale | 24,267 | 46,511 | ||||||||||||||||||||||||||||||
| Investment-non current, included in investments and deposits | $ | 4,080 | $ | — | ||||||||||||||||||||||||||||
| Aggregate | ||||
| Fair Value | ||||
| Due in one year or less | $ | 15,227 | ||
| Due between one and five years | 4,815 | |||
| Due between five and ten years | 1,000 | |||
| Due thereafter | 5,980 | |||
| Total | $ | 27,022 | ||
| Year Ended | Month Ended | Year Ended | ||||||||||||||
| Sept. 30, | Sept. 30, | August 31, | ||||||||||||||
| 2008 | 2007 | 2007 | 2006 | |||||||||||||
| Realized gains | $ | 45 | $ | — | $ | 71 | $ | 4,962 | ||||||||
| Realized losses | (9 | ) | — | (40 | ) | (1,708 | ) | |||||||||
| Net | $ | 36 | $ | — | $ | 31 | $ | 3,254 | ||||||||
58
Table of Contents
| Less than 12 months | 12 months or greater | Total | ||||||||||||||||||||||
| Fair | Unrealized | Fair | Unrealized | Fair | Unrealized | |||||||||||||||||||
| Value | Losses | Value | Losses | Value | Losses | |||||||||||||||||||
| Municipal bonds | $ | 14,961 | $ | 150 | $ | — | $ | — | $ | 14,961 | $ | 150 | ||||||||||||
| Corporate bonds | $ | — | — | 140 | 10 | 140 | 10 | |||||||||||||||||
| Total | $ | 14,961 | $ | 150 | $ | 140 | $ | 10 | $ | 15,101 | $ | 160 | ||||||||||||
59
Table of Contents
| September 30, | ||||||||
| 2008 | 2007 | |||||||
| Mortgage notes receivable on retail land sales | $ | 205 | $ | 299 | ||||
| Mortgage notes receivable on bulk land sales | 54,108 | 65,963 | ||||||
| Other notes receivable | 90 | — | ||||||
| Total mortgages and notes receivable | 54,403 | 66,262 | ||||||
| Less: Deferred revenue | (46,793 | ) | (53,253 | ) | ||||
| Discount on note to impute market interest | (6 | ) | (2,489 | ) | ||||
| Current portion | (2,830 | ) | (3,832 | ) | ||||
| Non-current portion | $ | 4,774 | $ | 6,688 | ||||
| Due within 1 year | $ | 2,830 | ||||||
| Due between 1 and 2 years | 1,083 | |||||||
| Due between 2 and 3 years | 4,073 | |||||||
| Due between 3 and 4 years | 8,039 | |||||||
| Due between 4 and 5 years | 12,037 | |||||||
| Due beyond five years | 26,341 | |||||||
| Total mortgages and notes receivable | 54,403 | |||||||
| Less: Deferred Revenue | (46,793 | ) | ||||||
| Discount on note to impute market interest | (6 | ) | ||||||
| Net mortgages and notes receivable | $ | 7,604 | ||||||
60
Table of Contents
| Due Date | Due before restructure | Due after restructure | ||||||
| 9/28/08 | $ | 3,980 | $ | 1,787 | ||||
| 9/28/09 | 12,000 | 1,000 | ||||||
| 9/28/10 | 12,000 | 1,000 | ||||||
| 9/28/11 | 26,128 | 4,000 | ||||||
| 9/28/12 | -0- | 8,000 | ||||||
| 9/28/13 | -0- | 12,000 | ||||||
| 9/28/14 | $ | -0- | $ | 26,321 | ||||
61
Table of Contents
| 2008 | 2007 | |||||||
| Unharvested fruit crop on trees | $ | 14,322 | $ | 12,982 | ||||
| Unharvested sugarcane | 5,978 | 5,410 | ||||||
| Beef cattle | 5,065 | 5,757 | ||||||
| Plants and vegetables | 1,563 | 1,484 | ||||||
| Sod | 449 | 1,476 | ||||||
| Other | 74 | 123 | ||||||
| Total inventories | $ | 27,451 | $ | 27,232 | ||||
62
Table of Contents
| Estimated | ||||||||||||
| 2008 | 2007 | Useful Lives | ||||||||||
| Breeding herd | $ | 12,686 | $ | 13,444 | 5-7 years | |||||||
| Buildings | 9,987 | 9,971 | 5-40 years | |||||||||
| Citrus trees | 32,440 | 31,466 | 22-40 years | |||||||||
| Sugarcane | 5,512 | 5,508 | 4-15 years | |||||||||
| Equipment and other facilities | 38,695 | 39,880 | 3-40 years | |||||||||
| Total depreciable properties | 99,320 | 100,269 | ||||||||||
| Less accumulated depreciation | 56,017 | 50,422 | ||||||||||
| Net depreciable properties | 43,303 | 49,847 | ||||||||||
| Land and land improvements | 82,109 | 78,699 | ||||||||||
| Net property, buildings and equipment | $ | 125,412 | $ | 128,546 | ||||||||
63
Table of Contents
| Revolving | Mortgage | |||||||||||||||||||
| line of | note | |||||||||||||||||||
| credit | Term note | payable | All other | Total | ||||||||||||||||
September 30, 2008 | ||||||||||||||||||||
| Principal balance outstanding | 80,740 | 50,000 | 6,967 | 51 | 137,758 | |||||||||||||||
| Remaining available credit | 44,260 | — | — | — | 44,260 | |||||||||||||||
| Effective interest rate | 4.25 | % | 6.79 | % | 6.68 | % | Various | |||||||||||||
| Scheduled maturity date | Aug 2011 | Sep 2018 | Mar 2014 | Various | ||||||||||||||||
| Collateral | Real estate | Real estate | Real estate | Various | ||||||||||||||||
September 30, 2007 | ||||||||||||||||||||
| Principal balance outstanding | 127,519 | — | 8,234 | 131 | 135,884 | |||||||||||||||
| Remaining available credit | 47,481 | — | — | — | 47,481 | |||||||||||||||
| Effective interest rate | — | 6.68 | % | Various | ||||||||||||||||
| Scheduled maturity date | Aug 2011 | — | Mar 2014 | Various | ||||||||||||||||
| Collateral | Real estate | — | Real estate | Various | ||||||||||||||||
64
Table of Contents
| Due within 1 year | $ | 5,470 | ||
| Due between 1 and 2 years | 5,108 | |||
| Due between 2 and 3 years | 86,114 | |||
| Due between 3 and 4 years | 5,653 | |||
| Due between 4 and 5 years | 5,961 | |||
| Due beyond five years | 29,452 | |||
| Total | $ | 137,758 | ||
| Year Ended | Month Ended | Year Ended | ||||||||||||||
| Sept. 30, | Sept. 30, | August 31, | ||||||||||||||
| 2008 | 2007 | 2007 | 2006 | |||||||||||||
| Interest expense | $ | 6,565 | $ | 820 | $ | 5,652 | $ | 3,852 | ||||||||
| Interest capitalized | 36 | 5 | 43 | 77 | ||||||||||||
| Total interest cost | $ | 6,601 | $ | 825 | $ | 5,695 | $ | 3,929 | ||||||||
65
Table of Contents
| Weighted average | Aggregate | |||||||||||||||
| Shares Under | Weighted average | remaining contractual | Intrinsic | |||||||||||||
| Option | exercise price | life (in years) | Value | |||||||||||||
| Options outstanding, August 31, 2005 | 16,371 | $ | 17.29 | |||||||||||||
| Granted | — | — | ||||||||||||||
| Exercised | 7,213 | 17.08 | ||||||||||||||
| Options outstanding, August 31, 2006 | 9,158 | $ | 18.05 | |||||||||||||
| Granted | — | |||||||||||||||
| Exercised | 1,000 | 18.55 | ||||||||||||||
| Options outstanding, August 31, 2007 | 8,158 | $ | 17.66 | |||||||||||||
| Granted | — | |||||||||||||||
| Exercised | — | 15.68 | ||||||||||||||
| Options outstanding, September 30, 2007 | 8,158 | $ | 17.66 | |||||||||||||
| Granted | — | |||||||||||||||
| Exercised | 2,000 | 15.68 | ||||||||||||||
| Options outstanding September 30, 2008 | 6,158 | 16.87 | 6 | $ | 188,188 | |||||||||||
66
Table of Contents
| Weighted | ||||||||||||||||||||||||
| Compensation | Compensation | Compensation | Average | |||||||||||||||||||||
| Expense | Expense | Expense | Grant date | |||||||||||||||||||||
| Fair Market Value | Recognized for | Recognized for | Recognized for | Fair value | ||||||||||||||||||||
| Grant Date | Shares Granted | on Date of Grant | FYE 9/30/08 | month of Sept. 07 | FYE 8/31/07 | Per share | ||||||||||||||||||
| April 2006 | 20,000 | $ | 908 | $ | (180 | ) | 14 | 172 | ||||||||||||||||
| July 2006 | 13,000 | 694 | — | — | (16 | ) | ||||||||||||||||||
| October 2006 | 20,000 | 1,239 | 453 | 22 | 516 | |||||||||||||||||||
| January 2008 | 25,562 | 1,040 | 541 | — | — | |||||||||||||||||||
| September 2008 | 7,500 | 331 | — | — | — | |||||||||||||||||||
| Total | 86,062 | $ | 4,212 | $ | 814 | $ | 36 | $ | 672 | $ | 48.94 | |||||||||||||
67
Table of Contents
| Year Ended | ||||||||||||||||
| Year Ended | One Month Ended | August 31, | ||||||||||||||
| Sept. 30, 2008 | Sept. 30, 2007 | 2007 | 2006 | |||||||||||||
| Current: | ||||||||||||||||
| Federal income tax | $ | (355 | ) | $ | 16 | $ | 46,097 | $ | 2,640 | |||||||
| State income tax | 763 | 12 | 8,507 | 282 | ||||||||||||
| 408 | 28 | 54,604 | 2,922 | |||||||||||||
| Deferred: | ||||||||||||||||
| Federal income tax | (1,245 | ) | (194 | ) | (18,493 | ) | 3,258 | |||||||||
| State income tax | (487 | ) | 25 | (2,769 | ) | 356 | ||||||||||
| (1,732 | ) | (169 | ) | (21,262 | ) | 3,614 | ||||||||||
Total provision for income taxes | $ | (1,324 | ) | $ | (141 | ) | $ | 33,342 | $ | 6,536 | ||||||
| Provision for continuing operations | (765 | ) | (176 | ) | 33,520 | 7,159 | ||||||||||
| Provision for discontinued operations | (559 | ) | 35 | (178 | ) | (623 | ) | |||||||||
Total provision for income taxes | (1,324 | ) | (141 | ) | 33,342 | 6,536 | ||||||||||
| Year Ended | ||||||||||||||||
| Year Ended | One Month Ended | August 31, | ||||||||||||||
| Sept. 30, 2008 | Sept. 30, 2007 | 2007 | 2006 | |||||||||||||
| Expected income tax | $ | 1,665 | $ | (359 | ) | $ | 7,044 | $ | 5,313 | |||||||
| Increase (decrease) resulting from: | ||||||||||||||||
| State income taxes, net of federal benefit | 317 | 28 | 3,732 | 407 | ||||||||||||
| Nontaxable interest and dividends | (590 | ) | (55 | ) | (708 | ) | (352 | ) | ||||||||
| Federal impacts from IRS exam and tax return amendments | (5,409 | ) | — | 22,272 | 2,204 | |||||||||||
| Deferred rate adjustment | — | (10 | ) | 397 | — | |||||||||||
| Tax liability adjustments | 334 | — | — | — | ||||||||||||
| Property, plant & equipment deferreds | 1,651 | — | — | — | ||||||||||||
| Other permanent items | 211 | — | — | — | ||||||||||||
| Other reconciling items, net | 1,056 | 220 | 783 | (413 | ) | |||||||||||
| Total provision for income taxes | $ | (765 | ) | $ | (176 | ) | $ | 33,520 | $ | 7,159 | ||||||
68
Table of Contents
| 2008 | 2007 | |||||||
| Deferred Tax Assets: | ||||||||
| Contribution carry forward | $ | 1,024 | $ | 917 | ||||
| Deferred retirement benefits | 1,748 | 2,027 | ||||||
| Federal benefit of state tax reserve | — | 2,229 | ||||||
| Inventories | 798 | — | ||||||
| Stock options appreciation | 134 | 243 | ||||||
| Property and Equipment | 3,614 | 2,095 | ||||||
| Net operating losses | 420 | — | ||||||
| Interest on taxes accrued for State amended returns | — | 1,437 | ||||||
| Other | 1,378 | 1,220 | ||||||
| Total gross deferred tax assets | $ | 9,116 | $ | 10,168 | ||||
| Deferred Tax Liabilities: | ||||||||
| Revenue recognized from citrus and sugarcane | $ | 319 | $ | 1,525 | ||||
| Patronage Dividends | 492 | 324 | ||||||
| Inventories | — | 452 | ||||||
| Other | 742 | 1,998 | ||||||
| Total gross deferred tax liabilities | $ | 1,553 | $ | 4,299 | ||||
| Net deferred income tax asset | $ | 7,563 | $ | 5,869 | ||||
69
Table of Contents
70
Table of Contents
71
Table of Contents
72
Table of Contents
73
Table of Contents
| Year ended | One month | Fiscal year ended | ||||||||||||||
| Sept. 30, | Sept. 30, | August 31, | ||||||||||||||
| 2008 | 2007 (1) | 2007 | 2006 | |||||||||||||
| Revenues (from external customers except as noted) | ||||||||||||||||
| Bowen | $ | 45,499 | $ | 143 | $ | 52,716 | $ | 30,869 | ||||||||
| Intersegment fruit sales through Bowen | 9,816 | — | 5,383 | 1,723 | ||||||||||||
| Citrus groves | 41,167 | 5 | 47,484 | 22,188 | ||||||||||||
| Sugarcane | 9,671 | — | 9,432 | 8,926 | ||||||||||||
| Cattle | 6,793 | 330 | 9,977 | 5,700 | ||||||||||||
| Real Estate | 3,870 | — | 3,329 | 113 | ||||||||||||
| Land leasing and rentals | 2,276 | 141 | 1,495 | 1,369 | ||||||||||||
| Vegetables | 5,460 | — | 3,803 | 2,389 | ||||||||||||
| Sod | 1,118 | 92 | 2,180 | 1,528 | ||||||||||||
| Revenue from segments | 125,670 | 711 | 135,799 | 74,805 | ||||||||||||
| Other operations | 528 | 47 | 1,589 | 1,082 | ||||||||||||
| Less: intersegment revenues eliminated | (9,816 | ) | — | (5,383 | ) | (1,723 | ) | |||||||||
| Total operating revenue | $ | 116,382 | $ | 758 | $ | 132,005 | $ | 74,164 | ||||||||
| Operating expenses | ||||||||||||||||
| Bowen | $ | 44,029 | $ | 222 | $ | 51,786 | $ | 31,137 | ||||||||
| Intersegment fruit sold through Bowen | 9,816 | — | 5,383 | 1,723 | ||||||||||||
| Citrus groves | 27,637 | 3 | 23,427 | 14,574 | ||||||||||||
| Sugarcane | 9,250 | — | 8,833 | 8,566 | ||||||||||||
| Cattle | 8,920 | 289 | 9,722 | 4,914 | ||||||||||||
| Real Estate | 3,529 | 59 | 3,408 | 61 | ||||||||||||
| Land leasing and rentals | 608 | 36 | 393 | 452 | ||||||||||||
| Vegetables | 5,601 | — | 3,307 | 1,404 | ||||||||||||
| Sod | 2,653 | 208 | 1,318 | 840 | ||||||||||||
| Segment operating expenses | 112,043 | 817 | 107,577 | 63,671 | ||||||||||||
| Other operations | 98 | 10 | 126 | — | ||||||||||||
| Less: intersegment expenses eliminated | (9,816 | ) | — | (5,383 | ) | (1,723 | ) | |||||||||
| Net casualty loss (recovery) | — | — | — | (4,036 | ) | |||||||||||
| Total operating expenses | $ | 102,325 | $ | 827 | $ | 102,320 | $ | 57,912 | ||||||||
| Gross profit (loss): | ||||||||||||||||
| Bowen | $ | 1,470 | $ | (79 | ) | $ | 930 | $ | (268 | ) | ||||||
| Citrus groves | 13,530 | 2 | 24,057 | 7,614 | ||||||||||||
| Sugarcane | 421 | — | 599 | 360 | ||||||||||||
| Cattle | (2,127 | ) | 41 | 255 | 786 | |||||||||||
| Real Estate | 341 | (59 | ) | (79 | ) | 52 | ||||||||||
| Land leasing and rentals | 1,668 | 105 | 1,102 | 917 | ||||||||||||
| Vegetables | (141 | ) | — | 496 | 985 | |||||||||||
| Sod | (1,535 | ) | (116 | ) | 862 | 688 | ||||||||||
| Gross profit (loss) from segments | 13,627 | (106 | ) | 28,222 | 11,134 | |||||||||||
| Other | 430 | 37 | 1,463 | 5,118 | ||||||||||||
| Gross profit (loss) | $ | 14,057 | $ | (69 | ) | $ | 29,685 | $ | 16,252 | |||||||
| (1) | Alico changed its fiscal year end from August 31 to September 30. The year ended September 30, 2008 was the first full year on the new fiscal year. Results for September 30, 2007 are for the one month transition period. |
74
Table of Contents
| Year ended | One month | Fiscal year ended | ||||||||||||||
| Sept. 30, | Sept. 30, | August 31, | ||||||||||||||
| 2008 | 2007 (1) | 2007 | 2006 | |||||||||||||
Capital expenditures: | ||||||||||||||||
| Bowen | $ | 38 | $ | — | $ | 554 | $ | 1,536 | ||||||||
| Citrus Groves | 1,899 | 9 | 1,231 | 9,929 | ||||||||||||
| Sugarcane | 63 | — | 1,288 | 3,065 | ||||||||||||
| Cattle | 1,588 | 60 | 1,893 | 3,490 | ||||||||||||
| Leasing | 449 | — | 459 | — | ||||||||||||
| Vegetables | 432 | 92 | 473 | 325 | ||||||||||||
| Sod | 116 | 27 | 908 | 1,103 | ||||||||||||
| Segment capital expenditures | 4,585 | 188 | 6,806 | 19,448 | ||||||||||||
| Other capital expenditures | 1,545 | 105 | 2,332 | 13,724 | ||||||||||||
| Total consolidated capital expenditures | $ | 6,130 | $ | 293 | $ | 9,138 | $ | 33,172 | ||||||||
Depreciation, depletion and amortization: | ||||||||||||||||
| Bowen | $ | 335 | $ | 21 | $ | 344 | $ | 913 | ||||||||
| Citrus Groves | 2,215 | 188 | 2,381 | 2,540 | ||||||||||||
| Sugarcane | 1,709 | 171 | 2,083 | 1,918 | ||||||||||||
| Cattle | 1,810 | 134 | 1,887 | 1,817 | ||||||||||||
| Leasing | 90 | 7 | 67 | 25 | ||||||||||||
| Vegetables | 146 | 12 | 68 | 17 | ||||||||||||
| Sod | 281 | 18 | 220 | 143 | ||||||||||||
| Total segment depreciation and amortization | 6,586 | 551 | 7,050 | 7,373 | ||||||||||||
| Other depreciation, depletion and amortization | 1,731 | 156 | 1,720 | 1,217 | ||||||||||||
| Total depreciation, depletion and amortizations | $ | 8,317 | $ | 707 | $ | 8,770 | $ | 8,590 | ||||||||
Total Assets: | ||||||||||||||||
| Bowen | $ | 2,581 | $ | 2,891 | ||||||||||||
| Citrus groves | 49,201 | 53,339 | ||||||||||||||
| Sugarcane | 43,525 | 45,128 | ||||||||||||||
| Cattle | 18,343 | 20,837 | ||||||||||||||
| Leasing | 2,370 | 2,012 | ||||||||||||||
| Vegetables | 4,213 | 3,238 | ||||||||||||||
| Sod | 3,906 | 5,400 | ||||||||||||||
| Segment assets | 124,139 | 132,845 | ||||||||||||||
| Other Corporate assets | 149,793 | 152,504 | ||||||||||||||
Total assets | $ | 273,932 | $ | 285,349 | ||||||||||||
| (1) | Alico changed its fiscal year end from August 31 to September 30. The year ended September 30, 2008 was the first full year on the new fiscal year. Capital expenditures and depreciation for September 30, 2007 are for the one month transition period. |
75
Table of Contents
| Total | ||||||||||||||||
| shares | ||||||||||||||||
| purchased | ||||||||||||||||
| as part of | ||||||||||||||||
| Total | Average | publicly | Total dollar | |||||||||||||
| number of | price | announced | value of | |||||||||||||
| shares | paid per | plans or | shares | |||||||||||||
| Fiscal period ended | purchased | share | programs | purchased | ||||||||||||
| September 30, 2008 | 27,968 | $ | 42.76 | 71,738 | $ | 1,195,818 | ||||||||||
| September 30, 2007 | — | $ | — | 43,770 | $ | — | ||||||||||
| August 31, 2007 | 27,770 | $ | 53.45 | 43,770 | $ | 1,484,291 | ||||||||||
| August 31, 2006 | 16,000 | $ | 47.70 | 16,000 | $ | 763,247 | ||||||||||
76
Table of Contents
77
Table of Contents
| Fiscal year ended | ||||||||||||||||||||||||
| August 31, 2007 | August 31, 2006 | |||||||||||||||||||||||
| Previously | Previously | |||||||||||||||||||||||
| reported | Adjustment | Revised | reported | Adjustment | Revised | |||||||||||||||||||
| Corporate general and administrative | $ | 12,887 | $ | (160 | ) | $ | 12,727 | $ | 11,212 | $ | (311 | ) | $ | 10,901 | ||||||||||
| Profit (loss) from continuing operations | 16,798 | 160 | 16,958 | 5,040 | 311 | 5,351 | ||||||||||||||||||
| Interest expense | 5,742 | (90 | ) | 5,652 | 4,066 | (214 | ) | 3,852 | ||||||||||||||||
| Total other income (expense) net | 3,077 | 90 | 3,167 | 9,615 | 214 | 9,829 | ||||||||||||||||||
| Income (loss) from continuing operations before income taxes | 19,875 | 250 | 20,125 | 14,655 | 525 | 15,180 | ||||||||||||||||||
| Provision (benefit) for income taxes | 33,424 | 96 | 33,520 | 6,956 | 203 | 7,159 | ||||||||||||||||||
| Income (loss) from continuing operations | (13,549 | ) | 154 | (13,395 | ) | 7,699 | 322 | 8,021 | ||||||||||||||||
| Net income (loss) | $ | (13,844 | ) | $ | 154 | $ | (13,690 | ) | $ | 6,469 | $ | 322 | $ | 6,791 | ||||||||||
| Earnings per share data: | ||||||||||||||||||||||||
| Basic earnings (loss) per share from continuing operations | $ | (1.84 | ) | $ | 0.02 | $ | (1.82 | ) | $ | 1.05 | $ | 0.04 | $ | 1.09 | ||||||||||
| Diluted earnings (loss) per share from continuing operations | $ | (1.84 | ) | $ | 0.02 | $ | (1.82 | ) | $ | 1.05 | $ | 0.04 | $ | 1.09 | ||||||||||
| Basic earnings (loss) per share | $ | (1.88 | ) | $ | 0.02 | $ | (1.86 | ) | $ | 0.88 | $ | 0.04 | $ | 0.92 | ||||||||||
| Diluted earnings (loss) per share | (1.88 | ) | 0.02 | (1.86 | ) | $ | 0.88 | $ | 0.04 | $ | 0.92 | |||||||||||||
| September 30, 2007 | ||||||||||||
| Previously | ||||||||||||
| reported | Adjustment | Revised | ||||||||||
| Accounts receivable | $ | 14,848 | $ | 278 | $ | 15,126 | ||||||
| Current assets | 135,098 | 278 | 135,376 | |||||||||
| Investments and deposits | 3,237 | 638 | 3,875 | |||||||||
| Deferred income taxes | 3,805 | (597 | ) | 3,208 | ||||||||
| Total other assets | 21,386 | 41 | 21,427 | |||||||||
| Total Assets | 285,030 | 319 | 285,349 | |||||||||
| Deferred retirement benefits | 5,098 | (632 | ) | 4,466 | ||||||||
| Total liabilities | 169,035 | (632 | ) | 168,403 | ||||||||
| Retained earnings | 99,262 | 951 | 100,213 | |||||||||
| Total Equity | $ | 115,995 | $ | 951 | $ | 116,946 | ||||||
78
Table of Contents
| Fiscal year ended | ||||||||||||||||||||||||
| August 31, 2007 | August 31, 2006 | |||||||||||||||||||||||
| Previously | Previously | |||||||||||||||||||||||
| reported | Adjustment | Revised | reported | Adjustment | Revised | |||||||||||||||||||
| Net income (loss) | (13,844 | ) | 154 | (13,690 | ) | 6,469 | 322 | 6,791 | ||||||||||||||||
| Deferred income taxes | (21,351 | ) | 96 | (21,255 | ) | 680 | 203 | 883 | ||||||||||||||||
| Deferred retirement benefits | (1,026 | ) | (160 | ) | (1,186 | ) | 556 | (311 | ) | 245 | ||||||||||||||
| Accounts receivable | (7,059 | ) | (90 | ) | (7,149 | ) | 2,537 | (214 | ) | 2,323 | ||||||||||||||
| Retained earnings | 9/30/07 | 8/31/07 | 8/31/06 | 8/31/05 | ||||||||||||
| Beginning balance, originally stated | 102,402 | 124,352 | 125,439 | 128,560 | ||||||||||||
| Original net income | (680 | ) | (13,844 | ) | 6,469 | 6,090 | ||||||||||
| Dividends | (2,024 | ) | (8,106 | ) | (7,556 | ) | (9,211 | ) | ||||||||
| Ending balance, originally stated | 99,698 | 102,402 | 124,352 | 125,439 | ||||||||||||
| Cumulative adjustment | — | — | — | 475 | ||||||||||||
| Restated beginning balance | 103,353 | 125,149 | 125,914 | 125,914 | ||||||||||||
| Restated net income | (680 | ) | (13,690 | ) | 6,791 | — | ||||||||||
| FIN 48 | (436 | ) | — | — | — | |||||||||||
| Dividends | (2,024 | ) | (8,106 | ) | (7,556 | ) | — | |||||||||
| Ending balance, restated | 100,213 | 103,353 | 125,149 | 125,914 | ||||||||||||
79
Table of Contents
| Due Date | Due before restructure | Due after restructure | ||||||
| 9/28/8 | $ | 3,980 | $ | 1,787 | ||||
| 9/28/9 | 12,000 | 1,000 | ||||||
| 9/28/10 | 12,000 | 1,000 | ||||||
| 9/28/11 | 26,128 | 4,000 | ||||||
| 9/28/12 | -0- | 8,000 | ||||||
| 9/28/13 | -0- | 12,000 | ||||||
| 9/28/14 | $ | -0- | $ | 26,321 | ||||
80
Table of Contents
| One Month Ended | ||||||||
| September 30, | September 30, | |||||||
| (In thousands, except per share data) | 2007 | 2006 | ||||||
| (Audited) | (Unaudited) | |||||||
Statement of operations data: | ||||||||
| Operating revenue | $ | 758 | $ | 1,682 | ||||
| Operating and general and administrative expenses | 1,642 | 2,499 | ||||||
| Earnings (loss) from operations | (884 | ) | (817 | ) | ||||
| Other earnings (loss) | 28 | 101 | ||||||
| Income taxes (benefit) | (176 | ) | (341 | ) | ||||
| Net earnings (loss) | $ | (680 | ) | $ | (375 | ) | ||
Earnings (loss) per share: | ||||||||
| Basic | $ | (0.09 | ) | $ | (0.05 | ) | ||
| Diluted | $ | (0.09 | ) | $ | (0.05 | ) | ||
| September 30, | September 30, | |||||||
| 2007 | 2006 | |||||||
| (Audited) | (Unaudited) | |||||||
Balance sheet data: | ||||||||
| Current assets | $ | 135,376 | $ | 110,183 | ||||
| Total assets | 285,349 | 262,587 | ||||||
| Current liabilities | 25,138 | 16,950 | ||||||
| Other liabilities | 143,265 | 104,014 | ||||||
| Stockholders’ equity | $ | 116,946 | $ | 141,573 | ||||
81
Table of Contents
| One month | ||||||||||||||||||||||||||||||||||||
| Ended | Quarters Ended | |||||||||||||||||||||||||||||||||||
| Sep 30, | December 31, | March 31, | June 30, | September 30, | ||||||||||||||||||||||||||||||||
| 2007 | 2007 | 2006 | 2008 | 2007 | 2008 | 2007 | 2008 | 2007 | ||||||||||||||||||||||||||||
| Net sales | ||||||||||||||||||||||||||||||||||||
| Continuing operations | $ | 758 | $ | 22,652 | $ | 25,779 | $ | 48,182 | $ | 55,466 | $ | 42,147 | $ | 46,149 | $ | 3,401 | $ | 3,953 | ||||||||||||||||||
| Discontinued operations | 419 | 902 | 749 | 1,093 | 992 | 463 | 617 | 112 | 627 | |||||||||||||||||||||||||||
Total net sales | 1,177 | 23,554 | 26,528 | 49,275 | 56,458 | 42,610 | 46,766 | 3,513 | 4,580 | |||||||||||||||||||||||||||
| Cost of sales | ||||||||||||||||||||||||||||||||||||
| Continuing operations | 827 | 18,381 | 20,082 | 42,027 | 42,696 | 35,790 | 33,491 | 6,127 | 5,645 | |||||||||||||||||||||||||||
| Discontinued operations | 190 | 833 | 491 | 1,264 | 1,093 | 1,025 | 859 | 150 | 322 | |||||||||||||||||||||||||||
| Total cost of sales | 1,017 | 19,214 | 20,573 | 43,291 | 43,789 | 36,815 | 34,350 | 6,277 | 5,967 | |||||||||||||||||||||||||||
| Gross profits | ||||||||||||||||||||||||||||||||||||
| Continuing operations | (69 | ) | 4,271 | 5,697 | 6,155 | 12,770 | 6,357 | 12,658 | (2,726 | ) | (1,692 | ) | ||||||||||||||||||||||||
| Discontinued operations | 229 | 69 | 258 | (171 | ) | (101 | ) | (562 | ) | (242 | ) | (38 | ) | 305 | ||||||||||||||||||||||
Total gross profit | 160 | 4,340 | 5,955 | 5,984 | 12,669 | 5,795 | 12,416 | (2,764 | ) | (1,387 | ) | |||||||||||||||||||||||||
| General & Administrative expense | ||||||||||||||||||||||||||||||||||||
| Continuing operations | 815 | 2,913 | 2,985 | 3,884 | 3,172 | 3,568 | 3,509 | 1,113 | 3,041 | |||||||||||||||||||||||||||
| Discontinued operations | 35 | 88 | 182 | 97 | 233 | 495 | 266 | 17 | (90 | ) | ||||||||||||||||||||||||||
| Total general & administrative expense | 850 | 3,001 | 3,167 | 3,981 | 3,405 | 4,063 | 3,775 | 1,130 | 2,951 | |||||||||||||||||||||||||||
| Other income (expense) | ||||||||||||||||||||||||||||||||||||
| Continuing operations | (141 | ) | 2,899 | 1,702 | 628 | 436 | (119 | ) | 1,061 | (1,149 | ) | (362 | ) | |||||||||||||||||||||||
| Discontinued operations | 10 | 50 | 29 | 17 | (5 | ) | (215 | ) | 60 | 98 | 21 | |||||||||||||||||||||||||
| Total other income (expense | (131 | ) | 2,949 | 1,731 | 645 | 431 | (334 | ) | 1,121 | (1,051 | ) | (341 | ) | |||||||||||||||||||||||
| Restatements (see note 15) | 154 | |||||||||||||||||||||||||||||||||||
| Income before income taxes | ||||||||||||||||||||||||||||||||||||
| Continuing operations | (1,025 | ) | 4,257 | 4,414 | 2,899 | 10,034 | 2,670 | 10,210 | (4,988 | ) | (5,095 | ) | ||||||||||||||||||||||||
| Discontinued operations | 204 | 31 | 105 | (251 | ) | (339 | ) | (1,272 | ) | (448 | ) | 43 | 416 | |||||||||||||||||||||||
| Total income before income taxes | (821 | ) | 4,288 | 4,519 | 2,648 | 9,695 | 1,398 | 9,762 | (4,945 | ) | (4,679 | ) | ||||||||||||||||||||||||
| Income tax (expense) benefit | ||||||||||||||||||||||||||||||||||||
| Continuing operations | (176 | ) | 1,486 | 1,899 | 1,015 | 4,321 | (3,129 | ) | 29,025 | (137 | ) | (1,626 | ) | |||||||||||||||||||||||
| Discontinued operations | 35 | 12 | 40 | 95 | (129 | ) | (456 | ) | (242 | ) | (210 | ) | 158 | |||||||||||||||||||||||
| Total income tax expense (benefit) | (141 | ) | 1,498 | 1,939 | 1,110 | 4,192 | (3,585 | ) | 28,783 | (347 | ) | (1,468 | ) | |||||||||||||||||||||||
| Net income (loss) | ||||||||||||||||||||||||||||||||||||
| Continuing operations | (849 | ) | 2,771 | 2,515 | 1,884 | �� | 5,713 | 5,799 | (18,815 | ) | (4,851 | ) | (3,469 | ) | ||||||||||||||||||||||
| Discontinued operations | 169 | 19 | 65 | (346 | ) | (210 | ) | (816 | ) | (206 | ) | 253 | 258 | |||||||||||||||||||||||
Total net income (loss) | $ | (680 | ) | $ | 2,790 | $ | 2,580 | $ | 1,538 | $ | 5,503 | $ | 4,983 | $ | (19,021 | ) | $ | (4,598 | ) | $ | (3,057 | ) | ||||||||||||||
Basic earnings per share | $ | (0.09 | ) | $ | 0.38 | $ | 0.35 | $ | 0.21 | $ | 0.75 | $ | 0.68 | $ | (2.58 | ) | $ | (0.62 | ) | $ | (0.41 | ) | ||||||||||||||
82
Table of Contents
83
Table of Contents
84
Table of Contents
85
Table of Contents
86
Table of Contents
87
Table of Contents
(Registrant)
| December 15 , 2008 Date | /s/ Steven M. Smith President & Principal Executive Officer | |||
| December 15 , 2008 Date | /s/ Patrick W. Murphy Senior Vice President and Chief Financial Officer |
88
Table of Contents
/s/ John R. Alexander | /s/ JD Alexander | |||||
| John R. Alexander | JD Alexander | |||||
| Chairman | Director | |||||
/s/ Robert E. Lee Caswell | /s/ Evelyn D’An | |||||
| Robert E. Lee Caswell | Evelyn D’An | |||||
| Director | Director | |||||
/s/ Phillip S. Dingle | /s/ Gregory T. Mutz | |||||
| Phillip S. Dingle | Gregory T. Mutz | |||||
| Director | Director | |||||
/s/ Charles L. Palmer | /s/ Robert J. Viguet, Jr. | |||||
| Charles L. Palmer | Robert J. Viguet, Jr. | |||||
| Director | Director | |||||
/s/ Gordon Walker | ||||||
| Director | ||||||
| December 15, 2008 Date |
89
Table of Contents
| Exhibit | ||||
| Number | Description | |||
| 3(i) | Articles of Incorporation: | |||
| 3(i)1 | Restated Certificate of Incorporation, Dated February 17, 1972 (incorporated by reference to Alico’s Registration Statement on Form S-1 dated February 24, 1972, Registration No. 2-43156). | |||
| 3(i)2 | Certificate of Amendment to Certificate of Incorporation, Dated January 14, 1974 (incorporated by reference to Alico’s Registration Statement on Form S-8, dated December 21, 2005, Registration No. 333-130575) | |||
| 3(i)3 | Amendment to Articles of Incorporation, Dated January 14, 1987 (incorporated by reference to Alico’s Registration Statement on Form S-8, dated December 21, 2005, Registration No. 333-130575) | |||
| 3(i)4 | Amendment to Articles of Incorporation, Dated December 27, 1988 (incorporated by reference to Alico’s Registration Statement on Form S-8, dated December 21, 2005, Registration No. 333-130575) | |||
| 3(ii) | Bylaws | |||
| 3(ii)(1) | By-Laws of Alico, Inc., amended and restated (incorporated by reference to Alico’s filing on Form 8-K dated October 4, 2007) | |||
| 3(ii)(2) | By-Laws of Alico, Inc. amended and restated (incorporated by reference to Alico’s filing on Form 8-K dated November 21, 2008) | |||
| (10 | ) | Material Contracts | ||
| (10.1 | ) | Citrus Processing and Marketing Agreement with Ben Hill Griffin, Inc., dated November 2, 1983, a Continuing Contract. (incorporated by reference to Alico’s filing on Form 10-K dated November 28, 2006) | ||
| (10.2 | ) | Cash Purchase Orange Agreement with Tropicana (incorporated by reference to Alico’s filing on Form 10-K dated November 14, 2007) | ||
| (10.3 | ) | Fruit Purchase Agreement with Southern Gardens Citrus Processing Corporation (incorporated by reference to Alico’s filing on Form 10-K dated November 14, 2007) | ||
| (10.4 | ) | Real Estate Sale Agreement with Ginn Development Corporation (incorporated by reference to Alico’s filing on Form 10Q/A dated January 6, 2005) | ||
| (10.5 | ) | First Amendment to Real Estate Sales Agreement with Ginn Development Corporation (incorporated by reference to Alico’s filing on Form 8-K dated December 27, 2006) | ||
Table of Contents
| Exhibit | ||||
| Number | Description | |||
| (10.6 | ) | Amended Real Estate Sales Agreement with Ginn Development Corporation dated November 11, 2008 | ||
| (10.7 | ) | Second Amendment and restate Renewal Promissory Note (incorporated by reference to Alico’s filing on Form 8-K dated October 25, 2007) | ||
| (10.8 | ) | Second Amendment to Mortgage Deed (incorporated by reference to Alico’s filing on Form 8-K dated October 25, 2007) | ||
| (10.9 | ) | Revolving Line of Credit Agreement (incorporated by reference to Alico’s filing on Form 8-K dated October 17, 2005) | ||
| (10.10 | ) | Amendment to Line of Credit Agreement (incorporated by reference to Alico’s filing on Form 8-K dated June 1, 2006) | ||
| (10.11 | ) | Amendment to Line of Credit Agreement (incorporated by reference to Alico’s filing on Form 10-K dated November 14, 2007) | ||
| (10.12 | ) | Term note with Farm Credit (incorporated by reference to Alico’s filing on Form 8-K dated September 8, 2008) | ||
| (10.13 | ) | Fourth Amendment to Amended and Restated Loan Agreement (incorporated by reference to Alico’s filing on Form 8-K dated September 8, 2008) | ||
| (10.14 | ) | Amended and Restated RLOC Note (incorporated by reference to Alico’s filing on Form 8-K dated September 8, 2008) | ||
| (10.15 | ) | Transition, Severence, Non-Compete and Consulting Agreement with John R. Alexander (incorporated by reference to Alico’s filing on Form 8-K dated June 30, 2008) | ||
| (10.16 | ) | Transition, Severence, Non-Compete and Consulting Agreement with Dan L. Gunter (incorporated by reference to Alico’s filing on Form 8-K dated November 21, 2008) | ||
| (14.1 | ) | Code of Ethics amended October 31, 2008 | ||
| (14.2 | ) | Whistleblower Policy amended October 31, 2008 | ||
| (21 | ) | Subsidiaries of the Registrant — Alico Land Development Company, Inc. (formerly Saddlebag Lake Resorts, Inc. (a Florida corporation incorporated in 1971));Agri-Insurance Company, Ltd. (a company formed under the laws of the country of Bermuda incorporated in 2000), Alico-Agri, Ltd (a Florida limited partnership formed in 2003), Alico Plant World, LLC (a Florida limited liability company organized in 2004), Bowen Brothers Fruit, LLC (a Florida limited liability company organized in 2005)) (incorporated by reference to Alico’s filing on Form 10-K dated November 28, 2006) | ||
| (31.1 | ) | Rule 13a-14(a) certification | ||
| (31.2 | ) | Rule 13a-14(a) certification | ||
| (32.1 | ) | Section 1350 certifications | ||