 Fifth Third Bank | All Rights Reserved June 2008 Capital Planning: Credit Scenario Analysis Exhibit 99.3 |
 2 © Fifth Third Bank | All Rights Reserved As of June 2008 Statement of purpose These scenarios do not constitute a forecast or otherwise reflect Fifth Third’s outlook for 2009 expected results. This exercise was designed for evaluating capital plans rather than for forecasting purposes. Therefore, it was intended to evaluate what could happen under significantly more stressed conditions, not to predict what will happen. These scenarios were produced as part of analysis related to the capital plan announced June 18, 2008. It is based on information available at that time. Please refer to the cautionary statement attached to this document which contains important information regarding certain forward-looking information and risk factors related to current and future results. |
 3 © Fifth Third Bank | All Rights Reserved As of June 2008 Capital planning: credit scenario analysis A key driver of the capital planning process was an analysis of potential credit losses under variety of economic and credit market conditions Analysis involved a detailed process that segregated our loan portfolio into approximately 50 granular pools of similar assets — e.g., loan type, collateral, industry exposure, and geography Scenarios were created by applying varying levels of stress to the relevant factors that affect asset pool performance — We believe the range of scenario outcomes represents reasonably possible results under varying levels of potential stress Capital plan based on maintaining Tier 1 capital ratio >8% through the end of 2009 under the most stressed scenario evaluated Credit modeling for capital plan intended to be conservative to ensure strong capital position — This was an exercise in what could happen, not what will happen – these are not forecasts — We do not view high stress 2009 outcome to be likely, we view it as possible if trends continue or deteriorate further and loss severity experience worsens — Excess capital created through the capital plan also provides for outcomes resulting from possible deterioration in credit trends beyond those currently viewed as plausible |
 4 © Fifth Third Bank | All Rights Reserved As of June 2008 Consumer charge-off scenario methodology Three-month moving average roll-rates used to project baseline charge-offs through the end of 2009 Used forecasts for relevant economic indicators to predict loss severities — Relied upon Moody’s Economy.com/Case-Shiller Home Price Index Forecast* for real estate — For the auto portfolio, assumed loss severity above recent loss given default trends to reflect additional stress related to large SUVs and trucks given higher recent gas prices – this added incremental loss severity of 14% to the overall auto portfolio in 2009 Stressed roll rate assumptions for all portfolios using economic forecasts and additional stress on loss frequency — For auto and credit cards, also used Moody’s forecast for bankruptcies to apply additional stress *Moody’s Economy.com/Case-Shiller Home Price Index Forecasts, April 2008. |
 5 Fifth Third Bank | All Rights Reserved As of June 2008 Consumer charge-off scenario methodology (cont.) High stress case added incremental losses related to severity and roll- rate shocks — For Florida and lot exposures, used Moody’s Florida severe recession home price forecast anticipating an additional 27% decline in home prices through the end of 2009*; for rest of portfolio, used Moody’s severe recession forecast for the national index, anticipating an additional 25% decline in home prices through the end of 2009* — Roll rates were further stressed in most consumer portfolios — These stress components represented approximately 55% in additional losses incorporated into the high stress scenario over the 18 months ended YE 2009 *Peak-to-current and current-to-trough devaluation is not additive (peak-to-current would be calculated off peak prices; current-to-trough would be calculated off current prices which embed devaluation from peak). For Florida, peak-to-current devaluation has been 22%, producing peak-to-trough devaluation of 43%; for national index, peak-to-current devaluation has been 17%, producing peak-to-trough devaluation of 38%. Moody ’s Economy.com/Case-Shiller Home Price Index Forecast, April 2008. |
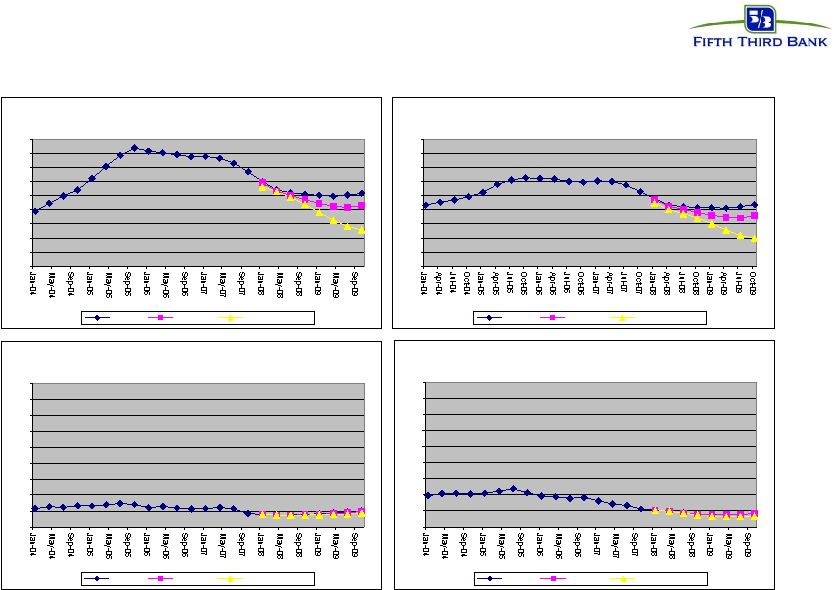 6 © Fifth Third Bank | All Rights Reserved As of June 2008 Home price appreciation trends and forecasts Source: Moody ’s Economy.com/Case-Shiller Home Price Index Forecast, April 2008 Florida 100 120 140 160 180 200 220 240 260 280 Baseline Recession Severe Recession US 100 120 140 160 180 200 220 240 260 280 Baseline Recession Severe Recession Ohio 100 120 140 160 180 200 220 240 260 280 Baseline Recession Severe Recession Michigan 100 120 140 160 180 200 220 240 260 280 Baseline Recession Severe Recession |
 7 © Fifth Third Bank | All Rights Reserved As of June 2008 Consumer segmentation for applying stress factors Mortgage — Florida other than lots — Lots — All other Home Equity — Delivery channel (Retail, retail brokered, HEA) — Loan-to-value (greater than and less than 85% LTV) — Type (loan or line) Auto — New and used — SUV/truck and other Credit card Other More granular segmentation for roll-rate analysis |
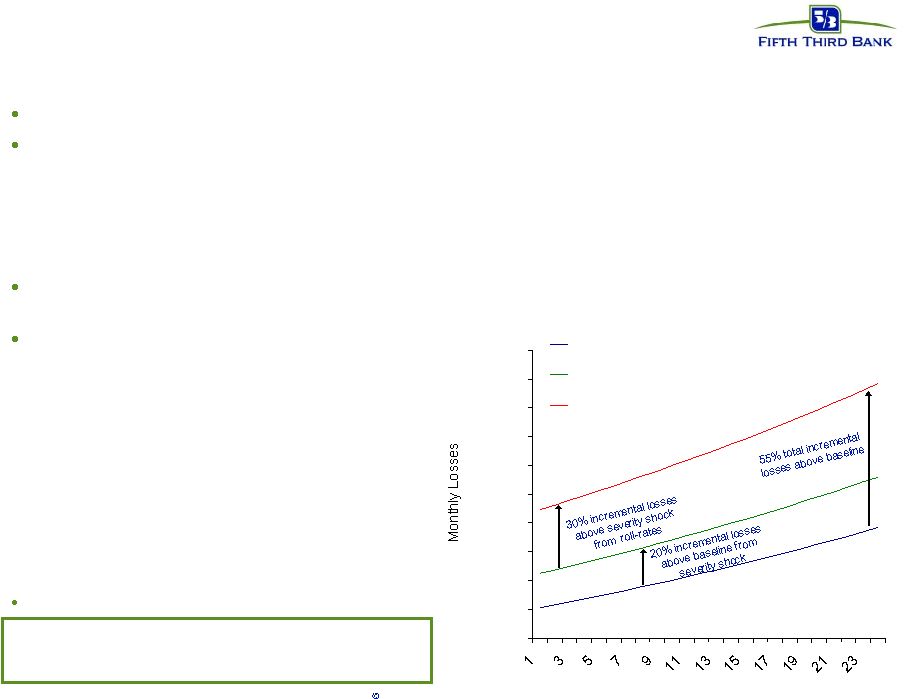 8 Fifth Third Bank | All Rights Reserved As of June 2008 Illustration of impact of roll rate and severity stresses Loss severities stressed as described earlier Due to compounding effects, roll rate shocks can have a dramatic effect on losses — In the example below, a 7% shock to each roll rate results in a 30% increase in losses holding all else equal — Bankruptcy shocks would be another example of a roll-rate shock (not depicted) — Roll rate shocks are applied in combination with loss severity shock The application of roll-rate shocks was an element of added conservativism, given that default unit results have generally been in-line with forecasts Assumptions for example: — 5% roll rate from current to 1 month past due shocked to 5.35% — 5% roll rate from 1 month past due to 2 months past due shocked to 5.35% — 5% roll rate from 2 month past due to 3 months past due shocked to 5.35% — 5% roll rate from 3 month past due to charge off shocked to 5.35% — 20% loss severity at charge off (shocked 20% to 24%) Example results in incremental 55% in losses Illustration not intended to depict a particular portfolio $1,000 $1,200 $1,400 $1,600 $1,800 $2,000 $2,200 $2,400 $2,600 $2,800 $3,000 Months Baseline Losses Loss Severity Shock Aggregate Shock (Loss Severity and Roll Rate) |
 9 Fifth Third Bank | All Rights Reserved As of June 2008 Capital planning: 2008 commercial charge-off scenario methodology Commercial loan portfolio was segmented into 30 portfolios — 10 industries segregated into 3 geographies (Florida, Michigan, and Other) Asset quality trends over last 3 and 6 quarters extrapolated to project baseline charge-off scenario for each portfolio — Inherent in baseline is continued deterioration following recent (typically high) trends — Each portfolio was reviewed with appropriate senior lending officers to determine if other segment specific factors should be included in the scenarios Additional scenarios were created by applying stresses to the baseline and by incorporating the lagging correlation of portfolio performance to relevant leading economic indicators — For real estate assets, property depreciation of 35%-50% was generally applied to any properties on highest risk nonaccruals Geographic economic outlooks, industry health, prior trends in asset quality, and current or expected stresses were considered when developing the range of scenarios |
 10 Fifth Third Bank | All Rights Reserved As of June 2008 Capital planning: 2009 commercial charge-off scenario methodology Builds upon 2008 methodology Utilized Moody’s Economy.com Industry Workstation Net Income Forecasts by industry to project baseline criticized assets (watch, classified, nonaccrual loans) — Moody’s industry net income forecast calls for modest improvement in economic activity in 2009 Assumed migration from criticized to nonaccrual to charge-off consistent with recent trends to create baseline — Baseline migration trends were stressed for certain segments (Michigan, Florida and real estate industries) to reflect probable higher loss frequency and severity than recently experienced High stress scenario added 10% growth in criticized assets per quarter and increased migration trends by 10-20% to the baseline — These stress components represented approximately 35% in additional losses incorporated into the high stress scenario over the 18 months ended YE 2009 * Moody ’s Economy.com Industry Workstation Net Income Forecasts, May 2008. |
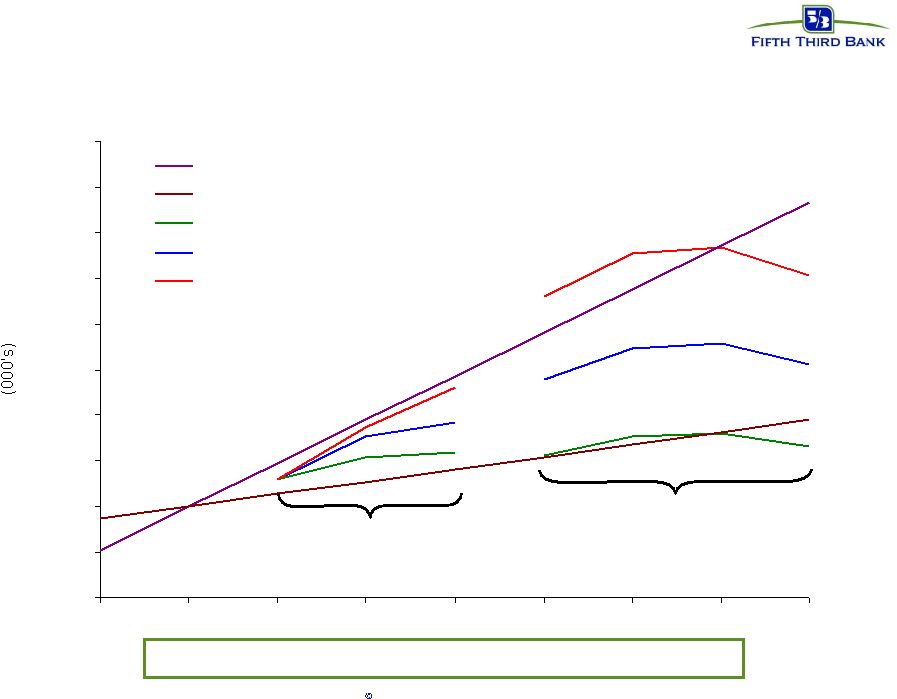 11 Fifth Third Bank | All Rights Reserved As of June 2008 Illustration of commercial scenario methodology 2008 methodology range 2009 methodology range Illustration not intended to depict a particular portfolio $0 $10,000 $20,000 $30,000 $40,000 $50,000 $60,000 $70,000 $80,000 $90,000 $100,000 4Q'07 1Q'08 2Q'08 3Q'08 4Q'08 1Q'09 2Q'09 3Q'09 4Q'09 3 Quarter Trend 6 Quarter Trend Scenario - Low Stress Baseline Scenario - High Stress |
 12 © Fifth Third Bank | All Rights Reserved As of June 2008 Industries — Accommodation — Auto Manufacturing — Construction — Finance and Insurance — Manufacturing — Real Estate — Retail Trade — Auto Retailers — Wholesale Trade — Other Commercial portfolio segmentation Geographies — Florida — Michigan — Other |
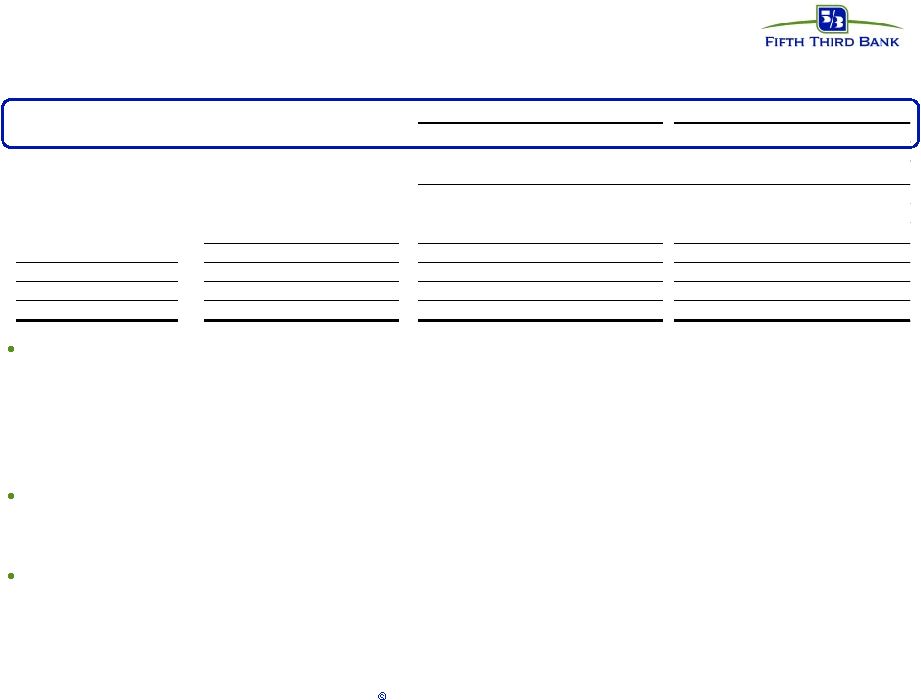 13 Fifth Third Bank | All Rights Reserved As of June 2008 FY 2008 FY 2009 160-170 bps $1.3-1.4 billion bps $ bps $ bps $ Actual Actual Scenarios Scenarios Scenarios Scenarios 1H08 1H08 FY2008 # FY2008 # FY2009 FY2009 Commercial 132 bps 317 million 120-160 bps $.6 - .8 billion 125-215 bps $.7 - 1.2 billion Consumer 180 bps 303 million 170-205 bps .6 - .7 billion 230-295 bps .8 - 1.0 billion Total 152 bps 620 million 145-180 bps $1.2 - 1.5 billion 170-250 bps $1.5 - 2.2 billion Scenarios (not projections or forecast) TBD in 2009 budget process Outlook (as of July 22, 2008) Outcome of loan loss scenarios for capital plan Purpose of credit scenario analysis: — Exercise designed for evaluating capital plans rather than for forecasting purposes (what could happen under a variety of stress scenarios, not what will happen); as a result, scenarios do not reflect the Company’s outlook for 2009 expected results — Scenarios produced for capital plan announced June 18, 2008, based on information available prior to that date Key loss drivers: — Real estate-related losses represented approximately two-thirds of 2009 losses in commercial and in consumer scenarios Capital plan intended to maintain Tier 1 capital ratio > 8% through end of 2009 under scenarios evaluated — The highest stress scenario outlined above (which we view as unlikely) would represent an increase in charge-offs of approximately 60% relative to our full year 2008 outlook. We believe our Tier 1 capital ratio would exceed 8% with 2009 loan losses of up to 85% more than expected 2008 loan losses #2008 full-year scenario range adjusted to reflect 2Q08 actual results vs. May forecast for 2Q08. |
 14 Fifth Third Bank | All Rights Reserved As of June 2008 Cautionary Statement This report may contain forward-looking statements about Fifth Third Bancorp and/or the company as combined acquired entities within the meaning of Sections 27A of the Securities Act of 1933, as amended, and Rule 175 promulgated thereunder, and 21E of the Securities Exchange Act of 1934, as amended, and Rule 3b-6 promulgated thereunder, that involve inherent risks and uncertainties. This report may contain certain forward-looking statements with respect to the financial condition, results of operations, plans, objectives, future performance and business of Fifth Third Bancorp and/or the combined company including statements preceded by, followed by or that include the words or phrases such as “believes,” “expects,” “anticipates,” “plans,” “trend,” “objective,” “continue,” “remain” or similar expressions or future or conditional verbs such as “will,” “would,” “should,” “could,” “might,” “can,” “may” or similar expressions. There are a number of important factors that could cause future results to differ materially from historical performance and these forward-looking statements. Factors that might cause such a difference include, but are not limited to: (1) general economic conditions and weakening in the economy, specifically the real estate market, either national or in the states in which Fifth Third, one or more acquired entities and/or the combined company do business, are less favorable than expected; (2) deteriorating credit quality; (3) political developments, wars or other hostilities may disrupt or increase volatility in securities markets or other economic conditions; (4) changes in the interest rate environment reduce interest margins; (5) prepayment speeds, loan origination and sale volumes, charge-offs and loan loss provisions; (6) Fifth Third’s ability to maintain required capital levels and adequate sources of funding and liquidity; (7) changes and trends in capital markets; (8) competitive pressures among depository institutions increase significantly; (9) effects of critical accounting policies and judgments; (10) changes in accounting policies or procedures as may be required by the Financial Accounting Standards Board or other regulatory agencies; (11) legislative or regulatory changes or actions, or significant litigation, adversely affect Fifth Third, one or more acquired entities and/or the combined company or the businesses in which Fifth Third, one or more acquired entities and/or the combined company are engaged; (12) ability to maintain favorable ratings from rating agencies; (13) fluctuation of Fifth Third’s stock price; (14) ability to attract and retain key personnel; (15) ability to receive dividends from its subsidiaries; (16) potentially dilutive effect of future acquisitions on current shareholders' ownership of Fifth Third; (17) effects of accounting or financial results of one or more acquired entities; (18) difficulties in combining the operations of acquired entities; (19) inability to generate the gains on sale and related increase in shareholders’ equity that it anticipates from the sale of certain non-core businesses, (20) loss of income from the sale of certain non-core businesses could have an adverse effect on Fifth Third’s earnings and future growth (21) ability to secure confidential information through the use of computer systems and telecommunications networks; and (22) the impact of reputational risk created by these developments on such matters as business generation and retention, funding and liquidity. Moreover,. Additional information concerning factors that could cause actual results to differ materially from those expressed or implied in the forward-looking statements is available in the Bancorp's Annual Report on Form 10-K for the year ended December 31, 2007, filed with the United States Securities and Exchange Commission (SEC). Copies of this filing are available at no cost on the SEC's Web site at www.sec.gov or on the Fifth Third’s Web site at www.53.com. Fifth Third undertakes no obligation to release revisions to these forward-looking statements or reflect events or circumstances after the date of this report. |