 Fifth Third Bank | All Rights Reserved 4Q08 Trends January 22, 2009 Please refer to earnings release dated January 22, 2009 for full results reported on a GAAP basis Exhibit 99.4 |
 2 Fifth Third Bank | All Rights Reserved 4Q08 in review Difficult quarter due to continued deterioration in credit and significant non-recurring items — 4Q08 net loss of $2.2 billion, or $3.82 per diluted share; full year net loss of $2.2 billion or $3.94 per diluted share — Sold or transferred to held-for-sale $1.6 billion in original loan balances, incurred losses of $800 million on these loans; allowance for loan and lease losses increased $729 million — Non-cash goodwill impairment charge of $965 million Core business momentum remains solid — Net interest income growth of 14% from the previous year driven by loan discount accretion related to the second quarter First Charter acquisition. Excluding loan discount accretion, net interest income increased 4% — Fee income growth of 26%, up 4% excluding BOLI and OTTI charges, on continued growth in payments processing revenue, deposit service revenue and corporate banking revenue — Average core deposits up 2% and average total deposits up 8% Strong capital position, well above target ranges — Tier 1 capital ratio of 10.6% — Total capital ratio of 14.8% — Tangible equity ratio of 7.9% — Capital actions included reducing the dividend to $0.01 from $0.15 per share and completing the sale of approximately $3.4 billion in preferred shares to the U.S. Treasury |
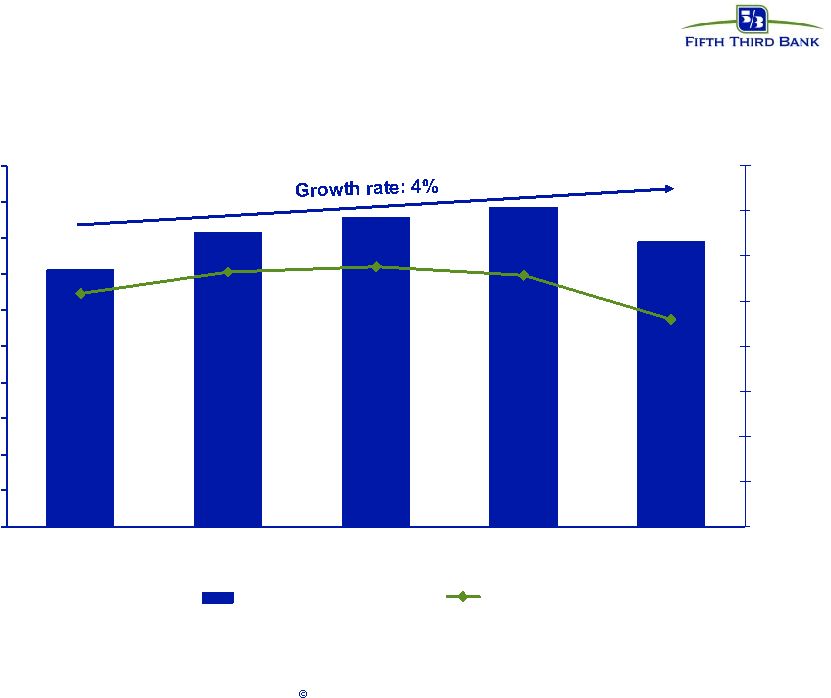 3 Fifth Third Bank | All Rights Reserved 2.00% 2.20% 2.40% 2.60% 2.80% 3.00% 3.20% 3.40% 3.60% 3.80% 4.00% 4Q07 1Q08 2Q08* 3Q08* 4Q08* $500 $550 $600 $650 $700 $750 $800 $850 $900 Net interest income NIM Net interest income * 4Q08 reported results: 14% year-over-year growth and 3.46% NIM. Results above exclude $130 million charge related to leveraged lease litigation in 2Q08 and exclude $31 million, $215 million and $81 million in loan discount accretion from the First Charter acquisition in 2Q08, 3Q08 and 4Q08, respectively. |
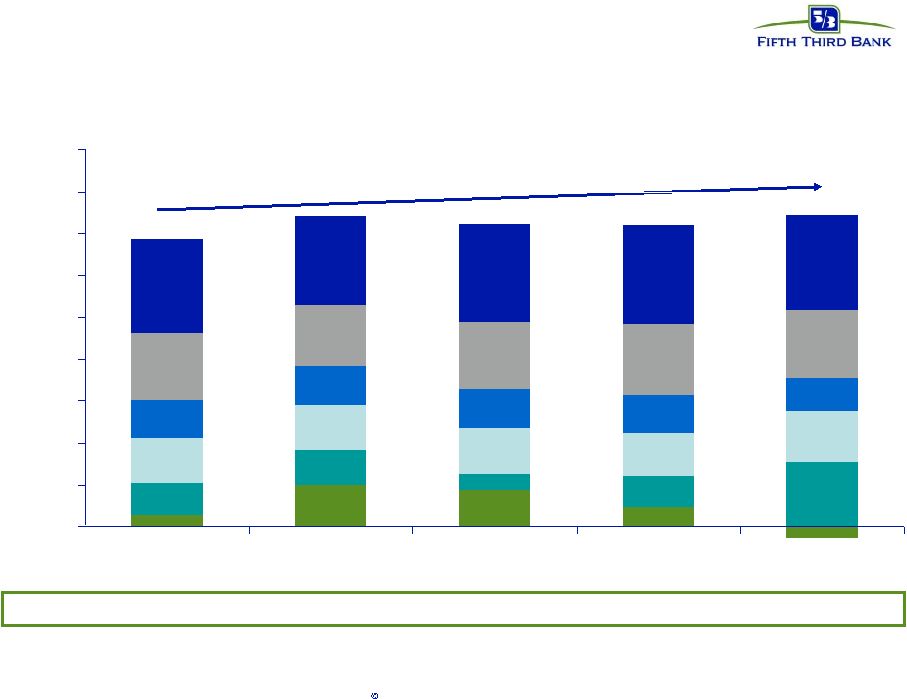 4 Fifth Third Bank | All Rights Reserved Fee income Growth rate: 4% Payment processing Deposit service charges Investment advisory Corporate banking Mortgage Secs/other Reported year-over-year fee income growth of 26%. Results above exclude $34 million estimated non-cash BOLI charge and $40 million OTTI charges in 4Q08. Excludes $76 million in litigation revenue from a prior acquisition, $27 million BOLI charge, and $51 million OTTI charges in 3Q08. Excludes $152 million BOLI charge and $273 million Visa IPO gain in 1Q08. Excludes $177 million BOLI charge in 4Q07. YOY growth +3% +2% -17% +14% NM NM Continued growth in processing, deposit fees and corporate banking fees $0 $100 $200 $300 $400 $500 $600 $700 $800 $900 4Q07 1Q08 2Q08 3Q08 4Q08 |
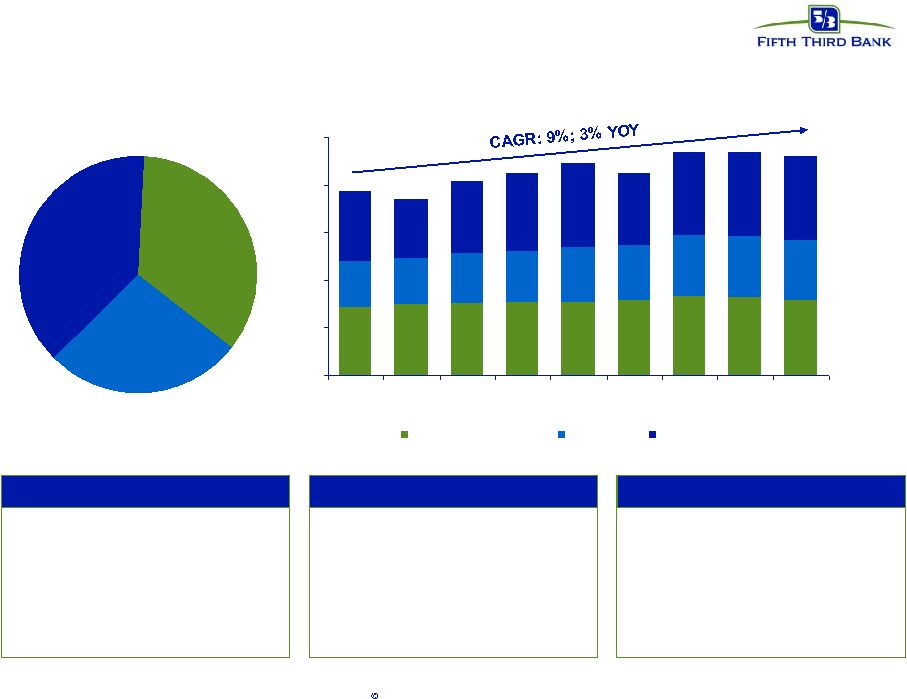 5 Fifth Third Bank | All Rights Reserved th Fifth Third Processing Solutions 4Q08 revenue 38% 35% 27% Merchant Services Financial Institutions Bankcard +5% 2-Yr CAGR YOY growth +14% +10% 0% +7% +4% Merchant Services Financial Institutions • 4 leading U.S. acquirer • Over 42,000 merchants • ~169,000 merchant locations • $192B in signature volume • $28.4B in credit/debit processing volume • e.g. Nordstrom, Saks, Walgreen's, Office Max, Barnes and Noble, U.S. Treasury • Drives nearly 11,000 ATMs throughout the U.S. and 11 countries • ~3,000 FI relationships • Supports more than 49 million debit cards • 1,400 correspondent banking relationships Bankcard • $2.2B in outstanding balances • 1.9 million cardholders • Top three Debit MasterCard Issuer • 11 offline and 12 online debit card issuer • 23 largest U.S. credit card issuer by total accounts $0 $50 $100 $150 $200 $250 4Q06 1Q07 2Q07 3Q07 4Q07 1Q08 2Q08 3Q08 4Q08 Financial Institutions Bankcard Merchant Services th th rd |
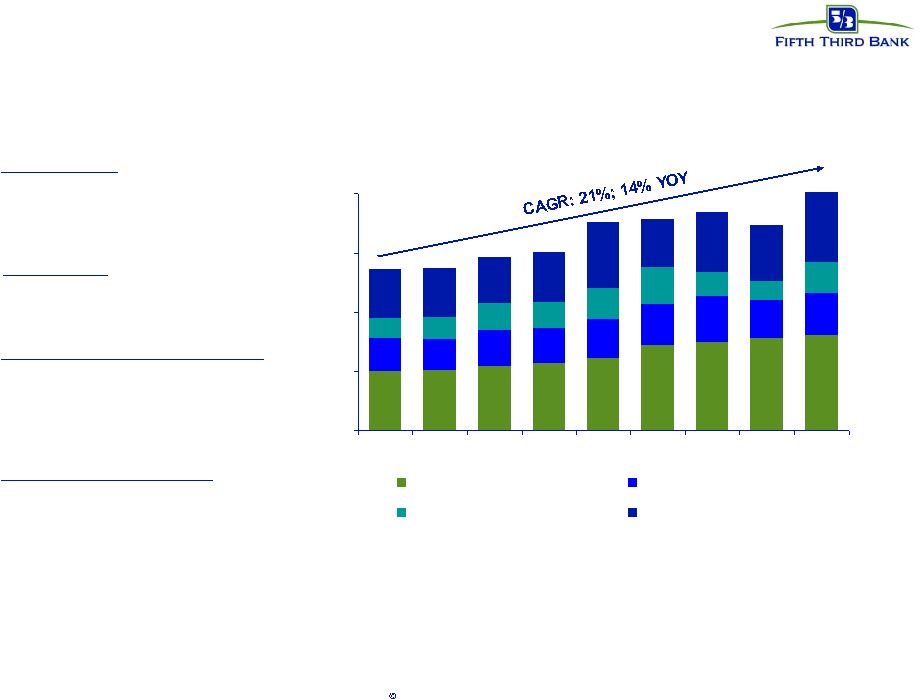 6 Fifth Third Bank | All Rights Reserved Corporate banking $0 $30 $60 $90 $120 4Q06 1Q07 2Q07 3Q07 4Q07 1Q08 2Q08 3Q08 4Q08 International Business lending Derivatives Capital markets lending fees 2-Yr CAGR YOY growth +19% +25% +12% +27% +6% -3% +10% +32% International • Letters of credit • Foreign exchange Capital markets lending fees • Institutional Sales • Asset securitization/conduit fees • Loan/lease syndication fees Derivatives • Customer interest rate derivatives Business lending fees • Commitment and other loan fees |
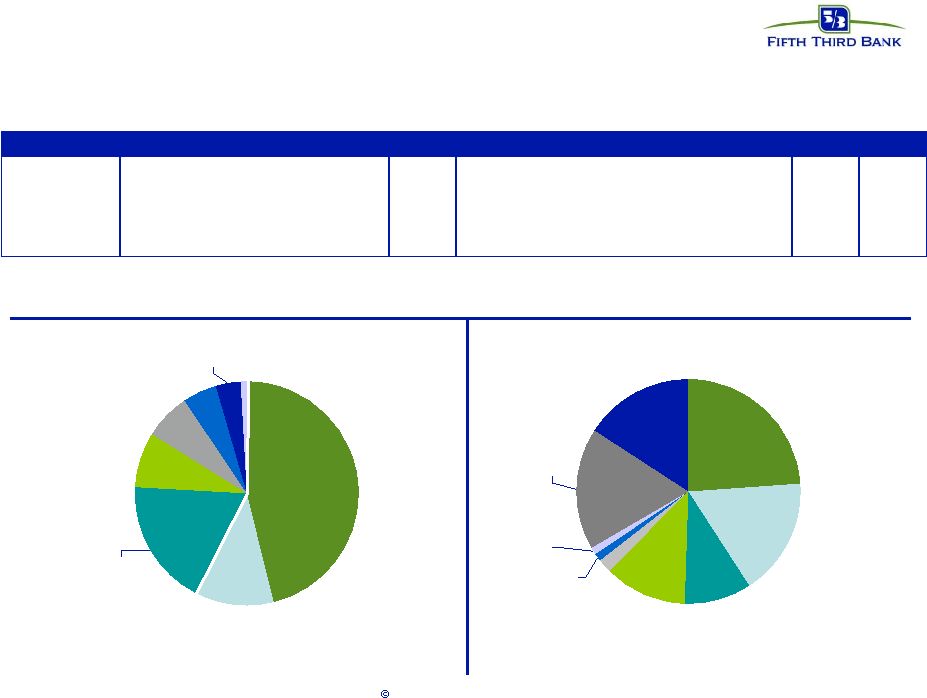 7 Fifth Third Bank | All Rights Reserved Credit by portfolio* C&I 46% Home equity 7% Other consumer 1% Auto 5% Residential mortgage 8% Commercial mortgage 11% Commercial construction 18% Card 4% MI 24% FL 16% Other / National 17% KY 2% TN 1% IL 12% OH 17% IN 10% NC 1% Net charge-offs by loan type Net charge-offs by geography ($ in millions) C&I Commercial mortgage Commercial construction Commercial lease Total commercial Residential mortgage Home equity Auto Credit card Other consumer Total consumer Total loans & leases Loan balances $29,197 $12,502 $5,114 $3,666 $50,479 $9,385 $12,752 $8,594 $1,811 $1,122 $33,664 $84,143 % of total 35% 15% 6% 4% 60% 11% 10% 2% 1% 40% Non-performing assets $548 $502 $400 $21 $1,472 $719 $243 $34 $30 $1 $1,027 $2,499 NPA ratio 1.88% 4.02% 7.82% 0.59% 2.92% 7.66% 1.90% 0.40% 1.68% 0.10% 3.05% 2.97% Net charge-offs $382 $94 $151 $0 $626 $68 $54 $43 $30 $6 $201 $827 Net charge-off ratio 5.03% 2.84% 10.00% 0.00% 4.70% 2.90% 1.68% 2.00% 6.82% 2.41% 2.40% 3.81% *Loans remaining in loan portfolio as of December 31, 2008 (data excludes loans held-for-sale) |
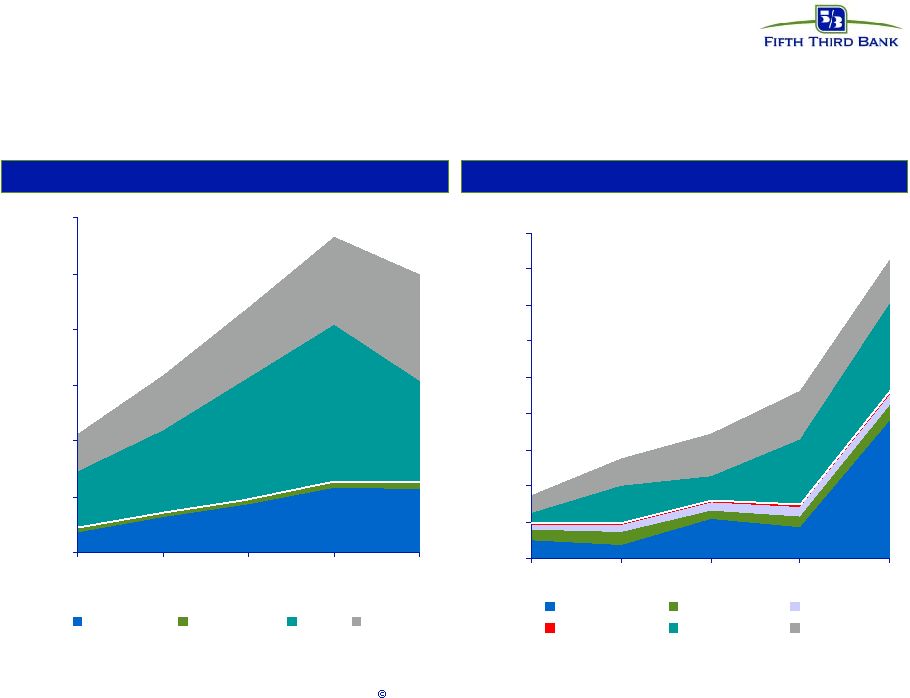 8 Fifth Third Bank | All Rights Reserved Non-performing assets and net charge-offs: Product view* 0 100,000 200,000 300,000 400,000 500,000 600,000 700,000 800,000 900,000 Q4 2007 Q1 2008 Q2 2008 Q3 2008 Q4 2008 C&I/Lease Auto Credit Card Other CRE Res RE 0 500,000 1,000,000 1,500,000 2,000,000 2,500,000 3,000,000 Q4 2007 Q1 2008 Q2 2008 Q3 2008 Q4 2008 C&I/Lease Auto/Other CRE Res RE Total NPAs Total NCOs *Loans remaining in loan portfolio as of December 31, 2008 (data excludes loans held-for-sale) |
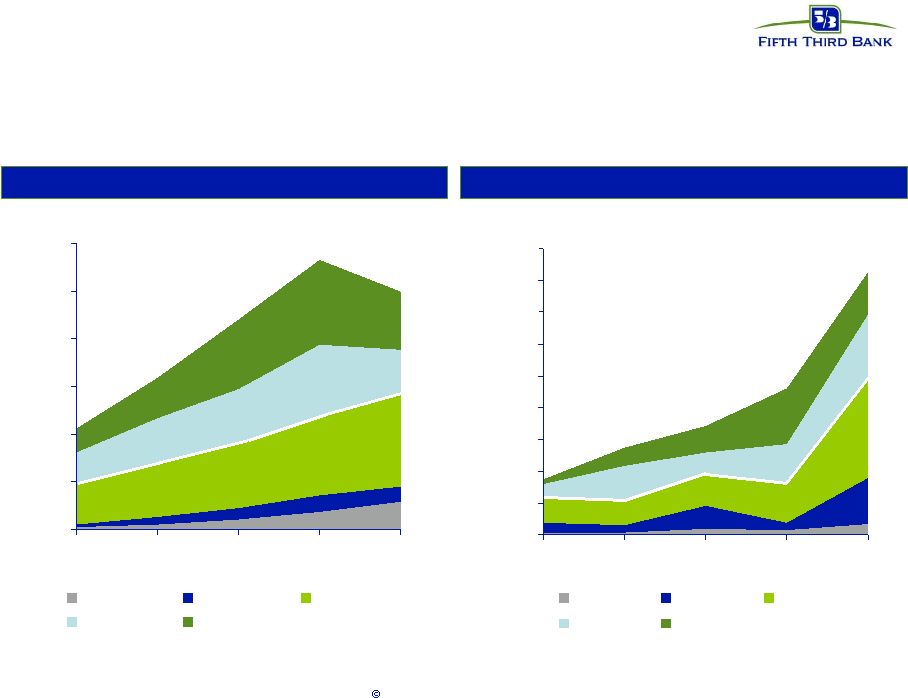 9 Fifth Third Bank | All Rights Reserved - 500,000 1,000,000 1,500,000 2,000,000 2,500,000 3,000,000 Q4 2007 Q1 2008 Q2 2008 3Q 2008 4Q 2008 Other SE National Other MW Michigan Florida - 100,000 200,000 300,000 400,000 500,000 600,000 700,000 800,000 900,000 Q4 2007 Q1 2008 Q2 2008 Q3 2008 Q4 2008 Other SE National Other MW Michigan Florida Non-performing assets and net charge-offs: Geographic view* Total NPAs Total NCOs *Loans remaining in loan portfolio as of December 31, 2008 (data excludes loans held-for-sale) |
 10 Fifth Third Bank | All Rights Reserved 9/30/2008 Total Current Contractual carrying 4Q08 carrying ($ in millions) balance value charge-offs value Sold 240 177 120 - Moved to held-for-sale 1,370 1,165 680 473 Total $1,610 $1,342 $800 $473 NPAs as of 9/30/2008 980 732 474 229 Non-NPAs as of 9/30/2008 630 609 326 244 Total $1,610 $1,342 $800 $473 Florida 808 669 393 261 Michigan 651 538 354 138 Georgia 17 16 5 7 North Carolina 27 16 2 14 Other 106 102 45 53 Total $1,610 $1,342 $800 $473 C&I 75 60 39 24 Commercial Mortgage 718 625 372 231 Commercial Construction 817 657 389 218 Commercial Lease - - - - Total $1,610 $1,342 $800 $473 Portfolio actions Loans identified where sale value believed to exceed work out value Portfolio actions reduced risk of further loss on more problematic loan portfolios Loans sold or transferred to held-for- sale reduced to value of approximately $0.33 on dollar $440 million, or 55%, of losses were on homebuilder / developer credits 55% of carrying values on non-accrual as of 9/30/08; remainder believed to have significant potential issues warranting sale Of the $800 million in 4Q08 losses: — 93% in Michigan and Florida — 95% on CRE loans |
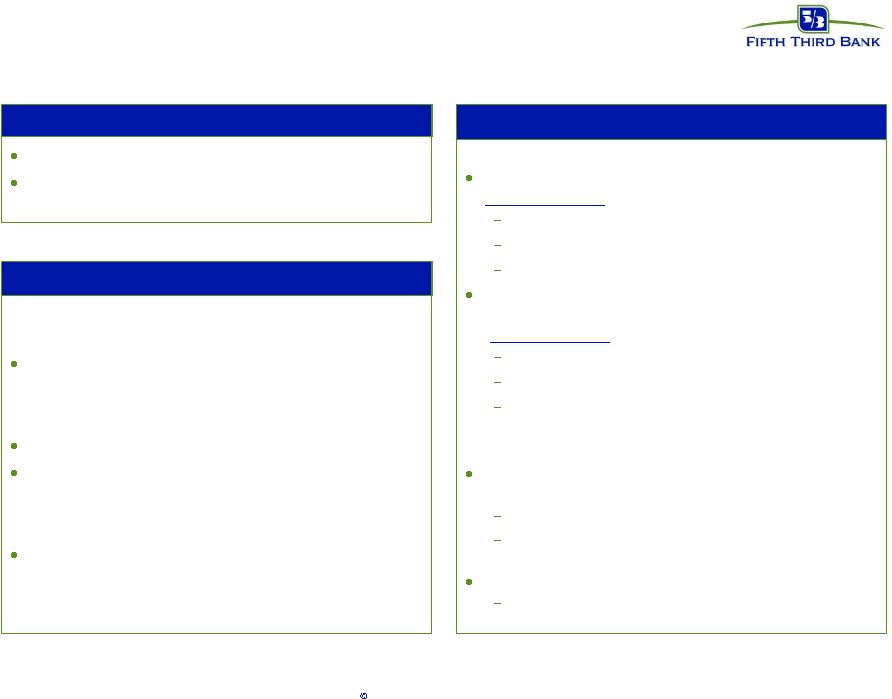 11 Fifth Third Bank | All Rights Reserved Portfolio performance drivers* Performance Largely Driven By No Participation In Subprime Option ARMs Discontinued or Suspended Lending Discontinued in 2007: Brokered home equity ($2.3B) Suspended in 2008: Homebuilder/residential development ($2.5B) Other non-owner occupied commercial RE ($8.6B) Saleability: All mortgages originated for intended sale** ** Residential construction-related consumer mortgages intended to be held in portfolio until permanent financing complete. Jumbo mortgage originations currently being held due to market conditions. Geography: Florida, Michigan most stressed 4Q08 C/O ratio: Total loan portfolio 5.27% Commercial portfolio 6.18% Consumer portfolio 3.93% Remaining Midwest, Southeast performance reflects economic trends 4Q08 C/O ratio: Total loan portfolio 3.22% ex-FL/MI Commercial portfolio 4.13% ex-FL/MI Consumer portfolio 1.74% ex-FL/MI Products: Homebuilder/developer charge-offs $128 million in 4Q08 Total charge-off ratio 3.81% (3.32% ex-HBs) Commercial charge-off ratio 4.70% (3.93% ex- HBs) Brokered home equity charge-offs 4.52% in 4Q08 Direct home equity portfolio 1.04% *Loans remaining in loan portfolio as of December 31, 2008 (data excludes loans held-for-sale) |
 12 Fifth Third Bank | All Rights Reserved Loss mitigation activities Reset policies and guidelines — Eliminated all brokered home equity production — Significantly tightened underwriting limits and exception authorities — Further restrictions on consumer guidelines for weaker geographies — Suspended all new residential development lending and non-owner occupied commercial property lending — New concentration limits for commercial portfolio Loss mitigation and containment — Implemented Watch and Criticized Asset Reduction initiative — Major expansion of commercial and consumer workout teams — Implemented aggressive home equity line management program — Expanded consumer credit outreach program — Rigorous review of geographic exposures — Sales of problem loans |
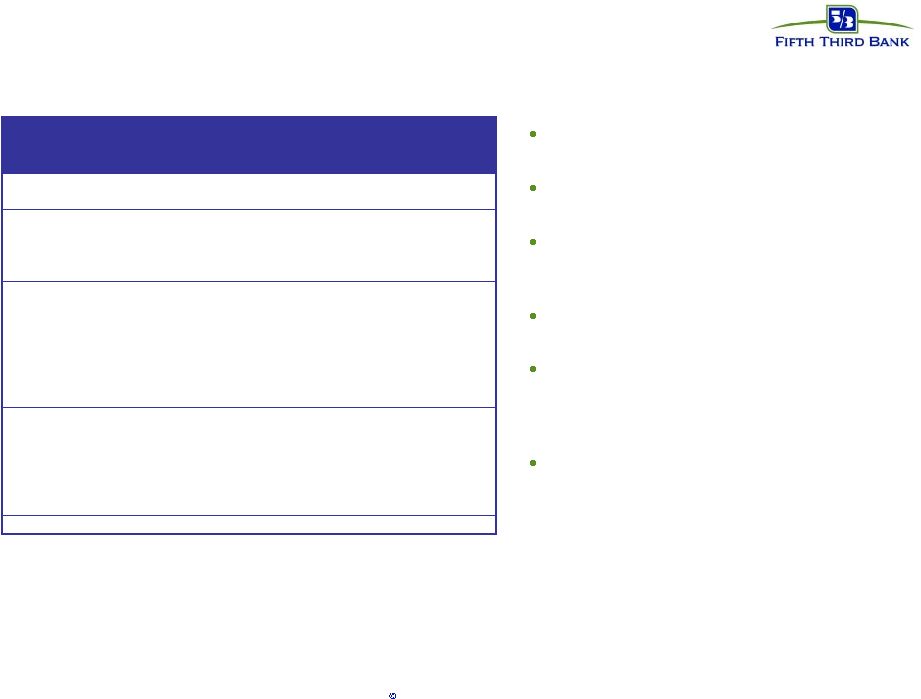
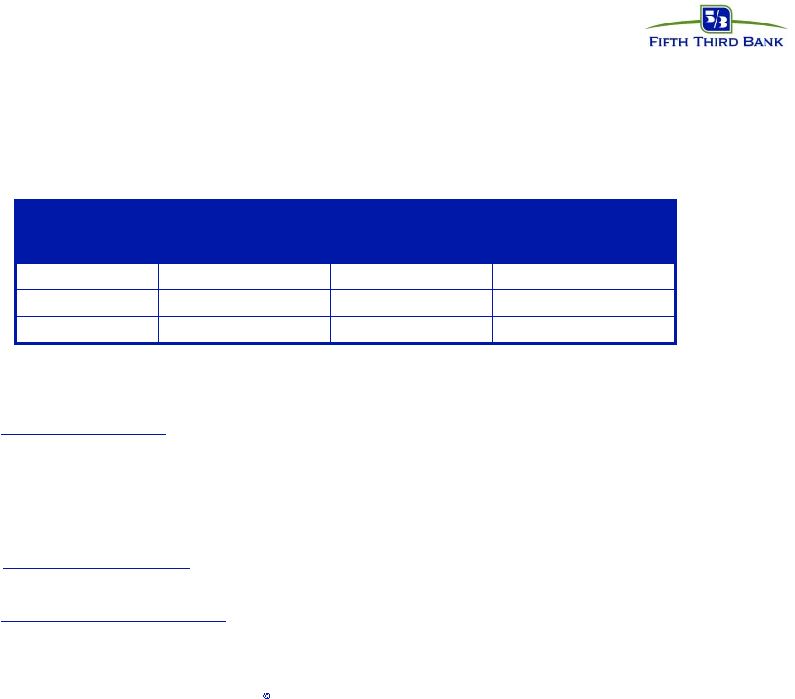 13 Fifth Third Bank | All Rights Reserved • Capital plan and targets designed to help ensure strong capital levels, positioning Fifth Third to absorb significant potential losses and provisions in a potentially more difficult environment through 2009 • Revised capital targets in June 2008 in order to provide greater cushion • Strengthened Fifth Third’s capital position through several capital actions intended to maintain a Tier 1 ratio within target range should credit deterioration persist — Capital issuances – Issued $1.1 billion of Tier 1 capital in the form of convertible preferred securities; achieved new Tier 1 target immediately – Completed the sale of $3.4 billion in senior preferred shares to the U.S. Department of the Treasury under the Capital Purchase Program — Dividend reductions – Reduced quarterly common dividend to $0.01 per share, conserves approximately $300 million in common equity on a full year basis — Asset sales/dispositions – Continue to evaluate businesses from a strategic planning perspective Strong capital position 7.9% 14.8% 10.6% 4Q08 6-7% 11.5-12.5% 8-9% Target N/A 10% 6% Regulatory “well- capitalized” minimum TE/TA Total Capital Tier 1 Capital Ratio |
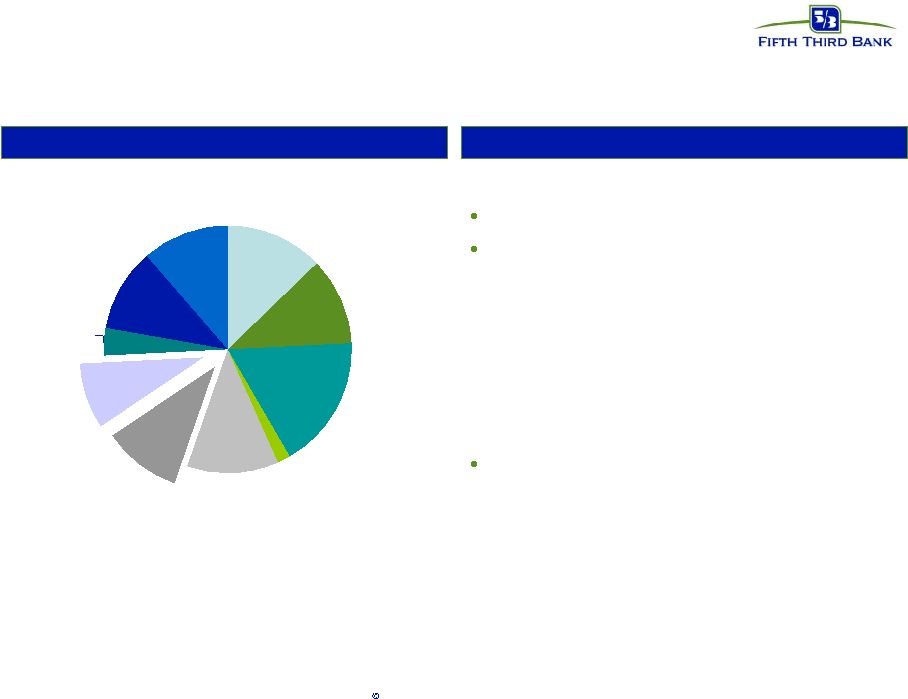 14 Fifth Third Bank | All Rights Reserved Active management of liquidity profile Fifth Third remains heavily core funded Flexibility and liquidity further enhanced by — Dividend reductions — Large capital raise further bolstered Holding Company cash and capital levels — Significant committed lines available to access secured borrowings against assets Strong debt ratings relative to peers Stable Funding Highlights Equity 10% Other liabilities 4% ST Borrowings 9% Savings / MMDA 17% Interest Checking 12% Foreign Office 2% Non-core Deposits 10% Consumer Time 12% Demand 13% Long Term Debt 11% |
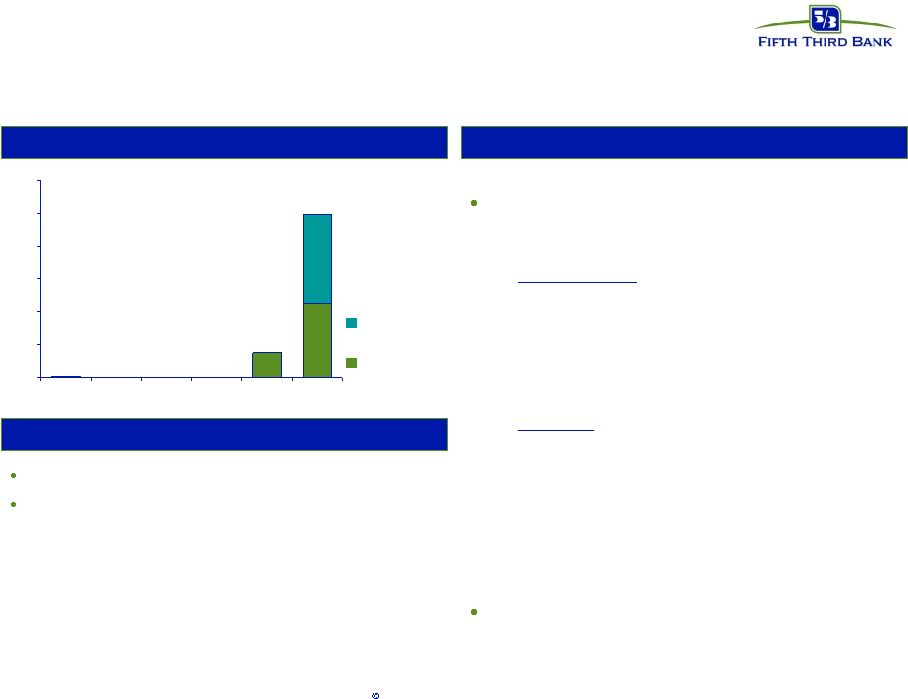 15 Fifth Third Bank | All Rights Reserved Strong holding company liquidity profile 750 4956 0 1000 2000 3000 4000 5000 6000 2009 2010 2011 2012 2013 2014 on Current holding company cash position through 1Q10 Sufficient to: — Satisfy all fixed obligations over the next twenty-four months (debt maturities, common and preferred dividends, interest and other expenses) Without: — Accessing capital markets — Relying on dividends from subsidiaries — Proceeds from asset sales $31 million in debt maturities in 2009; none in next four years Holding Company Unsecured Debt Maturities Highlights $mm Holding Company Liquidity Position Cash at 12/31/08: $2.7 billion Expected cash obligations over the next 12 months — $31 million in debt maturities — ~$23 million common dividends — ~$264 million preferred dividends — ~$442 million interest and other expenses Fifth Third Bancorp Fifth Third Capital Trust |
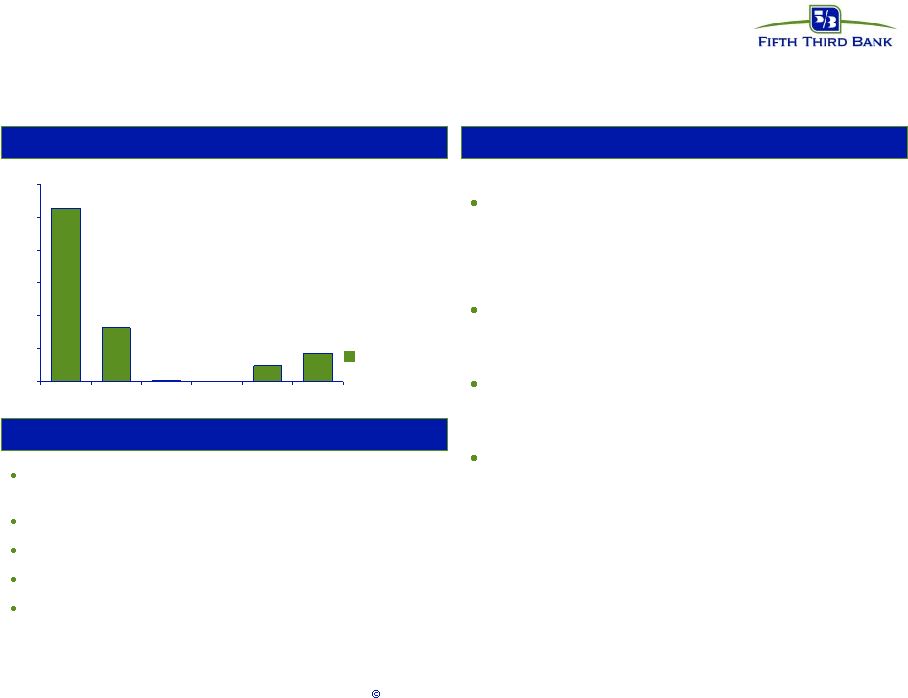 16 Fifth Third Bank | All Rights Reserved Strong bank liquidity profile 39 3 835 500 1639 5287 0 1000 2000 3000 4000 5000 6000 2009 2010 2011 2012 2013 2014 on Current unused borrowing capacity under secured facilities sufficient to fund all unsecured maturities for over five years — Assumes no access to capital markets Active management to maintain available lines associated with pledgeable assets to ensure contingency funding Reduction of overnight borrowings through use of more dependable, less expensive secured facilities Significant available borrowing capacity at each of subsidiary banks Bank Unsecured Debt Maturities Highlights $mm Bank Liquidity Position Current unused available borrowing capacity $17 billion FHLB borrowings $6.1 billion Core deposits of $66.5 billion Equity of $14.2 billion All market borrowings by Fifth Third Bank (OH) Fifth Third Bank (Ohio) |
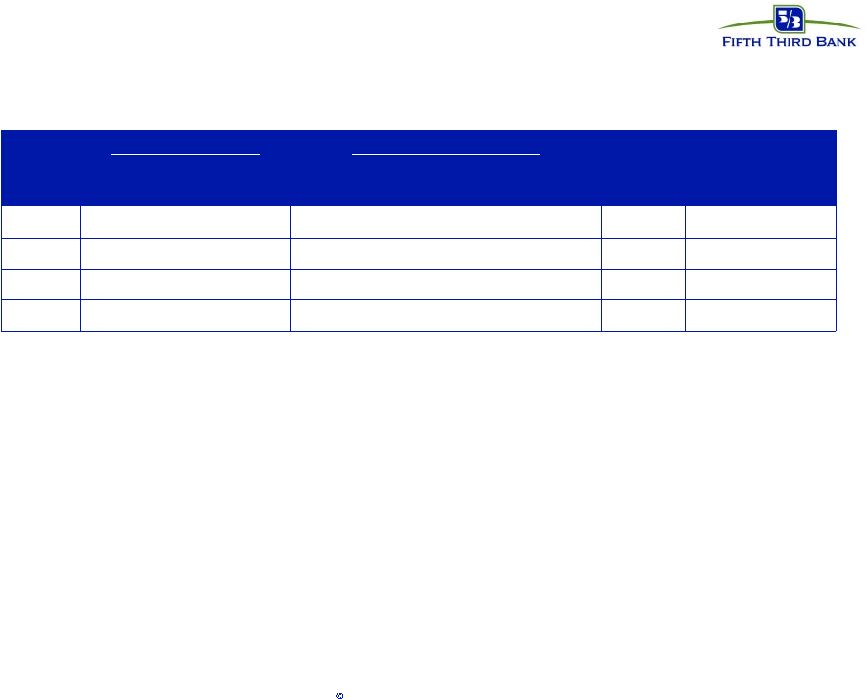 17 Fifth Third Bank | All Rights Reserved Fifth Third debt ratings* # Date of most recent change in rating or outlook AA A+ A Aa3 LT Deposit Negative 10/24/08 F1 A F1 A Fitch AA A Aa3 Senior Fifth Third Bank (OH, MI) R-1H A-1 P-1 Short-term 3/18/08 12/19/08 9/18/08 Rating Date # Current Outlook Fifth Third Bancorp Negative Negative Negative R-1M A-2 P-1 Short- term AA (low) DBRS A- S&P A1 Moody’s Senior Source: Bloomberg LLP as of 1/20/2009 The ratings listed in this document are generated from information provided to Fifth Third through Bloomberg LP. These ratings are subject to change based upon criteria developed by the applicable rating agency; Fifth Third does not necessarily agree with any of these ratings and has not independently verified or reviewed any of these companies to determine whether they would meet any ratings, underwriting or other credit criteria developed independently by Fifth Third. Neither you nor any customer should use these ratings as determinative in purchasing credit or other services from Fifth Third. Fifth Third does not provide legal, accounting, financial, tax or other expert advice. Consult your own legal, accounting, financial and tax advisors before making any decision to invest with or request credit from Fifth Third. |
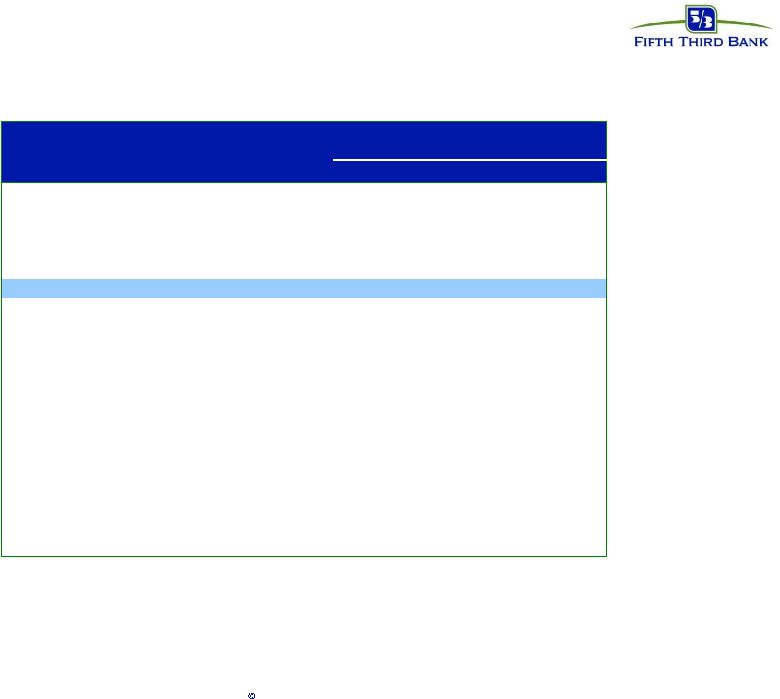 18 Fifth Third Bank | All Rights Reserved Fifth Third debt ratings Lead Bank Moody's S&P Fitch DBRS JPMorgan Chase (JPMorgan Chase Bank NA) Aa1 AA- AA- AAL Wells Fargo (Wells Fargo Bank NA) Aa1 AA+ AA AAH US Bank (US Bank NA North Dakota) Aa1 AA+ AA- NR Bank of America (Bank America America NA) Aa2 AA- A+ AAL BB&T (BB&T Co/WI) Aa2 AA- AA- AA Fifth Third Bancorp (Fifth Third Bank) Aa3 A A AA SunTrust (SunTrust Bank) Aa3 AA- A+ AAL PNC (PNC Bank NA) Aa3 A+ A+ AAL Citi (Citibank NA) Aa3 A+ A+ AA M&I (M&I Bank) Aa3 A A+ A Comerica (Comerica Bank) A1 A+ A+ AH Regions (Regions Bank) A1 A+ A+ AAL Key (Key Bank NA) A1 A A NR M&T (Manufacturers & Traders Trust Co.) A1 A A- A Capital One (Capital One Bank USA NA) A2 A- A- AL Huntington (Huntington National Bank) A2 A- A- A Zions (Zions First National Bank, Utah) A2 A- A- A NR: not rated Long-Term Issuer Rating Source: Bloomberg LLP as of 1/20/2009 The ratings listed in this document are generated from information provided to Fifth Third through Bloomberg LP. These ratings are subject to change based upon criteria developed by the applicable rating agency; Fifth Third does not necessarily agree with any of these ratings and has not independently verified or reviewed any of these companies to determine whether they would meet any ratings, underwriting or other credit criteria developed independently by Fifth Third. Neither you nor any customer should use these ratings as determinative in purchasing credit or other services from Fifth Third. Fifth Third does not provide legal, accounting, financial, tax or other expert advice. Consult your own legal, accounting, financial and tax advisors before making any decision to invest with or request credit from Fifth Third. |
 19 Fifth Third Bank | All Rights Reserved Appendix |
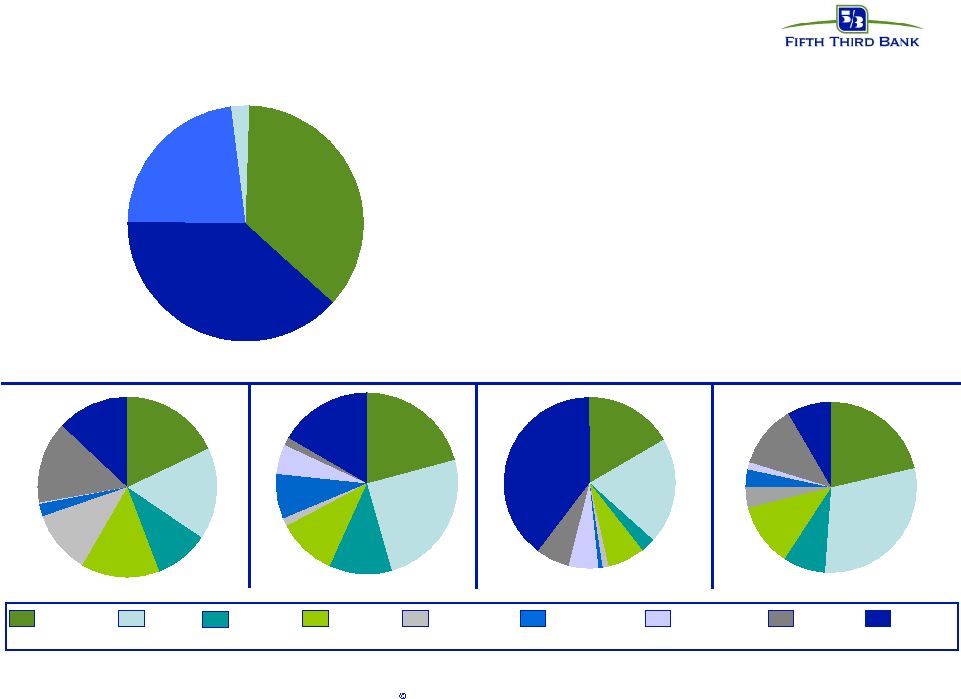 20 Fifth Third Bank | All Rights Reserved Nonperforming assets* • Total NPAs of $2.5B • Homebuilder/developer NPAs of $366 M; represent 15% of total NPAs • Commercial NPAs of $1.5B; down 26 percent from the third quarter • Consumer NPAs of $1.0B; recent growth driven by residential real estate, particularly in Michigan and Florida 2% 13% 20% 6% 14% 8% 21% 21% 3% 7% 40% 17% 6% 1% 1% 5% 20% 8% 4% 10% 15% 2% 28% 3% 20% 10% 11% 17% 34% 1% 11% 1% 8% 3% 25% C&I^ (23%) CRE (36%) Residential (38%) Other Consumer (3%) ILLINOIS INDIANA FLORIDA TENNESSEE KENTUCKY OHIO MICHIGAN Residential $961M 38% C&I* $570M 23% Other $66M 3% CRE $902M 36% ^C&I includes commercial lease NORTH CAROLINA OTHER / NATIONAL *Loans remaining in loan portfolio as of December 31, 2008 (data excludes loans held-for-sale) |
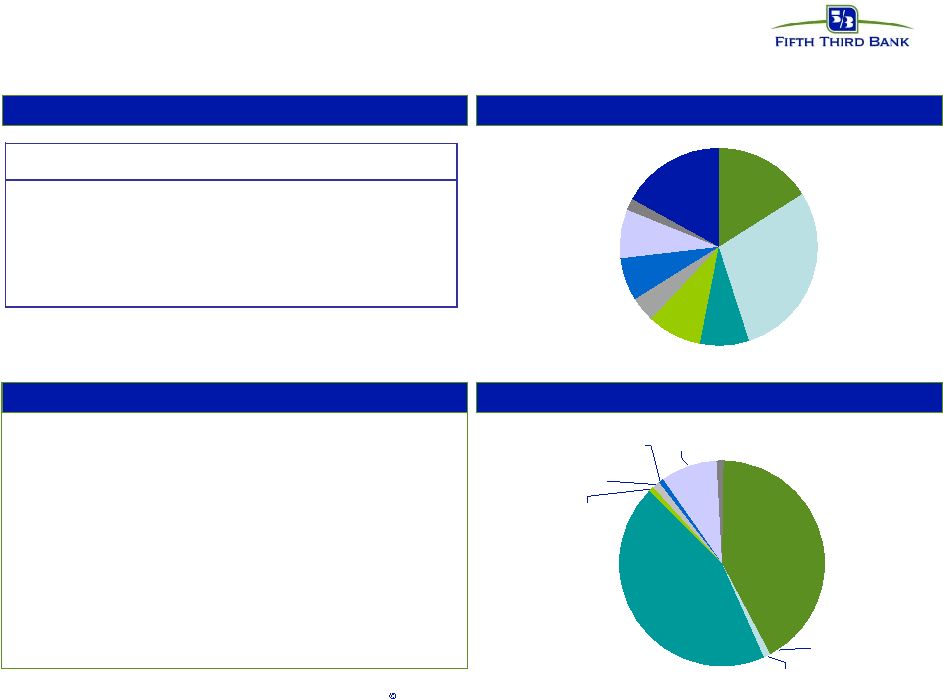 21 Fifth Third Bank | All Rights Reserved Commercial construction* Accomodation 1% Auto Retailers 1% Finance & insurance 3% Construction 39% Manufacturing 1% Real estate 44% Retail Trade 1% Other 9% Wholesale Trade 1% Loans by geography Credit trends Loans by industry Comments • Declining valuations in residential and land developments • In 4Q08 reduced concentrations in most stressed markets (Florida and Michigan) • Continued stress expected through 2009 OH 29% IN 8% IL 9% KY 4% TN 7% NC 8% Other 2% FL 17% MI 16% ($ in millions) 4Q07 1Q08 2Q08 3Q08 4Q08 Balance $5,561 $5,592 $6,007 $6,002 $5,114 90+ days delinquent $67 $49 $53 $84 $73 90+ days ratio 1.21% 0.87% 0.88% 1.40% 1.44% NPAs $257 $418 $552 $659 $400 as % of loans 4.61% 7.48% 9.19% 10.98% 7.82% Net charge-offs $12 $72 $49 $88 $151 as % of loans 0.83% 5.20% 3.46% 5.71% 10.00% Commercial construction *Loans remaining in loan portfolio as of December 31, 2008 (data excludes loans held-for-sale) |
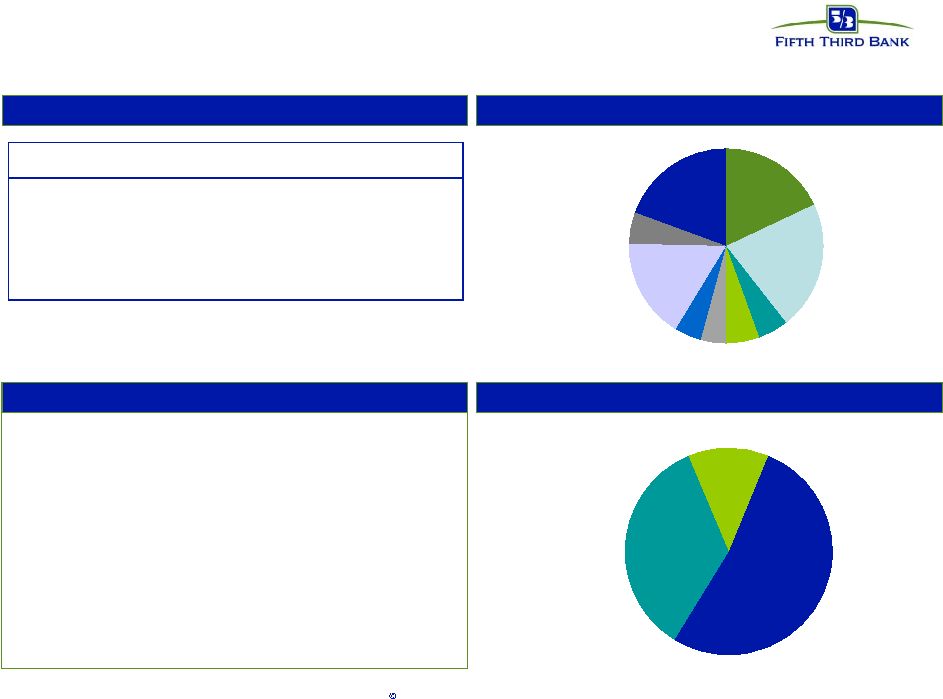 22 Fifth Third Bank | All Rights Reserved Homebuilders/developers* Loans by geography Credit trends Loans by industry Comments • Making no new loans to builder/developer sector • Residential & land valuations under continued stress • 5% of commercial loans; < 3% of total gross loans • Balance by product approximately 52% Construction, 35% Mortgage, 13% C&I MI 18% OH 22% IN 5% IL 6% KY 4% TN 4% NC 17% Other 5% FL 19% C&I 13% Commercial construction 52% Commercial mortgage 35% *Increase in 2Q08 balance due to the First Charter acquisition *Loans remaining in loan portfolio as of December 31, 2008 (data excludes loans held-for-sale) ($ in millions) 4Q07 1Q08 2Q08* 3Q08 4Q08 Balance $2,868 $2,705 $3,295 $3,065 $2,481 90+ days delinquent $57 $60 $123 $105 $74 90+ days ratio 1.99% 2.21% 3.73% 3.41% 2.98% NPAs $176 $309 $547 $702 $366 as % of loans 6.14% 11.42% 16.62% 22.89% 14.74% Net charge-offs $8 $43 $34 $163 $128 as % of loans 1.11% 6.14% 4.63% 19.75% 19.71% Homebuilders/developers |
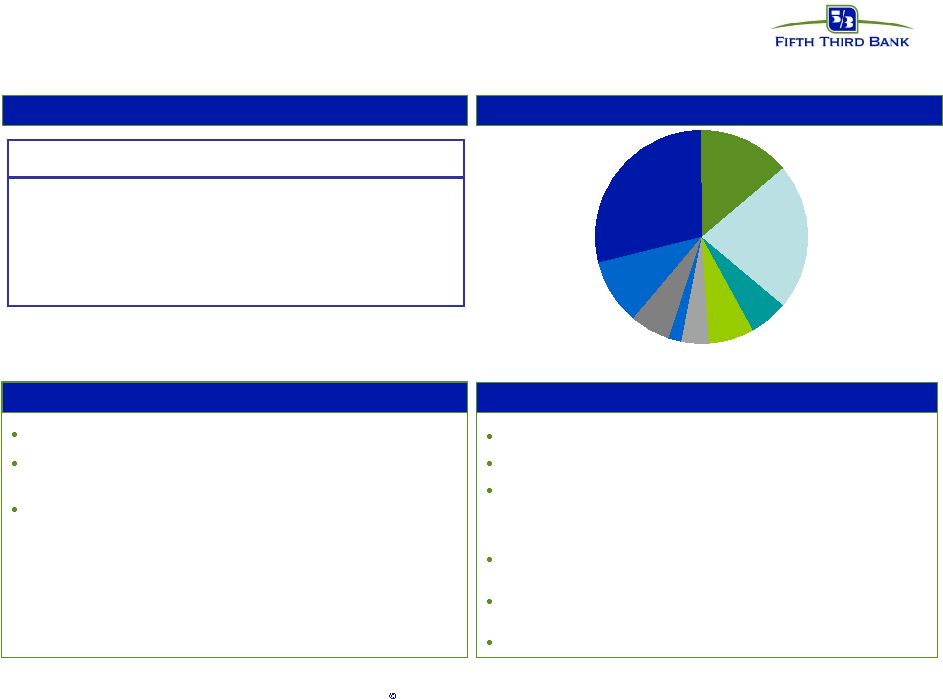 23 Fifth Third Bank | All Rights Reserved Residential mortgage 1 liens: 100% ; weighted average LTV: 77% Weighted average origination FICO: 729 Origination FICO distribution: <659 9%; 660-689 8%; 690-719 12%; 720-749 13%; 750+ 31%; Other ^ 27% (note: loans <659 includes CRA loans and FHA/VA loans) Origination LTV distribution: <70 26%; 70.1-80 41%; 80.1-90 12%; 90.1-95 5%; >95% 16% Vintage distribution: 2008 15%; 2007 18%; 2006 16%; 2005 20%; 2004 and prior 25% % through broker: 14%; performance similar to direct Loans by geography Credit trends Portfolio details Comments 29% FL concentration driving 69% total loss FL lots ($385 mm) running at 20% annualized loss rate (YTD) Mortgage company originations targeting 95% salability OH 22% IN 6% KY 4% NC 6% Other 10% FL 29% TN 2% MI 14% IL 7% ^ Includes acquired loans where FICO at origination is not available st ($ in millions) 4Q07 1Q08 2Q08 3Q08 4Q08 Balance $10,540 $9,873 $9,866 $9,351 $9,385 90+ days delinquent $186 $192 $229 $185 $198 90+ days ratio 1.76% 1.95% 2.32% 1.98% 2.11% NPAs $216 $333 $448 $593 $719 as % of loans 2.04% 3.37% 4.54% 6.34% 7.66% Net charge-offs $18 $34 $63 $77 $68 as % of loans 0.72% 1.33% 2.57% 3.16% 2.90% Residential mortgage |
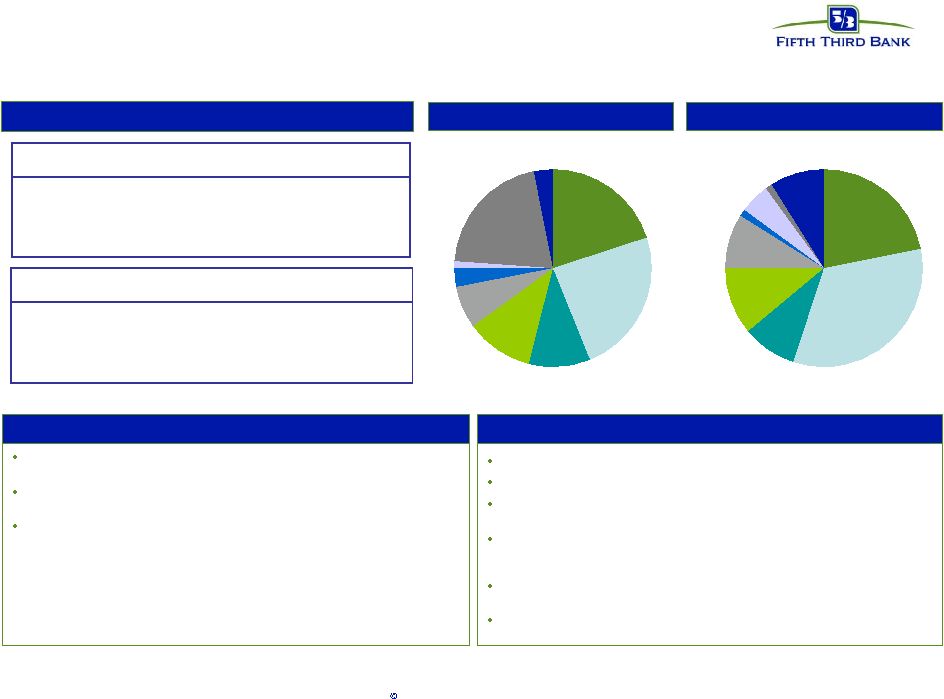 24 Fifth Third Bank | All Rights Reserved nd nd st nd nd st st Home equity 1 liens: 24%; 2 liens: 76% (18% of 2 liens behind FITB 1 s) Weighted average origination FICO: 755 Origination FICO distribution: <659 4%; 660-689 8%; 690-719 14%; 720- 749 17%; 750+ 47%; Other 10% Weighted average CLTV: 77% (1 liens 62%; 2 liens 82%) Origination CLTV distribution: <70 36%; 70.1-80 20%; 80.1-90 19%; 90.1-95 9%; >95 16% Vintage distribution: 2008 11%; 2007 13%; 2006 18%; 2005 16%; 2004 and prior 42% % through broker channels: 19% WA FICO: 740 brokered, 758 direct; WA CLTV: 89% brokered; 74% direct Portfolio details Comments Brokered loans by geography Direct loans by geography Credit trends Approximately 18% of portfolio concentration in broker product driving approximately 49% total loss Portfolio experiencing increased loss severity (losses on 2 liens approximately 100%) Aggressive home equity line management strategies in place Note: Brokered and direct home equity net charge-off ratios are calculated based on end of period loan balances ^ Includes acquired loans where FICO at origination is not available MI 22% OH 33% IN 9% IL 11% KY 9% Other 1% FL 9% NC 5% TN 1% *Increase in 2Q08 balance due to the First Charter acquisition ($ in millions) 4Q07 1Q08 2Q08 3Q08 4Q08 Balance $2,713 $2,651 $2,433 $2,368 $2,313 90+ days delinquent $34 $33 $34 $31 $37 90+ days ratio 1.25% 1.26% 1.40% 1.33% 1.58% Net charge-offs $17 $23 $28 $30 $26 as % of loans 2.52% 3.29% 4.64% 5.05% 4.52% Home equity - brokered MI 20% OH 24% IN 10% IL 11% KY 7% Other 21% FL 3% NC 1% TN 3% ($ in millions) 4Q07 1Q08 2Q08* 3Q08 4Q08 Balance $9,161 $9,152 $9,988 $10,232 $10,439 90+ days delinquent $38 $43 $42 $41 $58 90+ days ratio 0.41% 0.47% 0.42% 0.40% 0.55% Net charge-offs $15 $18 $27 $26 $27 as % of loans 0.66% 0.78% 1.07% 1.00% 1.04% Home equity - direct |
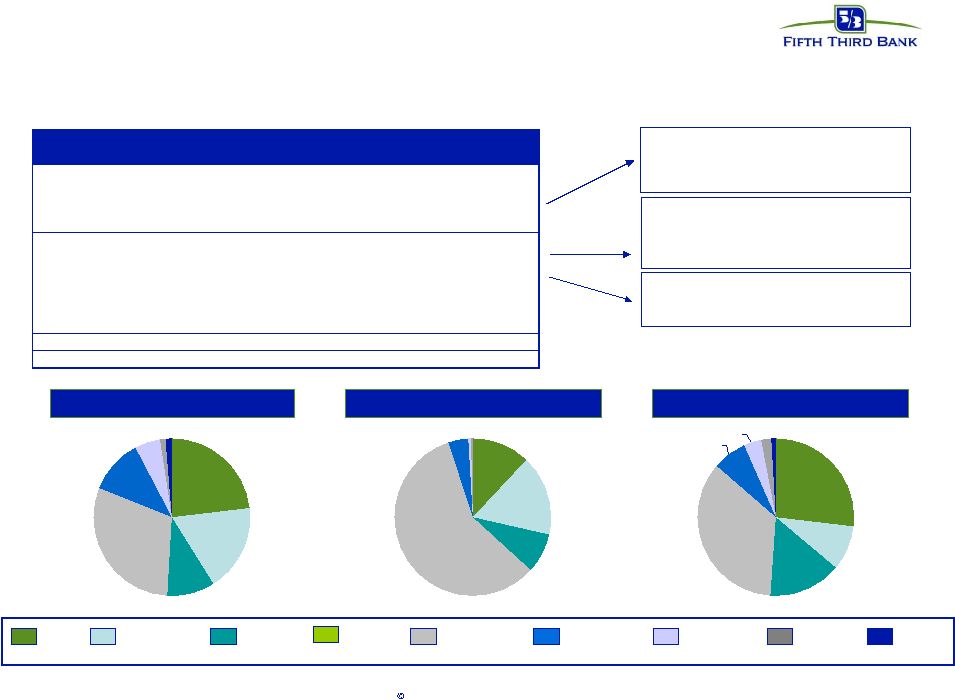  25 Fifth Third Bank | All Rights Reserved Florida market* Deterioration in real estate values having effect on credit trends as evidenced by increasing NPA/NCOs in real estate related products Homebuilders, developers tied to weakening real estate market Increasing severity of loss due to significant declines in valuations Valuations; relatively small home equity portfolio 23% 18% 10% 31% 11% 5% 1% 1% ($ in millions) Loans (bn) % of FITB NPAs (mm) % of FITB NCOs (mm) % of FITB Commercial loans 2.09 7% 74 13% 36 9% Commercial mortgage 1.63 13% 102 20% 12 13% Commercial construction 0.89 17% 49 12% 20 13% Commercial lease - 0% - 0% - 0% Commercial 4.61 9% 225 15% 68 11% Mortgage 2.74 29% 357 50% 47 69% Home equity 0.99 8% 26 11% 9 17% Auto 0.49 6% 4 12% 5 11% Credit card 0.10 5% 1 4% 3 9% Other consumer 0.12 11% - 0% 1 13% Consumer 4.44 13% 388 38% 65 32% Total 9.05 11% 613 25% 133 16% COML MORTGAGE C&I RESI MORTGAGE OTHER CONS COML CONST COML LEASE HOME EQUITY AUTO CREDIT CARD Total Loans NPAs NCOs 12% 17% 8% 58% 1% 4% 0% 27% 9% 15% 35% 1% 4% 7% 2% *Loans remaining in loan portfolio as of December 31, 2008 (data excludes loans held-for-sale) |
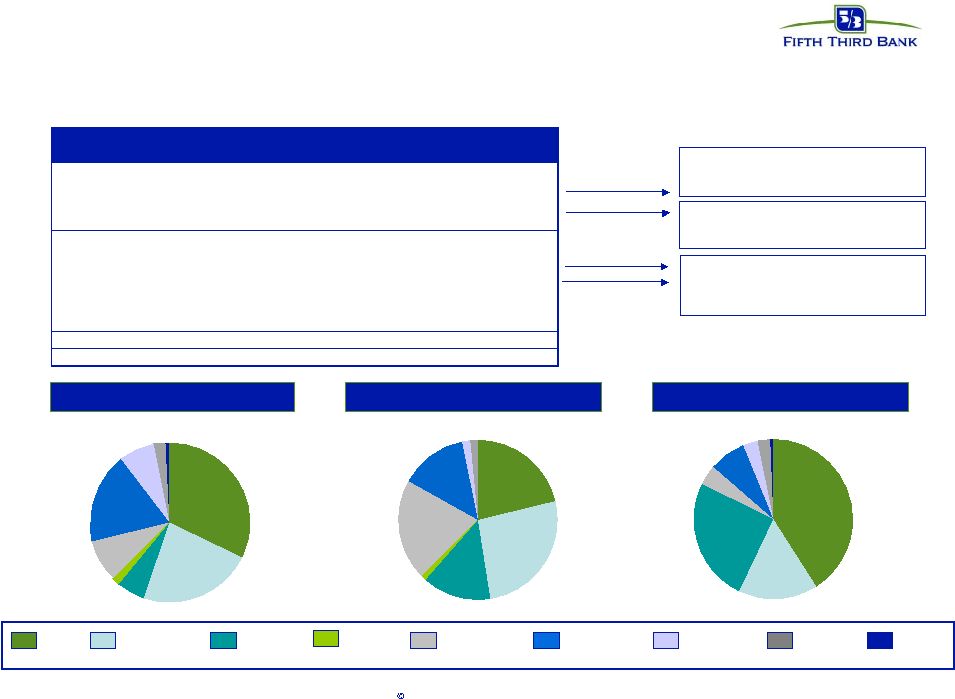  26 Fifth Third Bank | All Rights Reserved Michigan market* Deterioration in home price values coupled with weak economy impacting credit trends due to frequency of defaults and severity Homebuilders, developers tied to weak real estate market Negative impact from housing valuations, economy, unemployment Economic weakness impacts commercial real estate market ($ in millions) Loans (bn) % of FITB NPAs (mm) % of FITB NCOs (mm) % of FITB Commercial loans 4.78 16% 99 18% 81 21% Commercial mortgage 3.41 27% 122 24% 32 34% Commercial construction 0.82 16% 65 16% 50 33% Commercial lease 0.22 6% 4 18% - 0% Commercial 9.23 18% 290 20% 163 26% Mortgage 1.29 14% 96 13% 8 11% Home equity 2.72 21% 65 27% 15 28% Auto 1.12 13% 7 21% 6 14% Credit card 0.32 18% 7 23% 5 16% Other consumer 0.12 11% - 0% 1 14% Consumer 5.57 17% 175 17% 35 17% Total 14.80 18% 465 19% 198 24% COML MORTGAGE C&I RESI MORTGAGE OTHER CONS COML CONST COML LEASE HOME EQUITY AUTO CREDIT CARD Total Loans NPAs NCOs 40% 16% 25% 4% 8% 3% 3% 1% 21% 25% 14% 1% 14% 2% 21% 2% *Loans remaining in loan portfolio as of December 31, 2008 (data excludes loans held-for-sale) 32% 23% 6% 1% 9% 18% 8% 1% 2% |
 27 Fifth Third Bank | All Rights Reserved Cautionary statement This report may contain forward-looking statements about Fifth Third Bancorp within the meaning of Sections 27A of the Securities Act of 1933, as amended, and Rule 175 promulgated thereunder, and 21E of the Securities Exchange Act of 1934, as amended, and Rule 3b-6 promulgated thereunder, that involve inherent risks and uncertainties. This report may contain certain forward-looking statements with respect to the financial condition, results of operations, plans, objectives, future performance and business of Fifth Third Bancorp including statements preceded by, followed by or that include the words or phrases such as “believes,” “expects,” “anticipates,” “plans,” “trend,” “objective,” “continue,” “remain” or similar expressions or future or conditional verbs such as “will,” “would,” “should,” “could,” “might,” “can,” “may” or similar expressions. There are a number of important factors that could cause future results to differ materially from historical performance and these forward-looking statements. Factors that might cause such a difference include, but are not limited to: (1) general economic conditions and weakening in the economy, specifically the real estate market, either national or in the states in which Fifth Third, does business, are less favorable than expected; (2) deteriorating credit quality; (3) political developments, wars or other hostilities may disrupt or increase volatility in securities markets or other economic conditions; (4) changes in the interest rate environment reduce interest margins; (5) prepayment speeds, loan origination and sale volumes, charge-offs and loan loss provisions; (6) Fifth Third’s ability to maintain required capital levels and adequate sources of funding and liquidity; (7) changes and trends in capital markets; (8) competitive pressures among depository institutions increase significantly; (9) effects of critical accounting policies and judgments; (10) changes in accounting policies or procedures as may be required by the Financial Accounting Standards Board or other regulatory agencies; (11) legislative or regulatory changes or actions, or significant litigation, adversely affect Fifth Third, or the businesses in which Fifth Third, is engaged; (12) ability to maintain favorable ratings from rating agencies; (13) fluctuation of Fifth Third’s stock price; (14) ability to attract and retain key personnel; (15) ability to receive dividends from its subsidiaries; (16) potentially dilutive effect of future acquisitions on current shareholders' ownership of Fifth Third; (17) effects of accounting or financial results of one or more acquired entities; (18) difficulties in combining the operations of acquired entities; (19) lower than expected gains related to any potential sale of businesses, (20) loss of income from any potential sale of businesses that could have an adverse effect on Fifth Third’s earnings and future growth (21) ability to secure confidential information through the use of computer systems and telecommunications networks; and (22) the impact of reputational risk created by these developments on such matters as business generation and retention, funding and liquidity. Additional information concerning factors that could cause actual results to differ materially from those expressed or implied in the forward-looking statements is available in the Bancorp's Annual Report on Form 10-K for the year ended December 31, 2007, filed with the United States Securities and Exchange Commission (SEC). Copies of this filing are available at no cost on the SEC's Web site at or on the Fifth Third’s Web site at . Fifth Third undertakes no obligation to release revisions to these forward-looking statements or reflect events or circumstances after the date of this report. www.53.com www.sec.gov |