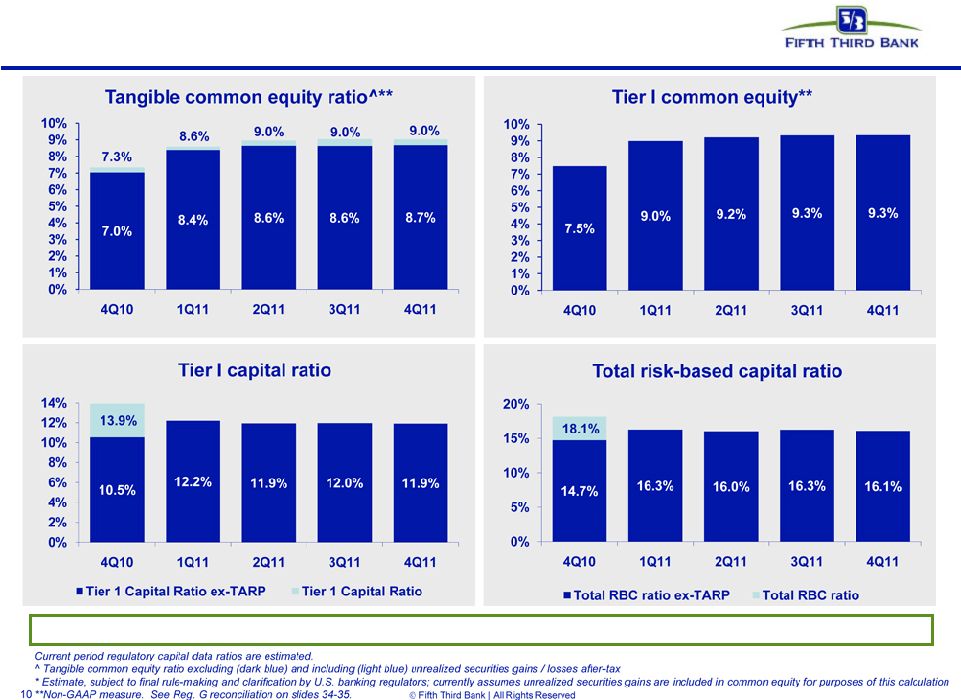
34 Fifth Third Bank | All Rights Reserved Regulation G Non-GAAP reconciliation $ and shares in millions (unaudited) For the Three Months Ended December September June March December 2011 2011 2011 2010 2010 Income before income taxes (U.S. GAAP) 418 530 506 377 417 Add: Provision expense (U.S. GAAP) 55 87 113 168 166 Pre-provision net revenue (a) 473 617 619 545 583 Net income available to common shareholders (U.S. GAAP) 305 373 328 88 270 Add: Intangible amortization, net of tax 3 3 4 5 7 Tangible net income available to common shareholders 308 376 332 93 277 Tangible net income available to common shareholders (annualized) (b) 1,222 1,492 1,332 377 1,099 Average Bancorp shareholders' equity (U.S. GAAP) 13,147 12,841 12,365 13,052 14,007 Less: Average preferred stock 398 398 398 1,557 3,648 Average goodwill 2,417 2,417 2,417 2,417 2,417 Average intangible assets 42 47 52 59 67 Average tangible common equity (c) 10,920 9,979 9,498 9,019 7,875 Total Bancorp shareholders' equity (U.S. GAAP) 13,201 13,029 12,572 12,163 14,051 Less: Preferred stock (398) (398) (398) (398) (3,654) Goodwill (2,417) (2,417) (2,417) (2,417) (2,417) Intangible assets (40) (45) (49) (55) (62) Tangible common equity, including unrealized gains / losses (d) 10,346 10,169 9,708 9,293 7,918 Less: Accumulated other comprehensive income / loss (470) (542) (396) (263) (314) Tangible common equity, excluding unrealized gains / losses (e) 9,876 9,627 9,312 9,030 7,604 Total assets (U.S. GAAP) 116,967 114,905 110,805 110,485 111,007 Less: Goodwill (2,417) (2,417) (2,417) (2,417) (2,417) Intangible assets (40) (45) (49) (55) (62) Tangible assets, including unrealized gains / losses (f) 114,510 112,443 108,339 108,013 108,528 Less: Accumulated other comprehensive income / loss, before tax (723) (834) (609) (405) (483) Tangible assets, excluding unrealized gains / losses (g) 113,787 111,609 107,730 107,608 108,045 Common shares outstanding (h) 920 920 920 919 796 Net charge-offs (i) 239 262 304 367 356 Ratios: Return on average tangible common equity (b) / (c) 11.88% 14.95% 14.02% 4.18% 13.95% Tangible common equity (excluding unrealized gains/losses) (e) / (g) 8.68% 8.63% 8.64% 8.39% 7.04% Tangible common equity (including unrealized gains/losses) (d) / (f) 9.04% 9.04% 8.96% 8.60% 7.30% Tangible book value per share (d) / (h) 11.25 11.05 10.55 10.11 9.94 Pre-provision net revenue / net charge-offs (a) / (i) 198% 235% 204% 149% 164% |