UNITED STATES
SECURITIES AND EXCHANGE COMMISSION
Washington, D.C. 20549
FORM N-CSR
CERTIFIED SHAREHOLDER REPORT OF REGISTERED
MANAGEMENT INVESTMENT COMPANIES
Investment Company Act file number 811-3275
Smith Barney Investment Funds Inc.
(Exact name of registrant as specified in charter)
| | |
| 125 Broad Street, New York, NY | | 10004 |
|
| (Address of principal executive offices) | | (Zip code) |
Robert I. Frenkel, Esq.
Smith Barney Fund Management LLC
300 First Stamford Place
Stamford, CT 06902
(Name and address of agent for service)
Registrant’s telephone number, including area code: (800) 451-2010
Date of fiscal year end: April 30,
Date of reporting period: October 31, 2004
| ITEM 1. | REPORT TO STOCKHOLDERS. |
The Semi-Annual Report to Stockholders is filed herewith.
SMITH BARNEY
MULTIPLE DISCIPLINE FUNDS
LARGE CAP GROWTH AND VALUE FUND
MULTIPLE DISCIPLINE SERIES | SEMI-ANNUAL REPORT | OCTOBER 31, 2004

NOT FDIC INSURED • NOT BANK GUARANTEED • MAY LOSE VALUE
WHAT’S INSIDE
LETTER FROM THE CHAIRMAN

R. JAY GERKEN, CFA
Chairman, President and Chief Executive Officer
Dear Shareholder,
Over the past six months, the domestic economy continued to recover from the recession of the prior three years, although a number of factors combined to slow its progress.
At the beginning of the period, the major U.S. equity indices had retreated after a strong beginning to 2004. Interest rates and inflation concerns were the primary culprits. Stronger-than-expected economic data painted a picture of improved growth. However, concerns about Iraq and uncertainty over the Presidential election weighed on the equity market. At the end of the second quarter, earnings were the focus for most investors. Corporate earnings, for the most part, were solid, though not as strong as in the first quarter.
Real gross domestic product (“GDP”)i grew at a rate of 3.3% during the second quarter, up from a previous estimate of 2.8% growth. Major contributors to the growth in GDP were business investment, consumer spending, and private inventory investment. Estimated GDP growth for the third quarter of 2004 is 3.7%.ii In the spring and summer, monthly job growth figures fluctuated between net gains and losses but improved through the fall, while the overall unemployment rate remained below the recent high of 6.3% set in June 2003.iii The U.S. Consumer Confidence Indexiv rose significantly through July, but has since declined through October, reflecting consumers’ growing concern about the rate of job growth and the outlook for the economy.
Crude oil prices rose to record highs during the period, leading to a spike in energy costs that helped curb consumer spending and acted as a brake on the domestic economy overall. The Federal Reserve Board (“Fed”) began a measured and deliberate cooling off of both the economy and inflation fears, at the end of the second quarter, by raising its federal funds rate targetv by 0.25% to 1.25%. By the end of the September, the rate would be raised twice more to 1.75%, and following the end of the fund’s reporting period, at its November meeting, the Fed increased the rate once more to 2.00%. Where the market had been concerned about the possibility of deflation at the start of the period, economic worries now center on the risks of inflation.
The past six months in the stock market saw small- and mid-capitalization stocks continue to generally outperform large-caps. The Russell 2000 Index,vi a proxy for the small-cap market, returned 4.87% for the period and the S&P MidCap 400 Indexvii returned 3.84%, while the S&P 500 Indexviii and the Dow Jones Industrial Average,ix which represent large-cap and blue chip stocks respectively, returned 2.96% and -0.92% for the same period. Value-oriented stocks continued to outpace growth-oriented stocks: the S&P 500/Barra Value Indexx returned 6.00% for the period versus -0.08% for the S&P 500/Barra Growth Index.xi
Foreign stock markets, as represented by the MSCI EAFE Index,xii which returned 5.74%, strongly outperformed the broad domestic market as represented by the broad Wilshire 5000 Index,xiii which returned 3.38%. Despite fluctuations during the period, bonds collectively generated positive total returns as reflected by the performance of the Lehman Brothers Aggregate Bond Index,xiv which returned 4.23% over the past six months.
1 Smith Barney Multiple Discipline Funds — Large Cap Growth and Value Fund | 2004 Semi-Annual Report
Special Notice to Shareholders
Effective August 19, 2004, John B. Cunningham is no longer the Large Cap Value segment manager. Mark McAllister and Robert Feitler, Jr. are responsible for the day-to-day management of that segment. Mr. McAllister is an investment officer of Smith Barney Fund Management LLC (“SBFM”) and a Managing Director of Citigroup Global Markets Inc. (“CGM”), and has been a portfolio manager with SBFM or its affiliates since 1999. Mr. Feitler is an investment officer of SBFM and a Director of CGM, and has been a portfolio manager and analyst with SBFM or its affiliates since 1995. Messrs. McAllister and Feitler also serve as portfolio managers for other Smith Barney funds.
Fund Performance
For the six-months ended October 31, 2004, Class A shares of the Smith Barney Multiple Discipline Funds — Large Cap Growth and Value Fund, excluding sales charges, returned -2.22%. These shares underperformed the fund’s unmanaged benchmark, the Russell 1000 Index,xv which returned 3.04% for the same period. They also underperformed the Lipper large-cap core funds category average,1 which was 1.21%.
PERFORMANCE SNAPSHOT
AS OF OCTOBER 31, 2004
(excluding sales charges)
| | | |
| | | 6 Months | |
| | | | |
Class A Shares – Multiple Discipline Funds — Large Cap Growth and Value Fund | | —2.22 | % |
| | | | |
Russell 1000 Index | | 3.04 | % |
| | | | |
Lipper Large-Cap Core Funds Category Average | | 1.21 | % |
The performance shown represents past performance. Past performance is no guarantee of future results and current performance may be higher or lower than the performance shown above. Principal value and investment returns will fluctuate and investors’ shares, when redeemed, may be worth more or less than their original cost. To obtain performance data current to the most recent month-end, please visit our website at www.smithbarneymutualfunds.com
Performance figures may reflect reimbursements or fee waivers, without which the performance would have been lower.
Class A share returns assume the reinvestment of income dividends and capital gains distributions at net asset value and the deduction of all fund expenses. Returns have not been adjusted to include sales charges that may apply when shares are purchased or the deduction of taxes that a shareholder would pay on fund distributions. Excluding sales charges, Class B shares returned -2.65% and Class C shares returned -2.65% over the six months ended October 31, 2004.
Performance Review
Over the six-month period, the fund’s most overweighted sectors relative to its benchmark were the consumer staples and healthcare sectors. The most underweighted sectors were in the industrials and financials sectors. In terms of individual holdings, the fund’s largest contribution to performance (percentage contributed to the portfolio’s total return for the period is in parentheses) were The Home Depot, Inc., warehouse-style stores selling building materials, home improvement supplies and lawn and garden products (0.39%), Microsoft Corp., a company which develops, manufactures, licenses and supports a wide range of software products (0.30%), General Electric Company, a company that produces aircraft engines, locomotives and other transportation equipment, appliances, lighting, electric distribution, etc. (0.28%), Johnson & Johnson, a company engaged in the manufacture and sale of products related to human health and well-being (0.26%), and ChevronTexaco Corporation, a company engaged in fully integrated petroleum operations, chemicals operations, coal mining, and power and energy services (0.25%). The largest detractors from performance for the
| 1 | | Lipper, Inc. is a major independent mutual-fund tracking organization. Returns are based on the 6-month period ended October 31, 2004, calculated among the 956 funds in the fund’s Lipper category, including the reinvestment of dividends and capital gains, if any, and excluding sales charges. |
2 Smith Barney Multiple Discipline Funds — Large Cap Growth and Value Fund | 2004 Semi-Annual Report
period were Merck & Co., Inc., a global research-driven pharmaceutical products company (-0.94%), Pfizer Inc., a research-based, global pharmaceutical company (-0.77%), IAC/InterActiveCorp, a multi-brand interactive commerce company (-0.66%), American International Group, Inc., a company engaged in a range of insurance and insurance-related activities (-0.59%), and The Coca-Cola Company, a firm which manufactures, distributes and markets non-alcoholic beverage concentrates and syrups, including fountain syrups, in markets across the world (-0.57%). At the close of the period, the fund continued to hold shares of all the issuers mentioned above.
Information About Your Fund
As you may be aware, several issues in the mutual fund industry have recently come under the scrutiny of federal and state regulators. The fund’s Adviser and some of its affiliates have received requests for information from various government regulators regarding market timing, late trading, fees, and other mutual fund issues in connection with various investigations. The regulators appear to be examining, among other things, the fund’s response to market timing and shareholder exchange activity, including compliance with prospectus disclosure related to these subjects. The fund has been informed that the Adviser and its affiliates are responding to those information requests, but are not in a position to predict the outcome of these requests and investigations.
In November 2003, Citigroup Asset Management (“CAM”) disclosed an investigation by the Securities and Exchange Commission (“SEC”) and the U.S. Attorney relating to CAM’s entry into the transfer agency business during 1997-1999. Citigroup has disclosed that the Staff of the SEC is considering recommending a civil injunctive action and/or an administrative proceeding against certain advisory and transfer agent entities affiliated with Citigroup, the former CEO of CAM, two former employees and a current employee of CAM, relating to the creation, operation and fees of its internal transfer agent unit that serves various CAM-managed funds. Citigroup is cooperating with the SEC and will seek to resolve this matter in discussion with the SEC Staff. Although there can be no assurance, Citigroup does not believe that this matter will have a material adverse effect on the fund.
As always, thank you for your confidence in our stewardship of your assets. We look forward to helping you continue to meet your financial goals.
Sincerely,

R. Jay Gerken, CFA
Chairman, President and Chief Executive Officer
November 17, 2004
3 Smith Barney Multiple Discipline Funds — Large Cap Growth and Value Fund | 2004 Semi-Annual Report
The information provided is not intended to be a forecast of future events, a guarantee of future results or investment advice. Views expressed may differ from those of the firm as a whole.
Portfolio holdings and breakdowns are as of October 31, 2004 and are subject to change and may not be representative of the fund’s current or future investments. The fund’s top ten holdings (as a % of net assets) as of this date were: Microsoft Corp. (4.6%), Merrill Lynch & Co., Inc. (3.7%), American International Group, Inc. (3.4%), Pfizer Inc. (3.3%), Texas Instruments Inc. (3.1%), Intel Corporation (3.0%), Johnson & Johnson (2.8%), Amgen Inc. (2.8%), The Coca-Cola Co. (2.6%), The Gillette Co. (2.4%). Please refer to pages 8 through 11 for a list and percentage breakdown of the fund’s holdings.
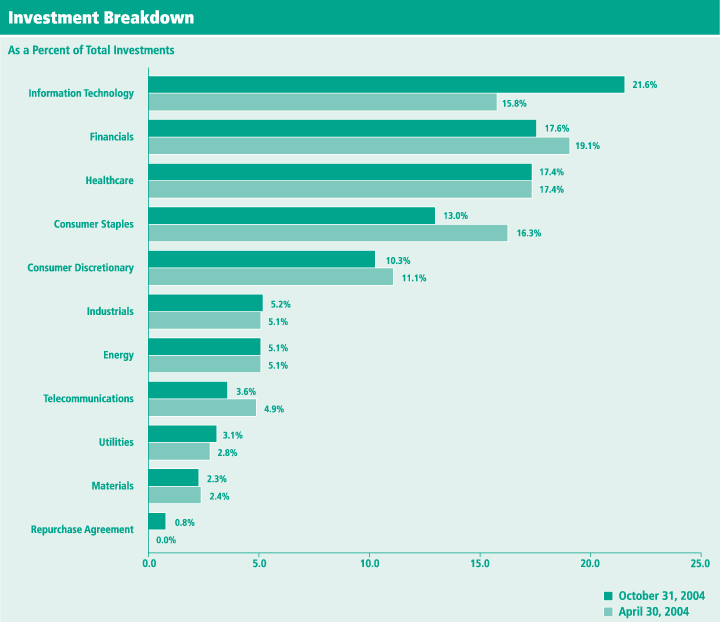
The mention of sector breakdowns is for informational purposes only and should not be construed as a recommendation to purchase or sell any securities. The information provided regarding such sectors is not a sufficient basis upon which to make an investment decision. Investors seeking financial advice regarding the appropriateness of investing in any securities or investment strategies discussed should consult their financial professional. Portfolio holdings are subject to change at any time and may not be representative of the fund’s current or future investments. The fund’s top five sector holdings (as a % of net assets) as of October 31, 2004 were: Information Technology (21.6%); Financials (17.6%); Healthcare (17.3%); Consumer Staples (13.0%); Consumer Discretionary (10.3%). The fund’s portfolio composition is subject to change at any time.
RISKS: The fund may use derivatives, such as options and futures, which can be illiquid, may disproportionately increase losses, and may have a potentially large impact on fund performance. Foreign stocks are subject to certain risks of overseas investing not associated with domestic investing such as currency fluctuations and changes in political and economic conditions, which could result in significant market fluctuations. These risks are magnified in emerging markets.
All index performance reflects no deduction for fees, expenses or taxes. Please note an investor cannot invest directly in an index.
| I | | Gross domestic product is a market value of goods and services produced by labor and property in a given country. |
| ii | | Source: Bureau of Economic Analysis, U.S. Department of Commerce, October 29, 2004. |
| iii | | Source: Bureau of Labor Statistics, U.S. Department of Labor, November 5, 2004. |
| iv | | Source: Consumer Confidence Index, The Conference Board, October 26, 2004. |
| v | | The federal funds rate is the interest rate that banks with excess reserves at a Federal Reserve district bank charge other banks that need overnight loans. |
| vi | | The Russell 2000 Index measures the performance of the 2000 smallest companies in the Russell 3000 Index, which represents approximately 8% of the total market capitalization of the Russell 3000 Index. |
| vii | | The S&P MidCap 400 Index is a market-value weighted index which consists of 400 domestic stocks chosen for market size, liquidity, and industry group representation |
| viii | | The S&P 500 Index is a market capitalization-weighted index of 500 widely held common stocks. |
| ix | | The Dow Jones Industrial Average is a widely followed measurement of the stock market. The average is comprised of 30 stocks that represent leading companies in major industries. These stocks, widely held by both individual and institutional investors, are considered to be all blue-chip companies. |
| x | | The S&P 500/Barra Value Index is a market-capitalization weighted index of stocks in the S&P 500 having lower price-to-book ratios relative to the S&P 500 as a whole. (A price-to-book ratio is the price of a stock compared to the difference between a company’s assets and liabilities.) |
| xi | | The S&P 500/Barra Growth Index is a market-capitalization weighted index of stocks in the S&P 500 having higher price-to-book ratios relative to the S&P 500 as a whole. (A price-to-book ratio is the price of a stock compared to the difference between a company’s assets and liabilities.) |
| xii | | The MSCI EAFE Index is an unmanaged index of common stocks of companies located in Europe, Australasia and the Far East. |
| xiii | | The Wilshire 5000 Index is the broadest stock market indicator covering the performance of the entire U.S. equity market, which consists of over 7,000 U.S. headquartered equity securities individually weighted by market capitalization. |
| xiv | | The Lehman Brothers Aggregate Bond Index is a broad-based bond index comprised of Government, Corporate, Mortgage and Asset-backed issues, rated investment grade or higher, and having at least one year to maturity. |
| xv | | The Russell 1000 Index measures the performance of the 1000 largest companies in the Russell 3000 Index, which represents approximately 92% of the total market capitalization of the Russell 3000 Index. |
4 Smith Barney Multiple Discipline Funds — Large Cap Growth and Value Fund | 2004 Semi-Annual Report
Fund at a Glance (unaudited)
5 Smith Barney Multiple Discipline Funds — Large Cap Growth and Value Fund | 2004 Semi-Annual Report
| | |
| Fund Expenses (unaudited) | | |
Example
As a shareholder of the Fund, you may incur two types of costs: (1) transaction costs, including front-end and back-end sales charges (loads) on purchase payments, reinvested dividends, or other distributions; and (2) ongoing costs, including management fees; distribution and/or service (12b-1) fees; and other Fund expenses. This example is intended to help you understand your ongoing costs (in dollars) of investing in the Fund and to compare these costs with the ongoing costs of investing in other mutual funds.
This example is based on an investment of $1,000 invested on May 1, 2004 and held for the six months ended October 31, 2004.
Actual Expenses
The table below titled “Based on Actual Total Return” provides information about actual account values and actual expenses. You may use the information provided in this table, together with the amount you invested, to estimate the expenses that you paid over the period. To estimate the expenses you paid on your account, divide your ending account value by $1,000 (for example, an $8,600 ending account value divided by $1,000 = 8.6), then multiply the result by the number under the heading entitled “Expenses Paid During the Period”.
Based on Actual Total Return(1)
| | | | | | | | | | | | | | | |
| | | Actual Total
Return Without
Sales Charges(2) | | | Beginning
Account
Value | | Ending
Account
Value | | Annualized
Expense
Ratios | | | Expenses
Paid During
the Period(3) |
Class A | | (2.22 | )% | | $ | 1,000 | | $ | 977.80 | | 1.12 | % | | $ | 5.58 |
|
Class B | | (2.65 | ) | | | 1,000 | | | 973.50 | | 1.87 | | | | 9.30 |
|
Class C | | (2.65 | ) | | | 1,000 | | | 973.50 | | 1.87 | | | | 9.30 |
|
| (1) | | For the six months ended October 31, 2004. |
| (2) | | Assumes reinvestment of all dividends and capital gain distributions, if any, at net asset value and does not reflect the deduction of the applicable sales charges with respect to Class A shares or the applicable contingent deferred sales charge (“CDSC”) with respect to Class B and Class C shares. Total return is not annualized, as it may not be representative of the total return for the year. Performance figures may reflect fee waivers and/or expense reimbursements. Past performance is no guarantee of future results. In the absence of fee waivers and/or expense reimbursements, the total return would have been lower. |
| (3) | | Expenses (net of voluntary waiver) are equal to each class’ respective annualized expense ratio multiplied by the average account value over the period, multiplied by the number of days in the most recent fiscal half-year, then divided by 365. |
6 Smith Barney Multiple Discipline Funds — Large Cap Growth and Value Fund | 2004 Semi-Annual Report
| | |
| Fund Expenses (unaudited) (continued) | | |
Hypothetical Example for Comparison Purposes
The table below titled “Based on Hypothetical Total Return” provides information about hypothetical account values and hypothetical expenses based on the actual expense ratio and an assumed rate of return of 5.00% per year before expenses, which is not the Fund’s actual return. The hypothetical account values and expenses may not be used to estimate the actual ending account balance or expenses you paid for the period. You may use the information provided in this table to compare the ongoing costs of investing in the Fund and other funds. To do so, compare the 5.00% hypothetical example relating to the Fund with the 5.00% hypothetical examples that appear in the shareholder reports of the other funds.
Please note that the expenses shown in the table below are meant to highlight your ongoing costs only and do not reflect any transactional costs, such as front-end or back-end sales charges (loads). Therefore, the table is useful in comparing ongoing costs only, and will not help you determine the relative total costs of owning different funds. In addition, if these transaction costs were included, your costs would have been higher.
Based on Hypothetical Total Return(1)
| | | | | | | | | | | | | | | |
| | | Hypothetical
Annualized
Total Return | | | Beginning
Account
Value | | Ending
Account
Value | | Annualized
Expense
Ratios | | | Expenses
Paid During
the Period(2) |
Class A | | 5.00 | % | | $ | 1,000 | | $ | 1,019.56 | | 1.12 | % | | $ | 5.70 |
|
Class B | | 5.00 | | | | 1,000 | | | 1,015.78 | | 1.87 | | | | 9.50 |
|
Class C | | 5.00 | | | | 1,000 | | | 1,015.78 | | 1.87 | | | | 9.50 |
|
| (1) | | For the six months ended October 31, 2004. |
| (2) | | Expenses (net of voluntary waiver) are equal to each class’ respective annualized expense ratio multiplied by the average account value over the period, multiplied by the number of days in the most recent fiscal half-year, then divided by 365. |
7 Smith Barney Multiple Discipline Funds — Large Cap Growth and Value Fund | 2004 Semi-Annual Report
| | |
| Schedule of Investments (unaudited) | | October 31, 2004 |
| | | | | |
| SHARES | | SECURITY | | VALUE |
| COMMON STOCK — 99.1% | | | |
| CONSUMER DISCRETIONARY — 10.3% | | | |
| Household Durables — 0.8% | | | |
| 75,000 | | Newell Rubbermaid Inc. | | $ | 1,617,000 |
|
| Media — 6.8% | | | |
| 80,000 | | Comcast Corp., Class A Shares (a) | | | 2,360,000 |
| 233,000 | | Liberty Media Corp., Series A Shares (a) | | | 2,078,360 |
| 25,000 | | The News Corp. Ltd., Sponsored ADR | | | 786,000 |
| 300,300 | | Time Warner Inc. (a) | | | 4,996,992 |
| 160,100 | | The Walt Disney Co. | | | 4,037,722 |
|
| | | | | | 14,259,074 |
|
| Multiline Retail — 0.7% |
| 30,000 | | Target Corp. | | | 1,500,600 |
|
| Specialty Retail — 2.0% | | | |
| 105,600 | | The Home Depot, Inc. | | | 4,338,048 |
|
| | | TOTAL CONSUMER DISCRETIONARY | | | 21,714,722 |
|
| CONSUMER STAPLES — 13.0% | | | |
| Beverages — 3.9% | | | |
| 134,000 | | The Coca-Cola Co. | | | 5,448,440 |
| 58,000 | | PepsiCo, Inc. | | | 2,875,640 |
|
| | | | | | 8,324,080 |
|
| Food & Drug Retailing — 2.5% | | | |
| 114,690 | | The Kroger Co. (a) | | | 1,732,966 |
| 190,900 | | Safeway Inc. (a) | | | 3,482,016 |
|
| | | | | | 5,214,982 |
|
| Food Products — 1.5% | | | |
| 48,100 | | Wm. Wrigley Jr. Co. | | | 3,145,740 |
|
| Household Products — 0.9% | | | |
| 30,400 | | Kimberly-Clark Corp. | | | 1,813,968 |
|
| Personal Products — 2.4% | | | |
| 123,500 | | The Gillette Co. | | | 5,122,780 |
|
| Tobacco — 1.8% | | | |
| 76,700 | | Altria Group, Inc. | | | 3,716,882 |
|
| | | TOTAL CONSUMER STAPLES | | | 27,338,432 |
|
| ENERGY — 5.1% | | | |
| Oil & Gas — 5.1% | | | |
| 45,000 | | BP PLC, Sponsored ADR | | | 2,621,250 |
| 49,600 | | ChevronTexaco Corp. | | | 2,631,776 |
| 55,000 | | Royal Dutch Petroleum Co., New York Shares | | | 2,983,200 |
| 23,000 | | Total SA, Sponsored ADR | | | 2,398,440 |
|
| | | TOTAL ENERGY | | | 10,634,666 |
|
| FINANCIALS — 17.6% | | | |
| Banks — 3.9% | | | |
| 53,318 | | Bank of America Corp. | | | 2,388,113 |
| 58,400 | | The Bank of New York Co., Inc. | | | 1,895,664 |
| 46,000 | | Wachovia Corp. | | | 2,263,660 |
| 45,000 | | Washington Mutual, Inc. | | | 1,741,950 |
|
| | | | | | 8,289,387 |
|
See Notes to Financial Statements.
8 Smith Barney Multiple Discipline Funds — Large Cap Growth and Value Fund | 2004 Semi-Annual Report
| | |
| Schedule of Investments (unaudited) (continued) | | October 31, 2004 |
| | | | | |
| SHARES | | SECURITY | | VALUE |
| Diversified Financials — 8.2% | | | |
| 34,500 | | American Express Co. | | $ | 1,830,915 |
| 34,500 | | Capital One Financial Corp. | | | 2,544,720 |
| 10,000 | | The Goldman Sachs Group, Inc. | | | 983,800 |
| 52,500 | | JPMorgan Chase & Co. | | | 2,026,500 |
| 145,600 | | Merrill Lynch & Co., Inc. | | | 7,853,664 |
| 23,500 | | Morgan Stanley | | | 1,200,615 |
| 34,200 | | Waddell & Reed Financial, Inc., Class A Shares | | | 718,542 |
|
| | | | | | 17,158,756 |
|
| Insurance — 5.5% | | | |
| 117,600 | | American International Group, Inc. | | | 7,139,496 |
| 38 | | Berkshire Hathaway Inc., Class A Shares (a) | | | 3,201,500 |
| 37,000 | | The St. Paul Travelers Cos., Inc. | | | 1,256,520 |
|
| | | | | | 11,597,516 |
|
| | | TOTAL FINANCIALS | | | 37,045,659 |
|
| HEALTHCARE — 17.3% | | | |
| Biotechnology — 4.7% | | | |
| 102,800 | | Amgen Inc. (a) | | | 5,839,040 |
| 35,000 | | Biogen Idec Inc. (a) | | | 2,035,600 |
| 45,000 | | Genentech, Inc. (a) | | | 2,048,850 |
|
| | | | | | 9,923,490 |
|
| Healthcare Providers & Services — 0.5% | | | |
| 30,000 | | HCA Inc. | | | 1,101,900 |
|
| Pharmaceuticals — 12.1% | | | |
| 43,000 | | GlaxoSmithKline PLC, Sponsored ADR | | | 1,823,200 |
| 100,600 | | Johnson & Johnson | | | 5,873,028 |
| 134,700 | | Merck & Co., Inc. | | | 4,217,457 |
| 241,720 | | Pfizer Inc. | | | 6,997,794 |
| 236,900 | | Schering-Plough Corp. | | | 4,290,259 |
| 56,800 | | Wyeth | | | 2,252,120 |
|
| | | | | | 25,453,858 |
|
| | | TOTAL HEALTHCARE | | | 36,479,248 |
|
| INDUSTRIALS — 5.2% | | | |
| Aerospace & Defense — 0.8% | | | |
| 35,500 | | The Boeing Co. | | | 1,771,450 |
|
| Commercial Services & Supplies — 0.8% | | | |
| 27,600 | | Avery Dennison Corp. | | | 1,679,184 |
|
| Industrial Conglomerates — 3.6% | | | |
| 129,400 | | General Electric Co. | | | 4,415,128 |
| 92,400 | | Honeywell International Inc. | | | 3,112,032 |
|
| | | | | | 7,527,160 |
|
| | | TOTAL INDUSTRIALS | | | 10,977,794 |
|
| INFORMATION TECHNOLOGY — 21.6% | | | |
| Communications Equipment — 3.8% | | | |
| 182,500 | | Cisco Systems, Inc. (a) | | | 3,505,825 |
| 70,000 | | Comverse Technology, Inc. (a) | | | 1,444,800 |
See Notes to Financial Statements.
9 Smith Barney Multiple Discipline Funds — Large Cap Growth and Value Fund | 2004 Semi-Annual Report
| | |
| Schedule of Investments (unaudited) (continued) | | October 31, 2004 |
| | | | | |
| SHARES | | SECURITY | | VALUE |
| Communications Equipment — 3.8% (continued) | | | |
| 197,400 | | Nokia Oyj, Sponsored ADR | | $ | 3,043,908 |
|
| | | | | | 7,994,533 |
|
| Computers & Peripherals — 5.3% | | | |
| 119,100 | | Dell Inc. (a) | | | 4,175,646 |
| 140,000 | | Hewlett-Packard Co. | | | 2,612,400 |
| 24,600 | | International Business Machines Corp. | | | 2,207,850 |
| 25,000 | | Lexmark International, Inc., Class A Shares (a) | | | 2,077,750 |
|
| | | | | | 11,073,646 |
|
| Electronic Equipment & Instruments — 0.3% | | | |
| 110,000 | | Solectron Corp. (a) | | | 574,200 |
|
| Internet Software & Services — 1.5% | | | |
| 148,000 | | IAC/InterActiveCorp (a) | | | 3,199,760 |
|
| Semiconductor Equipment & Products — 6.1% |
| 284,800 | | Intel Corp. | | | 6,339,648 |
| 263,700 | | Texas Instruments Inc. | | | 6,447,465 |
|
| | | | | | 12,787,113 |
|
| Software — 4.6% | | | |
| 343,700 | | Microsoft Corp. | | | 9,620,163 |
|
| | | TOTAL INFORMATION TECHNOLOGY | | | 45,249,415 |
|
| MATERIALS — 2.3% |
| Metals & Mining — 1.1% | | | |
| 74,000 | | Alcoa Inc. | | | 2,405,000 |
|
| Paper & Forest Products — 1.2% |
| 64,500 | | International Paper Co. | | | 2,483,895 |
|
| | | TOTAL MATERIALS | | | 4,888,895 |
|
| TELECOMMUNICATION SERVICES — 3.6% |
| Diversified Telecommunication Services — 3.6% |
| 63,000 | | AT&T Corp. | | | 1,077,930 |
| 87,600 | | SBC Communications Inc. | | | 2,212,776 |
| 107,900 | | Verizon Communications Inc. | | | 4,218,890 |
|
| | | TOTAL TELECOMMUNICATION SERVICES | | | 7,509,596 |
|
| UTILITIES — 3.1% | | | |
| Electric Utilities — 1.0% | | | |
| 45,000 | | Ameren Corp. | | | 2,160,000 |
|
| Gas Utilities — 1.0% | | | |
| 52,000 | | KeySpan Corp. | | | 2,077,400 |
|
| Multi-Utilities — 1.1% | | | |
| 109,580 | | NiSource Inc. | | | 2,350,491 |
|
| | | TOTAL UTILITIES | | | 6,587,891 |
|
| | | TOTAL COMMON STOCK
(Cost — $215,941,965) | | | 208,426,318 |
|
See Notes to Financial Statements.
10 Smith Barney Multiple Discipline Funds — Large Cap Growth and Value Fund | 2004 Semi-Annual Report
| | |
| Schedule of Investments (unaudited) (continued) | | October 31, 2004 |
| | | | | |
FACE AMOUNT | | SECURITY | | VALUE |
| REPURCHASE AGREEMENT — 0.8% | | | |
| $1,660,000 | | State Street Bank and Trust Co. dated 10/29/04, 1.700% due 11/1/04; Proceeds at maturity — $1,660,235; (Fully collateralized by U.S. Treasury Bonds, 7.250% due 5/15/16;
Market value — $1,698,088) (Cost — $1,660,000) | | $ | 1,660,000 |
|
| | | TOTAL INVESTMENTS — 99.9%
(Cost — $217,601,965*) | | | 210,086,318 |
| | | Other Assets in Excess of Liabilities — 0.1% | | | 124,706 |
|
| | | TOTAL NET ASSETS — 100.0% | | $ | 210,211,024 |
|
| (a) | | Non-income producing security. |
| * | | Aggregate cost for federal income tax purposes is substantially the same. |
Abbreviation used in this schedule:
ADR — American Depositary Receipt
See Notes to Financial Statements.
11 Smith Barney Multiple Discipline Funds — Large Cap Growth and Value Fund | 2004 Semi-Annual Report
| | |
| Statement of Assets and Liabilities (unaudited) | | October 31, 2004 |
| | | | |
| ASSETS: | | | | |
Investments, at value (Cost — $217,601,965) | | $ | 210,086,318 | |
Receivable for securities sold | | | 798,433 | |
Dividends and interest receivable | | | 246,051 | |
Receivable for Fund shares sold | | | 78,149 | |
Prepaid expenses | | | 21,789 | |
|
|
Total Assets | | | 211,230,740 | |
|
|
| LIABILITIES: | | | | |
Payable for Fund shares reacquired | | | 357,404 | |
Payable for securities purchased | | | 280,900 | |
Management fees payable | | | 133,757 | |
Due to custodian | | | 108,133 | |
Distribution plan fees payable | | | 46,233 | |
Accrued expenses | | | 93,289 | |
|
|
Total Liabilities | | | 1,019,716 | |
|
|
Total Net Assets | | $ | 210,211,024 | |
|
|
| NET ASSETS: | | | | |
Par value of capital shares ($0.001 par value, 10 billion shares authorized) | | $ | 25,772 | |
Capital paid in excess of par value | | | 379,715,183 | |
Accumulated net investment loss | | | (62,308 | ) |
Accumulated net realized loss from investment transactions | | | (161,951,976 | ) |
Net unrealized depreciation of investments | | | (7,515,647 | ) |
|
|
Total Net Assets | | $ | 210,211,024 | |
|
|
Shares Outstanding: | | | | |
Class A | | | 6,231,932 | |
| |
Class B | | | 11,226,222 | |
| |
Class C | | | 8,313,611 | |
| |
Net Asset Value: | | | | |
Class A (and redemption price) | | | $8.36 | |
| |
Class B * | | | $8.09 | |
| |
Class C * | | | $8.09 | |
| |
Maximum Public Offering Price Per Share: | | | | |
Class A (based on a maximum sales charge of 5.00%) | | | $8.80 | |
|
|
| * | | Redemption price is NAV of Class B and C shares reduced by a 5.00% and 1.00% CDSC, respectively, if shares are redeemed within one year from purchase payment (See Note 2). |
See Notes to Financial Statements.
12 Smith Barney Multiple Discipline Funds — Large Cap Growth and Value Fund | 2004 Semi-Annual Report
| | |
| Statement of Operations (unaudited) | | For the Six Months Ended October 31, 2004 |
| | | | |
| INVESTMENT INCOME: | | | | |
Dividends | | $ | 1,864,165 | |
Interest | | | 2,296 | |
Less: Foreign withholding tax | | | (20,433 | ) |
|
|
Total Investment Income | | | 1,846,028 | |
|
|
| EXPENSES: | | | | |
Distribution fees (Notes 2 and 4) | | | 922,529 | |
Management fee (Note 2) | | | 848,111 | |
Transfer agency services (Notes 2 and 4) | | | 173,711 | |
Shareholder communications (Note 4) | | | 46,735 | |
Audit and legal | | | 26,020 | |
Registration fees | | | 19,022 | |
Directors’ fees | | | 12,476 | |
Custody | | | 11,158 | |
Other | | | 4,219 | |
|
|
Total Expenses | | | 2,063,981 | |
Less: Management fee waiver (Notes 2 and 8) | | | (155,645 | ) |
|
|
Net Expenses | | | 1,908,336 | |
|
|
Net Investment Loss | | | (62,308 | ) |
|
|
| REALIZED AND UNREALIZED GAIN (LOSS) ON INVESTMENTS (NOTES 1 AND 3): | | | | |
Net realized gain from investment transactions | | | 6,337,054 | |
Net decrease in unrealized appreciation of investments | | | (12,164,259 | ) |
|
|
Net Loss on Investments | | | (5,827,205 | ) |
|
|
Decrease in Net Assets From Operations | | $ | (5,889,513 | ) |
|
|
See Notes to Financial Statements.
13 Smith Barney Multiple Discipline Funds — Large Cap Growth and Value Fund | 2004 Semi-Annual Report
Statements of Changes in Net Assets
For the Six Months Ended October 31, 2004 (unaudited)
and the Year Ended April 30, 2004
| | | | | | | | |
| | | October 31 | | | April 30 | |
| OPERATIONS: | | | | | | | | |
Net investment loss | | $ | (62,308 | ) | | $ | (721,385 | ) |
Net realized gain | | | 6,337,054 | | | | 14,332,077 | |
Increase (decrease) in net unrealized appreciation | | | (12,164,259 | ) | | | 39,623,883 | |
|
|
Increase (Decrease) in Net Assets From Operations | | | (5,889,513 | ) | | | 53,234,575 | |
|
|
| DIVIDENDS TO SHAREHOLDERS FROM (NOTE 5): | | | | | | | | |
Net investment income | | | — | | | | (641,438 | ) |
|
|
Decrease in Net Assets From Dividends to Shareholders | | | — | | | | (641,438 | ) |
|
|
| FUND SHARE TRANSACTIONS (NOTE 6): | | | | | | | | |
Net proceeds from sale of shares | | | 6,610,568 | | | | 10,263,570 | |
Net asset value of shares issued for reinvestment of dividends | | | — | | | | 589,713 | |
Cost of shares reacquired | | | (27,067,211 | ) | | | (58,552,566 | ) |
|
|
Decrease in Net Assets From Fund Share Transactions | | | (20,456,643 | ) | | | (47,699,283 | ) |
|
|
Increase (Decrease) in Net Assets | | | (26,346,156 | ) | | | 4,893,854 | |
| | |
| NET ASSETS: | | | | | | | | |
Beginning of period | | | 236,557,180 | | | | 231,663,326 | |
|
|
End of period* | | | $210,211,024 | | | $ | 236,557,180 | |
|
|
| * Includes undistributed net investment loss of: | | | $(62,308 | ) | | | — | |
|
|
See Notes to Financial Statements.
14 Smith Barney Multiple Discipline Funds — Large Cap Growth and Value Fund | 2004 Semi-Annual Report
Financial Highlights
For a share of each class of capital stock outstanding throughout each year or period ended April 30, unless otherwise noted:
| | | | | | | | | | | | | | | | | | |
| Class A Shares(1) | | 2004(2) | | | 2004 | | | 2003 | | | 2002 | | | 2001 | | | 2000(3) | |
Net Asset Value, Beginning of Period | | $8.55 | | | $6.89 | | | $9.55 | | | $11.10 | | | $12.34 | | | $11.40 | |
|
|
Income (Loss) From Operations: | | | | | | | | | | | | | | | | | | |
Net investment income | | 0.02 | | | 0.02 | | | 0.06 | | | 0.03 | | | 0.03 | | | 0.02 | |
Net realized and unrealized gain (loss) | | (0.21 | ) | | 1.71 | | | (2.72 | ) | | (1.58 | ) | | (1.12 | ) | | 0.92 | |
|
|
Total Income (Loss) From Operations | | (0.19 | ) | | 1.73 | | | (2.66 | ) | | (1.55 | ) | | (1.09 | ) | | 0.94 | |
|
|
Less Dividends and Distributions From: | | | | | | | | | | | | | | | | | | |
Net investment income | | — | | | (0.07 | ) | | — | | | — | | | — | | | — | |
Net realized gains | | — | | | — | | | — | | | — | | | (0.15 | ) | | — | |
Capital | | — | | | — | | | — | | | — | | | (0.00 | )* | | — | |
|
|
Total Dividends and Distributions | | — | | | (0.07 | ) | | — | | | — | | | (0.15 | ) | | — | |
| | | | | | | | | | | | | | | | | | | |
Net Asset Value, End of Period | | $8.36 | | | $8.55 | | | $6.89 | | | $ 9.55 | | | $11.10 | | | $12.34 | |
|
|
Total Return(4) | | (2.22 | )%‡ | | 25.09 | % | | (27.85 | )% | | (13.96 | )% | | (8.93 | )% | | 8.25 | %‡ |
|
|
Net Assets, End of Period (000s) | | $52,078 | | | $56,898 | | | $51,360 | | | $93,551 | | | $132,618 | | | $172,141 | |
|
|
Ratios to Average Net Assets: | | | | | | | | | | | | | | | | | | |
Expenses | | 1.12 | %†(5) | | 1.16 | % | | 1.19 | % | | 1.18 | % | | 1.16 | % | | 1.17 | %† |
Net investment income | | 0.51 | † | | 0.29 | | | 0.81 | | | 0.34 | | | 0.27 | | | 0.29 | † |
|
|
Portfolio Turnover Rate | | 8 | % | | 58 | % | | 55 | % | | 37 | % | | 10 | % | | 15 | % |
|
|
| | | | | | |
| Class B Shares(1) | | 2004(2) | | | 2004 | | | 2003 | | | 2002 | | | 2001 | | | 2000(3) | |
Net Asset Value, Beginning of Period | | $8.31 | | | $6.70 | | | $9.35 | | | $10.96 | | | $12.28 | | | $11.40 | |
|
|
Income (Loss) From Operations: | | | | | | | | | | | | | | | | | | |
Net investment income (loss) | | (0.01 | ) | | (0.04 | ) | | 0.00 | * | | (0.04 | ) | | (0.06 | ) | | (0.04 | ) |
Net realized and unrealized gain (loss) | | (0.21 | ) | | 1.66 | | | (2.65 | ) | | (1.57 | ) | | (1.11 | ) | | 0.92 | |
|
|
Total Income (Loss) From Operations | | (0.22 | ) | | 1.62 | | | (2.65 | ) | | (1.61 | ) | | (1.17 | ) | | 0.88 | |
|
|
Less Dividends and Distributions From: | | | | | | | | | | | | | | | | | | |
Net investment income | | — | | | (0.01 | ) | | — | | | — | | | — | | | — | |
Net realized gains | | — | | | — | | | — | | | — | | | (0.15 | ) | | — | |
Capital | | — | | | — | | | — | | | — | | | (0.00 | )* | | — | |
|
|
Total Dividends and Distributions | | — | | | (0.01 | ) | | — | | | — | | | (0.15 | ) | | — | |
|
|
Net Asset Value, End of Period | | $8.09 | | | $8.31 | | | $6.70 | | | $ 9.35 | | | $10.96 | | | $12.28 | |
|
|
Total Return(4) | | (2.65 | )%‡ | | 24.14 | % | | (28.34 | )% | | (14.69 | )% | | (9.63 | )% | | 7.72 | %‡ |
|
|
Net Assets, End of Period (000s) | | $90,851 | | | $104,478 | | | $106,276 | | | $194,364 | | | $278,048 | | | $348,987 | |
|
|
Ratios to Average Net Assets: | | | | | | | | | | | | | | | | | | |
Expenses | | 1.87 | %†(5) | | 1.91 | % | | 1.94 | % | | 1.92 | % | | 1.93 | % | | 1.94 | %† |
Net investment income (loss) | | (0.24 | )† | | (0.47 | ) | | 0.06 | | | (0.41 | ) | | (0.51 | ) | | (0.48 | )† |
|
|
Portfolio Turnover Rate | | 8 | % | | 58 | % | | 55 | % | | 37 | % | | 10 | % | | 15 | % |
|
|
| (1) | | Per share amounts have been calculated using the monthly average shares method. |
| (2) | | For the six months ended October 31, 2004 (unaudited). |
| (3) | | For the period August 31, 1999 (inception date) to April 30, 2000. |
| (4) | | Performance figures may reflect fee waivers and/or expense reimbursements. Past performance is no guarantee of future results. In the absence of fee waivers and/or expense reimbursements, the total return would have been lower. |
| (5) | | The investment advisor waived a portion of its advisory fee for the six months ended October 31, 2004. If such fees were not waived, the actual expense ratios for class A and Class B shares would have been 1.26% annualized and 2.01% annualized, respectively. |
| * | | Amount represents less than $0.01 per share. |
| ‡ | | Total return is not annualized, as it may not be representative of the total return for the year. |
See Notes to Financial Statements.
15 Smith Barney Multiple Discipline Funds — Large Cap Growth and Value Fund | 2004 Semi-Annual Report
Financial Highlights (continued)
For a share of each class of capital stock outstanding throughout each year or period ended April 30, unless otherwise noted:
| | | | | | | | | | | | | | | | | | |
| Class C Shares(1) | | 2004(2) | | | 2004 | | | 2003 | | | 2002 | | | 2001 | | | 2000(3) | |
Net Asset Value, Beginning of Period | | $8.31 | | | $6.70 | | | $9.35 | | | $10.96 | | | $12.28 | | | $11.40 | |
|
|
Income (Loss) From Operations: | | | | | | | | | | | | | | | | | | |
Net investment income (loss) | | (0.01 | ) | | (0.04 | ) | | 0.00 | * | | (0.04 | ) | | (0.06 | ) | | (0.04 | ) |
Net realized and unrealized gain (loss) | | (0.21 | ) | | 1.66 | | | (2.65 | ) | | (1.57 | ) | | (1.11 | ) | | 0.92 | |
|
|
Total Income (Loss) From Operations | | (0.22 | ) | | 1.62 | | | (2.65 | ) | | (1.61 | ) | | (1.17 | ) | | 0.88 | |
|
|
Less Dividends and Distributions From: | | | | | | | | | | | | | | | | | | |
Net investment income | | — | | | (0.01 | ) | | — | | | — | | | — | | | — | |
Net realized gains | | — | | | — | | | — | | | — | | | (0.15 | ) | | — | |
Capital | | — | | | — | | | — | | | — | | | (0.00 | )* | | — | |
|
|
Total Dividends and Distributions | | — | | | (0.01 | ) | | — | | | — | | | (0.15 | ) | | — | |
|
|
Net Asset Value, End of Period | | $8.09 | | | $8.31 | | | $6.70 | | | $ 9.35 | | | $10.96 | | | $12.28 | |
|
|
Total Return(4) | | (2.65 | )%‡ | | 24.15 | % | | (28.34 | )% | | (14.69 | )% | | (9.63 | )% | | 7.72 | %‡ |
|
|
Net Assets, End of Period (000s) | | $67,282 | | | $75,181 | | | $74,027 | | | $139,684 | | | $207,209 | | | $262,750 | |
|
|
Ratios to Average Net Assets: | | | | | | | | | | | | | | | | | | |
Expenses | | 1.87 | %†(5) | | 1.92 | % | | 1.93 | % | | 1.92 | % | | 1.93 | % | | 1.93 | %† |
Net investment income (loss) | | (0.24 | )† | | (0.48 | ) | | 0.07 | | | (0.41 | ) | | (0.51 | ) | | (0.48 | )† |
|
|
Portfolio Turnover Rate | | 8 | % | | 58 | % | | 55 | % | | 37 | % | | 10 | % | | 15 | % |
|
|
| (1) | | Per share amounts have been calculated using the monthly average shares method. |
| (2) | | For the six months ended October 31, 2004 (unaudited). |
| (3) | | For the period August 31, 1999 (inception date) to April 30, 2000. |
| (4) | | Performance figures may reflect fee waivers and/or expense reimbursements. Past performance is no guarantee of future results. In the absence of fee waivers and/or expense reimbursements, the total return would have been lower. |
| (5) | | The investment adviser waived a portion of its advisory fee for the six months ended October 31, 2004. If such fees were not waived, the actual expense ratio would have been 2.01% annualized. |
| * | | Amount represents less than $0.01 per share. |
| ‡ | | Total return is not annualized, as it may not be representative of the total return for the year. |
See Notes to Financial Statements.
16 Smith Barney Multiple Discipline Funds — Large Cap Growth and Value Fund | 2004 Semi-Annual Report
Notes to Financial Statements (unaudited)
| 1. | Organization and Significant Accounting Policies |
The Smith Barney Multiple Discipline Funds — Large Cap Growth and Value Fund (“Fund”), a separate investment fund of the Smith Barney Investment Funds Inc. (“Company”), a Maryland corporation, is registered under the Investment Company Act of 1940, as amended, as an open-end management investment company.
The following are significant accounting policies consistently followed by the Fund and are in conformity with U.S. generally accepted accounting principles (“GAAP”). Estimates and assumptions are required to be made regarding assets, liabilities and changes in net assets resulting from operations when financial statements are prepared. Changes in the economic environment, financial markets and any other parameters used in determining these estimates could cause actual results to differ.
(a) Investment Valuation. Securities traded on national securities markets are valued at the closing prices on such markets or, in the absence of sales, at the mean between the closing bid and asked prices. Over-the-counter securities for which no sales were reported on that date are valued at the mean between the bid and asked prices. Securities listed on the NASDAQ National Market System for which market quotations are available are valued at the official closing price or, if there is no official closing price on that day, at the last sale price. When market quotations or official closing prices are not readily available, or are determined not to reflect accurately fair value, such as when the value of a security has been significantly affected by events after the close of the exchange or market on which the security is principally traded, but before the Fund calculates its net asset value, the Fund may value these investments at fair value as determined in accordance with the procedures approved by the Fund’s Board of Directors. Fair valuing of securities may be determined with the assistance of a pricing service using calculations based on indices of domestic securities and other appropriate indicators, such as prices of relevant ADRs and futures contracts. Short-term obligations maturing within 60 days are valued at amortized cost, which approximates value.
(b) Repurchase Agreements. When entering into repurchase agreements, it is the Fund’s policy that a custodian takes possession of the underlying collateral securities, the value of which at least equals the principal amount of the repurchase transaction, including accrued interest. To the extent that any repurchase transaction exceeds one business day, the value of the collateral is marked-to-market to ensure the adequacy of the collateral. If the seller defaults and the value of the collateral declines or if bankruptcy proceedings are commenced with respect to the seller of the security, realization of the collateral by the Fund may be delayed or limited.
(c) Investment Transactions and Investment Income. Security transactions are accounted for on trade date. Dividend income is recorded on the ex-dividend date and interest income is recorded on an accrual basis. Foreign dividends are recorded on the ex-dividend date or as soon as practical after the Fund determines the existence of a dividend declaration after exercising reasonable due diligence. Gains or losses on the sale of securities are calculated by using the specific identification method.
(d) Foreign Currency Translation. The books and records of the Fund are maintained in U.S. dollars. Transactions denominated in foreign currencies are recorded at the current prevailing exchange rates. All assets and liabilities denominated in foreign currencies are translated into U.S. dollar amounts at the current exchange rates at the end of the period. Translation gains or losses resulting from changes in the exchange rates during the reporting period and realized gains and losses on the settlement of foreign currency transactions are reported in the statement of operations for the current period. The Fund does not isolate that portion of realized gains and losses on investments in securities, which are due to changes in the foreign exchange rates from that which is due to changes in market prices of equity securities.
17 Smith Barney Multiple Discipline Funds — Large Cap Growth and Value Fund | 2004 Semi-Annual Report
Notes to Financial Statements (unaudited) (continued)
(e) Dividends and Distributions to Shareholders. Dividends and distributions to shareholders are recorded on the ex-dividend date. The Fund distributes dividends and capital gains, if any, annually. The character of income and gains to be distributed is determined in accordance with income tax regulations which may differ from GAAP.
(f) Class Accounting. Class specific expenses are charged to each class. Investment advisory fees, general fund expenses, income, gains and/or losses are allocated on the basis of relative net assets of each class or on another reasonable basis.
(g) Federal and Other Taxes. It is the Fund’s policy to comply with the federal income and excise tax requirements of the Internal Revenue Code 1986, as amended, applicable to regulated investment companies. Accordingly, the Fund intends to distribute substantially all of its taxable income and net realized gains on investments, if any, to shareholders each year. Therefore, no federal income tax provision is required. Under the applicable foreign tax law, a withholding tax may be imposed on interest, dividends and capital gains at various rates.
| 2. | Management Agreement and Other Transactions |
Smith Barney Fund Management LLC (“SBFM”), an indirect wholly-owned subsidiary of Citigroup Inc. (“Citigroup”), acts as investment manager to the Fund. The Fund pays SBFM a management fee calculated at an annual rate of 0.75% of the Fund’s average daily net assets. This fee is calculated daily and paid monthly.
During the six months ended October 31, 2004, SBFM waived a portion of its management fee in the amount of $155,645.
Citicorp Trust Bank, fsb. (“CTB”), another subsidiary of Citigroup, acts as the Fund’s transfer agent. PFPC Inc. (“PFPC”) and Primerica Shareholder Services (“PSS”), another subsidiary of Citigroup, act as the Fund’s sub-transfer agents. CTB receives account fees and asset-based fees that vary according to the size and type of account. PFPC and PSS are responsible for shareholder recordkeeping and financial processing for all shareholder accounts and are paid by CTB. For the six months ended October 31, 2004, the Fund paid transfer agent fees of $112,654 to CTB.
Citigroup Global Markets Inc. (“CGM”) and PFS Distributors, Inc., both of which are subsidiaries of Citigroup, act as the Fund’s distributors.
There is a maximum sales charge of 5.00% for Class A shares. There is a contingent deferred sales charge (“CDSC”) of 5.00% on Class B shares, which applies if redemption occurs within one year from purchase payment and declines thereafter by 1.00% per year until no CDSC is incurred. Class C shares have a 1.00% CDSC, which applies if redemption occurs within one year from purchase payment. In certain cases, Class A shares have a 1.00% CDSC, which applies if redemption occurs within one year from purchase payment. This CDSC only applies to those purchases of Class A shares, which, when combined with current holdings of Class A shares, equal or exceed $1,000,000 in the aggregate. These purchases do not incur an initial sales charge.
For the six months ended October 31, 2004, CGM and its affiliates received sales charges of approximately $41,000 on sales of the Fund’s Class A shares. In addition, for the six months ended October 31, 2004, CDSCs paid to CGM and its affiliates were approximately $36,000 for Class B shares.
All officers and one Director of the Company are employees of Citigroup or its affiliates and do not receive compensation from the Company.
18 Smith Barney Multiple Discipline Funds — Large Cap Growth and Value Fund | 2004 Semi-Annual Report
Notes to Financial Statements (unaudited) (continued)
During the six months ended October 31, 2004, the aggregate cost of purchases and proceeds from sales of investments (excluding short-term investments) were as follows:
| | | |
|
Purchases | | $ | 16,845,414 |
|
Sales | | | 39,216,677 |
|
At October 31, 2004, the aggregate gross unrealized appreciation and depreciation of investments for federal income tax purposes were substantially as follows:
| | | | |
|
|
Gross unrealized appreciation | | $ | 16,496,092 | |
Gross unrealized depreciation | | | (24,011,739 | ) |
|
|
Net unrealized depreciation | | $ | (7,515,647 | ) |
|
|
| 4. | Class Specific Expenses |
Pursuant to a Rule 12b-1 Distribution Plan, the Fund pays a service fee with respect to its Class A, B and C shares calculated at the annual rate of 0.25% of the average daily net assets of each respective class. The Fund also pays a distribution fee with respect to Class B and C shares calculated at the annual rate of 0.75% of the average daily net assets of each class, respectively. For the six months ended October 31, 2004, total Rule 12b-1 Distribution Plan fees, which are accrued daily and paid monthly, were as follows:
| | | | | | | | | |
| | | Class A | | Class B | | Class C |
Rule 12b-1 Distribution Plan Fees | | $ | 69,428 | | $ | 493,660 | | $ | 359,441 |
|
For the six months ended October 31, 2004, total Transfer Agency Service expenses were as follows:
| | | | | | | | | |
| | | Class A | | Class B | | Class C |
Transfer Agency Service Expenses | | $ | 41,984 | | $ | 77,003 | | $ | 54,724 |
|
For the six months ended October 31, 2004, total Shareholder Communication expenses were as follows:
| | | | | | | | | |
| | | Class A | | Class B | | Class C |
Shareholder Communication Expenses | | $ | 12,038 | | $ | 20,525 | | $ | 14,172 |
|
| 5. | Distributions Paid to Shareholders by Class |
| | | | | |
| | | Six Months Ended
October 31, 2004 | | Year Ended
April 30, 2004 |
Net Investment Income | | | | | |
Class A | | — | | $ | 467,949 |
Class B | | — | | | 96,873 |
Class C | | — | | | 76,616 |
|
Total | | — | | $ | 641,438 |
|
At October 31, 2004, the Company had 10 billion shares of capital stock authorized with a par value of $0.001 per share. The Fund has the ability to issue multiple classes of shares. Each share of a class represents an identical interest and has the same rights, except that each class bears certain expenses, including those specifically related to the distribution of its shares.
19 Smith Barney Multiple Discipline Funds — Large Cap Growth and Value Fund | 2004 Semi-Annual Report
Notes to Financial Statements (unaudited) (continued)
Transactions in shares of each class were as follows:
| | | | | | | | | | | | | | |
| | | Six Months Ended
October 31, 2004
| | | Year Ended
April 30, 2004
| |
| | | Shares | | | Amount | | | Shares | | | Amount | |
Class A | | | | | | | | | | | | | | |
Shares sold | | 388,264 | | | $ | 3,279,012 | | | 569,345 | | | $ | 4,587,553 | |
Shares issued on reinvestment | | — | | | | — | | | 50,532 | | | | 428,516 | |
Shares reacquired | | (813,299 | ) | | | (6,790,325 | ) | | (1,422,081 | ) | | | (11,522,230 | ) |
|
|
Net Decrease | | (425,035 | ) | | $ | (3,511,313 | ) | | (802,204 | ) | | $ | (6,506,161 | ) |
|
|
Class B | | | | | | | | | | | | | | |
Shares sold | | 203,627 | | | $ | 1,658,939 | | | 307,509 | | | $ | 2,491,973 | |
Shares issued on reinvestment | | — | | | | — | | | 10,773 | | | | 88,986 | |
Shares reacquired | | (1,551,587 | ) | | | (12,619,193 | ) | | (3,615,492 | ) | | | (28,183,207 | ) |
|
|
Net Decrease | | (1,347,960 | ) | | $ | (10,960,254 | ) | | (3,297,210 | ) | | $ | (25,602,248 | ) |
|
|
Class C | | | | | | | | | | | | | | |
Shares sold | | 203,150 | | | $ | 1,672,617 | | | 389,549 | | | $ | 3,184,044 | |
Shares issued on reinvestment | | — | | | | — | | | 8,742 | | | | 72,211 | |
Shares reacquired | | (937,901 | ) | | | (7,657,693 | ) | | (2,403,096 | ) | | | (18,847,129 | ) |
|
|
Net Decrease | | (734,751 | ) | | $ | (5,985,076 | ) | | (2,004,805 | ) | | $ | (15,590,874 | ) |
|
|
| 7. | Capital Loss Carryforward |
On April 30, 2004, the Fund had a net capital loss carryforward of approximately $167,528,000 of which $18,808,000 expires in 2010, $88,347,000 expires in 2011 and $60,373,000 expires in 2012. This amount will be available to offset like amounts of any future taxable gains.
In connection with an investigation previously disclosed by Citigroup, the Staff of the Securities and Exchange Commission (“SEC”) has notified Citigroup Asset Management (“CAM”), the Citigroup business unit that includes the Fund’s investment manager and other investment advisory companies; Citigroup Trust Bank (“CTB”), an affiliate of CAM; Thomas W. Jones, the former CEO of CAM; and three other individuals, one of whom is an employee and the other two of whom are former employees of CAM, that the SEC Staff is considering recommending a civil injunctive action and/or an administrative proceeding against each of them relating to the creation and operation of an internal transfer agent unit to serve various CAM-managed funds.
In 1999, CTB entered the transfer agent business. CTB hired an unaffiliated subcontractor to perform some of the transfer agent services. The subcontractor, in exchange, had signed a separate agreement with CAM in 1998 that guaranteed investment management revenue to CAM and investment banking revenue to a CAM affiliate. The subcontractor’s business was later taken over by PFPC Inc., and at that time the revenue guarantee was eliminated and a one-time payment was made by the subcontractor to a CAM affiliate.
CAM did not disclose the revenue guarantee when the boards of various CAM-managed funds hired CTB as transfer agent. Nor did CAM disclose to the boards of the various CAM-managed funds the one-time payment received by the CAM affiliate when it was made.
20 Smith Barney Multiple Discipline Funds — Large Cap Growth and Value Fund | 2004 Semi-Annual Report
Notes to Financial Statements (unaudited) (continued)
In addition, the SEC Staff has indicated that it is considering recommending action based on the adequacy of the disclosures made to the fund boards that approved the transfer agency arrangement, CAM’s initiation and operation of, and compensation for, the transfer agent business and CAM’s retention of, and agreements with, the subcontractor.
Citigroup is cooperating fully in the investigation and will seek to resolve the matter in discussions with the SEC Staff. Although there can be no assurance, Citigroup does not believe that this matter will have a material adverse effect on the Fund. As previously disclosed, CAM has already agreed to pay the applicable funds, primarily through fee waivers, a total of approximately $17 million (plus interest) that is the amount of the revenue received by Citigroup relating to the revenue guarantee.
Beginning in June, 2004, class action lawsuits alleging violations of the federal securities laws were filed against Citigroup Global Markets Inc. (the “Distributor”) and a number of its affiliates, including Smith Barney Fund Management LLC and Salomon Brothers Asset Management Inc (the “Advisers”), substantially all of the mutual funds managed by the Advisers, including the Fund (the “Funds”), and directors or trustees of the Funds (collectively, the “Defendants”). The complaints alleged, among other things, that the Distributor created various undisclosed incentives for its brokers to sell Smith Barney and Salomon Brothers funds. In addition, according to the complaints, the Advisers caused the Funds to pay excessive brokerage commissions to the Distributor for steering clients towards proprietary funds. The complaints also alleged that the defendants breached their fiduciary duty to the Funds by improperly charging Rule 12b-1 fees and by drawing on fund assets to make undisclosed payments of soft dollars and excessive brokerage commissions. The complaints also alleged that the Funds failed to adequately disclose certain of the allegedly wrongful conduct. The complaints sought injunctive relief and compensatory and punitive damages, rescission of the Funds’ contracts with the Advisers, recovery of all fees paid to the Advisers pursuant to such contracts and an award of attorneys’ fees and litigation expenses.
On December 15, 2004, a consolidated amended complaint (the “Complaint”) was filed alleging substantially similar causes of action. While the lawsuit is in its earliest stages, to the extent that the Complaint purports to state causes of action against the Funds, Citigroup Asset Management believes the Funds have significant defenses to such allegations, which the Funds intend to vigorously assert in responding to the Complaint.
Additional lawsuits arising out of these circumstances and presenting similar allegations and requests for relief may be filed against the Defendants in the future.
As of the date of this report, Citigroup Asset Management and the Funds believe that the resolution of the pending lawsuit will not have a material effect on the financial position or results of operations of the Funds or the ability of the Advisers and their affiliates to continue to render services to the Funds under their respective contracts.
21 Smith Barney Multiple Discipline Funds — Large Cap Growth and Value Fund | 2004 Semi-Annual Report
SMITH BARNEY
MULTIPLE DISCIPLINE FUNDS
LARGE CAP GROWTH AND VALUE FUND
| | |
DIRECTORS Paul R. Ades Dwight B. Crane R. Jay Gerken, CFA
Chairman Frank G. Hubbard Jerome H. Miller Ken Miller OFFICERS R. Jay Gerken, CFA President and Chief Executive Officer Andrew B. Shoup Senior Vice President and Chief Administrative Officer Kaprel Ozsolak Chief Financial Officer and Treasurer Alan J. Blake Vice President and Investment Officer Robert Feitler, Jr. Vice President and Investment Officer Mark McAllister Vice President and Investment Officer Kirstin Mobyed Vice President and
Investment Officer Roger Paradiso Vice President and
Investment Officer | | OFFICERS (continued) Andrew Beagley Chief Anti-Money Laundering
Compliance Officer and
Chief Compliance Officer Robert I. Frenkel Secretary and
Chief Legal Officer INVESTMENT MANAGER Smith Barney Fund
Management LLC DISTRIBUTORS Citigroup Global Markets Inc. PFS Distributors, Inc. CUSTODIAN State Street Bank and
Trust Company TRANSFER AGENT Citicorp Trust Bank, fsb. 125 Broad Street, 11th Floor New York, New York 10004 SUB-TRANSFER AGENTS PFPC Inc. P.O. Box 9699 Providence, Rhode Island 02940-9699 Primerica Shareholder Services P.O. Box 9662 Providence, Rhode Island 02940-9662 |
Smith Barney Investment Funds Inc.
Smith Barney Multiple Discipline Funds
Large Cap Growth and Value Fund
The Fund is a separate investment fund of the Smith Barney Investment Funds Inc., a Maryland corporation.
The Fund files its complete schedule of portfolio holdings with Securities and Exchange Commission for the first and third quarters of each fiscal year on Form N-Q. The Fund’s Forms N-Q are available on the Commission’s website at www.sec.gov. The Fund’s Forms N-Q may be reviewed and copied at the Commission’s Public Reference Room in Washington, D.C., and information on the operation of the Public Reference Room may be obtained by calling 1-800-SEC-0330. To obtain information on Form N-Q from the Fund, shareholders can call 1-800-451-2010.
Information on how the fund voted proxies relating to portfolio securities during the 12 month period ended June 30, 2004 and a description of the policies and procedures that the fund uses to determine how to vote proxies relating to portfolio securities is available (1) without charge, upon request, by calling 1-800-451-2010, (2) on the fund’s website at www.citigroupAM.com and (3) on the SEC’s website at www.sec.gov.
This report is submitted for the general information of the shareholders of Smith Barney Investment Funds Inc. — Smith Barney Multiple Discipline Funds —Large Cap Growth and Value Fund, but it may also be used as sales literature when preceded or accompanied by the current Prospectus.
SMITH BARNEY MULTIPLE DISCIPLINE FUNDS
LARGE CAP GROWTH AND VALUE FUND
Smith Barney Mutual Funds
125 Broad Street
10th Floor, MF-2
New York, New York 10004
This document must be preceded or accompanied by a free prospectus. Investors should consider the fund’s investment objectives, risks, charges and expenses carefully before investing. The prospectus contains this and other important information about the fund. Please read the prospectus carefully before you invest or send money.
www.smithbarneymutualfunds.com
©2004 Citigroup Global Markets Inc. Member NASD, SIPC
FD01760 12/0404-7555
| ITEM 3. | AUDIT COMMITTEE FINANCIAL EXPERT. |
| ITEM 4. | PRINCIPAL ACCOUNTANT FEES AND SERVICES. |
| ITEM 5. | AUDIT COMMITTEE OF LISTED REGISTRANTS. |
| ITEM 7. | DISCLOSURE OF PROXY VOTING POLICIES AND PROCEDURES FOR CLOSED-END MANAGEMENT INVESTMENT COMPANIES. |
| ITEM 9. | SUBMISSION OF MATTERS TO A VOTE OF SECURITY HOLDERS. |
| ITEM 10. | CONTROLS AND PROCEDURES. |
| | (a) | The registrant’s principal executive officer and principal financial officer have concluded that the registrant’s disclosure controls and procedures (as defined in Rule 30a- 3(c) under the Investment Company Act of 1940, as amended (the “1940 Act”)) are effective as of a date within 90 days of the filing date of this report that includes the disclosure required by this paragraph, based on their evaluation of the disclosure controls and procedures required by Rule 30a-3(b) under the 1940 Act and 15d-15(b) under the Securities Exchange Act of 1934. |
| | (b) | There were no changes in the registrant’s internal control over financial reporting (as defined in Rule 30a-3(d) under the 1940 Act) that occurred during the registrant’s last fiscal half-year (the registrant’s second fiscal half-year in the case of an annual report) that have materially affected, or are likely to materially affect the registrant’s internal control over financial reporting. |
| | |
| Exhibit 99.CERT | | Certifications pursuant to section 302 of the Sarbanes-Oxley Act of 2002 |
| |
| Exhibit 99.906CERT | | Certifications pursuant to Section 906 of the Sarbanes-Oxley Act of 2002 |
SIGNATURES
Pursuant to the requirements of the Securities Exchange Act of 1934 and the Investment Company Act of 1940, the registrant has duly caused this Report to be signed on its behalf by the undersigned, there unto duly authorized.
Smith Barney Investment Funds Inc.
| | |
| By: | | /s/ R. Jay Gerken
|
| | | R. Jay Gerken |
| | | Chief Executive Officer of |
| | | Smith Barney Investment Funds Inc. |
Date: January 6, 2005
Pursuant to the requirements of the Securities Exchange Act of 1934 and the Investment Company Act of 1940, this report has been signed below by the following persons on behalf of the registrant and in the capacities and on the dates indicated.
| | |
| By: | | /s/ R. Jay Gerken
|
| | | R. Jay Gerken |
| | | Chief Executive Officer of |
| | | Smith Barney Investment Funds Inc. |
Date: January 6, 2005
| | |
| By: | | /s/ Kaprel Ozsolak
|
| | | Kaprel Ozsolak |
| | | Chief Financial Officer of |
| | | Smith Barney Investment Funds Inc. |
Date: January 6, 2005