UNITED STATES
SECURITIES AND EXCHANGE COMMISSION
Washington, D.C. 20549
FORM N-CSR
CERTIFIED SHAREHOLDER REPORT OF REGISTERED
MANAGEMENT INVESTMENT COMPANIES
Investment Company Act file number 811-3275
Smith Barney Investment Funds Inc.
(Exact name of registrant as specified in charter)
| | |
| 125 Broad Street, New York, NY | | 10004 |
|
| (Address of principal executive offices) | | (Zip code) |
Robert I. Frenkel, Esq.
Smith Barney Fund Management LLC
300 First Stamford Place
Stamford, CT 06902
(Name and address of agent for service)
Registrant’s telephone number, including area code: (800) 451-2010
Date of fiscal year end: September 30
Date of reporting period: March 31, 2005
ITEM 1. REPORT TO STOCKHOLDERS.
The Semi-Annual Report to Stockholders is filed herewith.
SMITH BARNEY
REAL RETURN
STRATEGY FUND
CLASSIC SERIES | SEMI-ANNUAL REPORT | MARCH 31, 2005

NOT FDIC INSURED • NOT BANK GUARANTEED • MAY LOSE VALUE
Classic Series

Semi-Annual Report • March 31, 2005
SMITH BARNEY
REAL RETURN STRATEGY FUND
MANAGEMENT
Smith Barney Fund Management LLC (SBFM) utilizes a team headed by Steven Bleiberg to manage the Fund’s assets. The Energy Securities Segment is managed by a team of investment professionals at Citigroup Asset Management Ltd., the Real Estate Securities and Metals and Mining Securities Segments are managed by teams of investment professionals at Travelers Investment Management Company, and the Inflation Protected Securities Segment is managed by David Torchia and Frederick Marki of SBFM.
FUND OBJECTIVE
The Fund seeks capital appreciation and income by investing substantially all of its net assets in securities of companies related to the energy, metals and mining and real estate industries and inflation protected securities.
What’s Inside
LETTER FROM THE CHAIRMAN

R. JAY GERKEN, CFA
Chairman, President and Chief Executive Officer
Dear Shareholder,
I would like to extend a warm welcome to you as a shareholder of the new Smith Barney Real Return Strategy Fund. The stewardship of your Fund is a responsibility we take very seriously and we will work diligently to achieve the Fund’s investment goals. Thank you again for your confidence in our investment management capabilities. This is the first of two shareholder reports that we will send to you each year detailing the economic and financial markets environment, the Fund’s investment strategy and how it affected performance, and what, if any, changes we have made in anticipation of the market outlook. We encourage you to read these reports carefully to monitor the Fund’s progress.
Despite rising interest rates, continued high oil prices, geopolitical concerns and uncertainties surrounding the U.S. Presidential election, the U.S. economy continued to expand during the six-month period ended March 31, 2005. Following a robust 4.0% gain in the third quarter of 2004, gross domestic product (“GDP”)i growth was 3.8% in the fourth quarter. On April 28, after the reporting period ended, first quarter 2005 GDP growth estimates came in at 3.1%.
Given the overall strength of the economy, the Federal Reserve Board (“Fed”)ii continued to raise interest rates over the period in an attempt to ward off inflation. Following three 0.25% rate hikes from June through September 2004, the Fed again increased its target for the federal funds rateiii by 0.25% increments four times during the reporting period. This brought the target for the federal funds rate to 2.75% by the end of March 2005. The Fed raised its target rate by an additional 0.25% to 3.00% at its May meeting, after the Fund’s reporting period.
During the six months covered by this report, the U.S. stock market as a whole generated positive results, with the S&P 500 Indexiv returning 6.88%. After treading water early in the period, from late October 2004 through the end of the year, equities in both the U.S. and abroad rallied sharply. Investors were drawn to the market as the uncertainty of the U.S. Presidential election ended and oil prices fell from their record highs. Thus far in 2005, the equity markets have been volatile. Equities were weak in January, but subsequently rallied in February and early March. However, toward the end of the period the market fell sharply, as oil prices reached new record highs and investors were concerned that the Fed may become more aggressive in terms of raising interest rates.
For much of the reporting period, the fixed-income market confounded many investors as short-term interest rates rose in concert with the Fed rate tightenings, while longer-term rates, remained fairly steady. However, this changed late in the period, coinciding with the Fed’s official statement accompanying its March rate hike. While the Fed continued to say it expected to raise rates at a “measured” pace, it made several adjustments to its statement, which many investors interpreted to mean larger rate hikes could be possible in the future. This subsequently caused longer-term interest rates to rise sharply.
Performance Review
The Smith Barney Real Return Strategy Fund commenced operations on November 12, 2004, and thus, only has returns for approximately four and half months of the six-month period. Since the Fund’s inception date on November 12, 2004, the Fund’s Class A shares, excluding sales charges, returned 3.66% through March 31, 2005. These shares outperformed the S&P 500 Index, the Lehman Brothers U.S. TIPS Indexv and the Morgan Stanley REIT Indexvi, which returned 0.37%, 1.53%, and -3.38%, respectively, for the same time period. The Fund underperformed the MSCI World Metals & Mining Indexvii and the MSCI World Energy Indexviii, which returned 7.33% and 14.95%, respectively, over the same time frame. The Lipper Multi-Cap Core Funds Category Average1 was 1.11% for the time period of 11/30/04 to 3/31/05.
1 Smith Barney Real Return Strategy Fund | 2005 Semi-Annual Report
PERFORMANCE SNAPSHOT
AS OF MARCH 31, 2005
(excluding sales charges)
(unaudited)
| | | |
| | | Since Inception
(11/12/04) | |
| | | | |
Real Return Strategy Fund — Class A Shares | | 3.66 | % |
| | | | |
S&P 500 Index | | 0.37 | % |
| | | | |
Lehman Brothers U.S. TIPS Index | | 1.53 | % |
| | | | |
Morgan Stanley REIT Index | | -3.38 | % |
| | | | |
MSCI World Energy Index | | 14.95 | % |
| | | | |
MSCI World Metals & Mining Index | | 7.33 | % |
| | | | |
| | | 11/30/04-3/31/05 | |
| | | | |
Lipper Multi-Cap Core Funds Category Average | | 1.11 | % |
The performance shown represents past performance. Past performance is no guarantee of future results and current performance may be higher or lower than the performance shown above. Principal value and investment returns will fluctuate and investors’ shares, when redeemed, may be worth more or less than their original cost. To obtain performance data current to the most recent month-end, please visit our website at www.citigroupam.com.
Performance figures may reflect reimbursements and/or fee waivers, without which the performance would have been lower.
Class A share returns assume the reinvestment of income dividends and capital gains distributions at net asset value and the deduction of all fund expenses. Returns have not been adjusted to include sales charges that may apply when shares are purchased or the deduction of taxes that a shareholder would pay on Fund distributions. Excluding sales charges, Class B shares returned 3.38% and Class C shares returned 3.38% since their inception date of 11/15/04.
Information About Your Fund
As you may be aware, several issues in the mutual fund industry have recently come under the scrutiny of federal and state regulators. The Fund’s Adviser and some of its affiliates have received requests for information from various government regulators regarding market timing, late trading, fees, and other mutual fund issues in connection with various investigations. The regulators appear to be examining, among other things, the Fund’s response to market timing and shareholder exchange activity, including compliance with prospectus disclosure related to these subjects. The Fund has been informed that the Adviser and its affiliates are responding to those information requests, but are not in a position to predict the outcome of these requests and investigations.
Important information concerning the Fund and its Adviser with regard to recent regulatory developments is contained in the "Additional Information" note in the Notes to the Financial Statements included in this report.
| 1 | | Lipper, Inc. is a major independent mutual-fund tracking organization. Returns are based on the time period from 11/30/04 to 03/31/05, including the reinvestment of dividends and capital gains distributions, if any, calculated among the 767 funds in the fund’s Lipper category, and excluding sales charges. |
2 Smith Barney Real Return Strategy Fund | 2005 Semi-Annual Report
Thank you for your investment in the Smith Barney Real Return Strategy Fund. We appreciate that you have entrusted us to manage your assets and we value our relationship with you.
Sincerely,

R. Jay Gerken, CFA
President, Chairman and Chief Executive Officer
May 3, 2005
The information provided is not intended to be a forecast of future events, a guarantee of future results or investment advice. Views expressed may differ from those of the firm as a whole.
RISKS: The Fund is subject to the risks associated with the individual equity market segments represented in the Fund and (“inflation-protected securities”) IPS. These equity segments may be more volatile than other types of investments and are sensitive to movements in the prices of their underlying commodities and as a result of geopolitical factors. The Fund is also subject to concentration, small-cap, mid-cap and foreign securities risks. The risks associated with IPS include deflation, interest rate, extension, liquidity, and prepayment risks. As interest rates rise, bond prices fall, reducing the value of the Fund’s share price. The Fund may use derivatives, such as options and futures, which can be illiquid, may disproportionately increase losses, and have a potentially large impact on Fund performance. These and other risks are detailed in the prospectus.
All index performance reflects no deduction for fees, expenses or taxes. Please note an investor cannot invest directly in an index.
| i | | Gross domestic product is a market value of goods and services produced by labor and property in a given country. |
| ii | | The Federal Reserve Board is responsible for the formulation of a policy designed to promote economic growth, full employment, stable prices, and a sustainable pattern of international trade and payments. |
| iii | | The federal funds rate is the interest rate that banks with excess reserves at a Federal Reserve district bank charge other banks that need overnight loans. |
| iv | | The S&P 500 Index is a market capitalization-weighted index of 500 widely held common stocks. |
| v | | The Lehman Brothers U.S. TIPS Index represents an unmanaged market index made up of U.S. Treasury Inflation Linked Index securities. |
| vi | | The Morgan Stanley REIT Index is a capitalization-weighted benchmark index of the most actively traded real estate investment trusts (REITs). |
| vii | | The MSCI World Metals & Mining Index is a free float-adjusted market capitalization index that is designed to measure global developed market equity performance and focuses on the metal and mining sectors. |
| viii | | The MSCI World Energy Index is a free float-adjusted market capitalization index that is designed to measure global developed market equity performance and focuses on the energy sector. |
3 Smith Barney Real Return Strategy Fund | 2005 Semi-Annual Report
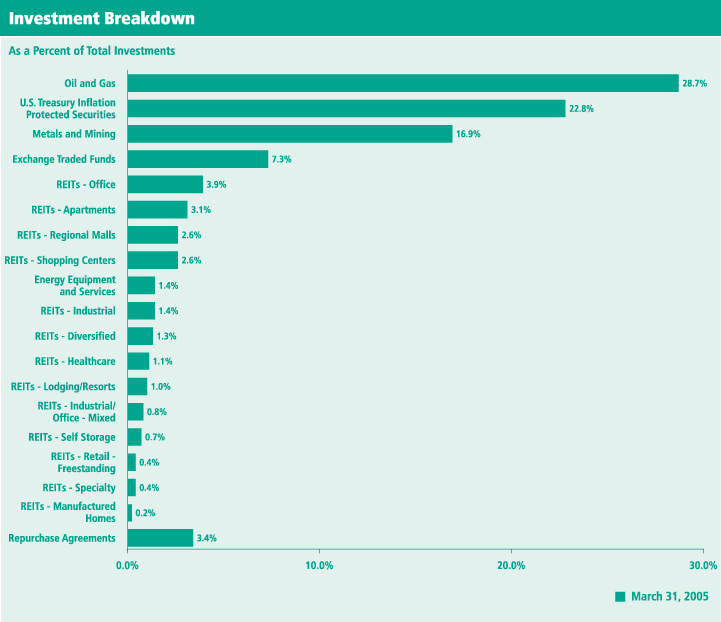
Fund at a Glance (unaudited)
4 Smith Barney Real Return Strategy Fund | 2005 Semi-Annual Report
| | |
| Fund Expenses (unaudited) | | |
Example
As a shareholder of the Fund, you may incur two types of costs: (1) transaction costs, including front-end and back-end sales charges (loads) on purchase payments, reinvested dividends, or other distributions; and (2) ongoing costs, including management fees; distribution and/or service (12b-1) fees; and other Fund expenses. This example is intended to help you understand your ongoing costs (in dollars) of investing in the Fund and to compare these costs with the ongoing costs of investing in other mutual funds.
This example is based on an investment of $1,000 invested on inception date and held through March 31, 2005.
Actual Expenses
The table below titled “Based on Actual Total Return” provides information about actual account values and actual expenses. You may use the information provided in this table, together with the amount you invested, to estimate the expenses that you paid over the period. To estimate the expenses you paid on your account, divide your ending account value by $1,000 (for example, an $8,600 ending account value divided by $1,000 = 8.6), then multiply the result by the number under the heading entitled “Expenses Paid During the Period”.
Based on Actual Total Return(1)
| | | | | | | | | | | | | | | |
| | | Actual Total
Return Without
Sales Charges(2) | | | Beginning
Account
Value | | Ending
Account
Value | | Annualized
Expense
Ratio | | | Expenses
Paid During
the Period(3) |
Class A | | 3.66 | % | | $ | 1,000.00 | | $ | 1,036.60 | | 1.20 | % | | $ | 4.59 |
|
Class B | | 3.38 | | | | 1,000.00 | | | 1,033.80 | | 1.95 | | | | 7.39 |
|
Class C | | 3.38 | | | | 1,000.00 | | | 1,033.80 | | 1.95 | | | | 7.39 |
|
| (1) | | For the period from inception date to March 31, 2005, for each class respectively. Inception date for Class A shares is November 12, 2004, and for Class B and C shares is November 15, 2004. |
| (2) | | Assumes reinvestment of all dividends and capital gain distributions, if any, at net asset value and does not reflect the deduction of the applicable sales charges with respect to Class A shares or the applicable CDSC with respect to Class B and C shares. Total return is not annualized, as it may not be representative of the total return for the year. Performance figures may reflect voluntary fee waivers and/or expense reimbursements. Past performance is no guarantee of future results. In the absence of voluntary fee waivers and/or expense reimbursements, the total return would have been lower. |
| (3) | | Expenses (net of voluntary fee waiver and/or expense reimbursement) are equal to each class’ respective annualized expense ratio multiplied by the average account value over the period, multiplied by the number of days in the most recent fiscal half-year, then divided by 365. |
5 Smith Barney Real Return Strategy Fund | 2005 Semi-Annual Report
| | |
| Fund Expenses (unaudited) (continued) | | |
Hypothetical Example for Comparison Purposes
The table below titled “Based on Hypothetical Total Return” provides information about hypothetical account values and hypothetical expenses based on the actual expense ratio and an assumed rate of return of 5.00% per year before expenses, which is not the Fund’s actual return. The hypothetical account values and expenses may not be used to estimate the actual ending account balance or expenses you paid for the period. You may use the information provided in this table to compare the ongoing costs of investing in the Fund and other funds. To do so, compare the 5.00% hypothetical example relating to the Fund with the 5.00% hypothetical examples that appear in the shareholder reports of the other funds.
Please note that the expenses shown in the table below are meant to highlight your ongoing costs only and do not reflect any transactional costs, such as front-end or back-end sales charges (loads). Therefore, the table is useful in comparing ongoing costs only, and will not help you determine the relative total costs of owning different funds. In addition, if these transaction costs were included, your costs would have been higher.
Based on Hypothetical Total Return(1)
| | | | | | | | | | | | | | | |
| | | Hypothetical
Total Return | | | Beginning
Account
Value | | Ending
Account
Value | | Annualized
Expense
Ratio | | | Expenses
Paid During
the Period(2) |
Class A | | 5.00 | % | | $ | 1,000.00 | | $ | 1,014.26 | | 1.20 | % | | $ | 4.54 |
|
Class B | | 5.00 | | | | 1,000.00 | | | 1,011.36 | | 1.95 | | | | 7.31 |
|
Class C | | 5.00 | | | | 1,000.00 | | | 1,011.36 | | 1.95 | | | | 7.31 |
|
| (1) | | For the period from inception date to March 31, 2005, for each class respectively. Inception date for Class A shares is November 12, 2004, and for Class B and C shares is November 15, 2004. |
| (2) | | Expenses (net of voluntary fee waiver and/or expense reimbursement) are equal to each class’ respective annualized expense ratio multiplied by the average account value over the period, multiplied by the number of days in the most recent fiscal half-year, then divided by 365. |
6 Smith Barney Real Return Strategy Fund | 2005 Semi-Annual Report
| | |
| Schedule of Investments (unaudited) | | March 31, 2005 |
| | | | | |
| SHARES | | SECURITY | | VALUE |
| COMMON STOCK — 74.4% | | | |
| ENERGY — 31.5% | | | |
| Energy Equipment and Services — 1.4% | | | |
| 3,213 | | Halliburton Co. | | $ | 138,962 |
| 1,273 | | Schlumberger Ltd. | | | 89,721 |
|
| | | | | | 228,683 |
|
| Exchange Traded Fund — 1.1% | | | |
| 4,306 | | The Energy Select Sector SPDR Fund | | | 184,727 |
|
| Oil and Gas — 29.0% | | | |
| 60,767 | | BP PLC | | | 629,450 |
| 7,179 | | ChevronTexaco Corp. | | | 418,607 |
| 973 | | ConocoPhillips | | | 104,928 |
| 2,194 | | EnCana Corp. | | | 154,501 |
| 9,963 | | Eni S.p.A. | | | 258,778 |
| 16,286 | | Exxon Mobil Corp. | | | 970,646 |
| 3,100 | | Kerr-McGee Corp. | | | 242,823 |
| 35,500 | | Nippon Mining Holdings, Inc. | | | 195,006 |
| 1,782 | | Norsk Hydro ASA | | | 146,850 |
| 938 | | OAO Gazprom, Sponsored ADR | | | 31,611 |
| 16,995 | | Origin Energy Ltd. | | | 93,582 |
| 4,755 | | Petroleo Brasileiro S.A., Sponsored ADR | | | 182,925 |
| 5,623 | | Royal Dutch Petroleum | | | 336,290 |
| 8,645 | | Saipem S.p.A. | | | 109,638 |
| 11,691 | | Santos Ltd. | | | 81,308 |
| 6,109 | | Statoil ASA | | | 103,958 |
| 1,819 | | Total S.A. | | | 425,761 |
| 2,605 | | Unocal Corp. | | | 160,702 |
| 5,720 | | The Williams Cos., Inc. | | | 107,593 |
|
| | | | | | 4,754,957 |
|
| | | TOTAL ENERGY | | | 5,168,367 |
|
| MATERIALS — 20.0% | | | |
| Exchange Traded Fund — 2.9% | | | |
| 9,350 | | iShares Dow Jones U.S. Basic Materials Sector Index Fund | | | 477,598 |
|
| Metals and Mining — 17.1% | | | |
| 324 | | Aber Diamond Corp. | | | 9,827 |
| 364 | | Acerinox, S.A. | | | 5,971 |
| 463 | | Agnico-Eagle Mines Ltd. | | | 6,756 |
| 2,413 | | Alcan Inc. | | | 91,760 |
| 5,797 | | Alcoa Inc. | | | 176,171 |
| 7,026 | | Alumina Ltd. | | | 31,979 |
| 9,000 | | Anglo American PLC | | | 213,306 |
| 3,194 | | Arcelor | | | 73,020 |
| 3,620 | | Barrick Gold Corp. | | | 86,785 |
| 23,420 | | BHP Billiton Ltd. | | | 323,408 |
| 17,343 | | BHP Billiton PLC | | | 232,868 |
| 5,526 | | BlueScope Steel Ltd. | | | 37,151 |
| 1,098 | | Cameco Corp. | | | 48,626 |
| 24,304 | | Corus Group PLC (a) | | | 24,785 |
| 476 | | Dofasco Inc. | | | 14,028 |
See Notes to Financial Statements.
7 Smith Barney Real Return Strategy Fund | 2005 Semi-Annual Report
| | |
| Schedule of Investments (unaudited) (continued) | | March 31, 2005 |
| | | | | |
| SHARES | | SECURITY | | VALUE |
| Metals and Mining — 17.1% (continued) | | | |
| 2,000 | | Dowa Mining Co., Ltd. | | $ | 13,486 |
| 793 | | Falconbridge Ltd. (a) | | | 28,451 |
| 1,068 | | Freeport-McMoRan Copper & Gold Inc., Class B Shares | | | 42,303 |
| 592 | | Glamis Gold Ltd. (a) | | | 9,191 |
| 1,475 | | Goldcorp Inc. | | | 21,022 |
| 2,560 | | Iluka Resources Ltd. | | | 11,236 |
| 1,340 | | Inco Ltd. (a) | | | 53,217 |
| 3,000 | | JFE Holdings, Inc. | | | 83,656 |
| 2,163 | | Kinross Gold Corp. (a) | | | 13,161 |
| 17,000 | | Kobe Steel, Ltd. | | | 29,965 |
| 367 | | Meridian Gold Inc. (a) | | | 6,189 |
| 3,000 | | Mitsubishi Materials Corp. | | | 7,163 |
| 5,000 | | Mitsui Mining & Smelting Co., Ltd. | | | 22,150 |
| 2,177 | | Newcrest Mining Ltd. | | | 29,288 |
| 3,022 | | Newmont Mining Corp. | | | 127,680 |
| 3,000 | | Nippon Light Metal Co., Ltd. | | | 7,806 |
| 37,000 | | Nippon Steel Corp. | | | 93,514 |
| 5,000 | | Nisshin Steel Co., Ltd. | | | 13,103 |
| 919 | | Noranda Inc. | | | 18,469 |
| 482 | | Novelis, Inc. | | | 10,559 |
| 1,052 | | Nucor Corp. | | | 60,553 |
| 5,914 | | OneSteel Ltd. | | | 11,836 |
| 992 | | Outokumpu Oyj | | | 17,739 |
| 544 | | Phelps Dodge Corp. | | | 55,341 |
| 2,603 | | Placer Dome Inc. | | | 42,090 |
| 1,232 | | Rautaruukki Oyj | | | 16,583 |
| 2,270 | | Rio Tinto Ltd. | | | 79,182 |
| 6,644 | | Rio Tinto PLC | | | 214,682 |
| 962 | | SSAB Svenskt Stal AB, Series A Shares | | | 23,895 |
| 28,000 | | Sumitomo Metal Industries, Ltd. | | | 50,399 |
| 3,000 | | Sumitomo Metal Mining Co., Ltd. | | | 22,579 |
| 1,441 | | Teck Cominco Ltd., Class B Shares | | | 53,428 |
| 2,411 | | ThyssenKrupp AG | | | 49,680 |
| 200 | | Umicore | | | 20,307 |
| 759 | | United States Steel Corp. | | | 38,595 |
| 305 | | Viohalco, Hellenic Copper and Aluminum Industry S.A. | | | 2,413 |
| 4,130 | | WMC Resources Ltd. | | | 25,436 |
|
| | | | | | 2,802,788 |
|
| | | TOTAL MATERIALS | | | 3,280,386 |
|
| REAL ESTATE INVESTMENT TRUSTS (REITs) — 22.9% | | | |
| Apartments — 3.1% | | | |
| 698 | | Amli Residential Properties Trust | | | 19,118 |
| 1,097 | | Apartment Investment and Management Co., Class A Shares | | | 40,808 |
| 3,182 | | Archstone-Smith Trust | | | 108,538 |
| 175 | | Associated Estates Realty Corp. | | | 1,745 |
| 743 | | AvalonBay Communities Inc. | | | 49,699 |
| 863 | | BRE Properties Inc., Class A Shares | | | 30,464 |
| 703 | | Camden Property Trust | | | 33,062 |
| 698 | | Cornerstone Realty Income Trust | | | 6,924 |
| 3,841 | | Equity Residential | | | 123,719 |
See Notes to Financial Statements.
8 Smith Barney Real Return Strategy Fund | 2005 Semi-Annual Report
| | |
| Schedule of Investments (unaudited) (continued) | | March 31, 2005 |
| | | | | |
| SHARES | | SECURITY | | VALUE |
| Apartments — 3.1% (continued) | | | |
| 90 | | Essex Property Trust, Inc. | | $ | 6,219 |
| 698 | | Gables Residential Trust | | | 23,243 |
| 628 | | Home Properties, Inc. | | | 24,366 |
| 175 | | Mid-America Apartment Communities, Inc. | | | 6,388 |
| 560 | | Post Properties, Inc. | | | 17,382 |
| 1,222 | | United Dominion Realty Trust, Inc. | | | 25,503 |
|
| | | | | | 517,178 |
|
| Diversified — 1.3% | | | |
| 761 | | Colonial Properties Trust | | | 29,230 |
| 524 | | Cousins Properties Inc. | | | 13,556 |
| 1,013 | | Crescent Real Estate Equities Co. | | | 16,552 |
| 524 | | Investors Real Estate Trust | | | 4,889 |
| 977 | | Lexington Corporate Properties Trust | | | 21,435 |
| 350 | | One Liberty Properties, Inc. | | | 6,531 |
| 350 | | Sizeler Property Investors, Inc. | | | 4,151 |
| 1,552 | | Vornado Realty Trust | | | 107,507 |
| 350 | | Washington Real Estate Investment Trust | | | 10,063 |
|
| | | | | | 213,914 |
|
| Exchange Traded Fund — 3.3% | | | |
| 4,843 | | iShares Dow Jones U.S. Real Estate Index Fund | | | 543,627 |
|
| Healthcare — 1.1% | | | |
| 1,572 | | Health Care Property Investors, Inc. | | | 36,895 |
| 925 | | Health Care REIT, Inc. | | | 29,600 |
| 650 | | Healthcare Realty Trust Inc. | | | 23,686 |
| 350 | | National Health Realty, Inc. | | | 6,510 |
| 614 | | Nationwide Health Properties, Inc. | | | 12,409 |
| 1,397 | | Senior Housing Properties Trust | | | 23,302 |
| 350 | | Universal Health Realty Income Trust | | | 9,888 |
| 1,047 | | Ventas, Inc. | | | 26,133 |
| 384 | | Windrose Medical Properties Trust | | | 5,265 |
|
| | | | | | 173,688 |
|
| Industrial — 1.4% | | | |
| 873 | | AMB Property Corp. | | | 32,999 |
| 1,222 | | Catellus Development Corp. | | | 32,566 |
| 524 | | CenterPoint Properties Trust | | | 21,484 |
| 175 | | EastGroup Properties, Inc. | | | 6,597 |
| 993 | | First Industrial Realty Trust, Inc. | | | 37,565 |
| 873 | | Monmouth Real Estate Investment Corp., Class A Shares | | | 7,369 |
| 2,379 | | ProLogis | | | 88,261 |
|
| | | | | | 226,841 |
|
| Industrial/Office – Mixed — 0.8% | | | |
| 524 | | Bedford Property Investors, Inc. | | | 11,439 |
| 1,572 | | Duke Realty Corp. | | | 46,924 |
| 1,582 | | Liberty Property Trust | | | 61,777 |
| 524 | | Mission West Properties, Inc. | | | 5,554 |
| 105 | | PS Business Parks Inc. | | | 4,232 |
|
| | | | | | 129,926 |
|
See Notes to Financial Statements.
9 Smith Barney Real Return Strategy Fund | 2005 Semi-Annual Report
| | |
| Schedule of Investments (unaudited) (continued) | | March 31, 2005 |
| | | | | |
| SHARES | | SECURITY | | VALUE |
| Lodging/Resorts — 1.0% | | | |
| 150 | | Ashford Hospitality Trust | | $ | 1,530 |
| 350 | | Equity Inns, Inc. | | | 3,861 |
| 524 | | FelCor Lodging Trust Inc. (a) | | | 6,513 |
| 175 | | Highland Hospitality Corp. | | | 1,811 |
| 1,297 | | Hospitality Properties Trust | | | 52,373 |
| 4,542 | | Host Marriott Corp. | | | 75,216 |
| 350 | | Innkeepers USA Trust | | | 4,519 |
| 350 | | LaSalle Hotel Properties | | | 10,168 |
| 698 | | Winston Hotels, Inc. | | | 8,167 |
|
| | | | | | 164,158 |
|
| Manufactured Homes — 0.2% | | | |
| 524 | | Affordable Residential Communities Inc. | | | 6,629 |
| 524 | | American Land Lease, Inc. | | | 12,125 |
| 175 | | Equity Lifestyle Properties, Inc. | | | 6,169 |
| 90 | | Sun Communities, Inc. | | | 3,222 |
| 524 | �� | United Mobile Homes, Inc. | | | 8,405 |
|
| | | | | | 36,550 |
|
| Office — 4.0% | | | |
| 25 | | Alexandria Real Estate Equities, Inc. | | | 1,610 |
| 1,222 | | American Financial Realty Trust | | | 17,878 |
| 698 | | Arden Realty Group, Inc. | | | 23,627 |
| 1,397 | | Boston Properties, Inc. | | | 84,141 |
| 1,222 | | Brandywine Realty Trust | | | 34,705 |
| 524 | | CarrAmerica Realty Corp. | | | 16,532 |
| 350 | | Corporate Office Properties Trust | | | 9,268 |
| 698 | | CRT Properties, Inc. | | | 15,202 |
| 5,938 | | Equity Office Properties Trust | | | 178,912 |
| 698 | | Glenborough Realty Trust Inc. | | | 13,346 |
| 524 | | Government Properties Trust, Inc. | | | 5,219 |
| 175 | | Highwoods Properties, Inc. | | | 4,694 |
| 3,318 | | HRPT Properties Trust | | | 39,517 |
| 384 | | Kilroy Realty Corp. | | | 15,709 |
| 1,217 | | Mack-Cali Realty Corp. | | | 51,540 |
| 350 | | Maguire Properties, Inc. | | | 8,358 |
| 1,063 | | Prentiss Properties Trust | | | 36,312 |
| 1,047 | | Reckson Associates Realty Corp. | | | 32,143 |
| 524 | | SL Green Realty Corp. | | | 29,459 |
| 1,746 | | Trizec Properties, Inc. | | | 33,174 |
|
| | | | | | 651,346 |
|
| Regional Malls — 2.6% | | | |
| 663 | | CBL & Associates Properties, Inc. | | | 47,411 |
| 3,067 | | General Growth Properties, Inc. | | | 104,585 |
| 350 | | Glimcher Realty Trust | | | 8,295 |
| 528 | | The Macerich Co. | | | 28,132 |
| 454 | | The Mills Corp. | | | 24,017 |
| 898 | | Pennsylvania Real Estate Investment Trust | | | 36,207 |
| 2,794 | | Simon Property Group, Inc. | | | 169,261 |
| 524 | | Taubman Centers, Inc. | | | 14,536 |
|
| | | | | | 432,444 |
|
See Notes to Financial Statements.
10 Smith Barney Real Return Strategy Fund | 2005 Semi-Annual Report
| | |
| Schedule of Investments (unaudited) (continued) | | March 31, 2005 |
| | | | | |
| SHARES | | SECURITY | | VALUE |
| Retail – Freestanding — 0.4% | | | |
| 1,047 | | Commercial Net Lease Realty, Inc. | | $ | 19,317 |
| 524 | | Getty Realty Corp. | | | 13,388 |
| 1,356 | | Realty Income Corp. | | | 31,025 |
| 524 | | Truststreet Properties, Inc. | | | 8,064 |
|
| | | | | | 71,794 |
|
| Self Storage — 0.7% | | | |
| 1,461 | | Public Storage, Inc. | | | 83,189 |
| 250 | | Shurgard Storage Centers, Inc., Class A Shares | | | 10,245 |
| 570 | | Sovran Self Storage, Inc. | | | 22,589 |
|
| | | | | | 116,023 |
|
| Shopping Centers — 2.6% | | | |
| 175 | | Acadia Realty Trust | | | 2,814 |
| 70 | | Cedar Shopping Centers Inc. | | | 997 |
| 1,907 | | Developers Diversified Realty Corp. | | | 75,803 |
| 1,222 | | Equity One, Inc. | | | 25,161 |
| 357 | | Federal Realty Investment Trust | | | 17,261 |
| 873 | | Heritage Property Investment Trust | | | 25,911 |
| 1,842 | | Kimco Realty Corp. | | | 99,284 |
| 524 | | Kramont Realty Trust | | | 12,262 |
| 1,746 | | New Plan Excel Realty Trust, Inc. | | | 43,842 |
| 668 | | Pan Pacific Retail Properties, Inc. | | | 37,909 |
| 350 | | Ramco-Gershenson Properties Trust | | | 9,503 |
| 540 | | Regency Centers Corp. | | | 25,720 |
| 350 | | Saul Centers, Inc. | | | 11,200 |
| 175 | | Urstadt Biddle Properties Inc., Class A Shares | | | 2,669 |
| 1,162 | | Weingarten Realty Investors | | | 40,101 |
|
| | | | | | 430,437 |
|
| Specialty — 0.4% | | | |
| 728 | | Capital Automotive REIT | | | 24,111 |
| 350 | | Correctional Properties Trust | | | 8,838 |
| 724 | | Entertainment Properties Trust | | | 29,995 |
|
| | | | | | 62,944 |
|
| | | TOTAL REAL ESTATE INVESTMENT TRUSTS (REITs) | | | 3,770,870 |
|
| | | TOTAL COMMON STOCK
(Cost — $11,781,356) | | | 12,219,623 |
|
| | |
FACE
AMOUNT | | | | |
| U.S. TREASURY INFLATION PROTECTED SECURITIES — 22.9% |
| $1,011,620 | | U.S. Treasury Inflationary Index Bonds, 2.375% due 1/15/25 | | | 1,088,447 |
| | | U.S. Treasury Inflationary Index Notes: | | | |
| 1,337,140 | | 3.875% due 1/15/09 | | | 1,475,017 |
| 1,083,600 | | 2.000% due 1/15/14 | | | 1,109,473 |
| 99,865 | | 1.625% due 1/15/15 | | | 98,422 |
|
| | | TOTAL U.S. TREASURY INFLATION PROTECTED SECURITIES
(Cost — $3,769,413) | | | 3,771,359 |
|
See Notes to Financial Statements.
11 Smith Barney Real Return Strategy Fund | 2005 Semi-Annual Report
| | |
| Schedule of Investments (unaudited) (continued) | | March 31, 2005 |
| | | | | | |
FACE
AMOUNT | | SECURITY | | VALUE | |
| REPURCHASE AGREEMENTS — 3.4% | |
| $189,000 | | Interest in $1,051,803,000 joint tri-party repurchase agreement dated 3/31/05 with Bank of America Corp., 2.850% due 4/1/05; Proceeds at maturity — $189,015; (Fully collateralized by various U.S. Government Issues, 0.000% to 7.000% due 6/29/05 to 3/24/25; Market value — $192,780) | | $ | 189,000 | |
| 366,000 | | State Street Bank & Trust Co. dated 3/31/05, 2.380% due 4/1/05; Proceeds at maturity — $366,024;
(Fully collateralized by U.S. Treasury Bonds, 7.625% to 9.250% due 2/15/16 to 2/15/25;
Market value — $383,559) | | | 366,000 | |
|
|
| | | TOTAL REPURCHASE AGREEMENTS
(Cost — $555,000) | | | 555,000 | |
|
|
| | | TOTAL INVESTMENTS — 100.7% (Cost — $16,105,769*) | | | 16,545,982 | |
| | | Liabilities in Excess of Other Assets — (0.7%) | | | (110,509 | ) |
|
|
| | | TOTAL NET ASSETS — 100.0% | | $ | 16,435,473 | |
|
|
| (a) | | Non-income producing security. |
| * | | Aggregate cost for federal income tax purposes is substantially the same. |
Abbreviation used in this schedule:
SPDR — Standard & Poor’s Depositary Receipt
| | | |
| Summary of Investments by Country** | | | |
United States | | 71.7 | % |
United Kingdom | | 8.0 | |
Australia | | 4.4 | |
Japan | | 3.3 | |
Canada | | 3.1 | |
France | | 3.0 | |
Italy | | 2.2 | |
The Netherlands | | 2.0 | |
Norway | | 1.5 | |
Germany | | 0.3 | |
Finland | | 0.2 | |
Sweden | | 0.2 | |
Belgium | | 0.1 | |
|
|
Total | | 100.0 | % |
|
|
| ** | | As a percentage of total investments. Please note that Fund holdings are as of March 31, 2005 and are subject to change. |
See Notes to Financial Statements.
12 Smith Barney Real Return Strategy Fund | 2005 Semi-Annual Report
| | |
| Statement of Assets and Liabilities (unaudited) | | March 31, 2005 |
| | | | |
| ASSETS: | | | | |
Investments, at value (Cost — $16,105,769) | | $ | 16,545,982 | |
Foreign currency, at value (Cost — $553) | | | 554 | |
Cash | | | 76,571 | |
Dividends and interest receivable | | | 60,370 | |
Receivable from manager | | | 44,290 | |
Receivable for Fund shares sold | | | 40,870 | |
Prepaid expenses | | | 20,185 | |
|
|
Total Assets | | | 16,788,822 | |
|
|
| LIABILITIES: | | | | |
Payable for securities purchased | | | 301,376 | |
Distribution plan fees payable | | | 2,576 | |
Directors’ fees payable | | | 1,930 | |
Transfer agency services payable | | | 995 | |
Accrued expenses | | | 46,472 | |
|
|
Total Liabilities | | | 353,349 | |
|
|
Total Net Assets | | $ | 16,435,473 | |
|
|
| NET ASSETS: | | | | |
Par value of capital shares (Note 6) | | $ | 1,401 | |
Capital paid in excess of par value | | | 16,019,714 | |
Undistributed net investment income | | | 4,017 | |
Accumulated net realized loss from investment transactions | | | (29,802 | ) |
Net unrealized appreciation of investments and foreign currencies | | | 440,143 | |
|
|
Total Net Assets | | $ | 16,435,473 | |
|
|
Shares Outstanding: | | | | |
Class A | | | 1,074,170 | |
| |
Class B | | | 184,952 | |
| |
Class C | | | 141,631 | |
| |
Net Asset Value: | | | | |
Class A (and redemption price) | | | $11.73 | |
| |
Class B * | | | $11.73 | |
| |
Class C * | | | $11.73 | |
| |
Maximum Public Offering Price Per Share: | | | | |
Class A (based on maximum sales charge of 5.00%) | | | $12.35 | |
|
|
| * | | Redemption price is NAV of Class B and Class C shares reduced by a 5.00% and 1.00% CDSC, respectively, if shares are redeemed within one year from purchase payment (See Note 2). |
See Notes to Financial Statements.
13 Smith Barney Real Return Strategy Fund | 2005 Semi-Annual Report
| | |
| Statement of Operations (unaudited) | | For the Period Ended March 31, 2005† |
| | | | |
| INVESTMENT INCOME: | | | | |
Dividends | | $ | 149,649 | |
Interest | | | 35,180 | |
Less: Foreign withholding tax | | | (4,964 | ) |
|
|
Total Investment Income | | | 179,865 | |
|
|
| EXPENSES: | | | | |
Management fee (Note 2) | | | 34,350 | |
Custody | | | 33,265 | |
Shareholder communications (Note 4) | | | 22,736 | |
Distribution fees (Notes 2 and 4) | | | 20,275 | |
Audit and legal | | | 17,003 | |
Organization expenses | | | 10,386 | |
Directors’ fees | | | 4,419 | |
Transfer agency services (Notes 2 and 4) | | | 2,749 | |
Registration fees | | | 1,613 | |
Other | | | 2,328 | |
|
|
Total Expenses | | | 149,124 | |
Less: Management fee waiver and expense reimbursement (Note 2) | | | (78,640 | ) |
|
|
Net Expenses | | | 70,484 | |
|
|
Net Investment Income | | | 109,381 | |
|
|
REALIZED AND UNREALIZED GAIN (LOSS) ON INVESTMENTS
AND FOREIGN CURRENCIES (NOTES 1 and 3): | | | | |
Realized Loss From: | | | | |
Investment transactions | | | (6,714 | ) |
Foreign currency transactions | | | (23,088 | ) |
|
|
Net Realized Loss | | | (29,802 | ) |
|
|
Net Change in Unrealized Appreciation/Depreciation From: | | | | |
Investments | | | 440,213 | |
Foreign currencies | | | (70 | ) |
|
|
Net Increase in Unrealized Appreciation/Depreciation | | | 440,143 | |
|
|
Net Gain on Investments and Foreign Currencies | | | 410,341 | |
|
|
Increase in Net Assets From Operations | | $ | 519,722 | |
|
|
| † | | For the period November 12, 2004 (commencement of operations) to March 31, 2005. |
See Notes to Financial Statements.
14 Smith Barney Real Return Strategy Fund | 2005 Semi-Annual Report
| | |
| Statement of Changes in Net Assets (unaudited) | | For the Period Ended March 31, 2005† |
| | | | |
| OPERATIONS: | | | | |
Net investment income | | $ | 109,381 | |
Net realized loss | | | (29,802 | ) |
Net change in unrealized appreciation/depreciation | | | 440,143 | |
|
|
Increase in Net Assets From Operations | | | 519,722 | |
|
|
| DISTRIBUTIONS TO SHAREHOLDERS FROM (NOTES 1 AND 5): | | | | |
Net investment income | | | (105,364 | ) |
|
|
Decrease in Net Assets From Distributions to Shareholders | | | (105,364 | ) |
|
|
| FUND SHARE TRANSACTIONS (NOTE 6): | | | | |
Net proceeds from sale of shares | | | 16,591,386 | |
Net asset value of shares issued for reinvestment of distributions | | | 95,850 | |
Cost of shares reacquired | | | (666,121 | ) |
|
|
Increase in Net Assets From Fund Share Transactions | | | 16,021,115 | |
|
|
Increase in Net Assets | | | 16,435,473 | |
| |
| NET ASSETS: | | | | |
Beginning of period | | | — | |
|
|
End of period* | | $ | 16,435,473 | |
|
|
* Includes undistributed net investment income of: | | | $4,017 | |
|
|
| † | | For the period November 12, 2004 (commencement of operations) to March 31, 2005. |
See Notes to Financial Statements.
15 Smith Barney Real Return Strategy Fund | 2005 Semi-Annual Report
| | |
| Financial Highlights (unaudited) | | |
For a share of each class of capital stock outstanding throughout the period ended March 31, 2005:
| | | | | | | | | |
| | | Class A
Shares(1)(2) | | | Class B
Shares(1)(3) | | | Class C
Shares(1)(3) | |
Net Asset Value, Beginning of Period | | $11.40 | | | $11.40 | | | $11.40 | |
|
|
Income from Operations: | | | | | | | | | |
Net investment income | | 0.09 | | | 0.06 | | | 0.06 | |
Net realized and unrealized gain | | 0.33 | | | 0.33 | | | 0.33 | |
|
|
Total Income from Operations | | 0.42 | | | 0.39 | | | 0.39 | |
|
|
Less Distributions From: | | | | | | | | | |
Net investment income | | (0.09 | ) | | (0.06 | ) | | (0.06 | ) |
|
|
Total Distributions | | (0.09 | ) | | (0.06 | ) | | (0.06 | ) |
|
|
Net Asset Value, End of Period | | $11.73 | | | $11.73 | | | $11.73 | |
|
|
Total Return(4)‡ | | 3.66 | % | | 3.38 | % | | 3.38 | % |
|
|
Net Assets, End of Period (000’s omitted) | | $12,603 | | | $2,170 | | | $1,662 | |
|
|
Ratios to Average Net Assets: | | | | | | | | | |
Expenses(5)(6)† | | 1.20 | % | | 1.95 | % | | 1.95 | % |
Net investment income† | | 2.17 | % | | 1.62 | % | | 1.56 | % |
|
|
Portfolio Turnover Rate | | 16 | % | | 16 | % | | 16 | % |
|
|
| (1) | | Per share amounts have been calculated using the monthly average shares method. |
| (2) | | For the period November 12, 2004 (commencement of operations) to March 31, 2005. |
| (3) | | For the period November 15, 2004 (commencement of operations) to March 31, 2005. |
| (4) | | Performance figures may reflect voluntary fee waivers and/or expense reimbursements. Past performance is no guarantee of future results. In the absence of voluntary fee waivers and/or expense reimbursements, the total return would have been lower. |
| (5) | | The Investment Manager voluntarily waived its management fee and reimbursed expenses for the period ended March 31, 2005. If such fees were not voluntarily waived and/or expenses reimbursed, the annualized expense ratio for Class A, Class B, and Class C shares would have been 2.53%, 4.33%, and 3.96%, respectively. |
| (6) | | As a result of a voluntary expense limitation, the ratio of expenses to average net assets will not exceed 1.20%, 1.95% and 1.95% for Class A, Class B, and Class C shares, respectively. |
| ‡ | | Total return in not annualized, as it may not be representative of the total return for the year. |
See Notes to Financial Statements.
16 Smith Barney Real Return Strategy Fund | 2005 Semi-Annual Report
Notes to Financial Statements (unaudited)
| 1. | Organization and Significant Accounting Policies |
Smith Barney Real Return Strategy Fund (“Fund”), a separate investment fund of Smith Barney Investment Funds, Inc. (“Company”), a Maryland corporation, is registered under the Investment Company Act of 1940, as amended, as a non-diversified, open-end management investment company.
The following are significant accounting policies consistently followed by the Fund and are in conformity with U.S. generally accepted accounting principles (“GAAP”). Estimates and assumptions are required to be made regarding assets, liabilities and changes in net assets resulting from operations when financial statements are prepared. Changes in the economic environment, financial markets and any other parameters used in determining these estimates could cause actual results to differ.
(a) Investment Valuation. Securities traded on national securities markets are valued at the last sale price on such markets. Securities listed on the NASDAQ National Market System for which market quotations are available are valued at the official closing price or, if there is no official closing price on that day, at the last sale price. Securities traded in the over-the-counter markets, securities for which no sales price was reported and fixed-income securities are valued at the mean between the closing bid and asked prices. Equity securities for which market quotations are available are valued at the last sale price or official closing price on the primary market or exchange on which they trade. Debt securities are valued at the mean between the bid and asked price provided by an independent pricing service that are based on transactions in debt obligations, quotations from bond dealers, market transactions in comparable securities and various relationships between securities. When market quotations or official closing prices are not readily available, or are determined not to reflect fair value, such as when the value of a security has been significantly affected by events after the close of the exchange or market on which the security is principally traded but before the Fund calculates its net asset value, the Fund may value these investments at fair value as determined in accordance with the procedures approved by the Fund’s Board of Directors. Fair valuing of securities may be determined with the assistance of a pricing service using calculations based on indices of domestic securities and other appropriate indicators, such as prices of relevant ADRs and futures contracts. Short-term obligations with maturities of 60 days or less are valued at amortized cost, which approximates value.
(b) Repurchase Agreements. When entering into repurchase agreements, it is the Fund’s policy that a custodian takes possession of the underlying collateral securities, the value of which at least equals the principal amount of the repurchase transaction, including accrued interest. To the extent that any repurchase transaction exceeds one business day, the value of the collateral is marked-to-market to ensure the adequacy of the collateral. If the seller defaults and the value of the collateral declines or if bankruptcy proceedings are commenced with respect to the seller of the security, realization of the collateral by the Fund may be delayed or limited.
(c) Other Risks. The Fund primarily invests in the energy, real estate and metals and mining sectors, as well as inflation protected securities. Therefore, the Fund is subject to additional concentrations of credit and market risks associated with these industry segments, such as fluctuating prices and supplies of oil and other energy fuels, fluctuating property values, interest and mortgage related risks, price volatility caused by global economic, financial and political factors, resource availability and government regulation.
Additionally, the Fund’s investments in foreign securities may involve risks not present in domestic investments. Since securities may be denominated in foreign currency and may require settlement in foreign currencies and pay interest and dividends in foreign currencies, changes in the relationship of these foreign currencies to the U.S. dollar can significantly affect the value of the investments and earnings of the Fund. Foreign investments may also subject the Fund to foreign government exchange restrictions, expropriation, taxation or other political, social or economic developments, all of which could affect the market and/or credit risk of the investments.
17 Smith Barney Real Return Strategy Fund | 2005 Semi-Annual Report
Notes to Financial Statements (unaudited) (continued)
(d) Security Transactions and Investment Income. Security transactions are accounted for on a trade date basis. Interest income, adjusted for amortization of premium and accretion of discount, is recorded on the accrual basis. Dividend income is recorded on the ex-dividend date. Foreign dividend income is recorded on the ex-dividend date or as soon as practical after the Fund determines the existence of a dividend declaration after exercising reasonable due diligence. The cost of investments sold is determined by use of the specific identification method.
(e) Foreign Currency Translation. The books and records of the Fund are maintained in U.S. dollars. Transactions denominated in foreign currencies are recorded at the current prevailing exchange rates. All assets and liabilities denominated in foreign currencies are translated into U.S. dollar amounts at the current exchange rates at the end of the period. Translation gains or losses resulting from changes in the exchange rates during the reporting period and realized gains and losses on the settlement of foreign currency transactions are reported in the statement of operations for the current period. The Fund does not isolate that portion of realized gains and losses on investments in securities which is due to changes in the foreign exchange rates from that which is due to changes in market prices of equity securities.
(f) Distributions to Shareholders. Distributions from net investment income for the Fund, if any, are declared and paid on a quarterly basis. Distributions of net realized gains to shareholders of the Fund, if any, are declared at least annually. Distributions to shareholders of the Fund are recorded on the ex-dividend date and are determined in accordance with income tax regulations, which may differ from GAAP.
(g) Class Accounting. Investment income, common expenses and realized/unrealized gain (loss) on investments are allocated to the various classes of the Fund on the basis of daily net assets of each class. Distribution, transfer agency service and shareholder communications fees relating to a specific class are charged directly to that class.
(h) Federal and Other Taxes. It is the Fund’s policy to comply with the federal income and excise tax requirements of the Internal Revenue Code of 1986, as amended, applicable to regulated investment companies. Accordingly, the Fund intends to distribute substantially all of its taxable income and net realized gains on investments, if any, to shareholders each year. Therefore, no federal income tax provision is required.
(i) Reclassification. GAAP requires that certain components of net assets be adjusted to reflect permanent differences between financial and tax reporting. These reclassifications have no effect on net assets or net asset values per share.
(j) Organization Costs. It is the Fund’s policy to expense all costs related to the organization of the Fund as they are incurred. For the period ended March 31, 2005, the Fund paid $10,386 for audit and legal fees related to the initial registration of the Fund and related activities.
| 2. | Investment Management Agreement and Other Transactions with Affiliates |
Smith Barney Fund Management LLC (“SBFM”), an indirect wholly-owned subsidiary of Citigroup Inc. (“Citigroup”), acts as investment manager to the Fund. The Fund pays SBFM an investment management fee calculated at an annual rate of 0.65% of the Fund’s average daily net assets.
During the period ended March 31, 2005, the Fund’s Class A, B and C shares had voluntary expense limitations in place of 1.20%, 1.95%, and 1.95%, respectively. These expense limitations can be terminated at anytime by SBFM. During the period November 12, 2004 through March 31, 2005, SBFM voluntarily waived its entire investment management fee. In addition, for the period November 12, 2004 through March 31, 2005. SBFM reimbursed the Fund for other operating expenses in the amount of $44,290.
18 Smith Barney Real Return Strategy Fund | 2005 Semi-Annual Report
Notes to Financial Statements (unaudited) (continued)
Citigroup Asset Management Limited (“CAM Ltd.”), an affiliate of SBFM, serves as investment sub-adviser to the Fund pursuant to a Sub-Advisory Agreement. CAM Ltd. manages the Fund’s Energy Securities segment under the supervision of SBFM. CAM Ltd. receives a fee from SBFM, not the Fund, for its services, computed daily and paid monthly, at the annual rate of 0.45% of the Fund’s average daily net assets allocated to the Energy Securities segment.
Travelers Investment Management Company (“TIMCO”), also an affiliate of SBFM, serves as investment sub-adviser to the Fund pursuant to a Sub-Advisory Agreement. TIMCO manages the Fund’s Real Estate Securities and Metals and Mining Securities segments under the supervision of SBFM. TIMCO receives a fee from SBFM, not the Fund, for its services, computed daily and paid monthly, at the annual rate of 0.45% of the Fund’s average daily net assets allocated to the Real Estate Securities and Metals and Mining Securities segments.
Citicorp Trust Bank, fsb. (“CTB”), another subsidiary of Citigroup, acts as the Fund’s transfer agent. PFPC Inc. (“PFPC”) acts as the Fund’s sub-transfer agent. CTB receives account fees and asset-based fees that vary according to the size and type of account. PFPC is responsible for shareholder recordkeeping and financial processing for all shareholder accounts and is paid by CTB. During the period November 12, 2004 through March 31, 2005, the Fund paid transfer agent fees of $1,138 to CTB.
Citigroup Global Markets Inc. (“CGM”), another indirect wholly-owned subsidiary of Citigroup, acts as the Fund’s distributor.
There is a maximum sales charge of 5.00% for Class A shares. There is a contingent deferred sales charge (“CDSC”) of 5.00% on Class B shares, which applies if redemption occurs within one year from purchase payment and declines thereafter by 1.00% per year until no CDSC is incurred. Class C shares have a 1.00% CDSC, which applies if redemption occurs within one year from purchase payment. In addition, Class A shares have a 1.00% CDSC, which applies if redemption occurs within one year from purchase payment. This CDSC only applies to those purchases of Class A shares which, when combined with current holdings of Class A shares, equal or exceed $1,000,000 in the aggregate. These purchases do not incur an sales charge.
For the period November 12, 2004, through March 31, 2005, CGM and its affiliates received sales charges of approximately $125,000 on sales of the Fund’s Class A shares. In addition, for the period November 12, 2004, through March 31, 2005, CDSCs paid to CGM and its affiliates were approximately:
| | | | | | |
| | | Class B | | Class C |
CDSCs | | $ | 328 | | $ | 300 |
|
All officers and one Director of the Company are employees of Citigroup or its affiliates and do not receive compensation from the Company.
During the period November 12, 2004 through March 31, 2005, the aggregate cost of purchases and proceeds from sales of investments (excluding short-term investments) were as follows:
| | | |
|
Purchases | | $ | 17,814,271 |
|
Sales | | | 2,253,833 |
|
19 Smith Barney Real Return Strategy Fund | 2005 Semi-Annual Report
Notes to Financial Statements (unaudited) (continued)
At March 31, 2005, the aggregate gross unrealized appreciation and depreciation of investments for federal income tax purposes were substantially as follows:
| | | | |
|
|
Gross unrealized appreciation | | $ | 807,674 | |
Gross unrealized depreciation | | | (367,461 | ) |
|
|
Net unrealized appreciation | | $ | 440,213 | |
|
|
| 4. | Class Specific Expenses |
Pursuant to a Rule 12b-1 Distribution Plan, the Fund pays a service fee with respect to Class A, B and C shares calculated at an annual rate of 0.25% of the average daily net assets of each respective class. In addition, the Fund pays a distribution fee with respect to Class B and C shares calculated at an annual rate of 0.75% of the average daily net assets for each class, respectively. For the period November 12, 2004 through March 31, 2005, total Rule 12b-1 Distribution Plan fees, which are accrued daily and paid monthly, were as follows:
| | | | | | | | | |
| | | Class A | | Class B | | Class C |
Rule 12b-1 Distribution Plan Fees | | $ | 10,859 | | $ | 5,089 | | $ | 4,327 |
|
For the period November 12, 2004 through March 31, 2005, total Transfer Agency Service fees were as follows:
| | | | | | | | | |
| | | Class A | | Class B | | Class C |
Transfer Agency Service Fees | | $ | 1,669 | | $ | 594 | | $ | 486 |
|
For the period November 12, 2004 through March 31, 2005, total Shareholder Communication expenses were as follows:
| | | | | | | | | |
| | | Class A | | Class B | | Class C |
Shareholder Communication Expenses | | $ | 15,706 | | $ | 4,346 | | $ | 2,684 |
|
| 5. | Distributions Paid to Shareholders by Class |
| | | |
| | | Period Ended
March 31, 2005 |
From Net Investment Income | | | |
Class A† | | $ | 91,195 |
Class B‡ | | | 7,786 |
Class C‡ | | | 6,383 |
|
Total | | $ | 105,364 |
|
| † | For the period November 12, 2004 (commencement of operations) through March 31, 2005. |
| ‡ | For the period November 15, 2004 (commencement of operations) through March 31, 2005. |
At March 31, 2005, the Company had ten billion shares of capital stock authorized with a par value of $0.001 per share. The Fund has the ability to issue multiple classes of shares. Each share of a class represents an identical interest in the Fund and has the same rights, except that each class bears certain expenses specifically related to the distribution of its shares.
20 Smith Barney Real Return Strategy Fund | 2005 Semi-Annual Report
Notes to Financial Statements (unaudited) (continued)
Transactions in shares of each class were as follows:
| | | | | | | |
| | | Period Ended
March 31, 2005
| |
| | | Shares | | | Amount | |
Class A† | | | | | | | |
Shares sold | | 1,084,926 | | | $ | 12,377,552 | |
Shares issued on reinvestment | | 7,128 | | | | 84,126 | |
Shares reacquired | | (17,884 | ) | | | (203,492 | ) |
|
|
Net Increase | | 1,074,170 | | | $ | 12,258,186 | |
|
|
Class B‡ | | | | | | | |
Shares sold | | 222,970 | | | $ | 2,567,754 | |
Shares issued on reinvestment | | 498 | | | | 5,894 | |
Shares reacquired | | (38,516 | ) | | | (432,476 | ) |
|
|
Net Increase | | 184,952 | | | $ | 2,141,172 | |
|
|
Class C‡ | | | | | | | |
Shares sold | | 143,791 | | | $ | 1,646,080 | |
Shares issued on reinvestment | | 494 | | | | 5,830 | |
Shares reacquired | | (2,654 | ) | | | (30,153 | ) |
|
|
Net Increase | | 141,631 | | | $ | 1,621,757 | |
|
|
| † | For the period November 12, 2004 (commencement of operations) through March 31, 2005. |
| ‡ | For the period November 15, 2004 (commencement of operations) through March 31, 2005. |
Smith Barney Fund Management LLC (“SBFM”) and Citigroup Global Markets Inc. (“CGMI”) have submitted an Offer of Settlement of an administrative proceeding to the U.S. Securities and Exchange Commission (“SEC”) in connection with an investigation into the 1999 appointment of an affiliated transfer agent for the Smith Barney family of mutual funds (the “Funds”). SBFM and CGMI understand that the SEC has accepted the Offer of Settlement, but has not yet issued the administrative order.
The SEC order will find that SBFM and CGMI willfully violated Section 206(1) of the Investment Advisers Act of 1940 (“Advisers Act”). Specifically, the order will find that SBFM and CGMI knowingly or recklessly failed to disclose to the boards of the Funds in 1999 when proposing a new transfer agent arrangement with an affiliated transfer agent that: First Data Investors Services Group (“First Data”), the Funds’ then-existing transfer agent, had offered to continue as transfer agent and do the same work for substantially less money than before; and that Citigroup Asset Management (“CAM”) had entered into a side letter with First Data under which CAM agreed to recommend the appointment of First Data as sub-transfer agent to the affiliated transfer agent in exchange, among other things, for a guarantee by First Data of specified amounts of asset management and investment banking fees to CAM and CGMI. The order also will find that SBFM and CGMI willfully violated Section 206(2) of the Advisers Act by virtue of the omissions discussed above and other misrepresentations and omissions in the materials provided to the Funds’ boards, including the failure to make clear that the affiliated transfer agent would earn a high profit for performing limited functions while First Data continued to perform almost all of the transfer agent functions, and the suggestion that the proposed arrangement was in the Funds’ best interests and that no viable alternatives existed. SBFM and CGMI do not admit or deny any wrongdoing or liability. The settlement will not establish wrongdoing or liability for purposes of any other proceeding.
The SEC will censure SBFM and CGMI and order them to cease and desist from violations of Sections 206(1) and 206(2) of the Advisers Act. The order will require Citigroup to pay $208.1 million, including $109 million in disgorgement of profits, $19.1 million in interest, and a civil money penalty of $80 million. Approximately $24.4 million has already been
21 Smith Barney Real Return Strategy Fund | 2005 Semi-Annual Report
Notes to Financial Statements (unaudited) (continued)
paid to the Funds, primarily through fee waivers. The remaining $183.7 million, including the penalty, will be paid to the U.S. Treasury and then distributed pursuant to a plan to be prepared by Citigroup and submitted within 90 days of the entry of the order for approval by the SEC. The distribution plan may also include a portion of certain escrowed transfer agency fees, in accordance with the terms of the order.
The order will require SBFM to recommend a new transfer agent contract to the Fund boards within 180 days of the entry of the order; if a Citigroup affiliate submits a proposal to serve as transfer agent or sub-transfer agent, an independent monitor must be engaged at the expense of SBFM and CGMI to oversee a competitive bidding process. Under the order, Citigroup also will be required to comply with an amended version of a vendor policy that Citigroup instituted in August 2004. That policy, as amended, among other things, requires that when requested by a Fund board, CAM will retain at its own expense an independent consulting expert to advise and assist the board on the selection of certain service providers affiliated with Citigroup.
At this time, there is no certainty as to how the proceeds of the settlement will be distributed, to whom such distributions will be made, the methodology by which such distribution will be allocated, and when such distribution will be made. Although there can be no assurance, Citigroup does not believe that this matter will have a material adverse effect on the Funds.
22 Smith Barney Real Return Strategy Fund | 2005 Semi-Annual Report
Investment Manager Contract Approval Discussion
The members of the Board of Directors of the Fund, including the Fund’s independent, or non-interested, Directors (the “Independent Directors”), received information from the Fund’s proposed manager to assist them in their consideration of the Fund’s management agreement (the “Investment Management Agreement”) and subadvisory agreements (the “Sub-Advisory Agreements”). The Board considered each of the factors set forth below. As the Fund is newly established, the Board could not consider Fund performance or profitability of the manager with respect to the Fund. The Board also understood that it would be provided with the opportunity at its annual contract renewal meeting in 2005 to consider the continuation of the Investment Management Agreement and the Sub-Advisory Agreements and would have information available at that time regarding the Fund’s performance and profitability data of the manager with respect to the Fund.
Nature, Extent and Quality of Services to Be Provided under the Investment Management Agreement and the Sub-Advisory Agreements
The Board received information about the nature, extent and quality of the services to be provided by the manager under the Investment Management Agreement (including administrative services) and the subadvisers under the Sub-Advisory Agreements. The Board’s evaluation of the services to be provided by the manager, CAM Ltd. and TIMCO took into account the Board’s knowledge and familiarity gained as Board members of funds in the Citigroup Asset Management (“CAM”) fund complex, including with respect to the manager’s services provided to other funds in the CAM fund complex. The Board took note that the manager would allocate assets among the four segments and manage the Inflation Protected Securities segment directly, as well as supervise the management of the other three segments by the sub-advisers, which are affiliated persons of the manager. The Board noted that it was familiar with the manager’s allocation process in other funds and the experience of the portfolio managers of the Inflation Protected Securities segment. The Board further noted that the manager had established policies and procedures that would be applicable to the sub-advisers’ advisory and compliance activities. Based on this information, the Board concluded that the services to be provided by the manager were similar to those currently provided by the manager to other funds that are overseen by the Board, which it had determined to be of high quality with respect to those other funds.
In reviewing the Sub-Advisory Agreement with CAM Ltd., the Board reviewed information provided about the investment strategies employed by and the experience of the team that would manage the Energy Securities segment and noted that CAM Ltd. provides investment sub-advisory services to other mutual funds managed by SBFM. Based on this information, the Board concluded that CAM Ltd. could provide high quality services to the Fund. The Board noted that the sub-advisory fee would be paid to CAM Ltd. by the manager, not by the Fund.
In reviewing the Sub-Advisory Agreement with TIMCO, the Board reviewed information provided about the investment strategies employed by and the experience of the teams that would manage the Metals and Mining Securities and Real Estate Securities segments. The Board took note of the fact that TIMCO will follow an enhanced indexing approach to the management of these segments designed to exceed the performance of the relevant index before fund expenses while maintaining risk characteristics similar to the index. The Board further considered that TIMCO attempts to identify stocks that will outperform and underperform the relevant index, so that the segment will overweight high-ranking stocks and underweight low-ranking stocks (or not hold them at all), and may hold securities not contained in the index. The Board also noted that TIMCO provides investment sub-advisory services to other mutual funds managed by SBFM. In approving the sub-advisory fee payable to TIMCO, the Board concluded that TIMCO’s approach contained a strong active management component and stated that it anticipated that the segments it manages will deviate in important respects from the relevant index. Based on this information, the Board concluded that TIMCO could provide high quality services to the Fund. The Board noted that the sub-advisory fee would be paid to TIMCO by the manager, not by the Fund.
23 Smith Barney Real Return Strategy Fund | 2005 Semi-Annual Report
Investment Manager Contract Approval Discussion (continued)
The Board concluded that, overall, it was satisfied with the nature, extent and quality of services expected to be provided under the Investment Management Agreement and the Sub-Advisory Agreements.
Management Fees and Expense Ratios
In approving the Fund’s Investment Management Agreement, the Board considered the reasonableness of the proposed investment management fee to be paid by the Fund in light of the nature, extent and quality of the management services to be provided, as described above. The Board was also provided by the manager with fee information on comparable funds (i.e., funds with investment objectives and policies similar to the Fund). The Board also took note that the sub-advisory fees would be paid by the manager, not by the Fund, and, accordingly, that the retention of the Sub-Advisers would not increase the fees and expenses otherwise incurred by the Fund’s shareholders. The Board determined, in light of the information provided, that the proposed investment management fee and sub-advisory fees were reasonable in light of the nature, extent and quality of services proposed to be provided to the Fund.
Other Benefits to the Manager
In reviewing the reasonableness of the investment management fee, the Board concluded that affiliates of the manager would benefit from the manager’s relationship with the Fund. The Board approved the applicability to the Fund of certain contracts between Smith Barney Investment Funds and affiliates of the manager under which those affiliates would serve as the Fund’s principal underwriter and transfer agent, and would receive compensation for their services in the form of sales commissions, deferred sales charges, fees to be paid under Rule 12b-1 plans and transfer agency fees. The Board concluded that these services were necessary for the operation of the Fund and that the manager’s affiliates could provide services the nature and quality of which were at least equal to those provided by unaffiliated third parties and at fees that were fair and reasonable in light of the usual and customary charges made by others for services of the same nature and quality. The Board further recognized that it had approved procedures under which the Fund would be permitted to use broker-dealer affiliates of the manager as brokers in securities transactions, subject to the conditions that the affiliate will provide the Fund with price and execution at least as favorable and a commission rate comparable to those provided by unaffiliated broker-dealers in similar transactions. The Board also recognized the existence of “fall-out benefits” to affiliates of the manager, such as the affiliated underwriter’s ability to use funds held in shareholders’ brokerage accounts as free credit balances if such shareholders pay for Fund shares prior to settlement date and do not otherwise specify a use for the funds. The Board concluded that the benefits to the manager and its affiliates were a necessary result of the manager’s being part of a diverse financial services organization providing a wide variety of services to investment companies, and noted that the Fund should be able to benefit from the manager’s experience and resources. The Board further reviewed the manager’s and sub-advisers’ use of research services received from broker-dealers that will execute transactions on behalf of the Fund and concluded that while such research services may benefit the manager and the sub-advisers, the Fund should also benefit from the manager’s and sub-advisers’ receipt of such services. In light of the anticipated costs of providing investment management, sub-advisory and other services to the Fund, the potential profits and other ancillary benefits the manager and its affiliates might be expected to receive were considered reasonable.
Manager Profitability
In analyzing the expenses expected to be incurred by the manager and sub-advisers with respect to the Fund, the Board members took note of the information they had received with respect to other funds they oversee regarding the profitability of the mutual fund business to the manager and its affiliates. The Board also considered the anticipated expense ratio of the Fund in comparison to that of other funds managed by the manager and to competitive funds with assets comparable to the Fund’s anticipated size. Since the Fund is newly established, the Board did not have available specific data regarding profitability of the manager with respect to the Fund.
24 Smith Barney Real Return Strategy Fund | 2005 Semi-Annual Report
Investment Manager Contract Approval Discussion (continued)
Economies of Scale
The Board members, in functioning for other funds, had reviewed and accepted the manager’s methodology for allocating the expenses of operating the funds in the complex and noted that the manager was passing on the benefits of economies of scale to the funds. Recognizing that the Fund had not commenced operations at the time of the Board’s meeting, consideration of economies of scale for the Fund seemed premature and the Board intended to monitor matters in this area as part of its annual contract renewal consideration.
No single factor was identified by the Board as the determining factor in deciding whether to approve the Investment Management Agreement and each Sub-Advisory Agreement. The Independent Directors were advised by separate independent legal counsel throughout this process.
25 Smith Barney Real Return Strategy Fund | 2005 Semi-Annual Report
SMITH BARNEY
REAL RETURN STRATEGY FUND
| | |
DIRECTORS Paul R. Ades Dwight B. Crane R. Jay Gerken, CFA Chairman Frank G. Hubbard Jerome H. Miller Ken Miller OFFICERS R. Jay Gerken, CFA President and Chief Executive Officer Andrew B. Shoup Senior Vice President and
Chief Administrative Officer Kaprel Ozsolak Chief Financial Officer
and Treasurer Steven Bleiberg Vice President and
Investment Officer Daniel Willey Vice President and
Investment Officer Frederick Marki Vice President and
Investment Officer Michael McElroy Vice President and
Investment Officer | | OFFICERS (continued) David Torchia Vice President and
Investment Officer Andrew Beagley Chief Anti-Money Laundering Compliance Officer and
Chief Compliance Officer Robert I. Frenkel Secretary and Chief Legal Officer INVESTMENT MANAGER Smith Barney Fund
Management LLC DISTRIBUTOR Citigroup Global Markets Inc. CUSTODIAN State Street Bank and Trust Company TRANSFER AGENT Citicorp Trust Bank, fsb. 125 Broad Street, 11th Floor New York, New York 10004 SUB-TRANSFER AGENT PFPC Inc. P.O. Box 9699 Providence, Rhode Island 02940-9699 |
Smith Barney Investment Funds Inc.
Smith Barney Real Return Strategy Fund
The Fund is a separate investment fund of the Smith Barney Investment Funds Inc., a Maryland corporation.
The Fund files its complete schedule of portfolio holdings with the Securities and Exchange Commission for the first and third quarters of each fiscal year on Form N-Q. The Fund’s Forms N-Q are available on the Commission’s website at www.sec.gov. The Fund’s Forms N-Q may be reviewed and copied at the Commission’s Public Reference Room in Washington D.C., and information on the operation of the Public Reference Room may be obtained by calling 1-800-SEC-0330. To obtain information on Form N-Q from the Fund, shareholders can call 1-800-451-2010.
A description of the policies and procedures that the Fund uses to determine how to vote proxies relating to portfolio securities is available (1) without charge, upon request, by calling 1-800-451-2010, (2) on the Fund’s website at www.citigroupAM.com and (3) on the SEC’s website at www.sec.gov.
This report is submitted for the general information of shareholders of Smith Barney Investment Funds Inc. — Smith Barney Real Return Strategy Fund, but it may also be used as sales literature when preceded or accompanied by the current Prospectus.
SMITH BARNEY
Smith Barney Mutual Funds
125 Broad Street
10th Floor, MF-2
New York, New York 10004
This document must be preceded or accompanied by a free prospectus. Investors should consider the fund’s investment objectives, risks, charges and expenses carefully before investing. The prospectus contains this and other important information about the fund. Please read the prospectus carefully before you invest or send money.
www.citigroupam.com
©2005 Citigroup Global Markets Inc.
Member NASD, SIPC
FD03160 5/05
05-8559
ITEM 2. CODE OF ETHICS.
Not Applicable.
ITEM 3. AUDIT COMMITTEE FINANCIAL EXPERT.
Not Applicable.
ITEM 4. PRINCIPAL ACCOUNTANT FEES AND SERVICES.
Not applicable.
ITEM 5. AUDIT COMMITTEE OF LISTED REGISTRANTS.
Not applicable.
ITEM 6. [RESERVED]
ITEM 7. DISCLOSURE OF PROXY VOTING POLICIES AND PROCEDURES FOR CLOSED-END MANAGEMENT INVESTMENT COMPANIES.
Not applicable.
ITEM 8. [RESERVED]
ITEM 9. SUBMISSION OF MATTERS TO A VOTE OF SECURITY HOLDERS.
Not applicable.
ITEM 10. CONTROLS AND PROCEDURES.
| | (a) | The registrant’s principal executive officer and principal financial officer have concluded that the registrant’s disclosure controls and procedures (as defined in Rule 30a-3(c) under the Investment Company Act of 1940, as amended (the “1940 Act”)) are effective as of a date within 90 days of the filing date of this report that includes the disclosure required by this paragraph, based on their evaluation of the disclosure controls and procedures required by Rule 30a-3(b) under the 1940 Act and 15d-15(b) under the Securities Exchange Act of 1934. |
| | (b) | There were no changes in the registrant’s internal control over financial reporting (as defined in Rule 30a-3(d) under the 1940 Act) that occurred during the registrant’s last fiscal half-year (the registrant’s second fiscal half-year in the case of an annual report) that have materially affected, or are likely to materially affect the registrant’s internal control over financial reporting. |
ITEM 11. EXHIBITS.
| | |
| Exhibit 99.CERT | | Certifications pursuant to section 302 of the Sarbanes-Oxley Act of 2002 |
| |
| Exhibit 99.906CERT | | Certifications pursuant to Section 906 of the Sarbanes-Oxley Act of 2002 |
SIGNATURES
Pursuant to the requirements of the Securities Exchange Act of 1934 and the Investment Company Act of 1940, the registrant has duly caused this Report to be signed on its behalf by the undersigned, there unto duly authorized.
| | |
| Smith Barney Investment Funds Inc. |
| |
By: | | /s/ R. Jay Gerken
|
| | | R. Jay Gerken |
| | | Chief Executive Officer of |
| | | Smith Barney Investment Funds Inc. |
| |
Date: | | June 9, 2005 |
Pursuant to the requirements of the Securities Exchange Act of 1934 and the Investment Company Act of 1940, this report has been signed below by the following persons on behalf of the registrant and in the capacities and on the dates indicated.
| | |
By: | | /s/ R. Jay Gerken
|
| | | R. Jay Gerken |
| | | Chief Executive Officer of |
| | | Smith Barney Investment Funds Inc. |
| |
Date: | | June 9, 2005 |
| |
By: | | /s/ Kaprel Ozsolak
|
| | | Kaprel Ozsolak |
| | | Chief Financial Officer of |
| | | Smith Barney Investment Funds Inc. |
| |
Date: | | June 9, 2005 |