UNITED STATES
SECURITIES AND EXCHANGE COMMISSION
Washington, D.C. 20549
FORM N-CSR
CERTIFIED SHAREHOLDER REPORT OF REGISTERED
MANAGEMENT INVESTMENT COMPANIES
Investment Company Act file number 811-3275
|
| Smith Barney Investment Funds Inc. |
| (Exact name of registrant as specified in charter) |
| | |
| 125 Broad Street, New York, NY 10004 |
| (Address of principal executive offices) (Zip code) |
|
| Robert I. Frenkel, Esq. |
| c/o Citigroup Asset Management |
| 300 First Stamford Place, 4th Floor |
| Stamford, CT 06902 |
| (Name and address of agent for service) |
Registrant’s telephone number, including area code: (800) 451-2010
Date of fiscal year end: December 31
Date of reporting period: June 30, 2005
ITEM 1. REPORT TO STOCKHOLDERS.
The Semi-Annual Report to Stockholders is filed herewith.
SMITH BARNEY
GOVERNMENT
SECURITIES FUND
CLASSIC SERIES | SEMI-ANNUAL REPORT | JUNE 30, 2005

NOT FDIC INSURED • NOT BANK GUARANTEED • MAY LOSE VALUE
WHAT’S INSIDE
LETTER FROM THE CHAIRMAN

R. JAY GERKEN, CFA
Chairman, President and Chief Executive Officer
Dear Shareholder,
The U.S. economy overcame a number of obstacles and continued to expand during the reporting period. Rising interest rates, record high oil prices and geopolitical issues threatened to send the economy into a “soft patch.” However, when all was said and done, first quarter 2005 gross domestic product (“GDP”)i growth was 3.8%, mirroring the solid gain that occurred during the fourth quarter of 2004.
Given the overall strength of the economy, the Federal Reserve Board (“Fed”)ii continued to raise interest rates over the period in an attempt to ward off inflation. Following five rate hikes from June 2004 through December 2004, the Fed again increased its target for the federal funds rateiii in 0.25% increments four additional times during the reporting period. The Fed’s nine rate hikes brought the target for the federal funds rate from 1.00% to 3.25%.
During the reporting period, the fixed income market confounded many investors as short-term interest rates rose in concert with the Fed rate tightening, while longer-term rates declined. When the period began, the federal funds target rate was 2.25% and the yield on the 10-year U.S. Treasury note was 4.24%. When the reporting period ended, the federal funds rate rose to 3.25% and the 10-year U.S. Treasury note yield had fallen to 3.92%. Declining long-term rates, mixed economic data, and periodic flights to quality all appeared to support bond prices. Looking at the six-month period as a whole, the overall bond market, as measured by the Lehman Brothers Aggregate Bond Indexiv, returned 2.51%.
Performance Review
For the six months ended June 30, 2005, Class A shares of the Smith Barney Government Securities Fund, excluding sales charges, returned 2.69%. These shares outperformed the Fund’s unmanaged benchmark, the Citigroup Treasury/Mortgage Indexv, which returned 2.61% for the same period. The Lipper General U.S. Government Funds Category Average1 increased 2.74% over the same time frame.
| 1 | Lipper, Inc. is a major independent mutual-fund tracking organization. Returns are based on the 6-month period ended June 30, 2005, including the reinvestment of dividends and capital gains distributions, if any, calculated among the 181 funds in the Fund’s Lipper category, and excluding sales charges. |
1 Smith Barney Government Securities Fund | 2005 Semi-Annual Report
PERFORMANCE SNAPSHOT
AS OF JUNE 30, 2005
(excluding sales charges)
(unaudited)
| | | |
| | | 6 Months | |
| | | | |
Government Securities Fund — Class A Shares | | 2.69 | % |
| | | | |
Citigroup Treasury/Mortgage Index | | 2.61 | % |
| | | | |
Lipper General U.S. Government Funds Category Average | | 2.74 | % |
The performance shown represents past performance. Past performance is no guarantee of future results and current performance may be higher or lower than the performance shown above. Principal value and investment returns will fluctuate and investors’ shares, when redeemed, may be worth more or less than their original cost. To obtain performance data current to the most recent month-end, please visit our website at www.citigroupam.com.
Returns for all share classes assume the reinvestment of all distributions at net asset value and the deduction of all Fund expenses. Returns have not been adjusted to include sales charges that may apply when shares are purchased or the deduction of taxes that a shareholder would pay on Fund distributions. Excluding sales charges, Class 1 shares returned 2.75%, Class B shares returned 2.31%, Class C shares returned 2.25% and Class Y shares returned 2.76% over the six months ended June 30, 2005.
Special Shareholder Notice
On June 24, 2005, Citigroup Inc. (“Citigroup”) announced that it has signed a definitive agreement under which Citigroup will sell substantially all of its worldwide asset management business to Legg Mason, Inc. (“Legg Mason”).
As part of this transaction, Smith Barney Fund Management LLC (the “Adviser”), currently an indirect wholly owned subsidiary of Citigroup, would become an indirect wholly owned subsidiary of Legg Mason. The Adviser is the investment adviser to the Fund.
The transaction is subject to certain regulatory approvals, as well as other customary conditions to closing. Subject to such approvals and the satisfaction of the other conditions, Citigroup expects the transaction to be completed later this year.
Under the Investment Company Act of 1940, consummation of the transaction will result in the automatic termination of the investment advisory contract between the Fund and the Adviser. Therefore, the Fund’s Board of Directors will be asked to approve a new investment advisory contract between the Fund and the Adviser. If approved
2 Smith Barney Government Securities Fund | 2005 Semi-Annual Report
by the Board, the new investment advisory contract will be presented to the shareholders of the Fund for their approval.
Subsequently, on August 1, 2005, the Board approved the new investment advisory contract between the Fund and the Adviser.
Information About Your Fund
As you may be aware, several issues in the mutual fund industry have recently come under the scrutiny of federal and state regulators. The Fund’s Adviser and some of its affiliates have received requests for information from various government regulators regarding market timing, late trading, fees, and other mutual fund issues in connection with various investigations. The regulators appear to be examining, among other things, the Fund’s response to market timing and shareholder exchange activity, including compliance with prospectus disclosure related to these subjects. The Fund has been informed that the Adviser and its affiliates are responding to those information requests, but are not in a position to predict the outcome of these requests and investigations.
Important information concerning the Fund and its Adviser with regard to recent regulatory developments is contained in the “Additional Information” note in the Notes to the Financial Statements included in this report.
As always, thank you for your confidence in our stewardship of your assets. We look forward to helping you continue to meet your financial goals.
Sincerely,

R. Jay Gerken, CFA
Chairman, President and Chief Executive Officer
August 2, 2005
3 Smith Barney Government Securities Fund | 2005 Semi-Annual Report
The information provided is not intended to be a forecast of future events, a guarantee of future results or investment advice. Views expressed may differ from those of the firm as a whole.
RISKS: Keep in mind, fixed-income securities are subject to interest rate, credit and market risks. As interest rates rise, bond prices fall, reducing the value of the Fund’s share price. The U.S. government guarantee of principal and interest payments only applies to underlying securities in the Fund’s portfolio, not the Fund’s shares. Please note that the Fund’s shares are not guaranteed by the U.S. government or its agencies. The Fund may use derivatives, such as options and futures, which can be illiquid, may disproportionately increase losses, and have a potentially large impact on Fund performance. Please see the Fund’s prospectus for more information on these and other risks.
All index performance reflects no deduction for fees, expenses or taxes. Please note an investor cannot invest directly in an index.
| i | Gross domestic product is a market value of goods and services produced by labor and property in a given country. |
| ii | The Federal Reserve Board is responsible for the formulation of a policy designed to promote economic growth, full employment, stable prices, and a sustainable pattern of international trade and payments. |
| iii | The federal funds rate is the interest rate that banks with excess reserves at a Federal Reserve district bank charge other banks that need overnight loans. |
| iv | The Lehman Brothers Aggregate Bond Index is a broad-based bond index comprised of government, corporate, mortgage and asset-backed issues, rated investment grade or higher, and having at least one year to maturity. |
| v | The Citigroup Treasury/Mortgage Index is a component of the Citigroup U.S. Broad Investment-Grade (“USBIG”) Bond Index. It includes institutionally-traded fixed rate US Treasury securities and mortgages. Mortgages are comprised of 30- and 15-year GNMA, FNMA and FHLMC pass-throughs and FNMA and FHLMC balloon mortgages. |
4 Smith Barney Government Securities Fund | 2005 Semi-Annual Report
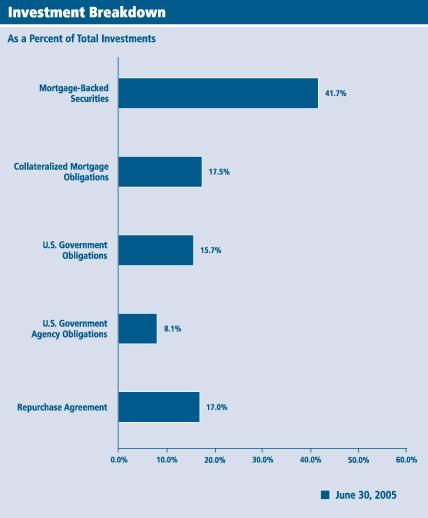
Fund at a Glance (unaudited)
5 Smith Barney Government Securities Fund | 2005 Semi-Annual Report
Fund Expenses (unaudited)
Example
As a shareholder of the Fund, you may incur two types of costs: (1) transaction costs, including front-end and back-end sales charges (loads) on purchase payments, reinvested dividends, or other distributions; and (2) ongoing costs, including management fees; distribution and/or service (12b-1) fees; and other Fund expenses. This example is intended to help you understand your ongoing costs (in dollars) of investing in the Fund and to compare these costs with the ongoing costs of investing in other mutual funds.
This example is based on an investment of $1,000 invested on January 1, 2005 and held for the six months ended June 30, 2005.
Actual Expenses
The table below titled “Based on Actual Total Return” provides information about actual account values and actual expenses. You may use the information provided in this table, together with the amount you invested, to estimate the expenses that you paid over the period. To estimate the expenses you paid on your account, divide your ending account value by $1,000 (for example, an $8,600 ending account value divided by $1,000 = 8.6), then multiply the result by the number under the heading entitled “Expenses Paid During the Period”.
Based on Actual Total Return(1)
| | | | | | | | | | | | | | | |
| | | Actual Total
Return Without
Sales Charges(2) | | | Beginning
Account
Value | | Ending
Account
Value | | Annualized
Expense
Ratio | | | Expenses
Paid During
the Period(3) |
Class 1 | | 2.75 | % | | $ | 1,000.00 | | $ | 1,027.50 | | 0.85 | % | | $ | 4.27 |
|
Class A | | 2.69 | | | | 1,000.00 | | | 1,026.90 | | 1.00 | | | | 5.03 |
|
Class B | | 2.31 | | | | 1,000.00 | | | 1,023.10 | | 1.57 | | | | 7.88 |
|
Class C | | 2.25 | | | | 1,000.00 | | | 1,022.50 | | 1.54 | | | | 7.72 |
|
Class Y | | 2.76 | | | | 1,000.00 | | | 1,027.60 | | 0.59 | | | | 2.97 |
|
| (1) | | For the six months ended June 30, 2005. |
| (2) | | Assumes reinvestment of dividends and capital gains distributions, if any, at net asset value and does not reflect applicable sales charges with respect to Class 1 and A shares or the applicable contingent deferred sales charges (“CDSC”) with respect to Class B and C shares. Total return is not annualized, as it may not be representative of the total return for the year. Performance figures may reflect voluntary fee waivers and/or expense reimbursements. Past performance is no guarantee of future results. In the absence of voluntary fee waivers and/or expense reimbursements, the total return would have been lower. |
| (3) | | Expenses are equal to each class’ respective annualized expense ratio multiplied by the average account value over the period, multiplied by the number of days in the most recent fiscal half-year, then divided by 365. |
6 Smith Barney Government Securities Fund | 2005 Semi-Annual Report
Fund Expenses (unaudited) (continued)
Hypothetical Example for Comparison Purposes
The table below titled “Based on Hypothetical Total Return” provides information about hypothetical account values and hypothetical expenses based on the actual expense ratio and an assumed rate of return of 5.00% per year before expenses, which is not the Fund’s actual return. The hypothetical account values and expenses may not be used to estimate the actual ending account balance or expenses you paid for the period. You may use the information provided in this table to compare the ongoing costs of investing in the Fund and other funds. To do so, compare the 5.00% hypothetical example relating to the Fund with the 5.00% hypothetical examples that appear in the shareholder reports of the other funds.
Please note that the expenses shown in the table below are meant to highlight your ongoing costs only and do not reflect any transactional costs, such as front-end or back-end sales charges (loads). Therefore, the table is useful in comparing ongoing costs only, and will not help you determine the relative total costs of owning different funds. In addition, if these transaction costs were included, your costs would have been higher.
Based on Hypothetical Total Return(1)
| | | | | | | | | | | | | | | |
| | | Hypothetical
Annualized
Total Return | | | Beginning
Account
Value | | Ending
Account
Value | | Annualized
Expense
Ratio | | | Expenses
Paid During
the Period(2) |
Class 1 | | 5.00 | % | | $ | 1,000.00 | | $ | 1,020.58 | | 0.85 | % | | $ | 4.26 |
|
Class A | | 5.00 | | | | 1,000.00 | | | 1,019.84 | | 1.00 | | | | 5.01 |
|
Class B | | 5.00 | | | | 1,000.00 | | | 1,017.01 | | 1.57 | | | | 7.85 |
|
Class C | | 5.00 | | | | 1,000.00 | | | 1,017.16 | | 1.54 | | | | 7.70 |
|
Class Y | | 5.00 | | | | 1,000.00 | | | 1,021.87 | | 0.59 | | | | 2.96 |
|
| (1) | | For the six months ended June 30, 2005. |
| (2) | | Expenses are equal to each class’ respective annualized expense ratio multiplied by the average account value over the period, multiplied by the number of days in the most recent fiscal half-year, then divided by 365. |
7 Smith Barney Government Securities Fund | 2005 Semi-Annual Report
| | |
| Schedule of Investments (unaudited) | | June 30, 2005 |
| | | | | |
FACE
AMOUNT | | SECURITY | | VALUE |
| MORTGAGE-BACKED SECURITIES — 50.9% | | | |
FHLMC — 12.5% | | | |
| | | Federal Home Loan Mortgage Corp. (FHLMC): | | | |
| $ 25,000,000 | | 4.500% due 7/1/35 (a) | | $ | 24,429,700 |
| 5,000,000 | | 6.500% due 7/1/35 (a) | | | 5,173,440 |
| | | Gold: | | | |
| 2,139,042 | | 6.500% due 1/1/16-6/1/31 | | | 2,226,441 |
| 16,704,443 | | 6.000% due 1/1/24-1/1/32 | | | 17,217,159 |
| 6,113,175 | | 7.000% due 6/1/32-7/1/32 | | | 6,438,942 |
| 11,213,874 | | 5.000% due 9/1/33 | | | 11,235,258 |
| | | One Year LIBOR: | | | |
| 10,153,805 | | 5.140% due 11/1/34 (b) | | | 10,335,904 |
| 9,744,950 | | 4.992% due 2/1/35 (b) | | | 9,873,614 |
|
| | | TOTAL FHLMC | | | 86,930,458 |
|
FNMA — 32.0% | | | |
| | | Federal National Mortgage Association (FNMA): | | | |
| 32,447,482 | | 5.500% due 5/1/16-9/1/23 | | | 33,143,154 |
| 4,207,082 | | 5.000% due 2/1/18-9/1/18 (c) | | | 4,260,490 |
| 61,000,000 | | 5.500% due 7/1/20-7/1/35 (a)(d) | | | 62,235,922 |
| 16,327,841 | | 6.500% due 5/1/22 (c) | | | 16,845,611 |
| 9,892,112 | | 6.000% due 11/1/22-7/1/32 | | | 10,191,990 |
| 3,630,703 | | 7.500% due 8/1/28-4/1/32 | | | 3,881,202 |
| 2,278,490 | | 7.000% due 8/1/29-5/1/32 | | | 2,404,206 |
| 1,710,805 | | 6.500% due 4/1/31-8/1/32 | | | 1,774,385 |
| 4,192,008 | | 4.505% due 6/1/33 (b)(c) | | | 4,204,855 |
| 4,588,411 | | 5.165% due 11/1/34 (b)(c) | | | 4,634,831 |
| 32,000,000 | | 6.000% due 7/1/35 (a)(d) | | | 32,809,984 |
| | | One Year LIBOR: | | | |
| 20,217,574 | | 4.997% due 5/1/35 (b)(c) | | | 20,449,106 |
| 20,000,000 | | 4.918% due 6/1/35 (b) | | | 20,230,460 |
| 4,773,779 | | Six Month LIBOR, 4.609% due 4/1/33 (b)(c) | | | 4,836,633 |
|
| | | TOTAL FNMA | | | 221,902,829 |
|
GNMA — 6.4% | | | |
| | | Government National Mortgage Association (GNMA): | | | |
| 3,614,316 | | 7.000% due 2/15/28-11/15/31 | | | 3,830,254 |
| 504,408 | | 7.500% due 4/15/29-9/15/31 | | | 540,801 |
| 1,466,490 | | 6.500% due 10/15/31-5/15/32 | | | 1,533,865 |
| 17,226,648 | | 5.000% due 8/15/33-9/15/33 | | | 17,390,225 |
| 6,000,000 | | 5.000% due 7/1/35 (a)(d) | | | 6,046,872 |
| 15,000,000 | | 5.500% due 7/1/35 (a)(d) | | | 15,318,750 |
|
| | | TOTAL GNMA | | | 44,660,767 |
|
| | | TOTAL MORTGAGE-BACKED SECURITIES
(Cost — $351,314,868) | | | 353,494,054 |
|
See Notes to Financial Statements.
8 Smith Barney Government Securities Fund | 2005 Semi-Annual Report
| | |
| Schedule of Investments (unaudited) (continued) | | June 30, 2005 |
| | | | | |
FACE
AMOUNT | | SECURITY | | VALUE |
| COLLATERALIZED MORTGAGE OBLIGATIONS — 21.3% | | | |
| $ 12,840,432 | | Adjustable Rate Mortgage Trust, Whole Loan, Series 2005-3,
Class 7A1, 5.091% due 7/25/35 (b) | | $ | 12,961,311 |
| | | Banc of America Mortgage Securities, Whole Loan: | | | |
| 9,041,852 | | Series 2003-I, Class 1A1, 3.285% due 10/25/33 (b) | | | 9,142,976 |
| 9,494,219 | | Series 2004-L, Class 4A1, 5.174% due 1/25/35 (b) | | | 9,533,191 |
| 4,755,407 | | Countrywide Home Loans Mortgage Pass-Through Trust, Whole Loan, Series 2003-HYB1, Class 1A1, 3.774% due 5/19/33 (b) | | | 4,706,583 |
| 2,656,784 | | CS First Boston Mortgage Securities Corp., Whole Loan,
Series 2002-10, Class 2A1, 7.500% due 5/25/32 | | | 2,718,312 |
| 16,992,160 | | Federal Home Loan Mortgage Corp. (FHLMC), Series 2446, Class KL, 6.000% due 5/15/32 (c) | | | 17,729,368 |
| | | Federal National Mortgage Association (FNMA): | | | |
| 2,441,807 | | Series 2001-81, Class HE, 6.500% due 1/25/32 | | | 2,539,187 |
| 3,137,819 | | Series 2004-45, Class Z, 4.500% due 6/25/34 (c) | | | 2,793,445 |
| | | Whole Loan: | | | |
| 17,500,000 | | Series 2002-W10, Class A4, 5.700% due 8/25/42 (c) | | | 17,828,533 |
| 15,000,000 | | Series 2003-W12, Class 1A6, 4.500% due 6/25/43 (c) | | | 14,988,712 |
| 14,500,000 | | Series 2003-W12, Class 2A4, 3.350% due 6/25/43 (c) | | | 14,234,071 |
| 15,000,000 | | Series 2003-W12, Class 2A7, 4.680% due 6/25/43 (c) | | | 14,821,698 |
| 6,072,075 | | GMAC Mortgage Corporation Loan Trust, Series 2003-J7, Class A10, 5.500% due 11/25/33 | | | 6,160,919 |
| | | Government National Mortgage Association (GNMA): | | | |
| 7,000,000 | | Series 2001-19, Class OH, 6.500% due 5/16/31 | | | 7,470,575 |
| 4,485,195 | | Series 2004-27, Class PD, 5.500% due 4/20/34 | | | 4,663,692 |
| 1,740,729 | | GSR Mortgage Loan Trust, Whole Loan, Series 2003-1, Class A11, 4.279% due 3/25/33 (b) | | | 1,739,206 |
| 4,430,767 | | Washington Mutual Mortgage Pass-Through Certificates, Whole Loan, Series 2003-AR5, Class A7, 4.208% due 6/25/33 (b) | | | 4,434,917 |
|
| | | TOTAL COLLATERALIZED MORTGAGE OBLIGATIONS
(Cost — $148,077,801) | | | 148,466,696 |
|
| U.S. GOVERNMENT & AGENCY OBLIGATIONS — 28.9% | | | |
U.S. Government Agency Obligations — 9.8% | | | |
| | | Federal Home Loan Bank (FHLB), Notes: | | | |
| 7,500,000 | | 2.100% due 10/13/06 | | | 7,348,200 |
| 4,000,000 | | Series 192, 5.125% due 3/6/06 | | | 4,037,784 |
| 15,000,000 | | Series 444, 2.000% due 2/13/06 | | | 14,846,595 |
| 3,255,000 | | Series 8A07, 3.250% due 7/30/07 | | | 3,218,274 |
| | | Federal Home Loan Mortgage Corp. (FHLMC): | | | |
| 5,000,000 | | Medium Term Notes, 4.000% due 11/7/08 | | | 4,970,340 |
| 23,300,000 | | Reference Notes, 2.750% due 10/15/06 (c) | | | 23,009,705 |
| | | U.S. Department of Housing & Urban Development, Senior Debentures, Series 2003-A: | | | |
| 5,000,000 | | 5.530% due 8/1/20 | | | 5,358,770 |
| 5,000,000 | | 5.590% due 8/1/21 | | | 5,428,790 |
|
| | | TOTAL U.S. GOVERNMENT AGENCY OBLIGATIONS | | | 68,218,458 |
|
See Notes to Financial Statements.
9 Smith Barney Government Securities Fund | 2005 Semi-Annual Report
| | |
| Schedule of Investments (unaudited) (continued) | | June 30, 2005 |
| | | | | | |
FACE
AMOUNT | | SECURITY | | VALUE | |
U.S. Government Obligations — 19.1% | | | | |
| $ 7,250,000 | | U.S. Treasury Bond STRIPS, Series S0, 6.875% due 8/15/25 | | $ | 3,025,846 | |
| | | U.S. Treasury Bonds: | | | | |
| 30,030,000 | | 7.250% due 5/15/16-8/15/22 (e) | | | 40,048,446 | |
| 10,900,000 | | 8.750% due 8/15/20 | | | 16,404,500 | |
| 16,350,000 | | 5.500% due 8/15/28 | | | 19,259,155 | |
| 2,500,000 | | 6.125% due 8/15/29 | | | 3,192,873 | |
| | | U.S. Treasury Notes: | | | | |
| 12,500,000 | | 3.500% due 2/15/10 | | | 12,378,425 | |
| 18,000,000 | | 4.250% due 8/15/13-11/15/14 | | | 18,431,266 | |
| 5,000,000 | | 4.750% due 5/15/14 | | | 5,307,035 | |
| 11,400,000 | | 4.000% due 2/15/15 | | | 11,444,095 | |
| 3,000,000 | | 4.125% due 5/15/15 | | | 3,044,766 | |
|
|
| | | TOTAL U.S. GOVERNMENT OBLIGATIONS | | | 132,536,407 | |
|
|
| | | TOTAL U.S. GOVERNMENT & AGENCY OBLIGATIONS
(Cost — $192,491,085) | | | 200,754,865 | |
|
|
| | | TOTAL INVESTMENTS BEFORE SHORT-TERM INVESTMENTS
(Cost — $691,883,754) | | | 702,715,615 | |
|
|
| SHORT-TERM INVESTMENTS — 20.7% | | | | |
Repurchase Agreement — 20.7% | | | | |
| 143,978,000 | | Interest in $1,009,251,000 joint tri-party repurchase agreement dated 6/30/05 with Bank of America Corp., 3.350% due 7/1/05, Proceeds at maturity — $143,991,398; (Fully collateralized by various U.S. government agency obligations, 0.000% to 7.000% due 7/15/05 to 2/26/24; Market value — $146,857,661) (Cost — $143,978,000) | | | 143,978,000 | |
|
|
| | | TOTAL INVESTMENTS — 121.9% (Cost — $835,861,754#) | | | 846,693,615 | |
| | | Liabilities In Excess of Other Assets — (21.9)% | | | (151,855,728 | ) |
|
|
| | | TOTAL NET ASSETS — 100.0% | | $ | 694,837,887 | |
|
|
| (a) | | This security is traded on a “to-be-announced” basis. |
| (b) | | Variable rate security. Coupon rate disclosed is that which is in effect at June 30, 2005. Maturity date shown is the date of the next coupon rate reset or actual maturity. |
| (c) | | All or a portion of this security has been segregated for mortgage dollar roll transactions. |
| (d) | | All or a portion of this security is acquired under a mortgage dollar roll agreement. |
| (e) | | All or a portion of this security is held at the broker as collateral for open futures contracts. |
| # | | Aggregate cost for Federal income tax purposes is substantially the same. |
| | | | |
Abbreviations used in this schedule:
|
| FHLB | | — | | Federal Home Loan Bank |
| FHLMC | | — | | Federal Home Loan Mortgage Corporation |
| FNMA | | — | | Federal National Mortgage Association |
| GNMA | | — | | Government National Mortgage Association |
| LIBOR | | — | | London Interbank Offered Rate |
See Notes to Financial Statements.
10 Smith Barney Government Securities Fund | 2005 Semi-Annual Report
| | |
| Statement of Assets and Liabilities (unaudited) | | June 30, 2005 |
| | | | |
| ASSETS: | | | | |
Investments, at value (Cost — $691,883,754) | | $ | 702,715,615 | |
Repurchase agreement, at value (Cost — $143,978,000) | | | 143,978,000 | |
Cash | | | 515 | |
Receivable for securities sold | | | 34,412,500 | |
Interest receivable | | | 4,522,842 | |
Receivable for Fund shares sold | | | 1,052,079 | |
Paydown receivable | | | 211,764 | |
Receivable from broker — variation margin on open futures contracts | | | 34,844 | |
Prepaid expenses | | | 19,321 | |
|
|
Total Assets | | | 886,947,480 | |
|
|
| LIABILITIES: | | | | |
Payable for securities purchased | | | 180,414,991 | |
Payable for Fund shares repurchased | | | 10,779,915 | |
Transfer agent fees payable | | | 272,081 | |
Investment advisory fee payable | | | 202,816 | |
Administration fee payable | | | 115,895 | |
Deferred dollar roll income | | | 113,881 | |
Distribution fees payable | | | 66,172 | |
Directors’ fees payable | | | 3,284 | |
Accrued expenses | | | 140,558 | |
|
|
Total Liabilities | | | 192,109,593 | |
|
|
Total Net Assets | | $ | 694,837,887 | |
|
|
| NET ASSETS: | | | | |
Par value (Note 6) | | $ | 69,884 | |
Paid-in capital in excess of par value | | | 759,014,653 | |
Overdistributed net investment income | | | (612,931 | ) |
Accumulated net realized loss on investment transactions, futures contracts and options | | | (74,456,950 | ) |
Net unrealized appreciation of investments and futures contracts | | | 10,823,231 | |
|
|
Total Net Assets | | $ | 694,837,887 | |
|
|
Shares Outstanding: | | | | |
Class 1 | | | 9,191,045 | |
| |
Class A | | | 35,658,537 | |
| |
Class B | | | 9,788,374 | |
| |
Class C | | | 1,584,102 | |
| |
Class Y | | | 13,661,795 | |
| |
Net Asset Value: | | | | |
Class 1 (and redemption price) | | | $9.95 | |
| |
Class A (and redemption price) | | | $9.94 | |
| |
Class B * | | | $9.94 | |
| |
Class C * | | | $9.93 | |
| |
Class Y (and redemption price) | | | $9.95 | |
| |
Maximum Public Offering Price Per Share: | | | | |
Class 1 (based on maximum sales charge of 6.75%) | | | $10.67 | |
| |
Class A (based on maximum sales charge of 4.50%) | | | $10.41 | |
|
|
| * | | Redemption price is NAV of Class B and C shares reduced by a 4.50% and 1.00% CDSC, respectively, if shares are redeemed within one year from purchase payment (See Note 2). |
See Notes to Financial Statements.
11 Smith Barney Government Securities Fund | 2005 Semi-Annual Report
| | |
| Statement of Operations (unaudited) | | |
For the Six Months Ended June 30, 2005
| | | | |
| INVESTMENT INCOME: | | | | |
Interest | | $ | 17,067,073 | |
|
|
| EXPENSES: | | | | |
Investment advisory fee (Note 2) | | | 1,326,299 | |
Distribution fees (Notes 2 and 4) | | | 870,272 | |
Administration fee (Note 2) | | | 757,885 | |
Transfer agent fees (Notes 2 and 4) | | | 440,089 | |
Shareholder reports (Note 4) | | | 89,440 | |
Registration fees | | | 45,691 | |
Directors’ fees | | | 33,762 | |
Custody | | | 32,000 | |
Legal fees | | | 22,350 | |
Audit and tax | | | 15,018 | |
Insurance | | | 10,267 | |
Miscellaneous expenses | | | 2,554 | |
|
|
Total Expenses | | | 3,645,627 | |
|
|
Net Investment Income | | | 13,421,446 | |
|
|
REALIZED AND UNREALIZED GAIN (LOSS) ON
INVESTMENTS, FUTURES CONTRACTS AND OPTIONS
(NOTES 1 AND 3): | | | | |
Net Realized Gain (Loss) From: | | | | |
Investment transactions | | | (1,024,917 | ) |
Futures contracts | | | 170,021 | |
Options written | | | 29,890 | |
Options purchased | | | (42,262 | ) |
|
|
Net Realized Loss | | | (867,268 | ) |
|
|
Change in Net Unrealized Appreciation/Depreciation From: | | | | |
Investments | | | 6,634,253 | |
Futures contracts | | | 59,128 | |
|
|
Change in Net Unrealized Appreciation/Depreciation | | | 6,693,381 | |
|
|
Net Gain on Investments, Futures Contracts and Options | | | 5,826,113 | |
|
|
Increase in Net Assets From Operations | | $ | 19,247,559 | |
|
|
See Notes to Financial Statements.
12 Smith Barney Government Securities Fund | 2005 Semi-Annual Report
| | |
| Statements of Changes in Net Assets | | |
For the Six Months Ended June 30, 2005 (unaudited)
and the Year Ended December 31, 2004
| | | | | | | | |
| | | 2005 | | | 2004 | |
| OPERATIONS: | | | | | | | | |
Net investment income | | $ | 13,421,446 | | | $ | 27,253,891 | |
Net realized loss | | | (867,268 | ) | | | (1,572,766 | ) |
Change in net unrealized appreciation/depreciation | | | 6,693,381 | | | | 3,639,428 | |
|
|
Increase in Net Assets From Operations | | | 19,247,559 | | | | 29,320,553 | |
|
|
DISTRIBUTIONS TO SHAREHOLDERS
FROM (NOTES 1 AND 5): | | | | | | | | |
Net investment income | | | (14,034,377 | ) | | | (30,549,653 | ) |
Return of capital | | | — | | | | (308,494 | ) |
|
|
Decrease in Net Assets From
Distributions to Shareholders | | | (14,034,377 | ) | | | (30,858,147 | ) |
|
|
| FUND SHARE TRANSACTIONS (NOTE 6): | | | | | | | | |
Net proceeds from sale of shares | | | 45,153,592 | | | | 90,505,996 | |
Reinvestment of distributions | | | 10,500,214 | | | | 22,219,131 | |
Cost of shares repurchased | | | (160,025,053 | ) | | | (181,959,088 | ) |
|
|
Decrease in Net Assets From Fund Share Transactions | | | (104,371,247 | ) | | | (69,233,961 | ) |
|
|
Decrease in Net Assets | | | (99,158,065 | ) | | | (70,771,555 | ) |
| NET ASSETS: | | | | | | | | |
Beginning of period | | | 793,995,952 | | | | 864,767,507 | |
|
|
End of period* | | $ | 694,837,887 | | | $ | 793,995,952 | |
|
|
* Includes overdistributed net investment income of: | | | $(612,931 | ) | | | — | |
|
|
See Notes to Financial Statements.
13 Smith Barney Government Securities Fund | 2005 Semi-Annual Report
For a share of capital stock outstanding throughout each year ended December 31, unless otherwise noted:
| | | | | | | | | | | | | | | | | | |
| Class 1 Shares(1) | | 2005(2) | | | 2004 | | | 2003 | | | 2002 | | | 2001 | | | 2000(3) | |
Net Asset Value, Beginning of Period | | $ 9.87 | | | $ 9.89 | | | $10.08 | | | $ 9.53 | | | $ 9.47 | | | $ 9.17 | |
|
|
Income (Loss) From Operations: | | | | | | | | | | | | | | | | | | |
Net investment income | | 0.18 | | | 0.34 | | | 0.33 | | | 0.39 | | | 0.44 | | | 0.12 | |
Net realized and unrealized gain (loss) | | 0.09 | | | 0.02 | | | (0.14 | ) | | 0.54 | | | 0.09 | | | 0.38 | |
|
|
Total Income From Operations | | 0.27 | | | 0.36 | | | 0.19 | | | 0.93 | | | 0.53 | | | 0.50 | |
|
|
Less Distributions From: | | | | | | | | | | | | | | | | | | |
Net investment income | | (0.19 | ) | | (0.38 | ) | | (0.38 | ) | | (0.38 | ) | | (0.45 | ) | | (0.20 | ) |
Return of capital | | — | | | (0.00 | )(4) | | — | | | — | | | (0.02 | ) | | — | |
|
|
Total Distributions | | (0.19 | ) | | (0.38 | ) | | (0.38 | ) | | (0.38 | ) | | (0.47 | ) | | (0.20 | ) |
|
|
Net Asset Value, End of Period | | $ 9.95 | | | $ 9.87 | | | $ 9.89 | | | $10.08 | | | $ 9.53 | | | $ 9.47 | |
|
|
Total Return(5) | | 2.75 | % | | 3.76 | % | | 1.95 | % | | 10.00 | % | | 5.74 | % | | 5.47 | % |
|
|
Net Assets, End of Period (millions) | | $92 | | | $96 | | | $108 | | | $120 | | | $117 | | | $127 | |
|
|
Ratios to Average Net Assets: | | | | | | | | | | | | | | | | | | |
Gross expenses | | 0.85 | %(6) | | 0.84 | % | | 0.81 | % | | 0.85 | % | | 0.85 | % | | 0.58 | %(6) |
Net expenses | | 0.85 | (6) | | 0.82 | (7) | | 0.81 | | | 0.85 | | | 0.85 | | | 0.58 | (6) |
Net investment income | | 3.66 | (6) | | 3.45 | | | 3.34 | | | 4.01 | | | 4.62 | | | 6.09 | (6) |
|
|
Portfolio Turnover Rate | | 75 | %(8) | | 138 | %(8) | | 148 | %(8) | | 280 | % | | 447 | % | | 280 | % |
|
|
| (1) | | Per share amounts have been calculated using the average shares method. |
| (2) | | For the six months ended June 30, 2005 (unaudited). |
| (3) | | For the period September 12, 2000 (inception date) to December 31, 2000. |
| (4) | | Amount represents less than $0.01 per share. |
| (5) | | Performance figures may reflect voluntary fee waivers and/or expense reimbursements. Past performance is no guarantee of future results. In the absence of voluntary fee waivers and/or expense reimbursements, the total return would be lower. Total returns for periods of less than one year are not annualized. |
| (7) | | The investment adviser has voluntarily waived all or a portion of its fee. |
| (8) | | Excluding mortgage dollar roll transactions. If mortgage dollar roll transactions had been included, the portfolio turnover rate would have been 170%, 292%, and 328% for the six months ended June 30, 2005 and years ended December 31, 2004 and 2003, respectively. |
See Notes to Financial Statements.
14 Smith Barney Government Securities Fund | 2005 Semi-Annual Report
| | |
| Financial Highlights (continued) | | |
For a share of capital stock outstanding throughout each year ended December 31, unless otherwise noted:
| | | | | | | | | | | | | | | | | | |
| Class A Shares(1) | | 2005(2) | | | 2004 | | | 2003 | | | 2002 | | | 2001 | | | 2000 | |
Net Asset Value, Beginning of Period | | $ 9.86 | | | $ 9.88 | | | $10.07 | | | $ 9.52 | | | $ 9.45 | | | $ 8.99 | |
|
|
Income (Loss) From Operations: | | | | | | | | | | | | | | | | | | |
Net investment income | | 0.17 | | | 0.33 | | | 0.32 | | | 0.38 | | | 0.43 | | | 0.55 | |
Net realized and unrealized gain (loss) | | 0.09 | | | 0.02 | | | (0.14 | ) | | 0.54 | | | 0.09 | | | 0.46 | |
|
|
Total Income From Operations | | 0.26 | | | 0.35 | | | 0.18 | | | 0.92 | | | 0.52 | | | 1.01 | |
|
|
Less Distributions From: | | | | | | | | | | | | | | | | | | |
Net investment income | | (0.18 | ) | | (0.37 | ) | | (0.37 | ) | | (0.37 | ) | | (0.45 | ) | | (0.55 | ) |
Return of capital | | — | | | (0.00 | )(3) | | — | | | — | | | — | | | — | |
|
|
Total Distributions | | (0.18 | ) | | (0.37 | ) | | (0.37 | ) | | (0.37 | ) | | (0.45 | ) | | (0.55 | ) |
|
|
Net Asset Value, End of Period | | $ 9.94 | | | $ 9.86 | | | $ 9.88 | | | $10.07 | | | $ 9.52 | | | $ 9.45 | |
|
|
Total Return(4) | | 2.69 | % | | 3.63 | % | | 1.83 | % | | 9.88 | % | | 5.60 | % | | 11.65 | % |
|
|
Net Assets, End of Period (millions) | | $354 | | | $358 | | | $378 | | | $395 | | | $334 | | | $331 | |
|
|
Ratios to Average Net Assets: | | | | | | | | | | | | | | | | | | |
Gross expenses | | 1.00 | %(5) | | 0.98 | % | | 0.95 | % | | 0.91 | % | | 0.96 | % | | 0.92 | % |
Net expenses | | 1.00 | (5) | | 0.97 | (6) | | 0.95 | | | 0.91 | | | 0.96 | | | 0.92 | |
Net investment income | | 3.51 | (5) | | 3.30 | | | 3.19 | | | 3.91 | | | 4.50 | | | 6.12 | |
|
|
Portfolio Turnover Rate | | 75 | %(7) | | 138 | %(7) | | 148 | %(7) | | 280 | % | | 447 | % | | 280 | % |
|
|
| (1) | | Per share amounts have been calculated using the average shares method. |
| (2) | | For the six months ended June 30, 2005 (unaudited). |
| (3) | | Amount represents less than $0.01 per share. |
| (4) | | Performance figures may reflect voluntary fee waivers and/or expense reimbursements. Past performance is no guarantee of future results. In the absence of voluntary fee waivers and/or expense reimbursements, the total return would be lower. Total returns for periods of less than one year are not annualized. |
| (6) | | The investment adviser has voluntarily waived all or a portion of its fee. |
| (7) | | Excluding mortgage dollar roll transactions. If mortgage dollar roll transactions had been included, the portfolio turnover rate would have been 170%, 292%, and 328% for the six months ended June 30, 2005 and years ended December 31, 2004 and 2003, respectively. |
See Notes to Financial Statements.
15 Smith Barney Government Securities Fund | 2005 Semi-Annual Report
| | |
| Financial Highlights (continued) | | |
For a share of capital stock outstanding throughout each year ended December 31, unless otherwise noted:
| | | | | | | | | | | | | | | | | | |
| Class B Shares(1) | | 2005(2) | | | 2004 | | | 2003 | | | 2002 | | | 2001 | | | 2000 | |
Net Asset Value, Beginning of Period | | $ 9.87 | | | $ 9.89 | | | $10.08 | | | $ 9.53 | | | $ 9.46 | | | $ 9.00 | |
|
|
Income (Loss) From Operations: | | | | | | | | | | | | | | | | | | |
Net investment income | | 0.14 | | | 0.27 | | | 0.27 | | | 0.33 | | | 0.37 | | | 0.50 | |
Net realized and unrealized gain (loss) | | 0.09 | | | 0.03 | | | (0.14 | ) | | 0.54 | | | 0.10 | | | 0.46 | |
|
|
Total Income From Operations | | 0.23 | | | 0.30 | | | 0.13 | | | 0.87 | | | 0.47 | | | 0.96 | |
|
|
Less Distributions From: | | | | | | | | | | | | | | | | | | |
Net investment income | | (0.16 | ) | | (0.32 | ) | | (0.32 | ) | | (0.32 | ) | | (0.40 | ) | | (0.50 | ) |
Return of capital | | — | | | (0.00 | )(3) | | — | | | — | | | — | | | — | |
|
|
Total Distributions | | (0.16 | ) | | (0.32 | ) | | (0.32 | ) | | (0.32 | ) | | (0.40 | ) | | (0.50 | ) |
|
|
Net Asset Value, End of Period | | $ 9.94 | | | $ 9.87 | | | $ 9.89 | | | $10.08 | | | $ 9.53 | | | $ 9.46 | |
|
|
Total Return(4) | | 2.31 | % | | 3.09 | % | | 1.30 | % | | 9.29 | % | | 5.05 | % | | 11.06 | % |
|
|
Net Assets, End of Period (millions) | | $97 | | | $103 | | | $122 | | | $132 | | | $78 | | | $61 | |
|
|
Ratios to Average Net Assets: | | | | | | | | | | | | | | | | | | |
Gross expenses | | 1.57 | %(5) | | 1.51 | % | | 1.51 | % | | 1.42 | % | | 1.48 | % | | 1.44 | % |
Net expenses | | 1.57 | (5) | | 1.50 | (6) | | 1.51 | | | 1.42 | | | 1.48 | | | 1.44 | |
Net investment income | | 2.93 | (5) | | 2.77 | | | 2.64 | | | 3.41 | | | 3.94 | | | 5.62 | |
|
|
Portfolio Turnover Rate | | 75 | %(7) | | 138 | %(7) | | 148 | %(7) | | 280 | % | | 447 | % | | 280 | % |
|
|
| (1) | | Per share amounts have been calculated using the average shares method. |
| (2) | | For the six months ended June 30, 2005 (unaudited). |
| (3) | | Amount represents less than $0.01 per share. |
| (4) | | Performance figures may reflect voluntary fee waivers and/or expense reimbursements. Past performance is no guarantee of future results. In the absence of voluntary fee waivers and/or expense reimbursements, the total return would be lower. Total returns for periods of less than one year are not annualized. |
| (6) | | The investment adviser has voluntarily waived all or a portion of its fee. |
| (7) | | Excluding mortgage dollar roll transactions. If mortgage dollar roll transactions had been included, the portfolio turnover rate would have been 170%, 292%, and 328% for the six months ended June 30, 2005 and years ended December 31, 2004 and 2003, respectively. |
See Notes to Financial Statements.
16 Smith Barney Government Securities Fund | 2005 Semi-Annual Report
| | |
| Financial Highlights (continued) | | |
++For a share of capital stock outstanding throughout each year ended December 31, unless otherwise noted:
| | | | | | | | | | | | | | | | | | |
| Class C Shares(1)(2) | | 2005(3) | | | 2004 | | | 2003 | | | 2002 | | | 2001 | | | 2000 | |
Net Asset Value, Beginning of Period | | $ 9.87 | | | $ 9.88 | | | $10.08 | | | $ 9.53 | | | $ 9.45 | | | $ 8.99 | |
|
|
Income (Loss) From Operations: | | | | | | | | | | | | | | | | | | |
Net investment income | | 0.15 | | | 0.28 | | | 0.28 | | | 0.34 | | | 0.38 | | | 0.51 | |
Net realized and unrealized gain (loss) | | 0.07 | | | 0.04 | | | (0.15 | ) | | 0.54 | | | 0.10 | | | 0.46 | |
|
|
Total Income From Operations | | 0.22 | | | 0.32 | | | 0.13 | | | 0.88 | | | 0.48 | | | 0.97 | |
|
|
Less Distributions From: | | | | | | | | | | | | | | | | | | |
Net investment income | | (0.16 | ) | | (0.33 | ) | | (0.33 | ) | | (0.33 | ) | | (0.40 | ) | | (0.51 | ) |
Return of capital | | — | | | (0.00 | )(4) | | — | | | — | | | — | | | — | |
|
|
Total Distributions | | (0.16 | ) | | (0.33 | ) | | (0.33 | ) | | (0.33 | ) | | (0.40 | ) | | (0.51 | ) |
|
|
Net Asset Value, End of Period | | $ 9.93 | | | $ 9.87 | | | $ 9.88 | | | $10.08 | | | $ 9.53 | | | $ 9.45 | |
|
|
Total Return(5) | | 2.25 | % | | 3.29 | % | | 1.29 | % | | 9.39 | % | | 5.22 | % | | 11.10 | % |
|
|
Net Assets, End of Period (millions) | | $16 | | | $17 | | | $25 | | | $32 | | | $17 | | | $8 | |
|
|
Ratios to Average Net Assets: | | | | | | | | | | | | | | | | | | |
Gross expenses | | 1.54 | %(6) | | 1.44 | % | | 1.41 | % | | 1.39 | % | | 1.42 | % | | 1.37 | % |
Net expenses | | 1.54 | (6) | | 1.42 | (7) | | 1.41 | | | 1.39 | | | 1.42 | | | 1.37 | % |
Net investment income | | 2.97 | (6) | | 2.84 | | | 2.75 | | | 3.45 | | | 3.95 | | | 5.67 | |
|
|
Portfolio Turnover Rate | | 75 | %(8) | | 138 | %(8) | | 148 | %(8) | | 280 | % | | 447 | % | | 280 | % |
|
|
| (1) | | Per share amounts have been calculated using the average shares method. |
| (2) | | On April 29, 2004, Class L shares were renamed as Class C shares. |
| (3) | | For the six months ended June 30, 2005 (unaudited). |
| (4) | | Amount represents less than $0.01 per share. |
| (5) | | Performance figures may reflect voluntary fee waivers and/or expense reimbursements. Past performance is no guarantee of future results. In the absence of voluntary fee waivers and/or expense reimbursements, the total return would be lower. Total returns for periods of less than one year are not annualized. |
| (7) | | The investment adviser has voluntarily waived all or a portion of its fee. |
| (8) | | Excluding mortgage dollar roll transactions. If mortgage dollar roll transactions had been included, the portfolio turnover rate would have been 170%, 292%, and 328% for the six months ended June 30, 2005 and years ended December 31, 2004 and 2003, respectively. |
See Notes to Financial Statements.
17 Smith Barney Government Securities Fund | 2005 Semi-Annual Report
| | |
| Financial Highlights (continued) | | |
For a share of capital stock outstanding throughout each year ended December 31, unless otherwise noted:
| | | | | | | | | | | | | | | | | | |
| Class Y Shares (1) | | 2005(2) | | | 2004 | | | 2003 | | | 2002 | | | 2001 | | | 2000 | |
Net Asset Value, Beginning of Period | | $ 9.88 | | | $ 9.89 | | | $10.08 | | | $ 9.53 | | | $ 9.45 | | | $ 8.99 | |
|
|
Income (Loss) From Operations: | | | | | | | | | | | | | | | | | | |
Net investment income | | 0.19 | | | 0.36 | | | 0.36 | | | 0.41 | | | 0.47 | | | 0.59 | |
Net realized and unrealized gain (loss) | | 0.08 | | | 0.04 | | | (0.14 | ) | | 0.55 | | | 0.09 | | | 0.45 | |
|
|
Total Income From Operations | | 0.27 | | | 0.40 | | | 0.22 | | | 0.96 | | | 0.56 | | | 1.04 | |
|
|
Less Distributions From: | | | | | | | | | | | | | | | | | | |
Net investment income | | (0.20 | ) | | (0.41 | ) | | (0.41 | ) | | (0.41 | ) | | (0.48 | ) | | (0.58 | ) |
Return of capital | | — | | | (0.00 | )(3) | | — | | | — | | | — | | | — | |
|
|
Total Distributions | | (0.20 | ) | | (0.41 | ) | | (0.41 | ) | | (0.41 | ) | | (0.48 | ) | | (0.58 | ) |
|
|
Net Asset Value, End of Period | | $ 9.95 | | | $ 9.88 | | | $ 9.89 | | | $10.08 | | | $ 9.53 | | | $ 9.45 | |
|
|
Total Return(4) | | 2.76 | % | | 4.09 | % | | 2.17 | % | | 10.25 | % | | 6.07 | % | | 12.02 | % |
|
|
Net Assets, End of Period (millions) | | $136 | | | $220 | | | $231 | | | $130 | | | $147 | | | $229 | |
|
|
Ratios to Average Net Assets: | | | | | | | | | | | | | | | | | | |
Gross expenses | | 0.59 | %(5) | | 0.59 | % | | 0.57 | % | | 0.58 | % | | 0.60 | % | | 0.58 | % |
Net expenses | | 0.59 | (5) | | 0.57 | (6) | | 0.57 | | | 0.58 | | | 0.60 | | | 0.58 | |
Net investment income | | 3.90 | (5) | | 3.70 | | | 3.54 | | | 4.25 | | | 4.94 | | | 6.47 | |
|
|
Portfolio Turnover Rate | | 75 | %(7) | | 138 | %(7) | | 148 | %(7) | | 280 | % | | 447 | % | | 280 | % |
|
|
| (1) | | Per share amounts have been calculated using the average shares method. |
| (2) | | For the six months ended June 30, 2005 (unaudited). |
| (3) | | Amount represents less than $0.01 per share. |
| (4) | | Performance figures may reflect voluntary fee waivers and/or expense reimbursements. Past performance is no guarantee of future results. In the absence of voluntary fee waivers and/or expense reimbursements, the total return would be lower. Total returns for periods of less than one year are not annualized. |
| (6) | | The investment adviser has voluntarily waived all or a portion of its fee. |
| (7) | | Excluding mortgage dollar roll transactions. If mortgage dollar roll transactions had been included, the portfolio turnover rate would have been 170%, 292%, and 328% for the six months ended June 30, 2005 and years ended December 31, 2004 and 2003, respectively. |
See Notes to Financial Statements.
18 Smith Barney Government Securities Fund | 2005 Semi-Annual Report
Notes to Financial Statements (unaudited)
| 1. | Organization and Significant Accounting Policies |
The Smith Barney Government Securities Fund (“Fund”), a separate diversified investment fund of Smith Barney Investment Funds Inc. (“Company”), a Maryland corporation, is registered under the Investment Company Act of 1940 (“1940 Act”), as amended, as an open-end management investment company.
The following are significant accounting policies consistently followed by the Fund. These policies are in conformity with U.S. generally accepted accounting principles (“GAAP”). Estimates and assumptions are required to be made regarding assets, liabilities and changes in net assets resulting from operations when financial statements are prepared. Changes in the economic environment, financial markets and any other parameters used in determining these estimates could cause actual results to differ.
(a) Investment Valuation. Securities are valued at the mean of bid and asked prices based on market quotations for those securities or if no quotations are available, then for securities of similar type, yield and maturity. Securities for which market quotations are not readily available or where market quotations are determined not to reflect fair value, will be valued in good faith by or under the direction of the Fund’s Board of Directors. Short-term obligations with maturities of 60 days or less are valued at amortized cost, which approximates market value.
(b) Repurchase Agreements. When entering into repurchase agreements, it is the Fund’s policy that its custodian or a third party custodian takes possession of the underlying collateral securities, the market value of which at least equals the principal amount of the repurchase transaction, including accrued interest. To the extent that any repurchase transaction exceeds one business day, the value of the collateral is marked-to-market to ensure the adequacy of the collateral. If the seller defaults and the market value of the collateral declines or if bankruptcy proceedings are commenced with respect to the seller of the security, realization of the collateral by the Fund may be delayed or limited.
(c) Financial Futures Contracts. The Fund may enter into financial futures contracts typically to hedge a portion of the portfolio. Upon entering into a financial futures contract, the Fund is required to deposit cash or securities as initial margin. Additional securities are also segregated up to the current market value of the financial futures contracts. Subsequent payments, known as variation
19 Smith Barney Government Securities Fund | 2005 Semi-Annual Report
Notes to Financial Statements (unaudited) (continued)
margin, are made or received by the Fund each day, depending on the daily fluctuation in the value of the underlying financial instruments. The Fund recognizes an unrealized gain or loss equal to the daily variation margin. When the financial futures contracts are closed, a realized gain or loss is recognized equal to the difference between the proceeds from (or cost of) the closing transactions and the Fund’s basis in the contracts.
The risks associated with entering into financial futures contracts include the possibility that a change in the value of the contract may not correlate with the changes in the value of the underlying instruments. In addition, investing in financial futures contracts involves the risk that the Fund could lose more than the original margin deposit and subsequent payments required for a futures transaction. Risk may also arise upon entering into these contracts from the potential inability of the counterparties to meet the terms of their contracts.
(d) Written Options. When the Fund writes an option, an amount equal to the premium received by the Fund is recorded as a liability, the value of which is marked-to-market daily to reflect the current market value of the option written. If the option expires, the Fund realizes a gain from investments equal to the amount of the premium received. When a written call option is exercised, the difference between the premium and the amount for effecting a closing purchase transaction, including brokerage commission, is also treated as a realized gain or loss. When a written put option is exercised, the amount of the premium received reduces the cost of the security purchased by the Fund.
A risk in writing a covered call option is that the Fund may forego the opportunity of profit if the market price of the underlying security increases and the option is exercised. The risk in writing a put option is that the Fund may incur a loss if the market price of the underlying security decreases and the option is exercised. The risk in writing a call option is that the Fund is exposed to the risk of loss if the market price of the underlying security increases. In addition, there is the risk that the Fund may not be able to enter into a closing transaction because of an illiquid secondary market.
(e) Securities Traded on a To-Be-Announced Basis. The Fund may trade securities on a to-be-announced (“TBA”) basis. In a TBA transaction, the Fund commits to purchasing or selling securities, which have not yet been issued by the issuer and for which specific information is not known, such as the face
20 Smith Barney Government Securities Fund | 2005 Semi-Annual Report
Notes to Financial Statements (unaudited) (continued)
amount and maturity date and the underlying pool of investments in U.S. government agency mortgage pass-through transactions. Securities purchased on a TBA basis are not settled until they are delivered to the Fund, normally 15 to 45 days later. Beginning on the date the Fund enters into a TBA transaction, cash, U.S. government securities or other liquid high-grade debt obligations are segregated in an amount equal in value to the purchase price of the TBA security. These transactions are subject to market fluctuations and their current value is determined in the same manner as for other securities.
(f) Mortgage Dollar Rolls. The Fund enters into dollar rolls in which the Fund sells mortgage-backed securities for delivery in the current month and simultaneously contracts to repurchase substantially similar (same type, coupon and maturity) securities to settle on a specified future date. During the roll period, the Fund forgoes principal and interest paid on the securities. The Fund is compensated by a fee paid by the counterparty, often in the form of a drop in the repurchase price of the securities. Dollar rolls are accounted for as financing arrangements; the fee is accrued into interest income ratably over the term of the dollar roll and any gain or loss on the roll is deferred and realized upon disposition of the rolled security.
The risk of entering into a mortgage dollar roll is that the market value of the securities the Fund is obligated to repurchase under the agreement may decline below the repurchase price. In the event the buyer of securities under a mortgage dollar roll files for bankruptcy or becomes insolvent, the Fund’s use of proceeds of the dollar roll may be restricted pending a determination by the other party, or its trustee or receiver, whether to enforce the Fund’s obligation to repurchase the securities.
(g) Stripped Securities. The Fund invests in “Stripped Securities,” a term used collectively for stripped fixed income securities. Stripped securities can be principal only securities (“PO”), which are debt obligations that have been stripped of unmatured interest coupons or interest only securities (“IO”), which are unmatured interest coupons that have been stripped from debt obligations. Stripped Securities do not make periodic payments of interest prior to maturity. As is the case with all securities, the market value of Stripped Securities will fluctuate in response to changes in economic conditions, interest rates and the market’s perception of the securities. However, fluctuations in response to interest rates may be greater in Stripped Securities than for debt obligations of
21 Smith Barney Government Securities Fund | 2005 Semi-Annual Report
Notes to Financial Statements (unaudited) (continued)
comparable maturities that pay interest currently. The amount of fluctuation increases with a longer period of maturity.
The yield to maturity on IO’s is sensitive to the rate of principal repayments (including prepayments) on the related underlying debt obligation and principal payments may have a material effect on yield to maturity. If the underlying debt obligation experiences greater than anticipated prepayments of principal, the Fund may not fully recoup its initial investment in IO’s.
(h) Security Transactions and Investment Income. Security transactions are accounted for on a trade date basis. Interest income, adjusted for amortization of premium and accretion of discount, is recorded on the accrual basis. Dividend income is recorded on the ex-dividend date. The cost of investments sold is determined by use of the specific identification method.
(i) Distributions to Shareholders. Distributions from net investment income for the Fund, if any, are declared and paid on a monthly basis. Distributions of net realized gains, if any, are declared at least annually. Distributions are recorded on the ex-dividend date and are determined in accordance with income tax regulations, which may differ from GAAP.
(j) Class Accounting. Investment income, common expenses and realized/unrealized gain (loss) on investments are allocated to the various classes of the Fund on the basis of daily net assets of each class. Fees relating to a specific class are charged directly to that class.
(k) Federal and Other Taxes. It is the Fund’s policy to comply with the federal income and excise tax requirements of the Internal Revenue Code of 1986, as amended, applicable to regulated investment companies. Accordingly, the Fund intends to distribute substantially all of its taxable income and net realized gains on investments, if any, to shareholders each year. Therefore, no federal income tax provision is required in the Fund’s financial statements.
(l) Reclassification. GAAP requires that certain components of net assets be adjusted to reflect permanent differences between financial and tax reporting. These reclassifications have no effect on net assets or net asset values per share.
22 Smith Barney Government Securities Fund | 2005 Semi-Annual Report
Notes to Financial Statements (unaudited) (continued)
| 2. | Investment Advisory Agreement, Administration Agreement and Other Transactions with Affiliates |
Smith Barney Fund Management LLC (“SBFM”), an indirect wholly-owned subsidiary of Citigroup Inc. (“Citigroup”), acts as investment adviser to the Fund. The Fund pays SBFM an investment advisory fee which is calculated daily and paid monthly at the annual rate of the Fund’s average daily net assets as follows:
| | | |
| | | Annual Rate | |
Average Daily Net Assets | | | |
First $2 billion | | 0.35 | % |
Next $2 billion | | 0.30 | % |
Next $2 billion | | 0.25 | % |
Next $2 billion | | 0.20 | % |
Over $8 billion | | 0.15 | % |
|
|
SBFM also acts as the Fund’s administrator for which the Fund pays a fee calculated at an annual rate of 0.20% of the Fund’s average daily net assets. These fees are calculated daily and paid monthly.
Citicorp Trust Bank, fsb. (“CTB”), another subsidiary of Citigroup, acts as the Fund’s transfer agent, PFPC Inc. (“PFPC”) and Primerica Shareholder Services (“PSS”), another subsidiary of Citigroup, act as the Fund’s sub-transfer agents. CTB receives account fees and asset-based fees that vary according to the size and type of account. PFPC and PSS are responsible for shareholder record-keeping and financial processing for all shareholder accounts and are paid by CTB. During the six months ended June 30, 2005, the Fund paid transfer agent fees of $303,095 to CTB. In addition, for the six months ended June 30, 2005, the Fund also paid $7,857 to other Citigroup affiliates for shareholder recordkeeping services.
Citigroup Global Markets Inc. (“CGM”) and PFS Distributors, Inc., both of which are subsidiaries of Citigroup, act as the Fund’s distributors.
There are maximum sales charges of 6.75% and 4.50% for Class 1 and A shares, respectively. There is a contingent deferred sales charge (“CDSC”) of 4.50% on Class B shares, which applies if redemption occurs within one year from purchase payment. This CDSC declines by 0.50% the first year after purchase payment and thereafter by 1.00% per year until no CDSC is incurred. Class C
23 Smith Barney Government Securities Fund | 2005 Semi-Annual Report
Notes to Financial Statements (unaudited) (continued)
shares have a 1.00% CDSC, which applies if redemption occurs within one year from purchase payment. In certain cases, Class A shares have a 1.00% CDSC, which applies if redemption occurs within one year from purchase payment. This CDSC only applies to those purchases of Class A shares which, when combined with current holdings of Class A shares, equal or exceed $500,000 in the aggregate. These purchases do not incur an initial sales charge.
For the six months ended June 30, 2005, CGM and its affiliates received sales charges of approximately $40,000 and $429,000 on sales of the Fund’s Class 1 and Class A shares, respectively. In addition, for the six months ended June 30, 2005, CDSCs paid to CGM and its affiliates were approximately:
| | | | |
| | | CDSCs | |
Class A | | $ | 0 | * |
Class B | | | 144,000 | |
Class C | | | 1,000 | |
|
|
| * | | Amount represents less than $1,000. |
All officers and one Director of the Company are employees of Citigroup or its affiliates and do not receive compensation from the Company.
During the six months ended June 30, 2005, the aggregate cost of purchases and proceeds from sales of investments (excluding short-term investments, mortgage dollar rolls and proceeds from paydowns) were as follows:
| | | |
|
Purchases | | $ | 559,489,273 |
|
Sales | | | 566,910,023 |
|
At June 30, 2005, the aggregate gross unrealized appreciation and depreciation of investments for federal income tax purposes were substantially as follows:
| | | | |
|
|
Gross unrealized appreciation | | $ | 12,997,247 | |
Gross unrealized depreciation | | | (2,165,386 | ) |
|
|
Net unrealized appreciation | | $ | 10,831,861 | |
|
|
24 Smith Barney Government Securities Fund | 2005 Semi-Annual Report
Notes to Financial Statements (unaudited) (continued)
At June 30, 2005, the Fund had the following open futures contracts:
| | | | | | | | | | | | | | |
| | | Number of
Contracts | | Expiration
Date | | Basis
Value | | Market
Value | | Unrealized
Gain (Loss) | |
Contracts to Sell: | | | | | | | | | | | | | | |
U.S. Treasury Notes | | 72 | | 9/05 | | $ | 14,934,083 | | $ | 14,953,500 | | $ | (19,417 | ) |
|
|
Contracts to Buy: | | | | | | | | | | | | | | |
U.S. Treasury Bonds | | 40 | | 9/05 | | | 4,557,019 | | | 4,538,750 | | | (18,269 | ) |
U.S. Treasury Notes | | 45 | | 9/05 | | | 5,314,694 | | | 5,343,750 | | | 29,056 | |
|
|
Net Unrealized Loss
on Open Futures Contracts | | | | | | | | | | | | $ | (8,630 | ) |
|
|
During the six months ended June 30, 2005, written option transactions for the Fund were as follows:
| | | | | |
| | | Number of Contracts | | Premiums |
Options written, outstanding December 31, 2004 | | — | | | — |
Options written | | 45 | | $ | 40,609 |
Options closed | | 45 | | | 40,609 |
Options expired | | — | | | — |
|
Options written, outstanding June 30, 2005 | | — | | | — |
|
During the six months ended June 30, 2005, the Fund entered into mortgage dollar roll transactions in the aggregate amount of $699,173,047.
For the six months ended June 30, 2005, the Fund recorded interest income of $1,372,710 related to such transactions.
At June 30, 2005, the Fund had outstanding mortgage dollar rolls with a total cost of $116,113,953.
| 4. | Class Specific Expenses |
Pursuant to a Distribution Plan, the Fund pays a service fee with respect to its Class A, B and C shares calculated at the annual rate of 0.25% of the average daily net assets of each respective class. The Fund also pays a distribution fee with respect to its Class B and C shares calculated at the annual rate of 0.50% and 0.45% of the average daily net assets of each class, respectively. For the six months ended June 30, 2005, total Distribution fees, which are accrued daily and paid monthly, were as follows:
25 Smith Barney Government Securities Fund | 2005 Semi-Annual Report
Notes to Financial Statements (unaudited) (continued)
| | | | | | | | | |
| | | Class A | | Class B | | Class C |
Distribution Fees | | $ | 441,497 | | $ | 371,556 | | $ | 57,219 |
|
For the six months ended June 30, 2005, total Transfer Agent fees were as follows:
| | | | | | | | | | | | | | | |
| | | Class 1 | | Class A | | Class B | | Class C | | Class Y |
Transfer Agent Fees | | $ | 105,068 | | $ | 227,891 | | $ | 91,660 | | $ | 15,361 | | $ | 109 |
|
For the six months ended June 30, 2005, total Shareholder Reports expenses were as follows:
| | | | | | | | | | | | | | | |
| | | Class 1 | | Class A | | Class B | | Class C | | Class Y |
Shareholder Reports Expenses | | $ | 13,825 | | $ | 47,784 | | $ | 22,315 | | $ | 4,497 | | $ | 1,019 |
|
| 5. | Distributions Paid to Shareholders by Class |
| | | | | | |
| | | Six Months Ended
June 30, 2005 | | Year Ended
December 31, 2004 |
Class 1 | | | | | | |
Net investment income | | $ | 1,766,246 | | $ | 3,864,627 |
Return of capital | | | — | | | 38,991 |
|
Total | | $ | 1,766,246 | | $ | 3,903,618 |
|
Class A | | | | | | |
Net investment income | | $ | 6,565,428 | | $ | 13,630,128 |
Return of capital | | | — | | | 137,657 |
|
Total | | $ | 6,565,428 | | $ | 13,767,785 |
|
Class B | | | | | | |
Net investment income | | $ | 1,570,418 | | $ | 3,527,399 |
Return of capital | | | — | | | 35,574 |
|
Total | | $ | 1,570,418 | | $ | 3,562,973 |
|
Class C* | | | | | | |
Net investment income | | $ | 265,975 | | $ | 649,228 |
Return of capital | | | — | | | 6,526 |
|
Total | | $ | 265,975 | | $ | 655,754 |
|
Class Y | | | | | | |
Net investment income | | $ | 3,866,310 | | $ | 8,878,271 |
Return of capital | | | — | | | 89,746 |
|
Total | | $ | 3,866,310 | | $ | 8,968,017 |
|
| * | | On April 29, 2004, Class L shares were renamed as Class C shares. |
26 Smith Barney Government Securities Fund | 2005 Semi-Annual Report
Notes to Financial Statements (unaudited) (continued)
At June 30, 2005, the Company had ten billion shares of capital stock authorized with a par value of $0.001 per share. The Fund has the ability to issue multiple classes of shares. Each share of a class represents an identical interest in the Fund and has the same rights, except that each class bears certain direct expenses specifically related to the distribution of its shares.
Transactions in shares of each class were as follows:
| | | | | | | | | | | | | | |
| | | Six Months Ended
June 30, 2005
| | | Year Ended
December 31, 2004
| |
| | | Shares | | | Amount | | | Shares | | | Amount | |
Class 1 | | | | | | | | | | | | | | |
Shares sold | | 124,124 | | | $ | 1,223,485 | | | 321,233 | | | $ | 3,171,578 | |
Shares issued on reinvestment | | 178,861 | | | | 1,766,244 | | | 396,096 | | | | 3,903,676 | |
Shares repurchased | | (801,837 | ) | | | (7,914,790 | ) | | (1,992,235 | ) | | | (19,661,696 | ) |
|
|
Net Decrease | | (498,852 | ) | | $ | (4,925,061 | ) | | (1,274,906 | ) | | $ | (12,586,442 | ) |
|
|
Class A | | | | | | | | | | | | | | |
Shares sold | | 2,652,422 | | | $ | 26,185,431 | | | 5,258,738 | | | $ | 51,889,739 | |
Shares issued on reinvestment | | 526,323 | | | | 5,192,129 | | | 1,097,329 | | | | 10,805,053 | |
Shares repurchased | | (3,815,904 | ) | | | (37,640,476 | ) | | (8,361,745 | ) | | | (82,335,412 | ) |
|
|
Net Decrease | | (637,159 | ) | | $ | (6,262,916 | ) | | (2,005,678 | ) | | $ | (19,640,620 | ) |
|
|
Class B | | | | | | | | | | | | | | |
Shares sold | | 585,136 | | | $ | 5,777,742 | | | 1,397,726 | | | $ | 13,785,316 | |
Shares issued on reinvestment | | 138,653 | | | | 1,368,878 | | | 311,422 | | | | 3,069,324 | |
Shares repurchased | | (1,362,137 | ) | | | (13,440,802 | ) | | (3,650,226 | ) | | | (35,966,404 | ) |
|
|
Net Decrease | | (638,348 | ) | | $ | (6,294,182 | ) | | (1,941,078 | ) | | $ | (19,111,764 | ) |
|
|
Class C* | | | | | | | | | | | | | | |
Shares sold | | 75,530 | | | $ | 744,667 | | | 148,983 | | | $ | 1,474,075 | |
Shares issued on reinvestment | | 19,190 | | | | 189,333 | | | 48,865 | | | | 481,257 | |
Shares repurchased | | (274,706 | ) | | | (2,707,340 | ) | | (935,056 | ) | | | (9,235,069 | ) |
|
|
Net Decrease | | (179,986 | ) | | $ | (1,773,340 | ) | | (737,208 | ) | | $ | (7,279,737 | ) |
|
|
Class Y | | | | | | | | | | | | | | |
Shares sold | | 1,132,969 | | | $ | 11,222,267 | | | 2,046,650 | | | $ | 20,185,288 | |
Shares issued on reinvestment | | 200,757 | | | | 1,983,630 | | | 401,761 | | | | 3,959,821 | |
Shares repurchased | | (9,935,835 | ) | | | (98,321,645 | ) | | (3,524,368 | ) | | | (34,760,507 | ) |
|
|
Net Decrease | | (8,602,109 | ) | | $ | (85,115,748 | ) | | (1,075,957 | ) | | $ | (10,615,398 | ) |
|
|
| * | | On April 29, 2004, Class L shares were renamed as Class C shares. |
27 Smith Barney Government Securities Fund | 2005 Semi-Annual Report
Notes to Financial Statements (unaudited) (continued)
| 7. | Capital Loss Carryforward |
On December 31, 2004, the Fund had a net capital loss carryforward of approximately $70,301,796, of which $3,192,660 expires in 2006, $48,487,598 expires in 2007, $16,358,450 expires in 2008 and $2,263,088 expires in 2012. This amount will be available to offset like amounts of any future taxable gains.
On May 31, 2005, the U.S. Securities and Exchange Commission (“SEC”) issued an order in connection with the settlement of an administrative proceeding against Smith Barney Fund Management LLC (“SBFM”) and Citigroup Global Markets Inc. (“CGMI”) relating to the appointment of an affiliated transfer agent for the Smith Barney family of mutual funds (the “Funds”).
The SEC order finds that SBFM and CGMI willfully violated Section 206(1) of the Investment Advisers Act of 1940 (“Advisers Act”). Specifically, the order finds that SBFM and CGMI knowingly or recklessly failed to disclose to the boards of the Funds in 1999 when proposing a new transfer agent arrangement with an affiliated transfer agent that: First Data Investors Services Group (“First Data”), the Funds’ then-existing transfer agent, had offered to continue as transfer agent and do the same work for substantially less money than before; and that Citigroup Asset Management (“CAM”), the Citigroup business unit that includes the fund’s investment manager and other investment advisory companies, had entered into a side letter with First Data under which CAM agreed to recommend the appointment of First Data as sub-transfer agent to the affiliated transfer agent in exchange, among other things, for a guarantee by First Data of specified amounts of asset management and investment banking fees to CAM and CGMI. The order also finds that SBFM and CGMI willfully violated Section 206(2) of the Advisers Act by virtue of the omissions discussed above and other misrepresentations and omissions in the materials provided to the Funds’ boards, including the failure to make clear that the affiliated transfer agent would earn a high profit for performing limited functions while First Data continued to perform almost all of the transfer agent functions, and the suggestion that the proposed arrangement was in the Funds’ best interests and that no viable alternatives existed. SBFM and CGMI do not admit or deny any wrongdoing or liability. The settlement does not establish wrongdoing or liability for purposes of any other proceeding.
28 Smith Barney Government Securities Fund | 2005 Semi-Annual Report
Notes to Financial Statements (unaudited) (continued)
The SEC censured SBFM and CGMI and ordered them to cease and desist from violations of Sections 206(1) and 206(2) of the Advisers Act. The order requires Citigroup to pay $208.1 million, including $109 million in disgorgement of profits, $19.1 million in interest, and a civil money penalty of $80 million. Approximately $24.4 million has already been paid to the Funds, primarily through fee waivers. The remaining $183.7 million, including the penalty, has been paid to the U.S. Treasury and will be distributed pursuant to a plan to be prepared by Citigroup and submitted within 90 days of the entry of the order for approval by the SEC. The order also requires that transfer agency fees received from the Funds since December 1, 2004 less certain expenses be placed in escrow and provides that a portion of such fees may be subsequently distributed in accordance with the terms of the order.
The order requires SBFM to recommend a new transfer agent contract to the Fund boards within 180 days of the entry of the order; if a Citigroup affiliate submits a proposal to serve as transfer agent or sub-transfer agent, an independent monitor must be engaged at the expense of SBFM and CGMI to oversee a competitive bidding process. Under the order, Citigroup also must comply with an amended version of a vendor policy that Citigroup instituted in August 2004. That policy, as amended, among other things, requires that when requested by a Fund board, CAM will retain at its own expense an independent consulting expert to advise and assist the board on the selection of certain service providers affiliated with Citigroup.
At this time, there is no certainty as to how the proceeds of the settlement will be distributed, to whom such distributions will be made, the methodology by which such distributions will be allocated, and when such distributions will be made. Although there can be no assurance, Citigroup does not believe that this matter will have a material adverse effect on the Funds.
Beginning in June 2004, class action lawsuits alleging violations of the federal securities laws were filed against Citigroup Global Markets Inc. (the “Distributor”) and a number of its affiliates, including Smith Barney Fund Management LLC and Salomon Brothers Asset Management Inc (the “Advisers”), substantially all of the mutual funds managed by the Advisers, including the Fund (the “Funds”), and directors or trustees of the Funds
29 Smith Barney Government Securities Fund | 2005 Semi-Annual Report
Notes to Financial Statements (unaudited) (continued)
(collectively, the “Defendants”). The complaints alleged, among other things, that the Distributor created various undisclosed incentives for its brokers to sell Smith Barney and Salomon Brothers funds. In addition, according to the complaints, the Advisers caused the Funds to pay excessive brokerage commissions to the Distributor for steering clients towards proprietary funds. The complaints also alleged that the defendants breached their fiduciary duty to the Funds by improperly charging Rule 12b-1 fees and by drawing on fund assets to make undisclosed payments of soft dollars and excessive brokerage commissions. The complaints also alleged that the Funds failed to adequately disclose certain of the allegedly wrongful conduct. The complaints sought injunctive relief and compensatory and punitive damages, rescission of the Funds’ contracts with the Advisers, recovery of all fees paid to the Advisers pursuant to such contracts and an award of attorneys’ fees and litigation expenses.
On December 15, 2004, a consolidated amended complaint (the “Complaint”) was filed alleging substantially similar causes of action. While the lawsuit is in its earliest stages, to the extent that the Complaint purports to state causes of action against the Funds, Citigroup Asset Management believes the Funds have significant defenses to such allegations, which the Funds intend to vigorously assert in responding to the Complaint.
Additional lawsuits arising out of these circumstances and presenting similar allegations and requests for relief may be filed against the Defendants in the future.
As of the date of this report, Citigroup Asset Management and the Funds believe that the resolution of the pending lawsuit will not have a material effect on the financial position or results of operations of the Funds or the ability of the Advisers and their affiliates to continue to render services to the Funds under their respective contracts.
On June 24, 2005, Citigroup announced that it has signed a definitive agreement under which Citigroup will sell substantially all of its worldwide asset management business to Legg Mason, Inc. (“Legg Mason”).
As part of this transaction, SBFM (“Adviser”), currently an indirect wholly owned subsidiary of Citigroup, would become an indirect wholly owned subsidiary of Legg Mason. The Adviser is the investment adviser to the Fund.
30 Smith Barney Government Securities Fund | 2005 Semi-Annual Report
Notes to Financial Statements (unaudited) (continued)
The transaction is subject to certain regulatory approvals, as well as other customary conditions to closing. Subject to such approvals and the satisfaction of the other conditions, Citigroup expects the transaction to be completed later this year.
Under the 1940 Act, consummation of the transaction will result in the automatic termination of the investment advisory contract between the Fund and the Adviser. Therefore, the Fund’s Board of Directors will be asked to approve a new investment advisory contract between the Fund and the Adviser. If approved by the Board, the new investment advisory contract will be presented to the shareholders of the Fund for their approval.
Subsequently, on August 1, 2005, the Board approved the new investment advisory contract between the Fund and the Adviser.
31 Smith Barney Government Securities Fund | 2005 Semi-Annual Report
SMITH BARNEY
GOVERNMENT SECURITIES FUND
| | |
DIRECTORS Paul R. Ades Dwight B. Crane R. Jay Gerken, CFA Chairman Frank G. Hubbard Jerome H. Miller Ken Miller OFFICERS R. Jay Gerken, CFA President and Chief Executive Officer Andrew B. Shoup Senior Vice President and Chief Administrative Officer Kaprel Ozsolak Chief Financial Officer and Treasurer Mark Lindbloom Vice President and Investment Officer Francis Mustaro Vice President and Investment Officer Andrew Beagley Chief Anti-Money Laundering Compliance Officer and Chief Compliance Officer | | OFFICERS (continued) Robert I. Frenkel Secretary and
Chief Legal Officer INVESTMENT ADVISER AND ADMINISTRATOR Smith Barney Fund Management LLC DISTRIBUTORS Citigroup Global Markets Inc. PFS Distributors, Inc. CUSTODIAN State Street Bank and
Trust Company TRANSFER AGENT Citicorp Trust Bank, fsb. 125 Broad Street, 11th Floor New York, New York 10004 SUB-TRANSFER AGENTS PFPC Inc. P.O. Box 9699 Providence, Rhode Island 02940-9699 Primerica Shareholder Services P.O. Box 9662 Providence, Rhode Island 02940-9662 |
Smith Barney Investment Funds Inc.
Smith Barney Government
Securities Fund
The Fund is a separate investment fund of the Smith Barney Investment Funds Inc., a Maryland corporation.
The Fund files its complete schedule of portfolio holdings with the Securities and Exchange Commission for the first and third quarters of each fiscal year on Form N-Q. The Fund’s Forms N-Q are available on the Commission’s website at www.sec.gov. The Fund’s Forms N-Q may be reviewed and copied at the Commission’s Public Reference Room in Washington D.C., and information on the operation of the Public Reference Room may be obtained by calling 1-800-SEC-0330. To obtain information on Form N-Q from the Fund, shareholders can call 1-800-451-2010.
Information on how the Fund voted proxies relating to portfolio securities during the most recent 12-month period ended June 30 and a description of the policies and procedures that the Fund uses to determine how to vote proxies relating to portfolio securities is available (1) without charge, upon request, by calling 1-800-451-2010, (2) on the Fund’s website at www.citigroupam.com and (3) on the SEC’s website at www.sec.gov.
This report is submitted for the general information of the shareholders of Smith Barney Investment Funds Inc. — Smith Barney Government Securities Fund, but it may also be used as sales literature.
SMITH BARNEY GOVERNMENT SECURITIES FUND
Smith Barney Mutual Funds
125 Broad Street
10th Floor, MF-2
New York, New York 10004
This report must be preceded or accompanied by a free prospectus. Investors should consider the Fund’s investment objectives, risks, charges and expenses carefully before investing. The prospectus contains this and other important information about the Fund. Please read the prospectus carefully before investing.
www.citigroupam.com
©2005 Citigroup Global Markets Inc.
Member NASD, SIPC
ITEM 2. CODE OF ETHICS.
Not applicable.
ITEM 3. AUDIT COMMITTEE FINANCIAL EXPERT.
Not applicable.
ITEM 4. PRINCIPAL ACCOUNTANT FEES AND SERVICES.
Not applicable.
ITEM 5. AUDIT COMMITTEE OF LISTED REGISTRANTS.
Not applicable.
ITEM 6. SCHEDULE OF INVESTMENTS.
Not applicable.
ITEM 7. DISCLOSURE OF PROXY VOTING POLICIES AND PROCEDURES FOR CLOSED-END MANAGEMENT INVESTMENT COMPANIES.
Not applicable.
ITEM 8. [RESERVED]
ITEM 9. PURCHASES OF EQUITY SECURITIES BY CLOSED-END MANAGEMENT INVESTMENT COMPANY AND AFFILIATED PURCHASERS.
Not applicable.
ITEM 10. SUBMISSION OF MATTERS TO A VOTE OF SECURITY HOLDERS.
Not applicable.
ITEM 11. CONTROLS AND PROCEDURES.
| | (a) | The registrant’s principal executive officer and principal financial officer have concluded that the registrant’s disclosure controls and procedures (as defined in Rule 30a-3(c) under the Investment Company Act of 1940, as amended (the “1940 Act”)) are effective as of a date within 90 days of the filing date of this report that includes the disclosure required by this paragraph, based on their evaluation of the disclosure controls and procedures required by Rule 30a-3(b) under the 1940 Act and 15d-15(b) under the Securities Exchange Act of 1934. |
| | (b) | There were no changes in the registrant’s internal control over financial reporting (as defined in Rule 30a-3(d) under the 1940 Act) that occurred during the registrant’s last fiscal half-year (the registrant’s second fiscal half-year in the case of an annual report) that have materially affected, or are likely to materially affect the registrant’s internal control over financial reporting. |
ITEM 12. EXHIBITS.
(a) Not applicable.
(b) Attached hereto.
| | | | |
| |
| | | Exhibit 99.CERT Certifications pursuant to section 302 of the Sarbanes-Oxley Act of 2002 |
| |
| | | Exhibit 99.906CERT Certifications pursuant to Section 906 of the Sarbanes-Oxley Act of 2002 |
SIGNATURES
Pursuant to the requirements of the Securities Exchange Act of 1934 and the Investment Company Act of 1940, the registrant has duly caused this Report to be signed on its behalf by the undersigned, there unto duly authorized.
| | |
| Smith Barney Investment Funds Inc. |
| |
| By: | | /s/ R. Jay Gerken
|
| | | R. Jay Gerken |
| | | Chief Executive Officer of |
| | | Smith Barney Investment Funds Inc. |
Date: September 7, 2005
Pursuant to the requirements of the Securities Exchange Act of 1934 and the Investment Company Act of 1940, this report has been signed below by the following persons on behalf of the registrant and in the capacities and on the dates indicated.
| | |
| By: | | /s/ R. Jay Gerken
|
| | | R. Jay Gerken |
| | | Chief Executive Officer of |
| | | Smith Barney Investment Funds Inc. |
Date: September 7, 2005
| | |
| By: | | /s/ Kaprel Ozsolak
|
| | | Kaprel Ozsolak |
| | | Chief Financial Officer of |
| | | Smith Barney Investment Funds Inc. |
Date: September 7, 2005