UNITED STATES
SECURITIES AND EXCHANGE COMMISSION
Washington, D.C. 20549
FORM N-CSR
CERTIFIED SHAREHOLDER REPORT OF REGISTERED
MANAGEMENT INVESTMENT COMPANIES
Investment Company Act file number 811-3275
Smith Barney Investment Funds Inc.
(Exact name of registrant as specified in charter)
125 Broad Street, New York, NY 10004
(Address of principal executive offices) (Zip code)
Robert I. Frenkel, Esq.
Legg Mason & Co., LLC
300 First Stamford Place, 4th Floor
Stamford, CT 06902
(Name and address of agent for service)
Registrant’s telephone number, including area code: (800) 451-2010
Date of fiscal year end: December 31
Date of reporting period: December 31, 2005
ITEM 1. REPORT TO STOCKHOLDERS.
The Annual Report to Stockholders is filed herewith.
EXPERIENCE
ANNUAL REPORT
DECEMBER 31, 2005

Smith Barney
Government Securities Fund
INVESTMENT PRODUCTS: NOT FDIC INSURED • NO BANK GUARANTEE • MAY LOSE VALUE
Smith Barney Government Securities Fund
Annual Report • December 31, 2005
What’s
Inside
Fund Objective:
The Fund seeks high current return.
Under a licensing agreement between Citigroup and Legg Mason, the names of funds, the names of any classes of shares of funds, and the names of investment advisers of funds, as well as all logos, trademarks and service marks related to Citigroup or any of its affiliates (“Citi Marks”) are licensed for use by Legg Mason. Citi Marks include, but are not limited to, “Smith Barney,” “Salomon Brothers,” “Citi” and “Citigroup Asset Management”. Legg Mason and its affiliates, as well as the Fund’s investment manager, are not affiliated with Citigroup.
All Citi Marks are owned by Citigroup, and are licensed for use until no later than one year after the date of the licensing agreement.
Letter from the Chairman

R. JAY GERKEN, CFA
Chairman, President and Chief Executive Officer
Dear Shareholder,
Despite numerous obstacles, including rising short-term interest rates, surging oil prices, a destructive hurricane season, and geopolitical issues, the U.S. economy continued to expand at a healthy pace during the reporting period. After a 3.8% advance in the first quarter of 2005, gross domestic product (“GDP”)i growth was 3.3% during the second quarter and 4.1% in the third quarter. While fourth quarter figures have not yet been released, another slight gain is anticipated.
Given the strength of the economy and inflationary pressures, the Federal Reserve Board (“Fed”)ii continued to raise interest rates throughout the period. After raising rates five times from June 2004 through December 2004, the Fed increased its target for the federal funds rateiii in 0.25% increments eight additional times over the reporting period. This represents the longest sustained Fed tightening cycle since the 1970s. All told, the Fed’s thirteen rate hikes have brought the target for the federal funds rate from 1.00% to 4.25%. After the end of the Fund’s reporting period, at its January meeting, the Fed once again raised its target for the federal funds rate by 0.25% to 4.50%.
As the year began, it was widely expected that both short- and long-term interest rates would rise. This panned out with short-term interest rates, as two-year U.S. Treasury notes’ yields rose from 3.08% to 4.41% over the 12-month period ended December 31, 2005. However, while there were periods of volatility, over the same period long-term interest rates experienced only a modest increase, as 10-year U.S. Treasury notes rose from 4.24% to 4.37%. In late December, the yield curve inverted, as the yield on two-year U.S. Treasury notes exceeded those of 10-year U.S. Treasury notes. This anomaly has historically foreshadowed an economic slowdown or recession.
Looking at the one-year period as a whole, the overall bond market, as measured by the Lehman Brothers Aggregate Bond Indexiv, returned 2.43%.
Smith Barney Government Securities Fund I
After two years of strong returns in 2003 and 2004, the high yield bond market took a step backwards in 2005. While corporate balance sheets continued to strengthen and corporate profits were strong, these positive developments took a back seat to the highly publicized downgrades of General Motors Corporation and Ford Motor Company. However, later in the year the high yield bond market rallied as the uncertainty surrounding the downgrades lifted and investors searched for incremental yield. During the one-year period ended December 31, 2005, the Citigroup High Yield Market Indexv returned 2.08%.
Emerging markets debt had another strong year in 2005, as the JPMorgan Emerging Markets Bond Index Global (“EMBI Global”)vi returned 10.73%. Many emerging market countries have improved their balance sheets in recent years. In addition, strong domestic demand and high energy and commodity prices, including prices of oil, metals, and agriculture, supported many emerging market countries. This more than offset the potential negatives associated with rising U.S. interest rates.
Please read on for a more detailed look at prevailing economic and market conditions during the Fund’s fiscal year and to learn how those conditions have affected Fund performance.
Special Shareholder Notices
On December 1, 2005, Citigroup Inc. (“Citigroup”) completed the sale of substantially all of its asset management business, Citigroup Asset Management (“CAM”), to Legg Mason, Inc. (“Legg Mason”). As a result, the Fund’s investment manager (the “Manager”), previously an indirect wholly-owned subsidiary of Citigroup, has become a wholly-owned subsidiary of Legg Mason. Completion of the sale caused the Fund’s existing investment management contract to terminate. The Fund’s shareholders previously approved a new investment management contract between the Fund and the Manager, which became effective on December 1, 2005.
On or about April 7, 2006, the Smith Barney Government Securities Fund will be renamed the Legg Mason Partners Government Securities Fund.
II Smith Barney Government Securities Fund
Information About Your Fund
As you may be aware, several issues in the mutual fund industry have recently come under the scrutiny of federal and state regulators. The Manager and some of its affiliates have received requests for information from various government regulators regarding market timing, late trading, fees, and other mutual fund issues in connection with various investigations. The regulators appear to be examining, among other things, the Fund’s response to market timing and shareholder exchange activity, including compliance with prospectus disclosure related to these subjects. The Fund has been informed that the Manager and its affiliates are responding to those information requests, but are not in a position to predict the outcome of these requests and investigations.
Important information concerning the Fund and its Manager with regard to recent regulatory developments is contained in the Notes to Financial Statements included in this report.
As always, thank you for your confidence in our stewardship of your assets. We look forward to helping you continue to meet your financial goals.
Sincerely,

R. Jay Gerken, CFA
Chairman, President and Chief Executive Officer
February 2, 2006
Smith Barney Government Securities Fund III
All index performance reflects no deduction for fees, expenses or taxes. Please note that an investor cannot invest directly in an index.
| i | | Gross domestic product is a market value of goods and services produced by labor and property in a given country. |
| ii | | The Federal Reserve Board is responsible for the formulation of a policy designed to promote economic growth, full employment, stable prices, and a sustainable pattern of international trade and payments. |
| iii | | The federal funds rate is the interest rate that banks with excess reserves at a Federal Reserve district bank charge other banks that need overnight loans. |
| iv | | The Lehman Brothers Aggregate Bond Index is a broad-based bond index comprised of government, corporate, mortgage and asset-backed issues, rated investment grade or higher, and having at least one year to maturity. |
| v | | The Citigroup High Yield Market Index is a broad-based unmanaged index of high yield securities. |
| vi | | JPMorgan Emerging Markets Bond Index Global (EMBI Global) tracks total returns for U.S. dollar denominated debt instruments issued by emerging market sovereign and quasi-sovereign entities: Brady bonds, loans, Eurobonds, and local market instruments. Countries covered are Algeria, Argentina, Brazil, Bulgaria, Chile, China, Colombia, Cote d’Ivoire, Croatia, Ecuador, Greece, Hungary, Lebanon, Malaysia, Mexico, Morocco, Nigeria, Panama, Peru, the Philippines, Poland, Russia, South Africa, South Korea, Thailand, Turkey and Venezuela. |
IV Smith Barney Government Securities Fund
Manager Overview
| | | | |
 | |  | | Mark Lindbloom (left) Vice President and
Investment Officer Francis Mustaro (right) Vice President and
Investment Officer |
Q. What were the overall market conditions during the Fund’s reporting period?
A. During the 12 months ended December 31, 2005, the markets were primarily driven by Federal Reserve Board (“Fed”)i activity, employment and inflation data and rising energy costs, exacerbated by the devastating impact of Hurricane Katrina on the U.S. Gulf Coast. The Fed’s eight “measured” 25-basis-pointii hikes during the period brought the federal funds rateiii from 2.25% to 4.25% by period end. After the end of the Fund’s reporting period, at its January meeting, the Fed once again raised its target for the federal funds rate by 0.25% to 4.50%. These rate hikes exerted upward pressure on short-term bond yields, driving two-year U.S. Treasury note yields up about 134 basis points during the 12 months. However, in what Fed Chairman Alan Greenspan termed a “conundrum,” yields on the long bond stayed relatively low, declining 29 basis points during the period. This sharp rise in shorter yields and decline in longer yields resulted in the extensive yield curve flattening seen during the period and, near year-end, a brief yield curve inversion as the yields on two-year U.S. Treasury notes broke above 10-year U.S. Treasury note yields on reports of stronger-than-expected housing starts.
As many market participants fully expected each 25-basis-point hike in the federal funds rate during the period — thanks to the Fed’s well-telegraphed intentions to raise rates at a measured pace — investors spent much of the period dissecting language from the Fed for clues on its assessment of the U.S. economy and the pace of rate hikes. The Fed reiterated throughout much of the year that it would increase rates “at a pace that is likely to be measured,” noting that core inflation remained low through the year and long-term inflation expectations were “contained”. However, higher energy costs, exacerbated by the supply disruption following Hurricanes Katrina and Rita, augmented building inflationary pressure. Although the Fed maintained its “measured” language until the very end of the quarter due to continued strong economic growth and manageable inflation, in an important departure from previous accompanying statements, the Federal Open Market Committee (“FOMC”) removed its characterization of monetary policy as “accommodative” in its December statement, as well as the signal phrase “at a pace that is likely to be measured”, a key indicator of future rate hikes. The overall tone of the December statement also indicated that monetary policy decisions will become more data-dependent as the Fed may shift from its focus on reaching neutral to limiting
Smith Barney Government Securities Fund 2005 Annual Report 1
pricing pressures. The nomination of Ben Bernanke in October as Fed Chairman Alan Greenspan’s replacement also affected markets, leaving open the question of future policy direction, as Mr. Bernanke’s specific focus and leadership skills are, in part, unknown.
Economic growth remained remarkably resilient during the annual period, particularly in light of the volatility seen in employment indicators and mixed industrial production, retail sales and consumer sentiment during Spring 2005 and in the aftermath of Fall 2005’s Hurricanes Katrina and Rita. Although the pace of improvement remained uneven from month to month, the U.S. labor market trended broadly positive during the annual period, continuing the upswing in employment that began in early 2004. Unemployment fell through the majority of the period, declining from 5.4% in December 2004 to 4.9% in December 2005. While September 2005 saw a 0.2% month-over-month uptick in unemployment to 5.1% as the dislocation in the Gulf region flowed through, the unemployment rate shifted back down in the fourth quarter. An exceedingly strong housing market also supported economic growth during the year, continuing its upward charge through the period despite some softening by year-end.
Industrial production and retail sales remained broadly positive through most of the period, even considering the volatility in the auto sector as General Motors Corporation and Ford Motor Company were successively downgraded by three major statistical credit rating agencies to below investment grade in Spring 2005. While auto sales dragged down headline retail numbers by period end, as reductions in auto production hit the market and the highly successful automotive dealer incentive packages offered through the summer came to an end, overall retail sales (ex-autos) remained reasonably stable. Industrial production declined in September on the impact of the hurricanes but rebounded sharply in October, resuming the strong upswing seen through the majority of the annual period. Consumer confidence, which plummeted through the Fall, ended the year up slightly at 103.6 versus the December 2004 reading of 102.3, as gasoline prices fell in the fourth quarter.
Despite the resilience of the U.S. economy during the period, slowing global growth, broadly rising inflation and higher oil prices undoubtedly restrained economic activity during the 12 months. U.S. gross domestic product (“GDP”)iv growth declined year-over-year to 3.8% growth in first quarter 2005 (from first quarter 2004’s 4.5% pace) and 3.3% growth in second quarter 2005 (from second quarter 2004’s 3.5%). While economic growth rebounded into the third quarter, gaining 4.1% on an annualized basis, the recovery was at least partially fueled by the massive fiscal stimulus injected into the Gulf region in the wake of the hurricanes. Therefore, although growth remained strong throughout the period, fears of potential slowing, combined with increasing inflation, drove markets. Oil prices, which breached $70 per barrel in late August before drifting back down to the mid-$60s, also cast a pall on growth and consumer spending expectations.
While inflationary pressures from sustained high commodity prices began to creep into the economy, particularly near the end of the year, continued strong growth and limited wage pressures kept long-term inflation expectations relatively “contained” through 2005. Core inflation rates, in particular, remained at moderate levels, with core Consumer Price Index (CPI)v
2 Smith Barney Government Securities Fund 2005 Annual Report
inflation consistently registering below market expectations through early Fall despite growing inflationary pressure. Inflation fears tapered off slightly during the last two months of the quarter as energy costs came off their September highs, with headline inflation even surprising on the downside in December. However, despite the apparently moderate pace of inflation through 2005, the Fed remained extremely vigilant, as some inflation pressures began to seep into producer prices and U.S. economic growth continued at its surprisingly strong pace. Consistently high energy prices also began to push up core CPI inflation by December end, stopping its downward month-to-month drift to end the year with a 0.2% month-over-month increase in December, near the upper end of what many investors perceive to be the Fed’s comfort range.
Performance Review
For the 12 months ended December 31, 2005, Class A shares of the Smith Barney Government Securities Fund, excluding sales charges, returned 2.36%. These shares outperformed the Lipper General U.S. Government Funds Category Average1, which increased 2.05%. The Fund’s unmanaged benchmark, the Citigroup Treasury/Mortgage Indexvi, returned 2.75% for the same period.
| | | | |
| Performance Snapshot as of December 31, 2005 (excluding sales charges) (unaudited) |
| | |
| | | 6 Months | | 12 Months |
| | | | | |
Government Securities Fund — Class A Shares | | -0.31% | | 2.36% |
|
Citigroup Treasury/Mortgage Index | | 0.13% | | 2.75% |
|
Lipper General U.S. Government Funds Category Average1 | | -0.66% | | 2.05% |
|
| The performance shown represents past performance. Past performance is no guarantee of future results and current performance may be higher or lower than the performance shown above. Principal value and investment returns will fluctuate and investors’ shares, when redeemed, may be worth more or less than their original cost. To obtain performance data current to the most recent month-end, please visit our website at www.citigroupam.com. |
| All share class returns assume the reinvestment of all distributions, including returns of capital, if any, at net asset value and the deduction of all Fund expenses. Returns have not been adjusted to include sales charges that may apply when shares are purchased or the deduction of taxes that a shareholder would pay on Fund distributions. Excluding sales charges, Class 1 shares returned -0.24%, Class B shares returned -0.50%, Class C shares returned -0.37% and Class Y shares returned -0.01% over the six months ended December 31, 2005. Excluding sales charges, Class 1 shares returned 2.50%, Class B shares returned 1.80%, Class C shares returned 1.87% and Class Y shares returned 2.75% over the 12 months ended December 31, 2005. |
1 Lipper, Inc. is a major independent mutual-fund tracking organization. Returns are based on the period ended December 31, 2005, including the reinvestment of all distributions, including returns of capital, if any, calculated among the 173 funds for the six-month period and among the 166 funds for the 12-month period in the Fund’s Lipper category and excluding sales charges. |
Q. What were the most significant factors affecting Fund performance?
What were the leading contributors to performance?
A. We structured the portfolio with a bias to curve flattening during the year. We also added to our hybrid adjustable-rate mortgages (“ARMs”) exposure and remained under - -
Smith Barney Government Securities Fund 2005 Annual Report 3
weight 15-year and 30-year collateral, which boosted performance as hybrid ARMs outperformed their fixed-rate counterparts during the 12 months.
Q. What were the leading detractors from performance?
A. Our generally neutral portfolio duration versus the benchmark slightly detracted from Fund performance during the annual period, as the longer end of the yield curve remained rangebond.
Q. Were there any significant changes to the Fund’s portfolio during the reporting period?
A. During the annual period, we continued to emphasize hybrid ARM positions and began to reduce our exposure to trades that would benefit the portfolio from yield curve flattening.
Thank you for your investment in the Smith Barney Government Securities Fund. As ever, we appreciate that you have chosen us to manage your assets and we remain focused on achieving the Fund’s investment goals.
Sincerely,
| | |
. Mark Lindbloom Vice President and Investment Officer | | 
Francis Mustaro Vice President and Investment Officer |
February 2, 2006
The information provided is not intended to be a forecast of future events, a guarantee of future results or investment advice. Views expressed may differ from those of the firm as a whole.
RISKS: Keep in mind, fixed-income securities are subject to interest rate, credit and market risks. As interest rates rise, bond prices fall, reducing the value of the Fund’s share price. The U.S. government guarantee of principal and interest payments only applies to underlying securities in the Fund’s portfolio, not the Fund’s shares. Please note that the Fund’s shares are not guaranteed by the U.S. government or its agencies. The Fund may use derivatives, such as options and futures, which can be illiquid, may disproportionately increase losses, and have a potentially large impact on Fund performance. Please see the Fund’s prospectus for more information on these and other risks.
All index performance reflects no deduction for fees, expenses or taxes. Please note an investor cannot invest directly in an index.
| i | | The Federal Reserve Board is responsible for the formulation of a policy designed to promote economic growth, full employment, stable prices, and a sustainable pattern of international trade and payments. |
| ii | | A basis point is one one-hundredth (1/100 or 0.01) of one percent. |
| iii | | The federal funds rate is the interest rate that banks with excess reserves at a Federal Reserve district bank charge other banks that need overnight loans. |
| iv | | Gross domestic product is a market value of goods and services produced by labor and property in a given country. |
| v | | The Consumer Price Index measures the average change in U.S. consumer prices over time in a fixed market basket of goods and services determined by the U.S. Bureau of Labor Statistics. |
| vi | | The Citigroup Treasury/Mortgage Index is a component of the Citigroup U.S. Broad Investment Grade (“USBIG”) Bond Index. It includes institutionally-traded fixed rate U.S. Treasury securities and mortgages. Mortgages are comprised of 30- and 15-year GNMA, FNMA and FHLMC pass-throughs and FNMA and FHLMC balloon mortgages. |
4 Smith Barney Government Securities Fund 2005 Annual Report
Fund at a Glance (unaudited)
Smith Barney Government Securities Fund 2005 Annual Report 5
Fund Expenses (unaudited)
Example
As a shareholder of the Fund, you may incur two types of costs: (1) transaction costs, including front-end and back-end sales charges (loads) on purchase payments; and (2) ongoing costs, including management fees; distribution and/or service (12b-1) fees; and other Fund expenses. This example is intended to help you understand your ongoing costs (in dollars) of investing in the Fund and to compare these costs with the ongoing costs of investing in other mutual funds.
This example is based on an investment of $1,000 invested on July 1, 2005 and held for the six months ended December 31, 2005.
Actual Expenses
The table below titled “Based on Actual Total Return” provides information about actual account values and actual expenses. You may use the information provided in this table, together with the amount you invested, to estimate the expenses that you paid over the period. To estimate the expenses you paid on your account, divide your ending account value by $1,000 (for example, an $8,600 ending account value divided by $1,000 = 8.6), then multiply the result by the number under the heading entitled “Expenses Paid During the Period”.
| | | | | | | | | | | | | | | |
| Based on Actual Total Return(1) | | | | | | | | | | | | | |
| | | | | |
| | | Actual Total
Return Without
Sales Charges(2) | | | Beginning
Account
Value | | Ending
Account
Value | | Annualized
Expense
Ratio | | | Expenses
Paid During
the Period(3) |
Class 1 | | (0.24 | )% | | $ | 1,000.00 | | $ | 997.60 | | 0.88 | % | | $ | 4.43 |
|
Class A | | (0.31 | ) | | | 1,000.00 | | | 996.90 | | 0.99 | | | | 4.98 |
|
Class B | | (0.50 | ) | | | 1,000.00 | | | 995.00 | | 1.52 | | | | 7.64 |
|
Class C | | (0.37 | ) | | | 1,000.00 | | | 996.30 | | 1.35 | | | | 6.79 |
|
Class Y | | (0.01 | ) | | | 1,000.00 | | | 999.90 | | 0.58 | | | | 2.92 |
|
| (1) | | For the six months ended December 31, 2005. |
| (2) | | Assumes reinvestment of all distributions, including returns of capital, if any, at net asset value and does not reflect the deduction of the applicable sales charges with respect to Class 1 and A shares or the applicable contingent deferred sales charges (“CDSC”) with respect to Class B and C shares. Total return is not annualized, as it may not be representative of the total return for the year. Past performance is no guarantee of future results. |
| (3) | | Expenses are equal to each class’ respective annualized expense ratio multiplied by the average account value over the period, multiplied by the number of days in the most recent fiscal half-year, then divided by 365. |
6 Smith Barney Government Securities Fund 2005 Annual Report
Fund Expenses (unaudited) (continued)
Hypothetical Example for Comparison Purposes
The table below titled “Based on Hypothetical Total Return” provides information about hypothetical account values and hypothetical expenses based on the actual expense ratio and an assumed rate of return of 5.00% per year before expenses, which is not the Fund’s actual return. The hypothetical account values and expenses may not be used to estimate the actual ending account balance or expenses you paid for the period. You may use the information provided in this table to compare the ongoing costs of investing in the Fund and other funds. To do so, compare the 5.00% hypothetical example relating to the Fund with the 5.00% hypothetical examples that appear in the shareholder reports of the other funds.
Please note that the expenses shown in the table below are meant to highlight your ongoing costs only and do not reflect any transactional costs, such as front-end or back-end sales charges (loads). Therefore, the table is useful in comparing ongoing costs only, and will not help you determine the relative total costs of owning different funds. In addition, if these transaction costs were included, your costs would have been higher.
| | | | | | | | | | | | | | | |
| Based on Hypothetical Total Return(1) |
| | | | | |
| | | Hypothetical
Annualized
Total Return | | | Beginning
Account
Value | | Ending
Account
Value | | Annualized
Expense
Ratio | | | Expenses
Paid During
the Period(2) |
Class 1 | | 5.00 | % | | $ | 1,000.00 | | $ | 1,020.77 | | 0.88 | % | | $ | 4.48 |
|
Class A | | 5.00 | | | | 1,000.00 | | | 1,020.21 | | 0.99 | | | | 5.04 |
|
Class B | | 5.00 | | | | 1,000.00 | | | 1,017.54 | | 1.52 | | | | 7.73 |
|
Class C | | 5.00 | | | | 1,000.00 | | | 1,018.40 | | 1.35 | | | | 6.87 |
|
Class Y | | 5.00 | | | | 1,000.00 | | | 1,022.28 | | 0.58 | | | | 2.96 |
|
| (1) | | For the six months ended December 31, 2005. |
| (2) | | Expenses are equal to each class’ respective annualized expense ratio multiplied by the average account value over the period, multiplied by the number of days in the most recent fiscal half-year, then divided by 365. |
Smith Barney Government Securities Fund 2005 Annual Report 7
Fund Performance
| | | | | | | | | | | | | | | |
| Average Annual Total Returns(1) (unaudited) | | | | | | | | | | | | | |
| |
| | | Without Sales Charges(2)
| |
| | | Class 1 | | | Class A | | | Class B | | | Class C | | | Class Y | |
Twelve Months Ended 12/31/05 | | 2.50 | % | | 2.36 | % | | 1.80 | % | | 1.87 | % | | 2.75 | % |
|
|
Five Years Ended 12/31/05 | | 4.75 | | | 4.62 | | | 4.07 | | | 4.17 | | | 5.03 | |
|
|
Ten Years Ended 12/31/05 | | N/A | | | 5.01 | | | 4.47 | | | 4.53 | | | N/A | |
|
|
Inception* through 12/31/05 | | 5.53 | | | 5.66 | | | 6.70 | | | 4.88 | | | 5.46 | |
|
|
| |
| | | With Sales Charges(3)
| |
| | | Class 1 | | | Class A | | | Class B | | | Class C | | | Class Y | |
Twelve Months Ended 12/31/05 | | (4.38 | )% | | (2.20 | )% | | (2.64 | )% | | 0.88 | % | | 2.75 | % |
|
|
Five Years Ended 12/31/05 | | 3.29 | | | 3.65 | | | 3.90 | | | 4.17 | | | 5.03 | |
|
|
Ten Years Ended 12/31/05 | | N/A | | | 4.53 | | | 4.47 | | | 4.53 | | | N/A | |
|
|
Inception* through 12/31/05 | | 4.15 | | | 5.29 | | | 6.70 | | | 4.88 | | | 5.46 | |
|
|
| | | | | | | | | | | |
| Cumulative Total Returns(1) (unaudited) | | | | | | | | | | | |
| | | Without Sales Charges(2) |
Class 1 (Inception* through 12/31/05) | | | | | | 33.01 | % | | | | |
|
Class A (12/31/95 through 12/31/05) | | | | | | 63.10 | | | | | |
|
Class B (12/31/95 through 12/31/05) | | | | | | 54.91 | | | | | |
|
Class C (12/31/95 through 12/31/05) | | | | | | 55.82 | | | | | |
|
Class Y (Inception* through 12/31/05) | | | | | | 69.21 | | | | | |
|
| (1) | | All figures represent past performance and are not a guarantee of future results. Investment return and principal value of an investment will fluctuate so that an investor’s shares, when redeemed, may be worth more or less than their original cost. The returns shown do not reflect the deduction of taxes that a shareholder would pay on fund distributions or the redemption of fund shares. Performance figures may reflect voluntary fee waivers and/or expense reimbursements. In the absence of voluntary fee waivers and/or expense reimbursements, the total return would have been lower. |
| (2) | | Assumes reinvestment of all distributions, including returns of capital, if any, at net asset value and does not reflect the deduction of the applicable sales charges with respect to Class 1 and A shares or the applicable CDSCs with respect to Class B and C shares. |
| (3) | | Assumes reinvestment of all distributions, including returns of capital, if any, at net asset value. In addition, Class 1 and A shares reflect the deduction of the maximum sales charges of 6.75% and 4.50%, respectively. Class B shares reflect the deduction of a 4.50% CDSC, which applies if shares are redeemed within one year from purchase payment. This CDSC declines by 0.50% the first year after purchase and thereafter by 1.00% per year until no CDSC is incurred. Class C shares reflect the deduction of a 1.00% CDSC, which applies if shares are redeemed within one year from purchase payment. |
| * | | Inception dates for Class 1, A, B, C and Y shares are September 12, 2000, November 6, 1992, March 20, 1984, February 4, 1993 and February 7, 1996, respectively. |
8 Smith Barney Government Securities Fund 2005 Annual Report
Historical Performance (unaudited)
Value of $10,000 Invested in Class B Shares of the Smith Barney Government Securities Fund vs. Citigroup Treasury/Mortgage Index and Lipper General U.S. Government Funds Category Average† (December 1995 — December 2005)
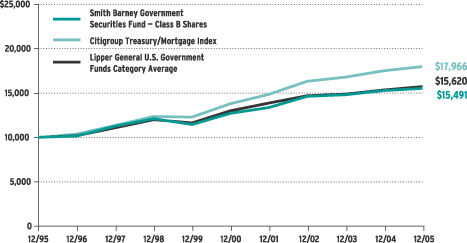
| † | | Hypothetical illustration of $10,000 invested in Class B shares of Smith Barney Government Securities Fund on December 31, 1995, assuming reinvestment of all distributions, including returns of capital, if any, at net asset value through December 31, 2005. The Citigroup Treasury/Mortgage Index is a component of the Citigroup U.S. Broad Investment-Grade (USBIG) Bond Index. It includes institutionally-traded fixed rate U.S. Treasury securities and mortgages. The Lipper General U.S. Government Funds Category Average is composed of the Fund’s peer group of 166 mutual funds investing in U.S. Government securities as of December 31, 2005. The Index is unmanaged and is not subject to the same management and trading expenses as a mutual fund. The performance of the Fund’s other classes may be greater or less than the Class B shares’ performance indicated on this chart, depending on whether higher or lower sales charges and fees were incurred by shareholders investing in other classes. The returns shown do not reflect the deduction of taxes that a shareholder would pay on fund distributions or the redemption of Fund shares. |
All figures represent past performance and are not a guarantee of future results. Investment return and principal value of an investment will fluctuate so that an investor’s shares, when redeemed, may be worth more or less than their original cost. The returns shown do not reflect the deduction of taxes that a shareholder would pay on Fund distributions or the redemption of Fund shares. Performance figures may reflect voluntary fee waivers and/or expense reimbursements. In the absence of voluntary fee waivers and/or expense reimbursements, the total return would have been lower.
Smith Barney Government Securities Fund 2005 Annual Report 9
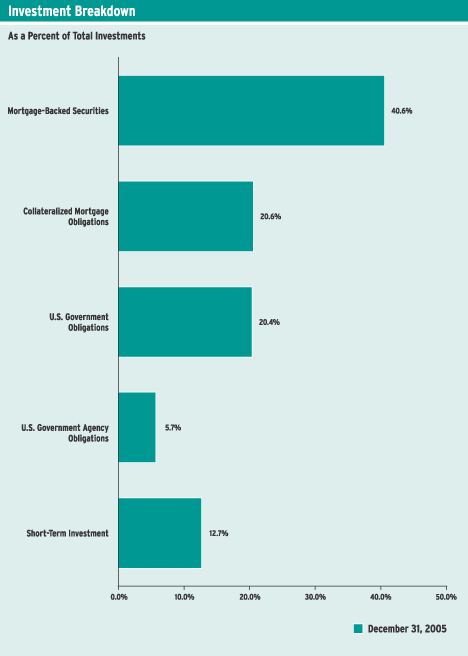
Schedule of Investments (December 31, 2005)
SMITH BARNEY GOVERNMENT SECURITIES FUND
| | | | | | | |
| | |
Face
Amount | | Security | | Value | |
| | | | | | | | |
| | MORTGAGE-BACKED SECURITIES — 46.4% | | | | |
| | FHLMC — 15.2% | | | | |
| | | | Federal Home Loan Mortgage Corp. (FHLMC): | | | | |
| $ | 25,000,000 | | 4.500% due 1/1/35 (a)(b) | | $ | 23,523,450 | |
| | 15,000,000 | | 6.000% due 1/1/35 (a)(b) | | | 15,150,000 | |
| | | | Gold: | | | | |
| | 1,824,922 | | 6.500% due 1/1/16-6/1/31 | | | 1,876,028 | |
| | 14,506,738 | | 6.000% due 1/1/24-1/1/32 | | | 14,757,873 | |
| | 5,009,815 | | 7.000% due 6/1/32-7/1/32 | | | 5,219,061 | |
| | 10,311,863 | | 5.000% due 9/1/33 | | | 10,022,357 | |
| | 8,000,000 | | 5.000% due 1/1/35 (a)(b) | | | 7,745,000 | |
| | | | One Year LIBOR: | | | | |
| | 9,033,855 | | 5.130% due 11/1/34 (c) | | | 9,006,824 | |
| | 8,775,360 | | 4.984% due 2/1/35 (c) | | | 8,685,773 | |
|
|
|
| | | | Total FHLMC | | | 95,986,366 | |
|
|
|
| | FNMA — 24.8% | | | | |
| | | | Federal National Mortgage Association (FNMA): | | | | |
| | 28,625,486 | | 5.500% due 5/1/16-9/1/23 | | | 28,649,442 | |
| | 3,859,609 | | 5.000% due 2/1/18-9/1/18 | | | 3,825,677 | |
| | 13,160,791 | | 6.000% due 11/1/22-8/1/34 | | | 13,357,209 | |
| | 14,841,819 | | 6.500% due 6/1/24-7/1/32 | | | 15,184,046 | |
| | 2,776,743 | | 7.500% due 8/1/28-4/1/32 | | | 2,910,867 | |
| | 1,802,088 | | 7.000% due 8/1/29-5/1/32 | | | 1,881,570 | |
| | 3,464,389 | | 4.522% due 6/1/33 (c) | | | 3,409,193 | |
| | 3,900,812 | | 5.118% due 11/1/34 (c) | | | 3,873,737 | |
| | 15,000,000 | | 5.500% due 1/1/35 (a)(b) | | | 14,854,680 | |
| | 12,000,000 | | 6.000% due 1/1/35 (a)(b) | | | 12,112,500 | |
| | | | One Year LIBOR: | | | | |
| | 17,012,766 | | 4.958% due 5/1/35 (c) | | | 16,920,670 | |
| | 18,340,879 | | 4.897% due 6/1/35 (c) | | | 18,189,752 | |
| | 21,376,156 | | 4.720% due 8/1/35 (c) | | | 21,157,963 | |
|
|
|
| | | | Total FNMA | | | 156,327,306 | |
|
|
|
| | GNMA — 6.4% | | | | |
| | | | Government National Mortgage Association (GNMA): | | | | |
| | 2,743,754 | | 7.000% due 2/15/28-11/15/31 | | | 2,882,433 | |
| | 398,212 | | 7.500% due 4/15/29-9/15/31 | | | 418,989 | |
| | 1,173,355 | | 6.500% due 10/15/31-5/15/32 | | | 1,226,738 | |
| | 14,921,379 | | 5.000% due 8/15/33-9/15/33 (d) | | | 14,751,387 | |
| | 6,000,000 | | 5.000% due 1/1/35 (a)(b) | | | 5,921,250 | |
| | 15,000,000 | | 5.500% due 1/1/35 (a)(b) | | | 15,093,750 | |
|
|
|
| | | | Total GNMA | | | 40,294,547 | |
|
|
|
| | | | TOTAL MORTGAGE-BACKED SECURITIES
(Cost — $295,700,767) | | | 292,608,219 | |
See Notes to Financial Statements.
10 Smith Barney Government Securities Fund 2005 Annual Report
Schedule of Investments (December 31, 2005) (continued)
| | | | | | | |
| | |
Face
Amount | | Security | | Value | |
| | | | | | | | |
| | COLLATERALIZED MORTGAGE OBLIGATIONS — 23.5% | | | | |
| $ | 12,068,216 | | Adjustable Rate Mortgage Trust, Whole Loan, Series 2005-3, Class 7A1,
5.084% due 7/25/35 (c) | | $ | 11,985,981 | |
| | 7,354,734 | | Banc of America Funding Corp., Series 2005-H, Class 1A1,
5.128% due 11/20/35 (c) | | | 7,336,758 | |
| | | | Banc of America Mortgage Securities, Whole Loan: | | | | |
| | 7,003,010 | | Series 2003-I, Class 1A1, 3.277% due 10/25/33 (c) | | | 7,100,794 | |
| | 8,587,368 | | Series 2004-L, Class 4A1, 5.170% due 1/25/35 (c) | | | 8,455,895 | |
| | 3,355,738 | | Countrywide Home Loans, Mortgage Pass-Through Trust, Whole Loan,
Series 2003-HYB1, Class 1A1, 3.714% due 5/19/33 (c) | | | 3,298,495 | |
| | 1,950,660 | | CS First Boston Mortgage Securities Corp., Whole Loan, Series 2002-10,
Class 2A1, 7.500% due 5/25/32 | | | 1,976,179 | |
| | 16,992,160 | | Federal Home Loan Mortgage Corp. (FHLMC), Series 2446, Class KL,
6.000% due 5/15/32 | | | 17,313,940 | |
| | | | Federal National Mortgage Association (FNMA): | | | | |
| | 1,943,965 | | Series 2001-81, Class HE, 6.500% due 1/25/32 | | | 1,995,388 | |
| | 3,209,041 | | Series 2004-45, Class Z, 4.500% due 6/25/34 | | | 2,595,222 | |
| | | | Whole Loan: | | | | |
| | 17,423,514 | | Series 2002-W10, Class A4, 5.700% due 8/25/42 | | | 17,328,371 | |
| | | | Series 2003-W12: | | | | |
| | 15,000,000 | | Class 1A6, 4.500% due 6/25/43 | | | 14,897,385 | |
| | 14,500,000 | | Class 2A4, 3.350% due 6/25/43 | | | 14,202,106 | |
| | 15,000,000 | | Class 2A7, 4.680% due 6/25/43 | | | 14,435,650 | |
| | 5,583,254 | | GMAC Mortgage Corporation Loan Trust, Series 2003-J7, Class A10, 5.500% due 11/25/33 | | | 5,542,753 | |
| | | | Government National Mortgage Association (GNMA): | | | | |
| | 7,000,000 | | Series 2001-19, Class OH, 6.500% due 5/16/31 (d) | | | 7,362,160 | |
| | 4,485,195 | | Series 2004-27, Class PD, 5.500% due 4/20/34 | | | 4,489,854 | |
| | 1,314,140 | | GSR Mortgage Loan Trust, Whole Loan, Series 2003-1, Class A11,
4.279% due 3/25/33 (c)(d) | | | 1,305,424 | |
| | 3,088,166 | | Structured Adjustable Rate Mortgage Loan Trust, Series 2005-5, Class A3,
4.609% due 5/25/35 (c) | | | 3,088,692 | |
| | 3,819,601 | | Washington Mutual Mortgage Pass-Through Certificates, Whole Loan,
Series 2003-AR5, Class A7, 4.208% due 6/25/33 (c) | | | 3,807,338 | |
|
|
|
| | | | TOTAL COLLATERALIZED MORTGAGE OBLIGATIONS
(Cost — $150,575,350) | | | 148,518,385 | |
|
|
|
| | U.S. GOVERNMENT & AGENCY OBLIGATIONS — 29.9% | |
| | U.S. Government Agency Obligations — 6.5% | | | | |
| | | | Federal Home Loan Bank (FHLB): | | | | |
| | 4,000,000 | | 5.125% due 3/6/06 | | | 4,003,292 | |
| | | | Notes: | | | | |
| | 7,500,000 | | 2.100% due 10/13/06 | | | 7,353,773 | |
| | 3,255,000 | | Series 8A07, 3.250% due 7/30/07 | | | 3,183,097 | |
| | 5,000,000 | | Federal Home Loan Mortgage Corp. (FHLMC), Medium Term Notes,
4.000% due 11/7/08 | | | 4,881,250 | |
| | | | Federal National Mortgage Association (FNMA): | | | | |
| | 7,500,000 | | 4.500% due 8/4/08 | | | 7,448,955 | |
See Notes to Financial Statements.
Smith Barney Government Securities Fund 2005 Annual Report 11
Schedule of Investments (December 31, 2005) (continued)
| | | | | | | |
| | |
Face
Amount | | Security | | Value | |
| | | | | | | | |
| | U.S. Government Agency Obligations — 6.5% (continued) | | | | |
| $ | 3,897,124 | | Six Month LIBOR, 4.579% due 4/1/33 (c) | | $ | 3,859,304 | |
| | | | U.S. Department of Housing & Urban Development, Senior Debentures, Series 2003-A: | | | | |
| | 5,000,000 | | 5.530% due 8/1/20 (d) | | | 5,067,345 | |
| | 5,000,000 | | 5.590% due 8/1/21 (d) | | | 5,103,190 | |
|
|
|
| | | | Total U.S. Government Agency Obligations | | | 40,900,206 | |
|
|
|
| | U.S. Government Obligations — 23.4% | | | | |
| | 3,250,000 | | U.S. Treasury Bond STRIPS, Series S0, Principal only, zero coupon to yield
5.102% due 8/15/25 | | | 1,316,370 | |
| | | | U.S. Treasury Bonds: | | | | |
| | 10,280,000 | | 7.250% due 5/15/16 (e) | | | 12,625,937 | |
| | 10,900,000 | | 8.750% due 8/15/20 (d) | | | 15,684,086 | |
| | 19,750,000 | | 7.250% due 8/15/22 (d) | | | 25,725,935 | |
| | 15,350,000 | | 5.500% due 8/15/28 (d) | | | 17,264,559 | |
| | 3,500,000 | | 6.125% due 8/15/29 (d) | | | 4,264,397 | |
| | | | U.S. Treasury Notes: | | | | |
| | 2,000,000 | | 3.375% due 2/28/07 | | | 1,976,252 | |
| | 21,500,000 | | 4.000% due 4/15/10 (d) | | | 21,194,313 | |
| | 2,000,000 | | 3.875% due 7/15/10 | | | 1,960,782 | |
| | 5,000,000 | | 4.125% due 8/15/10 | | | 4,952,345 | |
| | 2,500,000 | | 4.500% due 11/15/10 | | | 2,514,260 | |
| | 4,100,000 | | 4.250% due 8/15/13 (d) | | | 4,064,609 | |
| | 5,000,000 | | 4.750% due 5/15/14 (d) | | | 5,123,245 | |
| | 16,000,000 | | 4.250% due 11/15/14 (d) | | | 15,818,752 | |
| | 3,500,000 | | 4.000% due 2/15/15 (d) | | | 3,394,454 | |
| | 5,500,000 | | 4.250% due 8/15/15 | | | 5,430,607 | |
| | 4,000,000 | | 4.500% due 11/15/15 | | | 4,034,064 | |
|
|
|
| | | | Total U.S. Government Obligations | | | 147,344,967 | |
|
|
|
| | | | TOTAL U.S. GOVERNMENT & AGENCY OBLIGATIONS
(Cost — $185,350,226) | | | 188,245,173 | |
|
|
|
| | | | TOTAL INVESTMENTS BEFORE SHORT-TERM INVESTMENT
(Cost — $631,626,343) | | | 629,371,777 | |
|
|
|
See Notes to Financial Statements.
12 Smith Barney Government Securities Fund 2005 Annual Report
Schedule of Investments (December 31, 2005) (continued)
| | | | | | | |
| | |
Face
Amount | | Security | | Value | |
| | SHORT-TERM INVESTMENT — 14.5% | |
| | Repurchase Agreement — 14.5% | | | | |
| $ | 91,246,000 | | Interest in $405,369,000 joint tri-party repurchase agreement dated 12/30/05 with Greenwich Capital Markets Inc., 4.280% due 1/3/06, Proceeds at maturity- $91,289,393; (Fully collateralized by various U.S. government agency obligations, 0.000% to 8.950% due 1/11/06 to 11/15/30;
Market value - $93,071,377) (Cost — $91,246,000) | | $ | 91,246,000 | |
|
|
|
| | | | TOTAL INVESTMENTS — 114.3% (Cost — $722,872,343#) | | | 720,617,777 | |
| | | | Liabilities in Excess of Other Assets — (14.3)% | | | (90,399,898 | ) |
|
|
|
| | | | TOTAL NET ASSETS — 100.0% | | $ | 630,217,879 | |
|
|
|
| (a) | | This security is traded on a “to-be-announced” (“TBA”) basis (See Note 1). |
| (b) | | All or a portion of this security was acquired under a mortgage dollar roll agreement (See Notes 1 and 3). |
| (c) | | Variable rate security. Interest rate disclosed is that which is in effect at December 31, 2005. |
| (d) | | All or a portion of this security is segregated for open futures contracts and mortgage dollar rolls. |
| (e) | | All or a portion of this security is held at the broker as collateral for open futures contracts. |
| # | | Aggregate cost for federal income tax purposes is $723,101,448. |
| | |
Abbreviations used in this schedule:
|
| LIBOR | | —London Interbank Offered Rate |
| STRIPS | | —Separate Trading of Registered Interest and Principal of Securities |
See Notes to Financial Statements.
Smith Barney Government Securities Fund 2005 Annual Report 13
Statement of Assets and Liabilities (December 31, 2005)
| | | | |
| ASSETS: | | | | |
Investments, at value (Cost — $631,626,343) | | $ | 629,371,777 | |
Repurchase agreement, at value (Cost — $91,246,000) | | | 91,246,000 | |
Cash | | | 134 | |
Interest receivable | | | 4,449,737 | |
Receivable for Fund shares sold | | | 616,635 | |
Principal paydown receivable | | | 359,842 | |
Prepaid expenses | | | 34,580 | |
|
|
Total Assets | | | 726,078,705 | |
|
|
| LIABILITIES: | | | | |
Payable for securities purchased | | | 94,056,071 | |
Payable for Fund shares repurchased | | | 721,863 | |
Management fee payable | | | 294,582 | |
Distributions payable | | | 257,697 | |
Transfer agent fees payable | | | 231,956 | |
Distribution fees payable (Notes 2 and 4) | | | 70,789 | |
Deferred dollar roll income | | | 40,456 | |
Payable to broker — variation margin on open futures contracts | | | 9,500 | |
Directors’ fees payable | | | 5,001 | |
Accrued expenses | | | 172,911 | |
|
|
Total Liabilities | | | 95,860,826 | |
|
|
Total Net Assets | | $ | 630,217,879 | |
|
|
| NET ASSETS: | | | | |
Par value (Note 6) | | $ | 64,731 | |
Paid-in capital in excess of par value | | | 708,324,339 | |
Undistributed net investment income | | | 985,662 | |
Accumulated net realized loss on investments, futures contracts and options | | | (76,962,605 | ) |
Net unrealized depreciation on investments and futures contracts | | | (2,194,248 | ) |
|
|
Total Net Assets | | $ | 630,217,879 | |
|
|
Shares Outstanding: | | | | |
Class 1 | | | 8,639,121 | |
| |
Class A | | | 34,837,325 | |
| |
Class B | | | 9,137,281 | |
| |
Class C | | | 1,424,556 | |
| |
Class Y | | | 10,692,764 | |
| |
Net Asset Value: | | | | |
Class 1 (and redemption price) | | | $9.74 | |
| |
Class A (and redemption price) | | | $9.73 | |
| |
Class B * | | | $9.74 | |
| |
Class C * | | | $9.74 | |
| |
Class Y (and redemption price) | | | $9.75 | |
| |
Maximum Public Offering Price Per Share: | | | | |
Class 1 (based on maximum sales charge of 6.75%) | | | $10.45 | |
| |
Class A (based on maximum sales charge of 4.50%) | | | $10.19 | |
|
|
| * | | Redemption price is NAV of Class B and C shares reduced by a 4.50% and 1.00% CDSC, respectively, if shares are redeemed within one year from purchase payment (See Note 2). |
See Notes to Financial Statements.
14 Smith Barney Government Securities Fund 2005 Annual Report
Statement of Operations (For the year ended December 31, 2005)
| | | | |
| INVESTMENT INCOME: | | | | |
Interest | | $ | 32,386,639 | |
|
|
| EXPENSES: | | | | |
Management fee (Note 2) | | | 2,577,662 | |
Distribution fees (Notes 2 and 4) | | | 1,709,078 | |
Administration fees (Note 2) | | | 1,304,617 | |
Transfer agent fees (Notes 2 and 4) | | | 891,254 | |
Shareholder reports (Note 4) | | | 146,785 | |
Registration fees | | | 66,267 | |
Custody fees | | | 65,124 | |
Directors’ fees | | | 55,911 | |
Audit and tax | | | 30,164 | |
Legal fees | | | 29,484 | |
Insurance | | | 13,456 | |
Miscellaneous expenses | | | 1,355 | |
|
|
Total Expenses | | | 6,891,157 | |
|
|
Net Investment Income | | | 25,495,482 | |
|
|
REALIZED AND UNREALIZED GAIN (LOSS) ON INVESTMENTS,
FUTURES CONTRACTS AND OPTIONS
(NOTES 1 AND 3): | | | | |
Net Realized Gain (Loss) From: | | | | |
Investments | | | (2,097,798 | ) |
Futures contracts | | | (150,123 | ) |
Options written | | | 60,483 | |
|
|
Net Realized Loss | | | (2,187,438 | ) |
|
|
Change in Net Unrealized Appreciation/Depreciation From: | | | | |
Investments | | | (6,452,174 | ) |
Futures contracts | | | 128,076 | |
|
|
Change in Net Unrealized Appreciation/Depreciation | | | (6,324,098 | ) |
|
|
Net Loss on Investments, Futures Contracts and Options | | | (8,511,536 | ) |
|
|
Increase in Net Assets From Operations | | $ | 16,983,946 | |
|
|
See Notes to Financial Statements.
Smith Barney Government Securities Fund 2005 Annual Report 15
Statements of Changes in Net Assets (For the years ended December 31,)
| | | | | | | | |
| | |
| | | 2005 | | | 2004 | |
| OPERATIONS: | | | | | | | | |
Net investment income | | $ | 25,495,482 | | | $ | 27,253,891 | |
Net realized loss | | | (2,187,438 | ) | | | (1,572,766 | ) |
Change in net unrealized appreciation/depreciation | | | (6,324,098 | ) | | | 3,639,428 | |
|
|
Increase in Net Assets From Operations | | | 16,983,946 | | | | 29,320,553 | |
|
|
DISTRIBUTIONS TO SHAREHOLDERS
FROM (NOTES 1 AND 5): | | | | | | | | |
Net investment income | | | (25,695,305 | ) | | | (30,549,653 | ) |
Return of capital | | | — | | | | (308,494 | ) |
|
|
Decrease in Net Assets From
Distributions to Shareholders | | | (25,695,305 | ) | | | (30,858,147 | ) |
|
|
| FUND SHARE TRANSACTIONS (NOTE 6): | | | | | | | | |
Net proceeds from sale of shares | | | 79,021,214 | | | | 90,505,996 | |
Reinvestment of distributions | | | 20,639,254 | | | | 22,219,131 | |
Cost of shares repurchased | | | (254,727,182 | ) | | | (181,959,088 | ) |
|
|
Decrease in Net Assets From Fund Share Transactions | | | (155,066,714 | ) | | | (69,233,961 | ) |
|
|
Decrease in Net Assets | | | (163,778,073 | ) | | | (70,771,555 | ) |
| NET ASSETS: | | | | | | | | |
Beginning of year | | | 793,995,952 | | | | 864,767,507 | |
|
|
End of year* | | $ | 630,217,879 | | | $ | 793,995,952 | |
|
|
* Includes undistributed net investment income of: | | | $985,662 | | | | $— | |
|
|
See Notes to Financial Statements.
16 Smith Barney Government Securities Fund 2005 Annual Report
Financial Highlights
For a share of each class of capital stock outstanding throughout each year ended December 31:
| | | | | | | | | | | | | | | | | | | | |
| | | | | |
| Class 1 Shares(1) | | 2005 | | | 2004 | | | 2003 | | | 2002 | | | 2001 | |
Net Asset Value, Beginning of Year | | $ | 9.87 | | | $ | 9.89 | | | $ | 10.08 | | | $ | 9.53 | | | $ | 9.47 | |
|
|
Income (Loss) From Operations: | | | | | | | | | | | | | | | | | | | | |
Net investment income | | | 0.37 | | | | 0.34 | | | | 0.33 | | | | 0.39 | | | | 0.44 | |
Net realized and unrealized gain (loss) | | | (0.13 | ) | | | 0.02 | | | | (0.14 | ) | | | 0.54 | | | | 0.09 | |
|
|
Total Income From Operations | | | 0.24 | | | | 0.36 | | | | 0.19 | | | | 0.93 | | | | 0.53 | |
|
|
Less Distributions From: | | | | | | | | | | | | | | | | | | | | |
Net investment income | | | (0.37 | ) | | | (0.38 | ) | | | (0.38 | ) | | | (0.38 | ) | | | (0.45 | ) |
Return of capital | | | — | | | | (0.00 | )(2) | | | — | | | | — | | | | (0.02 | ) |
|
|
Total Distributions | | | (0.37 | ) | | | (0.38 | ) | | | (0.38 | ) | | | (0.38 | ) | | | (0.47 | ) |
|
|
Net Asset Value, End of Year | | $ | 9.74 | | | $ | 9.87 | | | $ | 9.89 | | | $ | 10.08 | | | $ | 9.53 | |
|
|
Total Return(3) | | | 2.50 | % | | | 3.76 | % | | | 1.95 | % | | | 10.00 | % | | | 5.74 | % |
|
|
Net Assets, End of Year (millions) | | | $84 | | | | $96 | | | | $108 | | | | $120 | | | | $117 | |
|
|
Ratios to Average Net Assets: | | | | | | | | | | | | | | | | | | | | |
Gross expenses | | | 0.87 | % | | | 0.84 | % | | | 0.81 | % | | | 0.85 | % | | | 0.85 | % |
Net expenses | | | 0.87 | | | | 0.82 | (4) | | | 0.81 | | | | 0.85 | | | | 0.85 | |
Net investment income | | | 3.73 | | | | 3.45 | | | | 3.34 | | | | 4.01 | | | | 4.62 | |
|
|
Portfolio Turnover Rate | | | 141 | %(5) | | | 138 | %(5) | | | 148 | %(5) | | | 280 | % | | | 447 | % |
|
|
| (1) | | Per share amounts have been calculated using the average shares method. |
| (2) | | Amount represents less than $0.01 per share. |
| (3) | | Performance figures may reflect voluntary fee waivers and/or expense reimbursements. Past performance is no guarantee of future results. In the absence of voluntary fee waivers and/or expense reimbursements, the total return would have been lower. |
| (4) | | The investment manager voluntarily waived a portion of its fees. |
| (5) | | Excluding mortgage dollar roll transactions. If mortgage dollar roll transactions had been included the portfolio turnover rate would have been 315%, 292% and 328% for the years ended December 31, 2005, 2004 and 2003, respectively. |
See Notes to Financial Statements.
Smith Barney Government Securities Fund 2005 Annual Report 17
Financial Highlights (continued)
For a share of each class of capital stock outstanding throughout each year ended December 31:
| | | | | | | | | | | | | | | | | | | | |
| | | | | |
| Class A Shares(1) | | 2005 | | | 2004 | | | 2003 | | | 2002 | | | 2001 | |
Net Asset Value, Beginning of Year | | $ | 9.86 | | | $ | 9.88 | | | $ | 10.07 | | | $ | 9.52 | | | $ | 9.45 | |
|
|
Income (Loss) From Operations: | | | | | | | | | | | | | | | | | | | | |
Net investment income | | | 0.35 | | | | 0.33 | | | | 0.32 | | | | 0.38 | | | | 0.43 | |
Net realized and unrealized gain (loss) | | | (0.12 | ) | | | 0.02 | | | | (0.14 | ) | | | 0.54 | | | | 0.09 | |
|
|
Total Income From Operations | | | 0.23 | | | | 0.35 | | | | 0.18 | | | | 0.92 | | | | 0.52 | |
|
|
Less Distributions From: | | | | | | | | | | | | | | | | | | | | |
Net investment income | | | (0.36 | ) | | | (0.37 | ) | | | (0.37 | ) | | | (0.37 | ) | | | (0.45 | ) |
Return of capital | | | — | | | | (0.00 | )(2) | | | — | | | | — | | | | — | |
|
|
Total Distributions | | | (0.36 | ) | | | (0.37 | ) | | | (0.37 | ) | | | (0.37 | ) | | | (0.45 | ) |
|
|
Net Asset Value, End of Year | | $ | 9.73 | | | $ | 9.86 | | | $ | 9.88 | | | $ | 10.07 | | | $ | 9.52 | |
|
|
Total Return(3) | | | 2.36 | % | | | 3.63 | % | | | 1.83 | % | | | 9.88 | % | | | 5.60 | % |
|
|
Net Assets, End of Year (millions) | | | $339 | | | | $358 | | | | $378 | | | | $395 | | | | $334 | |
|
|
Ratios to Average Net Assets: | | | | | | | | | | | | | | | | | | | | |
Gross expenses | | | 1.00 | % | | | 0.98 | % | | | 0.95 | % | | | 0.91 | % | | | 0.96 | % |
Net expenses | | | 1.00 | | | | 0.97 | (4) | | | 0.95 | | | | 0.91 | | | | 0.96 | |
Net investment income | | | 3.60 | | | | 3.30 | | | | 3.19 | | | | 3.91 | | | | 4.50 | |
|
|
Portfolio Turnover Rate | | | 141 | %(5) | | | 138 | %(5) | | | 148 | %(5) | | | 280 | % | | | 447 | % |
|
|
| (1) | | Per share amounts have been calculated using the average shares method. |
| (2) | | Amount represents less than $0.01 per share. |
| (3) | | Performance figures may reflect voluntary fee waivers and/or expense reimbursements. Past performance is no guarantee of future results. In the absence of voluntary fee waivers and/or expense reimbursements, the total return would have been lower. |
| (4) | | The investment manager voluntarily waived a portion of its fees. |
| (5) | | Excluding mortgage dollar roll transactions. If mortgage dollar roll transactions had been included the portfolio turnover rate would have been 315%, 292% and 328% for the years ended December 31, 2005, 2004 and 2003, respectively. |
See Notes to Financial Statements.
18 Smith Barney Government Securities Fund 2005 Annual Report
Financial Highlights (continued)
For a share of each class of capital stock outstanding throughout each year ended December 31:
| | | | | | | | | | | | | | | | | | | | |
| | | | | |
| Class B Shares(1) | | 2005 | | | 2004 | | | 2003 | | | 2002 | | | 2001 | |
Net Asset Value, Beginning of Year | | $ | 9.87 | | | $ | 9.89 | | | $ | 10.08 | | | $ | 9.53 | | | $ | 9.46 | |
|
|
Income (Loss) From Operations: | | | | | | | | | | | | | | | | | | | | |
Net investment income | | | 0.30 | | | | 0.27 | | | | 0.27 | | | | 0.33 | | | | 0.37 | |
Net realized and unrealized gain (loss) | | | (0.12 | ) | | | 0.03 | | | | (0.14 | ) | | | 0.54 | | | | 0.10 | |
|
|
Total Income From Operations | | | 0.18 | | | | 0.30 | | | | 0.13 | | | | 0.87 | | | | 0.47 | |
|
|
Less Distributions From: | | | | | | | | | | | | | | | | | | | | |
Net investment income | | | (0.31 | ) | | | (0.32 | ) | | | (0.32 | ) | | | (0.32 | ) | | | (0.40 | ) |
Return of capital | | | — | | | | (0.00 | )(2) | | | — | | | | — | | | | — | |
|
|
Total Distributions | | | (0.31 | ) | | | (0.32 | ) | | | (0.32 | ) | | | (0.32 | ) | | | (0.40 | ) |
|
|
Net Asset Value, End of Year | | $ | 9.74 | | | $ | 9.87 | | | $ | 9.89 | | | $ | 10.08 | | | $ | 9.53 | |
|
|
Total Return(3) | | | 1.80 | % | | | 3.09 | % | | | 1.30 | % | | | 9.29 | % | | | 5.05 | % |
|
|
Net Assets, End of Year (millions) | | | $89 | | | | $103 | | | | $122 | | | | $132 | | | | $78 | |
|
|
Ratios to Average Net Assets: | | | | | | | | | | | | | | | | | | | | |
Gross expenses | | | 1.55 | % | | | 1.51 | % | | | 1.51 | % | | | 1.42 | % | | | 1.48 | % |
Net expenses | | | 1.55 | | | | 1.50 | (4) | | | 1.51 | | | | 1.42 | | | | 1.48 | |
Net investment income | | | 3.04 | | | | 2.77 | | | | 2.64 | | | | 3.41 | | | | 3.94 | |
|
|
Portfolio Turnover Rate | | | 141 | %(5) | | | 138 | %(5) | | | 148 | %(5) | | | 280 | % | | | 447 | % |
|
|
| (1) | | Per share amounts have been calculated using the average shares method. |
| (2) | | Amount represents less than $0.01 per share. |
| (3) | | Performance figures may reflect voluntary fee waivers and/or expense reimbursements. Past performance is no guarantee of future results. In the absence of voluntary fee waivers and/or expense reimbursements, the total return would have been lower. |
| (4) | | The investment manager voluntarily waived a portion of its fees. |
| (5) | | Excluding mortgage dollar roll transactions. If mortgage dollar roll transactions had been included the portfolio turnover rate would have been 315%, 292% and 328% for the years ended December 31, 2005, 2004 and 2003, respectively. |
See Notes to Financial Statements.
Smith Barney Government Securities Fund 2005 Annual Report 19
Financial Highlights (continued)
For a share of each class of capital stock outstanding throughout each year ended December 31:
| | | | | | | | | | | | | | | | | | | | |
| | | | | |
| Class C Shares(1) (2) | | 2005 | | | 2004 | | | 2003 | | | 2002 | | | 2001 | |
Net Asset Value, Beginning of Year | | $ | 9.87 | | | $ | 9.88 | | | $ | 10.08 | | | $ | 9.53 | | | $ | 9.45 | |
|
|
Income (Loss) From Operations: | | | | | | | | | | | | | | | | | | | | |
Net investment income | | | 0.31 | | | | 0.28 | | | | 0.28 | | | | 0.34 | | | | 0.38 | |
Net realized and unrealized gain (loss) | | | (0.13 | ) | | | 0.04 | | | | (0.15 | ) | | | 0.54 | | | | 0.10 | |
|
|
Total Income From Operations | | | 0.18 | | | | 0.32 | | | | 0.13 | | | | 0.88 | | | | 0.48 | |
|
|
Less Distributions From: | | | | | | | | | | | | | | | | | | | | |
Net investment income | | | (0.31 | ) | | | (0.33 | ) | | | (0.33 | ) | | | (0.33 | ) | | | (0.40 | ) |
Return of capital | | | — | | | | (0.00 | )(3) | | | — | | | | — | | | | — | |
|
|
Total Distributions | | | (0.31 | ) | | | (0.33 | ) | | | (0.33 | ) | | | (0.33 | ) | | | (0.40 | ) |
|
|
Net Asset Value, End of Year | | $ | 9.74 | | | $ | 9.87 | | | $ | 9.88 | | | $ | 10.08 | | | $ | 9.53 | |
|
|
Total Return(4) | | | 1.87 | % | | | 3.29 | % | | | 1.29 | % | | | 9.39 | % | | | 5.22 | % |
|
|
Net Assets, End of Year (millions) | | | $14 | | | | $17 | | | | $25 | | | | $32 | | | | $17 | |
|
|
Ratios to Average Net Assets: | | | | | | | | | | | | | | | | | | | | |
Gross expenses | | | 1.45 | % | | | 1.44 | % | | | 1.41 | % | | | 1.39 | % | | | 1.42 | % |
Net expenses | | | 1.45 | | | | 1.42 | (5) | | | 1.41 | | | | 1.39 | | | | 1.42 | |
Net investment income | | | 3.14 | | | | 2.84 | | | | 2.75 | | | | 3.45 | | | | 3.95 | |
|
|
Portfolio Turnover Rate | | | 141 | %(6) | | | 138 | %(6) | | | 148 | %(6) | | | 280 | % | | | 447 | % |
|
|
| (1) | | Per share amounts have been calculated using the average shares method. |
| (2) | | On April 29, 2004, Class L shares were renamed as Class C shares. |
| (3) | | Amount represents less than $0.01 per share. |
| (4) | | Performance figures may reflect voluntary fee waivers and/or expense reimbursements. Past performance is no guarantee of future results. In the absence of voluntary fee waivers and/or expense reimbursements, the total return would have been lower. |
| (5) | | The investment manager voluntarily waived a portion of its fees. |
| (6) | | Excluding mortgage dollar roll transactions. If mortgage dollar roll transactions had been included the portfolio turnover rate would have been 315%, 292% and 328% for the years ended December 31, 2005, 2004 and 2003, respectively. |
See Notes to Financial Statements.
20 Smith Barney Government Securities Fund 2005 Annual Report
Financial Highlights (continued)
For a share of each class of capital stock outstanding throughout each year ended December 31:
| | | | | | | | | | | | | | | | | | | | |
| | | | | |
| Class Y Shares(1) | | 2005 | | | 2004 | | | 2003 | | | 2002 | | | 2001 | |
Net Asset Value, Beginning of Year | | $ | 9.88 | | | $ | 9.89 | | | $ | 10.08 | | | $ | 9.53 | | | $ | 9.45 | |
|
|
Income (Loss) From Operations: | | | | | | | | | | | | | | | | | | | | |
Net investment income | | | 0.39 | | | | 0.36 | | | | 0.36 | | | | 0.41 | | | | 0.47 | |
Net realized and unrealized gain (loss) | | | (0.12 | ) | | | 0.04 | | | | (0.14 | ) | | | 0.55 | | | | 0.09 | |
|
|
Total Income From Operations | | | 0.27 | | | | 0.40 | | | | 0.22 | | | | 0.96 | | | | 0.56 | |
|
|
Less Distributions From: | | | | | | | | | | | | | | | | | | | | |
Net investment income | | | (0.40 | ) | | | (0.41 | ) | | | (0.41 | ) | | | (0.41 | ) | | | (0.48 | ) |
Return of capital | | | — | | | | (0.00 | )(2) | | | — | | | | — | | | | — | |
|
|
Total Distributions | | | (0.40 | ) | | | (0.41 | ) | | | (0.41 | ) | | | (0.41 | ) | | | (0.48 | ) |
|
|
Net Asset Value, End of Year | | $ | 9.75 | | | $ | 9.88 | | | $ | 9.89 | | | $ | 10.08 | | | $ | 9.53 | |
|
|
Total Return(3) | | | 2.75 | % | | | 4.09 | % | | | 2.17 | % | | | 10.25 | % | | | 6.07 | % |
|
|
Net Assets, End of Year (millions) | | | $104 | | | | $220 | | | | $231 | | | | $130 | | | | $147 | |
|
|
Ratios to Average Net Assets: | | | | | | | | | | | | | | | | | | | | |
Gross expenses | | | 0.59 | % | | | 0.59 | % | | | 0.57 | % | | | 0.58 | % | | | 0.60 | % |
Net expenses | | | 0.59 | | | | 0.57 | (4) | | | 0.57 | | | | 0.58 | | | | 0.60 | |
Net investment income | | | 3.97 | | | | 3.70 | | | | 3.54 | | | | 4.25 | | | | 4.94 | |
|
|
Portfolio Turnover Rate | | | 141 | %(5) | | | 138 | %(5) | | | 148 | %(5) | | | 280 | % | | | 447 | % |
|
|
| (1) | | Per share amounts have been calculated using the average shares method. |
| (2) | | Amount represents less than $0.01 per share. |
| (3) | | Performance figures may reflect voluntary fee waivers and/or expense reimbursements. Past performance is no guarantee of future results. In the absence of voluntary fee waivers and/or expense reimbursements, the total return would have been lower. |
| (4) | | The investment manager voluntarily waived a portion of its fees. |
| (5) | | Excluding mortgage dollar roll transactions. If mortgage dollar roll transactions had been included the portfolio turnover rate would have been 315%, 292% and 328% for the years ended December 31, 2005, 2004 and 2003, respectively. |
See Notes to Financial Statements.
Smith Barney Government Securities Fund 2005 Annual Report 21
Notes to Financial Statements
| 1. | Organization and Significant Accounting Policies |
The Smith Barney Government Securities Fund (the “Fund”) is a separate diversified series of the Smith Barney Investment Funds Inc. (“Company”). The Company, a Maryland corporation, is registered under the Investment Company Act of 1940, as amended (“1940 Act”), as an open-end management investment company.
The following are significant accounting policies consistently followed by the Fund and are in conformity with U.S. generally accepted accounting principles (“GAAP”). Estimates and assumptions are required to be made regarding assets, liabilities and changes in net assets resulting from operations when financial statements are prepared. Changes in the economic environment, financial markets and any other parameters used in determining these estimates could cause actual results to differ.
(a) Investment Valuation. Securities are valued at the mean of bid and asked prices based on market quotations for those securities, or if no quotations are available, then for securities of similar type, yield and maturity. Securities for which market quotations are not readily available or where market quotations are determined not to reflect fair value, will be valued in good faith by or under the direction of the Fund’s Board of Directors. Short-term obligations with maturities of 60 days or less are valued at amortized cost, which approximates market value.
(b) Repurchase Agreements. When entering into repurchase agreements, it is the Fund’s policy that its custodian or a third party custodian take possession of the underlying collateral securities, the market value of which at least equals the principal amount of the repurchase transaction, including accrued interest. To the extent that any repurchase transaction exceeds one business day, the value of the collateral is marked-to-market to ensure the adequacy of the collateral. If the seller defaults, and the market value of the collateral declines or if bankruptcy proceedings are commenced with respect to the seller of the security, realization of the collateral by the Fund may be delayed or limited.
(c) Financial Futures Contracts. The Fund may enter into financial futures contracts typically to hedge a portion of the portfolio. Upon entering into a financial futures contract, the Fund is required to deposit cash or securities as initial margin. Additional securities are also segregated up to the current market value of the financial futures contracts. Subsequent payments, known as variation margin, are made or received by the Fund each day, depending on the daily fluctuation in the value of the underlying financial instruments. The Fund recognizes an unrealized gain or loss equal to the daily variation margin. When the financial futures contracts are closed, a realized gain or loss is recognized equal to the difference between the proceeds from (or cost of) the closing transactions and the Fund’s basis in the contracts.
The risks associated with entering into financial futures contracts include the possibility that a change in the value of the contract may not correlate with the changes in the value of the underlying instruments. In addition, investing in financial futures contracts involves the risk that the Fund could lose more than the original margin deposit and subsequent payments required for a futures transaction. Risks may also arise upon entering into these contracts from the potential inability of the counterparties to meet the terms of their contracts.
22 Smith Barney Government Securities Fund 2005 Annual Report
Notes to Financial Statements (continued)
(d) Written Options. When the Fund writes an option, an amount equal to the premium received by the Fund is recorded as a liability, the value of which is marked-to-market daily to reflect the current market value of the option written. If the option expires, the Fund realizes a gain from investments equal to the amount of the premium received. When a written call option is exercised, the difference between the premium and the amount for effecting a closing purchase transaction, including brokerage commission, is also treated as a realized gain or loss. When a written put option is exercised, the amount of the premium received reduces the cost of the security purchased by the Fund.
A risk in writing a covered call option is that the Fund may forego the opportunity of profit if the market price of the underlying security increases and the option is exercised. The risk in writing a put option is that the Fund may incur a loss if the market price of the underlying security decreases and the option is exercised. The risk in writing a call option is that the Fund is exposed to the risk of loss if the market price of the underlying security increases. In addition, there is the risk that the Fund may not be able to enter into a closing transaction because of an illiquid secondary market.
(e) Securities Traded on a To-Be-Announced Basis. The Fund may trade securities on a to-be-announced (“TBA”) basis. In a TBA transaction, the Fund commits to purchasing or selling securities which have not yet been issued by the issuer and for which specific information is not known, such as the face amount and maturity date and the underlying pool of investments in U.S. government agency mortgage pass-through transactions. Securities purchased on a TBA basis are not settled until they are delivered to the Fund, normally 15 to 45 days later. Beginning on the date the Fund enters into a TBA transaction, cash, U.S. government securities or other liquid high-grade debt obligations are segregated in an amount equal in value to the purchase price of the TBA security. These transactions are subject to market fluctuations and their current value is determined in the same manner as for other securities.
(f) Mortgage Dollar Rolls. The Fund enters into dollar rolls in which the Fund sells mortgage-backed securities for delivery in the current month and simultaneously contracts to repurchase substantially similar (same type, coupon and maturity) securities to settle on a specified future date. During the roll period, the Fund forgoes principal and interest paid on the securities. The Fund is compensated by a fee paid by the counterparty, often in the form of a drop in the repurchase price of the securities. Dollar rolls are accounted for as financing arrangements; the fee is accrued into interest income ratably over the term of the dollar roll and any gain or loss on the roll is deferred and realized upon disposition of the rolled security.
The risk of entering into a mortgage dollar roll is that the market value of the securities the Fund is obligated to repurchase under the agreement may decline below the repurchase price. In the event the buyer of securities under a mortgage dollar roll files for bankruptcy or becomes insolvent, the Fund’s use of proceeds of the dollar roll may be restricted pending a determination by the other party, or its trustee or receiver, whether to enforce the Fund’s obligation to repurchase the securities.
Smith Barney Government Securities Fund 2005 Annual Report 23
Notes to Financial Statements (continued)
(g) Stripped Securities. The Fund invests in “Stripped Securities,” a term used collectively for stripped fixed income securities. Stripped securities can be principal only securities (“PO”), which are debt obligations that have been stripped of unmatured interest coupons or interest only securities (“IO”), which are unmatured interest coupons that have been stripped from debt obligations. Stripped Securities do not make periodic payments of interest prior to maturity. As is the case with all securities, the market value of Stripped Securities will fluctuate in response to changes in economic conditions, interest rates and the market’s perception of the securities. However, fluctuations in response to interest rates may be greater in Stripped Securities than for debt obligations of comparable maturities that pay interest currently. The amount of fluctuation increases with a longer period of maturity.
The yield to maturity on IO’s is sensitive to the rate of principal repayments (including prepayments) on the related underlying debt obligation and principal payments may have a material effect on yield to maturity. If the underlying debt obligation experiences greater than anticipated prepayments of principal, the Fund may not fully recoup its initial investment in IO’s.
(h) Security Transactions and Investment Income. Security transactions are accounted for on a trade date basis. Interest income, adjusted for amortization of premium and accretion of discount, is recorded on the accrual basis. Dividend income is recorded on the ex-dividend date. The cost of investments sold is determined by use of the specific identification method. To the extent any issuer defaults on an expected interest payment, the Fund’s policy is to generally halt any additional interest income accruals and consider the realizability of interest accrued up to the date of default.
(i) Distributions to Shareholders. Distributions from net investment income for the Fund, if any, are declared and paid on a monthly basis. Distributions of net realized gains, if any, are declared at least annually. Distributions are recorded on the ex-dividend date and are determined in accordance with income tax regulations, which may differ from GAAP.
(j) Class Accounting. Investment income, common expenses and realized/unrealized gain (loss) on investments are allocated to the various classes of the Fund on the basis of daily net assets of each class. Fees relating to a specific class are charged directly to that class.
(k) Federal and Other Taxes. It is the Fund’s policy to comply with the federal income and excise tax requirements of the Internal Revenue Code of 1986, as amended, applicable to regulated investment companies. Accordingly, the Fund intends to distribute substantially all of its income and net realized gains on investments, if any, to shareholders each year. Therefore, no federal income tax provision is required in the Fund’s financial statements.
(l) Reclassification. GAAP requires that certain components of net assets be adjusted to reflect permanent differences between financial and tax reporting. These reclassifications have no effect on net assets or net asset values per share.
During the current year, the following reclassifications have been made:
| | | | | | | |
| | |
| | | Undistributed Net
Investment
Income | | Accumulated Net
Realized Loss | |
(a) | | $ | 1,185,485 | | $ | (1,185,485 | ) |
|
|
| (a) | | Reclassifications are primarily due to income from mortgage backed securities treated as capital gains for tax purposes. |
24 Smith Barney Government Securities Fund 2005 Annual Report
Notes to Financial Statements (continued)
| 2. | Management Agreement and Other Transactions with Affiliates |
On December 1, 2005, Citigroup Inc. (“Citigroup”) completed the sale of substantially all of its asset management business, Citigroup Asset Management (“CAM”), to Legg Mason, Inc. (“Legg Mason”). As a result, the Fund’s investment adviser, Smith Barney Fund Management LLC (“SBFM” or the “Manager”), previously an indirect wholly-owned subsidiary of Citigroup, has become a wholly-owned subsidiary of Legg Mason. Completion of the sale caused the Fund’s existing investment advisory and administrative contracts to terminate. The Fund’s shareholders approved a new investment management contract (the “Management Agreement”) between the Fund and the Manager, which became effective on December 1, 2005.
Legg Mason, whose principal executive offices are in Baltimore, Maryland, is a financial services holding company.
Prior to the transaction, the Fund paid SBFM an investment advisory fee, which was calculated daily and paid monthly at the annual rate of the Fund’s average daily net assets as follows:
| | | |
| |
| Average Daily Net Assets | | Annual Rate | |
First $2 billion | | 0.35 | % |
Next $2 billion | | 0.30 | % |
Next $2 billion | | 0.25 | % |
Next $2 billion | | 0.20 | % |
Over $8 billion | | 0.15 | % |
|
|
Prior to the transaction, SBFM also acted as the Fund’s administrator for which the Fund paid a fee calculated at an annual rate of 0.20% of the Fund’s average daily net assets. These fees were calculated daily and paid monthly.
Under the new Management Agreement, the Fund pays the Manager a management fee for advisory and administrative services calculated daily and paid monthly at the annual rate of the Fund’s average daily net assets as follows:
| | | |
| |
| Average Daily Net Assets | | Annual Rate | |
First $2 billion | | 0.55 | % |
Next $2 billion | | 0.50 | % |
Next $2 billion | | 0.45 | % |
Next $2 billion | | 0.40 | % |
Over $8 billion | | 0.35 | % |
|
|
The Fund’s Board has approved PFPC Inc. (“PFPC”) to serve as transfer agent for the Fund, effective January 1, 2006. The principal business office of PFPC is located at 4400 Computer Drive, Westborough, MA 01581 . During the period covered by this report, Citicorp Trust Bank, fsb. (“CTB”), a subsidiary of Citigroup, acted as the Fund’s transfer agent. PFPC and Primerica Shareholder Services (“PSS”) acted as the Fund’s sub-transfer agents. CTB received account fees and asset-based fees that varied according to the size
Smith Barney Government Securities Fund 2005 Annual Report 25
Notes to Financial Statements (continued)
and type of account. PFPC was responsible for shareholder recordkeeping and financial processing for all shareholder accounts, except PSS was responsible for shareholder recordkeeping and financial processing for all PFS Investments Inc. (“PFS”) shareholder accounts and was paid by CTB. For the period ended December 31, 2005, the Fund paid transfer agent fees of $506,081 to CTB. In addition, for the period ended December 31, 2005, the Fund also paid $25,798 to other Citigroup affiliates, including PSS, for shareholder recordkeeping services.
The Fund’s Board has appointed the Fund’s current distributors, Citigroup Global Markets Inc. (“CGM”) and PFS, and Legg Mason Investor Services, LLC (“LMIS”), a wholly-owned broker-dealer subsidiary of Legg Mason, as co-distributors of the Fund. The Fund’s Board has also approved an amended and restated Rule 12b-1 Plan (a “Rule 12b-1 Plan”). CGM and other broker-dealers, financial intermediaries and financial institutions (each called a “Service Agent”) that currently offer Fund shares will continue to make the Fund’s shares available to their clients. Additional Service Agents may offer Fund shares in the future.
There are maximum sales charges of 6.75% and 4.50% for Class 1 and A shares, respectively. There is a contingent deferred sales charge (“CDSC”) of 4.50% on Class B shares, which applies if redemption occurs within one year from purchase payment. This CDSC declines by 0.50% the first year after purchase payment and thereafter by 1.00% per year until no CDSC is incurred. Class C shares have a 1.00% CDSC, which applies if redemption occurs within one year from purchase payment. In certain cases, Class A shares have a 1.00% CDSC, which applies if redemption occurs within one year from purchase payment. This CDSC only applies to those purchases of Class A shares which, when combined with current holdings of Class A shares, equal or exceed $500,000 in the aggregate. These purchases do not incur an initial sales charge.
For the period ended December 31, 2005, CGM, its affiliates (including PFS) and LMIS received sales charges of approximately $67,000 and $725,000 on sales of the Fund’s Class 1 and Class A shares, respectively. In addition, for the period ended December 31, 2005, CDSCs paid to CGM, its affiliates (including PFS) and LMIS were approximately:
| | | | | | | | | | |
| | | |
| | | Class A | | | Class B | | Class C |
CDSCs | | $ | 0 | * | | $ | 78,000 | | $ | 1,000 |
|
| * | | Amount represents less than $1,000. |
Certain officers and one Director of the Company are employees of Legg Mason or its affiliates and do not receive compensation from the Company.
26 Smith Barney Government Securities Fund 2005 Annual Report
Notes to Financial Statements (continued)
During the year ended December 31, 2005, the aggregate cost of purchases and proceeds from sales of investments (excluding short-term investments, mortgage dollar rolls and proceeds from paydowns) were as follows:
| | | | | | |
| | |
| | | Investments | | U.S. Government &
Agency Obligations |
Purchases | | $ | 41,591,547 | | $ | 938,015,940 |
|
Sales | | | 75,058,683 | | | 1,007,297,577 |
|
At December 31, 2005, the aggregate gross unrealized appreciation and depreciation of investments for federal income tax purposes were as follows:
| | | | |
Gross unrealized appreciation | | $ | 4,732,624 | |
Gross unrealized depreciation | | | (7,216,295 | ) |
|
|
Net unrealized depreciation | | $ | (2,483,671 | ) |
|
|
At December 31, 2005, the Fund had the following open futures contracts:
| | | | | | | | | | | | | |
| | | | | |
| Contracts to Buy: | | Number of
Contracts | | Expiration
Date | | Basis Value | | Market
Value | | Unrealized
Gain |
U.S. Treasury 20-year 6% Bonds | | 38 | | 3/06 | | $ | 4,278,807 | | $ | 4,339,125 | | $ | 60,318 |
|
During the year ended December 31, 2005, written options transactions for the Fund were as follows:
| | | | | | | |
| | |
| | | Number of Contracts | | | Premiums
Received | |
Options written, outstanding at December 31, 2004 | | — | | | | — | |
Options written | | 90 | | | $ | 80,516 | |
Options closed | | (90 | ) | | | (80,516 | ) |
Options exercised | | — | | | | — | |
Options expired | | — | | | | — | |
|
|
Options written, outstanding at December 31, 2005 | | — | | | $ | — | |
|
|
During the year ended December 31, 2005, the Fund entered into mortgage dollar roll transactions in the aggregate amount of $1,200,249,180.
For the year ended December 31, 2005, the Fund recorded interest income of $2,130,237 related to such transactions.
At December 31, 2005, the Fund had outstanding mortgage dollar rolls with a total cost of $93,866,016.
Smith Barney Government Securities Fund 2005 Annual Report 27
Notes to Financial Statements (continued)
| 4. | Class Specific Expenses |
Pursuant to the Rule 12b-1 Plan, the Fund pays a service fee with respect to its Class A, B and C shares calculated at the annual rate of 0.25% of the average daily net assets of each respective class. The Fund also pays a distribution fee with respect to its Class B and C shares calculated at the annual rate of 0.50% and 0.45% of the average daily net assets of each class, respectively. For the year ended December 31, 2005, total distribution fees, which are accrued daily and paid monthly, were as follows:
| | | | | | | | | |
| | | |
| | | Class A | | Class B | | Class C |
Distribution Fees | | $ | 877,476 | | $ | 722,124 | | $ | 109,478 |
|
For the year ended December 31, 2005, total transfer agent fees were as follows:
| | | | | | | | | | | | | | | |
| | | | | |
| | | Class 1 | | Class A | | Class B | | Class C | | Class Y |
Transfer Agent Fees | | $ | 222,859 | | $ | 477,292 | | $ | 169,110 | | $ | 21,821 | | $ | 172 |
|
For the year ended December 31, 2005, total shareholder reports expenses were as follows:
| | | | | | | | | | | | | | | |
| | | | | |
| | | Class 1 | | Class A | | Class B | | Class C | | Class Y |
Shareholder Reports Expenses | | $ | 28,739 | | $ | 78,948 | | $ | 35,555 | | $ | 3,392 | | $ | 151 |
|
| 5. | Distributions to Shareholders by Class |
| | | | | | |
| | |
| | | Year Ended
December 31, 2005 | | Year Ended
December 31, 2004 |
Net Investment Income | | | | | | |
Class 1 | | $ | 3,408,433 | | $ | 3,864,627 |
Class A | | | 12,842,270 | | | 13,630,128 |
Class B | | | 2,979,795 | | | 3,527,399 |
Class C(1) | | | 494,560 | | | 649,228 |
Class Y | | | 5,970,247 | | | 8,878,271 |
|
Total | | $ | 25,695,305 | | $ | 30,549,653 |
|
Return of Capital | | | | | | |
Class 1 | | $ | — | | $ | 38,991 |
Class A | | | — | | | 137,657 |
Class B | | | — | | | 35,574 |
Class C(1) | | | — | | | 6,526 |
Class Y | | | — | | | 89,746 |
|
Total | | $ | — | | $ | 308,494 |
|
| (1) | | On April 29, 2004, Class L shares were renamed as Class C shares. |
28 Smith Barney Government Securities Fund 2005 Annual Report
Notes to Financial Statements (continued)
At December 31, 2005, the Company had 10 billion shares of capital stock authorized with a par value of $0.001 per share. The Fund has the ability to issue multiple classes of shares. Each share of a class represents an identical interest in the Fund and has the same rights, except that each class bears certain direct expenses, including those specifically related to the distribution of its shares.
Transactions in shares of each class were as follows:
| | | | | | | | | | | | | | |
| | |
| | | Year Ended
December 31, 2005
| | | Year Ended
December 31, 2004
| |
| | | Shares | | | Amount | | | Shares | | | Amount | |
Class 1 | | | | | | | | | | | | | | |
Shares sold | | 230,609 | | | $ | 2,265,126 | | | 321,233 | | | $ | 3,171,578 | |
Shares issued on reinvestment | | 346,994 | | | | 3,408,432 | | | 396,096 | | | | 3,903,676 | |
Shares repurchased | | (1,628,379 | ) | | | (16,001,565 | ) | | (1,992,235 | ) | | | (19,661,696 | ) |
|
|
Net Decrease | | (1,050,776 | ) | | $ | (10,328,007 | ) | | (1,274,906 | ) | | $ | (12,586,442 | ) |
|
|
Class A | | | | | | | | | | | | | | |
Shares sold | | 4,879,480 | | | $ | 47,963,361 | | | 5,258,738 | | | $ | 51,889,739 | |
Shares issued on reinvestment | | 1,041,506 | | | | 10,217,752 | | | 1,097,329 | | | | 10,805,053 | |
Shares repurchased | | (7,379,357 | ) | | | (72,449,453 | ) | | (8,361,745 | ) | | | (82,335,412 | ) |
|
|
Net Decrease | | (1,458,371 | ) | | $ | (14,268,340 | ) | | (2,005,678 | ) | | $ | (19,640,620 | ) |
|
|
Class B | | | | | | | | | | | | | | |
Shares sold | | 1,044,174 | | | $ | 10,272,493 | | | 1,397,726 | | | $ | 13,785,316 | |
Shares issued on reinvestment | | 266,231 | | | | 2,614,511 | | | 311,422 | | | | 3,069,324 | |
Shares repurchased | | (2,599,846 | ) | | | (25,544,949 | ) | | (3,650,226 | ) | | | (35,966,404 | ) |
|
|
Net Decrease | | (1,289,441 | ) | | $ | (12,657,945 | ) | | (1,941,078 | ) | | $ | (19,111,764 | ) |
|
|
Class C(1) | | | | | | | | | | | | | | |
Shares sold | | 161,216 | | | $ | 1,584,061 | | | 148,983 | | | $ | 1,474,075 | |
Shares issued on reinvestment | | 36,272 | | | | 355,972 | | | 48,865 | | | | 481,257 | |
Shares repurchased | | (537,020 | ) | | | (5,269,679 | ) | | (935,056 | ) | | | (9,235,069 | ) |
|
|
Net Decrease | | (339,532 | ) | | $ | (3,329,646 | ) | | (737,208 | ) | | $ | (7,279,737 | ) |
|
|
Class Y | | | | | | | | | | | | | | |
Shares sold | | 1,715,040 | | | $ | 16,936,173 | | | 2,046,650 | | | $ | 20,185,288 | |
Shares issued on reinvestment | | 411,490 | | | | 4,042,587 | | | 401,761 | | | | 3,959,821 | |
Shares repurchased | | (13,697,670 | ) | | | (135,461,536 | ) | | (3,524,368 | ) | | | (34,760,507 | ) |
|
|
Net Decrease | | (11,571,140 | ) | | $ | (114,482,776 | ) | | (1,075,957 | ) | | $ | (10,615,398 | ) |
|
|
| (1) | | On April 29, 2004, Class L shares were renamed as Class C shares. |
Smith Barney Government Securities Fund 2005 Annual Report 29
Notes to Financial Statements (continued)
| 7. | Income Tax Information and Distributions to Shareholders |
Subsequent to the fiscal year end, the Fund has made the following distributions:
| | | | | | | | | | |
| | | | | |
Record Date
Payable Date | | Class 1 | | Class A | | Class B | | Class C | | Class Y |
Daily 1/31/2006 | | $0.0344 | | $0.0334 | | $0.0286 | | $0.0296 | | $0.0368 |
|
The tax character of distributions paid during the fiscal years ended December 31, were as follows:
| | | | |
| | |
| | | 2005 | | 2004 |
Distributions paid from: | | | | |
Ordinary income | | $25,695,305 | | $30,549,653 |
|
Tax Return of Capital | | — | | 308,494 |
|
Total Distributions Paid | | $25,695,305 | | $30,858,147 |
|
As of December 31, 2005, the components of accumulated losses on a tax basis were as follows:
| | | | |
Undistributed ordinary income — net | | $ | 985,662 | |
Capital loss carryforward (*) | | | (73,939,965 | ) |
Other book/tax temporary differences (a) | | | (2,793,535 | ) |
Unrealized depreciation (b) | | | (2,423,353 | ) |
|
|
Total accumulated losses — net | | $ | (78,171,191 | ) |
|
|
| (*) | | As of December 31, 2005, the Fund had the following net capital loss carryforward remaining: |
| | | | |
Year of Expiration
| | Amount
| |
12/31/2006 | | $ | (2,822,382 | ) |
12/31/2007 | | | (48,857,876 | ) |
12/31/2008 | | | (16,358,450 | ) |
12/31/2012 | | | (2,474,230 | ) |
12/31/2013 | | | (3,427,027 | ) |
| | |
|
|
|
| | | $ | (73,939,965 | ) |
| | |
|
|
|
| | | These amounts will be available to offset any future taxable capital gains. |
| (a) | | Other book/tax temporary differences are attributable primarily to the tax deferral of losses on straddles, the realization for tax purposes of unrealized gains on certain futures contracts and the deferral of post-October capital losses for tax purposes. |
| (b) | | The difference between book-basis and tax-basis unrealized depreciation is attributable primarily to the tax deferral of losses on wash sales. |
30 Smith Barney Government Securities Fund 2005 Annual Report
Notes to Financial Statements (continued)
On May 31, 2005, the U.S. Securities and Exchange Commission (“SEC”) issued an order in connection with the settlement of an administrative proceeding against SBFM and CGM relating to the appointment of an affiliated transfer agent for the Smith Barney family of mutual funds (the “Funds”).
The SEC order finds that SBFM and CGM willfully violated Section 206(1) of the Investment Advisers Act of 1940 (“Advisers Act”). Specifically, the order finds that SBFM and CGM knowingly or recklessly failed to disclose to the boards of the Funds in 1999 when proposing a new transfer agent arrangement with an affiliated transfer agent that: First Data Investors Services Group (“First Data”), the Funds’ then-existing transfer agent, had offered to continue as transfer agent and do the same work for substantially less money than before; and that CAM, the Citigroup business unit that, at the time, included the Fund’s investment manager and other investment advisory companies, had entered into a side letter with First Data under which CAM agreed to recommend the appointment of First Data as sub-transfer agent to the affiliated transfer agent in exchange for, among other things, a guarantee by First Data of specified amounts of asset management and investment banking fees to CAM and CGM. The order also finds that SBFM and CGM willfully violated Section 206(2) of the Advisers Act by virtue of the omissions discussed above and other misrepresentations and omissions in the materials provided to the Funds’ boards, including the failure to make clear that the affiliated transfer agent would earn a high profit for performing limited functions while First Data continued to perform almost all of the transfer agent functions, and the suggestion that the proposed arrangement was in the Funds’ best interests and that no viable alternatives existed. SBFM and CGM do not admit or deny any wrongdoing or liability. The settlement does not establish wrongdoing or liability for purposes of any other proceeding.
The SEC censured SBFM and CGM and ordered them to cease and desist from violations of Sections 206(1) and 206(2) of the Advisers Act. The order requires Citigroup to pay $208.1 million, including $109 million in disgorgement of profits, $19.1 million in interest, and a civil money penalty of $80 million. Approximately $24.4 million has already been paid to the Funds, primarily through fee waivers. The remaining $183.7 million, including the penalty, has been paid to the U.S. Treasury and will be distributed pursuant to a plan prepared and submitted for approval by the SEC. The order also requires that transfer agency fees received from the Funds since December 1, 2004 less certain expenses be placed in escrow and provides that a portion of such fees may be subsequently distributed in accordance with the terms of the order.
The order required SBFM to recommend a new transfer agent contract to the Fund boards within 180 days of the entry of the order; if a Citigroup affiliate submitted a proposal to serve as transfer agent or sub-transfer agent, SBFM and CGM would have been required, at their expense, to engage an independent monitor to oversee a competitive bidding process. On November 21, 2005, and within the specified timeframe, the Fund’s Board selected a new transfer agent for the Fund. No Citigroup affiliate submitted a proposal to serve as transfer agent. Under the order, SBFM also must comply with an amended version of a vendor policy that Citigroup instituted in August 2004.
Smith Barney Government Securities Fund 2005 Annual Report 31
Notes to Financial Statements (continued)
At this time, there is no certainty as to how the proceeds of the settlement will be distributed, to whom such distributions will be made, the methodology by which such distributions will be allocated, and when such distributions will be made. Although there can be no assurance, SBFM does not believe that this matter will have a material adverse effect on the Funds.
On December 1, 2005, Citigroup completed the sale of substantially all of its global asset management business, including SBFM, to Legg Mason.
Beginning in August 2005, five class action lawsuits alleging violations of federal securities laws and state law were filed against CGM and SBFM, (collectively, the “Defendants”) based on the May 31, 2005 settlement order issued against the Defendants by the SEC described in Note 8. The complaints seek injunctive relief and compensatory and punitive damages, removal of SBFM as the investment manager for the Smith Barney family of funds, rescission of the Funds’ management and other contracts with SBFM, recovery of all fees paid to SBFM pursuant to such contracts, and an award of attorneys’ fees and litigation expenses.
On October 5, 2005, a motion to consolidate the five actions and any subsequently-filed, related action was filed. That motion contemplates that a consolidated amended complaint alleging substantially similar causes of action will be filed in the future.
As of the date of this report, SBFM believes that resolution of the pending lawsuit will not have a material effect on the financial position or results of operations of the Funds or the ability of SBFM and its affiliates to continue to render services to the Funds under their respective contracts.
* * *
Beginning in June 2004, class action lawsuits alleging violations of the federal securities laws were filed against CGM and a number of its affiliates, including SBFM and Salomon Brothers Asset Management Inc (“SBAM”) (collectively, the “Advisers”), substantially all of the mutual funds managed by the Advisers, including the Fund (the “Funds”), and directors or trustees of the Funds (collectively, the “Defendants”). The complaints alleged, among other things, that CGM created various undisclosed incentives for its brokers to sell Smith Barney and Salomon Brothers funds. In addition, according to the complaints, the Advisers caused the Funds to pay excessive brokerage commissions to CGM for steering clients towards proprietary funds. The complaints also alleged that the Defendants breached their fiduciary duty to the Funds by improperly charging Rule 12b-1 fees and by drawing on Fund assets to make undisclosed payments of soft dollars and excessive brokerage commissions. The complaints also alleged that the Funds failed to adequately disclose certain aspects of the allegedly wrongful conduct. The complaints sought injunctive relief and compensatory and punitive damages, rescission of the Funds’ contracts with the Advisers, recovery of all fees paid to the Advisers pursuant to such contracts and an award of attorneys’ fees and litigation expenses.
32 Smith Barney Government Securities Fund 2005 Annual Report
Notes to Financial Statements (continued)
On December 15, 2004, a consolidated amended complaint (the “Complaint”) was filed alleging substantially similar causes of action. While the lawsuit is in its earliest stages, to the extent that the Complaint purports to state causes of action against the Funds, SBFM believes the Funds have significant defenses to such allegations, which the Funds intend to vigorously assert in responding to the Complaint.
Additional lawsuits arising out of these circumstances and presenting similar allegations and requests for relief may be filed against the Defendants in the future.
As of the date of this report, SBFM and the Funds believe that the resolution of the pending lawsuit will not have a material effect on the financial position or results of operations of the Funds or the ability of the Advisers and their affiliates to continue to render services to the Funds under their respective contracts.
The Defendants have moved to dismiss the Complaint. Those motions are pending before the court.
On September 16, 2005, the staff of the SEC informed SBFM and SBAM that the staff is considering recommending that the SEC institute administrative proceedings against SBFM and SBAM for alleged violations of Section 19(a) and 34(b) of the 1940 Act (and related Rule 19a-1). The notification is a result of an industry wide inspection by the SEC and is based upon alleged deficiencies in disclosures regarding dividends and distributions paid to shareholders of certain funds. Section 19(a) and related Rule 19a-1 of the 1940 Act generally require funds that are making dividend and distribution payments to provide shareholders with a written statement disclosing the source of the dividends and distributions, and, in particular, the portion of the payments made from each of net investment income, undistributed net profits and/or paid-in capital. In connection with the contemplated proceedings, the staff may seek a cease and desist order and/or monetary damages from SBFM or SBAM.
Although there can be no assurance, SBFM believes that this matter is not likely to have a material adverse effect on the Fund or SBFM’s ability to perform investment management services relating to the Fund.
Smith Barney Government Securities Fund 2005 Annual Report 33
Report of Independent Registered Public Accounting Firm
The Shareholders and Board of Directors
Smith Barney Investment Funds Inc.:
We have audited the accompanying statement of assets and liabilities, including the schedule of investments, of Smith Barney Government Securities Fund, a series of Smith Barney Investment Funds Inc., as of December 31, 2005, and the related statement of operations for the year then ended, the statements of changes in net assets for each of the years in the two-year period then ended, and the financial highlights for each of the years in the five-year period then ended. These financial statements and financial highlights are the responsibility of the Fund’s management. Our responsibility is to express an opinion on these financial statements and financial highlights based on our audits.
We conducted our audits in accordance with the standards of the Public Company Accounting Oversight Board (United States). Those standards require that we plan and perform the audit to obtain reasonable assurance about whether the financial statements and financial highlights are free of material misstatement. An audit includes examining, on a test basis, evidence supporting the amounts and disclosures in the financial statements. Our procedures included confirmation of securities owned as of December 31, 2005, by correspondence with the custodian and brokers or by other appropriate auditing procedures. An audit also includes assessing the accounting principles used and significant estimates made by management, as well as evaluating the overall financial statement presentation. We believe that our audits provide a reasonable basis for our opinion.
In our opinion, the financial statements and financial highlights referred to above present fairly, in all material respects, the financial position of Smith Barney Government Securities Fund as of December 31, 2005, and the results of its operations for the year then ended, the changes in its net assets for each of the years in the two-year period then ended, and the financial highlights for each of the years in the five-year period then ended, in conformity with U.S. generally accepted accounting principles.

New York, New York
February 22, 2006
34 Smith Barney Government Securities Fund 2005 Annual Report
Board Approval of Management Agreement (unaudited)
At separate meetings of the Fund’s Board of Directors, the Board considered the re-approval for an annual period of the Fund’s management agreement (the “Agreement”), pursuant to which Smith Barney Fund Management LLC (the “Manager”) provides the Fund with investment advisory and administrative services. The Board members who are not “interested persons” (as defined in the Investment Company Act of 1940, as amended (the “1940 Act”) (the “Independent Directors”)) of the Fund were assisted in their review by Fund counsel and independent legal counsel and met with independent legal counsel in executive sessions separate from representatives of the Manager. The Independent Directors requested and received information from the Manager they deemed reasonably necessary for their review of the Agreement and the Manager’s performance. This information was initially reviewed by a special committee comprised of all of the Independent Directors and then by the full Board. Prior to the Board’s deliberations, Citigroup Inc. (“Citigroup”) had announced an agreement to sell the Manager to Legg Mason, which, subject to certain approvals, was expected to be effective later in the year. Consequently, representatives of Legg Mason Inc. (“Legg Mason”) discussed with the Board Legg Mason’s intentions regarding the preservation and strengthening of the Manager’s business. The Independent Directors also requested and received certain assurances from senior management of Legg Mason regarding the continuation of the Fund’s portfolio management team and of the level of other services provided to the Fund and its shareholders should the sale of the Manager be consummated. At subsequent Board meetings, representatives of Citigroup Asset Management (“CAM”) and Legg Mason made additional presentations to and responded to further questions from the Board regarding Legg Mason’s acquisition of CAM, which includes the Manager. After considering these presentations and reviewing additional written materials provided by CAM and Legg Mason, the Board, including the Independent Directors, approved, subject to shareholder approval, a new Agreement permitting the Manager to continue to provide its services to the Fund after consummation of the sale of the Manager to Legg Mason. (Shareholders approved the new Agreement and the sale of CAM to Legg Mason was consummated as of December 1, 2005.)
In voting to approve the Agreement, the Independent Directors considered whether the approval of the Agreement would be in the best interests of the Fund and its shareholders, an evaluation based on several factors including those discussed below.
Analysis of the Nature, Extent and Quality of the Services provided to the Fund
The Board received a presentation from representatives of the Manager regarding the nature, extent and quality of services provided to the Fund and other funds in the CAM fund complex. In addition, the Independent Directors received and considered other information regarding the services provided to the Fund by the Manager under the Agreement during the past year, including a description of the administrative and other services rendered to the Fund and its shareholders by the Manager. The Board noted information received at regular meetings throughout the year related to the services rendered by the Manager about the management of the Fund’s affairs and the Manager’s role in coordinating the activities of the Fund’s other service providers. The Board’s evaluation
Smith Barney Government Securities Fund 2005 Annual Report 35
Board Approval of Management Agreement (unaudited) (continued)
of the services provided by the Manager took into account the Board’s knowledge and familiarity gained as Board members of funds in the CAM fund complex, including the scope and quality of the Manager’s investment management and other capabilities and the quality of its administrative and other services. The Board observed that the scope of services provided by the Manager had expanded over time as a result of regulatory and other developments, including maintaining and monitoring its own and the Fund’s expanded compliance programs. The Board also considered the Manager’s response to recent regulatory compliance issues affecting the Manager and the CAM fund complex. The Board reviewed information received from the Manager and the Fund’s Chief Compliance Officer regarding the implementation to date of the Fund’s compliance policies and procedures established pursuant to Rule 38a-1 under the 1940 Act.
The Board reviewed the qualifications, backgrounds and responsibilities of the Fund’s senior personnel and the portfolio management team primarily responsible for the day-to-day portfolio management of the Fund. The Board also considered the willingness of the Manager to consider and implement organizational changes to improve investment results and the services provided to the CAM fund complex. The Board noted that the Manager’s Office of the Chief Investment Officer, comprised of the senior officers of the investment teams managing the funds in the CAM complex, participates in reporting to the Board on investment matters. The Board also considered, based on its knowledge of the Manager and its affiliates, the financial resources available to CAM and its parent organization, Citigroup.
The Board also considered the Manager’s brokerage policies and practices, the standards applied in seeking best execution, the Manager’s policies and practices regarding soft dollars, the use of a broker affiliated with the Manager and the existence of quality controls applicable to brokerage allocation procedures. In addition, management also reported to the Board on, among other things, its business plans, recent organizational changes and portfolio manager compensation plan.
The Board concluded that, overall, it was satisfied with the nature, extent and quality of services provided (and expected to be provided) under the Agreement by the Manager.
Fund Performance
The Board received and reviewed performance information for the Fund and for a group of comparable funds (the “Performance Universe”) selected by Lipper Inc. (“Lipper”), an independent provider of investment company data. The Board was provided with a description of the methodology Lipper used to determine the similarity of the Fund with the funds included in the Performance Universe. The Board also was provided with information comparing the Fund’s performance to the Lipper category averages over various time periods. The Board members noted that they had also received and discussed with management information throughout the year at periodic intervals comparing the Fund’s performance against its benchmark indexes. The information comparing the Fund’s performance to that of the Performance Universe, consisting of all retail and
36 Smith Barney Government Securities Fund 2005 Annual Report
Board Approval of Management Agreement (unaudited) (continued)
institutional funds classified as “general U.S. government funds” by Lipper, was for the one-, three-, five- and ten-year periods ended March 31, 2005. The Fund performed better than the median for the one- and three-year periods and, in fact, its performance ranked in the 1st quintile of the Performance Universe for the one-year period ended March 31, 2005. The Board noted that the Fund’s performance for the five-year period was slightly better than the median and that the Fund’s performance for the ten-year period was slightly lower than the median of the funds in the Performance Universe. The Board also reviewed performance information provided by the Manager for periods ended June 2005, which showed the Fund’s performance continued to be competitive compared to the Lipper category average during the second quarter. Based on its review, the Board generally was satisfied with the Fund’s performance.
Management Fees and Expense Ratios
The Board reviewed and considered the contractual management fee (the “Contractual Management Fee”) payable by the Fund to the Manager for investment advisory and administrative services in light of the nature, extent and quality of the management services provided by the Manager.
Additionally, the Board received and considered information comparing the Fund’s Contractual Management Fee and the Fund’s overall expense ratio with those of funds in both the relevant expense group (the “Expense Group”) and a broader group of funds, each selected and provided by Lipper. The Board also reviewed information regarding the fees the Manager charged any of its other U.S. clients investing primarily in an asset class similar to that of the Fund including, where applicable, separate accounts. The Manager reviewed with the Board the significant differences in the scope of services provided to the Fund and to these other clients, noting that the Fund is provided with regulatory compliance and administrative services, office facilities and fund officers (including the Fund’s chief executive, chief financial and chief compliance officers), and that the Manager coordinates and oversees the provision of services to the Fund by other fund service providers. The Board considered the fee comparisons in light of the scope of services required to manage these different types of accounts. The Board received an analysis of complex-wide management fees provided by the Manager, which, among other things, set out a proposed framework of fees based on asset classes.
Management also discussed with the Board the Fund’s distribution arrangements. The Board was provided with information concerning revenues received by and certain expenses incurred by the Fund’s affiliated distributors and how the amounts received by the distributors are expended.
The information comparing the Fund’s Contractual Management Fee as well as its actual total expense ratio to its Expense Group, consisting of 15 retail front-end load funds (including the Fund) classified as “general U.S. government funds” by Lipper, showed that the Fund’s Contractual Management Fee was at the median of management fees paid by the other funds in the Expense Group. The Board noted that the Fund’s actual total expense ratio was lower than the median of total expense ratios of the other funds in the Expense Group.
Smith Barney Government Securities Fund 2005 Annual Report 37
Board Approval of Management Agreement (unaudited) (continued)
Taking all of the above into consideration, the Board determined that the management fee was reasonable in light of the comparative performance and expense information and the nature, extent and quality of the services provided to the Fund under the Agreement.
Manager Profitability
The Board received and considered a profitability analysis of the Manager and its affiliates in providing services to the Fund. The Board also received profitability information with respect to the CAM fund complex as a whole. In addition, the Board received information with respect to the Manager’s allocation methodologies used in preparing this profitability data as well as a report from an outside consultant that had reviewed the Manager’s methodology. The Board also noted the profitability percentage ranges determined by appropriate court cases to be reasonable given the services rendered to investment companies. The Board determined that the Manager’s profitability was not excessive in light of the nature, extent and quality of the services provided to the Fund.
Economies of Scale
The Board received and considered information regarding whether there have been economies of scale with respect to the management of the Fund, whether the Fund has appropriately benefited from any economies of scale, and whether there is potential for realization of any further economies of scale. The Board considered whether economies of scale in the provision of services to the Fund were being passed along to the shareholders. The Board also considered whether alternative management fee structures (such as with additional breakpoints) would be more appropriate or reasonable taking into consideration economies of scale or other efficiencies.
The Board noted that the Fund had not yet reached the specified asset level at which a breakpoint to its Contractual Management Fee would be triggered. The Board noted, however, that the Contractual Management Fee increases the potential for sharing economies of scale with shareholders as the Fund’s assets grow than if no breakpoints were in place. The Board also noted that as the Fund’s assets increase over time, the Fund and its shareholders should realize other economies of scale as certain expenses, such as fixed Fund fees, become a smaller percentage of overall assets. The Board noted that it appeared that the benefits of any economies of scale also would be appropriately shared with shareholders through increased investment in fund management and administration resources.
Other Benefits to the Manager
The Board considered other benefits received by the Manager and its affiliates as a result of the Manager’s relationship with the Fund, including any soft dollar arrangements, receipt of brokerage commissions and the opportunity to offer additional products and services to Fund shareholders.
In light of the costs of providing investment management and other services to the Fund and the Manager’s ongoing commitment to the Fund, the profits and other ancillary benefits that the Manager and its affiliates received were considered reasonable.
38 Smith Barney Government Securities Fund 2005 Annual Report
Board Approval of Management Agreement (unaudited) (continued)
Based on their discussions and considerations, including those described above, the Board members approved the Agreement to continue for another year.
No single factor reviewed by the Board was identified by the Board as the principal factor in determining whether to approve the Agreement.
* * *
Additional Information
On June 23, 2005, Citigroup Inc. (“Citigroup”) entered into a definitive agreement (the “Transaction Agreement”) with Legg Mason, Inc. (“Legg Mason”) under which Citigroup agreed to sell substantially all of its asset management business, Citigroup Asset Management (“CAM”), which includes Smith Barney Fund Management LLC, (the “Manager”), to Legg Mason in exchange for the broker-dealer and investment banking businesses of Legg Mason and certain other considerations (the “Transaction”). The Transaction closed on December 1, 2005.
The consummation of the Transaction resulted in the automatic termination of the Fund’s current management agreement in accordance with the Investment Company Act of 1940, as amended (the “1940 Act”). Prior to the closing of the Transaction, the Fund’s Board approved a new management agreement between the Fund and the Manager (the ”New Management Agreement”) and authorized the Fund’s officers to submit the New Management Agreement to shareholders for their approval.
On July 11, 2005, members of the Board discussed with CAM management and certain Legg Mason representatives the Transaction and Legg Mason’s general plans and intentions regarding CAM’s business and its combination with Legg Mason’s business. The Board members also inquired about the plans for and anticipated roles and responsibilities of certain CAM employees and officers after the Transaction.
At a meeting held on August 1, 2005, the Fund’s Board, including a majority of the Board members who are not “interested persons” of the Fund or the Adviser as defined in the 1940 Act (the “Independent Board Members”), approved the New Management Agreement. To assist the Board in its consideration of the New Management Agreement, Legg Mason provided materials and information about Legg Mason, including its financial condition, asset management capabilities and organization, and CAM provided materials and information about the Transaction between Legg Mason and Citigroup. Representatives of CAM and Legg Mason also made presentations to and responded to questions from the Board. The Independent Board Members, through their independent legal counsel, also requested and received additional information from CAM and Legg Mason in connection with their consideration of the New Management Agreement. The additional information was provided in advance of and at the August meeting. After the presentations and after reviewing the written materials provided, the Independent Board Members met in executive session with their counsel to consider the New Management Agreement. The Independent Board Members also conferred separately and with their counsel about the Transaction on a number of occasions, including in connection with the July and August meetings.
Smith Barney Government Securities Fund 2005 Annual Report 39
Board Approval of Management Agreement (unaudited) (continued)
In their deliberations concerning the New Management Agreement, among other things, the Board Members considered:
(i) the reputation, financial strength and resources of Legg Mason and its investment advisory subsidiaries;
(ii) that, following the Transaction, CAM will be part of an organization focused on the asset management business;
(iii) that Legg Mason is an experienced and respected asset management firm, and that Legg Mason has advised the Board members that (a) it may wish to combine certain CAM operations with those of certain Legg Mason subsidiaries; (b) it is expected that these combination processes will result in changes to portfolio managers or portfolio management teams for a number of the CAM funds, subject to Board oversight and appropriate notice to shareholders, and that, in other cases, the current portfolio managers or portfolio management teams will remain in place; and (c) in the future, it may recommend that Legg Mason subsidiaries be appointed as the adviser or subadviser to some or all of the CAM funds, subject to applicable regulatory requirements;
(iv) that CAM management had advised the Board that a number of portfolio managers and other key CAM personnel would be retained after the closing of the Transaction;
(v) that CAM management and Legg Mason have advised the Board that following the Transaction, there is not expected to be any diminution in the nature, quality and extent of services provided to the Fund and their shareholders by the Manager, including compliance services;
(vi) that under the Transaction Agreement, Citigroup and Legg Mason have agreed not to take any action that is not contemplated by the Transaction or fail to take any action that to their respective knowledge would cause any “undue burden” on Fund shareholders under applicable provisions of the 1940 Act;
(vii) the assurances from Citigroup and Legg Mason that, for a three-year period following the closing of the Transaction, Citigroup-affiliated broker-dealers will continue to offer the Fund as an investment product, and the potential benefits to Fund shareholders from this and other third-party distribution access;
(viii) the potential benefits to Fund shareholders from being part of a combined fund family with Legg Mason-sponsored funds;
(ix) that Citigroup and Legg Mason would derive benefits from the Transaction and that, as a result, they have a financial interest in the matters that were being considered;
(x) the potential effects of regulatory restrictions on the Fund if Citigroup-affiliated broker-dealers remain principal underwriters of the Fund after the closing of the Transaction;
(xi) the fact that the Fund’s total advisory and administrative fees will not increase by virtue of the New Management Agreement, but will remain the same;
40 Smith Barney Government Securities Fund 2005 Annual Report
Board Approval of Management Agreement (unaudited) (continued)
(xii) the terms and conditions of the New Management Agreement, including the differences from the current management agreement, and the benefits of a single, uniform form of agreement covering these services;
(xiii) that the Fund would not bear the costs of obtaining shareholder approval of the New Management Agreement;
(xiv) that the Fund would avail itself of permissions granted under certain licensing arrangements between Citigroup and Legg Mason that would permit the Fund (including any share classes thereof) to maintain its current name, as well as all logos, trademarks and service marks, related to Citigroup or any of its affiliates for some agreed-upon time period after the closing of the Transaction ; and
(xv) that, as discussed in detail above, within the past year the Board had performed a full annual review of the current management agreement as required by the 1940 Act. In that regard, the Board, in its deliberations concerning the New Management Agreement, considered the same factors regarding the nature, quality and extent of services provided, costs of services provided, profitability, fall-out benefits, fees and economies of scale and investment performance as it did when it renewed the current management agreement, and reached substantially the same conclusions.
Smith Barney Government Securities Fund 2005 Annual Report 41
Additional Information (unaudited)
Information about Directors and Officers
The business and affairs of the Smith Barney Government Securities Fund (the “Fund”) are managed under the direction of the Board of Directors of Smith Barney Investment Funds Inc. (the “Company”). Information pertaining to the Directors and certain officers of the Company is set forth below. The Statement of Additional Information includes additional information about the Fund’s Directors and is available, without charge, upon request by calling Shareholder Services at 1-800-451-2010.
| | | | | | | | | | |
| | | | | |
Name, Address
and Birth Year | | Position(s)
Held with
Fund | | Term of
Office* and
Length
of Time
Served | | Principal
Occupation(s) During Past
5 Years | | Number of
Portfolios
in the Fund
Complex
Overseen by Director | | Other Board
Memberships
Held by
Director |
| Non-Interested Directors: | | | | | | |
Paul R. Ades Paul R. Ades, PLLC 181 West Main Street Suite C Babylon, NY 11702 Birth Year: 1940 | | Director | | Since
1994 | | Law Firm of Paul R. Ades, PLLC (from April 2000 to Present) | | 15 | | None |
| | | | | |
Dwight B. Crane Harvard Business School Soldiers Field Baker Library #337 Boston, MA 02163 Birth Year: 1937 | | Director | | Since
1981 | | Professor, Harvard Business School | | 46 | | None |
| | | | | |
Frank G. Hubbard c/o Smith Barney Mutual Funds 125 Broad Street New York, NY 10004 Birth Year: 1937 | | Director | | Since
1993 | | President of Avatar International, Inc. (Business Development) (since 1998) | | 15 | | None |
| | | | | |
Jerome H. Miller c/o Smith Barney Mutual Funds 125 Broad Street New York, NY 10004 Birth Year: 1938 | | Director | | Since
1998 | | Retired | | 15 | | None |
| | | | | |
Ken Miller Young Stuff Apparel Group, Inc. 930 Fifth Avenue Suite 610 New York, NY 10021 Birth Year: 1942 | | Director | | Since
1994 | | President of Young Stuff Apparel Group, Inc. (since 1963) | | 15 | | None |
42 Smith Barney Government Securities Fund 2005 Annual Report
Additional Information (unaudited) (continued)
| | | | | | | | | | |
| | | | | |
Name, Address
and Birth Year | | Position(s)
Held with
Fund | | Term of
Office* and
Length
of Time
Served | | Principal
Occupation(s) During Past 5 Years | | Number of
Portfolios
in the Fund
Complex
Overseen by Director | | Other Board
Memberships
Held by
Director |
| Interested Director: | | | | | | |
R. Jay Gerken, CFA** Citigroup Asset Management (“CAM”) 399 Park Avenue Mezzanine New York, NY 10022 Birth Year: 1951 | | Chairman, President and Chief Executive Officer | | Since
2002 | | Managing Director of CAM; President and Chief Executive Officer of SBFM and Citi Fund Management, Inc. (“CFM”); Chairman, President and Chief Executive Officer of certain mutual funds associated with CAM; Formerly Portfolio Manager of Smith Barney Allocation Series Inc. (from 1996 to 2001) | | 183 | | None |
| | | |
| Officers: | | | | | | |
Andrew B. Shoup CAM 125 Broad Street 11th Floor New York, NY 10004 Birth Year: 1956 | | Senior Vice President and Chief Administrative Officer | | Since
2003 | | Director of CAM; Chief Administrative Officer of mutual funds associated with CAM; Head of International Funds Administration of CAM (from 2001 to 2003); Director of Global Funds to Administration of CAM (from 2000 to 2001) | | N/A | | N/A |
| | | | | |
Kaprel Ozsolak CAM 125 Broad Street 11th Floor New York, NY 10004 Birth Year: 1965 | | Chief Financial Officer and Treasurer | | Since
2004 | | Director of CAM; Chief Financial Officer and Treasurer of certain mutual funds associated with CAM; Controller of certain mutual funds associated with CAM (from 2002 to 2004) | | N/A | | N/A |
| | | | | |
Mark Lindbloom CAM 399 Park Avenue
4th Floor New York, NY 10022 Birth Year: 1956 | | Vice President and Investment Officer | | Since 2002 | | Managing Director of CAM; Investment Officer of SBFM | | N/A | | N/A |
Smith Barney Government Securities Fund 2005 Annual Report 43
Additional Information (unaudited) (continued)
| | | | | | | | | | |
| | | | | |
Name, Address
and Birth Year | | Position(s)
Held with
Fund | | Term of
Office* and
Length
of Time
Served | | Principal
Occupation(s) During Past
5 Years | | Number of
Portfolios
in the Fund
Complex
Overseen by Director | | Other Board
Memberships
Held by
Director |
Francis Mustaro CAM 399 Park Avenue
4th Floor New York, NY 10022 Birth Year: 1950 | | Vice President and Investment Officer | | Since 2002 | | Managing Director of CAM; Investment Officer of SBFM | | N/A | | N/A |
| | | | | |
Ted P. Becker CAM 399 Park Avenue New York, NY 10022 Birth Year: 1951 | | Chief Compliance Officer | | Since 2006 | | Managing Director of Compliance at Legg Mason (since 2005); Chief Compliance Officer with certain mutual funds associated with CAM (since 2006); Managing Director of Compliance at CAM (2002-2005). Prior to 2002, Managing Director - Internal Audit & Risk Review at Citigroup | | N/A | | N/A |
| | | | | |
John Chiota CAM 100 First Stamford Place
5th Floor Stamford, CT 06902 Birth Year: 1968 | | Chief Anti-Money Laundering Compliance Officer | | Since 2006 | | Vice President of CAM (since 2004); Chief Anti-Money Laundering Compliance Officer with certain mutual funds associated with CAM (since 2006); prior to August 2004, Chief AML Compliance Officer with TD Waterhouse | | N/A | | N/A |
| | | | | |
Steven Frank CAM 125 Broad Street
11th Floor New York, NY 10004 Birth Year: 1967 | | Controller | | Since
2005 | | Vice President of CAM (since 2002); Assistant Controller of certain mutual funds associated with CAM (from 2001-2005) | | N/A | | N/A |
| | | | | |
Robert I. Frenkel CAM 300 First Stamford Place 4th Floor Stamford, CT 06902 Birth Year: 1954 | | Secretary and Chief Legal Officer | | Since
2003 | | Managing Director and General Counsel of Global Mutual Funds for CAM and its predecessor (since 1994); Secretary of CFM; Secretary and Chief Legal Officer of certain mutual funds associated with CAM | | N/A | | N/A |
| * | | Each Director and officer serves until his or her successor has been duly elected and qualified. |
| ** | | Mr. Gerken is an “interested person” of the Fund as defined in the Investment Company Act of 1940, as amended, because Mr. Gerken is an officer of SBFM and certain of its affiliates. |
44 Smith Barney Government Securities Fund 2005 Annual Report
Additional Shareholder Information (unaudited)
Results of a Special Meeting of Shareholders
On November 29, 2005, a Special Meeting of Shareholders was held for the following purposes: 1) to elect Directors of Smith Barney Investment Funds Inc. and 2) to approve a new management agreement for Smith Barney Government Securities Fund. The following tables provide the number of votes cast for, withheld or against, as well as the number of abstentions and broker non-votes as to each matter.
1. Election of Directors
| | | | | | |
| Nominees: | | Votes For | | Withheld | | Abstentions |
Paul R. Ades | | 154,295,546.159 | | 5,699,406.286 | | 1,101,216.604 |
Dwight B. Crane | | 154,269,645.182 | | 5,725,307.263 | | 1,101,216.604 |
Frank G. Hubbard | | 154,276,889.022 | | 5,718,063.423 | | 1,101,216.604 |
Jerome H. Miller | | 154,266,400.237 | | 5,728,552.208 | | 1,101,216.604 |
Ken Miller | | 154,326,232.680 | | 5,668,719.765 | | 1,101,216.604 |
R. Jay Gerken | | 154,204,059.413 | | 5,790,893.032 | | 1,101,216.604 |
|
2. Approval of New Management Agreement
| | | | | | | | |
| Item Voted On | | Votes For | | Votes
Against | | Abstentions | | Broker
Non-Votes |
New Management Agreement | | 38,384,518.388 | | 630,251.645 | | 1,625,378.656 | | 494,497.000 |
|
Smith Barney Government Securities Fund 2005 Annual Report 45
Important Tax Information (unaudited)
The following information is provided with respect to the distributions paid during the taxable year ended December 31, 2005:
| | |
Record Date: | | Monthly |
Payable Date: | | Monthly |
|
Interest from Federal Obligations | | 21.46% |
|
The law varies in each state as to whether and what percentage of dividend income attributable to Federal obligations is exempt from state income tax. We recommend that you consult with your tax adviser to determine if any portion of the dividends you received is exempt from state income taxes.
Please retain this information for your records.
46 Smith Barney Government Securities Fund 2005 Annual Report
Smith Barney Government Securities Fund
| | |
DIRECTORS Paul R. Ades Dwight B. Crane R. Jay Gerken, CFA
Chairman Frank G. Hubbard Jerome H. Miller Ken Miller OFFICERS R. Jay Gerken, CFA President and Chief Executive Officer Andrew B. Shoup Senior Vice President and Chief Administrative Officer Kaprel Ozsolak Chief Financial Officer and Treasurer Mark Lindbloom Vice President and Investment Officer Francis Mustaro Vice President and Investment Officer Ted P. Becker Chief Compliance Officer John Chiota Chief Anti-Money Laundering
Compliance Officer | | OFFICERS (continued) Steven Frank Controller Robert I. Frenkel Secretary and
Chief Legal Officer INVESTMENT MANAGER Smith Barney Fund
Management LLC DISTRIBUTORS Citigroup Global Markets Inc. Legg Mason Investor Services, LLC PFS Investments Inc. CUSTODIAN State Street Bank and
Trust Company TRANSFER AGENT PFPC Inc. 4400 Computer Drive Westborough, Massachusetts 01581 INDEPENDENT REGISTERED PUBLIC ACCOUNTING FIRM KPMG LLP 345 Park Avenue New York, New York 10154 |
This report is submitted for the general information of the shareholders of Smith Barney Investment Funds Inc. — Smith Barney Government Securities Fund, but it may also be used as sales literature.
This report must be preceded or accompanied by a free prospectus. Investors should consider the Fund’s investment objectives, risks, charges and expenses carefully before investing. The prospectus contains this and other important information about the Fund. Please read the prospectus carefully before investing.
www.citigroupam.com
©2005 Legg Mason Investor Services, LLC
Member NASD, SIPC
Smith Barney Investment Funds Inc.
Smith Barney
Government Securities Fund
The Fund is a separate series of Smith Barney Investment Funds Inc., a Maryland corporation.
SMITH BARNEY GOVERNMENT SECURITIES FUND
Smith Barney Mutual Funds
125 Broad Street
10th Floor, MF-2
New York, New York 10004
The Fund files its complete schedule of portfolio holdings with the Securities and Exchange Commission for the first and third quarters of each fiscal year on Form N-Q. The Fund’s Forms N-Q are available on the Commission’s website at www.sec.gov. The Fund’s Forms N-Q may be reviewed and copied at the Commission’s Public Reference Room in Washington D.C., and information on the operation of the Public Reference Room may be obtained by calling 1-800-SEC-0330. To obtain information on Form N-Q from the Fund, shareholders can call 1-800-451-2010.
Information on how the Fund voted proxies relating to portfolio securities during the most recent 12-month period ended June 30 and a description of the policies and procedures that the Fund uses to determine how to vote proxies relating to portfolio securities is available (1) without charge, upon request, by calling 1-800-451-2010, (2) on the Fund’s website at www.citigroupam.com and (3) on the SEC’s website at www.sec.gov.
ITEM 2. CODE OF ETHICS.
The registrant has adopted a code of ethics that applies to the registrant’s principal executive officer, principal financial officer, principal accounting officer or controller.
ITEM 3. AUDIT COMMITTEE FINANCIAL EXPERT.
The Board of Directors of the registrant has determined that Jerome H. Miller, a Member of the Board’s Audit Committee, possesses the technical attributes identified in Instruction 2(b) of Item 3 to Form N-CSR to qualify as an “audit committee financial expert,” and has designated Mr. Miller as the Audit Committee’s financial expert. Mr. Miller is an “independent” Director pursuant to paragraph (a)(2) of Item 3 to Form N-CSR.
ITEM 4. PRINCIPAL ACCOUNTANT FEES AND SERVICES.
a) Audit Fees. The aggregate fees billed in the last two fiscal years ending December 31, 2004 and December 31, 2005 (the “Reporting Periods”) for professional services rendered by the Registrant’s principal accountant (the “Auditor”) for the audit of the Registrant’s annual financial statements, or services that are normally provided by the Auditor in connection with the statutory and regulatory filings or engagements for the Reporting Periods, were $55,000 in 2004 and $55,000 in 2005.
b) Audit-Related Fees. There were no fees billed in the Reporting Periods for assurance and related services by the Auditor that are reasonably related to the performance of the audit of the Registrant’s financial statements and are not reported under paragraph (a) of this Item 4.
In addition, there were no Audit-Related Fees billed in the Reporting Period for assurance and related services by the Auditor to the Registrant’s investment adviser (not including any sub-adviser whose role is primarily portfolio management and is subcontracted with or overseen by another investment adviser), and any entity controlling, controlled by or under common control with the investment adviser that provides ongoing services to the Smith Barney Investment Funds Inc. (“service affiliates”), that were reasonably related to the performance of the annual audit of the service affiliates. Accordingly, there were no such fees that required pre-approval by the Audit Committee for the Reporting Periods (prior to May 6, 2003 services provided by the Auditor were not required to be pre-approved).
(c) Tax Fees. The aggregate fees billed in the Reporting Periods for professional services rendered by the Auditor for tax compliance, tax advice and tax planning (“Tax Services”) were $4,700 in 2004 and $4,700 in 2005. These services consisted of (i) review or preparation of U.S. federal, state, local and excise tax returns; (ii) U.S. federal, state and local tax planning, advice and assistance regarding statutory, regulatory or administrative developments, and (iii) tax advice regarding tax qualification matters and/or treatment of various financial instruments held or proposed to be acquired or held.
There were no fees billed for tax services by the Auditors to service affiliates during the Reporting Periods that required pre-approval by the Audit Committee.
d) All Other Fees. There were no other fees billed in the Reporting Periods for products and services provided by the Auditor, other than the services reported in paragraphs (a) through (c) of this Item for the Smith Barney Investment Funds Inc.
All Other Fees. There were no other non-audit services rendered by the Auditor to Smith Barney Fund Management LLC (“SBFM”), and any entity controlling, controlled by or under common control with SBFM that provided ongoing services to Smith Barney Investment Funds Inc. requiring pre-approval by the Audit Committee in the Reporting Period.
(e) Audit Committee’s pre–approval policies and procedures described in paragraph (c) (7) of Rule 2-01 of Regulation S-X.
(1) The Charter for the Audit Committee (the “Committee”) of the Board of each registered investment company (the “Fund”) advised by Smith Barney Fund Management LLC or Salomon Brothers Asset Management Inc. or one of their affiliates (each, an “Adviser”) requires that the Committee shall approve (a) all audit and permissible non-audit services to be provided to the Fund and (b) all permissible non-audit services to be provided by the Fund’s independent auditors to the Adviser and any Covered Service Providers if the engagement relates directly to the operations and financial reporting of the Fund. The Committee may implement policies and procedures by which such services are approved other than by the full Committee.
The Committee shall not approve non-audit services that the Committee believes may impair the independence of the auditors. As of the date of the approval of this Audit Committee Charter, permissible non-audit services include any professional services (including tax services), that are not prohibited services as described below, provided to the Fund by the independent auditors, other than those provided to the Fund in connection with an audit or a review of the financial statements of the Fund. Permissible non-audit services may not include: (i) bookkeeping or other services related to the accounting records or financial statements of the Fund; (ii) financial information systems design and implementation; (iii) appraisal or valuation services, fairness opinions or contribution-in-kind reports; (iv) actuarial services; (v) internal audit outsourcing services; (vi) management functions or human resources; (vii) broker or dealer, investment adviser or investment banking services; (viii) legal services and expert services unrelated to the audit; and (ix) any other service the Public Company Accounting Oversight Board determines, by regulation, is impermissible.
Pre-approval by the Committee of any permissible non-audit services is not required so long as: (i) the aggregate amount of all such permissible non-audit services provided to the Fund, the Adviser and any service providers controlling, controlled by or under common control with the Adviser that provide ongoing services to the Fund (“Covered Service Providers”) constitutes not more than 5% of the total amount of revenues paid to the independent auditors during the fiscal year in which the permissible non-audit services are provided to (a) the Fund, (b) the Adviser and (c) any entity controlling, controlled by or under common control with the Adviser that provides ongoing services to the Fund during the fiscal year in which the services are provided that would have to be approved by the Committee; (ii) the permissible non-audit services were not recognized by the Fund at the time of the engagement to be non-audit services; and (iii) such services are promptly brought to the attention of the Committee and approved by the Committee (or its delegate(s)) prior to the completion of the audit.
(2) For the Smith Barney Investment Funds Inc., the percentage of fees that were approved by the audit committee, with respect to: Audit-Related Fees were 100% and 100% for 2004 and 2005; Tax Fees were 100% and 100% for 2004 and 2005; and Other Fees were 100% and 100% for 2004 and 2005.
(f) N/A
(g) Non-audit fees billed by the Auditor for services rendered to Smith Barney Investment Funds Inc. and CAM and any entity controlling, controlled by, or under common control with CAM that provides ongoing services to Smith Barney Investment Funds Inc. during the reporting period were $0 in 2005 for fees related to the transfer agent matter as fully described in the notes the financial statements titled “additional information” and $75,000 for 2004.
(h) Yes. The Smith Barney Investment Funds Inc.’ Audit Committee has considered whether the provision of non-audit services that were rendered to Service Affiliates which were not pre-approved (not requiring pre-approval) is compatible with maintaining the Accountant’s independence. All services provided by the Auditor to the Smith Barney Investment Funds Inc. or to Service Affiliates, which were required to be pre-approved, were pre-approved as required.
ITEM 5. AUDIT COMMITTEE OF LISTED REGISTRANTS.
Not applicable.
ITEM 6. SCHEDULE OF INVESTMENTS.
Included herein under Item 1.
ITEM 7. DISCLOSURE OF PROXY VOTING POLICIES AND PROCEDURES FOR CLOSED-END MANAGEMENT INVESTMENT COMPANIES.
Not applicable.
ITEM 8. PORTFOLIO MANAGERS OF CLOSED-END MANAGEMENT INVESTMENT COMPANIES.
Not applicable.
ITEM 9. PURCHASES OF EQUITY SECURITIES BY CLOSED-END MANAGEMENT INVESTMENT COMPANY AND AFFILIATED PURCHASERS.
Not applicable.
ITEM 10. SUBMISSION OF MATTERS TO A VOTE OF SECURITY HOLDERS.
Not applicable.
ITEM 11. CONTROLS AND PROCEDURES.
| | (a) | The registrant’s principal executive officer and principal financial officer have concluded that the registrant’s disclosure controls and procedures (as defined in Rule 30a- 3(c) under the Investment Company Act of 1940, as amended (the “1940 Act”)) are effective as of a date within 90 days of the filing date of this report that includes the disclosure required by this paragraph, based on their evaluation of the disclosure controls and procedures required by Rule 30a-3(b) under the 1940 Act and 15d-15(b) under the Securities Exchange Act of 1934. |
| | (b) | There were no changes in the registrant’s internal control over financial reporting (as defined in Rule 30a-3(d) under the 1940 Act) that occurred during the registrant’s last fiscal half-year (the registrant’s second fiscal half-year in the case of an annual report) that have materially affected, or are likely to materially affect the registrant’s internal control over financial reporting. |
ITEM 12. EXHIBITS.
| | (a) | Code of Ethics attached hereto. |
Exhibit 99.CODE ETH
| | |
| Exhibit 99.CERT | | Certifications pursuant to section 302 of the Sarbanes-Oxley Act of 2002 |
| |
| Exhibit 99.906 CERT | | Certifications pursuant to Section 906 of the Sarbanes-Oxley Act of 2002 |
SIGNATURES
Pursuant to the requirements of the Securities Exchange Act of 1934 and the Investment Company Act of 1940, the registrant has duly caused this Report to be signed on its behalf by the undersigned, there unto duly authorized.
| | |
| Smith Barney Investment Funds Inc. |
| |
| By: | | /s/ R. Jay Gerken
|
| | | (R. Jay Gerken) |
| | | Chief Executive Officer of |
| | | Smith Barney Investment Funds Inc. |
| |
| Date: | | March 10, 2006 |
Pursuant to the requirements of the Securities Exchange Act of 1934 and the Investment Company Act of 1940, this report has been signed below by the following persons on behalf of the registrant and in the capacities and on the dates indicated.
| | |
| By: | | /s/ R. Jay Gerken
|
| | | (R. Jay Gerken) |
| | | Chief Executive Officer of |
| | | Smith Barney Investment Funds Inc. |
| |
| Date: | | March 10, 2006 |
| |
| By: | | /s/ Kaprel Ozsolak
|
| | | (Kaprel Ozsolak) |
| | | Chief Financial Officer of |
| | | Smith Barney Investment Funds Inc. |
| |
| Date: | | March 10, 2006 |