UNITED STATES
SECURITIES AND EXCHANGE COMMISSION
Washington, D.C. 20549
FORM N-CSR
CERTIFIED SHAREHOLDER REPORT OF REGISTERED
MANAGEMENT INVESTMENT COMPANIES
Investment Company Act file number 811-3275
Smith Barney Investment Funds Inc.
(Exact name of registrant as specified in charter)
| | |
| 125 Broad Street, New York, NY | | 10004 |
|
| (Address of principal executive offices) | | (Zip code) |
Robert I. Frenkel, Esq.
c/o Citigroup Asset Management
300 First Stamford Place, 4th Floor
Stamford, CT 06902
(Name and address of agent for service)
Registrant’s telephone number, including area code: (800) 451-2010
Date of fiscal year end: September 30
Date of reporting period: September 30, 2005
ITEM 1. REPORT TO STOCKHOLDERS.
The Annual Report to Stockholders is filed herewith.
EXPERIENCE
ANNUAL REPORT
SEPTEMBER 30, 2005


Smith Barney
Real Return Strategy Fund
INVESTMENT PRODUCTS: NOT FDIC INSURED Ÿ NO BANK GUARANTEE Ÿ MAY LOSE VALUE
Smith Barney
Real Return Strategy Fund
Annual Report • September 30, 2005
What’s
Inside
Fund Objective
The Fund seeks capital appreciation and income. The Fund seeks to achieve these objectives by investing substantially all of its net assets in securities of companies related to the energy, metals and mining and real estate industries and in inflation protected securities.
Letter from the Chairman

R. JAY GERKEN, CFA
Chairman, President and Chief Executive Officer
Dear Shareholder,
There was no shortage of potential threats to the U.S. economy during the reporting period. These included record high oil prices, rising short-term interest rates, the devastation inflicted by Hurricanes Katrina and Rita, geopolitical issues and falling consumer confidence. However, the economy proved to be surprisingly resilient during the period. Fourth quarter 2004 and first quarter 2005 gross domestic product (“GDP”)i growth was 3.8% and second quarter GDP growth was 3.3%, another solid advance. This marked nine consecutive quarters when GDP grew at least 3.0%.
The Federal Reserve Board (“Fed”)ii continued to raise interest rates over the period in an attempt to ward off inflation. After raising rates in June, August, September and early November 2004, the Fed increased its target for the federal funds rateiii in 0.25% increments seven additional times. All told, the Fed’s eleven rate hikes have brought the target for the federal funds rate from 1.00% to 3.75%. This also represents the longest sustained Fed tightening cycle since 1977-1979. Following the end of the Fund’s reporting period, at its November meeting, the Fed once again raised the target rate by 0.25% to 4.00%.
During the period from the Fund’s inception on November 12, 2004 through September 30, 2005, the U.S. stock market, as measured by the S&P 500 Index,iv returned 5.42%. Generally positive economic news, relatively benign core inflation, and strong corporate profits supported the market during much of the period. Looking at the reporting period as a whole, mid-cap stocks generated superior returns, with the Russell Midcap,v Russell 1000,vi and Russell 2000vii Indexes returning 15.49%, 7.19%, and 8.51%, respectively. From an investment style perspective, value-oriented stocks significantly outperformed their growth counterparts, with the Russell 3000 Valueviii and Russell 3000 Growthix Indexes returning 9.08% and 5.33%, respectively.
Smith Barney Real Return Strategy Fund 2005 Annual Report 1
During much of the reporting period, the fixed income market confounded investors as short-term interest rates rose in concert with the Fed rate tightenings, while longer-term rates declined. When the period began, the federal funds target rate was 1.75% and the yield on the 10-year U.S. Treasury note was 4.20%. When the reporting period ended, the federal funds rate had risen to 3.75%. Due to a spike in September, the yield on the 10-year U.S. Treasury note stood at 4.29%, slightly higher than when the period began, but still lower than its yield of 4.62% when the Fed began its tightening cycle on June 30, 2004.
Please read on for a more detailed look at prevailing economic and market conditions during the Fund’s fiscal period and to learn how those conditions have affected Fund performance.
Special Shareholder Notice
On June 24, 2005, Citigroup Inc. (“Citigroup”) announced that it has signed a definitive agreement under which Citigroup will sell substantially all of its worldwide asset management business to Legg Mason, Inc. (“Legg Mason”).
As part of this transaction, Smith Barney Fund Management LLC (the “Manager”), currently an indirect wholly-owned subsidiary of Citigroup, would become an indirect wholly-owned subsidiary of Legg Mason. The Manager is the investment manager to the Fund.
The transaction is subject to certain regulatory approvals, as well as other customary conditions to closing. Subject to such approvals and the satisfaction of the other conditions, Citigroup expects the transaction to be completed later this year.
Under the Investment Company Act of 1940, consummation of the transaction will result in the automatic termination of the investment management contract between the Fund and the Manager, and the subadvisory agreements between the Manager and the Fund’s subadvisors. Therefore, the Fund’s Board of Directors has approved a new investment management contract between the Fund and the Manager and new subadvisory agreements between the Manager and the Fund’s subadvisors to become effective
2 Smith Barney Real Return Strategy Fund 2005 Annual Report
upon the closing of the sale to Legg Mason. The new investment management contract and subadvisory agreements have been presented to shareholders for their approval.
Information About Your Fund
As you may be aware, several issues in the mutual fund industry have recently come under the scrutiny of federal and state regulators. The Fund’s Manager and some of its affiliates have received requests for information from various government regulators regarding market timing, late trading, fees, and other mutual fund issues in connection with various investigations. The regulators appear to be examining, among other things, the Fund’s response to market timing and shareholder exchange activity, including compliance with prospectus disclosure related to these subjects. The Fund has been informed that the Manager and its affiliates are responding to those information requests, but are not in a position to predict the outcome of these requests and investigations.
Important information concerning the Fund and its Manager with regard to recent regulatory developments is contained in the Notes to Financial Statements included in this report.
As always, thank you for your confidence in our stewardship of your assets. We look forward to helping you continue to meet your financial goals.
Sincerely,

R. Jay Gerken, CFA
Chairman, President and Chief Executive Officer
November 1, 2005
Smith Barney Real Return Strategy Fund 2005 Annual Report 3
Manager Overview
Q. What Were The Overall Market Conditions During The Fund’s Reporting Period?
A. No two issues have preoccupied the markets more over the last year than the increases in energy prices and short-term interest rates. The rise in short-term rates was widely anticipated, and has proceeded at a very steady pace (or as the Fed might say, a measured pace). The Fed has raised the fed funds rate by 25 basis pointsx at each of its last twelve meetings, bringing that rate from 1.00% to 4.00%. We believe the rise in energy prices, by contrast, came as more of a surprise to the markets, and has proceeded in a more volatile fashion. Nevertheless, the bottom line is that since November of 2004, the price of crude oil has risen from roughly $48 per barrel to $66 per barrel as of September 30, 2005, an increase of over 35%.
While all this occurred, the U.S. economy grew at a strong, steady pace. GDP growth has increased at an annualized rate of between 3.3% and 3.8% in each of the past four quarters. Despite this growth (and average profit growth of over 10% for the companies in the MSCI U.S. Indexxi as a whole), the broad stock market posted only very modest gains over the reporting period. The S&P 500 Index stood at 1,184 on the day the Fund commenced operations in November of 2004. On September 30, 2005, the Index stood at 1,229, up less than 4%. In an environment of higher interest rates and higher energy prices, we believe investors are less willing to pay for stocks selling at higher price/earnings multiples.
We believe the rise in energy prices has produced a significant increase in the rate of inflation as measured by the Consumer Price Index (“CPI”).xii At the end of October of 2004, the CPI had risen 3.2% over the previous twelve months. By September of 2005, the annual inflation rate was up to 4.7% although the “core” rate of inflation, which excludes food and energy prices, held steady at 2.0%. The Fund seeks to identify sectors of the markets that the Fund’s Manager believes will outperform the broader domestic equity markets during periods of higher inflation. While the S&P 500 Index returned 5.42% and inflation was higher for the reporting period, the three sectors of the equity market in which the Fund invests exceeded this performance. Energy stocks, as measured by the MSCI World Energy Index,xiii rose 40.9% during this period, and prices for metals and mining stocks rose 28.2%, as measured by the MSCI World Metals & Mining Index.xiv Share prices of real estate investment trusts, as measured by the Morgan Stanley REIT Index,xv rose 15.03%, also exceeding the gains of the S&P 500 Index for the period. For the period, the performance of Treasury inflation protected securities (“TIPS”),xvi as measured by the Lehman Global Real: U.S. TIPS Index,xvii was up 4.7%.
Performance Review
Since inception on November 12, 2004 through September 30, 2005, Class A shares of Smith Barney Real Return Strategy Fund, excluding sales charges, returned 18.92%. In comparison, the Fund’s unmanaged benchmarks, the S&P 500 Index, the Lehman Global Real: U.S. TIPS Index, the Morgan Stanley REIT Index, the MSCI World Energy Index
4 Smith Barney Real Return Strategy Fund 2005 Annual Report
and the MSCI World Metals & Mining Index, returned 5.42%, 4.65%, 15.03%, 40.90% and 28.17%, respectively, for the same period. The Lipper Multi Cap Core Funds Category Average1 increased 7.74% from November 30, 2004 through September 30, 2005.
| | | | | | |
| Performance Snapshot as of September 30, 2005 (excluding sales charges) (unaudited) |
| | | |
| | | 6 Months | | Since Inception 11/12/04 | | |
| | | | | | | |
Real Return Strategy Fund—
Class A Shares | | 14.73% | | 18.92% | | |
|
S&P 500 Index | | 5.02% | | 5.42% | | |
|
Lehman Global Real: U.S. TIPS Index | | 3.05% | | 4.65% | | |
|
Morgan Stanley REIT Index | | 14.89% | | 15.03% | | |
|
MSCI World Energy Index | | 3.90% | | 40.90% | | |
|
MSCI World Metals & Mining Index | | -6.41% | | 28.17% | | |
|
| | | |
| | | 6 Months | | 11/30/04-9/30/05 | | |
Lipper Multi Cap Core Funds
Category Average | | 6.51% | | 7.74% | | |
|
|
| The performance shown represents past performance. Past performance is no guarantee of future results and current performance may be higher or lower than the performance shown above. Principal value and investment returns will fluctuate and investors’ shares, when redeemed, may be worth more or less than their original cost. To obtain performance data current to the most recent month-end, please visit our website at www.citigroupam.com. |
|
| Current reimbursements and/or fee waivers are voluntary, and may be reduced or terminated at any time. Absent these reimbursements or waivers, performance would have been lower. |
|
| All share class returns assume the reinvestment of all distributions, including returns of capital, if any, at net asset value and the deduction of all Fund expenses. Returns have not been adjusted to include sales charges that may apply when shares are purchased or the deduction of taxes that a shareholder would pay on Fund distributions. Excluding sales charges, Class B shares returned 14.32% and Class C shares returned 14.32% over the six months ended September 30, 2005. Excluding sales charges, Class B shares returned 18.19% and Class C shares returned 18.19% since inception on November 15, 2004 through September 30, 2005. |
|
| Lipper, Inc. is a major independent mutual-fund tracking organization. Returns are based on the period ended September 30, 2005, including the reinvestment of all distibutions, including returns of capital, if any, calculated among the 818 funds for the six-month period and among the 807 funds for the period beginning November 30, 2004 and ending September 30, 2005 in the Fund’s Lipper category and excluding sales charges. |
| 1 | | Lipper, Inc. is a major independent mutual-fund tracking organization. Returns are based on the period between November 30, 2004 through September 30, 2005, including the reinvestment of all distributions, including returns of capital, if any, calculated among the 807 funds in the Fund’s Lipper category, and excluding sales charges. |
Smith Barney Real Return Strategy Fund 2005 Annual Report 5
Thank you for your investment in the Smith Barney Real Return Strategy Fund. As ever, we appreciate that you have chosen us to manage your assets and we remain focused on achieving the Fund’s investment goals.
Sincerely,

Steven Bleiberg
Portfolio Manager
November 1, 2005
The information provided is not intended to be a forecast of future events, a guarantee of future results or investment advice. Views expressed may differ from those of the firm as a whole.
RISKS: The Fund is subject to the risks associated with the individual equity market sectors represented in the Fund and IPS. The equity sectors may be more volatile than other types of investments and are sensitive to movements in the prices of their underlying commodities and geopolitical factors. The Fund is also subject to concentration, small-cap, mid-cap and foreign securities risks. The risks associated with IPS include deflation, interest rate, extension, liquidity and prepayment risks. As interest rates rise, bond prices fall, reducing the value of the Fund’s share price. The Fund may use derivatives, such as options and futures, which can be illiquid, may disproportionately increase losses, and have a potentially large impact on Fund performance. These and other risks are detailed in the prospectus. Please see the Fund’s prospectus for more information on these and other risks.
All index performance reflects no deduction for fees, expenses or taxes. Please note an investor cannot invest directly in an index.
| i | | Gross domestic product is a market value of goods and services produced by labor and property in a given country. |
| ii | | The Federal Reserve Board is responsible for the formulation of a policy designed to promote economic growth, full employment, stable prices, and a sustainable pattern of international trade and payments. |
| iii | | The federal funds rate is the interest rate that banks with excess reserves at a Federal Reserve district bank charge other banks that need overnight loans. |
| iv | | The S&P 500 Index is an unmanaged index of 500 stocks that is generally representative of the performance of larger companies in the U.S. |
| v | | The Russell Midcap Index measures the performance of the 800 smallest companies in the Russell 1000 Index whose average market capitalization was approximately $4.7 billion as of 6/24/05. |
| vi | | The Russell 1000 Index measures the performance of the 1,000 largest companies in the Russell 3000 Index, which represents approximately 92% of the total market capitalization of the Russell 3000 Index. |
| vii | | The Russell 2000 Index measures the performance of the 2,000 smallest companies in the Russell 3000 Index, which represents approximately 8% of the total market capitalization of the Russell 3000 Index. |
| viii | | The Russell 3000 Value Index measures the performance of those Russell 3000 Index companies with lower price-to-book ratios and lower forecasted growth values. (A price-to-book ratio is the price of a stock compared to the difference between a company’s assets and liabilities.) |
| ix | | The Russell 3000 Growth Index measures the performance of those Russell 3000 Index companies with higher price-to-book ratios and higher forecasted growth values. |
| x | | A basis point is one one-hundredth (1/100 or 0.01) of one percent. |
| xi | | The MSCI U.S. Index represents the universe of companies in the US equity market, including large, mid, small and micro cap companies. This index targets for inclusion 99.5% of the capitalization of the US equity market. |
| xii | | The Consumer Price Index measures the average change in U.S. consumer prices over time in a fixed market basket of goods and services determined by the U.S. Bureau of Labor Statistics. |
| xiii | | The MSCI World Energy Index is a free float-adjusted market capitalization index that is designed to measure global developed market equity performance and focuses on the energy sector. |
| xiv | | The MSCI World Metals & Mining Index is a free float-adjusted market capitalization index that is designed to measure global developed market equity performance and focuses on the metal and mining sectors. |
| xv | | The Morgan Stanley REIT Index is a capitalization-weighted benchmark index of the most actively traded real estate investment trusts (REITs). |
| xvi | | TIPS are bonds sold at auction and are available in 10- or 30-year maturities. They receive a fixed, stated rate of return. But they also increase principal by the changes in the CPI-U (the non-seasonally adjusted U.S. city average all items consumer price index for all urban consumers, published by the Bureau of Labor Statistics). Investors should note that TIPS, like most fixed income instruments with long maturities, are subject to price risk. |
| xvii | | The Lehman Global Real: U.S. TIPS Index is an unmanaged market index made up of U.S. Treasury Inflation Linked Indexed securities. |
6 Smith Barney Real Return Strategy Fund 2005 Annual Report
Fund at a Glance (unaudited)
Smith Barney Real Return Strategy Fund 2005 Annual Report 7
Fund Expenses (unaudited)
Example
As a shareholder of the Fund, you may incur two types of costs: (1) transaction costs, including front-end and back-end sales charges (loads) on purchase payments; and (2) ongoing costs, including management fees; distribution and/or service (12b-1) fees; and other Fund expenses. This example is intended to help you understand your ongoing costs (in dollars) of investing in the Fund and to compare these costs with the ongoing costs of investing in other mutual funds.
This example is based on an investment of $1,000 invested on April 1, 2005 and held for the six months ended September 30, 2005.
Actual Expenses
The table below titled “Based on Actual Total Return” provides information about actual account values and actual expenses. You may use the information provided in this table, together with the amount you invested, to estimate the expenses that you paid over the period. To estimate the expenses you paid on your account, divide your ending account value by $1,000 (for example, an $8,600 ending account value divided by $1,000 = 8.6), then multiply the result by the number under the heading entitled “Expenses Paid During the Period”.
| | | | | | | | | | | | | | | |
| Based on Actual Total Return(1) | | | | | | | | | |
| | | | | |
| | | Actual Total
Return Without
Sales Charges(2) | | | Beginning
Account
Value | | Ending
Account
Value | | Annualized
Expense
Ratio | | | Expenses
Paid During
the Period(3) |
Class A | | 14.73 | % | | $ | 1,000.00 | | $ | 1,147.30 | | 1.20 | % | | $ | 6.46 |
|
Class B | | 14.32 | | | | 1,000.00 | | | 1,143.20 | | 1.95 | | | | 10.48 |
|
Class C | | 14.32 | | | | 1,000.00 | | | 1,143.20 | | 1.95 | | | | 10.48 |
|
| (1) | | For the six months ended September 30, 2005. |
| (2) | | Assumes reinvestment of all distributions, including returns of capital, if any, at net asset value and does not reflect the deduction of the applicable sales charges with respect to Class A shares or the applicable contingent deferred sales charges (“CDSC”) with respect to Class B and C shares. Total return is not annualized, as it may not be representative of the total return for the year. Performance figures may reflect voluntary fee waivers and/or expense reimbursements. Past performance is no guarantee of future results. In the absence of voluntary fee waivers and/or expense reimbursements, the total return would have been lower. |
| (3) | | Expenses (net of voluntary fee waivers and/or expense reimbursements) are equal to each class’ respective annualized expense ratio multiplied by the average account value over the period, multiplied by the number of days in the most recent fiscal half-year, then divided by 365. |
8 Smith Barney Real Return Strategy Fund 2005 Annual Report
Fund Expenses (unaudited) (continued)
Hypothetical Example for Comparison Purposes
The table below titled “Based on Hypothetical Total Return” provides information about hypothetical account values and hypothetical expenses based on the actual expense ratio and an assumed rate of return of 5.00% per year before expenses, which is not the Fund’s actual return. The hypothetical account values and expenses may not be used to estimate the actual ending account balance or expenses you paid for the period. You may use the information provided in this table to compare the ongoing costs of investing in the Fund and other funds. To do so, compare the 5.00% hypothetical example relating to the Fund with the 5.00% hypothetical examples that appear in the shareholder reports of the other funds.
Please note that the expenses shown in the table below are meant to highlight your ongoing costs only and do not reflect any transactional costs, such as front-end or back-end sales charges (loads). Therefore, the table is useful in comparing ongoing costs only, and will not help you determine the relative total costs of owning different funds. In addition, if these transaction costs were included, your costs would have been higher.
| | | | | | | | | | | | | | | |
| Based on Hypothetical Total Return(1) | | | | | | | | | |
| | | | | |
| | | Hypothetical
Annualized
Total Return | | | Beginning
Account
Value | | Ending
Account
Value | | Annualized
Expense
Ratio | | | Expenses
Paid During
the Period(2) |
Class A | | 5.00 | % | | $ | 1,000.00 | | $ | 1,019.05 | | 1.20 | % | | $ | 6.07 |
|
Class B | | 5.00 | | | | 1,000.00 | | | 1,015.29 | | 1.95 | | | | 9.85 |
|
Class C | | 5.00 | | | | 1,000.00 | | | 1,015.29 | | 1.95 | | | | 9.85 |
|
| (1) | | For the six months ended September 30, 2005. |
| (2) | | Expenses (net of voluntary fee waivers and/or expense reimbursements) are equal to each class’ respective annualized expense ratio multiplied by the average account value over the period, multiplied by the number of days in the most recent fiscal half-year, then divided by 365. |
Smith Barney Real Return Strategy Fund 2005 Annual Report 9
Fund Performance
| | | | | | | | | |
| Average Annual Total Returns† (unaudited) | | | | | | | | | |
| |
| | | Without Sales Charges(1)
| |
| | | Class A | | | Class B | | | Class C | |
Inception* through 9/30/05 | | 18.92 | % | | 18.19 | % | | 18.19 | % |
|
|
|
|
| |
| | | With Sales Charges(2)
| |
| | | Class A | | | Class B | | | Class C | |
Inception* through 9/30/05 | | 12.98 | % | | 13.19 | % | | 17.19 | % |
|
|
| † | | All figures represent past performance and are not a guarantee of future results. Investment return and principal value of an investment will fluctuate so that an investor’s shares, when redeemed, may be worth more or less than their original cost. The returns shown do not reflect the deduction of taxes that a shareholder would pay on fund distributions or the redemption of fund shares. Performance figures may reflect voluntary fee waivers and/or expense reimbursements. In the absence of voluntary fee waivers and/or expense reimbursements, the total return would have been lower. |
| (1) | | Assumes reinvestment of all distributions, including returns of capital, if any, at net asset value and does not reflect the deduction of the applicable sales charge with respect to Class A shares or the applicable CDSC with respect to Class B and C shares. |
| (2) | | Assumes reinvestment of all distributions, including returns of capital, if any, at net asset value. In addition, Class A shares reflect the deduction of the maximum initial sales charge of 5.00%; Class B shares reflect the deduction of a 5.00% CDSC, which applies if shares are redeemed within one year from purchase payment. Thereafter, this CDSC declines by 1.00% per year until no CDSC is incurred. Class C shares reflect the deduction of a 1.00% CDSC, which applies if shares are redeemed within one year from purchase payment. |
| * | | Inception date for Class A shares is November 12, 2004. Inception date for Class B and C shares is November 15, 2004, respectively. |
10 Smith Barney Real Return Strategy Fund 2005 Annual Report
Historical Performance (unaudited)
Value of $10,000 Invested in Class A Shares of the Smith Barney Real Return Strategy Fund vs. S&P 500 Index† (November 2004 — September 2005)
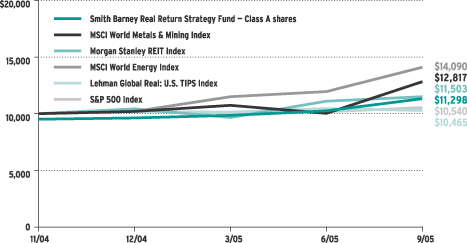
| † | | Hypothetical illustration of $10,000 invested in Class A shares on November 12, 2004, assuming deduction of the maximum 5.00% sales charge at the time of investment and reinvestment of distributions, including returns of capital, if any, at net asset value through September 30, 2005. The S&P 500 Index is a market capitalization-weighted index of 500 widely held common stocks. The Lehman Brothers U.S. TIPS Index represents an unmanaged market index comprised of U.S. Treasury Inflation Linked Index securities. The Morgan Stanley REIT Index is a capitalization-weighted benchmark index of the most actively traded real estate investment trusts. The MSCI World Metals & Mining Index is a free float-adjusted market capitalization index that is designed to measure global developed market equity performance and focuses on the metals and mining sectors. The MSCI World Energy Index is a free float-adjusted market capitalization index that is designed to measure global developed market equity performance and focuses on the energy sector. The Indexes are unmanaged and are not subject to the same management and trading expenses as a mutual fund. Please note that an investor cannot invest directly in an index. The performance of the Fund’s other classes may be greater or less than the Class A shares’ performance indicated on this chart, depending on whether greater or lesser sales charges and fees were incurred by shareholders investing in the other classes. |
All figures represent past performance and are not a guarantee of future results. Investment return and principal value of an investment will fluctuate so that an investor’s shares, when redeemed, may be worth more or less than their original cost. The returns shown do not reflect the deduction of taxes that a shareholder would pay on fund distributions or the redemption of fund shares. Performance figures may reflect fee waivers and/or expense reimbursements. In the absence of fee waivers and/or expense reimbursements, the total return would have been lower.
Smith Barney Real Return Strategy Fund 2005 Annual Report 11
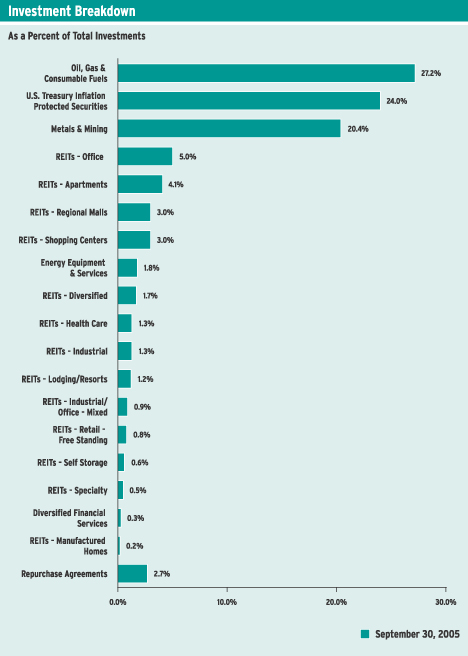
Schedule of Investments (September 30, 2005)
SMITH BARNEY REAL RETURN STRATEGY FUND
| | | | | | |
| | |
| Shares | | Security | | Value | |
| COMMON STOCKS — 72.4% | |
| ENERGY — 28.8% | |
| Energy Equipment & Services — 1.8% | |
| | | | | | | |
| 3,182 | | Halliburton Co. | | $ | 218,031 | |
| 750 | | Noble Corp. | | | 51,345 | |
| 1,261 | | Schlumberger Ltd. | | | 106,403 | |
|
|
| | | Total Energy Equipment & Services | | | 375,779 | |
|
|
| Oil, Gas & Consumable Fuels — 27.0% | |
| 60,181 | | BP PLC | | | 717,172 | |
| 12,298 | | Chevron Corp. | | | 796,050 | |
| 1,928 | | ConocoPhillips | | | 134,786 | |
| 4,346 | | EnCana Corp. | | | 253,415 | |
| 9,867 | | Eni SpA | | | 293,990 | |
| 16,036 | | Exxon Mobil Corp. | | | 1,018,927 | |
| 1,097 | | Gazprom, Registered Shares, Sponsored ADR | | | 73,499 | |
| 2,712 | | Kerr-McGee Corp. | | | 263,362 | |
| 29,000 | | Nippon Mining Holdings Inc. | | | 230,372 | |
| 1,765 | | Norsk Hydro ASA | | | 197,899 | |
| 17,017 | | Origin Energy Ltd. | | | 95,075 | |
| 4,709 | | Petroleo Brasileiro SA, Sponsored ADR | | | 300,199 | |
| 11,138 | | Royal Dutch Shell PLC, Class A Shares | | | 368,928 | |
| 8,562 | | Saipem SpA | | | 144,847 | |
| 11,766 | | Santos Ltd. | | | 112,499 | |
| 6,050 | | Statoil ASA | | | 150,385 | |
| 1,801 | | Total SA | | | 493,181 | |
| 5,665 | | Williams Cos. Inc. | | | 141,908 | |
|
|
| | | Total Oil, Gas & Consumable Fuels | | | 5,786,494 | |
|
|
| | | TOTAL ENERGY | | | 6,162,273 | |
|
|
| MATERIALS — 20.2% | |
| Metals & Mining — 20.2% | |
| 440 | | Aber Diamond Corp. | | | 16,108 | |
| 26 | | Acerinox SA | | | 362 | |
| 2,282 | | Agnico-Eagle Mines Ltd. | | | 33,868 | |
| 3,307 | | Alcan Inc. | | | 104,968 | |
| 7,792 | | Alcoa Inc. | | | 190,281 | |
| 359 | | Algoma Steel Inc. | | | 7,112 | |
| 9,136 | | Alumina Ltd. | | | 42,664 | |
| 13,437 | | Anglo American PLC | | | 401,805 | |
| 5,545 | | Arcelor | | | 130,113 | |
| 3,757 | | Barrick Gold Corp. | | | 109,058 | |
| 27,569 | | BHP Billiton Ltd. | | | 468,829 | |
| 22,471 | | BHP Billiton PLC | | | 364,204 | |
| 4,769 | | BlueScope Steel Ltd. | | | 34,846 | |
| 64,724 | | Corus Group PLC | | | 58,979 | |
See Notes to Financial Statements.
12 Smith Barney Real Return Strategy Fund 2005 Annual Report
Schedule of Investments (September 30, 2005) (continued)
| | | | | | |
| | |
| Shares | | Security | | Value | |
| | | | | | | |
| Metals & Mining — 20.2% (continued) | |
| 689 | | Dofasco Inc. | | $ | 25,911 | |
| 3,442 | | Falconbridge Ltd. | | | 92,117 | |
| 1,137 | | Freeport-McMoRan Copper & Gold Inc., Class B Shares | | | 55,247 | |
| 109 | | Glamis Gold Ltd.* | | | 2,394 | |
| 1,852 | | Goldcorp Inc. | | | 37,169 | |
| 2,165 | | Inco Ltd. | | | 102,548 | |
| 441 | | IPSCO Inc. | | | 31,399 | |
| 2,468 | | Ivanhoe Mines Ltd.* | | | 20,833 | |
| 4,300 | | JFE Holdings Inc. | | | 140,050 | |
| 3,598 | | Kinross Gold Corp.* | | | 27,676 | |
| 13,000 | | Kobe Steel Ltd. | | | 39,587 | |
| 719 | | Meridian Gold Inc.* | | | 15,700 | |
| 1,000 | | Mitsubishi Materials Corp. | | | 3,539 | |
| 8,000 | | Mitsui Mining & Smelting Co., Ltd. | | | 46,533 | |
| 2,593 | | Newcrest Mining Ltd. | | | 41,579 | |
| 4,459 | | Newmont Mining Corp. | | | 210,331 | |
| 4,000 | | Nippon Light Metal Co., Ltd. | | | 11,015 | |
| 55,000 | | Nippon Steel Corp. | | | 206,805 | |
| 13,000 | | Nisshin Steel Co., Ltd. | | | 44,980 | |
| 661 | | Novelis Inc. | | | 14,160 | |
| 1,431 | | Nucor Corp. | | | 84,415 | |
| 8,727 | | OneSteel Ltd. | | | 25,413 | |
| 2,559 | | Outokumpu OYJ | | | 34,251 | |
| 834 | | Phelps Dodge Corp. | | | 108,362 | |
| 5,205 | | Placer Dome Inc. | | | 89,175 | |
| 1,690 | | Rautaruukki OYJ | | | 38,087 | |
| 2,696 | | Rio Tinto Ltd. | | | 121,861 | |
| 9,002 | | Rio Tinto PLC | | | 369,214 | |
| 104 | | SSAB Svenskt Stal AB, Class A Shares | | | 3,154 | |
| 297 | | SSAB Svenskt Stal AB, Class B Shares | | | 8,547 | |
| 23,000 | | Sumitomo Metal Industries Ltd. | | | 80,798 | |
| 7,000 | | Sumitomo Metal Mining Co., Ltd. | | | 64,998 | |
| 1,270 | | Teck Cominco Ltd., Class B Shares | | | 57,049 | |
| 2,120 | | ThyssenKrupp AG | | | 44,403 | |
| 2,000 | | Tokyo Steel Manufacturing Co., Ltd. | | | 31,158 | |
| 1,020 | | United States Steel Corp. | | | 43,197 | |
|
|
| | | TOTAL MATERIALS | | | 4,336,852 | |
|
|
| REITs — 23.4% | |
| Apartments — 4.1% | |
| 1,036 | | Amli Residential Properties Trust | | | 33,225 | |
| 2,510 | | Apartment Investment and Management Co., Class A Shares | | | 97,338 | |
| 4,603 | | Archstone-Smith Trust | | | 183,522 | |
| 1,115 | | Avalonbay Communities Inc. | | | 95,555 | |
| 986 | | BRE Properties Inc., Class A Shares | | | 43,877 | |
| 1,510 | | Camden Property Trust | | | 84,182 | |
| 4,931 | | Equity Residential | | | 186,638 | |
See Notes to Financial Statements.
Smith Barney Real Return Strategy Fund 2005 Annual Report 13
Schedule of Investments (September 30, 2005) (continued)
| | | | | | |
| | |
| Shares | | Security | | Value | |
| | | | | | | |
| Apartments — 4.1% (continued) | |
| 131 | | Essex Property Trust Inc. | | $ | 11,790 | |
| 1,091 | | Gables Residential Trust | | | 47,622 | |
| 1,225 | | Home Properties Inc. | | | 48,081 | |
| 56 | | Post Properties Inc. | | | 2,086 | |
| 1,638 | | United Dominion Realty Trust Inc. | | | 38,821 | |
|
|
| | | Total Apartments | | | 872,737 | |
|
|
| Diversified — 1.7% | | | | |
| 1,394 | | Colonial Properties Trust | | | 62,005 | |
| 3,216 | | Crescent Real Estate Equities Co. | | | 65,960 | |
| 563 | | Investors Real Estate Trust | | | 5,349 | |
| 262 | | Lexington Corporate Properties Trust | | | 6,170 | |
| 3,322 | | Spirit Finance Corp. | | | 37,372 | |
| 2,137 | | Vornado Realty Trust | | | 185,107 | |
|
|
| | | Total Diversified | | | 361,963 | |
|
|
| Health Care — 1.3% | |
| 1,687 | | Health Care Property Investors Inc. | | | 45,532 | |
| 1,089 | | Health Care REIT Inc. | | | 40,391 | |
| 1,595 | | Healthcare Realty Trust Inc. | | | 64,023 | |
| 237 | | Nationwide Health Properties Inc. | | | 5,522 | |
| 2,262 | | Senior Housing Properties Trust | | | 42,978 | |
| 253 | | Universal Health Realty Income Trust | | | 8,412 | |
| 2,248 | | Ventas Inc. | | | 72,386 | |
|
|
| | | Total Health Care | | | 279,244 | |
|
|
| Industrial — 1.3% | |
| 1,054 | | AMB Property Corp. | | | 47,325 | |
| 369 | | CenterPoint Properties Trust | | | 16,531 | |
| 1,460 | | First Industrial Realty Trust Inc. | | | 58,473 | |
| 3,389 | | ProLogis | | | 150,166 | |
|
|
| | | Total Industrial | | | 272,495 | |
|
|
| Industrial/Office – Mixed — 0.9% | |
| 1,407 | | Bedford Property Investors Inc. | | | 33,543 | |
| 2,030 | | Duke Realty Corp. | | | 68,776 | |
| 2,253 | | Liberty Property Trust | | | 95,843 | |
| 1 | | PS Business Parks Inc. | | | 46 | |
|
|
| | | Total Industrial/Office – Mixed | | | 198,208 | |
|
|
| Lodging/Resorts — 1.2% | | | | |
| 941 | | FelCor Lodging Trust Inc.* | | | 14,256 | |
| 579 | | Highland Hospitality Corp. | | | 5,941 | |
| 1,895 | | Hospitality Properties Trust | | | 81,220 | |
| 5,074 | | Host Marriott Corp. | | | 85,751 | |
| 4,704 | | MeriStar Hospitality Corp.* | | | 42,947 | |
| 1,846 | | Strategic Hotel Capital Inc. | | | 33,708 | |
|
|
| | | Total Lodging/Resorts | | | 263,823 | |
|
|
See Notes to Financial Statements.
14 Smith Barney Real Return Strategy Fund 2005 Annual Report
Schedule of Investments (September 30, 2005) (continued)
| | | | | | |
| | |
| Shares | | Security | | Value | |
| | | | | | | |
| Manufactured Homes — 0.2% | | | | |
| 2,100 | | Affordable Residential Communities Inc. | | $ | 21,231 | |
| 768 | | Sun Communities Inc. | | | 25,160 | |
|
|
| | | Total Manufactured Homes | | | 46,391 | |
|
|
| Office — 4.9% | | | | |
| 99 | | Alexandria Real Estate Equities Inc. | | | 8,186 | |
| 4,173 | | American Financial Realty Trust | | | 59,256 | |
| 601 | | Arden Realty Group Inc. | | | 24,743 | |
| 1,676 | | BioMed Realty Trust Inc. | | | 41,565 | |
| 2,150 | | Boston Properties Inc. | | | 152,435 | |
| 1,875 | | Brandywine Realty Trust | | | 58,294 | |
| 379 | | CarrAmerica Realty Corp. | | | 13,625 | |
| 270 | | Corporate Office Properties Trust | | | 9,436 | |
| 7,162 | | Equity Office Properties Trust | | | 234,269 | |
| 1,914 | | Glenborough Realty Trust Inc. | | | 36,749 | |
| 1,786 | | Highwoods Properties Inc. | | | 52,705 | |
| 5,759 | | HRPT Properties Trust | | | 71,469 | |
| 195 | | Kilroy Realty Corp. | | | 10,926 | |
| 1,737 | | Mack-Cali Realty Corp. | | | 78,061 | |
| 790 | | Parkway Properties Inc. | | | 37,067 | |
| 900 | | Prentiss Properties Trust | | | 36,540 | |
| 802 | | Reckson Associates Realty Corp. | | | 27,709 | |
| 1,199 | | SL Green Realty Corp. | | | 81,748 | |
| 730 | | Trizec Properties Inc. | | | 16,834 | |
|
|
| | | Total Office | | | 1,051,617 | |
|
|
| Regional Malls — 3.0% | | | | |
| 1,785 | | CBL & Associates Properties Inc. | | | 73,167 | |
| 3,757 | | General Growth Properties Inc. | | | 168,802 | |
| 793 | | Macerich Co. | | | 51,497 | |
| 658 | | Mills Corp. | | | 36,243 | |
| 621 | | Pennsylvania Real Estate Investment Trust | | | 26,194 | |
| 3,767 | | Simon Property Group Inc. | | | 279,210 | |
| 207 | | Taubman Centers Inc. | | | 6,562 | |
|
|
| | | Total Regional Malls | | | 641,675 | |
|
|
| Retail – Free Standing — 0.8% | | | | |
| 2,245 | | Commercial Net Lease Realty Inc. | | | 44,900 | |
| 1,254 | | Getty Realty Corp. | | | 36,090 | |
| 2,596 | | Realty Income Corp. | | | 62,071 | |
| 1,997 | | Trustreet Properties Inc. | | | 31,253 | |
|
|
| | | Total Retail – Free Standing | | | 174,314 | |
|
|
| Self Storage — 0.6% | | | | |
| 1,084 | | Public Storage Inc. | | | 72,628 | |
| 318 | | Shurgard Storage Centers Inc., Class A Shares | | | 17,767 | |
| 874 | | Sovran Self Storage Inc. | | | 42,782 | |
|
|
| | | Total Self-Storage | | | 133,177 | |
|
|
See Notes to Financial Statements.
Smith Barney Real Return Strategy Fund 2005 Annual Report 15
Schedule of Investments (September 30, 2005) (continued)
| | | | | | | | | |
| | | |
| Shares | | | | Security | | Value | |
| | | | | | | | | | |
| | Shopping Centers — 2.9% | | | | |
| | 2,594 | | | | Developers Diversified Realty Corp. | | $ | 121,140 | |
| | 1,755 | | | | Equity One Inc. | | | 40,804 | |
| | 595 | | | | Federal Realty Investment Trust | | | 36,253 | |
| | 1,176 | | | | Heritage Property Investment Trust | | | 41,160 | |
| | 2,759 | | | | Inland Real Estate Corp. | | | 43,206 | |
| | 3,805 | | | | Kimco Realty Corp. | | | 119,553 | |
| | 2,929 | | | | New Plan Excel Realty Trust Inc. | | | 67,221 | |
| | 421 | | | | Pan Pacific Retail Properties Inc. | | | 27,744 | |
| | 1,237 | | | | Ramco-Gershenson Properties Trust | | | 36,108 | |
| | 540 | | | | Regency Centers Corp. | | | 31,023 | |
| | 1,857 | | | | Urstadt Biddle Properties, Class A Shares | | | 28,152 | |
| | 1,004 | | | | Weingarten Realty Investors | | | 38,001 | |
|
|
|
| | | | | | Total Shopping Centers | | | 630,365 | |
|
|
|
| | Specialty — 0.5% | | | | |
| | 1,454 | | | | Capital Automotive Real Estate Investment Trust | | | 56,284 | |
| | 938 | | | | Entertainment Properties Trust | | | 41,863 | |
|
|
|
| | | | | | Total Specialty | | | 98,147 | |
|
|
|
| | | | | | TOTAL REITs | | | 5,024,156 | |
|
|
|
| | | | | | TOTAL COMMON STOCKS
(Cost — $12,883,414) | | | 15,523,281 | |
|
|
|
| | | |
Face Amount | | Rating‡ | | | | | |
| | CORPORATE NOTES — 0.3% | | | | |
| | Diversified Financial Services — 0.3% | | | | |
| $ | 60,000 | | A+ | | Lehman Brothers Holdings Inc., Medium-Term Notes, Series G, 3.440% due 9/28/07 (a)
(Cost — $59,856) | | | 59,628 | |
|
|
|
| | U.S. TREASURY INFLATION PROTECTED SECURITIES — 23.8% | | | | |
| | | | | | U.S. Treasury Bonds, Inflation Indexed: | | | | |
| | 217,320 | | | | 3.000% due 7/15/12 | | | 236,556 | |
| | 1,761,982 | | | | 2.375% due 1/15/25 | | | 1,885,597 | |
| | | | | | U.S. Treasury Notes, Inflation Indexed: | | | | |
| | 338,607 | | | | 3.625% due 1/15/08 | | | 358,527 | |
| | 1,310,408 | | | | 3.875% due 1/15/09 | | | 1,421,999 | |
| | 696,732 | | | | 4.250% due 1/15/10 | | | 779,551 | |
| | 409,268 | | | | 1.625% due 1/15/15 | | | 404,536 | |
|
|
|
| | | | | | TOTAL U.S. TREASURY INFLATION PROTECTED SECURITIES
(Cost — $5,082,940) | | | 5,086,766 | |
|
|
|
| | | | | | TOTAL INVESTMENTS BEFORE SHORT-TERM INVESTMENTS
(Cost — $18,026,210) | | | 20,669,675 | |
|
|
|
See Notes to Financial Statements.
16 Smith Barney Real Return Strategy Fund 2005 Annual Report
Schedule of Investments (September 30, 2005) (continued)
| | | | | | | |
| | | |
Face
Amount | | | | Security | | Value |
| SHORT-TERM INVESTMENTS — 2.7% | | | |
| Repurchase Agreements — 2.7% | | | |
| $ 37,000 | | | | Interest in $836,655,000 joint tri-party repurchase agreement dated 9/30/05 with Greenwich Capital Markets Inc., 3.850% due 10/3/05, Proceeds at
maturity — $37,012; (Fully collateralized by various U.S. government & agency obligations, 0.000% to 8.875% due 10/15/05 to 8/6/38;
Market value — $37,740) | | $ | 37,000 |
| 545,000 | | | | State Street Bank & Trust Co., dated 9/30/05, 3.000% due 10/3/05, Proceeds at maturity — $545,136; (Fully collateralized by U.S. Treasury Bonds, 7.125% due 2/15/23; Market value — $570,666) | | | 545,000 |
|
| | | | | TOTAL SHORT-TERM INVESTMENTS
(Cost — $582,000) | | | 582,000 |
|
| | | | | TOTAL INVESTMENTS — 99.2% (Cost — $18,608,210#) | | | 21,251,675 |
| | | | | Other Assets in Excess of Liabilities — 0.8% | | | 180,503 |
|
| | | | | TOTAL NET ASSETS — 100.0% | | $ | 21,432,178 |
|
| * | | Non-income producing security. |
| ‡ | | All ratings are by Standard & Poor’s Ratings Service, unless otherwise footnoted. All ratings are unaudited. |
| (a) | | Variable rate security. Coupon rate disclosed is that which is in effect at September 30, 2005. |
| # | | Aggregate cost for federal income tax purposes is $18,650,295. |
See page 18 for definitions of ratings.
| | | | |
| | | Abbreviations used in this schedule: |
| | | ADR | | — American Depositary Receipt |
| | | REITs | | — Real Estate Investment Trusts |
| | | |
| Summary of Investments by Country* | | | |
United States | | 66.0 | % |
United Kingdom | | 9.0 | |
Canada | | 4.9 | |
Australia | | 4.5 | |
Japan | | 4.2 | |
France | | 2.3 | |
Netherlands | | 2.2 | |
Italy | | 2.1 | |
Norway | | 1.6 | |
Brazil | | 1.4 | |
Luxembourg | | 0.6 | |
Russia | | 0.4 | |
Finland | | 0.3 | |
Cayman Islands | | 0.2 | |
Germany | | 0.2 | |
Sweden | | 0.1 | |
Spain | | 0.0 | ** |
|
|
| | | 100.0 | % |
|
|
| * | | As a percentage of total investments. Please note that Fund holdings are as of September 30, 2005 and are subject to change. |
| ** | | Amount represents less than 0.01%. |
See Notes to Financial Statements.
Smith Barney Real Return Strategy Fund 2005 Annual Report 17
Bond Ratings (unaudited)
The definitions of the applicable rating symbols are set forth below:
Standard & Poor’s Ratings Service (“Standard & Poor’s”) — Ratings “AA” and “A” may be modified by the addition of a plus (+) or minus (–) sign to show relative standings within the major rating categories.
AAA | — Bonds rated “AAA” have the highest rating assigned by Standard & Poor’s. Capacity to pay interest and repay principal is extremely strong. |
AA | — Bonds rated “AA” have a very strong capacity to pay interest and repay principal and differ from the highest rated issues only in a small degree. |
A | — Bonds rated “A” have a strong capacity to pay interest and repay principal although they are somewhat more susceptible to the adverse effects of changes in circumstances and economic conditions than debt in higher rated categories. |
NR | — Indicates that the bond is not rated by Standard & Poor’s, Moody’s, or Fitch. |
18 Smith Barney Real Return Strategy Fund 2005 Annual Report
Statement of Assets and Liabilities (September 30, 2005)
| | | | |
| ASSETS: | | | | |
Investments, at value (Cost $18,608,210) | | $ | 21,251,675 | |
Foreign currency, at value (Cost $5,691) | | | 5,521 | |
Cash | | | 1,468 | |
Receivable for securities sold | | | 468,380 | |
Dividends and interest receivable | | | 84,013 | |
Receivable for Fund shares sold | | | 77,970 | |
Receivable from Manager | | | 2,501 | |
Prepaid expenses | | | 23,013 | |
|
|
Total Assets | | | 21,914,541 | |
|
|
| LIABILITIES: | | | | |
Payable for securities purchased | | | 383,616 | |
Payable for Fund shares repurchased | | | 10,723 | |
Distributions payable | | | 8,874 | |
Distribution fees payable | | | 4,062 | |
Transfer agent fees payable | | | 2,806 | |
Directors’ fees payable | | | 759 | |
Accrued expenses | | | 71,523 | |
|
|
Total Liabilities | | | 482,363 | |
|
|
Total Net Assets | | $ | 21,432,178 | |
|
|
| NET ASSETS: | | | | |
Par value (Note 6) | | $ | 1,610 | |
Paid-in capital in excess of par value | | | 18,606,182 | |
Undistributed net investment income | | | 49,168 | |
Accumulated net realized gain on investments and foreign currency transactions | | | 131,908 | |
Net unrealized appreciation on investments and foreign currency transactions | | | 2,643,310 | |
|
|
Total Net Assets | | $ | 21,432,178 | |
|
|
Shares Outstanding: | | | | |
Class A | | | 1,127,563 | |
| |
Class B | | | 304,939 | |
| |
Class C | | | 177,837 | |
| |
Net Asset Value: | | | | |
Class A (and redemption price) | | | $13.31 | |
| |
Class B* | | | $13.31 | |
| |
Class C* | | | $13.31 | |
| |
Maximum Public Offering Price Per Share: | | | | |
Class A (based on maximum sales charge of 5.00%) | | | $14.01 | |
|
|
| * | | Redemption price is NAV of Class B and C shares reduced by a 5.00% and 1.00% CDSC, respectively, if shares are redeemed within one year from purchase payment (See Note 2). |
See Notes to Financial Statements.
Smith Barney Real Return Strategy Fund 2005 Annual Report 19
Statement of Operations (For the period ended September 30, 2005*)
| | | | |
| INVESTMENT INCOME: | | | | |
Dividends | | $ | 336,719 | |
Interest | | | 167,545 | |
Less: Foreign taxes withheld | | | (15,327 | ) |
|
|
Total Investment Income | | | 488,937 | |
|
|
| EXPENSES: | | | | |
Management fee (Note 2) | | | 93,520 | |
Custody fees | | | 82,700 | |
Distribution fees (Notes 2 and 4) | | | 61,254 | |
Shareholder reports (Note 4) | | | 59,368 | |
Organization costs (Note 1) | | | 41,500 | |
Audit and tax | | | 26,500 | |
Legal fees | | | 16,144 | |
Directors’ fees | | | 8,695 | |
Transfer agent fees (Notes 2 and 4) | | | 7,619 | |
Registration fees | | | 5,999 | |
Miscellaneous expenses | | | 2,914 | |
|
|
Total Expenses | | | 406,213 | |
Less: Management fee waiver and expense reimbursement (Note 2 ) | | | (208,271 | ) |
|
|
Net Expenses | | | 197,942 | |
|
|
Net Investment Income | | | 290,995 | |
|
|
REALIZED AND UNREALIZED GAIN (LOSS) ON INVESTMENTS
AND FOREIGN CURRENCY TRANSACTIONS (NOTES 1 AND 3): | | | | |
Net Realized Gain (Loss) From: | | | | |
Investments | | | 176,223 | |
Foreign currency transactions | | | (23,962 | ) |
|
|
Net Realized Gain | | | 152,261 | |
|
|
Change in Net Unrealized Appreciation/Depreciation From: | | | | |
Investments | | | 2,643,465 | |
Foreign currency transactions | | | (155 | ) |
|
|
Change in Net Unrealized Appreciation/Depreciation | | | 2,643,310 | |
|
|
Net Gain on Investments and Foreign Currency Transactions | | | 2,795,571 | |
|
|
Increase in Net Assets From Operations | | $ | 3,086,566 | |
|
|
| * | | For the period November 12, 2004 (commencement of operations) to September 30, 2005. |
See Notes to Financial Statements.
20 Smith Barney Real Return Strategy Fund 2005 Annual Report
Statement of Changes in Net Assets (For the period ended September 30,**)
| | | | |
| |
| | | 2005 | |
| OPERATIONS: | | | | |
Net investment income | | $ | 290,995 | |
Net realized gain | | | 152,261 | |
Change in net unrealized appreciation/depreciation | | | 2,643,310 | |
|
|
Increase in Net Assets From Operations | | | 3,086,566 | |
|
|
DISTRIBUTIONS TO SHAREHOLDERS
FROM (NOTES 1 AND 5): | | | | |
Net investment income | | | (302,611 | ) |
|
|
Decrease in Net Assets From
Distributions to Shareholders | | | (302,611 | ) |
|
|
| FUND SHARE TRANSACTIONS (NOTE 6): | | | | |
Net proceeds from sale of shares | | | 20,279,118 | |
Reinvestment of distributions | | | 278,538 | |
Cost of shares repurchased | | | (1,909,433 | ) |
|
|
Increase in Net Assets From Fund Share Transactions | | | 18,648,223 | |
|
|
Increase in Net Assets | | | 21,432,178 | |
| NET ASSETS: | | | | |
End of period* | | $ | 21,432,178 | |
|
|
* Includes undistributed net investment income of: | | | $49,168 | |
|
|
| ** | | For the period November 12, 2004 (commencement of operations) to September 30, 2005. |
See Notes to Financial Statements.
Smith Barney Real Return Strategy Fund 2005 Annual Report 21
Financial Highlights
For a share of each class of capital stock outstanding throughout the period ended September 30:
| | | | |
| |
| Class A Shares(1) | | 2005(2) | |
Net Asset Value, Beginning of Period | | | $11.40 | |
|
|
Income From Operations: | | | | |
Net investment income | | | 0.23 | |
Net realized and unrealized gain | | | 1.91 | |
|
|
Total Income From Operations | | | 2.14 | |
|
|
Less Distributions From: | | | | |
Net investment income | | | (0.23 | ) |
|
|
Total Distributions | | | (0.23 | ) |
|
|
Net Asset Value, End of Period | | | $13.31 | |
|
|
Total Return(3) | | | 18.92 | % |
|
|
Net Assets, End of Period (000s) | | $ | 15,006 | |
|
|
Ratios to Average Net Assets: | | | | |
Gross expenses | | | 2.42 | %(4) |
Net expenses(5)(6) | | | 1.20 | (4) |
Net investment income | | | 2.17 | (4) |
|
|
Portfolio Turnover Rate | | | 52 | % |
|
|
| (1) | | Per share amounts have been calculated using the average shares method. |
| (2) | | For the period November 12, 2004 (commencement of operations) to September 30, 2005. |
| (3) | | Performance figures may reflect voluntary fee waivers and/or expense reimbursements. Past performance is no guarantee of future results. In the absence of voluntary fee waivers and/or expense reimbursements, the total return would have been lower. Total returns for periods of less than one year are not annualized. |
| (5) | | The investment manager voluntarily waived a portion of its fees. |
| (6) | | As a result of a voluntary expense limitation, the ratio of expenses to average net assets of Class A shares of the Fund will not exceed 1.20%. |
See Notes to Financial Statements.
22 Smith Barney Real Return Strategy Fund 2005 Annual Report
Financial Highlights (continued)
For a share of each class of capital stock outstanding throughout the period ended September 30:
| | | | |
| |
| Class B Shares(1) | | 2005(2) | |
Net Asset Value, Beginning of Period | | $ | 11.40 | |
|
|
Income From Operations: | | | | |
Net investment income | | | 0.16 | |
Net realized and unrealized gain | | | 1.90 | |
|
|
Total Income From Operations | | | 2.06 | |
|
|
Less Distributions From: | | | | |
Net investment income | | | (0.15 | ) |
|
|
Total Distributions | | | (0.15 | ) |
|
|
Net Asset Value, End of Period | | $ | 13.31 | |
|
|
Total Return(3) | | | 18.19 | % |
|
|
Net Assets, End of Period (000s) | | $ | 4,059 | |
|
|
Ratios to Average Net Assets: | | | | |
Gross expenses | | | 4.26 | %(4) |
Net expenses(5)(6) | | | 1.95 | (4) |
Net investment income | | | 1.57 | (4) |
|
|
Portfolio Turnover Rate | | | 52 | % |
|
|
| (1) | | Per share amounts have been calculated using the average shares method. |
| (2) | | For the period November 15, 2004 (commencement of operations) to September 30, 2005. |
| (3) | | Performance figures may reflect voluntary fee waivers and/or expense reimbursements. Past performance is no guarantee of future results. In the absence of voluntary fee waivers and/or expense reimbursements, the total return would have been lower. Total returns for periods of less than one year are not annualized. |
| (5) | | The investment manager voluntarily waived a portion of its fees. |
| (6) | | As a result of a voluntary expense limitation, the ratio of expenses to average net assets of Class B shares of the Fund will not exceed 1.95%. |
See Notes to Financial Statements.
Smith Barney Real Return Strategy Fund 2005 Annual Report 23
Financial Highlights (continued)
For a share of each class of capital stock outstanding throughout the period ended September 30:
| | | | |
| |
| Class C Shares(1) | | 2005(2) | |
Net Asset Value, Beginning of Period | | $ | 11.40 | |
|
|
Income From Operations: | | | | |
Net investment income | | | 0.16 | |
Net realized and unrealized gain | | | 1.90 | |
|
|
Total Income From Operations | | | 2.06 | |
|
|
Less Distributions From: | | | | |
Net investment income | | | (0.15 | ) |
|
|
Total Distributions | | | (0.15 | ) |
|
|
Net Asset Value, End of Period | | $ | 13.31 | |
|
|
Total Return(3) | | | 18.19 | % |
|
|
Net Assets, End of Period (000s) | | $ | 2,367 | |
|
|
Ratios to Average Net Assets: | | | | |
Gross expenses | | | 3.99 | %(4) |
Net expenses(5)(6) | | | 1.95 | (4) |
Net investment income | | | 1.52 | (4) |
|
|
Portfolio Turnover Rate | | | 52 | % |
|
|
| (1) | | Per share amounts have been calculated using the average shares method. |
| (2) | | For the period November 15, 2004 (commencement of operations) to September 30, 2005. |
| (3) | | Performance figures may reflect voluntary fee waivers and/or expense reimbursements. Past performance is no guarantee of future results. In the absence of voluntary fee waivers and/or expense reimbursements, the total return would have been lower. Total returns for periods of less than one year are not annualized. |
| (5) | | The investment manager voluntarily waived a portion of its fees. |
| (6) | | As a result of a voluntary expense limitation, the ratio of expenses to average net assets of Class C shares of the Fund will not exceed 1.95%. |
See Notes to Financial Statements.
24 Smith Barney Real Return Strategy Fund 2005 Annual Report
Notes to Financial Statements
| 1. | Organization and Significant Accounting Policies |
The Smith Barney Real Return Strategy Fund (the “Fund”) is a separate series of Smith Barney Investment Funds Inc. (“Company”). The Company, a Maryland corporation, is registered under the Investment Company Act of 1940 (“1940 Act”), as amended, as a non-diversified, open-end management investment company.
The following are significant accounting policies consistently followed by the Fund and are in conformity with U.S. generally accepted accounting principles (“GAAP”). Estimates and assumptions are required to be made regarding assets, liabilities and changes in net assets resulting from operations when financial statements are prepared. Changes in the economic environment, financial markets and any other parameters used in determining these estimates could cause actual results to differ.
(a) Investment Valuation. Equity securities for which market quotations are available are valued at the last sale price or official closing price on the primary market or exchange on which they trade. Debt securities are valued at the mean between the bid and asked prices provided by an independent pricing service that are based on transactions in debt obligations, quotations from bond dealers, market transactions in comparable securities and various relationships between securities. When prices are not readily available, or are determined not to reflect fair value, such as when the value of a security has been significantly affected by events after the close of the exchange or market on which the security is principally traded, but before the Fund calculates its net asset value, the Fund may value these investments at fair value as determined in accordance with the procedures approved by the Fund’s Board of Directors. Short-term obligations with maturities of 60 days or less are valued at amortized cost, which approximates market value.
(b) Repurchase Agreements. When entering into repurchase agreements, it is the Fund’s policy that its custodian or a third party custodian takes possession of the underlying collateral securities, the market value of which at least equals the principal amount of the repurchase transaction, including accrued interest. To the extent that any repurchase transaction exceeds one business day, the value of the collateral is marked-to-market to ensure the adequacy of the collateral. If the seller defaults, and the market value of the collateral declines or if bankruptcy proceedings are commenced with respect to the seller of the security, realization of the collateral by the Fund may be delayed or limited.
(c) Other Risks. The Fund primarily invests in the energy, real estate and metals and mining sectors, as well as in inflation protected securities. Therefore, the Fund is subject to additional concentrations of credit and market risks associated with these industry segments, such as fluctuating prices and supplies of oil and other energy fuels, fluctuating property values, interest and mortgage related risks, price volatility caused by global economic, financial and political factors, resource availability and government regulation.
Additionally, the Fund’s investments in foreign securities may involve risks not present in domestic investments. Since securities may be denominated in foreign currency and may require settlement in foreign currencies and pay interest and dividends in foreign currencies, changes in the relationship of these foreign currencies to the U.S. dollar can significantly affect the value of the investments and earnings of the Fund. Foreign investments may also subject the Fund to foreign government exchange restrictions, expropriation,
Smith Barney Real Return Strategy Fund 2005 Annual Report 25
Notes to Financial Statements (continued)
taxation or other political, social or economic developments, all of which could affect the market and/or credit risk of the investments.
(d) Security Transactions and Investment Income. Security transactions are accounted for on a trade date basis. Interest income, adjusted for amortization of premium and accretion of discount, is recorded on the accrual basis. Dividend income is recorded on the ex-dividend date. Foreign dividend income is recorded on the ex-dividend date or as soon as practical after the Fund determines the existence of a dividend declaration after exercising reasonable due diligence. The cost of investments sold is determined by use of the specific identification method. To the extent any issuer defaults on an expected interest payment, the Fund’s policy is to generally halt any additional interest income accruals and consider the realizability of interest accrued up to the date of default.
(e) REIT Distributions. The character of distributions received from Real Estate Investment Trusts (“REITs”) held by the Fund is generally comprised of net investment income, capital gains, and return of capital. It is the policy of the Fund to estimate the character of distributions received from underlying REITs based on historical data provided by the REITs. After each calendar year end, REITs report the true tax character of these distributions. Differences between the estimated and actual amounts reported by the REITs are reflected in the Fund’s records in the year in which they are reported by the REITs.
(f) Foreign Currency Translation. Investment securities and other assets and liabilities denominated in foreign currencies are translated into U.S. dollar amounts based upon prevailing exchange rates on the date of valuation. Purchases and sales of investment securities and income and expense items denominated in foreign currencies are translated into U.S. dollar amounts based upon prevailing exchange rates on the respective dates of such transactions.
The Fund does not isolate that portion of the results of operations resulting from changes in foreign exchange rates on investments from the fluctuations arising from changes in market prices of securities held. Such fluctuations are included with the net realized and unrealized gain or loss on investments.
Net realized foreign exchange gains or losses arise from sales of foreign currencies, including gains and losses on forward foreign currency contracts, currency gains or losses realized between the trade and settlement dates on securities transactions and the difference between the amounts of dividends, interest and foreign withholding taxes recorded on the Fund’s books and the U.S. dollar equivalent of the amounts actually received or paid. Net unrealized foreign exchange gains and losses arise from changes in the fair values of assets and liabilities, other than investments in securities, at the date of valuation, resulting from changes in exchange rates.
Foreign security and currency transactions may involve certain considerations and risks not typically associated with those of U.S. dollar denominated transactions as a result of, among other factors, the possibility of lower levels of governmental supervision and regulation of foreign securities markets and the possibility of political or economic instability.
(g) Distributions to Shareholders. Distributions from net investment income for the Fund, if any, are declared and paid on a quarterly basis. Distributions of net realized gains, if
26 Smith Barney Real Return Strategy Fund 2005 Annual Report
Notes to Financial Statements (continued)
any, are declared at least annually. Distributions are recorded on the ex-dividend date and are determined in accordance with income tax regulations, which may differ from GAAP.
(h) Class Accounting. Investment income, common expenses and realized/unrealized gain (loss) on investments are allocated to the various classes of the Fund on the basis of daily net assets of each class. Fees relating to a specific class are charged directly to that class.
(i) Federal and Other Taxes. It is the Fund’s policy to comply with the federal income and excise tax requirements of the Internal Revenue Code of 1986, as amended, applicable to regulated investment companies. Accordingly, the Fund intends to distribute substantially all of its taxable income and net realized gains on investments, if any, to shareholders each year. Therefore, no federal income tax provision is required in the Fund’s financial statements. Under the applicable foreign tax laws, a withholding tax may be imposed on interest, dividends and capital gains at various rates.
(j) Reclassification. GAAP requires that certain components of net assets be adjusted to reflect permanent differences between financial and tax reporting. These reclassifications have no effect on net assets or net asset values per share. During the current year, the following reclassifications have been made:
| | | | | | | | | | | |
| | | |
| | | Undistributed Net
Investment
Income | | Undistributed
Net Realized Gains | | | Paid-in Capital | |
(a) | | $ | 40,431 | | | — | | | $ | (40,431 | ) |
(b) | | | 20,353 | | $ | (20,353 | ) | | | — | |
|
|
| (a) | | Reclassifications are primarily due to non-deductible 12b-1 fees and non-deductible offering costs. |
| (b) | | Reclassifications are primarily due to foreign currency transactions treated as ordinary income for tax purposes and differences between book and tax amortization of premium on fixed income securities. |
(k) Organization Costs. It is the Fund’s policy to expense all costs related to the organization of the Fund as they are incurred. For the period ended September 30, 2005, the Fund paid $41,500 for audit and legal fees related to the initial registration of the Fund and related activities.
| 2. | Management Agreement and Other Transactions with Affiliates |
Smith Barney Fund Management LLC (“SBFM”), an indirect wholly-owned subsidiary of Citigroup Inc. (“Citigroup”), acts as investment manager to the Fund. The Fund pays SBFM an investment management fee calculated at an annual rate of 0.65% of the Fund’s average daily net assets. This fee is calculated daily and paid monthly.
During the period ended September 30, 2005, the Fund’s Class A, B and C shares had voluntary expense limitations in place of 1.20%, 1.95%, and 1.95%, respectively. These expense limitations can be terminated at anytime by SBFM. During the period November 12, 2004 through September 30, 2005, SBFM voluntarily waived its entire investment management fee. In addition, for the period November 12, 2004 through September 30, 2005, SBFM reimbursed the Fund for other operating expenses in the amount of $114,751.
Citigroup Asset Management Limited (“CAM Ltd.”), an affiliate of SBFM, serves as investment sub-adviser to the Fund pursuant to a Sub-Advisory Agreement. CAM Ltd.
Smith Barney Real Return Strategy Fund 2005 Annual Report 27
Notes to Financial Statements (continued)
manages the Fund’s Energy Securities segment under the supervision of SBFM. CAM Ltd. receives a fee from SBFM, not the Fund, for its services, computed daily and paid monthly, at the annual rate of 0.45% of the Fund’s average daily net assets allocated to the Energy Securities segment.
TIMCO Asset Management, Inc. (“TIMCO”), formerly known as Travelers Investment Management Company, also an affiliate of SBFM, serves as investment sub-adviser to the Fund pursuant to a Sub-Advisory Agreement. TIMCO manages the Fund’s Real Estate Securities and Metals and Mining Securities segments under the supervision of SBFM. TIMCO receives a fee from SBFM, not the Fund, for its services, computed daily and paid monthly, at the annual rate of 0.45% of the Fund’s average daily net assets allocated to the Real Estate Securities and Metals and Mining Securities segments.
Citicorp Trust Bank, fsb. (“CTB”), another subsidiary of Citigroup, acts as the Fund’s transfer agent. PFPC Inc. (“PFPC”) acts as the Fund’s sub-transfer agent. CTB receives account fees and asset-based fees that vary according to the size and type of account. PFPC is responsible for shareholder recordkeeping and financial processing for all shareholder accounts and is paid by CTB. During the period November 12, 2004 through September 30, 2005, the Fund paid transfer agent fees of $4,327 to CTB.
Citigroup Global Markets Inc. (“CGM”), another indirect wholly-owned subsidiary of Citigroup, acts as the Fund’s distributor.
There is a maximum initial sales charge of 5.00% for Class A shares. There is a contingent deferred sales charge (“CDSC”) of 5.00% on Class B shares, which applies if redemption occurs within one year from purchase payment and declines thereafter by 1.00% per year until no CDSC is incurred. Class C shares have a 1.00% CDSC, which applies if redemption occurs within one year from purchase payment. In addition, Class A shares have a 1.00% CDSC, which applies if redemption occurs within one year from purchase payment. This CDSC only applies to those purchases of Class A shares which, when combined with current holdings of Class A shares, equal or exceed $1,000,000 in the aggregate. These purchases do not incur a sales charge.
For the period November 12, 2004, through September 30, 2005, CGM and its affiliates received sales charges of approximately $154,000 on sales of the Fund’s Class A shares. In addition, for the period November 12, 2004, through September 30, 2005, CDSCs paid to CGM and its affiliates were approximately:
| | | | | | | |
| | |
| | | Class B | | Class C | |
CDSCs | | $ | 3,000 | | $ | 0 | * |
|
|
| * | | Amount represents less than $1,000. |
Certain officers and one Director of the Company are employees of Citigroup or its affiliates and do not receive compensation from the Company.
28 Smith Barney Real Return Strategy Fund 2005 Annual Report
Notes to Financial Statements (continued)
During the period ended September 30, 2005, the aggregate cost of purchases and proceeds from sales of investments (excluding short-term investments) and U.S. Government & Agency Obligations were as follows:
| | | | | | | |
| | |
| | | Investments | | U.S. Government &
Agency Obligations | |
Purchases | | $ | 19,777,751 | | $ | 6,321,854 | |
|
|
Sales | | | 6,949,901 | | | 1,300,737 | |
|
|
At September 30, 2005, the aggregate gross unrealized appreciation and depreciation of investments for federal income tax purposes were as follows:
| | | | |
Gross unrealized appreciation | | $ | 2,819,333 | |
Gross unrealized depreciation | | | (217,953 | ) |
|
|
Net unrealized appreciation | | $ | 2,601,380 | |
|
|
| 4. | Class Specific Expenses |
Pursuant to a Distribution Plan, the Fund pays a service fee with respect to its Class A, B and C shares calculated at the annual rate of 0.25% of the average daily net assets of each respective class. The Fund also pays a distribution fee with respect to its Class B and C shares calculated at the annual rate of 0.75% of the average daily net assets of each class, respectively. For the period November 12, 2004 through September 30, 2005, total Distribution fees, which are accrued daily and paid monthly, were as follows:
| | | | | | | | | |
| | | |
| | | Class A | | Class B | | Class C |
Distribution Fees | | $ | 27,542 | | $ | 19,488 | | $ | 14,224 |
|
For the period ended September 30, 2005, total Transfer Agent fees were as follows:
| | | | | | | | | |
| | | |
| | | Class A | | Class B | | Class C |
Transfer Agent Fees | | $ | 3,853 | | $ | 2,152 | | $ | 1,614 |
|
For the period ended September 30, 2005, total Shareholder Reports expenses were as follows:
| | | | | | | | | |
| | | |
| | | Class A | | Class B | | Class C |
Shareholder Reports Expenses | | $ | 24,810 | | $ | 22,188 | | $ | 12,370 |
|
Smith Barney Real Return Strategy Fund 2005 Annual Report 29
Notes to Financial Statements (continued)
| 5. | Distributions to Shareholders by Class |
| | | |
| |
| Net Investment Income | | Period Ended
September 30, 2005 |
Class A* | | $ | 246,666 |
Class B** | | | 33,191 |
Class C** | | | 22,754 |
|
Total | | $ | 302,611 |
|
| * | | For the period November 12, 2004 (commencement of operations) through September 30, 2005. |
| ** | | For the period November 15, 2004 (commencement of operations) through September 30, 2005. |
At September 30, 2005, the Company had ten billion shares of capital stock authorized with a par value of $0.001 per share. The Fund has the ability to issue multiple classes of shares. Each share of a class represents an identical interest in the Fund and has the same rights, except that each class bears certain direct expenses, including those specifically related to the distribution of its shares.
Transactions in shares of each class were as follows:
| | | | | | | |
| |
| | | Period Ended
September 30, 2005
| |
| | | Shares | | | Amount | |
Class A* | | | | | | | |
Shares sold | | 1,208,373 | | | $ | 13,876,263 | |
Shares issued on reinvestment | | 18,553 | | | | 230,077 | |
Shares repurchased | | (99,363 | ) | | | (1,156,258 | ) |
|
|
Net Increase | | 1,127,563 | | | $ | 12,950,082 | |
|
|
Class B** | | | | | | | |
Shares sold | | 362,405 | | | $ | 4,292,205 | |
Shares issued on reinvestment | | 2,195 | | | | 27,781 | |
Shares repurchased | | (59,661 | ) | | | (686,428 | ) |
|
|
Net Increase | | 304,939 | | | $ | 3,633,558 | |
|
|
Class C** | | | | | | | |
Shares sold | | 181,784 | | | $ | 2,110,650 | |
Shares issued on reinvestment | | 1,651 | | | | 20,680 | |
Shares repurchased | | (5,598 | ) | | | (66,747 | ) |
|
|
Net Increase | | 177,837 | | | $ | 2,064,583 | |
|
|
| * | | For the period November 12, 2004 (commencement of operations) through September 30, 2005. |
| ** | | For the period November 15, 2004 (commencement of operations) through September 30, 2005. |
30 Smith Barney Real Return Strategy Fund 2005 Annual Report
Notes to Financial Statements (continued)
| 7. | Income Tax Information and Distributions to Shareholders |
The tax character of distributions paid during the period ended September 30, 2005, was as follows:
| | | |
| | | 2005 |
Distributions paid from: | | | |
Ordinary Income | | $ | 302,611 |
|
Total taxable Distributions | | $ | 302,611 |
|
As of September 30, 2005, the components of accumulated earnings on a tax basis were as follows:
| | | |
Undistributed ordinary income — net | | $ | 193,154 |
Undistributed long-term capital gains — net | | | 30,007 |
|
Total undistributed earnings | | | 223,161 |
Unrealized appreciation(a) | | | 2,601,225 |
|
Total Accumulated Earnings/(Losses) — Net | | $ | 2,824,386 |
|
| (a) | | The difference between book-basis and tax-basis unrealized appreciation is attributable primarily to the tax deferral of losses on wash sales and the difference between book and tax amortization methods for premiums on fixed income securities. |
On May 31, 2005, the U.S. Securities and Exchange Commission (“SEC”) issued an order in connection with the settlement of an administrative proceeding against SBFM and CGM relating to the appointment of an affiliated transfer agent for the Smith Barney family of mutual funds (the “Funds”).
The SEC order finds that SBFM and CGM willfully violated Section 206(1) of the Investment Advisers Act of 1940 (“Advisers Act”). Specifically, the order finds that SBFM and CGM knowingly or recklessly failed to disclose to the boards of the Funds in 1999 when proposing a new transfer agent arrangement with an affiliated transfer agent that: First Data Investors Services Group (“First Data”), the Funds’ then-existing transfer agent, had offered to continue as transfer agent and do the same work for substantially less money than before; and that Citigroup Asset Management (“CAM”), the Citigroup business unit that includes the fund’s investment manager and other investment advisory companies, had entered into a side letter with First Data under which CAM agreed to recommend the appointment of First Data as sub-transfer agent to the affiliated transfer agent in exchange for among other things, a guarantee by First Data of specified amounts of asset management and investment banking fees to CAM and CGM. The order also finds that SBFM and CGM willfully violated Section 206(2) of the Advisers Act by virtue of the omissions discussed above and other misrepresentations and omissions in the materials provided to the Funds’ boards, including the failure to make clear that the affiliated transfer agent would earn a high profit for performing limited functions while First Data continued to perform almost all of the transfer agent functions, and the suggestion that the proposed arrangement was in the Funds’ best interests and that no viable alternatives existed. SBFM and CGM do not admit or deny any wrongdoing or liability. The settlement does not establish wrongdoing or liability for purposes of any other proceeding.
Smith Barney Real Return Strategy Fund 2005 Annual Report 31
Notes to Financial Statements (continued)
The SEC censured SBFM and CGM and ordered them to cease and desist from violations of Sections 206(1) and 206(2) of the Advisers Act. The order requires Citigroup to pay $208.1 million, including $109 million in disgorgement of profits, $19.1 million in interest, and a civil money penalty of $80 million. Approximately $24.4 million has already been paid to the Funds, primarily through fee waivers. The remaining $183.7 million, including the penalty, has been paid to the U.S. Treasury and will be distributed pursuant to a plan prepared by Citigroup and submitted for approval by the SEC. The order also requires that transfer agency fees received from the Funds since December 1, 2004 less certain expenses be placed in escrow and provides that a portion of such fees may be subsequently distributed in accordance with the terms of the order.
The order requires SBFM to recommend a new transfer agent contract to the Fund boards within 180 days of the entry of the order; if a Citigroup affiliate submits a proposal to serve as transfer agent or sub-transfer agent, an independent monitor must be engaged at the expense of SBFM and CGM to oversee a competitive bidding process. Under the order, Citigroup also must comply with an amended version of a vendor policy that Citigroup instituted in August 2004. That policy, as amended, among other things, requires that when requested by a Fund board, CAM will retain at its own expense an independent consulting expert to advise and assist the board on the selection of certain service providers affiliated with Citigroup.
At this time, there is no certainty as to how the proceeds of the settlement will be distributed, to whom such distributions will be made, the methodology by which such distributions will be allocated, and when such distributions will be made. Although there can be no assurance, Citigroup does not believe that this matter will have a material adverse effect on the Funds.
Beginning in August 2005, five class action lawsuits alleging violations of federal securities laws and state law were filed against CGM and SBFM, (collectively, the “Defendants”) based on the May 31, 2005 settlement order issued against the Defendants by the SEC described in Note 8. The complaints seek injunctive relief and compensatory and punitive damages, removal of SBFM as the adviser for the Smith Barney family of funds, rescission of the Funds’ management and other contracts with SBFM, recovery of all fees paid to SBFM pursuant to such contracts, and an award of attorneys’ fees and litigation expenses.
On October 5, 2005, a motion to consolidate the five actions and any subsequently-filed, related action was filed. That motion contemplates that a consolidated amended complaint alleging substantially similar causes of action will be filed in the future.
As of the date of this report, CAM believes that resolution of the pending lawsuit will not have a material effect on the financial position or results of operations of the Funds or the ability of the Advisers and their affiliates to continue to render services to the Funds under their respective contracts.
* * *
Beginning in June 2004, class action lawsuits alleging violations of the federal securities laws were filed against CGM and a number of its affiliates, including SBFM and Salomon Brothers Asset Management Inc (the “Advisers”), substantially all of the mutual funds
32 Smith Barney Real Return Strategy Fund 2005 Annual Report
Notes to Financial Statements (continued)
managed by the Advisers, including the Fund (the “Funds”), and directors or trustees of the Funds (collectively, the “Defendants”). The complaints alleged, among other things, that CGM created various undisclosed incentives for its brokers to sell Smith Barney and Salomon Brothers funds. In addition, according to the complaints, the Advisers caused the Funds to pay excessive brokerage commissions to CGM for steering clients towards proprietary funds. The complaints also alleged that the defendants breached their fiduciary duty to the Funds by improperly charging Rule 12b-1 fees and by drawing on fund assets to make undisclosed payments of soft dollars and excessive brokerage commissions. The complaints also alleged that the Funds failed to adequately disclose certain of the allegedly wrongful conduct. The complaints sought injunctive relief and compensatory and punitive damages, rescission of the Funds’ contracts with the Advisers, recovery of all fees paid to the Advisers pursuant to such contracts and an award of attorneys’ fees and litigation expenses.
On December 15, 2004, a consolidated amended complaint (the “Complaint”) was filed alleging substantially similar causes of action. While the lawsuit is in its earliest stages, to the extent that the Complaint purports to state causes of action against the Funds, CAM believes the Funds have significant defenses to such allegations, which the Funds intend to vigorously assert in responding to the Complaint.
Additional lawsuits arising out of these circumstances and presenting similar allegations and requests for relief may be filed against the Defendants in the future.
As of the date of this report, CAM and the Funds believe that the resolution of the pending lawsuit will not have a material effect on the financial position or results of operations of the Funds or the ability of the Advisers and their affiliates to continue to render services to the Funds under their respective contracts.
The Defendants have moved to dismiss the Complaint. Those motions are pending before the court.
On June 24, 2005, Citigroup announced that it has signed a definitive agreement under which Citigroup will sell substantially all of its worldwide asset management business to Legg Mason, Inc. (“Legg Mason”).
As part of this transaction, SBFM (the “Manager”), currently an indirect wholly owned subsidiary of Citigroup, would become an indirect wholly owned subsidiary of Legg Mason. The Manager is the investment manager to the Fund.
The transaction is subject to certain regulatory approvals, as well as other customary conditions to closing. Subject to such approvals and the satisfaction of the other conditions, Citigroup expects the transaction to be completed later this year.
Under the 1940 Act, consummation of the transaction will result in the automatic termination of the Fund’s investment management agreement with the Manager and the subadvisory agreements between the Manager and CAM Ltd. and TIMCO. Therefore, the Fund’s Board has approved a new investment management agreement between the Fund and the Manager and subadvisory agreements between the Manager and CAM Ltd. and TIMCO to become effective upon the closing of the sale to Legg Mason. The new investment management agreement and subadvisory agreements have been presented to the shareholders of the Fund for their approval.
Smith Barney Real Return Strategy Fund 2005 Annual Report 33
Notes to Financial Statements (continued)
The Fund has received information from CAM concerning SBFM, an investment management company that is part of CAM. The information received from CAM is as follows:
On September 16, 2005, the staff of the SEC informed SBFM that the staff is considering recommending that the SEC institute administrative proceedings against SBFM for alleged violations of Sections 19(a) and 34(b) of the 1940 Act (and related Rule 19a-1). The notification is a result of an industry wide inspection undertaken by the SEC and is based upon alleged deficiencies in disclosures regarding dividends and distributions paid to shareholders of certain funds. In connection with the contemplated proceedings, the staff may seek a cease and desist order and/or monetary damages from SBFM.
Although there can be no assurance, SBFM believes that this matter is not likely to have a material adverse effect on the Fund or SBFM’s ability to perform investment management services relating to the Fund.
The SEC staff’s recent notification will not affect the sale by Citigroup of substantially all of CAM’s worldwide business to Legg Mason, which Citigroup continues to expect will occur in the fourth quarter of this year.
34 Smith Barney Real Return Strategy Fund 2005 Annual Report
Report of Independent Registered Public Accounting Firm
The Shareholders and Board of Directors
Smith Barney Investment Funds Inc.:
We have audited the accompanying statement of assets and liabilities, including the schedule of investments, of Smith Barney Real Return Strategy Fund of Smith Barney Investment Funds Inc. as of September 30, 2005, and the related statement of operations, changes in net assets, and the financial highlights for the period November 12, 2004 (commencement of operations) to September 30, 2005. These financial statements and the financial highlights are the responsibility of the Fund’s management. Our responsibility is to express an opinion on these financial statements and financial highlights based on our audit.
We conducted our audit in accordance with the standards of the Public Company Accounting Oversight Board (United States). Those standards require that we plan and perform the audit to obtain reasonable assurance about whether the financial statements and financial highlights are free of material misstatement. An audit includes examining, on a test basis, evidence supporting the amounts and disclosures in the financial statements. Our procedures included confirmation of securities owned as of September 30, 2005, by correspondence with the custodian and brokers or by other appropriate auditing procedures. An audit also includes assessing the accounting principles used and significant estimates made by management, as well as evaluating the overall financial statement presentation. We believe that our audit provides a reasonable basis for our opinion.
In our opinion, the financial statements and financial highlights referred to above present fairly, in all material respects, the financial position of Smith Barney Real Return Strategy Fund of Smith Barney Investment Funds Inc. as of September 30, 2005, and the results of its operations, the changes in its net assets, and the financial highlights for the period from November 12, 2004 to September 30, 2005, in conformity with U.S. generally accepted accounting principles.

New York, New York
November 18, 2005
Smith Barney Real Return Strategy Fund 2005 Annual Report 35
Board Approval of Management Agreement and Subadvisory Agreements (unaudited)
At separate meetings of the Fund’s Board of Directors, the Board considered the re-approval for an annual period of the Fund’s management agreement, pursuant to which Smith Barney Fund Management LLC (the “Manager”) provides the Fund with investment advisory and administrative services, and the Fund’s sub-advisory agreements, pursuant to which Citigroup Asset Management Limited (“CAM Ltd.”) manages the Fund’s energy securities segment and Travelers Investment Management Company (“TIMCO” and, together with CAM Ltd., the “Sub-Advisers”) manages the Fund’s real estate and metals and mining securities segments. (The management agreement and sub-advisory agreements are collectively referred to as the “Agreements.”) The Board members who are not “interested persons” (as defined in the Investment Company Act of 1940, as amended (the “Independent Directors”)) of the Fund were assisted in their review by Fund counsel and independent legal counsel and met with independent legal counsel in executive sessions separate from representatives of the Manager and Sub-Advisers. The Independent Directors requested and received information from the Manager and Sub-Advisers they deemed reasonably necessary for their review of the Agreements and the performance of the Manager and Sub-Advisers. This information was initially reviewed by a special committee comprised of all of the Independent Directors and then by the full Board. Prior to the Board’s deliberations, Citigroup had announced an agreement to sell the Manager to Legg Mason, which, subject to certain approvals, was expected to be effective later in the year. Consequently, representatives of Legg Mason discussed with the Board Legg Mason’s intentions regarding the preservation and strengthening of the Manager’s business. The Independent Directors also requested and received certain assurances from senior management of Legg Mason regarding the continuation of the Fund’s portfolio management team and of the level of other services provided to the Fund and its shareholders should the sale of the Manager be consummated. At subsequent Board meetings, representatives of Citigroup Asset Management (“CAM”) and Legg Mason made additional presentations to and responded to further questions from the Board regarding Legg Mason’s acquisition of the Manager. After considering these presentations and reviewing additional written materials provided by CAM and Legg Mason, the Board, including the Independent Directors, approved, subject to shareholder approval, new Agreements permitting the Manager and Sub-Advisers to continue to provide their services to the Fund after consummation of the sale of the Manager to Legg Mason.
In voting to approve the Agreements, the Independent Directors considered whether the approval of the Agreements would be in the best interests of the Fund and its shareholders, an evaluation based on several factors including those discussed below.
Analysis of the Nature, Extent and Quality of the Services provided to the Fund
The Board received a presentation from representatives of the Manager regarding the nature, extent and quality of services provided to the Fund and other funds in the CAM fund complex. In addition, the Independent Directors received and considered other information regarding the services provided to the Fund by the Manager and Sub-Advisers
36 Smith Barney Real Return Strategy Fund 2005 Annual Report
Board Approval of Management Agreement and Subadvisory Agreements (unaudited) (continued)
under the respective Agreement during the past year, including a description of the administrative and other services rendered to the Fund and its shareholders by the Manager. The Board members also considered the Manager’s supervisory activities over the Sub-Advisers. The Board noted information received at regular meetings throughout the year related to the services rendered by the Manager and Sub-Advisers about the management of the Fund’s affairs and the Manager’s role in coordinating the activities of the Sub-Advisers and the Fund’s other service providers. The Board’s evaluation of the services provided by the Manager and Sub-Advisers took into account the Board’s knowledge and familiarity gained as Board members of funds in the CAM fund complex, including the scope and quality of the Manager’s investment management and other capabilities and the quality of its administrative and other services. The Board observed that the scope of services provided by the Manager and Sub-Advisers had expanded over time as a result of regulatory and other developments, including maintaining and monitoring their own and the Fund’s expanded compliance programs. The Board also considered the Manager’s response to recent regulatory compliance issues affecting it and the CAM fund complex. The Board reviewed information received from the Manager and the Fund’s Chief Compliance Officer regarding the implementation to date of the Fund’s compliance policies and procedures established pursuant to Rule 38a-1 under the Investment Company Act of 1940, as amended.
The Board reviewed the qualifications, backgrounds and responsibilities of the Fund’s senior personnel and the portfolio management team primarily responsible for the day-to-day portfolio management of the Fund. The Board also considered the willingness of the Manager to consider and implement organizational changes to improve investment results and the services provided to the CAM fund complex. The Board noted that the Manager’s Office of the Chief Investment Officer, comprised of the senior officers of the investment teams managing the funds in the CAM complex, participates in reporting to the Board on investment matters. The Board also considered, based on its knowledge of the Manager and its affiliates, the financial resources available to CAM and its parent organization, Citigroup Inc.
The Board also considered the Manager’s brokerage policies and practices, the standards applied in seeking best execution, the Manager’s policies and practices regarding soft dollars, the use of a broker affiliated with the Manager and the existence of quality controls applicable to brokerage allocation procedures. In addition, management also reported to the Board on, among other things, its business plans, recent organizational changes and portfolio manager compensation plan.
The Board concluded that, overall, it was satisfied with the nature, extent and quality of services provided (and expected to be provided) under the respective Agreement by the Manager and the Sub-Advisers.
Fund Performance
The Board received and reviewed performance information for the Fund and for a group of comparable funds (the “Performance Universe”) selected by Lipper Inc., an
Smith Barney Real Return Strategy Fund 2005 Annual Report 37
Board Approval of Management Agreement and Subadvisory Agreements (unaudited) (continued)
independent provider of investment company data. The Board was provided with a description of the methodology Lipper used to determine the similarity of the Fund with the funds included in the Performance Universe. The Board also was provided with information comparing the Fund’s performance since its inception to the Lipper category averages. The Board members noted that they had also received and discussed with management information at periodic intervals comparing the Fund’s performance against its benchmark index. The information comparing the Fund’s performance to that of the Performance Universe, consisting of all retail and institutional funds classified as “multi-cap core funds” by Lipper, was for the period November 30, 2004 through March 31, 2005. The Fund performed better than the median for the period. It was noted that the Fund commenced operations in November 2004 and, thus, had a limited performance track record upon which to judge the performance of the Manager and Sub-Advisers. The Board also reviewed performance information provided by the Manager for periods ended June 2005, which showed the Fund’s performance continued to be better than the Lipper category average during the second quarter. Based on its review, the Board was satisfied with the Fund’s performance.
Management Fees and Expense Ratios
The Board reviewed and considered the contractual management fee (the “Contractual Management Fee”) payable by the Fund to the Manager for investment advisory and administrative services in light of the nature, extent and quality of the management services provided by the Manager. The Board noted that the Manager, and not the Fund, pays the sub-investment advisory fees to the Sub-Advisers and, accordingly, that the retention of the Sub-Advisers does not increase the fees and expenses incurred by the Fund. The Board also reviewed and considered the fee waiver and/or expense reimbursement arrangements in place for the Fund during the review period and considered whether any actual fee rate (after taking the waivers and/or reimbursements into account) (the “Actual Management Fee”) and whether the fee waivers and reimbursements could be discontinued. It was noted that the Manager had waived receipt of its entire management fee.
Additionally, the Board received and considered information comparing the Fund’s Contractual and Actual Management Fees and the Fund’s overall expense ratio with those of funds in both the relevant expense group (the “Expense Group”) and a broader group of funds, each selected and provided by Lipper. The Board also reviewed information regarding the fees the Manager charged any of its other U.S. clients investing primarily in an asset class similar to that of the Fund including, where applicable, separate accounts. The Manager reviewed with the Board the significant differences in the scope of services provided to the Fund and to these other clients, noting that the Fund is provided with regulatory compliance and administrative services, office facilities and fund officers (including the Fund’s chief executive, chief financial and chief compliance officers), and that the Manager coordinates and oversees the provision of services to the Fund by other fund service providers, including the Sub-Advisers. The Board considered the fee comparisons in light of the scope of services required to manage these different types of accounts. The
38 Smith Barney Real Return Strategy Fund 2005 Annual Report
Board Approval of Management Agreement and Subadvisory Agreements (unaudited) (continued)
Board received an analysis of complex-wide management fees provided by the Manager, which, among other things, set out a proposed framework of fees based on asset classes.
Management also discussed with the Board the Fund’s distribution arrangements. The Board was provided with information concerning revenues received by and certain expenses incurred by the Fund’s affiliated distributors and how the amounts received by the distributors are expended.
The information comparing the Fund’s Contractual and Actual Management Fees as well as its actual total expense ratio to its Expense Group, consisting of 14 retail front-end load funds (including the Fund) classified as “multi-cap core funds” by Lipper, showed that the Fund’s Contractual and Actual Management Fees were lower than the median of management fees paid by the other funds in the Expense Group. The Board noted that the Fund’s actual total expense ratio was the lowest of the total expense ratios of the funds in the Expense Group.
Taking all of the above into consideration, the Board determined that the management fee was reasonable in light of the comparative performance and expense information and the nature, extent and quality of the services provided to the Fund under the Agreements.
Manager Profitability
The Board received and considered a profitability analysis of the Manager and its affiliates in providing services to the Fund. The Board also received profitability information with respect to the CAM fund complex as a whole. In addition, the Board received information with respect to the Manager’s allocation methodologies used in preparing this profitability data as well as a report from an outside consultant that had reviewed the Manager’s methodology. The Board also noted the profitability percentage ranges determined by appropriate court cases to be reasonable given the services rendered to investment companies. The Board also considered the Manager’s voluntary waiver of its entire management fee and the effect such waiver had on the Manager’s profitability managing the Fund. The Board determined that the Manager’s profitability was not excessive in light of the nature, extent and quality of the services provided to the Fund.
Economies of Scale
The Board received and considered information regarding whether there have been economies of scale with respect to the management of the Fund, whether the Fund has appropriately benefited from any economies of scale, and whether there is potential for realization of any further economies of scale. The Board considered whether economies of scale in the provision of services to the Fund were being passed along to the shareholders. The Board also considered whether alternative management fee structures (such as with breakpoints) would be more appropriate or reasonable taking into consideration economies of scale or other efficiencies.
The Board noted that, as a relatively new fund with assets of less $20 million, consideration of economies of scale with respect to the Fund was premature. The Board also noted that as the Fund’s assets increase over time, the Fund and its shareholders should realize economies of scale as certain expenses, such as fixed Fund fees, become a smaller
Smith Barney Real Return Strategy Fund 2005 Annual Report 39
Board Approval of Management Agreement and Subadvisory Agreements (unaudited) (continued)
percentage of overall assets. The Board noted that it appeared that the benefits of any economies of scale also would be appropriately shared with shareholders through increased investment in fund management and administration resources.
Other Benefits to the Manager
The Board considered other benefits received by the Manager and its affiliates, including the Sub-Advisers, as a result of the Manager’s relationship with the Fund, including any soft dollar arrangements, receipt of brokerage commissions and the opportunity to offer additional products and services to Fund shareholders.
In light of the costs of providing investment management and other services to the Fund and the Manager’s ongoing commitment to the Fund, the profits and other ancillary benefits that the Manager and its affiliates received were considered reasonable.
Based on their discussions and considerations, including those described above, the Board members approved the Agreements to continue for another year.
No single factor reviewed by the Board was identified by the Board as the principal factor in determining whether to approve the Agreements.
Approval of the New Agreements
The Board, including the Independent Directors, approved new Agreements to take effect if shareholders approve the new Agreements and Legg Mason acquires the Manager (the “Transaction”). Such approval was based on a number of factors, including Legg Mason’s assurances regarding the continuation of the Fund’s portfolio management team and the level of other services provided after the Transaction, and several of the factors discussed above continued to be relevant to the Board’s deliberations regarding the new Agreements. The Board also considered the following:
(i) the reputation, financial strength and resources of Legg Mason and its investment advisory subsidiaries;
(ii) that representatives of CAM and Legg Mason advised the Board that following the Transaction, there is not expected to be any diminution in the nature, quality and extent of services provided to the Fund and its shareholders by the Manager and Sub-Advisers, including compliance services and no change to the division of responsibilities between the Manager and each Sub-Adviser and the services provided by each of them;
(iii) that representatives of Legg Mason advised the Board that Legg Mason has no present intention to alter the expense waivers and/or reimbursements currently in effect and, while it reserves the right to do so in the future, it would consult with the Board before making any changes;
(iv) the assurances from Citigroup and Legg Mason that, for a three year period following the closing of the Transaction, the Manager and Sub-Advisers will have substantially the same access to the Citigroup sales force when distributing Fund shares as is currently provided to CAM and that other arrangements between the Manager and Sub-Advisers and Citigroup sales channels will be preserved;
40 Smith Barney Real Return Strategy Fund 2005 Annual Report
Board Approval of Management Agreement and Subadvisory Agreements (unaudited) (continued)
(v) that Legg Mason and Citigroup intend to enter into an agreement in connection with the Transaction under which Citigroup-affiliated broker-dealers will continue to offer the Fund as an investment product, and the potential benefits to Fund shareholders from this and other third-party distribution access;
(vi) the potential benefits to Fund shareholders from being part of a combined fund family with Legg Mason-sponsored funds, including possible economies of scale and access to investment opportunities;
(vii) that Citigroup and Legg Mason would derive benefits from the Transaction and that, as a result, they have a financial interest in the matters that were being considered;
(viii) the potential effects of regulatory restrictions on the Fund if Citigroup-affiliated broker-dealers remain the Fund’s principal underwriters; and
(ix) the fact that the Fund’s total advisory and administrative fees will not increase by virtue of the new Agreements, but will remain the same.
Based on their review of the materials provided and the assurances they had received from senior management of CAM and Legg Mason, the Board members determined that the Transaction was not expected to adversely affect the nature, extent and quality of services provided by the Manager and each Sub-Adviser and that the Transaction was not expected to have a material adverse effect on the ability of the Manager and Sub-Advisers to provide those services. It was noted, however, that changes in portfolio managers and other personnel could occur following the Transaction or after the combination of CAM’s operations with those of Legg Mason subsidiaries. The Board members noted that if current portfolio managers or other personnel cease to be available, the Board would consider all available options, which could include seeking the investment advisory or other services of Legg Mason affiliates or investment advisers not affiliated with Legg Mason. In this regard, it was noted that Legg Mason indicated that it could potentially make available to the Manager or Sub-Advisers additional portfolio management resources. Accordingly, the Board members concluded that, overall, they were satisfied at the present time with assurances from Legg Mason and CAM as to the expected nature, extent and quality of the services to be provided to the Fund under the new Agreements.
In evaluating the costs of the services to be provided by the Manager and Sub-Advisers under the new Agreements and the profitability to the Manager and Sub-Advisers resulting from their relationships with the Fund, the Board members considered, among other things, whether advisory and administrative fees or other expenses would change as a result of the Transaction. Based on their review of the materials provided and the assurances they had received from senior management of CAM and Legg Mason, the Board members determined that the Transaction would not increase the total fees payable for advisory and administrative services and that overall Fund expenses were not expected to increase materially as a result of the Transaction. The Board members noted that it was not possible to predict how the Transaction would affect the profitability to the Manager and Sub-Advisers from their relationship with the Fund, but that they had been satisfied in their most recent review of the current Agreements that the level of profitability from their relationship with the Fund was not excessive.
Smith Barney Real Return Strategy Fund 2005 Annual Report 41
Board Approval of Management Agreement and Subadvisory Agreements (unaudited) (continued)
In evaluating the fall-out benefits to be received by the Manager and Sub-Advisers under the new Agreements, the Board members considered whether the Transaction would have an impact on the fall-out benefits received by virtue of the current Agreements. The Board members determined that those benefits could include an increased ability for Legg Mason to distribute shares of its current funds and other investment products and to obtain research services using the Fund’s portfolio transaction brokerage. The Board members noted that any such benefits were difficult to quantify with certainty at this time, and indicated that they would continue to evaluate them going forward.
In reviewing the Transaction, the Board Members considered, among other things, whether advisory and administrative fees or other expenses would change as a result of the Transaction. Based on the assurances they had received from senior management of CAM and Legg Mason, the Board members determined that as a result of the Transaction, the Fund’s total advisory and administrative fees would not increase. The Board members concluded that because the advisory and administrative fees for the Fund were not expected to increase as a result of the Transaction, the Fund’s fees for advisory and administrative services remain appropriate and that no additional fee reductions or breakpoints were necessary at this time.
Finally, the Board members noted Legg Mason’s considerable investment management experience and capabilities, but were unable to predict what effect, if any, consummation of the Transaction would have on the future performance of the Fund.
42 Smith Barney Real Return Strategy Fund 2005 Annual Report
Additional Information (unaudited)
Information about Directors and Officers
The business and affairs of the Smith Barney Real Return Strategy Fund (the “Fund”) are managed under the direction of the Board of Directors of Smith Barney Investment Funds Inc. (“Company”). Information pertaining to the Directors and certain officers of the Company is set forth below. The Statement of Additional Information includes additional information about the Directors and is available, without charge, upon request by calling Citicorp Trust Bank, fsb. at 1-800-451-2010 or (PFPC at 1-800-451-2010 and Primerica Shareholder Services at 1-800-544-5445).
| | | | | | | | | | |
| | | | | |
| Name, Address and Birth Year | | Position(s)
Held with
Fund | | Term of
Office* and
Length of
Time
Served | | Principal
Occupation(s) During Past
5 Years | | Number of
Portfolios
in the Fund
Complex
Overseen
by Director | | Other Board
Memberships
Held by Director |
| Non-Interested Directors: | | | | | | |
Paul R. Ades Paul R. Ades, PLLC 181 West Main Street, Suite C Babylon, NY 11702 Birth Year: 1940 | | Director | | Since
1994 | | Law Firm of Paul R. Ades, PLLC (April 2000 to present); Partner in Law Firm of Murov & Ades, Esq. (from November 1976 to March 2000) | | 15 | | None |
| | | | | |
Dwight B. Crane Harvard Business School Soldiers Field Morgan Hall #375 Boston, MA 02163 Birth Year: 1937 | | Director | | Since
1981 | | Professor, Harvard Business School | | 49 | | None |
| | | | | |
Frank G. Hubbard Avatar International, Inc. 87 Whittredge Road Summit, NJ 07901 Birth Year: 1937 | | Director | | Since
1993 | | President of Avatar International, Inc. (business development) (since 1998); Vice President of S&S Industries (chemical distribution) (from 1995 to 1998) | | 15 | | None |
| | | | | |
Jerome H. Miller c/o Smith Barney Mutual Funds
125 Broad Street, 11th Floor New York, NY 10004 Birth Year: 1938 | | Director | | Since
1998 | | Retired | | 15 | | None |
| | | | | |
Ken Miller Young Stuff Apparel Group, Inc. 930 Fifth Avenue Suite 610 New York, NY 10021 Birth Year: 1942 | | Director | | Since
1994 | | President of Young Stuff Apparel Group Inc. (since 1963) | | 15 | | None |
Smith Barney Real Return Strategy Fund 2005 Annual Report 43
Additional Information (unaudited) (continued)
| | | | | | | | | | |
| | | | | |
| Name, Address and Birth Year | | Position(s)
Held with
Fund | | Term of
Office* and
Length of
Time
Served | | Principal
Occupation(s) During Past
5 Years | | Number of
Portfolios
in the Fund
Complex
Overseen
by Director | | Other Board
Memberships
Held by
Director |
| Interested Director: | | | | | | |
R. Jay Gerken, CFA** CAM 399 Park Avenue, Mezzanine New York, NY 10022 Birth Year: 1951 | | Chairman, President and Chief
Executive Officer | | Since
2002 | | Managing Director of Citigroup Global Markets Inc. (“CGM”); Chairman, President and Chief Executive Officer of Smith Barney Fund Management LLC (“SBFM”), and Citi Fund Management Inc. (“CFM”); President and Chief Executive Officer of certain mutual funds associated with Citigroup Inc. (“Citigroup”); Formerly Portfolio Manager of Smith Barney Allocation Series Inc. (from 1996 to 2001) and Smith Barney Growth and Income Fund (from 1996 to 2000); Chairman, President and Chief Executive Officer of Travelers Investment Advisers, Inc. (“TIA”) (from 2002 to 2005) | | 171 | | None |
| Officers: | | | | | | |
Andrew B. Shoup CAM 125 Broad Street, 11th Floor New York, NY 10004 Birth Year: 1956 | | Senior Vice President
and Chief Administrative Officer | | Since
2003 | | Director of CAM; Senior Vice President and Chief Administrative Officer of mutual funds associated with Citigroup; Head of International Funds Administration of CAM (from 2001 to 2003); Director of Global Funds Administration of CAM (from 2000 to 2001); Head of U.S. Citibank Funds Administration of CAM (from 1998 to 2000) | | N/A | | N/A |
44 Smith Barney Real Return Strategy Fund 2005 Annual Report
Additional Information (unaudited) (continued)
| | | | | | | | | | |
| | | | | |
| Name, Address and Birth Year | | Position(s)
Held with
Fund | | Term of
Office* and
Length of
Time
Served | | Principal
Occupation(s) During Past
5 Years | | Number of
Portfolios
in the Fund
Complex
Overseen
by Director | | Other Board
Memberships
Held by
Director |
Kaprel Ozsolak CAM 125 Broad Street, 11th Floor New York, NY 10004 Birth Year: 1965 | | Chief Financial Officer and Treasurer | | Since
2004 | | Vice President of CGM; Chief Financial Officer and Treasurer of certain mutual funds associated with Citigroup; Controller of certain mutual funds associated with Citigroup (from 2002 to 2004) | | N/A | | N/A |
| | | | | |
Steven Bleiberg CAM 399 Park Avenue, 4th Floor New York, NY 10022 Birth Year: 1959 | | Vice President and Investment Officer | | Since
2004 | | Managing Director and Head of Global Investment Strategy of CAM (since 2003); International Equity Portfolio Manager of Credit Suisse Asset Management (from 1991 to 1999); Chairman of the Global Equity Strategy Group (from 1999 to 2003) | | N/A | | N/A |
| | | | | |
Roger Garrett CAM Ltd. 33 Canada Square/Citigroup Centre Canary Wharf London, UK Birth Year: 1959 | | Vice President and Investment Officer | | Since
2005 | | Director and Senior Portfolio Manager of CAM Ltd.; Global Equities (from 1994 to 2004); Senior Portfolio Manager Emerging Markets Equities | | N/A | | N/A |
| | | | | |
William Hamlyn CAM Ltd. 33 Canada Square/Citigroup Centre Canary Wharf London, UK Birth Year: 1971 | | Vice President and Investment Officer | | Since
2005 | | Portfolio Manager of Global Equities of CAM Ltd. (since 2003); Portfolio Manager of AXA Investment Managers (from 1999 to 2003) | | N/A | | N/A |
| | | | | |
John W. Lau TIMCO 100 First Stamford Place Stamford, CT 06902 Birth Year: 1965 | | Vice President and Investment Officer | | Since
2005 | | Director of TIMCO (since 1995); Chartered Financial Analyst | | N/A | | N/A |
Smith Barney Real Return Strategy Fund 2005 Annual Report 45
Additional Information (unaudited) (continued)
| | | | | | | | | | |
| | | | | |
| Name, Address and Birth Year | | Position(s)
Held with
Fund | | Term of
Office* and
Length of
Time
Served | | Principal
Occupation(s) During Past
5 Years | | Number of
Portfolios
in the Fund
Complex
Overseen
by Director | | Other Board
Memberships
Held by
Director |
Frederick Marki CAM 399 Park Avenue New York, NY 10022 Birth Year: 1961 | | Vice President and Investment Officer | | Since
2004 | | Director of CGM | | N/A | | N/A |
| | | | | |
Lillyn Teh TIMCO 100 First Stamford Place Stamford, CT 06902 Birth Year: 1962 | | Vice President and Investment Officer | | Since
2005 | | Director and Head of Quantitative Research of TIMCO and joined CAM in1997 | | N/A | | N/A |
| | | | | |
David A. Torchia CAM 399 Park Avenue, 4th Floor New York, NY 10022 Birth Year: 1959 | | Vice President and Investment Officer | | Since
2002 | | Managing Director of CGM | | N/A | | N/A |
| | | | | |
Daniel Willey TIMCO 100 First Stamford Place Stamford, CT 06902 Birth Year: 1955 | | Vice President and Investment Officer | | Since
2004 | | Director, President and CEO of TIMCO (since 1994); Portfolio Manager and Head Equity Trader of TIMCO | | N/A | | N/A |
| | | | | |
Andrew Beagley CAM 399 Park Avenue, 4th Floor New York, NY 10022 Birth Year: 1962 | | Chief Anti-Money Laundering Compliance Officer Chief Compliance Officer | | Since 2002 Since 2004 | | Director of CGM (since 2000); Director of Compliance, North America, CAM (since 2000); Chief Anti-Money Laundering Compliance Officer and Vice President of certain mutual funds associated with Citigroup; Director of Compliance, Europe, the Middle East and Africa, CAM (from 1999 to 2000); Chief Compliance Officer, SBFM and CFM; Formerly Chief Compliance Officer, TIA (from 2002 to 2005) | | N/A | | N/A |
| | | | | |
Steven Frank CAM 125 Broad Street New York, NY 10004 Birth Year: 1967 | | Controller | | Since 2005 | | Vice President of CAM (since 2002); Controller of certain mutual funds associated with Citigroup; Assistant Controller of CAM (from 2001 to 2005); Accounting Manager of CAM (from 1996 to 2001) | | N/A | | N/A |
46 Smith Barney Real Return Strategy Fund 2005 Annual Report
Additional Information (unaudited) (continued)
| | | | | | | | | | |
| | | | | |
| Name, Address and Birth Year | | Position(s)
Held with
Fund | | Term of
Office* and
Length of
Time
Served | | Principal
Occupation(s) During Past
5 Years | | Number of
Portfolios
in the Fund
Complex
Overseen
by Director | | Other Board
Memberships
Held by
Director |
Robert I. Frenkel CAM 300 First Stamford Place,
4th Floor Stamford, CT 06902 Birth Year: 1954 | | Secretary and Chief Legal Officer | | Since
2003 | | Managing Director and General Counsel of Global Mutual Funds for CAM and its predecessor (since 1994); Secretary and Chief Legal Officer of mutual funds associated with Citigroup | | N/A | | N/A |
| * | | Each Director and officer serves until his or her successor has been duly elected and qualified. |
| ** | | Mr. Gerken is an “interested person” of the Fund as defined in the Investment Company Act of 1940, as amended, because Mr. Gerken is an officer of SBFM and certain of its affiliates. |
Smith Barney Real Return Strategy Fund 2005 Annual Report 47
Tax Information (unaudited)
The following information is provided with respect to the distribution paid during the taxable year ended September 30, 2005:
| | | | | | | | | | | | |
Record Date: | | 12/29/2004 | | | 3/15/2005 | | | 6/21/2005 | | | 9/27/2005 | |
Payable Date: | | 12/31/2004 | | | 3/18/2005 | | | 6/24/2005 | | | 9/30/2005 | |
|
|
Qualified Dividend Income for Individuals | | | | | 37.89 | % | | 37.89 | % | | 37.89 | % |
|
|
Dividends Qualifying for the Dividends Received Deduction for Corporations | | | | | 11.22 | % | | 11.22 | % | | 11.22 | % |
|
|
Interest from Federal Obligations | | 34.85 | % | | 34.85 | % | | 34.85 | % | | 34.85 | % |
|
|
The law varies in each state as to whether and what percentage of dividend income attributable to Federal obligations is exempt from state income tax. We recommend that you consult with your tax adviser to determine if any portion of the dividends you received is exempt from state income taxes.
Please retain this information for your records.
48 Smith Barney Real Return Strategy Fund 2005 Annual Report
Smith Barney Real Return Strategy Fund
| | |
DIRECTORS Paul R. Ades Dwight B. Crane R. Jay Gerken, CFA Chairman Frank G. Hubbard Jerome H. Miller Ken Miller OFFICERS R. Jay Gerken, CFA President and Chief
Executive Officer Andrew B. Shoup Senior Vice President and
Chief Administrative Officer Kaprel Ozsolak Chief Financial Officer
and Treasurer Steven Bleiberg Vice President and
Investment Officer Roger Garrett Vice President and
Investment Officer William Hamlyn Vice President and
Investment Officer John W. Lau Vice President and
Investment Officer Frederick Marki Vice President and
Investment Officer David A. Torchia Vice President and
Investment Officer Daniel Willey Vice President and
Investment Officer Lillyn Teh Vice President and
Investment Officer | | OFFICERS (continued) Andrew Beagley Chief Anti-Money Laundering Compliance Officer and Chief Compliance Officer Steven Frank Controller Robert I. Frenkel Secretary and
Chief Legal Officer INVESTMENT MANAGER Smith Barney Fund
Management LLC SUB-ADVISERS Citigroup Asset Management Ltd. TIMCO Asset Management, Inc. DISTRIBUTOR Citigroup Global Markets Inc. CUSTODIAN State Street Bank and Trust Company TRANSFER AGENT Citicorp Trust Bank, fsb. 125 Broad Street, 11th Floor New York, New York 10004 SUB-TRANSFER AGENT PFPC Inc. P.O. Box 9699 Providence, Rhode Island 02940-9699 INDEPENDENT REGISTERED PUBLIC ACCOUNTING FIRM KPMG LLP 345 Park Avenue New York, New York 10154 |
This report is submitted for the general information of shareholders of Smith Barney Investment Funds Inc. — Smith Barney Real Return Strategy Fund, but it may also be used as sales literature when preceded or accompanied by the current Prospectus.
This report must be preceded or accompanied by a free prospectus. Investors should consider the Fund’s Investment objectives, risks, charges and expenses carefully before investing. The prospectus contains this and other important information about the Fund. Please read the prospectus carefully before investing.
www.citigroupam.com
©2005 Citigroup Global Markets Inc.
Member NASD, SIPC
Smith Barney
Investment Funds Inc.
Smith Barney
Real Return Strategy Fund
The Fund is a separate series of the Smith Barney Investment Funds Inc., a Maryland corporation.
SMITH BARNEY REAL RETURN STRATEGY FUND
Smith Barney Mutual Funds
125 Broad Street
10th Floor, MF-2
New York, New York 10004
The Fund files its complete schedule of portfolio holdings with the Securities and Exchange Commission for the first and third quarters of each fiscal year on Form N-Q. The Fund’s Forms N-Q are available on the Commission’s website at www.sec.gov. The Fund’s Forms N-Q may be reviewed and copied at the Commission’s Public Reference Room in Washington D.C., and information on the operation of the Public Reference Room may be obtained by calling 1-800-SEC-0330. To obtain information on Form N-Q from the Fund, shareholders can call 1-800-451-2010.
Information on how the Fund voted proxies relating to portfolio securities during the most recent 12-month period ended June 30, and a description of the policies and procedures that the Fund uses to determine how to vote proxies relating to portfolio securities is available (1) without charge, upon request, by calling 1-800-451-2010, (2) on the Fund’s website at www.citigroupam.com and (3) on the SEC’s website at www.sec.gov.
ITEM 2. CODE OF ETHICS.
The registrant has adopted a code of ethics that applies to the registrant’s principal executive officer, principal financial officer, principal accounting officer or controller.
ITEM 3. AUDIT COMMITTEE FINANCIAL EXPERT.
The Board of Trustees of the registrant has determined that Jane F. Dasher, the Chairman of the Board’s Audit Committee, possesses the technical attributes identified in Instruction 2(b) of Item 3 to Form N-CSR to qualify as an “audit committee financial expert,” and has designated Ms. Dasher as the Audit Committee’s financial expert. Ms. Dasher is an “independent” Trustee pursuant to paragraph (a)(2) of Item 3 to Form N-CSR.
ITEM 4. PRINCIPAL ACCOUNTANT FEES AND SERVICES.
a) Audit Fees. The aggregate fees billed in the last two fiscal years ending September 30, 2004 and September 30, 2005 (the “Reporting Periods”) for professional services rendered by the Registrant’s principal accountant (the “Auditor”) for the audit of the Registrant’s annual financial statements, or services that are normally provided by the Auditor in connection with the statutory and regulatory filings or engagements for the Reporting Periods, were $118,100 in 2004 and $46,600 in 2005.
b) Audit-Related Fees. The aggregate fees billed in the Reporting Periods for assurance and related services by the Auditor that are reasonably related to the performance of the audit of the Registrant’s financial statements and are not reported under paragraph (a) of this Item 4 were $0 in 2004 and $4,000 in 2005. These services rendered in connection with the review of the registration statement filed on Form N-1A for the Smith Barney Investment Funds Inc.
In addition, there were no Audit-Related Fees billed in the Reporting Period for assurance and related services by the Auditor to the Registrant’s investment adviser (not including any sub-adviser whose role is primarily portfolio management and is subcontracted with or overseen by another investment adviser), and any entity controlling, controlled by or under common control with the investment adviser that provides ongoing services to the Smith Barney Investment Funds Inc. (“service affiliates”), that were reasonably related to the performance of the annual audit of the service affiliates. Accordingly, there were no such fees that required pre-approval by the Audit Committee for the Reporting Periods (prior to May 6, 2003 services provided by the Auditor were not required to be pre-approved).
(c) Tax Fees. The aggregate fees billed in the Reporting Periods for professional services rendered by the Auditor for tax compliance, tax advice and tax planning (“Tax Services”) were $12,500 in 2004 and $9,800 in 2005. These services consisted of (i) review or preparation of U.S. federal, state, local and excise tax returns;
(ii) U.S. federal, state and local tax planning, advice and assistance regarding statutory, regulatory or administrative developments, and (iii) tax advice regarding tax qualification matters and/or treatment of various financial instruments held or proposed to be acquired or held.
There were no fees billed for tax services by the Auditors to service affiliates during the Reporting Periods that required pre-approval by the Audit Committee.
d) All Other Fees. There were no other fees billed in the Reporting Periods for products and services provided by the Auditor, other than the services reported in paragraphs (a) through (c) of this Item for the Smith Barney Investment Funds Inc.
All Other Fees. There were no other non-audit services rendered by the Auditor to Smith Barney Fund Management LLC (“SBFM”), and any entity controlling, controlled by or under common control with SBFM that provided ongoing services to Smith Barney Investment Funds Inc. requiring pre-approval by the Audit Committee in the Reporting Period.
(e) Audit Committee’s pre–approval policies and procedures described in paragraph (c) (7) of Rule 2-01 of Regulation S-X.
(1) The Charter for the Audit Committee (the “Committee”) of the Board of each registered investment company (the “Fund”) advised by Smith Barney Fund Management LLC or Salomon Brothers Asset Management Inc. or one of their affiliates (each, an “Adviser”) requires that the Committee shall approve (a) all audit and permissible non-audit services to be provided to the Fund and (b) all permissible non-audit services to be provided by the Fund’s independent auditors to the Adviser and any Covered Service Providers if the engagement relates directly to the operations and financial reporting of the Fund. The Committee may implement policies and procedures by which such services are approved other than by the full Committee.
The Committee shall not approve non-audit services that the Committee believes may impair the independence of the auditors. As of the date of the approval of this Audit Committee Charter, permissible non-audit services include any professional services (including tax services), that are not prohibited services as described below, provided to the Fund by the independent auditors, other than those provided to the Fund in connection with an audit or a review of the financial statements of the Fund. Permissible non-audit services may not include: (i) bookkeeping or other services related to the accounting records or financial statements of the Fund; (ii) financial information systems design and implementation; (iii) appraisal or valuation services, fairness opinions or contribution-in-kind reports; (iv) actuarial services; (v) internal audit outsourcing services; (vi) management functions or human resources; (vii) broker or dealer, investment adviser or investment banking services; (viii) legal services and expert services unrelated to the audit; and (ix) any other service the Public Company Accounting Oversight Board determines, by regulation, is impermissible.
Pre-approval by the Committee of any permissible non-audit services is not required so long as: (i) the aggregate amount of all such permissible non-audit services provided to the Fund, the Adviser and any service providers controlling, controlled by or under common control with the Adviser that provide ongoing services to the Fund (“Covered Service Providers”) constitutes not more than 5% of the total amount of revenues paid to the independent auditors during the fiscal year in which the permissible non-audit services are provided to (a) the Fund, (b) the Adviser and (c) any entity controlling, controlled by or under common control with the Adviser that provides ongoing services to the Fund during the fiscal year in which the services are provided that would have to be approved by the Committee; (ii) the permissible non-audit services were not recognized by the Fund at the time of the engagement to be non-audit services; and (iii) such services are promptly brought to the attention of the Committee and approved by the Committee (or its delegate(s)) prior to the completion of the audit.
(2) For the Smith Barney Investment Funds Inc., the percentage of fees that were approved by the audit committee, with respect to: Audit-Related Fees were 100% and 100% for 2004 and 2005; Tax Fees were 100% and 100% for 2004 and 2005; and Other Fees were 100% and 100% for 2004 and 2005.
(f) N/A
(g) Non-audit fees billed by the Auditor for services rendered to Smith Barney Investment Funds Inc. and CAM and any entity controlling, controlled by, or under common control with CAM that provides ongoing services to Smith Barney Investment Funds Inc. during the reporting period were $0 in 2005 for fees related to the transfer agent matter as fully described in the notes the financial statements titled “additional information” and $75,000 for 2004.
(h) Yes. The Smith Barney Investment Funds Inc.’ Audit Committee has considered whether the provision of non-audit services that were rendered to Service Affiliates which were not pre-approved (not requiring pre-approval) is compatible with maintaining the Accountant’s independence. All services provided by the Auditor to the Smith Barney Investment Funds Inc. or to Service Affiliates, which were required to be pre-approved, were pre-approved as required.
ITEM 5. AUDIT COMMITTEE OF LISTED REGISTRANTS.
Not applicable.
ITEM 6. [RESERVED]
ITEM 7. DISCLOSURE OF PROXY VOTING POLICIES AND PROCEDURES FOR CLOSED-END MANAGEMENT INVESTMENT COMPANIES.
Not applicable.
ITEM 8. [RESERVED]
ITEM 9. SUBMISSION OF MATTERS TO A VOTE OF SECURITY HOLDERS.
Not applicable.
ITEM 10. CONTROLS AND PROCEDURES.
| | (a) | The registrant’s principal executive officer and principal financial officer have concluded that the registrant’s disclosure controls and procedures (as defined in Rule 30a- 3(c) under the Investment Company Act of 1940, as amended (the “1940 Act”)) are effective as of a date within 90 days of the filing date of this report that includes the disclosure required by this paragraph, based on their evaluation of the disclosure controls and procedures required by Rule 30a-3(b) under the 1940 Act and 15d-15(b) under the Securities Exchange Act of 1934. |
| | (b) | There were no changes in the registrant’s internal control over financial reporting (as defined in Rule 30a-3(d) under the 1940 Act) that occurred during the registrant’s last fiscal half-year (the registrant’s second fiscal half-year in the case of an annual report) that have materially affected, or are likely to materially affect the registrant’s internal control over financial reporting. |
| | (a) | Code of Ethics attached hereto. |
Exhibit 99.CODE ETH
| | |
| Exhibit 99.CERT | | Certifications pursuant to section 302 of the Sarbanes-Oxley Act of 2002 |
| |
| Exhibit 99.906CERT | | Certifications pursuant to Section 906 of the Sarbanes-Oxley Act of 2002 |
SIGNATURES
Pursuant to the requirements of the Securities Exchange Act of 1934 and the Investment Company Act of 1940, the registrant has duly caused this Report to be signed on its behalf by the undersigned, there unto duly authorized.
Smith Barney Investment Funds Inc.
| | |
| By: | | /s/ R. Jay Gerken
|
| | | (R. Jay Gerken) |
| | | Chief Executive Officer of |
| | | Smith Barney Investment Funds Inc. |
|
| Date: December 9, 2005 |
Pursuant to the requirements of the Securities Exchange Act of 1934 and the Investment Company Act of 1940, this report has been signed below by the following persons on behalf of the registrant and in the capacities and on the dates indicated.
| | |
| By: | | /s/ R. Jay Gerken
|
| | | (R. Jay Gerken) |
| | | Chief Executive Officer of |
| | | Smith Barney Investment Funds Inc. |
|
| Date: December 9, 2005 |
| | |
| By: | | /s/ Kaprel Ozsolak
|
| | | (Kaprel Ozsolak) |
| | | Chief Financial Officer of |
| | | Smith Barney Investment Funds Inc. |
|
| Date: December 9, 2005 |