UNITED STATES
SECURITIES AND EXCHANGE COMMISSION
Washington, D.C. 20549
FORM N-CSR
CERTIFIED SHAREHOLDER REPORT OF REGISTERED MANAGEMENT INVESTMENT
COMPANIES
Investment Company Act file number: 811-03290
Name of Fund: BlackRock Variable Series Funds, Inc.
BlackRock Basic Value V.I. Fund
BlackRock Capital Appreciation V.I. Fund
BlackRock Equity Dividend V.I. Fund
BlackRock Global Allocation V.I. Fund
BlackRock Global Opportunities V.I. Fund
BlackRock Government Money Market V.I. Fund
BlackRock High Yield V.I. Fund
BlackRock International V.I. Fund
BlackRock iShares Alternative Strategies V.I. Fund
BlackRock iShares Dynamic Allocation V.I Fund
BlackRock iShares Dynamic Fixed Income V.I. Fund
BlackRock iShares Equity Appreciation V.I. Fund
BlackRock Large Cap Core V.I. Fund
BlackRock Large Cap Growth V.I. Fund
BlackRock Large Cap Value V.I. Fund
BlackRock Managed Volatility V.I. Fund
BlackRock S&P 500 Index V.I. Fund
BlackRock Total Return V.I. Fund
BlackRock U.S. Government Bond V.I. Fund
BlackRock Value Opportunities V.I. Fund
Fund Address: 100 Bellevue Parkway, Wilmington, DE 19809
Name and address of agent for service: John M. Perlowski, Chief Executive Officer, BlackRock Variable Series Funds, Inc., 55 East 52nd Street, New York, NY 10055
Registrant’s telephone number, including area code: (800) 441-7762
Date of fiscal year end: 12/31/2016
Date of reporting period: 06/30/2016
Item 1 – Report to Stockholders
JUNE 30, 2016
| | | | |
SEMI-ANNUAL REPORT (UNAUDITED) | | | | BLACKROCK® |
BlackRock Variable Series Funds, Inc.
| | |
| Not FDIC Insured ¡ May Lose Value ¡ No Bank Guarantee | | |
Dear Shareholder,
Uneven economic outlooks and divergence of monetary policies across regions have been the overarching themes driving financial markets over the past couple of years. In the latter half of 2015, as U.S. growth outpaced other developed markets, investors were focused largely on the timing of the Federal Reserve’s (the “Fed”) decision to end its near-zero interest rate policy. The Fed ultimately hiked rates in December, whereas the European Central Bank and the Bank of Japan took additional steps to stimulate growth, even introducing negative interest rates. The U.S. dollar had strengthened considerably ahead of these developments, causing profit challenges for U.S. companies that generate revenues overseas, and pressuring emerging market currencies and commodities prices.
Also during this time period, oil prices collapsed due to excess global supply. China, one of the world’s largest consumers of oil, was another notable source of stress for financial markets as the country showed signs of slowing economic growth and took measures to devalue its currency. Declining confidence in the country’s policymakers stoked investors’ worries about the potential impact of China’s weakness on the global economy. Global market volatility increased and risk assets (such as equities and high yield bonds) suffered in this environment.
The elevated market volatility spilled over into 2016, but as the first quarter wore on, fears of a global recession began to fade, allowing markets to calm and risk assets to rebound. Central bank stimulus in Europe and Japan, combined with a more tempered outlook for rate hikes in the United States, helped bolster financial markets. A softening in U.S. dollar strength brought relief to U.S. exporters and emerging market economies. Oil prices rebounded as the world’s largest producers agreed to reduce supply.
Volatility spiked again in late June when the United Kingdom shocked investors with its vote to leave the European Union. Uncertainty around how the British exit might affect the global economy and political landscape long term drove investors to high quality assets, pushing already-low global yields to even lower levels.
At BlackRock, we believe investors need to think globally, extend their scope across a broad array of asset classes and be prepared to adjust accordingly as market conditions change over time. We encourage you to talk with your financial advisor and visit blackrock.com for further insight about investing in today’s markets.
Sincerely,

Rob Kapito
President, BlackRock Advisors, LLC

Rob Kapito
President, BlackRock Advisors, LLC
| | | | | | | | |
| Total Returns as of June 30, 2016 | |
| | | 6-month | | | 12-month | |
U.S. large cap equities (S&P 500® Index) | | | 3.84 | % | | | 3.99 | % |
U.S. small cap equities (Russell 2000® Index) | | | 2.22 | | | | (6.73 | ) |
International equities (MSCI Europe, Australasia,
Far East Index) | | | (4.42 | ) | | | (10.16 | ) |
Emerging market equities (MSCI Emerging Markets Index) | | | 6.41 | | | | (12.05 | ) |
3-month Treasury bill (BofA Merrill Lynch
3-Month U.S. Treasury
Bill Index) | | | 0.15 | | | | 0.19 | |
U.S. Treasury securities (BofA Merrill Lynch
10- Year U.S. Treasury
Index) | | | 7.95 | | | | 9.49 | |
U.S. investment grade
bonds (Barclays U.S.
Aggregate Bond Index) | | | 5.31 | | | | 6.00 | |
Tax-exempt municipal
bonds (S&P Municipal
Bond Index) | | | 4.35 | | | | 7.80 | |
U.S. high yield bonds (Barclays U.S. Corporate
High Yield 2% Issuer
Capped Index) | | | 9.06 | | | | 1.65 | |
|
| Past performance is no guarantee of future results. Index performance is shown for illustrative purposes only. You cannot invest directly in an index. | |
| | | | | | |
| | | THIS PAGE NOT PART OF YOUR FUND REPORT | | | | |
JUNE 30, 2016
| | | | |
SEMI-ANNUAL REPORT (UNAUDITED) | | | | BLACKROCK® |
BlackRock Variable Series Funds, Inc.
▶ BlackRock Basic Value V.I. Fund
| | |
| Not FDIC Insured ¡ May Lose Value ¡ No Bank Guarantee | | |
| | | | |
| Fund Summary as of June 30, 2016 | | | BlackRock Basic Value V.I. Fund | |
BlackRock Basic Value V.I. Fund’s (the “Fund”) investment objective is to seek capital appreciation and, secondarily, income.
|
| Portfolio Management Commentary |
How did the Fund perform?
| • | | For the six-month period ended June 30, 2016, the Fund underperformed its benchmark, the Russell 1000® Value Index. |
What factors influenced performance?
| • | | Stock selection in the financials sector was the leading detractor from performance relative to the benchmark over the six-month period. In particular, overweight positions in Capital One Financial Corporation and Discover Financial Services, Inc. lagged amid concerns regarding consumer credit quality, while overweight positions in Citigroup, Inc. and JP Morgan Chase & Co. detracted as falling interest rates renewed concerns about pressure on bank net interest margins. The Fund’s underweight to real estate investment trusts also weighed on relative returns as falling interest rates continued to increase investor demand for yield. |
| • | | The Fund’s underweight allocation to consumer staples detracted from relative performance over the period, as investors gravitated to the sector’s perceived safety and stability without regard for valuation. Selection within the sector also hindered performance, in particular an overweight position in Kroger Co. as the grocery-store operator lagged due in part to concerns that food inflation may dampen same-store sales. |
| • | | On the positive side, stock selection in both health care and utilities contributed to relative performance during the period. In health care, an |
| | overweight position in St. Jude Medical, Inc. added value as shares of the medical device company rallied following the announcement of a planned acquisition by Abbott Laboratories. In addition, a position in biopharmaceutical company Baxalta Inc. benefited from the closing of its merger with Shire PLC. Stock selection in utilities was highlighted by overweight positions in Exelon Corp., AES Corp., and Dynegy, Inc., all of which benefited from the rebound in power prices during the quarter. Finally, relative performance was aided by an overweight in telecommunication services (“telecom”), most notably the Fund’s position in Verizon Communications, Inc. |
Describe recent portfolio activity.
| • | | During the period, portfolio management modestly increased the Fund’s investments in the energy and utilities sectors, while reducing exposure to financials and telecom. |
Describe portfolio positioning at period end.
| • | | Relative to the Russell 1000® Value Index, the Fund ended the period with the largest sector overweights in the health care, information technology, and energy sectors, while the most significant underweights were consumer staples, industrials and materials. |
The views expressed reflect the opinions of BlackRock as of the date of this report and are subject to change based on changes in market, economic or other conditions. These views are not intended to be a forecast of future events and are no guarantee of future results.
| | |
| Sector Allocation | | Percent of Net Assets |
Financials | | 27% |
Health Care | | 16 |
Energy | | 15 |
Information Technology | | 13 |
Utilities | | 8 |
Consumer Discretionary | | 6 |
Industrials | | 5 |
Telecommunication Services | | 5 |
Materials | | 2 |
Consumer Staples | | 2 |
Short-Term Securities | | 8 |
Liabilities in Excess of Other Assets | | (7) |
For Fund compliance purposes, the Fund’s sector classifications refer to one or more of the sector sub-classifications used by one or more widely recognized market indexes or ratings group indexes, and/or as defined by the investment adviser. These definitions may not apply for purposes of this report, which may combine sector sub-classifications for reporting ease.
| | | | | | |
| 2 | | BLACKROCK VARIABLE SERIES FUNDS, INC. | | JUNE 30, 2016 | | |
| | | | |
| | | | BlackRock Basic Value V.I. Fund | |
|
| Total Return Based on a $10,000 Investment |
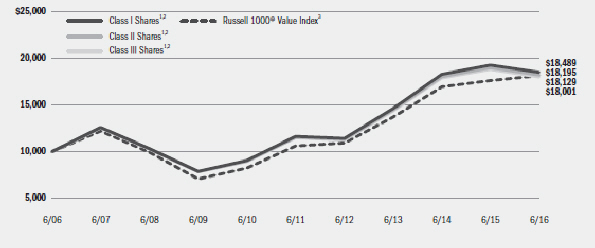
| | 1 | Assuming transaction costs, if any, and other operating expenses, including investment advisory fees. Does not include insurance-related fees and expenses. |
| | 2 | The Fund invests primarily in equity securities that Fund management believes are undervalued, which means that their prices are less than Fund management believes they are worth. |
| | 3 | An unmanaged index that is a subset of the Russell 1000® Index that consists of those Russell 1000® securities with lower price-to-book ratios and lower expected growth values. |
| | | | | | | | | | | | |
| Performance Summary for the Period Ended June 30, 2016 |
| | | | |
| | | | | | | | | Average Annual Total Returns |
| | | | | 6-Month Total Returns5 | | | | 1 Year5 | | 5 Years5 | | 10 Years5 |
Class I4 | | | | 5.24% | | | | (4.12)% | | 9.77% | | 6.34% |
Class II4 | | | | 5.10 | | | | (4.26) | | 9.59 | | 6.17 |
Class III4 | | | | 4.97 | | | | (4.41) | | 9.45 | | 6.05 |
Russell 1000® Value Index | | | | 6.30 | | | | 2.86 | | 11.35 | | 6.13 |
| | 4 | | Average annual and cumulative total returns are based on changes in net asset value for the periods shown, and assume reinvestment of all distributions at net asset value on the ex-dividend date. Insurance-related fees and expenses are not reflected in these returns. |
| | 5 | | For a portion of the period, the Fund’s investment advisor waived a portion of its fee. Without such waiver, the Fund’s performance would have been lower. |
| | | | Past performance is not indicative of future results. Performance results do not reflect the deduction of taxes that a shareholder would pay on Fund distributions or the redemption of Fund shares. |
| | | | | | | | | | | | | | |
| Expense Example |
| | | |
| | | Actual | | Hypothetical7 | | |
| | | Beginning
Account Value January 1, 2016 | | Ending
Account Value
June 30, 2016 | | Expenses Paid
During the Period6 | | Beginning
Account Value
January 1, 2016 | | Ending
Account Value
June 30, 2016 | | Expenses Paid
During the Period6 | | Annualized
Expense
Ratio |
Class I | | $1,000.00 | | $1,052.40 | | $3.73 | | $1,000.00 | | $1,021.23 | | $3.67 | | 0.73% |
Class II | | $1,000.00 | | $1,051.00 | | $4.59 | | $1,000.00 | | $1,020.39 | | $4.52 | | 0.90% |
Class III | | $1,000.00 | | $1,049.70 | | $5.15 | | $1,000.00 | | $1,019.84 | | $5.07 | | 1.01% |
| | 6 | | For each class of the Fund, expenses are equal to the annualized expense ratio for the class, multiplied by the average account value over the period, multiplied by 182/366 (to reflect the one-half year period shown). |
| | 7 | | Hypothetical 5% annual return before expenses is calculated by prorating the number of days in the most recent fiscal half year divided by 366. |
| | | | See “Disclosure of Expenses” on the following page for further information on how expenses were calculated. |
| | | | | | |
| | | BLACKROCK VARIABLE SERIES FUNDS, INC. | | JUNE 30, 2016 | | 3 |
| | | | |
| | | | BlackRock Basic Value V.I. Fund | |
Disclosure of Expenses
Shareholders of the Fund may incur the following charges: (a) transactional expenses, such as sales charges; and (b) operating expenses, including investment advisory fees, service and distribution fees, including 12b-1 fees, acquired fund fees and expenses, and other fund expenses. The expense example on the previous page (which is based on a hypothetical investment of $1,000 invested on January 1, 2016 and held through June 30, 2016) is intended to assist shareholders both in calculating expenses based on an investment in the Fund and in comparing these expenses with similar costs of investing in other mutual funds.
The expense example provides information about actual account values and actual expenses. In order to estimate the expenses a shareholder paid during the period covered by this report, shareholders can divide their account value by $1,000 and then multiply the result by the number corresponding to their share class under the heading entitled “Expenses Paid During the Period.”
The expense example also provides information about hypothetical account values and hypothetical expenses based on the Fund’s actual expense ratio and an assumed rate of return of 5% per year before expenses. In order to assist shareholders in comparing the ongoing expenses of investing in the Fund and other funds, compare the 5% hypothetical example with the 5% hypothetical examples that appear in shareholder reports of other funds.
The expenses shown in the expense example are intended to highlight shareholders’ ongoing costs only and do not reflect any transactional expenses, such as sales charges, if any. Therefore, the hypothetical example is useful in comparing ongoing expenses only, and will not help shareholders determine the relative total expenses of owning different funds. If these transactional expenses were included, shareholder expenses would have been higher.
| | | | | | |
| 4 | | BLACKROCK VARIABLE SERIES FUNDS, INC. | | JUNE 30, 2016 | | |
| | | | |
| Schedule of Investments June 30, 2016 (Unaudited) | | | BlackRock Basic Value V.I. Fund | |
| | | (Percentages shown are based on Net Assets) | |
| | | | | | | | |
| Common Stocks | | Shares | | | Value | |
Aerospace & Defense — 2.0% | | | | | | | | |
B/E Aerospace, Inc. | | | 20,180 | | | $ | 931,811 | |
Boeing Co. | | | 25,870 | | | | 3,359,737 | |
Honeywell International, Inc. | | | 11,560 | | | | 1,344,659 | |
Huntington Ingalls Industries, Inc. | | | 11,310 | | | | 1,900,419 | |
Northrop Grumman Corp. | | | 1,810 | | | | 402,327 | |
Raytheon Co. | | | 4,230 | | | | 575,069 | |
| | | | | | | | |
| | | | | | | | 8,514,022 | |
Airlines — 0.5% | | | | | | | | |
American Airlines Group, Inc. | | | 75,150 | | | | 2,127,497 | |
Auto Components — 1.3% | |
Lear Corp. | | | 51,290 | | | | 5,219,270 | |
Magna International, Inc. | | | 11,720 | | | | 411,020 | |
| | | | | | | | |
| | | | | | | | 5,630,290 | |
Automobiles — 0.2% | | | | | | | | |
Thor Industries, Inc. | | | 13,999 | | | | 906,295 | |
Banks — 12.4% | | | | | | | | |
Bank of America Corp. | | | 355,030 | | | | 4,711,248 | |
Citigroup, Inc. | | | 466,500 | | | | 19,774,935 | |
JPMorgan Chase & Co. | | | 336,946 | | | | 20,937,824 | |
KeyCorp | | | 221,490 | | | | 2,447,465 | |
Regions Financial Corp. | | | 327,260 | | | | 2,784,982 | |
Wells Fargo & Co. | | | 75,510 | | | | 3,573,888 | |
| | | | | | | | |
| | | | | | | | 54,230,342 | |
Biotechnology — 1.3% | | | | | | | | |
Gilead Sciences, Inc. | | | 69,600 | | | | 5,806,032 | |
Capital Markets — 0.9% | | | | | | | | |
Ameriprise Financial, Inc. | | | 10,320 | | | | 927,252 | |
KKR & Co. LP | | | 3,414 | | | | 42,129 | |
Morgan Stanley | | | 114,600 | | | | 2,977,308 | |
| | | | | | | | |
| | | | | | | | 3,946,689 | |
Chemicals — 0.5% | | | | | | | | |
Akzo Nobel NV — ADR | | | 63,985 | | | | 1,346,244 | |
Ashland, Inc. | | | 5,600 | | | | 642,712 | |
| | | | | | | | |
| | | | | | | | 1,988,956 | |
Communications Equipment — 6.0% | | | | | | | | |
Cisco Systems, Inc. | | | 774,970 | | | | 22,233,889 | |
Nokia OYJ — ADR (a) | | | 376,880 | | | | 2,144,447 | |
Telefonaktiebolaget LM Ericsson — ADR (a) | | | 256,091 | | | | 1,966,779 | |
| | | | | | | | |
| | | | | | | | 26,345,115 | |
Construction & Engineering — 0.4% | | | | | | | | |
AECOM (b) | | | 56,130 | | | | 1,783,250 | |
Consumer Finance — 6.9% | | | | | | | | |
Capital One Financial Corp. | | | 171,700 | | | | 10,904,667 | |
| | | | | | | | |
| Common Stocks | | Shares | | | Value | |
Consumer Finance (continued) | |
Discover Financial Services | | | 295,200 | | | $ | 15,819,768 | |
SLM Corp. (b) | | | 544,957 | | | | 3,367,834 | |
| | | | | | | | |
| | | | | | | | 30,092,269 | |
Containers & Packaging — 0.7% | | | | | | | | |
Avery Dennison Corp. | | | 10,840 | | | | 810,290 | |
Bemis Co., Inc. | | | 27,730 | | | | 1,427,818 | |
Crown Holdings, Inc. (b) | | | 16,870 | | | | 854,803 | |
| | | | | | | | |
| | | | | | | | 3,092,911 | |
Diversified Financial Services — 1.2% | |
Nasdaq, Inc. | | | 77,800 | | | | 5,031,326 | |
Diversified Telecommunication Services — 2.8% | |
Verizon Communications, Inc. | | | 215,830 | | | | 12,051,947 | |
Electric Utilities — 3.2% | | | | | | | | |
Exelon Corp. | | | 387,200 | | | | 14,078,592 | |
Energy Equipment & Services — 1.0% | |
Superior Energy Services, Inc. (b) | | | 244,122 | | | | 4,494,286 | |
Food & Staples Retailing — 1.2% | | | | | | | | |
CVS Health Corp. | | | 8,560 | | | | 819,534 | |
Kroger Co. | | | 119,652 | | | | 4,401,997 | |
| | | | | | | | |
| | | | | | | | 5,221,531 | |
Food Products — 0.3% | | | | | | | | |
Mondelez International, Inc., Class A | | | 28,860 | | | | 1,313,419 | |
Health Care Equipment & Supplies — 6.2% | |
Baxter International, Inc. | | | 242,200 | | | | 10,952,284 | |
Medtronic PLC | | | 63,218 | | | | 5,485,426 | |
St. Jude Medical, Inc. | | | 29,900 | | | | 2,332,200 | |
Zimmer Biomet Holdings, Inc. | | | 67,300 | | | | 8,101,574 | |
| | | | | | | | |
| | | | | | | | 26,871,484 | |
Hotels, Restaurants & Leisure — 0.0% | |
Wyndham Worldwide Corp. (a) | | | 620 | | | | 44,163 | |
Household Durables — 1.2% | | | | | | | | |
Newell Brands, Inc. | | | 101,880 | | | | 4,948,312 | |
Tupperware Brands Corp. (a) | | | 8,620 | | | | 485,134 | |
| | | | | | | | |
| | | | | | | | 5,433,446 | |
Independent Power and Renewable Electricity Producers — 4.5% | |
AES Corp. | | | 1,038,530 | | | | 12,960,854 | |
Dynegy, Inc. (b) | | | 377,290 | | | | 6,504,480 | |
| | | | | | | | |
| | | | | | | | 19,465,334 | |
Insurance — 3.9% | | | | | | | | |
Genworth Financial, Inc., Class A (b) | | | 381,450 | | | | 984,141 | |
Hartford Financial Services Group, Inc. | | | 117,701 | | | | 5,223,570 | |
Lincoln National Corp. | | | 81,727 | | | | 3,168,556 | |
| | |
| Portfolio Abbreviation |
| ADR | | American Depositary Receipts |
See Notes to Financial Statements.
| | | | | | |
| | | BLACKROCK VARIABLE SERIES FUNDS, INC. | | JUNE 30, 2016 | | 5 |
| | | | |
| Schedule of Investments (continued) | | | BlackRock Basic Value V.I. Fund | |
| | | | |
| | | | | | | | |
| Common Stocks | | Shares | | | Value | |
Insurance (continued) | | | | | | | | |
MetLife, Inc. | | | 11,131 | | | $ | 443,348 | |
Prudential Financial, Inc. | | | 58,570 | | | | 4,178,384 | |
XL Group PLC | | | 89,370 | | | | 2,976,915 | |
| | | | | | | | |
| | | | | | | | 16,974,914 | |
Internet & Catalog Retail — 0.0% | | | | | | | | |
Priceline Group, Inc. (b) | | | 100 | | | | 124,841 | |
IT Services — 0.2% | | | | | | | | |
Fidelity National Information Services, Inc. | | | 6,220 | | | | 458,290 | |
First Data Corp., Class A (b) | | | 48,920 | | | | 541,544 | |
| | | | | | | | |
| | | | | | | | 999,834 | |
Media — 2.9% | | | | | | | | |
Comcast Corp., Class A | | | 73,390 | | | | 4,784,294 | |
Interpublic Group of Cos., Inc. | | | 91,180 | | | | 2,106,258 | |
Omnicom Group, Inc. (a) | | | 17,890 | | | | 1,457,856 | |
Scripps Networks Interactive, Inc., Class A (a) | | | 66,980 | | | | 4,170,845 | |
| | | | | | | | |
| | | | | | | | 12,519,253 | |
Metals & Mining — 0.6% | | | | | | | | |
Allegheny Technologies, Inc. (a) | | | 20,100 | | | | 256,275 | |
Reliance Steel & Aluminum Co. | | | 31,800 | | | | 2,445,420 | |
| | | | | | | | |
| | | | | | | | 2,701,695 | |
Multiline Retail — 0.1% | | | | | | | | |
Dollar General Corp. (a) | | | 2,330 | | | | 219,020 | |
Oil, Gas & Consumable Fuels — 14.3% | | | | | | | | |
Apache Corp. (a) | | | 301,410 | | | | 16,779,495 | |
Devon Energy Corp. | | | 332,900 | | | | 12,067,625 | |
Gulfport Energy Corp. (b) | | | 253,940 | | | | 7,938,164 | |
Hess Corp. | | | 11,070 | | | | 665,307 | |
Marathon Oil Corp. | | | 800,362 | | | | 12,013,434 | |
Marathon Petroleum Corp. | | | 105,850 | | | | 4,018,066 | |
Parsley Energy, Inc., Class A (b) | | | 82,520 | | | | 2,232,991 | |
Suncor Energy, Inc. | | | 16,590 | | | | 460,041 | |
Valero Energy Corp. (a) | | | 125,710 | | | | 6,411,210 | |
| | | | | | | | |
| | | | | | | | 62,586,333 | |
Personal Products — 0.1% | | | | | | | | |
Unilever NV — NY Shares | | | 9,320 | | | | 437,481 | |
Pharmaceuticals — 8.9% | | | | | | | | |
Merck & Co., Inc. | | | 281,370 | | | | 16,209,726 | |
Pfizer, Inc. | | | 519,570 | | | | 18,294,060 | |
Shire PLC — ADR | | | 13,316 | | | | 2,451,209 | |
Teva Pharmaceutical Industries Ltd. — ADR | | | 41,290 | | | | 2,073,997 | |
| | | | | | | | |
| | | | | | | | 39,028,992 | |
Professional Services — 2.6% | | | | | | | | |
Dun & Bradstreet Corp. | | | 5,641 | | | | 687,299 | |
Nielsen Holdings PLC | | | 204,140 | | | | 10,609,156 | |
| | | | | | | | |
| | | | | | | | 11,296,455 | |
Real Estate Investment Trusts (REITs) — 1.1% | | | | | | | | |
Brixmor Property Group, Inc. | | | 49,290 | | | | 1,304,213 | |
Starwood Property Trust, Inc. (a) | | | 178,690 | | | | 3,702,457 | |
| | | | | | | | |
| | | | | | | | 5,006,670 | |
Semiconductors & Semiconductor Equipment — 5.1% | | | | | | | | |
Lam Research Corp. | | | 550 | | | | 46,233 | |
QUALCOMM, Inc. | | | 389,190 | | | | 20,848,908 | |
Teradyne, Inc. | | | 76,470 | | | | 1,505,694 | |
| | | | | | | | |
| | | | | | | | 22,400,835 | |
Software — 0.1% | | | | | | | | |
Oracle Corp. | | | 5,470 | | | | 223,887 | |
| | | | | | | | |
| Common Stocks | | Shares | | | Value | |
Specialty Retail — 0.6% | | | | | | | | |
GNC Holdings, Inc., Class A | | | 113,490 | | | $ | 2,756,672 | |
Technology Hardware, Storage & Peripherals — 1.0% | |
Apple Inc. | | | 46,730 | | | | 4,467,388 | |
Thrifts & Mortgage Finance — 0.5% | | | | | | | | |
New York Community Bancorp, Inc. (a) | | | 148,300 | | | | 2,223,017 | |
Trading Companies & Distributors — 0.1% | | | | | | | | |
AerCap Holdings NV (b) | | | 3,870 | | | | 129,993 | |
Air Lease Corp. (a) | | | 6,440 | | | | 172,463 | |
| | | | | | | | |
| | | | | | | | 302,456 | |
Wireless Telecommunication Services — 1.9% | | | | | | | | |
Telephone & Data Systems, Inc. | | | 242,554 | | | | 7,194,152 | |
United States Cellular Corp. (b) | | | 29,883 | | | | 1,173,505 | |
| | | | | | | | |
| | | | | | | | 8,367,657 | |
Total Common Stocks — 98.7% | | | | | | | 431,106,596 | |
| | | | | | | | |
| Preferred Stocks | | | | | | |
Food Products — 0.5% | | | | | | | | |
Tyson Foods, Inc., 4.75% (c) | | | 27,359 | | | | 2,021,283 | |
Machinery — 0.1% | | | | | | | | |
Stanley Black & Decker, Inc., 6.25% (a)(c) | | | 3,270 | | | | 379,647 | |
Total Preferred Stocks — 0.6% | | | | 2,400,930 | |
Total Long-Term Investments (Cost — $404,075,120) — 99.3% | | | | 433,507,526 | |
| | | | | | | | |
| Short-Term Securities | | | | | | |
BlackRock Liquidity Funds, TempFund, Institutional Class, 0.40% (d)(e) | | | 6,308,310 | | | | 6,308,310 | |
| | | Beneficial
Interest
(000) | | | | |
BlackRock Liquidity Series, LLC, Money Market Series, 0.59% (d)(e)(f) | | $ | 28,215 | | | | 28,215,428 | |
Total Short-Term Securities (Cost — $34,523,738) — 7.9% | | | | 34,523,738 | |
Total Investments (Cost — $438,598,858) — 107.2% | | | | 468,031,264 | |
Liabilities in Excess of Other Assets — (7.2)% | | | | (31,320,797 | ) |
| | | | | | | | |
Net Assets — 100.0% | | | | | | $ | 436,710,467 | |
| | | | | | | | |
See Notes to Financial Statements.
| | | | | | |
| 6 | | BLACKROCK VARIABLE SERIES FUNDS, INC. | | JUNE 30, 2016 | | |
| | | | |
| Schedule of Investments (concluded) | | | BlackRock Basic Value V.I. Fund | |
|
| Notes to Schedule of Investments |
| (a) | Security, or a portion of security, is on loan. |
| (b) | Non-income producing security. |
| (d) | During the six months ended June 30, 2016, investments in issuers considered to be affiliates of the Fund for purposes of Section 2(a)(3) of the Investment Company Act of 1940, as amended, were as follows: |
| | | | | | | | | | | | | | | | | | | | |
| Affiliate | | Shares/Beneficial
Interest Held at
December 31, 2015 | | | Net Activity | | | Shares/Beneficial
Interest Held at
June 30, 2016 | | | Value at
June 30, 2016 | | | Income | |
BlackRock Liquidity Funds, TempFund, Institutional Class | | | 2,943,348 | | | | 3,364,962 | | | | 6,308,310 | | | $ | 6,308,310 | | | $ | 2,560 | |
BlackRock Liquidity Series, LLC Money Market Series | | | 27,873,304 | | | $ | 342,124 | | | | 28,215,428 | | | | 28,215,428 | | | | 46,865 | 1 |
Total | | | | | | | | | | | | | | $ | 34,523,738 | | | $ | 49,425 | |
| | | | | | | | | | | | | | | | |
| | 1 | | Represents securities lending income earned from the reinvestment of cash collateral from loaned securities, net of fees and collateral investment expenses, and other payments to and from borrowers of securities. |
| (e) | Current yield as of period end. |
| (f) | Security was purchased with the cash collateral from loaned securities. The Fund may withdraw up to 25% of its investment daily, although the manager of the BlackRock Liquidity Series, LLC, Money Market Series, in its sole discretion, may permit an investor to withdraw more than 25% on any one day. |
| • | | For Fund compliance purposes, the Fund’s industry classifications refer to one or more of the industry sub-classifications used by one or more widely recognized market indexes or ratings group indexes, and/or as defined by the investment adviser. These definitions may not apply for purposes of this report, which may combine such industry sub-classifications for reporting ease. |
|
| Fair Value Hierarchy as of Period End |
Various inputs are used in determining the fair value of investments. For information about the Fund’s policy regarding valuation of investments, refer to the Notes to Financial Statements.
The following table summarizes the Fund’s investments categorized in the disclosure hierarchy:
| | | | | | | | | | | | | | | | |
| | | Level 1 | | | Level 2 | | | Level 3 | | | Total | |
Assets: | | | | | | | | | | | | | | | | |
Investments: | | | | | | | | | | | | | | | | |
Long-Term Investments1 | | $ | 433,507,526 | | | | — | | | | — | | | $ | 433,507,526 | |
Short-Term Securities | | | 6,308,310 | | | $ | 28,215,428 | | | | — | | | | 34,523,738 | |
| | | | |
Total | | $ | 439,815,836 | | | $ | 28,215,428 | | | | — | | | $ | 468,031,264 | |
| | | | |
| | 1 | | See above Schedule of Investments for values in each industry. |
The Fund may hold assets and/or liabilities in which the fair value approximates the carrying amount for financial statement purposes. As of period end, collateral on securities loaned at value of $28,215,428 is categorized as Level 2 within the disclosure hierarchy.
During the six months ended June 30, 2016, there were no transfers between levels.
See Notes to Financial Statements.
| | | | | | |
| | | BLACKROCK VARIABLE SERIES FUNDS, INC. | | JUNE 30, 2016 | | 7 |
| | | | |
| Statement of Assets and Liabilities | | | | |
| | | | |
| June 30, 2016 (Unaudited) | | BlackRock
Basic Value V.I. Fund | |
| | | | |
| Assets | | | | |
Investments at value — unaffiliated (including securities loaned at value of $27,711,546) (cost — $404,075,120) | | $ | 433,507,526 | |
Investments at value — affiliated (cost — $34,523,738) | | | 34,523,738 | |
Receivables: | | | | |
Investments sold | | | 7,467,597 | |
Securities lending income — affiliated | | | 7,430 | |
Capital shares sold | | | 24,373 | |
Dividends — affiliated | | | 868 | |
Dividends — unaffiliated | | | 477,552 | |
From the Manager | | | 83,351 | |
Prepaid expenses | | | 1,011 | |
| | | | |
Total assets | | | 476,093,446 | |
| | | | |
| | | | |
| Liabilities | | | | |
Collateral on securities loaned at value | | | 28,215,428 | |
Payables: | | | | |
Investments purchased | | | 2,501,658 | |
Capital shares redeemed | | | 8,099,677 | |
Distribution fees | | | 10,209 | |
Investment advisory fees | | | 219,193 | |
Officer’s and Directors’ fees | | | 4,011 | |
Other accrued expenses | | | 330,373 | |
Other affiliates | | | 2,430 | |
| | | | |
Total liabilities | | | 39,382,979 | |
| | | | |
Net Assets | | $ | 436,710,467 | |
| | | | |
| | | | |
| Net Assets Consist of | | | | |
Paid-in capital | | $ | 399,936,153 | |
Undistributed net investment income | | | 3,732,479 | |
Accumulated net realized gain | | | 3,609,429 | |
Net unrealized appreciation (depreciation) | | | 29,432,406 | |
| | | | |
Net Assets | | $ | 436,710,467 | |
| | | | |
| | | | |
| Net Asset Value | | | | |
Class I — Based on net assets of $385,144,215 and 27,402,747 shares outstanding, 300 million shares authorized, $0.10 par value | | $ | 14.05 | |
| | | | |
Class II — Based on net assets of $5,281,585 and 377,036 shares outstanding, 100 million shares authorized, $0.10 par value | | $ | 14.01 | |
| | | | |
Class III — Based on net assets of $46,284,667 and 3,318,730 shares outstanding, 100 million shares authorized, $0.10 par value | | $ | 13.95 | |
| | | | |
See Notes to Financial Statements.
| | | | | | |
| 8 | | BLACKROCK VARIABLE SERIES FUNDS, INC. | | JUNE 30, 2016 | | |
| | | | |
| Six Months Ended June 30, 2016 (Unaudited) | | BlackRock
Basic Value V.I. Fund | |
| | | | |
| Investment Income | | | | |
Dividends — unaffiliated | | $ | 5,370,564 | |
Securities lending — affiliated — net | | | 46,865 | |
Dividends — affiliated | | | 2,560 | |
Foreign taxes withheld | | | (68,384 | ) |
| | | | |
Total income | | | 5,351,605 | |
| | | | |
| | | | |
| Expenses | | | | |
Investment advisory | | | 1,280,954 | |
Transfer agent — class specific | | | 400,678 | |
Distribution — class specific | | | 58,570 | |
Accounting services | | | 48,462 | |
Professional | | | 36,359 | |
Custodian | | | 27,543 | |
Printing | | | 13,891 | |
Officer and Directors | | | 12,533 | |
Transfer agent | | | 2,463 | |
Miscellaneous | | | 7,606 | |
| | | | |
Total expenses | | | 1,889,059 | |
Less: | | | | |
Fees waived by the Manager | | | (466 | ) |
Transfer agent fees reimbursed — class specific | | | (265,132 | ) |
| | | | |
Total expenses after fees waived and/or reimbursed | | | 1,623,461 | |
| | | | |
Net investment income | | | 3,728,144 | |
| | | | |
| | | | |
| Realized and Unrealized Gain | | | | |
Net realized gain from investments | | | 2,047,576 | |
Net change in unrealized appreciation (depreciation) on investments | | | 15,726,168 | |
| | | | |
Total realized and unrealized gain | | | 17,773,744 | |
| | | | |
Net Increase in Net Assets Resulting from Operations | | $ | 21,501,888 | |
| | | | |
See Notes to Financial Statements.
| | | | | | |
| | | BLACKROCK VARIABLE SERIES FUNDS, INC. | | JUNE 30, 2016 | | 9 |
| | | | |
| Statements of Changes in Net Assets | | | BlackRock Basic Value V.I. Fund | |
| | | | | | | | |
| Increase (Decrease) in Net Assets: | | Six Months Ended
June 30, 2016
(Unaudited) | | | Year Ended December 31, 2015 | |
| | | | | | | | |
| Operations | | | | | | | | |
Net investment income | | $ | 3,728,144 | | | $ | 7,171,154 | |
Net realized gain | | | 2,047,576 | | | | 54,034,585 | |
Net change in unrealized appreciation (depreciation) | | | 15,726,168 | | | | (88,682,929 | ) |
| | | | |
Net increase (decrease) in net assets resulting from operations | | | 21,501,888 | | | | (27,477,190 | ) |
| | | | |
| | | | | | | | |
| Distributions to Shareholders1 | | | | | | | | |
From net investment income: | | | | | | | | |
Class I | | | — | | | | (6,536,936 | ) |
Class II | | | — | | | | (80,368 | ) |
Class III | | | — | | | | (614,442 | ) |
From net realized gain: | | | | | | | | |
Class I | | | — | | | | (47,597,385 | ) |
Class II | | | — | | | | (660,255 | ) |
Class III | | | — | | | | (5,510,489 | ) |
| | | | |
Decrease in net assets resulting from distributions to shareholders | | | — | | | | (60,999,875 | ) |
| | | | |
| | | | | | | | |
| Capital Share Transactions | | | | | | | | |
Net increase (decrease) in net assets derived from capital share transactions | | | (28,824,875 | ) | | | 3,007,568 | |
| | | | |
| | | | | | | | |
| Net Assets | | | | | | | | |
Total decrease in net assets | | | (7,322,987 | ) | | | (85,469,497 | ) |
Beginning of period | | | 444,033,454 | | | | 529,502,951 | |
| | | | |
End of period | | $ | 436,710,467 | | | $ | 444,033,454 | |
| | | | |
Undistributed net investment income, end of period | | $ | 3,732,479 | | | $ | 4,335 | |
| | | | |
| 1 | Distributions for annual periods determined in accordance with federal income tax regulations. |
See Notes to Financial Statements.
| | | | | | |
| 10 | | BLACKROCK VARIABLE SERIES FUNDS, INC. | | JUNE 30, 2016 | | |
| | | | |
| Financial Highlights | | | BlackRock Basic Value V.I. Fund | |
| | | | | | | | | | | | | | | | | | | | | | | | |
| | | Class I | |
| | | Six Months
Ended
June 30, 2016
(Unaudited) | | | Year Ended December 31, | |
| | | | 2015 | | | 2014 | | | 2013 | | | 2012 | | | 2011 | |
| Per Share Operating Performance | | | | | | | | | | | | | | | | | | | | | | | | |
Net asset value, beginning of period | | $ | 13.36 | | | $ | 16.42 | | | $ | 17.44 | | | $ | 12.80 | | | $ | 11.43 | | | $ | 11.94 | |
| | | | |
Net investment income1 | | | 0.12 | | | | 0.24 | | | | 0.25 | | | | 0.22 | | | | 0.22 | | | | 0.19 | |
Net realized and unrealized gain (loss) | | | 0.57 | | | | (1.20 | ) | | | 1.51 | | | | 4.65 | | | | 1.38 | | | | (0.48 | ) |
| | | | |
Net increase (decrease) from investment operations | | | 0.69 | | | | (0.96 | ) | | | 1.76 | | | | 4.87 | | | | 1.60 | | | | (0.29 | ) |
| | | | |
Distributions:2 | | | | | | | | | | | | | | | | | | | | | | | | |
From net investment income | | | — | | | | (0.25 | ) | | | (0.27 | ) | | | (0.23 | ) | | | (0.23 | ) | | | (0.22 | ) |
From net realized gain | | | — | | | | (1.85 | ) | | | (2.51 | ) | | | — | | | | — | | | | — | |
| | | | |
Total distributions | | | — | | | | (2.10 | ) | | | (2.78 | ) | | | (0.23 | ) | | | (0.23 | ) | | | (0.22 | ) |
| | | | |
Net asset value, end of period | | $ | 14.05 | | | $ | 13.36 | | | $ | 16.42 | | | $ | 17.44 | | | $ | 12.80 | | | $ | 11.43 | |
| | | | |
| | | | | | | | | | | | | | | | | | | | | | | | |
| Total Return3 | | | | | | | | | | | | | | | | | | | | | | | | |
Based on net asset value | | | 5.24 | %4 | | | (5.95 | )% | | | 9.93 | % | | | 38.07 | % | | | 14.05 | % | | | (2.45 | )% |
| | | | |
| | | | | | | | | | | | | | | | | | | | | | | | |
| Ratios to Average Net Assets | | | | | | | | | | | | | | | | | | | | | | | | |
Total expenses | | | 0.85 | %5 | | | 0.86 | % | | | 0.85 | % | | | 0.84 | % | | | 0.79 | % | | | 0.67 | % |
| | | | |
Total expenses after fees waived and/or reimbursed | | | 0.73 | %5 | | | 0.73 | % | | | 0.72 | % | | | 0.72 | % | | | 0.71 | % | | | 0.67 | % |
| | | | |
Net investment income | | | 1.78 | %5 | | | 1.47 | % | | | 1.40 | % | | | 1.41 | % | | | 1.79 | % | | | 1.58 | % |
| | | | |
| | | | | | | | | | | | | | | | | | | | | | | | |
| Supplemental Data | | | | | | | | | | | | | | | | | | | | | | | | |
Net assets, end of period (000) | | $ | 385,144 | | | $ | 393,370 | | | $ | 468,876 | | | $ | 448,299 | | | $ | 363,954 | | | $ | 366,990 | |
| | | | |
Portfolio turnover rate | | | 21 | % | | | 50 | % | | | 39 | % | | | 47 | % | | | 42 | % | | | 58 | % |
| | | | |
| |
| | | Class II | |
| | | Six Months
Ended
June 30, 2016
(Unaudited) | | | Year Ended December 31, | |
| | | | 2015 | | | 2014 | | | 2013 | | | 2012 | | | 2011 | |
| Per Share Operating Performance | | | | | | | | | | | | | | | | | | | | | | | | |
Net asset value, beginning of period | | $ | 13.33 | | | $ | 16.38 | | | $ | 17.40 | | | $ | 12.77 | | | $ | 11.40 | | | $ | 11.91 | |
| | | | |
Net investment income1 | | | 0.11 | | | | 0.21 | | | | 0.22 | | | | 0.19 | | | | 0.20 | | | | 0.17 | |
Net realized and unrealized gain (loss) | | | 0.57 | | | | (1.18 | ) | | | 1.51 | | | | 4.64 | | | | 1.38 | | | | (0.48 | ) |
| | | | |
Net increase (decrease) from investment operations | | | 0.68 | | | | (0.97 | ) | | | 1.73 | | | | 4.83 | | | | 1.58 | | | | (0.31 | ) |
| | | | |
Distributions:2 | | | | | | | | | | | | | | | | | | | | | | | | |
From net investment income | | | — | | | | (0.23 | ) | | | (0.24 | ) | | | (0.20 | ) | | | (0.21 | ) | | | (0.20 | ) |
From net realized gain | | | — | | | | (1.85 | ) | | | (2.51 | ) | | | — | | | | — | | | | — | |
| | | | |
Total distributions | | | — | | | | (2.08 | ) | | | (2.75 | ) | | | (0.20 | ) | | | (0.21 | ) | | | (0.20 | ) |
| | | | |
Net asset value, end of period | | $ | 14.01 | | | $ | 13.33 | | | $ | 16.38 | | | $ | 17.40 | | | $ | 12.77 | | | $ | 11.40 | |
| | | | |
| | | | | | | | | | | | | | | | | | | | | | | | |
| Total Return3 | | | | | | | | | | | | | | | | | | | | | | | | |
Based on net asset value | | | 5.10 | %4 | | | (6.07 | )% | | | 9.75 | % | | | 37.85 | % | | | 13.89 | % | | | (2.64 | )% |
| | | | |
| | | | | | | | | | | | | | | | | | | | | | | | |
| Ratios to Average Net Assets | | | | |
Total expenses | | | 1.03 | %5 | | | 1.02 | % | | | 1.02 | % | | | 1.01 | % | | | 0.95 | % | | | 0.82 | % |
| | | | |
Total expenses after fees waived and/or reimbursed | | | 0.90 | %5 | | | 0.90 | % | | | 0.89 | % | | | 0.89 | % | | | 0.87 | % | | | 0.82 | % |
| | | | |
Net investment income | | | 1.61 | %5 | | | 1.30 | % | | | 1.23 | % | | | 1.24 | % | | | 1.63 | % | | | 1.41 | % |
| | | | |
| | | | | | | | | | | | | | | | | | | | | | | | |
| Supplemental Data | | | | | | | | | | | | | | | | | | | | | | | | |
Net assets, end of period (000) | | $ | 5,282 | | | $ | 5,466 | | | $ | 6,233 | | | $ | 6,715 | | | $ | 6,058 | | | $ | 6,462 | |
| | | | |
Portfolio turnover rate | | | 21 | % | | | 50 | % | | | 39 | % | | | 47 | % | | | 42 | % | | | 58 | % |
| | | | |
| | 1 | | Based on average shares outstanding. |
| | 2 | | Distributions for annual periods determined in accordance with federal income tax regulations. |
| | 3 | | Where applicable, excludes insurance-related fees and expenses and assumes the reinvestment of distributions. |
| | 4 | | Aggregate total return. |
See Notes to Financial Statements.
| | | | | | |
| | | BLACKROCK VARIABLE SERIES FUNDS, INC. | | JUNE 30, 2016 | | 11 |
| | | | |
| Financial Highlights (concluded) | | | BlackRock Basic Value V.I. Fund | |
| | | | | | | | | | | | | | | | | | | | | | | | |
| | | Class III | |
| | | Six Months
Ended
June 30, 2016
(Unaudited) | | | Year Ended December 31, | |
| | | | 2015 | | | 2014 | | | 2013 | | | 2012 | | | 2011 | |
| Per Share Operating Performance | | | | | | | | | | | | | | | | | | | | | | | | |
Net asset value, beginning of period | | $ | 13.28 | | | $ | 16.32 | | | $ | 17.35 | | | $ | 12.74 | | | $ | 11.37 | | | $ | 11.89 | |
| | | | |
Net investment income1 | | | 0.10 | | | | 0.19 | | | | 0.20 | | | | 0.17 | | | | 0.19 | | | | 0.16 | |
Net realized and unrealized gain (loss) | | | 0.57 | | | | (1.17 | ) | | | 1.50 | | | | 4.62 | | | | 1.38 | | | | (0.49 | ) |
| | | | |
Net increase (decrease) from investment operations | | | 0.67 | | | | (0.98 | ) | | | 1.70 | | | | 4.79 | | | | 1.57 | | | | (0.33 | ) |
| | | | |
Distributions:2 | | | | | | | | | | | | | | | | | | | | | | | | |
From net investment income | | | — | | | | (0.21 | ) | | | (0.22 | ) | | | (0.18 | ) | | | (0.20 | ) | | | (0.19 | ) |
From net realized gain | | | — | | | | (1.85 | ) | | | (2.51 | ) | | | — | | | | — | | | | — | |
| | | | |
Total distributions | | | — | | | | (2.06 | ) | | | (2.73 | ) | | | (0.18 | ) | | | (0.20 | ) | | | (0.19 | ) |
| | | | |
Net asset value, end of period | | $ | 13.95 | | | $ | 13.28 | | | $ | 16.32 | | | $ | 17.35 | | | $ | 12.74 | | | $ | 11.37 | |
| | | | |
| | | | | | | | | | | | | | | | | | | | | | | | |
| Total Return3 | | | | | | | | | | | | | | | | | | | | | | | | |
Based on net asset value | | | 4.97 | %4 | | | (6.15 | )% | | | 9.63 | % | | | 37.65 | % | | | 13.81 | % | | | (2.78 | )% |
| | | | |
| | | | | | | | | | | | | | | | | | | | | | | | |
| Ratios to Average Net Assets | | | | | | | | | | | | | | | | | | | | | | | | |
Total expenses | | | 1.13 | %5 | | | 1.13 | % | | | 1.11 | % | | | 1.12 | % | | | 1.05 | % | | | 0.92 | % |
| | | | |
Total expenses after fees waived and/or reimbursed | | | 1.01 | %5 | | | 1.01 | % | | | 1.00 | % | | | 1.00 | % | | | 0.98 | % | | | 0.92 | % |
| | | | |
Net investment income | | | 1.50 | %5 | | | 1.19 | % | | | 1.11 | % | | | 1.14 | % | | | 1.52 | % | | | 1.37 | % |
| | | | |
| | | | | | | | | | | | | | | | | | | | | | | | |
| Supplemental Data | | | | | | | | | | | | | | | | | | | | | | | | |
Net assets, end of period (000) | | $ | 46,285 | | | $ | 45,197 | | | $ | 54,394 | | | $ | 47,184 | | | $ | 38,758 | | | $ | 35,132 | |
| | | | |
Portfolio turnover rate | | | 21 | % | | | 50 | % | | | 39 | % | | | 47 | % | | | 42 | % | | | 58 | % |
| | | | |
| | 1 | | Based on average shares outstanding. |
| | 2 | | Distributions for annual periods determined in accordance with federal income tax regulations. |
| | 3 | | Where applicable, excludes insurance-related fees and expenses and assumes the reinvestment of distributions. |
| | 4 | | Aggregate total return. |
See Notes to Financial Statements.
| | | | | | |
| 12 | | BLACKROCK VARIABLE SERIES FUNDS, INC. | | JUNE 30, 2016 | | |
| | | | |
| Notes to Financial Statements (Unaudited) | | | BlackRock Basic Value V.I. Fund | |
1. Organization:
BlackRock Variable Series Funds, Inc. (the “Company”) is registered under the Investment Company Act of 1940, as amended (the “1940 Act”), as an open-end management investment company. The Company is organized as a Maryland corporation that is comprised of 20 separate funds. The funds offer shares to insurance companies for their separate accounts to fund benefits under certain variable annuity and variable life insurance contracts. The financial statements presented are for BlackRock Basic Value V.I. Fund (the “Fund”). The Fund is classified as diversified. Class I, Class II and Class III Shares have equal voting, dividend, liquidation and other rights, except that only shares of the respective classes are entitled to vote on matters concerning only that class. In addition, Class II and Class III Shares bear certain expenses related to the distribution of such shares.
The Fund, together with certain other registered investment companies advised by BlackRock Advisors, LLC (the “Manager”) or its affiliates, is included in a complex of open-end funds referred to as the Equity-Bond Complex.
2. Significant Accounting Policies:
The financial statements are prepared in conformity with accounting principles generally accepted in the United States of America (“U.S. GAAP”), which may require management to make estimates and assumptions that affect the reported amounts of assets and liabilities in the financial statements, disclosure of contingent assets and liabilities at the date of the financial statements and the reported amounts of increases and decreases in net assets from operations during the reporting period. Actual results could differ from those estimates. The Fund is considered an investment company under U.S. GAAP and follows the accounting and reporting guidance applicable to investment companies. Below is a summary of significant accounting policies:
Investment Transactions and Investment Income: For financial reporting purposes, investment transactions are recorded on the dates the transactions are entered into (the trade dates). Realized gains and losses on investment transactions are determined on the identified cost basis. Dividend income is recorded on the ex-dividend date. Dividends from foreign securities where the ex-dividend date may have passed are subsequently recorded when the Fund is informed of the ex-dividend date. Under the applicable foreign tax laws, a withholding tax at various rates may be imposed on capital gains, dividends and interest. Upon notification from issuers, some of the dividend income received from a real estate investment trust may be redesignated as a reduction of cost of the related investment and/or realized gain. Income, expenses and realized and unrealized gains and losses are allocated daily to each class based on its relative net assets.
Distributions: Distributions paid by the Fund are recorded on the ex-dividend date. The character and timing of distributions are determined in accordance with federal income tax regulations, which may differ from U.S. GAAP.
Indemnifications: In the normal course of business, the Fund enters into contracts that contain a variety of representations that provide general indemnification. The Fund’s maximum exposure under these arrangements is unknown because it involves future potential claims against the Fund, which cannot be predicted with any certainty.
Other: Expenses directly related to the Fund or its classes are charged to the Fund or the applicable class. Other operating expenses shared by several funds, including other funds managed by the Manager, are prorated among those funds on the basis of relative net assets or other appropriate methods. Expenses directly related to the Fund and other shared expenses prorated to the Fund are allocated daily to each class based on its relative net assets or other appropriate methods.
The Fund has an arrangement with its custodian whereby fees may be reduced by credits earned on uninvested cash balances, which, if applicable, are shown as fees paid indirectly in the Statement of Operations. The custodian imposes fees on overdrawn cash balances, which can be offset by accumulated credits earned or may result in additional custody charges.
3. Investment Valuation and Fair Value Measurements:
Investment Valuation Policies: The Fund’s investments are valued at fair value (also referred to as “market value” within the financial statements) as of the close of trading on the New York Stock Exchange (“NYSE”) (generally 4:00 p.m., Eastern time) U.S. GAAP defines fair value as the price the Fund would receive to sell an asset or pay to transfer a liability in an orderly transaction between market participants at the measurement date. The Fund determines the fair values of its financial instruments using various independent dealers or pricing services under policies approved by the Board of Directors of the Company (the “Board”). The BlackRock Global Valuation Methodologies Committee (the “Global Valuation Committee”) is the committee formed by management to develop global pricing policies and procedures and to oversee the pricing function for all financial instruments.
| | | | | | |
| | | BLACKROCK VARIABLE SERIES FUNDS, INC. | | JUNE 30, 2016 | | 13 |
| | | | |
| Notes to Financial Statements (continued) | | | BlackRock Basic Value V.I. Fund | |
Fair Value Inputs and Methodologies: The following methods (or “techniques”) and inputs are used to establish the fair value of the Fund’s assets and liabilities:
| • | | Equity investments traded on a recognized securities exchange are valued at the official closing price each day, if available. For equity investments traded on more than one exchange, the official close price on the exchange where the stock is primarily traded is used. Equity investments traded on a recognized exchange for which there were no sales on that day may be valued at the last available bid (long positions) or ask (short positions) price. |
| • | | Investments in open-end U.S. mutual funds are valued at net asset value each business day. |
| • | | The Fund values its investment in BlackRock Liquidity Series, LLC, Money Market Series (the “Money Market Series”) at fair value, which is ordinarily based upon its pro rata ownership in the underlying fund’s net assets. The Money Market Series seeks current income consistent with maintaining liquidity and preserving capital. Although the Money Market Series is not registered under the 1940 Act, its investments may follow the parameters of investments by a money market fund that is subject to Rule 2a-7 under the 1940 Act. The Fund may withdraw up to 25% of its investment daily, although the manager of the Money Market Series, in its sole discretion, may permit an investor to withdraw more than 25% on any one day. |
If events (e.g., a company announcement, market volatility or a natural disaster) occur that are expected to materially affect the value of such instruments, or in the event that the application of these methods of valuation results in a price for an investment that is deemed not to be representative of the market value of such investment, or if a price is not available, the investment will be valued by the Global Valuation Committee or its delegate, in accordance with a policy approved by the Board as reflecting fair value (“Fair Valued Investments”). When determining the price for Fair Valued Investments, the Global Valuation Committee, or its delegate, seeks to determine the price that the Fund might reasonably expect to receive or pay from the current sale or purchase of that asset or liability in an arm’s-length transaction. Fair value determinations shall be based upon all available factors that the Global Valuation Committee, or its delegate, deems relevant consistent with the principles of fair value measurement. The pricing of all Fair Valued Investments is subsequently reported to the Board or a committee thereof on a quarterly basis.
Fair Value Hierarchy: Various inputs are used in determining the fair value of investments. These inputs to valuation techniques are categorized into a fair value hierarchy consisting of three broad levels for financial statement purposes as follows:
| • | | Level 1 — unadjusted price quotations in active markets/exchanges for identical assets or liabilities that the Fund has the ability to access |
| • | | Level 2 — other observable inputs (including, but not limited to, quoted prices for similar assets or liabilities in markets that are active, quoted prices for identical or similar assets or liabilities in markets that are not active, inputs other than quoted prices that are observable for the assets or liabilities (such as interest rates, yield curves, volatilities, prepayment speeds, loss severities, credit risks and default rates) or other market–corroborated inputs) |
| • | | Level 3 — unobservable inputs based on the best information available in the circumstances, to the extent observable inputs are not available (including the Fund’s own assumptions used in determining the fair value of investments) |
The hierarchy gives the highest priority to unadjusted quoted prices in active markets for identical assets or liabilities (Level 1 measurements) and the lowest priority to unobservable inputs (Level 3 measurements). Accordingly, the degree of judgment exercised in determining fair value is greatest for instruments categorized in Level 3. The inputs used to measure fair value may fall into different levels of the fair value hierarchy. In such cases, for disclosure purposes, the fair value hierarchy classification is determined based on the lowest level input that is significant to the fair value measurement in its entirety. The significant unobservable inputs used by the Global Valuation Committee in determining the price for Fair Valued Investments are typically categorized as Level 3. The fair value hierarchy for the Fund’s investments has been included in the Schedule of Investments.
Changes in valuation techniques may result in transfers into or out of an assigned level within the hierarchy. In accordance with the Fund’s policy, transfers between different levels of the fair value hierarchy are deemed to have occurred as of the beginning of the reporting period. The categorization of a value determined for investments is based on the pricing transparency of the investments and is not necessarily an indication of the risks associated with investing in those securities.
4. Securities and Other Investments:
Preferred Stock: Preferred stock has a preference over common stock in liquidation (and generally in receiving dividends as well) but is subordinated to the liabilities of the issuer in all respects. As a general rule, the market value of preferred stock with a fixed dividend rate and no conversion element varies inversely with interest rates and perceived credit risk, while the market price of convertible preferred stock generally also reflects some element of conversion value. Because preferred stock is junior to debt securities and other obligations of the issuer, deterioration in the credit quality of the issuer will cause greater changes in the value of a preferred stock than in a more senior debt security with similar stated yield characteristics. Unlike interest payments on debt securities, preferred stock dividends are payable only if declared by the issuer’s board of directors. Preferred stock also may be subject to optional or mandatory redemption provisions.
| | | | | | |
| 14 | | BLACKROCK VARIABLE SERIES FUNDS, INC. | | JUNE 30, 2016 | | |
| | |
| Notes to Financial Statements (continued) | | BlackRock Basic Value V.I. Fund |
Securities Lending: The Fund may lend its securities to approved borrowers, such as brokers, dealers and other financial institutions. The borrower pledges and maintains with the Fund collateral consisting of cash, an irrevocable letter of credit issued by a bank, or securities issued or guaranteed by the U.S. Government. The initial collateral received by the Fund is required to have a value of at least 102% of the current value of the loaned securities for securities traded on U.S. exchanges and a value of at least 105% for all other securities. The collateral is maintained thereafter at a value equal to at least 100% of the current market value of the securities on loan. The market value of the loaned securities is determined at the close of each business day of the Fund and any additional required collateral is delivered to the Fund, or excess collateral returned by the Fund, on the next business day. During the term of the loan, the Fund is entitled to all distributions made on or in respect of the loaned securities. Loans of securities are terminable at any time and the borrower, after notice, is required to return borrowed securities within the standard time period for settlement of securities transactions.
The market value of any securities on loan, all of which were classified as common stocks in the Fund’s Schedule of Investments, and the value of any related collateral are shown separately in the Statement of Assets and Liabilities as a component of investments at value-unaffiliated, and collateral on securities loaned at value, respectively. As of period end, any securities on loan were collateralized by cash. The cash collateral invested by the securities lending agent, BlackRock Investment Management, LLC (“BIM”), if any, is disclosed in the Schedule of Investments.
Securities lending transactions are entered into by the Fund under Master Securities Lending Agreements (each, an “MSLA”), which provide the right, in the event of default (including bankruptcy or insolvency), for the non-defaulting party to liquidate the collateral and calculate a net exposure to the defaulting party or request additional collateral. In the event that a borrower defaults, the Fund, as lender, would offset the market value of the collateral received against the market value of the securities loaned. When the value of the collateral is greater than that of the market value of the securities loaned, the lender is left with a net amount payable to the defaulting party. However, bankruptcy or insolvency laws of a particular jurisdiction may impose restrictions on or prohibitions against such a right of offset in the event of an MSLA counterparty’s bankruptcy or insolvency. Under the MSLA, absent an event of default the borrower can resell or re-pledge the loaned securities, and the Fund can reinvest cash collateral received in connection with loaned securities. Upon an event of default, the parties’ obligations to return the securities or collateral to the other party are extinguished, and the parties can resell or re-pledge the loaned securities or the collateral received in connection with the loaned securities in order to satisfy the defaulting party’s net payment obligation for all transactions under the MSLA. The defaulting party remains liable for any deficiency.
As of period end, the following table is a summary of the Fund’s securities lending agreements by counterparty which are subject to offset under an MSLA:
| | | | | | | | | | | | | | | | | | |
| Counterparty | | | | | Securities
Loaned at Value | | | Cash Collateral Received1 | | | Net Amount | | | |
Citigroup Global Markets, Inc. | | | | | | $ | 820,384 | | | $ | (820,384 | ) | | — | | | | |
JP Morgan Securities LLC | | | | | | | 3,978,172 | | | | (3,978,172 | ) | | — | | | | |
Morgan Stanley | | | | | | | 5,370,450 | | | | (5,370,450 | ) | | — | | | | |
State Street Bank & Trust Co. | | | | | | | 17,191,184 | | | | (17,191,184 | ) | | — | | | | |
UBS Securities LLC | | | | | | | 351,356 | | | | (351,356 | ) | | — | | | | |
| | | | |
Total | | | | | | $ | 27,711,546 | | | $ | (27,711,546 | ) | | — | | | | |
| | | | |
| | 1 | | Collateral with a value of $28,215,428 has been received in connection with securities lending agreements. Collateral received in excess of the value of securities loaned from the individual counterparty is not shown for financial reporting purposes in the above table. |
The risks of securities lending include the risk that the borrower may not provide additional collateral when required or may not return the securities when due. To mitigate these risks, the Fund benefits from a borrower default indemnity provided by BIM. BIM’s indemnity allows for full replacement of the securities loaned if the collateral received does not cover the value on the securities loaned in the event of borrower default. The Fund could suffer a loss if the value of an investment purchased with cash collateral falls below the market value of loaned securities or if the value of an investment purchased with cash collateral falls below the value of the original cash collateral received.
5. Investment Advisory Agreement and Other Transactions with Affiliates:
The PNC Financial Services Group, Inc. is the largest stockholder and an affiliate of BlackRock, Inc. (“BlackRock”) for 1940 Act purposes.
Investment Advisory
The Company, on behalf of the Fund, entered into an Investment Advisory Agreement with the Manager, the Fund’s investment adviser, an indirect, wholly owned subsidiary of BlackRock, to provide investment advisory and administration services. The Manager is responsible for the management of the Fund’s portfolio and provides the personnel, facilities, equipment and certain other services necessary to the operations of the Fund. For such services, the Fund pays the Manager a monthly fee, which is determined by calculating a percentage of the Fund’s average daily net assets, based on the following annual rates:
| | | | | | |
| | | BLACKROCK VARIABLE SERIES FUNDS, INC. | | JUNE 30, 2016 | | 15 |
| | |
| Notes to Financial Statements (continued) | | BlackRock Basic Value V.I. Fund |
| | |
| Average Daily Net Assets | | Investment
Advisory Fees |
First $1 Billion | | 0.60% |
$1 Billion — $3 Billion | | 0.56% |
$3 Billion — $5 Billion | | 0.54% |
$5 Billion — $10 Billion | | 0.52% |
Greater than $10 Billion | | 0.51% |
Distribution Fees
The Company, on behalf of the Fund, entered into a Distribution Agreement and a Distribution Plan with BlackRock Investments, LLC (“BRIL”), an affiliate of the Manager. Pursuant to the Distribution Plan and in accordance with Rule 12b-1 under the 1940 Act, the Fund pays BRIL ongoing distribution fees. The fees are accrued daily and paid monthly at annual rates of 0.15% and 0.25% based upon the average daily net assets attributable to Class II and Class III, respectively.
For the six months ended June 30, 2016, the following table shows the class specific distribution fees borne directly by each share class of the Fund:
| | | | |
| Class II | | Class III | | Total |
$3,845 | | $54,725 | | $58,570 |
Transfer Agent
The Manager, on behalf of the Fund, entered into agreements with insurance companies and other financial intermediaries (“Service Organizations”), some of which may be affiliates. Pursuant to these agreements, the Service Organizations provide the Fund with administrative, networking, recordkeeping, sub-transfer agency and shareholder services to sub-accounts they service. For these services, the Service Organizations receive an annual fee per shareholder account, which will vary depending on share class and/or net assets of Fund shareholders serviced by the Service Organizations which is shown as transfer agent — class specific. For the six months ended June 30, 2016, the Fund paid the following amounts to affiliates in return for these services, which is included in transfer agent — class specific in the Statement of Operations.
| | | | | | |
| Class I | | Class II | | Class III | | Total |
$350,080 | | $5,438 | | $45,160 | | $400,678 |
In addition, the Fund pays the transfer agent, which is not an affiliate, a fee for issuance, transfer and redemption of shares and the opening and maintenance of shareholder accounts, which is included in transfer agent in the Statement of Operations.
Expense Limitations, Waivers and Reimbursements
The Manager, with respect to the Fund, contractually agreed to waive and/or reimburse fees or expenses in order to limit expenses, excluding interest expense, dividend expense, tax expense, acquired fund fees and expenses, and certain other fund expenses, which constitute extraordinary expenses not incurred in the ordinary course of the Fund’s business. The expense limitations as a percentage of average daily net assets are as follows:
| | | | |
Class I | | | 1.25 | % |
Class II | | | 1.40 | % |
Class III | | | 1.50 | % |
The Manager has agreed not to reduce or discontinue this contractual expense limitation prior to May 1, 2017, unless approved by the Board, including a majority of the Independent Directors who are not “interested persons” of the Fund, as defined in the 1940 Act (“Independent Directors”) or by a majority of the outstanding voting securities of the Fund.
The Manager, with respect to the Fund, voluntarily agreed to waive its investment advisory fees by the amount of investment advisory fees the Fund pays to the Manager indirectly through its investment in affiliated money market funds. This amount is shown as fees waived by the Manager in the Statement of Operations. However, the Manager does not waive its investment advisory fees by the amount of investment advisory fees paid in connection with the Fund’s investment in other affiliated investment companies, if any. For the six months ended June 30, 2016, the amount waived was $466.
| | | | | | |
| 16 | | BLACKROCK VARIABLE SERIES FUNDS, INC. | | JUNE 30, 2016 | | |
| | | | |
| Notes to Financial Statements (continued) | | | BlackRock Basic Value V.I. Fund | |
The Manager has contractually agreed to reimburse transfer agent fees in order to limit such expenses to a percentage of average daily net assets as follows:
| | | | |
Class I | | | 0.06 | % |
Class II | | | 0.08 | % |
Class III | | | 0.09 | % |
The Manager has agreed not to reduce or discontinue this contractual reimbursement prior to May 1, 2017 unless approved by the Board, including a majority of the Independent Directors or by a majority of the outstanding voting securities of the Fund.
These amounts waived and/or reimbursed are included in fees waived by the Manager, and shown as transfer agent fees reimbursed — class specific in the Statement of Operations. Class specific expense waivers and/or reimbursements are as follows:
| | | | | | | | | | | | | | | | |
| | | Class I | | | Class II | | | Class III | | | Total | |
Transfer Agent Fees Reimbursed | | $ | 236,346 | | | | $3,382 | | | $ | 25,404 | | | $ | 265,132 | |
For the six months ended June 30, 2016, the Fund reimbursed the Manager $2,411 for certain accounting services, which is included in accounting services in the Statement of Operations.
Securities Lending
The U.S. Securities and Exchange Commission has issued an exemptive order which permits BIM, an affiliate of the Manager, to serve as securities lending agent for the Fund, subject to applicable conditions. As securities lending agent, BIM bears all operational costs directly related to securities lending. The Fund is responsible for expenses in connection with the investment of cash collateral received for securities on loan (the “collateral investment expenses”). The cash collateral is invested in a private investment company managed by the Manager or its affiliates. However, BIM has agreed to cap the collateral investment expenses of the private investment company to an annual rate of 0.04%. The investment adviser to the private investment company will not charge any advisory fees with respect to shares purchased by the Fund.
Securities lending income is equal to the total of income earned from the reinvestment of cash collateral, net of fees and other payments to and from borrowers of securities, and less the collateral investment expenses. The Fund retains a portion of securities lending income and remits a remaining portion to BIM as compensation for its services as securities lending agent.
Pursuant to a securities lending agreement, the Fund retains 71.5% of securities lending income, and this amount retained can never be less than 65% of the total of securities lending income plus the collateral investment expenses.
In addition, commencing the business day following the date that the aggregate securities lending income earned across the Equity-Bond Complex in a calendar year exceeds a specified threshold, the Fund, pursuant to the securities lending agreement, will retain for the remainder of that calendar year securities lending income as follows: 75% of securities lending income, and this amount retained can never be less than 65% of the total of securities lending income plus the collateral investment expenses.
The share of securities lending income earned by the Fund is shown as securities lending — affiliated — net in the Statement of Operations. For the six months ended June 30, 2016, the Fund paid BIM $16,872 for securities lending agent services.
Officers and Directors
Certain officers and/or directors of the Company are officers and/or directors of BlackRock or its affiliates. The Fund reimburses the Manager for a portion of the compensation paid to the Company’s Chief Compliance Officer, which is included in Officer and Directors in the Statement of Operations.
6. Purchases and Sales:
For the six months ended June 30, 2016, purchases and sales of investments, excluding short-term securities, were $91,496,993 and $115,587,307, respectively.
7. Income Tax Information:
It is the Fund’s policy to comply with the requirements of the Internal Revenue Code of 1986, as amended, applicable to regulated investment companies, and to distribute substantially all of its taxable income to its shareholders. Therefore, no federal income tax provision is required.
| | | | | | |
| | | BLACKROCK VARIABLE SERIES FUNDS, INC. | | JUNE 30, 2016 | | 17 |
| | | | |
| Notes to Financial Statements (continued) | | | BlackRock Basic Value V.I. Fund | |
The Fund files U.S. federal and various state and local tax returns. No income tax returns are currently under examination. The statute of limitations on the Fund’s U.S. federal tax returns generally remains open for each of the four years ended December 31, 2015. The statutes of limitations on the Fund’s state and local tax returns may remain open for an additional year depending upon the jurisdiction.
Management has analyzed tax laws and regulations and their application to the Fund as of June 30, 2016, inclusive of the open tax return years, and does not believe there are any uncertain tax positions that require recognition of a tax liability in the Fund’s financial statements.
As of June 30, 2016, gross unrealized appreciation and depreciation based on cost for federal income tax purposes were as follows:
| | | | |
Tax cost | | $ | 440,127,270 | |
| | | | |
Gross unrealized appreciation | | $ | 52,838,052 | |
Gross unrealized depreciation | | | (24,934,058 | ) |
| | | | |
Net unrealized appreciation | | $ | 27,903,994 | |
| | | | |
8. Bank Borrowings:
The Company, on behalf of the Fund, along with certain other funds managed by the Manager and its affiliates (“Participating Funds”), is a party to a 364-day, $2.1 billion credit agreement with a group of lenders. Under this agreement, the Fund may borrow to fund shareholder redemptions. Excluding commitments designated for certain individual funds, the Participating Funds, including the Fund, can borrow up to an aggregate commitment amount of $1.6 billion at any time outstanding, subject to asset coverage and other limitations as specified in the agreement. The credit agreement has the following terms: a fee of 0.12% per annum on unused commitment amounts and interest at a rate equal to the higher of (a) one-month LIBOR (but, in any event, not less than 0.00%) on the date the loan is made plus 0.80% per annum or (b) the Fed Funds rate (but, in any event, not less than 0.00%) in effect from time to time plus 0.80% per annum on amounts borrowed. The agreement expires in April 2017 unless extended or renewed. Prior to April 21, 2016, the credit agreement had a fee per annum of 0.06% on unused commitment amounts and interest at a rate equal to the higher of (a) one-month LIBOR (but, in any event, not less than 0.00%) on the date the loan is made plus 0.80% per annum or (b) the Fed Funds rate (but, in any event, not less than 0.00%) in effect from time to time plus 0.80% per annum on amounts borrowed. Participating Funds paid administration, legal and arrangement fees, which, if applicable, are included in miscellaneous expenses in the Statement of Operations. These fees were allocated among such funds based upon portions of the aggregate commitment available to them and relative net assets of Participating Funds. During the six months ended June 30, 2016, the Fund did not borrow under the credit agreement.
9. Principal Risks:
In the normal course of business, the Fund invests in securities and enters into transactions where risks exist due to fluctuations in the market (market risk) or failure of the issuer to meet all its obligations, including the ability to pay principal and interest when due (issuer credit risk). The value of securities held by the Fund may decline in response to certain events, including those directly involving the issuers of securities owned by the Fund. Changes arising from the general economy, the overall market and local, regional or global political and/or social instability, as well as currency, interest rate and price fluctuations, may also affect the securities’ value.
Counterparty Credit Risk: Similar to issuer credit risk, the Fund may be exposed to counterparty credit risk, or the risk that an entity may fail to or be unable to perform on its commitments related to unsettled or open transactions. The Fund manages counterparty credit risk by entering into transactions only with counterparties that the Manager believes have the financial resources to honor their obligations and by monitoring the financial stability of those counterparties. Financial assets, which potentially expose the Fund to market, issuer and counterparty credit risks, consist principally of financial instruments and receivables due from counterparties. The extent of the Fund’s exposure to market, issuer and counterparty credit risks with respect to these financial assets is approximately their value recorded in the Statement of Assets and Liabilities, less any collateral held by the Fund.
Concentration Risk: As of period end, the Fund invested a significant portion of its assets in securities in the financials sector. Changes in economic conditions affecting such sector would have a greater impact on the Fund and could affect the value, income and/or liquidity of positions in such securities.
| | | | | | |
| 18 | | BLACKROCK VARIABLE SERIES FUNDS, INC. | | JUNE 30, 2016 | | |
| | | | |
| Notes to Financial Statements (concluded) | | | BlackRock Basic Value V.I. Fund | |
10. Capital Share Transactions:
Transactions in capital shares for each class were as follows:
| | | | | | | | | | | | | | | | | | | | | | | | | | | | | | | | | | |
| | | Six Months Ended
June 30, 2016 | | | | | Year Ended
December 31, 2015 | |
| | | | | | Shares | | | Amount | | | | | | | | | | | Shares | | | Amount | | | | |
| Class l | | | | | | | | | | | | | | | | | | | | | | | | | | |
Shares sold | | | | | | | 278,628 | | | $ | 3,685,657 | | | | | | | | | | | | | | 691,099 | | | $ | 11,155,149 | | | | | |
Shares issued in reinvestment of distributions | | | | | | | — | | | | — | | | | | | | | | | | | | | 3,981,747 | | | | 54,134,322 | | | | | |
Shares redeemed | | | | | | | (2,312,040 | ) | | | (31,022,562 | ) | | | | | | | | | | | | | (3,796,900 | ) | | | (62,537,434 | ) | | | | |
| | | | | | | | | | |
Net increase (decrease) | | | | | | | (2,033,412 | ) | | $ | (27,336,905 | ) | | | | | | | | | | | | | 875,946 | | | $ | 2,752,037 | | | | | |
| | | | | | | | | | |
| | | | | | | | | | | | | | | | | | | | | | | | | | | | | | | | | | |
Class II | | | | | | | | | | | | | | | | | | | | | | | | | | | | | | | | | | |
Shares sold | | | | | | | — | | | | — | | | | | | | | | | | | | | 4,430 | | | $ | 65,251 | | | | | |
Shares issued in reinvestment of distributions | | | | | | | — | | | | — | | | | | | | | | | | | | | 54,627 | | | | 740,623 | | | | | |
Shares redeemed | | | | | | | (33,160 | ) | | $ | (426,749 | ) | | | | | | | | | | | | | (29,479 | ) | | | (471,738 | ) | | | | |
| | | | | | | | | | |
Net increase (decrease) | | | | | | | (33,160 | ) | | $ | (426,749 | ) | | | | | | | | | | | | | 29,578 | | | $ | 334,136 | | | | | |
| | | | | | | | | | |
| | | | | | | | | | | | | | | | | | | | | | | | | | | | | | | | | | |
Class III | | | | | | | | | | | | | | | | | | | | | | | | | | | | | | | | | | |
Shares sold | | | | | | | 340,207 | | | $ | 4,488,425 | | | | | | | | | | | | | | 592,749 | | | $ | 9,628,267 | | | | | |
Shares issued in reinvestment of distributions | | | | | | | — | | | | — | | | | | | | | | | | | | | 453,380 | | | | 6,124,932 | | | | | |
Shares redeemed | | | | | | | (426,149 | ) | | | (5,549,646 | ) | | | | | | | | | | | | | (974,870 | ) | | | (15,831,804 | ) | | | | |
| | | | | | | | | | |
Net increase (decrease) | | | | | | | (85,942 | ) | | $ | (1,061,221 | ) | | | | | | | | | | | | | 71,259 | | | $ | (78,605 | ) | | | | |
| | | | | | | | | | |
Total Net Increase (Decrease) | | | | | | | (2,152,514 | ) | | $ | (28,824,875 | ) | | | | | | | | | | | | | 976,783 | | | $ | 3,007,568 | | | | | |
| | | | | | | | | | |
11. Subsequent Events:
Management’s evaluation of the impact of all subsequent events on the Fund’s financial statements was completed through the date the financial statements were issued and the following item was noted:
The Fund paid a long-term capital gain distribution in the following amounts per share on July 22, 2016 to shareholders of record on July 20, 2016:
| | | | |
| | | Long-Term
Capital Gain | |
Class I | | | $0.087861 | |
Class II | | | $0.087861 | |
Class III | | | $0.087861 | |
| | | | | | |
| | | BLACKROCK VARIABLE SERIES FUNDS, INC. | | JUNE 30, 2016 | | 19 |
JUNE 30, 2016
| | | | |
SEMI-ANNUAL REPORT (UNAUDITED) | | | | BLACKROCK® |
BlackRock Variable Series Funds, Inc.
▶ BlackRock Capital Appreciation V.I. Fund
| | |
| Not FDIC Insured ¡ May Lose Value ¡ No Bank Guarantee | | |
| | | | |
| Fund Summary as of June 30, 2016 | | | BlackRock Capital Appreciation V.I. Fund | |
BlackRock Capital Appreciation V.I. Fund’s (the “Fund”) investment objective is to seek long-term growth of capital.
|
| Portfolio Management Commentary |
How did the Fund perform?
| • | | For the six-month period ended June 30, 2016, the Fund underperformed the benchmark Russell 1000® Growth Index and the broad-market S&P 500® Index. The following discussion of relative performance pertains to the Russell 1000® Growth Index. |
What factors influenced performance?
| • | | After a strong finish to 2015, the Fund was not immune to the broader risk-off environment and momentum reversal that gripped markets at the start of 2016. Investors began the year favoring dividend stocks amid fears of negative interest rates, then broadly rotated to more traditional value stocks at the expense of growth/momentum names as the first quarter progressed. The rotation exacted the greatest toll on last year’s winners (regardless of sound fundamentals) and higher volatility stocks. Further challenging performance has been the resilience of safe-haven assets as the low/negative interest rate environment continued to attract domestic and foreign investors to high-dividend segments in their quest for yield. The Fund did rebound in the latter half of the reporting period, but, unfortunately, it was not enough to offset the abovementioned weakness. |
| • | | On a sector basis, consumer discretionary was the prime detractor from relative performance, with weakness most notable in the internet & catalog retail, media and specialty retail segments. Health care and information technology (“IT”) also weighed on results, mainly with respect to biotechnology and IT services. Conversely, energy and materials were the top contributors to performance. Oil & gas holdings led in energy, while chemicals was a standout in materials. Financials also added value. |
| • | | In stock specifics, biotechnology holdings Vertex Pharmaceuticals, Inc. and United Therapeutics Corp. were among the top detractors. The stocks underperformed amid the broader market rotation away from volatility, momentum and growth in the first half of the reporting period, which had a particularly negative impact on the biotechnology segment. Vertex shares were further pressured by several near-term downward estimate revisions on the company’s newly-launched drug Orkambi (though peak sales for the drug remain constant). |
| • | | Positions in Alliance Data Systems Corp. and TripAdvisor, Inc. also weighed on results. Alliance Data Systems reported an in-line fourth quarter and reiterated 2016 guidance, but its guidance included slightly higher credit losses than previously forecasted due to 2015 coming in better than expected (the company is using the same end point in 2016). Given Alliance Data’s exposure to credit losses in a potential downturn and the higher increase in losses relative to 2015, the stock sold off primarily on macro worries. TripAdvisor underperformed amid worries about the global economy and, specifically, global travel |
| | | fundamentals post-terrorist attacks in Europe and fears about the Zika virus in Latin America. Adding to weakness in the shares were investor concerns about the company’s business transition to first party booking, especially in light of a challenging travel environment. |
| • | | On the positive side, UnitedHealth Group, Inc. and Amazon.com, Inc. were the top contributors in the six-month period. UnitedHealth outperformed as its pharmacy benefit management (PBM) unit, which represents about 20% of profits, won the business of the California and Texas government workers retirees program, and General Electric. These wins suggest that UnitedHealth’s recent purchase of Catamaran (a smaller PBM) is being well received in the marketplace, and that the company could continue to take share if its promises of using the PBM relationship to lower overall medical costs for its customers (not just drug costs) bear out. Amazon shares outperformed after the company’s first-quarter results showed both a revenue acceleration and significant margin expansion, resulting in operating profit that beat expectations by almost 40%. Moreover, the company’s fastest-growing business, Amazon Web Services, continued to show strong revenue growth (63% year-over-year) and margin expansion. |
| • | | Additional contributions came from positions in Tencent Holdings Ltd. and Facebook, Inc. Tencent reported first-quarter revenue growth and margins that exceeded expectations. In addition, Weixin user additions accelerated on a quarter-over-quarter basis, and the company’s outlook was bullish with respect to mobile games, subscriptions and advertising. Facebook outperformed earlier in the period after the company exceeded expectations for its fourth-quarter results by a wide margin. Revenues accelerated, margins topped expectations and the company’s plans for 2016 were in-line with expectations. |
Describe recent portfolio activity.
| • | | Due to a combination of portfolio trading activity and market movement during the six-month period, the Fund’s weighting in the consumer staples and energy sectors increased, largely with respect to beverages and oil, gas & consumable fuels. Industrials exposure also increased. The most notable reductions were in IT, mainly hardware, and health care, especially biotechnology and pharmaceuticals. |
Describe portfolio positioning at period end.
| • | | From a positioning standpoint, the investment adviser continues to barbell the portfolio, balancing best-in-class growth companies with low-volatility names that should perform well in a low growth, low interest rate environment. |
| • | | As of period end, the Fund’s largest sector overweight relative to the Russell 1000® Growth Index was in IT, while industrials remained the largest underweight. |
The views expressed reflect the opinions of BlackRock as of the date of this report and are subject to change based on changes in market, economic or other conditions. These views are not intended to be a forecast of future events and are no guarantee of future results.
| | | | | | |
| 2 | | BLACKROCK VARIABLE SERIES FUNDS, INC. | | JUNE 30, 2016 | | |
| | | | |
| | | | BlackRock Capital Appreciation V.I. Fund | |
|
| Total Return Based on a $10,000 Investment |
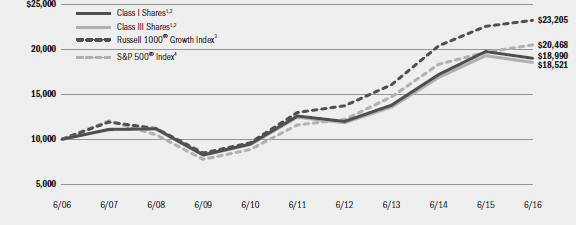
| | 1 | Assuming transaction costs, if any, and other operating expenses, including investment advisory fees. Does not include insurance-related fees and expenses. The returns for Class III Shares prior to June 15, 2010, the recommencement of operations of Class III Shares, are based upon the performance of the Fund’s Class I Shares, as adjusted to reflect the distribution and/or service (12b-1) fees applicable to the Class III Shares. |
| | 2 | The Fund invests primarily in a diversified portfolio consisting primarily of common stock of U.S. companies that the investment adviser believes have exhibited above-average growth rates in earnings over the long-term. |
| | 3 | An unmanaged index that measures the performance of the large cap growth segment of the U.S. equity universe and consists of those Russell 1000® securities with higher price-to-book ratios and higher forecasted growth values. |
| | 4 | An unmanaged index that covers 500 leading companies and captures approximately 80% coverage of available market capitalization. |
| | | | | | | | | | | | | | | | |
| Performance Summary for the Period Ended June 30, 2016 | | | | | | | | | | | | | | | | |
| | | | | | Average Annual Total Returns | |
| | | 6-Month
Total Returns6 | | | 1 Year6 | | | 5 Years6 | | | 10 Years6 | |
Class I5 | | | (4.29 | )% | | | (3.72 | )% | | | 8.60 | % | | | 6.62 | % |
Class III5 | | | (4.43 | ) | | | (4.00 | ) | | | 8.31 | | | | 6.36 | 7 |
Russell 1000® Growth Index | | | 1.36 | | | | 3.02 | | | | 12.35 | | | | 8.78 | |
S&P 500® Index | | | 3.84 | | | | 3.99 | | | | 12.10 | | | | 7.43 | |
| | 5 | | Average annual and cumulative total returns are based on changes in net asset value for the periods shown, and assume reinvestment of all distributions at net asset value on the ex-dividend date. Insurance-related fees and expenses are not reflected in these returns. |
| | 6 | | For a portion of the period, the Fund’s investment adviser waived a portion of its fee. Without such waiver, the Fund’s performance would have been lower. |
| | 7 | | The returns for Class III Shares prior to June 15, 2010, the recommencement of operations of Class III Shares, are based upon the performance of the Fund’s Class I Shares, as adjusted to reflect the distribution (12b-1) fees applicable to Class III Shares. |
| | | | Past performance is not indicative of future results. Performance results do not reflect the deduction of taxes that a shareholder would pay on Fund distributions or the redemption of Fund shares. |
| | | | | | | | | | | | | | |
| Expense Example |
| | | Actual | | Hypothetical9 | | |
| | | Beginning
Account Value
January 1, 2016 | | Ending
Account Value
June 30, 2016 | | Expenses Paid
During the Period8 | | Beginning
Account Value
January 1, 2016 | | Ending
Account Value
June 30, 2016 | | Expenses Paid
During the Period8 | | Annualized
Expense Ratio |
Class I | | $1,000.00 | | $957.10 | | $3.89 | | $1,000.00 | | $1,020.89 | | $4.02 | | 0.80% |
Class III | | $1,000.00 | | $955.70 | | $5.15 | | $1,000.00 | | $1,019.59 | | $5.32 | | 1.06% |
| | 8 | | For each class of the Fund, expenses are equal to the annualized expense ratio for the class, multiplied by the average account value over the period, multiplied by 182/366 (to reflect the one-half year period shown). |
| | 9 | | Hypothetical 5% annual return before expenses is calculated by prorating the number of days in the most recent fiscal half year divided by 366. See “Disclosure of Expenses” on the following page for further information on how expenses were calculated. |
| | | | | | |
| | | BLACKROCK VARIABLE SERIES FUNDS, INC. | | JUNE 30, 2016 | | 3 |
| | | | |
| | | | BlackRock Capital Appreciation V.I. Fund | |
|
| Portfolio Information as of June 30, 2016 |
| | | | |
| Sector Allocation | | Percent of
Net Assets | |
Information Technology | | | 36 | % |
Consumer Discretionary | | | 20 | |
Health Care | | | 16 | |
Consumer Staples | | | 11 | |
Industrials | | | 5 | |
Financials | | | 4 | |
Materials | | | 3 | |
Energy | | | 2 | |
Telecommunication Services | | | 1 | |
Short-Term Securities | | | 5 | |
Liabilities in Excess of Other Assets | | | (3 | ) |
| | | | For Fund compliance purposes, the Fund’s sector classifications refer to one or more of the sector sub-classifications used by one or more widely recognized market indexes or rating group indexes, and/or as defined by the investment adviser. These definitions may not apply for purposes of this report, which may combine sector sub-classifications for reporting ease. |
Shareholders of the Fund may incur the following charges: (a) transactional expenses, such as sales charges; and (b) operating expenses, including investment advisory fees, service and distribution fees, including 12b-1 fees, acquired fund fees and expenses, and other fund expenses. The expense example on the previous page (which is based on a hypothetical investment of $1,000 invested on January 1, 2016 and held through June 30, 2016) is intended to assist shareholders both in calculating expenses based on an investment in the Fund and in comparing these expenses with similar costs of investing in other mutual funds.
The expense example provides information about actual account values and actual expenses. In order to estimate the expenses a shareholder paid during the period covered by this report, shareholders can divide their account value by $1,000 and then multiply the result by the number corresponding to their share class under the heading entitled “Expenses Paid During the Period.”
The expense example also provides information about hypothetical account values and hypothetical expenses based on the Fund’s actual expense ratio and an assumed rate of return of 5% per year before expenses. In order to assist shareholders in comparing the ongoing expenses of investing in the Fund and other funds, compare the 5% hypothetical example with the 5% hypothetical examples that appear in shareholder reports of other funds.
The expenses shown in the expense example are intended to highlight shareholders’ ongoing costs only and do not reflect any transactional expenses, such as sales charges, if any. Therefore, the hypothetical example is useful in comparing ongoing expenses only, and will not help shareholders determine the relative total expenses of owning different funds. If these transactional expenses were included, shareholder expenses would have been higher.
| | | | | | |
| 4 | | BLACKROCK VARIABLE SERIES FUNDS, INC. | | JUNE 30, 2016 | | |
| | | | |
| Schedule of Investments June 30, 2016 (Unaudited) | | | BlackRock Capital Appreciation V.I. Fund | |
| | | (Percentages shown are based on Net Assets) | |
| | | | | | | | |
| Common Stocks | | Shares | | | Value | |
Aerospace & Defense — 2.0% | | | | | | | | |
Honeywell International, Inc. | | | 26,913 | | | $ | 3,130,520 | |
TransDigm Group, Inc. (a)(b) | | | 15,268 | | | | 4,026,019 | |
| | | | | | | | |
| | | | | | | | 7,156,539 | |
Beverages — 6.5% | | | | | | | | |
Anheuser-Busch InBev SA/NV — ADR | | | 91,034 | | | | 11,987,357 | |
Constellation Brands, Inc., Class A | | | 67,180 | | | | 11,111,572 | |
| | | | | | | | |
| | | | | | | | 23,098,929 | |
Biotechnology — 3.6% | | | | | | | | |
Alexion Pharmaceuticals, Inc. (a) | | | 8,595 | | | | 1,003,552 | |
Celgene Corp. (a) | | | 30,285 | | | | 2,987,010 | |
Regeneron Pharmaceuticals, Inc. (a) | | | 14,058 | | | | 4,909,475 | |
Vertex Pharmaceuticals, Inc. (a) | | | 44,010 | | | | 3,785,740 | |
| | | | | | | | |
| | | | | | | | 12,685,777 | |
Chemicals — 2.9% | | | | | | | | |
Ecolab, Inc. | | | 31,140 | | | | 3,693,204 | |
Sherwin-Williams Co. | | | 22,564 | | | | 6,626,370 | |
| | | | | | | | |
| | | | | | | | 10,319,574 | |
Diversified Financial Services — 2.9% | | | | | | | | |
Berkshire Hathaway, Inc., Class B (a) | | | 70,646 | | | | 10,228,834 | |
Diversified Telecommunication Services — 1.4% | | | | | | | | |
SBA Communications Corp., Class A (a) | | | 47,110 | | | | 5,085,053 | |
Electrical Equipment — 1.2% | | | | | | | | |
Acuity Brands, Inc. | | | 16,907 | | | | 4,192,260 | |
Food & Staples Retailing — 3.4% | | | | | | | | |
Costco Wholesale Corp. | | | 49,258 | | | | 7,735,476 | |
Walgreens Boots Alliance, Inc. | | | 53,698 | | | | 4,471,433 | |
| | | | | | | | |
| | | | | | | | 12,206,909 | |
Food Products — 0.6% | | | | | | | | |
Mead Johnson Nutrition Co. | | | 21,756 | | | | 1,974,357 | |
Health Care Equipment & Supplies — 4.1% | | | | | | | | |
Becton Dickinson and Co. | | | 34,103 | | | | 5,783,528 | |
Boston Scientific Corp. (a) | | | 221,029 | | | | 5,165,448 | |
Intuitive Surgical, Inc. (a) | | | 5,521 | | | | 3,651,645 | |
| | | | | | | | |
| | | | | | | | 14,600,621 | |
Health Care Providers & Services — 4.6% | | | | | | | | |
Humana, Inc. | | | 16,315 | | | | 2,934,742 | |
UnitedHealth Group, Inc. | | | 95,995 | | | | 13,554,494 | |
| | | | | | | | |
| | | | | | | | 16,489,236 | |
Hotels, Restaurants & Leisure — 2.6% | | | | | | | | |
Chipotle Mexican Grill, Inc. (a)(b) | | | 10,645 | | | | 4,287,380 | |
Domino’s Pizza, Inc. | | | 22,687 | | | | 2,980,618 | |
Starbucks Corp. | | | 36,122 | | | | 2,063,289 | |
| | | | | | | | |
| | | | | | | | 9,331,287 | |
| | | | | | | | |
| Common Stocks | | Shares | | | Value | |
Internet & Catalog Retail — 12.1% | | | | | | | | |
Amazon.com, Inc. (a) | | | 33,405 | | | $ | 23,905,286 | |
Netflix, Inc. (a) | | | 85,554 | | | | 7,826,480 | |
Priceline Group, Inc. (a) | | | 6,241 | | | | 7,791,327 | |
TripAdvisor, Inc. (a) | | | 57,464 | | | | 3,694,935 | |
| | | | | | | | |
| | | | | | | | 43,218,028 | |
Internet Software & Services — 16.0% | | | | | | | | |
Alphabet, Inc., Class A (a) | | | 37,337 | | | | 26,267,700 | |
Facebook, Inc., Class A (a) | | | 180,911 | | | | 20,674,509 | |
Tencent Holdings Ltd. | | | 435,900 | | | | 9,999,404 | |
| | | | | | | | |
| | | | | | | | 56,941,613 | |
IT Services — 9.2% | | | | | | | | |
Fiserv, Inc. (a) | | | 27,764 | | | | 3,018,780 | |
FleetCor Technologies, Inc. (a) | | | 55,023 | | | | 7,875,442 | |
Global Payments, Inc. | | | 78,235 | | | | 5,584,414 | |
Visa, Inc., Class A | | | 217,977 | | | | 16,167,354 | |
| | | | | | | | |
| | | | | | | | 32,645,990 | |
Life Sciences Tools & Services — 2.1% | | | | | | | | |
Illumina, Inc. (a) | | | 52,138 | | | | 7,319,132 | |
Media — 1.1% | | | | | | | | |
Liberty Global PLC LiLAC, Class A (a) | | | 20,918 | | | | 674,815 | |
Liberty Global PLC, Class A (a) | | �� | 115,124 | | | | 3,345,503 | |
| | | | | | | | |
| | | | | | | | 4,020,318 | |
Oil, Gas & Consumable Fuels — 2.2% | | | | | | | | |
Concho Resources, Inc. (a) | | | 38,346 | | | | 4,573,527 | |
EOG Resources, Inc. | | | 38,460 | | | | 3,208,333 | |
| | | | | | | | |
| | | | | | | | 7,781,860 | |
Pharmaceuticals — 1.4% | | | | | | | | |
Allergan PLC (a) | | | 21,950 | | | | 5,072,426 | |
Real Estate Investment Trusts (REITs) — 1.4% | | | | | | | | |
Crown Castle International Corp. | | | 50,234 | | | | 5,095,235 | |
Road & Rail — 1.5% | | | | | | | | |
Norfolk Southern Corp. | | | 64,011 | | | | 5,449,256 | |
Semiconductors & Semiconductor Equipment — 0.5% | | | | | | | | |
Applied Materials, Inc. | | | 72,948 | | | | 1,748,564 | |
Software — 7.9% | | | | | | | | |
Activision Blizzard, Inc. | | | 221,141 | | | | 8,763,818 | |
Microsoft Corp. | | | 216,021 | | | | 11,053,795 | |
salesforce.com, Inc. (a) | | | 103,323 | | | | 8,204,879 | |
| | | | | | | | |
| | | | | | | | 28,022,492 | |
Specialty Retail — 2.1% | | | | | | | | |
Home Depot, Inc. | | | 58,889 | | | | 7,519,536 | |
Technology Hardware, Storage & Peripherals — 1.3% | | | | | | | | |
Apple Inc. | | | 49,308 | | | | 4,713,845 | |
| | | | | | | | | | | | | | |
| ADR | | American Depositary Receipts | | | | | | | | | | | | |
See Notes to Financial Statements.
| | | | | | |
| | | BLACKROCK VARIABLE SERIES FUNDS, INC. | | JUNE 30, 2016 | | 5 |
| | | | |
| Schedule of Investments (continued) | | | BlackRock Capital Appreciation V.I. Fund | |
| | | | | | | | |
| Common Stocks | | Shares | | | Value | |
Textiles, Apparel & Luxury Goods — 1.9% | | | | | | | | |
NIKE, Inc., Class B | | | 124,557 | | | $ | 6,875,546 | |
Total Common Stocks — 96.5% | | | | | | | 343,793,217 | |
| | | | | | | | |
| Preferred Stock | | | | | | |
Software — 1.2% | | | | | | | | |
Palantir Technologies, Inc., Series I (Acquired 2/07/14, cost $2,858,021) (a)(c) | | | 466,235 | | | | 4,471,194 | |
Total Long-Term Investments (Cost — $303,171,140) — 97.7% | | | | | | | 348,264,411 | |
| | | | | | | | |
| | | | | | | |
| | | | | | | | |
| Short-Term Securities | | Shares | | | Value | |
BlackRock Liquidity Funds, TempFund, Institutional Class, 0.40% (d)(e) | | | 13,698,056 | | | $ | 13,698,056 | |
| | | | | | | | |
| | | Beneficial
Interest
(000) | | | | |
BlackRock Liquidity Series, LLC, Money Market Series, 0.59% (d)(e)(f) | | $ | 4,015 | | | | 4,014,509 | |
Total Short-Term Securities (Cost — $17,712,565) — 5.0% | | | | | | | 17,712,565 | |
Total Investments (Cost — $320,883,705) — 102.7% | | | | 365,976,976 | |
Liabilities in Excess of Other Assets — (2.7)% | | | | | | | (9,592,563 | ) |
| | | | | | | | |
Net Assets — 100.0% | | | | | | $ | 356,384,413 | |
| | | | | | | | |
|
| Notes to Schedule of Investments |
| (a) | Non-income producing security. |
| (b) | Security, or a portion of security, is on loan. |
| (c) | Restricted security as to resale, excluding 144A securities. As of period end, the Fund held restricted securities with a current value of $4,471,194 and an original cost of $2,858,021 which was 1.2% of its net assets. |
| (d) | During the six months ended June 30, 2016, investments in issuers considered to be affiliates of the Fund for purposes of Section 2(a)(3) of the Investment Company Act of 1940, as amended, were as follows: |
| | | | | | | | | | | | | | | | | | | |
| Affiliate | | Shares/Beneficial
Interest Held at
December 31, 2015 | | Net Activity | | Shares/Beneficial
Interest Held at
June 30, 2016 | | Value at
June 30, 2016 | | Income |
BlackRock Liquidity Funds, TempFund, Institutional Class | | 3,359,763 | | | | 10,338,293 | | | 13,698,056 | | | $ | 13,698,056 | | | | $ | 8,099 | |
BlackRock Liquidity Series, LLC, Money Market Series | | $8,602,385 | | | $ | (4,587,876 | ) | | $ 4,014,509 | | | | 4,014,509 | | | | | 7,382 | 1 |
Total | | | | | | | | | | | | $ | 17,712,565 | | | | $ | 15,481 | |
| | | | | | | | | | | | | | |
| | 1 | | Represents securities lending income earned from the reinvestment of cash collateral from loaned securities, net of fees and collateral investment expenses, and other payments to and from borrowers of securities. |
| (e) | Current yield as of period end. |
| (f) | Security was purchased with the cash collateral from loaned securities. The Fund may withdraw up to 25% of its investment daily, although the manager of the BlackRock Liquidity Series, LLC, Money Market Series, in its sole discretion, may permit an investor to withdraw more than 25% on any one day. |
| • | | For Fund compliance purposes, the Fund’s industry classifications refer to one or more of the industry sub-classifications used by one or more widely recognized market indexes or rating group indexes, and/or as defined by the investment adviser. These definitions may not apply for purposes of this report, which may combine such industry sub-classifications for reporting ease. |
|
| Fair Value Hierarchy as of Period End |
Various inputs are used in determining the fair value investments. For information about the Fund’s policy regarding valuation of investments, refer to the Notes to Financial Statements.
The following table summarizes the Fund’s investments categorized in the disclosure hierarchy:
| | | | | | | | | | | | | | | | |
| | | Level 1 | | | Level 2 | | | Level 3 | | | Total | |
Assets: | | | | | | | | | | | | | | | | |
Investments: | | | | | | | | | | | | | | | | |
Long-Term Investments: | | | | | | | | | | | | | | | | |
Common Stocks: | | | | | | | | | | | | | | | | |
Aerospace & Defense | | $ | 7,156,539 | | | | — | | | | — | | | $ | 7,156,539 | |
Beverages | | | 23,098,929 | | | | — | | | | — | | | | 23,098,929 | |
Biotechnology | | | 12,685,777 | | | | — | | | | — | | | | 12,685,777 | |
Chemicals | | | 10,319,574 | | | | — | | | | — | | | | 10,319,574 | |
Diversified Financial Services | | | 10,228,834 | | | | — | | | | — | | | | 10,228,834 | |
Diversified Telecommunication Services | | | 5,085,053 | | | | — | | | | — | | | | 5,085,053 | |
Electrical Equipment | | | 4,192,260 | | | | — | | | | — | | | | 4,192,260 | |
Food & Staples Retailing | | | 12,206,909 | | | | — | | | | — | | | | 12,206,909 | |
Food Products | | | 1,974,357 | | | | — | | | | — | | | | 1,974,357 | |
Health Care Equipment & Supplies | | | 14,600,621 | | | | — | | | | — | | | | 14,600,621 | |
Health Care Providers & Services | | | 16,489,236 | | | | — | | | | — | | | | 16,489,236 | |
See Notes to Financial Statements.
| | | | | | |
| 6 | | BLACKROCK VARIABLE SERIES FUNDS, INC. | | JUNE 30, 2016 | | |
| | | | |
| Schedule of Investments (concluded) | | | BlackRock Capital Appreciation V.I. Fund | |
| | | | | | | | | | | | | | | | |
| | | Level 1 | | | Level 2 | | | Level 3 | | | Total | |
Hotels, Restaurants & Leisure | | $ | 9,331,287 | | | | — | | | | — | | | $ | 9,331,287 | |
Internet & Catalog Retail | | | 43,218,028 | | | | — | | | | — | | | | 43,218,028 | |
Internet Software & Services | | | 46,942,209 | | | $ | 9,999,404 | | | | — | | | | 56,941,613 | |
IT Services | | | 32,645,990 | | | | — | | | | — | | | | 32,645,990 | |
Life Sciences Tools & Services | | | 7,319,132 | | | | — | | | | — | | | | 7,319,132 | |
Media | | | 4,020,318 | | | | — | | | | — | | | | 4,020,318 | |
Oil, Gas & Consumable Fuels | | | 7,781,860 | | | | — | | | | — | | | | 7,781,860 | |
Pharmaceuticals | | | 5,072,426 | | | | — | | | | — | | | | 5,072,426 | |
Real Estate Investment Trusts (REITs) | | | 5,095,235 | | | | — | | | | — | | | | 5,095,235 | |
Road & Rail | | | 5,449,256 | | | | — | | | | — | | | | 5,449,256 | |
Semiconductors & Semiconductor Equipment | | | 1,748,564 | | | | — | | | | — | | | | 1,748,564 | |
Software | | | 28,022,492 | | | | — | | | | — | | | | 28,022,492 | |
Specialty Retail | | | 7,519,536 | | | | — | | | | — | | | | 7,519,536 | |
Technology Hardware, Storage & Peripherals | | | 4,713,845 | | | | — | | | | — | | | | 4,713,845 | |
Textiles, Apparel & Luxury Goods | | | 6,875,546 | | | | — | | | | — | | | | 6,875,546 | |
Preferred Stock: | | | | | | | | | | | | | | | | |
Software | | | — | | | | — | | | $ | 4,471,194 | | | | 4,471,194 | |
Short-Term Securities | | | 13,698,056 | | | | 4,014,509 | | | | — | | | | 17,712,565 | |
| | | | |
Total | | $ | 347,491,869 | | | $ | 14,013,913 | | | $ | 4,471,194 | | | $ | 365,976,976 | |
| | | | |
The Fund may hold assets and/or liabilities in which the fair value approximates the carrying amount for financial statement purposes. As of period end, collateral on securities loaned at value of $4,014,509 is categorized as Level 2 within the disclosure hierarchy.
During the six months ended June 30, 2016, there were no transfers between Level 1 and Level 2.
A reconciliation of Level 3 investments is presented when the Fund had a significant amount of Level 3 investments at the beginning and/or end of the period in relation to net assets. The following table is a reconciliation of Level 3 investments for which significant unobservable inputs were used in determining fair value:
| | | | |
| | | Preferred
Stocks | |
Assets: | | | | |
Opening Balance, as of December 31, 2015 | | $ | 5,305,754 | |
Transfers into Level 3 | | | — | |
Transfers out of Level 3 | | | — | |
Accrued discounts/premiums | | | — | |
Net realized gain (loss) | | | — | |
Net change in unrealized appreciation (depreciation)1,2 | | | (834,560 | ) |
Purchases | | | — | |
Sales | | | — | |
| | | | |
Closing Balance, as of June 30, 2016 | | $ | 4,471,194 | |
| | | | |
Net change in unrealized appreciation (depreciation) on investments still held at June 30, 20162 | | $ | (834,560 | ) |
| | | | |
| | 1 | | Included in the related net change in unrealized appreciation (depreciation) in the Statement of Operations. |
| | 2 | | Any difference between net change in unrealized appreciation (depreciation) and net change in unrealized appreciation (depreciation) on investments still held at June 30, 2016 is generally due to investments no longer held or categorized as Level 3 at period end. |
The following table summarizes the valuation techniques used and unobservable inputs utilized by the BlackRock Global Valuation Methodologies Committee (the “Global Valuation Committee”) to determine the value of certain of the Fund’s Level 3 investments as of period end.
| | | | | | | | | | | | | | | | |
| | | Value | | | Valuation Techniques | | | Unobservable
Inputs | | | Range of
Unobservable Inputs
Utilized | |
Assets: | | | | | | | | | | | | | | | | |
Preferred Stocks | | $ | 4,471,194 | | | | Market Comparables | | | | Revenue Multiple1 | | | | 12.00x | |
| | | | | | | | | | | | Revenue Growth Rate1 | | | | 84.00% | |
| | 1 | | Increase in unobservable input may result in a significant increase to value, while a decrease in the unobservable input may result in a significant decrease to value. |
See Notes to Financial Statements.
| | | | | | |
| | | BLACKROCK VARIABLE SERIES FUNDS, INC. | | JUNE 30, 2016 | | 7 |
| | | | |
| Statement of Assets and Liabilities | | | | |
| | | | |
| June 30, 2016 (Unaudited) | | BlackRock
Capital Appreciation
V.I. Fund | |
| | | | |
| Assets | | | | |
Investments at value — unaffiliated (including securities loaned at value of $3,954,968) (cost — $303,171,140) | | $ | 348,264,411 | |
Investments at value — affiliated (cost — $17,712,565) | | | 17,712,565 | |
Receivables: | | | | |
Investments sold | | | 124,869 | |
Securities lending income — affiliated | | | 1,390 | |
Capital shares sold | | | 456,065 | |
Dividends — affiliated | | | 1,261 | |
Dividends — unaffiliated | | | 35,932 | |
From the Manager | | | 79,048 | |
Prepaid expenses | | | 826 | |
| | | | |
Total assets | | | 366,676,367 | |
| | | | |
| | | | |
| Liabilities | | | | |
Collateral on securities loaned at value | | | 4,014,509 | |
Payables: | | | | |
Investments purchased | | | 5,728,948 | |
Capital shares redeemed | | | 18,363 | |
Distribution fees | | | 47,204 | |
Investment advisory fees | | | 190,642 | |
Officer’s and Directors’ fees | | | 3,357 | |
Other accrued expenses | | | 286,945 | |
Other affiliates | | | 1,986 | |
| | | | |
Total liabilities | | | 10,291,954 | |
| | | | |
Net Assets | | $ | 356,384,413 | |
| | | | |
| | | | |
| Net Assets Consist of | | | | |
Paid-in capital | | $ | 310,325,870 | |
Accumulated net investment loss | | | (450,440 | ) |
Accumulated net realized gain | | | 1,415,712 | |
Net unrealized appreciation (depreciation) | | | 45,093,271 | |
| | | | |
Net Assets | | $ | 356,384,413 | |
| | | | |
| | | | |
| Net Asset Value | | | | |
Class I — Based on net assets of $126,633,758 and 14,937,252 shares outstanding, 100 million shares authorized, $0.10 par value | | $ | 8.48 | |
| | | | |
Class III — Based on net assets of $229,750,655 and 27,287,103 shares outstanding, 100 million shares authorized, $0.10 par value | | $ | 8.42 | |
| | | | |
See Notes to Financial Statements.
| | | | | | |
| 8 | | BLACKROCK VARIABLE SERIES FUNDS, INC. | | JUNE 30, 2016 | | |
| | | | |
| Six Months Ended June 30, 2016 (Unaudited) | | BlackRock
Capital Appreciation
V.I. Fund | |
| | | | |
| Investment Income | | | | |
Dividends — affiliated | | $ | 8,099 | |
Dividends — unaffiliated | | | 1,259,313 | |
Securities lending — affiliated — net | | | 7,382 | |
Foreign taxes withheld | | | (32,128 | ) |
| | | | |
Total income | | | 1,242,666 | |
| | | | |
| | | | |
| Expenses | | | | |
Investment advisory | | | 1,145,129 | |
Transfer agent | | | 2,463 | |
Transfer agent — class specific | | | 372,772 | |
Distribution — class specific | | | 281,547 | |
Accounting services | | | 40,318 | |
Printing | | | 31,766 | |
Professional | | | 28,916 | |
Custodian | | | 17,959 | |
Officer and Directors | | | 11,957 | |
Miscellaneous | | | 6,373 | |
| | | | |
Total expenses | | | 1,939,200 | |
Less: | | | | |
Fees waived by the Manager | | | (1,531 | ) |
Transfer agent fees reimbursed — class specific | | | (237,820 | ) |
| | | | |
Total expenses after fees waived and reimbursed | | | 1,699,849 | |
| | | | |
Net investment loss | | | (457,183 | ) |
| | | | |
| | | | |
| Realized and Unrealized Gain (Loss) | | | | |
Net realized gain (loss) from: | | | | |
Investments | | | (3,786,734 | ) |
Foreign currency transactions | | | 439 | |
| | | | |
| | | (3,786,295 | ) |
| | | | |
Net change in unrealized appreciation (depreciation) on: | | | | |
Investments | | | (10,986,438 | ) |
Foreign currency translations | | | (1 | ) |
| | | | |
| | | (10,986,439 | ) |
| | | | |
Net realized and unrealized loss | | | (14,772,734 | ) |
| | | | |
Net Decrease in Net Assets Resulting from Operations | | $ | (15,229,917 | ) |
| | | | |
See Notes to Financial Statements.
| | | | | | |
| | | BLACKROCK VARIABLE SERIES FUNDS, INC. | | JUNE 30, 2016 | | 9 |
| | | | |
| Statements of Changes in Net Assets | | | BlackRock Capital Appreciation V.I. Fund | |
| | | | | | | | |
| Increase (Decrease) in Net Assets: | | Six Months
Ended
June 30, 2016
(Unaudited) | | | Year Ended
December 31,
2015 | |
| | | | | | | | |
| Operations | | | | | | | | |
Net investment loss | | $ | (457,183 | ) | | $ | (1,196,132 | ) |
Net realized gain (loss) | | | (3,786,295 | ) | | | 29,921,614 | |
Net change in unrealized appreciation (depreciation) | | | (10,986,439 | ) | | | (2,661,862 | ) |
| | | | |
Net increase (decrease) in net assets resulting from operations | | | (15,229,917 | ) | | | 26,063,620 | |
| | | | |
| | | | | | | | |
| Distributions to Shareholders1 | | | | | | | | |
From net realized gain: | | | | | | | | |
Class I | | | — | | | | (11,704,904 | ) |
Class III | | | — | | | | (18,891,440 | ) |
| | | | |
Decrease in net assets resulting from distributions to shareholders | | | — | | | | (30,596,344 | ) |
| | | | |
| | | | | | | | |
| Capital Share Transactions | | | | | | | | |
Net decrease in net assets derived from capital share transactions | | | (1,136,731 | ) | | | (23,025,148 | ) |
| | | | |
| | | | | | | | |
| Net Assets | | | | | | | | |
Total decrease in net assets | | | (16,366,648 | ) | | | (27,557,872 | ) |
Beginning of period | | | 372,751,061 | | | | 400,308,933 | |
| | | | |
End of period | | $ | 356,384,413 | | | $ | 372,751,061 | |
| | | | |
Undistributed (accumulated) net investment income (loss), end of period | | $ | (450,440 | ) | | $ | 6,743 | |
| | | | |
| | 1 | | Distributions for annual periods determined in accordance with federal income tax regulations. |
See Notes to Financial Statements.
| | | | | | |
| 10 | | BLACKROCK VARIABLE SERIES FUNDS, INC. | | JUNE 30, 2016 | | |
| | | | |
| Financial Highlights | | | BlackRock Capital Appreciation V.I. Fund | |
| | | | | | | | | | | | | | | | | | | | | | | | |
| | | Class I | |
| | | Six Months
Ended
June 30, 2016
(Unaudited) | | | Year Ended December 31, | |
| | | | 2015 | | | 2014 | | | 2013 | | | 2012 | | | 2011 | |
| Per Share Operating Performance | |
Net asset value, beginning of period | | $ | 8.86 | | | $ | 9.02 | | | $ | 9.80 | | | $ | 8.50 | | | $ | 7.62 | | | $ | 8.59 | |
| | | | |
Net investment income (loss)1 | | | (0.00 | )2 | | | (0.01 | ) | | | (0.01 | ) | | | (0.00 | )2 | | | 0.07 | | | | 0.03 | |
Net realized and unrealized gain (loss) | | | (0.38 | ) | | | 0.63 | | | | 0.87 | | | | 2.86 | | | | 0.99 | | | | (0.77 | ) |
| | | | |
Net increase (decrease) from investment operations | | | (0.38 | ) | | | 0.62 | | | | 0.86 | | | | 2.86 | | | | 1.06 | | | | (0.74 | ) |
| | | | |
Distributions:3 | | | | | | | | | | | | | | | | | | | | | | | | |
From net investment income | | | — | | | | — | | | | — | | | | (0.00 | )2 | | | (0.07 | ) | | | (0.05 | ) |
From net realized gain | | | — | | | | (0.78 | ) | | | (1.64 | ) | | | (1.56 | ) | | | (0.11 | ) | | | (0.18 | ) |
| | | | |
Total distributions | | | — | | | | (0.78 | ) | | | (1.64 | ) | | | (1.56 | ) | | | (0.18 | ) | | | (0.23 | ) |
| | | | |
Net asset value, end of period | | $ | 8.48 | | | $ | 8.86 | | | $ | 9.02 | | | $ | 9.80 | | | $ | 8.50 | | | $ | 7.62 | |
| | | | |
| | | | | | | | | | | | | | | | | | | | | | | | |
| Total Return4 | | | | | | | | | | | | | | | | | | | | | | | | |
Based on net asset value | | | (4.29 | )%5 | | | 6.73 | % | | | 9.02 | % | | | 33.82 | % | | | 13.84 | % | | | (8.88 | )% |
| | | | |
| | | | | | | | | | | | | | | | | | | | | | | | |
| Ratios to Average Net Assets | | | | | | | | | | | | | | | | | | | | | | | | |
Total expenses | | | 0.95 | %6 | | | 0.93 | % | | | 0.91 | % | | | 0.93 | % | | | 0.86 | % | | | 0.72 | % |
| | | | |
Total expenses after fees waived and reimbursed | | | 0.80 | %6 | | | 0.79 | % | | | 0.79 | % | | | 0.80 | % | | | 0.77 | % | | | 0.72 | % |
| | | | |
Net investment income (loss) | | | (0.09 | )%6 | | | (0.15 | )% | | | (0.10 | )% | | | (0.00 | )%2 | | | 0.81 | % | | | 0.34 | % |
| | | | |
| | | | | | | | | | | | | | | | | | | | | | | | |
| Supplemental Data | | | | | | | | | | | | | | | | | | | | | | | | |
Net assets, end of period (000) | | $ | 126,634 | | | $ | 139,045 | | | $ | 166,586 | | | $ | 180,580 | | | $ | 191,093 | | | $ | 203,706 | |
| | | | |
Portfolio turnover rate | | | 47 | % | | | 70 | % | | | 102 | % | | | 158 | % | | | 63 | % | | | 84 | % |
| | | | |
| | 1 | | Based on average shares outstanding. |
| | 2 | | Amount is greater than $(0.005) per share. |
| | 3 | | Distributions for annual periods determined in accordance with federal income tax regulations. |
| | 4 | | Where applicable, excludes insurance-related fees and expenses and assumes the reinvestment of distributions. |
| | 5 | | Aggregate total return. |
See Notes to Financial Statements.
| | | | | | |
| | | BLACKROCK VARIABLE SERIES FUNDS, INC. | | JUNE 30, 2016 | | 11 |
| | | | |
| Financial Highlights (concluded) | | | BlackRock Capital Appreciation V.I. Fund | |
| | | | | | | | | | | | | | | | | | | | | | | | |
| | | Class III | |
| | | Six Months
Ended
June 30, 2016
(Unaudited) | | | Year Ended December 31, | |
| | | | 2015 | | | 2014 | | | 2013 | | | 2012 | | | 2011 | |
| Per Share Operating Performance | |
Net asset value, beginning of period | | $ | 8.81 | | | $ | 8.97 | | | $ | 9.76 | | | $ | 8.48 | | | $ | 7.61 | | | $ | 8.59 | |
| | | | |
Net investment income (loss)1 | | | (0.01 | ) | | | (0.04 | ) | | | (0.03 | ) | | | (0.03 | ) | | | 0.06 | | | | 0.02 | |
Net realized and unrealized gain (loss) | | | (0.38 | ) | | | 0.63 | | | | 0.86 | | | | 2.84 | | | | 0.97 | | | | (0.80 | ) |
| | | | |
Net increase (decrease) from investment operations | | | (0.39 | ) | | | 0.59 | | | | 0.83 | | | | 2.81 | | | | 1.03 | | | | (0.78 | ) |
| | | | |
Distributions:2 | | | | | | | | | | | | | | | | | | | | | | | | |
From net investment income | | | — | | | | — | | | | — | | | | (0.00 | )3 | | | (0.05 | ) | | | (0.02 | ) |
From net realized gain | | | — | | | | (0.75 | ) | | | (1.62 | ) | | | (1.53 | ) | | | (0.11 | ) | | | (0.18 | ) |
| | | | |
Total distributions | | | — | | | | (0.75 | ) | | | (1.62 | ) | | | (1.53 | ) | | | (0.16 | ) | | | (0.20 | ) |
| | | | |
Net asset value, end of period | | $ | 8.42 | | | $ | 8.81 | | | $ | 8.97 | | | $ | 9.76 | | | $ | 8.48 | | | $ | 7.61 | |
| | | | |
| | | | | | | | | | | | | | | | | | | | | | | | |
| Total Return4 | | | | | | | | | | | | | | | | | | | | | | | | |
Based on net asset value | | | (4.43 | )%5 | | | 6.49 | % | | | 8.68 | % | | | 33.40 | % | | | 13.57 | % | | | (9.08 | )% |
| | | | |
| | | | | | | | | | | | | | | | | | | | | | | | |
| Ratios to Average Net Assets | | | | | | | | | | | | | | | | | | | | | | | | |
Total expenses | | | 1.19 | %6 | | | 1.17 | % | | | 1.18 | % | | | 1.19 | % | | | 1.11 | % | | | 0.97 | % |
| | | | |
Total expenses after fees waived and reimbursed | | | 1.06 | %6 | | | 1.05 | % | | | 1.05 | % | | | 1.06 | % | | | 1.02 | % | | | 0.97 | % |
| | | | |
Net investment income (loss) | | | (0.35 | )%6 | | | (0.40 | )% | | | (0.35 | )% | | | (0.27 | )% | | | 0.72 | % | | | 0.21 | % |
| | | | |
| | | | | | | | | | | | | | | | | | | | | | | | |
| Supplemental Data | | | | | | | | | | | | | | | | | | | | | | | | |
Net assets, end of period (000) | | $ | 229,751 | | | $ | 233,706 | | | $ | 233,723 | | | $ | 207,582 | | | $ | 134,612 | | | $ | 38,791 | |
| | | | |
Portfolio turnover rate | | | 47 | % | | | 70 | % | | | 102 | % | | | 158 | % | | | 63 | % | | | 84 | % |
| | | | |
| | 1 | | Based on average shares outstanding. |
| | 2 | | Distributions for annual periods determined in accordance with federal income tax regulations. |
| | 3 | | Amount is greater than $(0.005) per share. |
| | 4 | | Where applicable, excludes insurance-related fees and expenses and assumes the reinvestment of distributions. |
| | 5 | | Aggregate total return. |
See Notes to Financial Statements.
| | | | | | |
| 12 | | BLACKROCK VARIABLE SERIES FUNDS, INC. | | JUNE 30, 2016 | | |
| | | | |
| Notes to Financial Statements (Unaudited) | | | BlackRock Capital Appreciation V.I. Fund | |
1. Organization:
BlackRock Variable Series Funds, Inc. (the “Company”) is registered under the Investment Company Act of 1940, as amended (the “1940 Act”), as an open-end management investment company. The Company is organized as a Maryland corporation that is comprised of 20 separate funds. The funds offer shares to insurance companies for their separate accounts to fund benefits under certain variable annuity and variable life insurance contracts. The financial statements presented are for BlackRock Capital Appreciation V.I. Fund (the “Fund”). The Fund is classified as diversified. Class I and Class III Shares have equal voting, dividend, liquidation and other rights, except that only shares of the respective classes are entitled to vote on matters concerning only that class. In addition, Class III Shares bear certain expenses related to the distribution of such shares. Class III Shares were redeemed on December 31, 2007 and sales of Class III Shares recommenced on June 15, 2010.
The Fund, together with certain other registered investment companies advised by BlackRock Advisors, LLC (the “Manager”) or its affiliates, is included in a complex of open-end funds referred to as the Equity-Bond Complex.
2. Significant Accounting Policies:
The financial statements are prepared in conformity with accounting principles generally accepted in the United States of America (“U.S. GAAP”), which may require management to make estimates and assumptions that affect the reported amounts of assets and liabilities in the financial statements, disclosure of contingent assets and liabilities at the date of the financial statements and the reported amounts of increases and decreases in net assets from operations during the reporting period. Actual results could differ from those estimates. The Fund is considered an investment company under U.S. GAAP and follows the accounting and reporting guidance applicable to investment companies. Below is a summary of significant accounting policies:
Foreign Currency: The Fund’s books and records are maintained in U.S. dollars. Purchases and sales of investments are recorded at the rates of exchange prevailing on the respective dates of such transactions. Generally, when the U.S. dollar rises in value against a foreign currency, the investments denominated in that currency will lose value; the opposite effect occurs if the U.S. dollar falls in relative value.
The Fund does not isolate the portion of the results of operations arising as a result of changes in the exchange rates from the changes in the market prices of investments held or sold for financial reporting purposes. Accordingly, the effects of changes in exchange rates on investments are not segregated in the Statement of Operations from the effects of changes in market prices of those investments, but are included as a component of net realized and unrealized gain (loss) from investments. The Fund reports realized currency gains (losses) on foreign currency related transactions as components of net realized gain (loss) for financial reporting purposes, whereas such components are generally treated as ordinary income for federal income tax purposes.
Investment Transactions and Investment Income: For financial reporting purposes, investment transactions are recorded on the dates the transactions are entered into (the trade dates). Realized gains and losses on investment transactions are determined on the identified cost basis. Dividend income is recorded on the ex-dividend date. Dividends from foreign securities where the ex-dividend date may have passed are subsequently recorded when the Fund is informed of the ex-dividend date. Under the applicable foreign tax laws, a withholding tax at various rates may be imposed on capital gains, dividends and interest. Upon notification from issuers, some of the dividend income received from a real estate investment trust may be redesignated as a reduction of cost of the related investment and/or realized gain. Income, expenses and realized and unrealized gains and losses are allocated daily to each class based on its relative net assets.
Distributions: Distributions paid by the Fund are recorded on the ex-dividend date. The character and timing of distributions are determined in accordance with federal income tax regulations, which may differ from U.S. GAAP.
Indemnifications: In the normal course of business, the Fund enters into contracts that contain a variety of representations that provide general indemnification. The Fund’s maximum exposure under these arrangements is unknown because it involves future potential claims against the Fund, which cannot be predicted with any certainty.
Other: Expenses directly related to the Fund or its classes are charged to the Fund or the applicable class. Other operating expenses shared by several funds, including other funds managed by the Manager, are prorated among those funds on the basis of relative net assets or other appropriate methods. Expenses directly related to the Fund and other shared expenses prorated to the Fund are allocated daily to each class based on its relative net assets or other appropriate methods.
The Fund has an arrangement with its custodian whereby fees may be reduced by credits earned on uninvested cash balances, which, if applicable, are shown as fees paid indirectly in the Statement of Operations. The custodian imposes fees on overdrawn cash balances, which can be offset by accumulated credits earned or may result in additional custody charges.
| | | | | | |
| | | BLACKROCK VARIABLE SERIES FUNDS, INC. | | JUNE 30, 2016 | | 13 |
| | | | |
| Notes to Financial Statements (continued) | | | BlackRock Capital Appreciation V.I. Fund | |
3. Investment Valuation and Fair Value Measurements:
Investment Valuation Policies: The Fund’s investments are valued at fair value (also referred to as “market value” within the financial statements) as of the close of trading on the New York Stock Exchange (“NYSE”) (generally 4:00 p.m., Eastern time). U.S. GAAP defines fair value as the price the Fund would receive to sell an asset or pay to transfer a liability in an orderly transaction between market participants at the measurement date. The Fund determines the fair values of its financial instruments using various independent dealers or pricing services under policies approved by the Board of Directors of the Company (the “Board”). The BlackRock Global Valuation Methodologies Committee (the “Global Valuation Committee”) is the committee formed by management to develop global pricing policies and procedures and to oversee the pricing function for all financial instruments.
Fair Value Inputs and Methodologies: The following methods (or “techniques”) and inputs are used to establish the fair value of the Fund’s assets and liabilities:
| • | | Equity investments traded on a recognized securities exchange are valued at the official closing price each day, if available. For equity investments traded on more than one exchange, the official close price on the exchange where the stock is primarily traded is used. Equity investments traded on a recognized exchange for which there were no sales on that day may be valued at the last available bid (long positions) or ask (short positions) price. Generally, trading in foreign instruments is substantially completed each day at various times prior to the close of business on the NYSE. Occasionally, events affecting the values of such instruments may occur between the foreign market close and the close of business on the NYSE that may not be reflected in the computation of the Fund’s net assets. Each business day, the Fund uses a pricing service to assist with the valuation of certain foreign exchange-traded equity securities and foreign exchange-traded and over-the-counter (“OTC”) options (the “Systematic Fair Value Price”). Using current market factors, the Systematic Fair Value Price is designed to value such foreign securities and foreign options at fair value as of the close of business on the NYSE, which follows the close of the local markets. |
| • | | Investments in open-end U.S. mutual funds are valued at net asset value each business day. |
| • | | The Fund values its investment in BlackRock Liquidity Series, LLC, Money Market Series (the “Money Market Series”) at fair value, which is ordinarily based upon its pro rata ownership in the underlying fund’s net assets. The Money Market Series seeks current income consistent with maintaining liquidity and preserving capital. Although the Money Market Series is not registered under the 1940 Act, its investments may follow the parameters of investments by a money market fund that is subject to Rule 2a-7 under the 1940 Act. The Fund may withdraw up to 25% of its investment daily, although the manager of the Money Market Series, in its sole discretion, may permit an investor to withdraw more than 25% on any one day. |
| • | | Securities and other assets and liabilities denominated in foreign currencies are translated into U.S. dollars using exchange rates determined as of the close of business on the NYSE. Forward foreign currency exchange contracts are valued at the mean between the bid and ask prices and are determined as of the close of business on the NYSE. Interpolated values are derived when the settlement date of the contract is an interim date for which quotations are not available. |
If events (e.g., a company announcement, market volatility or a natural disaster) occur that are expected to materially affect the value of such instruments, or in the event that the application of these methods of valuation results in a price for an investment that is deemed not to be representative of the market value of such investment, or if a price is not available, the investment will be valued by the Global Valuation Committee, or its delegate, in accordance with a policy approved by the Board as reflecting fair value (“Fair Valued Investments”). When determining the price for Fair Valued Investments, the Global Valuation Committee, or its delegate, seeks to determine the price that the Fund might reasonably expect to receive or pay from the current sale or purchase of that asset or liability in an arm’s-length transaction. Fair value determinations shall be based upon all available factors that the Global Valuation Committee, or its delegate, deems relevant consistent with the principles of fair value measurement, which include the market approach, income approach and/or in the case of recent investments, the cost approach, as appropriate. The market approach generally consists of using comparable market transactions. The income approach generally is used to discount future cash flows to present value and is adjusted for liquidity as appropriate. These factors include but are not limited to: (i) attributes specific to the investment or asset; (ii) the principal market for the investment or asset; (iii) the customary participants in the principal market for the investment or asset; (iv) data assumptions by market participants for the investment or asset, if reasonably available; (v) quoted prices for similar investments or assets in active markets; and (vi) other factors, such as future cash flows, interest rates, yield curves, volatilities, prepayment speeds, loss severities, credit risks, recovery rates, liquidation amounts and/or default rates. Due to the inherent uncertainty of valuations of such investments, the fair values may differ from the values that would have been used had an active market existed. The Global Valuation Committee, or its delegate, employs various methods for calibrating valuation approaches for investments where an active market does not exist, including regular due diligence of the Fund’s pricing vendors, regular reviews of key inputs and assumptions, transactional back-testing or disposition analysis to compare unrealized gains and losses to realized gains and losses, reviews of missing or stale prices and large movements in market values and reviews of any market related activity. The pricing of all Fair Valued Investments is subsequently reported to the Board or a committee thereof on a quarterly basis.
Fair Value Hierarchy: Various inputs are used in determining the fair value of investments. These inputs to valuation techniques are categorized into a fair value hierarchy consisting of three broad levels for financial statement purposes as follows:
| • | | Level 1 — unadjusted price quotations in active markets/exchanges for identical assets or liabilities that the Fund has the ability to access |
| | | | | | |
| 14 | | BLACKROCK VARIABLE SERIES FUNDS, INC. | | JUNE 30, 2016 | | |
| | | | |
| Notes to Financial Statements (continued) | | | BlackRock Capital Appreciation V.I. Fund | |
| • | | Level 2 — other observable inputs (including, but not limited to, quoted prices for similar assets or liabilities in markets that are active, quoted prices for identical or similar assets or liabilities in markets that are not active, inputs other than quoted prices that are observable for the assets or liabilities (such as interest rates, yield curves, volatilities, prepayment speeds, loss severities, credit risks and default rates) or other market-corroborated inputs) |
| • | | Level 3 — unobservable inputs based on the best information available in the circumstances, to the extent observable inputs are not available (including the Fund’s own assumptions used in determining the fair value of investments) |
The hierarchy gives the highest priority to unadjusted quoted prices in active markets for identical assets or liabilities (Level 1 measurements) and the lowest priority to unobservable inputs (Level 3 measurements). Accordingly, the degree of judgment exercised in determining fair value is greatest for instruments categorized in Level 3. The inputs used to measure fair value may fall into different levels of the fair value hierarchy. In such cases, for disclosure purposes, the fair value hierarchy classification is determined based on the lowest level input that is significant to the fair value measurement in its entirety. The significant unobservable inputs used by the Global Valuation Committee in determining the price for Fair Valued Investments are typically categorized as Level 3. The fair value hierarchy for the Fund’s investments has been included in the Schedule of Investments.
Changes in valuation techniques may result in transfers into or out of an assigned level within the hierarchy. In accordance with the Fund’s policy, transfers between different levels of the fair value hierarchy are deemed to have occurred as of the beginning of the reporting period. The categorization of a value determined for investments is based on the pricing transparency of the investments and is not necessarily an indication of the risks associated with investing in those securities.
4. Securities and Other Investments:
Preferred Stock: Preferred stock has a preference over common stock in liquidation (and generally in receiving dividends as well) but is subordinated to the liabilities of the issuer in all respects. As a general rule, the market value of preferred stock with a fixed dividend rate and no conversion element varies inversely with interest rates and perceived credit risk, while the market price of convertible preferred stock generally also reflects some element of conversion value. Because preferred stock is junior to debt securities and other obligations of the issuer, deterioration in the credit quality of the issuer will cause greater changes in the value of a preferred stock than in a more senior debt security with similar stated yield characteristics. Unlike interest payments on debt securities, preferred stock dividends are payable only if declared by the issuer’s board of directors. Preferred stock also may be subject to optional or mandatory redemption provisions.
Securities Lending: The Fund may lend its securities to approved borrowers, such as brokers, dealers and other financial institutions. The borrower pledges and maintains with the Fund collateral consisting of cash, an irrevocable letter of credit issued by a bank, or securities issued or guaranteed by the U.S. Government. The initial collateral received by the Fund is required to have a value of at least 102% of the current value of the loaned securities for securities traded on U.S. exchanges and a value of at least 105% for all other securities. The collateral is maintained thereafter at a value equal to at least 100% of the current market value of the securities on loan. The market value of the loaned securities is determined at the close of each business day of the Fund and any additional required collateral is delivered to the Fund, or excess collateral returned by the Fund, on the next business day. During the term of the loan, the Fund is entitled to all distributions made on or in respect of the loaned securities. Loans of securities are terminable at any time and the borrower, after notice, is required to return borrowed securities within the standard time period for settlement of securities transactions.
The market value of any securities on loan, all of which were classified as common stocks in the Fund’s Schedule of Investments, and the value of any related collateral are shown separately in the Statement of Assets and Liabilities as a component of investments at value — unaffiliated, and collateral on securities loaned at value, respectively. As of period end, any securities on loan were collateralized by cash. The cash collateral invested by the securities lending agent, BlackRock Investment Management, LLC (“BIM”), if any, is disclosed in the Schedule of Investments.
Securities lending transactions are entered into by the Fund under Master Securities Lending Agreements (each, an “MSLA”), which provide the right, in the event of default (including bankruptcy or insolvency), for the non-defaulting party to liquidate the collateral and calculate a net exposure to the defaulting party or request additional collateral. In the event that a borrower defaults, the Fund, as lender, would offset the market value of the collateral received against the market value of the securities loaned. When the value of the collateral is greater than that of the market value of the securities loaned, the lender is left with a net amount payable to the defaulting party. However, bankruptcy or insolvency laws of a particular jurisdiction may impose restrictions on or prohibitions against such a right of offset in the event of an MSLA counterparty’s bankruptcy or insolvency. Under the MSLA, absent an event of default the borrower can resell or re-pledge the loaned securities, and the Fund can reinvest cash collateral received in connection with loaned securities. Upon an event of default, the parties’ obligations to return the securities or collateral to the other party are extinguished, and the parties can resell or re-pledge the loaned securities or the collateral received in connection with the loaned securities in order to satisfy the defaulting party’s net payment obligation for all transactions under the MSLA. The defaulting party remains liable for any deficiency.
| | | | | | |
| | | BLACKROCK VARIABLE SERIES FUNDS, INC. | | JUNE 30, 2016 | | 15 |
| | | | |
| Notes to Financial Statements (continued) | | | BlackRock Capital Appreciation V.I. Fund | |
As of period end, the following table is a summary of the Fund’s securities lending agreements by counterparty which are subject to offset under an MSLA:
| | | | | | | | | | | | |
| Counterparty | | Securities
Loaned at Value | | | Cash
Collateral
Received1 | | | Net
Amount | | |
JP Morgan Securities LLC | | $ | 3,300,080 | | | $ | (3,300,080 | ) | | — | | |
Morgan Stanley | | | 654,888 | | | | (654,888 | ) | | — | | |
| | | |
Total | | $ | 3,954,968 | | | $ | (3,954,968 | ) | | — | | |
| | | |
| | 1 | | Collateral with a value of $4,014,509 has been received in connection with securities lending agreements. Collateral received in excess of the value of securities loaned from the individual counterparty is not shown for financial reporting purposes in the table above. |
The risks of securities lending include the risk that the borrower may not provide additional collateral when required or may not return the securities when due. To mitigate these risks, the Fund benefits from a borrower default indemnity provided by BIM. BIM’s indemnity allows for full replacement of the securities loaned if the collateral received does not cover the value on the securities loaned in the event of borrower default. The Fund could suffer a loss if the value of an investment purchased with cash collateral falls below the market value of loaned securities or if the value of an investment purchased with cash collateral falls below the value of the original cash collateral received.
5. Investment Advisory Agreement and Other Transactions with Affiliates:
The PNC Financial Services Group, Inc. is the largest stockholder and an affiliate of BlackRock, Inc. (“BlackRock”) for 1940 Act purposes.
Investment Advisory
The Company, on behalf of the Fund, entered into an Investment Advisory Agreement with the Manager, the Fund’s investment adviser, an indirect, wholly owned subsidiary of BlackRock, to provide investment advisory and administration services. The Manager is responsible for the management of the Fund’s portfolio and provides the personnel, facilities, equipment and certain other services necessary to the operations of the Fund. For such services, the Fund pays the Manager a monthly fee, which is determined by calculating a percentage of the Fund’s average daily net assets, based on the following annual rates:
| | | | |
| Average Daily Net Assets | | Investment
Advisory Fees | |
First $1 Billion | | | 0.65 | % |
$1 Billion - $3 Billion | | | 0.61 | % |
$3 Billion - $5 Billion | | | 0.59 | % |
$5 Billion - $10 Billion | | | 0.57 | % |
Greater than $10 Billion | | | 0.55 | % |
Distribution Fees
The Company, on behalf of the Fund, entered into a Distribution Agreement and a Distribution Plan with BlackRock Investments, LLC (“BRIL”), an affiliate of the Manager. Pursuant to the Distribution Plan and in accordance with Rule 12b-1 under the 1940 Act, the Fund pays BRIL ongoing distribution fees. The fees are accrued daily and paid monthly at an annual rate of 0.25% based upon the average daily net assets attributable to Class III.
For the six months ended June 30, 2016, the class specific distribution fees borne directly by Class III is $281,547.
Transfer Agent
The Manager, on behalf of the Fund, entered into agreements with insurance companies and other financial intermediaries (“Service Organizations”), some of which may be affiliates. Pursuant to these agreements, the Service Organizations provide the Fund with administrative, networking, recordkeeping, sub-transfer agency and shareholder services to sub-accounts they service. For these services, the Service Organizations receive an annual fee per shareholder account, which will vary depending on share class and/or net assets of Fund shareholders serviced by the Service Organizations, which is shown as transfer agent — class specific. For the six months ended June 30, 2016, the Fund paid the following amounts to affiliates in return for these services, which is included in transfer agent — class specific in the Statement of Operations:
| | | | | | | | |
| Class I | | Class III | | | Total | |
| $139,399 | | $ | 233,373 | | | $ | 372,772 | |
In addition, the Fund pays the transfer agent, which is not an affiliate, a fee for issuance, transfer and redemption of shares and the opening and maintenance of shareholder accounts, which is included in transfer agent in the Statement of Operations.
| | | | | | |
| 16 | | BLACKROCK VARIABLE SERIES FUNDS, INC. | | JUNE 30, 2016 | | |
| | | | |
| Notes to Financial Statements (continued) | | | BlackRock Capital Appreciation V.I. Fund | |
Expense Limitations, Waivers and Reimbursements
The Manager, with respect to the Fund, contractually agreed to waive and/or reimburse fees or expenses in order to limit expenses, excluding interest expense, dividend expense, tax expense, acquired fund fees and expenses, and certain other fund expenses, which constitute extraordinary expenses not incurred in the ordinary course of the Fund’s business. The expense limitations as a percentage of average daily net assets are as follows:
| | | | |
Class I | | | 1.25 | % |
Class III | | | 1.50 | % |
The Manager has agreed not to reduce or discontinue this contractual expense limitation prior to May 1, 2017, unless approved by the Board, including a majority of the Independent Directors who are not “interested persons” of the Fund, as defined in the 1940 Act (“Independent Directors”) or by a majority of the outstanding voting securities of the Fund.
The Manager, with respect to the Fund, voluntarily agreed to waive its investment advisory fees by the amount of investment advisory fees the Fund pays to the Manager indirectly through its investment in affiliated money market funds. This amount is shown as fees waived by the Manager in the Statement of Operations. However, the Manager does not waive its investment advisory fees by the amount of investment advisory fees paid in connection with the Fund’s investment in other affiliated investment companies, if any. For the six months ended June 30, 2016, the amount waived was $1,531.
The Manager has contractually agreed to reimburse transfer agent fees in order to limit such expenses to a percentage of average daily net assets as follows:
| | | | |
Class I | | | 0.07 | % |
Class III | | | 0.08 | % |
The Manager has agreed not to reduce or discontinue this contractual reimbursement prior to May 1, 2017, unless approved by the Board, including a majority of the Independent Directors or by a majority of the outstanding voting securities of the Fund.
These amounts are shown as transfer agent fees reimbursed — class specific in the Statement of Operations. Class specific expense waivers and/or reimbursements are as follows:
| | | | | | |
| | | Class I | | Class III | | Total |
Transfer Agent Fees Reimbursed | | $94,789 | | $143,031 | | $237,820 |
For the six months ended June 30, 2016, the Fund reimbursed the Manager $1,996 for certain accounting services, which is included in accounting services in the Statement of Operations.
Securities Lending
The U.S. Securities and Exchange Commission has issued an exemptive order which permits BIM, an affiliate of the Manager, to serve as securities lending agent for the Fund, subject to applicable conditions. As securities lending agent, BIM bears all operational costs directly related to securities lending. The Fund is responsible for expenses in connection with the investment of cash collateral received for securities on loan (the “collateral investment expenses”). The cash collateral is invested in a private investment company managed by the Manager or its affiliates. However, BIM has agreed to cap the collateral investment expenses of the private investment company to an annual rate of 0.04%. The investment adviser to the private investment company will not charge any advisory fees with respect to shares purchased by the Fund.
Securities lending income is equal to the total of income earned from the reinvestment of cash collateral, net of fees and other payments to and from borrowers of securities, and less the collateral investment expenses. The Fund retains a portion of securities lending income and remits a remaining portion to BIM as compensation for its services as securities lending agent.
Pursuant to a securities lending agreement, the Fund retains 71.5% of securities lending income, and this amount retained can never be less than 65% of the total of securities lending income plus the collateral investment expenses.
In addition, commencing the business day following the date that the aggregate securities lending income earned across the Equity-Bond Complex in a calendar year exceeds a specified threshold, the Fund, pursuant to the securities lending agreement, will retain for the remainder of that calendar year securities lending income as follows: 75% of securities lending income, and this amount retained can never be less than 65% of the total of securities lending income plus the collateral investment expenses.
The share of securities lending income earned by the Fund is shown as securities lending — affiliated — net in the Statement of Operations. For the six months ended June 30, 2016, the Fund paid BIM $2,500 for securities lending agent services.
| | | | | | |
| | | BLACKROCK VARIABLE SERIES FUNDS, INC. | | JUNE 30, 2016 | | 17 |
| | | | |
| Notes to Financial Statements (continued) | | | BlackRock Capital Appreciation V.I. Fund | |
Officers and Directors
Certain officers and/or directors of the Company are officers and/or directors of BlackRock or its affiliates. The Fund reimburses the Manager for a portion of the compensation paid to the Company’s Chief Compliance Officer, which is included in Officer and Directors in the Statement of Operations.
6. Purchases and Sales:
For the six months ended June 30, 2016, purchases and sales of investments, excluding short-term securities, were $165,835,068 and $175,929,109, respectively.
7. Income Tax Information:
It is the Fund’s policy to comply with the requirements of the Internal Revenue Code of 1986, as amended, applicable to regulated investment companies, and to distribute substantially all of its taxable income to its shareholders. Therefore, no federal income tax provision is required.
The Fund files U.S. federal and various state and local tax returns. No income tax returns are currently under examination. The statute of limitations on the Fund’s U.S. federal tax returns generally remains open for each of the four years ended December 31, 2015. The statutes of limitations on the Fund’s state and local tax returns may remain open for an additional year depending upon the jurisdiction.
Management has analyzed tax laws and regulations and their application to the Fund as of June 30, 2016, inclusive of the open tax return years, and does not believe there are any uncertain tax positions that require recognition of a tax liability in the Fund’s financial statements.
As of June 30, 2016, gross unrealized appreciation and depreciation based on cost for federal income tax purposes were as follows:
| | | | |
Tax cost | | $ | 321,902,443 | |
| | | | |
Gross unrealized appreciation | | $ | 51,553,542 | |
Gross unrealized depreciation | | | (7,479,009 | ) |
| | | | |
Net unrealized appreciation | | $ | 44,074,533 | |
| | | | |
8. Bank Borrowings:
The Company, on behalf of the Fund, along with certain other funds managed by the Manager and its affiliates (“Participating Funds”), is a party to a 364-day, $2.1 billion credit agreement with a group of lenders. Under this agreement, the Fund may borrow to fund shareholder redemptions. Excluding commitments designated for certain individual funds, the Participating Funds, including the Fund, can borrow up to an aggregate commitment amount of $1.6 billion at any time outstanding, subject to asset coverage and other limitations as specified in the agreement. The credit agreement has the following terms: a fee of 0.12% per annum on unused commitment amounts and interest at a rate equal to the higher of (a) one-month LIBOR (but, in any event, not less than 0.00%) on the date the loan is made plus 0.80% per annum or (b) the Fed Funds rate (but, in any event, not less than 0.00%) in effect from time to time plus 0.80% per annum on amounts borrowed. The agreement expires in April 2017 unless extended or renewed. Prior to April 21, 2016, the credit agreement had a fee per annum of 0.06% on unused commitment amounts and interest at a rate equal to the higher of (a) one-month LIBOR (but, in any event, not less than 0.00%) on the date the loan is made plus 0.80% per annum or (b) the Fed Funds rate (but, in any event, not less than 0.00%) in effect from time to time plus 0.80% per annum on amounts borrowed. Participating Funds paid administration, legal and arrangement fees, which, if applicable, are included in miscellaneous expenses in the Statement of Operations. These fees were allocated among such funds based upon portions of the aggregate commitment available to them and relative net assets of Participating Funds. During the six months ended June 30, 2016, the Fund did not borrow under the credit agreement.
9. Principal Risks:
In the normal course of business, the Fund invests in securities and enters into transactions where risks exist due to fluctuations in the market (market risk) or failure of the issuer to meet all its obligations, including the ability to pay principal and interest when due (issuer credit risk). The value of securities held by the Fund may decline in response to certain events, including those directly involving the issuers of securities owned by the Fund. Changes arising from the general economy, the overall market and local, regional or global political and/or social instability, as well as currency, interest rate and price fluctuations, may also affect the securities’ value.
Counterparty Credit Risk: Similar to issuer credit risk, the Fund may be exposed to counterparty credit risk, or the risk that an entity may fail to or be unable to perform on its commitments related to unsettled or open transactions. The Fund manages counterparty credit risk by entering into transactions only with counterparties that the Manager believes have the financial resources to honor their obligations and by monitoring the financial stability of those counterparties. Financial assets, which potentially expose the Fund to market, issuer and counterparty credit risks, consist principally of financial instruments and receivables due from counterparties. The extent of the Fund’s exposure to market, issuer and counterparty credit risks with respect to these financial assets is approximately their value recorded in the Statement of Assets and Liabilities, less any collateral held by the Fund.
| | | | | | |
| 18 | | BLACKROCK VARIABLE SERIES FUNDS, INC. | | JUNE 30, 2016 | | |
| | | | |
| Notes to Financial Statements (concluded) | | | BlackRock Capital Appreciation V.I. Fund | |
Concentration Risk: As of period end, the Fund invested a significant portion of its assets in securities in the information technology sector. Changes in economic conditions affecting such sector would have a greater impact on the Fund and could affect the value, income and/or liquidity of positions in such securities.
10. Capital Share Transactions:
Transactions in capital shares for each class were as follows:
| | | | | | | | | | | | | | | | |
| | | Six Months Ended
June 30, 2016 | | | Year Ended
December 31, 2015 | |
| | | Shares | | | Amount | | | Shares | | | Amount | |
Class I | | | | | | | | | | | | | | | | |
Shares sold | | | 558,824 | | | $ | 4,649,672 | | | | 508,302 | | | $ | 4,779,314 | |
Shares issued in reinvestment of distributions | | | — | | | | — | | | | 1,285,091 | | | | 11,704,904 | |
Shares redeemed | | | (1,318,679 | ) | | | (11,003,440 | ) | | | (4,571,788 | ) | | | (42,953,109 | ) |
| | | | | | | | |
Net decrease | | | (759,855 | ) | | $ | (6,353,768 | ) | | | (2,778,395 | ) | | $ | (26,468,891 | ) |
| | | | | | | | |
| | | | | | | | | | | | | | | | |
Class III | | | | | | | | | | | | | | | | |
Shares sold | | | 2,035,838 | | | $ | 15,808,263 | | | | 1,733,953 | | | $ | 15,998,016 | |
Shares issued in reinvestment of distributions | | | — | | | | — | | | | 2,085,369 | | | | 18,891,440 | |
Shares redeemed | | | (1,278,552 | ) | | | (10,591,226 | ) | | | (3,339,319 | ) | | | (31,445,713 | ) |
| | | | | | | | |
Net increase | | | 757,286 | | | $ | 5,217,037 | | | | 480,003 | | | $ | 3,443,743 | |
| | | | | | | | |
Total Net Decrease | | | (2,569 | ) | | $ | (1,136,731 | ) | | | (2,298,392 | ) | | $ | (23,025,148 | ) |
| | | | | | | | |
11. Subsequent Events:
Management’s evaluation of the impact of all subsequent events on the Fund’s financial statements was completed through the date the financial statements were issued and the following item was noted:
The Fund paid a long-term capital gain distribution in the following amounts per share on July 22, 2016 to shareholders of record on July 20, 2016:
| | | | |
| | | Long-Term
Capital Gain | |
Class I | | $ | 0.148124 | |
Class III | | $ | 0.148124 | |
| | | | | | |
| | | BLACKROCK VARIABLE SERIES FUNDS, INC. | | JUNE 30, 2016 | | 19 |
JUNE 30, 2016
| | | | |
SEMI-ANNUAL REPORT (UNAUDITED) | | | | BLACKROCK® |
BlackRock Variable Series Funds, Inc.
▶ BlackRock Equity Dividend V.I. Fund
| | |
| Not FDIC Insured ¡ May Lose Value ¡ No Bank Guarantee | | |
| | | | |
| Fund Summary as of June 30, 2016 | | | BlackRock Equity Dividend V.I. Fund | |
BlackRock Equity Dividend V.I. Fund’s (the “Fund”) investment objective is to seek long-term total return and current income.
|
Portfolio Management Commentary |
How did the Fund perform?
| • | | For the six-month period ended June 30, 2016, the Fund underperformed its benchmark, the Russell 1000® Value Index, and outperformed the broad-market S&P 500® Index. The following discussion of relative performance pertains to the Russell 1000® Value Index. |
What factors influenced performance?
| • | | The largest detractor from relative performance came from a combination of stock selection and allocation decisions in the financials sector. Falling U.S. interest rates negatively impacted overweight positions in life insurers MetLife, Inc. and Prudential Financial, Inc. as well as the Fund’s overweight to banks, notably Citigroup, Inc., Wells Fargo & Co. and SunTrust Banks, Inc. An underweight to real estate investment trusts also detracted from relative returns within the sector. Stock selection in consumer staples also hindered performance as the grocery store operator Kroger Co. lagged, due in part to concerns that food price deflation could hurt the company’s same-store sales. Lastly, stock selection in the materials and information technology sectors detracted during the period. |
| • | | The largest contributor to relative performance was stock selection in the consumer discretionary sector. Notably, non-benchmark holding Dollar General Corp. outperformed its peers after exceeding consensus earnings estimates in successive quarters. The company has benefited from same-store sales gains and new store productivity. In industrials, a combination of stock selection and an overweight to the aerospace & |
| | | defense industry boosted relative performance, as did holdings in the non-benchmark company United Parcel Service, Inc. Lastly, stock selection in the health care sector contributed to relative returns. |
Describe recent portfolio activity.
| • | | Over the six-month period, the Fund’s exposure to the energy and financials sectors was increased. Notable transactions within energy included the initiation of positions in Anadarko Petroleum Corp., Hess Corp. and Suncor Energy, Inc. Within financials, the Fund purchased shares of The Allstate Corp. and Marsh & McLennan Cos., Inc., and increased its holdings in Invesco Ltd. and Morgan Stanley. Conversely, exposure to the industrials sector was reduced through the elimination of the Fund’s positions in Tyco International PLC and United Technologies Corp., as well as by trimming exposure to strong performers within the aerospace & defense industry. Positions within materials were reduced by exiting BHP Billiton Ltd. and reducing the Fund’s allocation to International Paper Co. Lastly, the portfolio’s utilities exposure was trimmed by eliminating positions in ITC Holdings Corp. and WEC Energy Group, Inc. |
Describe portfolio positioning at period end.
| • | | Relative to the Russell 1000 Value benchmark, the Fund’s largest overweight positions were in the health care, consumer discretionary and industrials sectors. Conversely, the Fund’s largest relative underweights were in the financials, telecommunication services and energy sectors. |
The views expressed reflect the opinions of BlackRock as of the date of this report and are subject to change based on changes in market, economic or other conditions. These views are not intended to be a forecast of future events and are no guarantee of future results.
| | |
| Sector Allocation | | Percent of
Net Assets |
| | | | |
Financials | | | 23 | % |
Health Care | | | 15 | |
Industrials | | | 12 | |
Energy | | | 12 | |
Information Technology | | | 10 | |
Consumer Staples | | | 7 | |
Consumer Discretionary | | | 7 | |
Utilities | | | 5 | |
Materials | | | 3 | |
Telecommunication Services | | | 2 | |
Short-Term Securities | | | 10 | |
Liabilities in Excess of Other Assets | | | (6 | ) |
For Fund compliance purposes, the Fund’s classifications refer to one or more of the sector sub-classifications used by one or more widely recognized market indexes or rating group indexes, and/or as defined by the investment adviser. These definitions may not apply for purposes of this report, which may combine sector sub-classifications for reporting ease.
| | | | | | |
| 2 | | BLACKROCK VARIABLE SERIES FUNDS, INC. | | JUNE 30, 2016 | | |
| | | | |
| | | | BlackRock Equity Dividend V.I. Fund | |
|
Total Return Based on a $10,000 Investment |
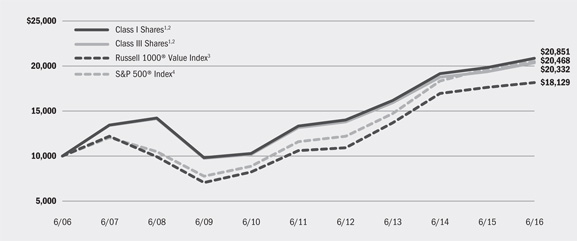
| | 1 | Assuming transaction costs, if any, and other operating expenses, including investment advisory fees. Does not include insurance-related fees and expenses. The returns for Class III Shares prior to July 1, 2011, the recommencement of operations of Class III Shares, are based upon the performance of the Fund’s Class I Shares, as adjusted to reflect the distribution (12b-1) fees applicable to Class III Shares. |
| | 2 | The Fund seeks to achieve its objective by investing primarily in a diversified portfolio of equity securities. Under normal circumstances, the Fund will invest in at least 80% of its assets in equity securities and at least 80% of its assets in dividend paying securities. The Fund’s total returns prior to October 1, 2010 are the returns of the Fund when it followed a different objective and different investment strategies under the name BlackRock Utilities & Telecommunications V.I. Fund. |
| | 3 | An unmanaged index that is a subset of the Russell 1000® Index that consists of those Russell 1000® securities with lower price-to-book ratios and lower expected growth values. |
| | 4 | An unmanaged index that covers 500 leading companies and captures approximately 80% coverage of available market capitalization. |
| | | | | | | | | | | | | | | | |
Performance Summary for the Period Ended June 30, 2016 | | | | | | | | | | | | | | | | |
| | | 6-Month Total Returns6 | | | Average Annual Total Returns | |
| | | | 1 Year6 | | | 5 Years6 | | | 10 Years6 | |
Class I5 | | | 4.96% | | | | 5.30% | | | | 9.39% | | | | 7.62% | |
Class III5 | | | 4.71 | | | | 5.00 | | | | 9.117 | | | | 7.357 | |
Russell 1000® Value Index | | | 6.30 | | | | 2.86 | | | | 11.35 | | | | 6.13 | |
S&P 500® Index | | | 3.84 | | | | 3.99 | | | | 12.10 | | | | 7.43 | |
| | 5 | | Average annual and cumulative total returns are based on changes in net asset value for the periods shown, and assume reinvestment of all distributions at net asset value on the ex-dividend date. Insurance-related fees and expenses are not reflected in these returns. The Fund’s total returns prior to October 1, 2010 are the returns of the Fund when it followed a different objective and different investment strategies under the name BlackRock Utilities & Telecommunications V.I. Fund. |
| | 6 | | For a portion of the period, the Fund’s investment adviser waived a portion of its fee. Without such waiver, the Fund’s performance would have been lower. |
| | 7 | | The returns for Class III Shares prior to July 1, 2011, the recommencement of operations of Class III Shares, are based upon the performance for the Fund’s Class I Shares, as adjusted to reflect the distribution (12b-1) fees applicable to Class III Shares. |
| | | | Past performance is not indicative of future results. Performance results do not reflect the deduction of taxes that a shareholder would pay on Fund distributions or the redemption of Fund shares. |
| | | | | | | | | | | | | | |
| Expense Example |
| | | Actual | | Hypothetical9 | | |
| | | Beginning
Account Value
January 1, 2016 | | Ending Account Value
June 30, 2016 | | Expenses Paid During the Period8 | | Beginning
Account Value
January 1, 2016 | | Ending Account Value
June 30, 2016 | | Expenses Paid During the Period8 | | Annualized Expense Ratio |
Class I | | $1,000.00 | | $1,049.60 | | $3.57 | | $1,000.00 | | $1,021.38 | | $3.52 | | 0.70% |
Class III | | $1,000.00 | | $1,047.10 | | $4.84 | | $1,000.00 | | $1,020.14 | | $4.77 | | 0.95% |
| | 8 | | For each class of the Fund, expenses are equal to the annualized expense ratio for the class, multiplied by the average account value over the period, multiplied by 182/366 (to reflect the one-half year period shown). |
| | 9 | | Hypothetical 5% annual return before expenses is calculated by prorating the number of days in the most recent fiscal half year divided by 366. |
| | | | See “Disclosure of Expenses” on the following page for further information on how expenses were calculated. |
| | | | | | |
| | | BLACKROCK VARIABLE SERIES FUNDS, INC. | | JUNE 30, 2016 | | 3 |
| | | | |
| Disclosure of Expenses | | | BlackRock Equity Dividend V.I. Fund | |
Shareholders of the Fund may incur the following charges: (a) transactional expenses, such as sales charges; and (b) operating expenses, including investment advisory fees, service and distribution fees, including 12b-1 fees, acquired fund fees and expenses, and other fund expenses. The expense example on the previous page (which is based on a hypothetical investment of $1,000 invested on January 1, 2016 and held through June 30, 2016) is intended to assist shareholders both in calculating expenses based on an investment in the Fund and in comparing these expenses with similar costs of investing in other mutual funds.
The expense example provides information about actual account values and actual expenses. In order to estimate the expenses a shareholder paid during the period covered by this report, shareholders can divide their account value by $1,000 and then multiply the result by the number corresponding to their share class under the heading entitled “Expenses Paid During the Period.”
The expense example also provides information about hypothetical account values and hypothetical expenses based on the Fund’s actual expense ratio and an assumed rate of return of 5% per year before expenses. In order to assist shareholders in comparing the ongoing expenses of investing in the Fund and other funds, compare the 5% hypothetical example with the 5% hypothetical examples that appear in shareholder reports of other funds.
The expenses shown in the expense example are intended to highlight shareholders’ ongoing costs only and do not reflect any transactional expenses, such as sales charges, if any. Therefore, the hypothetical example is useful in comparing ongoing expenses only, and will not help shareholders determine the relative total expenses of owning different funds. If these transactional expenses were included, shareholder expenses would have been higher.
| | | | | | |
| 4 | | BLACKROCK VARIABLE SERIES FUNDS, INC. | | JUNE 30, 2016 | | |
| | | | |
| Schedule of Investments June 30, 2016 (Unaudited) | | | BlackRock Equity Dividend V.I. Fund | |
| | | (Percentages shown are based on Net Assets) | |
| | | | | | |
| Common Stocks | | Shares | | | Value |
Aerospace & Defense — 5.9% | | | | | | |
Honeywell International, Inc. | | | 24,500 | | | $ 2,849,840 |
Lockheed Martin Corp. | | | 9,330 | | | 2,315,426 |
Northrop Grumman Corp. | | | 12,514 | | | 2,781,612 |
Raytheon Co. | | | 23,190 | | | 3,152,681 |
| | | | | | |
| | | | | | | 11,099,559 |
Air Freight & Logistics — 1.0% | | | | | | |
United Parcel Service, Inc., Class B | | | 17,530 | | | 1,888,332 |
Banks — 13.3% | | | | | | |
Bank of America Corp. | | | 298,820 | | | 3,965,341 |
Citigroup, Inc. | | | 89,200 | | | 3,781,188 |
JPMorgan Chase & Co. | | | 95,270 | | | 5,920,078 |
SunTrust Banks, Inc. | | | 76,067 | | | 3,124,832 |
U.S. Bancorp | | | 67,270 | | | 2,712,999 |
Wells Fargo & Co. | | | 114,925 | | | 5,439,400 |
| | | | | | |
| | | | | | | 24,943,838 |
Beverages — 2.0% | | | | | | |
Coca-Cola Co. | | | 52,205 | | | 2,366,453 |
Diageo PLC | | | 48,370 | | | 1,351,255 |
| | | | | | |
| | | | | | | 3,717,708 |
Capital Markets — 2.6% | | | | | | |
Goldman Sachs Group, Inc. | | | 9,440 | | | 1,402,595 |
Invesco Ltd. | | | 47,308 | | | 1,208,246 |
Morgan Stanley | | | 87,380 | | | 2,270,132 |
| | | | | | |
| | | | | | | 4,880,973 |
Chemicals — 2.8% | | | | | | |
Dow Chemical Co. | | | 44,025 | | | 2,188,483 |
E I du Pont de Nemours & Co. | | | 38,875 | | | 2,519,100 |
Praxair, Inc. (a) | | | 4,855 | | | 545,653 |
| | | | | | |
| | | | | | | 5,253,236 |
Communications Equipment — 0.7% | | | | | | |
Motorola Solutions, Inc. | | | 20,880 | | | 1,377,454 |
Consumer Finance — 0.3% | | | | | | |
American Express Co. | | | 8,346 | | | 507,103 |
Containers & Packaging — 0.5% | | | | | | |
International Paper Co. | | | 20,400 | | | 864,552 |
Diversified Financial Services — 0.9% | | | | | | |
CME Group, Inc. | | | 17,090 | | | 1,664,566 |
Diversified Telecommunication Services — 1.9% | | | | | | |
BCE, Inc. | | | 11,935 | | | 564,645 |
Verizon Communications, Inc. | | | 55,100 | | | 3,076,784 |
| | | | | | |
| | | | | | | 3,641,429 |
Electric Utilities — 2.1% | | | | | | |
Exelon Corp. | | | 38,390 | | | 1,395,860 |
NextEra Energy, Inc. | | | 20,245 | | | 2,639,948 |
| | | | | | |
| | | | | | | 4,035,808 |
Electrical Equipment — 0.3% | | | | | | |
Rockwell Automation, Inc. | | | 4,325 | | | 496,597 |
Energy Equipment & Services — 0.5% | | | | | | |
Schlumberger Ltd. | | | 10,785 | | | 852,878 |
| | | | | | |
| Common Stocks | | Shares | | | Value |
Food & Staples Retailing — 1.3% | | | | | | |
Kroger Co. | | | 67,500 | | | $ 2,483,325 |
Food Products — 0.6% | | | | | | |
Mondelez International, Inc., Class A | | | 23,210 | | | 1,056,287 |
Health Care Equipment & Supplies — 0.7% | | | | | | |
Becton Dickinson and Co. | | | 7,690 | | | 1,304,147 |
Health Care Providers & Services — 5.3% | | | | | | |
Aetna, Inc. | | | 23,173 | | | 2,830,118 |
Anthem, Inc. | | | 20,471 | | | 2,688,661 |
Quest Diagnostics, Inc. | | | 25,895 | | | 2,108,112 |
UnitedHealth Group, Inc. | | | 16,842 | | | 2,378,090 |
| | | | | | |
| | | | | | | 10,004,981 |
Hotels, Restaurants & Leisure — 0.7% | | | | | | |
McDonald’s Corp. | | | 11,283 | | | 1,357,796 |
Household Products — 1.1% | | | | | | |
Procter & Gamble Co. | | | 24,155 | | | 2,045,204 |
Industrial Conglomerates — 3.7% | | | | | | |
3M Co. | | | 4,685 | | | 820,437 |
General Electric Co. | | | 192,295 | | | 6,053,447 |
| | | | | | |
| | | | | | | 6,873,884 |
Insurance — 5.1% | | | | | | |
Allstate Corp. | | | 13,450 | | | 940,828 |
American International Group, Inc. | | | 44,460 | | | 2,351,489 |
Marsh & McLennan Cos., Inc. | | | 7,140 | | | 488,804 |
MetLife, Inc. | | | 47,100 | | | 1,875,993 |
Prudential Financial, Inc. | | | 28,690 | | | 2,046,745 |
Travelers Cos., Inc. | | | 15,908 | | | 1,893,688 |
| | | | | | |
| | | | | | | 9,597,547 |
Media — 1.7% | | | | | | |
Comcast Corp., Class A | | | 48,125 | | | 3,137,269 |
Multiline Retail — 2.3% | | | | | | |
Dollar General Corp. (a) | | | 45,420 | | | 4,269,480 |
Multi-Utilities — 2.9% | | | | | | |
CMS Energy Corp. | | | 28,060 | | | 1,286,832 |
Dominion Resources, Inc. | | | 27,040 | | | 2,107,227 |
DTE Energy Co. | | | 3,156 | | | 312,823 |
Public Service Enterprise Group, Inc. | | | 37,680 | | | 1,756,265 |
| | | | | | |
| | | | | | | 5,463,147 |
Oil, Gas & Consumable Fuels — 11.3% | | | | | | |
Anadarko Petroleum Corp. | | | 9,380 | | | 499,485 |
Chevron Corp. | | | 25,203 | | | 2,642,030 |
ConocoPhillips | | | 21,110 | | | 920,396 |
Exxon Mobil Corp. | | | 47,845 | | | 4,484,990 |
Hess Corp. | | | 21,080 | | | 1,266,908 |
Marathon Oil Corp. | | | 38,770 | | | 581,938 |
Marathon Petroleum Corp. | | | 32,190 | | | 1,221,932 |
Occidental Petroleum Corp. | | | 52,160 | | | 3,941,210 |
Pioneer Natural Resources Co. | | | 2,740 | | | 414,315 |
Spectra Energy Corp. | | | 22,086 | | | 809,010 |
Suncor Energy, Inc. | | | 51,490 | | | 1,427,818 |
TOTAL SA — ADR (a) | | | 61,058 | | | 2,936,890 |
| | | | | | |
| | | | | | | 21,146,922 |
| | | | | | | | | | |
Portfolio Abbreviations |
| ADR | | American Depositary Receipts | | | | | | | | |
| GDR | | Global Depositary Receipts | | | | | | | | |
See Notes to Financial Statements.
| | | | | | |
| | | BLACKROCK VARIABLE SERIES FUNDS, INC. | | JUNE 30, 2016 | | 5 |
| | | | |
| Schedule of Investments (continued) | | | BlackRock Equity Dividend V.I. Fund | |
| | | | | | |
| Common Stocks | | Shares | | | Value |
Personal Products — 0.7% | | | | | | |
Unilever NV — NY Shares (a) | | | 29,695 | | | $ 1,393,883 |
Pharmaceuticals — 8.5% | | | | | | |
AstraZeneca PLC | | | 35,566 | | | 2,126,272 |
Johnson & Johnson | | | 26,555 | | | 3,221,122 |
Merck & Co., Inc. | | | 66,630 | | | 3,838,554 |
Pfizer, Inc. | | | 192,510 | | | 6,778,277 |
| | | | | | |
| | | | | | | 15,964,225 |
Professional Services — 0.5% | | | | | | |
Nielsen Holdings PLC | | | 18,720 | | | 972,878 |
Real Estate Investment Trusts (REITs) — 0.4% | | | | | | |
Weyerhaeuser Co. | | | 25,280 | | | 752,586 |
Road & Rail — 0.6% | | | | | | |
Union Pacific Corp. | | | 11,975 | | | 1,044,819 |
Semiconductors & Semiconductor Equipment — 3.7% | | | | | | |
Intel Corp. | | | 136,750 | | | 4,485,400 |
NVIDIA Corp. (a) | | | 6,490 | | | 305,095 |
QUALCOMM, Inc. | | | 40,340 | | | 2,161,014 |
| | | | | | |
| | | | | | | 6,951,509 |
Software — 3.6% | | | | | | |
Microsoft Corp. | | | 71,995 | | | 3,683,984 |
Oracle Corp. | | | 77,500 | | | 3,172,075 |
| | | | | | |
| | | | | | | 6,856,059 |
Specialty Retail — 2.6% | | | | | | |
Gap, Inc. (a) | | | 59,770 | | | 1,268,319 |
Home Depot, Inc. | | | 27,945 | | | 3,568,297 |
| | | | | | |
| | | | | | | 4,836,616 |
Technology Hardware, Storage & Peripherals — 1.5% | | | | | | |
Lenovo Group Ltd. | | | 1,058,000 | | | 643,089 |
Samsung Electronics Co. Ltd. — GDR | | | 3,670 | | | 2,239,677 |
| | | | | | |
| | | | | | | 2,882,766 |
| | | | | | | | |
| Common Stocks | | Shares | | | Value | |
| |
Tobacco — 1.8% | | | | | | | | |
Altria Group, Inc. | | | 16,795 | | | $ | 1,158,183 | |
Philip Morris International, Inc. | | | 9,985 | | | | 1,015,674 | |
Reynolds American, Inc. | | | 22,274 | | | | 1,201,237 | |
| | | | | | | | |
| | | | | | | 3,375,094 | |
| |
Water Utilities — 0.4% | | | | | | | | |
American Water Works Co., Inc. | | | 10,045 | | | | 848,903 | |
| |
Wireless Telecommunication Services — 0.4% | | | | | | | | |
SK Telecom Co. Ltd — ADR | | | 36,630 | | | | 766,300 | |
| |
Total Long-Term Investments | | | | | | | | |
(Cost — $166,921,705) — 96.2% | | | | | | | 180,609,660 | |
| |
| | | | | | | | |
| |
| | |
| Short-Term Securities | | | | | | |
| |
BlackRock Liquidity Funds, TempFund, Institutional Class, 0.40% (b)(c) | | | 9,151,372 | | | | 9,151,372 | |
| |
| | | Beneficial | | | | | |
| | | Interest | | | | | |
| | | (000) | | | | | |
| |
BlackRock Liquidity Series, LLC, Money Market Series, 0.59% (b)(c)(d) | | | $ 10,147 | | | | 10,146,624 | |
| |
Total Short-Term Securities | | | | | | | | |
(Cost — $19,297,996) — 10.3% | | | | | | | 19,297,996 | |
| |
Total Investments (Cost — $186,219,701) — 106.5% | | | | 199,907,656 | |
Liabilities in Excess of Other Assets — (6.5)% | | | | (12,137,256 | ) |
| | | | | | | | |
Net Assets — 100.0% | | | | | | $ | 187,770,400 | |
| | | | | | | | |
|
|
| Notes to Schedule of Investments |
|
| (a) | Security, or a portion of security, is on loan. |
| (b) | During the six months ended June 30, 2016, investments in issuers considered to be affiliates of the Fund for purposes of Section 2(a)(3) of the Investment Company Act of 1940, as amended, were as follows: |
| | | | | | | | | | | | | | | | | | | | |
| |
| Affiliate | | Shares/Beneficial
Interest Held at
December 31, 2015 | | | Net Activity | | | Shares/Beneficial
Interest Held at
June 30, 2016 | | | Value at
June 30, 2016 | | | Income | |
| |
BlackRock Liquidity Funds, TempFund, Institutional Class | | | 5,156,067 | | | | 3,995,305 | | | | 9,151,372 | | | | $ 9,151,372 | | | | $12,389 | |
BlackRock Liquidity Series, LLC, Money Market Series | | | $2,303,512 | | | | $7,843,112 | | | | $10,146,624 | | | | 10,146,624 | | | | 7,079 | 1 |
| |
| | | | | | | | | | | | | | | $19,297,996 | | | | $19,468 | |
| | | | | | | | | | | | | | | | |
| | 1 | | Represents securities lending income earned from the reinvestment of cash collateral from loaned securities, net of fees and collateral investment expenses, and other payments to and from borrowers of securities. |
| (c) | Current yield as of period end. |
| (d) | Security was purchased with the cash collateral from loaned securities. The Fund may withdraw up to 25% of its investment daily, although the manager of the BlackRock Liquidity Series, LLC, Money Market Series, in its sole discretion, may permit an investor to withdraw more than 25% on any one day. |
| • | | For Fund compliance purposes, the Fund’s industry classifications refer to one or more of the industry sub-classifications used by one or more widely recognized market indexes or rating group indexes, and/or as defined by the investment adviser. These definitions may not apply for purposes of this report, which may combine such industry sub-classifications for reporting ease. |
See Notes to Financial Statements.
| | | | | | |
| 6 | | BLACKROCK VARIABLE SERIES FUNDS, INC. | | JUNE 30, 2016 | | |
| | | | |
| Schedule of Investments (continued) | | | BlackRock Equity Dividend V.I. Fund | |
|
Fair Value Hierarchy as of Period End |
Various inputs are used in determining the fair value of investments. For information about the Fund’s policy regarding valuation of investments, refer to the Notes to Financial Statements.
The following table summarizes the Fund’s investments categorized in the disclosure hierarchy:
| | | | | | | | | | | | | | |
| | | Level 1 | | | Level 2 | | | Level 3 | | Total | |
Assets: | | | | | | | | | | | | | | |
Investments: | | | | | | | | | | | | | | |
Common Stocks: | | | | | | | | | | | | | | |
Aerospace & Defense | | $ | 11,099,559 | | | | — | | | — | | $ | 11,099,559 | |
Air Freight & Logistics | | | 1,888,332 | | | | — | | | — | | | 1,888,332 | |
Banks | | | 24,943,838 | | | | — | | | — | | | 24,943,838 | |
Beverages | | | 2,366,453 | | | $ | 1,351,255 | | | — | | | 3,717,708 | |
Capital Markets | | | 4,880,973 | | | | — | | | — | | | 4,880,973 | |
Chemicals | | | 5,253,236 | | | | — | | | — | | | 5,253,236 | |
Communications Equipment | | | 1,377,454 | | | | — | | | — | | | 1,377,454 | |
Consumer Finance | | | 507,103 | | | | — | | | — | | | 507,103 | |
Containers & Packaging | | | 864,552 | | | | — | | | — | | | 864,552 | |
Diversified Financial Services | | | 1,664,566 | | | | — | | | — | | | 1,664,566 | |
Diversified Telecommunication Services | | | 3,641,429 | | | | — | | | — | | | 3,641,429 | |
Electric Utilities | | | 4,035,808 | | | | — | | | — | | | 4,035,808 | |
Electrical Equipment | | | 496,597 | | | | — | | | — | | | 496,597 | |
Energy Equipment & Services | | | 852,878 | | | | — | | | — | | | 852,878 | |
Food & Staples Retailing | | | 2,483,325 | | | | — | | | — | | | 2,483,325 | |
Food Products | | | 1,056,287 | | | | — | | | — | | | 1,056,287 | |
Health Care Equipment & Supplies | | | 1,304,147 | | | | — | | | — | | | 1,304,147 | |
Health Care Providers & Services | | | 10,004,981 | | | | — | | | — | | | 10,004,981 | |
Hotels, Restaurants & Leisure | | | 1,357,796 | | | | — | | | — | | | 1,357,796 | |
Household Products | | | 2,045,204 | | | | — | | | — | | | 2,045,204 | |
Industrial Conglomerates | | | 6,873,884 | | | | — | | | — | | | 6,873,884 | |
Insurance | | | 9,597,547 | | | | — | | | — | | | 9,597,547 | |
Media | | | 3,137,269 | | | | — | | | — | | | 3,137,269 | |
Multiline Retail | | | 4,269,480 | | | | — | | | — | | | 4,269,480 | |
Multi-Utilities | | | 5,463,147 | | | | — | | | — | | | 5,463,147 | |
Oil, Gas & Consumable Fuels | | | 21,146,922 | | | | — | | | — | | | 21,146,922 | |
Personal Products | | | 1,393,883 | | | | — | | | — | | | 1,393,883 | |
Pharmaceuticals | | | 13,837,953 | | | | 2,126,272 | | | — | | | 15,964,225 | |
Professional Services | | | 972,878 | | | | — | | | — | | | 972,878 | |
Real Estate Investment Trusts (REITs) | | | 752,586 | | | | — | | | — | | | 752,586 | |
Road & Rail | | | 1,044,819 | | | | — | | | — | | | 1,044,819 | |
Semiconductors & Semiconductor Equipment | | | 6,951,509 | | | | — | | | — | | | 6,951,509 | |
Software | | | 6,856,059 | | | | — | | | — | | | 6,856,059 | |
Specialty Retail | | | 4,836,616 | | | | — | | | — | | | 4,836,616 | |
Technology Hardware, Storage & Peripherals | | | 2,239,677 | | | | 643,089 | | | — | | | 2,882,766 | |
Tobacco | | | 3,375,094 | | | | — | | | — | | | 3,375,094 | |
Water Utilities | | | 848,903 | | | | — | | | — | | | 848,903 | |
Wireless Telecommunication Services | | | 766,300 | | | | — | | | — | | | 766,300 | |
Short-Term Securities | | | 9,151,372 | | | | 10,146,624 | | | — | | | 19,297,996 | |
| | | | |
Total | | $ | 185,640,416 | | | $ | 14,267,240 | | | — | | $ | 199,907,656 | |
| | | | |
See Notes to Financial Statements.
| | | | | | |
| | | BLACKROCK VARIABLE SERIES FUNDS, INC. | | JUNE 30, 2016 | | 7 |
| | | | |
| Schedule of Investments (concluded) | | | BlackRock Equity Dividend V.I. Fund | |
The Fund may hold assets and/or liabilities in which the fair value approximates the carrying amount for financial statement purposes. As of period end, such assets and/or liabilities are categorized within the disclosure hierarchy as follows:
| | | | | | | | | | | | | | | | |
| | | Level 1 | | | Level 2 | | | Level 3 | | | Total | |
Assets: | | | | | | | | | | | | | | | | |
Foreign currency at value | | $ | 14,411 | | | | — | | | | — | | | $ | 14,411 | |
Liabilities: | | | | | | | | | | | | | | | | |
Collateral on securities loaned at value | | | — | | | $ | (10,146,624 | ) | | | — | | | | (10,146,624 | ) |
| | | | |
Total | | $ | 14,411 | | | $ | (10,146,624 | ) | | | — | | | $ | (10,132,213 | ) |
| | | | |
During the six months ended June 30, 2016, there were no transfers between levels.
See Notes to Financial Statements.
| | | | | | |
| 8 | | BLACKROCK VARIABLE SERIES FUNDS, INC. | | JUNE 30, 2016 | | |
| | | | |
| Statement of Assets and Liabilities | | | | |
| | |
| June 30, 2016 (Unaudited) | | BlackRock
Equity Dividend V.I.
Fund |
| | |
| Assets | | |
Investments at value — unaffiliated (including securities loaned at value of $10,005,760) (cost — $166,921,705) | | $ 180,609,660 |
Investments at value — affiliated (cost — $19,297,996) | | 19,297,996 |
Foreign currency at value (cost — $14,425) | | 14,411 |
Receivables: | | |
Investments sold | | 1,408,311 |
Securities lending income — affiliated | | 1,864 |
Capital shares sold | | 368,265 |
Dividends — affiliated | | 2,541 |
Dividends — unaffiliated | | 260,571 |
From the Manager | | 42,840 |
Prepaid expenses | | 197 |
| | |
Total assets | | 202,006,656 |
| | |
| | |
| Liabilities | | |
Collateral on securities loaned at value | | 10,146,624 |
Payables: | | |
Investments purchased | | 3,936,981 |
Capital shares redeemed | | 5,659 |
Distribution fees | | 29,756 |
Investment advisory fees | | 88,034 |
Officer’s and Directors’ fees | | 2,031 |
Other accrued expenses | | 26,762 |
Other affiliates | | 409 |
| | |
Total liabilities | | 14,236,256 |
| | |
Net Assets | | $ 187,770,400 |
| | |
| | |
| Net Assets Consist of | | |
Paid-in capital | | $ 169,514,772 |
Undistributed net investment income | | 720,684 |
Accumulated net realized gain | | 3,846,474 |
Net unrealized appreciation (depreciation) | | 13,688,470 |
| | |
Net Assets | | $ 187,770,400 |
| | |
| | |
| Net Asset Value | | |
Class I — Based on net assets of $31,510,883 and 3,005,178 shares outstanding, 100 million shares authorized, $0.10 par value | | $ 10.49 |
| | |
Class III — Based on net assets of $156,259,517 and 14,932,223 shares outstanding, 100 million shares authorized, $0.10 par value | | $ 10.46 |
| | |
See Notes to Financial Statements.
| | | | | | |
| | | BLACKROCK VARIABLE SERIES FUNDS, INC. | | JUNE 30, 2016 | | 9 |
| | |
| Six Months Ended June 30, 2016 (Unaudited) | | BlackRock Equity Dividend V.I. Fund |
| | |
| Investment Income |
Dividends — unaffiliated | | $ 2,017,276 |
Dividends — affiliated | | 12,389 |
Securities lending — affiliated — net | | 7,079 |
Foreign taxes withheld | | (14,614) |
| | |
Total income | | 2,022,130 |
| | |
| | |
| Expenses | | |
Investment advisory | | 441,569 |
Distribution — class specific | | 147,034 |
Transfer agent | | 2,418 |
Transfer agent — class specific | | 85,663 |
Professional | | 18,207 |
Custodian | | 15,682 |
Accounting services | | 14,687 |
Officer and Directors | | 10,175 |
Printing | | 8,093 |
Miscellaneous | | 7,758 |
| | |
Total expenses | | 751,286 |
Less fees waived by the Manager | | (2,203) |
Less transfer agent fees reimbursed — class specific | | (85,663) |
| | |
Total expenses after fees waived and reimbursed | | 663,420 |
| | |
Net investment income | | 1,358,710 |
| | |
| | |
| Realized and Unrealized Gain | | |
Net realized gain from: | | |
| Investments | | 3,478,790 |
| Foreign currency transactions | | 165 |
| | |
| | 3,478,955 |
| | |
Net change in unrealized appreciation (depreciation) on: | | |
| Investments | | 4,435,008 |
| Foreign currency translations | | 578 |
| | |
| | 4,435,586 |
| | |
Net realized and unrealized gain | | 7,914,541 |
| | |
Net Increase in Net Assets Resulting from Operations | | $ 9,273,251 |
| | |
See Notes to Financial Statements.
| | | | | | |
| 10 | | BLACKROCK VARIABLE SERIES FUNDS, INC. | | JUNE 30, 2016 | | |
| | | | |
| Statements of Changes in Net Assets | | | BlackRock Equity Dividend V.I. Fund | |
| | | | | | | | | | | | | | |
| Increase (Decrease) in Net Assets: | | | | Six Months
Ended June 30, 2016
(Unaudited) | | | | | | | | Year Ended
December 31,
2015 |
| | | | | | | | | | | | | | |
| Operations | | | | | | | | | | | | | | |
Net investment income | | $ | | | 1,358,710 | | | | | | | $ | | 1,170,084 |
Net realized gain | | | | | 3,478,955 | | | | | | | | | 5,975,303 |
Net change in unrealized appreciation (depreciation) | | | | | 4,435,586 | | | | | | | | | (6,974,575) |
| | |
Net increase in net assets resulting from operations | | | | | 9,273,251 | | | | | | | | | 170,812 |
| | |
| | | | | | | | | | | | | | |
| Distributions to Shareholders1 | | | | | | | | | | | | | | |
From net investment income: | | | | | | | | | | | | | | |
Class I | | | | | (138,189 | ) | | | | | | | | (521,306) |
Class III | | | | | (501,820 | ) | | | | | | | | (648,439) |
From net realized gain: | | | | | | | | | | | | | | |
Class I | | | | | — | | | | | | | | | (1,820,371) |
Class III | | | | | — | | | | | | | | | (4,352,573) |
| | |
Decrease in net assets resulting from distributions to shareholders | | | | | (640,009 | ) | | | | | | | | (7,342,689) |
| | |
| | | | | | | | | | | | | | |
| Capital Share Transactions | | | | | | | | | | | | | | |
Net increase in net assets derived from capital share transactions | | | | | 63,446,896 | | | | | | | | | 64,548,587 |
| | |
| | | | | | | | | | | | | | |
| Net Assets | | | | | | | | | | | | | | |
Total increase in net assets | | | | | 72,080,138 | | | | | | | | | 57,376,710 |
Beginning of period | | | | | 115,690,262 | | | | | | | | | 58,313,552 |
| | |
End of period | | $ | | | 187,770,400 | | | | | | | $ | | 115,690,262 |
| | |
Undistributed net investment income, end of period | | $ | | | 720,684 | | | | | | | $ | | 1,983 |
| | |
| | 1 | | Distributions for annual periods determined in accordance with federal income tax regulations. |
See Notes to Financial Statements.
| | | | | | |
| | | BLACKROCK VARIABLE SERIES FUNDS, INC. | | JUNE 30, 2016 | | 11 |
| | | | |
| Financial Highlights | | | BlackRock Equity Dividend V.I. Fund | |
| | | | | | | | | | | | | | | | | | | | | | | | |
| | | Class I | |
| | | Six Months
Ended
June 30, 2016 | | | Year Ended December 31, | |
| | | (Unaudited) | | | 2015 | | | 2014 | | | 2013 | | | 2012 | | | 2011 | |
| | | | | | | | | | | | | | | | | | | | | | | | |
| |
| Per Share Operating Performance | | | | | | | | | | | | | | | | | | | | | | | | |
| |
Net asset value, beginning of period | | $ | 10.04 | | | $ | 10.90 | | | $ | 10.78 | | | $ | 8.95 | | | $ | 8.17 | | | $ | 7.92 | |
| | | | |
Net investment income1 | | | 0.10 | | | | 0.19 | | | | 0.20 | | | | 0.19 | | | | 0.21 | | | | 0.17 | |
Net realized and unrealized gain (loss) | | | 0.40 | | | | (0.25 | ) | | | 0.80 | | | | 1.99 | | | | 0.78 | | | | 0.30 | |
| | | | |
Net increase (decrease) from investment operations | | | 0.50 | | | | (0.06 | ) | | | 1.00 | | | | 2.18 | | | | 0.99 | | | | 0.47 | |
| | | | |
Distributions:2 | | | | | | | | | | | | | | | | | | | | | | | | |
From net investment income | | | (0.05 | ) | | | (0.18 | ) | | | (0.20 | ) | | | (0.20 | ) | | | (0.20 | ) | | | (0.17) | |
From net realized gain | | | — | | | | (0.62 | ) | | | (0.68 | ) | | | (0.15 | ) | | | (0.01 | ) | | | (0.05) | |
From return of capital | | | — | | | | — | | | | — | | | | — | | | | — | | | | (0.00)3 | |
| | | | |
Total distributions | | | (0.05 | ) | | | (0.80 | ) | | | (0.88 | ) | | | (0.35 | ) | | | (0.21 | ) | | | (0.22) | |
| | | | |
Net asset value, end of period | | $ | 10.49 | | | $ | 10.04 | | | $ | 10.90 | | | $ | 10.78 | | | $ | 8.95 | | | $ | 8.17 | |
| | | | |
| | | | | | | | | | | | | | | | | | | | | | | | |
| |
| Total Return4 | | | | | | | | | | | | | | | | | | | | | | | | |
| |
Based on net asset value | | | 4.96 | %5 | | | (0.61 | )% | | | 9.34 | % | | | 24.52 | % | | | 12.12 | % | | | 5.96% | |
| | | | |
| | | | | | | | | | | | | | | | | | | | | | | | |
| |
| Ratios to Average Net Assets | | | | | | | | | | | | | | | | | | | | | | | | |
| |
Total expenses | | | 0.91 | %6,7 | | | 1.00 | % | | | 0.99 | % | | | 1.04 | % | | | 0.96 | % | | | 1.02% | |
| | | | |
Total expenses after fees waived and reimbursed | | | 0.70 | %6,7 | | | 0.79 | % | | | 0.78 | % | | | 0.84 | % | | | 0.83 | % | | | 1.02% | |
| | | | |
Net investment income | | | 2.05 | %6,7 | | | 1.79 | % | | | 1.81 | % | | | 1.95 | % | | | 2.35 | % | | | 2.09% | |
| | | | |
| | | | | | | | | | | | | | | | | | | | | | | | |
| |
| Supplemental Data | | | | | | | | | | | | | | | | | | | | | | | | |
| |
Net assets, end of period (000) | | $ | 31,511 | | | $ | 30,527 | | | $ | 35,694 | | | $ | 36,658 | | | $ | 34,558 | | | $ | 30,925 | |
| | | | |
Portfolio turnover rate | | | 11 | % | | | 25 | % | | | 18 | % | | | 18 | % | | | 4 | % | | | 12% | |
| | | | |
| | 1 | | Based on average shares outstanding. |
| | 2 | | Distributions for annual periods determined in accordance with federal income tax regulations. |
| | 3 | | Amount is greater than $(0.005) per share. |
| | 4 | | Where applicable, excludes insurance-related fees and expenses and assumes the reinvestment of distributions. |
| | 5 | | Aggregate total return. |
| | 6 | | Ratios do not include expenses incurred indirectly as a result of investments in underlying funds of approximately 0.01%. |
See Notes to Financial Statements.
| | | | | | |
| 12 | | BLACKROCK VARIABLE SERIES FUNDS, INC. | | JUNE 30, 2016 | | |
| | | | |
| Financial Highlights (concluded) | | | BlackRock Equity Dividend V.I. Fund | |
| | | | | | | | | | | | | | | | | | | | | | |
| | | Class III |
| | | Six Months
Ended
June 30, 2016
(Unaudited) | | | | | | | | | | | | | | | Period July 1, 20111 to December 31,
2011 |
| | | |
Year Ended December 31, | | |
| | | | 2015 | | | 2014 | | | 2013 | | | 2012 | | |
| | | | | | | | | | | | | | | | | | | | | | |
| Per Share Operating Performance | | | | | | | | | | | | | | | | | | | | | | |
Net asset value, beginning of period | | $ | 10.03 | | | $ | 10.89 | | | $ | 10.77 | | | $ | 8.95 | | | $ | 8.17 | | | $ 8.60 |
| | | |
Net investment income2 | | | 0.09 | | | | 0.17 | | | | 0.17 | | | | 0.17 | | | | 0.20 | | | 0.06 |
Net realized and unrealized gain (loss) | | | 0.38 | | | | (0.25 | ) | | | 0.80 | | | | 1.97 | | | | 0.77 | | | (0.31) |
| | | |
Net increase (decrease) from investment operations | | | 0.47 | | | | (0.08 | ) | | | 0.97 | | | | 2.14 | | | | 0.97 | | | (0.25) |
| | | |
Distributions:3 | | | | | | | | | | | | | | | | | | | | | | |
From net investment income | | | (0.04 | ) | | | (0.16 | ) | | | (0.17 | ) | | | (0.17 | ) | | | (0.18 | ) | | (0.13) |
From net realized gain | | | — | | | | (0.62 | ) | | | (0.68 | ) | | | (0.15 | ) | | | (0.01 | ) | | (0.05) |
From return of capital | | | — | | | | — | | | | — | | | | — | | | | — | | | (0.00)4 |
| | | |
Total distributions | | | (0.04 | ) | | | (0.78 | ) | | | (0.85 | ) | | | (0.32 | ) | | | (0.19 | ) | | (0.18) |
| | | |
Net asset value, end of period | | $ | 10.46 | | | $ | 10.03 | | | $ | 10.89 | | | $ | 10.77 | | | $ | 8.95 | | | $ 8.17 |
| | | |
| | | | | | | | | | | | | | | | | | | | | | |
| Total Return5 | | | | | | | | | | | | | | | | | | | | | | |
Based on net asset value | | | 4.71 | %6 | | | (0.82 | )% | | | 9.07 | % | | | 24.12 | % | | | 11.90 | % | | (2.94)%6 |
| | | |
| | | | | | | | | | | | | | | | | | | | | | |
| Ratios to Average Net Assets | | | | | | | | | | | | | | | | | | | | | | |
Total expenses | | | 1.05 | %7,8 | | | 1.16 | % | | | 1.24 | % | | | 1.28 | % | | | 1.21 | % | | 1.26%8 |
| | | |
Total expenses after fees waived and reimbursed | | | 0.95 | %7,8 | | | 1.03 | % | | | 1.03 | % | | | 1.09 | % | | | 1.06 | % | | 1.26%8 |
| | | |
Net investment income | | | 1.80 | %7,8 | | | 1.59 | % | | | 1.56 | % | | | 1.71 | % | | | 2.24 | % | | 1.99%8 |
| | | |
| | | | | | | | | | | | | | | | | | | | | | |
| Supplemental Data | | | | | | | | | | | | | | | | | | | | | | |
Net assets, end of period (000) | | $ | 156,260 | | | $ | 85,163 | | | $ | 22,619 | | | $ | 20,567 | | | $ | 12,379 | | | $ 2,347 |
| | | |
Portfolio turnover rate | | | 11 | % | | | 25 | % | | | 18 | % | | | 18 | % | | | 4 | % | | 12% |
| | | |
| | 1 | | Recommencement of operations. |
| | 2 | | Based on average shares outstanding. |
| | 3 | | Distributions for annual periods determined in accordance with federal income tax regulations. |
| | 4 | | Amount is greater than $(0.005) per share. |
| | 5 | | Where applicable, excludes insurance-related fees and expenses and assumes the reinvestment of distributions. |
| | 6 | | Aggregate total return. |
| | 7 | | Ratios do not include expenses incurred indirectly as a result of investments in underlying funds of approximately 0.01%. |
See Notes to Financial Statements.
| | | | | | |
| | | BLACKROCK VARIABLE SERIES FUNDS, INC. | | JUNE 30, 2016 | | 13 |
| | | | |
| Notes to Financial Statements (Unaudited) | | | BlackRock Equity Dividend V.I. Fund | |
1. Organization:
BlackRock Variable Series Funds, Inc. (the “Company”) is registered under the Investment Company Act of 1940, as amended (the “1940 Act”), as an open-end management investment company. The Company is organized as a Maryland corporation that is comprised of 20 separate funds. The funds offer shares to insurance companies for their separate accounts to fund benefits under certain variable annuity and variable life insurance contracts. The financial statements presented are for BlackRock Equity Dividend V.I. Fund (the “Fund”). The Fund is classified as diversified. Class I and Class III Shares have equal voting, dividend, liquidation and other rights, except that only shares of the respective classes are entitled to vote on matters concerning only that class. In addition, Class III Shares bear certain expenses related to the distribution of such shares. Class III Shares were redeemed on December 31, 2007 and sales of Class III Shares recommenced on July 1, 2011.
The Fund, together with certain other registered investment companies advised by BlackRock Advisors, LLC (the “Manager”) or its affiliates, is included in a complex of open-end funds referred to as the Equity-Bond Complex.
2. Significant Accounting Policies:
The financial statements are prepared in conformity with accounting principles generally accepted in the United States of America (“U.S. GAAP”), which may require management to make estimates and assumptions that affect the reported amounts of assets and liabilities in the financial statements, disclosure of contingent assets and liabilities at the date of the financial statements and the reported amounts of increases and decreases in net assets from operations during the reporting period. Actual results could differ from those estimates. The Fund is considered an investment company under U.S. GAAP and follows the accounting and reporting guidance applicable to investment companies. Below is a summary of significant accounting policies:
Foreign Currency: The Fund’s books and records are maintained in U.S. dollars. Purchases and sales of investments are recorded at the rates of exchange prevailing on the respective dates of such transactions. Generally, when the U.S. dollar rises in value against a foreign currency, the investments denominated in that currency will lose value; the opposite effect occurs if the U.S. dollar falls in relative value.
The Fund does not isolate the portion of the results of operations arising as a result of changes in the exchange rates from the changes in the market prices of investments held or sold for financial reporting purposes. Accordingly, the effects of changes in exchange rates on investments are not segregated in the Statement of Operations from the effects of changes in market prices of those investments, but are included as a component of net realized and unrealized gain (loss) from investments. The Fund reports realized currency gains (losses) on foreign currency related transactions as components of net realized gain (loss) for financial reporting purposes, whereas such components are generally treated as ordinary income for federal income tax purposes.
Investment Transactions and Investment Income: For financial reporting purposes, investment transactions are recorded on the dates the transactions are entered into (the trade dates). Realized gains and losses on investment transactions are determined on the identified cost basis. Dividend income is recorded on the ex-dividend date. Dividends from foreign securities where the ex-dividend date may have passed are subsequently recorded when the Fund is informed of the ex-dividend date. Under the applicable foreign tax laws, a withholding tax at various rates may be imposed on capital gains, dividends and interest. Upon notification from issuers, some of the dividend income received from a real estate investment trust may be redesignated as a reduction of cost of the related investment and/or realized gain. Income, expenses and realized and unrealized gains and losses are allocated daily to each class based on its relative net assets.
Distributions: Distributions paid by the Fund are recorded on the ex-dividend date. The character and timing of distributions are determined in accordance with federal income tax regulations, which may differ from U.S. GAAP.
Indemnifications: In the normal course of business, the Fund enters into contracts that contain a variety of representations that provide general indemnification. The Fund’s maximum exposure under these arrangements is unknown because it involves future potential claims against the Fund, which cannot be predicted with any certainty.
Other: Expenses directly related to the Fund or its classes are charged to the Fund or the applicable class. Other operating expenses shared by several funds, including other funds managed by the Manager, are prorated among those funds on the basis of relative net assets or other appropriate methods. Expenses directly related to the Fund and other shared expenses prorated to the Fund are allocated daily to each class based on its relative net assets or other appropriate methods.
The Fund has an arrangement with its custodian whereby fees may be reduced by credits earned on uninvested cash balances, which, if applicable, are shown as fees paid indirectly in the Statement of Operations. The custodian imposes fees on overdrawn cash balances, which can be offset by accumulated credits earned or may result in additional custody charges.
| | | | | | |
| 14 | | BLACKROCK VARIABLE SERIES FUNDS, INC. | | JUNE 30, 2016 | | |
| | | | |
| Notes to Financial Statements (continued) | | | BlackRock Equity Dividend V.I. Fund | |
3. Investment Valuation and Fair Value Measurements:
Investment Valuation Policies: The Fund’s investments are valued at fair value (also referred to as “market value” within the financial statements) as of the close of trading on the New York Stock Exchange (“NYSE”) (generally 4:00 p.m., Eastern time). U.S. GAAP defines fair value as the price the Fund would receive to sell an asset or pay to transfer a liability in an orderly transaction between market participants at the measurement date. The Fund determines the fair values of its financial instruments using various independent dealers or pricing services under policies approved by the Board of Directors of the Company (the “Board”). The BlackRock Global Valuation Methodologies Committee (the “Global Valuation Committee”) is the committee formed by management to develop global pricing policies and procedures and to oversee the pricing function for all financial instruments.
Fair Value Inputs and Methodologies: The following methods (or “techniques”) and inputs are used to establish the fair value of the Fund’s assets and liabilities:
| • | | Equity investments traded on a recognized securities exchange are valued at the official closing price each day, if available. For equity investments traded on more than one exchange, the official close price on the exchange where the stock is primarily traded is used. Equity investments traded on a recognized exchange for which there were no sales on that day may be valued at the last available bid (long positions) or ask (short positions) price. Generally, trading in foreign instruments is substantially completed each day at various times prior to the close of business on the NYSE. Occasionally, events affecting the values of such instruments may occur between the foreign market close and the close of business on the NYSE that may not be reflected in the computation of the Fund’s net assets. Each business day, the Fund uses a pricing service to assist with the valuation of certain foreign exchange-traded equity securities and foreign exchange-traded and over-the-counter (“OTC”) options (the “Systematic Fair Value Price”). Using current market factors, the Systematic Fair Value Price is designed to value such foreign securities and foreign options at fair value as of the close of business on the NYSE, which follows the close of the local markets. |
| • | | Investments in open-end U.S. mutual funds are valued at net asset value each business day. |
| • | | The Fund values its investment in BlackRock Liquidity Series, LLC, Money Market Series (the “Money Market Series”) at fair value, which is ordinarily based upon its pro rata ownership in the underlying fund’s net assets. The Money Market Series seeks current income consistent with maintaining liquidity and preserving capital. Although the Money Market Series is not registered under the 1940 Act, its investments may follow the parameters of investments by a money market fund that is subject to Rule 2a-7 under the 1940 Act. The Fund may withdraw up to 25% of its investment daily, although the manager of the Money Market Series, in its sole discretion, may permit an investor to withdraw more than 25% on any one day. |
| • | | Securities and other assets and liabilities denominated in foreign currencies are translated into U.S. dollars using exchange rates determined as of the close of business on the NYSE. Forward foreign currency exchange contracts are valued at the mean between the bid and ask prices and are determined as of the close of business on the NYSE. Interpolated values are derived when the settlement date of the contract is an interim date for which quotations are not available. |
If events (e.g., a company announcement, market volatility or a natural disaster) occur that are expected to materially affect the value of such instruments, or in the event that the application of these methods of valuation results in a price for an investment that is deemed not to be representative of the market value of such investment, or if a price is not available, the investment will be valued by the Global Valuation Committee, or its delegate, in accordance with a policy approved by the Board as reflecting fair value (“Fair Valued Investments”). When determining the price for Fair Valued Investments, the Global Valuation Committee, or its delegate, seeks to determine the price that the Fund might reasonably expect to receive or pay from the current sale or purchase of that asset or liability in an arm’s-length transaction. Fair value determinations shall be based upon all available factors that the Global Valuation Committee, or its delegate, deems relevant consistent with the principles of fair value measurement. The pricing of all Fair Valued Investments is subsequently reported to the Board or a committee thereof on a quarterly basis.
Fair Value Hierarchy: Various inputs are used in determining the fair value of investments. These inputs to valuation techniques are categorized into a fair value hierarchy consisting of three broad levels for financial statement purposes as follows:
| • | | Level 1 — unadjusted price quotations in active markets/exchanges for identical assets or liabilities that the Fund has the ability to access |
| • | | Level 2 — other observable inputs (including, but not limited to, quoted prices for similar assets or liabilities in markets that are active, quoted prices for identical or similar assets or liabilities in markets that are not active, inputs other than quoted prices that are observable for the assets or liabilities (such as interest rates, yield curves, volatilities, prepayment speeds, loss severities, credit risks and default rates) or other market–corroborated inputs) |
| • | | Level 3 — unobservable inputs based on the best information available in the circumstances, to the extent observable inputs are not available (including the Fund’s own assumptions used in determining the fair value of investments) |
The hierarchy gives the highest priority to unadjusted quoted prices in active markets for identical assets or liabilities (Level 1 measurements) and the lowest priority to unobservable inputs (Level 3 measurements). Accordingly, the degree of judgment exercised in determining fair value is greatest for instruments categorized in Level 3. The inputs used to measure fair value may fall into different levels of the fair value hierarchy. In such cases, for
| | | | | | |
| | | BLACKROCK VARIABLE SERIES FUNDS, INC. | | JUNE 30, 2016 | | 15 |
| | | | |
| Notes to Financial Statements (continued) | | | BlackRock Equity Dividend V.I. Fund | |
disclosure purposes, the fair value hierarchy classification is determined based on the lowest level input that is significant to the fair value measurement in its entirety. The significant unobservable inputs used by the Global Valuation Committee in determining the price for Fair Valued Investments are typically categorized as Level 3. The fair value hierarchy for the Fund’s investments has been included in the Schedule of Investments.
Changes in valuation techniques may result in transfers into or out of an assigned level within the hierarchy. In accordance with the Fund’s policy, transfers between different levels of the fair value hierarchy are deemed to have occurred as of the beginning of the reporting period. The categorization of a value determined for investments is based on the pricing transparency of the investments and is not necessarily an indication of the risks associated with investing in those securities.
4. Securities and Other Investments:
Securities Lending: The Fund may lend its securities to approved borrowers, such as brokers, dealers and other financial institutions. The borrower pledges and maintains with the Fund collateral consisting of cash, an irrevocable letter of credit issued by a bank, or securities issued or guaranteed by the U.S. Government. The initial collateral received by the Fund is required to have a value of at least 102% of the current value of the loaned securities for securities traded on U.S. exchanges and a value of at least 105% for all other securities. The collateral is maintained thereafter at a value equal to at least 100% of the current market value of the securities on loan. The market value of the loaned securities is determined at the close of each business day of the Fund and any additional required collateral is delivered to the Fund, or excess collateral returned by the Fund, on the next business day. During the term of the loan, the Fund is entitled to all distributions made on or in respect of the loaned securities. Loans of securities are terminable at any time and the borrower, after notice, is required to return borrowed securities within the standard time period for settlement of securities transactions.
The market value of any securities on loan, all of which were classified as common stocks in the Fund’s Schedule of Investments, and the value of any related collateral are shown separately in the Statement of Assets and Liabilities as a component of investments at value — unaffiliated, and collateral on securities loaned at value, respectively. As of period end, any securities on loan were collateralized by cash. The cash collateral invested by the securities lending agent, BlackRock Investment Management, LLC (“BIM”), if any, is disclosed in the Schedule of Investments.
Securities lending transactions are entered into by the Fund under Master Securities Lending Agreements (each, an “MSLA”) which provide the right, in the event of default (including bankruptcy or insolvency), for the non-defaulting party to liquidate the collateral and calculate a net exposure to the defaulting party or request additional collateral. In the event that a borrower defaults, the Fund, as lender, would offset the market value of the collateral received against the market value of the securities loaned. When the value of the collateral is greater than that of the market value of the securities loaned, the lender is left with a net amount payable to the defaulting party. However, bankruptcy or insolvency laws of a particular jurisdiction may impose restrictions on or prohibitions against such a right of offset in the event of an MSLA counterparty’s bankruptcy or insolvency. Under the MSLA, absent an event of default the borrower can resell or re-pledge the loaned securities, and the Fund can reinvest cash collateral received in connection with loaned securities. Upon an event of default, the parties’ obligations to return the securities or collateral to the other party are extinguished, and the parties can resell or re-pledge the loaned securities or the collateral received in connection with the loaned securities in order to satisfy the defaulting party’s net payment obligation for all transactions under the MSLA. The defaulting party remains liable for any deficiency.
As of period end, the following table is a summary of the Fund’s securities lending agreements by counterparty which are subject to offset under an MSLA:
| | | | | | | | | | | | | | | | |
| Counterparty | | | | Securities
Loaned at Value | | | | | Cash
Collateral
Received1 | | | | | Net Amount |
JP Morgan Securities LLC | | | | $ | 5,023,344 | | | | | $ | (5,023,344 | ) | | | | — |
Morgan Stanley | | | | | 4,666,227 | | | | | | (4,666,227 | ) | | | | — |
State Street Bank & Trust Co. | | | | | 316,189 | | | | | | (316,189 | ) | | | | — |
| | |
Total | | | | $ | 10,005,760 | | | | | $ | (10,005,760 | ) | | | | — |
| | |
| | 1 | | Collateral with a value of $10,146,624 has been received in connection with securities lending agreements. Collateral received in excess of the value of securities loaned from the individual counterparty is not shown for financial reporting purposes. |
The risks of securities lending include the risk that the borrower may not provide additional collateral when required or may not return the securities when due. To mitigate these risks, the Fund benefits from a borrower default indemnity provided by BIM. BIM’s indemnity allows for full replacement of the securities loaned if the collateral received does not cover the value on the securities loaned in the event of borrower default. The Fund could suffer a loss if the value of an investment purchased with cash collateral falls below the market value of loaned securities or if the value of an investment purchased with cash collateral falls below the value of the original cash collateral received.
| | | | | | |
| 16 | | BLACKROCK VARIABLE SERIES FUNDS, INC. | | JUNE 30, 2016 | | |
| | | | |
| Notes to Financial Statements (continued) | | | BlackRock Equity Dividend V.I. Fund | |
5. Investment Advisory Agreement and Other Transactions with Affiliates:
The PNC Financial Services Group, Inc. is the largest stockholder and an affiliate of BlackRock, Inc. (“BlackRock”) for 1940 Act purposes.
Investment Advisory
The Company, on behalf of the Fund, entered into an Investment Advisory Agreement with the Manager, the Fund’s investment adviser, an indirect, wholly owned subsidiary of BlackRock, to provide investment advisory and administration services. The Manager is responsible for the management of the Fund’s portfolio and provides the personnel, facilities, equipment and certain other services necessary to the operations of the Fund. For such services, the Fund pays the Manager a monthly fee, which is determined by calculating a percentage of the Fund’s average daily net assets, based on the following annual rates:
| | | | |
| Average Daily Net Assets | | Investment
Advisory Fee | |
First $1 Billion | | | 0.60 | % |
$1 Billion - $3 Billion | | | 0.56 | % |
$3 Billion - $5 Billion | | | 0.54 | % |
$5 Billion - $10 Billion | | | 0.52 | % |
Greater than $10 Billion | | | 0.51 | % |
Distribution Fees
The Company, on behalf of the Fund, entered into a Distribution Agreement and a Distribution Plan with BlackRock Investments, LLC (“BRIL”), an affiliate of the Manager. Pursuant to the Distribution Plan and in accordance with Rule 12b-1 under the 1940 Act, the Fund pays BRIL ongoing distribution fees. The fees are accrued daily and paid monthly at an annual rate of 0.25% based upon the average daily net assets attributable to Class III.
For the six months ended June 30, 2016, the class specific distribution fees borne directly by Class III is $147,034.
Transfer Agent
The Manager, on behalf of the Fund, entered into agreements with insurance companies and other financial intermediaries (“Service Organizations”), some of which may be affiliates. Pursuant to these agreements, the Service Organizations provide the Fund with administrative, networking, recordkeeping, sub-transfer agency and shareholder services to sub-accounts they service. For these services, the Service Organizations receive an annual fee per shareholder account, which will vary depending on share class and/or net assets of Fund shareholders serviced by the Service Organizations, which is shown as transfer agent — class specific. For the six months ended June 30, 2016, the Fund paid the following amounts to affiliates in return for these services, which is included in transfer agent — class specific in the Statement of Operations:
| | | | | | | | |
| Class I | | Class III | | | Total | |
| $30,155 | | $ | 55,508 | | | $ | 85,663 | |
In addition, the Fund pays the transfer agent, which is not an affiliate, a fee for issuance, transfer and redemption of shares and the opening and maintenance of shareholder accounts, which is included in transfer agent in the Statement of Operations.
Expense Limitations, Waivers and Reimbursements
The Manager, with respect to the Fund, contractually agreed to waive and/or reimburse fees or expenses in order to limit expenses, excluding interest expense, dividend expense, tax expense, acquired fund fees and expenses and certain other fund expenses, which constitute extraordinary expenses not incurred in the ordinary course of the Fund’s business. The expense limitations as a percentage of average daily net assets are as follows:
| | | | |
Class I | | | 1.25 | % |
Class III | | | 1.50 | % |
The Manager has agreed not to reduce or discontinue this contractual expense limitation prior to May 1, 2017, unless approved by the Board, including a majority of the Independent Directors who are not “interested persons” of the Fund, as defined in the 1940 Act (“Independent Directors”) or by a majority of the outstanding voting securities of the Fund.
The Manager, with respect to the Fund, voluntarily agreed to waive its investment advisory fees by the amount of investment advisory fees the Fund pays to the Manager indirectly through its investment in affiliated money market funds. This amount is shown as fees waived by the Manager in the Statement of Operations. However, the Manager does not waive its investment advisory fees by the amount of investment advisory fees paid in connection with the Fund’s investments in other affiliated investment companies, if any. For the six months ended June 30, 2016, the amount waived was $2,203.
| | | | | | |
| | | BLACKROCK VARIABLE SERIES FUNDS, INC. | | JUNE 30, 2016 | | 17 |
| | | | |
| Notes to Financial Statements (continued) | | | BlackRock Equity Dividend V.I. Fund | |
The Manager has contractually agreed to reimburse all transfer agent fees for Class I and Class III.
The Manager has agreed not to reduce or discontinue this contractual reimbursement prior to May 1, 2017, unless approved by the Board, including a majority of the Independent Directors or by a majority of the outstanding voting securities of the Fund.
These amounts are shown as transfer agent fees reimbursed — class specific in the Statement of Operations. Class specific expense waivers and/or reimbursements are as follows:
| | | | | | | | | | | | | | | | |
| | | Class I | | | | | Class III | | | | | Total | |
Transfer Agent Fees Reimbursed | | $ | 30,155 | | | | | $ | 55,508 | | | | | $ | 85,663 | |
For the six months ended June 30, 2016, the Fund reimbursed the Manager $508 for certain accounting services, which is included in accounting services in the Statement of Operations.
Securities Lending
The U.S. Securities and Exchange Commission has issued an exemptive order which permits BIM, an affiliate of the Manager, to serve as securities lending agent for the Fund, subject to applicable conditions. As securities lending agent, BIM bears all operational costs directly related to securities lending. The Fund is responsible for expenses in connection with the investment of cash collateral received for securities on loan (the “collateral investment expenses”). The cash collateral is invested in a private investment company managed by the Manager or its affiliates. However, BIM has agreed to cap the collateral investment expenses of the private investment company to an annual rate of 0.04%. The investment adviser to the private investment company will not charge any advisory fees with respect to shares purchased by the Fund.
Securities lending income is equal to the total of income earned from the reinvestment of cash collateral, net of fees and other payments to and from borrowers of securities, and less the collateral investment expenses. The Fund retains a portion of securities lending income and remits a remaining portion to BIM as compensation for its services as securities lending agent.
Pursuant to a securities lending agreement, the Fund retains 71.5% of securities lending income, and this amount retained can never be less than 65% of the total of securities lending income plus the collateral investment expenses.
In addition, commencing the business day following the date that the aggregate securities lending income earned across the Equity-Bond Complex in a calendar year exceeds a specified threshold, the Fund, pursuant to the securities lending agreement, will retain for the remainder of that calendar year securities lending income as follows: 75% of securities lending income, and this amount retained can never be less than 65% of the total of securities lending income plus the collateral investment expenses.
The share of securities lending income earned by the Fund is shown as securities lending — affiliated — net in the Statement of Operations. For the six months ended June 30, 2016, the Fund paid BIM $2,558 for securities lending agent services.
Officers and Directors
Certain officers and/or directors of the Company are officers and/or directors of BlackRock or its affiliates. The Fund reimburses the Manager for a portion of the compensation paid to the Company’s Chief Compliance Officer, which is included in officer and directors in the Statement of Operations.
6. Purchases and Sales:
For the six months ended June 30, 2016, purchases and sales of investments, excluding short-term securities, were $78,366,573 and $16,093,643, respectively.
7. Income Tax Information:
It is the Fund’s policy to comply with the requirements of the Internal Revenue Code of 1986, as amended, applicable to regulated investment companies, and to distribute substantially all of its taxable income to its shareholders. Therefore, no federal income tax provision is required.
The Fund files U.S. federal and various state and local tax returns. No income tax returns are currently under examination. The statute of limitations on the Fund’s U.S. federal tax returns generally remains open for each of the four years ended December 31, 2015. The statutes of limitations on the Fund’s state and local tax returns may remain open for an additional year depending upon the jurisdiction.
Management has analyzed tax laws and regulations and their application to the Fund as of June 30, 2016, inclusive of the open tax return years, and does not believe there are any uncertain tax positions that require recognition of a tax liability in the Fund’s financial statements.
| | | | | | |
| 18 | | BLACKROCK VARIABLE SERIES FUNDS, INC. | | JUNE 30, 2016 | | |
| | | | |
| Notes to Financial Statements (continued) | | | BlackRock Equity Dividend V.I. Fund | |
As of June 30, 2016, gross unrealized appreciation and depreciation based on cost for federal income tax purposes were as follows:
| | | | |
Tax cost | | $ | 186,274,273 | |
| | | | |
Gross unrealized appreciation | | $ | 17,695,937 | |
Gross unrealized depreciation | | | (4,062,554 | ) |
| | | | |
Net unrealized appreciation | | $ | 13,633,383 | |
| | | | |
8. Bank Borrowings:
The Company, on behalf of the Fund, along with certain other funds managed by the Manager and its affiliates (“Participating Funds”), is a party to a 364-day, $2.1 billion credit agreement with a group of lenders. Under this agreement, the Fund may borrow to fund shareholder redemptions. Excluding commitments designated for certain individual funds, the Participating Funds, including the Fund, can borrow up to an aggregate commitment amount of $1.6 billion at any time outstanding, subject to asset coverage and other limitations as specified in the agreement. The credit agreement has the following terms: a fee of 0.12% per annum on unused commitment amounts and interest at a rate equal to the higher of (a) one-month LIBOR (but, in any event, not less than 0.00%) on the date the loan is made plus 0.80% per annum or (b) the Fed Funds rate (but, in any event, not less than 0.00%) in effect from time to time plus 0.80% per annum on amounts borrowed. The agreement expires in April 2017 unless extended or renewed. Prior to April 21, 2016, the credit agreement had a fee per annum of 0.06% on unused commitment amounts and interest at a rate equal to the higher of (a) one-month LIBOR (but, in any event, not less than 0.00%) on the date the loan is made plus 0.80% per annum or (b) the Fed Funds rate (but, in any event, not less than 0.00%) in effect from time to time plus 0.80% per annum on amounts borrowed. Participating Funds paid administration, legal and arrangement fees, which, if applicable, are included in miscellaneous expenses in the Statement of Operations. These fees were allocated among such funds based upon portions of the aggregate commitment available to them and relative net assets of Participating Funds. During the six months ended June 30, 2016, the Fund did not borrow under the credit agreement.
9. Principal Risks:
In the normal course of business, the Fund invests in securities and enters into transactions where risks exist due to fluctuations in the market (market risk) or failure of the issuer to meet all its obligations, including the ability to pay principal and interest when due (issuer credit risk). The value of securities held by the Fund may decline in response to certain events, including those directly involving the issuers of securities owned by the Fund. Changes arising from the general economy, the overall market and local, regional or global political and/or social instability, as well as currency, interest rate and price fluctuations, may also affect the securities’ value
Counterparty Credit Risk: Similar to issuer credit risk, the Fund may be exposed to counterparty credit risk, or the risk that an entity may fail to or be unable to perform on its commitments related to unsettled or open transactions. The Fund manages counterparty credit risk by entering into transactions only with counterparties that the Manager believes have the financial resources to honor their obligations and by monitoring the financial stability of those counterparties. Financial assets, which potentially expose the Fund to market, issuer and counterparty credit risks, consist principally of financial instruments and receivables due from counterparties. The extent of the Fund’s exposure to market, issuer and counterparty credit risks with respect to these financial assets is approximately their value recorded in the Statement of Assets and Liabilities, less any collateral held by the Fund.
10. Capital Share Transactions:
Transactions in capital shares for each class were as follows:
| | | | | | | | | | | | | | | | | | | | | | | | | | |
| | | Six Months Ended
June 30, 2016 | | | | | Year Ended
December 31, 2015 | |
| | | Shares | | | | | | Amount | | | | | Shares | | | | | | Amount | |
| |
Class I | | | | | | | | | | | | | | | | | | | | | | | | | | |
| |
Shares sold | | | 223,905 | | | | | | | $ | 2,248,591 | | | | | | 181,947 | | | | | | | $ | 1,952,844 | |
Shares issued in reinvestment of distributions | | | 13,548 | | | | | | | | 138,189 | | | | | | 227,026 | | | | | | | | 2,341,677 | |
Shares redeemed | | | (271,840 | ) | | | | | | | (2,671,875 | ) | | | | | (644,334 | ) | | | | | | | (6,890,290 | ) |
| | | | | | | | | | |
Net decrease | | | (34,387 | ) | | | | | | $ | (285,095 | ) | | | | | (235,361 | ) | | | | | | $ | (2,595,769 | ) |
| | | | | | | | | | |
| | | | | | |
| | | BLACKROCK VARIABLE SERIES FUNDS, INC. | | JUNE 30, 2016 | | 19 |
| | | | |
| Notes to Financial Statements (concluded) | | | BlackRock Equity Dividend V.I. Fund | |
| | | | | | | | | | | | | | | | | | | | | | | | | | |
| | | Six Months Ended
June 30, 2016 | | | | | Year Ended
December 31, 2015 | |
| | | Shares | | | | | | Amount | | | | | Shares | | | | | | Amount | |
| |
Class III | | | | | | | | | | | | | | | | | | | | | | | | | | |
| |
Shares sold | | | 6,947,000 | | | | | | | $ | 68,744,375 | | | | | | 6,377,749 | | | | | | | $ | 67,001,811 | |
Shares issued in reinvestment of distributions | | | 49,295 | | | | | | | | 501,820 | | | | | | 491,810 | | | | | | | | 5,001,012 | |
Shares redeemed | | | (554,349 | ) | | | | | | | (5,514,204 | ) | | | | | (456,240 | ) | | | | | | | (4,858,467 | ) |
| | | | | | | | | | |
Net increase | | | 6,441,946 | | | | | | | $ | 63,731,991 | | | | | | 6,413,319 | | | | | | | $ | 67,144,356 | |
| | | | | | | | | | |
Total Net Increase | | | 6,407,559 | | | | | | | $ | 63,446,896 | | | | | | 6,177,958 | | | | | | | $ | 64,548,587 | |
| | | | | | | | | | |
11. Subsequent Events:
Management’s evaluation of the impact of all subsequent events on the Fund’s financial statements was completed through the date the financial statements were issued and the following item was noted:
The Fund paid a net investment income, a short-term capital gain and a long-term capital gain distribution in the following amounts per share on July 22, 2016 to shareholders of record on July 20, 2016.
| | | | | | | | | | | | | | | | |
| | | Net Investment
Income | | | | | Short-Term
Capital Gain | | | | | Long-Term
Capital Gain | |
Class I | | $ | 0.042891 | | | | | $ | 0.001834 | | | | | $ | 0.021223 | |
Class III | | $ | 0.037325 | | | | | $ | 0.001834 | | | | | $ | 0.021223 | |
| | | | | | |
| 20 | | BLACKROCK VARIABLE SERIES FUNDS, INC. | | JUNE 30, 2016 | | |
JUNE 30, 2016
| | | | |
SEMI-ANNUAL REPORT (UNAUDITED) | | | | BLACKROCK® |
BlackRock Variable Series Funds, Inc.
▶ BlackRock Global Allocation V.I. Fund
| | |
| Not FDIC Insured ¡ May Lose Value ¡ No Bank Guarantee | | |
| | | | |
| Fund Summary as of June 30, 2016 | | | BlackRock Global Allocation V.I. Fund | |
BlackRock Global Allocation V.I. Fund’s (the “Fund”) investment objective is to seek high total investment return.
|
| Portfolio Management Commentary |
How did the Fund perform?
| • | | For the six-month period ended June 30, 2016, the Fund underperformed its reference benchmark, which is comprised of the S&P 500® Index (36%), FTSE World (ex-US) Index (24%), BofA Merrill Lynch Current 5-Year U.S. Treasury Index (24%) and Citigroup Non-U.S. Dollar World Government Bond Index (16%) (the “Reference Benchmark”). For the same period, the Fund also underperformed the broad-based all-equity benchmark, the FTSE World Index. The Fund invests in both equities and bonds; therefore, the Reference Benchmark provides a truer representation of the Fund’s composition and a more comparable means for measurement. The following discussion of relative performance pertains to the Reference Benchmark. The commentary (and referenced allocation percentages) are based on the economic exposures of the Fund, which reflect adjustments for futures, swaps, options and convertible bonds, and may vary relative to the market value. |
What factors influenced performance?
| • | | Within equities, an overweight in Japan and an underweight in the United States detracted from performance. From a sector perspective, stock selection in industrials, consumer discretionary, information technology (“IT”), financials, and telecommunication services (“telecom”) weighed on returns. An underweight in fixed income detracted from performance. Currency management, notably an overweight in the U.S. dollar, negatively impacted performance. |
| • | | The Fund uses derivatives, which may include options, futures, swaps and forward contracts both to seek to enhance returns of the Fund and to hedge (or protect) against adverse movements in currency exchange rates, interest rates and movements in the securities markets. During the period, the Fund’s use of derivatives had a negative impact on the absolute performance of the Fund. |
| • | | Positive contributors within equities included an overweight in precious metal securities, in particular, gold miners. From a sector perspective, an overweight in energy was additive. Exposure to commodity-related securities (notably gold) and to cash and cash equivalents positively impacted performance as well. |
Describe recent portfolio activity.
| • | | During the period, the Fund’s overall equity allocation increased slightly from 57% to 58% of net assets. Within equities, the Fund increased its exposure to the United States, and decreased exposure to Asia, notably Japan. On a sector basis, the Fund increased its weighting in financials, IT, and consumer staples, and decreased its weighting in health care, materials, energy, and telecom. |
| • | | The Fund’s overall allocation to fixed income increased from 22% to 32% of net assets. Within fixed income, the Fund increased exposure to government bonds, notably in the US, Australia, and Europe. The Fund’s exposure to commodity-related securities increased from 1% to 5% of net assets. |
| • | | Reflecting the above changes, the Fund’s allocation to cash and cash equivalents was reduced from 20% to 5% of net assets. Over the period, cash and cash equivalents helped mitigate portfolio volatility and served as a source of funds for new investments. |
Describe portfolio positioning at period end.
| • | | Relative to the Reference Benchmark, the Fund ended the period underweight equities and fixed income and overweight commodity-related securities and cash and cash equivalents. Within equities, the Fund was overweight Japan and Europe, and underweight the United States. Within Europe, the Fund was overweight France and the Netherlands, and underweight Switzerland and Germany. From a sector perspective, the Fund was overweight IT and telecom, and underweight consumer staples, consumer discretionary, materials, utilities, and financials. Within fixed income, the Fund was underweight U.S. Treasuries, Japanese government bonds, and European sovereign debt, and overweight government bonds in Australia, Mexico, and Hungary. In addition, the Fund was overweight corporate and convertible bonds. With respect to currency exposure, the Fund was overweight the U.S. dollar, and was underweight the Japanese yen, euro, and British pound sterling. |
The views expressed reflect the opinions of BlackRock as of the date of this report and are subject to change based on changes in market, economic or other conditions. These views are not intended to be a forecast of future events and are no guarantee of future results.
| | | | | | | | |
| | | Percent of Fund’s Net Assets1 | | Reference
Benchmark2 | | |
| Portfolio Composition | | 6/30/16 | | 12/31/15 | | Percentage | | |
| | | | |
U.S. Equities | | 30% | | 27% | | 35% | | |
European Equities | | 14 | | 13 | | 13 | | |
Asia Pacific Equities | | 12 | | 15 | | 9 | | |
Other Equities | | 2 | | 2 | | 3 | | |
Total Equity Securities | | 58 | | 57 | | 60 | | |
U.S. Dollar Denominated Fixed Income Securities | | 23 | | 17 | | 24 | | |
U.S. Issuers | | 18 | | 12 | | — | | |
Non-U.S. Issuers | | 5 | | 5 | | — | | |
Non-U.S. Dollar Denominated Fixed Income Securities | | 9 | | 5 | | 16 | | |
Total Fixed Income Securities | | 32 | | 22 | | 40 | | |
Commodity-Related Securities | | 5 | | 1 | | — | | |
Cash & Short-Term Securities | | 5 | | 20 | | — | | |
| | 1 | | Exposure based on market value and adjusted for the economic value of futures, swaps, options and convertible bonds. |
| | 2 | | The Reference Benchmark is an unmanaged weighted index comprised as follows: 36% of the S&P 500 Index®; 24% FTSE World (ex U.S.) Index; 24% BofA Merrill Lynch Current 5-Year U.S. Treasury Index; and 16% Citigroup Non-U.S. Dollar World Government Bond Index. Descriptions of these indexes are found on page 3 of this report to shareholders in the “Performance Summary” section. |
| | | | | | |
| 2 | | BLACKROCK VARIABLE SERIES FUNDS, INC. | | JUNE 30, 2016 | | |
| | | | |
| | | | BlackRock Global Allocation V.I. Fund | |
|
| Total Return Based on a $10,000 Investment |
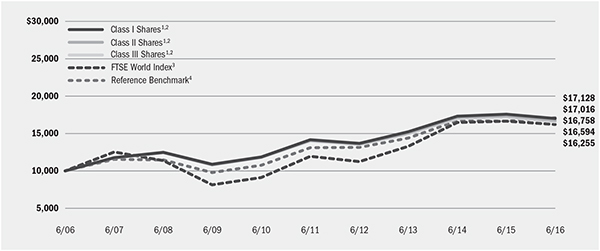
| | 1 | | Assuming transaction costs, if any, and other operating expenses, including investment advisory fees. Does not include insurance-related fees and expenses. |
| | 2 | | The Fund invests in a portfolio of U.S. and foreign equity securities, debt and money market securities, the combination of which will be varied from time to time with respect to types of securities and markets in response to changing markets and economic trends. |
| | 3 | | This unmanaged capitalization-weighted index is comprised of 2,544 equities from 35 countries in 4 regions, including the United States. |
| | 4 | | The Reference Benchmark is an unmanaged weighted index comprised as follows: 36% S&P 500® Index; 24% FTSE World (ex U.S.) Index; 24% BofA Merrill Lynch Current 5-Year U.S. Treasury Index; and 16% Citigroup Non-U.S. Dollar World Government Bond Index. |
| | | | | | | | | | | | | | | | | | | | |
| Performance Summary for the Period Ended June 30, 2016 | |
| | | 6-Month | | Average Annual Total Returns |
| | | | | Total Returns6 | | | | | 1 Year6 | | | | | 5 Years | 6 | | | | 10 Years6 | |
Class I5 | | | | 0.20% | | | | | (3.43) | % | | | | 3.69 | % | | | | 5.46% | |
Class II5 | | | | 0.13 | | | | | (3.60) | | | | | 3.53 | | | | | 5.30 | |
Class III5 | | | | 0.08 | | | | | (3.71) | | | | | 3.43 | | | | | 5.19 | |
FTSE World Index | | | | 1.55 | | | | | (2.57) | | | | | 6.34 | | | | | 4.98 | |
Reference Benchmark | | | | 4.42 | | | | | 2.71 | | | | | 5.49 | | | | | 5.53 | |
U.S. Stocks: S&P 500® Index7 | | | | 3.84 | | | | | 3.99 | | | | | 12.10 | | | | | 7.43 | |
Non-U.S. Stocks: FTSE World (ex U.S.) Index8 | | | | (1.03) | | | | | (9.03) | | | | | 0.96 | | | | | 2.48 | |
U.S. Bonds: BofA Merrill Lynch Current 5-Year U.S. Treasury Index9 | | | | 4.36 | | | | | 4.74 | | | | | 2.84 | | | | | 4.98 | |
Non-U.S. Bonds: Citigroup Non-U.S. Dollar World Government Bond Index10 | | | | 13.50 | | | | | 13.85 | | | | | 0.31 | | | | | 3.97 | |
| | 5 | | Average annual and cumulative total returns are based on changes in net asset value for the periods shown, and assume reinvestment of all distributions at net asset value on the ex-dividend date. Insurance-related fees and expenses are not reflected in these returns. |
| | 6 | | For a portion of the period, the Fund’s investment adviser waived a portion of its fees. Without such waiver, the Fund’s performance would have been lower. |
| | 7 | | This unmanaged index covers 500 leading companies and captures approximately 80% coverage of available market capitalization. |
| | 8 | | This unmanaged capitalization-weighted index is comprised of 1,920 equities from 34 countries, excluding the United States. |
| | 9 | | This unmanaged index is designed to track the total return of the current coupon five-year U.S. Treasury bond. |
| | 10 | | This unmanaged market capitalization-weighted index tracks 22 government bond indexes, excluding the United States. |
| | | | Past performance is not indicative of future results. Performance results do not reflect the deduction of taxes that a shareholder would pay on Fund distributions or the redemption of Fund shares. |
| | | | | | | | | | | | | | | | | | | | |
| Expense Example |
| | | Actual | | | | Hypothetical13 |
| | | | | | | Including
Dividend Expense
and Stock Loan Fees | | Excluding
Dividend Expense and Stock Loan Fees | | | | | | Including Dividend Expense and Stock Loan Fees | | Excluding Dividend Expense and Stock Loan Fees |
| | | Beginning Account Value January 1, 2016 | | Ending Account Value June 30, 2016 | | Expenses Paid During the Period11 | | Expenses Paid During the Period12 | | | | Beginning Account Value January 1, 2016 | | Ending Account Value June 30, 2016 | | Expenses Paid During the Period11 | | Ending Account Value June 30, 2016 | | Expenses Paid During the Period12 |
Class I | | $1,000.00 | | $1,002.00 | | $3.68 | | $3.63 | | | | $1,000.00 | | $1,021.18 | | $3.72 | | $1,021.23 | | $3.67 |
Class II | | $1,000.00 | | $1,001.30 | | $4.43 | | $4.38 | | | | $1,000.00 | | $1,020.44 | | $4.47 | | $1,020.49 | | $4.42 |
Class III | | $1,000.00 | | $1,000.80 | | $4.92 | | $4.88 | | | | $1,000.00 | | $1,019.94 | | $4.97 | | $1,019.99 | | $4.92 |
| | 11 | | For each class of the Fund, expenses are equal to the annualized expense ratio for the class (0.74% for Class I, 0.89% for Class II and 0.99% for Class III), multiplied by the average account value over the period, multiplied by 182/366 (to reflect the one-half year period shown). |
| | 12 | | For each class of the Fund, expenses are equal to the annualized expense ratio for the class (0.73% for Class I, 0.88% for Class II and 0.98% for Class III), multiplied by the average account value over the period, multiplied by 182/366 (to reflect the one-half year period shown). |
| | 13 | | Hypothetical 5% annual return before expenses is calculated by prorating the number of days in the most recent fiscal half year divided by 366. See “Disclosure of Expenses” on the following page for further information on how expenses were calculated. |
| | | | | | |
| | | BLACKROCK VARIABLE SERIES FUNDS, INC. | | JUNE 30, 2016 | | 3 |
| | | | |
| Disclosure of Expenses | | | BlackRock Global Allocation V.I. Fund | |
Shareholders of the Fund may incur the following charges: (a) transactional expenses, such as sales charges; and (b) operating expenses, including investment advisory fees, service and distribution fees, including 12b-1 fees, acquired fund fees and expenses, and other fund expenses. The expense example shown on the previous page (which is based on a hypothetical investment of $1,000 invested on January 1, 2016 and held through June 30, 2016) is intended to assist shareholders both in calculating expenses based on an investment in the Fund and in comparing these expenses with similar costs of investing in other mutual funds.
The expense example provides information about actual account values and actual expenses. In order to estimate the expenses a shareholder paid during the period covered by this report, shareholders can divide their account value by $1,000 and then multiply the result by the number corresponding to their share class under the heading entitled “Expenses Paid During the Period.”
The expense example also provides information about hypothetical account values and hypothetical expenses based on the Fund’s actual expense ratio and an assumed rate of return of 5% per year before expenses. In order to assist shareholders in comparing the ongoing expenses of investing in the Fund and other funds, compare the 5% hypothetical example with the 5% hypothetical examples that appears in shareholder reports of other funds.
The expenses shown in the expense example are intended to highlight shareholders’ ongoing costs only and do not reflect any transactional expenses, such as sales charges, if any. Therefore, the hypothetical example is useful in comparing ongoing expenses only, and will not help shareholders determine the relative total expenses of owning different funds. If these transactional expenses were included, shareholder expenses would have been higher.
|
| Derivative Financial Instruments |
The Fund may invest in various derivative financial instruments. These instruments are used to obtain exposure to a security, commodity, index, market, and/or other asset without owning or taking physical custody of securities, commodities and/or other referenced assets or to manage market, equity, credit, interest rate, foreign currency exchange rate, commodity and/or other risks. Derivative financial instruments may give rise to a form of economic leverage and involve risks, including the imperfect correlation between the value of a derivative financial instrument and the underlying asset, possible default of the counterparty to the
transaction or illiquidity of the instrument. The Fund’s successful use of a derivative financial instrument depends on the investment adviser’s ability to predict pertinent market movements accurately, which cannot be assured. The use of these instruments may result in losses greater than if they had not been used, may limit the amount of appreciation the Fund can realize on an investment and/or may result in lower distributions paid to shareholders. The Fund’s investments in these instruments, if any, are discussed in detail in the Notes to Consolidated Financial Statements.
| | | | | | |
| 4 | | BLACKROCK VARIABLE SERIES FUNDS, INC. | | JUNE 30, 2016 | | |
| | | | |
| Consolidated Schedule of Investments June 30, 2016 (Unaudited) | | | BlackRock Global Allocation V.I. Fund | |
| | | (Percentages shown are based on Net Assets) | |
| | | | | | | | |
| Common Stocks | | Shares | | | Value | |
Australia — 0.3% | | | | | | | | |
Commonwealth Bank of Australia | | | 154,050 | | | $ | 8,646,866 | |
Healthscope Ltd. | | | 4,757,008 | | | | 10,236,772 | |
Westpac Banking Corp. | | | 584,523 | | | | 12,962,136 | |
| | | | | | | | |
| | | | | | | | 31,845,774 | |
Belgium — 0.2% | | | | | | | | |
Anheuser-Busch InBev SA | | | 154,644 | | | | 20,449,659 | |
Umicore SA (a) | | | 123,730 | | | | 6,391,208 | |
| | | | | | | | |
| | | | | | | | 26,840,867 | |
Brazil — 0.0% | | | | | | | | |
SLC Agricola SA | | | 290,257 | | | | 1,334,588 | |
Canada — 0.8% | | | | | | | | |
Brookfield Asset Management, Inc., Class A | | | 458,442 | | | | 15,161,054 | |
Brookfield Business Partners LP (b) | | | 9,168 | | | | 174,941 | |
Cameco Corp. | | | 829,742 | | | | 9,102,270 | |
Canadian National Railway Co. | | | 100,478 | | | | 5,934,231 | |
Cenovus Energy, Inc. (a) | | | 542,848 | | | | 7,508,567 | |
Encana Corp. | | | 3,483,230 | | | | 27,134,362 | |
Platinum Group Metals Ltd. (a)(b) | | | 1,245,813 | | | | 4,223,306 | |
Platinum Group Metals Ltd. (b) | | | 500,789 | | | | 1,682,282 | |
Toronto-Dominion Bank | | | 440,681 | | | | 18,924,093 | |
| | | | | | | | |
| | | | | | | | 89,845,106 | |
China — 0.4% | | | | | | | | |
Alibaba Group Holding Ltd. — ADR (a)(b) | | | 366,181 | | | | 29,122,375 | |
Dongfeng Motor Group Co. Ltd., Class H | | | 1,538,800 | | | | 1,621,975 | |
Haitian International Holdings Ltd. | | | 2,541,800 | | | | 4,497,235 | |
Lenovo Group Ltd. | | | 3,550,000 | | | | 2,157,812 | |
Zhongsheng Group Holdings Ltd. | | | 2,469,706 | | | | 1,347,954 | |
| | | | | | | | |
| | | | | | | | 38,747,351 | |
Denmark — 0.1% | | | | | | | | |
Genmab A/S (b) | | | 7,986 | | | | 1,456,225 | |
Novo Nordisk A/S, Class B (a) | | | 146,248 | | | | 7,875,879 | |
| | | | | | | | |
| | | | | | | | 9,332,104 | |
Egypt — 0.0% | | | | | | | | |
Integrated Diagnostics Holdings PLC (a)(c) | | | 367,805 | | | | 1,452,830 | |
Finland — 0.1% | | | | | | | | |
Nokia OYJ | | | 1,530,366 | | | | 8,716,147 | |
France — 2.7% | | | | | | | | |
Accor SA | | | 243,758 | | | | 9,339,907 | |
Aeroports de Paris (a) | | | 32,901 | | | | 3,604,998 | |
Airbus Group SE | | | 436,488 | | | | 25,019,571 | |
Arkema SA | | | 29,141 | | | | 2,227,919 | |
AXA SA | | | 800,550 | | | | 15,829,035 | |
BNP Paribas SA | | | 343,418 | | | | 15,060,842 | |
Cie Generale des Etablissements Michelin | | | 12,018 | | | | 1,132,589 | |
Compagnie de Saint-Gobain | | | 237,702 | | | | 9,010,275 | |
Danone SA | | | 240,657 | | | | 16,841,884 | |
| | | | | | | | |
| Common Stocks | | Shares | | | Value | |
France (continued) | | | | | | | | |
Dassault Aviation SA | | | 10,376 | | | $ | 10,281,648 | |
Engie SA | | | 467,893 | | | | 7,512,831 | |
Legrand SA | | | 185,648 | | | | 9,503,611 | |
LVMH Moet Hennessy Louis Vuitton SE | | | 69,181 | | | | 10,428,025 | |
Orange SA | | | 488,429 | | | | 7,942,137 | |
Publicis Groupe SA | | | 289,851 | | | | 19,391,822 | |
Renault SA | | | 68,917 | | | | 5,203,085 | |
Safran SA | | | 479,106 | | | | 32,264,001 | |
Sanofi | | | 343,978 | | | | 28,578,754 | |
Sodexo SA | | | 88,905 | | | | 9,524,383 | |
TOTAL SA | | | 257,259 | | | | 12,337,172 | |
TOTAL SA — ADR (a) | | | 26,400 | | | | 1,269,840 | |
UbiSoft Entertainment (b) | | | 146,095 | | | | 5,322,401 | |
Unibail-Rodamco SE | | | 56,674 | | | | 14,661,290 | |
Veolia Environnement SA | | | 186,924 | | | | 4,036,570 | |
Vinci SA | | | 138,274 | | | | 9,757,605 | |
| | | | | | | | |
| | | | | | | | 286,082,195 | |
Germany — 1.0% | | | | | | | | |
adidas AG | | | 48,608 | | | | 6,977,672 | |
Allianz SE, Registered Shares | | | 66,381 | | | | 9,469,786 | |
BASF SE | | | 147,924 | | | | 11,342,676 | |
Bayer AG, Registered Shares | | | 82,540 | | | | 8,289,933 | |
Bayerische Motoren Werke AG | | | 75,841 | | | | 5,519,361 | |
Beiersdorf AG | | | 59,007 | | | | 5,586,485 | |
Deutsche Post AG, Registered Shares | | | 170,611 | | | | 4,806,561 | |
Deutsche Telekom AG, Registered Shares | | | 787,782 | | | | 13,433,531 | |
Evonik Industries AG | | | 209,735 | | | | 6,251,926 | |
HUGO BOSS AG (a) | | | 102,166 | | | | 5,808,373 | |
Siemens AG, Registered Shares | | | 96,089 | | | | 9,860,811 | |
Volkswagen AG | | | 4,512 | | | | 598,126 | |
Vonovia SE | | | 537,506 | | | | 19,626,561 | |
| | | | | | | | |
| | | | | | | | 107,571,802 | |
Hong Kong — 0.5% | | | | | | | | |
AIA Group Ltd. (a) | | | 2,056,600 | | | | 12,367,827 | |
Beijing Enterprises Holdings Ltd. | | | 2,062,542 | | | | 11,692,917 | |
Brilliance China Automotive Holdings Ltd. (a) | | | 3,420,000 | | | | 3,531,071 | |
Chaoda Modern Agriculture Holdings Ltd. (a)(b) | | | 19,748,798 | | | | 438,724 | |
Haier Electronics Group Co. Ltd. | | | 2,911,000 | | | | 4,447,781 | |
Sun Hung Kai Properties Ltd. | | | 1,582,083 | | | | 19,093,986 | |
Techtronic Industries Co. Ltd. | | | 793,000 | | | | 3,311,568 | |
| | | | | | | | |
| | | | | | | | 54,883,874 | |
India — 0.3% | | | | | | | | |
Coal India Ltd. | | | 2,121,451 | | | | 9,859,173 | |
Maruti Suzuki India Ltd. | | | 97,660 | | | | 6,071,151 | |
Reliance Industries Ltd. | | | 1,433,951 | | | | 20,655,695 | |
| | | | | | | | |
| | | | | | | | 36,586,019 | |
| | | | | | | | | | |
| Portfolio Abbreviations |
| ADR | | American Depositary Receipts | | EURIBOR | | Euro Interbank Offered Rate | | OTC | | Over-the-Counter |
| AED | | Emirati Dirham | | FTSE | | Financial Times Stock Exchange | | PLN | | Polish Zloty |
| AUD | | Australian Dollar | | GBP | | British Pound | | S&P | | Standard & Poor’s |
| BRL | | Brazilian Real | | HUF | | Hungarian Forint | | SGD | | Singapore Dollar |
| CAD | | Canadian Dollar | | JPY | | Japanese Yen | | SPDR | | Standard & Poor’s Depositary Receipts |
| CNH | | Chinese Yuan Offshore | | KRW | | South Korean Won | | TBA | | To-Be-Announced |
| CVA | | Certification Van Aandelon | | LIBOR | | London Interbank Offered Rate | | TWD | | Taiwan Dollar |
| | (Dutch Certificate) | | MSCI | | Morgan Stanley Capital International | | USD | | U.S. Dollar |
| ETF | | Exchange-Traded Fund | | MXN | | Mexican Peso | | ZAR | | South African Rand |
| EUR | | Euro | | NZD | | New Zealand Dollar | | | | |
See Notes to Consolidated Financial Statements.
| | | | | | |
| | | BLACKROCK VARIABLE SERIES FUNDS, INC. | | JUNE 30, 2016 | | 5 |
| | | | |
| Consolidated Schedule of Investments (continued) | | | BlackRock Global Allocation V.I. Fund | |
| | | | |
| | | | | | | | |
| Common Stocks | | Shares | | | Value | |
Indonesia — 0.1% | | | | | | | | |
Siloam International Hospitals Tbk PT | | | 8,494,808 | | | $ | 7,468,534 | |
Ireland — 0.4% | | | | | | | | |
CRH PLC (a) | | | 281,475 | | | | 8,253,910 | |
Shire PLC | | | 309,916 | | | | 19,153,689 | |
XL Group PLC | | | 387,716 | | | | 12,914,820 | |
| | | | | | | | |
| | | | | | | | 40,322,419 | |
Israel — 0.3% | | | | | | | | |
Teva Pharmaceutical Industries Ltd. — ADR | | | 649,061 | | | | 32,602,334 | |
Italy — 0.8% | | | | | | | | |
Ei Towers SpA (a) | | | 328,679 | | | | 16,678,430 | |
Enel SpA | | | 1,933,713 | | | | 8,584,656 | |
Intesa Sanpaolo SpA | | | 5,849,574 | | | | 11,141,799 | |
Luxottica Group SpA | | | 59,237 | | | | 2,887,084 | |
Prysmian SpA | | | 266,401 | | | | 5,847,304 | |
RAI Way SpA (a)(c) | | | 1,610,442 | | | | 7,238,142 | |
Recordati SpA | | | 84,539 | | | | 2,542,899 | |
Snam SpA | | | 948,235 | | | | 5,668,980 | |
Telecom Italia SpA (b) | | | 18,773,408 | | | | 15,418,841 | |
Telecom Italia SpA, Non-Convertible Savings
Shares | | | 895,768 | | | | 576,320 | |
UniCredit SpA | | | 3,149,964 | | | | 6,927,600 | |
| | | | | | | | |
| | | | | | | | 83,512,055 | |
Japan — 8.2% | | | | | | | | |
Aisin Seiki Co. Ltd. | | | 265,739 | | | | 10,824,424 | |
Ajinomoto Co., Inc. | | | 563,700 | | | | 13,281,316 | |
Alfresa Holdings Corp. | | | 96,500 | | | | 2,016,087 | |
Alpine Electronics, Inc. | | | 67,200 | | | | 658,576 | |
Asahi Group Holdings Ltd. | | | 279,800 | | | | 9,047,279 | |
Asahi Kasei Corp. | | | 1,479,100 | | | | 10,293,109 | |
Astellas Pharma, Inc. | | | 600,065 | | | | 9,410,425 | |
Autobacs Seven Co. Ltd. | | | 60,400 | | | | 856,085 | |
Bridgestone Corp. | | | 468,932 | | | | 15,070,041 | |
Canon Marketing Japan, Inc. | | | 81,800 | | | | 1,493,691 | |
Chiyoda Corp. | | | 255,000 | | | | 1,686,343 | |
Chubu Electric Power Co., Inc. | | | 484,100 | | | | 6,889,239 | |
COMSYS Holdings Corp. | | | 98,300 | | | | 1,593,687 | |
Daikin Industries Ltd. | | | 143,600 | | | | 12,068,830 | |
Daiwa Securities Group, Inc. | | | 863,000 | | | | 4,546,604 | |
Denso Corp. | | | 505,920 | | | | 17,800,963 | |
East Japan Railway Co. | | | 343,151 | | | | 31,800,946 | |
Eisai Co. Ltd. | | | 68,700 | | | | 3,835,940 | |
Electric Power Development Co. Ltd. | | | 105,500 | | | | 2,457,969 | |
Exedy Corp. | | | 40,800 | | | | 873,512 | |
FamilyMart Co. Ltd. | | | 122,700 | | | | 7,477,496 | |
FANUC Corp. | | | 29,018 | | | | 4,720,453 | |
Fuji Heavy Industries Ltd. | | | 953,764 | | | | 32,784,099 | |
FUJIFILM Holdings Corp. | | | 62,200 | | | | 2,413,386 | |
Fukuoka Financial Group, Inc. | | | 1,273,000 | | | | 4,197,399 | |
Futaba Industrial Co. Ltd. | | | 358,821 | | | | 1,687,887 | |
GS Yuasa Corp. | | | 1,178,000 | | | | 4,517,960 | |
Hino Motors Ltd. | | | 170,500 | | | | 1,698,173 | |
Hirose Electric Co. Ltd. | | | 16,600 | | | | 2,041,235 | |
Hitachi Chemical Co. Ltd. | | | 444,600 | | | | 8,303,528 | |
Honda Motor Co. Ltd. | | | 427,483 | | | | 10,723,524 | |
Hoya Corp. | | | 287,574 | | | | 10,270,991 | |
Inpex Corp. | | | 1,753,439 | | | | 13,712,947 | |
Isuzu Motors Ltd. | | | 917,700 | | | | 11,303,294 | |
Japan Airlines Co. Ltd. | | | 792,200 | | | | 25,487,146 | |
Japan Post Bank Co. Ltd. | | | 657,200 | | | | 7,727,780 | |
Japan Tobacco, Inc. | | | 120,300 | | | | 4,848,355 | |
JGC Corp. | | | 424,302 | | | | 6,074,143 | |
JSR Corp. | | | 456,000 | | | | 6,038,866 | |
Kamigumi Co. Ltd. | | | 185,000 | | | | 1,709,921 | |
Kansai Electric Power Co., Inc. (b) | | | 110,200 | | | | 1,073,266 | |
| | | | | | | | |
| Common Stocks | | Shares | | | Value | |
Japan (continued) | | | | | | | | |
KDDI Corp. | | | 756,000 | | | $ | 22,989,761 | |
Keyence Corp. | | | 11,800 | | | | 8,051,477 | |
Kinden Corp. | | | 117,300 | | | | 1,269,759 | |
Koito Manufacturing Co. Ltd. | | | 113,600 | | | | 5,230,650 | |
Komatsu Ltd. | | | 559,500 | | | | 9,719,453 | |
Kubota Corp. | | | 756,996 | | | | 10,238,618 | |
Kuraray Co. Ltd. | | | 337,670 | | | | 4,028,903 | |
Kurita Water Industries Ltd. | | | 69,100 | | | | 1,540,360 | |
Kyocera Corp. | | | 225,700 | | | | 10,739,442 | |
Kyushu Electric Power Co., Inc. | | | 459,600 | | | | 4,609,516 | |
Mabuchi Motor Co. Ltd. | | | 50,100 | | | | 2,121,973 | |
Maeda Road Construction Co. Ltd. | | | 65,000 | | | | 1,110,238 | |
Makita Corp. | | | 65,400 | | | | 4,342,369 | |
Medipal Holdings Corp. | | | 110,600 | | | | 1,818,356 | |
Mitsubishi Corp. | | | 431,147 | | | | 7,591,349 | |
Mitsubishi Electric Corp. | | | 1,906,000 | | | | 22,754,507 | |
Mitsubishi Estate Co. Ltd. | | | 1,295,000 | | | | 23,753,919 | |
Mitsubishi UFJ Financial Group, Inc. | | | 2,674,700 | | | | 11,990,288 | |
Mitsui & Co. Ltd. | | | 792,078 | | | | 9,455,175 | |
Mitsui Fudosan Co. Ltd. | | | 307,000 | | | | 7,045,891 | |
MS&AD Insurance Group Holdings, Inc. | | | 320,114 | | | | 8,294,194 | |
Murata Manufacturing Co. Ltd. | | | 75,328 | | | | 8,445,372 | |
Nabtesco Corp. | | | 175,400 | | | | 4,185,072 | |
NEC Corp. | | | 2,917,000 | | | | 6,796,214 | |
Nexon Co. Ltd. | | | 13,100 | | | | 193,881 | |
Nintendo Co. Ltd. | | | 91,100 | | | | 13,090,998 | |
Nippo Corp. | | | 90,000 | | | | 1,530,936 | |
Nippon Steel & Sumitomo Metal Corp. | | | 176,600 | | | | 3,418,912 | |
Nippon Telegraph & Telephone Corp. | | | 334,260 | | | | 15,675,094 | |
Nippon Television Holdings, Inc. | | | 116,500 | | | | 1,923,470 | |
Nitori Holdings Co. Ltd. | | | 40,600 | | | | 4,924,134 | |
Nitto Denko Corp. | | | 267,100 | | | | 16,943,276 | |
Nomura Holdings, Inc. | | | 1,372,900 | | | | 4,882,800 | |
NTT DOCOMO, Inc. | | | 219,800 | | | | 5,927,687 | |
Okumura Corp. | | | 1,138,751 | | | | 6,296,157 | |
Omron Corp. | | | 236,600 | | | | 7,722,807 | |
Otsuka Holdings Co. Ltd. | | | 291,400 | | | | 13,428,551 | |
Rinnai Corp. | | | 75,123 | | | | 6,638,096 | |
Rohm Co. Ltd. | | | 294,053 | | | | 11,606,302 | |
Sanrio Co. Ltd. (a) | | | 218,400 | | | | 3,888,688 | |
Sawai Pharmaceutical Co. Ltd. | | | 33,100 | | | | 2,565,878 | |
Secom Co. Ltd. | | | 37,400 | | | | 2,765,087 | |
Sega Sammy Holdings, Inc. | | | 547,200 | | | | 5,893,399 | |
Seino Holdings Co. Ltd. | | | 126,200 | | | | 1,156,916 | |
Sekisui Chemical Co. Ltd. | | | 396,500 | | | | 4,885,197 | |
Seven & i Holdings Co. Ltd. | | | 239,300 | | | | 10,033,398 | |
Shimamura Co. Ltd. | | | 24,000 | | | | 3,570,881 | |
Shin-Etsu Chemical Co. Ltd. | | | 555,134 | | | | 32,524,466 | |
Ship Healthcare Holdings, Inc. | | | 39,100 | | | | 1,216,944 | |
SHO-BOND Holdings Co Ltd. (a) | | | 22,000 | | | | 1,000,034 | |
SKY Perfect JSAT Holdings, Inc. | | | 191,000 | | | | 883,490 | |
SMC Corp. | | | 24,800 | | | | 6,101,449 | |
Sompo Japan Nipponkoa Holdings, Inc. | | | 213,900 | | | | 5,692,350 | |
Sony Financial Holdings, Inc. | | | 664,900 | | | | 7,517,941 | |
Stanley Electric Co. Ltd. | | | 110,300 | | | | 2,355,599 | |
Sumco Corp. (a) | | | 747,100 | | | | 4,786,127 | |
Sumitomo Corp. | | | 580,500 | | | | 5,851,383 | |
Sumitomo Electric Industries Ltd. | | | 520,648 | | | | 6,891,007 | |
Sumitomo Mitsui Financial Group, Inc. | | | 262,947 | | | | 7,592,610 | |
Suntory Beverage & Food Ltd. | | | 108,600 | | | | 4,914,273 | |
Suzuken Co. Ltd. | | | 48,900 | | | | 1,539,189 | |
Suzuki Motor Corp. | | | 720,489 | | | | 19,509,350 | |
Toda Corp. | | | 1,195,896 | | | | 5,173,672 | |
Toho Co. Ltd. | | | 73,900 | | | | 2,046,392 | |
Tokio Marine Holdings, Inc. | | | 361,823 | | | | 12,045,481 | |
Tokyo Gas Co. Ltd. | | | 4,256,070 | | | | 17,572,298 | |
See Notes to Consolidated Financial Statements.
| | | | | | |
| 6 | | BLACKROCK VARIABLE SERIES FUNDS, INC. | | JUNE 30, 2016 | | |
| | | | |
| Consolidated Schedule of Investments (continued) | | | BlackRock Global Allocation V.I. Fund | |
| | | | |
| | | | | | | | |
| Common Stocks | | Shares | | | Value | |
Japan (continued) | | | | | | | | |
Toyota Industries Corp. | | | 601,077 | | | $ | 23,898,755 | |
Toyota Motor Corp. | | | 157,300 | | | | 7,754,660 | |
Toyota Tsusho Corp. | | | 154,200 | | | | 3,319,826 | |
Trend Micro, Inc. | | | 91,600 | | | | 3,275,979 | |
TV Asahi Holdings Corp. | | | 69,400 | | | | 1,130,039 | |
Ube Industries Ltd. | | | 3,471,346 | | | | 5,745,242 | |
West Japan Railway Co. | | | 113,900 | | | | 7,218,220 | |
Yamada Denki Co. Ltd. | | | 1,384,100 | | | | 7,306,418 | |
Yamaha Corp. | | | 122,600 | | | | 3,304,488 | |
Yamato Kogyo Co. Ltd. | | | 51,300 | | | | 1,164,437 | |
Zenkoku Hosho Co. Ltd. | | | 50,200 | | | | 1,833,531 | |
| | | | | | | | |
| | | | | | | | 883,567,966 | |
Luxembourg — 0.0% | | | | | | | | |
RTL Group SA | | | 11,512 | | | | 940,177 | |
Mexico — 0.2% | | | | | | | | |
America Movil SAB de CV, Series L (a) | | | 5,227,858 | | | | 3,214,055 | |
America Movil SAB de CV, Series L — ADR | | | 349,636 | | | | 4,286,537 | �� |
Fibra Uno Administracion SA de CV (a) | | | 6,085,338 | | | | 12,964,489 | |
Telesites SAB de CV (a)(b) | | | 8,390,304 | | | | 5,185,843 | |
| | | | | | | | |
| | | | | | | | 25,650,924 | |
Netherlands — 1.6% | | | | | | | | |
Akzo Nobel NV | | | 599,429 | | | | 37,237,172 | |
Constellium NV, Class A (b) | | | 543,966 | | | | 2,551,201 | |
ING Groep NV CVA | | | 1,548,566 | | | | 16,021,398 | |
Koninklijke KPN NV | | | 4,918,865 | | | | 17,533,065 | |
Koninklijke Philips NV | | | 549,981 | | | | 13,659,538 | |
Randstad Holding NV (a) | | | 183,501 | | | | 7,338,417 | |
Royal Dutch Shell PLC, Class A — ADR (a) | | | 539,602 | | | | 29,796,822 | |
SBM Offshore NV | | | 1,532,180 | | | | 17,756,655 | |
Unilever NV CVA | | | 614,153 | | | | 28,564,146 | |
| | | | | | | | |
| | | | | | | | 170,458,414 | |
Norway — 0.0% | | | | | | | | |
Statoil ASA | | | 338,445 | | | | 5,847,809 | |
Portugal — 0.1% | | | | | | | | |
NOS SGPS SA (a) | | | 1,036,317 | | | | 6,271,485 | |
Singapore — 0.7% | | | | | | | | |
CapitaLand Ltd. | | | 8,897,050 | | | | 20,427,438 | |
Global Logistic Properties Ltd. | | | 18,075,100 | | | | 24,402,297 | |
Keppel Corp. Ltd. | | | 2,451,300 | | | | 10,112,367 | |
Singapore Telecommunications Ltd. | | | 4,713,030 | | | | 14,556,752 | |
United Overseas Bank Ltd. | | | 315,400 | | | | 4,345,567 | |
| | | | | | | | |
| | | | | | | | 73,844,421 | |
South Korea — 0.4% | | | | | | | | |
Hyundai Motor Co. | | | 117,499 | | | | 13,899,131 | |
Hyundai Wia Corp. (a) | | | 29,238 | | | | 2,279,358 | |
Samsung Electronics Co. Ltd. | | | 13,377 | | | | 16,659,064 | |
SK Hynix, Inc. (a) | | | 297,953 | | | | 8,478,844 | |
| | | | | | | | |
| | | | | | | | 41,316,397 | |
Spain — 0.3% | | | | | | | | |
Cellnex Telecom SAU (c) | | | 1,155,580 | | | | 18,134,078 | |
Gas Natural SDG SA (a) | | | 209,515 | | | | 4,164,680 | |
Iberdrola SA | | | 929,345 | | | | 6,339,617 | |
| | | | | | | | |
| | | | | | | | 28,638,375 | |
Sweden — 0.3% | | | | | | | | |
SKF AB, Class B (a) | | | 1,242,636 | | | | 19,910,721 | |
Svenska Handelsbanken AB, A Shares | | | 1,268,254 | | | | 15,397,256 | |
| | | | | | | | |
| | | | | | | | 35,307,977 | |
| | | | | | | | |
| Common Stocks | | Shares | | | Value | |
Switzerland — 1.2% | | | | | | | | |
Cie Financiere Richemont SA, Registered Shares (a) | | | 159,687 | | | $ | 9,347,231 | |
Nestle SA, Registered Shares | | | 825,565 | | | | 63,963,401 | |
Novartis AG, Registered Shares | | | 249,458 | | | | 20,589,902 | |
Roche Holding AG | | | 70,188 | | | | 18,521,197 | |
UBS Group AG, Registered Shares | | | 1,099,664 | | | | 14,268,793 | |
Zurich Insurance Group AG | | | 18,444 | | | | 4,562,727 | |
| | | | | | | | |
| | | | | | | | 131,253,251 | |
Taiwan — 0.2% | | | | | | | | |
Cheng Shin Rubber Industry Co. Ltd. | | | 1,930,323 | | | | 4,069,950 | |
Taiwan Semiconductor Manufacturing Co. Ltd. | | | 2,614,000 | | | | 13,173,769 | |
Yulon Motor Co. Ltd. | | | 2,220,000 | | | | 1,894,944 | |
| | | | | | | | |
| | | | | | | | 19,138,663 | |
United Arab Emirates — 0.2% | | | | | | | | |
Mediclinic International PLC | | | 210,783 | | | | 3,085,847 | |
NMC Health PLC | | | 846,065 | | | | 14,585,973 | |
| | | | | | | | |
| | | | | | | | 17,671,820 | |
United Kingdom — 3.5% | | | | | | | | |
Aggreko PLC (a) | | | 290,302 | | | | 4,965,070 | |
ARM Holdings PLC | | | 453,601 | | | | 6,890,112 | |
AstraZeneca PLC | | | 457,972 | | | | 27,379,323 | |
Aviva PLC | | | 345,561 | | | | 1,821,562 | |
BAE Systems PLC | | | 1,223,707 | | | | 8,566,683 | |
Berkeley Group Holdings PLC | | | 213,192 | | | | 7,199,041 | |
BP PLC — ADR (a) | | | 775,255 | | | | 27,529,305 | |
BT Group PLC | | | 1,587,260 | | | | 8,724,578 | |
Burberry Group PLC | | | 412,074 | | | | 6,410,021 | |
Coats Group PLC (b) | | | 1,865,979 | | | | 667,601 | |
Coca-Cola European Partners PLC | | | 21,523 | | | | 768,156 | |
Delphi Automotive PLC | | | 240,853 | | | | 15,077,398 | |
Delta Topco Ltd. (Acquired 5/02/12, cost $8,295,346) (b)(d) | | | 13,440,990 | | | | 4,569,937 | |
Diageo PLC — ADR (a) | | | 117,581 | | | | 13,272,543 | |
GlaxoSmithKline PLC | | | 1,044,565 | | | | 22,432,162 | |
HSBC Holdings PLC | | | 7,085,782 | | | | 43,900,573 | |
Legal & General Group PLC | | | 1,038,932 | | | | 2,659,781 | |
Liberty Global PLC LiLAC, Class A (b) | | | 25,386 | | | | 818,953 | |
Liberty Global PLC, Class A (b) | | | 248,392 | | | | 7,218,272 | |
National Grid PLC | | | 864,228 | | | | 12,708,823 | |
Pearson PLC (a) | | | 831,691 | | | | 10,818,795 | |
Prudential PLC | | | 466,193 | | | | 7,910,828 | |
Rio Tinto PLC | | | 259,558 | | | | 8,063,612 | |
Royal Bank of Scotland Group PLC (b) | | | 1,519,518 | | | | 3,443,481 | |
SABMiller PLC | | | 1,044,917 | | | | 60,938,968 | |
Smiths Group PLC | | | 630,607 | | | | 9,744,955 | |
Spire Healthcare Group PLC (c) | | | 2,869,126 | | | | 12,794,862 | |
Vodafone Group PLC | | | 5,581,718 | | | | 17,017,963 | |
Vodafone Group PLC — ADR (a) | | | 610,407 | | | | 18,855,472 | |
| | | | | | | | |
| | | | | | | | 373,168,830 | |
United States — 29.0% | | | | | | | | |
3M Co. | | | 14,317 | | | | 2,507,193 | |
Abbott Laboratories | | | 311,388 | | | | 12,240,662 | |
AbbVie, Inc. | | | 159,672 | | | | 9,885,294 | |
Accenture PLC, Class A | | | 27,392 | | | | 3,103,240 | |
Activision Blizzard, Inc. | | | 323,520 | | | | 12,821,098 | |
Adobe Systems, Inc. (b) | | | 86,682 | | | | 8,303,269 | |
Aetna, Inc. | | | 293,017 | | | | 35,786,166 | |
Agilent Technologies, Inc. | | | 93,127 | | | | 4,131,114 | |
Air Products & Chemicals, Inc. | | | 59,802 | | | | 8,494,276 | |
Alexion Pharmaceuticals, Inc. (b) | | | 102,859 | | | | 12,009,817 | |
See Notes to Consolidated Financial Statements.
| | | | | | |
| | | BLACKROCK VARIABLE SERIES FUNDS, INC. | | JUNE 30, 2016 | | 7 |
| | | | |
| Consolidated Schedule of Investments (continued) | | | BlackRock Global Allocation V.I. Fund | |
| | | | |
| | | | | | | | |
| Common Stocks | | Shares | | | Value | |
United States (continued) | | | | | | | | |
Alliance Data Systems Corp. (b) | | | 5,974 | | | $ | 1,170,426 | |
Allstate Corp. | | | 350,473 | | | | 24,515,586 | |
Alphabet, Inc., Class A (b) | | | 38,653 | | | | 27,193,545 | |
Alphabet, Inc., Class C (b) | | | 140,431 | | | | 97,192,295 | |
Altria Group, Inc. (e) | | | 346,829 | | | | 23,917,328 | |
Amazon.com, Inc. (b) | | | 15,838 | | | | 11,333,990 | |
Amdocs Ltd. | | | 43,872 | | | | 2,532,292 | |
American Electric Power Co., Inc. | | | 196,936 | | | | 13,803,244 | |
American International Group, Inc. | | | 298,610 | | | | 15,793,483 | |
American Tower Corp. | | | 29,750 | | | | 3,379,898 | |
American Water Works Co., Inc. | | | 235,539 | | | | 19,905,401 | |
Ameriprise Financial, Inc. | | | 9,091 | | | | 816,826 | |
AmerisourceBergen Corp. | | | 4,907 | | | | 389,223 | |
Amgen, Inc. | | | 208,804 | | | | 31,769,529 | |
Anadarko Petroleum Corp. (f) | | | 1,044,883 | | | | 55,640,020 | |
Anthem, Inc. | | | 131,048 | | | | 17,211,844 | |
Apple Inc. (g) | | | 1,564,224 | | | | 149,539,814 | |
Archer-Daniels-Midland Co. | | | 16,308 | | | | 699,450 | |
Axalta Coating Systems Ltd. (b) | | | 1,033,328 | | | | 27,414,192 | |
Axis Capital Holdings Ltd. | | | 42,362 | | | | 2,329,910 | |
Bank of America Corp. | | | 3,641,491 | | | | 48,322,585 | |
Baxter International, Inc. | | | 460,966 | | | | 20,844,882 | |
Bed Bath & Beyond, Inc. (a) | | | 131,123 | | | | 5,667,136 | |
Berkshire Hathaway, Inc., Class A (b) | | | 156 | | | | 33,848,100 | |
Berkshire Hathaway, Inc., Class B (b) | | | 254,320 | | | | 36,822,993 | |
Biogen, Inc. (b) | | | 67,995 | | | | 16,442,551 | |
Boeing Co. | | | 11,958 | | | | 1,552,985 | |
Bristol-Myers Squibb Co. | | | 264,351 | | | | 19,443,016 | |
Calpine Corp. (b) | | | 364,524 | | | | 5,376,729 | |
Capital One Financial Corp. | | | 30,176 | | | | 1,916,478 | |
Cardinal Health, Inc. | | | 31,529 | | | | 2,459,577 | |
Catalent, Inc. (a)(b) | | | 485,595 | | | | 11,163,829 | |
Caterpillar, Inc. (a) | | | 70,021 | | | | 5,308,292 | |
Celgene Corp. (b) | | | 82,677 | | | | 8,154,433 | |
Charles Schwab Corp. | | | 372,008 | | | | 9,415,522 | |
Charter Communications, Inc., Class A (b) | | | 72,990 | | | | 16,688,434 | |
Chevron Corp. | | | 8,743 | | | | 916,529 | |
Chipotle Mexican Grill, Inc. (b) | | | 26,418 | | | | 10,640,114 | |
Chubb Ltd. | | | 204,285 | | | | 26,702,092 | |
Cintas Corp. | | | 29,396 | | | | 2,884,629 | |
Cisco Systems, Inc. | | | 881,290 | | | | 25,284,210 | |
Citigroup, Inc. | | | 768,342 | | | | 32,570,017 | |
CME Group, Inc. | | | 136,399 | | | | 13,285,263 | |
Coca-Cola Co. | | | 312,097 | | | | 14,147,357 | |
Colfax Corp. (b) | | | 174,109 | | | | 4,606,924 | |
Colgate-Palmolive Co. | | | 51,245 | | | | 3,751,134 | |
Comcast Corp., Class A | | | 729,629 | | | | 47,564,515 | |
Computer Sciences Corp. | | | 40,133 | | | | 1,992,603 | |
Constellation Brands, Inc., Class A | | | 21,749 | | | | 3,597,285 | |
Crown Castle International Corp. | | | 33,951 | | | | 3,443,650 | |
Crown Holdings, Inc. (b) | | | 10,460 | | | | 530,008 | |
CSX Corp. | | | 206,232 | | | | 5,378,531 | |
CVS Health Corp. | | | 288,014 | | | | 27,574,460 | |
DaVita HealthCare Partners, Inc. (b) | | | 136,534 | | | | 10,556,809 | |
Delta Air Lines, Inc. | | | 178,986 | | | | 6,520,460 | |
Discover Financial Services | | | 195,775 | | | | 10,491,582 | |
DISH Network Corp., Class A (b) | | | 198,396 | | | | 10,395,950 | |
Dominion Resources, Inc. | | | 163,832 | | | | 12,767,428 | |
Dover Corp. | | | 9,976 | | | | 691,536 | |
Dr Pepper Snapple Group, Inc. | | | 16,317 | | | | 1,576,712 | |
DTE Energy Co. | | | 66,436 | | | | 6,585,136 | |
E I du Pont de Nemours & Co. | | | 298,232 | | | | 19,325,434 | |
Eaton Corp. PLC | | | 262,957 | | | | 15,706,422 | |
eBay, Inc. (b) | | | 258,762 | | | | 6,057,618 | |
Edgewell Personal Care Co. (b) | | | 331,849 | | | | 28,011,374 | |
Edison International | | | 30,587 | | | | 2,375,692 | |
| | | | | | | | |
| Common Stocks | | Shares | | | Value | |
United States (continued) | | | | | | | | |
Electronic Arts, Inc. (b) | | | 22,916 | | | $ | 1,736,116 | |
Eli Lilly & Co. | | | 322,220 | | | | 25,374,825 | |
Envision Healthcare Holdings, Inc. (b) | | | 27,797 | | | | 705,210 | |
EQT Corp. | | | 279,558 | | | | 21,646,176 | |
Equity Residential | | | 83,533 | | | | 5,753,753 | |
Expedia, Inc. | | | 58,926 | | | | 6,263,834 | |
Exxon Mobil Corp. | | | 189,299 | | | | 17,744,888 | |
Facebook, Inc., Class A (b) | | | 481,059 | | | | 54,975,423 | |
FedEx Corp. | | | 147,391 | | | | 22,371,006 | |
Fifth Third Bancorp | | | 58,873 | | | | 1,035,576 | |
FirstEnergy Corp. | | | 99,455 | | | | 3,471,974 | |
Fitbit, Inc., Class A (a)(b) | | | 506,618 | | | | 6,190,872 | |
Ford Motor Co. (a) | | | 1,307,587 | | | | 16,436,369 | |
Fortune Brands Home & Security, Inc. | | | 110,938 | | | | 6,431,076 | |
General Dynamics Corp. | | | 19,910 | | | | 2,772,268 | |
General Electric Co. (g) | | | 2,183,544 | | | | 68,737,965 | |
General Growth Properties, Inc. | | | 112,128 | | | | 3,343,657 | |
Gilead Sciences, Inc. | | | 215,533 | | | | 17,979,763 | |
Global Payments, Inc. | | | 22,509 | | | | 1,606,692 | |
GoDaddy, Inc., Class A (a)(b) | | | 127,259 | | | | 3,969,208 | |
Goldman Sachs Group, Inc. | | | 118,102 | | | | 17,547,595 | |
Goodyear Tire & Rubber Co. | | | 42,682 | | | | 1,095,220 | |
Hartford Financial Services Group, Inc. | | | 165,606 | | | | 7,349,594 | |
HCA Holdings, Inc. (b) | | | 13,516 | | | | 1,040,867 | |
HD Supply Holdings, Inc. (b) | | | 179,917 | | | | 6,264,710 | |
Helmerich & Payne, Inc. (a) | | | 25,837 | | | | 1,734,438 | |
Hershey Co. (e) | | | 35,897 | | | | 4,073,951 | |
Hewlett-Packard Co. (b)(h) | | | 369,148 | | | | 4,632,807 | |
Hexcel Corp. (a) | | | 65,205 | | | | 2,715,136 | |
Home Depot, Inc. | | | 21,519 | | | | 2,747,761 | |
HTG Molecular Diagnostics, Inc. (b) | | | 52,239 | | | | 135,821 | |
Illinois Tool Works, Inc. | | | 10,341 | | | | 1,077,119 | |
Ingersoll-Rand PLC | | | 197,045 | | | | 12,547,826 | |
Intel Corp. | | | 472,459 | | | | 15,496,655 | |
International Business Machines Corp. | | | 62,316 | | | | 9,458,322 | |
International Paper Co. | | | 44,092 | | | | 1,868,619 | |
Intuit, Inc. | | | 80,274 | | | | 8,959,381 | |
Invitae Corp. (b) | | | 435,262 | | | | 3,216,586 | |
Johnson & Johnson | | | 424,380 | | | | 51,477,294 | |
JPMorgan Chase & Co. (g) | | | 959,516 | | | | 59,624,324 | |
Kansas City Southern | | | 130,963 | | | | 11,798,457 | |
Kimberly-Clark Corp. | | | 21,664 | | | | 2,978,367 | |
KLA-Tencor Corp. | | | 23,398 | | | | 1,713,904 | |
Kohl’s Corp. | | | 57,813 | | | | 2,192,269 | |
Kroger Co. | | | 209,066 | | | | 7,691,538 | |
Las Vegas Sands Corp. (a) | | | 104,490 | | | | 4,544,270 | |
Lear Corp. | | | 28,932 | | | | 2,944,120 | |
Liberty Broadband Corp., Class A (b) | | | 79,558 | | | | 4,725,745 | |
Liberty Broadband Corp., Class C (b) | | | 142,696 | | | | 8,561,760 | |
Liberty Media Group, Class C (b) | | | 136,670 | | | | 2,592,630 | |
Liberty SiriusXM Group, Class A (b) | | | 285,285 | | | | 8,946,538 | |
Liberty SiriusXM Group, Class C (b) | | | 534,932 | | | | 16,513,351 | |
Lincoln National Corp. | | | 19,607 | | | | 760,163 | |
Lookout, Inc. (Acquired 3/04/15, cost $936,169) (b)(d) | | | 81,954 | | | | 751,444 | |
Lowe’s Cos., Inc. | | | 105,556 | | | | 8,356,869 | |
Macy’s, Inc. | | | 67,116 | | | | 2,255,769 | |
Marathon Oil Corp. (a) | | | 2,026,630 | | | | 30,419,716 | |
Marathon Petroleum Corp. | | | 1,883,715 | | | | 71,505,821 | |
Marsh & McLennan Cos., Inc. | | | 279,113 | | | | 19,108,076 | |
Masco Corp. | | | 199,449 | | | | 6,170,952 | |
MasterCard, Inc., Class A | | | 273,922 | | | | 24,121,571 | |
McDonald’s Corp. | | | 20,315 | | | | 2,444,707 | |
McKesson Corp. | | | 203,667 | | | | 38,014,446 | |
Medtronic PLC | | | 71,547 | | | | 6,208,133 | |
Merck & Co., Inc. | | | 358,925 | | | | 20,677,669 | |
See Notes to Consolidated Financial Statements.
| | | | | | |
| 8 | | BLACKROCK VARIABLE SERIES FUNDS, INC. | | JUNE 30, 2016 | | |
| | | | |
| Consolidated Schedule of Investments (continued) | | | BlackRock Global Allocation V.I. Fund | |
| | | | |
| | | | | | | | | | |
| Common Stocks | | Shares | | | Value | |
United States (continued) | | | | |
MetLife, Inc. | | | 314,405 | | | $ | 12,522,751 | |
Michael Kors Holdings Ltd. (a)(b) | | | 291,453 | | | | 14,421,094 | |
Micron Technology, Inc. (a)(b) | | | 1,034,696 | | | | 14,237,417 | |
Microsoft Corp. | | | 772,123 | | | | 39,509,534 | |
Mondelez International, Inc., Class A (e) | | | 548,485 | | | | 24,961,552 | |
Monsanto Co. | | | 92,898 | | | | 9,606,582 | |
Morgan Stanley | | | 27,221 | | | | 707,202 | |
Mylan NV (b) | | | 516,547 | | | | 22,335,492 | |
NextEra Energy Partners LP | | | 277,074 | | | | 8,417,508 | |
NextEra Energy, Inc. | | | 219,883 | | | | 28,672,743 | |
Northrop Grumman Corp. | | | 47,908 | | | | 10,648,990 | |
Norwegian Cruise Line Holdings Ltd. (b) | | | 126,918 | | | | 5,056,413 | |
Nuance Communications, Inc. (b) | | | 263,958 | | | | 4,125,664 | |
Oracle Corp. | | | 850,859 | | | | 34,825,659 | |
PACCAR, Inc. | | | 160,888 | | | | 8,345,261 | |
PayPal Holdings, Inc. (b) | | | 235,107 | | | | 8,583,757 | |
PepsiCo, Inc. | | | 350,075 | | | | 37,086,946 | |
Perrigo Co. PLC (e) | | | 81,392 | | | | 7,379,813 | |
Pfizer, Inc. | | | 1,337,427 | | | | 47,090,805 | |
Phillips 66 | | | 23,890 | | | | 1,895,433 | |
Pioneer Natural Resources Co. | | | 64,606 | | | | 9,769,073 | |
PPG Industries, Inc. | | | 47,581 | | | | 4,955,561 | |
Procter & Gamble Co. | | | 592,363 | | | | 50,155,375 | |
Progressive Corp. | | | 66,145 | | | | 2,215,858 | |
Prudential Financial, Inc. | | | 98,073 | | | | 6,996,528 | |
Public Service Enterprise Group, Inc. | | | 89,881 | | | | 4,189,353 | |
Pure Storage, Inc., Class A (b) | | | 815,919 | | | | 8,893,517 | |
QUALCOMM, Inc. | | | 579,245 | | | | 31,030,155 | |
Ralph Lauren Corp. (a) | | | 61,214 | | | | 5,485,999 | |
Raytheon Co. | | | 15,181 | | | | 2,063,857 | |
Realogy Holdings Corp. (b) | | | 82,561 | | | | 2,395,920 | |
Reinsurance Group of America, Inc. | | | 24,768 | | | | 2,402,248 | |
Rockwell Automation, Inc. | | | 21,109 | | | | 2,423,735 | |
Schlumberger Ltd. | | | 214,119 | | | | 16,932,531 | |
Scripps Networks Interactive, Inc., Class A (a) | | | 10,385 | | | | 646,674 | |
Sealed Air Corp. | | | 22,412 | | | | 1,030,280 | |
Sempra Energy (a) | | | 125,511 | | | | 14,310,764 | |
Simon Property Group, Inc. | | | 134,677 | | | | 29,211,441 | |
Southwest Airlines Co. | | | 140,810 | | | | 5,521,160 | |
Square, Inc., Class A (a)(b) | | | 310,323 | | | | 2,808,423 | |
St. Joe Co. (b) | | | 1,475,472 | | | | 26,145,364 | |
Stryker Corp. | | | 15,479 | | | | 1,854,849 | |
SunTrust Banks, Inc. | | | 207,502 | | | | 8,524,182 | |
Tahoe Resources, Inc. (a) | | | 988,881 | | | | 14,810,827 | |
Target Corp. | | | 272,741 | | | | 19,042,777 | |
Tenet Healthcare Corp. (a)(b) | | | 456,545 | | | | 12,618,904 | |
TESARO, Inc. (a)(b) | | | 37,577 | | | | 3,158,347 | |
Textron, Inc. | | | 548,869 | | | | 20,066,651 | |
Thermo Fisher Scientific, Inc. | | | 106,806 | | | | 15,781,655 | |
Tiffany & Co. (a) | | | 114,508 | | | | 6,943,765 | |
Time Warner, Inc. | | | 182,486 | | | | 13,420,020 | |
Travelers Cos., Inc. | | | 72,776 | | | | 8,663,255 | |
Tyco International PLC | | | 143,369 | | | | 6,107,519 | |
U.S. Bancorp | | | 545,463 | | | | 21,998,523 | |
Union Pacific Corp. | | | 128,650 | | | | 11,224,713 | |
United Continental Holdings, Inc. (b) | | | 449,379 | | | | 18,442,514 | |
United Parcel Service, Inc., Class B | | | 88,177 | | | | 9,498,426 | |
United Rentals, Inc. (b) | | | 222,043 | | | | 14,899,085 | |
United Technologies Corp. | | | 116,299 | | | | 11,926,462 | |
UnitedHealth Group, Inc. | | | 13,757 | | | | 1,942,488 | |
Univar, Inc. (b) | | | 139,602 | | | | 2,639,874 | |
Unum Group | | | 295,576 | | | | 9,396,361 | |
Urban Outfitters, Inc. (a)(b) | | | 228,721 | | | | 6,289,828 | |
Valero Energy Corp. | | | 50,673 | | | | 2,584,323 | |
Veeva Systems, Inc., Class A (b) | | | 311,065 | | | | 10,613,538 | |
VeriSign, Inc. (a)(b) | | | 29,720 | | | | 2,569,591 | |
| | | | | | | | | | | | |
| Common Stocks | | | | | Shares | | | Value | |
United States (continued) | | | | |
Verizon Communications, Inc. (a) | | | | | | | 637,061 | | | $ | 35,573,486 | |
Visa, Inc., Class A | | | | | | | 401,546 | | | | 29,782,667 | |
WABCO Holdings, Inc. (b) | | | | | | | 26,470 | | | | 2,423,858 | |
Walgreens Boots Alliance, Inc. | | | | | | | 200,590 | | | | 16,703,129 | |
Wells Fargo & Co. | | | 1,185,039 | | | | 56,087,896 | |
Western Digital Corp. | | | | | | | 185,902 | | | | 8,785,729 | |
WestRock Co. | | | | | | | 414,893 | | | | 16,126,891 | |
Whirlpool Corp. | | | | | | | 45,479 | | | | 7,578,621 | |
WhiteWave Foods Co. (b)(e) | | | | | | | 71,125 | | | | 3,338,608 | |
Whiting Petroleum Corp. (a)(b) | | | | | | | 339,244 | | | | 3,141,399 | |
Whole Foods Market, Inc. (a)(e) | | | | | | | 176,580 | | | | 5,654,092 | |
Williams Cos., Inc. | | | | | | | 696,910 | | | | 15,074,163 | |
Williams-Sonoma, Inc. (a) | | | | | | | 76,904 | | | | 4,009,006 | |
Wyndham Worldwide Corp. (a) | | | | | | | 27,137 | | | | 1,932,969 | |
Yahoo!, Inc. (b) | | | | | | | 162,934 | | | | 6,119,801 | |
Zimmer Biomet Holdings, Inc. | | | | | | | 166,388 | | | | 20,029,787 | |
| | | | | | | | | | | | |
| | | | | | | | | | | | 3,100,193,414 | |
Total Common Stocks — 53.9% | | | | | | | | | | | 5,770,413,922 | |
| | | | | | | | | | | | |
| Corporate Bonds | | | | | Par
(000) | | | | |
Argentina — 0.1% | | | | | | | | | | | | |
IRSA Propiedades Comerciales SA, 8.75%, 3/23/23 (c) | | | USD | | | | 4,875 | | | | 5,185,249 | |
Australia — 0.2% | | | | | | | | | | | | |
TFS Corp. Ltd., 11.00%, 7/15/18 (c) | | | | | | | 18,370 | | | | 18,370,000 | |
Belgium — 0.1% | | | | | | | | | | | | |
Anheuser-Busch InBev Finance, Inc., 2.65%, 2/01/21 | | | | | | | 11,836 | | | | 12,274,110 | |
Brazil — 0.0% | | | | | | | | | | | | |
Odebrecht Finance Ltd., 4.38%, 4/25/25 (c) | | | | | | | 6,347 | | | | 2,741,904 | |
Canada — 0.1% | | | | | | | | | | | | |
First Quantum Minerals Ltd.: | | | | | | | | | | | | |
6.75%, 2/15/20 | | | | | | | 4,323 | | | | 3,609,705 | |
7.00%, 2/15/21 | | | | | | | 12,060 | | | | 9,693,225 | |
| | | | | | | | | | | | |
| | | | | | | | | | | | 13,302,930 | |
Chile — 0.0% | | | | | | | | | | | | |
Inversiones Alsacia SA, 8.00%, 12/31/18 (b)(c)(i) | | | | | | | 7,809 | | | | 527,091 | |
China — 0.2% | | | | | | | | | | | | |
Alibaba Group Holding Ltd.: | | | | | | | | | | | | |
3.13%, 11/28/21 | | | | | | | 9,145 | | | | 9,352,180 | |
3.60%, 11/28/24 | | | | | | | 2,629 | | | | 2,684,656 | |
Celestial Nutrifoods Ltd., 0.00%, 6/12/11 (b)(i)(j) | | | SGD | | | | 11,400 | | | | 84,626 | |
China Milk Products Group Ltd., 0.00%,
1/05/12 (b)(i)(j) | | | USD | | | | 4,800 | | | | 48,000 | |
SINA Corp., 1.00%, 12/01/18 (j) | | | | | | | 6,127 | | | | 6,015,948 | |
| | | | | | | | | | | | |
| | | | | | | | | | | | 18,185,410 | |
France — 0.2% | | | | | | | | | | | | |
BNP Paribas SA, 2.40%, 12/12/18 | | | | | | | 15,761 | | | | 16,068,812 | |
Germany — 0.1% | | | | | | | | | | | | |
Deutsche Bank AG, 1.88%, 2/13/18 | | | | | | | 6,213 | | | | 6,174,100 | |
Unitymedia Hessen GmbH & Co. KG/Unitymedia NRW GmbH, 5.50%, 1/15/23 (c) | | | | | | | 2,662 | | | | 2,675,310 | |
| | | | | | | | | | | | |
| | | | | | | | | | | | 8,849,410 | |
Hong Kong — 0.0% | | | | | | | | | | | | |
Sun Hung Kai Properties Capital Market Ltd.,
4.50%, 2/14/22 | | | | | | | 4,186 | | | | 4,657,277 | |
See Notes to Consolidated Financial Statements.
| | | | | | |
| | | BLACKROCK VARIABLE SERIES FUNDS, INC. | | JUNE 30, 2016 | | 9 |
| | | | |
| Consolidated Schedule of Investments (continued) | | | BlackRock Global Allocation V.I. Fund | |
| | | | |
| | | | | | | | | | | | |
Corporate Bonds | | | | | Par (000) | | | Value | |
India — 0.1% | | | | | | | | | | | | |
REI Agro Ltd.: | | | | | | | | | | | | |
5.50%, 11/13/14 (b)(c)(i)(j) | | | USD | | | | 6,148 | | | $ | 30,740 | |
5.50%, 11/13/14 (b)(i)(j) | | | | | | | 2,291 | | | | 11,455 | |
Suzlon Energy Ltd., 5.75%, 7/16/19 (c)(j)(k) | | | | | | | 14,214 | | | | 14,800,327 | |
| | | | | | | | | | | | |
| | | | | | | | | | | | 14,842,522 | |
Italy — 0.3% | | | | | | | | | | | | |
Intesa Sanpaolo SpA, 3.88%, 1/15/19 | | | | | | | 12,821 | | | | 13,177,449 | |
Telecom Italia Finance SA: | | | | | | | | | | | | |
6.13%, 11/15/16 (c)(j) | | | EUR | | | | 8,100 | | | | 8,696,870 | |
6.13%, 11/15/16 (j) | | | | | | | 500 | | | | 536,844 | |
Telecom Italia SpA, 5.30%, 5/30/24 (c) | | | USD | | | | 8,517 | | | | 8,495,707 | |
| | | | | | | | | | | | |
| | | | | | | | | | | | 30,906,870 | |
Japan — 0.1% | | | | | | | | | | | | |
Sumitomo Mitsui Banking Corp., 2.45%, 1/10/19 | | | | | | | 7,197 | | | | 7,350,498 | |
Luxembourg — 0.1% | | | | | | | | | | | | |
Intelsat Jackson Holdings SA: | | | | | | | | | | | | |
7.50%, 4/01/21 | | | | | | | 8,184 | | | | 5,646,960 | |
8.00%, 2/15/24 (c) | | | | | | | 2,600 | | | | 2,561,000 | |
| | | | | | | | | | | | |
| | | | | | | | | | | | 8,207,960 | |
Mexico — 0.0% | | | | | | | | | | | | |
Trust F/1401, 5.25%, 12/15/24 (c) | | | | | | | 3,832 | | | | 3,918,220 | |
Netherlands — 0.2% | | | | | | | | | | | | |
Bio City Development Co. BV,
8.00%, 7/06/18 (b)(c)(i)(j) | | | | | | | 21,400 | | | | 8,829,640 | |
Constellium NV: | | | | | | | | | | | | |
7.00%, 1/15/23 (c) | | | EUR | | | | 4,437 | | | | 3,966,267 | |
8.00%, 1/15/23 (c) | | | USD | | | | 1,180 | | | | 1,038,400 | |
Cooperatieve Centrale Raiffeisen-
Boerenleenbank BA, 3.95%, 11/09/22 | | | | | | | 3,115 | | | | 3,221,474 | |
| | | | | | | | | | | | |
| | | | | | | | | | | | 17,055,781 | |
Singapore — 0.3% | | | | | | | | | | | | |
CapitaLand Ltd.: | | | | | | | | | | | | |
2.10%, 11/15/16 (j) | | | SGD | | | | 11,250 | | | | 8,299,078 | |
1.95%, 10/17/23 (c)(j) | | | | | | | 10,000 | | | | 7,395,516 | |
Global Logistic Properties Ltd., 3.88%, 6/04/25 | | | USD | | | | 15,759 | | | | 16,112,726 | |
| | | | | | | | | | | | |
| | | | | | | | | | | | 31,807,320 | |
Spain — 0.1% | | | | | | | | | | | | |
Telefonica Participaciones SAU, 4.90%, 9/25/17 (j) | | | EUR | | | | 12,800 | | | | 11,584,064 | |
Telefonica SA, 6.00%, 7/24/17 (j) | | | | | | | 4,100 | | | | 3,894,795 | |
| | | | | | | | | | | | |
| | | | | | | | | | | | 15,478,859 | |
Switzerland — 0.1% | | | | | | | | | | | | |
UBS AG, 2.38%, 8/14/19 | | | USD | | | | 5,345 | | | | 5,466,385 | |
UBS Group Funding Jersey Ltd., 4.13%, 9/24/25 (c) | | | | | | | 6,708 | | | | 6,953,164 | |
| | | | | | | | | | | | |
| | | | | | | | | | | | 12,419,549 | |
United Arab Emirates — 0.1% | | | | | | | | | | | | |
Dana Gas Sukuk Ltd., 7.00%, 10/31/17 (c)(j) | | | | | | | 17,922 | | | | 15,681,619 | |
United Kingdom — 0.2% | | | | | | | | | | | | |
Delta Topco Ltd. (Acquired 5/02/12-1/04/16,cost $13,856,992), 10.00%, 11/24/60 (d) | | | | | | | 13,639 | | | | 13,638,862 | |
Lloyds Bank PLC, 2.30%, 11/27/18 | | | | | | | 2,241 | | | | 2,253,617 | |
| | | | | | | | | | | | |
| | | | | | | | | | | | 15,892,479 | |
| | | | | | | | | | | | |
| Corporate Bonds | | | | | Par
(000) | | | Value | |
United States — 3.2% | | | | | | | | | | | | |
AbbVie, Inc.: | | | | | | | | | | | | |
2.50%, 5/14/20 (f) | | | USD | | | | 11,252 | | | $ | 11,503,178 | |
2.30%, 5/14/21 | | | | | | | 9,125 | | | | 9,235,905 | |
Actavis Funding SCS, 3.00%, 3/12/20 | | | | | | | 9,152 | | | | 9,438,723 | |
AliphCom (Acquired 11/11/15, cost $3,000,000), 12.00%, 4/28/20 (d)(j)(l) | | | | | | | 3,000 | | | | 1,170,000 | |
AliphCom (Acquired 4/27/15-7/21/15, cost $44,575,000), 12.00%, 4/28/20 (d)(j)(l) | | | | | | | 44,575 | | | | 17,384,250 | |
Ally Financial, Inc.: | | | | | | | | | | | | |
2.75%, 1/30/17 | | | | | | | 8,604 | | | | 8,644,215 | |
3.50%, 1/27/19 | | | | | | | 6,094 | | | | 6,055,913 | |
American Tower Corp., 3.40%, 2/15/19 | | | | | | | 2,448 | | | | 2,549,176 | |
AT&T Inc.: | | | | | | | | | | | | |
2.38%, 11/27/18 | | | | | | | 13,102 | | | | 13,371,076 | |
3.00%, 6/30/22 | | | | | | | 21,647 | | | | 22,168,130 | |
Bank of America Corp.: | | | | | | | | | | | | |
2.00%, 1/11/18 | | | | | | | 5,429 | | | | 5,463,708 | |
6.88%, 4/25/18 | | | | | | | 5,275 | | | | 5,758,965 | |
Series L, 2.60%, 1/15/19 | | | | | | | 5,306 | | | | 5,429,465 | |
Berkshire Hathaway, Inc., 2.75%, 3/15/23 | | | | | | | 7,485 | | | | 7,733,742 | |
BioMarin Pharmaceutical, Inc.: | | | | | | | | | | | | |
0.75%, 10/15/18 (j) | | | | | | | 2,660 | | | | 2,954,263 | |
1.50%, 10/15/20 (j) | | | | | | | 2,584 | | | | 2,987,750 | |
Cablevision Systems Corp., 5.88%, 9/15/22 | | | | | | | 3,424 | | | | 3,067,904 | |
Capital One Bank USA N.A., 2.15%, 11/21/18 | | | | | | | 4,266 | | | | 4,296,173 | |
Cisco Systems, Inc., 2.20%, 2/28/21 | | | | | | | 7,432 | | | | 7,659,546 | |
Citigroup, Inc., 1.80%, 2/05/18 | | | | | | | 15,047 | | | | 15,108,693 | |
Cobalt International Energy, Inc.: | | | | | | | | | | | | |
2.63%, 12/01/19 (j) | | | | | | | 12,966 | | | | 4,862,250 | |
3.13%, 5/15/24 (j) | | | | | | | 16,167 | | | | 5,335,110 | |
eBay, Inc., 3.80%, 3/09/22 | | | | | | | 5,251 | | | | 5,579,602 | |
Edgewell Personal Care Co.: | | | | | | | | | | | | |
4.70%, 5/19/21 | | | | | | | 5,240 | | | | 5,427,398 | |
4.70%, 5/24/22 | | | | | | | 4,773 | | | | 4,904,257 | |
Ford Motor Credit Co. LLC: | | | | | | | | | | | | |
5.00%, 5/15/18 | | | | | | | 8,564 | | | | 9,073,849 | |
2.55%, 10/05/18 | | | | | | | 2,998 | | | | 3,053,418 | |
Forest Laboratories LLC: | | | | | | | | | | | | |
4.38%, 2/01/19 (c) | | | | | | | 6,835 | | | | 7,209,168 | |
5.00%, 12/15/21 (c) | | | | | | | 4,818 | | | | 5,391,983 | |
Freeport-McMoRan, Inc., 3.88%, 3/15/23 | | | | | | | 4,484 | | | | 3,923,500 | |
GE Capital International Funding Co., 2.34%, 11/15/20 (c) | | | | | | | 3,486 | | | | 3,591,141 | |
General Electric Co., 5.55%, 5/04/20 | | | | | | | 1,294 | | | | 1,490,208 | |
General Motors Financial Co., Inc.: | | | | | | | | | | | | |
2.40%, 4/10/18 | | | | | | | 3,531 | | | | 3,558,740 | |
3.50%, 7/10/19 | | | | | | | 8,118 | | | | 8,400,060 | |
Hughes Satellite Systems Corp., 7.63%, 6/15/21 | | | | | | | 1,558 | | | | 1,676,603 | |
Hyundai Capital America, 2.00%, 3/19/18 (c) | | | | | | | 3,735 | | | | 3,758,418 | |
Intel Corp., 3.25%, 8/01/39 (j) | | | | | | | 3,323 | | | | 5,401,952 | |
JPMorgan Chase & Co., 4.35%, 8/15/21 | | | | | | | 4,447 | | | | 4,892,300 | |
Medtronic, Inc., 3.15%, 3/15/22 | | | | | | | 11,777 | | | | 12,568,049 | |
Molson Coors Brewing Co.: | | | | | | | | | | | | |
1.45%, 7/15/19 | | | | | | | 1,195 | | | | 1,198,026 | |
2.10%, 7/15/21 | | | | | | | 3,145 | | | | 3,154,561 | |
Mylan, Inc., 2.55%, 3/28/19 | | | | | | | 7,396 | | | | 7,486,889 | |
Oracle Corp., 1.90%, 9/15/21 | | | | | | | 29,795 | | | | 29,904,437 | |
QUALCOMM, Inc., 3.00%, 5/20/22 | | | | | | | 13,358 | | | | 14,096,751 | |
Sabine Pass Liquefaction LLC, 5.63%, 4/15/23 | | | | | | | 4,106 | | | | 4,121,398 | |
Synchrony Financial, 3.75%, 8/15/21 | | | | | | | 2,810 | | | | 2,910,983 | |
See Notes to Consolidated Financial Statements.
| | | | | | |
| 10 | | BLACKROCK VARIABLE SERIES FUNDS, INC. | | JUNE 30, 2016 | | |
| | | | |
| Consolidated Schedule of Investments (continued) | | | BlackRock Global Allocation V.I. Fund | |
| | | | |
| | | | | | | | | | | | |
| Corporate Bonds | | | | | Par (000) | | | Value | |
United States (continued) | | | | | | | | | | | | |
Take-Two Interactive Software, Inc., 1.75%, 12/01/16 (j) | | | USD | | | | 4,684 | | | $ | 9,288,957 | |
T-Mobile USA, Inc., 6.00%, 4/15/24 | | | | | | | 6,109 | | | | 6,322,815 | |
Volkswagen Group of America Finance LLC, 2.45%, 11/20/19 | | | | | | | 4,449 | | | | 4,524,993 | |
| | | | | | | | | | | | |
| | | | | | | | | | | | 345,088,591 | |
Total Corporate Bonds — 5.8% | | | | | | | | | | | 618,812,461 | |
| | | | | | | | | | | | |
| Floating Rate Loan Interests (l) | | | | | | | | | |
Canada — 0.1% | | | | | | | | | | | | |
Novelis, Inc., Initial Term Loan, 4.00%, 6/02/22 | | | | | | | 5,074 | | | | 5,018,801 | |
Cyprus — 0.1% | | | | | | | | | | | | |
Drillships Ocean Ventures, Inc., Term Loan, 5.50%, 7/25/21 | | | | | | | 6,372 | | | | 3,780,625 | |
Netherlands — 0.1% | | | | | | | | | | | | |
Promontoria Blue Holding 2 BV, Mezzanine Loan, 7.00%, 4/17/20 | | | EUR | | | | 13,045 | | | | 14,476,561 | |
Norway — 0.0% | | | | | | | | | | | | |
Drillships Financing Holding, Inc. (Ocean Rig), Tranche B-1 Term Loan, 6.00%, 3/31/21 | | | USD | | | | 5,556 | | | | 2,161,384 | |
United States — 0.6% | | | | | | | | | | | | |
Calpine Corp., Term Loan, 3.50%, 5/27/22 | | | | | | | 8,816 | | | | 8,713,068 | |
Fieldwood Energy LLC: | | | | | | | | | | | | |
Closing Date Loan (Second Lien), 8.38%, 9/30/20 | | | | | | | 4,979 | | | | 1,369,253 | |
FLLO Facility (First Lien), 8.38%, 9/30/20 | | | | | | | 2,958 | | | | 1,560,565 | |
Reserve Based Term Loan, 8.00%, 8/31/20 | | | | | | | 2,191 | | | | 1,804,261 | |
Hilton Worldwide Finance LLC, Initial Term Loan, 3.50%, 10/26/20 | | | | | | | 20,085 | | | | 20,084,823 | |
Seadrill Operating LP (Seadrill Partners Finco LLC), Initial Term Loan, 4.00%, 2/21/21 | | | | | | | 14,204 | | | | 6,306,422 | |
Sheridan Investment Partners II LP, Senior Secured Term Loan, 4.25%, 12/16/20 | | | | | | | 11,831 | | | | 7,217,196 | |
Sheridan Production Partners II-A LP, Senior Secured Term Loan, 4.25%, 12/16/20 | | | | | | | 1,646 | | | | 1,004,025 | |
Sheridan Production Partners II-M LP, Senior Secured Term Loan, 4.25%, 12/16/20 | | | | | | | 614 | | | | 374,475 | |
Univar USA, Inc., Initial Dollar Term Loan, 4.25%, 7/01/22 | | | | | | | 8,496 | | | | 8,360,802 | |
Univision Communications, Inc., Replacement First-Lien Term Loan (C-4), 4.00%, 3/01/20 | | | | | | | 10,999 | | | | 10,928,544 | |
| | | | | | | | | | | | |
| | | | | | | | | | | | 67,723,434 | |
Total Floating Rate Loan Interests — 0.9% | | | | | | | | | | | 93,160,805 | |
| | | | | | | | | | | | |
| Foreign Agency Obligations | | | | | | | | | |
Argentina — 0.2% | | | | | | | | | | | | |
YPF SA: | | | | | | | | | | | | |
8.88%, 12/19/18 (c) | | | | | | | 6,986 | | | | 7,527,415 | |
8.50%, 7/28/25 (c) | | | | | | | 17,504 | | | | 18,492,976 | |
| | | | | | | | | | | | |
| | | | | | | | | | | | 26,020,391 | |
Canada — 0.2% | | | | | | | | | | | | |
Canada Housing Trust No. 1, 1.25%, 6/15/21 | | | CAD | | | | 30,965 | | | | 24,261,010 | |
| | | | | | | | | | | | |
| Foreign Agency Obligations | | | | | Par (000) | | | Value | |
Mexico — 0.3% | | | | | | | | | | | | |
Petroleos Mexicanos: | | | | | | | | | | | | |
5.75%, 3/01/18 | | | USD | | | | 8,054 | | | $ | 8,421,746 | |
3.50%, 7/23/20 | | | | | | | 10,901 | | | | 10,891,298 | |
6.38%, 2/04/21 (c) | | | | | | | 12,049 | | | | 13,100,878 | |
| | | | | | | | | | | | |
| | | | | | | | | | | | 32,413,922 | |
South Korea — 0.2% | | | | | | | | | | | | |
Export-Import Bank of Korea: | | | | | | | | | | | | |
2.88%, 9/17/18 | | | | | | | 3,691 | | | | 3,796,980 | |
2.63%, 12/30/20 | | | | | | | 11,860 | | | | 12,220,414 | |
| | | | | | | | | | | | |
| | | | | | | | | | | | 16,017,394 | |
Total Foreign Agency Obligations — 0.9% | | | | | | | | | | | 98,712,717 | |
| | | | | | | | | | | | |
| Foreign Government Obligations | | | | | | | | | |
Argentina — 0.6% | | | | | | | | | | | | |
Provincia de Buenos Aires: | | | | | | | | | | | | |
8.95%, 2/19/21 (c) | | | | | | | 4,707 | | | | 5,248,305 | |
9.13%, 3/16/24 (c) | | | | | | | 6,243 | | | | 6,867,300 | |
Republic of Argentina: | | | | | | | | | | | | |
6.88%, 4/22/21 (c) | | | | | | | 20,404 | | | | 21,760,866 | |
7.50%, 4/22/26 (c) | | | | | | | 11,566 | | | | 12,502,846 | |
7.13%, 7/06/36 (c) | | | | | | | 12,475 | | | | 12,475,000 | |
7.63%, 4/22/46 (c) | | | | | | | 5,341 | | | | 5,768,280 | |
| | | | | | | | | | | | |
| | | | | | | | | | | | 64,622,597 | |
Australia — 1.4% | | | | | | | | | | | | |
Commonwealth of Australia: | | | | | | | | | | | | |
5.75%, 5/15/21 | | | AUD | | | | 57,016 | | | | 50,641,003 | |
5.75%, 7/15/22 | | | | | | | 102,574 | | | | 93,955,361 | |
| | | | | | | | | | | | |
| | | | | | | | | | | | 144,596,364 | |
Brazil — 0.4% | | | | | | | | | | | | |
Brazil Notas do Tesouro Nacional: | | | | | | | | | | | | |
Series B, 6.00%, 8/15/22 | | | BRL | | | | 6 | | | | 5,419,641 | |
Series F, 10.00%, 1/01/21 | | | | | | | 94 | | | | 27,397,928 | |
Federative Republic of Brazil: | | | | | | | | | | | | |
4.88%, 1/22/21 | | | USD | | | | 6,737 | | | | 7,097,429 | |
2.88%, 4/01/21 | | | EUR | | | | 3,678 | | | | 4,046,127 | |
| | | | | | | | | | | | |
| | | | | | | | | | | | 43,961,125 | |
Canada — 0.6% | | | | | | | | | | | | |
Canadian Government Bonds: | | | | | | | | | | | | |
0.25%, 5/01/18 | | | CAD | | | | 48,209 | | | | 37,138,785 | |
0.75%, 3/01/21 | | | | | | | 30,284 | | | | 23,630,404 | |
| | | | | | | | | | | | |
| | | | | | | | | | | | 60,769,189 | |
France — 0.6% | | | | | | | | | | | | |
France Government Bond OAT, 0.50%, 5/25/26 | | | EUR | | | | 55,666 | | | | 63,579,380 | |
Germany — 0.7% | | | | | | | | | | | | |
Bundesobligation, 0.00%, 4/09/21 | | | | | | | 63,018 | | | | 71,842,688 | |
See Notes to Consolidated Financial Statements.
| | | | | | |
| | | BLACKROCK VARIABLE SERIES FUNDS, INC. | | JUNE 30, 2016 | | 11 |
| | | | |
| Consolidated Schedule of Investments (continued) | | | BlackRock Global Allocation V.I. Fund | |
| | | | |
| | | | | | | | | | | | |
| Foreign Government Obligations | | | | | Par
(000) | | | Value | |
Hungary — 0.9% | | | | | | | | | | | | |
Republic of Hungary: | | | | | | | | | | | | |
6.25%, 1/29/20 | | | USD | | | | 6,166 | | | $ | 6,837,798 | |
6.38%, 3/29/21 | | | | | | | 42,230 | | | | 48,073,450 | |
5.50%, 6/24/25 | | | HUF | | | | 10,202,670 | | | | 42,602,263 | |
| | | | | | | | | | | | |
| | | | | | | | | | | | 97,513,511 | |
Indonesia — 0.2% | | | | | | | | | | | | |
Republic of Indonesia: | | | | | | | | | | | | |
6.88%, 1/17/18 (c) | | | USD | | | | 6,797 | | | | 7,301,643 | |
2.63%, 6/14/23 (c) | | | EUR | | | | 9,861 | | | | 11,040,654 | |
| | | | | | | | | | | | |
| | | | | | | | | | | | 18,342,297 | |
Italy — 0.6% | | | | | | | | | | | | |
Buoni Poliennali Del Tesoro, 1.50%, 6/01/25 | | | | | | | 55,432 | | | | 63,251,904 | |
Japan — 0.8% | | | | | | | | | | | | |
Government of Japan (2 Year): | | | | | | | | | | | | |
0.10%, 3/15/17 | | | JPY | | | | 2,383,000 | | | | 23,140,703 | |
0.10%, 3/15/18 | | | | | | | 6,086,800 | | | | 59,400,307 | |
| | | | | | | | | | | | |
| | | | | | | | | | | | 82,541,010 | |
Mexico — 0.9% | | | | | | | | | | | | |
United Mexican States, Series M, 6.50%, 6/10/21 | | | MXN | | | | 17,346 | | | | 99,146,882 | |
New Zealand — 0.4% | | | | | | | | | | | | |
New Zealand Government Bonds, 6.00%, 5/15/21 | | | NZD | | | | 54,408 | | | | 45,915,192 | |
Poland — 0.5% | | | | | | | | | | | | |
Republic of Poland: | | | | | | | | | | | | |
5.25%, 10/25/20 | | | PLN | | | | 60,810 | | | | 17,448,714 | |
5.75%, 10/25/21 | | | | | | | 51,368 | | | | 15,296,729 | |
3.25%, 7/25/25 | | | | | | | 70,694 | | | | 18,527,308 | |
2.50%, 7/25/26 | | | | | | | 30,817 | | | | 7,537,921 | |
| | | | | | | | | | | | |
| | | | | | | | | | | | 58,810,672 | |
Spain — 0.3% | | | | | | | | | | | | |
Kingdom of Spain, 1.95%, 4/30/26 | | | EUR | | | | 29,622 | | | | 35,010,436 | |
Turkey — 0.1% | | | | | | | | | | | | |
Republic of Turkey, 6.75%, 4/03/18 | | | USD | | | | 10,248 | | | | 11,021,724 | |
United Kingdom — 0.8% | | | | | | | | | | | | |
United Kingdom Gilt: | | | | | | | | | | | | |
1.50%, 1/22/21 | | | GBP | | | | 50,608 | | | | 70,728,458 | |
3.50%, 1/22/45 | | | | | | | 8,720 | | | | 16,162,696 | |
| | | | | | | | | | | | |
| | | | | | | | | | | | 86,891,154 | |
Total Foreign Government Obligations — 9.8% | | | | | | | | 1,047,816,125 | |
| | | | | | | | | | | | |
| Investment Companies | | | | | Shares | | | | |
ETFS Physical Palladium Shares (b)(m) | | | | | | | 80,940 | | | | 4,662,953 | |
ETFS Physical Platinum Shares (b)(m) | | | | | | | 67,020 | | | | 6,629,618 | |
ETFS Physical Swiss Gold Shares (b)(m) | | | | | | | 230,215 | | | | 29,686,224 | |
iShares Gold Trust (b)(m)(n) | | | | | | | 2,098,037 | | | | 26,770,952 | |
iShares iBoxx $ High Yield Corporate Bond ETF (n) | | | | | | | 128,161 | | | | 10,853,955 | |
SPDR Gold Shares (b)(e)(m) | | | | | | | 2,238,914 | | | | 283,267,399 | |
Total Investment Companies — 3.4% | | | | | | | | | | | 361,871,101 | |
| | | | | | | | | | | | |
| | | | | | | | | | |
| | | | | | | | | | | | |
| Non-Agency Mortgage-Backed Securities | | | | | Par
(000) | | | Value | |
Commercial Mortgage-Backed Securities — 0.1% | | | | | | | | | |
Logistics UK PLC, Series 2015-1A, Class F,
4.19%, 8/20/25 (c)(l) | | | GBP | | | | 6,637 | | | $ | 8,217,064 | |
| | | | | | | | | | | | |
| Preferred Securities | | | | | | | | | |
| | | | | | | | | | | | |
Capital Trusts | | | | | | | | | | | | |
Netherlands — 0.0% | | | | | | | | | | | | |
ING Groep NV, 6.00% (l)(o) | | | USD | | | | 4,790 | | | | 4,502,600 | |
Switzerland — 0.1% | | | | | | | | | | | | |
Credit Suisse Group Guernsey I Ltd., 7.88%, 2/24/41 (j)(l) | | | | | | | 5,934 | | | | 5,941,417 | |
United Kingdom — 0.4% | | | | | | | | | | | | |
HSBC Holdings PLC, 6.38% (l)(o) | | | | | | | 17,614 | | | | 16,645,230 | |
Lloyds Bank PLC, 13.00% (l)(o) | | | GBP | | | | 9,685 | | | | 21,143,972 | |
Standard Chartered PLC, 6.50% (c)(l)(o) | | | USD | | | | 6,810 | | | | 6,248,175 | |
| | | | | | | | | | | | |
| | | | | | | | | | | | 44,037,377 | |
United States — 1.0% | | | | | | | | | | | | |
American Express Co.Series C, 4.90% (l)(o) | | | | | | | 6,164 | | | | 5,894,325 | |
Citigroup, Inc.: | | | | | | | | | | | | |
5.95% (l)(o) | | | | | | | 4,081 | | | | 4,032,538 | |
Series O, 5.88% (l)(o) | | | | | | | 11,144 | | | | 10,698,240 | |
General Electric Co.: | | | | | | | | | | | | |
6.38%, 11/15/67 (l) | | | | | | | 6,423 | | | | 6,559,489 | |
Series D, 5.00% (l)(o) | | | | | | | 9,772 | | | | 10,368,092 | |
Goldman Sachs Group, Inc.: | | | | | | | | | | | | |
Series L, 5.70% (l)(o) | | | | | | | 9,459 | | | | 9,440,318 | |
Series M, 5.38% (l)(o) | | | | | | | 9,921 | | | | 9,811,075 | |
JPMorgan Chase & Co.: | | | | | | | | | | | | |
Series Q, 5.15% (l)(o) | | | | | | | 10,608 | | | | 10,317,341 | |
Series X, 6.10% (l)(o) | | | | | | | 21,067 | | | | 21,725,344 | |
Morgan Stanley, Series H, 5.45% (l)(o) | | | | | | | 7,002 | | | | 6,721,920 | |
NBCUniversal Enterprise, Inc., 5.25% (c)(o) | | | | | | | 5,389 | | | | 5,557,406 | |
USB Capital IX, 3.50% (l)(o) | | | | | | | 8,452 | | | | 6,909,510 | |
| | | | | | | | | | | | |
| | | | | | | | | | | | 108,035,598 | |
Total Capital Trusts — 1.5% | | | | | | | | | | | 162,516,992 | |
| | | | | | | | | | | | |
| Preferred Stocks | | | | | Shares | | | | |
Germany — 0.1% | | | | | | | | | | | | |
Volkswagen AG, Preference Shares, 0.02% | | | | | | | 96,584 | | | | 11,698,338 | |
Ireland — 0.2% | | | | | | | | | | | | |
Allergan PLC, Series A, 5.50% (j) | | | | | | | 24,949 | | | | 20,797,985 | |
Israel — 0.3% | | | | | | | | | | | | |
Teva Pharmaceutical Industries Ltd., 7.00% (j) | | | | | | | 40,680 | | | | 33,642,360 | |
South Korea — 0.1% | | | | | | | | | | | | |
Samsung Electronics Co. Ltd., Preference
Shares, 1.76% | | | | | | | 10,988 | | | | 11,335,083 | |
See Notes to Consolidated Financial Statements.
| | | | | | |
| 12 | | BLACKROCK VARIABLE SERIES FUNDS, INC. | | JUNE 30, 2016 | | |
| | | | |
| Consolidated Schedule of Investments (continued) | | | BlackRock Global Allocation V.I. Fund | |
| | | | |
| | | | | | | | | | | | |
| Preferred Stocks | | | | |
Shares | | | Value | |
United Kingdom — 0.1% | | | | | | | | | | | | |
HSBC Holdings PLC, Series 2, 8.00% | | | | | | | 231,249 | | | $ | 6,135,036 | |
Royal Bank of Scotland Group PLC,
Series T, 7.25% (a) | | | | | | | 215,015 | | | | 5,420,528 | |
| | | | | | | | | | | | |
| | | | | | | | | | | | 11,555,564 | |
United States — 1.8% | | | | | | | | | | | | |
American Tower Corp., Series A, 5.25% (j) | | | | | | | 45,686 | | | | 5,139,675 | |
Anthem, Inc., 5.25% (j) | | | | | | | 500,750 | | | | 22,398,548 | |
Crown Castle International Corp.,
Series A, 4.50% (j) | | | | | | | 126,859 | | | | 15,332,179 | |
Dominion Resources, Inc., 6.38% (j) | | | | | | | 104,846 | | | | 5,435,217 | |
Domo, Inc., Series D-2 (Acquired
4/01/15- 7/06/15, cost $17,824,428), 0.00% (b)(d) | | | | | | | 2,114,003 | | | | 15,939,583 | |
Dropbox, Inc., Series C (Acquired 1/28/14, cost $28,835,783), 0.00% (b)(d) | | | | | | | 1,509,632 | | | | 15,866,232 | |
Forestar Group, Inc., 6.00% (j) | | | | | | | 220,475 | | | | 3,518,781 | |
Grand Rounds, Inc., Series C (Acquired
3/31/15, cost $5,939,231), 0.00% (b)(d) | | | | | | | 2,139,107 | | | | 5,796,980 | |
Lookout, Inc., Series F (Acquired 9/19/14- 10/22/14, cost $10,936,522), 0.00% (b)(d) | | | | | | | 957,404 | | | | 8,778,533 | |
Palantir Technologies, Inc., Series I (Acquired 3/27/14, cost $11,447,321), 0.00% (b)(d) | | | | | | | 1,867,426 | | | | 17,908,615 | |
Stericycle, Inc., 5.25%, 9/15/18 | | | | | | | 89,492 | | | | 7,443,945 | |
U.S. Bancorp: | | | | | | | | | | | | |
Series F, 6.50% (a)(l) | | | | | | | 209,039 | | | | 6,438,401 | |
Series G, 6.00% (l) | | | | | | | 112,682 | | | | 2,942,127 | |
Uber Technologies, Inc., Series D (Acquired
6/10/14, cost $17,574,548), 0.00% (b)(d) | | | | | | | 1,132,888 | | | | 55,253,440 | |
Wells Fargo & Co., Series L, 7.50% (j) | | | | | | | 3,851 | | | | 5,003,219 | |
| | | | | | | | | | | | |
| | | | | | | | | | | | 193,195,475 | |
Total Preferred Stocks — 2.6% | | | | | | | | | | | 282,224,805 | |
| | | | | | | | | | | | |
| Trust Preferreds | | | | | | | | | |
United States — 0.5% | | | | | | | | | | | | |
Citigroup Capital XIII, 7.01%, 10/30/40 (l) | | | | | | | 378,355 | | | | 9,863,715 | |
GMAC Capital Trust I, Series 2, 6.41%, 2/15/40 (l) | | | | | | | 494,162 | | | | 12,265,101 | |
Mandatory Exchangeable Trust, 5.75%, 6/01/19 (c)(j) | | | | | | | 182,668 | | | | 18,652,229 | |
Welltower, Inc., Series I, 6.50% (j)(o) | | | | | | | 181,298 | | | | 12,292,004 | |
Total Trust Preferreds — 0.5% | | | | | | | | | | | 53,073,049 | |
Total Preferred Securities — 4.6% | | | | | | | | | | | 497,814,846 | |
| | | | | | | | | | | | |
| U.S. Government Sponsored Agency Securities | | | Par
(000) | | | | |
Mortgage-Backed Securities — 0.6% | | | | | | | | | | | | |
Fannie Mae Mortgage-Backed Securities, 3.00%, 7/01/46 (p) | | | USD | | | | 61,781 | | | | 64,114,666 | |
| | | | | | | | | | | | |
| U.S. Treasury Obligations | | | | | | | | | |
U.S. Treasury Inflation Indexed Bonds: | | | | | | | | | | | | |
1.00%, 2/15/46 (g) | | | | | | | 15,506 | | | | 16,739,956 | |
U.S. Treasury Inflation Indexed Notes: | | | | | | | | | | | | |
0.13%, 4/15/21 | | | | | | | 75,764 | | | | 77,628,715 | |
0.38%, 7/15/25 | | | | | | | 68,479 | | | | 70,512,357 | |
0.63%, 1/15/26 (g) | | | | | | | 320,789 | | | | 337,801,409 | |
| | | | | | | | | | | | |
| U.S. Treasury Obligations | | | | | Par (000) | | | Value | |
U.S. Treasury Notes: | | | | | | | | | | | | |
0.88%, 1/31/17 (m) | | | USD | | | | 31,897 | | | $ | 31,976,857 | |
1.25%, 3/31/21 | | | | | | | 112,890 | | | | 114,204,254 | |
1.38%, 4/30/21 (g)(q) | | | | | | | 543,446 | | | | 552,828,935 | |
1.75%, 3/31/22 (q) | | | | | | | 44,820 | | | | 46,310,113 | |
2.00%, 8/15/25 (g) | | | | | | | 25,102 | | | | 26,242,175 | |
1.63%, 2/15/26 (g) | | | | | | | 22,432 | | | | 22,684,259 | |
Total U.S. Treasury Obligations — 12.1% | | | | | | | | | | | 1,296,929,030 | |
| | | | | | | | | | | | |
| Warrants | | | | | Shares | | | | |
Australia — 0.0% | | | | | | | | | | | | |
TFS Corp. Ltd. (Issued/exercisable 8/01/11, 1 share for 1 warrant, Expires 7/15/18, Strike Price AUD 1.28) | | | | | | | 3,767,700 | | | | 933,681 | |
Total Long-Term Investments (Cost — $9,879,624,240) — 92.1% | | | | | | | | | | | 9,858,796,418 | |
| | | | | | | | | | | | |
| Short-Term Securities | | | | | | | | | |
| Foreign Agency Obligations (r) | | | | | Par (000) | | | | |
Japan Treasury Discount Bill: | | | | | | | | | | | | |
0.19%, 7/19/16 | | | JPY | | | | 12,580,000 | | | | 121,826,638 | |
0.28%, 8/22/16 | | | | | | | 12,520,000 | | | | 121,283,052 | |
0.27%, 9/05/16 | | | | | | | 12,740,000 | | | | 123,426,931 | |
0.18%, 9/12/16 | | | | | | | 6,090,000 | | | | 59,004,265 | |
0.34%, 10/03/16 | | | | | | | 12,460,000 | | | | 120,756,965 | |
Total Foreign Agency Obligations — 5.1% | | | | | | | | 546,297,851 | |
| | | | | | | | | | | | |
| | | | |
| Money Market Funds | | | | | Shares | | | | |
BlackRock Liquidity Funds, TempFund, Institutional Class, 0.40% (n)(s) | | | | | | | 6,016,752 | | | | 6,016,752 | |
| | | | | | | | | | | | |
| | | | | | Beneficial Interest (000) | | | | |
BlackRock Liquidity Series, LLC, Money Market Series, 0.59% (n)(s)(t) | | | USD | | | | 274,482 | | | | 274,482,165 | |
Total Money Market Funds — 2.7% | | | | | | | | | | | 280,498,917 | |
| | | | | | | | | | | | |
| Time Deposits | | | | | Par (000) | | | | |
Canada — 0.0% | | | | | | | | | | | | |
Brown Brothers Harriman & Co., 0.06%, 7/01/16 | | | CAD | | | | 11 | | | | 8,895 | |
See Notes to Consolidated Financial Statements.
| | | | | | |
| | | BLACKROCK VARIABLE SERIES FUNDS, INC. | | JUNE 30, 2016 | | 13 |
| | | | |
| Consolidated Schedule of Investments (continued) | | | BlackRock Global Allocation V.I. Fund | |
| | | | |
| | | | | | | | | | | | |
| Time Deposits | | | | | Par (000) | | | Value | |
Europe — 0.0% | | | | | | | | | | | | |
Brown Brothers Harriman & Co., (0.55)%, 7/01/16 | | | EUR | | | | 929 | | | $ | 1,030,759 | |
Japan — 0.0% | | | | | | | | | | | | |
Brown Brothers Harriman & Co., (0.33)%, 7/01/16 | | | JPY | | | | 372,238 | | | | 3,604,685 | |
United States — 0.1% | | | | | | | | | | | | |
Wells Fargo & Co., 0.36%, 7/01/16 | | | USD | | | | 8,218 | | | | 8,218,318 | |
Total Time Deposits — 0.1% | | | | | | | | | | | 12,862,657 | |
| | | | | | | | | | | | |
| U.S. Treasury Obligations | | | | | | | | | |
U.S. Treasury Bills (r): | | | | | | | | | | | | |
0.20%, 7/14/16 | | | | | | | 97,597 | | | | 97,592,608 | |
0.21%, 7/21/16-8/25/16 | | | | | | | 157,233 | | | | 157,205,012 | |
0.17%, 7/28/16 | | | | | | | 6,000 | | | | 5,999,208 | |
0.18%, 8/04/16 | | | | | | | 26,000 | | | | 25,994,722 | |
0.23%, 8/11/16-9/22/16 | | | | | | | 206,945 | | | | 206,861,229 | |
0.25%, 8/18/16 | | | | | | | 84,630 | | | | 84,604,103 | |
Total U.S. Treasury Obligations — 5.4% | | | | | | | | | | | 578,256,882 | |
Total Short-Term Securities (Cost — $1,396,802,722) — 13.3% | | | | | | | | | | | 1,417,916,307 | |
| | | | | | | | | | | | |
| | | | | | | | | | |
| | | | | | | | | | | | |
| Options Purchased | | | | | | | |
Value | |
(Cost — $88,840,036) — 0.5% | | | | | | | | | | $ | 54,799,725 | |
Total Investments Before Investments Sold Short and Options Written (Cost — $11,365,266,998) — 105.9% | | | | | | | | | | | 11,331,512,450 | |
| | | | | | | | | | | | |
| Investments Sold Short | | | | | Shares | | | | |
Alcoa, Inc. | | | | | | | 556,673 | | | | (5,160,359 | ) |
Church & Dwight Co., Inc. | | | | | | | 76,209 | | | | (7,841,144 | ) |
Ecolab, Inc. | | | | | | | 84,289 | | | | (9,996,675 | ) |
Gentex Corp. | | | | | | | 345,876 | | | | (5,343,784 | ) |
LafargeHolcim Ltd. | | | | | | | 133,974 | | | | (5,605,142 | ) |
Total Investments Sold Short (Proceeds — $34,876,751) — (0.3)% | | | | | | | | | | | (33,947,104 | ) |
| | | | | | | | | | | | |
| Options Written | | | | | | | | | |
(Premiums Received — $41,309,609) — (0.4)% | | | | | | | | (42,167,144 | ) |
Total Investments Net of Investments Sold
Short and Options Written — 105.2% | | | | | | | | 11,255,398,202 | |
Liabilities in Excess of Other Assets — (5.2)% | | | | | | | | (551,605,410 | ) |
| | | | | | | | | | | | |
Net Assets — 100.0% | | | | | | | | | | | $10,703,792,792 | |
| | | | | | | | | | | | |
|
| Notes to Consolidated Schedule of Investments |
| (a) | Security, or a portion of security, is on loan. |
| (b) | Non-income producing security. |
| (c) | Security exempt from registration pursuant to Rule 144A under the Securities Act of 1933, as amended. These securities may be resold in transactions exempt from registration to qualified institutional investors. |
| (d) | Restricted security as to resale, excluding 144a securities. As of period end, the Fund held restricted securities with a current value of $157,057,876 and an original cost of $163,221,340 which was 1.5% of its net assets. |
| (e) | All or a portion of security has been pledged and/or segregated as collateral in connection with outstanding exchange-traded options written. |
| (f) | All or a portion of security has been pledged as collateral in connection with short sales. |
| (g) | All or a portion of security has been pledged as collateral in connection with outstanding OTC derivatives. |
| (i) | Issuer filed for bankruptcy and/or is in default of interest payments. |
| (k) | Step-up bond that pays an initial coupon rate for the first period and then a higher coupon rate for the following periods. Rate as of period end. |
| (l) | Variable rate security. Rate as of period end. |
| (m) | All or a portion of security is held by a wholly owned subsidiary. See Note 1 of the Notes to Consolidated Financial Statements for details on the wholly owned subsidiary. |
See Notes to Consolidated Financial Statements.
| | | | | | |
| 14 | | BLACKROCK VARIABLE SERIES FUNDS, INC. | | JUNE 30, 2016 | | |
| | | | |
| Consolidated Schedule of Investments (continued) | | | BlackRock Global Allocation V.I. Fund | |
| (n) | During the six months ended June 30, 2016, investments in issuers considered to be affiliates of the Fund for purposes of Section 2(a)(3) of the Investment Company Act of 1940, as amended, were as follows: |
| | | | | | | | | | | | | | | | | | | | | | | | | | | | | | | | | | | |
| Affiliate | | Shares/Beneficial
Interest
Held at
December 31, 2015 | | Shares/Beneficial
Interest
Purchased | | Shares/Beneficial
Interest
Sold | | Shares/Beneficial
Interest
Held at
June 30, 2016 | | Value at
June 30, 2016 | | Income | | Realized
Gain |
BlackRock Liquidity Funds, TempFund, Institutional Class | | | | 8,973,878 | | | | | — | | | | | (2,957,126 | )1 | | | | 6,016,752 | | | | $ | 6,016,752 | | | | $ | 8,858 | | | | | — | |
BlackRock Liquidity Series, LLC, Money Market Series | | | $ | 290,256,248 | | | | | — | | | | $ | (15,774,083 | )2 | | | $ | 274,482,165 | | | | | 274,482,165 | | | | | 1,743,660 | 3 | | | | — | |
iShares Gold Trust | | | | 2,098,037 | | | | | — | | | | | — | | | | | 2,098,037 | | | | | 26,770,952 | | | | | — | | | | | — | |
iShares iBoxx $ High Yield Corporate Bond ETF | | | | — | | | | | 662,768 | | | | | (534,607 | ) | | | | 128,161 | | | | | 10,853,955 | | | | | 223,840 | | | | $ | 1,787,228 | |
Total | | | | | | | | | | | | | | | | | | | | | | | $ | 318,123,824 | | | | $ | 1,976,358 | | | | $ | 1,787,228 | |
| | | | | | | | | | | | | | | | | | | | | | | | | |
| 1 | Represents net shares sold. |
| 2 | Represents net beneficial interest sold. |
| 3 | Represents securities lending income earned from the reinvestment of cash collateral from loaned securities, net of fees and collateral investment expenses, and other payments to and from borrowers of securities. |
| (o) | Perpetual security with no stated maturity date. |
| (p) | Represents or includes a TBA transaction. As of period end, unsettled TBA transactions were as follows: |
| | | | | | | | | | |
| Counterparty | | Value | | Unrealized
Appreciation |
Merrill Lynch, Pierce, Fenner & Smith, Inc. | | | $ | 64,114,666 | | | | $ | 736,048 | |
| (q) | All or a portion of security has been pledged in connection with outstanding futures contracts. |
| (r) | Rates are discount rates or a range of discount rates at the time of purchase. |
| (s) | Current yield as of period end. |
| (t) | Security was purchased with the cash collateral from loaned securities. The Fund may withdraw up to 25% of its investment daily, although the manager of the BlackRock Liquidity Series, LLC, Money Market Series, in its sole discretion, may permit an investor to withdraw more than 25% on any one day. |
|
| Derivative Financial Instruments Outstanding as of Period End |
| | | | | | | | | | | | | | | | | | | |
Futures Contracts |
Contracts
Short | | Issue | | Expiration | | Notional
Value | | Unrealized
Appreciation
(Depreciation) |
| (87) | | MSCI Taiwan Stock Index | | July 2016 | | | | USD | | | | | 2,762,250 | | | | $ | (85,090 | ) |
| (665) | | Euro STOXX 50 Index | | September 2016 | | | | USD | | | | | 21,069,526 | | | | | 176,627 | |
| (7) | | FTSE 100 Index | | September 2016 | | | | USD | | | | | 598,500 | | | | | (52,151 | ) |
| (111) | | NASDAQ 100 E-Mini Index | | September 2016 | | | | USD | | | | | 9,783,540 | | | | | 25,323 | |
| (113) | | Nikkei 225 Yen Index | | September 2016 | | | | USD | | | | | 8,611,921 | | | | | 132,456 | |
| (176) | | S&P 500 E-Mini Index | | September 2016 | | | | USD | | | | | 18,393,760 | | | | | (369,352 | ) |
| (893) | | STOXX Europe 600 Index | | September 2016 | | | | USD | | | | | 16,207,985 | | | | | (339,785 | ) |
Total | | | | | | | | | | | | | | | | | $ | (511,972 | ) |
| | | | | | | | | | | | | | | | | | | |
| | | | | | | | | | | | | | | | | | | | | | |
Forward Foreign Currency Exchange Contracts | |
Currency
Purchased | | | Currency Sold | | | Counterparty | | Settlement
Date | | | Unrealized
Appreciation
(Depreciation) | |
| EUR | | | 33,508,000 | | | | USD | | | | 38,304,339 | | | Credit Suisse International | | | 7/01/16 | | | $ | (1,117,282 | ) |
| USD | | | 26,957,620 | | | | EUR | | | | 24,152,758 | | | Credit Suisse International | | | 7/01/16 | | | | 152,977 | |
| USD | | | 10,574,324 | | | | EUR | | | | 9,355,242 | | | Morgan Stanley & Co. International PLC | | | 7/01/16 | | | | 191,910 | |
| BRL | | | 21,395,445 | | | | USD | | | | 5,527,967 | | | Morgan Stanley Capital Services LLC | | | 7/13/16 | | | | 1,104,638 | |
| PLN | | | 107,167,193 | | | | USD | | | | 28,367,170 | | | JPMorgan Chase Bank N.A. | | | 7/13/16 | | | | (1,212,303 | ) |
| USD | | | 5,025,000 | | | | BRL | | | | 21,395,445 | | | Morgan Stanley Capital Services LLC | | | 7/13/16 | | | | (1,607,606 | ) |
See Notes to Consolidated Financial Statements.
| | | | | | |
| | | BLACKROCK VARIABLE SERIES FUNDS, INC. | | JUNE 30, 2016 | | 15 |
| | | | |
| Consolidated Schedule of Investments (continued) | | | BlackRock Global Allocation V.I. Fund | |
| | | | | | | | | | | | | | | | | | | | |
Currency
Purchased | | | Currency Sold | | | Counterparty | | Settlement
Date | | | Unrealized
Appreciation
(Depreciation) | |
| USD | | | 26,540,000 | | | PLN | | | 107,167,193 | | | JPMorgan Chase Bank N.A. | | | 7/13/16 | | | $ | (614,866 | ) |
| JPY | | | 1,079,793,000 | | | USD | | | 9,847,633 | | | Citibank N.A. | | | 7/15/16 | | | | 613,812 | |
| USD | | | 115,724,983 | | | JPY | | | 12,580,000,000 | | | Morgan Stanley & Co. International PLC | | | 7/19/16 | | | | (6,170,141 | ) |
| EUR | | | 33,121,000 | | | USD | | | 37,633,903 | | | Morgan Stanley & Co. International PLC | | | 7/28/16 | | | | (839,072 | ) |
| JPY | | | 3,020,039,000 | | | USD | | | 27,776,859 | | | Morgan Stanley & Co. International PLC | | | 7/28/16 | | | | 1,494,366 | |
| USD | | | 21,759,582 | | | EUR | | | 19,218,000 | | | Morgan Stanley & Co. International PLC | | | 7/28/16 | | | | 409,893 | |
| USD | | | 10,810,232 | | | JPY | | | 1,184,023,063 | | | Goldman Sachs International | | | 7/28/16 | | | | (665,715 | ) |
| EUR | | | 15,747,000 | | | USD | | | 17,795,370 | | | Deutsche Bank AG | | | 7/29/16 | | | | (301,032 | ) |
| GBP | | | 7,469,299 | | | USD | | | 10,818,981 | | | Deutsche Bank AG | | | 8/03/16 | | | | (872,409 | ) |
| GBP | | | 11,462,701 | | | USD | | | 16,578,504 | | | Deutsche Bank AG | | | 8/03/16 | | | | (1,314,075 | ) |
| TWD | | | 706,853,992 | | | USD | | | 21,970,000 | | | Citibank N.A. | | | 8/03/16 | | | | (40,532 | ) |
| TWD | | | 708,312,800 | | | USD | | | 21,970,000 | | | Deutsche Bank AG | | | 8/03/16 | | | | 4,726 | |
| TWD | | | 530,014,870 | | | USD | | | 16,478,000 | | | Goldman Sachs International | | | 8/03/16 | | | | (34,797 | ) |
| USD | | | 27,661,072 | | | GBP | | | 18,932,000 | | | Deutsche Bank AG | | | 8/03/16 | | | | 2,450,072 | |
| GBP | | | 7,440,000 | | | USD | | | 10,690,090 | | | Deutsche Bank AG | | | 8/04/16 | | | | (782,442 | ) |
| JPY | | | 2,818,118,110 | | | USD | | | 25,934,000 | | | Goldman Sachs International | | | 8/04/16 | | | | 1,386,373 | |
| USD | | | 10,727,885 | | | GBP | | | 7,440,000 | | | Deutsche Bank AG | | | 8/04/16 | | | | 820,237 | |
| EUR | | | 13,699,000 | | | JPY | | | 1,683,226,267 | | | Deutsche Bank AG | | | 8/09/16 | | | | (1,095,675 | ) |
| JPY | | | 1,754,047,358 | | | EUR | | | 13,699,000 | | | Deutsche Bank AG | | | 8/09/16 | | | | 1,782,367 | |
| USD | | | 656,977 | | | JPY | | | 70,821,091 | | | Goldman Sachs International | | | 8/09/16 | | | | (29,715 | ) |
| EUR | | | 23,005,000 | | | JPY | | | 2,862,500,647 | | | Morgan Stanley & Co. International PLC | | | 8/10/16 | | | | (2,187,360 | ) |
| JPY | | | 2,929,502,710 | | | EUR | | | 23,005,000 | | | Morgan Stanley Capital Services LLC | | | 8/10/16 | | | | 2,837,043 | |
| KRW | | | 12,231,258,893 | | | USD | | | 10,682,322 | | | Credit Suisse International | | | 8/10/16 | | | | (68,273 | ) |
| KRW | | | 12,496,233,107 | | | USD | | | 10,754,073 | | | Credit Suisse International | | | 8/10/16 | | | | 89,916 | |
| USD | | | 613,729 | | | JPY | | | 67,002,063 | | | Goldman Sachs International | | | 8/10/16 | | | | (35,955 | ) |
| USD | | | 20,416,540 | | | KRW | | | 24,727,492,000 | | | Credit Suisse International | | | 8/10/16 | | | | (1,041,498 | ) |
| EUR | | | 23,741,000 | | | JPY | | | 2,939,895,512 | | | Deutsche Bank AG | | | 8/19/16 | | | | (2,119,754 | ) |
| JPY | | | 2,947,017,812 | | | EUR | | | 23,741,000 | | | Deutsche Bank AG | | | 8/19/16 | | | | 2,188,836 | |
| USD | | | 65,126 | | | JPY | | | 7,122,300 | | | Goldman Sachs International | | | 8/19/16 | | | | (3,955 | ) |
| USD | | | 117,653,692 | | | JPY | | | 12,520,000,000 | | | JPMorgan Chase Bank N.A. | | | 8/22/16 | | | | (3,794,316 | ) |
| CAD | | | 34,418,000 | | | USD | | | 26,314,260 | | | Deutsche Bank AG | | | 8/24/16 | | | | 330,060 | |
| EUR | | | 18,692,000 | | | USD | | | 20,704,007 | | | Credit Suisse International | | | 8/24/16 | | | | 81,568 | |
| BRL | | | 35,936,000 | | | USD | | | 10,719,485 | | | Goldman Sachs International | | | 8/25/16 | | | | 270,367 | |
| USD | | | 19,729,901 | | | BRL | | | 71,659,000 | | | Goldman Sachs International | | | 8/25/16 | | | | (2,184,664 | ) |
| USD | | | 26,597,000 | | | MXN | | | 497,925,097 | | | Goldman Sachs International | | | 8/25/16 | | | | (482,911 | ) |
| USD | | | 18,698,000 | | | MXN | | | 349,665,053 | | | JPMorgan Chase Bank N.A. | | | 8/25/16 | | | | (318,713 | ) |
| ZAR | | | 170,034,888 | | | USD | | | 10,545,000 | | | Citibank N.A. | | | 8/26/16 | | | | 861,279 | |
| EUR | | | 18,860,000 | | | USD | | | 21,142,249 | | | JPMorgan Chase Bank N.A. | | | 9/01/16 | | | | (163,582 | ) |
| USD | | | 21,364,421 | | | EUR | | | 18,860,000 | | | JPMorgan Chase Bank N.A. | | | 9/01/16 | | | | 385,754 | |
| USD | | | 26,993,065 | | | GBP | | | 18,823,000 | | | HSBC Bank USA N.A. | | | 9/01/16 | | | | 1,920,219 | |
| CAD | | | 34,579,000 | | | USD | | | 26,944,328 | | | JPMorgan Chase Bank N.A. | | | 9/02/16 | | | | (175,199 | ) |
| USD | | | 27,116,602 | | | GBP | | | 18,823,000 | | | Goldman Sachs International | | | 9/02/16 | | | | 2,043,449 | |
| USD | | | 117,663,357 | | | JPY | | | 12,740,000,000 | | | Goldman Sachs International | | | 9/06/16 | | | | (5,991,236 | ) |
| USD | | | 27,097,149 | | | GBP | | | 18,822,000 | | | BNP Paribas S.A. | | | 9/09/16 | | | | 2,023,181 | |
| USD | | | 53,893,805 | | | JPY | | | 6,090,000,000 | | | Credit Suisse International | | | 9/12/16 | | | | (5,231,549 | ) |
| USD | | | 26,602,070 | | | GBP | | | 18,820,000 | | | JPMorgan Chase Bank N.A. | | | 9/15/16 | | | | 1,528,926 | |
| USD | | | 26,887,112 | | | GBP | | | 18,304,000 | | | Morgan Stanley & Co. International PLC | | | 9/16/16 | | | | 2,501,115 | |
| EUR | | | 23,670,000 | | | USD | | | 26,739,527 | | | HSBC Bank USA N.A. | | | 9/23/16 | | | | (387,628 | ) |
| USD | | | 15,022,921 | | | GBP | | | 10,985,000 | | | Credit Suisse International | | | 9/23/16 | | | | 386,606 | |
See Notes to Consolidated Financial Statements.
| | | | | | |
| 16 | | BLACKROCK VARIABLE SERIES FUNDS, INC. | | JUNE 30, 2016 | | |
| | | | |
| Consolidated Schedule of Investments (continued) | | | BlackRock Global Allocation V.I. Fund | |
| | | | | | | | | | | | | | | | | | | | | | |
Currency
Purchased | | | Currency Sold | | | Counterparty | | Settlement
Date | | | Unrealized
Appreciation
(Depreciation) | |
| USD | | | 10,462,897 | | | | AUD | | | | 14,202,000 | | | Deutsche Bank AG | | | 9/30/16 | | | $ | (93,276 | ) |
| USD | | | 15,063,238 | | | | GBP | | | | 10,984,000 | | | Credit Suisse International | | | 9/30/16 | | | | 426,981 | |
| USD | | | 14,974,414 | | | | GBP | | | | 10,980,000 | | | HSBC Bank USA N.A. | | | 9/30/16 | | | | 343,487 | |
| USD | | | 121,415,277 | | | | JPY | | | | 12,460,000,000 | | | Deutsche Bank AG | | | 10/03/16 | | | | 334,645 | |
| CNH | | | 180,900,000 | | | | USD | | | | 27,540,535 | | | Deutsche Bank AG | | | 11/04/16 | | | | (553,716 | ) |
| USD | | | 27,838,907 | | | | CNH | | | | 180,900,000 | | | Deutsche Bank AG | | | 11/04/16 | | | | 852,088 | |
| USD | | | 26,742,902 | | | | NZD | | | | 39,519,000 | | | Morgan Stanley & Co. International PLC | | | 11/08/16 | | | | (1,289,252 | ) |
| USD | | | 27,038,309 | | | | AUD | | | | 36,455,000 | | | Goldman Sachs International | | | 11/09/16 | | | | (20,480 | ) |
| USD | | | 26,978,685 | | | | AUD | | | | 37,033,000 | | | Deutsche Bank AG | | | 11/10/16 | | | | (508,167 | ) |
| USD | | | 26,726,694 | | | | NZD | | | | 40,064,000 | | | JPMorgan Chase Bank N.A. | | | 11/10/16 | | | | (1,689,339 | ) |
| BRL | | | 41,084,000 | | | | USD | | | | 11,531,056 | | | Deutsche Bank AG | | | 12/02/16 | | | | 671,634 | |
| USD | | | 11,014,477 | | | | BRL | | | | 41,084,000 | | | Deutsche Bank AG | | | 12/02/16 | | | | (1,188,213 | ) |
| TWD | | | 916,487,340 | | | | USD | | | | 28,069,197 | | | Citibank N.A. | | | 1/09/17 | | | | 460,509 | |
| TWD | | | 923,085,000 | | | | USD | | | | 28,324,179 | | | Goldman Sachs International | | | 1/09/17 | | | | 410,908 | |
| TWD | | | 912,385,998 | | | | USD | | | | 27,961,141 | | | JPMorgan Chase Bank N.A. | | | 1/09/17 | | | | 440,893 | |
| USD | | | 27,366,000 | | | | TWD | | | | 916,487,340 | | | Citibank N.A. | | | 1/09/17 | | | | (1,163,706 | ) |
| USD | | | 27,375,000 | | | | TWD | | | | 923,358,750 | | | Goldman Sachs International | | | 1/09/17 | | | | (1,368,609 | ) |
| USD | | | 27,366,000 | | | | TWD | | | | 912,385,998 | �� | | JPMorgan Chase Bank N.A. | | | 1/09/17 | | | | (1,036,034 | ) |
| TWD | | | 909,217,896 | | | | USD | | | | 27,908,954 | | | Credit Suisse International | | | 1/11/17 | | | | 395,751 | |
| USD | | | 27,102,000 | | | | TWD | | | | 909,217,896 | | | Credit Suisse International | | | 1/11/17 | | | | (1,202,705 | ) |
| USD | | | 10,577,000 | | | | AED | | | | 39,162,400 | | | BNP Paribas S.A. | | | 1/19/17 | | | | (69,582 | ) |
| USD | | | 10,576,000 | | | | AED | | | | 39,189,368 | | | Goldman Sachs International | | | 1/19/17 | | | | (77,913 | ) |
| USD | | | 10,475,000 | | | | AED | | | | 38,791,020 | | | BNP Paribas S.A. | | | 1/25/17 | | | | (69,534 | ) |
| EUR | | | 9,345,000 | | | | JPY | | | | 1,162,447,912 | | | HSBC Bank USA N.A. | | | 2/13/17 | | | | (896,444 | ) |
| JPY | | | 1,211,551,215 | | | | EUR | | | | 9,345,000 | | | HSBC Bank USA N.A. | | | 2/13/17 | | | | 1,376,296 | |
| USD | | | 453,250 | | | | JPY | | | | 49,103,303 | | | HSBC Bank USA N.A. | | | 2/13/17 | | | | (26,602 | ) |
| TWD | | | 344,727,300 | | | | USD | | | | 10,759,279 | | | Deutsche Bank AG | | | 2/16/17 | | | | (18,806 | ) |
| USD | | | 10,315,000 | | | | TWD | | | | 344,727,300 | | | Deutsche Bank AG | | | 2/16/17 | | | | (425,473 | ) |
| Total | | | | | | | | | | | | | | | | | | | | | $(19,009,224 | ) |
| | | | | | | | | | | | | | | | | | | | | | |
| | | | | | | | | | | | | | | | | | | | | | | | | | | | | | |
Exchange-Traded Options Purchased | | | | | | | | | | | | |
| Description | | Put/
Call | | Expiration
Date | | Strike Price | | Contracts | | Value |
SPDR Gold Trust ETF1 | | | | Call | | | | | 8/19/16 | | | | | USD | | | | | 124.00 | | | | | 6,188 | | | | $ | 2,877,420 | |
SPDR Gold Trust ETF1 | | | | Call | | | | | 9/30/16 | | | | | USD | | | | | 125.00 | | | | | 3,043 | | | | | 1,582,360 | |
Total | | | | | | | | | | | | | | | | | | | | | | | | | | | | $ | 4,459,780 | |
| | | | | | | | | | | | | | | | | | | | | | | | | | | | | | |
| | 1 | | All or a portion of security is held by a wholly owned subsidiary. See Note 1 of the Notes to Consolidated Financial Statements for details on the wholly owned subsidiary. |
| | | | | | | | | | | | | | | | | | | | | | | | | | | | |
| OTC Options Purchased | | | | | | | | | | | | | | | | | | | | | | | |
| Description | | Put/
Call | | Counterparty | | Expiration
Date | | Strike Price | | | | | | Notional
Amount
(000) | | | Contracts | | | Value | |
USD Currency | | Call | | Deutsche Bank AG | | 7/07/16 | | JPY | | | 110.00 | | | | USD | | | | 60,619 | | | | — | | | $ | 6 | |
| | | | Morgan Stanley & Co. | | | | | | | | | | | | | | | | | | | | | | | | |
USD Currency | | Call | | International PLC | | 8/08/16 | | JPY | | | 111.00 | | | | USD | | | | 60,655 | | | | — | | | | 42,628 | |
USD Currency | | Call | | Goldman Sachs International | | 9/08/16 | | JPY | | | 110.50 | | | | USD | | | | 60,678 | | | | — | | | | 128,267 | |
Apple Inc. | | Call | | Citibank N.A. | | 9/16/16 | | USD | | | 100.00 | | | | | | | | — | | | | 202,874 | | | | 403,395 | |
See Notes to Consolidated Financial Statements.
| | | | | | |
| | | BLACKROCK VARIABLE SERIES FUNDS, INC. | | JUNE 30, 2016 | | 17 |
| | | | |
| Consolidated Schedule of Investments (continued) | | | BlackRock Global Allocation V.I. Fund | |
| | | | | | | | | | | | | | | | | | | | | | | | | | | | |
| Description | | Put/
Call | | Counterparty | | Expiration
Date | | Strike Price | | | Notional
Amount (000) | | | Contracts | | | Value | |
SPDR Gold Trust ETF1 | | Call | | JPMorgan Chase Bank N.A. | | 9/16/16 | | USD | | | 125.00 | | | | | | | | — | | | | 307,736 | | | $ | 1,492,520 | |
SPDR Gold Trust ETF1 | | Call | | JPMorgan Chase Bank N.A. | | 9/16/16 | | USD | | | 120.00 | | | | | | | | — | | | | 304,500 | | | | 2,428,388 | |
SPDR Gold Trust ETF1 | | Call | | JPMorgan Chase Bank N.A. | | 9/16/16 | | USD | | | 100.00 | | | | | | | | — | | | | 215,416 | | | | 5,719,295 | |
STOXX Europe 600 Index | | Call | | Credit Suisse International | | 9/16/16 | | EUR | | | 345.00 | | | | | | | | — | | | | 48,196 | | | | 251,383 | |
Taiwan Stock Exchange | | | | | | | | | | | | | | | | | | | | | | | | | | | | |
Weighted Index | | Call | | Citibank N.A. | | 9/21/16 | | TWD | | | 9,000.77 | | | | | | | | — | | | | 101,800 | | | | 131,217 | |
USD Currency | | Call | | JPMorgan Chase Bank N.A. | | 10/04/16 | | JPY | | | 110.00 | | | | USD | | | | 60,804 | | | | — | | | | 229,567 | |
SPDR Gold Trust ETF1 | | Call | | JPMorgan Chase Bank N.A. | | 10/21/16 | | USD | | | 127.00 | | | | | | | | — | | | | 155,036 | | | | 744,173 | |
USD Currency | | Call | | Deutsche Bank AG | | 11/15/16 | | JPY | | | 108.50 | | | | USD | | | | 61,288 | | | | — | | | | 504,410 | |
SPDR Gold Trust ETF1 | | Call | | JPMorgan Chase Bank N.A. | | 12/16/16 | | USD | | | 125.00 | | | | | | | | — | | | | 307,736 | | | | 2,107,992 | |
SPDR Gold Trust ETF1 | | Call | | JPMorgan Chase Bank N.A. | | 12/16/16 | | USD | | | 100.00 | | | | | | | | — | �� | | | 166,178 | | | | 4,395,408 | |
MetLife, Inc. | | Call | | UBS AG | | 1/20/17 | | USD | | | 50.00 | | | | | | | | — | | | | 183,706 | | | | 45,008 | |
MetLife, Inc. | | Call | | UBS AG | | 1/20/17 | | USD | | | 52.50 | | | | | | | | — | | | | 167,100 | | | | 22,559 | |
| | | | Morgan Stanley & Co. | | | | | | | | | | | | | | | | | | | | | | | | |
Prudential Financial, Inc. | | Call | | International PLC | | 1/20/17 | | USD | | | 87.50 | | | | | | | | — | | | | 204,800 | | | | 116,736 | |
SPDR Gold Trust ETF1 | | Call | | Société Générale | | 1/20/17 | | USD | | | 121.00 | | | | | | | | — | | | | 308,755 | | | | 2,956,329 | |
| | | | Morgan Stanley & Co. | | | | | | | | | | | | | | | | | | | | | | | | |
Euro STOXX 50 Index | | Call | | International PLC | | 3/17/17 | | EUR | | | 3,450.00 | | | | | | | | — | | | | 3,894 | | | | 101,150 | |
| | | | Morgan Stanley & Co. | | | | | | | | | | | | | | | | | | | | | | | | |
Euro STOXX 50 Index | | Call | | International PLC | | 3/17/17 | | EUR | | | 3,025.00 | | | | | | | | — | | | | 2,031 | | | | 287,417 | |
| | | | Morgan Stanley & Co. | | | | | | | | | | | | | | | | | | | | | | | | |
Euro STOXX 50 Index | | Call | | International PLC | | 3/17/17 | | EUR | | | 3,025.00 | | | | | | | | — | | | | 2,029 | | | | 287,134 | |
STOXX Europe 600 Index | | Call | | Credit Suisse International | | 3/17/17 | | EUR | | | 355.61 | | | | | | | | — | | | | 69,976 | | | | 734,009 | |
QUALCOMM, Inc. | | Call | | Deutsche Bank AG | | 5/19/17 | | USD | | | 52.50 | | | | | | | | — | | | | 363,420 | | | | 1,838,138 | |
Euro STOXX 50 Index | | Call | | Citibank N.A. | | 6/16/17 | | EUR | | | 3,150.00 | | | | | | | | — | | | | 7,591 | | | | 729,531 | |
Euro STOXX 50 Index | | Call | | Bank of America N.A. | | 9/15/17 | | EUR | | | 3,600.00 | | | | | | | | — | | | | 7,747 | | | | 224,591 | |
STOXX Europe 600 Index | | Call | | JPMorgan Chase Bank N.A. | | 9/15/17 | | EUR | | | 372.06 | | | | | | | | — | | | | 47,705 | | | | 414,871 | |
Taiwan Capitalization Weighted | | | | Morgan Stanley & Co. | | | | | | | | | | | | | | | | | | | | | | | | |
Stock Index | | Call | | International PLC | | 9/20/17 | | TWD | | | 9,000.00 | | | | | | | | — | | | | 92,908 | | | | 669,537 | |
Euro STOXX 50 Index | | Call | | Barclays Bank PLC | | 12/15/17 | | EUR | | | 3,500.00 | | | | | | | | — | | | | 7,935 | | | | 434,076 | |
Taiwan Capitalization Weighted | | | | Morgan Stanley & Co. | | | | | | | | | | | | | | | | | | | | | | | | |
Stock Index | | Call | | International PLC | | 12/20/17 | | TWD | | | 9,000.00 | | | | | | | | — | | | | 94,754 | | | | 832,832 | |
Aflac, Inc. | | Call | | Goldman Sachs International | | 1/19/18 | | USD | | | 85.00 | | | | | | | | — | | | | 325,876 | | | | 433,415 | |
Allstate Corp. | | Call | | Goldman Sachs International | | 1/19/18 | | USD | | | 80.00 | | | | | | | | — | | | | 207,513 | | | | 423,327 | |
BB&T Corp. | | Call | | Goldman Sachs International | | 1/19/18 | | USD | | | 40.00 | | | | | | | | — | | | | 453,103 | | | | 847,303 | |
Capital One Financial Corp. | | Call | | Goldman Sachs International | | 1/19/18 | | USD | | | 80.00 | | | | | | | | — | | | | 463,825 | | | | 1,379,879 | |
Charles Schwab Corp. | | Call | | Goldman Sachs International | | 1/19/18 | | USD | | | 40.00 | | | | | | | | — | | | | 635,632 | | | | 397,270 | |
CIT Group, Inc. | | Call | | Goldman Sachs International | | 1/19/18 | | USD | | | 42.00 | | | | | | | | — | | | | 278,741 | | | | 497,553 | |
Citigroup, Inc. | | Call | | Goldman Sachs International | | 1/19/18 | | USD | | | 55.00 | | | | | | | | — | | | | 635,632 | | | | 1,220,413 | |
CME Group, Inc . | | Call | | Goldman Sachs International | | 1/19/18 | | USD | | | 115.00 | | | | | | | | — | | | | 223,046 | | | | 602,224 | |
Comerica, Inc. | | Call | | Goldman Sachs International | | 1/19/18 | | USD | | | 55.00 | | | | | | | | — | | | | 389,790 | | | | 613,919 | |
E*TRADE Financial Corp. | | Call | | Goldman Sachs International | | 1/19/18 | | USD | | | 35.00 | | | | | | | | — | | | | 577,281 | | | | 516,667 | |
Fifth Third Bancorp | | Call | | Goldman Sachs International | | 1/19/18 | | USD | | | 25.00 | | | | | | | | — | | | | 635,632 | | | | 228,828 | |
Franklin Resources, Inc. | | Call | | Goldman Sachs International | | 1/19/18 | | USD | | | 45.00 | | | | | | | | — | | | | 573,874 | | | | 516,487 | |
JPMorgan Chase & Co. | | Call | | Goldman Sachs International | | 1/19/18 | | USD | | | 70.00 | | | | | | | | — | | | | 635,632 | | | | 2,011,775 | |
KeyCorp | | Call | | Goldman Sachs International | | 1/19/18 | | USD | | | 15.00 | | | | | | | | — | | | | 635,632 | | | | 209,759 | |
Manulife Financial Corp. | | Call | | Goldman Sachs International | | 1/19/18 | | CAD | | | 22.00 | | | | | | | | — | | | | 635,632 | | | | 331,850 | |
MetLife, Inc. | | Call | | Goldman Sachs International | | 1/19/18 | | USD | | | 52.50 | | | | | | | | — | | | | 635,632 | | | | 670,592 | |
Morgan Stanley | | Call | | Goldman Sachs International | | 1/19/18 | | USD | | | 35.00 | | | | | | | | — | | | | 635,632 | | | | 502,149 | |
Regions Financial Corp. | | Call | | Goldman Sachs International | | 1/19/18 | | USD | | | 12.00 | | | | | | | | — | | | | 635,632 | | | | 184,333 | |
State Street Corp. | | Call | | Goldman Sachs International | | 1/19/18 | | USD | | | 72.50 | | | | | | | | — | | | | 430,051 | | | | 627,874 | |
SunTrust Banks, Inc. | | Call | | Goldman Sachs International | | 1/19/18 | | USD | | | 55.00 | | | | | | | | — | | | | 635,632 | | | | 626,098 | |
Synchrony Financial | | Call | | Goldman Sachs International | | 1/19/18 | | USD | | | 35.00 | | | | | | | | — | | | | 635,632 | | | | 619,741 | |
TD Ameritrade Holding Corp. | | Call | | Goldman Sachs International | | 1/19/18 | | USD | | | 40.00 | | | | | | | | — | | | | 541,773 | | | | 419,874 | |
Travelers Cos., Inc . | | Call | | Goldman Sachs International | | 1/19/18 | | USD | | | 135.00 | | | | | | | | — | | | | 196,582 | | | | 570,088 | |
See Notes to Consolidated Financial Statements.
| | | | | | |
| 18 | | BLACKROCK VARIABLE SERIES FUNDS, INC. | | JUNE 30, 2016 | | |
| | | | |
| Consolidated Schedule of Investments (continued) | | | BlackRock Global Allocation V.I. Fund | |
| | | | | | | | | | | | | | | | | | | | | | | | | | | | | | | | | | | | |
| Description | | Put/
Call | | | Counterparty | | | Expiration
Date | | | Strike Price | | | Notional
Amount (000) | | | Contracts | | | Value | |
Wells Fargo & Co. | | | Call | | | | Goldman Sachs International | | | | 1/19/18 | | | | USD | | | | 55.00 | | | | | | | | — | | | | 635,632 | | | $ | 1,118,712 | |
Zions Bancorp | | | Call | | | | Goldman Sachs International | | | | 1/19/18 | | | | USD | | | | 35.00 | | | | | | | | — | | | | 521,152 | | | | 349,172 | |
Nikkei 225 Index | | | Call | | | | Goldman Sachs International | | | | 3/09/18 | | | | JPY | | | | 21,968.28 | | | | | | | | — | | | | 247,564 | | | | 498,130 | |
Euro STOXX 50 Index | | | Call | | | | Goldman Sachs International | | | | 3/16/18 | | | | EUR | | | | 3,500.00 | | | | | | | | — | | | | 6,612 | | | | 407,497 | |
Euro STOXX 50 Index | | | Call | | | | UBS AG | | | | 6/15/18 | | | | EUR | | | | 3,600.00 | | | | | | | | — | | | | 3,205 | | | | 168,394 | |
Euro STOXX 50 Index | | | Call | | | | Deutsche Bank AG | | | | 9/21/18 | | | | EUR | | | | 3,426.55 | | | | | | | | — | | | | 3,336 | | | | 310,723 | |
Euro STOXX 50 Index | | | Put | | | | UBS AG | | | | 7/15/16 | | | | EUR | | | | 2,875.00 | | | | | | | | — | | | | 16,381 | | | | 1,165,154 | |
| | | | | | | Morgan Stanley & Co. | | | | | | | | | | | | | | | | | | | | | | | | | | | | | |
S&P 500 Index | | | Put | | | | International PLC | | | | 7/15/16 | | | | USD | | | | 2,035.00 | | | | | | | | — | | | | 119,894 | | | | 797,295 | |
| | | | | | | Morgan Stanley & Co. | | | | | | | | | | | | | | | | | | | | | | | | | | | | | |
Gentex Corp. | | | Put | | | | International PLC | | | | 9/16/16 | | | | USD | | | | 12.50 | | | | | | | | — | | | | 956,718 | | | | 47,836 | |
Total | | | | | | | | | | | | | | | | | | | | | | | | | | | | | | | | | | $ | 47,586,898 | |
| | | | | | | | | | | | | | | | | | | | | | | | | | | | | | | | | | | | |
| | 1 | | All or a portion of security is held by a wholly owned subsidiary. See Note 1 of the Notes to Consolidated Financial Statements for details on the wholly owned subsidiary. |
| | | | | | | | | | | | | | | | | | | | | | | | | | | | | | | | | | | | |
OTC Interest Rate Swaptions Purchased | | | | | | | | | | | | | | | | | | | | | | | | | |
| Description | | Counterparty | | | Put/
Call | | | Exercise Rate | | | Pay/Receive
Exercise Rate | | | Floating Rate
Index | | | Expiration
Date | | | Notional
Amount (000) | | | Value | |
10-Year Interest Rate Swap | | | Deutsche Bank AG | | | | Put | | | | 1.25% | | | | Pay | | | | 6-month JPY LIBOR | | | | 7/29/16 | | | | JPY | | | | 2,831,410 | | | $ | 12 | |
10-Year Interest Rate Swap | | | Goldman Sachs International | | | | Put | | | | 1.22% | | | | Pay | | | | 6-month GBP LIBOR | | | | 9/15/16 | | | | GBP | | | | 124,020 | | | | 1,102,077 | |
10-Year Interest Rate Swap | | | Goldman Sachs International | | | | Put | | | | 1.62% | | | | Pay | | | | 6-month GBP LIBOR | | | | 9/15/16 | | | | GBP | | | | 124,020 | | | | 141,671 | |
10-Year Interest Rate Swap | | | Goldman Sachs International | | | | Put | | | | 1.48% | | | | Pay | | | | 3-month LIBOR | | | | 9/16/16 | | | | USD | | | | 124,010 | | | | 1,280,400 | |
10-Year Interest Rate Swap | | | Goldman Sachs International | | | | Put | | | | 1.88% | | | | Pay | | | | 3-month LIBOR | | | | 9/16/16 | | | | USD | | | | 124,010 | | | | 207,552 | |
5-Year Interest Rate Swap | | | Deutsche Bank AG | | | | Put | | | | 1.07% | | | | Pay | | | | 6-month JPY LIBOR | | | | 4/04/18 | | | | JPY | | | | 2,370,178 | | | | 21,335 | |
Total | | | | | | | | | | | | | | | | | | | | | | | | | | | | | | | | | | $ | 2,753,047 | |
| | | | | | | | | | | | | | | | | | | | | | | | | | | | | | | | | | | | |
| | | | | | | | | | | | | | | | | | | | | | | | |
Exchange-Traded Options Written | | | | | | | | | | | | | | | | | | |
| Description | | Put/
Call | | | Expiration
Date | | | Strike Price | | | Contracts | | | Value | |
WhiteWave Foods Co. | | | Call | | | | 7/15/16 | | | | USD | | | | 37.50 | | | | 645 | | | $ | (619,200 | ) |
Hershey Co. | | | Call | | | | 8/19/16 | | | | USD | | | | 100.00 | | | | 358 | | | | (538,790 | ) |
SPDR Gold Trust ETF1 | | | Call | | | | 8/19/16 | | | | USD | | | | 136.00 | | | | 6,188 | | | | (513,604 | ) |
Altria Group, Inc. | | | Call | | | | 9/16/16 | | | | USD | | | | 67.50 | | | | 1,227 | | | | (346,628 | ) |
Mondelez International, Inc., Class A | | | Call | | | | 9/16/16 | | | | USD | | | | 43.00 | | | | 1,361 | | | | (534,193 | ) |
Whole Foods Market, Inc. | | | Call | | | | 9/16/16 | | | | USD | | | | 34.00 | | | | 1,765 | | | | (169,440 | ) |
SPDR Gold Trust ETF1 | | | Call | | | | 9/30/16 | | | | USD | | | | 145.00 | | | | 3,043 | | | | (222,139 | ) |
Perrigo Co. PLC | | | Call | | | | 11/18/16 | | | | USD | | | | 110.00 | | | | 406 | | | | (146,160 | ) |
Altria Group, Inc. | | | Call | | | | 12/16/16 | | | | USD | | | | 67.50 | | | | 1,227 | | | | (457,057 | ) |
Total | | | | | | | | | | | | | | | | | | | | | | $ | (3,547,211 | ) |
| | | | | | | | | | | | | | | | | | | | | | | | |
| | 1 | | All or a portion of security is held by a wholly owned subsidiary. See Note 1 of the Notes to Consolidated Financial Statements for details on the wholly owned subsidiary. |
See Notes to Consolidated Financial Statements.
| | | | | | |
| | | BLACKROCK VARIABLE SERIES FUNDS, INC. | | JUNE 30, 2016 | | 19 |
| | | | |
| Consolidated Schedule of Investments (continued) | | | BlackRock Global Allocation V.I. Fund | |
| | | | | | | | | | | | | | | | | | | | | | | | | | | | | | | | | | | | | | | | |
OTC Barrier Options Written | | | | | | | | | | | | | | | | | | | | | | | | | |
| Description | | Put/
Call | | | Type of
Options | | | Counterparty | | | Expiration Date | | | Strike Price | | | Barrier Price | | | Contracts | | | Value | |
Euro STOXX 50 Index | | | Put | | | | Down-and-In | | | | Morgan Stanley & Co. International PLC | | | | 03/17/17 | | | | EUR | | | | 2,375.00 | | | | EUR | | | | 2,000.00 | | | | 2,029 | | | $ | (166,932 | ) |
Euro STOXX 50 Index | | | Put | | | | Down-and-In | | | | Morgan Stanley & Co. International PLC | | | | 03/17/17 | | | | EUR | | | | 2,375.00 | | | | EUR | | | | 2,000.00 | | | | 2,031 | | | | (183,747 | ) |
Euro STOXX 50 Index | | | Put | | | | Down-and-In | | | | Citibank N.A. | | | | 06/16/17 | | | | EUR | | | | 2,350.00 | | | | EUR | | | | 1,823.00 | | | | 7,591 | | | | (950,244 | ) |
Nikkei 225 Index | | | Put | | | | Down-and-In | | | | Goldman Sachs International | | | | 03/09/18 | | | | JPY | | | | 17,974.04 | | | | JPY | | | | 14,978.37 | | | | 247,564 | | | | (8,824,810 | ) |
Euro STOXX 50 Index | | | Put | | | | Down-and-In | | | | Deutsche Bank AG | | | | 09/21/18 | | | | EUR | | | | 2,586.07 | | | | EUR | | | | 2,165.83 | | | | 3,336 | | | | (1,127,867 | ) |
Total | | | | | �� | | | | | | | | | | | | | | | | | | | | | | | | | | | | | | | | | $ | (11,253,600 | ) |
| | | | | | | | | | | | | | | | | | | | | | | | | | | | | | | | | | | | | | | | |
| | | | | | | | | | | | | | | | | | | | | | | | | | | | |
OTC Options Written | | | | | | | | | | | | | | | | | | | | | | | |
| Description | | Put/
Call | | Counterparty | | Expiration
Date | | Strike Price | | | Notional Amount (000) | | | Contracts | | | Value | |
Bank of America Corp. | | Call | | Morgan Stanley & Co. International PLC | | 7/15/16 | | USD | | | 14.00 | | | | | | | | — | | | | 365,200 | | | $ | (31,042 | ) |
Mylan NV | | Call | | Barclays Bank PLC | | 7/15/16 | | USD | | | 45.00 | | | | | | | | — | | | | 71,975 | | | | (35,628 | ) |
USD Currency | | Call | | Deutsche Bank AG | | 8/22/16 | | ZAR | | | 17.00 | | | | USD | | | | 30,558 | | | | — | | | | (97,279 | ) |
General Electric Co. | | Call | | UBS AG | | 9/16/16 | | USD | | | 31.00 | | | | | | | | — | | | | 1,079,636 | | | | (1,333,350 | ) |
SPDR Gold Trust ETF1 | | Call | | JPMorgan Chase Bank N.A. | | 9/16/16 | | USD | | | 140.00 | | | | | | | | — | | | | 304,500 | | | | (272,528 | ) |
SPDR Gold Trust ETF1 | | Call | | JPMorgan Chase Bank N.A. | | 9/16/16 | | USD | | | 137.00 | | | | | | | | — | | | | 307,736 | | | | (384,670 | ) |
USD Currency | | Call | | JPMorgan Chase Bank N.A. | | 10/04/16 | | JPY | | | 117.00 | | | | USD | | | | 60,804 | | | | — | | | | (36,823 | ) |
SPDR Gold Trust ETF1 | | Call | | JPMorgan Chase Bank N.A. | | 10/21/16 | | USD | | | 150.00 | | | | | | | | — | | | | 155,036 | | | | (103,874 | ) |
NZD Currency | | Call | | Morgan Stanley & Co. International PLC | | 11/08/16 | | USD | | | 0.73 | | | | NZD | | | | 39,519 | | | | — | | | | (494,744 | ) |
AUD Currency | | Call | | Goldman Sachs International | | 11/09/16 | | USD | | | 0.80 | | | | AUD | | | | 36,455 | | | | — | | | | (117,980 | ) |
AUD Currency | | Call | | Deutsche Bank AG | | 11/10/16 | | USD | | | 0.79 | | | | AUD | | | | 37,033 | | | | — | | | | (174,918 | ) |
NZD Currency | | Call | | JPMorgan Chase Bank N.A. | | 11/10/16 | | USD | | | 0.73 | | | | NZD | | | | 40,064 | | | | — | | | | (580,641 | ) |
USD Currency | | Call | | Deutsche Bank AG | | 11/15/16 | | JPY | | | 115.00 | | | | USD | | | | 61,288 | | | | — | | | | (133,589 | ) |
Alexion Pharmaceuticals, Inc. | | Call | | Credit Suisse International | | 11/18/16 | | USD | | | 125.00 | | | | | | | | — | | | | 19,811 | | | | (162,450 | ) |
SPDR Gold Trust ETF1 | | Call | | JPMorgan Chase Bank N.A. | | 12/16/16 | | USD | | | 145.00 | | | | | | | | — | | | | 307,736 | | | | (524,690 | ) |
General Electric Co. | | Call | | Deutsche Bank AG | | 1/20/17 | | USD | | | 32.50 | | | | | | | | — | | | | 932,852 | | | | (941,378 | ) |
Johnson & Johnson | | Call | | Barclays Bank PLC | | 1/20/17 | | USD | | | 110.00 | | | | | | | | — | | | | 299,959 | | | | (3,764,485 | ) |
SPDR Gold Trust ETF1 | | Call | | Société Générale | | 1/20/17 | | USD | | | 145.00 | | | | | | | | — | | | | 308,755 | | | | (646,842 | ) |
QUALCOMM, Inc. | | Call | | Deutsche Bank AG | | 5/19/17 | | USD | | | 70.00 | | | | | | | | — | | | | 363,420 | | | | (186,911 | ) |
Euro STOXX 50 Index | | Put | | UBS AG | | 7/15/16 | | EUR | | | 2,650.00 | | | | | | | | — | | | | 16,381 | | | | (172,699 | ) |
GBP Currency | | Put | | Goldman Sachs International | | 7/15/16 | | USD | | | 1.30 | | | | GBP | | | | 61,402 | | | | — | | | | (409,096 | ) |
S&P 500 Index | | Put | | Morgan Stanley & Co. International PLC | | 7/15/16 | | USD | | | 1,870.00 | | | | | | | | — | | | | 119,894 | | | | (95,915 | ) |
USD Currency | | Put | | Morgan Stanley & Co. International PLC | | 8/08/16 | | JPY | | | 101.00 | | | | USD | | | | 60,655 | | | | — | | | | (727,915 | ) |
USD Currency | | Put | | Goldman Sachs International | | 8/22/16 | | ZAR | | | 14.20 | | | | USD | | | | 30,558 | | | | — | | | | (396,682 | ) |
USD Currency | | Put | | Goldman Sachs International | | 9/08/16 | | JPY | | | 100.50 | | | | USD | | | | 60,678 | | | | — | | | | (925,764 | ) |
Apple Inc. | | Put | | Citibank N.A. | | 9/16/16 | | USD | | | 90.00 | | | | | | | | — | | | | 202,874 | | | | (421,534 | ) |
Taiwan Stock Exchange Weighted Index | | Put | | Citibank N.A. | | 9/21/16 | | TWD | | | 8,100.70 | | | | | | | | — | | | | 101,800 | | | | (502,623 | ) |
USD Currency | | Put | | JPMorgan Chase Bank N.A. | | 10/04/16 | | JPY | | | 100.00 | | | | USD | | | | 60,804 | | | | — | | | | (1,033,621 | ) |
NZD Currency | | Put | | Morgan Stanley & Co. International PLC | | 11/08/16 | | USD | | | 0.62 | | | | NZD | | | | 39,519 | | | | — | | | | (101,117 | ) |
AUD Currency | | Put | | Goldman Sachs International | | 11/09/16 | | USD | | | 0.69 | | | | AUD | | | | 36,455 | | | | — | | | | (204,520 | ) |
AUD Currency | | Put | | Deutsche Bank AG | | 11/10/16 | | USD | | | 0.67 | | | | AUD | | | | 37,033 | | | | — | | | | (141,518 | ) |
NZD Currency | | Put | | JPMorgan Chase Bank N.A. | | 11/10/16 | | USD | | | 0.62 | | | | NZD | | | | 40,064 | | | | — | | | | (91,521 | ) |
USD Currency | | Put | | Deutsche Bank AG | | 11/15/16 | | JPY | | | 98.00 | | | | USD | | | | 61,288 | | | | — | | | | (975,566 | ) |
See Notes to Consolidated Financial Statements.
| | | | | | |
| 20 | | BLACKROCK VARIABLE SERIES FUNDS, INC. | | JUNE 30, 2016 | | |
| | | | |
| Consolidated Schedule of Investments (continued) | | | BlackRock Global Allocation V.I. Fund | |
| | | | | | | | | | | | | | | | | | | | | | | | | | | | | | | | |
| Description | | Put/
Call | | | Counterparty | | | Expiration
Date | | | Strike Price | | | Notional
Amount
(000) | | | Contracts | | | Value | |
Johnson & Johnson | | | Put | | | | Barclays Bank PLC | | | | 1/20/17 | | | | USD | | | | 97.50 | | | | — | | | | 299,959 | | | $ | (292,460 | ) |
MetLife, Inc. | | | Put | | | | UBS AG | | | | 1/20/17 | | | | USD | | | | 46.00 | | | | — | | | | 83,550 | | | | (749,725 | ) |
MetLife, Inc. | | | Put | | | | UBS AG | | | | 1/20/17 | | | | USD | | | | 45.00 | | | | — | | | | 91,853 | | | | (647,564 | ) |
Prudential Financial, Inc. | | | Put | | | | Morgan Stanley & Co. International PLC | | | | 1/20/17 | | | | USD | | | | 77.50 | | | | — | | | | 102,400 | | | | (1,039,360 | ) |
QUALCOMM, Inc. | | | Put | | | | Deutsche Bank AG | | | | 5/19/17 | | | | USD | | | | 40.00 | | | | — | | | | 363,420 | | | | (605,280 | ) |
Taiwan Capitalization Weighted Stock Index | | | Put | | | | Morgan Stanley & Co. International PLC | | | | 9/20/17 | | | | TWD | | | | 8,600.00 | | | | — | | | | 92,908 | | | | (2,794,611 | ) |
Taiwan Capitalization Weighted Stock Index | | | Put | | | | Morgan Stanley & Co. International PLC | | | | 12/20/17 | | | | TWD | | | | 8,600.00 | | | | — | | | | 94,754 | | | | (3,058,644 | ) |
Total | | | | | | | | | | | | | | | | | | | | | | | | | | | | | | $ | (25,411,557 | ) |
| | | | | | | | | | | | | | | | | | | | | | | | | | | | | | | | |
| | 1 | | All or a portion of security is held by a wholly owned subsidiary. See Note 1 of the Notes to Consolidated Financial Statements for details on the wholly owned subsidiary. |
| | | | | | | | | | | | | | | | | | | | | | | | | | | | | | | | | | | | |
OTC Interest Rate Swaptions Written | |
| Description | | Counterparty | | | Put/
Call | | | Exercise Rate | | | Pay/Receive
Exercise Rate | | | Floating Rate Index | | | Expiration
Date | | | Notional Amount (000) | | | Value | |
10-Year Interest Rate Swap | | | Goldman Sachs International | | | | Put | | | | 1.42% | | | | Receive | | | | 6-month GBP LIBOR | | | | 9/15/16 | | | | GBP | | | | 248,040 | | | $ | (868,895 | ) |
10-Year Interest Rate Swap | | | Goldman Sachs International | | | | Put | | | | 1.68% | | | | Receive | | | | 3-month LIBOR | | | | 9/16/16 | | | | USD | | | | 248,020 | | | | (1,085,881 | ) |
Total | | | | | | | | | | | | | | | | | | | | | | | | | | | | | | | | | | $ | (1,954,776 | ) |
| | | | | | | | | | | | | | | | | | | | | | | | | | | | | | | | | | | | |
| | | | | | | | | | | | | | | | | | | | | | | | |
Centrally Cleared Credit Default Swaps — Sell Protection | | | | | | | | | | | | | | | | | | |
| Index | | Receive
Fixed
Rate | | | Expiration
Date | | | Credit
Rating1 | | | Notional
Amount (000)2 | | | Unrealized
Appreciation
(Depreciation) | |
CDX.NA.HY Series 26 Version 1 | | | 5.00% | | | | 6/20/21 | | | | B+ | | | | USD | | | | 40,354 | | | $ | 144,989 | |
CDX.NA.IG Series 26 Version 1 | | | 1.00% | | | | 6/20/21 | | | | BBB+ | | | | USD | | | | 213,449 | | | | 258,636 | |
iTraxx Europe Crossover Series 25 Version 1 | | | 5.00% | | | | 6/20/21 | | | | B+ | | | | EUR | | | | 74,434 | | | | (1,767,065 | ) |
iTraxx Europe Series 25 Version 1 | | | 1.00% | | | | 6/20/21 | | | | BBB+ | | | | EUR | | | | 46,940 | | | | (273,543 | ) |
Total | | | | | | | | | | | | | | | | | | | | | | $ | (1,636,983 | ) |
| | | | | | | | | | | | | | | | | | | | | | | | |
| | 1 | | Using S&P’s rating of the issuer or the underlying securities of the index, as applicable. |
| | 2 | | The maximum potential amount the Fund may pay should a negative credit event take place as defined under the terms of the agreement. |
| | | | | | | | | | | | | | | | | | | | | | | | |
Centrally Cleared Interest Rate Swaps | | | | | | | | | | | | | | | | | | |
Fixed Rate | | Floating Rate | | | Effective
Date | | | Expiration
Date | | | Notional Amount (000) | | | Unrealized
Depreciation | |
0.02%1 | | | 6-month EURIBOR | | | | N/A | | | | 4/09/21 | | | | EUR | | | | 16,078 | | | | $(89,932 | ) |
1.45%1 | | | 3-month LIBOR | | | | 6/28/192 | | | | 6/28/22 | | | | USD | | | | 124,556 | | | | (341,014 | ) |
1.38%1 | | | 3-month LIBOR | | | | 6/28/192 | | | | 6/28/22 | | | | USD | | | | 62,278 | | | | (52,678 | ) |
1.45%1 | | | 3-month LIBOR | | | | 6/28/192 | | | | 6/28/22 | | | | USD | | | | 62,278 | | | | (179,571 | ) |
Total | | | | | | | | | | | | | | | | | | | | | | | $(663,195 | ) |
| | | | | | | | | | | | | | | | | | | | | | | | |
| | 1 | | Fund pays the fixed rate and receives the floating rate. |
See Notes to Consolidated Financial Statements.
| | | | | | |
| | | BLACKROCK VARIABLE SERIES FUNDS, INC. | | JUNE 30, 2016 | | 21 |
| | | | |
| Consolidated Schedule of Investments (continued) | | | BlackRock Global Allocation V.I. Fund | |
| | | | | | | | | | | | | | | | | | | | | | | | | | | | | | | | | | | | | | |
OTC Currency Swaps | | | | | | | | | | | | | | | | | | | | | | | | | | | | | |
| | | | | | Notional Amount (000) | | | | | | | | | | | | | | | |
| Fund Pays | | Fund Receives | | | Notional
Delivered | | | Notional
Received | | | Counterparty | | | Expiration
Date1 | | | Value | | | Premiums
Paid
(Received) | | Unrealized
Depreciation | |
0.10 JPY% | | | 1.23% | | | | JPY | | | | 2,383,000 | | | | USD | | | | 19,769 | | | | Bank of America N.A. | | | | 3/15/2017 | | | $ | (6,514,372 | ) | | — | | $ | (6,514,372 | ) |
0.10 JPY% | | | 1.84% | | | | JPY | | | | 2,434,450 | | | | USD | | | | 21,624 | | | | Bank of America N.A. | | | | 3/15/2018 | | | | (3,691,296 | ) | | — | | | (3,691,296 | ) |
0.10 JPY% | | | 1.96% | | | | JPY | | | | 3,652,350 | | | | USD | | | | 32,208 | | | | Bank of America N.A. | | | | 3/15/2018 | | | | (5,907,961 | ) | | — | | | (5,907,961 | ) |
Total | | | | | | | | | | | | | | | | | | | | | | | | | | | | | | $ | (16,113,629 | ) | | — | | $ | (16,113,629 | ) |
| | | | | | | | | | | | | | | | | | | | | | | | | | | | | | | | |
| | 1 | | At expiration date, the notional amount delivered will be exchanged for the notional amount received. |
| | | | | | | | | | | | | | | | | | | | | | | | |
OTC Total Return Swaps | | | | | | | | | | | | | | | | | | | | |
| Reference Entity | | Fixed Amount/ Floating Rate | | Counterparty | | Expiration
Date | | Contract
Amount | | | Value | | | Premiums
Paid
(Received) | | Unrealized
Appreciation
(Depreciation) | |
SGX Nikkei Stock Average Dividend Point
Index Future December 2016 | | JPY 506,870,0001 | | BNP Paribas S.A. | | 3/31/17 | | | JPY | | | | 182 | | | $ | 854,791 | | | — | | $ | 854,791 | |
SGX Nikkei Stock Average Dividend Point
Index Future December 2016 | | JPY 515,970,0001 | | BNP Paribas S.A. | | 3/31/17 | | | JPY | | | | 182 | | | | 766,668 | | | — | | | 766,668 | |
Euro STOXX 50 Index Dividend Future
December 2017 | | EUR 5,355,9801 | | BNP Paribas S.A. | | 12/15/17 | | | EUR | | | | 469 | | | | (109,300 | ) | | — | | | (109,300 | ) |
Euro STOXX 50 Index Dividend Future
December 2017 | | EUR 5,360,1901 | | BNP Paribas S.A. | | 12/15/17 | | | EUR | | | | 465 | | | | (163,733 | ) | | — | | | (163,733 | ) |
SGX Nikkei Stock Average Dividend Point
Index Future December 2017 | | JPY 594,918,0001 | | BNP Paribas S.A. | | 4/02/18 | | | JPY | | | | 180 | | | | (61,182 | ) | | — | | | (61,182 | ) |
SGX Nikkei Stock Average Dividend Point
Index Future December 2017 | | JPY 600,750,0001 | | BNP Paribas S.A. | | 4/02/18 | | | JPY | | | | 180 | | | | (117,659 | ) | | — | | | (117,659 | ) |
Euro STOXX 50 Index Dividend Future
December 2018 | | EUR 2,618,4601 | | BNP Paribas S.A. | | 12/21/18 | | | EUR | | | | 234 | | | | (202,552 | ) | | — | | | (202,552 | ) |
Euro STOXX 50 Index Dividend Future
December 2018 | | EUR 2,892,8001 | | BNP Paribas S.A. | | 12/21/18 | | | EUR | | | | 256 | | | | (252,847 | ) | | — | | | (252,847 | ) |
Euro STOXX 50 Index Dividend Future
December 2018 | | EUR 5,310,6301 | | BNP Paribas S.A. | | 12/21/18 | | | EUR | | | | 468 | | | | (486,905 | ) | | — | | | (486,905 | ) |
S&P 500 Annual Dividend Index Future
December 2018 | | USD 7,094,3131 | | BNP Paribas S.A. | | 12/21/18 | | | USD | | | | 607 | | | | 60,700 | | | — | | | 60,700 | |
SGX Nikkei Stock Average Dividend Point
Index Future December 2018 | | JPY 309,375,0001 | | BNP Paribas S.A. | | 3/29/19 | | | JPY | | | | 90 | | | | (142,497 | ) | | — | | | (142,497 | ) |
SGX Nikkei Stock Average Dividend Point
Index Future December 2018 | | JPY 316,800,0001 | | BNP Paribas S.A. | | 3/29/19 | | | JPY | | | | 90 | | | | (214,400 | ) | | — | | | (214,400 | ) |
See Notes to Consolidated Financial Statements.
| | | | | | |
| 22 | | BLACKROCK VARIABLE SERIES FUNDS, INC. | | JUNE 30, 2016 | | |
| | | | |
| Consolidated Schedule of Investments (continued) | | | BlackRock Global Allocation V.I. Fund | |
| | | | | | | | | | | | | | | | | | | | | | | | | | | | |
| Reference Entity | | Fixed Amount/ Floating Rate | | Counterparty | | | Expiration
Date | | | Contract
Amount | | | Value | | | Premiums
Paid
(Received) | | Unrealized
Appreciation
(Depreciation) | |
SGX Nikkei Stock Average Dividend Point
Index Future December 2018 | | JPY 618,839,0001 | | | BNP Paribas S.A. | | | | 3/29/19 | | | | JPY | | | | 181 | | | $ | (254,152 | ) | | — | | $ | (254,152 | ) |
SGX Nikkei Stock Average Dividend Point
Index Future December 2019 | | JPY 314,640,0001 | | | BNP Paribas S.A. | | | | 3/31/20 | | | | JPY | | | | 90 | | | | (207,427 | ) | | — | | | (207,427 | ) |
SGX Nikkei Stock Average Dividend Point
Index Future December 2019 | | JPY 418,800,0001 | | | BNP Paribas S.A. | | | | 3/31/20 | | | | JPY | | | | 120 | | | | (269,598 | ) | | — | | | (269,598 | ) |
SGX Nikkei Stock Average Dividend Point
Index Future December 2019 | | JPY 510,000,0001 | | | BNP Paribas S.A. | | | | 3/31/20 | | | | JPY | | | | 150 | | | | (206,265 | ) | | — | | | (206,265 | ) |
S&P 500 Annual Dividend Index Future
December 2020 | | USD 2,937,2631 | | | Goldman Sachs International | | | | 12/18/20 | | | | USD | | | | 243 | | | | 50,119 | | | — | | | 50,119 | |
S&P 500 Annual Dividend Index Future
December 2021 | | USD 3,726,2131 | | | BNP Paribas S.A. | | | | 12/17/21 | | | | USD | | | | 307 | | | | 92,100 | | | — | | | 92,100 | |
Total | | | | | | | | | | | | | | | | | | | | $ | (864,139 | ) | | — | | $ | (864,139 | ) |
| | | | | | | | | | | | | | | | | | | | | | |
| | 1 | | Fund receives the total return of the reference entity and pays the fixed amount. Net payment made at termination. |
|
| Transactions in Options Written for the Six Months Ended June 30, 2016 |
| | | | | | | | | | | | | | | | | | | | |
| | | Calls | |
| | | | | | Notional (000) | |
| | | Contracts | | | AUD | | | NZD | | | USD | | | Premiums
Received | |
| | | | |
Outstanding options, beginning of period | | | 14,290,521 | | | | — | | | | — | | | | 354,800 | | | $ | 16,320,399 | |
Options written | | | 5,603,118 | | | | 73,488 | | | | 79,583 | | | | 1,733,156 | | | | 20,576,210 | |
Options exercised | | | (770,271 | ) | | | — | | | | — | | | | — | | | | (1,006,325 | ) |
Options expired | | | (12,988,578 | ) | | | — | | | | — | | | | — | | | | (7,335,380 | ) |
Options closed | | | (1,601,954 | ) | | | — | | | | — | | | | (1,935,306 | ) | | | (17,921,711 | ) |
| | | | |
Outstanding options, end of period | | | 4,532,836 | | | | 73,488 | | | | 79,583 | | | | 152,650 | | | $ | 10,633,193 | |
| | | | |
| | | | | | | | | | | | | | | | | | | | | | | | |
| | | Puts | |
| | | | | | Notional (000) | |
| | | Contracts | | | AUD | | | GBP | | | NZD | | | USD | | | Premiums
Received | |
| | | | |
Outstanding options, beginning of period | | | 39,408,444 | | | | — | | | | — | | | | — | | | | 296,405 | | | $ | 30,731,387 | |
Options written | | | 18,552,937 | | | | 73,488 | | | | 309,442 | | | | 79,583 | | | | 1,132,914 | | | | 26,588,489 | |
Options exercised | | | (827,763 | ) | | | — | | | | — | | | | — | | | | — | | | | (3,097,382 | ) |
Options expired | | | (82,120 | ) | | | — | | | | — | | | | — | | | | — | | | | (748,950 | ) |
Options closed | | | (55,219,154 | ) | | | — | | | | — | | | | — | | | | (907,316 | ) | | | (22,797,128 | ) |
| | | | |
Outstanding options, end of period | | | 1,832,344 | | | | 73,488 | | | | 309,442 | | | | 79,583 | | | | 522,003 | | | $ | 30,676,416 | |
| | | | |
As of period end, the value of portfolio securities subject to covered call options written was $449,242,794.
See Notes to Consolidated Financial Statements.
| | | | | | |
| | | BLACKROCK VARIABLE SERIES FUNDS, INC. | | JUNE 30, 2016 | | 23 |
| | | | |
| Consolidated Schedule of Investments (continued) | | | BlackRock Global Allocation V.I. Fund | |
|
| Derivative Financial Instruments Categorized by Risk Exposure |
As of period end, the fair values of derivative financial instruments located in the Consolidated Statement of Assets and Liabilities were as follows:
| | | | | | | | | | | | | | | | | | | | | | | | | | | | |
| Assets — Derivative Financial Instruments | | | Commodity
Contracts | | Credit
Contracts | | | Equity
Contracts | | | Foreign
Currency
Exchange
Contracts | | | Interest
Rate
Contracts | | | Other
Contracts | | Total | |
Futures contracts | | | Net unrealized appreciation1 | | | — | | | — | | | $ | 334,406 | | | | — | | | | — | | | — | | $ | 334,406 | |
Forward foreign currency exchange contracts | |
| Unrealized appreciation on forward
foreign currency exchange contracts |
| | — | | | — | | | | — | | | $ | 33,572,882 | | | | — | | | — | | | 33,572,882 | |
Options purchased | | | Investments at value — unaffiliated2 | | | — | | | — | | | | 51,141,800 | | | | 904,878 | | | $ | 2,753,047 | | | — | | | 54,799,725 | |
Swaps — OTC | | | Unrealized appreciation on OTC swaps | | | — | | | — | | | | 1,824,378 | | | | — | | | | — | | | — | | | 1,824,378 | |
Swaps — centrally cleared | | | Net unrealized appreciation1 | | | — | | $ | 403,625 | | | | — | | | | — | | | | — | | | — | | | 403,625 | |
Total | | | | | | — | | $ | 403,625 | | | $ | 53,300,584 | | | $ | 34,477,760 | | | $ | 2,753,047 | | | — | | $ | 90,935,016 | |
| | | | | | | |
| | | | | | | | | | | | | | | | | | | | | | | | | | | | |
| Liabilities — Derivative Financial Instruments | | | | | | | | | | | | | | | | | | | | |
Futures contracts | | | Net unrealized depreciation1 | | | — | | | — | | | $ | 846,378 | | | | — | | | | — | | | — | | $ | 846,378 | |
Forward foreign currency exchange contracts | |
| Unrealized depreciation on forward
foreign currency exchange contracts |
| | — | | | — | | | | — | | | $ | 52,582,106 | | | | — | | | — | | | 52,582,106 | |
Options written | | | Options written at value | | | — | | | — | | | | 33,569,074 | | | | 6,643,294 | | | $ | 1,954,776 | | | — | | | 42,167,144 | |
Swaps — OTC | | | Unrealized depreciation on OTC swaps | | | — | | | — | | | | 2,688,517 | | | | — | | | | 16,113,629 | | | — | | | 18,802,146 | |
Swaps — centrally cleared | | | Net unrealized depreciation1 | | | — | | $ | 2,040,608 | | | | — | | | | — | | | | 663,195 | | | — | | | 2,703,803 | |
Total | | | | | | — | | $ | 2,040,608 | | | $ | 37,103,969 | | | $ | 59,225,400 | | | $ | 18,731,600 | | | — | | $ | 117,101,577 | |
| | | | | | | |
| | 1 | | Includes cumulative appreciation (depreciation) on futures contracts and centrally cleared swaps, if any, as reported in the Consolidated Schedule of Investments. Only current day’s variation margin is reported within the Consolidated Statement of Assets and Liabilities. |
| | 2 | | Includes options purchased at value as reported in the Consolidated Schedule of Investments. |
For the six months ended June 30, 2016, the effect of derivative financial instruments in the Consolidated Statement of Operations was as follows:
| | | | | | | | | | | | | | | | | | | | | | | | |
| Net Realized Gain (Loss) from: | | Commodity
Contracts | | Credit
Contracts | | | Equity
Contracts | | | Foreign
Currency
Exchange
Contracts | | | Interest
Rate
Contracts | | | Other
Contracts | | Total | |
Futures contracts | | — | | | — | | | $ | (8,576,328 | ) | | | — | | | | — | | | — | | $ | (8,576,328 | ) |
Forward foreign currency exchange contracts | | — | | | — | | | | — | | | $ | (76,803,292 | ) | | | — | | | — | | | (76,803,292 | ) |
Options purchased1 | | — | | | — | | | | (23,528,082 | ) | | | (848,229 | ) | | $ | (5,374,888 | ) | | — | | | (29,751,199 | ) |
Options written | | — | | | — | | | | (8,532,002 | ) | | | 751,881 | | | | (4,134,081 | ) | | — | | | (11,914,202 | ) |
Swaps | | — | | $ | 4,225,798 | | | | 2,062,655 | | | | — | | | | 2,287,092 | | | — | | | 8,575,545 | |
| | | |
Total | | — | | $ | 4,225,798 | | | $ | (38,573,757 | ) | | $ | (76,899,640 | ) | | $ | (7,221,877 | ) | | — | | $ | (118,469,476 | ) |
| | | |
| | | | | | | | | | | | | | | | | | | | | | | | |
| Net Change in Unrealized Appreciation (Depreciation) on: | | | | | | | | | | | | | | | | | | | |
Futures contracts | | — | | | — | | | $ | 1,911,280 | | | | — | | | | — | | | — | | $ | 1,911,280 | |
Forward foreign currency exchange contracts | | — | | | — | | | | — | | | $ | (18,452,080 | ) | | | — | | | — | | | (18,452,080 | ) |
Options purchased2 | | — | | | — | | | | (3,061,043 | ) | | | (4,470,711 | ) | | $ | 2,929,174 | | | — | | | (4,602,580 | ) |
Options written | | — | | | — | | | | (5,894,504 | ) | | | (122,755 | ) | | | 930,005 | | | — | | | (5,087,254 | ) |
Swaps | | — | | $ | (892,623 | ) | | | (4,245,361 | ) | | | — | | | | (17,240,467 | ) | | — | | | (22,378,451 | ) |
| | | |
Total | | — | | $ | (892,623 | ) | | $ | (11,289,628 | ) | | $ | (23,045,546 | ) | | $ | (13,381,288 | ) | | — | | $ | (48,609,085 | ) |
| | | |
| | 1 | | Options purchased are included in net realized gain (loss) from investments. |
| | 2 | | Options purchased are included in net change in unrealized appreciation (depreciation) on investments. |
See Notes to Consolidated Financial Statements.
| | | | | | |
| 24 | | BLACKROCK VARIABLE SERIES FUNDS, INC. | | JUNE 30, 2016 | | |
| | | | |
| Consolidated Schedule of Investments (continued) | | | BlackRock Global Allocation V.I. Fund | |
|
| Average Quarterly Balances of Outstanding Derivative Financial Instruments |
| | | | |
Futures contracts: | | | | |
Average notional value of contracts — long | | $ | 118,123,475 | 1 |
Average notional value of contracts — short | | $ | 143,294,995 | |
Forward foreign currency exchange contracts: | | | | |
Average amounts purchased — in USD | | $ | 1,411,585,128 | |
Average amounts sold — in USD | | $ | 851,126,302 | |
Options: | | | | |
Average value of option contracts purchased | | $ | 38,778,234 | |
Average value of option contracts written | | $ | 35,650,568 | |
Average notional value of swaption contracts purchased | | $ | 459,257,048 | |
Average notional value of swaption contracts written | | $ | 532,812,493 | |
Credit default swaps: | | | | |
Average notional value — buy protection | | $ | 29,468,000 | |
Average notional value — sell protection | | $ | 250,950,517 | |
Interest rate swaps: | | | | |
Average notional value — pays fixed rate | | $ | 331,569,791 | |
Currency swaps: | | | | |
Average notional value — pays | | $ | 73,601,000 | |
Average notional value — receives | | $ | 78,638,527 | |
Total return swaps: | | | | |
Average notional value | | $ | 66,975,221 | |
| | 1 | | Actual amounts for the period are shown due to limited outstanding derivative financial instruments as of each quarter end. |
For more information about the Fund’s investment risks regarding derivative financial instruments, refer to the Notes to Consolidated Financial Statements.
|
| Derivative Financial Instruments — Offsetting as of Period End |
| | | | | | | | | | | | |
The Fund’s derivative assets and liabilities (by type) were as follows: | | | | | | | | | |
| | | Assets | | | | | | Liabilities | |
Derivative Financial Instruments: | | | | | | | | | | | | |
Futures contracts | | $ | 176,627 | | | | | | | $ | 638,929 | |
Forward foreign currency exchange contracts | | | 33,572,882 | | | | | | | | 52,582,106 | |
Options | | | 54,799,725 | 1 | | | | | | | 42,167,144 | |
Swaps — centrally cleared | | | 739,645 | | | | | | | | — | |
Swaps — OTC2 | | | 1,824,378 | | | | | | | | 18,802,146 | |
Total derivative assets and liabilities in the Consolidated Statement of Assets and Liabilities | | $ | 91,113,257 | | | | | | | $ | 114,190,325 | |
Derivatives not subject to a Master Netting Agreement or similar agreement (“MNA”) | | | (5,376,052 | ) | | | | | | | (4,186,140 | ) |
Total derivative assets and liabilities subject to an MNA | | $ | 85,737,205 | | | | | | | $ | 110,004,185 | |
| | 1 | | Includes options purchased at value which is included in Investments at value—unaffiliated in the Consolidated Statement of Assets and Liabilities and reported in the Consolidated Schedule of Investments. |
| | 2 | | Includes unrealized appreciation (depreciation) on OTC swaps in the Consolidated Statement of Assets and Liabilities. |
The following tables present the Fund’s derivative assets and liabilities by counterparty net of amounts available for offset under an MNA and net of the related collateral received and pledged by the Fund:
| | | | | | | | | | | | | | | | | | | | | | | | | |
| Counterparty | | Derivative Assets
Subject to an MNA by
Counterparty | | Derivatives Available
for Offset1 | | Non-cash
Collateral
Received2 | | Cash Collateral
Received2 | | Net Amount of
Derivative Assets3,6 |
Bank of America N.A | | | $ | 224,591 | | | | $ | (224,591 | ) | | — | | | | — | | | | | — | |
Barclays Bank PLC | | | | 434,076 | | | | | (434,076 | ) | | — | | | | — | | | | | — | |
BNP Paribas S.A | | | | 3,797,440 | | | | | (2,827,633 | ) | | — | | | | — | | | | $ | 969,807 | |
Citibank N.A | | | | 3,199,743 | | | | | (3,078,639 | ) | | — | | | | — | | | | | 121,104 | |
Credit Suisse International | | | | 2,519,191 | | | | | (2,519,191 | ) | | — | | | | — | | | | | — | |
Deutsche Bank AG | | | | 12,109,289 | | | | | (12,109,289 | ) | | — | | | | — | | | | | — | |
Goldman Sachs International | | | | 23,846,112 | | | | | (23,729,578 | ) | | — | | | | — | | | | | 116,534 | |
HSBC Bank USA N.A | | | | 3,640,002 | | | | | (1,310,674 | ) | | — | | | | — | | | | | 2,329,328 | |
JPMorgan Chase Bank N.A | | | | 19,887,787 | | | | | (12,032,720 | ) | | — | | | $ | (7,855,067 | ) | | | | — | |
Morgan Stanley & Co. International PLC | | | | 7,779,849 | | | | | (7,779,849 | ) | | — | | | | — | | | | | — | |
Morgan Stanley Capital Services LLC | | | | 3,941,681 | | | | | (1,607,606 | ) | | — | | | | — | | | | | 2,334,075 | |
Société Générale | | | | 2,956,329 | | | | | (646,842 | ) | | — | | | | (2,280,000 | ) | | | | 29,487 | |
UBS AG | | | | 1,401,115 | | | | | (1,401,115 | ) | | — | | | | — | | | | | — | |
Total | | | $ | 85,737,205 | | | | $ | (69,701,803 | ) | | — | | | $ | (10,135,067 | ) | | | | $5,900,335 | |
See Notes to Consolidated Financial Statements.
| | | | | | |
| | | BLACKROCK VARIABLE SERIES FUNDS, INC. | | JUNE 30, 2016 | | 25 |
| | | | |
| Consolidated Schedule of Investments (continued) | | | BlackRock Global Allocation V.I. Fund | |
| | | | | | | | | | | | | | | | | | | | | | | | | |
| Counterparty | | Derivative Liabilities
Subject to an MNA by
Counterparty | | Derivatives Available
for Offset1 | | Non-cash
Collateral
Pledged4 | | Cash
Collateral
Pledged | | Net Amount of
Derivative Liabilities5,6 |
Bank of America N.A | | | $ | 16,113,629 | | | | $ | (224,591 | ) | | | $ | (9,145,167 | ) | | — | | | $ | 6,743,871 | |
Barclays Bank PLC | | | | 4,092,573 | | | | | (434,076 | ) | | | | (3,658,497 | ) | | — | | | | — | |
BNP Paribas S.A | | | | 2,827,633 | | | | | (2,827,633 | ) | | | | — | | | — | | | | — | |
Citibank N.A | | | | 3,078,639 | | | | | (3,078,639 | ) | | | | — | | | — | | | | — | |
Credit Suisse International | | | | 8,823,757 | | | | | (2,519,191 | ) | | | | — | | | — | | | | 6,304,566 | |
Deutsche Bank AG | | | | 13,657,344 | | | | | (12,109,289 | ) | | | | (621,246 | ) | | — | | | | 926,809 | |
Goldman Sachs International | | | | 23,729,578 | | | | | (23,729,578 | ) | | | | — | | | — | | | | — | |
HSBC Bank USA N.A | | | | 1,310,674 | | | | | (1,310,674 | ) | | | | — | | | — | | | | — | |
JPMorgan Chase Bank N.A | | | | 12,032,720 | | | | | (12,032,720 | ) | | | | — | | | — | | | | — | |
Morgan Stanley & Co. International PLC | | | | 19,179,852 | | | | | (7,779,849 | ) | | | | (4,334,160 | ) | | — | | | | 7,065,843 | |
Morgan Stanley Capital Services LLC | | | | 1,607,606 | | | | | (1,607,606 | ) | | | | — | | | — | | | | — | |
Société Générale | | | | 646,842 | | | | | (646,842 | ) | | | | — | | | — | | | | — | |
UBS AG | | | | 2,903,338 | | | | | (1,401,115 | ) | | | | (679,655 | ) | | — | | | | 822,568 | |
Total | | | $ | 110,004,185 | | | | $ | (69,701,803 | ) | | | $ | (18,438,725 | ) | | — | | | $ | 21,863,657 | |
| | 1 | | The amount of derivatives available for offset is limited to the amount of derivative assets and/or liabilities that are subject to an MNA. |
| | 2 | | Excess of collateral received from the individual counterparty is not shown for financial reporting purposes. |
| | 3 | | Net amount represents the net amount receivable from the counterparty in the event of default. |
| | 4 | | Excess of collateral pledged to the individual counterparty is not shown for financial reporting purposes. |
| | 5 | | Net amount represents the net amount payable due to the counterparty in the event of default. Net amount may be offset further by the options written receivable/payable on the Consolidated Statement of Assets and Liabilities. |
| | 6 | | Net amount may also include forward foreign currency exchange contracts and currency options that are not required to be collateralized. |
|
| Fair Value Hierarchy as of Period End |
Various inputs are used in determining the fair value of investments and derivative financial instruments. For information about the Fund’s policy regarding valuation of investments and derivative financial instruments, refer to the Notes to Consolidated Financial Statements.
The following tables summarize the Fund’s investments and derivative financial instruments categorized in the disclosure hierarchy:
| | | | | | | | | | | | | | | | |
| | | Level 1 | | | Level 2 | | | Level 3 | | | Total | |
Assets: | | | | | | | | | | | | | | | | |
Investments: | | | | | | | | | | | | | | | | |
Long-Term Investments: | | | | | | | | | | | | | | | | |
Common Stocks: | | | | | | | | | | | | | | | | |
Australia | | | — | | | $ | 31,845,774 | | | | — | | | $ | 31,845,774 | |
Belgium | | | — | | | | 26,840,867 | | | | — | | | | 26,840,867 | |
Brazil | | $ | 1,334,588 | | | | — | | | | — | | | | 1,334,588 | |
Canada | | | 89,845,106 | | | | — | | | | — | | | | 89,845,106 | |
China | | | 29,122,375 | | | | 9,624,976 | | | | — | | | | 38,747,351 | |
Denmark | | | — | | | | 9,332,104 | | | | — | | | | 9,332,104 | |
Egypt | | | 1,452,830 | | | | — | | | | — | | | | 1,452,830 | |
Finland | | | — | | | | 8,716,147 | | | | — | | | | 8,716,147 | |
France | | | 1,269,840 | | | | 284,812,355 | | | | — | | | | 286,082,195 | |
Germany | | | — | | | | 107,571,802 | | | | — | | | | 107,571,802 | |
Hong Kong | | | — | | | | 54,883,874 | | | | — | | | | 54,883,874 | |
India | | | — | | | | 36,586,019 | | | | — | | | | 36,586,019 | |
Indonesia | | | — | | | | 7,468,534 | | | | — | | | | 7,468,534 | |
Ireland | | | 12,914,820 | | | | 27,407,599 | | | | — | | | | 40,322,419 | |
Israel | | | 32,602,334 | | | | — | | | | — | | | | 32,602,334 | |
Italy | | | 7,238,142 | | | | 76,273,913 | | | | — | | | | 83,512,055 | |
Japan | | | — | | | | 883,567,966 | | | | — | | | | 883,567,966 | |
Luxembourg | | | — | | | | 940,177 | | | | — | | | | 940,177 | |
Mexico | | | 25,650,924 | | | | — | | | | — | | | | 25,650,924 | |
Netherlands | | | 60,912,169 | | | | 109,546,245 | | | | — | | | | 170,458,414 | |
Norway | | | — | | | | 5,847,809 | | | | — | | | | 5,847,809 | |
Portugal | | | — | | | | 6,271,485 | | | | — | | | | 6,271,485 | |
Singapore | | | — | | | | 73,844,421 | | | | — | | | | 73,844,421 | |
South Korea | | | — | | | | 41,316,397 | | | | — | | | | 41,316,397 | |
Spain | | | — | | | | 28,638,375 | | | | — | | | | 28,638,375 | |
Sweden | | | — | | | | 35,307,977 | | | | — | | | | 35,307,977 | |
See Notes to Consolidated Financial Statements.
| | | | | | |
| 26 | | BLACKROCK VARIABLE SERIES FUNDS, INC. | | JUNE 30, 2016 | | |
| | | | |
| Consolidated Schedule of Investments (continued) | | | BlackRock Global Allocation V.I. Fund | |
| | | | | | | | | | | | | | | | |
| | | Level 1 | | | Level 2 | | | Level 3 | | | Total | |
Switzerland | | | — | | | $ | 131,253,251 | | | | — | | | $ | 131,253,251 | |
Taiwan | | | — | | | | 19,138,663 | | | | — | | | | 19,138,663 | |
United Arab Emirates | | $ | 14,585,973 | | | | 3,085,847 | | | | — | | | | 17,671,820 | |
United Kingdom | | | 84,207,700 | | | | 284,391,193 | | | $ | 4,569,937 | | | | 373,168,830 | |
United States | | | 3,099,441,970 | | | | — | | | | 751,444 | | | | 3,100,193,414 | |
Corporate Bonds | | | — | | | | 577,614,888 | | | | 41,197,573 | | | | 618, 812,461 | |
Floating Rate Loan Interests | | | — | | | | 78,684,244 | | | | 14,476,561 | | | | 93,160,805 | |
Foreign Agency Obligations | | | — | | | | 98,712,717 | | | | — | | | | 98,712,717 | |
Foreign Government Obligations | | | — | | | | 1,047,816,125 | | | | — | | | | 1,047,816,125 | |
Investment Companies | | | 361,871,101 | | | | — | | | | — | | | | 361,871,101 | |
Non-Agency Mortgage-Backed Securities | | | — | | | | — | | | | 8,217,064 | | | | 8,217,064 | |
Preferred Securities | | | 170,550,040 | | | | 207,721,423 | | | | 119,543,383 | | | | 497,814,846 | |
U.S. Government Sponsored Agency Securities | | | — | | | | 64,114,666 | | | | — | | | | 64,114,666 | |
U.S. Treasury Obligations | | | — | | | | 1,296,929,030 | | | | — | | | | 1,296,929,030 | |
Warrants | | | — | | | | 933,681 | | | | — | | | | 933,681 | |
Short-Term Securities: | | | | | | | | | | | | | | | | |
Foreign Agency Obligations | | | — | | | | 546,297,851 | | | | — | | | | 546,297,851 | |
Money Market Funds | | | 6,016,752 | | | | 274,482,165 | | | | — | | | | 280,498,917 | |
Time Deposits | | | — | | | | 12,862,657 | | | | — | | | | 12,862,657 | |
U.S. Treasury Obligations | | | — | | | | 578,256,882 | | | | — | | | | 578,256,882 | |
Options Purchased: | | | | | | | | | | | | | | | | |
Equity contracts | | | 4,459,780 | | | | 46,682,020 | | | | — | | | | 51,141,800 | |
Foreign currency exchange contracts | | | — | | | | 904,878 | | | | — | | | | 904,878 | |
Interest rate contracts | | | — | | | | 2,753,047 | | | | — | | | | 2,753,047 | |
Liabilities: | | | | | | | | | | | | | | | | |
Investments: | | | | | | | | | | | | | | | | |
Investments Sold Short | | | (28,341,962 | ) | | | (5,605,142 | ) | | | — | | | | (33,947,104 | ) |
| | | | |
Total | | $ | 3,975,134,482 | | | $ | 7,133,674,902 | | | $ | 188,755,962 | | | $ | 11,297,565,346 | |
| | | | |
| | | | | | | | | | | | | | | | |
Derivative Financial Instruments1 | | | | | | | | | | | | | | | | |
Assets: | | | | | | | | | | | | | | | | |
Credit contracts | | | — | | | $ | 403,625 | | | | — | | | $ | 403,625 | |
Equity contracts | | $ | 334,406 | | | | 1,824,378 | | | | — | | | | 2,158,784 | |
Foreign currency exchange contracts | | | — | | | | 33,572,882 | | | | — | | | | 33,572,882 | |
Liabilities: | | | | | | | | | | | | | | | | |
Credit contracts | | | — | | | | (2,040,608 | ) | | | — | | | | (2,040,608 | ) |
Equity contracts | | | (4,393,589 | ) | | | (32,710,380 | ) | | | — | | | | (37,103,969 | ) |
Foreign currency exchange contracts | | | — | | | | (59,225,400 | ) | | | — | | | | (59,225,400 | ) |
Interest rate contracts | | | — | | | | (18,731,600 | ) | | | — | | | | (18,731,600 | ) |
| | | | |
Total | | $ | (4,059,183 | ) | | $ | (76,907,103 | ) | | | — | | | $ | (80,966,286 | ) |
| | | | |
1 Derivative financial instruments are swaps, futures contracts, forward foreign currency exchange contracts and options written. Swaps, financial futures contracts and forward foreign currency exchange contracts are valued at the unrealized appreciation (depreciation) on the instrument and options written are shown at value. | |
|
| The Fund may hold assets and/or liabilities in which the fair value approximates the carrying amount for financial statement purposes. As of period end, such assets and/or liabilities are categorized within the disclosure hierarchy as follows: | |
| | | | | | | | | | | | | | | | |
| | | Level 1 | | | Level 2 | | | Level 3 | | | Total | |
Assets: | | | | | | | | | | | | | | | | |
Cash | | $ | 658,738 | | | | — | | | | — | | | $ | 658,738 | |
Cash held for investments sold short | | | 36,317,738 | | | | — | | | | — | | | | 36,317,738 | |
Cash pledged for centrally cleared swaps | | | 15,286,960 | | | | — | | | | — | | | | 15,286,960 | |
Liabilities: | | | | | | | | | | | | | | | | |
Foreign bank overdraft | | | — | | | $ | (683,278 | ) | | | — | | | | (683,278 | ) |
Cash received: | | | | | | | | | | | | | | | | |
Collateral — Options written | | | — | | | | (18,520,000 | ) | | | — | | | | (18,520,000 | ) |
Collateral — TBA commitments | | | — | | | | (503,000 | ) | | | — | | | | (503,000 | ) |
Collateral on securities loaned at value | | | — | | | | (274,482,165 | ) | | | — | | | | (274,482,165 | ) |
| | | | |
Total | | $ | 52,263,436 | | | $ | (294,188,443 | ) | | | — | | | $ | (241,925,007 | ) |
| | | | |
See Notes to Consolidated Financial Statements.
| | | | | | |
| | | BLACKROCK VARIABLE SERIES FUNDS, INC. | | JUNE 30, 2016 | | 27 |
| | | | |
| Consolidated Schedule of Investments (continued) | | | BlackRock Global Allocation V.I. Fund | |
During the six months ended June 30, 2016, there were no transfers between Level 1 and Level 2.
A reconciliation of Level 3 investments is presented when the Fund had a significant amount of Level 3 investments at the beginning and/or end of the period in relation to net assets. The following table is a reconciliation of Level 3 investments for which significant unobservable inputs were used in determining fair value:
| | | | | | | | | | | | | | | | | | | | | | | | | | | | | | | | |
| | | Common
Stocks | | | Corporate
Bonds | | | Floating
Rate Loan
Interests | | | Non-Agency
Mortgage-Backed
Securities | | | Preferred
Securities | | | Rights | | | Options
Purchased | | | Total | |
Assets: | | | | | | | | | | | | | | | | | | | | | | | | | | | | | | | | |
Opening balance, as of December 31, 2015 | | $ | 6,823,323 | | | $ | 91,576,847 | | | $ | 15,440,951 | | | | $ 9,349,901 | | | | $129,809,258 | | | | $1 | | | $ | 1,273,536 | | | $ | 254,273,817 | |
Transfers into Level 3 | | | — | | | | — | | | | — | | | | — | | | | — | | | | — | | | | — | | | | — | |
Transfers out of Level 3 | | | — | | | | (2,264,539 | ) | | | — | | | | — | | | | — | | | | — | | | | — | | | | (2,264,539 | ) |
Accrued discounts/premiums | | | — | | | | (449 | ) | | | 11,352 | | | | 62,127 | | | | — | | | | — | | | | — | | | | 73,030 | |
Net realized gain (loss) | | | — | | | | — | | | | 8,614 | | | | — | | | | — | | | | — | | | | (1,232,743 | ) | | | (1,224,129 | ) |
Net change in unrealized appreciation
(depreciation)1,2 | | | (1,501,942 | ) | | | (49,354,183 | ) | | | 399,066 | | | | (1,194,964 | ) | | | (10,265,875 | ) | | | (1 | ) | | | (38,414 | ) | | | (61,956,313 | ) |
Purchases | | | — | | | | 1,239,897 | | | | — | | | | — | | | | — | | | | — | | | | — | | | | 1,239,897 | |
Sales | | | — | | | | — | | | | (1,383,422 | ) | | | — | | | | — | | | | — | | | | (2,379 | ) | | | (1,385,801 | ) |
| |
Closing balance, as of June 30, 2016 | | $ | 5,321,381 | | | $ | 41,197,573 | | | $ | 14,476,561 | | | | $ 8,217,064 | | | | $119,543,383 | | | | — | | | | — | | | $ | 188,755,962 | |
| | | | |
Net change in unrealized appreciation (depreciation) on investments still held at June 30, 20162 | | ��$ | (1,501,942 | ) | | $ | (49,354,183 | ) | | $ | 399,066 | | | | $(1,194,964 | ) | | | $(10,265,875) | | | | — | | | | — | | | $ | (61,917,898 | ) |
| | | | |
| | 1 | | Included in the related net change in unrealized appreciation (depreciation) in the Consolidated Statement of Operations. |
| | 2 | | Any difference between net change in unrealized appreciation (depreciation) and net change in unrealized appreciation (depreciation) on investments still held at June 30, 2016 is generally due to investments no longer held or categorized as Level 3 at period end. |
The following table is a reconciliation of Level 3 derivative financial instruments for which significant unobservable inputs were used in determining fair value:
| | | | | | |
| | | | | | |
| | | Equity Contracts | |
| | | Assets | | Liabilities | |
Opening Balance, as of December 31, 2015 | | — | | $ | (875,797 | ) |
Transfers into Level 3 | | — | | | — | |
Transfers out of Level 3 | | — | | | — | |
Accrued discounts/premiums | | — | | | — | |
Net realized gain (loss) | | — | | | (2,649,027 | ) |
Net change in unrealized appreciation (depreciation)1 | | — | | | 7,090,454 | |
Purchases | | — | | | — | |
Issues | | — | | | — | |
Sales | | — | | | (3,565,630 | ) |
Settlements | | — | | | — | |
| |
Closing Balance, as of June 30, 2016 | | — | | | — | |
| | | |
Net change in unrealized appreciation (depreciation) on derivative financial instruments still held at June 30, 2016 | | — | | | — | |
| | | |
| | 1 | | Included in the related net change in unrealized appreciation (depreciation) in the Consolidated Statement of Operations. |
The Fund’s investments that are categorized as Level 3 were valued utilizing third party pricing information without adjustment. Such valuations are based on unobservable inputs. A significant change in third party information could result in a significantly lower or higher value of such Level 3 investments.
See Notes to Consolidated Financial Statements.
| | | | | | |
| 28 | | BLACKROCK VARIABLE SERIES FUNDS, INC. | | JUNE 30, 2016 | | |
| | | | |
| Consolidated Schedule of Investments (concluded) | | | BlackRock Global Allocation V.I. Fund | |
The following table summarizes the valuation techniques used and unobservable inputs utilized by the BlackRock Global Valuation Methodologies Committee (“Global Valuation Committee”) to determine the value of certain of the Fund’s Level 3 investments as of period end. The table does not include Level 3 investments with values based upon unadjusted third party pricing information in the amount of $22,783,820.
| | | | | | | | | | | | | | | | |
| | | Value | | | Valuation Techniques | | Unobservable Inputs | | Range of
Unobservable Inputs
Utilized | | | Weighted Average of
Unobservable Inputs | |
Assets: | | | | | | | | | | | | | | | | |
Common Stocks | | $ | 5,321,381 | | | Market Comparables | | Run Rate EBITDA Multiple2 | | | 20.50x | | | | — | |
| | | | | | Probability-Weighted Expected Return Model | | Discount Rate1 | | | 20.00% | | | | — | |
| | | | | | | | IPO Exit Probability2 | | | 45.00% | | | | — | |
| | | | | | | | Merger & Acquisition Probability2 | | | 50.00% | | | | — | |
| | | | | | | | Revenue Multiple2 | | | 9.0x - 13.25x | | | | — | |
| | | | | | | | Revenue Growth Rate1 | | | 78.00% | | | | — | |
| | | | | | | | Time to Exit1 | | | 1-2 years | | | | — | |
Corporate Bonds3 | | | 41,107,378 | | | Coverage Analysis | | Revenue Multiple2 | | | 0.70x | | | | — | |
| | | | | | Discounted Cash Flow | | Discount Rate1 | | | 15.00% | | | | — | |
| | | | | | Estimated Recovery Value | | Recovery Rate2 | | | — | | | | — | |
| | | | | | Market Comparables | | Run Rate EBITDA Multiple 2 | | | 20.50x | | | | — | |
Preferred Stocks | | | 119,543,383 | | | Market Comparables | | Priced to new financing round2 | | | — | | | | — | |
| | | | | | | | Revenue Multiple2 | | | 7.0x - 12.0x | | | | 9.65 | x |
| | | | | | | | Revenue Growth Rate1 | | | 84.00% | | | | — | |
| | | | | | Option Pricing Model | | Gross Profit Growth Rate2 | | | 83.00% | | | | | |
| | | | | | | | Revenue Multiple2 | | | 4.50x-9.00x | | | | 7.80 | x |
| | | | | | | | Risk Free Rate1 | | | 0.48% - 0.64% | | | | 0.52 | % |
| | | | | | | | Revenue Growth Rate1 | | | 182.00% | | | | — | |
| | | | | | | | Volatility2 | | | 54.00% - 57.00% | | | | 54.80 | % |
| | | | | | | | Time to Exit1 | | | 1-2 years | | | | — | |
| | | | | | Probability-Weighted Expected Return Model | | Discount Rate1 | | | 20.00% | | | | — | |
| | | | | | | | IPO Exit Probability2 | | | 45.00% - 85.00% | | | | 70.79 | % |
| | | | | | | | Merger & Acquisition Probability2 | | | 10.00% - 50.00% | | | | 24.21 | % |
| | | | | | | | Revenue Multiple2 | | | 9.0x - 14.25x | | | | 12.33 | x |
| | | | | | | | Revenue Growth Rate1 | | | 78.00% - 83.00% | | | | 81.22 | % |
| | | | | | | | Time to Exit1 | | | 1-3 years | | | | — | |
| | | | |
Total | | $ | 165,972,142 | | | | | | | | | | | | | |
| | | | |
| | 1 | | Decrease in unobservable input may result in a significant increase to value, while an increase in unobservable input may result in a significant decrease to value. |
| | 2 | | Increase in unobservable input may result in a significant increase to value, while a decrease in unobservable input may result in a significant decrease to value. |
| | 3 | | For the period ended June 30, 2016, the valuation technique for certain investments classified as corporate bonds changed to a Coverage Analysis Model. The investment was previously valued utilizing an Option Pricing Model. A Coverage Analysis Model was considered to be a more relevant measure of fair value for this investment. |
See Notes to Consolidated Financial Statements.
| | | | | | |
| | | BLACKROCK VARIABLE SERIES FUNDS, INC. | | JUNE 30, 2016 | | 29 |
| | | | |
| Consolidated Statement of Assets and Liabilities | | | | |
| | | | |
| June 30, 2016 (Unaudited) | | BlackRock
Global Allocation V.I.
Fund | |
| | | | |
| Assets | | | | |
Investments at value — unaffiliated (including securities loaned at value of $268,397,632)(cost — $11,045,041,601) | | $ | 11,013,388,626 | |
Investments at value — affiliated (cost — $320,225,397) | | | 318,123,824 | |
Cash | | | 658,738 | |
Cash held for investments sold short | | | 36,317,738 | |
Cash pledged for centrally cleared swaps | | | 15,286,960 | |
Receivables: | | | | |
Investments sold | | | 35,679,808 | |
Securities lending income — affiliated | | | 104,455 | |
Capital shares sold | | | 1,893,081 | |
Dividends — affiliated | | | 193 | |
Dividends — unaffiliated | | | 11,846,526 | |
Interest | | | 27,294,817 | |
From the Manager | | | 2,000,572 | |
Variation margin on futures contracts | | | 176,627 | |
Variation margin on centrally cleared swaps | | | 739,645 | |
Unrealized appreciation on: | | | | |
Forward foreign currency exchange contracts | | | 33,572,882 | |
OTC swaps | | | 1,824,378 | |
Prepaid expenses | | | 28,359 | |
| | | | |
Total assets | | | 11,498,937,229 | |
| | | | |
| | | | |
| Liabilities | | | | |
Investments sold short at value (proceeds — $34,876,751) | | | 33,947,104 | |
Foreign bank overdraft — (cost — $668,299) | | | 683,278 | |
Cash received: | | | | |
Collateral — Options written | | | 18,520,000 | |
Collateral — TBA commitments | | | 503,000 | |
Collateral on securities loaned at value | | | 274,482,165 | |
Options written at value (premiums received — $41,309,609) | | | 42,167,144 | |
Payables: | | | | |
Investments purchased | | | 329,271,509 | |
Capital shares redeemed | | | 9,131,115 | |
Deferred foreign capital gain tax | | | 212,618 | |
Distribution fees | | | 1,764,299 | |
Dividends on short sales | | | 29,501 | |
Investment advisory fees | | | 5,500,311 | |
Officer’s and Directors’ fees | | | 43,800 | |
Options written | | | 138,055 | |
Other accrued expenses | | | 6,668,218 | |
Other affiliates | | | 59,139 | |
Variation margin on futures contracts | | | 638,929 | |
Unrealized depreciation on: | | | | |
Forward foreign currency exchange contracts | | | 52,582,106 | |
OTC swaps | | | 18,802,146 | |
| | | | |
Total liabilities | | | 795,144,437 | |
| | | | |
Net Assets | | $ | 10,703,792,792 | |
| | | | |
| | | | |
| Net Assets Consist of | | | | |
Paid-in capital | | $ | 11,054,783,461 | |
Undistributed net investment income | | | 43,535,153 | |
Accumulated net realized loss | | | (323,960,713 | ) |
Net unrealized appreciation (depreciation) | | | (70,565,109 | ) |
| | | | |
Net Assets | | $ | 10,703,792,792 | |
| | | | |
| | | | |
| Net Asset Value | | | | |
| |
Class I — Based on net assets of $2,061,298,121 and 136,379,307 shares outstanding, 400 million shares authorized, $0.10 par value | | $ | 15.11 | |
| | | | |
Class II — Based on net assets of $238,012,527 and 15,810,417 shares outstanding, 200 million shares authorized, $0.10 par value | | $ | 15.05 | |
| | | | |
Class III — Based on net assets of $8,404,482,144 and 644,272,041 shares outstanding, 1.5 billion shares authorized, $0.10 par value | | $ | 13.04 | |
| | | | |
See Notes to Consolidated Financial Statements.
| | | | | | |
| 30 | | BLACKROCK VARIABLE SERIES FUNDS, INC. | | JUNE 30, 2016 | | |
| | | | |
| Consolidated Statement of Operations | | | | |
| | | | |
| Six Months Ended June 30, 2016 (Unaudited) | | BlackRock
Global Allocation V.I.
Fund | |
| | | | |
| Investment Income | | | | |
Dividends — unaffiliated | | $ | 86,835,729 | |
Interest | | | 55,019,981 | |
Securities lending — affiliated — net | | | 1,743,660 | |
Dividends — affiliated | | | 232,698 | |
Foreign taxes withheld | | | (5,411,979 | ) |
| | | | |
Total income | | | 138,420,089 | |
| | | | |
| | | | |
| Expenses | | | | |
Investment advisory | | | 33,381,516 | |
Distribution — class specific | | | 10,725,663 | |
Transfer agent | | | 2,379 | |
Transfer agent — class specific | | | 9,832,377 | |
Custodian | | | 583,532 | |
Accounting services | | | 305,845 | |
Printing | | | 287,036 | |
Professional | | | 286,516 | |
Officer and Directors | | | 80,967 | |
Registration | | | 2,765 | |
Miscellaneous | | | 269,069 | |
| | | | |
Total expenses excluding dividend expense and stock loan fees | | | 55,757,665 | |
Dividend expense | | | 363,624 | |
Stock loan fees | | | 4,032 | |
| | | | |
Total expenses | | | 56,125,321 | |
Less: | | | | |
Fees waived by the Manager | | | (1,284 | ) |
Transfer agent fees reimbursed — class specific | | | (6,089,573 | ) |
| | | | |
Total expenses after fees waived and reimbursed | | | 50,034,464 | |
| | | | |
Net investment income | | | 88,385,625 | |
| | | | |
| | | | |
| Realized and Unrealized Gain (Loss) | | | | |
Net realized gain (loss) from: | | | | |
Investments — unaffiliated | | | (152,234,911 | ) |
Investments — affiliated | | | 1,787,228 | |
Futures contracts | | | (8,576,328 | ) |
Foreign currency transactions | | | (75,934,450 | ) |
Options written | | | (11,914,202 | ) |
Short sales | | | 3,007,060 | |
Swaps | | | 8,575,545 | |
| | | | |
| | | (235,290,058 | ) |
| | | | |
Net change in unrealized appreciation (depreciation) on: | | | | |
Investments — unaffiliated (net of $184,163 foreign capital gain tax) | | | 187,820,844 | |
Investments — affiliated | | | 5,438,957 | |
Futures contracts | | | 1,911,280 | |
Foreign currency translations | | | (18,125,968 | ) |
Options written | | | (5,087,254 | ) |
Short sales | | | 292,569 | |
Swaps | | | (22,378,451 | ) |
| | | | |
| | | 149,871,977 | |
| | | | |
Net realized and unrealized loss | | | (85,418,081 | ) |
| | | | |
Net Increase in Net Assets Resulting from Operations | | $ | 2,967,544 | |
| | | | |
See Notes to Consolidated Financial Statements.
| | | | | | |
| | | BLACKROCK VARIABLE SERIES FUNDS, INC. | | JUNE 30, 2016 | | 31 |
| | | | |
| Consolidated Statements of Changes in Net Assets | | | BlackRock Global Allocation V.I. Fund | |
| | | | | | | | |
| Increase (Decrease) in Net Assets: | | Six Months Ended
June 30, 2016
(Unaudited) | | | Year Ended
December 31,
2015 | |
| | | | | | | | |
| Operations | | | | | |
Net investment income. | | $ | 88,385,625 | | | $ | 129,521,516 | |
Net realized gain (loss) | | | (235,290,058 | ) | | | 472,061,666 | |
Net change in unrealized appreciation (depreciation) | | | 149,871,977 | | | | (729,403,422 | ) |
| | | | |
Net increase (decrease) in net assets resulting from operations | | | 2,967,544 | | | | (127,820,240 | ) |
| | | | |
| | | | | | | | |
| Distributions to Shareholders1 | | | | | | | | |
From net investment income: | | | | | | | | |
Class I | | | — | | | | (22,591,667 | ) |
Class II | | | — | | | | (2,596,531 | ) |
Class III | | | — | | | | (96,000,973 | ) |
From net realized gain: | | | | | | | | |
Class I | | | — | | | | (104,343,065 | ) |
Class II | | | — | | | | (13,712,126 | ) |
Class III | | | — | | | | (543,917,999 | ) |
From return of capital: | | | | | | | | |
Class I | | | — | | | | (1,227,074 | ) |
Class II | | | — | | | | (159,076 | ) |
Class III | | | — | | | | (6,297,189 | ) |
| | | | |
Decrease in net assets resulting from distributions to shareholders | | | — | | | | (790,845,700 | ) |
| | | | |
| | | | | | | | |
| Capital Share Transactions | | | | | | | | |
Net increase (decrease) in net assets derived from capital share transactions | | | (419,798,333 | ) | | | 290,068,576 | |
| | | | |
| | | | | | | | |
| Net Assets | | | | | | | | |
Total decrease in net assets | | | (416,830,789 | ) | | | (628,597,364 | ) |
Beginning of period | | | 11,120,623,581 | | | | 11,749,220,945 | |
| | | | |
End of period | | $ | 10,703,792,792 | | | $ | 11,120,623,581 | |
| | | | |
Undistributed (distributions in excess of) net investment income, end of period | | $ | 43,535,153 | | | $ | (44,850,472 | ) |
| | | | |
| | 1 | | Distributions for annual periods determined in accordance with federal income tax regulations. |
See Notes to Consolidated Financial Statements.
| | | | | | |
| 32 | | BLACKROCK VARIABLE SERIES FUNDS, INC. | | JUNE 30, 2016 | | |
| | | | |
| Consolidated Financial Highlights | | | BlackRock Global Allocation V.I. Fund | |
| | | | | | | | | | | | | | | | | | | | | | | | |
| | | Class I | |
| | | Six Months
Ended
June 30, 2016 | | | Year Ended December 31, | |
| | | (Unaudited) | | | 2015 | | | 2014 | | | 2013 | | | 2012 | | | 2011 | |
| | | | | | | | | | | | | | | | | | | | | | | | |
| Per Share Operating Performance | | | | | | | | | | | | | | | | | | | | | | | | |
Net asset value, beginning of period | | $ | 15.09 | | | $ | 16.26 | | | $ | 17.61 | | | $ | 16.10 | | | $ | 14.87 | | | $ | 16.15 | |
| | | | |
Net investment income1 | | | 0.14 | | | | 0.22 | | | | 0.29 | | | | 0.22 | | | | 0.26 | | | | 0.28 | |
Net realized and unrealized gain (loss) | | | (0.12 | ) | | | (0.35 | ) | | | 0.12 | | | | 2.14 | | | | 1.27 | | | | (0.84 | ) |
| | | | |
Net increase (decrease) from investment operations | | | 0.02 | | | | (0.13 | ) | | | 0.41 | | | | 2.36 | | | | 1.53 | | | | (0.56 | ) |
| | | | |
Distributions:2 | | | | | | | | | | | | | | | | | | | | | | | | |
From net investment income | | | — | | | | (0.19 | ) | | | (0.39 | ) | | | (0.20 | ) | | | (0.25 | ) | | | (0.36 | ) |
From net realized gain | | | — | | | | (0.84 | ) | | | (1.37 | ) | | | (0.65 | ) | | | (0.05 | ) | | | (0.36 | ) |
From return of capital | | | — | | | | (0.01 | ) | | | — | | | | — | | | | — | | | | — | |
| | | | |
Total distributions | | | — | | | | (1.04 | ) | | | (1.76 | ) | | | (0.85 | ) | | | (0.30 | ) | | | (0.72 | ) |
| | | | |
Net asset value, end of period | | $ | 15.11 | | | $ | 15.09 | | | $ | 16.26 | | | $ | 17.61 | | | $ | 16.10 | | | $ | 14.87 | |
| | | | |
| | | | | | | | | | | | | | | | | | | | | | | | |
| Total Return3 | | | | | | | | | | | | | | | | | | | | | | | | |
Based on net asset value | | | 0.20 | %4 | | | (0.89 | )% | | | 2.30 | % | | | 14.76 | % | | | 10.28 | % | | | (3.49 | )% |
| | | | |
| | | | | | | | | | | | | | | | | | | | | | | | |
| Ratios to Average Net Assets | | | | | | | | | | | | | | | | | | | | | | | | |
Total expenses | | | 0.74 | %5,6 | | | 0.75 | % | | | 0.74 | % | | | 0.72 | % | | | 0.74 | % | | | 0.69 | % |
| | | | |
Total expenses after fees waived and/or reimbursed | | | 0.74 | %5,6 | | | 0.73 | % | | | 0.72 | % | | | 0.72 | % | | | 0.74 | % | | | 0.69 | % |
| | | | |
Total expenses after fees waived and/or reimbursed and excluding dividend expense, interest expense and stock loan fees | | | 0.73 | %5,6 | | | 0.73 | % | | | 0.72 | % | | | 0.72 | % | | | 0.74 | % | | | 0.69 | % |
| | | | |
Net investment income | | | 1.87 | %5,6 | | | 1.32 | % | | | 1.64 | % | | | 1.26 | % | | | 1.66 | % | | | 1.75 | % |
| | | | | | | | | | | | | | | | | | | | | | | | |
| Supplemental Data | | | | | | | | | | | | | | | | | | | | | | | | |
Net assets, end of period (000) | | $ | 2,061,298 | | | $ | 1,994,371 | | | $ | 1,708,903 | | | $ | 2,426,154 | | | $ | 1,868,059 | | | $ | 1,737,294 | |
| | | | |
Portfolio turnover rate7 | | | 58 | % | | | 90 | % | | | 72 | % | | | 53 | % | | | 49 | % | | | 31 | % |
| | | | |
| | 1 | | Based on average shares outstanding. |
| | 2 | | Distributions for annual periods determined in accordance with federal income tax regulations. |
| | 3 | | Where applicable, excludes insurance-related fees and expenses and assumes the reinvestment of distributions. |
| | 4 | | Aggregate total return. |
| | 5 | | Ratios do not include expenses incurred indirectly as a result of investments in underlying funds of approximately 0.01%. |
| | 7 | | Includes mortgage dollar roll transactions (“MDRs”). Additional information regarding portfolio turnover is as follows: |
| | | | | | | | | | | | | | | | | | | | | | | | |
| | | Six Months
Ended
June 30, 2016 | | | Year Ended December 31, | |
| | | (Unaudited) | | | 2015 | | | 2014 | | | 2013 | | | 2012 | | | 2011 | |
| | | | | | | | | | | | | | | | | | | | | | | | | |
Portfolio turnover rate (excluding MDRs) | | | 57 | % | | | 88 | % | | | 72 | % | | | 53 | % | | | 49 | % | | | 31 | % |
See Notes to Consolidated Financial Statements.
| | | | | | |
| | | BLACKROCK VARIABLE SERIES FUNDS, INC. | | JUNE 30, 2016 | | 33 |
| | | | |
| Consolidated Financial Highlights (continued) | | | BlackRock Global Allocation V.I. Fund | |
| | | | | | | | | | | | | | | | | | | | | | | | |
| | | Class II | |
| | | Six Months
Ended
June 30, 2016 | | | Year Ended December 31, | |
| | | (Unaudited) | | | 2015 | | | 2014 | | | 2013 | | | 2012 | | | 2011 | |
| | | | | | | | | | | | | | | | | | | | | | | | |
| Per Share Operating Performance | | | | | | | | | | | | | | | | | | | | | | | | |
Net asset value, beginning of period | | $ | 15.04 | | | $ | 16.21 | | | $ | 17.56 | | | $ | 16.07 | | | $ | 14.85 | | | $ | 16.13 | |
| | | | |
Net investment income1 | | | 0.12 | | | | 0.19 | | | | 0.25 | | | | 0.19 | | | | 0.23 | | | | 0.26 | |
Net realized and unrealized gain (loss) | | | (0.11 | ) | | | (0.35 | ) | | | 0.14 | | | | 2.14 | | | | 1.28 | | | | (0.84 | ) |
| | | | |
Net increase (decrease) from investment operations | | | 0.01 | | | | (0.16 | ) | | | 0.39 | | | | 2.33 | | | | 1.51 | | | | (0.58 | ) |
| | | | |
Distributions:2 | | | | | | | | | | | | | | | | | | | | | | | | |
From net investment income | | | — | | | | (0.16 | ) | | | (0.37 | ) | | | (0.19 | ) | | | (0.24 | ) | | | (0.34 | ) |
From net realized gain | | | — | | | | (0.84 | ) | | | (1.37 | ) | | | (0.65 | ) | | | (0.05 | ) | | | (0.36 | ) |
From return of capital | | | — | | | | (0.01 | ) | | | — | | | | — | | | | — | | | | — | |
| | | | |
Total distributions | | | — | | | | (1.01 | ) | | | (1.74 | ) | | | (0.84 | ) | | | (0.29 | ) | | | (0.70 | ) |
| | | | |
Net asset value, end of period | | $ | 15.05 | | | $ | 15.04 | | | $ | 16.21 | | | $ | 17.56 | | | $ | 16.07 | | | $ | 14.85 | |
| | | | |
| | | | | | | | | | | | | | | | | | | | | | | | |
| Total Return3 | | | | | | | | | | | | | | | | | | | | | | | | |
Based on net asset value | | | 0.13 | %4 | | | (1.05 | )% | | | 2.16 | % | | | 14.55 | % | | | 10.14 | % | | | (3.63 | )% |
| | | | |
| | | | | | | | | | | | | | | | | | | | | | | | |
| Ratios to Average Net Assets | | | | | | | | | | | | | | | | | | | | | | | | |
Total expenses | | | 1.01 | %5,6 | | | 1.02 | % | | | 1.01 | % | | | 1.00 | % | | | 0.98 | % | | | 0.84 | % |
| | | | |
Total expenses after fees waived and/or reimbursed | | | 0.89 | %5,6 | | | 0.88 | % | | | 0.88 | % | | | 0.87 | % | | | 0.90 | % | | | 0.84 | % |
| | | | |
Total expenses after fees waived and/or reimbursed and excluding dividend expense, interest expense and stock loan fees | | | 0.88 | %5,6 | | | 0.88 | % | | | 0.87 | % | | | 0.87 | % | | | 0.90 | % | | | 0.84 | % |
| | | | |
Net investment income | | | 1.70 | %5,6 | | | 1.17 | % | | | 1.39 | % | | | 1.07 | % | | | 1.43 | % | | | 1.60 | % |
| | | | |
| | | | | | | | | | | | | | | | | | | | | | | | |
| Supplemental Data | | | | | | | | | | | | | | | | | | | | | | | | |
Net assets, end of period (000) | | $ | 238,013 | | | $ | 256,964 | | | $ | 260,312 | | | $ | 216,395 | | | $ | 80,236 | | | $ | 25,768 | |
| | | | |
Portfolio turnover rate7 | | | 58 | % | | | 90 | % | | | 72 | % | | | 53 | % | | | 49 | % | | | 31 | % |
| | | | |
| | 1 | | Based on average shares outstanding. |
| | 2 | | Distributions for annual periods determined in accordance with federal income tax regulations. |
| | 3 | | Where applicable, excludes insurance-related fees and expenses and assumes the reinvestment of distributions. |
| | 4 | | Aggregate total return. |
| | 5 | | Ratios do not include expenses incurred indirectly as a result of investments in underlying funds of approximately 0.01%. |
| | 7 | | Includes mortgage dollar roll transactions (“MDRs”). Additional information regarding portfolio turnover is as follows: |
| | | | | | | | | | | | | | | | | | | | | | | | |
| | | Six Months
Ended
June 30, 2016 | | | Year Ended December 31, | |
| | | (Unaudited) | | | 2015 | | | 2014 | | | 2013 | | | 2012 | | | 2011 | |
| | | | | | | | | | | | | | | | | | | | | | | | | |
Portfolio turnover rate (excluding MDRs) | | | 57 | % | | | 88 | % | | | 72 | % | | | 53 | % | | | 49 | % | | | 31 | % |
See Notes to Consolidated Financial Statements.
| | | | | | |
| 34 | | BLACKROCK VARIABLE SERIES FUNDS, INC. | | JUNE 30, 2016 | | |
| | | | |
| Consolidated Financial Highlights (concluded) | | | BlackRock Global Allocation V.I. Fund | |
| | | | | | | | | | | | | | | | | | | | | | | | |
| | | Class III | |
| | | Six Months
Ended
June 30, 2016 | | | Year Ended December 31, | |
| | | (Unaudited) | | | 2015 | | | 2014 | | | 2013 | | | 2012 | | | 2011 | |
| | | | | | | | | | | | | | | | | | | | | | | | |
| Per Share Operating Performance | | | | | | | | | | | | | | | | | | | | | | | | |
Net asset value, beginning of period | | $ | 13.04 | | | $ | 14.19 | | | $ | 15.58 | | | $ | 14.34 | | | $ | 13.28 | | | $ | 14.49 | |
| | | | |
Net investment income1 | | | 0.10 | | | | 0.15 | | | | 0.21 | | | | 0.16 | | | | 0.20 | | | | 0.22 | |
Net realized and unrealized gain (loss) | | | (0.10 | ) | | | (0.30 | ) | | | 0.12 | | | | 1.89 | | | | 1.12 | | | | (0.74 | ) |
| | | | |
Net increase (decrease) from investment operations | | | — | | | | (0.15 | ) | | | 0.33 | | | | 2.05 | | | | 1.32 | | | | (0.52 | ) |
| | | | |
Distributions:2 | | | | | | | | | | | | | | | | | | | | | | | | |
From net investment income | | | — | | | | (0.15 | ) | | | (0.35 | ) | | | (0.16 | ) | | | (0.21 | ) | | | (0.33 | ) |
From net realized gain | | | — | | | | (0.84 | ) | | | (1.37 | ) | | | (0.65 | ) | | | (0.05 | ) | | | (0.36 | ) |
From return of capital | | | — | | | | (0.01 | ) | | | — | | | | — | | | | — | | | | — | |
| | | | |
Total distributions | | | — | | | | (1.00 | ) | | | (1.72 | ) | | | (0.81 | ) | | | (0.26 | ) | | | (0.69 | ) |
| | | | |
Net asset value, end of period | | $ | 13.04 | | | $ | 13.04 | | | $ | 14.19 | | | $ | 15.58 | | | $ | 14.34 | | | $ | 13.28 | |
| | | | |
| | | | | | | | | | | | | | | | | | | | | | | | |
| Total Return3 | | | | | | | | | | | | | | | | | | | | | | | | |
Based on net asset value | | | 0.08 | %4 | | | (1.14 | )% | | | 2.08 | % | | | 14.42 | % | | | 9.97 | % | | | (3.64 | )% |
| | | | |
| | | | | | | | | | | | | | | | | | | | | | | | |
| Ratios to Average Net Assets | | | | | | | | | | | | | | | | | | | | | | | | |
Total expenses | | | 1.13 | %5,6 | | | 1.12 | % | | | 1.11 | % | | | 1.11 | % | | | 1.07 | % | | | 0.94 | % |
| | | | |
Total expenses after fees waived and/or reimbursed | | | 0.99 | %5,6 | | | 0.98 | % | | | 0.98 | % | | | 0.97 | % | | | 0.99 | % | | | 0.94 | % |
| | | | |
Total expenses after fees waived and/or reimbursed and excluding dividend expense, interest expense and stock loan fees | | | 0.98 | %5,6 | | | 0.98 | % | | | 0.97 | % | | | 0.97 | % | | | 0.99 | % | | | 0.94 | % |
| | | | |
Net investment income | | | 1.61 | %5,6 | | | 1.07 | % | | | 1.32 | % | | | 1.02 | % | | | 1.41 | % | | | 1.50 | % |
| | | | |
| | | | | | | | | | | | | | | | | | | | | | | | |
| Supplemental Data | | | | | | | | | | | | | | | | | | | | | | | | |
Net assets, end of period (000) | | $ | 8,404,482 | | | $ | 8,869,288 | | | $ | 9,780,007 | | | $ | 10,014,301 | | | $ | 8,702,140 | | | $ | 7,704,593 | |
| | | | |
Portfolio turnover rate7 | | | 58 | % | | | 90 | % | | | 72 | % | | | 53 | % | | | 49 | % | | | 31 | % |
| | | | |
| | 1 | | Based on average shares outstanding. |
| | 2 | | Distributions for annual periods determined in accordance with federal income tax regulations. |
| | 3 | | Where applicable, excludes insurance-related fees and expenses and assumes the reinvestment of distributions. |
| | 4 | | Aggregate total return. |
| | 5 | | Ratios do not include expenses incurred indirectly as a result of investments in underlying funds of approximately 0.01%. |
| | 7 | | Includes mortgage dollar roll transactions (“MDRs”). Additional information regarding portfolio turnover is as follows: |
| | | | | | | | | | | | | | | | | | | | | | | | |
| | | Six Months
Ended
June 30, 2016 | | | Year Ended December 31, | |
| | | (Unaudited) | | | 2015 | | | 2014 | | | 2013 | | | 2012 | | | 2011 | |
| | | | | | | | | | | | | | | | | | | | | | | | | |
Portfolio turnover rate (excluding MDRs) | | | 57 | % | | | 88 | % | | | 72 | % | | | 53 | % | | | 49 | % | | | 31 | % |
See Notes to Consolidated Financial Statements.
| | | | | | |
| | | BLACKROCK VARIABLE SERIES FUNDS, INC. | | JUNE 30, 2016 | | 35 |
| | | | |
| Notes to Consolidated Financial Statements (Unaudited) | | | BlackRock Global Allocation V.I. Fund | |
1. Organization:
BlackRock Variable Series Funds, Inc. (the “Company”) is registered under the Investment Company Act of 1940, as amended (the “1940 Act”), as an open-end management investment company. The Company is organized as a Maryland corporation that is comprised of 20 separate funds. The funds offer shares to insurance companies for their separate accounts to fund benefits under certain variable annuity and variable life insurance contracts. The consolidated financial statements presented are for BlackRock Global Allocation V.I. Fund (the “Fund”). The Fund is classified as diversified. Class I, Class II and Class III Shares have equal voting, dividend, liquidation and other rights, except that only shares of the respective classes are entitled to vote on matters concerning only that class. In addition, Class II and Class III Shares bear certain expenses related to the distribution of such shares.
Basis of Consolidation: The accompanying consolidated financial statements of the Fund include the accounts of BlackRock Cayman Global Allocation V.I. Fund I, Ltd. (the “Subsidiary”), which is a wholly owned subsidiary of the Fund and primarily invests in commodity-related instruments. The Subsidiary enables the Fund to hold these commodity-related instruments and satisfy regulated investment company tax requirements. The Fund may invest up to 25% of its total assets in the Subsidiary. The net assets of the Subsidiary as of period end were $350,752,241 and 3.3% of the Fund’s consolidated net assets. Intercompany accounts and transactions, if any, have been eliminated. The Subsidiary is subject to the same investment policies and restrictions that apply to the Fund, except that the Subsidiary may invest without limitation in commodity-related instruments.
The Fund, together with certain other registered investment companies advised by BlackRock Advisors, LLC (the “Manager”) or its affiliates, is included in a complex of open-end funds referred to as the Equity-Bond Complex.
2. Significant Accounting Policies:
The consolidated financial statements are prepared in conformity with accounting principles generally accepted in the United States of America (“U.S. GAAP”), which may require management to make estimates and assumptions that affect the reported amounts of assets and liabilities in the consolidated financial statements, disclosure of contingent assets and liabilities at the date of the consolidated financial statements and the reported amounts of increases and decreases in net assets from operations during the reporting period. Actual results could differ from those estimates. The Fund is considered an investment company under U.S. GAAP and follows the accounting and reporting guidance applicable to investment companies. Below is a summary of significant accounting policies:
Foreign Currency: The Fund’s books and records are maintained in U.S. dollars. Purchases and sales of investments are recorded at the rates of exchange prevailing on the respective dates of such transactions. Generally, when the U.S. dollar rises in value against a foreign currency, the investments denominated in that currency will lose value; the opposite effect occurs if the U.S. dollar falls in relative value.
The Fund does not isolate the portion of the results of operations arising as a result of changes in the exchange rates from the changes in the market prices of investments held or sold for financial reporting purposes. Accordingly, the effects of changes in exchange rates on investments are not segregated in the Consolidated Statement of Operations from the effects of changes in market prices of those investments, but are included as a component of net realized and unrealized gain (loss) from investments. The Fund reports realized currency gains (losses) on foreign currency related transactions as components of net realized gain (loss) for financial reporting purposes, whereas such components are generally treated as ordinary income for federal income tax purposes.
Segregation and Collateralization: In cases where the Fund enters into certain investments (e.g., futures contracts, forward foreign currency exchange contracts, options written, swaps and short sales), that would be treated as “senior securities” for 1940 Act purposes, the Fund may segregate or designate on its books and records cash or liquid assets having a market value at least equal to the amount of its future obligations under such investments. Doing so allows the investment to be excluded from treatment as a “senior security.” Furthermore, if required by an exchange or counterparty agreement, the Fund may be required to deliver/deposit cash and/or securities to/with an exchange, or broker-dealer or custodian as collateral for certain investments or obligations.
Investment Transactions and Investment Income: For financial reporting purposes, investment transactions are recorded on the dates the transactions are entered into (the trade dates). Realized gains and losses on investment transactions are determined on the identified cost basis. Dividend income is recorded on the ex-dividend date. Dividends from foreign securities where the ex-dividend date may have passed are subsequently recorded when the Fund is informed of the ex-dividend date. Under the applicable foreign tax laws, a withholding tax at various rates may be imposed on capital gains, dividends and interest. Upon notification from issuers, some of the dividend income received from a real estate investment trust may be redesignated as a reduction of cost of the related investment and/or realized gain. Interest income, including amortization and accretion of premiums and discounts on debt securities, is recognized on the accrual basis. Income, expenses and realized and unrealized gains and losses are allocated daily to each class based on its relative net assets.
| | | | | | |
| 36 | | BLACKROCK VARIABLE SERIES FUNDS, INC. | | JUNE 30, 2016 | | |
| | | | |
| Notes to Consolidated Financial Statements (continued) | | | BlackRock Global Allocation V.I. Fund | |
Distributions: Distributions paid by the Fund are recorded on the ex-dividend date. The portion of distributions, if any, that exceeds the Fund’s current and accumulated earnings and profits, as measured on a tax basis, constitute a non-taxable return of capital. The character and timing of distributions are determined in accordance with federal income tax regulations, which may differ from U.S. GAAP.
Net income and realized gains from investments held by the Subsidiary are treated as ordinary income for tax purposes. If a net loss is realized by the Subsidiary in any taxable year, the loss will generally not be available to offset the Fund’s ordinary income and/or capital gains for that year.
Indemnifications: In the normal course of business, the Fund enters into contracts that contain a variety of representations that provide general indemnification. The Fund’s maximum exposure under these arrangements is unknown because it involves future potential claims against the Fund, which cannot be predicted with any certainty.
Other: Expenses directly related to the Fund or its classes are charged to the Fund or the applicable class. Other operating expenses shared by several funds, including other funds managed by the Manager, are pro-rated among those funds on the basis of relative net assets or other appropriate methods. Expenses directly related to the Fund and other shared expenses prorated to the Fund are allocated daily to each class based on its relative net assets or other appropriate methods.
The Fund has an arrangement with its custodian whereby fees may be reduced by credits earned on uninvested cash balances, which, if applicable, are shown as fees paid indirectly in the Consolidated Statement of Operations. The custodian imposes fees on overdrawn cash balances, which can be offset by accumulated credits earned or may result in additional custody charges.
3. Investment Valuation and Fair Value Measurements:
Investment Valuation Policies: The Fund’s investments are valued at fair value (also referred to as “market value” within the consolidated financial statements) as of the close of trading on the New York Stock Exchange (“NYSE”) (generally 4:00 p.m., Eastern time). U.S. GAAP defines fair value as the price the Fund would receive to sell an asset or pay to transfer a liability in an orderly transaction between market participants at the measurement date. The Fund determines the fair values of its financial instruments using various independent dealers or pricing services under policies approved by the Board of Directors of the Company (the “Board”). The BlackRock Global Valuation Methodologies Committee (the “Global Valuation Committee”) is the committee formed by management to develop global pricing policies and procedures and to oversee the pricing function for all financial instruments.
Fair Value Inputs and Methodologies: The following methods (or “techniques”) and inputs are used to establish the fair value of the Fund’s assets and liabilities:
| • | | Equity investments traded on a recognized securities exchange are valued at the official closing price each day, if available. For equity investments traded on more than one exchange, the official close price on the exchange where the stock is primarily traded is used. Equity investments traded on a recognized exchange for which there were no sales on that day may be valued at the last available bid (long positions) or ask (short positions) price. |
| • | | Bond investments are valued on the basis of last available bid prices or current market quotations provided by dealers or pricing services. Floating rate loan interests are valued at the mean of the bid prices from one or more brokers or dealers as obtained from a pricing service. In determining the value of a particular investment, pricing services may use certain information with respect to transactions in such investments, quotations from dealers, pricing matrixes, market transactions in comparable investments, various relationships observed in the market between investments and calculated yield measures. Asset-backed and mortgage-backed securities are valued by independent pricing services using models that consider estimated cash flows of each tranche of the security, establish a benchmark yield and develop an estimated tranche-specific spread to the benchmark yield based on the unique attributes of the tranche. |
| • | | Generally, trading in foreign instruments is substantially completed each day at various times prior to the close of business on the NYSE. Occasionally, events affecting the values of such instruments may occur between the foreign market close and the close of business on the NYSE that may not be reflected in the computation of the Fund’s net assets. Each business day, the Fund uses a pricing service to assist with the valuation of certain foreign exchange-traded equity securities and foreign exchange-traded OTC options (the “Systematic Fair Value Price”). Using current market factors, the Systematic Fair Value Price is designed to value such foreign securities and foreign options at fair value as of the close of business on the NYSE, which follows the close of the local markets. |
| • | | To-be-announced (“TBA”) commitments are valued on the basis of last available bid prices or current market quotations provided by pricing services. |
| • | | Investments in open-end U.S. mutual funds are valued at net asset value each business day. |
| • | | The Fund values its investment in BlackRock Liquidity Series, LLC, Money Market Series (the “Money Market Series”) at fair value, which is ordinarily based upon its pro rata ownership in the underlying fund’s net assets. The Money Market Series seeks current income consistent with maintaining liquidity and preserving capital. Although the Money Market Series is not registered under the 1940 Act, its investments may follow the parameters |
| | | | | | |
| | | BLACKROCK VARIABLE SERIES FUNDS, INC. | | JUNE 30, 2016 | | 37 |
| | | | |
| Notes to Consolidated Financial Statements (continued) | | | BlackRock Global Allocation V.I. Fund | |
| | of investments by a money market fund that is subject to Rule 2a-7 under the 1940 Act. The Fund may withdraw up to 25% of its investment daily, although the manager of the Money Market Series, in its sole discretion, may permit an investor to withdraw more than 25% on any one day. |
| • | | Futures contracts traded on exchanges are valued at their last sale price. |
| • | | Securities and other assets and liabilities denominated in foreign currencies are translated into U.S. dollars using exchange rates determined as of the close of business on the NYSE. Forward foreign currency exchange contracts are valued at the mean between the bid and ask prices and are determined as of the close of business on the NYSE. Interpolated values are derived when the settlement date of the contract is an interim date for which quotations are not available. |
| • | | Exchange-traded options are valued at the mean between the last bid and ask prices at the close of the options market in which the options trade. An exchange-traded option for which there is no mean price is valued at the last bid (long positions) or ask (short positions) price. If no bid or ask price is available, the prior day’s price will be used, unless it is determined that the prior day’s price no longer reflects the fair value of the option. OTC options and options on swaps (“swaptions”) are valued by an independent pricing service using a mathematical model, which incorporates a number of market data factors, such as the trades and prices of the underlying instruments. |
| • | | Swap agreements are valued utilizing quotes received daily by the Fund’s pricing service or through brokers, which are derived using daily swap curves and models that incorporate a number of market data factors, such as discounted cash flows, trades and values of the underlying reference instruments. |
If events (e.g., a company announcement, market volatility or a natural disaster) occur that are expected to materially affect the value of such instruments, or in the event that the application of these methods of valuation results in a price for an investment that is deemed not to be representative of the market value of such investment, or if a price is not available, the investment will be valued by the Global Valuation Committee, or its delegate, in accordance with a policy approved by the Board as reflecting fair value (“Fair Valued Investments”). When determining the price for Fair Valued Investments, the Global Valuation Committee, or its delegate, seeks to determine the price that the Fund might reasonably expect to receive or pay from the current sale or purchase of that asset or liability in an arm’s-length transaction. Fair value determinations shall be based upon all available factors that the Global Valuation Committee, or its delegate, deems relevant consistent with the principles of fair value measurement which include the market approach, income approach and/or in the case of recent investments, the cost approach, as appropriate. The market approach generally consists of using comparable market transactions. The income approach generally is used to discount future cash flows to present value and is adjusted for liquidity as appropriate. These factors include but are not limited to: (i) attributes specific to the investment or asset; (ii) the principal market for the investment or asset; (iii) the customary participants in the principal market for the investment or asset; (iv) data assumptions by market participants for the investment or asset, if reasonably available; (v) quoted prices for similar investments or assets in active markets; and (vi) other factors, such as future cash flows, interest rates, yield curves, volatilities, prepayment speeds, loss severities, credit risks, recovery rates, liquidation amounts and/or default rates. Due to the inherent uncertainty of valuations of such investments, the fair values may differ from the values that would have been used had an active market existed. The Global Valuation Committee, or its delegate, employs various methods for calibrating valuation approaches for investments where an active market does not exist, including regular due diligence of the Fund’s pricing vendors, regular reviews of key inputs and assumptions, transactional back-testing or disposition analysis to compare unrealized gains and losses to realized gains and losses, reviews of missing or stale prices and large movements in market values and reviews of any market related activity. The pricing of all Fair Valued Investments is subsequently reported to the Board or a committee thereof on a quarterly basis.
Fair Value Hierarchy: Various inputs are used in determining the fair value of investments and derivative financial instruments. These inputs to valuation techniques are categorized into a fair value hierarchy consisting of three broad levels for financial statement purposes as follows:
| • | | Level 1 — unadjusted price quotations in active markets/exchanges for identical assets or liabilities that the Fund has the ability to access |
| • | | Level 2 — other observable inputs (including, but not limited to, quoted prices for similar assets or liabilities in markets that are active, quoted prices for identical or similar assets or liabilities in markets that are not active, inputs other than quoted prices that are observable for the assets or liabilities (such as interest rates, yield curves, volatilities, prepayment speeds, loss severities, credit risks and default rates) or other market–corroborated inputs) |
| • | | Level 3 — unobservable inputs based on the best information available in the circumstances, to the extent observable inputs are not available (including the Fund’s own assumptions used in determining the fair value of investments and derivative financial instruments) |
The hierarchy gives the highest priority to unadjusted quoted prices in active markets for identical assets or liabilities (Level 1 measurements) and the lowest priority to unobservable inputs (Level 3 measurements). Accordingly, the degree of judgment exercised in determining fair value is greatest for instruments categorized in Level 3. The inputs used to measure fair value may fall into different levels of the fair value hierarchy. In such cases, for disclosure purposes, the fair value hierarchy classification is determined based on the lowest level input that is significant to the fair value measurement in its entirety. The significant unobservable inputs used by the Global Valuation Committee in determining the price for Fair Valued Investments are typically categorized as Level 3. The fair value hierarchy for the Fund’s investments and derivative financial instruments has been included in the Consolidated Schedule of Investments.
| | | | | | |
| 38 | | BLACKROCK VARIABLE SERIES FUNDS, INC. | | JUNE 30, 2016 | | |
| | | | |
| Notes to Consolidated Financial Statements (continued) | | | BlackRock Global Allocation V.I. Fund | |
Changes in valuation techniques may result in transfers into or out of an assigned level within the hierarchy. In accordance with the Fund’s policy, transfers between different levels of the fair value hierarchy are deemed to have occurred as of the beginning of the reporting period. The categorization of a value determined for investments and derivative financial instruments is based on the pricing transparency of the investments and derivative financial instruments and is not necessarily an indication of the risks associated with investing in those securities.
4. Securities and Other Investments:
Asset-Backed and Mortgage-Backed Securities: Asset-backed securities are generally issued as pass-through certificates or as debt instruments. Asset-backed securities issued as pass-through certificates represent undivided fractional ownership interests in an underlying pool of assets. Asset-backed securities issued as debt instruments, which are also known as collateralized obligations, are typically issued as the debt of a special purpose entity organized solely for the purpose of owning such assets and issuing such debt. Asset-backed securities are often backed by a pool of assets representing the obligations of a number of different parties. The yield characteristics of certain asset-backed securities may differ from traditional debt securities. One such major difference is that all or a principal part of the obligations may be prepaid at any time because the underlying assets (i.e., loans) may be prepaid at any time. As a result, a decrease in interest rates in the market may result in increases in the level of prepayments as borrowers, particularly mortgagors, refinance and repay their loans. An increased prepayment rate with respect to an asset-backed security will have the effect of shortening the maturity of the security. In addition, the Fund may subsequently have to reinvest the proceeds at lower interest rates. If the Fund has purchased such an asset-backed security at a premium, a faster than anticipated prepayment rate could result in a loss of principal to the extent of the premium paid.
For mortgage pass-through securities (the “Mortgage Assets”) there are a number of important differences among the agencies and instrumentalities of the U.S. Government that issue mortgage-related securities and among the securities that they issue. For example, mortgage-related securities guaranteed by Ginnie Mae are guaranteed as to the timely payment of principal and interest by Ginnie Mae and such guarantee is backed by the full faith and credit of the United States. However, mortgage-related securities issued by Freddie Mac and Fannie Mae, including Freddie Mac and Fannie Mae guaranteed mortgage pass-through certificates, which are solely the obligations of Freddie Mac and Fannie Mae, are not backed by or entitled to the full faith and credit of the United States, but are supported by the right of the issuer to borrow from the U.S. Treasury.
Non-agency mortgage-backed securities are securities issued by non-governmental issuers and have no direct or indirect government guarantees of payment and are subject to various risks. Non-agency mortgage loans are obligations of the borrowers thereunder only and are not typically insured or guaranteed by any other person or entity. The ability of a borrower to repay a loan is dependent upon the income or assets of the borrower. A number of factors, including a general economic downturn, acts of God, terrorism, social unrest and civil disturbances, may impair a borrower’s ability to repay its loans.
Inflation-Indexed Bonds: Inflation-indexed bonds (other than municipal inflation-indexed and certain corporate inflation-indexed bonds) are fixed income securities whose principal value is periodically adjusted according to the rate of inflation. If the index measuring inflation rises or falls, the principal value of inflation-indexed bonds (other than municipal inflation-indexed and certain corporate inflation-indexed bonds) will be adjusted upward or downward, and consequently the interest payable on these securities (calculated with respect to a larger or smaller principal amount) will be increased or reduced, respectively. Any upward or downward adjustment in the principal amount of an inflation-indexed bond will be included as interest income in the Consolidated Statement of Operations, even though investors do not receive their principal until maturity. Repayment of the original bond principal upon maturity (as adjusted for inflation) is guaranteed in the case of U.S. Treasury inflation-indexed bonds. For bonds that do not provide a similar guarantee, the adjusted principal value of the bond repaid at maturity may be less than the original principal. With regard to municipal inflation-indexed bonds and certain corporate inflation-indexed bonds, the inflation adjustment is typically reflected in the semi-annual coupon payment. As a result, the principal value of municipal inflation-indexed bonds and such corporate inflation-indexed bonds does not adjust according to the rate of inflation.
Multiple Class Pass-Through Securities: Multiple class pass-through securities, including collateralized mortgage obligations (“CMOs”) and commercial mortgage-backed securities. may be issued by Ginnie Mae, U.S. Government agencies or instrumentalities or by trusts formed by private originators of, or investors in, mortgage loans. In general, CMOs are debt obligations of a legal entity that are collateralized by, a pool of residential or commercial mortgage loans or Mortgage Assets. The payments on these are used to make payments on the CMOs or multiple pass-through securities. Multiple class pass-through securities represent direct ownership interests in the Mortgage Assets. Classes of CMOs include interest only (“IOs”), principal only (“POs”), planned amortization classes and targeted amortization classes. IOs and POs are stripped mortgage-backed securities representing interests in a pool of mortgages, the cash flow from which has been separated into interest and principal components. IOs receive the interest portion of the cash flow while POs receive the principal portion. IOs and POs can be extremely volatile in response to changes in interest rates. As interest rates rise and fall, the value of IOs tends to move in the same direction as interest rates. POs perform best when prepayments on the underlying mortgages rise since this increases the rate at which the principal is returned and the yield to maturity on the PO. When payments on mortgages underlying a PO are slower than anticipated, the life of the PO is lengthened and the yield to maturity is reduced. If the underlying Mortgage Assets experience greater than anticipated prepayments of principal, the Fund’s initial investment in the IOs may not fully recoup.
| | | | | | |
| | | BLACKROCK VARIABLE SERIES FUNDS, INC. | | JUNE 30, 2016 | | 39 |
| | | | |
| Notes to Consolidated Financial Statements (continued) | | | BlackRock Global Allocation V.I. Fund | |
Zero-Coupon Bonds: Zero-coupon bonds, are normally issued at a significant discount from face value and do not provide for periodic interest payments. These bonds may experience greater volatility in market value than other debt obligations of similar maturity which provide for regular interest payments.
Capital Securities and Trust Preferred Securities: Capital securities, including trust preferred securities, are typically issued by corporations, generally in the form of interest-bearing notes with preferred securities characteristics. In the case of trust preferred securities, an affiliated business trust of a corporation issues these securities, generally in the form of beneficial interests in subordinated debentures or similarly structured securities. The securities can be structured with either a fixed or adjustable coupon that can have either a perpetual or stated maturity date. For trust preferred securities, the issuing bank or corporation pays interest to the trust, which is then distributed to holders of the these securities as a dividend. Dividends can be deferred without creating an event of default or acceleration, although maturity cannot take place unless all cumulative payment obligations have been met. The deferral of payments does not affect the purchase or sale of these securities in the open market. Payments on these securities are treated as interest rather than dividends for federal income tax purposes. These securities generally are rated below that of the issuing company’s senior debt securities and are freely callable at the issuer’s option.
Preferred Stock: Preferred stock has a preference over common stock in liquidation (and generally in receiving dividends as well) but is subordinated to the liabilities of the issuer in all respects. As a general rule, the market value of preferred stock with a fixed dividend rate and no conversion element varies inversely with interest rates and perceived credit risk, while the market price of convertible preferred stock generally also reflects some element of conversion value. Because preferred stock is junior to debt securities and other obligations of the issuer, deterioration in the credit quality of the issuer will cause greater changes in the value of a preferred stock than in a more senior debt security with similar stated yield characteristics. Unlike interest payments on debt securities, preferred stock dividends are payable only if declared by the issuer’s board of directors. Preferred stock also may be subject to optional or mandatory redemption provisions.
Warrants: Warrants entitle the Fund to purchase a specified number of shares of common stock and are non-income producing. The purchase price and number of shares are subject to adjustment under certain conditions until the expiration date of the warrants, if any. If the price of the underlying stock does not rise above the strike price before the warrant expires, the warrant generally expires without any value and the Fund will lose any amount it paid for the warrant. Thus, investments in warrants may involve more risk than investments in common stock. Warrants may trade in the same markets as their underlying stock; however, the price of the warrant does not necessarily move with the price of the underlying stock.
Floating Rate Loan Interests: Floating rate loan interests are typically issued to companies (the “borrower”) by banks, other financial institutions, or privately and publicly offered corporations (the “lender”). Floating rate loan interests are generally non-investment grade, often involve borrowers whose financial condition is troubled or uncertain and companies that are highly leveraged in bankruptcy proceedings. In addition, transactions in floating rate loan interests may settle on a delayed basis, which may result to proceeds from the sale to not be readily available for the Fund to make additional investments or meet its redemption obligations. Floating rate loan interests may include fully funded term loans or revolving lines of credit. Floating rate loan interests are typically senior in the corporate capital structure of the borrower. Floating rate loan interests generally pay interest at rates that are periodically determined by reference to a base lending rate plus a premium. Since the rates reset only periodically, changes in prevailing interest rates (and particularly sudden and significant changes) can be expected to cause some fluctuations in the net asset value of the Fund to the extent that it invests in floating rate debt securities. The base lending rates are generally the lending rate offered by one or more European banks, such as the London Interbank Offered Rate (“LIBOR”), the prime rate offered by one or more U.S. banks or the certificate of deposit rate. Floating rate loan interests may involve foreign borrowers, and investments may be denominated in foreign currencies. These investments are treated as investments in debt securities for purposes of the Fund’s investment policies.
When the Fund purchases a floating rate loan interest, it may receive a facility fee and when it sells a floating rate loan interest, it may pay a facility fee. On an ongoing basis, the Fund may receive a commitment fee based on the undrawn portion of the underlying line of credit amount of a floating rate loan interest. Facility and commitment fees are typically amortized to income over the term of the loan or term of the commitment, respectively. Consent and amendment fees are recorded to income as earned. Prepayment penalty fees, which may be received by the Fund upon the prepayment of a floating rate loan interest by a borrower, are recorded as realized gains. The Fund may invest in multiple series or tranches of a loan. A different series or tranche may have varying terms and carry different associated risks.
Floating rate loan interests are usually freely callable at the borrower’s option. The Fund may invest in such loans in the form of participations in loans (“Participations”) or assignments (“Assignments”) of all or a portion of loans from third parties. Participations typically will result in the Fund having a contractual relationship only with the lender, not with the borrower. The Fund has the right to receive payments of principal, interest and any fees to which it is entitled only from the lender selling the Participation and only upon receipt by the lender of the payments from the borrower. In connection with purchasing Participations, the Fund generally will have no right to enforce compliance by the borrower with the terms of the loan agreement, nor any rights of offset against the borrower. The Fund may not benefit directly from any collateral supporting the loan in which it has purchased the Participation. As a result, the Fund assumes the credit risk of both the borrower and the lender that is selling the Participation. The Fund’s investment in
| | | | | | |
| 40 | | BLACKROCK VARIABLE SERIES FUNDS, INC. | | JUNE 30, 2016 | | |
| | | | |
| Notes to Consolidated Financial Statements (continued) | | | BlackRock Global Allocation V.I. Fund | |
loan participation interests involves the risk of insolvency of the financial intermediaries who are parties to the transactions. In the event of the insolvency of the lender selling the Participation, the Fund may be treated as a general creditor of the lender and may not benefit from any offset between the lender and the borrower. Assignments typically result in the Fund having a direct contractual relationship with the borrower, and the Fund may enforce compliance by the borrower with the terms of the loan agreement.
Forward Commitments and When-Issued Delayed Delivery Securities: The Fund may purchase securities on a when-issued basis and may purchase or sell securities on a forward commitment basis. Settlement of such transactions normally occurs within a month or more after the purchase or sale commitment is made. The Fund may purchase securities under such conditions with the intention of actually acquiring them, but may enter into a separate agreement to sell the securities before the settlement date. Since the value of securities purchased may fluctuate prior to settlement, the Fund may be required to pay more at settlement than the security is worth. In addition, the Fund is not entitled to any of the interest earned prior to settlement. When purchasing a security on a delayed delivery basis, the Fund assumes the rights and risks of ownership of the security, including the risk of price and yield fluctuations. In the event of default by the counterparty, the Fund’s maximum amount of loss is the unrealized appreciation of unsettled when-issued transactions.
TBA Commitments: TBA commitments are forward agreements for the purchase or sale of mortgage-backed securities for a fixed price, with payment and delivery on an agreed upon future settlement date. The specific securities to be delivered are not identified at the trade date. However, delivered securities must meet specified terms, including issuer, rate and mortgage terms. When entering into TBA commitments, the Fund may take possession of or deliver the underlying mortgage-backed securities but can extend the settlement or roll the transaction. TBA commitments involve a risk of loss if the value of the security to be purchased or sold declines or increases, respectively, prior to settlement date.
In order to better define contractual rights and to secure rights that will help the Fund mitigate its counterparty risk, TBA commitments may be entered into by the Fund under Master Securities Forward Transaction Agreements (each, an “MSFTA”). An MSFTA typically contains, among other things, collateral posting terms and netting provisions in the event of default and/or termination event. The collateral requirements are typically calculated by netting the mark-to-market amount for each transaction under such agreement and comparing that amount to the value of the collateral currently pledged by the Fund and the counterparty. Cash collateral that has been pledged to cover the obligations of the Fund and cash collateral received from the counterparty, if any, is reported separately on the Consolidated Statement of Assets and Liabilities as cash pledged as collateral for TBA commitments or cash received as collateral for TBA commitments, respectively. Non-cash collateral pledged by the Fund, if any, is noted in the Consolidated Schedule of Investments. Typically, the Fund is permitted to sell, repledge or use the collateral it receives; however, the counterparty is not permitted to do so. To the extent amounts due to the Fund is not fully collateralized, contractually or otherwise, the Fund bears the risk of loss from counterparty non-performance.
Mortgage Dollar Roll Transactions: The Fund may sell TBA mortgage-backed securities and simultaneously contract to repurchase substantially similar (i.e., same type, coupon and maturity) securities on a specific future date at an agreed upon price. During the period between the sale and repurchase, the Fund is not entitled to receive interest and principal payments on the securities sold. Mortgage dollar roll transactions are treated as purchases and sales and realizes gains and losses on these transactions. Mortgage dollar rolls involve the risk that the market value of the securities that the Fund is required to purchase may decline below the agreed upon repurchase price of those securities.
Short Sales Transactions: In short sale transaction, the Fund sells a security it does not hold in anticipation of a decline in the market price of that security. When the Fund makes a short sale, it will borrow the security sold short from a broker/counterparty and deliver the security to the purchaser. To close out a short position, the Fund delivers the same security to the broker and records a liability to reflect the obligation to return the security to the broker. The amount of the liability is subsequently marked-to-market to reflect the market value of the short sale. The Fund maintains a segregated account of securities or deposits cash with the broker-dealer as collateral for the short sales. Cash deposited with the broker is recorded as an asset in the Consolidated Statement of Assets and Liabilities. Securities segregated as collateral are denoted in the Consolidated Schedule of Investments. The Fund may pay a financing fee for the difference between the market value of the short position and the cash collateral deposited with the broker which would be recorded as interest expense. The Fund is required to repay the counterparty any dividends received on the security sold short, which, if applicable, is shown as dividend expense in the Consolidated Statement of Operations. The Fund may pay a fee on the assets borrowed from the counterparty, which, if applicable, is shown as stock loan fees in the Consolidated Statement of Operations. The Fund is exposed to market risk based on the amount, if any, that the market value of the security increases beyond the market value at which the position was sold. Thus, a short sale of a security involves the risk that instead of declining, the price of the security sold short will rise. The short sale of securities involves the possibility of an unlimited loss since there is an unlimited potential for the market price of the security sold short to increase. A gain, limited to the price at which the Fund sold the security short. A realized gain or loss is recognized upon the termination of a short sale if the market price is either less than or greater than the proceeds originally received. There is no assurance that the Fund will be able to close out a short position at a particular time or at an acceptable price.
Securities Lending: The Fund may lend its securities to approved borrowers, such as brokers, dealers and other financial institutions. The borrower pledges and maintains with the Fund collateral consisting of cash, an irrevocable letter of credit issued by a bank, or securities issued or guaranteed by
| | | | | | |
| | | BLACKROCK VARIABLE SERIES FUNDS, INC. | | JUNE 30, 2016 | | 41 |
| | | | |
| Notes to Consolidated Financial Statements (continued) | | | BlackRock Global Allocation V.I. Fund | |
the U.S. Government. The initial collateral received by the Fund is required to have a value of at least 102% of the current value of the loaned securities for securities traded on U.S. exchanges and a value of at least 105% for all other securities. The collateral is maintained thereafter at a value equal to at least 100% of the current market value of the securities on loan. The market value of the loaned securities is determined at the close of each business day of the Fund and any additional required collateral is delivered to the Fund, or excess collateral returned by the Fund, on the next business day. During the term of the loan, the Fund is entitled to all distributions made on or in respect of the loaned securities. Loans of securities are terminable at any time and the borrower, after notice, is required to return borrowed securities within the standard time period for settlement of securities transactions.
The market value of any securities on loan, all of which were classified as common or preferred stocks in the Fund’s Consolidated Schedule of Investments, and the value of any related collateral are shown separately in the Consolidated Statement of Assets and Liabilities as a component of investments at value — unaffiliated, and collateral on securities loaned at value, respectively. As of period end, any securities on loan were collateralized by cash. The cash collateral invested by the securities lending agent, BlackRock Investment Management, LLC (“BIM”), if any, is disclosed in the Consolidated Schedule of Investments.
Securities lending transactions are entered into by the Fund under Master Securities Lending Agreements (each, an “MSLA”), which provide the right, in the event of default (including bankruptcy or insolvency), for the non-defaulting party to liquidate the collateral and calculate a net exposure to the defaulting party or request additional collateral. In the event that a borrower defaults, the Fund, as lender, would offset the market value of the collateral received against the market value of the securities loaned. When the value of the collateral is greater than that of the market value of the securities loaned, the lender is left with a net amount payable to the defaulting party. However, bankruptcy or insolvency laws of a particular jurisdiction may impose restrictions on or prohibitions against such a right of offset in the event of an MSLA counterparty’s bankruptcy or insolvency. Under the MSLA, absent an event of default the borrower can resell or re-pledge the loaned securities, and the Fund can reinvest cash collateral received in connection with loaned securities. Upon an event of default, the parties’ obligations to return the securities or collateral to the other party are extinguished, and the parties can resell or re-pledge the loaned securities or the collateral received in connection with the loaned securities in order to satisfy the defaulting party’s net payment obligation for all transactions under the MSLA. The defaulting party remains liable for any deficiency.
As of period end, the following table is a summary of the Fund’s securities lending agreements by counterparty which are subject to offset under an MSLA:
| | | | | | | | | | | | | | | |
| Counterparty | | Securities Loaned
at Value1 | | Cash Collateral
Received2 | | Net Amount3 |
Barclays Capital, Inc. | | | $ | 5,322,750 | | | | $ | (5,322,750 | ) | | | | — | |
BNP Paribas S.A. | | | | 2,946,886 | | | | | (2,946,886 | ) | | | | — | |
Citigroup Global Markets, Inc. | | | | 4,407,744 | | | | | (4,407,744 | ) | | | | — | |
Credit Suisse Securities (USA) LLC | | | | 4,986,645 | | | | | (4,986,645 | ) | | | | — | |
Goldman Sachs & Co. | | | | 14,390,231 | | | | | (14,390,231 | ) | | | | — | |
JP Morgan Securities LLC | | | | 115,459,428 | | | | | (115,459,428 | ) | | | | — | |
Merrill Lynch, Pierce, Fenner & Smith, Inc. | | | | 6,929,118 | | | | | (6,929,118 | ) | | | | — | |
Morgan Stanley | | | | 77,726,684 | | | | | (77,726,684 | ) | | | | — | |
Nomura Securities International Inc. | | | | 4,206,840 | | | | | (4,206,684 | ) | | | $ | 156 | |
State Street Bank & Trust Co. | | | | 19,921,530 | | | | | (19,921,530 | ) | | | | — | |
UBS AG | | | | 12,099,776 | | | | | (12,099,776 | ) | | | | — | |
| | | | | |
Total | | | $ | 268,397,632 | | | | $ | (268,397,476 | ) | | | $ | 156 | |
| | | | | |
| | 1 | | Securities loaned with a value of $805,991 have been sold and are pending settlement as of June 30, 2016. |
| | 2 | | Collateral with a value of $274,482,165 has been received in connection with securities lending agreements. Collateral received in excess of the value of securities loaned from the individual counterparty is not shown for financial reporting purposes in the table above. |
| | 3 | | The market value of the loaned securities is determined as of June 30, 2016. Additional collateral is delivered to the Fund on the next business day in accordance with the MSLA. The net amount would be subject to the borrower default indemnity in the event of default by the counterparty. |
The risks of securities lending include the risk that the borrower may not provide additional collateral when required or may not return the securities when due. To mitigate these risks, the Fund benefits from a borrower default indemnity provided by BIM. BIM’s indemnity allows for full replacement of the securities loaned if the collateral received does not cover the value on the securities loaned in the event of borrower default. The Fund could suffer a loss if the value of an investment purchased with cash collateral falls below the market value of loaned securities or if the value of an investment purchased with cash collateral falls below the value of the original cash collateral received.
5. Derivative Financial Instruments:
The Fund engages in various portfolio investment strategies using derivative contracts both to increase the returns of the Fund and/or to manage its exposure to certain risks such as credit risk, equity risk, interest rate risk, foreign currency exchange rate risk, commodity price risk or other risks (e.g. inflation risk). Derivative financial instruments categorized by risk exposure are included in the Consolidated Schedule of Investments. These contracts may be transacted on an exchange or OTC.
| | | | | | |
| 42 | | BLACKROCK VARIABLE SERIES FUNDS, INC. | | JUNE 30, 2016 | | |
| | | | |
| Notes to Consolidated Financial Statements (continued) | | | BlackRock Global Allocation V.I. Fund | |
Futures Contracts: The Fund invests in long and/or short positions in futures and options on futures contracts to gain exposure to, or manage exposure to, changes in interest rates (interest rate risk), changes in the value of equity securities (equity risk) or foreign currencies (foreign currency exchange rate risk.
Futures contracts are agreements between the Fund and a counterparty to buy or sell a specific quantity of an underlying instrument at a specified price and on a specified date. Depending on the terms of a contract, it is settled either through physical delivery of the underlying instrument on the settlement date or by payment of a cash amount on the settlement date. Upon entering into a futures contract, the Fund is required to deposit initial margin with the broker in the form of cash or securities in an amount that varies depending on a contract’s size and risk profile. The initial margin deposit must then be maintained at an established level over the life of the contract.
Securities deposited as initial margin are designated in the Consolidated Schedule of Investments and cash deposited, if any, is shown as cash pledged for futures contracts in the Consolidated Statement of Assets and Liabilities. Pursuant to the contract, the Fund agrees to receive from or pay to the broker an amount of cash equal to the daily fluctuation in market value of the contract (“variation margin”). Variation margin is recorded as unrealized appreciation (depreciation) and, if any, shown as variation margin receivable (or payable) on futures contracts in the Consolidated Statement of Assets and Liabilities. When the contract is closed, a realized gain or loss is recorded in the Consolidated Statement of Operations equal to the difference between the value of the contract at the time it was opened and the value at the time it was closed. The use of futures contracts involves the risk of an imperfect correlation in the movements in the price of futures contracts and interest, foreign currency exchange rates or underlying assets.
Forward Foreign Currency Exchange Contracts: The Fund enters into forward foreign currency exchange contracts to gain or reduce exposure, to foreign currencies (foreign currency exchange rate risk).
A forward foreign currency exchange contract is an agreement between two parties to buy and sell a currency at a set exchange rate on a specified date. These contracts help to manage the overall exposure to the currencies in which some of the investments held by the Fund are denominated and in some cases, may be used to obtain exposure to a particular market.
The contract is marked to market daily and the change in market value is recorded as unrealized appreciation (depreciation) in the Consolidated Statement of Assets and Liabilities. When a contract is closed, a realized gain or loss is recorded in the Consolidated Statement of Operations equal to the difference between the value at the time it was opened and the value at the time it was closed. Non-deliverable forward foreign currency exchange contracts are settled with the counterparty in cash without the delivery of foreign currency. The use of forward foreign currency exchange contracts involves the risk that the value of a forward foreign currency exchange contract changes unfavorably due to movements in the value of the referenced foreign currencies.
Options: The Fund purchases and writes call and put options to increase or decrease its exposure to the risks of underlying instruments, including equity risk, interest rate risk and/or commodity price risk and/or, in the case of options written, to generate gains from options premiums.
A call option gives the purchaser (holder) of the option the right (but not the obligation) to buy, and obligates the seller (writer) to sell (when the option is exercised) the underlying instrument at the exercise or strike price at any time or at a specified time during the option period. A put option gives the holder the right to sell and obligates the writer to buy the underlying instrument at the exercise or strike price at any time or at a specified time during the option period.
Premiums paid on options purchased and premiums received on options written, as well as the daily fluctuation in market value, are included in investments at value — unaffiliated and options written at value, respectively, in the Consolidated Statement of Assets and Liabilities. When an instrument is purchased or sold through the exercise of an option, the premium is offset against the cost or proceeds of the underlying instrument. When an option expires, a realized gain or loss is recorded in the Consolidated Statement of Operations to the extent of the premiums received or paid. When an option is closed or sold, a gain or loss is recorded in the Consolidated Statement of Operations to the extent the cost of the closing transaction exceeds the premiums received or paid. When the Fund writes a call option, such option is typically “covered,” meaning that it holds the underlying instrument subject to being called by the option counterparty. When the Fund writes a put option, such option is covered by cash in an amount sufficient to cover the obligation.
| • | | Swaptions — The Fund purchases and writes options on swaps (“swaptions”) primarily to preserve a return or spread on a particular investment or portion of the Fund’s holdings, as a duration management technique or to protect against an increase in the price of securities it anticipates purchasing at a later date. The purchaser and writer of a swaption is buying or granting the right to enter into a previously agreed upon interest rate or credit default swap agreement (interest rate risk and/or credit risk) at any time before the expiration of the option. |
| | | | | | |
| | | BLACKROCK VARIABLE SERIES FUNDS, INC. | | JUNE 30, 2016 | | 43 |
| | | | |
| Notes to Consolidated Financial Statements (continued) | | | BlackRock Global Allocation V.I. Fund | |
| • | | Foreign Currency options — The Fund purchases and writes foreign currency options, foreign currency futures and options on foreign currency futures to gain or reduce exposure to foreign currencies (foreign currency exchange rate risk). Foreign currency options give the purchaser the right to buy from or sell to the writer a foreign currency at any time before the expiration of the option. |
| • | | Barrier options — The Fund may purchase and write a variety of options with non-standard payout structures or other features (“barrier options”) that are generally traded OTC. |
The Fund may invest in various types of barrier options, including down-and-out options, down-and-in options, double no-touch options, one-touch options and up-and-out options. Down-and-out options expire worthless to the purchaser if the price of the underlying instrument falls below a specific barrier price level prior to the expiration date. Down-and-in options expire worthless to the purchaser unless the price of the underlying instrument falls below a specific barrier price level prior to the expiration date. Double no-touch options provide the purchaser an agreed-upon payout if the price of the underlying instrument does not reach or surpass predetermined barrier price levels prior to the option’s expiration date. One-touch options provide the purchaser an agreed-upon payout if the price of the underlying instrument reaches or surpasses predetermined barrier price levels prior to the expiration date. Up-and-out options expire worthless if the price of the underlying instrument increases beyond a predetermined barrier price level prior to the expiration date.
| • | | Structured options — The Fund invests in structured options to increase or decrease its exposure to an underlying index or group of securities (equity risk). |
These options may consist of single or multiple OTC options which are priced as a single instrument. They may only be exercised at the expiration date, but may be transferred/sold prior to the expiration date. The value of a structured option may either increase or decrease with the underlying index or group of securities, depending on the combination of options used. Structured options are issued in units whereby each unit represents a structure based on the specific index with an initial reference strike price. One type of structure involves the combination of selling a put while buying a call on a specific index. This option would rise in value as the underlying index increases and fall in value as the underlying index decreases. Alternatively, another structure involves the sale of a call and the purchase of a put. This option structure would rise in value as the underlying index decreases and fall in value as the underlying index increases. Upon the exercise of the structured option, the Fund will receive a payment from, or be required to remit a payment to, the counterparty depending on the value of the underlying index at exercise.
In purchasing and writing options, the Fund bears the risk of an unfavorable change in the value of the underlying instrument or the risk that it may not be able to enter into a closing transaction due to an illiquid market. Exercise of a written option could result in the Fund purchasing or selling a security when it otherwise would not, or at a price different from the current market value.
Swaps: The Fund enters into swap contracts to manage exposure to issuers, markets and securities. Such contracts are agreements between the Fund and a counterparty to make periodic net payments on a specified notional amount or a net payment upon termination. Swap agreements are privately negotiated in the OTC market and may be entered into as a bilateral contract (“OTC swaps”) or centrally cleared (“centrally cleared swaps”).
For OTC swaps, any upfront premiums paid and any upfront fees received are shown as swap premiums paid and swap premiums received, respectively, in the Consolidated Statement of Assets and Liabilities and amortized over the term of the contract. The daily fluctuation in market value is recorded as unrealized appreciation (depreciation) on OTC Swaps in the Consolidated Statement of Assets and Liabilities. Payments received or paid are recorded in the Consolidated Statement of Operations as realized gains or losses, respectively. When an OTC swap is terminated, a realized gain or loss is recorded in the Consolidated Statement of Operations equal to the difference between the proceeds from (or cost of) the closing transaction and the Fund’s basis in the contract, if any. Generally, the basis of the contract is the premium received or paid.
In a centrally cleared swap, immediately following execution of the swap contract, the swap contract is novated to a central counterparty (the “CCP”) and the Fund’s counterparty on the swap agreement becomes the CCP. The Fund is required to interface with the CCP through the broker. Upon entering into a centrally cleared swap, the Fund is required to deposit initial margin with the broker in the form of cash or securities in an amount that varies depending on the size and risk profile of the particular swap. Securities deposited as initial margin are designated in the Consolidated Schedule of Investments and cash deposited is shown as cash pledged for centrally cleared swaps in the Consolidated Statement of Assets and Liabilities. Pursuant to the contract, the Fund agrees to receive from or pay to the broker an amount of cash equal to the daily fluctuation in market value of the contract (“variation margin”). Variation margin is recorded as unrealized appreciation (depreciation) and shown as variation margin receivable (or payable) on centrally cleared swaps in the Consolidated Statement of Assets and Liabilities. Payments received from (paid to) the counterparty, including at termination, are recorded as realized gains (losses) in the Consolidated Statement of Operations.
| • | | Credit default swaps — The Fund enters into credit default swaps to manage its exposure to the market or certain sectors of the market, to reduce their risk exposure to defaults of corporate and/or sovereign issuers or to create exposure to corporate and/or sovereign issuers to which it is not otherwise exposed (credit risk). |
The Fund may either buy or sell (write) credit default swaps on single-name issuers (corporate or sovereign), a combination or basket of single-name issuers or traded indexes. Credit default swaps are agreements in which the protection buyer pays fixed periodic payments to the seller in
| | | | | | |
| 44 | | BLACKROCK VARIABLE SERIES FUNDS, INC. | | JUNE 30, 2016 | | |
| | | | |
| Notes to Consolidated Financial Statements (continued) | | | BlackRock Global Allocation V.I. Fund | |
consideration for a promise from the protection seller to make a specific payment should a negative credit event take place with respect to the referenced entity (e.g., bankruptcy, failure to pay, obligation acceleration, repudiation, moratorium or restructuring). As a buyer, if an underlying credit event occurs, the Fund will either (i) receive from the seller an amount equal to the notional amount of the swap and deliver the referenced security or underlying securities comprising the index, or (ii) receive a net settlement of cash equal to the notional amount of the swap less the recovery value of the security or underlying securities comprising the index. As a seller (writer), if an underlying credit event occurs, the Fund will either pay the buyer an amount equal to the notional amount of the swap and take delivery of the referenced security or underlying securities comprising the index or pay a net settlement of cash equal to the notional amount of the swap less the recovery value of the security or underlying securities comprising the index.
| • | | Total return swaps — The Fund enters into total return swaps to obtain exposure to a security or market without owning such security or investing directly in such market or to exchange the risk/return of one market (e.g., fixed income) with another market (e.g., equity or commodity prices) (equity risk, commodity price risk and/or interest rate risk). |
Total return swaps are agreements in which there is an exchange of cash flows whereby one party commits to make payments based on the total return (distributions plus capital gains/losses) of an underlying instrument in exchange for fixed or floating rate interest payments. If the total return of the instrument or index underlying the transaction exceeds or falls short of the offsetting fixed or floating interest rate obligation, the Fund receives payment from or makes a payment to the counterparty.
| • | | Interest rate swaps — The Fund enters into interest rate swaps to gain or reduce exposure to interest rates or to manage duration, the yield curve or interest rate (interest rate risk). |
Interest rate swaps are agreements in which one party pays a stream of interest payments, either fixed or floating, in exchange for another party’s stream of interest payments, either fixed or floating, on the same notional amount for a specified period of time. In more complex interest rate swaps, the notional principal amount may decline (or amortize) over time.
| • | | Currency swaps — The Fund enters into currency swaps to gain or reduce exposure to foreign currencies (foreign currency exchange rate risk). |
Currency swaps are interest rate swaps in which one party pays a stream of interest payments, either fixed or floating, in exchange for another party’s stream of interest payments, either fixed or floating, based on the notional amounts of two different currencies. The notional amounts are typically determined based on the spot exchange rates at the inception of the trade. Currency swaps may also involve an exchange of notional amounts at the start, during and/or at expiration of the contract, either at the current spot rate or another specified rate.
| • | | Forward swaps — The Fund enters into forward interest rate swaps and forward total return swaps. In a forward swap, the Fund and the counterparty agree to make periodic net payments beginning on a specified date or a net payment at termination. |
Swap transactions involve, to varying degrees, elements of interest rate, credit and market risk in excess of the amounts recognized in the Consolidated Statement of Assets and Liabilities. Such risks involve the possibility that there will be no liquid market for these agreements, that the counterparty to the agreements may default on its obligation to perform or disagree as to the meaning of the contractual terms in the agreements, and that there may be unfavorable changes in interest rates and/or market values associated with these transactions.
Master Netting Arrangements: In order to define its contractual rights and to secure rights that will help it mitigate its counterparty risk, the Fund may enter into an International Swaps and Derivatives Association, Inc. Master Agreement (“ISDA Master Agreement”) or similar agreement with its counterparties. An ISDA Master Agreement is a bilateral agreement between the Fund and a counterparty that governs certain OTC derivatives and typically contains, among other things, collateral posting terms and netting provisions in the event of a default and/or termination event. Under an ISDA Master Agreement, the Fund may, under certain circumstances, offset with the counterparty certain derivative financial instruments’ payables and/or receivables with collateral held and/or posted and create one single net payment. The provisions of the ISDA Master Agreement typically permit a single net payment in the event of default including the bankruptcy or insolvency of the counterparty. Bankruptcy or insolvency laws of a particular jurisdiction may restrict or prohibit the right of offset in bankruptcy, insolvency or other events. In addition, certain ISDA Master Agreements allow counterparties to terminate derivative contracts prior to maturity in the event the Fund’s net assets decline by a stated percentage or the Fund fails to meet the terms of its ISDA Master Agreements. The result would cause the Fund to accelerate payment of any net liability owed to the counterparty.
Collateral Requirements: For derivatives traded under an ISDA Master Agreement, the collateral requirements are typically calculated by netting the mark-to-market amount for each transaction under such agreement and comparing that amount to the value of any collateral currently pledged by the Fund and the counterparty.
Cash collateral that has been pledged to cover obligations of the Fund and cash collateral received from the counterparty, if any, is reported separately on the Consolidated Statement of Assets and Liabilities as cash pledged as collateral and cash received as collateral, respectively. Non-cash collateral pledged by the Fund, if any, is noted in the Consolidated Schedule of Investments. Generally, the amount of collateral due from or to a counterparty is
| | | | | | |
| | | BLACKROCK VARIABLE SERIES FUNDS, INC. | | JUNE 30, 2016 | | 45 |
| | | | |
| Notes to Consolidated Financial Statements (continued) | | | BlackRock Global Allocation V.I. Fund | |
subject to a certain minimum transfer amount threshold before a transfer is required, which is determined at the close of business of the Fund. Any additional required collateral is delivered to/pledged by the Fund on the next business day. Typically, the counterparty is not permitted to sell, re-pledge or use cash and non-cash collateral it receives. The Fund generally agrees not to use non-cash collateral that it receives but may, absent default or certain other circumstances defined in the underlying ISDA Master Agreement, be permitted to use cash collateral received. In such cases, interest may be paid pursuant to the collateral arrangement with the counterparty. To the extent amounts due to the Fund from its counterparties are not fully collateralized, it bears the risk of loss from counterparty non-performance. Likewise, to the extent the Fund has delivered collateral to a counterparty and stands ready to perform under the terms of its agreement with such counterparty, it bears the risk of loss from a counterparty in the amount of the value of the collateral in the event the counterparty fails to return such collateral. Based on the terms of agreements, collateral may not be required for all derivative contracts.
For financial reporting purposes, the Fund does not offset derivative assets and derivative liabilities that are subject to netting arrangements, if any, in the Consolidated Statement of Assets and Liabilities.
6. Investment Advisory Agreement and Other Transactions with Affiliates:
The PNC Financial Services Group, Inc. is the largest stockholder and an affiliate of BlackRock, Inc. (“BlackRock”) for 1940 Act purposes.
Investment Advisory
The Company, on behalf of the Fund, entered into an Investment Advisory Agreement with the Manager, the Fund’s investment adviser, an indirect, wholly owned subsidiary of BlackRock, to provide investment advisory and administration services. The Manager is responsible for the management of the Fund’s portfolio and provides the personnel, facilities, equipment and certain other services necessary to the operations of the Fund. For such services, the Fund pays the Manager a monthly fee, which is determined by calculating a percentage of the Fund’s average daily net assets, based on the following annual rates:
| | | | | |
| Average Daily Net Assets | | Investment
Advisory Fee |
First $6 Billion | | | | 0.65 | % |
$6 Billion - $8 Billion | | | | 0.61 | % |
$8 Billion - $10 Billion | | | | 0.59 | % |
$10 Billion - $15 Billion | | | | 0.57 | % |
Greater than $15 Billion | | | | 0.55 | % |
The Manager provides investment management and other services to the Subsidiary. The Manager does not receive separate compensation from the Subsidiary for providing investment management or administrative services. However, the Fund pays the Manager based on the Fund’s net assets, which includes the assets of the Subsidiary.
Distribution Fees
The Company, on behalf of the Fund, entered into a Distribution Agreement and a Distribution Plan with BlackRock Investments, LLC (“BRIL”), an affiliate of the Manager. Pursuant to the Distribution Plan and in accordance with Rule 12b-1 under the 1940 Act, the Fund pays BRIL ongoing service and distribution fees. The fees are accrued daily and paid monthly at annual rates based upon the average daily net assets of the relevant share class of the Fund as follows:
| | | | |
| | | Class II | | Class III |
| | | 0.15% | | 0.25% |
For the six months ended June 30, 2016, the following table shows the class specific distribution fees borne directly by each share class of the Fund:
| | | | | | | | |
| Class II | | Class III | | | Total | |
$181,129 | | $ | 10,544,534 | | | $ | 10,725,663 | |
Transfer Agent
The Manager, on behalf of the Fund, entered into agreements with insurance companies and other financial intermediaries (“Service Organizations”), some of which may be affiliates. Pursuant to these agreements, the Service Organizations provide the Fund with administrative, networking, recordkeeping, sub-transfer agency and shareholder services to sub-accounts they service. For these services, the Service Organizations receive an annual fee per shareholder account, which will vary depending on share class and/or net assets of Fund shareholders serviced by the Service Organizations, which is shown as transfer agent — class specific. For the six months ended June 30, 2016, the Fund did not pay any amounts to affiliates in return for these services.
| | | | | | |
| 46 | | BLACKROCK VARIABLE SERIES FUNDS, INC. | | JUNE 30, 2016 | | |
| | | | |
| Notes to Consolidated Financial Statements (continued) | | | BlackRock Global Allocation V.I. Fund | |
In addition, the Fund pays the transfer agent, which is not an affiliate, a fee for issuance, transfer and redemption of shares and the opening and maintenance of shareholder accounts, which is included in transfer agent in the Consolidated Statement of Operations.
For the six months ended June 30, 2016, the following table shows the class specific transfer agent fees borne directly by each class of the Fund:
| | | | | | | | | | | | |
| Class I | | Class II | | | Class III | | | Total | |
| $721,232 | | $ | 238,855 | | | $ | 8,872,290 | | | $ | 9,832,377 | |
Expense Limitations, Waivers and Reimbursements
The Manager, with respect to the Fund, contractually agreed to waive and/or reimburse fees or expenses in order to limit expenses, excluding interest expense, dividend expense, tax expense, acquired fund fees and expenses, and certain other fund expenses, which constitute extraordinary expenses not incurred in the ordinary course of the Fund’s business. The expense limitations as a percentage of average daily net assets are as follows:
| | | | |
Class I | | | 1.25 | % |
Class II | | | 1.40 | % |
Class III | | | 1.50 | % |
The Manager has agreed not to reduce or discontinue this contractual expense limitation prior to May 1, 2017 unless approved by the Board, including a majority of the Independent Directors who are not “interested persons” of the Fund, as defined in the 1940 Act (“Independent Directors”) or by a majority of the outstanding voting securities of the Fund.
The Manager, with respect to the Fund, voluntarily agreed to waive its investment advisory fees by the amount of investment advisory fees the Fund pays to the Manager indirectly through its investment in affiliated money market funds. This amount is shown as fees waived by the Manager in the Consolidated Statement of Operations. However, the Manager does not waive its investment advisory fees by the amount of investment advisory fees paid in connection with the Fund’s investment in other affiliated investment companies, if any. For the six months ended June 30, 2016, the amount waived was $1,284.
The Manager has contractually agreed to reimburse transfer agent fees in order to limit such expenses as a percentage of average daily net assets as follows:
| | | | |
Class I | | | 0.07 | % |
Class II | | | 0.07 | % |
Class III | | | 0.07 | % |
The Manager has agreed not to reduce or discontinue this contractual expense limitation prior to May 1, 2017 unless approved by the Board, including a majority of the Independent Directors or by a majority of the outstanding voting securities of the Fund.
These amounts reimbursed are shown as transfer agent fees reimbursed — class specific in the Consolidated Statement of Operations. Class specific expense reimbursements are as follows:
| | | | | | | | | | | | | | | | |
| | | Class I | | | Class II | | | Class III | | | Total | |
Transfer Agent Fees Reimbursed | | $ | 23,745 | | | $ | 154,096 | | | $ | 5,911,732 | | | $ | 6,089,573 | |
For the six months ended June 30, 2016, the Fund reimbursed the Manager $59,272 for certain accounting services, which is included in accounting services in the Consolidated Statement of Operations.
Securities Lending
The U.S. Securities and Exchange Commission has issued an exemptive order which permits BIM, an affiliate of the Manager, to serve as securities lending agent for the Fund, subject to applicable conditions. As securities lending agent, BIM bears all operational costs directly related to securities lending. The Fund is responsible for expenses in connection with the investment of cash collateral received for securities on loan (the “collateral investment expenses”). The cash collateral is invested in a private investment company managed by the Manager or its affiliates. However, BIM has agreed to cap the collateral investment expenses of the private investment company to an annual rate of 0.04%. The investment adviser to the private investment company will not charge any advisory fees with respect to shares purchased by the Fund.
Securities lending income is equal to the total of income earned from the reinvestment of cash collateral, net of fees and other payments to and from borrowers of securities, and less the collateral investment expenses. The Fund retains a portion of securities lending income and remits a remaining portion to BIM as compensation for its services as securities lending agent.
| | | | | | |
| | | BLACKROCK VARIABLE SERIES FUNDS, INC. | | JUNE 30, 2016 | | 47 |
| | | | |
| Notes to Consolidated Financial Statements (continued) | | | BlackRock Global Allocation V.I. Fund | |
Pursuant to a securities lending agreement, the Fund retains 80% of securities lending income, and this amount retained can never be less than 70% of the total of securities lending income plus the collateral investment expenses.
In addition, commencing the business day following the date that the aggregate securities lending income earned across the Equity-Bond Complex in a calendar year exceeds a specified threshold, the Fund, pursuant to the securities lending agreement, will retain for the remainder of that calendar year securities lending income as follows: 85% of securities lending income, and this amount retained can never be less than 70% of the total of securities lending income plus the collateral investment expenses.
The share of securities lending income earned by the Fund is shown as securities lending — affiliated — net in the Consolidated Statement of Operations. For the six months ended June 30, 2016, the Fund paid BIM $426,366 for securities lending agent services.
Officers and Directors
Certain officers and/or directors of the Company are officers and/or directors of BlackRock or its affiliates. The Fund reimburses the Manager for a portion of the compensation paid to the Fund’s Chief Compliance Officer, which is included in Officer and Directors in the Consolidated Statement of Operations.
Other Transactions
The Fund may purchase securities from, or sell securities to, an affiliated fund provided the affiliation is due solely to having a common investment adviser, common officers, or common directors. For the six months ended June 30, 2016, the purchase and sale transactions which resulted in net realized gains (losses) with an affiliated fund in compliance with Rule 17a-7 under the 1940 Act were as follows.
| | | | | | |
| Purchases | | Sales | | | Net Realized
Gain |
$9,877,590 | | $ | 4,566,154 | | | $557,197 |
7. Purchases and Sales:
For the six months ended June 30, 2016, purchases and sales of investments, including paydowns and excluding short-term securities, were as follows:
| | | | | | | | |
| | | Purchases | | | Sales | |
Non-U.S. Government Securities | | $ | 4,263,686,951 | | | $ | 3,623,825,858 | |
U.S. Government Securities. | | $ | 2,351,879,960 | | | $ | 1,884,222,567 | |
For the six months ended June 30, 2016, purchases and sales related to mortgage dollar rolls were $148,044,015 and $147,522,701, respectively.
8. Income Tax Information:
It is the Fund’s policy to comply with the requirements of the Internal Revenue Code of 1986, as amended, applicable to regulated investment companies and to distribute substantially all of its taxable income to its shareholders. Therefore, no federal income tax provision is required.
The Fund files U.S. federal and various state and local tax returns. No income tax returns are currently under examination. The statute of limitations on the Fund’s U.S. federal tax returns generally remains open for each of the four years ended December 31, 2015. The statutes of limitations on the Fund’s state and local tax returns may remain open for an additional year depending upon the jurisdiction.
Management has analyzed tax laws and regulations and their application to the Fund as of June 30, 2016, inclusive of the open tax return years, and does not believe there are any uncertain tax positions that require recognition of a tax liability in the Fund’s financial statements.
As of June 30, 2016, gross unrealized appreciation and depreciation based on cost for federal income tax purposes were as follows:
| | | | |
Tax cost | | $ | 11,432,839,176 | |
| | | | |
Gross unrealized appreciation | | $ | 657,725,138 | |
Gross unrealized depreciation | | | (759,051,864 | ) |
| | | | |
Net unrealized depreciation | | $ | (101,326,726 | ) |
9. Bank Borrowings:
The Company, on behalf of the Fund, along with certain other funds managed by the Manager and its affiliates (“Participating Funds”), is a party to a 364-day, $2.1 billion credit agreement with a group of lenders. Under this agreement, the Fund may borrow to fund shareholder redemptions. Excluding
| | | | | | |
| 48 | | BLACKROCK VARIABLE SERIES FUNDS, INC. | | JUNE 30, 2016 | | |
| | | | |
| Notes to Consolidated Financial Statements (continued) | | | BlackRock Global Allocation V.I. Fund | |
commitments designated for certain individual funds, the Participating Funds, including the Fund, can borrow up to an aggregate commitment amount of $1.6 billion at any time outstanding, subject to asset coverage and other limitations as specified in the agreement. The credit agreement has the following terms: a fee of 0.12% per annum on unused commitment amounts and interest at a rate equal to the higher of (a) one-month LIBOR (but, in any event, not less than 0.00%) on the date the loan is made plus 0.80% per annum or (b) the Fed Funds rate (but, in any event, not less than 0.00%) in effect from time to time plus 0.80% per annum on amounts borrowed. The agreement expires in April 2017 unless extended or renewed. Prior to April 21, 2016, the credit agreement had a fee per annum of 0.06% on unused commitment amounts and interest at a rate equal to the higher of (a) one-month LIBOR (but, in any event, not less than 0.00%) on the date the loan is made plus 0.80% per annum or (b) the Fed Funds rate (but, in any event, not less than 0.00%) in effect from time to time plus 0.80% per annum on amounts borrowed. Participating Funds paid administration, legal and arrangement fees, which, if applicable, are included in miscellaneous expenses in the Consolidated Statement of Operations. These fees were allocated among such funds based upon portions of the aggregate commitment available to them and relative net assets of Participating Funds. During the six months ended June 30, 2016, the Fund did not borrow under the credit agreement.
10. Principal Risks:
In the normal course of business, the Fund invests in securities and enters into transactions where risks exist due to fluctuations in the market (market risk) or failure of the issuer to meet all its obligations, including the ability to pay principal and interest when due (issuer credit risk). The value of securities held by the Fund may decline in response to certain events, including those directly involving the issuers of securities owned by the Fund. Changes arising from the general economy; the overall market and local, regional or global political or/and social instability, as well as currency, interest rate and price fluctuations, may also affect the securities’ value.
The Fund may be exposed to prepayment risk, which is the risk that borrowers may exercise their option to prepay principal earlier than scheduled during periods of declining interest rates, which would force the Fund to reinvest in lower yielding securities. The Fund may also be exposed to reinvestment risk, which is the risk that income from the Fund’s portfolio will decline if the Fund invests the proceeds from matured, traded or called fixed income securities at market interest rates that are below the Fund portfolio’s current earnings rate.
Counterparty Credit Risk: Similar to issuer credit risk, the Fund may be exposed to counterparty credit risk, or the risk that an entity may fail to or be unable to perform on its commitments related to unsettled or open transactions. The Fund manages counterparty credit risk by entering into transactions only with counterparties that the Manager believes have the financial resources to honor their obligations and by monitoring the financial stability of those counterparties. Financial assets, which potentially expose the Fund to market, issuer and counterparty credit risks, consist principally of financial instruments and receivables due from counterparties. The extent of the Fund’s exposure to market, issuer and counterparty credit risks with respect to these financial assets is approximately their value recorded in the Consolidated Statement of Assets and Liabilities, less any collateral held by the Fund.
A derivative contract may suffer a mark-to-market loss if the value of the contract decreases due to an unfavorable change in the market rates or values of the underlying instrument. Losses can also occur if the counterparty does not perform under the contract.
The Fund’s risk of loss from counterparty credit risk on OTC derivatives is generally limited to the aggregate unrealized gain less the value of any collateral held by the Fund.
For OTC options purchased, the Fund bears the risk of loss of the amount of the premiums paid plus the positive change in market values net of any collateral held by such Fund should the counterparty fail to perform under the contracts. Options written by the Fund do not typically give rise to counterparty credit risk, as options written generally obligate the Fund, and not the counterparty, to perform. The Fund may be exposed to counterparty credit risk with respect to options written to the extent the Fund deposits collateral with its counterparty to a written option.
With exchange-traded options purchased, futures and centrally cleared swaps, there is less counterparty credit risk to the Fund since the exchange or clearinghouse, as counterparty to such instruments, guarantees against a possible default. The clearinghouse stands between the buyer and the seller of the contract; therefore, credit risk is limited to failure of the clearinghouse. While offset rights may exist under applicable law, the Fund does not have a contractual right of offset against a clearing broker or clearinghouse in the event of a default (including the bankruptcy or insolvency). Additionally, credit risk exists in exchange-traded futures and centrally cleared swaps with respect to initial and variation margin that is held in a clearing broker’s customer accounts. While clearing brokers are required to segregate customer margin from their own assets, in the event that a clearing broker becomes insolvent or goes into bankruptcy and at that time there is a shortfall in the aggregate amount of margin held by the clearing broker for all its clients, typically the shortfall would be allocated on a pro rata basis across all the clearing broker’s customers, potentially resulting in losses to the Fund.
The Fund invests a significant portion of its assets in fixed-income securities and/or uses derivatives tied to the fixed-income markets. Changes in market interest rates or economic conditions, may affect the value and/or liquidity of such investments. Interest rate risk is the risk that prices of bonds and other fixed-income securities will increase as interest rates fall and decrease as interest rates rise. The Fund may be subject to a greater risk of rising interest rates due to the current period of historically low rates.
| | | | | | |
| | | BLACKROCK VARIABLE SERIES FUNDS, INC. | | JUNE 30, 2016 | | 49 |
| | | | |
| Notes to Consolidated Financial Statements (continued) | | | BlackRock Global Allocation V.I. Fund | |
11. Capital Share Transactions:
Transactions in capital shares for each class were as follows:
| | | | | | | | | | | | | | | | | | | | |
| | | Six Months Ended
June 30, 2016 | | | | | | Year Ended
December 31, 2015 | |
| | | Shares | | | Amount | | | | | | Shares | | | Amount | |
Class I | | | | | | | | | | | | | | | | | | | | |
Shares sold | | | 10,277,855 | | | $ | 152,287,171 | | | | | | | | 29,942,559 | | | $ | 491,454,627 | |
Shares issued in reinvestment of distributions. | | | — | | | | — | | | | | | | | 7,239,930 | | | | 111,785,594 | |
Shares redeemed | | | (6,104,793 | ) | | | (90,886,023 | ) | | | | | | | (10,045,140 | ) | | | (164,284,586 | ) |
| | | | | | | | | | | | |
Net increase | | | 4,173,062 | | | $ | 61,401,148 | | | | | | | | 27,137,349 | | | $ | 438,955,635 | |
| | | | | | | | | | | | |
| | | | | | | | | | | | | | | | | | | | |
Class II | | | | | | | | | | | | | | | | | | | | |
Shares sold | | | 374,658 | | | $ | 5,539,660 | | | | | | | | 1,738,682 | | | $ | 28,612,376 | |
Shares issued in reinvestment of distributions. | | | — | | | | — | | | | | | | | 1,068,549 | | | | 16,467,733 | |
Shares redeemed | | | (1,653,195 | ) | | | (24,374,446 | ) | | | | | | | (1,772,664 | ) | | | (28,738,978 | ) |
| | | | | | | | | | | | |
Net increase (decrease) | | | (1,278,537 | ) | | $ | (18,834,786 | ) | | | | | | | 1,034,567 | | | $ | 16,341,131 | |
| | | | | | | | | | | | |
| | | | | | | | | | | | | | | | | | | | |
Class III | | | | | | | | | | | | | | | | | | | | |
Shares sold | | | 7,948,227 | | | $ | 101,529,025 | | | | | | | | 21,372,342 | | | $ | 305,722,607 | |
Shares issued in reinvestment of distributions. | | | — | | | | — | | | | | | | | 48,275,550 | | | | 646,216,116 | |
Shares redeemed | | | (44,046,068 | ) | | | (563,893,720 | ) | | | | | | | (78,303,391 | ) | | | (1,117,166,913 | ) |
| | | | | | | | | | | | |
Net decrease | | | (36,097,841 | ) | | $ | (462,364,695 | ) | | | | | | | (8,655,499 | ) | | $ | (165,228,190 | ) |
| | | | | | | | | | | | |
Total Net Increase (Decrease) | | | (33,203,316 | ) | | $ | (419,798,333 | ) | | | | | | | 19,516,417 | | | $ | 290,068,576 | |
| | | | | | | | | | | | |
12. Subsequent Events:
Management has evaluated the impact of all subsequent events on the Fund through the date the financial statements were issued and has determined that there were no subsequent events requiring adjustment or additional disclosure in the consolidated financial statements.
| | | | | | |
| 50 | | BLACKROCK VARIABLE SERIES FUNDS, INC. | | JUNE 30, 2016 | | |
JUNE 30, 2016
| | | | |
SEMI-ANNUAL REPORT (UNAUDITED) | | | | BLACKROCK® |
BlackRock Variable Series Funds, Inc.
▶ BlackRock Global Opportunities V.I. Fund
| | |
| Not FDIC Insured ¡ May Lose Value ¡ No Bank Guarantee | | |
| | | | |
| Fund Summary as of June 30, 2016 | | | BlackRock Global Opportunities V.I. Fund | |
BlackRock Global Opportunities V.I. Fund’s (the “Fund”) investment objective is to seek long-term growth of capital.
|
| Portfolio Management Commentary |
How did the Fund perform?
| • | | For the six-month period ended June 30, 2016, the Fund underperformed its benchmark, the MSCI All Country World Index. |
What factors influenced performance?
| • | | Stock selection decisions in the internet software & services sub-industry of the information technology (“IT”) sector led detractors. In particular, the Fund’s position in Hortonworks, Inc. weighed on performance after investors rotated out of higher growth names for safer relative investments. Stock selection in the construction machinery & heavy trucks sub-industry of the industrials sector was the next largest detractor as global growth concerns, particularly manufacturing based in China, negatively impacted the Fund’s position in CRRC Corp. Ltd. Given the concerns, the Fund exited the stock. |
| • | | Conversely, the Fund’s underweight positioning within the automobile manufacturers sub-industry of the consumer discretionary sector led gains for the period after the group traded broadly lower. The investment adviser believes that global growth concerns could continue to hamper demand, and the Fund remains underweight in the sub-industry. The other notable contributor to relative returns during the period was stock selection within the oil & gas exploration & production sub-industry of |
| | the energy sector, as the Fund’s position in Encana Corp. traded higher after energy prices continued to stabilize. |
| • | | For the period, derivatives were utilized to obtain currency exposure for risk management purposes. Given some extreme relative moves for currency values during the period, the Fund’s derivative exposure positively contributed to performance. |
Describe recent portfolio activity.
| • | | During the six-month period, the Fund shifted to more defensive stocks in the consumer staples and utilities sectors, funded by profit taking in the financials and health care sectors. Regionally, these sector decisions resulted in increased exposure to Europe and the Pacific Basin, and decreased exposure to North America and the emerging markets. |
Describe portfolio positioning at period end.
| • | | Relative to the MSCI All Country World Index, the Fund ended the period with its largest overweights in the IT and consumer discretionary sectors, and underweights in the financials and industrials sectors. Regionally, this resulted in overweight positions in Europe and underweights in North America and the Pacific Basin. |
The views expressed reflect the opinions of BlackRock as of the date of this report and are subject to change based on changes in market, economic or other conditions. These views are not intended to be a forecast of future events and are no guarantee of future results.
| | | | | |
| Geographic Allocation | | Percent of
Net Assets |
United States | | | | 53 | % |
United Kingdom | | | | 11 | |
Japan | | | | 5 | |
Belgium | | | | 3 | |
Switzerland | | | | 3 | |
India | | | | 3 | |
Italy | | | | 2 | |
Netherlands | | | | 2 | |
China | | | | 2 | |
Other1 | | | | 15 | |
Short-Term Securities | | | | 5 | |
Liabilities in Excess of Other Assets | | | | (4 | ) |
| | 1 | | Includes holdings within countries that are 1% or less of net assets. Please refer to the Schedule of Investments for such countries. |
| | | | | | |
| 2 | | BLACKROCK VARIABLE SERIES FUNDS, INC. | | JUNE 30, 2016 | | |
| | | | |
| | | | BlackRock Global Opportunities V.I. Fund | |
|
| Total Return Based on a $10,000 Investment |
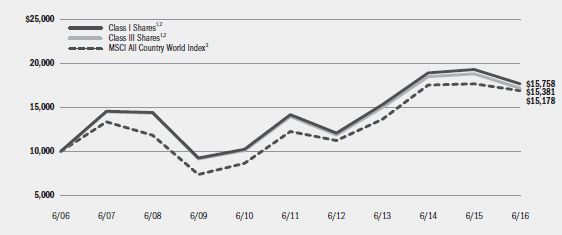
| | 1 | Assuming transaction costs, if any, and other operating expenses, including investment advisory fees. Does not include insurance-related fees and expenses. The returns for Class III Shares prior to June 23, 2008, the recommencement of operations of Class III Shares, are based upon the performance of the Fund’s Class I Shares, as adjusted to reflect the distribution (12b-1) fees applicable to Class III Shares. |
| | 2 | Under normal conditions, the Fund will invest at least 75% of its total assets in global equity securities of any market capitalization, selected for their above-average return potential. The returns prior to October 1, 2011 are the returns of the Fund when it followed different investment strategies. |
| | 3 | A free float-adjusted market capitalization weighted index that is designed to measure the equity market performance of developed and emerging markets. The index consists of 46 country indexes comprising 23 developed and 23 emerging market country indexes. |
|
| Performance Summary for the Period Ended June 30, 2016 |
| | | | | | | | | | | | | | | | | | | | |
| | | | | Average Annual Total Returns |
| | | 6-Month
Total Returns5 | | 1 Year5 | | 5 Years5 | | 10 Years5 |
Class I4 | | | | (1.81) | %6 | | | | (7.26) | % | | | | 3.72 | % | | | | 4.65 | % |
Class III4 | | | | (1.88) | 6 | | | | (7.49) | | | | | 3.47 | | | | | 4.40 | 7 |
MSCI All Country World Index | | | | 1.23 | | | | | (3.73) | | | | | 5.38 | | | | | 4.26 | |
| | 4 | | Average annual and cumulative total returns are based on changes in net asset value for the periods shown, and assume reinvestment of all distributions at net asset value on the ex-dividend date. Insurance-related fees and expenses are not reflected in these returns. The returns prior to October 1, 2011 are the returns of a Fund that followed different investment strategies. |
| | 5 | | For a portion of the period, the Fund’s investment adviser waived a portion of its fee. Without such waiver, the Fund’s performance would have been lower. |
| | 6 | | Performance results do not include adjustments made for financial reporting purposes in accordance with U.S. generally accepted accounting principles and may differ from results reported in the financial highlights. |
| | 7 | | The returns for Class III Shares prior to June 23, 2008, the recommencement of operations of Class III Shares, are based upon performance of the Fund’s Class I Shares, as adjusted to reflect the distribution (12b-1) fees applicable to Class III Shares. |
| | | | Past performance is not indicative of future results. Performance results do not reflect the deduction of taxes that a shareholder would pay on Fund distributions or the redemption of Fund shares. |
| | | | | | | | | | | | | | |
| | | Actual | | Hypothetical9 | | |
| | | Beginning
Account Value
January 1, 2016 | | Ending
Account Value
June 30, 2016 | | Expenses Paid
During the Period8 | | Beginning
Account Value
January 1, 2016 | | Ending
Account Value
June 30, 2016 | | Expenses Paid
During the Period8 | | Annualized
Expense
Ratio |
Class I | | $1,000.00 | | $981.90 | | $4.78 | | $1,000.00 | | $1,020.04 | | $4.87 | | 0.97% |
| Class III | | $1,000.00 | | $981.20 | | $6.01 | | $1,000.00 | | $1,018.80 | | $6.12 | | 1.22% |
| | 8 | | For each class of the Fund, expenses are equal to the annualized expense ratio for the class, multiplied by the average account value over the period, multiplied by 182/366 (to reflect the one-half year period shown). |
| | 9 | | Hypothetical 5% annual return before expenses is calculated by prorating the number of days in the most recent fiscal half year divided by 366. See “Disclosure of Expenses” on the following page for further information on how expenses were calculated. |
| | | | | | |
| | | BLACKROCK VARIABLE SERIES FUNDS, INC. | | JUNE 30, 2016 | | 3 |
| | | | |
| Disclosure of Expenses | | | BlackRock Global Opportunities V.I. Fund | |
Shareholders of the Fund may incur the following charges: (a) transactional expenses, such as sales charges; and (b) operating expenses, including investment advisory fees, service and distribution fees, including 12b-1 fees, acquired fund fees and expenses, and other fund expenses. The expense example on the previous page (which is based on a hypothetical investment of $1,000 invested on January 1, 2016 and held through June 30, 2016) is intended to assist shareholders both in calculating expenses based on an investment in the Fund and in comparing these expenses with similar costs of investing in other mutual funds.
The expense example provides information about actual account values and actual expenses. In order to estimate the expenses a shareholder paid during the period covered by this report, shareholders can divide their account value by $1,000 and then multiply the result by the number corresponding to their share class under the heading entitled “Expenses Paid During the Period.”
The expense example also provides information about hypothetical account values and hypothetical expenses based on the Fund’s actual expense ratio and an assumed rate of return of 5% per year before expenses. In order to assist shareholders in comparing the ongoing expenses of investing in the Fund and other funds, compare the 5% hypothetical example with the 5% hypothetical examples that appear in shareholder reports of other funds.
The expenses shown in the expense example are intended to highlight shareholders’ ongoing costs only and do not reflect any transactional expenses, such as sales charges, if any. Therefore, the hypothetical example is useful in comparing ongoing expenses only, and will not help shareholders determine the relative total expenses of owning different funds. If these transactional expenses were included, shareholder expenses would have been higher.
|
| Derivative Financial Instruments |
The Fund may invest in various derivative financial instruments. These instruments are used to obtain exposure to a security, commodity, index, market, and/or other asset without owning or taking physical custody of securities, commodities and/or other referenced assets or to manage market, equity, credit, interest rate, foreign currency exchange rate, commodity and/or other risks. Derivative financial instruments may give rise to a form of economic leverage and involve risks, including the imperfect correlation between the value of a derivative financial instrument and the underlying asset, possible default of the counterparty to the transaction
or illiquidity of the instrument. The Fund’s successful use of a derivative financial instrument depends on the investment adviser’s ability to predict pertinent market movements accurately, which cannot be assured. The use of these instruments may result in losses greater than if they had not been used, may limit the amount of appreciation the Fund can realize on an investment and/or may result in lower distributions paid to shareholders. The Fund’s investments in these instruments, if any, are discussed in detail in the Notes to Financial Statements.
| | | | | | |
| 4 | | BLACKROCK VARIABLE SERIES FUNDS, INC. | | JUNE 30, 2016 | | |
| | | | |
| Schedule of Investments June 30, 2016 (Unaudited) | | | BlackRock Global Opportunities V.I. Fund | |
| | | (Percentages shown are based on Net Assets) | |
| | | | | | | | |
| Common Stocks | | Shares | | | Value | |
Australia — 0.5% | | | | | | | | |
Ensogo Ltd. (a) | | | 18,821 | | | $ | 9,118 | |
Newcrest Mining Ltd. (a) | | | 12,100 | | | | 209,716 | |
| | | | | | | | |
| | | | | | �� | | 218,834 | |
Belgium — 3.5% | | | | | | | | |
Anheuser-Busch InBev SA | | | 9,296 | | | | 1,229,275 | |
Delhaize Group | | | 1,512 | | | | 159,720 | |
| | | | | | | | |
| | | | | | | | 1,388,995 | |
Canada — 1.4% | | | | | | | | |
Fairfax Financial Holdings Ltd. | | | 1,011 | | | | 544,513 | |
China — 2.0% | | | | | | | | |
Alibaba Group Holding Ltd. — ADR (a) | | | 5,721 | | | | 454,991 | |
China Construction Bank Corp., H Shares | | | 488,000 | | | | 325,319 | |
| | | | | | | | |
| | | | | | | | 780,310 | |
France — 1.1% | | | | | | | | |
Unibail-Rodamco SE — REIT | | | 1,672 | | | | 432,538 | |
Hong Kong — 0.7% | | | | | | | | |
AIA Group Ltd. | | | 49,289 | | | | 296,410 | |
India — 1.5% | | | | | | | | |
Bharti Infratel Ltd. | | | 41,555 | | | | 212,930 | |
HDFC Bank Ltd. | | | 19,759 | | | | 400,520 | |
| | | | | | | | |
| | | | | | | | 613,450 | |
Indonesia — 0.5% | | | | | | | | |
Matahari Department Store Tbk PT | | | 133,789 | | | | 203,909 | |
Ireland — 0.7% | | | | | | | | |
Green REIT PLC | | | 187,988 | | | | 289,774 | |
Israel — 0.5% | | | | | | | | |
Teva Pharmaceutical Industries Ltd. — ADR | | | 3,900 | | | | 195,897 | |
Italy — 2.2% | | | | | | | | |
Atlantia SpA | | | 9,700 | | | | 242,355 | |
Eni SpA | | | 18,795 | | | | 302,736 | |
Snam SpA | | | 53,200 | | | | 318,054 | |
| | | | | | | | |
| | | | | | | | 863,145 | |
Japan — 5.2% | | | | | | | | |
Alps Electric Co. Ltd. | | | 9,718 | | | | 184,625 | |
FANUC Corp. | | | 2,564 | | | | 417,094 | |
Nintendo Co. Ltd. | | | 1,937 | | | | 278,345 | |
Panasonic Corp. | | | 18,868 | | | | 162,332 | |
SoftBank Group Corp. | | | 5,935 | | | | 335,637 | |
Sony Corp. | | | 9,200 | | | | 271,050 | |
| | | | | | | | |
| Common Stocks | | Shares | | | Value | |
Japan (continued) | | | | | | | | |
Sumitomo Mitsui Financial Group, Inc. | | | 14,981 | | | $ | 432,577 | |
| | | | | | | | |
| | | | | | | | 2,081,660 | |
Mexico — 0.7% | | | | | | | | |
Fomento Economico Mexicano SAB de CV — ADR | | | 2,919 | | | | 269,978 | |
Netherlands — 2.0% | | | | | | | | |
ASML Holding NV | | | 2,092 | | | | 205,934 | |
InterXion Holding NV (a) | | | 5,955 | | | | 219,620 | |
Koninklijke Philips NV | | | 15,848 | | | | 393,607 | |
| | | | | | | | |
| | | | | | | | 819,161 | |
New Zealand — 0.4% | | | | | | | | |
Xero Ltd. (a) | | | 13,604 | | | | 177,560 | |
Nigeria — 0.2% | | | | | | | | |
Lekoil Ltd. (a) | | | 382,903 | | | | 91,754 | |
Norway — 0.8% | | | | | | | | |
Statoil ASA | | | 18,292 | | | | 316,058 | |
Portugal — 1.0% | | | | | | | | |
Galp Energia SGPS SA | | | 27,486 | | | | 382,286 | |
South Africa — 1.0% | | | | | | | | |
Naspers Ltd., N Shares | | | 2,686 | | | | 410,139 | |
South Korea — 0.3% | | | | | | | | |
LG Chem Ltd. | | | 600 | | | | 137,021 | |
Spain — 1.3% | | | | | | | | |
Cellnex Telecom SAU | | | 33,466 | | | | 525,169 | |
Sweden — 0.7% | | | | | | | | |
Nordea Bank AB | | | 31,697 | | | | 268,906 | |
Switzerland — 2.7% | | | | | | | | |
Nestle SA, Registered Shares | | | 5,811 | | | | 450,227 | |
Roche Holding AG | | | 1,344 | | | | 354,654 | |
UBS Group AG, Registered Shares (b) | | | 21,445 | | | | 278,262 | |
| | | | | | | | |
| | | | | | | | 1,083,143 | |
Taiwan — 1.4% | | | | | | | | |
Largan Precision Co. Ltd. | | | 2,750 | | | | 254,329 | |
Taiwan Semiconductor Manufacturing Co. Ltd. | | | 58,577 | | | | 295,210 | |
| | | | | | | | |
| | | | | | | | 549,539 | |
Thailand — 0.4% | | | | | | | | |
True Corp. PCL | | | 762,100 | | | | 156,150 | |
United Kingdom — 11.3% | | | | | | | | |
AstraZeneca PLC | | | 6,780 | | | | 405,334 | |
BAE Systems PLC | | | 48,769 | | | | 341,412 | |
| | | | | | | | | | |
| Portfolio Abbreviations |
| ADR | | American Depositary Receipts | | EUR | | Euro | | REIT | | Real Estate Investment Trust |
| AUD | | Australian Dollar | | GBP | | British Pound | | SEK | | Swedish Krona |
| CAD | | Canadian Dollar | | JPY | | Japanese Yen | | SGD | | Singapore Dollar |
| CHF | | Swiss Franc | | NOK | | Norwegian Krone | | USD | | U.S. Dollar |
| DKK | | Danish Krone | | NZD | | New Zealand Dollar | | | | |
See Notes to Financial Statements.
| | | | | | |
| | | BLACKROCK VARIABLE SERIES FUNDS, INC. | | JUNE 30, 2016 | | 5 |
| | | | |
| Schedule of Investments (continued) | | | BlackRock Global Opportunities V.I. Fund | |
| | | | |
| | | | | | | | |
| Common Stocks | | Shares | | | Value | |
United Kingdom (continued) | | | | | | | | |
Delphi Automotive PLC | | | 3,935 | | | $ | 246,331 | |
Diageo PLC | | | 15,330 | | | | 428,256 | |
GlaxoSmithKline PLC | | | 12,500 | | | | 268,439 | |
Imperial Brands PLC | | | 9,003 | | | | 488,260 | |
Kennedy Wilson Europe Real Estate PLC | | | 11,227 | | | | 144,164 | |
Lloyds Banking Group PLC | | | 377,765 | | | | 273,613 | |
Metro Bank PLC (a) | | | 12,199 | | | | 293,619 | |
Nomad Foods Ltd. (a) | | | 35,966 | | | | 287,009 | |
Unilever PLC | | | 13,232 | | | | 634,017 | |
Vodafone Group PLC — ADR | | | 11,757 | | | | 363,174 | |
Worldpay Group PLC (a) | | | 92,250 | | | | 335,764 | |
| | | | | | | | |
| | | | | | | | 4,509,392 | |
United States — 51.6% | | | | | | | | |
Acuity Brands, Inc. | | | 925 | | | | 229,363 | |
Adobe Systems, Inc. (a) | | | 3,344 | | | | 320,322 | |
Allergan PLC (a) | | | 850 | | | | 196,427 | |
Alphabet, Inc., Class A (a) | | | 635 | | | | 446,742 | |
Alphabet, Inc., Class C (a) | | | 950 | | | | 657,495 | |
Altria Group, Inc. | | | 6,649 | | | | 458,515 | |
Amazon.com, Inc. (a) | | | 602 | | | | 430,803 | |
Amgen, Inc. | | | 1,400 | | | | 213,010 | |
Apple Inc. | | | 6,256 | | | | 598,074 | |
Aramark | | | 10,863 | | | | 363,041 | |
Assured Guaranty Ltd. | | | 7,153 | | | | 181,472 | |
AT&T Inc. | | | 8,500 | | | | 367,285 | |
BankUnited, Inc. | | | 12,990 | | | | 399,053 | |
Biogen, Inc. (a)(b) | | | 600 | | | | 145,092 | |
Boston Scientific Corp. (a) | | | 23,450 | | | | 548,027 | |
Cerner Corp. (a) | | | 3,500 | | | | 205,100 | |
Cigna Corp. | | | 1,500 | | | | 191,985 | |
Citigroup, Inc. | | | 11,248 | | | | 476,803 | |
Comcast Corp., Class A | | | 7,171 | | | | 467,477 | |
Concho Resources, Inc. (a) | | | 3,254 | | | | 388,105 | |
Crown Holdings, Inc. (a) | | | 4,263 | | | | 216,006 | |
Duke Energy Corp. | | | 3,700 | | | | 317,423 | |
Eastman Chemical Co. | | | 3,884 | | | | 263,724 | |
Enterprise Products Partners LP | | | 9,800 | | | | 286,748 | |
EOG Resources, Inc. (b) | | | 4,498 | | | | 375,223 | |
Facebook, Inc., Class A (a) | | | 4,690 | | | | 535,973 | |
FirstEnergy Corp. | | | 8,354 | | | | 291,638 | |
Hartford Financial Services Group, Inc. | | | 12,306 | | | | 546,140 | |
Hess Corp. | | | 4,900 | | | | 294,490 | |
Hortonworks, Inc. (a) | | | 18,597 | | | | 198,802 | |
Humana, Inc. (b) | | | 1,300 | | | | 233,844 | |
Intercontinental Exchange, Inc. | | | 1,300 | | | | 332,748 | |
Kellogg Co. | | | 5,000 | | | | 408,250 | |
Kennedy-Wilson Holdings, Inc. | | | 11,855 | | | | 224,771 | |
Lam Research Corp. | | | 2,860 | | | | 240,412 | |
Lowe’s Cos., Inc. | | | 4,732 | | | | 374,632 | |
Macquarie Infrastructure Corp. | | | 3,236 | | | | 239,626 | |
MasterCard, Inc., Class A | | | 5,615 | | | | 494,457 | |
McDonald’s Corp. | | | 6,299 | | | | 758,022 | |
Medtronic PLC | | | 5,893 | | | | 511,336 | |
Merck & Co., Inc. | | | 3,611 | | | | 208,030 | |
Micron Technology, Inc. (a) | | | 10,372 | | | | 142,719 | |
Mondelez International, Inc., Class A | | | 8,572 | | | | 390,112 | |
Monsanto Co. | | | 3,300 | | | | 341,253 | |
Mosaic Co. (b) | | | 15,244 | | | | 399,088 | |
Pioneer Natural Resources Co. | | | 1,778 | | | | 268,851 | |
Platform Specialty Products Corp. (a) | | | 19,743 | | | | 175,318 | |
PPL Corp. | | | 8,169 | | | | 308,380 | |
Public Service Enterprise Group, Inc. | | | 9,728 | | | | 453,422 | |
Roper Technologies, Inc. | | | 1,352 | | | | 230,597 | |
Samsonite International SA | | | 67,516 | | | | 186,672 | |
| | | | | | | | |
| Common Stocks | | Shares | | | Value | |
United States (continued) | | | | | | | | |
ServiceMaster Global Holdings, Inc. (a) | | | 8,200 | | | $ | 326,360 | |
Sherwin-Williams Co. | | | 948 | | | | 278,399 | |
Shire PLC — ADR | | | 1,056 | | | | 194,388 | |
Starbucks Corp. | | | 9,154 | | | | 522,876 | |
Strategic Growth Bancorp (Acquired 3/10/14, cost $247,382) (a)(c) | | | 19,870 | | | | 149,025 | |
Union Pacific Corp. | | | 3,131 | | | | 273,180 | |
UnitedHealth Group, Inc. | | | 2,453 | | | | 346,364 | |
Walt Disney Co. | | | 3,085 | | | | 301,775 | |
WestRock Co. | | | 6,500 | | | | 252,655 | |
Whirlpool Corp. | | | 1,450 | | | | 241,628 | |
WisdomTree Investments, Inc. (b) | | | 19,101 | | | | 186,999 | |
| | | | | | | | |
| | | | | | | | 20,606,547 | |
Total Common Stocks — 95.6% | | | | | | | 38,212,238 | |
| | | | | | | | |
| Preferred Stocks | | | | | | |
India — 1.0% | | | | | | | | |
Jasper Infotech Private Ltd., Series F (Acquired 5/07/14, cost $85,441) (a)(c) | | | 12 | | | | 294,999 | |
Jasper Infotech Private Ltd., Series G (Acquired 10/29/14, cost $33,723) (a)(c) | | | 4 | | | | 98,333 | |
| | | | | | | | |
| | | | | | | | 393,332 | |
United States — 1.9% | | | | | | | | |
Palantir Technologies, Inc., Series I (Acquired 2/07/14, cost $138,814) (a)(c) | | | 22,645 | | | | 217,165 | |
Uber Technologies, Inc., Series D (Acquired 6/10/14, cost $172,691) (a)(c) | | | 11,132 | | | | 542,932 | |
| | | | | | | | |
| | | | | | | | 760,097 | |
Total Preferred Stocks — 2.9% | | | | | | | 1,153,429 | |
Total Long-Term Investments (Cost — $37,424,925) — 98.5% | | | | | | | 39,365,667 | |
| | | | | | | | |
| Short-Term Securities | | | | | | |
BlackRock Liquidity Funds, TempFund, Institutional Class, 0.40% (d)(e) | | | 380,533 | | | | 380,533 | |
| | |
| | | Beneficial
Interest
(000) | | | | |
BlackRock Liquidity Series, LLC, Money Market Series, 0.59% (d)(e)(f) | | $ | 1,484 | | | | 1,484,211 | |
Total Short-Term Securities (Cost — $1,864,744) — 4.7% | | | | | | | 1,864,744 | |
Total Investments (Cost — $39,289,669) — 103.2% | | | | 41,230,411 | |
Liabilities in Excess of Other Assets — (3.2)% | | | | | | | (1,274,649 | ) |
| | | | | | | | |
Net Assets — 100.0% | | | | | | $ | 39,955,762 | |
| | | | | | | | |
See Notes to Financial Statements.
| | | | | | |
| 6 | | BLACKROCK VARIABLE SERIES FUNDS, INC. | | JUNE 30, 2016 | | |
| | | | |
| Schedule of Investments (continued) | | | BlackRock Global Opportunities V.I. Fund | |
|
| Notes to Schedule of Investments |
| (a) | | Non-income producing security. |
| (b) | | Security, or a portion of security, is on loan. |
| (c) | | Restricted security as to resale, excluding 144A securities. As of period end, the Fund held restricted securities with a current value of $1,302,454 and an original cost of $678,051, which was 3.3% of its net assets. |
| (d) | | During the six months ended June 30, 2016, investments in issuers considered to be affiliates of the Fund for purposes of Section 2(a)(3) of the Investment Company Act of 1940, as amended, were as follows: |
| | | | | | | | | | | | | | | | | | | | |
| Affiliate | | Shares/Beneficial
Interest Held at
December 31, 2015 | | | Net Activity | | | Shares/Beneficial
Interest Held at
June 30, 2016 | | | Value at
June 30, 2016 | | | Income | |
BlackRock Liquidity Funds, TempFund, Institutional Class | | | 943,288 | | | | (562,755 | ) | | | 380,533 | | | | $ 380,533 | | | | $2,451 | |
BlackRock Liquidity Series, LLC, Money Market Series | | | $1,924,659 | | | $ | (440,448 | ) | | | $1,484,211 | | | | 1,484,211 | | | | 3,748 | 1 |
| | | | | | | | | | | | | | | $1,864,744 | | | | $6,199 | |
| | | | | | | | | | | | | | | | |
| | 1 | | Represents securities lending income earned from the reinvestment of cash collateral from loaned securities, net of fees and collateral investment expenses, and other payments to and from borrowers of securities. |
| (e) | | Current yield as of period end. |
| (f) | | Security was purchased with the cash collateral from loaned securities. The Fund may withdraw up to 25% of its investment daily, although the manager of the BlackRock Liquidity Series, LLC, Money Market Series, in its sole discretion, may permit an investor to withdraw more than 25% on any one day. |
|
| Derivative Financial Instruments Outstanding as of Period End |
Forward Foreign Currency Exchange Contracts
| | | | | | | | | | | | | | | | | | |
Currency Purchased | | | Currency
Sold | | | Counterparty | | Settlement
Date | | Unrealized
Appreciation
(Depreciation) | |
| AUD | | | 1,324,000 | | | USD | | | 952,152 | | | HSBC Bank PLC | | 7/13/16 | | $ | 34,800 | |
| CAD | | | 355,000 | | | USD | | | 270,148 | | | Citibank N.A. | | 7/13/16 | | | 4,645 | |
| CHF | | | 18,228 | | | USD | | | 18,596 | | | Bank of New York Mellon | | 7/13/16 | | | 87 | |
| CHF | | | 195,535 | | | USD | | | 201,270 | | | HSBC Bank PLC | | 7/13/16 | | | (858 | ) |
| DKK | | | 978,471 | | | USD | | | 150,025 | | | Commonwealth Bank of Australia | | 7/13/16 | | | (3,957 | ) |
| DKK | | | 806,121 | | | USD | | | 123,618 | | | Morgan Stanley & Co. International PLC | | 7/13/16 | | | (3,279 | ) |
| EUR | | | 9,587 | | | USD | | | 10,998 | | | Citibank N.A. | | 7/13/16 | | | (353 | ) |
| EUR | | | 127,356 | | | USD | | | 146,948 | | | Goldman Sachs International | | 7/13/16 | | | (5,545 | ) |
| EUR | | | 166,000 | | | USD | | | 191,479 | | | Goldman Sachs International | | 7/13/16 | | | (7,170 | ) |
| EUR | | | 13,572 | | | USD | | | 15,656 | | | HSBC Bank PLC | | 7/13/16 | | | (587 | ) |
| EUR | | | 128,719 | | | USD | | | 146,422 | | | HSBC Bank PLC | | 7/13/16 | | | (3,506 | ) |
| EUR | | | 18,989 | | | USD | | | 21,318 | | | Morgan Stanley & Co. International PLC | | 7/13/16 | | | (235 | ) |
| GBP | | | 102,000 | | | USD | | | 146,276 | | | Citibank N.A. | | 7/13/16 | | | (10,472 | ) |
| GBP | | | 11,000 | | | USD | | | 16,071 | | | Goldman Sachs International | | 7/13/16 | | | (1,426 | ) |
| GBP | | | 120,000 | | | USD | | | 172,572 | | | Morgan Stanley & Co. International PLC | | 7/13/16 | | | (12,802 | ) |
| GBP | | | 150,000 | | | USD | | | 216,840 | | | Morgan Stanley & Co. International PLC | | 7/13/16 | | | (17,129 | ) |
| JPY | | | 239,675 | | | USD | | | 2,240 | | | Bank of New York Mellon | | 7/13/16 | | | 81 | |
| JPY | | | 146,581,390 | | | USD | | | 1,361,812 | | | HSBC Bank PLC | | 7/13/16 | | | 58,235 | |
| SEK | | | 192,580 | | | USD | | | 23,692 | | | Northern Trust Corp. | | 7/13/16 | | | (917 | ) |
| SEK | | | 941,922 | | | USD | | | 115,793 | | | State Street Bank and Trust Co. | | 7/13/16 | | | (4,400 | ) |
| SGD | | | 239,148 | | | USD | | | 176,658 | | | State Street Bank and Trust Co. | | 7/13/16 | | | 850 | |
| USD | | | 205,409 | | | AUD | | | 274,000 | | | Morgan Stanley & Co. International PLC | | 7/13/16 | | | 1,160 | |
| USD | | | 106,727 | | | CHF | | | 102,779 | | | State Street Bank and Trust Co. | | 7/13/16 | | | 1,384 | |
| USD | | | 543,235 | | | EUR | | | 476,260 | | | HSBC Bank PLC | | 7/13/16 | | | 14,445 | |
| USD | | | 217,430 | | | EUR | | | 198,000 | | | Morgan Stanley & Co. International PLC | | 7/13/16 | | | (2,408 | ) |
| USD | | | 92,491 | | | EUR | | | 81,846 | | | State Street Bank and Trust Co. | | 7/13/16 | | | 1,618 | |
| USD | | | 236,569 | | | EUR | | | 207,655 | | | State Street Bank and Trust Co. | | 7/13/16 | | | 6,011 | |
| USD | | | 2,723,218 | | | GBP | | | 1,931,159 | | | Commonwealth Bank of Australia | | 7/13/16 | | | 152,054 | |
| USD | | | 207,918 | | | JPY | | | 22,623,184 | | | HSBC Bank PLC | | 7/13/16 | | | (11,250 | ) |
See Notes to Financial Statements.
| | | | | | |
| | | BLACKROCK VARIABLE SERIES FUNDS, INC. | | JUNE 30, 2016 | | 7 |
| | | | |
| Schedule of Investments (continued) | | | BlackRock Global Opportunities V.I. Fund | |
| | | | | | | | | | | | | | | | | | | | | | |
Currency Purchased | | | Currency Sold | | | Counterparty | | Settlement
Date | | | Unrealized
Appreciation
(Depreciation) | |
| USD | | | 25,627 | | | | JPY | | | | 2,615,485 | | | Morgan Stanley & Co. International PLC | | | 7/13/16 | | | $ | 288 | |
| USD | | | 124,886 | | | | JPY | | | | 13,197,896 | | | Morgan Stanley & Co. International PLC | | | 7/13/16 | | | | (2,972 | ) |
| USD | | | 709,185 | | | | JPY | | | | 76,391,334 | | | Morgan Stanley & Co. International PLC | | | 7/13/16 | | | | (30,877 | ) |
| USD | | | 531,268 | | | | JPY | | | | 55,194,000 | | | State Street Bank and Trust Co. | | | 7/13/16 | | | | (3,439 | ) |
| USD | | | 25,588 | | | | NOK | | | | 212,970 | | | HSBC Bank PLC | | | 7/13/16 | | | | 140 | |
| USD | | | 177,015 | | | | NOK | | | | 1,472,914 | | | HSBC Bank PLC | | | 7/13/16 | | | | 1,016 | |
| USD | | | 130,381 | | | | NZD | | | | 193,206 | | | Morgan Stanley & Co. International PLC | | | 7/13/16 | | | | (7,472 | ) |
| USD | | | 47,331 | | | | SEK | | | | 384,224 | | | Commonwealth Bank of Australia | | | 7/13/16 | | | | 1,892 | |
| Total | | | | | | | | | | | | | | | | | | | | $ | 147,652 | |
| | | | | | | | | | | | | | | | | | | | | | |
|
| Derivative Financial Instruments Categorized by Risk Exposure |
| | | | | | | | | | | | | | | | | | | | | | | | | | | | | | |
As of period end, the fair values of derivative financial instruments located in the Statement of Assets and Liabilities were as follows: | |
| Assets — Derivative Financial Instruments | | Commodity
Contracts | | | Credit
Contracts | | | Equity
Contracts | | | Foreign
Currency
Exchange
Contracts | | | Interest
Rate
Contracts | | | Other
Contracts | | | Total | |
Forward foreign currency exchange contracts | | Unrealized appreciation on forward foreign currency exchange contracts | | | — | | | | — | | | | — | | | $ | 278,706 | | | | — | | | | — | | | $ | 278,706 | |
| | | | | | | | | | | | | | | | | | | | | | | | | | | | | | |
| Liabilities — Derivative Financial Instruments | |
Forward foreign currency exchange contracts | | Unrealized depreciation on forward foreign currency exchange contracts | | | — | | | | — | | | | — | | | $ | (131,054) | | | | — | | | | — | | | $ | (131,054) | |
| |
| For the six months ended June 30, 2016, the effect of derivative financial instruments in the Statement of Operations was as follows: | | | | | |
| | | | | | | | | | | | | | | | | | | | | | | | | | | | |
| | | Commodity
Contracts | | | Credit
Contracts | | | Equity
Contracts | | | Foreign
Currency
Exchange
Contracts | | | Interest
Rate
Contracts | | | Other
Contracts | | | Total | |
Net Realized Gain (Loss) from: | | | | | | | | | | | | | | | | | | | | | | | | | | | | |
Forward foreign currency exchange contracts | | | — | | | | — | | | | — | | | $ | 257,639 | | | | — | | | | — | | | $ | 257,639 | |
| | | | | | | | | | | | | | | | | | | | | | | | | | | | |
Net Change in Unrealized Appreciation (Depreciation) on: | | | | | | | | | | | | | | | | | | | | | | | | | | | | |
Forward foreign currency exchange contracts | | | — | | | | — | | | | — | | | $ | 73,585 | | | | — | | | | — | | | $ | 73,585 | |
|
| Average Quarterly Balances of Outstanding Derivative Financial Instruments |
| | | | |
Forward foreign currency exchange contracts: | | | | |
Average amounts purchased — in USD | | $ | 6,192,499 | |
Average amounts sold — in USD | | $ | 4,531,490 | |
For more information about the Fund’s investment risks regarding derivative financial instruments, refer to the Notes to Financial Statements.
See Notes to Financial Statements.
| | | | | | |
| 8 | | BLACKROCK VARIABLE SERIES FUNDS, INC. | | JUNE 30, 2016 | | |
| | | | |
| Schedule of Investments (continued) | | | BlackRock Global Opportunities V.I. Fund | |
| | | | |
| Derivative Financial Instruments — Offsetting as of Period End |
The Fund’s derivative assets and liabilities (by type) were as follows: |
| | | | | | | | |
| | | Assets | | | Liabilities | |
Derivative Financial Instruments: | | | | | | | | |
Forward foreign currency exchange contracts | | | $278,706 | | | | $131,054 | |
| | | | |
Total derivative assets and liabilities in the Statement of Assets and Liabilities | | | 278,706 | | | | 131,054 | |
| | | | |
Derivatives not subject to a Master Netting Agreement or similar agreement (“MNA”) | | | — | | | | — | |
| | | | |
Total derivative assets and liabilities subject to an MNA | | | $278,706 | | | | $131,054 | |
| | | | |
|
The following table presents the Fund’s derivative assets and liabilities by counterparty net of amounts available for offset under an MNA and net of the related collateral received and pledged by the Fund: |
| | | | | | | | | | | | | | | | | | | | | | | | | |
| Counterparty | | Derivative Assets
Subject to an MNA
by Counterparty | | Derivatives
Available for
Offset1 | | Non-cash
Collateral
Received | | Cash Collateral
Received | | Net Amount of
Derivative Assets2 |
Bank of New York Mellon | | | | $ 168 | | | | | — | | | | | — | | | | | — | | | | | $ 168 | |
Citibank N.A. | | | | 4,645 | | | | | $ (4,645 | ) | | | | — | | | | | — | | | | | — | |
Commonwealth Bank of Australia | | | | 153,946 | | | | | (3,957 | ) | | | | — | | | | | — | | | | | 149,989 | |
HSBC Bank PLC | | | | 108,636 | | | | | (16,201 | ) | | | | — | | | | | — | | | | | 92,435 | |
Morgan Stanley & Co. International PLC | | | | 1,448 | | | | | (1,448 | ) | | | | — | | | | | — | | | | | — | |
State Street Bank and Trust Co. | | | | 9,863 | | | | | (7,839 | ) | | | | — | | | | | — | | | | | 2,024 | |
Total | | | | $278,706 | | | | | $(34,090 | ) | | | | — | | | | | — | | | | | $244,616 | |
| | | | | | | | | | | | | | | | | | | | | | | | | |
| Counterparty | | Derivative Liabilities
Subject to an MNA
by Counterparty | | Derivatives
Available for
Offset1 | | Non-cash
Collateral
Pledged | | Cash Collateral
Pledged | | Net Amount of
Derivative
Liabilities3 |
Citibank N.A. | | | | $ 10,825 | | | | | $ (4,645 | ) | | | | — | | | | | — | | | | | $ 6,180 | |
Commonwealth Bank of Australia | | | | 3,957 | | | | | (3,957 | ) | | | | — | | | | | — | | | | | — | |
Goldman Sachs International | | | | 14,141 | | | | | — | | | | | — | | | | | — | | | | | 14,141 | |
HSBC Bank PLC | | | | 16,201 | | | | | (16,201 | ) | | | | — | | | | | — | | | | | — | |
Morgan Stanley & Co. International PLC | | | | 77,174 | | | | | (1,448 | ) | | | | — | | | | | — | | | | | 75,726 | |
Northern Trust Corp. | | | | 917 | | | | | — | | | | | — | | | | | — | | | | | 917 | |
State Street Bank and Trust Co. | | | | 7,839 | | | | | (7,839 | ) | | | | — | | | | | — | | | | | — | |
Total | | | | $131,054 | | | | | $(34,090 | ) | | | | — | | | | | — | | | | | $96,964 | |
| | 1 | | The amount of derivatives available for offset is limited to the amount of derivative assets and/or liabilities that are subject to an MNA. |
| | 2 | | Net amount represents the net amount receivable from the counterparty in the event of default. |
| | 3 | | Net amount represents the net amount payable due to the counterparty in the event of default. |
|
| Fair Value Hierarchy as of Period End |
|
Various inputs are used in determining the fair value of investments and derivative financial instruments. For information about the Fund’s policy regarding valuation of investments and derivative financial instruments, refer to the Notes to Financial Statements. |
See Notes to Financial Statements.
| | | | | | |
| | | BLACKROCK VARIABLE SERIES FUNDS, INC. | | JUNE 30, 2016 | | 9 |
| | | | |
| Schedule of Investments (continued) | | | BlackRock Global Opportunities V.I. Fund | |
| | | | | | | | | | | | | | | | |
The following tables summarize the Fund’s investments and derivative financial instruments categorized in the disclosure hierarchy: | |
| | | Level 1 | | | Level 2 | | | Level 3 | | | Total | |
Assets: | | | | | | | | | | | | | | | | |
Investments: | | | | | | | | | | | | | | | | |
Long-Term Investments: | | | | | | | | | | | | | | | | |
Common Stocks: | | | | | | | | | | | | | | | | |
Australia | | | — | | | $ | 218,834 | | | | — | | | $ | 218,834 | |
Belgium | | | — | | | | 1,388,995 | | | | — | | | | 1,388,995 | |
Canada | | $ | 544,513 | | | | — | | | | — | | | | 544,513 | |
China | | | 454,991 | | | | 325,319 | | | | — | | | | 780,310 | |
France | | | — | | | | 432,538 | | | | — | | | | 432,538 | �� |
Hong Kong | | | — | | | | 296,410 | | | | — | | | | 296,410 | |
India | | | — | | | | 613,450 | | | | — | | | | 613,450 | |
Indonesia | | | — | | | | 203,909 | | | | — | | | | 203,909 | |
Ireland | | | 289,774 | | | | — | | | | — | | | | 289,774 | |
Israel | | | 195,897 | | | | — | | | | — | | | | 195,897 | |
Italy | | | — | | | | 863,145 | | | | — | | | | 863,145 | |
Japan | | | — | | | | 2,081,660 | | | | — | | | | 2,081,660 | |
Mexico | | | 269,978 | | | | — | | | | — | | | | 269,978 | |
Netherlands | | | 219,620 | | | | 599,541 | | | | — | | | | 819,161 | |
New Zealand | | | — | | | | 177,560 | | | | — | | | | 177,560 | |
Nigeria | | | 91,754 | | | | — | | | | — | | | | 91,754 | |
Norway | | | — | | | | 316,058 | | | | — | | | | 316,058 | |
Portugal | | | — | | | | 382,286 | | | | — | | | | 382,286 | |
South Africa | | | — | | | | 410,139 | | | | — | | | | 410,139 | |
South Korea | | | — | | | | 137,021 | | | | — | | | | 137,021 | |
Spain | | | — | | | | 525,169 | | | | — | | | | 525,169 | |
Sweden | | | — | | | | 268,906 | | | | — | | | | 268,906 | |
Switzerland | | | — | | | | 1,083,143 | | | | — | | | | 1,083,143 | |
Taiwan | | | — | | | | 549,539 | | | | — | | | | 549,539 | |
Thailand | | | 156,150 | | | | — | | | | — | | | | 156,150 | |
United Kingdom | | | 1,190,133 | | | | 3,319,259 | | | | — | | | | 4,509,392 | |
United States | | | 20,270,850 | | | | 186,672 | | | $ | 149,025 | | | | 20,606,547 | |
Preferred Stocks: | | | | | | | | | | | | | | | | |
India | | | — | | | | — | | | | 393,332 | | | | 393,332 | |
United States | | | — | | | | — | | | | 760,097 | | | | 760,097 | |
Short-Term Securities | | | 380,533 | | | | 1,484,211 | | | | — | | | | 1,864,744 | |
| | | | |
Total | | $ | 24,064,193 | | | $ | 15,863,764 | | | $ | 1,302,454 | | | $ | 41,230,411 | |
| | | | |
| | | | | | | | | | | | | | | | |
Derivative Financial Instruments1 | | | | | | | | | | | | | | | | |
Assets: | | | | | | | | | | | | | | | | |
Foreign currency exchange contracts | | | — | | | | $ 278,706 | | | | — | | | | $ 278,706 | |
Liabilities: | | | | | | | | | | | | | | | | |
Foreign currency exchange contracts | | | — | | | | (131,054) | | | | — | | | | (131,054) | |
| | | | |
Total | | | — | | | | $ 147,652 | | | | — | | | | $ 147,652 | |
| | | | |
1 Derivative financial instruments are forward foreign currency exchange contracts, which are valued at the unrealized appreciation (depreciation) on the instrument. | |
|
The Fund may hold assets and/or liabilities in which the fair value approximates the carrying amount for financial statement purposes. As of period end, such assets and/or liabilities are categorized within the disclosure hierarchy as follows: | |
| | | Level 1 | | | Level 2 | | | Level 3 | | | Total | |
Assets: | | | | | | | | | | | | | | | | |
Cash | | | $ 14,499 | | | | — | | | | — | | | | $ 14,499 | |
Foreign currency at value | | | 323,764 | | | | — | | | | — | | | | 323,764 | |
Liabilities: | | | | | | | | | | | | | | | | |
Collateral on securities loaned at value | | | — | | | | $(1,484,211) | | | | — | | | | (1,484,211) | |
| | | | |
Total | | | $ 338,263 | | | | $(1,484,211) | | | | — | | | | $ (1,145,948) | |
| | | | |
See Notes to Financial Statements.
| | | | | | |
| 10 | | BLACKROCK VARIABLE SERIES FUNDS, INC. | | JUNE 30, 2016 | | |
| | | | |
| Schedule of Investments (concluded) | | | BlackRock Global Opportunities V.I. Fund | |
During the six months ended June 30, 2016, there were no transfers between Level 1 and Level 2.
A reconciliation of Level 3 investments is presented when the Fund had a significant amount of Level 3 investments at the beginning and/or end of the year in relation to net assets. The following table is a reconciliation of Level 3 investments for which significant unobservable inputs were used in determining fair value:
| | | | | | | | | | | | |
| | | Common
Stocks | | | Preferred
Stocks | | | Total | |
Assets: | | | | | | | | | | | | |
Opening balance, as of December 31, 2015 | | | $ 414,599 | | | | $1,197,796 | | | | $1,612,395 | |
Transfers into Level 3 | | | — | | | | — | | | | — | |
Transfers out of Level 3 | | | (235,769 | ) | | | — | | | | (235,769 | ) |
Accrued discounts/premiums | | | — | | | | — | | | | — | |
Net realized gain (loss) | | | — | | | | — | | | | — | |
Net change in unrealized appreciation (depreciation)1 | | | (29,805 | ) | | | (44,367 | ) | | | (74,172 | ) |
Purchases | | | — | | | | — | | | | — | |
Sales | | | — | | | | — | | | | — | |
| | | | |
Closing balance, as of June 30, 2016 | | | $ 149,025 | | | | $1,153,429 | | | | $1,302,454 | |
| | | | |
Net change in unrealized appreciation (depreciation) on investments still held at June 30, 20161 | | | $ (29,805) | | | | $ (44,367) | | | | $ (74,172) | |
| | | | |
| | 1 | | Included in the related net change in unrealized appreciation (depreciation) in the Statement of Operations. |
| | 2 | | Any difference between net change in unrealized appreciation (depreciation) and net change in unrealized appreciation (depreciation) on investments still held at June 30, 2016 is generally due to investments no longer held or categorized as Level 3 at year end. |
The following table summarizes the valuation techniques used and unobservable inputs utilized by the BlackRock Global Valuation Methodologies Committee (“Global Valuation Committee”) to determine the value of certain of the Fund’s Level 3 investments as of period end.
| | | | | | | | | | | | |
| Assets: | | Value | | | Valuation Techniques | | Unobservable Inputs | | Range of
Unobservable Inputs
Utilized | |
Common Stocks | | $ | 149,025 | | | Market Comparables | | Tangible Book Value Multiple1 | | | 1.35x | |
Preferred Stocks | | | 1,153,429 | | | Market Comparables | | Priced to new financing round1 | | | — | |
| | | | | | | | Revenue Multiple1 | | | 12.0x | |
| | | | | | | | Revenue Growth Rate1 | | | 84.00% | |
| | | | | | Probability-Weighted Expected Return Model | | Discount Rate2 | | | 25.00% | |
| | | | | | | | IPO Exit Probability1 | | | 70.00% | |
| | | | | | | | Merger and Acquisition Probability1 | | | 25.00% | |
| | | | | | | | Revenue Growth Rate1 | | | 80.00% | |
| | | | | | | | Revenue Multiple1 | | | 13.55x-20.70x | |
| | | | | | | | | Time to Exit2 | | | 1-2 years | |
Total | | $ | 1,302,454 | | | | | | | | | |
| | | | |
| | 1 | | Increase in unobservable input may result in a significant increase to value, while a decrease in unobservable input may result in a significant decrease to value. |
| | 2 | | Decrease in unobservable input may result in a significant increase to value, while an increase in unobservable input may result in a significant decrease to value. |
See Notes to Financial Statements.
| | | | | | |
| | | BLACKROCK VARIABLE SERIES FUNDS, INC. | | JUNE 30, 2016 | | 11 |
| | | | |
| Statement of Assets and Liabilities | | | | |
| | | | |
| June 30, 2016 (Unaudited) | | BlackRock
Global Opportunities
V.I. Fund | |
| | | | |
| Assets | | | | |
Investments at value — unaffiliated (including securities loaned at value of $1,460,466) (cost — $37,424,925) | | $ | 39,365,667 | |
Investments at value — affiliated (cost — $1,864,744) | | | 1,864,744 | |
Cash | | | 14,499 | |
Foreign currency at value (cost — $326,460) | | | 323,764 | |
Receivables: | | | | |
Investments sold | | | 107,757 | |
Securities lending income — affiliated | | | 550 | |
Capital shares sold | | | 284 | |
Dividends — affiliated | | | 175 | |
Dividends — unaffiliated | | | 96,289 | |
Litigation proceeds | | | 129,658 | |
From the Manager | | | 14,334 | |
Unrealized appreciation on forward foreign currency exchange contracts | | | 278,706 | |
Prepaid expenses | | | 95 | |
| | | | |
Total assets | | | 42,196,522 | |
| | | | |
| | | | |
| Liabilities | | | | |
Collateral on securities loaned at value | | | 1,484,211 | |
Payables: | | | | |
Investments purchased | | | 384,445 | |
Capital shares redeemed | | | 133,387 | |
Distribution fees | | | 767 | |
Investment advisory fees | | | 16,286 | |
Officer’s and Directors’ fees | | | 2,353 | |
Other accrued expenses | | | 88,026 | |
Other affiliates | | | 231 | |
Unrealized depreciation on forward foreign currency exchange contracts | | | 131,054 | |
| | | | |
Total liabilities | | | 2,240,760 | |
| | | | |
Net Assets | | $ | 39,955,762 | |
| | | | |
| | | | |
| Net Assets Consist of | | | | |
Paid-in capital | | $ | 38,243,136 | |
Undistributed net investment income | | | 65,028 | |
Accumulated net realized loss | | | (434,815 | ) |
Net unrealized appreciation (depreciation) | | | 2,082,413 | |
| | | | |
Net Assets | | $ | 39,955,762 | |
| | | | |
| | | | |
| Net Asset Value | | | | |
Class I — Based on net assets of $36,020,934 and 2,285,261 shares outstanding, 100 million shares authorized, $0.10 par value | | $ | 15.76 | |
| | | | |
Class III — Based on net assets of $3,934,828 and 250,944 shares outstanding, 100 million shares authorized, $0.10 par value | | $ | 15.68 | |
| | | | |
See Notes to Financial Statements.
| | | | | | |
| 12 | | BLACKROCK VARIABLE SERIES FUNDS, INC. | | JUNE 30, 2016 | | |
| | | | |
| Six Months Ended June 30, 2016 (Unaudited) | | BlackRock Global Opportunities V.I. Fund | |
| | | | |
| Investment Income | | | | |
Dividends — unaffiliated | | $ | 483,268 | |
Dividends — affiliated | | | 2,451 | |
Securities lending — affiliated — net | | | 3,748 | |
Foreign taxes withheld | | | (37,309 | ) |
| | | | |
Total income | | | 452,158 | |
| | | | |
| | | | |
| Expenses | | | | |
Investment advisory | | | 147,420 | |
Transfer agent | | | 2,415 | |
Transfer agent — class specific | | | 41,765 | |
Professional | | | 32,528 | |
Custodian | | | 13,963 | |
Printing | | | 12,065 | |
Officer and Directors | | | 9,892 | |
Accounting services | | | 8,088 | |
Distribution — class specific | | | 4,606 | |
Miscellaneous | | | 12,077 | |
| | | | |
Total expenses | | | 284,819 | |
Less fees waived by the Manager | | | (47,712 | ) |
Less transfer agent fees reimbursed — class specific | | | (41,765 | ) |
| | | | |
Total expenses after fees waived and reimbursed | | | 195,342 | |
| | | | |
Net investment income | | | 256,816 | |
| | | | |
| | | | |
| Realized and Unrealized Gain (Loss) | | | | |
Net realized gain (loss) from: | | | | |
Investments | | | (765,493 | ) |
Litigation proceeds | | | 129,658 | |
Foreign currency transactions | | | 238,344 | |
| | | | |
| | | (397,491 | ) |
| | | | |
Net change in unrealized appreciation (depreciation) on: | | | | |
Investments | | | (629,660 | ) |
Foreign currency translations | | | 69,311 | |
| | | | |
| | | (560,349 | ) |
| | | | |
Net realized and unrealized loss | | | (957,840 | ) |
| | | | |
Net Decrease in Net Assets Resulting from Operations | | $ | (701,024 | ) |
| | | | |
See Notes to Financial Statements.
| | | | | | |
| | | BLACKROCK VARIABLE SERIES FUNDS, INC. | | JUNE 30, 2016 | | 13 |
| | | | |
| Statements of Changes in Net Assets | | | BlackRock Global Opportunities V.I. Fund | |
| | | | | | | | |
| Increase (Decrease) in Net Assets: | | Six Months
Ended
June 30, 2016
(Unaudited) | | | Year Ended
December 31,
2015 | |
| Operations | | | | | | | | |
Net investment income | | $ | 256,816 | | | $ | 322,477 | |
Net realized gain (loss) | | | (397,491 | ) | | | 948,479 | |
Net change in unrealized appreciation (depreciation) | | | (560,349 | ) | | | (1,022,313 | ) |
| | | | |
Net increase (decrease) in net assets resulting from operations | | | (701,024 | ) | | | 248,643 | |
| | | | |
| | | | | | | | |
| Distributions to Shareholders1 | | | | | | | | |
From net investment income: | | | | | | | | |
Class I | | | — | | | | (385,681 | ) |
Class III | | | — | | | | (29,195 | ) |
From net realized gain: | | | | | | | | |
Class I | | | — | | | | (556,120 | ) |
Class III | | | — | | | | (53,873 | ) |
| | | | |
Decrease in net assets resulting from distributions to shareholders | | | — | | | | (1,024,869 | ) |
| | | | |
| | | | | | | | |
| Capital Share Transactions | | | | | | | | |
Net decrease in net assets derived from capital share transactions | | | (1,842,063 | ) | | | (3,832,518 | ) |
| | | | |
| | | | | | | | |
| Net Assets | | | | | | | | |
Total decrease in net assets | | | (2,543,087 | ) | | | (4,608,744 | ) |
Beginning of period | | | 42,498,849 | | | | 47,107,593 | |
| | | | |
End of period | | $ | 39,955,762 | | | $ | 42,498,849 | |
| | | | |
Undistributed (distributions in excess of) net investment income, end of period | | $ | 65,028 | | | $ | (191,788 | ) |
| | | | |
| | 1 | | Distributions for annual periods determined in accordance with federal income tax regulations. |
See Notes to Financial Statements.
| | | | | | |
| 14 | | BLACKROCK VARIABLE SERIES FUNDS, INC. | | JUNE 30, 2016 | | |
| | | | |
| Financial Highlights | | | BlackRock Global Opportunities V.I. Fund | |
| | | | | | | | | | | | | | | | | | | | | | | | |
| | | Class I | |
| | | Six Months
Ended
June 30, 2016 (Unaudited) | | | Year Ended December 31, | |
| | | | 2015 | | | 2014 | | | 2013 | | | 2012 | | | 2011 | |
| Per Share Operating Performance | | | | | | | | | | | | | | | | | | | | | | | | |
Net asset value, beginning of period | | $ | 16.00 | | | $ | 16.35 | | | $ | 17.98 | | | $ | 13.89 | | | $ | 12.26 | | | $ | 14.17 | |
| | | | |
Net investment income1 | | | 0.10 | | | | 0.12 | | | | 0.14 | | | | 0.07 | | | | 0.18 | | | | 0.14 | |
Net realized and unrealized gain (loss) | | | (0.34 | ) | | | (0.07 | ) | | | (0.81 | ) | | | 4.08 | | | | 1.60 | | | | (1.89) | |
| | | | |
Net increase (decrease) from investment operations | | | (0.24 | ) | | | 0.05 | | | | (0.67 | ) | | | 4.15 | | | | 1.78 | | | | (1.75) | |
| | | | |
Distributions:2 | | | | | | | | | | | | | | | | | | | | | | | | |
From net investment income | | | — | | | | (0.17 | ) | | | (0.20 | ) | | | (0.06 | ) | | | (0.15 | ) | | | (0.16) | |
From net realized gain | | | — | | | | (0.23 | ) | | | (0.76 | ) | | | — | | | | — | | | | — | |
| | | | |
Total distributions | | | — | | | | (0.40 | ) | | | (0.96 | ) | | | (0.06 | ) | | | (0.15 | ) | | | (0.16) | |
| | | | |
Net asset value, end of period | | $ | 15.76 | | | $ | 16.00 | | | $ | 16.35 | | | $ | 17.98 | | | $ | 13.89 | | | $ | 12.26 | |
| | | | |
| | | | | | | | | | | | | | | | | | | | | | | | |
| Total Return3 | | | | | | | | | | | | | | | | | | | | | | | | |
Based on net asset value | | | (1.50 | )%4,5 | | | 0.28 | % | | | (3.74 | )% | | | 29.87 | %6 | | | 14.53 | % | | | (12.39)% | |
| | | | |
| | | | | | | | | | | | | | | | | | | | | | | | |
| Ratios to Average Net Assets | | | | | | | | | | | | | | | | | | | | | | | | |
Total expenses | | | 1.43 | %7 | | | 1.35 | % | | | 1.33 | % | | | 1.33 | % | | | 1.19 | % | | | 1.09% | |
| | | | |
Total expenses after fees waived and reimbursed | | | 0.97 | %7 | | | 1.03 | % | | | 1.12 | % | | | 1.14 | % | | | 1.06 | % | | | 1.09% | |
| | | | |
Net investment income | | | 1.33 | %7 | | | 0.72 | % | | | 0.82 | % | | | 0.44 | % | | | 1.36 | % | | | 1.04% | |
| | | | |
| | | | | | | | | | | | | | | | | | | | | | | | |
| Supplemental Data | | | | | | | | | | | | | | | | | | | | | | | | |
Net assets, end of period (000) | | $ | 36,021 | | | $ | 38,686 | | | $ | 44,136 | | | $ | 52,175 | | | $ | 43,102 | | | $ | 43,381 | |
| | | | |
Portfolio turnover rate | | | 27 | % | | | 69 | % | | | 87 | % | | | 135 | % | | | 139 | % | | | 119% | |
| | | | |
| | 1 | | Based on average shares outstanding. |
| | 2 | | Distributions for annual periods determined in accordance with federal income tax regulations. |
| | 3 | | Where applicable, excludes insurance-related fees and expenses and assumes the reinvestment of distributions. |
| | 4 | | Includes the litigation settlement amount. Excluding this amount, the Fund’s total return is (1.81)%. |
| | 5 | | Aggregate total return. |
| | 6 | | Includes the litigation settlement amount. Excluding this amount, the Fund’s total return is 29.72%. |
See Notes to Financial Statements.
| | | | | | |
| | | BLACKROCK VARIABLE SERIES FUNDS, INC. | | JUNE 30, 2016 | | 15 |
| | |
| Financial Highlights (concluded) | | BlackRock Global Opportunities V.I. Fund |
| | | | | | | | | | | | | | | | | | | | | | | | |
| | | Class III | |
| | | Six Months
Ended
June 30, 2016 (Unaudited) | | | Year Ended December 31, | |
| | | | 2015 | | | 2014 | | | 2013 | | | 2012 | | | 2011 | |
| Per Share Operating Performance | | | | | | | | | | | | | | | | | | | | | | | | |
Net asset value, beginning of period | | $ | 15.93 | | | $ | 16.29 | | | $ | 17.93 | | | $ | 13.86 | | | $ | 12.23 | | | $ | 14.12 | |
| | | | |
Net investment income1 | | | 0.08 | | | | 0.08 | | | | 0.06 | | | | 0.03 | | | | 0.14 | | | | 0.11 | |
Net realized and unrealized gain (loss) | | | (0.33 | ) | | | (0.08 | ) | | | (0.77 | ) | | | 4.06 | | | | 1.60 | | | | (1.88) | |
| | | | |
Net increase (decrease) from investment operations | | | (0.25 | ) | | | — | | | | (0.71 | ) | | | 4.09 | | | | 1.74 | | | | (1.77) | |
| | | | |
Distributions:2 | | | | | | | | | | | | | | | | | | | | | | | | |
From net investment income | | | — | | | | (0.13 | ) | | | (0.17 | ) | | | (0.02 | ) | | | (0.11 | ) | | | (0.12) | |
From net realized gain | | | — | | | | (0.23 | ) | | | (0.76 | ) | | | — | | | | — | | | | — | |
| | | | |
Total distributions | | | — | | | | (0.36 | ) | | | (0.93 | ) | | | (0.02 | ) | | | (0.11 | ) | | | (0.12) | |
| | | | |
Net asset value, end of period | | $ | 15.68 | | | $ | 15.93 | | | $ | 16.29 | | | $ | 17.93 | | | $ | 13.86 | | | $ | 12.23 | |
| | | | |
| | | | | | | | | | | | | | | | | | | | | | | | |
| Total Return3 | | | | | | | | | | | | | | | | | | | | | | | | |
Based on net asset value | | | (1.57 | )%4,5 | | | 0.02 | % | | | (4.00 | )% | | | 29.51 | %6 | | | 14.28 | % | | | (12.53)% | |
| | | | |
| | | | | | | | | | | | | | | | | | | | | | | | |
| Ratios to Average Net Assets | | | | | | | | | | | | | | | | | | | | | | | | |
Total expenses | | | 1.64 | %7 | | | 1.63 | % | | | 1.57 | % | | | 1.58 | % | | | 1.43 | % | | | 1.35% | |
| | | | |
Total expenses after fees waived and reimbursed | | | 1.22 | %7 | | | 1.27 | % | | | 1.39 | % | | | 1.39 | % | | | 1.31 | % | | | 1.35% | |
| | | | |
Net investment income | | | 1.10 | %7 | | | 0.45 | % | | | 0.32 | % | | | 0.16 | % | | | 1.09 | % | | | 0.78% | |
| | | | |
| | | | | | | | | | | | | | | | | | | | | | | | |
| Supplemental Data | | | | | | | | | | | | | | | | | | | | | | | | |
Net assets, end of period (000) | | $ | 3,935 | | | $ | 3,813 | | | $ | 2,972 | | | $ | 1,404 | | | $ | 1,051 | | | $ | 1,070 | |
| | | | |
Portfolio turnover rate | | | 27 | % | | | 69 | % | | | 87 | % | | | 135 | % | | | 139 | % | | | 119% | |
| | | | |
| | 1 | | Based on average shares outstanding. |
| | 2 | | Distributions for annual periods determined in accordance with federal income tax regulations. |
| | 3 | | Where applicable, excludes insurance-related fees and expenses and assumes the reinvestment of distributions. |
| | 4 | | Includes the litigation settlement amount. Excluding this amount, the Fund’s total return is (1.88)%. |
| | 5 | | Aggregate total return. |
| | 6 | | Includes the litigation settlement amount. Excluding this amount, the Fund’s total return is 29.37%. |
See Notes to Financial Statements.
| | | | | | |
| 16 | | BLACKROCK VARIABLE SERIES FUNDS, INC. | | JUNE 30, 2016 | | |
| | |
| Notes to Financial Statements (Unaudited) | | BlackRock Global Opportunities V.I. Fund |
1. Organization:
BlackRock Variable Series Funds, Inc. (the “Company”) is registered under the Investment Company Act of 1940, as amended (the “1940 Act”), as an open-end management investment company. The Company is organized as a Maryland corporation that is comprised of 20 separate funds. The funds offer shares to insurance companies for their separate accounts to fund benefits under certain variable annuity and variable life insurance contracts. The financial statements presented are for BlackRock Global Opportunities V.I. Fund (the “Fund”). The Fund is classified as diversified. Class I and Class III Shares have equal voting, dividend, liquidation and other rights, except that only shares of the respective classes are entitled to vote on matters concerning only that class. In addition, Class III Shares also bear certain expenses related to the distribution of such shares.
The Fund, together with certain other registered investment companies advised by BlackRock Advisors, LLC (the “Manager”) or its affiliates, is included in a complex of open-end funds referred to as the Equity-Bond Complex.
2. Significant Accounting Policies:
The financial statements are prepared in conformity with accounting principles generally accepted in the United States of America (“U.S. GAAP”), which may require management to make estimates and assumptions that affect the reported amounts of assets and liabilities in the financial statements, disclosure of contingent assets and liabilities at the date of the financial statements and the reported amounts of increases and decreases in net assets from operations during the reporting period. Actual results could differ from those estimates. The Fund is considered an investment company under U.S. GAAP and follows the accounting and reporting guidance applicable to investment companies. Below is a summary of significant accounting policies:
Foreign Currency: The Fund’s books and records are maintained in U.S. dollars. Purchases and sales of investments are recorded at the rates of exchange prevailing on the respective dates of such transactions. Generally, when the U.S. dollar rises in value against a foreign currency, the investments denominated in that currency will lose value; the opposite effect occurs if the U.S. dollar falls in relative value.
The Fund does not isolate the portion of the results of operations arising as a result of changes in the exchange rates from the changes in the market prices of investments held or sold for financial reporting purposes. Accordingly, the effects of changes in exchange rates on investments are not segregated in the Statement of Operations from the effects of changes in market prices of those investments, but are included as a component of net realized and unrealized gain (loss) from investments. The Fund reports realized currency gains (losses) on foreign currency related transactions as components of net realized gain (loss) for financial reporting purposes, whereas such components are generally treated as ordinary income for federal income tax purposes.
Segregation and Collateralization: In cases where the Fund enters into certain investments (e.g., forward foreign currency exchange contracts) that would be treated as “senior securities” for 1940 Act purposes, the Fund may segregate or designate on its books and records cash or liquid assets having a market value at least equal to the amount of its future obligations under such investments. Doing so allows the investment to be excluded from treatment as a “senior security.” Furthermore, if required by an exchange or counterparty agreement, the Fund may be required to deliver/deposit cash and/or securities to/with an exchange, or broker-dealer or custodian as collateral for certain investments or obligations.
Investment Transactions and Investment Income: For financial reporting purposes, investment transactions are recorded on the dates the transactions are entered into (the trade dates). Realized gains and losses on investment transactions are determined on the identified cost basis. Dividend income is recorded on the ex-dividend date. Dividends from foreign securities where the ex-dividend date may have passed are subsequently recorded when the Fund is informed of the ex-dividend date. Under the applicable foreign tax laws, a withholding tax at various rates may be imposed on capital gains, dividends and interest. Upon notification from issuers, some of the dividend income received from a real estate investment trust may be redesignated as a reduction of cost of the related investment and/or realized gain. Income, expenses and realized and unrealized gains and losses are allocated daily to each class based on its relative net assets.
The Fund recorded a settlement amount from litigation related to certain foreign exchange trades. This amount is shown as litigation proceeds in the Statement of Operations.
Distributions: Distributions paid by the Fund are recorded on the ex-dividend date. The character and timing of distributions are determined in accordance with federal income tax regulations, which may differ from U.S. GAAP.
Indemnifications: In the normal course of business, the Fund enters into contracts that contain a variety of representations that provide general indemnification. The Fund’s maximum exposure under these arrangements is unknown because it involves future potential claims against the Fund, which cannot be predicted with any certainty.
| | | | | | |
| | | BLACKROCK VARIABLE SERIES FUNDS, INC. | | JUNE 30, 2016 | | 17 |
| | |
| Notes to Financial Statements (continued) | | BlackRock Global Opportunities V.I. Fund |
Other: Expenses directly related to the Fund or its classes are charged to the Fund or the applicable class. Other operating expenses shared by several funds, including other funds managed by the Manager, are prorated among those funds on the basis of relative net assets or other appropriate methods. Expenses directly related to the Fund and other shared expenses prorated to the Fund are allocated daily to each class based on its relative net assets or other appropriate methods.
The Fund has an arrangement with its custodian whereby fees may be reduced by credits earned on uninvested cash balances, which, if applicable, are shown as fees paid indirectly in the Statement of Operations. The custodian imposes fees on overdrawn cash balances, which can be offset by accumulated credits earned or may result in additional custody charges.
3. Investment Valuation and Fair Value Measurements:
Investment Valuation Policies: The Fund’s investments are valued at fair value (also referred to as “market value” within the financial statements) as of the close of trading on the New York Stock Exchange (“NYSE”) (generally 4:00 p.m., Eastern time). U.S. GAAP defines fair value as the price the Fund would receive to sell an asset or pay to transfer a liability in an orderly transaction between market participants at the measurement date. The Fund determines the fair values of its financial instruments using various independent dealers or pricing services under policies approved by the Board of Directors of the Company (the “Board”). The BlackRock Global Valuation Methodologies Committee (the “Global Valuation Committee”) is the committee formed by management to develop global pricing policies and procedures and to oversee the pricing function for all financial instruments.
Fair Value Inputs and Methodologies: The following methods (or “techniques”) and inputs are used to establish the fair value of the Fund’s assets and liabilities:
| • | | Equity investments traded on a recognized securities exchange are valued at the official closing price each day, if available. For equity investments traded on more than one exchange, the official close price on the exchange where the stock is primarily traded is used. Equity investments traded on a recognized exchange for which there were no sales on that day may be valued at the last available bid (long positions) or ask (short positions) price. Generally, trading in foreign instruments is substantially completed each day at various times prior to the close of business on the NYSE. Occasionally, events affecting the values of such instruments may occur between the foreign market close and the close of business on the NYSE that may not be reflected in the computation of the Fund’s net assets. Each business day, the Fund uses a pricing service to assist with the valuation of certain foreign exchange-traded equity securities and foreign exchange-traded and over-the-counter (“OTC”) options (the “Systematic Fair Value Price”). Using current market factors, the Systematic Fair Value Price is designed to value such foreign securities and foreign options at fair value as of the close of business on the NYSE, which follows the close of the local markets. |
| • | | Investments in open-end U.S. mutual funds are valued at net asset value each business day. |
| • | | The Fund values its investment in BlackRock Liquidity Series, LLC, Money Market Series (the “Money Market Series”) at fair value, which is ordinarily based upon its pro rata ownership in the underlying fund’s net assets. The Money Market Series seeks current income consistent with maintaining liquidity and preserving capital. Although the Money Market Series is not registered under the 1940 Act, its investments may follow the parameters of investments by a money market fund that is subject to Rule 2a-7 under the 1940 Act. The Fund may withdraw up to 25% of its investment daily, although the manager of the Money Market Series, in its sole discretion, may permit an investor to withdraw more than 25% on any one day. |
| • | | Securities and other assets and liabilities denominated in foreign currencies are translated into U.S. dollars using exchange rates determined as of the close of business on the NYSE. Forward foreign currency exchange contracts are valued at the mean between the bid and ask prices and are determined as of the close of business on the NYSE. Interpolated values are derived when the settlement date of the contract is an interim date for which quotations are not available. |
If events (e.g., a company announcement, market volatility or a natural disaster) occur that are expected to materially affect the value of such instruments, or in the event that the application of these methods of valuation results in a price for an investment that is deemed not to be representative of the market value of such investment, or if a price is not available, the investment will be valued by the Global Valuation Committee, or its delegate, in accordance with a policy approved by the Board as reflecting fair value (“Fair Valued Investments”). When determining the price for Fair Valued Investments, the Global Valuation Committee, or its delegate, seeks to determine the price that the Fund might reasonably expect to receive or pay from the current sale or purchase of that asset or liability in an arm’s-length transaction. Fair value determinations shall be based upon all available factors that the Global Valuation Committee, or its delegate, deems relevant consistent with the principles of fair value measurement, which include the market approach, income approach and/or in the case of recent investments, the cost approach, as appropriate. The market approach generally consists of using comparable market transactions. The income approach generally is used to discount future cash flows to present value and is adjusted for liquidity as appropriate. These factors include but are not limited to: (i) attributes specific to the investment or asset; (ii) the principal market for the investment or asset; (iii) the customary participants in the principal market for the investment or asset; (iv) data assumptions by market participants for the investment or asset, if reasonably available; (v) quoted prices for similar investments or assets in active markets; and (vi) other factors, such as future cash flows, interest rates, yield curves, volatilities, prepayment speeds, loss severities, credit risks, recovery rates, liquidation amounts and/or default rates. Due to the inherent uncertainty of valuations of such investments, the fair values may differ from the values that would have been used had an active market existed. The Global Valuation Committee, or its delegate, employs various methods for calibrating valuation approaches for investments where an active market does not exist, including regular due diligence of the Fund’s pricing vendors, regular reviews of key inputs and
| | | | | | |
| 18 | | BLACKROCK VARIABLE SERIES FUNDS, INC. | | JUNE 30, 2016 | | |
| | |
| Notes to Financial Statements (continued) | | BlackRock Global Opportunities V.I. Fund |
assumptions, transactional back-testing or disposition analysis to compare unrealized gains and losses to realized gains and losses, reviews of missing or stale prices and large movements in market values and reviews of any market related activity. The pricing of all Fair Valued Investments is subsequently reported to the Board or a committee thereof on a quarterly basis.
Fair Value Hierarchy: Various inputs are used in determining the fair value of investments and derivative financial instruments. These inputs to valuation techniques are categorized into a fair value hierarchy consisting of three broad levels for financial statement purposes as follows:
| • | | Level 1 — unadjusted price quotations in active markets/exchanges for identical assets or liabilities that the Fund has the ability to access |
| • | | Level 2 — other observable inputs (including, but not limited to, quoted prices for similar assets or liabilities in markets that are active, quoted prices for identical or similar assets or liabilities in markets that are not active, inputs other than quoted prices that are observable for the assets or liabilities (such as interest rates, yield curves, volatilities, prepayment speeds, loss severities, credit risks and default rates) or other market–corroborated inputs) |
| • | | Level 3 — unobservable inputs based on the best information available in the circumstances, to the extent observable inputs are not available (including the Fund’s own assumptions used in determining the fair value of investments and derivative financial instruments) |
The hierarchy gives the highest priority to unadjusted quoted prices in active markets for identical assets or liabilities (Level 1 measurements) and the lowest priority to unobservable inputs (Level 3 measurements). Accordingly, the degree of judgment exercised in determining fair value is greatest for instruments categorized in Level 3. The inputs used to measure fair value may fall into different levels of the fair value hierarchy. In such cases, for disclosure purposes, the fair value hierarchy classification is determined based on the lowest level input that is significant to the fair value measurement in its entirety. The significant unobservable inputs used by the Global Valuation Committee in determining the price for Fair Valued Investments are typically categorized as Level 3. The fair value hierarchy for the Fund’s investments and derivative financial instruments have been included in the Schedule of Investments.
Changes in valuation techniques may result in transfers into or out of an assigned level within the hierarchy. In accordance with the Fund’s policy, transfers between different levels of the fair value hierarchy are deemed to have occurred as of the beginning of the reporting period. The categorization of a value determined for investments and derivative financial instruments is based on the pricing transparency of the investments and derivative financial instruments and is not necessarily an indication of the risks associated with investing in those securities.
4. Securities and Other Investments:
Preferred Stock: Preferred stock has a preference over common stock in liquidation (and generally in receiving dividends as well) but is subordinated to the liabilities of the issuer in all respects. As a general rule, the market value of preferred stock with a fixed dividend rate and no conversion element varies inversely with interest rates and perceived credit risk, while the market price of convertible preferred stock generally also reflects some element of conversion value. Because preferred stock is junior to debt securities and other obligations of the issuer, deterioration in the credit quality of the issuer will cause greater changes in the value of a preferred stock than in a more senior debt security with similar stated yield characteristics. Unlike interest payments on debt securities, preferred stock dividends are payable only if declared by the issuer’s board of directors. Preferred stock also may be subject to optional or mandatory redemption provisions.
Securities Lending: The Fund may lend its securities to approved borrowers, such as brokers, dealers and other financial institutions. The borrower pledges and maintains with the Fund collateral consisting of cash, an irrevocable letter of credit issued by a bank, or securities issued or guaranteed by the U.S. Government. The initial collateral received by the Fund is required to have a value of at least 102% of the current value of the loaned securities for securities traded on U.S. exchanges and a value of at least 105% for all other securities. The collateral is maintained thereafter, at a value equal to at least 100% of the current market value of the securities on loan. The market value of the loaned securities is determined at the close of each business day of the Fund and any additional required collateral is delivered to the Fund, or excess collateral returned by the Fund, on the next business day. During the term of the loan, the Fund is entitled to all distributions made on or in respect of the loaned securities. Loans of securities are terminable at any time and the borrower, after notice, is required to return borrowed securities within the standard time period for settlement of securities transactions.
The market value of any securities on loan, all of which were classified as common stocks in the Fund’s Schedule of Investments, and the value of any related collateral are shown separately in the Statement of Assets and Liabilities as a component of investments at value — unaffiliated, and collateral on securities loaned at value, respectively. As of period end, any securities on loan were collateralized by cash. The cash collateral invested by the securities lending agent, BlackRock Investment Management, LLC (“BIM”), if any, is disclosed in the Schedule of Investments.
Securities lending transactions are entered into by the Fund under Master Securities Lending Agreements (each, an “MSLA”), which provide the right, in the event of default (including bankruptcy or insolvency), for the non-defaulting party to liquidate the collateral and calculate a net exposure to the defaulting party or request additional collateral. In the event that a borrower defaults, the Fund, as lender, would offset the market value of the collateral received against the market value of the securities loaned. When the value of the collateral is greater than that of the market value of the securities loaned, the lender is left with a net amount payable to the defaulting party. However, bankruptcy or insolvency laws of a particular jurisdiction may
| | | | | | |
| | | BLACKROCK VARIABLE SERIES FUNDS, INC. | | JUNE 30, 2016 | | 19 |
| | |
| Notes to Financial Statements (continued) | | BlackRock Global Opportunities V.I. Fund |
impose restrictions on or prohibitions against such a right of offset in the event of an MSLA counterparty’s bankruptcy or insolvency. Under the MSLA, absent an event of default the borrower can resell or re-pledge the loaned securities, and the Fund can reinvest cash collateral received in connection with loaned securities. Upon an event of default, the parties’ obligations to return the securities or collateral to the other party are extinguished, and the parties can resell or re-pledge the loaned securities or the collateral received in connection with the loaned securities in order to satisfy the defaulting party’s net payment obligation for all transactions under the MSLA. The defaulting party remains liable for any deficiency.
As of period end, the following table is a summary of the Fund’s securities lending agreements by counterparty which are subject to offset under an MSLA:
| | | | | | | | | | | | | | | | | | | | | | |
| Counterparty | | | | | Securities Loaned at Value | | | | | Cash Collateral
Received1 | | | | | Net
Amount2 | | | |
BNP Paribas S.A. | | | | | | | $ 143,641 | | | | | | $ (143,641) | | | | | | — | | | |
Citigroup Global Markets, Inc. | | | | | | | 88,227 | | | | | | (86,966) | | | | | | $1,261 | | | |
Goldman Sachs & Co. | | | | | | | 602,975 | | | | | | (602,975) | | | | | | — | | | |
Morgan Stanley | | | | | | | 395,082 | | | | | | (395,082) | | | | | | — | | | |
State Street Bank & Trust Co. | | | | | | | 96,892 | | | | | | (96,496) | | | | | | 396 | | | |
UBS Securities LLC | | | | | | | 133,649 | | | | | | (133,649) | | | | | | — | | | |
| | | |
Total | | | | | | | $1,460,466 | | | | | | $(1,458,809) | | | | | | $1,657 | | | |
| | | |
| | 1 | | Collateral with a value of $1,484,211 has been received in connection with securities lending agreements. Collateral received in excess of the value of securities loaned from the individual counterparty is not shown for financial reporting purposes in the table above. |
| | 2 | | The market value of the loaned securities is determined as of June 30, 2016. Additional collateral is delivered to the Fund on the next business day in accordance with the MSLA. The net amount would be subject to the borrower default indemnity in the event of default by the counterparty. |
The risks of securities lending include the risk that the borrower may not provide additional collateral when required or may not return the securities when due. To mitigate these risks, the Fund benefits from a borrower default indemnity provided by BIM. BIM’s indemnity allows for full replacement of the securities loaned if the collateral received does not cover the value on the securities loaned in the event of borrower default. The Fund could suffer a loss if the value of an investment purchased with cash collateral falls below the market value of loaned securities or if the value of an investment purchased with cash collateral falls below the value of the original cash collateral received.
5. Derivative Financial Instruments:
The Fund engages in various portfolio investment strategies using derivative contracts both to increase the returns of the Fund and/or to manage its exposure to certain risks such as credit risk, equity risk, interest rate risk, foreign currency exchange rate risk, commodity price risk or other risks (e.g., inflation risk). Derivative financial instruments categorized by risk exposure are included in the Schedule of Investments. These contracts may be transacted on an exchange or OTC.
Forward Foreign Currency Exchange Contracts: The Fund enters into forward foreign currency exchange contracts to gain or reduce exposure, to foreign currencies (foreign currency exchange rate risk).
A forward foreign currency exchange contract is an agreement between two parties to buy and sell a currency at a set exchange rate on a specified date. These contracts help to manage the overall exposure to the currencies in which some of the investments held by the Fund are denominated and in some cases, may be used to obtain exposure to a particular market.
The contract is marked to market daily and the change in market value is recorded as unrealized appreciation (depreciation) in the Statement of Assets and Liabilities. When a contract is closed, a realized gain or loss is recorded in the Statement of Operations equal to the difference between the value at the time it was opened and the value at the time it was closed. Non-deliverable forward foreign currency exchange contracts are settled with the counterparty in cash without the delivery of foreign currency. The use of forward foreign currency exchange contracts involves the risk that the value of a forward foreign currency exchange contract changes unfavorably due to movements in the value of the referenced foreign currencies.
Master Netting Arrangements: In order to better define it’s contractual rights and to secure rights that will help it mitigate its counterparty risk, the Fund may enter into an International Swaps and Derivatives Association, Inc. Master Agreement (“ISDA Master Agreement”) or similar agreement with its counterparties. An ISDA Master Agreement is a bilateral agreement between the Fund and a counterparty that governs certain OTC derivatives and typically contains, among other things, collateral posting terms and netting provisions in the event of a default and/or termination event. Under an ISDA Master Agreement, the Fund may, under certain circumstances, offset with the counterparty certain derivative financial instruments’ payables and/or receivables with collateral held and/or posted and create one single net payment. The provisions of the ISDA Master Agreement typically permit a single net payment in the event of default including the bankruptcy or insolvency of the counterparty. Bankruptcy or insolvency laws of a particular jurisdiction may restrict or prohibit the right of offset in bankruptcy, insolvency or other events. In addition, certain ISDA Master Agreements allow counterparties to terminate derivative contracts prior to maturity in the event the Fund’s net assets decline by a stated percentage or the Fund fails to meet the terms of its ISDA Master Agreements. The result would cause the Fund to accelerate payment of any net liability owed to the counterparty.
| | | | | | |
| 20 | | BLACKROCK VARIABLE SERIES FUNDS, INC. | | JUNE 30, 2016 | | |
| | |
| Notes to Financial Statements (continued) | | BlackRock Global Opportunities V.I. Fund |
Collateral Requirements: For derivatives traded under an ISDA Master Agreement, the collateral requirements are typically calculated by netting the mark-to-market amount for each transaction under such agreement and comparing that amount to the value of any collateral currently pledged by the Fund and the counterparty.
Cash collateral that has been pledged to cover obligations of the Fund and cash collateral received from the counterparty, if any, is reported separately on the Statement of Assets and Liabilities as cash pledged as collateral and cash received as collateral, respectively. Non-cash collateral pledged by the Fund, if any, is noted in the Schedule of Investments. Generally, the amount of collateral due from or to a counterparty is subject to a certain minimum transfer amount threshold before a transfer is required, which is determined at the close of business of the Fund. Any additional required collateral is delivered to/pledged by the Fund on the next business day. Typically, the counterparty is not permitted to sell, re-pledge or use cash and non-cash collateral it receives. The Fund generally agrees not to use non-cash collateral that it receives but may, absent default or certain other circumstances defined in the underlying ISDA Master Agreement, be permitted to use cash collateral received. In such cases, interest may be paid pursuant to the collateral arrangement with the counterparty. To the extent amounts due to the Fund from its counterparties are not fully collateralized, it bears the risk of loss from counterparty non-performance. Likewise, to the extent the Fund has delivered collateral to a counterparty and stands ready to perform under the terms of its agreement with such counterparty, it bears the risk of loss from a counterparty in the amount of the value of the collateral in the event the counterparty fails to return such collateral. Based on the terms of agreements, collateral may not be required for all derivative contracts.
For financial reporting purposes, the Fund does not offset derivative assets and derivative liabilities that are subject to netting arrangements, if any, in the Statement of Assets and Liabilities.
6. Investment Advisory Agreement and Other Transactions with Affiliates:
The PNC Financial Services Group, Inc. is the largest stockholder and an affiliate of BlackRock, Inc. (“BlackRock”) for 1940 Act purposes.
Investment Advisory
The Company, on behalf of the Fund, entered into an Investment Advisory Agreement with the Manager, the Fund’s investment adviser, an indirect, wholly owned subsidiary of BlackRock, to provide investment advisory and administration services. The Manager is responsible for the management of the Fund’s portfolio and provides the necessary personnel, facilities, equipment and certain other services to the operations of the Fund. For such services, the Fund pays the Manager a monthly fee, which is determined by calculating a percentage of the Fund’s average daily net assets, based on the following annual rates:
| | | | |
| Average Daily Net Assets | | Investment
Advisory Fee | |
First $1 Billion | | | 0.75% | |
$1 Billion - $3 Billion | | | 0.71% | |
$3 Billion - $5 Billion | | | 0.68% | |
$5 Billion - $10 Billion | | | 0.65% | |
Greater than $10 Billion | | | 0.64% | |
Distribution Fees
The Company, on behalf of the Fund, entered into a Distribution Agreement and a Distribution Plan with BlackRock Investments, LLC (“BRIL”), an affiliate of the Manager. Pursuant to the Distribution Plan and in accordance with Rule 12b-1 under the 1940 Act, the Fund pays BRIL ongoing distribution fees. The fees are accrued daily and paid monthly at the annual rate of 0.25% based upon the average daily net assets attributable to Class III.
For the six months ended June 30, 2016, the class specific distribution fees borne directly by Class III is $4,606.
Transfer Agent
The Manager, on behalf of the Fund, entered into agreements with insurance companies and other financial intermediaries (“Service Organizations”), some of which may be affiliates. Pursuant to these agreements, the Service Organizations provide the Fund with administrative, networking, recordkeeping, sub-transfer agency and shareholder services to sub-accounts they service. For these services, the Service Organizations receive an annual fee per shareholder account, which will vary depending on share class and/or net assets of Fund shareholders serviced by the Service Organizations, which is shown as transfer agent — class specific. For the six months ended June 30, 2016, the Fund paid the following amounts to affiliates in return for these services, which is included in transfer agent — class specific in the Statement of Operations:
| | | | | | | | |
| Class I | | Class III | | | Total | |
| $38,470 | | $ | 3,295 | | | $ | 41,765 | |
| | | | | | |
| | | BLACKROCK VARIABLE SERIES FUNDS, INC. | | JUNE 30, 2016 | | 21 |
| | |
| Notes to Financial Statements (continued) | | BlackRock Global Opportunities V.I. Fund |
In addition, the Fund pays the transfer agent, which is not an affiliate, a fee for issuance, transfer and redemption of shares and the opening and maintenance of shareholder accounts, which is included in transfer agent in the Statement of Operations.
Expense Limitations, Waivers and Reimbursements
The Manager, with respect to the Fund, contractually agreed to waive and/or reimburse fees or expenses in order to limit expenses, excluding interest expense, dividend expense, tax expense, acquired fund fees and expenses and certain other fund expenses, which constitute extraordinary expenses not incurred in the ordinary course of the Fund’s business. The expense limitations as a percentage of average daily net assets are as follows:
| | | | |
Class I | | | 0.97 | % |
Class III | | | 1.22 | % |
The Manager has agreed not to reduce or discontinue this contractual reimbursement prior to May 1, 2017 unless approved by the Board, including a majority of the Independent Directors who are not “interested persons” of the Fund, as defined in the 1940 Act (“Independent Directors”) or by a majority of the outstanding voting securities of the Fund. This amount is included in fees waived by the Manager in the Statement of Operations. For the six months ended June 30, 2016, the amount waived was $47,267.
The Manager, with respect to the Fund, voluntarily agreed to waive its investment advisory fees by the amount of investment advisory fees the Fund pays to the Manager indirectly through its investment in affiliated money market funds. This amount is included in fees waived by the Manager in the Statement of Operations. However, the Manager does not waive its investment advisory fees by the amount of investment advisory fees paid in connection with the Fund’s investments in other affiliated investment companies, if any. For the six months ended, June 30, 2016, the amount waived was $445.
The Manager has contractually agreed to reimburse all transfer agent fees for Class I and Class III.
The Manager has agreed not to reduce or discontinue this contractual expense limitation prior to May 1, 2017, unless approved by the Board, including a majority of the Independent Directors or by a majority of the outstanding voting securities of the Fund.
These amounts waived and/or reimbursed are included in fees waived by the Manager, and shown as transfer agent fees reimbursed — class specific in the Statement of Operations. Class specific expense waivers and/or reimbursements are as follows:
| | | | | | | | | | | | |
| | | Class I | | | Class III | | | Total | |
Transfer Agent Fees Reimbursed | | | $38,470 | | | | $3,295 | | | | $41,765 | |
For the six months ended June 30, 2016, the Fund reimbursed the Manager $229 for certain accounting services, which is included in accounting services in the Statement of Operations.
Securities Lending
The U.S. Securities and Exchange Commission has issued an exemptive order which permits BIM, an affiliate of the Manager, to serve as securities lending agent for the Fund subject to applicable conditions. As securities lending agent, BIM bears all operational costs directly related to securities lending. The Fund is responsible for expenses in connection with the investment of cash collateral received for securities on loan (the “collateral investment expenses”). The cash collateral is invested in a private investment company managed by the Manager or its affiliates. However, BIM has agreed to cap the collateral investment expenses of the private investment company to an annual rate of 0.04%. The investment adviser to the private investment company will not charge any advisory fees with respect to shares purchased by the Fund.
Securities lending income is equal to the total of income earned from the reinvestment of cash collateral, net of fees and other payments to and from borrowers of securities, and less the collateral investment expenses. The Fund retains a portion of securities lending income and remits a remaining portion to BIM as compensation for its services as securities lending agent.
Pursuant to a securities lending agreement, the Fund retains 80% of securities lending income, and this amount retained can never be less than 70% of the total of securities lending income plus the collateral investment expenses.
In addition, commencing the business day following the date that the aggregate securities lending income earned across the Equity-Bond Complex in a calendar year exceeds a specified threshold, the Fund, pursuant to the securities lending agreement, will retain for the remainder of that calendar year securities lending income as follows: 85% of securities lending income, and this amount retained can never be less than 70% of the total of securities lending income plus the collateral investment expenses.
| | | | | | |
| 22 | | BLACKROCK VARIABLE SERIES FUNDS, INC. | | JUNE 30, 2016 | | |
| | |
| Notes to Financial Statements (continued) | | BlackRock Global Opportunities V.I. Fund |
The share of securities lending income earned by the Fund is shown as securities lending — affiliated — net in the Statement of Operations. For the six months ended June 30, 2016, the Fund paid BIM $887 for securities lending agent services.
Officers and Directors
Certain officers and/or directors of the Company are officers and/or directors of BlackRock or its affiliates. The Fund reimburses the Manager for a portion of the compensation paid to the Company’s Chief Compliance Officer, which is included in officer and directors in the Statement of Operations.
7. Purchases and Sales:
For the six months ended June 30, 2016, purchases and sales of investments, excluding short-term securities, were $10,569,998 and $11,148,687, respectively.
8. Income Tax Information:
It is the Fund’s policy to comply with the requirements of the Internal Revenue Code of 1986, as amended, applicable to regulated investment companies, and to distribute substantially all of its taxable income to its shareholders. Therefore, no federal income tax provision is required.
The Fund files U.S. federal and various state and local tax returns. No income tax returns are currently under examination. The statute of limitations on the Fund’s U.S. federal tax returns generally remains open for each of the four years ended December 31, 2015. The statutes of limitations on the Fund’s state and local tax returns may remain open for an additional year depending upon the jurisdiction.
Management has analyzed tax laws and regulations and their application to the Fund as of June 30, 2016, inclusive of the open tax return years, and does not believe that there are any uncertain tax positions that require recognition of a tax liability in the Fund’s financial statements.
As of June 30, 2016, gross unrealized appreciation and depreciation based on cost for federal income tax purposes were as follows:
| | | | |
| | |
Tax cost | | | $39,494,387 | |
| | | | |
Gross unrealized appreciation | | | $ 4,479,704 | |
Gross unrealized depreciation | | | (2,743,680 | ) |
| | | | |
Net unrealized appreciation | | | $ 1,736,024 | |
| | | | |
9. Bank Borrowings:
The Company, on behalf of the Fund, along with certain other funds managed by the Manager and its affiliates (“Participating Funds”), is a party to a 364-day, $2.1 billion credit agreement with a group of lenders. Under this agreement, the Fund may borrow to fund shareholder redemptions. Excluding commitments designated for certain individual funds, the Participating Funds, including the Fund, can borrow up to an aggregate commitment amount of $1.6 billion at any time outstanding, subject to asset coverage and other limitations as specified in the agreement. The credit agreement has the following terms: a fee of 0.12% per annum on unused commitment amounts and interest at a rate equal to the higher of (a) one-month LIBOR (but, in any event, not less than 0.00%) on the date the loan is made plus 0.80% per annum or (b) the Fed Funds rate (but, in any event, not less than 0.00%) in effect from time to time plus 0.80% per annum on amounts borrowed. The agreement expires in April 2017 unless extended or renewed. Prior to April 21, 2016, the credit agreement had a fee per annum of 0.06% on unused commitment amounts and interest at a rate equal to the higher of (a) one-month LIBOR (but, in any event, not less than 0.00%) on the date the loan is made plus 0.80% per annum or (b) the Fed Funds rate (but, in any event, not less than 0.00%) in effect from time to time plus 0.80% per annum on amounts borrowed. Participating Funds paid administration, legal and arrangement fees, which, if applicable, are included in miscellaneous expenses in the Statement of Operations. These fees were allocated among such funds based upon portions of the aggregate commitment available to them and relative net assets of Participating Funds. During the six months ended June 30, 2016, the Fund did not borrow under the credit agreement.
10. Principal Risks:
In the normal course of business, the Fund invests in securities and enters into transactions where risks exist due to fluctuations in the market (market risk) or failure of the issuer to meet all its obligations, including the ability to pay principal and interest when due (issuer credit risk). The value of securities held by the Fund may decline in response to certain events, including those directly involving the issuers of securities owned by the Fund. Changes arising from the general economy, the overall market and local, regional or global political and/or social instability, as well as currency, interest rate and price fluctuations, may also affect the securities’ value.
Counterparty Credit Risk: Similar to issuer credit risk, the Fund may be exposed to counterparty credit risk, or the risk that an entity may fail to or be unable to perform on its commitments related to unsettled or open transactions. The Fund manages counterparty credit risk by entering into transactions only with counterparties that the Manager believes have the financial resources to honor their obligations and by monitoring the financial stability
| | | | | | |
| | | BLACKROCK VARIABLE SERIES FUNDS, INC. | | JUNE 30, 2016 | | 23 |
| | |
| Notes to Financial Statements (concluded) | | BlackRock Global Opportunities V.I. Fund |
of those counterparties. Financial assets, which potentially expose the Fund to market, issuer and counterparty credit risks, consist principally of financial instruments and receivables due from counterparties. The extent of the Fund’s exposure to market, issuer and counterparty credit risks with respect to these financial assets is approximately their value recorded in the Statement of Assets and Liabilities, less any collateral held by the Fund.
A derivative contract may suffer a mark-to-market loss if the value of the contract decreases due to an unfavorable change in the market rates or values of the underlying instrument. Losses can also occur if the counterparty does not perform under the contract.
The Fund’s risk of loss from counterparty credit risk on OTC derivatives is generally limited to the aggregate unrealized gain less the value of any collateral held by the Fund.
Concentration Risk: The Fund invests a substantial amount of its assets in issuers located in a single country or a limited number of countries. When the Fund concentrates its investments in this manner, it assumes the risk that economic, political and social conditions in those countries may have a significant impact on their investment performance. Foreign issuers may not be subject to the same uniform accounting, auditing and financial reporting standards and practices as used in the United States. Foreign securities markets may also be less liquid, more volatile, and less subject to governmental supervision not typically associated with investing in U.S. securities. Investment percentages in specific countries are presented in the Schedule of Investments.
The Fund invests a significant portion of its assets in securities of issuers located in Europe or with significant exposure to European issuers or countries. The European financial markets have recently experienced volatility and adverse trends due to concerns about economic downturns in, or rising government debt levels of, several European countries. These events may spread to other countries in Europe and may affect the value and liquidity of certain of the Fund’s investments.
The United Kingdom has voted to withdraw from the European Union on June 23, 2016, which may introduce significant new uncertainties and instability in the financial markets across Europe.
11. Capital Share Transactions:
Transactions in capital shares for each class were as follows:
| | | | | | | | | | | | | | | | | | | | |
| | | Six Months Ended
June 30, 2016 | | | | | | Year Ended
December 31, 2015 | |
| | | Shares | | | Amount | | | | | | Shares | | | Amount | |
Class I | | | | | | | | | | | | | | | | | | | | |
Shares sold | | | 55,017 | | | $ | 858,119 | | | | | | | | 122,089 | | | $ | 2,096,203 | |
Shares issued in reinvestment of distributions | | | — | | | | — | | | | | | | | 58,562 | | | | 941,801 | |
Shares redeemed | | | (188,163 | ) | | | (2,856,977 | ) | | | | | | | (462,187 | ) | | | (7,788,272 | ) |
| | | | | | | | | | | | |
Net decrease | | | (133,146 | ) | | $ | (1,998,858 | ) | | | | | | | (281,536 | ) | | $ | (4,750,268 | ) |
| | | | | | | | | | | | |
| | | | | | | | | | | | | | | | | | | | |
Class III | | | | | | | | | | | | | | | | | | | | |
Shares sold | | | 45,559 | | | $ | 682,851 | | | | | | | | 106,889 | | | $ | 1,752,107 | |
Shares issued in reinvestment of distributions | | | — | | | | — | | | | | | | | 5,187 | | | | 83,068 | |
Shares redeemed | | | (33,993 | ) | | | (526,056 | ) | | | | | | | (55,156 | ) | | | (917,425 | ) |
| | | | | | | | | | | | |
Net increase | | | 11,566 | | | $ | 156,795 | | | | | | | | 56,920 | | | $ | 917,750 | |
| | | | | | | | | | | | |
Total Net Decrease | | | (121,580 | ) | | $ | (1,842,063 | ) | | | | | | | (224,616 | ) | | $ | (3,832,518 | ) |
| | | | | | | | | | | | |
12. Subsequent Events:
Management’s evaluation of the impact of all subsequent events on the Fund’s financial statements was completed through the date the financial statements were issued and the following item was noted:
The Fund paid a long-term capital gain distribution in the following amounts per share on July 22, 2016 to shareholders of record on July 20, 2016:
| | | | |
| | | Long-Term
Capital Gain | |
Class I | | | $0.026400 | |
Class III | | | $0.026400 | |
| | | | | | |
| 24 | | BLACKROCK VARIABLE SERIES FUNDS, INC. | | JUNE 30, 2016 | | |
JUNE 30, 2016
| | | | |
SEMI-ANNUAL REPORT (UNAUDITED) | | | | BLACKROCK® |
BlackRock Variable Series Funds, Inc.
▶ BlackRock Government Money Market V.I. Fund
| | |
| Not FDIC Insured ¡ May Lose Value ¡ No Bank Guarantee | | |
| | | | |
| Money Market Overview | | | BlackRock Government Money Market V.I. Fund | |
|
| For the Six-Month Period Ended June 30, 2016 |
After the Federal Open Market Committee (the “FOMC”) raised the target range for the federal funds rate by 25 basis points (0.25%) to 0.25-0.50% at its December 2015 meeting, the FOMC was clear in its expectation that the future removal of monetary accommodation would likely be gradual and dependent on incoming data. The positive momentum that resulted from the rate increase diminished fairly quickly in early 2016 as an economic slowdown in China spurred selling in equity markets around the world. On the back of this broader financial market turmoil, which abated in mid-February, the FOMC left rates unchanged for the remainder of the six-month period ended June 2016 and tempered its outlook for future short-term interest rate increases.
After the United Kingdom voted in late June to leave the European Union, markets broadly factored in expectations that the FOMC would not resume its course of raising interest rates before 2018, and reflected that investors anticipated the Bank of England and European Central Bank would turn more accommodative. Additionally, major credit rating agencies generally viewed the result of the “leave” decision unfavorably, assigning or maintaining a negative outlook on the United Kingdom, and in certain cases, downgrading the nation’s long-term credit rating by as much as two “notches” to AA.
While conditions in U.S. short-term markets were relatively stable and investment activity in credit was generally muted, some credit spread widening occurred on an issuer-specific basis, which was likely a combination of quarter-end factors and Brexit concerns. The U.S. short Rates Market benefited from the “flight to safety” flows, while core global bond yields hit record lows. In Europe, this raised expectations for more active central bank policy loosening, as well as a great deal of uncertainty in the political environment.
London Interbank Offered Rates (“LIBOR”) moved higher early in the period as a result of the hike in rates by the FOMC and speculation of another possible rate hike later this year. LIBOR remained elevated toward the end of the period even as expectations of a 2016 rate increase came down. The benchmark three-month LIBOR ended the period at 0.654%, which is just over 4 basis points higher than it had been six months prior.
We believe one 25-basis-point rate hike in 2016 is unlikely, though still possible should recent upward pressure on inflation prove lasting and labor market and financial conditions remain supportive of such an action.
The short-term tax-exempt market ended the six-month period with the SIFMA Index, which represents the average yield on seven-day variable rate demand note (“VRDN”) securities, at a multi-year high of 0.41%, well above the six-month average of 0.24%. VRDN new issuance remained light as municipal issuers continued to lock in low fixed rates through longer-dated bond deals. However, over the past six months, the tax-exempt money fund industry experienced outflows of approximately 24%, or $62 billion, due to pending money fund reform. These outflows caused dealer VRDN inventories to increase substantially, forcing dealers to reset levels on VRDNs higher in order to attract the interest of taxable crossover buyers. During the six months ended June 30, yields on short term municipal securities essentially matched those of comparable taxable investments, making the tax-exempt investment space very attractive to crossover buyers.
In the primary note market, the Municipal Market Advisors AAA General Obligation One-Year Index ended the six-month period at 0.46%, reflective of the selectivity of investors with regard to purchases of one-year maturities. Ahead of “note season” in July and August, when municipalities issue the bulk of their one-year tax and revenue anticipation notes, municipal note issuance is anticipated to remain light as municipalities continue to assess their operating cash needs and formulate their budgets for the upcoming fiscal year. However, we expect one-year levels to continue to move higher throughout the summer as issuers will need to offer greater yield premiums to entice buyers to extend out to the full year maturity. Also, short-term tax-exempt industry assets are expected to decrease further over the coming months as money continues to move out of municipal money funds and into government funds as a result of technical provisions of the money fund reform that becomes effective in October. Due to this widespread uncertainty over shareholder activity, and in addition to the possibility of a further hike in short-term rates by the Fed, we expect an upward bias on short-term municipal rates throughout the remainder of 2016 as municipal money fund investors remain defensively positioned, favoring higher levels of liquidity and shorter weighted average maturities.
Past performance is no guarantee of future results. Index performance is shown for illustrative purposes only. You cannot invest directly in an index.
| | | | | | |
| 2 | | BLACKROCK VARIABLE SERIES FUNDS, INC. | | JUNE 30, 2016 | | |
| | | | |
| Fund Summary as of June 30, 2016 | | | BlackRock Government Money Market V.I. Fund | |
BlackRock Government Money Market V.I. Fund’s (the “Fund”) investment objective is to seek to preserve capital, maintain liquidity, and achieve the highest possible current income consistent with the foregoing.
| | | | |
| Yields | | 7-Day SEC Yield | | 7-Day Yield |
Class I | | 0.17% | | 0.17% |
| | | | | |
| Portfolio Composition | | Percent of Net Assets |
Repurchase Agreements | | | | 48 | % |
U.S. Government Sponsored Agency Obligations | | | | 47 | |
U.S. Treasury Obligations | | | | 7 | |
Liabilities in Excess of Other Assets | | | | (2 | ) |
| | | | | |
Total | | | | 100 | % |
| | | | | |
The 7-Day SEC Yield may differ from the 7-Day Yield shown above due to the fact that the 7-Day SEC Yield excludes distributed capital gains.
Past performance is not indicative of future results. Performance results do not reflect the deduction of taxes that a shareholder would pay on Fund distributions or the redemption of Fund shares.
Shareholders of the Fund may incur the following charges: (a) transactional expenses, and (b) operating expenses, including investment advisory fees, service and distribution fees, and other fund expenses. The expense example shown below (which is based on a hypothetical investment of $1,000 invested on January 1, 2016 and held through June 30, 2016) is intended to assist shareholders both in calculating expenses based on an investment in the Fund and in comparing these expenses with similar costs of investing in other mutual funds.
The expense example provides information about actual account values and actual expenses. In order to estimate the expenses a shareholder paid during the period covered by this report, shareholders can divide their account value by $1,000 and then multiply the result by the number corresponding to their share class under the heading entitled “Expenses Paid During the Period.”
The expense example also provides information about hypothetical account values and hypothetical expenses based on the Fund’s actual expense ratio and an assumed rate of return of 5% per year before expenses. In order to assist shareholders in comparing the ongoing expenses of investing in the Fund and other funds, compare the 5% hypothetical expense with the 5% hypothetical examples that appear in shareholder reports of other funds.
The expenses shown in the expense example are intended to highlight shareholders’ ongoing costs only and do not reflect any transactional expenses, such as sales charges, if any. Therefore, the hypothetical example is useful in comparing ongoing expenses only, and will not help shareholders determine the relative total expenses of owning different funds. If these transactional expenses were included, shareholder expenses would have been higher.
| | | | | | | | | | | | | | |
| Expense Example | | | | | | | | |
| | | Actual | | Hypothetical2 | | |
| | | Beginning Account Value January 1, 2016 | | Ending Account Value June 30, 2016 | | Expenses Paid During the Period1 | | Beginning Account Value January 1, 2016 | | Ending Account Value June 30, 2016 | | Expenses Paid During the Period1 | | Annualized Expense Ratio |
Class I | | $1,000.00 | | $1,000.50 | | $1.49 | | $1,000.00 | | $1,023.37 | | $1.51 | | 0.30% |
| | 1 | | Expenses are equal to the annualized expense ratio, multiplied by the average account value over the period, multiplied by 182/366 (to reflect the one-half year period shown). |
| | 2 | | Hypothetical 5% annual return before expenses is calculated by prorating the number of days in the most recent fiscal half year divided by 366. |
| | | | | | |
| | | BLACKROCK VARIABLE SERIES FUNDS, INC. | | JUNE 30, 2016 | | 3 |
| | | | |
| Schedule of Investments June 30, 2016 (Unaudited) | | | BlackRock Government Money Market V.I. Fund | |
| | | (Percentages shown are based on Net Assets) | |
| | | | | | | | |
U.S. Government Sponsored Agency Obligations | | Par (000) | | | Value | |
Fannie Mae Variable Rate Notes: (a) | | | | | | | | |
0.47%, 07/20/17 | | $ | 2,500 | | | $ | 2,499,865 | |
0.45%, 08/16/17 | | | 2,000 | | | | 1,999,772 | |
0.47%, 10/05/17 | | | 1,500 | | | | 1,499,711 | |
Federal Farm Credit Bank Discount Notes,
0.55%, 07/14/16 (b) | | | 2,000 | | | | 1,999,603 | |
Federal Farm Credit Bank Variable Rate Notes: (a) | | | | | | | | |
0.46%, 11/14/16 | | | 2,000 | | | | 1,999,931 | |
0.46%, 03/16/17 | | | 2,000 | | | | 1,999,711 | |
0.46%, 09/22/17 | | | 2,000 | | | | 1,999,876 | |
0.52%, 11/20/17 | | | 1,000 | | | | 999,930 | |
0.56%, 01/23/18 | | | 575 | | | | 575,009 | |
0.64%, 04/04/18 | | | 1,000 | | | | 999,823 | |
Federal Home Loan Bank Discount Notes: (b) | | | | | | | | |
0.34%, 07/05/16 | | | 1,810 | | | | 1,809,932 | |
0.34%, 07/06/16 | | | 1,390 | | | | 1,389,934 | |
0.35%, 07/15/16 | | | 1,500 | | | | 1,499,796 | |
0.45%, 07/22/16 | | | 300 | | | | 299,921 | |
0.52%, 07/27/16 | | | 2,000 | | | | 1,999,256 | |
0.49%, 07/29/16 | | | 491 | | | | 490,813 | |
0.49%, 08/10/16 | | | 5,000 | | | | 4,997,278 | |
0.47%, 08/31/16 | | | 4,090 | | | | 4,086,770 | |
0.52%, 08/31/16 | | | 475 | | | | 474,582 | |
0.41%, 09/14/16 | | | 1,500 | | | | 1,498,734 | |
0.40%, 09/16/16 | | | 1,000 | | | | 999,144 | |
0.50%, 09/19/16 | | | 2,000 | | | | 1,997,778 | |
0.42%, 09/23/16 | | | 2,000 | | | | 1,998,063 | |
0.51%, 09/23/16 | | | 2,000 | | | | 1,997,620 | |
0.46%, 10/21/16 | | | 1,400 | | | | 1,398,023 | |
0.45%, 10/26/16 | | | 1,000 | | | | 998,538 | |
0.45%, 11/14/16 | | | 2,145 | | | | 2,141,370 | |
0.58%, 12/23/16 | | | 900 | | | | 897,463 | |
Federal Home Loan Bank Variable Rate Notes: (a) | | | | | | | | |
0.61%, 11/25/16 | | | 2,500 | | | | 2,500,000 | |
0.50%, 02/07/17 | | | 1,500 | | | | 1,499,856 | |
0.46%, 03/14/17 | | | 2,000 | | | | 1,999,725 | |
0.46%, 03/15/17 | | | 1,000 | | | | 1,000,000 | |
0.52%, 07/06/17 | | | 1,970 | | | | 1,970,000 | |
0.59%, 08/25/17 | | | 1,260 | | | | 1,260,000 | |
0.55%, 10/27/17 | | | 1,670 | | | | 1,670,000 | |
Freddie Mac Discount Notes: (b) | | | | | | | | |
0.37%, 07/06/16 | | | 2,000 | | | | 1,999,897 | |
0.54%, 07/06/16 | | | 2,000 | | | | 1,999,850 | |
0.43%, 07/13/16 | | | 3,500 | | | | 3,499,498 | |
0.46%, 07/22/16 | | | 2,000 | | | | 1,999,463 | |
0.46%, 08/12/16 | | | 2,000 | | | | 1,998,938 | |
0.40%, 10/06/16 | | | 1,000 | | | | 998,936 | |
Total U.S. Government Sponsored Agency Obligations — 46.5% | | | | 71,944,409 | |
| | | | | | | | |
| U.S. Treasury Obligations | | | | | | |
U.S. Treasury Bills: | | | | | | | | |
0.51%, 9/15/16 (b) | | | 4,500 | | | | 4,495,155 | |
0.54%, 2/02/17 (b) | | | 1,500 | | | | 1,495,140 | |
0.61%, 4/27/17 (b) | | | 1,800 | | | | 1,790,925 | |
| | | | | | | | |
| U.S. Treasury Obligations | | Par (000) | | | Value | |
U.S. Treasury Notes: | | | | | | | | |
0.33%, 4/30/17 (a) | | $ | 2,000 | | | $ | 1,999,966 | |
0.43%, 10/31/17 (a) | | | 1,274 | | | | 1,273,090 | |
Total U.S. Treasury Obligations — 7.2% | | | | | | | 11,054,276 | |
| | | | | | | | |
| Repurchase Agreements | | | | | | |
Bank of Montreal, 0.40%, 7/01/16
(Purchased on 6/30/16 to be repurchased at $10,000,111, collateralized by various U.S. government sponsored agency obligations, 1.88% to 4.50% due from 11/01/19 to 2/01/46, aggregate original par and fair value of $33,601,111 and $10,286,245, respectively) | | | 10,000 | | | | 10,000,000 | |
Total Value of Bank of Montreal
(collateral value of $10,286,245) | | | | | | | 10,000,000 | |
BNP Paribas Securities Corp., 0.36%, 7/22/16 (c)
(Purchased on 6/23/16 to be repurchased at $2,000,580, collateralized by various U.S. Treasury obligations, 0.00% to 2.13% due from 7/21/16 to 2/15/43, aggregate original par and fair value of $2,096,524 and $2,040,000, respectively) | | | 2,000 | | | | 2,000,000 | |
Total Value of BNP Paribas Securities Corp.
(collateral value of $2,040,000) | | | | | | | 2,000,000 | |
Goldman Sachs & Co., 0.40%, 7/05/16
(Purchased on 6/28/16 to be repurchased at $3,000,233, collateralized by various Ginnie Mae Bonds, 5.00% due from 3/15/23 to 7/20/41, aggregate original par and fair value of $8,612,070 and $3,060,000, respectively) | | | 3,000 | | | | 3,000,000 | |
Goldman Sachs & Co., 0.46%, 7/07/16
(Purchased on 6/30/16 to be repurchased at $1,000,089, collateralized by various U.S. government sponsored agency obligations, 1.93% to 11.00% due from 7/15/16 to 5/01/46, aggregate original par and fair value of $282,130,164 and $1,030,000, respectively) | | | 1,000 | | | | 1,000,000 | |
Total Value of Goldman Sachs & Co.
(collateral value of $4,090,000) | | | | | | | 4,000,000 | |
JPMorgan Securities LLC, 0.40%, 7/01/16
(Purchased on 6/30/16 to be repurchased at $10,000,111, collateralized by U.S. Treasury obligation, 0.00% due at 3/30/17, original par and fair value of $10,235,000 and $10,203,272, respectively) | | | 10,000 | | | | 10,000,000 | |
See Notes to Financial Statements.
| | | | | | |
| 4 | | BLACKROCK VARIABLE SERIES FUNDS, INC. | | JUNE 30, 2016 | | |
| | | | |
| Schedule of Investments (continued) | | | BlackRock Government Money Market V.I. Fund | |
| | | | |
| | | | | | | | |
| Repurchase Agreements | | Par (000) | | | Value | |
JPMorgan Securities LLC, 0.64%, 7/01/16 (c)
(Purchased on 6/30/16 to be repurchased at $3,500,062, collateralized by Ginnie Mae Bond, 3.00% due at 10/20/42, original par and fair value of $5,175,000 and $3,570,591, respectively) | | $ | 3,500 | | | $ | 3,500,000 | |
Total Value of JPMorgan Securities LLC
(collateral value of $13,773,863) | | | | | | | 13,500,000 | |
Merrill Lynch, Pierce, Fenner & Smith, Inc., 0.48%, 7/07/16
(Purchased on 6/30/16 to be repurchased at $1,500,140, collateralized by U.S. government sponsored agency obligation, 5.70% due at 10/25/39, original par and fair value of $63,675,275 and $1,605,000, respectively) | | | 1,500 | | | | 1,500,000 | |
Total Value of Merrill Lynch, Pierce, Fenner & Smith, Inc. (collateral value of $1,605,000) | | | | | | | 1,500,000 | |
Mizuho Securities USA, Inc., 0.53%, 7/01/16
(Purchased on 6/30/16 to be repurchased at $15,000,221, collateralized by various Ginnie Mae Bonds, 1.90% to 1.99% due at 12/31/50, aggregate original par and fair value of $83,148,977 and $16,650,000, respectively) | | | 15,000 | | | | 15,000,000 | |
Total Value of Mizuho Securities USA, Inc.
(collateral value of $16,650,000) | | | | | | | 15,000,000 | |
RBC Capital Markets LLC, 0.40%, 7/01/16
(Purchased on 6/30/16 to be repurchased at $11,000,122, collateralized by various U.S. government sponsored agency obligations, 0.00% to 4.86% due from 7/25/43 to 10/25/43, aggregate original par and fair value of $15,691,887 and $11,770,001, respectively) | | | 11,000 | | | | 11,000,000 | |
Total Value of RBC Capital Markets LLC
(collateral value of $11,770,001) | | | | | | | 11,000,000 | |
| | | | | | | | |
| Repurchase Agreements | | Par (000) | | | Value | |
Societe Generale, 0.40%, 7/01/16
(Purchased on 6/30/16 to be repurchased at $10,000,111, collateralized by various U.S. Treasury obligations, 0.00% to 3.38% due from 8/31/16 to 5/15/44, aggregate original par and fair value of $10,054,200 and $10,200,058, respectively) | | $ | 10,000 | | | $ | 10,000,000 | |
Total Value of Societe Generale
(collateral value of $10,200,058) | | | | | | | 10,000,000 | |
Wells Fargo Securities LLC, 0.45%, 7/05/16
(Purchased on 6/28/16 to be repurchased at $4,000,350, collateralized by U.S. government sponsored agency obligation, 3.00% due at 6/01/46, original par and fair value of $3,962,974 and $4,120,000, respectively) | | | 4,000 | | | | 4,000,000 | |
Wells Fargo Securities LLC, 0.44%, 7/07/16
(Purchased on 6/30/16 to be repurchased at $4,000,342, collateralized by U.S. government sponsored agency obligation, 3.00% due at 6/01/46, original par and fair value of $3,962,974 and $4,120,000, respectively) | | | 4,000 | | | | 4,000,000 | |
Total Value of Wells Fargo Securities LLC
(collateral value of $8,240,000) | | | | | | | 8,000,000 | |
Total Repurchase Agreements — 48.5% | | | | | | | 75,000,000 | |
Total Investments (Cost — $157,998,685*) — 102.2% | | | | | | | 157,998,685 | |
Liabilities in Excess of Other Assets — (2.2)% | | | | | | | (3,377,370 | ) |
| | | | | | | | |
Net Assets — 100.0% | | | | | | $ | 154,621,315 | |
| | | | | | | | |
|
| Notes to Schedule of Investments |
| * | Cost for federal income tax purposes. |
| (a) | Variable rate security. Rate as of period end. |
| (b) | Rates are discount rates or a range of discount rates at the time of purchase. |
| (c) | Variable rate security. Rate as of period end and maturity is the date the principal owed can be recovered through demand. |
|
| Fair Value Hierarchy as of Period End |
Various inputs are used in determining the fair value of investments. For information about the Fund’s policy regarding valuation of investments, refer to the Notes to Financial Statements.
The following table summarizes the Fund’s investments categorized in the disclosure hierarchy:
| | | | | | | | | | | | | | | | |
| | | Level 1 | | | Level 2 | | | Level 3 | | | Total | |
Assets: | | | | | | | | | | | | | | | | |
Investments: | | | | | | | | | | | | | | | | |
Short-Term Securities1 | | | — | | | $ | 157,998,685 | | | | — | | | $ | 157,998,685 | |
1 See above Schedule of Investments for values in each security type.
See Notes to Financial Statements.
| | | | | | |
| | | BLACKROCK VARIABLE SERIES FUNDS, INC. | | JUNE 30, 2016 | | 5 |
| | | | |
| Schedule of Investments (concluded) | | | BlackRock Government Money Market V.I. Fund | |
The Fund may hold assets and/or liabilities in which the fair value approximates the carrying amount for financial reporting purposes. As of period end, cash of $147,965 is categorized as Level 1 within the disclosure hierarchy.
During the six months ended June 30, 2016, there were no transfers between levels.
See Notes to Financial Statements.
| | | | | | |
| 6 | | BLACKROCK VARIABLE SERIES FUNDS, INC. | | JUNE 30, 2016 | | |
| | | | |
| Statement of Assets and Liabilities | | | | |
| | | | |
| June 30, 2016 (Unaudited) | | BlackRock Government Money Market V.I. Fund | |
| | | | |
| Assets | | | | |
Investments at value (cost — $82,998,685) | | $ | 82,998,685 | |
Repurchase agreements at value (cost — $75,000,000) | | | 75,000,000 | |
Cash | | | 147,965 | |
Receivables: | | | | |
Capital shares sold | | | 400,851 | |
Interest | | | 10,252 | |
From the Manager | | | 732 | |
Prepaid expenses | | | 340 | |
| | | | |
Total assets | | | 158,558,825 | |
| | | | |
| | | | |
| Liabilities | | | | |
Payables: | | | | |
Investments purchased | | | 1,970,000 | |
Capital shares redeemed | | | 1,846,318 | |
Investment advisory fees | | | 25,460 | |
Officer’s and Directors’ fees | | | 3,196 | |
Other accrued expenses | | | 91,333 | |
Other affiliates | | | 1,203 | |
| | | | |
Total liabilities | | | 3,937,510 | |
| | | | |
Net Assets | | $ | 154,621,315 | |
| | | | |
| | | | |
| Net Assets Consist of | | | | |
Paid-in capital | | $ | 154,620,214 | |
Accumulated net realized gain | | | 1,101 | |
| | | | |
Net Assets | | $ | 154,621,315 | |
| | | | |
| | | | |
| Net Asset Value | | | | |
Class I — Based on net assets of $154,621,315 and 154,624,354 shares outstanding, 3.3 billion shares authorized, $0.10 par value | | $ | 1.00 | |
| | | | |
See Notes to Financial Statements.
| | | | | | |
| | | BLACKROCK VARIABLE SERIES FUNDS, INC. | | JUNE 30, 2016 | | 7 |
| | | | |
| Six Months Ended June 30, 2016 (Unaudited) | | BlackRock
Government
Money Market V.I.
Fund | |
| | | | |
| Investment Income | | | | |
Interest — unaffiliated | | $ | 310,670 | |
| | | | |
| | | | |
| Expenses | | | | |
Investment advisory | | | 394,407 | |
Professional | | | 24,082 | |
Transfer agent — Class I | | | 22,365 | |
Custodian | | | 14,415 | |
Officer and Directors | | | 10,832 | |
Accounting services | | | 3,076 | |
Transfer agent | | | 2,419 | |
Miscellaneous | | | 16,515 | |
| | | | |
Total expenses | | | 488,111 | |
Less: | | | | |
Fees waived by the Manager | | | (229,623 | ) |
Transfer agent fees reimbursed | | | (22,365 | ) |
| | | | |
Total expenses after fees waived and/or reimbursed | | | 236,123 | |
| | | | |
Net investment income | | | 74,547 | |
| | | | |
| | | | |
| Realized Gain | | | | |
Net realized gain from investments | | | 154 | |
| | | | |
Net Increase in Net Assets Resulting from Operations | | $ | 74,701 | |
| | | | |
See Notes to Financial Statements.
| | | | | | |
| 8 | | BLACKROCK VARIABLE SERIES FUNDS, INC. | | JUNE 30, 2016 | | |
| | | | |
| Statements of Changes in Net Assets | | | BlackRock Government Money Market V.I. Fund | |
| | | | | | | | |
| Increase (Decrease) in Net Assets: | | Six Months Ended June 30, 2016 (Unaudited) | | | Year Ended December 31, 2015 | |
| | | | | | | | |
| Operations | | | | | | | | |
Net investment income | | $ | 74,547 | | | $ | 69 | |
Net realized gain | | | 154 | | | | 10,697 | |
| | | | |
Net increase in net assets resulting from operations | | | 74,701 | | | | 10,766 | |
| | | | |
| | | | | | | | |
| Distributions to Shareholders1 | | | | | | | | |
From net investment income | | | (74,547 | ) | | | (69 | ) |
From net realized gain | | | — | | | | (12,794 | ) |
| | | | |
Decrease in net assets resulting from distributions to shareholders | | | (74,547 | ) | | | (12,863 | ) |
| | | | |
| | | | | | | | |
| Capital Share Transactions | | | | | | | | |
Net proceeds from sales of shares | | | 49,572,881 | | | | 209,256,424 | |
Reinvestment of distributions | | | 74,547 | | | | 12,861 | |
Cost of shares redeemed | | | (47,144,463 | ) | | | (285,390,343 | ) |
| | | | |
Net increase (decrease) in net assets derived from capital share transactions | | | 2,502,965 | | | | (76,121,058 | ) |
| | | | |
| | | | | | | | |
| Net Assets | | | | | | | | |
Total increase (decrease) in net assets | | | 2,503,119 | | | | (76,123,155 | ) |
Beginning of period | | | 152,118,196 | | | | 228,241,351 | |
| | | | |
End of period | | $ | 154,621,315 | | | $ | 152,118,196 | |
| | | | |
1 Distributions for annual periods determined in accordance with federal income tax regulations.
See Notes to Financial Statements.
| | | | | | |
| | | BLACKROCK VARIABLE SERIES FUNDS, INC. | | JUNE 30, 2016 | | 9 |
| | | | |
| Financial Highlights | | | BlackRock Government Money Market V.I. Fund | |
| | | | | | | | | | | | | | | | | | | | | | | | |
| | | Class I | |
| | | Six Months
Ended
June 30, 2016 | | | Year Ended December 31, | |
| | (Unaudited) | | | 2015 | | | 2014 | | | 2013 | | | 2012 | | | 2011 | |
| | | | | | | | | | | | | | | | | | | | | | | | |
| Per Share Operating Performance | | | | | | | | | | | | | | | | | | | | | | | | |
Net asset value, beginning of period | | $ | 1.00 | | | $ | 1.00 | | | $ | 1.00 | | | $ | 1.00 | | | $ | 1.00 | | | $ | 1.00 | |
| | | | |
Net investment income | | | 0.0005 | | | | 0.0000 | 1 | | | 0.0000 | 1 | | | 0.0000 | 1 | | | 0.0000 | 1 | | | 0.0000 | 1 |
Net realized gain | | | 0.0000 | 1 | | | 0.0001 | | | | 0.0001 | | | | 0.0000 | 1 | | | 0.0000 | 1 | | | 0.0000 | 1 |
| | | | |
Net increase from investment operations | | | 0.0005 | | | | 0.0001 | | | | 0.0001 | | | | 0.0000 | | | | 0.0000 | | | | 0.0000 | |
| | | | |
Distributions:2 | | | | | | | | | | | | | | | | | | | | | | | | |
From net investment income | | | (0.0005 | ) | | | (0.0000 | )3 | | | (0.0000 | )3 | | | (0.0000 | )3 | | | (0.0000 | )3 | | | (0.0000 | )3 |
From net realized gains | | | — | | | | (0.0001 | ) | | | (0.0001 | ) | | | (0.0000 | )3 | | | (0.0000 | )3 | | | (0.0000 | )3 |
| | | | |
Total distributions | | | (0.0005 | ) | | | (0.0001 | ) | | | (0.0001 | ) | | | (0.0000 | ) | | | (0.0000 | ) | | | (0.0000 | ) |
| | | | |
Net asset value, end of period | | $ | 1.00 | | | $ | 1.00 | | | $ | 1.00 | | | $ | 1.00 | | | $ | 1.00 | | | $ | 1.00 | |
| | | | |
| | | | | | | | | | | | | | | | | | | | | | | | |
| Total Return4 | | | | | | | | | | | | | | | | | | | | | | | | |
Based on net asset value | | | 0.05 | %5 | | | 0.01 | % | | | 0.01 | % | | | 0.00 | % | | | 0.00 | % | | | 0.00 | % |
| | | | |
| | | | | | | | | | | | | | | | | | | | | | | | |
| Ratios to Average Net Assets | | | | | | | | | | | | | | | | | | | | | | | | |
Total expenses | | | 0.62 | %6 | | | 0.61 | % | | | 0.61 | % | | | 0.63 | % | | | 0.61 | % | | | 0.58 | % |
| | | | |
Total expenses after fees waived and/or reimbursed | | | 0.30 | %6 | | | 0.18 | % | | | 0.17 | % | | | 0.20 | % | | | 0.25 | % | | | 0.24 | % |
| | | | |
Net investment income | | | 0.09 | %6 | | | 0.00 | % | | | 0.00 | % | | | 0.00 | % | | | 0.00 | % | | | 0.00 | % |
| | | | |
| | | | | | | | | | | | | | | | | | | | | | | | |
| Supplemental Data | | | | | | | | | | | | | | | | | | | | | | | | |
Net assets, end of period (000) | | $ | 154,621 | | | $ | 152,118 | | | $ | 228,241 | | | $ | 179,570 | | | $ | 198,888 | | | $ | 235,527 | |
| | | | |
| | 1 | | Amount is less than $0.00005 per share. |
| | 2 | | Distributions for annual periods determined in accordance with federal income tax regulations. |
| | 3 | | Amount is greater than $(0.00005) per share. |
| | 4 | | Where applicable, excludes insurance-related fees and expenses and assumes the reinvestment of distributions. |
| | 5 | | Aggregate total return. |
See Notes to Financial Statements.
| | | | | | |
| 10 | | BLACKROCK VARIABLE SERIES FUNDS, INC. | | JUNE 30, 2016 | | |
| | | | |
| Notes to Financial Statements (Unaudited) | | | BlackRock Government Money Market V.I. Fund | |
1. Organization:
BlackRock Variable Series Funds, Inc. (the “Company”) is registered under the Investment Company Act of 1940, as amended (the “1940 Act”), as an open-end management investment company. The Company is organized as a Maryland corporation that is comprised of 20 separate funds. The Funds offer shares to insurance companies for their separate accounts to fund benefits under certain variable annuity and variable life insurance contracts. The financial statements presented are for BlackRock Government Money Market Fund V.I. Fund. The Fund is classified as diversified.
The Fund, together with certain other registered investment companies advised by BlackRock Advisors, LLC (the “Manager”) or its affiliates, is included in a complex of open-end funds referred to as the Equity-Bond Complex.
2. Significant Accounting Policies:
The financial statements are prepared in conformity with accounting principles generally accepted in the United States of America (“U.S. GAAP”), which may require management to make estimates and assumptions that affect the reported amounts of assets and liabilities in the financial statements, disclosure of contingent assets and liabilities at the date of the financial statements and the reported amounts of increases and decreases in net assets from operations during the reporting period. Actual results could differ from those estimates. The Fund is considered an investment company under U.S. GAAP and follows the accounting and reporting guidance applicable to investment companies. Below is a summary of significant accounting policies:
Investment Transactions and Investment Income: For financial reporting purposes, investment transactions are recorded on the dates the transactions are entered into (the trade dates). Realized gains and losses on investment transactions are determined on the identified cost basis. Interest income, including amortization and accretion of premiums and discounts on debt securities, is recognized on the accrual basis.
Distributions: Distributions from net investment income are declared daily and paid monthly. Distributions of capital gains are recorded on the ex-dividend date. The character and timing of distributions are determined in accordance with federal income tax regulations, which may differ from U.S. GAAP.
Indemnifications: In the normal course of business, the Fund enters into contracts that contain a variety of representations that provide general indemnification. The Fund’s maximum exposure under these arrangements is unknown because it involves future potential claims against the Fund, which cannot be predicted with any certainty.
Other: Expenses directly related to the Fund are charged to the Fund. Other operating expenses shared by several funds, including other funds managed by the Manager, are prorated among those funds on the basis of relative net assets or other appropriate methods.
The Fund has an arrangement with its custodian whereby fees may be reduced by credits earned on uninvested cash balances, which, if applicable, are shown as fees paid indirectly in the Statement of Operations. The custodian imposes fees on overdrawn cash balances, which can be offset by accumulated credits earned or may result in additional custody charges.
3. Investment Valuation and Fair Value Measurements:
Investment Valuation Policies: U.S. GAAP defines fair value as the price the Fund would receive to sell an asset or pay to transfer a liability in an orderly transaction between market participants at the measurement date. The Fund’s investments are valued under the amortized cost method which approximates current market value in accordance with Rule 2a-7 under the 1940 Act. Under this method, investments are valued at cost when purchased and, thereafter, a constant proportionate accretion of discounts and amortization of premiums are recorded until the maturity of the security. The Fund seeks to maintain its net asset value per share at $1.00, although there is no assurance that it will be able to do so on a continuing basis.
Fair Value Inputs and Methodologies: The following methods (or “techniques”) and inputs are used to establish the fair value of the Fund’s assets and liabilities:
Fair Value Hierarchy: Various inputs are used in determining the fair value of investments. These inputs to valuation techniques are categorized into a fair value hierarchy consisting of three broad levels for financial statement purposes as follows:
| • | | Level 1 — unadjusted price quotations in active markets/exchanges for identical assets or liabilities that the Fund has the ability to access |
| • | | Level 2 — other observable inputs (including, but not limited to, quoted prices for similar assets or liabilities in markets that are active, quoted prices for identical or similar assets or liabilities in markets that are not active, inputs other than quoted prices that are observable for the assets or liabilities (such as interest rates, yield curves, volatilities, prepayment speeds, loss severities, credit risks and default rates) or other market–corroborated inputs) |
| • | | Level 3 — unobservable inputs based on the best information available in the circumstances, to the extent observable inputs are not available (including the Fund’s own assumptions used in determining the fair value of investments) |
| | | | | | |
| | | BLACKROCK VARIABLE SERIES FUNDS, INC. | | JUNE 30, 2016 | | 11 |
| | | | |
| Notes to Financial Statements (continued) | | | BlackRock Government Money Market V.I. Fund | |
The hierarchy gives the highest priority to unadjusted quoted prices in active markets for identical assets or liabilities (Level 1 measurements) and the lowest priority to unobservable inputs (Level 3 measurements). Accordingly, the degree of judgment exercised in determining fair value is greatest for instruments categorized in Level 3. The inputs used to measure fair value may fall into different levels of the fair value hierarchy. In such cases, for disclosure purposes, the fair value hierarchy classification is determined based on the lowest level input that is significant to the fair value measurement in its entirety.
Changes in valuation techniques may result in transfers into or out of an assigned level within the hierarchy. In accordance with the Fund’s policy, transfers between different levels of the fair value hierarchy are deemed to have occurred as of the beginning of the reporting period. The categorization of a value determined for investments is based on the pricing transparency of the investments and is not necessarily an indication of the risks associated with investing in those securities.
4. Securities and Other Investments:
Repurchase Agreements: Repurchase agreements are commitments to purchase a security from a counterparty who agrees to repurchase the same security at a mutually agreed upon date and price. On a daily basis, the counterparty is required to maintain collateral subject to the agreement and in value no less than the agreed upon repurchase amount. Pursuant to the custodial undertaking associated with a tri-party repurchase arrangement, an unaffiliated third party custodian maintains accounts to hold collateral for the Fund and its counterparties. Typically, the Fund and counterparty are not permitted to sell, re-pledge or use the collateral absent a default by the counterparty or the Fund, respectively.
In the event the counterparty defaults and the fair value of the collateral declines, the Fund could experience losses, delays and costs in liquidating the collateral.
Repurchase agreements are entered into by the Fund under Master Repurchase Agreements (each, an “MRA”). The MRA permits the Fund, under certain circumstances including an event of default (such as bankruptcy or insolvency), to offset payables and/or receivables with collateral held by and/or posted to the counterparty. As a result, one single net payment is created. Bankruptcy or insolvency laws of a particular jurisdiction may impose restrictions on or prohibitions against such a right of offset in the event of the MRA counterparty’s bankruptcy or insolvency. Based on the terms of the MRA, the Fund receives securities as collateral with a market value in excess of the repurchase price at maturity. Upon a bankruptcy or insolvency of the MRA counterparty, the Fund would recognize a liability with respect to such excess collateral. The liability reflects the Fund’s obligation under bankruptcy law to return the excess to the counterparty.
5. Investment Advisory Agreement and Other Transactions with Affiliates:
The PNC Financial Services Group, Inc. is the largest stockholder and an affiliate of BlackRock, Inc. (“BlackRock”) for 1940 Act purposes.
Investment Advisory
The Company, on behalf of the Fund, entered into an Investment Advisory Agreement with the Manager, the Fund’s investment adviser, an indirect, wholly owned subsidiary of BlackRock, to provide investment advisory and administration services. The Manager is responsible for the management of the Fund’s portfolio and provides the personnel, facilities, equipment and certain other services necessary to the operations of the Fund. For such services, the Fund pays the Manager a monthly fee, which is determined by calculating a percentage of the Fund’s average daily net assets, based on the following annual rates:
| | | | | |
| Average Daily Net Assets | | Investment
Advisory Fees |
First $1 Billion | | | | 0.500 | % |
$1 Billion - $2 Billion | | | | 0.450 | % |
$2 Billion - $3 Billion | | | | 0.400 | % |
$3 Billion - $4 Billion | | | | 0.375 | % |
$4 Billion - $7 Billion | | | | 0.350 | % |
$7 Billion - $10 Billion | | | | 0.325 | % |
$10 Billion - $ 15 Billion | | | | 0.300 | % |
Greater than $15 Billion | | | | 0.290 | % |
Service and Distribution Fees
The Company, on behalf of the Fund, entered into a Distribution Agreement with BlackRock Investments, LLC (“BRIL”), an affiliate of the Manager.
| | | | | | |
| 12 | | BLACKROCK VARIABLE SERIES FUNDS, INC. | | JUNE 30, 2016 | | |
| | | | |
| Notes to Financial Statements (continued) | | | BlackRock Government Money Market V.I. Fund | |
Transfer Agent
The Manager, on behalf of the Fund, entered into agreements with insurance companies and other financial intermediaries (“Service Organizations”), some of which may be affiliates. Pursuant to these agreements, the Service Organizations provide the Fund with administrative, networking, recordkeeping, sub-transfer agency and shareholder services to sub-accounts they service. For these services, the Service Organizations receive an annual fee per shareholder account, which will vary depending on share class and/or net assets of Fund shareholders serviced by the Service Organizations. For the six months ended June 30, 2016, the Fund did not pay any amounts to affiliates in return for these services. Prior to March 1, 2016, the Manager had contractually agreed to reimburse such fees in order to limit such expenses to 0.02% for class I shares of average daily net assets. Effective March 1, 2016, the expense cap relating to operational and record keeping fees was eliminated.
Expense Limitations, Waivers and Reimbursements
The Manager, with respect to the Fund, agreed to waive and/or reimburse fees or expenses in order to limit expenses, excluding interest expense, dividend expense, tax expense, acquired fund fees and expenses, and certain other fund expenses, which constitute extraordinary expenses not incurred in the ordinary course of the Fund’s business (“expense limitation”). Prior to March 1, 2016, the Manager agreed to a voluntary expense limitation of 0.30% of average daily net assets and a contractual expense limitation of 1.25% of average daily net assets of Class I. Effective March 1, 2016, the Manager terminated its voluntary expense limitation and agreed to a contractual expense limitation of 0.30% of average daily net assets of Class I through April 30, 2018. The Manager has agreed not to reduce or discontinue this contractual expense limitation prior to May 1, 2018 unless approved by the Board, including a majority of the Independent Directors who are not “interested persons” of the Fund, as defined in the 1940 Act or by a majority of the outstanding voting securities of the Fund. For the six months ended June 30, 2016, the Manager waived $228,918, which is included in fees waived by the Manager in the Statement of Operations.
The Manager voluntarily agreed to waive a portion of the investment advisory fees to enable the Fund to maintain minimum levels of daily net investment income. The Manager may discontinue this waiver and/or reimbursement at any time without notice. For the six months ended June 30, 2016, the Manager waived $705, which is included in fees waived by the Manager the Statement of Operations
For the six months ended June 30, 2016, the Fund reimbursed the Manager $681 for certain accounting services, which is included in accounting services in the Statement of Operations.
Officers and Directors
Certain officers and/or directors of the Company are officers and/or directors of BlackRock or its affiliates. The Fund reimburses the Manager for a portion of the compensation paid to the Company’s Chief Compliance Officer, which is included in Officer and Directors in the Statement of Operations.
6. Income Tax Information:
It is the Fund’s policy to comply with the requirements of the Internal Revenue Code of 1986, as amended, applicable to regulated investment companies, and to distribute substantially all of its taxable income to its shareholders. Therefore, no federal income tax provision is required.
The Fund files U.S. federal and various state and local tax returns. No income tax returns are currently under examination. The statute of limitations on the Fund’s U.S. federal tax returns generally remains open for each of the four years ended December 31, 2015. The statutes of limitations on the Fund’s state and local tax returns may remain open for an additional year depending upon the jurisdiction.
Management has analyzed tax laws and regulations and their application to the Fund as of June 30, 2016, inclusive of the open tax return years, and does not believe that there are any uncertain tax positions that require recognition of a tax liability in the Fund’s financial statements.
7. Principal Risks:
In the normal course of business, the Fund invests in securities and enters into transactions where risks exist due to fluctuations in the market (market risk) or failure of the issuer to meet all its obligations, including the ability to pay principal and interest when due (issuer credit risk). The value of securities held by the Fund may decline in response to certain events, including those directly involving the issuers of securities owned by the Fund.
On July 23, 2014, the U.S. Securities and Exchange Commission adopted amendments to money market fund regulations, which structurally change the way that certain money market funds will be required to operate. The compliance period for amendments range between July 2015 and October 2016. The changes may affect BlackRock Money Market Portfolio’s/ BlackRock Government Money Market V.I. Fund’s return potential.
Counterparty Credit Risk: Similar to issuer credit risk, the Fund may be exposed to counterparty credit risk, or the risk that an entity may fail to or be unable to perform on its commitments related to unsettled or open transactions. The Fund manages counterparty credit risk by entering into transactions only with counterparties that the Manager believes have the financial resources to honor their obligations and by monitoring the financial stability of those counterparties. Financial assets, which potentially expose the Fund to market, issuer and counterparty credit risks, consist principally of financial instruments and receivables due from counterparties. The extent of the Fund’s exposure to market, issuer and counterparty credit risks with respect to these financial assets is approximately their value recorded in the Statement of Assets and Liabilities, less any collateral held by the Fund.
| | | | | | |
| | | BLACKROCK VARIABLE SERIES FUNDS, INC. | | JUNE 30, 2016 | | 13 |
| | | | |
| Notes to Financial Statements (concluded) | | | BlackRock Government Money Market V.I. Fund | |
Concentration Risk: The Fund invests a significant portion of its assets in fixed-income securities and/or uses derivatives tied to the fixed-income markets. Changes in market interest rates or economic conditions may affect the value and/or liquidity of such investments. Interest rate risk is the risk that prices of bonds and other fixed-income securities will increase as interest rates fall and decrease as interest rates rise. The Fund may be subject to a greater risk of rising interest rates due to the current period of historically low rates.
8. Capital Share Transactions:
The number of shares sold, reinvested and redeemed corresponds to the net proceeds from the sale of shares, reinvestment of all distributions and cost of shares redeemed, respectively, since shares are sold and redeemed at $1.00 per share.
9. Subsequent Events:
Management’s evaluation of the impact of all subsequent events on the Fund’s financial statements was completed through the date the financial statements were issued and the following items were noted:
The Fund paid a long-term capital gain distribution of $0.000006 and short-term capital gain distribution of $0.000001 per share on July 22, 2016 to shareholders of record on July 20, 2016.
| | | | | | |
| 14 | | BLACKROCK VARIABLE SERIES FUNDS, INC. | | JUNE 30, 2016 | | |
JUNE 30, 2016
| | | | |
SEMI-ANNUAL REPORT (UNAUDITED) | | | | BLACKROCK® |
BlackRock Variable Series Funds, Inc.
▶ BlackRock High Yield V.I. Fund
| | |
| Not FDIC Insured ¡ May Lose Value ¡ No Bank Guarantee | | |
| | | | |
| Fund Summary as of June 30, 2016 | | | BlackRock High Yield V.I. Fund | |
BlackRock High Yield V.I. Fund’s (the “Fund”) investment objective is to seek to maximize total return, consistent with income generation and prudent investment management.
|
| Portfolio Management Commentary |
How did the Fund perform?
| • | | For the six-month period ended June 30, 2016, the Fund underperformed its benchmark, the Barclays U.S. Corporate High Yield 2% Issuer Capped Index. |
What factors influenced performance?
| • | | Despite a poor showing in the initial weeks of the year, high yield bonds finished with a positive return in the first half of 2016. The early weakness was driven by a “risk-off” tone in the market that was largely fueled by the sharp decline in oil prices. The environment changed for the better in mid-February, when favorable actions by the world’s central banks sparked a significant recovery in oil and led to a rebound in riskier assets such as high yield bonds. Energy issues performed particularly well in the rally, as investors grew more confident in the credit outlook for many companies in the sector. |
| • | | The Fund entered the period with a below-average risk profile, which aided performance during the early sell-off. However, this aspect of its positioning caused it to underperform in the subsequent rally. Underweight allocations in the metals & mining and oil field services industries weighed on results, as did security selection and an underweight position in the independent energy space. In this case, the underweight was due to the Fund’s underweight position in Chesapeake Energy Corp., a high-beta issue that rallied considerably from mid-February onward. |
| • | | Security selection within the cable & satellite and gaming industries – which stemmed from an underweight position in Intelsat Jackson Holdings SA and an overweight in Amaya, Inc., respectively – contributed positively to returns. Performance was also aided by the Fund’s overweight position in the technology sector. |
| • | | The Fund may utilize credit default swaps (“CDS”), high yield total returns swaps, high yield exchange traded funds and currency forward contracts. CDS are normally used as a strategy to manage risk, but are also used to express credit views and as a means to put capital to work in moving markets. On occasion, the Fund utilizes futures on the S&P 500 Index and Russell 2000 Index to manage portfolio beta and offset general market volatility. During the six-month period, the Fund used derivatives to add risk quickly during the rally and to provide liquidity as necessary. The Fund’s exposure to derivatives had a positive impact on performance during the period. |
Describe recent portfolio activity.
| • | | The Fund increased its allocation to the metals & mining, independent energy and midstream industries. Although the Fund added to its energy weighting, it remained underweight the oil field services industry. The Fund held only select positions in higher-quality issuers within oil field services, as the investment adviser believed the industry would continue to face pressure despite the rebound in oil prices. Although oil field services issues rallied in conjunction with the rest of energy sector, companies in the industry typically have higher break-even levels that those in the independent energy and midstream areas. |
Describe portfolio positioning at period end.
| • | | The Fund’s general investment themes and core positions reflected the investment adviser’s views regarding issuer cash flows, firm or industry catalysts, and idiosyncratic factors. Top issuer overweights include First Data Holdings, Inc. (technology), Ally Financial, Inc. (banking), and iHeartmedia, Inc. (Media and Entertainment). |
| • | | Relative to the Barclays U.S. Corporate High Yield 2% Issuer Capped Index, the Fund was underweight in BB rated credits (which are more interest-rate sensitive), overweight in single B issuers and approximately neutral to the benchmark in bonds rated CCC and below. The Fund remained underweight the distressed part of the CCC tier, focusing on select issues with improving credit positions and/or attractive yields. |
| • | | In addition to credit, the investment adviser sought opportunities in equity and equity-like instruments, such as preferred stocks and convertible bonds, to enhance the Fund’s total return profile. The Fund closed the period with a net short exposure to equities, reflecting its strategy of tactically implementing hedges to mitigate this risk when markets conditions warrant. |
| • | | The Fund maintained a strategic allocation to bank loans, which have little duration risk and, as senior secured instruments, help offset the portfolio’s underweight in BB-rated bonds. (Duration is a measure of interest rate sensitivity.) The Fund has a slightly short duration relative to the benchmark overall, but this isn’t a core aspect of its strategy. |
The views expressed reflect the opinions of BlackRock as of the date of this report and are subject to change based on changes in market, economic or other conditions. These views are not intended to be a forecast of future events and are no guarantee of future results.
| | | | | | |
| 2 | | BLACKROCK VARIABLE SERIES FUNDS, INC. | | JUNE 30, 2016 | | |
| | | | |
| | | | BlackRock High Yield V.I. Fund | |
|
| Total Return Based on a $10,000 Investment |
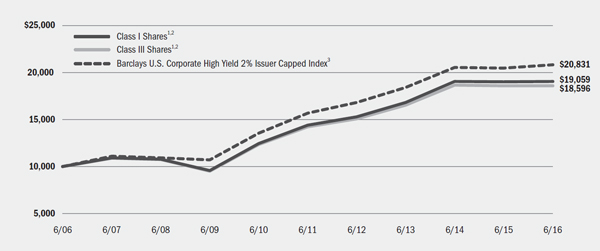
| | 1 | | Assuming transaction costs, if any, and other operating expenses, including investment advisory fees. Does not include insurance-related fees and expenses. The returns for Class III Shares, prior to February 15, 2012, the recommencement of Class III Shares, are based upon performance of the Fund’s Class I Shares, as adjusted to reflect the distribution and/or service (12b-1) fees applicable to Class III Shares. |
| | 2 | | The Fund invests primarily in non-investment grade bonds with maturities of ten years or less. The Fund’s total returns prior to October 1, 2011 are the returns of the Fund that followed different investment objectives and investment strategies under the name “BlackRock High Income V.I. Fund”. |
| | 3 | | An unmanaged index comprised of issues that meet the following criteria: at least $150 million par value outstanding; maximum credit rating of Ba1; at least one year to maturity; and no issuer represents more than 2% of the index. |
|
| Performance Summary for the Period Ended June 30, 2016 |
| | | | | | | | | | | | | | | | | | | | |
| | | | | | | | | | | | Average Annual Total Returns |
| | | Standardized
30-Day Yields5 | | | Unsubsidized
30-Day Yields5 | | | 6-Month
Total Returns6 | | | 1 Year6 | | | 5 Years6 | | 10 Years6 |
Class I4 | | | 5.60% | | | | 5.49% | | | | 5.83%7 | | | | (0.33)% | | | 5.61% | | 6.66% |
Class III4 | | | 5.36 | | | | 5.31 | | | | 5.86 | | | | (0.43) | | | 5.358 | | 6.408 |
Barclays U.S. Corporate High Yield 2% Issuer Capped Index | | | — | | | | — | | | | 9.06 | | | | 1.65 | | | 5.84 | | 7.61 |
| | 4 | | Average annual and cumulative total returns are based on changes in net asset value for the periods shown, and assume reinvestment of all distributions at net asset value on the ex-dividend/payable date. Insurance-related fees and expenses are not reflected in these returns. The Fund’s total returns prior to October 1, 2011 are the returns of the Fund that followed different investment objectives and investment strategies under the name “BlackRock High Income V.I. Fund”. |
| | 5 | | The standardized 30-day yield includes the effects of any waivers and/or reimbursements. The unsubsidized 30-day yield excludes the effects of any waivers and/or reimbursements. |
| | 6 | | For a portion of the period, the Fund’s investment adviser waived a portion of its fees. Without such waiver, the Fund’s performance would have been lower. |
| | 7 | | Performance results do not include adjustments made for financial reporting purposes in accordance with U.S. generally accepted accounting principles and may differ from results reported in the financial highlights. |
| | 8 | | The returns for Class III Shares prior to February 15, 2012, the recommencement of operations of Class III Shares, are based upon the performance of the Fund’s Class I Shares, as adjusted to reflect the distribution and/or service (12b-1) fees applicable to Class III Shares. |
| | | | Past performance is not indicative of future results. Performance results do not reflect the deduction of taxes that a shareholder would pay on Fund distributions or the redemption of Fund shares. |
| | | | | | | | | | | | | | |
| | | Actual | | Hypothetical10 | | |
| | | Beginning Account Value
January 1, 2016 | | Ending Account Value June 30, 2016 | | Expenses Paid
During the Period9 | | Beginning Account Value
January 1, 2016 | | Ending Account Value
June 30, 2016 | | Expenses Paid
During the Period9 | | Annualized Expense Ratio |
Class I | | $1,000.00 | | $1,058.30 | | $3.48 | | $1,000.00 | | $1,021.48 | | $3.42 | | 0.68% |
Class III | | $1,000.00 | | $1,058.60 | | $4.71 | | $1,000.00 | | $1,020.29 | | $4.62 | | 0.92% |
| | 9 | | For each class of the Fund, expenses are equal to the annualized expense ratio for the class, multiplied by the average account value over the period, multiplied by 182/366 (to reflect the one-half year period shown). |
| | 10 | | Hypothetical 5% annual return before expenses is calculated by prorating the number of days in the most recent fiscal half year divided by 366. |
| | | | See “Disclosure of Expenses” on the following page for further information on how expenses were calculated. |
| | | | | | |
| | | BLACKROCK VARIABLE SERIES FUNDS, INC. | | JUNE 30, 2016 | | 3 |
| | | | |
| | | | BlackRock High Yield V.I. Fund | |
|
| Portfolio Information as of June 30, 2016 |
| | |
| Credit Quality Allocations1 | | Percent of Total Investments2 |
BBB/Baa | | 6% |
BB/Ba | | 39 |
B | | 41 |
CCC/Caa | | 8 |
N/R | | 6 |
| | 1 | | For financial reporting purposes, credit quality ratings shown above reflect the highest rating assigned by either Standard & Poor’s or Moody’s Investors Service if ratings differ. These rating agencies are independent, nationally recognized statistical rating organizations and are widely used. Investment grade ratings are credit ratings of BBB/Baa or higher. Below investment grade ratings are credit ratings of BB/Ba or lower. Investments designated N/R are not rated by either rating agency. Unrated investments do not necessarily indicate low credit quality. Credit quality ratings are subject to change. |
| | 2 | | Total investments exclude short-term securities. |
Shareholders of the Fund may incur the following charges: (a) transactional expenses, such as sales charges; and (b) operating expenses, including investment advisory fees, service and distribution fees, including 12b-1 fees, acquired fund fees and expenses, and other fund expenses. The expense example on the previous page (which is based on a hypothetical investment of $1,000 invested on January 1, 2016 and held through June 30, 2016) is intended to assist shareholders both in calculating expenses based on an investment in the Fund and in comparing these expenses with similar costs of investing in other mutual funds.
The expense example provides information about actual account values and actual expenses. In order to estimate the expenses a shareholder paid during the period covered by this report, shareholders can divide their account value by $1,000 and then multiply the result by the number corresponding to their share class under the heading entitled “Expenses Paid During the Period.”
The expense example also provides information about hypothetical account values and hypothetical expenses based on the Fund’s actual expense ratio and an assumed rate of return of 5% per year before expenses. In order to assist shareholders in comparing the ongoing expenses of investing in the Fund and other funds, compare the 5% hypothetical example with the 5% hypothetical examples that appear in shareholder reports of other funds.
The expenses shown in the expense example are intended to highlight shareholders’ ongoing costs only and do not reflect any transactional expenses, such as sales charges, if any. Therefore, the hypothetical example is useful in comparing ongoing expenses only, and will not help shareholders determine the relative total expenses of owning different funds. If these transactional expenses were included, shareholder expenses would have been higher.
| | | | |
| Derivative Financial Instruments | | | | |
The Fund may invest in various derivative financial instruments. These instruments are used to obtain exposure to a security, commodity, index, market, and/or other asset without owning or taking physical custody of securities, commodities and/or other referenced assets or to manage market, equity, credit, interest rate, foreign currency exchange rate, commodity and/or other risks. Derivative financial instruments may give rise to a form of economic leverage and involve risks, including the imperfect correlation between the value of a derivative financial instrument and the underlying asset, possible default of the counterparty to the
transaction or illiquidity of the instrument. The Fund’s successful use of a derivative financial instrument depends on the investment adviser’s ability to predict pertinent market movements accurately, which cannot be assured. The use of these instruments may result in losses greater than if they had not been used, may limit the amount of appreciation the Fund can realize on an investment and/or may result in lower distributions paid to shareholders. The Fund’s investments in these instruments, if any, are discussed in detail in the Notes to Financial Statements.
| | | | | | |
| 4 | | BLACKROCK VARIABLE SERIES FUNDS, INC. | | JUNE 30, 2016 | | |
| | | | |
| Schedule of Investments June 30, 2016 (Unaudited) | | | BlackRock High Yield V.I. Fund | |
| | | (Percentages shown are based on Net Assets) | |
| | | | | | | | |
Common Stocks | | | Shares | | | | Value | |
Capital Markets — 1.3% | | | | | | | | |
American Capital Ltd. (a) | | | 222,258 | | | $ | 3,518,344 | |
Chemicals — 0.0% | | | | | | | | |
Advanced Emissions Solutions, Inc. (a) | | | 1,644 | | | | 11,689 | |
Consumer Finance — 0.9% | | | | | | | | |
Ally Financial, Inc. (a) | | | 60,914 | | | | 1,039,811 | |
Ally Financial, Inc. (a) | | | 51,770 | | | | 883,705 | |
Ally Financial, Inc. (a) | | | 29,273 | | | | 499,690 | |
| | | | | | | | |
| | | | | | | | 2,423,206 | |
Diversified Financial Services — 0.0% | | | | | | | | |
Concrete Investment II SCA — Stapled (a)(b) | | | 623 | | | | — | |
Diversified Telecommunication Services — 0.0% | | | | | | | | |
Broadview Networks Holdings, Inc. (a) | | | 13,812 | | | | 10,359 | |
Hotels, Restaurants & Leisure — 0.2% | | | | | | | | |
Amaya, Inc. (a) | | | 30,619 | | | | 469,731 | |
Amaya, Inc. (a) | | | 9,024 | | | | 138,439 | |
| | | | | | | | |
| | | | | | | | 608,170 | |
Oil, Gas & Consumable Fuels — 0.1% | | | | | | | | |
Denbury Resources, Inc. | | | 40,160 | | | | 144,174 | |
Real Estate Investment Trusts (REITs) — 0.0% | | | | | | | | |
Ovation Acquisition I, LLC (Acquired 12/28/15,
cost $1,200) (a)(c) | | | 1,200 | | | | 1,200 | |
Wireless Telecommunication Services — 0.1% | | | | | | | | |
T-Mobile U.S., Inc. (a) | | | 6,800 | | | | 294,236 | |
Total Common Stocks — 2.6% | | | | | | | 7,011,378 | |
| | | | | | | | |
| | | | | | | | | | | | |
| Corporate Bonds | | | | | Par (000) | | | | |
Aerospace & Defense — 1.4% | | | | | | | | | | | | |
Bombardier, Inc.: | | | | | | | | | | | | |
5.50%, 9/15/18 (d) | | | USD | | | | 250 | | | | 247,500 | |
6.00%, 10/15/22 (d) | | | | | | | 143 | | | | 122,265 | |
7.50%, 3/15/25 (d) | | | | | | | 465 | | | | 402,225 | |
KLX, Inc., 5.88%, 12/01/22 (d) | | | | | | | 392 | | | | 384,160 | |
TransDigm, Inc.: | | | | | | | | | | | | |
7.50%, 7/15/21 | | | | | | | 205 | | | | 217,300 | |
6.00%, 7/15/22 | | | | | | | 1,261 | | | | 1,267,532 | |
6.50%, 7/15/24 | | | | | | | 666 | | | | 675,577 | |
6.38%, 6/15/26 (d) | | | | | | | 438 | | | | 436,905 | |
| | | | | | | | | | | | |
| | | | | | | | | | | | 3,753,464 | |
Air Freight & Logistics — 0.3% | | | | | | | | | | | | |
CEVA Group PLC, 7.00%, 3/01/21 (d) | | | | | | | 80 | | | | 68,800 | |
XPO Logistics, Inc.: | | | | | | | | | | | | |
7.88%, 9/01/19 (d) | | | | | | | 292 | | | | 297,840 | |
5.75%, 6/15/21 | | | EUR | | | | 100 | | | | 104,274 | |
6.50%, 6/15/22 (d) | | | USD | | | | 406 | | | | 387,223 | |
| | | | | | | | | | | | |
| | | | | | | | | | | | 858,137 | |
Airlines — 0.6% | | | | | | | | | | | | |
Air Medical Merger Sub Corp., 6.38%, 5/15/23 (d) | | | | | | | 147 | | | | 139,650 | |
American Airlines Group, Inc., 5.50%, 10/01/19 (d) | | | | | | | 30 | | | | 29,700 | |
| | | | | | | | | | | | |
| Corporate Bonds | | | | | Par (000) | | | Value | |
Airlines (continued) | | | | | | | | | | | | |
American Airlines Pass-Through Trust, Series 2013-2, Class C, 6.00%, 1/15/17 (d) | | | USD | | | | 651 | | | $ | 659,498 | |
Continental Airlines Pass-Through Certificates, Series 2012-3, Class C, 6.13%, 4/29/18 | | | | | | | 365 | | | | 384,163 | |
National Air Cargo Group, Inc.: | | | | | | | | | | | | |
11.88%, 5/02/18 | | | | | | | 68 | | | | 67,764 | |
11.88%, 5/08/18 | | | | | | | 70 | | | | 69,903 | |
Virgin Australia Trust, Series 2013-1C, 7.13%, 10/23/18 (d) | | | | | | | 243 | | | | 243,366 | |
| | | | | | | | | | | | |
| | | | | | | | | | | | 1,594,044 | |
Auto Components — 0.5% | | | | | | | | | | | | |
AA Bond Co. Ltd., 5.50%, 7/31/43 | | | GBP | | | | 125 | | | | 158,503 | |
Dakar Finance SA, 9.00% (9.00% Cash or 9.25% PIK), 11/15/20 (e) | | | EUR | | | | 100 | | | | 107,757 | |
Goodyear Tire & Rubber Co.: | | | | | | | | | | | | |
7.00%, 5/15/22 | | | USD | | | | 100 | | | | 106,625 | |
5.00%, 5/31/26 | | | | | | | 68 | | | | 69,275 | |
Icahn Enterprises LP/Icahn Enterprises Finance Corp.: | | | | | | | | | | | | |
4.88%, 3/15/19 | | | | | | | 475 | | | | 464,313 | |
5.88%, 2/01/22 | | | | | | | 270 | | | | 254,510 | |
ZF North America Capital, Inc., 4.50%, 4/29/22 (d) | | | | | | | 150 | | | | 152,063 | |
| | | | | | | | | | | | |
| | | | | | | | | | | | 1,313,046 | |
Automobiles — 0.1% | | | | | | | | | | | | |
Fiat Chrysler Finance Europe, 4.75%, 3/22/21 | | | EUR | | | | 200 | | | | 238,497 | |
Jaguar Land Rover Automotive PLC, 5.63%, 2/01/23 (d) | | | USD | | | | 150 | | | | 155,813 | |
| | | | | | | | | | | | |
| | | | | | | | | | | | 394,310 | |
Banks — 0.9% | | | | | | | | | | | | |
Allied Irish Banks PLC, 4.13%, 11/26/25 (f) | | | EUR | | | | 100 | | | | 103,191 | |
Banco Espirito Santo SA: | | | | | | | | | | | | |
2.63%, 5/08/17 (a)(g) | | | | | | | 100 | | | | 27,744 | |
4.75%, 1/15/18 (a)(g) | | | | | | | 100 | | | | 27,744 | |
4.00%, 1/21/19 (a)(g) | | | | | | | 100 | | | | 27,744 | |
Bankia SA, 4.00%, 5/22/24 (f) | | | | | | | 200 | | | | 209,259 | |
CIT Group, Inc.: | | | | | | | | | | | | |
6.63%, 4/01/18 (d) | | | USD | | | | 445 | | | | 469,475 | |
5.50%, 2/15/19 (d) | | | | | | | 100 | | | | 104,625 | |
5.00%, 8/01/23 | | | | | | | 771 | | | | 776,783 | |
Commerzbank AG: | | | | | | | | | | | | |
7.75%, 3/16/21 | | | EUR | | | | 100 | | | | 132,155 | |
4.00%, 3/23/26 | | | | | | | 100 | | | | 113,456 | |
Ibercaja Banco SA, 5.00%, 7/28/25 (f) | | | | | | | 100 | | | | 101,083 | |
UniCredit SpA: | | | | | | | | | | | | |
6.95%, 10/31/22 | | | | | | | 100 | | | | 124,630 | |
5.75%, 10/28/25 (f) | | | | | | | 100 | | | | 114,871 | |
4.38%, 1/03/27 (f) | | | | | | | 100 | | | | 109,039 | |
| | | | | | | | | | | | |
| | | | | | | | | | | | 2,441,799 | |
Beverages — 0.0% | | | | | | | | | | | | |
Constellation Brands, Inc., 6.00%, 5/01/22 | | | USD | | | | 100 | | | | 111,750 | |
Building Products — 1.3% | | | | | | | | | | | | |
Builders FirstSource, Inc., 7.63%, 6/01/21 (d) | | | | | | | 45 | | | | 47,025 | |
CPG Merger Sub LLC, 8.00%, 10/01/21 (d) | | | | | | | 529 | | | | 529,000 | |
| | | | | | | | | | |
| Portfolio Abbreviations |
| AKA | | Also Know As | | FKA | | Formerly Known As | | PIK | | Payment-in-kind |
| CAD | | Canadian Dollar | | GBP | | British Pound | | S&P | | Standard & Poor’s |
| EUR | | Euro | | OTC | | Over-the-counter | | USD | | US Dollar |
See Notes to Financial Statements.
| | | | | | |
| | | BLACKROCK VARIABLE SERIES FUNDS, INC. | | JUNE 30, 2016 | | 5 |
| | | | |
| Schedule of Investments (continued) | | | BlackRock High Yield V.I. Fund | |
| | | | |
| | | | | | | | | | | | |
| Corporate Bonds | | | | | Par (000) | | | Value | |
Building Products (continued) | | | | | | | | | | | | |
Masonite International Corp., 5.63%, 3/15/23 (d) | | | USD | | | | 201 | | | $ | 208,537 | |
Pfleiderer GmbH, 7.88%, 8/01/19 | | | EUR | | | | 100 | | | | 114,440 | |
Ply Gem Industries, Inc., 6.50%, 2/01/22 | | | USD | | | | 1,096 | | | | 1,079,560 | |
Standard Industries, Inc.: | | | | | | | | | | | | |
5.13%, 2/15/21 (d) | | | | | | | 125 | | | | 128,437 | |
5.50%, 2/15/23 (d) | | | | | | | 204 | | | | 208,590 | |
6.00%, 10/15/25 (d) | | | | | | | 667 | | | | 697,015 | |
USG Corp.: | | | | | | | | | | | | |
9.75%, 1/15/18 | | | | | | | 90 | | | | 98,663 | |
5.88%, 11/01/21 (d) | | | | | | | 415 | | | | 434,194 | |
5.50%, 3/01/25 (d) | | | | | | | 54 | | | | 56,565 | |
| | | | | | | | | | | | |
| | | | | | | | | | | | 3,602,026 | |
Capital Markets — 0.1% | | | | | | | | | | | | |
CPUK Finance Ltd., 7.00%, 2/28/42 | | | GBP | | | | 100 | | | | 136,454 | |
Deutsche Bank AG, 4.50%, 5/19/26 | | | EUR | | | | 100 | | | | 107,663 | |
E*TRADE Financial Corp.: | | | | | | | | | | | | |
5.38%, 11/15/22 | | | USD | | | | 10 | | | | 10,550 | |
Series A, 0.00%, 8/31/19 (h)(i) | | | | | | | 3 | | | | 6,759 | |
| | | | | | | | | | | | |
| | | | | | | | | | | | 261,426 | |
Chemicals — 1.1% | | | | | | | | | | | | |
Chemours Co.: | | | | | | | | | | | | |
6.63%, 5/15/23 | | | | | | | 117 | | | | 99,450 | |
7.00%, 5/15/25 | | | | | | | 202 | | | | 169,427 | |
Huntsman International LLC: | | | | | | | | | | | | |
4.88%, 11/15/20 | | | | | | | 111 | | | | 111,555 | |
5.13%, 4/15/21 | | | EUR | | | | 100 | | | | 112,363 | |
INEOS Finance PLC, 4.00%, 5/01/23 | | | | | | | 100 | | | | 106,432 | |
INOVYN Finance PLC, 6.25%, 5/15/21 | | | | | | | 100 | | | | 112,934 | |
Momentive Performance Materials, Inc.: | | | | | | | | | | | | |
3.88%, 10/24/21 | | | USD | | | | 439 | | | | 348,456 | |
Escrow, 0.00%, 10/15/20 (a)(g) | | | | | | | 334 | | | | — | |
Platform Specialty Products Corp.: | | | | | | | | | | | | |
10.38%, 5/01/21 (d) | | | | | | | 52 | | | | 52,390 | |
6.50%, 2/01/22 (d) | | | | | | | 1,454 | | | | 1,272,250 | |
PQ Corp., 6.75%, 11/15/22 (d) | | | | | | | 331 | | | | 345,067 | |
WR Grace & Co-Conn, 5.13%, 10/01/21 (d) | | | | | | | 176 | | | | 180,840 | |
| | | | | | | | | | | | |
| | | | | | | | | | | | 2,911,164 | |
Commercial Services & Supplies — 1.6% | | | | | | | | | | | | |
Acosta, Inc., 7.75%, 10/01/22 (d) | | | | | | | 514 | | | | 451,035 | |
ADT Corp.: | | | | | | | | | | | | |
3.50%, 7/15/22 | | | | | | | 466 | | | | 426,973 | |
4.13%, 6/15/23 | | | | | | | 83 | | | | 77,709 | |
Advanced Disposal Services, Inc., 8.25%, 10/01/20 | | | | | | | 92 | | | | 92,920 | |
Befesa Zinc SAU Via Zinc Capital SA, 8.88%, 5/15/18 | | | EUR | | | | 100 | | | | 110,314 | |
Bilbao Luxembourg SA, 10.50% (10.50% Cash or 11.25% PIK), 12/01/18 (e) | | | | | | | 107 | | | | 114,539 | |
Ceridian HCM Holding, Inc., 11.00%, 3/15/21 (d) | | | USD | | | | 226 | | | | 224,870 | |
Herc Spinoff Escrow Issuer LLC/Herc Spinoff Escrow Issuer Corp.: | | | | | | | | | | | | |
7.50%, 6/01/22 (d) | | | | | | | 98 | | | | 96,285 | |
7.75%, 6/01/24 (d) | | | | | | | 144 | | | | 140,400 | |
Mobile Mini, Inc., 5.88%, 7/01/24 (d) | | | | | | | 418 | | | | 429,495 | |
Prime Security One MS, Inc., 4.88%, 7/15/32 (d) | | | | | | | 40 | | | | 30,550 | |
Prime Security Services Borrower LLC/Prime Finance, Inc., 9.25%, 5/15/23 (d) | | | | | | | 456 | | | | 483,360 | |
Safway Group Holding LLC/Safway Finance Corp., 7.00%, 5/15/18 (d) | | | | | | | 625 | | | | 623,437 | |
Verisure Holding AB, 6.00%, 11/01/22 | | | EUR | | | | 100 | | | | 118,133 | |
| | | | | | | | | | | | |
| Corporate Bonds | | | | | Par (000) | | | Value | |
Commercial Services & Supplies (continued) | | | | | | | | | |
WaveDivision Escrow LLC/WaveDivision Escrow Corp., 8.13%, 9/01/20 (d) | | | USD | | | | 794 | | | $ | 825,760 | |
| | | | | | | | | | | | |
| | | | | | | | | | | | 4,245,780 | |
Communications Equipment — 1.1% | | | | | | | | | | | | |
Alcatel-Lucent USA, Inc., 6.45%, 3/15/29 | | | | | | | 1,372 | | | | 1,430,310 | |
Blue Coat Holdings, Inc., 8.38%, 6/01/23 (d) | | | | | | | 205 | | | | 231,650 | |
CommScope Technologies Finance LLC, 6.00%, 6/15/25 (d) | | | | | | | 262 | | | | 268,550 | |
CommScope, Inc.: | | | | | | | | | | | | |
4.38%, 6/15/20 (d) | | | | | | | 470 | | | | 484,100 | |
5.00%, 6/15/21 (d) | | | | | | | 90 | | | | 91,935 | |
Nokia OYJ, 6.63%, 5/15/39 | | | | | | | 373 | | | | 394,447 | |
Riverbed Technology, Inc., 8.88%, 3/01/23 (d) | | | | | | | 243 | | | | 251,505 | |
| | | | | | | | | | | | |
| | | | | | | | | | | | 3,152,497 | |
Construction & Engineering — 0.2% | | | | | | | | | | | | |
Brand Energy & Infrastructure Services, Inc., 8.50%, 12/01/21 (d) | | | | | | | 207 | | | | 198,720 | |
Modular Space Corp., 10.25%, 1/31/19 (d) | | | | | | | 837 | | | | 401,760 | |
| | | | | | | | | | | | |
| | | | | | | | | | | | 600,480 | |
Construction Materials — 0.0% | | | | | | | | | | | | |
HeidelbergCement AG, 2.25%, 3/30/23 | | | EUR | | | | 75 | | | | 84,901 | |
Consumer Finance — 1.2% | | | | | | | | | | | | |
Ally Financial, Inc.: | | | | | | | | | | | | |
5.13%, 9/30/24 | | | USD | | | | 367 | | | | 373,881 | |
4.63%, 3/30/25 | | | | | | | 715 | | | | 703,381 | |
8.00%, 11/01/31 | | | | | | | 1,586 | | | | 1,835,795 | |
DFC Finance Corp., 10.50%, 6/15/20 (d) | | | | | | | 210 | | | | 126,000 | |
Navient Corp.: | | | | | | | | | | | | |
5.50%, 1/25/23 | | | | | | | 20 | | | | 17,550 | |
6.13%, 3/25/24 | | | | | | | 113 | | | | 99,157 | |
5.88%, 10/25/24 | | | | | | | 122 | | | | 104,310 | |
OneMain Financial Holdings LLC: | | | | | | | | | | | | |
6.75%, 12/15/19 (d) | | | | | | | 101 | | | | 98,475 | |
7.25%, 12/15/21 (d) | | | | | | | 34 | | | | 32,555 | |
| | | | | | | | | | | | |
| | | | | | | | | | | | 3,391,104 | |
Containers & Packaging — 2.8% | | | | | | | | | | | | |
Ardagh Packaging Finance PLC/Ardagh Holdings USA, Inc.: | | | | | | | | | | | | |
6.25%, 1/31/19 (d) | | | | | | | 400 | | | | 406,500 | |
6.75%, 1/31/21 (d) | | | | | | | 400 | | | | 402,500 | |
3.88%, 5/15/21 (d)(f) | | | | | | | 303 | | | | 304,136 | |
6.00%, 6/30/21 (d) | | | | | | | 400 | | | | 397,000 | |
4.25%, 1/15/22 | | | EUR | | | | 210 | | | | 237,127 | |
4.63%, 5/15/23 (d) | | | USD | | | | 224 | | | | 220,640 | |
6.75%, 5/15/24 | | | EUR | | | | 200 | | | | 225,280 | |
7.25%, 5/15/24 (d) | | | USD | | | | 682 | | | | 696,066 | |
Ball Corp.: | | | | | | | | | | | | |
5.00%, 3/15/22 | | | | | | | 257 | | | | 272,805 | |
4.38%, 12/15/23 | | | | | | | 100 | | | | 119,576 | |
Beverage Packaging Holdings Luxembourg II SA, 5.63%, 12/15/16 (d) | | | | | | | 26 | | | | 26,065 | |
Reynolds Group Issuer, Inc.: | | | | | | | | | | | | |
5.75%, 10/15/20 | | | | | | | 636 | | | | 656,670 | |
6.88%, 2/15/21 | | | | | | | 219 | | | | 225,570 | |
8.25%, 2/15/21 | | | | | | | 1,332 | | | | 1,393,432 | |
4.13%, 7/15/21 (d)(f) | | | | | | | 510 | | | | 511,275 | |
5.13%, 7/15/23 (d) | | | | | | | 39 | | | | 39,487 | |
7.00%, 7/15/24 (d) | | | | | | | 452 | | | | 465,334 | |
Sealed Air Corp.: | | | | | | | | | | | | |
4.88%, 12/01/22 (d) | | | | | | | 369 | | | | 379,609 | |
4.50%, 9/15/23 | | | EUR | | | | 100 | | | | 117,079 | |
6.88%, 7/15/33 (d) | | | USD | | | | 212 | | | | 224,720 | |
Smurfit Kappa Acquisitions, 2.75%, 2/01/25 | | | EUR | | | | 100 | | | | 111,253 | |
See Notes to Financial Statements.
| | | | | | |
| 6 | | BLACKROCK VARIABLE SERIES FUNDS, INC. | | JUNE 30, 2016 | | |
| | | | |
| Schedule of Investments (continued) | | | BlackRock High Yield V.I. Fund | |
| | | | |
| | | | | | | | | | | | |
| Corporate Bonds | | | | | Par (000) | | | Value | |
Containers & Packaging (continued) | | | | | | | | | | | | |
Verallia Packaging SASU, 5.13%, 8/01/22 | | | EUR | | | | 100 | | | $ | 114,443 | |
| | | | | | | | | | | | |
| | | | | | | | | | | | 7,546,567 | |
Distributors — 0.1% | | | | | | | | | | | | |
American Tire Distributors, Inc., 10.25%, 3/01/22 (d) | | | USD | | | | 202 | | | | 177,255 | |
LKQ Italia Bondco SpA, 3.88%, 4/01/24 | | | EUR | | | | 100 | | | | 113,750 | |
| | | | | | | | | | | | |
| | | | | | | | | | | | 291,005 | |
Diversified Consumer Services — 0.1% | | | | | | | | | | | | |
Service Corp. International: | | | | | | | | | | | | |
4.50%, 11/15/20 | | | USD | | | | 60 | | | | 61,050 | |
5.38%, 1/15/22 | | | | | | | 120 | | | | 123,600 | |
| | | | | | | | | | | | |
| | | | | | | | | | | | 184,650 | |
Diversified Financial Services — 2.2% | | | | | | | | | | | | |
AerCap Ireland Capital Ltd./AerCap Global Aviation Trust: | | | | | | | | | | | | |
4.63%, 10/30/20 | | | | | | | 843 | | | | 873,980 | |
5.00%, 10/01/21 | | | | | | | 730 | | | | 759,200 | |
Altice Financing SA: | | | | | | | | | | | | |
6.50%, 1/15/22 (d) | | | | | | | 360 | | | | 363,600 | |
5.25%, 2/15/23 | | | EUR | | | | 100 | | | | 111,808 | |
7.50%, 5/15/26 (d) | | | USD | | | | 247 | | | | 242,060 | |
CNH Industrial Finance Europe SA, 2.88%, 5/17/23 | | | EUR | | | | 175 | | | | 194,207 | |
eircom Finance DAC, 4.50%, 5/31/22 | | | | | | | 100 | | | | 109,566 | |
Garfunkelux Holdco 3 SA, 8.50%, 11/01/22 | | | GBP | | | | 100 | | | | 125,924 | |
Mercury Bondco PLC, 8.25% (8.25% Cash or 9.00% PIK), 5/30/21 (e) | | | EUR | | | | 100 | | | | 109,677 | |
MGM Growth Properties Operating Partnership LP/MGP Escrow Co-Issuer, Inc., 5.63%, 5/01/24 (d) | | | USD | | | | 1,001 | | | | 1,058,557 | |
Solera LLC/Solera Finance, Inc., 10.50%, 3/01/24 (d) | | | | | | | 830 | | | | 872,537 | |
Virgin Media Finance PLC, 5.75%, 1/15/25 (d) | | | | | | | 400 | | | | 383,000 | |
Virgin Media Secured Finance PLC: | | | | | | | | | | | | |
6.00%, 4/15/21 | | | GBP | | | | 396 | | | | 541,675 | |
5.50%, 8/15/26 (d) | | | USD | | | | 200 | | | | 194,500 | |
| | | | | | | | | | | | |
| | | | | | | | | | | | 5,940,291 | |
Diversified Telecommunication Services — 3.7% | | | | | | | | | | | | |
CenturyLink, Inc., Series S, 6.45%, 6/15/21 | | | | | | | 120 | | | | 121,950 | |
Columbus International, Inc., 7.38%, 3/30/21 (d) | | | | | | | 370 | | | | 390,720 | |
Consolidated Communications, Inc., 6.50%, 10/01/22 | | | | | | | 80 | | | | 71,800 | |
Frontier Communications Corp.: | | | | | | | | | | | | |
6.25%, 9/15/21 | | | | | | | 280 | | | | 263,973 | |
7.13%, 1/15/23 | | | | | | | 170 | | | | 152,150 | |
7.63%, 4/15/24 | | | | | | | 562 | | | | 497,370 | |
6.88%, 1/15/25 | | | | | | | 664 | | | | 557,345 | |
11.00%, 9/15/25 | | | | | | | 275 | | | | 284,625 | |
Intelsat Jackson Holdings SA: | | | | | | | | | | | | |
7.25%, 10/15/20 | | | | | | | 333 | | | | 237,263 | |
6.63%, 12/15/22 | | | | | | | 163 | | | | 110,025 | |
5.50%, 8/01/23 | | | | | | | 337 | | | | 213,995 | |
Level 3 Financing, Inc.: | | | | | | | | | | | | |
5.38%, 8/15/22 | | | | | | | 533 | | | | 538,330 | |
5.63%, 2/01/23 | | | | | | | 452 | | | | 456,240 | |
5.13%, 5/01/23 | | | | | | | 226 | | | | 224,023 | |
5.38%, 1/15/24 | | | | | | | 330 | | | | 331,237 | |
5.38%, 5/01/25 | | | | | | | 507 | | | | 503,197 | |
5.25%, 3/15/26 (d) | | | | | | | 246 | | | | 241,080 | |
OTE PLC, 3.50%, 7/09/20 | | | EUR | | | | 100 | | | | 108,479 | |
SBA Communications Corp., 5.63%, 10/01/19 | | | USD | | | | 278 | | | | 287,035 | |
| | | | | | | | | | | | |
| Corporate Bonds | | | | | Par (000) | | | Value | |
Diversified Telecommunication Services (continued) | | | | | | | | | |
Telecom Italia Capital SA: | | | | | | | | | | | | |
6.00%, 9/30/34 | | | USD | | | | 750 | | | $ | 716,250 | |
7.20%, 7/18/36 | | | | | | | 140 | | | | 140,175 | |
Telecom Italia SpA: | | | | | | | | | | | | |
6.38%, 6/24/19 | | | GBP | | | | 150 | | | | 219,759 | |
5.88%, 5/19/23 | | | | | | | 200 | | | | 297,807 | |
Telenet Finance V Luxembourg SCA: | | | | | | | | | | | | |
6.25%, 8/15/22 | | | EUR | | | | 200 | | | | 236,933 | |
6.75%, 8/15/24 | | | | | | | 210 | | | | 255,771 | |
Wind Acquisition Finance SA: | | | | | | | | | | | | |
6.50%, 4/30/20 (d) | | | USD | | | | 200 | | | | 205,500 | |
4.00%, 7/15/20 | | | EUR | | | | 130 | | | | 142,104 | |
7.00%, 4/23/21 | | | | | | | 100 | | | | 108,201 | |
Zayo Group LLC/Zayo Capital, Inc.: | | | | | | | | | | | | |
6.00%, 4/01/23 | | | USD | | | | 1,261 | | | | 1,279,915 | |
6.38%, 5/15/25 | | | | | | | 464 | | | | 473,280 | |
Ziggo Bond Finance BV: | | | | | | | | | | | | |
4.63%, 1/15/25 | | | EUR | | | | 100 | | | | 105,704 | |
5.88%, 1/15/25 (d) | | | USD | | | | 400 | | | | 386,000 | |
| | | | | | | | | | | | |
| | | | | | | | | | | | 10,158,236 | |
Electric Utilities — 0.1% | | | | | | | | | | | | |
ContourGlobal Power Holdings SA, 5.13%, 6/15/21 | | | EUR | | | | 100 | | | | 109,122 | |
FPL Energy National Wind Portfolio LLC, 6.13%, 3/25/19 (d) | | | USD | | | | 10 | | | | 10,091 | |
Viridian Group FundCo II Ltd., 7.50%, 3/01/20 | | | EUR | | | | 100 | | | | 114,776 | |
| | | | | | | | | | | | |
| | | | | | | | | | | | 233,989 | |
Electrical Equipment — 0.3% | | | | | | | | | | | | |
GrafTech International Ltd., 6.38%, 11/15/20 | | | USD | | | | 103 | | | | 79,310 | |
Sensata Technologies BV: | | | | | | | | | | | | |
5.63%, 11/01/24 (d) | | | | | | | 72 | | | | 74,745 | |
5.00%, 10/01/25 (d) | | | | | | | 256 | | | | 257,124 | |
Sensata Technologies UK Financing Co. PLC, 6.25%, 2/15/26 (d) | | | | | | | 200 | | | | 207,000 | |
Trionista Holdco GmbH, 5.00%, 4/30/20 | | | EUR | | | | 105 | | | | 119,292 | |
| | | | | | | | | | | | |
| | | | | | | | | | | | 737,471 | |
Electronic Equipment, Instruments & Components — 0.5% | |
Belden, Inc., 5.50%, 4/15/23 | | | | | | | 160 | | | | 178,005 | |
CDW LLC/CDW Finance Corp.: | | | | | | | | | | | | |
6.00%, 8/15/22 | | | USD | | | | 215 | | | | 224,675 | |
5.00%, 9/01/23 | | | | | | | 349 | | | | 351,439 | |
5.50%, 12/01/24 | | | | | | | 485 | | | | 500,763 | |
| | | | | | | | | | | | |
| | | | | | | | | | | | 1,254,882 | |
Energy Equipment & Services — 0.9% | | | | | | | | | | | | |
Ensco PLC: | | | | | | | | | | | | |
4.70%, 3/15/21 | | | | | | | 75 | | | | 62,319 | |
4.50%, 10/01/24 | | | | | | | 293 | | | | 196,310 | |
5.20%, 3/15/25 | | | | | | | 296 | | | | 205,720 | |
Noble Holding International Ltd.: | | | | | | | | | | | | |
4.63%, 3/01/21 | | | | | | | 40 | | | | 32,400 | |
6.95%, 4/01/25 | | | | | | | 100 | | | | 79,750 | |
Noble Holding U.S. Corp./Noble Drilling Services 6 LLC/Noble Drilling Holding LLC, 7.50%, 3/15/19 | | | | | | | 140 | | | | 141,400 | |
Transocean, Inc.: | | | | | | | | | | | | |
3.75%, 10/15/17 | | | | | | | 139 | | | | 140,043 | |
6.00%, 3/15/18 | | | | | | | 436 | | | | 442,540 | |
7.38%, 4/15/18 | | | | | | | 35 | | | | 35,437 | |
6.50%, 11/15/20 | | | | | | | 29 | | | | 25,772 | |
7.13%, 12/15/21 | | | | | | | 85 | | | | 71,825 | |
5.05%, 10/15/22 | | | | | | | 240 | | | | 169,800 | |
Weatherford International LLC, 6.80%, 6/15/37 | | | | | | | 52 | | | | 38,366 | |
See Notes to Financial Statements.
| | | | | | |
| | | BLACKROCK VARIABLE SERIES FUNDS, INC. | | JUNE 30, 2016 | | 7 |
| | | | |
| Schedule of Investments (continued) | | | BlackRock High Yield V.I. Fund | |
| | | | |
| | | | | | | | | | | | |
| Corporate Bonds | | | | | Par (000) | | | Value | |
Energy Equipment & Services (continued) | | | | | | | | | | | | |
Weatherford International Ltd.: | | | | | | | | | | | | |
7.75%, 6/15/21 | | | USD | | | | 607 | | | $ | 591,066 | |
4.50%, 4/15/22 | | | | | | | 109 | | | | 93,467 | |
6.50%, 8/01/36 | | | | | | | 77 | | | | 55,247 | |
7.00%, 3/15/38 | | | | | | | 98 | | | | 72,520 | |
5.95%, 4/15/42 | | | | | | | 100 | | | | 71,000 | |
| | | | | | | | | | | | |
| | | | | | | | | | | | 2,524,982 | |
Food & Staples Retailing — 1.2% | | | | | | | | | | | | |
Albertsons Cos. LLC/Safeway, Inc./New Albertson’s, Inc./Albertson’s LLC, 6.63%, 6/15/24 (d) | | | | | | | 159 | | | | 164,167 | |
Casino Guichard Perrachon SA: | | | | | | | | | | | | |
3.31%, 1/25/23 | | | EUR | | | | 100 | | | | 118,883 | |
3.30%, 3/07/24 | | | | | | | 200 | | | | 231,575 | |
2.33%, 2/07/25 | | | | | | | 100 | | | | 109,636 | |
Rite Aid Corp.: | | | | | | | | | | | | |
9.25%, 3/15/20 | | | USD | | | | 90 | | | | 94,966 | |
6.75%, 6/15/21 | | | | | | | 559 | | | | 588,347 | |
6.13%, 4/01/23 (d) | | | | | | | 1,197 | | | | 1,277,797 | |
7.70%, 2/15/27 | | | | | | | 288 | | | | 343,440 | |
Tesco PLC, 5.00%, 3/24/23 | | | GBP | | | | 100 | | | | 137,099 | |
Tesco Property Finance 1 PLC, 7.62%, 7/13/39 | | | | | | | 46 | | | | 68,678 | |
Tesco Property Finance 4 PLC, 5.80%, 10/13/40 | | | | | | | 99 | | | | 121,231 | |
| | | | | | | | | | | | |
| | | | | | | | | | | | 3,255,819 | |
Food Products — 1.1% | | | | | | | | | | | | |
JBS USA LLC/JBS USA Finance, Inc.: | | | | | | | | | | | | |
7.25%, 6/01/21 (d) | | | USD | | | | 175 | | | | 181,125 | |
5.75%, 6/15/25 (d) | | | | | | | 161 | | | | 151,340 | |
Pinnacle Foods Finance LLC/Pinnacle Foods Finance Corp., 5.88%, 1/15/24 (d) | | | | | | | 55 | | | | 57,544 | |
Post Holdings, Inc.: | | | | | | | | | | | | |
6.75%, 12/01/21 (d) | | | | | | | 265 | | | | 280,237 | |
7.38%, 2/15/22 | | | | | | | 204 | | | | 214,455 | |
7.75%, 3/15/24 (d) | | | | | | | 724 | | | | 795,495 | |
8.00%, 7/15/25 (d) | | | | | | | 431 | | | | 477,871 | |
R&R Pik PLC, 9.25% (9.25% Cash or 9.75% PIK), 5/15/18 (e) | | | EUR | | | | 213 | | | | 235,823 | |
Smithfield Foods, Inc.: | | | | | | | | | | | | |
5.88%, 8/01/21 (d) | | | USD | | | | 52 | | | | 54,210 | |
6.63%, 8/15/22 | | | | | | | 220 | | | | 230,382 | |
Tereos Finance Groupe I SA, 4.13%, 6/16/23 | | | EUR | | | | 100 | | | | 110,554 | |
TreeHouse Foods, Inc., 6.00%, 2/15/24 (d) | | | USD | | | | 121 | | | | 128,260 | |
WhiteWave Foods Co., 5.38%, 10/01/22 | | | | | | | 143 | | | | 153,010 | |
| | | | | | | | | | | | |
| | | | | | | | | | | | 3,070,306 | |
Health Care Equipment & Supplies — 0.9% | | | | | | | | | | | | |
Alere, Inc.: | | | | | | | | | | | | |
6.50%, 6/15/20 | | | | | | | 318 | | | | 316,410 | |
6.38%, 7/01/23 (d) | | | | | | | 235 | | | | 244,987 | |
DJO Finco, Inc./DJO Finance LLC/DJO Finance Corp., 8.13%, 6/15/21 (d) | | | | | | | 981 | | | | 848,565 | |
Hologic, Inc., 5.25%, 7/15/22 (d) | | | | | | | 952 | | | | 994,840 | |
Teleflex, Inc., 4.88%, 6/01/26 | | | | | | | 98 | | | | 98,980 | |
| | | | | | | | | | | | |
| | | | | | | | | | | | 2,503,782 | |
Health Care Providers & Services — 5.1% | | | | | | | | | | | | |
Acadia Healthcare Co., Inc.: | | | | | | | | | | | | |
5.13%, 7/01/22 | | | | | | | 37 | | | | 35,890 | |
5.63%, 2/15/23 | | | | | | | 309 | | | | 302,820 | |
6.50%, 3/01/24 (d) | | | | | | | 57 | | | | 57,855 | |
Amsurg Corp., 5.63%, 7/15/22 | | | | | | | 959 | | | | 985,373 | |
| | | | | | | | | | | | |
| Corporate Bonds | | | | | Par (000) | | | Value | |
Health Care Providers & Services (continued) | | | | | | | | | | | | |
Centene Corp.: | | | | | | | | | | | | |
5.63%, 2/15/21 (d) | | | USD | | | | 330 | | | $ | 344,025 | |
4.75%, 5/15/22 | | | | | | | 378 | | | | 385,560 | |
6.13%, 2/15/24 (d) | | | | | | | 426 | | | | 452,891 | |
CHS/Community Health Systems, Inc., 6.88%, 2/01/22 | | | | | | | 423 | | | | 370,125 | |
DaVita HealthCare Partners, Inc.: | | | | | | | | | | | | |
5.13%, 7/15/24 | | | | | | | 174 | | | | 175,931 | |
5.00%, 5/01/25 | | | | | | | 754 | | | | 747,403 | |
Envision Healthcare Corp., 5.13%, 7/01/22 (d) | | | | | | | 584 | | | | 586,920 | |
ExamWorks Group, Inc., 5.63%, 4/15/23 | | | | | | | 223 | | | | 247,530 | |
Fresenius Medical Care U.S. Finance II, Inc.: | | | | | | | | | | | | |
5.88%, 1/31/22 (d) | | | | | | | 160 | | | | 175,400 | |
4.75%, 10/15/24 (d) | | | | | | | 354 | | | | 365,505 | |
Fresenius U.S. Finance II, Inc., 4.50%, 1/15/23 (d) | | | | | | | 127 | | | | 129,857 | |
HCA Holdings, Inc., 6.25%, 2/15/21 | | | | | | | 610 | | | | 651,175 | |
HCA, Inc.: | | | | | | | | | | | | |
6.50%, 2/15/20 | | | | | | | 244 | | | | 269,925 | |
7.50%, 2/15/22 | | | | | | | 514 | | | | 584,418 | |
5.88%, 3/15/22 | | | | | | | 180 | | | | 195,750 | |
4.75%, 5/01/23 | | | | | | | 375 | | | | 384,375 | |
5.00%, 3/15/24 | | | | | | | 563 | | | | 582,705 | |
5.38%, 2/01/25 | | | | | | | 606 | | | | 621,150 | |
5.25%, 4/15/25 | | | | | | | 338 | | | | 353,210 | |
5.25%, 6/15/26 | | | | | | | 315 | | | | 327,009 | |
Series 1, 5.88%, 5/01/23 | | | | | | | 203 | | | | 216,195 | |
HealthSouth Corp.: | | | | | | | | | | | | |
5.13%, 3/15/23 | | | | | | | 170 | | | | 166,600 | |
5.75%, 11/01/24 | | | | | | | 523 | | | | 525,092 | |
5.75%, 9/15/25 | | | | | | | 150 | | | | 148,500 | |
MEDNAX, Inc., 5.25%, 12/01/23 (d) | | | | | | | 346 | | | | 350,325 | |
MPH Acquisition Holdings LLC, 7.13%, 6/01/24 (d) | | | | | | | 316 | | | | 331,800 | |
RegionalCare Hospital Partners Holdings, Inc., 8.25%, 5/01/23 (d) | | | | | | | 391 | | | | 400,775 | |
Surgery Center Holdings, Inc., 8.88%, 4/15/21 (d) | | | | | | | 71 | | | | 72,953 | |
Surgical Care Affiliates, Inc., 6.00%, 4/01/23 (d) | | | | | | | 89 | | | | 90,780 | |
Synlab Bondco PLC, 6.25%, 7/01/22 | | | | | | | 175 | | | | 204,888 | |
Tenet Healthcare Corp.: | | | | | | | | | | | | |
6.25%, 11/01/18 | | | | | | | 69 | | | | 72,795 | |
6.00%, 10/01/20 | | | | | | | 172 | | | | 181,460 | |
4.50%, 4/01/21 | | | | | | | 54 | | | | 54,405 | |
4.38%, 10/01/21 | | | | | | | 184 | | | | 182,620 | |
8.13%, 4/01/22 | | | | | | | 588 | | | | 602,582 | |
6.75%, 6/15/23 | | | | | | | 820 | | | | 785,150 | |
Voyage Care Bondco PLC, 6.50%, 8/01/18 | | | GBP | | | | 100 | | | | 127,441 | |
WellCare Health Plans, Inc., 5.75%, 11/15/20 | | | USD | | | | 120 | | | | 124,050 | |
| | | | | | | | | | | | |
| | | | | | | | | | | | 13,971,213 | |
Hotels, Restaurants & Leisure — 3.2% | | | | | | | | | | | | |
Aramark Services, Inc.: | | | | | | | | | | | | |
5.75%, 3/15/20 | | | | | | | 47 | | | | 48,410 | |
5.13%, 1/15/24 | | | | | | | 266 | | | | 271,320 | |
5.13%, 1/15/24 (d) | | | | | | | 141 | | | | 143,820 | |
BC ULC/New Red Finance, Inc., 6.00%, 4/01/22 (d) | | | | | | | 610 | | | | 632,686 | |
Boyd Gaming Corp., 6.88%, 5/15/23 | | | | | | | 338 | | | | 359,970 | |
Caesars Entertainment Resort Properties LLC, 8.00%, 10/01/20 | | | | | | | 800 | | | | 802,000 | |
Cirsa Funding Luxembourg SA, 5.88%, 5/15/23 | | | EUR | | | | 100 | | | | 111,586 | |
Gala Group Finance PLC, 8.88%, 9/01/18 | | | GBP | | | | 50 | | | | 68,550 | |
Hilton Worldwide Finance LLC/Hilton Worldwide Finance Corp., 5.63%, 10/15/21 | | | USD | | | | 390 | | | | 403,650 | |
See Notes to Financial Statements.
| | | | | | |
| 8 | | BLACKROCK VARIABLE SERIES FUNDS, INC. | | JUNE 30, 2016 | | |
| | | | |
| Schedule of Investments (continued) | | | BlackRock High Yield V.I. Fund | |
| | | | |
| | | | | | | | | | | | |
| Corporate Bonds | | | | | Par (000) | | | Value | |
Hotels, Restaurants & Leisure (continued) | | | | | | | | | | | | |
International Game Technology PLC, 6.25%, 2/15/22 (d) | | | USD | | | | 200 | | | $ | 203,250 | |
Intralot Finance Luxembourg SA, 9.75%, 8/15/18 | | | EUR | | | | 115 | | | | 133,051 | |
KFC Holding Co./Pizza Hut Holdings LLC/Taco Bell of America LLC: | | | | | | | | | | | | |
5.00%, 6/01/24 (d) | | | USD | | | | 35 | | | | 35,613 | |
5.25%, 6/01/26 (d) | | | | | | | 142 | | | | 145,550 | |
MGM Resorts International: | | | | | | | | | | | | |
8.63%, 2/01/19 | | | | | | | 153 | | | | 171,819 | |
5.25%, 3/31/20 | | | | | | | 150 | | | | 157,500 | |
6.75%, 10/01/20 | | | | | | | 681 | | | | 743,993 | |
6.63%, 12/15/21 | | | | | | | 764 | | | | 830,850 | |
6.00%, 3/15/23 | | | | | | | 54 | | | | 56,970 | |
NAI Entertainment Holdings/NAI Entertainment Holdings Finance Corp., 5.00%, 8/01/18 (d) | | | | | | | 41 | | | | 41,615 | |
Pinnacle Entertainment, Inc., 5.63%, 5/01/24 (d) | | | | | | | 69 | | | | 68,827 | |
Pizzaexpress Financing 2 PLC, 6.63%, 8/01/21 | | | GBP | | | | 100 | | | | 124,784 | |
PortAventura Entertainment Barcelona BV, 7.25%, 12/01/20 | | | EUR | | | | 100 | | | | 115,140 | |
Scientific Games International, Inc.: | | | | | | | | | | | | |
7.00%, 1/01/22 (d) | | | USD | | | | 307 | | | | 308,535 | |
10.00%, 12/01/22 | | | | | | | 93 | | | | 75,563 | |
Six Flags Entertainment Corp.: | | | | | | | | | | | | |
5.25%, 1/15/21 (d) | | | | | | | 170 | | | | 175,313 | |
4.88%, 7/31/24 (d) | | | | | | | 211 | | | | 208,363 | |
Snai SpA, 7.63%, 6/15/18 | | | EUR | | | | 100 | | | | 114,305 | |
Station Casinos LLC, 7.50%, 3/01/21 | | | USD | | | | 925 | | | | 979,344 | |
Sterling Entertainment Enterprises LLC, 9.75%, 12/25/19 (d) | | | | | | | 475 | | | | 470,250 | |
Unique Pub Finance Co. PLC: | | | | | | | | | | | | |
Series A4, 5.66%, 6/30/27 | | | GBP | | | | 207 | | | | 271,798 | |
Series N, 6.46%, 3/30/32 | | | | | | | 100 | | | | 111,783 | |
Vougeot Bidco PLC, 7.88%, 7/15/20 | | | | | | | 115 | | | | 156,539 | |
Yum! Brands, Inc.: | | | | | | | | | | | | |
3.75%, 11/01/21 | | | USD | | | | 67 | | | | 65,660 | |
3.88%, 11/01/23 | | | | | | | 30 | | | | 28,313 | |
| | | | | | | | | | | | |
| | | | | | | | | | | | 8,636,720 | |
Household Durables — 1.3% | | | | | | | | | | | | |
Allegion U.S. Holding Co., Inc., 5.75%, 10/01/21 | | | | | | | 109 | | | | 113,905 | |
Beazer Homes USA, Inc., 6.63%, 4/15/18 | | | | | | | 111 | | | | 112,943 | |
Brookfield Residential Properties, Inc., 6.50%, 12/15/20 (d) | | | | | | | 20 | | | | 19,950 | |
CalAtlantic Group, Inc.: | | | | | | | | | | | | |
6.63%, 5/01/20 | | | | | | | 255 | | | | 279,863 | |
8.38%, 1/15/21 | | | | | | | 368 | | | | 424,120 | |
5.88%, 11/15/24 | | | | | | | 95 | | | | 97,850 | |
Lennar Corp.: | | | | | | | | | | | | |
4.50%, 11/15/19 | | | | | | | 40 | | | | 41,666 | |
4.75%, 4/01/21 | | | | | | | 307 | | | | 319,280 | |
4.75%, 11/15/22 | | | | | | | 294 | | | | 298,777 | |
4.88%, 12/15/23 | | | | | | | 140 | | | | 140,350 | |
Meritage Homes Corp., 7.15%, 4/15/20 | | | | | | | 70 | | | | 75,075 | |
PulteGroup, Inc.: | | | | | | | | | | | | |
5.50%, 3/01/26 | | | | | | | 273 | | | | 279,825 | |
6.38%, 5/15/33 | | | | | | | 250 | | | | 259,375 | |
Tempur Sealy International, Inc., 5.50%, 6/15/26 (d) | | | | | | | 141 | | | | 138,533 | |
TRI Pointe Group, Inc.: | | | | | | | | | | | | |
4.38%, 6/15/19 | | | | | | | 165 | | | | 165,825 | |
4.88%, 7/01/21 | | | | | | | 195 | | | | 194,513 | |
5.88%, 6/15/24 | | | | | | | 180 | | | | 182,925 | |
William Lyon Homes, Inc., 8.50%, 11/15/20 | | | | | | | 210 | | | | 215,775 | |
| | | | | | | | | | | | |
| Corporate Bonds | | | | | Par (000) | | | Value | |
Household Durables (continued) | | | | | | | | | | | | |
Woodside Homes Co. LLC/Woodside Homes Finance, Inc., 6.75%, 12/15/21 (d) | | | USD | | | | 190 | | | $ | 175,750 | |
| | | | | | | | | | | | |
| | | | | | | | | | | | 3,536,300 | |
Household Products — 0.4% | | | | | | | | | | | | |
HRG Group, Inc., 7.88%, 7/15/19 | | | | | | | 155 | | | | 162,556 | |
Spectrum Brands, Inc.: | | | | | | | | | | | | |
6.38%, 11/15/20 | | | | | | | 100 | | | | 104,375 | |
6.63%, 11/15/22 | | | | | | | 395 | | | | 419,194 | |
6.13%, 12/15/24 | | | | | | | 214 | | | | 225,770 | |
5.75%, 7/15/25 | | | | | | | 262 | | | | 272,807 | |
| | | | | | | | | | | | |
| | | | | | | | | | | | 1,184,702 | |
Independent Power and Renewable Electricity Producers — 1.1% | | | | | |
AES Corp.: | | | | | | | | | | | | |
8.00%, 6/01/20 | | | | | | | 95 | | | | 110,675 | |
7.38%, 7/01/21 | | | | | | | 50 | | | | 56,375 | |
4.88%, 5/15/23 | | | | | | | 98 | | | | 96,775 | |
5.50%, 3/15/24 | | | | | | | 171 | | | | 175,061 | |
Calpine Corp.: | | | | | | | | | | | | |
6.00%, 1/15/22 (d) | | | | | | | 106 | | | | 111,035 | |
5.38%, 1/15/23 | | | | | | | 35 | | | | 34,125 | |
5.88%, 1/15/24 (d) | | | | | | | 246 | | | | 255,840 | |
5.50%, 2/01/24 | | | | | | | 662 | | | | 638,830 | |
Dynegy, Inc.: | | | | | | | | | | | | |
6.75%, 11/01/19 | | | | | | | 615 | | | | 615,769 | |
7.38%, 11/01/22 | | | | | | | 164 | | | | 158,260 | |
NRG Energy, Inc.: | | | | | | | | | | | | |
8.25%, 9/01/20 | | | | | | | 25 | | | | 25,852 | |
7.88%, 5/15/21 | | | | | | | 201 | | | | 208,035 | |
6.63%, 3/15/23 | | | | | | | 40 | | | | 39,400 | |
7.25%, 5/15/26 (d) | | | | | | | 397 | | | | 395,015 | |
NRG Yield Operating LLC, 5.38%, 8/15/24 | | | | | | | 95 | | | | 94,525 | |
| | | | | | | | | | | | |
| | | | | | | | | | | | 3,015,572 | |
Insurance — 0.6% | | | | | | | | | | | | |
HUB International Ltd.: | | | | | | | | | | | | |
9.25%, 2/15/21 (d) | | | | | | | 273 | | | | 285,285 | |
7.88%, 10/01/21 (d) | | | | | | | 535 | | | | 513,600 | |
Pension Insurance Corp. PLC, 6.50%, 7/03/24 | | | GBP | | | | 100 | | | | 122,356 | |
Radian Group, Inc., 5.25%, 6/15/20 | | | USD | | | | 381 | | | | 383,857 | |
Wayne Merger Sub LLC, 8.25%, 8/01/23 (d) | | | | | | | 426 | | | | 420,675 | |
| | | | | | | | | | | | |
| | | | | | | | | | | | 1,725,773 | |
Internet & Catalog Retail — 0.1% | | | | | | | | | | | | |
Netflix, Inc.: | | | | | | | | | | | | |
5.50%, 2/15/22 | | | | | | | 154 | | | | 160,545 | |
5.88%, 2/15/25 | | | | | | | 120 | | | | 125,850 | |
| | | | | | | | | | | | |
| | | | | | | | | | | | 286,395 | |
Internet Software & Services — 0.0% | | | | | | | | | | | | |
IAC/InterActiveCorp., 4.88%, 11/30/18 | | | | | | | 115 | | | | 117,444 | |
IT Services — 0.6% | | | | | | | | | | | | |
Alliance Data Systems Corp., 5.38%, 8/01/22 (d) | | | | | | | 320 | | | | 306,400 | |
APX Group, Inc.: | | | | | | | | | | | | |
6.38%, 12/01/19 | | | | | | | 158 | | | | 156,420 | |
8.75%, 12/01/20 | | | | | | | 116 | | | | 106,430 | |
Sabre GLBL, Inc.: | | | | | | | | | | | | |
5.38%, 4/15/23 (d) | | | | | | | 135 | | | | 138,037 | |
5.25%, 11/15/23 (d) | | | | | | | 170 | | | | 172,975 | |
WEX, Inc., 4.75%, 2/01/23 (d) | | | | | | | 700 | | | | 679,000 | |
| | | | | | | | | | | | |
| | | | | | | | | | | | 1,559,262 | |
Leisure Products — 0.0% | | | | | | | | | | | | |
Brunswick Corp., 4.63%, 5/15/21 (d) | | | | | | | 84 | | | | 85,050 | |
See Notes to Financial Statements.
| | | | | | |
| | | BLACKROCK VARIABLE SERIES FUNDS, INC. | | JUNE 30, 2016 | | 9 |
| | | | |
| Schedule of Investments (continued) | | | BlackRock High Yield V.I. Fund | |
| | | | |
| | | | | | | | | | | | |
| Corporate Bonds | | | | | Par (000) | | | Value | |
Life Sciences Tools & Services — 0.9% | | | | | | | | | | | | |
Crimson Merger Sub, Inc., 6.63%, 5/15/22 (d) | | | USD | | | | 641 | | | $ | 528,825 | |
DPx Holdings BV, 7.50%, 2/01/22 (d) | | | | | | | 275 | | | | 282,563 | |
Jaguar Holding Co. II/Pharmaceutical Product Development LLC, 6.38%, 8/01/23 (d) | | | | | | | 1,421 | | | | 1,452,973 | |
Sterigenics-Nordion Holdings LLC, 6.50%, 5/15/23 (d) | | | | | | | 70 | | | | 70,875 | |
| | | | | | | | | | | | |
| | | | | | | | | | | | 2,335,236 | |
Machinery — 0.7% | | | | | | | | | | | | |
Accudyne Industries Borrower/Accudyne Industries LLC, 7.75%, 12/15/20 (d) | | | | | | | 460 | | | | 405,950 | |
Gardner Denver, Inc., 6.88%, 8/15/21 (d) | | | | | | | 145 | | | | 131,587 | |
Gates Global LLC/Gates Global Co.: | | | | | | | | | | | | |
5.75%, 7/15/22 | | | EUR | | | | 100 | | | | 92,545 | |
6.00%, 7/15/22 (d) | | | USD | | | | 272 | | | | 238,000 | |
Schaeffler Holding Finance BV: | | | | | | | | | | | | |
6.88% (6.88% Cash or 7.38% PIK), 8/15/18 (e) | | | EUR | | | | 60 | | | | 68,004 | |
6.25% (6.25% Cash or 6.75% PIK), 11/15/19 (d)(e) | | | USD | | | | 482 | | | | 501,280 | |
5.75% (5.75% Cash or 6.50% PIK), 11/15/21 (e) | | | EUR | | | | 60 | | | | 71,246 | |
6.75% (6.75% Cash or 7.25% PIK), 11/15/22 (d)(e) | | | USD | | | | 478 | | | | 525,963 | |
| | | | | | | | | | | | |
| | | | | | | | | | | | 2,034,575 | |
Marine — 0.2% | | | | | | | | | | | | |
Global Ship Lease, Inc., 10.00%, 4/01/19 (d) | | | | | | | 464 | | | | 414,120 | |
Onorato Armatori SpA, 7.75%, 2/15/23 | | | EUR | | | | 200 | | | | 212,518 | |
| | | | | | | | | | | | |
| | | | | | | | | | | | 626,638 | |
Media — 9.8% | | | | | | | | | | | | |
Altice Luxembourg SA: | | | | | | | | | | | | |
7.25%, 5/15/22 | | | | | | | 100 | | | | 111,669 | |
7.75%, 5/15/22 (d) | | | USD | | | | 395 | | | | 398,950 | |
6.25%, 2/15/25 | | | EUR | | | | 278 | | | | 282,288 | |
7.63%, 2/15/25 (d) | | | USD | | | | 200 | | | | 195,250 | |
Altice U.S. Finance I Corp.: | | | | | | | | | | | | |
5.38%, 7/15/23 (d) | | | | | | | 926 | | | | 919,055 | |
5.50%, 5/15/26 (d) | | | | | | | 454 | | | | 454,000 | |
Altice U.S. Finance II Corp., 7.75%, 7/15/25 (d) | | | | | | | 784 | | | | 817,320 | |
AMC Networks, Inc.: | | | | | | | | | | | | |
4.75%, 12/15/22 | | | | | | | 360 | | | | 357,300 | |
5.00%, 4/01/24 | | | | | | | 137 | | | | 135,613 | |
Cablevision Systems Corp.: | | | | | | | | | | | | |
8.63%, 9/15/17 | | | | | | | 115 | | | | 121,469 | |
7.75%, 4/15/18 | | | | | | | 204 | | | | 218,406 | |
CCO Holdings LLC/CCO Holdings Capital Corp.: | | | | | | | | | | | | |
5.25%, 9/30/22 | | | | | | | 900 | | | | 923,625 | |
5.13%, 5/01/23 (d) | | | | | | | 476 | | | | 478,677 | |
5.88%, 4/01/24 (d) | | | | | | | 399 | | | | 413,963 | |
5.75%, 2/15/26 (d) | | | | | | | 294 | | | | 302,820 | |
5.50%, 5/01/26 (d) | | | | | | | 429 | | | | 435,435 | |
5.88%, 5/01/27 (d) | | | | | | | 893 | | | | 922,023 | |
Cengage Learning Acquisitions, Inc., 0.00%, 4/15/20 (a)(g)(i) | | | | | | | 230 | | | | — | |
Cequel Communications Holdings I LLC/Cequel Capital Corp.: | | | | | | | | | | | | |
6.38%, 9/15/20 (d) | | | | | | | 168 | | | | 170,822 | |
5.13%, 12/15/21 (d) | | | | | | | 490 | | | | 465,500 | |
5.13%, 12/15/21 (d) | | | | | | | 267 | | | | 254,317 | |
Charter Communications Operating LLC/Charter Communications Operating Capital, 4.91%, 7/23/25 (d) | | | | | | | 10 | | | | 10,933 | |
Clear Channel International BV, 8.75%, 12/15/20 (d) | | | | | | | 366 | | | | 380,640 | |
| | | | | | | | | | | | |
| Corporate Bonds | | | | | Par (000) | | | Value | |
Media (continued) | | | | | | | | | | | | |
Clear Channel Worldwide Holdings, Inc.: | | | | | | | | | | | | |
Series A, 6.50%, 11/15/22 | | | USD | | | | 509 | | | $ | 489,913 | |
Series B, 7.63%, 3/15/20 | | | | | | | 779 | | | | 741,219 | |
Series B, 6.50%, 11/15/22 | | | | | | | 1,950 | | | | 1,950,000 | |
CSC Holdings LLC, 5.25%, 6/01/24 | | | | | | | 727 | | | | 661,570 | |
DISH DBS Corp.: | | | | | | | | | | | | |
6.75%, 6/01/21 | | | | | | | 232 | | | | 240,410 | |
5.88%, 7/15/22 | | | | | | | 194 | | | | 188,665 | |
5.00%, 3/15/23 | | | | | | | 220 | | | | 200,200 | |
5.88%, 11/15/24 | | | | | | | 236 | | | | 219,480 | |
7.75%, 7/01/26 (d) | | | | | | | 749 | | | | 771,470 | |
DreamWorks Animation SKG, Inc., 6.88%, 8/15/20 (d) | | | | | | | 134 | | | | 141,789 | |
iHeartCommunications, Inc.: | | | | | | | | | | | | |
9.00%, 12/15/19 | | | | | | | 279 | | | | 209,250 | |
9.00%, 3/01/21 | | | | | | | 46 | | | | 32,430 | |
9.00%, 9/15/22 | | | | | | | 345 | | | | 236,325 | |
10.63%, 3/15/23 | | | | | | | 820 | | | | 567,850 | |
Lamar Media Corp., 5.75%, 2/01/26 (d) | | | | | | | 212 | | | | 220,614 | |
Live Nation Entertainment, Inc.: | | | | | | | | | | | | |
7.00%, 9/01/20 (d) | | | | | | | 69 | | | | 71,846 | |
5.38%, 6/15/22 (d) | | | | | | | 47 | | | | 48,293 | |
McGraw-Hill Global Education Holdings LLC/McGraw-Hill Global Education Finance, 7.88%, 5/15/24 (d) | | | | | | | 95 | | | | 98,325 | |
MDC Partners, Inc., 6.50%, 5/01/24 (d) | | | | | | | 503 | | | | 499,227 | |
Midcontinent Communications & Midcontinent Finance Corp., 6.25%, 8/01/21 (d) | | | | | | | 125 | | | | 128,750 | |
Neptune Finco Corp.: | | | | | | | | | | | | |
10.13%, 1/15/23 (d) | | | | | | | 820 | | | | 918,400 | |
6.63%, 10/15/25 (d) | | | | | | | 396 | | | | 415,800 | |
Nielsen Finance LLC/Nielsen Finance Co., 5.00%, 4/15/22 (d) | | | | | | | 522 | | | | 532,440 | |
Numericable-SFR SA: | | | | | | | | | | | | |
5.38%, 5/15/22 | | | EUR | | | | 100 | | | | 112,485 | |
6.00%, 5/15/22 (d) | | | USD | | | | 705 | | | | 685,613 | |
5.63%, 5/15/24 | | | EUR | | | | 200 | | | | 223,252 | |
7.38%, 5/01/26 (d) | | | USD | | | | 2,184 | | | | 2,159,430 | |
Outfront Media Capital LLC/Outfront Media Capital Corp.: | | | | | | | | | | | | |
5.63%, 2/15/24 | | | | | | | 37 | | | | 38,110 | |
5.88%, 3/15/25 | | | | | | | 315 | | | | 324,450 | |
Radio One, Inc., 7.38%, 4/15/22 (d) | | | | | | | 60 | | | | 57,300 | |
RCN Telecom Services LLC/RCN Capital Corp., 8.50%, 8/15/20 (d) | | | | | | | 305 | | | | 312,625 | |
Regal Entertainment Group, 5.75%, 2/01/25 | | | | | | | 48 | | | | 47,280 | |
Sirius XM Radio, Inc., 4.63%, 5/15/23 (d) | | | | | | | 295 | | | | 286,174 | |
TEGNA, Inc.: | | | | | | | | | | | | |
4.88%, 9/15/21 (d) | | | | | | | 70 | | | | 71,750 | |
5.50%, 9/15/24 (d) | | | | | | | 115 | | | | 118,450 | |
Townsquare Media, Inc., 6.50%, 4/01/23 (d) | | | | | | | 48 | | | | 47,460 | |
Trader Corp., 9.88%, 8/15/18 (d) | | | | | | | 43 | | | | 44,397 | |
Tribune Media Co., 5.88%, 7/15/22 | | | | | | | 645 | | | | 641,775 | |
Unitymedia Hessen GmbH & Co. KG/Unitymedia NRW GmbH: | | | | | | | | | | | | |
5.50%, 1/15/23 (d) | | | | | | | 490 | | | | 492,450 | |
4.00%, 1/15/25 | | | EUR | | | | 148 | | | | 165,137 | |
5.00%, 1/15/25 (d) | | | USD | | | | 206 | | | | 201,880 | |
3.50%, 1/15/27 | | | EUR | | | | 211 | | | | 225,377 | |
Univision Communications, Inc.: | | | | | | | | | | | | |
8.50%, 5/15/21 (d) | | | USD | | | | 208 | | | | 217,360 | |
6.75%, 9/15/22 (d) | | | | | | | 260 | | | | 274,300 | |
5.13%, 5/15/23 (d) | | | | | | | 1,130 | | | | 1,121,525 | |
5.13%, 2/15/25 (d) | | | | | | | 411 | | | | 406,376 | |
UPCB Finance IV Ltd., 4.00%, 1/15/27 | | | EUR | | | | 100 | | | | 107,230 | |
| | | | | | | | | | | | |
| | | | | | | | | | | | 26,736,527 | |
See Notes to Financial Statements.
| | | | | | |
| 10 | | BLACKROCK VARIABLE SERIES FUNDS, INC. | | JUNE 30, 2016 | | |
| | | | |
| Schedule of Investments (continued) | | | BlackRock High Yield V.I. Fund | |
| | | | |
| | | | | | | | | | | | |
| Corporate Bonds | | | | | Par (000) | | | Value | |
Metals & Mining — 4.4% | | | | | | | | | | | | |
Alcoa, Inc.: | | | | | | | | | | | | |
6.15%, 8/15/20 | | | USD | | | | 535 | | | $ | 579,137 | |
5.13%, 10/01/24 | | | | | | | 252 | | | | 251,370 | |
5.90%, 2/01/27 | | | | | | | 14 | | | | 14,210 | |
5.95%, 2/01/37 | | | | | | | 18 | | | | 16,830 | |
Anglo American Capital PLC: | | | | | | | | | | | | |
2.75%, 6/07/19 | | | EUR | | | | 100 | | | | 108,783 | |
1.50%, 4/01/20 | | | | | | | 100 | | | | 100,659 | |
3.63%, 5/14/20 (d) | | | USD | | | | 200 | | | | 192,250 | |
4.45%, 9/27/20 (d) | | | | | | | 106 | | | | 103,350 | |
3.50%, 3/28/22 | | | EUR | | | | 100 | | | | 104,308 | |
4.13%, 9/27/22 (d) | | | USD | | | | 200 | | | | 185,500 | |
ArcelorMittal: | | | | | | | | | | | | |
6.13%, 6/01/18 | | | | | | | 326 | | | | 343,076 | |
7.25%, 2/25/22 | | | | | | | 22 | | | | 23,155 | |
8.00%, 10/15/39 | | | | | | | 64 | | | | 62,080 | |
7.75%, 3/01/41 | | | | | | | 290 | | | | 276,225 | |
Constellium NV: | | | | | | | | | | | | |
8.00%, 1/15/23 (d) | | | | | | | 610 | | | | 536,800 | |
5.75%, 5/15/24 (d) | | | | | | | 755 | | | | 594,563 | |
First Quantum Minerals Ltd.: | | | | | | | | | | | | |
7.00%, 2/15/21 (d) | | | | | | | 58 | | | | 46,617 | |
7.25%, 5/15/22 (d) | | | | | | | 187 | | | | 144,457 | |
Freeport-McMoRan, Inc.: | | | | | | | | | | | | |
2.30%, 11/14/17 | | | | | | | 224 | | | | 220,080 | |
2.38%, 3/15/18 | | | | | | | 1,071 | | | | 1,049,580 | |
3.10%, 3/15/20 | | | | | | | 135 | | | | 127,575 | |
4.00%, 11/14/21 | | | | | | | 172 | | | | 155,391 | |
3.55%, 3/01/22 | | | | | | | 1,013 | | | | 891,440 | |
3.88%, 3/15/23 | | | | | | | 985 | | | | 861,875 | |
5.40%, 11/14/34 | | | | | | | 130 | | | | 103,350 | |
5.45%, 3/15/43 | | | | | | | 198 | | | | 158,895 | |
Glencore Finance Europe SA, 3.38%, 9/30/20 | | | EUR | | | | 100 | | | | 113,023 | |
Joseph T Ryerson & Son, Inc., 11.00%, 5/15/22 (d) | | | USD | | | | 177 | | | | 183,195 | |
Kaiser Aluminum Corp., 5.88%, 5/15/24 (d) | | | | | | | 81 | | | | 83,227 | |
Novelis, Inc.: | | | | | | | | | | | | |
8.38%, 12/15/17 | | | | | | | 245 | | | | 250,513 | |
8.75%, 12/15/20 | | | | | | | 1,074 | | | | 1,119,645 | |
Officine Maccaferri SpA, 5.75%, 6/01/21 | | | EUR | | | | 100 | | | | 94,615 | |
Ovako AB, 6.50%, 6/01/19 | | | | | | | 100 | | | | 78,793 | |
Steel Dynamics, Inc.: | | | | | | | | | | | | |
5.13%, 10/01/21 | | | USD | | | | 165 | | | | 168,919 | |
6.38%, 8/15/22 | | | | | | | 260 | | | | 273,000 | |
5.25%, 4/15/23 | | | | | | | 278 | | | | 283,560 | |
5.50%, 10/01/24 | | | | | | | 57 | | | | 58,283 | |
SunCoke Energy Partners LP/SunCoke Energy Partners Finance Corp., 7.38%, 2/01/20 (d) | | | | | | | 123 | | | | 103,320 | |
Teck Resources Ltd.: | | | | | | | | | | | | |
3.00%, 3/01/19 | | | | | | | 207 | | | | 194,580 | |
8.00%, 6/01/21 (d) | | | | | | | 402 | | | | 414,060 | |
8.50%, 6/01/24 (d) | | | | | | | 483 | | | | 501,113 | |
6.00%, 8/15/40 | | | | | | | 176 | | | | 123,200 | |
United States Steel Corp., 8.38%, 7/01/21 (d) | | | | | | | 333 | | | | 349,650 | |
Wise Metals Group LLC/Wise Alloys Finance Corp., 8.75%, 12/15/18 (d) | | | | | | | 354 | | | | 325,680 | |
| | | | | | | | | | | | |
| | | | | | | | | | | | 11,969,932 | |
Multiline Retail — 0.7% | | | | | | | | | | | | |
Dollar Tree, Inc.: | | | | | | | | | | | | |
5.25%, 3/01/20 (d) | | | | | | | 24 | | | | 24,720 | |
5.75%, 3/01/23 (d) | | | | | | | 1,314 | | | | 1,396,125 | |
Family Dollar Stores, Inc., 5.00%, 2/01/21 | | | | | | | 263 | | | | 278,780 | |
Hema Bondco I BV, 6.25%, 6/15/19 | | | EUR | | | | 100 | | | | 84,147 | |
| | | | | | | | | | | | |
| Corporate Bonds | | | | | Par (000) | | | Value | |
Multiline Retail (continued) | | | | | | | | | | | | |
New Look Secured Issuer PLC, 6.50%, 7/01/22 | | | GBP | | | | 100 | | | $ | 122,303 | |
| | | | | | | | | | | | |
| | | | | | | | | | | | 1,906,075 | |
Oil, Gas & Consumable Fuels — 11.9% | | | | | | | | | | | | |
Alberta Energy Co. Ltd., 7.38%, 11/01/31 | | | USD | | | | 65 | | | | 68,697 | |
Antero Resources Corp., 5.63%, 6/01/23 | | | | | | | 40 | | | | 38,800 | |
California Resources Corp.: | | | | | | | | | | | | |
8.00%, 12/15/22 (d) | | | | | | | 854 | | | | 606,340 | |
6.00%, 11/15/24 | | | | | | | 235 | | | | 115,150 | |
Carrizo Oil & Gas, Inc.: | | | | | | | | | | | | |
7.50%, 9/15/20 | | | | | | | 101 | | | | 102,263 | |
6.25%, 4/15/23 | | | | | | | 911 | | | | 876,837 | |
Cenovus Energy, Inc.: | | | | | | | | | | | | |
5.70%, 10/15/19 | | | | | | | 40 | | | | 42,308 | |
3.80%, 9/15/23 | | | | | | | 95 | | | | 89,406 | |
6.75%, 11/15/39 | | | | | | | 64 | | | | 67,209 | |
5.20%, 9/15/43 | | | | | | | 20 | | | | 17,183 | |
Cheniere Corpus Christi Holdings LLC, 7.00%, 6/30/24 (d) | | | | | | | 658 | | | | 675,687 | |
Chesapeake Energy Corp.: | | | | | | | | | | | | |
3.88%, 4/15/19 (f) | | | | | | | 508 | | | | 382,270 | |
6.63%, 8/15/20 | | | | | | | 50 | | | | 35,125 | |
8.00%, 12/15/22 (d) | | | | | | | 345 | | | | 292,387 | |
Concho Resources, Inc., 6.50%, 1/15/22 | | | | | | | 26 | | | | 26,617 | |
CONSOL Energy, Inc.: | | | | | | | | | | | | |
5.88%, 4/15/22 | | | | | | | 1,529 | | | | 1,334,053 | |
8.00%, 4/01/23 | | | | | | | 89 | | | | 78,765 | |
Continental Resources, Inc.: | | | | | | | | | | | | |
5.00%, 9/15/22 | | | | | | | 472 | | | | 461,380 | |
4.50%, 4/15/23 | | | | | | | 260 | | | | 242,450 | |
3.80%, 6/01/24 | | | | | | | 605 | | | | 527,863 | |
4.90%, 6/01/44 | | | | | | | 335 | | | | 276,375 | |
Crestwood Midstream Partners LP/Crestwood Midstream Finance Corp., 6.25%, 4/01/23 (d) | | | | | | | 35 | | | | 32,200 | |
CrownRock LP/CrownRock Finance, Inc.: | | | | | | | | | | | | |
7.13%, 4/15/21 (d) | | | | | | | 375 | | | | 384,375 | |
7.75%, 2/15/23 (d) | | | | | | | 100 | | | | 104,500 | |
Denbury Resources, Inc., 9.00%, 5/15/21 (d) | | | | | | | 578 | | | | 578,000 | |
Diamondback Energy, Inc., 7.63%, 10/01/21 | | | | | | | 409 | | | | 432,006 | |
Encana Corp.: | | | | | | | | | | | | |
3.90%, 11/15/21 | | | | | | | 135 | | | | 130,917 | |
6.50%, 8/15/34 | | | | | | | 253 | | | | 253,617 | |
6.63%, 8/15/37 | | | | | | | 157 | | | | 156,323 | |
6.50%, 2/01/38 | | | | | | | 401 | | | | 398,309 | |
5.15%, 11/15/41 | | | | | | | 188 | | | | 147,580 | |
Energy Transfer Equity LP: | | | | | | | | | | | | |
7.50%, 10/15/20 | | | | | | | 55 | | | | 58,300 | |
5.88%, 1/15/24 | | | | | | | 483 | | | | 469,717 | |
5.50%, 6/01/27 | | | | | | | 315 | | | | 296,100 | |
Freeport-McMoRan Oil & Gas LLC/FCX Oil & Gas, Inc.: | | | | | | | | | | | | |
6.50%, 11/15/20 | | | | | | | 125 | | | | 125,265 | |
6.63%, 5/01/21 | | | | | | | 125 | | | | 124,375 | |
Genesis Energy LP/Genesis Energy Finance Corp.: | | | | | | | | | | | | |
5.75%, 2/15/21 | | | | | | | 57 | | | | 53,865 | |
6.75%, 8/01/22 | | | | | | | 220 | | | | 213,400 | |
6.00%, 5/15/23 | | | | | | | 51 | | | | 47,685 | |
5.63%, 6/15/24 | | | | | | | 85 | | | | 77,350 | |
Gulfport Energy Corp.: | | | | | | | | | | | | |
7.75%, 11/01/20 | | | | | | | 502 | | | | 515,805 | |
6.63%, 5/01/23 | | | | | | | 21 | | | | 20,685 | |
Halcon Resources Corp., 8.63%, 2/01/20 (d) | | | | | | | 150 | | | | 141,468 | |
Hilcorp Energy I LP/Hilcorp Finance Co.: | | | | | | | | | | | | |
7.63%, 4/15/21 (d) | | | | | | | 45 | | | | 46,237 | |
See Notes to Financial Statements.
| | | | | | |
| | | BLACKROCK VARIABLE SERIES FUNDS, INC. | | JUNE 30, 2016 | | 11 |
| | | | |
| Schedule of Investments (continued) | | | BlackRock High Yield V.I. Fund | |
| | | | |
| | | | | | | | | | | | |
| Corporate Bonds | | | | | Par (000) | | | Value | |
Oil, Gas & Consumable Fuels (continued) | | | | | | | | | | | | |
5.00%, 12/01/24 (d) | | | USD | | | | 215 | | | $ | 200,466 | |
Matador Resources Co., 6.88%, 4/15/23 | | | | | | | 400 | | | | 408,000 | |
MEG Energy Corp.: | | | | | | | | | | | | |
6.50%, 3/15/21 (d) | | | | | | | 501 | | | | 388,275 | |
6.38%, 1/30/23 (d) | | | | | | | 227 | | | | 167,980 | |
7.00%, 3/31/24 (d) | | | | | | | 1,012 | | | | 779,240 | |
Memorial Production Partners LP/Memorial Production Finance Corp.: | | | | | | | | | | | | |
7.63%, 5/01/21 | | | | | | | 129 | | | | 69,337 | |
6.88%, 8/01/22 | | | | | | | 113 | | | | 56,500 | |
Memorial Resource Development Corp., 5.88%, 7/01/22 | | | | | | | 496 | | | | 494,760 | |
NGPL PipeCo LLC: | | | | | | | | | | | | |
7.12%, 12/15/17 (d) | | | | | | | 1,982 | | | | 2,066,235 | |
9.63%, 6/01/19 (d) | | | | | | | 92 | | | | 96,140 | |
7.77%, 12/15/37 (d) | | | | | | | 125 | | | | 121,250 | |
Oasis Petroleum, Inc.: | | | | | | | | | | | | |
7.25%, 2/01/19 | | | | | | | 40 | | | | 38,300 | |
6.50%, 11/01/21 | | | | | | | 339 | | | | 309,337 | |
6.88%, 3/15/22 | | | | | | | 563 | | | | 520,071 | |
6.88%, 1/15/23 | | | | | | | 180 | | | | 163,800 | |
ONEOK, Inc.: | | | | | | | | | | | | |
4.25%, 2/01/22 | | | | | | | 70 | | | | 64,400 | |
7.50%, 9/01/23 | | | | | | | 135 | | | | 143,775 | |
Parsley Energy LLC/Parsley Finance Corp.: | | | | | | | | | | | | |
7.50%, 2/15/22 (d) | | | | | | | 668 | | | | 696,390 | |
6.25%, 6/01/24 (d) | | | | | | | 76 | | | | 76,950 | |
QEP Resources, Inc.: | | | | | | | | | | | | |
6.88%, 3/01/21 | | | | | | | 153 | | | | 154,530 | |
5.38%, 10/01/22 | | | | | | | 803 | | | | 748,797 | |
5.25%, 5/01/23 | | | | | | | 196 | | | | 180,320 | |
Range Resources Corp.: | | | | | | | | | | | | |
5.00%, 8/15/22 | | | | | | | 37 | | | | 34,873 | |
5.00%, 3/15/23 | | | | | | | 280 | | | | 262,500 | |
Rockies Express Pipeline LLC: | | | | | | | | | | | | |
5.63%, 4/15/20 (d) | | | | | | | 405 | | | | 406,013 | |
6.88%, 4/15/40 (d) | | | | | | | 346 | | | | 329,565 | |
RSP Permian, Inc., 6.63%, 10/01/22 | | | | | | | 469 | | | | 483,070 | |
Sabine Pass Liquefaction LLC: | | | | | | | | | | | | |
5.63%, 2/01/21 | | | | | | | 145 | | | | 146,450 | |
6.25%, 3/15/22 | | | | | | | 450 | | | | 462,375 | |
5.63%, 4/15/23 | | | | | | | 597 | | | | 599,239 | |
5.75%, 5/15/24 | | | | | | | 1,009 | | | | 1,001,433 | |
5.63%, 3/01/25 | | | | | | | 69 | | | | 68,741 | |
5.88%, 6/30/26 (d) | | | | | | | 516 | | | | 517,935 | |
Sabine Pass LNG LP, 6.50%, 11/01/20 | | | | | | | 313 | | | | 325,716 | |
Sanchez Energy Corp.: | | | | | | | | | | | | |
7.75%, 6/15/21 | | | | | | | 68 | | | | 57,630 | |
6.13%, 1/15/23 | | | | | | | 1,108 | | | | 855,930 | |
Seven Generations Energy Ltd.: | | | | | | | | | | | | |
8.25%, 5/15/20 (d) | | | | | | | 1,055 | | | | 1,093,244 | |
6.75%, 5/01/23 (d) | | | | | | | 105 | | | | 105,787 | |
SM Energy Co.: | | | | | | | | | | | | |
6.13%, 11/15/22 | | | | | | | 439 | | | | 403,331 | |
6.50%, 1/01/23 | | | | | | | 15 | | | | 13,950 | |
5.00%, 1/15/24 | | | | | | | 350 | | | | 299,250 | |
Southern Star Central Corp., 5.13%, 7/15/22 (d) | | | | | | | 162 | | | | 157,950 | |
Southwestern Energy Co.: | | | | | | | | | | | | |
3.30%, 1/23/18 | | | | | | | 409 | | | | 417,998 | |
7.50%, 2/01/18 | | | | | | | 188 | | | | 199,750 | |
4.05%, 1/23/20 | | | | | | | 250 | | | | 245,625 | |
4.10%, 3/15/22 | | | | | | | 202 | | | | 180,285 | |
4.95%, 1/23/25 | | | | | | | 75 | | | | 71,813 | |
| | | | | | | | | | | | |
| Corporate Bonds | | | | | Par (000) | | | Value | |
Oil, Gas & Consumable Fuels (continued) | | | | | | | | | | | | |
Targa Resources Partners LP/Targa Resources Partners Finance Corp.: | | | | | | | | | | | | |
6.88%, 2/01/21 | | | USD | | | | 73 | | | $ | 74,277 | |
6.38%, 8/01/22 | | | | | | | 440 | | | | 441,100 | |
5.25%, 5/01/23 | | | | | | | 15 | | | | 14,175 | |
6.75%, 3/15/24 (d) | | | | | | | 73 | | | | 74,825 | |
Tesoro Logistics LP/Tesoro Logistics Finance Corp.: | | | | | | | | | | | | |
6.13%, 10/15/21 | | | | | | | 41 | | | | 42,435 | |
6.25%, 10/15/22 | | | | | | | 272 | | | | 283,560 | |
6.38%, 5/01/24 | | | | | | | 108 | | | | 113,130 | |
Whiting Petroleum Corp.: | | | | | | | | | | | | |
5.00%, 3/15/19 (h) | | | | | | | 57 | | | | 55,005 | |
1.25%, 6/05/20 (h) | | | | | | | 1,133 | | | | 1,011,203 | |
5.75%, 3/15/21 (h) | | | | | | | 740 | | | | 699,300 | |
5.75%, 3/15/21 | | | | | | | 28 | | | | 25,270 | |
6.25%, 4/01/23 (h) | | | | | | | 316 | | | | 295,460 | |
Williams Cos., Inc.: | | | | | | | | | | | | |
3.70%, 1/15/23 | | | | | | | 38 | | | | 33,630 | |
4.55%, 6/24/24 | | | | | | | 252 | | | | 231,462 | |
WPX Energy, Inc.: | | | | | | | | | | | | |
5.25%, 1/15/17 | | | | | | | 50 | | | | 50,125 | |
7.50%, 8/01/20 | | | | | | | 70 | | | | 69,868 | |
6.00%, 1/15/22 | | | | | | | 718 | | | | 667,740 | |
8.25%, 8/01/23 | | | | | | | 175 | | | | 175,437 | |
5.25%, 9/15/24 | | | | | | | 275 | | | | 242,000 | |
| | | | | | | | | | | | |
| | | | | | | | | | | | 32,450,552 | |
Paper & Forest Products — 0.2% | | | | | | | | | | | | |
Louisiana-Pacific Corp., 7.50%, 6/01/20 | | | | | | | 100 | | | | 103,375 | |
Norbord, Inc., 6.25%, 4/15/23 (d) | | | | | | | 117 | | | | 119,925 | |
PH Glatfelter Co., 5.38%, 10/15/20 | | | | | | | 34 | | | | 34,510 | |
Unifrax I LLC/Unifrax Holding Co., 7.50%, 2/15/19 (d) | | | | | | | 417 | | | | 360,705 | |
| | | | | | | | | | | | |
| | | | | | | | | | | | 618,515 | |
Personal Products — 0.2% | | | | | | | | | | | | |
NBTY, Inc., 7.63%, 5/15/21 (d) | | | | | | | 616 | | | | 616,770 | |
Pharmaceuticals — 1.6% | | | | | | | | | | | | |
Capsugel SA, 7.00% (7.00% Cash or 7.75% PIK), 5/15/19 (d)(e) | | | | | | | 69 | | | | 69,173 | |
Concordia International Corp., 7.00%, 4/15/23 (d) | | | | | | | 75 | | | | 63,937 | |
Endo Finance LLC/Endo Finco, Inc., 7.75%, 1/15/22 (d) | | | | | | | 136 | | | | 126,140 | |
Endo Ltd./Endo Finance LLC/Endo Finco, Inc.: | | | | | | | | | | | | |
6.00%, 7/15/23 (d) | | | | | | | 290 | | | | 253,750 | |
6.00%, 2/01/25 (d) | | | | | | | 367 | | | | 318,373 | |
Mallinckrodt International Finance SA/Mallinckrodt CB LLC: | | | | | | | | | | | | |
4.88%, 4/15/20 (d) | | | | | | | 125 | | | | 120,625 | |
5.75%, 8/01/22 (d) | | | | | | | 80 | | | | 76,000 | |
Prestige Brands, Inc., 6.38%, 3/01/24 (d) | | | | | | | 144 | | | | 149,400 | |
Valeant Pharmaceuticals International, Inc.: | | | | | | | | | | | | |
6.75%, 8/15/18 (d) | | | | | | | 40 | | | | 38,700 | |
5.38%, 3/15/20 (d) | | | | | | | 1,306 | | | | 1,115,814 | |
7.00%, 10/01/20 (d) | | | | | | | 84 | | | | 74,130 | |
6.38%, 10/15/20 (d) | | | | | | | 820 | | | | 705,200 | |
7.50%, 7/15/21 (d) | | | | | | | 570 | | | | 502,669 | |
5.63%, 12/01/21 (d) | | | | | | | 50 | | | | 41,250 | |
7.25%, 7/15/22 (d) | | | | | | | 55 | | | | 47,173 | |
5.50%, 3/01/23 (d) | | | | | | | 48 | | | | 38,550 | |
4.50%, 5/15/23 | | | EUR | | | | 125 | | | | 104,733 | |
5.88%, 5/15/23 (d) | | | USD | | | | 531 | | | | 428,783 | |
6.13%, 4/15/25 (d) | | | | | | | 65 | | | | 52,163 | |
| | | | | | | | | | | | |
| | | | | | | | | | | | 4,326,563 | |
See Notes to Financial Statements.
| | | | | | |
| 12 | | BLACKROCK VARIABLE SERIES FUNDS, INC. | | JUNE 30, 2016 | | |
| | | | |
| Schedule of Investments (continued) | | | BlackRock High Yield V.I. Fund | |
| | | | |
| | | | | | | | | | | | |
| Corporate Bonds | | | | | Par
(000) | | | Value | |
Real Estate Investment Trusts (REITs) — 1.0% | |
Communications Sales & Leasing, Inc./CSL Capital LLC: | | | | | | | | | | | | |
6.00%, 4/15/23 (d) | | | USD | | | | 72 | | | $ | 73,260 | |
8.25%, 10/15/23 | | | | | | | 403 | | | | 408,795 | |
Corrections Corp. of America, 5.00%, 10/15/22 | | | | | | | 130 | | | | 134,875 | |
Equinix, Inc.: | | | | | | | | | | | | |
5.38%, 4/01/23 | | | | | | | 70 | | | | 72,275 | |
5.88%, 1/15/26 | | | | | | | 295 | | | | 307,353 | |
ESH Hospitality, Inc., 5.25%, 5/01/25 (d) | | | | | | | 705 | | | | 686,494 | |
FelCor Lodging LP, 5.63%, 3/01/23 | | | | | | | 116 | | | | 116,000 | |
GEO Group, Inc.: | | | | | | | | | | | | |
5.88%, 1/15/22 | | | | | | | 70 | | | | 71,400 | |
5.88%, 10/15/24 | | | | | | | 220 | | | | 222,750 | |
6.00%, 4/15/26 | | | | | | | 103 | | | | 104,030 | |
GLP Capital LP/GLP Financing II, Inc.: | | | | | | | | | | | | |
4.38%, 11/01/18 | | | | | | | 110 | | | | 112,887 | |
5.38%, 11/01/23 | | | | | | | 48 | | | | 50,100 | |
Iron Mountain, Inc.: | | | | | | | | | | | | |
6.00%, 10/01/20 (d) | | | | | | | 250 | | | | 261,563 | |
6.00%, 8/15/23 | | | | | | | 70 | | | | 73,675 | |
VEREIT Operating Partnership LP, 4.13%, 6/01/21 | | | | | | | 81 | | | | 84,493 | |
| | | | | | | | | | | | |
| | | | | | | | | | | | 2,779,950 | |
Real Estate Management & Development — 0.7% | |
Aroundtown Property Holdings PLC, 3.00%, 12/09/21 | | | EUR | | | | 100 | | | | 113,208 | |
Crescent Resources LLC/Crescent Ventures, Inc., 10.25%, 8/15/17 (d) | | | USD | | | | 57 | | | | 57,000 | |
Realogy Group LLC/Realogy Co-Issuer Corp.: | | | | | | | | | | | | |
4.50%, 4/15/19 (d) | | | | | | | 127 | | | | 130,175 | |
5.25%, 12/01/21 (d) | | | | | | | 624 | | | | 638,820 | |
4.88%, 6/01/23 (d) | | | | | | | 1,002 | | | | 989,475 | |
Tropicana Entertainment LLC/Tropicana Finance Corp., 9.63%, 12/15/14 (a)(g) | | | | | | | 95 | | | | — | |
| | | | | | | | | | | | |
| | | | | | | | | | | | 1,928,678 | |
Road & Rail — 0.7% | |
Avis Budget Car Rental LLC/Avis Budget Finance, Inc.: | | | | | | | | | | | | |
5.13%, 6/01/22 (d) | | | | | | | 175 | | | | 168,875 | |
6.38%, 4/01/24 (d) | | | | | | | 165 | | | | 163,350 | |
5.25%, 3/15/25 (d) | | | | | | | 510 | | | | 461,550 | |
EC Finance PLC, 5.13%, 7/15/21 | | | EUR | | | | 100 | | | | 115,414 | |
Europcar Groupe SA, 5.75%, 6/15/22 | | | | | | | 173 | | | | 200,627 | |
Florida East Coast Holdings Corp., 6.75%, 5/01/19 (d) | | | USD | | | | 305 | | | | 303,475 | |
Hertz Corp., 7.38%, 1/15/21 | | | | | | | 195 | | | | 201,337 | |
Jack Cooper Enterprises, Inc., 10.50% (10.50% Cash or 11.25% PIK), 3/15/19 (d)(e) | | | | | | | 464 | | | | 146,104 | |
Watco Cos. LLC/Watco Finance Corp., 6.38%, 4/01/23 (d) | | | | | | | 99 | | | | 98,010 | |
| | | | | | | | | | | | |
| | | | | | | | | | | | 1,858,742 | |
Semiconductors & Semiconductor Equipment — 0.5% | |
Advanced Micro Devices, Inc., 7.50%, 8/15/22 NXP BV/NXP Funding LLC: | | | | | | | 65 | | | | 57,850 | |
4.13%, 6/15/20 (d) | | | | | | | 245 | | | | 248,063 | |
4.63%, 6/15/22 (d) | | | | | | | 430 | | | | 436,450 | |
4.63%, 6/01/23 (d) | | | | | | | 555 | | | | 564,713 | |
| | | | | | | | | | | | |
| | | | | | | | | | | | 1,307,076 | |
Software — 3.1% | |
Ensemble S Merger Sub, Inc., 9.00%, 9/30/23 (d) | | | | | | | 110 | | | | 108,625 | |
First Data Corp.: | | | | | | | | | | | | |
5.38%, 8/15/23 (d) | | | | | | | 1,230 | | | | 1,249,077 | |
| | | | | | | | | | | | |
| Corporate Bonds | | | | | Par
(000) | | | Value | |
Software (continued) | |
7.00%, 12/01/23 (d) | | | USD | | | | 2,720 | | | $ | 2,753,901 | |
5.00%, 1/15/24 (d) | | | | | | | 684 | | | | 685,710 | |
5.75%, 1/15/24 (d) | | | | | | | 1,021 | | | | 1,013,343 | |
Infinity Acquisition LLC/Infinity Acquisition Finance Corp., 7.25%, 8/01/22 (d) | | | | | | | 46 | | | | 40,135 | |
Infor Software Parent LLC/Infor Software Parent, Inc., 7.13% (7.13% Cash or 7.88% PIK), 5/01/21 (d)(e) | | | | | | | 479 | | | | 423,915 | |
Infor U.S., Inc., 6.50%, 5/15/22 | | | | | | | 1,112 | | | | 1,050,151 | |
Informatica LLC, 7.13%, 7/15/23 (d) | | | | | | | 364 | | | | 344,890 | |
Nuance Communications, Inc.: | | | | | | | | | | | | |
5.38%, 8/15/20 (d) | | | | | | | 75 | | | | 76,313 | |
6.00%, 7/01/24 (d) | | | | | | | 140 | | | | 140,700 | |
PTC, Inc., 6.00%, 5/15/24 | | | | | | | 111 | | | | 114,885 | |
SS&C Technologies Holdings, Inc., 5.88%, 7/15/23 | | | | | | | 395 | | | | 403,887 | |
| | | | | | | | | | | | |
| | | | | | | | | | | | 8,405,532 | |
Specialty Retail — 1.1% | |
Asbury Automotive Group, Inc., 6.00%, 12/15/24 | | | | | | | 502 | | | | 505,765 | |
CST Brands, Inc., 5.00%, 5/01/23 | | | | | | | 59 | | | | 59,885 | |
L Brands, Inc., 6.88%, 11/01/35 | | | | | | | 318 | | | | 321,975 | |
Michaels Stores, Inc., 5.88%, 12/15/20 (d) | | | | | | | 272 | | | | 281,520 | |
Neiman Marcus Group Ltd. LLC, 8.00%, 10/15/21 (d) | | | | | | | 778 | | | | 634,070 | |
Penske Automotive Group, Inc.: | | | | | | | | | | | | |
5.75%, 10/01/22 | | | | | | | 471 | | | | 471,000 | |
5.38%, 12/01/24 | | | | | | | 98 | | | | 94,570 | |
5.50%, 5/15/26 | | | | | | | 194 | | | | 184,300 | |
Sally Holdings LLC/Sally Capital, Inc.: | | | | | | | | | | | | |
5.75%, 6/01/22 | | | | | | | 80 | | | | 82,900 | |
5.50%, 11/01/23 | | | | | | | 161 | | | | 167,037 | |
THOM Europe SAS, 7.38%, 7/15/19 | | | EUR | | | | 120 | | | | 139,030 | |
| | | | | | | | | | | | |
| | | | | | | | | | | | 2,942,052 | |
Technology Hardware, Storage & Peripherals — 0.3% | |
Diamond 1 Finance Corp./Diamond 2 Finance Corp.: | | | | | | | | | | | | |
5.88%, 6/15/21 (d) | | | USD | | | | 217 | | | | 221,290 | |
7.13%, 6/15/24 (d) | | | | | | | 264 | | | | 275,727 | |
Western Digital Corp., 7.38%, 4/01/23 (d) | | | | | | | 194 | | | | 206,610 | |
| | | | | | | | | | | | |
| | | | | | | | | | | | 703,627 | |
Textiles, Apparel & Luxury Goods — 0.1% | |
BiSoho SAS, 5.88%, 5/01/23 | | | EUR | | | | 100 | | | | 114,671 | |
Springs Industries, Inc., 6.25%, 6/01/21 | | | USD | | | | 53 | | | | 53,530 | |
| | | | | | | | | | | | |
| | | | | | | | | | | | 168,201 | |
Thrifts & Mortgage Finance — 0.3% | |
Jefferies Finance LLC/JFIN Co-Issuer Corp.: | | | | | | | | | | | | |
7.38%, 4/01/20 (d) | | | | | | | 200 | | | | 185,250 | |
6.88%, 4/15/22 (d) | | | | | | | 451 | | | | 387,860 | |
Rialto Holdings LLC/Rialto Corp., 7.00%, 12/01/18 (d) | | | | | | | 145 | | | | 145,363 | |
| | | | | | | | | | | | |
| | | | | | | | | | | | 718,473 | |
Trading Companies & Distributors — 2.4% | |
Aircastle Ltd.: | | | | | | | | | | | | |
6.25%, 12/01/19 | | | | | | | 125 | | | | 135,625 | |
7.63%, 4/15/20 | | | | | | | 12 | | | | 13,515 | |
5.13%, 3/15/21 | | | | | | | 68 | | | | 70,720 | |
5.50%, 2/15/22 | | | | | | | 424 | | | | 440,960 | |
5.00%, 4/01/23 | | | | | | | 100 | | | | 101,620 | |
American Builders & Contractors Supply Co., Inc., 5.75%, 12/15/23 (d) | | | | | | | 366 | | | | 378,810 | |
Beacon Roofing Supply, Inc., 6.38%, 10/01/23 | | | | | | | 171 | | | | 179,123 | |
See Notes to Financial Statements.
| | | | | | |
| | | BLACKROCK VARIABLE SERIES FUNDS, INC. | | JUNE 30, 2016 | | 13 |
| | | | |
| Schedule of Investments (continued) | | | BlackRock High Yield V.I. Fund | |
| | | | |
| | | | | | | | | | | | |
| Corporate Bonds | | | | | Par
(000) | | | Value | |
Trading Companies & Distributors (continued) | |
BlueLine Rental Finance Corp., 7.00%, 2/01/19 (d) | | | USD | | | | 577 | | | $ | 496,220 | |
HD Supply, Inc.: | | | | | | | | | | | | |
7.50%, 7/15/20 | | | | | | | 1,009 | | | | 1,056,827 | |
5.25%, 12/15/21 (d) | | | | | | | 1,522 | | | | 1,588,587 | |
5.75%, 4/15/24 (d) | | | | | | | 364 | | | | 378,560 | |
International Lease Finance Corp.: | | | | | | | | | | | | |
8.25%, 12/15/20 | | | | | | | 345 | | | | 407,900 | |
4.63%, 4/15/21 | | | | | | | 71 | | | | 73,130 | |
5.88%, 8/15/22 | | | | | | | 480 | | | | 519,600 | |
Loxam SAS, 3.50%, 5/03/23 | | | EUR | | | | 100 | | | | 112,390 | |
Rexel SA, 3.50%, 6/15/23 | | | | | | | 195 | | | | 218,079 | |
Travis Perkins PLC, 4.50%, 9/07/23 | | | GBP | | | | 100 | | | | 127,128 | |
United Rentals North America, Inc.: | | | | | | | | | | | | |
7.38%, 5/15/20 | | | USD | | | | 18 | | | | 18,720 | |
7.63%, 4/15/22 | | | | | | | 65 | | | | 69,387 | |
5.75%, 11/15/24 | | | | | | | 46 | | | | 46,345 | |
5.50%, 7/15/25 | | | | | | | 48 | | | | 47,280 | |
| | | | | | | | | | | | |
| | | | | | | | | | | | 6,480,526 | |
Transportation Infrastructure — 0.1% | |
OHL Investments SA, 4.00%, 4/25/18 (h) | | | EUR | | | | 100 | | | | 95,994 | |
Silk Bidco AS, 7.50%, 2/01/22 | | | | | | | 100 | | | | 112,224 | |
Swissport Investments SA, 6.75%, 12/15/21 | | | | | | | 100 | | | | 113,750 | |
| | | | | | | | | | | | |
| | | | | | | | | | | | 321,968 | |
Wireless Telecommunication Services — 2.7% | |
Digicel Ltd., 6.00%, 4/15/21 (d) | | | USD | | | | 815 | | | | 698,618 | |
Matterhorn Telecom SA, 3.88%, 5/01/22 | | | EUR | | | | 100 | | | | 106,783 | |
Play Finance 2 SA, 5.25%, 2/01/19 | | | | | | | 110 | | | | 124,829 | |
SoftBank Group Corp., 4.75%, 7/30/25 | | | | | | | 172 | | | | 205,318 | |
Sprint Capital Corp.: | | | | | | | | | | | | |
6.90%, 5/01/19 | | | USD | | | | 55 | | | | 52,525 | |
6.88%, 11/15/28 | | | | | | | 885 | | | | 694,725 | |
8.75%, 3/15/32 | | | | | | | 53 | | | | 45,315 | |
Sprint Communications, Inc.: | | | | | | | | | | | | |
9.00%, 11/15/18 (d) | | | | | | | 1,814 | | | | 1,931,910 | |
7.00%, 8/15/20 | | | | | | | 60 | | | | 53,400 | |
Sprint Corp.: | | | | | | | | | | | | |
7.25%, 9/15/21 | | | | | | | 512 | | | | 436,480 | |
7.13%, 6/15/24 | | | | | | | 750 | | | | 598,125 | |
7.63%, 2/15/25 | | | | | | | 530 | | | | 419,363 | |
T-Mobile USA, Inc.: | | | | | | | | | | | | |
6.25%, 4/01/21 | | | | | | | 140 | | | | 146,037 | |
6.63%, 4/28/21 | | | | | | | 137 | | | | 143,165 | |
6.13%, 1/15/22 | | | | | | | 38 | | | | 39,853 | |
6.73%, 4/28/22 | | | | | | | 325 | | | | 341,754 | |
6.00%, 3/01/23 | | | | | | | 605 | | | | 626,175 | |
6.38%, 3/01/25 | | | | | | | 207 | | | | 216,315 | |
6.50%, 1/15/26 | | | | | | | 537 | | | | 566,535 | |
| | | | | | | | | | | | |
| | | | | | | | | | | | 7,447,225 | |
Total Corporate Bonds — 80.3% | | | | | | | | | | | 219,219,772 | |
| | | | | | | | | | | | |
| Floating Rate Loan Interests (f) | | | | | | | | | |
Air Freight & Logistics — 0.2% | | | | | | | | | | | | |
Ceva Group PLC (FKA Louis No.1 PLC/TNT Logistics), Pre-Funded L/C Loan, 6.50%, 3/19/21 | | | | | | | 148 | | | | 121,163 | |
Ceva Intercompany BV, Dutch BV Term Loan, 6.50%, 3/19/21 | | | | | | | 153 | | | | 124,897 | |
Ceva Logistics Canada ULC (FKA TNT Canada ULC), Canadian Term Loan, 6.50%, 3/19/21 | | | | | | | 26 | | | | 21,534 | |
| | | | | | | | | | | | |
| Floating Rate Loan Interests (f) | | | | | Par
(000) | | | Value | |
Air Freight & Logistics (continued) | |
Ceva Logistics U.S. Holdings, Inc. (FKA Louis U.S. Holdco, Inc.), U.S. Term Loan, 6.50%, 3/19/21 | | | USD | | | | 211 | | | $ | 172,271 | |
| | | | | | | | | | | | |
| | | | | | | | | | | | 439,865 | |
Airlines — 0.1% | |
Air Medical Group Holdings, Inc., Initial Term Loan, 4.25%, 4/28/22 | | | | | | | 168 | | | | 163,934 | |
Chemicals — 0.3% | |
Ascend Performance Materials Operations LLC, Term B Loan, 6.75%, 4/10/18 | | | | | | | 482 | | | | 479,146 | |
MacDermid, Inc. (Platform Specialty Products Corp.), Tranche B-3 Term Loan, 5.50%, 6/07/20 | | | | | | | 141 | | | | 138,891 | |
PQ Corp., Tranche B-1 Term Loan, 5.75%, 11/04/22 | | | | | | | 142 | | | | 141,742 | |
| | | | | | | | | | | | |
| | | | | | | | | | | | 759,779 | |
Commercial Services & Supplies — 0.1% | |
Laureate Education, Inc., New Series 2018 Extended Term Loan, 5.00%, 6/15/18 | | | | | | | 300 | | | | 290,331 | |
Trugreen Limited Partnership, Initial Term Loan (First Lien), 6.50%, 4/13/23 | | | | | | | 112 | | | | 112,280 | |
| | | | | | | | | | | | |
| | | | | | | | | | | | 402,611 | |
Communications Equipment — 0.0% | |
Blue Coat Holdings, Inc., Initial Term Loan, 4.50%, 5/20/22 | | | | | | | 63 | | | | 62,587 | |
Construction & Engineering — 0.1% | |
Brand Energy & Infrastructure Services, Inc. (FKA FR Brand Acquisition Corp.), Initial Term Loan, 4.75%, 11/26/20 | | | | | | | 247 | | | | 240,036 | |
Diversified Financial Services — 0.1% | |
Solera LLC (Solera Finance, Inc.), Dollar Term Loan, 5.75%, 3/03/23 | | | | | | | 355 | | | | 354,517 | |
Diversified Telecommunication Services — 0.7% | |
Intelsat Jackson Holdings SA, Tranche B-2 Term Loan, 3.75%, 6/30/19 | | | | | | | 146 | | | | 132,579 | |
Ligado Networks LLC (FKA New LightSquared LLC), Junior Loan, 13.50%, 12/07/20 | | | | | | | 440 | | | | 272,104 | |
New LightSquared LLC, Loan, 9.75%, 6/15/20 | | | | | | | 1,860 | | | | 1,650,630 | |
| | | | | | | | | | | | |
| | | | | | | | | | | | 2,055,313 | |
Electric Utilities — 0.2% | |
Energy Future Intermediate Holding Co. LLC (EFIH Finance, Inc.), Term Loan, 4.25%, 12/19/16 | | | | | | | 207 | | | | 206,483 | |
Texas Competitive Electric Holdings Co. LLC (TXU), DIP Term Loan, 3.75%, 11/07/16 | | | | | | | 271 | | | | 269,937 | |
| | | | | | | | | | | | |
| | | | | | | | | | | | 476,420 | |
Energy Equipment & Services — 0.1% | |
Weatherford International Ltd., Term Loan, 3.20%, 7/13/20 | | | | | | | 397 | | | | 367,173 | |
Health Care Equipment & Supplies — 0.1% | |
DJO Finance LLC, Initial Term Loan, 4.25%, 6/08/20 | | | | | | | 128 | | | | 121,358 | |
Immucor, Inc. (FKA IVD Acquisition Corp.), Term B-2 Loan, 5.00%, 8/19/18 | | | | | | | 234 | | | | 218,398 | |
| | | | | | | | | | | | |
| | | | | | | | | | | | 339,756 | |
Health Care Providers & Services — 0.2% | |
MPH Acquisition Holdings LLC, Initial Term Loan, 5.00%, 6/07/23 | | | | | | | 331 | | | | 331,745 | |
Surgery Center Holdings, Inc., Initial Term Loan (First Lien), 5.25%, 11/03/20 | | | | | | | 74 | | | | 73,610 | |
See Notes to Financial Statements.
| | | | | | |
| 14 | | BLACKROCK VARIABLE SERIES FUNDS, INC. | | JUNE 30, 2016 | | |
| | | | |
| Schedule of Investments (continued) | | | BlackRock High Yield V.I. Fund | |
| | | | |
| | | | | | | | | | | | |
| Floating Rate Loan Interests (f) | | | | | Par
(000) | | | Value | |
Health Care Providers & Services (continued) | |
Vizient, Inc., Initial Term Loan, 6.25%, 2/13/23 | | | USD | | | | 104 | | | $ | 104,952 | |
| | | | | | | | | | | | |
| | | | | | | | | | | | 510,307 | |
Hotels, Restaurants & Leisure — 0.6% | |
Amaya Holdings BV: | | | | | | | | | | | | |
Initial Term B Loan (First Lien), 5.00%, 8/01/21 | | | | | | | 416 | | | | 402,499 | |
Initial Term B Loan (Second Lien), 8.00%, 8/01/22 | | | | | | | 20 | | | | 19,231 | |
Caesars Entertainment Resort Properties LLC, Term B Loan, 7.00%, 10/11/20 | | | | | | | 1,215 | | | | 1,158,706 | |
Scientific Games International, Inc., Initial Term Loan, 5.00%, 10/18/20 | | | | | | | 86 | | | | 84,637 | |
| | | | | | | | | | | | |
| | | | | | | | | | | | 1,665,073 | |
Insurance — 0.0% | |
AssuredPartners, Inc., First Lien Term Loan, 5.75%, 10/21/22 | | | | | | | 138 | | | | 137,010 | |
IT Services — 0.0% | |
WEX, Inc., Term Loan B, 3.50%, 6/24/23 | | | | | | | 144 | | | | 142,920 | |
Life Sciences Tools & Services — 0.3% | |
DPX Holdings BV (FKA JLL/Delta Dutch Newco BV), 2015 Incremental Dollar Term Loan, 4.25%, 3/11/21 | | | | | | | 257 | | | | 249,433 | |
Jaguar Holding Co. I (AKA Pharmaceutical Product Development, Inc.), Initial Term Loan, 4.25%, 8/18/22 | | | | | | | 469 | | | | 464,542 | |
| | | | | | | | | | | | |
| | | | | | | | | | | | 713,975 | |
Machinery — 0.3% | |
Accudyne Industries Borrower SCA/Accudyne Industries LLC (AKA Hamilton Sundstrand), Refinancing Term Loan, 4.00%, 12/13/19 | | | | | | | 438 | | | | 392,210 | |
Gates Global LLC, Initial Dollar Term Loan, 4.25%, 7/06/21 | | | | | | | 376 | | | | 355,913 | |
| | | | | | | | | | | | |
| | | | | | | | | | | | 748,123 | |
Media — 0.5% | |
Advantage Sales & Marketing, Inc.: | | | | | | | | | | | | |
Initial Term Loan (First Lien), 4.25%, 7/23/21 | | | | | | | 128 | | | | 124,266 | |
Term Loan (Second Lien), 7.50%, 7/25/22 | | | | | | | 331 | | | | 306,247 | |
Cengage Learning Acquisitions, Inc. (FKA TL Acquisitions, Inc.), Term Loan,
0.00%, 6/30/16 (a)(g) | | | | | | | 49 | | | | — | |
Cengage Learning, Inc., 2016 Refinancing Term Loan, 5.25%, 6/07/23 | | | | | | | 73 | | | | 71,721 | |
iHeartCommunications, Inc. (FKA Clear Channel Communications, Inc.), Tranche D Term Loan, 7.21%, 1/30/19 | | | | | | | 751 | | | | 546,608 | |
Telenet Financing USD LLC, Term Loan AD Facility, 4.25%, 6/30/24 | | | | | | | 200 | | | | 198,042 | |
Univision Communications, Inc., Replacement First-Lien Term Loan (C-4), 4.00%, 3/01/20 | | | | | | | 11 | | | | 10,858 | |
| | | | | | | | | | | | |
| | | | | | | | | | | | 1,257,742 | |
Metals & Mining — 0.2% | |
FMG Resources (August 2006) Pty Ltd. (FMG America Finance, Inc.), Loan, 4.25%, 6/30/19 | | | | | | | 442 | | | | 421,759 | |
Novelis, Inc., Initial Term Loan, 4.00%, 6/02/22 | | | | | | | 88 | | | | 87,309 | |
| | | | | | | | | | | | |
| | | | | | | | | | | | 509,068 | |
Oil, Gas & Consumable Fuels — 0.1% | |
CITGO Holding, Inc., Term Loan, 9.50%, 5/12/18 | | | | | | | 131 | | | | 131,852 | |
| | | | | | | | | | | | |
| Floating Rate Loan Interests (f) | | | | | Par (000) | | | Value | |
Oil, Gas & Consumable Fuels (continued) | |
MEG Energy Corp., New Term Loan, 3.75%, 3/31/20 | | | USD | | | | 80 | | | $ | 69,912 | |
| | | | | | | | | | | | |
| | | | | | | | | | | | 201,764 | |
Personal Products — 0.0% | |
NBTY, Inc., Dollar Term B Loan, 5.00%, 5/05/23 | | | | | | | 165 | | | | 163,527 | |
Pharmaceuticals — 0.2% | |
Capsugel Holdings U.S., Inc., New Dollar Term Loan, 4.00%, 7/31/21 | | | | | | | 55 | | | | 54,519 | |
Valeant Pharmaceuticals International, Inc.: | | | | | | | | | | | | |
Series A-3 Tranche A Term Loan, 3.72%, 10/20/18 | | | | | | | 97 | | | | 94,681 | |
Series C-2 Tranche B Term Loan, 4.75%, 12/11/19 | | | | | | | 53 | | | | 51,073 | |
Series E-1 Tranche B Term Loan, 4.75%, 8/05/20 | | | | | | | 219 | | | | 212,240 | |
Series F-1 Tranche B Term Loan, 5.00%, 4/01/22 | | | | | | | 89 | | | | 86,981 | |
| | | | | | | | | | | | |
| | | | | | | | | | | | 499,494 | |
Semiconductors & Semiconductor Equipment — 0.2% | |
Avago Technologies Cayman Holdings Ltd., Term B-1 Dollar Loan, 4.25%, 2/01/23 | | | | | | | 196 | | | | 196,388 | |
Microsemi Corp., Closing Date Term B Loan, 5.25%, 1/15/23 | | | | | | | 37 | | | | 36,436 | |
ON Semiconductor Corp., Closing Date Term Loan, 5.25%, 3/31/23 | | | | | | | 252 | | | | 252,630 | |
| | | | | | | | | | | | |
| | | | | | | | | | | | 485,454 | |
Software — 0.3% | |
First Data Corp., 2021 Extended Dollar Term Loan, 4.45%, 3/24/21 | | | | | | | 296 | | | | 294,424 | |
Informatica Corp., Dollar Term Loan, 4.50%, 8/05/22 | | | | | | | 283 | | | | 274,331 | |
Kronos, Inc., Initial Term Loan (Second Lien), 9.75%, 4/30/20 | | | | | | | 145 | | | | 145,369 | |
| | | | | | | | | | | | |
| | | | | | | | | | | | 714,124 | |
Specialty Retail — 0.0% | |
J. Crew Group, Inc., Initial Loan,, 4.00%, 3/05/21 | | | | | | | 125 | | | | 84,901 | |
Total Floating Rate Loan Interests — 4.9% | | | | | | | | 13,495,473 | |
| | | | | | | | | | | | |
| Foreign Agency Obligations | | | | | | | | | |
Canada — 0.1% | |
NOVA Chemicals Corp., 5.00%, 5/01/25 (d) | | | | | | | 143 | | | | 141,570 | |
Total Foreign Agency Obligations — 0.1% | | | | | | | | 141,570 | |
| | | | | | | | | | | | |
| Non-Agency Mortgage-Backed Securities | | | | | | | | | |
Commercial Mortgage-Backed Securities — 0.2% | |
Hilton USA Trust, Series 2013-HLT, Class EFX, 4.60%, 11/05/30 (d)(f) | | | | | | | 442 | | | | 444,777 | |
| | | | | | | | | | | | |
| Other Interests (j) | | | | | Beneficial
Interest
(000) | | | | |
Household Durables — 0.1% | |
Stanley-Martin, Class B Membership Units (a) | | | | | | | — | (k) | | | 274,500 | |
| | | | | | | | | | | | |
| | | | | | | | | | |
See Notes to Financial Statements.
| | | | | | |
| | | BLACKROCK VARIABLE SERIES FUNDS, INC. | | JUNE 30, 2016 | | 15 |
| | |
| Schedule of Investments (continued) | | BlackRock High Yield V.I. Fund |
| | | | | | | | | | | | |
Preferred Securities | | | | | | | | | |
| Capital Trusts (f) | | | | | Par
(000) | | | Value | |
Banks — 2.0% | |
ABN AMRO Bank NV, 5.75% (l) | | | EUR | | | | 200 | | | $ | 206,215 | |
Banco Bilbao Vizcaya Argentaria SA, 7.00% (l) | | | | | | | 200 | | | | 190,722 | |
Banco Popular Espanol SA, 8.25% (l) | | | | | | | 200 | | | | 188,929 | |
Banco Santander SA, 6.25% (l) | | | | | | | 200 | | | | 187,549 | |
Bank of America Corp.: | | | | | | | | | | | | |
Series X, 6.25% (l) | | | USD | | | | 1,128 | | | | 1,145,597 | |
Series Z, 6.50% (l) | | | | | | | 306 | | | | 325,890 | |
Bank of Ireland, 7.38% (l) | | | EUR | | | | 200 | | | | 205,251 | |
BNP Paribas SA, 6.13% (l) | | | | | | | 200 | | | | 211,686 | |
Citigroup, Inc.: | | | | | | | | | | | | |
5.95% (l) | | | USD | | | | 112 | | | | 110,670 | |
Series N, 5.80% (l) | | | | | | | 80 | | | | 77,300 | |
Series O, 5.88% (l) | | | | | | | 315 | | | | 302,400 | |
Series P, 5.95% (l) | | | | | | | 641 | | | | 626,577 | |
Series R, 6.13% (l) | | | | | | | 175 | | | | 177,625 | |
Cooperatieve Rabobank UA, 6.63% (l) | | | EUR | | | | 200 | | | | 222,724 | |
Intesa Sanpaolo SpA, 7.00% (l) | | | | | | | 200 | | | | 204,195 | |
JPMorgan Chase & Co.: | | | | | | | | | | | | |
Series 1, 7.90% (l) | | | USD | | | | 170 | | | | 173,400 | |
Series V, 5.00% (l) | | | | | | | 600 | | | | 573,750 | |
Wells Fargo & Co., Series U, 5.88% (l) | | | | | | | 287 | | | | 306,014 | |
| | | | | | | | | | | | |
| | | | | | | | | | | | 5,436,494 | |
Capital Markets — 0.2% | |
Goldman Sachs Group, Inc., Series L, 5.70% (l) | | | | | | | 243 | | | | 242,520 | |
Morgan Stanley, Series H, 5.45% (l) | | | | | | | 162 | | | | 155,520 | |
UBS Group AG, 5.75% (l) | | | EUR | | | | 200 | | | | 223,061 | |
| | | | | | | | | | | | |
| | | | | | | | | | | | 621,101 | |
Diversified Telecommunication Services — 0.1% | |
Koninklijke KPN NV, 6.13% (l) | | | | | | | 164 | | | | 193,616 | |
Electric Utilities — 0.1% | |
Enel SpA, 6.50% | | | | | | | 100 | | | | 119,851 | |
Gas Natural Fenosa Finance BV, 3.38% (l) | | | | | | | 200 | | | | 197,803 | |
| | | | | | | | | | | | |
| | | | | | | | | | | | 317,654 | |
Oil, Gas & Consumable Fuels — 0.0% | |
TOTAL SA, 3.88% (l) | | | | | | | 100 | | | | 115,054 | |
Wireless Telecommunication Services — 0.2% | |
Orange SA, 4.00% (l) | | | | | | | 125 | | | | 143,950 | |
| | | | | | | | | | | | |
| Capital Trusts (f) | | | | | Par (000) | | | Value | |
Wireless Telecommunication Services (continued) | |
Telefonica Europe BV: | | | | | | | | | | | | |
4.20% (l) | | | EUR 200 | | | $ | 220,320 | |
5.00% (l) | | | | | | | 100 | | | | 111,789 | |
| | | | | | | | | | | | |
| | | | | | | | | | | | 476,059 | |
Total Capital Trusts — 2.6% | | | | | | | | | | | 7,159,978 | |
| | | | | | | | | | | | |
| Preferred Stocks | | | | | Shares | | | | |
Diversified Financial Services — 0.0% | |
Concrete Investment II SCA (a) | | | | | | | 623 | | | | 73,286 | |
Hotels, Restaurants & Leisure — 0.5% | |
Amaya, Inc. (a) | | | | | | | 1,516 | | | | 1,258,376 | |
Total Preferred Stocks — 0.5% | | | | | | | | | | | 1,331,662 | |
| | | | | | | | | | | | |
| Trust Preferreds | | | | | | | | | |
Consumer Finance — 0.3% | |
GMAC Capital Trust I, Series 2, 6.41%, 2/15/40 (f) | | | | | | | 32,966 | | | | 818,216 | |
Total Preferred Securities — 3.4% | | | | | | | | | | | 9,309,856 | |
Total Long-Term Investments (Cost — $253,384,814) — 91.6% | | | | | | | | | | | 249,897,326 | |
| | | | | | | | | | | | |
| Short-Term Securities | | | | | | | | | |
BlackRock Liquidity Funds, TempFund, Institutional Class, 0.40% (m)(n) | | | | | | | 7,094,060 | | | | 7,094,060 | |
Total Short-Term Securities (Cost — $7,094,060) — 2.6% | | | | | | | | | | | 7,094,060 | |
Total Investments — 94.2% (Cost — $260,478,874) | | | | 256,991,386 | |
Other Assets Less Liabilities — 5.8% | | | | | | | | | | | 15,903,642 | |
| | | | | | | | | | | | |
Net Assets — 100.0% | | | | | | | | | | $ | 272,895,028 | |
| | | | | | | | | | | | |
|
| Notes to Schedule of Investments |
| (a) | Non-income producing security. |
| (b) | Security contractually bound to one or more other securities to form a single saleable unit which cannot be sold separately. |
| (c) | Restricted security as to resale, excluding 144A securities. As of period end, the Fund held restricted securities with a current value of $1,200 and an original cost of $1,200 which was less than 0.05% of its net assets. |
| (d) | Security exempt from registration pursuant to Rule 144A under the Securities Act of 1933, as amended. These securities may be resold in transactions exempt from registration to qualified institutional investors. |
| (e) | Payment-in-kind security which may pay interest/dividends in additional par/shares and/or in cash. Rates shown are the current rate and possible payment rates. |
| (f) | Variable rate security. Rate as of period end. |
| (g) | Issuer filed for bankruptcy and/or is in default of interest payments. |
| (j) | Other interests represent beneficial interests in liquidation trusts and other reorganization or private entities. |
| (k) | Amount is less than $500. |
| (l) | Perpetual security with no stated maturity date. |
See Notes to Financial Statements.
| | | | | | |
| 16 | | BLACKROCK VARIABLE SERIES FUNDS, INC. | | JUNE 30, 2016 | | |
| | |
| Schedule of Investments (continued) | | BlackRock High Yield V.I. Fund |
| (m) | During the six months ended June 30, 2016, investments in issuers considered to be an affiliate of the Fund for purposes of Section 2(a)(3) of the Investment Company Act of 1940, as amended, were as follows: |
| | | | | | | | | | | | | | | | | | | | |
| Affiliate | | Shares Held at
December 31, 2015 | | | Net Activity | | | Shares
Held at
June 30, 2016 | | | Value at
June 30, 2016 | | | Income | |
BlackRock Liquidity Funds, TempFund, Institutional Class | | | 13,560,297 | | | | (6,466,237 | ) | | | 7,094,060 | | | | $7,094,060 | | | $ | 18,312 | |
| (n) | Current yield as of period end. |
| • | | For Fund compliance purposes, the Fund’s industry classifications refer to one or more of the industry sub-classifications used by one or more widely recognized market indexes or rating group indexes, and/or as defined by the investment adviser. These definitions may not apply for purposes of this report, which may combine such industry sub-classifications for reporting ease. |
|
| Derivative Financial Instruments Outstanding as of Period End |
| | | | | | | | | | | | | | | | | | | | | | |
Futures Contracts | | | | | | | | | | | | |
Contracts Short | | Issue | | | | | Expiration | | | Notional Value | | | Unrealized
Depreciation | |
(14) | | | Russell 2000 Mini Index | | | | | | September 2016 | | | | USD | | | | 1,606,360 | | | | $ (4,519 | ) |
(66) | | | S&P 500 E-Mini Index | | | | | | September 2016 | | | | USD | | | | 6,897,660 | | | | (255,448 | ) |
Total | | | | | | | | | | | | | | | | | | | | | $(259,967 | ) |
| | | | | | | | | | | | | | | | | | | | | | |
| | | | | | | | | | | | | | | | | | | | | | | | |
Forward Foreign Currency Exchange Contracts | |
Currency Purchased | | | | | Currency Sold | | | Counterparty | | Settlement
Date | | | | | Unrealized
Appreciation
(Depreciation) | |
GBP | | | 290,000 | | | | USD | | | | 424,821 | | | Citibank N.A. | | | 7/06/16 | | | | | | $ (38,736 | ) |
USD | | | 1,585,401 | | | | CAD | | | | 2,065,000 | | | Royal Bank of Canada | | | 7/06/16 | | | | | | (12,998 | ) |
USD | | | 12,456,454 | | | | EUR | | | | 11,155,000 | | | Barclays Bank PLC | | | 7/06/16 | | | | | | 74,353 | |
USD | | | 28,405 | | | | EUR | | | | 25,000 | | | Citibank N.A. | | | 7/06/16 | | | | | | 655 | |
USD | | | 56,617 | | | | EUR | | | | 50,000 | | | Citibank N.A. | | | 7/06/16 | | | | | | 1,117 | |
USD | | | 111,084 | | | | EUR | | | | 98,000 | | | Citibank N.A. | | | 7/06/16 | | | | | | 2,303 | |
USD | | | 78,419 | | | | EUR | | | | 70,000 | | | Morgan Stanley & Co. International PLC | | | 7/06/16 | | | | | | 719 | |
USD | | | 88,132 | | | | EUR | | | | 78,000 | | | Morgan Stanley & Co. International PLC | | | 7/06/16 | | | | | | 1,552 | |
USD | | | 118,180 | | | | EUR | | | | 105,000 | | | Morgan Stanley & Co. International PLC | | | 7/06/16 | | | | | | 1,630 | |
USD | | | 125,495 | | | | EUR | | | | 110,000 | | | Morgan Stanley & Co. International PLC | | | 7/06/16 | | | | | | 3,395 | |
USD | | | 156,630 | | | | EUR | | | | 138,000 | | | Morgan Stanley & Co. International PLC | | | 7/06/16 | | | | | | 3,449 | |
USD | | | 646,462 | | | | EUR | | | | 579,000 | | | Morgan Stanley & Co. International PLC | | | 7/06/16 | | | | | | 3,769 | |
USD | | | 627,922 | | | | EUR | | | | 552,000 | | | Morgan Stanley & Co. International PLC | | | 7/06/16 | | | | | | 15,199 | |
USD | | | 3,545,562 | | | | GBP | | | | 2,421,000 | | | Barclays Bank PLC | | | 7/06/16 | | | | | | 322,418 | |
USD | | | 191,737 | | | | GBP | | | | 140,000 | | | Morgan Stanley & Co. International PLC | | | 7/15/16 | | | | | | 5,336 | |
USD | | | 1,590,226 | | | | CAD | | | | 2,065,000 | | | TD Securities, Inc. | | | 8/03/16 | | | | | | (8,338 | ) |
USD | | | 14,383,190 | | | | EUR | | | | 12,945,000 | | | Morgan Stanley & Co. International PLC | | | 8/03/16 | | | | | | (850 | ) |
USD | | | 2,652,802 | | | | GBP | | | | 1,970,000 | | | Royal Bank of Scotland PLC | | | 8/03/16 | | | | | | 29,430 | |
Total | | | | | | | | | | | | | | | | | | | | | | | $404,403 | |
| | | | | | | | | | | | | | | | | | | | | | | | |
| | | | | | | | | | | | | | | | | | | | |
Centrally Cleared Credit Default Swaps - Buy Protection | | | | | | | | | | | | | | | | | | | | |
| Index | | Pay
Fixed
Rate | | | Expiration
Date | | | Notional
Amount
(000) | | | Unrealized
Depreciation | |
iTraxx Europe Crossover Series 25 Version 1 | | | 5.00% | | | | 6/20/21 | | | | EUR | | | | 390 | | | | $(4,216 | ) |
See Notes to Financial Statements.
| | | | | | |
| | | BLACKROCK VARIABLE SERIES FUNDS, INC. | | JUNE 30, 2016 | | 17 |
| | |
| Schedule of Investments (continued) | | BlackRock High Yield V.I. Fund |
| | | | | | | | | | | | | | |
Centrally Cleared Credit Default Swaps - Sell Protection | | | | | | | | | | | | |
| Index | | Receive
Fixed
Rate | | Expiration
Date | | Credit
Rating1 | | Notional
Amount (000)2 | | Unrealized
Appreciation | |
CDX.NA.HY Series 26 Version 1 | | 5.00% | | 6/20/21 | | B+ | | USD 12,149 | | | $177,117 | |
| | 1 | | Using S&P’s rating of the underlying securities of the index, as applicable. |
| | 2 | | The maximum potential amount the Fund may pay should a negative credit event take place as defined under the terms of the agreement. |
| | | | | | | | | | | | | | | | | | | | | | | | | | | | | | | | | | | | | | |
OTC Credit Default Swaps - Sell Protection | | | | | | | | | | | | | | | | | | | | | | | | | | | | | | | | | | | | | | |
| Issuer | | Receive
Fixed
Rate | | | | | Counterparty | | | Expiration
Date | | | Credit
Rating1 | | | Notional
Amount
(000)2 | | | Value | | | Premiums
Paid | | | Unrealized
Depreciation | |
CNH Industrial NV | | | 5.00% | | | | |
| Goldman Sachs
International |
| | | 6/20/21 | | | | BB+ | | | | EUR | | | | 79 | | | | $7,606 | | | | $ 7,810 | | | | $ (204 | ) |
Fiat Finance North America, Inc. | | | 5.00% | | | | | | Citibank N.A. | | | | 6/20/21 | | | | BB | | | | EUR | | | | 31 | | | | 1,272 | | | | 2,467 | | | | (1,195 | ) |
Wind Acquisition Finance SA | | | 5.00% | | | | |
| JPMorgan Chase Bank
N.A. |
| | | 6/20/21 | | | | B | | | | EUR | | | | 20 | | | | 577 | | | | 663 | | | | (86 | ) |
Total | | | | | | | | | | | | | | | | | | | | | | | | | | | | | $9,455 | | | | $10,940 | | | | $(1,485 | ) |
| | | | | | | | | | | | | | | | | | | | | | | | | | | | | | |
| | 1 | | Using S&P’s rating of the underlying securities of the index, as applicable. |
| | 2 | | The maximum potential amount the Fund may pay should a negative credit event take place as defined under the terms of the agreement. |
|
| Derivative Financial Instruments Categorized by Risk Exposure |
As of period end, the fair values of derivative financial instruments located in the Statement of Assets and Liabilities were as follows:
| | | | | | | | | | | | | | | | | | | | | | | | |
| Assets - Derivative Financial Instruments | | Commodity
Contracts | | Credit
Contracts | | | Equity
Contracts | | | Foreign
Currency
Exchange
Contracts | | | Interest
Rate
Contracts | | Other
Contracts | | Total | |
Forward foreign currency exchange contracts | | Unrealized appreciation on forward foreign currency exchange contracts | | — | | | — | | | | — | | | | $465,325 | | | — | | — | | | $465,325 | |
Swaps - OTC | | Unrealized appreciation on OTC swaps; Swap premiums paid | | — | | | $ 10,940 | | | | — | | | | — | | | — | | — | | | 10,940 | |
Swaps - centrally cleared | | Net unrealized appreciation1 | | — | | | 177,117 | | | | — | | | | — | | | — | | — | | | 177,117 | |
Total | | — | | | $188,057 | | | | — | | | | $465,325 | | | — | | — | | | $653,382 | |
| | | | | |
| | | | | | | | | | | | | | | | | | | | | | | | |
| Liabilities - Derivative Financial Instruments | | | | | | | | | | | | | | | | | | |
Futures contracts | | Net unrealized depreciation1 | | — | | | — | | | | $259,967 | | | | — | | | — | | — | | | $259,967 | |
Forward foreign currency exchange contracts | | Unrealized depreciation on forward foreign currency exchange contracts | | — | | | — | | | | — | | | | $ 60,922 | | | — | | — | | | 60,922 | |
Swaps - OTC | | Unrealized depreciation on OTC swaps; Swap premiums received | | — | | | $ 1,485 | | | | — | | | | — | | | — | | — | | | 1,485 | |
Swaps - centrally cleared | | Net unrealized depreciation1 | | — | | | 4,216 | | | | — | | | | — | | | — | | — | | | 4,216 | |
Total | | — | | | $ 5,701 | | | | $259,967 | | | | $ 60,922 | | | — | | — | | | $326,590 | |
| | | | | |
| | 1 | | Includes cumulative appreciation (depreciation) on futures contracts and centrally cleared swaps, if any, as reported in the Schedule of Investments. Only current day’s variation margin is reported within the Statement of Assets and Liabilities. |
See Notes to Financial Statements.
| | | | | | |
| 18 | | BLACKROCK VARIABLE SERIES FUNDS, INC. | | JUNE 30, 2016 | | |
| | | | |
| Schedule of Investments (continued) | | | BlackRock High Yield V.I. Fund | |
For the six months ended June 30, 2016, the effect of derivative financial instruments in the Statement of Operations was as follows:
| | | | | | | | | | | | | | | | | | | | | | | | |
| Net Realized Gain (Loss) from: | | Commodity
Contracts | | Credit
Contracts | | | Equity
Contracts | | | Foreign
Currency
Exchange
Contracts | | | Interest
Rate
Contracts | | | Other
Contracts | | Total | |
Futures contracts | | — | | | — | | | | $(753,824 | ) | | | — | | | | $(63,360) | | | — | | | $(817,184 | ) |
Forward foreign currency exchange contracts | | — | | | — | | | | — | | | | $(387,187 | ) | | | — | | | — | | | (387,187 | ) |
Swaps | | — | | | $718,672 | | | | — | | | | — | | | | — | | | — | | | 718,672 | |
| | | |
Total | | — | | | $718,672 | | | | $(753,824 | ) | | | $(387,187 | ) | | | $(63,360) | | | — | | | $(485,699 | ) |
| | | |
| | | | | | | | | | | | | | | | | | | | | | | | |
| Net Change in Unrealized Appreciation (Depreciation) on: | | | | | | | | | | | | | | | | | | | |
Futures contracts | | — | | | — | | | | $ (3,791 | ) | | | — | | | | $(13,130) | | | — | | | $ (16,921 | ) |
Forward foreign currency exchange contracts | | — | | | — | | | | — | | | | $ 522,001 | | | | — | | | — | | | 522,001 | |
Swaps | | — | | | $160,853 | | | | — | | | | — | | | | — | | | — | | | 160,853 | |
| | | |
Total | | — | | | $160,853 | | | | $ (3,791 | ) | | | $ 522,001 | | | | $(13,130) | | | — | | | $ 665,933 | |
| | | |
| | | | | | | | | | | | | | | | | | | | | | | | |
| Average Quarterly Balances of Outstanding Derivative Financial Instruments | |
| |
Futures contracts: | | | | |
Average notional value of contracts - short | | $ | 8,970,155 | |
Forward foreign currency exchange contracts: | | | | |
Average amounts purchased - in USD | | $ | 35,366,863 | |
Average amounts sold - in USD | | $ | 212,411 | |
Credit default swaps: | | | | |
Average notional value - buy protection | | $ | 216,402 | |
Average notional value - sell protection. | | $ | 13,533,495 | |
For more information about the Fund’s investment risks regarding derivative financial instruments, refer to the Notes to the Financial Statements.
| | | | | | | | | | | | | | |
| Derivative Financial Instruments — Offsetting as of Period End |
The Fund’s derivative assets and liabilities (by type) were as follows:
| | | | | | | | |
| | | Assets | | | Liabilities | |
Derivative Financial Instruments: | | | | | | | | |
Futures contracts | | | — | | | | $ 103,076 | |
Forward foreign currency exchange contracts | | | $465,325 | | | | 60,922 | |
Swaps - centrally cleared | | | 42,657 | | | | — | |
Swaps - OTC1 | | | 10,940 | | | | 1,485 | |
| | | | |
Total derivative assets and liabilities in the Statement of Assets and Liabilities | | | $518,922 | | | | $ 165,483 | |
Derivatives not subject to a Master Netting Agreement or similar agreement (“MNA”) | | | (42,657) | | | | (103,076 | ) |
| | | | |
Total derivative assets and liabilities subject to an MNA | | | $476,265 | | | | $ 62,407 | |
| | | | |
| | 1 | | Includes unrealized appreciation (depreciation) on OTC swaps and swap premiums paid in the Statement of Assets and Liabilities and reported in the Schedule of Investments. |
The following tables present the Fund’s derivative assets and liabilities by counterparty net of amounts available for offset under an MNA and net of the related collateral received and pledged by the Fund:
| | | | | | | | | | | | | | | | |
| Counterparty | | Derivative Assets
Subject to an MNA by
Counterparty | | | Derivatives Available
for Offset1 | | | Non-cash
Collateral
Received | | Cash
Collateral
Received | | Net Amount of
Derivative Assets2 | |
Barclays Bank PLC | | | $396,771 | | | | — | | | — | | — | | | $396,771 | |
Citibank N.A. | | | 6,542 | | | | $(6,542) | | | — | | — | | | — | |
Goldman Sachs International | | | 7,810 | | | | (204) | | | — | | — | | | 7,606 | |
JPMorgan Chase Bank N.A. | | | 663 | | | | (86) | | | — | | — | | | 577 | |
Morgan Stanley & Co. International PLC | | | 35,049 | | | | (850) | | | — | | — | | | 34,199 | |
Royal Bank of Scotland PLC | | | 29,430 | | | | — | | | — | | — | | | 29,430 | |
| | | | |
Total | | | $476,265 | | | | $(7,682) | | | — | | — | | | $468,583 | |
| | | | |
See Notes to Financial Statements.
| | | | | | |
| | | BLACKROCK VARIABLE SERIES FUNDS, INC. | | JUNE 30, 2016 | | 19 |
| | | | |
| Schedule of Investments (continued) | | | BlackRock High Yield V.I. Fund | |
| | | | | | | | | | | | | | | | |
| Counterparty | | Derivative Liabilities
Subject to an MNA by
Counterparty | | | Derivatives Available
for Offset1 | | | Non-cash
Collateral
Pledged | | Cash
Collateral
Pledged | | Net Amount of
Derivative Liabilities3 | |
Citibank N.A. | | | $39,931 | | | | $(6,542) | | | — | | — | | | $33,389 | |
Goldman Sachs International | | | 204 | | | | (204) | | | — | | — | | | — | |
JPMorgan Chase Bank N.A. | | | 86 | | | | (86) | | | — | | — | | | — | |
Morgan Stanley & Co. International PLC | | | 850 | | | | (850) | | | — | | — | | | — | |
Royal Bank of Canada | | | 12,998 | | | | — | | | — | | — | | | 12,998 | |
TD Securities, Inc. | | | 8,338 | | | | — | | | — | | — | | | 8,338 | |
| | | | |
Total | | | $62,407 | | | | $(7,682) | | | — | | — | | | $54,725 | |
| | | | |
| | 1 | | The amount of derivatives available for offset is limited to the amount of derivative assets and/or liabilities that are subject to an MNA. |
| | 2 | | Net amount represents the net amount receivable from the counterparty in the event of default. |
| | 3 | | Net amount represents the net amount payable due to the counterparty in the event of default. |
|
| Fair Value Hierarchy as of Period End |
Various inputs are used in determining the fair value of investments and derivative financial instruments. For information about the Fund’s policy regarding valuation of investments and derivative financial instruments, refer to the Notes to Financial Statement.
The following tables summarize the Fund’s investments and derivative financial instruments categorized in the disclosure hierarchy:
| | | | | | | | | | | | | | | | |
| | | Level 1 | | | Level 2 | | | Level 3 | | | Total | |
Assets: | | | | | | | | | | | | | | | | |
Investments: | | | | | | | | | | | | | | | | |
Long-Term Investments: | | | | | | | | | | | | | | | | |
Common Stocks | | $ | 4,804,049 | | | $ | 2,206,129 | | | $ | 1,200 | | | $ | 7,011,378 | |
Corporate Bonds | | | — | | | | 218,611,855 | | | | 607,917 | | | | 219,219,772 | |
Floating Rate Loan Interests | | | — | | | | 13,383,193 | | | | 112,280 | | | | 13,495,473 | |
Foreign Agency Obligations | | | — | | | | 141,570 | | | | — | | | | 141,570 | |
Non-Agency Mortgage-Backed Securities | | | — | | | | 444,777 | | | | — | | | | 444,777 | |
Other Interests | | | — | | | | — | | | | 274,500 | | | | 274,500 | |
Preferred Securities | | | 818,216 | | | | 7,159,978 | | | | 1,331,662 | | | | 9,309,856 | |
Short-Term Securities | | | 7,094,060 | | | | — | | | | — | | | | 7,094,060 | |
| | | | |
Total | | $ | 12,716,325 | | | $ | 241,947,502 | | | $ | 2,327,559 | | | $ | 256,991,386 | |
| | | | |
| | | | | | | | | | | | | | | | |
Derivative Financial Instruments1 | | | | | | | | | | | | | | | | |
Assets: | | | | | | | | | | | | | | | | |
Credit contracts | | | — | | | $ | 177,117 | | | | — | | | $ | 177,117 | |
Foreign currency exchange contracts | | | — | | | | 465,325 | | | | — | | | | 465,325 | |
Liabilities: | | | | | | | | | | | | | | | | |
Credit contracts | | | — | | | | (5,701 | ) | | | — | | | | (5,701 | ) |
Equity contracts | | $ | (259,967 | ) | | | — | | | | — | | | | (259,967 | ) |
Foreign currency exchange contracts | | | — | | | | (60,922 | ) | | | — | | | | (60,922 | ) |
| | | | |
Total | | $ | (259,967 | ) | | $ | 575,819 | | | | — | | | $ | 315,852 | |
| | | | |
| | 1 | | Derivative financial instruments are swaps, futures contracts and forward foreign currency exchange contracts. Swaps, futures contracts and forward foreign currency exchange contracts are valued at the unrealized appreciation (depreciation) on the instrument. |
The Fund may hold assets and/or liabilities in which the fair value approximates the carrying amount for financial statement purposes. As of period end, such assets are categorized within the disclosure hierarchy as follows:
| | | | | | | | | | | | | | | | |
| | | Level 1 | | | Level 2 | | | Level 3 | | | Total | |
Assets: | | | | | | | | | | | | | | | | |
Cash | | $ | 56,950 | | | | — | | | | — | | | $ | 56,950 | |
Foreign currency at value | | | 38,301 | | | | — | | | | — | | | | 38,301 | |
Cash pledged: | | | | | | | | | | | | | | | | |
Futures contracts | | | 465,570 | | | | — | | | | — | | | | 465,570 | |
Centrally cleared swaps | | | 737,600 | | | | — | | | | — | | | | 737,600 | |
| | | | |
Total | | $ | 1,298,421 | | | | — | | | | — | | | $ | 1,298,421 | |
| | | | |
During the six months ended June 30, 2016, there were no transfers between Level 1 and Level 2.
See Notes to Financial Statements.
| | | | | | |
| 20 | | BLACKROCK VARIABLE SERIES FUNDS, INC. | | JUNE 30, 2016 | | |
| | | | |
| Schedule of Investments (concluded) | | | BlackRock High Yield V.I. Fund | |
A reconciliation of Level 3 investments is presented when the Fund had a significant amount of Level 3 investments at the beginning and/or end of the period in relation to net assets. The following table is a reconciliation of Level 3 investments for which significant unobservable inputs were used in determining fair value:
| | | | | | | | | | | | | | | | | | | | | | | | |
| | | Common
Stocks | | | Corporate
Bonds | | | Floating
Rate Loan
Interests | | | Other
Interests | | | Preferred
Securities | | | Total | |
Assets: | | | | | | | | | | | | | | | | | | | | | | | | |
Opening Balance, as of December 31, 2015 | | $ | 1,200 | | | $ | 644,667 | | | $ | 308,782 | | | $ | 312,300 | | | $ | 1,030,915 | | | $ | 2,297,864 | |
Transfers into Level 3 | | | — | | | | — | | | | — | | | | — | | | | — | | | | — | |
Transfers out of Level 3 | | | — | | | | — | | | | — | | | | — | | | | — | | | | — | |
Accrued discounts/premiums | | | — | | | | — | | | | 156 | | | | — | | | | — | | | | 156 | |
Net realized gain (loss) | | | — | | | | — | | | | (3,754 | ) | | | — | | | | — | | | | (3,754 | ) |
Net change in unrealized appreciation (depreciation)1,2 | | | — | | | | — | | | | 13,088 | | | | (37,800 | ) | | | 300,747 | | | | 276,035 | |
Purchases | | | — | | | | — | | | | 110,320 | | | | — | | | | — | | | | 110,320 | |
Sales | | | — | | | | (36,750 | ) | | | (316,312 | ) | | | — | | | | — | | | | (353,062 | ) |
| | | | |
Closing Balance, as of June 30, 2016 | | $ | 1,200 | | | $ | 607,917 | | | $ | 112,280 | | | $ | 274,500 | | | $ | 1,331,662 | | | $ | 2,327,559 | |
| | | | |
Net change in unrealized appreciation (depreciation) on investments still held at June 30, 20162 | | | — | | | | — | | | $ | 1,916 | | | $ | (37,800 | ) | | $ | 300,747 | | | $ | 264,863 | |
| | | | |
| | 1 | | Included in the related net change in unrealized appreciation (depreciation) in the Statement of Operations. |
| | 2 | | Any difference between net change in unrealized appreciation (depreciation) and net change in unrealized appreciation (depreciation) on investments still held at June 30, 2016 is generally due to investments no longer held or categorized as Level 3 at period end. |
The Fund’s investments that are categorized as Level 3 were valued utilizing third party pricing information without adjustment. Such valuations are based on unobservable inputs. A significant change in third party information could result in a significantly lower or higher value of such Level 3 investments.
See Notes to Financial Statements.
| | | | | | |
| | | BLACKROCK VARIABLE SERIES FUNDS, INC. | | JUNE 30, 2016 | | 21 |
| | | | |
| Statement of Assets and Liabilities | | | | |
| | | | |
| June 30, 2016 (Unaudited) | | BlackRock High Yield V.I. Fund | |
| Assets | | | | |
Investments at value — unaffiliated (cost — $253,384,814) | | $ | 249,897,326 | |
Investments at value — affiliated (cost — $7,094,060) | | | 7,094,060 | |
Cash | | | 56,950 | |
Cash pledged: | | | | |
Futures contracts | | | 465,570 | |
Centrally cleared swaps | | | 737,600 | |
Foreign currency at value (cost — $38,566) | | | 38,301 | |
Receivables: | | | | |
Investments sold | | | 6,409,288 | |
Capital shares sold | | | 7,749,670 | |
Dividends — affiliated | | | 1,386 | |
Interest | | | 3,701,705 | |
From the Manager | | | 37,348 | |
Variation margin on centrally cleared swaps | | | 42,657 | |
Swap premiums paid | | | 10,940 | |
Unrealized appreciation on forward foreign currency exchange contracts | | | 465,325 | |
Prepaid expenses | | | 512 | |
| | | | |
Total assets | | | 276,708,638 | |
| | | | |
| | | | |
| Liabilities | | | | |
Payables: | | | | |
Investments purchased | | | 1,824,715 | |
Capital shares redeemed | | | 283,127 | |
Distribution fees | | | 28,230 | |
Income dividends | | | 1,213,442 | |
Investment advisory fees | | | 116,658 | |
Officer’s and Directors’ fees | | | 2,633 | |
Other accrued expenses | | | 178,189 | |
Other affiliates | | | 1,133 | |
Variation margin on futures contracts | | | 103,076 | |
Unrealized depreciation on: | | | | |
Forward foreign currency exchange contracts | | | 60,922 | |
OTC swaps | | | 1,485 | |
| | | | |
Total liabilities | | | 3,813,610 | |
| | | | |
Net Assets | | $ | 272,895,028 | |
| | | | |
| | | | |
| Net Assets Consist of | | | | |
Paid-in capital | | $ | 311,016,196 | |
Undistributed net investment income | | | 356,942 | |
Accumulated net realized loss | | | (35,270,449 | ) |
Net unrealized appreciation (depreciation) | | | (3,207,661 | ) |
| | | | |
Net Assets | | $ | 272,895,028 | |
| | | | |
| | | | |
| Net Asset Value | | | | |
Class I — Based on net assets of $130,625,210 and 18,722,110 shares outstanding, 200 million shares authorized, $0.10 par value | | $ | 6.98 | |
| | | | |
Class III — Based on net assets of $142,269,818 and 20,398,087 shares outstanding, 100 million shares authorized, $0.10 par value | | $ | 6.97 | |
| | | | |
See Notes to Financial Statements.
| | | | | | |
| 22 | | BLACKROCK VARIABLE SERIES FUNDS, INC. | | JUNE 30, 2016 | | |
| | | | |
| Six Months Ended June 30, 2016 (Unaudited) | | BlackRock
High Yield V.I. Fund | |
| Investment Income | | | | |
Dividends — affiliated | | $ | 18,312 | |
Dividends — unaffiliated | | | 43,031 | |
Interest | | | 7,490,034 | |
| | | | |
Total income | | | 7,551,377 | |
| | | | |
| | | | |
| Expenses | | | | |
Investment advisory | | | 658,035 | |
Transfer agent | | | 2,419 | |
Transfer agent — class specific | | | 184,061 | |
Distribution — class specific | | | 156,597 | |
Professional | | | 36,864 | |
Accounting services | | | 26,938 | |
Custodian | | | 17,249 | |
Printing | | | 14,334 | |
Officer and Directors | | | 11,002 | |
Registration | | | 4,347 | |
Miscellaneous | | | 15,793 | |
| | | | |
Total expenses | | | 1,127,639 | |
Less: | | | | |
Fees waived by the Manager | | | (3,513 | ) |
Transfer agent fees reimbursed — class specific | | | (114,540 | ) |
| | | | |
Total expenses after fees waived and reimbursed | | | 1,009,586 | |
| | | | |
Net investment income | | | 6,541,791 | |
| | | | |
| | | | |
| Realized and Unrealized Gain (Loss) | | | | |
Net realized gain (loss) from: | | | | |
Investments | | | (5,801,852 | ) |
Futures contracts | | | (817,184 | ) |
Swaps | | | 718,672 | |
Foreign currency transactions | | | (406,623 | ) |
| | | | |
| | | (6,306,987 | ) |
| | | | |
| |
Net change in unrealized appreciation (depreciation) on: | | | | |
Investments | | | 14,404,098 | |
Futures contracts | | | (16,921 | ) |
Swaps | | | 160,853 | |
Foreign currency translations | | | 492,369 | |
| | | | |
| | | 15,040,399 | |
| | | | |
Net realized and unrealized gain | | | 8,733,412 | |
| | | | |
Net Increase in Net Assets Resulting from Operations | | $ | 15,275,203 | |
| | | | |
See Notes to Financial Statements.
| | | | | | |
| | | BLACKROCK VARIABLE SERIES FUNDS, INC. | | JUNE 30, 2016 | | 23 |
| | |
| Statements of Changes in Net Assets | | BlackRock High Yield V.I. Fund |
| | | | | | | | |
| Increase (Decrease) in Net Assets: | | Six Months Ended
June 30, 2016
(Unaudited) | | | Year Ended
December 31,
2015 | |
| Operations | | | | | | | | |
Net investment income | | $ | 6,541,791 | | | $ | 10,530,772 | |
Net realized loss | | | (6,306,987 | ) | | | (4,607,177 | ) |
Net change in unrealized appreciation (depreciation) | | | 15,040,399 | | | | (15,022,452 | ) |
| | | | |
Net increase (decrease) in net assets resulting from operations | | | 15,275,203 | | | | (9,098,857 | ) |
| | | | |
| | | | | | | | |
| Distributions to Shareholders1 | | | | | | | | |
From net investment income: | | | | | | | | |
Class I | | | (3,540,904 | ) | | | (7,614,399 | ) |
Class III | | | (3,352,615 | ) | | | (4,886,376 | ) |
| | | | |
Decrease in net assets resulting from distributions to shareholders | | | (6,893,519 | ) | | | (12,500,775 | ) |
| | | | |
| | | | | | | | |
| Capital Share Transactions | | | | | | | | |
Net increase in net assets derived from capital share transactions | | | 41,632,673 | | | | 53,227,604 | |
| | | | |
| | | | | | | | |
| Net Assets | | | | | | | | |
Total increase in net assets | | | 50,014,357 | | | | 31,627,972 | |
Beginning of period | | | 222,880,671 | | | | 191,252,699 | |
| | | | |
End of period | | $ | 272,895,028 | | | $ | 222,880,671 | |
| | | | |
Undistributed net investment income, end of period | | $ | 356,942 | | | $ | 708,670 | |
| | | | |
| | 1 | | Distributions for annual periods determined in accordance with federal income tax regulations. |
See Notes to Financial Statements.
| | | | | | |
| 24 | | BLACKROCK VARIABLE SERIES FUNDS, INC. | | JUNE 30, 2016 | | |
| | | | |
| Financial Highlights | | | BlackRock High Yield V.I Fund | |
| | | | | | | | | | | | | | | | | | | | | | | | |
| | | Class I | |
| | | Six Months
Ended June 30, 2016 | | | Year Ended December 31, | |
| | | (Unaudited) | | | 2015 | | | 2014 | | | 2013 | | | 2012 | | | 2011 | |
| | | | | | | | | | | | | | | | | | | | | | | | |
| Per Share Operating Performance | | | | | | | | | | | | | | | | | | | | | | | | |
Net asset value, beginning of period | | $ | 6.77 | | | $ | 7.44 | | | $ | 7.67 | | | $ | 7.44 | | | $ | 6.87 | | | $ | 7.13 | |
| | | | |
Net investment income1 | | | 0.18 | | | | 0.36 | | | | 0.40 | | | | 0.43 | | | | 0.48 | | | | 0.50 | |
Net realized and unrealized gain (loss) | | | 0.22 | | | | (0.61 | ) | | | (0.18 | ) | | | 0.24 | | | | 0.56 | | | | (0.27 | ) |
| | | | |
Net increase (decrease) from investment operations | | | 0.40 | | | | (0.25 | ) | | | 0.22 | | | | 0.67 | | | | 1.04 | | | | 0.23 | |
| | | | |
Distributions from net investment income2 | | | (0.19 | ) | | | (0.42 | ) | | | (0.45 | ) | | | (0.44 | ) | | | (0.47 | ) | | | (0.49 | ) |
| | | | |
Net asset value, end of period | | $ | 6.98 | | | $ | 6.77 | | | $ | 7.44 | | | $ | 7.67 | | | $ | 7.44 | | | $ | 6.87 | |
| | | | |
| | | | | | | | | | | | | | | | | | | | | | | | |
| Total Return3 | | | | | | | | | | | | | | | | | | | | | | | | |
Based on net asset value | | | 5.98 | %4 | | | (3.60 | )% | | | 2.89 | % | | | 9.33 | % | | | 15.65 | % | | | 3.33 | % |
| | | | |
| | | | | | | | | | | | | | | | | | | | | | | | |
| Ratios to Average Net Assets | | | | | | | | | | | | | | | | | | | | | | | | |
Total expenses5 | | | 0.81 | %6 | | | 0.84 | % | | | 0.87 | % | | | 0.85 | % | | | 0.86 | % | | | 0.68 | % |
| | | | |
Total expenses after fees waived and/or reimbursed5 | | | 0.68 | %6 | | | 0.70 | % | | | 0.73 | % | | | 0.73 | % | | | 0.77 | % | | | 0.67 | % |
| | | | |
Net investment income5 | | | 5.30 | %6 | | | 4.86 | % | | | 5.23 | % | | | 5.65 | % | | | 6.65 | % | | | 6.98 | % |
| | | | |
| | | | | | | | | | | | | | | | | | | | | | | | |
| Supplemental Data | | | | | | | | | | | | | | | | | | | | | | | | |
Net assets, end of period (000) | | $ | 130,625 | | | $ | 127,742 | | | $ | 139,729 | | | $ | 150,691 | | | $ | 142,392 | | | $ | 134,486 | |
| | | | |
Portfolio turnover rate | | | 48 | % | | | 73 | % | | | 87 | % | | | 101 | % | | | 88 | % | | | 82 | % |
| | | | |
| | 1 | | Based on average shares outstanding. |
| | 2 | | Distributions for annual periods determined in accordance with federal income tax regulations. |
| | 3 | | Where applicable, excludes insurance-related fees and expenses and assumes the reinvestment of distributions. |
| | 4 | | Aggregate total return. |
| | 5 | | Excludes expenses incurred indirectly as a result of investments in underlying funds as follows: |
| | | | | | | | | | | | | | | | | | | | | | | | |
| | | Six Months Ended
June 30, 2016 (Unaudited) | | | Year Ended December 31, | |
| | | 2015 | | | 2014 | | | 2013 | | | 2012 | | | 2011 | |
Investments in underlying funds | | | 0.01 | % | | | 0.01 | % | | | — | | | | — | | | | — | | | | — | |
See Notes to Financial Statements.
| | | | | | |
| | | BLACKROCK VARIABLE SERIES FUNDS, INC. | | JUNE 30, 2016 | | 25 |
| | |
| Financial Highlights (concluded) | | BlackRock High Yield V.I. Fund |
| | | | | | | | | | | | | | | | | | | | |
| | | Class III | |
| | | Six Months
Ended
June 30, 2016 | | | Year Ended December 31, | | | Period
February 15,
20121 to
December 31, | |
| | | (Unaudited) | | | 2015 | | | 2014 | | | 2013 | | | 2012 | |
| | | | | | | | | | | | | | | | | | | | |
| Per Share Operating Performance | | | | | | | | | | | | | | | | | | | | |
Net asset value, beginning of period | | $ | 6.76 | | | $ | 7.43 | | | $ | 7.67 | | | $ | 7.44 | | | $ | 7.12 | |
| | | | |
Net investment income2 | | | 0.17 | | | | 0.34 | | | | 0.38 | | | | 0.40 | | | | 0.38 | |
Net realized and unrealized gain (loss) | | | 0.22 | | | | (0.61 | ) | | | (0.18 | ) | | | 0.25 | | | | 0.34 | |
| | | | |
Net increase (decrease) from investment operations | | | 0.39 | | | | (0.27 | ) | | | 0.20 | | | | 0.65 | | | | 0.72 | |
| | | | |
Distributions from net investment income3 | | | (0.18 | ) | | | (0.40 | ) | | | (0.44 | ) | | | (0.42 | ) | | | (0.40 | ) |
| | | | |
Net asset value, end of period | | $ | 6.97 | | | $ | 6.76 | | | $ | 7.43 | | | $ | 7.67 | | | $ | 7.44 | |
| | | | |
| | | | | | | | | | | | | | | | | | | | |
| Total Return4 | | | | | | | | | | | | | | | | | | | | |
Based on net asset value | | | 5.86 | %5 | | | (3.85 | )% | | | 2.51 | % | | | 9.07 | % | | | 10.39 | %5 |
| | | | |
| | | | | | | | | | | | | | | | | | | | |
| Ratios to Average Net Assets | | | | | | | | | | | | | | | | | | | | |
Total expenses6 | | | 0.99 | %7 | | | 1.06 | % | | | 1.07 | % | | | 1.07 | % | | | 1.29 | %7 |
| | | | |
Total expenses after fees waived and/or reimbursed6 | | | 0.92 | %7 | | | 0.94 | % | | | 0.98 | % | | | 0.96 | % | | | 1.19 | %7 |
| | | | |
Net investment income6 | | | 5.08 | %7 | | | 4.63 | % | | | 4.86 | % | | | 5.23 | % | | | 6.74 | %7 |
| | | | |
| | | | | | | | | | | | | | | | | | | | |
| Supplemental Data | | | | | | | | | | | | | | | | | | | | |
Net assets, end of period (000) | | $ | 142,270 | | | $ | 95,139 | | | $ | 51,524 | | | $ | 18,567 | | | $ | 14,824 | |
| | | | |
Portfolio turnover rate | | | 48 | % | | | 73 | % | | | 87 | % | | | 101 | % | | | 88 | % |
| | | | |
| | 1 | | Recommencement of operations. |
| | 2 | | Based on average shares outstanding. |
| | 3 | | Distributions for annual periods determined in accordance with federal income tax regulations. |
| | 4 | | Where applicable, excludes insurance-related fees and expenses and assumes the reinvestment of distributions. |
| | 5 | | Aggregate total return. |
| | 6 | | Excludes expenses incurred indirectly as a result of investments in underlying funds as follows: |
| | | | | | | | | | | | | | | | | | | | |
| | | Six Months
Ended
June 30, 2016 (Unaudited) | | | Year Ended December 31, | | | Period
February 15,
20121 to
December 31, 2012 | |
| | | 2015 | | | 2014 | | | 2013 | | |
Investments in underlying funds | | | 0.01 | % | | | 0.01 | % | | | — | | | | — | | | | — | |
See Notes to Financial Statements.
| | | | | | |
| 26 | | BLACKROCK VARIABLE SERIES FUNDS, INC. | | JUNE 30, 2016 | | |
| | |
| Notes to Financial Statements (Unaudited) | | BlackRock High Yield V.I. Fund |
1. Organization:
BlackRock Variable Series Funds, Inc. (the “Company”) is registered under the Investment Company Act of 1940, as amended (the “1940 Act”), as an open-end management investment company. The Company is organized as a Maryland corporation that is comprised of 20 separate funds. The funds offer shares to insurance companies for their separate accounts to fund benefits under certain variable annuity and variable life insurance contracts. The financial statements presented are for BlackRock High Yield V.I. Fund (the “Fund”). The Fund is classified as diversified. Class I and Class III Shares have equal voting, dividend, liquidation and other rights, except that only shares of the respective classes are entitled to vote on matters concerning only that class. In addition, Class III Shares bear certain expenses related to the distribution of such shares. Class III Shares were redeemed on December 31, 2007, and recommenced on February 15, 2012.
The Fund, together with certain other registered investment companies advised by BlackRock Advisors, LLC (the “Manager”) or its affiliates, is included in a complex of open-end funds referred to as the Equity-Bond Complex.
2. Significant Accounting Policies:
The financial statements are prepared in conformity with accounting principles generally accepted in the United States of America (“U.S. GAAP”), which may require management to make estimates and assumptions that affect the reported amounts of assets and liabilities in the financial statements, disclosure of contingent assets and liabilities at the date of the financial statements and the reported amounts of increases and decreases in net assets from operations during the reporting period. Actual results could differ from those estimates. The Fund is considered an investment company under U.S. GAAP and follows the accounting and reporting guidance applicable to investment companies. Below is a summary of significant accounting policies:
Foreign Currency: The Fund’s books and records are maintained in U.S. dollars. Purchases and sales of investments are recorded at the rates of exchange prevailing on the respective dates of such transactions. Generally, when the U.S. dollar rises in value against a foreign currency, the investments denominated in that currency will lose value; the opposite effect occurs if the U.S. dollar falls in relative value.
The Fund does not isolate the portion of the results of operations arising as a result of changes in the exchange rates from the changes in the market prices of investments held or sold for financial reporting purposes. Accordingly, the effects of changes in exchange rates on investments are not segregated in the Statement of Operations from the effects of changes in market prices of those investments, but are included as a component of net realized and unrealized gain (loss) from investments. The Fund reports realized currency gains (losses) on foreign currency related transactions as components of net realized gain (loss) for financial reporting purposes, whereas such components are generally treated as ordinary income for federal income tax purposes.
Segregation and Collateralization: In cases where the Fund enters into certain investments (e.g., futures contracts, forward foreign currency exchange contracts and swaps) that would be treated as “senior securities” for 1940 Act purposes, the Fund may segregate or designate on its books and records cash or liquid assets having a market value at least equal to the amount of its future obligations under such investments. Doing so allows the investment to be excluded from treatment as a “senior security”. Furthermore, if required by an exchange or counterparty agreement, the Fund may be required to deliver/deposit cash and/or securities to/with an exchange, or broker-dealer or custodian as collateral for certain investments or obligations.
Investment Transactions and Investment Income: For financial reporting purposes, investment transactions are recorded on the dates the transactions are entered into (the trade dates). Realized gains and losses on investment transactions are determined on the identified cost basis. Dividend income is recorded on the ex-dividend date. Dividends from foreign securities where the ex-dividend date may have passed are subsequently recorded when the Fund is informed of the ex-dividend date. Under the applicable foreign tax laws, a withholding tax at various rates may be imposed on capital gains, dividends and interest. Upon notification from issuers, some of the dividend income received from a real estate investment trust may be redesignated as a reduction of cost of the related investment and/or realized gain. Interest income, including amortization and accretion of premiums and discounts on debt securities, is recognized on the accrual basis. Income, expenses and realized and unrealized gains and losses are allocated daily to each class based on its relative net assets.
Distributions: Distributions from net investment income are declared daily and paid monthly. Distributions of capital gains are recorded on the ex-dividend date and made at least annually. The character and timing of distributions are determined in accordance with federal income tax regulations, which may differ from U.S. GAAP.
Indemnifications: In the normal course of business, the Fund enters into contracts that contain a variety of representations that provide general indemnification. The Fund’s maximum exposure under these arrangements is unknown because it involves future potential claims against the Fund, which cannot be predicted with any certainty.
| | | | | | |
| | | BLACKROCK VARIABLE SERIES FUNDS, INC. | | JUNE 30, 2016 | | 27 |
| | | | |
| Notes to Financial Statements (continued) | | | BlackRock High Yield V.I. Fund | |
Other: Expenses directly related to the Fund or its classes are charged to the Fund or the applicable class. Other operating expenses shared by several funds, including other funds managed by the Manager, are prorated among those funds on the basis of relative net assets or other appropriate methods. Expenses directly related to the Fund and other shared expenses prorated to the Fund are allocated daily to each class based on its relative net assets or other appropriate methods.
The Fund has an arrangement with its custodian whereby fees may be reduced by credits earned on uninvested cash balances, which, if applicable, are shown as fees paid indirectly in the Statement of Operations. The custodian imposes fees on overdrawn cash balances, which can be offset by accumulated credits earned or may result in additional custody charges.
3. Investment Valuation and Fair Value Measurements:
Investment Valuation Policies: The Fund’s investments are valued at fair value (also referred to as “market value” within the financial statements) as of the close of trading on the New York Stock Exchange (“NYSE”) (generally 4:00 p.m., Eastern time). U.S. GAAP defines fair value as the price the Fund would receive to sell an asset or pay to transfer a liability in an orderly transaction between market participants at the measurement date. The Fund determines the fair values of its financial instruments using various independent dealers or pricing services under policies approved by the Board of Directors of the Company (the “Board”). The BlackRock Global Valuation Methodologies Committee (the “Global Valuation Committee”) is the committee formed by management to develop global pricing policies and procedures and to oversee the pricing function for all financial instruments.
Fair Value Inputs and Methodologies: The following methods (or “techniques”) and inputs are used to establish the fair value of the Fund’s assets and liabilities:
| • | | Equity investments traded on a recognized securities exchange are valued at the official closing price each day, if available. For equity investments traded on more than one exchange, the official close price on the exchange where the stock is primarily traded is used. Equity investments traded on a recognized exchange for which there were no sales on that day may be valued at the last available bid (long positions) or ask (short positions) price. |
| • | | Bond investments are valued on the basis of last available bid prices or current market quotations provided by dealers or pricing services. Floating rate loan interests are valued at the mean of the bid prices from one or more brokers or dealers as obtained from a pricing service. In determining the value of a particular investment, pricing services may use certain information with respect to transactions in such investments, quotations from dealers, pricing matrixes, market transactions in comparable investments, various relationships observed in the market between investments and calculated yield measures. Asset-backed and mortgage-backed securities are valued by independent pricing services using models that consider estimated cash flows of each tranche of the security, establish a benchmark yield and develop an estimated tranche-specific spread to the bench-mark yield based on the unique attributes of the tranche. Generally, trading in foreign instruments is substantially completed each day at various times prior to the close of business on the NYSE. Occasionally, events affecting the values of such instruments may occur between the foreign market close and the close of business on the NYSE that may not be reflected in the computation of the Fund’s net assets. Each business day, the Fund uses a pricing service to assist with the valuation of certain foreign exchange-traded equity securities and foreign exchange-traded over-the-counter (“OTC”) options (the “Systematic Fair Value Price”). Using current market factors, the Systematic Fair Value Price is designed to value such foreign securities and foreign options at fair value as of the close of business on the NYSE, which follows the close of the local markets. |
| • | | Investments in open-end U.S. mutual funds are valued at net asset value each business day. |
| • | | Futures contracts traded on exchanges are valued at their last sale price. |
| • | | Securities and other assets and liabilities denominated in foreign currencies are translated into U.S. dollars using exchange rates determined as of the close of business on the NYSE. Forward foreign currency exchange contracts are valued at the mean between the bid and ask prices and are determined as of the close of business on the NYSE. Interpolated values are derived when the settlement date of the contract is an interim date for which quotations are not available. |
| • | | Swap agreements are valued utilizing quotes received daily by the Fund’s pricing service or through brokers, which are derived using daily swap curves and models that incorporate a number of market data factors, such as discounted cash flows, trades and values of the underlying reference instruments. |
If events (e.g., a company announcement, market volatility or a natural disaster) occur that are expected to materially affect the value of such instruments, or in the event that the application of these methods of valuation results in a price for an investment that is deemed not to be representative of the market value of such investment, or if a price is not available, the investment will be valued by the Global Valuation Committee, or its delegate, in accordance with a policy approved by the Board as reflecting fair value (“Fair Valued Investments”). When determining the price for Fair Valued Investments, the Global Valuation Committee, or its delegate, seeks to determine the price that the Fund might reasonably expect to receive or pay from the current sale or purchase of that asset or liability in an arm’s-length transaction. Fair value determinations shall be based upon all available factors that the Global Valuation Committee, or its delegate, deems relevant consistent with the principles of fair value measurement, which include the market approach, income approach and/or in the case of recent investments, the cost approach, as appropriate. The market approach generally consists of using comparable market transactions. The income approach generally is used to discount future cash flows to present value and is adjusted for
| | | | | | |
| 28 | | BLACKROCK VARIABLE SERIES FUNDS, INC. | | JUNE 30, 2016 | | |
| | |
| Notes to Financial Statements (continued) | | BlackRock High Yield V.I. Fund |
liquidity as appropriate. These factors include but are not limited to: (i) attributes specific to the investment or asset; (ii) the principal market for the investment or asset; (iii) the customary participants in the principal market for the investment or asset; (iv) data assumptions by market participants for the investment or asset, if reasonably available; (v) quoted prices for similar investments or assets in active markets; and (vi) other factors, such as future cash flows, interest rates, yield curves, volatilities, prepayment speeds, loss severities, credit risks, recovery rates, liquidation amounts and/or default rates. Due to the inherent uncertainty of valuations of such investments, the fair values may differ from the values that would have been used had an active market existed. The Global Valuation Committee, or its delegate, employs various methods for calibrating valuation approaches for investments where an active market does not exist, including regular due diligence of the Fund’s pricing vendors, regular reviews of key inputs and assumptions, transactional back-testing or disposition analysis to compare unrealized gains and losses to realized gains and losses, reviews of missing or stale prices and large movements in market values and reviews of any market related activity. The pricing of all Fair Valued Investments is subsequently reported to the Board or a committee thereof on a quarterly basis.
Fair Value Hierarchy: Various inputs are used in determining the fair value of investments and derivative financial instruments. These inputs to valuation techniques are categorized into a fair value hierarchy consisting of three broad levels for financial statement purposes as follows:
| • | | Level 1 — unadjusted price quotations in active markets/exchanges for identical assets or liabilities that the Fund has the ability to access |
| • | | Level 2 — other observable inputs (including, but not limited to, quoted prices for similar assets or liabilities in markets that are active, quoted prices for identical or similar assets or liabilities in markets that are not active, inputs other than quoted prices that are observable for the assets or liabilities (such as interest rates, yield curves, volatilities, prepayment speeds, loss severities, credit risks and default rates) or other market–corroborated inputs) |
| • | | Level 3 — unobservable inputs based on the best information available in the circumstances, to the extent observable inputs are not available (including the Fund’s own assumptions used in determining the fair value of investments and derivative financial instruments) |
The hierarchy gives the highest priority to unadjusted quoted prices in active markets for identical assets or liabilities (Level 1 measurements) and the lowest priority to unobservable inputs (Level 3 measurements). Accordingly, the degree of judgment exercised in determining fair value is greatest for instruments categorized in Level 3. The inputs used to measure fair value may fall into different levels of the fair value hierarchy. In such cases, for disclosure purposes, the fair value hierarchy classification is determined based on the lowest level input that is significant to the fair value measurement in its entirety. The significant unobservable inputs used by the Global Valuation Committee in determining the price for Fair Valued Investments are typically categorized as Level 3. The fair value hierarchy for the Fund’s investments and derivative financial instruments has been included in the Schedule of Investments.
Changes in valuation techniques may result in transfers into or out of an assigned level within the hierarchy. In accordance with the Fund’s policy, transfers between different levels of the fair value hierarchy are deemed to have occurred as of the beginning of the reporting period. The categorization of a value determined for investments and derivative financial instruments is based on the pricing transparency of the investments and derivative financial instruments and is not necessarily an indication of the risks associated with investing in those securities.
4. Securities and Other Investments:
Asset-Backed and Mortgage-Backed Securities: Asset-backed securities are generally issued as pass-through certificates or as debt instruments. Asset-backed securities issued as pass-through certificates represent undivided fractional ownership interests in an underlying pool of assets. Asset-backed securities issued as debt instruments, which are also known as collateralized obligations, are typically issued as the debt of a special purpose entity organized solely for the purpose of owning such assets and issuing such debt. Asset-backed securities are often backed by a pool of assets representing the obligations of a number of different parties. The yield characteristics of certain asset-backed securities may differ from traditional debt securities. One such major difference is that all or a principal part of the obligations may be prepaid at any time because the underlying assets (i.e., loans) may be prepaid at any time. As a result, a decrease in interest rates in the market may result in increases in the level of prepayments as borrowers, particularly mortgagors, refinance and repay their loans. An increased prepayment rate with respect to an asset-backed security will have the effect of shortening the maturity of the security. In addition, the Fund may subsequently have to reinvest the proceeds at lower interest rates. If the Fund has purchased such an asset-backed security at a premium, a faster than anticipated prepayment rate could result in a loss of principal to the extent of the premium paid.
For mortgage pass-through securities (the “Mortgage Assets”) there are a number of important differences among the agencies and instrumentalities of the U.S. Government that issue mortgage-related securities and among the securities that they issue. For example, mortgage-related securities guaranteed by Ginnie Mae are guaranteed as to the timely payment of principal and interest by Ginnie Mae and such guarantee is backed by the full faith and credit of the United States. However, mortgage-related securities issued by Freddie Mac and Fannie Mae, including Freddie Mac and Fannie Mae guaranteed mortgage pass-through certificates, which are solely the obligations of Freddie Mac and Fannie Mae, are not backed by or entitled to the full faith and credit of the United States, but are supported by the right of the issuer to borrow from the U.S. Treasury.
| | | | | | |
| | | BLACKROCK VARIABLE SERIES FUNDS, INC. | | JUNE 30, 2016 | | 29 |
| | |
| Notes to Financial Statements (continued) | | BlackRock High Yield V.I. Fund |
Non-agency mortgage-backed securities are securities issued by non-governmental issuers and have no direct or indirect government guarantees of payment and are subject to various risks. Non-agency mortgage loans are obligations of the borrowers thereunder only and are not typically insured or guaranteed by any other person or entity. The ability of a borrower to repay a loan is dependent upon the income or assets of the borrower. A number of factors, including a general economic downturn, acts of God, terrorism, social unrest and civil disturbances, may impair a borrower’s ability to repay its loans.
Zero-Coupon Bonds: Zero-coupon bonds, are normally issued at a significant discount from face value and do not provide for periodic interest payments. These bonds may experience greater volatility in market value than other debt obligations of similar maturity which provide for regular interest payments.
Capital Securities and Trust Preferred Securities: Capital securities, including trust preferred securities, are typically issued by corporations, generally in the form of interest-bearing notes with preferred securities characteristics. In the case of trust preferred securities, an affiliated business trust of a corporation issues these securities, generally in the form of beneficial interests in subordinated debentures or similarly structured securities. The securities can be structured with either a fixed or adjustable coupon that can have either a perpetual or stated maturity date. For trust preferred securities, the issuing bank or corporation pays interest to the trust, which is then distributed to holders of the these securities as a dividend. Dividends can be deferred without creating an event of default or acceleration, although maturity cannot take place unless all cumulative payment obligations have been met. The deferral of payments does not affect the purchase or sale of these securities in the open market. Payments on these securities are treated as interest rather than dividends for federal income tax purposes. These securities generally are rated below that of the issuing company’s senior debt securities and are freely callable at the issuer’s option.
Preferred Stock: Preferred stock has a preference over common stock in liquidation (and generally in receiving dividends as well) but is subordinated to the liabilities of the issuer in all respects. As a general rule, the market value of preferred stock with a fixed dividend rate and no conversion element varies inversely with interest rates and perceived credit risk, while the market price of convertible preferred stock generally also reflects some element of conversion value. Because preferred stock is junior to debt securities and other obligations of the issuer, deterioration in the credit quality of the issuer will cause greater changes in the value of a preferred stock than in a more senior debt security with similar stated yield characteristics. Unlike interest payments on debt securities, preferred stock dividends are payable only if declared by the issuer’s board of directors. Preferred stock also may be subject to optional or mandatory redemption provisions.
Floating Rate Loan Interests: Floating rate loan interests are typically issued to companies (the “borrower”) by banks, other financial institutions, or privately and publicly offered corporations (the “lender”). Floating rate loan interests are generally non-investment grade, often involve borrowers whose financial condition is troubled or uncertain and companies that are highly leveraged or in bankruptcy proceedings. In addition, transactions in floating rate loan interests may settle on a delayed basis, which may result to proceeds from the sale to not be readily available for the Fund to make additional investments or meet its redemption obligations. Floating rate loan interests may include fully funded term loans or revolving lines of credit. Floating rate loan interests are typically senior in the corporate capital structure of the borrower. Floating rate loan interests generally pay interest at rates that are periodically determined by reference to a base lending rate plus a premium. Since the rates reset only periodically, changes in prevailing interest rates (and particularly sudden and significant changes) can be expected to cause some fluctuations in the net asset value of the Fund to the extent that it invests in floating rate debt securities. The base lending rates are generally the lending rate offered by one or more European banks, such as the London Interbank Offered Rate (“LIBOR”), the prime rate offered by one or more U.S. banks or the certificate of deposit rate. Floating rate loan interests may involve foreign borrowers, and investments may be denominated in foreign currencies. These investments are treated as investments in debt securities for purposes of the Fund’s investment policies.
When the Fund purchases a floating rate loan interest, it may receive a facility fee and when it sells a floating rate loan interest, it may pay a facility fee. On an ongoing basis, the Fund may receive a commitment fee based on the undrawn portion of the underlying line of credit amount of a floating rate loan interest. Facility and commitment fees are typically amortized to income over the term of the loan or term of the commitment, respectively. Consent and amendment fees are recorded to income as earned. Prepayment penalty fees, which may be received by the Fund upon the prepayment of a floating rate loan interest by a borrower, are recorded as realized gains. The Fund may invest in multiple series or tranches of a loan. A different series or tranche may have varying terms and carry different associated risks.
Floating rate loan interests are usually freely callable at the borrower’s option. The Fund may invest in such loans in the form of participations in loans (“Participations”) or assignments (“Assignments”) of all or a portion of loans from third parties. Participations typically will result in the Fund having a contractual relationship only with the lender, not with the borrower. The Fund has the right to receive payments of principal, interest and any fees to which it is entitled only from the lender selling the Participation and only upon receipt by the lender of the payments from the borrower. In connection with purchasing Participations, the Fund generally will have no right to enforce compliance by the borrower with the terms of the loan agreement, nor any rights of offset against the borrower. The Fund may not benefit directly from any collateral supporting the loan in which it has purchased the Participation. As a result, the Fund assumes the credit risk of both the borrower and the lender that is selling the Participation. The Fund’s investment in loan participation interests involves the risk of insolvency of the financial intermediaries who are parties to the transactions. In the event of the insolvency of the lender selling the Participation, the Fund may be treated as a general creditor of the lender and may not benefit from any offset between the lender and the borrower. Assignments typically result in the Fund having a direct contractual relationship with the borrower, and the Fund may enforce compliance by the borrower with the terms of the loan agreement.
| | | | | | |
| 30 | | BLACKROCK VARIABLE SERIES FUNDS, INC. | | JUNE 30, 2016 | | |
| | | | |
| Notes to Financial Statements (continued) | | | BlackRock High Yield V.I. Fund | |
5. Derivative Financial Instruments:
The Fund engages in various portfolio investment strategies using derivative contracts both to increase the returns of the Fund and/or to manage its exposure to certain risks such as credit risk, equity risk, interest rate risk, foreign currency exchange rate risk, commodity price risk or other risks (e.g., inflation risk). Derivative financial instruments categorized by risk exposure are included in the Schedule of Investments. These contracts may be transacted on an exchange or OTC.
Futures Contracts: The Fund invests in long and/or short positions in futures and options on futures contracts to gain exposure to, or manage exposure to, changes in interest rates (interest rate risk), changes in the value of equity securities (equity risk) or foreign currencies (foreign currency exchange rate risk).
Futures contracts are agreements between the Fund and a counterparty to buy or sell a specific quantity of an underlying instrument at a specified price and on a specified date. Depending on the terms of a contract, it is settled either through physical delivery of the underlying instrument on the settlement date or by payment of a cash amount on the settlement date. Upon entering into a futures contract, the Fund is required to deposit initial margin with the broker in the form of cash or securities in an amount that varies depending on a contract’s size and risk profile. The initial margin deposit must then be maintained at an established level over the life of the contract.
Securities deposited as initial margin are designated in the Schedule of Investments and cash deposited, if any, is shown as cash pledged for futures contracts in the Statement of Assets and Liabilities. Pursuant to the contract, the Fund agrees to receive from or pay to the broker an amount of cash equal to the daily fluctuation in market value of the contract (“variation margin”). Variation margin is recorded as unrealized appreciation (depreciation) and, if any, shown as variation margin receivable (or payable) on futures contracts in the Statement of Assets and Liabilities. When the contract is closed, a realized gain or loss is recorded in the Statement of Operations equal to the difference between the value of the contract at the time it was opened and the value at the time it was closed. The use of futures contracts involves the risk of an imperfect correlation in the movements in the price of futures contracts and interest, foreign currency exchange rates or underlying assets.
Forward Foreign Currency Exchange Contracts: The Fund enters into forward foreign currency exchange contracts to gain or reduce exposure, to foreign currencies (foreign currency exchange rate risk).
A forward foreign currency exchange contract is an agreement between two parties to buy and sell a currency at a set exchange rate on a specified date. These contracts help to manage the overall exposure to the currencies in which some of the investments held by the Fund are denominated and in some cases, may be used to obtain exposure to a particular market.
The contract is marked to market daily and the change in market value is recorded as unrealized appreciation (depreciation) in the Statement of Assets and Liabilities. When a contract is closed, a realized gain or loss is recorded in the Statement of Operations equal to the difference between the value at the time it was opened and the value at the time it was closed. Non-deliverable forward foreign currency exchange contracts are settled with the counterparty in cash without the delivery of foreign currency. The use of forward foreign currency exchange contracts involves the risk that the value of a forward foreign currency exchange contract changes unfavorably due to movements in the value of the referenced foreign currencies.
Swaps: The Fund enters into swap contracts to manage exposure to issuers, markets and securities. Such contracts are agreements between the Fund and a counterparty to make periodic net payments on a specified notional amount or a net payment upon termination. Swap agreements are privately negotiated in the OTC market and may be entered into as a bilateral contract (“OTC swaps”) or centrally cleared (“centrally cleared swaps”).
For OTC swaps, any upfront premiums paid and any upfront fees received are shown as swap premiums paid and swap premiums received, respectively, in the Statement of Assets and Liabilities and amortized over the term of the contract. The daily fluctuation in market value is recorded as unrealized appreciation (depreciation) on OTC Swaps in the Statement of Assets and Liabilities. Payments received or paid are recorded in the Statement of Operations as realized gains or losses, respectively. When an OTC swap is terminated, a realized gain or loss is recorded in the Statement of Operations equal to the difference between the proceeds from (or cost of) the closing transaction and the Fund’s basis in the contract, if any. Generally, the basis of the contract is the premium received or paid.
In a centrally cleared swap, immediately following execution of the swap contract, the swap contract is novated to a central counterparty (the “CCP”) and the Fund’s counterparty on the swap agreement becomes the CCP. The Fund is required to interface with the CCP through the broker. Upon entering into a centrally cleared swap, the Fund is required to deposit initial margin with the broker in the form of cash or securities in an amount that varies depending on the size and risk profile of the particular swap. Securities deposited as initial margin are designated in the Schedule of Investments and cash deposited is shown as cash pledged for centrally cleared swaps in the Statement of Assets and Liabilities. Pursuant to the contract, the Fund
| | | | | | |
| | | BLACKROCK VARIABLE SERIES FUNDS, INC. | | JUNE 30, 2016 | | 31 |
| | | | |
| Notes to Financial Statements (continued) | | | BlackRock High Yield V.I. Fund | |
agrees to receive from or pay to the broker an amount of cash equal to the daily fluctuation in market value of the contract (“variation margin”). Variation margin is recorded as unrealized appreciation (depreciation) and shown as variation margin receivable (or payable) on centrally cleared swaps in the Statement of Assets and Liabilities. Payments received from (paid to) the counterparty, including at termination, are recorded as realized gains (losses) in the Statement of Operations.
| • | | Credit default swaps — The Fund enters into credit default swaps to manage its exposure to the market or certain sectors of the market, to reduce its risk exposure to defaults of corporate and/or sovereign issuers or to create exposure to corporate and/or sovereign issuers to which it is not otherwise exposed (credit risk). |
The Fund may either buy or sell (write) credit default swaps on single-name issuers (corporate or sovereign), a combination or basket of single-name issuers or traded indexes. Credit default swaps are agreements in which the protection buyer pays fixed periodic payments to the seller in consideration for a promise from the protection seller to make a specific payment should a negative credit event take place with respect to the referenced entity (e.g., bankruptcy, failure to pay, obligation acceleration, repudiation, moratorium or restructuring). As a buyer, if an underlying credit event occurs, the Fund will either (i) receive from the seller an amount equal to the notional amount of the swap and deliver the referenced security or underlying securities comprising the index, or (ii) receive a net settlement of cash equal to the notional amount of the swap less the recovery value of the security or underlying securities comprising the index. As a seller (writer), if an underlying credit event occurs, the Fund will either pay the buyer an amount equal to the notional amount of the swap and take delivery of the referenced security or underlying securities comprising the index or pay a net settlement of cash equal to the notional amount of the swap less the recovery value of the security or underlying securities comprising the index.
Swap transactions involve, to varying degrees, elements of interest rate, credit and market risk in excess of the amounts recognized in the Statement of Assets and Liabilities. Such risks involve the possibility that there will be no liquid market for these agreements, that the counterparty to the agreements may default on its obligation to perform or disagree as to the meaning of the contractual terms in the agreements, and that there may be unfavorable changes in interest rates and/or market values associated with these transactions.
Master Netting Arrangements: In order to define its contractual rights and to secure rights that will help it mitigate its counterparty risk, the Fund may enter into an International Swaps and Derivatives Association, Inc. Master Agreement (“ISDA Master Agreement”) or similar agreement with its counterparties. An ISDA Master Agreement is a bilateral agreement between the Fund and a counterparty that governs certain OTC derivatives and typically contains, among other things, collateral posting terms and netting provisions in the event of a default and/or termination event. Under an ISDA Master Agreement, the Fund may, under certain circumstances, offset with the counterparty certain derivative financial instruments’ payables and/or receivables with collateral held and/or posted and create one single net payment. The provisions of the ISDA Master Agreement typically permit a single net payment in the event of default including the bankruptcy or insolvency of the counterparty. Bankruptcy or insolvency laws of a particular jurisdiction may restrict or prohibit the right of offset in bankruptcy, insolvency or other events. In addition, certain ISDA Master Agreements allow counterparties to terminate derivative contracts prior to maturity in the event the Fund’s net assets decline by a stated percentage or the Fund fails to meet the terms of its ISDA Master Agreements. The result would cause the Fund to accelerate payment of any net liability owed to the counterparty.
Collateral Requirements: For derivatives traded under an ISDA Master Agreement, the collateral requirements are typically calculated by netting the mark-to-market amount for each transaction under such agreement and comparing that amount to the value of any collateral currently pledged by the Fund and the counterparty.
Cash collateral that has been pledged to cover obligations of the Fund and cash collateral received from the counterparty, if any, is reported separately on the Statement of Assets and Liabilities as cash pledged as collateral and cash received as collateral, respectively. Non-cash collateral pledged by the Fund, if any, is noted in the Schedule of Investments. Generally, the amount of collateral due from or to a counterparty is subject to a certain minimum transfer amount threshold before a transfer is required, which is determined at the close of business of the Fund. Any additional required collateral is delivered to/pledged by the Fund on the next business day. Typically, the counterparty is not permitted to sell, re-pledge or use cash and non-cash collateral it receives. The Fund generally agrees not to use non-cash collateral that it receives but may, absent default or certain other circumstances defined in the underlying ISDA Master Agreement, be permitted to use cash collateral received. In such cases, interest may be paid pursuant to the collateral arrangement with the counterparty. To the extent amounts due to the Fund from its counterparties are not fully collateralized, it bears the risk of loss from counterparty non-performance. Likewise, to the extent the Fund has delivered collateral to a counterparty and stands ready to perform under the terms of its agreement with such counterparty, it bears the risk of loss from a counterparty in the amount of the value of the collateral in the event the counterparty fails to return such collateral. Based on the terms of agreements, collateral may not be required for all derivative contracts.
For financial reporting purposes, the Fund does not offset derivative assets and derivative liabilities that are subject to netting arrangements, if any, in the Statement of Assets and Liabilities.
| | | | | | |
| 32 | | BLACKROCK VARIABLE SERIES FUNDS, INC. | | JUNE 30, 2016 | | |
| | | | |
| Notes to Financial Statements (continued) | | | BlackRock High Yield V.I. Fund | |
6. Investment Advisory Agreement and Other Transactions with Affiliates:
The PNC Financial Services Group, Inc. is the largest stockholder and an affiliate of BlackRock, Inc. (“BlackRock”) for 1940 Act purposes.
Investment Advisory
The Company, on behalf of the Fund, entered into an Investment Advisory Agreement with the Manager, the Fund’s investment adviser, an indirect, wholly owned subsidiary of BlackRock, to provide investment advisory and administration services. The Manager is responsible for the management of the Fund’s portfolio and provides the personnel, facilities, equipment and certain other services necessary to the operations of the Fund. For such services, the Fund pays the Manager a monthly fee based on a percentage of the Fund’s and BlackRock Total Return V.I. Fund’s, a series of the Company, aggregate average daily net assets at the following annual rates:
| | |
| Average Daily Net Assets | | Investment Advisory Fees |
Up to $250 Million | | 0.55% |
Over $250 Million up to $500 Million | | 0.50% |
Over $500 Million up to $750 Million | | 0.45% |
Over $750 Million | | 0.40% |
For the six months ended June 30, 2016, the aggregate average daily net assets of the Fund and the Company’s BlackRock Total Return V.I. Fund were approximately $508,857,986.
Distribution Fees
The Company, on behalf of the Fund, entered into a Distribution Agreement and a Distribution Plan with BlackRock Investments, LLC (“BRIL”), an affiliate of the Manager. Pursuant to the Distribution Plan and in accordance with Rule 12b-1 under the 1940 Act, the Fund pays BRIL ongoing distribution fees. The fees are accrued daily and paid monthly at an annual rate of 0.25% based upon the average daily net assets attributable to Class III.
For the six months ended June 30, 2016, the class specific distribution fees borne directly by Class III is $156,597.
Transfer Agent
The Manager, on behalf of the Fund, entered into agreements with insurance companies and other financial intermediaries (“Service Organizations”), some of which may be affiliates. Pursuant to these agreements, the Service Organizations provide the Fund with administrative, networking, recordkeeping, sub-transfer agency and shareholder services to sub-accounts they service. For these services, the Service Organizations receive an annual fee per shareholder account, which will vary depending on share class and/or net assets of Fund shareholders serviced by the Service Organizations, which is shown as transfer agent — class specific. For the six months ended June 30, 2016, the Fund paid the following amounts to affiliates in return for these services, which is included in transfer agent — class specific in the Statement of Operations:
| | | | |
| Class I | | Class III | | Total |
| $114,018 | | $70,043 | | $184,061 |
In addition, the Fund pays the transfer agent, which is not an affiliate, a fee for issuance, transfer and redemption of shares and the opening and maintenance of shareholder accounts, which is included in transfer agent in the Statement of Operations.
Expense Limitations, Waivers and Reimbursements
The Manager, with respect to the Fund, contractually agreed to waive and/or reimburse fees or expenses in order to limit expenses, excluding interest expense, dividend expense, tax expense, acquired fund fees and expenses, and certain other fund expenses, which constitute extraordinary expenses not incurred in the ordinary course of the Fund’s business. The expense limitations as a percentage of average daily net assets are as follows:
| | | | |
Class I | | | 1.25 | % |
Class III | | | 1.50 | % |
The Manager has agreed not to reduce or discontinue this contractual expense limitation prior to May 1, 2017, unless approved by the Board, including a majority of the Independent Directors who are not “interested persons” of the Fund, as defined in the 1940 Act (“Independent Directors”) or by a majority of the outstanding voting securities of the Fund.
The Manager, with respect to the Fund, voluntarily agreed to waive its investment advisory fees by the amount of investment advisory fees the Fund pays to the Manager indirectly through its investment in affiliated money market funds. This amount is shown as fees waived by the Manager in the
| | | | | | |
| | | BLACKROCK VARIABLE SERIES FUNDS, INC. | | JUNE 30, 2016 | | 33 |
| | | | |
| Notes to Financial Statements (continued) | | | BlackRock High Yield V.I. Fund | |
Statement of Operations. However, the Manager does not waive its investment advisory fees by the amount of investment advisory fees paid in connection with the Fund’s investment in other affiliated investment companies, if any. For the six months ended June 30, 2016, the amount waived was $3,513.
The Manager has contractually agreed to reimburse transfer agent fees in order to limit such expenses to a percentage of average daily net assets as follows:
| | | | |
Class I | | | 0.06 | % |
Class III | | | 0.05 | % |
The Manager has agreed not to reduce or discontinue this contractual reimbursement prior to May 1, 2017, unless approved by the Board, including a majority of the Independent Directors or by a majority of the outstanding voting securities of the Fund.
These amounts are shown as transfer agent fees reimbursed — class specific in the Statement of Operations. Class specific expense waivers and/or reimbursements are as follows:
| | | | | | | | | | | | |
| | | Class I | | | Class III | | | Total | |
Transfer Agent Fees Reimbursed | | $ | 75,949 | | | $ | 38,591 | | | $ | 114,540 | |
For the six months ended June 30, 2016, the Fund reimbursed the Manager $1,167 for certain accounting services, which is included in accounting services in the Statement of Operations.
Officers and Directors
Certain officers and/or directors of the Company are officers and/or directors of BlackRock or its affiliates. The Fund reimburses the Manager for a portion of the compensation paid to the Company’s Chief Compliance Officer, which is included in Officer and Directors in the Statement of Operations.
Other Transactions
The Fund may purchase securities from, or sell securities to, an affiliated fund provided the affiliation is due solely to having a common investment adviser, common officers, or common directors. For the six months ended June 30, 2016, the purchase and sale transactions and any realized gains (losses) with an affiliated fund in compliance with Rule 17a-7 under the 1940 Act were as follows:
| | | | | | |
| Purchases | | Sales | | | Net Realized Gain (Loss) |
| $178,634 | | | — | | | — |
7. Purchases and Sales:
For the six months ended June 30, 2016, purchases and sales of investments, including paydowns and excluding short-term securities, were $151,954,362 and $115,512,810, respectively.
8. Income Tax Information:
It is the Fund’s policy to comply with the requirements of the Internal Revenue Code of 1986, as amended, applicable to regulated investment companies, and to distribute substantially all of its taxable income to its shareholders. Therefore, no federal income tax provision is required.
The Fund files U.S. federal and various state and local tax returns. No income tax returns are currently under examination. The statute of limitations on the Fund’s U.S. federal tax returns generally remains open for each of the four years ended December 31, 2015. The statutes of limitations on the Fund’s state and local tax returns may remain open for an additional year depending upon the jurisdiction.
Management has analyzed tax laws and regulations and their application to the Fund as of June 30, 2016, inclusive of the open tax return years, and does not believe there are any uncertain tax positions that require recognition of a tax liability in the Fund’s financial statements.
As of December 31, 2015, the Fund had capital loss carryforwards available to offset future realized capital gains through the indicated expiration dates as follows:
| | | | |
| Expires December 31, | | | |
No expiration date1 | | $ | 8,442,669 | |
2016 | | | 9,129,091 | |
2017 | | | 11,211,061 | |
| | | | |
Total | | $ | 28,782,821 | |
| | | | |
| | 1 | | Must be utilized prior to losses subject to expiration. |
| | | | | | |
| 34 | | BLACKROCK VARIABLE SERIES FUNDS, INC. | | JUNE 30, 2016 | | |
| | | | |
| Notes to Financial Statements (continued) | | | BlackRock High Yield V.I. Fund | |
As of June 30, 2016, gross unrealized appreciation and depreciation based on cost for federal income tax purposes were as follows:
| | | | |
Tax cost | | $ | 261,046,753 | |
| | | | |
Gross unrealized appreciation | | $ | 5,151,123 | |
Gross unrealized depreciation | | | (9,206,490 | ) |
| | | | |
Net unrealized depreciation | | $ | (4,055,367 | ) |
| | | | |
9. Bank Borrowings:
The Company, on behalf of the Fund, along with certain other funds managed by the Manager and its affiliates (“Participating Funds”), is a party to a 364-day, $2.1 billion credit agreement with a group of lenders. Under this agreement, the Fund may borrow to fund shareholder redemptions. Excluding commitments designated for certain individual funds, the Participating Funds, including the Fund, can borrow up to an aggregate commitment amount of $1.6 billion at any time outstanding, subject to asset coverage and other limitations as specified in the agreement. The credit agreement has the following terms: a fee of 0.12% per annum on unused commitment amounts and interest at a rate equal to the higher of (a) one-month LIBOR (but, in any event, not less than 0.00%) on the date the loan is made plus 0.80% per annum or (b) the Fed Funds rate (but, in any event, not less than 0.00%) in effect from time to time plus 0.80% per annum on amounts borrowed. The agreement expires in April 2017 unless extended or renewed. Prior to April 21, 2016, the credit agreement had a fee per annum of 0.06% on unused commitment amounts and interest at a rate equal to the higher of (a) one-month LIBOR (but, in any event, not less than 0.00%) on the date the loan is made plus 0.80% per annum or (b) the Fed Funds rate (but, in any event, not less than 0.00%) in effect from time to time plus 0.80% per annum on amounts borrowed. Participating Funds paid administration, legal and arrangement fees, which, if applicable, are included in miscellaneous expenses in the Statement of Operations. These fees were allocated among such funds based upon portions of the aggregate commitment available to them and relative net assets of Participating Funds. During the six months ended June 30, 2016, the Fund did not borrow under the credit agreement.
10. Principal Risks:
In the normal course of business, the Fund invests in securities and enters into transactions where risks exist due to fluctuations in the market (market risk) or failure of the issuer to meet all its obligations, including the ability to pay principal and interest when due (issuer credit risk). The value of securities held by the Fund may decline in response to certain events, including those directly involving the issuers of securities owned by the Fund. Changes arising from the general economy; the overall market and local, regional or global political and/or social instability, as well as currency, interest rate and price fluctuations, may also affect the securities’ value.
The Fund may be exposed to prepayment risk, which is the risk that borrowers may exercise their option to prepay principal earlier than scheduled during periods of declining interest rates, which would force the Fund to reinvest in lower yielding securities. The Fund may also be exposed to reinvestment risk, which is the risk that income from the Fund’s portfolio will decline if the Fund invests the proceeds from matured, traded or called fixed income securities at market interest rates that are below the Fund portfolio’s current earnings rate.
Counterparty Credit Risk: Similar to issuer credit risk, the Fund may be exposed to counterparty credit risk, or the risk that an entity may fail to or be unable to perform on its commitments related to unsettled or open transactions. The Fund manages counterparty credit risk by entering into transactions only with counterparties that the Manager believes have the financial resources to honor their obligations and by monitoring the financial stability of those counterparties. Financial assets, which potentially expose the Fund to market, issuer and counterparty credit risks, consist principally of financial instruments and receivables due from counterparties. The extent of the Fund’s exposure to market, issuer and counterparty credit risks with respect to these financial assets is approximately their value recorded in the Statement of Assets and Liabilities, less any collateral held by the Fund.
A derivative contract may suffer a mark-to-market loss if the value of the contract decreases due to an unfavorable change in the market rates or values of the underlying instrument. Losses can also occur if the counterparty does not perform under the contract.
The Fund’s risk of loss from counterparty credit risk on OTC derivatives is generally limited to the aggregate unrealized gain less the value of any collateral held by the Fund.
With exchange-traded futures and centrally cleared swaps, there is less counterparty credit risk to the Fund since the exchange or clearinghouse, as counterparty to such instruments, guarantees against a possible default. The clearinghouse stands between the buyer and the seller of the contract; therefore, credit risk is limited to failure of the clearinghouse. While offset rights may exist under applicable law, the Fund does not have a contractual right of offset against a clearing broker or clearinghouse in the event of a default (including the bankruptcy or insolvency). Additionally, credit risk exists in exchange-traded futures and centrally cleared swaps with respect to initial and variation margin that is held in a clearing broker’s customer accounts. While clearing brokers are required to segregate customer margin from their own assets, in the event that a clearing broker becomes insolvent or goes into bankruptcy and at that time there is a shortfall in the aggregate amount of margin held by the clearing broker for all its clients, typically the shortfall would be allocated on a pro rata basis across all the clearing broker’s customers, potentially resulting in losses to the Fund.
| | | | | | |
| | | BLACKROCK VARIABLE SERIES FUNDS, INC. | | JUNE 30, 2016 | | 35 |
| | | | |
| Notes to Financial Statements (concluded) | | | BlackRock High Yield V.I. Fund | |
Concentration Risk: The Fund invests a significant portion of its assets in fixed-income securities and/or uses derivatives tied to the fixed-income markets. Changes in market interest rates or economic conditions may affect the value and/or liquidity of such investments. Interest rate risk is the risk that prices of bonds and other fixed-income securities will increase as interest rates fall and decrease as interest rates rise. The Fund may be subject to a greater risk of rising interest rates due to the current period of historically low rates.
11. Capital Share Transactions:
Transactions in capital shares for each class were as follows:
| | | | | | | | | | | | | | | | | | | | |
| | | Six Months Ended
June 30, 2016 | | | | | | Year Ended
December 31, 2015 | |
| | | Shares | | | Amount | | | | | | Shares | | | Amount | |
| Class I | | | | | | | | | | | | | | | |
Shares sold | | | 947,664 | | | | $ 6,501,931 | | | | | | | | 2,469,573 | | | | $ 17,493,607 | |
Shares issued in reinvestment of distributions | | | 513,632 | | | | 3,503,312 | | | | | | | | 1,058,601 | | | | 7,723,213 | |
Shares redeemed | | | (1,616,240) | | | | (10,978,615) | | | | | | | | (3,441,699) | | | | (25,310,952) | |
| | | | | | | | | | | | |
Net increase (decrease) | | | (154,944) | | | | $ (973,372) | | | | | | | | 86,475 | | | | $ (94,132) | |
| | | | | | | | | | | | |
| | | | | | | | | | | | | | | | | | | | |
| Class III | | | | | | | | | | | | | | | |
Shares sold | | | 18,318,216 | | | | $124,354,783 | | | | | | | | 23,405,785 | | | | $ 171,738,346 | |
Shares issued in reinvestment of distributions | | | 458,406 | | | | 3,134,298 | | | | | | | | 647,949 | | | | 4,701,923 | |
Shares redeemed | | | (12,445,609) | | | | (84,883,036) | | | | | | | | (16,920,447) | | | | (123,118,533) | |
| | | | | | | | | | | | |
Net increase | | | 6,331,013 | | | | $ 42,606,045 | | | | | | | | 7,133,287 | | | | $ 53,321,736 | |
| | | | | | | | | | | | |
Total Net Increase | | | 6,176,069 | | | | $ 41,632,673 | | | | | | | | 7,219,762 | | | | $ 53,227,604 | |
| | | | | | | | | | | | |
12. Subsequent Events:
Management has evaluated the impact of all subsequent events on the Fund through the date the financial statements were issued and has determined that there were no subsequent events requiring adjustment or additional disclosure in the financial statements.
| | | | | | |
| 36 | | BLACKROCK VARIABLE SERIES FUNDS, INC. | | JUNE 30, 2016 | | |
JUNE 30, 2016
| | | | |
SEMI-ANNUAL REPORT (UNAUDITED) | | | | BLACKROCK® |
BlackRock Variable Series Funds, Inc.
▶ BlackRock International V.I. Fund
| | |
| Not FDIC Insured ¡ May Lose Value ¡ No Bank Guarantee | | |
| | | | |
| Fund Summary as of June 30, 2016 | | | BlackRock International V.I. Fund | |
|
| Investment Objective |
| BlackRock International V.I. Fund’s (the “Fund”) investment objective is long-term capital growth. |
|
| Portfolio Management Commentary |
How did the Fund perform?
| • | | For the six-month period ended June 30, 2016, the Fund underperformed its benchmark, the MSCI All Country World (ACWI) ex USA Index. |
What factors influenced performance?
| • | | From a sector perspective, negative stock selection in health care, financials and consumer discretionary detracted from performance. The most significant individual detractors included Alexion Pharmaceuticals, Inc., which suffered in the rotation away from health care companies during the first quarter on concerns about potential price controls. Shares of Lloyds Banking Group PLC suffered in the wake of the surprise result of the U.K. referendum on leaving the European Union. A position in Japanese automaker Mazda Motor Corp. also lagged notably as the company’s results were negatively impacted by a strong yen. |
| • | | Positive stock selection in telecommunication services (“telecom”), industrials and information technology (“IT”) contributed the most to performance. The top individual contributors included Recruit Holdings Co., Ltd., a Japanese staffing company which saw its shares perform well following strong full year earnings released in May. Shares of Royal Dutch Shell PLC rose in line with oil prices, and also benefited from the British pound’s weakness post-Brexit, given that most of its revenue is earned in U.S. dollars. A position in Telefonica Brasil SA also outperformed. |
Describe recent portfolio activity.
| • | | The largest change to active positioning was a material increase in the Fund’s position in financials, bringing the allocation almost to the benchmark weight. A significant increase to the Fund’s IT overweight and a significant decrease in the consumer discretionary overweight were the other notable changes. Examples of new financial holdings include pan-Asian insurer AIA Group Ltd., along with banks Intesa Sanpaolo SpA (Italy) and Axis Bank Ltd. (India). Within IT, Omron Corp. (Japan) and Baidu Inc. (China) were added, and additional capital was invested into ASML Holding NV (Netherlands) and Trend Micro, Inc. (Japan). Conversely, a number of consumer discretionary stocks were sold, including Mazda Motor Corp., Mattel, Inc. and Magna International, Inc. |
Describe portfolio positioning at period end.
| • | | Relative to the benchmark, the Fund’s largest sector overweight positions were in health care, IT and telecom. The largest underweight exposures were consumer staples, materials and utilities. On a regional basis, the largest overweight exposures were in the United Kingdom and the Netherlands, while the largest underweight allocations were in Canada and Germany. |
The views expressed reflect the opinions of BlackRock as of the date of this report and are subject to change based on changes in market, economic or other conditions. These views are not intended to be a forecast of future events and are no guarantee of future results.
| | |
| Geographic Allocation | | Percent of
Net Assets |
United Kingdom | | 20% |
Japan | | 18 |
Netherlands | | 13 |
United States | | 6 |
Ireland | | 6 |
China | | 5 |
Belgium | | 4 |
Hong Kong | | 3 |
Israel | | 3 |
India. | | 3 |
South Korea | | 3 |
France | | 2 |
Brazil | | 2 |
Indonesia | | 2 |
Sweden. | | 2 |
Taiwan | | 2 |
Italy | | 2 |
Switzerland | | 2 |
Short-Term Securities | | 3 |
Liabilities in Excess of Other Assets | | (1) |
| | | | | | |
| 2 | | BLACKROCK VARIABLE SERIES FUNDS, INC. | | JUNE 30, 2016 | | |
| | | | |
| | | | BlackRock International V.I. Fund | |
|
| Total Return Based on a $10,000 Investment |
| | 1 | Assuming transaction costs, if any, and other operating expenses, including investment advisory fees. Does not include insurance-related fees and expenses. |
| | 2 | The Fund invests primarily in stocks of companies located outside the U.S. The Fund’s total returns prior to October 1, 2011 are the returns of the Fund when it followed a different investment strategy under the name “BlackRock International Value V.I. Fund.” |
| | 3 | A free float-adjusted market capitalization index designed to measure the combined equity market performance of developed and emerging market countries, excluding the United States. |
| | | | | | | | |
| Performance Summary for the Period Ended June 30, 2016 | | | | | | | | |
| | | | | Average Annual Total Returns |
| | | 6-Month
Total Returns5 | | 1 Year5 | | 5 Years5 | | 10 Years5 |
Class I4 | | (5.56)% | | (12.58)% | | (0.22)% | | 0.47% |
MSCI ACWI ex USA Index | | (1.02) | | (10.24) | | 0.10 | | 1.87 |
| | 4 | | Average annual and cumulative total returns are based on changes in net asset value for the periods shown, and assume reinvestment of all distributions at net asset value on the ex-dividend date. Insurance-related fees and expenses are not reflected in these returns. The Fund’s total returns prior to October 1, 2011 are the returns of the Fund when it followed a different investment strategy under the name “BlackRock International Value V.I. Fund.” |
| | 5 | | For a portion of the period, the Fund’s investment adviser waived a portion of its fee. Without such waiver, the Fund’s performance would have been lower. |
| | | | Past performance is not indicative of future results. Performance results do not reflect the deduction of taxes that a shareholder would pay on Fund distributions or the redemption of Fund shares. |
| | | | | | | | | | | | | | |
| Expense Example | | | | | | | | | | | | | | |
| | | Actual | | Hypothetical7 | | |
| | | Beginning
Account Value
January 1, 2016 | | Ending
Account Value
June 30, 2016 | | Expenses Paid
During the Period6 | | Beginning
Account Value
January 1, 2016 | | Ending
Account Value
June 30, 2016 | | Expenses Paid
During the Period6 | | Annualized
Expense Ratio |
Class I | | $1,000.00 | | $944.40 | | $4.93 | | $1,000.00 | | $1,019.79 | | $5.12 | | 1.02% |
| | 6 | | Expenses are equal to the annualized expense ratio, multiplied by the average account value over the period, multiplied by 182/366 (to reflect the one-half year period shown). |
| | 7 | | Hypothetical 5% annual return before expenses is calculated by prorating the number of days in the most recent fiscal half year divided by 366. |
| | | | See “Disclosure of Expenses” on the following page for further information on how expenses were calculated. |
| | | | | | |
| | | BLACKROCK VARIABLE SERIES FUNDS, INC. | | JUNE 30, 2016 | | 3 |
| | | | |
| Disclosure of Expenses | | | BlackRock International V.I. Fund | |
Shareholders of the Fund may incur the following charges: (a) transactional expenses, such as sales charges; and (b) operating expenses, including investment advisory fees, service and distribution fees, including 12b-1 fees, acquired fund fees and expenses and other fund expenses. The expense example on the previous page (which is based on a hypothetical investment of $1,000 invested on January 1, 2016 and held through June 30, 2016) is intended to assist shareholders both in calculating expenses based on an investment in the Fund and in comparing these expenses with similar costs of investing in other mutual funds.
The expense example provides information about actual account values and actual expenses. In order to estimate the expenses a shareholder paid during the period covered by this report, shareholders can divide their account value by $1,000 and then multiply the result by the number corresponding to their share class under the heading entitled “Expenses Paid During the Period.”
The expense example also provides information about hypothetical account values and hypothetical expenses based on the Fund’s actual expense ratio and an assumed rate of return of 5% per year before expenses. In order to assist shareholders in comparing the ongoing expenses of investing in the Fund and other funds, compare the 5% hypothetical example with the 5% hypothetical example that appears in shareholder reports of other funds.
The expenses shown in the expense example are intended to highlight shareholders’ ongoing costs only and do not reflect any transactional expenses, such as sales charges, if any. Therefore, the hypothetical example is useful in comparing ongoing expenses only, and will not help shareholders determine the relative total expenses of owning different funds. If these transactional expenses were included, shareholder expenses would have been higher.
|
| Derivative Financial Instruments |
The Fund may invest in various derivative financial instruments. These instruments are used to obtain exposure to a security, commodity, index, market, and/or other asset without owning or taking physical custody of securities, commodities and/or other referenced assets or to manage market, equity, credit, interest rate, foreign currency exchange rate, commodity and/or other risks. Derivative financial instruments may give rise to a form of economic leverage and involve risks, including the imperfect correlation between the value of a derivative financial instrument and the underlying asset, possible default of the counterparty to the transaction
or illiquidity of the instrument. The Fund’s successful use of a derivative financial instrument depends on the investment adviser’s ability to predict pertinent market movements accurately, which cannot be assured. The use of these instruments may result in losses greater than if they had not been used, may limit the amount of appreciation the Fund can realize on an investment and/or may result in lower distributions paid to shareholders. The Fund’s investments in these instruments, if any, are discussed in detail in the Notes to Financial Statements.
| | | | | | |
| 4 | | BLACKROCK VARIABLE SERIES FUNDS, INC. | | JUNE 30, 2016 | | |
| | | | |
| Schedule of Investments June 30, 2016 (Unaudited) | | | BlackRock International V.I. Fund | |
| | | (Percentages shown are based on Net Assets) | |
| | | | | | | | |
| Common Stocks | | Shares | | | Value | |
Belgium — 3.6% | | | | | | | | |
KBC Groep NV (a) | | | 69,931 | | | $ | 3,439,285 | |
Brazil — 2.4% | | | | | | | | |
Telefonica Brasil SA, Preferred Shares (a) | | | 165,928 | | | | 2,263,476 | |
China — 5.3% | | | | | | | | |
Baidu, Inc. — ADR (a) | | | 8,984 | | | | 1,483,708 | |
Bank of China Ltd., H Shares | | | 8,807,000 | | | | 3,539,603 | |
| | | | | | | | |
| | | | | | | | 5,023,311 | |
France — 2.5% | | | | | | | | |
Compagnie de Saint-Gobain | | | 63,811 | | | | 2,418,805 | |
Hong Kong — 3.5% | | | | | | | | |
AIA Group Ltd. | | | 561,000 | | | | 3,373,700 | |
India — 2.7% | | | | | | | | |
Axis Bank Ltd. | | | 329,454 | | | | 2,617,906 | |
Indonesia — 2.2% | | | | | | | | |
Bank Mandiri Perseo Tbk PT | | | 2,866,100 | | | | 2,074,068 | |
Ireland — 5.9% | | | | | | | | |
Shire PLC | | | 91,636 | | | | 5,663,365 | |
Israel — 3.4% | | | | | | | | |
Teva Pharmaceutical Industries Ltd. — ADR | | | 64,005 | | | | 3,214,971 | |
Italy — 1.7% | | | | | | | | |
Intesa Sanpaolo SpA | | | 877,232 | | | | 1,670,881 | |
Japan — 18.3% | | | | | | | | |
Bridgestone Corp. | | | 32,800 | | | | 1,054,092 | |
Omron Corp. | | | 121,200 | | | | 3,956,062 | |
Recruit Holdings Co. Ltd. | | | 153,700 | | | | 5,615,294 | |
THK Co. Ltd. | | | 204,800 | | | | 3,490,696 | |
Trend Micro, Inc. | | | 95,800 | | | | 3,426,188 | |
| | | | | | | | |
| | | | | | | | 17,542,332 | |
Netherlands — 13.1% | | | | | | | | |
ASML Holding NV | | | 40,057 | | | | 3,943,157 | |
Heineken NV | | | 18,532 | | | | 1,699,796 | |
ING Groep NV CVA | | | 288,383 | | | | 2,983,598 | |
Royal Dutch Shell PLC, A Shares | | | 143,007 | | | | 3,922,759 | |
| | | | | | | | |
| | | | | | | | 12,549,310 | |
South Korea — 2.7% | | | | | | | | |
SK Telecom Co. Ltd | | | 13,710 | | | | 2,575,655 | |
Sweden — 2.1% | | | | | | | | |
SKF AB, Class B | | | 124,460 | | | | 1,994,219 | |
Switzerland — 1.5% | | | | | | | | |
Cie Financiere Richemont SA, Registered Shares | | | 24,475 | | | | 1,432,637 | |
Taiwan — 2.1% | | | | | | | | |
Hermes Microvision, Inc. | | | 48,000 | | | | 1,990,281 | |
| | | | | | | | |
| Common Stocks | | Shares | | | Value | |
United Kingdom — 19.6% | | | | | | | | |
AstraZeneca PLC | | | 88,819 | | | $ | 5,309,941 | |
Kingfisher PLC | | | 967,761 | | | | 4,156,638 | |
Liberty Global PLC LiLAC, Class A (a) | | | 11,605 | | | | 374,377 | |
Liberty Global PLC, Class A (a) | | | 60,742 | | | | 1,765,162 | |
Lloyds Banking Group PLC | | | 3,624,361 | | | | 2,625,104 | |
Vodafone Group PLC | | | 1,487,908 | | | | 4,536,446 | |
| | | | | | | | |
| | | | | | | | 18,767,668 | |
United States — 6.0% | | | | | | | | |
Alexion Pharmaceuticals, Inc. (a) | | | 14,905 | | | | 1,740,308 | |
Estee Lauder Cos., Inc., Class A | | | 16,214 | | | | 1,475,798 | |
TripAdvisor, Inc. (a) | | | 39,630 | | | | 2,548,209 | |
| | | | | | | | |
| | | | | | | | 5,764,315 | |
Total Long-Term Investments (Cost — $99,386,371) — 98.6% | | | | | | | 94,376,185 | |
| | | | | | | | |
| Short-Term Securities | | | | | | |
BlackRock Liquidity Funds, TempFund, Institutional Class, 0.40% (b)(c) | | | 2,447,980 | | | | 2,447,980 | |
| | | | | | | | |
| Time Deposits | | Par (000) | | | | |
Japan — 0.0% | | | | | | | | |
Brown Brothers Harriman & Co., (0.33)%, 7/01/16 | | $ | 2,528 | | | | 24,484 | |
Switzerland — 0.1% | | | | | | | | |
Brown Brothers Harriman & Co., (1.45)%, 7/01/16 | | | 81 | | | | 82,858 | |
Total Time Deposits — 0.1% | | | | | | | 107,342 | |
Total Short-Term Securities (Cost — $2,555,322) — 2.6% | | | | | | | 2,555,322 | |
Total Investments (Cost — $101,941,693) — 101.2% | | | | | | | 96,931,507 | |
Liabilities in Excess of Other Assets — (1.2)% | | | | | | | (1,193,475 | ) |
| | | | | | | | |
Net Assets — 100.0% | | | | | | $ | 95,738,032 | |
| | | | | | | | |
| | | | | | |
| Portfolio Abbreviations |
| ADR | | American Depositary Receipts | | USD | | U.S. Dollar |
| AUD | | Australian Dollar | | | | |
See Notes to Financial Statements.
| | | | | | |
| | | BLACKROCK VARIABLE SERIES FUNDS, INC. | | JUNE 30, 2016 | | 5 |
| | | | |
| Schedule of Investments (continued) | | | BlackRock International V.I. Fund | |
|
| Notes to Schedule of Investments |
| (a) | Non-income producing security. |
| (b) | During the six months ended June 30, 2016, investments in issuers considered to be affiliates of the Fund for purposes of Section 2(a)(3) of the Investment Company Act of 1940, as amended, were as follows: |
| | | | | | | | | | | | | | | | | | | | |
| Affiliate | | Shares/Beneficial Interest Held at December 31, 2015 | | | Net Activity | | | Shares Held at June 30, 2016 | | | Value at June 30, 2016 | | | Income | |
BlackRock Liquidity Funds, TempFund, Institutional Class | | | 869,748 | | | | 1,578,232 | | | | 2,447,980 | | | | $2,447,980 | | | | $3,057 | |
BlackRock Liquidity Series, LLC, Money Market Series | | | $3,559,780 | | | | $(3,559,780 | ) | | | — | | | | — | | | | 6,032 | 1 |
| | | | | | | | | | | | | | | $2,447,980 | | | | $9,089 | |
| | | | | | | | | | | | | | | | |
| | 1 | | Represents securities lending income earned from the reinvestment of cash collateral from loaned securities, net of fees and collateral investment expenses, and other payments to and from borrowers of securities. |
| (c) | Current yield as of period end. |
|
| Derivative Financial Instruments Outstanding as of Period End |
| | | | | | | | | | | | | | | | | | | | | | | | |
| Forward Foreign Currency Exchange Contracts | |
Currency Purchased | | | | | Currency Sold | | | | | Counterparty | | Settlement Date | | | | | | Unrealized Depreciation | |
AUD | | | 4,469,000 | | | USD | | | 3,349,158 | | | Citibank N.A. | | | 7/07/16 | | | | | | | | $(17,061 | ) |
|
| Derivative Financial Instruments Categorized by Risk Exposure |
As of period end, the fair values of derivative financial instruments located in the Statement of Assets and Liabilities were as follows:
| | | | | | | | | | | | | | | | | | | | | | | | | | | | | | |
| Liabilities - Derivative Financial Instruments | | Commodity Contracts | | | Credit Contracts | | | Equity Contracts | | | Foreign Currency Exchange Contracts | | | Interest Rate Contracts | | | Other Contracts | | | Total | |
Forward foreign currency exchange contracts | | Unrealized depreciation on forward foreign currency exchange contracts | | | — | | | | — | | | | — | | | | $(17,061 | ) | | | — | | | | — | | | | $(17,061) | |
For the six months ended June 30, 2016, the effect of derivative financial instruments in the Statement of Operations was as follows:
| | | | | | | | | | | | | | | | | | | | | | | | | | | | |
| | | Commodity Contracts | | | Credit Contracts | | | Equity Contracts | | | Foreign Currency Exchange Contracts | | | Interest Rate Contracts | | | Other Contracts | | | Total | |
Net Realized Gain (Loss) from: | | | | | | | | | | | | | | | | | | | | | | | | | | | | |
Forward foreign currency exchange contracts | | | — | | | | — | | | | — | | | | $135,121 | | | | — | | | | — | | | | $135,121 | |
| | | | | | | | | | | | | | | | | | | | | | | | | | | | |
Net Change in Unrealized Appreciation (Depreciation) on: | | | | | | | | | | | | | | | | | | | | | | | | | | | | |
Forward foreign currency exchange contracts | | | — | | | | — | | | | — | | | | $ (30,896 | ) | | | — | | | | — | | | | $ (30,896 | ) |
|
| Average Quarterly Balances of Outstanding Derivative Financial Instruments |
| | | | |
Forward foreign currency exchange contracts: | | | | |
Average amounts purchased — in USD. | | $ | 6,499,928 | 1 |
Average amounts sold — in USD | | $ | 3,236,778 | |
| | 1 | | Actual amounts for the period are shown due to limited outstanding derivative financial instruments as of each quarter end. |
For more information about the Fund’s investment risks regarding derivative financial instruments, refer to the Notes to Financial Statements.
See Notes to Financial Statements.
| | | | | | |
| 6 | | BLACKROCK VARIABLE SERIES FUNDS, INC. | | JUNE 30, 2016 | | |
| | | | |
| Schedule of Investments (continued) | | | BlackRock International V.I. Fund | |
|
| Derivative Financial Instruments – Offsetting as of Period End |
The Fund’s derivative assets and liabilities (by type) were as follows:
| | | | | | | | |
| | | Assets | | | Liabilities | |
Derivative Financial Instruments: | | | | | | | | |
Forward foreign currency exchange contracts | | | — | | | | $17,061 | |
| | | | |
Total derivative assets and liabilities in the Statement of Assets and Liabilities | | | — | | | | 17,061 | |
| | | | |
Derivatives not subject to a Master Netting Agreement or similar agreement (“MNA”) | | | — | | | | — | |
| | | | |
Total derivative assets and liabilities subject to an MNA | | | — | | | | $17,061 | |
| | | | |
The following table presents the Fund’s derivative assets and liabilities by counterparty net of amounts available for offset under an MNA and net of the related collateral received and pledged
by the Fund:
| | | | | | | | | | |
| Counterparty | | Derivative Liabilities Subject to an MNA by Counterparty | | Derivatives Available for Offset | | Non-cash Collateral Pledged | | Cash Collateral Pledged | | Net Amount of Derivative Liabilities1 |
Citibank N.A | | $17,061 | | — | | — | | — | | $17,061 |
| | 1 | | Net amount represents the net amount payable due to the counterparty in the event of default. |
|
| Fair Value Hierarchy as of Period End |
Various inputs are used in determining the fair value of investments and derivative financial instruments. For information about the Fund’s policy regarding valuation of investments and
derivative financial instruments, refer to the Notes to Financial Statements.
The following tables summarize the Fund’s investments and derivative financial instruments categorized in the disclosure hierarchy:
| | | | | | | | | | | | | | | | |
| | | Level 1 | | | Level 2 | | | Level 3 | | | Total | |
Assets: | | | | | | | | | | | | | | | | |
Investments: | | | | | | | | | | | | | | | | |
Long-Term Investments: | | | | | | | | | | | | | | | | |
Common Stocks: | | | | | | | | | | | | | | | | |
Belgium | | | — | | | $ | 3,439,285 | | | | — | | | $ | 3,439,285 | |
Brazil | | $ | 2,263,476 | | | | — | | | | — | | | | 2,263,476 | |
China | | | 1,483,708 | | | | 3,539,603 | | | | — | | | | 5,023,311 | |
France | | | — | | | | 2,418,805 | | | | — | | | | 2,418,805 | |
Hong Kong | | | — | | | | 3,373,700 | | | | — | | | | 3,373,700 | |
India. | | | — | | | | 2,617,906 | | | | — | | | | 2,617,906 | |
Indonesia | | | — | | | | 2,074,068 | | | | — | | | | 2,074,068 | |
Ireland | | | — | | | | 5,663,365 | | | | — | | | | 5,663,365 | |
Israel | | | 3,214,971 | | | | — | | | | — | | | | 3,214,971 | |
Italy | | | — | | | | 1,670,881 | | | | — | | | | 1,670,881 | |
Japan | | | — | | | | 17,542,332 | | | | — | | | | 17,542,332 | |
Netherlands | | | — | | | | 12,549,310 | | | | — | | | | 12,549,310 | |
South Korea. | | | — | | | | 2,575,655 | | | | — | | | | 2,575,655 | |
Sweden | | | — | | | | 1,994,219 | | | | — | | | | 1,994,219 | |
Switzerland | | | — | | | | 1,432,637 | | | | — | | | | 1,432,637 | |
Taiwan | | | — | | | | 1,990,281 | | | | — | | | | 1,990,281 | |
United Kingdom | | | 2,139,539 | | | | 16,628,129 | | | | — | | | | 18,767,668 | |
United States | | | 5,764,315 | | | | — | | | | — | | | | 5,764,315 | |
Short-Term Securities: | | | | | | | | | | | | | | | | |
Money Market Funds | | | 2,447,980 | | | | — | | | | — | | | | 2,447,980 | |
Time Deposits | | | — | | | | 107,342 | | | | — | | | | 107,342 | |
| | | | |
Total | | $ | 17,313,989 | | | $ | 79,617,518 | | | | — | | | $ | 96,931,507 | |
| | | | |
| | | | | | | | | | | | | | | | |
Derivative Financial Instruments1 | | | | | | | | | | | | | | | | |
Liabilities: | | | | | | | | | | | | | | | | |
Foreign currency exchange contracts | | | — | | | $ | (17,061 | ) | | | — | | | $ | (17,061 | ) |
| 1 | Derivative financial instruments are forward foreign currency exchange contracts, which are valued at the unrealized appreciation (depreciation) on the instrument. |
See Notes to Financial Statements.
| | | | | | |
| | | BLACKROCK VARIABLE SERIES FUNDS, INC. | | JUNE 30, 2016 | | 7 |
| | | | |
| Schedule of Investments (concluded) | | | BlackRock International V.I. Fund | |
The Fund may hold assets and/or liabilities in which the fair value approximates the carrying amount for financial statement purposes. As of period end, foreign currency at value of $81,549 is
categorized as Level 1 within the disclosure hierarchy.
Transfers between Level 1 and Level 2 were as follows:
| | | | | | | | | | | | | | | | |
| | | Transfers into Level 1 | | | Transfers out of Level 11 | | | Transfers into Level 21 | | | Transfers out of Level 2 | |
Assets: | | | | | | | | | | | | | | | | |
Long-Term Investments: | | | | | | | | | | | | | | | | |
Netherlands | | | — | | | $ | (3,303,809 | ) | | $ | 3,303,809 | | | | — | |
| | 1 | | External pricing service used to reflect any significant market movements between the time the Fund valued such foreign securities and the earlier closing of foreign markets. |
See Notes to Financial Statements.
| | | | | | |
| 8 | | BLACKROCK VARIABLE SERIES FUNDS, INC. | | JUNE 30, 2016 | | |
| | | | |
| Statement of Assets and Liabilities | | | | |
| | | | |
| June 30, 2016 (Unaudited) | | BlackRock
International
V.I. Fund | |
| | | | |
| Assets | | | | |
Investments at value — unaffiliated (cost — $99,493,713) | | $ | 94,483,527 | |
Investments at value — affiliated (cost — $2,447,980) | | | 2,447,980 | |
Foreign currency at value (cost — $81,487) | | | 81,549 | |
Receivables: | | | | |
Investments sold | | | 3,887,628 | |
Securities lending income — affiliated | | | 280 | |
Capital shares sold | | | 4,708 | |
Dividends — affiliated | | | 571 | |
Dividends — unaffiliated | | | 475,542 | |
From the Manager | | | 19,415 | |
Prepaid expenses | | | 244 | |
| | | | |
Total assets | | | 101,401,444 | |
| | | | |
| | | | |
| Liabilities | | | | |
Payables: | | | | |
Investments purchased | | | 5,099,573 | |
Capital shares redeemed | | | 278,350 | |
Deferred foreign capital gain tax | | | 69,848 | |
Investment advisory fees | | | 60,696 | |
Officer’s and Directors’ fees | | | 2,675 | |
Other accrued expenses | | | 134,607 | |
Other affiliates | | | 602 | |
Unrealized depreciation on forward foreign currency exchange contracts | | | 17,061 | |
| | | | |
Total liabilities | | | 5,663,412 | |
| | | | |
Net Assets | | $ | 95,738,032 | |
| | | | |
| | | | |
| Net Assets Consist of | | | | |
Paid-in capital | | $ | 131,180,775 | |
Undistributed net investment income | | | 1,169,742 | |
Accumulated net realized loss | | | (31,566,404 | ) |
Net unrealized appreciation (depreciation) | | | (5,046,081 | ) |
| | | | |
Net Assets | | $ | 95,738,032 | |
| | | | |
| | | | |
| Net Asset Value | | | | |
Class I — Based on net assets of $95,738,032 and 10,436,953 shares outstanding, 100 million shares authorized, $0.10 par value | | $ | 9.17 | |
| | | | |
See Notes to Financial Statements.
| | | | | | |
| | | BLACKROCK VARIABLE SERIES FUNDS, INC. | | JUNE 30, 2016 | | 9 |
| | | | |
| Six Months Ended June 30, 2016 (Unaudited) | | BlackRock
International
V.I. Fund | |
| | | | |
| Investment Income | | | | |
Dividends — unaffiliated | | $ | 1,790,776 | |
Dividends — affiliated | | | 3,057 | |
Securities lending — affiliated — net | | | 6,032 | |
Foreign taxes withheld | | | (163,353 | ) |
| | | | |
Total income | | | 1,636,512 | |
| | | | |
| | | | |
| Expenses | | | | |
Investment advisory | | | 370,703 | |
Transfer agent | | | 102,365 | |
Professional | | | 30,177 | |
Accounting services | | | 16,302 | |
Custodian | | | 15,032 | |
Printing | | | 11,662 | |
Officer and Directors | | | 10,328 | |
Miscellaneous | | | 9,678 | |
| | | | |
Total expenses | | | 566,247 | |
Less fees waived by the Manager | | | (540 | ) |
Less transfer agent fees reimbursed | | | (60,303 | ) |
| | | | |
Total expenses after fees waived and reimbursed | | | 505,404 | |
| | | | |
Net investment income | | | 1,131,108 | |
| | | | |
| | | | |
| Realized and Unrealized Gain (Loss) | | | | |
Net realized gain (loss) from: | | | | |
Investments | | | (4,763,997 | ) |
Foreign currency transactions | | | 113,496 | |
| | | | |
| | | (4,650,501 | ) |
| | | | |
Net change in unrealized appreciation (depreciation) on: | | | | |
Investments | | | (2,383,413 | ) |
Foreign currency translations | | | (33,086 | ) |
| | | | |
| | | (2,416,499 | ) |
| | | | |
Net realized and unrealized loss | | | (7,067,000 | ) |
| | | | |
Net Decrease in Net Assets Resulting from Operations | | $ | (5,935,892 | ) |
| | | | |
See Notes to Financial Statements.
| | | | | | |
| 10 | | BLACKROCK VARIABLE SERIES FUNDS, INC. | | JUNE 30, 2016 | | |
| | | | |
| Statements of Changes in Net Assets | | | BlackRock International V.I. Fund | |
| | | | | | | | |
| Increase (Decrease) in Net Assets: | | Six Months Ended June 30, 2016 (Unaudited) | | | Year Ended December 31, 2015 | |
| | | | | | | | |
Operations | | | | | | | | |
Net investment income. | | $ | 1,131,108 | | | $ | 1,610,161 | |
Net realized loss | | | (4,650,501 | ) | | | (698,346 | ) |
Net change in unrealized appreciation (depreciation) | | | (2,416,499 | ) | | | (3,801,604 | ) |
| | | | |
Net decrease in net assets resulting from operations | | | (5,935,892 | ) | | | (2,889,789 | ) |
| | | | |
| | | | | | | | |
Distributions to Shareholders1 | | | | | | | | |
From net investment income | | | — | | | | (1,257,545 | ) |
| | | | |
| | | | | | | | |
Capital Share Transactions | | | | | | | | |
Net decrease in net assets derived from capital share transactions | | | (6,268,394 | ) | | | (13,053,953 | ) |
| | | | |
| | | | | | | | |
Net Assets | | | | | | | | |
Total decrease in net assets | | | (12,204,286 | ) | | | (17,201,287 | ) |
Beginning of period | | | 107,942,318 | | | | 125,143,605 | |
| | | | |
End of period | | $ | 95,738,032 | | | $ | 107,942,318 | |
| | | | |
Undistributed net investment income, end of period | | $ | 1,169,742 | | | $ | 38,634 | |
| | | | |
| | 1 | | Distributions for annual periods determined in accordance with federal income tax regulations. |
See Notes to Financial Statements.
| | | | | | |
| | | BLACKROCK VARIABLE SERIES FUNDS, INC. | | JUNE 30, 2016 | | 11 |
| | | | |
| Financial Highlights | | | BlackRock International V.I. Fund | |
| | | | | | | | | | | | | | | | | | | | | | | | |
| | | Class I | |
| | | Six Months Ended June 30, 2016 (Unaudited) | | | Year Ended December 31, | |
| | | | 2015 | | | 2014 | | | 2013 | | | 2012 | | | 2011 | |
| | | | | | | | | | | | | | | | | | | | | | | | |
Per Share Operating Performance | | | | | | | | | | | | | | | | | | | | | | | | |
Net asset value, beginning of period | | $ | 9.71 | | | $ | 10.10 | | | $ | 10.87 | | | $ | 9.04 | | | $ | 8.00 | | | $ | 9.55 | |
| | | | |
Net investment income1 | | | 0.10 | | | | 0.14 | | | | 0.13 | | | | 0.19 | | | | 0.16 | | | | 0.19 | |
Net realized and unrealized gain (loss) | | | (0.64 | ) | | | (0.42 | ) | | | (0.69 | ) | | | 1.86 | | | | 1.04 | | | | (1.50 | ) |
| | | | |
Net increase (decrease) from investment operations | | | (0.54 | ) | | | (0.28 | ) | | | (0.56 | ) | | | 2.05 | | | | 1.20 | | | | (1.31 | ) |
| | | | |
Distributions from net investment income2 | | | — | | | | (0.11 | ) | | | (0.21 | ) | | | (0.22 | ) | | | (0.16 | ) | | | (0.24 | ) |
| | | | |
Net asset value, end of period | | $ | 9.17 | | | $ | 9.71 | | | $ | 10.10 | | | $ | 10.87 | | | $ | 9.04 | | | $ | 8.00 | |
| | | | |
| | | | | | | | | | | | | | | | | | | | | | | | |
Total Return3 | | | | | | | | | | | | | | | | | | | | | | | | |
Based on net asset value | | | (5.56 | )%4 | | | (2.76 | )% | | | (5.19 | )% | | | 22.75 | % | | | 15.08 | % | | | (13.71 | )% |
| | | | |
| | | | | | | | | | | | | | | | | | | | | | | | |
Ratios to Average Net Assets | | | | | | | | | | | | | | | | | | | | | | | | |
Total expenses | | | 1.15 | %5 | | | 1.09 | % | | | 1.11 | % | | | 1.08 | % | | | 1.05 | % | | | 0.89 | % |
| | | | |
Total expenses after fees waived and reimbursed | | | 1.02 | %5 | | | 0.98 | % | | | 0.99 | % | | | 0.97 | % | | | 0.96 | % | | | 0.88 | % |
| | | | |
Net investment income | | | 2.29 | %5 | | | 1.35 | % | | | 1.21 | % | | | 1.92 | % | | | 1.84 | % | | | 2.08 | % |
| | | | |
| | | | | | | | | | | | | | | | | | | | | | | | |
Supplemental Data | | | | | | | | | | | | | | | | | | | | | | | | |
Net assets, end of period (000) | | $ | 95,738 | | | $ | 107,942 | | | $ | 125,144 | | | $ | 150,314 | | | $ | 133,308 | | | $ | 134,471 | |
| | | | |
Portfolio turnover rate | | | 38 | % | | | 112 | % | | | 129 | % | | | 121 | % | | | 106 | % | | | 153 | % |
| | | | |
| | 1 | | Based on average shares outstanding. |
| | 2 | | Distributions for annual periods determined in accordance with federal income tax regulations. |
| | 3 | | Where applicable, excludes insurance-related fees and expenses and assumes the reinvestment of distributions. |
| | 4 | | Aggregate total return. |
See Notes to Financial Statements.
| | | | | | |
| 12 | | BLACKROCK VARIABLE SERIES FUNDS, INC. | | JUNE 30, 2016 | | |
| | | | |
| Notes to Financial Statements (Unaudited) | | | BlackRock International V.I. Fund | |
1. Organization:
BlackRock Variable Series Funds, Inc. (the “Company”) is registered under the Investment Company Act of 1940, as amended (the “1940 Act”), as an open-end management investment company. The Company is organized as a Maryland corporation that is comprised of 20 separate funds. The funds offer shares to insurance companies for their separate accounts to fund benefits under certain variable annuity and variable life insurance contracts. The financial statements presented are for BlackRock International V.I. Fund (the “Fund”). The Fund is classified as diversified.
The Fund, together with certain other registered investment companies advised by BlackRock Advisors, LLC (the “Manager”) or its affiliates, is included in a complex of open-end funds referred to as the Equity-Bond Complex.
2. Significant Accounting Policies:
The financial statements are prepared in conformity with accounting principles generally accepted in the United States of America (“U.S. GAAP”), which may require management to make estimates and assumptions that affect the reported amounts of assets and liabilities in the financial statements, disclosure of contingent assets and liabilities at the date of the financial statements and the reported amounts of increases and decreases in net assets from operations during the reporting period. Actual results could differ from those estimates. The Fund is considered an investment company under U.S. GAAP and follows the accounting and reporting guidance applicable to investment companies. Below is a summary of significant accounting policies:
Foreign Currency: The Fund’s books and records are maintained in U.S. dollars. Purchases and sales of investments are recorded at the rates of exchange prevailing on the respective dates of such transactions. Generally, when the U.S. dollar rises in value against a foreign currency, the investments denominated in that currency will lose value; the opposite effect occurs if the U.S. dollar falls in relative value.
The Fund does not isolate the portion of the results of operations arising as a result of changes in the exchange rates from the changes in the market prices of investments held or sold for financial reporting purposes. Accordingly, the effects of changes in exchange rates on investments are not segregated in the Statement of Operations from the effects of changes in market prices of those investments, but are included as a component of net realized and unrealized gain (loss) from investments. The Fund reports realized currency gains (losses) on foreign currency related transactions as components of net realized gain (loss) for financial reporting purposes, whereas such components are generally treated as ordinary income for federal income tax purposes.
Segregation and Collateralization: In cases where the Fund enters into certain investments (e.g., forward foreign currency exchange contracts) that would be treated as “senior securities” for 1940 Act purposes, the Fund may segregate or designate on its books and records cash or liquid assets having a market value at least equal to the amount of its future obligations under such investments. Doing so allows the investment to be excluded from treatment as a “senior security.” Furthermore, if required by an exchange or counterparty agreement, the Fund may be required to deliver/deposit cash and/or securities to/with an exchange, or broker-dealer or custodian as collateral for certain investments or obligations.
Investment Transactions and Investment Income: For financial reporting purposes, investment transactions are recorded on the dates the transactions are entered into (the trade dates). Realized gains and losses on investment transactions are determined on the identified cost basis. Dividend income is recorded on the ex-dividend date. Dividends from foreign securities where the ex-dividend date may have passed are subsequently recorded when the Fund is informed of the ex-dividend date. Under the applicable foreign tax laws, a withholding tax at various rates may be imposed on capital gains, dividends and interest.
Distributions: Distributions paid by the Fund are recorded on the ex-dividend date. The character and timing of distributions are determined in accordance with federal income tax regulations, which may differ from U.S. GAAP.
Indemnifications: In the normal course of business, the Fund enters into contracts that contain a variety of representations that provide general indemnification. The Fund’s maximum exposure under these arrangements is unknown because it involves future potential claims against the Fund, which cannot be predicted with any certainty.
Other: Expenses directly related to the Fund are charged to the Fund. Other operating expenses shared by several funds, including other funds managed by the Manager, are prorated among those funds on the basis of relative net assets or other appropriate methods.
The Fund has an arrangement with its custodian whereby fees may be reduced by credits earned on uninvested cash balances, which, if applicable, are shown as fees paid indirectly in the Statement of Operations. The custodian imposes fees on overdrawn cash balances, which can be offset by accumulated credits earned or may result in additional custody charges.
3. Investment Valuation and Fair Value Measurements:
Investment Valuation Policies: The Fund’s investments are valued at fair value (also referred to as “market value” within the financial statements) as of the close of trading on the New York Stock Exchange (“NYSE”) (generally 4:00 p.m., Eastern time). U.S. GAAP defines fair value as the price the Fund
| | | | | | |
| | | BLACKROCK VARIABLE SERIES FUNDS, INC. | | JUNE 30, 2016 | | 13 |
| | | | |
| Notes to Financial Statements (continued) | | | BlackRock International V.I. Fund | |
would receive to sell an asset or pay to transfer a liability in an orderly transaction between market participants at the measurement date. The Fund determines the fair values of its financial instruments using various independent dealers or pricing services under policies approved by the Board of Directors of the Company (the “Board”). The BlackRock Global Valuation Methodologies Committee (the “Global Valuation Committee”) is the committee formed by management to develop global pricing policies and procedures and to oversee the pricing function for all financial instruments.
Fair Value Inputs and Methodologies: The following methods (or “techniques”) and inputs are used to establish the fair value of the Fund’s assets and liabilities:
| • | | Equity investments traded on a recognized securities exchange are valued at the official closing price each day, if available. For equity investments traded on more than one exchange, the official close price on the exchange where the stock is primarily traded is used. Equity investments traded on a recognized exchange for which there were no sales on that day may be valued at the last available bid (long positions) or ask (short positions) price. Generally, trading in foreign instruments is substantially completed each day at various times prior to the close of business on the NYSE. Occasionally, events affecting the values of such instruments may occur between the foreign market close and the close of business on the NYSE that may not be reflected in the computation of the Fund’s net assets. Each business day, the Fund uses a pricing service to assist with the valuation of certain foreign exchange-traded equity securities and foreign exchange-traded and over-the-counter (“OTC”) options (the “Systematic Fair Value Price”). Using current market factors, the Systematic Fair Value Price is designed to value such foreign securities and foreign options at fair value as of the close of business on the NYSE, which follows the close of the local markets. |
| • | | Investments in open-end U.S. mutual funds are valued at net asset value each business day. |
| • | | The Fund values its investment in BlackRock Liquidity Series, LLC, Money Market Series (the “Money Market Series”) at fair value, which is ordinarily based upon its pro rata ownership in the underlying fund’s net assets. The Money Market Series seeks current income consistent with maintaining liquidity and preserving capital. Although the Money Market Series is not registered under the 1940 Act, its investments may follow the parameters of investments by a money market fund that is subject to Rule 2a-7 under the 1940 Act. The Fund may withdraw up to 25% of its investment daily, although the manager of the Money Market Series, in its sole discretion, may permit an investor to withdraw more than 25% on any one day. |
| • | | Securities and other assets and liabilities denominated in foreign currencies are translated into U.S. dollars using exchange rates determined as of the close of business on the NYSE. Forward foreign currency exchange contracts are valued at the mean between the bid and ask prices and are determined as of the close of business on the NYSE. Interpolated values are derived when the settlement date of the contract is an interim date for which quotations are not available. |
If events (e.g., a company announcement, market volatility or a natural disaster) occur that are expected to materially affect the value of such instruments, or in the event that the application of these methods of valuation results in a price for an investment that is deemed not to be representative of the market value of such investment, or if a price is not available, the investment will be valued by the Global Valuation Committee, or its delegate, in accordance with a policy approved by the Board as reflecting fair value (“Fair Valued Investments”). When determining the price for Fair Valued Investments, the Global Valuation Committee, or its delegate, seeks to determine the price that the Fund might reasonably expect to receive or pay from the current sale or purchase of that asset or liability in an arm’s-length transaction. Fair value determinations shall be based upon all available factors that the Global Valuation Committee, or its delegate, deems relevant consistent with the principles of fair value measurement. The pricing of all Fair Valued Investments is subsequently reported to the Board or a committee thereof on a quarterly basis.
Fair Value Hierarchy: Various inputs are used in determining the fair value of investments and derivative financial instruments. These inputs to valuation techniques are categorized into a fair value hierarchy consisting of three broad levels for financial statement purposes as follows:
| • | | Level 1 — unadjusted price quotations in active markets/exchanges for identical assets or liabilities that the Fund has the ability to access |
| • | | Level 2 — other observable inputs (including, but not limited to, quoted prices for similar assets or liabilities in markets that are active, quoted prices for identical or similar assets or liabilities in markets that are not active, inputs other than quoted prices that are observable for the assets or liabilities (such as interest rates, yield curves, volatilities, prepayment speeds, loss severities, credit risks and default rates) or other market–corroborated inputs) |
| • | | Level 3 — unobservable inputs based on the best information available in the circumstances, to the extent observable inputs are not available (including the Fund’s own assumptions used in determining the fair value of investments and derivative financial instruments) |
The hierarchy gives the highest priority to unadjusted quoted prices in active markets for identical assets or liabilities (Level 1 measurements) and the lowest priority to unobservable inputs (Level 3 measurements). Accordingly, the degree of judgment exercised in determining fair value is greatest for instruments categorized in Level 3. The inputs used to measure fair value may fall into different levels of the fair value hierarchy. In such cases, for disclosure purposes, the fair value hierarchy classification is determined based on the lowest level input that is significant to the fair value measurement in its entirety. The significant unobservable inputs used by the Global Valuation Committee in determining the price for Fair Valued Investments are typically categorized as Level 3. The fair value hierarchy for the Fund’s investments and derivative financial instruments have been included in the Schedule of Investments.
| | | | | | |
| 14 | | BLACKROCK VARIABLE SERIES FUNDS, INC. | | JUNE 30, 2016 | | |
| | | | |
| Notes to Financial Statements (continued) | | | BlackRock International V.I. Fund | |
Changes in valuation techniques may result in transfers into or out of an assigned level within the hierarchy. In accordance with the Fund’s policy, transfers between different levels of the fair value hierarchy are deemed to have occurred as of the beginning of the reporting period. The categorization of a value determined for investments and derivative financial instruments is based on the pricing transparency of the investments and derivative financial instruments and is not necessarily an indication of the risks associated with investing in those securities.
4. Securities and Other Investments:
Securities Lending: The Fund may lend its securities to approved borrowers, such as brokers, dealers and other financial institutions. The borrower pledges and maintains with the Fund collateral consisting of cash, an irrevocable letter of credit issued by a bank, or securities issued or guaranteed by the U.S. Government. The initial collateral received by the Fund is required to have a value of at least 102% of the current value of the loaned securities for securities traded on U.S. exchanges and a value of at least 105% for all other securities. The collateral is maintained thereafter at a value equal to at least 100% of the current market value of the securities on loan. The market value of the loaned securities is determined at the close of each business day of the Fund and any additional required collateral is delivered to the Fund, or excess collateral returned by the Fund, on the next business day. During the term of the loan, the Fund is entitled to all distributions made on or in respect of the loaned securities. Loans of securities are terminable at any time and the borrower, after notice, is required to return borrowed securities within the standard time period for settlement of securities transactions.
The market value of any securities on loan, all of which were classified as common stocks in the Fund’s Schedule of Investments, and the value of any related collateral are shown separately in the Statement of Assets and Liabilities as a component of investments at value — unaffiliated, and collateral on securities loaned at value, respectively. As of period end, any securities on loan were collateralized by cash. The cash collateral invested by the securities lending agent, BlackRock Investment Management, LLC (“BIM”), if any, is disclosed in the Schedule of Investments.
Securities lending transactions are entered into by the Fund under Master Securities Lending Agreements (each, an “MSLA”) which provide the right, in the event of default (including bankruptcy or insolvency), for the non-defaulting party to liquidate the collateral and calculate a net exposure to the defaulting party or request additional collateral. In the event that a borrower defaults, the Fund, as lender, would offset the market value of the collateral received against the market value of the securities loaned. When the value of the collateral is greater than that of the market value of the securities loaned, the lender is left with a net amount payable to the defaulting party. However, bankruptcy or insolvency laws of a particular jurisdiction may impose restrictions on or prohibitions against such a right of offset in the event of an MSLA counterparty’s bankruptcy or insolvency. Under the MSLA, absent an event of default the borrower can resell or re-pledge the loaned securities, and the Fund can reinvest cash collateral received in connection with loaned securities. Upon an event of default, the parties’ obligations to return the securities or collateral to the other party are extinguished, and the parties can resell or re-pledge the loaned securities or the collateral received in connection with the loaned securities in order to satisfy the defaulting party’s net payment obligation for all transactions under the MSLA. The defaulting party remains liable for any deficiency.
The risks of securities lending include the risk that the borrower may not provide additional collateral when required or may not return the securities when due. To mitigate these risks, the Fund benefits from a borrower default indemnity provided by BIM. BIM’s indemnity allows for full replacement of the securities loaned if the collateral received does not cover the value on the securities loaned in the event of borrower default. The Fund could suffer a loss if the value of an investment purchased with cash collateral falls below the market value of loaned securities or if the value of an investment purchased with cash collateral falls below the value of the original cash collateral received.
5. Derivative Financial Instruments:
The Fund engages in various portfolio investment strategies using derivative contracts both to increase the returns of the Fund and/or to manage its exposure to certain risks such as credit risk, equity risk, interest rate risk, foreign currency exchange rate risk, commodity price risk or other risks (e.g., inflation risk). Derivative financial instruments categorized by risk exposure are included in the Schedule of Investments. These contracts may be transacted on an exchange or OTC.
Forward Foreign Currency Exchange Contracts: The Fund enters into forward foreign currency exchange contracts to gain or reduce exposure, to foreign currencies (foreign currency exchange rate risk).
A forward foreign currency exchange contract is an agreement between two parties to buy and sell a currency at a set exchange rate on a specified date. These contracts help to manage the overall exposure to the currencies in which some of the investments held by the Fund are denominated and in some cases, may be used to obtain exposure to a particular market.
The contract is marked to market daily and the change in market value is recorded as unrealized appreciation (depreciation) in the Statement of Assets and Liabilities. When a contract is closed, a realized gain or loss is recorded in the Statement of Operations equal to the difference between the value at the time it was opened and the value at the time it was closed. Non-deliverable forward foreign currency exchange contracts are settled with the counterparty in cash without the delivery of foreign currency. The use of forward foreign currency exchange contracts involves the risk that the value of a forward foreign currency exchange contract changes unfavorably due to movements in the value of the referenced foreign currencies.
| | | | | | |
| | | BLACKROCK VARIABLE SERIES FUNDS, INC. | | JUNE 30, 2016 | | 15 |
| | | | |
| Notes to Financial Statements (continued) | | | BlackRock International V.I. Fund | |
Master Netting Arrangements: In order to better define it’s contractual rights and to secure rights that will help it mitigate its counterparty risk, the Fund may enter into an International Swaps and Derivatives Association, Inc. Master Agreement (“ISDA Master Agreement”) or similar agreement with its counterparties. An ISDA Master Agreement is a bilateral agreement between the Fund and a counterparty that governs certain OTC derivatives and typically contains, among other things, collateral posting terms and netting provisions in the event of a default and/or termination event. Under an ISDA Master Agreement, the Fund may, under certain circumstances, offset with the counterparty certain derivative financial instruments’ payables and/or receivables with collateral held and/or posted and create one single net payment. The provisions of the ISDA Master Agreement typically permit a single net payment in the event of default including the bankruptcy or insolvency of the counterparty. Bankruptcy or insolvency laws of a particular jurisdiction may restrict or prohibit the right of offset in bankruptcy, insolvency or other events. In addition, certain ISDA Master Agreements allow counterparties to terminate derivative contracts prior to maturity in the event the Fund’s net assets decline by a stated percentage or the Fund fails to meet the terms of its ISDA Master Agreements. The result would cause the Fund to accelerate payment of any net liability owed to the counterparty.
Collateral Requirements: For derivatives traded under an ISDA Master Agreement, the collateral requirements are typically calculated by netting the mark-to-market amount for each transaction under such agreement and comparing that amount to the value of any collateral currently pledged by the Fund and the counterparty.
Cash collateral that has been pledged to cover obligations of the Fund and cash collateral received from the counterparty, if any, is reported separately on the Statement of Assets and Liabilities as cash pledged as collateral and cash received as collateral, respectively. Non-cash collateral pledged by the Fund, if any, is noted in the Schedule of Investments. Generally, the amount of collateral due from or to a counterparty is subject to a certain minimum transfer amount threshold before a transfer is required, which is determined at the close of business of the Fund. Any additional required collateral is delivered to/pledged by the Fund on the next business day. Typically, the counterparty is not permitted to sell, re-pledge or use cash and non-cash collateral it receives. The Fund generally agrees not to use non-cash collateral that it receives but may, absent default or certain other circumstances defined in the underlying ISDA Master Agreement, be permitted to use cash collateral received. In such cases, interest may be paid pursuant to the collateral arrangement with the counterparty. To the extent amounts due to the Fund from its counterparties are not fully collateralized, it bears the risk of loss from counterparty non-performance. Likewise, to the extent the Fund has delivered collateral to a counterparty and stands ready to perform under the terms of its agreement with such counterparty, it bears the risk of loss from a counterparty in the amount of the value of the collateral in the event the counterparty fails to return such collateral. Based on the terms of agreements, collateral may not be required for all derivative contracts.
For financial reporting purposes, the Fund does not offset derivative assets and derivative liabilities that are subject to netting arrangements, if any, in the Statement of Assets and Liabilities.
6. Investment Advisory Agreement and Other Transactions with Affiliates:
The PNC Financial Services Group, Inc. is the largest stockholder and an affiliate of BlackRock, Inc. (“BlackRock”) for 1940 Act purposes.
Investment Advisory
The Company, on behalf of the Fund, entered into an Investment Advisory Agreement with the Manager, the Fund’s investment adviser, an indirect, wholly owned subsidiary of BlackRock, to provide investment advisory and administration services. The Manager is responsible for the management of the Fund’s portfolio and provides the personnel, facilities, equipment and certain other services necessary to the operations of the Fund. For such services, the Fund pays the Manager a monthly fee, which is determined by calculating a percentage of the Fund’s average daily net assets, based on the following annual rates:
| | | | |
| Average Daily Net Assets | | Investment
Advisory Fee | |
First $1 Billion | | | 0.75 | % |
$1 Billion - $3 Billion | | | 0.71 | % |
$3 Billion - $5 Billion | | | 0.68 | % |
$5 Billion - $10 Billion | | | 0.65 | % |
Greater than $10 Billion | | | 0.64 | % |
The Manager, with respect to the Fund, entered into a sub-advisory agreement with BlackRock International Limited (“BIL”), an affiliate of the Manager. The Manager pays BIL, for services it provides, a monthly fee that is a percentage of the investment advisory fees paid by the Fund to the Manager.
| | | | | | |
| 16 | | BLACKROCK VARIABLE SERIES FUNDS, INC. | | JUNE 30, 2016 | | |
| | | | |
| Notes to Financial Statements (continued) | | | BlackRock International V.I. Fund | |
Distribution Fees
The Company, on behalf of the Fund, entered into a Distribution Agreement and a Distribution Plan with BlackRock Investments, LLC (“BRIL”), an affiliate of the Manager. Pursuant to the Distribution Plan and in accordance with Rule 12b-1 under the 1940 Act, the Fund pays BRIL ongoing distribution fees. The fees are accrued daily and paid monthly at annual rates based upon the average daily net assets of the relevant share class of the Fund. For the six months ended June 30, 2016, the Fund had no distribution fees.
Transfer Agent
The Manager, on behalf of the Fund, entered into agreements with insurance companies and other financial intermediaries (“Service Organizations”), some of which may be affiliates. Pursuant to these agreements, the Service Organizations provide the Fund with administrative, networking, recordkeeping, sub-transfer agency and shareholder services to sub-accounts they service. For these services, the Service Organizations receive an annual fee per shareholder account, which will vary depending on share class and/or net assets of Fund shareholders serviced by the Service Organizations, which is shown as transfer agent. For the six months ended June 30, 2016, the Fund did not pay any amounts to affiliates in return for these services.
In addition, the Fund pays the transfer agent, which is not an affiliate, a fee for issuance, transfer and redemption of shares and the opening and maintenance of shareholder accounts, which is included in transfer agent in the Statement of Operations.
Expense Limitations, Waivers and Reimbursements
The Manager, with respect to the Fund, contractually agreed to waive and/or reimburse fees or expenses in order to limit expenses, excluding interest expense, dividend expense, tax expense, acquired fund fees and expenses and certain other fund expenses, which constitute extraordinary expenses not incurred in the ordinary course of the Fund’s business. The expense limitation as a percentage of average daily net assets is 1.25% for Class I.
The Manager has agreed not to reduce or discontinue this contractual expense limitation prior to May 1, 2017 unless approved by the Board, including a majority of the Independent Directors who are not “interested persons” of the Fund, as defined in the 1940 Act (“Independent Directors”) or by a majority of the outstanding voting securities of the Fund.
The Manager, with respect to the Fund, voluntarily agreed to waive its investment advisory fees by the amount of investment advisory fees the Fund pays to the Manager indirectly through its investment in affiliated money market funds. This amount is shown as fees waived by the Manager in the Statement of Operations. However, the Manager does not waive its investment advisory fees by the amount of investment advisory fees paid in connection with the Fund’s investment in other affiliated investment companies, if any. For the six months ended June 30, 2016, the amount waived was $540.
The Manager has contractually agreed to reimburse transfer agent fees in order to limit such expenses at 0.08% of average daily net assets.
The Manager has agreed not to reduce or discontinue this contractual reimbursement prior to May 1, 2017 unless approved by the Board, including a majority of the Independent Directors or by a majority of the outstanding voting securities of the Fund.
These amounts are shown as transfer agent fees reimbursed in the Statement of Operations.
For the six months ended June 30, 2016, the Fund reimbursed the Manager $594 for certain accounting services, which is included in accounting services in the Statement of Operations.
Securities Lending
The U.S. Securities and Exchange Commission has issued an exemptive order which permits BIM, an affiliate of the Manager, to serve as securities lending agent for the Fund, subject to applicable conditions. As securities lending agent, BIM bears all operational costs directly related to securities lending. The Fund is responsible for expenses in connection with the investment of cash collateral received for securities on loan (the “collateral investment expenses”). The cash collateral is invested in a private investment company managed by the Manager or its affiliates. However, BIM has agreed to cap the collateral investment expenses of the private investment company to an annual rate of 0.04%. The investment adviser to the private investment company will not charge any advisory fees with respect to shares purchased by the Fund.
Securities lending income is equal to the total of income earned from the reinvestment of cash collateral, net of fees and other payments to and from borrowers of securities, and less the collateral investment expenses. The Fund retains a portion of securities lending income and remits a remaining portion to BIM as compensation for its services as securities lending agent.
| | | | | | |
| | | BLACKROCK VARIABLE SERIES FUNDS, INC. | | JUNE 30, 2016 | | 17 |
| | | | |
| Notes to Financial Statements (continued) | | | BlackRock International V.I. Fund | |
Pursuant to a securities lending agreement, the Fund retains 80% of securities lending income, and this amount retained can never be less than 70% of the total of securities lending income plus the collateral investment expenses.
In addition, commencing the business day following the date that the aggregate securities lending income earned across the Equity-Bond Complex in a calendar year exceeds a specified threshold, the Fund, pursuant to the securities lending agreement, will retain for the remainder of that calendar year securities lending income as follows: 85% of securities lending income, and this amount retained can never be less than 70% of the total of securities lending income plus the collateral investment expenses.
The share of securities lending income earned by the Fund is shown as securities lending — affiliated — net in the Statement of Operations. For the six months ended June 30, 2016, the Fund paid BIM $1,415 for securities lending agent services.
Officers and Directors
Certain officers and/or directors of the Company are officers and/or directors of BlackRock or its affiliates. The Fund reimburses the Manager for a portion of the compensation paid to the Company’s Chief Compliance Officer, which is included in Officer and Directors in the Statement of Operations
Other Transactions
The Fund may purchase securities from, or sell securities to, an affiliated fund provided the affiliation is due solely to having a common investment adviser, common officers, or common directors. For the six months ended June 30, 2016, the purchase and sale transactions which resulted in net realized gains (losses) with an affiliated fund in compliance with Rule 17a-7 under the 1940 Act were as follows:
| | | | | | |
| Purchases | | | Sales | | Net Realized Loss |
| | — | | | $2,064,492 | | $(531,224) |
7. Purchases and Sales:
For the six months ended June 30, 2016, purchases and sales of investments, excluding short-term securities, were $37,737,947 and $43,037,606, respectively.
8. Income Tax Information:
It is the Fund’s policy to comply with the requirements of the Internal Revenue Code of 1986, as amended, applicable to regulated investment companies, and to distribute substantially all of its taxable income to its shareholders. Therefore, no federal income tax provision is required.
The Fund files U.S. federal and various state and local tax returns. No income tax returns are currently under examination. The statute of limitations on the Fund’s U.S. federal tax returns generally remains open for each of the four years ended December 31, 2015. The statutes of limitations on the Fund’s state and local tax returns may remain open for an additional year depending upon the jurisdiction.
Management has analyzed tax laws and regulations and their application to the Fund as of June 30, 2016, inclusive of the open tax return years, and does not believe there are any uncertain tax positions that require recognition of a tax liability in the Fund’s financial statements.
As of December 31, 2015, the Fund had a capital loss carryforward available to offset future realized capital gains through the indicated expiration dates as follows:
| | | | |
Expires December 31, | | | | |
No expiration date1 | | $ | 1,771,920 | |
2017 | | | 25,133,494 | |
| | | | |
Total | | $ | 26,905,414 | |
| | | | |
| | 1 | | Must be utilized prior to losses subject to expiration. |
As of June 30, 2016, gross unrealized appreciation and depreciation based on cost for federal income tax purposes were as follows:
| | | | |
| | | | | |
Tax cost | | $ | 101,948,340 | |
| | | | |
Gross unrealized appreciation | | $ | 3,970,104 | |
Gross unrealized depreciation | | | (8,986,937 | ) |
| | | | |
Net unrealized depreciation | | $ | (5,016,833 | ) |
| | | | |
9. Bank Borrowings:
The Company, on behalf of the Fund, along with certain other funds managed by the Manager and its affiliates (“Participating Funds”), is a party to a 364-day, $2.1 billion credit agreement with a group of lenders. Under this agreement, the Fund may borrow to fund shareholder redemptions. Excluding
| | | | | | |
| 18 | | BLACKROCK VARIABLE SERIES FUNDS, INC. | | JUNE 30, 2016 | | |
| | | | |
| Notes to Financial Statements (continued) | | | BlackRock International V.I. Fund | |
commitments designated for certain individual funds, the Participating Funds, including the Fund, can borrow up to an aggregate commitment amount of $1.6 billion at any time outstanding, subject to asset coverage and other limitations as specified in the agreement. The credit agreement has the following terms: a fee of 0.12% per annum on unused commitment amounts and interest at a rate equal to the higher of (a) one-month LIBOR (but, in any event, not less than 0.00%) on the date the loan is made plus 0.80% per annum or (b) the Fed Funds rate (but, in any event, not less than 0.00%) in effect from time to time plus 0.80% per annum on amounts borrowed. The agreement expires in April 2017 unless extended or renewed. Prior to April 21, 2016, the credit agreement had a fee per annum of 0.06% on unused commitment amounts and interest at a rate equal to the higher of (a) one-month LIBOR (but, in any event, not less than 0.00%) on the date the loan is made plus 0.80% per annum or (b) the Fed Funds rate (but, in any event, not less than 0.00%) in effect from time to time plus 0.80% per annum on amounts borrowed. Participating Funds paid administration, legal and arrangement fees, which, if applicable, are included in miscellaneous expenses in the Statement of Operations. These fees were allocated among such funds based upon portions of the aggregate commitment available to them and relative net assets of Participating Funds. During the six months ended June 30, 2016, the Fund did not borrow under the credit agreement.
10. Principal Risks:
In the normal course of business, the Fund invests in securities and enters into transactions where risks exist due to fluctuations in the market (market risk) or failure of the issuer to meet all its obligations, including the ability to pay principal and interest when due (issuer credit risk). The value of securities held by the Fund may decline in response to certain events, including those directly involving the issuers of securities owned by the Fund. Changes arising from the general economy, the overall market and local, regional or global political and/or social instability, as well as currency, interest rate and price fluctuations, may also affect the securities’ value.
Counterparty Credit Risk: Similar to issuer credit risk, the Fund may be exposed to counterparty credit risk, or the risk that an entity may fail to or be unable to perform on its commitments related to unsettled or open transactions. The Fund manages counterparty credit risk by entering into transactions only with counterparties that the Manager believes have the financial resources to honor their obligations and by monitoring the financial stability of those counterparties. Financial assets, which potentially expose the Fund to market, issuer and counterparty credit risks, consist principally of financial instruments and receivables due from counterparties. The extent of the Fund’s exposure to market, issuer and counterparty credit risks with respect to these financial assets is approximately their value recorded in the Statement of Assets and Liabilities, less any collateral held by the Fund.
A derivative contract may suffer a mark-to-market loss if the value of the contract decreases due to an unfavorable change in the market rates or values of the underlying instrument. Losses can also occur if the counterparty does not perform under the contract.
The Fund’s risk of loss from counterparty credit risk on OTC derivatives is generally limited to the aggregate unrealized gain less the value of any collateral held by the Fund.
Concentration Risk: The Fund invests a substantial amount of its assets in issuers located in a single country or a limited number of countries. When the Fund concentrates its investments in this manner, it assumes the risk that economic, political and social conditions in those countries may have a significant impact on their investment performance. Foreign issuers may not be subject to the same uniform accounting, auditing and financial reporting standards and practices as used in the United States. Foreign securities markets may also be less liquid, more volatile, and less subject to governmental supervision not typically associated with investing in U.S. securities. Investment percentages in specific countries are presented in the Schedule of Investments.
The Fund invests a significant portion of its assets in securities of issuers located in Europe or with significant exposure to European issuers or countries. The European financial markets have recently experienced volatility and adverse trends due to concerns about economic downturns in, or rising government debt levels of, several European countries. These events may spread to other countries in Europe and may affect the value and liquidity of certain of the Fund’s investments.
The United Kingdom has voted to withdraw from the European Union on June 23, 2016, which may introduce significant new uncertainties and instability in the financial markets across Europe.
| | | | | | |
| | | BLACKROCK VARIABLE SERIES FUNDS, INC. | | JUNE 30, 2016 | | 19 |
| | | | |
| Notes to Financial Statements (concluded) | | | BlackRock International V.I. Fund | |
11. Capital Share Transactions:
Transactions in capital shares were as follows:
| | | | | | | | | | | | | | | | | | | | |
| | | Six Months Ended
June 30, 2016 | | | | | | Year Ended
December 31, 2015 | |
| | | Shares | | | Amount | | | | | | Shares | | | Amount | |
| Class I | | | | | | | | | | | | | | | |
Shares sold | | | 96,965 | | | $ | 888,351 | | | | | | | | 428,873 | | | $ | 4,374,274 | |
Shares issued in reinvestment of distributions. | | | — | | | | — | | | | | | | | 127,785 | | | | 1,257,545 | |
Shares redeemed | | | (779,887 | ) | | | (7,156,745 | ) | | | | | | | (1,822,740 | ) | | | (18,685,772 | ) |
| | | | | | | | | | | | |
Net decrease | | | (682,922 | ) | | $ | (6,268,394 | ) | | | | | | | (1,266,082 | ) | | $ | (13,053,953 | ) |
| | | | | | | | | | | | |
12. Subsequent Events:
Management’s evaluation of the impact of all subsequent events on the Fund’s financial statements was completed through the date the financial statements were issued and the following item was noted:
The Fund paid a net investment income distribution of $0.004688 per share on July 22, 2016 to shareholders of record on July 20, 2016.
| | | | | | |
| 20 | | BLACKROCK VARIABLE SERIES FUNDS, INC. | | JUNE 30, 2016 | | |
JUNE 30, 2016
| | | | |
SEMI-ANNUAL REPORT (UNAUDITED) | | | | BLACKROCK® |
BlackRock Variable Series Funds, Inc.
▶ BlackRock iShares® Alternative Strategies V.I. Fund
| | |
| Not FDIC Insured ¡ May Lose Value ¡ No Bank Guarantee | | |
| | | | |
| Fund Summary as of June 30, 2016 | | | BlackRock iShares® Alternative Strategies V.I. Fund | |
BlackRock iShares® Alternative Strategies V.I. Fund’s (the “Fund”) investment objective is to seek to achieve long-term growth of capital and risk adjusted returns.
|
| Portfolio Management Commentary |
How did the Fund perform?
| • | | For the six-month period ended June 30, 2016, the Fund outperformed its blended benchmark, the 60% MSCI All Country World Index/40% Barclays U.S. Aggregate Bond Index. |
What factors influenced performance?
| • | | The largest contributor to Fund performance was exposure to potentially less risky global stocks through the iShares Edge MSCI Minimum Volatility Global ETF. This was followed by exposure to U.S. dollar-denominated government bonds issued by emerging market countries through the iShares J.P. Morgan USD Emerging Markets Bond ETF. |
| • | | The largest detractor from Fund performance was exposure to Canadian, European and Asian real estate through the iShares International Developed Real Estate ETF. The next-largest detractor was exposure to U.S. real estate companies and real estate investment trusts (“REITs”) through the iShares U.S. Real Estate ETF. |
Describe recent portfolio activity.
| • | | Post-Brexit, the investment adviser favors U.S. REITs over international REITs due to their relative safety and reduced expectations of Fed rate hikes. In light of this, the Fund increased its allocation to U.S. REITs and sold international REITs. In addition, the Fund’s broad commodity exposure was marginally reduced in favor of increased exposure to global equities with minimum volatility, and silver. |
Describe portfolio positioning at period end.
| • | | At period end, the Fund was positioned with a defensive tilt via exposure to minimum volatility assets and precious metals. In addition, the Fund held exposures to higher yielding assets such as preferred stock and REITs. |
The views expressed reflect the opinions of BlackRock as of the date of this report and are subject to change based on changes in market, economic or other conditions. These views are not intended to be a forecast of future events and are no guarantee of future results.
| | | | | |
| Portfolio Composition | | Percent of
Affiliated Investment Companies |
Fixed Income Funds | | | | 42 | % |
Equity Funds | | | | 35 | |
Short-Term Securities | | | | 13 | |
Commodity Funds | | | | 10 | |
| | | | | | |
| 2 | | BLACKROCK VARIABLE SERIES FUNDS, INC. | | JUNE 30, 2016 | | |
| | | | |
| | | | BlackRock iShares® Alternative Strategies V.I. Fund | |
|
| Total Return Based on a $10,000 Investment |
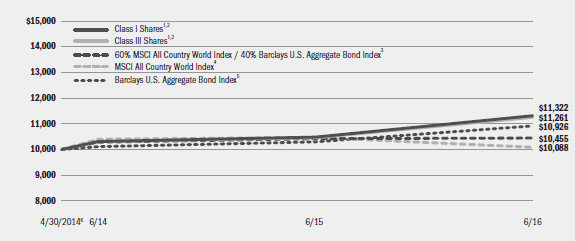
| | 1 | Assuming transaction costs, if any, and other operating expenses, including investment advisory fees. Does not include insurance-related fees and expenses. |
| | 2 | The Fund invests in a portfolio of underlying exchange-traded funds that seek to track alternative indices. |
| | 3 | A customized weighted index comprised of 60% MSCI All Country World Index and 40% Barclays U.S. Aggregate Bond Index. |
| | 4 | A free float-adjusted market capitalization weighted index that is designed to measure the equity market performance of developed and emerging markets. The MSCI All Country World Index consists of 46 country indexes comprising 23 developed and 23 emerging market country indexes. |
| | 5 | A widely recognized unmanaged market-weighted index, comprised of investment-grade corporate bonds rated BBB or better, mortgages and U.S. Treasury and U.S. Government agency issues with at least one year to maturity. |
| | 6 | Commencement of operations. |
|
| Performance Summary for the Period Ended June 30, 2016 |
| | | | | | | | | | | | | | | |
| | | | | Average Annual Total Returns |
| | | 6-Month
Total Returns8 | | 1 Year8 | | Since
Inception8,10 |
Class I7 | | | | 10.61 | %9 | | | | 7.90 | % | | | | 5.90 | % |
Class III7 | | | | 10.43 | 9 | | | | 7.58 | | | | | 5.63 | |
60% MSCI All Country World Index / 40% Barclays U.S. Aggregate Bond Index | | | | 2.97 | | | | | 0.33 | | | | | 2.08 | |
MSCI All Country World Index | | | | 1.23 | | | | | (3.73 | ) | | | | 0.41 | |
Barclays U.S. Aggregate Bond Index | | | | 5.31 | | | | | 6.00 | | | | | 4.17 | |
| | 7 | | Average annual and cumulative total returns are based on changes in net asset value for the periods shown, and assume reinvestment of all distributions at net asset value on the ex-dividend date. Insurance-related fees and expenses are not reflected in these returns. |
| | 8 | | For a portion of the period, the Fund’s investment adviser waived a portion of its fee. Without such waiver, the Fund’s performance would have been lower. |
| | 9 | | Performance results do not include adjustments made for financial reporting purposes in accordance with U.S. generally accepted accounting principles and may differ from results reported in the financial highlights. |
| | 10 | | The Fund commenced operations on April 30, 2014. |
| | | | Past performance is not indicative of future results. Performance results do not reflect the deduction of taxes that a shareholder would pay on Fund distributions or the redemption of Fund shares. |
| | | | | | | | | | | | | | | | | | | | | | | | | | | | | | | | | | | |
| | | Actual | | Hypothetical12 | | |
| | | Beginning
Account Value
January 1, 2016 | | Ending
Account Value
June 30, 2016 | | Expenses Paid
During the Period11 | | Beginning
Account Value
January 1, 2016 | | Ending
Account Value
June 30, 2016 | | Expenses Paid
During the Period11 | | Annualized
Expense
Ratio |
Class I | | | $ | 1,000.00 | | | | $ | 1,106.10 | | | | $ | 3.40 | | | | $ | 1,000.00 | | | | $ | 1,021.63 | | | | $ | 3.27 | | | | | 0.65 | % |
Class III | | | $ | 1,000.00 | | | | $ | 1,104.30 | | | | $ | 4.71 | | | | $ | 1,000.00 | | | | $ | 1,020.39 | | | | $ | 4.52 | | | | | 0.90 | % |
| | 11 | | For each class of the Fund, expenses are equal to the annualized expense ratio for the class, multiplied by the average account value over the period, multiplied by 182/366 (to reflect the one-half year period shown). |
| | 12 | | Hypothetical 5% annual return before expenses is calculated by prorating the number of days in the most recent fiscal half-year divided by 366. |
| | | | See “Disclosure of Expenses” on the following page for further information on how expenses were calculated. |
| | | | | | |
| | | BLACKROCK VARIABLE SERIES FUNDS, INC. | | JUNE 30, 2016 | | 3 |
| | | | |
| Disclosure of Expenses | | | BlackRock iShares® Alternative Strategies V.I. Fund | |
Shareholders of the Fund may incur the following charges: (a) transactional expenses, such as sales charges; and (b) operating expenses, including investment advisory fees, service and distribution fees, including 12b-1 fees, acquired fund fees and expenses, and other fund expenses. The expense example on the previous page (which is based on a hypothetical investment of $1,000 invested on January 1, 2016 and held through June 30, 2016) is intended to assist shareholders both in calculating expenses based on an investment in the Fund and in comparing these expenses with similar costs of investing in other mutual funds.
The expense example provides information about actual account values and actual expenses. In order to estimate the expenses a shareholder paid during the period covered by this report, shareholders can divide their account value by $1,000 and then multiply the result by the number corresponding to their share class under the heading entitled “Expenses Paid During the Period.”
The expense example also provides information about hypothetical account values and hypothetical expenses based on the Fund’s actual expense ratio and an assumed rate of return of 5% per year before expenses. In order to assist shareholders in comparing the ongoing expenses of investing in the Fund and other funds, compare the 5% hypothetical example with the 5% hypothetical examples that appear in shareholder reports of other funds.
The expenses shown in the expense example are intended to highlight shareholders’ ongoing costs only and do not reflect any transactional expenses, such as sales charges, if any. Therefore, the hypothetical example is useful in comparing ongoing expenses only, and will not help shareholders determine the relative total expenses of owning different funds. If these transactional expenses were included, shareholder expenses would have been higher.
| | | | | | |
| 4 | | BLACKROCK VARIABLE SERIES FUNDS, INC. | | JUNE 30, 2016 | | |
| | | | |
| Consolidated Schedule of Investments June 30, 2016 (Unaudited) | | | BlackRock iShares® Alternative Strategies V.I. Fund | |
| | | (Percentages shown are based on Net Assets) | |
| | | | | | | | |
Affiliated Investment Companies (a) | | Shares | | | Value | |
Commodity Funds — 11.3% | | | | | | | | |
iShares Commodities Select Strategy ETF | | | 19,184 | | | $ | 629,619 | |
iShares Gold Trust (b)(c) | | | 69,394 | | | | 885,467 | |
iShares Silver Trust (b)(c) | | | 31,172 | | | | 557,044 | |
| | | | | | | | |
| | | | | | | | 2,072,130 | |
| | | | | | | | |
| Equity Funds — 40.1% | | | | | | | | |
iShares Edge MSCI Minimum Volatility Global ETF | | | 72,257 | | | | 5,518,267 | |
iShares U.S. Real Estate ETF | | | 22,266 | | | | 1,832,492 | |
| | | | | | | | |
| | | | | | | | 7,350,759 | |
| | | | | | | | |
| Fixed Income Funds — 48.5% | | | | | | | | |
iShares J.P. Morgan USD Emerging Markets Bond ETF | | | 46,291 | | | | 5,330,409 | |
| | | | | | | | |
| Affiliated Investment Companies (a) | | Shares/
Beneficial
Interest
(000) | | | Value | |
Fixed Income Funds (continued) | | | | | | | | |
iShares U.S. Preferred Stock ETF (d) | | | 89,381 | | | $ | 3,565,408 | |
| | | | | | | | |
| | | | | | | | 8,895,817 | |
| | | | | | | | |
| Short-Term Securities — 15.4% | | | | | | | | |
BlackRock Liquidity Funds, TempFund, Institutional Class, 0.40% (e) | | | 586,598 | | | | 586,598 | |
BlackRock Liquidity Series, LLC, Money Market Series, 0.59% (e)(f) | | $ | 2,239 | | | | 2,239,009 | |
| | | | | | | | |
| | | | | | | | 2,825,607 | |
| | | | | | | | |
Total Affiliated Investment Companies
(Cost — $20,144,635) — 115.3% | | | | | | | 21,144,313 | |
Liabilities in Excess of Other Assets — (15.3)% | | | | | | | (2,813,556 | ) |
| | | | | | | | |
Net Assets — 100.0% | | | | | | $ | 18,330,757 | |
| | | | | | | | |
|
| Notes to Schedule of Investments |
| (a) | During the six months ended June 30, 2016, investments in issuers considered to be affiliates of the Fund for purposes of Section 2(a)(3) of the Investment Company Act of 1940, as amended, were as follows: |
| | | | | | | | | | | | | | | | | | | | | | | | | | | | | | | | | | | |
| Affiliate | | Shares/
Beneficial
Interest
Held at
December 31,
2015 | | Shares
Purchased | | Shares/
Beneficial
Interest
Sold | | Shares/
Beneficial
Interest
Held at
June 30,
2016 | | Value at
June 30,
2016 | | Income | | Realized
Gain (Loss) |
BlackRock Liquidity Funds, TempFund, Institutional Class | | | | 150,886 | | | | | 435,712 | 1 | | | | — | | | | | 586,598 | | | | $ | 586,598 | | | | $ | 299 | | | | | — | |
BlackRock Liquidity Series, LLC, Money Market Series | | | | — | | | | $ | 2,239,009 | 2 | | | | — | | | | $ | 2,239,009 | | | | | 2,239,009 | | | | | 16,089 | 3 | | | | — | |
iShares Commodities Select Strategy ETF | | | | 20,386 | | | | | 7,881 | | | | | 9,083 | | | | | 19,184 | | | | | 629,619 | | | | | 1,850 | | | | $ | (55,405 | ) |
iShares Edge MSCI Minimum Volatility Global ETF | | | | 47,124 | | | | | 28,486 | | | | | 3,353 | | | | | 72,257 | | | | | 5,518,267 | | | | | 51,601 | | | | | (3,981 | ) |
iShares Gold Trust | | | | 52,477 | | | | | 18,817 | | | | | 1,900 | | | | | 69,394 | | | | | 885,467 | | | | | — | | | | | (351 | ) |
iShares International Developed Real Estate ETF | | | | 42,690 | | | | | 23,917 | | | | | 66,607 | | | | | — | | | | | — | | | | | 27,375 | | | | | (72,260 | ) |
iShares J.P. Morgan USD Emerging Markets Bond ETF | | | | 32,705 | | | | | 16,888 | | | | | 3,302 | | | | | 46,291 | | | | | 5,330,409 | | | | | 79,804 | | | | | (6,560 | ) |
iShares Silver Trust | | | | 16,629 | | | | | 17,743 | | | | | 3,200 | | | | | 31,172 | | | | | 557,044 | | | | | — | | | | | (1,674 | ) |
iShares U.S. Preferred Stock ETF | | | | 61,210 | | | | | 36,038 | | | | | 7,867 | | | | | 89,381 | | | | | 3,565,408 | | | | | 64,764 | | | | | (6,280 | ) |
iShares U.S. Real Estate ETF | | | | 3,328 | | | | | 19,033 | | | | | 95 | | | | | 22,266 | | | | | 1,832,492 | | | | | 6,916 | | | | | 7 | |
Total | | | | | | | | | | | | | | | | | | | | | | | $ | 21,144,313 | | | | $ | 248,698 | | | | $ | (146,504 | ) |
| | | | | | | | | | | | | | | | | | | | | | | | | |
| 1 | Represents net shares purchased. |
| 2 | Represents net beneficial interest purchased. |
| 3 | Represents securities lending income earned from the reinvestment of cash collateral from loaned securities, net of fees and collateral investment expenses, and other payments to and from borrowers of securities. |
| (b) | Non-income producing security. |
| (c) | Security is held by a wholly-owned subsidiary. See Note 1 of the Notes to Consolidated Financial Statements for details on the wholly-owned subsidiary. |
| (d) | Security, or a portion of security, is on loan. |
| (e) | Current yield as of period end. |
| (f) | Security was purchased with the cash collateral from loaned securities. The Fund may withdraw up to 25% of its investment daily, although the manager of the BlackRock Liquidity Series, LLC, Money Market Series, in its sole discretion, may permit an investor to withdraw more than 25% on any one day. |
| | | | | | | | | | |
| Portfolio Abbreviation |
| ETF | | Exchange-Traded Fund | | | | | | | | |
See Notes to Consolidated Financial Statements.
| | | | | | |
| | | BLACKROCK VARIABLE SERIES FUNDS, INC. | | JUNE 30, 2016 | | 5 |
| | | | |
| Consolidated Schedule of Investments (concluded) | | | BlackRock iShares® Alternative Strategies V.I. Fund | |
|
| Fair Value Hierarchy as of Period End |
Various inputs are used in determining the fair value of investments. For information about the Fund’s policy regarding valuation of investments, refer to the Notes to Consolidated Financial Statements.
The following table summarizes the Fund’s investments categorized in the disclosure hierarchy:
| | | | | | | | | | | | | | | | | | | | |
| | | Level 1 | | Level 2 | | Level 3 | | Total |
Assets: | | | | | | | | | | | | | | | | | | | | |
Investments: | | | | | | | | | | | | | | | | | | | | |
Affiliated Investment Companies | | | $ | 18,905,304 | | | | $ | 2,239,009 | | | | | — | | | | $ | 21,144,313 | |
| | | | | |
|
| The Fund may hold assets and/or liabilities in which the fair value approximates the carrying amount for financial statement purposes. As of period end, such assets and/or liabilities are categorized within the disclosure hierarchy as follows: | |
| | | | | | | | | | | | | | | | | | | | |
| | | Level 1 | | Level 2 | | Level 3 | | Total |
Assets: | | | | | | | | | | | | | | | | | | | | |
Cash | | | $ | 47,897 | | | | | — | | | | | — | | | | $ | 47,897 | |
Liabilities: | | | | | | | | | | | | | | | | | | | | |
Collateral on securities loaned at value | | | | — | �� | | | $ | (2,239,009 | ) | | | | — | | | | | (2,239,009 | ) |
| | | | | |
Total | | | $ | 47,897 | | | | $ | (2,239,009 | ) | | | | — | | | | $ | (2,191,112 | ) |
| | | | | |
|
| During the six months ended June 30, 2016, there were no transfers between levels. | |
See Notes to Consolidated Financial Statements.
| | | | | | |
| 6 | | BLACKROCK VARIABLE SERIES FUNDS, INC. | | JUNE 30, 2016 | | |
| | | | |
| Consolidated Statement of Assets and Liabilities | | | | |
| | | | |
| June 30, 2016 (Unaudited) | | BlackRock
iShares® Alternative
Strategies V.I. Fund | |
| | | | |
| Assets | | | | |
Investments at value — affiliated (including securities loaned at value of $2,202,566)(cost — $20,144,635) | | $ | 21,144,313 | |
Cash | | | 47,897 | |
Receivables: | | | | |
Investments sold | | | 1,994,926 | |
Securities lending income — affiliated | | | 3,020 | |
Capital shares sold | | | 24,600 | |
Dividends — affiliated | | | 54 | |
From the Manager | | | 1,971 | |
Prepaid expenses | | | 353 | |
| | | | |
Total assets | | | 23,217,134 | |
| | | | |
| | | | |
| Liabilities | | | | |
Collateral on securities loaned at value | | | 2,239,009 | |
Payables: | | | | |
Investments purchased | | | 2,587,246 | |
Capital shares redeemed | | | 4,163 | |
Distribution fees | | | 987 | |
Officer’s and Directors’ fees | | | 855 | |
Other affiliates | | | 52 | |
Other accrued expenses | | | 54,065 | |
| | | | |
Total liabilities | | | 4,886,377 | |
| | | | |
Net Assets | | $ | 18,330,757 | |
| | | | |
| | | | |
| Net Assets Consist of | | | | |
Paid-in capital | | $ | 17,498,044 | |
Undistributed net investment income | | | 200,094 | |
Accumulated net realized loss | | | (367,059 | ) |
Net unrealized appreciation (depreciation) | | | 999,678 | |
| | | | |
Net Assets | | $ | 18,330,757 | |
| | | | |
| | | | |
| Net Asset Value | | | | |
Class I — Based on net assets of $12,967,617 and 1,196,593 shares outstanding, 100 million shares authorized, $0.10 par value | | $ | 10.84 | |
| | | | |
Class III — Based on net assets of $5,363,140 and 496,747 shares outstanding, 100 million shares authorized, $0.10 par value | | $ | 10.80 | |
| | | | |
See Notes to Consolidated Financial Statements.
| | | | | | |
| | | BLACKROCK VARIABLE SERIES FUNDS, INC. | | JUNE 30, 2016 | | 7 |
| | | | |
| Consolidated Statement of Operations | | | | |
| | | | |
| Six Months Ended June 30, 2016 (Unaudited) | | BlackRock
iShares® Alternative
Strategies V.I. Fund | |
| | | | |
| Investment Income | | | | |
Dividends — affiliated | | $ | 232,609 | |
Securities lending — affiliated — net | | | 16,089 | |
| | | | |
Total income | | | 248,698 | |
| | | | |
| | | | |
| Expenses | | | | |
Professional | | | 27,791 | |
Investment advisory | | | 17,703 | |
Transfer agent | | | 2,390 | |
Transfer agent — Class Specific | | | 10,602 | |
Printing | | | 9,142 | |
Distribution — Class Specific | | | 4,221 | |
Accounting services | | | 4,006 | |
Officer and Directors | | | 2,813 | |
Custodian | | | 1,921 | |
Registration | | | 391 | |
Miscellaneous | | | 3,381 | |
| | | | |
Total expenses | | | 84,361 | |
Less fees waived by the Manager | | | (14,948 | ) |
Less transfer agent fees reimbursed — Class specific | | | (10,591 | ) |
Less expenses reimbursed by the Manager | | | (8,500 | ) |
| | | | |
Total expenses after fees waived and reimbursed | | | 50,322 | |
| | | | |
Net investment income | | | 198,376 | |
| | | | |
| | | | |
| Realized and Unrealized Gain (Loss) | | | | |
Net realized gain (loss) from: | | | | |
Net realized loss on investments — affiliated | | | (146,504 | ) |
Net change in unrealized appreciation (depreciation) on investments — affiliated | | | 1,456,981 | |
| | | | |
Net realized and unrealized gain | | | 1,310,477 | |
| | | | |
Net Increase in Net Assets Resulting from Operations | | $ | 1,508,853 | |
| | | | |
See Notes to Consolidated Financial Statements.
| | | | | | |
| 8 | | BLACKROCK VARIABLE SERIES FUNDS, INC. | | JUNE 30, 2016 | | |
| | | | |
| Consolidated Statements of Changes in Net Assets | | | BlackRock iShares® Alternative Strategies V.I. Fund | |
| | | | | | | | |
| Increase (Decrease) in Net Assets: | | Six Months Ended
June 30, 2016 (Unaudited) | | | Year Ended
December 31, 2015 | |
| | | | | | | | |
| Operations | | | | | | | | |
Net investment income | | $ | 198,376 | | | $ | 340,498 | |
Net realized loss | | | (146,504 | ) | | | (223,189 | ) |
Net change in unrealized appreciation (depreciation) | | | 1,456,981 | | | | (427,276 | ) |
| | | | |
Net increase (decrease) in net assets resulting from operations | | | 1,508,853 | | | | (309,967 | ) |
| | | | |
| | | | | | | | |
| Distributions to Shareholders1 | | | | | | | | |
From net investment income: | | | | | | | | |
Class I | | | — | | | | (283,383 | ) |
Class III | | | — | | | | (60,376 | ) |
From return of capital: | | | | | | | | |
Class I | | | — | | | | (10,016 | ) |
Class III | | | — | | | | (2,226 | ) |
| | | | |
Decrease in net assets resulting from distributions to shareholders | | | — | | | | (356,001 | ) |
| | | | |
| | | | | | | | |
| Capital Share Transactions | | | | | | | | |
Net increase in net assets derived from capital share transactions | | | 4,954,661 | | | | 7,083,164 | |
| | | | |
| | | | | | | | |
| Net Assets | | | | | | | | |
Total increase in net assets | | | 6,463,514 | | | | 6,417,196 | |
Beginning of period | | | 11,867,243 | | | | 5,450,047 | |
| | | | |
End of period | | $ | 18,330,757 | | | $ | 11,867,243 | |
| | | | |
Undistributed net investment income, end of period | | $ | 200,094 | | | $ | 1,718 | |
| | | | |
| | 1 | | Distributions for annual periods determined in accordance with federal income tax regulations. |
See Notes to Consolidated Financial Statements.
| | | | | | |
| | | BLACKROCK VARIABLE SERIES FUNDS, INC. | | JUNE 30, 2016 | | 9 |
| | | | |
| Consolidated Financial Highlights | | | BlackRock iShares® Alternative Strategies V.I. Fund | |
| | | | | | | | | | | | | | | | | | | | | | | | |
| | | Class I | | | Class III | |
| | | Six Months
Ended
June 30, 2016
(Unaudited) | | | Year Ended
December 31,
2015 | | | Period
April 30, 20141
to
December 31,
2014 | | | Six Months
Ended
June 30, 2016
(Unaudited) | | | Year Ended
December 31,
2015 | | | Period
April 30, 20141
to
December 31,
2014 | |
| | | | | | | | | | | | | | | | | | | | | | | | |
| Per Share Operating Performance | | | | | | | | | | | | | |
Net asset value, beginning of period | | $ | 9.79 | | | $ | 10.20 | | | $ | 10.00 | | | $ | 9.77 | | | $ | 10.20 | | | $ | 10.00 | |
| | | | | | | | |
Net investment income2 | | | 0.14 | | | | 0.37 | | | | 0.31 | | | | 0.14 | | | | 0.39 | | | | 0.36 | |
Net realized and unrealized gain (loss) | | | 0.91 | | | | (0.47 | ) | | | 0.03 | | | | 0.89 | | | | (0.52 | ) | | | (0.03 | ) |
| | | | | | | | |
Net increase (decrease) from investment operations | | | 1.05 | | | | (0.10 | ) | | | 0.34 | | | | 1.03 | | | | (0.13 | ) | | | 0.33 | |
| | | | | | | | |
Distributions:3 | | | | | | | | | | | | | | | | | | | | | | | | |
From net investment income | | | — | | | | (0.30 | ) | | | (0.13 | ) | | | — | | | | (0.29 | ) | | | (0.12 | ) |
From net realized capital gains | | | — | | | | — | | | | (0.01 | ) | | | — | | | | — | | | | (0.01 | ) |
From return of capital | | | — | | | | (0.01 | ) | | | (0.00 | )4 | | | — | | | | (0.01 | ) | | | (0.00 | )4 |
| | | | | | | | |
Total distributions | | | — | | | | (0.31 | ) | | | (0.14 | ) | | | — | | | | (0.30 | ) | | | (0.13 | ) |
| | | | | | | | |
Net asset value, end of period | | $ | 10.84 | | | $ | 9.79 | | | $ | 10.20 | | | $ | 10.80 | | | $ | 9.77 | | | $ | 10.20 | |
| | | | | | | | |
| | | | | | | | | | | | | | | | | | | | | | | | |
| Total Return5 | | | | | |
Based on net asset value | | | 10.73 | %6 | | | (1.02 | )% | | | 3.32 | %6 | | | 10.54 | %6 | | | (1.24 | )% | | | 3.26 | %6 |
| | | | | | | | |
| | | | | | | | | | | | | | | | | | | | | | | | |
| Ratios to Average Net Assets7 | | | | | |
Total expenses | | | 1.17 | %8 | | | 2.15 | % | | | 8.81 | %8,9 | | | 1.27 | %8 | | | 2.26 | % | | | 8.54 | %8,9 |
| | | | | | | | |
Total expenses after fees waived and reimbursed | | | 0.65 | %8 | | | 0.71 | % | | | 0.75 | %8 | | | 0.90 | %8 | | | 0.94 | % | | | 1.00 | %8 |
| | | | | | | | |
Net investment income | | | 2.81 | %8 | | | 3.59 | % | | | 4.36 | %8 | | | 2.77 | %8 | | | 3.81 | % | | | 5.05 | %8 |
| | | | | | | | |
| | | | | | | | | | | | | | | | | | | | | | | | |
| Supplemental Data | | | | | | | | | | | | | | | | | | | | | | | | |
Net assets, end of period (000) | | $ | 12,968 | | | $ | 9,707 | | | $ | 5,116 | | | $ | 5,363 | | | $ | 2,160 | | | $ | 334 | |
| | | | | | | | |
Portfolio turnover rate | | | 22 | % | | | 37 | % | | | 34 | % | | | 22 | % | | | 37 | % | | | 34 | % |
| | | | | | | | |
| | 1 | | Commencement of operations. |
| | 2 | | Based on average shares outstanding. |
| | 3 | | Distributions for annual periods determined in accordance with federal income tax regulations. |
| | 4 | | Amount is greater than $(0.005) per share. |
| | 5 | | Where applicable, excludes insurance-related fees and expenses and assumes the reinvestment of distributions. |
| | 6 | | Aggregate total return. |
| | 7 | | Excludes expenses incurred indirectly as a result of investments in underlying funds as follows: |
| | | | | | | | | | | | |
| | | Six Months
Ended
June 30, 2016
(Unaudited) | | | Year Ended
December 31,
2015 | | | Period
April 30, 20141
to
December 31,
2014 | |
Investments in underlying funds | | | 0.34 | % | | | 0.37 | % | | | 0.41 | % |
| | 9 | | Organization and/or offering costs were not annualized in the calculation of the expense ratios. If these expenses were annualized, the total expenses for Class I and Class III would have been 9.60% and 9.03%, respectively. |
See Notes to Consolidated Financial Statements.
| | | | | | |
| 10 | | BLACKROCK VARIABLE SERIES FUNDS, INC. | | JUNE 30, 2016 | | |
| | | | |
| Notes to Consolidated Financial Statements (Unaudited) | | | BlackRock iShares® Alternative Strategies V.I. Fund | |
1. Organization:
BlackRock Variable Series Funds, Inc. (the “Company”) is registered under the Investment Company Act of 1940, as amended (the “1940 Act”), as an open-end management investment company. The Company is organized as a Maryland corporation that is comprised of 20 separate funds. The funds offer shares to insurance companies for their separate accounts to fund benefits under certain variable annuity and variable life insurance contracts. The consolidated financial statements presented are for BlackRock iShares® Alternative Strategies V.I. Fund (the “Fund”). The Fund is classified as diversified. Class I and Class III Shares have equal voting, dividend, liquidation and other rights, except that only shares of the respective classes are entitled to vote on matters concerning only that class. In addition, Class III Shares bear certain expenses related to the distribution of such shares.
The Fund, together with certain other registered investment companies advised by BlackRock Advisors, LLC (the “Manager”) or its affiliates, is included in a complex of open-end funds referred to as the Equity-Bond Complex.
Basis of Consolidation: The accompanying consolidated financial statements of the Fund include the accounts of iShares® Alternative Strategies V.I. Fund (Cayman) (the “Subsidiary”), which is a wholly-owned subsidiary of the Fund and primarily invests in underlying ETFs that primarily invest in commodities. The Subsidiary enables the Fund to hold these commodity-related instruments and satisfy regulated investment company tax requirements. The Fund may invest up to 25% of its total assets in the Subsidiary. The net assets of the Subsidiary as of June 30, 2016 were $1,347,936, which is 7.4% of the Fund’s consolidated net assets. Intercompany accounts and transactions, if any, have been eliminated. The Subsidiary is subject to the same investment policies and restrictions that apply to the Fund, except that the Subsidiary may invest without limitation in commodity-related instruments.
2. Significant Accounting Policies:
The consolidated financial statements are prepared in conformity with accounting principles generally accepted in the United States of America (“U.S. GAAP”), which may require management to make estimates and assumptions that affect the reported amounts of assets and liabilities in the consolidated financial statements, disclosure of contingent assets and liabilities at the date of the financial statements and the reported amounts of increases and decreases in net assets from operations during the reporting period. Actual results could differ from those estimates. The Fund is considered an investment company under U.S. GAAP and follows the accounting and reporting guidance applicable to investment companies. Below is a summary of significant accounting policies:
Investment Transactions and Investment Income: For financial reporting purposes, investment transactions are recorded on the dates the transactions are entered into (the trade dates). Realized gains and losses on investment transactions are determined on the identified cost basis. Dividend income is recorded on the ex-dividend date. Income, expenses and realized and unrealized gains and losses are allocated daily to each class based on its relative net assets.
Distributions: Distributions paid by the Fund are recorded on the ex-dividend date. The portion of distributions, if any, that exceeds the Fund’s current and accumulated earnings and profits, as measured on a tax basis, constitute a non-taxable return of capital. The character and timing of distributions are determined in accordance with federal income tax regulations, which may differ from U.S. GAAP.
Net income and realized gains from investments held by the Subsidiary are treated as ordinary income for tax purposes. If a net loss is realized by the Subsidiary in any taxable year, the loss will generally not be available to offset the Fund’s ordinary income and/or capital gains for that year.
Indemnifications: In the normal course of business, the Fund enters into contracts that contain a variety of representations that provide general indemnification. The Fund’s maximum exposure under these arrangements is unknown because it involves future potential claims against the Fund, which cannot be predicted with any certainty.
Other: Expenses directly related to the Fund or its classes are charged to the Fund or the applicable class. Other operating expenses shared by several funds, including other funds managed by the Manager, are prorated among those funds on the basis of relative net assets or other appropriate methods. Expenses directly related to the Fund and other shared expenses prorated to the Fund are allocated daily to each class based on its relative net assets or other appropriate methods.
The Fund has an arrangement with its custodian whereby fees may be reduced by credits earned on uninvested cash balances, which, if applicable, are shown as fees paid indirectly in the Consolidated Statement of Operations. The custodian imposes fees on overdrawn cash balances, which can be offset by accumulated credits earned or may result in additional custody charges.
3. Investment Valuation and Fair Value Measurements:
Investment Valuation Policies: The Fund’s investments are valued at fair value (also referred to as “market value” within the financial statements) as of the close of trading on the New York Stock Exchange (“NYSE”) (generally 4:00 p.m., Eastern time). U.S. GAAP defines fair value as the price the Fund would receive to sell an asset or pay to transfer a liability in an orderly transaction between market participants at the measurement date. The Fund determines the fair values of its financial instruments using various independent dealers or pricing services under policies approved by the Board of Directors of the Company (the “Board”). The BlackRock Global Valuation Methodologies Committee (the “Global Valuation Committee”) is the committee formed by management to develop global pricing policies and procedures and to oversee the pricing function for all financial instruments.
| | | | | | |
| | | BLACKROCK VARIABLE SERIES FUNDS, INC. | | JUNE 30, 2016 | | 11 |
| | | | |
| Notes to Consolidated Financial Statements (continued) | | | BlackRock iShares® Alternative Strategies V.I. Fund | |
Fair Value Inputs and Methodologies: The following methods (or “techniques”) and inputs are used to establish the fair value of the Fund’s assets and liabilities:
| • | | Equity investments traded on a recognized securities exchange are valued at the official closing price each day, if available. For equity investments traded on more than one exchange, the official close price on the exchange where the stock is primarily traded is used. Equity investments traded on a recognized exchange for which there were no sales on that day may be valued at the last available bid (long positions) or ask (short positions) price. |
| • | | The market value of the Fund’s investments in the underlying funds is based on the published net asset value (“NAV”) of each underlying fund computed as of the close of regular trading on the NYSE on days when the NYSE is open. |
| • | | Investments in open-end U.S. mutual funds are valued at NAV each business day. |
| • | | The Fund values its investment in BlackRock Liquidity Series, LLC, Money Market Series (the “Money Market Series”) at fair value, which is ordinarily based upon its pro rata ownership in the underlying fund’s net assets. The Money Market Series seeks current income consistent with maintaining liquidity and preserving capital. Although the Money Market Series is not registered under the 1940 Act, its investments may follow the parameters of investments by a money market fund that is subject to Rule 2a-7 under the 1940 Act. The Fund may withdraw up to 25% of its investment daily, although the manager of the Money Market Series, in its sole discretion, may permit an investor to withdraw more than 25% on any one day. |
If events (e.g., a company announcement, market volatility or a natural disaster) occur that are expected to materially affect the value of such instruments, or in the event that the application of these methods of valuation results in a price for an investment that is deemed not to be representative of the market value of such investment, or if a price is not available, the investment will be valued by the Global Valuation Committee or its delegate, in accordance with a policy approved by the Board as reflecting fair value (“Fair Valued Investments”). When determining the price for Fair Valued Investments, the Global Valuation Committee, or its delegate, seeks to determine the price that the Fund might reasonably expect to receive or pay from the current sale or purchase of that asset or liability in an arm’s-length transaction. Fair value determinations shall be based upon all available factors that the Global Valuation Committee, or its delegate, deems relevant consistent with the principles of fair value measurement. The pricing of all Fair Valued Investments is subsequently reported to the Board or a committee thereof on a quarterly basis.
Fair Value Hierarchy: Various inputs are used in determining the fair value of investments. These inputs to valuation techniques are categorized into a fair value hierarchy consisting of three broad levels for financial statement purposes as follows:
| | • | | Level 1 — unadjusted price quotations in active markets/exchanges for identical assets or liabilities that the Fund has the ability to access |
| | • | | Level 2 — other observable inputs (including, but not limited to, quoted prices for similar assets or liabilities in markets that are active, quoted prices for identical or similar assets or liabilities in markets that are not active, inputs other than quoted prices that are observable for the assets or liabilities (such as interest rates, yield curves, volatilities, prepayment speeds, loss severities, credit risks and default rates) or other market-corroborated inputs) |
| | • | | Level 3 — unobservable inputs based on the best information available in the circumstances, to the extent observable inputs are not available (including the Fund’s own assumptions used in determining the fair value of investments and derivative financial instruments) |
The hierarchy gives the highest priority to unadjusted quoted prices in active markets for identical assets or liabilities (Level 1 measurements) and the lowest priority to unobservable inputs (Level 3 measurements). Accordingly, the degree of judgment exercised in determining fair value is greatest for instruments categorized in Level 3. The inputs used to measure fair value may fall into different levels of the fair value hierarchy. In such cases, for disclosure purposes, the fair value hierarchy classification is determined based on the lowest level input that is significant to the fair value measurement in its entirety. The significant unobservable inputs used by the Global Valuation Committee in determining the price for Fair Valued Investments are typically categorized as Level 3. The fair value hierarchy for the Fund’s investments has been included in the Consolidated Schedules of Investments.
Changes in valuation techniques may result in transfers into or out of an assigned level within the hierarchy. In accordance with the Fund’s policy, transfers between different levels of the fair value hierarchy are deemed to have occurred as of the beginning of the reporting period. The categorization of a value determined for investments is based on the pricing transparency of the investments and is not necessarily an indication of the risks associated with investing in those securities.
| | | | | | |
| 12 | | BLACKROCK VARIABLE SERIES FUNDS, INC. | | JUNE 30, 2016 | | |
| | | | |
| Notes to Consolidated Financial Statements (continued) | | | BlackRock iShares® Alternative Strategies V.I. Fund | |
4. Securities and Other Investments:
Securities Lending: The Fund may lend its securities to approved borrowers, such as brokers, dealers and other financial institutions. The borrower pledges and maintains with the Fund collateral consisting of cash, an irrevocable letter of credit issued by a bank, or securities issued or guaranteed by the U.S. Government. The initial collateral received by the Fund is required to have a value of at least 102% of the current value of the loaned securities for securities traded on U.S. exchanges and a value of at least 105% for all other securities. The collateral is maintained thereafter at a value equal to at least 100% of the current market value of the securities on loan. The market value of the loaned securities is determined at the close of each business day of the Fund and any additional required collateral is delivered to the Fund, or excess collateral returned by the Fund, on the next business day. During the term of the loan, the Fund is entitled to all distributions made on or in respect of the loaned securities. Loans of securities are terminable at any time and the borrower, after notice, is required to return borrowed securities within the standard time period for settlement of securities transactions.
The market value of any securities on loan, all of which were classified as affiliated investment companies in the Fund’s Consolidated Schedule of Investments, and the value of any related collateral are shown separately in the Consolidated Statement of Assets and Liabilities as a component of investments at value — unaffiliated, and collateral on securities loaned at value, respectively. As of period end, any securities on loan were collateralized by cash. The cash collateral invested by the securities lending agent, BlackRock Investment Management, LLC (“BIM”), if any, is disclosed in the Consolidated Schedule of Investments.
Securities lending transactions are entered into by the Fund under Master Securities Lending Agreements (each, an “MSLA”), which provide the right, in the event of default (including bankruptcy or insolvency), for the non-defaulting party to liquidate the collateral and calculate a net exposure to the defaulting party or request additional collateral. In the event that a borrower defaults, the Fund, as lender, would offset the market value of the collateral received against the market value of the securities loaned. When the value of the collateral is greater than that of the market value of the securities loaned, the lender is left with a net amount payable to the defaulting party. However, bankruptcy or insolvency laws of a particular jurisdiction may impose restrictions on or prohibitions against such a right of offset in the event of an MSLA counterparty’s bankruptcy or insolvency. Under the MSLA, absent an event of default the borrower can resell or re-pledge the loaned securities, and the Fund can reinvest cash collateral received in connection with loaned securities. Upon an event of default, the parties’ obligations to return the securities or collateral to the other party are extinguished, and the parties can resell or re-pledge the loaned securities or the collateral received in connection with the loaned securities in order to satisfy the defaulting party’s net payment obligation for all transactions under the MSLA. The defaulting party remains liable for any deficiency.
As of period end, the following table is a summary of the Fund’s securities lending agreements by counterparty which are subject to offset under an MSLA:
| | | | | | | | | | | | | | | | | |
| Counterparty | | Securities
Loaned
at Value | | Cash
Collateral
Received1 | | Net Amount | | |
Citigroup Global Markets, Inc. | | | $ | 2,202,566 | | | | $ | (2,202,566 | ) | | | | — | | | |
| | 1 | Collateral with a value of $2,239,009 has been received in connection with securities lending agreements. Collateral received in excess of the value of securities loaned from the individual counterparty is not shown for financial reporting purposes in the table above. |
The risks of securities lending include the risk that the borrower may not provide additional collateral when required or may not return the securities when due. To mitigate these risks, the Fund benefits from a borrower default indemnity provided by BIM. BIM’s indemnity allows for full replacement of the securities loaned if the collateral received does not cover the value on the securities loaned in the event of a borrower default. The Fund could suffer a loss if the value of an investment purchased with cash collateral falls below the market value of loaned securities or if the value of an investment purchased with cash collateral falls below the value of the original cash collateral received.
5. Investment Advisory Agreement and Other Transactions with Affiliates:
The PNC Financial Services Group, Inc. is the largest stockholder and an affiliate of BlackRock, Inc. (“BlackRock”) for 1940 Act purposes.
Investment Advisory
The Company, on behalf of the Fund, entered into an Investment Advisory Agreement with the Manager, the Fund’s investment adviser, an indirect, wholly-owned subsidiary of BlackRock, to provide investment advisory and administration services. The Manager is responsible for the management of the Fund’s portfolio and provides the personnel, facilities, equipment and certain other services necessary to the operations of the Fund. For such
| | | | | | |
| | | BLACKROCK VARIABLE SERIES FUNDS, INC. | | JUNE 30, 2016 | | 13 |
| | | | |
| Notes to Consolidated Financial Statements (continued) | | | BlackRock iShares® Alternative Strategies V.I. Fund | |
services, the Fund pays the Manager a monthly fee, which is determined by calculating a percentage of the Fund’s average daily net assets, based on the following annual rates:
| | | | | |
| Average Daily Net Assets | | Investment Advisory Fee |
First $1 Billion | | | | 0.250 | % |
$1 Billion - $3 Billion | | | | 0.240 | % |
$3 Billion - $5 Billion | | | | 0.225 | % |
$5 Billion - $10 Billion | | | | 0.220 | % |
Greater than $10 Billion | | | | 0.210 | % |
The Manager provides investment management and other services to the Subsidiary. The Manager does not receive separate compensation from the Subsidiary for providing investment management or administrative services. However, the Fund pays the Manager based on the Fund’s net assets, which includes the assets of the Subsidiary.
Distribution Fees
The Company, on behalf of the Fund, entered into a Distribution Agreement and a Distribution Plan with BlackRock Investments, LLC (“BRIL”), an affiliate of the Manager. Pursuant to the Distribution Plan and in accordance with Rule 12b-1 under the 1940 Act, the Fund pays BRIL ongoing distribution fees. The fees are accrued daily and paid monthly at an annual rate of 0.25% based upon the average daily net assets attributable to Class III.
For the six months ended June 30, 2016, the class specific distribution fees borne directly by Class III is $4,221.
Transfer Agent
The Manager on behalf of the Fund, entered into agreements with insurance companies and other financial intermediaries (“Service Organizations”), some of which may be affiliates. Pursuant to these agreements, the Service Organizations provide the Fund with administrative, networking, recordkeeping, sub-transfer agency and shareholder services to sub-accounts they service. For these services, the Service Organizations receive an annual fee per shareholder account, which will vary depending on share class and/or net assets of Fund shareholders serviced by the Service Organizations, which is shown as transfer agent — class specific. For the six months ended June 30, 2016, the Fund did not pay any amounts to affiliates in return for these services.
In addition, the Fund pays the transfer agent, which is not an affiliate, a fee for issuance, transfer and redemption of shares and the opening and maintenance of shareholder accounts, which is included in transfer agent in the Consolidated Statement of Operations.
For the six months ended June 30, 2016, the following table shows the class specific transfer agent fees borne directly by each class of the Fund:
| | | | | | | | |
| | | Class I | | Class III | | | | Total |
| | | $9,394 | | $1,208 | | | | $10,602 |
Expense Limitations, Waivers, Reimbursements and Recoupments
The Manager, with respect to the Fund, contractually agreed to waive and/or reimburse fees or expenses in order to limit expenses, excluding interest expense, dividend expense, tax expense, acquired fund fees and expenses, and certain other fund expenses, which constitute extraordinary expenses not incurred in the ordinary course of the Fund’s business. The expense limitations as a percentage of average daily net assets are as follows:
| | | | |
| |
Class I | | | 0.65 | % |
Class III | | | 0.90 | % |
| |
The Manager has agreed not to reduce or discontinue this contractual expense limitation prior to May 1, 2017, unless approved by the Board, including a majority of the Independent Directors who are not “interested persons” of the Fund, as defined in the 1940 Act (“Independent Directors”) or by a majority of the outstanding voting securities of the Fund.
For the six months ended June 30, 2016, the amount is shown as fees waived by the Manager on the Consolidated Statement of Operations and the amount included in fees waived by the Manager was $14,895.
These amounts waived and/or reimbursed are included in fees waived by the Manager shown as transfer agent fees reimbursed — class specific in the Consolidated Statement of Operations. Class specific expense waivers and/or reimbursements are as follows:
| | | | | | |
| | | Class I | | Class III | | Total |
Transfer Agent Fees Reimbursed | | $9,386 | | $1,205 | | $10,591 |
| | | | | | |
| 14 | | BLACKROCK VARIABLE SERIES FUNDS, INC. | | JUNE 30, 2016 | | |
| | | | |
| Notes to Consolidated Financial Statements (continued) | | | BlackRock iShares® Alternative Strategies V.I. Fund | |
The Manager, with respect to the Fund, voluntarily agreed to waive its investment advisory fees by the amount of investment advisory fees the Fund pays to the Manager indirectly through its investment in affiliated money market funds. In addition, the Manager has contractually agreed to waive the management fee on assets estimated to be attributable to the Fund’s investments in other equity and fixed-income mutual funds managed by BlackRock or its affiliates, if any. This amount is included in fees waived by the Manager in the Consolidated Statement of Operations. For the six months ended June 30, 2016, the amount waived was $53.
For the six months ended June 30, 2016, the Fund reimbursed the Manager $55 for certain accounting services, which is included in accounting services in the Consolidated Statement of Operations.
If during the Fund’s fiscal year the operating expenses of a share class, that at any time during the prior two fiscal years received a waiver and/or reimbursement from the Manager, are less than the expense cap for that share class, the Manager is entitled to be reimbursed by such share class up to the lesser of the following expenses:
| | (a) | The amount of fees waived or expenses reimbursed during those prior two fiscal years under the agreement. |
| | (b) | The amount by which the expense cap for that share class exceeds the operating expenses of the share class for the current fiscal year, provided that: |
| | • | | The Fund, of which the share class is a part, has more than $50 million in assets for the fiscal year. |
| | • | | The Manager or an affiliate continues to serve as the Fund’s investment adviser or administrator. |
In the event the expense cap for a share class is changed subsequent to a fiscal year in which the Manager becomes entitled to reimbursement for fees waived and/or reimbursed, the amount available to reimburse the Manager shall be calculated by reference to the expense cap for that share class in effect at the time the Manager became entitled to receive such reimbursement, rather than the subsequently changed expense cap for that share class.
On June 30, 2016, the Fund level and class specific waivers and/or reimbursements subject to possible future recoupment under the expense limitation agreement are as follows:
| | | | | | | | | | | | |
| | | Expires December 31, | |
| | | 2016 | | | 2017 | | | 2018 | |
Fund Level | | $ | 89,728 | | | $ | 116,781 | | | $ | 23,395 | |
Class I | | $ | 1,140 | | | $ | 17,186 | | | $ | 9,386 | |
Class III | | $ | 24 | | | $ | 1,013 | | | $ | 1,205 | |
Securities Lending
The U.S. Securities and Exchange Commission has issued an exemptive order which permits BIM, an affiliate of the Manager, to serve as securities lending agent for the Fund, subject to applicable conditions. As securities lending agent, BIM bears all operational costs directly related to securities lending. The Fund is responsible for expenses in connection with the investment of cash collateral received for securities on loan (the “collateral investment expenses”). The cash collateral is invested in a private investment company managed by the Manager or its affiliates. However, BIM has agreed to cap the collateral investment expenses of the private investment company to an annual rate of 0.04%. The investment adviser to the private investment company will not charge any advisory fees with respect to shares purchased by the Fund.
Securities lending income is equal to the total of income earned from the reinvestment of cash collateral, net of fees and other payments to and from borrowers of securities, and less the collateral investment expenses. The Fund retains a portion of securities lending income and remits a remaining portion to BIM as compensation for its services as securities lending agent.
Pursuant to a securities lending agreement, the Fund retains 80% of securities lending income, and this amount retained can never be less than 70% of the total of securities lending income plus the collateral investment expenses.
In addition, commencing the business day following the date that the aggregate securities lending income earned across the Equity-Bond Complex in a calendar year exceeds a specified threshold, the Fund, pursuant to the securities lending agreement, will retain for the remainder of that calendar year securities lending income as follows: 85% of securities lending income, and this amount retained can never be less than 70% of the total of securities lending income plus the collateral investment expenses.
The share of securities lending income earned by the Fund is shown as securities lending — affiliated — net in the Consolidated Statement of Operations. For the six months ended June 30, 2016, the Fund paid BIM $3,727 for securities lending agent services.
| | | | | | |
| | | BLACKROCK VARIABLE SERIES FUNDS, INC. | | JUNE 30, 2016 | | 15 |
| | | | |
| Notes to Consolidated Financial Statements (continued) | | | BlackRock iShares® Alternative Strategies V.I. Fund | |
Officers and Directors
Certain officers and/or directors of the Company are officers and/or directors of BlackRock or its affiliates. The Fund reimburses the Manager for a portion of the compensation paid to the Company’s Chief Compliance Officer, which is included in officer and directors in the Consolidated Statement of Operations.
6. Purchases and Sales:
For the six months ended June 30, 2016, purchases and sales of investments, excluding short-term securities, were $8,313,882 and $3,183,699, respectively.
7. Income Tax Information:
It is the Fund’s policy to comply with the requirements of the Internal Revenue Code of 1986, as amended, applicable to regulated investment companies, and to distribute substantially all of its taxable income to its shareholders. Therefore, no federal income tax provision is required.
The Fund files U.S. federal and various state and local tax returns. No income tax returns are currently under examination. The statute of limitations on the Fund’s U.S. federal tax returns generally remains open for the period ended December 31, 2014 and year ended December 31, 2015. The statutes of limitations on the Fund’s state and local tax returns may remain open for an additional year depending upon the jurisdiction.
Management has analyzed tax laws and regulations and their application to the Fund as of June 30, 2016, inclusive of the open tax years and does not believe there are any uncertain tax positions that require recognition of a tax liability.
As of December 31, 2015, the Fund had a capital loss carryforward, with no expiration date, available to offset future realized capital gains of $34,842.
As of June 30, 2016, gross unrealized appreciation and depreciation based on cost for federal income tax purposes were as follows:
| | | | | |
Tax cost | | | $ | 20,330,348 | |
| | | | | |
Gross unrealized appreciation | | | $ | 813,965 | |
Gross unrealized depreciation | | | | — | |
| | | | | |
Net unrealized appreciation | | | $ | 813,965 | |
| | | | | |
| | | | | | |
8. Bank Borrowings:
The Company, on behalf of the Fund, along with certain other funds managed by the Manager and its affiliates (“Participating Funds”), is a party to a 364-day, $2.1 billion credit agreement with a group of lenders. Under this agreement, the Fund may borrow to fund shareholder redemptions. Excluding commitments designated for certain individual funds, the Participating Funds, including the Fund, can borrow up to an aggregate commitment amount of $1.6 billion at any time outstanding, subject to asset coverage and other limitations as specified in the agreement. The credit agreement has the following terms: a fee of 0.12% per annum on unused commitment amounts and interest at a rate equal to the higher of (a) one-month LIBOR (but, in any event, not less than 0.00%) on the date the loan is made plus 0.80% per annum or (b) the Fed Funds rate (but, in any event, not less than 0.00%) in effect from time to time plus 0.80% per annum on amounts borrowed. The agreement expires in April 2017 unless extended or renewed. Prior to April 21, 2016, the credit agreement had a fee per annum of 0.06% on unused commitment amounts and interest at a rate equal to the higher of (a) one-month LIBOR (but, in any event, not less than 0.00%) on the date the loan is made plus 0.80% per annum or (b) the Fed Funds rate (but, in any event, not less than 0.00%) in effect from time to time plus 0.80% per annum on amounts borrowed. Participating Funds paid administration, legal and arrangement fees, which, if applicable, are included in miscellaneous expenses in the Consolidated Statement of Operations. These fees were allocated among such funds based upon portions of the aggregate commitment available to them and relative net assets of Participating Funds. During the six months ended June 30, 2016, the Fund did not borrow under the credit agreement.
9. Principal Risks:
In the normal course of business, the Fund invests in securities and enters into transactions where risks exist due to fluctuations in the market (market risk) or failure of the issuer to meet all its obligations, including the ability to pay principal and interest when due (issuer credit risk). The value of securities held by the Fund may decline in response to certain events, including those directly involving the issuers of securities owned by the Fund. Changes arising from the general economy, the overall market and local, regional or global political and/or social instability, as well as currency, interest rate and price fluctuations, may also affect the securities’ value.
Counterparty Credit Risk: Similar to issuer credit risk, the Fund may be exposed to counterparty credit risk, or the risk that an entity may fail to or be unable to perform on its commitments related to unsettled or open transactions. The Fund manages counterparty credit risk by entering into transactions only with counterparties that the Manager believes have the financial resources to honor their obligations and by monitoring the financial stability
| | | | | | |
| 16 | | BLACKROCK VARIABLE SERIES FUNDS, INC. | | JUNE 30, 2016 | | |
| | | | |
| Notes to Consolidated Financial Statements (concluded) | | | BlackRock iShares® Alternative Strategies V.I. Fund | |
of those counterparties. Financial assets, which potentially expose the Fund to market, issuer and counterparty credit risks, consist principally of financial instruments and receivables due from counterparties. The extent of the Fund’s exposure to market, issuer and counterparty credit risks with respect to these financial assets approximated by their value recorded in the Consolidated Statement of Assets and Liabilities, less any collateral held by the Fund.
Concentration Risk: The Fund invests a significant portion of its assets in fixed-income securities and/or uses derivatives tied to the fixed-income markets. Changes in market interest rates or economic conditions may affect the value and/or liquidity of such investments. Interest rate risk is the risk that prices of bonds and other fixed-income securities will increase as interest rates fall and decrease as interest rates rise. The Fund may be subject to a greater risk of rising interest rates due to the current period of historically low rates.
10. Capital Share Transactions:
Transactions in capital shares for each class were as follows:
| | | | | | | | | | | | | | | | | | | | | | | | | | | | | | | | | | |
| | | Six Months Ended
June 30, 2016 | | | | | | | | Year Ended
December 31, 2015 | |
| | | | | | Shares | | | Amount | | | | | | | | | | | Shares | | | Amount | | | | |
Class I | | | | | | | | | | | | | | | | | | | | | | | | | | | | | | | | | | |
Shares sold | | | | | | | 303,243 | | | $ | 3,130,892 | | | | | | | | | | | | | | 788,065 | | | $ | 8,190,739 | | | | | |
Shares issued in reinvestment of distributions | | | | | | | — | | | | — | | | | | | | | | | | | | | 29,757 | | | | 293,399 | | | | | |
Shares redeemed | | | | | | | (97,791 | ) | | | (1,002,027 | ) | | | | | | | | | | | | | (328,008 | ) | | | (3,333,637 | ) | | | | |
| | | | | | | | | | |
Net increase | | | | | | | 205,452 | | | $ | 2,128,865 | | | | | | | | | | | | | | 489,814 | | | $ | 5,150,501 | | | | | |
| | | | | | | | | | |
| | | | | | | | | | | | | | | |
Class III | | | | | | | | | | | | | | | | | | | | | | | | | | | | | | | | | | |
Shares sold | | | | | | | 376,755 | | | $ | 3,883,593 | | | | | | | | | | | | | | 209,618 | | | $ | 2,155,730 | | | | | |
Shares issued in reinvestment of distributions | | | | | | | — | | | | — | | | | | | | | | | | | | | 6,362 | | | | 62,602 | | | | | |
Shares redeemed | | | | | | | (101,093 | ) | | | (1,057,797 | ) | | | | | | | | | | | | | (27,667 | ) | | | (285,669 | ) | | | | |
| | | | | | | | | | |
Net increase | | | | | | | 275,662 | | | $ | 2,825,796 | | | | | | | | | | | | | | 188,313 | | | $ | 1,932,663 | | | | | |
| | | | | | | | | | |
Total Net Increase | | | | | | | 481,114 | | | $ | 4,954,661 | | | | | | | | | | | | | | 678,127 | | | $ | 7,083,164 | | | | | |
| | | | | | | | | | |
11. Subsequent Events:
Management has evaluated the impact of all subsequent events on the Fund through the date the financial statements were issued and has determined that there were no subsequent events requiring adjustment or additional disclosure in the financial statements.
| | | | | | |
| | | BLACKROCK VARIABLE SERIES FUNDS, INC. | | JUNE 30, 2016 | | 17 |
JUNE 30, 2016
| | | | |
SEMI-ANNUAL REPORT (UNAUDITED) | | | | BLACKROCK® |
BlackRock Variable Series Funds, Inc.
▶ BlackRock iShares® Dynamic Allocation V.I. Fund
| | |
| Not FDIC Insured ¡ May Lose Value ¡ No Bank Guarantee | | |
| | | | |
| Fund Summary as of June 30, 2016 | | | BlackRock iShares® Dynamic Allocation V.I. Fund | |
BlackRock iShares® Dynamic Allocation V.I. Fund’s (the “Fund”) investment objective is to seek to provide total return.
|
| Portfolio Management Commentary |
How did the Fund perform?
| • | | For the six-month period ended June 30, 2016, the Fund outperformed its blended benchmark (60% MSCI All Country World Index/40% Barclays U.S. Aggregate Bond Index). |
What factors influenced performance?
| • | | The largest contributor to Fund performance was exposure to U.S. investment grade bonds through the iShares Core U.S. Credit Bond ETF. This was followed by exposure to a broad range of U.S. investment grade corporate bonds through the iShares iBoxx $ Investment Grade Corporate Bond ETF. |
| • | | The largest detractor from Fund performance was exposure to a broad range of companies in Europe, Australia, Asia and the Far East through the iShares MSCI EAFE ETF. The second-largest detractor was exposure to small public U.S. companies through the iShares Russell 2000 ETF. |
Describe recent portfolio activity.
| • | | During the six-month period, the Fund raised its allocation to the alternatives portfolio, which has access to safe haven assets such as gold, and |
| | smart beta (market sensitivity) exposures such as global minimum volatility equities that have performed well in this environment. The investment adviser expects the outperformance of alternatives over market cap equity and bond ETFs to continue. The Fund’s asset allocation is now 45% equity, 35% fixed income and 20% alternatives. |
Describe portfolio positioning at period end.
| • | | At period end, the Fund was generally defensively positioned, with a higher weighting to alternative asset classes, lower beta and higher duration (interest rate sensitivity) versus the benchmark. From an equity perspective, the Fund was overweight U.S. equities relative to international equities, with an underweight in diversified banks. Within fixed income, the Fund was overweight duration via long-term investment grade credit. Within alternatives, the Fund held a defensive tilt via minimum volatility equities, precious metals and higher yielding assets. Lastly, in terms of currency exposure, the Fund held an overweight to the U.S. dollar, primarily versus the euro, British pound and Japanese yen. |
The views expressed reflect the opinions of BlackRock as of the date of this report and are subject to change based on changes in market, economic or other conditions. These views are not intended to be a forecast of future events and are no guarantee of future results.
| | |
| Portfolio Composition | | Percent of
Affiliated Investment Companies |
Equity Funds | | 42% |
Fixed Income Funds | | 35 |
Short-Term Securities | | 22 |
Commodity Funds | | 1 |
| | | | | | |
| 2 | | BLACKROCK VARIABLE SERIES FUNDS, INC. | | JUNE 30, 2016 | | |
| | | | |
| | | | BlackRock iShares® Dynamic Allocation V.I. Fund | |
|
| Total Return Based on a $10,000 Investment |
| | 1 | Assuming transaction costs, if any, and other operating expenses, including investment advisory fees. Does not include insurance-related fees and expenses. |
| | 2 | The Fund invests in a portfolio of underlying exchange-traded funds that seek to track equity, fixed income and alternative indices. |
| | 3 | A customized weighted index comprised of 60% MSCI All Country World Index and 40% Barclays U.S. Aggregate Bond Index. |
| | 4 | A free float-adjusted market capitalization weighted index that is designed to measure the equity market performance of developed and emerging markets. The MSCI All Country World Index consists of 46 country indexes comprising 23 developed and 23 emerging market country indexes. |
| | 5 | A widely recognized unmanaged market-weighted index, comprised of investment-grade corporate bonds rated BBB or better, mortgages and U.S. Treasury and U.S. Government agency issues with at least one year to maturity. |
| | 6 | Commencement of operations. |
| | | | | | |
| Performance Summary for the Period Ended June 30, 2016 |
| | | | | Average Annual Total Returns |
| | | 6-Month Total Returns8 | | 1 Year8 | | Since Inception8,9 |
Class I7 | | 4.34% | | (0.80)% | | 0.72% |
Class III7 | | 4.13 | | (1.01) | | 0.47 |
60% MSCI All Country World Index / 40% Barclays U.S. Aggregate Bond Index | | 2.97 | | 0.33 | | 2.08 |
MSCI All Country World Index | | 1.23 | | (3.73) | | 0.41 |
Barclays U.S. Aggregate Bond Index | | 5.31 | | 6.00 | | 4.17 |
| | 7 | | Average annual and cumulative total returns are based on changes in net asset value for the periods shown, and assume reinvestment of all distributions at net asset value on the ex-dividend date. Insurance-related fees and expenses are not reflected in these returns. |
| | 8 | | For a portion of the period, the Fund’s investment adviser waived a portion of its fee. Without such waiver, the Fund’s performance would have been lower. |
| | 9 | | The Fund commenced operations on April 30, 2014. |
| | | | Past performance is not indicative of future results. Performance results do not reflect the deduction of taxes that a shareholder would pay on Fund distributions or the redemption of Fund shares. |
| | | | | | | | | | | | | | |
| Expense Example |
| | | Actual | | Hypothetical11 | | |
| | | Beginning Account Value January 1, 2016 | | Ending Account Value June 30, 2016 | | Expenses Paid During the Period10 | | Beginning Account Value January 1, 2016 | | Ending Account Value June 30, 2016 | | Expenses Paid During the Period10 | | Annualized Expense Ratio |
Class I | | $1,000.00 | | $1,043.40 | | $2.69 | | $1,000.00 | | $1,022.23 | | $2.66 | | 0.53% |
Class III | | $1,000.00 | | $1,041.30 | | $3.96 | | $1,000.00 | | $1,020.98 | | $3.92 | | 0.78% |
| | 10 | | For each class of the Fund, expenses are equal to the annualized expense ratio for the class, multiplied by the average account value over the period, multiplied by 182/366 (to reflect the one-half year period shown). |
| | 11 | | Hypothetical 5% annual return before expenses is calculated by prorating the number of days in the most recent fiscal half year divided by 366. |
| | | | See “Disclosure of Expenses” on the following page for further information on how expenses were calculated. |
| | | | | | |
| | | BLACKROCK VARIABLE SERIES FUNDS, INC. | | JUNE 30, 2016 | | 3 |
| | | | |
| Disclosure of Expenses | | | BlackRock iShares® Dynamic Allocation V.I. Fund | |
Shareholders of the Fund may incur the following charges: (a) transactional expenses, such as sales charges; and (b) operating expenses, including investment advisory fees, service and distribution fees, including 12b-1 fees, acquired fund fees and expenses, and other fund expenses. The expense example on the previous page (which is based on a hypothetical investment of $1,000 invested on January 1, 2016 and held through June 30, 2016) is intended to assist shareholders both in calculating expenses based on an investment in the Fund and in comparing these expenses with similar costs of investing in other mutual funds.
The expense example provides information about actual account values and actual expenses. In order to estimate the expenses a shareholder paid during the period covered by this report, shareholders can divide their account value by $1,000 and then multiply the result by the number corresponding to their share class under the heading entitled “Expenses Paid During the Period.”
The expense example also provides information about hypothetical account values and hypothetical expenses based on the Fund’s actual expense ratio and an assumed rate of return of 5% per year before expenses. In order to assist shareholders in comparing the ongoing expenses of investing in the Fund and other funds, compare the 5% hypothetical example with the 5% hypothetical examples that appear in shareholder reports of other funds.
The expenses shown in the expense example are intended to highlight shareholders’ ongoing costs only and do not reflect any transactional expenses, such as sales charges, if any. Therefore, the hypothetical example is useful in comparing ongoing expenses only, and will not help shareholders determine the relative total expenses of owning different funds. If these transactional expenses were included, shareholder expenses would have been higher.
| | | | | | |
| 4 | | BLACKROCK VARIABLE SERIES FUNDS, INC. | | JUNE 30, 2016 | | |
| | | | |
| Consolidated Schedule of Investments June 30, 2016 (Unaudited) | | | BlackRock iShares® Dynamic Allocation V.I. Fund | |
| | | (Percentages shown are based on Net Assets) | |
| | | | | | | | |
| Affiliated Investment Companies (a) | |
Shares | | | Value | |
Commodity Funds — 1.6% | | | | | | | | |
iShares Gold Trust (b)(c) | | | 14,073 | | | $ | 179,572 | |
iShares Silver Trust (b)(c) | | | 6,406 | | | | 114,475 | |
| | | | | | | | |
| | | | | | | | 294,047 | |
| | | | | | | | |
| Equity Funds — 54.8% | | | | | | |
iShares Core MSCI Emerging Markets ETF | | | 22,562 | | | | 943,768 | |
iShares Core S&P 500 ETF (d) | | | 4,909 | | | | 1,034,326 | |
iShares Core S&P Mid-Cap ETF (d) | | | 5,473 | | | | 817,611 | |
iShares Core S&P Small-Cap ETF (d) | | | 5,981 | | | | 695,052 | |
iShares Edge MSCI Minimum Volatility Global ETF | | | 14,310 | | | | 1,092,855 | |
iShares High Dividend ETF | | | 6,577 | | | | 540,301 | |
iShares MSCI Canada ETF | | | 8,225 | | | | 201,595 | |
iShares MSCI EAFE ETF (d) | | | 34,657 | | | | 1,934,207 | |
iShares MSCI EAFE Small-Cap ETF | | | 2,053 | | | | 99,078 | |
iShares Russell 1000 ETF (d) | | | 17,748 | | | | 2,074,741 | |
iShares S&P 100 ETF (d) | | | 2,983 | | | | 277,121 | |
iShares U.S. Real Estate ETF | | | 4,048 | | | | 333,150 | |
| | | | | | | | |
| | | | | | | | 10,043,805 | |
| | | | | | | | |
| Fixed Income Funds — 45.3% | | | | | | |
iShares 10+ Year Credit Bond ETF (d) | | | 6,167 | | | | 386,362 | |
iShares 20+ Year Treasury Bond ETF | | | 464 | | | | 64,450 | |
iShares Agency Bond ETF | | | 8,512 | | | | 986,371 | |
| | | | | | | | |
| Affiliated Investment Companies (a) | | Shares/
Beneficial
Interest
(000) | | | Value | |
Fixed Income Funds (continued) | | | | | | | | |
iShares CMBS ETF | | | 1,365 | | | $ | 72,604 | |
iShares Core U.S. Credit Bond ETF | | | 14,706 | | | | 1,666,925 | |
iShares Core U.S. Treasury Bond ETF (d) | | | 35,443 | | | | 930,024 | |
iShares iBoxx $ High Yield Corporate Bond ETF (d) | | | 4,922 | | | | 416,844 | |
iShares iBoxx $ Investment Grade Corporate Bond ETF | | | 6,905 | | | | 847,451 | |
iShares J.P. Morgan USD Emerging Markets Bond ETF | | | 9,211 | | | | 1,060,647 | |
iShares MBS ETF | | | 8,797 | | | | 967,406 | |
iShares TIPS Bond ETF | | | 1,894 | | | | 220,973 | |
iShares U.S. Preferred Stock ETF (d) | | | 16,976 | | | | 677,173 | |
| | | | | | | | |
| | | | | | | | 8,297,230 | |
| | | | | | | | |
| Short-Term Securities — 28.7% | | | | | | |
BlackRock Liquidity Funds, TempFund, Institutional Class, 0.40% (e) | | | 25,624 | | | | 25,625 | |
BlackRock Liquidity Series, LLC, Money Market Series, 0.59% (e)(f) | | $ | 5,221 | | | | 5,221,479 | |
| | | | | | | | |
| | | | | | | | 5,247,104 | |
| | | | | | | | |
Total Affiliated Investment Companies
(Cost — $23,336,922) — 130.4% | | | | | 23,882,186 | |
Liabilities in Excess of Other Assets — (30.4)% | | | | | | | (5,563,087 | ) |
| | | | | | | | |
Net Assets — 100.0% | | | | | | $ | 18,319,099 | |
| | | | | | | | |
| | |
| Portfolio Abbreviation |
| ETF | | Exchange-Traded Fund |
See Notes to Consolidated Financial Statements.
| | | | | | |
| | | BLACKROCK VARIABLE SERIES FUNDS, INC. | | JUNE 30, 2016 | | 5 |
| | | | |
| Consolidated Schedule of Investments (continued) | | | BlackRock iShares® Dynamic Allocation V.I. Fund | |
| | |
Notes to Schedule of Investments |
| (a) | During the six months ended June 30, 2016, investments in issuers considered to be affiliates of the Fund for purposes of Section 2(a)(3) of the Investment Company Act of 1940, as amended, were as follows: |
| | | | | | | | | | | | | | | | | | | | | | | | | | | | | | |
| Affiliate | | Shares/ Beneficial Interest Held at December 31, 2015 | | | Shares/ Beneficial Interest Purchased | | | Shares Sold | | | Shares/ Beneficial Interest Held at June 30, 2016 | | | Value at June 30, 2016 | | | Income | | | Realized Gain (Loss) | |
BlackRock Liquidity Funds, TempFund, Institutional Class | | | 175,512 | | | | — | | | | 149,887 | 1 | | | 25,625 | | | | $25,625 | | | | $ 205 | | | | — | |
BlackRock Liquidity Series, LLC, Money Market Series | | | $666,937 | | | | $4,554,542 | 2 | | | — | | | | $5,221,479 | | | | 5,221,479 | | | | 11,637 | 3 | | | — | |
iShares 1-3 Year Treasury Bond ETF | | | 3,689 | | | | 1,034 | | | | 4,723 | | | | — | | | | — | | | | 394 | | | | $ 2,535 | |
iShares 10+ Year Credit Bond ETF | | | — | | | | 7,133 | | | | 966 | | | | 6,167 | | | | 386,362 | | | | 4,141 | | | | 1,168 | |
iShares 20+ Year Treasury Bond ETF | | | — | | | | 464 | | | | — | | | | 464 | | | | 64,450 | | | | — | | | | — | |
iShares Agency Bond ETF | | | 8,619 | | | | 2,111 | | | | 2,218 | | | | 8,512 | | | | 986,371 | | | | 5,848 | | | | 1,758 | |
iShares CMBS ETF | | | 1,221 | | | | 144 | | | | — | | | | 1,365 | | | | 72,604 | | | | 616 | | | | | |
iShares Commodities Select Strategy ETF | | | 2,776 | | | | 300 | | | | 3,076 | | | | — | | | | — | | | | 248 | | | | (10,149) | |
iShares Core MSCI Emerging Markets ETF | | | 23,208 | | | | 4,662 | | | | 5,308 | | | | 22,562 | | | | 943,768 | | | | 9,207 | | | | (44,326) | |
iShares Core S&P 500 ETF | | | 4,193 | | | | 1,335 | | | | 619 | | | | 4,909 | | | | 1,034,326 | | | | 10,699 | | | | (1,395) | |
iShares Core S&P Mid-Cap ETF | | | 1,189 | | | | 4,744 | | | | 460 | | | | 5,473 | | | | 817,611 | | | | 4,189 | | | | (311) | |
iShares Core S&P Small-Cap ETF | | | — | | | | 6,590 | | | | 609 | | | | 5,981 | | | | 695,052 | | | | 2,190 | | | | (600) | |
iShares Core U.S. Credit Bond ETF | | | 14,869 | | | | 3,312 | | | | 3,475 | | | | 14,706 | | | | 1,666,925 | | | | 23,553 | | | | 2,337 | |
iShares Core U.S. Treasury Bond ETF | | | 37,842 | | | | 9,410 | | | | 11,809 | | | | 35,443 | | | | 930,024 | | | | 5,871 | | | | 4,690 | |
iShares Edge MSCI Minimum Volatility Global ETF | | | 6,378 | | | | 8,325 | | | | 393 | | | | 14,310 | | | | 1,092,855 | | | | 5,433 | | | | 372 | |
iShares Gold Trust | | | 7,142 | | | | 7,474 | | | | 543 | | | | 14,073 | | | | 179,572 | | | | — | | | | (181) | |
iShares High Dividend ETF | | | — | | | | 6,577 | | | | — | | | | 6,577 | | | | 540,301 | | | | — | | | | — | |
iShares iBoxx $ High Yield Corporate Bond ETF | | | 6,421 | | | | 570 | | | | 2,069 | | | | 4,922 | | | | 416,844 | | | | 12,805 | | | | (13,098) | |
iShares iBoxx $ Investment Grade Corporate Bond ETF | | | 6,792 | | | | 1,730 | | | | 1,617 | | | | 6,905 | | | | 847,451 | | | | 12,835 | | | | 7,370 | |
iShares International Developed Real Estate ETF | | | 5,583 | | | | 950 | | | | 6,533 | | | | — | | | | — | | | | 3,130 | | | | (11,089) | |
iShares International Select Dividend ETF | | | 5,786 | | | | — | | | | 5,786 | | | | — | | | | — | | | | 1,964 | | | | (2,754) | |
iShares J.P. Morgan USD Emerging Markets Bond ETF | | | 4,329 | | | | 5,159 | | | | 277 | | | | 9,211 | | | | 1,060,647 | | | | 9,890 | | | | (1,292) | |
iShares MBS ETF | | | 9,388 | | | | 2,594 | | | | 3,185 | | | | 8,797 | | | | 967,406 | | | | 9,184 | | | | 576 | |
iShares Micro-Cap ETF | | | 2,059 | | | | — | | | | 2,059 | | | | — | | | | — | | | | 404 | | | | (8,949) | |
iShares MSCI Canada ETF | | | — | | | | 8,715 | | | | 490 | | | | 8,225 | | | | 201,595 | | | | 1,610 | | | | (173) | |
iShares MSCI EAFE ETF | | | 36,286 | | | | 15,132 | | | | 16,761 | | | | 34,657 | | | | 1,934,207 | | | | 54,288 | | | | (178,537) | |
iShares MSCI EAFE Small-Cap ETF | | | 5,960 | | | | 2,619 | | | | 6,526 | | | | 2,053 | | | | 99,078 | | | | 5,291 | | | | (12,886) | |
iShares Russell 1000 ETF | | | 16,288 | | | | 3,664 | | | | 2,204 | | | | 17,748 | | | | 2,074,741 | | | | 10,722 | | | | (10,363) | |
iShares Russell 2000 ETF | | | 10,576 | | | | 2,181 | | | | 12,757 | | | | — | | | | — | | | | 4,167 | | | | (46,221) | |
iShares S&P 100 ETF | | | 1,705 | | | | 1,351 | | | | 73 | | | | 2,983 | | | | 277,121 | | | | 1,749 | | | | (180) | |
iShares Silver Trust | | | 2,217 | | | | 4,410 | | | | 221 | | | | 6,406 | | | | 114,475 | | | | — | | | | (419) | |
iShares TIPS Bond ETF | | | 1,729 | | | | 165 | | | | — | | | | 1,894 | | | | 220,973 | | | | 68 | | | | — | |
iShares U.S. Preferred Stock ETF | | | 8,161 | | | | 9,895 | | | | 1,080 | | | | 16,976 | | | | 677,173 | | | | 8,062 | | | | (1,258) | |
iShares U.S. Real Estate ETF | | | 418 | | | | 3,630 | | | | — | | | | 4,048 | | | | 333,150 | | | | 711 | | | | — | |
Total | | | | | | | | | | | | | | | | | | | $23,882,186 | | | | $221,111 | | | | $(323,375) | |
| | | | | | | | | | | | | | | | | | | | | | |
| | 1 | | Represents net shares sold. |
| | 2 | | Represents net beneficial interest purchased. |
| | 3 | | Represents securities lending income earned from the reinvestment of cash collateral from loaned securities, net of fees and collateral investment expenses, and other payments to and from borrowers of securities. |
| (b) | Non-income producing security. |
| (c) | Security is held by a wholly-owned subsidiary. See Note 1 of the Notes to Consolidated Financial Statements for details on the wholly-owned subsidiary. |
| (d) | Security, or a portion of security, is on loan. |
| (e) | Current yield as of period end. |
| (f) | Security was purchased with the cash collateral from loaned securities. The Fund may withdraw up to 25% of its investment daily, although the manager of the BlackRock Liquidity Series, LLC, Money Market Series, in its sole discretion, may permit an investor to withdraw more than 25% on any one day. |
See Notes to Consolidated Financial Statements.
| | | | | | |
| 6 | | BLACKROCK VARIABLE SERIES FUNDS, INC. | | JUNE 30, 2016 | | |
| | | | |
| Consolidated Schedule of Investments (concluded) | | | BlackRock iShares® Dynamic Allocation V.I. Fund | |
|
Fair Value Hierarchy as of Period End |
Various inputs are used in determining the fair value of investments. For information about the Fund’s policy regarding valuation of investments, refer to the Notes to Consolidated Financial Statements.
The following table summarizes the Fund’s investments categorized in the disclosure hierarchy:
| | | | | | | | | | | | | | | | |
| | | Level 1 | | | Level 2 | | | Level 3 | | | Total | |
Assets: | | | | | | | | | | | | | | | | |
Investments: | | | | | | | | | | | | | | | | |
Affiliated Investment Companies | | $ | 18,660,707 | | | $ | 5,221,479 | | | | — | | | $ | 23,882,186 | |
| | | | |
The Fund may hold liabilities in which the fair value approximates the carrying amount for financial statement purposes. As of period end, collateral on securities loaned at value of $5,221,479 is categorized as Level 2 within the disclosure hierarchy.
During the six months ended June 30, 2016, there were no transfers between levels.
See Notes to Consolidated Financial Statements.
| | | | | | |
| | | BLACKROCK VARIABLE SERIES FUNDS, INC. | | JUNE 30, 2016 | | 7 |
| | | | |
| Consolidated Statement of Assets and Liabilities | | | | |
| | | | |
| June 30, 2016 (Unaudited) | | BlackRock
iShares® Dynamic
Allocation V.I. Fund | |
| | | | |
| Assets | | | | |
Investments at value — affiliated (including securities loaned at value of $ 5,176,547) (cost — $ 23,336,922) | | $ | 23,882,186 | |
Receivables: | | | | |
Investments sold | | | 2,531,603 | |
Securities lending income — affiliated | | | 3,499 | |
Capital shares sold | | | 865 | |
Dividends — affiliated | | | 18 | |
From the Manager | | | 3,667 | |
Prepaid expenses | | | 362 | |
| | | | |
Total assets | | | 26,422,200 | |
| | | | |
| | | | |
| Liabilities | | | | |
Collateral on securities loaned at value | | | 5,221,479 | |
Payables: | | | | |
Investments purchased | | | 2,523,273 | |
Capital shares redeemed | | | 273,271 | |
Distribution fees | | | 324 | |
Officer’s and Directors’ fees | | | 859 | |
Other affiliates | | | 69 | |
Other accrued expenses | | | 83,826 | |
| | | | |
Total liabilities | | | 8,103,101 | |
| | | | |
Net Assets | | $ | 18,319,099 | |
| | | | |
| | | | |
| Net Assets Consist of | | | | |
Paid-in capital | | $ | 18,613,539 | |
Undistributed net investment income | | | 175,540 | |
Accumulated net realized loss | | | (1,015,244 | ) |
Net unrealized appreciation (depreciation) | | | 545,264 | |
| | | | |
Net Assets | | $ | 18,319,099 | |
| | | | |
| | | | |
| Net Asset Value | | | | |
Class I — Based on net assets of $16,717,373 and 1,696,101 shares outstanding, 100 million shares authorized, $0.10 par value | | $ | 9.86 | |
| | | | |
Class III — Based on net assets of $1,601,726 and 162,952 shares outstanding, 100 million shares authorized, $0.10 par value | | $ | 9.83 | |
| | | | |
See Notes to Consolidated Financial Statements.
| | | | | | |
| 8 | | BLACKROCK VARIABLE SERIES FUNDS, INC. | | JUNE 30, 2016 | | |
| | | | |
| Consolidated Statement of Operations | | | | |
| | | | |
Six Months Ended June 30, 2016 (Unaudited) | | BlackRock
iShares® Dynamic
Allocation V.I. Fund | |
| Investment Income | | | | |
Dividends — affiliated | | $ | 209,474 | |
Securities lending — affiliated — net | | | 11,637 | |
| | | | |
Total income | | | 221,111 | |
| | | | |
| | | | |
| Expenses | | | | |
Professional | | | 26,531 | |
Transfer agent | | | 2,390 | |
Transfer agent — class specific | | | 15,099 | |
Investment advisory | | | 12,904 | |
Printing | | | 8,383 | |
Accounting services | | | 4,417 | |
Officer and Directors | | | 2,835 | |
Custodian | | | 2,468 | |
Distribution — class specific | | | 1,765 | |
Registration | | | 655 | |
Miscellaneous | | | 3,751 | |
| | | | |
Total expenses | | | 81,198 | |
Less fees waived by the Manager | | | (8,554 | ) |
Less transfer agent fees reimbursed — class specific | | | (15,086 | ) |
Less expenses reimbursed by the Manager | | | (10,126 | ) |
| | | | |
Total expenses after fees waived and reimbursed | | | 47,432 | |
| | | | |
Net investment income | | | 173,679 | |
| | | | |
| | | | |
| Realized and Unrealized Gain (Loss) | | | | |
Net realized loss on investments — affiliated | | | (323,375 | ) |
Net change in unrealized appreciation (depreciation) on investments — affiliated | | | 976,444 | |
| | | | |
Net realized and unrealized gain | | | 653,069 | |
| | | | |
Net Increase in Net Assets Resulting from Operations | | $ | 826,748 | |
| | | | |
See Notes to Consolidated Financial Statements.
| | | | | | |
| | | BLACKROCK VARIABLE SERIES FUNDS, INC. | | JUNE 30, 2016 | | 9 |
| | | | |
| Consolidated Statements of Changes in Net Assets | | | BlackRock iShares® Dynamic Allocation V.I. Fund | |
| | | | | | | | |
| Increase (Decrease) in Net Assets: | | Six Months Ended June 30, 2016 (Unaudited) | | | Year Ended
December 31, 2015 | |
| | | | | | | | |
| Operations | | | | | | | | |
Net investment income | | $ | 173,679 | | | $ | 279,655 | |
Net realized loss | | | (323,375 | ) | | | (670,387 | ) |
Net change in unrealized appreciation (depreciation) | | | 976,444 | | | | (382,117 | ) |
| | | | |
Net increase (decrease) in net assets resulting from operations | | | 826,748 | | | | (772,849 | ) |
| | | | |
| | | | | | | | |
| Distributions to Shareholders1 | | | | | | | | |
From net investment income: | | | | | | | | |
Class I | | | — | | | | (267,341 | ) |
Class III | | | — | | | | (19,225 | ) |
From return of capital | | | | | | | | |
Class I | | | — | | | | (9,695 | ) |
Class III | | | — | | | | (741 | ) |
| | | | |
Decrease in net assets resulting from distributions to shareholders | | | — | | | | (297,002 | ) |
| | | | |
| | | | | | | | |
| Capital Share Transactions | | | | | | | | |
Net increase in net assets derived from capital share transactions | | | 1,682,232 | | | | 10,767,798 | |
| | | | |
| | | | | | | | |
| Net Assets | | | | | | | | |
Total increase in net assets | | | 2,508,980 | | | | 9,697,947 | |
Beginning of period | | | 15,810,119 | | | | 6,112,172 | |
| | | | |
End of period | | $ | 18,319,099 | | | $ | 15,810,119 | |
| | | | |
Undistributed net investment income, end of period | | $ | 175,540 | | | $ | 1,861 | |
| | | | |
| | 1 | | Distributions for annual periods determined in accordance with federal income tax regulations. |
See Notes to Consolidated Financial Statements.
| | | | | | |
| 10 | | BLACKROCK VARIABLE SERIES FUNDS, INC. | | JUNE 30, 2016 | | |
| | | | |
| Consolidated Financial Highlights | | | BlackRock iShares® Dynamic Allocation V.I. Fund | |
| | | | | | | | | | | | | | | | | | | | | | | | |
| | | Class I | | | Class III | |
| | | Six Months
Ended
June 30, 2016
(Unaudited) | | | Year Ended
December 31,
2015 | | | Period
April 30, 20141
to December 31,
2014 | | | Six Months
Ended
June 30, 2016
(Unaudited) | | | Year Ended
December 31,
2015 | | | Period
April 30, 20141
to December 31,
2014 | |
| | | | | | | | | | | | | | | | | | | | | | | | |
| Per Share Operating Performance | | | | | | | | | | | | | | | | | | | | | | | | |
Net asset value, beginning of period | | $ | 9.45 | | | $ | 10.02 | | | $ | 10.00 | | | $ | 9.44 | | | $ | 10.01 | | | $ | 10.00 | |
| | | | | | | | |
Net investment income2 | | | 0.10 | | | | 0.24 | | | | 0.20 | | | | 0.09 | | | | 0.26 | | | | 0.17 | |
Net realized and unrealized gain (loss) | | | 0.31 | | | | (0.63 | ) | | | (0.07 | ) | | | 0.30 | | | | (0.66 | ) | | | (0.06 | ) |
| | | | | | | | |
Net increase (decrease) from investment operations | | | 0.41 | | | | (0.39 | ) | | | 0.13 | | | | 0.39 | | | | (0.40 | ) | | | 0.11 | |
| | | | | | | | |
Distributions:3 | | | | | | | | | | | | | | | | | | | | | | | | |
From net investment income | | | — | | | | (0.17 | ) | | | (0.10 | ) | | | — | | | | (0.16 | ) | | | (0.09 | ) |
From net realized capital gains | | | — | | | | — | | | | (0.01 | ) | | | — | | | | — | | | | (0.01 | ) |
From return of capital | | | — | | | | (0.01 | ) | | | — | | | | — | | | | (0.01 | ) | | | — | |
| | | | | | | | |
Total distributions | | | — | | | | (0.18 | ) | | | (0.11 | ) | | | — | | | | (0.17 | ) | | | (0.10 | ) |
| | | | | | | | |
Net asset value, end of period | | $ | 9.86 | | | $ | 9.45 | | | $ | 10.02 | | | $ | 9.83 | | | $ | 9.44 | | | $ | 10.01 | |
| | | | | | | | |
| | | | | | | | | | | | | | | | | | | | | | | | |
| Total Return4 | | | | | | | | | | | | | | | | | | | | | | | | |
Based on net asset value | | | 4.34 | %5 | | | (3.88 | )% | | | 1.27 | %5 | | | 4.13 | %5 | | | (3.99 | )% | | | 1.05 | %5 |
| | | | | | | | |
| | | | | | | | | | | | | | | | | | | | | | | | |
| | | | | | | | | | | | | | | | | | | | | | | | |
| Ratios to Average Net Assets6 | | | | | | | | | | | | | | | | | | | | | | | | |
Total expenses | | | 0.93 | %7 | | | 1.90 | % | | | 6.47 | %7,8 | | | 1.07 | %7 | | | 1.87 | % | | | 8.32 | %7,8 |
| | | | | | | | |
Total expenses after fees waived and reimbursed | | | 0.53 | %7 | | | 0.64 | % | | | 0.75 | %7 | | | 0.78 | %7 | | | 0.86 | % | | | 1.00 | %7 |
| | | | | | | | |
Net investment income | | | 2.03 | %7 | | | 2.41 | % | | | 2.85 | %7 | | | 1.86 | %7 | | | 2.56 | % | | | 2.54 | %7 |
| | | | | | | | |
| | | | | | | | | | | | | | | | | | | | | | | | |
| Supplemental Data | | | | | | | | | | | | | | | | | | | | | | | | |
Net assets, end of period (000) | | $ | 16,717 | | | $ | 14,636 | | | $ | 6,092 | | | $ | 1,602 | | | $ | 1,174 | | | $ | 20 | |
| | | | | | | | |
Portfolio turnover | | | 36 | % | | | 54 | % | | | 25 | % | | | 36 | % | | | 54 | % | | | 25 | % |
| | | | | | | | |
| | 1 | | Commencement of operations. |
| | 2 | | Based on average shares outstanding. |
| | 3 | | Distributions for annual periods determined in accordance with federal income tax regulations. |
| | 4 | | Where applicable, excludes insurance-related fees and expenses and assumes the reinvestment of distributions. |
| | 5 | | Aggregate total return. |
| | 6 | | Excludes expenses incurred indirectly as a result of investments in underlying funds as follows: |
| | | | | | | | | | | | |
| | | Six Months
Ended
June 30, 2016
(Unaudited) | | | Year Ended
December 31,
2015 | | | Period
April 30, 20141
to
December 31,
2014 | |
Investments in underlying funds | | | 0.23 | % | | | 0.29 | % | | | 0.27 | % |
| | 8 | | Organization and/or offering costs were not annualized in the calculation of the expense ratios. If these expenses were annualized, the total expenses for Class I and Class III would have been 7.00% and 9.13%, respectively. |
See Notes to Consolidated Financial Statements.
| | | | | | |
| | | BLACKROCK VARIABLE SERIES FUNDS, INC. | | JUNE 30, 2016 | | 11 |
| | | | |
| Notes to Consolidated Financial Statements (Unaudited) | | | BlackRock iShares® Dynamic Allocation V.I. Fund | |
1. Organization:
BlackRock Variable Series Funds, Inc. (the “Company”) is registered under the Investment Company Act of 1940, as amended (the “1940 Act”), as an open-end management investment company. The Company is organized as a Maryland corporation that is comprised of 20 separate funds. The funds offer shares to insurance companies for their separate accounts to fund benefits under certain variable annuity and variable life insurance contracts. The consolidated financial statements presented are for BlackRock iShares® Dynamic Allocation V.I. Fund (the “Fund”). The Fund is classified as diversified. Class I and Class III Shares have equal voting, dividend, liquidation and other rights, except that only shares of the respective classes are entitled to vote on matters concerning only that class. In addition, Class III Shares bear certain expenses related to the distribution of such shares.
The Fund, together with certain other registered investment companies advised by BlackRock Advisors, LLC (the “Manager”) or its affiliates, is included in a complex of open-end funds referred to as the Equity-Bond Complex.
Basis of Consolidation: The accompanying consolidated financial statements of the Fund include the accounts of iShares® Dynamic Allocation V.I. Fund (Cayman) (the “Subsidiary”), which is a wholly-owned subsidiary of the Fund and primarily invests in commodity-related instruments. The Subsidiary enables the Fund to hold these commodity-related instruments and satisfy regulated investment company tax requirements. The Fund may invest up to 25% of its total assets in the Subsidiary. The net assets of the Subsidiary as of June 30, 2016 were $150,720, which is 0.8% of the Fund’s consolidated net assets. Intercompany accounts and transactions, if any, have been eliminated. The Subsidiary is subject to the same investment policies and restrictions that apply to the Fund, except that the Subsidiary may invest without limitation in commodity-related instruments.
2. Significant Accounting Policies:
The consolidated financial statements are prepared in conformity with accounting principles generally accepted in the United States of America (“U.S. GAAP”), which may require management to make estimates and assumptions that affect the reported amounts of assets and liabilities in the consolidated financial statements, disclosure of contingent assets and liabilities at the date of the financial statements and the reported amounts of increases and decreases in net assets from operations during the reporting period. Actual results could differ from those estimates. The Fund is considered an investment company under U.S. GAAP and follows the accounting and reporting guidance applicable to investment companies. Below is a summary of significant accounting policies:
Investment Transactions and Investment Income: For financial reporting purposes, investment transactions are recorded on the dates the transactions are entered into (the trade dates). Realized gains and losses on investment transactions are determined on the identified cost basis. Dividend income is recorded on the ex- dividend date. Income, expenses and realized and unrealized gains and losses are allocated daily to each class based on its relative net assets.
Distributions: Distributions paid by the Fund are recorded on the ex-dividend date. The portion of distributions, if any, that exceeds the Fund’s current and accumulated earnings and profits, as measured on a tax basis, constitute a non-taxable return of capital. The character and timing of distributions are determined in accordance with federal income tax regulations, which may differ from U.S. GAAP.
Net income and realized gains from investments held by the Subsidiary are treated as ordinary income for tax purposes. If a net loss is realized by the Subsidiary in any taxable year, the loss will generally not be available to offset the Fund’s ordinary income and/or capital gains for that year.
Indemnifications: In the normal course of business, the Fund enters into contracts that contain a variety of representations that provide general indemnification. The Fund’s maximum exposure under these arrangements is unknown because it involves future potential claims against the Fund, which cannot be predicted with any certainty.
Other: Expenses directly related to the Fund or its classes are charged to the Fund or the applicable class. Other operating expenses shared by several funds, including other funds managed by the Manager, are prorated among those funds on the basis of relative net assets or other appropriate methods. Expenses directly related to the Fund and other shared expenses prorated to the Fund are allocated daily to each class based on its relative net assets or other appropriate methods.
The Fund has an arrangement with its custodian whereby fees may be reduced by credits earned on uninvested cash balances, which, if applicable, are shown as fees paid indirectly in the Consolidated Statement of Operations. The custodian imposes fees on overdrawn cash balances, which can be offset by accumulated credits earned or may result in additional custody charges.
3. Investment Valuation and Fair Value Measurements:
Investment Valuation Policies: The Fund’s investments are valued at fair value (also referred to as “market value” within the financial statements) as of the close of trading on the New York Stock Exchange (“NYSE”) (generally 4:00 p.m., Eastern time). U.S. GAAP defines fair value as the price the Fund would receive to sell an asset or pay to transfer a liability in an orderly transaction between market participants at the measurement date. The Fund determines the fair values of its financial instruments using various independent dealers or pricing services under policies approved by the Board of Directors of the Company (the “Board”). The BlackRock Global Valuation Methodologies Committee (the “Global Valuation Committee”) is the committee formed by management to develop global pricing policies and procedures and to oversee the pricing function for all financial instruments.
| | | | | | |
| 12 | | BLACKROCK VARIABLE SERIES FUNDS, INC. | | JUNE 30, 2016 | | |
| | | | |
| Notes to Consolidated Financial Statements (continued) | | | BlackRock iShares® Dynamic Allocation V.I. Fund | |
Fair Value Inputs and Methodologies: The following methods (or “techniques”) and inputs are used to establish the fair value of the Fund’s assets and liabilities:
| • | | Equity investments traded on a recognized securities exchange are valued at the official closing price each day, if available. For equity investments traded on more than one exchange, the official close price on the exchange where the stock is primarily traded is used. Equity investments traded on a recognized exchange for which there were no sales on that day may be valued at the last available bid (long positions) or ask (short positions) price. |
| • | | The market value of the Fund’s investments in the underlying funds is based on the published net asset value (“NAV”) of each underlying fund computed as of the close of regular trading on the New York Stock Exchange (“NYSE”) on days when the NYSE is open. |
| • | | Investments in U.S. mutual funds are valued at NAV each business day. |
| • | | The Fund values its investment in BlackRock Liquidity Series, LLC, Money Market Series (the “Money Market Series”) at fair value, which is ordinarily based upon its pro rata ownership in the underlying fund’s net assets. The Money Market Series seeks current income consistent with maintaining liquidity and preserving capital. Although the Money Market Series is not registered under the 1940 Act, its investments may follow the parameters of investments by a money market fund that is subject to Rule 2a-7 under the 1940 Act. The Fund may withdraw up to 25% of its investment daily, although the manager of the Money Market Series, in its sole discretion, may permit an investor to withdraw more than 25% on any one day. |
If events (e.g., a company announcement, market volatility or a natural disaster) occur that are expected to materially affect the value of such instruments, or in the event that the application of these methods of valuation results in a price for an investment that is deemed not to be representative of the market value of such investment, or if a price is not available, the investment will be valued by the Global Valuation Committee or its delegate, in accordance with a policy approved by the Board as reflecting fair value (“Fair Valued Investments”). When determining the price for Fair Valued Investments, the Global Valuation Committee, or its delegate, seeks to determine the price that the Fund might reasonably expect to receive or pay from the current sale or purchase of that asset or liability in an arm’s-length transaction. Fair value determinations shall be based upon all available factors that the Global Valuation Committee, or its delegate, deems relevant consistent with the principles of fair value measurement. The pricing of all Fair Valued Investments is subsequently reported to the Board or a committee thereof on a quarterly basis.
Fair Value Hierarchy: Various inputs are used in determining the fair value of investments. These inputs to valuation techniques are categorized into a fair value hierarchy consisting of three broad levels for financial statement purposes as follows:
| | • | | Level 1 — unadjusted price quotations in active markets/exchanges for identical assets or liabilities that the Fund has the ability to access |
| | • | | Level 2 — other observable inputs (including, but not limited to, quoted prices for similar assets or liabilities in markets that are active, quoted prices for identical or similar assets or liabilities in markets that are not active, inputs other than quoted prices that are observable for the assets or liabilities (such as interest rates, yield curves, volatilities, prepayment speeds, loss severities, credit risks and default rates) or other market-corroborated inputs) |
| | • | | Level 3 — unobservable inputs based on the best information available in the circumstances, to the extent observable inputs are not available (including the Fund’s own assumptions used in determining the fair value of investments and derivative financial instruments) |
The hierarchy gives the highest priority to unadjusted quoted prices in active markets for identical assets or liabilities (Level 1 measurements) and the lowest priority to unobservable inputs (Level 3 measurements). Accordingly, the degree of judgment exercised in determining fair value is greatest for instruments categorized in Level 3. The inputs used to measure fair value may fall into different levels of the fair value hierarchy. In such cases, for disclosure purposes, the fair value hierarchy classification is determined based on the lowest level input that is significant to the fair value measurement in its entirety. The significant unobservable inputs used by the Global Valuation Committee in determining the price for Fair Valued Investments are typically categorized as Level 3. The fair value hierarchy for the Fund’s investments has been included in the Consolidated Schedules of Investments.
Changes in valuation techniques may result in transfers into or out of an assigned level within the hierarchy. In accordance with the Fund’s policy, transfers between different levels of the fair value hierarchy are deemed to have occurred as of the beginning of the reporting period. The categorization of a value determined for investments is based on the pricing transparency of the investments and is not necessarily an indication of the risks associated with investing in those securities.
| | | | | | |
| | | BLACKROCK VARIABLE SERIES FUNDS, INC. | | JUNE 30, 2016 | | 13 |
| | | | |
| Notes to Consolidated Financial Statements (continued) | | | BlackRock iShares® Dynamic Allocation V.I. Fund | |
4. Securities and Other Investments:
Securities Lending: The Fund may lend its securities to approved borrowers, such as brokers, dealers and other financial institutions. The borrower pledges and maintains with the Fund collateral consisting of cash, an irrevocable letter of credit issued by a bank, or securities issued or guaranteed by the U.S. Government. The initial collateral received by the Fund is required to have a value of at least 102% of the current value of the loaned securities for securities traded on U.S. exchanges and a value of at least 105% for all other securities. The collateral is maintained thereafter at a value equal to at least 100% of the current market value of the securities on loan. The market value of the loaned securities is determined at the close of each business day of the Fund and any additional required collateral is delivered to the Fund, or excess collateral returned by the Fund, on the next business day. During the term of the loan, the Fund is entitled to all distributions made on or in respect of the loaned securities. Loans of securities are terminable at any time and the borrower, after notice, is required to return borrowed securities within the standard time period for settlement of securities transactions.
The market value of any securities on loan, all of which were classified as affiliated investment companies in the Fund’s Consolidated Schedule of Investments, and the value of any related collateral are shown separately in the Consolidated Statement of Assets and Liabilities as a component of investments at value — unaffiliated, and collateral on securities loaned at value, respectively. As of period end, any securities on loan were collateralized by cash. The cash collateral invested by the securities lending agent, BlackRock Investment Management, LLC (“BIM”), if any, is disclosed in the Consolidated Schedule of Investments.
Securities lending transactions are entered into by the Fund under Master Securities Lending Agreements (each, an “MSLA”), which provide the right, in the event of default (including bankruptcy or insolvency), for the non-defaulting party to liquidate the collateral and calculate a net exposure to the defaulting party or request additional collateral. In the event that a borrower defaults, the Fund, as lender, would offset the market value of the collateral received against the market value of the securities loaned. When the value of the collateral is greater than that of the market value of the securities loaned, the lender is left with a net amount payable to the defaulting party. However, bankruptcy or insolvency laws of a particular jurisdiction may impose restrictions on or prohibitions against such a right of offset in the event of an MSLA counterparty’s bankruptcy or insolvency. Under the MSLA, absent an event of default the borrower can resell or re-pledge the loaned securities, and the Fund can reinvest cash collateral received in connection with loaned securities. Upon an event of default, the parties’ obligations to return the securities or collateral to the other party are extinguished, and the parties can resell or re-pledge the loaned securities or the collateral received in connection with the loaned securities in order to satisfy the defaulting party’s net payment obligation for all transactions under the MSLA. The defaulting party remains liable for any deficiency.
As of period end, the following table is a summary of the Fund’s securities lending agreements by counterparty which are subject to offset under an MSLA:
| | | | | | | | | | |
| Counterparty | | Securities Loaned at Value | | Cash Collateral Received1 | | | Net Amount | |
Citigroup Global Markets, Inc. | | $ 552,539 | | | $ (552,539 | ) | | | — | |
Credit Suisse Securities (USA) LLC | | 437,413 | | | (437,413 | ) | | | — | |
J.P. Morgan Securities LLC | | 4,074,550 | | | (4,074,550 | ) | | | — | |
Merrill Lynch, Pierce, Fenner & Smith, Inc. | | 112,045 | | | (112,045 | ) | | | — | |
| | | |
Total | | $5,176,547 | | | $(5,176,547 | ) | | | — | |
| | | |
| | 1 | | Collateral with a value of $5,221,479 has been received in connection with securities lending agreements. Collateral received in excess of the value of securities loaned from the individual counterparty is not shown for financial reporting purposes in the table above. |
The risks of securities lending include the risk that the borrower may not provide additional collateral when required or may not return the securities when due. To mitigate these risks, the Fund benefits from a borrower default indemnity provided by BIM. BIM’s indemnity allows for full replacement of the securities loaned if the collateral received does not cover the value on the securities loaned in the event of borrower default. The Fund could suffer a loss if the value of an investment purchased with cash collateral falls below the market value of loaned securities or if the value of an investment purchased with cash collateral falls below the value of the original cash collateral received.
5. Investment Advisory Agreement and Other Transactions with Affiliates:
The PNC Financial Services Group, Inc. is the largest stockholder and an affiliate of BlackRock, Inc. (“BlackRock”) for 1940 Act purposes.
Investment Advisory
The Company, on behalf of the Fund, entered into an Investment Advisory Agreement with the Manager, the Fund’s investment adviser, an indirect, wholly-owned subsidiary of BlackRock, to provide investment advisory and administration services. The Manager is responsible for the management of the Fund’s portfolio and provides the personnel, facilities, equipment and certain other services necessary to the operations of the Fund. For such
| | | | | | |
| 14 | | BLACKROCK VARIABLE SERIES FUNDS, INC. | | JUNE 30, 2016 | | |
| | | | |
| Notes to Consolidated Financial Statements (continued) | | | BlackRock iShares® Dynamic Allocation V.I. Fund | |
services, the Fund pays the Manager a monthly fee, which is determined by calculating a percentage of the Fund’s average daily net assets based on the following annual rates:
| | |
| Average Daily Net Assets | | Investment Advisory Fee |
First $1 Billion | | 0.150% |
$1 Billion - $3 Billion | | 0.140% |
$3 Billion - $5 Billion | | 0.135% |
Greater than $5 Billion | | 0.130% |
The Manager provides investment management and other services to the Subsidiary. The Manager does not receive separate compensation from the Subsidiary for providing investment management or administrative services. However, the Fund pays the Manager based on the Fund’s net assets, which includes the assets of the Subsidiary.
Distribution Fees
The Company, on behalf of the Fund, entered into a Distribution Agreement and a Distribution Plan with BlackRock Investments, LLC (“BRIL”), an affiliate of the Manager. Pursuant to the Distribution Plan and in accordance with Rule 12b-1 under the 1940 Act, the Fund pays BRIL ongoing distribution fees. The fees are accrued daily and paid monthly at an annual rate of 0.25% based upon the average daily net assets attributable to Class III.
For the six months ended June 30, 2016, the class specific distribution fees borne directly by Class III is $1,765.
Transfer Agent
The Manager on behalf of the Fund, entered into agreements with insurance companies and other financial intermediaries (“Service Organizations”), some of which may be affiliates. Pursuant to these agreements, the Service Organizations provide the Fund with administrative, networking, recordkeeping, sub-transfer agency and shareholder services to sub-accounts they service. For these services, the Service Organizations receive an annual fee per shareholder account, which will vary depending on share class and/or net assets of Fund shareholders serviced by the Service Organizations, which is shown as transfer agent — class specific. For the six months ended June 30, 2016, the Fund did not pay any amounts to affiliates in return for these services.
In addition, the Fund pays the transfer agent, which is not an affiliate, a fee for issuance, transfer and redemption of shares and the opening and maintenance of shareholder accounts, which is included in transfer agent in the Consolidated Statement of Operations.
For the six months ended June 30, 2016, the following table shows the class specific transfer agent fees borne directly by each class of the Fund:
| | | | | | | | | | |
| | | Class I | | | | Class III | | | | Total |
| | | $14,480 | | | | $619 | | | | $15,099 |
Expense Limitations, Waivers, Reimbursements and Recoupments
The Manager, with respect to the Fund, contractually agreed to waive and/or reimburse fees or expenses in order to limit expenses, excluding interest expense, dividend expense, tax expense, acquired fund fees and expenses, and certain other fund expenses, which constitute extraordinary expenses not incurred in the ordinary course of the Fund’s business. The expense limitations as a percentage of average daily net assets are as follows:
| | | | |
Class I | | | 0.53 | % |
Class III | | | 0.78 | % |
The Manager has agreed not to reduce or discontinue this contractual expense limitation prior to May 1, 2017, unless approved by the Board, including a majority of the Independent Directors who are not “interested persons” of the Fund, as defined in the 1940 Act (“Independent Directors”) or by a majority of the outstanding voting securities of the Fund.
For the six months ended June 30, 2016, the amount is shown as fees waived by the Manager on the Consolidated Statement of Operations and the amount included in expenses reimbursed by the Manager was $8,515.
These amounts waived and/or reimbursed are included in fees waived by the Manager shown as transfer agent fees reimbursed — class specific in the Consolidated Statement of Operations. Class specific expense waivers and/or reimbursements are as follows:
| | | | | | |
| | | Class I | | Class III | | Total |
Transfer Agent Fees Reimbursed | | $14,469 | | $617 | | $15,086 |
| | | | | | |
| | | BLACKROCK VARIABLE SERIES FUNDS, INC. | | JUNE 30, 2016 | | 15 |
| | | | |
| Notes to Consolidated Financial Statements (continued) | | | BlackRock iShares® Dynamic Allocation V.I. Fund | |
The Manager, with respect to the Fund, voluntarily agreed to waive its investment advisory fees by the amount of investment advisory fees the Fund pays to the Manager indirectly through its investment in affiliated money market funds. In addition, the Manager has contractually agreed to waive the management fee on assets estimated to be attributable to the Fund’s investments in other equity and fixed-income mutual funds managed by BlackRock or its affiliates, if any. This amount is included in fee waived by the Manager in the Consolidated Statement of Operations. For the six months ended June 30, 2016, the amount waived was $39.
For the six months ended June 30, 2016, the Fund reimbursed the Manager $75 for certain accounting services, which is included in accounting services in the Consolidated Statement of Operations.
If during the Fund’s fiscal year the operating expenses of a share class, that at any time during the prior two fiscal years received a waiver and/or reimbursement from the Manager, are less than the expense cap for that share class, the Manager is entitled to be reimbursed by such share class up to the lesser of the following expenses:
| | (a) | The amount of fees waived or expenses reimbursed during those prior two fiscal years under the agreement. |
| | (b) | The amount by which the expense cap for that share class exceeds the operating expenses of the share class for the current fiscal year, provided that: |
| | • | | The Fund, of which the share class is a part, has more than $50 million in assets for the fiscal year. |
| | • | | The Manager or an affiliate continues to serve as the Fund’s investment adviser or administrator. |
In the event the expense cap for a share class is changed subsequent to a fiscal year in which the Manager becomes entitled to reimbursement for fees waived and/or reimbursed, the amount available to reimburse the Manager shall be calculated by reference to the expense cap for that share class in effect at the time the Manager became entitled to receive such reimbursement, rather than the subsequently changed expense cap for that share class.
On June 30, 2016, the Fund level and class specific waivers and/or reimbursements subject to possible future recoupment under the expense limitation agreement are as follows:
| | | | | | | | | | | | | | | | | | |
| | | | | Expires December 31, | |
| | | | | 2016 | | | | | 2017 | | | | | 2018 | |
Fund Level | | | | $ | 91,762 | | | | | $ | 122,310 | | | | | $ | 18,641 | |
Class I | | | | $ | 2,453 | | | | | $ | 21,925 | | | | | $ | 14,469 | |
Class III | | | | | — | | | | | $ | 265 | | | | | $ | 617 | |
Securities Lending
The U.S. Securities and Exchange Commission has issued an exemptive order which permits BIM, an affiliate of the Manager, to serve as securities lending agent for the Fund, subject to applicable conditions. As securities lending agent, BIM bears all operational costs directly related to securities lending. The Fund is responsible for expenses in connection with the investment of cash collateral received for securities on loan (the “collateral investment expenses”). The cash collateral is invested in a private investment company managed by the Manager or its affiliates. However, BIM has agreed to cap the collateral investment expenses of the private investment company to an annual rate of 0.04%. The investment adviser to the private investment company will not charge any advisory fees with respect to shares purchased by the Fund.
Securities lending income is equal to the total of income earned from the reinvestment of cash collateral, net of fees and other payments to and from borrowers of securities, and less the collateral investment expenses. The Fund retains a portion of securities lending income and remits a remaining portion to BIM as compensation for its services as securities lending agent.
Pursuant to a securities lending agreement, the Fund retains 80% of securities lending income, and this amount retained can never be less than 70% of the total of securities lending income plus the collateral investment expenses.
In addition, commencing the business day following the date that the aggregate securities lending income earned across the Equity-Bond Complex in a calendar year exceeds a specified threshold, the Fund, pursuant to the securities lending agreement, will retain for the remainder of that calendar year securities lending income as follows: 85% of securities lending income, and this amount retained can never be less than 70% of the total of securities lending income plus the collateral investment expenses.
The share of securities lending income earned by the Fund is shown as securities lending — affiliated — net in the Consolidated Statement of Operations. For the six months ended June 30, 2016, the Fund paid BIM $2,612 for securities lending agent services.
| | | | | | |
| 16 | | BLACKROCK VARIABLE SERIES FUNDS, INC. | | JUNE 30, 2016 | | |
| | | | |
| Notes to Consolidated Financial Statements (continued) | | | BlackRock iShares® Dynamic Allocation V.I. Fund | |
Officers and Directors
Certain officers and/or directors of the Company are officers and/or directors of BlackRock or its affiliates. The Fund reimburses the Manager for a portion of the compensation paid to the Company’s Chief Compliance Officer, which is included in officer and directors in the Consolidated Statement of Operations.
6. Purchases and Sales:
For the six months ended June 30, 2016, purchases and sales of investments, excluding short-term securities, were $8,359,238 and $6,211,834, respectively.
7. Income Tax Information:
It is the Fund’s policy to comply with the requirements of the Internal Revenue Code of 1986, as amended, applicable to regulated investment companies, and to distribute substantially all of its taxable income to its shareholders. Therefore, no federal income tax provision is required.
The Fund files U.S. federal and various state and local tax returns. No income tax returns are currently under examination. The statute of limitations on the Fund’s U.S. federal tax returns generally remains open for the period ended December 31, 2014 and year ended December 31, 2015. The statutes of limitations on the Fund’s state and local tax returns may remain open for an additional year depending upon the jurisdiction.
Management has analyzed tax laws and regulations and their application to the Fund as of June 30, 2016, inclusive of the open tax years and does not believe there are any uncertain tax positions that require recognition of a tax liability.
As of December 31, 2015, the Fund had a capital loss carryforward, with no expiration date, available to offset future realized capital gains of $21,932.
As of June 30, 2016, gross unrealized appreciation and depreciation based on cost for federal income tax purposes were as follows:
| | | | |
| | |
Tax cost | | $ | 23,560,219 | |
| | | | |
Gross unrealized appreciation | | $ | 411,022 | |
Gross unrealized depreciation | | | (89,055 | ) |
| | | | |
Net unrealized appreciation | | $ | 321,967 | |
| | | | |
| |
| | | | | |
8. Bank Borrowings:
The Company, on behalf of the Fund, along with certain other funds managed by the Manager and its affiliates (“Participating Funds”), is a party to a 364-day, $2.1 billion credit agreement with a group of lenders. Under this agreement, the Fund may borrow to fund shareholder redemptions. Excluding commitments designated for certain individual funds, the Participating Funds, including the Fund, can borrow up to an aggregate commitment amount of $1.6 billion at any time outstanding, subject to asset coverage and other limitations as specified in the agreement. The credit agreement has the following terms: a fee of 0.12% per annum on unused commitment amounts and interest at a rate equal to the higher of (a) one-month LIBOR (but, in any event, not less than 0.00%) on the date the loan is made plus 0.80% per annum or (b) the Fed Funds rate (but, in any event, not less than 0.00%) in effect from time to time plus 0.80% per annum on amounts borrowed. The agreement expires in April 2017 unless extended or renewed. Prior to April 21, 2016, the credit agreement had a fee per annum of 0.06% on unused commitment amounts and interest at a rate equal to the higher of (a) one-month LIBOR (but, in any event, not less than 0.00%) on the date the loan is made plus 0.80% per annum or (b) the Fed Funds rate (but, in any event, not less than 0.00%) in effect from time to time plus 0.80% per annum on amounts borrowed. Participating Funds paid administration, legal and arrangement fees, which, if applicable, are included in miscellaneous expenses in the Consolidated Statement of Operations. These fees were allocated among such funds based upon portions of the aggregate commitment available to them and relative net assets of Participating Funds. During the six months ended June 30, 2016, the Fund did not borrow under the credit agreement.
9. Principal Risks:
In the normal course of business, the Fund invests in securities and enters into transactions where risks exist due to fluctuations in the market (market risk) or failure of the issuer to meet all its obligations, including the ability to pay principal and interest when due (issuer credit risk). The value of securities held by the Fund may decline in response to certain events, including those directly involving the issuers of securities owned by the Fund. Changes arising from the general economy, the overall market and local, regional or global political and/or social instability, as well as currency, interest rate and price fluctuations, may also affect the securities’ value.
Counterparty Credit Risk: Similar to issuer credit risk, the Fund may be exposed to counterparty credit risk, or the risk that an entity may fail to or be unable to perform on its commitments related to unsettled or open transactions. The Fund manages counterparty credit risk by entering into transactions only with counterparties that the Manager believes have the financial resources to honor their obligations and by monitoring the financial stability
| | | | | | |
| | | BLACKROCK VARIABLE SERIES FUNDS, INC. | | JUNE 30, 2016 | | 17 |
| | | | |
| Notes to Consolidated Financial Statements (concluded) | | | BlackRock iShares® Dynamic Allocation V.I. Fund | |
of those counterparties. Financial assets, which potentially expose the Fund to market, issuer and counterparty credit risks, consist principally of financial instruments and receivables due from counterparties. The extent of the Fund’s exposure to market, issuer and counterparty credit risks with respect to these financial assets approximated by their value recorded in the Consolidated Statement of Assets and Liabilities, less any collateral held by the Fund.
Concentration Risk: The Fund invests a significant portion of its assets in fixed-income securities and/or uses derivatives tied to the fixed-income markets. Changes in market interest rates or economic conditions may affect the value and/or liquidity of such investments. Interest rate risk is the risk that prices of bonds and other fixed-income securities will increase as interest rates fall and decrease as interest rates rise. The Fund may be subject to a greater risk of rising interest rates due to the current period of historically low rates.
10. Capital Share Transactions:
Transactions in capital shares for each class were as follows:
| | | | | | | | | | | | | | | | | | | | |
| | | Six Months Ended
June 30, 2016 | | | | | | Year Ended
December 31, 2015 | |
| | | Shares | | | Amount | | | | | | Shares | | | Amount | |
| Class I | | | | | | | | | | | | | | | |
Shares sold | | | 361,885 | | | $ | 3,371,191 | | | | | | | | 1,158,756 | | | $ | 11,694,893 | |
Shares issued in reinvestment of distributions | | | — | | | | — | | | | | | | | 29,070 | | | | 277,036 | |
Shares redeemed | | | (214,101 | ) | | | (2,044,129 | ) | | | | | | | (247,618 | ) | | | (2,424,902 | ) |
| | | | | | | | | | | | |
Net increase | | | 147,784 | | | $ | 1,327,062 | | | | | | | | 940,208 | | | $ | 9,547,027 | |
| | | | | | | | | | | | |
| | | | | | | | | | | | | | | | | | | | |
Class III | | | | | | | | | | | | | | | | | | | | |
Shares sold | | | 57,602 | | | $ | 539,942 | | | | | | | | 127,645 | | | $ | 1,273,061 | |
Shares issued in reinvestment of distributions | | | — | | | | — | | | | | | | | 2,097 | | | | 19,966 | |
Shares redeemed | | | (19,083 | ) | | | (184,772 | ) | | | | | | | (7,323 | ) | | | (72,256 | ) |
| | | | | | | | | | | | |
Net increase | | | 38,519 | | | $ | 355,170 | | | | | | | | 122,419 | | | $ | 1,220,771 | |
| | | | | | | | | | | | |
Total Net Increase | | | 186,303 | | | $ | 1,682,232 | | | | | | | | 1,062,627 | | | $ | 10,767,798 | |
| | | | | | | | | | | | |
11. Subsequent Events:
Management has evaluated the impact of all subsequent events on the Fund through the date the financial statements were issued and has determined that there were no subsequent events requiring adjustment or additional disclosure in the financial statements.
| | | | | | |
| 18 | | BLACKROCK VARIABLE SERIES FUNDS, INC. | | JUNE 30, 2016 | | |
JUNE 30, 2016
| | | | |
SEMI-ANNUAL REPORT (UNAUDITED) | | | | BLACKROCK® |
BlackRock Variable Series Funds, Inc.
▶ BlackRock iShares® Dynamic Fixed Income V.I. Fund
| | |
| Not FDIC Insured ¡ May Lose Value ¡ No Bank Guarantee | | |
| | | | |
| Fund Summary as of June 30, 2016 | | | BlackRock iShares® Dynamic Fixed Income V.I. Fund | |
BlackRock iShares® Dynamic Fixed Income V.I. Fund’s (the “Fund”) investment objective is to seek to provide total return.
|
| Portfolio Management Commentary |
How did the Fund perform?
| • | | For the six-month period ended June 30, 2016, the Fund outperformed its benchmark, the Barclays U.S. Aggregate Bond Index. |
What factors influenced performance?
| • | | The largest contributor to Fund performance was exposure to corporate and non-corporate U.S. investment grade bonds through the iShares Core U.S. Credit Bond ETF. This was followed by exposure to U.S. investment grade corporate bonds through the iShares iBoxx $ Investment Grade Corporate Bond ETF. |
| • | | The largest detractor from Fund performance was exposure to U.S. floating rate bonds through the iShares Floating Rate Bond ETF. The next-largest detractor was exposure to short-term U.S. Treasury bonds through the iShares 1-3 Year Treasury Bond ETF. |
Describe recent portfolio activity.
| • | | During the six-month period, the Fund marginally reduced its high yield bond position in favor of long-duration U.S. Treasuries and investment grade credits to better align credit and interest rate exposures given the investment adviser’s cautious near-term outlook. |
Describe portfolio positioning at period end.
| • | | At period end, the Fund was positioned with higher duration (interest rate sensitivity) via an overweight to U.S. investment grade credit. In addition, the Fund maintained a small exposure to Treasury inflation-protected securities. |
The views expressed reflect the opinions of BlackRock as of the date of this report and are subject to change based on changes in market, economic or other conditions. These views are not intended to be a forecast of future events and are no guarantee of future results.
| | |
| Portfolio Composition | | Percent of
Affiliated Investment Companies |
Fixed Income Funds | | 95% |
Short-Term Securities | | 5 |
| | | | | | |
| 2 | | BLACKROCK VARIABLE SERIES FUNDS, INC. | | JUNE 30, 2016 | | |
| | | | |
| | | | BlackRock iShares® Dynamic Fixed Income V.I. Fund | |
|
| Total Return Based on a $10,000 Investment |
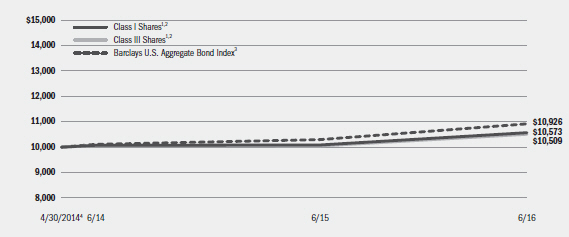
| | 1 | Assuming transaction costs, if any, and other operating expenses, including investment advisory fees. Does not include insurance-related fees and expenses. |
| | 2 | The Fund invests in a portfolio of underlying exchange-traded funds that seek to track fixed income indices. |
| | 3 | A widely recognized unmanaged market-weighted index, comprised of investment-grade corporate bonds rated BBB or better, mortgages and U.S. Treasury and U.S. Government agency issues with at least one year to maturity. |
| | 4 | Commencement of operations. |
|
| Performance Summary for the Period Ended June 30, 2016 |
| | | | | | | | | | | | | | | |
| | | | | Average Annual Total Returns |
| | | 6-Month
Total Returns6 | | 1 Year6 | | Since
Inception6,7 |
Class I5 | | | | 5.65 | % | | | | 4.80 | % | | | | 2.61 | % |
Class III5 | | | | 5.57 | | | | | 4.53 | | | | | 2.32 | |
Barclays U.S. Aggregate Bond Index | | | | 5.31 | | | | | 6.00 | | | | | 4.17 | |
| | 5 | | Average annual and cumulative total returns are based on changes in net asset value for the periods shown, and assume reinvestment of all distributions at net asset value on the ex-dividend date. Insurance-related fees and expenses are not reflected in these returns. |
| | 6 | | For a portion of the period, the Fund’s investment adviser waived a portion of its fee. Without such waiver, the Fund’s performance would have been lower. |
| | 7 | | The Fund commenced operations on April 30, 2014. |
| | | | Past performance is not indicative of future results. Performance results do not reflect the deduction of taxes that a shareholder would pay on Fund distributions or the redemption of Fund shares. |
| | | | | | | | | | | | | | |
| Expense Example |
| | | Actual | | Hypothetical9 | | |
| | | Beginning
Account Value
January 1, 2016 | | Ending
Account Value
June 30, 2016 | | Expenses Paid
During the Period8 | | Beginning
Account Value
January 1, 2016 | | Ending
Account Value
June 30, 2016 | | Expenses Paid
During the Period8 | | Annualized
Expense
Ratio |
Class I | | $1,000.00 | | $1,056.50 | | $2.56 | | $1,000.00 | | $1,022.38 | | $2.51 | | 0.50% |
Class III | | $1,000.00 | | $1,055.70 | | $3.83 | | $1,000.00 | | $1,021.13 | | $3.77 | | 0.75% |
| | 8 | | For each class of the Fund, expenses are equal to the annualized expense ratio for the class, multiplied by the average account value over the period, multiplied by 182/366 (to reflect the one-half year period shown). |
| | 9 | | Hypothetical 5% annual return before expenses is calculated by prorating the number of days in the most recent fiscal half year divided by 366. |
| | | | See “Disclosure of Expenses” on the following page for further information on how expenses were calculated. |
| | | | | | |
| | | BLACKROCK VARIABLE SERIES FUNDS, INC. | | JUNE 30, 2016 | | 3 |
| | | | |
| Disclosure of Expenses | | | BlackRock iShares Dynamic Fixed Income V.I. Fund | |
Shareholders of the Fund may incur the following charges: (a) transactional expenses, such as sales charges; and (b) operating
expenses, including investment advisory fees, service and distribution fees, including 12b-1 fees, acquired fund fees and expenses, and other fund expenses. The expense example on the previous page (which is based on a hypothetical investment of $1,000 invested on January 1, 2016 and held through June 30, 2016) is intended to assist shareholders both in calculating expenses based on an investment in the Fund and in comparing these expenses with similar costs of investing in other mutual funds.
The expense example provides information about actual account values and actual expenses. In order to estimate the expenses a shareholder paid during the period covered by this report, shareholders can divide their account value by $1,000 and then multiply the result by the number corresponding to their share class under the heading entitled “Expenses Paid During the Period.”
The expense example also provides information about hypothetical account values and hypothetical expenses based on the Fund’s actual expense ratio and an assumed rate of return of 5% per year before expenses. In order to assist shareholders in comparing the ongoing expenses of investing in the Fund and other funds, compare the 5% hypothetical example with the 5% hypothetical examples that appear in shareholder reports of other funds.
The expenses shown in the expense example are intended to highlight shareholders’ ongoing costs only and do not reflect any transactional expenses, such as sales charges, if any. Therefore, the hypothetical example is useful in comparing ongoing expenses only, and will not help shareholders determine the relative total expenses of owning different funds. If these transactional expenses were included, shareholder expenses would have been higher.
| | | | | | |
| 4 | | BLACKROCK VARIABLE SERIES FUNDS, INC. | | JUNE 30, 2016 | | |
| | | | |
| Schedule of Investments June 30, 2016 (Unaudited) | | | BlackRock iShares® Dynamic Fixed Income V.I. Fund | |
| | | (Percentages shown are based on Net Assets) | |
| | | | | | | | |
| Affiliated Investment Companies (a) | | Shares | | | Value | |
Fixed Income Funds — 100.0% | | | | | | | | |
iShares 10+ Year Credit Bond ETF | | | 11,886 | | | $ | 744,658 | |
iShares 20+ Year Treasury Bond ETF | | | 1,344 | | | | 186,682 | |
iShares Agency Bond ETF | | | 17,406 | | | | 2,017,007 | |
iShares CMBS ETF | | | 2,486 | | | | 132,230 | |
iShares Core U.S. Credit Bond ETF | | | 29,829 | | | | 3,381,117 | |
iShares Core U.S. Treasury Bond ETF | | | 71,521 | | | | 1,876,711 | |
iShares iBoxx $ High Yield Corporate Bond ETF (b) | | | 9,326 | | | | 789,819 | |
iShares iBoxx $ Investment Grade Corporate Bond ETF | | | 13,957 | | | | 1,712,943 | |
iShares MBS ETF | | | 18,100 | | | | 1,990,457 | |
iShares TIPS Bond ETF | | | 3,454 | | | | 402,978 | |
| | | | | | | | |
| | | | | | | | 13,234,602 | |
| | | | | | | | |
| | | | | | | |
| | | | | | | | |
| Affiliated Investment Companies (a) | | Shares/ Beneficial Interest (000) | | | Value | |
Short-Term Securities — 5.1% | | | | | | | | |
BlackRock Liquidity Funds, TempFund,
Institutional Class, 0.40% (c) | | | 638,528 | | | $ | 638,528 | |
BlackRock Liquidity Series, LLC, Money Market
Series, 0.59% (c)(d) | | $ | 36 | | | | 36,336 | |
| | | | | | | | |
| | | | | | | | 674,864 | |
| | | | | | | | |
| | | | | | | |
Total Affiliated Investment Companies
(Cost — $13,451,835) — 105.1% | | | | 13,909,466 | |
Liabilities in Excess of Other Assets — (5.1)% | | | | (680,842 | ) |
| | | | | | | | |
Net Assets — 100.0% | | | | | | $ | 13,228,624 | |
| | | | | | | | |
|
| Notes to Schedule of Investments |
| (a) | During the six months ended June 30, 2016, investments in issuers considered to be affiliates of the Fund for purposes of Section 2(a)(3) of the Investment Company Act of 1940, as amended, were as follows: |
| | | | | | | | | | | | | | | | | | | | | | | | | | | | |
| Affiliate | | Shares/
Beneficial
Interest
Held at
December 31,
2015 | | | Shares/
Beneficial
Interest
Purchased | | | Shares/
Beneficial
Interest
Sold | | | Shares/
Beneficial
Interest
Held at
June 30,
2016 | | | Value at
June 30,
2016 | | | Income | | | Realized
Gain
(Loss) | |
BlackRock Liquidity Funds, TempFund, Institutional Class | | | 62,237 | | | | 576,291 | 1 | | | — | | | | 638,528 | | | | $638,528 | | | | $284 | | | | — | |
BlackRock Liquidity Series, LLC, Money Market Series | | | $80,190 | | | | — | | | | $43,854 | 2 | | | $36,336 | | | | 36,336 | | | | 3,986 | 3 | | | — | |
iShares 1-3 Year Treasury Bond ETF | | | 5,920 | | | | 2,190 | | | | 8,110 | | | | — | | | | | | | | 591 | | | | $4,240 | |
iShares 10+ Year Credit Bond ETF | | | — | | | | 13,061 | | | | 1,175 | | | | 11,886 | | | | 744,658 | | | | 6,902 | | | | (2 | ) |
iShares 20+ Year Treasury Bond ETF | | | — | | | | 1,344 | | | | — | | | | 1,344 | | | | 186,682 | | | | — | | | | — | |
iShares Agency Bond ETF | | | 13,006 | | | | 6,453 | | | | 2,053 | | | | 17,406 | | | | 2,017,007 | | | | 9,539 | | | | (527 | ) |
iShares CMBS ETF | | | 1,861 | | | | 829 | | | | 204 | | | | 2,486 | | | | 132,230 | | | | 1,060 | | | | (18 | ) |
iShares Core U.S. Credit Bond ETF | | | 22,463 | | | | 11,071 | | | | 3,705 | | | | 29,829 | | | | 3,381,117 | | | | 37,853 | | | | (8,250 | ) |
iShares Core U.S. Treasury Bond ETF | | | 54,936 | | | | 26,330 | | | | 9,745 | | | | 71,521 | | | | 1,876,711 | | | | 9,480 | | | | (1,167 | ) |
iShares iBoxx $ High Yield Corporate Bond ETF | | | 9,282 | | | | 4,662 | | | | 4,618 | | | | 9,326 | | | | 789,819 | | | | 19,339 | | | | (20,738 | ) |
iShares iBoxx $ Investment Grade Corporate Bond ETF | | | 10,412 | | | | 5,354 | | | | 1,809 | | | | 13,957 | | | | 1,712,943 | | | | 20,485 | | | | (119 | ) |
iShares MBS ETF | | | 13,663 | | | | 6,861 | | | | 2,424 | | | | 18,100 | | | | 1,990,457 | | | | 14,883 | | | | (815 | ) |
iShares TIPS Bond ETF | | | 2,599 | | | | 1,157 | | | | 302 | | | | 3,454 | | | | 402,978 | | | | 113 | | | | (181 | ) |
Total | | | | | | | | | | | | | | | | | | | $13,909,466 | | | | $124,515 | | | | $(27,577) | |
| | | | | | | | | | | | | | | | | | | | |
| | 1 | | Represents net shares purchased. |
| | 2 | | Represents net beneficial interest sold. |
| | 3 | | Represents securities lending income earned from the reinvestment of cash collateral from loaned securities, net of fees and collateral investment expenses, and other payments to and from borrowers of securities. |
| (b) | Security, or a portion of security, is on loan. |
| (c) | Current yield as of period end. |
| (d) | Security was purchased with the cash collateral from loaned securities. The Fund may withdraw up to 25% of its investment daily, although the manager of the BlackRock Liquidity Series, LLC, Money Market Series, in its sole discretion, may permit an investor to withdraw more than 25% on any one day. |
|
| Portfolio Abbreviation |
ETF Exchange-Traded Fund |
See Notes to Financial Statements.
| | | | | | |
| | | BLACKROCK VARIABLE SERIES FUNDS, INC. | | JUNE 30, 2016 | | 5 |
| | | | |
| Schedule of Investments (concluded) | | | BlackRock iShares® Dynamic Fixed Income V.I. Fund | |
|
| Fair Value Hierarchy as of Period End |
Various inputs are used in determining the fair value of investments. For information about the Fund’s policy regarding valuation of investments, refer to the Notes to Financial Statements.
The following table summarizes the Fund’s investments categorized in the disclosure hierarchy:
| | | | | | | | | | | | | | | | |
| | | Level 1 | | | Level 2 | | | Level 3 | | | Total | |
Assets: | | | | | | | | | | | | | | | | |
Investments: | | | | | | | | | | | | | | | | |
Affiliated Investment Companies | | | $ 13,873,130 | | | $ | 36,336 | | | | — | | | $ | 13,909,466 | |
The Fund may hold assets and/or liabilities in which the fair value approximates the carrying amount for financial statement purposes. As of period end, collateral on securities loaned at value of $36,336 is categorized as Level 2 within the disclosure hierarchy.
During the six months ended June 30, 2016, there were no transfers between levels.
See Notes to Financial Statements.
| | | | | | |
| 6 | | BLACKROCK VARIABLE SERIES FUNDS, INC. | | JUNE 30, 2016 | | |
| | | | |
| Statement of Assets and Liabilities | | | | |
| | | | |
| June 30, 2016 (Unaudited) | | BlackRock iShares® Dynamic Fixed Income V.I. Fund | |
| | | | |
| Assets | | | | |
Investments at value — affiliated (including securities loaned at value of $35,824)(cost — $13,451,835) | | $ | 13,909,466 | |
Receivables: | | | | |
Investments sold | | | 234,570 | |
Securities lending income — affiliated | | | 889 | |
Capital shares sold | | | 24,256 | |
Dividends — affiliated | | | 54 | |
From the Manager | | | 5,978 | |
Prepaid expenses | | | 349 | |
| | | | |
Total assets | | | 14,175,562 | |
| | | | |
| | | | |
| Liabilities | | | | |
Collateral on securities loaned at value | | | 36,336 | |
Payables: | | | | |
Investments purchased | | | 852,086 | |
Capital shares redeemed | | | 3,160 | |
Distribution fees | | | 467 | |
Officer’s and Directors’ fees | | | 906 | |
Other accrued expenses | | | 53,944 | |
Other affiliates | | | 39 | |
| | | | |
Total liabilities | | | 946,938 | |
| | | | |
Net Assets | | $ | 13,228,624 | |
| | | | |
| | | | |
| Net Assets Consist of | | | | |
Paid-in capital | | $ | 12,921,375 | |
Undistributed net investment income | | | 95,107 | |
Accumulated net realized loss | | | (245,489 | ) |
Net unrealized appreciation (depreciation) | | | 457,631 | |
| | | | |
Net Assets | | $ | 13,228,624 | |
| | | | |
| | | | |
| Net Asset Value | | | | |
Class I — Based on net assets of $10,767,926 and 1,046,283 shares outstanding, 100 million shares authorized, $0.10 par value | | $ | 10.29 | |
| | | | |
Class III — Based on net assets of $2,460,698 and 240,216 shares outstanding, 100 million shares authorized, $0.10 par value | | $ | 10.24 | |
| | | | |
See Notes to Financial Statements.
| | | | | | |
| | | BLACKROCK VARIABLE SERIES FUNDS, INC. | | JUNE 30, 2016 | | 7 |
| | | | |
| Six Months Ended June 30, 2016 (Unaudited) | | BlackRock iShares® Dynamic Fixed Income V.I. Fund | |
| | | | |
| Investment Income | | | | |
Dividends — affiliated | | $ | 120,529 | |
Securities lending — affiliated — net | | | 3,986 | |
| | | | |
Total income | | | 124,515 | |
| | | | |
| | | | |
| Expenses | | | | |
Professional | | | 22,577 | |
Transfer agent | | | 2,390 | |
Transfer agent — class specific | | | 6,593 | |
Investment advisory | | | 8,417 | |
Printing | | | 7,428 | |
Accounting services | | | 3,783 | |
Officer and Directors | | | 2,809 | |
Distribution — class specific | | | 2,211 | |
Custodian | | | 1,890 | |
Miscellaneous | | | 3,629 | |
| | | | |
Total expenses | | | 61,727 | |
Less: | | | | |
Fees waived by the Manager | | | (8,417 | ) |
Transfer agent fees reimbursed — class specific | | | (6,585 | ) |
Expenses reimbursed by the Manager | | | (16,385 | ) |
| | | | |
Total expenses after fees waived and reimbursed | | | 30,340 | |
| | | | |
Net investment income | | | 94,175 | |
| | | | |
| | | | |
| Realized and Unrealized Gain (Loss) | | | | |
Net realized loss on investments — affiliated | | | (27,577 | ) |
Net change in unrealized appreciation (depreciation) on investments — affiliated | | | 567,856 | |
| | | | |
Net realized and unrealized gain | | | 540,279 | |
| | | | |
Net Increase in Net Assets Resulting from Operations | | $ | 634,454 | |
| | | | |
See Notes to Financial Statements.
| | | | | | |
| 8 | | BLACKROCK VARIABLE SERIES FUNDS, INC. | | JUNE 30, 2016 | | |
| | | | |
| Statements of Changes in Net Assets | | | BlackRock iShares® Dynamic Fixed Income V.I. Fund | |
| | | | | | | | |
| Increase (Decrease) in Net Assets: | | Six Months Ended June 30, 2016 (Unaudited) | | | Year Ended December 31, 2015 | |
| | | | | | | | |
| Operations | | | | | | | | |
Net investment income | | $ | 94,175 | | | $ | 165,898 | |
Net realized loss | | | (27,577 | ) | | | (197,794 | ) |
Net change in unrealized appreciation (depreciation) | | | 567,856 | | | | (113,654 | ) |
| | | | |
Net increase (decrease) in net assets resulting from operations | | | 634,454 | | | | (145,550 | ) |
| | | | |
| | | | | | | | |
| Distributions to Shareholders1 | | | | | | | | |
From net investment income: | | | | | | | | |
Class I | | | — | | | | (158,654 | ) |
Class III | | | — | | | | (20,719 | ) |
From return of capital: | | | | | | | | |
Class I | | | — | | | | (553 | ) |
Class III | | | — | | | | (75 | ) |
| | | | |
Decrease in net assets resulting from distributions to shareholders | | | — | | | | (180,001 | ) |
| | | | |
| | | | | | | | |
| Capital Share Transactions | | | | | | | | |
Net increase in net assets derived from capital share transactions | | | 3,102,188 | | | | 6,115,663 | |
| | | | |
| | | | | | | | |
| Net Assets | | | | | | | | |
Total increase in net assets | | | 3,736,642 | | | | 5,790,112 | |
Beginning of period | | | 9,491,982 | | | | 3,701,870 | |
| | | | |
End of period | | $ | 13,228,624 | | | $ | 9,491,982 | |
| | | | |
Undistributed net investment income, end of period | | $ | 95,107 | | | $ | 932 | |
| | | | |
| | 1 | | Distributions for annual periods determined in accordance with federal income tax regulations. |
See Notes to Financial Statements.
| | | | | | |
| | | BLACKROCK VARIABLE SERIES FUNDS, INC. | | JUNE 30, 2016 | | 9 |
| | | | |
| Financial Highlights | | | BlackRock iShares® Dynamic Fixed Income V.I. Fund | |
| | | | | | | | | | | | | | | | | | | | | | | | | | | | |
| | | Class I | | | | | | Class III | |
| | | Six Months Ended June 30, 2016 | | | Year Ended December 31, | | | Period April 30, 20141
to December 31, | | | | | | Six Months Ended June 30, 2016 | | | Year Ended December 31, | | | Period April 30, 20141
to December 31, | |
| | | (Unaudited) | | | 2015 | | | 2014 | | | | | | (Unaudited) | | | 2015 | | | 2014 | |
| | | | | | | | | | | | | | | | | | | | | | | | | | | | |
| Per Share Operating Performance | | | | | | | | | | | | | | | | | | | | | | | | | |
Net asset value, beginning of period | | $ | 9.74 | | | $ | 10.05 | | | $ | 10.00 | | | | | | | $ | 9.70 | | | $ | 10.03 | | | $ | 10.00 | |
| | | | | | | | | | | | |
Net investment income2 | | | 0.09 | | | | 0.24 | | | | 0.12 | | | | | | | | 0.07 | | | | 0.27 | | | | 0.14 | |
Net realized and unrealized gain (loss) | | | 0.46 | | | | (0.36 | ) | | | 0.01 | | | | | | | | 0.47 | | | | (0.42 | ) | | | (0.04 | ) |
| | | | | | | | | | | | |
Net increase (decrease) from investment operations | | | 0.55 | | | | (0.12 | ) | | | 0.13 | | | | | | | | 0.54 | | | | (0.15 | ) | | | 0.10 | |
| | | | | | | | | | | | |
Distributions:3 | | | | | | | | | | | | | | | | | | | | | | | | | | | | |
From net investment income | | | — | | | | (0.19 | ) | | | (0.08 | ) | | | | | | | — | | | | (0.18 | ) | | | (0.07 | ) |
From net realized capital gains | | | — | | | | — | | | | (0.00 | )4 | | | | | | | — | | | | — | | | | (0.00 | )4 |
From return of capital | | | — | | | | (0.00 | )4 | | | (0.00 | )4 | | | | | | | — | | | | (0.00 | )4 | | | (0.00 | )4 |
| | | | | | | | | | | | |
Total distributions | | | — | | | | (0.19 | ) | | | (0.08 | ) | | | | | | | — | | | | (0.18 | ) | | | (0.07 | ) |
| | | | | | | | | | | | |
Net asset value, end of period | | $ | 10.29 | | | $ | 9.74 | | | $ | 10.05 | | | | | | | $ | 10.24 | | | $ | 9.70 | | | $ | 10.03 | |
| | | | | | | | | | | | |
| | | | | | | | | | | | | | | | | | | | | | | | | | | | |
| Total Return5 | | | | | | | | | | | | | | | | | | | | | | | | | | | | |
Based on net asset value | | | 5.65 | %6 | | | (1.20 | )% | | | 1.30 | %6 | | | | | | | 5.57 | %6 | | | (1.47 | )% | | | 1.03 | %6 |
| | | | | | | | | | | | |
| | | | | | | | | | | | | | | | | | | | | | | | | | | | |
| Ratios to Average Net Assets7 | | | | | | | | | | | | | | | | | | | | | | | | | | | | |
Total expenses | | | 1.08 | %8 | | | 1.91 | % | | | 7.16 | %8,9 | | | | | | | 1.22 | %8 | | | 2.06 | % | | | 8.57 | %8,9 |
| | | | | | | | | | | | |
Total expenses after fees waived and reimbursed | | | 0.50 | %8 | | | 0.63 | % | | | 0.75 | %8 | | | | | | | 0.75 | %8 | | | 0.84 | % | | | 1.00 | %8 |
| | | | | | | | | | | | |
Net investment income | | | 1.72 | %8 | | | 2.33 | % | | | 1.83 | %8 | | | | | | | 1.47 | %8 | | | 2.71 | % | | | 1.98 | %8 |
| | | | | | | | | | | | |
| | | | | | | | | | | | | | | | | | | | | | | | | | | | |
| Supplemental Data | | | | | | | | | | | | | | | | | | | | | | | | | | | | |
Net assets, end of period (000) | | $ | 10,768 | | | $ | 8,346 | | | $ | 3,624 | | | | | | | $ | 2,461 | | | $ | 1,146 | | | $ | 78 | |
| | | | | | | | | | | | |
Portfolio turnover rate | | | 23 | % | | | 58 | % | | | 61 | % | | | | | | | 23 | % | | | 58 | % | | | 61 | % |
| | | | | | | | | | | | |
| | 1 | | Commencement of operations. |
| | 2 | | Based on average shares outstanding. |
| | 3 | | Distributions for annual periods determined in accordance with federal income tax regulations. |
| | 4 | | Amount is greater than $(0.005) per share. |
| | 5 | | Where applicable, excludes insurance-related fees and expenses and assumes the reinvestment of distributions. |
| | 6 | | Aggregate total return. |
| | 7 | | Excludes expenses incurred indirectly as a result of investments in underlying funds as follows: |
| | | | | | | | | | | | | | |
| | | Six Months Ended June 30, 2016 | | | | | Year Ended December 31, | | | | | Period April 30, 20141
to December 31, |
| | | (Unaudited) | | | | | 2015 | | | | | 2014 |
Investments in underlying funds | | 0.22% | | | | | | 0.26% | | | | | | 0.25% |
| | 9 | | Organization and/or offering costs were not annualized in the calculation of the expense ratios. If these expenses were annualized, the total expenses for Class I and Class III would have been 7.71% and 8.93%, respectively. |
See Notes to Financial Statements.
| | | | | | |
| 10 | | BLACKROCK VARIABLE SERIES FUNDS, INC. | | JUNE 30, 2016 | | |
| | | | |
| Notes to Financial Statements (Unaudited) | | | BlackRock iShares® Dynamic Fixed Income V.I. Fund | |
1. Organization:
BlackRock Variable Series Funds, Inc. (the “Company”) is registered under the Investment Company Act of 1940, as amended (the “1940 Act”), as an open-end management investment company. The Company is organized as a Maryland corporation that is comprised of 20 separate funds. The funds offer shares to insurance companies for their separate accounts to fund benefits under certain variable annuity and variable life insurance contracts. The financial statements presented are for BlackRock iShares® Dynamic Fixed Income V.I. Fund (the “Fund”). The Fund is classified as diversified. Class I and Class III Shares have equal voting, dividend, liquidation and other rights, except that only shares of the respective classes are entitled to vote on matters concerning only that class. In addition, Class III Shares bear certain expenses related to the distribution of such shares.
The Fund, together with certain other registered investment companies advised by BlackRock Advisors, LLC (the “Manager”) or its affiliates, is included in a complex of open-end funds referred to as the Equity-Bond Complex.
2. Significant Accounting Policies:
The financial statements are prepared in conformity with accounting principles generally accepted in the United States of America (“U.S. GAAP”), which may require management to make estimates and assumptions that affect the reported amounts of assets and liabilities in the financial statements, disclosure of contingent assets and liabilities at the date of the financial statements and the reported amounts of increases and decreases in net assets from operations during the reporting period. Actual results could differ from those estimates. The Fund is considered an investment company under U.S. GAAP and follows the accounting and reporting guidance applicable to investment companies. Below is a summary of significant accounting policies:
Investment Transactions and Investment Income: For financial reporting purposes, investment transactions are recorded on the dates the transactions are entered into (the trade dates). Realized gains and losses on investment transactions are determined on the identified cost basis. Dividend income is recorded on the ex-dividend date. Income, expenses and realized and unrealized gains and losses are allocated daily to each class based on its relative net assets.
Distributions: Distributions paid by the Fund are recorded on the ex-dividend date. The portion of distributions, if any, that exceeds the Fund’s current and accumulated earnings and profits, as measured on a tax basis, constitute a non-taxable return of capital. The character and timing of distributions are determined in accordance with federal income tax regulations, which may differ from U.S. GAAP.
Indemnifications: In the normal course of business, the Fund enters into contracts that contain a variety of representations that provide general indemnification. The Fund’s maximum exposure under these arrangements is unknown because it involves future potential claims against the Fund, which cannot be predicted with any certainty.
Other: Expenses directly related to the Fund or its classes are charged to the Fund or the applicable class. Other operating expenses shared by several funds, including other funds managed by the Manager, are prorated among those funds on the basis of relative net assets or other appropriate methods. Expenses directly related to the Fund and other shared expenses prorated to the Fund are allocated daily to each class based on its relative net assets or other appropriate methods.
The Fund has an arrangement with its custodian whereby fees may be reduced by credits earned on uninvested cash balances, which, if applicable, are shown as fees paid indirectly in the Statement of Operations. The custodian imposes fees on overdrawn cash balances, which can be offset by accumulated credits earned or may result in additional custody charges.
3. Investment Valuation and Fair Value Measurements:
Investment Valuation Policies: The Fund’s investments are valued at fair value (also referred to as “market value” within the financial statements) as of the close of trading on the New York Stock Exchange (“NYSE”) (generally 4:00 p.m., Eastern time). U.S. GAAP defines fair value as the price the Fund would receive to sell an asset or pay to transfer a liability in an orderly transaction between market participants at the measurement date. The Fund determines the fair values of its financial instruments using various independent dealers or pricing services under policies approved by the Board of Directors of the Company (the “Board”). The BlackRock Global Valuation Methodologies Committee (the “Global Valuation Committee”) is the committee formed by management to develop global pricing policies and procedures and to oversee the pricing function for all financial instruments.
Fair Value Inputs and Methodologies: The following methods (or “techniques”) and inputs are used to establish the fair value of the Fund’s assets and liabilities:
| • | | Equity investments traded on a recognized securities exchange are valued at the official closing price each day, if available. For equity investments traded on more than one exchange, the official close price on the exchange where the stock is primarily traded is used. Equity investments traded on a recognized exchange for which there were no sales on that day may be valued at the last available bid (long positions) or ask (short positions) price. |
| | | | | | |
| | | BLACKROCK VARIABLE SERIES FUNDS, INC. | | JUNE 30, 2016 | | 11 |
| | | | |
| Notes to Financial Statements (continued) | | | BlackRock iShares® Dynamic Fixed Income V.I. Fund | |
| • | | The market value of the Fund’s investments in the underlying funds is based on the published net asset value (“NAV”) of each underlying fund computed as of the close of regular trading on the NYSE on days when the NYSE is open. |
| • | | Investments in open-end U.S. mutual funds are valued at NAV each business day. |
| • | | The Fund values its investment in BlackRock Liquidity Series, LLC, Money Market Series (the “Money Market Series”) at fair value, which is ordinarily based upon its pro rata ownership in the underlying fund’s net assets. The Money Market Series seeks current income consistent with maintaining liquidity and preserving capital. Although the Money Market Series is not registered under the 1940 Act, its investments may follow the parameters of investments by a money market fund that is subject to Rule 2a-7 under the 1940 Act. The Fund may withdraw up to 25% of its investment daily, although the manager of the Money Market Series, in its sole discretion, may permit an investor to withdraw more than 25% on any one day. |
If events (e.g., a company announcement, market volatility or a natural disaster) occur that are expected to materially affect the value of such instruments, or in the event that the application of these methods of valuation results in a price for an investment that is deemed not to be representative of the market value of such investment, or if a price is not available, the investment will be valued by the Global Valuation Committee, or its delegate, in accordance with a policy approved by the Board as reflecting fair value (“Fair Valued Investments”). When determining the price for Fair Valued Investments, the Global Valuation Committee, or its delegate, seeks to determine the price that the Fund might reasonably expect to receive or pay from the current sale or purchase of that asset or liability in an arm’s-length transaction. Fair value determinations shall be based upon all available factors that the Global Valuation Committee, or its delegate, deems relevant consistent with the principles of fair value measurement. The pricing of all Fair Valued Investments is subsequently reported to the Board or a committee thereof on a quarterly basis.
Fair Value Hierarchy: Various inputs are used in determining the fair value of investments. These inputs to valuation techniques are categorized into a fair value hierarchy consisting of three broad levels for financial statement purposes as follows:
| • | | Level 1 — unadjusted price quotations in active markets/exchanges for identical assets or liabilities that the Fund has the ability to access |
| • | | Level 2 — other observable inputs (including, but not limited to, quoted prices for similar assets or liabilities in markets that are active, quoted prices for identical or similar assets or liabilities in markets that are not active, inputs other than quoted prices that are observable for the assets or liabilities (such as interest rates, yield curves, volatilities, prepayment speeds, loss severities, credit risks and default rates) or other market–corroborated inputs) |
| • | | Level 3 — unobservable inputs based on the best information available in the circumstances, to the extent observable inputs are not available (including the Fund’s own assumptions used in determining the fair value of investments and derivative financial instruments) |
The hierarchy gives the highest priority to unadjusted quoted prices in active markets for identical assets or liabilities (Level 1 measurements) and the lowest priority to unobservable inputs (Level 3 measurements). Accordingly, the degree of judgment exercised in determining fair value is greatest for instruments categorized in Level 3. The inputs used to measure fair value may fall into different levels of the fair value hierarchy. In such cases, for disclosure purposes, the fair value hierarchy classification is determined based on the lowest level input that is significant to the fair value measurement in its entirety. The significant unobservable inputs used by the Global Valuation Committee in determining the price for Fair Valued Investments are typically categorized as Level 3. The fair value hierarchy for the Fund’s investments has included in the Schedules of Investments.
Changes in valuation techniques may result in transfers into or out of an assigned level within the hierarchy. In accordance with the Fund’s policy, transfers between different levels of the fair value hierarchy are deemed to have occurred as of the beginning of the reporting period. The categorization of a value determined for investments and derivative financial instruments is based on the pricing transparency of the investments and derivative financial instruments and is not necessarily an indication of the risks associated with investing in those securities.
4. Securities and Other Investments:
Securities Lending: The Fund may lend its securities to approved borrowers, such as brokers, dealers and other financial institutions. The borrower pledges and maintains with the Fund collateral consisting of cash, an irrevocable letter of credit issued by a bank, or securities issued or guaranteed by the U.S. Government. The initial collateral received by the Fund is required to have a value of at least 102% of the current value of the loaned securities for securities traded on U.S. exchanges and a value of at least 105% for all other securities. The collateral is maintained thereafter at a value equal to at least 100% of the current market value of the securities on loan. The market value of the loaned securities is determined at the close of each business day of the Fund and any additional required collateral is delivered to the Fund, or excess collateral returned by the Fund, on the next business day. During the term of the loan, the Fund is entitled to all distributions made on or in respect of the loaned securities. Loans of securities are terminable at any time and the borrower, after notice, is required to return borrowed securities within the standard time period for settlement of securities transactions.
The market value of any securities on loan, all of which were classified as affiliated investment companies in the Fund’s Schedule of Investments, and the value of any related collateral are shown separately in the Statement of Assets and Liabilities as a component of investments at value — unaffiliated, and collateral on securities loaned at value, respectively. As of period end, any securities on loan were collateralized by cash. The cash collateral invested by the securities lending agent, BlackRock Investment Management, LLC (“BIM”), if any, is disclosed in the Schedule of Investments.
| | | | | | |
| 12 | | BLACKROCK VARIABLE SERIES FUNDS, INC. | | JUNE 30, 2016 | | |
| | | | |
| Notes to Financial Statements (continued) | | | BlackRock iShares® Dynamic Fixed Income V.I. Fund | |
Securities lending transactions are entered into by the Fund under Master Securities Lending Agreements (each, an “MSLA”), which provide the right, in the event of default (including bankruptcy or insolvency), for the non-defaulting party to liquidate the collateral and calculate a net exposure to the defaulting party or request additional collateral. In the event that a borrower defaults, the Fund, as lender, would offset the market value of the collateral received against the market value of the securities loaned. When the value of the collateral is greater than that of the market value of the securities loaned, the lender is left with a net amount payable to the defaulting party. However, bankruptcy or insolvency laws of a particular jurisdiction may impose restrictions on or prohibitions against such a right of offset in the event of an MSLA counterparty’s bankruptcy or insolvency. Under the MSLA, absent an event of default the borrower can resell or re-pledge the loaned securities, and the Fund can reinvest cash collateral received in connection with loaned securities. Upon an event of default, the parties’ obligations to return the securities or collateral to the other party are extinguished, and the parties can resell or re-pledge the loaned securities or the collateral received in connection with the loaned securities in order to satisfy the defaulting party’s net payment obligation for all transactions under the MSLA. The defaulting party remains liable for any deficiency.
As of period end, the following table is a summary of the Fund’s securities lending agreements by counterparty which are subject to offset under an MSLA:
| | | | | | |
| Counterparty | | Securities Loaned at Value | | Cash Collateral Received1
| | Net Amount |
UBS Securities LLC | | $35,824 | | $(35,824) | | — |
| | 1 | | Collateral with a value of $36,336 has been received in connection with securities lending agreements. Collateral received in excess of the value of securities loaned from the individual counterparty is not shown for financial reporting purposes in the table above. |
The risks of securities lending include the risk that the borrower may not provide additional collateral when required or may not return the securities when due. To mitigate these risks, the Fund benefits from a borrower default indemnity provided by BIM. BIM’s indemnity allows for full replacement of the securities loaned if the collateral received does not cover the value on the securities loaned in the event of borrower default. The Fund could suffer a loss if the value of an investment purchased with cash collateral falls below the market value of loaned securities or if the value of an investment purchased with cash collateral falls below the value of the original cash collateral received.
5. Investment Advisory Agreement and Other Transactions with Affiliates:
The PNC Financial Services Group, Inc. is the largest stockholder and an affiliate of BlackRock, Inc. (“BlackRock”) for 1940 Act purposes.
Investment Advisory
The Company, on behalf of the Fund, entered into an Investment Advisory Agreement with the Manager, the Fund’s investment adviser, an indirect, wholly-owned subsidiary of BlackRock, to provide investment advisory and administration services. The Manager is responsible for the management of the Fund’s portfolio and provides the personnel, facilities, equipment and certain other services necessary to the operations of the Fund. For such services, the Fund pays the Manager a monthly fee, which is determined by calculating a percentage of the Fund’s average daily net assets, based on the following annual rates:
| | |
| Average Daily Net Assets | | Investment Advisory Fee |
First $1 Billion | | 0.150% |
$1 Billion - $3 Billion | | 0.140% |
$3 Billion - $5 Billion | | 0.135% |
Greater than $5 Billion | | 0.130% |
Distribution Fees
The Company, on behalf of the Fund, entered into a Distribution Agreement and a Distribution Plan with BlackRock Investments, LLC (“BRIL”), an affiliate of the Manager. Pursuant to the Distribution Plan and in accordance with Rule 12b-1 under the 1940 Act, the Fund pays BRIL ongoing distribution fees. The fees are accrued daily and paid monthly at an annual rate of 0.25% based upon the average daily net assets attributable to Class III.
For the six months ended June 30, 2016, the class specific distribution fees borne directly by Class III is $2,211.
| | | | | | |
| | | BLACKROCK VARIABLE SERIES FUNDS, INC. | | JUNE 30, 2016 | | 13 |
| | | | |
| Notes to Financial Statements (continued) | | | BlackRock iShares® Dynamic Fixed Income V.I. Fund | |
Transfer Agent
The Manager on behalf of the Fund, entered into agreements with insurance companies and other financial intermediaries (“Service Organizations”), some of which may be affiliates. Pursuant to these agreements, the Service Organizations provide the Fund with administrative, networking, recordkeeping, sub-transfer agency and shareholder services to sub-accounts they service. For these services, the Service Organizations receive an annual fee per shareholder account, which will vary depending on share class and/or net assets of Fund shareholders serviced by the Service Organizations, which is shown as transfer agent — class specific. For the six months ended June 30, 2016, the Fund did not pay any amounts to affiliates in return for these services.
In addition, the Fund pays the transfer agent, which is not an affiliate, a fee for issuance, transfer and redemption of shares and the opening and maintenance of shareholder accounts, which is included in transfer agent in the Statement of Operations.
For the six months ended June 30, 2016, the following table shows the class specific transfer agent fees borne directly by each class of the Fund:
| | | | |
| Class I | | Class III | | Total |
$6,236 | | $357 | | $6,593 |
Expense Limitations, Waivers, Reimbursements and Recoupments
The Manager, with respect to the Fund, contractually agreed to waive and/or reimburse fees or expenses in order to limit expenses, excluding interest expense, dividend expense, tax expense, acquired fund fees and expenses, and certain other fund expenses, which constitute extraordinary expenses not incurred in the ordinary course of the Fund’s business. The expense limitations as a percentage of average daily net assets are as follows:
| | | | |
Class I | | | 0.50 | % |
Class III | | | 0.75 | % |
The Manager has agreed not to reduce or discontinue this contractual expense limitation prior to May 1, 2017, unless approved by the Board, including a majority of the Independent Directors who are not “interested persons” of the Fund, as defined in the 1940 Act (“Independent Directors”) or by a majority of the outstanding voting securities of the Fund.
For the six months ended June 30, 2016, the amount is shown as fees waived by the Manager on the Statement of Operations and the amount included in expenses reimbursed by the Manager was $16,335.
These amounts waived and/or reimbursed are included in fees waived by the Manager shown as transfer agent fees reimbursed — class specific in the Statement of Operations. Class specific expense waivers and/or reimbursements are as follows:
| | | | | | | | |
| | | Class I | | Class III | | | Total | |
Transfer Agent Fees Reimbursed | | $6,230 | | $355 | | $ | 6,585 | |
The Manager, with respect to the Fund, voluntarily agreed to waive its investment advisory fees by the amount of investment advisory fees the Fund pays to the Manager indirectly through its investment in affiliated money market funds. In addition, the Manager has contractually agreed to waive the management fee on assets estimated to be attributable to the Fund’s investments in other equity and fixed-income mutual funds managed by BlackRock or its affiliates, if any. This amount is included in expenses reimbursed by the Manager in the Statement of Operations. For the six months ended June 30, 2016, the amount reimbursed was $50.
For the six months ended June 30, 2016, the Fund reimbursed the Manager $44 for certain accounting services, which is included in accounting services in the Statement of Operations.
| | | | | | |
| 14 | | BLACKROCK VARIABLE SERIES FUNDS, INC. | | JUNE 30, 2016 | | |
| | | | |
| Notes to Financial Statements (continued) | | | BlackRock iShares® Dynamic Fixed Income V.I. Fund | |
If during the Fund’s fiscal year the operating expenses of a share class, that at any time during the prior two fiscal years received a waiver and/or reimbursement from the Manager, are less than the expense cap for that share class, the Manager is entitled to be reimbursed by such share class up to the lesser of the following expenses:
| | (a) | The amount of fees waived or expenses reimbursed during those prior two fiscal years under the agreement. |
| | (b) | The amount by which the expense cap for that share class exceeds the operating expenses of the share class for the current fiscal year, provided that: |
| | • | | The Fund, of which the share class is a part, has more than $50 million in assets for the fiscal year. |
| | • | | The Manager or an affiliate continues to serve as the Fund’s investment adviser or administrator. |
In the event the expense cap for a share class is changed subsequent to a fiscal year in which the Manager becomes entitled to reimbursement for fees waived and/or reimbursed, the amount available to reimburse the Manager shall be calculated by reference to the expense cap for that share class in effect at the time the Manager became entitled to receive such reimbursement, rather than the subsequently changed expense cap for that share class.
On June 30, 2016, the Fund level and class specific waivers and/or reimbursements subject to possible future recoupment under the expense limitation agreement are as follows:
| | | | | | | | | | | | |
| | | Expires December 31, | |
| | | 2016 | | | 2017 | | | 2018 | |
Fund Level | | $ | 75,070 | | | $ | 80,571 | | | $ | 24,752 | |
Class I | | $ | 1,455 | | | $ | 9,548 | | | $ | 6,229 | |
Class III | | | — | | | $ | 282 | | | $ | 355 | |
Securities Lending
The U.S. Securities and Exchange Commission has issued an exemptive order which permits BIM, an affiliate of the Manager, to serve as securities lending agent for the Fund, subject to applicable conditions. As securities lending agent, BIM bears all operational costs directly related to securities lending. The Fund is responsible for expenses in connection with the investment of cash collateral received for securities on loan (the “collateral investment expenses”). The cash collateral is invested in a private investment company managed by the Manager or its affiliates. However, BIM has agreed to cap the collateral investment expenses of the private investment company to an annual rate of 0.04%. The investment adviser to the private investment company will not charge any advisory fees with respect to shares purchased by the Fund.
Securities lending income is equal to the total of income earned from the reinvestment of cash collateral, net of fees and other payments to and from borrowers of securities, and less the collateral investment expenses. The Fund retains a portion of securities lending income and remits a remaining portion to BIM as compensation for its services as securities lending agent.
Pursuant to a securities lending agreement, the Fund retains 80% of securities lending income, and this amount retained can never be less than 70% of the total of securities lending income plus the collateral investment expenses.
In addition, commencing the business day following the date that the aggregate securities lending income earned across the Equity-Bond Complex in a calendar year exceeds a specified threshold, the Fund, pursuant to the securities lending agreement, will retain for the remainder of that calendar year securities lending income as follows: 85% of securities lending income, and this amount retained can never be less than 70% of the total of securities lending income plus the collateral investment expenses.
The share of securities lending income earned by the Fund is shown as securities lending — affiliated — net in the Statement of Operations. For the six months ended June 30, 2016, the Fund paid BIM $915 for securities lending agent services.
Officers and Directors
Certain officers and/or directors of the Company are officers and/or directors of BlackRock or its affiliates. The Fund reimburses the Manager for a portion of the compensation paid to the Company’s Chief Compliance Officer, which is included in Officer and Directors in the Statement of Operations.
6. Purchases and Sales:
For the six months ended June 30, 2016, purchases and sales of investments, excluding short-term securities, were $5,721,718 and $2,557,830, respectively.
| | | | | | |
| | | BLACKROCK VARIABLE SERIES FUNDS, INC. | | JUNE 30, 2016 | | 15 |
| | | | |
| Notes to Financial Statements (continued) | | | BlackRock iShares® Dynamic Fixed Income V.I. Fund | |
7. Income Tax Information:
It is the Fund’s policy to comply with the requirements of the Internal Revenue Code of 1986, as amended, applicable to regulated investment companies, and to distribute substantially all of its taxable income to its shareholders. Therefore, no federal income tax provision is required.
The Fund files U.S. federal and various state and local tax returns. No income tax returns are currently under examination. The statute of limitations on the Fund’s U.S. federal tax returns generally remains open for the period ended December 31, 2014 and the year ended December 31, 2015. The statutes of limitations on the Fund’s state and local tax returns may remain open for an additional year depending upon the jurisdiction.
Management has analyzed tax laws and regulations and their application to the Fund as of June 30, 2016, inclusive of the open tax returns years and does not believe there are any uncertain tax positions that require recognition of a tax liability in the Fund’s financial statements.
As of December 31, 2015, the Fund had a capital loss carryforward, with no expiration date, available to offset future realized capital gains of $5,270.
As of June 30, 2016, gross unrealized appreciation and depreciation based on cost for federal income tax purposes were as follows:
| | | | |
Tax cost | | $ | 13,522,488 | |
| | | | |
Gross unrealized appreciation | | $ | 387,739 | |
Gross unrealized depreciation | | | (761 | ) |
| | | | |
Net unrealized appreciation | | $ | 386,978 | |
| | | | |
| | | | | |
8. Bank Borrowings:
The Company, on behalf of the Fund, along with certain other funds managed by the Manager and its affiliates (“Participating Funds”), is a party to a 364-day, $2.1 billion credit agreement with a group of lenders. Under this agreement, the Fund may borrow to fund shareholder redemptions. Excluding commitments designated for certain individual funds, the Participating Funds, including the Fund, can borrow up to an aggregate commitment amount of $1.6 billion at any time outstanding, subject to asset coverage and other limitations as specified in the agreement. The credit agreement has the following terms: a fee of 0.12% per annum on unused commitment amounts and interest at a rate equal to the higher of (a) one-month LIBOR (but, in any event, not less than 0.00%) on the date the loan is made plus 0.80% per annum or (b) the Fed Funds rate (but, in any event, not less than 0.00%) in effect from time to time plus 0.80% per annum on amounts borrowed. The agreement expires in April 2017 unless extended or renewed. Prior to April 21, 2016, the credit agreement had a fee per annum of 0.06% on unused commitment amounts and interest at a rate equal to the higher of (a) one-month LIBOR (but, in any event, not less than 0.00%) on the date the loan is made plus 0.80% per annum or (b) the Fed Funds rate (but, in any event, not less than 0.00%) in effect from time to time plus 0.80% per annum on amounts borrowed. Participating Funds paid administration, legal and arrangement fees, which, if applicable, are included in miscellaneous expenses in the Statement of Operations. These fees were allocated among such funds based upon portions of the aggregate commitment available to them and relative net assets of Participating Funds. During the six months ended June 30, 2016, the Fund did not borrow under the credit agreement.
9. Principal Risks:
In the normal course of business, the Fund invests in securities and enters into transactions where risks exist due to fluctuations in the market (market risk) or failure of the issuer to meet all its obligations, including the ability to pay principal and interest when due (issuer credit risk). The value of securities held by the Fund may decline in response to certain events, including those directly involving the issuers of securities owned by the Fund. Changes arising from the general economy, the overall market and local, regional or global political and/or social instability, as well as currency, interest rate and price fluctuations, may also affect the securities’ value.
Counterparty Credit Risk: Similar to issuer credit risk, the Fund may be exposed to counterparty credit risk, or the risk that an entity may fail to or be unable to perform on its commitments related to unsettled or open transactions. The Fund manages counterparty credit risk by entering into transactions only with counterparties that the Manager believes have the financial resources to honor their obligations and by monitoring the financial stability of those counterparties. Financial assets, which potentially expose the Fund to market, issuer and counterparty credit risks, consist principally of financial instruments and receivables due from counterparties. The extent of the Fund’s exposure to market, issuer and counterparty credit risks with respect to these financial assets approximated by their value recorded in the Statement of Assets and Liabilities, less any collateral held by the Fund.
Concentration Risk: The Fund invests a significant portion of its assets in fixed-income securities and/or uses derivatives tied to the fixed-income markets. Changes in market interest rates or economic conditions may affect the value and/or liquidity of such investments. Interest rate risk is the risk that prices of bonds and other fixed-income securities will increase as interest rates fall and decrease as interest rates rise. The Fund may be subject to a greater risk of rising interest rates due to the current period of historically low rates.
| | | | | | |
| 16 | | BLACKROCK VARIABLE SERIES FUNDS, INC. | | JUNE 30, 2016 | | |
| | | | |
| Notes to Financial Statements (concluded) | | | BlackRock iShares® Dynamic Fixed Income V.I. Fund | |
10. Capital Share Transactions:
Transactions in capital shares for each class were as follows:
| | | | | | | | | | | | | | | | | | |
| | | Six Months Ended
June 30, 2016 | | | | | Year Ended
December 31, 2015 | |
| | | Shares | | | Amount | | | | | Shares | | | Amount | |
| Class I | | | | | | | | | | | | | | |
Shares sold | | | 385,187 | | | $ | 3,857,935 | | | | | | 628,288 | | | $ | 6,345,522 | |
Shares issued in reinvestment of distributions | | | — | | | | — | | | | | | 16,379 | | | | 159,206 | |
Shares redeemed | | | (196,193 | ) | | | (1,968,372 | ) | | | | | (148,160 | ) | | | (1,488,001 | ) |
| | | | | | | | | | |
Net increase | | | 188,994 | | | $ | 1,889,563 | | | | | | 496,507 | | | $ | 5,016,727 | |
| | | | | | | | | | |
| | | | | | | | | | | | | | | | | | |
Class III | | | | | | | | | | |
Shares sold | | | 129,937 | | | $ | 1,289,855 | | | | | | 119,320 | | | $ | 1,189,039 | |
Shares issued in reinvestment of distributions | | | — | | | | — | | | | | | 2,148 | | | | 20,794 | |
Shares redeemed | | | (7,822 | ) | | | (77,230 | ) | | | | | (11,110 | ) | | | (110,897 | ) |
| | | | | | | | | | |
Net increase | | | 122,115 | | | $ | 1,212,625 | | | | | | 110,358 | | | $ | 1,098,936 | |
| | | | | | | | | | |
Total Net Increase | | | 311,109 | | | $ | 3,102,188 | | | | | | 606,865 | | | $ | 6,115,663 | |
| | | | | | | | | | |
11. Subsequent Events:
Management has evaluated the impact of all subsequent events on the Funds through the date the financial statements were issued and has determined that there were no subsequent events requiring adjustment or additional disclosure in the financial statements.
| | | | | | |
| | | BLACKROCK VARIABLE SERIES FUNDS, INC. | | JUNE 30, 2016 | | 17 |
JUNE 30, 2016
| | | | |
SEMI-ANNUAL REPORT (UNAUDITED) | | | | BLACKROCK® |
BlackRock Variable Series Funds, Inc.
▶ BlackRock iShares® Equity Appreciation V.I. Fund
| | |
| Not FDIC Insured ¡ May Lose Value ¡ No Bank Guarantee | | |
| | | | |
| Fund Summary as of June 30, 2016 | | | BlackRock iShares® Equity Appreciation V.I. Fund | |
BlackRock iShares® Equity Appreciation V.I. Fund’s (the “Fund”) investment objective is to seek to provide growth of capital.
|
| Portfolio Management Commentary |
How did the Fund perform?
| • | | For the six-month period ended June 30, 2016, the Fund outperformed its benchmark, the MSCI All Country World Index. |
What factors influenced performance?
| • | | The largest contributor to Fund performance was exposure to large U.S. companies through the iShares Russell 1000 ETF. This was followed by exposure to a broad range of emerging market companies through the iShares Core MSCI Emerging Markets ETF. |
| • | | The largest detractors from Fund performance came from exposure to a broad range of companies in Europe, Australia, Asia, and the Far East, through the iShares MSCI EAFE ETF. The second-largest detractor was exposure to small public U.S. companies through the iShares Russell 2000 ETF. |
Describe recent portfolio activity.
| • | | Post-Brexit, the investment advisor has a negative outlook on European equities and believes that uncertainty and market volatility may be heightened near term. For these reasons, the Fund reduced exposure to European equities and reduced overall portfolio sensitivity to equity markets. Proceeds were reallocated to U.S. mega-cap stocks and U.S. dividend-paying stocks where the investment adviser sees more opportunity over the near term. |
Describe portfolio positioning at period end.
| • | | At period end, the Fund was neutral in terms of overall market sensitivity, with an overweight to U.S. equities and underweights to Japanese and European stocks. From a sector and currency perspective, the Fund was underweight diversified banks and overweight the U.S. dollar, particularly versus the euro, British pound and Japanese yen. |
The views expressed reflect the opinions of BlackRock as of the date of this report and are subject to change based on changes in market, economic or other conditions. These views are not intended to be a forecast of future events and are no guarantee of future results.
| | | | | |
| Portfolio Composition | | Percent of
Affiliated Investment Companies |
Equity Funds | | 68% |
Short-Term Securities | | 32 |
| | | | | | |
| 2 | | BLACKROCK VARIABLE SERIES FUNDS, INC. | | JUNE 30, 2016 | | |
| | | | |
| | | | BlackRock iShares® Equity Appreciation V.I. Fund | |
|
| Total Return Based on a $10,000 Investment |
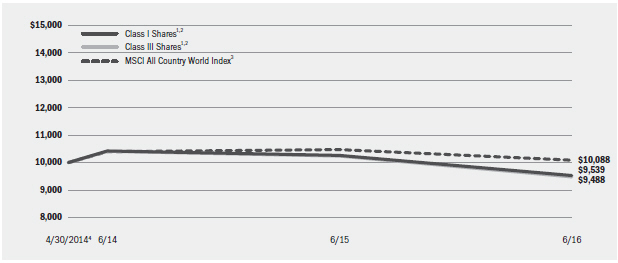
| | 1 | Assuming transaction costs, if any, and other operating expenses, including investment advisory fees. Does not include insurance-related fees and expenses. |
| | 2 | The Fund invests in a portfolio of underlying exchange-traded funds that seek to track equity indices. |
| | 3 | This unmanaged index is a free float-adjusted market capitalization weighted index that is designed to measure the equity market performance of developed and emerging markets. The MSCI All Country World Index consists of 46 country indexes comprising 23 developed and 23 emerging market country indexes. |
| | 4 | Commencement of operations. |
|
| Performance Summary for the Period Ended June 30, 2016 |
| | | | | | | | | | | | | | | |
| | | | | Average Annual Total Returns |
| | | 6-Month
Total Returns6 | | 1 Year6 | | Since
Inception6,7 |
Class I5 | | | | 1.65 | % | | | | (7.11 | )% | | | | (2.16 | )% |
Class III5 | | | | 1.54 | | | | | (7.32 | ) | | | | (2.39 | ) |
MSCI All Country World Index | | | | 1.23 | | | | | (3.73 | ) | | | | 0.41 | |
| | 5 | | Average annual and cumulative total returns are based on changes in net asset value for the periods shown, and assume reinvestment of all distributions at net asset value on the ex-dividend date. Insurance-related fees and expenses are not reflected in these returns. |
| | 6 | | For a portion of the period, the Fund’s investment adviser waived a portion of its fee. Without such waiver, the Fund’s performance would have been lower. |
| | 7 | | The Fund commenced operations on April 30, 2014. |
| | | | Past performance is not indicative of future results. Performance results do not reflect the deduction of taxes that a shareholder would pay on Fund distributions or the redemption of Fund shares. |
| | | | | | | | | | | | | | |
| | | Actual | | Hypothetical9 | | |
| | | Beginning Account Value January 1, 2016 | | Ending Account Value June 30, 2016 | | Expenses Paid During the Period8 | | Beginning Account Value January 1, 2016 | | Ending Account Value June 30, 2016 | | Expenses Paid During the Period8 | | Annualized
Expense
Ratio |
Class I | | $1,000.00 | | $1,016.50 | | $2.26 | | $1,000.00 | | $1,022.63 | | $2.26 | | 0.45% |
Class III | | $1,000.00 | | $1,015.40 | | $3.51 | | $1,000.00 | | $1,021.38 | | $3.52 | | 0.70% |
| | 8 | | For each class of the Fund, expenses are equal to the annualized expense ratio for the class, multiplied by the average account value over the period, multiplied by 182/366 (to reflect the one-half year period shown). |
| | 9 | | Hypothetical 5% annual return before expenses is calculated by prorating the number of days in the most recent fiscal half-year divided by 366. |
| | | | See “Disclosure of Expenses” on the following page for further information on how expenses were calculated. |
| | | | | | |
| | | BLACKROCK VARIABLE SERIES FUNDS, INC. | | JUNE 30, 2016 | | 3 |
| | | | |
| Disclosure of Expenses | | | BlackRock iShares® Equity Appreciation V.I. Fund | |
Shareholders of the Fund may incur the following charges: (a) transactional expenses, such as sales charges; and (b) operating expenses, including investment advisory fees, service and distribution fees, including 12b-1 fees, acquired fund fees and expenses, and other fund expenses. The expense example on the previous page (which is based on a hypothetical investment of $1,000 invested on January 1, 2016 and held through June 30, 2016) is intended to assist shareholders both in calculating expenses based on an investment in the Fund and in comparing these expenses with similar costs of investing in other mutual funds.
The expense example provides information about actual account values and actual expenses. In order to estimate the expenses a shareholder paid during the period covered by this report, shareholders can divide their account value by $1,000 and then multiply the result by the number corresponding to their share class under the heading entitled “Expenses Paid During the Period.”
The expense example also provides information about hypothetical account values and hypothetical expenses based on the Fund’s actual expense ratio and an assumed rate of return of 5% per year before expenses. In order to assist shareholders in comparing the ongoing expenses of investing in the Fund and other funds, compare the 5% hypothetical example with the 5% hypothetical examples that appear in shareholder reports of other funds.
The expenses shown in the expense example are intended to highlight shareholders’ ongoing costs only and do not reflect any transactional expenses, such as sales charges, if any. Therefore, the hypothetical example is useful in comparing ongoing expenses only, and will not help shareholders determine the relative total expenses of owning different funds. If these transactional expenses were included, shareholder expenses would have been higher.
| | | | | | |
| 4 | | BLACKROCK VARIABLE SERIES FUNDS, INC. | | JUNE 30, 2016 | | |
| | | | |
| Schedule of Investments June 30, 2016 (Unaudited) | | | BlackRock iShares® Equity Appreciation V.I. Fund | |
| | | (Percentages shown are based on Net Assets) | |
| | | | | | | | |
| Affiliated Investment Companies (a) | | Shares | | | Value | |
Equity Funds — 100.2% | | | | | | | | |
iShares Core MSCI Emerging Markets ETF | | | 24,099 | | | $ | 1,008,061 | |
iShares Core S&P 500 ETF (b) | | | 5,287 | | | | 1,113,971 | |
iShares Core S&P Mid-Cap ETF (b) | | | 5,923 | | | | 884,837 | |
iShares Core S&P Small-Cap ETF (b) | | | 6,447 | | | | 749,206 | |
iShares High Dividend ETF | | | 7,772 | | | | 638,470 | |
iShares MSCI Canada ETF | | | 8,380 | | | | 205,394 | |
iShares MSCI EAFE ETF (b) | | | 37,751 | | | | 2,106,883 | |
iShares MSCI EAFE Small-Cap ETF | | | 2,409 | | | | 116,258 | |
iShares Russell 1000 ETF (b) | | | 19,447 | | | | 2,273,354 | |
iShares S&P 100 ETF (b) | | | 3,726 | | | | 346,146 | |
| | | | | | | | |
| | | | | | | | 9,442,580 | |
| | | | | | | | |
| | | | | | | |
| | | | | | | | |
| Affiliated Investment Companies(a) | | Shares/
Beneficial
Interest
(000) | | | Value | |
Short-Term Securities — 47.0% | | | | | | | | |
BlackRock Liquidity Funds, TempFund, Institutional Class, 0.40% (c) | | | 159,809 | | | $ | 159,809 | |
BlackRock Liquidity Series, LLC, Money Market Series, 0.59% (c)(d) | | $ | 4,267 | | | | 4,267,259 | |
| | | | | | | | |
| | | | | | | | 4,427,068 | |
| | | | | | | | |
Total Affiliated Investment Companies
(Cost — $13,779,942) — 147.2% | | | | | 13,869,648 | |
Liabilities in Excess of Other Assets — (47.2)% | | | | | | | (4,446,459 | ) |
| | | | | | | | |
Net Assets — 100.0% | | | | | | $ | 9,423,189 | |
| | | | | | | | |
| | |
Notes to Schedule of Investments |
| (a) | During the six months ended June 30, 2016, investments in issuers considered to be affiliates of the Fund for purposes of Section 2(a)(3) of the Investment Company Act of 1940, as amended, were as follows: |
| | | | | | | | | | | | | | | | | | | | | | | | | | | | |
| Affiliate | | Shares/
Beneficial
Interest
Held at
December 31,
2015 | | | Shares/
Beneficial
Interest
Purchased | | | Shares/
Beneficial
Interest
Sold | | | Shares/
Beneficial
Interest
Held at
June 30,
2016 | | | Value at
June 30,
2016 | | | Income | | | Realized
Loss | |
BlackRock Liquidity Funds, TempFund, Institutional Class | | | 106,288 | | | | 53,521 | 1 | | | — | | | | 159,809 | | | $ | 159,809 | | | $ | 88 | | | | — | |
BlackRock Liquidity Series, LLC, Money Market Series | | | 459,990 | | | $ | 3,807,269 | 2 | | | — | | | $ | 4,267,259 | | | | 4,267,259 | | | | 4,124 | 3 | | | — | |
iShares Core MSCI Emerging Markets ETF | | | 21,540 | | | | 2,799 | | | | 240 | | | | 24,099 | | | | 1,008,061 | | | | 9,097 | | | $ | (2,014 | ) |
iShares Core S&P 500 ETF | | | 4,104 | | | | 1,283 | | | | 100 | | | | 5,287 | | | | 1,113,971 | | | | 10,361 | | | | (200 | ) |
iShares Core S&P Mid-Cap ETF | | | 1,260 | | | | 4,663 | | | | — | | | | 5,923 | | | | 884,837 | | | | 4,064 | | | | — | |
iShares Core S&P Small-Cap ETF | | | — | | | | 6,447 | | | | — | | | | 6,447 | | | | 749,206 | | | | 2,161 | | | | — | |
iShares High Dividend ETF | | | — | | | | 7,772 | | | | — | | | | 7,772 | | | | 638,470 | | | | — | | | | — | |
iShares International Select Dividend ETF | | | 4,823 | | | | — | | | | 4,823 | | | | — | | | | — | | | | 1,637 | | | | (196 | ) |
iShares Micro-Cap ETF | | | 1,708 | | | | 66 | | | | 1,774 | | | | — | | | | — | | | | 335 | | | | (5,575 | ) |
iShares MSCI Canada ETF | | | — | | | | 8,380 | | | | — | | | | 8,380 | | | | 205,394 | | | | 1,601 | | | | — | |
iShares MSCI EAFE ETF | | | 34,834 | | | | 14,285 | | | | 11,368 | | | | 37,751 | | | | 2,106,883 | | | | 55,698 | | | | (123,055 | ) |
iShares MSCI EAFE Small-Cap ETF | | | 5,717 | | | | 2,386 | | | | 5,694 | | | | 2,409 | | | | 116,258 | | | | 5,275 | | | | (10,863 | ) |
iShares Russell 1000 ETF | | | 15,291 | | | | 4,416 | | | | 260 | | | | 19,447 | | | | 2,273,354 | | | | 9,817 | | | | (773 | ) |
iShares Russell 2000 ETF | | | 10,016 | | | | 1,959 | | | | 11,975 | | | | — | | | | — | | | | 3,851 | | | | (35,110 | ) |
iShares S&P 100 ETF | | | 1,721 | | | | 2,005 | | | | — | | | | 3,726 | | | | 346,146 | | | | 1,717 | | | | — | |
Total | | | | | | | | | | | | | | | | | | $ | 13,869,648 | | | $ | 109,826 | | | $ | (177,786 | ) |
| | | | | | | | | | | | | | | | | | | | |
| | 1 | Represents net shares purchased. |
| | 2 | Represents net beneficial interest purchased. |
| | 3 | Represents securities lending income earned from the reinvestment of cash collateral from loaned securities, net of fees and collateral investment expenses, and other payments to and from borrowers of securities. |
| (b) | Security, or a portion of security, is on loan. |
| (c) | Current yield as of period end. |
| (d) | Security was purchased with the cash collateral from loaned securities. The Fund may withdraw up to 25% of its investment daily, although the manager of the BlackRock Liquidity Series, LLC, Money Market Series, in its sole discretion, may permit an investor to withdraw more than 25% on any one day. |
| | |
Portfolio Abbreviation |
| |
| ETF | | Exchange-Traded Fund |
See Notes to Financial Statements.
| | | | | | |
| | | | |
| | BLACKROCK VARIABLE SERIES FUNDS, INC. | | JUNE 30, 2016 | | 5 |
| | | | |
| Schedule of Investments (concluded) | | | BlackRock iShares® Equity Appreciation V.I. Fund | |
| | |
| |
| Fair Value Hierarchy as of Period End |
Various inputs are used in determining the fair value of investments. For information about the Fund’s policy regarding valuation of investments, refer to the Notes to Financial Statements.
The following table summarizes the Fund’s investments categorized in the disclosure hierarchy:
| | | | | | | | | | | | | | | | |
| | | Level 1 | | | Level 2 | | | Level 3 | | | Total | |
Assets: | | | | | | | | | | | | | | | | |
Investments: | | | | | | | | | | | | | | | | |
Affiliated Investment Companies | | $ | 9,602,389 | | | $ | 4,267,259 | | | | — | | | $ | 13,869,648 | |
The Fund may hold assets and/or liabilities in which the fair value approximates the carrying amount for financial statement purposes. As of period end, collateral on securities loaned at value of $4,267,259 is categorized as Level 2 within the disclosure hierarchy.
During the six months ended June 30, 2016, there were no transfers between levels.
See Notes to Financial Statements.
| | | | | | |
| 6 | | BLACKROCK VARIABLE SERIES FUNDS, INC. | | JUNE 30, 2016 | | |
| | | | |
| Statement of Assets and Liabilities | | | | |
| | | | |
| June 30, 2016 (Unaudited) | | BlackRock iShares® Equity AppreciationV.I. Fund | |
| | | | |
| Assets | | | | |
Investments at value — affiliated (including securities loaned at value of $4,244,568)(cost — $13,779,942) | | $ | 13,869,648 | |
Receivables: | | | | |
Investments sold | | | 860,906 | |
Securities lending income — affiliated | | | 957 | |
Capital shares sold | | | 1,632 | |
Dividends — affiliated | | | 19 | |
From the Manager | | | 10,032 | |
Prepaid expenses | | | 343 | |
| | | | |
Total assets | | | 14,743,537 | |
| | | | |
| | | | |
| Liabilities | | | | |
Collateral on securities loaned at value | | | 4,267,259 | |
Payables: | | | | |
Investments purchased | | | 1,002,680 | |
Capital shares redeemed | | | 55 | |
Distribution fees | | | 180 | |
Officer’s and Directors’ fees | | | 886 | |
Other accrued expenses | | | 49,254 | |
Other affiliates | | | 34 | |
| | | | |
Total liabilities | | | 5,320,348 | |
| | | | |
Net Assets | | $ | 9,423,189 | |
| | | | |
| | | | |
| Net Assets Consist of | | | | |
Paid-in capital | | $ | 10,088,265 | |
Undistributed net investment income | | | 91,125 | |
Accumulated net realized loss | | | (845,907 | ) |
Net unrealized appreciation (depreciation) | | | 89,706 | |
| | | | |
Net Assets | | $ | 9,423,189 | |
| | | | |
| | | | |
| Net Asset Value | | | | |
Class I — Based on net assets of $8,476,127 and 914,289 shares outstanding, 100 million shares authorized, $0.10 par value | | $ | 9.27 | |
| | | | |
Class III — Based on net assets of $947,062 and 102,506 shares outstanding, 100 million shares authorized, $0.10 par value | | $ | 9.24 | |
| | | | |
See Notes to Financial Statements.
| | | | | | |
| | | BLACKROCK VARIABLE SERIES FUNDS, INC. | | JUNE 30, 2016 | | 7 |
| | | | |
| Six Months Ended June 30, 2016 (Unaudited) | | BlackRock
iShares® Equity
AppreciationV.I. Fund | |
| | | | |
| Investment Income | | | | |
Dividends — affiliated | | $ | 105,702 | |
Securities lending — affiliated — net | | | 4,124 | |
| | | | |
Total income | | | 109,826 | |
| | | | |
| | | | |
| Expenses | | | | |
Professional | | | 21,727 | |
Transfer agent | | | 2,390 | |
Transfer agent — class specific | | | 6,858 | |
Printing | | | 7,520 | |
Investment advisory | | | 6,177 | |
Accounting services | | | 3,556 | |
Officer and Directors | | | 2,793 | |
Custodian | | | 1,798 | |
Distribution — class specific | | | 888 | |
Registration | | | 243 | |
Miscellaneous | | | 3,383 | |
| | | | |
Total expenses | | | 57,333 | |
Less: | | | | |
Fees waived by the Manager | | | (6,177 | ) |
Transfer agent fees reimbursed — class specific | | | (6,851 | ) |
Expenses reimbursed by the Manager | | | (24,814 | ) |
| | | | |
Total expenses after fees waived and reimbursed | | | 19,491 | |
| | | | |
Net investment income | | | 90,335 | |
| | | | |
| | | | |
| Realized and Unrealized Gain (Loss) | | | | |
Net realized loss on investments — affiliated | | | (177,786 | ) |
Net change in unrealized appreciation (depreciation) on investments — affiliated | | | 290,717 | |
| | | | |
Net realized and unrealized gain | | | 112,931 | |
| | | | |
Net Increase in Net Assets Resulting from Operations | | $ | 203,266 | |
| | | | |
See Notes to Financial Statements.
| | | | | | |
| 8 | | BLACKROCK VARIABLE SERIES FUNDS, INC. | | JUNE 30, 2016 | | |
| | | | |
| Statements of Changes in Net Assets | | | BlackRock iShares® Equity Appreciation V.I. Fund | |
| | | | | | | | |
| Increase (Decrease) in Net Assets: | | Six Months Ended
June 30, 2016
(Unaudited) | | | Year Ended
December 31, 2015 | |
| | | | | | | | |
| Operations | | | | | | | | |
Net investment income | | $ | 90,335 | | | $ | 125,278 | |
Net realized loss | | | (177,786 | ) | | | (646,821 | ) |
Net change in unrealized appreciation (depreciation) | | | 290,717 | | | | (139,408 | ) |
| | | | |
Net increase (decrease) in net assets resulting from operations | | | 203,266 | | | | (660,951 | ) |
| | | | |
| | | | | | | | |
| Distributions to Shareholders1 | | | | | | | | |
From net investment income: | | | | | | | | |
Class I | | | — | | | | (121,605 | ) |
Class III | | | — | | | | (8,233 | ) |
Return of capital: | | | | | | | | |
Class I | | | — | | | | (3,687 | ) |
Class III | | | — | | | | (266 | ) |
| | | | |
Decrease in net assets resulting from distributions to shareholders | | | — | | | | (133,791 | ) |
| | | | |
| | | | | | | | |
| Capital Share Transactions | | | | | | | | |
Net increase in net assets derived from capital share transactions | | | 1,769,495 | | | | 4,474,171 | |
| | | | |
| | | | | | | | |
| Net Assets | | | | | | | | |
Total increase in net assets | | | 1,972,761 | | | | 3,679,429 | |
Beginning of period | | | 7,450,428 | | | | 3,770,999 | |
| | | | |
End of period | | $ | 9,423,189 | | | $ | 7,450,428 | |
| | | | |
Undistributed net investment income, end of period | | $ | 91,125 | | | $ | 790 | |
| | | | |
| | 1 | | Distributions for annual periods determined in accordance with federal income tax regulations. |
See Notes to Financial Statements.
| | | | | | |
| | | BLACKROCK VARIABLE SERIES FUNDS, INC. | | JUNE 30, 2016 | | 9 |
| | | | |
| Financial Highlights | | | BlackRock iShares® Equity Appreciation V.I. Fund | |
| | | | | | | | | | | | | | | | | | | | | | | | |
| | | Class I | | | Class III | |
| | | Six Months
Ended
June 30, 2016
(Unaudited) | | | Year Ended
December 31,
2015 | | | Period April 30,
20141 to December 31,
2014 | | | Six Months
Ended
June 30, 2016
(Unaudited) | | | Year Ended
December 31,
2015 | | | Period April 30,
20141 to December 31,
2014 | |
| | | | | | | | | | | | | | | | | | | | | | | | |
| Per Share Operating Performance | | | | | | | | | | | | | | | | | | | | | | | | |
Net asset value, beginning of period | | $ | 9.12 | | | $ | 9.93 | | | $ | 10.00 | | | $ | 9.10 | | | $ | 9.92 | | | $ | 10.00 | |
| | | | | | | | |
Net investment income2 | | | 0.10 | | | | 0.20 | | | | 0.21 | | | | 0.10 | | | | 0.25 | | | | 0.21 | |
Net realized and unrealized gain (loss) | | | 0.05 | | | | (0.84 | ) | | | (0.17 | ) | | | 0.04 | | | | (0.91 | ) | | | (0.19 | ) |
| | | | | | | | |
Net increase (decrease) from investment operations | | | 0.15 | | | | (0.64 | ) | | | 0.04 | | | | 0.14 | | | | (0.66 | ) | | | 0.02 | |
| | | | | | | | |
Distributions:3 | | | | | | | | | | | | | | | | | | | | | | | | |
From net investment income | | | — | | | | (0.16 | ) | | | (0.11 | ) | | | — | | | | (0.15 | ) | | | (0.10 | ) |
Return of capital | | | — | | | | (0.01 | ) | | | — | | | | — | | | | (0.01 | ) | | | — | |
| | | | | | | | |
Total distributions | | | — | | | | (0.17 | ) | | | (0.11 | ) | | | — | | | | (0.16 | ) | | | (0.10 | ) |
| | | | | | | | |
Net asset value, end of period | | $ | 9.27 | | | $ | 9.12 | | | $ | 9.93 | | | $ | 9.24 | | | $ | 9.10 | | | $ | 9.92 | |
| | | | | | | | |
| | | | | | | | | | | | | | | | | | | | | | | | |
| Total Return4 | | | | | | | | | | | | | | | | | | | | | | | | |
Based on net asset value | | | 1.65 | %5 | | | (6.50 | )% | | | 0.37 | %5 | | | 1.54 | %5 | | | (6.70 | )% | | | 0.16 | %5 |
| | | | | | | | |
| | | | | | | | | | | | | | | | | | | | | | | | |
| Ratios to Average Net Assets6 | | | | | | | | | | | | | | | | | | | | | | | | |
Total expenses | | | 1.38 | %7 | | | 2.08 | % | | | 7.84 | %7,8 | | | 1.50 | %7 | | | 2.18 | % | | | 10.67 | %7,8 |
| | | | | | | | |
Total expenses after fees waived and reimbursed | | | 0.45 | %7 | | | 0.62 | % | | | 0.75 | %7 | | | 0.70 | %7 | | | 0.81 | % | | | 1.00 | %7 |
| | | | | | | | |
Net investment income | | | 2.19 | %7 | | | 1.98 | % | | | 3.04 | %7 | | | 2.28 | %7 | | | 2.58 | % | | | 3.01 | %7 |
| | | | | | | | |
| | | | | | | | | | | | | | | | | | | | | | | | |
| Supplemental Data | | | | | | | | | | | | | | | | | | | | | | | | |
Net assets, end of period (000) | | $ | 8,476 | | | $ | 6,948 | | | $ | 3,749 | | | $ | 947 | | | $ | 502 | | | $ | 22 | |
| | | | | | | | |
Portfolio turnover rate | | | 30 | % | | | 76 | % | | | 16 | % | | | 30 | % | | | 76 | % | | | 16 | % |
| | | | | | | | |
| | 1 | | Commencement of operations. |
| | 2 | | Based on average shares outstanding. |
| | 3 | | Distributions for annual periods determined in accordance with federal income tax regulations. |
| | 4 | | Where applicable, excludes insurance-related fees and expenses and assumes the reinvestment of distributions. |
| | 5 | | Aggregate total return. |
| | 6 | | Excludes expenses incurred indirectly as a result of investments in underlying funds as follows: |
| | | | | | |
| | | Six Months
Ended
June 30, 2016
(Unaudited) | | Year Ended
December 31,
2015 | | Period
April 30, 20141 to
December 31,
2014 |
| Investments in underlying funds | | 0.22% | | 0.30% | | 0.27% |
| | 8 | | Organization and/or offering costs were not annualized in the calculation of the expense ratios. If these expenses were annualized, the total expenses for Class I and Class III would have been 8.47% and 11.83%, respectively. |
See Notes to Financial Statements.
| | | | | | |
| 10 | | BLACKROCK VARIABLE SERIES FUNDS, INC. | | JUNE 30, 2016 | | |
| | | | |
| Notes to Financial Statements (Unaudited) | | | BlackRock iShares® Equity Appreciation V.I. Fund | |
1. Organization:
BlackRock Variable Series Funds, Inc. (the “Company”) is registered under the Investment Company Act of 1940, as amended (the “1940 Act”), as an open-end management investment company. The Company is organized as a Maryland corporation that is comprised of 20 separate funds. The funds offer shares to insurance companies for their separate accounts to fund benefits under certain variable annuity and variable life insurance contracts. The financial statements presented are for BlackRock iShares® Equity Appreciation V.I. Fund (the “Fund”). The Fund is classified as diversified. Class I and Class III Shares have equal voting, dividend, liquidation and other rights, except that only shares of the respective classes are entitled to vote on matters concerning only that class. In addition, Class III Shares bear certain expenses related to the distribution of such shares.
The Fund, together with certain other registered investment companies advised by BlackRock Advisors, LLC (the “Manager”) or its affiliates, is included in a complex of open-end funds referred to as the Equity-Bond Complex.
2. Significant Accounting Policies:
The financial statements are prepared in conformity with accounting principles generally accepted in the United States of America (“U.S. GAAP”), which may require management to make estimates and assumptions that affect the reported amounts of assets and liabilities in the financial statements, disclosure of contingent assets and liabilities at the date of the financial statements and the reported amounts of increases and decreases in net assets from operations during the reporting period. Actual results could differ from those estimates. The Fund is considered an investment company under U.S. GAAP and follows the accounting and reporting guidance applicable to investment companies. Below is a summary of significant accounting policies:
Investment Transactions and Investment Income: For financial reporting purposes, investment transactions are recorded on the dates the transactions are entered into (the trade dates). Realized gains and losses on investment transactions are determined on the identified cost basis. Dividend income is recorded on the ex-dividend date. Income, expenses and realized and unrealized gains and losses are allocated daily to each class based on its relative net assets.
Distributions: Distributions paid by the Fund are recorded on the ex-dividend date. The portion of distributions, if any, that exceeds the Fund’s current and accumulated earnings and profits, as measured on a tax basis, constitute a non-taxable return of capital. The character and timing of distributions are determined in accordance with federal income tax regulations, which may differ from U.S. GAAP.
Indemnifications: In the normal course of business, the Fund enters into contracts that contain a variety of representations that provide general indemnification. The Fund’s maximum exposure under these arrangements is unknown because it involves future potential claims against the Fund, which cannot be predicted with any certainty.
Other: Expenses directly related to the Fund or its classes are charged to the Fund or the applicable class. Other operating expenses shared by several funds, including other funds managed by the Manager, are prorated among those funds on the basis of relative net assets or other appropriate methods. Expenses directly related to the Fund and other shared expenses prorated to the Fund are allocated daily to each class based on its relative net assets or other appropriate methods.
The Fund has an arrangement with its custodian whereby fees may be reduced by credits earned on uninvested cash balances, which, if applicable, are shown as fees paid indirectly in the Statement of Operations. The custodian imposes fees on overdrawn cash balances, which can be offset by accumulated credits earned or may result in additional custody charges.
3. Investment Valuation and Fair Value Measurements:
Investment Valuation Policies: The Fund’s investments are valued at fair value (also referred to as “market value” within the financial statements) as of the close of trading on the New York Stock Exchange (“NYSE”) (generally 4:00 p.m., Eastern time). U.S. GAAP defines fair value as the price the Fund would receive to sell an asset or pay to transfer a liability in an orderly transaction between market participants at the measurement date. The Fund determines the fair values of its financial instruments using various independent dealers or pricing services under policies approved by the Board of Directors of the Company (the “Board”). The BlackRock Global Valuation Methodologies Committee (the “Global Valuation Committee”) is the committee formed by management to develop global pricing policies and procedures and to oversee the pricing function for all financial instruments.
Fair Value Inputs and Methodologies: The following methods (or “techniques”) and inputs are used to establish the fair value of the Fund’s assets and liabilities:
| • | | Equity investments traded on a recognized securities exchange are valued at the official closing price each day, if available. For equity investments traded on more than one exchange, the official close price on the exchange where the stock is primarily traded is used. Equity investments traded on a recognized exchange for which there were no sales on that day may be valued at the last available bid (long positions) or ask (short positions) price. |
| | | | | | |
| | | BLACKROCK VARIABLE SERIES FUNDS, INC. | | JUNE 30, 2016 | | 11 |
| | | | |
| Notes to Financial Statements (continued) | | | BlackRock iShares® Equity Appreciation V.I. Fund | |
| • | | The market value of the Fund’s investments in the underlying funds is based on the published net asset value (“NAV”) of each underlying fund computed as of the close of regular trading on the NYSE on days when the NYSE is open. |
| • | | Investments in open-end U.S. mutual funds are valued at NAV each business day. |
| • | | The Fund values its investment in BlackRock Liquidity Series, LLC, Money Market Series (the “Money Market Series”) at fair value, which is ordinarily based upon its pro rata ownership in the underlying fund’s net assets. The Money Market Series seeks current income consistent with maintaining liquidity and preserving capital. Although the Money Market Series is not registered under the 1940 Act, its investments may follow the parameters of investments by a money market fund that is subject to Rule 2a-7 under the 1940 Act. The Fund may withdraw up to 25% of its investment daily, although the manager of the Money Market Series, in its sole discretion, may permit an investor to withdraw more than 25% on any one day. |
If events (e.g., a company announcement, market volatility or a natural disaster) occur that are expected to materially affect the value of such instruments, or in the event that the application of these methods of valuation results in a price for an investment that is deemed not to be representative of the market value of such investment, or if a price is not available, the investment will be valued by the Global Valuation Committee, or its delegate, in accordance with a policy approved by the Board as reflecting fair value (“Fair Valued Investments”). When determining the price for Fair Valued Investments, the Global Valuation Committee, or its delegate, seeks to determine the price that the Fund might reasonably expect to receive or pay from the current sale or purchase of that asset or liability in an arm’s-length transaction. Fair value determinations shall be based upon all available factors that the Global Valuation Committee, or its delegate, deems relevant consistent with the principles of fair value measurement. The pricing of all Fair Valued Investments is subsequently reported to the Board or a committee thereof on a quarterly basis.
Fair Value Hierarchy: Various inputs are used in determining the fair value of investments. These inputs to valuation techniques are categorized into a fair value hierarchy consisting of three broad levels for financial statement purposes as follows:
| • | | Level 1 — unadjusted price quotations in active markets/exchanges for identical assets or liabilities that the Fund has the ability to access |
| • | | Level 2 — other observable inputs (including, but not limited to, quoted prices for similar assets or liabilities in markets that are active, quoted prices for identical or similar assets or liabilities in markets that are not active, inputs other than quoted prices that are observable for the assets or liabilities (such as interest rates, yield curves, volatilities, prepayment speeds, loss severities, credit risks and default rates) or other market–corroborated inputs) |
| • | | Level 3 — unobservable inputs based on the best information available in the circumstances, to the extent observable inputs are not available (including the Fund’s own assumptions used in determining the fair value of investments and derivative financial instruments) |
The hierarchy gives the highest priority to unadjusted quoted prices in active markets for identical assets or liabilities (Level 1 measurements) and the lowest priority to unobservable inputs (Level 3 measurements). Accordingly, the degree of judgment exercised in determining fair value is greatest for instruments categorized in Level 3. The inputs used to measure fair value may fall into different levels of the fair value hierarchy. In such cases, for disclosure purposes, the fair value hierarchy classification is determined based on the lowest level input that is significant to the fair value measurement in its entirety. The significant unobservable inputs used by the Global Valuation Committee in determining the price for Fair Valued Investments are typically categorized as Level 3. The fair value hierarchy for the Fund’s investments has been included in the Schedules of Investments.
Changes in valuation techniques may result in transfers into or out of an assigned level within the hierarchy. In accordance with the Fund’s policy, transfers between different levels of the fair value hierarchy are deemed to have occurred as of the beginning of the reporting period. The categorization of a value determined for investments based on the pricing transparency of the investments and is not necessarily an indication of the risks associated with investing in those securities.
4. Securities and Other Investments:
Securities Lending: The Fund may lend its securities to approved borrowers, such as brokers, dealers and other financial institutions. The borrower pledges and maintains with the Fund collateral consisting of cash, an irrevocable letter of credit issued by a bank, or securities issued or guaranteed by the U.S. Government. The initial collateral received by the Fund is required to have a value of at least 102% of the current value of the loaned securities for securities traded on U.S. exchanges and a value of at least 105% for all other securities. The collateral is maintained thereafter, at a value equal to at least 100% of the current market value of the securities on loan. The market value of the loaned securities is determined at the close of each business day of the Fund and any additional required collateral is delivered to the Fund, or excess collateral returned by the Fund, on the next business day. During the term of the loan, the Fund is entitled to all distributions made on or in respect of the loaned securities. Loans of securities are terminable at any time and the borrower, after notice, is required to return borrowed securities within the standard time period for settlement of securities transactions.
The market value of any securities on loan, all of which were classified as affiliated investment companies in the Fund’s Schedule of Investments, and the value of any related collateral are shown separately in the Statement of Assets and Liabilities as a component of investments at value
| | | | | | |
| 12 | | BLACKROCK VARIABLE SERIES FUNDS, INC. | | JUNE 30, 2016 | | |
| | | | |
| Notes to Financial Statements (continued) | | | BlackRock iShares® Equity Appreciation V.I. Fund | |
– unaffiliated, and collateral on securities loaned at value, respectively. As of period end, any securities on loan were collateralized by cash. The cash collateral invested by the securities lending agent, BlackRock Investment Management, LLC (“BIM”), if any, is disclosed in the Schedule of Investments.
Securities lending transactions are entered into by the Fund under Master Securities Lending Agreements (each, an “MSLA”), which provide the right, in the event of default (including bankruptcy or insolvency), for the non-defaulting party to liquidate the collateral and calculate a net exposure to the defaulting party or request additional collateral. In the event that a borrower defaults, the Fund, as lender, would offset the market value of the collateral received against the market value of the securities loaned. When the value of the collateral is greater than that of the market value of the securities loaned, the lender is left with a net amount payable to the defaulting party. However, bankruptcy or insolvency laws of a particular jurisdiction may impose restrictions on or prohibitions against such a right of offset in the event of an MSLA counterparty’s bankruptcy or insolvency. Under the MSLA, absent an event of default the borrower can resell or re-pledge the loaned securities, and the Fund can reinvest cash collateral received in connection with loaned securities. Upon an event of default, the parties’ obligations to return the securities or collateral to the other party are extinguished, and the parties can resell or re-pledge the loaned securities or the collateral received in connection with the loaned securities in order to satisfy the defaulting party’s net payment obligation for all transactions under the MSLA. The defaulting party remains liable for any deficiency.
As of period end, the following table is a summary of the Fund’s securities lending agreements by counterparty which are subject to offset under an MSLA:
| | | | | | | | | | |
| Counterparty | | Securities
Loaned at Value | | | Cash
Collateral
Received1 | | | Net Amount |
Credit Suisse Securities (USA) LLC | | $ | 1,037,487 | | | $ | (1,037,487 | ) | | — |
JP Morgan Securities LLC | | | 3,207,081 | | | | (3,207,081 | ) | | — |
Total | | $ | 4,244,568 | | | $ | (4,244,568) | | | — |
| | 1 | | Collateral with a value of $4,267,259 has been received in connection with securities lending agreements. Collateral received in excess of the value of securities loaned from the individual counterparty is not shown for financial reporting purposes in the table above. |
The risks of securities lending include the risk that the borrower may not provide additional collateral when required or may not return the securities when due. To mitigate these risks, the Fund benefits from a borrower default indemnity provided by BIM. BIM’s indemnity allows for full replacement of the securities loaned if the collateral received does not cover the value on the securities loaned in the event of borrower default. The Fund could suffer a loss if the value of an investment purchased with cash collateral falls below the market value of loaned securities or if the value of an investment purchased with cash collateral falls below the value of the original cash collateral received.
5. Investment Advisory Agreement and Other Transactions with Affiliates:
The PNC Financial Services Group, Inc. is the largest stockholder and an affiliate of BlackRock, Inc. (“BlackRock”) for 1940 Act purposes.
Investment Advisory
The Company, on behalf of the Fund, entered into an Investment Advisory Agreement with the Manager, the Fund’s investment adviser, an indirect, wholly-owned subsidiary of BlackRock, to provide investment advisory and administration services. The Manager is responsible for the management of the Fund’s portfolio and provides the personnel, facilities, equipment and certain other services necessary to the operations of the Fund. For such services, the Fund pays the Manager a monthly fee, which is determined by calculating a percentage of the Fund’s average daily net assets, based on the following annual rates:
| | |
| Average Daily Net Assets | | Investment Advisory Fee |
First $1 Billion | | 0.150% |
$1 Billion - $3 Billion | | 0.140% |
$3 Billion - $5 Billion | | 0.135% |
Greater than $5 Billion | | 0.130% |
Distribution Fees
The Company, on behalf of the Fund, entered into a Distribution Agreement and a Distribution Plan with BlackRock Investments, LLC (“BRIL”), an affiliate of the Manager. Pursuant to the Distribution Plan and in accordance with Rule 12b-1 under the 1940 Act, the Fund pays BRIL ongoing distribution fees. The fees are accrued daily and paid monthly at an annual rate of 0.25% based upon the average daily net assets attributable to Class III.
For the six months ended June 30, 2016, the class specific distribution fees borne directly by Class III is $888.
| | | | |
| Notes to Financial Statements (continued) | | | BlackRock iShares® Equity Appreciation V.I. Fund | |
Transfer Agent
The Manager on behalf of the Fund, entered into agreements with insurance companies and other financial intermediaries (“Service Organizations”), some of which may be affiliates. Pursuant to these agreements, the Service Organizations provide the Fund with administrative, networking, recordkeeping, sub-transfer agency and shareholder services to sub-accounts they service. For these services, the Service Organizations receive an annual fee per shareholder account, which will vary depending on share class and/or net assets of Fund shareholders serviced by the Service Organizations, which is shown as transfer agent – class specific. For the six months ended June 30, 2016, the Fund did not pay any amounts to affiliates in return for these services.
In addition, the Fund pays the transfer agent, which is not an affiliate, a fee for issuance, transfer and redemption of shares and the opening and maintenance of shareholder accounts, which is included in transfer agent in the Statement of Operations.
For the six months ended June 30, 2016, the following table shows the class specific transfer agent fees borne directly by each class of the Fund:
| | | | | | | | | | | | | | | | |
| | | | | Class I | | | | | | Class III | | | | Total | | |
| | | | | $6,659 | | | | | | $199 | | | | $6,858 | | |
Expense Limitations, Waivers, Reimbursements and Recoupments
The Manager, with respect to the Fund, contractually agreed to waive and/or reimburse fees or expenses in order to limit expenses, excluding interest expense, dividend expense, tax expense, acquired fund fees and expenses, and certain other fund expenses, which constitute extraordinary expenses not incurred in the ordinary course of the Fund’s business. The expense limitations as a percentage of average daily net assets are as follows:
| | | | |
Class I | | | 0.45 | % |
Class III | | | 0.70 | % |
The Manager has agreed not to reduce or discontinue this contractual expense limitation prior to May 1, 2017, unless approved by the Board, including a majority of the Independent Directors who are not “interested persons” of the Fund, as defined in the 1940 Act (“Independent Directors”) or by a majority of the outstanding voting securities of the Fund.
For the six months ended June 30, 2016, the amount is shown as fees waived by the Manager on the Statement of Operations and the amount included in expenses reimbursed by the Manager was $24,798.
These amounts waived and/or reimbursed are included in fees waived by the Manager shown as transfer agent fees reimbursed – class specific in the Statement of Operations. Class specific expense waivers and/or reimbursements are as follows:
| | | | | | | | | | | | |
| | | Class I | | | Class III | | | Total | |
Transfer Agent Fees Reimbursed | | $ | 6,653 | | | $ | 198 | | | $ | 6,851 | |
The Manager, with respect to the Fund, voluntarily agreed to waive its investment advisory fees by the amount of investment advisory fees the Fund pays to the Manager indirectly through its investment in affiliated money market funds. In addition, the Manager has contractually agreed to waive the management fee on assets estimated to be attributable to the Fund’s investments in other equity and fixed-income mutual funds managed by BlackRock or its affiliates, if any. This amount is included in expenses reimbursed by the Manager in the Statement of Operations. For the six months ended June 30, 2016, the amount reimbursed was $16.
For the six months ended June 30, 2016, the Fund reimbursed the Manager $35 for certain accounting services, which is included in accounting services in the Statement of Operations.
If during the Fund’s fiscal year the operating expenses of a share class, that at any time during the prior two fiscal years received a waiver and/or reimbursement from the Manager, are less than the expense cap for that share class, the Manager is entitled to be reimbursed by such share class up to the lesser of the following expenses:
| | (a) | The amount of fees waived or expenses reimbursed during those prior two fiscal years under the agreement. |
| | | | | | |
| 14 | | BLACKROCK VARIABLE SERIES FUNDS, INC. | | JUNE 30, 2016 | | |
| | | | |
| Notes to Financial Statements (continued) | | | BlackRock iShares® Equity Appreciation V.I. Fund | |
| | (b) | The amount by which the expense cap for that share class exceeds the operating expenses of the share class for the current fiscal year, provided that: |
| | • | | The Fund, of which the share class is a part, has more than $50 million in assets for the fiscal year. |
| | • | | The Manager or an affiliate continues to serve as the Fund’s investment adviser or administrator. |
In the event the expense cap for a share class is changed subsequent to a fiscal year in which the Manager becomes entitled to reimbursement for fees waived and/or reimbursed, the amount available to reimburse the Manager shall be calculated by reference to the expense cap for that share class in effect at the time the Manager became entitled to receive such reimbursement, rather than the subsequently changed expense cap for that share class.
On June 30, 2016, the Fund level and class specific waivers and/or reimbursements subject to possible future recoupment under the expense limitation agreement are as follows:
| | | | | | | | | | | | |
| | Expires December 31, | |
| | | 2016 | | | 2017 | | | 2018 | |
Fund Level | | $ | 72,150 | | | $ | 79,049 | | | $ | 30,975 | |
Class I | | $ | 1,138 | | | $ | 12,427 | | | $ | 6,653 | |
Class III | | | — | | | $ | 168 | | | $ | 198 | |
Securities Lending
The U.S. Securities and Exchange Commission has issued an exemptive order which permits BIM, an affiliate of the Manager, to serve as securities lending agent for the Fund, subject to applicable conditions. As securities lending agent, BIM bears all operational costs directly related to securities lending. The Fund is responsible for expenses in connection with the investment of cash collateral received for securities on loan (the “collateral investment expenses”). The cash collateral is invested in a private investment company managed by the Manager or its affiliates. However, BIM has agreed to cap the collateral investment expenses of the private investment company to an annual rate of 0.04%. The investment adviser to the private investment company will not charge any advisory fees with respect to shares purchased by the Fund.
Securities lending income is equal to the total of income earned from the reinvestment of cash collateral, net of fees and other payments to and from borrowers of securities, and less the collateral investment expenses. The Fund retains a portion of securities lending income and remits a remaining portion to BIM as compensation for its services as securities lending agent.
Pursuant to a securities lending agreement, the Fund retains 80% of securities lending income, and this amount retained can never be less than 70% of the total of securities lending income plus the collateral investment expenses.
In addition, commencing the business day following the date that the aggregate securities lending income earned across the Equity-Bond Complex in a calendar year exceeds a specified threshold, the Fund, pursuant to the securities lending agreement, will retain for the remainder of that calendar year securities lending income as follows: 85% of securities lending income, and this amount retained can never be less than 70% of the total of securities lending income plus the collateral investment expenses.
The share of securities lending income earned by the Fund is shown as securities lending – affiliated – net in the Statement of Operations. For the six months ended June 30, 2016, the Fund paid BIM $945 for securities lending agent services.
Officers and Directors
Certain officers and/or directors of the Company are officers and/or directors of BlackRock or its affiliates. The Fund reimburses the Manager for a portion of the compensation paid to the Company’s Chief Compliance Officer, which is included in Officer and Directors in the Statement of Operations.
6. Purchases and Sales:
For the six months ended June 30, 2016, purchases and sales of investments, excluding short-term securities, were $4,383,900 and $2,529,145, respectively.
7. Income Tax Information:
It is the Fund’s policy to comply with the requirements of the Internal Revenue Code of 1986, as amended, applicable to regulated investment companies, and to distribute substantially all of its taxable income to its shareholders. Therefore, no federal income tax provision is required.
| | | | | | |
| | | BLACKROCK VARIABLE SERIES FUNDS, INC. | | JUNE 30, 2016 | | 15 |
| | | | |
| Notes to Financial Statements (continued) | | | BlackRock iShares® Equity Appreciation V.I. Fund | |
The Fund files U.S. federal and various state and local tax returns. No income tax returns are currently under examination. The statute of limitations on the Fund’s U.S. federal tax returns generally remains open for the period ended December 31, 2014 and the year ended December 31, 2015. The statutes of limitations on the Fund’s state and local tax returns may remain open for an additional year depending upon the jurisdiction.
Management has analyzed tax laws and regulations and their application to the Fund as of June 30, 2016, inclusive of the open tax return years and does not believe there are any uncertain tax positions that require recognition of a tax liability in the financial statements.
As of December 31, 2015, the Fund had a capital loss carryforward, with no expiration date, available to offset future realized capital gains of $98,349.
As of June 30, 2016, gross unrealized appreciation and depreciation based on cost for federal income tax purposes were as follows:
| | | | |
Tax cost | | $ | 14,012,679 | |
| | | | |
Gross unrealized appreciation | | $ | 13,288 | |
Gross unrealized depreciation | | | (156,319 | ) |
| | | | |
Net unrealized depreciation | | $ | (143,031 | ) |
| | | | |
| | | | | |
8. Bank Borrowings:
The Company, on behalf of the Fund, along with certain other funds managed by the Manager and its affiliates (“Participating Funds”), is a party to a 364-day, $2.1 billion credit agreement with a group of lenders. Under this agreement, the Fund may borrow to fund shareholder redemptions. Excluding commitments designated for certain individual funds, the Participating Funds, including the Fund, can borrow up to an aggregate commitment amount of $1.6 billion at any time outstanding, subject to asset coverage and other limitations as specified in the agreement. The credit agreement has the following terms: a fee of 0.12% per annum on unused commitment amounts and interest at a rate equal to the higher of (a) one-month LIBOR (but, in any event, not less than 0.00%) on the date the loan is made plus 0.80% per annum or (b) the Fed Funds rate (but, in any event, not less than 0.00%) in effect from time to time plus 0.80% per annum on amounts borrowed. The agreement expires in April 2017 unless extended or renewed. Prior to April 21, 2016, the credit agreement had a fee per annum of 0.06% on unused commitment amounts and interest at a rate equal to the higher of (a) one-month LIBOR (but, in any event, not less than 0.00%) on the date the loan is made plus 0.80% per annum or (b) the Fed Funds rate (but, in any event, not less than 0.00%) in effect from time to time plus 0.80% per annum on amounts borrowed. Participating Funds paid administration, legal and arrangement fees, which, if applicable, are included in miscellaneous expenses in the Statement of Operations. These fees were allocated among such funds based upon portions of the aggregate commitment available to them and relative net assets of Participating Funds. During the six months ended June 30, 2016, the Fund did not borrow under the credit agreement.
9. Principal Risks:
In the normal course of business, the Fund invests in securities and enters into transactions where risks exist due to fluctuations in the market (market risk) or failure of the issuer to meet all its obligations, including the ability to pay principal and interest when due (issuer credit risk). The value of securities held by the Fund may decline in response to certain events, including those directly involving the issuers of securities owned by the Fund. Changes arising from the general economy; the overall market and local, regional or global political and/or social instability, as well as currency, interest rate and price fluctuations, may also affect the securities’ value.
Counterparty Credit Risk: Similar to issuer credit risk, the Fund may be exposed to counterparty credit risk, or the risk that an entity may fail to or be unable to perform on its commitments related to unsettled or open transactions. The Fund manages counterparty credit risk by entering into transactions only with counterparties that the Manager believes have the financial resources to honor their obligations and by monitoring the financial stability of those counterparties. Financial assets, which potentially expose the Fund to market, issuer and counterparty credit risks, consist principally of financial instruments and receivables due from counterparties. The extent of the Fund’s exposure to market, issuer and counterparty credit risks with respect to these financial assets is approximately their value recorded in the Statement of Assets and Liabilities, less any collateral held by the Fund.
Concentration Risk: The Fund invests a significant portion of its assets in fixed-income securities and/or uses derivatives tied to the fixed-income markets. Changes in market interest rates or economic conditions may affect the value and/or liquidity of such investments. Interest rate risk is the risk that prices of bonds and other fixed-income securities will increase as interest rates fall and decrease as interest rates rise. The Fund may be subject to a greater risk of rising interest rates due to the current period of historically low rates.
| | | | | | |
| 16 | | BLACKROCK VARIABLE SERIES FUNDS, INC. | | JUNE 30, 2016 | | |
| | | | |
| Notes to Financial Statements (concluded) | | | BlackRock iShares® Equity Appreciation V.I. Fund | |
10. Capital Share Transactions:
Transactions in capital shares for each class were as follows:
| | | | | | | | | | | | | | | | | | | | |
| | | Six Months Ended
June 30, 2016 | | | | | | Year Ended
December 31, 2015 | |
| | | Shares | | | Amount | | | | | | Shares | | | Amount | |
Class I | | | | | | | | | | | | | | | | | | | | |
Shares sold | | | 175,474 | | | $ | 1,560,877 | | | | | | | | 627,937 | | | $ | 6,297,929 | |
Shares issued in reinvestment of distributions | | | — | | | | — | | | | | | | | 13,498 | | | | 125,292 | |
Shares redeemed | | | (22,952 | ) | | | (206,827 | ) | | | | | | | (257,060 | ) | | | (2,467,085 | ) |
| | | | | | | | | | | | |
Net increase | | | 152,522 | | | $ | 1,354,050 | | | | | | | | 384,375 | | | $ | 3,956,136 | |
| | | | | | | | | | | | |
| | | | | | | | | | | | | | | | | | | | |
Class III | | | | | | | | | | | | | | | | | | | | |
Shares sold | | | 49,881 | | | $ | 438,831 | | | | | | | | 54,945 | | | $ | 537,987 | |
Shares issued in reinvestment of distributions | | | — | | | | — | | | | | | | | 917 | | | | 8,499 | |
Shares redeemed | | | (2,566 | ) | | | (23,386 | ) | | | | | | | (2,921 | ) | | | (28,451 | ) |
| | | | | | | | | | | | |
Net increase | | | 47,315 | | | $ | 415,445 | | | | | | | | 52,941 | | | $ | 518,035 | |
| | | | | | | | | | | | |
Total Net Increase | | | 199,837 | | | $ | 1,769,495 | | | | | | | | 437,316 | | | $ | 4,474,171 | |
| | | | | | | | | | | | |
11. Subsequent Events:
Management has evaluated the impact of all subsequent events on the Funds through the date the financial statements were issued and has determined that there were no subsequent events requiring adjustment or additional disclosure in the financial statements.
| | | | | | |
| | | BLACKROCK VARIABLE SERIES FUNDS, INC. | | JUNE 30, 2016 | | 17 |
JUNE 30, 2016
| | | | |
SEMI-ANNUAL REPORT (UNAUDITED) | | | | BLACKROCK® |
BlackRock Variable Series Funds, Inc.
▶ BlackRock Large Cap Core V.I. Fund
| | |
| Not FDIC Insured ¡ May Lose Value ¡ No Bank Guarantee | | |
| | |
| Fund Summary as of June 30, 2016 | | BlackRock Large Cap Core V.I. Fund |
BlackRock Large Cap Core V.I. Fund’s (the “Fund”) investment objective is to seek long-term capital growth.
|
| Portfolio Management Commentary |
How did the Fund perform?
| • | | For the six-month period ended June 30, 2016, the Fund underperformed its benchmark, the Russell 1000® Index. |
What factors influenced performance?
| • | | Financials was the prime detractor from relative performance. Bank holdings, including Bank of America Corp. and Citigroup Inc., underperformed early in 2016 on speculation that low commodity prices would weigh further on inflation expectations and credit markets. At the same time, market volatility and uncertainty led to a sharp slowdown in mergers & acquisitions, equity & debt underwriting and trading activity, which resulted in negatively revised expectations for bank earnings reports. More recently, the group experienced weakness as the Brexit result exacerbated the concern around lower long-term rates and the perpetual Federal Reserve waiting game. Elsewhere in the sector, insurance was a drag, as was an underweight to real estate investment trusts (“REITs”). |
| • | | Consumer discretionary and health care were additional sources of weakness. Cruise operator Carnival Corp. and auto components holding Lear Corp. were the top detractors in consumer discretionary. Carnival underperformed as rising oil prices are expected to modestly pressure the company’s near-term earnings. At the same time, recent terrorist incidents have continued to weigh on US-sourced demand for European cruises. Lear underperformed on concerns around peaking domestic auto sales. Within health care, the position in Teva Pharmaceutical Industries Limited weighed. The broader generics space has been under extreme pressure, with rival companies seeing high rates of deflation in their businesses, which has caused contagion to Teva. Concerns that the acquisition of Allergan, Plc’s generics unit will be delayed also dampened sentiment for the shares, though the timing has little fundamental impact as long as the deal closes. |
| • | | Finally, the Fund’s long-standing underweight to stability/bond proxies, especially telecommunication services and utilities, proved disadvantageous in the six months. The sectors significantly outperformed amid the broad flight to safety in the period, with investors’ search for yield in the lower for longer interest rate environment lending additional support. |
| • | | On the positive side, select holdings within the consumer sectors added value. Media name Comcast Corp. outperformed on better than expected |
| | | earnings results. The company delivered the best subscriber growth numbers (in both video and high speed data) in over eight years, confirming it is gaining share despite fears that competition from over-the-top (internet-based distribution) is driving accelerated “cord cutting”. In addition, Comcast’s operations, profits and free cash flow generation were increasingly attractive to investors seeking stability and total yield. Tobacco holding Altria Group Inc. gained as the company delivered solid earnings upside and maintained 2016 earnings growth guidance of 7% – 9%. The stock was also a beneficiary of the broader flight to high-yielding dividend growers in the period. |
| • | | Additional contributions came from managed-care holdings UnitedHealth Group Inc. and Aetna Inc. Managed-care stocks broadly performed well on continued strong fundamentals. The companies appear to be managing cost trends well, and pricing remains solid in the majority of businesses. Though the healthcare exchanges continue to struggle, UnitedHealth has almost entirely withdrawn from these markets and Aetna has made a number of changes, including significantly raising prices, which should stabilize the business and remove this headwind. Positive developments in its services arm, Optum, further supported UnitedHealth shares as the unit won several high-profile contracts from CVS Health, aided by its new partnership with Walgreens Boots Alliance. Meanwhile, anticipation around the closing of its proposed merger with Humana further supported Aetna shares in the period (albeit sentiment reversed in July amid renewed uncertainty of the acquisition receiving regulatory approval). |
Describe recent portfolio activity.
| • | | Due to a combination of portfolio trading activity and market movement during the six-month period, the Fund’s exposure to the industrials sector increased, particularly within aerospace & defense, construction & engineering and airlines. Exposure to consumer staples and materials also increased. The largest reduction was in financials, largely with respect to banks and insurance. Consumer discretionary and health care exposure also declined. |
Describe portfolio positioning at period end.
| • | | Relative to the Russell 1000® Index, the Fund ended the period with its largest sector overweights in information technology, consumer discretionary and health care. Utilities, telecommunication services and industrials were the most significant underweights. |
The views expressed reflect the opinions of BlackRock as of the date of this report and are subject to change based on changes in market, economic or other conditions. These views are not intended to be a forecast of future events and are no guarantee of future results.
| | | | | | |
| 2 | | BLACKROCK VARIABLE SERIES FUNDS, INC. | | JUNE 30, 2016 | | |
| | | | |
| | | | BlackRock Large Cap Core V.I. Fund | |
|
| Total Return Based on a $10,000 Investment |
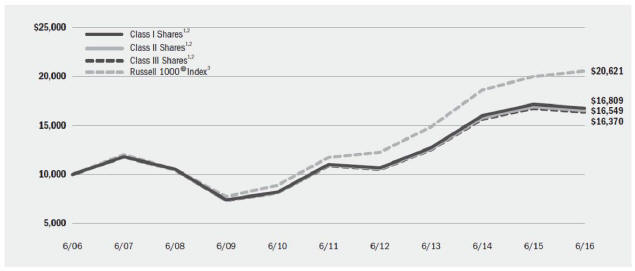
| | 1 | Assuming transaction costs, if any, and other operating expenses, including investment advisory fees. Does not include insurance related fees and expenses. For a portion of the period, returns do not show the effects of distribution fees (12b-1 fees) applicable to Class II Shares. If such fees were included, returns shown would have been lower. The returns for Class III Shares prior to January 27, 2009, the recommencement of operations of Class III Shares, are based upon the performance of the Fund’s Class I Shares. The returns for Class III Shares, however, are adjusted to reflect the distribution (12b-1) fees applicable to Class III Shares. |
| | 2 | Under normal circumstances, the Fund invests at least 80% of its assets in a diversified portfolio of equity securities, primarily common stock, of large cap companies located in the United States included at the time of purchase in the Russell 1000® Index. |
| | 3 | An index that measures the performance of the large cap segment of the U.S. equity universe. It is a subset of the Russell 3000® Index and includes approximately 1,000 of the largest securities based on a combination of their market capitalization and current index membership. The index represents approximately 92% of the total market capitalization of the Russell 3000® Index. |
| | | | | | | | | | |
| Performance Summary for the Period Ended June 30, 2016 |
| | | | | | | Average Annual Total Returns |
| | | | | 6-Month
Total Returns5 | | 1 Year5 | | 5 Years5 | | 10 Years5 |
Class I4 | | | | (1.98)% | | (2.18)% | | 8.78% | | 5.33% |
Class II4 | | | | (2.04) | | (2.32) | | 8.61 | | 5.17 |
Class III4 | | | | (2.11) | | (2.44) | | 8.49 | | 5.056 |
Russell 1000® Index | | | | 3.74 | | 2.93 | | 11.88 | | 7.51 |
| | 4 | | Average annual and cumulative total returns are based on changes in net asset value for the periods shown, and assume reinvestment of all distributions at net asset value on the ex-dividend date. Insurance-related fees and expenses are not reflected in these returns. For a portion of the period, returns do not show the effects of distribution fees (12b-1 fees) applicable to Class II Shares. If such fees were included, returns shown would have been lower. |
| | 5 | | For a portion of the period, the Fund’s investment adviser waived a portion of its fee. Without such waiver, the Fund’s performance would have been lower. |
| | 6 | | The returns for Class III Shares prior to January 27, 2009, the recommencement of operations of Class III Shares, are based upon the performance of the Fund’s Class I Shares. The returns for Class III Shares, however, are adjusted to reflect the distribution (12b-1) fees applicable to Class III Shares. |
| | | | Past performance is not indicative of future results. Performance results do not reflect the deduction of taxes that a shareholder would pay on Fund distributions or the redemption of Fund shares. |
| | | | | | | | | | | | | | |
| Expense Example |
| | | Actual | | Hypothetical8 | | |
| | | Beginning
Account Value
January 1, 2016 | | Ending
Account Value
June 30, 2016 | | Expenses Paid
During the Period7 | | Beginning
Account Value
January 1, 2016 | | Ending
Account Value
June 30, 2016 | | Expenses Paid
During the Period7 | | Annualized
Expense
Ratio |
Class I | | $1,000.00 | | $980.20 | | $2.86 | | $1,000.00 | | $1,021.98 | | $2.92 | | 0.58% |
Class II | | $1,000.00 | | $979.60 | | $3.69 | | $1,000.00 | | $1,021.13 | | $3.77 | | 0.75% |
Class III | | $1,000.00 | | $978.90 | | $4.23 | | $1,000.00 | | $1,020.59 | | $4.32 | | 0.86% |
| | 7 | | For each class of the Fund, expenses are equal to the annualized expense ratio for the class, multiplied by the average account value over the period, multiplied by 182/366 (to reflect the one-half year period shown). |
| | 8 | | Hypothetical 5% annual return before expenses is calculated by prorating the number of days in the most recent fiscal half year divided by 366. |
| | | | See “Disclosure of Expenses” on the following page for further information on how expenses were calculated. |
| | | | | | |
| | | BLACKROCK VARIABLE SERIES FUNDS, INC. | | JUNE 30, 2016 | | 3 |
| | | | |
| | | | BlackRock Large Cap Core V.I. Fund | |
|
| Portfolio Information as of June 30, 2016 |
| | | | |
| Sector Allocation | | Percent of
Net Assets | |
Information Technology | | | 24 | % |
Health Care | | | 17 | |
Consumer Discretionary | | | 16 | |
Financials | | | 15 | |
Consumer Staples | | | 9 | |
Industrials | | | 7 | |
Energy | | | 6 | |
Materials | | | 3 | |
Utilities | | | 1 | |
Short-Term Securities | | | 8 | |
Liabilities in Excess of Other Assets | | | (6 | ) |
For Fund compliance purposes, the Fund’s sector classifications refer to one or more of the sector sub-classifications used by one or more widely recognized market indexes or ratings group indexes, and/or as defined by the investment adviser. These definitions may not apply for purposes of this report, which may combine sector sub-classifications for reporting ease.
Shareholders of the Fund may incur the following charges: (a) transactional expenses, such as sales charges; and (b) operating expenses, including investment advisory fees, service and distribution fees, including 12b-1 fees, acquired fund fees and expenses, and other fund expenses. The expense example on the previous page (which is based on a hypothetical investment of $1,000 invested on January 1, 2016 and held through June 30, 2016) is intended to assist shareholders both in calculating expenses based on an investment in the Fund and in comparing these expenses with similar costs of investing in other mutual funds.
The expense example provides information about actual account values and actual expenses. In order to estimate the expenses a shareholder paid during the period covered by this report, shareholders can divide their account value by $1,000 and then multiply the result by the number corresponding to their share class under the heading entitled “Expenses Paid During the Period.”
The expense example also provides information about hypothetical account values and hypothetical expenses based on the Fund’s actual expense ratio and an assumed rate of return of 5% per year before expenses. In order to assist shareholders in comparing the ongoing expenses of investing in the Fund and other funds, compare the 5% hypothetical example with the 5% hypothetical examples that appear in shareholder reports of other funds.
The expenses shown in the expense example are intended to highlight shareholders’ ongoing costs only and do not reflect any transactional expenses, such as sales charges, if any. Therefore, the hypothetical example is useful in comparing ongoing expenses only, and will not help shareholders determine the relative total expenses of owning different funds. If these transactional expenses were included, shareholder expenses would have been higher.
|
| Derivative Financial Instruments |
The Fund may invest in various derivative financial instruments. These instruments are used to obtain exposure to a security, commodity, index, market and/or other asset without owning or taking physical custody of securities, commodities and/or other referenced assets or to manage market, equity, credit, interest rate, foreign currency exchange rate, commodity and/or other risks. Derivative financial instruments may give rise to a form of economic leverage and involve risks, including the imperfect correlation between the value of a derivative financial instrument and the underlying asset, possible default of the counterparty to the
transaction or illiquidity of the instrument. The Fund’s successful use of a derivative financial instrument depends on the investment adviser’s ability to predict pertinent market movements accurately, which cannot be assured. The use of these instruments may result in losses greater than if they had not been used, may limit the amount of appreciation the Fund can realize on an investment and/or may result in lower distributions paid to shareholders. The Fund’s investments in these instruments, if any, are discussed in detail in the Notes to Financial Statements.
| | | | | | |
| 4 | | BLACKROCK VARIABLE SERIES FUNDS, INC. | | JUNE 30, 2016 | | |
| | | | |
| Schedule of Investments June 30, 2016 (Unaudited) | | | BlackRock Large Cap Core V.I. Fund | |
| | | (Percentages shown are based on Net Assets) | |
| | | | | | | | |
| Common Stocks | | Shares | | | Value | |
Aerospace & Defense — 2.5% | | | | | | | | |
L-3 Communications Holdings, Inc. | | | 26,104 | | | $ | 3,829,196 | |
Raytheon Co. | | | 58,100 | | | | 7,898,695 | |
| | | | | | | | |
| | | | | | | | 11,727,891 | |
Airlines — 2.8% | | | | | | | | |
Delta Air Lines, Inc. | | | 125,900 | | | | 4,586,537 | |
Southwest Airlines Co. | �� | | 186,800 | | | | 7,324,428 | |
United Continental Holdings, Inc. (a) | | | 30,290 | | | | 1,243,102 | |
| | | | | | | | |
| | | | | | | | 13,154,067 | |
Auto Components — 2.3% | | | | | | | | |
Goodyear Tire & Rubber Co. | | | 126,500 | | | | 3,245,990 | |
Lear Corp. | | | 74,129 | | | | 7,543,367 | |
| | | | | | | | |
| | | | | | | | 10,789,357 | |
Banks — 10.5% | | | | | | | | |
Bank of America Corp. | | | 935,603 | | | | 12,415,452 | |
Citigroup, Inc. | | | 123,367 | | | | 5,229,527 | |
JPMorgan Chase & Co. | | | 256,983 | | | | 15,968,924 | |
SunTrust Banks, Inc. | | | 137,026 | | | | 5,629,028 | |
U.S. Bancorp | | | 266,535 | | | | 10,749,356 | |
| | | | | | | | |
| | | | | | | | 49,992,287 | |
Beverages — 1.8% | | | | | | | | |
Dr Pepper Snapple Group, Inc. | | | 73,000 | | | | 7,053,990 | |
Molson Coors Brewing Co., Class B | | | 15,408 | | | | 1,558,211 | |
| | | | | | | | |
| | | | | | | | 8,612,201 | |
Biotechnology — 4.0% | | | | | | | | |
Amgen, Inc. | | | 62,720 | | | | 9,542,848 | |
Gilead Sciences, Inc. | | | 111,690 | | | | 9,317,180 | |
| | | | | | | | |
| | | | | | | | 18,860,028 | |
Building Products — 0.7% | | | | | | | | |
Owens Corning | | | 62,700 | | | | 3,230,304 | |
Capital Markets — 1.6% | | | | | | | | |
Goldman Sachs Group, Inc. | | | 51,020 | | | | 7,580,552 | |
Chemicals — 1.0% | | | | | | | | |
Dow Chemical Co. | | | 34,732 | | | | 1,726,528 | |
Eastman Chemical Co. | | | 41,180 | | | | 2,796,122 | |
| | | | | | | | |
| | | | | | | | 4,522,650 | |
Communications Equipment — 2.5% | | | | | | | | |
Cisco Systems, Inc. | | | 416,630 | | | | 11,953,115 | |
Construction & Engineering — 0.7% | | | | | | | | |
AECOM (a)(b) | | | 69,382 | | | | 2,204,266 | |
EMCOR Group, Inc. | | | 20,200 | | | | 995,052 | |
| | | | | | | | |
| | | | | | | | 3,199,318 | |
Consumer Finance — 0.8% | | | | | | | | |
SLM Corp. (a) | | | 638,680 | | | | 3,947,042 | |
| | | | | | | | |
| Common Stocks | | Shares | | | Value | |
Containers & Packaging — 1.5% | | | | | | | | |
Avery Dennison Corp. | | | 33,400 | | | $ | 2,496,650 | |
Packaging Corp. of America | | | 69,577 | | | | 4,656,788 | |
| | | | | | | | |
| | | | | | | | 7,153,438 | |
Electronic Equipment, Instruments & Components — 1.1% | |
CDW Corp. | | | 73,150 | | | | 2,931,852 | |
Flextronics International Ltd. (a) | | | 183,600 | | | | 2,166,480 | |
| | | | | | | | |
| | | | | | | | 5,098,332 | |
Energy Equipment & Services — 0.3% | | | | | | | | |
Schlumberger Ltd. | | | 19,040 | | | | 1,505,683 | |
Food & Staples Retailing — 3.9% | | | | | | | | |
CVS Health Corp. | | | 128,350 | | | | 12,288,229 | |
Walgreens Boots Alliance, Inc. | | | 76,700 | | | | 6,386,809 | |
| | | | | | | | |
| | | | | | | | 18,675,038 | |
Food Products — 0.9% | | | | | | | | |
Tyson Foods, Inc., Class A (b) | | | 64,930 | | | | 4,336,675 | |
Health Care Providers & Services — 8.8% | | | | | | | | |
Aetna, Inc. | | | 100,700 | | | | 12,298,491 | |
Centene Corp. (a)(b) | | | 95,500 | | | | 6,815,835 | |
Cigna Corp. | | | 48,938 | | | | 6,263,575 | |
Humana, Inc. (b) | | | 16,600 | | | | 2,986,008 | |
Laboratory Corp. of America Holdings (a) | | | 38,050 | | | | 4,956,773 | |
UnitedHealth Group, Inc. | | | 58,700 | | | | 8,288,440 | |
| | | | | | | | |
| | | | | | | | 41,609,122 | |
Hotels, Restaurants & Leisure — 1.9% | | | | | | | | |
Carnival Corp. (b) | | | 204,717 | | | | 9,048,491 | |
Household Durables — 1.6% | | | | | | | | |
D.R. Horton, Inc. | | | 131,039 | | | | 4,125,108 | |
Lennar Corp., Class A | | | 45,077 | | | | 2,078,050 | |
NVR, Inc. (a) | | | 909 | | | | 1,618,329 | |
| | | | | | | | |
| | | | | | | | 7,821,487 | |
Insurance — 2.1% | | | | | | | | |
American International Group, Inc. | | | 85,711 | | | | 4,533,255 | |
Travelers Cos., Inc. | | | 44,895 | | | | 5,344,301 | |
| | | | | | | | |
| | | | | | | | 9,877,556 | |
Internet Software & Services — 4.6% | | | | | | | | |
Alphabet, Inc., Class A (a) | | | 12,923 | | | | 9,091,718 | |
Alphabet, Inc., Class C (a) | | | 14,234 | | | | 9,851,351 | |
Facebook, Inc., Class A (a) | | | 25,627 | | | | 2,928,653 | |
| | | | | | | | |
| | | | | | | | 21,871,722 | |
IT Services — 2.0% | | | | | | | | |
Amdocs Ltd. | | | 67,924 | | | | 3,920,573 | |
| | |
| Portfolio Abbreviations |
| ADR | | American Depositary Receipts |
| S&P | | Standard & Poor’s |
See Notes to Financial Statements.
| | | | | | |
| | | BLACKROCK VARIABLE SERIES FUNDS, INC. | | JUNE 30, 2016 | | 5 |
| | | | |
| Schedule of Investments (continued) | | | BlackRock Large Cap Core V.I. Fund | |
| | | | |
| | | | | | | | |
| Common Stocks | | Shares | | | Value | |
IT Services (continued) | | | | | | | | |
Cognizant Technology Solutions Corp., Class A (a) | | | 93,300 | | | $ | 5,340,492 | |
| | | | | | | | |
| | | | | | | | 9,261,065 | |
Machinery — 0.4% | | | | | | | | |
WABCO Holdings, Inc. (a) | | | 21,700 | | | | 1,987,069 | |
Media — 4.3% | | | | | | | | |
Comcast Corp., Class A | | | 237,500 | | | | 15,482,625 | |
Omnicom Group, Inc. (b) | | | 59,490 | | | | 4,847,840 | |
| | | | | | | | |
| | | | | | | | 20,330,465 | |
Metals & Mining — 0.7% | | | | | | | | |
Rio Tinto PLC — ADR (b) | | | 108,682 | | | | 3,401,746 | |
Multi-Utilities — 0.8% | | | | | | | | |
Public Service Enterprise Group, Inc. | | | 82,700 | | | | 3,854,647 | |
Oil, Gas & Consumable Fuels — 5.5% | | | | | | | | |
Anadarko Petroleum Corp. | | | 28,340 | | | | 1,509,105 | |
BP PLC — ADR (b) | | | 215,950 | | | | 7,668,385 | |
Chevron Corp. | | | 53,100 | | | | 5,566,473 | |
Hess Corp. | | | 41,205 | | | | 2,476,421 | |
Marathon Oil Corp. | | | 79,010 | | | | 1,185,940 | |
Statoil ASA — ADR | | | 92,520 | | | | 1,601,521 | |
Suncor Energy, Inc. (b) | | | 176,310 | | | | 4,889,076 | |
Valero Energy Corp. (b) | | | 26,300 | | | | 1,341,300 | |
| | | | | | | | |
| | | | | | | | 26,238,221 | |
Pharmaceuticals — 4.3% | | | | | | | | |
Johnson & Johnson | | | 17,985 | | | | 2,181,581 | |
Pfizer, Inc. | | | 341,910 | | | | 12,038,651 | |
Teva Pharmaceutical Industries Ltd. — ADR | | | 126,144 | | | | 6,336,213 | |
| | | | | | | | |
| | | | | | | | 20,556,445 | |
Road & Rail — 0.6% | | | | | | | | |
Norfolk Southern Corp. | | | 30,919 | | | | 2,632,134 | |
Semiconductors & Semiconductor Equipment — 2.5% | | | | | | | | |
Intel Corp. | | | 69,430 | | | | 2,277,304 | |
Lam Research Corp. (b) | | | 97,212 | | | | 8,171,641 | |
NVIDIA Corp. (b) | | | 33,580 | | | | 1,578,596 | |
| | | | | | | | |
| | | | | | | | 12,027,541 | |
| | | | | | | | |
| Common Stocks | | Shares | | | Value | |
Software — 5.1% | | | | | | | | |
Activision Blizzard, Inc. | | | 251,540 | | | $ | 9,968,530 | |
Microsoft Corp. | | | 281,410 | | | | 14,399,750 | |
| | | | | | | | |
| | | | | | | | 24,368,280 | |
Specialty Retail — 5.5% | | | | | | | | |
GNC Holdings, Inc., Class A | | | 74,200 | | | | 1,802,318 | |
Home Depot, Inc. | | | 85,400 | | | | 10,904,726 | |
Lowe’s Cos., Inc. | | | 117,900 | | | | 9,334,143 | |
Ross Stores, Inc. | | | 69,650 | | | | 3,948,459 | |
| | | | | | | | |
| | | | | | | | 25,989,646 | |
Technology Hardware, Storage & Peripherals — 5.8% | | | | | |
Apple Inc. | | | 215,260 | | | | 20,578,856 | |
EMC Corp. | | | 219,000 | | | | 5,950,230 | |
Western Digital Corp. | | | 25,560 | | | | 1,207,966 | |
| | | | | | | | |
| | | | | | | | 27,737,052 | |
Tobacco — 2.6% | | | | | | | | |
Altria Group, Inc. | | | 176,445 | | | | 12,167,647 | |
Total Long-Term Investments (Cost — $391,908,957) — 98.0% | | | | | | | 465,118,314 | |
| | | | | | | | |
| Short-Term Securities | | | | | | |
BlackRock Liquidity Funds, TempFund, Institutional Class, 0.40% (c)(d) | | | 2,772,232 | | | | 2,772,232 | |
| | | Beneficial
Interest
(000) | | | | |
BlackRock Liquidity Series, LLC, Money Market
Series, 0.59% (c)(d)(e) | | $ | 36,399 | | | | 36,398,892 | |
Total Short-Term Securities (Cost — $39,171,124) — 8.3% | | | | | | | 39,171,124 | |
Total Investments (Cost — $431,080,081) — 106.3% | | | | 504,289,438 | |
Liabilities in Excess of Other Assets — (6.3)% | | | | | | | (29,803,074 | ) |
| | | | | | | | |
Net Assets — 100.0% | | | | | | $ | 474,486,364 | |
| | | | | | | | |
|
| Notes to Schedule of Investments |
| (a) | Non-income producing security. |
| (b) | Security, or a portion of security, is on loan. |
| (c) | During the six months ended June 30, 2016, investments in issuers considered to be affiliates of the Fund for purposes of Section 2(a)(3) of the Investment Company Act of 1940, as amended, were as follows: |
| | | | | | | | | | | | | | | | | | | | | | |
| Affiliate | | Shares/Beneficial
Interest Held at
December 31, 2015 | | | Net Activity | | | Shares/Beneficial
Interest Held at
June 30, 2016 | | | | | Value at
June 30, 2016 | | | Income | |
BlackRock Liquidity Funds, TempFund, Institutional Class | | | 1,724,257 | | | | 1,047,975 | | | | 2,772,232 | | | | | | $ 2,772,232 | | | | $20,004 | |
BlackRock Liquidity Series, LLC, Money Market Series | | | $19,784,132 | | | | $16,614,760 | | | | $36,398,892 | | | | | | 36,398,892 | | | | 31,318 | 1 |
Total | | | | | | | | | | | | | | | | | $39,171,124 | | | | $51,322 | |
| | | | | | | | | | | | | | | |
| 1 | Represents securities lending income earned from the reinvestment of cash collateral from loaned securities, net of fees and collateral investment expenses, and other payments to and from borrowers of securities. |
| (d) | Current yield as of period end. |
| (e) | Security was purchased with the cash collateral from loaned securities. The Fund may withdraw up to 25% of its investment daily, although the manager of the BlackRock Liquidity Series, LLC, Money Market Series, in its sole discretion, may permit an investor to withdraw more than 25% on any one day. |
| • | | For Fund compliance purposes, the Fund’s industry classifications refer to one or more of the industry sub-classifications used by one or more widely recognized market indexes or ratings group indexes, and/or as defined by the investment adviser. These definitions may not apply for purposes of this report, which may combine such industry sub-classifications for reporting ease. |
See Notes to Financial Statements.
| | | | | | |
| 6 | | BLACKROCK VARIABLE SERIES FUNDS, INC. | | JUNE 30, 2016 | | |
| | | | |
| Schedule of Investments (continued) | | | BlackRock Large Cap Core V.I. Fund | |
|
| Derivative Financial Instruments Outstanding as of Period End |
Futures Contracts
| | | | | | | | | | |
Contracts Long | | Issue | | Expiration | | Notional
Value | | Unrealized
Appreciation | |
| 14 | | S&P 500 E-Mini Index | | September 2016 | | $1,463,140 | | | $14,278 | |
|
| Derivative Financial Instruments Categorized by Risk Exposure |
As of period end, the fair values of derivative financial instruments located in the Statement of Assets and Liabilities were as follows:
| | | | | | | | | | | | | | | | | | | | | | | | | | | | |
| | | Statements of Assets and
Liabilities Location | | | Credit
Contracts | | | Commodity
Contracts | | | Equity
Contracts | | | Foreign Currency
Exchange Contracts | | | Interest Rate
Contracts | | | Total | |
Assets - Derivative Financial Instruments | | | | | | | | | | | | | | | | | | | | | | | | | | | | |
Futures contracts | | | Net unrealized appreciation | 1 | | | — | | | | — | | | | $14,278 | | | | — | | | | — | | | | $14,278 | |
| | 1 | | Includes cumulative appreciation (depreciation) on futures contracts, if any, as reported in the Schedule of Investments. Only current day’s variation margin is reported within the Statement of Assets and Liabilities. |
For the six months ended June 30, 2016, the effect of derivative financial instruments in the Statement of Operations was as follows:
| | | | | | | | | | | | | | | | | | | | | | | | |
| | | Credit
Contracts | | | Commodity
Contracts | | | Equity
Contracts | | | Foreign Currency
Exchange Contracts | | | Interest Rate
Contracts | | | Total | |
Net Realized Gain from: | | | | | | | | | | | | | | | | | | | | | | | | |
Futures contracts | | | — | | | | — | | | | $655,203 | | | | — | | | | — | | | | $655,203 | |
| | | | | | | | | | | | | | | | | | | | | | | | |
Net Change in Unrealized Appreciation (Depreciation) on: | | | | | | | | | | | | | | | | | | | | | | | | |
Futures contracts | | | — | | | | — | | | | $ 14,278 | | | | — | | | | — | | | | $ 14,278 | |
|
| Average Quarterly Balances of Outstanding Derivative Financial Instruments |
| | | | |
Futures contracts: | | | | |
Average notional value of contract — long | | $ | 2,731,783 | |
For more information about the Fund’s investment risks regarding derivative financial instruments, refer to the Notes to Financial Statements.
|
| Derivative Financial Instruments — Offsetting as of Period End |
The Fund’s derivative assets and liabilities (by type) were as follows:
| | | | | | | | |
| | | Assets | | | Liabilities | |
Derivative Financial Instruments: | | | | | | | | |
Futures contracts | | $ | 16,383 | | | | — | |
Derivatives not subject to a Master Netting Agreement or similar agreement (“MNA”) | | | (16,383 | ) | | | — | |
Total derivative assets and liabilities subject to an MNA | | | — | | | | — | |
|
| Fair Value Hierarchy as of Period End |
Various inputs are used in determining the fair value of investments and derivative financial instruments. For information about the Fund’s policy regarding valuation of investments and derivative financial instruments, refer to the Notes to Financial Statements.
The following tables summarize the Fund’s investments and derivative financial instruments categorized in the disclosure hierarchy:
| | | | | | | | | | | | | | | | | | | | |
| | | Level 1 | | Level 2 | | Level 3 | | Total |
Assets: | | | | | | | | | | | | | | | | | | | | |
Investments: | | | | | | | | | | | | | | | | | | | | |
Long-Term Investments: | | | | | | | | | | | | | | | | | | | | |
Common Stocks1 | | | $ | 465,118,314 | | | | | — | | | | | — | | | | $ | 465,118,314 | |
Short-Term Securities | | | | 2,772,232 | | | | $ | 36,398,892 | | | | | — | | | | | 39,171,124 | |
| | | | | |
Total | | | $ | 467,890,546 | | | | $ | 36,398,892 | | | | | — | | | | $ | 504,289,438 | |
| | | | | |
| | 1 | | See above Schedule of Investments for values in each industry |
See Notes to Financial Statements.
| | | | | | |
| | | BLACKROCK VARIABLE SERIES FUNDS, INC. | | JUNE 30, 2016 | | 7 |
| | | | |
| Schedule of Investments (concluded) | | | BlackRock Large Cap Core V.I. Fund | |
| | | | | | | | | | | | | | | | | | | | |
| | | Level 1 | | Level 2 | | Level 3 | | Total |
Derivative Financial Instruments2 | | | | | | | | | | | | | | | | | | | | |
Assets: | | | | | | | | | | | | | | | | | | | | |
Equity contracts | | | $ | 14,278 | | | | | — | | | | | — | | | | $ | 14,278 | |
| |
2 Derivative financial instruments are futures contracts which are valued at the unrealized appreciation (depreciation) on the instrument. | | | | | | |
|
| The Fund may hold assets and/or liabilities in which the fair value approximates the carrying amount for financial statement purposes. As of period end, such assets and/or liabilities are categorized within the disclosure hierarchy as follows: | |
| | | | | | | | | | | | | | | | | | | | |
| | | Level 1 | | Level 2 | | Level 3 | | Total |
Assets: | | | | | | | | | | | | | | | | | | | | |
Cash pledged for futures contracts | | | $ | 59,000 | | | | | — | | | | | — | | | | $ | 59,000 | |
Liabilities: | | | | | | | | | | | | | | | | | | | | |
Collateral on securities loaned at value | | | | — | | | | $ | (36,398,892 | ) | | | | — | | | | | (36,398,892 | ) |
Total | | | $ | 59,000 | | | | $ | (36,398,892 | ) | | | | — | | | | $ | (36,339,892 | ) |
| | | | | |
| |
| During the six months ended June 30, 2016, there were no transfers between levels. | | | | | | |
See Notes to Financial Statements.
| | | | | | |
| 8 | | BLACKROCK VARIABLE SERIES FUNDS, INC. | | JUNE 30, 2016 | | |
| | | | |
| Statement of Assets and Liabilities | | | | |
| | | | |
| June 30, 2016 (unaudited) | | BlackRock Large Cap Core V.I. Fund | |
| | | | |
| Assets | | | | |
Investments at value — unaffiliated (including securities loaned at value of $36,238,993) (cost — $391,908,957) | | $ | 465,118,314 | |
Investments at value — affiliated (cost — $39,171,124) | | | 39,171,124 | |
Cash pledged for futures contracts | | | 59,000 | |
Receivables: | | | | |
Investments sold | | | 9,678,265 | |
Securities lending income — affiliated | | | 8,141 | |
Capital shares sold | | | 4,154 | |
Dividends — affiliated | | | 2,818 | �� |
Dividends — unaffiliated | | | 384,673 | |
From the Manager | | | 111,174 | |
Variation margin on futures contracts | | | 16,383 | |
Prepaid expenses | | | 1,112 | |
| | | | |
Total assets | | | 514,555,158 | |
| | | | |
| | | | |
| Liabilities | | | | |
Collateral on securities loaned at value | | | 36,398,892 | |
Payables: | | | | |
Investments purchased | | | 2,952,702 | |
Capital shares redeemed | | | 91,353 | |
Distribution fees | | | 62,612 | |
Investment advisory fees | | | 180,568 | |
Officer’s and Directors’ fees | | | 3,863 | |
Other accrued expenses | | | 61,197 | |
Other affiliates | | | 2,642 | |
Professional fees | | | 31,373 | |
Transfer agent fees | | | 283,592 | |
| | | | |
Total liabilities | | | 40,068,794 | |
| | | | |
Net Assets | | $ | 474,486,364 | |
| | | | |
| | | | |
| Net Assets Consist of | | | | |
Paid-in capital | | $ | 385,629,667 | |
Undistributed net investment income | | | 2,491,031 | |
Undistributed net realized gain | | | 13,142,031 | |
Net unrealized appreciation (depreciation) | | | 73,223,635 | |
| | | | |
Net Assets | | $ | 474,486,364 | |
| | | | |
| | | | |
| Net Asset Value | | | | |
Class I — Based on net assets of $168,488,508 and 5,474,041 shares outstanding, 200 million shares authorized, $0.10 par value | | $ | 30.78 | |
| | | | |
Class II — Based on net assets of $4,617,779 and 150,038 shares outstanding, 100 million shares authorized, $0.10 par value | | $ | 30.78 | |
| | | | |
Class III — Based on net assets of $301,380,077 and 9,852,742 shares outstanding, 100 million shares authorized, $0.10 par value | | $ | 30.59 | |
| | | | |
See Notes to Financial Statements.
| | | | | | |
| | | BLACKROCK VARIABLE SERIES FUNDS, INC. | | JUNE 30, 2016 | | 9 |
| | | | |
| Six Months Ended June 30, 2016 (unaudited) | | BlackRock
Large Cap
Core V.I. Fund | |
| | | | |
| Investment Income | | | | |
Dividends — unaffiliated | | $ | 4,249,359 | |
Securities lending — affiliated — net | | | 31,318 | |
Dividends — affiliated | | | 20,004 | |
Foreign taxes withheld | | | (35,092 | ) |
| | | | |
Total income | | | 4,265,589 | |
| | | | |
| | | | |
| Expenses | | | | |
Investment advisory | | | 1,093,628 | |
Transfer agent | | | 2,346 | |
Transfer agent — class specific | | | 495,241 | |
Distribution — class specific | | | 374,975 | |
Accounting services | | | 54,263 | |
Printing | | | 26,711 | |
Professional | | | 34,170 | |
Officer and Directors | | | 12,764 | |
Custodian | | | 14,842 | |
Registration | | | 13 | |
Miscellaneous | | | 7,858 | |
| | | | |
Total expenses | | | 2,116,811 | |
Less: | | | | |
Fees waived by the Manager | | | (3,567 | ) |
Transfer agent fees reimbursed — class specific | | | (331,691 | ) |
| | | | |
Total expenses after fees waived and/or reimbursed | | | 1,781,553 | |
| | | | |
Net investment income | | | 2,484,036 | |
| | | | |
| | | | |
| Realized and Unrealized Gain (Loss) from: | | | | |
Net realized gain from: | | | | |
Investments | | | 8,975,358 | |
Futures contracts | | | 655,203 | |
| | | | |
| | | 9,630,561 | |
| | | | |
Net change in unrealized appreciation (depreciation) on: | | | | |
Investments | | | (21,688,389 | ) |
Futures contracts | | | 14,278 | |
| | | | |
| | | (21,674,111 | ) |
| | | | |
Total realized and unrealized loss | | | (12,043,550 | ) |
| | | | |
Net Decrease in Net Assets Resulting from Operations | | $ | (9,559,514 | ) |
| | | | |
See Notes to Financial Statements.
| | | | | | |
| 10 | | BLACKROCK VARIABLE SERIES FUNDS, INC. | | JUNE 30, 2016 | | |
| | | | |
| Statements of Changes in Net Assets | | | BlackRock Large Cap Core V.I. Fund | |
| | | | | | | | |
| Increase (Decrease) in Net Assets: | | Six Months Ended June 30, 2016 (Unaudited) | | | Year Ended December 31, 2015 | |
| | | | | | | | |
| Operations | | | | | | | | |
Net investment income | | $ | 2,484,036 | | | $ | 4,768,437 | |
Net realized gain | | | 9,630,561 | | | | 24,180,947 | |
Net change in unrealized appreciation (depreciation) | | | (21,674,111 | ) | | | (26,765,746 | ) |
| | | | |
Net increase (decrease) in net assets resulting from operations | | | (9,559,514 | ) | | | 2,183,638 | |
| | | | |
| | | | | | | | |
| Distributions to Shareholders1 | | | | | | | | |
From net investment income: | | | | | | | | |
Class I | | | — | | | | (2,154,309 | ) |
Class II | | | — | | | | (49,177 | ) |
Class III | | | — | | | | (2,726,763 | ) |
From net realized gain: | | | | | | | | |
Class I | | | — | | | | (9,419,280 | ) |
Class II | | | — | | | | (272,636 | ) |
Class III | | | — | | | | (15,768,565 | ) |
| | | | |
Decrease in net assets resulting from distributions to shareholders | | | — | | | | (30,390,730 | ) |
| | | | |
| | | | | | | | |
| Capital Share Transactions | | | | | | | | |
Net decrease in net assets derived from capital share transactions | | | (12,005,027 | ) | | | (16,430,161 | ) |
| | | | |
| | | | | | | | |
| Net Assets | | | | | | | | |
Total decrease in net assets | | | (21,564,541 | ) | | | (44,637,253 | ) |
Beginning of period | | | 496,050,905 | | | | 540,688,158 | |
| | | | |
End of period | | $ | 474,486,364 | | | $ | 496,050,905 | |
| | | | |
Undistributed net investment income, end of period | | $ | 2,491,031 | | | $ | 6,995 | |
| | | | |
| 1 | Distributions for annual periods determined in accordance with federal income tax regulations. |
See Notes to Financial Statements.
| | | | | | |
| | | BLACKROCK VARIABLE SERIES FUNDS, INC. | | JUNE 30, 2016 | | 11 |
| | |
| Financial Highlights | | BlackRock Large Cap Core V.I. Fund |
| | | | | | | | | | | | | | | | | | | | | | | | |
| | | Class I | |
| | | Six Months
Ended
June 30, 2016 (Unaudited) | | | Year Ended December 31, | |
| | | | 2015 | | | 2014 | | | 2013 | | | 2012 | | | 2011 | |
| Per Share Operating Performance | | | | | | | | | | | | | | | | | | | | | | | | |
Net asset value, beginning of period | | $ | 31.40 | | | $ | 33.26 | | | $ | 33.80 | | | $ | 25.55 | | | $ | 23.00 | | | $ | 22.73 | |
| | | | |
Net investment income1 | | | 0.18 | | | | 0.36 | | | | 0.34 | | | | 0.30 | | | | 0.39 | | | | 0.29 | |
Net realized and unrealized gain (loss) | | | (0.80 | ) | | | (0.16 | ) | | | 3.86 | | | | 8.27 | | | | 2.54 | | | | 0.26 | |
| | | | |
Net increase (decrease) from investment operations | | | (0.62 | ) | | | 0.20 | | | | 4.20 | | | | 8.57 | | | | 2.93 | | | | 0.55 | |
| | | | |
Distributions:2 | | | | | | | | | | | | | | | | | | | | | | | | |
From net investment income | | | — | | | | (0.39 | ) | | | (0.36 | ) | | | (0.32 | ) | | | (0.38 | ) | | | (0.28 | ) |
From net realized gain | | | — | | | | (1.67 | ) | | | (4.38 | ) | | | — | | | | — | | | | — | |
| | | | |
Total distributions | | | — | | | | (2.06 | ) | | | (4.74 | ) | | | (0.32 | ) | | | (0.38 | ) | | | (0.28 | ) |
| | | | |
Net asset value, end of period | | $ | 30.78 | | | $ | 31.40 | | | $ | 33.26 | | | $ | 33.80 | | | $ | 25.55 | | | $ | 23.00 | |
| | | | |
| | | | | | | | | | | | | | | | | | | | | | | | |
| Total Return3 | | | | | | | | | | | | | | | | | | | | | | | | |
Based on net asset value | | | (1.98 | )%4 | | | 0.52 | % | | | 12.36 | % | | | 33.56 | % | | | 12.75 | % | | | 2.40 | % |
| | | | |
| | | | | | | | | | | | | | | | | | | | | | | | |
| Ratios to Average Net Assets | | | | | | | | | | | | | | | | | | | | | | | | |
Total expenses | | | 0.74 | %5 | | | 0.71 | % | | | 0.73 | % | | | 0.73 | % | | | 0.69 | % | | | 0.56 | % |
| | | | |
Total expenses after fees waived and/or reimbursed | | | 0.58 | %5 | | | 0.56 | % | | | 0.57 | % | | | 0.58 | % | | | 0.59 | % | | | 0.56 | % |
| | | | |
Net investment income | | | 1.23 | %5 | | | 1.08 | % | | | 0.97 | % | | | 1.03 | % | | | 1.56 | % | | | 1.21 | % |
| | | | |
| | | | | | | | | | | | | | | | | | | | | | | | |
| Supplemental Data | | | | | | | | | | | | | | | | | | | | | | | | |
Net assets, end of period (000) | | $ | 168,489 | | | $ | 184,151 | | | $ | 212,067 | | | $ | 219,418 | | | $ | 191,227 | | | $ | 193,953 | |
| | | | |
Portfolio turnover rate | | | 28 | % | | | 31 | % | | | 48 | % | | | 42 | % | | | 110 | % | | | 101 | % |
| | | | |
| | 1 | | Based on average shares outstanding. |
| | 2 | | Distributions for annual periods determined in accordance with federal income tax regulations. |
| | 3 | | Where applicable, excludes insurance-related fees and expenses and assumes the reinvestment of distributions. |
| | 4 | | Aggregate total return. |
See Notes to Financial Statements.
| | | | | | |
| 12 | | BLACKROCK VARIABLE SERIES FUNDS, INC. | | JUNE 30, 2016 | | |
| | | | |
| Financial Highlights (continued) | | | BlackRock Large Cap Core V.I. Fund | |
| | | | | | | | | | | | | | | | | | | | | | | | |
| | | Class II | |
| | | Six Months
Ended
June 30, 2016 (Unaudited) | | | Year Ended December 31, | |
| | | | 2015 | | | 2014 | | | 2013 | | | 2012 | | | 2011 | |
| Per Share Operating Performance | | | | | | | | | | | | | | | | | | | | | | | | |
Net asset value, beginning of period | | $ | 31.42 | | | $ | 33.27 | | | $ | 33.79 | | | $ | 25.56 | | | $ | 23.01 | | | $ | 22.74 | |
| | | | |
Net investment income1 | | | 0.16 | | | | 0.30 | | | | 0.28 | | | | 0.25 | | | | 0.35 | | | | 0.23 | |
Net realized and unrealized gain (loss) | | | (0.80 | ) | | | (0.16 | ) | | | 3.87 | | | | 8.25 | | | | 2.54 | | | | 0.27 | |
| | | | |
Net increase (decrease) from investment operations | | | (0.64 | ) | | | 0.14 | | | | 4.15 | | | | 8.50 | | | | 2.89 | | | | 0.50 | |
| | | | |
Distributions:2 | | | | | | | | | | | | | | | | | | | | | | | | |
From net investment income | | | — | | | | (0.32 | ) | | | (0.29 | ) | | | (0.27 | ) | | | (0.34 | ) | | | (0.23 | ) |
From net realized gain | | | — | | | | (1.67 | ) | | | (4.38 | ) | | | — | | | | — | | | | — | |
| | | | |
Total distributions | | | — | | | | (1.99 | ) | | | (4.67 | ) | | | (0.27 | ) | | | (0.34 | ) | | | (0.23 | ) |
| | | | |
Net asset value, end of period | | $ | 30.78 | | | $ | 31.42 | | | $ | 33.27 | | | $ | 33.79 | | | $ | 25.56 | | | $ | 23.01 | |
| | | | |
| | | | | | | | | | | | | | | | | | | | | | | | |
| Total Return3 | | | | | | | | | | | | | | | | | | | | | | | | |
Based on net asset value | | | (2.04 | )%4 | | | 0.34 | % | | | 12.23 | % | | | 33.28 | % | | | 12.59 | % | | | 2.20 | % |
| | | | |
| | | | | | | | | | | | | | | | | | | | | | | | |
| Ratios to Average Net Assets | | | | | | | | | | | | | | | | | | | | | | | | |
Total expenses | | | 0.92 | %5 | | | 0.85 | % | | | 0.89 | % | | | 0.86 | % | | | 0.85 | % | | | 0.71 | % |
| | | | |
Total expenses after fees waived and/or reimbursed | | | 0.75 | %5 | | | 0.73 | % | | | 0.74 | % | | | 0.75 | % | | | 0.74 | % | | | 0.71 | % |
| | | | |
Net investment income | | | 1.05 | %5 | | | 0.91 | % | | | 0.81 | % | | | 0.86 | % | | | 1.42 | % | | | 1.00 | % |
| | | | |
| | | | | | | | | | | | | | | | | | | | | | | | |
| Supplemental Data | | | | | | | | | | | | | | | | | | | | | | | | |
Net assets, end of period (000) | | $ | 4,618 | | | $ | 5,333 | | | $ | 6,203 | | | $ | 6,080 | | | $ | 4,603 | | | $ | 4,239 | |
| | | | |
Portfolio turnover rate | | | 28 | % | | | 31 | % | | | 48 | % | | | 42 | % | | | 110 | % | | | 101 | % |
| | | | |
| | 1 | | Based on average shares outstanding. |
| | 2 | | Distributions for annual periods determined in accordance with federal income tax regulations. |
| | 3 | | Where applicable, excludes insurance-related fees and expenses and assumes the reinvestment of distributions. |
| | 4 | | Aggregate total return. |
See Notes to Financial Statements.
| | | | | | |
| | | BLACKROCK VARIABLE SERIES FUNDS, INC. | | JUNE 30, 2016 | | 13 |
| | | | |
| Financial Highlights (concluded) | | | BlackRock Large Cap Core V.I. Fund | |
| | | | | | | | | | | | | | | | | | | | | | | | |
| | | Class III | |
| | | Six Months
Ended
June 30, 2016 (Unaudited) | | | Year Ended December 31, | |
| | | | 2015 | | | 2014 | | | 2013 | | | 2012 | | | 2011 | |
| Per Share Operating Performance | | | | | | | | | | | | | | | | | | | | | | | | |
Net asset value, beginning of period | | $ | 31.25 | | | $ | 33.11 | | | $ | 33.66 | | | $ | 25.46 | | | $ | 22.92 | | | $ | 22.67 | |
| | | | |
Net investment income1 | | | 0.14 | | | | 0.27 | | | | 0.24 | | | | 0.22 | | | | 0.32 | | | | 0.25 | |
Net realized and unrealized gain (loss) | | | (0.80 | ) | | | (0.17 | ) | | | 3.84 | | | | 8.22 | | | | 2.54 | | | | 0.23 | |
| | | | |
Net increase (decrease) from investment operations | | | (0.66 | ) | | | 0.10 | | | | 4.08 | | | | 8.44 | | | | 2.86 | | | | 0.48 | |
| | | | |
Distributions:2 | | | | | | | | | | | | | | | | | | | | | | | | |
From net investment income | | | — | | | | (0.29 | ) | | | (0.25 | ) | | | (0.24 | ) | | | (0.32 | ) | | | (0.23 | ) |
From net realized gain | | | — | | | | (1.67 | ) | | | (4.38 | ) | | | — | | | | — | | | | — | |
| | | | |
Total distributions | | | — | | | | (1.96 | ) | | | (4.63 | ) | | | (0.24 | ) | | | (0.32 | ) | | | (0.23 | ) |
| | | | |
Net asset value, end of period | | $ | 30.59 | | | $ | 31.25 | | | $ | 33.11 | | | $ | 33.66 | | | $ | 25.46 | | | $ | 22.92 | |
| | | | |
| | | | | | | | | | | | | | | | | | | | | | | | |
| Total Return3 | | | | | | | | | | | | | | | | | | | | | | | | |
Based on net asset value | | | (2.11 | )%4 | | | 0.23 | % | | | 12.07 | % | | | 33.16 | % | | | 12.49 | % | | | 2.11 | % |
| | | | |
| | | | | | | | | | | | | | | | | | | | | | | | |
| Ratios to Average Net Assets | | | | | | | | | | | | | | | | | | | | | | | | |
Total expenses | | | 0.99 | %5 | | | 0.96 | % | | | 0.98 | % | | | 0.99 | % | | | 0.94 | % | | | 0.81 | % |
| | | | |
Total expenses after fees waived and/or reimbursed | | | 0.86 | %5 | | | 0.84 | % | | | 0.85 | % | | | 0.86 | % | | | 0.87 | % | | | 0.81 | % |
| | | | |
Net investment income | | | 0.95 | %5 | | | 0.80 | % | | | 0.69 | % | | | 0.75 | % | | | 1.30 | % | | | 1.05 | % |
| | | | |
| | | | | | | | | | | | | | | | | | | | | | | | |
| Supplemental Data | | | | | | | | | | | | | | | | | | | | | | | | |
Net assets, end of period (000) | | $ | 301,380 | | | $ | 306,567 | | | $ | 322,418 | | | $ | 300,005 | | | $ | 232,024 | | | $ | 145,432 | |
| | | | |
Portfolio turnover rate | | | 28 | % | | | 31 | % | | | 48 | % | | | 42 | % | | | 110 | % | | | 101 | % |
| | | | |
| | 1 | | Based on average shares outstanding. |
| | 2 | | Distributions for annual periods determined in accordance with federal income tax regulations. |
| | 3 | | Where applicable, excludes insurance-related fees and expenses and assumes the reinvestment of distributions. |
| | 4 | | Aggregate total return. |
See Notes to Financial Statements.
| | | | | | |
| 14 | | BLACKROCK VARIABLE SERIES FUNDS, INC. | | JUNE 30, 2016 | | |
| | | | |
| Notes to Financial Statements (Unaudited) | | | BlackRock Large Cap Core V.I. Fund | |
1. Organization:
BlackRock Variable Series Funds, Inc. (the “Company”) is registered under the Investment Company Act of 1940, as amended (the “1940 Act”), as an open-end management investment company. The Company is organized as a Maryland corporation that is comprised of 20 separate funds. The Funds offer shares to insurance companies for their separate accounts to fund benefits under certain variable annuity and variable life insurance contracts. The financial statements presented are for BlackRock Large Cap Core V.I. Fund (the “Fund”). The Fund is classified as diversified. Class I, Class II and Class III Shares have equal voting, dividend, liquidation and other rights, except that only shares of the respective classes are entitled to vote on matters concerning only that class. In addition, Class II and Class III Shares bear certain expenses related to the distribution of such shares.
The Fund, together with certain other registered investment companies advised by BlackRock Advisors, LLC (the “Manager”) or its affiliates, is included in a complex of open-end funds referred to as the Equity-Bond Complex.
2. Significant Accounting Policies:
The financial statements are prepared in conformity with accounting principles generally accepted in the United States of America (“U.S. GAAP”), which may require management to make estimates and assumptions that affect the reported amounts of assets and liabilities in the financial statements, disclosure of contingent assets and liabilities at the date of the financial statements and the reported amounts of increases and decreases in net assets from operations during the reporting period. Actual results could differ from those estimates. The Fund is considered an investment company under U.S. GAAP and follows the accounting and reporting guidance applicable to investment companies. Below is a summary of significant accounting policies:
Segregation and Collateralization: In cases where the Fund enters into certain investments (e.g., futures contracts) that would be treated as “senior securities” for 1940 Act purposes, the Fund may segregate or designate on its books and records cash or liquid assets having a market value at least equal to the amount of the Fund’s future obligations under such investments. Doing so allows the investment to be excluded from treatment as a “senior security.” Furthermore, if required by an exchange or counterparty agreement, the Fund may be required to deliver/deposit cash and/or securities to/with an exchange, or broker-dealer or custodian as collateral for certain investments or obligations.
Investment Transactions and Investment Income: For financial reporting purposes, investment transactions are recorded on the dates the transactions are entered into (the trade dates). Realized gains and losses on investment transactions are determined on the identified cost basis. Dividend income is recorded on the ex-dividend date. Dividends from foreign securities where the ex-dividend date may have passed are subsequently recorded when the Fund is informed of the ex-dividend date. Under the applicable foreign tax laws, a withholding tax at various rates may be imposed on capital gains, dividends and interest. Income, expenses and realized and unrealized gains and losses are allocated daily to each class based on its relative net assets.
Distributions: Distributions paid by the Fund are recorded on the ex-dividend date. The character and timing of distributions are determined in accordance with federal income tax regulations, which may differ from U.S. GAAP.
Indemnifications: In the normal course of business, the Fund enters into contracts that contain a variety of representations that provide general indemnification. The Fund’s maximum exposure under these arrangements is unknown because it involves future potential claims against the Fund, which cannot be predicted with any certainty.
Other: Expenses directly related to the Fund or its classes are charged to the Fund or the applicable class. Other operating expenses shared by several funds, including other funds managed by the Manager, are prorated among those funds on the basis of relative net assets or other appropriate methods. Expenses directly related to the Fund and other shared expenses prorated to the Fund are allocated daily to each class based on its relative net assets or other appropriate methods.
The Fund has an arrangement with its custodian whereby fees may be reduced by credits earned on uninvested cash balances, which, if applicable, are shown as fees paid indirectly in the Statement of Operations. The custodian imposes fees on overdrawn cash balances, which can be offset by accumulated credits earned or may result in additional custody charges.
3. Investment Valuation and Fair Value Measurements:
Investment Valuation Policies: The Fund’s investments are valued at fair value (also referred to as “market value” within the financial statements) as of the close of trading on the New York Stock Exchange (“NYSE”) (generally 4:00 p.m., Eastern time). U.S. GAAP defines fair value as the price the Fund would receive to sell an asset or pay to transfer a liability in an orderly transaction between market participants at the measurement date. The Fund determines the fair values of its financial instruments using various independent dealers or pricing services under policies approved by the Board of Directors of the Company (the “Board”). The BlackRock Global Valuation Methodologies Committee (the “Global Valuation Committee”) is the committee formed by management to develop global pricing policies and procedures and to oversee the pricing function for all financial instruments.
| | | | | | |
| | | BLACKROCK VARIABLE SERIES FUNDS, INC. | | JUNE 30, 2016 | | 15 |
| | | | |
| Notes to Financial Statements (continued) | | | BlackRock Large Cap Core V.I. Fund | |
Fair Value Inputs and Methodologies: The following methods (or “techniques”) and inputs are used to establish the fair value of the Fund’s assets and liabilities:
| • | | Equity investments traded on a recognized securities exchange are valued at the official closing price each day, if available. For equity investments traded on more than one exchange, the official close price on the exchange where the stock is primarily traded is used. Equity investments traded on a recognized exchange for which there were no sales on that day may be valued at the last available bid (long positions) or ask (short positions) price. |
| • | | Investments in open-end U.S. mutual funds are valued at net asset value each business day. |
| • | | The Fund values its investment in BlackRock Liquidity Series, LLC, Money Market Series (the “Money Market Series”) at fair value, which is ordinarily based upon its pro rata ownership in the underlying fund’s net assets. The Money Market Series seeks current income consistent with maintaining liquidity and preserving capital. Although the Money Market Series is not registered under the 1940 Act, its investments may follow the parameters of investments by a money market fund that is subject to Rule 2a-7 under the 1940 Act. The Fund may withdraw up to 25% of its investment daily, although the manager of the Money Market Series, in its sole discretion, may permit an investor to withdraw more than 25% on any one day. |
| • | | Futures contracts traded on exchanges are valued at their last sale price. |
If events (e.g., a company announcement, market volatility or a natural disaster) occur that are expected to materially affect the value of such instruments, or in the event that the application of these methods of valuation results in a price for an investment that is deemed not to be representative of the market value of such investment, or if a price is not available, the investment will be valued by the Global Valuation Committee, or its delegate, in accordance with a policy approved by the Board as reflecting fair value (“Fair Valued Investments”). When determining the price for Fair Valued Investments, the Global Valuation Committee, or its delegate, seeks to determine the price that the Fund might reasonably expect to receive or pay from the current sale or purchase of that asset or liability in an arm’s-length transaction. Fair value determinations shall be based upon all available factors that the Global Valuation Committee, or its delegate, deems relevant consistent with the principles of fair value measurement. The pricing of all Fair Valued Investments is subsequently reported to the Board or a committee thereof on a quarterly basis.
Fair Value Hierarchy: Various inputs are used in determining the fair value of investments and derivative financial instruments. These inputs to valuation techniques are categorized into a fair value hierarchy consisting of three broad levels for financial statement purposes as follows:
| • | | Level 1 — unadjusted price quotations in active markets/exchanges for identical assets or liabilities that the Fund has the ability to access |
| • | | Level 2 — other observable inputs (including, but not limited to, quoted prices for similar assets or liabilities in markets that are active, quoted prices for identical or similar assets or liabilities in markets that are not active, inputs other than quoted prices that are observable for the assets or liabilities (such as interest rates, yield curves, volatilities, prepayment speeds, loss severities, credit risks and default rates) or other market–corroborated inputs) |
| • | | Level 3 — unobservable inputs based on the best information available in the circumstances, to the extent observable inputs are not available (including the Fund’s own assumptions used in determining the fair value of investments and derivative financial instruments) |
The hierarchy gives the highest priority to unadjusted quoted prices in active markets for identical assets or liabilities (Level 1 measurements) and the lowest priority to unobservable inputs (Level 3 measurements). Accordingly, the degree of judgment exercised in determining fair value is greatest for instruments categorized in Level 3. The inputs used to measure fair value may fall into different levels of the fair value hierarchy. In such cases, for disclosure purposes, the fair value hierarchy classification is determined based on the lowest level input that is significant to the fair value measurement in its entirety. The significant unobservable inputs used by the Global Valuation Committee in determining the price for Fair Valued Investments and derivative financial instruments are typically categorized as Level 3. The fair value hierarchy for the Fund’s investments and derivative financial instruments has been included in the Schedule of Investments.
Changes in valuation techniques may result in transfers into or out of an assigned level within the hierarchy. In accordance with the Fund’s policy, transfers between different levels of the fair value hierarchy are deemed to have occurred as of the beginning of the reporting period. The categorization of a value determined for investments and derivative financial instruments is based on the pricing transparency of the investments and derivative financial instruments and is not necessarily an indication of the risks associated with investing in those securities.
4. Securities and Other Investments:
Securities Lending: The Fund may lend its securities to approved borrowers, such as brokers, dealers and other financial institutions. The borrower pledges and maintains with the Fund collateral consisting of cash, an irrevocable letter of credit issued by a bank, or securities issued or guaranteed by the U.S. Government. The initial collateral received by the Fund is required to have a value of at least 102% of the current value of the loaned securities for securities traded on U.S. exchanges and a value of at least 105% for all other securities. The collateral is maintained thereafter at a value equal
| | | | | | |
| 16 | | BLACKROCK VARIABLE SERIES FUNDS, INC. | | JUNE 30, 2016 | | |
| | | | |
| Notes to Financial Statements (continued) | | | BlackRock Large Cap Core V.I. Fund | |
to at least 100% of the current market value of the securities on loan. The market value of the loaned securities is determined at the close of each business day of the Fund and any additional required collateral is delivered to the Fund, or excess collateral returned by the Fund, on the next business day. During the term of the loan, the Fund is entitled to all distributions made on or in respect of the loaned securities. Loans of securities are terminable at any time and the borrower, after notice, is required to return borrowed securities within the standard time period for settlement of securities transactions.
The market value of any securities on loan, all of which were classified as common stocks in the Fund’s Schedule of Investments, and the value of any related collateral are shown separately in the Statement of Assets and Liabilities as a component of investments at value - unaffiliated, and collateral on securities loaned at value, respectively. As of period end, any securities on loan were collateralized by cash. The cash collateral invested by the securities lending agent, BlackRock Investment Management, LLC (“BIM”), if any, is disclosed in the Schedule of Investments.
Securities lending transactions are entered into by the Fund under Master Securities Lending Agreements (each, an “MSLA”), which provide the right, in the event of default (including bankruptcy or insolvency), for the non-defaulting party to liquidate the collateral and calculate a net exposure to the defaulting party or request additional collateral. In the event that a borrower defaults, the Fund, as lender, would offset the market value of the collateral received against the market value of the securities loaned. When the value of the collateral is greater than that of the market value of the securities loaned, the lender is left with a net amount payable to the defaulting party. However, bankruptcy or insolvency laws of a particular jurisdiction may impose restrictions on or prohibitions against such a right of offset in the event of an MSLA counterparty’s bankruptcy or insolvency. Under the MSLA, absent an event of default the borrower can resell or re-pledge the loaned securities, and the Fund can reinvest cash collateral received in connection with loaned securities. Upon an event of default, the parties’ obligations to return the securities or collateral to the other party are extinguished, and the parties can resell or re-pledge the loaned securities or the collateral received in connection with the loaned securities in order to satisfy the defaulting party’s net payment obligation for all transactions under the MSLA. The defaulting party remains liable for any deficiency.
As of period end, the following table is a summary of the Fund’s securities lending agreements by counterparty which are subject to offset under an MSLA:
| | | | | | | | | | | | | | | | | | | | |
| Counterparty | | | | | Securities Loaned at Value | | | Cash Collateral Received1 | | | Net Amount2 | | | | |
Citigroup Global Markets, Inc. | | | | | | $ | 5,208,281 | | | $ | (5,197,659 | ) | | | $10,622 | | | | | |
Goldman Sachs & Co. | | | | | | | 136,169 | | | | (136,169 | ) | | | — | | | | | |
JP Morgan Securities LLC | | | | | | | 14,933,981 | | | | (14,913,161 | ) | | | 20,820 | | | | | |
Morgan Stanley | | | | | | | 8,244,810 | | | | (8,244,810 | ) | | | — | | | | | |
State Street Bank & Trust Co. | | | | | | | 7,715,752 | | | | (7,715,752 | ) | | | — | | | | | |
| | | | |
Total | | | | | | $ | 36,238,993 | | | $ | (36,207,551 | ) | | | $31,442 | | | | | |
| | | | |
| | 1 | | Collateral with a value of $36,398,892 has been received in connection with securities lending agreements. Collateral received in excess of the value of securities loaned from the individual counterparty is not shown for financial reporting purposes in the table above. |
| | 2 | | The market value of the loaned securities is determined as of June 30, 2016. Additional collateral is delivered to the Fund on the next business day in accordance with the MSLA. The net amount would be subject to the borrower default indemnity in the event of default by the counterparty. |
The risks of securities lending include the risk that the borrower may not provide additional collateral when required or may not return the securities when due. To mitigate these risks, the Fund benefits from a borrower default indemnity provided by BIM. BIM’s indemnity allows for full replacement of the securities loaned if the collateral received does not cover the value on the securities loaned in the event of borrower default. The Fund could suffer a loss if the value of an investment purchased with cash collateral falls below the market value of loaned securities or if the value of an investment purchased with cash collateral falls below the value of the original cash collateral received.
5. Derivative Financial Instruments:
The Fund engages in various portfolio investment strategies using derivative contracts both to increase the returns of the Fund and/or to manage its exposure to certain risks such as credit risk, equity risk, interest rate risk, foreign currency exchange rate risk, commodity price risk or other risks (e.g., inflation risk). Derivative financial instruments categorized by risk exposure are included in the Schedule of Investments. These contracts may be transacted on an exchange or over-the-counter (“OTC”).
Futures Contracts: The Fund invests in long and/or short positions in futures and options on futures contracts to gain exposure to, or manage exposure to changes in interest rates (interest rate risk), changes in the value of equity securities (equity risk) or foreign currencies (foreign currency exchange rate risk).
Futures contracts are agreements between the Fund and a counterparty to buy or sell a specific quantity of an underlying instrument at a specified price and on a specified date. Depending on the terms of a contract, it is settled either through physical delivery of the underlying instrument on the settlement date or by payment of a cash amount on the settlement date. Upon entering into a futures contract, the Fund are required to deposit initial margin with the broker in the form of cash or securities in an amount that varies depending on a contract’s size and risk profile. The initial margin deposit must then be maintained at an established level over the life of the contract.
| | | | | | |
| | | BLACKROCK VARIABLE SERIES FUNDS, INC. | | JUNE 30, 2016 | | 17 |
| | | | |
| Notes to Financial Statements (continued) | | | BlackRock Large Cap Core V.I. Fund | |
Securities deposited as initial margin are designated in the Schedule of Investments and cash deposited, if any, is shown as cash pledged for futures contracts in the Statement of Assets and Liabilities. Pursuant to the contract, the Fund agrees to receive from or pay to the broker an amount of cash equal to the daily fluctuation in market value of the contract (“variation margin”). Variation margin is recorded as unrealized appreciation (depreciation) and, if any, shown as variation margin receivable (or payable) on futures contracts in the Statement of Assets and Liabilities. When the contract is closed, a realized gain or loss is recorded in the Statement of Operations equal to the difference between the value of the contract at the time it was opened and the value at the time it was closed. The use of futures contracts involves the risk of an imperfect correlation in the movements in the price of futures contracts and interest, foreign currency exchange rates or underlying assets.
6. Investment Advisory Agreement and Other Transactions with Affiliates:
The PNC Financial Services Group, Inc. is the largest stockholder and an affiliate of BlackRock, Inc. (“BlackRock”) for 1940 Act purposes.
Investment Advisory
The Company, on behalf of the Fund, entered into an Investment Advisory Agreement with the Manager, the Fund’s investment adviser, an indirect, wholly owned subsidiary of BlackRock, to provide investment advisory and administration services. The Manager is responsible for the management of the Fund’s portfolio and provides the personnel, facilities, equipment and certain other services necessary to the operations of the Fund. For such services, the Fund pays the Manager a monthly fee, which is determined by calculating a percentage of the Fund’s average daily net assets based on the following annual rates:
| | | | | |
| Average Daily Net Assets | | Investment
Advisory Fee |
First $250 Million | | | | 0.500 | % |
$250 Million - $300 Million | | | | 0.450 | % |
$300 Million - $400 Million | | | | 0.425 | % |
Greater than $400 Million | | | | 0.400 | % |
Distribution Fees
The Company, on behalf of the Fund, entered into a Distribution Agreement and a Distribution Plan with BlackRock Investments, LLC (“BRIL”), an affiliate of the Manager. Pursuant to the Distribution Plan and in accordance with Rule 12b-1 under the 1940 Act, the Fund pays BRIL ongoing distribution fees. The fees are accrued daily and paid monthly at annual rates based upon the average daily net assets of the relevant share class of the Funds as follows:
| | | | | | | | | | | | |
| | | Class II | | | | Class III |
Distribution Fee | | | | 0.15 | % | | | | | | 0.25 | % |
For the six months ended June 30, 2016, the following table shows the class specific distribution fees borne directly by each share class of the Fund:
| | | | |
| Class II | | Class III | | Total |
$3,763 | | $371,212 | | $374,975 |
Transfer Agent
The Manager, on behalf of the Fund, entered into agreements with insurance companies and other financial intermediaries (“Service Organizations”), some of which may be affiliates. Pursuant to these agreements, the Service Organizations provide the Fund with administrative, networking, recordkeeping, sub-transfer agency and shareholder services to sub-accounts they service. For these services, the Service Organizations receive an annual fee per shareholder account, which will vary depending on share class and/or net assets of Fund shareholders serviced by the Service Organizations, which is shown as transfer agent — class specific. For the six months ended June 30, 2016, the Fund paid the following amounts to affiliates in return for these services, which is included in transfer agent — class specific in the Statement of Operations:
| | | | | | |
| Class I | | Class II | | Class III | | Total |
$180,118 | | $6,112 | | $309,011 | | $495,241 |
In addition, the Fund pays the transfer agent, which is not an affiliate, a fee for issuance, transfer and redemption of shares and the opening and maintenance of shareholder accounts, which is included in transfer agent in the Statement of Operations.
| | | | | | |
| 18 | | BLACKROCK VARIABLE SERIES FUNDS, INC. | | JUNE 30, 2016 | | |
| | | | |
| Notes to Financial Statements (continued) | | | BlackRock Large Cap Core V.I. Fund | |
Expense Limitations, Waivers and Reimbursements
The Manager, with respect to the Fund, contractually agreed to waive and/or reimburse fees or expenses in order to limit expenses, excluding interest expense, dividend expense, tax expense, acquired fund fees and expenses, and certain other fund expenses, which constitute extraordinary expenses not incurred in the ordinary course of the Fund’s business. The expense limitations as a percentage of average daily net assets are as follows:
| | | | |
Class I | | | 1.25 | % |
Class III | | | 1.40 | % |
Class III | | | 1.50 | % |
The Manager has agreed not to reduce or discontinue this contractual expense limitation prior to May 1, 2017 unless approved by the Board, including a majority of the Independent Directors who are not “interested persons” of the Fund, as defined in the 1940 Act or by a majority of the outstanding voting securities of the Fund.
The Manager, with respect to the Fund, voluntarily agreed to waive its investment advisory fees by the amount of investment advisory fees the Fund pays to the Manager indirectly through its investment in affiliated money market funds. This amount is included in fees waived by the Manager in the Statement of Operations. However, the Manager does not waive its investment advisory fees by the amount of investment advisory fees paid in connection with the Fund’s investment in other affiliated investment companies, if any. For the six months ended June 30, 2016, the amount was $3,567.
The Manager has contractually agreed to reimburse transfer agent fees in order to limit such expenses to a percentage of average daily net assets as follows:
| | | | |
Class I | | | 0.05 | % |
Class II | | | 0.07 | % |
Class III | | | 0.08 | % |
The Manager has agreed not to reduce or discontinue this contractual reimbursement prior to May 1, 2017 unless approved by the Board, including a majority of the Independent Directors or by a majority of the outstanding voting securities of the Fund.
These amounts are shown as transfer agent fees reimbursed - class specific in the Statement of Operation. Class specific expense waivers and/or reimbursements are as follows:
| | | | | | | | | | | | | | | | | | | | |
| | | Class I | | Class II | | Class III | | Total |
Transfer Agent Fees Reimbursed | | | $ | 137,443 | | | | $ | 4,351 | | | | $ | 189,897 | | | | $ | 331,691 | |
For the six months ended June 30, 2016, the Fund reimbursed the Manager $2,657 for certain accounting services, which is included in accounting services in the Statement of Operations.
Securities Lending
The U.S. Securities and Exchange Commission has issued an exemptive order which permits BIM, an affiliate of the Manager, to serve as securities lending agent for the Fund subject to applicable conditions. As securities lending agent, BIM bears all operational costs directly related to securities lending. The Fund is responsible for expenses in connection with the investment of cash collateral received for securities on loan (the “collateral investment expenses”). The cash collateral is invested in a private investment company managed by the Manager or its affiliates. However, BIM has agreed to cap the collateral investment expenses of the private investment company to an annual rate of 0.04%. The investment adviser to the private investment company will not charge any advisory fees with respect to shares purchased by the Fund.
Securities lending income is equal to the total of income earned from the reinvestment of cash collateral, net of fees and other payments to and from borrowers of securities, and less the collateral investment expenses. The Fund retains a portion of securities lending income and remits a remaining portion to BIM as compensation for its services as securities lending agent.
Pursuant to a securities lending agreement, the Fund retains 71.5% of securities lending income, and this amount retained can never be less than 65% of the total of securities lending income plus the collateral investment expenses.
In addition, commencing the business day following the date that the aggregate securities lending income earned across the Equity-Bond Complex in a calendar year exceeds a specified threshold, the Fund, pursuant to the securities lending agreement, will retain for the remainder of that calendar year securities lending income as follows: 75% of securities lending income, and this amount retained can never be less than 65% of the total of securities lending income plus the collateral investment expenses.
| | | | | | |
| | | BLACKROCK VARIABLE SERIES FUNDS, INC. | | JUNE 30, 2016 | | 19 |
| | | | |
| Notes to Financial Statements (continued) | | | BlackRock Large Cap Core V.I. Fund | |
The share of securities lending income earned by the Fund is shown as securities lending — affiliated — net in the Statement of Operations. For the six months ended June 30, 2016, the Fund paid BIM $11,382 for securities lending agent services.
Officers and Directors
Certain officers and/or directors of the Company are officers and/or directors of BlackRock or its affiliates. The Fund reimburses the Manager for a portion of the compensation paid to the Company’s Chief Compliance Officer, which is included in Officer and Directors in the Statement of Operations.
7. Purchases and Sales:
For the six months ended June 30, 2016, purchases and sales of investments, excluding short-term securities, were $132,526,929 and $148,735,329, respectively.
8. Income Tax Information:
It is the Fund’s policy to comply with the requirements of the Internal Revenue Code of 1986, as amended, applicable to regulated investment companies, and to distribute substantially all of its taxable income to its shareholders. Therefore, no federal income tax provision is required.
The Fund files U.S. federal and various state and local tax returns. No income tax returns are currently under examination. The statute of limitations on the Fund’s U.S. federal tax returns generally remains open for each of the four years ended December 31, 2015. The statutes of limitations on the Fund’s state and local tax returns may remain open for an additional year depending upon the jurisdiction.
Management has analyzed tax laws and regulations and their application to the Fund as of June 30, 2016, inclusive of the open tax return years, and does not believe there are any uncertain tax positions that require recognition of a tax liability in the Fund’s financial statements.
As of June 30, 2016, gross unrealized appreciation and depreciation based on cost for federal income tax purposes were as follows:
| | | | | | | | |
Tax cost | | | | | | $ | 432,496,005 | |
| | | | |
Gross unrealized appreciation | | | | | | $ | 85,543,856 | |
Gross unrealized depreciation | | | | | | | (13,750,423 | ) |
| | | | |
Net unrealized appreciation | | | | | | $ | 71,793,433 | |
| | | | |
9. Bank Borrowings:
The Company, on behalf of the Fund, along with certain other funds managed by the Manager and its affiliates (“Participating Funds”), is a party to a 364-day, $2.1 billion credit agreement with a group of lenders. Under this agreement, the Fund may borrow to fund shareholder redemptions. Excluding commitments designated for certain individual funds, the Participating Funds, including the Fund, can borrow up to an aggregate commitment amount of $1.6 billion at any time outstanding, subject to asset coverage and other limitations as specified in the agreement. The credit agreement has the following terms: a fee of 0.12% per annum on unused commitment amounts and interest at a rate equal to the higher of (a) one-month LIBOR (but, in any event, not less than 0.00%) on the date the loan is made plus 0.80% per annum or (b) the Fed Funds rate (but, in any event, not less than 0.00%) in effect from time to time plus 0.80% per annum on amounts borrowed. The agreement expires in April 2017 unless extended or renewed. Prior to April 21, 2016, the credit agreement had a fee per annum of 0.06% on unused commitment amounts and interest at a rate equal to the higher of (a) one-month LIBOR (but, in any event, not less than 0.00%) on the date the loan is made plus 0.80% per annum or (b) the Fed Funds rate (but, in any event, not less than 0.00%) in effect from time to time plus 0.80% per annum on amounts borrowed. Participating Funds paid administration, legal and arrangement fees, which, if applicable, are included in miscellaneous expenses in the Statement of Operations. These fees were allocated among such funds based upon portions of the aggregate commitment available to them and relative net assets of Participating Funds. During the six months ended June 30, 2016, the Fund did not borrow under the credit agreement.
10. Principal Risks:
In the normal course of business, the Fund invests in securities and enters into transactions where risks exist due to fluctuations in the market (market risk) or failure of the issuer to meet all its obligations, including the ability to pay principal and interest when due (issuer credit risk). The value of securities held by the Fund may decline in response to certain events, including those directly involving the issuers of securities owned by the Fund. Changes arising from the general economy, the overall market and local, regional or global political or/and social instability, as well as currency, interest rate and price fluctuations, may also affect the securities’ value.
Counterparty Credit Risk: Similar to issuer credit risk, the Fund may be exposed to counterparty credit risk, or the risk that an entity may fail to or be unable to perform on its commitments related to unsettled or open transactions. The Fund manages counterparty credit risk by entering into transactions only with counterparties that the Manager believes have the financial resources to honor their obligations and by monitoring the financial stability
| | | | | | |
| 20 | | BLACKROCK VARIABLE SERIES FUNDS, INC. | | JUNE 30, 2016 | | |
| | | | |
| Notes to Financial Statements (concluded) | | | BlackRock Large Cap Core V.I. Fund | |
of those counterparties. Financial assets, which potentially expose the Fund to market, issuer and counterparty credit risks, consist principally of financial instruments and receivables due from counterparties. The extent of the Fund’s exposure to market, issuer and counterparty credit risks with respect to these financial assets is approximately their value recorded in the Statement of Assets and Liabilities, less any collateral held by the Fund.
A derivative contract may suffer a mark-to-market loss if the value of the contract decreases due to an unfavorable change in the market rates or values of the underlying instrument. Losses can also occur if the counterparty does not perform under the contract.
With exchange-traded futures, there is less counterparty credit risk to the Fund since the exchange or clearinghouse, as counterparty to such instruments, guarantees against a possible default. The clearinghouse stands between the buyer and the seller of the contract; therefore, credit risk is limited to failure of the clearinghouse. While offset rights may exist under applicable law, the Fund does not have a contractual right of offset against a clearing broker or clearinghouse in the event of a default (including the bankruptcy or insolvency). Additionally, credit risk exists in exchange-traded futures with respect to initial and variation margin that is held in a clearing broker’s customer accounts. While clearing brokers are required to segregate customer margin from their own assets, in the event that a clearing broker becomes insolvent or goes into bankruptcy and at that time there is a shortfall in the aggregate amount of margin held by the clearing broker for all its clients, typically the shortfall would be allocated on a pro rata basis across all the clearing broker’s customers, potentially resulting in losses to the Fund.
11. Capital Share Transactions:
Transactions in capital shares for each class were as follows:
| | | | | | | | | | | | | | | | | | | | | | | | | | | | | | | | | | |
| | | Six Months Ended
June 30, 2016 | | | | | Year Ended
December 31, 2015 | |
| | | | | | Shares | | | Amount | | | | | | | | | | | Shares | | | Amount | | | | |
| Class l | | | | | | | | | | | | | | | | | | | | | | | | | | |
Shares sold | | | | | | | 70,419 | | | $ | 2,137,125 | | | | | | | | | | | | | | 61,356 | | | $ | 2,027,889 | | | | | |
Shares issued in reinvestment of distributions | | | | | | | — | | | | — | | | | | | | | | | | | | | 360,977 | | | | 11,573,589 | | | | | |
Shares redeemed | | | | | | | (460,873 | ) | | | (13,944,228 | ) | | | | | | | | | | | | | (933,673 | ) | | | (31,107,976 | ) | | | | |
| | | | | | | | | | |
Net decrease | | | | | | | (390,454 | ) | | $ | (11,807,103 | ) | | | | | | | | | | | | | (511,340 | ) | | $ | (17,506,498 | ) | | | | |
| | | | | | | | | | |
| | | | | | | | | | | | | | | | | | | | | | | | | | | | | | | | | | |
Class ll | | | | | | | | | | | | | | | | | | | | | | | | | | | | | | | | | | |
Shares sold | | | | | | | 27,348 | | | $ | 814,266 | | | | | | | | | | | | | | 87,132 | | | $ | 2,879,243 | | | | | |
Shares issued in reinvestment of distributions | | | | | | | — | | | | — | | | | | | | | | | | | | | 10,010 | | | | 321,813 | | | | | |
Shares redeemed | | | | | | | (47,027 | ) | | | (1,437,273 | ) | | | | | | | | | | | | | (113,855 | ) | | | (3,800,979 | ) | | | | |
| | | | | | | | | | |
Net decrease | | | | | | | (19,679 | ) | | $ | (623,007 | ) | | | | | | | | | | | | | (16,713 | ) | | $ | (599,923 | ) | | | | |
| | | | | | | | | | |
| | | | | | | | | | | | | | | | | | | | | | | | | | | | | | | | | | |
Class lll | | | | | | | | | | | | | | | | | | | | | | | | | | | | | | | | | | |
Shares sold | | | | | | | 428,198 | | | $ | 11,991,667 | | | | | | | | | | | | | | 270,465 | | | $ | 8,947,440 | | | | | |
Shares issued in reinvestment of distributions | | | | | | | — | | | | — | | | | | | | | | | | | | | 579,467 | | | | 18,495,328 | | | | | |
Shares redeemed | | | | | | | (385,757 | ) | | | (11,566,584 | ) | | | | | | | | | | | | | (777,765 | ) | | | (25,766,508 | ) | | | | |
| | | | | | | | | | |
Net increase | | | | | | | 42,441 | | | $ | 425,083 | | | | | | | | | | | | | | 72,167 | | | $ | 1,676,260 | | | | | |
| | | | | | | | | | |
Total Net decrease | | | | | | | (367,692 | ) | | $ | (12,005,027 | ) | | | | | | | | | | | | | (455,886 | ) | | $ | (16,430,161 | ) | | | | |
| | | | | | | | | | |
12. Subsequent Events:
Management’s evaluation of the impact of all subsequent events on the Fund’s financial statements was completed through the date the financial statements were issued and the following item was noted:
The Fund paid a long-term capital gain distribution in the following amounts per share on July 22, 2016 to shareholders of record on July 20, 2016:
| | | | | |
| | | Long-Term
Capital Gain |
Class I | | | $ | 0.320562 | |
Class II | | | $ | 0.320562 | |
Class III | | | $ | 0.320562 | |
| | | | | | |
| | | BLACKROCK VARIABLE SERIES FUNDS, INC. | | JUNE 30, 2016 | | 21 |
JUNE 30, 2016
| | | | |
SEMI-ANNUAL REPORT (UNAUDITED) | | | | BLACKROCK® |
BlackRock Variable Series Funds, Inc.
▶ BlackRock Large Cap Growth V.I. Fund
| | |
| Not FDIC Insured ¡ May Lose Value ¡ No Bank Guarantee | | |
| | | | |
| Fund Summary as of June 30, 2016 | | | BlackRock Large Cap Growth V.I. Fund | |
BlackRock Large Cap Growth V.I. Fund’s (the “Fund”) investment objective is to seek long-term capital growth.
|
| Portfolio Management Commentary |
How did the Fund perform?
| • | | For the six-month period ended June 30, 2016, the Fund underperformed its benchmark, the Russell 1000® Growth Index. |
What factors influenced performance?
| • | | At the sector level, industrials was the prime detractor from performance, with airlines having the greatest negative impact. Carriers, including Delta Air Lines Inc. and Southwest Airlines Co., underperformed in the latter half of the reporting period as second-quarter PRASM (passenger revenue per available seat mile) guidance disappointed the market. Weakness persisted through the end of the period as companies further lowered PRASM guidance, weighing on sentiment and earnings estimates. Higher fuel prices were an additional drag for the group. |
| • | | The Fund’s long-standing underweight to stability/bond proxies, especially real estate investment trusts (“REITs”) within financials and telecommunication services, also hindered relative results. The sectors significantly outperformed amid the broad flight to safety in the period, with investors’ search for yield in the lower for longer interest rate environment lending additional support. |
| • | | In stock specifics, Alliance Data Systems Corp. and Lear Corp. were top detractors. Alliance Data Systems reported an in-line fourth quarter and reiterated 2016 guidance, but the stock sold off primarily on macro worries as the guidance included higher credit losses versus a year ago. The stock was eliminated by the end of the reporting period. Lear underperformed on concerns around peaking domestic auto sales. |
| • | | On the positive side, the top contributor to performance was health care, where a tilt to managed care proved most advantageous. Managed-care stocks broadly performed well on continued strong fundamentals. The |
| | | companies appear to be managing cost trends well, and pricing remains solid in the majority of businesses. Though the healthcare exchanges continue to struggle, most companies seem to have found a solution, either by significantly improving margins or simply exiting the business. Anticipation of accretive M&A opportunities further boosted sentiment for the group, with the successful closing and initial integration of the Centene/Health Net merger. Elsewhere, an underweight to biotechnology was beneficial as it was the worst-performing industry in the sector. |
| • | | On an individual stock basis, information technology (“IT”) holding NVIDIA Corp. was the largest portfolio contributor in the six months. The company delivered strong quarterly results, driven by 17% gaming growth, despite tough comparisons and ahead of a new product cycle. Also notable, datacenter growth accelerated and automotive demand remains robust. Select holdings within the consumer sectors also added value, namely tobacco holding Altria Group Inc. and media name Comcast Corp. |
Describe recent portfolio activity.
| • | | Due to a combination of portfolio trading activity and market movement during the six-month period, the Fund’s exposure to the materials and consumer staples sectors increased, particularly within containers & packaging and food & staples retailing. The largest reduction was in industrials, largely with respect to air freight & logistics and aerospace & defense. Energy exposure also declined. |
Describe portfolio positioning at period end.
| • | | Relative to the Russell 1000® Growth Index, the Fund ended the period with its largest sector overweight in IT, while industrials was the most significant underweight. |
The views expressed reflect the opinions of BlackRock as of the date of this report and are subject to change based on changes in market, economic or other conditions. These views are not intended to be a forecast of future events and are no guarantee of future results.
| | | | |
| Sector Allocation | | Percent of
Net Assets | |
Information Technology | | | 33 | % |
Consumer Discretionary | | | 20 | |
Health Care | | | 19 | |
Consumer Staples | | | 10 | |
Industrials | | | 6 | |
Financials | | | 6 | |
Materials | | | 4 | |
Energy | | | 1 | |
Short-Term Securities | | | 4 | |
Liabilities in Excess of Other Assets | | | (3 | ) |
For Fund compliance purposes, the Fund’s sector classifications refer to one or more of the sector sub-classifications used by one or more widely recognized market indexes or ratings group indexes, and/or as defined by the investment adviser. These definitions may not apply for purposes of this report, which may combine sector sub-classifications for reporting ease.
| | | | | | |
| 2 | | BLACKROCK VARIABLE SERIES FUNDS, INC. | | JUNE 30, 2016 | | |
| | |
| | | BlackRock Large Cap Growth V.I. Fund |
|
| Total Return Based on a $10,000 Investment |
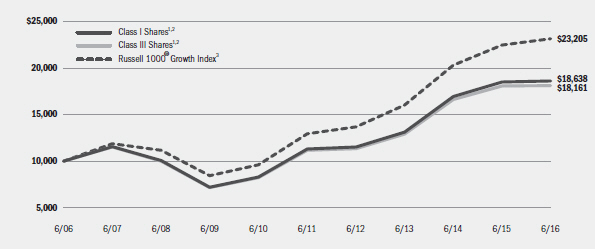
| | 1 | Assuming transaction costs, if any, and other operating expenses, including investment advisory fees. Does not include insurance related fees and expenses. |
| | 2 | The Fund invests primarily in a diversified portfolio of equity securities of large cap companies located in the United States. |
| | 3 | An unmanaged index that measures the performance of the large cap growth segment of the U.S. equity universe and consists of those Russell 1000® securities with higher price-to-book ratios and higher forecasted growth values. |
| | | | | | | | |
| Performance Summary for the Period Ended June 30, 2016 | | | | | | | | |
| | | | | Average Annual Total Returns |
| | | 6-Month
Total Returns5 | | 1 Year5 | | 5 Years5 | | 10 Years5 |
Class I4 | | (1.03)% | | 0.60% | | 10.47% | | 6.42% |
Class III4 | | (1.26) | | 0.29 | | 10.18 | | 6.15 |
Russell 1000® Growth Index | | 1.36 | | 3.02 | | 12.35 | | 8.78 |
| | 4 | | Average annual and cumulative total returns are based on changes in net asset value for the periods shown, and assume reinvestment of all distributions at net asset value on the ex-dividend date. Insurance-related fees and expenses are not reflected in these returns. |
| | 5 | | For a portion of the period, the Fund’s investment adviser waived a portion of its fee. Without such waiver, the Fund’s performance would have been lower. |
| | | | Past performance is not indicative of future results. Performance results do not reflect the deduction of taxes that a shareholder would pay on Fund distributions or the redemption of Fund shares. |
| | | | | | | | | | | | | | |
| | | Actual | | Hypothetical7 | | |
| | | Beginning
Account Value
January 1, 2016 | | Ending
Account Value
June 30, 2016 | | Expenses Paid
During the Period6 | | Beginning
Account Value
January 1, 2016 | | Ending
Account Value
June 30, 2016 | | Expenses Paid
During the Period6 | | Annualized
Expense Ratio |
Class I | | $1,000.00 | | $989.70 | | $4.11 | | $1,000.00 | | $1,020.74 | | $4.17 | | 0.83% |
Class III | | $1,000.00 | | $987.40 | | $5.34 | | $1,000.00 | | $1,019.49 | | $5.42 | | 1.08% |
| | 6 | | For each class of the Fund, expenses are equal to the annualized expense ratio for the class, multiplied by the average account value over the period, multiplied by 182/366 (to reflect the one-half year period shown). |
| | 7 | | Hypothetical 5% annual return before expenses is calculated by prorating the number of days in the most recent fiscal half year divided by 366. |
| | | | See “Disclosure of Expenses” on the following page for further information on how expenses were calculated. |
| | | | | | |
| | | BLACKROCK VARIABLE SERIES FUNDS, INC. | | JUNE 30, 2016 | | 3 |
| | | | |
| Disclosure of Expenses | | | BlackRock Large Cap Growth V.I. Fund | |
Shareholders of the Fund may incur the following charges: (a) transactional expenses, such as sales charges; and (b) operating expenses, including investment advisory fees, service and distribution fees, including 12b-1 fees, acquired fund fees and expenses, and other fund expenses. The expense example on the previous page (which is based on a hypothetical investment of $1,000 invested on January 1, 2016 and held through June 30, 2016) is intended to assist shareholders both in calculating expenses based on an investment in the Fund and in comparing these expenses with similar costs of investing in other mutual funds.
The expense example provides information about actual account values and actual expenses. In order to estimate the expenses a shareholder paid during the period covered by this report, shareholders can divide their account value by $1,000 and then multiply the result by the number corresponding to their share class under the heading entitled “Expenses Paid During the Period.”
The expense example also provides information about hypothetical account values and hypothetical expenses based on the Fund’s actual expense ratio and an assumed rate of return of 5% per year before expenses. In order to assist shareholders in comparing the ongoing expenses of investing in the Fund and other funds, compare the 5% hypothetical example with the 5% hypothetical examples that appear in shareholder reports of other funds.
The expenses shown in the expense example are intended to highlight shareholders’ ongoing costs only and do not reflect any transactional expenses, such as sales charges, if any. Therefore, the hypothetical example is useful in comparing ongoing expenses only, and will not help shareholders determine the relative total expenses of owning different funds. If these transactional expenses were included, shareholder expenses would have been higher.
|
| Derivative Financial Instruments |
The Fund may invest in various derivative financial instruments. These instruments are used to obtain exposure to a security, commodity, index, market and/or other asset without owning or taking physical custody of securities, commodities and/or other referenced assets or to manage market, equity, credit, interest rate, foreign currency exchange rate, commodity and/or other risks. Derivative financial instruments may give rise to a form of economic leverage and involve risks, including the imperfect correlation between the value of a derivative financial instrument and the underlying asset, possible default of the counterparty to the
transaction or illiquidity of the instrument. The Fund’s successful use of a derivative financial instrument depends on the investment adviser’s ability to predict pertinent market movements accurately, which cannot be assured. The use of these instruments may result in losses greater than if they had not been used, may limit the amount of appreciation the Fund can realize on an investment and/or may result in lower distributions paid to shareholders. The Fund’s investments in these instruments, if any, are discussed in detail in the Notes to Financial Statements.
| | | | | | |
| 4 | | BLACKROCK VARIABLE SERIES FUNDS, INC. | | JUNE 30, 2016 | | |
| | | | |
| Schedule of Investments June 30, 2016 (Unaudited) | | | BlackRock Large Cap Growth V.I. Fund | |
| | | (Percentages shown are based on Net Assets) | |
| | | | | | | | |
| Common Stocks | | Shares | | | Value | |
Airlines — 4.1% | | | | | | | | |
Delta Air Lines, Inc. | | | 37,962 | | | $ | 1,382,956 | |
JetBlue Airways Corp. (a) | | | 21,083 | | | | 349,134 | |
Southwest Airlines Co. | | | 66,244 | | | | 2,597,427 | |
United Continental Holdings, Inc. (a) | | | 16,810 | | | | 689,882 | |
| | | | | | | | |
| | | | | | | | 5,019,399 | |
Auto Components — 2.4% | | | | | | | | |
Goodyear Tire & Rubber Co. | | | 29,392 | | | | 754,199 | |
Lear Corp. | | | 21,541 | | | | 2,192,012 | |
| | | | | | | | |
| | | | | | | | 2,946,211 | |
Banks — 2.4% | | | | | | | | |
U.S. Bancorp | | | 59,150 | | | | 2,385,519 | |
Wells Fargo & Co. | | | 11,620 | | | | 549,975 | |
| | | | | | | | |
| | | | | | | | 2,935,494 | |
Beverages — 2.2% | | | | | | | | |
Dr Pepper Snapple Group, Inc. | | | 28,350 | | | | 2,739,460 | |
Biotechnology — 6.1% | | | | | | | | |
Amgen, Inc. | | | 24,960 | | | | 3,797,664 | |
Biogen, Inc. (a) | | | 1,287 | | | | 311,222 | |
Gilead Sciences, Inc. | | | 40,553 | | | | 3,382,931 | |
| | | | | | | | |
| | | | | | | | 7,491,817 | |
Capital Markets — 0.8% | | | | | | | | |
Goldman Sachs Group, Inc. | | | 6,383 | | | | 948,386 | |
Chemicals — 1.6% | | | | | | | | |
Dow Chemical Co. | | | 16,150 | | | | 802,817 | |
Eastman Chemical Co. | | | 17,623 | | | | 1,196,602 | |
| | | | | | | | |
| | | | | | | | 1,999,419 | |
Communications Equipment — 1.5% | | | | | | | | |
Cisco Systems, Inc. | | | 66,009 | | | | 1,893,798 | |
Construction & Engineering — 0.6% | | | | | | | | |
AECOM (a) | | | 25,073 | | | | 796,569 | |
Consumer Finance — 0.9% | | | | | | | | |
SLM Corp. (a) | | | 187,083 | | | | 1,156,173 | |
Containers & Packaging — 2.6% | | | | | | | | |
Avery Dennison Corp. | | | 21,928 | | | | 1,639,118 | |
Packaging Corp. of America | | | 23,354 | | | | 1,563,083 | |
| | | | | | | | |
| | | | | | | | 3,202,201 | |
Electronic Equipment, Instruments & Components — 1.6% | | | | | |
CDW Corp. | | | 48,335 | | | | 1,937,267 | |
Energy Equipment & Services — 0.9% | | | | | | | | |
Schlumberger Ltd. | | | 14,541 | | | | 1,149,902 | |
Food & Staples Retailing — 3.4% | | | | | | | | |
CVS Health Corp. | | | 28,989 | | | | 2,775,407 | |
Walgreens Boots Alliance, Inc. | | | 16,189 | | | | 1,348,058 | |
| | | | | | | | |
| | | | | | | | 4,123,465 | |
Food Products — 0.9% | | | | | | | | |
Tyson Foods, Inc., Class A | | | 17,024 | | | | 1,137,033 | |
Health Care Providers & Services — 10.0% | | | | | | | | |
Aetna, Inc. | | | 24,500 | | | | 2,992,185 | |
Centene Corp. (a) | | | 27,430 | | | | 1,957,679 | |
Cigna Corp. | | | 9,460 | | | | 1,210,785 | |
| | | | | | | | |
| Common Stocks | | Shares | | | Value | |
Health Care Providers & Services (continued) | | | | | | | | |
Laboratory Corp. of America Holdings (a) | | | 12,120 | | | $ | 1,578,872 | |
UnitedHealth Group, Inc. | | | 23,410 | | | | 3,305,492 | |
Universal Health Services, Inc., Class B | | | 9,527 | | | | 1,277,571 | |
| | | | | | | | |
| | | | | | | | 12,322,584 | |
Household Durables — 2.2% | | | | | | | | |
D.R. Horton, Inc. | | | 41,495 | | | | 1,306,263 | |
Lennar Corp., Class A | | | 14,451 | | | | 666,191 | |
NVR, Inc. (a) | | | 381 | | | | 678,310 | |
| | | | | | | | |
| | | | | | | | 2,650,764 | |
Industrial Conglomerates — 0.7% | | | | | | | | |
3M Co. | | | 4,763 | | | | 834,097 | |
Insurance — 1.5% | | | | | | | | |
Travelers Cos., Inc. | | | 15,910 | | | | 1,893,926 | |
Internet & Catalog Retail — 1.9% | | | | | | | | |
Priceline Group, Inc. (a) | | | 1,844 | | | | 2,302,068 | |
Internet Software & Services — 8.8% | | | | | | | | |
Alphabet, Inc., Class A (a) | | | 5,385 | | | | 3,788,509 | |
Alphabet, Inc., Class C (a) | | | 5,670 | | | | 3,924,207 | |
Facebook, Inc., Class A (a) | | | 27,235 | | | | 3,112,416 | |
| | | | | | | | |
| | | | | | | | 10,825,132 | |
IT Services — 4.3% | | | | | | | | |
Amdocs Ltd. | | | 20,067 | | | | 1,158,267 | |
Cognizant Technology Solutions Corp., Class A (a) | | | 50,860 | | | | 2,911,226 | |
Total System Services, Inc. | | | 22,840 | | | | 1,213,032 | |
| | | | | | | | |
| | | | | | | | 5,282,525 | |
Machinery — 0.4% | | | | | | | | |
WABCO Holdings, Inc. (a) | | | 5,740 | | | | 525,612 | |
Media — 6.2% | | | | | | | | |
Comcast Corp., Class A | | | 74,300 | | | | 4,843,617 | |
Omnicom Group, Inc. (b) | | | 33,485 | | | | 2,728,693 | |
| | | | | | | | |
| | | | | | | | 7,572,310 | |
Pharmaceuticals — 2.3% | | | | | | | | |
Merck & Co., Inc. | | | 15,955 | | | | 919,168 | |
Pfizer, Inc. | | | 20,237 | | | | 712,545 | |
Teva Pharmaceutical Industries Ltd. — ADR | | | 23,850 | | | | 1,197,985 | |
| | | | | | | | |
| | | | | | | | 2,829,698 | |
Semiconductors & Semiconductor Equipment — 3.2% | | | | | |
Lam Research Corp. (b) | | | 25,862 | | | | 2,173,960 | |
NVIDIA Corp. (b) | | | 36,867 | | | | 1,733,118 | |
| | | | | | | | |
| | | | | | | | 3,907,078 | |
Software — 6.3% | | | | | | | | |
Activision Blizzard, Inc. | | | 63,568 | | | | 2,519,200 | |
Microsoft Corp. | | | 101,290 | | | | 5,183,009 | |
| | | | | | | | |
| | | | | | | | 7,702,209 | |
Specialty Retail — 7.8% | | | | | | | | |
GNC Holdings, Inc., Class A | | | 18,885 | | | | 458,717 | |
Home Depot, Inc. | | | 31,714 | | | | 4,049,561 | |
Lowe’s Cos., Inc. | | | 35,600 | | | | 2,818,452 | |
| | | | | | | | | | |
| Portfolio Abbreviations |
| ADR | | American Depositary Receipts | | | | | | | | |
See Notes to Financial Statements.
| | | | | | |
| | | BLACKROCK VARIABLE SERIES FUNDS, INC. | | JUNE 30, 2016 | | 5 |
| | | | |
| Schedule of Investments (continued) | | | BlackRock Large Cap Growth V.I. Fund | |
| | | | |
| | | | | | | | |
| Common Stocks | | Shares | | | Value | |
Specialty Retail (continued) | | | | | | | | |
Ross Stores, Inc. | | | 40,561 | | | $ | 2,299,403 | |
| | | | | | | | |
| | | | | | | | 9,626,133 | |
Technology Hardware, Storage & Peripherals — 7.5% | | | | | | | | |
Apple Inc. | | | 80,735 | | | | 7,718,266 | |
EMC Corp. | | | 53,705 | | | | 1,459,165 | |
| | | | | | | | |
| | | | | | | | 9,177,431 | |
Tobacco — 3.5% | | | | | | | | |
Altria Group, Inc. | | | 63,080 | | | | 4,349,997 | |
Total Long-Term Investments (Cost — $99,204,409) — 98.6% | | | | | | | 121,278,158 | |
| | | | | | | | |
| Short-Term Securities | | Shares | | | Value | |
BlackRock Liquidity Funds, TempFund, Institutional Class, 0.40% (c)(d) | | | 184,081 | | | $ | 184,081 | |
| | | Beneficial
Interest
(000) | | | | |
BlackRock Liquidity Series, LLC, Money Market
Series, 0.59% (c)(d)(e) | | $ | 5,309 | | | | 5,309,142 | |
Total Short-Term Securities (Cost — $5,493,223) — 4.5% | | | | | | | 5,493,223 | |
Total Investments (Cost — $104,697,632) — 103.1% | | | | 126,771,381 | |
Liabilities in Excess of Other Assets — (3.1)% | | | | | | | (3,753,679 | ) |
| | | | | | | | |
Net Assets — 100.0% | | | | | | $ | 123,017,702 | |
| | | | | | | | |
|
| Notes to Schedule of Investments |
| (a) | Non-income producing security. |
| (b) | Security, or a portion of security, is on loan. |
| (c) | During the six months ended June 30, 2016, investments in issuers considered to be affiliates of the Fund for purposes of Section 2(a)(3) of the Investment Company Act of 1940, as amended, were as follows: |
| | | | | | | | | | | | | | | | | | | | | | | | |
| Affiliate | | Shares/Beneficial
Interest Held at
December 31, 2015 | | | Net Activity | | | Shares/Beneficial
Interest Held at
June 30, 2016 | | | | | | Value at
June 30, 2016 | | | Income | |
BlackRock Liquidity Funds, TempFund, Institutional Class | | | 3,211,665 | | | | (3,027,584 | ) | | | 184,081 | | | | | | | | $ 184,081 | | | $ | 7,593 | |
BlackRock Liquidity Series, LLC, Money Market Series | | | $3,728,591 | | | | $ 1,580,551 | | | | $5,309,142 | | | | | | | | 5,309,142 | | | | 7,963 | 1 |
Total | | | | | | | | | | | | | | | | | | | $5,493,223 | | | $ | 15,556 | |
| | | | | | | | | | | | | | | | |
| | 1 | | Represents securities lending income earned from the reinvestment of cash collateral from loaned securities, net of fees and collateral investment expenses, and other payments to and from borrowers of securities. |
| (d) | Current yield as of period end. |
| (e) | Security was purchased with the cash collateral from loaned securities. The Fund may withdraw up to 25% of its investment daily, although the manager of the BlackRock Liquidity Series, LLC, Money Market Series, in its sole discretion, may permit an investor to withdraw more than 25% on any one day. |
| • | | For Fund compliance purposes, the Fund’s industry classifications refer to one or more of the industry sub-classifications used by one or more widely recognized market indexes or ratings group indexes, and/or as defined by the investment adviser. These definitions may not apply for purposes of this report, which may combine such industry sub-classifications for reporting ease. |
|
| Derivative Financial Instruments Categorized by Risk Exposure |
For the six months ended June 30, 2016, the effect of derivative financial instruments in the Statement of Operations was as follows:
| | | | | | | | | | | | | | | | | | | | | | | | | | | | |
| | | Commodity
Contracts | | | Credit
Contracts | | | Equity
Contracts | | | Foreign Currency
Exchange Contracts | | | Interest Rate
Contracts | | | Other
Contacts | | | Total | |
Net Realized Gain from: | | | | | | | | | | | | | | | | | | | | | | | | | | | | |
Futures contracts | | | — | | | | — | | | | $90,064 | | | | — | | | | — | | | | — | | | | $90,064 | |
| | | Commodity
Contracts | | | Credit
Contracts | | | Equity
Contracts | | | Foreign Currency
Exchange Contracts | | | Interest Rate
Contracts | | | Other
Contacts | | | Total | |
Net Change in Unrealized Appreciation (Depreciation) on: | | | | | | | | | | | | | | | | | | | | | | | | | | | | |
Futures contracts | | | — | | | | — | | | | $(39,568) | | | | — | | | | — | | | | — | | | | $(39,568) | |
|
| Average Quarterly Balances of Outstanding Derivative Financial Instruments |
| | | | |
Futures contracts: | | | | |
Average notional value of contracts — long | | $ | 1,077,038 | |
For more information about the Fund’s investment risks regarding derivative financial instruments, refer to the Notes to Financial Statements.
See Notes to Financial Statements.
| | | | | | |
| 6 | | BLACKROCK VARIABLE SERIES FUNDS, INC. | | JUNE 30, 2016 | | |
| | | | |
| Schedule of Investments (concluded) | | | BlackRock Large Cap Growth V.I. Fund | |
|
| Fair Value Hierarchy as of Period End |
Various inputs are used in determining the fair value of investments and derivative financial instruments. For information about the Fund’s policy regarding valuation of investments and derivative financial instruments, refer to the Notes to Financial Statements.
The following tables summarize the Fund’s investments and derivative financial instruments categorized in the disclosure hierarchy:
| | | | | | | | | | | | | | | | |
| | | Level 1 | | | Level 2 | | | Level 3 | | | Total | |
Assets: | | | | | | | | | | | | | | | | |
Investments: | | | | | | | | | | | | | | | | |
Long-Term Investments: | | | | | | | | | | | | | | | | |
Common Stocks1 | | $ | 121,278,158 | | | | — | | | | — | | | $ | 121,278,158 | |
Short-Term Securities | | | 184,081 | | | $ | 5,309,142 | | | | — | | | | 5,493,223 | |
| | | | |
Total | | $ | 121,462,239 | | | $ | 5,309,142 | | | | — | | | $ | 126,771,381 | |
| | | | |
1 See above Schedule of Investments for values in each industry. | | | | | | | | | | | | | | | | |
The Fund may hold assets and/or liabilities in which the fair value approximates the carrying amount for financial statement purposes. As of period end, collateral on securities loaned at value of $5,309,142 is categorized as Level 2 within the disclosure hierarchy.
During the six months ended June 30, 2016, there were no transfers between levels.
See Notes to Financial Statements.
| | | | | | |
| | | BLACKROCK VARIABLE SERIES FUNDS, INC. | | JUNE 30, 2016 | | 7 |
| | | | |
| Statement of Assets and Liabilities | | | | |
| | | | |
| June 30, 2016 (unaudited) | | BlackRock
Large Cap Growth V.I. Fund | |
| | | | |
| Assets | | | | |
Investments at value — unaffiliated (including securities loaned at value of $5,291,595) (cost — $99,204,409) | | $ | 121,278,158 | |
Investments at value — affiliated (cost — $5,493,223) | | | 5,493,223 | |
Receivables: | | | | |
Investments sold | | | 1,732,503 | |
Securities lending income — affiliated | | | 1,708 | |
Capital shares sold | | | 3,958 | |
Dividends — affiliated | | | 647 | |
Dividends — unaffiliated | | | 142,570 | |
From the Manager | | | 29,451 | |
Prepaid expenses | | | 302 | |
| | | | |
Total assets | | | 128,682,520 | |
| | | | |
| | | | |
| Liabilities | | | | |
Collateral on securities loaned at value | | | 5,309,142 | |
Payables: | | | | |
Investments purchased | | | 97,989 | |
Capital shares redeemed | | | 68,924 | |
Distribution fees | | | 7,292 | |
Investment advisory fees | | | 66,926 | |
Officer’s and Directors’ fees | | | 2,570 | |
Other accrued expenses | | | 14,481 | |
Other affiliates | | | 700 | |
Professional fees | | | 19,787 | |
Transfer agent fees | | | 77,007 | |
| | | | |
Total liabilities | | | 5,664,818 | |
| | | | |
Net Assets | | $ | 123,017,702 | |
| | | | |
| | | | |
| Net Assets Consist of | | | | |
Paid-in capital | | $ | 96,005,029 | |
Undistributed net investment income | | | 414,819 | |
Accumulated net realized gain | | | 4,524,105 | |
Net unrealized appreciation (depreciation) | | | 22,073,749 | |
| | | | |
Net Assets | | $ | 123,017,702 | |
| | | | |
| | | | |
| Net Asset Value | | | | |
Class I — Based on net assets of $87,080,668 and 6,476,599 shares outstanding, 100 million shares authorized, $0.10 par value | | $ | 13.45 | |
| | | | |
Class III — Based on net assets of $35,937,034 and 2,695,448 shares outstanding, 100 million shares authorized, $0.10 par value | | $ | 13.33 | |
| | | | |
See Notes to Financial Statements.
| | | | | | |
| 8 | | BLACKROCK VARIABLE SERIES FUNDS, INC. | | JUNE 30, 2016 | | |
| | | | |
| Six Months Ended June 30, 2016 (unaudited) | | BlackRock
Large Cap
Growth V.I. Fund | |
| | | | |
| Investment Income | | | | |
Dividends — unaffiliated | | $ | 969,297 | |
Securities lending — affiliated — net | | | 7,963 | |
Dividends — affiliated | | | 7,593 | |
Foreign taxes withheld | | | (2,840 | ) |
| | | | |
Total income | | | 982,013 | |
| | | | |
| | | | |
| Expenses | | | | |
Investment advisory | | | 414,982 | |
Transfer agent | | | 2,418 | |
Transfer agent — class specific | | | 130,353 | |
Distribution — class specific | | | 44,405 | |
Professional | | | 22,148 | |
Accounting services | | | 16,581 | |
Officer and Directors | | | 10,457 | |
Printing | | | 8,643 | |
Custodian | | | 3,845 | |
Miscellaneous | | | 5,070 | |
| | | | |
Total expenses | | | 658,902 | |
Less: | | | | |
Fees waived by the Manager | | | (1,368 | ) |
Transfer agent fees reimbursed — class specific | | | (85,541 | ) |
| | | | |
Total expenses after fees waived and/or reimbursed | | | 571,993 | |
| | | | |
Net investment income | | | 410,020 | |
| | | | |
| | | | |
| Realized and Unrealized Gain (Loss) | | | | |
Net realized gain from: | | | | |
Investments | | | 4,495,439 | |
Futures contracts | | | 90,064 | |
| | | | |
| | | 4,585,503 | |
| | | | |
Net change in unrealized appreciation (depreciation) on: | | | | |
Investments | | | (6,605,164 | ) |
Futures contracts | | | (39,568 | ) |
| | | | |
| | | (6,644,732 | ) |
| | | | |
Total realized and unrealized loss | | | (2,059,229 | ) |
| | | | |
Net Decrease in Net Assets Resulting from Operations | | $ | (1,649,209 | ) |
| | | | |
See Notes to Financial Statements.
| | | | | | |
| | | BLACKROCK VARIABLE SERIES FUNDS, INC. | | JUNE 30, 2016 | | 9 |
| | | | |
| Statements of Changes in Net Assets | | | BlackRock Large Cap Growth V.I. Fund | |
| | | | | | | | |
| Increase (Decrease) in Net Assets: | | Six Months
Ended June 30, 2016
(Unaudited) | | | Year Ended
December 31,
2015 | |
| | | | | | | | |
| Operations | | | | | | | | |
Net investment income | | $ | 410,020 | | | $ | 736,453 | |
Net realized gain | | | 4,585,503 | | | | 6,419,484 | |
Net change in unrealized appreciation (depreciation) | | | (6,644,732 | ) | | | (3,326,946 | ) |
| | | | |
Net increase (decrease) in net assets resulting from operations | | | (1,649,209 | ) | | | 3,828,991 | |
| | | | |
| | | | | | | | |
| Distributions to Shareholders1 | | | | | | | | |
From net investment income: | | | | | | | | |
Class I | | | — | | | | (597,684 | ) |
Class III | | | — | | | | (142,881 | ) |
From net realized gain: | | | | | | | | |
Class I | | | — | | | | (5,506,016 | ) |
Class III | | | — | | | | (2,107,188 | ) |
| | | | |
Decrease in net assets resulting from distributions to shareholders | | | — | | | | (8,353,769 | ) |
| | | | |
| | | | | | | | |
| Capital Share Transactions | | | | | | | | |
Net increase (decrease) in net assets derived from capital share transactions | | | (11,635,480 | ) | | | 408,212 | |
| | | | |
| | | | | | | | |
| Net Assets | | | | | | | | |
Total decrease in net assets | | | (13,284,689 | ) | | | (4,116,566 | ) |
Beginning of period | | | 136,302,391 | | | | 140,418,957 | |
| | | | |
End of period | | $ | 123,017,702 | | | $ | 136,302,391 | |
| | | | |
Undistributed net investment income, end of period | | $ | 414,819 | | | $ | 4,799 | |
| | | | |
| | 1 | | Distributions for annual periods determined in accordance with federal income tax regulations. |
See Notes to Financial Statements.
| | | | | | |
| 10 | | BLACKROCK VARIABLE SERIES FUNDS, INC. | | JUNE 30, 2016 | | |
| | | | |
| Financial Highlights | | | BlackRock Large Cap Growth V.I. Fund | |
| | | | | | | | | | | | | | | | | | | | | | | | |
| | | Class I | |
| | | Six Months
Ended
June 30, 2016
(Unaudited) | | | Year Ended December 31, | |
| | | | 2015 | | | 2014 | | | 2013 | | | 2012 | | | 2011 | |
| Per Share Operating Performance | | | | | | | | | | | | | | | | | | | | | | | | |
Net asset value, beginning of period | | $ | 13.59 | | | $ | 14.08 | | | $ | 14.22 | | | $ | 11.54 | | | $ | 10.99 | | | $ | 10.84 | |
| | | | |
Net investment income1 | | | 0.05 | | | | 0.08 | | | | 0.09 | | | | 0.09 | | | | 0.17 | | | | 0.09 | |
Net realized and unrealized gain (loss) | | | (0.19 | ) | | | 0.31 | | | | 1.92 | | | | 3.82 | | | | 1.48 | | | | 0.19 | |
| | | | |
Net increase (decrease) from investment operations | | | (0.14 | ) | | | 0.39 | | | | 2.01 | | | | 3.91 | | | | 1.65 | | | | 0.28 | |
| | | | |
Distributions:2 | | | | | | | | | | | | | | | | | | | | | | | | |
From net investment income | | | — | | | | (0.09 | ) | | | (0.08 | ) | | | (0.10 | ) | | | (0.18 | ) | | | (0.10 | ) |
From net realized gain | | | — | | | | (0.79 | ) | | | (2.07 | ) | | | (1.13 | ) | | | (0.92 | ) | | | (0.03 | ) |
| | | | |
Total distributions | | | — | | | | (0.88 | ) | | | (2.15 | ) | | | (1.23 | ) | | | (1.10 | ) | | | (0.13 | ) |
| | | | |
Net asset value, end of period | | $ | 13.45 | | | $ | 13.59 | | | $ | 14.08 | | | $ | 14.22 | | | $ | 11.54 | | | $ | 10.99 | |
| | | | |
| | | | | | | | | | | | | | | | | | | | | | | | |
| Total Return3 | | | | | | | | | | | | | | | | | | | | | | | | |
Based on net asset value | | | (1.03 | )%4 | | | 2.73 | % | | | 14.16 | % | | | 33.92 | % | | | 15.22 | % | | | 2.55 | % |
| | | | |
| | | | | | | | | | | | | | | | | | | | | | | | |
| Ratios to Average Net Assets | | | | | | | | | | | | | | | | | | | | | | | | |
Total expenses | | | 0.96 | %5 | | | 0.95 | % | | | 0.96 | % | | | 0.97 | % | | | 0.91 | % | | | 0.78 | % |
| | | | |
Total expenses after fees waived and/or reimbursed | | | 0.83 | %5 | | | 0.82 | % | | | 0.83 | % | | | 0.84 | % | | | 0.82 | % | | | 0.78 | % |
| | | | |
Net investment income | | | 0.71 | %5 | | | 0.59 | % | | | 0.57 | % | | | 0.70 | % | | | 1.38 | % | | | 0.81 | % |
| | | | |
| | | | | | | | | | | | | | | | | | | | | | | | |
| Supplemental Data | | | | | | | | | | | | | | | | | | | | | | | | |
Net assets, end of period (000) | | $ | 87,081 | | | $ | 98,485 | | | $ | 108,329 | | | $ | 107,378 | | | $ | 91,778 | | | $ | 90,543 | |
| | | | |
Portfolio turnover rate | | | 21 | % | | | 35 | % | | | 51 | % | | | 36 | % | | | 102 | % | | | 106 | % |
| | | | |
| | 1 | | Based on average shares outstanding. |
| | 2 | | Distributions for annual periods determined in accordance with federal income tax regulations. |
| | 3 | | Where applicable, excludes insurance-related fees and expenses and assumes the reinvestment of distributions. |
| | 4 | | Aggregate total return. |
See Notes to Financial Statements.
| | | | | | |
| | | BLACKROCK VARIABLE SERIES FUNDS, INC. | | JUNE 30, 2016 | | 11 |
| | | | |
| Financial Highlights (concluded) | | | BlackRock Large Cap Growth V.I. Fund | |
| | | | | | | | | | | | | | | | | | | | | | | | |
| | | Class III | |
| | | Six Months
Ended
June 30, 2016 (Unaudited) | | | Year Ended December 31, | |
| | | | 2015 | | | 2014 | | | 2013 | | | 2012 | | | 2011 | |
| Per Share Operating Performance | | | | | | | | | | | | | | | | | | | | | | | | |
Net asset value, beginning of period | | $ | 13.50 | | | $ | 13.99 | | | $ | 14.14 | | | $ | 11.49 | | | $ | 10.96 | | | $ | 10.81 | |
| | | | |
Net investment income1 | | | 0.03 | | | | 0.05 | | | | 0.05 | | | | 0.06 | | | | 0.14 | | | | 0.07 | |
Net realized and unrealized gain (loss) | | | (0.20 | ) | | | 0.30 | | | | 1.92 | | | | 3.79 | | | | 1.46 | | | | 0.19 | |
| | | | |
Net increase (decrease) from investment operations | | | (0.17 | ) | | | 0.35 | | | | 1.97 | | | | 3.85 | | | | 1.60 | | | | 0.26 | |
| | | | |
Distributions:2 | | | | | | | | | | | | | | | | | | | | | | | | |
From net investment income | | | — | | | | (0.05 | ) | | | (0.05 | ) | | | (0.07 | ) | | | (0.15 | ) | | | (0.08 | ) |
From net realized gain | | | — | | | | (0.79 | ) | | | (2.07 | ) | | | (1.13 | ) | | | (0.92 | ) | | | (0.03 | ) |
| | | | |
Total distributions | | | — | | | | (0.84 | ) | | | (2.12 | ) | | | (1.20 | ) | | | (1.07 | ) | | | (0.11 | ) |
| | | | |
Net asset value, end of period | | $ | 13.33 | | | $ | 13.50 | | | $ | 13.99 | | | $ | 14.14 | | | $ | 11.49 | | | $ | 10.96 | |
| | | | |
| | | | | | | | | | | | | | | | | | | | | | | | |
| Total Return3 | | | | | | | | | | | | | | | | | | | | | | | | |
Based on net asset value | | | (1.26 | )%4 | | | 2.51 | % | | | 13.96 | % | | | 33.58 | % | | | 14.82 | % | | | 2.33 | % |
| | | | |
| | | | | | | | | | | | | | | | | | | | | | | | |
| Ratios to Average Net Assets | | | | | | | | | | | | | | | | | | | | | | | | |
Total expenses | | | 1.22 | %5 | | | 1.21 | % | | | 1.22 | % | | | 1.22 | % | | | 1.16 | % | | | 1.03 | % |
| | | | |
Total expenses after fees waived and/or reimbursed | | | 1.08 | %5 | | | 1.07 | % | | | 1.09 | % | | | 1.09 | % | | | 1.08 | % | | | 1.03 | % |
| | | | |
Net investment income | | | 0.46 | %5 | | | 0.35 | % | | | 0.32 | % | | | 0.45 | % | | | 1.16 | % | | | 0.65 | % |
| | | | |
| | | | | | | | | | | | | | | | | | | | | | | | |
| Supplemental Data | | | | | | | | | | | | | | | | | | | | | | | | |
Net assets, end of period (000) | | $ | 35,937 | | | $ | 37,818 | | | $ | 32,090 | | | $ | 20,864 | | | $ | 11,528 | | | $ | 8,677 | |
| | | | |
Portfolio turnover rate | | | 21 | % | | | 35 | % | | | 51 | % | | | 36 | % | | | 102 | % | | | 106 | % |
| | | | |
| | 1 | | Based on average shares outstanding. |
| | 2 | | Distributions for annual periods determined in accordance with federal income tax regulations. |
| | 3 | | Where applicable, excludes insurance-related fees and expenses and assumes the reinvestment of distributions. |
| | 4 | | Aggregate total return. |
See Notes to Financial Statements.
| | | | | | |
| 12 | | BLACKROCK VARIABLE SERIES FUNDS, INC. | | JUNE 30, 2016 | | |
| | | | |
| Notes to Financial Statements (Unaudited) | | | BlackRock Large Cap Growth V.I. Fund | |
1. Organization:
BlackRock Variable Series Funds, Inc. (the “Company”) is registered under the Investment Company Act of 1940, as amended (the “1940 Act”), as an open-end management investment company. The Company is organized as a Maryland corporation that is comprised of 20 separate funds. The funds offer shares to insurance companies for their separate accounts to fund benefits under certain variable annuity and variable life insurance contracts. The financial statements presented are for BlackRock Large Cap Growth V.I. Fund (the “Fund”). The Fund is classified as diversified. Class I and Class III Shares have equal voting, dividend, liquidation and other rights, except that only shares of the respective classes are entitled to vote on matters concerning only that class. In addition, Class III Shares bear certain expenses related to the distribution of such shares.
The Fund, together with certain other registered investment companies advised by BlackRock Advisors, LLC (the “Manager”) or its affiliates, is included in a complex of open-end funds referred to as the Equity-Bond Complex.
2. Significant Accounting Policies:
The financial statements are prepared in conformity with accounting principles generally accepted in the United States of America (“U.S. GAAP”), which may require management to make estimates and assumptions that affect the reported amounts of assets and liabilities in the financial statements, disclosure of contingent assets and liabilities at the date of the financial statements and the reported amounts of increases and decreases in net assets from operations during the reporting period. Actual results could differ from those estimates. The Fund is considered an investment company under U.S. GAAP and follows the accounting and reporting guidance applicable to investment companies. Below is a summary of significant accounting policies:
Segregation and Collateralization: In cases where the Fund enters into certain investments (e.g., futures contracts) that would be treated as “senior securities” for 1940 Act purposes, the Fund may segregate or designate on its books and records cash or liquid assets having a market value at least equal to the amount of the Fund’s future obligations under such investments. Doing so allows the investment to be excluded from treatment as a “senior security.” Furthermore, if required by an exchange or counterparty agreement, the Fund may be required to deliver/deposit cash and/or securities to/with an exchange, or broker-dealer or custodian as collateral for certain investments or obligations.
Investment Transactions and Investment Income: For financial reporting purposes, investment transactions are recorded on the dates the transactions are entered into (the trade dates). Realized gains and losses on investment transactions are determined on the identified cost basis. Dividend income is recorded on the ex-dividend date. Dividends from foreign securities where the ex-dividend date may have passed are subsequently recorded when the Fund is informed of the ex-dividend date. Under the applicable foreign tax laws, a withholding tax at various rates may be imposed on capital gains, dividends and interest. Income, expenses and realized and unrealized gains and losses are allocated daily to each class based on its relative net assets.
Distributions: Distributions paid by the Fund are recorded on the ex-dividend date. The character and timing of distributions are determined in accordance with federal income tax regulations, which may differ from U.S. GAAP.
Indemnifications: In the normal course of business, the Fund enters into contracts that contain a variety of representations that provide general indemnification. The Fund’s maximum exposure under these arrangements is unknown because it involves future potential claims against the Fund, which cannot be predicted with any certainty.
Other: Expenses directly related to the Fund or its classes are charged to the Fund or the applicable class. Other operating expenses shared by several funds, including other funds managed by the Manager, are prorated among those funds on the basis of relative net assets or other appropriate methods. Expenses directly related to the Fund and other shared expenses prorated to the Fund are allocated daily to each class based on its relative net assets or other appropriate methods.
The Fund has an arrangement with its custodian whereby fees may be reduced by credits earned on uninvested cash balances, which, if applicable, are shown as fees paid indirectly in the Statement of Operations. The custodian imposes fees on overdrawn cash balances, which can be offset by accumulated credits earned or may result in additional custody charges.
3. Investment Valuation and Fair Value Measurements:
Investment Valuation Policies: The Fund’s investments are valued at fair value (also referred to as “market value” within the financial statements) as of the close of trading on the New York Stock Exchange (“NYSE”) (generally 4:00 p.m., Eastern time). U.S. GAAP defines fair value as the price the Fund would receive to sell an asset or pay to transfer a liability in an orderly transaction between market participants at the measurement date. The Fund determines the fair values of its financial instruments using various independent dealers or pricing services under policies approved by the Board of Directors of the Company (the “Board”). The BlackRock Global Valuation Methodologies Committee (the “Global Valuation Committee”) is the committee formed by management to develop global pricing policies and procedures and to oversee the pricing function for all financial instruments.
| | | | | | |
| | | BLACKROCK VARIABLE SERIES FUNDS, INC. | | JUNE 30, 2016 | | 13 |
| | | | |
| Notes to Financial Statements (continued) | | | BlackRock Large Cap Growth V.I. Fund | |
Fair Value Inputs and Methodologies: The following methods (or “techniques”) and inputs are used to establish the fair value of the Fund’s assets and liabilities:
| • | | Equity investments traded on a recognized securities exchange are valued at the official closing price each day, if available. For equity investments traded on more than one exchange, the official close price on the exchange where the stock is primarily traded is used. Equity investments traded on a recognized exchange for which there were no sales on that day may be valued at the last available bid (long positions) or ask (short positions) price. |
| • | | Investments in open-end U.S. mutual funds are valued at net asset value each business day. |
| • | | The Fund values its investment in BlackRock Liquidity Series, LLC, Money Market Series (the “Money Market Series”) at fair value, which is ordinarily based upon its pro rata ownership in the underlying fund’s net assets. The Money Market Series seeks current income consistent with maintaining liquidity and preserving capital. Although the Money Market Series is not registered under the 1940 Act, its investments may follow the parameters of investments by a money market fund that is subject to Rule 2a-7 under the 1940 Act. The Fund may withdraw up to 25% of its investment daily, although the manager of the Money Market Series, in its sole discretion, may permit an investor to withdraw more than 25% on any one day. |
| • | | Futures contracts traded on exchanges are valued at their last sale price. |
If events (e.g., a company announcement, market volatility or a natural disaster) occur that are expected to materially affect the value of such instruments, or in the event that the application of these methods of valuation results in a price for an investment that is deemed not to be representative of the market value of such investment, or if a price is not available, the investment will be valued by the Global Valuation Committee, or its delegate, in accordance with a policy approved by the Board as reflecting fair value (“Fair Valued Investments”). When determining the price for Fair Valued Investments, the Global Valuation Committee, or its delegate, seeks to determine the price that the Fund might reasonably expect to receive or pay from the current sale or purchase of that asset or liability in an arm’s-length transaction. Fair value determinations shall be based upon all available factors that the Global Valuation Committee, or its delegate, deems relevant consistent with the principles of fair value measurement. The pricing of all Fair Valued Investments is subsequently reported to the Board or a committee thereof on a quarterly basis.
Fair Value Hierarchy: Various inputs are used in determining the fair value of investments and derivative financial instruments. These inputs to valuation techniques are categorized into a fair value hierarchy consisting of three broad levels for financial statement purposes as follows:
| • | | Level 1 — unadjusted price quotations in active markets/exchanges for identical assets or liabilities that the Fund has the ability to access |
| • | | Level 2 — other observable inputs (including, but not limited to, quoted prices for similar assets or liabilities in markets that are active, quoted prices for identical or similar assets or liabilities in markets that are not active, inputs other than quoted prices that are observable for the assets or liabilities (such as interest rates, yield curves, volatilities, prepayment speeds, loss severities, credit risks and default rates) or other market–corroborated inputs) |
| • | | Level 3 — unobservable inputs based on the best information available in the circumstances, to the extent observable inputs are not available (including the Fund’s own assumptions used in determining the fair value of investments and derivative financial instruments) |
The hierarchy gives the highest priority to unadjusted quoted prices in active markets for identical assets or liabilities (Level 1 measurements) and the lowest priority to unobservable inputs (Level 3 measurements). Accordingly, the degree of judgment exercised in determining fair value is greatest for instruments categorized in Level 3. The inputs used to measure fair value may fall into different levels of the fair value hierarchy. In such cases, for disclosure purposes, the fair value hierarchy classification is determined based on the lowest level input that is significant to the fair value measurement in its entirety. The significant unobservable inputs used by the Global Valuation Committee in determining the price for Fair Valued Investments and derivative financial instruments are typically categorized as Level 3. The fair value hierarchy for the Fund’s investments and derivative financial instruments has been included in the Schedule of Investments.
Changes in valuation techniques may result in transfers into or out of an assigned level within the hierarchy. In accordance with the Fund’s policy, transfers between different levels of the fair value hierarchy are deemed to have occurred as of the beginning of the reporting period. The categorization ofa value determined for investments and derivative financial instruments is based on the pricing transparency of the investments and derivative financial instruments and is not necessarily an indication of the risks associated with investing in those securities.
4. Securities and Other Investments:
Securities Lending: The Fund may lend its securities to approved borrowers, such as brokers, dealers and other financial institutions. The borrower pledges and maintains with the Fund collateral consisting of cash, an irrevocable letter of credit issued by a bank, or securities issued or guaranteed by
| | | | | | |
| 14 | | BLACKROCK VARIABLE SERIES FUNDS, INC. | | JUNE 30, 2016 | | |
| | | | |
| Notes to Financial Statements (continued) | | | BlackRock Large Cap Growth V.I. Fund | |
the U.S. Government. The initial collateral received by the Fund is required to have a value of at least 102% of the current value of the loaned securities for securities traded on U.S. exchanges and a value of at least 105% for all other securities. The collateral is maintained thereafter, at a value equal to at least 100% of the current market value of the securities on loan. The market value of the loaned securities is determined at the close of each business day of the Fund and any additional required collateral is delivered to the Fund, or excess collateral returned by the Fund, on the next business day. During the term of the loan, the Fund is entitled to all distributions made on or in respect of the loaned securities. Loans of securities are terminable at any time and the borrower, after notice, is required to return borrowed securities within the standard time period for settlement of securities transactions.
The market value of any securities on loan, all of which were classified as common stocks in the Fund’s Schedule of Investments, and the value of any related collateral are shown separately in the Statement of Assets and Liabilities as a component of investments at value — unaffiliated, and collateral on securities loaned at value, respectively. As of period end, any securities on loan were collateralized by cash. The cash collateral invested by the securities lending agent, BlackRock Investment Management, LLC (“BIM”), if any, is disclosed in the Schedule of Investments.
Securities lending transactions are entered into by the Fund under Master Securities Lending Agreements (each, an “MSLA”), which provide the right, in the event of default (including bankruptcy or insolvency), for the non-defaulting party to liquidate the collateral and calculate a net exposure to the defaulting party or request additional collateral. In the event that a borrower defaults, the Fund, as lender, would offset the market value of the collateral received against the market value of the securities loaned. When the value of the collateral is greater than that of the market value of the securities loaned, the lender is left with a net amount payable to the defaulting party. However, bankruptcy or insolvency laws of a particular jurisdiction may impose restrictions on or prohibitions against such a right of offset in the event of an MSLA counterparty’s bankruptcy or insolvency. Under the MSLA, absent an event of default the borrower can resell or re-pledge the loaned securities, and the Fund can reinvest cash collateral received in connection with loaned securities. Upon an event of default, the parties’ obligations to return the securities or collateral to the other party are extinguished, and the parties can resell or re-pledge the loaned securities or the collateral received in connection with the loaned securities in order to satisfy the defaulting party’s net payment obligation for all transactions under the MSLA. The defaulting party remains liable for any deficiency.
As of period end, the following table is a summary of the Fund’s securities lending agreements by counterparty which are subject to offset under an MSLA:
| | | | | | | | | | | | | | | | | | |
| Counterparty | | | | | Securities Loaned at Value | | | Cash Collateral Received1 | | | Net Amount2 | | | |
JP Morgan Securities LLC | | | | | | $ | 2,036,521 | | | $ | (2,035,068 | ) | | | $1,453 | | | |
State Street Bank and Trust Co. | | | | | | | 3,255,074 | | | | (3,255,074 | ) | | | — | | | |
| | | |
Total | | | | | | $ | 5,291,595 | | | $ | (5,290,142 | ) | | | $1,453 | | | |
| | | |
| | 1 | | Collateral with a value of $5,309,142 has been received in connection with securities lending agreements. Collateral received in excess of the value of securities loaned from the individual counterparty is not shown for financial reporting purposes in the table above. |
| | 2 | | The market value of the loaned securities is determined as of June 30, 2016. Additional collateral is delivered to the Fund on the next business day in accordance with the MSLA. The net amount would be subject to the borrower default indemnity in the event of default by the counterparty. |
The risks of securities lending include the risk that the borrower may not provide additional collateral when required or may not return the securities when due. To mitigate these risks, the Fund benefits from a borrower default indemnity provided by BIM. BIM’s indemnity allows for full replacement of the securities loaned if the collateral received does not cover the value on the securities loaned in the event of borrower default. The Fund could suffer a loss if the value of an investment purchased with cash collateral falls below the market value of loaned securities or if the value of an investment purchased with cash collateral falls below the value of the original cash collateral received.
5. Derivative Financial Instruments:
The Fund engages in various portfolio investment strategies using derivative contracts both to increase the returns of the Fund and/or to manage its exposure to certain risks such as credit risk, equity risk, interest rate risk, foreign currency exchange rate risk, commodity price risk or other risks (e.g., inflation risk). Derivative financial instruments categorized by risk exposure are included in the Schedule of Investments. These contracts may be transacted on an exchange or over-the-counter (“OTC”).
Futures Contracts: The Fund invests in long and/or short positions in futures and options on futures contracts to gain exposure to, or manage exposure to changes in interest rates (interest rate risk), changes in the value of equity securities (equity risk) or foreign currencies (foreign currency exchange rate risk).
Futures contracts are agreements between the Fund and a counterparty to buy or sell a specific quantity of an underlying instrument at a specified price and on a specified date. Depending on the terms of a contract, it is settled either through physical delivery of the underlying instrument on the settlement date or by payment of a cash amount on the settlement date. Upon entering into a futures contract, the Fund are required to deposit initial margin with the broker in the form of cash or securities in an amount that varies depending on a contract’s size and risk profile. The initial margin deposit must then be maintained at an established level over the life of the contract.
| | | | | | |
| | | BLACKROCK VARIABLE SERIES FUNDS, INC. | | JUNE 30, 2016 | | 15 |
| | | | |
| Notes to Financial Statements (continued) | | | BlackRock Large Cap Growth V.I. Fund | |
Securities deposited as initial margin are designated in the Schedule of Investments and cash deposited, if any, is shown as cash pledged for futures contracts in the Statement of Assets and Liabilities. Pursuant to the contract, the Fund agrees to receive from or pay to the broker an amount of cash equal to the daily fluctuation in market value of the contract (“variation margin”). Variation margin is recorded as unrealized appreciation (depreciation) and, if any, shown as variation margin receivable (or payable) on futures contracts in the Statement of Assets and Liabilities. When the contract is closed, a realized gain or loss is recorded in the Statement of Operations equal to the difference between the value of the contract at the time it was opened and the value at the time it was closed. The use of futures contracts involves the risk of an imperfect correlation in the movements in the price of futures contracts and interest, foreign currency exchange rates or underlying assets.
6. Investment Advisory Agreement and Other Transactions with Affiliates:
The PNC Financial Services Group, Inc. is the largest stockholder and an affiliate of BlackRock, Inc. (“BlackRock”) for 1940 Act purposes.
Investment Advisory
The Company, on behalf of the Fund, entered into an Investment Advisory Agreement with the Manager, the Fund’s investment adviser, an indirect, wholly owned subsidiary of BlackRock, to provide investment advisory and administration services. The Manager is responsible for the management of the Fund’s portfolio and provides the personnel, facilities, equipment and certain other services necessary to the operations of the Fund. For such services, the Fund pays the Manager a monthly fee, which is determined by calculating a percentage of the Fund’s average daily net assets based on the following annual rates:
| | | | |
| Average Daily Net Assets | | Investment
Advisory Fee | |
First $1 Billion | | | 0.65% | |
$1 Billion - $3 Billion | | | 0.61% | |
$3 Billion - $5 Billion | | | 0.59% | |
$5 Billion - $10 Billion | | | 0.57% | |
Greater than $10 Billion | | | 0.55% | |
Distribution Fees
The Company, on behalf of the Fund, entered into a Distribution Agreement and a Distribution Plan with BlackRock Investments, LLC (“BRIL”), an affiliate of the Manager. Pursuant to the Distribution Plan and in accordance with Rule 12b-1 under the 1940 Act, the Fund pays BRIL ongoing distribution fees. The fees are accrued daily and paid monthly at an annual rate of 0.25% based upon the average daily net assets attributable to Class III.
For the six months ended June 30, 2016, the class specific distribution fees borne directly by Class III were $44,405.
Transfer Agent
The Manager, on behalf of the Fund, entered into agreements with insurance companies and other financial intermediaries (“Service Organizations”), some of which may be affiliates. Pursuant to these agreements, the Service Organizations provide the Fund with administrative, networking, recordkeeping, sub-transfer agency and shareholder services to sub-accounts they service. For these services, the Service Organizations receive an annual fee per shareholder account, which will vary depending on share class and/or net assets of Fund shareholders serviced by the Service Organizations, which is shown as transfer agent — class specific. For the six months ended June 30, 2016, the Fund paid the following amounts to affiliates in return for these services, which is included in transfer agent — class specific in the Statement of Operations:
| | | | | | | | |
| Class I | | Class III | | | Total | |
| $93,653 | | $ | 36,700 | | | $ | 130,353 | |
In addition, the Fund pays the transfer agent, which is not an affiliate, a fee for issuance, transfer and redemption of shares and the opening and maintenance of shareholder accounts, which is included in transfer agent in the Statement of Operations.
Expense Limitations, Waivers and Reimbursements
The Manager, with respect to the Fund, contractually agreed to waive and/or reimburse fees or expenses in order to limit expenses, excluding interest expense, dividend expense, tax expense, acquired fund fees and expenses, and certain other fund expenses, which constitute extraordinary expenses not incurred in the ordinary course of the Fund’s business. The expense limitations as a percentage of average daily net assets are as follows:
| | | | |
Class I | | | 1.25 | % |
Class III | | | 1.50 | % |
| | | | | | |
| 16 | | BLACKROCK VARIABLE SERIES FUNDS, INC. | | JUNE 30, 2016 | | |
| | | | |
| Notes to Financial Statements (continued) | | | BlackRock Large Cap Growth V.I. Fund | |
The Manager has agreed not to reduce or discontinue this contractual expense limitation prior to May 1, 2017, unless approved by the Board, including a majority of the Independent Directors who are not “interested persons” of the Fund, as defined in the 1940 Act (“Independent Directors”) or by a majority of the outstanding voting securities of the Fund.
The Manager, with respect to the Fund, voluntarily agreed to waive its investment advisory fees by the amount of investment advisory fees the Fund pays to the Manager indirectly through its investment in affiliated money market funds. This amount is included in fees waived by the Manager in the Statement of Operations. However, the Manager does not waive its investment advisory fees by the amount of investment advisory fees paid in connection with the Fund’s investments in other affiliated investment companies, if any. For the six months ended June 30, 2016, the amount waived was $1,368.
The Manager has contractually agreed to reimburse transfer agent fees in order to limit such expenses to a percentage of average daily net assets as follows:
| | | | |
Class I | | | 0.07 | % |
Class III | | | 0.07 | % |
The Manager has agreed not to reduce or discontinue this contractual reimbursement prior to May 1, 2017 unless approved by the Board, including a majority of the Independent Directors or by a majority of the outstanding voting securities of the Fund.
These amounts are shown as transfer agent fees reimbursed — class specific in the Statement of Operation. Class specific expense waivers and/or reimbursements are as follows:
| | | | | | | | |
| | | Class I | | Class III | | | Total | |
Transfer Agent Fees Reimbursed | | $61,308 | | $24,233 | | $ | 85,541 | |
For the six months ended June 30, 2016, the Fund reimbursed the Manager $718 for certain accounting services, which is included in accounting services in the Statement of Operations.
Securities Lending
The U.S. Securities and Exchange Commission has issued an exemptive order which permits BIM, an affiliate of the Manager, to serve as securities lending agent for the Fund subject to applicable conditions. As securities lending agent, BIM bears all operational costs directly related to securities lending. The Fund is responsible for expenses in connection with the investment of cash collateral received for securities on loan (the “collateral investment expenses”). The cash collateral is invested in a private investment company managed by the Manager or its affiliates. However, BIM has agreed to cap the collateral investment expenses of the private investment company to an annual rate of 0.04%. The investment adviser to the private investment company will not charge any advisory fees with respect to shares purchased by the Fund.
Securities lending income is equal to the total of income earned from the reinvestment of cash collateral, net of fees and other payments to and from borrowers of securities, and less the collateral investment expenses. The Fund retains a portion of securities lending income and remits a remaining portion to BIM as compensation for its services as securities lending agent.
Pursuant to a securities lending agreement, the Fund retains 71.5% of securities lending income, and this amount retained can never be less than 65% of the total of securities lending income plus the collateral investment expenses.
In addition, commencing the business day following the date that the aggregate securities lending income earned across the Equity-Bond Complex in a calendar year exceeds a specified threshold, the Fund, pursuant to the securities lending agreement, will retain for the remainder of that calendar year securities lending income as follows: 75% of securities lending income, and this amount retained can never be less than 65% of the total of securities lending income plus the collateral investment expenses.
The share of securities lending income earned by the Fund is shown as securities lending — affiliated — net in the Statement of Operations. For the six months ended June 30, 2016, the Fund paid BIM $2,865 for securities lending agent services.
| | | | | | |
| | | BLACKROCK VARIABLE SERIES FUNDS, INC. | | JUNE 30, 2016 | | 17 |
| | | | |
| Notes to Financial Statements (continued) | | | BlackRock Large Cap Growth V.I. Fund | |
Officers and Directors
Certain officers and/or directors of the Company are officers and/or directors of BlackRock or its affiliates. The Fund reimburses the Manager for a portion of the compensation paid to the Company’s Chief Compliance Officer, which is included in Officer and Directors in the Statement of Operations.
7. Purchases and Sales:
For the six months ended June 30, 2016, purchases and sales of investments, excluding short-term securities, were $25,932,873 and $35,683,937, respectively.
8. Income Tax Information:
It is the Fund’s policy to comply with the requirements of the Internal Revenue Code of 1986, as amended, applicable to regulated investment companies, and to distribute substantially all of its taxable income to its shareholders. Therefore, no federal income tax provision is required.
The Fund files U.S. federal and various state and local tax returns. No income tax returns are currently under examination. The statute of limitations on the Fund’s U.S. federal tax returns generally remains open for each of the four years ended December 31, 2015. The statutes of limitations on the Fund’s state and local tax returns may remain open for an additional year depending upon the jurisdiction.
Management has analyzed tax laws and regulations and their application to the Fund as of June 30, 2016, inclusive of the open tax return years, and does not believe there are any uncertain tax positions that require recognition of a tax liability in the Fund’s financial statements.
As of June 30, 2016, gross unrealized appreciation and depreciation based on cost for federal income tax purposes were as follows:
| | | | |
Tax cost | | $ | 104,882,295 | |
| | | | |
Gross unrealized appreciation | | $ | 24,738,855 | |
Gross unrealized depreciation | | | (2,849,769 | ) |
| | | | |
Net unrealized appreciation | | $ | 21,889,086 | |
| | | | |
9. Bank Borrowings:
The Company, on behalf of the Fund, along with certain other funds managed by the Manager and its affiliates (“Participating Funds”), is a party to a 364-day, $2.1 billion credit agreement with a group of lenders. Under this agreement, the Fund may borrow to fund shareholder redemptions. Excluding commitments designated for certain individual funds, the Participating Funds, including the Fund, can borrow up to an aggregate commitment amount of $1.6 billion at any time outstanding, subject to asset coverage and other limitations as specified in the agreement. The credit agreement has the following terms: a fee of 0.12% per annum on unused commitment amounts and interest at a rate equal to the higher of (a) one-month LIBOR (but, in any event, not less than 0.00%) on the date the loan is made plus 0.80% per annum or (b) the Fed Funds rate (but, in any event, not less than 0.00%) in effect from time to time plus 0.80% per annum on amounts borrowed. The agreement expires in April 2017 unless extended or renewed. Prior to April 21, 2016, the credit agreement had a fee per annum of 0.06% on unused commitment amounts and interest at a rate equal to the higher of (a) one-month LIBOR (but, in any event, not less than 0.00%) on the date the loan is made plus 0.80% per annum or (b) the Fed Funds rate (but, in any event, not less than 0.00%) in effect from time to time plus 0.80% per annum on amounts borrowed. Participating Funds paid administration, legal and arrangement fees, which, if applicable, are included in miscellaneous expenses in the Statement of Operations. These fees were allocated among such funds based upon portions of the aggregate commitment available to them and relative net assets of Participating Funds. During the six months ended June 30, 2016, the Fund did not borrow under the credit agreement.
10. Principal Risks:
In the normal course of business, the Fund invests in securities and enters into transactions where risks exist due to fluctuations in the market (market risk) or failure of the issuer to meet all its obligations, including the ability to pay principal and interest when due (issuer credit risk). The value of securities held by the Fund may decline in response to certain events, including those directly involving the issuers of securities owned by the Fund. Changes arising from the general economy, the overall market and local, regional or global political or/and social instability, as well as currency, interest rate and price fluctuations, may also affect the securities’ value.
Counterparty Credit Risk: Similar to issuer credit risk, the Fund may be exposed to counterparty credit risk, or the risk that an entity may fail to or be unable to perform on its commitments related to unsettled or open transactions. The Fund manages counterparty credit risk by entering into transactions only with counterparties that the Manager believes have the financial resources to honor their obligations and by monitoring the financial stability of those counterparties. Financial assets, which potentially expose the Funds to market, issuer and counterparty credit risks, consist principally of financial instruments and receivables due from counterparties. The extent of the Fund’s exposure to market, issuer and counterparty credit risks with respect to these financial assets is approximately their value recorded in the Statement of Assets and Liabilities, less any collateral held by the Fund.
| | | | | | |
| 18 | | BLACKROCK VARIABLE SERIES FUNDS, INC. | | JUNE 30, 2016 | | |
| | | | |
| Notes to Financial Statements (concluded) | | | BlackRock Large Cap Growth V.I. Fund | |
A derivative contract may suffer a mark-to-market loss if the value of the contract decreases due to an unfavorable change in the market rates or values of the underlying instrument. Losses can also occur if the counterparty does not perform under the contract.
With exchange-traded futures, there is less counterparty credit risk to the Fund since the exchange or clearinghouse, as counterparty to such instruments, guarantees against a possible default. The clearinghouse stands between the buyer and the seller of the contract; therefore, credit risk is limited to failure of the clearinghouse. While offset rights may exist under applicable law, the Fund does not have a contractual right of offset against a clearing broker or clearinghouse in the event of a default (including the bankruptcy or insolvency). Additionally, credit risk exists in exchange-traded futures with respect to initial and variation margin that is held in a clearing broker’s customer accounts. While clearing brokers are required to segregate customer margin from their own assets, in the event that a clearing broker becomes insolvent or goes into bankruptcy and at that time there is a shortfall in the aggregate amount of margin held by the clearing broker for all its clients, typically the shortfall would be allocated on a pro rata basis across all the clearing broker’s customers, potentially resulting in losses to the Fund.
Concentration Risk: As of period end, the Fund invested a significant portion of its assets in securities in the information technology sector. Changes in economic conditions affecting such sector would have a greater impact on the Fund and could affect the value, income and/or liquidity of positions in such securities.
11. Capital Share Transactions:
Transactions in capital shares for each class were as follows:
| | | | | | | | | | | | | | | | | | | | |
| | | Six Months Ended
June 30, 2016 | | Year Ended
December 31, 2015 |
| | | Shares | | | Amount | | | | | Shares | | | Amount | | | |
Class l | | | | | | | | | | | | | | | | | | | | |
Shares sold | | | 137,036 | | | $ | 1,799,369 | | | | | | 291,593 | | | $ | 4,171,239 | | | |
Shares issued in reinvestment of distributions | | | — | | | | — | | | | | | 441,977 | | | | 6,103,700 | | | |
Shares redeemed | | | (904,792 | ) | | | (12,055,227 | ) | | | | | (1,180,358 | ) | | | (16,844,312 | ) | | |
| | | | | | |
Net decrease | | | (767,756 | ) | | $ | (10,255,858 | ) | | | | | (446,788 | ) | | $ | (6,569,373 | ) | | |
| | | | | | |
| | | | | | | | | | | | | | | | | | | | |
Class lll | | | | | | | | | | | | | | | | | | | | |
Shares sold | | | 357,404 | | | $ | 4,564,805 | | | | | | 1,229,537 | | | $ | 17,336,452 | | | |
Shares issued in reinvestment of distributions | | | — | | | | — | | | | | | 164,216 | | | | 2,250,069 | | | |
Shares redeemed | | | (463,638 | ) | | | (5,944,427 | ) | | | | | (885,404 | ) | | | (12,608,936 | ) | | |
| | | | | | |
Net increase (decrease) | | | (106,234 | ) | | $ | (1,379,622 | ) | | | | | 508,349 | | | $ | 6,977,585 | | | |
| | | | | | |
Total Net Increase (Decrease) | | | (873,990 | ) | | $ | (11,635,480 | ) | | | | | 61,561 | | | $ | 408,212 | | | |
| | | | | | |
12. Subsequent Events:
Management’s evaluation of the impact of all subsequent events on the Fund’s financial statements was completed through the date the financial statements were issued and the following item was noted:
The Fund paid a net investment income and a long-term capital gain distribution in the following amounts per share on July 22, 2016 to shareholders of record on July 20, 2016:
| | | | |
| | | Net Investment
Income | | Long-Term
Capital Gain |
Class I | | $0.000280 | | $0.018157 |
Class III | | $0.000280 | | $0.018157 |
| | | | | | |
| | | BLACKROCK VARIABLE SERIES FUNDS, INC. | | JUNE 30, 2016 | | 19 |
JUNE 30, 2016
| | | | |
SEMI-ANNUAL REPORT (UNAUDITED) | | | | BLACKROCK® |
BlackRock Variable Series Funds, Inc.
▶ BlackRock Large Cap Value V.I. Fund
| | |
| Not FDIC Insured ¡ May Lose Value ¡ No Bank Guarantee | | |
| | | | |
| Fund Summary as of June 30, 2016 | | | BlackRock Large Cap Value V.I. Fund | |
BlackRock Large Cap Value V.I. Fund’s (the “Fund”) investment objective is to seek long-term capital growth.
|
| Portfolio Management Commentary |
How did the Fund perform?
| • | | For the six-month period ended June 30, 2016, the Fund underperformed its benchmark, the Russell 1000® Value Index. |
What factors influenced performance?
| • | | Financials was the prime detractor from relative performance. Bank holdings, including Bank of America Corp. and Citigroup Inc., underperformed early in 2016 on speculation that low commodity prices would weigh further on inflation expectations and credit markets. At the same time, market volatility and uncertainty led to a sharp slowdown in mergers & acquisitions, equity & debt underwriting and trading activity, which resulted in negatively revised expectations for bank earnings reports. More recently, the group experienced weakness as the Brexit result exacerbated the concern around lower long-term rates and the perpetual Fed waiting game. Elsewhere in the sector, insurance was a drag, as was an underweight to real estate investment trusts (“REITs”). |
| • | | Consumer discretionary also hindered relative returns in the period. Cruise operator Carnival Corp. underperformed as rising oil prices are expected to modestly pressure the company’s near-term earnings. Moreover, recent terrorist incidents have continued to weigh on US-sourced demand for European cruises. Auto components holdings Lear Corp. and Goodyear Tire & Rubber Co. also weighed in the sector. Lear underperformed on concerns around peaking domestic auto sales, while Goodyear Tire & Rubber fell on in-line first-quarter earnings results that failed to meet elevated investor expectations. |
| • | | Health care was an added source of weakness, most notably the position in Teva Pharmaceutical Industries Ltd. The broader generics space has been under extreme pressure, with rival companies seeing high rates of deflation in their businesses, which has caused contagion to Teva. Concerns that the acquisition of Allergan’s generics unit will be delayed also dampened sentiment for the shares, though the timing has little fundamental impact as long as the deal closes. |
| • | | Elsewhere, the Fund’s long-standing underweight to stability/bond proxies, especially utilities and telecommunication services, proved disadvantageous in the six months. The sectors significantly outperformed amid the broad flight to safety in the period, with investors’ search for yield in the lower for longer interest rate environment lending additional support. |
| • | | On the positive side, managed-care holding UnitedHealth Group Inc. was a top contributor. Managed-care stocks broadly performed well on continued strong fundamentals. The companies appear to be managing cost trends well, and pricing remains solid in the majority of businesses. Though the healthcare exchanges continue to struggle, UnitedHealth has almost entirely withdrawn from these markets to address investor concerns. Positive developments in its services arm, Optum, further supported UnitedHealth shares as the unit won several high-profile contracts from CVS, aided by its new partnership with Walgreens Boots Alliance. |
| • | | Select holdings within the consumer sectors also added value. Tobacco holding Altria Group Inc. gained as the company delivered solid earnings upside and maintained 2016 earnings growth guidance of 7% — 9%. The stock was also a beneficiary of the broader flight to high-yielding dividend growers in the period. Media name Comcast Corp. outperformed on better than expected earnings results. The company delivered the best subscriber growth numbers (in both video and high speed data) in over eight years, confirming it is gaining share despite fears that competition from over-the-top (internet-based distribution) is driving accelerated “cord cutting”. In addition, Comcast’s operations, profits and free cash flow generation were increasingly attractive to investors seeking stability and total yield. |
| • | | Information technology (“IT”) holding NVIDIA Corp. was an additional standout in the period. The company delivered strong quarterly results, driven by 17% gaming growth, despite tough comparisons and ahead of a new product cycle. Also notable, datacenter growth accelerated and automotive demand remains robust. An underweight to poor-performing Wells Fargo & Co. benefited as well. |
Describe recent portfolio activity.
| • | | Due to a combination of portfolio trading activity and market movement during the six-month period, the Fund’s exposure to the health care sector increased, particularly within pharmaceuticals and biotechnology. Exposure to energy and materials also increased. The largest reduction was in financials, largely with respect to banks and insurance. Industrials exposure also declined. |
Describe portfolio positioning at period end.
| • | | Relative to the Russell 1000® Value Index, the Fund ended the period with its largest sector overweights in health care, consumer discretionary and IT. Financials (primarily REITs), utilities and telecommunication services were the most significant underweights. |
The views expressed reflect the opinions of BlackRock as of the date of this report and are subject to change based on changes in market, economic or other conditions. These views are not intended to be a forecast of future events and are no guarantee of future results.
| | | | | | |
| 2 | | BLACKROCK VARIABLE SERIES FUNDS, INC. | | JUNE 30, 2016 | | |
| | | | |
| | | | BlackRock Large Cap Value V.I. Fund | |
|
| Total Return Based on a $10,000 Investment |
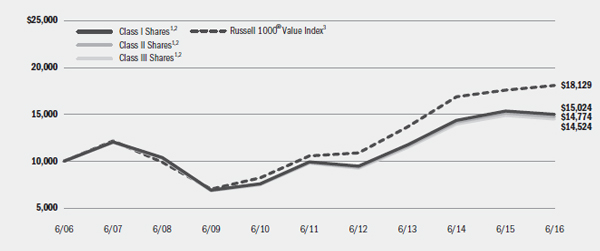
| | 1 | Assuming transaction costs, if any, and other operating expenses, including investment advisory fees. Does not include insurance related fees and expenses. For a portion of the period, returns do not show the effects of distribution fees (12b-1 fees) applicable to Class II Shares. If such fees were included, returns shown would have been lower. The returns for Class III Shares prior to January 27, 2009, the recommencement of operations of Class III Shares, are based upon the performance of the Fund’s Class I Shares, as adjusted to reflect the distribution (12b-1) fees applicable to Class III Shares. |
| | 2 | Under normal circumstances, the Fund invests at least 80% of its assets in a diversified portfolio of equity securities, primarily common stock, of large cap companies located in the United States included at the time of purchase in the Russell 1000® Value Index. |
| | 3 | An unmanaged index that is a subset of the Russell 1000® Index that consists of those Russell 1000® securities with lower price-to-book ratios and lower expected growth values. |
| | | | | | | | |
| Performance Summary for the Period Ended June 30, 2016 |
| | | | | | | | | | | | | | | | | | | | | | | | | | | | | | | | | | | | |
| | | | | | | | | Average Annual Total Returns |
| | | 6-Month
Total Returns5 | | | | | | 1 Year5 | | | | 5 Years5 | | | | 10 Years5 | | |
Class I4 | | | | (0.52 | )% | | | | | | | | | | | | | | (2.39 | )% | | | | | | 8.62 | % | | | | | | 4.15 | % | | |
Class II4 | | | | (0.61 | ) | | | | | | | | | | | | | | (2.56 | ) | | | | | | 8.41 | | | | | | | 3.98 | | | |
Class III4 | | | | (0.70 | ) | | | | | | | | | | | | | | (2.72 | ) | | | | | | 8.24 | | | | | | | 3.80 | 6 | | |
Russell 1000® Value Index | | | | 6.30 | | | | | | | | | | | | | | | 2.86 | | | | | | | 11.35 | | | | | | | 6.13 | | | |
| | 4 | | Average annual and cumulative total returns are based on changes in net asset value for the periods shown, and assume reinvestment of all distributions at net asset value on the ex-dividend date. Insurance-related fees and expenses are not reflected in these returns. For a portion of the period, returns do not show the effects of distribution fees (12b-1 fees) applicable to Class II Shares. If such fees were included, returns shown would have been lower. |
| | 5 | | For a portion of the period, the Fund’s investment adviser waived a portion of its fee. Without such waiver, the Fund’s performance would have been lower. |
| | 6 | | The returns for Class III Shares prior to January 27, 2009, the recommencement of operations of Class III Shares, are based upon the performance of the Fund’s Class I Shares, as adjusted to reflect the distribution (12b-1) fees applicable to Class III Shares. |
| | | | Past performance is not indicative of future results. Performance results do not reflect the deduction of taxes that a shareholder would pay on Fund distributions or the redemption of Fund shares. |
| | | | | | | | | | | | | | | | | | | | | | | | | | | | | | | | | | | |
| | | Actual | | Hypothetical8 | | |
| | | Beginning
Account Value
January 1, 2016 | | Ending
Account Value
June 30, 2016 | | Expenses Paid
During the Period7 | | Beginning
Account Value
January 1, 2016 | | Ending
Account Value
June 30, 2016 | | Expenses Paid
During the Period7 | | Annualized
Expense
Ratio |
Class I | | | $ | 1,000.00 | | | | $ | 994.80 | | | | $ | 3.92 | | | | $ | 1,000.00 | | | | $ | 1,020.93 | | | | $ | 3.97 | | | | | 0.79 | % |
Class II | | | $ | 1,000.00 | | | | $ | 993.90 | | | | $ | 4.91 | | | | $ | 1,000.00 | | | | $ | 1,019.94 | | | | $ | 4.97 | | | | | 0.99 | % |
Class III | | | $ | 1,000.00 | | | | $ | 993.00 | | | | $ | 5.70 | | | | $ | 1,000.00 | | | | $ | 1,019.14 | | | | $ | 5.77 | | | | | 1.15 | % |
| | 7 | | For each class of the Fund, expenses are equal to the annualized expense ratio for the class, multiplied by the average account value over the period, multiplied by 182/366 (to reflect the one-half year period shown). |
| | 8 | | Hypothetical 5% annual return before expenses is calculated by prorating the number of days in the most recent fiscal half year divided by 366. |
| | | | See “Disclosure of Expenses” on the following page for further information on how expenses were calculated. |
| | | | | | |
| | | BLACKROCK VARIABLE SERIES FUNDS, INC. | | JUNE 30, 2016 | | 3 |
| | | | |
| | | | BlackRock Large Cap Value V.I. Fund | |
| | | | | | | | | | | | | | |
| Portfolio Information as of June 30, 2016 |
| | | | | |
| Sector Allocation | | Percent of
Net Assets |
Financials | | | | 22 | % |
Health Care | �� | | | 18 | |
Information Technology | | | | 15 | |
Energy | | | | 11 | |
Consumer Discretionary | | | | 11 | |
Consumer Staples | | | | 7 | |
Industrials | | | | 7 | |
Materials | | | | 4 | |
Utilities | | | | 2 | |
Telecommunication Services | | | | 1 | |
Short-Term Securities | | | | 10 | |
Liabilities in Excess of Other Assets | | | | (8 | ) |
For Fund compliance purposes, the Fund’s sector classifications refer to one or more of the sector sub-classifications used by one or more widely recognized market indexes or ratings group indexes, and/or as defined by the investment adviser. These definitions may not apply for purposes of this report, which may combine sector sub-classifications for reporting ease.
Shareholders of the Fund may incur the following charges: (a) transactional expenses, such as sales charges; and (b) operating expenses, including investment advisory fees, service and distribution fees, including 12b-1 fees, acquired fund fees and expenses, and other fund expenses. The expense example on the previous page (which is based on a hypothetical investment of $1,000 invested on January 1, 2016 and held through June 30, 2016) is intended to assist shareholders both in calculating expenses based on an investment in the Fund and in comparing these expenses with similar costs of investing in other mutual funds.
The expense example provides information about actual account values and actual expenses. In order to estimate the expenses a shareholder paid during the period covered by this report, shareholders can divide their account value by $1,000 and then multiply the result by the number corresponding to their share class under the heading entitled “Expenses Paid During the Period.”
The expense example also provides information about hypothetical account values and hypothetical expenses based on the Fund’s actual expense ratio and an assumed rate of return of 5% per year before expenses. In order to assist shareholders in comparing the ongoing expenses of investing in the Fund and other funds, compare the 5% hypothetical example with the 5% hypothetical examples that appear in shareholder reports of other funds.
The expenses shown in the expense example are intended to highlight shareholders’ ongoing costs only and do not reflect any transactional expenses, such as sales charges, if any. Therefore, the hypothetical example is useful in comparing ongoing expenses only, and will not help shareholders determine the relative total expenses of owning different funds. If these transactional expenses were included, shareholder expenses would have been higher.
| | | | | | |
| 4 | | BLACKROCK VARIABLE SERIES FUNDS, INC. | | JUNE 30, 2016 | | |
| | | | |
| Schedule of Investments June 30, 2016 (Unaudited) | | | BlackRock Large Cap Value V.I. Fund | |
| | | (Percentages shown are based on Net Assets) | |
| | | | | | | | |
| Common Stocks | | Shares | | | Value | |
Aerospace & Defense — 1.6% | | | | | | | | |
Raytheon Co. | | | 11,346 | | | $ | 1,542,489 | |
Airlines — 1.6% | | | | | | | | |
Delta Air Lines, Inc. | | | 2,337 | | | | 85,137 | |
JetBlue Airways Corp. (a) | | | 16,710 | | | | 276,718 | |
Southwest Airlines Co. | | | 19,186 | | | | 752,283 | |
United Continental Holdings, Inc. (a) | | | 10,900 | | | | 447,336 | |
| | | | | | | | |
| | | | | | | | 1,561,474 | |
Auto Components — 3.2% | | | | | | | | |
Goodyear Tire & Rubber Co. | | | 54,983 | | | | 1,410,864 | |
Lear Corp. | | | 16,040 | | | | 1,632,230 | |
| | | | | | | | |
| | | | | | | | 3,043,094 | |
Banks — 15.7% | | | | | | | | |
Bank of America Corp. | | | 246,273 | | | | 3,268,043 | |
Citigroup, Inc. | | | 46,488 | | | | 1,970,626 | |
JPMorgan Chase & Co. | | | 76,006 | | | | 4,723,013 | |
SunTrust Banks, Inc. | | | 40,072 | | | | 1,646,158 | |
U.S. Bancorp | | | 69,579 | | | | 2,806,121 | |
Wells Fargo & Co. | | | 11,573 | | | | 547,750 | |
| | | | | | | | |
| | | | | | | | 14,961,711 | |
Biotechnology — 1.8% | | | | | | | | |
Amgen, Inc. | | | 5,325 | | | | 810,199 | |
Gilead Sciences, Inc. | | | 10,906 | | | | 909,778 | |
| | | | | | | | |
| | | | | | | | 1,719,977 | |
Building Products — 1.2% | | | | | | | | |
Owens Corning | | | 21,580 | | | | 1,111,802 | |
Capital Markets — 2.0% | | | | | | | | |
Goldman Sachs Group, Inc. | | | 12,719 | | | | 1,889,789 | |
Chemicals — 1.8% | | | | | | | | |
Dow Chemical Co. | | | 15,880 | | | | 789,395 | |
Eastman Chemical Co. | | | 14,429 | | | | 979,729 | |
| | | | | | | | |
| | | | | | | | 1,769,124 | |
Communications Equipment — 3.3% | | | | | | | | |
Cisco Systems, Inc. | | | 110,025 | | | | 3,156,617 | |
Construction & Engineering — 0.6% | | | | | | | | |
AECOM (a)(b) | | | 12,149 | | | | 385,974 | |
EMCOR Group, Inc. | | | 4,531 | | | | 223,197 | |
| | | | | | | | |
| | | | | | | | 609,171 | |
Consumer Finance — 0.9% | | | | | | | | |
SLM Corp. (a) | | | 134,153 | | | | 829,066 | |
Containers & Packaging — 1.0% | | | | | | | | |
Avery Dennison Corp. | | | 13,061 | | | | 976,310 | |
Diversified Financial Services — 1.0% | | | | | | | | |
Berkshire Hathaway, Inc., Class B (a) | | | 6,443 | | | | 932,882 | |
| | | | | | | | |
| Common Stocks | | Shares | | | Value | |
Diversified Telecommunication Services — 0.9% | | | | | | | | |
AT&T Inc. | | | 18,872 | | | $ | 815,459 | |
Electric Utilities — 0.7% | | | | | | | | |
FirstEnergy Corp. | | | 19,004 | | | | 663,430 | |
Electronic Equipment, Instruments & Components — 1.5% | | | | | |
CDW Corp. | | | 24,120 | | | | 966,730 | |
Flextronics International Ltd. (a) | | | 40,090 | | | | 473,062 | |
| | | | | | | | |
| | | | | | | | 1,439,792 | |
Energy Equipment & Services — 1.7% | | | | | | | | |
Schlumberger Ltd. | | | 18,327 | | | | 1,449,299 | |
Weatherford International PLC (a)(b) | | | 40,296 | | | | 223,643 | |
| | | | | | | | |
| | | | | | | | 1,672,942 | |
Food & Staples Retailing — 3.4% | | | | | | | | |
CVS Health Corp. | | | 18,196 | | | | 1,742,085 | |
Walgreens Boots Alliance, Inc. | | | 18,358 | | | | 1,528,671 | |
| | | | | | | | |
| | | | | | | | 3,270,756 | |
Food Products — 0.9% | | | | | | | | |
Tyson Foods, Inc., Class A (b) | | | 13,037 | | | | 870,741 | |
Health Care Providers & Services — 9.9% | | | | | | | | |
Aetna, Inc. | | | 19,638 | | | | 2,398,389 | |
Centene Corp. (a)(b) | | | 13,911 | | | | 992,828 | |
Cigna Corp. | | | 8,674 | | | | 1,110,185 | |
Humana, Inc. | | | 4,873 | | | | 876,555 | |
Laboratory Corp. of America Holdings (a) | | | 8,396 | | | | 1,093,747 | |
UnitedHealth Group, Inc. | | | 13,511 | | | | 1,907,753 | |
Universal Health Services, Inc., Class B | | | 8,007 | | | | 1,073,739 | |
| | | | | | | | |
| | | | | | | | 9,453,196 | |
Hotels, Restaurants & Leisure — 2.0% | | | | | | | | |
Carnival Corp. (b) | | | 43,635 | | | | 1,928,667 | |
Household Durables — 2.0% | | | | | | | | |
DR Horton, Inc. | | | 44,792 | | | | 1,410,052 | |
Lennar Corp., Class A | | | 11,148 | | | | 513,923 | |
| | | | | | | | |
| | | | | | | | 1,923,975 | |
Industrial Conglomerates — 0.9% | | | | | | | | |
General Electric Co. | | | 26,674 | | | | 839,697 | |
Insurance — 3.0% | | | | | | | | |
American International Group, Inc. | | | 25,537 | | | | 1,350,652 | |
Travelers Cos., Inc. | | | 12,633 | | | | 1,503,832 | |
| | | | | | | | |
| | | | | | | | 2,854,484 | |
IT Services — 1.0% | | | | | | | | |
Amdocs Ltd. | | | 17,001 | | | | 981,298 | |
Media — 2.7% | | | | | | | | |
Comcast Corp., Class A | | | 39,970 | | | | 2,605,644 | |
| | |
| ADR | | American Depositary Receipts |
See Notes to Financial Statements.
| | | | | | |
| | | BLACKROCK VARIABLE SERIES FUNDS, INC. | | JUNE 30, 2016 | | 5 |
| | | | |
| Schedule of Investments (continued) | | | BlackRock Large Cap Value V.I. Fund | |
| | | | |
| | | | | | | | |
| Common Stocks | | Shares | | | Value | |
Metals & Mining — 0.9% | | | | | | | | |
Rio Tinto PLC — ADR (b) | | | 29,015 | | | $ | 908,169 | |
Multi-Utilities — 1.5% | | | | | | | | |
Public Service Enterprise Group, Inc. | | | 22,632 | | | | 1,054,878 | |
SCANA Corp. | | | 4,855 | | | | 367,329 | |
| | | | | | | | |
| | | | | | | | 1,422,207 | |
Oil, Gas & Consumable Fuels — 9.5% | | | | | | | | |
Anadarko Petroleum Corp. | | | 4,927 | | | | 262,363 | |
BP PLC — ADR (b) | | | 50,457 | | | | 1,791,728 | |
Chevron Corp. | | | 19,315 | | | | 2,024,791 | |
Exxon Mobil Corp. | | | 19,345 | | | | 1,813,400 | |
Hess Corp. | | | 4,260 | | | | 256,026 | |
Marathon Oil Corp. | | | 12,359 | | | | 185,509 | |
Statoil ASA — ADR | | | 12,800 | | | | 221,568 | |
Suncor Energy, Inc. | | | 64,135 | | | | 1,778,464 | |
Tesoro Corp. | | | 4,414 | | | | 330,697 | |
Valero Energy Corp. (b) | | | 7,231 | | | | 368,781 | |
| | | | | | | | |
| | | | | | | | 9,033,327 | |
Pharmaceuticals — 6.5% | | | | | | | | |
Johnson & Johnson | | | 8,435 | | | | 1,023,165 | |
Merck & Co., Inc. | | | 8,802 | | | | 507,083 | |
Mylan NV (a) | | | 5,277 | | | | 228,177 | |
Pfizer, Inc. | | | 88,380 | | | | 3,111,860 | |
Teva Pharmaceutical Industries Ltd. — ADR | | | 26,020 | | | | 1,306,985 | |
| | | | | | | | |
| | | | | | | | 6,177,270 | |
Road & Rail — 0.6% | | | | | | | | |
Norfolk Southern Corp. | | | 6,398 | | | | 544,662 | |
Semiconductors & Semiconductor Equipment — 3.1% | | | | | | | | |
Intel Corp. | | | 21,980 | | | | 720,944 | |
Lam Research Corp. (b) | | | 15,732 | | | | 1,322,432 | |
NVIDIA Corp. (b) | | | 18,567 | | | | 872,835 | |
| | | | | | | | |
| | | | | | | | 2,916,211 | |
Software — 3.1% | | | | | | | | |
Activision Blizzard, Inc. | | | 44,692 | | | | 1,771,144 | |
Microsoft Corp. | | | 22,365 | | | | 1,144,417 | |
| | | | | | | | |
| | | | | | | | 2,915,561 | |
| | | | | | | | |
| Common Stocks | | Shares | | | Value | |
Specialty Retail — 0.9% | | | | | | | | |
GNC Holdings, Inc., Class A | | | 23,804 | | | $ | 578,199 | |
Lowe’s Cos., Inc. | | | 4,118 | | | | 326,022 | |
| | | | | | | | |
| | | | | | | | 904,221 | |
Technology Hardware, Storage & Peripherals — 3.5% | | | | | |
Apple Inc. | | | 19,422 | | | | 1,856,743 | |
EMC Corp. | | | 48,722 | | | | 1,323,777 | |
Western Digital Corp. | | | 4,443 | | | | 209,976 | |
| | | | | | | | |
| | | | | | | | 3,390,496 | |
Tobacco — 2.2% | | | | | | | | |
Altria Group, Inc. | | | 30,143 | | | | 2,078,661 | |
Total Common Stocks — 98.1% | | | | | | | 93,714,372 | |
Total Long-Term Investments (Cost — $76,947,427) — 98.1% | | | | 93,714,372 | |
| | | | | | | | |
| Short-Term Securities | | | | | | |
BlackRock Liquidity Funds, TempFund, Institutional Class, 0.40% (c)(d) | | | 1,009,793 | | | | 1,009,793 | |
| | | Beneficial
Interest
(000) | | | | |
BlackRock Liquidity Series, LLC, Money Market Series, 0.59% (c)(d)(e) | | | $ 8,091 | | | | 8,090,639 | |
Total Short-Term Securities (Cost — $9,100,432) — 9.6% | | | | | | | 9,100,432 | |
Total Investments (Cost — $86,047,859) — 107.7% | | | | | | | 102,814,804 | |
Liabilities in Excess of Other Assets — (7.7)% | | | | | | | (7,312,565 | ) |
| | | | | | | | |
Net Assets — 100.0% | | | | | | $ | 95,502,239 | |
| | | | | | | | |
|
| Notes to Schedule of Investments |
| (a) | Non-income producing security. |
| (b) | Security, or a portion of security, is on loan. |
| (c) | During the six months ended June 30, 2016, investments in issuers considered to be affiliates of the Fund for purposes of Section 2(a)(3) of the Investment Company Act of 1940, as amended, were as follows: |
| | | | | | | | | | | | | | | | | | | | |
| Affiliate | | Shares/Beneficial
Interest Held at
December 31, 2015 | | | Net Activity | | | Shares/Beneficial
Interest Held at June 30, 2016 | | | Value at
June 30, 2016 | | | Income | |
BlackRock Liquidity Funds, TempFund, Institutional Class | | | 415,233 | | | | 594,560 | | | | 1,009,793 | | | | $1,009,793 | | | | $1,660 | |
BlackRock Liquidity Series, LLC, Money Market Series | | | $2,974,751 | | | $ | 5,115,888 | | | | $8,090,639 | | | | 8,090,639 | | | | 6,970 | 1 |
| |
Total | | | | | | | | | | | | | | | $9,100,432 | | | | $8,630 | |
| | | | | | | | | | | | | | | | |
| | 1 | | Represents securities lending income earned from the reinvestment of cash collateral from loaned securities, net of fees and collateral investment expenses, and other payments to and from borrowers of securities. |
| (d) | Current yield as of period end. |
| (e) | Security was purchased with the cash collateral from loaned securities. The Fund may withdraw up to 25% of its investment daily, although the manager of the BlackRock Liquidity Series, LLC, Money Market Series, in its sole discretion, may permit an investor to withdraw more than 25% on any one day. |
| • | For Fund compliance purposes, the Fund’s industry classifications refer to one or more of the industry sub-classifications used by one or more widely recognized market indexes or ratings group indexes, and/or as defined by the investment adviser. These definitions may not apply for purposes of this report, which may combine such industry sub-classifications for reporting ease. |
See Notes to Financial Statements.
| | | | | | |
| 6 | | BLACKROCK VARIABLE SERIES FUNDS, INC. | | JUNE 30, 2016 | | |
| | |
| Schedule of Investments (concluded) | | BlackRock Large Cap Value V.I. Fund |
|
| Fair Value Hierarchy as of Period End |
Various inputs are used in determining the fair value of investments. For information about the Fund’s policy regarding valuation of investments, refer to the Notes to Financial Statements.
The following table summarizes the Fund’s investments categorized in the disclosure hierarchy:
| | | | | | | | | | | | | | | | |
| | | Level 1 | | | Level 2 | | | Level 3 | | | Total | |
Assets: | | | | | | | | | | | | | | | | |
Investments: | | | | | | | | | | | | | | | | |
Long-Term Investments: | | | | | | | | | | | | | | | | |
Common Stocks1 | | $ | 93,714,372 | | | | — | | | | — | | | $ | 93,714,372 | |
Short-Term Securities | | | 1,009,793 | | | $ | 8,090,639 | | | | — | | | | 9,100,432 | |
| | | | |
Total | | $ | 94,724,165 | | | $ | 8,090,639 | | | | — | | | $ | 102,814,804 | |
| | | | |
1 See above Schedule of Investments for values in each industry. | | | | | | | | | | | | | |
The Fund may hold assets and/or liabilities in which the fair value approximates the carrying amount for financial statement purposes. As of period end, collateral on securities loaned at value of $8,090,639 are categorized as Level 2 within the disclosure hierarchy.
During the six months ended June 30, 2016, there were no transfers between levels.
See Notes to Financial Statements.
| | | | | | |
| | | BLACKROCK VARIABLE SERIES FUNDS, INC. | | JUNE 30, 2016 | | 7 |
| | | | |
| Statement of Assets and Liabilities | | | | |
| | | | |
| June 30, 2016 (unaudited) | | BlackRock
Large Cap
Value V.I. Fund | |
| | | | |
| Assets | | | | |
Investments at value — unaffiliated (including securities loaned at value of $8,048,510) (cost — $76,947,427) | | $ | 93,714,372 | |
Investments at value — affiliated (cost — $9,100,432) | | | 9,100,432 | |
Receivables: | | | | |
Investments sold | | | 1,138,164 | |
Securities lending income — affiliated | | | 2,063 | |
Capital shares sold | | | 699 | |
Dividends — affiliated | | | 133 | |
Dividends — unaffiliated | | | 86,987 | |
From the Manager | | | 32,944 | |
Prepaid expenses | | | 227 | |
| | | | |
Total assets | | | 104,076,021 | |
| | | | |
| | | | |
| Liabilities | | | | |
Collateral on securities loaned at value | | | 8,090,639 | |
Payables: | | | | |
Investments purchased | | | 297,153 | |
Capital shares redeemed | | | 30,164 | |
Distribution fees | | | 1,121 | |
Investment advisory fees | | | 52,975 | |
Officer’s and Directors’ fees | | | 2,557 | |
Other accrued expenses | | | 35,647 | |
Other affiliates | | | 551 | |
Transfer agent fees | | | 62,975 | |
| | | | |
Total liabilities | | | 8,573,782 | |
| | | | |
Net Assets | | $ | 95,502,239 | |
| | | | |
| | | | |
| Net Assets Consist of | | | | |
Paid-in capital | | $ | 76,718,697 | |
Undistributed net investment income | | | 641,159 | |
Accumulated net realized gain | | | 1,375,438 | |
Net unrealized appreciation (depreciation) | | | 16,766,945 | |
| | | | |
Net Assets | | $ | 95,502,239 | |
| | | | |
| | | | |
| Net Asset Value | | | | |
Class I — Based on net assets of $87,550,673 and 7,658,687 shares outstanding, 100 million shares authorized, $0.10 par value | | $ | 11.43 | |
| | | | |
Class II — Based on net assets of $6,055,404 and 528,762 shares outstanding, 100 million shares authorized, $0.10 par value | | $ | 11.45 | |
| | | | |
Class III — Based on net assets of $1,896,162 and 167,891 shares outstanding, 100 million shares authorized, $0.10 par value | | $ | 11.29 | |
| | | | |
See Notes to Financial Statements.
| | | | | | |
| 8 | | BLACKROCK VARIABLE SERIES FUNDS, INC. | | JUNE 30, 2016 | | |
| | | | |
| Six Months Ended June 30, 2016 (unaudited) | | BlackRock
Large Cap
Value V.I. Fund | |
| | | | |
| Investment Income | | | | |
Dividends — unaffiliated | | $ | 1,023,460 | |
Securities lending — affiliated — net | | | 6,970 | |
Dividends — affiliated | | | 1,660 | |
Foreign taxes withheld | | | (9,150 | ) |
| | | | |
Total income | | | 1,022,940 | |
| | | | |
| | | | |
| Expenses | | | | |
Investment advisory | | | 356,260 | |
Transfer agent | | | 2,418 | |
Transfer agent — class specific | | | 100,998 | |
Professional | | | 21,839 | |
Accounting services | | | 13,095 | |
Officer and Directors | | | 10,270 | |
Printing | | | 6,488 | |
Distribution — class specific | | | 6,535 | |
Custodian | | | 5,355 | |
Miscellaneous | | | 4,827 | |
| | | | |
Total expenses | | | 528,085 | |
Less: | | | | |
Fees waived by the Manager | | | (45,996 | ) |
Transfer agent fees reimbursed — class specific | | | (98,638 | ) |
| | | | |
Total expenses after fees waived and/or reimbursed | | | 383,451 | |
| | | | |
Net investment income | | | 639,489 | |
| | | | |
| | | | |
| Realized and Unrealized Gain (Loss) | | | | |
Net realized gain from investments | | | 2,469,069 | |
Net change in unrealized appreciation (depreciation) on investments | | | (3,710,203 | ) |
| | | | |
Total realized and unrealized loss | | | (1,241,134 | ) |
| | | | |
Net Decrease in Net Assets Resulting from Operations | | $ | (601,645 | ) |
| | | | |
See Notes to Financial Statements.
| | | | | | |
| | | BLACKROCK VARIABLE SERIES FUNDS, INC. | | JUNE 30, 2016 | | 9 |
| | |
| Statements of Changes in Net Assets | | BlackRock Large Cap Value V.I. Fund |
| | | | | | | | |
| Increase (Decrease) in Net Assets: | | Six Months Ended June 30, 2016
(Unaudited) | | | Year Ended
December 31, 2015 | |
| | | | | | | | |
| Operations | | | | | | | | |
Net investment income | | $ | 639,489 | | | $ | 1,216,396 | |
Net realized gain | | | 2,469,069 | | | | 6,196,830 | |
Net change in unrealized appreciation (depreciation) | | | (3,710,203 | ) | | | (9,348,119 | ) |
| | | | |
Net decrease in net assets resulting from operations | | | (601,645 | ) | | | (1,934,893 | ) |
| | | | |
| | | | | | | | |
| Distributions to Shareholders1 | | | | | | | | |
From net investment income: | | | | | | | | |
Class I | | | — | | | | (1,145,336 | ) |
Class II | | | — | | | | (59,859 | ) |
Class III | | | — | | | | (15,449 | ) |
From net realized gain: | | | | | | | | |
Class I | | | — | | | | (6,785,472 | ) |
Class II | | | — | | | | (412,379 | ) |
Class III | | | — | | | | (131,738 | ) |
| | | | |
Decrease in net assets resulting from distributions to shareholders | | | — | | | | (8,550,233 | ) |
| | | | |
| | | | | | | | |
| Capital Share Transactions | | | | | | | | |
Net decrease in net assets derived from capital share transactions | | | (5,368,725 | ) | | | (3,545,460 | ) |
| | | | |
| | | | | | | | |
| Net Assets | | | | | | | | |
Total decrease in net assets | | | (5,970,370 | ) | | | (14,030,586 | ) |
Beginning of period | | | 101,472,609 | | | | 115,503,195 | |
| | | | |
End of period | | $ | 95,502,239 | | | $ | 101,472,609 | |
| | | | |
Undistributed net investment income, end of period | | $ | 641,159 | | | $ | 1,670 | |
| | | | |
| 1 | | Distributions for annual periods determined in accordance with federal income tax regulations. |
See Notes to Financial Statements.
| | | | | | |
| 10 | | BLACKROCK VARIABLE SERIES FUNDS, INC. | | JUNE 30, 2016 | | |
| | |
| Financial Highlights | | BlackRock Large Cap Value V.I. Fund |
| | | | | | | | | | | | | | | | | | | | | | | | |
| | | Class I | |
| | | Six Months | | | | | | | | | | | | | | | | |
| | | Ended | | | | | | | | | | | | | | | | |
| | | June 30, | | | | | | | | | | | | | | | | |
| | | 2016 | | | Year Ended December 31, | |
| | | (Unaudited) | | | 2015 | | | 2014 | | | 2013 | | | 2012 | | | 2011 | |
| | | | | | | | | | | | | | | | | | | | | | | | |
| Per Share Operating Performance | | | | | | | | | | | | | | | | | | | | | | | | |
Net asset value, beginning of period | | $ | 11.49 | | | $ | 12.74 | | | $ | 13.22 | | | $ | 10.73 | | | $ | 9.59 | | | $ | 9.80 | |
| | | | |
Net investment income1 | | | 0.07 | | | | 0.14 | | | | 0.15 | | | | 0.14 | | | | 0.15 | | | | 0.12 | |
Net realized and unrealized gain (loss) | | | (0.13 | ) | | | (0.36 | ) | | | 1.47 | | | | 3.46 | | | | 1.15 | | | | (0.19 | ) |
| | | | |
Net increase (decrease) from investment operations | | | (0.06 | ) | | | (0.22 | ) | | | 1.62 | | | | 3.60 | | | | 1.30 | | | | (0.07 | ) |
| | | | |
Distributions:2 | | | | | | | | | | | | | | | | | | | | | | | | |
From net investment income | | | — | | | | (0.15 | ) | | | (0.16 | ) | | | (0.16 | ) | | | (0.16 | ) | | | (0.14 | ) |
From net realized gain | | | — | | | | (0.88 | ) | | | (1.94 | ) | | | (0.95 | ) | | | — | | | | — | |
| | | | |
Total distributions | | | — | | | | (1.03 | ) | | | (2.10 | ) | | | (1.11 | ) | | | (0.16 | ) | | | (0.14 | ) |
| | | | |
Net asset value, end of period | | $ | 11.43 | | | $ | 11.49 | | | $ | 12.74 | | | $ | 13.22 | | | $ | 10.73 | | | $ | 9.59 | |
| | | | |
| | | | | | | | | | | | | | | | | | | | | | | | |
| Total Return3 | | | | | | | | | | | | | | | | | | | | | | | | |
Based on net asset value | | | (0.52 | )%4 | | | (1.72 | )% | | | 12.22 | % | | | 33.61 | % | | | 13.58 | % | | | (0.76 | )% |
| | | | |
| | | | | | | | | | | | | | | | | | | | | | | | |
| Ratios to Average Net Assets | | | | | | | | | | | | | | | | | | | | | | | | |
Total expenses | | | 1.10 | %5 | | | 1.08 | % | | | 1.08 | % | | | 1.08 | % | | | 1.01 | % | | | 0.88 | % |
| | | | |
Total expenses after fees waived and/or reimbursed | | | 0.79 | %5 | | | 0.77 | % | | | 0.77 | % | | | 0.78 | % | | | 0.82 | % | | | 0.88 | % |
| | | | |
Net investment income | | | 1.36 | %5 | | | 1.14 | % | | | 1.10 | % | | | 1.10 | % | | | 1.41 | % | | | 1.13 | % |
| | | | |
| | | | | | | | | | | | | | | | | | | | | | | | |
| Supplemental Data | | | | | | | | | | | | | | | | | | | | | | | | |
Net assets, end of period (000) | | $ | 87,551 | | | $ | 93,983 | | | $ | 109,570 | | | $ | 115,094 | | | $ | 97,758 | | | $ | 98,462 | |
| | | | |
Portfolio turnover rate | | | 26 | % | | | 29 | % | | | 35 | % | | | 41 | % | | | 114 | % | | | 117 | % |
| | | | |
| | 1 | | Based on average shares outstanding. |
| | 2 | | Distributions for annual periods determined in accordance with federal income tax regulations. |
| | 3 | | Where applicable, excludes insurance-related fees and expenses and assumes the reinvestment of distributions. |
| | 4 | | Aggregate total return. |
See Notes to Financial Statements.
| | | | | | |
| | | BLACKROCK VARIABLE SERIES FUNDS, INC. | | JUNE 30, 2016 | | 11 |
| | |
| Financial Highlights (continued) | | BlackRock Large Cap Value V.I. Fund |
| | | | | | | | | | | | | | | | | | | | | | | | |
| | | Class II | |
| | | Six Months | | | | | | | | | | | | | | | | |
| | | Ended | | | | | | | | | | | | | | | | |
| | | June 30, | | | | | | | | | | | | | | | | |
| | | 2016 | | | Year Ended December 31, | |
| | | (Unaudited) | | | 2015 | | | 2014 | | | 2013 | | | 2012 | | | 2011 | |
| | | | | | | | | | | | | | | | | | | | | | | | |
| Per Share Operating Performance | | | | | | | | | | | | | | | | | | | | | | | | |
Net asset value, beginning of period | | $ | 11.52 | | | $ | 12.77 | | | $ | 13.25 | | | $ | 10.75 | | | $ | 9.60 | | | $ | 9.81 | |
| | | | |
Net investment income1 | | | 0.07 | | | | 0.12 | | | | 0.13 | | | | 0.11 | | | | 0.12 | | | | 0.11 | |
Net realized and unrealized gain (loss) | | | (0.14 | ) | | | (0.36 | ) | | | 1.46 | | | | 3.47 | | | | 1.16 | | | | (0.19 | ) |
| | | | |
Net increase (decrease) from investment operations | | | (0.07 | ) | | | (0.24 | ) | | | 1.59 | | | | 3.58 | | | | 1.28 | | | | (0.08 | ) |
| | | | |
Distributions:2 | | | | | | | | | | | | | | | | | | | | | | | | |
From net investment income | | | — | | | | (0.13 | ) | | | (0.13 | ) | | | (0.13 | ) | | | (0.13 | ) | | | (0.13 | ) |
From net realized gain | | | — | | | | (0.88 | ) | | | (1.94 | ) | | | (0.95 | ) | | | — | | | | — | |
| | | | |
Total distributions | | | — | | | | (1.01 | ) | | | (2.07 | ) | | | (1.08 | ) | | | (0.13 | ) | | | (0.13 | ) |
| | | | |
Net asset value, end of period | | $ | 11.45 | | | $ | 11.52 | | | $ | 12.77 | | | $ | 13.25 | | | $ | 10.75 | | | $ | 9.60 | |
| | | | |
| | | | | | | | | | | | | | | | | | | | | | | | |
| Total Return3 | | | | | | | | | | | | | | | | | | | | | | | | |
Based on net asset value | | | (0.61 | )%4 | | | (1.96 | )% | | | 11.94 | % | | | 33.39 | % | | | 13.35 | % | | | (0.89 | )% |
| | | | |
| | | | | | | | | | | | | | | | | | | | | | | | |
| Ratios to Average Net Assets | | | | | | | | | | | | | | | | | | | | | | | | |
Total expenses | | | 1.26 | %5 | | | 1.19 | % | | | 1.23 | % | | | 1.20 | % | | | 1.18 | % | | | 1.03 | % |
| | | | |
Total expenses after fees waived and/or reimbursed | | | 0.99 | %5 | | | 0.96 | % | | | 0.97 | % | | | 0.98 | % | | | 1.00 | % | | | 1.03 | % |
| | | | |
Net investment income | | | 1.18 | %5 | | | 0.95 | % | | | 0.92 | % | | | 0.90 | % | | | 1.22 | % | | | 0.99 | % |
| | | | |
| | | | | | | | | | | | | | | | | | | | | | | | |
| Supplemental Data | | | | | | | | | | | | | | | | | | | | | | | | |
Net assets, end of period (000) | | $ | 6,055 | | | $ | 5,680 | | | $ | 4,002 | | | $ | 5,324 | | | $ | 3,682 | | | $ | 2,909 | |
| | | | |
Portfolio turnover rate | | | 26 | % | | | 29 | % | | | 35 | % | | | 41 | % | | | 114 | % | | | 117 | % |
| | | | |
| | 1 | | Based on average shares outstanding. |
| | 2 | | Distributions for annual periods determined in accordance with federal income tax regulations. |
| | 3 | | Where applicable, excludes insurance-related fees and expenses and assumes the reinvestment of distributions. |
| | 4 | | Aggregate total return. |
See Notes to Financial Statements.
| | | | | | |
| 12 | | BLACKROCK VARIABLE SERIES FUNDS, INC. | | JUNE 30, 2016 | | |
| | |
| Financial Highlights (concluded) | | BlackRock Large Cap Value V.I. Fund |
| | | | | | | | | | | | | | | | | | | | | | | | |
| | | Class III | |
| | | Six Months | | | | | | | | | | | | | | | | |
| | | Ended | | | | | | | | | | | | | | | | |
| | | June 30, | | | | | | | | | | | | | | | | |
| | | 2016 | | | Year Ended December 31, | |
| | | (Unaudited) | | | 2015 | | | 2014 | | | 2013 | | | 2012 | | | 2011 | |
| | | | | | | | | | | | | | | | | | | | | | | | |
| Per Share Operating Performance | | | | | | | | | | | | | | | | | | | | | | | | |
Net asset value, beginning of period | | $ | 11.37 | | | $ | 12.61 | | | $ | 13.12 | | | $ | 10.66 | | | $ | 9.52 | | | $ | 9.74 | |
| | | | |
Net investment income1 | | | 0.05 | | | | 0.10 | | | | 0.10 | | | | 0.09 | | | | 0.12 | | | | 0.10 | |
Net realized and unrealized gain (loss) | | | (0.13 | ) | | | (0.36 | ) | | | 1.44 | | | | 3.44 | | | | 1.14 | | | | (0.20 | ) |
| | | | |
Net increase (decrease) from investment operations | | | (0.08 | ) | | | (0.26 | ) | | | 1.54 | | | | 3.53 | | | | 1.26 | | | | (0.10 | ) |
| | | | |
Distributions:2 | | | | | | | | | | | | | | | | | | | | | | | | |
From net investment income | | | — | | | | (0.10 | ) | | | (0.11 | ) | | | (0.12 | ) | | | (0.12 | ) | | | (0.12 | ) |
From net realized gain | | | — | | | | (0.88 | ) | | | (1.94 | ) | | | (0.95 | ) | | | — | | | | — | |
| | | | |
Total distributions | | | — | | | | (0.98 | ) | | | (2.05 | ) | | | (1.07 | ) | | | (0.12 | ) | | | (0.12 | ) |
| | | | |
Net asset value, end of period | | $ | 11.29 | | | $ | 11.37 | | | $ | 12.61 | | | $ | 13.12 | | | $ | 10.66 | | | $ | 9.52 | |
| | | | |
| | | | | | | | | | | | | | | | | | | | | | | | |
| Total Return3 | | | | | | | | | | | | | | | | | | | | | | | | |
Based on net asset value | | | (0.70 | )%4 | | | (2.11 | )% | | | 11.72 | % | | | 33.16 | % | | | 13.26 | % | | | (1.09 | )% |
| | | | |
| | | | | | | | | | | | | | | | | | | | | | | | |
| Ratios to Average Net Assets | | | | | | | | | | | | | | | | | | | | | | | | |
Total expenses | | | 1.34 | %5 | | | 1.34 | % | | | 1.32 | % | | | 1.33 | % | | | 1.26 | % | | | 1.13 | % |
| | | | |
Total expenses after fees waived and/or reimbursed | | | 1.15 | %5 | | | 1.13 | % | | | 1.13 | % | | | 1.14 | % | | | 1.15 | % | | | 1.13 | % |
| | | | |
Net investment income | | | 1.00 | %5 | | | 0.78 | % | | | 0.73 | % | | | 0.74 | % | | | 1.13 | % | | | 0.93 | % |
| | | | |
| | | | | | | | | | | | | | | | | | | | | | | | |
| Supplemental Data | | | | | | | | | | | | | | | | | | | | | | | | |
Net assets, end of period (000) | | $ | 1,896 | | | $ | 1,810 | | | $ | 1,931 | | | $ | 1,576 | | | $ | 987 | | | $ | 928 | |
| | | | |
Portfolio turnover rate | | | 26 | % | | | 29 | % | | | 35 | % | | | 41 | % | | | 114 | % | | | 117 | % |
| | | | |
| | 1 | | Based on average shares outstanding. |
| | 2 | | Distributions for annual periods determined in accordance with federal income tax regulations. |
| | 3 | | Where applicable, excludes insurance-related fees and expenses and assumes the reinvestment of distributions. |
| | 4 | | Aggregate total return. |
See Notes to Financial Statements.
| | | | | | |
| | | BLACKROCK VARIABLE SERIES FUNDS, INC. | | JUNE 30, 2016 | | 13 |
| | | | |
| Notes to Financial Statements (Unaudited) | | | BlackRock Large Cap Value V.I. Fund | |
1. Organization:
BlackRock Variable Series Funds, Inc. (the “Company”) is registered under the Investment Company Act of 1940, as amended (the “1940 Act”), as an open-end management investment company. The Company is organized as a Maryland corporation that is comprised of 20 separate funds. The funds offer shares to insurance companies for their separate accounts to fund benefits under certain variable annuity and variable life insurance contracts. The financial statements presented are for BlackRock Large Cap Value V.I. Fund (the “Fund”). The Fund is classified as diversified. Class I, Class II and Class III Shares have equal voting, dividend, liquidation and other rights, except that only shares of the respective classes are entitled to vote on matters concerning only that class. In addition, Class II and Class III Shares bear certain expenses related to the distribution of such shares.
The Fund, together with certain other registered investment companies advised by BlackRock Advisors, LLC (the “Manager”) or its affiliates, is included in a complex of open-end funds referred to as the Equity-Bond Complex.
2. Significant Accounting Policies:
The financial statements are prepared in conformity with accounting principles generally accepted in the United States of America (“U.S. GAAP”), which may require management to make estimates and assumptions that affect the reported amounts of assets and liabilities in the financial statements, disclosure of contingent assets and liabilities at the date of the financial statements and the reported amounts of increases and decreases in net assets from operations during the reporting period. Actual results could differ from those estimates. The Fund is considered an investment company under U.S. GAAP and follows the accounting and reporting guidance applicable to investment companies. Below is a summary of significant accounting policies:
Investment Transactions and Investment Income: For financial reporting purposes, investment transactions are recorded on the dates the transactions are entered into (the trade dates). Realized gains and losses on investment transactions are determined on the identified cost basis. Dividend income is recorded on the ex-dividend date. Dividends from foreign securities where the ex-dividend date may have passed are subsequently recorded when the Fund is informed of the ex-dividend date. Under the applicable foreign tax laws, a withholding tax at various rates may be imposed on capital gains, dividends and interest. Income, expenses and realized and unrealized gains and losses are allocated daily to each class based on its relative net assets.
Distributions: Distributions paid by the Fund are recorded on the ex-dividend date. The character and timing of distributions are determined in accordance with federal income tax regulations, which may differ from U.S. GAAP.
Indemnifications: In the normal course of business, the Fund enters into contracts that contain a variety of representations that provide general indemnification. The Fund’s maximum exposure under these arrangements is unknown because it involves future potential claims against the Fund, which cannot be predicted with any certainty.
Other: Expenses directly related to the Fund or its classes are charged to the Fund or the applicable class. Other operating expenses shared by several funds, including other funds managed by the Manager, are prorated among those funds on the basis of relative net assets or other appropriate methods. Expenses directly related to the Fund and other shared expenses prorated to the Fund are allocated daily to each class based on its relative net assets or other appropriate methods.
The Fund has an arrangement with its custodian whereby fees may be reduced by credits earned on uninvested cash balances, which, if applicable, are shown as fees paid indirectly in the Statement of Operations. The custodian imposes fees on overdrawn cash balances, which can be offset by accumulated credits earned or may result in additional custody charges.
3. Investment Valuation and Fair Value Measurements:
Investment Valuation Policies: The Fund’s investments are valued at fair value (also referred to as “market value” within the financial statements) as of the close of trading on the New York Stock Exchange (“NYSE”) (generally 4:00 p.m., Eastern time). U.S. GAAP defines fair value as the price the Fund would receive to sell an asset or pay to transfer a liability in an orderly transaction between market participants at the measurement date. The Fund determines the fair values of its financial instruments using various independent dealers or pricing services under policies approved by the Board of Directors of the Company (the “Board”). The BlackRock Global Valuation Methodologies Committee (the “Global Valuation Committee”) is the committee formed by management to develop global pricing policies and procedures and to oversee the pricing function for all financial instruments.
Fair Value Inputs and Methodologies: The following methods (or “techniques”) and inputs are used to establish the fair value of the Fund’s assets and liabilities:
| | • | | Equity investments traded on a recognized securities exchange are valued at the official closing price each day, if available. For equity investments traded on more than one exchange, the official close price on the exchange where the stock is primarily traded is used. Equity investments traded on a recognized exchange for which there were no sales on that day may be valued at the last available bid (long positions) or ask (short positions) price. |
| | | | | | |
| 14 | | BLACKROCK VARIABLE SERIES FUNDS, INC. | | JUNE 30, 2016 | | |
| | | | |
| Notes to Financial Statements (continued) | | | BlackRock Large Cap Value V.I. Fund | |
| | • | | Investments in open-end U.S. mutual funds are valued at net asset value each business day. |
| | • | | The Fund values its investment in BlackRock Liquidity Series, LLC, Money Market Series (the “Money Market Series”) at fair value, which is ordinarily based upon its pro rata ownership in the underlying fund’s net assets. The Money Market Series seeks current income consistent with maintaining liquidity and preserving capital. Although the Money Market Series is not registered under the 1940 Act, its investments may follow the parameters of investments by a money market fund that is subject to Rule 2a-7 under the 1940 Act. The Fund may withdraw up to 25% of its investment daily, although the manager of the Money Market Series, in its sole discretion, may permit an investor to withdraw more than 25% on any one day. |
If events (e.g., a company announcement, market volatility or a natural disaster) occur that are expected to materially affect the value of such instruments, or in the event that the application of these methods of valuation results in a price for an investment that is deemed not to be representative of the market value of such investment, or if a price is not available, the investment will be valued by the Global Valuation Committee, or its delegate, in accordance with a policy approved by the Board as reflecting fair value (“Fair Valued Investments”). When determining the price for Fair Valued Investments, the Global Valuation Committee, or its delegate, seeks to determine the price that the Fund might reasonably expect to receive or pay from the current sale or purchase of that asset or liability in an arm’s-length transaction. Fair value determinations shall be based upon all available factors that the Global Valuation Committee, or its delegate, deems relevant consistent with the principles of fair value measurement. The pricing of all Fair Valued Investments is subsequently reported to the Board or a committee thereof on a quarterly basis.
Fair Value Hierarchy: Various inputs are used in determining the fair value of investments. These inputs to valuation techniques are categorized into a fair value hierarchy consisting of three broad levels for financial statement purposes as follows:
| | • | | Level 1 — unadjusted price quotations in active markets/exchanges for identical assets or liabilities that the Fund has the ability to access |
| | • | | Level 2 — other observable inputs (including, but not limited to, quoted prices for similar assets or liabilities in markets that are active, quoted prices for identical or similar assets or liabilities in markets that are not active, inputs other than quoted prices that are observable for the assets or liabilities (such as interest rates, yield curves, volatilities, prepayment speeds, loss severities, credit risks and default rates) or other market–corroborated inputs) |
| | • | | Level 3 — unobservable inputs based on the best information available in the circumstances, to the extent observable inputs are not available (including the Fund’s own assumptions used in determining the fair value of investments) |
The hierarchy gives the highest priority to unadjusted quoted prices in active markets for identical assets or liabilities (Level 1 measurements) and the lowest priority to unobservable inputs (Level 3 measurements). Accordingly, the degree of judgment exercised in determining fair value is greatest for instruments categorized in Level 3. The inputs used to measure fair value may fall into different levels of the fair value hierarchy. In such cases, for disclosure purposes, the fair value hierarchy classification is determined based on the lowest level input that is significant to the fair value measurement in its entirety. The significant unobservable inputs used by the Global Valuation Committee in determining the price for Fair Valued Investments are typically categorized as Level 3. The fair value hierarchy for the Fund’s investments have been included in the Schedule of Investments.
Changes in valuation techniques may result in transfers into or out of an assigned level within the hierarchy. In accordance with the Fund’s policy, transfers between different levels of the fair value hierarchy are deemed to have occurred as of the beginning of the reporting period. The categorization of a value determined for investments is based on the pricing transparency of the investments and is not necessarily an indication of the risks associated with investing in those securities.
4. Securities and Other Investments:
Securities Lending: The Fund may lend its securities to approved borrowers, such as brokers, dealers and other financial institutions. The borrower pledges and maintains with the Fund collateral consisting of cash, an irrevocable letter of credit issued by a bank, or securities issued or guaranteed by the U.S. Government. The initial collateral received by the Fund is required to have a value of at least 102% of the current value of the loaned securities for securities traded on U.S. exchanges and a value of at least 105% for all other securities. The collateral is maintained thereafter, at a value equal to at least 100% of the current market value of the securities on loan. The market value of the loaned securities is determined at the close of each business day of the Fund and any additional required collateral is delivered to the Fund, or excess collateral returned by the Fund, on the next business day. During the term of the loan, the Fund is entitled to all distributions made on or in respect of the loaned securities. Loans of securities are terminable at any time and the borrower, after notice, is required to return borrowed securities within the standard time period for settlement of securities transactions.
The market value of any securities on loan, all of which were classified as common stocks in the Fund’s Schedule of Investments, and the value of any related collateral are shown separately in the Statement of Assets and Liabilities as a component of investments at value — unaffiliated, and collateral on securities loaned at value, respectively. As of period end, any securities on loan were collateralized by cash. The cash collateral invested by the securities lending agent, BlackRock Investment Management, LLC (“BIM”), if any, is disclosed in the Schedule of Investments.
| | | | | | |
| | | BLACKROCK VARIABLE SERIES FUNDS, INC. | | JUNE 30, 2016 | | 15 |
| | | | |
| Notes to Financial Statements (continued) | | | BlackRock Large Cap Value V.I. Fund | |
Securities lending transactions are entered into by the Fund under Master Securities Lending Agreements (each, an “MSLA”), which provide the right, in the event of default (including bankruptcy or insolvency), for the non-defaulting party to liquidate the collateral and calculate a net exposure to the defaulting party or request additional collateral. In the event that a borrower defaults, the Fund, as lender, would offset the market value of the collateral received against the market value of the securities loaned. When the value of the collateral is greater than that of the market value of the securities loaned, the lender is left with a net amount payable to the defaulting party. However, bankruptcy or insolvency laws of a particular jurisdiction may impose restrictions on or prohibitions against such a right of offset in the event of an MSLA counterparty’s bankruptcy or insolvency. Under the MSLA, absent an event of default the borrower can resell or re-pledge the loaned securities, and the Fund can reinvest cash collateral received in connection with loaned securities. Upon an event of default, the parties’ obligations to return the securities or collateral to the other party are extinguished, and the parties can resell or re-pledge the loaned securities or the collateral received in connection with the loaned securities in order to satisfy the defaulting party’s net payment obligation for all transactions under the MSLA. The defaulting party remains liable for any deficiency.
As of period end, the following table is a summary of the Fund’s securities lending agreements by counterparty which are subject to offset under an MSLA:
| | | | | | | | | | |
| Counterparty | | Securities Loaned at Value | | | Cash
Collateral
Received1 | | | Net Amount |
JP Morgan Securities LLC | | | $5,006,135 | | | $ | (5,006,135 | ) | | — |
Morgan Stanley | | | 2,209,886 | | | | (2,209,886 | ) | | — |
State Street Bank & Trust Company | | | 832,489 | | | | (832,489 | ) | | — |
| | | |
Total | | | $8,048,510 | | | $ | (8,048,510 | ) | | — |
| | | |
| | 1 | | Collateral with a value of $8,090,639 has been received in connection with securities lending agreements. Collateral received in excess of the value of securities loaned from the individual counterparty is not shown for financial reporting purposes in the table above. |
The risks of securities lending include the risk that the borrower may not provide additional collateral when required or may not return the securities when due. To mitigate these risks, the Fund benefits from a borrower default indemnity provided by BIM. BIM’s indemnity allows for full replacement of the securities loaned if the collateral received does not cover the value on the securities loaned in the event of borrower default. The Fund could suffer a loss if the value of an investment purchased with cash collateral falls below the market value of loaned securities or if the value of an investment purchased with cash collateral falls below the value of the original cash collateral received.
5. Investment Advisory Agreement and Other Transactions with Affiliates:
The PNC Financial Services Group, Inc. is the largest stockholder and an affiliate of BlackRock, Inc. (“BlackRock”) for 1940 Act purposes.
Investment Advisory
The Company, on behalf of the Fund, entered into an Investment Advisory Agreement with the Manager, the Fund’s investment adviser, an indirect, wholly owned subsidiary of BlackRock, to provide investment advisory and administration services. The Manager is responsible for the management of the Fund’s portfolio and provides the personnel, facilities, equipment and certain other services necessary to the operations of the Fund. For such services, the Fund pays the Manager a monthly fee, which is determined by calculating a percentage of the Fund’s average daily net assets based on the following annual rates:
| | | | | |
| Average Daily Net Assets | | Investment
Advisory Fee |
First $1 Billion | | | | 0.75 | % |
$1 Billion - $3 Billion | | | | 0.71 | % |
$3 Billion - $5 Billion | | | | 0.68 | % |
$5 Billion - $10 Billion | | | | 0.65 | % |
Greater than $10 Billion | | | | 0.64 | % |
| | | | | | |
| 16 | | BLACKROCK VARIABLE SERIES FUNDS, INC. | | JUNE 30, 2016 | | |
| | | | |
| Notes to Financial Statements (continued) | | | BlackRock Large Cap Value V.I. Fund | |
Distribution Fees
The Company, on behalf of the Fund, entered into a Distribution Agreement and a Distribution Plan with BlackRock Investments, LLC (“BRIL”), an affiliate of the Manager. Pursuant to the Distribution Plan and in accordance with Rule 12b-1 under the 1940 Act, the Fund pays BRIL ongoing distribution fees. The fees are accrued daily and paid monthly at annual rates based upon the average daily net assets of the relevant share class of the Fund as follows:
| | | | | | |
| | | Class II | | | Class III |
Distribution Fee | | | 0.15% | | | 0.25% |
For the six months ended June 30, 2016, the following table shows the class specific distribution fees borne directly by each share class of the Fund:
| | | | |
| Class II | | Class III | | Total |
$4,252 | | $2,283 | | $6,535 |
Transfer Agent
The Manager, on behalf of the Fund, entered into agreements with insurance companies and other financial intermediaries (“Service Organizations”), some of which may be affiliates. Pursuant to these agreements, the Service Organizations provide the Fund with administrative, networking, recordkeeping, sub-transfer agency and shareholder services to sub-accounts they service. For these services, the Service Organizations receive an annual fee per shareholder account, which will vary depending on share class and/or net assets of Fund shareholders serviced by the Service Organizations, which is shown as transfer agent — class specific. For the six months ended June 30, 2016, the Fund paid the following amounts to affiliates in return for these services, which is included in transfer agent — class specific in the Statement of Operations:
| | | | | | |
| Class I | | Class II | | Class III | | Total |
$92,808 | | $6,349 | | $1,841 | | $100,998 |
In addition, the Fund pays the transfer agent, which is not an affiliate, a fee for issuance, transfer and redemption of shares and the opening and maintenance of shareholder accounts, which is included in transfer agent in the Statement of Operations.
Expense Limitations, Waivers and Reimbursements
The Manager, with respect to the Fund, contractually agreed to waive and/or reimburse fees or expenses in order to limit expenses, excluding interest expense, dividend expense, tax expense, acquired fund fees and expenses, and certain other fund expenses, which constitute extraordinary expenses not incurred in the ordinary course of the Fund’s business. The expense limitations as a percentage of average daily net assets are as follows:
| | | | |
| |
Class I | | | 1.25 | % |
Class II | | | 1.40 | % |
Class III | | | 1.50 | % |
| |
The Manager has agreed not to reduce or discontinue this contractual expense limitation prior to May 1, 2017, unless approved by the Board, including a majority of the Independent Directors who are not “interested persons” of the Fund, as defined in the 1940 Act (“Independent Directors”) or by a majority of outstanding voting securities of the Fund.
The Manager has agreed to voluntarily waive 0.05% of its investment advisory fee payable by the Fund. Prior to June 16, 2016, the waiver was 0.10%. This voluntary waiver may be reduced or discontinued at any time without notice. For the six months ended June 30, 2016, the Manager waived $45,693, which is included in fees waived by the Manager in the Statement of Operations.
The Manager, with respect to the Fund, voluntarily agreed to waive its investment advisory fees by the amount of investment advisory fees the Fund pays to the Manager indirectly through its investment in affiliated money market funds. This amount is included in fees waived by the Manager in the Statement of Operations. However, the Manager does not waive its investment advisory fees by the amount of investment advisory fees paid in connection with the Fund’s investment in other affiliated investment companies, if any. For the six months ended June 30, 2016, the amount waived was $303.
The Manager has contractually agreed to reimburse transfer agent fees in order to limit such expenses to a percentage of average daily net assets as follows:
| | | | |
| |
Class I | | | 0.00 | % |
Class II | | | 0.05 | % |
Class III | | | 0.11 | % |
| |
| | | | | | |
| | | BLACKROCK VARIABLE SERIES FUNDS, INC. | | JUNE 30, 2016 | | 17 |
| | | | |
| Notes to Financial Statements (continued) | | | BlackRock Large Cap Value V.I. Fund | |
The Manager has agreed not to reduce or discontinue this contractual reimbursement prior to May 1, 2017 unless approved by the Board, including a majority of the Independent Directors or by a majority of the outstanding voting securities of the Fund.
These amounts are shown as transfer agent fees reimbursed — class specific in the Statement of Operations. Class specific expense waivers and/or reimbursements are as follows:
| | | | | | | | | | |
| | Class I | | Class II | | Class III | | | | Total |
Transfer Agent Fees Reimbursed | | $92,808 | | $4,997 | | $833 | | | | $98,638 |
For the six months ended June 30, 2016, the Fund reimbursed the Manager $551 for certain accounting services, which is included in accounting services in the Statement of Operations.
Securities Lending
The U.S. Securities and Exchange Commission has issued an exemptive order which permits BIM, an affiliate of the Manager, to serve as securities lending agent for the Fund subject to applicable conditions. As securities lending agent, BIM bears all operational costs directly related to securities lending. The Fund is responsible for expenses in connection with the investment of cash collateral received for securities on loan (the “collateral investment expenses”). The cash collateral is invested in a private investment company managed by the Manager or its affiliates. However, BIM has agreed to cap the collateral investment expenses of the private investment company to an annual rate of 0.04%. The investment adviser to the private investment company will not charge any advisory fees with respect to shares purchased by the Fund.
Securities lending income is equal to the total of income earned from the reinvestment of cash collateral, net of fees and other payments to and from borrowers of securities, and less the collateral investment expenses. The Fund retains a portion of securities lending income and remits a remaining portion to BIM as compensation for its services as securities lending agent.
Pursuant to a securities lending agreement, the Fund retains 71.5% of securities lending income, and this amount retained can never be less than 65% of the total of securities lending income plus the collateral investment expenses.
In addition, commencing the business day following the date that the aggregate securities lending income earned across the Equity-Bond Complex in a calendar year exceeds a specified threshold, the Fund, pursuant to the securities lending agreement, will retain for the remainder of that calendar year securities lending income as follows: 75% of securities lending income, and this amount retained can never be less than 65% of the total of securities lending income plus the collateral investment expenses.
The share of securities lending income earned by the Fund is shown as securities lending — affiliated — net in the Statement of Operations. For the six months ended June 30, 2016, the Fund paid BIM $2,508 for securities lending agent services.
Officers and Directors
Certain officers and/or directors of the Company are officers and/or directors of BlackRock or its affiliates. The Fund reimburses the Manager for a portion of the compensation paid to the Company’s Chief Compliance Officer, which is included in Officer and Directors in the Statement of Operations.
6. Purchases and Sales:
For the six months ended June 30, 2016, purchases and sales of investments, excluding short-term securities, were $24,533,735 and $30,545,885, respectively.
7. Income Tax Information:
It is the Fund’s policy to comply with the requirements of the Internal Revenue Code of 1986, as amended, applicable to regulated investment companies, and to distribute substantially all of its taxable income to its shareholders. Therefore, no federal income tax provision is required.
The Fund files U.S. federal and various state and local tax returns. No income tax returns are currently under examination. The statute of limitations on the Fund’s U.S. federal tax returns generally remains open for each of the four years ended December 31, 2015. The statutes of limitations on the Fund’s state and local tax returns may remain open for an additional year depending upon the jurisdiction.
Management has analyzed tax laws and regulations and their application to the Fund as of June 30, 2016, inclusive of the open tax return years, and does not believe there are any uncertain tax positions that require recognition of a tax liability in the Fund’s financial statements.
| | | | | | |
| 18 | | BLACKROCK VARIABLE SERIES FUNDS, INC. | | JUNE 30, 2016 | | |
| | | | |
| Notes to Financial Statements (continued) | | | BlackRock Large Cap Value V.I. Fund | |
As of June 30, 2016, gross unrealized appreciation and depreciation based on cost for federal income tax purposes were as follows:
| | | | |
| |
Tax cost | | | $87,643,187 | |
| | | | |
Gross unrealized appreciation | | | $17,894,397 | |
Gross unrealized depreciation | | | (2,722,780 | ) |
| | | | |
Net unrealized appreciation | | | $15,171,617 | |
| | | | |
8. Bank Borrowings:
The Company, on behalf of the Fund, along with certain other funds managed by the Manager and its affiliates (“Participating Funds”), is a party to a 364-day, $2.1 billion credit agreement with a group of lenders. Under this agreement, the Fund may borrow to fund shareholder redemptions. Excluding commitments designated for certain individual funds, the Participating Funds, including the Fund, can borrow up to an aggregate commitment amount of $1.6 billion at any time outstanding, subject to asset coverage and other limitations as specified in the agreement. The credit agreement has the following terms: a fee of 0.12% per annum on unused commitment amounts and interest at a rate equal to the higher of (a) one-month LIBOR (but, in any event, not less than 0.00%) on the date the loan is made plus 0.80% per annum or (b) the Fed Funds rate (but, in any event, not less than 0.00%) in effect from time to time plus 0.80% per annum on amounts borrowed. The agreement expires in April 2017 unless extended or renewed. Prior to April 21, 2016, the credit agreement had a fee per annum of 0.06% on unused commitment amounts and interest at a rate equal to the higher of (a) one-month LIBOR (but, in any event, not less than 0.00%) on the date the loan is made plus 0.80% per annum or (b) the Fed Funds rate (but, in any event, not less than 0.00%) in effect from time to time plus 0.80% per annum on amounts borrowed. Participating Funds paid administration, legal and arrangement fees, which, if applicable, are included in miscellaneous expenses in the Statement of Operations. These fees were allocated among such funds based upon portions of the aggregate commitment available to them and relative net assets of Participating Funds. During the six months ended June 30, 2016, the Fund did not borrow under the credit agreement.
9. Principal Risks:
In the normal course of business, the Fund invests in securities and enters into transactions where risks exist due to fluctuations in the market (market risk) or failure of the issuer to meet all its obligations, including the ability to pay principal and interest when due (issuer credit risk). The value of securities held by the Fund may decline in response to certain events, including those directly involving the issuers of securities owned by the Fund. Changes arising from the general economy, the overall market and local, regional or global political or/and social instability, as well as currency, interest rate and price fluctuations, may also affect the securities’ value.
Counterparty Credit Risk: Similar to issuer credit risk, the Fund may be exposed to counterparty credit risk, or the risk that an entity may fail to or be unable to perform on its commitments related to unsettled or open transactions. The Fund manages counterparty credit risk by entering into transactions only with counterparties that the Manager believes have the financial resources to honor their obligations and by monitoring the financial stability of those counterparties. Financial assets, which potentially expose the Fund to market, issuer and counterparty credit risks, consist principally of financial instruments and receivables due from counterparties. The extent of the Fund’s exposure to market, issuer and counterparty credit risks with respect to these financial assets is approximately their value recorded in the Statement of Assets and Liabilities, less any collateral held by the Fund.
10. Capital Share Transactions:
Transactions in capital shares for each class were as follows:
| | | | | | | | | | | | | | | | |
| | | Six Months Ended
June 30, 2016 | | | Year Ended
December 31, 2015 | |
| | | | |
| | Shares | | | Amount | | | Shares | | | Amount | |
| Class l | | | | | | | | | | | | |
Shares sold | | | 119,801 | | | $ | 1,317,180 | | | | 192,858 | | | $ | 2,428,202 | |
Shares issued in reinvestment of distributions | | | — | | | | — | | | | 674,510 | | | | 7,930,808 | |
Shares redeemed | | | (641,422) | | | | (7,151,153) | | | | (1,290,868) | | | | (16,250,700) | |
| | | | | | | | |
Net decrease | | | (521,621) | | | $ | (5,833,973) | | | | (423,500) | | | $ | (5,891,690) | |
| | | | | | | | |
| | | | | | |
| | | BLACKROCK VARIABLE SERIES FUNDS, INC. | | JUNE 30, 2016 | | 19 |
| | | | |
| Notes to Financial Statements (concluded) | | | BlackRock Large Cap Value V.I. Fund | |
| | | | | | | | | | | | | | | | |
| | | Six Months Ended
June 30, 2016 | | | Year Ended
December 31, 2015 | |
| | | | |
| | | Shares | | | Amount | | | Shares | | | Amount | |
| Class ll | | | | | | | | | | | | |
Shares sold | | | 136,290 | | | $ | 1,484,548 | | | | 338,290 | | | $ | 4,262,284 | |
Shares issued in reinvestment of distributions | | | — | | | | — | | | | 40,057 | | | | 472,238 | |
Shares redeemed | | | (100,591) | | | | (1,106,725) | | | | (198,689) | | | | (2,459,051) | |
| | | | | | | | |
Net increase | | | 35,699 | | | $ | 377,823 | | | | 179,658 | | | $ | 2,275,471 | |
| | | | | | | | |
| | | | | | | | | | | | | |
| Class lll | | | | | | | | | | | | |
Shares sold | | | 20,227 | | | $ | 216,149 | | | | 16,120 | | | $ | 200,909 | |
Shares issued in reinvestment of distributions | | | — | | | | — | | | | 12,646 | | | | 147,187 | |
Shares redeemed | | | (11,498) | | | | (128,724) | | | | (22,713) | | | | (277,337) | |
| | | | | | | | |
Net increase | | | 8,729 | | | $ | 87,425 | | | | 6,053 | | | $ | 70,759 | |
| | | | | | | | |
Total Net Decrease | | | (477,193) | | | $ | (5,368,725) | | | | (237,789) | | | $ | (3,545,460) | |
| | | | | | | | |
11. Subsequent Events:
Management’s evaluation of the impact of all subsequent events on the Fund’s financial statements was completed through the date the financial statements were issued and the following item was noted:
The Fund paid a long-term capital gain distribution in the following amounts per share on July 22, 2016 to shareholders of record on July 20, 2016:
| | | | | |
| | | Long-Term
Capital Gain |
Class I | | | $ | 0.061033 | |
Class II | | | $ | 0.061033 | |
Class III | | | $ | 0.061033 | |
| | | | | | |
| 20 | | BLACKROCK VARIABLE SERIES FUNDS, INC. | | JUNE 30, 2016 | | |
JUNE 30, 2016
| | | | |
SEMI-ANNUAL REPORT (UNAUDITED) | | | | BLACKROCK® |
BlackRock Variable Series Funds, Inc.
▶ BlackRock Managed Volatility V.I. Fund
| | |
| Not FDIC Insured ¡ May Lose Value ¡ No Bank Guarantee | | |
| | | | |
| Fund Summary as of June 30, 2016 | | | BlackRock Managed Volatility V.I. Fund | |
BlackRock Managed Volatility V.I. Fund’s (the “Fund”) investment objective is to seek a level of current income and degree of stability of principal not normally available from an investment solely in equity securities, as well as the opportunity for capital appreciation greater than is normally available from an investment solely in debt securities.
|
| Portfolio Management Commentary |
How did the Fund perform?
| • | | For the six-month period ended June 30, 2016, the Fund underperformed both its blended benchmark (50% MSCI All Country World Index (“ACWI”)/50% Citi World Government Bond Index (“WGBI”) (hedged into USD)) and its performance benchmark, the BofA Merrill Lynch 3-Month U.S. Treasury Bill Index. |
What factors influenced performance?
| • | | Within fixed income, a short position in U.S. bonds was the main drag on performance as the expected timetable for U.S. rate increases was pushed back and risk aversion rose in the wake of the U.K. vote to leave the European Union, driving U.S. Treasury yields sharply lower. On the equity side, international exposure weighed on returns given the heightened political uncertainty in Europe. Currency strength also posed head-winds for international equities, particularly in Europe and Japan. |
| • | | Exposure to global equities supported performance as firmer economic activity offset Brexit concerns and underpinned positive equity returns. Gains were concentrated in U.S. stocks, which outperformed their international developed counterparts on the back of renewed strength in domestic economic data. Within fixed income, exposure to international bonds added value as weak inflation dynamics supported policy easing, particularly in Europe and Asia. |
Describe recent portfolio activity.
| • | | The Fund’s overall risk profile was reduced over the period, primarily through decreasing exposure to U.S. and European equities. In terms of currency positioning, the Fund initiated a short position in the euro against the U.S. dollar on expectations that continued economic divergence |
| | would drive renewed divergence in monetary policy. This view also led the Fund to favor international bonds relative to U.S. bonds given weakness in inflation and expectations of policy action by central banks overseas. |
| • | | Derivatives such as futures contracts are used by the investment adviser team as a means to manage risk and/or take outright views on interest rates, credit risk and/or foreign exchange positions in the Fund. During the period, the Fund’s use of derivatives had a positive impact on the absolute performance of the Fund. |
| • | | The Fund held a relatively high allocation to cash as a means of reducing overall portfolio volatility. The cash position did not have a material impact on performance. |
Describe portfolio positioning at period end.
| • | | From a broad asset allocation perspective, the Fund maintained exposure to U.S., European and Japanese equities, while continuing to favor global bonds over U.S. Treasuries. Within the United States, the Fund remained long equities and cautious on fixed income given a re-acceleration in economic activity and firming in inflationary pressures. In Europe, the Fund held a long equity position on the view that monetary policy is likely to remain accommodative as the European Central Bank assesses the impact on economic activity of the British referendum. In Japan, equity exposure was motivated by an expectation that the central bank will respond to the recent tightening in financial conditions and, in turn, provide a tailwind for equities. Finally, the Fund continued to favor global bonds relative to U.S. bonds given stronger inflation dynamics in the latter market. |
The views expressed reflect the opinions of BlackRock as of the date of this report and are subject to change based on changes in market, economic or other conditions. These views are not intended to be a forecast of future events and are no guarantee of future results.
| | | | | |
| Portfolio Composition | | Percent of
Total Investments1 |
Investment Companies | | | | 99% | |
Non-Agency Mortgage-Backed Securities | | | | 1 | |
| | 1 | | Total investments exclude short-term securities. |
| | | | | | |
| 2 | | BLACKROCK VARIABLE SERIES FUNDS, INC. | | JUNE 30, 2016 | | |
| | | | |
| | | | BlackRock Managed Volatility V.I. Fund | |
|
| Total Return Based on a $10,000 Investment |
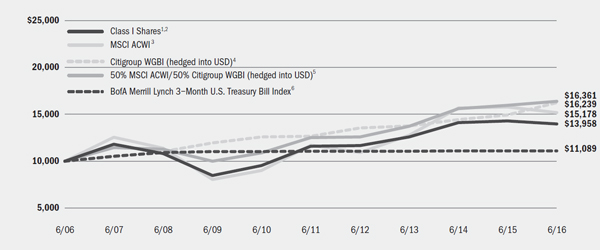
| | 1 | Assuming transaction costs, if any, and other operating expenses, including investment advisory fees. Does not include insurance-related fees and expenses. |
| | 2 | The Fund uses an asset allocation strategy, investing varying percentages of its portfolio in three major categories: stocks, bonds and money market investments. The Fund’s total returns prior to January 22, 2013 are the returns of the Fund when it followed different investment strategies under the name BlackRock Balanced Capital V.I. Fund. |
| | 3 | A free float-adjusted market capitalization weighted index that is designed to measure the equity market performance of developed and emerging markets. The MSCI All Country World Index consists of 46 country indexes comprising of 23 developed and 23 emerging market country indexes. |
| | 4 | A market capitalization weighted bond index consisting of government bond markets of 23 countries, including the United States. |
| | 5 | A customized weighted index comprised of the returns of 50% MSCI ACWI/50% Citigroup WGBI (hedged into USD). |
| | 6 | An unmanaged index that tracks 3-month U.S. Treasury securities. Effective June 2, 2014, the BofA Merrill Lynch 3-Month U.S. Treasury Bill Index was added to the performance benchmarks against which the Fund measures its performance. |
|
| Performance Summary for the Period Ended June 30, 2016 |
| | | | | | | | | | | | | | | | | | | | | | | | | | | | | | | | | | | | |
| | | | | | | | | Average Annual Total Returns |
| | | 6-Month
Total Returns8 | | | | | | 1 Year8 | | | | 5 Years8 | | | | 10 Years8 | | |
Class I7 | | | | (0.46 | )% | | | | | | | | | | | | | | (2.30 | )% | | | | | | 3.79 | % | | | | | | 3.39 | % | | |
50% MSCI ACWI/50% Citigroup WGBI (hedged into USD) | | | | 4.10 | | | | | | | | | | | | | | | 2.69 | | | | | | | 5.52 | | | | | | | 5.05 | | | |
MSCI ACWI | | | | 1.23 | | | | | | | | | | | | | | | (3.73 | ) | | | | | | 5.38 | | | | | | | 4.26 | | | |
Citigroup WGBI (hedged into USD) | | | | 6.71 | | | | | | | | | | | | | | | 8.84 | | | | | | | 5.11 | | | | | | | 4.97 | | | |
BofA Merrill Lynch 3-Month U.S. Treasury Bill Index | | | | 0.15 | | | | | | | | | | | | | | | 0.19 | | | | | | | 0.09 | | | | | | | 1.04 | | | |
| | 7 | | Average annual and cumulative total returns are based on changes in net asset value for the periods shown, and assume reinvestment of all distributions at net asset value on the ex-dividend date. Insurance-related fees and expenses are not reflected in these returns. The Fund’s total returns prior to January 22, 2013 are the returns of the Fund when it followed different investment strategies under the name BlackRock Balanced Capital V.I. Fund. |
| | 8 | | For a portion of the period, the Fund’s investment adviser waived a portion of its fees. Without such waiver, the Fund’s performance would have been lower. |
| | | | Past performance is not indicative of future results. Performance results do not reflect the deduction of taxes that a shareholder would pay on Fund distributions or the redemption of Fund shares. |
| | | | | | | | | | | | | | | | | | | | | | | | | | | | | | | | | | | |
| | | Actual | | Hypothetical10 | | |
| | | Beginning
Account Value
January 1, 2016 | | Ending
Account Value
June 30, 2016 | | Expenses Paid
During the Period9 | | Beginning
Account Value
January 1, 2016 | | Ending
Account Value
June 30, 2016 | | Expenses Paid
During the Period9 | | Annualized
Expense
Ratio |
Class I | | | $ | 1,000.00 | | | | $ | 995.40 | | | | $ | 4.96 | | | | $ | 1,000.00 | | | | $ | 1,019.89 | | | | $ | 5.02 | | | | | 1.00 | % |
| | 9 | | Expenses are equal to the annualized expense ratio, multiplied by the average account value over the period, multiplied by 182/366 (to reflect the one-half year period shown). The fees and expenses of the underlying funds in which the Fund invests are not included in the Fund’s annualized expense ratio. |
| | 10 | | Hypothetical 5% annual return before expenses is calculated by prorating the number of days in the most recent fiscal half year divided by 366. |
| | | | See “Disclosure of Expenses” on the following page for further information on how expenses were calculated. |
| | | | | | |
| | | BLACKROCK VARIABLE SERIES FUNDS, INC. | | JUNE 30, 2016 | | 3 |
| | | | |
| Disclosure of Expenses | | | BlackRock Managed Volatility V.I. Fund | |
Shareholders of the Fund may incur the following charges: (a) transactional expenses, such as sales charges; and (b) operating expenses, including investment advisory fees, service and distribution fees, including 12b-1 fees, acquired fund fees and expenses, and other fund expenses. The expense example on the previous page (which is based on a hypothetical investment of $1,000 invested on January 1, 2016 and held through June 30, 2016) is intended to assist shareholders both in calculating expenses based on an investment in the Fund and in comparing these expenses with similar costs of investing in other mutual funds.
The expense example provides information about actual account values and actual expenses. In order to estimate the expenses a shareholder paid during the period covered by this report, shareholders can divide their account value by $1,000 and then multiply the result by the number corresponding to their Fund under the heading entitled “Expenses Paid During the Period.”
The expense example also provides information about hypothetical account values and hypothetical expenses based on the Fund’s actual expense ratio and an assumed rate of return of 5% per year before expenses. In order to assist shareholders in comparing the ongoing expenses of investing in the Fund and other funds, compare the 5% hypothetical example with the 5% hypothetical examples that appear in shareholder reports of other funds.
The expenses shown in the expense example are intended to highlight shareholders’ ongoing costs only and do not reflect any transactional expenses, such as sales charges, if any. Therefore, the hypothetical example is useful in comparing ongoing expenses only, and will not help shareholders determine the relative total expenses of owning different funds. If these transactional expenses were included, shareholder expenses would have been higher.
| | | | |
Derivative Financial Instruments | | | | |
The Fund may invest in various derivative financial instruments. These instruments are used to obtain exposure to a security, commodity, index, market, and/or other asset without owning or taking physical custody of securities, commodities and/or other referenced assets or to manage market, equity, credit, interest rate, foreign currency exchange rate, commodity and/or other risks. Derivative financial instruments may give rise to a form of economic leverage and involve risks, including the imperfect correlation between the value of a derivative financial instrument and the underlying asset, possible default of the counterparty to the transaction
or illiquidity of the instrument. The Fund’s successful use of a derivative financial instrument depends on the investment adviser’s ability to predict pertinent market movements accurately, which cannot be assured. The use of these instruments may result in losses greater than if they had not been used, may limit the amount of appreciation the Fund can realize on an investment and/or may result in lower distributions paid to shareholders. The Fund’s investments in these instruments, if any, are discussed in detail in the Notes to Financial Statements.
| | | | | | |
| 4 | | BLACKROCK VARIABLE SERIES FUNDS, INC. | | JUNE 30, 2016 | | |
| | | | |
| Schedule of Investments June 30, 2016 (Unaudited) | | | BlackRock Managed Volatility V.I. Fund | |
| | | (Percentages shown are based on Net Assets) | |
| | | | | | | | |
Asset-Backed Securities (a) | | Par (000) | | | Value | |
Countrywide Asset-Backed Certificates, Series 2004-5, Class A, 1.35%, 10/25/34 | | $ | 7 | | | | $ 6,943 | |
Morgan Stanley ABS Capital I, Inc., Trust, Series 2005-HE1, Class A2MZ, 1.05%, 12/25/34 | | | 8 | | | | 6,942 | |
Structured Asset Investment Loan Trust, Series 2004-8, Class M4, 1.95%, 9/25/34 | | | 11 | | | | 9,571 | |
Structured Asset Securities Corp. Mortgage Pass-Through Certificates, Series 2004-23XS, Class 2A1, 0.75%, 1/25/35 | | | 11 | | | | 9,641 | |
Total Asset-Backed Securities — 0.2% | | | | | | | 33,097 | |
| | | | | | | | |
| Investment Companies | | Shares | | | | |
iShares 1-3 Year Credit Bond ETF (b)(c) | | | 15,923 | | | | 1,689,271 | |
iShares 3-7 Year Treasury Bond ETF (c) | | | 6,491 | | | | 826,629 | |
iShares Core U.S. Aggregate Bond ETF (c) | | | 17,278 | | | | 1,944,984 | |
iShares MSCI EAFE ETF (b)(c) | | | 21,263 | | | | 1,186,688 | |
SPDR Barclays International Treasury Bond ETF (b) | | | 80,574 | | | | 4,605,610 | |
Total Investment Companies — 61.8% | | | | | | | 10,253,182 | |
| | | | | | | | |
| Non-Agency Mortgage-Backed Securities | | Par (000) | | | | |
Collateralized Mortgage Obligations — 0.4% | | | | | | | | |
Countrywide Alternative Loan Trust, Series 2007-22, Class 2A16, 6.50%, 9/25/37 | | $ | 28 | | | | 19,827 | |
Credit Suisse Mortgage Capital Certificates: | | | | | | | | |
Series 2011-2R, Class 2A1, 2.90%, 7/27/36 (a)(d) | | | 15 | | | | 14,975 | |
Series 2011-5R, Class 2A1, 2.97%, 8/27/46 (a)(d) | | | 20 | | | | 19,773 | |
Impac Secured Assets CMN Owner Trust, Series 2004-3, Class 1A4, 1.25%, 11/25/34 (a) | | | 4 | | | | 3,779 | |
Total Non-Agency Mortgage-Backed Securities — 0.4% | | | | 58,354 | |
| | | | | | | | |
| Other Interests (e) | | Beneficial
Interest (000) | | | Value | |
Capital Markets — 0.0% | | | | | | | | |
Lehman Brothers Holdings, Inc. (f)(g) | | | $25 | | | | — | |
Total Long-Term Investments (Cost — $10,718,956) — 62.4% | | | | | | $ | 10,344,633 | |
| | | | | | | | |
| Short-Term Securities | | Shares | | | | |
BlackRock Liquidity Funds, TempFund, Institutional Class, 0.40% (c)(h) | | | 5,851,791 | | | | 5,851,791 | |
| | | Beneficial
Interest (000) | | | | |
BlackRock Liquidity Series, LLC, Money Market Series, 0.59% (c)(h)(i) | | $ | 5,810 | | | | 5,810,457 | |
Total Short-Term Securities (Cost — $11,662,248) — 70.3% | | | | | | | 11,662,248 | |
Total Investments (Cost — $22,381,204) — 132.7% | | | | | | | 22,006,881 | |
Liabilities in Excess of Other Assets — (32.7)% | | | | | | | (5,427,330 | ) |
| | | | | | | | |
Net Assets — 100.0% | | | | | | $ | 16,579,551 | |
| | | | | | | | |
| | | | | | | | | | |
| Portfolio Abbreviations |
| AUD | | Australian Dollar | | ETF | | Exchange Traded Fund | | MSCI | | Morgan Stanley Capital International |
| CAD | | Canadian Dollar | | GBP | | British Pound | | SPDR | | Standard & Poor’s Depositary Receipts |
| CHF | | Swiss Franc | | JPY | | Japanese Yen | | USD | | U.S. Dollar |
See Notes to Financial Statements.
| | | | | | |
| | | BLACKROCK VARIABLE SERIES FUNDS, INC. | | JUNE 30, 2016 | | 5 |
| | |
| Schedule of Investments (continued) | | BlackRock Managed Volatility V.I. Fund |
|
| Notes to Schedule of Investments |
| (a) | Variable rate security. Rate as of period end. |
| (b) | Security, or a portion of security, is on loan. |
| (c) | During the six months ended June 30, 2016, investments in issuers considered to be affiliates of the Fund for purposes of Section 2(a)(3) of the Investment Company Act of 1940, as amended, were as follows: |
| | | | | | | | | | | | | | | | | | | | | | | | |
| Affiliate | | Shares/
Beneficial Interest
Held at December 31,
2015 | | | Shares/
Beneficial Interest
Purchased | | | Shares/
Beneficial Interest
Sold | | | Shares/
Beneficial Interest
Held at June 30, 2016 | | | Value at June 30, 2016 | | | Income | |
BlackRock Liquidity Funds, TempFund, Institutional Class | | | $7,158,009 | | | | — | | | | (1,306,218 | )1 | | | $5,851,791 | | | | $ 5,851,791 | | | | $12,795 | |
BlackRock Liquidity Series, LLC, Money Market Series | | | — | | | | 5,810,457 | 2 | | | — | | | | $5,810,457 | | | | 5,810,457 | | | | 7,335 | 3 |
iShares 1-3 Year Credit Bond ETF | | | 15,923 | | | | — | | | | — | | | | 15,923 | | | | 1,689,271 | | | | 9,830 | |
iShares 3-7 Year Treasury Bond ETF | | | 6,491 | | | | — | | | | — | | | | 6,491 | | | | 826,629 | | | | 4,572 | |
iShares Core U.S. Aggregate Bond ETF | | | 17,278 | | | | — | | | | — | | | | 17,278 | | | | 1,944,984 | | | | 18,892 | |
iShares MSCI EAFE ETF | | | 27,461 | | | | — | | | | — | | | | 21,263 | �� | | | 1,186,688 | | | | 24,980 | |
| | | | |
Total | | | | | | | | | | | | | | | | | | | $17,309,820 | | | | $78,404 | |
| | | | | | | | | | | | | | | | | | | | |
| | 1 | | Represents net shares/beneficial interest sold. |
| | 2 | | Represents net shares/beneficial interest purchased. |
| | 3 | | Represents securities lending income earned from the reinvestment of cash collateral from loaned securities, net of fees and collateral investment expenses, and other payments to and from borrowers of securities. |
| (d) | Security exempt from registration pursuant to Rule 144A under the Securities Act of 1933, as amended. These securities may be resold in transactions exempt from registration to qualified institutional investors. |
| (e) | Other interests represent beneficial interests in liquidation trusts and other reorganization or private entities. |
| (f) | Issuer filed for bankruptcy and/or is in default of interest payments. |
| (g) | Non-income producing security. |
| (h) | Current yield as of period end. |
| (i) | Security was purchased with the cash collateral from loaned securities. The Fund may withdraw up to 25% of its investment daily, although the manager of the BlackRock Liquidity Series, LLC, Money Market Series, in its sole discretion, may permit an investor to withdraw more than 25% on any one day. |
|
| Derivative Financial Instruments Outstanding as of Period End |
| | | | | | | | | | | | | | | | |
| Futures Contracts | | | | | | | | | |
Contracts Long
(Short) | | Issue | | Expiration | | Notional Value | | | Unrealized
Appreciation
(Depreciation) | |
(3) | | AUD Currency | | September 2016 | | | USD | | | | 222,720 | | | | $ 84 | |
(1) | | CAD Currency | | September 2016 | | | USD | | | | 77,120 | | | | 1,228 | |
(1) | | CHF Currency | | September 2016 | | | USD | | | | 128,300 | | | | 1,873 | |
(20) | | Euro Currency | | September 2016 | | | USD | | | | 2,776,875 | | | | 73,589 | |
2 | | Euro STOXX 50 Index | | September 2016 | | | USD | | | | 63,367 | | | | 895 | |
(9) | | GBP Currency | | September 2016 | | | USD | | | | 745,200 | | | | 73,841 | |
(21) | | JPY Currency | | September 2016 | | | USD | | | | 2,548,088 | | | | (93,489 | ) |
10 | | S&P 500 E-Mini Index | | September 2016 | | | USD | | | | 1,045,100 | | | | 3,238 | |
5 | | TOPIX Index | | September 2016 | | | USD | | | | 603,060 | | | | 14,699 | |
(11) | | U.S. Treasury Notes (10 Year) | | September 2016 | | | USD | | | | 1,462,828 | | | | (38,345 | ) |
(12) | | U.S. Ultra Treasury Bonds | | September 2016 | | | USD | | | | 2,236,500 | | | | (116,751 | ) |
Total | | | | | | | | | | | | | | | $ (79,138 | ) |
| | | | | | | | | | | | | | | | |
See Notes to Financial Statements.
| | | | | | |
| 6 | | BLACKROCK VARIABLE SERIES FUNDS, INC. | | JUNE 30, 2016 | | |
| | | | |
| Schedule of Investments (continued) | | | BlackRock Managed Volatility V.I. Fund | |
|
| Derivative Financial Instruments Categorized by Risk Exposure |
As of period end, the fair values of derivative financial instruments were as follows:
| | | | | | | | | | | | | | | | | | | | |
| Assets - Derivative Financial Instruments | | Commodity
Contracts | | Credit
Contracts | | Equity
Contracts | | | Foreign
Currency
Exchange
Contracts | | Interest
Rate
Contracts | | Other
Contracts | | Total | |
Futures contracts | | Net unrealized appreciation1 | | — | | — | | | $4,133 | | | $150,615 | | $ 14,699 | | — | | $ | 169,447 | |
| Liabilities - Derivative Financial Instruments | | | | | | | | | | | | | | | | |
Futures contracts | | Net unrealized depreciation1 | | — | | — | | | — | | | $ 93,489 | | $155,096 | | — | | $ | 248,585 | |
| | 1 | | Includes cumulative appreciation (depreciation) on financial futures contracts as reported in the Schedule of Investments. Only current day’s variation margin is reported within the Statement of Assets and Liabilities. |
For the six months ended June 30, 2016, the effect of derivative financial instruments in the Statement of Operations was as follows:
| | | | | | | | | | | | | | | | | | | | | | |
| Net Realized Gain (Loss) from: | | Commodity
Contracts | | Credit
Contracts | | Equity
Contracts | | | Foreign
Currency
Exchange
Contracts | | | Interest Rate
Contracts | | | Other
Contracts | | Total | |
Futures contracts | | — | | — | | $ | (169,067 | ) | | $ | (433,651 | ) | | $ | (61,326 | ) | | — | | $ | (664,044 | ) |
| Net Change in Unrealized Appreciation (Depreciation) on: | | | | | | | | | | | | | | | | | | |
Futures contracts | | — | | — | | $ | 58,549 | | | $ | 100,952 | | | $ | (159,489 | ) | | — | | $ | 12 | |
|
| Average Quarterly Balances of Outstanding Derivative Financial Instruments |
| | | | |
Futures contracts: | | | | |
Average notional value of contracts — long | | $ | 4,458,367 | |
Average notional value of contracts — short | | $ | 10,654,252 | |
For more information about the Fund’s investment risks regarding derivative financial instruments, refer to the Notes to Financial Statements.
|
| Derivative Financial Instruments – Offsetting as of Period End |
The Fund’s derivative assets and liabilities (by type) were as follows:
| | | | | | | | |
| | | Assets | | | Liabilities | |
Derivative Financial Instruments: | | | | | | | | |
Futures contracts | | | $ 64,814 | | | | $ 473 | |
| | | | |
Derivatives not subject to a Master Netting Agreement or similar agreement (“MNA”) | | | (64,814) | | | | (473) | |
| | | | |
Total derivative assets and liabilities subject to an MNA | | | — | | | | — | |
| | | | |
|
| Fair Value Hierarchy as of Period End |
Various inputs are used in determining the fair value of investments and derivative financial instruments. These inputs to valuation techniques are categorized into a fair value hierarchy consisting of three broad levels for financial reporting purposes as follows:
The following tables summarize the Fund’s investments and derivative financial instruments categorized in the disclosure hierarchy:
| | | | | | | | | | | | | | | | |
| | | Level 1 | | | Level 2 | | | Level 3 | | | Total | |
Assets: | | | | | | | | | | | | | | | | |
Investments: | | | | | | | | | | | | | | | | |
Long-Term Investments: | | | | | | | | | | | | | | | | |
Asset-Backed Securities | | | — | | | $ | 33,097 | | | | — | | | $ | 33,097 | |
Investment Companies | | $ | 10,253,182 | | | | — | | | | — | | | | 10,253,182 | |
Non-Agency Mortgage-Backed Securities | | | — | | | | 58,354 | | | | — | | | | 58,354 | |
Other Interests | | | — | | | | — | | | | — | | | | — | |
Short-Term Securities | | | 5,851,791 | | | | 5,810,457 | | | | — | | | | 11,662,248 | |
| | | | |
Total | | $ | 16,104,973 | | | $ | 5,901,908 | | | $ | — | | | $ | 22,006,881 | |
| | | | |
See Notes to Financial Statements.
| | | | | | |
| | | BLACKROCK VARIABLE SERIES FUNDS, INC. | | JUNE 30, 2016 | | 7 |
| | | | |
| Schedule of Investments (concluded) | | | BlackRock Managed Volatility V.I. Fund | |
| | | | | | | | | | | | | | | | |
| | | Level 1 | | | Level 2 | | | Level 3 | | | Total | |
Derivative Financial Instruments1 | | | | | | | | | | | | | | | | |
Assets: | | | | | | | | | | | | | | | | |
Equity contracts | | $ | 4,133 | | | | — | | | | — | | | $ | 4,133 | |
Foreign currency exchange contracts | | | 150,615 | | | | — | | | | — | | | | 150,615 | |
Interest rate contracts | | | 14,699 | | | | — | | | | — | | | | 14,699 | |
Liabilities: | | | | | | | | | | | | | | | | |
Foreign currency exchange contracts | | | (93,489 | ) | | | — | | | | — | | | | (93,489 | ) |
Interest rate contracts | | | (155,096 | ) | | | — | | | | — | | | | (155,096 | ) |
| | | | |
Total | | $ | (79,138 | ) | | | — | | | | — | | | $ | (79,138 | ) |
| | | | |
| | | | | | | | |
1 Derivative financial instruments are financial futures contracts, which are valued at the unrealized appreciation (depreciation) on the instrument. The Fund may hold assets in which the fair value approximates the carrying amount for financial statement purposes. As of period end, such assets are categorized within the disclosure hierarchy as follows: |
| | | | | | | | | | | | | | | | |
| | | Level 1 | | | Level 2 | | | Level 3 | | | Total | |
Assets: | | | | | | | | | | | | | | | | |
Cash | | $ | 59,895 | | | | — | | | | — | | | $ | 59,895 | |
Foreign currency at value | | | 13,502 | | | | — | | | | — | | | | 13,502 | |
Cash pledged for futures contracts | | | 345,750 | | | | — | | | | — | | | | 345,750 | |
Liabilities: | | | | | | | | | | | | | | | | |
Collateral on securities loaned at value. | | | — | | | $ | (5,810,457 | ) | | | — | | | | (5,810,457 | ) |
| | | | |
Total | | $ | 419,147 | | | $ | (5,810,457 | ) | | | — | | | $ | (5,391,310 | ) |
| | | | |
During the six months ended June 30, 2016, there were no transfers between levels.
See Notes to Financial Statements.
| | | | | | |
| 8 | | BLACKROCK VARIABLE SERIES FUNDS, INC. | | JUNE 30, 2016 | | |
| | | | |
| Statement of Assets and Liabilities | | | | |
| | | | |
| June 30, 2016 (Unaudited) | | BlackRock Managed
Volatility V.I. Fund | |
| | | | |
| Assets | | | | |
Investments at value — unaffiliated (including securities loaned at value of $5,714,597) (cost — $4,944,138) | | $ | 4,697,061 | |
Investments at value — affiliated (cost — $17,437,066) | | | 17,309,820 | |
Cash | | | 59,895 | |
Cash pledged for futures contracts | | | 345,750 | |
Foreign currency at value (cost — $17,706) | | | 13,502 | |
Receivables: | | | | |
Securities lending income — affiliated | | | 1,419 | |
Dividends — affiliated | | | 2,093 | �� |
Interest | | | 242 | |
From the Manager | | | 5,819 | |
Variation margin receivable on futures contracts | | | 64,814 | |
Prepaid expenses | | | 41 | |
Other assets | | | 442 | |
| | | | |
Total assets | | | 22,500,898 | |
| | | | |
| | | | |
| Liabilities | | | | |
Collateral on securities loaned at value | | | 5,810,457 | |
Payables: | | | | |
Capital shares redeemed | | | 828 | |
Investment advisory fees | | | 5,794 | |
Officer’s and Directors’ fees | | | 907 | |
Other accrued expenses | | | 102,787 | |
Other affiliates | | | 101 | |
Variation margin payable on futures contracts | | | 473 | |
| | | | |
Total liabilities | | | 5,921,347 | |
| | | | |
Net Assets | | $ | 16,579,551 | |
| | | | |
| | | | |
| Net Assets Consist of | | | | |
Paid-in capital | | $ | 17,580,660 | |
Accumulated net investment loss | | | (5,130 | ) |
Accumulated net realized loss | | | (538,757 | ) |
Net unrealized appreciation (depreciation) | | | (457,222 | ) |
| | | | |
Net Assets | | $ | 16,579,551 | |
| | | | |
| | | | |
| Net Asset Value | | | | |
Class I — Based on net assets of $16,579,551 and 1,273,587 shares outstanding, 100 million shares authorized, $0.10 par value | | $ | 13.02 | |
| | | | |
See Notes to Financial Statements.
| | | | | | |
| | | BLACKROCK VARIABLE SERIES FUNDS, INC. | | JUNE 30, 2016 | | 9 |
| | | | |
| Six Months Ended June 30, 2016 (Unaudited) | | BlackRock Managed
Volatility V.I. Fund | |
| | | | |
| Investment Income | |
Dividends — affiliated | | $ | 71,069 | |
Securities lending — affiliated — net | | | 7,335 | |
Interest | | | 2,205 | |
| | | | |
Total income | | | 80,609 | |
| | | | |
| | | | |
| Expenses | | | | |
Investment advisory | | | 47,258 | |
Professional | | | 37,271 | |
Transfer agent | | | 2,427 | |
Transfer agent — class specific | | | 17,612 | |
Printing | | | 7,819 | |
Accounting services | | | 4,680 | |
Officer and Directors | | | 2,863 | |
Custodian | | | 1,766 | |
Miscellaneous | | | 3,633 | |
| | | | |
Total expenses | | | 125,329 | |
Less: | | | | |
Fees waived by the Manager | | | (21,722 | ) |
Transfer agent fees reimbursed — class specific | | | (17,612 | ) |
| | | | |
Total expenses after fees waived and/or reimbursed | | | 85,995 | |
| | | | |
Net investment loss | | | (5,386 | ) |
| | | | |
| | | | |
| Realized and Unrealized Gain (Loss) | | | | |
Net realized gain (loss) from: | | | | |
Investments — unaffiliated | | | (13,783 | ) |
Futures contracts | | | (664,044 | ) |
Foreign currency transactions | | | 75,984 | |
| | | | |
| | | (601,843 | ) |
| | | | |
Net change in unrealized appreciation (depreciation) on: | | | | |
Investments — unaffiliated | | | 444,651 | |
Investments — affiliated | | | 66,675 | |
Futures contracts | | | 12 | |
Foreign currency translations | | | 5,222 | |
| | | | |
| | | 516,560 | |
| | | | |
Net realized and unrealized loss | | | (85,283 | ) |
| | | | |
Net Decrease in Net Assets Resulting from Operations | | $ | (90,669 | ) |
| | | | |
See Notes to Financial Statements.
| | | | | | |
| 10 | | BLACKROCK VARIABLE SERIES FUNDS, INC. | | JUNE 30, 2016 | | |
| | |
| Statements of Changes in Net Assets | | BlackRock Managed Volatility V.I. Fund |
| | | | | | | | |
| | | Six Months | | | | |
| | | Ended | | | | |
| | | June 30, | | | Year Ended | |
| | | 2016 | | | December 31, | |
| Decrease in Net Assets: | | (Unaudited) | | | 2015 | |
| | | | | | | | |
| Operations | | | | | | | | |
Net investment loss | | $ | (5,386 | ) | | $ | (91,974 | ) |
Net realized gain (loss) | | | (601,843 | ) | | | 741,025 | |
Net change in unrealized appreciation (depreciation) | | | 516,560 | | | | (713,526 | ) |
| | | | |
Net decrease in net assets resulting from operations | | | (90,669 | ) | | | (64,475 | ) |
| | | | |
| | | | | | | | |
| Distributions to Shareholders1 | | | | | | | | |
From net realized gain | | | — | | | | (765,860 | ) |
| | | | |
| | | | | | | | |
| Capital Share Transactions | | | | | | | | |
Net decrease in net assets derived from capital share transactions | | | (1,509,397 | ) | | | (2,272,790 | ) |
| | | | |
| | | | | | | | |
| Net Assets | | | | | | | | |
Total decrease in net assets | | | (1,600,066 | ) | | | (3,103,125 | ) |
Beginning of period | | | 18,179,617 | | | | 21,282,742 | |
| | | | |
End of period | | $ | 16,579,551 | | | $ | 18,179,617 | |
| | | | |
Undistributed (accumulated) net investment income (loss), end of period | | $ | (5,130 | ) | | $ | 256 | |
| | | | |
| 1 | | Distributions for annual periods determined in accordance with federal income tax regulations. |
See Notes to Financial Statements.
| | | | | | |
| | | BLACKROCK VARIABLE SERIES FUNDS, INC. | | JUNE 30, 2016 | | 11 |
| | | | |
| Financial Highlights | | | BlackRock Managed Volatility V.I. Fund | |
| | | | | | | | | | | | | | | | | | | | | | | | |
| | | Class I | |
| | | Six Months
Ended
June 30, 2016 | | | Year Ended December 31, | |
| | | (Unaudited) | | | 2015 | | | 2014 | | | 2013 | | | 2012 | | | 2011 | |
| | | | | | | | | | | | | | | | | | | | | | | | |
| Per Share Operating Performance | | | | | | | | | | | | | | | | | | | | | | | | |
Net asset value, beginning of period | | | $ 13.08 | | | $ | 13.70 | | | $ | 14.41 | | | $ | 13.28 | | | $ | 12.26 | | | $ | 12.07 | |
| | | | |
Net investment income (loss)1 | | | (0.00 | )2 | | | (0.06 | ) | | | 0.04 | | | | 0.07 | | | | 0.20 | | | | 0.21 | |
Net realized and unrealized gain (loss) | | | (0.06 | ) | | | (0.01 | ) | | | 0.29 | | | | 1.60 | | | | 1.01 | | | | 0.26 | |
| | | | |
Net increase (decrease) from investment operations | | | (0.06 | ) | | | (0.07 | ) | | | 0.33 | | | | 1.67 | | | | 1.21 | | | | 0.47 | |
| | | | |
Distributions from:3 | | | | | | | | | | | | | | | | | | | | | | | | |
Net investment income | | | — | | | | — | | | | — | | | | (0.13 | ) | | | (0.19 | ) | | | (0.28 | ) |
Net realized gain | | | — | | | | (0.55 | ) | | | (1.04 | ) | | | (0.41 | ) | | | — | | | | — | |
| | | | |
Total distributions | | | — | | | | (0.55 | ) | | | (1.04 | ) | | | (0.54 | ) | | | (0.19 | ) | | | (0.28 | ) |
| | | | |
Net asset value, end of period | | | $ 13.02 | | | $ | 13.08 | | | $ | 13.70 | | | $ | 14.41 | | | $ | 13.28 | | | $ | 12.26 | |
| | | | |
| | | | | | | | | | | | | | | | | | | | | | | | |
| Total Return4 | | | | | | | | | | | | | | | | | | | | | | | | |
Based on net asset value | | | (0.46 | )%5 | | | (0.57 | )% | | | 2.28 | % | | | 12.62 | % | | | 9.88 | % | | | 3.84 | % |
| | | | |
| | | | | | | | | | | | | | | | | | | | | | | | |
| Ratios to Average Net Assets | | | | | | | | | | | | | | | | | | | | | | | | |
Total expenses6 | | | 1.46 | %7 | | | 1.47 | % | | | 1.60 | % | | | 1.78 | % | | | 1.36 | % | | | 1.16 | % |
| | | | |
Total expenses after fees waived and/or reimbursed6 | | | 1.00 | %7 | | | 1.00 | % | | | 1.07 | % | | | 1.23 | % | | | 1.22 | % | | | 1.14 | % |
| | | | |
Total expenses after fees waived and/or reimbursed and excluding interest expense6 | | | 1.00 | %7 | | | 1.00 | % | | | 1.07 | % | | | 1.23 | % | | | 1.22 | % | | | 1.13 | % |
| | | | |
Net investment income (loss)6 | | | (0.06 | )%7 | | | (0.46 | )% | | | 0.25 | % | | | 0.47 | % | | | 1.49 | % | | | 1.71 | % |
| | | | |
| | | | | | | | | | | | | | | | | | | | | | | | |
| Supplemental Data | | | | | | | | | | | | | | | | | | | | | | | | |
Net assets, end of period (000) | | | $16,580 | | | $ | 18,180 | | | $ | 21,283 | | | $ | 24,092 | | | $ | 25,975 | | | $ | 26,860 | |
| | | | |
Portfolio turnover rate | | | 0 | % | | | 13 | % | | | 64 | % | | | 241 | %8 | | | 502 | %8 | | | 570 | %8 |
| | | | |
| | 1 | | Based on average shares outstanding. |
| | 2 | | Amount is greater than $(0.005) per share. |
| | 3 | | Distributions for annual periods determined in accordance with federal income tax regulations. |
| | 4 | | Where applicable, excludes insurance-related fees and expenses and assumes the reinvestment of distributions. |
| | 5 | | Aggregate total return. |
| | 6 | | Excludes expenses incurred indirectly as a result of investments in underlying funds as follows: |
| | | | | | | | | | | | | | | | | | | | | | | | |
| | | Six Months
Ended
June 30,
2016 | | | Year Ended December 31, | |
| | | (Unaudited) | | | 2015 | | | 2014 | | | 2013 | | | 2012 | | | 2011 | |
| |
Investments in underlying funds | | | 0.25 | % | | | 0.23 | % | | | 0.23 | % | | | 0.22 | % | | | — | | | | — | |
| |
| | 8 | | Includes mortgage dollar roll transactions (“MDRs”). Additional information regarding portfolio turnover rate is as follows: |
| | | | | | | | | | | | | | | | | | | | | | | | |
| | | Six Months
Ended
June 30,
2016 | | | Year Ended December 31, | |
| | | (Unaudited) | | | 2015 | | | 2014 | | | 2013 | | | 2012 | | | 2011 | |
| |
Portfolio turnover rate (excluding MDRs) | | | 0 | % | | | 13 | % | | | 64 | % | | | 229 | % | | | 400 | % | | | 400% | |
| |
See Notes to Financial Statements.
| | | | | | |
| 12 | | BLACKROCK VARIABLE SERIES FUNDS, INC. | | JUNE 30, 2016 | | |
| | | | |
| Notes to Financial Statements (Unaudited) | | | BlackRock Managed Volatility V.I. Fund | |
1. Organization:
BlackRock Variable Series Funds, Inc. (the “Company”) is registered under the Investment Company Act of 1940, as amended (the “1940 Act”), as an open-end management investment company. The Company is organized as a Maryland corporation that is comprised of 20 separate funds. The funds offer shares to insurance companies for their separate accounts to fund benefits under certain variable annuity and variable life insurance contracts. The financial statements presented are for BlackRock Managed Volatility V.I. Fund (the “Fund”). The Fund is classified as diversified.
The Fund, together with certain other registered investment companies advised by BlackRock Advisors, LLC (the “Manager”) or its affiliates, is included in a complex of open-end funds referred to as the Equity-Bond Complex.
2. Significant Accounting Policies:
The financial statements are prepared in conformity with accounting principles generally accepted in the United States of America (“U.S. GAAP”), which may require management to make estimates and assumptions that affect the reported amounts of assets and liabilities in the financial statements, disclosure of contingent assets and liabilities at the date of the financial statements and the reported amounts of increases and decreases in net assets from operations during the reporting period. Actual results could differ from those estimates. The Fund is considered an investment company under U.S. GAAP and follows the accounting and reporting guidance applicable to investment companies. Below is a summary of significant accounting policies:
Foreign Currency: The Fund’s books and records are maintained in U.S. dollars. Purchases and sales of investments are recorded at the rates of exchange prevailing on the respective dates of such transactions. Generally, when the U.S. dollar rises in value against a foreign currency, the investments denominated in that currency will lose value; the opposite effect occurs if the U.S. dollar falls in relative value.
The Fund does not isolate the portion of the results of operations arising as a result of changes in the exchange rates from the changes in the market prices of investments held or sold for financial reporting purposes. Accordingly, the effects of changes in exchange rates on investments are not segregated in the Statement of Operations from the effects of changes in market prices of those investments, but are included as a component of net realized and unrealized gain (loss) from investments. The Fund reports realized currency gains (losses) on foreign currency related transactions as components of net realized gain (loss) for financial reporting purposes, whereas such components are generally treated as ordinary income for federal income tax purposes.
Defensive Positions: Investment policies may vary for temporary defensive purposes during periods in which the investment adviser believes that conditions in the securities markets or other economic, financial or political conditions warrant. Under such conditions, the Fund may invest up to 100% of its total assets in U.S. Government securities, certificates of deposit, repurchase agreements that involve purchases of debt securities, bankers’ acceptances and other bank obligations, commercial paper, money market funds and/or other debt securities, or may hold its assets in cash. The investment adviser applies this defensive position as applicable and consistent with the Fund’s investment policies.
Segregation and Collateralization: In cases where the Fund enters into certain investments (e.g., futures contracts), that would be treated as “senior securities” for 1940 Act purposes, the Fund may segregate or designate on its books and records cash or liquid assets having a market value at least equal to the amount of its future obligations under such investments. Doing so allows the investment to be excluded from treatment as a “senior security.” Furthermore, if required by an exchange or counterparty agreement, the Fund may be required to deliver/deposit cash and/or securities to/with an exchange, or broker-dealer or custodian as collateral for certain investments or obligations.
Investment Transactions and Investment Income: For financial reporting purposes, investment transactions are recorded on the dates the transactions are entered into (the trade dates). Realized gains and losses on investment transactions are determined on the identified cost basis. Dividend income is recorded on the ex-dividend date. Dividends from foreign securities where the ex-dividend date may have passed are subsequently recorded when the Fund is informed of the ex-dividend date. Under the applicable foreign tax laws, a withholding tax at various rates may be imposed on capital gains, dividends and interest. Interest income, including amortization and accretion of premiums and discounts on debt securities, is recognized on the accrual basis.
Distributions: Distributions paid by the Fund are recorded on the ex-dividend date. The character and timing of distributions are determined in accordance with federal income tax regulations, which may differ from U.S. GAAP.
Indemnifications: In the normal course of business, the Fund enters into contracts that contain a variety of representations that provide general indemnification. The Fund’s maximum exposure under these arrangements is unknown because it involves future potential claims against the Fund, which cannot be predicted with any certainty.
Other: Expenses directly related to the Fund are charged to the Fund. Other operating expenses shared by several funds, including other funds managed by the Manager, are prorated among those funds on the basis of relative net assets or other appropriate methods.
| | | | | | |
| | | BLACKROCK VARIABLE SERIES FUNDS, INC. | | JUNE 30, 2016 | | 13 |
| | |
| Notes to Financial Statements (continued) | | BlackRock Managed Volatility V.I. Fund |
The Fund has an arrangement with its custodian whereby fees may be reduced by credits earned on uninvested cash balances, which, if applicable, are shown as fees paid indirectly in the Statement of Operations. The custodian imposes fees on overdrawn cash balances, which can be offset by accumulated credits earned or may result in additional custody charges.
3. Investment Valuation and Fair Value Measurements:
Investment Valuation Policies: The Fund’s investments are valued at fair value (also referred to as “market value” within the financial statements) as of the close of trading on the New York Stock Exchange (“NYSE”) (generally 4:00 p.m., Eastern time). U.S. GAAP defines fair value as the price the Fund would receive to sell an asset or pay to transfer a liability in an orderly transaction between market participants at the measurement date. The Fund determines the fair values of its financial instruments using various independent dealers or pricing services under policies approved by the Board of Directors of the Company (the “Board”). The BlackRock Global Valuation Methodologies Committee (the “Global Valuation Committee”) is the committee formed by management to develop global pricing policies and procedures and to oversee the pricing function for all financial instruments.
Fair Value Inputs and Methodologies: The following methods (or “techniques”) and inputs are used to establish the fair value of the Fund’s assets and liabilities:
| • | | Equity investments traded on a recognized securities exchange are valued at the official closing price each day, if available. For equity investments traded on more than one exchange, the official close price on the exchange where the stock is primarily traded is used. Equity investments traded on a recognized exchange for which there were no sales on that day may be valued at the last available bid (long positions) or ask (short positions) price. |
| • | | Bond investments are valued on the basis of last available bid prices or current market quotations provided by dealers or pricing services. Floating rate loan interests are valued at the mean of the bid prices from one or more brokers or dealers as obtained from a pricing service. In determining the value of a particular investment, pricing services may use certain information with respect to transactions in such investments, quotations from dealers, pricing matrixes, market transactions in comparable investments, various relationships observed in the market between investments and calculated yield measures. Asset-backed and mortgage-backed securities are valued by independent pricing services using models that consider estimated cash flows of each tranche of the security, establish a benchmark yield and develop an estimated tranche-specific spread to the bench-mark yield based on the unique attributes of the tranche. |
| • | | Investments in open-end registered investment companies are valued at net asset value each business day. |
| • | | The Fund values its investment in BlackRock Liquidity Series, LLC, Money Market Series (the “Money Market Series”) at fair value, which is ordinarily based upon its pro rata ownership in the underlying fund’s net assets. The Money Market Series seeks current income consistent with maintaining liquidity and preserving capital. Although the Money Market Series is not registered under the 1940 Act, its investments may follow the parameters of investments by a money market fund that is subject to Rule 2a-7 under the 1940 Act. The Fund may withdraw up to 25% of its investment daily, although the manager of the Money Market Series, in its sole discretion, may permit an investor to withdraw more than 25% on any one day. |
| • | | Futures contracts traded on exchanges are valued at their last sale price. |
| • | | Securities and other assets and liabilities denominated in foreign currencies are translated into U.S. dollars using exchange rates determined as of the close of business on the NYSE. |
If events (e.g., a company announcement, market volatility or a natural disaster) occur that are expected to materially affect the value of such instruments, or in the event that the application of these methods of valuation results in a price for an investment that is deemed not to be representative of the market value of such investment, or if a price is not available, the investment will be valued by the Global Valuation Committee, or its delegate, in accordance with a policy approved by the Board as reflecting fair value (“Fair Valued Investments”). When determining the price for Fair Valued Investments, the Global Valuation Committee, or its delegate, seeks to determine the price that the Fund might reasonably expect to receive or pay from the current sale or purchase of that asset or liability in an arm’s-length transaction. Fair value determinations shall be based upon all available factors that the Global Valuation Committee, or its delegate, deems relevant consistent with the principles of fair value measurement, which include the market approach, income approach and/or in the case of recent investments, the cost approach, as appropriate. The market approach generally consists of using comparable market transactions. The income approach generally is used to discount future cash flows to present value and is adjusted for liquidity as appropriate. These factors include but are not limited to: (i) attributes specific to the investment or asset; (ii) the principal market for the investment or asset; (iii) the customary participants in the principal market for the investment or asset; (iv) data assumptions by market participants for the investment or asset, if reasonably available; (v) quoted prices for similar investments or assets in active markets; and (vi) other factors, such as future cash flows, interest rates, yield curves, volatilities, prepayment speeds, loss severities, credit risks, recovery rates, liquidation amounts and/or default rates. Due to the inherent uncertainty of valuations of such investments, the fair values may differ from the values that would have been used had an active market existed. The Global Valuation Committee, or its delegate, employs various methods for calibrating valuation approaches for investments where an active market does not exist, including regular due diligence of the Fund’s pricing vendors, regular reviews of key inputs and assumptions, transactional back-testing or disposition analysis to compare unrealized gains and losses to realized gains and losses, reviews of missing or stale prices and large movements in market values and reviews of any market related activity. The pricing of all Fair Valued Investments is subsequently reported to the Board or a committee thereof on a quarterly basis.
| | | | | | |
| 14 | | BLACKROCK VARIABLE SERIES FUNDS, INC. | | JUNE 30, 2016 | | |
| | |
| Notes to Financial Statements (continued) | | BlackRock Managed Volatility V.I. Fund |
Fair Value Hierarchy: Various inputs are used in determining the fair value of investments and derivative financial instruments. These inputs to valuation techniques are categorized into a fair value hierarchy consisting of three broad levels for financial statement purposes as follows:
| • | | Level 1 — unadjusted price quotations in active markets/exchanges for identical assets or liabilities that the Fund has the ability to access |
| • | | Level 2 — other observable inputs (including, but not limited to, quoted prices for similar assets or liabilities in markets that are active, quoted prices for identical or similar assets or liabilities in markets that are not active, inputs other than quoted prices that are observable for the assets or liabilities (such as interest rates, yield curves, volatilities, prepayment speeds, loss severities, credit risks and default rates) or other market–corroborated inputs) |
| • | | Level 3 — unobservable inputs based on the best information available in the circumstances, to the extent observable inputs are not available (including the Fund’s own assumptions used in determining the fair value of investments and derivative instruments) |
The hierarchy gives the highest priority to unadjusted quoted prices in active markets for identical assets or liabilities (Level 1 measurements) and the lowest priority to unobservable inputs (Level 3 measurements). Accordingly, the degree of judgment exercised in determining fair value is greatest for instruments categorized in Level 3. The inputs used to measure fair value may fall into different levels of the fair value hierarchy. In such cases, for disclosure purposes, the fair value hierarchy classification is determined based on the lowest level input that is significant to the fair value measurement in its entirety. The significant unobservable inputs used by the Global Valuation Committee in determining the price for Fair Valued Investments are typically categorized as Level 3. The fair value hierarchy for the Fund’s investments and derivative financial instruments has been included in the Schedule of Investments.
Changes in valuation techniques may result in transfers into or out of an assigned level within the hierarchy. In accordance with the Fund’s policy, transfers between different levels of the fair value hierarchy are deemed to have occurred as of the beginning of the reporting period. The categorization of a value determined for investments and derivative financial instruments is based on the pricing transparency of the investments and derivative financial instruments and is not necessarily an indication of the risks associated with investing in those securities.
4. Securities and Other Investments:
Asset-Backed and Mortgage-Backed Securities: Asset-backed securities are generally issued as pass-through certificates or as debt instruments. Asset-backed securities issued as pass-through certificates represent undivided fractional ownership interests in an underlying pool of assets. Asset-backed securities issued as debt instruments, which are also known as collateralized obligations, are typically issued as the debt of a special purpose entity organized solely for the purpose of owning such assets and issuing such debt. Asset-backed securities are often backed by a pool of assets representing the obligations of a number of different parties. The yield characteristics of certain asset-backed securities may differ from traditional debt securities. One such major difference is that all or a principal part of the obligations may be prepaid at any time because the underlying assets (i.e., loans) may be prepaid at any time. As a result, a decrease in interest rates in the market may result in increases in the level of prepayments as borrowers, particularly mortgagors, refinance and repay their loans. An increased prepayment rate with respect to an asset-backed security will have the effect of shortening the maturity of the security. In addition, the Fund may subsequently have to reinvest the proceeds at lower interest rates. If the Fund has purchased such an asset-backed security at a premium, a faster than anticipated prepayment rate could result in a loss of principal to the extent of the premium paid.
For mortgage pass through securities (the “Mortgage Assets”) there are a number of important differences among the agencies and instrumentalities of the U.S. Government that issue mortgage-related securities and among the securities that they issue. For example, mortgage-related securities guaranteed by Ginnie Mae are guaranteed as to the timely payment of principal and interest by Ginnie Mae and such guarantee is backed by the full faith and credit of the United States. However, mortgage-related securities issued by Freddie Mac and Fannie Mae, including Freddie Mac and Fannie Mae guaranteed mortgage pass-through certificates, which are solely the obligations of Freddie Mac and Fannie Mae, are not backed by or entitled to the full faith and credit of the United States, but are supported by the right of the issuer to borrow from the U.S. Treasury.
Non-agency mortgage-backed securities are securities issued by non-governmental issuers and have no direct or indirect government guarantees of payment and are subject to various risks. Non-agency mortgage loans are obligations of the borrowers thereunder only and are not typically insured or guaranteed by any other person or entity. The ability of a borrower to repay a loan is dependent upon the income or assets of the borrower. A number of factors, including a general economic downturn, acts of God, terrorism, social unrest and civil disturbances, may impair a borrower’s ability to repay its loans.
Multiple Class Pass-Through Securities: Multiple class pass-through securities, including collateralized mortgage obligations (“CMOs”) and commercial mortgage-backed securities may be issued by Ginnie Mae, U.S. Government agencies or instrumentalities or by trusts formed by private originators of, or investors in, mortgage loans. In general, CMOs are debt obligations of a legal entity that are collateralized by, a pool of residential or commercial mortgage loans or Mortgage Assets. The payments on these are used to make payments on the CMOs or multiple pass-through securities. Multiple class pass-through securities represent direct ownership interests in the Mortgage Assets. Classes of CMOs include interest only (“IOs”), principal only (“POs”), planned amortization classes and targeted amortization classes. IOs and POs are stripped mortgage-backed securities representing interests
| | | | | | |
| | | BLACKROCK VARIABLE SERIES FUNDS, INC. | | JUNE 30, 2016 | | 15 |
| | | | |
| Notes to Financial Statements (continued) | | | BlackRock Managed Volatility V.I. Fund | |
in a pool of mortgages, the cash flow from which has been separated into interest and principal components. IOs receive the interest portion of the cash flow while POs receive the principal portion. IOs and POs can be extremely volatile in response to changes in interest rates. As interest rates rise and fall, the value of IOs tends to move in the same direction as interest rates. POs perform best when prepayments on the underlying mortgages rise since this increases the rate at which the principal is returned and the yield to maturity on the PO. When payments on mortgages underlying a PO are slower than anticipated, the life of the PO is lengthened and the yield to maturity is reduced. If the underlying Mortgage Assets experience greater than anticipated prepayments of principal, the Fund’s initial investment in the IOs may not fully recoup.
Securities Lending: The Fund may lend its securities to approved borrowers, such as brokers, dealers and other financial institutions. The borrower pledges and maintains with the Fund collateral consisting of cash, an irrevocable letter of credit issued by a bank, or securities issued or guaranteed by the U.S. Government. The initial collateral received by the Fund is required to have a value of at least 102% of the current value of the loaned securities for securities traded on U.S. exchanges and a value of at least 105% for all other securities. The collateral is maintained thereafter, at a value equal to at least 100% of the current market value of the securities on loan. The market value of the loaned securities is determined at the close of each business day of the Fund and any additional required collateral is delivered to the Fund, or excess collateral returned by the Fund, on the next business day. During the term of the loan, the Fund is entitled to all distributions made on or in respect of the loaned securities. Loans of securities are terminable at any time and the borrower, after notice, is required to return borrowed securities within the standard time period for settlement of securities transactions.
The market value of any securities on loan, all of which were classified as investment companies in the Fund’s Schedule of Investments, and the value any related collateral are shown separately in the Statement of Assets and Liabilities as a component of investments at value — unaffiliated, and collateral on securities loaned at value, respectively. As of period end, any securities on loan were collateralized by cash. The cash collateral invested by the securities lending agent, BlackRock Investment Management, LLC (“BIM”), if any, is disclosed in the Schedule of Investments.
Securities lending transactions are entered into by the Fund under Master Securities Lending Agreements (each, an “MSLA”) which provide the right, in the event of default (including bankruptcy or insolvency), for the non-defaulting party to liquidate the collateral and calculate a net exposure to the defaulting party or request additional collateral. In the event that a borrower defaults, the Fund, as lender, would offset the market value of the collateral received against the market value of the securities loaned. When the value of the collateral is greater than that of the market value of the securities loaned, the lender is left with a net amount payable to the defaulting party. However, bankruptcy or insolvency laws of a particular jurisdiction may impose restrictions on or prohibitions against such a right of offset in the event of an MSLA counterparty’s bankruptcy or insolvency. Under the MSLA, absent an event of default, the borrower can resell or re-pledge the loaned securities, and the Fund can reinvest cash collateral received in connection with loaned securities. Upon an event of default, the parties’ obligations to return the securities or collateral to the other party are extinguished, and the parties can resell or re-pledge the loaned securities or the collateral received in connection with the loaned securities in order to satisfy the defaulting party’s net payment obligation for all transactions under the MSLA. The defaulting party remains liable for any deficiency.
As of period end, the following table is a summary of the Fund’s securities lending agreements by counterparty which are subject to offset under an MSLA:
| | | | | | | | | | | | |
| Counterparty | | Securities Loaned at Value | | | Cash Collateral
Received1 | | | Net Amount | |
Citigroup Global Markets, Inc. | | | $ 26,947 | | | | $ (26,947 | ) | | | — | |
JP Morgan Securities LLC | | | 5,687,650 | | | | (5,687,650 | ) | | | — | |
| | | | |
Total | | | $5,714,597 | | | | $(5,714,597 | ) | | | — | |
| | | | |
| | 1 | | Collateral with a value of $5,810,457 has been received in connection with securities lending agreements. Collateral received in excess of the value of securities loaned from the individual counterparty is not shown for financial reporting purposes in the table above. |
The risks of securities lending include the risk that the borrower may not provide additional collateral when required or may not return the securities when due. To mitigate these risks, the Fund benefits from a borrower default indemnity provided by BIM. BIM’s indemnity allows for full replacement of the securities loaned if the collateral received does not cover the value on the securities loaned in the event of borrower default. The Fund could suffer a loss if the value of an investment purchased with cash collateral falls below the market value of loaned securities or if the value of an investment purchased with cash collateral falls below the value of the original cash collateral received.
5. Derivative Financial Instruments:
The Fund engages in various portfolio investment strategies using derivative contracts both to increase the returns of the Fund and/or to manage its exposure to certain risks such as credit risk, equity risk, interest rate risk, foreign currency exchange rate risk, commodity price risk or other risks (e.g., inflation risk). Derivative financial instruments categorized by risk exposure are included in the Schedule of Investments. These contracts may be transacted on an exchange or over-the-counter.
| | | | | | |
| 16 | | BLACKROCK VARIABLE SERIES FUNDS, INC. | | JUNE 30, 2016 | | |
| | | | |
| Notes to Financial Statements (continued) | | | BlackRock Managed Volatility V.I. Fund | |
Futures Contracts: The Fund invests in long and/or short positions in futures and options on futures contracts to gain exposure to, or manage exposure to changes in interest rates (interest rate risk), changes in the value of equity securities (equity risk) or foreign currencies (foreign currency exchange rate risk).
Futures contracts are agreements between the Fund and a counterparty to buy or sell a specific quantity of an underlying instrument at a specified price and on a specified date. Depending on the terms of a contract, it is settled either through physical delivery of the underlying instrument on the settlement date or by payment of a cash amount on the settlement date. Upon entering into a futures contract, the Fund is required to deposit initial margin with the broker in the form of cash or securities in an amount that varies depending on a contract’s size and risk profile. The initial margin deposit must then be maintained at an established level over the life of the contract.
Securities deposited as initial margin are designated in the Schedule of Investments and cash deposited, if any, is shown as cash pledged for futures contracts in the Statement of Assets and Liabilities. Pursuant to the contract, the Fund agrees to receive from or pay to the broker an amount of cash equal to the daily fluctuation in market value of the contract (“variation margin”). Variation margin is recorded as unrealized appreciation (depreciation) and, if any, shown as variation margin receivable (or payable) on futures contracts in the Statement of Assets and Liabilities. When the contract is closed, a realized gain or loss is recorded in the Statement of Operations equal to the difference between the value of the contract at the time it was opened and the value at the time it was closed. The use of futures contracts involves the risk of an imperfect correlation in the movements in the price of futures contracts and interest, foreign currency exchange rates or underlying assets.
6. Investment Advisory Agreement and Other Transactions with Affiliates:
The PNC Financial Services Group, Inc. is the largest stockholder and an affiliate of BlackRock, Inc. (“BlackRock”) for 1940 Act purposes.
Investment Advisory
The Company, on behalf of the Fund, entered into an Investment Advisory Agreement with the Manager, the Fund’s investment adviser, an indirect, wholly owned subsidiary of BlackRock, to provide investment advisory and administration services. The Manager is responsible for the management of the Fund’s portfolio and provides the personnel, facilities, equipment and certain other services necessary to the operations of the Fund. For such services, the Fund pays the Manager a monthly fee, which is determined by calculating a percentage of the Fund’s average daily net assets, based on the following annual rates:
| | |
| Average Daily Net Assets | | Investment Advisory Fee |
First $1 Billion | | 0.55% |
$1 Billion — $3 Billion | | 0.52% |
$3 Billion — $5 Billion | | 0.50% |
$5 Billion — $10 Billion | | 0.48% |
Greater than $10 Billion | | 0.47% |
The Manager, with respect to the Fund, entered into sub-advisory agreements with BlackRock International Limited (“BIL”), BlackRock Asset Management North Asia Limited (“BNA”) and BlackRock (Singapore) Limited (“BSL”), each an affiliate of the Manager. The Manager pays BIL, BNA and BSL, for services they provide, a monthly fee that is a percentage of the investment advisory fees paid by the Fund to the Manager.
Distribution Fees
The Company, on behalf of the Fund, entered into a Distribution Agreement and a Distribution Plan with BlackRock Investments, LLC (“BRIL”), an affiliate of the Manager. Pursuant to the Distribution Plan and in accordance with Rule 12b-1 under the 1940 Act, the Fund pays BRIL ongoing distribution fees. The fees are accrued daily and paid monthly at annual rates based upon the average daily net assets of the relevant share class of the Fund. For the six months ended June 30, 2016, the Fund had no distribution fees.
Transfer Agent
The Manager, on behalf of the Fund, entered into agreements with insurance companies and other financial intermediaries (“Service Organizations”), some of which may be affiliates. Pursuant to these agreements, the Service Organizations provide the Fund with administrative, networking, recordkeeping, sub-transfer agency and shareholder services to sub-accounts they service. For these services, the Service Organizations receive an annual fee per shareholder account, which will vary depending on share class and/or net assets of Fund shareholders serviced by the Service Organizations, which is shown as transfer agent — class specific. For the six months ended June 30, 2016, the Fund did not pay any amounts to affiliates in return for these services.
In addition, the Fund pays the transfer agent, which is not an affiliate, a fee for issuance, transfer and redemption of shares and the opening and maintenance of shareholder accounts, which is included in transfer agent in the Statement of Operations.
| | | | | | |
| | | BLACKROCK VARIABLE SERIES FUNDS, INC. | | JUNE 30, 2016 | | 17 |
| | | | |
| Notes to Financial Statements (continued) | | | BlackRock Managed Volatility V.I. Fund | |
Expense Limitations, Waivers and Reimbursements
The Manager, with respect to the Fund, contractually agreed to waive and/or reimburse fees or expenses in order to limit expenses, excluding interest expense, dividend expense, tax expense, acquired fund fees and expenses and certain other fund expenses, which constitute extraordinary expenses not incurred in the ordinary course of the Fund’s business. The expense limitation as a percentage of average daily net assets is 1.00% for Class I. This amount is included in fees waived by the Manager in the Statement of Operations. For the six months ended June 30, 2016, the amount waived was $19,403.
The Manager has agreed not to reduce or discontinue this contractual reimbursement prior to May 1, 2017 unless approved by the Board, including a majority of the Independent Directors who are not “interested persons” of the Fund, as defined in the 1940 Act (“Independent Directors”) or by a majority of the outstanding voting securities of the Fund.
The Manager, with respect to the Fund, voluntarily agreed to waive its investment advisory fees by the amount of investment advisory fees the Fund pays to the Manager indirectly through its investment in affiliated money market funds. In addition, the Manager has contractually agreed to waive the management fee on assets estimated to be attributed to the Fund’s investments in other equity and fixed-income mutual funds managed by Manager of its affiliates, if any. This amount is included in fees waived by the Manager in the Statement of Operations. For the six months ended June 30, 2016, the amount waived was $2,319.
The Manager has contractually agreed to reimburse all transfer agent fees for Class I Shares.
The Manager has agreed not to reduce or discontinue this contractual expense limitation prior to May 1, 2017, unless approved by the Board, including a majority of the Independent Directors or by a majority of the outstanding voting securities of the Fund.
For the six months ended June 30, 2016, the Fund reimbursed the Manager $99 for certain accounting services, which is included in accounting services in the Statement of Operations.
Securities Lending
The U.S. Securities and Exchange Commission has issued an exemptive order which permits BIM, an affiliate of the Manager, to serve as securities lending agent for the Fund, subject to applicable conditions. As securities lending agent, BIM bears all operational costs directly related to securities lending. The Fund is responsible for expenses in connection with the investment of cash collateral received for securities on loan (the “collateral investment expenses”). The cash collateral is invested in a private investment company managed by the Manager or its affiliates. However, BIM has agreed to cap the collateral investment expenses of the private investment company to an annual rate of 0.04%. The investment adviser to the private investment company will not charge any advisory fees with respect to shares purchased by the Fund.
Securities lending income is equal to the total of income earned from the reinvestment of cash collateral, net of fees and other payments to and from borrowers of securities, and less the collateral investment expenses. The Fund retains a portion of securities lending income and remits a remaining portion to BIM as compensation for its services as securities lending agent.
Pursuant to a securities lending agreement, the Fund retains 80% of securities lending income, and this amount retained can never be less than 70% of the total of securities lending income plus the collateral investment expenses.
In addition, commencing the business day following the date that the aggregate securities lending income earned across the Equity-Bond Complex in a calendar year exceeds a specified threshold, the Fund, pursuant to the securities lending agreement, will retain for the remainder of that calendar year securities lending income as follows: 85% of securities lending income, and this amount retained can never be less than 70% of the total of securities lending income plus the collateral investment expenses.
The share of securities lending income earned by the Fund is shown as securities lending — affiliated — net in the Statement of Operations. For the six months ended June 30, 2016, the Fund paid BIM $1,717 for securities lending agent services.
Officers and Directors
Certain officers and/or directors of the Company are officers and/or directors of BlackRock or its affiliates. The Fund reimburses the Manager for a portion of the compensation paid to the Company’s Chief Compliance Officer, which is included in officer and directors in the Statement of Operations.
7. Purchases and Sales:
For the six months ended June 30, 2016, purchases and sales of investments, including paydowns and excluding short-term securities, were $0 and $354,897, respectively.
| | | | | | |
| 18 | | BLACKROCK VARIABLE SERIES FUNDS, INC. | | JUNE 30, 2016 | | |
| | | | |
| Notes to Financial Statements (continued) | | | BlackRock Managed Volatility V.I. Fund | |
8. Income Tax Information:
It is the Fund’s policy to comply with the requirements of the Internal Revenue Code of 1986, as amended, applicable to regulated investment companies, and to distribute substantially all of its taxable income to its shareholders. Therefore, no federal income tax provision is required.
The Fund files U.S. federal and various state and local tax returns. No income tax returns are currently under examination. The statute of limitations on the Fund’s U.S. federal tax returns generally remains open for each of the four years ended December 31, 2015. The statutes of limitations on the Fund’s state and local tax returns may remain open for an additional year depending upon the jurisdiction.
Management has analyzed tax laws and regulations and their application to the Fund as of June 30, 2016, inclusive of the open tax return years, and does not believe there are any uncertain tax positions that require recognition of a tax liability in the Fund’s financial statements.
As of June 30, 2016, gross unrealized appreciation and depreciation based on cost for federal income tax purposes were as follows:
| | | | |
Tax cost | | $ | 22,380,952 | |
| | | | |
| |
Gross unrealized appreciation | | $ | 67,461 | |
Gross unrealized depreciation | | | (441,532 | ) |
| | | | |
Net unrealized depreciation | | $ | (374,071 | ) |
| | | | |
9. Bank Borrowings:
The Company, on behalf of the Fund, along with certain other funds managed by the Manager and its affiliates (“Participating Funds”), is a party to a 364-day, $2.1 billion credit agreement with a group of lenders. Under this agreement, the Fund may borrow to fund shareholder redemptions. Excluding commitments designated for certain individual funds, the Participating Funds, including the Fund, can borrow up to an aggregate commitment amount of $1.6 billion at any time outstanding, subject to asset coverage and other limitations as specified in the agreement. The credit agreement has the following terms: a fee of 0.12% per annum on unused commitment amounts and interest at a rate equal to the higher of (a) one-month LIBOR (but, in any event, not less than 0.00%) on the date the loan is made plus 0.80% per annum or (b) the Fed Funds rate (but, in any event, not less than 0.00%) in effect from time to time plus 0.80% per annum on amounts borrowed. The agreement expires in April 2017 unless extended or renewed. Prior to April 21, 2016, the credit agreement had a fee per annum of 0.06% on unused commitment amounts and interest at a rate equal to the higher of (a) one-month LIBOR (but, in any event, not less than 0.00%) on the date the loan is made plus 0.80% per annum or (b) the Fed Funds rate (but, in any event, not less than 0.00%) in effect from time to time plus 0.80% per annum on amounts borrowed. Participating Funds paid administration, legal and arrangement fees, which, if applicable, are included in miscellaneous expenses in the Statement of Operations. These fees were allocated among such funds based upon portions of the aggregate commitment available to them and relative net assets of Participating Funds. During the six months ended June 30, 2016, the Fund did not borrow under the credit agreement.
10. Principal Risks:
In the normal course of business, the Fund invests in securities and enters into transactions where risks exist due to fluctuations in the market (market risk) or failure of the issuer to meet all its obligations, including the ability to pay principal and interest when due (issuer credit risk). The value of securities held by the Fund may decline in response to certain events, including those directly involving the issuers of securities owned by the Fund. Changes arising from the general economy, the overall market and local, regional or global political and/or social instability, as well as currency, interest rate and price fluctuations, may also affect the securities’ value.
Counterparty Credit Risk: Similar to issuer credit risk, the Fund may be exposed to counterparty credit risk, or the risk that an entity may fail to or be unable to perform on its commitments related to unsettled or open transactions. The Fund manages counterparty credit risk by entering into transactions only with counterparties that the Manager believes have the financial resources to honor their obligations and by monitoring the financial stability of those counterparties. Financial assets, which potentially expose the Fund to market, issuer and counterparty credit risks, consist principally of financial instruments and receivables due from counterparties. The extent of the Fund’s exposure to market, issuer and counterparty credit risks with respect to these financial assets is approximately their value recorded in the Statement of Assets and Liabilities, less any collateral held by the Fund.
A derivative contract may suffer a mark-to-market loss if the value of the contract decreases due to an unfavorable change in the market rates or values of the underlying instrument. Losses can also occur if the counterparty does not perform under the contract.
With exchange-traded futures, there is less counterparty credit risk to the Fund since the exchange or clearinghouse, as counterparty to such instruments, guarantees against a possible default. The clearinghouse stands between the buyer and the seller of the contract; therefore, credit risk is limited to failure of the clearinghouse. While offset rights may exist under applicable law, the Fund does not have a contractual right of offset against a clearing broker or clearinghouse in the event of a default (including the bankruptcy or insolvency). Additionally, credit risk exists in exchange-traded futures with respect to initial and variation margin that is held in a clearing broker’s customer accounts. While clearing brokers are required to segregate customer margin from their own assets, in the event that a clearing broker becomes insolvent or goes into bankruptcy and at that time there is a shortfall in the aggregate amount of margin held by the clearing broker for all its clients, typically the shortfall would be allocated on a pro rata basis across all the clearing broker’s customers, potentially resulting in losses to the Fund.
| | | | | | |
| | | BLACKROCK VARIABLE SERIES FUNDS, INC. | | JUNE 30, 2016 | | 19 |
| | | | |
| Notes to Financial Statements (concluded) | | | BlackRock Managed Volatility V.I. Fund | |
11. Capital Share Transactions:
Transactions in capital shares were as follows:
| | | | | | | | | | | | | | | | | | | | |
| | | Six Months Ended
June 30, 2016 | | | | | | Year Ended
December 31, 2015 | |
| | | Shares | | | Amount | | | | | | Shares | | | Amount | |
| Class I | | | | | | | | | | | | | | | |
Shares sold | | | 6,688 | | | $ | 86,513 | | | | | | | | 22,048 | | | $ | 299,746 | |
Shares issued in reinvestment of distributions | | | — | | | | — | | | | | | | | 57,130 | | | | 765,860 | |
Shares redeemed | | | (123,382) | | | | (1,595,910) | | | | | | | | (242,731) | | | | (3,338,396) | |
| | | | | | | | | | | | |
Net decrease | | | (116,694) | | | $ | (1,509,397) | | | | | | | | (163,553) | | | $ | (2,272,790) | |
| | | | | | | | | | | | |
12. Subsequent Events:
Management has evaluated the impact of all subsequent events on the Fund through the date the financial statements were issued and has determined that there were no subsequent events requiring adjustment or additional disclosure in the financial statements.
| | | | | | |
| 20 | | BLACKROCK VARIABLE SERIES FUNDS, INC. | | JUNE 30, 2016 | | |
JUNE 30, 2016
| | | | |
SEMI-ANNUAL REPORT (UNAUDITED) | | | | BLACKROCK® |
BlackRock Variable Series Funds, Inc.
▶ BlackRock S&P 500 Index V.I. Fund
| | |
| Not FDIC Insured ¡ May Lose Value ¡ No Bank Guarantee | | |
| | | | |
| Fund Summary as of June 30, 2016 | | | BlackRock S&P 500 Index V.I. Fund | |
BlackRock S&P 500 Index V.I. Fund’s (the “Fund”) investment objective is to seek investment results that, before expenses, correspond to the aggregate price and yield performance of the Standard and Poor’s (“S&P”) 500® Index.
|
| Portfolio Management Commentary |
How did the Fund perform?
| • | | For the six-month period ended June 30, 2016, the Fund’s Class I and Class II Shares returned 3.62% and 3.54%, respectively, while the benchmark S&P 500® Index returned 3.84%. |
| • | | Returns for the Fund’s respective share classes differ from the benchmark index based on individual share-class expenses. |
Describe the market environment.
| • | | Market-moving events and headlines in the first half of the year have been dominated by slowing global growth fears and geopolitical events. |
| • | | The first week of the year was the worst start to a year since 2009, and by February 11, the S&P 500® Total Return Index hit a low for the year of (10.27)%. With fears of a global economic slowdown, oil prices cratering, and terrorist attacks in Istanbul, Jakarta and Pakistan, equities suffered. |
| • | | Russia and Saudi Arabia agreed to freeze oil production, and oil began to rebound in February. U.S. equities responded in kind, aided by dovish comments from Fed officials. In March, the European Central Bank unexpectedly cut rates and increased asset purchases, while the Fed kept |
| | | rates unchanged and scaled back the expected number of rate hikes this year. Despite the terror attacks in Brussels, the market rallied in March and the S&P 500® Index ended the first quarter up 1.35%. |
| • | | Domestic equity markets posted gains in the first half of the year despite increased volatility in June from the “Brexit”, i.e., the United Kingdom’s vote to leave the European Union. Following the vote, equity markets declined worldwide and investors rushed to high quality assets, driving U.S. Treasury yields further down. However, U.S. equities capitalized on the upward momentum from their March rally, which continued through the second quarter as commodities rebounded and dovish comments from the Fed fueled the market. |
Describe recent portfolio activity.
| • | | During the period, as changes were made to the composition of the S&P 500® Index, the Fund purchased and sold securities to maintain its objective of seeking to correspond to the risks and return of the benchmark index. |
Describe portfolio positioning at period end.
| • | | The Fund remains positioned to match the risk characteristics of its benchmark index, irrespective of the market’s future direction. |
The views expressed reflect the opinions of BlackRock as of the date of this report and are subject to change based on changes in market, economic or other conditions. These views are not intended to be a forecast of future events and are no guarantee of future results.
| | | | | |
| Sector Allocation | | Percent of Net Assets |
Information Technology | | | | 19 | % |
Financials | | | | 15 | |
Health Care | | | | 14 | |
Consumer Discretionary | | | | 12 | |
Consumer Staples | | | | 10 | |
Industrials | | | | 9 | |
Energy | | | | 7 | |
Utilities | | | | 3 | |
Telecommunication Services | | | | 3 | |
Materials | | | | 3 | |
Short-Term Securities | | | | 9 | |
Liabilities in Excess of Other Assets | | | | (4 | ) |
For Fund compliance purposes, the Fund’s sector classifications refer to one or more of the sector sub-classifications used by one or more widely recognized market indexes or rating group indexes, and/or as defined by the investment adviser. These definitions may not apply for purposes of this report, which may combine sector sub-classifications for reporting ease.
| | | | | | |
| 2 | | BLACKROCK VARIABLE SERIES FUNDS, INC. | | JUNE 30, 2016 | | |
| | | | |
| | | | BlackRock S&P 500 Index V.I. Fund | |
|
| Total Return Based on a $10,000 Investment |
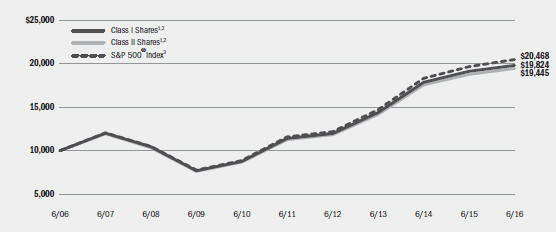
| | 1 | Assuming transaction costs, if any, and other operating expenses, including investment advisory fees. Does not include insurance-related fees and expenses. |
| | 2 | Under normal circumstances, the Fund invests at least 80% of its assets in the common stocks represented in the S&P 500® Index and in derivative instruments linked to the S&P 500®Index. |
| | 3 | An unmanaged index that covers 500 leading companies and captures approximately 80% coverage of available market capitalization. |
| | | | | | | | | | | | | | | | | | | | |
| Performance Summary for the Period Ended June 30, 2016 | | | | | | | | | | | | | | | | | | | | |
| | | | | Average Annual Total Returns |
| | | 6-Month
Total Returns5 | | 1 Year5 | | 5 Years5 | | 10 Years5 |
Class I4 | | | | 3.62 | % | | | | 3.60 | % | | | | 11.70 | % | | | | 7.08 | % |
Class II4 | | | | 3.54 | | | | | 3.45 | | | | | 11.52 | | | | | 6.88 | |
S&P 500® Index | | | | 3.84 | | | | | 3.99 | | | | | 12.10 | | | | | 7.43 | |
| | 4 | | Average annual and cumulative total returns are based on changes in net asset value for the periods shown, and assume reinvestment of all distributions at net asset value on the ex-dividend date. Insurance-related fees and expenses are not reflected in these returns. |
| | 5 | | For a portion of the period, the Fund’s investment adviser waived a portion of its fee. Without such waiver, the Fund’s performance would have been lower. |
| | | | Past performance is not indicative of future results. Performance results do not reflect the deduction of taxes that a shareholder would pay on Fund distributions or the redemption of Fund shares. |
| | | | | | | | | | | | | | |
| Expense Example | | | | | | | | | | | | | | |
| | | Actual | | Hypothetical7 | | |
| | | Beginning
Account Value
January 1, 2016 | | Ending
Account Value
June 30, 2016 | | Expenses Paid
During the Period6 | | Beginning
Account Value
January 1, 2016 | | Ending
Account Value
June 30, 2016 | | Expenses Paid
During the Period6 | | Annualized
Expense
Ratio |
Class I | | $1,000.00 | | $1,036.20 | | $1.57 | | $1,000.00 | | $1,023.32 | | $1.56 | | 0.31% |
Class II | | $1,000.00 | | $1,035.40 | | $2.33 | | $1,000.00 | | $1,022.58 | | $2.31 | | 0.46% |
| | 6 | | For each class of the Fund, expenses are equal to the annualized expense ratio for the class, multiplied by the average account value over the period, multiplied by 182/366 (to reflect the one-half year period shown). |
| | 7 | | Hypothetical 5% annual return before expenses is calculated by prorating the number of days in the most recent fiscal half year divided by 366. |
| | | | See “Disclosure of Expenses” on the following page for further information on how expenses were calculated. |
| | | | | | |
| | | BLACKROCK VARIABLE SERIES FUNDS, INC. | | JUNE 30, 2016 | | 3 |
| | | | |
| Disclosure of Expenses | | | BlackRock S&P 500 Index V.I. Fund | |
Shareholders of the Fund may incur the following charges: (a) transactional expenses, such as sales charges; and (b) operating expenses, including investment advisory fees, service and distribution fees, including 12b-1 fees, acquired fund fees and expenses, and other fund expenses. The expense example on the previous page (which is based on a hypothetical investment of $1,000 invested on January 1, 2016 and held through June 30, 2016) is intended to assist shareholders both in calculating expenses based on an investment in the Fund and in comparing these expenses with similar costs of investing in other mutual funds.
The expense example provides information about actual account values and actual expenses. In order to estimate the expenses a shareholder paid during the period covered by this report, shareholders can divide their account value by $1,000 and then multiply the result by the number corresponding to their share class under the heading entitled “Expenses Paid During the Period.”
The expense example also provides information about hypothetical account values and hypothetical expenses based on the Fund’s actual expense ratio and an assumed rate of return of 5% per year before expenses. In order to assist shareholders in comparing the ongoing expenses of investing in the Fund and other funds, compare the 5% hypothetical example with the 5% hypothetical examples that appear in shareholder reports of other funds.
The expenses shown in the expense example are intended to highlight shareholders’ ongoing costs only and do not reflect any transactional expenses, such as sales charges, if any. Therefore, the hypothetical example is useful in comparing ongoing expenses only, and will not help shareholders determine the relative total expenses of owning different funds. If these transactional expenses were included, shareholder expenses would have been higher.
|
| Derivative Financial Instruments |
The Fund may invest in various derivative financial instruments. These instruments are used to obtain exposure to a security, commodity, index, market, and/or other asset without owning or taking physical custody of securities, commodities and/or other referenced assets or to manage market, equity, credit, interest rate, foreign currency exchange rate, commodity and/or other risks. Derivative financial instruments may give rise to a form of economic leverage and involve risks, including the imperfect correlation between the value of a derivative financial instrument and the underlying asset, possible default of the counterparty to the
transaction or illiquidity of the instrument. The Fund’s successful use of a derivative financial instrument depends on the investment adviser’s ability to predict pertinent market movements accurately, which cannot be assured. The use of these instruments may result in losses greater than if they had not been used, may limit the amount of appreciation the Fund can realize on an investment and/or may result in lower distributions paid to shareholders. The Fund’s investments in these instruments, if any, are discussed in detail in the Notes to Financial Statements.
| | | | | | |
| 4 | | BLACKROCK VARIABLE SERIES FUNDS, INC. | | JUNE 30, 2016 | | |
| | | | |
| Schedule of Investments June 30, 2016 (Unaudited) | | | BlackRock S&P 500 Index V.I. Fund | |
| | | (Percentages shown are based on Net Assets) | |
| | | | | | | | |
| Common Stocks | | Shares | | | Value | |
Aerospace & Defense — 2.5% | | | | | | | | |
Boeing Co. | | | 5,986 | | | $ | 777,402 | |
General Dynamics Corp. | | | 2,911 | | | | 405,328 | |
Honeywell International, Inc. | | | 7,617 | | | | 886,009 | |
L-3 Communications Holdings, Inc. | | | 782 | | | | 114,712 | |
Lockheed Martin Corp. | | | 2,620 | | | | 650,205 | |
Northrop Grumman Corp. | | | 1,803 | | | | 400,771 | |
Raytheon Co. | | | 2,977 | | | | 404,723 | |
Rockwell Collins, Inc. | | | 1,325 | | | | 112,811 | |
Textron, Inc. | | | 2,719 | | | | 99,407 | |
TransDigm Group, Inc. (a)(b) | | | 535 | | | | 141,074 | |
United Technologies Corp. | | | 7,733 | | | | 793,019 | |
| | | | | | | | |
| | | | | | | | 4,785,461 | |
Air Freight & Logistics — 0.7% | | | | | | | | |
C.H. Robinson Worldwide, Inc. | | | 1,388 | | | | 103,059 | |
Expeditors International of Washington, Inc. | | | 1,847 | | | | 90,577 | |
FedEx Corp. | | | 2,495 | | | | 378,691 | |
United Parcel Service, Inc., Class B | | | 6,883 | | | | 741,437 | |
| | | | | | | | |
| | | | | | | | 1,313,764 | |
Airlines — 0.5% | | | | | | | | |
Alaska Air Group, Inc. | | | 1,242 | | | | 72,396 | |
American Airlines Group, Inc. | | | 5,777 | | | | 163,547 | |
Delta Air Lines, Inc. | | | 7,752 | | | | 282,405 | |
Southwest Airlines Co. | | | 6,345 | | | | 248,787 | |
United Continental Holdings, Inc. (a) | | | 3,356 | | | | 137,730 | |
| | | | | | | | |
| | | | | | | | 904,865 | |
Auto Components — 0.3% | | | | | | | | |
BorgWarner, Inc. | | | 2,227 | | | | 65,741 | |
Delphi Automotive PLC | | | 2,738 | | | | 171,399 | |
Goodyear Tire & Rubber Co. | | | 2,680 | | | | 68,769 | |
Johnson Controls, Inc. | | | 6,409 | | | | 283,662 | |
| | | | | | | | |
| | | | | | | | 589,571 | |
Automobiles — 0.5% | | | | | | | | |
Ford Motor Co. | | | 38,638 | | | | 485,680 | |
General Motors Co. | | | 13,934 | | | | 394,332 | |
Harley-Davidson, Inc. | | | 1,867 | | | | 84,575 | |
| | | | | | | | |
| | | | | | | | 964,587 | |
Banks — 5.0% | | | | | | | | |
Bank of America Corp. | | | 102,586 | | | | 1,361,316 | |
BB&T Corp. (b) | | | 8,206 | | | | 292,216 | |
Citigroup, Inc. | | | 29,273 | | | | 1,240,882 | |
Citizens Financial Group, Inc. | | | 5,350 | | | | 106,893 | |
Comerica, Inc. | | | 1,667 | | | | 68,564 | |
Fifth Third Bancorp | | | 7,949 | | | | 139,823 | |
Huntington Bancshares, Inc. | | | 7,688 | | | | 68,731 | |
JPMorgan Chase & Co. | | | 36,540 | | | | 2,270,596 | |
KeyCorp | | | 8,158 | | | | 90,146 | |
M&T Bank Corp. | | | 1,604 | | | | 189,641 | |
People’s United Financial, Inc. | | | 3,233 | | | | 47,396 | |
PNC Financial Services Group, Inc. (c) | | | 4,998 | | | | 406,787 | |
Regions Financial Corp. | | | 12,890 | | | | 109,694 | |
SunTrust Banks, Inc. | | | 4,953 | | | | 203,469 | |
U.S. Bancorp | | | 16,289 | | | | 656,935 | |
Wells Fargo & Co. | | | 46,181 | | | | 2,185,747 | |
Zions Bancorporation | | | 2,099 | | | | 52,748 | |
| | | | | | | | |
| | | | | | | | 9,491,584 | |
Beverages — 2.2% | | | | | | | | |
Brown-Forman Corp., Class B | | | 1,022 | | | | 101,955 | |
Coca-Cola Co. | | | 38,819 | | | | 1,759,665 | |
Constellation Brands, Inc., Class A | | | 1,753 | | | | 289,946 | |
Dr Pepper Snapple Group, Inc. | | | 1,847 | | | | 178,476 | |
Molson Coors Brewing Co., Class B | | | 1,824 | | | | 184,461 | |
| | | | | | | | |
| Common Stocks | | Shares | | | Value | |
Beverages (continued) | | | | | | | | |
Monster Beverage Corp. (a) | | | 1,407 | | | $ | 226,119 | |
PepsiCo, Inc. | | | 14,408 | | | | 1,526,384 | |
| | | | | | | | |
| | | | | | | | 4,267,006 | |
Biotechnology — 2.8% | | | | | | | | |
AbbVie, Inc. | | | 16,166 | | | | 1,000,837 | |
Alexion Pharmaceuticals, Inc. (a) | | | 2,238 | | | | 261,309 | |
Amgen, Inc. | | | 7,487 | | | | 1,139,147 | |
Biogen, Inc. (a)(b) | | | 2,174 | | | | 525,717 | |
Celgene Corp. (a) | | | 7,776 | | | | 766,947 | |
Gilead Sciences, Inc. | | | 13,310 | | | | 1,110,320 | |
Regeneron Pharmaceuticals, Inc. (a) | | | 777 | | | | 271,352 | |
Vertex Pharmaceuticals, Inc. (a)(b) | | | 2,443 | | | | 210,147 | |
| | | | | | | | |
| | | | | | | | 5,285,776 | |
Building Products — 0.1% | | | | | | | | |
Allegion PLC | | | 993 | | | | 68,944 | |
Fortune Brands Home & Security, Inc. | | | 1,531 | | | | 88,752 | |
Masco Corp. | | | 3,257 | | | | 100,772 | |
| | | | | | | | |
| | | | | | | | 258,468 | |
Capital Markets — 1.7% | | | | | | | | |
Affiliated Managers Group, Inc. (a) | | | 526 | | | | 74,045 | |
Ameriprise Financial, Inc. | | | 1,711 | | | | 153,733 | |
Bank of New York Mellon Corp. | | | 10,700 | | | | 415,695 | |
BlackRock, Inc. (c) | | | 1,260 | | | | 431,588 | |
Charles Schwab Corp. | | | 11,937 | | | | 302,125 | |
E*TRADE Financial Corp. (a) | | | 2,856 | | | | 67,087 | |
Franklin Resources, Inc. (b) | | | 3,654 | | | | 121,934 | |
Goldman Sachs Group, Inc. | | | 3,861 | | | | 573,667 | |
Invesco Ltd. | | | 4,056 | | | | 103,590 | |
Legg Mason, Inc. | | | 1,051 | | | | 30,994 | |
Morgan Stanley | | | 15,129 | | | | 393,051 | |
Northern Trust Corp. | | | 2,182 | | | | 144,579 | |
State Street Corp. | | | 3,969 | | | | 214,008 | |
T. Rowe Price Group, Inc. | | | 2,456 | | | | 179,214 | |
| | | | | | | | |
| | | | | | | | 3,205,310 | |
Chemicals — 2.0% | | | | | | | | |
Air Products & Chemicals, Inc. | | | 1,931 | | | | 274,279 | |
Albemarle Corp. | | | 1,121 | | | | 88,906 | |
CF Industries Holdings, Inc. | | | 2,227 | | | | 53,671 | |
Dow Chemical Co. | | | 11,222 | | | | 557,846 | |
E I du Pont de Nemours & Co. | | | 8,669 | | | | 561,751 | |
Eastman Chemical Co. | | | 1,489 | | | | 101,103 | |
Ecolab, Inc. | | | 2,651 | | | | 314,409 | |
FMC Corp. | | | 1,384 | | | | 64,093 | |
International Flavors & Fragrances, Inc. | | | 802 | | | | 101,108 | |
LyondellBasell Industries NV, Class A | | | 3,438 | | | | 255,856 | |
Monsanto Co. | | | 4,373 | | | | 452,212 | |
Mosaic Co. (b) | | | 3,618 | | | | 94,719 | |
PPG Industries, Inc. | | | 2,653 | | | | 276,310 | |
Praxair, Inc. (b) | | | 2,833 | | | | 318,401 | |
Sherwin-Williams Co. | | | 777 | | | | 228,182 | |
| | | | | | | | |
| | | | | | | | 3,742,846 | |
Commercial Services & Supplies — 0.4% | | | | | | | | |
Cintas Corp. | | | 896 | | | | 87,924 | |
Pitney Bowes, Inc. | | | 1,919 | | | | 34,158 | |
Republic Services, Inc. | | | 2,417 | | | | 124,016 | |
Stericycle, Inc. (a) | | | 832 | | | | 86,628 | |
Tyco International PLC | | | 4,202 | | | | 179,005 | |
Waste Management, Inc. | | | 4,096 | | | | 271,442 | |
| | | | | | | | |
| | | | | | | | 783,173 | |
Communications Equipment — 0.9% | | | | | | | | |
Cisco Systems, Inc. | | | 50,099 | | | | 1,437,340 | |
See Notes to Financial Statements.
| | | | | | |
| | | BLACKROCK VARIABLE SERIES FUNDS, INC. | | JUNE 30, 2016 | | 5 |
| | | | |
| Schedule of Investments (continued) | | | BlackRock S&P 500 Index V.I. Fund | |
| | | | |
| | | | | | | | |
| Common Stocks | | Shares | | | Value | |
Communications Equipment (continued) | | | | | | | | |
F5 Networks, Inc. (a) | | | 698 | | | $ | 79,460 | |
Harris Corp. | | | 1,203 | | | | 100,378 | |
Juniper Networks, Inc. | | | 3,420 | | | | 76,916 | |
Motorola Solutions, Inc. | | | 1,606 | | | | 105,948 | |
| | | | | | | | |
| | | | | | | | 1,800,042 | |
Construction & Engineering — 0.1% | | | | | | | | |
Fluor Corp. | | | 1,425 | | | | 70,224 | |
Jacobs Engineering Group, Inc. (a) | | | 1,274 | | | | 63,458 | |
Quanta Services, Inc. (a) | | | 1,687 | | | | 39,003 | |
| | | | | | | | |
| | | | | | | | 172,685 | |
Construction Materials — 0.2% | | | | | | | | |
Martin Marietta Materials, Inc. | | | 649 | | | | 124,608 | |
Vulcan Materials Co. | | | 1,345 | | | | 161,884 | |
| | | | | | | | |
| | | | | | | | 286,492 | |
Consumer Finance — 0.7% | | | | | | | | |
American Express Co. | | | 8,132 | | | | 494,100 | |
Capital One Financial Corp. | | | 5,117 | | | | 324,981 | |
Discover Financial Services | | | 4,105 | | | | 219,987 | |
Navient Corp. | | | 3,561 | | | | 42,554 | |
Synchrony Financial (a) | | | 8,275 | | | | 209,192 | |
| | | | | | | | |
| | | | | | | | 1,290,814 | |
Containers & Packaging — 0.3% | | | | | | | | |
Avery Dennison Corp. | | | 856 | | | | 63,986 | |
Ball Corp. (b) | | | 1,737 | | | | 125,568 | |
International Paper Co. | | | 4,152 | | | | 175,962 | |
Owens-Illinois, Inc. (a) | | | 1,677 | | | | 30,203 | |
Sealed Air Corp. | | | 1,979 | | | | 90,975 | |
WestRock Co. | | | 2,568 | | | | 99,818 | |
| | | | | | | | |
| | | | | | | | 586,512 | |
Distributors — 0.1% | | | | | | | | |
Genuine Parts Co. | | | 1,468 | | | | 148,635 | |
LKQ Corp. (a) | | | 3,046 | | | | 96,558 | |
| | | | | | | | |
| | | | | | | | 245,193 | |
Diversified Consumer Services — 0.0% | | | | | | | | |
H&R Block, Inc. | | | 2,409 | | | | 55,407 | |
Diversified Financial Services — 2.1% | | | | | | | | |
Berkshire Hathaway, Inc., Class B (a) | | | 18,722 | | | | 2,710,758 | |
CME Group, Inc. | | | 3,383 | | | | 329,504 | |
Intercontinental Exchange, Inc. | | | 1,188 | | | | 304,080 | |
Leucadia National Corp. | | | 3,467 | | | | 60,083 | |
Moody’s Corp. | | | 1,675 | | | | 156,964 | |
Nasdaq, Inc. | | | 1,169 | | | | 75,599 | |
S&P Global, Inc. | | | 2,633 | | | | 282,416 | |
| | | | | | | | |
| | | | | | | | 3,919,404 | |
Diversified Telecommunication Services — 2.8% | | | | | |
AT&T Inc. | | | 61,524 | | | | 2,658,452 | |
CenturyLink, Inc. | | | 5,329 | | | | 154,594 | |
Frontier Communications Corp. (b) | | | 12,108 | | | | 59,814 | |
Level 3 Communications, Inc. (a) | | | 2,831 | | | | 145,768 | |
Verizon Communications, Inc. | | | 40,745 | | | | 2,275,201 | |
| | | | | | | | |
| | | | | | | | 5,293,829 | |
Electric Utilities — 2.1% | | | | | | | | |
Alliant Energy Corp. | | | 2,268 | | | | 90,040 | |
American Electric Power Co., Inc. | | | 4,888 | | | | 342,600 | |
Duke Energy Corp. | | | 6,872 | | | | 589,549 | |
Edison International | | | 3,242 | | | | 251,806 | |
Entergy Corp. | | | 1,745 | | | | 141,956 | |
Eversource Energy | | | 3,131 | | | | 187,547 | |
Exelon Corp. | | | 9,146 | | | | 332,549 | |
| | | | | | | | |
| Common Stocks | | Shares | | | Value | |
Electric Utilities (continued) | | | | | | | | |
FirstEnergy Corp. | | | 4,205 | | | $ | 146,797 | |
NextEra Energy, Inc. | | | 4,603 | | | | 600,231 | |
PG&E Corp. | | | 4,923 | | | | 314,678 | |
Pinnacle West Capital Corp. | | | 1,082 | | | | 87,707 | |
PPL Corp. | | | 6,706 | | | | 253,151 | |
Southern Co. | | | 9,380 | | | | 503,049 | |
Xcel Energy, Inc. | | | 5,034 | | | | 225,422 | |
| | | | | | | | |
| | | | | | | | 4,067,082 | |
Electrical Equipment — 0.5% | | | | | | | | |
Acuity Brands, Inc. | | | 435 | | | | 107,863 | |
AMETEK, Inc. | | | 2,382 | | | | 110,120 | |
Eaton Corp. PLC | | | 4,556 | | | | 272,130 | |
Emerson Electric Co. (b) | | | 6,388 | | | | 333,198 | |
Rockwell Automation, Inc. | | | 1,323 | | | | 151,907 | |
| | | | | | | | |
| | | | | | | | 975,218 | |
Electronic Equipment, Instruments & Components — 0.3% | |
Amphenol Corp., Class A | | | 3,045 | | | | 174,570 | |
Corning, Inc. | | | 10,745 | | | | 220,058 | |
FLIR Systems, Inc. | | | 1,378 | | | | 42,649 | |
TE Connectivity Ltd. | | | 3,666 | | | | 209,365 | |
| | | | | | | | |
| | | | | | | | 646,642 | |
Energy Equipment & Services — 1.0% | | | | | | | | |
Baker Hughes, Inc. | | | 4,314 | | | | 194,691 | |
Diamond Offshore Drilling, Inc. | | | 668 | | | | 16,252 | |
FMC Technologies, Inc. (a) | | | 2,368 | | | | 63,155 | |
Halliburton Co. | | | 8,506 | | | | 385,237 | |
Helmerich & Payne, Inc. (b) | | | 1,024 | | | | 68,741 | |
National Oilwell Varco, Inc. | | | 3,830 | | | | 128,879 | |
Schlumberger Ltd. | | | 13,829 | | | | 1,093,597 | |
Transocean Ltd. | | | 3,493 | | | | 41,532 | |
| | | | | | | | |
| | | | | | | | 1,992,084 | |
Food & Staples Retailing — 2.2% | | | | | | | | |
Costco Wholesale Corp. | | | 4,378 | | | | 687,521 | |
CVS Health Corp. | | | 10,735 | | | | 1,027,769 | |
Kroger Co. | | | 9,531 | | | | 350,645 | |
Sysco Corp. | | | 5,239 | | | | 265,827 | |
Walgreens Boots Alliance, Inc. | | | 8,585 | | | | 714,873 | |
Wal-Mart Stores, Inc. | | | 15,262 | | | | 1,114,431 | |
Whole Foods Market, Inc. (b) | | | 3,270 | | | | 104,705 | |
| | | | | | | | |
| | | | | | | | 4,265,771 | |
Food Products — 1.8% | | | | | | | | |
Archer-Daniels-Midland Co. | | | 5,867 | | | | 251,636 | |
Campbell Soup Co. (b) | | | 1,809 | | | | 120,353 | |
ConAgra Foods, Inc. | | | 4,295 | | | | 205,344 | |
General Mills, Inc. | | | 5,924 | | | | 422,500 | |
Hershey Co. | | | 1,445 | | | | 163,993 | |
Hormel Foods Corp. | | | 2,655 | | | | 97,173 | |
JM Smucker Co. | | | 1,179 | | | | 179,691 | |
Kellogg Co. | | | 2,477 | | | | 202,247 | |
Kraft Heinz Co. | | | 5,925 | | | | 524,244 | |
McCormick & Co, Inc., Non-Voting Shares | | | 1,163 | | | | 124,057 | |
Mead Johnson Nutrition Co. | | | 1,831 | | | | 166,163 | |
Mondelez International, Inc., Class A | | | 15,616 | | | | 710,684 | |
Tyson Foods, Inc., Class A (b) | | | 3,004 | | | | 200,637 | |
| | | | | | | | |
| | | | | | | | 3,368,722 | |
Gas Utilities — 0.0% | | | | | | | | |
AGL Resources, Inc. | | | 1,162 | | | | 76,657 | |
Health Care Equipment & Supplies — 2.3% | | | | | | | | |
Abbott Laboratories | | | 14,654 | | | | 576,049 | |
Baxter International, Inc. | | | 5,398 | | | | 244,098 | |
See Notes to Financial Statements.
| | | | | | |
| 6 | | BLACKROCK VARIABLE SERIES FUNDS, INC. | | JUNE 30, 2016 | | |
| | | | |
| Schedule of Investments (continued) | | | BlackRock S&P 500 Index V.I. Fund | |
| | | | |
| | | | | | | | |
| Common Stocks | | Shares | | | Value | |
Health Care Equipment & Supplies (continued) | | | | | | | | |
Becton Dickinson and Co. | | | 2,112 | | | $ | 358,174 | |
Boston Scientific Corp. (a) | | | 13,391 | | | | 312,948 | |
CR Bard, Inc. | | | 726 | | | | 170,726 | |
DENTSPLY SIRONA, Inc. | | | 2,341 | | | | 145,236 | |
Edwards Lifesciences Corp. (a) | | | 2,128 | | | | 212,225 | |
Hologic, Inc. (a) | | | 2,517 | | | | 87,088 | |
Intuitive Surgical, Inc. (a) | | | 381 | | | | 251,997 | |
Medtronic PLC | | | 13,999 | | | | 1,214,693 | |
St. Jude Medical, Inc. | | | 2,776 | | | | 216,528 | |
Stryker Corp. | | | 3,124 | | | | 374,349 | |
Varian Medical Systems, Inc. (a) | | | 919 | | | | 75,569 | |
Zimmer Biomet Holdings, Inc. | | | 1,989 | | | | 239,436 | |
| | | | | | | | |
| | | | | | | | 4,479,116 | |
Health Care Providers & Services — 2.6% | | | | | | | | |
Aetna, Inc. | | | 3,474 | | | | 424,280 | |
AmerisourceBergen Corp. | | | 1,902 | | | | 150,867 | |
Anthem, Inc. | | | 2,591 | | | | 340,302 | |
Cardinal Health, Inc. | | | 3,267 | | | | 254,859 | |
Centene Corp. (a)(b) | | | 1,733 | | | | 123,684 | |
Cigna Corp. | | | 2,543 | | | | 325,479 | |
DaVita HealthCare Partners, Inc. (a) | | | 1,670 | | | | 129,124 | |
Express Scripts Holding Co. (a) | | | 6,296 | | | | 477,237 | |
HCA Holdings, Inc. (a) | | | 3,028 | | | | 233,186 | |
Henry Schein, Inc. (a) | | | 825 | | | | 145,860 | |
Humana, Inc. (b) | | | 1,471 | | | | 264,603 | |
Laboratory Corp. of America Holdings (a) | | | 991 | | | | 129,098 | |
McKesson Corp. | | | 2,271 | | | | 423,882 | |
Patterson Cos., Inc. | | | 887 | | | | 42,478 | |
Quest Diagnostics, Inc. | | | 1,435 | | | | 116,823 | |
UnitedHealth Group, Inc. | | | 9,502 | | | | 1,341,682 | |
Universal Health Services, Inc., Class B | | | 917 | | | | 122,970 | |
| | | | | | | | |
| | | | | | | | 5,046,414 | |
Health Care Technology — 0.1% | | | | | | | | |
Cerner Corp. (a) | | | 2,967 | | | | 173,866 | |
Hotels, Restaurants & Leisure — 1.6% | | | | | | | | |
Carnival Corp. (b) | | | 4,477 | | | | 197,883 | |
Chipotle Mexican Grill, Inc. (a) | | | 293 | | | | 118,009 | |
Darden Restaurants, Inc. | | | 1,174 | | | | 74,361 | |
Marriott International, Inc., Class A | | | 1,917 | | | | 127,403 | |
McDonald’s Corp. | | | 8,777 | | | �� | 1,056,224 | |
Royal Caribbean Cruises Ltd. (b) | | | 1,715 | | | | 115,162 | |
Starbucks Corp. | | | 14,714 | | | | 840,464 | |
Starwood Hotels & Resorts Worldwide, Inc. | | | 1,642 | | | | 121,426 | |
Wyndham Worldwide Corp. (b) | | | 1,139 | | | | 81,131 | |
Wynn Resorts Ltd. (b) | | | 831 | | | | 75,322 | |
Yum! Brands, Inc. | | | 4,058 | | | | 336,489 | |
| | | | | | | | |
| | | | | | | | 3,143,874 | |
Household Durables — 0.5% | | | | | | | | |
DR Horton, Inc. | | | 3,184 | | | | 100,232 | |
Garmin Ltd. | | | 1,226 | | | | 52,007 | |
Harman International Industries, Inc. | | | 734 | | | | 52,716 | |
Leggett & Platt, Inc. | | | 1,408 | | | | 71,963 | |
Lennar Corp., Class A | | | 1,711 | | | | 78,877 | |
Mohawk Industries, Inc. (a) | | | 639 | | | | 121,257 | |
Newell Brands, Inc. | | | 4,541 | | | | 220,556 | |
PulteGroup, Inc. | | | 3,325 | | | | 64,804 | |
Whirlpool Corp. | | | 782 | | | | 130,312 | |
| | | | | | | | |
| | | | | | | | 892,724 | |
Household Products — 1.9% | | | | | | | | |
Church & Dwight Co., Inc. | | | 1,263 | | | | 129,950 | |
Clorox Co. | | | 1,286 | | | | 177,970 | |
Colgate-Palmolive Co. | | | 8,895 | | | | 651,114 | |
| | | | | | | | |
| Common Stocks | | Shares | | | Value | |
Household Products (continued) | | | | | | | | |
Kimberly-Clark Corp. | | | 3,597 | | | $ | 494,516 | |
Procter & Gamble Co. | | | 26,600 | | | | 2,252,222 | |
| | | | | | | | |
| | | | | | | | 3,705,772 | |
Independent Power and Renewable Electricity Producers — 0.1% | |
AES Corp. | | | 6,698 | | | | 83,591 | |
NRG Energy, Inc. | | | 3,283 | | | | 49,212 | |
| | | | | | | | |
| | | | | | | | 132,803 | |
Industrial Conglomerates — 2.5% | | | | | | | | |
3M Co. | | | 6,028 | | | | 1,055,623 | |
Danaher Corp. | | | 5,960 | | | | 601,960 | |
General Electric Co. | | | 91,899 | | | | 2,892,980 | |
Roper Technologies, Inc. | | | 999 | | | | 170,389 | |
| | | | | | | | |
| | | | | | | | 4,720,952 | |
Insurance — 2.5% | | | | | | | | |
Aflac, Inc. | | | 4,155 | | | | 299,825 | |
Allstate Corp. | | | 3,766 | | | | 263,432 | |
American International Group, Inc. | | | 11,182 | | | | 591,416 | |
Aon PLC | | | 2,689 | | | | 293,719 | |
Arthur J. Gallagher & Co. | | | 1,761 | | | | 83,824 | |
Assurant, Inc. | | | 646 | | | | 55,756 | |
Chubb Ltd. | | | 4,597 | | | | 600,874 | |
Cincinnati Financial Corp. | | | 1,439 | | | | 107,767 | |
Hartford Financial Services Group, Inc. | | | 3,915 | | | | 173,748 | |
Lincoln National Corp. | | | 2,465 | | | | 95,568 | |
Loews Corp. | | | 2,709 | | | | 111,313 | |
Marsh & McLennan Cos., Inc. | | | 5,186 | | | | 355,034 | |
MetLife, Inc. | | | 10,984 | | | | 437,493 | |
Principal Financial Group, Inc. | | | 2,644 | | | | 108,695 | |
Progressive Corp. | | | 5,816 | | | | 194,836 | |
Prudential Financial, Inc. | | | 4,418 | | | | 315,180 | |
Torchmark Corp. | | | 1,136 | | | | 70,228 | |
Travelers Cos., Inc. | | | 2,943 | | | | 350,335 | |
Unum Group | | | 2,433 | | | | 77,345 | |
Willis Towers Watson PLC | | | 1,360 | | | | 169,062 | |
XL Group PLC | | | 2,974 | | | | 99,064 | |
| | | | | | | | |
| | | | | | | | 4,854,514 | |
Internet & Catalog Retail — 2.1% | | | | | | | | |
Amazon.com, Inc. (a) | | | 3,868 | | | | 2,768,018 | |
Expedia, Inc. | | | 1,157 | | | | 122,989 | |
Netflix, Inc. (a) | | | 4,259 | | | | 389,613 | |
Priceline Group, Inc. (a) | | | 494 | | | | 616,715 | |
TripAdvisor, Inc. (a)(b) | | | 1,178 | | | | 75,745 | |
| | | | | | | | |
| | | | | | | | 3,973,080 | |
Internet Software & Services — 3.9% | | | | | | | | |
Akamai Technologies, Inc. (a) | | | 1,784 | | | | 99,779 | |
Alphabet, Inc.: | | | | | | | | |
Class A (a) | | | 2,935 | | | | 2,064,861 | |
Class C (a) | | | 2,958 | | | | 2,047,232 | |
eBay, Inc. (a) | | | 10,779 | | | | 252,336 | |
Facebook, Inc., Class A (a) | | | 23,102 | | | | 2,640,097 | |
VeriSign, Inc. (a) | | | 961 | | | | 83,088 | |
Yahoo!, Inc. (a) | | | 8,651 | | | | 324,932 | |
| | | | | | | | |
| | | | | | | | 7,512,325 | |
IT Services — 3.5% | | | | | | | | |
Accenture PLC, Class A | | | 6,253 | | | | 708,402 | |
Alliance Data Systems Corp. (a) | | | 598 | | | | 117,160 | |
Automatic Data Processing, Inc. | | | 4,558 | | | | 418,743 | |
Cognizant Technology Solutions Corp., Class A (a) | | | 6,049 | | | | 346,245 | |
CSRA, Inc. | | | 1,428 | | | | 33,458 | |
See Notes to Financial Statements.
| | | | | | |
| | | BLACKROCK VARIABLE SERIES FUNDS, INC. | | JUNE 30, 2016 | | 7 |
| | | | |
| Schedule of Investments (continued) | | | BlackRock S&P 500 Index V.I. Fund | |
| | | | |
| | | | | | | | |
| Common Stocks | | Shares | | | Value | |
IT Services (continued) | | | | | | | | |
Fidelity National Information Services, Inc. | | | 2,711 | | | $ | 199,746 | |
Fiserv, Inc. (a)(b) | | | 2,218 | | | | 241,163 | |
Global Payments, Inc. | | | 1,533 | | | | 109,426 | |
International Business Machines Corp. (b) | | | 8,800 | | | | 1,335,664 | |
MasterCard, Inc., Class A | | | 9,703 | | | | 854,446 | |
Paychex, Inc. (b) | | | 3,170 | | | | 188,615 | |
PayPal Holdings, Inc. (a) | | | 11,067 | | | | 404,056 | |
Teradata Corp. (a) | | | 1,400 | | | | 35,098 | |
Total System Services, Inc. | | | 1,629 | | | | 86,516 | |
Visa, Inc., Class A | | | 19,113 | | | | 1,417,611 | |
Western Union Co. | | | 5,148 | | | | 98,739 | |
Xerox Corp. | | | 9,314 | | | | 88,390 | |
| | | | | | | | |
| | | | | | | | 6,683,478 | |
Leisure Products — 0.1% | | | | | | | | |
Hasbro, Inc. | | | 1,131 | | | | 94,993 | |
Mattel, Inc. | | | 3,313 | | | | 103,664 | |
| | | | | | | | |
| | | | | | | | 198,657 | |
Life Sciences Tools & Services — 0.6% | | | | | | | | |
Agilent Technologies, Inc. | | | 3,336 | | | | 147,985 | |
Illumina, Inc. (a)(b) | | | 1,461 | | | | 205,095 | |
PerkinElmer, Inc. | | | 1,100 | | | | 57,662 | |
Thermo Fisher Scientific, Inc. | | | 3,947 | | | | 583,209 | |
Waters Corp. (a) | | | 789 | | | | 110,973 | |
| | | | | | | | |
| | | | | | | | 1,104,924 | |
Machinery — 1.2% | | | | | | | | |
Caterpillar, Inc. | | | 5,773 | | | | 437,651 | |
Cummins, Inc. | | | 1,588 | | | | 178,555 | |
Deere & Co. (b) | | | 2,964 | | | | 240,203 | |
Dover Corp. | | | 1,562 | | | | 108,278 | |
Flowserve Corp. | | | 1,299 | | | | 58,676 | |
Illinois Tool Works, Inc. | | | 3,259 | | | | 339,457 | |
Ingersoll-Rand PLC | | | 2,525 | | | | 160,792 | |
PACCAR, Inc. | | | 3,548 | | | | 184,035 | |
Parker-Hannifin Corp. | | | 1,321 | | | | 142,734 | |
Pentair PLC | | | 1,865 | | | | 108,711 | |
Snap-on, Inc. | | | 565 | | | | 89,168 | |
Stanley Black & Decker, Inc. | | | 1,492 | | | | 165,940 | |
Xylem, Inc. | | | 1,720 | | | | 76,798 | |
| | | | | | | | |
| | | | | | | | 2,290,998 | |
Media — 2.6% | | | | | | | | |
CBS Corp., Class B, Non-Voting Shares | | | 4,178 | | | | 227,450 | |
Comcast Corp., Class A | | | 24,219 | | | | 1,578,837 | |
Discovery Communications, Inc.: | | | | | | | | |
Class A (a) | | | 1,525 | | | | 38,476 | |
Class C (a) | | | 2,448 | | | | 58,385 | |
Interpublic Group of Cos., Inc. | | | 4,080 | | | | 94,248 | |
News Corp.: | | | | | | | | |
Class A | | | 3,904 | | | | 44,310 | |
Class B | | | 1,142 | | | | 13,327 | |
Omnicom Group, Inc. (b) | | | 2,363 | | | | 192,561 | |
Scripps Networks Interactive, Inc., Class A (b) | | | 973 | | | | 60,589 | |
TEGNA, Inc. | | | 2,192 | | | | 50,789 | |
Time Warner, Inc. | | | 7,855 | | | | 577,657 | |
Twenty-First Century Fox, Inc.: | | | | | | | | |
Class A | | | 10,951 | | | | 296,225 | |
Class B | | | 4,309 | | | | 117,420 | |
Viacom, Inc., Class B | | | 3,396 | | | | 140,832 | |
Walt Disney Co. | | | 14,939 | | | | 1,461,333 | |
| | | | | | | | |
| | | | | | | | 4,952,439 | |
Metals & Mining — 0.3% | | | | | | | | |
Alcoa, Inc. | | | 12,940 | | | | 119,954 | |
Freeport-McMoRan, Inc. | | | 12,753 | | | | 142,068 | |
| | | | | | | | |
| Common Stocks | | Shares | | | Value | |
Metals & Mining (continued) | | | | | | | | |
Newmont Mining Corp. | | | 5,343 | | | $ | 209,018 | |
Nucor Corp. | | | 3,104 | | | | 153,369 | |
| | | | | | | | |
| | | | | | | | 624,409 | |
Multiline Retail — 0.6% | | | | | | | | |
Dollar General Corp. (b) | | | 2,897 | | | | 272,318 | |
Dollar Tree, Inc. (a) | | | 2,328 | | | | 219,391 | |
Kohl’s Corp. | | | 1,901 | | | | 72,086 | |
Macy’s, Inc. | | | 3,055 | | | | 102,679 | |
Nordstrom, Inc. (b) | | | 1,323 | | | | 50,340 | |
Target Corp. | | | 5,889 | | | | 411,170 | |
| | | | | | | | |
| | | | | | | | 1,127,984 | |
Multi-Utilities — 1.2% | | | | | | | | |
Ameren Corp. | | | 2,394 | | | | 128,270 | |
CenterPoint Energy, Inc. | | | 4,158 | | | | 99,792 | |
CMS Energy Corp. | | | 2,819 | | | | 129,279 | |
Consolidated Edison, Inc. | | | 3,040 | | | | 244,538 | |
Dominion Resources, Inc. | | | 6,158 | | | | 479,893 | |
DTE Energy Co. | | | 1,764 | | | | 174,848 | |
NiSource, Inc. | | | 3,292 | | | | 87,304 | |
Public Service Enterprise Group, Inc. | | | 5,040 | | | | 234,914 | |
SCANA Corp. | | | 1,396 | | | | 105,621 | |
Sempra Energy | | | 2,354 | | | | 268,403 | |
TECO Energy, Inc. | | | 2,436 | | | | 67,331 | |
WEC Energy Group, Inc. | | | 3,117 | | | | 203,540 | |
| | | | | | | | |
| | | | | | | | 2,223,733 | |
Oil, Gas & Consumable Fuels — 6.0% | | | | | | | | |
Anadarko Petroleum Corp. | | | 5,022 | | | | 267,421 | |
Apache Corp. | | | 3,715 | | | | 206,814 | |
Cabot Oil & Gas Corp. | | | 4,650 | | | | 119,691 | |
Chesapeake Energy Corp. (a)(b) | | | 5,314 | | | | 22,744 | |
Chevron Corp. | | | 18,835 | | | | 1,974,473 | |
Cimarex Energy Co. | | | 914 | | | | 109,058 | |
Columbia Pipeline Group, Inc. | | | 4,052 | | | | 103,285 | |
Concho Resources, Inc. (a) | | | 1,310 | | | | 156,244 | |
ConocoPhillips | | | 12,258 | | | | 534,449 | |
Devon Energy Corp. | | | 5,178 | | | | 187,703 | |
EOG Resources, Inc. (b) | | | 5,456 | | | | 455,140 | |
EQT Corp. | | | 1,727 | | | | 133,722 | |
Exxon Mobil Corp. (b) | | | 41,437 | | | | 3,884,304 | |
Hess Corp. | | | 2,681 | | | | 161,128 | |
Kinder Morgan, Inc. | | | 18,171 | | | | 340,161 | |
Marathon Oil Corp. | | | 8,660 | | | | 129,987 | |
Marathon Petroleum Corp. | | | 5,235 | | | | 198,721 | |
Murphy Oil Corp. | | | 1,682 | | | | 53,403 | |
Newfield Exploration Co. (a) | | | 1,999 | | | | 88,316 | |
Noble Energy, Inc. | | | 4,207 | | | | 150,905 | |
Occidental Petroleum Corp. | | | 7,594 | | | | 573,803 | |
ONEOK, Inc. | | | 1,986 | | | | 94,236 | |
Phillips 66 | | | 4,679 | | | | 371,232 | |
Pioneer Natural Resources Co. | | | 1,611 | | | | 243,599 | |
Range Resources Corp. | | | 1,599 | | | | 68,981 | |
Southwestern Energy Co (a) | | | 3,980 | | | | 50,068 | |
Spectra Energy Corp. | | | 6,838 | | | | 250,476 | |
Tesoro Corp. | | | 1,217 | | | | 91,178 | |
Valero Energy Corp. (b) | | | 4,684 | | | | 238,884 | |
Williams Cos., Inc. | | | 6,672 | | | | 144,315 | |
| | | | | | | | |
| | | | | | | | 11,404,441 | |
Personal Products — 0.1% | | | | | | | | |
Estee Lauder Cos., Inc., Class A | | | 2,180 | | | | 198,424 | |
Pharmaceuticals — 5.6% | | | | | | | | |
Allergan PLC (a) | | | 3,954 | | | | 913,730 | |
Bristol-Myers Squibb Co. | | | 16,621 | | | | 1,222,475 | |
See Notes to Financial Statements.
| | | | | | |
| 8 | | BLACKROCK VARIABLE SERIES FUNDS, INC. | | JUNE 30, 2016 | | |
| | | | |
| Schedule of Investments (continued) | | | BlackRock S&P 500 Index V.I. Fund | |
| | | | |
| | | | | | | | |
| Common Stocks | | Shares | | | Value | |
Pharmaceuticals (continued) | | | | | | | | |
Eli Lilly & Co. | | | 9,697 | | | $ | 763,639 | |
Endo International PLC (a) | | | 2,047 | | | | 31,913 | |
Johnson & Johnson | | | 27,491 | | | | 3,334,658 | |
Mallinckrodt PLC (a) | | | 1,139 | | | | 69,228 | |
Merck & Co., Inc. | | | 27,628 | | | | 1,591,649 | |
Mylan NV (a) | | | 4,165 | | | | 180,095 | |
Perrigo Co. PLC | | | 1,453 | | | | 131,744 | |
Pfizer, Inc. | | | 60,605 | | | | 2,133,902 | |
Zoetis, Inc. | | | 4,496 | | | | 213,380 | |
| | | | | | | | |
| | | | | | | | 10,586,413 | |
Professional Services — 0.3% | | | | | | | | |
Dun & Bradstreet Corp. | | | 377 | | | | 45,934 | |
Equifax, Inc. | | | 1,174 | | | | 150,742 | |
Nielsen Holdings PLC | | | 3,556 | | | | 184,805 | |
Robert Half International, Inc. | | | 1,308 | | | | 49,913 | |
Verisk Analytics, Inc. (a) | | | 1,559 | | | | 126,404 | |
| | | | | | | | |
| | | | | | | | 557,798 | |
Real Estate Investment Trusts (REITs) — 3.0% | | | | | | | | |
American Tower Corp. | | | 4,227 | | | | 480,229 | |
Apartment Investment & Management Co., Class A | | | 1,610 | | | | 71,098 | |
AvalonBay Communities, Inc. | | | 1,370 | | | | 247,134 | |
Boston Properties, Inc. | | | 1,524 | | | | 201,016 | |
Crown Castle International Corp. (b) | | | 3,309 | | | | 335,632 | |
Digital Realty Trust, Inc. | | | 1,460 | | | | 159,125 | |
Equinix, Inc. | | | 688 | | | | 266,758 | |
Equity Residential | | | 3,605 | | | | 248,312 | |
Essex Property Trust, Inc. | | | 639 | | | | 145,750 | |
Extra Space Storage, Inc. | | | 1,230 | | | | 113,824 | |
Federal Realty Investment Trust (b) | | | 705 | | | | 116,713 | |
General Growth Properties, Inc. | | | 5,754 | | | | 171,584 | |
HCP, Inc. | | | 4,580 | | | | 162,040 | |
Host Hotels & Resorts, Inc. (b) | | | 7,324 | | | | 118,722 | |
Iron Mountain, Inc. | | | 2,399 | | | | 95,552 | |
Kimco Realty Corp. | | | 4,068 | | | | 127,654 | |
Macerich Co. | | | 1,292 | | | | 110,324 | |
Prologis, Inc. | | | 5,263 | | | | 258,098 | |
Public Storage | | | 1,475 | | | | 376,995 | |
Realty Income Corp. (b) | | | 2,541 | | | | 176,244 | |
Simon Property Group, Inc. | | | 3,087 | | | | 669,568 | |
SL Green Realty Corp. | | | 966 | | | | 102,850 | |
UDR, Inc. | | | 2,600 | | | | 95,992 | |
Ventas, Inc. | | | 3,312 | | | | 241,180 | |
Vornado Realty Trust | | | 1,745 | | | | 174,706 | |
Welltower, Inc. | | | 3,526 | | | | 268,575 | |
Weyerhaeuser Co. | | | 7,467 | | | | 222,293 | |
| | | | | | | | |
| | | | | | | | 5,757,968 | |
Real Estate Management & Development — 0.0% | | | | | | | | |
CBRE Group, Inc., Class A (a) | | | 2,796 | | | | 74,038 | |
Road & Rail — 0.8% | | | | | | | | |
CSX Corp. | | | 9,545 | | | | 248,934 | |
JB Hunt Transport Services, Inc. | | | 900 | | | | 72,837 | |
Kansas City Southern | | | 1,097 | | | | 98,829 | |
Norfolk Southern Corp. | | | 2,962 | | | | 252,155 | |
Ryder System, Inc. | | | 568 | | | | 34,728 | |
Union Pacific Corp. | | | 8,424 | | | | 734,994 | |
| | | | | | | | |
| | | | | | | | 1,442,477 | |
Semiconductors & Semiconductor Equipment — 2.7% | | | | | | | | |
Analog Devices, Inc. | | | 3,035 | | | | 171,902 | |
Applied Materials, Inc. | | | 10,884 | | | | 260,889 | |
Broadcom Ltd. | | | 3,698 | | | | 574,669 | |
First Solar, Inc. (a)(b) | | | 774 | | | | 37,524 | |
| | | | | | | | |
| Common Stocks | | Shares | | | Value | |
Semiconductors & Semiconductor Equipment (continued) | |
Intel Corp. | | | 47,103 | | | $ | 1,544,978 | |
KLA-Tencor Corp. | | | 1,514 | | | | 110,901 | |
Lam Research Corp. (b) | | | 1,566 | | | | 131,638 | |
Linear Technology Corp. | | | 2,350 | | | | 109,345 | |
Microchip Technology, Inc. (b) | | | 2,148 | | | | 109,032 | |
Micron Technology, Inc. (a) | | | 10,475 | | | | 144,136 | |
NVIDIA Corp. (b) | | | 5,067 | | | | 238,200 | |
Qorvo, Inc. (a) | | | 1,303 | | | | 72,004 | |
QUALCOMM, Inc. | | | 14,677 | | | | 786,247 | |
Skyworks Solutions, Inc. | | | 1,899 | | | | 120,169 | |
Texas Instruments, Inc. | | | 10,061 | | | | 630,322 | |
Xilinx, Inc. | | | 2,500 | | | | 115,325 | |
| | | | | | | | |
| | | | | | | | 5,157,281 | |
Software — 4.0% | | | | | | | | |
Activision Blizzard, Inc. | | | 4,985 | | | | 197,556 | |
Adobe Systems, Inc. (a) | | | 4,964 | | | | 475,502 | |
Autodesk, Inc. (a) | | | 2,279 | | | | 123,385 | |
CA, Inc. | | | 3,021 | | | | 99,179 | |
Citrix Systems, Inc. (a) | | | 1,568 | | | | 125,581 | |
Electronic Arts, Inc. (a) | | | 3,045 | | | | 230,689 | |
Intuit, Inc. | | | 2,559 | | | | 285,610 | |
Microsoft Corp. (d) | | | 78,565 | | | | 4,020,171 | |
Oracle Corp. | | | 31,105 | | | | 1,273,128 | |
Red Hat, Inc. (a) | | | 1,798 | | | | 130,535 | |
salesforce.com, Inc. (a) | | | 6,363 | | | | 505,286 | |
Symantec Corp. | | | 6,029 | | | | 123,836 | |
| | | | | | | | |
| | | | | | | | 7,590,458 | |
Specialty Retail — 2.5% | | | | | | | | |
Advance Auto Parts, Inc. | | | 722 | | | | 116,697 | |
AutoNation, Inc. (a) | | | 724 | | | | 34,014 | |
AutoZone, Inc. (a) | | | 301 | | | | 238,946 | |
Bed Bath & Beyond, Inc. | | | 1,635 | | | | 70,665 | |
Best Buy Co., Inc. | | | 2,854 | | | | 87,332 | |
CarMax, Inc. (a) | | | 1,914 | | | | 93,843 | |
Foot Locker, Inc. | | | 1,400 | | | | 76,804 | |
Gap, Inc. (b) | | | 2,340 | | | | 49,655 | |
Home Depot, Inc. | | | 12,430 | | | | 1,587,187 | |
L Brands, Inc. (b) | | | 2,509 | | | | 168,429 | |
Lowe’s Cos., Inc. | | | 8,858 | | | | 701,288 | |
O’Reilly Automotive, Inc. (a) | | | 965 | | | | 261,611 | |
Ross Stores, Inc. | | | 4,012 | | | | 227,440 | |
Signet Jewelers Ltd. | | | 777 | | | | 64,033 | |
Staples, Inc. | | | 6,626 | | | | 57,116 | |
Tiffany & Co. | | | 1,081 | | | | 65,552 | |
TJX Cos., Inc. | | | 6,657 | | | | 514,120 | |
Tractor Supply Co. (b) | | | 1,310 | | | | 119,446 | |
Ulta Salon Cosmetics & Fragrance, Inc. (a) | | | 633 | | | | 154,224 | |
Urban Outfitters, Inc. (a) | | | 856 | | | | 23,540 | |
| | | | | | | | |
| | | | | | | | 4,711,942 | |
Technology Hardware, Storage & Peripherals — 3.4% | | | | | | | | |
Apple Inc. | | | 54,751 | | | | 5,234,196 | |
EMC Corp. | | | 19,389 | | | | 526,799 | |
Hewlett Packard Enterprise Co. | | | 16,605 | | | | 303,373 | |
Hewlett-Packard Co. (a) | | | 17,072 | | | | 214,254 | |
NetApp, Inc. | | | 2,870 | | | | 70,573 | |
Seagate Technology PLC (b) | | | 2,889 | | | | 70,376 | |
Western Digital Corp. | | | 2,732 | | | | 129,114 | |
| | | | | | | | |
| | | | | | | | 6,548,685 | |
Textiles, Apparel & Luxury Goods — 0.8% | | | | | | | | |
Coach, Inc. | | | 2,713 | | | | 110,528 | |
Hanesbrands, Inc. | | | 3,834 | | | | 96,348 | |
Michael Kors Holdings Ltd. (a) | | | 1,818 | | | | 89,955 | |
See Notes to Financial Statements.
| | | | | | |
| | | BLACKROCK VARIABLE SERIES FUNDS, INC. | | JUNE 30, 2016 | | 9 |
| | | | |
| Schedule of Investments (continued) | | | BlackRock S&P 500 Index V.I. Fund | |
| | | | | | | | |
| Common Stocks | | Shares | | | Value | |
Textiles, Apparel & Luxury Goods (continued) | | | | | | | | |
NIKE, Inc., Class B | | | 13,307 | | | $ | 734,546 | |
PVH Corp. | | | 789 | | | | 74,347 | |
Ralph Lauren Corp. | | | 582 | | | | 52,159 | |
Under Armour, Inc., Class A (a)(b) | | | 1,793 | | | | 71,953 | |
Under Armour, Inc., Class C (a) | | | 1,805 | | | | 65,702 | |
VF Corp. | | | 3,382 | | | | 207,959 | |
| | | | | | | | |
| | | | | | | | 1,503,497 | |
Tobacco — 1.8% | | | | | | | | |
Altria Group, Inc. | | | 19,513 | | | | 1,345,616 | |
Philip Morris International, Inc. | | | 15,507 | | | | 1,577,372 | |
Reynolds American, Inc. | | | 8,264 | | | | 445,678 | |
| | | | | | | | |
| | | | | | | | 3,368,666 | |
Trading Companies & Distributors — 0.2% | | | | | | | | |
Fastenal Co. | | | 2,928 | | | | 129,974 | |
United Rentals, Inc. (a) | | | 900 | | | | 60,390 | |
W.W. Grainger, Inc. (b) | | | 572 | | | | 129,987 | |
| | | | | | | | |
| | | | | | | | 320,351 | |
Water Utilities — 0.1% | | | | | | | | |
American Water Works Co., Inc. | | | 1,735 | | | | 146,625 | |
Total Long-Term Investments (Cost — $67,222,128) — 95.3% | | | | | | | 181,846,091 | |
| | | | | | | | |
| | | | | | | |
| | | | | | | | |
| Short-Term Securities | | Shares | | | Value | |
BlackRock Liquidity Funds, TempFund, Institutional Class, 0.40% (c)(e) | | | 8,868,035 | | | $ | 8,868,035 | |
| | | Beneficial
Interest
(000) | | | | |
BlackRock Liquidity Series, LLC, Money Market Series, 0.59% (c)(e)(f) | | $ | 8,292 | | | | 8,292,298 | |
Total Short-Term Securities (Cost — $17,160,333) — 9.0% | | | | | | | 17,160,333 | |
Total Investments (Cost — $84,382,461) — 104.3% | | | | 199,006,424 | |
Liabilities in Excess of Other Assets — (4.3)% | | | | | | | (8,183,854 | ) |
| | | | | | | | |
Net Assets — 100.0% | | | | | | $ | 190,822,570 | |
| | | | | | | | |
|
| Notes to Schedule of Investments |
| (a) | Non-income producing security. |
| (b) | Security, or a portion of security, is on loan. |
| (c) | During the six months ended June 30, 2016, investments in issuers considered to be affiliates of the Fund for purposes of Section 2(a)(3) of the Investment Company Act of 1940, as amended, were as follows: |
| | | | | | | | | | | | | | | | | | | | | | | | | | | | |
| Affiliate | | Shares/
Beneficial
Interest Held at
December 31,
2015 | | | Shares/
Beneficial
Interest
Purchased | | | Shares/
Beneficial
Interest
Sold | | | Shares/
Beneficial
Interest Held at
June 30,
2016 | | | Value at
June 30, 2016 | | | Income | | | Realized
Gain | |
BlackRock, Inc. | | | 1,316 | | | | — | | | | (56 | ) | | | 1,260 | | | $ | 431,588 | | | $ | 5,821 | | | $ | 7,336 | |
BlackRock Liquidity Funds, TempFund, Institutional Class | | | 2,417,775 | | | | 6,450,260 | 1 | | | — | | | | 8,868,035 | | | | 8,868,035 | | | | 7,622 | | | | — | |
BlackRock Liquidity Series, LLC, Money Market Series | | $ | 4,672,922 | | | $ | 3,619,376 | 2 | | | — | | | $ | 8,292,298 | | | | 8,292,298 | | | | 7,024 | 3 | | | — | |
PNC Financial Services Group, Inc. | | | 5,319 | | | | — | | | | (321 | ) | | | 4,998 | | | | 406,787 | | | | 5,180 | | | | 14,563 | |
Total | | | | | | | | | | | | | | | | | | $ | 17,998,708 | | | $ | 25,647 | | | $ | 21,899 | |
| | | | | | | | | | | | | | | | | | | | |
| | 1 | | Represents net shares purchased. |
| | 2 | | Represents net beneficial interest purchased. |
| | 3 | | Represents securities lending income earned from the reinvestment of cash collateral from loaned securities, net of fees and collateral investment expenses, and other payments to and from borrowers of securities. |
| (d) | All or a portion of security has been pledged in connection with outstanding futures contracts. |
| (e) | Current yield as of period end. |
| (f) | Security was purchased with the cash collateral from loaned securities. The Fund may withdraw up to 25% of its investment daily, although the manager of the BlackRock Liquidity Series, LLC, Money Market Series, in its sole discretion, may permit an investor to withdraw more than 25% on any one day. |
| • | | For Fund compliance purposes, the Fund’s industry classifications refer to one or more of the industry sub-classifications used by one or more widely recognized market indexes or rating group indexes, and/or as defined by the investment adviser. These definitions may not apply for purposes of this report, which may combine such industry sub-classifications for reporting ease. |
See Notes to Financial Statements.
| | | | | | |
| 10 | | BLACKROCK VARIABLE SERIES FUNDS, INC. | | JUNE 30, 2016 | | |
| | | | |
| Schedule of Investments (continued) | | | BlackRock S&P 500 Index V.I. Fund | |
|
| Derivative Financial Instruments Outstanding as of Period End |
| | | | | | | | | | | | | | | | |
| Futures Contracts | |
Contracts
Long | | Issue | | | Expiration | | | Notional
Value | | | Unrealized
Appreciation | |
| 88 | | | S&P 500 E-Mini Index | | | | September 2016 | | | $ | 9,196,880 | | | | $53,673 | |
|
| Derivative Financial Instruments Categorized by Risk Exposure |
As of period end, the fair values of derivative financial instruments located in the Statement of Assets and Liabilities were as follows:
| | | | | | | | | | | | | | | | | | | | | | | | | | | | | | | | |
| | | | | | Commodity
Contracts | | | Credit
Contracts | | | Equity
Contracts | | | Foreign
Currency
Exchange
Contracts | | | Interest
Rate
Contracts | | | Other
Contracts | | | Total | |
Assets - Derivative Financial Instruments | | | | | | | | | | | | | | | | | | | | | | | | | |
| Futures contracts | | | Net unrealized appreciation | 1 | | | — | | | | — | | | | $53,673 | | | | — | | | | — | | | | — | | | $ | 53,673 | |
| |
| | 1 | | Includes cumulative appreciation (depreciation) on futures contracts, if any, as reported in the Schedule of Investments. Only current day’s variation margin is reported within the Statement of Assets and Liabilities. |
For the six months ended June 30, 2016, the effect of derivative financial instruments in the Statement of Operations was as follows:
| | | | | | | | | | | | | | | | | | | | | | | | | | | | |
| | | Commodity
Contracts | | | Credit
Contracts | | | Equity
Contracts | | | Foreign
Currency
Exchange
Contracts | | | Interest
Rate
Contracts | | | Other
Contracts | | | Total | |
Net Realized Gain from: | | | | | | | | | | | | | | | | | | | | | |
| Futures contracts | | | — | | | | — | | | | $24,336 | | | | — | | | | — | | | | — | | | $ | 24,336 | |
| Net Change in Unrealized Appreciation (Depreciation) on: | | | | | | | | | | | | | | | | | | | | | | | | | | | | |
| Futures contracts | | | — | | | | — | | | | $70,173 | | | | — | | | | — | | | | — | | | $ | 70,173 | |
|
| Average Quarterly Balances of Outstanding Derivative Financial Instruments |
| | | | |
Futures contracts: | | | | |
Average notional value of contracts - long | | $ | 4,803,590 | |
For more information about the Fund’s investment risks regarding derivative financial instruments, refer to the Notes to Financial Statements.
|
| Derivative Financial Instruments - Offsetting as of Period End |
The Fund’s derivative assets and liabilities (by type) were as follows:
| | | | | | | | |
| | | Assets | | | Liabilities | |
Derivative Financial Instruments: | | | | | | | | |
Futures contracts | | $ | 103,003 | | | | — | |
| | | | |
Derivatives not subject to a Master Netting Agreement or similar agreement (“MNA”) | | | (103,003 | ) | | | — | |
| | | | |
Total derivative assets and liabilities subject to an MNA | | | — | | | | — | |
| | | | |
See Notes to Financial Statements.
| | | | | | |
| | | BLACKROCK VARIABLE SERIES FUNDS, INC. | | JUNE 30, 2016 | | 11 |
| | | | |
| Schedule of Investments (concluded) | | | BlackRock S&P 500 Index V.I. Fund | |
|
| Fair Value Hierarchy as of Period End |
Various inputs are used in determining the fair value investments and derivative financial instruments. For information about the Fund’s policy regarding valuation of investments and derivative financial instruments, refer to the Notes to Financial Statements.
The following tables summarize the Fund’s investments and derivative financial instruments categorized in the disclosure hierarchy:
| | | | | | | | | | | | | | | | | | | | |
| | | Level 1 | | Level 2 | | Level 3 | | Total |
Assets: | | | | | | | | | | | | | | | | | | | | |
Investments: | | | | | | | | | | | | | | | | | | | | |
Long-Term Investments1 | | | $ | 181,846,091 | | | | | — | | | | | — | | | | $ | 181,846,091 | |
Short-Term Securities | | | | 8,868,035 | | | | $ | 8,292,298 | | | | | — | | | | | 17,160,333 | |
| | | | | |
Total | | | $ | 190,714,126 | | | | $ | 8,292,298 | | | | | — | | | | $ | 199,006,424 | |
| | | | | |
| | | | | | | | | | | | | | | | | | | | |
| | | | | | | | | | | | | | | | | | | | | |
Derivative Financial Instruments2 | | | | | | | | | | | | | | | | | | | | |
Assets: | | | | | | | | | | | | | | | | | | | | |
Equity contracts | | | $ | 53,673 | | | | | — | | | | | — | | | | $ | 53,673 | |
1 See above Schedule of Investments for values in each industry. 2 Derivative financial instruments are futures contracts, which are valued at the unrealized appreciation (depreciation) on the instrument. The Fund may hold assets and/or liabilities in which the fair value approximates the carrying amount for financial statement purposes. As of June 30, 2016, such assets and/or liabilities are categorized within the disclosure hierarchy as follows: | |
| | | Level 1 | | Level 2 | | Level 3 | | Total |
Assets: | | | | | | | | | | | | | | | | | | | | |
Cash | | | $ | 112,292 | | | | | — | | | | | — | | | | $ | 112,292 | |
Liabilities: | | | | | | | | | | | | | | | | | | | | |
Collateral on securities loaned at value | | | | — | | | | $ | (8,292,298 | ) | | | | — | | | | | (8,292,298 | ) |
| | | | | |
Total | | | $ | 112,292 | | | | $ | (8,292,298 | ) | | | | — | | | | $ | (8,180,006 | ) |
| | | | | |
During the six months ended June 30, 2016, there were no transfers between levels.
See Notes to Financial Statements.
| | | | | | |
| 12 | | BLACKROCK VARIABLE SERIES FUNDS, INC. | | JUNE 30, 2016 | | |
| | | | |
| Statement of Assets and Liabilities | | | | |
| | | | |
| June 30, 2016 (Unaudited) | | BlackRock S&P 500 Index V.I. Fund | |
| | | | |
| Assets | | | | |
Investments at value — unaffiliated (including securities loaned at value of $8,206,599) (cost — $66,774,220) | | $ | 181,007,716 | |
Investments at value — affiliated (cost — $17,608,241) | | | 17,998,708 | |
Cash | | | 112,292 | |
Receivables: | | | | |
Investments sold | | | 1,740 | |
Securities lending income — affiliated | | | 1,812 | |
Capital shares sold | | | 626 | |
Dividends — affiliated | | | 1,523 | |
Dividends — unaffiliated | | | 207,680 | |
From the Manager | | | 15,498 | |
Variation margin on futures contracts | | | 103,003 | |
Prepaid expenses | | | 10,422 | |
| | | | |
Total assets | | | 199,461,020 | |
| | | | |
| | | | |
| Liabilities | | | | |
Collateral on securities loaned at value | | | 8,292,298 | |
Payables: | | | | |
Investments purchased | | | 201,724 | |
Capital shares redeemed | | | 14,630 | |
Distribution fees | | | 313 | |
Investment advisory fees | | | 30,085 | |
Officer’s and Directors’ fees | | | 2,782 | |
Other accrued expenses | | | 95,601 | |
Other affiliates | | | 1,017 | |
| | | | |
Total liabilities | | | 8,638,450 | |
| | | | |
Net Assets | | $ | 190,822,570 | |
| | | | |
| | | | |
| Net Assets Consist of | | | | |
Paid-in capital | | $ | 72,217,865 | |
Undistributed net investment income | | | 1,665,656 | |
Accumulated net realized gain | | | 2,261,413 | |
Net unrealized appreciation (depreciation) | | | 114,677,636 | |
| | | | |
Net Assets | | $ | 190,822,570 | |
| | | | |
| | | | |
| Net Asset Value | | | | |
Class I — Based on net assets of $188,245,086 and 9,521,964 shares outstanding, 100 million shares authorized, $0.10 par value | | $ | 19.77 | |
| | | | |
Class II — Based on net assets of $2,577,484 and 131,411 shares outstanding, 100 million shares authorized, $0.10 par value | | $ | 19.61 | |
| | | | |
See Notes to Financial Statements.
| | | | | | |
| | | BLACKROCK VARIABLE SERIES FUNDS, INC. | | JUNE 30, 2016 | | 13 |
| | | | |
| Six Months Ended June 30, 2016 (Unaudited) | | BlackRock
S&P 500 Index
V.I. Fund | |
| | | | |
| Investment Income | | | | |
Dividends — affiliated | | $ | 18,623 | |
Dividends — unaffiliated | | | 1,920,584 | |
Securities lending — affiliated — net | | | 7,024 | |
| | | | |
Total income | | | 1,946,231 | |
| | | | |
| | | | |
| Expenses | | | | |
Investment advisory | | | 270,062 | |
Transfer agent | | | 2,429 | |
Transfer agent — class specific | | | 46,420 | |
Professional | | | 27,300 | |
Accounting services | | | 21,946 | |
Custodian | | | 13,950 | |
Officer and Directors | | | 10,814 | |
Printing | | | 9,947 | |
Distribution — class specific | | | 1,643 | |
Miscellaneous | | | 15,558 | |
| | | | |
Total expenses | | | 420,069 | |
Less: | | | | |
Fees waived by the Manager | | | (91,408 | ) |
Transfer agent fees reimbursed — class specific | | | (46,420 | ) |
| | | | |
Total expenses after fees waived and reimbursed | | | 282,241 | |
| | | | |
Net investment income | | | 1,663,990 | |
| | | | |
| | | | |
| Realized and Unrealized Gain (Loss) | | | | |
Net realized gain from: | | | | |
Investments — unaffiliated | | | 6,512,012 | |
Investments — affiliated | | | 21,899 | |
Futures contracts | | | 24,336 | |
| | | | |
| | | 6,558,247 | |
| | | | |
Net change in unrealized appreciation (depreciation) on: | | | | |
Investments — unaffiliated | | | (1,734,980 | ) |
Investments — affiliated | | | (91,504 | ) |
Futures contracts | | | 70,173 | |
| | | | |
| | | (1,756,311 | ) |
| | | | |
Net realized and unrealized gain | | | 4,801,936 | |
| | | | |
Net Increase in Net Assets Resulting from Operations | | $ | 6,465,926 | |
| | | | |
See Notes to Financial Statements.
| | | | | | |
| 14 | | BLACKROCK VARIABLE SERIES FUNDS, INC. | | JUNE 30, 2016 | | |
| | | | |
| Statements of Changes in Net Assets | | | BlackRock S&P 500 Index V.I. Fund | |
| | | | | | | | |
| Increase (Decrease) in Net Assets: | | Six Months
Ended
June 30, 2016
(Unaudited) | | | Year Ended
December 31,
2015 | |
| | | | | | | | |
| Operations | | | | | | | | |
Net investment income | | $ | 1,663,990 | | | $ | 3,529,445 | |
Net realized gain | | | 6,558,247 | | | | 13,787,874 | |
Net change in unrealized appreciation (depreciation) | | | (1,756,311 | ) | | | (14,654,572 | ) |
| | | | |
Net increase in net assets resulting from operations | | | 6,465,926 | | | | 2,662,747 | |
| | | | |
| | | | | | | | |
| Distributions to Shareholders1 | | | | | | | | |
From net investment income: | | | | | | | | |
Class I | | | — | | | | (3,773,318 | ) |
Class II | | | — | | | | (33,237 | ) |
From net realized gain: | | | | | | | | |
Class I | | | — | | | | (12,239,083 | ) |
Class II | | | — | | | | (117,425 | ) |
| | | | |
Decrease in net assets resulting from distributions to shareholders | | | — | | | | (16,163,063 | ) |
| | | | |
| | | | | | | | |
| Capital Share Transactions | | | | | | | | |
Net decrease in net assets derived from capital share transactions | | | (4,471,639 | ) | | | (3,662,364 | ) |
| | | | |
| | | | | | | | |
| Net Assets | | | | | | | | |
Total increase (decrease) in net assets | | | 1,994,287 | | | | (17,162,680 | ) |
Beginning of period | | | 188,828,283 | | | | 205,990,963 | |
| | | | |
End of period | | $ | 190,822,570 | | | $ | 188,828,283 | |
| | | | |
Undistributed net investment income, end of period | | $ | 1,665,656 | | | $ | 1,666 | |
| | | | |
| | 1 | | Distributions for annual periods determined in accordance with federal income tax regulations. |
See Notes to Financial Statements.
| | | | | | |
| | | BLACKROCK VARIABLE SERIES FUNDS, INC. | | JUNE 30, 2016 | | 15 |
| | | | |
| Financial Highlights | | | BlackRock S&P 500 Index V.I. Fund | |
| | | | | | | | | | | | | | | | | | | | | | | | |
| | | Class I | |
| | | Six Months Ended June 30, 2016 | | | Year Ended December 31, | |
| | | (Unaudited) | | | 2015 | | | 2014 | | | 2013 | | | 2012 | | | 2011 | |
| | | | | | | | | | | | | | | | | | | | | | | | |
| Per Share Operating Performance | | | | | | | | | | | | | | | | | | | | | | | | |
Net asset value, beginning of period | | $ | 19.08 | | | $ | 20.63 | | | $ | 19.43 | | | $ | 15.43 | | | $ | 13.92 | | | $ | 14.52 | |
| | | | |
Net investment income1 | | | 0.17 | | | | 0.37 | | | | 0.35 | | | | 0.30 | | | | 0.29 | | | | 0.24 | |
Net realized and unrealized gain (loss) | | | 0.52 | | | | (0.14 | ) | | | 2.25 | | | | 4.61 | | | | 1.87 | | | | 0.02 | |
| | | | |
Net increase from investment operations | | | 0.69 | | | | 0.23 | | | | 2.60 | | | | 4.91 | | | | 2.16 | �� | | | 0.26 | |
| | | | |
Distributions:2 | | | | | | | | | | | | | | | | | | | | | | | | |
From net investment income | | | — | | | | (0.42 | ) | | | (0.36 | ) | | | (0.31 | ) | | | (0.30 | ) | | | (0.26 | ) |
From net realized gain | | | — | | | | (1.36 | ) | | | (1.04 | ) | | | (0.60 | ) | | | (0.35 | ) | | | (0.60 | ) |
| | | | |
Total distributions | | | — | | | | (1.78 | ) | | | (1.40 | ) | | | (0.91 | ) | | | (0.65 | ) | | | (0.86 | ) |
| | | | |
Net asset value, end of period | | $ | 19.77 | | | $ | 19.08 | | | $ | 20.63 | | | $ | 19.43 | | | $ | 15.43 | | | $ | 13.92 | |
| | | | |
| | | | | | | | | | | | | | | | | | | | | | | | |
| Total Return3 | | | | | | | | | | | | | | | | | | | | | | | | |
Based on net asset value | | | 3.62 | %4 | | | 1.05 | % | | | 13.30 | % | | | 31.87 | % | | | 15.60 | % | | | 1.70 | % |
| | | | |
| | | | | | | | | | | | | | | | | | | | | | | | |
| Ratios to Average Net Assets | | | | | | | | | | | | | | | | | | | | | | | | |
Total expenses | | | 0.46 | %5 | | | 0.46 | % | | | 0.46 | % | | | 0.46 | % | | | 0.46 | % | | | 0.43 | % |
| | | | |
Total expenses after fees waived and reimbursed | | | 0.31 | %5 | | | 0.31 | % | | | 0.34 | % | | | 0.41 | % | | | 0.43 | % | | | 0.43 | % |
| | | | |
Net investment income | | | 1.85 | %5 | | | 1.76 | % | | | 1.70 | % | | | 1.69 | % | | | 1.87 | % | | | 1.65 | % |
| | | | |
| | | | | | | | | | | | | | | | | | | | | | | | |
| Supplemental Data | | | | | | | | | | | | | | | | | | | | | | | | |
Net assets, end of period (000) | | $ | 188,245 | | | $ | 187,048 | | | $ | 204,029 | | | $ | 199,825 | | | $ | 158,160 | | | $ | 147,145 | |
| | | | |
Portfolio turnover rate | | | 2 | % | | | 4 | % | | | 3 | % | | | 4 | % | | | 4 | % | | | 4 | % |
| | | | |
| | 1 | | Based on average shares outstanding. |
| | 2 | | Distributions for annual periods determined in accordance with federal income tax regulations. |
| | 3 | | Where applicable, excludes insurance-related fees and expenses and assumes the reinvestment of distributions. |
| | 4 | | Aggregate total return. |
See Notes to Financial Statements.
| | | | | | |
| 16 | | BLACKROCK VARIABLE SERIES FUNDS, INC. | | JUNE 30, 2016 | | |
| | | | |
| Financial Highlights (concluded) | | | BlackRock S&P 500 Index V.I. Fund | |
| | | | | | | | | | | | | | | | | | | | | | | | |
| | | Class II | |
| | | Six Months
Ended
June 30, 2016 | | | Year Ended December 31, | |
| | | (Unaudited) | | | 2015 | | | 2014 | | | 2013 | | | 2012 | | | 2011 | |
| | | | | | | | | | | | | | | | | | | | | | | | |
| Per Share Operating Performance | | | | | | | | | | | | | | | | | | | | | | | | |
Net asset value, beginning of period | | $ | 18.94 | | | $ | 20.49 | | | $ | 19.31 | | | $ | 15.34 | | | $ | 13.84 | | | $ | 14.44 | |
| | | | |
Net investment income1 | | | 0.16 | | | | 0.33 | | | | 0.32 | | | | 0.27 | | | | 0.26 | | | | 0.22 | |
Net realized and unrealized gain (loss) | | | 0.51 | | | | (0.13 | ) | | | 2.22 | | | | 4.58 | | | | 1.86 | | | | 0.02 | |
| | | | |
Net increase from investment operations | | | 0.67 | | | | 0.20 | | | | 2.54 | | | | 4.85 | | | | 2.12 | | | | 0.24 | |
| | | | |
Distributions:2 | | | | | | | | | | | | | | | | | | | | | | | | |
From net investment income | | | — | | | | (0.39 | ) | | | (0.32 | ) | | | (0.28 | ) | | | (0.27 | ) | | | (0.24 | ) |
From net realized gain | | | — | | | | (1.36 | ) | | | (1.04 | ) | | | (0.60 | ) | | | (0.35 | ) | | | (0.60 | ) |
| | | | |
Total distributions | | | — | | | | (1.75 | ) | | | (1.36 | ) | | | (0.88 | ) | | | (0.62 | ) | | | (0.84 | ) |
| | | | |
Net asset value, end of period | | $ | 19.61 | | | $ | 18.94 | | | $ | 20.49 | | | $ | 19.31 | | | $ | 15.34 | | | $ | 13.84 | |
| | | | |
| | | | | | | | | | | | | | | | | | | | | | | | |
| Total Return3 | | | | | | | | | | | | | | | | | | | | | | | | |
Based on net asset value | | | 3.54 | %4 | | | 0.89 | % | | | 13.11 | % | | | 31.67 | % | | | 15.44 | % | | | 1.58 | % |
| | | | |
| | | | | | | | | | | | | | | | | | | | | | | | |
| Ratios to Average Net Assets | | | | | | | | | | | | | | | | | | | | | | | | |
Total expenses | | | 0.61 | %5 | | | 0.61 | % | | | 0.60 | % | | | 0.60 | % | | | 0.61 | % | | | 0.58 | % |
| | | | |
Total expenses after fees waived and reimbursed | | | 0.46 | %5 | | | 0.46 | % | | | 0.48 | % | | | 0.56 | % | | | 0.58 | % | | | 0.58 | % |
| | | | |
Net investment income | | | 1.67 | %5 | | | 1.61 | % | | | 1.55 | % | | | 1.54 | % | | | 1.72 | % | | | 1.52 | % |
| | | | |
| | | | | | | | | | | | | | | | | | | | | | | | |
| Supplemental Data | | | | | | | | | | | | | | | | | | | | | | | | |
Net assets, end of period (000) | | $ | 2,577 | | | $ | 1,780 | | | $ | 1,962 | | | $ | 1,828 | | | $ | 1,584 | | | $ | 1,355 | |
| | | | |
Portfolio turnover rate | | | 2 | % | | | 4 | % | | | 3 | % | | | 4 | % | | | 4 | % | | | 4 | % |
| | | | |
| | 1 | | Based on average shares outstanding. |
| | 2 | | Distributions for annual periods determined in accordance with federal income tax regulations. |
| | 3 | | Where applicable, excludes insurance-related fees and expenses and assumes the reinvestment of distributions. |
| | 4 | | Aggregate total return. |
See Notes to Financial Statements.
| | | | | | |
| | | BLACKROCK VARIABLE SERIES FUNDS, INC. | | JUNE 30, 2016 | | 17 |
| | | | |
| Notes to Financial Statements (Unaudited) | | | BlackRock S&P 500 Index V.I. Fund | |
1. Organization:
BlackRock Variable Series Funds, Inc. (the “Company”) is registered under the Investment Company Act of 1940, as amended (the “1940 Act”), as an open-end management investment company. The Company is organized as a Maryland corporation that is comprised of 20 separate funds. The funds offer shares to insurance companies for their separate accounts to fund benefits under certain variable annuity and variable life insurance contracts. The financial statements presented are for BlackRock S&P 500 Index V.I. Fund (the “Fund”). The Fund is classified as diversified. Class I and Class II Shares have equal voting, dividend, liquidation and other rights, except that only shares of the respective classes are entitled to vote on matters concerning only that class. In addition, Class II Shares bear certain expenses related to the distribution of such shares.
The Fund, together with certain other registered investment companies advised by BlackRock Advisors, LLC (the “Manager”) or its affiliates, is included in a complex of open-end funds referred to as the Equity-Bond Complex.
2. Significant Accounting Policies:
The financial statements are prepared in conformity with accounting principles generally accepted in the United States of America (“U.S. GAAP”), which may require management to make estimates and assumptions that affect the reported amounts of assets and liabilities in the financial statements, disclosure of contingent assets and liabilities at the date of the financial statements and the reported amounts of increases and decreases in net assets from operations during the reporting period. Actual results could differ from those estimates. The Fund is considered an investment company under U.S. GAAP and follows the accounting and reporting guidance applicable to investment companies. Below is a summary of significant accounting policies:
Segregation and Collateralization: In cases where the Fund enters into certain investments (e.g., futures contracts) that would be treated as “senior securities” for 1940 Act purposes, the Fund may segregate or designate on its books and records cash or liquid assets having a market value at least equal to the amount of its future obligations under such investments. Doing so allows the investment to be excluded from treatment as a “senior security.” Furthermore, if required by an exchange or counterparty agreement, the Fund may be required to deliver/deposit cash and/or securities to/with an exchange, or broker-dealer or custodian as collateral for certain investments or obligations.
Investment Transactions and Investment Income: For financial reporting purposes, investment transactions are recorded on the dates the transactions are entered into (the trade dates). Realized gains and losses on investment transactions are determined on the identified cost basis. Dividend income is recorded on the ex-dividend date. Dividends from foreign securities where the ex-dividend date may have passed are subsequently recorded when the Fund is informed of the ex-dividend date. Under the applicable foreign tax laws, a withholding tax at various rates may be imposed on capital gains, dividends and interest. Upon notification from issuers, some of the dividend income received from a real estate investment trust may be redesignated as a reduction of cost of the related investment and/or realized gain. Income, expenses and realized and unrealized gains and losses are allocated daily to each class based on its relative net assets.
Distributions: Distributions paid by the Fund are recorded on the ex-dividend date. The character and timing of distributions are determined in accordance with federal income tax regulations, which may differ from U.S. GAAP.
Indemnifications: In the normal course of business, the Fund enters into contracts that contain a variety of representations that provide general indemnification. The Fund’s maximum exposure under these arrangements is unknown because it involves future potential claims against the Fund, which cannot be predicted with any certainty.
Other: Expenses directly related to the Fund or its classes are charged to the Fund or the applicable class. Other operating expenses shared by several funds, including other funds managed by the Manager, are prorated among those funds on the basis of relative net assets or other appropriate methods. Expenses directly related to the Fund and other shared expenses prorated to the Fund are allocated daily to each class based on its relative net assets or other appropriate methods.
The Fund has an arrangement with its custodian whereby fees may be reduced by credits earned on uninvested cash balances, which, if applicable, are shown as fees paid indirectly in the Statement of Operations. The custodian imposes fees on overdrawn cash balances, which can be offset by accumulated credits earned or may result in additional custody charges.
3. Investment Valuation and Fair Value Measurements:
Investment Valuation Policies: The Fund’s investments are valued at fair value (also referred to as “market value” within the financial statements) as of the close of trading on the New York Stock Exchange (“NYSE”) (generally 4:00 p.m., Eastern time). U.S. GAAP defines fair value as the price the Fund would receive to sell an asset or pay to transfer a liability in an orderly transaction between market participants at the measurement date. The Fund determines the fair values of its financial instruments using independent dealers or pricing services under policies approved by the Board of Directors of the Company (the “Board”). The BlackRock Global Valuation Methodologies Committee (the “Global Valuation Committee”) is the committee formed by management to develop global pricing policies and procedures and to oversee the pricing function for all financial instruments.
| | | | | | |
| 18 | | BLACKROCK VARIABLE SERIES FUNDS, INC. | | JUNE 30, 2016 | | |
| | | | |
| Notes to Financial Statements (continued) | | | BlackRock S&P 500 Index V.I. Fund | |
Fair Value Inputs and Methodologies: The following methods (or “techniques”) and inputs are used to establish the fair value of the Fund’s assets and liabilities:
| • | | Equity investments traded on a recognized securities exchange are valued at the official closing price each day, if available. For equity investments traded on more than one exchange, the official close price on the exchange where the stock is primarily traded is used. Equity investments traded on a recognized exchange for which there were no sales on that day may be valued at the last available bid (long positions) or ask (short positions) price. |
| • | | Investments in open-end U.S. mutual funds are valued at net asset value each business day. |
| • | | The Fund values its investment in BlackRock Liquidity Series, LLC, Money Market Series (the “Money Market Series”) at fair value, which is ordinarily based upon its pro rata ownership in the underlying fund’s net assets. The Money Market Series seeks current income consistent with maintaining liquidity and preserving capital. Although the Money Market Series is not registered under the 1940 Act, its investments may follow the parameters of investments by a money market fund that is subject to Rule 2a-7 under the 1940 Act. The Fund may withdraw up to 25% of its investment daily, although the manager of the Money Market Series, in its sole discretion, may permit an investor to withdraw more than 25% on any one day. |
| • | | Futures contracts traded on exchanges are valued at their last sale price. |
If events (e.g., a company announcement, market volatility or a natural disaster) occur that are expected to materially affect the value of such instruments, or in the event that the application of these methods of valuation results in a price for an investment that is deemed not to be representative of the market value of such investment, or if a price is not available, the investment will be valued by the Global Valuation Committee, or its delegate, in accordance with a policy approved by the Board as reflecting fair value (“Fair Valued Investments”). When determining the price for Fair Valued Investments, the Global Valuation Committee, or its delegate, seeks to determine the price that the Fund might reasonably expect to receive or pay from the current sale or purchase of that asset or liability in an arm’s-length transaction. Fair value determinations shall be based upon all available factors that the Global Valuation Committee, or its delegate, deems relevant consistent with the principles of fair value measurement. The pricing of all Fair Valued Investments is subsequently reported to the Board or a committee thereof on a quarterly basis.
Fair Value Hierarchy: Various inputs are used in determining the fair value of investments and derivative financial instruments. These inputs to valuation techniques are categorized into a fair value hierarchy consisting of three broad levels for financial statement purposes as follows:
| • | | Level 1 — unadjusted price quotations in active markets/exchanges for identical assets or liabilities that the Fund has the ability to access |
| • | | Level 2 — other observable inputs (including, but not limited to, quoted prices for similar assets or liabilities in markets that are active, quoted prices for identical or similar assets or liabilities in markets that are not active, inputs other than quoted prices that are observable for the assets or liabilities (such as interest rates, yield curves, volatilities, prepayment speeds, loss severities, credit risks and default rates) or other market–corroborated inputs) |
| • | | Level 3 — unobservable inputs based on the best information available in the circumstances, to the extent observable inputs are not available (including the Fund’s own assumptions used in determining the fair value of investments and derivative financial instruments) |
The hierarchy gives the highest priority to unadjusted quoted prices in active markets for identical assets or liabilities (Level 1 measurements) and the lowest priority to unobservable inputs (Level 3 measurements). Accordingly, the degree of judgment exercised in determining fair value is greatest for instruments categorized in Level 3. The inputs used to measure fair value may fall into different levels of the fair value hierarchy. In such cases, for disclosure purposes, the fair value hierarchy classification is determined based on the lowest level input that is significant to the fair value measurement in its entirety. The significant unobservable inputs used by the Global Valuation Committee in determining the price for Fair Valued Investments are typically categorized as Level 3. The fair value hierarchy for the Fund’s investments and derivative financial instruments has been included in the Schedule of Investments.
Changes in valuation techniques may result in transfers into or out of an assigned level within the hierarchy. In accordance with the Fund’s policy, transfers between different levels of the fair value hierarchy are deemed to have occurred as of the beginning of the reporting period. The categorization of a value determined for investments and derivative financial instruments is based on the pricing transparency of the investments and derivative financial instruments and is not necessarily an indication of the risks associated with investing in those securities.
4. Securities and Other Investments:
Securities Lending: The Fund may lend its securities to approved borrowers, such as brokers, dealers and other financial institutions. The borrower pledges and maintains with the Fund collateral consisting of cash, an irrevocable letter of credit issued by a bank, or securities issued or guaranteed by the U.S. Government. The initial collateral received by the Fund is required to have a value of at least 102% of the current value of the loaned securities for securities traded on U.S. exchanges and a value of at least 105% for all other securities. The collateral is maintained thereafter, at a value equal to at least 100% of the current market value of the securities on loan. The market value of the loaned securities is determined at the close of each business day of the Fund and any additional required collateral is delivered to the Fund, or excess collateral returned by the Fund, on the next business
| | | | | | |
| | | BLACKROCK VARIABLE SERIES FUNDS, INC. | | JUNE 30, 2016 | | 19 |
| | | | |
| Notes to Financial Statements (continued) | | | BlackRock S&P 500 Index V.I. Fund | |
day. During the term of the loan, the Fund is entitled to all distributions made on or in respect of the loaned securities. Loans of securities are terminable at any time and the borrower, after notice, is required to return borrowed securities within the standard time period for settlement of securities transactions.
The market value of any securities on loan, all of which were classified as common stocks in the Fund’s Schedule of Investments, and the value of any related collateral are shown separately in the Statement of Assets and Liabilities as a component of investments at value — unaffiliated, and collateral on securities loaned at value, respectively. As of period end, any securities on loan were collateralized by cash. The cash collateral invested by the securities lending agent, BlackRock Investment Management, LLC (“BIM”), if any, is disclosed in the Schedule of Investments.
Securities lending transactions are entered into by the Fund under Master Securities Lending Agreements (each, an “MSLA”), which provide the right, in the event of default (including bankruptcy or insolvency), for the non-defaulting party to liquidate the collateral and calculate a net exposure to the defaulting party or request additional collateral. In the event that a borrower defaults, the Fund, as lender, would offset the market value of the collateral received against the market value of the securities loaned. When the value of the collateral is greater than that of the market value of the securities loaned, the lender is left with a net amount payable to the defaulting party. However, bankruptcy or insolvency laws of a particular jurisdiction may impose restrictions on or prohibitions against such a right of offset in the event of an MSLA counterparty’s bankruptcy or insolvency. Under the MSLA, absent an event of default the borrower can resell or re-pledge the loaned securities, and the Fund can reinvest cash collateral received in connection with loaned securities. Upon an event of default, the parties’ obligations to return the securities or collateral to the other party are extinguished, and the parties can resell or re-pledge the loaned securities or the collateral received in connection with the loaned securities in order to satisfy the defaulting party’s net payment obligation for all transactions under the MSLA. The defaulting party remains liable for any deficiency.
As of period end, the following table is a summary of the Fund’s securities lending agreements by counterparty which are subject to offset under an MSLA:
| | | | | | | | | | | | | | | |
| Counterparty | | Securities Loaned
at Value | | Cash Collateral
Received1 | | Net
Amount2 |
BNP Paribas S.A. | | | $ | 520,397 | | | | $ | (520,397 | ) | | | | — | |
Citigroup Global Markets, Inc. | | | | 285,399 | | | | | (285,399 | ) | | | | — | |
Goldman Sachs & Co. | | | | 687,204 | | | | | (687,204 | ) | | | | — | |
JP Morgan Securities LLC | | | | 2,204,814 | | | | | (2,204,814 | ) | | | | — | |
Morgan Stanley | | | | 3,143,751 | | | | | (3,143,751 | ) | | | | — | |
Nomura Securities International, Inc. | | | | 1,349,856 | | | | | (1,349,856 | ) | | | | — | |
UBS Securities LLC | | | | 15,178 | | | | | (15,150 | ) | | | $ | 28 | |
| | | | | |
Total | | | $ | 8,206,599 | | | | $ | (8,206,571 | ) | | | $ | 28 | |
| | | | | |
| | 1 | | Collateral with a value of $8,292,298 has been received in connection with securities lending agreements. Collateral received in excess of the value of securities loaned from the individual counterparty is not shown for financial reporting purposes in the table above. |
| | 2 | | The market value of the loaned securities is determined as of June 30, 2016. Additional collateral is delivered to the Fund on the next business day in accordance with the MSLA. The net amount would be subject to the borrower default indemnity in the event of default by the counterparty. |
The risks of securities lending include the risk that the borrower may not provide additional collateral when required or may not return the securities when due. To mitigate these risks, the Fund benefits from a borrower default indemnity provided by BIM. BIM’s indemnity allows for full replacement of the securities loaned if the collateral received does not cover the value on the securities loaned in the event of borrower default. The Fund could suffer a loss if the value of an investment purchased with cash collateral falls below the market value of loaned securities or if the value of an investment purchased with cash collateral falls below the value of the original cash collateral received.
5. Derivative Financial Instruments:
The Fund engages in various portfolio investment strategies using derivative contracts both to increase the returns of the Fund and/or to manage its exposure to certain risks such as credit risk, equity risk, interest rate risk, foreign currency exchange rate risk, commodity price risk or other risks (e.g., inflation risk). Derivative financial instruments categorized by risk exposure are included in the Schedule of Investments. These contracts may be transacted on an exchange or over-the-counter (“OTC”).
Futures Contracts: The Fund invests in long and/or short positions in futures and options on futures contracts to gain exposure to, or manage exposure to, changes in interest rates (interest rate risk), changes in the value of equity securities (equity risk) or foreign currencies (foreign currency exchange rate risk).
Futures contracts are agreements between the Fund and a counterparty to buy or sell a specific quantity of an underlying instrument at a specified price and on a specified date. Depending on the terms of a contract, it is settled either through physical delivery of the underlying instrument on the settlement date or by payment of a cash amount on the settlement date. Upon entering into a futures contract, the Fund is required to deposit initial margin with the broker in the form of cash or securities in an amount that varies depending on a contract’s size and risk profile. The initial margin deposit must then be maintained at an established level over the life of the contract.
| | | | | | |
| 20 | | BLACKROCK VARIABLE SERIES FUNDS, INC. | | JUNE 30, 2016 | | |
| | | | |
| Notes to Financial Statements (continued) | | | BlackRock S&P 500 Index V.I. Fund | |
Securities deposited as initial margin are designated in the Schedule of Investments and cash deposited, if any, is shown as cash pledged for futures contracts in the Statement of Assets and Liabilities. Pursuant to the contract, the Fund agrees to receive from or pay to the broker an amount of cash equal to the daily fluctuation in market value of the contract (“variation margin”). Variation margin is recorded as unrealized appreciation (depreciation) and, if any, shown as variation margin receivable (or payable) on futures contracts in the Statement of Assets and Liabilities. When the contract is closed, a realized gain or loss is recorded in the Statement of Operations equal to the difference between the value of the contract at the time it was opened and the value at the time it was closed. The use of futures contracts involves the risk of an imperfect correlation in the movements in the price of futures contracts and interest, foreign currency exchange rates or underlying assets.
6. Investment Advisory Agreement and Other Transactions with Affiliates:
The PNC Financial Services Group, Inc. is the largest stockholder and an affiliate of BlackRock, Inc. (“BlackRock”) for 1940 Act purposes.
Investment Advisory
The Company, on behalf of the Fund, entered into an Investment Advisory Agreement with the Manager, the Fund’s investment adviser, an indirect, wholly owned subsidiary of BlackRock, to provide investment advisory and administration services. The Manager is responsible for the management of the Fund’s portfolio and provides the personnel, facilities, equipment and certain other services necessary to the operations of the Fund. For such services, the Fund pays the Manager a monthly fee of 0.30%, which is determined by calculating a percentage of the Fund’s average daily net assets.
Distribution Fees
The Company, on behalf of the Fund, entered into a Distribution Agreement and a Distribution Plan with BlackRock Investments, LLC (“BRIL”), an affiliate of the Manager. Pursuant to the Distribution Plan and in accordance with Rule 12b-1 under the 1940 Act, the Fund pays BRIL ongoing distribution fees. The fees are accrued daily and paid monthly at an annual rate of 0.15% based upon the average daily net assets attributable to Class II.
For the six months ended June 30, 2016, the class specific distribution fees borne directly by Class II is $1,643.
Transfer Agent
The Manager, on behalf of the Fund, entered into agreements with insurance companies and other financial intermediaries (“Service Organizations”), some of which may be affiliates. Pursuant to these agreements, the Service Organizations provide the Fund with administrative, networking, recordkeeping, sub-transfer agency and shareholder services to sub-accounts they service. For these services, the Service Organizations receive an annual fee per shareholder account, which will vary depending on share class and/or net assets of Fund shareholders serviced by the Service Organizations, which is shown as transfer agent — class specific. For the six months ended June 30, 2016, the Fund paid the following amounts to affiliates in return for these services, which is included in transfer agent — class specific in the Statement of Operations:
| | | | |
| Class I | | Class II | | Total |
$45,956 | | $464 | | $46,420 |
In addition, the Fund pays the transfer agent, which is not an affiliate, a fee for issuance, transfer and redemption of shares and the opening and maintenance of shareholder accounts, which is included in transfer agent in the Statement of Operations.
Expense Limitations, Waivers and Reimbursements
The Manager, with respect to the Fund, contractually agreed to waive and/or reimburse fees or expenses in order to limit expenses, excluding interest expense, dividend expense, tax expense, acquired fund fees and expenses, and certain other fund expenses, which constitute extraordinary expenses not incurred in the ordinary course of the Fund’s business. The expense limitations as a percentage of average daily net assets are as follows:
| | | | |
Class I | | | 1.25 | % |
Class II | | | 1.40 | % |
The Manager has agreed not to reduce or discontinue this contractual expense limitation prior to May 1, 2017, unless approved by the Board, including a majority of the Independent Directors who are not “interested persons” of the Fund, as defined in the 1940 Act (“Independent Directors”) or by a majority of the outstanding voting securities of the Fund.
The Manager, with respect to the Fund, voluntarily agreed to waive its investment advisory fees by the amount of investment advisory fees the Fund pays to the Manager indirectly through its investment in affiliated money market funds. This amount is included in fees waived by the Manager in the
| | | | | | |
| | | BLACKROCK VARIABLE SERIES FUNDS, INC. | | JUNE 30, 2016 | | 21 |
| | | | |
| Notes to Financial Statements (continued) | | | BlackRock S&P 500 Index V.I. Fund | |
Statement of Operations. However, the Manager does not waive its investment advisory fees by the amount of investment advisory fees paid in connection with the Fund’s investments in other affiliated investment companies, if any. For the six months ended June 30, 2016, the amount waived was $1,381.
BlackRock has contractually agreed to waive 0.10% of its management fee through April 30, 2017. This amount is included in fees waived by the Manager in the Statement of Operations. For the six months ended June 30, 2016, the waiver was $90,027.
The Manager has contractually agreed to reimburse all transfer agent fees for Class I and Class II.
The Manager has agreed not to reduce or discontinue this contractual reimbursement prior to May 1, 2017, unless approved by the Board, including a majority of the Independent Directors or by a majority of the outstanding voting securities of the Fund.
These amounts are shown as transfer agent fees reimbursed — class specific in the Statement of Operations. Class specific expense waivers and/or reimbursements are as follows:
| | | | | | | | | | | | | | | |
| | | Class I | | Class II | | Total |
| Transfer Agent Fees Reimbursed | | $45,956 | | $464 | | $46,420 |
For the six months ended June 30, 2016, the Fund reimbursed the Manager $1,015 for certain accounting services, which is included in accounting services in the Statement of Operations.
Securities Lending
The U.S. Securities and Exchange Commission has issued an exemptive order which permits BIM, an affiliate of the Manager, to serve as securities lending agent for the Fund, subject to applicable conditions. As securities lending agent, BIM bears all operational costs directly related to securities lending. The Fund is responsible for expenses in connection with the investment of cash collateral received for securities on loan (the “collateral investment expenses”). The cash collateral is invested in a private investment company managed by the Manager or its affiliates. However, BIM has agreed to cap the collateral investment expenses of the private investment company to an annual rate of 0.04%. The investment adviser to the private investment company will not charge any advisory fees with respect to shares purchased by the Fund.
Securities lending income is equal to the total of income earned from the reinvestment of cash collateral, net of fees and other payments to and from borrowers of securities, and less the collateral investment expenses. The Fund retains a portion of securities lending income and remits a remaining portion to BIM as compensation for its services as securities lending agent.
Pursuant to a securities lending agreement, the Fund retains 71.5% of securities lending income, and this amount retained can never be less than 65% of the total of securities lending income plus the collateral investment expenses.
In addition, commencing the business day following the date that the aggregate securities lending income earned across the Equity-Bond Complex in a calendar year exceeds a specified threshold, the Fund, pursuant to the securities lending agreement, will retain for the remainder of that calendar year securities lending income as follows: 75% of securities lending income, and this amount retained can never be less than 65% of the total of securities lending income plus the collateral investment expenses.
The share of securities lending income earned by the Fund is shown as securities lending — affiliated — net in the Statement of Operations. For the six months ended June 30, 2016, the Fund paid BIM $2,614 for securities lending agent services.
Officers and Directors
Certain officers and/or directors of the Company are officers and/or directors of BlackRock or its affiliates. The Fund reimburses the Manager for a portion of the compensation paid to the Company’s Chief Compliance Officer, which is included in Officer and Directors in the Statement of Operations.
Other Transactions
The Fund may purchase securities from, or sell securities to, an affiliated fund provided the affiliation is due solely to having a common investment adviser, common officers, or common directors. For the six months ended June 30, 2016, the purchase and sale transactions which resulted in net realized gains (losses) with an affiliated fund in compliance with Rule 17a-7 under the 1940 Act were as follows:
| | | | |
| Purchases | | Sales | | Net Realized Loss |
$1,987,742 | | $263,369 | | $(201,779) |
| | | | | | |
| 22 | | BLACKROCK VARIABLE SERIES FUNDS, INC. | | JUNE 30, 2016 | | |
| | | | |
| Notes to Financial Statements (continued) | | | BlackRock S&P 500 Index V.I. Fund | |
7. Purchases and Sales:
For the six months ended June 30, 2016, purchases and sales of investments, excluding short-term securities, were $3,992,475 and $13,115,426, respectively.
8. Income Tax Information:
It is the Fund’s policy to comply with the requirements of the Internal Revenue Code of 1986, as amended, applicable to regulated investment companies, and to distribute substantially all of its taxable income to its shareholders. Therefore, no federal income tax provision is required.
The Fund files U.S. federal and various state and local tax returns. No income tax returns are currently under examination. The statute of limitations on the Fund’s U.S. federal tax returns generally remains open for each of the four years ended December 31, 2015. The statutes of limitations on the Fund’s state and local tax returns may remain open for an additional year depending upon the jurisdiction.
Management has analyzed tax laws and regulations and their application to the Fund as of June 30, 2016, inclusive of the open tax return years, and does not believe there are any uncertain tax positions that require recognition of a tax liability in the Fund’s financial statements.
As of June 30, 2016, gross unrealized appreciation and depreciation based on cost for federal income tax purposes were as follows:
| | | | |
Tax cost | | $ | 89,824,272 | |
| | | | |
Gross unrealized appreciation | | $ | 111,701,311 | |
Gross unrealized depreciation | | | (2,519,159 | ) |
| | | | |
Net unrealized appreciation | | $ | 109,182,152 | |
| | | | |
9. Bank Borrowings:
The Company, on behalf of the Fund, along with certain other funds managed by the Manager and its affiliates (“Participating Funds”), is a party to a 364-day, $2.1 billion credit agreement with a group of lenders. Under this agreement, the Fund may borrow to fund shareholder redemptions. Excluding commitments designated for certain individual funds, the Participating Funds, including the Fund, can borrow up to an aggregate commitment amount of $1.6 billion at any time outstanding, subject to asset coverage and other limitations as specified in the agreement. The credit agreement has the following terms: a fee of 0.12% per annum on unused commitment amounts and interest at a rate equal to the higher of (a) one-month LIBOR (but, in any event, not less than 0.00%) on the date the loan is made plus 0.80% per annum or (b) the Fed Funds rate (but, in any event, not less than 0.00%) in effect from time to time plus 0.80% per annum on amounts borrowed. The agreement expires in April 2017 unless extended or renewed. Prior to April 21, 2016, the credit agreement had a fee per annum of 0.06% on unused commitment amounts and interest at a rate equal to the higher of (a) one-month LIBOR (but, in any event, not less than 0.00%) on the date the loan is made plus 0.80% per annum or (b) the Fed Funds rate (but, in any event, not less than 0.00%) in effect from time to time plus 0.80% per annum on amounts borrowed. Participating Funds paid administration, legal and arrangement fees, which, if applicable, are included in miscellaneous expenses in the Statement of Operations. These fees were allocated among such funds based upon portions of the aggregate commitment available to them and relative net assets of Participating Funds. During the six months ended June 30, 2016, the Fund did not borrow under the credit agreement.
10. Principal Risks:
In the normal course of business, the Fund invests in securities and enters into transactions where risks exist due to fluctuations in the market (market risk) or failure of the issuer to meet all its obligations, including the ability to pay principal and interest when due (issuer credit risk). The value of securities held by the Fund may decline in response to certain events, including those directly involving the issuers of securities owned by the Fund. Changes arising from the general economy, the overall market and local, regional or global political and/or social instability, as well as currency, interest rate and price fluctuations, may also affect the securities’ value.
Counterparty Credit Risk: Similar to issuer credit risk, the Fund may be exposed to counterparty credit risk, or the risk that an entity may fail to or be unable to perform on its commitments related to unsettled or open transactions. The Fund manages counterparty credit risk by entering into transactions only with counterparties that the Manager believes have the financial resources to honor their obligations and by monitoring the financial stability of those counterparties. Financial assets, which potentially expose the Fund to market, issuer and counterparty credit risks, consist principally of financial instruments and receivables due from counterparties. The extent of the Fund’s exposure to market, issuer and counterparty credit risks with respect to these financial assets is approximately their value recorded in the Statement of Assets and Liabilities, less any collateral held by the Fund.
A derivative contract may suffer a mark-to-market loss if the value of the contract decreases due to an unfavorable change in the market rates or values of the underlying instrument. Losses can also occur if the counterparty does not perform under the contract.
With exchange-traded futures, there is less counterparty credit risk to the Fund since the exchange or clearinghouse, as counterparty to such instruments, guarantees against a possible default. The clearinghouse stands between the buyer and the seller of the contract; therefore, credit risk is limited
| | | | | | |
| | | BLACKROCK VARIABLE SERIES FUNDS, INC. | | JUNE 30, 2016 | | 23 |
| | | | |
| Notes to Financial Statements (concluded) | | | BlackRock S&P 500 Index V.I. Fund | |
to failure of the clearinghouse. While offset rights may exist under applicable law, the Fund does not have a contractual right of offset against a clearing broker or clearinghouse in the event of a default (including the bankruptcy or insolvency). Additionally, credit risk exists in exchange-traded futures with respect to initial and variation margin that is held in a clearing broker’s customer accounts. While clearing brokers are required to segregate customer margin from their own assets, in the event that a clearing broker becomes insolvent or goes into bankruptcy and at that time there is a shortfall in the aggregate amount of margin held by the clearing broker for all its clients, typically the shortfall would be allocated on a pro rata basis across all the clearing broker’s customers, potentially resulting in losses to the Fund.
11. Capital Share Transactions:
Transactions in capital shares for each class were as follows:
| | | | | | | | | | | | | | | | | | | | |
| | | Six Months Ended
June 30, 2016 | | | | | | Year Ended
December 31, 2015 | |
| | | Shares | | | Amount | | | | | | Shares | | | Amount | |
Class I | | | | | | | | | | | | | | | | | | | | |
Shares sold | | | 801,710 | | | $ | 14,997,544 | | | | | | | | 1,265,682 | | | $ | 25,868,715 | |
Shares issued in reinvestment of distributions | | | — | | | | — | | | | | | | | 832,898 | | | | 16,012,401 | |
Shares redeemed | | | (1,083,594 | ) | | | (20,158,428 | ) | | | | | | | (2,186,358 | ) | | | (45,490,878 | ) |
| | | | | | | | | | | | |
Net decrease | | | (281,884 | ) | | $ | (5,160,884 | ) | | | | | | | (87,778 | ) | | $ | (3,609,762 | ) |
| | | | | | | | | | | | |
| | | | | | | | | | | | | | | | | | | | |
Class II | | | | | | | | | | | | | | | | | | | | |
Shares sold | | | 39,194 | | | $ | 722,349 | | | | | | | | 10,619 | | | $ | 221,862 | |
Shares issued in reinvestment of distributions | | | — | | | | — | | | | | | | | 7,893 | | | | 150,662 | |
Shares redeemed | | | (1,758 | ) | | | (33,104 | ) | | | | | | | (20,309 | ) | | | (425,126 | ) |
| | | | | | | | | | | | |
Net increase (decrease) | | | 37,436 | | | $ | 689,245 | | | | | | | | (1,797 | ) | | $ | (52,602 | ) |
| | | | | | | | | | | | |
Total Net Decrease | | | (244,448 | ) | | $ | (4,471,639 | ) | | | | | | | (89,575 | ) | | $ | (3,662,364 | ) |
| | | | | | | | | | | | |
12. Subsequent Events:
Management’s evaluation of the impact of all subsequent events on the Fund’s financial statements was completed through the date the financial statements were issued and the following item was noted:
The Fund paid a short-term and long-term capital gain distributions in the following amounts per share on July 22, 2016 to shareholders of record on July 20, 2016:
| | | | | | | | | | |
| | | Short-Term
Capital Gain | | Long-Term
Capital Gain |
Class I | | | | $0.012854 | | | | | $0.107342 | |
Class II | | | | $0.012854 | | | | | $0.107342 | |
| | | | | | |
| 24 | | BLACKROCK VARIABLE SERIES FUNDS, INC. | | JUNE 30, 2016 | | |
JUNE 30, 2016
| | | | |
SEMI-ANNUAL REPORT (UNAUDITED) | | | | BLACKROCK® |
BlackRock Variable Series Funds, Inc.
▶ BlackRock Total Return V.I. Fund
| | |
| Not FDIC Insured ¡ May Lose Value ¡ No Bank Guarantee | | |
| | | | |
| Fund Summary as of June 30, 2016 | | | BlackRock Total Return V.I. Fund | |
BlackRock Total Return V.I. Fund’s (the “Fund”) investment objective is to maximize total return, consistent with income generation and prudent investment management.
|
| Portfolio Management Commentary |
How did the Fund perform?
| • | | For the six-month period ended June 30, 2016, the Fund underperformed its benchmark, the Barclays U.S. Aggregate Bond Index. |
What factors influenced performance?
| • | | The Fund’s underweight allocation to U.S. investment grade credit detracted from performance, as did its European peripheral duration exposure. The Fund’s management of currency exposures was also a negative contributor to performance. |
| • | | Positive performance for the year was driven by allocations to U.S. securitized assets including commercial mortgage-backed securities, asset-backed securities and non-agency residential mortgage-backed securities. In addition, allocations to high yield corporates, municipal bonds, agency mortgage-backed securities (“MBS”) and emerging markets debt added to relative return. |
Describe recent portfolio activity.
| • | | The Fund maintained a generally defensive stance while tactically shifting its stance with respect to overall portfolio duration (and corresponding interest rate sensitivity). Through the first quarter of 2016, the Fund maintained a neutral duration, but shifted to an underweight as the U.S. Federal Reserve struck a surprisingly hawkish tone in April. As the U.K. referendum approached, expecting safe-haven assets to be in demand, the Fund returned to a neutral duration stance. Towards the end of the period, taking into consideration the extent of the rally within U.S. Treasuries |
| | | alongside generally stable U.S. economic data, the Fund moved to a slight duration underweight. Additionally, given the spread compression between higher and lower quality assets across the fixed income universe since the middle of February, the Fund increased exposure to higher quality assets such as U.S. investment grade credit, agency MBS and municipal bonds. The Fund was overweight securitized assets, modestly increasing this allocation during the second quarter of 2016. With respect to currency exposures, the Fund tactically maintained a long U.S. dollar bias during the period. |
| • | | The Fund held derivatives, most notably futures contracts, during the period as a part of its investment strategy. Derivatives are used as a means to obtain exposure and/or take outright views on equities, interest rates, credit risk and/or foreign exchange positions. The use of derivatives did not have a material impact on performance. |
Describe portfolio positioning at period end.
| • | | The Fund ended the quarter positioned slightly underweight duration. In the expectation that the global demand for yield will support high quality credit sectors, the Fund was overweight U.S. investment grade credit and agency MBS. The Fund maintained an increased allocation to municipals, modest exposure to U.S. high yield corporate and emerging market debt, and remained overweight securitized assets. The Fund remained slightly long the U.S. dollar versus the Chinese renminbi, the Saudi Arabian Riyal and British pound. |
The views expressed reflect the opinions of BlackRock as of the date of this report and are subject to change based on changes in market, economic or other conditions. These views are not intended to be a forecast of future events and are no guarantee of future results.
| | |
| Portfolio Composition | | Percent of
Total Investments1 |
U.S. Government Sponsored Agency Securities | | 37% |
Corporate Bonds | | 24 |
U.S. Treasury Obligations | | 20 |
Asset-Backed Securities | | 9 |
Non-Agency Mortgage-Backed Securities | | 6 |
Taxable Municipal Bonds | | 3 |
Foreign Government Obligations | | 1 |
| | 1 | | Total investments exclude short-term securities and options purchased. |
| | | | | |
| Credit Quality Allocations1 | | Percent of Total Investments2 |
AAA/Aaa3 | | | | 61 | % |
AA/Aa | | | | 8 | |
A | | | | 12 | |
BBB/Baa | | | | 12 | |
BB/Ba | | | | 1 | |
B | | | | 1 | |
CCC/Caa | | | | 1 | |
CC/Ca | | | | 1 | |
N/R | | | | 3 | |
| | 1 | | For financial reporting purposes, credit quality ratings shown above reflect the highest rating assigned by either Standard & Poor’s or Moody’s Investors Service if ratings differ. These rating agencies are independent, nationally recognized statistical rating organizations and are widely used. Investment grade ratings are credit ratings of BBB/Baa or higher. Below investment grade ratings are credit ratings of BB/Ba or lower. Investments designated N/R are not rated by either rating agency. Unrated investments do not necessarily indicate low credit quality. Credit quality ratings are subject to change. |
| | 2 | | Total investments exclude short-term securities and options purchased. |
| | 3 | | The investment adviser evaluates the credit quality of unrated investments based upon certain factors including, but not limited to, credit ratings for similar investments and financial analysis of sectors, individual investments and/or issuers. Using this approach, the investment adviser has deemed unrated U.S. Government Sponsored Agency Securities and U.S. Treasury Obligations to be of similar credit quality as investments rated AAA/Aaa. |
| | | | | | |
| 2 | | BLACKROCK VARIABLE SERIES FUNDS, INC. | | JUNE 30, 2016 | | |
| | | | |
| | | | BlackRock Total Return V.I. Fund | |
|
| Total Return Based on a $10,000 Investment |
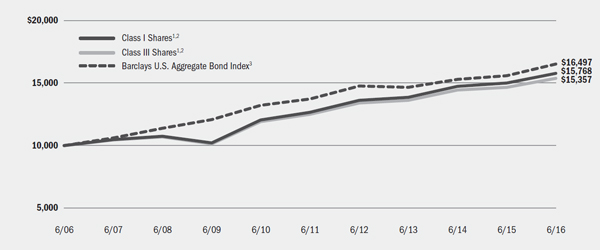
| | 1 | Assuming transaction costs, if any, and other operating expenses, including investment advisory fees. Does not include insurance-related fees and expenses. The returns for Class III Shares prior to August 14, 2012, the recommencement of operations of Class III Shares, are based upon the performance of the Fund’s Class I Shares, as adjusted to reflect the distribution and/or service (12b-1) fees applicable to Class III Shares. |
| | 2 | Under normal circumstances, the Fund invests at least 80%, and typically invests 90% or more, of its assets in fixed income securities, such as corporate bonds and notes, mortgage-backed securities, asset-backed securities, convertible securities, preferred stocks, government obligations and money market securities. |
| | 3 | A widely recognized unmanaged market-weighted index, comprised of investment-grade corporate bonds rated BBB or better, mortgages and U.S. Treasury and U.S. Government agency issues with at least one year to maturity. |
| | | | | | | | | | | | |
| Performance Summary for the Period Ended June 30, 2016 |
| | | | | | | | | | | | |
| | | | | | | | | Average Annual Total Returns |
| | | Standardized
30-Day Yields5 | | Unsubsidized
30-Day Yields5 | | 6-Month
Total Returns6 | | 1 Year6 | | 5 Years6 | | 10 Years6 |
Class I4 | | 1.55% | | 1.33% | | 4.96% | | 5.09% | | 4.45% | | 4.66% |
Class III4 | | 1.25 | | 1.20 | | 4.85 | | 4.82 | | 4.167 | | 4.387 |
Barclays U.S. Aggregate Bond Index | | — | | — | | 5.31 | | 6.00 | | 3.76 | | 5.13 |
| | 4 | | Average annual and cumulative total returns are based on changes in net asset value for the periods shown, and assume reinvestment of all distributions at net asset value on the ex-dividend/payable date. Insurance-related fees and expenses are not reflected in these returns. |
| | 5 | | The standardized 30-day yield includes the effects of any waivers and/or reimbursements. The unsubsidized 30-day yield excludes the effects of any waivers and/or reimbursements. |
| | 6 | | For a portion of the period, the Fund’s investment adviser waived a portion of its fees. Without such waiver, the Fund’s performance would have been lower. |
| | 7 | | The returns for Class III Shares prior to August 14, 2012, the recommencement of operations of Class III Shares, are based upon the performance of the Fund’s Class I Shares, as adjusted to reflect the distribution and/or service (12b-1) fees applicable to Class III Shares. |
| | | | Past performance is not indicative of future results. Performance results do not reflect the deduction of taxes that a shareholder would pay on Fund distributions or the redemption of Fund shares. |
| | | | | | | | | | | | | | | | | | | | | | | | | | | | | | | | | | | | | | | | | | | | | |
| | | Actual | | Hypothetical10 |
| | | | | | | Including
Interest Expense
and Fees | | Excluding
Interest Expense
and Fees | | | | Including
Interest Expense
and Fees | | Excluding
Interest Expense
and Fees |
| | | Beginning
Account Value
January 1, 2016 | | Ending Account Value
June 30, 2016 | | Expenses Paid During the Period8 | | Expenses
Paid During the Period9 | | Beginning
Account Value
January 1, 2016 | | Ending Account Value
June 30, 2016 | | Expenses Paid During the Period8 | | Ending Account Value
June 30, 2016 | | Expenses Paid During the Period9 |
Class I | | | $ | 1,000.00 | | | | $ | 1,049.60 | | | | $ | 3.11 | | | | $ | 3.01 | | | | $ | 1,000.00 | | | | $ | 1,021.83 | | | | $ | 3.07 | | | | $ | 1,021.93 | | | | $ | 2.97 | |
Class III | | | $ | 1,000.00 | | | | $ | 1,048.50 | | | | $ | 4.58 | | | | $ | 4.48 | | | | $ | 1,000.00 | | | | $ | 1,020.39 | | | | $ | 4.52 | | | | $ | 1,020.49 | | | | $ | 4.42 | |
| | 8 | | For each class of the Fund, expenses are equal to the annualized expense ratio for the class (0.61% for Class I and 0.90% for Class III), multiplied by the average account value over the period, multiplied by 182/366 (to reflect the one-half year period shown). |
| | 9 | | For each class of the Fund, expenses are equal to the annualized expense ratio for the class (0.59% for Class I and 0.88% for Class III), multiplied by the average account value over the period, multiplied by 182/366 (to reflect the one-half year period shown). |
| | 10 | | Hypothetical 5% annual return before expenses is calculated by prorating the number of days in the most recent fiscal half year divided by 366. |
| | | | See “Disclosure of Expenses” on the following page for further information on how expenses were calculated. |
| | | | | | |
| | | BLACKROCK VARIABLE SERIES FUNDS, INC. | | JUNE 30, 2016 | | 3 |
| | | | |
| Disclosure of Expenses | | | BlackRock Total Return V.I. Fund | |
Shareholders of the Fund may incur the following charges: (a) transactional expenses, such as sales charges; and (b) operating expenses, including investment advisory fees, service and distribution fees, including 12b-1 fees, acquired fund fees and expenses, and other fund expenses. The expense example on the previous page (which is based on a hypothetical investment of $1,000 invested on January 1, 2016 and held through June 30, 2016) is intended to assist shareholders both in calculating expenses based on an investment in the Fund and in comparing these expenses with similar costs of investing in other mutual funds.
The expense example provides information about actual account values and actual expenses. In order to estimate the expenses a shareholder paid during the period covered by this report, shareholders can divide their account value by $1,000 and then multiply the result by the number corresponding to their share class under the heading entitled “Expenses Paid During the Period.”
The expense example also provides information about hypothetical account values and hypothetical expenses based on the Fund’s actual expense ratio and an assumed rate of return of 5% per year before expenses. In order to assist shareholders in comparing the ongoing expenses of investing in the Fund and other funds, compare the 5% hypothetical example with the 5% hypothetical examples that appear in shareholder reports of other funds.
The expenses shown in the expense example are intended to highlight shareholders’ ongoing costs only and do not reflect any transactional expenses, such as sales charges, if any. Therefore, the hypothetical example is useful in comparing ongoing expenses only, and will not help shareholders determine the relative total expenses of owning different funds. If these transactional expenses were included, shareholder expenses would have been higher.
| | | | |
| The Benefits and Risks of Leveraging | | | | |
The Fund may utilize leverage to seek to enhance returns and net asset value (“NAV”). However, these objectives cannot be achieved in all interest rate environments.
The Fund may utilize leverage by entering into reverse repurchase agreements. In general, the concept of leveraging is based on the premise that the financing cost of leverage, which is based on short-term interest rates, is normally lower than the income earned by the Fund on its longer-term portfolio investments purchased with the proceeds from leverage. To the extent that the total assets of the Fund (including the assets obtained from leverage) are invested in higher-yielding portfolio investments, the Fund’s shareholders benefit from the incremental net income.
The interest earned on securities purchased with the proceeds from leverage is distributed to the Fund’s shareholders, and the value of these portfolio holdings is reflected in the Fund’s per share NAV. However, in order to benefit shareholders, the return on assets purchased with leverage proceeds must exceed the ongoing costs associated with the leverage. If interest and other ongoing costs of leverage exceed the Fund’s return on assets purchased with leverage proceeds, income to shareholders is lower than if the Fund had not used leverage.
Furthermore, the value of the Fund’s portfolio investments generally varies inversely with the direction of long-term interest rates, although other factors can also influence the value of portfolio investments. As a result, changes in interest rates can influence the Fund’s NAV positively or negatively in addition to the impact on the Fund’s performance from leverage. Changes in the direction of interest rates are difficult to predict accurately, and there is no assurance that the Fund’s leveraging strategy will be successful.
The use of leverage also generally causes greater changes in the Fund’s NAV and dividend rates than comparable portfolios without leverage. In a declining market, leverage is likely to cause a greater decline in the NAV of the Fund’s shares than if the Fund were not leveraged. In addition, the Fund may be required to sell portfolio securities at inopportune times or at distressed values in order to comply with regulatory requirements applicable to the use of leverage or as required by the terms of the leverage instruments, which may cause the Fund to incur losses. The use of leverage may limit the Fund’s ability to invest in certain types of securities or use certain types of hedging strategies. The Fund incurs expenses in connection with the use of leverage, all of which are borne by the Fund’s shareholders and may reduce income.
| | | | |
| Derivative Financial Instruments | | | | |
The Fund may invest in various derivative financial instruments. These instruments are used to obtain exposure to a security, commodity, index, market, and/or other asset without owning or taking physical custody of securities, commodities and/or other referenced assets or to manage market, equity, credit, interest rate, foreign currency exchange rate, commodity and/or other risks. Derivative financial instruments may give rise to a form of economic leverage and involve risks, including the imperfect correlation between the value of a derivative financial instrument and the underlying asset, possible default of the counterparty to the
transaction or illiquidity of the instrument. The Fund’s successful use of a derivative financial instrument depends on the investment adviser’s ability to predict pertinent market movements accurately, which cannot be assured. The use of these instruments may result in losses greater than if they had not been used, may limit the amount of appreciation the Fund can realize on an investment and/or may result in lower distributions paid to shareholders. The Fund’s investments in these instruments, if any, are discussed in detail in the Notes to Financial Statements.
| | | | | | |
| 4 | | BLACKROCK VARIABLE SERIES FUNDS, INC. | | JUNE 30, 2016 | | |
| | | | |
| Schedule of Investments June 30, 2016 (Unaudited) | | | BlackRock Total Return V.I. Fund | |
| | | (Percentages shown are based on Net Assets) | |
| | | | | | | | | | | | |
| Asset-Backed Securities | | | | | Par (000) | | | Value | |
ACAS CLO Ltd., Series 2012-1A, Class BR,
2.97%, 9/20/23 (a)(b) | | | USD | | | | 250 | | | $ | 249,786 | |
ACE Securities Corp. Home Equity Loan Trust, Series 2003-OP1, Class A2, 1.17%, 12/25/33 (b) | | | | | | | 122 | | | | 100,605 | |
ALM V Ltd., Series 2012-5A, Class A2R,
2.78%, 10/18/27 (a)(b) | | | | | | | 250 | | | | 248,753 | |
ALM XIV Ltd., Series 2014-14A, Class A1,
2.06%, 7/28/26 (a)(b) | | | | | | | 1,250 | | | | 1,244,391 | |
AMMC CLO IX Ltd., Series 2011-9A, Class B1R,
3.13%, 1/15/22 (a)(b) | | | | | | | 290 | | | | 290,000 | |
AMMC CLO XII Ltd., Series 2013-12A, Class B,
2.53%, 5/10/25 (a)(b) | | | | | | | 500 | | | | 492,171 | |
Anchorage Capital CLO Ltd., Series 2013-1A, Class A2A, 2.38%, 7/13/25 (a)(b) | | | | | | | 250 | | | | 242,477 | |
Apidos CLO XII, Series 2013-12A, Class A,
1.73%, 4/15/25 (a)(b) | | | | | | | 500 | | | | 495,100 | |
Apidos CLO XV, Series 2013-15A, Class A1,
1.98%, 10/20/25 (a)(b) | | | | | | | 500 | | | | 495,305 | |
Argent Mortgage Loan Trust, Series 2005-W1, Class A2, 0.69%, 5/25/35 (b) | | | | | | | 73 | | | | 56,336 | |
Atlas Senior Loan Fund IV Ltd., Series 2013-2A, Class A1L, 2.13%, 2/17/26 (a)(b) | | | | | | | 250 | | | | 249,375 | |
B2R Mortgage Trust: | | | | | | | | | | | | |
Series 2015-1, Class A1, 2.52%, 5/15/48 (a) | | | | | | | 94 | | | | 95,045 | |
Series 2015-2, Class A, 3.34%, 11/15/48 (a) | | | | | | | 98 | | | | 101,472 | |
Babson CLO Ltd., Series 2013-IA, Class A,
1.73%, 4/20/25 (a)(b) | | | | | | | 250 | | | | 247,358 | |
BankAmerica Manufactured Housing Contract Trust, Series 1998-2, Class B1, 7.93%, 12/10/25 (b) | | | | | | | 300 | | | | 287,250 | |
Battalion CLO IV Ltd., Series 2013-4A, Class A1, 2.04%, 10/22/25 (a)(b) | | | | | | | 250 | | | | 247,947 | |
Bayview Financial Revolving Asset Trust: | | | | | | | | | | | | |
Series 2004-B, Class A1, 1.45%, 5/28/39 (a)(b) | | | | | | | 170 | | | | 124,057 | |
Series 2005-E, Class A1, 1.44%, 12/28/40 (a)(b) | | | | | | | 123 | | | | 90,307 | |
Bayview Opportunity Master Fund IIIA Trust, Series 2014-16RP, Class A, 3.84%, 11/28/29 (a)(c) | | | | | | | 49 | | | | 48,588 | |
BCMSC Trust: | | | | | | | | | | | | |
Series 2000-A, Class A2, 7.58%, 6/15/30 (b) | | | | | | | 40 | | | | 21,077 | |
Series 2000-A, Class A3, 7.83%, 6/15/30 (b) | | | | | | | 37 | | | | 20,207 | |
Series 2000-A, Class A4, 8.29%, 6/15/30 (b) | | | | | | | 64 | | | | 36,684 | |
| | | | | | | | | | | | |
| Asset-Backed Securities | | | | | Par (000) | | | Value | |
Bear Stearns Asset-Backed Securities I Trust: | | | | | | | | | | | | |
Series 2006-HE10, Class 22A, 0.59%, 12/25/36 (b) | | | USD | | | | 81 | | | $ | 67,358 | |
Series 2007-FS1, Class 1A3, 0.62%, 5/25/35 (b) | | | | | | | 86 | | | | 71,368 | |
Series 2007-HE2, Class 23A, 0.59%, 3/25/37 (b) | | | | | | | 70 | | | | 52,784 | |
Bear Stearns Asset-Backed Securities Trust, Series 2005-4, Class M2, 1.25%, 1/25/36 (b) | | | | | | | 30 | | | | 28,206 | |
Benefit Street Partners CLO Ltd., Series 2012-IA, Class A2R, 2.88%, 10/15/25 (a)(b) | | | | | | | 500 | | | | 499,350 | |
BlueMountain CLO Ltd.: | | | | | | | | | | | | |
Series 2013-2A, Class A, 1.84%, 1/22/25 (a)(b) | | | | | | | 250 | | | | 247,652 | |
Series 2013-3A, Class A, 2.04%, 10/29/25 (a)(b) | | | | | | | 250 | | | | 248,622 | |
Series 2013-4A, Class A, 2.13%, 4/15/25 (a)(b) | | | | | | | 250 | | | | 250,000 | |
Carlyle Global Market Strategies CLO Ltd., Series 2012-4A, Class A, 2.02%, 1/20/25 (a)(b) | | | | | | | 300 | | | | 299,368 | |
Carrington Mortgage Loan Trust: Series 2006-FRE2, Class A2, 0.57%, 10/25/36 (b) | | | | | | | 93 | | | | 53,242 | |
Series 2006-FRE2, Class A3, 0.61%, 10/25/36 (b) | | | | | | | 209 | | | | 131,873 | |
Series 2006-FRE2, Class A5, 0.53%, 10/25/36 (b) | | | | | | | 31 | | | | 17,841 | |
Series 2006-NC2, Class A3, 0.60%, 6/25/36 (b) | | | | | | | 500 | | | | 427,181 | |
Series 2007-HE1, Class A2, 0.60%, 6/25/37 (b) | | | | | | | 655 | | | | 594,034 | |
Series 2007-RFC1, Class A4, 0.67%, 12/25/36 (b) | | | | | | | 100 | | | | 54,611 | |
C-BASS Trust: | | | | | | | | | | | | |
Series 2006-CB9, Class A2, 0.56%, 11/25/36 (b) | | | | | | | 41 | | | | 24,758 | |
Series 2006-CB9, Class A4, 0.68%, 11/25/36 (b) | | | | | | | 19 | | | | 11,462 | |
Series 2007-CB1, Class AF2, 3.93%, 1/25/37 (c) | | | | | | | 199 | | | | 95,819 | |
CHLUPA Trust, Series 2013-VM, Class A, 3.33%, 8/15/20 (a) | | | | | | | 54 | | | | 54,237 | |
CIFC Funding Ltd.: | | | | | | | | | | | | |
Series 2011-1AR, Class A1R, 1.93%, 1/19/23 (a)(b) | | | | | | | 66 | | | | 66,218 | |
Series 2014-2A, Class A1L, 2.14%, 5/24/26 (a)(b) | | | | | | | 250 | | | | 248,128 | |
| | | | | | | | | | |
| Portfolio Abbreviations |
| AGM | | Assurance Guaranty Municipal Corp. | | COP | | Colombian Peso | | MXIBTIIE | | Mexican Equilibrium Interbank Interest Rate |
| AMBAC | | AMBAC Assurance Corp. | | EUR | | Euro | | OTC | | Over-the-counter |
| AUD | | Australian Dollar | | GBP | | British Pound | | PLN | | Polish Zloty |
| BRL | | Brazilian Real | | GO | | General Obligation | | RB | | Revenue Bonds |
| BZDIOVER | | Overnight Brazil CETIP Interbank Rate | | IDR | | Indonesian Rupiah | | RUB | | Russian Ruble |
| CDO | | Collateralized Debt Obligation | | JPY | | Japanese Yen | | TBA | | To-be-announced |
| CLO | | Collateralized Loan Obligation | | KRW | | South Korean Won | | TRY | | Turkish Lira |
| CNH | | Chinese Yuan Offshore | | LIBOR | | London Interbank Offered Rate | | USD | | U.S. Dollar |
| CNY | | Chinese Yuan | | MXN | | Mexican Peso | | | | |
See Notes to Financial Statements.
| | | | | | |
| | | BLACKROCK VARIABLE SERIES FUNDS, INC. | | JUNE 30, 2016 | | 5 |
| | | | |
| Schedule of Investments (continued) | | | BlackRock Total Return V.I. Fund | |
| | | | |
| | | | | | | | | | | | |
| Asset-Backed Securities | | | | | Par (000) | | | Value | |
Citigroup Mortgage Loan Trust, Series 2006-NC1, Class A2D, 0.70%, 8/25/36 (b) | | | USD | | | | 100 | | | $ | 73,848 | |
Colony American Homes, Series 2015-1A, Class A, 1.65%, 7/17/32 (a)(b) | | | | | | | 100 | | | | 98,940 | |
Conseco Finance Securitizations Corp., Series 2000-4, Class A6, 8.31%, 5/01/32 (b) | | | | | | | 157 | | | | 95,361 | |
Conseco Financial Corp.: | | | | | | | | | | | | |
Series 1997-3, Class M1, 7.53%, 3/15/28 (b) | | | | | | | 65 | | | | 63,905 | |
Series 1999-5, Class A5, 7.86%, 3/01/30 (b) | | | | | | | 55 | | | | 46,493 | |
Series 1999-5, Class A6, 7.50%, 3/01/30 (b) | | | | | | | 39 | | | | 32,422 | |
Countrywide Asset-Backed Certificates: | | | | | | | | | | | | |
Series 2003-BC3, Class A2, 1.07%, 9/25/33 (b) | | | | | | | 127 | | | | 118,213 | |
Series 2004-5, Class A, 1.35%, 10/25/34 (b) | | | | | | | 143 | | | | 140,587 | |
Series 2006-S10, Class A3, 0.77%, 10/25/36 (b) | | | | | | | 80 | | | | 67,800 | |
Series 2006-SPS1, Class A, 0.67%, 12/25/25 (b) | | | | | | | 4 | | | | 3,911 | |
Series 2007-S3, Class A3, 0.83%, 5/25/37 (b) | | | | | | | 108 | | | | 81,654 | |
Credit-Based Asset Servicing & Securitization LLC: | | | | | | | | | | | | |
Series 2006-SL1, Class A2, 6.06%, 9/25/36 (a)(c) | | | | | | | 97 | | | | 27,085 | |
Series 2007-CB6, Class A4, 0.79%, 7/25/37 (a)(b) | | | | | | | 75 | | | | 46,130 | |
Series 2007-RP1, Class A, 0.76%, 5/25/46 (a)(b) | | | | | | | 54 | | | | 43,187 | |
CT CDO IV Ltd., Series 2006-4A, Class A1, 0.76%, 10/20/43 (a)(b) | | | | | | | 2 | | | | 2,069 | |
CWABS Revolving Home Equity Loan Trust, Series 2004-U, Class 2A, 0.71%, 3/15/34 (b) | | | | | | | 61 | | | | 47,268 | |
CWHEQ Home Equity Loan Trust: | | | | | | | | | | | | |
Series 2006-S5, Class A4, 5.84%, 6/25/35 | | | | | | | 21 | | | | 20,917 | |
Series 2006-S5, Class A5, 6.16%, 6/25/35 | | | | | | | 18 | | | | 16,251 | |
Series 2007-S1, Class A3, 5.81%, 11/25/36 (b) | | | | | | | 102 | | | | 101,389 | |
CWHEQ Revolving Home Equity Loan Resecuritization Trust, Series 2006-RES, Class 4Q1B, 0.73%, 12/15/33 (a)(b) | | | | | | | 37 | | | | 30,479 | |
CWHEQ Revolving Home Equity Loan Resuritization Trust, Series 2006-RES, Class 5B1B, 0.62%, 5/15/35 (a)(b) | | | | | | | 26 | | | | 21,606 | |
CWHEQ Revolving Home Equity Loan Trust, Series 2005-B, Class 2A, 0.62%, 5/15/35 (b) | | | | | | | 48 | | | | 39,970 | |
DCP Rights LLC, Series 2014-1A, Class A, 5.46%, 10/25/44 (a) | | | | | | | 221 | | | | 220,095 | |
Dryden XXV Senior Loan Fund, Series 2012-25A, Class A, 2.01%, 1/15/25 (a)(b) | | | | | | | 260 | | | | 259,039 | |
Eastland CLO Ltd., Series 2007-1A, Class A2A, 0.87%, 5/01/22 (a)(b) | | | | | | | 292 | | | | 289,489 | |
First Franklin Mortgage Loan Trust, Series 2006-FF5, Class 2A3, 0.61%, 4/25/36 (b) | | | | | | | 48 | | | | 41,542 | |
Flatiron CLO Ltd., Series 2011-1A, Class A, 2.18%, 1/15/23 (a)(b) | | | | | | | 274 | | | | 274,163 | |
GFT Mortgage Loan Trust, Series 2015-GFT2, Class A, 4.34%, 6/25/59 (a)(c) | | | | | | | 115 | | | | 115,087 | |
| | | | | | | | | | | | |
| Asset-Backed Securities | | | | | Par
(000) | | | Value | |
GMACM Home Equity Loan Trust, Series 2006-HE4, Class A2, 0.63%, 12/25/36 (b) | | | USD | | | | 192 | | | $ | 170,116 | |
GSAA Trust, Series 2007-2, Class AF3, 5.92%, 3/25/37 (b) | | | | | | | 33 | | | | 14,181 | |
GSAMP Trust: | | | | | | | | | | | | |
Series 2006-FM2, Class A2B, 0.57%, 9/25/36 (b) | | | | | | | 91 | | | | 40,811 | |
Series 2007-H1, Class A1B, 0.65%, 1/25/47 (b) | | | | | | | 36 | | | | 22,724 | |
GT Loan Financing I Ltd., Series 2013-1A, Class A, 1.90%, 10/28/24 (a)(b) | | | | | | | 250 | | | | 247,559 | |
Highbridge Loan Management Ltd.: | | | | | | | | | | | | |
Series 2012-1AR, Class A2R, 2.90%, 9/20/22 (a)(b) | | | | | | | 250 | | | | 250,346 | |
Series 6A-2015, Class A, 2.08%, 5/05/27 (a)(b) | | | | | | | 250 | | | | 247,815 | |
Home Equity Mortgage Loan Asset-Backed Trust, Series 2004-A, Class M2, 2.46%, 7/25/34 (b) | | | | | | | 36 | | | | 33,940 | |
Home Equity Mortgage Trust, Series 2006-2, Class 1A1, 5.87%, 7/25/36 (c) | | | | | | | 95 | | | | 40,501 | |
Home Loan Mortgage Loan Trust, Series 2005-1, Class A3, 0.80%, 4/15/36 (b) | | | | | | | 39 | | | | 34,934 | |
Invitation Homes Trust: | | | | | | | | | | | | |
Series 2014-SFR1, Class A, 1.45%, 6/17/31 (a)(b) | | | | | | | 98 | | | | 96,214 | |
Series 2014-SFR3, Class A, 1.65%, 12/17/31 (a)(b) | | | | | | | 100 | | | | 99,087 | |
Series 2015-SFR3, Class A, 1.75%, 8/17/32 (a)(b) | | | | | | | 99 | | | | 98,098 | |
JPMorgan Mortgage Acquisition Trust: | | | | | | | | | | | | |
Series 2006-WF1, Class A3A, 5.83%, 7/25/36 (c) | | | | | | | 318 | | | | 172,695 | |
Series 2006-WF1, Class A5, 6.41%, 7/25/36 (c) | | | | | | | 70 | | | | 37,909 | |
Series 2006-WF1, Class A6, 6.00%, 7/25/36 (c) | | | | | | | 64 | | | | 34,555 | |
LCM XI LP, Series 11A, Class B, 2.78%, 4/19/22 (a)(b) | | | | | | | 250 | | | | 250,003 | |
Lehman ABS Manufactured Housing Contract Trust: | | | | | | | | | | | | |
Series 2001-B, Class M1, 6.63%, 4/15/40 (b) | | | | | | | 90 | | | | 96,410 | |
Series 2001-B, Class M2, 7.17%, 4/15/40 (b) | | | | | | | 276 | | | | 188,766 | |
Litigation Fee Residual Funding LLC, Series 2015-1, Class A, 4.00%, 10/01/27 (a) | | | | | | | 124 | | | | 122,907 | |
Long Beach Mortgage Loan Trust: | | | | | | | | | | | | |
Series 2006-10, Class 2A3, 0.61%, 11/25/36 (b) | | | | | | | 104 | | | | 43,127 | |
Series 2006-10, Class 2A4, 0.67%, 11/25/36 (b) | | | | | | | 78 | | | | 32,743 | |
Series 2006-2, Class 2A3, 0.64%, 3/25/46 (b) | | | | | | | 754 | | | | 321,579 | |
Series 2006-2, Class 2A4, 0.74%, 3/25/46 (b) | | | | | | | 64 | | | | 28,274 | |
Series 2006-3, Class 2A3, 0.63%, 5/25/46 (b) | | | | | | | 273 | | | | 95,149 | |
Series 2006-4, Class 2A4, 0.71%, 5/25/36 (b) | | | | | | | 67 | | | | 28,167 | |
Series 2006-7, Class 2A2, 0.56%, 8/25/36 (b) | | | | | | | 67 | | | | 32,010 | |
Series 2006-9, Class 2A3, 0.61%, 10/25/36 (b) | | | | | | | 126 | | | | 51,533 | |
Series 2006-9, Class 2A4, 0.68%, 10/25/36 (b) | | | | | | | 148 | | | | 61,650 | |
Madison Avenue Manufactured Housing Contract Trust, Series 2002-A, Class B2, 3.70%, 3/25/32 (b) | | | | | | | 40 | | |
| 39,325
|
|
See Notes to Financial Statements.
| | | | | | |
| 6 | | BLACKROCK VARIABLE SERIES FUNDS, INC. | | JUNE 30, 2016 | | |
| | | | |
| Schedule of Investments (continued) | | | BlackRock Total Return V.I. Fund | |
| | | | |
| | | | | | | | | | | | |
| Asset-Backed Securities | | | | | Par (000) | | | Value | |
Madison Park Funding X Ltd., Series 2012-10A, Class B1, 2.98%, 1/20/25 (a)(b) | | | USD | | | | 250 | | | $ | 250,586 | |
MASTR Specialized Loan Trust, Series 2006-3, Class A, 0.71%, 6/25/46 (a)(b) | | | | | | | 24 | | | | 20,190 | |
Merrill Lynch Mortgage Investors Trust, Series 2006-RM3, Class A2B, 0.54%, 6/25/37 (b) | | | | | | | 30 | | | | 8,482 | |
Morgan Stanley ABS Capital I, Inc., Trust, Series 2005-HE1, Class A2MZ, 1.05%, 12/25/34 (b) | | | | | | | 155 | | | | 139,993 | |
Morgan Stanley IXIS Real Estate Capital Trust, Series 2006-2, Class A2, 0.56%, 11/25/36 (b) | | | | | | | 39 | | | | 16,995 | |
Mountain Hawk I CLO Ltd., Series 2013-1A, Class B1, 2.81%, 1/20/24 (a)(b) | | | | | | | 250 | | | | 240,156 | |
Navient Private Education Loan Trust: | | | | | | | | | | | | |
Series 2014-AA, Class A2B, 1.44%, 2/15/29 (a)(b) | | | | | | | 670 | | | | 664,770 | |
Series 2014-CTA, Class B, 2.19%, 10/17/44 (a)(b) | | | | | | | 200 | | | | 183,710 | |
Series 2015-AA, Class A3, 2.14%, 11/15/30 (a)(b) | | | | | | | 203 | | | | 201,073 | |
Series 2016-AA, Class A2B, 2.59%, 12/15/45 (a)(b) | | | | | | | 110 | | | | 110,562 | |
Series 2016-AA, Class B, 3.50%, 12/16/58 (a) | | | | | | | 100 | | | | 84,737 | |
NextGear Floorplan Master Owner Trust, Series 2015-1A, Class B, 2.18%, 7/15/19 (a)(b) | | | | | | | 100 | | | | 99,115 | |
Northwoods Capital IX Ltd., Series 2012-9A, Class A, 2.05%, 1/18/24 (a)(b) | | | | | | | 260 | | | | 259,408 | |
Oakwood Mortgage Investors, Inc.: | | | | | | | | | | | | |
Series 2001-D, Class A2, 5.26%, 1/15/19 (b) | | | | | | | 30 | | | | 22,262 | |
Series 2001-D, Class A4, 6.93%, 9/15/31 (b) | | | | | | | 17 | | | | 14,595 | |
Octagon Investment Partners XVI Ltd., Series 2013-1A, Class A, 1.75%, 7/17/25 (a)(b) | | | | | | | 260 | | | | 256,048 | |
OHA Credit Partners VII Ltd., Series 2012-7A, Class A, 2.06%, 11/20/23 (a)(b) | | | | | | | 250 | | | | 249,359 | |
OHA Loan Funding Ltd., Series 2013-2A, Class A, 1.92%, 8/23/24 (a)(b) | | | | | | | 225 | | | | 222,783 | |
OneMain Financial Issuance Trust: | | | | | | | | | | | | |
Series 2014-1A, Class A, 2.43%, 6/18/24 (a) | | | | | | | 160 | | | | 160,273 | |
Series 2014-1A, Class B, 3.24%, 6/18/24 (a) | | | | | | | 200 | | | | 200,171 | |
Series 2014-2A, Class B, 3.02%, 9/18/24 (a) | | | | | | | 100 | | | | 99,503 | |
Series 2014-2A, Class D, 5.31%, 9/18/24 (a) | | | | | | | 200 | | | | 197,906 | |
Option One Mortgage Acceptance Corp. Asset-Backed Certificates, Series 2003-4, Class A2, 1.09%, 7/25/33 (b) | | | | | | | 222 | | | | 205,746 | |
OZLM Funding IV Ltd., Series 2013-4A, Class A1, 1.79%, 7/22/25 (a)(b) | | | | | | | 390 | | | | 386,373 | |
OZLM Funding Ltd., Series 2012-2A, Class A1, 2.12%, 10/30/23 (a)(b) | | | | | | | 360 | | | | 359,525 | |
Palmer Square Loan Funding Ltd., Series 2016-2A, Class B, 3.79%, 6/21/24 (a)(b) | | | | | | | 250 | | | | 247,114 | |
Pretium Mortgage Credit Partners I LLC, Series 2016-NPL3, Class A1, 4.38%, 5/27/31 (a)(c) | | | | | | | 237 | | | | 237,252 | |
Race Point VIII CLO Ltd., Series 2013-8A, Class A, 1.87%, 2/20/25 (a)(b) | | | | | | | 250 | | | | 247,200 | |
Race Point X CLO Ltd., Series 2016-10A, Class A, 2.23%, 7/25/28 (a)(b) | | | | | | | 250 | | | | 250,000 | |
RASC Trust, Series 2003-KS5, Class AIIB, 1.03%, 7/25/33 (b) | | | | | | | 80 | | | | 70,341 | |
| | | | | | | | | | | | |
| Asset-Backed Securities | | | | | Par (000) | | | Value | |
RCO Mortgage LLC, Series 2015-NQM1, Class A, 3.94%, 11/25/45 (a)(b) | | | USD | | | | 56 | | | $ | 55,561 | |
RMAT LLC, Series 2015-RPL1, Class A1, 3.97%, 5/26/20 (a)(c) | | | | | | | 90 | | | | 89,750 | |
Santander Drive Auto Receivables Trust: | | | | | | | | | | | | |
Series 2014-S4, Class R, 1.43%, 4/16/19 (a) | | | | | | | 3 | | | | 3,444 | |
Series 2014-S5, Class R, 1.43%, 6/18/19 (a) | | | | | | | 1 | | | | 1,234 | |
Scholar Funding Trust, Series 2011-A, Class A, 1.53%, 10/28/43 (a)(b) | | | | | | | 127 | | | | 120,571 | |
SG Mortgage Securities Trust, Series 2006-OPT2, Class A3D, 0.66%, 10/25/36 (b) | | | | | | | 100 | | | | 60,621 | |
SLM Private Credit Student Loan Trust: | | | | | | | | | | | | |
Series 2004-B, Class A2, 0.85%, 6/15/21 (b) | | | | | | | 67 | | | | 66,833 | |
Series 2004-B, Class A3, 0.98%, 3/15/24 (b) | | | | | | | 450 | | | | 420,676 | |
Series 2006-C, Class A4, 0.82%, 3/15/23 (b) | | | | | | | 37 | | | | 36,875 | |
SLM Private Education Loan Trust: | | | | | | | | | | | | |
Series 2011-B, Class A3, 2.69%, 6/16/42 (a)(b) | | | | | | | 100 | | | | 102,720 | |
Series 2012-A, Class A1, 1.84%, 8/15/25 (a)(b) | | | | | | | 163 | | | | 162,999 | |
SMB Private Education Loan Trust: | | | | | | | | | | | | |
Series 2014-A, Class A1, 0.94%, 9/15/21 (a)(b) | | | | | | | 79 | | | | 79,372 | |
Series 2014-A, Class A3, 1.93%, 4/15/32 (a)(b) | | | | | | | 100 | | | | 96,567 | |
Series 2015-A, Class A3, 1.94%, 2/17/32 (a)(b) | | | | | | | 100 | | | | 98,431 | |
Series 2015-B, Class A3, 2.19%, 5/17/32 (a)(b) | | | | | | | 560 | | | | 561,403 | |
Series 2015-B, Class B, 3.50%, 12/17/40 (a) | | | | | | | 100 | | | | 98,403 | |
Series 2015-C, Class A3, 2.39%, 8/16/32 (a)(b) | | | | | | | 100 | | | | 101,696 | |
Series 2016-A, Class A2A, 2.70%, 5/15/31 (a) | | | | | | | 700 | | | | 709,598 | |
Series 2016-A, Class A2B, 1.94%, 5/15/31 (a)(b) | | | | | | | 170 | | | | 169,782 | |
Sound Point CLO XI Ltd., Series 2016-1A, Class A, 2.18%, 7/20/28 (a)(b) | | | | | | | 250 | | | | 249,625 | |
Structured Asset Securities Corp. Mortgage Pass-Through Certificates, Series 2004-23XS, Class 2A1, 0.75%, 1/25/35 (b) | | | | | | | 205 | | | | 187,999 | |
Sunset Mortgage Loan Co. LLC, Series 2014-NPL2, Class A, 3.72%, 11/16/44 (a)(c) | | | | | | | 32 | | | | 32,143 | |
SWAY Residential Trust, Series 2014-1, Class A, 1.75%, 1/17/32 (a)(b) | | | | | | | 193 | | | | 192,053 | |
Symphony CLO XII Ltd.: | | | | | | | | | | | | |
Series 2013-12A, Class A, 1.93%, 10/15/25 (a)(b) | | | | | | | 255 | | | | 252,846 | |
Series 2013-12A, Class C, 3.38%, 10/15/25 (a)(b) | | | | | | | 250 | | | | 239,165 | |
Symphony CLO XV Ltd., Series 2014-15A, Class B1, 2.83%, 10/17/26 (a)(b) | | | | | | | 250 | | | | 248,779 | |
Synchrony Credit Card Master Note Trust, Series 2016-2, Class A, 2.04%, 5/15/24 | | | | | | | 340 | | | | 346,320 | |
TICP CLO III Ltd., Series 2014-3A, Class A,
2.17%, 1/20/27 (a)(b) | | | | | | | 250 | | | | 248,421 | |
Tricon American Homes Trust, Series 2015-SFR1, Class A, 1.69%, 5/17/32 (a)(b) | | | | | | | 100 | | | | 98,138 | |
Venture XIX CLO Ltd., Series 2014-19A, Class A, 2.23%, 1/15/27 (a)(b) | | | | | | | 250 | | | | 249,025 | |
VOLT XLIV LLC, Series 2016-NPL4, Class A1, 4.25%, 4/25/46 (a)(c) | | | | | | | 98 | | | | 98,665 | |
See Notes to Financial Statements.
| | | | | | |
| | | BLACKROCK VARIABLE SERIES FUNDS, INC. | | JUNE 30, 2016 | | 7 |
| | | | |
| Schedule of Investments (continued) | | | BlackRock Total Return V.I. Fund | |
| | | | |
| | | | | | | | | | | | |
| Asset-Backed Securities | | | | | Par (000) | | | Value | |
VOLT XLVI LLC, Series 2016-NPL6, Class A1, 3.84%, 6/25/46 (a)(c) | | | USD | | | | 590 | | | $ | 590,000 | |
VOLT XLVII LLC, Series 2016-NPL7, Class A1, 3.75%, 6/25/46 (a)(c) | | | | | | | 670 | | | | 670,000 | |
Voya Investment Management CLO Ltd., Series 2013-2A, Class A1, 1.79%, 4/25/25 (a)(b) | | | | | | | 250 | | | | 247,228 | |
Wachovia Asset Securitization Issuance II LLC Trust, Series 2007-HE2A, Class A, 0.58%, 7/25/37 (a)(b) | | | | | | | 137 | | | | 116,172 | |
Washington Mutual Asset-Backed Certificates, Series 2006-HE4, Class 2A2, 0.63%, 9/25/36 (b) | | | | | | | 188 | | | | 87,804 | |
WVUE, Series 2015-1A, Class A, 4.50%, 9/25/20 (a)(c) | | | | | | | 69 | | | | 69,122 | |
Total Asset-Backed Securities — 9.0% | | | | | | | | | | | 27,446,700 | |
| | | | | | | | | | | | |
| Corporate Bonds | | | | | | | | | |
Aerospace & Defense — 0.3% | | | | | | | | | | | | |
BAE Systems Holdings, Inc.: | | | | | | | | | | | | |
2.85%, 12/15/20 (a) | | | | | | | 39 | | | | 39,851 | |
3.85%, 12/15/25 (a) | | | | | | | 25 | | | | 26,499 | |
4.75%, 10/07/44 (a) | | | | | | | 8 | | | | 8,728 | |
Boeing Co.: | | | | | | | | | | | | |
2.20%, 10/30/22 | | | | | | | 11 | | | | 11,293 | |
2.60%, 10/30/25 | | | | | | | 16 | | | | 16,661 | |
Lockheed Martin Corp.: | | | | | | | | | | | | |
3.10%, 1/15/23 | | | | | | | 16 | | | | 16,864 | |
3.55%, 1/15/26 | | | | | | | 44 | | | | 47,795 | |
3.60%, 3/01/35 | | | | | | | 68 | | | | 68,935 | |
4.50%, 5/15/36 | | | | | | | 18 | | | | 20,092 | |
4.07%, 12/15/42 | | | | | | | 94 | | | | 100,071 | |
4.70%, 5/15/46 | | | | | | | 50 | | | | 58,939 | |
Northrop Grumman Corp., 3.85%, 4/15/45 | | | | | | | 38 | | | | 39,559 | |
United Technologies Corp.: | | | | | | | | | | | | |
1.78%, 5/04/18 (c) | | | | | | | 284 | | | | 286,551 | |
4.15%, 5/15/45 | | | | | | | 58 | | | | 63,706 | |
| | | | | | | | | | | | |
| | | | | | | | | | | | 805,544 | |
Air Freight & Logistics — 0.2% | | | | | | | | | | | | |
FedEx Corp.: | | | | | | | | | | | | |
4.90%, 1/15/34 | | | | | | | 185 | | | | 209,984 | |
3.90%, 2/01/35 | | | | | | | 27 | | | | 27,447 | |
4.10%, 2/01/45 | | | | | | | 88 | | | | 89,474 | |
4.75%, 11/15/45 | | | | | | | 54 | | | | 60,178 | |
4.55%, 4/01/46 | | | | | | | 94 | | | | 101,999 | |
| | | | | | | | | | | | |
| | | | | | | | | | | | 489,082 | |
Airlines — 0.2% | | | | | | | | | | | | |
American Airlines Group, Inc., 4.63%, 3/01/20 (a) | | | | | | | 69 | | | | 65,895 | |
American Airlines Pass-Through Trust, Series 2015-1, Class A, 3.38%, 5/01/27 | | | | | | | 256 | | | | 257,394 | |
Southwest Airlines Co.: | | | | | | | | | | | | |
2.75%, 11/06/19 | | | | | | | 33 | | | | 34,115 | |
2.65%, 11/05/20 | | | | | | | 81 | | | | 83,605 | |
Turkish Airlines Pass-Through Trust, Series 2015-1, Class A, 4.20%, 9/15/28 (a) | | | | | | | 40 | | | | 39,248 | |
United Airlines Pass-Through Trust, Series 2014-1, Class B, 4.75%, 10/11/23 | | | | | | | 17 | | | | 17,373 | |
| | | | | | | | | | | | |
| | | | | | | | | | | | 497,630 | |
Auto Components — 0.1% | | | | | | | | | | | | |
BorgWarner, Inc., 3.38%, 3/15/25 | | | | | | | 67 | | | | 68,509 | |
Delphi Automotive PLC, 4.25%, 1/15/26 | | | | | | | 100 | | | | 109,284 | |
| | | | | | | | | | | | |
| | | | | | | | | | | | 177,793 | |
| | | | | | | | | | | | |
| Corporate Bonds | | | | | Par (000) | | | Value | |
Automobiles — 0.1% | | | | | | | | | | | | |
Daimler Finance North America LLC, 2.45%, 5/18/20 (a) | | | USD | | | | 150 | | | $ | 154,356 | |
Banks — 2.1% | | | | | | | | | | | | |
Bank of America Corp.: | | | | | | | | | | | | |
2.25%, 4/21/20 | | | | | | | 501 | | | | 503,801 | |
3.30%, 1/11/23 | | | | | | | 202 | | | | 207,888 | |
3.88%, 8/01/25 | | | | | | | 558 | | | | 591,933 | |
4.88%, 4/01/44 | | | | | | | 22 | | | | 25,071 | |
BB&T Corp., 2.45%, 1/15/20 | | | | | | | 96 | | | | 98,675 | |
Citigroup, Inc.: | | | | | | | | | | | | |
1.80%, 2/05/18 | | | | | | | 142 | | | | 142,582 | |
2.50%, 9/26/18 | | | | | | | 191 | | | | 194,786 | |
2.50%, 7/29/19 | | | | | | | 453 | | | | 461,439 | |
3.50%, 5/15/23 | | | | | | | 114 | | | | 116,339 | |
3.88%, 3/26/25 | | | | | | | 135 | | | | 136,365 | |
Cooperatieve Rabobank UA, 4.38%, 8/04/25 | | | | | | | 250 | | | | 261,132 | |
Fifth Third Bank, 2.25%, 6/14/21 | | | | | | | 216 | | | | 219,369 | |
JPMorgan Chase & Co.: | | | | | | | | | | | | |
1.35%, 2/15/17 | | | | | | | 225 | | | | 225,457 | |
2.20%, 10/22/19 | | | | | | | 71 | | | | 72,169 | |
2.75%, 6/23/20 | | | | | | | 42 | | | | 43,278 | |
2.55%, 10/29/20 | | | | | | | 205 | | | | 209,446 | |
3.88%, 9/10/24 | | | | | | | 261 | | | | 270,223 | |
3.90%, 7/15/25 | | | | | | | 196 | | | | 211,398 | |
3.20%, 6/15/26 | | | | | | | 465 | | | | 477,940 | |
4.25%, 10/01/27 | | | | | | | 95 | �� | | | 100,513 | |
U.S. Bancorp: | | | | | | | | | | | | |
2.95%, 7/15/22 | | | | | | | 190 | | | | 197,721 | |
3.10%, 4/27/26 | | | | | | | 136 | | | | 141,460 | |
Washington Mutual Bank, 0.00%, 5/01/09 (b)(d)(e) | | | | | | | 250 | | | | 52,500 | |
Wells Fargo & Co.: | | | | | | | | | | | | |
2.60%, 7/22/20 | | | | | | | 77 | | | | 79,134 | |
2.55%, 12/07/20 | | | | | | | 95 | | | | 97,768 | |
3.55%, 9/29/25 | | | | | | | 175 | | | | 186,505 | |
3.00%, 4/22/26 | | | | | | | 825 | | | | 840,965 | |
3.90%, 5/01/45 | | | | | | | 130 | | | | 136,451 | |
4.90%, 11/17/45 | | | | | | | 51 | | | | 55,809 | |
| | | | | | | | | | | | |
| | | | | | | | | | | | 6,358,117 | |
Beverages — 0.5% | | | | | | | | | | | | |
Anheuser-Busch InBev Finance, Inc.: | | | | | | | | | | | | |
2.65%, 2/01/21 | | | | | | | 316 | | | | 327,697 | |
3.30%, 2/01/23 | | | | | | | 185 | | | | 194,929 | |
3.65%, 2/01/26 | | | | | | | 412 | | | | 441,353 | |
4.70%, 2/01/36 | | | | | | | 75 | | | | 84,280 | |
4.90%, 2/01/46 | | | | | | | 110 | | | | 128,903 | |
Anheuser-Busch InBev Worldwide, Inc., 3.75%, 7/15/42 | | | | | | | 35 | | | | 35,020 | |
Molson Coors Brewing Co.: | | | | | | | | | | | | |
3.00%, 7/15/26 | | | | | | | 197 | | | | 196,806 | |
5.00%, 5/01/42 | | | | | | | 25 | | | | 28,019 | |
4.20%, 7/15/46 | | | | | | | 71 | | | | 71,304 | |
PepsiCo., Inc., 4.45%, 4/14/46 | | | | | | | 140 | | | | 163,377 | |
| | | | | | | | | | | | |
| | | | | | | | | | | | 1,671,688 | |
Biotechnology — 0.7% | | | | | | | | | | | | |
AbbVie, Inc.: | | | | | | | | | | | | |
2.50%, 5/14/20 | | | | | | | 439 | | | | 448,800 | |
2.90%, 11/06/22 | | | | | | | 106 | | | | 108,080 | |
4.50%, 5/14/35 | | | | | | | 38 | | | | 39,716 | |
Amgen, Inc.: | | | | | | | | | | | | |
2.13%, 5/01/20 | | | | | | | 107 | | | | 108,690 | |
4.40%, 5/01/45 | | | | | | | 88 | | | | 91,420 | |
4.66%, 6/15/51 (a) | | | | | | | 200 | | | | 208,963 | |
See Notes to Financial Statements.
| | | | | | |
| 8 | | BLACKROCK VARIABLE SERIES FUNDS, INC. | | JUNE 30, 2016 | | |
| | | | |
| Schedule of Investments (continued) | | | BlackRock Total Return V.I. Fund | |
| | | | |
| | | | | | | | | | | | |
| Corporate Bonds | | | | | Par (000) | | | Value | |
Biotechnology (continued) | | | | | | | | | | | | |
Biogen, Inc.: | | | | | | | | | | | | |
2.90%, 9/15/20 | | | USD | | | | 44 | | | $ | 45,855 | |
3.63%, 9/15/22 | | | | | | | 76 | | | | 80,675 | |
4.05%, 9/15/25 | | | | | | | 63 | | | | 67,816 | |
5.20%, 9/15/45 | | | | | | | 50 | | | | 56,227 | |
Celgene Corp.: | | | | | | | | | | | | |
2.25%, 5/15/19 | | | | | | | 81 | | | | 82,350 | |
3.25%, 8/15/22 | | | | | | | 82 | | | | 84,694 | |
Gilead Sciences, Inc.: | | | | | | | | | | | | |
2.35%, 2/01/20 | | | | | | | 20 | | | | 20,516 | |
3.65%, 3/01/26 | | | | | | | 74 | | | | 80,525 | |
4.60%, 9/01/35 | | | | | | | 27 | | | | 30,021 | |
4.80%, 4/01/44 | | | | | | | 328 | | | | 369,010 | |
4.50%, 2/01/45 | | | | | | | 105 | | | | 114,452 | |
4.75%, 3/01/46 | | | | | | | 75 | | | | 85,283 | |
| | | | | | | | | | | | |
| | | | | | | | | | | | 2,123,093 | |
Building Products — 0.0% | | | | | | | | | | | | |
Standard Industries, Inc., 6.00%, 10/15/25 (a) | | | | | | | 34 | | | | 35,530 | |
Capital Markets — 1.6% | | | | | | | | | | | | |
Bank of New York Mellon Corp.: | | | | | | | | | | | | |
2.10%, 1/15/19 | | | | | | | 176 | | | | 179,931 | |
2.05%, 5/03/21 | | | | | | | 946 | | | | 960,872 | |
Credit Suisse AG, 3.00%, 10/29/21 | | | | | | | 259 | | | | 265,293 | |
Credit Suisse Group Funding Guernsey Ltd., 2.75%, 3/26/20 | | | | | | | 250 | | | | 246,825 | |
Goldman Sachs Group, Inc.: | | | | | | | | | | | | |
2.63%, 1/31/19 | | | | | | | 263 | | | | 269,172 | |
2.00%, 4/25/19 | | | | | | | 68 | | | | 68,698 | |
2.60%, 4/23/20 | | | | | | | 138 | | | | 140,297 | |
2.75%, 9/15/20 | | | | | | | 65 | | | | 66,348 | |
2.63%, 4/25/21 | | | | | | | 143 | | | | 145,020 | |
3.50%, 1/23/25 | | | | | | | 73 | | | | 75,008 | |
3.75%, 5/22/25 | | | | | | | 452 | | | | 472,056 | |
4.80%, 7/08/44 | | | | | | | 45 | | | | 49,814 | |
4.75%, 10/21/45 | | | | | | | 98 | | | | 108,024 | |
Jefferies Group LLC, 6.50%, 1/20/43 | | | | | | | 30 | | | | 29,788 | |
Morgan Stanley: | | | | | | | | | | | | |
2.80%, 6/16/20 | | | | | | | 239 | | | | 244,881 | |
3.75%, 2/25/23 | | | | | | | 193 | | | | 204,421 | |
3.70%, 10/23/24 | | | | | | | 126 | | | | 131,843 | |
4.00%, 7/23/25 | | | | | | | 581 | | | | 622,128 | |
3.88%, 1/27/26 | | | | | | | 187 | | | | 198,517 | |
4.30%, 1/27/45 | | | | | | | 137 | | | | 144,199 | |
State Street Corp., 2.65%, 5/19/26 | | | | | | | 293 | | | | 298,973 | |
| | | | | | | | | | | | |
| | | | | | | | | | | | 4,922,108 | |
Chemicals — 0.2% | | | | | | | | | | | | |
Agrium, Inc., 4.13%, 3/15/35 | | | | | | | 46 | | | | 44,422 | |
CF Industries, Inc.: | | | | | | | | | | | | |
3.45%, 6/01/23 | | | | | | | 60 | | | | 59,946 | |
5.38%, 3/15/44 | | | | | | | 92 | | | | 86,761 | |
Dow Chemical Co.: | | | | | | | | | | | | |
4.38%, 11/15/42 | | | | | | | 23 | | | | 23,486 | |
4.63%, 10/01/44 | | | | | | | 39 | | | | 41,300 | |
Eastman Chemical Co., 4.80%, 9/01/42 | | | | | | | 59 | | | | 61,154 | |
Ecolab, Inc., 2.25%, 1/12/20 | | | | | | | 64 | | | | 65,150 | |
Monsanto Co., 3.60%, 7/15/42 | | | | | | | 56 | | | | 48,399 | |
Sherwin-Williams Co., 4.00%, 12/15/42 | | | | | | | 20 | | | | 19,959 | |
| | | | | | | | | | | | |
| | | | | | | | | | | | 450,577 | |
Commercial Services & Supplies — 0.1% | | | | | | | | | | | | |
Aviation Capital Group Corp., 2.88%, 9/17/18 (a) | | | | | | | 160 | | | | 158,400 | |
Republic Services, Inc., 3.20%, 3/15/25 | | | | | | | 121 | | | | 126,392 | |
| | | | | | | | | | | | |
| Corporate Bonds | | | | | Par (000) | | | Value | |
Commercial Services & Supplies (continued) | | | | | | | | | | | | |
Waste Management, Inc.: | | | | | | | | | | | | |
3.13%, 3/01/25 | | | USD | | | | 47 | | | $ | 49,143 | |
3.90%, 3/01/35 | | | | | | | 56 | | | | 58,681 | |
| | | | | | | | | | | | |
| | | | | | | | | | | | 392,616 | |
Communications Equipment — 0.1% | | | | | | | | | | | | |
Harris Corp.: | | | | | | | | | | | | |
2.70%, 4/27/20 | | | | | | | 28 | | | | 28,381 | |
4.85%, 4/27/35 | | | | | | | 100 | | | | 109,778 | |
5.05%, 4/27/45 | | | | | | | 40 | | | | 45,369 | |
Juniper Networks, Inc., 3.30%, 6/15/20 | | | | | | | 63 | | | | 64,958 | |
| | | | | | | | | | | | |
| | | | | | | | | | | | 248,486 | |
Consumer Finance — 2.0% | | | | | | | | | | | | |
American Express Credit Corp.: | | | | | | | | | | | | |
1.13%, 6/05/17 | | | | | | | 334 | | | | 333,954 | |
2.25%, 8/15/19 | | | | | | | 177 | | | | 180,685 | |
Capital One Financial Corp.: | | | | | | | | | | | | |
4.75%, 7/15/21 | | | | | | | 5 | | | | 5,566 | |
4.20%, 10/29/25 | | | | | | | 107 | | | | 110,000 | |
Capital One N.A., 2.95%, 7/23/21 | | | | | | | 513 | | | | 527,166 | |
Ford Motor Credit Co. LLC: | | | | | | | | | | | | |
1.72%, 12/06/17 | | | | | | | 690 | | | | 691,468 | |
2.15%, 1/09/18 | | | | | | | 200 | | | | 201,751 | |
2.02%, 5/03/19 | | | | | | | 1,240 | | | | 1,250,551 | |
3.34%, 3/18/21 | | | | | | | 359 | | | | 372,329 | |
4.25%, 9/20/22 | | | | | | | 200 | | | | 215,678 | |
General Motors Financial Co., Inc.: | | | | | | | | | | | | |
2.63%, 7/10/17 | | | | | | | 480 | | | | 484,437 | |
4.75%, 8/15/17 | | | | | | | 230 | | | | 237,322 | |
3.10%, 1/15/19 | | | | | | | 41 | | | | 41,884 | |
3.70%, 11/24/20 | | | | | | | 117 | | | | 120,207 | |
3.20%, 7/06/21 | | | | | | | 600 | | | | 600,955 | |
3.45%, 4/10/22 | | | | | | | 88 | | | | 87,938 | |
4.00%, 1/15/25 | | | | | | | 151 | | | | 152,783 | |
Synchrony Financial: | | | | | | | | | | | | |
2.60%, 1/15/19 | | | | | | | 94 | | | | 95,029 | |
2.70%, 2/03/20 | | | | | | | 48 | | | | 48,131 | |
4.50%, 7/23/25 | | | | | | | 105 | | | | 108,874 | |
Toyota Motor Credit Corp., 2.75%, 5/17/21 | | | | | | | 159 | | | | 166,671 | |
| | | | | | | | | | | | |
| | | | | | | | | | | | 6,033,379 | |
Containers & Packaging — 0.0% | | | | | | | | | | | | |
International Paper Co.: | | | | | | | | | | | | |
3.65%, 6/15/24 | | | | | | | 59 | | | | 62,390 | |
4.80%, 6/15/44 | | | | | | | 66 | | | | 67,099 | |
| | | | | | | | | | | | |
| | | | | | | | | | | | 129,489 | |
Diversified Consumer Services — 0.0% | | | | | | | | | | | | |
Wesleyan University, 4.78%, 7/01/16 | | | | | | | 79 | | | | 84,740 | |
Diversified Financial Services — 0.8% | | | | | | | | | | | | |
Berkshire Hathaway, Inc., 3.13%, 3/15/26 | | | | | | | 307 | | | | 321,903 | |
BP Capital Markets PLC, 2.24%, 5/10/19 | | | | | | | 459 | | | | 471,345 | |
GE Capital International Funding Co., 3.37%, 11/15/25 (a) | | | | | | | 319 | | | | 346,188 | |
General Electric Capital Corp.: | | | | | | | | | | | | |
3.15%, 9/07/22 | | | | | | | 153 | | | | 164,197 | |
3.10%, 1/09/23 | | | | | | | 201 | | | | 214,710 | |
Intercontinental Exchange, Inc.: | | | | | | | | | | | | |
2.75%, 12/01/20 | | | | | | | 58 | | | | 60,733 | |
3.75%, 12/01/25 | | | | | | | 37 | | | | 39,914 | |
Moody’s Corp., 4.50%, 9/01/22 | | | | | | | 54 | | | | 60,035 | |
See Notes to Financial Statements.
| | | | | | |
| | | BLACKROCK VARIABLE SERIES FUNDS, INC. | | JUNE 30, 2016 | | 9 |
| | | | |
| Schedule of Investments (continued) | | | BlackRock Total Return V.I. Fund | |
| | | | |
| | | | | | | | | | | | |
| Corporate Bonds | | | | | Par (000) | | | Value | |
Diversified Financial Services (continued) | |
Shell International Finance BV: | | | | | | | | | | | | |
2.13%, 5/11/20 | | | USD | | | | 455 | | | $ | 464,385 | |
4.13%, 5/11/35 | | | | | | | 291 | | | | 313,810 | |
3.63%, 8/21/42 | | | | | | | 44 | | | | 42,343 | |
Woodside Finance Ltd., 3.65%, 3/05/25 (a) | | | | | | | 16 | | | | 15,629 | |
| | | | | | | | | | | | |
| | | | | | | | | | | | 2,515,192 | |
Diversified Telecommunication Services — 1.3% | |
AT&T Inc.: | | | | | | | | | | | | |
2.38%, 11/27/18 | | | | | | | 69 | | | | 70,417 | |
2.30%, 3/11/19 | | | | | | | 91 | | | | 92,937 | |
2.45%, 6/30/20 | | | | | | | 184 | | | | 187,856 | |
4.60%, 2/15/21 | | | | | | | 451 | | | | 493,523 | |
3.88%, 8/15/21 | | | | | | | 123 | | | | 132,511 | |
3.00%, 6/30/22 | | | | | | | 682 | | | | 698,418 | |
3.40%, 5/15/25 | | | | | | | 365 | | | | 373,361 | |
6.38%, 3/01/41 | | | | | | | 43 | | | | 52,329 | |
4.30%, 12/15/42 | | | | | | | 104 | | | | 100,694 | |
4.75%, 5/15/46 | | | | | | | 45 | | | | 46,119 | |
Verizon Communications, Inc.: | | | | | | | | | | | | |
2.63%, 2/21/20 | | | | | | | 231 | | | | 239,054 | |
3.45%, 3/15/21 | | | | | | | 212 | | | | 227,143 | |
5.05%, 3/15/34 | | | | | | | 55 | | | | 61,044 | |
4.40%, 11/01/34 | | | | | | | 224 | | | | 230,977 | |
3.85%, 11/01/42 | | | | | | | 350 | | | | 329,161 | |
4.86%, 8/21/46 | | | | | | | 535 | | | | 584,802 | |
| | | | | | | | | | | | |
| | | | | | | | | | | | 3,920,346 | |
Electric Utilities — 1.3% | | | | | | | | | | | | |
Alabama Power Co., 2.80%, 4/01/25 | | | | | | | 21 | | | | 21,754 | |
Commonwealth Edison Co., 4.70%, 1/15/44 | | | | | | | 136 | | | | 163,657 | |
Duke Energy Carolinas LLC: | | | | | | | | | | | | |
4.25%, 12/15/41 | | | | | | | 180 | | | | 201,696 | |
3.75%, 6/01/45 | | | | | | | 100 | | | | 105,584 | |
Duke Energy Corp.: | | | | | | | | | | | | |
3.05%, 8/15/22 | | | | | | | 6 | | | | 6,235 | |
3.75%, 4/15/24 | | | | | | | 75 | | | | 80,534 | |
4.80%, 12/15/45 | | | | | | | 75 | | | | 86,834 | |
Duke Energy Florida LLC, 3.85%, 11/15/42 | | | | | | | 53 | | | | 56,006 | |
Emera U.S. Finance LP: | | | | | | | | | | | | |
2.15%, 6/15/19 (a) | | | | | | | 147 | | | | 148,710 | |
2.70%, 6/15/21 (a) | | | | | | | 222 | | | | 226,226 | |
3.55%, 6/15/26 (a) | | | | | | | 175 | | | | 179,067 | |
Entergy Arkansas, Inc., 3.70%, 6/01/24 | | | | | | | 172 | | | | 188,541 | |
Exelon Corp.: | | | | | | | | | | | | |
2.85%, 6/15/20 | | | | | | | 161 | | | | 166,082 | |
2.45%, 4/15/21 | | | | | | | 38 | | | | 38,535 | |
Florida Power & Light Co., 3.80%, 12/15/42 | | | | | | | 44 | | | | 47,359 | |
Northern States Power Co., 3.60%, 5/15/46 | | | | | | | 262 | | | | 275,481 | |
PacifiCorp: | | | | | | | | | | | | |
3.60%, 4/01/24 | | | | | | | 284 | | | | 311,947 | |
3.35%, 7/01/25 | | | | | | | 251 | | | | 271,375 | |
Progress Energy, Inc., 4.88%, 12/01/19 | | | | | | | 16 | | | | 17,616 | |
Public Service Co. of Colorado, 2.50%, 3/15/23 | | | | | | | 103 | | | | 105,130 | |
Puget Sound Energy, Inc., 4.30%, 5/20/45 | | | | | | | 133 | | | | 152,192 | |
Southern California Edison Co., 1.25%, 11/01/17 | | | | | | | 47 | | | | 47,229 | |
Southern Co., 3.25%, 7/01/26 | | | | | | | 818 | | | | 849,675 | |
Trans-Allegheny Interstate Line Co., 3.85%, 6/01/25 (a) | | | | | | | 161 | | | | 172,134 | |
| | | | | | | | | | | | |
| | | | | | | | | | | | 3,919,599 | |
Electrical Equipment — 0.0% | | | | | | | | | | | | |
Rockwell Automation, Inc., 2.88%, 3/01/25 | | | | | | | 78 | | | | 80,935 | |
| | | | | | | | | | | | |
| Corporate Bonds | | | | | Par (000) | | | Value | |
Energy Equipment & Services — 0.1% | |
Schlumberger Holdings Corp., 3.00%, 12/21/20 (a) | | | USD | | | | 164 | | | $ | 171,045 | |
Transocean, Inc., 6.80%, 3/15/38 | | | | | | | 16 | | | | 10,440 | |
| | | | | | | | | | | | |
| | | | | | | | | | | | 181,485 | |
Food & Staples Retailing — 0.2% | |
CVS Health Corp.: | | | | | | | | | | | | |
4.00%, 12/05/23 | | | | | | | 76 | | | | 84,045 | |
5.30%, 12/05/43 | | | | | | | 58 | | | | 72,403 | |
Sysco Corp., 4.50%, 4/01/46 | | | | | | | 46 | | | | 49,069 | |
Walgreens Boots Alliance, Inc.: | | | | | | | | | | | | |
4.80%, 11/18/44 | | | | | | | 387 | | | | 416,333 | |
4.65%, 6/01/46 | | | | | | | 8 | | | | 8,532 | |
Wal-Mart Stores, Inc.: | | | | | | | | | | | | |
2.55%, 4/11/23 | | | | | | | 58 | | | | 60,537 | |
4.00%, 4/11/43 | | | | | | | 35 | | | | 38,850 | |
| | | | | | | | | | | | |
| | | | | | | | | | | | 729,769 | |
Food Products — 0.1% | |
Kraft Heinz Foods Co.: | | | | | | | | | | | | |
3.00%, 6/01/26 (a) | | | | | | | 132 | | | | 133,079 | |
6.88%, 1/26/39 | | | | | | | 28 | | | | 38,234 | |
| | | | | | | | | | | | |
| | | | | | | | | | | | 171,313 | |
Health Care Equipment & Supplies — 0.7% | |
Abbott Laboratories, 2.55%, 3/15/22 | | | | | | | 205 | | | | 209,676 | |
Becton Dickinson and Co.: | | | | | | | | | | | | |
1.45%, 5/15/17 | | | | | | | 96 | | | | 96,249 | |
1.80%, 12/15/17 | | | | | | | 34 | | | | 34,278 | |
2.68%, 12/15/19 | | | | | | | 130 | | | | 133,709 | |
3.13%, 11/08/21 | | | | | | | 59 | | | | 61,905 | |
4.69%, 12/15/44 | | | | | | | 30 | | | | 33,797 | |
Boston Scientific Corp.: | | | | | | | | | | | | |
2.65%, 10/01/18 | | | | | | | 82 | | | | 83,819 | |
2.85%, 5/15/20 | | | | | | | 100 | | | | 103,594 | |
3.85%, 5/15/25 | | | | | | | 179 | | | | 189,338 | |
Medtronic, Inc.: | | | | | | | | | | | | |
2.50%, 3/15/20 | | | | | | | 67 | | | | 69,487 | |
3.13%, 3/15/22 | | | | | | | 63 | | | | 66,782 | |
3.63%, 3/15/24 | | | | | | | 345 | | | | 379,716 | |
4.63%, 3/15/44 | | | | | | | 190 | | | | 221,908 | |
4.63%, 3/15/45 | | | | | | | 93 | | | | 109,358 | |
St. Jude Medical, Inc.: | | | | | | | | | | | | |
2.80%, 9/15/20 | | | | | | | 75 | | | | 77,316 | |
3.88%, 9/15/25 | | | | | | | 25 | | | | 26,629 | |
Stryker Corp.: | | | | | | | | | | | | |
3.38%, 11/01/25 | | | | | | | 35 | | | | 36,729 | |
3.50%, 3/15/26 | | | | | | | 80 | | | | 84,870 | |
4.63%, 3/15/46 | | | | | | | 69 | | | | 77,524 | |
Zimmer Biomet Holdings, Inc.: | | | | | | | | | | | | |
3.55%, 4/01/25 | | | | | | | 41 | | | | 42,259 | |
4.25%, 8/15/35 | | | | | | | 89 | | | | 89,219 | |
| | | | | | | | | | | | |
| | | | | | | | | | | | 2,228,162 | |
Health Care Providers & Services — 1.0% | | | | | | | | | | | | |
Aetna, Inc.: | | | | | | | | | | | | |
2.40%, 6/15/21 | | | | | | | 268 | | | | 273,436 | |
3.20%, 6/15/26 | | | | | | | 467 | | | | 480,461 | |
4.50%, 5/15/42 | | | | | | | 88 | | | | 93,158 | |
4.13%, 11/07/42 | | | | | | | 32 | | | | 32,381 | |
AmerisourceBergen Corp.: | | | | | | | | | | | | |
1.15%, 5/15/17 | | | | | | | 109 | | | | 108,972 | |
3.25%, 3/01/25 | | | | | | | 21 | | | | 22,028 | |
4.25%, 3/01/45 | | | | | | | 21 | | | | 22,189 | |
See Notes to Financial Statements.
| | | | | | |
| 10 | | BLACKROCK VARIABLE SERIES FUNDS, INC. | | JUNE 30, 2016 | | |
| | | | |
| Schedule of Investments (continued) | | | BlackRock Total Return V.I. Fund | |
| | | | |
| | | | | | | | | | | | |
| Corporate Bonds | | | | | Par (000) | | | Value | |
Health Care Providers & Services (continued) | | | | | | | | | | | | |
Anthem, Inc.: | | | | | | | | | | | | |
1.88%, 1/15/18 | | | USD | | | | 276 | | | $ | 277,562 | |
2.30%, 7/15/18 | | | | | | | 457 | | | | 463,574 | |
Series A, 3.70%, 8/15/21 | | | | | | | 161 | | | | 172,107 | |
3.30%, 1/15/23 | | | | | | | 172 | | | | 177,663 | |
4.65%, 8/15/44 | | | | | | | 50 | | | | 53,247 | |
Baylor Scott & White Holdings, 4.19%, 11/15/45 | | | | | | | 40 | | | | 44,600 | |
Catholic Health Initiatives, 4.35%, 11/01/42 | | | | | | | 30 | | | | 30,264 | |
Cigna Corp., 3.25%, 4/15/25 | | | | | | | 181 | | | | 183,840 | |
Dignity Health, 5.27%, 11/01/64 | | | | | | | 45 | | | | 53,623 | |
Express Scripts Holding Co.: | | | | | | | | | | | | |
1.25%, 6/02/17 | | | | | | | 79 | | | | 78,945 | |
3.90%, 2/15/22 | | | | | | | 63 | | | | 67,516 | |
Laboratory Corp. of America Holdings, 2.63%, 2/01/20 | | | | | | | 63 | | | | 64,348 | |
New York & Presbyterian Hospital, 3.56%, 8/01/36 | | | | | | | 40 | | | | 42,105 | |
Ochsner Clinic Foundation, 5.90%, 5/15/45 | | | | | | | 35 | | | | 44,214 | |
Southern Baptist Hospital of Florida, Inc., 4.86%, 7/15/45 | | | | | | | 35 | | | | 42,718 | |
UnitedHealth Group, Inc.: | | | | | | | | | | | | |
2.70%, 7/15/20 | | | | | | | 46 | | | | 47,910 | |
2.88%, 12/15/21 | | | | | | | 85 | | | | 89,527 | |
3.35%, 7/15/22 | | | | | | | 45 | | | | 48,142 | |
4.63%, 7/15/35 | | | | | | | 16 | | | | 18,582 | |
3.95%, 10/15/42 | | | | | | | 133 | | | | 139,151 | |
| | | | | | | | | | | | |
| | | | | | | | | | | | 3,172,263 | |
Hotels, Restaurants & Leisure — 0.1% | | | | | | | | | | | | |
McDonald’s Corp.: | | | | | | | | | | | | |
2.75%, 12/09/20 | | | | | | | 34 | | | | 35,496 | |
3.70%, 1/30/26 | | | | | | | 32 | | | | 34,574 | |
4.70%, 12/09/35 | | | | | | | 25 | | | | 28,201 | |
4.60%, 5/26/45 | | | | | | | 25 | | | | 27,903 | |
4.88%, 12/09/45 | | | | | | | 27 | | | | 31,571 | |
| | | | | | | | | | | | |
| | | | | | | | | | | | 157,745 | |
Household Durables — 0.1% | | | | | | | | | | | | |
Newell Brands, Inc.: | | | | | | | | | | | | |
2.88%, 12/01/19 | | | | | | | 164 | | | | 168,541 | |
4.20%, 4/01/26 | | | | | | | 119 | | | | 129,002 | |
| | | | | | | | | | | | |
| | | | | | | | | | | | 297,543 | |
Household Products — 0.1% | | | | | | | | | | | | |
Kimberly-Clark Corp.: | | | | | | | | | | | | |
1.90%, 5/22/19 | | | | | | | 185 | | | | 189,786 | |
2.65%, 3/01/25 | | | | | | | 35 | | | | 36,783 | |
2.75%, 2/15/26 | | | | | | | 67 | | | | 70,334 | |
| | | | | | | | | | | | |
| | | | | | | | | | | | 296,903 | |
Industrial Conglomerates — 0.3% | | | | | | | | | | | | |
Eaton Corp., 2.75%, 11/02/22 | | | | | | | 437 | | | | 448,000 | |
General Electric Co., 4.50%, 3/11/44 | | | | | | | 305 | | | | 351,964 | |
| | | | | | | | | | | | |
| | | | | | | | | | | | 799,964 | |
Insurance — 1.4% | | | | | | | | | | | | |
Aflac, Inc., 3.63%, 6/15/23 | | | | | | | 53 | | | | 56,712 | |
Allstate Corp., 3.15%, 6/15/23 | | | | | | | 43 | | | | 45,727 | |
American International Group, Inc.: | | | | | | | | | | | | |
3.38%, 8/15/20 | | | | | | | 87 | | | | 91,278 | |
3.75%, 7/10/25 | | | | | | | 72 | | | | 73,383 | |
3.90%, 4/01/26 | | | | | | | 1,108 | | | | 1,141,829 | |
3.88%, 1/15/35 | | | | | | | 59 | | | | 56,490 | |
4.50%, 7/16/44 | | | | | | | 87 | | | | 84,168 | |
4.38%, 1/15/55 | | | | | | | 47 | | | | 43,455 | |
Aon PLC, 4.75%, 5/15/45 | | | | | | | 110 | | | | 117,996 | |
| | | | | | | | | | | | |
| Corporate Bonds | | | | | Par (000) | | | Value | |
Insurance (continued) | | | | | | | | | | | | |
Lincoln National Corp., 3.35%, 3/09/25 | | | USD | | | | 31 | | | $ | 30,788 | |
Loews Corp., 2.63%, 5/15/23 | | | | | | | 53 | | | | 53,437 | |
Marsh & McLennan Cos., Inc., 3.75%, 3/14/26 | | | | | | | 18 | | | | 18,984 | |
MassMutual Global Funding II, 2.35%, 4/09/19 (a) | | | | | | | 200 | | | | 205,245 | |
MetLife, Inc., 4.05%, 3/01/45 | | | | | | | 143 | | | | 140,870 | |
Metropolitan Life Global Funding I: | | | | | | | | | | | | |
1.30%, 4/10/17 (a) | | | | | | | 920 | | | | 922,872 | |
2.30%, 4/10/19 (a) | | | | | | | 407 | | | | 416,495 | |
Prudential Financial, Inc.: | | | | | | | | | | | | |
4.50%, 11/15/20 | | | | | | | 392 | | | | 432,607 | |
4.60%, 5/15/44 | | | | | | | 153 | | | | 164,263 | |
Travelers Cos., Inc., 4.60%, 8/01/43 | | | | | | | 120 | | | | 143,433 | |
XLIT Ltd., 2.30%, 12/15/18 | | | | | | | 85 | | | | 85,875 | |
| | | | | | | | | | | | |
| | | | | | | | | | | | 4,325,907 | |
Internet & Catalog Retail — 0.0% | | | | | | | | | | | | |
Amazon.com, Inc., 2.60%, 12/05/19 | | | | | | | 129 | | | | 134,555 | |
IT Services — 0.9% | | | | | | | | | | | | |
Fidelity National Information Services, Inc., 3.63%, 10/15/20 | | | | | | | 12 | | | | 12,685 | |
Hewlett Packard Enterprise Co.: | | | | | | | | | | | | |
2.85%, 10/05/18 (a) | | | | | | | 470 | | | | 481,308 | |
3.60%, 10/15/20 (a) | | | | | | | 228 | | | | 237,982 | |
International Business Machines Corp., 3.45%, 2/19/26 | | | | | | | 940 | | | | 1,022,344 | |
MasterCard, Inc., 3.38%, 4/01/24 | | | | | | | 120 | | | | 130,033 | |
Total System Services, Inc., 4.80%, 4/01/26 | | | | | | | 235 | | | | 254,830 | |
Visa, Inc.: | | | | | | | | | | | | |
2.80%, 12/14/22 | | | | | | | 198 | | | | 208,888 | |
3.15%, 12/14/25 | | | | | | | 291 | | | | 311,111 | |
4.15%, 12/14/35 | | | | | | | 53 | | | | 59,941 | |
| | | | | | | | | | | | |
| | | | | | | | | | | | 2,719,122 | |
Life Sciences Tools & Services — 0.0% | | | | | | | | | | | | |
Thermo Fisher Scientific, Inc.: | | | | | | | | | | | | |
3.30%, 2/15/22 | | | | | | | 76 | | | | 78,849 | |
3.65%, 12/15/25 | | | | | | | 31 | | | | 32,547 | |
| | | | | | | | | | | | |
| | | | | | | | | | | | 111,396 | |
Machinery — 0.1% | | | | | | | | | | | | |
Ingersoll-Rand Luxembourg Finance SA: | | | | | | | | | | | | |
2.63%, 5/01/20 | | | | | | | 52 | | | | 52,839 | |
4.65%, 11/01/44 | | | | | | | 16 | | | | 17,155 | |
John Deere Capital Corp., 3.35%, 6/12/24 | | | | | | | 142 | | | | 152,922 | |
| | | | | | | | | | | | |
| | | | | | | | | | | | 222,916 | |
Media — 1.7% | | | | | | | | | | | | |
21st Century Fox America, Inc.: | | | | | | | | | | | | |
3.70%, 9/15/24 | | | | | | | 48 | | | | 51,826 | |
3.70%, 10/15/25 | | | | | | | 25 | | | | 27,080 | |
4.75%, 9/15/44 | | | | | | | 37 | | | | 40,992 | |
4.95%, 10/15/45 | | | | | | | 12 | | | | 13,664 | |
CBS Corp., 2.30%, 8/15/19 | | | | | | | 96 | | | | 97,477 | |
Charter Communications Operating LLC/Charter Communications Operating Capital: | | | | | | | | | | | | |
3.58%, 7/23/20 (a) | | | | | | | 118 | | | | 123,362 | |
4.46%, 7/23/22 (a) | | | | | | | 336 | | | | 361,111 | |
4.91%, 7/23/25 (a) | | | | | | | 666 | | | | 728,139 | |
6.38%, 10/23/35 (a) | | | | | | | 99 | | | | 117,234 | |
See Notes to Financial Statements.
| | | | | | |
| | | BLACKROCK VARIABLE SERIES FUNDS, INC. | | JUNE 30, 2016 | | 11 |
| | | | |
| Schedule of Investments (continued) | | | BlackRock Total Return V.I. Fund | |
| | | | |
| | | | | | | | | | | | |
| Corporate Bonds | | | | | Par (000) | | | Value | |
Media (continued) | | | | | | | | | | | | |
Comcast Corp.: | | | | | | | | | | | | |
2.75%, 3/01/23 | | | USD | | | | 443 | | | $ | 463,935 | |
3.38%, 8/15/25 | | | | | | | 279 | | | | 301,469 | |
3.15%, 3/01/26 | | | | | | | 744 | | | | 791,905 | |
4.25%, 1/15/33 | | | | | | | 35 | | | | 38,618 | |
4.40%, 8/15/35 | | | | | | | 196 | | | | 221,087 | |
4.60%, 8/15/45 | | | | | | | 45 | | | | 51,811 | |
Discovery Communications LLC: | | | | | | | | | | | | |
3.45%, 3/15/25 | | | | | | | 59 | | | | 57,725 | |
4.90%, 3/11/26 | | | | | | | 567 | | | | 601,289 | |
4.88%, 4/01/43 | | | | | | | 29 | | | | 26,162 | |
Interpublic Group of Cos., Inc.: | | | | | | | | | | | | |
4.00%, 3/15/22 | | | | | | | 62 | | | | 65,992 | |
3.75%, 2/15/23 | | | | | | | 55 | | | | 57,259 | |
NBCUniversal Media LLC, 4.45%, 1/15/43 | | | | | | | 76 | | | | 85,084 | |
Scripps Networks Interactive, Inc., 2.75%, 11/15/19 | | | | | | | 65 | | | | 66,356 | |
Time Warner Cable, Inc.: | | | | | | | | | | | | |
5.00%, 2/01/20 | | | | | | | 58 | | | | 63,043 | |
4.13%, 2/15/21 | | | | | | | 160 | | | | 169,382 | |
4.00%, 9/01/21 | | | | | | | 22 | | | | 23,385 | |
5.50%, 9/01/41 | | | | | | | 63 | | | | 66,174 | |
4.50%, 9/15/42 | | | | | | | 9 | | | | 8,383 | |
Time Warner, Inc.: | | | | | | | | | | | | |
2.10%, 6/01/19 | | | | | | | 260 | | | | 263,496 | |
3.60%, 7/15/25 | | | | | | | 50 | | | | 52,907 | |
4.65%, 6/01/44 | | | | | | | 121 | | | | 127,186 | |
Viacom, Inc.: | | | | | | | | | | | | |
2.75%, 12/15/19 | | | | | | | 19 | | | | 19,276 | |
4.50%, 3/01/21 | | | | | | | 69 | | | | 75,066 | |
| | | | | | | | | | | | |
| | | | | | | | | | | | 5,257,875 | |
Metals & Mining — 0.2% | | | | | | | | | | | | |
Barrick Gold Corp., 4.10%, 5/01/23 | | | | | | | 140 | | | | 147,681 | |
Newmont Mining Corp., 4.88%, 3/15/42 | | | | | | | 50 | | | | 49,440 | |
Novelis, Inc., 8.75%, 12/15/20 | | | | | | | 310 | | | | 323,175 | |
Nucor Corp., 5.20%, 8/01/43 | | | | | | | 40 | | | | 43,253 | |
Rio Tinto Finance USA PLC, 4.13%, 8/21/42 | | | | | | | 110 | | | | 108,591 | |
| | | | | | | | | | | | |
| | | | | | | | | | | | 672,140 | |
Multiline Retail — 0.1% | | | | | | | | | | | | |
Macy’s Retail Holdings, Inc., 4.50%, 12/15/34 | | | | | | | 59 | | | | 52,267 | |
Target Corp.: | | | | | | | | | | | | |
3.50%, 7/01/24 | | | | | | | 28 | | | | 31,026 | |
4.00%, 7/01/42 | | | | | | | 76 | | | | 82,148 | |
| | | | | | | | | | | | |
| | | | | | | | | | | | 165,441 | |
Multi-Utilities — 0.5% | | | | | | | | | | | | |
Berkshire Hathaway Energy Co.: | | | | | | | | | | | | |
2.40%, 2/01/20 | | | | | | | 50 | | | | 51,358 | |
3.50%, 2/01/25 | | | | | | | 50 | | | | 53,926 | |
CenterPoint Energy Houston Electric LLC, 4.50%, 4/01/44 | | | | | | | 44 | | | | 51,910 | |
CMS Energy Corp., 3.88%, 3/01/24 | | | | | | | 198 | | | | 215,335 | |
Consumers Energy Co., 3.95%, 5/15/43 | | | | | | | 44 | | | | 47,654 | |
Dominion Resources, Inc.: | | | | | | | | | | | | |
1.95%, 8/15/16 | | | | | | | 161 | | | | 161,154 | |
2.50%, 12/01/19 | | | | | | | 171 | | | | 174,707 | |
DTE Electric Co., 3.95%, 6/15/42 | | | | | | | 102 | | | | 110,691 | |
DTE Energy Co.: | | | | | | | | | | | | |
2.40%, 12/01/19 | | | | | | | 40 | | | | 40,842 | |
3.50%, 6/01/24 | | | | | | | 104 | | | | 110,384 | |
NiSource Finance Corp., 3.85%, 2/15/23 | | | | | | | 86 | | | | 92,813 | |
Pacific Gas & Electric Co.: | | | | | | | | | | | | |
4.75%, 2/15/44 | | | | | | | 51 | | | | 60,250 | |
4.30%, 3/15/45 | | | | | | | 44 | | | | 49,336 | |
PG&E Corp., 2.40%, 3/01/19 | | | | | | | 71 | | | | 72,392 | |
| | | | | | | | | | | | |
| Corporate Bonds | | | | | Par (000) | | | Value | |
Multi-Utilities (continued) | | | | | | | | | | | | |
Sempra Energy, 2.88%, 10/01/22 | | | USD | | | | 44 | | | $ | 45,012 | |
Virginia Electric & Power Co.: | | | | | | | | | | | | |
3.45%, 2/15/24 | | | | | | | 50 | | | | 54,152 | |
4.45%, 2/15/44 | | | | | | | 44 | | | | 50,573 | |
4.20%, 5/15/45 | | | | | | | 143 | | | | 159,268 | |
| | | | | | | | | | | | |
| | | | | | | | | | | | 1,601,757 | |
Oil, Gas & Consumable Fuels — 1.6% | | | | | | | | | | | | |
Anadarko Petroleum Corp.: | | | | | | | | | | | | |
7.95%, 6/15/39 | | | | | | | 40 | | | | 48,773 | |
4.50%, 7/15/44 | | | | | | | 99 | | | | 90,925 | |
Apache Corp., 4.25%, 1/15/44 | | | | | | | 100 | | | | 96,804 | |
California Resources Corp., 8.00%, 12/15/22 (a) | | | | | | | 15 | | | | 10,650 | |
Chevron Corp.: | | | | | | | | | | | | |
2.19%, 11/15/19 | | | | | | | 35 | | | | 35,982 | |
1.96%, 3/03/20 | | | | | | | 288 | | | | 291,684 | |
ConocoPhillips Co., 4.95%, 3/15/26 | | | | | | | 320 | | | | 362,855 | |
CONSOL Energy, Inc., 5.88%, 4/15/22 | | | | | | | 70 | | | | 61,075 | |
Continental Resources, Inc.: | | | | | | | | | | | | |
3.80%, 6/01/24 | | | | | | | 55 | | | | 47,987 | |
4.90%, 6/01/44 | | | | | | | 63 | | | | 51,975 | |
Devon Energy Corp., 5.85%, 12/15/25 | | | | | | | 70 | | | | 77,216 | |
Enterprise Products Operating LLC: | | | | | | | | | | | | |
3.90%, 2/15/24 | | | | | | | 57 | | | | 60,326 | |
3.70%, 2/15/26 | | | | | | | 300 | | | | 312,197 | |
4.45%, 2/15/43 | | | | | | | 245 | | | | 242,931 | |
EOG Resources, Inc., 2.45%, 4/01/20 | | | | | | | 343 | | | | 347,824 | |
Exxon Mobil Corp.: | | | | | | | | | | | | |
1.82%, 3/15/19 | | | | | | | 529 | | | | 539,041 | |
4.11%, 3/01/46 | | | | | | | 118 | | | | 133,083 | |
Kinder Morgan Energy Partners LP: | | | | | | | | | | | | |
3.50%, 3/01/21 | | | | | | | 674 | | | | 676,197 | |
5.63%, 9/01/41 | | | | | | | 15 | | | | 14,358 | |
4.70%, 11/01/42 | | | | | | | 89 | | | | 80,183 | |
Kinder Morgan, Inc., 3.05%, 12/01/19 | | | | | | | 33 | | | | 33,345 | |
Marathon Petroleum Corp., 4.75%, 9/15/44 | | | | | | | 40 | | | | 34,109 | |
MEG Energy Corp.: | | | | | | | | | | | | |
6.50%, 3/15/21 (a) | | | | | | | 16 | | | | 12,400 | |
7.00%, 3/31/24 (a) | | | | | | | 140 | | | | 107,800 | |
Noble Energy, Inc., 5.05%, 11/15/44 | | | | | | | 70 | | | | 70,492 | |
Occidental Petroleum Corp., 3.40%, 4/15/26 | | | | | | | 120 | | | | 126,563 | |
Phillips 66, 4.88%, 11/15/44 | | | | | | | 43 | | | | 46,937 | |
Pioneer Natural Resources Co., 4.45%, 1/15/26 | | | | | | | 50 | | | | 54,475 | |
Plains All American Pipeline LP/PAA Finance Corp., 4.65%, 10/15/25 | | | | | | | 110 | | | | 111,061 | |
Sabine Pass Liquefaction LLC, 5.63%, 2/01/21 | | | | | | | 300 | | | | 303,000 | |
Sunoco Logistics Partners Operations LP, 5.35%, 5/15/45 | | | | | | | 50 | | | | 49,547 | |
TransCanada PipeLines Ltd.: | | | | | | | | | | | | |
1.88%, 1/12/18 | | | | | | | 48 | | | | 48,230 | |
2.50%, 8/01/22 | | | | | | | 44 | | | | 43,707 | |
4.63%, 3/01/34 | | | | | | | 119 | | | | 125,118 | |
Valero Energy Corp., 3.65%, 3/15/25 | | | | | | | 177 | | | | 177,247 | |
| | | | | | | | | | | | |
| | | | | | | | | | | | 4,926,097 | |
Paper & Forest Products — 0.0% | | | | | | | | | | | | |
Georgia-Pacific LLC, 7.38%, 12/01/25 | | | | | | | 97 | | | | 129,268 | |
Pharmaceuticals — 1.1% | | | | | | | | | | | | |
Actavis Funding SCS: | | | | | | | | | | | | |
2.35%, 3/12/18 | | | | | | | 354 | | | | 358,825 | |
3.00%, 3/12/20 | | | | | | | 578 | | | | 596,108 | |
See Notes to Financial Statements.
| | | | | | |
| 12 | | BLACKROCK VARIABLE SERIES FUNDS, INC. | | JUNE 30, 2016 | | |
| | | | |
| Schedule of Investments (continued) | | | BlackRock Total Return V.I. Fund | |
| | | | |
| | | | | | | | | | | | |
| Corporate Bonds | | | | | Par
(000) | | | Value | |
Pharmaceuticals (continued) | | | | | | | | | | | | |
AstraZeneca PLC: | | | | | | | | | | | | |
3.38%, 11/16/25 | | | USD | | | | 145 | | | $ | 152,010 | |
4.38%, 11/16/45 | | | | | | | 42 | | | | 45,807 | |
Bristol-Myers Squibb Co., 4.50%, 3/01/44 | | | | | | | 62 | | | | 76,568 | |
Eli Lilly & Co., 3.70%, 3/01/45 | | | | | | | 42 | | | | 44,733 | |
GlaxoSmithKline Capital PLC, 2.85%, 5/08/22 | | | | | | | 69 | | | | 72,606 | |
Johnson & Johnson, 2.45%, 3/01/26 | | | | | | | 367 | | | | 379,793 | |
Mylan, Inc., 3.13%, 1/15/23 (a) | | | | | | | 60 | | | | 59,580 | |
Novartis Capital Corp.: | | | | | | | | | | | | |
4.40%, 4/24/20 | | | | | | | 125 | | | | 139,257 | |
3.00%, 11/20/25 | | | | | | | 60 | | | | 63,732 | |
4.00%, 11/20/45 | | | | | | | 40 | | | | 45,596 | |
Pfizer, Inc.: | | | | | | | | | | | | |
2.75%, 6/03/26 | | | | | | | 707 | | | | 729,063 | |
4.30%, 6/15/43 | | | | | | | 58 | | | | 65,186 | |
4.40%, 5/15/44 | | | | | | | 43 | | | | 49,014 | |
Roche Holdings, Inc.: | | | | | | | | | | | | |
2.88%, 9/29/21 (a) | | | | | | | 200 | | | | 212,730 | |
3.00%, 11/10/25 (a) | | | | | | | 200 | | | | 212,758 | |
Teva Pharmaceutical Finance Co. BV,
3.65%, 11/10/21 | | | | | | | 47 | | | | 49,807 | |
Zoetis, Inc., 3.25%, 2/01/23 | | | | | | | 42 | | | | 42,799 | |
| | | | | | | | | | | | |
| | | | | | | | | | | | 3,395,972 | |
Real Estate Investment Trusts (REITs) — 0.3% | | | | | | | | | | | | |
American Tower Corp.: | | | | | | | | | | | | |
3.30%, 2/15/21 | | | | | | | 81 | | | | 84,499 | |
3.45%, 9/15/21 | | | | | | | 77 | | | | 80,146 | |
4.40%, 2/15/26 | | | | | | | 16 | | | | 17,371 | |
3.38%, 10/15/26 | | | | | | | 228 | | | | 229,186 | |
AvalonBay Communities, Inc., 3.50%, 11/15/25 | | | | | | | 13 | | | | 13,683 | |
Crown Castle International Corp.: | | | | | | | | | | | | |
3.40%, 2/15/21 | | | | | | | 48 | | | | 50,109 | |
3.70%, 6/15/26 | | | | | | | 37 | | | | 38,173 | |
ERP Operating LP, 3.38%, 6/01/25 | | | | | | | 53 | | | | 55,902 | |
Omega Healthcare Investors, Inc., 4.50%, 4/01/27 | | | | | | | 38 | | | | 37,849 | |
Prologis LP, 3.75%, 11/01/25 | | | | | | | 22 | | | | 23,448 | |
Simon Property Group LP: | | | | | | | | | | | | |
2.50%, 7/15/21 | | | | | | | 48 | | | | 49,453 | |
3.38%, 10/01/24 | | | | | | | 87 | | | | 93,319 | |
4.25%, 10/01/44 | | | | | | | 53 | | | | 57,190 | |
| | | | | | | | | | | | |
| | | | | | | | | | | | 830,328 | |
Road & Rail — 0.5% | | | | | | | | | | | | |
Burlington Northern Santa Fe LLC: | | | | | | | | | | | | |
3.45%, 9/15/21 | | | | | | | 35 | | | | 37,930 | |
3.00%, 3/15/23 | | | | | | | 61 | | | | 64,151 | |
4.15%, 4/01/45 | | | | | | | 28 | | | | 30,493 | |
4.70%, 9/01/45 | | | | | | | 35 | | | | 41,158 | |
Canadian National Railway Co., 2.75%, 3/01/26 | | | | | | | 210 | | | | 219,329 | |
CSX Corp.: | | | | | | | | | | | | |
3.35%, 11/01/25 | | | | | | | 39 | | | | 41,447 | |
4.10%, 3/15/44 | | | | | | | 42 | | | | 44,868 | |
Norfolk Southern Corp.: | | | | | | | | | | | | |
2.90%, 6/15/26 | | | | | | | 314 | | | | 323,083 | |
4.45%, 6/15/45 | | | | | | | 55 | | | | 60,609 | |
Penske Truck Leasing Co. LP/PTL Finance Corp.,
3.38%, 2/01/22 (a) | | | | | | | 133 | | | | 135,632 | |
Ryder System, Inc., 2.45%, 9/03/19 | | | | | | | 75 | | | | 76,267 | |
Union Pacific Corp.: | | | | | | | | | | | | |
3.38%, 2/01/35 | | | | | | | 27 | | | | 27,201 | |
4.05%, 11/15/45 | | | | | | | 9 | | | | 9,747 | |
3.88%, 2/01/55 | | | | | | | 214 | | | | 218,096 | |
4.38%, 11/15/65 | | | | | | | 45 | | | | 48,115 | |
| | | | | | | | | | | | |
| Corporate Bonds | | | | | Par
(000) | | | Value | |
Road & Rail (continued) | | | | | | | | | | | | |
Union Pacific Railroad Co. Pass-Through Trust, Series 2014-1, 3.23%, 5/14/26 | | | USD | | | | 106 | | | $ | 111,369 | |
| | | | | | | | | | | | |
| | | | | | | | | | | | 1,489,495 | |
Semiconductors & Semiconductor Equipment — 0.1% | |
Analog Devices, Inc.: | | | | | | | | | | | | |
3.90%, 12/15/25 | | | | | | | 20 | | | | 22,294 | |
5.30%, 12/15/45 | | | | | | | 20 | | | | 24,096 | |
Lam Research Corp.: | | | | | | | | | | | | |
2.80%, 6/15/21 | | | | | | | 116 | | | | 118,754 | |
3.90%, 6/15/26 | | | | | | | 170 | | | | 178,973 | |
QUALCOMM, Inc., 4.80%, 5/20/45 | | | | | | | 64 | | | | 67,134 | |
| | | | | | | | | | | | |
| | | | | | | | | | | | 411,251 | |
Software — 0.7% | | | | | | | | | | | | |
Microsoft Corp.: | | | | | | | | | | | | |
3.50%, 2/12/35 | | | | | | | 231 | | | | 239,008 | |
4.45%, 11/03/45 | | | | | | | 10 | | | | 11,277 | |
Oracle Corp.: | | | | | | | | | | | | |
2.80%, 7/08/21 | | | | | | | 884 | | | | 927,867 | |
2.65%, 7/15/26 | | | | | | | 574 | | | | 575,440 | |
3.25%, 5/15/30 | | | | | | | 223 | | | | 230,544 | |
4.00%, 7/15/46 | | | | | | | 210 | | | | 211,591 | |
4.38%, 5/15/55 | | | | | | | 60 | | | | 63,024 | |
| | | | | | | | | | | | |
| | | | | | | | | | | | 2,258,751 | |
Specialty Retail — 0.1% | | | | | | | | | | | | |
Home Depot, Inc.: | | | | | | | | | | | | |
3.35%, 9/15/25 | | | | | | | 21 | | | | 22,886 | |
5.40%, 9/15/40 | | | | | | | 28 | | | | 36,420 | |
4.40%, 3/15/45 | | | | | | | 40 | | | | 46,351 | |
Lowe’s Cos., Inc.: | | | | | | | | | | | | |
3.38%, 9/15/25 | | | | | | | 22 | | | | 24,058 | |
4.25%, 9/15/44 | | | | | | | 63 | | | | 70,086 | |
4.38%, 9/15/45 | | | | | | | 17 | | | | 19,480 | |
QVC, Inc.: | | | | | | | | | | | | |
3.13%, 4/01/19 | | | | | | | 42 | | | | 43,117 | |
5.13%, 7/02/22 | | | | | | | 80 | | | | 86,245 | |
| | | | | | | | | | | | |
| | | | | | | | | | | | 348,643 | |
Technology Hardware, Storage & Peripherals — 0.6% | |
Apple Inc.: | | | | | | | | | | | | |
2.10%, 5/06/19 | | | | | | | 481 | | | | 495,003 | |
3.25%, 2/23/26 | | | | | | | 467 | | | | 495,756 | |
3.45%, 2/09/45 | | | | | | | 39 | | | | 36,646 | |
4.65%, 2/23/46 | | | | | | | 749 | | | | 846,053 | |
HP, Inc., 3.75%, 12/01/20 | | | | | | | 16 | | | | 16,901 | |
| | | | | | | | | | | | |
| | | | | | | | | | | | 1,890,359 | |
Textiles, Apparel & Luxury Goods — 0.0% | |
NIKE, Inc., 3.88%, 11/01/45 | | | | | | | 61 | | | | 67,622 | |
Tobacco — 0.5% | | | | | | | | | | | | |
Altria Group, Inc.: | | | | | | | | | | | | |
2.63%, 1/14/20 | | | | | | | 64 | | | | 66,531 | |
2.85%, 8/09/22 | | | | | | | 46 | | | | 48,182 | |
4.25%, 8/09/42 | | | | | | | 34 | | | | 37,122 | |
5.38%, 1/31/44 | | | | | | | 190 | | | | 243,599 | |
Philip Morris International, Inc.: | | | | | | | | | | | | |
1.13%, 8/21/17 | | | | | | | 224 | | | | 224,452 | |
2.75%, 2/25/26 | | | | | | | 746 | | | | 769,321 | |
4.13%, 3/04/43 | | | | | | | 48 | | | | 51,485 | |
4.88%, 11/15/43 | | | | | | | 105 | | | | 124,998 | |
Reynolds American, Inc.: | | | | | | | | | | | | |
2.30%, 6/12/18 | | | | | | | 60 | | | | 60,963 | |
3.25%, 6/12/20 | | | | | | | 25 | | | | 26,427 | |
| | | | | | | | | | | | |
| | | | | | | | | | | | 1,653,080 | |
See Notes to Financial Statements.
| | | | | | |
| | | BLACKROCK VARIABLE SERIES FUNDS, INC. | | JUNE 30, 2016 | | 13 |
| | | | |
| Schedule of Investments (continued) | | | BlackRock Total Return V.I. Fund | |
| | | | |
| | | | | | | | |
| Corporate Bonds | | Par (000) | | | Value | |
Trading Companies & Distributors — 0.0% | | | | | | | | |
GATX Corp., 2.60%, 3/30/20 | | | USD 59 | | | $ | 58,639 | |
Wireless Telecommunication Services — 0.2% | | | | | | | | |
America Movil SAB de CV, 2.38%, 9/08/16 | | | 385 | | | | 386,130 | |
Orange SA, 5.50%, 2/06/44 | | | 55 | | | | 69,048 | |
Rogers Communications, Inc.: | | | | | | | | |
3.63%, 12/15/25 | | | 25 | | | | 26,709 | |
5.00%, 3/15/44 | | | 22 | | | | 24,990 | |
Vodafone Group PLC, 2.50%, 9/26/22 | | | 61 | | | | 60,164 | |
| | | | | | | | |
| | | | | | | | 567,041 | |
Total Corporate Bonds — 24.9% | | | | | | | 76,283,102 | |
| | | | | | | | |
| Foreign Agency Obligations | | | | | | |
Argentina — 0.0% | | | | | | | | |
YPF SA: | | | | | | | | |
8.75%, 4/04/24 (a) | | | 12 | | | | 12,900 | |
8.50%, 7/28/25 (a) | | | 41 | | | | 43,316 | |
| | | | | | | | |
| | | | | | | | 56,216 | |
Brazil — 0.2% | | | | | | | | |
Petrobras Global Finance BV: | | | | | | | | |
8.38%, 5/23/21 | | | 330 | | | | 340,560 | |
6.75%, 1/27/41 | | | 29 | | | | 23,273 | |
6.85%, 6/05/15 | | | 106 | | | | 80,560 | |
| | | | | | | | |
| | | | | | | | 444,393 | |
Norway — 0.1% | | | | | | | | |
Statoil ASA, 2.90%, 11/08/20 | | | 280 | | | | 291,619 | |
Venezuela — 0.0% | | | | | | | | |
Petroleos de Venezuela SA: | | | | | | | | |
6.00%, 5/16/24 | | | 238 | | | | 84,169 | |
6.00%, 11/15/26 | | | 54 | | | | 18,830 | |
| | | | | | | | |
| | | | | | | | 102,999 | |
Total Foreign Agency Obligations — 0.3% | | | | | | | 895,227 | |
| | | | | | | | |
| Foreign Government Obligations | | | | | | |
Argentina — 0.2% | | | | | | | | |
Republic of Argentina: | | | | | | | | |
6.25%, 4/22/19 (a) | | | 391 | | | | 407,617 | |
6.88%, 4/22/21 (a) | | | 150 | | | | 159,975 | |
| | | | | | | | |
| | | | | | | | 567,592 | |
Brazil — 0.0% | | | | | | | | |
Federative Republic of Brazil, 7.13%, 1/20/37 | | | 36 | | | | 40,500 | |
Colombia — 0.1% | | | | | | | | |
Republic of Colombia, 4.00%, 2/26/24 | | | 205 | | | | 214,123 | |
Germany — 0.3% | | | | | | | | |
Deutsche Bundesrepublik Inflation Linked Bonds, 0.10%, 4/15/26 | | | EUR 670 | | | | 830,440 | |
Indonesia — 0.2% | | | | | | | | |
Republic of Indonesia: | | | | | | | | |
2.63%, 6/14/23 (a) | | | 110 | | | | 123,159 | |
8.38%, 3/15/24 | | | 1,211,000 | | | | 96,651 | |
8.75%, 5/15/31 | | | 1,523,000 | | | | 126,691 | |
6.63%, 5/15/33 | | | 709,000 | | | | 46,703 | |
8.38%, 3/15/34 | | | IDR2,719,000 | | | | 218,137 | |
8.25%, 5/15/36 | | | 1,377,000 | | | | 110,045 | |
| | | | | | | | |
| | | | | | | | 721,386 | |
| | | | | | | | | | | | |
| Foreign Government Obligations | | | | | Par (000) | | | Value | |
Mexico — 0.4% | | | | | | | | | | | | |
United Mexican States: | | | | | | | | | | | | |
4.75%, 6/14/18 | | | MXN | | | | 2,300 | | | $ | 125,566 | |
4.00%, 10/02/23 | | | USD | | | | 950 | | | | 1,022,723 | |
| | | | | | | | | | | | |
| | | | | | | | | | | | 1,148,289 | |
Peru — 0.0% | | | | | | | | | | | | |
Republic of Peru, 7.35%, 7/21/25 | | | | | | | 100 | | | | 136,000 | |
Poland — 0.1% | | | | | | | | | | | | |
Republic of Poland, 1.50%, 4/25/20 | | | | | | | 1,683 | | | | 419,865 | |
Russia — 0.0% | | | | | | | | | | | | |
Russian Federation, 7.00%, 8/16/23 | | | | | | | 940 | | | | 13,730 | |
Turkey — 0.2% | | | | | | | | | | | | |
Republic of Turkey, 5.75%, 3/22/24 | | | | | | | 530 | | | | 591,008 | |
Venezuela — 0.0% | | | | | | | | | | | | |
Bolivarian Republic of Venezuela: | | | | | | | | | | | | |
8.25%, 10/13/24 | | | | | | | 58 | | | | 24,215 | |
7.00%, 3/31/38 | | | | | | | 66 | | | | 26,235 | |
| | | | | | | | | | | | |
| | | | | | | | | | | | 50,450 | |
Total Foreign Government Obligations — 1.5% | | | | | | | | | | | 4,733,383 | |
| | | | | | | | | | | | |
| Non-Agency Mortgage-Backed Securities | | | | | | | | | |
Collateralized Mortgage Obligations — 2.0% | | | | | | | | | | | | |
Adjustable Rate Mortgage Trust, Series 2005-12, Class 4A1, 3.67%, 3/25/36 (b) | | | | | | | 55 | | | | 39,290 | |
Ajax Mortgage Loan Trust: | | | | | | | | | | | | |
Series 2015-C, Class A, 3.88%, 3/25/57 (a)(c) | | | | | | | 257 | | | | 254,023 | |
Series 2016-A, Class A, 4.25%, 8/25/64 (a)(c) | | | | | | | 137 | | | | 135,701 | |
American Home Mortgage Assets Trust: | | | | | | | | | | | | |
Series 2006-3, Class 2A11, 1.35%, 10/25/46 (b) | | | | | | | 95 | | | | 65,622 | |
Series 2006-4, Class 1A12, 0.65%, 10/25/46 (b) | | | | | | | 115 | | | | 75,759 | |
Series 2006-5, Class A1, 1.33%, 11/25/46 (b) | | | | | | | 157 | | | | 73,244 | |
Series 2007-1, Class A1, 1.11%, 2/25/47 (b) | | | | | | | 88 | | | | 47,890 | |
Angel Oak Mortgage Trust LLC, Series 2015-1, Class A,
4.50%, 11/25/45 (a)(c) | | | | | | | 72 | | | | 72,682 | |
Bear Stearns ALT-A Trust II, Series 2007-1, Class 1A1,
2.87%, 9/25/47 (b) | | | | | | | 136 | | | | 86,220 | |
Bear Stearns Mortgage Funding Trust: | | | | | | | | | | | | |
Series 2007-AR1, Class 1A1, 0.61%, 1/25/37 (b) | | | | | | | 48 | | | | 36,291 | |
Series 2007-AR2, Class A1, 0.62%, 3/25/37 (b) | | | | | | | 236 | | | | 189,548 | |
Series 2007-AR3, Class 1A1, 0.59%, 3/25/37 (b) | | | | | | | 25 | | | | 20,514 | |
Series 2007-AR4, Class 1A1, 0.65%, 9/25/47 (b) | | | | | | | 105 | | | | 83,215 | |
Series 2007-AR4, Class 2A1, 0.66%, 6/25/37 (b) | | | | | | | 34 | | | | 27,901 | |
COLT LLC, Series 2015-1, Class A1V, 3.45%, 12/26/45 (a)(b) | | | | | | | 81 | | | | 80,038 | |
COLT Mortgage Loan Trust, Series 2016-1, Class A1, 3.00%, 5/25/46 (a) | | | | | | | 100 | | | | 100,723 | |
See Notes to Financial Statements.
| | | | | | |
| 14 | | BLACKROCK VARIABLE SERIES FUNDS, INC. | | JUNE 30, 2016 | | |
| | | | |
| Schedule of Investments (continued) | | | BlackRock Total Return V.I. Fund | |
| | | | |
| | | | | | | | | | | | |
| Non-Agency Mortgage-Backed Securities | | | | | Par
(000) | | | Value | |
Collateralized Mortgage Obligations (continued) | | | | | | | | | | | | |
Countrywide Alternative Loan Trust: | | | | | | | | | | | | |
Series 2005-72, Class A3,
0.75%, 1/25/36 (b) | | | USD | | | | 125 | | | $ | 104,304 | |
Series 2005-76, Class 2A1,
1.44%, 2/25/36 (b) | | | | | | | 41 | | | | 35,290 | |
Series 2005-80CB, Class 4A1,
6.00%, 2/25/36 | | | | | | | 50 | | | | 38,678 | |
Series 2006-15CB, Class A1,
6.50%, 6/25/36 | | | | | | | 16 | | | | 10,251 | |
Series 2006-OA14, Class 1A1,
2.14%, 11/25/46 (b) | | | | | | | 148 | | | | 123,833 | |
Series 2006-OA16, Class A1D,
0.72%, 10/25/46 (b) | | | | | | | 25 | | | | 19,501 | |
Series 2006-OA6, Class 1A2,
0.66%, 7/25/46 (b) | | | | | | | 61 | | | | 50,912 | |
Series 2006-OA8, Class 1A1,
0.64%, 7/25/46 (b) | | | | | | | 23 | | | | 18,616 | |
Series 2007-22, Class 2A16,
6.50%, 9/25/37 | | | | | | | 834 | | | | 600,487 | |
Series 2007-OA2, Class 1A1,
1.25%, 3/25/47 (b) | | | | | | | 488 | | | | 374,020 | |
Series 2007-OA3, Class 1A1,
0.59%, 4/25/47 (b) | | | | | | | 36 | | | | 30,132 | |
Countrywide Home Loan Mortgage Pass-Through Trust, Series 2006-OA4, Class A1, 1.37%, 4/25/46 (b) | | | | | | | 217 | | | | 118,363 | |
Credit Suisse Mortgage Capital Certificates: | | | | | | | | | | | | |
Series 2013-5R, Class 1A6,
0.69%, 2/27/36 (a)(b) | | | | | | | 45 | | | | 34,200 | |
Series 2014-11R, Class 16A1,
3.17%, 9/27/47 (a)(b) | | | | | | | 92 | | | | 87,399 | |
Series 2015-10R, Class 4A1,
4.75%, 7/27/37 (a)(b) | | | | | | | 68 | | | | 67,768 | |
Series 2015-5R, Class 3A1,
4.75%, 1/29/37 (a) | | | | | | | 26 | | | | 25,502 | |
Series 2015-6R, Class 5A1,
0.62%, 1/27/37 (a)(b) | | | | | | | 34 | | | | 31,050 | |
Series 2015-6R, Class 5A2,
0.62%, 10/27/36 (a)(b) | | | | | | | 60 | | | | 26,450 | |
Series 2015-8R, Class 5A1,
4.75%, 8/27/37 (a)(b) | | | | | | | 37 | | | | 37,054 | |
Deutsche Alt-A Securities Mortgage Loan Trust, Series 2007-RMP1, Class A2, 0.60%, 12/25/36 (b) | | | | | | | 176 | | | | 142,046 | |
GreenPoint Mortgage Funding Trust, Series 2006-AR2, Class 4A1, 2.41%, 3/25/36 (b) | | | | | | | 38 | | | | 30,504 | |
Impac Secured Assets CMN Owner Trust, Series 2004-3, Class 1A4, 1.25%, 11/25/34 (b) | | | | | | | 96 | | | | 93,720 | |
Lehman XS Trust, Series 2007-20N, Class A1,
1.59%, 12/25/37 (b) | | | | | | | 51 | | | | 38,077 | |
LSTAR Securities Investment Trust: | | | | | | | | | | | | |
Series 2014-1, Class Note,
3.54%, 9/01/21 (a)(b) | | | | | | | 245 | | | | 242,299 | |
Series 2015-10, Class A1,
2.44%, 11/01/20 (a)(b) | | | | | | | 64 | | | | 62,154 | |
Series 2015-10, Class A2,
3.94%, 11/01/20 (a)(b) | | | | | | | 110 | | | | 105,050 | |
Series 2015-2, Class A, 2.44%, 1/01/20 (a)(b) | | | | | | | 86 | | | | 84,402 | |
Series 2015-3, Class A, 2.44%, 3/01/20 (a)(b) | | | | | | | 251 | | | | 246,423 | |
Series 2015-8, Class A1, 2.44%, 8/01/20 (a)(b) | | | | | | | 82 | | | | 80,253 | |
Series 2016-2, Class A, 2.43%, 3/01/21 (a)(b) | | | | | | | 396 | | | | 387,524 | |
MASTR Resecuritization Trust, Series 2008-3, Class A1, 0.87%, 8/25/37 (a)(b) | | | | | | | 52 | | | | 36,488 | |
| | | | | | | | | | | | |
| Non-Agency Mortgage-Backed Securities | | | | | Par
(000) | | | Value | |
Morgan Stanley Resecuritization Trust, Series 2014-R8, Class 3B1, 1.13%, 6/26/47 (a)(b) | | | USD | | | | 93 | | | $ | 81,956 | |
Mortgage Loan Resecuritization Trust, Series 2009-RS1, Class A85, 0.77%, 4/16/36 (a)(b) | | | | | | | 562 | | | | 452,841 | |
New Residential Mortgage Loan Trust, Series 2015-2A, Class A2, 3.75%, 8/25/55 (a)(b) | | | | | | | 87 | | | | 88,753 | |
Nomura Resecuritization Trust, Series 2014-3R, Class 3A9, 0.96%, 11/26/35 (a)(b) | | | | | | | 100 | | | | 88,464 | |
RALI Trust: | | | | | | | | | | | | |
Series 2006-QO2, Class A1,
0.67%, 2/25/46 (b) | | | | | | | 281 | | | | 121,929 | |
Series 2007-QH1, Class A1,
0.61%, 2/25/37 (b) | | | | | | | 119 | | | | 96,195 | |
Series 2007-QH6, Class A1,
0.64%, 7/25/37 (b) | | | | | | | 65 | | | | 50,808 | |
Series 2007-QH9, Class A1,
1.67%, 11/25/37 (b) | | | | | | | 65 | | | | 43,310 | |
RBSSP Resecuritization Trust, Series 2012-2, Class 1A6, 0.57%, 5/26/47 (a)(b) | | | | | | | 7 | | | | 6,417 | |
Structured Asset Mortgage Investments II Trust, Series 2006-AR4, Class 3A1, 0.64%, 6/25/36 (b) | | | | | | | 68 | | | | 53,212 | |
Washington Mutual Mortgage Pass-Through Certificates, Series 2006-4, Class 3A1, 6.50%, 5/25/36 (c) | | | | | | | 74 | | | | 52,835 | |
Wedgewood Real Estate Trust, Series 2016-1, Class A1, 3.45%, 7/15/46 (a)(b) | | | | | | | 100 | | | | 99,993 | |
| | | | | | | | | | | | |
| | | | | | | | | | | | 6,008,124 | |
Commercial Mortgage-Backed Securities — 4.0% | | | | | | | | | | | | |
Banc of America Commercial Mortgage Trust: | | | | | | | | | | | | |
Series 2007-1, Class A4, 5.45%, 1/15/49 | | | | | | | 143 | | | | 145,389 | |
Series 2007-1, Class AMFX, 5.48%, 1/15/49 (b) | | | | | | | 45 | | | | 44,498 | |
Series 2007-2, Class AM, 5.80%, 4/10/49 (b) | | | | | | | 35 | | | | 36,050 | |
Series 2007-3, Class A1A, 5.72%, 6/10/49 (b) | | | | | | | 250 | | | | 256,401 | |
Series 2007-3, Class A4, 5.72%, 6/10/49 (b) | | | | | | | 453 | | | | 460,890 | |
Series 2007-3, Class AJ, 5.72%, 6/10/49 (b) | | | | | | | 40 | | | | 40,202 | |
Series 2007-5, Class AM, 5.77%, 2/10/51 (b) | | | | | | | 85 | | | | 87,799 | |
Banc of America Merrill Lynch Commercial Mortgage Securities Trust: | | | | | | | | | | | | |
Series 2013-DSNY, Class E,
3.04%, 9/15/26 (a)(b) | | | | | | | 100 | | | | 99,568 | |
Series 2015-200P, Class F,
3.60%, 4/14/33 (a)(b) | | | | | | | 200 | | | | 184,613 | |
Barclays Commercial Mortgage Trust, Series 2015-SRCH, Class A1,
3.31%, 8/10/35 (a) | | | | | | | 100 | | | | 105,971 | |
Bayview Commercial Asset Trust: | | | | | | | | | | | | |
Series 2005-2A, Class A1,
0.76%, 8/25/35 (a)(b) | | | | | | | 93 | | | | 79,737 | |
Series 2006-3A, Class A2,
0.75%, 10/25/36 (a)(b) | | | | | | | 32 | | | | 25,945 | |
Series 2007-2A, Class A1,
0.72%, 7/25/37 (a)(b) | | | | | | | 58 | | | | 48,277 | |
Series 2007-4A, Class A1,
0.90%, 9/25/37 (a)(b) | | | | | | | 196 | | | | 159,185 | |
See Notes to Financial Statements.
| | | | | | |
| | | BLACKROCK VARIABLE SERIES FUNDS, INC. | | JUNE 30, 2016 | | 15 |
| | | | |
| Schedule of Investments (continued) | | | BlackRock Total Return V.I. Fund | |
| | | | |
| | | | | | | | | | | | |
| Non-Agency Mortgage-Backed Securities | | | | | Par (000) | | | Value | |
Commercial Mortgage-Backed Securities (continued) | | | | | | | | | |
Bear Stearns Commercial Mortgage Securities Trust: | | | | | | | | | | | | |
Series 2007-PW15, Class A1A, 5.32%, 2/11/44 | | | USD | | | | 167 | | | $ | 169,937 | |
Series 2007-PW16, Class AM, 5.91%, 6/11/40 (b) | | | | | | | 41 | | | | 42,376 | |
BHMS Mortgage Trust, Series 2014-ATLS, Class AFL, 1.96%, 7/05/33 (a)(b) | | | | | | | 100 | | | | 98,529 | |
BWAY Mortgage Trust: | | | | | | | | | | | | |
Series 2013-1515, Class A2, 3.45%, 3/10/25 (a) | | | | | | | 150 | | | | 160,025 | |
Series 2013-1515, Class C, 3.45%, 3/10/33 (a) | | | | | | | 105 | | | | 106,263 | |
Series 2013-1515, Class F,
3.93%, 3/10/33 (a)(b) | | | | | | | 100 | | | | 92,776 | |
BXHTL Mortgage Trust, Series 2015-JWRZ, Class A, 1.67%, 5/15/29 (a)(b) | | | | | | | 100 | | | | 99,662 | |
CCRESG Commercial Mortgage Trust, Series 2016-HEAT, Class D, 5.49%, 4/10/29 (a)(b) | | | | | | | 20 | | | | 20,145 | |
CD Mortgage Trust, Series 2006-CD3, Class AM, 5.65%, 10/15/48 | | | | | | | 40 | | | | 40,297 | |
CDGJ Commercial Mortgage Trust, Series 2014-BXCH, Class A, 1.84%, 12/15/27 (a)(b) | | | | | | | 529 | | | | 528,990 | |
CFCRE Commercial Mortgage Trust, Series 2016-C4, Class A4, 3.28%, 5/10/58 | | | | | | | 20 | | | | 21,033 | |
CGGS Commercial Mortgage Trust: | | | | | | | | | | | | |
Series 2016-RNDB, Class CFL,
3.94%, 2/15/33 (a)(b) | | | | | | | 120 | | | | 120,304 | |
Series 2016-RNDB, Class DFL,
5.19%, 2/15/33 (a)(b) | | | | | | | 100 | | | | 101,574 | |
Citigroup Commercial Mortgage Trust: | | | | | | | | | | | | |
Series 2016-C1, Class C, 5.12%, 5/10/49 (b) | | | | | | | 40 | | | | 39,672 | |
Series 2016-GC37, Class C, 4.92%, 2/10/26 | | | | | | | 20 | | | | 20,024 | |
Citigroup/Deutsche Bank Commercial Mortgage Trust,
Series 2007-CD5, Class AMA, 6.33%, 11/15/44 (b) | | | | | | | 127 | | | | 133,947 | |
COBALT CMBS Commercial Mortgage Trust,
Series 2007-C3, Class AM, 5.96%, 5/15/46 (b) | | | | | | | 86 | | | | 88,677 | |
Commercial Mortgage Pass-Through Certificates: | | | | | | | | | | | | |
Series 2007-C9, Class AJFL,
1.14%, 12/10/49 (a)(b) | | | | | | | 90 | | | | 85,233 | |
Series 2010-RR1, Class GEB,
5.54%, 12/11/49 (a)(b) | | | | | | | 110 | | | | 111,530 | |
Series 2012-LTRT, Class A2, 3.40%, 10/05/30 (a) | | | | | | | 180 | | | | 188,932 | |
Series 2014-CR21, Class A3, 3.53%, 12/10/47 | | | | | | | 160 | | | | 172,829 | |
Series 2014-FL5, Class D,
4.44%, 10/15/31 (a)(b) | | | | | | | 100 | | | | 89,493 | |
Series 2014-LC15, Class A4, 4.01%, 4/10/47 | | | | | | | 100 | | | | 111,160 | |
Series 2015-LC19, Class C, 4.26%, 2/10/48 (b) | | | | | | | 40 | | | | 39,369 | |
Series 2015-LC19, Class D, 2.87%, 2/10/48 (a) | | | | | | | 60 | | | | 43,681 | |
Series 2015-LC21, Class C, 4.46%, 6/10/25 (b) | | | | | | | 150 | | | | 136,574 | |
Series 2016-DC2, Class B, 3.93%, 2/10/49 (b) | | | | | | | 20 | | | | 21,818 | |
Series 2016-DC2, Class C, 4.80%, 2/10/49 (b) | | | | | | | 40 | | | | 38,598 | |
Series 2007-GG11, Class AM, 5.87%, 12/10/49 (b) | | | | | | | 130 | | | | 134,479 | |
Core Industrial Trust, Series 2015-TEXW, Class A, 3.08%, 2/10/34 (a) | | | | | | | 100 | | | | 104,958 | |
| | | | | | | | | | | | |
| Non-Agency Mortgage-Backed Securities | | | | | Par (000) | | | Value | |
Countrywide Commercial Mortgage Trust, Series 2007-MF1, Class A, 6.27%, 11/12/43 (a)(b) | | | USD | | | | 35 | | | $ | 35,892 | |
Credit Suisse Commercial Mortgage Trust, Series 2008-C1, Class A3, 6.27%, 2/15/41 (b) | | | | | | | 80 | | | | 83,238 | |
Credit Suisse Mortgage Capital Certificates: | | | | | | | | | | | | |
Series 2010-RR2, Class 2A,
6.14%, 9/15/39 (a)(b) | | | | | | | 271 | | | | 276,140 | |
Series 2015-DEAL, Class D,
3.54%, 4/15/29 (a)(b) | | | | | | | 100 | | | | 96,367 | |
Series 2015-GLPB, Class A,
3.64%, 11/15/34 (a) | | | | | | | 100 | | | | 108,058 | |
CSAIL Commercial Mortgage Trust: | | | | | | | | | | | | |
Series 2015-C1, Class D, 3.80%, 4/17/50 (a)(b) | | | | | | | 450 | | | | 358,498 | |
Series 2015-C3, Class D, 3.36%, 8/15/48 (b) | | | | | | | 250 | | | | 177,312 | |
Series 2016-C6, Class C, 4.91%, 1/15/49 (b) | | | | | | | 40 | | | | 40,948 | |
Deutsche Bank Re-REMIC Trust: | | | | | | | | | | | | |
Series 2011-C32, Class A3A,
5.89%, 6/17/49 (a)(b) | | | | | | | 165 | | | | 167,761 | |
Series 2013-EZ3, Class A,
1.64%, 12/18/49 (a)(b) | | | | | | | 31 | | | | 31,477 | |
Eleven Madison Mortgage Trust, Series 2015-11MD, Class A, 3.67%, 9/10/35 (a)(b) | | | | | | | 100 | | | | 108,669 | |
Extended Stay America Trust, Series 2013-ESH7, Class A27, 2.96%, 12/05/31 (a) | | | | | | | 142 | | | | 142,819 | |
FREMF Mortgage Trust: | | | | | | | | | | | | |
Series 2015-K47, Class B,
3.72%, 6/25/48 (a)(b) | | | | | | | 47 | | | | 44,920 | |
Series 2015-K50, Class B,
3.78%, 10/25/48 (a)(b) | | | | | | | 110 | | | | 104,757 | |
Series 2016-K54, Class B,
3.85%, 2/25/26 (a)(b) | | | | | | | 90 | | | | 86,279 | |
GAHR Commercial Mortgage Trust: | | | | | | | | | | | | |
Series 2015-NRF, Class AFL1, 1.74%, 12/15/16 (a)(b) | | | | | | | 99 | | | | 99,147 | |
Series 2015-NRF, Class EFX,
3.38%, 12/15/34 (a)(b) | | | | | | | 100 | | | | 95,941 | |
Series 2015-NRF, Class FFX,
3.38%, 12/15/34 (a)(b) | | | | | | | 60 | | | | 56,386 | |
GS Mortgage Securities Corp. II, Series 2013-KING, Class E, 3.55%, 12/10/27 (a)(b) | | | | | | | 360 | | | | 344,558 | |
GS Mortgage Securities Trust, Series 2007-GG10, Class A4, 5.99%, 8/10/45 (b) | | | | | | | 96 | | | | 98,307 | |
Hilton USA Trust, Series 2013-HLT, Class EFX, 4.60%, 11/05/30 (a)(b) | | | | | | | 290 | | | | 291,822 | |
JPMBB Commercial Mortgage Securities Trust: | | | | | | | | | | | | |
Series 2014-C22, Class A4, 3.80%, 9/15/47 | | | | | | | 200 | | | | 219,410 | |
Series 2014-C22, Class D,
4.56%, 9/15/47 (a)(b) | | | | | | | 200 | | | | 156,254 | |
JPMDB Commercial Mortgage Securities Trust,
Series 2016-C2, Class A4, 3.14%, 6/15/49 | | | | | | | 70 | | | | 73,602 | |
JPMorgan Chase Commercial Mortgage Securities Trust: | | | | | | | | | | | | |
Series 2006-CB16, Class AM, 5.59%, 5/12/45 | | | | | | | 102 | | | | 101,986 | |
Series 2007-LD11, Class A4, 5.93%, 5/15/17 (b) | | | | | | | 200 | | | | 203,597 | |
Series 2007-LDPX, Class AM,
5.46%, 1/15/49 (b) | | | | | | | 235 | | | | 231,193 | |
Series 2008-C2, Class ASB, 6.13%, 2/12/51 (b) | | | | | | | 48 | | | | 49,370 | |
Series 2014-FL6, Class A,
1.84%, 11/15/31 (a)(b) | | | | | | | 97 | | | | 96,844 | |
See Notes to Financial Statements.
| | | | | | |
| 16 | | BLACKROCK VARIABLE SERIES FUNDS, INC. | | JUNE 30, 2016 | | |
| | | | |
| Schedule of Investments (continued) | | | BlackRock Total Return V.I. Fund | |
| | | | |
| | | | | | | | | | | | |
| Non-Agency Mortgage-Backed Securities | | | | | Par (000) | | | Value | |
Series 2015-CSMO, Class D, 3.74%, 1/15/32 (a)(b) | | | USD | | | | 100 | | | $ | 99,184 | |
Series 2015-JP1, Class C,
4.90%, 1/15/49 (b) | | | | | | | 20 | | | | 20,344 | |
Series 2015-JP1, Class D,
4.40%, 1/15/49 (b) | | | | | | | 50 | | | | 44,322 | |
Series 2015-SGP, Class A,
2.13%, 7/15/36 (a)(b) | | | | | | | 261 | | | | 260,837 | |
Series 2015-UES, Class E,
3.62%, 9/05/32 (a)(b) | | | | | | | 100 | | | | 96,273 | |
Series 2016-ATRM, Class D,
5.35%, 10/05/28 (a) | | | | | | | 100 | | | | 100,535 | |
LB-UBS Commercial Mortgage Trust,
Series 2007-C1, Class AJ, 5.48%, 2/15/40 | | | | | | | 30 | | | | 30,165 | |
Lone Star Portfolio Trust, Series 2015-LSP,
Class A1A2, 2.24%, 9/15/28 (a)(b) | | | | | | | 71 | | | | 72,433 | |
Merrill Lynch Mortgage Trust, Series 2007-C1,
Class A1A, 6.02%, 6/12/50 (b) | | | | | | | 105 | | | | 107,520 | |
ML-CFC Commercial Mortgage Trust,
Series 2007-7, Class A4, 5.74%, 6/12/50 (b) | | | | | | | 90 | | | | 92,300 | |
Morgan Stanley Bank of America Merrill Lynch Trust: | | | | | | | | | | | | |
Series 2015-C25, Class C,
4.68%, 10/15/48 (b) | | | | | | | 200 | | | | 198,107 | |
Series 2015-C26, Class D,
3.06%, 10/15/48 (a) | | | | | | | 110 | | | | 76,049 | |
Morgan Stanley Capital I Trust: | | | | | | | | | | | | |
Series 2007-HQ11, Class AMFL,
0.62%, 2/12/44 (b) | | | | | | | 25 | | | | 24,517 | |
Series 2007-HQ12, Class AM,
5.90%, 4/12/49 (b) | | | | | | | 95 | | | | 95,659 | |
Series 2007-IQ13, Class AM,
5.41%, 3/15/44 | | | | | | | 120 | | | | 122,302 | |
Series 2007-IQ15, Class AM,
6.10%, 6/11/49 (b) | | | | | | | 405 | | | | 417,553 | |
Morgan Stanley Re-REMIC Trust,
Series 2012-XA, Class A, 2.00%, 7/27/49 (a) | | | | | | | 52 | | | | 51,935 | |
RBSCF Trust, Series 2010-RR3, Class WBTA, 6.15%, 2/16/51 (a)(b) | | | | | | | 690 | | | | 691,837 | |
SCG Trust, Series 2013-SRP1, Class AJ, 2.38%, 11/15/26 (a)(b) | | | | | | | 120 | | | | 119,661 | |
STRIPs Ltd.: | | | | | | | | | | | | |
Series 2012-1A, Class A,
1.50%, 12/25/44 (a) | | | | | | | 43 | | | | 42,529 | |
Series 2012-1A, Class B,
0.50%, 12/25/44 (a) | | | | | | | 100 | | | | 90,141 | |
Velocity Commercial Capital Loan Trust: | | | | | | | | | | | | |
Series 2015-1, Class AFL,
2.88%, 6/25/45 (a)(b) | | | | | | | 205 | | | | 206,449 | |
Series 2016-1, Class AFL,
2.89%, 4/25/46 (a)(b) | | | | | | | 183 | | | | 183,357 | |
Wachovia Bank Commercial Mortgage Trust: | | | | | | | | | | | | |
Series 2006-C28, Class AJ, 5.63%, 10/15/48 (b) | | | | | | | 12 | | | | 11,975 | |
Series 2006-C29, Class AM, 5.34%, 11/15/48 | | | | | | | 30 | | | | 30,290 | |
Wells Fargo Commercial Mortgage Trust: | | | | | | | | | | | | |
Series 2015-C27, Class C, 3.89%, 2/15/48 | | | | | | | 30 | | | | 27,702 | |
Series 2015-C31, Class D, 3.85%, 11/15/48 | | | | | | | 20 | | | | 14,056 | |
Wells Fargo Resecuritization Trust,
Series 2012-IO, Class A, 1.75%, 8/20/21 (a) | | | | | | | 7 | | | | 7,427 | |
| | | | | | | | | | | | |
| | | | | | | | | | | | 12,254,421 | |
| | | | | | | | | | | | |
| Non-Agency Mortgage-Backed Securities | | | | | Par (000) | | | Value | |
Interest Only Commercial Mortgage-Backed Securities — 0.5% | | | | | |
Barclays Commercial Mortgage Trust, Series 2015-SRCH, Class XA, 1.12%, 8/10/35 (a)(b) | | | USD | | | | 1,030 | | | $ | 83,275 | |
BB-UBS Trust, Series 2012-SHOW, Class XA, 0.73%, 11/05/36 (a)(b) | | | | | | | 3,475 | | | | 160,435 | |
CFCRE Commercial Mortgage Trust: | | | | | | | | | | | | |
Series 2016-C4, Class XA, 1.78%, 5/10/58 (b) | | | | | | | 309 | | | | 38,529 | |
Series 2016-C4, Class XB, 0.89%, 5/10/58 (b) | | | | | | | 170 | | | | 10,599 | |
Citigroup Commercial Mortgage Trust: | | | | | | | | | | | | |
Series 2014-GC19, Class XA, 1.46%, 3/10/47 (b) | | | | | | | 1,103 | | | | 71,964 | |
Series 2016-P3, Class XA, 1.88%, 4/15/49 (b) | | | | | | | 1,000 | | | | 119,045 | |
Commercial Mortgage Pass-Through Certificates: | | | | | | | | | | | | |
Series 2013-LC6, Class XA, 1.87%, 1/10/46 (b) | | | | | | | 876 | | | | 54,769 | |
Series 2014-CR14, Class XA, 1.00%, 2/10/47 (b) | | | | | | | 1,238 | | | | 45,141 | |
Series 2015-3BP, Class XA,
0.17%, 2/10/35 (a)(b) | | | | | | | 1,916 | | | | 15,041 | |
Series 2015-CR23, Class XA,
1.15%, 5/10/48 (b) | | | | | | | 615 | | | | 36,335 | |
Series 2016-DC2, Class XA,
1.14%, 2/10/26 (b) | | | | | | | 629 | | | | 46,235 | |
Credit Suisse Mortgage Capital Certificates,
Series 2015-GLPA, Class XA,
0.40%, 11/15/37 (a)(b) | | | | | | | 1,000 | | | | 22,700 | |
GS Mortgage Securities Corp. II, Series 2013-GC10, Class XA, 1.75%, 2/10/46 (b) | | | | | | | 1,568 | | | | 123,194 | |
Hilton USA Trust, Series 2013-HLT, Class X1FX, 0.00%, 11/05/30 (a)(b) | | | | | | | 2,340 | | | | 23 | |
JPMBB Commercial Mortgage Securities Trust: | | | | | | | | | | | | |
Series 2014-C21, Class XA, 1.26%, 8/15/47 (b) | | | | | | | 987 | | | | 64,436 | |
Series 2014-C22, Class XA, 1.12%, 9/15/47 (b) | | | | | | | 1,043 | | | | 58,809 | |
Series 2014-C23, Class XA, 1.02%, 9/15/47 (b) | | | | | | | 1,720 | | | | 68,207 | |
Series 2015-C28, Class XA, 1.34%, 10/15/48 (b) | | | | | | | 994 | | | | 65,999 | |
Series 2015-C33, Class XA, 1.20%, 12/15/48 (b) | | | | | | | 428 | | | | 30,397 | |
Series 2016-C1, Class XA, 1.56%, 3/15/49 (b) | | | | | | | 999 | | | | 91,576 | |
Morgan Stanley Bank of America Merrill Lynch Trust: | | | | | | | | | | | | |
Series 2014-C19, Class XA, 1.30%, 12/15/47 (b) | | | | | | | 611 | | | | 37,201 | |
Series 2014-C19, Class XF,
1.34%, 12/15/47 (a)(b) | | | | | | | 130 | | | | 8,722 | |
Series 2015-C25, Class XA, 1.15%, 10/15/48 (b) | | | | | | | 523 | | | | 40,345 | |
Series 2015-C26, Class XD,
1.50%, 10/15/48 (a)(b) | | | | | | | 120 | | | | 12,985 | |
Series 2016-C29, Class XB, 1.12%, 5/15/49 (b) | | | | | | | 1,020 | | | | 82,009 | |
Morgan Stanley Capital I Trust, Series 2016-UBS9, Class XD, 1.70%, 3/15/49 (a)(b) | | | | | | | 1,000 | | | | 118,730 | |
Wells Fargo Commercial Mortgage Trust,
Series 2016-C33, 1.98%, 3/17/59 (b) | | | | | | | 399 | | | | 47,601 | |
See Notes to Financial Statements.
| | | | | | |
| | | BLACKROCK VARIABLE SERIES FUNDS, INC. | | JUNE 30, 2016 | | 17 |
| | | | |
| Schedule of Investments (continued) | | | BlackRock Total Return V.I. Fund | |
| | | | |
| | | | | | | | | | | | |
| Non-Agency Mortgage-Backed Securities | | | Par (000) | | | Value | |
Interest Only Commercial Mortgage-Backed Securities (continued) | | | | | |
WF-RBS Commercial Mortgage Trust: | | | | | | | | | | | | |
Series 2012-C9, Class XA, 2.29%, 11/15/45 (a)(b) | | | USD 341 | | | $ | 29,036 | |
Series 2014-C24, Class XA, 1.12%, 11/15/47 (b) | | | | | | | 818 | | | | 45,656 | |
Series 2014-LC14, Class XA, 1.40%, 3/15/47 (b) | | | | | | | 970 | | | | 64,816 | |
| | | | | | | | | | | | |
| | | | | | | | | | | | 1,693,810 | |
Total Non-Agency Mortgage-Backed Securities — 6.5% | | | | 19,956,355 | |
| | | | | | | | | | | | |
| Other Interests (f) | | | | | Beneficial Interest (000) | | | | |
Capital Markets — 0.0% | | | | | | | | | | | | |
Lehman Brothers Holdings Capital Trust VII (d)(e) | | | | 185 | | | | — | |
Lehman Brothers Holdings, Inc. (d)(e) | | | | | | | 1,025 | | | | — | |
Total Other Interests — 0.0% | | | | | | | | — | |
| | | | | | | | | | | | |
| Preferred Securities | | | | | Par (000) | | | | |
Capital Trusts | | | | | | | | | | | | |
Capital Markets — 0.0% | | | | | | | | | | | | |
State Street Capital Trust IV, 1.65%, 6/01/77 (b) | | | | | | | 40 | | | | 33,413 | |
Media — 0.1% | | | | | | | | | | | | |
NBCUniversal Enterprise, Inc., 5.25% (a)(g) | | | | 200 | | | | 206,250 | |
Total Capital Trusts — 0.1% | | | | | | | | 239,663 | |
| | | | | | | | | | | | |
| Preferred Stocks | | | | | Shares | | | | |
Thrifts & Mortgage Finance — 0.0% | | | | | | | | | | | | |
Fannie Mae, Series S, 8.25% | | | | | | | 10,000 | | | | 44,700 | |
Freddie Mac, Series Z, 8.38% | | | | | | | 10,000 | | | | 44,500 | |
| | | | | | | | | | | | |
| | | | | | | | | | | | 89,200 | |
Total Preferred Stocks — 0.0% | | | | | | | | 89,200 | |
| | | | | | | | | | | | |
| Trust Preferreds | | | | | | | | | |
Banks — 0.1% | | | | | | | | | | | | |
Citigroup Capital XIII, 7.01%, 10/30/40 (b) | | | | | | | 13,971 | | | | 364,224 | |
Consumer Finance — 0.1% | | | | | | | | | | | | |
GMAC Capital Trust I, 6.41%, 2/15/40 (b) | | | | | | | 13,000 | | | | 322,660 | |
Total Trust Preferreds — 0.2% | | | | | | | | 686,884 | |
Total Preferred Securities — 0.3% | | | | | | | | 1,015,747 | |
| | | | | | | | | | | | |
| Taxable Municipal Bonds | | | | | Par (000) | | | | |
Arizona Health Facilities Authority RB, 1.23%, 1/01/37 (b) | | | | | | | 65 | | | | 60,479 | |
Bay Area Toll Authority RB: | | | | | | | | | | | | |
6.92%, 4/01/40 | | | | | | | 65 | | | | 95,091 | |
7.04%, 4/01/50 | | | | | | | 45 | | | | 70,712 | |
California State Public Works Board RB, 8.36%, 10/01/34 | | | | | | | 35 | | | | 54,110 | |
| | | | | | | | | | | | |
| Taxable Municipal Bonds | | | | | Par (000) | | | Value | |
City of Atlanta, GA Water & Wastewater Revenue RB,
5.00%, 11/01/33 | | | USD | | | | 55 | | | $ | 68,453 | |
City of San Jose, CA Airport Revenue RB, AMBAC,
5.00%, 3/01/37 | | | | | | | 30 | | | | 30,798 | |
City of Seattle, WA Municipal Light & Power Revenue RB, 5.00%, 4/01/23-4/01/25 | | | | | | | 115 | | | | 145,697 | |
City Public Service Board of San Antonio, TX RB,
5.81%, 2/01/41 | | | | | | | 90 | | | | 125,668 | |
Clark County School District GO, 5.00%, 6/15/23-6/15/28 | | | | | | | 350 | | | | 439,327 | |
Colorado Health Facilities Authority RB,
5.25%, 2/01/31 | | | | | | | 45 | | | | 51,251 | |
Commonwealth of Massachusetts GO,
5.00%, 7/01/22-7/01/28 | | | | | | | 385 | | | | 486,653 | |
Contra Costa Community College District GO,
6.50%, 8/01/34 | | | | | | | 10 | | | | 13,765 | |
County of Miami-Dade, FL Aviation Revenue RB,
5.00%, 10/01/38 | | | | | | | 10 | | | | 11,863 | |
County of Miami-Dade, FL GO,
5.00%, 7/01/29-7/01/38 | | | | | | | 350 | | | | 442,900 | |
County of Sacramento, CA Airport System Revenue RB, AGM, 5.25%, 7/01/39 | | | | | | | 25 | | | | 26,871 | |
Energy Northwest RB: | | | | | | | | | | | | |
2.81%, 7/01/24 | | | | | | | 95 | | | | 100,010 | |
5.00%, 7/01/27-7/01/28 | | | | | | | 70 | | | | 91,359 | |
Grant County Public Utility District No. 2 RB, 4.58%, 1/01/40 | | | | | | | 15 | | | | 16,375 | |
Health & Educational Facilities Authority of the State of Missouri RB, 5.00%, 11/15/29-11/15/34 | | | | | | | 75 | | | | 94,054 | |
Horry County School District, SC GO, 5.00%, 3/01/19-3/01/25 | | | | | | | 225 | | | | 274,735 | |
Las Vegas Valley Water District GO, 5.00%, 6/01/41 | | | | | | | 20 | | | | 24,805 | |
Los Angeles Community College District GO, 6.60%, 8/01/42 | | | | | | | 55 | | | | 84,022 | |
Los Angeles Department of Water & Power RB, 6.60%, 7/01/50 | | | | | | | 30 | | | | 46,616 | |
Los Angeles Unified School District GO, 6.76%, 7/01/34 | | | | | | | 150 | | | | 216,210 | |
Massachusetts Clean Water Trust RB, 5.00%, 2/01/25-2/01/28 | | | | | | | 155 | | | | 204,008 | |
Massachusetts Development Finance Agency RB, 5.00%, 7/01/44 | | | | | | | 95 | | | | 111,613 | |
Metropolitan Transportation Authority RB: | | | | | | | | | | | | |
6.67%, 11/15/39 | | | | | | | 55 | | | | 79,249 | |
6.69%, 11/15/40 | | | | | | | 30 | | | | 43,247 | |
Metropolitan Washington Airports Authority Dulles Toll Road Revenue RB, 7.46%, 10/01/46 | | | | | | | 30 | | | | 46,391 | |
Miami-Dade County Educational Facilities Authority RB, 5.07%, 4/01/50 | | | | | | | 30 | | | | 35,767 | |
Municipal Electric Authority of Georgia RB, 6.64%, 4/01/57 | | | | | | | 40 | | | | 52,673 | |
New Jersey Educational Facilities Authority RB, 5.00%, 7/01/23 | | | | | | | 55 | | | | 69,441 | |
New Jersey State Turnpike Authority RB, 7.41%, 1/01/40 | | | | | | | 60 | | | | 93,920 | |
New Jersey Turnpike Authority RB, 5.00%, 1/01/45 | | | | | | | 20 | | | | 23,961 | |
New York City Water & Sewer System RB: | | | | | | | | | | | | |
5.75%, 6/15/41 | | | | | | | 35 | | | | 48,397 | |
6.01%, 6/15/42 | | | | | | | 25 | | | | 35,951 | |
5.38%, 6/15/43 | | | | | | | 200 | | | | 235,720 | |
5.50%, 6/15/43 | | | | | | | 240 | | | | 284,390 | |
5.88%, 6/15/44 | | | | | | | 40 | | | | 57,496 | |
New York State Dormitory Authority RB: | | | | | | | | | | | | |
5.00%, 3/15/32 | | | | | | | 40 | | | | 50,894 | |
5.39%, 3/15/40 | | | | | | | 30 | | | | 39,769 | |
See Notes to Financial Statements.
| | | | | | |
| 18 | | BLACKROCK VARIABLE SERIES FUNDS, INC. | | JUNE 30, 2016 | | |
| | | | |
| Schedule of Investments (continued) | | | BlackRock Total Return V.I. Fund | |
| | | | |
| | | | | | | | | | | | |
| Taxable Municipal Bonds | | | | | Par (000) | | | Value | |
New York State Housing Finance Agency RB, 3.25%, 11/01/41 | | | USD | | | | 25 | | | $ | 25,403 | |
New York State Thruway Authority RB, 5.00%, 5/01/19-1/01/31 | | | | | | | 35 | | | | 42,054 | |
New York State Urban Development Corp. RB, 5.00%, 3/15/24-3/15/28 | | | | | | | 400 | | | | 518,602 | |
New York Transportation Development Corp. RB: | | | | | | | | | | | | |
5.00%, 7/01/41-7/01/46 | | | | | | | 125 | | | | 144,149 | |
5.25%, 1/01/50 | | | | | | | 100 | | | | 117,066 | |
Orange County Local Transportation Authority RB, 6.91%, 2/15/41 | | | | | | | 75 | | | | 109,263 | |
Port Authority of New York & New Jersey RB, 4.96%, 8/01/46 | | | | | | | 80 | | | | 99,415 | |
Regents of the University of California Medical Center Pooled Revenue RB, 6.58%, 5/15/49 | | | | | | | 75 | | | | 108,312 | |
State of California GO: | | | | | | | | | | | | |
5.00%, 9/01/27-9/01/32 | | | | | | | 140 | | | | 182,592 | |
7.50%, 4/01/34 | | | | | | | 60 | | | | 91,010 | |
4.99%, 4/01/39 | | | | | | | 40 | | | | 43,312 | |
7.55%, 4/01/39 | | | | | | | 265 | | | | 419,309 | |
7.30%, 10/01/39 | | | | | | | 25 | | | | 37,832 | |
7.35%, 11/01/39 | | | | | | | 50 | | | | 76,034 | |
7.60%, 11/01/40 | | | | | | | 40 | | | | 64,704 | |
State of Georgia GO, 5.00%, 7/01/23-2/01/29 (h) | | | | | | | 420 | | | | 542,105 | |
State of Hawaii GO, 5.00%, 4/01/19-4/01/23 | | | | | | | 225 | | | | 265,953 | |
State of Illinois GO, 5.10%, 6/01/33 | | | | | | | 220 | | | | 211,189 | |
State of Maryland GO, 5.00%, 6/01/21-6/01/24 | | | | | | | 200 | | | | 248,526 | |
State of Nevada Highway Improvement Revenue RB, 5.00%, 12/01/27-12/01/28 | | | | | | | 65 | | | | 84,596 | |
State of North Carolina GO, 5.00%, 6/01/24-6/01/26 | | | | | | | 325 | | | | 427,746 | |
State of Ohio GO, 5.00%, 12/15/23-12/15/24 | | | | | | | 185 | | | | 236,206 | |
State of Washington GO, 5.00%, 8/01/25-8/01/32 (h) | | | | | | | 485 | | | | 625,441 | |
State of Wisconsin GO, 5.00%, 5/01/34 | | | | | | | 100 | | | | 125,381 | |
Texas Private Activity Bond Surface | | | | | | | | | | | | |
Transportation Corp. RB, 5.00%, 12/31/55 | | | | | | | 50 | | | | 58,213 | |
University of California RB, 4.86%, 5/15/12 | | | | | | | 20 | | | | 22,297 | |
Virginia Public School Authority RB, 5.00%, 8/01/25 | | | | | | | 30 | | | | 39,463 | |
West Virginia Hospital Finance Authority RB, 5.00%, 6/01/19-6/01/24 | | | | | | | 165 | | | | 195,096 | |
Total Taxable Municipal Bonds — 3.2% | | | | | | | | | | | 9,745,980 | |
| | | | | | | | | | | | |
| U.S. Government Sponsored Agency Securities | | | | | | | | | |
Collateralized Mortgage Obligations — 0.1% | | | | | | | | | | | | |
Fannie Mae: | | | | | | | | | | | | |
Series 2013-C01, Class M2, 5.70%, 10/25/23 (b) | | | | | | | 220 | | | | 232,918 | |
Series 2016-C02, Class 1M2, 6.44%, 9/25/28 (b) | | | | | | | 20 | | | | 21,136 | |
| | | | | | | | | | | | |
| | | | | | | | | | | | 254,054 | |
Commercial Mortgage-Backed Securities — 0.0% | | | | | | | | | | | | |
Freddie Mac: | | | | | | | | | | | | |
Series K050, Class A2, 3.33%, 8/25/25 (b) | | | | | | | 80 | | | | 88,191 | |
Series K052, Class A2, 3.15%, 11/25/25 | | | | | | | 56 | | | | 60,347 | |
Series K055, Class A2, 2.67%, 3/25/26 | | | | | | | 75 | | | | 78,538 | |
| | | | | | | | | | | | |
| | | | | | | | | | | | 227,076 | |
| | | | | | | | | | | | |
| U.S. Government Sponsored Agency Securities | | | Par (000) | | | Value | |
Interest Only Commercial Mortgage-Backed Securities — 0.1% | |
Fannie Mae: | | | | | | | | | | | | |
Series 2013-M5, Class X2, 2.32%, 1/25/22 (b) | | | USD | | | | 529 | | | $ | 46,346 | |
Series 2014-M13, Class X2, 0.24%, 2/25/24 (b) | | | | | | | 3,743 | | | | 40,631 | |
Freddie Mac: | | | | | | | | | | | | |
Series K049, Class X1, 0.74%, 7/25/25 (b) | | | | | | | 241 | | | | 10,770 | |
Series K055, Class X1, 1.37%, 3/25/26 (b) | | | | | | | 747 | | | | 78,281 | |
Series K721, Class X1, 0.46%, 8/25/22 (b) | | | | | | | 359 | | | | 6,563 | |
Ginnie Mae: | | | | | | | | | | | | |
Series 2012-120, Class IO, 0.90%, 2/16/53 (b) | | | | | | | 996 | | | | 60,852 | |
Series 2016-87, Class IO, 1.01%, 8/16/58 (b) | | | | | | | 280 | | | | 23,363 | |
| | | | | | | | | | | | |
| | | | | | | | | | | | 266,806 | |
Mortgage-Backed Securities — 37.9% | |
Fannie Mae Mortgage-Backed Securities: | | | | | | | | | | | | |
2.35%, 8/01/38 (b) | | | | | | | 131 | | | | 137,871 | |
2.50%, 4/01/30-7/01/31 (i) | | | | | | | 1,451 | | | | 1,502,579 | |
2.80%, 3/01/41 (b) | | | | | | | 65 | | | | 68,521 | |
2.95%, 3/01/41 (b) | | | | | | | 28 | | | | 29,583 | |
3.00%, 11/01/26-7/01/46 (i) | | | | | | | 12,708 | | | | 13,293,501 | |
3.16%, 12/01/40 (b) | | | | | | | 93 | | | | 97,627 | |
3.37%, 6/01/41 (b) | | | | | | | 74 | | | | 76,830 | |
3.50%, 7/01/26-7/01/46 (i) | | | | | | | 11,920 | | | | 12,641,440 | |
3.52%, 9/01/41 (b) | | | | | | | 81 | | | | 85,236 | |
4.00%, 2/01/25-7/01/46 (i) | | | | | | | 16,187 | | | | 17,430,696 | |
4.50%, 2/01/25-7/01/46 (i) | | | | | | | 4,926 | | | | 5,402,650 | |
5.00%, 9/01/33-7/01/46 (i) | | | | | | | 3,441 | | | | 3,830,851 | |
5.50%, 2/01/35-7/01/46 (i) | | | | | | | 956 | | | | 1,082,991 | |
6.00%, 2/01/17-7/01/46 (i) | | | | | | | 1,038 | | | | 1,192,712 | |
6.50%, 5/01/40 | | | | | | | 286 | | | | 332,111 | |
Freddie Mac Mortgage-Backed Securities: | | | | | | | | | | | | |
2.50%, 3/01/30-7/01/31 (i) | | | | | | | 1,501 | | | | 1,554,393 | |
2.88%, 4/01/38 (b) | | | | | | | 147 | | | | 155,989 | |
3.00%, 5/01/27-7/01/46 (b)(i) | | | | | | | 4,719 | | | | 4,937,437 | |
3.50%, 7/01/31-7/01/46 (i) | | | | | | | 11,026 | | | | 11,692,263 | |
4.00%, 7/01/31-7/01/46 (i) | | | | | | | 5,064 | | | | 5,418,411 | |
4.50%, 2/01/39-7/01/46 (i) | | | | | | | 1,501 | | | | 1,640,694 | |
5.00%, 8/01/40-7/01/46 (i) | | | | | | | 1,308 | | | | 1,444,315 | |
5.50%, 5/01/40-7/01/46 (i) | | | | | | | 527 | | | | 591,129 | |
Ginnie Mae Mortgage-Backed Securities: | | | | | | | | | | | | |
3.00%, 7/15/46 (i) | | | | | | | 4,479 | | | | 4,682,596 | |
3.50%, 12/20/41-7/15/46 (i) | | | | | | | 13,818 | | | | 14,663,702 | |
4.00%, 9/20/40-7/15/46 (i) | | | | | | | 7,075 | | | | 7,567,828 | |
4.50%, 12/20/39-7/15/46 (i) | | | | | | | 2,298 | | | | 2,509,745 | |
5.00%, 12/15/38-7/15/46 (i) | | | | | | | 1,345 | | | | 1,483,187 | |
5.50%, 7/15/46 (i) | | | | | | | 500 | | | | 561,797 | |
| | | | | | | | | | | | |
| | | | | | | | | | | | 116,108,685 | |
Total U.S. Government Sponsored Agency Securities — 38.1% | | | | 116,856,621 | |
| | | | | | | | | | | | |
| U.S. Treasury Obligations | | | | | | | | | |
U.S. Treasury Bonds: | | | | | | | | | | | | |
2.88%, 8/15/45 | | | | | | | 3,910 | | | | 4,390,504 | |
3.00%, 11/15/45 | | | | | | | 2,513 | | | | 2,889,558 | |
U.S. Treasury Inflation Indexed Notes, 0.63%, 1/15/26 | | | | | | | 2,875 | | | | 3,027,856 | |
See Notes to Financial Statements.
| | | | | | |
| | | BLACKROCK VARIABLE SERIES FUNDS, INC. | | JUNE 30, 2016 | | 19 |
| | | | |
| Schedule of Investments (continued) | | | BlackRock Total Return V.I. Fund | |
| | | | |
| | | | | | | | | | | | |
| U.S. Treasury Obligations | | | Par (000) | | | Value | |
U.S. Treasury Notes: | | | | | | | | | | | | |
0.75%, 2/28/18-2/15/19 | | | USD 19,362 | | | $ | 19,411,945 | |
0.88%, 3/31/18-5/31/18 | | | | | | | 8,217 | | | | 8,257,832 | |
1.00%, 3/15/19 | | | | | | | 1,830 | | | | 1,845,513 | |
1.25%, 3/31/21 | | | | | | | 7,380 | | | | 7,465,911 | |
1.38%, 4/30/21 | | | | | | | 6,511 | | | | 6,623,419 | |
1.50%, 3/31/23 | | | | | | | 1,600 | | | | 1,623,062 | |
1.63%, 4/30/23-2/15/26 | | | | | | | 3,281 | | | | 3,343,573 | |
2.00%, 8/15/25 | | | | | | | 2,405 | | | | 2,514,259 | |
2.25%, 11/15/25 | | | | | | | 1,686 | | | | 1,798,751 | |
Total U.S. Treasury Obligations — 20.6% | | | | | | | | | | | 63,192,183 | |
Total Long-Term Investments (Cost — $314,280,966) — 104.4% | | | | 320,125,298 | |
| | | | | | | | | | | | |
| Short-Term Securities | | | | | | | | | |
Borrowed Bond Agreements — 1.0% (j) | |
BNP Paribas Securities Corp., 0.46%, Open (k)
(Purchased on 6/14/16 to be repurchased at $378,966, collateralized by U.S. Treasury Bonds, 2.50% due at 5/15/46, par and fair value of USD 371,000 and $386,608, respectively) | | | | 379 | | | | 378,884 | |
BNP Paribas Securities Corp., 0.77%, Open (k)
(Purchased on 5/03/16 to be repurchased at $177,870, collateralized by U.S. Treasury Notes, 2.13% due at 12/31/22, par and fair value of USD 170,000 and $179,237, respectively) | | | | 178 | | | | 177,650 | |
Deutsche Bank Securities, Inc., 0.00%, 7/01/16
(Purchased on 6/30/16 to be repurchased at $146,650, collateralized by U.S. Treasury Bonds, 2.50% due at 2/15/46, par and fair value of USD 140,000 and $145,781, respectively) | | | | 147 | | | | 146,650 | |
J.P. Morgan Securities LLC, 0.00%, 7/01/16
(Purchased on 6/30/16 to be repurchased at $2,390,325, collateralized by U.S. Treasury Notes, 1.63% due at 5/15/26, par and fair value of USD 2,355,000 and $2,383,795, respectively) | | | | 2,390 | | | | 2,390,325 | |
| | | | | | | | | | | | |
| | | | | | | | | | | | 3,093,509 | |
| | | | | | Shares | | | | |
Money Market Fund — 10.9% | |
BlackRock Liquidity Funds, TempFund, Institutional Class, 0.40% (l)(m) | | | | | | | 33,391,456 | | | | 33,391,456 | |
Total Short-Term Securities (Cost — $36,484,965) — 11.9% | | | | 36,484,965 | |
| | | | | | | | | | | | |
| | | | | | | | | | |
| | | | | | | | | | | | |
Options Purchased | | | | | | Value | |
(Cost — $52,737) — 0.0% | | | | | | | $ | 27,656 | |
Total Investments Before Borrowed Bonds, TBA Sale Commitments and Options Written (Cost — $350,818,668) — 116.3% | | | | | | | | 356,637,919 | |
| | | | | | | | | | | | |
| Borrowed Bonds | | | | | Par
(000) | | | | |
U.S. Treasury Obligations — (1.0)% | | | | | | | | | | | | |
U.S. Treasury Bonds, | | | | | | | | | | | | |
2.50%, 2/15/46 | | | USD | | | | 140 | | | | (145,781 | ) |
2.50%, 5/15/46 | | | | | | | 371 | | | | (386,608 | ) |
U.S. Treasury Notes, | | | | | | | | | | | | |
2.13%, 12/31/22 | | | | | | | 170 | | | | (179,237 | ) |
1.63%, 5/15/26 | | | | | | | 2,355 | | | | (2,383,795 | ) |
Total Borrowed Bonds (Proceeds — $3,031,134) — (1.0)% | | | | | | | | | | | (3,095,421 | ) |
| | | | | | | | | | | | |
| TBA Sale Commitments (i) | | | | | | | | | |
Fannie Mae Mortgage-Backed Securities: | | | | | | | | | | | | |
2.50%, 7/01/31 | | | | | | | 1,009 | | | | (1,043,745 | ) |
3.00%, 7/01/31-7/01/46 | | | | | | | 9,261 | | | | (9,617,292 | ) |
3.50%, 7/01/31-7/01/46 | | | | | | | 1,944 | | | | (2,055,889 | ) |
4.00%, 7/01/31-7/01/46 | | | | | | | 3,981 | | | | (4,265,704 | ) |
4.50%, 7/01/46 | | | | | | | 1,995 | | | | (2,177,657 | ) |
5.00%, 7/01/46 | | | | | | | 2,211 | | | | (2,456,338 | ) |
5.50%, 7/01/46 | | | | | | | 226 | | | | (254,038 | ) |
6.50%, 7/01/46 | | | | | | | 1 | | | | (1,153 | ) |
Freddie Mac Mortgage-Backed Securities: | | | | | | | | | | | | |
2.50%, 7/01/31 | | | | | | | 75 | | | | (77,558 | ) |
3.00%, 7/01/46 | | | | | | | 1,025 | | | | (1,062,570 | ) |
3.50%, 7/01/46 | | | | | | | 4,877 | | | | (5,141,425 | ) |
4.00%, 7/01/46 | | | | | | | 1,400 | | | | (1,498,437 | ) |
5.00%, 7/01/46 | | | | | | | 460 | | | | (507,781 | ) |
Ginnie Mae Mortgage-Backed Securities: | | | | | | | | | | | | |
3.50%, 7/15/46 | | | | | | | 5,845 | | | | (6,203,691 | ) |
4.00%, 7/15/46 | | | | | | | 3,061 | | | | (3,271,922 | ) |
4.50%, 7/15/46 | | | | | | | 201 | | | | (218,431 | ) |
5.00%, 7/15/46 | | | | | | | 326 | | | | (362,715 | ) |
Total TBA Sale Commitments (Proceeds — $40,031,406) — (13.1)% | | | | | | | | | | | (40,216,346 | ) |
| | | | | | | | | | | | |
| Options Written | | | | | | | | | |
(Premiums Received — $33,513) — (0.0)% | | | | | | | | | | | (4,897 | ) |
Total Investments Net of Borrowed Bonds, TBA Sale Commitments and Options Written — 102.2% | | | | | | | | 313,321,255 | |
Liabilities in Excess of Other Assets — (2.2)% | | | | | | | | | | | (6,847,988 | ) |
| | | | | | | | | | | | |
Net Assets — 100.0% | | | | | | | | | | $ | 306,473,267 | |
| | | | | | | | | | | | |
|
| Notes to Schedule of Investments |
| (a) | Security exempt from registration pursuant to Rule 144A under the Securities Act of 1933, as amended. These securities may be resold in transactions exempt from registration to qualified institutional investors. |
| (b) | Variable rate security. Rate as of period end. |
| (c) | Step-up bond that pays an initial coupon rate for the first period and then a higher coupon rate for the following periods. Rate as of period end. |
| (d) | Issuer filed for bankruptcy and/or is in default of interest payments. |
| (e) | Non-income producing security. |
| (f) | Other interests represent beneficial interests in liquidation trusts and other reorganization or private entities. |
| (g) | Perpetual security with no stated maturity date. |
See Notes to Financial Statements.
| | | | | | |
| 20 | | BLACKROCK VARIABLE SERIES FUNDS, INC. | | JUNE 30, 2016 | | |
| | | | |
| Schedule of Investments (continued) | | | BlackRock Total Return V.I. Fund | |
| (i) | Represents or includes a TBA transaction. Unsettled TBA transactions as of June 30, 2016 were as follows: |
| | | | | | | | |
| Counterparty | | Value | | | Unrealized Appreciation (Depreciation) | |
Barclays Capital, Inc. | | $ | (1,613,260 | ) | | | $ (7,824 | ) |
BNP Paribas Securities Corp. | | $ | 719,452 | | | | $ 4,165 | |
Citigroup Global Markets, Inc. | | $ | 2,484,614 | | | | $14,185 | |
Credit Suisse Securities (USA) LLC | | $ | (610,380 | ) | | | $ (9,394 | ) |
Daiwa Capital Markets America, Inc. | | $ | 1,579,410 | | | | $12,441 | |
Deutsche Bank Securities, Inc. | | $ | 805,033 | | | | $ 1,501 | |
Goldman Sachs & Co. | | $ | 3,459,142 | | | | $ (6,084 | ) |
J.P. Morgan Securities LLC | | $ | 3,487,960 | | | | $ 9,218 | |
Merrill Lynch, Pierce, Fenner & Smith, Inc. | | $ | 2,579,288 | | | | $ 552 | |
Morgan Stanley & Co. LLC | | $ | 1,867,825 | | | | $ 4,273 | |
Nomura Securities International, Inc. | | $ | (538,230 | ) | | | $ (8,223 | ) |
RBC Capital Markets, LLC | | $ | 794,674 | | | | $ 3,943 | |
Wells Fargo Securities, LLC | | $ | 1,005,129 | | | | $ 3,593 | |
| (j) | Certain agreements have no stated maturity and can be terminated by either party at any time. |
| (k) | The amount to be repurchased assumes the maturity will be the day after the period end. |
| (l) | During the six months ended June 30, 2016, investments in issuers considered to be an affiliate of the Fund for purposes of Section 2(a)(3) of the Investment Company Act of 1940, as amended, were as follows: |
| | | | | | | | | | | | | | | | | | | | |
| Affiliate | | Shares Held at
December 31, 2015 | | | Net Activity | | | Shares Held at June 30, 2016 | | | Value at June 30, 2016 | | | Income | |
BlackRock Liquidity Funds, TempFund, Institutional Class | | | 18,757,657 | | | | 14,633,799 | | | | 33,391,456 | | | | $33,391,456 | | | | $41,357 | |
| (m) | Current yield as of period end. |
| • | For Fund compliance purposes, the Fund’s industry classifications refer to one or more of the industry sub-classifications used by one or more widely recognized market indexes or rating group indexes, and/or as defined by the investment adviser. These definitions may not apply for purposes of this report, which may combine such industry sub-classifications for reporting ease. |
|
| Derivative Financial Instruments Outstanding as of Period End |
| | | | | | | | | | | | | | | | |
Futures Contracts | |
Contracts Long (Short) | | Issue | | Expiration | | Notional Value | | | Unrealized
Appreciation
(Depreciation) | |
| (3) | | Euro-Bobl | | September 2016 | | | USD | | | | 444,790 | | | | $ (3,485 | ) |
| (18) | | Euro-BTP Italian Government Bond | | September 2016 | | | USD | | | | 2,848,718 | | | | (24,272 | ) |
| (23) | | Euro-Bund | | September 2016 | | | USD | | | | 4,265,631 | | | | (25,931 | ) |
| 23 | | U.S. Treasury Bonds (30 Year) | | September 2016 | | | USD | | | | 3,963,906 | | | | 161,386 | |
| 109 | | U.S. Treasury Notes (10 Year) | | September 2016 | | | USD | | | | 14,495,297 | | | | 52,025 | |
| 23 | | U.S. Treasury Notes (2 Year) | | September 2016 | | | USD | | | | 5,044,547 | | | | 11,748 | |
| 160 | | U.S. Treasury Notes (5 Year) | | September 2016 | | | USD | | | | 19,546,250 | | | | 233,315 | |
| 37 | | U.S. Ultra Treasury Bonds | | September 2016 | | | USD | | | | 6,895,875 | | | | 312,198 | |
| (4) | | Euro Dollar | | December 2016 | | | USD | | | | 993,250 | | | | (3,005 | ) |
Total | | | | | | | | | | | | | | | $713,979 | |
| | | | | | | | | | | | | | | | |
| | | | | | | | | | | | | | | | | | | | | | |
Forward Foreign Currency Exchange Contracts | |
Currency Purchased | | | Currency Sold | | | Counterparty | | Settlement
Date | | | Unrealized
Appreciation
(Depreciation) | |
| TRY | | | 843,530 | | | | USD | | | | 290,000 | | | Deutsche Bank AG | | | 7/01/16 | | | | $ 3,176 | |
| TRY | | | 842,329 | | | | USD | | | | 290,000 | | | Morgan Stanley & Co. International PLC | | | 7/01/16 | | | | 2,758 | |
| USD | | | 580,000 | | | | TRY | | | | 1,702,520 | | | Morgan Stanley & Co. International PLC | | | 7/01/16 | | | | (11,725 | ) |
| CAD | | | 741,116 | | | | USD | | | | 570,000 | | | Deutsche Bank AG | | | 7/05/16 | | | | 3,653 | |
See Notes to Financial Statements.
| | | | | | |
| | | BLACKROCK VARIABLE SERIES FUNDS, INC. | | JUNE 30, 2016 | | 21 |
| | | | |
| Schedule of Investments (continued) | | | BlackRock Total Return V.I. Fund | |
| | | | | | | | | | | | | | | | | | | | |
Currency
Purchased | | | Currency
Sold | | | Counterparty | | Settlement
Date | | | Unrealized
Appreciation
(Depreciation) | |
| EUR | | | 525,008 | | | USD | | | 580,000 | | | Morgan Stanley & Co. International PLC | | | 7/05/16 | | | | $ 2,740 | |
| EUR | | | 580,000 | | | USD | | | 640,764 | | | Morgan Stanley & Co. International PLC | | | 7/05/16 | | | | 3,015 | |
| GBP | | | 422,919 | | | USD | | | 580,000 | | | JPMorgan Chase Bank N.A. | | | 7/05/16 | | | | (16,961 | ) |
| JPY | | | 59,398,670 | | | USD | | | 580,000 | | | Goldman Sachs International | | | 7/05/16 | | | | (4,704 | ) |
| RUB | | | 18,061,978 | | | USD | | | 280,000 | | | Société Générale | | | 7/05/16 | | | | 2,070 | |
| RUB | | | 18,730,488 | | | USD | | | 290,000 | | | Société Générale | | | 7/05/16 | | | | 2,510 | |
| SEK | | | 4,949,953 | | | USD | | | 580,000 | | | BNP Paribas S.A. | | | 7/05/16 | | | | 5,182 | |
| USD | | | 290,000 | | | CAD | | | 370,928 | | | Royal Bank of Scotland PLC | | | 7/05/16 | | | | 2,887 | |
| USD | | | 280,000 | | | CAD | | | 358,992 | | | State Street Bank and Trust Co. | | | 7/05/16 | | | | 2,126 | |
| USD | | | 290,000 | | | EUR | | | 256,333 | | | Citibank N.A. | | | 7/05/16 | | | | 5,480 | |
| USD | | | 642,318 | | | EUR | | | 580,000 | | | Morgan Stanley & Co. International PLC | | | 7/05/16 | | | | (1,461 | ) |
| USD | | | 290,000 | | | EUR | | | 256,825 | | | Morgan Stanley & Co. International PLC | | | 7/05/16 | | | | 4,934 | |
| USD | | | 290,000 | | | GBP | | | 197,224 | | | HSBC Bank PLC | | | 7/05/16 | | | | 27,432 | |
| USD | | | 290,000 | | | GBP | | | 197,331 | | | Northern Trust Corp. | | | 7/05/16 | | | | 27,290 | |
| USD | | | 290,000 | | | JPY | | | 30,249,447 | | | Citibank N.A. | | | 7/05/16 | | | | (2,976 | ) |
| USD | | | 290,000 | | | JPY | | | 30,336,276 | | | Morgan Stanley & Co. International PLC | | | 7/05/16 | | | | (3,817 | ) |
| USD | | | 570,000 | | | RUB | | | 37,477,500 | | | Morgan Stanley & Co. International PLC | | | 7/05/16 | | | | (16,078 | ) |
| USD | | | 290,000 | | | SEK | | | 2,400,743 | | | Barclays Bank PLC | | | 7/05/16 | | | | 6,185 | |
| USD | | | 290,000 | | | SEK | | | 2,391,473 | | | Deutsche Bank AG | | | 7/05/16 | | | | 7,281 | |
| BRL | | | 980,925 | | | USD | | | 290,000 | | | Goldman Sachs International | | | 7/06/16 | | | | 14,774 | |
| BRL | | | 984,405 | | | USD | | | 290,000 | | | Royal Bank of Scotland PLC | | | 7/06/16 | | | | 15,855 | |
| COP | | | 384,150,000 | | | USD | | | 130,000 | | | BNP Paribas S.A. | | | 7/06/16 | | | | 1,330 | |
| COP | | | 387,855,000 | | | USD | | | 130,000 | | | BNP Paribas S.A. | | | 7/06/16 | | | | 2,597 | |
| COP | | | 476,992,000 | | | USD | | | 160,000 | | | Credit Suisse International | | | 7/06/16 | | | | 3,071 | |
| COP | | | 472,960,000 | | | USD | | | 160,000 | | | HSBC Bank PLC | | | 7/06/16 | | | | 1,692 | |
| USD | | | 580,000 | | | BRL | | | 2,001,000 | | | Morgan Stanley & Co. International PLC | | | 7/06/16 | | | | (41,712 | ) |
| USD | | | 100,000 | | | COP | | | 298,500,000 | | | BNP Paribas S.A. | | | 7/06/16 | | | | (2,049 | ) |
| USD | | | 255,000 | | | COP | | | 764,334,450 | | | Credit Suisse International | | | 7/06/16 | | | | (6,305 | ) |
| USD | | | 105,000 | | | COP | | | 313,950,000 | | | HSBC Bank PLC | | | 7/06/16 | | | | (2,331 | ) |
| USD | | | 120,000 | | | COP | | | 358,200,000 | | | Royal Bank of Scotland PLC | | | 7/06/16 | | | | (2,459 | ) |
| USD | | | 846,436 | | | EUR | | | 758,000 | | | Barclays Bank PLC | | | 7/06/16 | | | | 5,052 | |
| USD | | | 28,327 | | | EUR | | | 25,000 | | | Morgan Stanley & Co. International PLC | | | 7/06/16 | | | | 577 | |
| IDR | | | 3,851,200,000 | | | USD | | | 290,000 | | | JPMorgan Chase Bank N.A. | | | 7/11/16 | | | | 981 | |
| IDR | | | 3,852,070,000 | | | USD | | | 290,000 | | | Standard Chartered Bank | | | 7/11/16 | | | | 1,047 | |
| USD | | | 580,000 | | | IDR | | | 7,818,400,000 | | | Standard Chartered Bank | | | 7/11/16 | | | | (10,726 | ) |
| MXN | | | 1,441,422 | | | USD | | | 77,575 | | | Citibank N.A. | | | 7/13/16 | | | | 1,168 | |
| MXN | | | 1,572,144 | | | USD | | | 84,619 | | | Citibank N.A. | | | 7/13/16 | | | | 1,265 | |
| MXN | | | 2,365,050 | | | USD | | | 127,825 | | | Goldman Sachs International | | | 7/13/16 | | | | 1,374 | |
| MXN | | | 3,003,622 | | | USD | | | 161,589 | | | Royal Bank of Scotland PLC | | | 7/13/16 | | | | 2,495 | |
| MXN | | | 709,072 | | | USD | | | 38,020 | | | State Street Bank and Trust Co. | | | 7/13/16 | | | | 716 | |
| USD | | | 29,190 | | | MXN | | | 540,062 | | | BNP Paribas S.A. | | | 7/13/16 | | | | (313 | ) |
| USD | | | 129,114 | | | MXN | | | 2,365,050 | | | JPMorgan Chase Bank N.A. | | | 7/13/16 | | | | (86 | ) |
| USD | | | 127,275 | | | MXN | | | 2,331,354 | | | JPMorgan Chase Bank N.A. | | | 7/13/16 | | | | (84 | ) |
| USD | | | 58,762 | | | MXN | | | 1,076,364 | | | JPMorgan Chase Bank N.A. | | | 7/13/16 | | | | (39 | ) |
| USD | | | 16,081 | | | MXN | | | 294,566 | | | JPMorgan Chase Bank N.A. | | | 7/13/16 | | | | (11 | ) |
| USD | | | 134,073 | | | MXN | | | 2,483,915 | | | Morgan Stanley & Co. International PLC | | | 7/13/16 | | | | (1,620 | ) |
| JPY | | | 26,264,455 | | | USD | | | 245,000 | | | Standard Chartered Bank | | | 7/14/16 | | | | 9,452 | |
| KRW | | | 144,393,600 | | | USD | | | 124,800 | | | Morgan Stanley & Co. International PLC | | | 7/14/16 | | | | 540 | |
| KRW | | | 72,945,600 | | | USD | | | 62,400 | | | Standard Chartered Bank | | | 7/14/16 | | | | 920 | |
See Notes to Financial Statements.
| | | | | | |
| 22 | | BLACKROCK VARIABLE SERIES FUNDS, INC. | | JUNE 30, 2016 | | |
| | | | |
| Schedule of Investments (continued) | | | BlackRock Total Return V.I. Fund | |
| | | | | | | | | | | | | | | | | | | | | | |
Currency
Purchased | | | Currency
Sold | | | Counterparty | | Settlement
Date | | | Unrealized
Appreciation
(Depreciation) | |
| USD | | | 245,000 | | | | JPY | | | | 26,152,476 | | | Royal Bank of Scotland PLC | | | 7/14/16 | | | | $ (8,367 | ) |
| USD | | | 312,000 | | | | KRW | | | | 362,871,600 | | | JPMorgan Chase Bank N.A. | | | 7/14/16 | | | | (2,989 | ) |
| USD | | | 14,305 | | �� | | RUB | | | | 945,261 | | | JPMorgan Chase Bank N.A. | | | 7/20/16 | | | | (396 | ) |
| CNH | | | 2,592,470 | | | | USD | | | | 390,000 | | | Deutsche Bank AG | | | 7/29/16 | | | | (1,475 | ) |
| USD | | | 1,120,000 | | | | CNH | | | | 7,383,488 | | | Barclays Bank PLC | | | 7/29/16 | | | | 13,462 | |
| USD | | | 1,470,000 | | | | CNH | | | | 9,797,418 | | | UBS AG | | | 7/29/16 | | | | 1,695 | |
| COP | | | 190,287,500 | | | | USD | | | | 65,000 | | | Credit Suisse International | | | 8/01/16 | | | | (341 | ) |
| COP | | | 192,270,000 | | | | USD | | | | 65,000 | | | Credit Suisse International | | | 8/01/16 | | | | 333 | |
| COP | | | 278,236,000 | | | | USD | | | | 95,000 | | | Standard Chartered Bank | | | 8/01/16 | | | | (456 | ) |
| COP | | | 398,655,000 | | | | USD | | | | 135,000 | | | Standard Chartered Bank | | | 8/01/16 | | | | 462 | |
| USD | | | 819,992 | | | | EUR | | | | 738,000 | | | Morgan Stanley & Co. International PLC | | | 8/03/16 | | | | (249 | ) |
| EUR | | | 221,303 | | | | USD | | | | 250,491 | | | Royal Bank of Scotland PLC | | | 8/12/16 | | | | (4,508 | ) |
| USD | | | 252,901 | | | | EUR | | | | 221,303 | | | Royal Bank of Scotland PLC | | | 8/12/16 | | | | 6,918 | |
| EUR | | | 110,045 | | | | USD | | | | 123,649 | | | Citibank N.A. | | | 8/16/16 | | | | (1,314 | ) |
| JPY | | | 26,127,118 | | | | USD | | | | 245,000 | | | Royal Bank of Scotland PLC | | | 8/16/16 | | | | 8,391 | |
| PLN | | | 1,031,858 | | | | USD | | | | 260,718 | | | BNP Paribas S.A. | | | 8/16/16 | | | | 512 | |
| PLN | | | 970,500 | | | | USD | | | | 250,578 | | | JPMorgan Chase Bank N.A. | | | 8/16/16 | | | | (4,881 | ) |
| PLN | | | 2,250,673 | | | | USD | | | | 562,124 | | | Royal Bank of Scotland PLC | | | 8/16/16 | | | | 7,668 | |
| PLN | | | 2,278,086 | | | | USD | | | | 587,893 | | | State Street Bank and Trust Co. | | | 8/16/16 | | | | (11,161 | ) |
| USD | | | 250,523 | | | | EUR | | | | 221,303 | | | Royal Bank of Scotland PLC | | | 8/16/16 | | | | 4,505 | |
| USD | | | 6,748 | | | | GBP | | | | 5,000 | | | Barclays Bank PLC | | | 8/16/16 | | | | 89 | |
| USD | | | 67,540 | | | | GBP | | | | 50,000 | | | BNP Paribas S.A. | | | 8/16/16 | | | | 949 | |
| USD | | | 67,542 | | | | GBP | | | | 50,000 | | | BNP Paribas S.A. | | | 8/16/16 | | | | 951 | |
| USD | | | 67,385 | | | | GBP | | | | 50,000 | | | Deutsche Bank AG | | | 8/16/16 | | | | 794 | |
| USD | | | 60,747 | | | | GBP | | | | 45,000 | | | JPMorgan Chase Bank N.A. | | | 8/16/16 | | | | 815 | |
| USD | | | 67,577 | | | | GBP | | | | 50,000 | | | JPMorgan Chase Bank N.A. | | | 8/16/16 | | | | 986 | |
| USD | | | 27,019 | | | | GBP | | | | 20,000 | | | Royal Bank of Scotland PLC | | | 8/16/16 | | | | 382 | |
| USD | | | 52,500 | | | | JPY | | | | 5,400,570 | | | BNP Paribas S.A. | | | 8/16/16 | | | | 123 | |
| USD | | | 70,000 | | | | JPY | | | | 7,191,800 | | | BNP Paribas S.A. | | | 8/16/16 | | | | 251 | |
| USD | | | 52,500 | | | | JPY | | | | 5,396,212 | | | Goldman Sachs International | | | 8/16/16 | | | | 165 | |
| USD | | | 70,000 | | | | JPY | | | | 7,200,200 | | | Morgan Stanley & Co. International PLC | | | 8/16/16 | | | | 170 | |
| USD | | | 127,397 | | | | MXN | | | | 2,365,050 | | | Goldman Sachs International | | | 8/16/16 | | | | (1,354 | ) |
| USD | | | 1,952,857 | | | | PLN | | | | 7,618,904 | | | Royal Bank of Scotland PLC | | | 8/16/16 | | | | 24,015 | |
| USD | | | 147,970 | | | | PLN | | | | 573,619 | | | State Street Bank and Trust Co. | | | 8/16/16 | | | | 2,749 | |
| USD | | | 374,836 | | | | IDR | | | | 5,035,921,938 | | | Nomura Securities International, Inc. | | | 8/22/16 | | | | (2,722 | ) |
| AUD | | | 1,868,000 | | | | USD | | | | 1,381,153 | | | Bank of America N.A. | | | 9/21/16 | | | | 7,741 | |
| AUD | | | 1,870,000 | | | | USD | | | | 1,383,707 | | | Morgan Stanley & Co. International PLC | | | 9/21/16 | | | | 6,674 | |
| CNH | | | 7,344,727 | | | | USD | | | | 1,099,000 | | | HSBC Bank PLC | | | 9/21/16 | | | | (850 | ) |
| USD | | | 2,747,299 | | | | AUD | | | | 3,738,000 | | | State Street Bank and Trust Co. | | | 9/21/16 | | | | (31,976 | ) |
| Total | | | | | | | | | | | | | | | | | | | | | $ 65,929 | |
| | | | | | | | | | | | | | | | | | | | | | |
See Notes to Financial Statements.
| | | | | | |
| | | BLACKROCK VARIABLE SERIES FUNDS, INC. | | JUNE 30, 2016 | | 23 |
| | | | |
| Schedule of Investments (continued) | | | BlackRock Total Return V.I. Fund | |
| | | | | | | | | | | | | | | | | | | | | | | | | | | | | | | | | | | | | | | | |
OTC Barrier Options Purchased | |
| Description | | Put/
Call | | | Type of Option | | Counterparty | | Expiration
Date | | | Strike Price | | | Barrier
Price | | | Notional
Amount
(000) | | | Value | |
GBP Currency | | | Put | | | Down-and-Out | | BNP Paribas S.A. | | | 7/27/16 | | | | USD | | | | 1.34 | | | | USD | | | | 1.25 | | | | GBP | | | | 1,366 | | | | $14,774 | |
| | | | | | | | | | | | | | | | | | | | | | | | | | | | | | | | | | | | | | | | | | | | | | | | | | | | | | | |
Exchange-Traded Options Purchased | | | | | | | | |
| Description | | Put/
Call | | | | Expiration
Date | | | | Strike Price | | | | Contracts | | | | Value |
U.S. Treasury Notes (10 Year) Futures | | | | Put | | | | | | | | | | 7/22/16 | | | | | | | | | | USD | | | | | | | | | | 132.00 | | | | | | | | | | 39 | | | | | | | | | $ | 10,360 | |
U.S. Treasury Notes (10 Year) Futures | | | | Put | | | | | | | | | | 7/22/16 | | | | | | | | | | USD | | | | | | | | | | 130.50 | | | | | | | | | | 32 | | | | | | | | | | 2,500 | |
Total | | | | | | | | | | | | | | | | | | | | | | | | | | | | | | | | | | | | | | | | | | | | | | | | | | | | | $ | 12,860 | |
| | | | | | | | | | | | | | | | | | | | | | | | | | | | | | | | | | | | | | | | | | | | | | | | | | | | | | | |
| | | | | | | | | | | | | | | | | | | | | | | | | | | | | | | | | | | | | | | | | | | | | | | | | | | | | | | | |
OTC Options Purchased | | | | | | | | | | | | | | | | | | | |
| Description | | Put/
Call | | | | | | Counterparty | | | | | Expiration
Date | | | | | Strike
Price | | | | | | Notional
Amount (000) | | | | | | Value | |
USD Currency | | | Call | | | | | | | HSBC Bank PLC | | | | | | 7/29/16 | | | | | | | CNH | | | | | | | | 7.25 | | | | | | | | USD | | | | | | | | 5,226 | | | | | | | | $22 | |
| | | | | | | | | | | | | | | | | | | | | | | | | | | | | | | | | | | | | | |
Exchange-Traded Options Written | | | | | | | | | | | | | | | | | | | | | | | | | | | | | | |
| Description | | Put/
Call | | | | | | Expiration
Date | | | | | Strike
Price | | | | | | Contracts | | | | | Value | |
U.S. Treasury Notes (10 Year) Futures | | | Call | | | | | | | 7/22/16 | | | | | | | USD | | | | | | 135.00 | | | | | | | 39 | | | | | | | $(4,875 | ) |
| | | | | | | | | | | | | | | | | | | | | | | | | | | | | | | | | | | | | | | | | | | | | | | | | | | | | | | | | | |
OTC Options Written | | | | | | | | | | | | | | | | | | | |
| Description | | Put/
Call | | | | | | Counterparty | | | | | | Expiration
Date | | | | | Strike
Price | | | | | | Notional Amount | | | | | | Value | |
USD Currency | | | Call | | | | | | | | Deutsche Bank AG | | | | | | | 7/29/16 | | | | | | | CNH | | | | | | | | 7.25 | | | | | | | | USD | | | | | | | | 5,226 | | | | | | | | $(22 | ) |
| | | | | | | | | | | | | | | | | | | | | | | | | | | | |
Centrally Cleared Credit Default Swaps — Sell Protection | |
| Index | | Receive
Fixed
Rate | | | | | | Expiration
Date | | | Credit
Rating1 | | | Notional
Amount
(000)2 | | | Unrealized
Appreciation | |
CDX.NA.HY Series 26 Version 1 | | | 5.00% | | | | | | | | 6/20/21 | | | | B+ | | | | USD | | | | 4,693 | | | | $ 54,597 | |
CDX.NA.IG Series 26 Version 1 | | | 1.00% | | | | | | | | 6/20/21 | | | | BBB+ | | | | USD | | | | 28,966 | | | | 104,720 | |
Total | | | | | | | | | | | | | | | | | | | | | | | | | | | $159,317 | |
| | | | | | | | | | | | | | | | | | | | | | | | | | | | |
| | 1 | | Using S&P’s rating of the issuer or the underlying securities of the index, as applicable. |
| | 2 | | The maximum potential amount the Fund may pay should a negative credit event take place as defined under the terms of the agreement. |
| | | | | | | | | | | | | | | | | | |
Centrally Cleared Interest Rate Swaps | |
Fixed
Rate | | Floating Rate | | Effective
Date | | Expiration
Date | | Notional Amount (000) | | | Unrealized
Appreciation
(Depreciation) | |
| 0.65%1 | | 3-month LIBOR | | N/A | | 11/26/16 | | | USD | | | | 535 | | | | $ 40 | |
| 1.26%1 | | 3-month LIBOR | | N/A | | 1/12/17 | | | USD | | | | 7,141 | | | | (55,227 | ) |
| 1.44%1 | | 3-month LIBOR | | 6/15/202 | | 6/14/21 | | �� | USD | | | | 14,915 | | | | (13,463 | ) |
| 1.51%1 | | 3-month LIBOR | | 6/14/202 | | 6/14/21 | | | USD | | | | 14,735 | | | | (22,941 | ) |
| 2.13%3 | | 3-month LIBOR | | N/A | | 8/25/25 | | | USD | | | | 60 | | | | 4,680 | |
See Notes to Financial Statements.
| | | | | | |
| 24 | | BLACKROCK VARIABLE SERIES FUNDS, INC. | | JUNE 30, 2016 | | |
| | | | |
| Schedule of Investments (continued) | | | BlackRock Total Return V.I. Fund | |
| | | | | | | | | | | | | | | | | | | | | | |
Fixed
Rate | | Floating Rate | | Effective
Date | | | Expiration
Date | | | Notional Amount (000) | | | Unrealized
Appreciation
(Depreciation) | |
| 2.27%1 | | 3-month LIBOR | | | N/A | | | | 9/11/25 | | | | USD | | | | 91 | | | | $ (8,224 | ) |
| 1.46%1 | | 3-month LIBOR | | | N/A | | | | 6/28/26 | | | | USD | | | | 287 | | | | (2,315 | ) |
| 1.46%1 | | 3-month LIBOR | | | N/A | | | | 6/28/26 | | | | USD | | | | 72 | | | | (582 | ) |
| Total | | | | | | | | | | | | | | | | | | | | | $(98,032 | ) |
| | | | | | | | | | | | | | | | | | | | | | |
| | 1 | | Fund pays the fixed rate and receives the floating rate. |
| | 3 | | Fund pays the floating rate and receives the fixed rate. |
| | | | | | | | | | | | | | | | | | | | | | | | | | | | |
OTC Credit Default Swaps — Buy Protection | |
| Issuer/Index | | Pay
Fixed
Rate | | | Counterparty | | Expiration
Date | | Notional
Amount (000) | | | Value | | | Premiums
Paid
(Received) | | | Unrealized
Appreciation
(Depreciation) | |
United Mexican States | | | 1.00 | % | | JPMorgan Chase Bank N.A. | | 6/20/20 | | | USD | | | | 135 | | | | $ 1,507 | | | | $ 945 | | | | $ 562 | |
United Mexican States | | | 1.00 | % | | Bank of America N.A. | | 9/20/20 | | | USD | | | | 135 | | | | 2,092 | | | | 1,436 | | | | 656 | |
Loews Corp. | | | 1.00 | % | | Barclays Bank PLC | | 12/20/20 | | | USD | | | | 120 | | | | (3,525 | ) | | | (3,786 | ) | | | 261 | |
Valero Energy Corp. | | | 1.00 | % | | Morgan Stanley Capital Services LLC | | 12/20/20 | | | USD | | | | 130 | | | | 2,933 | | | | 2,872 | | | | 61 | |
HSBC Bank PLC | | | 1.00 | % | | Bank of America N.A. | | 6/20/21 | | | EUR | | | | 659 | | | | (78 | ) | | | 39 | | | | (117 | ) |
HSBC Bank PLC | | | 1.00 | % | | Bank of America N.A. | | 6/20/21 | | | EUR | | | | 267 | | | | (31 | ) | | | (559 | ) | | | 528 | |
Standard Chartered PLC | | | 1.00 | % | | Bank of America N.A. | | 6/20/21 | | | EUR | | | | 250 | | | | 7,426 | | | | 5,548 | | | | 1,878 | |
Standard Chartered PLC | | | 1.00 | % | | Bank of America N.A. | | 6/20/21 | | | EUR | | | | 50 | | | | 1,485 | | | | 1,110 | | | | 375 | |
Standard Chartered PLC | | | 1.00 | % | | BNP Paribas S.A. | | 6/20/21 | | | EUR | | | | 58 | | | | 1,723 | | | | 1,555 | | | | 168 | |
Standard Chartered PLC | | | 1.00 | % | | BNP Paribas S.A. | | 6/20/21 | | | EUR | | | | 55 | | | | 1,826 | | | | 2,880 | | | | (1,054 | ) |
Standard Chartered PLC | | | 1.00 | % | | BNP Paribas S.A. | | 6/20/21 | | | EUR | | | | 44 | | | | 1,306 | | | | 1,179 | | | | 127 | |
HSBC Bank PLC | | | 1.00 | % | | Citibank N.A. | | 6/20/21 | | | EUR | | | | 240 | | | | (28 | ) | | | (554 | ) | | | 526 | |
HSBC Bank PLC | | | 1.00 | % | | Citibank N.A. | | 6/20/21 | | | EUR | | | | 139 | | | | (16 | ) | | | (321 | ) | | | 305 | |
HSBC Bank PLC | | | 1.00 | % | | Citibank N.A. | | 6/20/21 | | | EUR | | | | 110 | | | | (13 | ) | | | (254 | ) | | | 241 | |
HSBC Bank PLC | | | 1.00 | % | | Citibank N.A. | | 6/20/21 | | | EUR | | | | 73 | | | | (9 | ) | | | (169 | ) | | | 160 | |
HSBC Bank PLC | | | 1.00 | % | | Citibank N.A. | | 6/20/21 | | | EUR | | | | 61 | | | | (7 | ) | | | (141 | ) | | | 134 | |
HSBC Bank PLC | | | 1.00 | % | | Citibank N.A. | | 6/20/21 | | | EUR | | | | 37 | | | | (5 | ) | | | (86 | ) | | | 81 | |
HSBC Bank PLC | | | 1.00 | % | | Credit Suisse International | | 6/20/21 | | | EUR | | | | 501 | | | | 311 | | | | 2,265 | | | | (1,954 | ) |
HSBC Bank PLC | | | 1.00 | % | | JPMorgan Chase Bank N.A. | | 6/20/21 | | | EUR | | | | 170 | | | | (20 | ) | | | (677 | ) | | | 657 | |
HSBC Bank PLC | | | 1.00 | % | | JPMorgan Chase Bank N.A. | | 6/20/21 | | | EUR | | | | 8 | | | | (1 | ) | | | (32 | ) | | | 31 | |
HSBC Bank PLC | | | 1.00 | % | | JPMorgan Chase Bank N.A. | | 6/20/21 | | | EUR | | | | 3 | | | | (1 | ) | | | (4 | ) | | | 3 | |
Standard Chartered PLC | | | 1.00 | % | | JPMorgan Chase Bank N.A. | | 6/20/21 | | | EUR | | | | 89 | | | | 2,670 | | | | 4,659 | | | | (1,989 | ) |
Republic of South Africa | | | 1.00 | % | | Bank of America N.A. | | 6/20/21 | | | USD | | | | 100 | | | | 8,186 | | | | 10,611 | | | | (2,425 | ) |
Republic of the Philippines | | | 1.00 | % | | Bank of America N.A. | | 6/20/21 | | | USD | | | | 14 | | | | 86 | | | | 65 | | | | 21 | |
Russian Federation | | | 1.00 | % | | Bank of America N.A. | | 6/20/21 | | | USD | | | | 70 | | | | 4,212 | | | | 4,441 | | | | (229 | ) |
Federation of Malaysia | | | 1.00 | % | | Barclays Bank PLC | | 6/20/21 | | | USD | | | | 167 | | | | 4,256 | | | | 4,887 | | | | (631 | ) |
Republic of South Africa | | | 1.00 | % | | Barclays Bank PLC | | 6/20/21 | | | USD | | | | 230 | | | | 18,827 | | | | 25,356 | | | | (6,529 | ) |
Republic of South Africa | | | 1.00 | % | | Barclays Bank PLC | | 6/20/21 | | | USD | | | | 120 | | | | 9,823 | | | | 12,058 | | | | (2,235 | ) |
Republic of the Philippines | | | 1.00 | % | | Barclays Bank PLC | | 6/20/21 | | | USD | | | | 165 | | | | 1,048 | | | | 1,015 | | | | 33 | |
Republic of the Philippines | | | 1.00 | % | | Barclays Bank PLC | | 6/20/21 | | | USD | | | | 99 | | | | 629 | | | | 655 | | | | (26 | ) |
Republic of the Philippines | | | 1.00 | % | | Barclays Bank PLC | | 6/20/21 | | | USD | | | | 78 | | | | 493 | | | | 481 | | | | 12 | |
Republic of the Philippines | | | 1.00 | % | | Barclays Bank PLC | | 6/20/21 | | | USD | | | | 66 | | | | 419 | | | | 406 | | | | 13 | |
Republic of the Philippines | | | 1.00 | % | | Barclays Bank PLC | | 6/20/21 | | | USD | | | | 66 | | | | 420 | | | | 437 | | | | (17 | ) |
Republic of the Philippines | | | 1.00 | % | | Barclays Bank PLC | | 6/20/21 | | | USD | | | | 65 | | | | 411 | | | | 431 | | | | (20 | ) |
Republic of the Philippines | | | 1.00 | % | | Barclays Bank PLC | | 6/20/21 | | | USD | | | | 64 | | | | 405 | | | | 421 | | | | (16 | ) |
Republic of the Philippines | | | 1.00 | % | | Barclays Bank PLC | | 6/20/21 | | | USD | | | | 64 | | | | 405 | | | | 421 | | | | (16 | ) |
Republic of the Philippines | | | 1.00 | % | | Barclays Bank PLC | | 6/20/21 | | | USD | | | | 64 | | | | 405 | | | | 480 | | | | (75 | ) |
Republic of the Philippines | | | 1.00 | % | | Barclays Bank PLC | | 6/20/21 | | | USD | | | | 52 | | | | 329 | | | | 321 | | | | 8 | |
Australia & New Zealand Banking Group Ltd. | | | 1.00 | % | | BNP Paribas S.A. | | 6/20/21 | | | USD | | | | 1,073 | | | | (8,465 | ) | | | 11,493 | | | | (19,958 | ) |
See Notes to Financial Statements.
| | | | | | |
| | | BLACKROCK VARIABLE SERIES FUNDS, INC. | | JUNE 30, 2016 | | 25 |
| | | | |
| Schedule of Investments (continued) | | | BlackRock Total Return V.I. Fund | |
| | | | | | | | | | | | | | | | | | | | | | | | | | | | | | | | |
| Issuer/Index | | Pay
Fixed
Rate | | | Counterparty | | | Expiration
Date | | | Notional
Amount (000) | | | Value | | | Premiums
Paid
(Received) | | | Unrealized
Appreciation
(Depreciation) | |
Republic of South Africa | | | 1.00 | % | | | BNP Paribas S.A. | | | | 6/20/21 | | | | USD | | | | 60 | | | | $ 4,912 | | | | $ 6,553 | | | | $ (1,641 | ) |
Republic of South Africa | | | 1.00 | % | | | BNP Paribas S.A. | | | | 6/20/21 | | | | USD | | | | 55 | | | | 4,502 | | | | 5,830 | | | | (1,328 | ) |
Federation of Malaysia | | | 1.00 | % | | | Citibank N.A. | | | | 6/20/21 | | | | USD | | | | 9 | | | | 233 | | | | 217 | | | | 16 | |
Prudential Financial, Inc. | | | 1.00 | % | | | Citibank N.A. | | | | 6/20/21 | | | | USD | | | | 372 | | | | 4,957 | | | | 4,875 | | | | 82 | |
Prudential Financial, Inc. | | | 1.00 | % | | | Citibank N.A. | | | | 6/20/21 | | | | USD | | | | 150 | | | | 1,999 | | | | 1,966 | | | | 33 | |
Republic of South Africa | | | 1.00 | % | | | Citibank N.A. | | | | 6/20/21 | | | | USD | | | | 225 | | | | 18,423 | | | | 18,396 | | | | 27 | |
Republic of South Africa | | | 1.00 | % | | | Citibank N.A. | | | | 6/20/21 | | | | USD | | | | 65 | | | | 5,321 | | | | 6,610 | | | | (1,289 | ) |
Republic of South Africa | | | 1.00 | % | | | Citibank N.A. | | | | 6/20/21 | | | | USD | | | | 1 | | | | 82 | | | | 105 | | | | (23 | ) |
Republic of the Philippines | | | 1.00 | % | | | Citibank N.A. | | | | 6/20/21 | | | | USD | | | | 90 | | | | 570 | | | | 594 | | | | (24 | ) |
Republic of the Philippines | | | 1.00 | % | | | Citibank N.A. | | | | 6/20/21 | | | | USD | | | | 73 | | | | 465 | | | | 420 | | | | 45 | |
Australia & New Zealand Banking Group Ltd. | | | 1.00 | % | | | Deutsche Bank AG | | | | 6/20/21 | | | | USD | | | | 882 | | | | (6,960 | ) | | | 11,297 | | | | (18,257 | ) |
Commonwealth Bank of Australia | | | 1.00 | % | | | Deutsche Bank AG | | | | 6/20/21 | | | | USD | | | | 460 | | | | (3,625 | ) | | | 4,511 | | | | (8,136 | ) |
Commonwealth Bank of Australia | | | 1.00 | % | | | Deutsche Bank AG | | | | 6/20/21 | | | | USD | | | | 132 | | | | (1,043 | ) | | | 2,326 | | | | (3,369 | ) |
Republic of South Africa | | | 1.00 | % | | | Goldman Sachs International | | | | 6/20/21 | | | | USD | | | | 60 | | | | 4,912 | | | | 6,564 | | | | (1,652 | ) |
Republic of South Africa | | | 1.00 | % | | | HSBC Bank PLC | | | | 6/20/21 | | | | USD | | | | 65 | | | | 5,321 | | | | 7,082 | | | | (1,761 | ) |
Republic of South Africa | | | 1.00 | % | | | HSBC Bank PLC | | | | 6/20/21 | | | | USD | | | | 65 | | | | 5,321 | | | | 7,155 | | | | (1,834 | ) |
Australia & New Zealand Banking Group Ltd. | | | 1.00 | % | | | JPMorgan Chase Bank N.A. | | | | 6/20/21 | | | | USD | | | | 526 | | | | (4,151 | ) | | | 5,457 | | | | (9,608 | ) |
Australia & New Zealand Banking Group Ltd. | | | 1.00 | % | | | JPMorgan Chase Bank N.A. | | | | 6/20/21 | | | | USD | | | | 227 | | | | (1,796 | ) | | | 2,915 | | | | (4,711 | ) |
Commonwealth Bank of Australia | | | 1.00 | % | | | JPMorgan Chase Bank N.A. | | | | 6/20/21 | | | | USD | | | | 405 | | | | (3,190 | ) | | | 5,002 | | | | (8,192 | ) |
National Australia Bank Ltd. | | | 1.00 | % | | | JPMorgan Chase Bank N.A. | | | | 6/20/21 | | | | USD | | | | 310 | | | | (2,533 | ) | | | 3,239 | | | | (5,772 | ) |
Republic of South Africa | | | 1.00 | % | | | JPMorgan Chase Bank N.A. | | | | 6/20/21 | | | | USD | | | | 140 | | | | 11,460 | | | | 14,687 | | | | (3,227 | ) |
Republic of the Philippines | | | 1.00 | % | | | JPMorgan Chase Bank N.A. | | | | 6/20/21 | | | | USD | | | | 217 | | | | 1,379 | | | | 1,166 | | | | 213 | |
Republic of the Philippines | | | 1.00 | % | | | JPMorgan Chase Bank N.A. | | | | 6/20/21 | | | | USD | | | | 85 | | | | 538 | | | | 487 | | | | 51 | |
Republic of the Philippines | | | 1.00 | % | | | JPMorgan Chase Bank N.A. | | | | 6/20/21 | | | | USD | | | | 20 | | | | 129 | | | | 125 | | | | 4 | |
CMBX.NA Series 8 AAA | | | 0.50 | % | | | Credit Suisse International | | | | 10/17/57 | | | | USD | | | | 70 | | | | 2,609 | | | | 3,160 | | | | (551 | ) |
Total | | | | | | | | | | | | | | | | | | | | | | | $111,269 | | | | $212,623 | | | | $(101,354 | ) |
| | | | | | | | | | | | | | | | | | | | | | | | |
| | | | | | | | | | | | | | | | | | | | | | | | | | | | | | |
OTC Credit Default Swaps — Sell Protection | |
| Issuer/Index | | Receive
Fixed
Rate | | | Counterparty | | Expiration
Date | | Credit
Rating1 | | Notional
Amount
(000)2 | | | Value | | | Premiums
Paid
(Received) | | | Unrealized
Appreciation
(Depreciation) | |
Transocean Ltd. | | | 1.00% | | | Goldman Sachs International | | 6/20/19 | | BB- | | | USD | | | | 95 | | | | $(14,355 | ) | | | $ (1,770 | ) | | | $(12,585 | ) |
Transocean Ltd. | | | 1.00% | | | Goldman Sachs International | | 6/20/19 | | BB- | | | USD | | | | 15 | | | | (2,267 | ) | | | (279 | ) | | | (1,988 | ) |
United Mexican States | | | 1.00% | | | Bank of America N.A. | | 6/20/20 | | BBB+ | | | USD | | | | 135 | | | | (1,507 | ) | | | (1,096 | ) | | | (411 | ) |
United Mexican States | | | 1.00% | | | JPMorgan Chase Bank N.A. | | 9/20/20 | | BBB+ | | | USD | | | | 135 | | | | (2,092 | ) | | | (1,251 | ) | | | (841 | ) |
Federative Republic of Brazil | | | 1.00% | | | Barclays Bank PLC | | 6/20/21 | | BB | | | USD | | | | 307 | | | | (29,519 | ) | | | (33,495 | ) | | | 3,976 | |
CMBX.NA Series 7 A | | | 2.00% | | | Deutsche Bank AG | | 1/17/47 | | A- | | | USD | | | | 50 | | | | (3,439 | ) | | | (3,970 | ) | | | 531 | |
CMBX.NA Series 3 AM | | | 0.50% | | | Credit Suisse International | | 12/13/49 | | BBB | | | USD | | | | 390 | | | | (7,996 | ) | | | (35,444 | ) | | | 27,448 | |
CMBX.NA Series 4 AM | | | 0.50% | | | Deutsche Bank AG | | 2/17/51 | | BB+ | | | USD | | | | 95 | | | | (2,619 | ) | | | (13,051 | ) | | | 10,432 | |
CMBX.NA Series 8 A | | | 2.00% | | | Goldman Sachs International | | 10/17/57 | | Not Rated | | | USD | | | | 60 | | | | (6,486 | ) | | | (6,270 | ) | | | (216 | ) |
CMBX.NA Series 8 A | | | 2.00% | | | Morgan Stanley Capital Services LLC | | 10/17/57 | | Not Rated | | | USD | | | | 400 | | | | (43,244 | ) | | | (45,027 | ) | | | 1,783 | |
CMBX.NA Series 8 A | | | 2.00% | | | Morgan Stanley Capital Services LLC | | 10/17/57 | | Not Rated | | | USD | | | | 25 | | | | (2,703 | ) | | | (2,379 | ) | | | (324 | ) |
See Notes to Financial Statements.
| | | | | | |
| 26 | | BLACKROCK VARIABLE SERIES FUNDS, INC. | | JUNE 30, 2016 | | |
| | | | |
| Schedule of Investments (continued) | | | BlackRock Total Return V.I. Fund | |
| | | | | | | | | | | | | | | | | | | | | | | | | | | | | | | | | | | | |
| Issuer/Index | | Receive
Fixed
Rate | | | Counterparty | | | Expiration
Date | | | Credit
Rating1 | | | Notional Amount (000)2 | | | Value | | | Premiums
Paid
(Received) | | | Unrealized
Appreciation
(Depreciation) | |
CMBX.NA Series 8 A | | | 2.00% | | | | Morgan Stanley Capital Services LLC | | | | 10/17/57 | | | | Not Rated | | | | USD | | | | 25 | | | | $ (2,703 | ) | | | $ (2,362 | ) | | | $ (341 | ) |
CMBX.NA Series 8 AA | | | 1.50% | | | | Goldman Sachs International | | | | 10/17/57 | | | | Not Rated | | | | USD | | | | 50 | | | | (3,620 | ) | | | (4,978 | ) | | | 1,358 | |
CMBX.NA Series 9 A | | | 2.00% | | | | Credit Suisse International | | | | 9/17/58 | | | | Not Rated | | | | USD | | | | 40 | | | | (5,274 | ) | | | (5,769 | ) | | | 495 | |
CMBX.NA Series 9 A | | | 2.00% | | | | J.P. Morgan Securities LLC | | | | 9/17/58 | | | | Not Rated | | | | USD | | | | 16 | | | | (2,088 | ) | | | (2,010 | ) | | | (78 | ) |
CMBX.NA Series 9 A | | | 2.00% | | | | Morgan Stanley Capital Services LLC | | | | 9/17/58 | | | | Not Rated | | | | USD | | | | 40 | | | | (5,273 | ) | | | (5,713 | ) | | | 440 | |
CMBX.NA Series 9 BBB- | | | 3.00% | | | | Credit Suisse International | | | | 9/17/58 | | | | Not Rated | | | | USD | | | | 50 | | | | (11,202 | ) | | | (9,756 | ) | | | (1,446 | ) |
Total | | | | | | | | | | | | | | | | | | | | | | | | | | | $(146,387 | ) | | | $(174,620 | ) | | | $28,233 | |
| | | | | | | | | | | | | | | | | | | | | | | | | | | | |
| | 1 | | Using S&P’s rating of the issuer or the underlying securities of the index, as applicable. |
| | 2 | | The maximum potential amount the Fund may pay should a negative credit event take place as defined under the terms of the agreement. |
| | | | | | | | | | | | | | | | | | | | | | | | |
OTC Interest Rate Swaps | |
Fixed
Rate | | Floating Rate | | Counterparty | | Expiration
Date | | Notional Amount (000) | | | Value | | | Premiums
Paid
(Received) | | | Unrealized
Appreciation
(Depreciation) | |
| 6.51%1 | | 1-day COOIS | | Credit Suisse International | | 7/06/16 | | COP | | | 3,087,570 | | | $ | 591 | | | | — | | | $ | 591 | |
| 6.64%1 | | 1-day COOIS | | Credit Suisse International | | 8/22/16 | | COP | | | 1,232,921 | | | | 917 | | | | — | | | | 917 | |
| 1.92%1 | | 3-month KRW Certificate of Deposit | | Deutsche Bank AG | | 11/10/17 | | KRW | | | 205,250 | | | | 1,677 | | | $ | 374 | | | | 1,303 | |
| 1.69%2 | | 3-month KRW Certificate of Deposit | | Deutsche Bank AG | | 11/10/17 | | KRW | | | 205,250 | | | | (1,058 | ) | | | — | | | | (1,058 | ) |
| 4.55%2 | | 28-day MXIBTIIE | | Barclays Bank PLC | | 3/21/18 | | MXN | | | 826 | | | | 310 | | | | 12 | | | | 298 | |
| 4.85%2 | | 28-day MXIBTIIE | | Bank of America N.A. | | 11/01/18 | | MXN | | | 716 | | | | 201 | | | | 2 | | | | 199 | |
| 12.24%1 | | 1-day BZDIOVER | | Bank of America N.A. | | 1/02/19 | | BRL | | | 1,948 | | | | (779 | ) | | | — | | | | (779 | ) |
| 12.46%1 | | 1-day BZDIOVER | | Bank of America N.A. | | 1/02/19 | | BRL | | | 925 | | | | 636 | | | | — | | | | 636 | |
| 12.29%1 | | 1-day BZDIOVER | | Bank of America N.A. | | 1/02/19 | | BRL | | | 923 | | | | (383 | ) | | | — | | | | (383 | ) |
| 12.52%1 | | 1-day BZDIOVER | | JPMorgan Chase Bank N.A. | | 1/02/19 | | BRL | | | 924 | | | | 1,043 | | | | — | | | | 1,043 | |
| 12.31%1 | | 1-day BZDIOVER | | JPMorgan Chase Bank N.A. | | 1/02/19 | | BRL | | | 532 | | | | 540 | | | | — | | | | 540 | |
| 2.57%1 | | 3-month LIBOR | | Deutsche Bank AG | | 10/27/20 | | USD | | | 300 | | | | 22,070 | | | | — | | | | 22,070 | |
| 11.41%2 | | 1-day BZDIOVER | | Bank of America N.A. | | 1/04/21 | | BRL | | | 162 | | | | 3,030 | | | | — | | | | 3,030 | |
| 12.05%1 | | 1-day BZDIOVER | | Bank of America N.A. | | 1/04/21 | | BRL | | | 87 | | | | (522 | ) | | | — | | | | (522 | ) |
| 12.75%1 | | 1-day BZDIOVER | | Citibank N.A. | | 1/04/21 | | BRL | | | 553 | | | | 5,385 | | | | — | | | | 5,385 | |
| 11.84%1 | | 1-day BZDIOVER | | HSBC Bank PLC | | 1/04/21 | | BRL | | | 58 | | | | (589 | ) | | | — | | | | (589 | ) |
| 12.74%1 | | 1-day BZDIOVER | | JPMorgan Chase Bank N.A. | | 1/04/21 | | BRL | | | 380 | | | | 3,635 | | | | — | | | | 3,635 | |
| 11.72%1 | | 1-day BZDIOVER | | JPMorgan Chase Bank N.A. | | 1/04/21 | | BRL | | | 16 | | | | (205 | ) | | | — | | | | (205 | ) |
| 3.30%2 | | 3-month LIBOR | | Morgan Stanley Capital Services LLC | | 5/06/21 | | USD | | | 700 | | | | (80,700 | ) | | | — | | | | (80,700 | ) |
| 2.77%1 | | 7-day China Fixing Repo Rates | | Bank of America N.A. | | 5/12/21 | | CNY | | | 945 | | | | 1,385 | | | | (1 | ) | | | 1,386 | |
| 2.75%1 | | 7-day China Fixing Repo Rates | | Bank of America N.A. | | 5/12/21 | | CNY | | | 755 | | | | 989 | | | | (1 | ) | | | 990 | |
| 2.75%1 | | 7-day China Fixing Repo Rates | | Bank of America N.A. | | 5/12/21 | | CNY | | | 755 | | | | 989 | | | | (1 | ) | | | 990 | |
| 2.75%1 | | 7-day China Fixing Repo Rates | | Bank of America N.A. | | 5/12/21 | | CNY | | | 608 | | | | 811 | | | | (4 | ) | | | 815 | |
| 2.74%1 | | 7-day China Fixing Repo Rates | | Bank of America N.A. | | 5/12/21 | | CNY | | | 605 | | | | 765 | | | | (3 | ) | | | 768 | |
| 2.75%1 | | 7-day China Fixing Repo Rates | | Bank of America N.A. | | 5/12/21 | | CNY | | | 380 | | | | 497 | | | | (1 | ) | | | 498 | |
| 2.73%1 | | 7-day China Fixing Repo Rates | | Bank of America N.A. | | 5/12/21 | | CNY | | | 380 | | | | 430 | | | | (1 | ) | | | 431 | |
| 3.27%2 | | 3-month LIBOR | | Deutsche Bank AG | | 5/16/21 | | USD | | | 470 | | | | (53,332 | ) | | | — | | | | (53,332 | ) |
| 12.92%1 | | 1-day BZDIOVER | | Bank of America N.A. | | 1/02/23 | | BRL | | | 516 | | | | 8,519 | | | | — | | | | 8,519 | |
| 12.62%1 | | 1-day BZDIOVER | | Bank of America N.A. | | 1/02/23 | | BRL | | | 138 | | | | 1,474 | | | | — | | | | 1,474 | |
See Notes to Financial Statements.
| | | | | | |
| | | BLACKROCK VARIABLE SERIES FUNDS, INC. | | JUNE 30, 2016 | | 27 |
| | | | |
| Schedule of Investments (continued) | | | BlackRock Total Return V.I. Fund | |
| | | | | | | | | | | | | | | | | | | | | | | | | | | | |
Fixed
Rate | | Floating Rate | | Counterparty | | Expiration
Date | | | Notional Amount (000) | | | Value | | | Premiums
Paid
(Received) | | | Unrealized
Appreciation
(Depreciation) | |
| 12.73%1 | | 1-day BZDIOVER | | Bank of America N.A. | | | 1/02/23 | | | | BRL | | | | 118 | | | | $ 1,520 | | | | — | | | | $ 1,520 | |
| 12.37%1 | | 1-day BZDIOVER | | Citibank N.A. | | | 1/02/23 | | | | BRL | | | | 231 | | | | 1,404 | | | | — | | | | 1,404 | |
| 12.75%1 | | 1-day BZDIOVER | | Citibank N.A. | | | 1/02/23 | | | | BRL | | | | 120 | | | | 1,595 | | | | — | | | | 1,595 | |
| 2.16%2 | | 3-month LIBOR | | Bank of America N.A. | | | 5/28/23 | | | | USD | | | | 200 | | | | (13,759 | ) | | | — | | | | (13,759 | ) |
| 2.31%2 | | 3-month LIBOR | | Deutsche Bank AG | | | 5/31/23 | | | | USD | | | | 200 | | | | (15,851 | ) | | | — | | | | (15,851 | ) |
| 5.73%2 | | 28-day MXIBTIIE | | Bank of America N.A. | | | 1/03/25 | | | | MXN | | | | 672 | | | | 521 | | | | $ 9 | | | | 512 | |
| 6.43%1 | | 28-day MXIBTIIE | | Bank of America N.A. | | | 6/06/25 | | | | MXN | | | | 541 | | | | 945 | | | | (9 | ) | | | 954 | |
| 6.33%1 | | 28-day MXIBTIIE | | Citibank N.A. | | | 6/09/25 | | | | MXN | | | | 271 | | | | 370 | | | | (1 | ) | | | 371 | |
| 6.33%1 | | 28-day MXIBTIIE | | Citibank N.A. | | | 7/17/25 | | | | MXN | | | | 864 | | | | 1,115 | | | | (4 | ) | | | 1,119 | |
| 6.32%1 | | 28-day MXIBTIIE | | Morgan Stanley Capital Services LLC | | | 7/17/25 | | | | MXN | | | | 1,733 | | | | 2,203 | | | | (9 | ) | | | 2,212 | |
| 6.31%2 | | 28-day MXIBTIIE | | Deutsche Bank AG | | | 8/11/25 | | | | MXN | | | | 3,395 | | | | (4,125 | ) | | | 16 | | | | (4,141 | ) |
| 6.27%1 | | 28-day MXIBTIIE | | Bank of America N.A. | | | 12/05/25 | | | | MXN | | | | 122 | | | | 129 | | | | (2 | ) | | | 131 | |
| 6.30%1 | | 28-day MXIBTIIE | | Goldman Sachs International | | | 6/15/26 | | | | MXN | | | | 7,878 | | | | 7,588 | | | | (25 | ) | | | 7,613 | |
| Total | | | | | | | | | | | | | | | | | | | $(98,019 | ) | | | $351 | | | | $(98,370 | ) |
| | | | | | | | | | | | | | | | | | | | |
| | 1 | | Fund pays the floating rate and receives the fixed rate. |
| | 2 | | Fund pays the fixed rate and receives the floating rate. |
|
| Transactions in Options Written for the Period Ended June 30, 2016 |
| | | | | | | | | | | | | | | | | | | | | | | | | | | | |
| | | Calls | | | Puts | |
| | | | | | | |
| | | | | | Notional (000) | | | | | | | | Notional (000) | | | |
| | | | | | | | | | | | | | | | | | | | | |
| | | Contracts | | | GBP | | | USD | | | Premiums
Received | | | Contracts | | AUD | | | USD | | Premiums
Received | |
| | | | | | | |
Outstanding options, beginning of period | | | — | | | | — | | | | — | | | | — | | | — | | | — | | | — | | | — | |
Options written | | | 205 | | | | 7,160 | | | | 6,346 | | | $ | 184,161 | | | — | | | 5,700 | | | — | | | $ 67,700 | |
Options exercised | | | — | | | | — | | | | — | | | | — | | | — | | | — | | | — | | | — | |
Options expired | | | — | | | | — | | | | — | | | | — | | | — | | | — | | | — | | | — | |
Options closed | | | (166) | | | | (7,160 | ) | | | (1,120 | ) | | | (150,648) | | | — | | | (5,700) | | | — | | | (67,700 | ) |
| | | | | | | |
Outstanding options, end of period | | | 39 | | | | — | | | | 5,226 | | | $ | 33,513 | | | — | | | — | | | — | | | — | |
| | | | | | | |
|
| Derivative Financial Instruments Categorized by Risk Exposure |
As of period end, the fair values of derivative financial instruments located in the Statement of Assets and Liabilities were as follows:
| | | | | | | | | | | | | | | | | | | | | | | | |
| Assets - Derivative Financial Instruments | | Commodity
Contracts | | Credit
Contracts | | | Equity
Contracts | | Foreign
Currency
Exchange
Contracts | | | Interest
Rate
Contracts | | | Other
Contracts | | Total | |
Futures contracts | | Net unrealized appreciation1 | | — | | | — | | | — | | | — | | | | $770,672 | | | — | | | $ 770,672 | |
Forward foreign currency exchange contracts | | Unrealized appreciation on forward foreign currency exchange contracts | | — | | | — | | | — | | | $264,425 | | | | — | | | — | | | 264,425 | |
Options purchased | | Investments at value — unaffiliated2 | | — | | | — | | | — | | | — | | | | 27,656 | | | — | | | 27,656 | |
| | Unrealized appreciation on OTC swaps; | | | | | | | | | | | | | | | | | | | | | | |
Swaps - OTC | | Swap premiums paid | | — | | | $272,981 | | | — | | | — | | | | 73,362 | | | — | | | 346,343 | |
Swaps - centrally cleared | | Net unrealized appreciation1 | | — | | | 159,317 | | | — | | | — | | | | 4,720 | | | — | | | 164,037 | |
Total | | | | — | | | $432,298 | | | — | | | $264,425 | | | | $876,410 | | | — | | | $1,573,133 | |
| | | | | |
| | | | | | | | | | | | | | | | | | | | | | | | |
| Liabilities - Derivative Financial Instruments | | | | | | | | | | | | | | | | | | |
Futures contracts | | Net unrealized depreciation1 | | — | | | — | | | — | | | — | | | | $ 56,693 | | | — | | | $ 56,693 | |
Forward foreign currency exchange contracts | | Unrealized depreciation on forward foreign currency exchange contracts | | — | | | — | | | — | | | $198,496 | | | | — | | | — | | | 198,496 | |
Options written | | Options written at value | | — | | | — | | | — | | | — | | | | 4,897 | | | — | | | 4,897 | |
| | Unrealized depreciation on OTC swaps; | | | | | | | | | | | | | | | | | | | | | | |
Swaps - OTC | | Swap premiums received | | — | | | $308,099 | | | — | | | — | | | | 171,381 | | | — | | | 479,480 | |
Swaps - centrally cleared | | Net unrealized depreciation1 | | — | | | — | | | — | | | — | | | | 102,752 | | | — | | | 102,752 | |
Total | | | | — | | | $308,099 | | | — | | | $198,496 | | | | $335,723 | | | — | | | $842,318 | |
| | | | | |
See Notes to Financial Statements.
| | | | | | |
| 28 | | BLACKROCK VARIABLE SERIES FUNDS, INC. | | JUNE 30, 2016 | | |
| | | | |
| Schedule of Investments (continued) | | | BlackRock Total Return V.I. Fund | |
| | 1 | | Includes cumulative appreciation (depreciation) on futures contracts and centrally cleared swaps, if any, as reported in the Schedule of Investments. Only current day’s variation margin is reported within the Statement of Assets and Liabilities. |
| | 2 | | Includes options purchased at value as reported in the Schedule of Investments. |
For the six months ended June 30, 2016, the effect of derivative financial instruments in the Statement of Operations was as follows:
| | | | | | | | | | | | | | | | | | | | | | | | | | | | | | | | | | | | | | | | |
| Net Realized Gain (Loss) from: | | Commodity
Contracts | | | | Credit
Contracts | | | | | | Equity
Contracts | | | | Foreign
Currency
Exchange
Contracts | | | | | | Interest
Rate
Contracts | | | | | | Other
Contracts | | | | Total | |
Futures contracts | | — | | | | | — | | | | | | | — | | | | | — | | | | | | | | $1,760,697 | | | | | | | — | | | | | $1,760,697 | |
Foreign currency transactions | | — | | | | | — | | | | | | | — | | | | | $(126,278 | ) | | | | | | | — | | | | | | | — | | | | | (126,278 | ) |
Options purchased1 | | — | | | | | — | | | | | | | — | | | | | — | | | | | | | | (152,124 | ) | | | | | | — | | | | | (152,124 | ) |
Options written | | — | | | | | — | | | | | | | — | | | | | — | | | | | | | | (14,355 | ) | | | | | | — | | | | | (14,355 | ) |
Swaps | | — | | | | | $ 33,173 | | | | | | | — | | | | | — | | | | | | | | 45,293 | | | | | | | — | | | | | 78,466 | |
| | | |
Total | | — | | | | | $ 33,173 | | | | | | | — | | | | | $(126,278 | ) | | | | | | | $1,639,511 | | | | | | | — | | | | | $1,546,406 | |
| | | |
| | | | | | | | | | | | | | | | | | | | | | | | | | | | | | | | | | | | | | | | |
| Net Change in Unrealized Appreciation (Depreciation) on: | | | | | | | | | | | | | | | | | | | |
Futures contracts | | — | | | | | — | | | | | | | — | | | | | — | | | | | | | | $ 723,161 | | | | | | | — | | | | | $ 723,161 | |
Foreign currency translations | | — | | | | | — | | | | | | | — | | | | | $ 87,039 | | | | | | | | — | | | | | | | — | | | | | 87,039 | |
Options purchased2 | | — | | | | | — | | | | | | | — | | | | | — | | | | | | | | (15,132 | ) | | | | | | — | | | | | (15,132 | ) |
Options written | | — | | | | | — | | | | | | | — | | | | | — | | | | | | | | 28,616 | | | | | | | — | | | | | 28,616 | |
Swaps | | — | | | | | $151,133 | | | | | | | — | | | | | — | | | | | | | | (69,936 | ) | | | | | | — | | | | | 81,197 | |
| | | |
Total | | — | | | | | $151,133 | | | | | | | — | | | | | $ 87,039 | | | | | | | | $ 666,709 | | | | | | | — | | | | | $ 904,881 | |
| | | |
| | 1 | | Options purchased are included in net realized gain (loss) from investments. |
| | 2 | | Options purchased are included in net change in unrealized appreciation (depreciation) on investments. |
|
| Average Quarterly Balances of Outstanding Derivative Financial Instruments |
| | | | |
Futures contracts: | | | | |
Average notional value of contracts - long | | $ | 47,145,051 | |
Average notional value of contracts - short | | $ | 5,412,976 | |
Forward foreign currency exchange contracts: | | | | |
Average amounts purchased - in USD | | $ | 14,080,488 | |
Average amounts sold - in USD | | $ | 8,410,853 | |
Options: | | | | |
Average value of option contracts purchased | | $ | 121,960 | |
Average value of option contracts written | | $ | 92,041 | |
Credit default swaps: | | | | |
Average notional value - buy protection | | $ | 13,137,455 | |
Average notional value - sell protection | | $ | 20,756,500 | |
Interest rate swaps: | | | | |
Average notional value - pays fixed rate | | $ | 26,495,024 | |
Average notional value - receives fixed rate | | $ | 5,515,631 | |
For more information about the Fund’s investment risks regarding derivative financial instruments, refer to the Notes to Financial Statements.
|
| Derivative Financial Instruments — Offsetting as of Period End |
The Fund’s derivative assets and liabilities (by type) were as follows:
| | | | | | | | |
| | | Assets | | | Liabilities | |
Derivative Financial Instruments: | | | | | | | | |
Futures contracts | | | $ 15,785 | | | | $ 72,623 | |
Forward foreign currency exchange contracts | | | 264,425 | | | | 198,496 | |
Options | | | 27,656 | 1 | | | 4,897 | |
Swaps - centrally cleared | | | 57,085 | | | | — | |
Swaps - OTC2 | | | 346,343 | | | | 479,480 | |
| | | | |
Total derivative assets and liabilities in the Statements of Assets and Liabilities | | | $711,294 | | | | $755,496 | |
Derivatives not subject to a Master Netting Agreement or similar agreement (“MNA”) | | | (85,730 | ) | | | (77,498 | ) |
| | | | |
Total derivative assets and liabilities subject to an MNA | | | $625,564 | | | | $677,998 | |
| | | | |
| | 1 | | Includes options purchased at value which is included in Investments at value - unaffiliated in the Statement of Assets and Liabilities and reported in the Schedule of Investments. |
| | 2 | | Includes unrealized appreciation (depreciation) on OTC swaps and swap premiums paid/received in the Statement of Assets and Liabilities. |
See Notes to Financial Statements.
| | | | | | |
| | | BLACKROCK VARIABLE SERIES FUNDS, INC. | | JUNE 30, 2016 | | 29 |
| | | | |
| Schedule of Investments (continued) | | | BlackRock Total Return V.I. Fund | |
The following tables present the Fund’s derivative assets and liabilities by counterparty net of amounts available for offset under an MNA and net of the related collateral received and pledged by the Fund:
| | | | | | | | | | | | | | | | | | | | | | | | | | | | | | | | | | | | | | | | | | | | | |
| Counterparty | | Derivative Assets
Subject to an MNA by
Counterparty | | | | Derivatives Available
for Offset1 | | | | Non-cash
Collateral
Received | | | | Cash
Collateral
Received | | | | Net Amount of
Derivative Assets2 |
Bank of America N.A. | | | | $ 57,313 | | | | | | | | | | $ (20,303 | ) | | | | | | | | | — | | | | | | | | | | — | | | | | | | | | | $ 37,010 | |
Barclays Bank PLC | | | | 76,770 | | | | | | | | | | (46,846 | ) | | | | | | | | | — | | | | | | | | | | — | | | | | | | | | | 29,924 | |
BNP Paribas S.A. | | | | 56,454 | | | | | | | | | | (26,343 | ) | | | | | | | | | — | | | | | | | | | | — | | | | | | | | | | 30,111 | |
Citibank N.A. | | | | 52,620 | | | | | | | | | | (7,156 | ) | | | | | | | | | — | | | | | | | | | | — | | | | | | | | | | 45,464 | |
Credit Suisse International | | | | 38,280 | | | | | | | | | | (38,280 | ) | | | | | | | | | — | | | | | | | | | | — | | | | | | | | | | — | |
Deutsche Bank AG | | | | 67,764 | | | | | | | | | | (67,764 | ) | | | | | | | | | — | | | | | | | | | | — | | | | | | | | | | — | |
Goldman Sachs International | | | | 31,848 | | | | | | | | | | (31,848 | ) | | | | | | | | | — | | | | | | | | | | — | | | | | | | | | | — | |
HSBC Bank PLC | | | | 43,383 | | | | | | | | | | (7,365 | ) | | | | | | | | | — | | | | | | | | | | — | | | | | | | | | | 36,018 | |
JPMorgan Chase Bank N.A. | | | | 48,203 | | | | | | | | | | (48,203 | ) | | | | | | | | | — | | | | | | | | | | — | | | | | | | | | | — | |
Morgan Stanley & Co. International PLC | | | | 21,408 | | | | | | | | | | (21,408 | ) | | | | | | | | | — | | | | | | | | | | — | | | | | | | | | | — | |
Morgan Stanley Capital Services LLC | | | | 7,368 | | | | | | | | | | (7,368 | ) | | | | | | | | | — | | | | | | | | | | — | | | | | | | | | | — | |
Northern Trust Corp. | | | | 27,290 | | | | | | | | | | — | | | | | | | | | | — | | | | | | | | | | — | | | | | | | | | | 27,290 | |
Royal Bank of Scotland PLC | | | | 73,116 | | | | | | | | | | (15,334 | ) | | | | | | | | | — | | | | | | | | | | — | | | | | | | | | | 57,782 | |
Société Générale | | | | 4,580 | | | | | | | | | | — | | | | | | | | | | — | | | | | | | | | | — | | | | | | | | | | 4,580 | |
Standard Chartered Bank | | | | 11,881 | | | | | | | | | | (11,182 | ) | | | | | | | | | — | | | | | | | | | | — | | | | | | | | | | 699 | |
State Street Bank and Trust Co. | | | | 5,591 | | | | | | | | | | (5,591 | ) | | | | | | | | | — | | | | | | | | | | — | | | | | | | | | | — | |
UBS AG | | | | 1,695 | | | | | | | | | | — | | | | | | | | | | — | | | | | | | | | | — | | | | | | | | | | 1,695 | |
Total | | | | $625,564 | | | | | | | | | | $(354,991 | ) | | | | | | | | | — | | | | | | | | | | — | | | | | | | | | | $270,573 | |
| | | | | | | | | | | | | | | | | | | | | | | | | | | | | | | | | | | | | | | | | | | | | |
| Counterparty | | Derivative Liabilities
Subject to an MNA by Counterparty | | | | Derivatives Available
for Offset1 | | | | Non-cash
Collateral
Pledged | | | | Cash
Collateral
Pledged | | | | Net Amount of
Derivative Liabilities3 |
Bank of America N.A. | | | | $ 20,303 | | | | | | | | | | $ (20,303 | ) | | | | | | | | | — | | | | | | | | | | — | | | | | | | | | | — | |
Barclays Bank PLC | | | | 46,846 | | | | | | | | | | (46,846 | ) | | | | | | | | | — | | | | | | | | | | — | | | | | | | | | | — | |
BNP Paribas S.A. | | | | 26,343 | | | | | | | | | | (26,343 | ) | | | | | | | | | — | | | | | | | | | | — | | | | | | | | | | — | |
Citibank N.A. | | | | 7,156 | | | | | | | | | | (7,156 | ) | | | | | | | | | — | | | | | | | | | | — | | | | | | | | | | — | |
Credit Suisse International | | | | 61,566 | | | | | | | | | | (38,280 | ) | | | | | | | | | — | | | | | | | | | | — | | | | | | | | | | $ 23,286 | |
Deutsche Bank AG | | | | 122,662 | | | | | | | | | | (67,764 | ) | | | | | | | | | — | | | | | | | | | | — | | | | | | | | | | 54,898 | |
Goldman Sachs International | | | | 35,821 | | | | | | | | | | (31,848 | ) | | | | | | | | | — | | | | | | | | | | — | | | | | | | | | | 3,973 | |
HSBC Bank PLC | | | | 7,365 | | | | | | | | | | (7,365 | ) | | | | | | | | | — | | | | | | | | | | — | | | | | | | | | | — | |
J.P. Morgan Securities LLC | | | | 2,088 | | | | | | | | | | — | | | | | | | | | | — | | | | | | | | | | — | | | | | | | | | | 2,088 | |
JPMorgan Chase Bank N.A. | | | | 61,956 | | | | | | | | | | (48,203 | ) | | | | | | | | | — | | | | | | | | | | — | | | | | | | | | | 13,753 | |
Morgan Stanley & Co. International PLC | | | | 76,662 | | | | | | | | | | (21,408 | ) | | | | | | | | | — | | | | | | | | | | — | | | | | | | | | | 55,254 | |
Morgan Stanley Capital Services LLC | | | | 136,855 | | | | | | | | | | (7,368 | ) | | | | | | | | | — | | | | | | | | | | — | | | | | | | | | | 129,487 | |
Nomura Securities International, Inc. | | | | 2,722 | | | | | | | | | | — | | | | | | | | | | — | | | | | | | | | | — | | | | | | | | | | 2,722 | |
Royal Bank of Scotland PLC | | | | 15,334 | | | | | | | | | | (15,334 | ) | | | | | | | | | — | | | | | | | | | | — | | | | | | | | | | — | |
Standard Chartered Bank | | | | 11,182 | | | | | | | | | | (11,182 | ) | | | | | | | | | — | | | | | | | | | | — | | | | | | | | | | — | |
State Street Bank and Trust Co. | | | | 43,137 | | | | | | | | | | (5,591 | ) | | | | | | | | | — | | | | | | | | | | — | | | | | | | | | | 37,546 | |
Total | | | | $677,998 | | | | | | | | | | $(354,991 | ) | | | | | | | | | — | | | | | | | | | | — | | | | | | | | | | $323,007 | |
| | 1 | | The amount of derivatives available for offset is limited to the amount of derivative assets and/or liabilities that are subject to an MNA. |
| | 2 | | Net amount represents the net amount receivable from the counterparty in the event of default. |
| | 3 | | Net amount represents the net amount payable due to the counterparty in the event of default. |
See Notes to Financial Statements.
| | | | | | |
| 30 | | BLACKROCK VARIABLE SERIES FUNDS, INC. | | JUNE 30, 2016 | | |
| | | | |
| Schedule of Investments (continued) | | | BlackRock Total Return V.I. Fund | |
|
| Fair Value Hierarchy as of Period End |
Various inputs are used in determining the fair value of investments and derivative financial instruments. For information about the Fund’s policy regarding valuation of investments and derivative financial instruments, refer to the Notes to Financial Statements.
The following tables summarize the Fund’s investments and derivative financial instruments categorized in the disclosure hierarchy:
| | | | | | | | | | | | | | | | | | | | |
| | | Level 1 | | Level 2 | | Level 3 | | Total |
Assets: | | | | | | | | | | | | | | | | | | | | |
Investments: | | | | | | | | | | | | | | | | | | | | |
Long-Term Investments: | | | | | | | | | | | | | | | | | | | | |
Asset-Backed Securities | | | | — | | | | $ | 21,939,989 | | | | $ | 5,506,711 | | | | $ | 27,446,700 | |
Corporate Bonds | | | | — | | | | | 76,283,102 | | | | | — | | | | | 76,283,102 | |
Foreign Agency Obligations | | | | — | | | | | 895,227 | | | | | — | | | | | 895,227 | |
Foreign Government Obligations | | | | — | | | | | 4,733,383 | | | | | — | | | | | 4,733,383 | |
Non-Agency Mortgage-Backed Securities | | | | — | | | | | 18,402,844 | | | | | 1,553,511 | | | | | 19,956,355 | |
Other Interests | | | | — | | | | | — | | | | | — | | | | | — | |
Preferred Securities | | | $ | 776,084 | | | | | 239,663 | | | | | — | | | | | 1,015,747 | |
Taxable Municipal Bonds | | | | — | | | | | 9,745,980 | | | | | — | | | | | 9,745,980 | |
U.S. Government Sponsored Agency Securities | | | | — | | | | | 116,856,621 | | | | | — | | | | | 116,856,621 | |
U.S. Treasury Obligations | | | | — | | | | | 63,192,183 | | | | | — | | | | | 63,192,183 | |
Short-Term Securities: | | | | | | | | | | | | | | | | | | | | |
Money Market Fund | | | | 33,391,456 | | | | | — | | | | | — | | | | | 33,391,456 | |
Borrowed Bond Agreements | | | | — | | | | | 3,093,509 | | | | | — | | | | | 3,093,509 | |
Options Purchased: | | | | | | | | | | | | | | | | | | | | |
Foreign currency exchange contracts | | | | — | | | | | 14,796 | | | | | — | | | | | 14,796 | |
Interest rate contracts | | | | 12,860 | | | | | — | | | | | — | | | | | 12,860 | |
Liabilities: | | | | | | | | | | | | | | | | | | | | |
Investments: | | | | | | | | | | | | | | | | | | | | |
Borrowed Bonds | | | | — | | | | | (3,095,421 | ) | | | | — | | | | | (3,095,421 | ) |
TBA Sale Commitments | | | | — | | | | | (40,216,346 | ) | | | | — | | | | | (40,216,346 | ) |
| | | | | |
Total | | | $ | 34,180,400 | | | | $ | 272,085,530 | | | | $ | 7,060,222 | | | | $ | 313,326,152 | |
| | | | | |
| | | | | | | | | | | | | | | | | | | | |
| | | | | | | | | | | | | | | | | | | | | |
Derivative Financial Instruments1 | | | | | | | | | | | | | | | | | | | | |
Assets: | | | | | | | | | | | | | | | | | | | | |
Credit contracts | | | | — | | | | $ | 213,092 | | | | | — | | | | $ | 213,092 | |
Foreign currency exchange contracts | | | | — | | | | | 264,425 | | | | | — | | | | | 264,425 | |
Interest rate contracts | | | $ | 770,672 | | | | | 77,669 | | | | | — | | | | | 848,341 | |
Liabilities: | | | | | | | | | | | | | | | | | | | | |
Credit contracts | | | | — | | | | | (126,896 | ) | | | | — | | | | | (126,896 | ) |
Foreign currency exchange contracts | | | | — | | | | | (198,518 | ) | | | | — | | | | | (198,518 | ) |
Interest rate contracts | | | | (61,568 | ) | | | | (274,071 | ) | | | | — | | | | | (335,639 | ) |
| | | | | |
Total | | | $ | 709,104 | | | | $ | (44,299 | ) | | | | — | | | | $ | 664,805 | |
| | | | | |
1 Derivative financial instruments are swaps, futures contracts, forward foreign currency exchange contracts and options written. Swaps, futures contracts and forward foreign currency exchange contracts are valued at the unrealized appreciation (depreciation) on the instrument and options written are shown at value. | |
|
| The Fund may hold assets in which the fair value approximates the carrying amount for financial statement purposes. As of period end, such assets are categorized within the disclosure hierarchy as follows: | |
| | | | | | | | | | | | | | | | | | | | |
| | | Level 1 | | Level 2 | | Level 3 | | Total |
Assets: | | | | | | | | | | | | | | | | | | | | |
Cash | | | $ | 50,229 | | | | | — | | | | | — | | | | $ | 50,229 | |
Foreign currency at value | | | | 332,195 | | | | | — | | | | | — | | | | | 332,195 | |
Cash Pledged: | | | | | | | | | | | | | | | | | | | | |
Futures contracts | | | | 514,050 | | | | | — | | | | | — | | | | | 514,050 | |
Centrally cleared swaps | | | | 935,960 | | | | | — | | | | | — | | | | | 935,960 | |
| | | | | |
Total | | | $ | 1,832,434 | | | | | — | | | | | — | | | | $ | 1,832,434 | |
| | | | | |
During the period ended June 30, 2016, there were no transfers between Level 1 and Level 2.
See Notes to Financial Statements.
| | | | | | |
| | | BLACKROCK VARIABLE SERIES FUNDS, INC. | | JUNE 30, 2016 | | 31 |
| | | | |
| Schedule of Investments (concluded) | | | BlackRock Total Return V.I. Fund | |
A reconciliation of Level 3 investments is presented when the Fund had a significant amount of Level 3 investments at the beginning and/or end of the year in relation to net assets. The following table is a reconciliation of Level 3 investments for which significant unobservable inputs were used in determining fair value:
| | | | | | | | | | | | | | | | |
| | | Asset-Backed
Securities | | | Non-Agency
Mortgage-
Backed
Securities | | | Other
Interests | | | Total | |
Assets: | | | | | | | | | | | | | | | | |
Opening Balance, as of December 31, 2015 | | $ | 3,225,869 | | | $ | 1,508,987 | | | $ | 122 | | | $ | 4,734,978 | |
Transfers into Level 3 | | | 146,736 | | | | — | | | | — | | | | 146,736 | |
Transfers out of Level 3 | | | (873,873 | ) | | | (501,499 | ) | | | — | | | | (1,375,372 | ) |
Accrued discounts/premiums | | | 2,480 | | | | 5,756 | | | | — | | | | 8,236 | |
Net realized gain (loss) | | | 2,503 | | | | 3,455 | | | | — | | | | 5,958 | |
Net change in unrealized appreciation (depreciation)1,2 | | | (28,393 | ) | | | (34,499 | ) | | | (122 | ) | | | (63,014 | ) |
Purchases | | | 3,528,004 | | | | 949,676 | | | | — | | | | 4,477,680 | |
Sales | | | (496,615 | ) | | | (378,365 | ) | | | — | | | | (874,980 | ) |
| | | | |
Closing Balance, as of June 30, 2016 | | $ | 5,506,711 | | | $ | 1,553,511 | | | | — | | | $ | 7,060,222 | |
| | | | |
Net change in unrealized appreciation (depreciation) on investments still held at June 30, 20162 | | $ | (30,662 | ) | | $ | (42,026 | ) | | $ | (122 | ) | | $ | (72,810 | ) |
| | | | |
| | 1 | | Included in the related net change in unrealized appreciation (depreciation) in the Statement of Operations. |
| | 2 | | Any difference between net change in unrealized appreciation (depreciation) and net change in unrealized appreciation (depreciation) on investments still held at June 30, 2016 is generally due to investments no longer held or categorized as Level 3 at period end. |
The Fund’s investments that are categorized as Level 3 were valued utilizing third party pricing information without adjustment. Such valuations are based on unobservable inputs. A significant change in third party information could result in a significantly lower or higher value of such Level 3 investments.
See Notes to Financial Statements.
| | | | | | |
| 32 | | BLACKROCK VARIABLE SERIES FUNDS, INC. | | JUNE 30, 2016 | | |
| | | | |
| Statement of Assets and Liabilities | | | | |
| | | | |
| June 30, 2016 (Unaudited) | | BlackRock
Total Return V.I. Fund | |
| | | | |
| Assets | | | | |
Investments at value — unaffiliated (cost — $317,427,212) | | $ | 323,246,463 | |
Investments at value — affiliated (cost — $33,391,456) | | | 33,391,456 | |
Cash | | | 50,229 | |
Cash pledged: | | | | |
Futures contracts | | | 514,050 | |
Centrally cleared swaps | | | 935,960 | |
Foreign currency at value (cost — $330,281) | | | 332,195 | |
Receivables: | | | | |
Investments sold | | | 702,423 | |
Swaps | | | 1,358 | |
TBA sale commitments | | | 40,031,406 | |
Capital shares sold | | | 16,170,215 | |
Dividends — affiliated | | | 10,564 | |
Interest | | | 1,291,700 | |
From the Manager | | | 61,825 | |
Principal paydowns | | | 1,341 | |
Variation margin on futures contracts | | | 15,785 | |
Variation margin on centrally cleared swaps | | | 57,085 | |
Swap premiums paid | | | 219,619 | |
Unrealized appreciation on: | | | | |
Forward foreign currency exchange contracts | | | 264,425 | |
OTC swaps | | | 126,724 | |
Prepaid expenses | | | 432 | |
Other assets | | | 33,691 | |
| | | | |
Total assets | | | 417,458,946 | |
| | | | |
| | | | |
| Liabilities | | | | |
Borrowed bonds at value (proceeds — $3,031,134) | | | 3,095,421 | |
Options written at value (premiums received — $33,513) | | | 4,897 | |
TBA sale commitments at value (proceeds — $40,031,406) | | | 40,216,346 | |
Payables: | | | | |
Investments purchased | | | 66,158,596 | |
Swaps | | | 25,988 | |
Capital shares redeemed | | | 615 | |
Distribution fees | | | 25,806 | |
Income dividends | | | 417,082 | |
Interest expense | | | 7,398 | |
Investment advisory fees | | | 106,232 | |
Officer’s and Directors’ fees | | | 2,397 | |
Other affiliates | | | 989 | |
Variation margin on futures contracts | | | 72,623 | |
Swap premiums received | | | 181,265 | |
Unrealized depreciation on: | | | | |
Forward foreign currency exchange contracts | | | 198,496 | |
OTC swaps | | | 298,215 | |
Other accrued expenses payable | | | 173,313 | |
| | | | |
Total liabilities | | | 110,985,679 | |
| | | | |
Net Assets | | $ | 306,473,267 | |
| | | | |
| | | | |
| Net Assets Consist of | | | | |
Paid-in capital | | $ | 324,083,159 | |
Distributions in excess of net investment income | | | (144,236 | ) |
Accumulated net realized loss | | | (23,769,173 | ) |
Net unrealized appreciation (depreciation) | | | 6,303,517 | |
| | | | |
Net Assets | | $ | 306,473,267 | |
| | | | |
| | | | |
| Net Asset Value | | | | |
Class I — Based on net assets of $166,073,895 and 13,642,267 shares outstanding, 600 million shares authorized, $0.10 par value | | $ | 12.17 | |
| | | | |
Class III — Based on net assets of $140,399,372 and 11,671,307 shares outstanding, 100 million shares authorized, $0.10 par value | | $ | 12.03 | |
| | | | |
See Notes to Financial Statements.
| | | | | | |
| | | BLACKROCK VARIABLE SERIES FUNDS, INC. | | JUNE 30, 2016 | | 33 |
| | | | |
| Six Months Ended June 30, 2016 (Unaudited) | | BlackRock
Total Return V.I. Fund | |
| | | | |
| Investment Income | | | | |
Interest | | $ | 3,110,148 | |
Dividends | | | 23,939 | |
Dividends — affiliated | | | 41,357 | |
Foreign taxes withheld | | | (62 | ) |
| | | | |
Total income | | | 3,175,382 | |
| | | | |
| | | | |
| Expenses | | | | |
Investment advisory | | | 599,893 | |
Transfer agent | | | 2,386 | |
Transfer agent — class specific | | | 189,451 | |
Distribution — class specific | | | 127,116 | |
Custodian | | | 42,643 | |
Professional | | | 35,153 | |
Accounting services | | | 25,769 | |
Printing | | | 10,974 | |
Officer and Directors | | | 10,861 | |
Registration | | | 4,856 | |
Miscellaneous | | | 21,139 | |
| | | | |
Total expenses excluding interest expense | | | 1,070,241 | |
Interest expense | | | 30,087 | |
| | | | |
Total expenses | | | 1,100,328 | |
Less: | | | | |
Fees waived by the Manager | | | (7,295 | ) |
Transfer agent fees reimbursed — class specific | | | (166,506 | ) |
| | | | |
Total expenses after fees waived and reimbursed | | | 926,527 | |
| | | | |
Net investment income | | | 2,248,855 | |
| | | | |
| | | | |
| Realized and Unrealized Gain (Loss) | | | | |
Net realized gain (loss) from: | | | | |
Borrowed bonds | | | (152,806 | ) |
Foreign currency transactions | | | (52,758 | ) |
Futures contracts | | | 1,760,697 | |
Investments (net of $1,940 foreign capital gain tax) | | | 21,855 | |
Options written | | | (14,355 | ) |
Swaps | | | 78,466 | |
| | | | |
| | | 1,641,099 | |
| | | | |
Net change in unrealized appreciation (depreciation) on: | | | | |
Borrowed bonds | | | (106,473 | ) |
Foreign currency translations | | | 89,216 | |
Futures contracts | | | 723,161 | |
Investments | | | 7,669,892 | |
Options written | | | 28,616 | |
Swaps | | | 81,197 | |
| | | | |
| | | 8,485,609 | |
| | | | |
Net realized and unrealized gain | | | 10,126,708 | |
| | | | |
Net Increase in Net Assets Resulting from Operations | | $ | 12,375,563 | |
| | | | |
See Notes to Financial Statements.
| | | | | | |
| 34 | | BLACKROCK VARIABLE SERIES FUNDS, INC. | | JUNE 30, 2016 | | |
| | | | |
| Statements of Changes in Net Assets | | | BlackRock Total Return V.I. Fund | |
| | | | | | | | | | | | |
| Increase (Decrease) in Net Assets: | | Six Months
Ended
June 30, 2016
(Unaudited) | | | | | | Year Ended
December 31,
2015 | |
| | | | | | | | | | | | |
| Operations | | | | | | | | | | | | |
Net investment income | | $ | 2,248,855 | | | | | | | $ | 3,059,654 | |
Net realized gain | | | 1,641,099 | | | | | | | | 681,785 | |
Net change in unrealized appreciation (depreciation) | | | 8,485,609 | | | | | | | | (3,541,127 | ) |
| | | | |
Net increase in net assets resulting from operations | | | 12,375,563 | | | | | | | | 200,312 | |
| | | | |
| | | | | | | | | | | | |
| Distributions to Shareholders1 | | | | | | | | | | | | |
From net investment income: | | | | | | | | | | | | |
Class I | | | (1,512,672 | ) | | | | | | | (3,011,155 | ) |
Class III | | | (861,203 | ) | | | | | | | (392,472 | ) |
| | | | |
Decrease in net assets resulting from distributions to shareholders | | | (2,373,875 | ) | | | | | | | (3,403,627 | ) |
| | | | |
| | | | | | | | | | | | |
| Capital Share Transactions | | | | | | | | | | | | |
Net increase in net assets derived from capital share transactions | | | 73,582,122 | | | | | | | | 88,027,041 | |
| | | | |
| | | | | | | | | | | | |
| Net Assets | | | | | | | | | | | | |
Total increase in net assets | | | 83,583,810 | | | | | | | | 84,823,726 | |
Beginning of period | | | 222,889,457 | | | | | | | | 138,065,731 | |
| | | | |
End of period | | $ | 306,473,267 | | | | | | | $ | 222,889,457 | |
| | | | |
Distributions in excess of net investment income, end of period | | $ | (144,236 | ) | | | | | | $ | (19,216 | ) |
| | | | |
| | 1 | | Distributions for annual periods determined in accordance with federal income tax regulations. |
See Notes to Financial Statements.
| | | | | | |
| | | BLACKROCK VARIABLE SERIES FUNDS, INC. | | JUNE 30, 2016 | | 35 |
| | | | |
| Financial Highlights | | | BlackRock Total Return V.I. Fund | |
| | | | | | | | | | | | | | | | | | | | | | | | |
| | | Class I | |
| | | Six Months Ended June 30, 2016 | | | | | | | | | | | | | | | | |
| | | Year Ended December 31, | |
| | (Unaudited) | | | 2015 | | | 2014 | | | 2013 | | | 2012 | | | 2011 | |
| | | | | | | | | | | | | | | | | | | | | | | | |
| Per Share Operating Performance | | | | | | | | | | | | | | | | | | | | | | | | |
Net asset value, beginning of period | | $ | 11.71 | | | $ | 11.93 | | | $ | 11.51 | | | $ | 12.01 | | | $ | 11.49 | | | $ | 11.29 | |
| | | | |
Net investment income1 | | | 0.11 | | | | 0.22 | | | | 0.32 | | | | 0.32 | | | | 0.38 | | | | 0.46 | |
Net realized and unrealized gain (loss) | | | 0.47 | | | | (0.19 | ) | | | 0.44 | | | | (0.45 | ) | | | 0.55 | | | | 0.21 | |
| | | | |
Net increase (decrease) from investment operations | | | 0.58 | | | | 0.03 | | | | 0.76 | | | | (0.13 | ) | | | 0.93 | | | | 0.67 | |
| | | | |
Distributions from net investment income2 | | | (0.12 | ) | | | (0.25 | ) | | | (0.34 | ) | | | (0.37 | ) | | | (0.41 | ) | | | (0.47) | |
| | | | |
Net asset value, end of period | | $ | 12.17 | | | $ | 11.71 | | | $ | 11.93 | | | $ | 11.51 | | | $ | 12.01 | | | $ | 11.49 | |
| | | | |
| | | | | | | | | | | | | | | | | | | | | | | | |
| Total Return3 | | | | | | | | | | | | | | | | | | | | | | | | |
Based on net asset value | | | 4.96 | %4 | | | 0.26 | % | | | 6.66 | % | | | (1.14 | )% | | | 8.25 | % | | | 6.07% | |
| | | | |
| | | | | | | | | | | | | | | | | | | | | | | | |
| Ratios to Average Net Assets | | | | | | | | | | | | | | | | | | | | | | | | |
Total expenses5 | | | 0.83 | %6 | | | 0.92 | % | | | 0.88 | % | | | 0.87 | % | | | 0.80 | % | | | 0.69% | |
| | | | |
Total expenses after fees reimbursed and paid indirectly5 | | | 0.61 | %6 | | | 0.74 | % | | | 0.69 | % | | | 0.67 | % | | | 0.67 | % | | | 0.69% | |
| | | | |
Total expenses after fees reimbursed and paid indirectly and excluding interest expense5 | | | 0.59 | %6 | | | 0.69 | % | | | 0.66 | % | | | 0.65 | % | | | 0.64 | % | | | 0.64% | |
| | | | |
Net investment income5 | | | 1.90 | %6 | | | 1.89 | % | | | 2.68 | % | | | 2.75 | % | | | 3.24 | % | | | 4.04% | |
| | | | |
| | | | | | | | | | | | | | | | | | | | | | | | |
| Supplemental Data | | | | | | | | | | | | | | | | | | | | | | | | |
Net assets, end of period (000) | | $ | 166,074 | | | $ | 154,046 | | | $ | 130,765 | | | $ | 135,943 | | | $ | 162,921 | | | $ | 171,452 | |
| | | | |
Portfolio turnover rate7 | | | 299 | % | | | 900 | % | | | 772 | % | | | 724 | % | | | 953 | % | | | 1,203% | |
| | | | |
| | 1 | | Based on average shares outstanding. |
| | 2 | | Distributions for annual periods determined in accordance with federal income tax regulations. |
| | 3 | | Where applicable, excludes insurance-related fees and expenses and assumes the reinvestment of distributions. |
| | 4 | | Aggregate total return. |
| | 5 | | Excludes expenses incurred indirectly as a result of investments in underlying funds as follows: |
| | | | | | | | | | | | | | | | | | | | | | | | |
| | | Six Months
Ended
June 30, 2016 | | | | | | | | | | | | | | | | |
| | | Year Ended December 31, | |
| | (Unaudited) | | | 2015 | | | 2014 | | | 2013 | | | 2012 | | | 2011 | |
Investments in underlying funds | | | 0.01 | % | | | 0.01 | % | | | — | | | | — | | | | — | | | | — | |
| | 7 | | Includes mortgage dollar roll transactions (“MDRs”). Additional information regarding portfolio turnover rate is as follows: |
| | | | | | | | | | | | | | | | | | | | | | | | |
| | | Six Months
Ended
June 30, 2016 | | | | | | | | | | | | | | | | |
| | | Year Ended December 31, | |
| | (Unaudited) | | | 2015 | | | 2014 | | | 2013 | | | 2012 | | | 2011 | |
Portfolio turnover rate (excluding MDRs) | | | 205 | % | | | 625 | % | | | 560 | % | | | 498 | % | | | 729 | % | | | 755 | % |
See Notes to Financial Statements.
| | | | | | |
| 36 | | BLACKROCK VARIABLE SERIES FUNDS, INC. | | JUNE 30, 2016 | | |
| | | | |
| Financial Highlights (concluded) | | | BlackRock Total Return V.I. Fund | |
| | | | | | | | | | | | | | | | | | | | | | | | |
| | | Class III | |
| | | Six Months
Ended
June 30, 2016 | | | | | | | | | | | | Period
August 14,
20121 to December 31, 2012 | | | Period
April 25,
20121 to June 19, 20122 | |
| | | | Year Ended December 31, | | | |
| | | (Unaudited) | | | 2015 | | | 2014 | | | 2013 | | | |
| | | | | | | | | | | | | | | | | | | | | | | | |
| Per Share Operating Performance | | | | | | | | | | | | | | | | | | | | | | | | |
Net asset value, beginning of period | | $ | 11.57 | | | $ | 11.79 | | | $ | 11.38 | | | $ | 11.86 | | | $ | 11.71 | | | $ | 11.65 | |
| | | | |
Net investment income3 | | | 0.09 | | | | 0.18 | | | | 0.27 | | | | 0.28 | | | | 0.13 | | | | 0.05 | |
Net realized and unrealized gain (loss) | | | 0.47 | | | | (0.19 | ) | | | 0.44 | | | | (0.42 | ) | | | 0.16 | | | | 0.07 | |
| | | | |
Net increase (decrease) from investment operations | | | 0.56 | | | | (0.01 | ) | | | 0.71 | | | | (0.14 | ) | | | 0.29 | | | | 0.12 | |
| | | | |
Distributions from net investment income4 | | | (0.10 | ) | | | (0.21 | ) | | | (0.30 | ) | | | (0.34 | ) | | | (0.14 | ) | | | (0.06) | |
| | | | |
Net asset value, end of period | | $ | 12.03 | | | $ | 11.57 | | | $ | 11.79 | | | $ | 11.38 | | | $ | 11.86 | | | $ | 11.71 | |
| | | | |
| | | | | | | | | | | | | | | | | | | | | | | | |
| Total Return5 | | | | | | | | | | | | | | | | | | | | | | | | |
Based on net asset value | | | 4.85 | %6 | | | (0.08 | )% | | | 6.28 | % | | | (1.30 | )% | | | 2.50 | %6 | | | 1.00%6 | |
| | | | |
| | | | | | | | | | | | | | | | | | | | | | | | |
| Ratios to Average Net Assets | | | | | | | | | | | | | | | | | | | | | | | | |
Total expenses7 | | | 0.93 | %8 | | | 1.06 | % | | | 1.11 | % | | | 1.06 | % | | | 0.95 | %8 | | | 1.09%8 | |
| | | | |
Total expenses after fees reimbursed and paid indirectly7 | | | 0.90 | %8 | | | 1.04 | % | | | 1.01 | % | | | 0.96 | % | | | 0.95 | %8 | | | 0.98%8 | |
| | | | |
Total expenses after fees reimbursed and paid indirectly and excluding interest expense7 | | | 0.88 | %8 | | | 0.98 | % | | | 0.98 | % | | | 0.94 | % | | | 0.91 | %8 | | | 0.95%8 | |
| | | | |
Net investment income7 | | | 1.58 | %8 | | | 1.54 | % | | | 2.31 | % | | | 2.45 | % | | | 2.83 | %8 | | | 3.22%8 | |
| | | | |
| | | | | | | | | | | | | | | | | | | | | | | | |
| Supplemental Data | | | | | | | | | | | | | | | | | | | | | | | | |
Net assets, end of period (000) | | $ | 140,399 | | | $ | 68,844 | | | $ | 7,300 | | | $ | 2,750 | | | $ | 344 | | | | —2 | |
| | | | |
Portfolio turnover rate9 | | | 299 | % | | | 900 | % | | | 772 | % | | | 724 | % | | | 953 | % | | | 953% | |
| | | | |
| | 1 | | Recommencement of operations. |
| | 2 | | There were no Class III Shares outstanding as of June 19, 2012. |
| | 3 | | Based on average shares outstanding. |
| | 4 | | Distributions for annual periods determined in accordance with federal income tax regulations. |
| | 5 | | Where applicable, excludes insurance-related fees and expenses and assumes the reinvestment of distributions. |
| | 6 | | Aggregate total return. |
| | 7 | | Excludes expenses incurred indirectly as a result of investments in underlying funds as follows: |
| | | | | | | | | | | | | | | | | | | | |
| | | Six Months
Ended June 30, 2016 | | | | | | | | | | | | | |
| | | Year Ended December 31, | |
| | (Unaudited) | | | 2015 | | | 2014 | | | 2013 | | | 2012 | |
Investments in underlying funds | | | 0.01 | % | | | 0.01 | % | | | — | | | | — | | | | — | |
| | 9 | | Includes mortgage dollar roll transactions (“MDRs”). Additional information regarding portfolio turnover rate is as follows: |
| | | | | | | | | | | | | | | | | | | | |
| | | Six Months Ended June 30, 2016 | | | | | | | | | | | | | |
| | | Year Ended December 31, | |
| | (Unaudited) | | | 2015 | | | 2014 | | | 2013 | | | 2012 | |
Portfolio turnover rate (excluding MDRs) | | | 205 | % | | | 625 | % | | | 560 | % | | | 498 | % | | | 729% | * |
| |
| | * | | The portfolio turnover is from period August 14, 2012 to December 31, 2012 and period April 25, 2012 to June 19, 2012. |
See Notes to Financial Statements.
| | | | | | |
| | | BLACKROCK VARIABLE SERIES FUNDS, INC. | | JUNE 30, 2016 | | 37 |
| | | | |
| Notes to Financial Statements (Unaudited) | | | BlackRock Total Return V.I. Fund | |
1. Organization:
BlackRock Variable Series Funds, Inc. (the “Company”) is registered under the Investment Company Act of 1940, as amended (the “1940 Act”), as an open-end management investment company. The Company is organized as a Maryland corporation that is comprised of 20 separate funds. The funds offer shares to insurance companies for their separate accounts to fund benefits under certain variable annuity and variable life insurance contracts. The financial statements presented are for BlackRock Total Return V.I. Fund (the “Fund”). The Fund is classified as diversified. Class I and Class III Shares have equal voting, dividend, liquidation and other rights, except that only shares of the respective classes are entitled to vote on matters concerning only that class. In addition, Class III Shares bear certain expenses related to the distribution of such shares. Class III Shares recommenced on April 25, 2012, were redeemed on June 19, 2012 and recommenced on August 14, 2012.
The Fund, together with certain other registered investment companies advised by BlackRock Advisors, LLC (the “Manager”) or its affiliates, is included in a complex of open-end funds referred to as the Equity-Bond Complex.
2. Significant Accounting Policies:
The financial statements are prepared in conformity with accounting principles generally accepted in the United States of America (“U.S. GAAP”), which may require management to make estimates and assumptions that affect the reported amounts of assets and liabilities in the financial statements, disclosure of contingent assets and liabilities at the date of the financial statements and the reported amounts of increases and decreases in net assets from operations during the reporting period. Actual results could differ from those estimates. The Fund is considered an investment company under U.S. GAAP and follows the accounting and reporting guidance applicable to investment companies. Below is a summary of significant accounting policies:
Foreign Currency: The Fund’s books and records are maintained in U.S. dollars. Purchases and sales of investments are recorded at the rates of exchange prevailing on the respective dates of such transactions. Generally, when the U.S. dollar rises in value against a foreign currency, the investments denominated in that currency will lose value; the opposite effect occurs if the U.S. dollar falls in relative value.
The Fund does not isolate the portion of the results of operations arising as a result of changes in the exchange rates from the changes in the market prices of investments held or sold for financial reporting purposes. Accordingly, the effects of changes in exchange rates on investments are not segregated in the Statement of Operations from the effects of changes in market prices of those investments, but are included as a component of net realized and unrealized gain (loss) from investments. The Fund reports realized currency gains (losses) on foreign currency related transactions as components of net realized gain (loss) for financial reporting purposes, whereas such components are generally treated as ordinary income for federal income tax purposes.
Segregation and Collateralization: In cases where the Fund enters into certain investments (e.g., dollar rolls, TBA sale commitments, futures contracts, forward foreign currency exchange contracts, options written and swaps), or certain borrowings (e.g., reverse repurchase agreements) that would be treated as “senior securities” for 1940 Act purposes, the Fund may segregate or designate on its books and records cash or liquid assets having a market value at least equal to the amount of its future obligations under such investments or borrowings. Doing so allows the investment or borrowing to be excluded from treatment as a “senior security.” Furthermore, if required by an exchange or counterparty agreement, the Fund may be required to deliver/deposit cash and/or securities to/with an exchange, or broker-dealer or custodian as collateral for certain investments or obligations.
Investment Transactions and Investment Income: For financial reporting purposes, investment transactions are recorded on the dates the transactions are entered into (the trade dates). Realized gains and losses on investment transactions are determined on the identified cost basis. Dividend income is recorded on the ex-dividend date. Dividends from foreign securities where the ex-dividend date may have passed are subsequently recorded when the Fund is informed of the ex-dividend date. Under the applicable foreign tax laws, a withholding tax at various rates may be imposed on capital gains, dividends and interest. Interest income, including amortization and accretion of premiums and discounts on debt securities, is recognized on the accrual basis. Income, expenses and realized and unrealized gains and losses are allocated daily to each class based on its relative net assets.
Distributions: Distributions from net investment income are declared daily and paid monthly. Distributions of capital gains are recorded on the ex-dividend date and made at least annually. The character and timing of distributions are determined in accordance with federal income tax regulations, which may differ from U.S. GAAP.
Indemnifications: In the normal course of business, the Fund enters into contracts that contain a variety of representations that provide general indemnification. The Fund’s maximum exposure under these arrangements is unknown because it involves future potential claims against the Fund, which cannot be predicted with any certainty.
Other: Expenses directly related to the Fund or its classes are charged to the Fund or the applicable class. Other operating expenses shared by several funds, including other funds managed by the Manager, are prorated among those funds on the basis of relative net assets or other appropriate methods. Expenses directly related to the Fund and other shared expenses prorated to the Fund are allocated daily to each class based on its relative net assets or other appropriate methods.
| | | | | | |
| 38 | | BLACKROCK VARIABLE SERIES FUNDS, INC. | | JUNE 30, 2016 | | |
| | | | |
| Notes to Financial Statements (continued) | | | BlackRock Total Return V.I. Fund | |
The Fund has an arrangement with its custodian whereby fees may be reduced by credits earned on uninvested cash balances, which, if applicable, are shown as fees paid indirectly in the Statement of Operations. The custodian imposes fees on overdrawn cash balances, which can be offset by accumulated credits earned or may result in additional custody charges.
3. Investment Valuation and Fair Value Measurements:
Investment Valuation Policies: The Fund’s investments are valued at fair value (also referred to as “market value” within the financial statements) as of the close of trading on the New York Stock Exchange (“NYSE”) (generally 4:00 p.m., Eastern time). U.S. GAAP defines fair value as the price the Fund would receive to sell an asset or pay to transfer a liability in an orderly transaction between market participants at the measurement date. The Fund determines the fair values of its financial instruments using various independent dealers or pricing services under policies approved by the Board of Directors of the Company (the “Board”). The BlackRock Global Valuation Methodologies Committee (the “Global Valuation Committee”) is the committee formed by management to develop global pricing policies and procedures and to provide oversight of the pricing function for the Fund for all financial instruments.
Fair Value Inputs and Methodologies: The following methods (or “techniques”) and inputs are used to establish the fair value of the Fund’s assets and liabilities:
| • | | Equity investments traded on a recognized securities exchange are valued at the official closing price each day, if available. For equity investments traded on more than one exchange, the official close price on the exchange where the stock is primarily traded is used. Equity investments traded on a recognized exchange for which there were no sales on that day may be valued at the last available bid (long positions) or ask (short positions) price. |
| • | | Bond investments are valued on the basis of last available bid prices or current market quotations provided by dealers or pricing services. Floating rate loan interests are valued at the mean of the bid prices from one or more brokers or dealers as obtained from a pricing service. In determining the value of a particular investment, pricing services may use certain information with respect to transactions in such investments, quotations from dealers, pricing matrixes, market transactions in comparable investments, various relationships observed in the market between investments and calculated yield measures. Asset-backed and mortgage-backed securities are valued by independent pricing services using models that consider estimated cash flows of each tranche of the security, establish a benchmark yield and develop an estimated tranche-specific spread to the benchmark yield based on the unique attributes of the tranche. |
| • | | Generally, trading in foreign instruments is substantially completed each day at various times prior to the close of business on the NYSE. Occasionally, events affecting the values of such instruments may occur between the foreign market close and the close of business on the NYSE that may not be reflected in the computation of the Fund’s net assets. Each business day, the Fund uses a pricing service to assist with the valuation of certain foreign exchange-traded equity securities and foreign exchange-traded and over-the-counter (“OTC”) options (the “Systematic Fair Value Price”). Using current market factors, the Systematic Fair Value Price is designed to value such foreign securities and foreign options at fair value as of the close of business on the NYSE, which follows the close of the local markets. |
| • | | Municipal investments (including commitments to purchase such investments on a “when-issued” basis) are valued on the basis of prices provided by dealers or pricing services. In determining the value of a particular investment, pricing services may use certain information with respect to transactions in such investments, quotations from dealers, pricing matrixes, market transactions in comparable investments and information with respect to various relationships between investments. |
| • | | To-be-announced (“TBA”) commitments are valued on the basis of last available bid prices or current market quotations provided by pricing services. |
| • | | Investments in open-end U.S. mutual funds are valued at net asset value each business day. |
| • | | Futures contracts traded on exchanges are valued at their last sale price. |
| • | | Securities and other assets and liabilities denominated in foreign currencies are translated into U.S. dollars using exchange rates determined as of the close of business on the NYSE. Forward foreign currency exchange contracts are valued at the mean between the bid and ask prices and are determined as of the close of business on the NYSE. Interpolated values are derived when the settlement date of the contract is an interim date for which quotations are not available. |
| • | | Exchange-traded options are valued at the mean between the last bid and ask prices at the close of the options market in which the options trade. An exchange-traded option for which there is no mean price is valued at the last bid (long positions) or ask (short positions) price. If no bid or ask price is available, the prior day’s price will be used, unless it is determined that the prior day’s price no longer reflects the fair value of the option. OTC options and options on swaps (“swaptions”) are valued by an independent pricing service using a mathematical model, which incorporates a number of market data factors, such as the trades and prices of the underlying instruments. |
| • | | Swap agreements are valued utilizing quotes received daily by the Fund’s pricing service or through brokers, which are derived using daily swap curves and models that incorporate a number of market data factors, such as discounted cash flows, trades and values of the underlying reference instruments. |
| | | | | | |
| | | BLACKROCK VARIABLE SERIES FUNDS, INC. | | JUNE 30, 2016 | | 39 |
| | | | |
| Notes to Financial Statements (continued) | | | BlackRock Total Return V.I. Fund | |
If events (e.g., a company announcement, market volatility or a natural disaster) occur that are expected to materially affect the value of such instruments, or in the event that the application of these methods of valuation results in a price for an investment that is deemed not to be representative of the market value of such investment, or if a price is not available, the investment will be valued by the Global Valuation Committee, or its delegate, in accordance with a policy approved by the Board as reflecting fair value (“Fair Valued Investments”). When determining the price for Fair Valued Investments, the Global Valuation Committee, or its delegate, seeks to determine the price that the Fund might reasonably expect to receive or pay from the current sale or purchase of that asset or liability in an arm’s-length transaction. Fair value determinations shall be based upon all available factors that the Global Valuation Committee, or its delegate, deems relevant consistent with the principles of fair value measurement, which include the market approach, income approach and/or in the case of recent investments, the cost approach, as appropriate. The market approach generally consists of using comparable market transactions. The income approach generally is used to discount future cash flows to present value and is adjusted for liquidity as appropriate. These factors include but are not limited to: (i) attributes specific to the investment or asset; (ii) the principal market for the investment or asset; (iii) the customary participants in the principal market for the investment or asset; (iv) data assumptions by market participants for the investment or asset, if reasonably available; (v) quoted prices for similar investments or assets in active markets; and (vi) other factors, such as future cash flows, interest rates, yield curves, volatilities, prepayment speeds, loss severities, credit risks, recovery rates, liquidation amounts and/or default rates. Due to the inherent uncertainty of valuations of such investments, the fair values may differ from the values that would have been used had an active market existed. The Global Valuation Committee, or its delegate, employs various methods for calibrating valuation approaches for investments where an active market does not exist, including regular due diligence of the Fund’s pricing vendors, regular reviews of key inputs and assumptions, transactional back-testing or disposition analysis to compare unrealized gains and losses to realized gains and losses, reviews of missing or stale prices and large movements in market values and reviews of any market related activity. The pricing of all Fair Valued Investments is subsequently reported to the Board or a committee thereof on a quarterly basis.
Fair Value Hierarchy: Various inputs are used in determining the fair value of investments and derivative financial instruments. These inputs to valuation techniques are categorized into a fair value hierarchy consisting of three broad levels for financial statement purposes as follows:
| • | | Level 1 — unadjusted price quotations in active markets/exchanges for identical assets or liabilities that the Fund has the ability to access |
| • | | Level 2 — other observable inputs (including, but not limited to, quoted prices for similar assets or liabilities in markets that are active, quoted prices for identical or similar assets or liabilities in markets that are not active, inputs other than quoted prices that are observable for the assets or liabilities (such as interest rates, yield curves, volatilities, prepayment speeds, loss severities, credit risks and default rates) or other market–corroborated inputs) |
| • | | Level 3 — unobservable inputs based on the best information available in the circumstances, to the extent observable inputs are not available (including the Fund’s own assumptions used in determining the fair value of investments and derivative financial instruments) |
The hierarchy gives the highest priority to unadjusted quoted prices in active markets for identical assets or liabilities (Level 1 measurements) and the lowest priority to unobservable inputs (Level 3 measurements). Accordingly, the degree of judgment exercised in determining fair value is greatest for instruments categorized in Level 3. The inputs used to measure fair value may fall into different levels of the fair value hierarchy. In such cases, for disclosure purposes, the fair value hierarchy classification is determined based on the lowest level input that is significant to the fair value measurement in its entirety. The significant unobservable inputs used by the Global Valuation Committee in determining the price for Fair Valued Investments are typically categorized as Level 3. The fair value hierarchy for the Fund’s investments and derivative financial instruments has been included in the Schedule of Investments.
Changes in valuation techniques may result in transfers into or out of an assigned level within the hierarchy. In accordance with the Fund’s policy, transfers between different levels of the fair value hierarchy are deemed to have occurred as of the beginning of the reporting period. The categorization of a value determined for investments and derivative financial instruments is based on the pricing transparency of the investments and derivative financial instruments and is not necessarily an indication of the risks associated with investing in those securities.
4. Securities and Other Investments:
Asset-Backed and Mortgage-Backed Securities: Asset-backed securities are generally issued as pass-through certificates or as debt instruments. Asset-backed securities issued as pass-through certificates represent undivided fractional ownership interests in an underlying pool of assets. Asset-backed securities issued as debt instruments, which are also known as collateralized obligations, are typically issued as the debt of a special purpose entity organized solely for the purpose of owning such assets and issuing such debt. Asset-backed securities are often backed by a pool of assets representing the obligations of a number of different parties. The yield characteristics of certain asset-backed securities may differ from traditional debt securities. One such major difference is that all or a principal part of the obligations may be prepaid at any time because the underlying assets (i.e., loans) may be prepaid at any time. As a result, a decrease in interest rates in the market may result in increases in the level of prepayments as borrowers, particularly mortgagors, refinance and repay their loans. An increased prepayment rate with respect to an asset-backed security will have the effect of shortening the maturity of the security. In addition, the Fund may subsequently have to reinvest the proceeds at lower interest rates. If the Fund has purchased such an asset-backed security at a premium, a faster than anticipated prepayment rate could result in a loss of principal to the extent of the premium paid.
| | | | | | |
| 40 | | BLACKROCK VARIABLE SERIES FUNDS, INC. | | JUNE 30, 2016 | | |
| | | | |
| Notes to Financial Statements (continued) | | | BlackRock Total Return V.I. Fund | |
For mortgage pass-through securities (the “Mortgage Assets”) there are a number of important differences among the agencies and instrumentalities of the U.S. Government that issue mortgage-related securities and among the securities that they issue. For example, mortgage-related securities guaranteed by Ginnie Mae are guaranteed as to the timely payment of principal and interest by Ginnie Mae and such guarantee is backed by the full faith and credit of the United States. However, mortgage-related securities issued by Freddie Mac and Fannie Mae, including Freddie Mac and Fannie Mae guaranteed mortgage pass-through certificates, which are solely the obligations of Freddie Mac and Fannie Mae, are not backed by or entitled to the full faith and credit of the United States, but are supported by the right of the issuer to borrow from the U.S. Treasury.
Non-agency mortgage-backed securities are securities issued by non-governmental issuers and have no direct or indirect government guarantees of payment and are subject to various risks. Non-agency mortgage loans are obligations of the borrowers thereunder only and are not typically insured or guaranteed by any other person or entity. The ability of a borrower to repay a loan is dependent upon the income or assets of the borrower. A number of factors, including a general economic downturn, acts of God, terrorism, social unrest and civil disturbances, may impair a borrower’s ability to repay its loans.
Collateralized Debt Obligations: Collateralized debt obligations (“CDOs”), including collateralized bond obligations (“CBOs”) and collateralized loan obligations (“CLOs”), are types of asset-backed securities. A CDO is an entity that is backed by a diversified pool of debt securities (CBOs) or syndicated bank loans (CLOs). The cash flows of the CDO can be split into multiple segments, called “tranches,” which will vary in risk profile and yield. The riskiest segment is the subordinated or “equity” tranche. This tranche bears the greatest risk of defaults from the underlying assets in the CDO and serves to protect the other, more senior, tranches from default in all but the most severe circumstances. Since it is shielded from defaults by the more junior tranches, a “senior” tranche will typically have higher credit ratings and lower yields than their underlying securities, and often receive investment grade ratings from one or more of the nationally recognized rating agencies. Despite the protection from the more junior tranches, senior tranches can experience substantial losses due to actual defaults, increased sensitivity to future defaults and the disappearance of one or more protecting tranches as a result of changes in the credit profile of the underlying pool of assets.
Inflation-Indexed Bonds: Inflation-indexed bonds (other than municipal inflation-indexed and certain corporate inflation-indexed bonds) are fixed income securities whose principal value is periodically adjusted according to the rate of inflation. If the index measuring inflation rises or falls, the principal value of inflation-indexed bonds (other than municipal inflation-indexed and certain corporate inflation-indexed bonds) will be adjusted upward or downward, and consequently the interest payable on these securities (calculated with respect to a larger or smaller principal amount) will be increased or reduced, respectively. Any upward or downward adjustment in the principal amount of an inflation-indexed bond will be included as interest income in the Statement of Operations, even though investors do not receive their principal until maturity. Repayment of the original bond principal upon maturity (as adjusted for inflation) is guaranteed in the case of U.S. Treasury inflation-indexed bonds. For bonds that do not provide a similar guarantee, the adjusted principal value of the bond repaid at maturity may be less than the original principal. With regard to municipal inflation-indexed bonds and certain corporate inflation-indexed bonds, the inflation adjustment is typically reflected in the semi-annual coupon payment. As a result, the principal value of municipal inflation-indexed bonds and such corporate inflation-indexed bonds does not adjust according to the rate of inflation.
Multiple Class Pass-Through Securities: Multiple class pass-through securities, including collateralized mortgage obligations (“CMOs”) and commercial mortgage-backed securities, may be issued by Ginnie Mae, U.S. Government agencies or instrumentalities or by trusts formed by private originators of, or investors in, mortgage loans. In general, CMOs are debt obligations of a legal entity that are collateralized by a pool of residential or commercial mortgage loans or Mortgage Assets. The payments on these are used to make payments on the CMOs or multiple pass-through securities. Multiple class pass-through securities represent direct ownership interests in the Mortgage Assets. Classes of CMOs include interest only (“IOs”), principal only (“POs”), planned amortization classes and targeted amortization classes. IOs and POs are stripped mortgage-backed securities representing interests in a pool of mortgages, the cash flow from which has been separated into interest and principal components. IOs receive the interest portion of the cash flow while POs receive the principal portion. IOs and POs can be extremely volatile in response to changes in interest rates. As interest rates rise and fall, the value of IOs tends to move in the same direction as interest rates. POs perform best when prepayments on the underlying mortgages rise since this increases the rate at which the principal is returned and the yield to maturity on the PO. When payments on mortgages underlying a PO are slower than anticipated, the life of the PO is lengthened and the yield to maturity is reduced. If the underlying Mortgage Assets experience greater than anticipated prepayments of principal, the Fund’s initial investment in the IOs may not fully recoup.
Stripped Mortgage-Backed Securities: Stripped mortgage-backed securities are typically issued by the U.S. Government, its agencies and instrumentalities. Stripped mortgage-backed securities are usually structured with two classes that receive different proportions of the interest (IOs) and principal (POs) distributions on a pool of Mortgage Assets. Stripped mortgage-backed securities may be privately issued.
Zero-Coupon Bonds: Zero-coupon bonds are normally issued at a significant discount from face value and do not provide for periodic interest payments. These bonds may experience greater volatility in market value than other debt obligations of similar maturity which provide for regular interest payments.
| | | | | | |
| | | BLACKROCK VARIABLE SERIES FUNDS, INC. | | JUNE 30, 2016 | | 41 |
| | | | |
| Notes to Financial Statements (continued) | | | BlackRock Total Return V.I. Fund | |
Capital Securities and Trust Preferred Securities: Capital securities, including trust preferred securities, are typically issued by corporations, generally in the form of interest-bearing notes with preferred securities characteristics. In the case of trust preferred securities, an affiliated business trust of a corporation issues these securities, generally in the form of beneficial interests in subordinated debentures or similarly structured securities. The securities can be structured with either a fixed or adjustable coupon that can have either a perpetual or stated maturity date. For trust preferred securities, the issuing bank or corporation pays interest to the trust, which is then distributed to holders of the these securities as a dividend. Dividends can be deferred without creating an event of default or acceleration, although maturity cannot take place unless all cumulative payment obligations have been met. The deferral of payments does not affect the purchase or sale of these securities in the open market. Payments on these securities are treated as interest rather than dividends for federal income tax purposes. These securities generally are rated below that of the issuing company’s senior debt securities and are freely callable at the issuer’s option.
Preferred Stock: Preferred stock has a preference over common stock in liquidation (and generally in receiving dividends as well) but is subordinated to the liabilities of the issuer in all respects. As a general rule, the market value of preferred stock with a fixed dividend rate and no conversion element varies inversely with interest rates and perceived credit risk, while the market price of convertible preferred stock generally also reflects some element of conversion value. Because preferred stock is junior to debt securities and other obligations of the issuer, deterioration in the credit quality of the issuer will cause greater changes in the value of a preferred stock than in a more senior debt security with similar stated yield characteristics. Unlike interest payments on debt securities, preferred stock dividends are payable only if declared by the issuer’s board of directors. Preferred stock also may be subject to optional or mandatory redemption provisions.
Forward Commitments and When-Issued Delayed Delivery Securities: The Fund may purchase securities on a when-issued basis and may purchase or sell securities on a forward commitment basis. Settlement of such transactions normally occurs within a month or more after the purchase or sale commitment is made. The Fund may purchase securities under such conditions with the intention of actually acquiring them, but may enter into a separate agreement to sell the securities before the settlement date. Since the value of securities purchased may fluctuate prior to settlement, the Fund may be required to pay more at settlement than the security is worth. In addition, the Fund is not entitled to any of the interest earned prior to settlement. When purchasing a security on a delayed delivery basis, the Fund assumes the rights and risks of ownership of the security, including the risk of price and yield fluctuations. In the event of default by the counterparty, the Fund’s maximum amount of loss is the unrealized appreciation of unsettled when-issued transactions.
TBA Commitments: TBA commitments are forward agreements for the purchase or sale of mortgage-backed securities for a fixed price, with payment and delivery on an agreed upon future settlement date. The specific securities to be delivered are not identified at the trade date. However, delivered securities must meet specified terms, including issuer, rate and mortgage terms. When entering into TBA commitments, the Fund may take possession of or deliver the underlying mortgage-backed securities but can extend the settlement or roll the transaction. TBA commitments involve a risk of loss if the value of the security to be purchased or sold declines or increases, respectively, prior to settlement date.
In order to better define contractual rights and to secure rights that will help the Fund mitigate its counterparty risk, TBA commitments may be entered into by the Fund under Master Securities Forward Transaction Agreements (each, an “MSFTA”). An MSFTA typically contains, among other things, collateral posting terms and netting provisions in the event of default and/or termination event. The collateral requirements are typically calculated by netting the mark-to-market amount for each transaction under such agreement and comparing that amount to the value of the collateral currently pledged by the Fund and the counterparty. Cash collateral that has been pledged to cover the obligations of the Fund and cash collateral received from the counterparty, if any, is reported separately on the Statement of Assets and Liabilities as cash pledged as collateral for TBA commitments or cash received as collateral for TBA commitments, respectively. Non-cash collateral pledged by the Fund, if any, is noted in the Schedule of Investments. Typically, the Fund is permitted to sell, repledge or use the collateral it receives; however, the counterparty is not permitted to do so. To the extent amounts due to the Fund is not fully collateralized, contractually or otherwise, the Fund bears the risk of loss from counterparty non-performance.
Mortgage Dollar Roll Transactions: The Fund may sell TBA mortgage-backed securities and simultaneously contract to repurchase substantially similar (i.e., same type, coupon and maturity) securities on a specific future date at an agreed upon price. During the period between the sale and repurchase, the Fund is not entitled to receive interest and principal payments on the securities sold. Mortgage dollar roll transactions are treated as purchases and sales and realizes gains and losses on these transactions. Mortgage dollar rolls involve the risk that the market value of the securities that the Fund is required to purchase may decline below the agreed upon repurchase price of those securities.
Borrowed Bond Agreements: Repurchase agreements may be referred to as borrowed bond agreements when entered into in connection with short sales of bonds. In a borrowed bond agreement, the Fund borrows a bond from a counterparty in exchange for cash collateral. The agreement contains a commitment that the security and the cash will be returned to the counterparty and the Fund at a mutually agreed upon date. Certain agreements have no stated maturity and can be terminated by either party at any time. Earnings on cash collateral and compensation to the lender of the bond are based on agreed upon rates between the Fund and the counterparty. The value of the underlying cash collateral approximates the market value and accrued interest of the borrowed bond. To the extent that a borrowed bond transaction exceeds one business day, the value of the cash collateral in the possession of the counterparty is monitored on a daily basis to ensure the adequacy of the collateral. As the market value of the borrowed bond changes, the cash collateral is periodically increased or decreased with a frequency and in amounts prescribed in the borrowed bond agreement. The Fund may also experience delays in gaining access to the collateral.
| | | | | | |
| 42 | | BLACKROCK VARIABLE SERIES FUNDS, INC. | | JUNE 30, 2016 | | |
| | | | |
| Notes to Financial Statements (continued) | | | BlackRock Total Return V.I. Fund | |
Reverse Repurchase Agreements: Reverse repurchase agreements are agreements with qualified third party broker dealers in which the Fund sells securities to a bank or broker-dealer and agrees to repurchase the same securities at a mutually agreed upon date and price. The Fund receives cash from the sale to use for other investment purposes. During the term of the reverse repurchase agreement, the Fund continues to receive the principal and interest payments on the securities sold. Certain agreements have no stated maturity and can be terminated by either party at any time. Interest on the value of the reverse repurchase agreements issued and outstanding is based upon competitive market rates determined at the time of issuance. The Fund may utilize reverse repurchase agreements when it is anticipated that the interest income to be earned from the investment of the proceeds of the transaction is greater than the interest expense of the transaction. Reverse repurchase agreements involve leverage risk. If the Fund suffers a loss on its investment of the transaction proceeds from a reverse repurchase agreement, the Fund would still be required to pay the full repurchase price. Further, the Fund remains subject to the risk that the market value of the securities repurchased declines below the repurchase price. In such cases, the Fund would be required to return a portion of the cash received from the transaction or provide additional securities to the counterparty.
Cash received in exchange for securities delivered plus accrued interest due to the counterparty is recorded as a liability in the Statement of Assets and Liabilities at face value including accrued interest. Due to the short-term nature of the reverse repurchase agreements, face value approximates fair value. Interest payments made by the Fund to the counterparties are recorded as a component of interest expense in the Statement of Operations. In periods of increased demand for the security, the Fund may receive a fee for use of the security by the counterparty, which may result in interest income to the Fund.
For the six months ended June 30, 2016, the average amount of reverse repurchase agreements, and the daily weighted average interest rate for the Fund were $410,990 and (1.16)%, respectively.
Borrowed bond agreements and reverse repurchase transactions are entered into by the Fund under Master Repurchase Agreements (each, an “MRA”), which permit the Fund, under certain circumstances, including an event of default (such as bankruptcy or insolvency), to offset payables and/or receivables under the MRA with collateral held and/or posted to the counterparty and create one single net payment due to or from the Fund. With borrowed bond agreements and reverse repurchase transactions, typically the Fund and counterparty under an MRA are permitted to sell, re-pledge, or use the collateral associated with the transaction. Bankruptcy or insolvency laws of a particular jurisdiction may impose restrictions on or prohibitions against such a right of offset in the event of the MRA counterparty’s bankruptcy or insolvency. Pursuant to the terms of the MRA, the Fund receives or posts securities as collateral with a market value in excess of the repurchase price to be paid or received by the Fund upon the maturity of the transaction. Upon a bankruptcy or insolvency of the MRA counterparty, the Fund is considered an unsecured creditor with respect to excess collateral and, as such, the return of excess collateral may be delayed.
As of period end, the following table is a summary of the Fund’s open borrowed bond agreements by counterparty which are subject to offset under an MRA on a net basis:
| | | | | | | | | | | | | | | | | | | | |
| Counterparty | | Borrowed
Bond
Agreements1 | | Borrowed Bonds
at Value
including
Accrued Interest2 | | Exposure Due (to) / from
Counterparty before
Collateral | | Net Exposure
Due (to)/from
Counterparty3 |
BNP Paribas Securities Corp. | | | $ | 556,534 | | | | $ | (567,039 | ) | | | $ | (10,505 | ) | | | $ | (10,505 | ) |
Deutsche Bank Securities, Inc. | | | | 146,650 | | | | | (147,098 | ) | | | | (448 | ) | | | | (448 | ) |
J.P. Morgan Securities LLC | | | | 2,390,325 | | | | | (2,388,682 | ) | | | | 1,643 | | | | | 1,643 | |
Total | | | $ | 3,093,509 | | | | $ | (3,102,819 | ) | | | $ | (9,310 | ) | | | $ | (9,310 | ) |
| | 1 | | Included in Investments at value — unaffiliated in the Statement of Assets and Liabilities. |
| | 2 | | Includes accrued interest on borrowed bonds in the amount of $7,398 which is shown as interest expense payable in the Statement of Assets and Liabilities. |
| | 3 | | Net exposure represents the net receivable (payable) that would be due from/to the counterparty in the event of default. |
In the event the counterparty of securities under an MRA files for bankruptcy or becomes insolvent, the Fund’s use of the proceeds from the agreement may be restricted while the counterparty, or its trustee or receiver, determines whether or not to enforce the Fund’s obligation to repurchase the securities.
Short Sale Transactions: In short sale transactions, the Fund sells a security it does not hold in anticipation of a decline in the market price of that security. When the Fund makes a short sale, it will borrow the security sold short (borrowed bond) and deliver the security to the counterparty to which it sold the security short. An amount equal to the proceeds received by the Fund is reflected as an asset and an equivalent liability. The amount of the liability is subsequently marked-to-market to reflect the market value of the short sale. The Fund is required to repay the counterparty interest on the security sold short, which, if applicable, is shown as interest expense in the Statement of Operations. The Fund is exposed to market risk based on the amount, if any, that the market value of the security increases beyond the market value at which the position was sold. Thus, a short sale of a security
| | | | | | |
| | | BLACKROCK VARIABLE SERIES FUNDS, INC. | | JUNE 30, 2016 | | 43 |
| | | | |
| Notes to Financial Statements (continued) | | | BlackRock Total Return V.I. Fund | |
involves the risk that instead of declining, the price of the security sold short will rise. The short sale of securities involves the possibility of an unlimited loss since there is an unlimited potential for the market price of the security sold short to increase. A gain is limited to the price at which the Fund sold the security short. A realized gain or loss is recognized upon the termination of a short sale if the market price is either less than or greater than the proceeds originally received. There is no assurance that the Fund will be able to close out a short position at a particular time or at an acceptable price.
5. Derivative Financial Instruments:
The Fund engages in various portfolio investment strategies using derivative contracts both to increase the returns of the Fund and/or to manage its exposure to certain risks such as credit risk, equity risk, interest rate risk, foreign currency exchange rate risk, commodity price risk or other risks (e.g., inflation risk). Derivative financial instruments categorized by risk exposure are included in the Schedule of Investments. These contracts may be transacted on an exchange or OTC.
Futures Contracts: The Fund invests in long and/or short positions in futures and options on futures contracts to gain exposure to, or manage exposure to changes in interest rates (interest rate risk), changes in the value of equity securities (equity risk) or foreign currencies (foreign currency exchange rate risk).
Futures contracts are agreements between the Fund and a counterparty to buy or sell a specific quantity of an underlying instrument at a specified price and on a specified date. Depending on the terms of a contract, it is settled either through physical delivery of the underlying instrument on the settlement date or by payment of a cash amount on the settlement date. Upon entering into a futures contract, the Fund is required to deposit initial margin with the broker in the form of cash or securities in an amount that varies depending on a contract’s size and risk profile. The initial margin deposit must then be maintained at an established level over the life of the contract.
Securities deposited as initial margin are designated in the Schedule of Investments and cash deposited, if any, is shown as cash pledged for futures contracts in the Statement of Assets and Liabilities. Pursuant to the contract, the Fund agrees to receive from or pay to the broker an amount of cash equal to the daily fluctuation in market value of the contract (“variation margin”). Variation margin is recorded as unrealized appreciation (depreciation) and, if any, shown as variation margin receivable (or payable) on futures contracts in the Statement of Assets and Liabilities. When the contract is closed, a realized gain or loss is recorded in the Statement of Operations equal to the difference between the value of the contract at the time it was opened and the value at the time it was closed. The use of futures contracts involves the risk of an imperfect correlation in the movements in the price of futures contracts and interest, foreign currency exchange rates or underlying assets.
Forward Foreign Currency Exchange Contracts: The Fund enters into forward foreign currency exchange contracts to gain or reduce exposure, to foreign currencies (foreign currency exchange rate risk).
A forward foreign currency exchange contract is an agreement between two parties to buy and sell a currency at a set exchange rate on a specified date. These contracts help to manage the overall exposure to the currencies in which some of the investments held by the Fund are denominated and in some cases, may be used to obtain exposure to a particular market.
The contract is marked to market daily and the change in market value is recorded as unrealized appreciation (depreciation) in the Statement of Assets and Liabilities. When a contract is closed, a realized gain or loss is recorded in the Statement of Operations equal to the difference between the value at the time it was opened and the value at the time it was closed. Non-deliverable forward foreign currency exchange contracts are settled with the counterparty in cash without the delivery of foreign currency. The use of forward foreign currency exchange contracts involves the risk that the value of a forward foreign currency exchange contract changes unfavorably due to movements in the value of the referenced foreign currencies.
Options: The Fund purchases and writes call and put options to increase or decrease its exposure to the risks of underlying instruments, including equity risk, interest rate risk and/or commodity price risk and/or, in the case of options written, to generate gains from options premiums.
A call option gives the purchaser (holder) of the option the right (but not the obligation) to buy, and obligates the seller (writer) to sell (when the option is exercised) the underlying instrument at the exercise or strike price at any time or at a specified time during the option period. A put option gives the holder the right to sell and obligates the writer to buy the underlying instrument at the exercise or strike price at any time or at a specified time during the option period.
Premiums paid on options purchased and premiums received on options written, as well as the daily fluctuation in market value, are included in investments at value — unaffiliated and options written at value, respectively, in the Statement of Assets and Liabilities. When an instrument is purchased or sold through the exercise of an option, the premium is offset against the cost or proceeds of the underlying instrument. When an option expires, a realized gain or loss is recorded in the Statement of Operations to the extent of the premiums received or paid. When an option is closed or sold, a gain or loss is recorded in the Statement of Operations to the extent the cost of the closing transaction exceeds the premiums received or paid). When the Fund writes a call option, such option is typically “covered,” meaning that it holds the underlying instrument subject to being called by the option counterparty. When the Fund writes a put option, such option is covered by cash in an amount sufficient to cover the obligation.
| | | | | | |
| 44 | | BLACKROCK VARIABLE SERIES FUNDS, INC. | | JUNE 30, 2016 | | |
| | | | |
| Notes to Financial Statements (continued) | | | BlackRock Total Return V.I. Fund | |
| • | | Swaptions — The Fund purchases and writes options on swaps (“swaptions”) primarily to preserve a return or spread on a particular investment or portion of the Fund’s holdings, as a duration management technique or to protect against an increase in the price of securities it anticipates purchasing at a later date. The purchaser and writer of a swaption is buying or granting the right to enter into a previously agreed upon interest rate or credit default swap agreement (interest rate risk and/or credit risk) at any time before the expiration of the option. |
In purchasing and writing options, the Fund bears the risk of an unfavorable change in the value of the underlying instrument or the risk that it may not be able to enter into a closing transaction due to an illiquid market. Exercise of a written option could result in the Fund purchasing or selling a security when it otherwise would not, or at a price different from the current market value.
Swaps: The Fund enters into swap contracts to manage exposure to issuers, markets and securities. Such contracts are agreements between the Fund and a counterparty to make periodic net payments on a specified notional amount or a net payment upon termination. Swap agreements are privately negotiated in the OTC market and may be entered into as a bilateral contract (“OTC swaps”) or centrally cleared (“centrally cleared swaps”).
For OTC swaps, any upfront premiums paid and any upfront fees received are shown as swap premiums paid and swap premiums received, respectively, in the Statement of Assets and Liabilities and amortized over the term of the contract. The daily fluctuation in market value is recorded as unrealized appreciation (depreciation) on OTC Swaps in the Statement of Assets and Liabilities. Payments received or paid are recorded in the Statement of Operations as realized gains or losses, respectively. When an OTC swap is terminated, a realized gain or loss is recorded in the Statement of Operations equal to the difference between the proceeds from (or cost of) the closing transaction and the Fund’s basis in the contract, if any. Generally, the basis of the contract is the premium received or paid.
In a centrally cleared swap, immediately following execution of the swap contract, the swap contract is novated to a central counterparty (the “CCP”) and the Fund’s counterparty on the swap agreement becomes the CCP. The Fund is required to interface with the CCP through the broker. Upon entering into a centrally cleared swap, the Fund is required to deposit initial margin with the broker in the form of cash or securities in an amount that varies depending on the size and risk profile of the particular swap. Securities deposited as initial margin are designated in the Schedule of Investments and cash deposited is shown as cash pledged for centrally cleared swaps in the Statement of Assets and Liabilities. Pursuant to the contract, the Fund agrees to receive from or pay to the broker an amount of cash equal to the daily fluctuation in market value of the contract (“variation margin”). Variation margin is recorded as unrealized appreciation (depreciation) and shown as variation margin receivable (or payable) on centrally cleared swaps in the Statement of Assets and Liabilities. Payments received from (paid to) the counterparty, including at termination, are recorded as realized gains (losses) in the Statement of Operations.
| • | | Credit default swaps — The Fund enters into credit default swaps to manage its exposure to the market or certain sectors of the market, to reduce their risk exposure to defaults of corporate and/or sovereign issuers or to create exposure to corporate and/or sovereign issuers to which it is not otherwise exposed (credit risk). |
The Fund may either buy or sell (write) credit default swaps on single-name issuers (corporate or sovereign), a combination or basket of single-name issuers or traded indexes. Credit default swaps are agreements in which the protection buyer pays fixed periodic payments to the seller in consideration for a promise from the protection seller to make a specific payment should a negative credit event take place with respect to the referenced entity (e.g., bankruptcy, failure to pay, obligation acceleration, repudiation, moratorium or restructuring). As a buyer, if an underlying credit event occurs, the Fund will either (i) receive from the seller an amount equal to the notional amount of the swap and deliver the referenced security or underlying securities comprising the index, or (ii) receive a net settlement of cash equal to the notional amount of the swap less the recovery value of the security or underlying securities comprising the index. As a seller (writer), if an underlying credit event occurs, the Fund will either pay the buyer an amount equal to the notional amount of the swap and take delivery of the referenced security or underlying securities comprising the index or pay a net settlement of cash equal to the notional amount of the swap less the recovery value of the security or underlying securities comprising the index.
| • | | Total return swaps — The Fund enters into total return swaps to obtain exposure to a security or market without owning such security or investing directly in such market or to exchange the risk/return of one market (e.g., fixed income) with another market (e.g., equity or commodity prices) (equity risk, commodity price risk and/or interest rate risk). |
Total return swaps are agreements in which there is an exchange of cash flows whereby one party commits to make payments based on the total return (distributions plus capital gains/losses) of an underlying instrument in exchange for fixed or floating rate interest payments. If the total return of the instrument or index underlying the transaction exceeds or falls short of the offsetting fixed or floating interest rate obligation, the Fund receives payment from or makes a payment to the counterparty.
| • | | Interest rate swaps — The Fund enters into interest rate swaps to gain or reduce exposure to interest rates or to manage duration, the yield curve or interest rate (interest rate risk). |
| | | | | | |
| | | BLACKROCK VARIABLE SERIES FUNDS, INC. | | JUNE 30, 2016 | | 45 |
| | | | |
| Notes to Financial Statements (continued) | | | BlackRock Total Return V.I. Fund | |
Interest rate swaps are agreements in which one party pays a stream of interest payments, either fixed or floating, in exchange for another party’s stream of interest payments, either fixed or floating, on the same notional amount for a specified period of time. In more complex interest rate swaps, the notional principal amount may decline (or amortize) over time.
| • | | Forward swaps — The Fund enters into forward interest rate swaps and forward total return swaps. In a forward swap, the Fund and the counterparty agree to make periodic net payments beginning on a specified date or a net payment at termination. |
| • | | Interest rate caps and floors — The Fund enters into interest rate caps and floors to gain or reduce exposure to interest rates (interest rate risk). Caps are agreements whereby one party agrees to make payments to the other, in return for a premium, to the extent that interest rate indexes exceed a specified rate, or “cap”. Floors are agreements whereby one party agrees to make payments to the other, in return for a premium, to the extent that interest rate indexes fall below a specified rate, or “floor”. The maximum potential amount of future payments that the Fund would be required to make under an interest rate cap would be the notional amount times the percentage increase in interest rates determined by the difference between the interest rate index current value and the value at the time the cap was entered into. |
Swap transactions involve, to varying degrees, elements of interest rate, credit and market risk in excess of the amounts recognized in the Statement of Assets and Liabilities. Such risks involve the possibility that there will be no liquid market for these agreements, that the counterparty to the agreements may default on its obligation to perform or disagree as to the meaning of the contractual terms in the agreements, and that there may be unfavorable changes in interest rates and/or market values associated with these transactions.
Master Netting Arrangements: In order to define its contractual rights and to secure rights that will help it mitigate its counterparty risk, the Fund may enter into an International Swaps and Derivatives Association, Inc. Master Agreement (“ISDA Master Agreement”) or similar agreement with its counterparties. An ISDA Master Agreement is a bilateral agreement between the Fund and a counterparty that governs certain OTC derivatives and typically contains, among other things, collateral posting terms and netting provisions in the event of a default and/or termination event. Under an ISDA Master Agreement, the Fund may, under certain circumstances, offset with the counterparty certain derivative financial instruments’ payables and/or receivables with collateral held and/or posted and create one single net payment. The provisions of the ISDA Master Agreement typically permit a single net payment in the event of default including the bankruptcy or insolvency of the counterparty. Bankruptcy or insolvency laws of a particular jurisdiction may restrict or prohibit the right of offset in bankruptcy, insolvency or other events. In addition, certain ISDA Master Agreements allow counterparties to terminate derivative contracts prior to maturity in the event the Fund’s net assets decline by a stated percentage or the Fund fails to meet the terms of its ISDA Master Agreements. The result would cause the Fund to accelerate payment of any net liability owed to the counterparty.
Collateral Requirements: For derivatives traded under an ISDA Master Agreement, the collateral requirements are typically calculated by netting the mark-to-market amount for each transaction under such agreement and comparing that amount to the value of any collateral currently pledged by the Fund and the counterparty.
Cash collateral that has been pledged to cover obligations of the Fund and cash collateral received from the counterparty, if any, is reported separately on the Statement of Assets and Liabilities as cash pledged as collateral and cash received as collateral, respectively. Non-cash collateral pledged by the Fund, if any, is noted in the Schedule of Investments. Generally, the amount of collateral due from or to a counterparty is subject to a certain minimum transfer amount threshold before a transfer is required, which is determined at the close of business of the Fund. Any additional required collateral is delivered to/pledged by the Fund on the next business day. Typically, the counterparty is not permitted to sell, re-pledge or use cash and non-cash collateral it receives. The Fund generally agrees not to use non-cash collateral that it receives but may, absent default or certain other circumstances defined in the underlying ISDA Master Agreement, be permitted to use cash collateral received. In such cases, interest may be paid pursuant to the collateral arrangement with the counterparty. To the extent amounts due to the Fund from its counterparties are not fully collateralized, it bears the risk of loss from counterparty non-performance. Likewise, to the extent the Fund has delivered collateral to a counterparty and stands ready to perform under the terms of its agreement with such counterparty, it bears the risk of loss from a counterparty in the amount of the value of the collateral in the event the counterparty fails to return such collateral. Based on the terms of agreements, collateral may not be required for all derivative contracts.
For financial reporting purposes, the Fund does not offset derivative assets and derivative liabilities that are subject to netting arrangements, if any, in the Statement of Assets and Liabilities.
6. Investment Advisory Agreement and Other Transactions with Affiliates:
The PNC Financial Services Group, Inc. is the largest stockholder and an affiliate of BlackRock, Inc. (“BlackRock”) for 1940 Act purposes.
| | | | | | |
| 46 | | BLACKROCK VARIABLE SERIES FUNDS, INC. | | JUNE 30, 2016 | | |
| | | | |
| Notes to Financial Statements (continued) | | | BlackRock Total Return V.I. Fund | |
Investment Advisory
The Company, on behalf of the Fund, entered into an Investment Advisory Agreement with the Manager, the Fund’s investment adviser, an indirect, wholly owned subsidiary of BlackRock, to provide investment advisory and administration services. The Manager is responsible for the management of the Fund’s portfolio and provides the personnel, facilities, equipment and certain other services necessary to the operations of the Fund. For such services, the Fund pays the Manager a monthly fee based on a percentage of the Fund’s and BlackRock High Yield V.I. Fund’s, a series of the Company, aggregate average daily net assets at the following annual rates:
| | |
| Average Daily Net Assets | | Investment Advisory Fee |
Up to $250 Million | | 0.50% |
Over $250 Million up to $500 Million | | 0.45% |
Over $500 Million up to $750 Million | | 0.40% |
Over $750 Million | | 0.35% |
For the six months ended June 30, 2016, the aggregate average daily net assets of the Fund and the Company’s BlackRock High Yield V.I. Fund were approximately $508,857,986.
Distribution Fees
The Company, on behalf of the Fund, entered into a Distribution Agreement and a Distribution Plan with BlackRock Investments, LLC (“BRIL”), an affiliate of the Manager. Pursuant to the Distribution Plan and in accordance with Rule 12b-1 under the 1940 Act, the Fund pays BRIL ongoing distribution fees. The fees are accrued daily and paid monthly at an annual rate of 0.25% based upon the average daily net assets attributable to Class III.
For the six months ended June 30, 2016, the class specific distribution fees borne directly by Class III is $127,116.
Transfer Agent
The Manager, on behalf of the Fund, entered into agreements with insurance companies and other financial intermediaries (“Service Organizations”), some of which may be affiliates. Pursuant to these agreements, the Service Organizations provide the Fund with administrative, networking, recordkeeping, sub-transfer agency and shareholder services to sub-accounts they service. For these services, the Service Organizations receive an annual fee per shareholder account, which will vary depending on share class and/or net assets of Fund shareholders serviced by the Service Organizations, which is shown as transfer agent — class specific. For the six months ended June 30, 2016, the Fund paid the following amounts to affiliates in return for these services, which is included in transfer agent — class specific in the Statement of Operations:
| | | | | | |
| Class I | | Class III | | Total | |
| $158,462 | | $30,989 | | | $189,451 | |
In addition, the Fund pays the transfer agent, which is not an affiliate, a fee for issuance, transfer and redemption of shares and the opening and maintenance of shareholder accounts, which is included in transfer agent in the Statement of Operations.
Expense Limitations, Waivers and Reimbursements
The Manager, with respect to the Fund, contractually agreed to waive and/or reimburse fees or expenses in order to limit expenses, excluding interest expense, dividend expense, tax expense, acquired fund fees and expenses, and certain other fund expenses, which constitute extraordinary expenses not incurred in the ordinary course of the Fund’s business. The expense limitations as a percentage of average daily net assets are as follows:
| | | | |
| |
Class I | | | 1.25 | % |
Class III | | | 1.50 | % |
| |
The Manager has agreed not to reduce or discontinue this contractual expense limitation prior to May 1, 2017 unless approved by the Board, including a majority of the Independent Directors who are not “interested persons” of the Fund, as defined in the 1940 Act (“Independent Directors”) or by a majority of the outstanding voting securities of the Fund.
The Manager, with respect to the Fund, voluntarily agreed to waive its investment advisory fees by the amount of investment advisory fees the Fund pays to the Manager indirectly through its investment in affiliated money market funds. This amount is shown as fees waived by the Manager in the Statement of Operations. However, the Manager does not waive its investment advisory fees by the amount of investment advisory fees paid in connection with the Fund’s investment in other affiliated investment companies, if any. For the six months ended June 30, 2016, the amount waived was $7,295.
The Manager has contractually agreed to reimburse transfer agent fees in order to limit such expenses as a percentage of average daily net assets as follows:
| | | | |
| |
Class I | | | 0.00 | % |
Class III | | | 0.06 | % |
| |
The Manager has agreed not to reduce or discontinue this contractual reimbursement prior to May 1, 2017 unless approved by the Board, including a majority of the Independent Directors or by a majority of the outstanding voting securities of the Fund.
| | | | | | |
| | | BLACKROCK VARIABLE SERIES FUNDS, INC. | | JUNE 30, 2016 | | 47 |
| | | | |
| Notes to Financial Statements (continued) | | | BlackRock Total Return V.I. Fund | |
These amounts waived and/or reimbursed are included in fees waived by the Manager, and shown as transfer agent fees reimbursed — class specific in the Statement of Operations. Class specific expense waivers and/or reimbursements are as follows:
| | | | | | | | | | | | |
| | | Class I | | | Class III | | | Total | |
Transfer Agent Fees Reimbursed | | $ | 158,466 | | | | $8,040 | | | $ | 166,506 | |
For the six months ended June 30, 2016, the Fund reimbursed the Manager $1,068 for certain accounting services, which is included in accounting services in the Statement of Operations.
Officers and Directors
Certain officers and/or directors of the Company are officers and/or directors of BlackRock or its affiliates. The Fund reimburses the Manager for a portion of the compensation paid to the Company’s Chief Compliance Officer, which is included in Officer and Directors in the Statement of Operations.
Other Transactions
The Fund may purchase securities from, or sell securities to, an affiliated fund provided the affiliation is due solely to having a common investment adviser, common officers, or common directors. For the six months ended June 30, 2016, the purchase and sale transactions which resulted in net realized gains (losses) with an affiliated fund in compliance with Rule 17a-7 under the 1940 Act were as follows:
| | | | | | |
| Purchases | | Sales | | Net Realized Gain | |
| $136,466 | | $13,319 | | | $1,119 | |
7. Purchases and Sales:
For the six months ended June 30, 2016, purchases and sales of investments, including paydowns and excluding short-term securities, were as follows:
| | | | | | | | | | | | |
| | | Purchases | | | | | | Sales | |
Non-U.S. Government Securities | | $ | 580,365,157 | | | | | | | $ | 558,646,075 | |
U.S. Government Securities | | $ | 169,896,962 | | | | | | | $ | 145,361,287 | |
For the six months ended June 30, 2016, purchases and sales related to mortgage dollar rolls were $220,709,363 and $220,713,458, respectively.
8. Income Tax Information:
It is the Fund’s policy to comply with the requirements of the Internal Revenue Code of 1986, as amended, applicable to regulated investment companies, and to distribute substantially all of its taxable income to its shareholders. Therefore, no federal income tax provision is required.
The Fund files U.S. federal and various state and local tax returns. No income tax returns are currently under examination. The statute of limitations on the Fund’s U.S. federal tax returns generally remains open for each of the four years ended December 31, 2015. The statutes of limitations on the Fund’s state and local tax returns may remain open for an additional year depending upon the jurisdiction.
Management has analyzed tax laws and regulations and their application to the Fund as of June 30, 2016, inclusive of the open tax return years, and does not believe there are any uncertain tax positions that require recognition of a tax liability in the Fund’s financial statements.
As of December 31, 2015, the Fund had capital loss carryforwards available to offset future realized capital gains through the indicated expiration dates as follows:
| | | | |
| Expires December 31, | | | |
2016 | | | $ 709,087 | |
2017 | | | 24,152,425 | |
| | | | |
Total | | | $24,861,512 | |
| | | | |
As of June 30, 2016, gross unrealized appreciation and depreciation based on cost for federal income tax purposes were as follows: | |
Tax cost | | | $351,002,236 | |
| | | | |
Gross unrealized appreciation | | | $ 6,482,647 | |
Gross unrealized depreciation | | | (846,964 | ) |
| | | | |
Net unrealized appreciation | | | $ 5,635,683 | |
| | | | |
| | | | | | |
| 48 | | BLACKROCK VARIABLE SERIES FUNDS, INC. | | JUNE 30, 2016 | | |
| | | | |
| Notes to Financial Statements (continued) | | | BlackRock Total Return V.I. Fund | |
9. Bank Borrowings:
The Company, on behalf of the Fund, along with certain other funds managed by the Manager and its affiliates (“Participating Funds”), is a party to a 364-day, $2.1 billion credit agreement with a group of lenders. Under this agreement, the Fund may borrow to fund shareholder redemptions. Excluding commitments designated for certain individual funds, the Participating Funds, including the Fund, can borrow up to an aggregate commitment amount of $1.6 billion at any time outstanding, subject to asset coverage and other limitations as specified in the agreement. The credit agreement has the following terms: a fee of 0.12% per annum on unused commitment amounts and interest at a rate equal to the higher of (a) one-month LIBOR (but, in any event, not less than 0.00%) on the date the loan is made plus 0.80% per annum or (b) the Fed Funds rate (but, in any event, not less than 0.00%) in effect from time to time plus 0.80% per annum on amounts borrowed. The agreement expires in April 2017 unless extended or renewed. Prior to April 21, 2016, the credit agreement had a fee per annum of 0.06% on unused commitment amounts and interest at a rate equal to the higher of (a) one-month LIBOR (but, in any event, not less than 0.00%) on the date the loan is made plus 0.80% per annum or (b) the Fed Funds rate (but, in any event, not less than 0.00%) in effect from time to time plus 0.80% per annum on amounts borrowed. Participating Funds paid administration, legal and arrangement fees, which, if applicable, are included in miscellaneous expenses in the Statement of Operations. These fees were allocated among such funds based upon portions of the aggregate commitment available to them and relative net assets of Participating Funds. During the six months ended June 30, 2016, the Fund did not borrow under the credit agreement.
10. Principal Risks:
Many municipalities insure repayment of their bonds, which may reduce the potential for loss due to credit risk. The market value of these bonds may fluctuate for other reasons, including market perception of the value of such insurance, and there is no guarantee that the insurer will meet its obligation.
Inventories of municipal bonds held by brokers and dealers may decrease, which would lessen their ability to make a market in these securities. Such a reduction in market making capacity could potentially decrease the Fund’s ability to buy or sell bonds. As a result, the Fund may sell a security at a lower price, sell other securities to raise cash, or give up an investment opportunity, any of which could have a negative impact on performance. If the Fund needed to sell large blocks of bonds, those sales could further reduce the bonds’ prices and impact performance.
In the normal course of business, the Fund invests in securities and enters into transactions where risks exist due to fluctuations in the market (market risk) or failure of the issuer to meet all its obligations, including the ability to pay principal and interest when due (issuer credit risk). The value of securities held by the Fund may decline in response to certain events, including those directly involving the issuers of securities owned by the Fund. Changes arising from the general economy, the overall market and local, regional or global political and/or social instability, as well as currency, interest rate and price fluctuations, may also affect the securities’ value.
The Fund may be exposed to prepayment risk, which is the risk that borrowers may exercise their option to prepay principal earlier than scheduled during periods of declining interest rates, which would force the Fund to reinvest in lower yielding securities. The Fund may also be exposed to reinvestment risk, which is the risk that income from the Fund’s portfolio will decline if the Fund invests the proceeds from matured, traded or called fixed income securities at market interest rates that are below the Fund portfolio’s current earnings rate.
Counterparty Credit Risk: Similar to issuer credit risk, the Fund may be exposed to counterparty credit risk, or the risk that an entity may fail to or be unable to perform on its commitments related to unsettled or open transactions. The Fund manages counterparty credit risk by entering into transactions only with counterparties that the Manager believes have the financial resources to honor their obligations and by monitoring the financial stability of those counterparties. Financial assets, which potentially expose the Fund to market, issuer and counterparty credit risks, consist principally of financial instruments and receivables due from counterparties. The extent of the Fund’s exposure to market, issuer and counterparty credit risks with respect to these financial assets is approximately their value recorded in the Statement of Assets and Liabilities, less any collateral held by the Fund.
A derivative contract may suffer a mark-to-market loss if the value of the contract decreases due to an unfavorable change in the market rates or values of the underlying instrument. Losses can also occur if the counterparty does not perform under the contract.
The Fund’s risk of loss from counterparty credit risk on OTC derivatives is generally limited to the aggregate unrealized gain less the value of any collateral held by the Fund.
For OTC options purchased, the Fund bears the risk of loss of the amount of the premiums paid plus the positive change in market values net of any collateral held by the Fund should the counterparty fail to perform under the contracts. Options written by the Fund do not typically give rise to counterparty credit risk, as options written generally obligate the Fund, and not the counterparty, to perform. The Fund may be exposed to counterparty credit risk with respect to options written to the extent the Fund deposits collateral with its counterparty to a written option.
With exchange-traded options purchased, futures and centrally cleared swaps, there is less counterparty credit risk to the Fund since the exchange or clearinghouse, as counterparty to such instruments, guarantees against a possible default. The clearinghouse stands between the buyer and the seller of the contract; therefore, credit risk is limited to failure of the clearinghouse. While offset rights may exist under applicable law, the Fund does not have
| | | | | | |
| | | BLACKROCK VARIABLE SERIES FUNDS, INC. | | JUNE 30, 2016 | | 49 |
| | | | |
| Notes to Financial Statements (concluded) | | | BlackRock Total Return V.I. Fund | |
a contractual right of offset against a clearing broker or clearinghouse in the event of a default (including the bankruptcy or insolvency). Additionally, credit risk exists in exchange-traded futures and centrally cleared swaps with respect to initial and variation margin that is held in a clearing broker’s customer accounts. While clearing brokers are required to segregate customer margin from their own assets, in the event that a clearing broker becomes insolvent or goes into bankruptcy and at that time there is a shortfall in the aggregate amount of margin held by the clearing broker for all its clients, typically the shortfall would be allocated on a pro rata basis across all the clearing broker’s customers, potentially resulting in losses to the Fund.
Concentration Risk: The Fund invests a significant portion of its assets in fixed-income securities and/or uses derivatives tied to the fixed-income markets. Changes in market interest rates or economic conditions may affect the value and/or liquidity of such investments. Interest rate risk is the risk that prices of bonds and other fixed-income securities will increase as interest rates fall and decrease as interest rates rise. The Fund may be subject to a greater risk of rising interest rates due to the current period of historically low rates.
11. Capital Share Transactions:
Transactions in capital shares for each class were as follows:
| | | | | | | | | | | | | | | | | | | | |
| | | Six Months Ended
June 30, 2016 | | | | | | Year Ended
December 31, 2015 | |
| | | Shares | | | Amount | | | | | | Shares | | | Amount | |
| Class I | | | | | | | | | | | | | | | |
Shares sold | | | 1,514,141 | | | | $ 18,376,751 | | | | | | | | 3,999,034 | | | | $ 47,243,403 | |
Shares issued in reinvestment of distributions | | | 129,488 | | | | 1,537,741 | | | | | | | | 254,419 | | | | 3,034,094 | |
Shares redeemed | | | (1,156,432) | | | | (13,830,486) | | | | | | | | (2,059,998) | | | | (24,514,021) | |
| | | | | | | | | | | | |
Net increase | | | 487,197 | | | | $ 6,084,006 | | | | | | | | 2,193,455 | | | | $ 25,763,476 | |
| | | | | | | | | | | | |
| | | | | |
| | | | | | | | | | | | | | | | | | | | |
| Class III | | | | | | | | | | | | | | | |
Shares sold | | | 5,952,546 | | | | $70,207,928 | | | | | | | | 5,907,118 | | | | $69,027,091 | |
Shares issued in reinvestment of distributions | | | 65,951 | | | | 775,168 | | | | | | | | 26,674 | | | | 313,146 | |
Shares redeemed | | | (296,919) | | | | (3,484,980) | | | | | | | | (603,431) | | | | (7,076,672) | |
| | | | | | | | | | | | |
Net increase | | | 5,721,578 | | | | $67,498,116 | | | | | | | | 5,330,361 | | | | $62,263,565 | |
| | | | | | | | | | | | |
Total Net Increase | | | 6,208,775 | | | | $73,582,122 | | | | | | | | 7,523,816 | | | | $88,027,041 | |
| | | | | | | | | | | | |
12. Subsequent Events:
Management has evaluated the impact of all subsequent events on the Fund through the date the financial statements were issued and has determined that there were no subsequent events requiring adjustment or additional disclosure in the financial statements.
| | | | | | |
| 50 | | BLACKROCK VARIABLE SERIES FUNDS, INC. | | JUNE 30, 2016 | | |
JUNE 30, 2016
| | | | |
SEMI-ANNUAL REPORT (UNAUDITED) | | | | BLACKROCK® |
BlackRock Variable Series Funds, Inc.
▶ BlackRock U.S. Government Bond V.I. Fund
| | |
| Not FDIC Insured ¡ May Lose Value ¡ No Bank Guarantee | | |
| | | | |
| Fund Summary as of June 30, 2016 | | | BlackRock U.S. Government Bond V.I. Fund | |
BlackRock U.S. Government Bond V.I. Fund’s (the “Fund”) investment objective is to seek to maximize total return, consistent with income generation and prudent investment management.
|
| Portfolio Management Commentary |
How did the Fund perform?
| • | | For the six-month period ended June 30, 2016, the Fund’s Class I performed in line with and Class III underperformed its benchmark, the Barclays U.S. Government/Mortgage Index. |
What factors influenced performance?
| • | | The principal detractors from the Fund’s performance versus the benchmark included the use of interest rate swaps. Specifically, the Fund held fixed-rate payer positions (with a corresponding right to receive payments based upon a floating rate index) designed to benefit from an upward move in shorter-term rates. This position declined in value as interest rates fell during the period. In addition, the Fund’s stance with respect to overall portfolio duration (and corresponding interest rate sensitivity) and positioning along the yield curve acted to constrain returns. Finally, positioning with respect to currency weightings detracted as well. |
| • | | Positive contributors to performance during the six-month period include allocations to securitized assets including commercial mortgage-backed securities (“CMBS”), particularly interest-only and agency CMBS. Also contributing were positions in asset-backed securities (“ABS”) and exposure to the 10-year segment of the treasury inflation protected security (“TIPS”) curve. The Fund’s overweighting of 30-year agency mortgage-backed securities (“MBS”) also added to performance during the period. |
Describe recent portfolio activity.
| • | | During the six-month period, the Fund increased its allocation to swap payer positions, as well as to 10-year TIPS. The Fund’s allocation to currency trades was reduced, and its position in CMBS trimmed. The portfolio increased its allocation to MBS with strong call protection characteristics, while further reducing exposure to to-be-announced MBS contracts. The Fund also increased its exposure to higher coupon MBS with a more stable profile with respect to carry (incremental income) and less sensitivity to refinancing risk. |
Describe portfolio positioning at period end.
| • | | The Fund finished the six-month period underweight in duration, implemented primarily via short Treasury positions and fixed-rate payer positions in interest rate swaps. The Fund had a long 10-year TIPS position, and was overweight CMBS and slightly overweight ABS. The Fund was essentially neutrally weighted with respect to its MBS exposure relative to the benchmark. |
The views expressed reflect the opinions of BlackRock as of the date of this report and are subject to change based on changes in market, economic or other conditions. These views are not intended to be a forecast of future events and are no guarantee of future results.
| | | | | |
| Portfolio Composition | | Percent of Total Investments1 |
U.S. Government Sponsored Agency Securities | | | | 62 | % |
U.S. Treasury Obligations | | | | 31 | |
Non-Agency Mortgage-Backed Securities | | | | 4 | |
Asset-Backed Securities | | | | 3 | |
| | 1 | | Total investments exclude short-term securities and options purchased. |
| | | | | | |
| 2 | | BLACKROCK VARIABLE SERIES FUNDS, INC. | | JUNE 30, 2016 | | |
| | | | |
| | | | BlackRock U.S. Government Bond V.I. Fund | |
|
| Total Return Based on a $10,000 Investment |
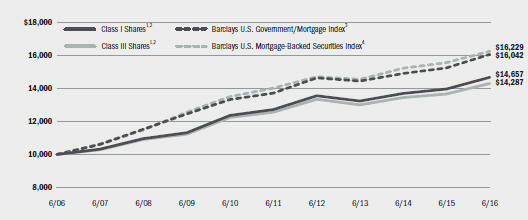
| | 1 | Assuming transaction costs, if any, and other operating expenses, including investment advisory fees. Does not include insurance related fees and expenses. The returns for Class III Shares prior to July 15, 2013, the recommencement of operations of Class III Shares, are based upon the performance of the Fund’s Class I Shares. The returns for Class III Shares, however, are adjusted to reflect the distribution and/or service (12b-1) fees applicable to Class III Shares. |
| | 2 | The Fund invests, under normal circumstances, at least 80% of its assets in bonds that are issued or guaranteed by the U.S. Government and its agencies. The Fund’s total returns prior to October 1, 2011 are the returns of the Fund when it followed a different investment objective and different investment strategies under the name “BlackRock Government Income V.I. Fund”. |
| | 3 | An index that measures debt issued by the U.S. Government, and its agencies, as well as mortgage-backed pass-through securities of Ginnie Mae, Fannie Mae and Freddie Mac. |
| | 4 | An unmanaged index that includes the mortgage-backed pass-through securities of Ginnie Mae, Fannie Mae and Freddie Mac that meet certain maturity and liquidity criteria. |
|
| Performance Summary for the Period Ended June 30, 2016 |
| | | | | | | | | | | | | | | | | | | | | | | | | | | | | | | | | | | | | | | | |
| | | | | | | Standardized 30-Day Yields6 | | | | Unsubsidized 30-Day Yields6 | | | | 6-Month Total Returns7 | | | | Average Annual Total Returns |
| | | | | | | | | | | | 1 Year7 | | 5 Years7 | | 10 Years7 |
Class I5 | | | | | | | | 1.34 | % | | | | | | 1.07 | % | | | | | | 4.32 | % | | | | | | 4.91 | % | | | | 2.83 | % | | | | 3.90 | % |
Class III5 | | | | | | | | 1.03 | | | | | | | 0.92 | | | | | | | 4.17 | | | | | | | 4.52 | | | | | 2.56 | 8 | | | | 3.63 | 8 |
Barclays U.S. Government/Mortgage Index | | | | | | | | — | | | | | | | — | | | | | | | 4.33 | | | | | | | 5.33 | | | | | 3.20 | | | | | 4.84 | |
Barclays U.S. Mortgage-Backed Securities Index | | | | | | | | — | | | | | | | — | | | | | | | 3.10 | | | | | | | 4.34 | | | | | 3.01 | | | | | 4.96 | |
| | 5 | | Average annual and cumulative total returns are based on changes in net asset value for the periods shown, and assume reinvestment of all dividends and capital gains distributions at net asset value on the ex-dividend/payable date. Insurance-related fees and expenses are not reflected in these returns. The Fund’s total returns prior to October 1, 2011 are the returns of the Fund when it followed a different investment objective and different investment strategies under the name “BlackRock Government Income V.I. Fund”. |
| | 6 | | The standardized 30-day yield includes the effects of any waivers and/or reimbursements. The unsubsidized 30-day yield excludes the effects of any waivers and/or reimbursements. |
| | 7 | | For a portion of the period, the Fund’s investment adviser waived a portion of its fee. Without such waiver, the Fund’s performance would have been lower. |
| | 8 | | The returns for Class III Shares prior to July 15, 2013, the recommencement of operations of Class III Shares, are based upon the performance of the Fund’s Class I Shares. The returns for Class III Shares, however, are adjusted to reflect the distribution and/or service (12b-1) fees applicable to Class III Shares. |
| | | | Past performance is not indicative of future results. Performance results do not reflect the deduction of taxes that a shareholder would pay on Fund distributions or the redemption of Fund shares. |
| | | | | | | | | | | | | | | | | | | | |
| | | Actual | | | | Hypothetical11 |
| | | | | | | Including
Interest Expense
and Fees | | Excluding
Interest Expense
and Fees | | | | | | Including
Interest Expense
and Fees | | Excluding
Interest Expense
and Fees |
| | | Beginning
Account Value
January 1, 2016 | | Ending
Account Value
June 30, 2016 | | Expenses
Paid During
the Period9 | | Expenses
Paid During the Period10 | | | | Beginning
Account Value
January 1, 2016 | | Ending
Account Value
June 30, 2016 | | Expenses
Paid During
the Period9 | | Ending
Account Value
June 30, 2016 | | Expenses
Paid During
the Period10 |
Class I | | $1,000.00 | | $1,043.20 | | $3.96 | | $3.51 | | | | $1,000.00 | | $1,020.98 | | $3.92 | | $1,021.43 | | $3.47 |
Class III | | $1,000.00 | | $1,041.70 | | $5.53 | | $5.08 | | | | $1,000.00 | | $1,019.44 | | $5.47 | | $1,019.89 | | $5.02 |
| | 9 | | For each class of the Fund, expenses are equal to the annualized expense ratio for the class (0.78% for Class I and 1.09% for Class III), multiplied by the average account value over the period, multiplied by 182/366 (to reflect the one-half year period shown). |
| | 10 | | For each class of the Fund, expenses are equal to the annualized expense ratio for the class (0.69% for Class I and 1.00% for Class III), multiplied by the average account value over the period, multiplied by 182/366 (to reflect the one-half year period shown). |
| | 11 | | Hypothetical 5% annual return before expenses is calculated by pro rating the number of days in the most recent fiscal half year divided by 366. |
| | | | See “Disclosure of Expenses” on the following page for further information on how expenses were calculated. |
| | | | | | |
| | | BLACKROCK VARIABLE SERIES FUNDS, INC. | | JUNE 30, 2016 | | 3 |
| | | | |
| Disclosure of Expenses | | | BlackRock U.S. Government Bond V.I. Fund | |
Shareholders of the Fund may incur the following charges: (a) transactional expenses, such as sales charges; and (b) operating expenses, including investment advisory fees, service and distribution fees, including 12b-1 fees, acquired fund fees and expenses, and other fund expenses. The expense example shown on the previous page (which is based on a hypothetical investment of $1,000 invested on January 1, 2016 and held through June 30, 2016) is intended to assist shareholders both in calculating expenses based on an investment in the Fund and in comparing these expenses with similar costs of investing in other mutual funds.
The expense example provides information about actual account values and actual expenses. In order to estimate the expenses a shareholder paid during the period covered by this report, shareholders can divide their account value by $1,000 and then multiply the result by the number corresponding to their share class under the heading entitled “Expenses Paid During the Period.”
The expense example also provides information about hypothetical account values and hypothetical expenses based on the Fund’s actual expense ratio and an assumed rate of return of 5% per year before expenses. In order to assist shareholders in comparing the ongoing expenses of investing in the Fund and other funds, compare the 5% hypothetical example with the 5% hypothetical examples that appear in shareholder reports of other funds.
The expenses shown in the expense example are intended to highlight shareholders’ ongoing costs only and do not reflect any transactional expenses, such as sales charges, if any. Therefore, the hypothetical examples are useful in comparing ongoing expenses only, and will not help shareholders determine the relative total expenses of owning different funds. If these transactional expenses were included, shareholder expenses would have been higher.
| | | | |
| The Benefits and Risks of Leveraging | | | | |
The Fund may utilize leverage to seek to enhance returns and net asset value (“NAV”). However, these objectives cannot be achieved in all interest rate environments.
The Fund may utilize leverage by entering into reverse repurchase agreements. In general, the concept of leveraging is based on the premise that the financing cost of leverage, which is based on short-term interest rates, is normally lower than the income earned by the Fund on its longer-term portfolio investments purchased with the proceeds from leverage. To the extent that the total assets of the Fund (including the assets obtained from leverage) are invested in higher-yielding portfolio investments, the Fund’s shareholders benefit from the incremental net income.
The interest earned on securities purchased with the proceeds from leverage is distributed to Fund shareholders, and the value of these portfolio holdings is reflected in the Fund’s per share NAV. However, in order to benefit shareholders, the return on assets purchased with leverage proceeds must exceed the ongoing costs associated with the leverage. If interest and other ongoing costs of leverage exceed the Fund’s return on assets purchased with leverage proceeds, income to shareholders is lower than if the Fund had not used leverage.
Furthermore, the value of the Fund’s portfolio investments generally varies inversely with the direction of long-term interest rates, although other factors can also influence the value of portfolio investments. As a result, changes in interest rates can influence the Fund’s NAV positively or negatively in addition to the impact on Fund performance from leverage. Changes in the direction of interest rates are difficult to predict accurately, and there is no assurance that the Fund’s leveraging strategy will be successful.
The use of leverage also generally causes greater changes in the Fund’s NAV and dividend rates than comparable portfolios without leverage. In a declining market, leverage is likely to cause a greater decline in the NAV of the Fund’s shares than if the Fund were not leveraged. In addition, the Fund may be required to sell portfolio securities at inopportune times or at distressed values in order to comply with regulatory requirements applicable to the use of leverage or as required by the terms of the leverage instruments, which may cause the Fund to incur losses. The use of leverage may limit the Fund’s ability to invest in certain types of securities or use certain types of hedging strategies. The Fund incurs expenses in connection with the use of leverage, all of which are borne by the Fund’s shareholders and may reduce income.
| | | | |
| Derivative Financial Instruments | | | | |
The Fund may invest in various derivative financial instruments. These instruments are used to obtain exposure to a security, commodity, index, market, and/or other asset without owning or taking physical custody of securities, commodities and/or other referenced assets or to manage market, equity, credit, interest rate, foreign currency exchange rate, commodity and/or other risks. Derivative financial instruments may give rise to a form of economic leverage and involve risks, including the imperfect correlation between the value of a derivative financial instrument and the underlying asset, possible default of the counterparty to the
transaction or illiquidity of the instrument. The Fund’s successful use of a derivative financial instrument depends on the investment adviser’s ability to predict pertinent market movements accurately, which cannot be assured. The use of these instruments may result in losses greater than if they had not been used, may limit the amount of appreciation the Fund can realize on an investment and/or may result in lower distributions paid to shareholders. The Fund’s investments in these instruments, if any, are discussed in detail in the Notes to Financial Statements.
| | | | | | |
| 4 | | BLACKROCK VARIABLE SERIES FUNDS, INC. | | JUNE 30, 2016 | | |
| | | | |
| Schedule of Investments June 30, 2016 (Unaudited) | | | BlackRock U.S. Government Bond V.I. Fund | |
| | | (Percentages shown are based on Net Assets) | |
| | | | | | | | | | | | |
| Asset-Backed Securities | | | | | Par
(000) | | | Value | |
Cedar Funding III CLO Ltd., Series 2014-3A, Class A1, 2.17%, 5/20/26 (a)(b) | | | USD | | | | 500 | | | $ | 499,029 | |
Dryden XXVIII Senior Loan Fund, Series 2013-28A, Class A1L, 1.73%, 8/15/25 (a)(b) | | | | | | | 700 | | | | 690,835 | |
OCP CLO Ltd., Series 2012-2A,
Class A2, 2.13%, 11/22/23 (a)(b) | | | | | | | 661 | | | | 659,525 | |
OHA Credit Partners VIII Ltd., Series 2013-8A, Class A, 1.75%, 4/20/25 (a)(b) | | | | | | | 500 | | | | 494,150 | |
Progress Residential Trust, Series 2015-SFR1, Class A, 1.84%, 2/17/32 (a)(b) | | | | | | | 497 | | | | 496,379 | |
SMB Private Education Loan Trust, Series 2015-C, Class A3, 2.39%, 8/16/32 (a)(b) | | | | | | | 200 | | | | 203,391 | |
Tricon American Homes Trust, Series 2015-SFR1, Class A, 1.69%, 5/17/32 (a)(b) | | | | | | | 199 | | | | 196,277 | |
Washington Mill CLO Ltd., Series 2014-1A,
Class A1, 2.13%, 4/20/26 (a)(b) | | | | | | | 500 | | | | 499,300 | |
Total Asset-Backed Securities — 4.2% | | | | | | | | | | | 3,738,886 | |
| | | | | | | | | | | | |
| Non-Agency Mortgage-Backed Securities | | | | |
Commercial Mortgage-Backed Securities — 2.9% | | | | | | | | | | | | |
Banc of America Commercial Mortgage Trust, Series 2007-1, Class A4, 5.45%, 1/15/49 | | | USD | | | | 421 | | | | 427,614 | |
BHMS Mortgage Trust, Series 2014-ATLS, Class AFL, 1.96%, 7/05/33 (a)(b) | | | | | | | 700 | | | | 689,703 | |
Commercial Mortgage Pass-Through Certificates, Series 2015-CR25, Class A4, 3.76%, 8/10/48 | | | | | | | 400 | | | | 438,696 | |
GAHR Commercial Mortgage Trust, Series 2015-NRF, Class AFL1, 1.74%, 12/15/16 (a)(b) | | | | | | | 991 | | | | 991,470 | |
| | | | | | | | | | | | |
| | | | | | | | | | | | 2,547,483 | |
Interest Only Commercial Mortgage-Backed Securities — 2.6% | |
CFCRE Commercial Mortgage Trust, Series 2016-C4, Class XA, 1.78%, 5/10/58 (b) | | | | | | | 1,724 | | | | 215,254 | |
Commercial Mortgage Pass-Through Certificates: | | | | | | | | | | | | |
Series 2013-CR7, Class XA, 1.47%, 3/10/46 (b) | | | | | | | 3,644 | | | | 226,873 | |
Series 2014-CR14, Class XA, 1.00%, 2/10/47 (b) | | | | | | | 1,403 | | | | 51,184 | |
Series 2015-CR22, Class XA, 1.58%, 3/10/48 (b) | | | | | | | 2,379 | | | | 141,831 | |
Series 2015-CR24, Class XA, 0.88%, 8/10/55 (b) | | | | | | | 1,189 | | | | 71,307 | |
Series 2015-CR25, Class XA, 0.97%, 8/10/48 (b) | | | | | | | 2,286 | | | | 148,387 | |
| | | | | | | | | | | | |
| Non-Agency Mortgage-Backed Securities | | | | | Par
(000) | | | Value | |
Interest Only Commercial Mortgage-Backed Securities (continued) | |
Series 2015-LC19, Class XA, 1.23%, 2/10/48 (b) | | | USD | | | | 1,585 | | | $ | 122,731 | |
Series 2015-LC21, Class XA, 1.02%, 7/10/48 (b) | | | | | | | 6,942 | | | | 348,352 | |
Core Industrial Trust: | | | | | | | | | | | | |
Series 2015-CALW, Class XA, 0.81%, 2/10/34 (a)(b) | | | | | | | 3,895 | | | | 159,062 | |
Series 2015-TEXW, Class XA, 0.77%, 2/10/34 (a)(b) | | | | | | | 3,300 | | | | 128,907 | |
Series 2015-WEST, Class XA, 0.93%, 2/10/37 (a)(b) | | | | | | | 1,600 | | | | 110,438 | |
FREMF Mortgage Trust, Series 2015-K718,
Class X2A, 0.10%, 2/25/22 (a)(b) | | | | | | | 23,039 | | | | 106,482 | |
Morgan Stanley Bank of America Merrill Lynch Trust: | | | | | | | | | | | | |
Series 2015-C25, Class XA, 1.15%, 10/15/48 (b) | | | | | | | 797 | | | | 61,477 | |
Series 2016-C29, Class XA, 1.66%, 5/15/49 (b) | | | | | | | 999 | | | | 114,432 | |
Wells Fargo Commercial Mortgage Trust: | | | | | | | | | | | | |
Series 2015-C30, Class XA, 1.17%, 9/15/58 (b) | | | | | | | 992 | | | | 66,888 | |
Series 2015-NXS4, Class XA, 0.97%, 12/15/48 (b) | | | | | | | 1,495 | | | | 97,130 | |
WF-RBS Commercial Mortgage Trust, Series 2014-LC14, Class XA,
1.40%, 3/15/47 (b) | | | | | | | 1,598 | | | | 106,789 | |
| | | | | | | | | | | | |
| | | | | | | | | | | | 2,277,524 | |
Total Non-Agency Mortgage-Backed Securities — 5.5% | | | | 4,825,007 | |
| | | | | | | | | | | | |
| U.S. Government Sponsored Agency Securities | | | | |
Agency Obligations — 3.8% | | | | | |
Federal Home Loan Bank, 4.00%, 4/10/28 | | | | | | | 500 | | | | 596,187 | |
Freddie Mac, 6.25%, 7/15/32 | | | | | | | 1,800 | | | | 2,723,247 | |
| | | | | | | | | | | | |
| | | | | | | | | | | | 3,319,434 | |
Collateralized Mortgage Obligations — 0.4%
Collateralized Mortgage Obligations (concluded) | | | | | |
Ginnie Mae, Series 2014-107, Class WX, 6.83%, 7/20/39 (b) | | | | | | | 270 | | | | 321,514 | |
Interest Only Commercial Mortgage-Backed Securities — 0.1% | | | | | |
Freddie Mac: | | | | | | | | | | | | |
Series K043, Class X1, 0.68%, 12/25/24 (b) | | | | | | | 3,189 | | | | 125,970 | |
Series K718, Class X1, 0.77%, 1/25/22 (b) | | | | | | | 333 | | | | 10,097 | |
| | | | | | | | | | |
| Portfolio Abbreviations |
| AUD | | Australian Dollar | | INR | | Indian Rupee | | SAR | | Saudi Arabian Riyal |
| BRL | | Brazilian Real | | JPY | | Japanese Yen | | SEK | | Swedish Krona |
| CAD | | Canadian Dollar | | KRW | | Korean Won | | TBA | | To-be-announced |
| CNH | | Chinese Yuan Offshore | | LIBOR | | London Interbank Offered Rate | | TRY | | Turkish Lira |
| COP | | Colombian Peso | | MXIBTIIE | | Mexico Interbank TIIE 28 Day | | USD | | U.S. Dollar |
| EUR | | Euro | | MXN | | Mexican Peso | | ZAR | | South African Rand |
| GBP | | British Pound | | OTC | | Over-the-counter | | | | |
| IDR | | Indonesian Rupiah | | RUB | | Russian Ruble | | | | |
See Notes to Financial Statements.
| | | | | | |
| | | BLACKROCK VARIABLE SERIES FUNDS, INC. | | JUNE 30, 2016 | | 5 |
| | | | |
| Schedule of Investments (continued) | | | BlackRock U.S. Government Bond V.I. Fund | |
| | | | |
| | | | | | | | | | | | |
| U.S. Government Sponsored Agency Securities | | | | | Par (000) | | | Value | |
Interest Only Commercial Mortgage-Backed Securities (concluded) | |
Ginnie Mae: | | | | | | | | | | | | |
Series 2002-83, Class IO, 0.00%, 10/16/42 (b) | | | USD | | | | 996 | | | $ | — | |
Series 2003-109, Class IO, 0.00%, 11/16/43 (b) | | | | | | | 2,624 | | | | 26 | |
Series 2003-17, Class IO, 0.00%, 3/16/43 (b) | | | | | | | 2,420 | | | | — | |
| | | | | | | | | | | | |
| | | | | | | | | | | | 136,093 | |
Mortgage-Backed Securities — 85.2% | |
Fannie Mae Mortgage-Backed Securities: | | | | | |
2.50%, 4/01/30-7/01/31 (c) | | | | | | | 1,090 | | | | 1,129,206 | |
2.80%, 3/01/41 (b) | | | | | | | 80 | | | | 84,795 | |
2.95%, 3/01/41 (b) | | | | | | | 42 | | | | 44,375 | |
3.00%, 11/01/26-7/01/46 (c) | | | | | | | 9,560 | | | | 9,997,595 | |
3.37%, 6/01/41 (b) | | | | | | | 74 | | | | 76,830 | |
3.50%, 7/01/26-7/01/46 (c) | | | | | | | 11,002 | | | | 11,671,309 | |
3.52%, 9/01/41 (b) | | | | | | | 81 | | | | 85,236 | |
4.00%, 9/01/25-7/01/46 (c) | | | | | | | 13,194 | | | | 14,190,941 | |
4.50%, 5/01/24-7/01/46 (c) | | | | | | | 3,407 | | | | 3,731,917 | |
5.00%, 9/01/33-7/01/46 (c) | | | | | | | 3,206 | | | | 3,565,623 | |
5.50%, 5/01/34-7/01/46 (c) | | | | | | | 562 | | | | 635,168 | |
6.00%, 4/01/35-6/01/41 | | | | | | | 503 | | | | 582,130 | |
6.50%, 5/01/40 | | | | | | | 102 | | | | 118,022 | |
Freddie Mac Mortgage-Backed Securities: | | | | | |
2.50%, 3/01/30-7/01/31 (c) | | | | | | | 599 | | | | 620,650 | |
2.77%, 10/01/45 (b) | | | | | | | 258 | | | | 266,582 | |
3.00%, 5/01/27-7/01/46 (c) | | | | | | | 2,000 | | | | 2,086,063 | |
3.50%, 7/01/31-7/01/46 (c) | | | | | | | 4,017 | | | | 4,255,923 | |
4.00%, 8/01/40-7/01/46 (c) | | | | | | | 1,986 | | | | 2,132,585 | |
4.50%, 2/01/39-7/01/45 | | | | | | | 773 | | | | 844,590 | |
5.00%, 8/01/40-7/01/46 (c) | | | | | | | 450 | | | | 497,511 | |
5.50%, 6/01/41 | | | | | | | 243 | | | | 272,393 | |
8.00%, 12/01/29-7/01/30 | | | | | | | 47 | | | | 59,110 | |
Ginnie Mae Mortgage-Backed Securities: | | | | | |
3.00%, 7/15/46 (c) | | | | | | | 2,073 | | | | 2,167,204 | |
3.50%, 12/20/41-7/15/46 (c) | | | | | | | 6,612 | | | | 7,017,647 | |
4.00%, 9/20/40-7/15/46 (c) | | | | | | | 3,173 | | | | 3,395,720 | |
4.50%, 12/20/39-7/15/46 (c) | | | | | | | 3,159 | | | | 3,457,938 | |
5.00%, 12/15/38-7/15/46 (c) | | | | | | | 848 | | | | 944,827 | |
5.50%, 1/15/34 | | | | | | | 915 | | | | 1,053,190 | |
| | | | | | | | | | | | |
| | | | | | | | | | | | 74,985,080 | |
Total U.S. Government Sponsored Agency Securities — 89.5% | | | | 78,762,121 | |
| | | | | | | | | | | | |
| U.S. Treasury Obligations | | | | |
U.S. Treasury Bonds: | | | | | | | | | | | | |
2.88%, 8/15/45 (d) | | | | | | | 3,782 | | | | 4,246,661 | |
3.00%, 11/15/45 | | | | | | | 1,831 | | | | 2,105,364 | |
2.50%, 2/15/46 | | | | | | | 286 | | | | 297,809 | |
U.S. Treasury Inflation Indexed Notes, 0.63%, 1/15/26 | | | | | | | 907 | | | | 955,216 | |
| | | | | | | | | | | | |
| U.S. Treasury Obligations | | | | | Par (000) | | | Value | |
U.S. Treasury Notes: | | | | | | | | | | | | |
0.88%, 6/15/17-4/15/19 | | | USD | | | | 6,319 | | | $ | 6,349,301 | |
0.75%, 2/28/18-4/30/18 | | | | | | | 6,780 | | | | 6,799,068 | |
1.25%, 3/31/21 | | | | | | | 3,614 | | | | 3,656,071 | |
1.38%, 4/30/21 | | | | | | | 3,439 | | | | 3,498,378 | |
1.50%, 2/28/23-3/31/23 | | | | | | | 2,577 | | | | 2,614,189 | |
2.50%, 8/15/23 | | | | | | | 1,610 | | | | 1,744,145 | |
2.38%, 8/15/24 (d) | | | | | | | 1,478 | | | | 1,591,251 | |
2.00%, 8/15/25 | | | | | | | 2,357 | | | | 2,464,078 | |
2.25%, 11/15/25 | | | | | | | 1,266 | | | | 1,350,664 | |
1.63%, 2/15/26 | | | | | | | 1,318 | | | | 1,332,322 | |
Total U.S. Treasury Obligations — 44.3% | | | | 39,004,517 | |
Total Long-Term Investments (Cost — $123,754,403) — 143.5% | | | | | | | | 126,330,531 | |
| | | | | | | | | | | | |
| | | | |
| Short-Term Securities | | | | | Par (000) | | | | |
Borrowed Bond Agreements — 1.2% | | | | | |
BNP Paribas Securities Corp., 0.72%, Open (e) (Purchased on 5/03/16 to be repurchased at $398,402, collateralized by U.S. Treasury Notes, 1.38% due at 1/31/21, par and fair value of USD 394,000 and $400,972, respectively) | | | | | | | 398 | | | | 397,940 | |
BNP Paribas Securities Corp., 0.76%, Open (e) (Purchased on 5/03/16 to be repurchased at $605,991, collateralized by U.S. Treasury Notes, 1.38% due at 9/30/20, par and fair value of USD 600,000 and $610,898, respectively) | | | | | | | 605 | | | | 605,250 | |
J.P. Morgan Securities LLC, 0.00%, 7/01/16 (Purchased on 6/30/16 to be repurchased at $21,315, collateralized by U.S. Treasury Notes, 1.63% due at 5/15/26, par and fair value of USD 21,000 and $21,257, respectively) | | | | | | | 21 | | | | 21,315 | |
| | | | | | | | | | | | |
Total Borrowed Bond Agreements | | | | 1,024,505 | |
| | | | | | Shares | | | | |
Money Market Funds — 7.6% | | | | | |
BlackRock Liquidity Funds, TempFund, Institutional Class, 0.40% (f)(g) | | | | | | | 6,683,964 | | | | 6,683,964 | |
Total Short-Term Securities (Cost — $7,708,469) — 8.8% | | | | 7,708,469 | |
| | | | | | | | | | | | |
| Options Purchased | | | | | | | | | |
(Cost — $24,248) — 0.0% | | | | | | | | | | | 15,428 | |
Total Investments Before Options Written, Borrowed Bonds and TBA Sale Commitments | |
(Cost — $131,487,120) — 152.3% | | | | | | | | | | | 134,054,428 | |
| | | | | | | | | | | | |
| | | | | | | | | | |
See Notes to Financial Statements.
| | | | | | |
| 6 | | BLACKROCK VARIABLE SERIES FUNDS, INC. | | JUNE 30, 2016 | | |
| | | | |
| Schedule of Investments (continued) | | | BlackRock U.S. Government Bond V.I. Fund | |
| | | | |
| | | | | | | | | | | | |
| Options Written | | | | | | | | Value | |
(Premiums Received — $ 92,774) — (0.1)% | | | $ | (73,317 | ) |
| | | | | | | | | | | | |
| Borrowed Bonds | | | | | Par (000) | | | | |
U.S. Treasury Obligations — (1.2)% | | | | | |
U.S. Treasury Notes: | | | | | | | | | | | | |
1.38%, 9/30/20 | | | USD | | | | 600 | | | | (610,898 | ) |
1.38%, 1/31/21 | | | | | | | 394 | | | | (400,972 | ) |
1.63%, 5/15/26 | | | | | | | 21 | | | | (21,257 | ) |
(Proceeds — $1,009,340) — (1.2)% | | | | (1,033,127 | ) |
| | | | | | | | | | | | |
| | | | |
| TBA Sale Commitments (c) | | | | | | | | | |
Fannie Mae Mortgage-Backed Securities: | | | | | | | | | | | | |
2.50%, 7/01/31 | | | | | | | 1,334 | | | | (1,379,360) | |
3.00%, 7/01/31-7/01/46 | | | | | | | 8,458 | | | | (8,797,183 | ) |
3.50%, 7/01/31-7/01/46 | | | | | | | 5,573 | | | | (5,882,779 | ) |
4.00%, 7/01/46 | | | | | | | 4,606 | | | | (4,938,363 | ) |
4.50%, 7/01/46 | | | | | | | 972 | | | | (1,060,994 | ) |
5.00%, 7/01/46 | | | | | | | 1,825 | | | | (2,027,688 | ) |
6.00%, 7/01/46 | | | | | | | 23 | | | | (26,302 | ) |
| | | | | | | | | | | | |
| TBA Sale Commitments | | | | | Par
(000) | | | Value | |
Freddie Mac Mortgage-Backed Securities: | | | | | | | | | | | | |
3.00%, 7/01/46 | | | USD | | | | 141 | | | $ | (146,168 | ) |
3.50%, 7/01/46 | | | | | | | 1,199 | | | | (1,264,008 | ) |
4.00%, 7/01/46 | | | | | | | 400 | | | | (428,125 | ) |
4.50%, 7/01/46 | | | | | | | 77 | | | | (83,966 | ) |
5.00%, 7/01/46 | | | | | | | 53 | | | | (58,505 | ) |
Ginnie Mae Mortgage-Backed Securities: | | | | | | | | | | | | |
3.00%, 7/15/46 | | | | | | | 25 | | | | (26,115 | ) |
3.50%, 7/15/46 | | | | | | | 2,959 | | | | (3,140,588 | ) |
4.00%, 7/15/46 | | | | | | | 1,325 | | | | (1,416,437 | ) |
4.50%, 7/15/46 | | | | | | | 1,101 | | | | (1,181,505 | ) |
5.00%, 7/15/46 | | | | | | | 330 | | | | (367,166 | ) |
5.50%, 7/15/46 | | | | | | | 900 | | | | (1,011,234 | ) |
Total TBA Sale Commitments (Proceeds — $33,073,835) — (37.7)% | | | | | | | | | | | (33,236,486 | ) |
Total Investments Net of Options Written, Borrowed Bonds and TBA Sale Commitments — 113.3% | | | $ | 99,711,498 | |
Liabilities in Excess of Other Assets — (13.3)% | | | | (11,699,604 | ) |
| | | | | | | | | | | | |
Net Assets — 100.0% | | | $ | 88,011,894 | |
| | | | | | | | | | | | |
|
| Notes to Schedule of Investments |
| (a) | Security exempt from registration pursuant to Rule 144A under the Securities Act of 1933, as amended. These securities may be resold in transactions exempt from registration to qualified institutional investors. |
| (b) | Variable rate security. Rate as of period end. |
| (c) | Represents or includes a TBA transaction. As of period end, unsettled TBA transactions were as follows: |
| | | | | | | | |
| Counterparty | | Value | | | Unrealized
Appreciation
(Depreciation) | |
Barclays Capital, Inc. | | $ | 1,916,885 | | | | $ 9,407 | |
BNP Paribas Securities Corp. | | $ | (769,479 | ) | | | $(5,240 | ) |
Citigroup Global Markets, Inc. | | $ | 920,313 | | | | $ 5,942 | |
Credit Suisse Securities (USA) LLC | | $ | (1,650,703 | ) | | | $(4,589 | ) |
Daiwa Capital Markets America, Inc. | | $ | 736,637 | | | | $ 5,918 | |
Deutsche Bank Securities, Inc. | | $ | (208,618 | ) | | | $(3,785 | ) |
Goldman Sachs & Co. | | $ | 3,908,215 | | | | $(3,476 | ) |
J.P. Morgan Securities LLC | | $ | (391,268 | ) | | | $(2,882 | ) |
Merrill Lynch, Pierce, Fenner & Smith, Inc. | | $ | 391,807 | | | | $(1,239 | ) |
Morgan Stanley & Co. LLC | | $ | 1,288,159 | | | | $ 3,159 | |
Nomura Securities International, Inc. | | $ | 332,331 | | | | $ 433 | |
RBC Capital Markets, LLC | | $ | 204,697 | | | | $ (96 | ) |
Wells Fargo Securities, LLC | | $ | 354,507 | | | | $ 629 | |
| (d) | All or a portion of security has been pledged as collateral in connection with outstanding reverse repurchase agreements. |
| (e) | The amount to be repurchased assumes the maturity will be the day after the period end. |
| (f) | During the six months ended June 30, 2016, investments in issuers considered to be an affiliate of the Fund for purposes of Section 2(a)(3) of the Investment Company Act of 1940, as amended, were as follows: |
| | | | | | | | | | | | | | | | |
| Affiliate | | Shares Held at
December 31, 2015 | | | Net Activity | | | Shares Held at June 30, 2016 | | | Income | |
BlackRock Liquidity Funds, TempFund, Institutional Class | | | 1,354,283 | | | | 5,329,681 | | | | 6,683,964 | | | | $4,043 | |
| (g) | Current yield as of period end. |
See Notes to Financial Statements.
| | | | | | |
| | | BLACKROCK VARIABLE SERIES FUNDS, INC. | | JUNE 30, 2016 | | 7 |
| | | | |
| Schedule of Investments (continued) | | | BlackRock U.S. Government Bond V.I. Fund | |
Reverse Repurchase Agreements
| | | | | | | | | | | | | | | | | | | | | | | | | | | | | | | | | | | |
| Counterparty | | Interest Rate | | Trade Date | | Maturity Date1 | | Face Value | | Face Value Including Accrued Interest | | Type of Underlying Collateral | | Remaining Contractual Maturity of the Agreements |
BNP Paribas Securities Corp. | | | | 0.41% | | | | | 5/03/16 | | | | | Open | | | | | $1,564,833 | | | | | $1,565,866 | | | |
| U.S. Treasury
Obligations |
| | | | Open/Demand | 1 |
BNP Paribas Securities Corp. | | | | 0.42% | | | | | 5/03/16 | | | | | Open | | | | | 3,161,250 | | | | | 3,163,389 | | | |
| U.S. Treasury
Obligations |
| | | | Open/Demand | 1 |
Total | | | | | | | | | | | | | | | | | | | $4,726,083 | | | | | $4,729,255 | | | | | | | | | | | |
| | | | | | | | | | | | | | | | | | | | | | | | | | | | | | |
| | 1 | | Certain agreements have no stated maturity and can be terminated by either party at any time. |
|
| Derivative Financial Instruments Outstanding as of Period End |
Futures Contracts
| | | | | | | | | | | | | | | | |
Contracts Long (Short) | | Issue | | Expiration | | Notional Value | | | Unrealized Appreciation (Depreciation) | |
| 1 | | Euro Dollar | | September 2016 | | | USD | | | | 248,388 | | | | $ 211 | |
| (5) | | Euro-BTP Italian Government Bond | | September 2016 | | | USD | | | | 791,311 | | | | (6,918 | ) |
| (6) | | Euro-Bund | | September 2016 | | | USD | | | | 1,112,773 | | | | (3,023 | ) |
| (19) | | U.S. Treasury Bonds (30 Year) | | September 2016 | | | USD | | | | 3,274,531 | | | | (121,903 | ) |
| (19) | | U.S. Treasury Notes (10 Year) | | September 2016 | | | USD | | | | 2,526,703 | | | | 2,776 | |
| (42) | | U.S. Treasury Notes (2 Year) | | September 2016 | | | USD | | | | 9,211,781 | | | | (61,401 | ) |
| 51 | | U.S. Treasury Notes (5 Year) | | September 2016 | | | USD | | | | 6,230,367 | | | | 96,723 | |
| 7 | | U.S. Ultra Treasury Bonds | | September 2016 | | | USD | | | | 1,304,625 | | | | 83,686 | |
| 45 | | Euro Dollar | | December 2016 | | | USD | | | | 11,174,063 | | | | 20,693 | |
| (44) | | Euro Dollar | | December 2017 | | | USD | | | | 10,909,250 | | | | (37,672 | ) |
| Total | | | | | | | | | | | | | | | $ (26,828 | ) |
| | | | | | | | | | | | | | | | |
Forward Foreign Currency Exchange Contracts
| | | | | | | | | | | | | | | | | | | | |
Currency Purchased | | | | | Currency Sold | | | | | Counterparty | | Settlement Date | | | Unrealized Appreciation (Depreciation) | |
| TRY | | | 261,785 | | | USD | | | 90,000 | | | Deutsche Bank AG | | | 7/01/16 | | | | $ 985 | |
| TRY | | | 261,412 | | | USD | | | 90,000 | | | Morgan Stanley & Co. International PLC | | | 7/01/16 | | | | 856 | |
| USD | | | 180,000 | | | TRY | | | 528,368 | | | Morgan Stanley & Co. International PLC | | | 7/01/16 | | | | (3,639 | ) |
| BRL | | | 24,164 | | | USD | | | 7,000 | | | Goldman Sachs International | | | 7/05/16 | | | | 510 | |
| BRL | | | 35,695 | | | USD | | | 10,000 | | | Goldman Sachs International | | | 7/05/16 | | | | 1,094 | |
| BRL | | | 43,536 | | | USD | | | 12,000 | | | Goldman Sachs International | | | 7/05/16 | | | | 1,531 | |
| BRL | | | 95,898 | | | USD | | | 26,600 | | | HSBC Bank PLC | | | 7/05/16 | | | | 3,205 | |
| BRL | | | 24,514 | | | USD | | | 7,000 | | | JPMorgan Chase Bank N.A. | | | 7/05/16 | | | | 619 | |
| BRL | | | 47,600 | | | USD | | | 14,000 | | | Morgan Stanley & Co. International PLC | | | 7/05/16 | | | | 794 | |
| BRL | | | 3,746 | | | USD | | | 1,039 | | | Royal Bank of Scotland PLC | | | 7/05/16 | | | | 125 | |
| BRL | | | 36,150 | | | USD | | | 10,000 | | | Royal Bank of Scotland PLC | | | 7/05/16 | | | | 1,235 | |
| CAD | | | 234,037 | | | USD | | | 180,000 | | | Deutsche Bank AG | | | 7/05/16 | | | | 1,154 | |
| COP | | | 24,165,600 | | | USD | | | 8,000 | | | Credit Suisse International | | | 7/05/16 | | | | 264 | |
| EUR | | | 162,934 | | | USD | | | 180,000 | | | Morgan Stanley & Co. International PLC | | | 7/05/16 | | | | 850 | |
| EUR | | | 180,000 | | | USD | | | 198,858 | | | Morgan Stanley & Co. International PLC | | | 7/05/16 | | | | 936 | |
| GBP | | | 131,251 | | | USD | | | 180,000 | | | JPMorgan Chase Bank N.A. | | | 7/05/16 | | | | (5,264 | ) |
| JPY | | | 18,434,070 | | | USD | | | 180,000 | | | Goldman Sachs International | | | 7/05/16 | | | | (1,460 | ) |
| MXN | | | 245,876 | | | USD | | | 13,435 | | | JPMorgan Chase Bank N.A. | | | 7/05/16 | | | | 7 | |
See Notes to Financial Statements.
| | | | | | |
| 8 | | BLACKROCK VARIABLE SERIES FUNDS, INC. | | JUNE 30, 2016 | | |
| | | | |
| Schedule of Investments (continued) | | | BlackRock U.S. Government Bond V.I. Fund | |
| | | | | | | | | | | | | | | | | | | | |
Currency Purchased | | | | | Currency Sold | | | | | Counterparty | | Settlement Date | | | Unrealized Appreciation (Depreciation) | |
| MXN | | | 364,258 | | | USD | | | 21,000 | | | JPMorgan Chase Bank N.A. | | | 7/05/16 | | | | $(1,086 | ) |
| RUB | | | 5,805,636 | | | USD | | | 90,000 | | | Société Générale | | | 7/05/16 | | | | 665 | |
| RUB | | | 5,812,910 | | | USD | | | 90,000 | | | Société Générale | | | 7/05/16 | | | | 779 | |
| SEK | | | 1,536,192 | | | USD | | | 180,000 | | | BNP Paribas S.A. | | | 7/05/16 | | | | 1,608 | |
| USD | | | 8,574 | | | BRL | | | 31,201 | | | Goldman Sachs International | | | 7/05/16 | | | | (1,123 | ) |
| USD | | | 14,000 | | | BRL | | | 46,830 | | | Goldman Sachs International | | | 7/05/16 | | | | (555 | ) |
| USD | | | 36,065 | | | BRL | | | 120,637 | | | Goldman Sachs International | | | 7/05/16 | | | | (1,429 | ) |
| USD | | | 14,000 | | | BRL | | | 47,474 | | | Morgan Stanley & Co. International PLC | | | 7/05/16 | | | | (755 | ) |
| USD | | | 15,000 | | | BRL | | | 52,425 | | | Royal Bank of Scotland PLC | | | 7/05/16 | | | | (1,294 | ) |
| USD | | | 90,000 | | | CAD | | | 115,116 | | | Royal Bank of Scotland PLC | | | 7/05/16 | | | | 896 | |
| USD | | | 90,000 | | | CAD | | | 115,390 | | | State Street Bank and Trust Co. | | | 7/05/16 | | | | 683 | |
| USD | | | 8,000 | | | COP | | | 25,139,120 | | | Credit Suisse International | | | 7/05/16 | | | | (596 | ) |
| USD | | | 90,000 | | | EUR | | | 79,552 | | | Citibank N.A. | | | 7/05/16 | | | | 1,701 | |
| USD | | | 90,000 | | | EUR | | | 79,704 | | | Morgan Stanley & Co. International PLC | | | 7/05/16 | | | | 1,531 | |
| USD | | | 199,340 | | | EUR | | | 180,000 | | | Morgan Stanley & Co. International PLC | | | 7/05/16 | | | | (453 | ) |
| USD | | | 90,000 | | | GBP | | | 61,208 | | | HSBC Bank PLC | | | 7/05/16 | | | | 8,513 | |
| USD | | | 90,000 | | | GBP | | | 61,241 | | | Northern Trust Corp. | | | 7/05/16 | | | | 8,469 | |
| USD | | | 90,000 | | | JPY | | | 9,387,759 | | | Citibank N.A. | | | 7/05/16 | | | | (924 | ) |
| USD | | | 90,000 | | | JPY | | | 9,414,706 | | | Morgan Stanley & Co. International PLC | | | 7/05/16 | | | | (1,185 | ) |
| USD | | | 8,935 | | | MXN | | | 166,036 | | | Citibank N.A. | | | 7/05/16 | | | | (142 | ) |
| USD | | | 10,500 | | | MXN | | | 191,034 | | | Goldman Sachs International | | | 7/05/16 | | | | 56 | |
| USD | | | 15,000 | | | MXN | | | 274,515 | | | JPMorgan Chase Bank N.A. | | | 7/05/16 | | | | (8 | ) |
| USD | | | 180,000 | | | RUB | | | 11,835,000 | | | Morgan Stanley & Co. International PLC | | | 7/05/16 | | | | (5,077 | ) |
| USD | | | 90,000 | | | SEK | | | 745,058 | | | Barclays Bank PLC | | | 7/05/16 | | | | 1,919 | |
| USD | | | 90,000 | | | SEK | | | 742,181 | | | Deutsche Bank AG | | | 7/05/16 | | | | 2,260 | |
| BRL | | | 304,425 | | | USD | | | 90,000 | | | Goldman Sachs International | | | 7/06/16 | | | | 4,585 | |
| BRL | | | 305,505 | | | USD | | | 90,000 | | | Royal Bank of Scotland PLC | | | 7/06/16 | | | | 4,921 | |
| COP | | | 118,200,000 | | | USD | | | 40,000 | | | BNP Paribas S.A. | | | 7/06/16 | | | | 409 | |
| COP | | | 119,340,000 | | | USD | | | 40,000 | | | BNP Paribas S.A. | | | 7/06/16 | | | | 799 | |
| COP | | | 149,060,000 | | | USD | | | 50,000 | | | Credit Suisse International | | | 7/06/16 | | | | 960 | |
| COP | | | 147,800,000 | | | USD | | | 50,000 | | | HSBC Bank PLC | | | 7/06/16 | | | | 529 | |
| EUR | | | 12,801 | | | RUB | | | 920,001 | | | Deutsche Bank AG | | | 7/06/16 | | | | (154 | ) |
| MXN | | | 223,253 | | | USD | | | 12,000 | | | Morgan Stanley & Co. International PLC | | | 7/06/16 | | | | 204 | |
| MXN | | | 73,934 | | | USD | | | 4,000 | | | State Street Bank and Trust Co. | | | 7/06/16 | | | | 42 | |
| RUB | | | 970,501 | | | EUR | | | 12,801 | | | Deutsche Bank AG | | | 7/06/16 | | | | 943 | |
| RUB | | | 866,450 | | | USD | | | 13,000 | | | Deutsche Bank AG | | | 7/06/16 | | | | 527 | |
| RUB | | | 876,200 | | | USD | | | 13,000 | | | Deutsche Bank AG | | | 7/06/16 | | | | 680 | |
| USD | | | 180,000 | | | BRL | | | 621,000 | | | Morgan Stanley & Co. International PLC | | | 7/06/16 | | | | (12,945 | ) |
| USD | | | 35,000 | | | COP | | | 104,475,000 | | | BNP Paribas S.A. | | | 7/06/16 | | | | (717 | ) |
| USD | | | 80,000 | | | COP | | | 239,791,200 | | | Credit Suisse International | | | 7/06/16 | | | | (1,978 | ) |
| USD | | | 30,000 | | | COP | | | 89,700,000 | | | HSBC Bank PLC | | | 7/06/16 | | | | (666 | ) |
| USD | | | 35,000 | | | COP | | | 104,475,000 | | | Royal Bank of Scotland PLC | | | 7/06/16 | | | | (717 | ) |
| USD | | | 16,000 | | | MXN | | | 298,691 | | | Citibank N.A. | | | 7/06/16 | | | | (328 | ) |
| USD | | | 13,000 | | | RUB | | | 853,034 | | | BNP Paribas S.A. | | | 7/06/16 | | | | (318 | ) |
| USD | | | 13,000 | | | RUB | | | 841,750 | | | Deutsche Bank AG | | | 7/06/16 | | | | (142 | ) |
| MXN | | | 221,845 | | | USD | | | 12,000 | | | Goldman Sachs International | | | 7/07/16 | | | | 126 | |
| MXN | | | 493,906 | | | USD | | | 25,965 | | | Goldman Sachs International | | | 7/07/16 | | | | 1,032 | |
| USD | | | 4,000 | | | MXN | | | 74,855 | | | Deutsche Bank AG | | | 7/07/16 | | | | (92 | ) |
| USD | | | 25,965 | | | MXN | | | 484,966 | | | Deutsche Bank AG | | | 7/07/16 | | | | (543 | ) |
See Notes to Financial Statements.
| | | | | | |
| | | BLACKROCK VARIABLE SERIES FUNDS, INC. | | JUNE 30, 2016 | | 9 |
| | | | |
| Schedule of Investments (continued) | | | BlackRock U.S. Government Bond V.I. Fund | |
| | | | | | | | | | | | | | | | | | | | |
Currency Purchased | | | | | Currency Sold | | | | | Counterparty | | Settlement Date | | | Unrealized Appreciation (Depreciation) | |
| USD | | | 4,000 | | | MXN | | | 74,883 | | | Royal Bank of Scotland PLC | | | 7/07/16 | | | | $ (93 | ) |
| USD | | | 4,000 | | | MXN | | | 74,832 | | | UBS AG | | | 7/07/16 | | | | (90 | ) |
| TRY | | | 26,148 | | | USD | | | 9,000 | | | Morgan Stanley & Co. International PLC | | | 7/08/16 | | | | 72 | |
| USD | | | 9,000 | | | TRY | | | 26,146 | | | BNP Paribas S.A. | | | 7/08/16 | | | | (71 | ) |
| USD | | | 7,700 | | | ZAR | | | 122,187 | | | Citibank N.A. | | | 7/08/16 | | | | (582 | ) |
| USD | | | 9,965 | | | ZAR | | | 158,208 | | | Citibank N.A. | | | 7/08/16 | | | | (759 | ) |
| USD | | | 19,250 | | | ZAR | | | 305,413 | | | HSBC Bank PLC | | | 7/08/16 | | | | (1,452 | ) |
| ZAR | | | 248,010 | | | USD | | | 16,200 | | | BNP Paribas S.A. | | | 7/08/16 | | | | 611 | |
| ZAR | | | 161,641 | | | USD | | | 10,800 | | | Goldman Sachs International | | | 7/08/16 | | | | 157 | |
| ZAR | | | 150,637 | | | USD | | | 9,915 | | | Morgan Stanley & Co. International PLC | | | 7/08/16 | | | | 296 | |
| CNH | | | 200,235 | | | USD | | | 30,000 | | | BNP Paribas S.A. | | | 7/11/16 | | | | 29 | |
| IDR | | | 1,195,200,000 | | | USD | | | 90,000 | | | JPMorgan Chase Bank N.A. | | | 7/11/16 | | | | 304 | |
| IDR | | | 1,195,470,000 | | | USD | | | 90,000 | | | Standard Chartered Bank | | | 7/11/16 | | | | 325 | |
| USD | | | 180,000 | | | IDR | | | 2,426,400,000 | | | Standard Chartered Bank | | | 7/11/16 | | | | (3,329 | ) |
| INR | | | 1,075,520 | | | USD | | | 16,000 | | | JPMorgan Chase Bank N.A. | | | 7/13/16 | | | | (103 | ) |
| USD | | | 16,000 | | | INR | | | 1,091,680 | | | Standard Chartered Bank | | | 7/13/16 | | | | (136 | ) |
| USD | | | 10,000 | | | ZAR | | | 148,850 | | | BNP Paribas S.A. | | | 7/13/16 | | | | (79 | ) |
| USD | | | 10,000 | | | ZAR | | | 147,377 | | | Morgan Stanley & Co. International PLC | | | 7/13/16 | | | | 21 | |
| ZAR | | | 149,774 | | | USD | | | 10,000 | | | Citibank N.A. | | | 7/13/16 | | | | 142 | |
| ZAR | | | 151,441 | | | USD | | | 10,000 | | | Goldman Sachs International | | | 7/13/16 | | | | 255 | |
| CAD | | | 12,329 | | | USD | | | 9,500 | | | Deutsche Bank AG | | | 7/14/16 | | | | 43 | |
| CAD | | | 12,263 | | | USD | | | 9,500 | | | Royal Bank of Canada | | | 7/14/16 | | | | (7 | ) |
| CAD | | | 6,171 | | | USD | | | 4,750 | | | Royal Bank of Scotland PLC | | | 7/14/16 | | | | 27 | |
| EUR | | | 15,000 | | | USD | | | 16,953 | | | Royal Bank of Scotland PLC | | | 7/14/16 | | | | (298 | ) |
| JPY | | | 1,715,375 | | | USD | | | 16,000 | | | Citibank N.A. | | | 7/14/16 | | | | 619 | |
| JPY | | | 1,072,018 | | | USD | | | 10,000 | | | Standard Chartered Bank | | | 7/14/16 | | | | 386 | |
| KRW | | | 6,016,400 | | | USD | | | 5,200 | | | Morgan Stanley & Co. International PLC | | | 7/14/16 | | | | 23 | |
| KRW | | | 3,039,400 | | | USD | | | 2,600 | | | Standard Chartered Bank | | | 7/14/16 | | | | 38 | |
| MYR | | | 32,606 | | | USD | | | 8,000 | | | JPMorgan Chase Bank N.A. | | | 7/14/16 | | | | 80 | |
| RUB | | | 717,283 | | | USD | | | 11,000 | | | BNP Paribas S.A. | | | 7/14/16 | | | | 174 | |
| RUB | | | 1,377,653 | | | USD | | | 21,000 | | | BNP Paribas S.A. | | | 7/14/16 | | | | 462 | |
| RUB | | | 1,384,110 | | | USD | | | 21,000 | | | Deutsche Bank AG | | | 7/14/16 | | | | 562 | |
| USD | | | 9,500 | | | CAD | | | 12,170 | | | Morgan Stanley & Co. International PLC | | | 7/14/16 | | | | 80 | |
| USD | | | 17,067 | | | EUR | | | 15,000 | | | Morgan Stanley & Co. International PLC | | | 7/14/16 | | | | 412 | |
| USD | | | 26,000 | | | JPY | | | 2,775,364 | | | Royal Bank of Scotland PLC | | | 7/14/16 | | | | (888 | ) |
| USD | | | 13,000 | | | KRW | | | 15,119,650 | | | JPMorgan Chase Bank N.A. | | | 7/14/16 | | | | (125 | ) |
| USD | | | 18,900 | | | RUB | | | 1,219,239 | | | Deutsche Bank AG | | | 7/14/16 | | | | (94 | ) |
| USD | | | 10,500 | | | RUB | | | 701,400 | | | Morgan Stanley & Co. International PLC | | | 7/14/16 | | | | (427 | ) |
| USD | | | 11,000 | | | RUB | | | 710,710 | | | Société Générale | | | 7/14/16 | | | | (72 | ) |
| USD | | | 16,000 | | | TWD | | | 515,760 | | | JPMorgan Chase Bank N.A. | | | 7/14/16 | | | | 7 | |
| USD | | | 9,093 | | | MXN | | | 168,812 | | | Bank of America N.A. | | | 7/19/16 | | | | (123 | ) |
| USD | | | 9,507 | | | MXN | | | 176,246 | | | Bank of America N.A. | | | 7/19/16 | | | | (116 | ) |
| TRY | | | 44,554 | | | USD | | | 15,200 | | | HSBC Bank PLC | | | 7/22/16 | | | | 204 | |
| TRY | | | 22,446 | | | USD | | | 7,600 | | | Royal Bank of Scotland PLC | | | 7/22/16 | | | | 161 | |
| USD | | | 22,800 | | | TRY | | | 66,296 | | | Citibank N.A. | | | 7/22/16 | | | | (122 | ) |
| MXN | | | 113,730 | | | USD | | | 6,000 | | | BNP Paribas S.A. | | | 7/28/16 | | | | 204 | |
| BRL | | | 47,193 | | | USD | | | 14,000 | | | Goldman Sachs International | | | 8/02/16 | | | | 536 | |
| BRL | | | 121,571 | | | USD | | | 36,065 | | | Goldman Sachs International | | | 8/02/16 | | | | 1,382 | |
| EUR | | | 7,600 | | | RUB | | | 553,052 | | | Deutsche Bank AG | | | 8/16/16 | | | | (90 | ) |
See Notes to Financial Statements.
| | | | | | |
| 10 | | BLACKROCK VARIABLE SERIES FUNDS, INC. | | JUNE 30, 2016 | | |
| | | | |
| Schedule of Investments (continued) | | | BlackRock U.S. Government Bond V.I. Fund | |
| | | | | | | | | | | | | | | | | | | | | | |
Currency Purchased | | | | | Currency Sold | | | | | | Counterparty | | Settlement Date | | | Unrealized Appreciation (Depreciation) | |
| EUR | | | 15,000 | | | | USD | | | | 17,005 | | | Deutsche Bank AG | | | 8/16/16 | | | | $ (330 | ) |
| EUR | | | 9,450 | | | | USD | | | | 10,487 | | | JPMorgan Chase Bank N.A. | | | 8/16/16 | | | | 18 | |
| JPY | | | 2,772,673 | | | | USD | | | | 26,000 | | | Royal Bank of Scotland PLC | | | 8/16/16 | | | | 890 | |
| MXN | | | 166,721 | | | | USD | | | | 8,935 | | | Citibank N.A. | | | 8/16/16 | | | | 141 | |
| MXN | | | 228,688 | | | | USD | | | | 12,000 | | | Deutsche Bank AG | | | 8/16/16 | | | | 449 | |
| MXN | | | 486,970 | | | | USD | | | | 25,965 | | | Deutsche Bank AG | | | 8/16/16 | | | | 545 | |
| MXN | | | 225,039 | | | | USD | | | | 12,000 | | | Royal Bank of Scotland PLC | | | 8/16/16 | | | | 251 | |
| RUB | | | 559,497 | | | | EUR | | | | 7,600 | | | Deutsche Bank AG | | | 8/16/16 | | | | 190 | |
| RUB | | | 1,000,200 | | | | USD | | | | 15,000 | | | Deutsche Bank AG | | | 8/16/16 | | | | 443 | |
| RUB | | | 1,341,360 | | | | USD | | | | 20,700 | | | Deutsche Bank AG | | | 8/16/16 | | | | 10 | |
| USD | | | 10,419 | | | | EUR | | | | 9,450 | | | Royal Bank of Scotland PLC | | | 8/16/16 | | | | (86 | ) |
| USD | | | 16,971 | | | | EUR | | | | 15,000 | | | Royal Bank of Scotland PLC | | | 8/16/16 | | | | 296 | |
| USD | | | 3,000 | | | | JPY | | | | 308,604 | | | BNP Paribas S.A. | | | 8/16/16 | | | | 7 | |
| USD | | | 10,000 | | | | JPY | | | | 1,027,400 | | | BNP Paribas S.A. | | | 8/16/16 | | | | 36 | |
| USD | | | 3,000 | | | | JPY | | | | 308,355 | | | Goldman Sachs International | | | 8/16/16 | | | | 9 | |
| USD | | | 10,000 | | | | JPY | | | | 1,028,600 | | | Morgan Stanley & Co. International PLC | | | 8/16/16 | | | | 24 | |
| USD | | | 12,000 | | | | MXN | | | | 229,179 | | | Citibank N.A. | | | 8/16/16 | | | | (476 | ) |
| USD | | | 9,900 | | | | MXN | | | | 185,629 | | | Goldman Sachs International | | | 8/16/16 | | | | (205 | ) |
| USD | | | 12,000 | | | | MXN | | | | 222,727 | | | Goldman Sachs International | | | 8/16/16 | | | | (125 | ) |
| USD | | | 4,000 | | | | MXN | | | | 74,239 | | | State Street Bank and Trust Co. | | | 8/16/16 | | | | (41 | ) |
| USD | | | 20,700 | | | | RUB | | | | 1,382,243 | | | Deutsche Bank AG | | | 8/16/16 | | | | (641 | ) |
| USD | | | 15,000 | | | | RUB | | | | 978,000 | | | JPMorgan Chase Bank N.A. | | | 8/16/16 | | | | (100 | ) |
| AUD | | | 661,000 | | | | USD | | | | 488,727 | | | Bank of America N.A. | | | 9/21/16 | | | | 2,739 | |
| AUD | | | 580,000 | | | | USD | | | | 429,171 | | | Morgan Stanley & Co. International PLC | | | 9/21/16 | | | | 2,070 | |
| USD | | | 912,092 | | | | AUD | | | | 1,241,000 | | | State Street Bank and Trust Co. | | | 9/21/16 | | | | (10,616 | ) |
| USD | | | 286,000 | | | | SAR | | | | 1,090,804 | | | BNP Paribas S.A. | | | 11/23/16 | | | | (3,730 | ) |
| USD | | | 213,000 | | | | SAR | | | | 809,507 | | | Citibank N.A. | | | 11/23/16 | | | | (2,014 | ) |
| USD | | | 290,000 | | | | SAR | | | | 1,105,480 | | | Citibank N.A. | | | 11/23/16 | | | | (3,628 | ) |
| Total | | | | | | | | | | | | | | | | | | | | | $ 94 | |
| | | | | | | | | | | | | | | | | | | | | | |
Exchange-Traded Options Purchased
| | | | | | | | | | | | | | | | | | | | | | | | |
| Description | | Put/
Call | | | Expiration
Date | | | Strike Price | | | Contracts | | | Value | |
U.S. Treasury Notes (10 Year) Futures | | | Put | | | | 7/22/16 | | | | USD | | | | 132.00 | | | | 12 | | | $ | 3,187 | |
U.S. Treasury Notes (10 Year) Futures | | | Put | | | | 7/22/16 | | | | USD | | | | 130.50 | | | | 10 | | | | 781 | |
Total | | | | | | | | | | | | | | | | | | | | | | $ | 3,968 | |
| | | | | | | | | | | | | | | | | | | | | | | | |
OTC Barrier Options Purchased
| | | | | | | | | | | | | | | | | | | | | | | | | | | | | | | | | | | | | | | | | | | | |
| Description | | Put/ Call | | | Type of Option | | | Counterparty | | | Expiration Date | | | Strike Price | | | Barrier Price | | | Notional Amount (000) | | | Value | |
USD Currency | | | Call | | | | Up-and-out | | | | Deutsche Bank AG | | | | 7/07/16 | | | | CNH | | | | 6.62 | | | | CNH | | | | 6.88 | | | | USD | | | | 30 | | | $ | 244 | |
GBP Currency | | | Put | | | | Down-and-Out | | | | BNP Paribas S.A. | | | | 7/27/16 | | | | USD | | | | 1.34 | | | | USD | | | | 1.25 | | | | GBP | | | | 419 | | | | 4,532 | |
Total | | | | | | | | | | | | | | | | | | | | | | | | | | | | | | | | | | | | | | | | | | $ | 4,776 | |
| | | | | | | | | | | | | | | | | | | | | | | | | | | | | | | | | | | | | | | | | | | | |
See Notes to Financial Statements.
| | | | | | |
| | | BLACKROCK VARIABLE SERIES FUNDS, INC. | | JUNE 30, 2016 | | 11 |
| | | | |
| Schedule of Investments (continued) | | | BlackRock U.S. Government Bond V.I. Fund | |
OTC Options Purchased
| | | | | | | | | | | | | | | | | | | | | | | | | | | | | | | | |
| Description | | Put/ Call | | | Counterparty | | | Expiration
Date | | | Strike Price | | | Notional Amount (000) | | | Value | |
USD Currency | | | Call | | | | Citibank N.A. | | | | 7/01/16 | | | | MXN | | | | 17.65 | | | | USD | | | | 21 | | | $ | 925 | |
USD Currency | | | Call | | |
| Morgan Stanley Capital Services
LLC |
| | | 7/01/16 | | | | TRY | | | | 2.95 | | | | USD | | | | 38 | | | | — | |
USD Currency | | | Call | | | | UBS AG | | | | 7/01/16 | | | | RUB | | | | 64.50 | | | | USD | | | | 32 | | | | 36 | |
USD Currency | | | Call | | | | BNP Paribas S.A. | | | | 7/08/16 | | | | ZAR | | | | 15.00 | | | | USD | | | | 31 | | | | 149 | |
USD Currency | | | Call | | | | Goldman Sachs Bank USA | | | | 7/12/16 | | | | CAD | | | | 1.29 | | | | USD | | | | 19 | | | | 204 | |
USD Currency | | | Call | | | | Goldman Sachs International | | | | 7/18/16 | | | | MXN | | | | 19.25 | | | | USD | | | | 28 | | | | 92 | |
USD Currency | | | Call | | | | UBS AG | | | | 7/18/16 | | | | MXN | | | | 19.25 | | | | USD | | | | 16 | | | | 53 | |
USD Currency | | | Call | | | | UBS AG | | | | 7/18/16 | | | | MXN | | | | 19.00 | | | | USD | | | | 12 | | | | 66 | |
USD Currency | | | Call | | | | Deutsche Bank AG | | | | 8/05/16 | | | | JPY | | | | 106.00 | | | | USD | | | | 21 | | | | 99 | |
USD Currency | | | Call | | | | BNP Paribas S.A. | | | | 8/16/16 | | | | SAR | | | | 3.78 | | | | USD | | | | 440 | | | | 642 | |
USD Currency | | | Call | | | | Citibank N.A. | | | | 8/16/16 | | | | SAR | | | | 3.78 | | | | USD | | | | 445 | | | | 649 | |
USD Currency | | | Put | | | | JPMorgan Chase Bank N.A. | | | | 7/15/16 | | | | MXN | | | | 18.50 | | | | USD | | | | 82 | | | | 1,139 | |
USD Currency | | | Put | | | | JPMorgan Chase Bank N.A. | | | | 7/15/16 | | | | MXN | | | | 18.30 | | | | USD | | | | 31 | | | | 270 | |
GBP Currency | | | Put | | | | Deutsche Bank AG | | | | 7/27/16 | | | | USD | | | | 1.45 | | | | GBP | | | | 16 | | | | 1,871 | |
GBP Currency | | | Put | | | | HSBC Bank PLC | | | | 7/27/16 | | | | USD | | | | 1.35 | | | | GBP | | | | 16 | | | | 489 | |
Total | | | | | | | | | | | | | | | | | | | | | | | | | | | | | | $ | 6,684 | |
| | | | | | | | | | | | | | | | | | | | | | | | | | | | | | | | |
Exchange-Traded Options Written
| | | | | | | | | | | | | | | | | | |
| Description | | Put/
Call | | Expiration
Date | | Strike Price | | | Contracts | | Value | |
U.S. Treasury Notes (10 Year) Futures | | Call | | 07/22/16 | | | USD | | | | 135.00 | | | 12 | | $ | (1,500 | ) |
OTC Options Written
| | | | | | | | | | | | | | | | | | | | | | | | | | | | | | | | |
| Description | | Put/ Call | | | Counterparty | | | Expiration
Date | | | Strike Price | | | Notional Amount (000) | | | Value | |
USD Currency | | | Call | | | | JPMorgan Chase Bank N.A. | | | | 7/18/16 | | | | MXN | | | | 19.25 | | | | USD | | | | 16 | | | $ | (53 | ) |
USD Currency | | | Call | | | | JPMorgan Chase Bank N.A. | | | | 7/18/16 | | | | MXN | | | | 19.25 | | | | USD | | | | 28 | | | | (92 | ) |
GBP Currency | | | Put | | | | Deutsche Bank AG | | | | 7/27/16 | | | | USD | | | | 1.35 | | | | GBP | | | | 16 | | | | (489 | ) |
GBP Currency | | | Put | | | | HSBC Bank PLC | | | | 7/27/16 | | | | USD | | | | 1.45 | | | | GBP | | | | 16 | | | | (1,871 | ) |
Total | | | | | | | | | | | | | | | | | | | | | | | | | | | | | | $ | (2,505 | ) |
| | | | | | | | | | | | | | | | | | | | | | | | | | | | | | | | |
OTC Interest Rate Swaptions Written
| | | | | | | | | | | | | | | | | | | | | | | | | | | | | | | | | | |
| Description | | Counterparty | | | Put/ Call | | | Exercise Rate | | | Pay/Receive Exercise Rate | | | Floating Rate Index | | Expiration Date | | | Notional Amount (000) | | | Value | |
10-Year Interest Rate Swap | | | Deutsche Bank AG | | | | Call | | | | 1.50% | | | | Pay | | | 3-month LIBOR | | | 2/09/18 | | | | USD | | | | 190 | | | | $ (6,493 | ) |
2-Year Interest Rate Swap | | | Deutsche Bank AG | | | | Call | | | | 0.90% | | | | Pay | | | 3-month LIBOR | | | 4/05/18 | | | | USD | | | | 2,300 | | | | (14,074 | ) |
2-Year Interest Rate Swap | | | Deutsche Bank AG | | | | Call | | | | 0.80% | | | | Pay | | | 3-month LIBOR | | | 4/12/18 | | | | USD | | | | 5,650 | | | | (29,930 | ) |
10-Year Interest Rate Swap | | | Deutsche Bank AG | | | | Put | | | | 2.50% | | | | Receive | | | 3-month LIBOR | | | 2/09/18 | | | | USD | | | | 190 | | | | (2,049 | ) |
2-Year Interest Rate Swap | | | Deutsche Bank AG | | | | Put | | | | 1.90% | | | | Receive | | | 3-month LIBOR | | | 4/05/18 | | | | USD | | | | 2,300 | | | | (4,221 | ) |
2-Year Interest Rate Swap | | | Deutsche Bank AG | | | | Put | | | | 1.80% | | | | Receive | | | 3-month LIBOR | | | 4/12/18 | | | | USD | | | | 5,650 | | | | (12,545 | ) |
Total | | | | | | | | | | | | | | | | | | | | | | | | | | | | | | | | | $(69,312 | ) |
| | | | | | | | | | | | | | | | | | | | | | | | | | | | | | | | | | |
See Notes to Financial Statements.
| | | | | | |
| 12 | | BLACKROCK VARIABLE SERIES FUNDS, INC. | | JUNE 30, 2016 | | |
| | | | |
| Schedule of Investments (continued) | | | BlackRock U.S. Government Bond V.I. Fund | |
Centrally Cleared Interest Rate Swaps
| | | | | | | | | | | | | | | | | | | | |
Fixed Rate | | Floating Rate | | Effective Date | | Expiration Date | | | Notional Amount (000) | | | Unrealized Appreciation (Depreciation) | |
| 1.26%1 | | 3-month LIBOR | | N/A | | | 1/12/17 | | | | USD | | | | 4,812 | | | | $(37,309 | ) |
| 1.37%1 | | 3-month LIBOR | | 10/05/162 | | | 11/30/20 | | | | USD | | | | 2,470 | | | | (42,119 | ) |
| 1.44%1 | | 3-month LIBOR | | 6/15/202 | | | 6/14/21 | | | | USD | | | | 4,640 | | | | (4,188 | ) |
| 1.51%1 | | 3-month LIBOR | | 6/14/202 | | | 6/14/21 | | | | USD | | | | 4,600 | | | | (7,162 | ) |
| 3.26%3 | | 3-month LIBOR | | N/A | | | 11/18/24 | | | | USD | | | | 700 | | | | 20,467 | |
| 2.13%3 | | 3-month LIBOR | | N/A | | | 8/25/25 | | | | USD | | | | 15 | | | | 1,175 | |
| 2.38%1 | | 3-month LIBOR | | N/A | | | 4/24/45 | | | | USD | | | | 135 | | | | (17,840 | ) |
| 2.39%1 | | 3-month LIBOR | | N/A | | | 4/24/45 | | | | USD | | | | 130 | | | | (17,511 | ) |
| 2.83%3 | | 3-month LIBOR | | N/A | | | 7/10/45 | | | | USD | | | | 265 | | | | 66,204 | |
| Total | | | | | | | | | | | | | | | | | | | $(38,283 | ) |
| | | | | | | | | | | | | | | | | | | | |
| | 1 | | Fund pays the fixed rate and receives the floating rate. |
| | 3 | | Fund pays the floating rate and receives the fixed rate. |
OTC Interest Rate Swaps
| | | | | | | | | | | | | | | | | | | | | | | | | | | | |
Fixed Rate | | Floating Rate | | Counterparty | | Expiration Date | | | Notional Amount (000) | | | Value | | | Premiums Paid (Received) | | | Unrealized Appreciation (Depreciation) | |
| 6.32%1 | | 28-day MXIBTIIE | | Goldman Sachs International | | | 8/06/25 | | | | MXN | | | | 640 | | | | $ 829 | | | | $(3 | ) | | | $ 832 | |
| 6.31%2 | | 28-day MXIBTIIE | | Deutsche Bank AG | | | 8/11/25 | | | | MXN | | | | 810 | | | | (988 | ) | | | 4 | | | | (992 | ) |
| Total | | | | | | | | | | | | | | | | | | | $(159 | ) | | | $ 1 | | | | $(160 | ) |
| | | | | | | | | | | | | | | | | | | | |
| | 1 | | Fund pays the floating rate and receives the fixed rate. |
| | 2 | | Fund pays the fixed rate and receives the floating rate. |
|
| Transactions in Options Written for the Six Months Ended June 30, 2016 |
| | | | | | | | | | | | | | | | | | | | | | | | |
| | | Calls | | | Puts | |
| | | | | | Notional (000) | | | | | | | | Notional (000) | | | | |
| | | Contracts | | | USD | | | Premiums Received | | | Contracts | | GBP | | USD | | | Premiums
Received | |
| | | | | | | |
Outstanding options, beginning of period | | | — | | | | 900 | | | | $ 35,730 | | | — | | — | | | 900 | | | | $ 35,730 | |
Options written | | | 69 | | | | 9,407 | | | | 108,971 | | | — | | 32 | | | 9,351 | | | | 73,286 | |
Options closed | | | (57) | | | | (2,123) | | | | (94,463) | | | — | | — | | | (2,111) | | | | (66,480 | ) |
| | | | | | | |
Outstanding options, end of period | | | 12 | | | | 8,184 | | | | $ 50,238 | | | — | | 32 | | | 8,140 | | | | $ 42,536 | |
| | | | | | | |
See Notes to Financial Statements.
| | | | | | |
| | | BLACKROCK VARIABLE SERIES FUNDS, INC. | | JUNE 30, 2016 | | 13 |
| | | | |
| Schedule of Investments (continued) | | | BlackRock U.S. Government Bond V.I. Fund | |
|
| Derivative Financial Instruments Categorized by Risk Exposure |
As of period end, the fair values of derivative financial instruments located in the Statement of Assets and Liabilities were as follows:
| | | | | | | | | | | | | | | | | | | | | | |
| Assets — Derivative Financial Instruments | | Commodity Contracts | | Credit Contracts | | Equity Contracts | | Foreign Currency Exchange Contracts | | | Interest Rate Contracts | | | Other Contracts | | Total | |
Futures contracts | | Net unrealized appreciation1 | | — | | — | | — | | | — | | | $ | 204,089 | | | — | | $ | 204,089 | |
Forward foreign currency exchange contracts | | Unrealized appreciation on forward foreign currency exchange contracts | | — | | — | | — | | $ | 74,732 | | | | — | | | — | | | 74,732 | |
Options purchased | | Investments at value — unaffiliated2 | | — | | — | | — | | | 11,460 | | | | 3,968 | | | — | | | 15,428 | |
Swaps — OTC | | Unrealized appreciation on OTC swaps; Swap premiums paid | | — | | — | | — | | | — | | | | 836 | | | — | | | 836 | |
Swaps — centrally cleared | | Net unrealized appreciation1 | | — | | — | | — | | | — | | | | 87,846 | | | — | | | 87,846 | |
| | | | | |
Total | | | | — | | — | | — | | $ | 86,192 | | | $ | 296,739 | | | — | | $ | 382,931 | |
| | | | | |
| | | | | | |
| Liabilities — Derivative Financial Instruments | | | | | | | | | | | | | | | | | |
Futures contracts | | Net unrealized depreciation1 | | — | | — | | — | | | — | | | $ | 230,917 | | | — | | $ | 230,917 | |
Forward foreign currency exchange contracts | | Unrealized depreciation on forward foreign currency exchange contracts | | — | | — | | — | | $ | 74,638 | | | | | | | — | | | 74,638 | |
Options written | | Options written at value | | — | | — | | — | | | 2,505 | | | | 70,812 | | | — | | | 73,317 | |
Swaps — OTC | | Unrealized depreciation on OTC swaps; Swap premiums received | | — | | — | | — | | | — | | | | 995 | | | — | | | 995 | |
Swaps — centrally cleared | | Net unrealized depreciation1 | | — | | — | | — | | | — | | | | 126,129 | | | — | | | 126,129 | |
| | | | | |
Total | | | | — | | — | | — | | $ | 77,143 | | | $ | 428,853 | | | — | | $ | 505,996 | |
| | | | | |
| | 1 | | Includes cumulative appreciation (depreciation) on futures contracts and centrally cleared swaps, if any, as reported in the Schedule of Investments. Only current day’s variation margin is reported within the Statement of Assets and Liabilities. |
| | 2 | | Includes options purchased at value as reported in the Schedule of Investments. |
For the six months ended June 30, 2016, the effect of derivative financial instruments in the Statement of Operations was as follows:
| | | | | | | | | | | | | | | | | | | | |
| Net Realized Gain (Loss) from: | | Commodity Contracts | | Credit Contracts | | Equity Contracts | | Foreign Currency Exchange Contracts | | | Interest Rate Contracts | | | Other Contracts | | Total | |
Futures contracts | | — | | — | | — | | | — | | | $ | 196,867 | | | — | | $ | 196,867 | |
Foreign currency transactions | | — | | — | | — | | $ | (874 | ) | | | — | | | — | | | (874 | ) |
Options purchased1 | | — | | — | | — | | | 12,932 | | | | (46,028 | ) | | — | | | (33,096 | ) |
Options written | | — | | — | | — | | | — | | | | (70,591 | ) | | — | | | (70,591 | ) |
Swaps | | — | | — | | — | | | — | | | | (394,276 | ) | | — | | | (394,276 | ) |
| | | |
Total | | — | | — | | — | | $ | 12,058 | | | $ | (314,028 | ) | | — | | $ | (301,970 | ) |
| | | |
| | | | | | | | | | | | | | | | | | | | | |
| Net Change in Unrealized Appreciation (Depreciation) on: | | | | | | | | | | | | | | | | | |
Futures contracts | | — | | — | | — | | | — | | | $ | (7,725 | ) | | — | | $ | (7,725 | ) |
Foreign currency translations | | — | | — | | — | | $ | (3,758 | ) | | | — | | | — | | | (3,758 | ) |
Options purchased2 | | — | | — | | — | | | (8,725 | ) | | | 694 | | | — | | | (8,031 | ) |
Options written | | — | | — | | — | | | 15 | | | | 45,543 | | | — | | | 45,558 | |
Swaps | | — | | — | | — | | | — | | | | 100,465 | | | — | | | 100,465 | |
| | | |
Total | | — | | — | | — | | $ | (12,468 | ) | | $ | 138,977 | | | — | | $ | 126,509 | |
| | | |
| | 1 | | Options purchased are included in net realized gain (loss) from investments. |
| | 2 | | Options purchased are included in net change in unrealized appreciation (depreciation) on investments. |
See Notes to Financial Statements.
| | | | | | |
| 14 | | BLACKROCK VARIABLE SERIES FUNDS, INC. | | JUNE 30, 2016 | | |
| | | | |
| Schedule of Investments (continued) | | | BlackRock U.S. Government Bond V.I. Fund | |
| | | | |
| Average Quarterly Balances of Outstanding Derivative Financial Instruments | | | | |
| |
Futures contracts: | | | | |
Average notional value of contracts — long | | $ | 21,562,072 | |
Average notional value of contracts — short | | $ | 25,366,052 | |
Forward foreign currency exchange contracts: | | | | |
Average amounts purchased — in USD | | $ | 3,360,997 | |
Average amounts sold — in USD | | $ | 2,167,803 | |
Options: | | | | |
Average value of option contracts purchased | | $ | 24,950 | |
Average value of option contracts written | | $ | 14,564 | |
Average notional value of swaption contracts written | | $ | 9,530,000 | |
Interest rate swaps: | | | | |
Average notional value — pays fixed rate | | $ | 13,435,211 | |
Average notional value — receives fixed rate | | $ | 1,579,027 | |
For more information about the Fund’s investment risks regarding derivative financial instruments, refer to the Notes to Financial Statements.
|
| Derivative Financial Instruments — Offsetting as of Period End |
The Fund’s derivative assets and liabilities (by type) were as follows:
| | | | | | | | |
| | | Assets | | | Liabilities | |
Derivative Financial Instruments: | | | | | | | | |
Futures contracts | | $ | 21,230 | | | $ | 20,361 | |
Forward foreign currency exchange contracts | | | 74,732 | | | | 74,638 | |
Options | | | 15,428 | 1 | | | 73,317 | |
Swaps — centrally cleared | | | — | | | | 811 | |
Swaps — OTC2 | | | 836 | | | | 995 | |
| | | | |
Total derivative assets and liabilities in the Statements of Assets and Liabilities | | $ | 112,226 | | | $ | 170,122 | |
Derivatives not subject to a Master Netting Agreement or similar agreement (“MNA”) | | | (25,198 | ) | | | (22,672 | ) |
| | | | |
Total derivative assets and liabilities subject to an MNA | | $ | 87,028 | | | $ | 147,450 | |
| | | | |
| | 1 | | Includes options purchased at value which is included in Investments at value - unaffiliated in the Statement of Assets and Liabilities and reported in the Schedule of Investments. |
| | 2 | | Includes unrealized appreciation (depreciation) on OTC swaps and swap premiums paid/received in the Statement of Assets and Liabilities. |
The following tables present the Fund’s derivative assets and liabilities by counterparty net of amounts available for offset under a Master Netting Agreement (“MNA”) and net of the related collateral received and pledged by the Fund:
| | | | | | | | | | | | | | | | |
| Counterparty | | Derivative Assets Subject to an MNA by Counterparty | | | Derivatives Available for Offset1 | | | Non-cash Collateral Received | | Cash Collateral Received | | Net Amount of Derivative Assets2 | |
Bank of America N.A. | | | $ 2,739 | | | | $ (239) | | | — | | — | | | $ 2,500 | |
Barclays Bank PLC | | | 1,919 | | | | — | | | — | | — | | | 1,919 | |
BNP Paribas S.A. | | | 9,662 | | | | (4,915) | | | — | | — | | | 4,747 | |
Citibank N.A. | | | 4,177 | | | | (4,177) | | | — | | — | | | — | |
Credit Suisse International | | | 1,224 | | | | (1,224) | | | — | | — | | | — | |
Deutsche Bank AG | | | 11,009 | | | | (11,009) | | | — | | — | | | — | |
Goldman Sachs Bank USA | | | 204 | | | | — | | | — | | — | | | 204 | |
Goldman Sachs International | | | 12,197 | | | | (4,900) | | | — | | — | | | 7,297 | |
HSBC Bank PLC | | | 12,940 | | | | (3,989) | | | — | | — | | | 8,951 | |
JPMorgan Chase Bank N.A. | | | 2,444 | | | | (2,444) | | | — | | — | | | — | |
Morgan Stanley & Co. International PLC | | | 8,169 | | | | (8,169) | | | — | | — | | | — | |
Northern Trust Corp. | | | 8,469 | | | | — | | | — | | — | | | 8,469 | |
Royal Bank of Scotland PLC | | | 8,802 | | | | (3,376) | | | — | | — | | | 5,426 | |
Société Générale | | | 1,444 | | | | (72) | | | — | | — | | | 1,372 | |
Standard Chartered Bank | | | 749 | | | | (749) | | | — | | — | | | — | |
State Street Bank and Trust Co. | | | 725 | | | | (725) | | | — | | — | | | — | |
UBS AG | | | 155 | | | | (90) | | | — | | — | | | 65 | |
| | | | |
Total | | | $87,028 | | | | $(46,078) | | | — | | — | | | $40,950 | |
| | | | |
| | 1 | | The amount of derivatives available for offset is limited to the amount of derivative assets and/or liabilities that are subject to an MNA. |
| | 2 | | Net amount represents the net amount receivable from the counterparty in the event of default. |
See Notes to Financial Statements.
| | | | | | |
| | | BLACKROCK VARIABLE SERIES FUNDS, INC. | | JUNE 30, 2016 | | 15 |
| | | | |
| Schedule of Investments (continued) | | | BlackRock U.S. Government Bond V.I. Fund | |
| | | | | | | | | | | | | | | | |
| Counterparty | | Derivative Liabilities Subject to an MNA by Counterparty | | | Derivatives Available for Offset1 | | | Non-cash Collateral Pledged | | Cash Collateral Pledged | | Net Amount of Derivative Liabilities2 | |
Bank of America N.A. | | | $ 239 | | | | $ (239) | | | — | | — | | | — | |
BNP Paribas S.A. | | | 4,915 | | | | (4,915) | | | — | | — | | | — | |
Citibank N.A. | | | 8,975 | | | | (4,177) | | | — | | — | | | $ 4,798 | |
Credit Suisse International | | | 2,574 | | | | (1,224) | | | — | | — | | | 1,350 | |
Deutsche Bank AG | | | 72,879 | | | | (11,009) | | | — | | — | | | 61,870 | |
Goldman Sachs International | | | 4,900 | | | | (4,900) | | | — | | — | | | — | |
HSBC Bank PLC | | | 3,989 | | | | (3,989) | | | — | | — | | | — | |
JPMorgan Chase Bank N.A. | | | 6,831 | | | | (2,444) | | | — | | — | | | 4,387 | |
Morgan Stanley & Co. International PLC | | | 24,481 | | | | (8,169) | | | — | | — | | | 16,312 | |
Royal Bank of Canada | | | 7 | | | | — | | | — | | — | | | 7 | |
Royal Bank of Scotland PLC | | | 3,376 | | | | (3,376) | | | — | | — | | | — | |
Société Générale | | | 72 | | | | (72) | | | — | | — | | | — | |
Standard Chartered Bank | | | 3,465 | | | | (749) | | | — | | — | | | 2,716 | |
State Street Bank and Trust Co. | | | 10,657 | | | | (725) | | | — | | — | | | 9,932 | |
UBS AG | | | 90 | | | | (90) | | | — | | — | | | — | |
| | | | |
Total | | | $147,450 | | | | $(46,078) | | | — | | — | | | $101,372 | |
| | | | |
| | 1 | | The amount of derivatives available for offset is limited to the amount of derivative assets and/or liabilities that are subject to an MNA. |
| | 2 | | Net amount represents the net amount payable due to the counterparty in the event of default. |
|
| Fair Value Hierarchy as of Period End |
Various inputs are used in determining the fair value of investments and derivative financial instruments. For information about the Fund’s policy regarding valuation of investments and derivative financial instruments, refer to the Notes to Financial Statements.
The following tables summarize the Fund’s investments and derivative financial instruments categorized in the disclosure hierarchy:
| | | | | | | | | | | | | | | | | | | | |
| | | Level 1 | | Level 2 | | Level 3 | | Total |
Assets: | | | | | | | | | | | | | | | | | | | | |
Investments: | | | | | | | | | | | | | | | | | | | | |
Long-Term Investments: | | | | | | | | | | | | | | | | | | | | |
Asset-Backed Securities | | | | — | | | | $ | 2,745,436 | | | | $ | 993,450 | | | | $ | 3,738,886 | |
Non-Agency Mortgage-Backed Securities | | | | — | | | | | 4,825,007 | | | | | — | | | | | 4,825,007 | |
U.S. Government Sponsored Agency Securities | | | | — | | | | | 78,762,121 | | | | | — | | | | | 78,762,121 | |
U.S. Treasury Obligations | | | | — | | | | | 39,004,517 | | | | | — | | | | | 39,004,517 | |
Short-Term Securities: | | | | | | | | | | | | | | | | | | | | |
Borrowed Bond Agreements | | | | — | | | | | 1,024,505 | | | | | — | | | | | 1,024,505 | |
Money Market Funds | | | $ | .6,683,964 | | | | | — | | | | | — | | | | | 6,683,964 | |
Options Purchased: | | | | | | | | | | | | | | | | | | | | |
Foreign currency exchange contracts | | | | — | | | | | 11,460 | | | | | — | | | | | 11,460 | |
Interest rate contracts | | | | 3,968 | | | | | — | | | | | — | | | | | 3,968 | |
Liabilities: | | | | | | | | | | | | | | | | | | | | |
Investments: | | | | | | | | | | | | | | | | | | | | |
Borrowed Bonds | | | | — | | | | | (1,033,127 | ) | | | | — | | | | | (1,033,127 | ) |
TBA Sale Commitments | | | | — | | | | | (33,236,486 | ) | | | | — | | | | | (33,236,486 | ) |
| | | | | |
Total | | | $ | 6,687,932 | | | | $ | 92,103,433 | | | | $ | 993,450 | | | | $ | 99,784,815 | |
| | | | | |
| | | | | | | | | | | | | | | | | | | | |
Derivative Financial Instruments1 | | | | | | | | | | | | | | | | | | | | |
Assets: | | | | | | | | | | | | | | | | | | | | |
Foreign currency exchange contracts | | | | — | | | | $ | 74,732 | | | | | — | | | | $ | 74,732 | |
Interest rate contracts | | | $ | 204,089 | | | | | 88,678 | | | | | — | | | | | 292,767 | |
Liabilities: | | | | | | | | | | | | | | | | | | | | |
Foreign currency exchange contracts | | | | — | | | | | (77,143 | ) | | | | — | | | | | (77,143 | ) |
Interest rate contracts | | | | (232,417 | ) | | | | (196,433 | ) | | | | — | | | | | (428,850 | ) |
| | | | | |
Total | | | $ | (28,328 | ) | | | $ | (110,166 | ) | | | | — | | | | $ | (138,494 | ) |
| | | | | |
| | 1 | | Derivative financial instruments are swaps, futures contracts, forward foreign currency exchange contracts and options written. Swaps, futures contracts and forward foreign currency exchange contracts are valued at the unrealized appreciation (depreciation) on the instrument and options written are shown at value. |
See Notes to Financial Statements.
| | | | | | |
| 16 | | BLACKROCK VARIABLE SERIES FUNDS, INC. | | JUNE 30, 2016 | | |
| | | | |
| Schedule of Investments (concluded) | | | BlackRock U.S. Government Bond V.I. Fund | |
The Fund may hold assets and/or liabilities in which the fair value approximates the carrying amount or face value, including accrued interest, for financial statement purposes. As of period end, such assets and/or liabilities are categorized within the disclosure hierarchy as follows:
| | | | | | | | | | | | | | | | | | | | |
| | | Level 1 | | Level 2 | | Level 3 | | Total |
Assets: | | | | | | | | | | | | | | | | | | | | |
Foreign currency at value | | | $ | 72,087 | | | | | — | | | | | — | | | | $ | 72,087 | |
Cash pledged: | | | | | | | | | | | | | | | | | | | | |
Futures contracts | | | | 94,710 | | | | | — | | | | | — | | | | | 94,710 | |
Centrally cleared swaps | | | | 44,940 | | | | | — | | | | | — | | | | | 44,940 | |
Liabilities: | | | | | | | | | | | | | | | | | | | | |
Cash received as collateral for reverse repurchase agreements | | | | — | | | | $ | (278,000 | ) | | | | — | | | | | (278,000 | ) |
Reverse repurchase agreements | | | | — | | | | | (4,729,255 | ) | | | | — | | | | | (4,729,255 | ) |
| | | | | |
Total | | | $ | 211,737 | | | | $ | (5,007,255 | ) | | | | — | | | | $ | (4,795,518 | ) |
| | | | | |
During the six months ended June 30, 2016, there were no transfers between Level 1 and Level 2.
A reconciliation of Level 3 investments is presented when the Fund had a significant amount of Level 3 investments at the beginning and/or end of the period in relation to net assets. The following table is a reconciliation of Level 3 investments for which significant unobservable inputs were used in determining fair value:
| | | | | | | | | | | | |
| | | Asset-Backed Securities | | | Non-Agency Mortgage-Backed Securities | | | Total | |
Assets: | | | | | | | | | | | | |
Opening Balance, as of December 31, 2015 | | $ | 1,483,775 | | | | $ 75,070 | | | $ | 1,558,845 | |
Transfers into Level 3 | | | — | | | | — | | | | — | |
Transfers out of Level 3 | | | (498,125 | ) | | | (75,070 | ) | | | (573,195 | ) |
Accrued discounts/premiums | | | 299 | | | | — | | | | 299 | |
Net realized gain (loss) | | | — | | | | — | | | | — | |
Net change in unrealized appreciation (depreciation)1,2 | | | 7,501 | | | | — | | | | 7,501 | |
Purchases | | | — | | | | | | | | — | |
Sales | | | — | | | | — | | | | — | |
| | | | |
Closing Balance, as of June 30, 2016 | | $ | 993,450 | | | | — | | | $ | 993,450 | |
| | | | |
Net change in unrealized appreciation (depreciation) on investments still held at June 30, 20162 | | $ | 7,501 | | | | — | | | $ | 7,501 | |
| | | | |
| | 1 | | Included in the related net change in unrealized appreciation (depreciation) in the Statement of Operations. |
| | 2 | | Any difference between net change in unrealized appreciation (depreciation) and net change in unrealized appreciation (depreciation) on investments still held at June 30, 2016 is generally due to investments no longer held or categorized as Level 3 at period end. |
The Fund’s investments that are categorized as Level 3 were valued utilizing third party pricing information without adjustment. Such valuations are based on unobservable inputs. A significant change in third party information could result in a significantly lower or higher value of such Level 3 investments.
See Notes to Financial Statements.
| | | | | | |
| | | BLACKROCK VARIABLE SERIES FUNDS, INC. | | JUNE 30, 2016 | | 17 |
| | | | |
| Statement of Assets and Liabilities | | | | |
| | | | |
| June 30, 2016 (Unaudited) | | BlackRock U.S. Government Bond V.I. Fund | |
| | | | |
| Assets | | | | |
Investments at value — unaffiliated (cost — $124,803,156) | | $ | 127,370,464 | |
Investments at value — affiliated (cost — $6,683,964) | | | 6,683,964 | |
Cash pledged: | | | | |
Centrally cleared swaps | | | 44,940 | |
Futures contracts | | | 94,710 | |
Foreign currency at value (cost — $71,241) | | | 72,087 | |
Receivables: | | | | |
Investments sold | | | 95,463 | |
TBA sale commitments | | | 33,073,835 | |
Dividends — affiliated | | | 1,560 | |
Interest | | | 378,956 | |
From the Manager | | | 28,097 | |
Principal paydowns | | | 6,102 | |
Swap premiums paid | | | 4 | |
Unrealized appreciation on: | | | | |
Forward foreign currency exchange contracts | | | 74,732 | |
OTC swaps | | | 832 | |
Variation margin receivable on futures contracts | | | 21,230 | |
Prepaid expenses | | | 190 | |
Other assets | | | 29,534 | |
| | | | |
Total assets | | | 167,976,700 | |
| | | | |
| | | | |
| Liabilities | | | | |
Cash received as collateral for reverse repurchase agreements | | | 278,000 | |
Borrowed bonds at value (proceeds — $1,009,340) | | | 1,033,127 | |
Options written at value (premiums received — $92,774) | | | 73,317 | |
TBA sale commitments at value (proceeds — $33,073,835) | | | 33,236,486 | |
Reverse repurchase agreements | | | 4,729,255 | |
Payables: | | | | |
Investments purchased | | | 40,163,367 | |
Capital shares redeemed | | | 76,787 | |
Distribution fees | | | 1,143 | |
Income dividends | | | 122,734 | |
Interest expense | | | 4,380 | |
Investment advisory fees | | | 30,781 | |
Officer’s and Directors’ fees | | | 2,556 | |
Other accrued expenses | | | 115,609 | |
Other affiliates | | | 459 | |
Swap premiums received | | | 3 | |
Unrealized depreciation on: | | | | |
Forward foreign currency exchange contracts | | | 74,638 | |
OTC swaps | | | 992 | |
Variation margin payable on futures contracts | | | 20,361 | |
Variation margin payable on centrally cleared swaps | | | 811 | |
| | | | |
Total liabilities | | | 79,964,806 | |
| | | | |
Net Assets | | $ | 88,011,894 | |
| | | | |
| | | | |
| Net Assets Consist of | | | | |
Paid-in capital | | $ | 89,215,547 | |
Undistributed net investment income | | | 106,876 | |
Accumulated net realized loss | | | (3,676,068 | ) |
Net unrealized appreciation (depreciation) | | | 2,365,539 | |
| | | | |
Net Assets | | $ | 88,011,894 | |
| | | | |
| | | | |
| Net Asset Value | | | | |
Class I — Based on net assets of $81,934,401 and 7,755,041 shares outstanding, 300 million shares authorized, $0.10 par value | | $ | 10.57 | |
| | | | |
Class III — Based on net assets of $6,077,493 and 575,622 shares outstanding, 100 million shares authorized, $0.10 par value | | $ | 10.56 | |
| | | | |
See Notes to Financial Statements.
| | | | | | |
| 18 | | BLACKROCK VARIABLE SERIES FUNDS, INC. | | JUNE 30, 2016 | | |
| | | | |
| Six Months Ended June 30, 2016 (Unaudited) | | BlackRock U.S. Government Bond V.I. Fund | |
| | | | |
| Investment Income: | | | | |
Interest | | $ | 1,020,005 | |
Dividends — affiliated | | | 4,043 | |
| | | | |
Total income | | | 1,024,048 | |
| | | | |
| | | | |
| Expenses: | | | | |
Investment advisory | | | 217,669 | |
Transfer agent | | | 2,384 | |
Transfer agent — Class Specific | | | 84,693 | |
Professional | | | 28,633 | |
Custodian | | | 32,229 | |
Accounting Services | | | 11,861 | |
Officer and Directors | | | 10,187 | |
Printing | | | 7,088 | |
Distribution — Class Specific | | | 6,334 | |
Miscellaneous | | | 7,524 | |
| | | | |
Total expenses excluding interest expense | | | 408,602 | |
Interest expense | | | 36,508 | |
| | | | |
Total expenses | | | 445,110 | |
Less: | | | | |
Fees waived by the Manager | | | (16,402 | ) |
Transfer agent fees reimbursed — Class Specific | | | (83,270 | ) |
| | | | |
Total expenses after fees waived and reimbursed | | | 345,438 | |
| | | | |
Net investment income | | | 678,610 | |
| | | | |
| | | | |
| Realized and Unrealized Gain (Loss): | | | | |
Net realized gain (loss) from: | | | | |
Investments | | | 576,081 | |
Futures contracts | | | 196,867 | |
Options written | | | (70,591 | ) |
Swaps | | | (394,276 | ) |
Foreign currency transactions | | | (6,985 | ) |
Borrowed bonds | | | (23,985 | ) |
| | | | |
| | | 277,111 | |
| | | | |
Net change in unrealized appreciation (depreciation) on: | | | | |
Investments | | | 2,600,056 | |
Futures contracts | | | (7,725 | ) |
Options written | | | 45,558 | |
Borrowed bonds | | | (26,431 | ) |
Swaps | | | 100,465 | |
Foreign currency translations | | | (2,724 | ) |
| | | | |
| | | 2,709,199 | |
| | | | |
Net realized and unrealized gain | | | 2,986,310 | |
| | | | |
Net Increase in Net Assets Resulting from Operations | | $ | 3,664,920 | |
| | | | |
See Notes to Financial Statements.
| | | | | | |
| | | BLACKROCK VARIABLE SERIES FUNDS, INC. | | JUNE 30, 2016 | | 19 |
| | | | |
| Statements of Changes in Net Assets | | | BlackRock U.S. Government Bond V.I. Fund | |
| | | | | | | | |
| Increase (Decrease) in Net Assets: | | Six Months Ended June 30, 2016 (Unaudited) | | | Year Ended December 31, 2015 | |
| | | | | | | | |
| Operations | | | | | | | | |
Net investment income | | $ | 678,610 | | | $ | 1,255,888 | |
Net realized gain | | | 277,111 | | | | 497,713 | |
Net change in unrealized appreciation (depreciation) | | | 2,709,199 | | | | (1,307,223) | |
| | | | |
Net increase in net assets resulting from operations | | | 3,664,920 | | | | 446,378 | |
| | | | |
| | | | | | | | |
| Distributions to Shareholders1 | | | | | | | | |
From net investment income: | | | | | | | | |
Class I | | | (792,490 | ) | | | (1,748,149) | |
Class III | | | (41,567 | ) | | | (31,059) | |
| | | | |
Decrease in net assets resulting from distributions to shareholders | | | (834,057 | ) | | | (1,779,208) | |
| | | | |
| | | | | | | | |
| Capital Share Transactions | | | | | | | | |
Net increase (decrease) in net assets derived from capital share transactions | | | 270,562 | | | | (7,481,244) | |
| | | | |
| | | | | | | | |
| Net Assets | | | | | | | | |
Total increase (decrease) in net assets | | | 3,101,425 | | | | (8,814,074) | |
Beginning of period | | | 84,910,469 | | | | 93,724,543 | |
| | | | |
End of period | | $ | 88,011,894 | | | $ | 84,910,469 | |
| | | | |
Undistributed net investment income, end of period | | $ | 106,876 | | | $ | 262,323 | |
| | | | |
| | 1 | | Distributions for annual periods determined in accordance with federal income tax regulations. |
See Notes to Financial Statements.
| | | | | | |
| 20 | | BLACKROCK VARIABLE SERIES FUNDS, INC. | | JUNE 30, 2016 | | |
| | | | |
| Financial Highlights | | | BlackRock U.S. Government Bond V.I. Fund | |
| | | | | | | | | | | | | | | | | | | | | | | | |
| | | Class I | |
| | | Six Months Ended June 30, 2016 (Unaudited) | | | Year Ended December 31, | |
| | | | 2015 | | | 2014 | | | 2013 | | | 2012 | | | 2011 | |
| | | | | | | | | | | | | | | | | | | | | | | | |
| Per Share Operating Performance | | | | | | | | | | | | | | | | | | | | | | | | |
Net asset value, beginning of period | | $ | 10.23 | | | $ | 10.39 | | | $ | 10.04 | | | $ | 10.71 | | | $ | 10.76 | | | $ | 10.45 | |
| | | | |
Net investment income1 | | | 0.08 | | | | 0.15 | | | | 0.19 | | | | 0.13 | | | | 0.23 | | | | 0.29 | |
Net realized and unrealized gain (loss) | | | 0.36 | | | | (0.10 | ) | | | 0.39 | | | | (0.48 | ) | | | 0.03 | | | | 0.36 | |
| | | | |
Net increase (decrease) from investment operations | | | 0.44 | | | | 0.05 | | | | 0.58 | | | | (0.35 | ) | | | 0.26 | | | | 0.65 | |
| | | | |
Distributions:2 | | | | | | | | | | | | | | | | | | | | | | | | |
From net investment income | | | (0.10 | ) | | | (0.21 | ) | | | (0.23 | ) | | | (0.25 | ) | | | (0.27 | ) | | | (0.34) | |
From net realized gain | | | — | | | | — | | | | — | | | | (0.07 | ) | | | (0.04 | ) | | | — | |
| | | | |
Total distributions | | | (0.10 | ) | | | (0.21 | ) | | | (0.23 | ) | | | (0.32 | ) | | | (0.31 | ) | | | (0.34) | |
| | | | |
Net asset value, end of period | | $ | 10.57 | | | $ | 10.23 | | | $ | 10.39 | | | $ | 10.04 | | | $ | 10.71 | | | $ | 10.76 | |
| | | | |
| | | | | | | | | | | | | | | | | | | | | | | | |
| Total Return3 | | | | | | | | | | | | | | | | | | | | | | | | |
Based on net asset value | | | 4.32 | %4 | | | 0.45 | % | | | 5.87 | % | | | (3.25 | )% | | | 2.41 | % | | | 6.31% | |
| | | | |
| | | | | | | | | | | | | | | | | | | | | | | | |
| Ratios to Average Net Assets | | | | | | | | | | | | | | | | | | | | | | | | |
Total expenses | | | 1.01 | %5 | | | 0.96 | % | | | 0.89 | % | | | 0.90 | % | | | 0.83 | % | | | 0.66% | |
| | | | |
Total expenses after fees waived and/or reimbursed | | | 0.78 | %5 | | | 0.73 | % | | | 0.69 | % | | | 0.69 | % | | | 0.69 | % | | | 0.66% | |
| | | | |
Total expenses after fees waived and/or reimbursed and excluding interest expense | | | 0.69 | %5 | | | 0.70 | % | | | 0.66 | % | | | 0.68 | % | | | 0.68 | % | | | 0.66% | |
| | | | |
Net investment income | | | 1.58 | %5 | | | 1.41 | % | | | 1.88 | % | | | 1.24 | % | | | 2.13 | % | | | 2.80% | |
| | | | |
| | | | | | | | | | | | | | | | | | | | | | | | |
| Supplemental Data | | | | | | | | | | | | | | | | | | | | | | | | |
Net assets, end of period (000) | | $ | 81,934 | | | $ | 83,016 | | | $ | 92,975 | | | $ | 103,218 | | | $ | 130,938 | | | $ | 145,886 | |
| | | | |
Portfolio turnover rate6 | | | 637 | % | | | 1,581 | % | | | 1,388 | % | | | 1,956 | % | | | 1,529 | % | | | 2,601% | |
| | | | |
| | 1 | | Based on average shares outstanding. |
| | 2 | | Distributions for annual periods determined in accordance with federal income tax regulations. |
| | 3 | | Where applicable, excludes insurance-related fees and expenses and assumes the reinvestment of distributions. |
| | 4 | | Aggregate total return. |
| | 6 | | Includes mortgage dollar roll transactions (“MDRs”). Additional information regarding portfolio turnover is as follows: |
| | | | | | | | | | | | | | | | | | | | | | | | |
| | | | |
| | | Six Months Ended June 30, 2016 (Unaudited) | | | Year Ended December 31, | |
| | | | 2015 | | | 2014 | | | 2013 | | | 2012 | | | 2011 | |
| |
Portfolio turnover rate (excluding MDRs) | | | 423 | % | | | 991 | % | | | 956 | % | | | 1,415 | % | | | 1,119 | % | | | 1,825 | % |
| |
| | | | | | |
| | | BLACKROCK VARIABLE SERIES FUNDS, INC. | | JUNE 30, 2016 | | 21 |
| | | | |
| Financial Highlights (concluded) | | | BlackRock U.S. Government Bond V.I. Fund | |
| | | | | | | | | | | | | | | | | | | | | | | | |
| | | Class III | |
| | | Six Months Ended June 30, 2016 (Unaudited) | | | Year Ended December 31, | | | Period July 15, 20131
to December 31, 2013 | | | Period January 1, 2013 to July 9, 20132 | | | Period May 9, 20121 to December 31, 2012 | |
| | | | 2015 | | | 2014 | | | | |
| | | | | | | | | | | | | | | | | | | | | | | | |
| Per Share Operating Performance | | | | | | | | | | | | | | | | | | | | | | | | |
Net asset value, beginning of period | | $ | 10.22 | | | $ | 10.39 | | | $ | 10.04 | | | $ | 10.19 | | | $ | 10.71 | | | $ | 10.77 | |
| | | | |
Net investment income3 | | | 0.06 | | | | 0.13 | | | | 0.17 | | | | 0.11 | | | | 0.01 | | | | 0.08 | |
Net realized and unrealized gain (loss) | | | 0.37 | | | | (0.12 | ) | | | 0.38 | | | | (0.09 | ) | | | (0.38 | ) | | | 0.05 | |
| | | | |
Net increase (decrease) from investment operations | | | 0.43 | | | | 0.01 | | | | 0.55 | | | | 0.02 | | | | (0.37 | ) | | | 0.13 | |
| | | | |
Distributions:4 | | | | | | | | | | | | | | | | | | | | | | | | |
From net investment income | | | (0.09 | ) | | | (0.18 | ) | | | (0.20 | ) | | | (0.10 | ) | | | (0.15 | ) | | | (0.15) | |
From net realized gain | | | — | | | | — | | | | — | | | | (0.07 | ) | | | — | | | | (0.04) | |
| | | | |
Total distributions | | | (0.09 | ) | | | (0.18 | ) | | | (0.20 | ) | | | (0.17 | ) | | | (0.15 | ) | | | (0.19) | |
| | | | |
Net asset value, end of period | | $ | 10.56 | | | $ | 10.22 | | | $ | 10.39 | | | $ | 10.04 | | | $ | 10.19 | | | $ | 10.71 | |
| | | | |
| | | | | | | | | | | | | | | | | | | | | | | | |
| Total Return5 | | | | | | | | | | | | | | | | | | | | | | | | |
Based on net asset value | | | 4.17 | %6 | | | 0.08 | % | | | 5.56 | % | | | 0.26 | %6 | | | (3.60 | )%6 | | | 1.24% | 6 |
| | | | |
| | | | | | | | | | | | | | | | | | | | | | | | |
| Ratios to Average Net Assets | | | | | | | | | | | | | | | | | | | | | | | | |
Total expenses | | | 1.16 | %7 | | | 1.11 | % | | | 1.09 | % | | | 0.86 | %7 | | | 1.66 | %7 | | | 1.14% | 7 |
| | | | |
Total expenses after fees waived and/or reimbursed | | | 1.09 | %7 | | | 1.00 | % | | | 1.00 | % | | | 0.85 | %7 | | | 0.85 | %7 | | | 1.01% | 7 |
| | | | |
Total expenses after fees waived and/or reimbursed and excluding interest expense | | | 1.00 | %7 | | | 0.97 | % | | | 0.98 | % | | | 0.84 | %7 | | | 0.85 | %7 | | | 0.99% | 7 |
| | | | |
Net investment income | | | 1.22 | %7 | | | 1.27 | % | | | 1.63 | % | | | 2.30 | %7 | | | 0.25 | %7 | | | 1.20% | 7 |
| | | | |
| | | | | | | | | | | | | | | | | | | | | | | | |
| Supplemental Data | | | | | | | | | | | | | | | | | | | | | | | | |
Net assets, end of period (000) | | $ | 6,077 | | | $ | 1,894 | | | $ | 750 | | | $ | 225 | | | | — | 2 | | $ | 29 | |
| | | | |
Portfolio turnover rate8 | | | 637 | % | | | 1,581 | % | | | 1,388 | % | | | 1,956 | % | | | 1,956 | % | | | 1,529% | |
| | | | |
| | 1 | | Recommencement of operations. |
| | 2 | | There were no Class III Shares outstanding from July 9, 2013 to July 14, 2013. On July 15, 2013, operations recommenced. |
| | 3 | | Based on average shares outstanding. |
| | 4 | | Distributions for annual periods determined in accordance with federal income tax regulations. |
| | 5 | | Where applicable, excludes insurance-related fees and expenses and assumes the reinvestment of distributions. |
| | 6 | | Aggregate total return. |
| | 8 | | Includes mortgage dollar roll transactions (“MDRs”). Additional information regarding portfolio turnover is as follows: |
| | | | | | | | | | | | | | | | | | | | | | | | |
| | | | |
| | | Six Months Ended June 30, 2016 (Unaudited) | | | Year Ended December 31, | | | Period July 15, 2013
to December 31, 2013 | | | Period January 1, 2013 to July 9, 2013 | | | Period May 9, 2012 to December 31, 2012 | |
| | | | 2015 | | | 2014 | | | | |
| |
Portfolio turnover rate (excluding MDRs) | | | 423% | | | | 991 | % | | | 956 | % | | | 1,415 | % | | | 1,415 | % | | | 1,119% | |
| |
| | | | | | |
| 22 | | BLACKROCK VARIABLE SERIES FUNDS, INC. | | JUNE 30, 2016 | | |
| | | | |
| Notes to Financial Statements (Unaudited) | | | BlackRock U.S. Government Bond V.I. Fund | |
1. Organization:
BlackRock Variable Series Funds, Inc. (the “Company”) is registered under the Investment Company Act of 1940, as amended (the “1940 Act”), as an open-end management investment company. The Company is organized as a Maryland corporation that is comprised of 20 separate funds. The funds offer shares to insurance companies for their separate accounts to fund benefits under certain variable annuity and variable life insurance contracts. The financial statements presented are for BlackRock U.S. Government Bond V.I. Fund (the “Fund”). The Fund is classified as diversified. Class I and Class III Shares have equal voting, dividend, liquidation and other rights, except that only shares of the respective classes are entitled to vote on matters concerning only that class. In addition, Class III Shares bear certain expenses related to the distribution of such shares. Class III Shares recommenced on May 9, 2012, were redeemed on July 9, 2013 and recommenced on July 15, 2013.
The Fund, together with certain other registered investment companies advised by BlackRock Advisors, LLC (the “Manager”) or its affiliates, is included in a complex of open-end funds referred to as the Equity-Bond Complex.
2. Significant Accounting Policies:
The financial statements are prepared in conformity with accounting principles generally accepted in the United States of America (“U.S. GAAP”), which may require management to make estimates and assumptions that affect the reported amounts of assets and liabilities in the financial statements, disclosure of contingent assets and liabilities at the date of the financial statements and the reported amounts of increases and decreases in net assets from operations during the reporting period. Actual results could differ from those estimates. The Fund is considered an investment company under U.S. GAAP and follows the accounting and reporting guidance applicable to investment companies. Below is a summary of significant accounting policies:
Segregation and Collateralization: In cases where the Fund enters into certain investments (e.g., futures contracts, forward foreign currency exchange contracts, options written and swaps), or certain borrowings (e.g., reverse repurchase transactions) that would be treated as “senior securities” for 1940 Act purposes, the Fund may segregate or designate on its books and records cash or liquid assets having a market value at least equal to the amount of its future obligations under such investments or borrowings. Doing so allows the investment or borrowing to be excluded from treatment as a “senior security.” Furthermore, if required by an exchange or counterparty agreement, the Fund may be required to deliver/deposit cash and/or securities to/with an exchange, or broker-dealer or custodian as collateral for certain investments or obligations.
Investment Transactions and Investment Income: For financial reporting purposes, investment transactions are recorded on the dates the transactions are entered into (the trade dates). Realized gains and losses on investment transactions are determined on the identified cost basis. Interest income, including amortization and accretion of premiums and discounts on debt securities, is recognized on the accrual basis. Income, expenses and realized and unrealized gains and losses are allocated daily to each class based on its relative net assets.
Distributions: Distributions from net investment income are declared daily and paid monthly. Distributions of capital gains are recorded on the ex-dividend date and made at least annually. The character and timing of distributions are determined in accordance with federal income tax regulations, which may differ from U.S. GAAP.
Indemnifications: In the normal course of business, the Fund enters into contracts that contain a variety of representations that provide general indemnification. The Fund’s maximum exposure under these arrangements is unknown because it involves future potential claims against the Fund, which cannot be predicted with any certainty.
Other: Expenses directly related to the Fund or its classes are charged to the Fund or the applicable class. Other operating expenses shared by several funds, including other funds managed by the Manager, are prorated among those funds on the basis of relative net assets or other appropriate methods. Expenses directly related to the Fund and other shared expenses prorated to the Fund are allocated daily to each class based on its relative net assets or other appropriate methods.
The Fund have an arrangement with its custodian whereby fees may be reduced by credits earned on uninvested cash balances, which, if applicable, are shown as fees paid indirectly in the Statement of Operations. The custodian imposes fees on overdrawn cash balances, which can be offset by accumulated credits earned or may result in additional custody charges.
3. Investment Valuation and Fair Value Measurements:
Investment Valuation Policies: The Fund’s investments are valued at fair value (also referred to as “market value” within the financial statements) as of the close of trading on the New York Stock Exchange (“NYSE”) (generally 4:00 p.m., Eastern time). U.S. GAAP defines fair value as the price the Fund would receive to sell an asset or pay to transfer a liability in an orderly transaction between market participants at the measurement date. The Fund determines the fair values of its financial instruments using various independent dealers or pricing services under policies approved by the Board of Directors of the Company (the “Board”). The BlackRock Global Valuation Methodologies Committee (the “Global Valuation Committee”) is the committee formed by management to develop global pricing policies and procedures and to oversee the pricing function for all financial instruments.
| | | | | | |
| | | BLACKROCK VARIABLE SERIES FUNDS, INC. | | JUNE 30, 2016 | | 23 |
| | | | |
| Notes to Financial Statements (continued) | | | BlackRock U.S. Government Bond V.I. Fund | |
Fair Value Inputs and Methodologies: The following methods (or “techniques”) and inputs are used to establish the fair value of the Fund’s assets and liabilities:
| • | | Bond investments are valued on the basis of last available bid prices or current market quotations provided by dealers or pricing services. Floating rate loan interests are valued at the mean of the bid prices from one or more brokers or dealers as obtained from a pricing service. In determining the value of a particular investment, pricing services may use certain information with respect to transactions in such investments, quotations from dealers, pricing matrixes, market transactions in comparable investments, various relationships observed in the market between investments and calculated yield measures. Asset-backed and mortgage-backed securities are valued by independent pricing services using models that consider estimated cash flows of each tranche of the security, establish a benchmark yield and develop an estimated tranche-specific spread to the benchmark yield based on the unique attributes of the tranche. |
| • | | Generally, trading in foreign instruments is substantially completed each day at various times prior to the close of business on the NYSE. Occasionally, events affecting the values of such instruments may occur between the foreign market close and the close of business on the NYSE that may not be reflected in the computation of the Fund’s net assets. Each business day, the Fund uses a pricing service to assist with the valuation of certain foreign exchange-traded equity securities and foreign exchange-traded and over-the-counter (“OTC”) options (the “Systematic Fair Value Price”). Using current market factors, the Systematic Fair Value Price is designed to value such foreign securities and foreign options at fair value as of the close of business on the NYSE, which follows the close of the local markets. |
| • | | To-be-announced (“TBA”) commitments are valued on the basis of last available bid prices or current market quotations provided by pricing services. |
| • | | Investments in open-end U.S. mutual funds are valued at net asset value each business day. |
| • | | Futures contracts traded on exchanges are valued at their last sale price. |
| • | | Securities and other assets and liabilities denominated in foreign currencies are translated into U.S. dollars using exchange rates determined as of the close of business on the NYSE. Forward foreign currency exchange contracts are valued at the mean between the bid and ask prices and are determined as of the close of business on the NYSE. Interpolated values are derived when the settlement date of the contract is an interim date for which quotations are not available. |
| • | | Exchange-traded options are valued at the mean between the last bid and ask prices at the close of the options market in which the options trade. An exchange-traded option for which there is no mean price is valued at the last bid (long positions) or ask (short positions) price. If no bid or ask price is available, the prior day’s price will be used, unless it is determined that the prior day’s price no longer reflects the fair value of the option. OTC options and options on swaps (“swaptions”) are valued by an independent pricing service using a mathematical model, which incorporates a number of market data factors, such as the trades and prices of the underlying instruments. |
| • | | Swap agreements are valued utilizing quotes received daily by the Fund’s pricing service or through brokers, which are derived using daily swap curves and models that incorporate a number of market data factors, such as discounted cash flows, trades and values of the underlying reference instruments. |
If events (e.g., a company announcement, market volatility or a natural disaster) occur that are expected to materially affect the value of such instruments, or in the event that the application of these methods of valuation results in a price for an investment that is deemed not to be representative of the market value of such investment, or if a price is not available, the investment will be valued by the Global Valuation Committee, or its delegate, in accordance with a policy approved by the Board as reflecting fair value (“Fair Valued Investments”). When determining the price for Fair Valued Investments, the Global Valuation Committee, or its delegate, seeks to determine the price that the Fund might reasonably expect to receive or pay from the current sale or purchase of that asset or liability in an arm’s-length transaction. Fair value determinations shall be based upon all available factors that the Global Valuation Committee, or its delegate, deems relevant consistent with the principles of fair value measurement which include the market approach, income approach and/or in the case of recent investments, the cost approach, as appropriate. The market approach generally consists of using comparable market transactions. The income approach generally is used to discount future cash flows to present value and is adjusted for liquidity as appropriate. These factors include but are not limited to: (i) attributes specific to the investment or asset; (ii) the principal market for the investment or asset; (iii) the customary participants in the principal market for the investment or asset; (iv) data assumptions by market participants for the investment or asset, if reasonably available; (v) quoted prices for similar investments or assets in active markets; and (vi) other factors, such as future cash flows, interest rates, yield curves, volatilities, prepayment speeds, loss severities, credit risks, recovery rates, liquidation amounts and/or default rates. Due to the inherent uncertainty of valuations of such investments, the fair values may differ from the values that would have been used had an active market existed. The Global Valuation Committee, or its delegate, employs various methods for calibrating valuation approaches for investments where an active market does not exist, including regular due diligence of the Fund’s pricing vendors, regular reviews of key inputs and assumptions, transactional back-testing or disposition analysis to compare unrealized gains and losses to realized gains and losses, reviews of missing or stale prices and large movements in market values and reviews of any market related activity. The pricing of all Fair Valued Investments is subsequently reported to the Board or a committee thereof on a quarterly basis.
| | | | | | |
| 24 | | BLACKROCK VARIABLE SERIES FUNDS, INC. | | JUNE 30, 2016 | | |
| | | | |
| Notes to Financial Statements (continued) | | | BlackRock U.S. Government Bond V.I. Fund | |
Fair Value Hierarchy: Various inputs are used in determining the fair value of investments and derivative financial instruments. These inputs to valuation techniques are categorized into a fair value hierarchy consisting of three broad levels for financial statement purposes as follows:
| • | | Level 1 – unadjusted price quotations in active markets/exchanges for identical assets or liabilities that the Fund has the ability to access |
| • | | Level 2 – other observable inputs (including, but not limited to, quoted prices for similar assets or liabilities in markets that are active, quoted prices for identical or similar assets or liabilities in markets that are not active, inputs other than quoted prices that are observable for the assets or liabilities (such as interest rates, yield curves, volatilities, prepayment speeds, loss severities, credit risks and default rates) or other market–corroborated inputs) |
| • | | Level 3 – unobservable inputs based on the best information available in the circumstances, to the extent observable inputs are not available (including the Fund’s own assumptions used in determining the fair value of investments and derivative financial instruments) |
The hierarchy gives the highest priority to unadjusted quoted prices in active markets for identical assets or liabilities (Level 1 measurements) and the lowest priority to unobservable inputs (Level 3 measurements). Accordingly, the degree of judgment exercised in determining fair value is greatest for instruments categorized in Level 3. The inputs used to measure fair value may fall into different levels of the fair value hierarchy. In such cases, for disclosure purposes, the fair value hierarchy classification is determined based on the lowest level input that is significant to the fair value measurement in its entirety. The significant unobservable inputs used by the Global Valuation Committee in determining the price for Fair Valued Investments are typically categorized as Level 3. The fair value hierarchy for the Fund’s investments and derivative financial instruments have been included in the Schedule of Investments.
Changes in valuation techniques may result in transfers into or out of an assigned level within the hierarchy. In accordance with the Fund’s policy, transfers between different levels of the fair value hierarchy are deemed to have occurred as of the beginning of the reporting period. The categorization of a value determined for investments and derivative financial instruments is based on the pricing transparency of the investments and derivative financial instruments and is not necessarily an indication of the risks associated with investing in those securities.
4. Securities and Other Investments:
Asset-Backed and Mortgage-Backed Securities: Asset-backed securities are generally issued as pass-through certificates or as debt instruments. Asset-backed securities issued as pass-through certificates represent undivided fractional ownership interests in an underlying pool of assets. Asset-backed securities issued as debt instruments, which are also known as collateralized obligations, are typically issued as the debt of a special purpose entity organized solely for the purpose of owning such assets and issuing such debt. Asset-backed securities are often backed by a pool of assets representing the obligations of a number of different parties. The yield characteristics of certain asset-backed securities may differ from traditional debt securities. One such major difference is that all or a principal part of the obligations may be prepaid at any time because the underlying assets (i.e., loans) may be prepaid at any time. As a result, a decrease in interest rates in the market may result in increases in the level of prepayments as borrowers, particularly mortgagors, refinance and repay their loans. An increased prepayment rate with respect to an asset-backed security will have the effect of shortening the maturity of the security. In addition, the Fund may subsequently have to reinvest the proceeds at lower interest rates. If the Fund has purchased such an asset-backed security at a premium, a faster than anticipated prepayment rate could result in a loss of principal to the extent of the premium paid.
For mortgage pass-through securities (the “Mortgage Assets”) there are a number of important differences among the agencies and instrumentalities of the U.S. Government that issue mortgage-related securities and among the securities that they issue. For example, mortgage-related securities guaranteed by Ginnie Mae are guaranteed as to the timely payment of principal and interest by Ginnie Mae and such guarantee is backed by the full faith and credit of the United States. However, mortgage-related securities issued by Freddie Mac and Fannie Mae, including Freddie Mac and Fannie Mae guaranteed mortgage pass-through certificates, which are solely the obligations of Freddie Mac and Fannie Mae, are not backed by or entitled to the full faith and credit of the United States, but are supported by the right of the issuer to borrow from the U.S. Treasury.
Non-agency mortgage-backed securities are securities issued by non-governmental issuers and have no direct or indirect government guarantees of payment and are subject to various risks. Non-agency mortgage loans are obligations of the borrowers thereunder only and are not typically insured or guaranteed by any other person or entity. The ability of a borrower to repay a loan is dependent upon the income or assets of the borrower. A number of factors, including a general economic downturn, acts of God, terrorism, social unrest and civil disturbances, may impair a borrower’s ability to repay its loans.
Inflation-Indexed Bonds: Inflation-indexed bonds (other than municipal inflation-indexed and certain corporate inflation-indexed bonds) are fixed income securities whose principal value is periodically adjusted according to the rate of inflation. If the index measuring inflation rises or falls, the principal value of inflation-indexed bonds (other than municipal inflation-indexed and certain corporate inflation-indexed bonds) will be adjusted upward or downward, and consequently the interest payable on these securities (calculated with respect to a larger or smaller principal amount) will be increased or reduced, respectively. Any upward or downward adjustment in the principal amount of an inflation-indexed bond will be included as interest income in the Statement of Operations, even though investors do not receive their principal until maturity. Repayment of the original bond principal
| | | | | | |
| | | BLACKROCK VARIABLE SERIES FUNDS, INC. | | JUNE 30, 2016 | | 25 |
| | | | |
| Notes to Financial Statements (continued) | | | BlackRock U.S. Government Bond V.I. Fund | |
upon maturity (as adjusted for inflation) is guaranteed in the case of U.S. Treasury inflation-indexed bonds. For bonds that do not provide a similar guarantee, the adjusted principal value of the bond repaid at maturity may be less than the original principal. With regard to municipal inflation-indexed bonds and certain corporate inflation-indexed bonds, the inflation adjustment is typically reflected in the semi-annual coupon payment. As a result, the principal value of municipal inflation-indexed bonds and such corporate inflation-indexed bonds does not adjust according to the rate of inflation.
Multiple Class Pass-Through Securities: Multiple class pass-through securities, including collateralized mortgage obligations (“CMOs”) and commercial mortgage-backed securities, may be issued by Ginnie Mae, U.S. Government agencies or instrumentalities or by trusts formed by private originators of, or investors in, mortgage loans. In general, CMOs are debt obligations of a legal entity that are collateralized by a pool of residential or commercial mortgage loans or Mortgage Assets. The payments on these are used to make payments on the CMOs or multiple pass-through securities. Multiple class pass-through securities represent direct ownership interests in the Mortgage Assets. Classes of CMOs include interest only (“IOs”), principal only (“POs”), planned amortization classes and targeted amortization classes. IOs and POs are stripped mortgage-backed securities representing interests in a pool of mortgages, the cash flow from which has been separated into interest and principal components. IOs receive the interest portion of the cash flow while POs receive the principal portion. IOs and POs can be extremely volatile in response to changes in interest rates. As interest rates rise and fall, the value of IOs tends to move in the same direction as interest rates. POs perform best when prepayments on the underlying mortgages rise since this increases the rate at which the principal is returned and the yield to maturity on the PO. When payments on mortgages underlying a PO are slower than anticipated, the life of the PO is lengthened and the yield to maturity is reduced. If the underlying Mortgage Assets experience greater than anticipated prepayments of principal, the Fund’s initial investment in the IOs may not fully recoup.
Stripped Mortgage-Backed Securities: Stripped mortgage-backed securities are typically issued by the U.S. Government, its agencies and instrumentalities. Stripped mortgage-backed securities are usually structured with two classes that receive different proportions of the interest (IOs) and principal (POs) distributions on a pool of Mortgage Assets. Stripped mortgage-backed securities may be privately issued.
Zero-Coupon Bonds: Zero-coupon bonds are normally issued at a significant discount from face value and do not provide for periodic interest payments. These bonds may experience greater volatility in market value than other debt obligations of similar maturity which provide for regular interest payments.
TBA Commitments: TBA commitments are forward agreements for the purchase or sale of mortgage-backed securities for a fixed price, with payment and delivery on an agreed upon future settlement date. The specific securities to be delivered are not identified at the trade date. However, delivered securities must meet specified terms, including issuer, rate and mortgage terms. When entering into TBA commitments, the Fund may take possession of or deliver the underlying mortgage-backed securities but can extend the settlement or roll the transaction. TBA commitments involve a risk of loss if the value of the security to be purchased or sold declines or increases, respectively, prior to settlement date.
In order to better define contractual rights and to secure rights that will help the Fund mitigate its counterparty risk, TBA commitments may be entered into by the Fund under Master Securities Forward Transaction Agreements (each, an “MSFTA”). An MSFTA typically contains, among other things, collateral posting terms and netting provisions in the event of default and/or termination event. The collateral requirements are typically calculated by netting the mark-to-market amount for each transaction under such agreement and comparing that amount to the value of the collateral currently pledged by the Fund and the counterparty. Cash collateral that has been pledged to cover the obligations of the Fund and cash collateral received from the counterparty, if any, is reported separately on the Statement of Assets and Liabilities as cash pledged as collateral for TBA commitments or cash received as collateral for TBA commitments, respectively. Non-cash collateral pledged by the Fund, if any, is noted in the Schedule of Investments. Typically, the Fund is permitted to sell, repledge or use the collateral it receives; however, the counterparty is not permitted to do so. To the extent amounts due to the Fund are not fully collateralized, contractually or otherwise, the Fund bears the risk of loss from counterparty non-performance.
Mortgage Dollar Roll Transactions: The Fund may sell TBA mortgage-backed securities and simultaneously contract to repurchase substantially similar (i.e., same type, coupon and maturity) securities on a specific future date at an agreed upon price. During the period between the sale and repurchase, the Fund is not entitled to receive interest and principal payments on the securities sold. Mortgage dollar roll transactions are treated as purchases and sales and realizes gains and losses on these transactions. Mortgage dollar rolls involve the risk that the market value of the securities that the Fund is required to purchase may decline below the agreed upon repurchase price of those securities.
Borrowed Bond Agreements: Repurchase agreements may be referred to as borrowed bond agreements when entered into in connection with short sales of bonds. In a borrowed bond agreement, the Fund borrows a bond from a counterparty in exchange for cash collateral. The agreement contains a commitment that the security and the cash will be returned to the counterparty and the Fund at a mutually agreed upon date. Certain agreements have no stated maturity and can be terminated by either party at any time. Earnings on cash collateral and compensation to the lender of the bond are based on agreed upon rates between the Fund and the counterparty. The value of the underlying cash collateral approximates the market value and accrued interest of the borrowed bond. To the extent that a borrowed bond transaction exceeds one business day, the value of the cash collateral in the possession of the counterparty is monitored on a daily basis to ensure the adequacy of the collateral. As the market value of the borrowed bond changes, the cash collateral is periodically increased or decreased with a frequency and in amounts prescribed in the borrowed bond agreement. The Fund may also experience delays in gaining access to the collateral.
| | | | | | |
| 26 | | BLACKROCK VARIABLE SERIES FUNDS, INC. | | JUNE 30, 2016 | | |
| | | | |
| Notes to Financial Statements (continued) | | | BlackRock U.S. Government Bond V.I. Fund | |
Reverse Repurchase Agreements: Reverse repurchase agreements are agreements with qualified third party broker-dealers in which the Fund sells securities to a bank or broker-dealer and agrees to repurchase the same securities at a mutually agreed upon date and price. The Fund receives cash from the sale to use for other investment purposes. During the term of the reverse repurchase agreement, the Fund continues to receive the principal and interest payments on the securities sold. Certain agreements have no stated maturity and can be terminated by either party at any time. Interest on the value of the reverse repurchase agreements issued and outstanding is based upon competitive market rates determined at the time of issuance. The Fund may utilize reverse repurchase agreements when it is anticipated that the interest income to be earned from the investment of the proceeds of the transaction is greater than the interest expense of the transaction. Reverse repurchase agreements involve leverage risk. If the Fund suffers a loss on its investment of the transaction proceeds from a reverse repurchase agreement, the Fund would still be required to pay the full repurchase price. Further, the Fund remains subject to the risk that the market value of the securities repurchased declines below the repurchase price. In such cases, the Fund would be required to return a portion of the cash received from the transaction or provide additional securities to the counterparty.
Cash received in exchange for securities delivered plus accrued interest due to the counterparty is recorded as a liability in the Statement of Assets and Liabilities at face value including accrued interest. Due to the short-term nature of the reverse repurchase agreements, face value approximates fair value. Interest payments made by the Fund to the counterparties are recorded as a component of interest expense in the Statement of Operations. In periods of increased demand for the security, the Fund may receive a fee for use of the security by the counterparty, which may result in interest income to the Fund.
For the six months ended June 30, 2016, the average amount of reverse repurchase agreements outstanding and the daily weighted average interest rate for the Fund were $15,927,557 and 0.31%, respectively.
Borrowed bond agreements and reverse repurchase transactions are entered into by the Fund under Master Repurchase Agreements (each, an “MRA”), which permit the Fund, under certain circumstances, including an event of default (such as bankruptcy or insolvency), to offset payables and/or receivables under the MRA with collateral held and/or posted to the counterparty and create one single net payment due to or from the Fund. With reverse repurchase transactions, typically the Fund and the counterparty under the MRA are permitted to sell, re-pledge, or use the collateral associated with the transaction. Bankruptcy or insolvency laws of a particular jurisdiction may impose restrictions on or prohibitions against such a right of offset in the event of the MRA counterparty’s bankruptcy or insolvency. Pursuant to the terms of the MRA, the Fund receives or posts securities as collateral with a market value in excess of the repurchase price to be paid or received by the Fund upon the maturity of the transaction. Upon a bankruptcy or insolvency of the MRA counterparty, the Fund is considered an unsecured creditor with respect to excess collateral and, as such, the return of excess collateral may be delayed.
As of period end, the following table is a summary of the Fund’s open borrowed bond agreements and reverse repurchase agreements by counterparty which are subject to offset under an MRA on a net basis:
| | | | | | | | | | | | | | | | |
| Counterparty | | Borrowed Bond Agreements1 | | Reverse Repurchase Agreements | | Borrowed Bonds at Value Including Accrued Interest2 | | Net Amount before Collateral | | Cash Collateral Received | | Non-cash Collateral Pledged | | Net Collateral (Received)/ Pledged3 | | Net Exposure Due (to)/from Counterparty4 |
BNP Paribas Securities Corp. | | $1,003,190 | | $(4,729,255) | | $(1,016,206) | | $(4,742,271) | | $(263,004) | | $5,005,275 | | $4,742,271 | | — |
J.P. Morgan Securities LLC | | 21,315 | | — | | (21,301) | | 14 | | — | | — | | — | | $14 |
| | |
Total | | $1,024,505 | | $(4,729,255) | | $(1,037,507) | | $(4,742,257) | | $(263,004) | | $5,005,275 | | $4,742,271 | | $14 |
| | |
| | 1 | | Included in Investments at value-unaffiliated in the Statement of Assets and Liabilities. |
| | 2 | | Includes accrued interest on borrowed bonds in the amount of $4,380 which is shown as interest expense payable in the Statement of Assets and Liabilities. |
| | 3 | | Net collateral with a value of $4,727,275 has been pledged/received in connection with open reverse repurchase agreements. Excess of net collateral pledged to the individual counterparty is not shown for financial reporting purposes. |
| | 4 | | Net exposure represents the net receivable (payable) that would be due from/to the counterparty in the event of default. |
In the event the counterparty of securities under an MRA files for bankruptcy or becomes insolvent, the Fund’s use of the proceeds from the agreement may be restricted while the counterparty, or its trustee or receiver, determines whether or not to enforce the Fund’s obligation to repurchase the securities.
5. Derivative Financial Instruments:
The Fund engages in various portfolio investment strategies using derivative contracts both to increase the returns of the Fund and/or to manage its exposure to certain risks such as credit risk, equity risk, interest rate risk, foreign currency exchange rate risk, commodity price risk or other risks (e.g., inflation risk). Derivative financial instruments categorized by risk exposure are included in the Schedule of Investments. These contracts may be transacted on an exchange or OTC.
| | | | | | |
| | | BLACKROCK VARIABLE SERIES FUNDS, INC. | | JUNE 30, 2016 | | 27 |
| | | | |
| Notes to Financial Statements (continued) | | | BlackRock U.S. Government Bond V.I. Fund | |
Futures Contracts: The Fund invests in long and/or short positions in futures and options on futures contracts to gain exposure to, or manage exposure to changes in interest rates (interest rate risk), changes in the value of equity securities (equity risk) or foreign currencies (foreign currency exchange rate risk).
Futures contracts are agreements between the Fund and a counterparty to buy or sell a specific quantity of an underlying instrument at a specified price and on a specified date. Depending on the terms of a contract, it is settled either through physical delivery of the underlying instrument on the settlement date or by payment of a cash amount on the settlement date. Upon entering into a futures contract, the Fund is required to deposit initial margin with the broker in the form of cash or securities in an amount that varies depending on a contract’s size and risk profile. The initial margin deposit must then be maintained at an established level over the life of the contract.
Securities deposited as initial margin are designated in the Schedule of Investments and cash deposited, if any, is shown as cash pledged for futures contracts in the Statement of Assets and Liabilities. Pursuant to the contract, the Fund agrees to receive from or pay to the broker an amount of cash equal to the daily fluctuation in market value of the contract (“variation margin”). Variation margin is recorded as unrealized appreciation (depreciation) and, if any, shown as variation margin receivable (or payable) on futures contracts in the Statement of Assets and Liabilities. When the contract is closed, a realized gain or loss is recorded in the Statement of Operations equal to the difference between the value of the contract at the time it was opened and the value at the time it was closed. The use of futures contracts involves the risk of an imperfect correlation in the movements in the price of futures contracts and interest, foreign currency exchange rates or underlying assets.
Forward Foreign Currency Exchange Contracts: The Fund enters into forward foreign currency exchange contracts to gain or reduce exposure, to foreign currencies (foreign currency exchange rate risk).
A forward foreign currency exchange contract is an agreement between two parties to buy and sell a currency at a set exchange rate on a specified date. These contracts help to manage the overall exposure to the currencies in which some of the investments held by the Fund are denominated and in some cases, may be used to obtain exposure to a particular market.
The contract is marked to market daily and the change in market value is recorded as unrealized appreciation (depreciation) in the Statement of Assets and Liabilities. When a contract is closed, a realized gain or loss is recorded in the Statement of Operations equal to the difference between the value at the time it was opened and the value at the time it was closed. Non-deliverable forward foreign currency exchange contracts are settled with the counterparty in cash without the delivery of foreign currency. The use of forward foreign currency exchange contracts involves the risk that the value of a forward foreign currency exchange contract changes unfavorably due to movements in the value of the referenced foreign currencies.
Options: The Fund purchases and writes call and put options to increase or decrease its exposure to the risks of underlying instruments, including equity risk, interest rate risk and/or commodity price risk and/or, in the case of options written, to generate gains from options premiums.
A call option gives the purchaser (holder) of the option the right (but not the obligation) to buy, and obligates the seller (writer) to sell (when the option is exercised) the underlying instrument at the exercise or strike price at any time or at a specified time during the option period. A put option gives the holder the right to sell and obligates the writer to buy the underlying instrument at the exercise or strike price at any time or at a specified time during the option period.
Premiums paid on options purchased and premiums received on options written, as well as the daily fluctuation in market value, are included in investments at value – unaffiliated and options written at value, respectively, in the Statement of Assets and Liabilities. When an instrument is purchased or sold through the exercise of an option, the premium is offset against the cost or proceeds of the underlying instrument. When an option expires, a realized gain or loss is recorded in the Statement of Operations to the extent of the premiums received or paid. When an option is closed or sold, a gain or loss is recorded in the Statement of Operations to the extent the cost of the closing transaction exceeds the premiums received or paid). When the Fund writes a call option, such option is typically “covered,” meaning that it holds the underlying instrument subject to being called by the option counterparty. When the Fund writes a put option, such option is covered by cash in an amount sufficient to cover the obligation.
| • | | Swaptions — The Fund purchases and writes options on swaps (“swaptions”) primarily to preserve a return or spread on a particular investment or portion of the Fund’s holdings, as a duration management technique or to protect against an increase in the price of securities it anticipates purchasing at a later date. The purchaser and writer of a swaption is buying or granting the right to enter into a previously agreed upon interest rate or credit default swap agreement (interest rate risk and/or credit risk) at any time before the expiration of the option. |
| • | | Foreign Currency options — The Fund purchases and writes foreign currency options, foreign currency futures and options on foreign currency futures to gain or reduce exposure to foreign currencies (foreign currency exchange rate risk). Foreign currency options give the purchaser the right to buy from or sell to the writer a foreign currency at any time before the expiration of the option. |
| | | | | | |
| 28 | | BLACKROCK VARIABLE SERIES FUNDS, INC. | | JUNE 30, 2016 | | |
| | | | |
| Notes to Financial Statements (continued) | | | BlackRock U.S. Government Bond V.I. Fund | |
In purchasing and writing options, the Fund bears the risk of an unfavorable change in the value of the underlying instrument or the risk that they may not be able to enter into a closing transaction due to an illiquid market. Exercise of a written option could result in the Fund purchasing or selling a security when it otherwise would not, or at a price different from the current market value.
Swaps: The Fund enters into swap contracts to manage exposure to issuers, markets and securities. Such contracts are agreements between the Fund and a counterparty to make periodic net payments on a specified notional amount or a net payment upon termination. Swap agreements are privately negotiated in the OTC market and may be entered into as a bilateral contract (“OTC swaps”) or centrally cleared (“centrally cleared swaps”).
For OTC swaps, any upfront premiums paid and any upfront fees received are shown as swap premiums paid and swap premiums received, respectively, in the Statement of Assets and Liabilities and amortized over the term of the contract. The daily fluctuation in market value is recorded as unrealized appreciation (depreciation) on OTC Swaps in the Statement of Assets and Liabilities. Payments received or paid are recorded in the Statement of Operations as realized gains or losses, respectively. When an OTC swap is terminated, a realized gain or loss is recorded in the Statement of Operations equal to the difference between the proceeds from (or cost of) the closing transaction and the Fund’s basis in the contract, if any. Generally, the basis of the contract is the premium received or paid.
In a centrally cleared swap, immediately following execution of the swap contract, the swap contract is novated to a central counterparty (the “CCP”) and the Fund’s counterparty on the swap agreement becomes the CCP. The Fund is required to interface with the CCP through the broker. Upon entering into a centrally cleared swap, the Fund is required to deposit initial margin with the broker in the form of cash or securities in an amount that varies depending on the size and risk profile of the particular swap. Securities deposited as initial margin are designated in the Schedule of Investments and cash deposited is shown as cash pledged for centrally cleared swaps in the Statement of Assets and Liabilities. Pursuant to the contract, the Fund agrees to receive from or pay to the broker an amount of cash equal to the daily fluctuation in market value of the contract (“variation margin”). Variation margin is recorded as unrealized appreciation (depreciation) and shown as variation margin receivable (or payable) on centrally cleared swaps in the Statement of Assets and Liabilities. Payments received from (paid to) the counterparty, including at termination, are recorded as realized gains (losses) in the Statement of Operations.
| • | | Credit default swaps — The Fund enters into credit default swaps to manage its exposure to the market or certain sectors of the market, to reduce their risk exposure to defaults of corporate and/or sovereign issuers or to create exposure to corporate and/or sovereign issuers to which it is not otherwise exposed (credit risk). |
The Fund may either buy or sell (write) credit default swaps on single-name issuers (corporate or sovereign), a combination or basket of single-name issuers or traded indexes. Credit default swaps are agreements in which the protection buyer pays fixed periodic payments to the seller in consideration for a promise from the protection seller to make a specific payment should a negative credit event take place with respect to the referenced entity (e.g., bankruptcy, failure to pay, obligation acceleration, repudiation, moratorium or restructuring). As a buyer, if an underlying credit event occurs, the Fund will either (i) receive from the seller an amount equal to the notional amount of the swap and deliver the referenced security or underlying securities comprising the index, or (ii) receive a net settlement of cash equal to the notional amount of the swap less the recovery value of the security or underlying securities comprising the index. As a seller (writer), if an underlying credit event occurs, the Fund will either pay the buyer an amount equal to the notional amount of the swap and take delivery of the referenced security or underlying securities comprising the index or pay a net settlement of cash equal to the notional amount of the swap less the recovery value of the security or underlying securities comprising the index.
| • | | Total return swaps — The Fund enters into total return swaps to obtain exposure to a security or market without owning such security or investing directly in such market or to exchange the risk/return of one market (e.g., fixed income) with another market (e.g., equity or commodity prices) (equity risk, commodity price risk and/or interest rate risk). |
Total return swaps are agreements in which there is an exchange of cash flows whereby one party commits to make payments based on the total return (distributions plus capital gains/losses) of an underlying instrument in exchange for fixed or floating rate interest payments. If the total return of the instrument or index underlying the transaction exceeds or falls short of the offsetting fixed or floating interest rate obligation, the Fund receives payment from or makes a payment to the counterparty.
| • | | Interest rate swaps — The Fund enters into interest rate swaps to gain or reduce exposure to interest rates or to manage duration, the yield curve or interest rate (interest rate risk). |
Interest rate swaps are agreements in which one party pays a stream of interest payments, either fixed or floating, in exchange for another party’s stream of interest payments, either fixed or floating, on the same notional amount for a specified period of time. In more complex interest rate swaps, the notional principal amount may decline (or amortize) over time.
| • | | Forward swaps — The Fund enters into forward interest rate swaps and forward total return swaps. In a forward swap, the Fund and the counterparty agree to make periodic net payments beginning on a specified date or a net payment at termination. |
| | | | | | |
| | | BLACKROCK VARIABLE SERIES FUNDS, INC. | | JUNE 30, 2016 | | 29 |
| | | | |
| Notes to Financial Statements (continued) | | | BlackRock U.S. Government Bond V.I. Fund | |
Swap transactions involve, to varying degrees, elements of interest rate, credit and market risk in excess of the amounts recognized in the Statement of Assets and Liabilities. Such risks involve the possibility that there will be no liquid market for these agreements, that the counterparty to the agreements may default on its obligation to perform or disagree as to the meaning of the contractual terms in the agreements, and that there may be unfavorable changes in interest rates and/or market values associated with these transactions.
Master Netting Arrangements: In order to define its contractual rights and to secure rights that will help it mitigate its counterparty risk, the Fund may enter into an International Swaps and Derivatives Association, Inc. Master Agreement (“ISDA Master Agreement”) or similar agreement with its counterparties. An ISDA Master Agreement is a bilateral agreement between the Fund and a counterparty that governs certain OTC derivatives and typically contains, among other things, collateral posting terms and netting provisions in the event of a default and/or termination event. Under an ISDA Master Agreement, the Fund may, under certain circumstances, offset with the counterparty certain derivative financial instruments’ payables and/or receivables with collateral held and/or posted and create one single net payment. The provisions of the ISDA Master Agreement typically permit a single net payment in the event of default including the bankruptcy or insolvency of the counterparty. Bankruptcy or insolvency laws of a particular jurisdiction may restrict or prohibit the right of offset in bankruptcy, insolvency or other events. In addition, certain ISDA Master Agreements allow counterparties to terminate derivative contracts prior to maturity in the event the Fund’s net assets decline by a stated percentage or the Fund fails to meet the terms of its ISDA Master Agreements. The result would cause the Fund to accelerate payment of any net liability owed to the counterparty.
Collateral Requirements: For derivatives traded under an ISDA Master Agreement, the collateral requirements are typically calculated by netting the mark-to-market amount for each transaction under such agreement and comparing that amount to the value of any collateral currently pledged by the Fund and the counterparty.
Cash collateral that has been pledged to cover obligations of the Fund and cash collateral received from the counterparty, if any, is reported separately on the Statement of Assets and Liabilities as cash pledged as collateral and cash received as collateral, respectively. Non-cash collateral pledged by the Fund, if any, is noted in the Schedule of Investments. Generally, the amount of collateral due from or to a counterparty is subject to a certain minimum transfer amount threshold before a transfer is required, which is determined at the close of business of the Fund. Any additional required collateral is delivered to/pledged by the Fund on the next business day. Typically, the counterparty is not permitted to sell, re-pledge or use cash and non-cash collateral it receives. The Fund generally agrees not to use non-cash collateral that it receives but may, absent default or certain other circumstances defined in the underlying ISDA Master Agreement, be permitted to use cash collateral received. In such cases, interest may be paid pursuant to the collateral arrangement with the counterparty. To the extent amounts due to the Fund from its counterparties are not fully collateralized, it bears the risk of loss from counterparty non-performance. Likewise, to the extent the Fund has delivered collateral to a counterparty and stands ready to perform under the terms of its agreement with such counterparty, it bears the risk of loss from a counterparty in the amount of the value of the collateral in the event the counterparty fails to return such collateral. Based on the terms of agreements, collateral may not be required for all derivative contracts.
For financial reporting purposes, the Fund does not offset derivative assets and derivative liabilities that are subject to netting arrangements, if any, in the Statement of Assets and Liabilities.
6. Investment Advisory Agreement and Other Transactions with Affiliates:
The PNC Financial Services Group, Inc. is the largest stockholder and an affiliate of BlackRock, Inc. (“BlackRock”) for 1940 Act purposes.
Investment Advisory
The Company, on behalf of the Fund, entered into an Investment Advisory Agreement with the Manager, the Fund’s investment advisor, an indirect, wholly owned subsidiary of BlackRock, to provide investment advisory and administration services. The Manager is responsible for the management of the Fund’s portfolio and provides the personnel, facilities, equipment and certain other services necessary to the operations of the Fund. For such services, the Fund pays the Manager a monthly fee which is determined by calculating a percentage of the Fund’s average daily net assets, plus the proceeds of any debt securities or outstanding borrowings used for leverage, based on the following annual rates:
| | | | | |
| Average Daily Net Assets | | Investment Advisory Fee |
First $1 Billion | | | | 0.50 | % |
$1 Billion — $3 Billion | | | | 0.47 | % |
$3 Billion — $5 Billion | | | | 0.45 | % |
$5 Billion — $10 Billion | | | | 0.44 | % |
Greater than $10 Billion | | | | 0.43 | % |
| | | | | | |
| 30 | | BLACKROCK VARIABLE SERIES FUNDS, INC. | | JUNE 30, 2016 | | |
| | | | |
| Notes to Financial Statements (continued) | | | BlackRock U.S. Government Bond V.I. Fund | |
Distribution Fees
The Company, on behalf of the Fund, entered into a Distribution Agreement and a Distribution Plan with BlackRock Investments, LLC (“BRIL”), an affiliate of the Manager. Pursuant to the Distribution Plan and in accordance with Rule 12b-1 under the 1940 Act, the Fund pays BRIL ongoing distribution fees. The fees are accrued daily and paid monthly at an annual rate of 0.25% based upon the average daily net assets attributable to Class III.
For the six months ended June 30, 2016, the class specific distribution fees borne directly by Class III is $6,334.
Transfer Agent
The Manager, on behalf of the Fund, entered into agreements with insurance companies and other financial intermediaries (“Service Organizations”), some of which may be affiliates. Pursuant to these agreements, the Service Organizations provide the Fund with administrative, networking, recordkeeping, sub-transfer agency and shareholder services to sub-accounts they service. For these services, the Service Organizations receive an annual fee per shareholder account, which will vary depending on share class and/or net assets of Fund shareholders serviced by the Service Organizations, which is shown as Transfer agent — class specific. For the six months ended June 30, 2016, the Fund paid the following amounts to affiliates in return for these services, which is included in transfer agent — class specific in the Statement of Operations:
| | | | |
| Class I | | Class III | | Total |
$82,390 | | $2,303 | | $84,693 |
In addition, the Fund pays the transfer agent, which is not an affiliate, a fee for issuance, transfer and redemption of shares and the opening and maintenance of shareholder accounts, which is included in transfer agent in the Statement of Operations.
Expense Limitations, Waivers and Reimbursements
The Manager, with respect to the Fund, contractually agreed to waive and/or reimburse fees or expenses in order to limit expenses, excluding interest expense, dividend expense, tax expense, acquired fund fees and expenses, and certain other fund expenses, which constitute extraordinary expenses not incurred in the ordinary course of the Fund’s business. The expense limitations as a percentage of average daily net assets are as follows:
| | | | |
Class I | | | 1.25 | % |
Class III | | | 1.50 | % |
The Manager has agreed not to reduce or discontinue this contractual expense limitation prior to May 1, 2017 unless approved by the Board, including a majority of the Independent Directors who are not “interested persons” of the Fund, as defined in the 1940 Act (“Independent Directors”) or by a majority of the outstanding voting securities of the Fund.
The Manager, with respect to the Fund, has agreed to voluntarily waive 0.10% of its investment advisory fee. Prior to June 15, 2016, the voluntary waiver was 0.03%. This voluntary waiver may be reduced or discontinued at any time without notice. For the six months ended June 30, 2016, the Manager waived $15,744, which is included in fees waived by the Manager in the Statement of Operations.
The Manager, with respect to the Fund, voluntarily agreed to waive its investment advisory fees by the amount of investment advisory fees the Fund pays to the Manager indirectly through its investment in affiliated money market funds. This amount is included in fees waived by the Manager in the Statement of Operations. However, the Manager does not waive its investment advisory fees by the amount of investment advisory fees paid in connection with the Fund’s investment in other affiliated investment companies, if any. For the six months ended June 30, 2016, the amount waived was $658.
The Manager has contractually agreed to reimburse transfer agent fees in order to limit such expenses as a percentage of average daily net assets as follows:
| | | | |
Class I | | | 0.00 | % |
Class III | | | 0.06 | % |
The Manager has agreed not to reduce or discontinue this contractual reimbursement prior to May 1, 2017 unless approved by the Board, including a majority of the Independent Directors or by a majority of the outstanding voting securities of the Fund.
These amounts waived and/or reimbursed are included in fees waived by the Manager, and shown as transfer agent fees reimbursed — class specific in the Statement of Operations. Class specific expense waivers and/or reimbursements are as follows:
| | | | | | |
| | | Class I | | Class III | | Total |
Transfer Agent Fees Reimbursed | | $82,390 | | $880 | | $83,270 |
| | | | | | |
| | | BLACKROCK VARIABLE SERIES FUNDS, INC. | | JUNE 30, 2016 | | 31 |
| | | | |
| Notes to Financial Statements (continued) | | | BlackRock U.S. Government Bond V.I. Fund | |
For the six months ended June 30, 2016, the Fund reimbursed the Manager $456 for certain accounting services, which is included in accounting services in the Statement of Operations.
Officers and Directors
Certain officers and/or directors of the Company are officers and/or directors of BlackRock or its affiliates. The Fund reimburses the Manager for a portion of the compensation paid to the Company’s Chief Compliance Officer, which is included in officer and directors in the Statement of Operations.
7. Purchases and Sales:
For the six months ended June 30, 2016, purchases and sales of investments, including paydowns and mortgage dollar rolls and excluding short-term securities, were as follows:
| | | | | | | | |
| | | Purchases | | | Sales | |
Non-U.S. Government Securities | | $ | 539,098,539 | | | $ | 585,149,134 | |
U.S. Government Securities | | $ | 72,807,917 | | | $ | 66,675,276 | |
For the six months ended June 30, 2016, purchases and sales related to mortgage dollar rolls were $205,499,901 and $205,533,312, respectively.
8. Income Tax Information:
It is the Fund’s policy to comply with the requirements of the Internal Revenue Code of 1986, as amended, applicable to regulated investment companies, and to distribute substantially all of its taxable income to its shareholders. Therefore, no federal income tax provision is required.
The Fund files U.S. federal and various state and local tax returns. No income tax returns are currently under examination. The statute of limitations on the Fund’s U.S. federal tax returns generally remains open for each of the four years ended December 31, 2015. The statutes of limitations on the Fund’s state and local tax returns may remain open for an additional year depending upon the jurisdiction.
Management has analyzed tax laws and regulations and their application to the Fund as of June 30, 2016, inclusive of the open tax return years, and does not believe there are any uncertain tax positions that require recognition of a tax liability in the Fund’s financial statements.
As of December 31, 2015, the Fund had a capital loss carryforward of $3,685,849 available to offset future realized capital gains. This amount is not subject to expiration.
As of June 30, 2016, gross unrealized appreciation and depreciation based on cost for federal income tax purposes were as follows:
| | | | |
Tax cost | | $ | 131,654,071 | |
| | | | |
Gross unrealized appreciation | | $ | 2,560,233 | |
Gross unrealized depreciation | | | (159,876 | ) |
| | | | |
Net unrealized appreciation | | $ | 2,400,357 | |
| | | | |
9. Bank Borrowings:
The Company, on behalf of the Fund, along with certain other funds managed by the Manager and its affiliates (“Participating Funds”), is a party to a 364-day, $2.1 billion credit agreement with a group of lenders. Under this agreement, the Fund may borrow to fund shareholder redemptions. Excluding commitments designated for certain individual funds, the Participating Funds, including the Fund, can borrow up to an aggregate commitment amount of $1.6 billion at any time outstanding, subject to asset coverage and other limitations as specified in the agreement. The credit agreement has the following terms: a fee of 0.12% per annum on unused commitment amounts and interest at a rate equal to the higher of (a) one-month LIBOR (but, in any event, not less than 0.00%) on the date the loan is made plus 0.80% per annum or (b) the Fed Funds rate (but, in any event, not less than 0.00%) in effect from time to time plus 0.80% per annum on amounts borrowed. The agreement expires in April 2017 unless extended or renewed. Prior to April 21, 2016, the credit agreement had a fee per annum of 0.06% on unused commitment amounts and interest at a rate equal to the higher of (a) one-month LIBOR (but, in any event, not less than 0.00%) on the date the loan is made plus 0.80% per annum or (b) the Fed Funds rate (but, in any event, not less than 0.00%) in effect from time to time plus 0.80% per annum on amounts borrowed. Participating Funds paid administration, legal and arrangement fees, which, if applicable, are included in miscellaneous expenses in the Statement of Operations. These fees were allocated among such funds based upon portions of the aggregate commitment available to them and relative net assets of Participating Funds. During the six months ended June 30, 2016, the Fund did not borrow under the credit agreement.
| | | | | | |
| 32 | | BLACKROCK VARIABLE SERIES FUNDS, INC. | | JUNE 30, 2016 | | |
| | | | |
| Notes to Financial Statements (continued) | | | BlackRock U.S. Government Bond V.I. Fund | |
10. Principal Risks:
In the normal course of business, the Fund invests in securities and enters into transactions where risks exist due to fluctuations in the market (market risk) or failure of the issuer to meet all its obligations, including the ability to pay principal and interest when due (issuer credit risk). The value of securities held by the Fund may decline in response to certain events, including those directly involving the issuers of securities owned by the Fund. Changes arising from the general economy; the overall market and local, regional or global political or/and social instability, as well as currency, interest rate and price fluctuations, may also affect the securities’ value.
The Fund may be exposed to prepayment risk, which is the risk that borrowers may exercise their option to prepay principal earlier than scheduled during periods of declining interest rates, which would force the Fund to reinvest in lower yielding securities. The Fund may also be exposed to reinvestment risk, which is the risk that income from the Fund’s portfolio will decline if the Fund invests the proceeds from matured, traded or called fixed income securities at market interest rates that are below the Fund portfolio’s current earnings rate.
Counterparty Credit Risk: Similar to issuer credit risk, the Fund may be exposed to counterparty credit risk, or the risk that an entity may fail to or be unable to perform on its commitments related to unsettled or open transactions. The Fund manages counterparty credit risk by entering into transactions only with counterparties that the Manager believes have the financial resources to honor their obligations and by monitoring the financial stability of those counterparties. Financial assets, which potentially exposes the Fund to market, issuer and counterparty credit risks, consist principally of financial instruments and receivables due from counterparties. The extent of the Fund’s exposure to market, issuer and counterparty credit risks with respect to these financial assets is approximately their value recorded in the Statement of Assets and Liabilities, less any collateral held by the Fund.
A derivative contract may suffer a mark-to-market loss if the value of the contract decreases due to an unfavorable change in the market rates or values of the underlying instrument. Losses can also occur if the counterparty does not perform under the contract.
The Fund’s risk of loss from counterparty credit risk on OTC derivatives is generally limited to the aggregate unrealized gain less the value of any collateral held by the Fund.
For OTC options purchased, the Fund bears the risk of loss of the amount in the premiums paid plus the positive change in market values net of any collateral held by the Fund should the counterparty fail to perform under the contracts. Options written by the Fund do not typically give rise to counterparty credit risk, as options written generally obligate the Fund, and not the counterparty, to perform. The Fund may be exposed to counterparty credit risk with respect to options written to the extent the Fund deposits collateral with its counterparty to a written option.
With exchange-traded options purchased, futures and centrally cleared swaps, there is less counterparty credit risk to the Fund since the exchange or clearinghouse, as counterparty to such instruments, guarantees against a possible default. The clearinghouse stands between the buyer and the seller of the contract; therefore, credit risk is limited to failure of the clearinghouse. While offset rights may exist under applicable law, the Fund does not have a contractual right of offset against a clearing broker or clearinghouse in the event of a default (including the bankruptcy or insolvency). Additionally, credit risk exists in exchange-traded futures and centrally cleared swaps with respect to initial and variation margin that is held in a clearing broker’s customer accounts. While clearing brokers are required to segregate customer margin from their own assets, in the event that a clearing broker becomes insolvent or goes into bankruptcy and at that time there is a shortfall in the aggregate amount of margin held by the clearing broker for all its clients, typically the shortfall would be allocated on a prorata basis across all the clearing broker’s customers, potentially resulting in losses to the Fund.
Concentration Risk: The Fund invests a significant portion of its assets in fixed-income securities and/or uses derivatives tied to the fixed-income markets. Changes in market interest rates or economic conditions, may affect the value and/or liquidity of such investments. Interest rate risk is the risk that prices of bonds and other fixed-income securities will increase as interest rates fall and decrease as interest rates rise. The Fund may be subject to a greater risk of rising interest rates due to the current period of historically low rates.
11. Capital Share Transactions:
Transactions in capital shares for each class were as follows:
| | | | | | | | | | | | | | | | | | | | |
Class I | | Six Months Ended
June 30, 2016 | | | | | | Year Ended
December 31, 2015 | |
| | Shares | | | Amount | | | | Shares | | | Amount | |
Shares sold | | | 181,568 | | | | $ 1,895,028 | | | | | | | | 446,716 | | | | $ 4,605,226 | |
Shares issued in reinvestment of distributions | | | 79,661 | | | | 826,412 | | | | | | | | 170,922 | | | | 1,774,199 | |
Shares redeemed | | | (622,574 | ) | | | (6,483,871) | | | | | | | | (1,451,715 | ) | | | (15,051,324) | |
| | | | | | | | | | | | |
Net decrease | | | (361,345 | ) | | | $(3,762,431) | | | | | | | | (834,077 | ) | | | $ (8,671,899) | |
| | | | | | | | | | | | |
| | | | | | |
| | | BLACKROCK VARIABLE SERIES FUNDS, INC. | | JUNE 30, 2016 | | 33 |
| | | | |
| Notes to Financial Statements (concluded) | | | BlackRock U.S. Government Bond V.I. Fund | |
| | | | | | | | | | | | | | | | | | | | |
Class III | | Six Months Ended
June 30, 2016 | | | | | | Year Ended
December 31, 2015 | |
| | Shares | | | Amount | | | | Shares | | | Amount | |
Shares sold | | | 578,064 | | | | $ 5,987,548 | | | | | | | | 453,676 | | | | $ 4,699,960 | |
Shares issued in reinvestment of distributions | | | 3,754 | | | | 38,980 | | | | | | | | 2,638 | | | | 27,289 | |
Shares redeemed | | | (191,535 | ) | | | (1,993,535) | | | | | | | | (343,153 | ) | | | (3,536,594) | |
| | | | | | | | | | | | |
Net increase | | | 390,283 | | | | $ 4,032,993 | | | | | | | | 113,161 | | | | $ 1,190,655 | |
| | | | | | | | | | | | |
Total Net Increase (Decrease) | | | 28,938 | | | | $ 270,562 | | | | | | | | (720,916 | ) | | | $(7,481,244) | |
| | | | | | | | | | | | |
At June 30, 2016, 1,963 Class III Shares of the Fund were owned by BlackRock HoldCo 2, Inc., an affiliate of the Fund.
12. Subsequent Events:
Management has evaluated the impact of all subsequent events on the Fund through the date the financial statements were issued and has determined that there were no subsequent events requiring adjustment or additional disclosure in the financial statements.
| | | | | | |
| 34 | | BLACKROCK VARIABLE SERIES FUNDS, INC. | | JUNE 30, 2016 | | |
JUNE 30, 2016
| | | | |
SEMI-ANNUAL REPORT (UNAUDITED) | | | | BLACKROCK® |
BlackRock Variable Series Funds, Inc.
▶ BlackRock Value Opportunities V.I. Fund
| | |
| Not FDIC Insured ¡ May Lose Value ¡ No Bank Guarantee | | |
| | | | |
| Fund Summary as of June 30, 2016 | | | BlackRock Value Opportunities V.I. Fund | |
BlackRock Value Opportunities V.I. Fund’s (the “Fund”) investment objective is to seek long-term growth of capital.
|
| Portfolio Management Commentary |
How did the Fund perform?
| • | | For the six-month period ended June 30, 2016, the Fund underperformed its benchmark, the Standard & Poor’s (“S&P”) SmallCap 600® Value Index. |
What factors influenced performance?
| • | | The Fund’s overweight in the underperforming health care sector, along with its stock selection in the group, was the most significant detractor from performance in the first half of 2016. The adverse impact of selection was most pronounced in the health care equipment & supplies and life sciences tools & services industries. Selection in industrials, particularly within the aerospace & defense subsector, also hurt results. Stock selection in the information technology sector, mostly within the communications equipment group, was a further detractor. |
| • | | The Fund’s overweight position in the energy sector, together with its stock selection in the energy equipment & services and oil, gas & consumable |
| | | fuels industries, made the largest contribution to performance. Security selection in the materials sector, especially the paper & forest products industry, was an additional contributor of note. |
Describe recent portfolio activity.
| • | | The Fund’s weightings in the consumer discretionary, energy, materials, and utilities sectors increased during the period. The Fund substantially reduced its allocation to financials and made smaller reductions in healthcare, consumer staples and industrials. |
Describe portfolio positioning at period end.
| • | | Relative to the S&P SmallCap 600® Value Index, the Fund ended the period with overweight positions in the health care, financials and information technology sectors, while it was underweight in consumer discretionary, industrials, materials, telecommunications services, utilities and consumer staples. |
The views expressed reflect the opinions of BlackRock as of the date of this report and are subject to change based on changes in market, economic or other conditions. These views are not intended to be a forecast of future events and are no guarantee of future results.
| | | | |
| Sector Allocation | | Percent of
Net Assets | |
Financials | | | 20 | % |
Industrials | | | 17 | |
Information Technology | | | 16 | |
Consumer Discretionary | | | 14 | |
Health Care | | | 8 | |
Utilities | | | 8 | |
Materials | | | 7 | |
Energy | | | 7 | |
Consumer Staples | | | 2 | |
Short-Term Securities | | | 19 | |
Liabilities in Excess of Other Assets | | | (18 | ) |
For Fund compliance purposes, the Fund’s classifications refer to one or more of the sector sub-classifications used by one or more widely recognized market indexes or rating group indexes, and/or as defined by the investment adviser. These definitions may not apply for purposes of this report, which may combine sector sub-classifications for reporting ease.
| | | | | | |
| 2 | | BLACKROCK VARIABLE SERIES FUNDS, INC. | | JUNE 30, 2016 | | |
| | |
| | | BlackRock Value Opportunities V.I. Fund |
|
| Total Return Based on a $10,000 Investment |
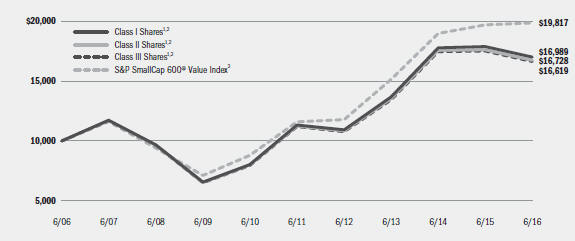
| | 1 | Assuming transaction costs, if any, and other operating expenses, including investment advisory fees. Does not include insurance-related fees and expenses. |
| | 2 | The Fund invests primarily in common stocks of small cap companies and emerging growth companies that the investment adviser believes have special investment value. |
| | 3 | An unmanaged index that is a subset of the S&P 600® Index that consists of those stocks in the S&P 600® Index exhibiting the strongest value characteristics. |
|
| Performance Summary for the Period Ended June 30, 2016 |
| | | | | | | | | | | | | | |
| | | | | Average Annual Total Returns | |
| | | 6-Month
Total Returns5 | | 1 Year5 | | | 5 Years5 | | | 10 Years5 | |
Class I4 | | 4.60% | | | (4.81 | )% | | | 8.46 | % | | | 5.44 | % |
Class II4 | | 4.53 | | | (4.98 | ) | | | 8.29 | | | | 5.28 | |
Class III4 | | 4.52 | | | (4.97 | ) | | | 8.26 | | | | 5.21 | |
S&P SmallCap 600® Value Index | | 8.76 | | | 0.72 | | | | 11.36 | | | | 7.08 | |
| | 4 | | Average annual and cumulative total returns are based on changes in net asset value for the periods shown, and assume reinvestment of all distributions at net asset value on the ex-dividend date. Insurance-related fees and expenses are not reflected in these returns. |
| | 5 | | For a portion of the period, the Fund’s investment adviser waived a portion of its fees. Without such waiver, the Fund’s performance would have been lower. |
| | | | Past performance is not indicative of future results. Performance results do not reflect the deduction of taxes that a shareholder would pay on Fund distributions or the redemption of Fund shares. |
| | | | | | | | | | | | | | |
| | | Actual | | Hypothetical7 | | |
| | | Beginning Account Value
January 1, 2016 | | Ending
Account Value
June 30, 2016 | | Expenses Paid
During the Period6 | | Beginning Account Value
January 1, 2016 | | Ending
Account Value
June 30, 2016 | | Expenses Paid
During the Period6 | | Annualized
Expense
Ratio |
Class I | | $1,000.00 | | $1,046.00 | | $4.63 | | $1,000.00 | | $1,020.34 | | $4.57 | | 0.91% |
Class II | | $1,000.00 | | $1,045.30 | | $5.49 | | $1,000.00 | | $1,019.49 | | $5.42 | | 1.08% |
Class III | | $1,000.00 | | $1,045.20 | | $5.59 | | $1,000.00 | | $1,019.39 | | $5.52 | | 1.10% |
| | 6 | | For each class of the Fund, expenses are equal to the annualized expense ratio for the class, multiplied by the average account value over the period, multiplied by 182/366 (to reflect the one-half year period shown). |
| | 7 | | Hypothetical 5% annual return before expenses is calculated by prorating the number of days in the most recent fiscal half year divided by 366. |
| | | | See “Disclosure of Expenses” on the following page for further information on how expenses were calculated. |
| | | | | | |
| | | BLACKROCK VARIABLE SERIES FUNDS, INC. | | JUNE 30, 2016 | | 3 |
| | | | |
| Disclosure of Expenses | | | BlackRock Value Opportunities V.I. Fund | |
Shareholders of the Fund may incur the following charges: (a) transactional expenses, such as sales charges; and (b) operating expenses, including investment advisory fees, service and distribution fees, including 12b-1 fees, acquired fund fees and expenses, and other fund expenses. The expense example on the previous page (which is based on a hypothetical investment of $1,000 invested on January 1, 2016 and held through June 30, 2016) is intended to assist shareholders both in calculating expenses based on an investment in the Fund and in comparing these expenses with similar costs of investing in other mutual funds.
The expense example provides information about actual account values and actual expenses. In order to estimate the expenses a shareholder paid during the period covered by this report, shareholders can divide their account value by $1,000 and then multiply the result by the number corresponding to their share class under the heading entitled “Expenses Paid During the Period.”
The expense example also provides information about hypothetical account values and hypothetical expenses based on the Fund’s actual expense ratio and an assumed rate of return of 5% per year before expenses. In order to assist shareholders in comparing the ongoing expenses of investing in the Fund and other funds, compare the 5% hypothetical example with the 5% hypothetical examples that appear in shareholder reports of other funds.
The expenses shown in the expense example are intended to highlight shareholders’ ongoing costs only and do not reflect any transactional expenses, such as sales charges, if any. Therefore, the hypothetical example is useful in comparing ongoing expenses only, and will not help shareholders determine the relative total expenses of owning different funds. If these transactional expenses were included, shareholder expenses would have been higher.
| | | | | | |
| 4 | | BLACKROCK VARIABLE SERIES FUNDS, INC. | | JUNE 30, 2016 | | |
| | | | |
| Schedule of Investments June 30, 2016 (Unaudited) | | | BlackRock Value Opportunities V.I. Fund | |
| | | (Percentages shown are based on Net Assets) | |
| | | | | | | | |
| Common Stocks | | Shares | | | Value | |
Aerospace & Defense — 3.8% | | | | | | | | |
Aerojet Rocketdyne Holdings, Inc. (a) | | | 119,900 | | | $ | 2,191,772 | |
American Science & Engineering, Inc. | | | 28,265 | | | | 1,057,394 | |
Cubic Corp. (b) | | | 57,700 | | | | 2,317,232 | |
KLX, Inc. (a) | | | 55,500 | | | | 1,720,500 | |
Triumph Group, Inc. (b) | | | 39,584 | | | | 1,405,232 | |
| | | | | | | | |
| | | | | | | | 8,692,130 | |
Air Freight & Logistics — 1.3% | | | | | | | | |
Forward Air Corp. | | | 35,100 | | | | 1,563,003 | |
Hub Group, Inc., Class A (a) | | | 35,125 | | | | 1,347,746 | |
| | | | | | | | |
| | | | | | | | 2,910,749 | |
Auto Components — 0.5% | | | | | | | | |
Dorman Products, Inc. (a)(b) | | | 18,127 | | | | 1,036,864 | |
Banks — 7.2% | | | | | | | | |
CenterState Banks, Inc. | | | 95,600 | | | | 1,505,700 | |
Green Bancorp, Inc. (a) | | | 106,013 | | | | 924,433 | |
IBERIABANK Corp. | | | 21,800 | | | | 1,302,114 | |
NBT Bancorp, Inc. | | | 62,700 | | | | 1,795,101 | |
OFG Bancorp | | | 158,000 | | | | 1,311,400 | |
Opus Bank | | | 58,687 | | | | 1,983,621 | |
Texas Capital Bancshares, Inc. (a) | | | 42,700 | | | | 1,996,652 | |
TriState Capital Holdings, Inc. (a) | | | 176,800 | | | | 2,427,464 | |
UMB Financial Corp. (b) | | | 61,700 | | | | 3,283,057 | |
| | | | | | | | |
| | | | | | | | 16,529,542 | |
Beverages — 0.6% | | | | | | | | |
Cott Corp. | | | 106,352 | | | | 1,484,674 | |
Biotechnology — 0.0% | | | | | | | | |
XOMA Corp. (a)(b) | | | 5,307 | | | | 2,926 | |
Building Products — 0.2% | | | | | | | | |
Continental Building Products, Inc. (a) | | | 24,600 | | | | 546,858 | |
Chemicals — 1.8% | | | | | | | | |
Kraton Performance Polymers, Inc. (a) | | | 63,577 | | | | 1,775,706 | |
Stepan Co. | | | 39,465 | | | | 2,349,351 | |
| | | | | | | | |
| | | | | | | | 4,125,057 | |
Commercial Services & Supplies — 2.5% | | | | | | | | |
ABM Industries, Inc. | | | 39,523 | | | | 1,441,799 | |
Essendant, Inc. | | | 61,813 | | | | 1,889,005 | |
Matthews International Corp., Class A (b) | | | 42,332 | | | | 2,355,352 | |
| | | | | | | | |
| | | | | | | | 5,686,156 | |
Communications Equipment — 2.1% | | | | | | | | |
ARRIS International PLC (a) | | | 35,740 | | | | 749,110 | |
Ciena Corp. (a)(b) | | | 87,700 | | | | 1,644,375 | |
NetScout Systems, Inc. (a)(b) | | | 75,300 | | | | 1,675,425 | |
Viavi Solutions, Inc. (a) | | | 112,454 | | | | 745,570 | |
| | | | | | | | |
| | | | | | | | 4,814,480 | |
Construction & Engineering — 1.0% | | | | | | | | |
EMCOR Group, Inc. | | | 34,200 | | | | 1,684,692 | |
KBR, Inc. | | | 53,000 | | | | 701,720 | |
| | | | | | | | |
| | | | | | | | 2,386,412 | |
Consumer Finance — 1.3% | | | | | | | | |
Cash America International, Inc. | | | 11,628 | | | | 495,585 | |
First Cash Financial Services, Inc. | | | 49,000 | | | | 2,515,170 | |
| | | | | | | | |
| | | | | | | | 3,010,755 | |
Diversified Consumer Services — 0.3% | | | | | | | | |
Regis Corp. (a)(b) | | | 63,640 | | | | 792,318 | |
Electric Utilities — 2.5% | | | | | | | | |
ALLETE, Inc. | | | 46,300 | | | | 2,992,369 | |
| | | | | | | | |
| Common Stocks | | Shares | | | Value | |
Electric Utilities (continued) | | | | | | | | |
El Paso Electric Co. | | | 58,500 | | | $ | 2,765,295 | |
| | | | | | | | |
| | | | | | | | 5,757,664 | |
Electronic Equipment, Instruments & Components — 3.1% | | | | | |
Anixter International, Inc. (a) | | | 19,300 | | | | 1,028,304 | |
FARO Technologies, Inc. (a) | | | 12,000 | | | | 405,960 | |
Itron, Inc. (a) | | | 59,400 | | | | 2,560,140 | |
MTS Systems Corp. | | | 28,400 | | | | 1,245,056 | |
OSI Systems, Inc. (a)(b) | | | 19,549 | | | | 1,136,383 | |
Sanmina Corp. (a) | | | 24,600 | | | | 659,526 | |
| | | | | | | | |
| | | | | | | | 7,035,369 | |
Energy Equipment & Services — 4.6% | | | | | | | | |
CARBO Ceramics, Inc. | | | 83,800 | | | | 1,097,780 | |
Dril-Quip, Inc. (a) | | | 23,500 | | | | 1,373,105 | |
Newpark Resources, Inc. (a) | | | 396,800 | | | | 2,297,472 | |
Patterson-UTI Energy, Inc. (b) | | | 95,000 | | | | 2,025,400 | |
Superior Energy Services, Inc. | | | 129,600 | | | | 2,385,936 | |
U.S. Silica Holdings, Inc. | | | 44,000 | | | | 1,516,680 | |
| | | | | | | | |
| | | | | | | | 10,696,373 | |
Food & Staples Retailing — 1.1% | | | | | | | | |
Smart & Final Stores, Inc. (a) | | | 61,300 | | | | 912,757 | |
SUPERVALU, Inc. (a)(b) | | | 352,815 | | | | 1,665,287 | |
| | | | | | | | |
| | | | | | | | 2,578,044 | |
Food Products — 0.5% | | | | | | | | |
Pinnacle Foods, Inc. | | | 24,943 | | | | 1,154,611 | |
Gas Utilities — 4.9% | | | | | | | | |
Northwest Natural Gas Co. | | | 31,900 | | | | 2,067,758 | |
South Jersey Industries, Inc. (b) | | | 109,800 | | | | 3,471,876 | |
Southwest Gas Corp. | | | 36,149 | | | | 2,845,288 | |
Spire, Inc. | | | 41,000 | | | | 2,904,440 | |
| | | | | | | | |
| | | | | | | | 11,289,362 | |
Health Care Equipment & Supplies — 5.1% | | | | | | | | |
Invacare Corp. (b) | | | 165,037 | | | | 2,001,899 | |
Merit Medical Systems, Inc. (a) | | | 156,500 | | | | 3,103,395 | |
NuVasive, Inc. (a) | | | 58,291 | | | | 3,481,138 | |
OraSure Technologies, Inc. (a) | | | 341,976 | | | | 2,021,078 | |
Tandem Diabetes Care, Inc. (a) | | | 151,135 | | | | 1,139,558 | |
| | | | | | | | |
| | | | | | | | 11,747,068 | |
Health Care Providers & Services — 2.6% | | | | | | | | |
Landauer, Inc. | | | 77,567 | | | | 3,192,658 | |
Owens & Minor, Inc. | | | 71,827 | | | | 2,684,893 | |
| | | | | | | | |
| | | | | | | | 5,877,551 | |
Hotels, Restaurants & Leisure — 3.0% | | | | | | | | |
Bloomin’ Brands, Inc. | | | 96,630 | | | | 1,726,778 | |
Bob Evans Farms, Inc. | | | 56,674 | | | | 2,150,778 | |
Interval Leisure Group, Inc. | | | 166,294 | | | | 2,644,075 | |
Papa John’s International, Inc. (b) | | | 7,034 | | | | 478,312 | |
| | | | | | | | |
| | | | | | | | 6,999,943 | |
Household Durables — 0.4% | | | | | | | | |
iRobot Corp. (a)(b) | | | 6,300 | | | | 221,004 | |
Taylor Morrison Home Corp., Class A (a) | | | 48,803 | | | | 724,237 | |
| | | | | | | | |
| | | | | | | | 945,241 | |
Insurance — 3.1% | | | | | | | | |
American Equity Investment Life Holding Co. | | | 33,000 | | | | 470,250 | |
Atlas Financial Holdings, Inc. (a) | | | 65,374 | | | | 1,125,740 | |
Heritage Insurance Holdings, Inc. (b) | | | 85,900 | | | | 1,028,223 | |
Maiden Holdings Ltd. | | | 98,400 | | | | 1,204,416 | |
See Notes to Financial Statements.
| | | | | | |
| | | BLACKROCK VARIABLE SERIES FUNDS, INC. | | JUNE 30, 2016 | | 5 |
| | | | |
| Schedule of Investments (continued) | | | BlackRock Value Opportunities V.I. Fund | |
| | | | |
| | | | | | | | |
| Common Stocks | | Shares | | | Value | |
Insurance (continued) | | | | | | | | |
ProAssurance Corp. | | | 33,700 | | | $ | 1,804,635 | |
Selective Insurance Group, Inc. | | | 40,400 | | | | 1,543,684 | |
| | | | | | | | |
| | | | | | | | 7,176,948 | |
Internet & Catalog Retail — 0.6% | | | | | | | | |
1-800-Flowers.com, Inc., Class A (a) | | | 155,793 | | | | 1,405,253 | |
Internet Software & Services — 0.6% | | | | | | | | |
comScore, Inc. (a) | | | 26,400 | | | | 630,432 | |
Rackspace Hosting, Inc. (a) | | | 35,700 | | | | 744,702 | |
| | | | | | | | |
| | | | | | | | 1,375,134 | |
IT Services — 1.9% | | | | | | | | |
CACI International, Inc., Class A (a) | | | 33,800 | | | | 3,055,858 | |
CSG Systems International, Inc. | | | 32,009 | | | | 1,290,283 | |
| | | | | | | | |
| | | | | | | | 4,346,141 | �� |
Life Sciences Tools & Services — 0.6% | | | | | | | | |
Pacific Biosciences of California, Inc. (a)(b) | | | 205,104 | | | | 1,442,907 | |
Machinery — 4.6% | | | | | | | | |
Actuant Corp., Class A (b) | | | 74,500 | | | | 1,684,445 | |
Albany International Corp., Class A | | | 39,900 | | | | 1,593,207 | |
Astec Industries, Inc. | | | 29,200 | | | | 1,639,580 | |
Chart Industries, Inc. (a)(b) | | | 72,104 | | | | 1,739,870 | |
Franklin Electric Co., Inc. | | | 51,800 | | | | 1,711,990 | |
Joy Global, Inc. (b) | | | 19,800 | | | | 418,572 | |
Kennametal, Inc. | | | 30,500 | | | | 674,355 | |
RBC Bearings, Inc. (a) | | | 14,700 | | | | 1,065,750 | |
| | | | | | | | |
| | | | | | | | 10,527,769 | |
Marine — 0.2% | | | | | | | | |
Scorpio Bulkers, Inc. (a)(b) | | | 191,500 | | | | 534,285 | |
Media — 1.3% | | | | | | | | |
Cable One, Inc. | | | 5,534 | | | | 2,830,143 | |
Carmike Cinemas, Inc. (a) | | | 3,632 | | | | 109,396 | |
| | | | | | | | |
| | | | | | | | 2,939,539 | |
Metals & Mining — 2.9% | | | | | | | | |
Haynes International, Inc. (b) | | | 80,147 | | | | 2,571,116 | |
Hecla Mining Co. (b) | | | 387,900 | | | | 1,978,290 | |
Materion Corp. (b) | | | 81,514 | | | | 2,018,287 | |
| | | | | | | | |
| | | | | | | | 6,567,693 | |
Multiline Retail — 0.6% | | | | | | | | |
Fred’s, Inc., Class A (b) | | | 91,473 | | | | 1,473,630 | |
Oil, Gas & Consumable Fuels — 2.1% | | | | | | | | |
Callon Petroleum Co. (a) | | | 126,800 | | | | 1,423,964 | |
Eclipse Resources Corp. (a)(b) | | | 319,400 | | | | 1,066,796 | |
Energen Corp. | | | 35,300 | | | | 1,701,813 | |
Whiting Petroleum Corp. (a)(b) | | | 70,900 | | | | 656,534 | |
| | | | | | | | |
| | | | | | | | 4,849,107 | |
Paper & Forest Products — 2.2% | | | | | | | | |
Clearwater Paper Corp. (a) | | | 36,200 | | | | 2,366,394 | |
PH Glatfelter Co. | | | 143,700 | | | | 2,810,772 | |
| | | | | | | | |
| | | | | | | | 5,177,166 | |
Professional Services — 1.0% | | | | | | | | |
Kforce, Inc. | | | 35,300 | | | | 596,217 | |
TriNet Group, Inc. (a) | | | 79,300 | | | | 1,648,647 | |
| | | | | | | | |
| | | | | | | | 2,244,864 | |
Real Estate Investment Trusts (REITs) — 5.1% | | | | | | | | |
Armada Hoffler Properties, Inc. | | | 77,844 | | | | 1,069,577 | |
Cedar Realty Trust, Inc. | | | 370,136 | | | | 2,750,110 | |
| | | | | | | | |
| Common Stocks | | Shares | | | Value | |
Real Estate Investment Trusts (REITs) (continued) | | | | | | | | |
CyrusOne, Inc. | | | 24,753 | | | $ | 1,377,752 | |
LTC Properties, Inc. (b) | | | 65,271 | | | | 3,376,469 | |
Pennsylvania Real Estate Investment Trust (b) | | | 152,979 | | | | 3,281,400 | |
| | | | | | | | |
| | | | | | | | 11,855,308 | |
Real Estate Management & Development — 1.2% | | | | | | | | |
Marcus & Millichap, Inc. (a) | | | 105,115 | | | | 2,670,972 | |
Road & Rail — 0.5% | | | | | | | | |
ArcBest Corp. | | | 69,220 | | | | 1,124,825 | |
Semiconductors & Semiconductor Equipment — 4.6% | | | | | | | | |
DSP Group, Inc. (a) | | | 82,967 | | | | 880,280 | |
Integrated Device Technology, Inc. (a) | | | 72,200 | | | | 1,453,386 | |
Kulicke & Soffa Industries, Inc. (a) | | | 151,200 | | | | 1,840,104 | |
Microsemi Corp. (a)(b) | | | 36,331 | | | | 1,187,297 | |
Rambus, Inc. (a)(b) | | | 120,400 | | | | 1,454,432 | |
Semtech Corp. (a) | | | 15,200 | | | | 362,672 | |
Ultratech, Inc. (a) | | | 89,800 | | | | 2,062,706 | |
Veeco Instruments, Inc. (a) | | | 77,000 | | | | 1,275,120 | |
| | | | | | | | |
| | | | | | | | 10,515,997 | |
Software — 3.3% | | | | | | | | |
Bottomline Technologies, Inc. (a) | | | 42,800 | | | | 921,484 | |
Mentor Graphics Corp. | | | 65,900 | | | | 1,401,034 | |
PTC, Inc. (a) | | | 47,100 | | | | 1,770,018 | |
Rovi Corp. (a)(b) | | | 53,000 | | | | 828,920 | |
Verint Systems, Inc. (a) | | | 49,400 | | | | 1,636,622 | |
Zynga, Inc., Class A (a) | | | 404,200 | | | | 1,006,458 | |
| | | | | | | | |
| | | | | | | | 7,564,536 | |
Specialty Retail — 4.0% | | | | | | | | |
Caleres, Inc. | | | 28,300 | | | | 685,143 | |
Children’s Place, Inc. (b) | | | 11,244 | | | | 901,544 | |
DSW, Inc., Class A (b) | | | 15,340 | | | | 324,901 | |
Five Below, Inc. (a)(b) | | | 35,500 | | | | 1,647,555 | |
Genesco, Inc. (a) | | | 1,388 | | | | 89,262 | |
GNC Holdings, Inc., Class A (b) | | | 49,200 | | | | 1,195,068 | |
Hibbett Sports, Inc. (a)(b) | | | 36,900 | | | | 1,283,751 | |
Murphy USA, Inc. (a) | | | 15,234 | | | | 1,129,753 | |
Party City Holdco, Inc. (a)(b) | | | 86,560 | | | | 1,204,050 | |
Penske Automotive Group, Inc. | | | 24,031 | | | | 756,015 | |
| | | | | | | | |
| | | | | | | | 9,217,042 | |
Technology Hardware, Storage & Peripherals — 0.4% | | | | | | | | |
Diebold, Inc. (b) | | | 36,300 | | | | 901,329 | |
Textiles, Apparel & Luxury Goods — 3.2% | | | | | | | | |
Deckers Outdoor Corp. (a) | | | 11,177 | | | | 642,901 | |
G-III Apparel Group Ltd. (a) | | | 40,554 | | | | 1,854,129 | |
Oxford Industries, Inc. | | | 22,900 | | | | 1,296,598 | |
Perry Ellis International, Inc. (a) | | | 22,400 | | | | 450,688 | |
Steven Madden Ltd. (a)(b) | | | 33,900 | | | | 1,158,702 | |
Wolverine World Wide, Inc. | | | 97,890 | | | | 1,989,125 | |
| | | | | | | | |
| | | | | | | | 7,392,143 | |
Thrifts & Mortgage Finance — 2.4% | | | | | | | | |
Essent Group Ltd. (a) | | | 73,700 | | | | 1,607,397 | |
HomeStreet, Inc. (a) | | | 64,000 | | | | 1,274,880 | |
Northwest Bancshares, Inc. (b) | | | 181,600 | | | | 2,693,128 | |
| | | | | | | | |
| | | | | | | | 5,575,405 | |
Trading Companies & Distributors — 2.1% | | | | | | | | |
Applied Industrial Technologies, Inc. | | | 55,100 | | | | 2,487,214 | |
DXP Enterprises, Inc. (a)(b) | | | 39,273 | | | | 586,346 | |
SiteOne Landscape Supply, Inc. (a)(b) | | | 29,605 | | | | 1,006,274 | |
See Notes to Financial Statements.
| | | | | | |
| 6 | | BLACKROCK VARIABLE SERIES FUNDS, INC. | | JUNE 30, 2016 | | |
| | | | |
| Schedule of Investments (concluded) | | | BlackRock Value Opportunities V.I. Fund | |
| | | | | | | | |
| Common Stocks | | Shares | | | Value | |
Trading Companies & Distributors (continued) | | | | | | | | |
WESCO International, Inc. (a) | | | 13,600 | | | $ | 700,264 | |
| | | | | | | | |
| | | | | | | | 4,780,098 | |
Total Common Stocks — 98.9% | | | | | | | 227,758,238 | |
| | | | | | | | |
| Warrants | | | | | | |
Biotechnology — 0.0% | | | | | | | | |
XOMA Corp. (Issued/exercisable 3/09/12, 0.50 Share for 1 Warrant, Expires 3/09/17, Strike Price $1.76) (a) | | | 47,650 | | | | — | |
Total Long-Term Investments (Cost — $212,036,411) — 98.9% | | | | 227,758,238 | |
| | | | | | | | |
| | | | | | | |
| | | | | | | | |
| Short-Term Securities | | Shares | | | Value | |
BlackRock Liquidity Funds, TempFund, Institutional Class, 0.40% (c)(d) | | | 1,384,471 | | | $ | 1,384,471 | |
| | | Beneficial
Interest (000) | | | | |
BlackRock Liquidity Series, LLC, Money Market Series, 0.59% (c)(d)(e) | | $ | 41,807 | | | | 41,807,289 | |
Total Short-Term Securities (Cost — $43,191,760) — 18.8% | | | | 43,191,760 | |
Total Investments (Cost — $255,228,171) — 117.7% | | | | 270,949,998 | |
Liabilities in Excess of Other Assets — (17.7)% | | | | (40,738,643 | ) |
| | | | | | | | |
Net Assets — 100.0% | | | | | | $ | 230,211,355 | |
| | | | | | | | |
|
| Notes to Schedule of Investments |
| (a) | Non-income producing security. |
| (b) | Security, or a portion of security, is on loan. |
| (c) | During the six months ended June 30, 2016, investments in issuers considered to be affiliates of the Fund for purposes of Section 2(a)(3) of the Investment Company Act of 1940, as amended, were as follows: |
| | | | | | | | | | | | | | | | | | | | | | | | |
| Affiliate | | Shares/Beneficial
Interest Held at
December 31, 2015 | | | Net Activity | | | Shares/Beneficial
Interest Held at
June 30, 2016 | | | | | | Value at
June 30, 2016 | | | Income | |
BlackRock Liquidity Funds, TempFund, Institutional Class | | | 1,410,711 | | | | (26,240 | ) | | | 1,384,471 | | | | | | | | $ 1,384,471 | | | $ | 3,400 | |
BlackRock Liquidity Series, LLC, Money Market Series | | | $24,589,615 | | | | $17,217,674 | | | | $41,807,289 | | | | | | | | 41,807,289 | | | | 71,089 | 1 |
Total | | | | | | | | | | | | | | | | | | | $43,191,760 | | | $ | 74,489 | |
| | | | | | | | | | | | | | | | |
| | 1 | | Represents securities lending income earned from the reinvestment of cash collateral from loaned securities, net of fees and collateral investment expenses, and other payments to and from borrowers of securities. |
| (d) | Current yield as of period end. |
| (e) | Security was purchased with the cash collateral from loaned securities. The Fund may withdraw up to 25% of its investment daily, although the manager of the BlackRock Liquidity Series, LLC, Money Market Series, in its sole discretion, may permit an investor to withdraw more than 25% on any one day. Securities loaned with a value of $590,241 have been sold and are pending settlement as of June 30, 2016. |
| • | | For Fund compliance purposes, the Fund’s industry classifications refer to one or more of the industry sub-classifications used by one or more widely recognized market indexes or rating group indexes, and/or as defined by the investment adviser. These definitions may not apply for purposes of this report, which may combine such industry sub-classifications for reporting ease. |
|
| Fair Value Hierarchy as of Period End |
Various inputs are used in determining the fair value investments. For information about the Fund’s policy regarding valuation of investments, refer to the Notes to Financial Statements.
The following table summarizes the Fund’s investments categorized in the disclosure hierarchy:
| | | | | | | | | | | | | | | | |
| | | Level 1 | | | Level 2 | | | Level 3 | | | Total | |
Assets: | | | | | | | | | | | | | | | | |
Investments: | | | | | | | | | | | | | | | | |
Long-Term Investments: | | | | | | | | | | | | | | | | |
Common Stocks1 | | $ | 227,758,238 | | | | — | | | | — | | | $ | 227,758,238 | |
Warrants1 | | | — | | | | — | | | | — | | | | — | |
Short-Term Securities | | | 1,384,471 | | | $ | 41,807,289 | | | | — | | | | 43,191,760 | |
| | | | |
Total | | $ | 229,142,709 | | | $ | 41,807,289 | | | | — | | | $ | 270,949,998 | |
| | | | |
| | 1 | | See above Schedule of Investments for values in each industry. |
The Fund may hold assets and/or liabilities in which the fair value approximates the carrying amount for financial statement purposes. As of period end, collateral on securities loaned at value of $41,807,289 is categorized as Level 2 within the disclosure hierarchy.
During the six months ended June 30, 2016, there were no transfers between levels.
See Notes to Financial Statements.
| | | | | | |
| | | BLACKROCK VARIABLE SERIES FUNDS, INC. | | JUNE 30, 2016 | | 7 |
| | | | |
| Statement of Assets and Liabilities | | | | |
| | | | |
| June 30, 2016 (Unaudited) | | BlackRock
Value Opportunities
V.I. Fund | |
| Assets | | | | |
Investments at value — unaffiliated (including securities loaned at value of $41,411,375) (cost — $212,036,411) | | $ | 227,758,238 | |
Investments at value — affiliated (cost — $43,191,760) | | | 43,191,760 | |
Receivables: | | | | |
Investments sold | | | 1,716,329 | |
Securities lending income — affiliated | | | 10,377 | |
Capital shares sold | | | 61,866 | |
Dividends — affiliated | | | 299 | |
Dividends — unaffiliated | | | 216,577 | |
From the Manager | | | 38,891 | |
Prepaid expenses | | | 523 | |
| | | | |
Total assets | | | 272,994,860 | |
| | | | |
| | | | |
| Liabilities | | | | |
Collateral on securities loaned at value | | | 41,807,289 | |
Payables: | | | | |
Investments purchased | | | 589,293 | |
Capital shares redeemed | | | 51,315 | |
Distribution fees | | | 1,656 | |
Investment advisory fees | | | 142,588 | |
Officer’s and Directors’ fees | | | 3,039 | |
Other accrued expenses | | | 187,046 | |
Other affiliates | | | 1,279 | |
| | | | |
Total liabilities | | | 42,783,505 | |
| | | | |
Net Assets | | $ | 230,211,355 | |
| | | | |
| | | | |
| Net Assets Consist of | | | | |
Paid-in capital | | | 219,648,857 | |
Undistributed net investment income | | | 171,326 | |
Accumulated net realized loss | | | (5,330,625 | ) |
Net unrealized appreciation (depreciation) | | | 15,721,797 | |
| | | | |
Net Assets | | $ | 230,211,355 | |
| | | | |
| | | | |
| Net Asset Value | | | | |
Class I — Based on net assets of $221,043,289 and 9,091,358 shares outstanding, 100 million shares authorized, $0.10 par value | | $ | 24.31 | |
| | | | |
Class II — Based on net assets of $3,053,311 and 125,894 shares outstanding, 100 million shares authorized, $0.10 par value | | $ | 24.25 | |
| | | | |
Class III — Based on net assets of $6,114,755 and 318,680 shares outstanding, 10 million shares authorized, $0.10 par value | | $ | 19.19 | |
| | | | |
See Notes to Financial Statements.
| | | | | | |
| 8 | | BLACKROCK VARIABLE SERIES FUNDS, INC. | | JUNE 30, 2016 | | |
| | | | |
| Six Months Ended June 30, 2016 (Unaudited) | | BlackRock
Value Opportunities
V.I. Fund | |
| | | | |
| Investment Income | | | | |
Dividends — affiliated | | $ | 3,400 | |
Dividends — unaffiliated | | | 1,096,564 | |
Securities lending — affiliated — net | | | 71,089 | |
Foreign taxes withheld | | | (2,673 | ) |
| | | | |
Total income | | | 1,168,380 | |
| | | | |
| | | | |
| Expenses | | | | |
Investment advisory | | | 823,433 | |
Transfer agent | | | 2,476 | |
Transfer agent — class specific | | | 200,290 | |
Professional | | | 26,850 | |
Accounting services | | | 26,353 | |
Custodian | | | 19,698 | |
Officer and Directors | | | 11,123 | |
Distribution — class specific | | | 9,530 | |
Printing | | | 7,687 | |
Miscellaneous | | | 7,650 | |
| | | | |
Total expenses | | | 1,135,090 | |
Less: | | | | |
Fees waived by the Manager | | | (620 | ) |
Transfer agent fees reimbursed — class specific | | | (124,688 | ) |
| | | | |
Total expenses after fees waived and reimbursed | | | 1,009,782 | |
| | | | |
Net investment income | | | 158,598 | |
| | | | |
| | | | |
| Realized and Unrealized Gain (Loss) | | | | |
Net realized loss from investments | | | (459,080 | ) |
Net change in unrealized appreciation (depreciation) on: | | | | |
Investments | | | 10,391,479 | |
Foreign currency translations | | | 50 | |
| | | | |
| | | 10,391,529 | |
| | | | |
Net realized and unrealized gain | | | 9,932,449 | |
| | | | |
Net Increase in Net Assets Resulting from Operations | | $ | 10,091,047 | |
| | | | |
See Notes to Financial Statements.
| | | | | | |
| | | BLACKROCK VARIABLE SERIES FUNDS, INC. | | JUNE 30, 2016 | | 9 |
| | | | |
| Statements of Changes in Net Assets | | | BlackRock Value Opportunities V.I. Fund | |
| | | | | | | | |
| Increase (Decrease) in Net Assets: | | Six Months
Ended June 30, 2016
(Unaudited) | | | Year Ended
December 31,
2015 | |
| | | | | | | | |
| Operations | | | | | | | | |
Net investment income | | $ | 158,598 | | | $ | 649,751 | |
Net realized gain (loss) | | | (459,080 | ) | | | 9,036,749 | |
Net change in unrealized appreciation (depreciation) | | | 10,391,529 | | | | (26,171,341 | ) |
| | | | |
Net increase (decrease) in net assets resulting from operations | | | 10,091,047 | | | | (16,484,841 | ) |
| | | | |
| | | | | | | | |
| Distributions to Shareholders1 | | | | | | | | |
From net investment income: | | | | | | | | |
Class I | | | — | | | | (651,545 | ) |
Class II | | | — | | | | (3,112 | ) |
Class III | | | — | | | | (9,719 | ) |
From net realized gain: | | | | | | | | |
Class I | | | — | | | | (17,292,816 | ) |
Class II | | | — | | | | (245,993 | ) |
Class III | | | — | | | | (610,854 | ) |
From return of capital: | | | | | | | | |
Class I | | | — | | | | (6,430 | ) |
Class II | | | — | | | | (93 | ) |
Class III | | | — | | | | (237 | ) |
| | | | |
Decrease in net assets resulting from distributions to shareholders | | | — | | | | (18,820,799 | ) |
| | | | |
| | | | | | | | |
| Capital Share Transactions | | | | | | | | |
Net decrease in net assets derived from capital share transactions | | | (9,832,059 | ) | | | (7,368,829 | ) |
| | | | |
| | | | | | | | |
| Net Assets | | | | | | | | |
Total increase (decrease) in net assets | | | 258,988 | | | | (42,674,469 | ) |
Beginning of period | | | 229,952,367 | | | | 272,626,836 | |
| | | | |
End of period | | $ | 230,211,355 | | | $ | 229,952,367 | |
| | | | |
Undistributed net investment income, end of period | | $ | 171,326 | | | $ | 12,728 | |
| | | | |
| | 1 | | Distributions for annual periods determined in accordance with federal income tax regulations. |
See Notes to Financial Statements.
| | | | | | |
| 10 | | BLACKROCK VARIABLE SERIES FUNDS, INC. | | JUNE 30, 2016 | | |
| | | | |
| Financial Highlights | | | BlackRock Value Opportunities V.I. Fund | |
| | | | | | | | | | | | | | | | | | | | | | | | |
| | | Class I | |
| | | Six Months
Ended
June 30, 2016
(Unaudited) | | | Year Ended December 31, | |
| | | | 2015 | | | 2014 | | | 2013 | | | 2012 | | | 2011 | |
| | | | | | | | | | | | | | | | | | | | | | | | |
| Per Share Operating Performance | | | | | | | | | | | | | | | | | | | | | | | | |
Net asset value, beginning of period | | $ | 23.24 | | | $ | 26.96 | | | $ | 27.48 | | | $ | 19.39 | | | $ | 17.16 | | | $ | 17.66 | |
| | | | |
Net investment income1 | | | 0.02 | | | | 0.07 | | | | 0.10 | | | | 0.09 | | | | 0.09 | | | | 0.07 | |
Net realized and unrealized gain (loss) | | | 1.05 | | | | (1.80 | ) | | | 1.35 | | | | 8.13 | | | | 2.23 | | | | (0.50 | ) |
| | | | |
Net increase (decrease) from investment operations | | | 1.07 | | | | (1.73 | ) | | | 1.45 | | | | 8.22 | | | | 2.32 | | | | (0.43 | ) |
| | | | |
Distributions:2 | | | | | | | | | | | | | | | | | | | | | | | | |
From net investment income | | | — | | | | (0.07 | ) | | | (0.08 | ) | | | (0.13 | ) | | | (0.09 | ) | | | (0.07 | ) |
From net realized gain | | | — | | | | (1.92 | ) | | | (1.89 | ) | | | — | | | | — | | | | — | |
From return of capital | | | — | | | | (0.00 | )3 | | | — | | | | — | | | | — | | | | — | |
| | | | |
Total distributions | | | — | | | | (1.99 | ) | | | (1.97 | ) | | | (0.13 | ) | | | (0.09 | ) | | | (0.07 | ) |
| | | | |
Net asset value, end of period | | $ | 24.31 | | | $ | 23.24 | | | $ | 26.96 | | | $ | 27.48 | | | $ | 19.39 | | | $ | 17.16 | |
| | | | |
| | | | | | | | | | | | | | | | | | | | | | | | |
| Total Return4 | | | | | | | | | | | | | | | | | | | | | | | | |
Based on net asset value | | | 4.60 | %5 | | | (6.61 | )% | | | 5.22 | % | | | 42.40 | % | | | 13.54 | % | | | (2.43 | )% |
| | | | |
| | | | | | | | | | | | | | | | | | | | | | | | |
| Ratios to Average Net Assets | | | | | | | | | | | | | | | | | | | | | | | | |
Total expenses | | | 1.02 | %6 | | | 1.01 | % | | | 1.02 | % | | | 1.00 | % | | | 0.95 | % | | | 0.84 | % |
| | | | |
Total expenses after fees waived and reimbursed | | | 0.91 | %6 | | | 0.90 | % | | | 0.90 | % | | | 0.90 | % | | | 0.87 | % | | | 0.84 | % |
| | | | |
Net investment income | | | 0.15 | %6 | | | 0.26 | % | | | 0.37 | % | | | 0.37 | % | | | 0.48 | % | | | 0.37 | % |
| | | | |
| | | | | | | | | | | | | | | | | | | | | | | | |
| Supplemental Data | | | | | | | | | | | | | | | | | | | | | | | | |
Net assets, end of period (000) | | $ | 221,043 | | | $ | 220,681 | | | $ | 260,860 | | | $ | 279,345 | | | $ | 213,871 | | | $ | 216,551 | |
| | | | |
Portfolio turnover rate | | | 45 | % | | | 61 | % | | | 57 | % | | | 66 | % | | | 47 | % | | | 45 | % |
| | | | |
| | 1 | | Based on average shares outstanding. |
| | 2 | | Distributions for annual periods determined in accordance with federal income tax regulations. |
| | 3 | | Amount is greater than $(0.005) per share. |
| | 4 | | Where applicable, excludes insurance-related fees and expenses and assumes the reinvestment of distributions. |
| | 5 | | Aggregate total return. |
See Notes to Financial Statements.
| | | | | | |
| | | BLACKROCK VARIABLE SERIES FUNDS, INC. | | JUNE 30, 2016 | | 11 |
| | | | |
| Financial Highlights (continued) | | | BlackRock Value Opportunities V.I. Fund | |
| | | | | | | | | | | | | | | | | | | | | | | | |
| | | Class II | |
| | | Six Months
Ended
June 30, 2016
(Unaudited) | | | Year Ended December 31, | |
| | | | 2015 | | | 2014 | | | 2013 | | | 2012 | | | 2011 | |
| | | | | | | | | | | | | | | | | | | | | | | | |
| Per Share Operating Performance | | | | | | | | | | | | | | | | | | | | | | | | |
Net asset value, beginning of period | | $ | 23.21 | | | $ | 26.91 | | | $ | 27.43 | | | $ | 19.35 | | | $ | 17.13 | | | $ | 17.62 | |
| | | | |
Net investment income (loss)1 | | | (0.00 | )2 | | | 0.02 | | | | 0.05 | | | | 0.05 | | | | 0.06 | | | | 0.04 | |
Net realized and unrealized gain (loss) | | | 1.04 | | | | (1.77 | ) | | | 1.34 | | | | 8.12 | | | | 2.22 | | | | (0.49 | ) |
| | | | |
Net increase (decrease) from investment operations | | | 1.04 | | | | (1.75 | ) | | | 1.39 | | | | 8.17 | | | | 2.28 | | | | (0.45 | ) |
| | | | |
Distributions:3 | | | | | | | | | | | | | | | | | | | | | | | | |
From net investment income | | | — | | | | (0.03 | ) | | | (0.02 | ) | | | (0.09 | ) | | | (0.06 | ) | | | (0.04 | ) |
From net realized gain | | | — | | | | (1.92 | ) | | | (1.89 | ) | | | — | | | | — | | | | — | |
From return of capital | | | — | | | | (0.00 | )2 | | | — | | | | — | | | | — | | | | — | |
| | | | |
Total distributions | | | — | | | | (1.95 | ) | | | (1.91 | ) | | | (0.09 | ) | | | (0.06 | ) | | | (0.04 | ) |
| | | | |
Net asset value, end of period | | $ | 24.25 | | | $ | 23.21 | | | $ | 26.91 | | | $ | 27.43 | | | $ | 19.35 | | | $ | 17.13 | |
| | | | |
| | | | | | | | | | | | | | | | | | | | | | | | |
| Total Return4 | | | | | | | | | | | | | | | | | | | | | | | | |
Based on net asset value | | | 4.53 | %5 | | | (6.76 | )% | | | 5.03 | % | | | 42.25 | % | | | 13.31 | % | | | (2.55 | )% |
| | | | |
| | | | | | | | | | | | | | | | | | | | | | | | |
| Ratios to Average Net Assets | | | | | | | | | | | | | | | | | | | | | | | | |
Total expenses | | | 1.21 | %6 | | | 1.18 | % | | | 1.19 | % | | | 1.14 | % | | | 1.16 | % | | | 0.99 | % |
| | | | |
Total expenses after fees waived and reimbursed | | | 1.08 | %6 | | | 1.07 | % | | | 1.07 | % | | | 1.04 | % | | | 1.04 | % | | | 0.99 | % |
| | | | |
Net investment income (loss) | | | (0.02 | )%6 | | | 0.08 | % | | | 0.20 | % | | | 0.22 | % | | | 0.31 | % | | | 0.21 | % |
| | | | |
| | | | | | | | | | | | | | | | | | | | | | | | |
| Supplemental Data | | | | | | | | | | | | | | | | | | | | | | | | |
Net assets, end of period (000) | | $ | 3,053 | | | $ | 3,120 | | | $ | 3,764 | | | $ | 4,701 | | | $ | 3,968 | | | $ | 3,980 | |
| | | | |
Portfolio turnover rate | | | 45 | % | | | 61 | % | | | 57 | % | | | 66 | % | | | 47 | % | | | 45 | % |
| | | | |
| | 1 | | Based on average shares outstanding. |
| | 2 | | Amount is greater than $(0.005) per share. |
| | 3 | | Distributions for annual periods determined in accordance with federal income tax regulations. |
| | 4 | | Where applicable, excludes insurance-related fees and expenses and assumes the reinvestment of distributions. |
| | 5 | | Aggregate total return. |
See Notes to Financial Statements.
| | | | | | |
| 12 | | BLACKROCK VARIABLE SERIES FUNDS, INC. | | JUNE 30, 2016 | | |
| | | | |
| Financial Highlights (concluded) | | | BlackRock Value Opportunities V.I. Fund | |
| | | | | | | | | | | | | | | | | | | | | | | | |
| | | Class III | |
| | | Six Months
Ended
June 30, 2016 (Unaudited) | | | Year Ended December 31, | |
| | | | 2015 | | | 2014 | | | 2013 | | | 2012 | | | 2011 | |
| | | | | | | | | | | | | | | | | | | | | | | | |
| Per Share Operating Performance | | | | | | | | | | | | | | | | | | | | | | | | |
Net asset value, beginning of period | | $ | 18.36 | | | $ | 21.73 | | | $ | 22.50 | | | $ | 15.90 | | | $ | 14.09 | | | $ | 14.50 | |
| | | | |
Net investment income (loss)1 | | | (0.00 | )2 | | | 0.01 | | | | 0.04 | | | | 0.02 | | | | 0.04 | | | | 0.02 | |
Net realized and unrealized gain (loss) | | | 0.83 | | | | (1.43 | ) | | | 1.11 | | | | 6.67 | | | | 1.83 | | | | (0.40 | ) |
| | | | |
Net increase (decrease) from investment operations | | | 0.83 | | | | (1.42 | ) | | | 1.15 | | | | 6.69 | | | | 1.87 | | | | (0.38 | ) |
| | | | |
Distributions:3 | | | | | | | | | | | | | | | | | | | | | | | | |
From net investment income | | | — | | | | (0.03 | ) | | | (0.03 | ) | | | (0.09 | ) | | | (0.06 | ) | | | (0.03 | ) |
From net realized gain | | | — | | | | (1.92 | ) | | | (1.89 | ) | | | — | | | | — | | | | — | |
From return of capital | | | — | | | | (0.00 | )2 | | | — | | | | — | | | | — | | | | — | |
| | | | |
Total distributions | | | — | | | | (1.95 | ) | | | (1.92 | ) | | | (0.09 | ) | | | (0.06 | ) | | | (0.03 | ) |
| | | | |
Net asset value, end of period | | $ | 19.19 | | | $ | 18.36 | | | $ | 21.73 | | | $ | 22.50 | | | $ | 15.90 | | | $ | 14.09 | |
| | | | |
| | | | | | | | | | | | | | | | | | | | | | | | |
| Total Return4 | | | | | | | | | | | | | | | | | | | | | | | | |
Based on net asset value | | | 4.52 | %5 | | | (6.78 | )% | | | 5.07 | % | | | 42.08 | % | | | 13.28 | % | | | (2.61 | )% |
| | | | |
| | | | | | | | | | | | | | | | | | | | | | | | |
| Ratios to Average Net Assets | | | | | | | | | | | | | | | | | | | | | | | | |
Total expenses | | | 1.31 | %6 | | | 1.29 | % | | | 1.25 | % | | | 1.32 | % | | | 1.21 | % | | | 1.09 | % |
| | | | |
Total expenses after fees waived and reimbursed | | | 1.10 | %6 | | | 1.09 | % | | | 1.09 | % | | | 1.09 | % | | | 1.08 | % | | | 1.09 | % |
| | | | |
Net investment income (loss) | | | (0.04 | )%6 | | | 0.06 | % | | | 0.18 | % | | | 0.13 | % | | | 0.28 | % | | | 0.11 | % |
| | | | |
| | | | | | | | | | | | | | | | | | | | | | | | |
| Supplemental Data | | | | | | | | | | | | | | | | | | | | | | | | |
Net assets, end of period (000) | | $ | 6,115 | | | $ | 6,152 | | | $ | 8,002 | | | $ | 8,764 | | | $ | 11,262 | | | $ | 10,571 | |
| | | | |
Portfolio turnover rate | | | 45 | % | | | 61 | % | | | 57 | % | | | 66 | % | | | 47 | % | | | 45 | % |
| | | | |
| | 1 | | Based on average shares outstanding. |
| | 2 | | Amount is greater than $(0.005) per share. |
| | 3 | | Distributions for annual periods determined in accordance with federal income tax regulations. |
| | 4 | | Where applicable, excludes insurance-related fees and expenses and assumes the reinvestment of distributions. |
| | 5 | | Aggregate total return. |
See Notes to Financial Statements.
| | | | | | |
| | | BLACKROCK VARIABLE SERIES FUNDS, INC. | | JUNE 30, 2016 | | 13 |
| | | | |
| Notes to Financial Statements (Unaudited) | | | BlackRock Value Opportunities V.I. Fund | |
1. Organization:
BlackRock Variable Series Funds, Inc. (the “Company”) is registered under the Investment Company Act of 1940, as amended (the “1940 Act”), as an open-end management investment company. The Company is organized as a Maryland corporation that is comprised of 20 separate funds. The funds offer shares to insurance companies for their separate accounts to fund benefits under certain variable annuity and variable life insurance contracts. The financial statements presented are for BlackRock Value Opportunities V.I. Fund (the “Fund”). The Fund is classified as diversified. Class I, Class II and Class III Shares have equal voting, dividend, liquidation and other rights, except that only shares of the respective classes are entitled to vote on matters concerning only that class. In addition, Class II and Class III Shares bear certain expenses related to the distribution of such shares.
The Fund, together with certain other registered investment companies advised by BlackRock Advisors, LLC (the “Manager”) or its affiliates, is included in a complex of open-end funds referred to as the Equity-Bond Complex.
2. Significant Accounting Policies:
The financial statements are prepared in conformity with accounting principles generally accepted in the United States of America (“U.S. GAAP”), which may require management to make estimates and assumptions that affect the reported amounts of assets and liabilities in the financial statements, disclosure of contingent assets and liabilities at the date of the financial statements and the reported amounts of increases and decreases in net assets from operations during the reporting period. Actual results could differ from those estimates. The Fund is considered an investment company under U.S. GAAP and follows the accounting and reporting guidance applicable to investment companies. Below is a summary of significant accounting policies:
Foreign Currency: The Fund’s books and records are maintained in U.S. dollars. Purchases and sales of investments are recorded at the rates of exchange prevailing on the respective dates of such transactions. Generally, when the U.S. dollar rises in value against a foreign currency, the investments denominated in that currency will lose value; the opposite effect occurs if the U.S. dollar falls in relative value.
The Fund does not isolate the portion of the results of operations arising as a result of changes in the exchange rates from the changes in the market prices of investments held or sold for financial reporting purposes. Accordingly, the effects of changes in exchange rates on investments are not segregated in the Statement of Operations from the effects of changes in market prices of those investments, but are included as a component of net realized and unrealized gain (loss) from investments. The Fund reports realized currency gains (losses) on foreign currency related transactions as components of net realized gain (loss) for financial reporting purposes, whereas such components are generally treated as ordinary income for federal income tax purposes.
Investment Transactions and Investment Income: For financial reporting purposes, investment transactions are recorded on the dates the transactions are entered into (the trade dates). Realized gains and losses on investment transactions are determined on the identified cost basis. Dividend income is recorded on the ex-dividend date. Dividends from foreign securities where the ex-dividend date may have passed are subsequently recorded when the Fund is informed of the ex-dividend date. Under the applicable foreign tax laws, a withholding tax at various rates may be imposed on capital gains, dividends and interest. Upon notification from issuers, some of the dividend income received from a real estate investment trust may be redesignated as a reduction of cost of the related investment and/or realized gain. Income, expenses and realized and unrealized gains and losses are allocated daily to each class based on its relative net assets.
Distributions: Distributions paid by the Fund are recorded on the ex-dividend date. The portion of distributions, if any, that exceeds the Fund’s current and accumulated earnings and profits, as measured on a tax basis, constitute a non-taxable return of capital. The character and timing of distributions are determined in accordance with federal income tax regulations, which may differ from U.S. GAAP.
Indemnifications: In the normal course of business, the Fund enters into contracts that contain a variety of representations that provide general indemnification. The Fund’s maximum exposure under these arrangements is unknown because it involves future potential claims against the Fund, which cannot be predicted with any certainty.
Other: Expenses directly related to the Fund or its classes are charged to the Fund or the applicable class. Other operating expenses shared by several funds, including other funds managed by the Manager, are prorated among those funds on the basis of relative net assets or other appropriate methods. Expenses directly related to the Fund and other shared expenses prorated to the Fund are allocated daily to each class based on its relative net assets or other appropriate methods.
The Fund has an arrangement with its custodian whereby fees may be reduced by credits earned on uninvested cash balances, which, if applicable, are shown as fees paid indirectly in the Statement of Operations. The custodian imposes fees on overdrawn cash balances, which can be offset by accumulated credits earned or may result in additional custody charges.
| | | | | | |
| 14 | | BLACKROCK VARIABLE SERIES FUNDS, INC. | | JUNE 30, 2016 | | |
| | | | |
| Notes to Financial Statements (continued) | | | BlackRock Value Opportunities V.I. Fund | |
3. Investment Valuation and Fair Value Measurements:
Investment Valuation Policies: The Fund’s investments are valued at fair value (also referred to as “market value” within the financial statements) as of the close of trading on the New York Stock Exchange (“NYSE”) (generally 4:00 p.m., Eastern time). U.S. GAAP defines fair value as the price the Fund would receive to sell an asset or pay to transfer a liability in an orderly transaction between market participants at the measurement date. The Fund determines the fair values of its financial instruments using various independent dealers or pricing services under policies approved by the Board of Directors of the Company (the “Board”). The BlackRock Global Valuation Methodologies Committee (the “Global Valuation Committee”) is the committee formed by management to develop global pricing policies and procedures and to oversee the pricing function for all financial instruments.
Fair Value Inputs and Methodologies: The following methods (or “techniques”) and inputs are used to establish the fair value of the Fund’s assets and liabilities:
| • | | Equity investments traded on a recognized securities exchange are valued at the official closing price each day, if available. For equity investments traded on more than one exchange, the official close price on the exchange where the stock is primarily traded is used. Equity investments traded on a recognized exchange for which there were no sales on that day may be valued at the last available bid (long positions) or ask (short positions) price. Generally, trading in foreign instruments is substantially completed each day at various times prior to the close of business on the NYSE. Occasionally, events affecting the values of such instruments may occur between the foreign market close and the close of business on the NYSE that may not be reflected in the computation of the Fund’s net assets. Each business day, the Fund uses a pricing service to assist with the valuation of certain foreign exchange-traded equity securities and foreign exchange-traded and over-the-counter (“OTC”) options (the “Systematic Fair Value Price”). Using current market factors, the Systematic Fair Value Price is designed to value such foreign securities and foreign options at fair value as of the close of business on the NYSE, which follows the close of the local markets. |
| • | | Investments in open-end U.S. mutual funds are valued at net asset value each business day. |
| • | | The Fund values its investment in BlackRock Liquidity Series, LLC, Money Market Series (the “Money Market Series”) at fair value, which is ordinarily based upon its pro rata ownership in the underlying fund’s net assets. The Money Market Series seeks current income consistent with maintaining liquidity and preserving capital. Although the Money Market Series is not registered under the 1940 Act, its investments may follow the parameters of investments by a money market fund that is subject to Rule 2a-7 under the 1940 Act. The Fund may withdraw up to 25% of its investment daily, although the manager of the Money Market Series, in its sole discretion, may permit an investor to withdraw more than 25% on any one day. |
| • | | Securities and other assets and liabilities denominated in foreign currencies are translated into U.S. dollars using exchange rates determined as of the close of business on the NYSE. Forward foreign currency exchange contracts are valued at the mean between the bid and ask prices and are determined as of the close of business on the NYSE. Interpolated values are derived when the settlement date of the contract is an interim date for which quotations are not available. |
If events (e.g., a company announcement, market volatility or a natural disaster) occur that are expected to materially affect the value of such instruments, or in the event that the application of these methods of valuation results in a price for an investment that is deemed not to be representative of the market value of such investment, or if a price is not available, the investment will be valued by the Global Valuation Committee, or its delegate, in accordance with a policy approved by the Board as reflecting fair value (“Fair Valued Investments”). When determining the price for Fair Valued Investments, the Global Valuation Committee, or its delegate, seeks to determine the price that the Fund might reasonably expect to receive or pay from the current sale or purchase of that asset or liability in an arm’s-length transaction. Fair value determinations shall be based upon all available factors that the Global Valuation Committee, or its delegate, deems relevant consistent with the principles of fair value measurement. The pricing of all Fair Valued Investments is subsequently reported to the Board or a committee thereof on a quarterly basis.
Fair Value Hierarchy: Various inputs are used in determining the fair value of investments. These inputs to valuation techniques are categorized into a fair value hierarchy consisting of three broad levels for financial statement purposes as follows:
| • | | Level 1 — unadjusted price quotations in active markets/exchanges for identical assets or liabilities that the Fund has the ability to access |
| • | | Level 2 — other observable inputs (including, but not limited to, quoted prices for similar assets or liabilities in markets that are active, quoted prices for identical or similar assets or liabilities in markets that are not active, inputs other than quoted prices that are observable for the assets or liabilities (such as interest rates, yield curves, volatilities, prepayment speeds, loss severities, credit risks and default rates) or other market–corroborated inputs) |
| • | | Level 3 — unobservable inputs based on the best information available in the circumstances, to the extent observable inputs are not available (including the Fund’s own assumptions used in determining the fair value of investments) |
The hierarchy gives the highest priority to unadjusted quoted prices in active markets for identical assets or liabilities (Level 1 measurements) and the lowest priority to unobservable inputs (Level 3 measurements). Accordingly, the degree of judgment exercised in determining fair value is greatest for instruments categorized in Level 3. The inputs used to measure fair value may fall into different levels of the fair value hierarchy. In such cases, for disclosure purposes, the fair value hierarchy classification is determined based on the lowest level input that is significant to the fair value measurement in its entirety. The significant unobservable inputs used by the Global Valuation Committee in determining the price for Fair Valued Investments are typically categorized as Level 3. The fair value hierarchy for the Fund’s investments has been included in the Schedule of Investments.
| | | | | | |
| | | BLACKROCK VARIABLE SERIES FUNDS, INC. | | JUNE 30, 2016 | | 15 |
| | | | |
| Notes to Financial Statements (continued) | | | BlackRock Value Opportunities V.I. Fund | |
Changes in valuation techniques may result in transfers into or out of an assigned level within the hierarchy. In accordance with the Fund’s policy, transfers between different levels of the fair value hierarchy are deemed to have occurred as of the beginning of the reporting period. The categorization of a value determined for investments is based on the pricing transparency of the investments and is not necessarily an indication of the risks associated with investing in those securities.
4. Securities and Other Investments:
Warrants: Warrants entitle the Fund to purchase a specified number of shares of common stock and are non-income producing. The purchase price and number of shares are subject to adjustment under certain conditions until the expiration date of the warrants, if any. If the price of the underlying stock does not rise above the strike price before the warrant expires, the warrant generally expires without any value and the Fund will lose any amount it paid for the warrant. Thus, investments in warrants may involve more risk than investments in common stock. Warrants may trade in the same markets as their underlying stock; however, the price of the warrant does not necessarily move with the price of the underlying stock.
Securities Lending: The Fund may lend its securities to approved borrowers, such as brokers, dealers and other financial institutions. The borrower pledges and maintains with the Fund collateral consisting of cash, an irrevocable letter of credit issued by a bank, or securities issued or guaranteedby the U.S. Government. The initial collateral received by the Fund is required to have a value of at least 102% of the current value of the loaned securities for securities traded on U.S. exchanges and a value of at least 105% for all other securities. The collateral is maintained thereafter at a value equal to at least 100% of the current market value of the securities on loan. The market value of the loaned securities is determined at the close of each business day of the Fund and any additional required collateral is delivered to the Fund, or excess collateral returned by the Fund, on the next business day. During the term of the loan, the Fund is entitled to all distributions made on or in respect of the loaned securities. Loans of securities are terminable at any time and the borrower, after notice, is required to return borrowed securities within the standard time period for settlement of securities transactions.
The market value of any securities on loan, all of which were classified as common stocks in the Fund’s Schedule of Investments, and the value of any related collateral are shown separately in the Statement of Assets and Liabilities as a component of investments at value — unaffiliated, and collateral on securities loaned at value, respectively. As of period end, any securities on loan were collateralized by cash. The cash collateral invested by the securities lending agent, BlackRock Investment Management, LLC (“BIM”), if any, is disclosed in the Schedule of Investments.
Securities lending transactions are entered into by the Fund under Master Securities Lending Agreements (each, an “MSLA”), which provide the right, in the event of default (including bankruptcy or insolvency), for the non-defaulting party to liquidate the collateral and calculate a net exposure to the defaulting party or request additional collateral. In the event that a borrower defaults, the Fund, as lender, would offset the market value of the collateral received against the market value of the securities loaned. When the value of the collateral is greater than that of the market value of the securities loaned, the lender is left with a net amount payable to the defaulting party. However, bankruptcy or insolvency laws of a particular jurisdiction may impose restrictions on or prohibitions against such a right of offset in the event of an MSLA counterparty’s bankruptcy or insolvency. Under the MSLA, absent an event of default the borrower can resell or re-pledge the loaned securities, and the Fund can reinvest cash collateral received in connection with loaned securities. Upon an event of default, the parties’ obligations to return the securities or collateral to the other party are extinguished, and the parties can resell or re-pledge the loaned securities or the collateral received in connection with the loaned securities in order to satisfy the defaulting party’s net payment obligation for all transactions under the MSLA. The defaulting party remains liable for any deficiency.
| | | | | | |
| 16 | | BLACKROCK VARIABLE SERIES FUNDS, INC. | | JUNE 30, 2016 | | |
| | | | |
| Notes to Financial Statements (continued) | | | BlackRock Value Opportunities V.I. Fund | |
As of period end, the following table is a summary of the Fund’s securities lending agreements by counterparty which are subject to offset under an MSLA:
| | | | | | | | | | | | |
| Counterparty | | Securities
Loaned at Value | | | Cash
Collateral
Received1 | | | Net
Amount2 | |
BNP Paribas S.A. | | $ | 765,762 | | | $ | (765,762 | ) | | | — | |
Citigroup Global Markets, Inc. | | | 2,872,406 | | | | (2,859,403 | ) | | $ | 13,003 | |
Goldman Sachs & Co. | | | 3,600,259 | | | | (3,600,259 | ) | | | — | |
JP Morgan Securities LLC | | | 12,642,228 | | | | (12,642,228 | ) | | | — | |
Morgan Stanley | | | 17,459,967 | | | | (17,459,967 | ) | | | — | |
SG Americas Securities LLC | | | 1,126,021 | | | | (1,126,021 | ) | | | — | |
State Street Bank & Trust Co. | | | 2,504,082 | | | | (2,495,045 | ) | | | 9,037 | |
UBS Securities LLC | | | 440,650 | | | | (440,650 | ) | | | — | |
| | | | |
Total | | $ | 41,411,375 | | | $ | (41,389,335 | ) | | $ | 22,040 | |
| | | | |
| | 1 | | Collateral with a value of $41,807,289 has been received in connection with securities lending agreements. Collateral received in excess of the value of securities loaned from the individual counterparty is not shown for financial reporting purposes in the table above. |
| | 2 | | The market value of the loaned securities is determined as of June 30, 2016. Additional collateral is delivered to the Fund on the next business day in accordance with the MSLA. The net amount would be subject to the borrower default indemnity in the event of default by the counterparty. |
The risks of securities lending include the risk that the borrower may not provide additional collateral when required or may not return the securities when due. To mitigate these risks, the Fund benefits from a borrower default indemnity provided by BIM. BIM’s indemnity allows for full replacement of the securities loaned if the collateral received does not cover the value on the securities loaned in the event of borrower default. The Fund could suffer a loss if the value of an investment purchased with cash collateral falls below the market value of loaned securities or if the value of an investment purchased with cash collateral falls below the value of the original cash collateral received.
5. Investment Advisory Agreement and Other Transactions with Affiliates:
The PNC Financial Services Group, Inc. is the largest stockholder and an affiliate of BlackRock, Inc. (“BlackRock”) for 1940 Act purposes.
Investment Advisory
The Company, on behalf of the Fund, entered into an Investment Advisory Agreement with the Manager, the Fund’s investment adviser, an indirect, wholly owned subsidiary of BlackRock, to provide investment advisory and administration services. The Manager is responsible for the management of the Fund’s portfolio and provides the personnel, facilities, equipment and certain other services necessary to the operations of the Fund. For such services, the Fund pays the Manager a monthly fee, which is determined by calculating a percentage of the Fund’s average daily net assets, based on the following annual rates:
| | |
| Average Daily Net Assets | | Investment
Advisory Fees |
First $1 Billion | | 0.75% |
$1 Billion - $3 Billion | | 0.71% |
$3 Billion - $5 Billion | | 0.68% |
$5 Billion - $10 Billion | | 0.65% |
Greater than $10 Billion | | 0.64% |
Distribution Fees
The Company, on behalf of the Fund, entered into a Distribution Agreement and a Distribution Plan with BlackRock Investments, LLC (“BRIL”), an affiliate of the Manager. Pursuant to the Distribution Plan and in accordance with Rule 12b-1 under the 1940 Act, the Fund pays BRIL ongoing distribution fees. The fees are accrued daily and paid monthly at annual rates of 0.15% and 0.25% based upon the average daily net assets attributable to Class II and Class III, respectively.
For the six months ended June 30, 2016, the following table shows the class specific distribution fees borne directly by each share class of the Fund:
| | | | | | | | |
| Class II | | Class III | | | Total | |
| $2,219 | | $ | 7,311 | | | $ | 9,530 | |
Transfer Agent
The Manager, on behalf of the Fund, entered into agreements with insurance companies and other financial intermediaries (“Service Organizations”), some of which may be affiliates. Pursuant to these agreements, the Service Organizations provide the Fund with administrative, networking, recordkeeping, sub-transfer agency and shareholder services to sub-accounts they service. For these services, the Service Organizations receive an
| | | | | | |
| | | BLACKROCK VARIABLE SERIES FUNDS, INC. | | JUNE 30, 2016 | | 17 |
| | | | |
| Notes to Financial Statements (continued) | | | BlackRock Value Opportunities V.I. Fund | |
annual fee per shareholder account, which will vary depending on share class and/or net assets of Fund shareholders serviced by the Service Organizations, which is shown as transfer agent — class specific. For the six months ended June 30, 2016, the Fund paid the following amounts to affiliates in return for these services, which is included in transfer agent — class specific in the Statement of Operations:
| | | | | | | | | | | | |
| Class I | | Class II | | | Class III | | | Total | |
| $190,669 | | $ | 3,199 | | | $ | 6,422 | | | $ | 200,290 | |
In addition, the Fund pays the transfer agent, which is not an affiliate, a fee for issuance, transfer and redemption of shares and the opening and maintenance of shareholder accounts, which is included in transfer agent in the Statement of Operations.
Expense Limitations, Waivers and Reimbursements
The Manager, with respect to the Fund, contractually agreed to waive and/or reimburse fees or expenses in order to limit expenses, excluding interest expense, dividend expense, tax expense, acquired fund fees and expenses, and certain other fund expenses, which constitute extraordinary expenses not incurred in the ordinary course of the Fund’s business. The expense limitations as a percentage of average daily net assets are as follows:
| | | | |
Class I | | | 1.25 | % |
Class II | | | 1.40 | % |
Class III | | | 1.50 | % |
The Manager has agreed not to reduce or discontinue this contractual expense limitation prior to May 1, 2017, unless approved by the Board, including a majority of the Independent Directors who are not “interested persons” of the Fund, as defined in the 1940 Act (“Independent Directors”) or by a majority of the outstanding voting securities of the Fund.
The Manager, with respect to the Fund, voluntarily agreed to waive its investment advisory fees by the amount of investment advisory fees the Fund pays to the Manager indirectly through its investment in affiliated money market funds. This amount is shown as fees waived by the Manager in the Statement of Operations. However, the Manager does not waive its investment advisory fees by the amount of investment advisory fees paid in connection with the Fund’s investment in other affiliated investment companies, if any. For the six months ended June 30, 2016, the amount waived was $620.
The Manager has contractually agreed to reimburse transfer agent fees in order to limit such expenses to a percentage of average daily net assets as follows:
| | | | |
Class I | | | 0.07 | % |
Class II | | | 0.09 | % |
Class III | | | 0.01 | % |
The Manager has agreed not to reduce or discontinue this contractual reimbursement prior to May 1, 2017, unless approved by the Board, including a majority of the Independent Directors or by a majority of the outstanding voting securities of the Fund.
These amounts are shown as transfer agent fees reimbursed — class specific in the Statement of Operations. Class specific expense waivers and/or reimbursements are as follows:
| | | | | | | | | | |
| | | Class I | | Class II | | Class III | | | Total | |
Transfer Agent Fees Reimbursed | | $116,695 | | $1,865 | | $6,128 | | $ | 124,688 | |
For the six months ended June 30, 2016, the Fund reimbursed the Manager $1,265 for certain accounting services, which is included in accounting services in the Statement of Operations.
Securities Lending
The U.S. Securities and Exchange Commission has issued an exemptive order which permits BIM, an affiliate of the Manager, to serve as securities lending agent for the Fund, subject to applicable conditions. As securities lending agent, BIM bears all operational costs directly related to securities lending. The Fund is responsible for expenses in connection with the investment of cash collateral received for securities on loan (the “collateral investment expenses”). The cash collateral is invested in a private investment company managed by the Manager or its affiliates. However, BIM has agreed to cap the collateral investment expenses of the private investment company to an annual rate of 0.04%. The investment adviser to the private investment company will not charge any advisory fees with respect to shares purchased by the Fund.
Securities lending income is equal to the total of income earned from the reinvestment of cash collateral, net of fees and other payments to and from borrowers of securities, and less the collateral investment expenses. The Fund retains a portion of securities lending income and remits a remaining portion to BIM as compensation for its services as securities lending agent.
| | | | | | |
| 18 | | BLACKROCK VARIABLE SERIES FUNDS, INC. | | JUNE 30, 2016 | | |
| | | | |
| Notes to Financial Statements (continued) | | | BlackRock Value Opportunities V.I. Fund | |
Pursuant to a securities lending agreement, the Fund retains 71.5% of securities lending income, and this amount retained can never be less than 65% of the total of securities lending income plus the collateral investment expenses.
In addition, commencing the business day following the date that the aggregate securities lending income earned across the Equity-Bond Complex in a calendar year exceeds a specified threshold, the Fund, pursuant to the securities lending agreement, will retain for the remainder of that calendar year securities lending income as follows: 75% of securities lending income, and this amount retained can never be less than 65% of the total of securities lending income plus the collateral investment expenses.
The share of securities lending income earned by the Fund is shown as securities lending — affiliated — net in the Statement of Operations. For the six months ended June 30, 2016, the Fund paid BIM $27,464 for securities lending agent services.
Officers and Directors
Certain officers and/or directors of the Company are officers and/or directors of BlackRock or its affiliates. The Fund reimburses the Manager for a portion of the compensation paid to the Company’s Chief Compliance Officer, which is included in Officer and Directors in the Statement of Operations.
Other Transactions
The Fund may purchase securities from, or sell securities to, an affiliated fund provided the affiliation is due solely to having a common investment adviser, common officers, or common directors. For the six months ended June 30, 2016, the purchase and sale transactions which resulted in net realized gains (losses) with an affiliated fund in compliance with Rule 17a-7 under the 1940 Act were as follows:
| | | | | | | | |
| Purchases | | Sales | | | Net Realized Gain | |
| $137,236 | | $ | 1,136,406 | | | | $334,971 | |
6. Purchases and Sales:
For the six months ended June 30, 2016, purchases and sales of investments, excluding short-term securities, were $99,402,542 and $110,145,778, respectively.
7. Income Tax Information:
It is the Fund’s policy to comply with the requirements of the Internal Revenue Code of 1986, as amended, applicable to regulated investment companies, and to distribute substantially all of its taxable income to its shareholders. Therefore, no federal income tax provision is required.
The Fund files U.S. federal and various state and local tax returns. No income tax returns are currently under examination. The statute of limitations on the Fund’s U.S. federal tax returns generally remains open for each of the four years ended December 31, 2015. The statutes of limitations on the Fund’s state and local tax returns may remain open for an additional year depending upon the jurisdiction.
Management has analyzed tax laws and regulations and their application to the Fund as of June 30, 2016, inclusive of the open tax return years, and does not believe there are any uncertain tax positions that require recognition of a tax liability in the Fund’s financial statements.
As of June 30, 2016, gross unrealized appreciation and depreciation based on cost for federal income tax purposes were as follows:
| | | | |
Tax cost | | $ | 255,834,750 | |
| | | | |
Gross unrealized appreciation | | $ | 28,577,062 | |
Gross unrealized depreciation | | | (13,461,814 | ) |
| | | | |
Net unrealized appreciation | | $ | 15,115,248 | |
| | | | |
8. Bank Borrowings:
The Company, on behalf of the Fund, along with certain other funds managed by the Manager and its affiliates (“Participating Funds”), is a party to a 364-day, $2.1 billion credit agreement with a group of lenders. Under this agreement, the Fund may borrow to fund shareholder redemptions. Excluding commitments designated for certain individual funds, the Participating Funds, including the Fund, can borrow up to an aggregate commitment amount of $1.6 billion at any time outstanding, subject to asset coverage and other limitations as specified in the agreement. The credit agreement has the following terms: a fee of 0.12% per annum on unused commitment amounts and interest at a rate equal to the higher of (a) one-month LIBOR (but, in any event, not less than 0.00%) on the date the loan is made plus 0.80% per annum or (b) the Fed Funds rate (but, in any event, not less than 0.00%) in effect from time to time plus 0.80% per annum on amounts borrowed. The agreement expires in April 2017 unless extended or renewed. Prior to April 21, 2016, the credit agreement had a fee per annum of 0.06% on unused commitment amounts and interest at a rate equal to the higher of (a) one-month LIBOR (but, in any event, not less than 0.00%) on the date the loan is made plus 0.80% per annum or (b) the Fed Funds rate (but, in any event, not less than 0.00%) in effect from time to time plus 0.80% per annum on amounts borrowed. Participating Funds paid administration,
| | | | | | |
| | | BLACKROCK VARIABLE SERIES FUNDS, INC. | | JUNE 30, 2016 | | 19 |
| | | | |
| Notes to Financial Statements (concluded) | | | BlackRock Value Opportunities V.I. Fund | |
legal and arrangement fees, which, if applicable, are included in miscellaneous expenses in the Statement of Operations. These fees were allocated among such funds based upon portions of the aggregate commitment available to them and relative net assets of Participating Funds. During the six months ended June 30, 2016, the Fund did not borrow under the credit agreement.
9. Principal Risks:
In the normal course of business, the Fund invests in securities and enters into transactions where risks exist due to fluctuations in the market (market risk) or failure of the issuer to meet all its obligations, including the ability to pay principal and interest when due (issuer credit risk). The value of securities held by the Fund may decline in response to certain events, including those directly involving the issuers of securities owned by the Fund. Changes arising from the general economy, the overall market and local, regional or global political and/or social instability, as well as currency, interest rate and price fluctuations, may also affect the securities’ value.
Counterparty Credit Risk: Similar to issuer credit risk, the Fund may be exposed to counterparty credit risk, or the risk that an entity may fail to or be unable to perform on its commitments related to unsettled or open transactions. The Fund manages counterparty credit risk by entering into transactions only with counterparties that the Manager believes have the financial resources to honor their obligations and by monitoring the financial stability of those counterparties. Financial assets, which potentially expose the Fund to market, issuer and counterparty credit risks, consist principally of financial instruments and receivables due from counterparties. The extent of the Fund’s exposure to market, issuer and counterparty credit risks with respect to these financial assets is approximately their value recorded in the Statement of Assets and Liabilities, less any collateral held by the Fund.
10. Capital Share Transactions:
Transactions in capital shares for each class were as follows:
| | | | | | | | | | | | | | | | |
| | | Six Months Ended
June 30, 2016 | | | Year Ended
December 31, 2015 | |
| | | Shares | | | Amount | | | Shares | | | Amount | |
Class I | | | | | | | | | | | | | | | | |
Shares sold | | | 178,569 | | | $ | 3,970,763 | | | | 269,901 | | | $ | 7,098,928 | |
Shares issued in reinvestment of distributions | | | — | | | | — | | | | 739,405 | | | | 17,950,791 | |
Shares redeemed | | | (581,244 | ) | | | (13,305,599 | ) | | | (1,190,218 | ) | | | (31,496,476 | ) |
| | | | | | | | |
Net decrease | | | (402,675 | ) | | $ | (9,334,836 | ) | | | (180,912 | ) | | $ | (6,446,757 | ) |
| | | | | | | | |
| | | | | | | | | | | | | | | | |
Class II | | | | | | | | | | | | | | | | |
Shares sold | | | 17 | | | $ | 387 | | | | 7,945 | | | $ | 209,975 | |
Shares issued in reinvestment of distributions | | | — | | | | — | | | | 10,266 | | | | 249,198 | |
Shares redeemed | | | (8,563 | ) | | | (199,940 | ) | | | (23,627 | ) | | | (620,132 | ) |
| | | | | | | | |
Net decrease | | | (8,546 | ) | | $ | (199,553 | ) | | | (5,416 | ) | | $ | (160,959 | ) |
| | | | | | | | |
| | | | | | | | | | | | | | | | |
Class III | | | | | | | | | | | | | | | | |
Shares sold | | | 6,154 | | | $ | 106,144 | | | | 11,375 | | | $ | 242,760 | |
Shares issued in reinvestment of distributions | | | — | | | | — | | | | 32,182 | | | | 620,810 | |
Shares redeemed | | | (22,547 | ) | | | (403,814 | ) | | | (76,771 | ) | | | (1,624,683 | ) |
| | | | | | | | |
Net decrease | | | (16,393 | ) | | $ | (297,670 | ) | | | (33,214 | ) | | $ | (761,113 | ) |
| | | | | | | | |
Total Net Decrease | | | (427,614 | ) | | $ | (9,832,059 | ) | | | (219,542 | ) | | $ | (7,368,829 | ) |
| | | | | | | | |
11. Subsequent Events:
Management has evaluated the impact of all subsequent events on the Fund through the date the financial statements were issued and has determined that there were no subsequent events requiring adjustment or additional disclosure in the financial statements.
| | | | | | |
| 20 | | BLACKROCK VARIABLE SERIES FUNDS, INC. | | JUNE 30, 2016 | | |
| | | | |
| Disclosure of Investment Advisory Agreements and Sub-Advisory Agreements | | | | |
The Board of Directors (the “Board,” the members of which are referred to as “Board Members”) of BlackRock Variable Series Funds, Inc. (the “Corporation”) met in person on April 12, 2016 (the “April Meeting”) and May 10-11, 2016 (the “May Meeting”) to consider the approval of the investment advisory agreements (collectively, the “Advisory Agreements”) between the Corporation, on behalf of BlackRock Basic Value V.I. Fund (the “Basic Value V.I. Fund”), BlackRock Capital Appreciation V.I. Fund (the “Capital Appreciation V.I. Fund”), BlackRock Equity Dividend V.I. Fund (the “Equity Dividend V.I. Fund”), BlackRock Global Allocation V.I. Fund (the “Global Allocation V.I. Fund”), BlackRock Global Opportunities V.I. Fund (the “Global Opportunities V.I. Fund”), BlackRock Government Money Market V.I. Fund (the “Government Money Market V.I. Fund”), BlackRock High Yield V.I. Fund (the “High Yield V.I. Fund”), BlackRock International V.I. Fund (the “International V.I. Fund”), BlackRock iShares Alternative Strategies V.I. Fund (the “iShares Alternative Strategies V.I. Fund”), BlackRock iShares Dynamic Allocation V.I. Fund (the “iShares Dynamic Allocation V.I. Fund”), BlackRock iShares Dynamic Fixed Income V.I. Fund (the “iShares Dynamic Fixed Income V.I. Fund”), BlackRock iShares Equity Appreciation V.I. Fund (the “iShares Equity Appreciation V.I. Fund), BlackRock Large Cap Core V.I. Fund (the “Large Cap Core V.I. Fund”), BlackRock Large Cap Growth V.I. Fund (the “Large Cap Growth V.I. Fund”), BlackRock Large Cap Value V.I. Fund (the “Large Cap Value V.I. Fund”), BlackRock Managed Volatility V.I. Fund (the “Managed Volatility V.I. Fund”), BlackRock S&P 500 Index V.I. Fund (the “S&P 500 Index V.I. Fund”), BlackRock Total Return V.I. Fund (the “Total Return V.I. Fund”), BlackRock U.S. Government Bond V.I. Fund (the “U.S. Government Bond V.I. Fund”) and BlackRock Value Opportunities V.I. Fund (the “Value Opportunities V.I. Fund”) (each, a “Fund,” and collectively, the “Funds”), each a series of the Corporation, and BlackRock Advisors, LLC (the “Manager”), each Fund’s investment advisor. The Board also considered the approval of the sub-advisory agreements (collectively, the “Sub-Advisory Agreements”) between the Manager and (a) BlackRock International Limited; (b) BlackRock Asset Management North Asia Limited; and (c) BlackRock (Singapore) Limited (collectively, the “Sub-Advisors”), respectively with respect to the Funds, as applicable. The Manager and the Sub-Advisors are referred to herein as “BlackRock.” The Advisory Agreements and the Sub-Advisory Agreements are referred to herein as the “Agreements.”
Activities and Composition of the Board
On the date of the May Meeting, the Board consisted of thirteen individuals, ten of whom were not “interested persons” of the Corporation as defined in the Investment Company Act of 1940, as amended (the “1940 Act”) (the “Independent Board Members”). One of the Board Members is a non-management interested Board Member by virtue of his former positions with BlackRock, Inc. and its affiliates. The Board Members are responsible for the oversight of the operations of the Funds and perform the various duties imposed on the directors of investment companies by the 1940 Act. The Independent Board Members have retained independent legal counsel to assist them in connection with their duties. The Chair of the Board is an Independent Board Member. The Board has established five standing committees: an Audit Committee, a Governance and Nominating Committee, a Compliance Committee, a Performance Oversight Committee and an Executive Committee, each of which is chaired by an Independent Board Member and composed of Independent Board Members (except for the Performance Oversight Committee and the Executive Committee, each of which also has one interested Board Member).
The Agreements
Pursuant to the 1940 Act, the Board is required to consider the continuation of the Agreements on an annual basis. The Board has four quarterly meetings per year, each extending over two days, a fifth one-day meeting to consider specific information surrounding the consideration of renewing the Agreements and additional in-person and telephonic meetings as needed. In connection with this year-long deliberative process, the Board assessed, among other things, the nature, extent and quality of the services provided to each Fund by BlackRock, BlackRock’s personnel and affiliates, including (as applicable): investment management; administrative and shareholder services; the oversight of fund service providers; marketing; risk oversight; compliance; and ability to meet applicable legal and regulatory requirements.
The Board, acting directly and through its committees, considers at each of its meetings, and from time to time as appropriate, factors that are relevant to its annual consideration of the renewal of the Agreements, including the services and support provided by BlackRock to each Fund and its shareholders. BlackRock also furnished additional information to the Board in response to specific questions from the Board. This additional information is discussed further below in the section titled “Board Considerations in Approving the Agreements.” Among the matters the Board considered were: (a) investment performance for one-year, three-year, five-year, ten-year, and/or since inception periods, as applicable, against peer funds, applicable benchmark, and performance metrics, as applicable, as well as senior management’s and portfolio managers’ analysis of the reasons for any over-performance or underperformance relative to its peers, benchmarks, and other performance metrics, as applicable; (b) fees, including advisory, administration, if applicable, and other amounts paid to BlackRock and its affiliates by each Fund for services; (c) Fund operating expenses and how BlackRock allocates expenses to each Fund; (d) the resources devoted to, risk oversight of, and compliance reports relating to, implementation of each Fund’s investment objective(s), policies and restrictions, and meeting regulatory requirements; (e) each Fund’s compliance with its compliance policies and procedures; (f) the nature, cost and character of non-investment management services provided by BlackRock and its affiliates; (g) BlackRock’s and other service providers’ internal controls and risk and compliance oversight mechanisms; (h) BlackRock’s implementation of the proxy voting policies approved by the Board; (i) the use of brokerage commissions and execution quality of portfolio transactions; (j) BlackRock’s implementation of each Fund’s valuation and liquidity procedures; (k) an analysis of management fees for products with similar investment mandates across the open-end fund, exchange-traded fund (“ETF”), closed-end fund and institutional account product channels, as applicable, and the similarities and
| | | | | | |
| | | BLACKROCK VARIABLE SERIES FUNDS, INC. | | JUNE 30, 2016 | | |
| | | | |
| Disclosure of Investment Advisory Agreements and Sub-Advisory Agreements (continued) | | | | |
differences between these products and the services provided as compared to each Fund; (l) BlackRock’s compensation methodology for its investment professionals and the incentives and accountability it creates, along with investment professionals’ investments in the fund(s) they manage; and (m) periodic updates on BlackRock’s business.
Board Considerations in Approving the Agreements
The Approval Process: Prior to the April Meeting, the Board requested and received materials specifically relating to the Agreements. The Board is continuously engaged in a process with its independent legal counsel and BlackRock to review the nature and scope of the information provided to better assist its deliberations. The materials provided in connection with the April Meeting included (a) information independently compiled and prepared by Broadridge Financial Solutions, Inc. (“Broadridge”) on Fund fees and expenses as compared with a peer group of funds as determined by Broadridge (“Expense Peers”) and the investment performance of each Fund (other than the Large Cap Growth V.I. Fund, the Global Opportunities V.I. Fund and the S&P 500 Index V.I. Fund) as compared with a peer group of funds as determined by Broadridge,1 for the Large Cap Growth V.I. Fund and the Global Opportunities V.I. Fund, customized peer groups selected by BlackRock (each a “Customized Peer Group”), and for the S&P 500 Index V.I. Fund, the performance of the Fund as compared with its benchmark; (b) information on the profits realized by BlackRock and its affiliates pursuant to the Agreements and a discussion of fall-out benefits to BlackRock and its affiliates; (c) a general analysis provided by BlackRock concerning investment management fees charged to other clients, such as institutional clients, sub-advised mutual funds, ETFs and closed-end funds, under similar investment mandates, as well as the performance of such other clients, as applicable; (d) review of non-management fees; (e) the existence, impact and sharing of potential economies of scale; (f) a summary of aggregate amounts paid by each Fund to BlackRock; and (g) sales and redemption data regarding each Fund’s shares.
At the April Meeting, the Board reviewed materials relating to its consideration of the Agreements. As a result of the discussions that occurred during the April Meeting, and as a culmination of the Board’s year-long deliberative process, the Board presented BlackRock with questions and requests for additional information. BlackRock responded to these requests with additional written information in advance of the May Meeting.
At the May Meeting, the Board, including the Independent Board Members, approved the continuation of the Advisory Agreements between the Manager and the Corporation, on behalf of each Fund, and the Sub-Advisory Agreements between the Manager and the Sub-Advisors, with respect to each Fund, as applicable, each for a one-year term ending June 30, 2017. In approving the continuation of the Agreements, the Board considered: (a) the nature, extent and quality of the services provided by BlackRock; (b) the investment performance of each Fund; (c) the advisory fee and the cost of the services and profits to be realized by BlackRock and its affiliates from their relationship with each Fund; (d) each Fund’s costs to investors compared to the costs of Expense Peers and performance compared to the relevant performance metrics as previously discussed; (e) the sharing of potential economies of scale; (f) fall-out benefits to BlackRock and its affiliates as a result of its relationship with each Fund; and (g) other factors deemed relevant by the Board Members.
The Board also considered other matters it deemed important to the approval process, such as other payments made to BlackRock or its affiliates, securities lending and cash management, services related to the valuation and pricing of Fund portfolio holdings, and materials submitted for the Board’s review. The Board noted the willingness of BlackRock personnel to engage in open, candid discussions with the Board. The Board did not identify any particular information as determinative, and each Board Member may have attributed different weights to the various items considered.
A. Nature, Extent and Quality of the Services Provided by BlackRock
The Board, including the Independent Board Members, reviewed the nature, extent and quality of services provided by BlackRock, including the investment advisory services and the resulting performance of each Fund. Throughout the year, the Board compared Fund performance to the performance of a comparable group of mutual funds, a relevant benchmark, and performance metrics, as applicable. The Board met with BlackRock’s senior management personnel responsible for investment activities, including the senior investment officers. The Board also reviewed the materials provided by each Fund’s portfolio management team discussing each Fund’s performance and each Fund’s investment objective(s), strategies and outlook.
The Board considered, among other factors, with respect to BlackRock: the number, education and experience of investment personnel generally and each Fund’s portfolio management team; BlackRock’s research capabilities; investments by portfolio managers in the funds they manage; portfolio trading capabilities; use of technology; commitment to compliance; credit analysis capabilities; risk analysis and oversight capabilities; and the approach to training and retaining portfolio managers and other research, advisory and management personnel. The Board engaged in a review of BlackRock’s compensation structure with respect to each Fund’s portfolio management team and BlackRock’s ability to attract and retain high-quality talent and create performance incentives.
In addition to investment advisory services, the Board considered the quality of the administrative and other non-investment advisory services provided to each Fund. BlackRock and its affiliates provide each Fund with certain administrative, shareholder and other services (in addition to any such services provided to each Fund by third parties) and officers and other personnel as are necessary for the operations of each Fund. In particular,
1 Funds are ranked by Broadridge in quartiles, ranging from first to fourth, where first is the most desirable quartile position and fourth is the least desirable.
| | | | | | |
| | | BLACKROCK VARIABLE SERIES FUNDS, INC. | | JUNE 30, 2016 | | |
| | | | |
| Disclosure of Investment Advisory Agreements and Sub-Advisory Agreements (continued) | | | | |
BlackRock and its affiliates provide each Fund with administrative services including, among others: (i) preparing disclosure documents, such as the prospectus, the summary prospectus (as applicable), the statement of additional information and periodic shareholder reports; (ii) oversight of daily accounting and pricing; (iii) preparing periodic filings with regulators; (iv) overseeing and coordinating the activities of other service providers; (v) organizing Board meetings and preparing the materials for such Board meetings; (vi) providing legal and compliance support; (vii) furnishing analytical and other support to assist the Board in its consideration of strategic issues such as the merger, consolidation or repurposing of certain open-end funds; and (viii) performing other administrative functions necessary for the operation of each Fund, such as tax reporting, fulfilling regulatory filing requirements and call center services. The Board reviewed the structure and duties of BlackRock’s fund administration, shareholder services, and legal & compliance departments and considered BlackRock’s policies and procedures for assuring compliance with applicable laws and regulations.
B. The Investment Performance of each Fund and BlackRock
The Board, including the Independent Board Members, also reviewed and considered the performance history of each Fund. In preparation for the April Meeting, the Board was provided with reports independently prepared by Broadridge, which included a comprehensive analysis of each Fund’s performance. The Board also reviewed a narrative and statistical analysis of the Broadridge data that was prepared by BlackRock. In connection with its review, the Board received and reviewed information regarding the investment performance of each Fund (other than the Large Cap Growth V.I. Fund, Global Opportunities V.I. Fund and the S&P 500 Index V.I. Fund) as compared to other funds in its applicable Broadridge category, for the Large Cap Growth V.I. Fund and the Global Opportunities V.I. Fund, Customized Peer Groups, and for the S&P 500 Index V.I. Fund, the performance of the Fund as compared with its benchmark. The Board was provided with a description of the methodology used by Broadridge to select peer funds and periodically meets with Broadridge representatives to review its methodology. The Board was provided with information on the composition of the Broadridge performance universes and expense universes. The Board and its Performance Oversight Committee regularly review, and meet with Fund management to discuss, the performance of each Fund throughout the year.
In evaluating performance, the Board recognized that the performance data reflects a snapshot of a period as of a particular date and that selecting a different performance period could produce significantly different results. Further, the Board recognized that it is possible that long-term performance can be adversely affected by even one period of significant underperformance so that a single investment decision or theme has the ability to affect long-term performance disproportionately.
The Board noted that for the one-, three- and five-year periods reported, the Basic Value V.I. Fund ranked in the fourth, second and third quartiles, respectively, against its Broadridge Performance Universe. The Board and BlackRock reviewed and discussed the reasons for the Basic Value V.I. Fund’s underperformance during the one- and five-year periods.
The Board and BlackRock discussed BlackRock’s strategy for improving the Basic Value V.I. Fund’s investment performance. Discussions covered topics such as: investment risks undertaken by the Basic Value V.I. Fund; performance attribution; the Fund’s investment personnel; and the resources appropriate to support the Fund’s investment processes. The Board and BlackRock also discussed BlackRock’s active equity platform, and it was noted that BlackRock has recruited a Head of Global Active Equity, and has appointed a Chief Performance Officer to provide analysis of investment performance to senior management and the Board.
The Board noted that for the one-, three- and five-year periods reported, the Capital Appreciation V.I. Fund ranked in the second, third and fourth quartiles, respectively, against its Broadridge Performance Universe. The Board noted the Capital Appreciation V.I. Fund’s improved performance during the one-year period. The Board and BlackRock reviewed and discussed the reasons for the Capital Appreciation V.I. Fund’s underperformance during the three- and five-year periods.
The Board and BlackRock discussed BlackRock’s strategy for improving the Capital Appreciation V.I. Fund’s investment performance. Discussions covered topics such as: investment risks undertaken by the Capital Appreciation V.I. Fund; performance attribution; the Fund’s investment personnel; and the resources appropriate to support the Fund’s investment processes. The Board and BlackRock also discussed BlackRock’s active equity platform, and it was noted that BlackRock has recruited a Head of Global Active Equity, and has appointed a Chief Performance Officer to provide analysis of investment performance to senior management and the Board.
The Board noted that for the one-, three- and five-year periods reported, the Equity Dividend V.I. Fund ranked in the first, third and second quartiles, respectively, against its Broadridge Performance Universe.
The Board noted that for the one-, three- and five-year periods reported, the Global Allocation V.I. Fund ranked in the first, second and third quartiles, respectively, against its Broadridge Performance Universe.
The Board noted that for the one-, three- and five-year periods reported, the Global Opportunities V.I. Fund ranked in the first, fourth, and fourth quartiles, respectively, against its Customized Peer Group. BlackRock believes that the Customized Peer Group is an appropriate performance metric for the Global Opportunities V.I. Fund. The Board noted the Global Opportunities V.I. Fund’s improved performance during the one-year period. The Board and BlackRock reviewed and discussed the reasons for the Global Opportunities V.I. Fund’s underperformance during the three- and five-year periods.
| | | | | | |
| | | BLACKROCK VARIABLE SERIES FUNDS, INC. | | JUNE 30, 2016 | | |
| | | | |
| Disclosure of Investment Advisory Agreements and Sub-Advisory Agreements (continued) | | | | |
In response to the Board’s ongoing concerns about underperformance, among other factors, the Board and BlackRock agreed to a continuation of a contractual expense cap, as detailed in Section C.
The Board and BlackRock discussed BlackRock’s strategy for improving the Global Opportunities V.I. Fund’s investment performance. Discussions covered topics such as: investment risks undertaken by the Global Opportunities V.I. Fund; performance attribution; the Fund’s investment personnel; and the resources appropriate to support the Fund’s investment processes. The Board and BlackRock also discussed BlackRock’s active equity platform, and it was noted that BlackRock has recruited a Head of Global Active Equity, and has appointed a Chief Performance Officer to provide analysis of investment performance to senior management and the Board.
The Board noted that for the one-, three- and five-year periods reported, the Government Money Market V.I. Fund ranked in the first, first, and third quartiles, respectively, against its Broadridge Performance Universe. Additionally, the Board noted that the Government Money Market V.I. Fund performed within the one basis point threshold of its Broadridge Performance Universe peer median for the five-year period. The Board reviewed the Government Money Market V.I. Fund’s performance within the context of the low yield environment that has existed over the past few years. The Board noted that effective September 1, 2015, the Government Money Market V.I. Fund had undergone a change in its investment strategy, and in that connection had changed its name from BlackRock Money Market V.I. Fund to BlackRock Government Money Market V.I. Fund.
The quartile standing of the Government Money Market V.I. Fund in its Broadridge Performance Universe takes into account the Fund’s current yield only. The Board believes that a money market fund can only be understood holistically, accounting for current yield and risk. While the Board reviews the Government Money Market V.I. Fund’s current yield performance, it also examines the liquidity, duration, and credit quality of the Fund’s portfolio. In the Board’s view, BlackRock’s money market funds have performed well over the one-, three- and five-year periods given BlackRock’s emphasis on preserving capital and seeking as high a level of current income as is consistent with liquidity while simultaneously managing risk.
The Board noted that for the one-, three- and five-year periods reported, the High Yield V.I. Fund ranked in the third, first and first quartiles, respectively, against its Broadridge Performance Universe. The Board and BlackRock reviewed and discussed the reasons for the High Yield V.I. Fund’s underperformance during the one-year period.
The Board noted that for the one-, three- and five-year periods reported, the International V.I. Fund ranked in the third, third and fourth quartiles, respectively, against its Broadridge Performance Universe. The Board and BlackRock reviewed and discussed the reasons for the International V.I. Fund’s underperformance during these periods.
The Board and BlackRock discussed BlackRock’s strategy for improving the International V.I. Fund’s investment performance. Discussions covered topics such as: investment risks undertaken by the International V.I. Fund; performance attribution; the Fund’s investment personnel; and the resources appropriate to support the Fund’s investment processes. The Board and BlackRock also discussed BlackRock’s active equity platform, and it was noted that BlackRock has recruited a Head of Global Active Equity, and has appointed a Chief Performance Officer to provide analysis of investment performance to senior management and the Board.
The Board noted that for each of the one-year and since-inception periods reported, the iShares Alternative Strategies V.I. Fund ranked in the first quartile against its Broadridge Performance Universe.
The Board noted that for each of the one-year and since-inception periods reported, the iShares Dynamic Allocation V.I. Fund ranked in the third quartile against its Broadridge Performance Universe. The Board and BlackRock reviewed and discussed the reasons for the iShares Dynamic Allocation V.I. Fund’s underperformance during these periods.
The Board and BlackRock discussed BlackRock’s strategy for improving the iShares Dynamic Allocation V.I. Fund’s investment performance. Discussions covered topics such as: investment risks undertaken by the iShares Dynamic Allocation V.I. Fund; performance attribution; the Fund’s investment personnel; and the resources appropriate to support the Fund’s investment processes.
The Board noted that for each of the one-year and since-inception periods reported, the iShares Dynamic Fixed Income V.I. Fund ranked in the second quartile against its Broadridge Performance Universe.
The Board noted that for each of the one-year and since-inception periods reported, the iShares Equity Appreciation V.I. Fund ranked in the fourth quartile against its Broadridge Performance Universe. The Board and BlackRock reviewed and discussed the reasons for the iShares Equity Appreciation V.I. Fund’s underperformance during these periods.
The Board and BlackRock discussed BlackRock’s strategy for improving the iShares Equity Appreciation V.I. Fund’s investment performance. Discussions covered topics such as: investment risks undertaken by the iShares Equity Appreciation V.I. Fund; performance attribution; the Fund’s investment personnel; and the resources appropriate to support the Fund’s investment processes.
The Board noted that for the one-, three- and five-year periods reported, the Large Cap Core V.I. Fund ranked in the third, second and second quartiles, respectively, against its Broadridge Performance Universe. The Board and BlackRock reviewed and discussed the reasons for the Large Cap Core V.I. Fund’s underperformance during the one-year period.
| | | | | | |
| | | BLACKROCK VARIABLE SERIES FUNDS, INC. | | JUNE 30, 2016 | | |
| | | | |
| Disclosure of Investment Advisory Agreements and Sub-Advisory Agreements (continued) | | | | |
The Board noted that for the one-, three- and five-year periods reported, the Large Cap Growth V.I. Fund ranked in the fourth, third and second quartiles, respectively, against its Customized Peer Group. BlackRock believes that the Customized Peer Group is an appropriate performance metric for the Large Cap Growth V.I. Fund. The Board and BlackRock reviewed and discussed the reasons for the Large Cap Growth V.I. Fund’s underperformance during one- and three-year periods.
The Board and BlackRock discussed BlackRock’s strategy for improving the Large Cap Growth V.I. Fund’s investment performance. Discussions covered topics such as: investment risks undertaken by the Large Cap Growth V.I. Fund; performance attribution; the Fund’s investment personnel; and the resources appropriate to support the Fund’s investment processes. The Board and BlackRock also discussed BlackRock’s active equity platform, and it was noted that BlackRock has recruited a Head of Global Active Equity, and has appointed a Chief Performance Officer to provide analysis of investment performance to senior management and the Board.
The Board noted that for the one-, three- and five-year periods reported, the Large Cap Value V.I. Fund ranked in the first, first and second quartiles, respectively, against its Broadridge Performance Universe.
The Board noted that for each of the one-, three- and five-year periods reported, the Managed Volatility V.I. Fund ranked in the first quartile against its Broadridge Performance Universe.
The Board noted that for the past five one-year periods reported, the S&P 500 Index V.I. Fund’s net performance was within the tolerance range of its benchmark index for four of the five periods. BlackRock believes that net performance relative to the benchmark is an appropriate performance metric for the Fund.
The Board noted that for each of the one-, three- and five-year periods reported, the Total Return V.I. Fund ranked in the second quartile against its Broadridge Performance Universe.
The Board noted that for the one-, three- and five-year periods reported, the U.S. Government Bond V.I. Fund ranked in the third, second and third quartiles, respectively, against its Broadridge Performance Universe. The Board and BlackRock reviewed and discussed the reasons for the U.S. Government Bond V.I. Fund’s underperformance during one- and five-year periods.
The Board and BlackRock discussed BlackRock’s strategy for improving the U.S. Government Bond V.I. Fund’s investment performance. Discussions covered topics such as: investment risks undertaken by the U.S. Government Bond V.I. Fund; performance attribution; the Fund’s investment personnel; and the resources appropriate to support the Fund’s investment processes.
The Board noted that for the one-, three- and five-year periods reported, the Value Opportunities V.I. Fund ranked in the fourth, second, and third quartiles, respectively, against its Broadridge Performance Universe. The Board and BlackRock reviewed and discussed the reasons for the Value Opportunities V.I. Fund’s underperformance during one- and five-year periods.
The Board and BlackRock discussed BlackRock’s strategy for improving the Value Opportunities V.I. Fund’s investment performance. Discussions covered topics such as: investment risks undertaken by the Value Opportunities V.I. Fund; performance attribution; the Fund’s investment personnel; and the resources appropriate to support the Fund’s investment processes. The Board and BlackRock also discussed BlackRock’s active equity platform, and it was noted that BlackRock has recruited a Head of Global Active Equity, and has appointed a Chief Performance Officer to provide analysis of investment performance to senior management and the Board.
C. Consideration of the Advisory/Management Fees and the Cost of the Services and Profits to be Realized by BlackRock and its Affiliates from their Relationship with each Fund
The Board, including the Independent Board Members, reviewed each Fund’s contractual management fee rate compared with the other funds in its Broadridge category. The contractual management fee rate represents a combination of the advisory fee and any administrative fees, before taking into account any reimbursements or fee waivers. The Board also compared each Fund’s total expense ratio, as well as its actual management fee rate, to those of other funds in its Broadridge category. The total expense ratio represents a fund’s total net operating expenses, including any 12b-1 or non 12b-1 service fees. The total expense ratio gives effect to any expense reimbursements or fee waivers that benefit a fund, and the actual management fee rate gives effect to any management fee reimbursements or waivers that benefit a fund. The Board considered the services provided and the fees charged by BlackRock and its affiliates to other types of clients with similar investment mandates, as applicable, including institutional accounts and sub-advised mutual funds (including mutual funds sponsored by third parties).
The Board received and reviewed statements relating to BlackRock’s financial condition. The Board reviewed BlackRock’s profitability methodology and was also provided with a profitability analysis that detailed the revenues earned and the expenses incurred by BlackRock for services provided to each Fund. The Board reviewed BlackRock’s profitability with respect to each Fund and other funds the Board currently oversees for the year ended December 31, 2015 compared to available aggregate profitability data provided for the prior two years. The Board reviewed BlackRock’s profitability with respect to certain other U.S. fund complexes managed by the Manager and/or its affiliates. The Board reviewed BlackRock’s assumptions and methodology of allocating expenses in the profitability analysis, noting the inherent limitations in allocating costs among various advisory products. The Board recognized that profitability may be affected by numerous factors including, among other things, fee waivers and expense reimbursements by the Manager, the types of funds managed, precision of expense allocations and business mix. As a result, calculating and comparing profitability at individual fund level is difficult.
| | | | | | |
| | | BLACKROCK VARIABLE SERIES FUNDS, INC. | | JUNE 30, 2016 | | |
| | | | |
| Disclosure of Investment Advisory Agreements and Sub-Advisory Agreements (continued) | | | | |
The Board noted that, in general, individual fund or product line profitability of other advisors is not publicly available. The Board reviewed BlackRock’s overall operating margin, in general, compared to that of certain other publicly-traded asset management firms. The Board considered the differences between BlackRock and these other firms, including the contribution of technology at BlackRock, BlackRock’s expense management, and the relative product mix.
In addition, the Board considered the cost of the services provided to each Fund by BlackRock, and BlackRock’s and its affiliates’ profits relating to the management and distribution of each Fund and the other funds advised by BlackRock and its affiliates. As part of its analysis, the Board reviewed BlackRock’s methodology in allocating its costs of managing each Fund, to each Fund. The Board may receive and review information from independent third parties as part of its annual evaluation. The Board considered whether BlackRock has the financial resources necessary to attract and retain high quality investment management personnel to perform its obligations under the Agreements and to continue to provide the high quality of services that is expected by the Board. The Board further considered factors including but not limited to BlackRock’s commitment of time, assumption of risk, and liability profile in servicing each Fund in contrast to what is required of BlackRock with respect to other products with similar investment mandates across the open-end fund, ETF, closed-end fund, sub-advised mutual fund and institutional account product channels, as applicable.
The Board noted that the Basic Value V.I. Fund’s contractual management fee rate ranked in the first quartile, and that the actual management fee rate and total expense ratio each ranked in the first quartile, relative to the Fund’s Expense Peers. The Board also noted that the Basic Value V.I. Fund has an advisory fee arrangement that includes breakpoints that adjust the fee rate downward as the size of the Fund increases above certain contractually specified levels. The Board further noted that BlackRock has contractually agreed to a cap on the Basic Value V.I. Fund’s total expenses as a percentage of the Fund’s average daily net assets on a class-by-class basis. Additionally, the Board noted that BlackRock has contractually agreed to a cap on certain operational and recordkeeping fees for the Basic Value V.I. Fund on a class-by-class basis.
The Board noted that the Capital Appreciation V.I. Fund’s contractual management fee rate ranked in the first quartile, and that the actual management fee rate and total expense ratio ranked in the first and second quartiles, respectively, relative to the Fund’s Expense Peers. The Board also noted that the Capital Appreciation V.I. Fund has an advisory fee arrangement that includes breakpoints that adjust the fee rate downward as the size of the Fund increases above certain contractually specified levels. The Board further noted that BlackRock has contractually agreed to a cap on the Capital Appreciation V.I. Fund’s total expenses as a percentage of the Fund’s average daily net assets on a class-by-class basis. Additionally, the Board noted that BlackRock has contractually agreed to a cap on certain operational and recordkeeping fees for the Capital Appreciation V.I. Fund on a class-by-class basis.
The Board noted that the Equity Dividend V.I. Fund’s contractual management fee rate ranked in the first quartile, and that the actual management fee rate and total expense ratio each ranked in the second quartile, relative to the Fund’s Expense Peers. The Board also noted that the Equity Dividend V.I. Fund has an advisory fee arrangement that includes breakpoints that adjust the fee rate downward as the size of the Fund increases above certain contractually specified levels. The Board further noted that BlackRock has contractually agreed to a cap on the Equity Dividend V.I. Fund’s total expenses as a percentage of the Fund’s average daily net assets on a class-by-class basis. Additionally, the Board noted that BlackRock has contractually agreed to a cap on certain operational and recordkeeping fees for the Equity Dividend V.I. Fund on a class-by-class basis.
The Board noted that the Global Allocation V.I. Fund’s contractual management fee rate ranked in the second quartile, and that the actual management fee rate and total expense ratio each ranked in the second quartile, relative to the Fund’s Expense Peers. The Board also noted that the Global Allocation V.I. Fund has an advisory fee arrangement that includes breakpoints that adjust the fee rate downward as the size of the Fund increases above certain contractually specified levels. The Board further noted that BlackRock has contractually agreed to a cap on the Global Allocation V.I. Fund’s total expenses as a percentage of the Fund’s average daily net assets on a class-by-class basis. Additionally, the Board noted that BlackRock has contractually agreed to a cap on certain operational and recordkeeping fees for the Global Allocation V.I. Fund on a class-by-class basis.
The Board noted that the Global Opportunities V.I. Fund’s contractual management fee rate ranked in the first quartile, and that the actual management fee rate and total expense ratio ranked in the first and second quartiles, respectively, relative to the Fund’s Expense Peers. The Board also noted that the Global Opportunities V.I. Fund has an advisory fee arrangement that includes breakpoints that adjust the fee rate downward as the size of the Fund increases above certain contractually specified levels. The Board further noted that BlackRock has contractually agreed to a cap on the Global Opportunities V.I. Fund’s total expenses as a percentage of the Fund’s average daily net assets on a class-by-class basis. The Board also noted that BlackRock agreed to a lower contractual expense cap on a class-by-class basis. The expense cap reduction was implemented on June 1, 2015. After discussions between the Board, including the Independent Board Members, and BlackRock, the Board and BlackRock agreed to a continuation of the contractual cap. Additionally, the Board noted that BlackRock has contractually agreed to a cap on certain operational and recordkeeping fees for the Global Opportunities V.I. Fund on a class-by-class basis.
The Board noted that the Government Money Market V.I. Fund’s contractual management fee rate ranked in the third quartile, and that the actual management fee rate and total expense ratio each ranked in the fourth quartile, relative to the Fund’s Expense Peers. The Board reviewed the Government Money Market V.I. Fund’s expenses within the context of the low yield environment and consequent expense waivers and reimbursements. The Board
| | | | | | |
| | | BLACKROCK VARIABLE SERIES FUNDS, INC. | | JUNE 30, 2016 | | |
| | | | |
| Disclosure of Investment Advisory Agreements and Sub-Advisory Agreements (continued) | | | | |
also noted that the Government Money Market V.I. Fund has an advisory fee arrangement that includes breakpoints that adjust the fee rate downward as the size of the Fund increases above certain contractually specified levels. The Board further noted that BlackRock has contractually agreed to a cap on the Government Money Market V.I. Fund’s total expenses as a percentage of the Fund’s average daily net assets on a class-by-class basis. In addition, the Board noted that BlackRock proposed, and the Board agreed to, a lower contractual expense cap on a class by class basis, which was implemented on March 1, 2016. The Board also noted that, in connection with the lower contractual expense cap, effective March 1, 2016, BlackRock had discontinued the cap on certain operational and recordkeeping fees for the Government Money Market V.I. Fund on a class-by-class basis. Finally, the Board noted that, to enable the Government Money Market V.I. Fund to maintain minimum levels of daily net investment income, BlackRock has voluntarily agreed to waive a portion of its fees and/or reimburse the Fund’s operating expenses as necessary. This waiver and/or reimbursement may be discontinued at any time without notice.
The Board noted that the High Yield V.I. Fund’s contractual management fee rate ranked in the first quartile, and that the actual management fee rate and total expense ratio each ranked in the first quartile, relative to the Fund’s Expense Peers. The Board also noted that the High Yield V.I. Fund has an advisory fee arrangement that includes breakpoints that adjust the fee rate downward as the aggregate assets of the Fund, combined with the assets of Total Return V.I. Fund, increase above certain contractually specified levels. The Board further noted that BlackRock has contractually agreed to a cap on the High Yield V.I. Fund’s total expenses as a percentage of the Fund’s average daily net assets on a class-by-class basis. Additionally, the Board noted that BlackRock has contractually agreed to a cap on certain operational and recordkeeping fees for the High Yield V.I. Fund on a class-by-class basis.
The Board noted that the International V.I. Fund’s contractual management fee rate ranked in the first quartile, and that the actual management fee rate and total expense ratio each ranked in the second quartile, relative to the Fund’s Expense Peers. The Board also noted that the International V.I. Fund has an advisory fee arrangement that includes breakpoints that adjust the fee rate downward as the size of the Fund increases above certain contractually specified levels. The Board further noted that BlackRock has contractually agreed to a cap on the International V.I. Fund’s total expenses as a percentage of the Fund’s average daily net assets on a class-by-class basis. Additionally, the Board noted that BlackRock has contractually agreed to a cap on certain operational and recordkeeping fees for the International V.I. Fund on a class-by-class basis.
The Board noted that the varying fee structure for fund of funds can limit the value of management fee comparisons. The Board also noted that the iShares Alternative Strategies V.I. Fund’s contractual management fee rate ranked in the first quartile, and that the actual management fee rate and total expense ratio each ranked in the first quartile, relative to the Fund’s Expense Peers. The Board further noted that the iShares Alternative Strategies V.I. Fund has an advisory fee arrangement that includes breakpoints that adjust the fee rate downward as the size of the Fund increases above certain contractually specified levels. Additionally, the Board noted that BlackRock has contractually agreed to a cap on the iShares Alternative Strategies V.I. Fund’s total expenses as a percentage of the Fund’s average daily net assets on a class-by-class basis. The Board noted that BlackRock proposed, and the Board agreed to, a lower contractual expense cap on a class-by-class basis. The contractual expense cap reduction was implemented on August 1, 2015.
The Board noted that the varying fee structure for fund of funds can limit the value of management fee comparisons. The Board also noted that the iShares Dynamic Allocation V.I. Fund’s contractual management fee rate ranked in the first quartile, and that the actual management fee rate and total expense ratio each ranked in the first quartile, relative to the Fund’s Expense Peers. The Board further noted that the iShares Dynamic Allocation V.I. Fund has an advisory fee arrangement that includes breakpoints that adjust the fee rate downward as the size of the Fund increases above certain contractually specified levels. Additionally, the Board noted that BlackRock has contractually agreed to a cap on the iShares Dynamic Allocation V.I. Fund’s total expenses as a percentage of the Fund’s average daily net assets on a class-by-class basis. The Board noted that BlackRock proposed, and the Board agreed to, a lower contractual expense cap on a class-by-class basis. The contractual expense cap reduction was implemented on August 1, 2015.
The Board noted that the varying fee structure for fund of funds can limit the value of management fee comparisons. The Board also noted that the iShares Dynamic Fixed Income V.I. Fund’s contractual management fee rate ranked in the first quartile, and that the actual management fee rate and total expense ratio each ranked in the first quartile, relative to the Fund’s Expense Peers. The Board further noted that the iShares Dynamic Fixed Income V.I. Fund has an advisory fee arrangement that includes breakpoints that adjust the fee rate downward as the size of the Fund increases above certain contractually specified levels. Additionally, the Board noted that BlackRock has contractually agreed to a cap on the iShares Dynamic Fixed Income V.I. Fund’s total expenses as a percentage of the Fund’s average daily net assets on a class-by-class basis. The Board noted that BlackRock proposed, and the Board agreed to, a lower contractual expense cap on a class-by-class basis. The contractual expense cap reduction was implemented on August 1, 2015.
The Board noted that the varying fee structure for fund of funds can limit the value of management fee comparisons. The Board also noted that the iShares Equity Appreciation V.I. Fund’s contractual management fee rate ranked in the first quartile, and that the actual management fee rate and total expense ratio ranked in the first and second quartiles, respectively, relative to the Fund’s Expense Peers. The Board further noted that the iShares Equity Appreciation V.I. Fund has an advisory fee arrangement that includes breakpoints that adjust the fee rate downward as the size of the Fund increases above certain contractually specified levels. Additionally, the Board noted that BlackRock has contractually agreed to a cap on the iShares Equity Appreciation V.I. Fund’s total expenses as a percentage of the Fund’s average daily net assets on a class-by-class basis. The Board noted that BlackRock proposed, and the Board agreed to, a lower contractual expense cap on a class-by-class basis. The contractual expense cap reduction was implemented on August 1, 2015.
| | | | | | |
| | | BLACKROCK VARIABLE SERIES FUNDS, INC. | | JUNE 30, 2016 | | |
| | | | |
| Disclosure of Investment Advisory Agreements and Sub-Advisory Agreements (continued) | | | | |
The Board noted that the Large Cap Core V.I. Fund’s contractual management fee rate ranked in the first quartile, and that the actual management fee rate and total expense ratio each ranked in the first quartile, relative to the Fund’s Expense Peers. The Board also noted that the Large Cap Core V.I. Fund has an advisory fee arrangement that includes breakpoints that adjust the fee rate downward as the size of the Fund increases above certain contractually specified levels. The Board further noted that BlackRock has contractually agreed to a cap on the Large Cap Core V.I. Fund’s total expenses as a percentage of the Fund’s average daily net assets on a class-by-class basis. Additionally, the Board noted that BlackRock has contractually agreed to a cap on certain operational and recordkeeping fees for the Large Cap Core V.I. Fund on a class-by-class basis.
The Board noted that the Large Cap Growth V.I. Fund’s contractual management fee rate ranked in the second quartile, and that the actual management fee rate and total expense ratio each ranked in the second quartile, relative to the Fund’s Expense Peers. The Board also noted that the Large Cap Growth V.I. Fund has an advisory fee arrangement that includes breakpoints that adjust the fee rate downward as the size of the Fund increases above certain contractually specified levels. The Board further noted that BlackRock has contractually agreed to a cap on the Large Cap Growth V.I. Fund’s total expenses as a percentage of the Fund’s average daily net assets on a class-by-class basis. Additionally, the Board noted that BlackRock has contractually agreed to a cap on certain operational and recordkeeping fees for the Large Cap Growth V.I. Fund on a class-by-class basis.
The Board noted that the Large Cap Value V.I. Fund’s contractual management fee rate ranked in the second quartile, and that the actual management fee rate and total expense ratio each ranked in the first quartile, relative to the Fund’s Expense Peers. The Board also noted that the Large Cap Value V.I. Fund has an advisory fee arrangement that includes breakpoints that adjust the fee rate downward as the size of the Fund increases above certain contractually specified levels. The Board further noted that BlackRock has contractually agreed to a cap on the Large Cap Value V.I. Fund’s total expenses as a percentage of the Fund’s average daily net assets on a class-by-class basis. After discussions between the Board, including the Independent Board Members, and BlackRock, the Board and BlackRock agreed to reduce the existing voluntary advisory fee waiver. This voluntary waiver reduction was implemented on June 17, 2016. Finally, the Board noted that BlackRock has contractually agreed to a cap on certain operational and recordkeeping fees for the Large Cap Value V.I. Fund on a class-by-class basis.
The Board noted that the Managed Volatility V.I. Fund’s contractual management fee rate ranked in the first quartile, and that the actual management fee rate and total expense ratio ranked in the first and fourth quartiles, respectively, relative to the Fund’s Expense Peers. The Board also noted that the Managed Volatility V.I. Fund has an advisory fee arrangement that includes breakpoints that adjust the fee rate downward as the size of the Fund increases above certain contractually specified levels. The Board further noted that BlackRock has contractually agreed to a cap on the Managed Volatility V.I. Fund’s total expenses as a percentage of the Fund’s average daily net assets on a class-by-class basis. Finally, the Board noted that BlackRock has contractually agreed to a cap on certain operational and recordkeeping fees for the Managed Volatility V.I. Fund on a class-by-class basis. In addition, the Board noted that BlackRock had agreed to a lower contractual expense cap on a class-by-class basis. The contractual expense cap reduction was implemented on June 1, 2014. After discussions between the Board, including the Independent Board Members, and BlackRock, the Board and BlackRock agreed to a continuation of the contractual cap.
The Board noted that the S&P 500 Index V.I. Fund’s contractual management fee rate ranked in the second quartile, and that the actual management fee rate and total expense ratio each ranked in the first quartile, relative to the Fund’s Expense Peers. The Board also noted that BlackRock has contractually agreed to a cap on the S&P 500 Index V.I. Fund’s total expenses as a percentage of the Fund’s average daily net assets on a class-by-class basis. Additionally, the Board noted that BlackRock has contractually agreed to waive a portion of the advisory fee payable by the S&P 500 Index V.I. Fund. Finally, the Board noted that BlackRock has contractually agreed to a cap on certain operational and recordkeeping fees for the S&P 500 Index V.I. Fund on a class-by-class basis.
The Board noted that the Total Return V.I. Fund’s contractual management fee rate ranked in the second quartile, and that the actual management fee rate and total expense ratio each ranked in the third quartile, relative to the Fund’s Expense Peers. The Board also noted that the Total Return V.I. Fund has an advisory fee arrangement that includes breakpoints that adjust the fee rate downward as the aggregate assets of the Fund, combined with the assets of High Yield V.I. Fund, increase above certain contractually specified levels. The Board further noted that BlackRock has contractually agreed to a cap on the Total Return V.I. Fund’s total expenses as a percentage of the Fund’s average daily net assets on a class-by-class basis. Additionally, the Board noted that BlackRock has contractually agreed to a cap on certain operational and recordkeeping fees for the Total Return V.I. Fund on a class-by-class basis.
The Board noted that the U.S. Government Bond V.I. Fund’s contractual management fee rate ranked in the second quartile, and that the actual management fee rate and total expense ratio ranked in the second and fourth quartiles, respectively, relative to the Fund’s Expense Peers. The Board also noted that the U.S. Government Bond V.I. Fund has an advisory fee arrangement that includes breakpoints that adjust the fee rate downward as the size of the Fund increases above certain contractually specified levels. The Board further noted that BlackRock has contractually agreed to a cap on the U.S. Government Bond V.I. Fund’s total expenses as a percentage of the Fund’s average daily net assets on a class-by-class basis. Additionally, the Board noted that BlackRock has contractually agreed to a cap on certain operational and recordkeeping fees for the U.S. Government Bond V.I. Fund on a class-by-class basis. After discussions between the Board, including the Independent Board Members, and BlackRock, the Board and BlackRock agreed to increase the existing voluntary advisory fee waiver. This waiver increase was implemented on June 15, 2016.
| | | | | | |
| | | BLACKROCK VARIABLE SERIES FUNDS, INC. | | JUNE 30, 2016 | | |
| | | | |
| Disclosure of Investment Advisory Agreements and Sub-Advisory Agreements (concluded) | | | | |
The Board noted that the Value Opportunities V.I. Fund’s contractual management fee rate ranked in the first quartile, and that the actual management fee rate and total expense ratio ranked in the first and second quartiles, respectively, relative to the Fund’s Expense Peers. The Board also noted that the Value Opportunities V.I. Fund has an advisory fee arrangement that includes breakpoints that adjust the fee rate downward as the size of the Fund increases above certain contractually specified levels. The Board further noted that BlackRock has contractually agreed to a cap on the Value Opportunities V.I. Fund’s total expenses as a percentage of the Fund’s average daily net assets on a class-by-class basis. Additionally, the Board noted that BlackRock has contractually agreed to a cap on certain operational and recordkeeping fees for the Value Opportunities V.I. Fund on a class-by-class basis.
D. Economies of Scale
The Board, including the Independent Board Members, considered the extent to which economies of scale might be realized as the assets of each Fund increase, as well as the existence of expense caps, as applicable. The Board also considered the extent to which each Fund benefits from such economies in a variety of ways, and whether there should be changes in the advisory fee rate or breakpoint structure in order to enable each Fund to more fully participate in these economies of scale. The Board considered each Fund’s asset levels and whether the current fee schedule was appropriate. In its consideration, the Board Members took into account the existence of any expense caps and further considered the continuation and/or implementation, as applicable, of such caps.
E. Other Factors Deemed Relevant by the Board Members
The Board, including the Independent Board Members, also took into account other ancillary or “fall-out” benefits that BlackRock or its affiliates may derive from their respective relationships with each Fund, both tangible and intangible, such as BlackRock’s ability to leverage its investment professionals who manage other portfolios and risk management personnel, an increase in BlackRock’s profile in the investment advisory community, and the engagement of BlackRock’s affiliates as service providers to each Fund, including for administrative, distribution, securities lending and cash management services. The Board also considered BlackRock’s overall operations and its efforts to expand the scale of, and improve the quality of, its operations. The Board also noted that BlackRock may use and benefit from third party research obtained by soft dollars generated by certain registered fund transactions to assist in managing all or a number of its other client accounts. The Board further noted that, except with respect to the Government Money Market V.I. Fund, it had considered the investment by BlackRock’s funds in affiliated ETFs without any offset against the management fees payable by the funds to BlackRock.
In connection with its consideration of the Agreements, the Board also received information regarding BlackRock’s brokerage and soft dollar practices. The Board received reports from BlackRock which included information on brokerage commissions and trade execution practices throughout the year.
The Board noted the competitive nature of the open-end fund marketplace, and that shareholders are able to redeem their Fund shares if they believe that each Fund’s fees and expenses are too high or if they are dissatisfied with the performance of each Fund.
Conclusion
The Board, including the Independent Board Members, approved the continuation of the Advisory Agreements between the Manager and the Corporation, on behalf of each Fund, for a one-year term ending June 30, 2017, and the Sub-Advisory Agreements between the Manager and the Sub-Advisors, with respect to each Fund, as applicable, for a one-year term ending June 30, 2017. Based upon its evaluation of all of the aforementioned factors in their totality, as well as other information, the Board, including the Independent Board Members, was satisfied that the terms of the Agreements were fair and reasonable and in the best interest of each Fund and its shareholders. In arriving at its decision to approve the Agreements, the Board did not identify any single factor or group of factors as all-important or controlling, but considered all factors together, and different Board Members may have attributed different weights to the various factors considered. The Independent Board Members were also assisted by the advice of independent legal counsel in making this determination. The contractual fee arrangements for each Fund reflect the results of several years of review by the Board Members and predecessor Board Members, and discussions between such Board Members (and predecessor Board Members) and BlackRock. As a result, the Board Members’ conclusions may be based in part on their consideration of these arrangements in prior years.
| | | | | | |
| | | BLACKROCK VARIABLE SERIES FUNDS, INC. | | JUNE 30, 2016 | | |
Availability of Quarterly Schedule of Investments
The Funds file their complete schedule of portfolio holdings with the SEC for the first and third quarters of each fiscal year on Form N-Q. The Funds’ Forms N-Q are available on the SEC’s website at http://www.sec.gov and may also be reviewed and copied at the SEC’s Public Reference Room in Washington, DC. Information on the operation of the Public Reference Room or how to access documents on the SEC’s website without charge may be obtained by calling (800) SEC-0330. The Funds’ Forms N-Q may also be obtained upon request and without charge by calling (800) 441-7762.
Availability of Proxy Voting Policies and Procedures
A description of the policies and procedures that the Funds use to determine how to vote proxies relating to portfolio securities is available upon request and without charge (1) by calling (800) 441-7762; (2) at http://www.blackrock.com/prospectus/insurance; and (3) on the SEC’s website at http://www.sec.gov.
Availability of Proxy Voting Record
Information about how the Funds voted proxies relating to securities held in the Funds’ portfolios during the most recent 12-month period ended June 30 is available upon request and without charge (1) at http://www.blackrock.com/prospectus/insurance or by calling (800) 441-7762 and (2) on the SEC’s website at http://www.sec.gov.
|
| BlackRock Privacy Principles |
BlackRock is committed to maintaining the privacy of its current and former fund investors and individual clients (collectively, “Clients”) and to safeguarding their non-public personal information. The following information is provided to help you understand what personal information BlackRock collects, how we protect that information and why in certain cases we share such information with select parties.
If you are located in a jurisdiction where specific laws, rules or regulations require BlackRock to provide you with additional or different privacy-related rights beyond what is set forth below, then BlackRock will comply with those specific laws, rules or regulations.
BlackRock obtains or verifies personal non-public information from and about you from different sources, including the following: (i) information we receive from you or, if applicable, your financial intermediary, on applications, forms or other documents; (ii) information about your transactions with us, our affiliates, or others; (iii) information we receive from a consumer reporting agency; and (iv) from visits to our websites.
BlackRock does not sell or disclose to non-affiliated third parties any non-public personal information about its Clients, except as permitted by law or as is necessary to respond to regulatory requests or to service Client accounts. These non-affiliated third parties are required to protect the confidentiality and security of this information and to use it only for its intended purpose.
We may share information with our affiliates to service your account or to provide you with information about other BlackRock products or services that may be of interest to you. In addition, BlackRock restricts access to non-public personal information about its Clients to those BlackRock employees with a legitimate business need for the information. BlackRock maintains physical, electronic and procedural safeguards that are designed to protect the non-public personal information of its Clients, including procedures relating to the proper storage and disposal of such information.
| | | | | | |
| | | BLACKROCK VARIABLE SERIES FUNDS, INC. | | JUNE 30, 2016 | | |
Robert M. Hernandez, Chair of the Board and Director
Fred G. Weiss, Vice Chair of the Board and Director
James H. Bodurtha, Director
Bruce R. Bond, Director
Donald W. Burton, Director
Honorable Stuart E. Eizenstat, Director
Robert Fairbairn, Director
Henry Gabbay, Director
John F. O’Brien, Director
Donald C. Opatrny, Director
Roberta Cooper Ramo, Director
David H. Walsh, Director
John M. Perlowski, Director, President and Chief Executive Officer
Jennifer McGovern, Vice President
Neal J. Andrews, Chief Financial Officer
Jay M. Fife, Treasurer
Charles Park, Chief Compliance Officer
Fernanda Piedra, Anti-Money Laundering Compliance Officer
Benjamin Archibald, Secretary
Effective May 6, 2016, Valerie G. Brown resigned as a Director of the Company.
Effective May 10, 2016, Kenneth A. Froot resigned as a Director of the Company.
On June 2, 2016, the Board appointed Henry R. Keizer as a Director of the Company, effective July 28, 2016.
| | | | | | |
| | | | |
Investment Advisor BlackRock Advisors, LLC Wilmington, DE 19809 | | Sub-Advisors BlackRock International Limited1 Edinburgh, United Kingdom BlackRock Asset Management North Asia Limited2 Hong Kong BlackRock (Singapore) Limited2 079912 Singapore | | Accounting Agent and Transfer Agent BNY Mellon Investment Servicing (US) Inc. Wilmington, DE 19809 | | Custodians The Bank of New York Mellon3 New York, NY 10286 Brown Brothers Harriman & Co.4 Boston, MA 02109 |
| | | | | | |
Distributor BlackRock Investments, LLC New York, NY 10022 | | Legal Counsel Willkie Farr & Gallagher LLP New York, NY 10019 | | Independent Registered Public Accounting Firm Deloitte & Touche LLP Philadelphia, PA 19103 | | Address of the Funds 100 Bellevue Parkway Wilmington, DE 19809 |
1For BlackRock International V.I. Fund and BlackRock Managed Volatility V.I Fund.
2For BlackRock Managed Volatility V.I. Fund.
3For all Funds except BlackRock Global Allocation V.I. Fund, BlackRock International V.I. Fund and BlackRock Large Cap Growth V.I. Fund.
4For BlackRock Global Allocation V.I. Fund, BlackRock International V.I. Fund and BlackRock Large Cap Growth V.I. Fund.
| | | | | | |
| | | BLACKROCK VARIABLE SERIES FUNDS, INC. | | JUNE 30, 2016 | | |
This report is only for distribution to shareholders of the Funds of BlackRock Variable Series Funds, Inc. Past performance results shown in this report should not be considered a representation of future performance. Investment return and principal value of non-money market fund shares will fluctuate so that shares, when redeemed, may be worth more or less than their original cost. An investment in the BlackRock Government Money Market V.I. Fund is not insured or guaranteed by the Federal Deposit Insurance Corporation or any other government agency. Although the money market fund seeks to preserve the value of your investment at $1.00 per share, it is possible to lose money by investing in money market funds. Statements and other information herein are as dated and are subject to change.

| | |
| |
| VS-6/16-SAR | |  |
Item 2 – Code of Ethics – Not Applicable to this semi-annual report
Item 3 – Audit Committee Financial Expert – Not Applicable to this semi-annual report
| Item 4 – | Principal Accountant Fees and Services – Not Applicable to this semi-annual report |
| Item 5 – | Audit Committee of Listed Registrants – Not Applicable |
(a) The registrant’s Schedule of Investments is included as part of the Report to Stockholders filed under Item 1 of this Form.
(b) Not Applicable due to no such divestments during the semi-annual period covered since the previous Form N-CSR filing.
| Item 7 – | Disclosure of Proxy Voting Policies and Procedures for Closed-End Management Investment Companies – Not Applicable |
| Item 8 – | Portfolio Managers of Closed-End Management Investment Companies – Not Applicable |
| Item 9 – | Purchases of Equity Securities by Closed-End Management Investment Company and Affiliated Purchasers – Not Applicable |
| Item 10 – | Submission of Matters to a Vote of Security Holders –There have been no material changes to these procedures. |
| Item 11 – | Controls and Procedures |
(a) – The registrant’s principal executive and principal financial officers, or persons performing similar functions, have concluded that the registrant’s disclosure controls and procedures (as defined in Rule 30a-3(c) under the Investment Company Act of 1940, as amended (the “1940 Act”)) are effective as of a date within 90 days of the filing of this report based on the evaluation of these controls and procedures required by Rule 30a-3(b) under the 1940 Act and Rule 15d-15(b) under the Securities Exchange Act of 1934, as amended.
(b) – There were no changes in the registrant’s internal control over financial reporting (as defined in Rule 30a-3(d) under the 1940 Act) that occurred during the second fiscal quarter of the period covered by this report that have materially affected, or are reasonably likely to materially affect, the registrant’s internal control over financial reporting.
| Item 12 – | Exhibits attached hereto |
(a)(1) – Code of Ethics – Not Applicable to this semi-annual report
(a)(2) – Certifications – Attached hereto
(a)(3) – Not Applicable
(b) – Certifications – Attached hereto
2
Pursuant to the requirements of the Securities Exchange Act of 1934 and the Investment Company Act of 1940, the registrant has duly caused this report to be signed on its behalf by the undersigned, thereunto duly authorized.
BlackRock Variable Series Funds, Inc.
| | |
| By: | | /s/ John M. Perlowski |
| | John M. Perlowski |
| | Chief Executive Officer (principal executive officer) of |
| | BlackRock Variable Series Funds, Inc. |
| |
| Date: | | August 25, 2016 |
Pursuant to the requirements of the Securities Exchange Act of 1934 and the Investment Company Act of 1940, this report has been signed below by the following persons on behalf of the registrant and in the capacities and on the dates indicated.
| | |
| By: | | /s/ John M. Perlowski |
| | John M. Perlowski |
| | Chief Executive Officer (principal executive officer) of |
| | BlackRock Variable Series Funds, Inc. |
| |
| Date: | | August 25, 2016 |
| |
| By: | | /s/ Neal J. Andrews |
| | Neal J. Andrews |
| | Chief Financial Officer (principal financial officer) of |
| | BlackRock Variable Series Funds, Inc. |
| |
| Date: | | August 25, 2016 |
3