UNITED STATES
SECURITIES AND EXCHANGE COMMISSION
Washington, D.C. 20549
FORM N-CSR
CERTIFIED SHAREHOLDER REPORT OF REGISTERED MANAGEMENT
INVESTMENT COMPANIES
Investment Company Act file number: 811-03290
Name of Fund: BlackRock Variable Series Funds, Inc.
BlackRock Advantage Large Cap Core V.I. Fund
BlackRock Advantage Large Cap Value V.I. Fund
BlackRock Advantage U.S. Total Market V.I. Fund
BlackRock Basic Value V.I. Fund
BlackRock Capital Appreciation V.I. Fund
BlackRock Equity Dividend V.I. Fund
BlackRock Global Allocation V.I. Fund
BlackRock Global Opportunities V.I. Fund
BlackRock Government Money Market V.I. Fund
BlackRock High Yield V.I. Fund
BlackRock International V.I. Fund
BlackRock iShares Alternative Strategies V.I. Fund
BlackRock iShares Dynamic Allocation V.I Fund
BlackRock iShares Dynamic Fixed Income V.I. Fund
BlackRock iShares Equity Appreciation V.I. Fund
BlackRock Large Cap Focus Growth V.I. Fund
BlackRock Managed Volatility V.I. Fund
BlackRock S&P 500 Index V.I. Fund
BlackRock Total Return V.I. Fund
BlackRock U.S. Government Bond V.I. Fund
Fund Address: 100 Bellevue Parkway, Wilmington, DE 19809
Name and address of agent for service: John M. Perlowski, Chief Executive Officer, BlackRock Variable Series Funds, Inc., 55 East 52nd Street, New York, NY 10055
Registrant’s telephone number, including area code: (800) 441-7762
Date of fiscal year end: 12/31/2017
Date of reporting period: 12/31/2017
Item 1 – Report to Stockholders
DECEMBER 31, 2017
| | |
ANNUAL REPORT | |  |
BlackRock Variable Series Funds, Inc.
|
| Not FDIC Insured • May Lose Value • No Bank Guarantee |
The Markets in Review
Dear Shareholder,
In the 12 months ended December 31, 2017, risk assets, such as stocks and high-yield bonds, continued to deliver strong performance. The equity market advanced, month after month, despite geopolitical uncertainty and relatively high valuations, while bond returns were constrained by higher interest rates.
Rising interest rates worked against high-quality assets with more interest rate sensitivity. Consequently, longer-term U.S. Treasuries posted modest returns, as rising energy prices, modest wage increases, and steady job growth led to expectations of higher inflation and interest rate increases by the U.S. Federal Reserve (the “Fed”).
The market’s performance reflected reflationary expectations early in the reporting period, as investors began to sense that a global recovery was afoot. Thereafter, many countries throughout the world experienced sustained and synchronized growth for the first time since the financial crisis. Growth rates and inflation are still relatively low, but they are finally rising together.
The Fed responded to these positive developments by increasing short-term interest rates three times and setting expectations for additional interest rate increases. The Fed also began reducing the vast balance sheet reserves that had accumulated in the wake of the financial crisis. In October 2017, the Fed reduced its $4.5 trillion balance sheet by only $10 billion, while setting expectations for additional modest reductions and rate hikes in 2018.
By contrast, the European Central Bank (“ECB”) and the Bank of Japan (“BoJ”) both continued to expand their balance sheets despite nascent signs of sustained economic growth. The Eurozone and Japan are both approaching the limits of central banks’ ownership share of national debt, which is a structural pressure point that limits their capacity to deliver additional monetary stimulus. In October 2017, the ECB announced plans to cut the amount of its bond purchases in half for 2018, while the BoJ reiterated its commitment to economic stimulus until the inflation rate rises to its target of 2%.
Emerging market growth also stabilized, as accelerating growth in China, the second largest economy in the world and the most influential of all developing economies, improved the outlook for corporate profits and economic growth across most developing nations. Chinese demand for commodities and other raw materials allayed concerns about the country’s banking system, leading to rising equity prices and foreign investment flows.
While escalating tensions between the United States and North Korea and our nation’s divided politics are concerning, benign credit conditions, modest inflation, solid corporate earnings, and the positive outlook for growth in the world’s largest economies have kept markets relatively tranquil.
Rising consumer confidence and improving business sentiment are driving momentum for the U.S. economy. If the Fed maintains a measured pace of stimulus reduction, to the extent that inflation rises, it’s likely to be accompanied by rising real growth and higher wages. That could lead to a favorable combination of moderately higher inflation, steadily rising interest rates, and improving growth in 2018.
Further fueling optimism, Congress passed a sweeping tax reform bill in December 2017. The U.S. tax overhaul is likely to accentuate the reflationary themes already in place, including faster growth and rising interest rates. Changing the corporate tax rate to a flat 21% will create many winners and losers among high-and-low tax companies, while the windfall from lower taxes could boost business and consumer spending.
In this environment, investors need to think globally, extend their scope across a broad array of asset classes, and be nimble as market conditions change. We encourage you to talk with your financial advisor and visit blackrock.com for further insight about investing in today’s markets.
Sincerely,

Rob Kapito
President, BlackRock Advisors, LLC

Rob Kapito
President, BlackRock Advisors, LLC
| | | | |
| Total Returns as of December 31, 2017 |
| | | 6-month | | 12-month |
U.S. large cap equities
(S&P 500® Index) | | 11.42% | | 21.83% |
U.S. small cap equities
(Russell 2000® Index) | | 9.20 | | 14.65 |
International equities
(MSCI Europe, Australasia,
Far East Index) | | 9.86 | | 25.03 |
Emerging market equities
(MSCI Emerging Markets Index) | | 15.92 | | 37.28 |
3-month Treasury bills
(ICE BofAML 3-Month
U.S. Treasury Bill Index) | | 0.55 | | 0.86 |
U.S. Treasury securities
(ICE BofAML 10-Year
U.S. Treasury Index) | | (0.01) | | 2.07 |
U.S. investment grade bonds
(Bloomberg Barclays U.S.
Aggregate Bond Index) | | 1.24 | | 3.54 |
Tax-exempt municipal bonds
(S&P Municipal Bond Index) | | 1.64 | | 4.95 |
U.S. high yield bonds
(Bloomberg Barclays U.S. Corporate High Yield 2% Issuer
Capped Index) | | 2.46 | | 7.50 |
| Past performance is no guarantee of future results. Index performance is shown for illustrative purposes only. You cannot invest directly in an index. |
| | | | |
| THIS PAGEISNOT PARTOF YOUR FUND REPORT | | | | |
DECEMBER 31, 2017
| | |
ANNUAL REPORT | |  |
BlackRock Variable Series Funds, Inc.
| Ø | | BlackRock Advantage Large Cap Core V.I. Fund |
|
| Not FDIC Insured • May Lose Value • No Bank Guarantee |
| | |
| Fund Summary as of December 31, 2017 | | BlackRock Advantage Large Cap Core V.I. Fund |
Investment Objective
BlackRock Advantage Large Cap Core V.I. Fund’s (the “Fund”) investment objective is to seek high total investment return.
On March 27, 2017, the Fund’s Board approved a proposal to change the name of BlackRock Large Cap Core V.I. Fund to BlackRock Advantage Large Cap Core V.I. Fund. The Board also approved certain changes to the Fund’s investment strategies. These changes were effective on June 12, 2017.
Portfolio Management Commentary
How did the Fund perform?
For the 12-month period ended December 31, 2017, the Fund outperformed its benchmark, the Russell 1000® Index.
What factors influenced performance?
From January 1, 2017 through June 12, 2017, the information technology (“IT”) sector was the largest contributor to the Fund’s performance, with strength across segments including semiconductors, software and hardware. Additional contributions came from stock selection in consumer discretionary, in particular media and household durables. Selection in materials and an underweight to telecommunication services proved advantageous as well.
From June 12, 2017 through period-end, positive contributions to performance came from signals that seek to capture sentiment and trends from market participants. Specifically, insights driven by proprietary text-based analyses of company executive conference calls and sell-side analyst reports performed well. Additionally, sentiment-based measures that evaluate investor flow aided performance during the period. Fundamental signals that focus on company value and quality were additive to performance as well. Notably, an insight that evaluates stocks based on key corporate events such as initial public offerings, CEO changes and revisions to forward guidance proved beneficial.
Health care was the principal detractor from relative performance for the period of January 1, 2017 through June 12, 2017. Weakness in the sector was most notable in the Fund’s biotechnology and pharmaceutical industry holdings, with an underweight to the equipment & supplies segment also weighing on returns. Positioning with respect to financials constrained performance, driven by holdings within the capital markets and bank segments, as did positioning with respect to consumer staples, where food & staples retailing names held back returns.
Negative contributions to performance from June 12, 2017 to period-end came primarily from stock-specific events. Notably, an underweight in Microsoft Corp. hindered results. The underweight was motivated by deteriorating sentiment as identified by the company’s non-equity securities along with declining supply chain trends. An insight that takes a contrarian stance on crowded positions also constrained relative performance. Unsurprisingly as investors continued to favor growth assets, select quality-based insights lagged, in particular a signal that identifies dividend growth.
Describe recent portfolio activity.
The Fund was repurposed during the period. Effective June 12, 2017, the Fund changed its name to BlackRock Advantage Large Cap Core V.I. Fund. Concurrently, there were changes to its investment strategy. The Fund is now being managed by BlackRock’s Systematic Active Equity (SAE) team, which incorporates a research-driven, systematic approach to identifying differentiated performance opportunities across markets.
Describe portfolio positioning at period end.
Relative to the Russell 1000® Index, the Fund was positioned neutrally from a sector perspective. The Fund had slight overweight positions in utilities and materials and slight underweight positions in consumer staples and IT.
The views expressed reflect the opinions of BlackRock as of the date of this report and are subject to change based on changes in market, economic or other conditions. These views are not intended to be a forecast of future events and are no guarantee of future results.
| | |
| 2 | | 2017 BLACKROCK ANNUAL REPORTTO SHAREHOLDERS |
| | |
| Fund Summary as of December 31, 2017 (continued) | | BlackRock Advantage Large Cap Core V.I. Fund |
TOTAL RETURN BASED ON A $10,000 INVESTMENT
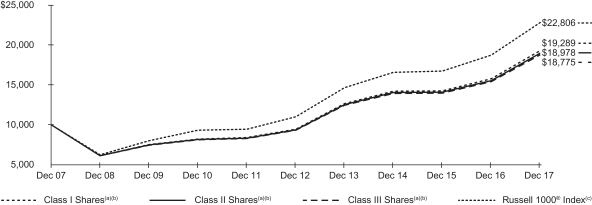
| (a) | Assuming transaction costs, if any, and other operating expenses, including investment advisory fees. Does not include insurance related fees and expenses. For a portion of the period, returns do not show the effects of distribution fees (12b-1 fees) applicable to Class II Shares. If such fees were included, returns shown would have been lower. The returns for Class III Shares prior to January 27, 2009, the recommencement of operations of Class III Shares, are based upon the performance of the Fund’s Class I Shares. The returns for Class III Shares, however, are adjusted to reflect the distribution (12b-1) fees applicable to Class III Shares. |
| (b) | Under normal circumstances, the Fund seeks to invest at least 80% of its net assets, plus the amount of any borrowings for investment purposes, in large cap equity securities and derivatives that have similar economic characteristics to such securities. The Fund’s total returns prior to June 12, 2017 are the returns of the Fund when it followed different investment strategies under the name BlackRock Large Cap Core V.I. Fund. |
| (c) | An index that measures the performance of the large cap segment of the U.S. equity universe. It is a subset of the Russell 3000® Index and includes approximately 1,000 of the largest securities based on a combination of their market capitalization and current index membership. The index represents approximately 92% of the total market capitalization of the Russell 3000® Index. |
Performance Summary for the Period Ended December 31, 2017
| | | | | | | | | | | | | | | | | | | | | | | | | | | | |
| | | 6-Month
Total Returns (b) | | | | | | Average Annual Total Returns | |
| | | | | | | 1 Year (b) | | | | | | 5 Years (b) | | | | | | 10 Years (b) | |
Class I(a) | | | 11.59 | % | | | | | | | 22.33 | % | | | | | | | 15.33 | % | | | | | | | 6.79 | % |
Class II(a) | | | 11.50 | | | | | | | | 22.12 | | | | | | | | 15.13 | | | | | | | | 6.62 | |
Class III(a) | | | 11.47 | | | | | | | | 21.97 | | | | | | | | 15.00 | | | | | | | | 6.50 | (c) |
Russell 1000® Index | | | 11.36 | | | | | | | | 21.69 | | | | | | | | 15.71 | | | | | | | | 8.59 | |
| | (a) | Average annual and cumulative total returns are based on changes in net asset value for the periods shown, and assume reinvestment of all distributions at net asset value on the ex-dividend date. Insurance-related fees and expenses are not reflected in these returns. For a portion of the period, returns do not show the effects of distribution fees (12b-1 fees) applicable to Class II Shares. If such fees were included, returns shown would have been lower. The Fund’s total returns prior to June 12, 2017 are the returns of the Fund when it followed different investment strategies under the name BlackRock Large Cap Core V.I. Fund. | |
| | (b) | For a portion of the period, the Fund’s investment adviser waived a portion of its fee. Without such waiver, the Fund’s performance would have been lower. | |
| | (c) | The returns for Class III Shares prior to January 27, 2009, the recommencement of operations of Class III Shares, are based upon the performance of the Fund’s Class I Shares. The returns for Class III Shares, however, are adjusted to reflect the distribution (12b-1) fees applicable to Class III Shares. | |
Past performance is not indicative of future results. Performance results do not reflect the deduction of taxes that a shareholder would pay on Fund distributions or the redemption of Fund shares.
Performance results may include adjustments made for financial reporting purposes in accordance with U.S. generally accepted accounting principles.
Expense Example
| | | | | | | | | | | | | | | | | | | | | | | | | | | | | | | | |
| | | Actual | | | | | | Hypothetical (a) | | | | |
| | | Beginning
Account Value
(07/01/17) | | | Ending
Account Value
(12/31/17) | | | Expenses
Paid During
the Period (b) | | | | | | Beginning
Account Value
(07/01/17) | | | Ending
Account Value
(12/31/17) | | | Expenses
Paid During
the Period (b) | | | Annualized
Expense
Ratio | |
Class I | | $ | 1,000.00 | | | $ | 1,115.90 | | | $ | 3.09 | | | | | | | $ | 1,000.00 | | | $ | 1,022.28 | | | $ | 2.96 | | | | 0.58 | % |
Class II | | | 1,000.00 | | | | 1,115.00 | | | | 4.00 | | | | | | | | 1,000.00 | | | | 1,021.42 | | | | 3.82 | | | | 0.75 | |
Class III | | | 1,000.00 | | | | 1,114.70 | | | | 4.58 | | | | | | | | 1,000.00 | | | | 1,020.87 | | | | 4.38 | | | | 0.86 | |
| | (a) | Hypothetical 5% annual return before expenses is calculated by prorating the number of days in the most recent fiscal half year divided by 365. | |
| | (b) | For each class of the Fund, expenses are equal to the annualized expense ratio for the class, multiplied by the average account value over the period, multiplied by 184/365 (to reflect the one-half year period shown). | |
See “Disclosure of Expenses” on the following page for further information on how expenses were calculated.
| | |
| Fund Summary as of December 31, 2017 (continued) | | BlackRock Advantage Large Cap Core V.I. Fund |
Portfolio Information
SECTOR ALLOCATION
| | | | |
| Sector | | Percent of
Net Assets | |
Information Technology | | | 23 | % |
Financials | | | 14 | |
Health Care | | | 14 | |
Consumer Discretionary | | | 13 | |
Industrials | | | 11 | |
Consumer Staples | | | 7 | |
Energy | | | 5 | |
Materials | | | 4 | |
Utilities | | | 3 | |
Real Estate | | | 3 | |
Telecommunication Services | | | 2 | |
Short-Term Securities | | | 3 | |
Liabilities in Excess of Other Assets | | | (2 | ) |
For Fund compliance purposes, the Fund’s sector classifications refer to one or more of the sector sub-classifications used by one or more widely recognized market indexes or ratings group indexes, and/or as defined by the investment adviser. These definitions may not apply for purposes of this report, which may combine sector sub classifications for reporting ease.
Disclosure of Expenses
Shareholders of the Fund may incur the following charges: (a) transactional expenses, such as sales charges; and (b) operating expenses, including investment advisory fees, service and distribution fees, including 12b-1 fees, acquired fund fees and expenses, and other fund expenses. The expense example on the previous page (which is based on a hypothetical investment of $1,000 invested on July 1, 2017 and held through December 31, 2017) is intended to assist shareholders both in calculating expenses based on an investment in the Fund and in comparing these expenses with similar costs of investing in other mutual funds.
The expense example provides information about actual account values and actual expenses. In order to estimate the expenses a shareholder paid during the period covered by this report, shareholders can divide their account value by $1,000 and then multiply the result by the number corresponding to their share class under the heading entitled “Expenses Paid During the Period.”
The expense example also provides information about hypothetical account values and hypothetical expenses based on the Fund’s actual expense ratio and an assumed rate of return of 5% per year before expenses. In order to assist shareholders in comparing the ongoing expenses of investing in the Fund and other funds, compare the 5% hypothetical example with the 5% hypothetical examples that appear in shareholder reports of other funds.
The expenses shown in the expense example are intended to highlight shareholders’ ongoing costs only and do not reflect any transactional expenses, such as sales charges, if any. Therefore, the hypothetical example is useful in comparing ongoing expenses only, and will not help shareholders determine the relative total expenses of owning different funds. If these transactional expenses were included, shareholder expenses would have been higher.
Derivative Financial Instruments
The Fund may invest in various derivative financial instruments. These instruments are used to obtain exposure to a security, commodity, index, market, and/or other assets without owning or taking physical custody of securities, commodities and/or other referenced assets or to manage market, equity, credit, interest rate, foreign currency exchange rate, commodity and/or other risks. Derivative financial instruments may give rise to a form of economic leverage and involve risks, including the imperfect correlation between the value of a derivative financial instrument and the underlying asset, possible default of the counterparty to the transaction or illiquidity of the instrument. The Fund’s successful use of a derivative financial instrument depends on the investment adviser’s ability to predict pertinent market movements accurately, which cannot be assured. The use of these instruments may result in losses greater than if they had not been used, may limit the amount of appreciation the Fund can realize on an investment and/or may result in lower distributions paid to shareholders. The Fund’s investments in these instruments, if any, are discussed in detail in the Notes to Financial Statements.
| | |
| 4 | | 2017 BLACKROCK ANNUAL REPORTTO SHAREHOLDERS |
| | |
Schedule of Investments December 31, 2017 | | BlackRock Advantage Large Cap Core V.I. Fund (Percentages shown are based on Net Assets) |
| | | | | | | | |
| Security | | Shares | | | Value | |
Common Stocks — 99.0% | |
|
| Aerospace & Defense — 3.0% | |
Boeing Co. (The) | | | 31,272 | | | $ | 9,222,425 | |
Curtiss-Wright Corp. | | | 689 | | | | 83,955 | |
Orbital ATK, Inc. | | | 1,198 | | | | 157,537 | |
Raytheon Co. | | | 33,500 | | | | 6,292,975 | |
Rockwell Collins, Inc. | | | 3,384 | | | | 458,938 | |
| | | | | | | | |
| | | | | | | 16,215,830 | |
| Auto Components — 1.7% | |
Aptiv plc | | | 27,368 | | | | 2,321,628 | |
BorgWarner, Inc. | | | 116,267 | | | | 5,940,081 | |
Delphi Technologies plc | | | 9,122 | | | | 478,631 | |
Lear Corp. | | | 2,287 | | | | 404,021 | |
| | | | | | | | |
| | | | | | | 9,144,361 | |
| Banks — 5.6% | |
Bank of America Corp. | | | 304,409 | | | | 8,986,154 | |
Citigroup, Inc. | | | 53,119 | | | | 3,952,585 | |
Citizens Financial Group, Inc.(a) | | | 148,298 | | | | 6,225,550 | |
First Republic Bank | | | 46,901 | | | | 4,063,502 | |
JPMorgan Chase & Co. | | | 17,368 | | | | 1,857,334 | |
SunTrust Banks, Inc. | | | 63,139 | | | | 4,078,148 | |
Synovus Financial Corp. | | | 13,645 | | | | 654,141 | |
| | | | | | | | |
| | | | | | | 29,817,414 | |
| Beverages — 0.7% | |
Coca-Cola European Partners plc | | | 39,356 | | | | 1,568,337 | |
Dr Pepper Snapple Group, Inc. | | | 17,064 | | | | 1,656,232 | |
Molson Coors Brewing Co., Class B | | | 7,251 | | | | 595,089 | |
| | | | | | | | |
| | | | | | | 3,819,658 | |
| Biotechnology — 3.9% | |
AbbVie, Inc. | | | 92,834 | | | | 8,977,976 | |
Amgen, Inc. | | | 3,299 | | | | 573,696 | |
Celgene Corp.(b) | | | 38,223 | | | | 3,988,953 | |
Gilead Sciences, Inc. | | | 99,952 | | | | 7,160,561 | |
| | | | | | | | |
| | | | | | | 20,701,186 | |
| Capital Markets — 4.1% | |
CME Group, Inc. | | | 10,067 | | | | 1,470,285 | |
Evercore, Inc., Class A | | | 21,908 | | | | 1,971,720 | |
Intercontinental Exchange, Inc. | | | 94,195 | | | | 6,646,399 | |
S&P Global, Inc. | | | 39,592 | | | | 6,706,885 | |
SEI Investments Co. | | | 72,429 | | | | 5,204,748 | |
| | | | | | | | |
| | | | | | | 22,000,037 | |
| Chemicals — 2.4% | |
Air Products & Chemicals, Inc. | | | 40,305 | | | | 6,613,244 | |
Eastman Chemical Co. | | | 54,662 | | | | 5,063,888 | |
WR Grace & Co. | | | 13,544 | | | | 949,841 | |
| | | | | | | | |
| | | | | | | 12,626,973 | |
| Commercial Services & Supplies — 0.1% | |
Brink’s Co. (The) | | | 3,580 | | | | 281,746 | |
LSC Communications, Inc. | | | 13,129 | | | | 198,904 | |
| | | | | | | | |
| | | | | | | 480,650 | |
| Communications Equipment — 0.3% | |
InterDigital, Inc. | | | 17,487 | | | | 1,331,635 | |
Palo Alto Networks, Inc.(b) | | | 2,331 | | | | 337,855 | |
| | | | | | | | |
| | | | | | | 1,669,490 | |
| Containers & Packaging — 0.3% | |
WestRock Co. | | | 23,113 | | | | 1,460,973 | |
| | | | | | | | |
| Diversified Consumer Services — 0.3% | |
H&R Block, Inc.(a) | | | 69,591 | | | | 1,824,676 | |
| | | | | | | | |
| | | | | | | | |
| Security | | Shares | | | Value | |
| Diversified Financial Services — 0.7% | |
Berkshire Hathaway, Inc., Class B(b) | | | 18,819 | | | $ | 3,730,302 | |
| | | | | | | | |
| Diversified Telecommunication Services — 0.2% | |
Zayo Group Holdings, Inc.(b) | | | 23,140 | | | | 851,552 | |
| | | | | | | | |
| Electric Utilities — 1.9% | |
Portland General Electric Co. | | | 81,937 | | | | 3,734,689 | |
Westar Energy, Inc. | | | 105,088 | | | | 5,548,646 | |
Xcel Energy, Inc. | | | 22,225 | | | | 1,069,245 | |
| | | | | | | | |
| | | | | | | 10,352,580 | |
| Electrical Equipment — 2.2% | |
AMETEK, Inc. | | | 11,609 | | | | 841,304 | |
Hubbell, Inc. | | | 33,017 | | | | 4,468,521 | |
Rockwell Automation, Inc. | | | 31,199 | | | | 6,125,924 | |
| | | | | | | | |
| | | | | | | 11,435,749 | |
| Electronic Equipment, Instruments & Components — 1.1% | |
CDW Corp. | | | 10,588 | | | | 735,760 | |
Dolby Laboratories, Inc., Class A | | | 15,622 | | | | 968,564 | |
IPG Photonics Corp.(b) | | | 5,827 | | | | 1,247,736 | |
SYNNEX Corp. | | | 2,774 | | | | 377,125 | |
TE Connectivity Ltd. | | | 16,428 | | | | 1,561,317 | |
Zebra Technologies Corp., Class A(b) | | | 7,431 | | | | 771,338 | |
| | | | | | | | |
| | | | | | | 5,661,840 | |
| Energy Equipment & Services — 0.0% | |
Halliburton Co. | | | 4,834 | | | | 236,238 | |
| | | | | | | | |
| Equity Real Estate Investment Trusts (REITs) — 2.6% | |
Alexandria Real Estate Equities, Inc.(a) | | | 2,595 | | | | 338,881 | |
Gaming and Leisure Properties, Inc. | | | 27,364 | | | | 1,012,468 | |
Outfront Media, Inc. | | | 91,484 | | | | 2,122,429 | |
Prologis, Inc. | | | 26,981 | | | | 1,740,544 | |
Simon Property Group, Inc. | | | 21,784 | | | | 3,741,184 | |
Ventas, Inc. | | | 55,961 | | | | 3,358,220 | |
Weingarten Realty Investors | | | 42,866 | | | | 1,409,005 | |
| | | | | | | | |
| | | | | | | 13,722,731 | |
| Food & Staples Retailing — 1.0% | |
Costco Wholesale Corp. | | | 9,524 | | | | 1,772,607 | |
Performance Food Group Co.(b) | | | 73,742 | | | | 2,440,860 | |
Wal-Mart Stores, Inc. | | | 12,077 | | | | 1,192,604 | |
| | | | | | | | |
| | | | | | | 5,406,071 | |
| Food Products — 2.9% | |
Archer-Daniels-Midland Co. | | | 130,436 | | | | 5,227,875 | |
Bunge Ltd. | | | 55,306 | | | | 3,709,927 | |
Hershey Co. (The) | | | 40,289 | | | | 4,573,204 | |
Kellogg Co. | | | 15,235 | | | | 1,035,675 | |
Tyson Foods, Inc., Class A | | | 12,829 | | | | 1,040,047 | |
| | | | | | | | |
| | | | | | | 15,586,728 | |
| Health Care Equipment & Supplies — 3.1% | |
Baxter International, Inc. | | | 98,333 | | | | 6,356,245 | |
Danaher Corp.(a) | | | 25,621 | | | | 2,378,141 | |
Edwards Lifesciences Corp.(b) | | | 27,563 | | | | 3,106,626 | |
IDEXX Laboratories, Inc.(b) | | | 30,562 | | | | 4,779,286 | |
| | | | | | | | |
| | | | | | | 16,620,298 | |
| Health Care Providers & Services — 2.7% | |
Aetna, Inc. | | | 6,685 | | | | 1,205,907 | |
AmerisourceBergen Corp. | | | 16,885 | | | | 1,550,381 | |
Humana, Inc. | | | 25,251 | | | | 6,264,015 | |
McKesson Corp. | | | 12,721 | | | | 1,983,840 | |
UnitedHealth Group, Inc. | | | 15,043 | | | | 3,316,380 | |
| | | | | | | | |
| | | | | | | 14,320,523 | |
| Health Care Technology — 0.5% | |
Veeva Systems, Inc., Class A(a)(b) | | | 49,708 | | | | 2,747,858 | |
| | | | | | | | |
| | | | |
| SCHEDULE OF INVESTMENTS | | | 5 | |
| | |
Schedule of Investments (continued) December 31, 2017 | | BlackRock Advantage Large Cap Core V.I. Fund (Percentages shown are based on Net Assets) |
| | | | | | | | |
| Security | | Shares | | | Value | |
| Hotels, Restaurants & Leisure — 3.0% | |
Carnival Corp. | | | 79,900 | | | $ | 5,302,963 | |
Choice Hotels International, Inc. | | | 4,120 | | | | 319,712 | |
Extended Stay America, Inc. | | | 52,268 | | | | 993,092 | |
International Game Technology plc | | | 15,360 | | | | 407,194 | |
McDonald’s Corp. | | | 50,600 | | | | 8,709,272 | |
| | | | | | | | |
| | | | | | | 15,732,233 | |
| Industrial Conglomerates — 1.7% | |
3M Co. | | | 32,857 | | | | 7,733,552 | |
General Electric Co. | | | 60,855 | | | | 1,061,920 | |
| | | | | | | | |
| | | | | | | 8,795,472 | |
| Insurance — 3.6% | |
Allstate Corp. (The) | | | 9,798 | | | | 1,025,948 | |
Aon plc | | | 3,113 | | | | 417,142 | |
Athene Holding Ltd., Class A(b) | | | 1,960 | | | | 101,352 | |
First American Financial Corp. | | | 20,647 | | | | 1,157,058 | |
Hartford Financial Services Group, Inc. (The) | | | 7,360 | | | | 414,221 | |
Lincoln National Corp. | | | 79,207 | | | | 6,088,642 | |
Marsh & McLennan Cos., Inc. | | | 37,423 | | | | 3,045,858 | |
Principal Financial Group, Inc. | | | 959 | | | | 67,667 | |
Prudential Financial, Inc. | | | 40,882 | | | | 4,700,612 | |
Reinsurance Group of America, Inc. | | | 1,127 | | | | 175,733 | |
Unum Group | | | 33,111 | | | | 1,817,463 | |
| | | | | | | | |
| | | | | | | 19,011,696 | |
| Internet & Direct Marketing Retail — 1.9%(b) | |
Amazon.com, Inc. | | | 7,039 | | | | 8,231,900 | |
Netflix, Inc. | | | 673 | | | | 129,189 | |
Priceline Group, Inc. (The) | | | 899 | | | | 1,562,228 | |
| | | | | | | | |
| | | | | | | 9,923,317 | |
| Internet Software & Services — 4.7%(b) | |
Alphabet, Inc., Class A | | | 4,767 | | | | 5,021,558 | |
Alphabet, Inc., Class C | | | 6,317 | | | | 6,610,109 | |
Facebook, Inc., Class A | | | 66,911 | | | | 11,807,115 | |
VeriSign, Inc.(a) | | | 12,799 | | | | 1,464,718 | |
Yelp, Inc. | | | 1,317 | | | | 55,261 | |
| | | | | | | | |
| | | | | | | 24,958,761 | |
| IT Services — 4.9% | |
Booz Allen Hamilton Holding Corp. | | | 8,522 | | | | 324,944 | |
Broadridge Financial Solutions, Inc. | | | 31,111 | | | | 2,818,034 | |
Euronet Worldwide, Inc.(a)(b) | | | 3,397 | | | | 286,265 | |
Fidelity National Information Services, Inc. | | | 7,677 | | | | 722,329 | |
International Business Machines Corp. | | | 36,213 | | | | 5,555,799 | |
Mastercard, Inc., Class A | | | 58,150 | | | | 8,801,584 | |
Total System Services, Inc. | | | 16,331 | | | | 1,291,619 | |
Visa, Inc., Class A | | | 54,906 | | | | 6,260,382 | |
| | | | | | | | |
| | | | | | | 26,060,956 | |
| Leisure Products — 0.1% | |
Hasbro, Inc. | | | 6,994 | | | | 635,685 | |
| | | | | | | | |
| Life Sciences Tools & Services — 0.1% | |
Waters Corp.(b) | | | 2,445 | | | | 472,350 | |
| | | | | | | | |
| Machinery — 3.8% | | | | | | |
Cummins, Inc. | | | 3,293 | | | | 581,676 | |
Graco, Inc. | | | 4,839 | | | | 218,820 | |
Illinois Tool Works, Inc. | | | 35,477 | | | | 5,919,337 | |
Ingersoll-Rand plc | | | 22,174 | | | | 1,977,699 | |
Oshkosh Corp. | | | 18,945 | | | | 1,721,911 | |
PACCAR, Inc.(a) | | | 88,998 | | | | 6,325,978 | |
Xylem, Inc. | | | 51,161 | | | | 3,489,180 | |
| | | | | | | | |
| | | | | | | 20,234,601 | |
| | | | | | | | |
| Security | | Shares | | | Value | |
| Media — 2.3% | |
Comcast Corp., Class A | | | 43,216 | | | $ | 1,730,801 | |
John Wiley & Sons, Inc., Class A | | | 44,741 | | | | 2,941,721 | |
Scripps Networks Interactive, Inc., Class A | | | 1,509 | | | | 128,838 | |
Time Warner, Inc. | | | 16,201 | | | | 1,481,905 | |
Walt Disney Co. (The) | | | 57,735 | | | | 6,207,090 | |
| | | | | | | | |
| | | | | | | 12,490,355 | |
| Metals & Mining — 1.2% | |
Newmont Mining Corp. | | | 166,279 | | | | 6,238,788 | |
| | | | | | | | |
| Multiline Retail — 1.3% | |
Kohl’s Corp.(a) | | | 18,120 | | | | 982,648 | |
Target Corp. | | | 87,998 | | | | 5,741,869 | |
| | | | | | | | |
| | | | | | | 6,724,517 | |
| Multi-Utilities — 1.5% | |
CMS Energy Corp. | | | 125,107 | | | | 5,917,561 | |
Vectren Corp. | | | 28,308 | | | | 1,840,586 | |
| | | | | | | | |
| | | | | | | 7,758,147 | |
| Oil, Gas & Consumable Fuels — 5.3% | |
Anadarko Petroleum Corp. | | | 50,606 | | | | 2,714,506 | |
ConocoPhillips | | | 129,758 | | | | 7,122,417 | |
Continental Resources, Inc.(b) | | | 2,214 | | | | 117,276 | |
Exxon Mobil Corp. | | | 47,187 | | | | 3,946,721 | |
Marathon Petroleum Corp. | | | 21,375 | | | | 1,410,322 | |
Occidental Petroleum Corp. | | | 26,740 | | | | 1,969,668 | |
Suncor Energy, Inc. | | | 63,552 | | | | 2,333,629 | |
Valero Energy Corp. | | | 72,568 | | | | 6,669,725 | |
Williams Cos., Inc. (The) | | | 66,607 | | | | 2,030,847 | |
| | | | | | | | |
| | | | | | | 28,315,111 | |
| Personal Products — 1.2% | |
Estee Lauder Cos., Inc. (The), Class A | | | 50,208 | | | | 6,388,466 | |
Herbalife Ltd.(b) | | | 1,232 | | | | 83,431 | |
| | | | | | | | |
| | | | | | | 6,471,897 | |
| Pharmaceuticals — 3.2% | |
Bristol-Myers Squibb Co. | | | 88,606 | | | | 5,429,775 | |
Catalent, Inc.(b) | | | 40,184 | | | | 1,650,759 | |
Johnson & Johnson | | | 22,926 | | | | 3,203,221 | |
Merck & Co., Inc. | | | 35,919 | | | | 2,021,162 | |
Zoetis, Inc. | | | 67,075 | | | | 4,832,083 | |
| | | | | | | | |
| | | | | | | 17,137,000 | |
| Real Estate Management & Development — 0.8% | |
CBRE Group, Inc., Class A(b) | | | 84,392 | | | | 3,655,018 | |
Jones Lang LaSalle, Inc. | | | 2,356 | | | | 350,879 | |
| | | | | | | | |
| | | | | | | 4,005,897 | |
| Road & Rail — 0.2% | |
Norfolk Southern Corp. | | | 6,507 | | | | 942,864 | |
| | | | | | | | |
| Semiconductors & Semiconductor Equipment — 3.4% | |
Intel Corp. | | | 33,990 | | | | 1,568,978 | |
KLA-Tencor Corp. | | | 4,542 | | | | 477,228 | |
Lam Research Corp. | | | 2,009 | | | | 369,797 | |
Maxim Integrated Products, Inc. | | | 91,047 | | | | 4,759,937 | |
QUALCOMM, Inc. | | | 30,319 | | | | 1,941,022 | |
Skyworks Solutions, Inc. | | | 11,642 | | | | 1,105,408 | |
Texas Instruments, Inc. | | | 76,907 | | | | 8,032,167 | |
| | | | | | | | |
| | | | | | | 18,254,537 | |
| Software — 4.5% | |
Activision Blizzard, Inc. | | | 101,945 | | | | 6,455,157 | |
Adobe Systems, Inc.(b) | | | 20,987 | | | | 3,677,762 | |
Intuit, Inc. | | | 4,069 | | | | 642,007 | |
Microsoft Corp. | | | 88,422 | | | | 7,563,618 | |
Oracle Corp. | | | 117,342 | | | | 5,547,930 | |
| | |
| 6 | | 2017 BLACKROCK ANNUAL REPORTTO SHAREHOLDERS |
| | |
Schedule of Investments (continued) December 31, 2017 | | BlackRock Advantage Large Cap Core V.I. Fund (Percentages shown are based on Net Assets) |
| | | | | | | | |
| Security | | Shares | | | Value | |
| Software (continued) | |
RingCentral, Inc., Class A(b) | | | 1,181 | | | $ | 57,160 | |
Verint Systems, Inc.(b) | | | 5,773 | | | | 241,600 | |
| | | | | | | | |
| | | | | | | 24,185,234 | |
| Specialty Retail — 1.6% | |
Aaron’s, Inc. | | | 24,368 | | | | 971,065 | |
Lowe’s Cos., Inc. | | | 46,204 | | | | 4,294,200 | |
Penske Automotive Group, Inc.(a) | | | 68,417 | | | | 3,273,753 | |
| | | | | | | | |
| | | | | | | 8,539,018 | |
| Technology Hardware, Storage & Peripherals — 3.9% | |
Apple, Inc. | | | 112,647 | | | | 19,063,252 | |
HP, Inc. | | | 61,600 | | | | 1,294,216 | |
Pure Storage, Inc., Class A(b) | | | 24,817 | | | | 393,597 | |
| | | | | | | | |
| | | | | | | 20,751,065 | |
| Textiles, Apparel & Luxury Goods — 0.6% | |
Ralph Lauren Corp. | | | 7,613 | | | | 789,392 | |
Skechers U.S.A., Inc., Class A(b) | | | 64,311 | | | | 2,433,528 | |
| | | | | | | | |
| | | | | | | 3,222,920 | |
| Thrifts & Mortgage Finance — 0.4% | |
Essent Group Ltd.(b) | | | 50,487 | | | | 2,192,146 | |
| | | | | | | | |
| Tobacco — 1.2% | |
Altria Group, Inc. | | | 89,049 | | | | 6,358,989 | |
| | | | | | | | |
| Wireless Telecommunication Services — 1.3%(a) | |
Sprint Corp. | | | 138,130 | | | | 813,586 | |
Telephone & Data Systems, Inc. | | | 46,760 | | | | 1,299,928 | |
T-Mobile US, Inc.(b) | | | 76,795 | | | | 4,877,250 | |
| | | | | | | | |
| | | | | | | 6,990,764 | |
| | | | | | | | |
| |
Total Common Stocks — 99.0%
(Cost: $472,962,785) | | | | 526,838,038 | |
| | | | | | | | |
| |
Total Long-Term Investments — 99.0%
(Cost: $472,962,785) | | | | 526,838,038 | |
| | | | | | | | |
| | | | | | | | |
| Security | | Shares | | | Value | |
Short-Term Securities — 2.5%(c)(e) | |
BlackRock Liquidity Funds, T-Fund, Institutional Class,
1.17% | | | 4,977,061 | | | $ | 4,977,061 | |
SL Liquidity Series, LLC, Money Market Series,
1.48%(d) | | | 8,447,651 | | | | 8,446,806 | |
| | | | | | | | |
Total Short-Term Securities — 2.5%
(Cost: $13,423,888) | | | | 13,423,867 | |
| | | | | | | | |
| |
Total Investments — 101.5%
(Cost: $486,386,673) | | | | 540,261,905 | |
Liabilities in Excess of Other Assets — (1.5)% | | | | (7,832,363 | ) |
| | | | | | | | |
Net Assets — 100.0% | | | $ | 532,429,542 | |
| | | | | | | | |
| (a) | Security, or a portion of the security, is on loan. |
| (b) | Non-income producing security. |
| (c) | Annualized 7-day yield as of period end. |
| (d) | Security was purchased with the cash collateral from loaned securities. |
| (e) | During the year ended December 31, 2017, investments in issuers considered to be affiliates of the Fund for the purposes of Section 2(a)(3) of the Investment Company Act of 1940, as amended, were as follows: |
| | | | | | | | | | | | | | | | | | | | | | | | | | | | |
| Affiliate | | Shares
Held at
12/31/16 | | | Net Activity | | | Shares
Held at
12/31/17 | | | Value at
12/31/17 | | | Income | | | Net Realized
Gain (Loss) (a) | | | Change in
Unrealized
Appreciation
(Depreciation) | |
BlackRock Liquidity Funds, T-Fund, Institutional Class | | | 16,275,353 | | | | (11,298,292 | ) | | | 4,977,061 | | | $ | 4,977,061 | | | $ | 58,563 | | | $ | 19 | | | $ | — | |
SL Liquidity Series, LLC, Money Market Series | | | 15,692,070 | | | | (7,244,419 | ) | | | 8,447,651 | | | | 8,446,806 | | | | 58,039 | (b) | | | (3,796 | ) | | | 1,465 | |
| | | | | | | | | | | | | | | | | | | | | | | | | | | | |
| | | | | | | | | | | | | | $ | 13,423,867 | | | $ | 116,602 | | | $ | (3,777 | ) | | $ | 1,465 | |
| | | | | | | | | | | | | | | | | | | | | | | | | | | | |
| | (a) | Includes net capital gain distributions, if applicable. | |
| | (b) | Represents securities lending income earned from the reinvestment of cash collateral from loaned securities, net of fees and collateral investment expenses, and other payments to and from borrowers of securities. | |
For Fund compliance purposes, the Fund’s industry classifications refer to one or more of the industry sub-classifications used by one or more widely recognized market indexes or ratings group indexes, and/or as defined by the investment advisor. These definitions may not apply for purposes of this report, which may combine such industry sub-classifications for reporting ease.
Derivative Financial Instruments Outstanding as of Period End
Futures Contracts
| | | | | | | | | | | | | | | | |
| Description | | Number of
Contracts | | | Expiration
Date | | | Notional
Amount (000) | | | Value/
Unrealized
Appreciation
(Depreciation) | |
Long Contracts | | | | | | | | | | | | | | | | |
S&P 500 E-Mini Index | | | 48 | | | | 03/16/18 | | | $ | 6,422 | | | $ | 35,726 | |
| | | | | | | | | | | | | | | | |
| | | | |
| SCHEDULE OF INVESTMENTS | | | 7 | |
| | |
Schedule of Investments (continued) December 31, 2017 | | BlackRock Advantage Large Cap Core V.I. Fund |
Derivative Financial Instruments Categorized by Risk Exposure
As of period end, the fair values of derivative financial instruments located in the Statement of Assets and Liabilities were as follows:
| | | | | | | | | | | | | | | | | | | | | | | | | | | | |
| | | Commodity
Contracts | | | Credit
Contracts | | | Equity
Contracts | | | Foreign
Currency
Exchange
Contracts | | | Interest
Rate
Contracts | | | Other
Contracts | | | Total | |
Assets — Derivative Financial Instruments | | | | | | | | | | | | | | | | | | | | | | | | | | | | |
Futures contracts | | | | | | | | | | | | | | | | | | | | | | | | | | | | |
Net unrealized appreciation(a) | | $ | — | | | $ | — | | | $ | 35,726 | | | $ | — | | | $ | — | | | $ | — | | | $ | 35,726 | |
| | | | | | | | | | | | | | | | | | | | | | | | | | | | |
| | (a) | Includes cumulative appreciation (depreciation) on futures contracts, if any, as reported in the Schedule of Investments. Only current day’s variation margin is reported within the Statement of Assets and Liabilities. | |
For the year ended December 31, 2017, the effect of derivative financial instruments in the Statement of Operations was as follows:
| | | | | | | | | | | | | | | | | | | | | | | | | | | | |
| | | Commodity
Contracts | | | Credit
Contracts | | | Equity
Contracts | | | Foreign
Currency
Exchange
Contracts | | | Interest
Rate
Contracts | | | Other
Contracts | | | Total | |
Net Realized Gain from: | | | | | | | | | | | | | | | | | | | | | | | | | | | | |
Futures contracts | | $ | — | | | $ | — | | | $ | 671,664 | | | $ | — | | | $ | — | | | $ | — | | | $ | 671,664 | |
| | | | | | | | | | | | | | | | | | | | | | | | | | | | |
| Net Change in Unrealized Appreciation (Depreciation) on: | | | | | | | | | | | | | | | | | | | | | |
Futures contracts | | $ | — | | | $ | — | | | $ | 126,008 | | | $ | — | | | $ | — | | | $ | — | | | $ | 126,008 | |
| | | | | | | | | | | | | | | | | | | | | | | | | | | | |
Average Quarterly Balances of Outstanding Derivative Financial Instruments
| | | | |
Futures contracts: | | | | |
Average notional value of contracts — long | | $ | 4,592,108 | |
For more information about the Fund’s investment risks regarding derivative financial instruments, refer to the Notes to Financial Statements.
Fair Value Hierarchy as of Period End
Various inputs are used in determining the fair value of investments and derivative financial instruments. For information about the Fund’s policy regarding valuation of investments and derivative financial instruments, refer to the Notes to Financial Statements.
The following tables summarize the Fund’s investments and derivative financial instruments categorized in the disclosure hierarchy:
| | | | | | | | | | | | | | | | |
| | | Level 1 | | | Level 2 | | | Level 3 | | | Total | |
Investments: | | | | | | | | | | | | | | | | |
Assets: | | | | | | | | | | | | | | | | |
Long-Term Investments | | | | | | | | | | | | | | | | |
Common Stocks(a) | | $ | 526,838,038 | | | $ | — | | | $ | — | | | $ | 526,838,038 | |
Short-Term Securities | | | 4,977,061 | | | | — | | | | — | | | | 4,977,061 | |
| | | | | | | | | | | | | | | | |
Subtotal | | $ | 531,815,099 | | | $ | — | | | $ | — | | | $ | 531,815,099 | |
| | | | | | | | | | | | | | | | |
Investments valued at NAV(b) | | | | | | | | | | | | | | | 8,446,806 | |
| | | | | | | | | | | | | | | | |
Total Investments | | | | | | | | | | | | | | $ | 540,261,905 | |
| | | | | | | | | | | | | | | | |
Derivative Financial Instruments(c) | | | | | | | | | | | | | | | | |
Assets: | | | | | | | | | | | | | | | | |
Equity contracts | | $ | 35,726 | | | $ | — | | | $ | — | | | $ | 35,726 | |
| | | | | | | | | | | | | | | | |
| | (a) | See above Schedule of Investments for values in each industry. | |
| | (b) | As of December 31, 2017, certain investments of the Fund were fair valued using NAV per share as no quoted market value is available and therefore have been excluded from the fair value hierarchy. | |
| | (c) | Derivative financial instruments are futures contracts, which are valued at the unrealized appreciation (depreciation) on the instrument. | |
During the year ended December 31, 2017, there were no transfers between levels.
See notes to financial statements.
| | |
| 8 | | 2017 BLACKROCK ANNUAL REPORTTO SHAREHOLDERS |
Statement of Assets and Liabilities
December 31, 2017
| | | | |
| | | BlackRock
Advantage
Large Cap Core
V.I. Fund | |
|
ASSETS | |
Investments at value — unaffiliated (including securities loaned at value of $8,166,397) (cost — $472,962,785) | | $ | 526,838,038 | |
Investments at value — affiliated (cost — $13,423,888) | | | 13,423,867 | |
Cash | | | 787 | |
Cash pledged for futures contracts | | | 206,000 | |
Receivables: | | | | |
Investments sold | | | 6,040,879 | |
Securities lending income — affiliated | | | 1,212 | |
Capital shares sold | | | 20,865 | |
Dividends — affiliated | | | 4,650 | |
Dividends — unaffiliated | | | 672,587 | |
Prepaid expenses | | | 2,485 | |
| | | | |
Total assets | | | 547,211,370 | |
| | | | |
|
LIABILITIES | |
Cash collateral on securities loaned at value | | | 8,447,600 | |
Payables: | | | | |
Investments purchased | | | 5,424,779 | |
Capital shares redeemed | | | 302,023 | |
Distribution fees | | | 73,115 | |
Variation margin on futures contracts | | | 21,815 | |
Investment advisory fees | | | 251,671 | |
Officer’s and Directors’ fees | | | 4,855 | |
Other affiliates | | | 1,008 | |
Other accrued expenses | | | 254,962 | |
| | | | |
Total liabilities | | | 14,781,828 | |
| | | | |
| |
NET ASSETS | | $ | 532,429,542 | |
| | | | |
|
NET ASSETS CONSIST OF | |
Paid-in capital | | $ | 469,610,703 | |
Undistributed net investment income | | | 36,205 | |
Accumulated net realized gain | | | 8,871,065 | |
Net unrealized appreciation (depreciation) | | | 53,911,569 | |
| | | | |
NET ASSETS | | $ | 532,429,542 | |
| | | | |
|
NET ASSET VALUE | |
Class I — Based on net assets of $185,938,116 and 6,536,460 shares outstanding, 200 million shares authorized, $0.10 par value. | | $ | 28.45 | |
| | | | |
Class II — Based on net assets of $4,861,652 and 170,765 shares outstanding, 100 million shares authorized, $0.10 par value. | | $ | 28.47 | |
| | | | |
Class III — Based on net assets of $341,629,774 and 12,103,286 shares outstanding, 100 million shares authorized, $0.10 par value. | | $ | 28.23 | |
| | | | |
See notes to financial statements.
Statement of Operations
Year Ended December 31, 2017
| | | | |
| | | BlackRock
Advantage
Large Cap Core
V.I. Fund | |
| |
INVESTMENT INCOME | | | | |
Dividends — affiliated | | $ | 58,563 | |
Dividends — unaffiliated | | | 9,445,844 | |
Securities lending income — affiliated — net | | | 58,039 | |
Foreign taxes withheld | | | (45,064 | ) |
| | | | |
Total investment income | | | 9,517,382 | |
| | | | |
| |
EXPENSES | | | | |
Investment advisory | | | 2,364,757 | |
Transfer agent — class specific | | | 1,060,499 | |
Distribution — class specific | | | 834,053 | |
Accounting services | | | 91,674 | |
Printing | | | 70,205 | |
Professional | | | 66,664 | |
Custodian | | | 46,423 | |
Directors and Officer | | | 26,971 | |
Transfer agent | | | 5,000 | |
Miscellaneous | | | 60,703 | |
| | | | |
Total expenses | | | 4,626,949 | |
Less: | | | | |
Transfer agent fees reimbursed — class specific | | | (704,713 | ) |
Fees waived and/or reimbursed by the Manager | | | (5,601 | ) |
| | | | |
Total expenses after fees waived and/or reimbursed | | | 3,916,635 | |
| | | | |
Net investment income | | | 5,600,747 | |
| | | | |
| |
REALIZED AND UNREALIZED GAIN (LOSS) | | | | |
Net realized gain (loss) from: | | | | |
Investments — affiliated | | | (3,796 | ) |
Investments — unaffiliated | | | 141,377,766 | |
Capital gain distributions from investment companies — affiliated | | | 19 | |
Foreign currency transactions | | | (655 | ) |
Futures contracts | | | 671,664 | |
| | | | |
| | | 142,044,998 | |
| | | | |
Net change in unrealized appreciation (depreciation) on: | | | | |
Investments — affiliated | | | 1,465 | |
Investments — unaffiliated | | | (44,490,610 | ) |
Foreign currency translations | | | 611 | |
Futures contracts | | | 126,008 | |
| | | | |
| | | (44,362,526 | ) |
| | | | |
Net realized and unrealized gain | | | 97,682,472 | |
| | | | |
NET INCREASE IN NET ASSETS RESULTING FROM OPERATIONS | | $ | 103,283,219 | |
| | | | |
See notes to financial statements.
| | |
| 10 | | 2017 BLACKROCK ANNUAL REPORTTO SHAREHOLDERS |
Statements of Changes in Net Assets
| | | | | | | | |
| | | BlackRock Advantage Large Cap
Core V.I. Fund | |
| | | Year Ended December 31, | |
| | | 2017 | | | 2016 | |
| | |
INCREASE (DECREASE) IN NET ASSETS | | | | | | | | |
| | |
OPERATIONS | | | | | | | | |
Net investment income | | $ | 5,600,747 | | | $ | 5,228,756 | |
Net realized gain | | | 142,044,998 | | | | 40,746,201 | |
Net change in unrealized appreciation (depreciation) | | | (44,362,526 | ) | | | 3,376,349 | |
| | | | | | | | |
Net increase in net assets resulting from operations | | | 103,283,219 | | | | 49,351,306 | |
| | | | | | | | |
| | |
DISTRIBUTIONS TO SHAREHOLDERS(a) | | | | | | | | |
From net investment income: | | | | | | | | |
Class I | | | (2,307,598 | ) | | | (2,047,574 | ) |
Class II | | | (51,894 | ) | | | (53,362 | ) |
Class III | | | (3,340,143 | ) | | | (2,999,067 | ) |
From net realized gain: | | | | | | | | |
Class I | | | (49,237,913 | ) | | | (12,366,480 | ) |
Class II | | | (1,276,586 | ) | | | (370,135 | ) |
Class III | | | (91,053,975 | ) | | | (23,127,170 | ) |
| | | | | | | | |
Decrease in net assets resulting from distributions to shareholders | | | (147,268,109 | ) | | | (40,963,788 | ) |
| | | | | | | | |
| | |
CAPITAL SHARE TRANSACTIONS | | | | | | | | |
Net increase in net assets derived from capital share transactions | | | 67,256,971 | | | | 4,719,038 | |
| | | | | | | | |
| | |
NET ASSETS | | | | | | | | |
Total increase in net assets | | | 23,272,081 | | | | 13,106,556 | |
Beginning of year | | | 509,157,461 | | | | 496,050,905 | |
| | | | | | | | |
End of year | | $ | 532,429,542 | | | $ | 509,157,461 | |
| | | | | | | | |
Undistributed net investment income, end of year | | $ | 36,205 | | | $ | 135,748 | |
| | | | | | | | |
| (a) | Distributions for annual periods determined in accordance with U.S. federal income tax regulations. |
See notes to financial statements.
Financial Highlights
(For a share outstanding throughout each period)
| | | | | | | | | | | | | | | | | | | | |
| | | BlackRock Advantage Large Cap Core V.I. Fund | |
| | | Class I | |
| | | Year Ended December 31, | |
| | | 2017 | | | 2016 | | | 2015 | | | 2014 | | | 2013 | |
Net asset value, beginning of year | | $ | 31.91 | | | $ | 31.40 | | | $ | 33.26 | | | $ | 33.80 | | | $ | 25.55 | |
| | | | | | | | | | | | | | | | | | | | |
Net investment income(a) | | | 0.44 | | | | 0.39 | | | | 0.36 | | | | 0.34 | | | | 0.30 | |
Net realized and unrealized gain (loss) | | | 6.64 | | | | 2.91 | | | | (0.16 | ) | | | 3.86 | | | | 8.27 | |
| | | | | | | | | | | | | | | | | | | | |
Net increase from investment operations | | | 7.08 | | | | 3.30 | | | | 0.20 | | | | 4.20 | | | | 8.57 | |
| | | | | | | | | | | | | | | | | | | | |
| Distributions:(b) | | | | | | | | | | | | | | | |
From net investment income | | | (0.47 | ) | | | (0.40 | ) | | | (0.39 | ) | | | (0.36 | ) | | | (0.32 | ) |
From net realized gain | | | (10.07 | ) | | | (2.39 | ) | | | (1.67 | ) | | | (4.38 | ) | | | — | |
| | | | | | | | | | | | | | | | | | | | |
Total distributions | | | (10.54 | ) | | | (2.79 | ) | | | (2.06 | ) | | | (4.74 | ) | | | (0.32 | ) |
| | | | | | | | | | | | | | | | | | | | |
Net asset value, end of year | | $ | 28.45 | | | $ | 31.91 | | | $ | 31.40 | | | $ | 33.26 | | | $ | 33.80 | |
| | | | | | | | | | | | | | | | | | | | |
| | | | | |
Total Return:(c) | | | | | | | | | | | | | | | | | | | | |
Based on net asset value | | | 22.33 | % | | | 10.55 | % | | | 0.52 | % | | | 12.36 | % | | | 33.56 | % |
| | | | | | | | | | | | | | | | | | | | |
| | | | | |
Ratios to Average Net Assets: | | | | | | | | | | | | | | | | | | | | |
Total expenses | | | 0.73 | % | | | 0.72 | % | | | 0.71 | % | | | 0.73 | % | | | 0.73 | % |
| | | | | | | | | | | | | | | | | | | | |
Total expenses after fees waived and/or reimbursed | | | 0.58 | % | | | 0.58 | % | | | 0.56 | % | | | 0.57 | % | | | 0.58 | % |
| | | | | | | | | | | | | | | | | | | | |
Net investment income | | | 1.27 | % | | | 1.26 | % | | | 1.08 | % | | | 0.97 | % | | | 1.03 | % |
| | | | | | | | | | | | | | | | | | | | |
| | | | | |
Supplemental Data: | | | | | | | | | | | | | | | | | | | | |
Net assets, end of year (000) | | $ | 185,938 | | | $ | 175,947 | | | $ | 184,151 | | | $ | 212,067 | | | $ | 219,418 | |
| | | | | | | | | | | | | | | | | | | | |
Portfolio turnover rate | | | 149 | % | | | 50 | % | | | 31 | % | | | 48 | % | | | 42 | % |
| | | | | | | | | | | | | | | | | | | | |
| (a) | Based on average shares outstanding. |
| (b) | Distributions for annual periods determined in accordance with U.S. federal income tax regulations. |
| (c) | Where applicable, excludes insurance-related fees and expenses and assumes the reinvestment of distributions. |
See notes to financial statements.
| | |
| 12 | | 2017 BLACKROCK ANNUAL REPORTTO SHAREHOLDERS |
Financial Highlights (continued)
(For a share outstanding throughout each period)
| | | | | | | | | | | | | | | | | | | | |
| | | BlackRock Advantage Large Cap Core V.I. Fund | |
| | | Class II | |
| | | Year Ended December 31, | |
| | | 2017 | | | 2016 | | | 2015 | | | 2014 | | | 2013 | |
Net asset value, beginning of year | | $ | 31.93 | | | $ | 31.42 | | | $ | 33.27 | | | $ | 33.79 | | | $ | 25.56 | |
| | | | | | | | | | | | | | | | | | | | |
Net investment income(a) | | | 0.38 | | | | 0.34 | | | | 0.30 | | | | 0.28 | | | | 0.25 | |
Net realized and unrealized gain (loss) | | | 6.64 | | | | 2.90 | | | | (0.16 | ) | | | 3.87 | | | | 8.25 | |
| | | | | | | | | | | | | | | | | | | | |
Net increase from investment operations | | | 7.02 | | | | 3.24 | | | | 0.14 | | | | 4.15 | | | | 8.50 | |
| | | | | | | | | | | | | | | | | | | | |
| Distributions:(b) | | | | | | | | | | | | | | | |
From net investment income | | | (0.41 | ) | | | (0.34 | ) | | | (0.32 | ) | | | (0.29 | ) | | | (0.27 | ) |
From net realized gain | | | (10.07 | ) | | | (2.39 | ) | | | (1.67 | ) | | | (4.38 | ) | | | — | |
| | | | | | | | | | | | | | | | | | | | |
Total distributions | | | (10.48 | ) | | | (2.73 | ) | | | (1.99 | ) | | | (4.67 | ) | | | (0.27 | ) |
| | | | | | | | | | | | | | | | | | | | |
Net asset value, end of year | | $ | 28.47 | | | $ | 31.93 | | | $ | 31.42 | | | $ | 33.27 | | | $ | 33.79 | |
| | | | | | | | | | | | | | | | | | | | |
| | | | | |
Total Return:(c) | | | | | | | | | | | | | | | | | | | | |
Based on net asset value | | | 22.12 | % | | | 10.37 | % | | | 0.34 | % | | | 12.23 | % | | | 33.28 | % |
| | | | | | | | | | | | | | | | | | | | |
| | | | | |
Ratios to Average Net Assets: | | | | | | | | | | | | | | | | | | | | |
Total expenses | | | 0.88 | % | | | 0.88 | % | | | 0.85 | % | | | 0.89 | % | | | 0.86 | % |
| | | | | | | | | | | | | | | | | | | | |
Total expenses after fees waived and/or reimbursed | | | 0.75 | % | | | 0.75 | % | | | 0.73 | % | | | 0.74 | % | | | 0.75 | % |
| | | | | | | | | | | | | | | | | | | | |
Net investment income | | | 1.08 | % | | | 1.09 | % | | | 0.91 | % | | | 0.81 | % | | | 0.86 | % |
| | | | | | | | | | | | | | | | | | | | |
| | | | | |
Supplemental Data: | | | | | | | | | | | | | | | | | | | | |
Net assets, end of year (000) | | $ | 4,862 | | | $ | 5,170 | | | $ | 5,333 | | | $ | 6,203 | | | $ | 6,080 | |
| | | | | | | | | | | | | | | | | | | | |
Portfolio turnover rate | | | 149 | % | | | 50 | % | | | 31 | % | | | 48 | % | | | 42 | % |
| | | | | | | | | | | | | | | | | | | | |
| (a) | Based on average shares outstanding. |
| (b) | Distributions for annual periods determined in accordance with U.S. federal income tax regulations. |
| (c) | Where applicable, excludes insurance-related fees and expenses and assumes the reinvestment of distributions. |
See notes to financial statements.
Financial Highlights (continued)
(For a share outstanding throughout each period)
| | | | | | | | | | | | | | | | | | | | |
| | | BlackRock Advantage Large Cap Core V.I. Fund | |
| | | Class III | |
| | | Year Ended December 31, | |
| | | 2017 | | | 2016 | | | 2015 | | | 2014 | | | 2013 | |
Net asset value, beginning of year | | $ | 31.74 | | | $ | 31.25 | | | $ | 33.11 | | | $ | 33.66 | | | $ | 25.46 | |
| | | | | | | | | | | | | | | | | | | | |
Net investment income(a) | | | 0.34 | | | | 0.31 | | | | 0.27 | | | | 0.24 | | | | 0.22 | |
Net realized and unrealized gain (loss) | | | 6.59 | | | | 2.88 | | | | (0.17 | ) | | | 3.84 | | | | 8.22 | |
| | | | | | | | | | | | | | | | | | | | |
Net increase from investment operations | | | 6.93 | | | | 3.19 | | | | 0.10 | | | | 4.08 | | | | 8.44 | |
| | | | | | | | | | | | | | | | | | | | |
| Distributions:(b) | | | | | | | | | | | | | | | |
From net investment income | | | (0.37 | ) | | | (0.31 | ) | | | (0.29 | ) | | | (0.25 | ) | | | (0.24 | ) |
From net realized gain | | | (10.07 | ) | | | (2.39 | ) | | | (1.67 | ) | | | (4.38 | ) | | | — | |
| | | | | | | | | | | | | | | | | | | | |
Total distributions | | | (10.44 | ) | | | (2.70 | ) | | | (1.96 | ) | | | (4.63 | ) | | | (0.24 | ) |
| | | | | | | | | | | | | | | | | | | | |
Net asset value, end of year | | $ | 28.23 | | | $ | 31.74 | | | $ | 31.25 | | | $ | 33.11 | | | $ | 33.66 | |
| | | | | | | | | | | | | | | | | | | | |
| | | | | |
Total Return:(c) | | | | | | | | | | | | | | | | | | | | |
Based on net asset value | | | 21.97 | % | | | 10.26 | % | | | 0.23 | % | | | 12.07 | % | | | 33.16 | % |
| | | | | | | | | | | | | | | | | | | | |
| | | | | |
Ratios to Average Net Assets: | | | | | | | | | | | | | | | | | | | | |
Total expenses | | | 0.99 | % | | | 0.97 | % | | | 0.96 | % | | | 0.98 | % | | | 0.99 | % |
| | | | | | | | | | | | | | | | | | | | |
Total expenses after fees waived and/or reimbursed | | | 0.86 | % | | | 0.86 | % | | | 0.84 | % | | | 0.85 | % | | | 0.86 | % |
| | | | | | | | | | | | | | | | | | | | |
Net investment income | | | 0.98 | % | | | 0.98 | % | | | 0.80 | % | | | 0.69 | % | | | 0.75 | % |
| | | | | | | | | | | | | | | | | | | | |
| | | | | |
Supplemental Data: | | | | | | | | | | | | | | | | | | | | |
Net assets, end of year (000) | | $ | 341,630 | | | $ | 328,040 | | | $ | 306,567 | | | $ | 322,418 | | | $ | 300,005 | |
| | | | | | | | | | | | | | | | | | | | |
Portfolio turnover rate | | | 149 | % | | | 50 | % | | | 31 | % | | | 48 | % | | | 42 | % |
| | | | | | | | | | | | | | | | | | | | |
| (a) | Based on average shares outstanding. |
| (b) | Distributions for annual periods determined in accordance with U.S. federal income tax regulations. |
| (c) | Where applicable, excludes insurance-related fees and expenses and assumes the reinvestment of distributions. |
See notes to financial statements.
| | |
| 14 | | 2017 BLACKROCK ANNUAL REPORTTO SHAREHOLDERS |
Notes to Financial Statements
BlackRock Variable Series Funds, Inc. (the “Company”) is registered under the Investment Company Act of 1940, as amended (the “1940 Act”), as an open-end management investment company. The Company is organized as a Maryland corporation that is comprised of 20 separate funds. The funds offer shares to insurance companies for their separate accounts to fund benefits under certain variable annuity and variable life insurance contracts. The financial statements presented are for BlackRock Advantage Large Cap Core V.I. Fund (the “Fund”) (formerly known as BlackRock Large Cap Core V.I. Fund). The Fund is classified as diversified. Class I, Class II and Class III Shares have equal voting, dividend, liquidation and other rights, except that only shares of the respective classes are entitled to vote on matters concerning only that class. In addition, Class II and Class III Shares bear certain expenses related to the distribution of such shares.
The Fund, together with certain other registered investment companies advised by BlackRock Advisors, LLC (the “Manager”) or its affiliates, is included in a complex of open-end funds referred to as the Equity-Bond Complex.
| 2. | SIGNIFICANT ACCOUNTING POLICIES |
The financial statements are prepared in conformity with accounting principles generally accepted in the United States of America (“U.S. GAAP”), which may require management to make estimates and assumptions that affect the reported amounts of assets and liabilities in the financial statements, disclosure of contingent assets and liabilities at the date of the financial statements and the reported amounts of increases and decreases in net assets from operations during the reporting period. Actual results could differ from those estimates. The Fund is considered an investment company under U.S. GAAP and follows the accounting and reporting guidance applicable to investment companies. Below is a summary of significant accounting policies:
Segregation and Collateralization: In cases where the Fund enters into certain investments (e.g., futures contracts) that would be treated as “senior securities” for 1940 Act purposes, the Fund may segregate or designate on its books and records cash or liquid assets having a market value at least equal to the amount of the Fund’s future obligations under such investments. Doing so allows the investment to be excluded from treatment as a “senior security.” Furthermore, if required by an exchange or counterparty agreement, the Fund may be required to deliver/deposit cash and/or securities to/with an exchange, or broker-dealer or custodian as collateral for certain investments or obligations.
Investment Transactions and Income Recognition: For financial reporting purposes, investment transactions are recorded on the dates the transactions are entered into (the trade dates). Realized gains and losses on investment transactions are determined on the identified cost basis. Dividend income is recorded on the ex-dividend date. Dividends from foreign securities where the ex-dividend date may have passed are subsequently recorded when the Fund is informed of the ex-dividend date. Under the applicable foreign tax laws, a withholding tax at various rates may be imposed on capital gains, dividends and interest. Income, expenses and realized and unrealized gains and losses are allocated daily to each class based on its relative net assets.
Foreign Currency Translation: The Fund’s books and records are maintained in U.S. dollars. Securities and other assets and liabilities denominated in foreign currencies are translated into U.S. dollars using exchange rates determined as of the close of trading on the New York Stock Exchange (“NYSE”). Purchases and sales of investments are recorded at the rates of exchange prevailing on the respective dates of such transactions. Generally, when the U.S. dollar rises in value against a foreign currency, the investments denominated in that currency will lose value; the opposite effect occurs if the U.S. dollar falls in relative value.
The Fund does not isolate the portion of the results of operations arising as a result of changes in the exchange rates from the changes in the market prices of investments held or sold for financial reporting purposes. Accordingly, the effects of changes in exchange rates on investments are not segregated in the Statement of Operations from the effects of changes in market prices of those investments, but are included as a component of net realized and unrealized gain (loss) from investments. The Fund reports realized currency gains (losses) on foreign currency related transactions as components of net realized gain (loss) for financial reporting purposes, whereas such components are generally treated as ordinary income for U.S. federal income tax purposes.
Distributions: Distributions paid by the Fund are recorded on the ex-dividend date. Distributions of capital gains are recorded on the ex-dividend date and made at least annually. The character and timing of distributions are determined in accordance with U.S. federal income tax regulations, which may differ from U.S. GAAP.
Indemnifications: In the normal course of business, the Fund enters into contracts that contain a variety of representations that provide general indemnification. The Fund’s maximum exposure under these arrangements is unknown because it involves future potential claims against the Fund, which cannot be predicted with any certainty.
Other: Expenses directly related to the Fund or its classes are charged to the Fund or the applicable class. Other operating expenses shared by several funds, including other funds managed by the Manager, are prorated among those funds on the basis of relative net assets or other appropriate methods. Expenses directly related to the Fund and other shared expenses prorated to the Fund are allocated daily to each class based on its relative net assets or other appropriate methods.
| 3. | INVESTMENT VALUATION AND FAIR VALUE MEASUREMENTS |
Investment Valuation Policies: The Fund’s investments are valued at fair value (also referred to as “market value” within the financial statements) as of the close of trading on the New York Stock Exchange (“NYSE”) (generally 4:00 p.m., Eastern time) (or if the reporting date falls on a day the NYSE is closed, investments are valued at fair value as of the period end). U.S. GAAP defines fair value as the price the Fund would receive to sell an asset or pay to transfer a liability in an orderly transaction between market participants at the measurement date. The Fund determines the fair values of its financial instruments using various independent dealers or pricing services under policies approved by the Board of Directors of the Company (the “Board”). The BlackRock Global Valuation Methodologies Committee (the “Global Valuation Committee”) is the committee formed by management to develop global pricing policies and procedures and to oversee the pricing function for all financial instruments.
| | | | |
| NOTESTO FINANCIAL STATEMENTS | | | 15 | |
Notes to Financial Statements (continued)
Fair Value Inputs and Methodologies: The following methods and inputs are used to establish the fair value of the Fund’s assets and liabilities:
| | • | | Equity investments traded on a recognized securities exchange are valued at the official closing price each day, if available. For equity investments traded on more than one exchange, the official closing price on the exchange where the stock is primarily traded is used. Equity investments traded on a recognized exchange for which there were no sales on that day may be valued at the last available bid (long positions) or ask (short positions) price. |
| | • | | Investments in open-end U.S. mutual funds are valued at net asset value (“NAV”) each business day. |
| | • | | The Fund values its investment in SL Liquidity Series, LLC, Money Market Series (the “Money Market Series”) at fair value, which is ordinarily based upon its pro rata ownership in the underlying fund’s net assets. The Money Market Series seeks current income consistent with maintaining liquidity and preserving capital. Although the Money Market Series is not registered under the 1940 Act, its investments may follow the parameters of investments by a money market fund that is subject to Rule 2a-7 under the 1940 Act. |
| | • | | Futures contracts traded on exchanges are valued at their last sale price. |
If events (e.g., a company announcement, market volatility or a natural disaster) occur that are expected to materially affect the value of such instruments, or in the event that the application of these methods of valuation results in a price for an investment that is deemed not to be representative of the market value of such investment, or if a price is not available, the investment will be valued by the Global Valuation Committee, or its delegate, in accordance with a policy approved by the Board as reflecting fair value (“Fair Valued Investments”). The fair valuation approaches that may be used by the Global Valuation Committee will include market approach, income approach and the cost approach. Valuation techniques such as discounted cash flow, use of market comparables and matrix pricing are types of valuation approaches and are typically used in determining fair value. When determining the price for Fair Valued Investments, the Global Valuation Committee, or its delegate, seeks to determine the price that the Fund might reasonably expect to receive or pay from the current sale or purchase of that asset or liability in an arm’s-length transaction. Fair value determinations shall be based upon all available factors that the Global Valuation Committee, or its delegate, deems relevant and consistent with the principles of fair value measurement. The pricing of all Fair Valued Investments is subsequently reported to the Board or a committee thereof on a quarterly basis.
Fair Value Hierarchy: Various inputs are used in determining the fair value of investments and derivative financial instruments. These inputs to valuation techniques are categorized into a fair value hierarchy consisting of three broad levels for financial statement purposes as follows:
| | • | | Level 1 — Unadjusted price quotations in active markets/exchanges for identical assets or liabilities that the Fund has the ability to access |
| | • | | Level 2 — Other observable inputs (including, but not limited to, quoted prices for similar assets or liabilities in markets that are active, quoted prices for identical or similar assets or liabilities in markets that are not active, inputs other than quoted prices that are observable for the assets or liabilities (such as interest rates, yield curves, volatilities, prepayment speeds, loss severities, credit risks and default rates) or other market– corroborated inputs) |
| | • | | Level 3 — Unobservable inputs based on the best information available in the circumstances, to the extent observable inputs are not available (including the Fund’s own assumptions used in determining the fair value of investments and derivative financial instruments) |
The hierarchy gives the highest priority to unadjusted quoted prices in active markets for identical assets or liabilities (Level 1 measurements) and the lowest priority to unobservable inputs (Level 3 measurements). Accordingly, the degree of judgment exercised in determining fair value is greatest for instruments categorized in Level 3. The inputs used to measure fair value may fall into different levels of the fair value hierarchy. In such cases, for disclosure purposes, the fair value hierarchy classification is determined based on the lowest level input that is significant to the fair value measurement in its entirety. Investments classified within Level 3 have significant unobservable inputs used by the Global Valuation Committee in determining the price for Fair Valued investments. Level 3 investments include equity or debt issued by privately held companies or funds. There may not be a secondary market, and/or there are a limited number of investors. Level 3 investments may also be adjusted to reflect illiquidity and/or non-transferability, with the amount of such discount estimated by the Global Valuation Committee in the absence of market information.
Changes in valuation techniques may result in transfers into or out of an assigned level within the hierarchy. In accordance with the Fund’s policy, transfers between different levels of the fair value hierarchy are deemed to have occurred as of the beginning of the reporting period. The categorization of a value determined for investments and derivative financial instruments is based on the pricing transparency of the investments and derivative financial instruments and is not necessarily an indication of the risks associated with investing in those securities.
As of December 31, 2017, certain investments of the Fund were valued using NAV as no quoted market value is available and therefore have been excluded from the fair value hierarchy.
| 4. | SECURITIES AND OTHER INVESTMENTS |
Securities Lending: The Fund may lend its securities to approved borrowers, such as brokers, dealers and other financial institutions. The borrower pledges and maintains with the Fund collateral consisting of cash, an irrevocable letter of credit issued by a bank, or securities issued or guaranteed by the U.S. Government. The initial collateral received by the Fund is required to have a value of at least 102% of the current value of the loaned securities for securities traded on U.S. exchanges and a value of at least 105% for all other securities. The collateral is maintained thereafter at a value equal to at least 100% of the current market value of the securities on loan. The market value of the loaned securities is determined at the close of each business day of the Fund and any additional required collateral is delivered to the Fund, or excess collateral returned by the Fund, on the next business day. During the term of the loan, the Fund is entitled to all distributions made on or in respect of the loaned securities, but does not receive interest income on securities received as collateral. Loans of securities are terminable at any time and the borrower, after notice, is required to return borrowed securities within the standard time period for settlement of securities transactions.
The market value of any securities on loan, all of which were classified as common stocks in the Fund’s Schedule of Investments, and the value of any related collateral are shown separately in the Statement of Assets and Liabilities as a component of investments at value—unaffiliated, and collateral on securities loaned at value,
| | |
| 16 | | 2017 BLACKROCK ANNUAL REPORTTO SHAREHOLDERS |
Notes to Financial Statements (continued)
respectively. As of period end, any securities on loan were collateralized by cash and/or U.S. Government obligations. Cash collateral invested by the securities lending agent, BlackRock Investment Management, LLC (“BIM”), if any, is disclosed in the Schedule of Investments.
Securities lending transactions are entered into by the Fund under Master Securities Lending Agreements (each, an “MSLA”), which provide the right, in the event of default (including bankruptcy or insolvency), for the non-defaulting party to liquidate the collateral and calculate a net exposure to the defaulting party or request additional collateral. In the event that a borrower defaults, the Fund, as lender, would offset the market value of the collateral received against the market value of the securities loaned. When the value of the collateral is greater than that of the market value of the securities loaned, the lender is left with a net amount payable to the defaulting party.
However, bankruptcy or insolvency laws of a particular jurisdiction may impose restrictions on or prohibitions against such a right of offset in the event of an MSLA counterparty’s bankruptcy or insolvency. Under the MSLA, absent an event of default the borrower can resell or re-pledge the loaned securities, and the Fund can reinvest cash collateral received in connection with loaned securities. Upon an event of default, the parties’ obligations to return the securities or collateral to the other party are extinguished, and the parties can resell or re-pledge the loaned securities or the collateral received in connection with the loaned securities in order to satisfy the defaulting party’s net payment obligation for all transactions under the MSLA. The defaulting party remains liable for any deficiency.
As of period end, the following table is a summary of the Fund’s securities lending agreements by counterparty which are subject to offset under an MSLA:
| | | | | | | | | | | | |
| Counterparty | | Securities
Loaned at Value | | | Cash Collateral
Received (a) | | | Net
Amount | |
Citigroup Global Markets, Inc. | | $ | 4,379,463 | | | $ | (4,379,463 | ) | | $ | — | |
JP Morgan Securities LLC | | | 1,592,719 | | | | (1,592,719 | ) | | | — | |
Morgan Stanley | | | 2,169,837 | | | | (2,169,837 | ) | | | — | |
State Street Bank & Trust Co. | | | 24,378 | | | | (24,378 | ) | | | — | |
| | | | | | | | | | | | |
| | $ | 8,166,397 | | | $ | (8,166,397 | ) | | $ | — | |
| | | | | | | | | | | | |
| | (a) | Cash collateral with a value of $8,447,600 has been received in connection with securities lending agreements. Collateral received in excess of the value of securities loaned from the individual counterparty is not shown for financial reporting purposes in the table above. | |
The risks of securities lending include the risk that the borrower may not provide additional collateral when required or may not return the securities when due. To mitigate these risks, the Fund benefits from a borrower default indemnity provided by BIM. BIM’s indemnity allows for full replacement of the securities loaned if the collateral received does not cover the value on the securities loaned in the event of borrower default. The Fund could incur a loss if the value of an investment purchased with cash collateral falls below the market value of loaned securities or if the value of an investment purchased with cash collateral falls below the value of the original cash collateral received.
| 5. | DERIVATIVE FINANCIAL INSTRUMENTS |
The Fund engages in various portfolio investment strategies using derivative contracts both to increase the returns of the Fund and/or to manage its exposure to certain risks such as credit risk, equity risk, interest rate risk, foreign currency exchange rate risk, commodity price risk or other risks (e.g., inflation risk). Derivative financial instruments categorized by risk exposure are included in the Schedule of Investments. These contracts may be transacted on an exchange or over-the-counter (“OTC”).
Futures Contracts: Futures contracts are purchased or sold to gain exposure to, or manage exposure to changes in interest rates (interest rate risk), changes in the value of equity securities (equity risk) or foreign currencies (foreign currency exchange rate risk).
Futures contracts are agreements between the Fund and a counterparty to buy or sell a specific quantity of an underlying instrument at a specified price and on a specified date. Depending on the terms of a contract, it is settled either through physical delivery of the underlying instrument on the settlement date or by payment of a cash amount on the settlement date. Upon entering into a futures contract, the Fund is required to deposit initial margin with the broker in the form of cash or securities in an amount that varies depending on a contract’s size and risk profile. The initial margin deposit must then be maintained at an established level over the life of the contract.
Securities deposited as initial margin are designated in the Schedule of Investments and cash deposited, if any, is shown as cash pledged for futures contracts in the Statement of Assets and Liabilities. Pursuant to the contract, the Fund agrees to receive from or pay to the broker an amount of cash equal to the daily fluctuation in market value of the contract (“variation margin”). Variation margin is recorded as unrealized appreciation (depreciation) and, if any, shown as variation margin receivable (or payable) on futures contracts in the Statement of Assets and Liabilities. When the contract is closed, a realized gain or loss is recorded in the Statement of Operations equal to the difference between the notional amount of the contract at the time it was opened and the notional amount at the time it was closed. The use of futures contracts involves the risk of an imperfect correlation in the movements in the price of futures contracts and interest, foreign currency exchange rates or underlying assets.
| 6. | INVESTMENT ADVISORY AGREEMENT AND OTHER TRANSACTIONS WITH AFFILIATES |
The PNC Financial Services Group, Inc. is the largest stockholder and an affiliate of BlackRock, Inc. (“BlackRock”) for 1940 Act purposes.
Investment Advisory: The Company, on behalf of the Fund, entered into an Investment Advisory Agreement with the Manager, the Fund’s investment adviser, an indirect, wholly-owned subsidiary of BlackRock, to provide investment advisory and administrative services. The Manager is responsible for the management of the Fund’s portfolio and provides the personnel, facilities, equipment and certain other services necessary to the operations of the Fund.
| | | | |
| NOTESTO FINANCIAL STATEMENTS | | | 17 | |
Notes to Financial Statements (continued)
For such services, the Fund pays the Manager a monthly fee at an annual rate equal to the following percentages of the average daily value of the Fund’s net assets:
| | | | |
| Average Daily Net Assets | | Investment
Advisory Fee | |
First $250 Million | | | 0.500 | % |
$250 Million — $300 Million | | | 0.450 | |
$300 Million — $400 Million | | | 0.425 | |
Greater than $400 Million | | | 0.400 | |
Distribution Fees: The Company, on behalf of the Fund, entered into a Distribution Agreement and a Distribution Plan with BlackRock Investments, LLC (“BRIL”), an affiliate of the Manager. Pursuant to the Distribution Plan and in accordance with Rule 12b-1 under the 1940 Act, the Fund pays BRIL ongoing distribution fees. The fees are accrued daily and paid monthly at annual rates based upon the average daily net assets of the relevant share class of the Fund as follows:
| | | | | | | | | | | | |
| | | Class II | | | | | | Class III | |
Distribution Fees | | | 0.15 | % | | | | | | | 0.25 | % |
For the year ended December 31, 2017, the following table shows the class specific distribution fees borne directly by each share class of the Fund:
| | | | | | | | | | | | |
| | | Class II | | | Class III | | | Total | |
Distribution Fees | | $ | 6,997 | | | $ | 827,056 | | | $ | 834,053 | |
Transfer Agent: On behalf of the Fund, the Manager entered into agreements with insurance companies and other financial intermediaries (“Service Organizations”), some of which may be affiliates. Pursuant to these agreements, the Service Organizations provide the Fund with administrative, networking, recordkeeping, sub-transfer agency and shareholder services to sub-accounts they service. For these services, the Service Organizations receive an annual fee per shareholder account, which will vary depending on share class and/or net assets of Fund shareholders serviced by the Service Organizations, which is shown as transfer agent — class specific. For the year ended December 31, 2017, the Fund did not pay any amounts to affiliates in return for these services.
In addition, the Fund pays the transfer agent, which is not an affiliate, a fee for the issuance, transfer and redemption of shares and the opening and maintenance of shareholder accounts, which is included in transfer agent in the Statement of Operations.
For the year ended December 31, 2017, the following table shows the class specific transfer agent fees borne directly by each share class of the Fund:
| | | | | | | | | | | | | | | | | | | | |
| Class I | | | | | Class II | | | | | Class III | | | | | Total | |
| $ | 367,758 | | | | | $ | 9,482 | | | | | $ | 683,259 | | | | | $ | 1,060,499 | |
Expense Limitations, Waivers and Reimbursements: With respect to the Fund, the Manager voluntarily agreed to waive its investment advisory fees by the amount of investment advisory fees the Fund pays to the Manager indirectly through its investment in affiliated money market funds (the “affiliated money market fund waiver”). The amount of waivers and/or reimbursements of fees and expenses made pursuant to the expense limitation will be reduced by the amount of the affiliated money market fund waiver. This amount is included in fees waived and/or reimbursed by the Manager in the Statement of Operations. For the year ended December 31, 2017, the amount waived was $5,601.
The Manager has contractually agreed to waive its investment advisory fee with respect to any portion of the Fund’s assets invested in affiliated equity and fixed-income mutual funds and affiliated exchange-traded funds that have a contractual management fee through April 30, 2019. The contractual agreement may be terminated upon 90 days’ notice by a majority of the independent directors who are not “interested persons” of the Fund, as defined in the 1940 Act (“Independent Directors”) or by a vote of a majority of the outstanding voting securities of the Fund. For the year ended December 31, 2017, there were no fees waived by the Manager.
For the year ended December 31, 2017, the Fund reimbursed the Manager $5,407 for certain accounting services, which is included in accounting services in the Statement of Operations.
The Manager has contractually agreed to reimburse transfer agent fees in order to limit such expenses to a percentage of average daily net assets as follows:
| | | | |
Class I | | | 0.05 | % |
Class II | | | 0.07 | % |
Class III | | | 0.08 | % |
The Manager has agreed not to reduce or discontinue this contractual reimbursement through April 30, 2019 unless approved by the Board, including a majority of the Independent Directors or by a vote of a majority of the outstanding voting securities of the Fund.
These amounts waived and/or reimbursed are shown as transfer agent fees reimbursed — class specific in the Statement of Operations. For the year ended December 31, 2017, class specific expense waivers and/or reimbursements were as follows:
| | | | | | | | | | | | | | | | |
| | | Class I | | | Class II | | | Class III | | | Total | |
Transfer Agent Fees Reimbursed | | $ | 279,908 | | | $ | 6,216 | | | $ | 418,589 | | | $ | 704,713 | |
With respect to the Fund, the Manager contractually agreed to waive and/or reimburse fees or expenses in order to limit expenses, excluding interest expense, dividend expense, tax expense, acquired fund fees and expenses, and certain other fund expenses, which constitute extraordinary expenses not incurred in the ordinary course of the Fund’s business (“expense limitation”). The expense limitations as a percentage of average daily net assets are as follows:
| | | | | | | | | | | | | | |
| Class I | | | | | Class II | | | | | Class III | |
| | 1.25% | | | | | | 1.40% | | | | | | 1.50% | |
| | |
| 18 | | 2017 BLACKROCK ANNUAL REPORTTO SHAREHOLDERS |
Notes to Financial Statements (continued)
The Manager has agreed not to reduce or discontinue this contractual expense limitation through April 30, 2019, unless approved by the Board, including a majority of the Independent Directors or by a vote of a majority of the outstanding voting securities of the Fund. For the year ended December 31, 2017, there were no fees waived and/or reimbursed by the Manager.
Securities Lending: The U.S. Securities and Exchange Commission (“SEC”) has issued an exemptive order which permits BIM, an affiliate of the Manager, to serve as securities lending agent for the Fund, subject to applicable conditions. As securities lending agent, BIM bears all operational costs directly related to securities lending. The Fund is responsible for expenses in connection with the investment of cash collateral received for securities on loan (the “collateral investment expenses”). The cash collateral is invested in a private investment company managed by the Manager or its affiliates. However, BIM has agreed to cap the collateral investment expenses of the private investment company to an annual rate of 0.04%. The investment adviser to the private investment company will not charge any advisory fees with respect to shares purchased by the Fund. The private investment company in which the cash collateral has been invested may, under certain circumstances, impose a liquidity fee of up to 2% of the value withdrawn or temporarily restrict withdrawals for up to 10 business days during a 90 day period, in the event that the private investment company’s weekly liquid assets fall below certain thresholds.
Securities lending income is equal to the total of income earned from the reinvestment of cash collateral, net of fees and other payments to and from borrowers of securities, and less the collateral investment expenses. The Fund retains a portion of securities lending income and remits a remaining portion to BIM as compensation for its services as securities lending agent.
Pursuant to a securities lending agreement, the Fund retains 71.5% of securities lending income, and this amount retained can never be less than 65% of the total of securities lending income plus the collateral investment expenses.
In addition, commencing the business day following the date that the aggregate securities lending income earned across the Equity-Bond Complex in a calendar year exceeds a specified threshold, the Fund, pursuant to the securities lending agreement, will retain for the remainder of that calendar year securities lending income as follows: 75% of securities lending income, and this amount retained can never be less than 65% of the total of securities lending income plus the collateral investment expenses.
The share of securities lending income earned by the Fund is shown as securities lending income — affiliated — net in the Statement of Operations. For the year ended December 31, 2017, the Fund paid BIM $22,601 for securities lending agent services.
Interfund Lending: In accordance with an exemptive order (the “Order”) from the SEC, the Fund may participate in a joint lending and borrowing facility for temporary purposes (the “Interfund Lending Program”), subject to compliance with the terms and conditions of the Order, and to the extent permitted by the Fund’s investment policies and restrictions. The Fund is currently permitted to borrow under the Interfund Lending Program.
A lending BlackRock fund may lend in aggregate up to 15% of its net assets, but may not lend more than 5% of its net assets, to any one borrowing fund through the Interfund Lending Program. A borrowing BlackRock fund may not borrow through the Interfund Lending Program or from any other source more than 33 1/3% of its total assets (or any lower threshold provided for by the fund’s investment restrictions). If a borrowing BlackRock fund’s total outstanding borrowings exceed 10% of its total assets, each of its outstanding interfund loans will be subject to collateralization of at least 102% of the outstanding principal value of the loan. All interfund loans are for temporary or emergency purposes and the interest rate to be charged will be the average of the highest current overnight repurchase agreement rate available to a lending fund and the bank loan rate, as calculated according to a formula established by the Board.
During the year ended December 31, 2017, the Fund did not participate in the Interfund Lending Program.
Officers and Directors: Certain directors and/or officers of the Company are directors and/or officers of BlackRock or its affiliates. The Fund reimburses the Manager for a portion of the compensation paid to the Company’s Chief Compliance Officer, which is included in Directors and Officer in the Statement of Operations.
Other Transactions: The Fund may purchase securities from, or sell securities to, an affiliated fund provided the affiliation is due solely to having a common investment adviser, common officers, or common directors. For the year ended December 31, 2017, the purchase and sale transactions and any net realized gains (losses) with an affiliated fund in compliance with Rule 17a-7 under the 1940 Act were as follows:
| | | | |
Purchases | | $ | 17,504,678 | |
Sales | | | 52,509,485 | |
Net Realized Gain | | | 15,355,921 | |
For the year ended December 31, 2017, purchases and sales of investments, excluding short-term securities, were $757,950,052 and $819,893,686, respectively.
It is the Fund’s policy to comply with the requirements of the Internal Revenue Code of 1986, as amended, applicable to regulated investment companies, and to distribute substantially all of its taxable income to its shareholders. Therefore, no U.S. federal income tax provision is required.
The Fund files U.S. federal and various state and local tax returns. No income tax returns are currently under examination. The statute of limitations on the Fund’s U.S. federal tax returns generally remains open for each of the four years ended December 31, 2017. The statutes of limitations on the Fund’s state and local tax returns may remain open for an additional year depending upon the jurisdiction.
| | | | |
| NOTESTO FINANCIAL STATEMENTS | | | 19 | |
Notes to Financial Statements (continued)
Management has analyzed tax laws and regulations and their application to the Fund as of December 31, 2017, inclusive of the open tax return years, and does not believe that there are any uncertain tax positions that require recognition of a tax liability in the Fund’s financial statements.
U.S. GAAP requires that certain components of net assets be adjusted to reflect permanent differences between financial and tax reporting. These reclassifications have no effect on net assets or net asset values per share. As of period end, the following permanent differences attributable to foreign currency transactions were reclassified to the following accounts:
| | | | |
Undistributed net investment income | | $ | (655 | ) |
Accumulated net realized gain. | | $ | 655 | |
The tax character of distributions paid was as follows:
| | | | | | | | |
| | | 12/31/2017 | | | 12/31/2016 | |
Ordinary income. | | $ | 18,336,131 | | | $ | 5,100,003 | |
Long-term capital gains | | $ | 128,931,978 | | | $ | 35,863,785 | |
| | | | | | | | |
| | $ | 147,268,109 | | | $ | 40,963,788 | |
| | | | | | | | |
As of December 31, 2017, the tax components of accumulated net earnings (losses) were as follows:
| | | | |
Undistributed ordinary income | | $ | 5,317,049 | |
Undistributed long-term capital gains | | | 5,205,253 | |
Net unrealized gains(a) | | | 52,296,537 | |
| | | | |
| | $ | 62,818,839 | |
| | | | |
| | (a) | The difference between book-basis and tax-basis net unrealized gains was attributable primarily to the tax deferral of losses on wash sales, the realization for tax purposes of unrealized gains/losses on certain futures contracts and the timing and recognition of partnership income. | |
As of December 31, 2017, gross unrealized appreciation and depreciation for investments and derivatives based on cost for U.S. federal income tax purposes were as follows:
| | | | |
Tax cost | | $ | 487,965,980 | |
| | | | |
Gross unrealized appreciation | | $ | 58,367,965 | |
Gross unrealized depreciation | | | (6,072,040 | ) |
| | | | |
Net unrealized appreciation (depreciation) | | $ | 52,295,925 | |
| | | | |
The Company, on behalf of the Fund, along with certain other funds managed by the Manager and its affiliates (“Participating Funds”), is a party to a 364-day, $2.1 billion credit agreement with a group of lenders. Under this agreement, the Fund may borrow to fund shareholder redemptions. Excluding commitments designated for certain individual funds, the Participating Funds, including the Fund, can borrow up to an aggregate commitment amount of $1.6 billion at any time outstanding, subject to asset coverage and other limitations as specified in the agreement. The credit agreement has the following terms: a fee of 0.12% per annum on unused commitment amounts and interest at a rate equal to the higher of (a) one-month LIBOR (but, in any event, not less than 0.00%) on the date the loan is made plus 0.80% per annum or (b) the Fed Funds rate (but, in any event, not less than 0.00%) in effect from time to time plus 0.80% per annum on amounts borrowed. The agreement expires in April 2018 unless extended or renewed. Participating Funds paid administration, legal and arrangement fees, which, if applicable, are included in miscellaneous expenses in the Statement of Operations. These fees were allocated among such funds based upon portions of the aggregate commitment available to them and relative net assets of Participating Funds. During the year ended December 31, 2017, the Fund did not borrow under the credit agreement.
In the normal course of business, the Fund invests in securities or other instruments and may enter into certain transactions, and such activities subject the Fund to various risks, including among others, fluctuations in the market (market risk) or failure of an issuer to meet all of its obligations. The value of securities or other instruments may also be affected by various factors, including, without limitation: (i) the general economy; (ii) the overall market as well as local, regional or global political and/or social instability; (iii) regulation, taxation or international tax treaties between various countries; or (iv) currency, interest rate and price fluctuations. The Fund’s prospectus provides details of the risks to which the Fund is subject.
The Fund may be exposed to additional risks when reinvesting cash collateral in money market funds that do not seek to maintain a stable NAV per share of $1.00 and which may be subject to redemption gates or liquidity fees under certain circumstances.
Valuation Risk: The market values of equities, such as common stocks and preferred securities or equity related investments, such as futures and options, may decline due to general market conditions which are not specifically related to a particular company. They may also decline due to factors which affect a particular industry or industries. The Fund may invest in illiquid investments and may experience difficulty in selling those investments in a timely manner at the price that it believes the investments are worth. Prices may fluctuate widely over short or extended periods in response to company, market or economic news. Markets also tend to move in cycles, with periods of rising and falling prices. This volatility may cause the Fund’s NAV to experience significant increases or decreases over short periods of time. If there is a general decline in the securities and other markets, the NAV of the Fund may lose value, regardless of the individual results of the securities and other instruments in which the Fund invests.
| | |
| 20 | | 2017 BLACKROCK ANNUAL REPORTTO SHAREHOLDERS |
Notes to Financial Statements (continued)
Counterparty Credit Risk: The Fund may be exposed to counterparty credit risk, or the risk that an entity may fail to or be unable to perform on its commitments related to unsettled or open transactions. The Fund manages counterparty credit risk by entering into transactions only with counterparties that the Manager believes have the financial resources to honor their obligations and by monitoring the financial stability of those counterparties. Financial assets, which potentially expose the Fund to market, issuer and counterparty credit risks, consist principally of financial instruments and receivables due from counterparties. The extent of the Fund’s exposure to market, issuer and counterparty credit risks with respect to these financial assets is approximately their value recorded in the Statement of Assets and Liabilities, less any collateral held by the Fund.
A derivative contract may suffer a mark-to-market loss if the value of the contract decreases due to an unfavorable change in the market rates or values of the underlying instrument. Losses can also occur if the counterparty does not perform under the contract.
With exchange-traded futures, there is less counterparty credit risk to the Fund since the exchange or clearinghouse, as counterparty to such instruments, guarantees against a possible default. The clearinghouse stands between the buyer and the seller of the contract; therefore, credit risk is limited to failure of the clearinghouse. While offset rights may exist under applicable law, the Fund does not have a contractual right of offset against a clearing broker or clearinghouse in the event of a default (including the bankruptcy or insolvency). Additionally, credit risk exists in exchange-traded futures with respect to initial and variation margin that is held in a clearing broker’s customer accounts. While clearing brokers are required to segregate customer margin from their own assets, in the event that a clearing broker becomes insolvent or goes into bankruptcy and at that time there is a shortfall in the aggregate amount of margin held by the clearing broker for all its clients, typically the shortfall would be allocated on a pro rata basis across all the clearing broker’s customers, potentially resulting in losses to the Fund.
Concentration Risk: As of period end, the Fund invested a significant portion of its assets in securities in the information technology sector. Changes in economic conditions affecting such sector would have a greater impact on the Fund and could affect the value, income and/or liquidity of positions in such securities.
| 11. | CAPITAL SHARE TRANSACTIONS |
Transactions in capital shares for each class were as follows:
| | | | | | | | | | | | | | | | |
| | | Year Ended
12/31/2017 | | | Year Ended
12/31/2016 | |
| Share Class | | Shares | | | Amount | | | Shares | | | Amount | |
Class I | | | | | | | | | | | | | | | | |
Shares sold | | | 53,694 | | | $ | 1,884,794 | | | | 94,700 | | | $ | 2,914,564 | |
Shares issued in reinvestment of distributions | | | 1,784,901 | | | | 51,545,512 | | | | 449,540 | | | | 14,414,054 | |
Shares redeemed | | | (815,802 | ) | | | (28,296,841 | ) | | | (895,068 | ) | | | (28,046,866 | ) |
| | | | | | | | | | | | | | | | |
Net increase (decrease) | | | 1,022,793 | | | $ | 25,133,465 | | | | (350,828 | ) | | $ | (10,718,248 | ) |
| | | | | | | | | | | | | | | | |
| | | | |
Class II | | | | | | | | | | | | | | | | |
Shares sold | | | 17,194 | | | $ | 592,585 | | | | 51,189 | | | $ | 1,579,995 | |
Shares issued in reinvestment of distributions | | | 45,977 | | | | 1,328,480 | | | | 13,197 | | | | 423,497 | |
Shares redeemed | | | (54,296 | ) | | | (1,841,122 | ) | | | (72,213 | ) | | | (2,256,990 | ) |
| | | | | | | | | | | | | | | | |
Net increase (decrease) | | | 8,875 | | | $ | 79,943 | | | | (7,827 | ) | | $ | (253,498 | ) |
| | | | | | | | | | | | | | | | |
| | | | |
Class III | | | | | | | | | | | | | | | | |
Shares sold | | | 117,007 | | | $ | 4,065,534 | | | | 537,136 | | | $ | 15,388,629 | |
Shares issued in reinvestment of distributions | | | 3,293,938 | | | | 94,394,117 | | | | 819,291 | | | | 26,126,237 | |
Shares redeemed | | | (1,644,501 | ) | | | (56,416,088 | ) | | | (829,886 | ) | | | (25,824,082 | ) |
| | | | | | | | | | | | | | | | |
Net increase | | | 1,766,444 | | | $ | 42,043,563 | | | | 526,541 | | | $ | 15,690,784 | |
| | | | | | | | | | | | | | | | |
Total Net Increase | | | 2,798,112 | | | $ | 67,256,971 | | | | 167,886 | | | $ | 4,719,038 | |
| | | | | | | | | | | | | | | | |
Management has evaluated the impact of all subsequent events on the Fund through the date the financial statements were issued and has determined that there were no subsequent events requiring adjustment or additional disclosure in the financial statements.
| | | | |
| NOTESTO FINANCIAL STATEMENTS | | | 21 | |
Report of Independent Registered Public Accounting Firm
To the Shareholders of BlackRock Advantage Large Cap Core V.I. Fund and the Board of Directors of BlackRock Variable Series Funds, Inc.:
Opinion on the Financial Statements and Financial Highlights
We have audited the accompanying statement of assets and liabilities, including the schedule of investments, of BlackRock Advantage Large Cap Core V.I. Fund (formerly BlackRock Large Cap Core V.I. Fund), of BlackRock Variable Series Funds, Inc. (the “Fund”), as of December 31, 2017, the related statement of operations for the year then ended, the statements of changes in net assets for each of the two years in the period then ended, the financial highlights for each of the five years in the period then ended, and the related notes. In our opinion, the financial statements and financial highlights present fairly, in all material respects, the financial position of the Fund as of December 31, 2017, and the results of its operations for the year then ended, the changes in its net assets for each of the two years in the period then ended, and the financial highlights for each of the five years in the period then ended, in conformity with accounting principles generally accepted in the United States of America.
Basis for Opinion
These financial statements and financial highlights are the responsibility of the Fund’s management. Our responsibility is to express an opinion on the Fund’s financial statements and financial highlights based on our audits. We are a public accounting firm registered with the Public Company Accounting Oversight Board (United States) (PCAOB) and are required to be independent with respect to the Fund in accordance with the U.S. federal securities laws and the applicable rules and regulations of the Securities and Exchange Commission and the PCAOB.
We conducted our audits in accordance with the standards of the PCAOB. Those standards require that we plan and perform the audit to obtain reasonable assurance about whether the financial statements and financial highlights are free of material misstatement, whether due to error or fraud. The Fund is not required to have, nor were we engaged to perform, an audit of its internal control over financial reporting. As part of our audits we are required to obtain an understanding of internal control over financial reporting but not for the purpose of expressing an opinion on the effectiveness of the Fund’s internal control over financial reporting. Accordingly, we express no such opinion.
Our audits included performing procedures to assess the risks of material misstatement of the financial statements and financial highlights, whether due to error or fraud, and performing procedures that respond to those risks. Such procedures included examining, on a test basis, evidence regarding the amounts and disclosures in the financial statements and financial highlights. Our audits also included evaluating the accounting principles used and significant estimates made by management, as well as evaluating the overall presentation of the financial statements and financial highlights. Our procedures included confirmation of securities owned as of December 31, 2017, by correspondence with the custodian and brokers; when replies were not received from brokers, we performed other auditing procedures. We believe that our audits provide a reasonable basis for our opinion.
Deloitte & Touche LLP
Boston, Massachusetts
February 19, 2018
We have served as the auditor of one or more BlackRock investment companies since 1992.
| | |
| 22 | | 2017 BLACKROCK ANNUAL REPORTTO SHAREHOLDERS |
DECEMBER 31, 2017
| | |
ANNUAL REPORT | |  |
BlackRock Variable Series Funds, Inc.
| Ø | | BlackRock Advantage Large Cap Value V.I. Fund |
|
| Not FDIC Insured • May Lose Value • No Bank Guarantee |
| | |
| Fund Summary as of December 31, 2017 | | BlackRock Advantage Large Cap Value V.I. Fund |
Investment Objective
BlackRock Advantage Large Cap Value V.I. Fund’s (the “Fund”) investment objective is to seek long-term capital appreciation.
On March 27, 2017, the Fund’s Board approved a proposal to change the name of BlackRock Large Cap Value V.I. Fund to BlackRock Advantage Large Cap Value V.I. Fund. The Board also approved certain changes to the Fund’s investment objective and investment strategies. These changes were effective on June 12, 2017.
Portfolio Management Commentary
How did the Fund perform?
For the 12-month period ended December 31, 2017, the Fund outperformed its benchmark, the Russell 1000® Value Index.
What factors influenced performance?
From January 1, 2017 through June 12, 2017, the information technology (“IT”) and consumer discretionary sectors were the largest contributors to performance. Strength was notable across multiple segments in IT, led by semiconductors, while hotels, restaurants & leisure, household durables and auto components drove gains in consumer discretionary. Additional contributions came from stock selection and an underweight in energy, as well as selection in materials.
From June 12, 2017 through period-end, strong performance came from signals that seek to capture sentiment and trends from market participants. Specifically, insights gained from proprietary text-based analyses of company executive conference calls and sell-side analyst reports performed well. Similarly, a newer insight that identifies longer-term trends in company fundamentals from executive statements added value. Elsewhere, fundamental signals that focus on company value and quality were additive to performance. Notably, an insight that evaluates stocks based on key corporate events like initial public offerings, CEO changes and revisions to forward guidance proved beneficial. Further, insights that use cash flows and top-line sales as measures performed well.
Health care was the prime detractor from relative performance for the period of January 1, 2017 through June 12, 2017. Weakness in the sector was most notable in the pharmaceutical and biotechnology industries, with an underweight to equipment & supplies also weighing on returns. Selection within and underweights in utilities and consumer staples also proved disadvantageous during this period.
Despite broad strength across the stock selection model, macro thematic insights were challenged during the period from June 12, 2017 to December 31, 2017. In particular, an insight that evaluates a company’s sensitivity to foreign currencies declined. Another detractor for the period was an insight that identifies excessive corporate leverage. Unsurprisingly, as investors continued to favor growth assets, select quality-based insights struggled into period-end. In this vein, a signal that identifies dividend growth struggled during the period. Finally, an insight that takes a contrarian stance on crowded positions detracted from relative performance for the period.
Describe recent portfolio activity.
The Fund was repurposed during the period. Effective June 12, 2017, the Fund changed its name to the BlackRock Advantage Large Cap Value V.I. Fund. Concurrently, there were changes to its investment strategy. The Fund is now being managed by BlackRock’s Systematic Active Equity (SAE) team, which incorporates a research-driven, systematic approach to identifying differentiated performance opportunities across markets.
Describe portfolio positioning at period end.
Relative to the Russell 1000® Value Index, the Fund was positioned neutrally from a sector perspective. The Fund ended the period with slight overweight positions in materials and industrials and slight underweights in financials and consumer staples.
The views expressed reflect the opinions of BlackRock as of the date of this report and are subject to change based on changes in market, economic or other conditions. These views are not intended to be a forecast of future events and are no guarantee of future results.
| | |
| 2 | | 2017 BLACKROCK ANNUAL REPORTTO SHAREHOLDERS |
| | |
| Fund Summary as of December 31, 2017 (continued) | | BlackRock Advantage Large Cap Value V.I. Fund |
TOTAL RETURN BASED ON A $10,000 INVESTMENT
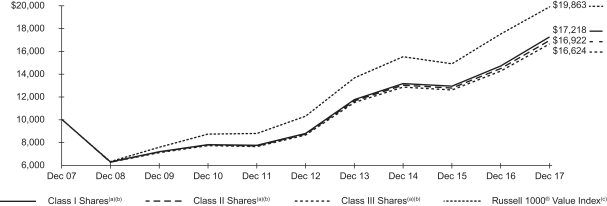
| (a) | Assuming transaction costs, if any, and other operating expenses, including investment advisory fees. Does not include insurance related fees and expenses. For a portion of the period, returns do not show the effects of distribution fees (12b-1 fees) applicable to Class II Shares. If such fees were included, returns shown would have been lower. The returns for Class III Shares prior to January 27, 2009, the recommencement of operations of Class III Shares, are based upon the performance of the Fund’s Class I Shares, as adjusted to reflect the distribution (12b-1) fees applicable to Class III Shares. |
| (b) | Under normal circumstances, the Fund seeks to invest at least 80% of its net assets, plus the amount of any borrowings for investment purposes, in large cap equity securities and derivatives that have similar economic characteristics to such securities. The Fund’s total returns prior to June 12, 2017 are the returns of the Fund when it followed a different investment objective and different investment strategies under the name BlackRock Large Cap Value V.I. Fund. |
| (c) | An unmanaged index that is a subset of the Russell 1000® Index that consists of those Russell 1000® securities with lower price-tobook ratios and lower expected growth values. |
Performance Summary for the Period Ended December 31, 2017
| | | | | | | | | | | | | | | | | | | | | | | | |
| | | 6-Month
Total Returns (b) | | | | | | Average Annual Total Returns | |
| | | | | | | 1 Year (b) | | | 5 Years (b) | | | | | | 10 Years (b) | |
Class I(a) | | | 10.45 | % | | | | | | | 17.22 | % | | | 14.41 | % | | | | | | | 5.58 | % |
Class II(a) | | | 10.39 | | | | | | | | 17.06 | | | | 14.20 | | | | | | | | 5.40 | |
Class III(a) | | | 10.29 | | | | | | | | 16.86 | | | | 14.01 | | | | | | | | 5.21 | (c) |
Russell 1000® Value Index | | | 8.61 | | | | | | | | 13.66 | | | | 14.04 | | | | | | | | 7.10 | |
| | (a) | Average annual and cumulative total returns are based on changes in net asset value for the periods shown, and assume reinvestment of all distributions at net asset value on the ex-dividend date. Insurance-related fees and expenses are not reflected in these returns. For the portion of the period, returns do not show the effects of distribution fees (12b-1 fees) applicable to Class II Shares. If such fees were included, returns shown would have been lower. The Fund’s total returns prior to June 12, 2017 are the returns of the Fund when it followed a different investment objective and different investment strategies under the name BlackRock Large Cap Value V.I. Fund. | |
| | (b) | For the portion of the period, the Fund’s investment adviser waived a portion of its fee. Without such waiver, the Fund’s performance would have been lower. | |
| | (c) | The returns for Class III Shares prior to January 27, 2009, the recommencement of operations of Class III Shares, are based upon the performance of the Fund’s Class I Shares, as adjusted to reflect the distribution (12b-1) fees applicable to Class III Shares. | |
Past performance is not indicative of future results. Performance results do not reflect the deduction of taxes that a shareholder would pay on Fund distributions or the redemption of Fund shares.
Performance results may include adjustments made for financial reporting purposes in accordance with U.S. generally accepted accounting principles.
Expense Example
| | | | | | | | | | | | | | | | | | | | | | | | | | | | | | | | |
| | | Actual | | | | | | Hypothetical (a) | | | | |
| | | Beginning
Account Value
(07/01/17) | | | Ending
Account Value
(12/31/17) | | | Expenses
Paid During
the Period (b) | | | | | | Beginning
Account Value
(07/01/17) | | | Ending
Account Value
(12/31/17) | | | Expenses
Paid During
the Period (b) | | | Annualized
Expense
Ratio | |
Class I | | $ | 1,000.00 | | | $ | 1,104.50 | | | $ | 3.13 | | | | | | | $ | 1,000.00 | | | $ | 1,022.20 | | | $ | 3.01 | | | | 0.60 | % |
Class II | | | 1,000.00 | | | | 1,103.90 | | | | 3.98 | | | | | | | | 1,000.00 | | | | 1,021.40 | | | | 3.82 | | | | 0.75 | |
Class III | | | 1,000.00 | | | | 1,102.90 | | | | 4.51 | | | | | | | | 1,000.00 | | | | 1,020.90 | | | | 4.33 | | | | 0.85 | |
| | (a) | Hypothetical 5% annual return before expenses is calculated by prorating the number of days in the most recent fiscal half year divided by 365. | |
| | (b) | For each class of the Fund, expenses are equal to the annualized expense ratio for the class, multiplied by the average account value over the period, multiplied by 184/365 (to reflect the one-half year period shown). | |
See “Disclosure of Expenses” on the following page for further information on how expenses were calculated.
| | |
| Fund Summary as of December 31, 2017 (continued) | | BlackRock Advantage Large Cap Value V.I. Fund |
Portfolio Information
SECTOR ALLOCATION
| | | | |
| Sector | | Percent of
Net Assets | |
Financials | | | 26 | % |
Health Care | | | 14 | |
Energy | | | 10 | |
Information Technology | | | 9 | |
Industrials | | | 9 | |
Consumer Staples | | | 8 | |
Consumer Discretionary | | | 7 | |
Utilities | | | 6 | |
Real Estate | | | 5 | |
Materials | | | 3 | |
Telecommunication Services | | | 2 | |
Short-Term Securities | | | 5 | |
Liabilities in Excess of Other Assets | | | (4 | ) |
For Fund compliance purposes, the Fund’s sector classifications refer to one or more of the sector sub-classifications used by one or more widely recognized market indexes or ratings group indexes, and/or as defined by the investment adviser. These definitions may not apply for purposes of this report, which may combine sector sub classifications for reporting ease.
Disclosure of Expenses
Shareholders of the Fund may incur the following charges: (a) transactional expenses, such as sales charges; and (b) operating expenses, including investment advisory fees, service and distribution fees, including 12b-1 fees, acquired fund fees and expenses, and other fund expenses. The expense example on the previous page (which is based on a hypothetical investment of $1,000 invested on July 1, 2017 and held through December 31, 2017) is intended to assist shareholders both in calculating expenses based on an investment in the Fund and in comparing these expenses with similar costs of investing in other mutual funds.
The expense example provides information about actual account values and actual expenses. In order to estimate the expenses a shareholder paid during the period covered by this report, shareholders can divide their account value by $1,000 and then multiply the result by the number corresponding to their share class under the heading entitled “Expenses Paid During the Period.”
The expense example also provides information about hypothetical account values and hypothetical expenses based on the Fund’s actual expense ratio and an assumed rate of return of 5% per year before expenses. In order to assist shareholders in comparing the ongoing expenses of investing in the Fund and other funds, compare the 5% hypothetical example with the 5% hypothetical examples that appear in shareholder reports of other funds.
The expenses shown in the expense example are intended to highlight shareholders’ ongoing costs only and do not reflect any transactional expenses, such as sales charges, if any. Therefore, the hypothetical example is useful in comparing ongoing expenses only, and will not help shareholders determine the relative total expenses of owning different funds. If these transactional expenses were included, shareholder expenses would have been higher.
Derivative Financial Instruments
The Fund may invest in various derivative financial instruments. These instruments are used to obtain exposure to a security, commodity, index, market, and/or other assets without owning or taking physical custody of securities, commodities and/or other referenced assets or to manage market, equity, credit, interest rate, foreign currency exchange rate, commodity and/or other risks. Derivative financial instruments may give rise to a form of economic leverage and involve risks, including the imperfect correlation between the value of a derivative financial instrument and the underlying asset, possible default of the counterparty to the transaction or illiquidity of the instrument. The Fund’s successful use of a derivative financial instrument depends on the investment adviser’s ability to predict pertinent market movements accurately, which cannot be assured. The use of these instruments may result in losses greater than if they had not been used, may limit the amount of appreciation the Fund can realize on an investment and/or may result in lower distributions paid to shareholders. The Fund’s investments in these instruments, if any, are discussed in detail in the Notes to Financial Statements.
| | |
| 4 | | 2017 BLACKROCK ANNUAL REPORTTO SHAREHOLDERS |
| | |
Schedule of Investments December 31, 2017 | | BlackRock Advantage Large Cap Value V.I. Fund (Percentages shown are based on Net Assets) |
| | | | | | | | |
| Security | | Shares | | | Value | |
Common Stocks — 98.8% | |
|
| Aerospace & Defense — 1.7% | |
Boeing Co. (The) | | | 1,103 | | | $ | 325,286 | |
Orbital ATK, Inc. | | | 493 | | | | 64,829 | |
Raytheon Co. | | | 7,900 | | | | 1,484,015 | |
| | | | | | | | |
| | | | | | | 1,874,130 | |
| Auto Components — 1.2% | |
BorgWarner, Inc. | | | 23,491 | | | | 1,200,155 | |
Delphi Technologies plc | | | 1,436 | | | | 75,347 | |
| | | | | | | | |
| | | | | | | 1,275,502 | |
| Banks — 12.5% | |
Bank of America Corp. | | | 124,087 | | | | 3,663,048 | |
Citigroup, Inc. | | | 20,453 | | | | 1,521,908 | |
Citizens Financial Group, Inc. | | | 32,599 | | | | 1,368,506 | |
First Horizon National Corp.(a) | | | 58,390 | | | | 1,167,216 | |
First Republic Bank | | | 14,011 | | | | 1,213,913 | |
JPMorgan Chase & Co. | | | 19,152 | | | | 2,048,115 | |
SunTrust Banks, Inc. | | | 22,168 | | | | 1,431,831 | |
US Bancorp | | | 590 | | | | 31,612 | |
Wells Fargo & Co. | | | 18,403 | | | | 1,116,510 | |
Western Alliance Bancorp(b) | | | 1,994 | | | | 112,901 | |
| | | | | | | | |
| | | | | | | 13,675,560 | |
| Beverages — 0.4% | |
Coca-Cola European Partners plc | | | 7,995 | | | | 318,601 | |
Molson Coors Brewing Co., Class B | | | 1,555 | | | | 127,619 | |
| | | | | | | | |
| | | | | | | 446,220 | |
| Biotechnology — 1.9% | |
AbbVie, Inc. | | | 5,841 | | | | 564,883 | |
Amgen, Inc. | | | 700 | | | | 121,730 | |
Gilead Sciences, Inc. | | | 19,044 | | | | 1,364,312 | |
| | | | | | | | |
| | | | | | | 2,050,925 | |
| Capital Markets — 4.6% | |
CME Group, Inc. | | | 1,894 | | | | 276,619 | |
Evercore, Inc., Class A | | | 5,611 | | | | 504,990 | |
Intercontinental Exchange, Inc. | | | 19,617 | | | | 1,384,175 | |
Invesco Ltd. | | | 14,709 | | | | 537,467 | |
S&P Global, Inc. | | | 6,970 | | | | 1,180,718 | |
SEI Investments Co. | | | 16,610 | | | | 1,193,595 | |
| | | | | | | | |
| | | | | | | 5,077,564 | |
| Chemicals — 2.2% | | | | |
Air Products & Chemicals, Inc. | | | 7,713 | | | | 1,265,549 | |
Eastman Chemical Co. | | | 12,340 | | | | 1,143,178 | |
| | | | | | | | |
| | | | | | | 2,408,727 | |
| Commercial Services & Supplies — 0.0% | |
LSC Communications, Inc. | | | 2,354 | | | | 35,663 | |
| | | | | | | | |
| Communications Equipment — 1.0% | |
Cisco Systems, Inc. | | | 14,125 | | | | 540,987 | |
InterDigital, Inc. | | | 6,204 | | | | 472,435 | |
Motorola Solutions, Inc. | | | 367 | | | | 33,155 | |
Palo Alto Networks, Inc.(b) | | | 99 | | | | 14,349 | |
| | | | | | | | |
| | | | | | | 1,060,926 | |
| Diversified Consumer Services — 0.0% | |
H&R Block, Inc.(a) | | | 1,430 | | | | 37,495 | |
| | | | | | | | |
| Diversified Financial Services — 2.2% | | | | |
Berkshire Hathaway, Inc., Class B(b) | | | 12,175 | | | | 2,413,328 | |
| | | | | | | | |
| Diversified Telecommunication Services — 1.0% | |
AT&T, Inc. | | | 22,461 | | | | 873,284 | |
Verizon Communications, Inc. | | | 3,110 | | | | 164,612 | |
| | | | | | | | |
| | | | | | | 1,037,896 | |
| | | | | | | | |
| Security | | Shares | | | Value | |
| Electric Utilities — 3.3% | |
Portland General Electric Co. | | | 23,504 | | | $ | 1,071,313 | |
PPL Corp. | | | 2,638 | | | | 81,646 | |
Westar Energy, Inc. | | | 21,769 | | | | 1,149,403 | |
Xcel Energy, Inc. | | | 26,612 | | | | 1,280,303 | |
| | | | | | | | |
| | | | | | | 3,582,665 | |
| Electrical Equipment — 2.0% | |
AMETEK, Inc. | | | 5,642 | | | | 408,876 | |
Hubbell, Inc. | | | 7,158 | | | | 968,763 | |
Rockwell Automation, Inc. | | | 4,317 | | | | 847,643 | |
| | | | | | | | |
| | | | | | | 2,225,282 | |
| Electronic Equipment, Instruments & Components — 0.5% | |
Dolby Laboratories, Inc., Class A | | | 6,665 | | | | 413,230 | |
SYNNEX Corp. | | | 852 | | | | 115,829 | |
| | | | | | | | |
| | | | | | | 529,059 | |
| Energy Equipment & Services — 0.7% | |
Baker Hughes a GE Co. | | | 8,438 | | | | 266,978 | |
Halliburton Co. | | | 10,402 | | | | 508,346 | |
| | | | | | | | |
| | | | | | | 775,324 | |
| Equity Real Estate Investment Trusts (REITs) — 3.5% | |
Alexandria Real Estate Equities, Inc. | | | 5,429 | | | | 708,973 | |
Gaming and Leisure Properties, Inc. | | | 2,041 | | | | 75,517 | |
Outfront Media, Inc. | | | 45,190 | | | | 1,048,408 | |
Prologis, Inc. | | | 4,479 | | | | 288,940 | |
Simon Property Group, Inc. | | | 4,596 | | | | 789,317 | |
Ventas, Inc. | | | 4,935 | | | | 296,149 | |
Weingarten Realty Investors | | | 17,580 | | | | 577,855 | |
| | | | | | | | |
| | | | | | | 3,785,159 | |
| Food & Staples Retailing — 1.4% | | | | |
Performance Food Group Co.(b) | | | 28,966 | | | | 958,775 | |
Wal-Mart Stores, Inc. | | | 5,534 | | | | 546,482 | |
| | | | | | | | |
| | | | | | | 1,505,257 | |
| Food Products — 3.6% | | | | |
Archer-Daniels-Midland Co. | | | 30,075 | | | | 1,205,406 | |
Bunge Ltd. | | | 10,768 | | | | 722,317 | |
Hershey Co. (The)(a) | | | 10,303 | | | | 1,169,494 | |
Kellogg Co. | | | 7,983 | | | | 542,684 | |
Tyson Foods, Inc., Class A | | | 3,070 | | | | 248,885 | |
| | | | | | | | |
| | | | | | | 3,888,786 | |
| Gas Utilities — 0.3% | |
UGI Corp. | | | 8,026 | | | | 376,821 | |
| | | | | | | | |
| Health Care Equipment & Supplies — 3.1% | |
Baxter International, Inc. | | | 21,849 | | | | 1,412,319 | |
Danaher Corp. | | | 18,045 | | | | 1,674,937 | |
Edwards Lifesciences Corp.(b) | | | 2,807 | | | | 316,377 | |
| | | | | | | | |
| | | | | | | 3,403,633 | |
| Health Care Providers & Services — 3.1% | |
Aetna, Inc. | | | 1,890 | | | | 340,937 | |
AmerisourceBergen Corp. | | | 3,521 | | | | 323,298 | |
Cardinal Health, Inc. | | | 2,356 | | | | 144,352 | |
Express Scripts Holding Co.(b) | | | 8,176 | | | | 610,257 | |
Humana, Inc. | | | 4,694 | | | | 1,164,441 | |
McKesson Corp. | | | 5,210 | | | | 812,499 | |
| | | | | | | | |
| | | | | | | 3,395,784 | |
| Hotels, Restaurants & Leisure — 1.5% | |
Carnival Corp. | | | 13,473 | | | | 894,203 | |
McDonald’s Corp. | | | 4,275 | | | | 735,813 | |
| | | | | | | | |
| | | | | | | 1,630,016 | |
| | | | |
| SCHEDULE OF INVESTMENTS | | | 5 | |
| | |
Schedule of Investments (continued) December 31, 2017 | | BlackRock Advantage Large Cap Value V.I. Fund (Percentages shown are based on Net Assets) |
| | | | | | | | |
| Security | | Shares | | | Value | |
| Household Products — 1.8% | |
Clorox Co. (The) | | | 3,574 | | | $ | 531,597 | |
Kimberly-Clark Corp. | | | 5,865 | | | | 707,671 | |
Procter & Gamble Co. (The) | | | 7,799 | | | | 716,572 | |
| | | | | | | | |
| | | | | | | 1,955,840 | |
| Industrial Conglomerates — 0.7% | |
3M Co. | | | 134 | | | | 31,540 | |
General Electric Co. | | | 37,146 | | | | 648,198 | |
Honeywell International, Inc. | | | 312 | | | | 47,848 | |
| | | | | | | | |
| | | | | | | 727,586 | |
| Insurance — 5.8% | |
Allstate Corp. (The) | | | 13,606 | | | | 1,424,684 | |
First American Financial Corp. | | | 9,598 | | | | 537,872 | |
Hanover Insurance Group, Inc. (The) | | | 1,727 | | | | 186,654 | |
Hartford Financial Services Group, Inc. (The) | | | 2,332 | | | | 131,245 | |
Lincoln National Corp. | | | 16,853 | | | | 1,295,490 | |
Marsh & McLennan Cos., Inc. | | | 942 | | | | 76,669 | |
Principal Financial Group, Inc. | | | 10,001 | | | | 705,671 | |
Prudential Financial, Inc. | | | 9,350 | | | | 1,075,063 | |
Reinsurance Group of America, Inc. | | | 552 | | | | 86,073 | |
Unum Group | | | 12,785 | | | | 701,769 | |
Validus Holdings Ltd. | | | 2,470 | | | | 115,893 | |
| | | | | | | | |
| | | | | | | 6,337,083 | |
| IT Services — 2.2% | | | | |
Broadridge Financial Solutions, Inc. | | | 5,441 | | | | 492,846 | |
Fidelity National Information Services, Inc. | | | 884 | | | | 83,175 | |
International Business Machines Corp. | | | 7,469 | | | | 1,145,894 | |
Mastercard, Inc., Class A | | | 4,675 | | | | 707,608 | |
| | | | | | | | |
| | | | | | | 2,429,523 | |
| Machinery — 4.0% | |
Cummins, Inc. | | | 3,747 | | | | 661,870 | |
Ingersoll-Rand plc | | | 3,265 | | | | 291,205 | |
Oshkosh Corp. | | | 7,907 | | | | 718,667 | |
PACCAR, Inc. | | | 19,836 | | | | 1,409,943 | |
Stanley Black & Decker, Inc. | | | 389 | | | | 66,010 | |
Xylem, Inc. | | | 18,245 | | | | 1,244,309 | |
| | | | | | | | |
| | | | | | | 4,392,004 | |
| Media — 2.2% | |
John Wiley & Sons, Inc., Class A | | | 15,580 | | | | 1,024,385 | |
Scripps Networks Interactive, Inc., Class A | | | 334 | | | | 28,517 | |
Time Warner, Inc. | | | 6,688 | | | | 611,751 | |
Walt Disney Co. (The) | | | 6,878 | | | | 739,454 | |
| | | | | | | | |
| | | | | | | 2,404,107 | |
| Metals & Mining — 1.2% | |
Newmont Mining Corp. | | | 36,350 | | | | 1,363,852 | |
| | | | | | | | |
| Multiline Retail — 0.8% | |
Target Corp. | | | 12,666 | | | | 826,457 | |
| | | | | | | | |
| Multi-Utilities — 2.3% | | | | |
CMS Energy Corp. | | | 27,891 | | | | 1,319,244 | |
Vectren Corp. | | | 17,780 | | | | 1,156,056 | |
| | | | | | | | |
| | | | | | | 2,475,300 | |
| Oil, Gas & Consumable Fuels — 9.7% | |
Anadarko Petroleum Corp. | | | 24,071 | | | | 1,291,168 | |
Chevron Corp. | | | 6,815 | | | | 853,170 | |
ConocoPhillips | | | 31,955 | | | | 1,754,010 | |
Continental Resources, Inc.(b) | | | 1,416 | | | | 75,005 | |
Devon Energy Corp. | | | 1,012 | | | | 41,897 | |
Exxon Mobil Corp. | | | 33,498 | | | | 2,801,773 | |
Marathon Oil Corp. | | | 9,757 | | | | 165,186 | |
Marathon Petroleum Corp. | | | 4,552 | | | | 300,341 | |
Occidental Petroleum Corp. | | | 5,566 | | | | 409,992 | |
| | | | | | | | |
| Security | | Shares | | | Value | |
| Oil, Gas & Consumable Fuels (continued) | |
Suncor Energy, Inc. | | | 11,863 | | | $ | 435,609 | |
Valero Energy Corp. | | | 16,957 | | | | 1,558,518 | |
Williams Cos., Inc. (The) | | | 31,121 | | | | 948,879 | |
| | | | | | | | |
| | | | | | | 10,635,548 | |
| Personal Products — 0.4% | |
Estee Lauder Cos., Inc. (The), Class A | | | 3,095 | | | | 393,808 | |
| | | | | | | | |
| Pharmaceuticals — 5.7% | |
Bristol-Myers Squibb Co. | | | 26,683 | | | | 1,635,134 | |
Johnson & Johnson | | | 13,412 | | | | 1,873,925 | |
Merck & Co., Inc. | | | 30,320 | | | | 1,706,106 | |
Pfizer, Inc. | | | 18,016 | | | | 652,540 | |
Zoetis, Inc. | | | 5,285 | | | | 380,731 | |
| | | | | | | | |
| | | | | | | 6,248,436 | |
| Real Estate Management & Development — 1.1% | |
CBRE Group, Inc., Class A(b) | | | 21,253 | | | | 920,468 | |
Jones Lang LaSalle, Inc. | | | 1,727 | | | | 257,202 | |
| | | | | | | | |
| | | | | | | 1,177,670 | |
| Road & Rail — 0.2% | |
Norfolk Southern Corp. | | | 1,393 | | | | 201,846 | |
| | | | | | | | |
| Semiconductors & Semiconductor Equipment — 2.9% | |
Intel Corp. | | | 24,515 | | | | 1,131,612 | |
QUALCOMM, Inc. | | | 12,746 | | | | 815,999 | |
Texas Instruments, Inc. | | | 11,552 | | | | 1,206,491 | |
| | | | | | | | |
| | | | | | | 3,154,102 | |
| Software — 1.9% | |
Activision Blizzard, Inc. | | | 11,598 | | | | 734,385 | |
Oracle Corp. | | | 28,120 | | | | 1,329,514 | |
| | | | | | | | |
| | | | | | | 2,063,899 | |
| Specialty Retail — 1.2% | |
Lowe’s Cos., Inc. | | | 4,308 | | | | 400,385 | |
Penske Automotive Group, Inc.(a) | | | 18,622 | | | | 891,063 | |
| | | | | | | | |
| | | | | | | 1,291,448 | |
| Technology Hardware, Storage & Peripherals — 0.1% | |
HP, Inc. | | | 7,397 | | | | 155,411 | |
| | | | | | | | |
| Textiles, Apparel & Luxury Goods — 0.3% | |
Skechers U.S.A., Inc., Class A(b) | | | 9,375 | | | | 354,750 | |
| | | | | | | | |
| Thrifts & Mortgage Finance — 0.7% | |
Essent Group Ltd.(b) | | | 17,322 | | | | 752,121 | |
| | | | | | | | |
| Tobacco — 0.4% | |
Altria Group, Inc. | | | 4,850 | | | | 346,338 | |
Philip Morris International, Inc. | | | 789 | | | | 83,358 | |
| | | | | | | | |
| | | | | | | 429,696 | |
| Wireless Telecommunication Services — 1.5% | |
Sprint Corp. | | | 40,476 | | | | 238,404 | |
Telephone & Data Systems, Inc.(a) | | | 20,592 | | | | 572,458 | |
T-Mobile US, Inc.(a)(b) | | | 13,546 | | | | 860,306 | |
| | | | | | | | |
| | | | | | | 1,671,168 | |
| | | | | | | | |
Total Common Stocks — 98.8%
(Cost: $95,471,005) | | | | 107,933,377 | |
| | | | | | | | |
Total Long-Term Investments — 98.8%
(Cost: $95,471,005) | | | | 107,933,377 | |
| | | | | | | | |
|
Short-Term Securities — 4.6%(c) | |
BlackRock Liquidity Funds, T-Fund, Institutional Class, 1.17%(e) | | | 1,446,302 | | | | 1,446,302 | |
| | |
| 6 | | 2017 BLACKROCK ANNUAL REPORTTO SHAREHOLDERS |
| | |
Schedule of Investments (continued) December 31, 2017 | | BlackRock Advantage Large Cap Value V.I. Fund (Percentages shown are based on Net Assets) |
| | | | | | | | |
| Security | | Shares | | | Value | |
| Short-Term Securities (continued) | |
JPMorgan US Treasury Plus Money Market Fund, Agency Class, 1.14% | | | 24,371 | | | $ | 24,371 | |
SL Liquidity Series, LLC, Money Market Series,
1.48%(d)(e) | | | 3,613,873 | | | | 3,613,512 | |
| | | | | | | | |
Total Short-Term Securities — 4.6%
(Cost: $5,084,269) | | | | 5,084,185 | |
| | | | | |
| |
Total Investments — 103.4%
(Cost: $100,555,274) | | | | 113,017,562 | |
| | | | | | | | |
Liabilities in Excess of Other Assets — (3.4)% | | | | (3,722,685 | ) |
| | | | | | | | |
Net Assets — 100.0% | | | $ | 109,294,877 | |
| | | | | |
| (a) | Security, or a portion of the security, is on loan. |
| (b) | Non-income producing security. |
| (c) | Annualized 7-day yield as of period end. |
| (d) | Security was purchased with the cash collateral from loaned securities. |
| (e) | During the year ended December 31, 2017, investments in issuers considered to be affiliates of the Fund for the purposes of Section 2(a)(3) of the Investment Company Act of 1940, as amended, were as follows: |
| | | | | | | | | | | | | | | | | | | | | | | | | | | | |
| Affiliate | | Shares
Held at
12/31/16 | | | Net
Activity | | | Shares
Held at
12/31/17 | | | Value at
12/31/17 | | | Income | | | Net
Realized
Gain (Loss) (a) | | | Change in
Unrealized
Appreciation
(Depreciation) | |
BlackRock Liquidity Funds, T-Fund, Institutional Class | | | 2,392,712 | | | | (946,410 | ) | | | 1,446,302 | | | $ | 1,446,302 | | | $ | 17,995 | | | $ | 6 | | | $ | — | |
SL Liquidity Series, LLC, Money Market Series | | | 3,499,173 | | | | 114,700 | | | | 3,613,873 | | | | 3,613,512 | | | | 13,245 | (b) | | | (679 | ) | | | (104 | ) |
| | | | | | | | | | | | | | | | | | | | | | | | | | | | |
| | | | | | | | | | | | | | $ | 5,059,814 | | | $ | 31,240 | | | $ | (673 | ) | | $ | (104 | ) |
| | | | | | | | | | | | | | | | | | | | | | | | | | | | |
| | (a) | Includes net capital gain distributions, if applicable. | |
| | (b) | Represents securities lending income earned from the reinvestment of cash collateral from loaned securities, net of fees and collateral investment expenses, and other payments to and from borrowers of securities. | |
For Fund compliance purposes, the Fund’s industry classifications refer to one or more of the industry sub-classifications used by one or more widely recognized market indexes or ratings group indexes, and/or as defined by the investment advisor. These definitions may not apply for purposes of this report, which may combine such industry sub-classifications for reporting ease.
Portfolio Abbreviation
S&P — Standard & Poor’s
Derivative Financial Instruments Outstanding as of Period End
Futures Contracts
| | | | | | | | | | | | | | | | |
| Description | | Number of
Contracts | | | Expiration
Date | | | Notional
Amount (000) | | | Value/ Unrealized
Appreciation (Depreciation) | |
Long Contracts | | | | | | | | | | | | | | | | |
S&P 500 E-Mini Index | | | 11 | | | | 03/16/18 | | | $ | 1,472 | | | $ | 8,234 | |
| | | | | | | | | | | | | | | | |
| | | | |
| SCHEDULE OF INVESTMENTS | | | 7 | |
| | |
Schedule of Investments (continued) December 31, 2017 | | BlackRock Advantage Large Cap Value V.I. Fund |
Derivative Financial Instruments Categorized by Risk Exposure
As of period end, the fair values of derivative financial instruments located in the Statement of Assets and Liabilities were as follows:
| | | | | | | | | | | | | | | | | | | | | | | | | | | | |
| | | Commodity
Contracts | | | Credit
Contracts | | | Equity
Contracts | | | Foreign
Currency
Exchange
Contracts | | | Interest
Rate
Contracts | | | Other
Contracts | | | Total | |
Assets — Derivative Financial Instruments | | | | | | | | | | | | | | | | | | | | | | | | | | | | |
Future Contracts | | | | | | | | | | | | | | | | | | | | | | | | | | | | |
Net unrealized appreciation(a) | | $ | — | | | $ | — | | | $ | 8,234 | | | $ | — | | | $ | — | | | $ | — | | | $ | 8,234 | |
| | | | | | | | | | | | | | | | | | | | | | | | | | | | |
| | (a) | Includes cumulative appreciation (depreciation) on futures contracts, if any, as reported in the Schedule of Investments. Only current day’s variation margin is reported within the Statement of Assets and Liabilities. | |
For the year ended December 31, 2017, the effect of derivative financial instruments in the Statement of Operations was as follows:
| | | | | | | | | | | | | | | | | | | | | | | | | | | | |
| | | Commodity
Contracts | | | Credit
Contracts | | | Equity
Contracts | | | Foreign
Currency
Exchange
Contracts | | | Interest
Rate
Contracts | | | Other
Contracts | | | Total | |
Net Realized Gain from: | | | | | | | | | | | | | | | | | | | | | | | | | | | | |
Futures contracts | | $ | — | | | $ | — | | | $ | 184,413 | | | $ | — | | | $ | — | | | $ | — | | | $ | 184,413 | |
| | | | | | | | | | | | | | | | | | | | | | | | | | | | |
| Net Change in Unrealized Appreciation (Depreciation) | | | | | | | | | | | | | | | | | | | | | |
Futures contracts | | $ | — | | | $ | — | | | $ | 8,234 | | | $ | — | | | $ | — | | | $ | — | | | $ | 8,234 | |
| | | | | | | | | | | | | | | | | | | | | | | | | | | | |
Average Quarterly Balances of Outstanding Derivative Financial Instruments
| | | | |
Futures contracts: | | | | |
Average notional value of contracts — long | | $ | 1,395,191 | |
For more information about the Fund’s investment risks regarding derivative instruments, refer to the Notes to Financial Statements.
Fair Value Hierarchy as of Period End
Various inputs are used in determining the fair value of investments and derivative financial instruments. For information about the Fund’s policy regarding valuation of investments and derivative financial instruments, refer to the Notes to Financial Statements.
The following tables summarize the Fund’s investments and derivative financial instruments categorized in the disclosure hierarchy:
| | | | | | | | | | | | | | | | |
| | | Level 1 | | | Level 2 | | | Level 3 | | | Total | |
Investments: | | | | | | | | | | | | | | | | |
Assets: | | | | | | | | | | | | | | | | |
Long-Term Investments | | | | | | | | | | | | | | | | |
Common Stock(a) | | $ | 107,933,377 | | | $ | — | | | $ | — | | | $ | 107,933,377 | |
Short-Term Securities | | | 1,470,673 | | | | — | | | | — | | | | 1,470,673 | |
| | | | | | | | | | | | | | | | |
| | $ | 109,404,050 | | | $ | — | | | $ | — | | | $ | 109,404,050 | |
| | | | | | | | | | | | | | | | |
Investments valued at NAV(b) | | | | | | | | | | | | | | | 3,613,512 | |
| | | | | | | | | | | | | | | | |
Total Investments | | | | | | | | | | | | | | $ | 113,017,562 | |
| | | | | | | | | | | | | | | | |
Derivative Financial Instruments(c) | | | | | | | | | | | | | | | | |
Assets: | | | | | | | | | | | | | | | | |
Equity contracts | | $ | 8,234 | | | $ | — | | | $ | — | | | $ | 8,234 | |
| | | | | | | | | | | | | | | | |
| | (a) | See above Schedule of Investments for values in each industry. | |
| | (b) | As of December 31, 2017, certain investments of the Fund were fair valued using NAV per share as no quoted market value is available and therefore have been excluded from the fair value hierarchy. | |
| | (c) | Derivative financial instruments are futures contracts, which are valued at the unrealized appreciation (depreciation) on the instrument. | |
During the year ended December 31, 2017, there were no transfers between levels.
See notes to financial statements.
| | |
| 8 | | 2017 BLACKROCK ANNUAL REPORTTO SHAREHOLDERS |
Statement of Assets and Liabilities
December 31, 2017
| | | | |
| | | BlackRock
Advantage
Large Cap
Value V.I. Fund | |
| |
ASSETS | | | | |
Investments at value — unaffiliated (including securities loaned at value of $3,510,771) (cost — $95,495,376) | | $ | 107,957,748 | |
Investments at value — affiliated (cost — $5,059,898) | | | 5,059,814 | |
Cash pledged for futures contracts | | | 55,000 | |
Receivables: | | | | |
Investments sold | | | 1,580,363 | |
Securities lending income — affiliated | | | 345 | |
Dividends — affiliated | | | 1,243 | |
Dividends — unaffiliated | | | 166,330 | |
From custodian | | | 24,371 | |
From the Manager | | | 1,633 | |
Prepaid expenses | | | 501 | |
| | | | |
Total assets | | | 114,847,348 | |
| | | | |
| |
LIABILITIES | | | | |
Cash collateral on securities loaned at value | | | 3,613,881 | |
Payables: | | | | |
Investments purchased | | | 1,806,500 | |
Capital shares redeemed | | | 1,671 | |
Investment advisory fees | | | 6,426 | |
Officer’s and Directors’ fees | | | 3,546 | |
Other accrued expenses | | | 112,666 | |
Other affiliates | | | 177 | |
Distribution fees | | | 1,500 | |
Variation margin on futures contracts | | | 6,104 | |
| | | | |
Total liabilities | | | 5,552,471 | |
| | | | |
| |
NET ASSETS | | $ | 109,294,877 | |
| | | | |
| |
NET ASSETS CONSIST OF | | | | |
Paid-in capital | | $ | 96,336,373 | |
Distributions in excess of net investment income | | | 5,506 | |
Accumulated net realized gain | | | 482,476 | |
Net unrealized appreciation (depreciation) | | | 12,470,522 | |
| | | | |
NET ASSETS | | $ | 109,294,877 | |
| | | | |
| |
NET ASSET VALUE | | | | |
Class I — Based on net assets of $99,213,030 and 9,329,288 shares outstanding, 100 million shares authorized, $0.10 par value. | | $ | 10.63 | |
| | | | |
Class II — Based on net assets of $7,062,678 and 661,734 shares outstanding, 100 million shares authorized, $0.10 par value. | | $ | 10.67 | |
| | | | |
Class III — Based on net assets of $3,019,169 and 288,538 shares outstanding, 100 million shares authorized, $0.10 par value. | | $ | 10.46 | |
| | | | |
See notes to financial statements.
Statement of Operations
December 31, 2017
| | | | |
| | | BlackRock
Advantage
Large Cap
Value V.I. Fund | |
| |
INVESTMENT INCOME | | | | |
Dividends — affiliated | | $ | 17,995 | |
Dividends — unaffiliated | | | 2,308,732 | |
Securities lending income — affiliated — net | | | 13,245 | |
Foreign taxes withheld | | | (10,570 | ) |
| | | | |
Total investment income | | | 2,329,402 | |
| | | | |
| |
EXPENSES | | | | |
Investment advisory | | | 783,086 | |
Transfer agent — class specific | | | 212,707 | |
Professional | | | 58,031 | |
Printing | | | 41,999 | |
Accounting services | | | 33,808 | |
Custodian | | | 21,418 | |
Directors and Officer | | | 21,303 | |
Distribution — class specific | | | 15,807 | |
Transfer agent | | | 4,999 | |
Miscellaneous | | | 45,036 | |
| | | | |
Total expenses | | | 1,238,194 | |
Less: | | | | |
Fees waived and/or reimbursed by the Manager | | | (318,504 | ) |
Transfer agent fees reimbursed — class specific | | | (207,687 | ) |
| | | | |
Total expenses after fees waived and/or reimbursed | | | 712,003 | |
| | | | |
Net investment income | | | 1,617,399 | |
| | | | |
| |
REALIZED AND UNREALIZED GAIN (LOSS) | | | | |
Net realized gain (loss) from: | | | | |
Investments — affiliated | | | (679 | ) |
Investments — unaffiliated | | | 25,364,382 | |
Capital gain distributions from investment companies — affiliated | | | 6 | |
Futures contracts | | | 184,413 | |
| | | | |
| | | 25,548,122 | |
| | | | |
Net change in unrealized appreciation (depreciation) on: | | | | |
Investments — affiliated | | | (104 | ) |
Investments — unaffiliated | | | (10,482,247 | ) |
Futures contracts | | | 8,234 | |
| | | | |
| | | (10,474,117 | ) |
| | | | |
Net realized and unrealized gain | | | 15,074,005 | |
| | | | |
NET INCREASE IN NET ASSETS RESULTING FROM OPERATIONS | | $ | 16,691,404 | |
| | | | |
See notes to financial statements.
| | |
| 10 | | 2017 BLACKROCK ANNUAL REPORTTO SHAREHOLDERS |
Statements of Changes in Net Assets
| | | | | | | | |
| | | BlackRock Advantage
Large Cap Value V.I. Fund | |
| | | Year Ended December 31, | |
| | 2017 | | | 2016 | |
| | |
INCREASE (DECREASE) IN NET ASSETS | | | | | | | | |
| | |
OPERATIONS | | | | | | | | |
Net investment income | | $ | 1,617,399 | | | $ | 1,222,135 | |
Net realized gain | | | 25,548,122 | | | | 8,536,426 | |
Net change in unrealized appreciation (depreciation) | | | (10,474,117 | ) | | | 2,467,491 | |
| | | | | | | | |
Net increase in net assets resulting from operations | | | 16,691,404 | | | | 12,226,052 | |
| | | | | | | | |
| | |
DISTRIBUTIONS TO SHAREHOLDERS(a) | | | | | | | | |
From net investment income: | | | | | | | | |
Class I | | | (1,493,752 | ) | | | (1,140,896 | ) |
Class II | | | (93,118 | ) | | | (62,189 | ) |
Class III | | | (38,131 | ) | | | (16,917 | ) |
From net realized gain: | | | | | | | | |
Class I | | | (23,621,034 | ) | | | (5,972,331 | ) |
Class II | | | (1,667,678 | ) | | | (388,346 | ) |
Class III | | | (725,996 | ) | | | (123,751 | ) |
| | | | | | | | |
Decrease in net assets resulting from distributions to shareholders | | | (27,639,709 | ) | | | (7,704,430 | ) |
| | | | | | | | |
| | |
CAPITAL SHARE TRANSACTIONS | | | | | | | | |
Net increase (decrease) in net assets derived from capital share transactions | | | 19,457,704 | | | | (5,208,753 | ) |
| | | | | | | | |
| | |
NET ASSETS | | | | | | | | |
Total increase (decrease) in net assets | | | 8,509,399 | | | | (687,131 | ) |
Beginning of year | | | 100,785,478 | | | | 101,472,609 | |
| | | | | | | | |
End of year | | $ | 109,294,877 | | | $ | 100,785,478 | |
| | | | | | | | |
Undistributed (distributions in excess of) net investment income, end of year | | $ | 5,506 | | | $ | 7,169 | |
| | | | | | | | |
| (a) | Distributions for annual periods determined in accordance with U.S. federal income tax regulations. |
See notes to financial statements.
Financial Highlights
(For a share outstanding throughout each period)
| | | | | | | | | | | | | | | | | | | | |
| | | BlackRock Advantage Large Cap Value V.I. Fund | |
| | | Class I | |
| | | Year Ended December 31, | |
| | 2017 | | | 2016 | | | 2015 | | | 2014 | | | 2013 | |
Net asset value, beginning of year | | $ | 12.06 | | | $ | 11.49 | | | $ | 12.74 | | | $ | 13.22 | | | $ | 10.73 | |
| | | | | | | | | | | | | | | | | | | | |
Net investment income(a) | | | 0.20 | | | | 0.15 | | | | 0.14 | | | | 0.15 | | | | 0.14 | |
Net realized and unrealized gain (loss) | | | 1.86 | | | | 1.41 | | | | (0.36 | ) | | | 1.47 | | | | 3.46 | |
| | | | | | | | | | | | | | | | | | | | |
Net increase (decrease) from investment operations | | | 2.06 | | | | 1.56 | | | | (0.22 | ) | | | 1.62 | | | | 3.60 | |
| | | | | | | | | | | | | | | | | | | | |
| Distributions:(b) | | | | | | | | | | | | | | | |
From net investment income | | | (0.21 | ) | | | (0.16 | ) | | | (0.15 | ) | | | (0.16 | ) | | | (0.16 | ) |
From net realized gain | | | (3.28 | ) | | | (0.83 | ) | | | (0.88 | ) | | | (1.94 | ) | | | (0.95 | ) |
| | | | | | | | | | | | | | | | | | | | |
Total distributions | | | (3.49 | ) | | | (0.99 | ) | | | (1.03 | ) | | | (2.10 | ) | | | (1.11 | ) |
| | | | | | | | | | | | | | | | | | | | |
Net asset value, end of year | | $ | 10.63 | | | $ | 12.06 | | | $ | 11.49 | | | $ | 12.74 | | | $ | 13.22 | |
| | | | | | | | | | | | | | | | | | | | |
| | | | | |
Total Return:(c) | | | | | | | | | | | | | | | | | | | | |
Based on net asset value | | | 17.22 | % | | | 13.60 | % | | | (1.72 | )% | | | 12.22 | % | | | 33.61 | % |
| | | | | | | | | | | | | | | | | | | | |
| | | | | |
Ratios to Average Net Assets: | | | | | | | | | | | | | | | | | | | | |
Total expenses | | | 1.17 | %(d) | | | 1.09 | % | | | 1.08 | % | | | 1.08 | % | | | 1.08 | % |
| | | | | | | | | | | | | | | | | | | | |
Total expenses after fees waived and/or reimbursed | | | 0.71 | %(d) | | | 0.82 | % | | | 0.77 | % | | | 0.77 | % | | | 0.78 | % |
| | | | | | | | | | | | | | | | | | | | |
Net investment income | | | 1.57 | %(d) | | | 1.29 | % | | | 1.14 | % | | | 1.10 | % | | | 1.10 | % |
| | | | | | | | | | | | | | | | | | | | |
| | | | | |
Supplemental Data: | | | | | | | | | | | | | | | | | | | | |
Net assets, end of year (000) | | $ | 99,213 | | | $ | 92,795 | | | $ | 93,983 | | | $ | 109,570 | | | $ | 115,094 | |
| | | | | | | | | | | | | | | | | | | | |
Portfolio turnover rate | | | 168 | % | | | 47 | % | | | 29 | % | | | 35 | % | | | 41 | % |
| | | | | | | | | | | | | | | | | | | | |
| (a) | Based on average shares outstanding. |
| (b) | Distributions for annual periods determined in accordance with U.S. federal income tax regulations. |
| (c) | Where applicable, excludes insurance-related fees and expenses and assumes the reinvestment of distributions. |
| (d) | Excludes expenses incurred indirectly as a result of investments in underlying funds of 0.01%. |
See notes to financial statements.
| | |
| 12 | | 2017 BLACKROCK ANNUAL REPORTTO SHAREHOLDERS |
Financial Highlights (continued)
(For a share outstanding throughout each period)
| | | | | | | | | | | | | | | | | | | | |
| | | BlackRock Advantage Large Cap Value V.I. Fund | |
| | | Class II | |
| | | Year Ended December 31, | |
| | 2017 | | | 2016 | | | 2015 | | | 2014 | | | 2013 | |
Net asset value, beginning of year | | $ | 12.09 | | | $ | 11.52 | | | $ | 12.77 | | | $ | 13.25 | | | $ | 10.75 | |
| | | | | | | | | | | | | | | | | | | | |
Net investment income(a) | | | 0.18 | | | | 0.13 | | | | 0.12 | | | | 0.13 | | | | 0.11 | |
Net realized and unrealized gain (loss) | | | 1.86 | | | | 1.40 | | | | (0.36 | ) | | | 1.46 | | | | 3.47 | |
| | | | | | | | | | | | | | | | | | | | |
Net increase (decrease) from investment operations | | | 2.04 | | | | 1.53 | | | | (0.24 | ) | | | 1.59 | | | | 3.58 | |
| | | | | | | | | | | | | | | | | | | | |
| Distributions:(b) | | | | | | | | | | | | | | | |
From net investment income | | | (0.18 | ) | | | (0.13 | ) | | | (0.13 | ) | | | (0.13 | ) | | | (0.13 | ) |
From net realized gain | | | (3.28 | ) | | | (0.83 | ) | | | (0.88 | ) | | | (1.94 | ) | | | (0.95 | ) |
| | | | | | | | | | | | | | | | | | | | |
Total distributions | | | (3.46 | ) | | | (0.96 | ) | | | (1.01 | ) | | | (2.07 | ) | | | (1.08 | ) |
| | | | | | | | | | | | | | | | | | | | |
Net asset value, end of year | | $ | 10.67 | | | $ | 12.09 | | | $ | 11.52 | | | $ | 12.77 | | | $ | 13.25 | |
| | | | | | | | | | | | | | | | | | | | |
| | | | | |
Total Return:(c) | | | | | | | | | | | | | | | | | | | | |
Based on net asset value | | | 17.06 | % | | | 13.35 | % | | | (1.96 | )% | | | 11.94 | % | | | 33.39 | % |
| | | | | | | | | | | | | | | | | | | | |
| | | | | |
Ratios to Average Net Assets: | | | | | | | | | | | | | | | | | | | | |
Total expenses | | | 1.32 | %(d) | | | 1.27 | % | | | 1.19 | % | | | 1.23 | % | | | 1.20 | % |
| | | | | | | | | | | | | | | | | | | | |
Total expenses after fees waived and/or reimbursed | | | 0.88 | %(d) | | | 1.03 | % | | | 0.96 | % | | | 0.97 | % | | | 0.98 | % |
| | | | | | | | | | | | | | | | | | | | |
Net investment income | | | 1.38 | %(d) | | | 1.10 | % | | | 0.95 | % | | | 0.92 | % | | | 0.90 | % |
| | | | | | | | | | | | | | | | | | | | |
| | | | | |
Supplemental Data: | | | | | | | | | | | | | | | | | | | | |
Net assets, end of year (000) | | $ | 7,063 | | | $ | 6,060 | | | $ | 5,680 | | | $ | 4,002 | | | $ | 5,324 | |
| | | | | | | | | | | | | | | | | | | | |
Portfolio turnover rate | | | 168 | % | | | 47 | % | | | 29 | % | | | 35 | % | | | 41 | % |
| | | | | | | | | | | | | | | | | | | | |
| (a) | Based on average shares outstanding. |
| (b) | Distributions for annual periods determined in accordance with U.S. federal income tax regulations. |
| (c) | Where applicable, excludes insurance-related fees and expenses and assumes the reinvestment of distributions. |
| (d) | Excludes expenses incurred indirectly as a result of investments in underlying funds of 0.01%. |
See notes to financial statements.
Financial Highlights (continued)
(For a share outstanding throughout each period)
| | | | | | | | | | | | | | | | | | | | |
| | | BlackRock Advantage Large Cap Value V.I. Fund | |
| | | Class III | |
| | | Year Ended December 31, | |
| | | 2017 | | | 2016 | | | 2015 | | | 2014 | | | 2013 | |
Net asset value, beginning of year | | $ | 11.92 | | | $ | 11.37 | | | $ | 12.61 | | | $ | 13.12 | | | $ | 10.66 | |
| | | | | | | | | | | | | | | | | | | | |
Net investment income(a) | | | 0.16 | | | | 0.11 | | | | 0.10 | | | | 0.10 | | | | 0.09 | |
Net realized and unrealized gain (loss) | | | 1.83 | | | | 1.38 | | | | (0.36 | ) | | | 1.44 | | | | 3.44 | |
| | | | | | | | | | | | | | | | | | | | |
Net increase (decrease) from investment operations | | | 1.99 | | | | 1.49 | | | | (0.26 | ) | | | 1.54 | | | | 3.53 | |
| | | | | | | | | | | | | | | | | | | | |
| Distributions:(b) | | | | | | | | | | | | | | | |
From net investment income | | | (0.17 | ) | | | (0.11 | ) | | | (0.10 | ) | | | (0.11 | ) | | | (0.12 | ) |
From net realized gain | | | (3.28 | ) | | | (0.83 | ) | | | (0.88 | ) | | | (1.94 | ) | | | (0.95 | ) |
| | | | | | | | | | | | | | | | | | | | |
Total distributions | | | (3.45 | ) | | | (0.94 | ) | | | (0.98 | ) | | | (2.05 | ) | | | (1.07 | ) |
| | | | | | | | | | | | | | | | | | | | |
Net asset value, end of year | | $ | 10.46 | | | $ | 11.92 | | | $ | 11.37 | | | $ | 12.61 | | | $ | 13.12 | |
| | | | | | | | | | | | | | | | | | | | |
| | | | | |
Total Return:(c) | | | | | | | | | | | | | | | | | | | | |
Based on net asset value | | | 16.86 | % | | | 13.17 | % | | | (2.11 | )% | | | 11.72 | % | | | 33.16 | % |
| | | | | | | | | | | | | | | | | | | | |
| | | | | |
Ratios to Average Net Assets: | | | | | | | | | | | | | | | | | | | | |
Total expenses | | | 1.43 | %(d) | | | 1.35 | % | | | 1.34 | % | | | 1.32 | % | | | 1.33 | % |
| | | | | | | | | | | | | | | | | | | | |
Total expenses after fees waived and/or reimbursed | | | 0.99 | %(d) | | | 1.18 | % | | | 1.13 | % | | | 1.13 | % | | | 1.14 | % |
| | | | | | | | | | | | | | | | | | | | |
Net investment income | | | 1.26 | %(d) | | | 0.92 | % | | | 0.78 | % | | | 0.73 | % | | | 0.74 | % |
| | | | | | | | | | | | | | | | | | | | |
| | | | | |
Supplemental Data: | | | | | | | | | | | | | | | | | | | | |
Net assets, end of year (000) | | $ | 3,019 | | | $ | 1,930 | | | $ | 1,810 | | | $ | 1,931 | | | $ | 1,576 | |
| | | | | | | | | | | | | | | | | | | | |
Portfolio turnover rate | | | 168 | % | | | 47 | % | | | 29 | % | | | 35 | % | | | 41 | % |
| | | | | | | | | | | | | | | | | | | | |
| (a) | Based on average shares outstanding. |
| (b) | Distributions for annual periods determined in accordance with U.S. federal income tax regulations. |
| (c) | Where applicable, excludes insurance-related fees and expenses and assumes the reinvestment of distributions. |
| (d) | Excludes expenses incurred indirectly as a result of investments in underlying funds of 0.01%. |
See notes to financial statements.
| | |
| 14 | | 2017 BLACKROCK ANNUAL REPORTTO SHAREHOLDERS |
Notes to Financial Statements
BlackRock Variable Series Funds, Inc. (the “Company”) is registered under the Investment Company Act of 1940, as amended (the “1940 Act”), as an open-end management investment company. The Company is organized as a Maryland corporation that is comprised of 20 separate funds. The funds offer shares to insurance companies for their separate accounts to fund benefits under certain variable annuity and variable life insurance contracts. The financial statements presented are for BlackRock Advantage Large Cap Value V.I. Fund (the “Fund”) (formerly known as BlackRock Large Cap Value V.I. Fund). The Fund is classified as diversified. Class I, Class II and Class III Shares have equal voting, dividend, liquidation and other rights, except that only shares of the respective classes are entitled to vote on matters concerning only that class. In addition, Class II and Class III Shares bear certain expenses related to the distribution of such shares.
The Fund, together with certain other registered investment companies advised by BlackRock Advisors, LLC (the “Manager”) or its affiliates, is included in a complex of open-end funds referred to as the Equity-Bond Complex.
| 2. | SIGNIFICANT ACCOUNTING POLICIES |
The financial statements are prepared in conformity with accounting principles generally accepted in the United States of America (“U.S. GAAP”), which may require management to make estimates and assumptions that affect the reported amounts of assets and liabilities in the financial statements, disclosure of contingent assets and liabilities at the date of the financial statements and the reported amounts of increases and decreases in net assets from operations during the reporting period. Actual results could differ from those estimates. The Fund is considered an investment company under U.S. GAAP and follows the accounting and reporting guidance applicable to investment companies. Below is a summary of significant accounting policies:
Segregation and Collateralization: In cases where the Fund enters into certain investments (e.g., futures contracts) that would be treated as “senior securities” for 1940 Act purposes, the Fund may segregate or designate on its books and records cash or liquid assets having a market value at least equal to the amount of the Fund’s future obligations under such investments. Doing so allows the investment to be excluded from treatment as a “senior security.” Furthermore, if required by an exchange or counterparty agreement, the Fund may be required to deliver/deposit cash and/or securities to/with an exchange, or broker-dealer or custodian as collateral for certain investments or obligations.
Investment Transactions and Income Recognition: For financial reporting purposes, investment transactions are recorded on the dates the transactions are entered into (the trade dates). Realized gains and losses on investment transactions are determined on the identified cost basis. Dividend income is recorded on the ex-dividend date. Dividends from foreign securities where the ex-dividend date may have passed are subsequently recorded when the Fund is informed of the ex-dividend date. Under the applicable foreign tax laws, a withholding tax at various rates may be imposed on capital gains, dividends and interest. Income, expenses and realized and unrealized gains and losses are allocated daily to each class based on its relative net assets.
Distributions: Distributions paid by the Fund are recorded on the ex-dividend date. Distributions of capital gains are recorded on the ex-dividend date and made at least annually. The character and timing of distributions are determined in accordance with U.S. federal income tax regulations, which may differ from U.S. GAAP.
Indemnifications: In the normal course of business, the Fund enters into contracts that contain a variety of representations that provide general indemnification. The Fund’s maximum exposure under these arrangements is unknown because it involves future potential claims against the Fund, which cannot be predicted with any certainty.
Other: Expenses directly related to the Fund or its classes are charged to the Fund or the applicable class. Other operating expenses shared by several funds, including other funds managed by the Manager, are prorated among those funds on the basis of relative net assets or other appropriate methods. Expenses directly related to the Fund and other shared expenses prorated to the Fund are allocated daily to each class based on its relative net assets or other appropriate methods.
| 3. | INVESTMENT VALUATION AND FAIR VALUE MEASUREMENTS |
Investment Valuation Policies: The Fund’s investments are valued at fair value (also referred to as “market value” within the financial statements) as of the close of trading on the New York Stock Exchange (“NYSE”) (generally 4:00 p.m., Eastern time) (or, if the reporting date falls on a day the NYSE is closed, investments are valued at fair value as of the period end). U.S. GAAP defines fair value as the price the Fund would receive to sell an asset or pay to transfer a liability in an orderly transaction between market participants at the measurement date. The Fund determines the fair values of its financial instruments using various independent dealers or pricing services under policies approved by the Board of Directors of the Company (the “Board”). The BlackRock Global Valuation Methodologies Committee (the “Global Valuation Committee”) is the committee formed by management to develop global pricing policies and procedures and to oversee the pricing function for all financial instruments.
Fair Value Inputs and Methodologies: The following methods and inputs are used to establish the fair value of the Fund’s assets and liabilities:
| | • | | Equity investments traded on a recognized securities exchange are valued at the official closing price each day, if available. For equity investments traded on more than one exchange, the official closing price on the exchange where the stock is primarily traded is used. Equity investments traded on a recognized exchange for which there were no sales on that day may be valued at the last available bid (long positions) or ask (short positions) price. |
| | • | | Investments in open-end U.S. mutual funds are valued at net asset value (“NAV”) each business day. |
| | • | | The Fund values its investment in SL Liquidity Series, LLC, Money Market Series (the “Money Market Series”) at fair value, which is ordinarily based upon its pro rata ownership in the underlying fund’s net assets. The Money Market Series seeks current income consistent with maintaining liquidity and preserving capital. Although the Money Market Series is not registered under the 1940 Act, its investments may follow the parameters of investments by a money market fund that is subject to Rule 2a-7 under the 1940 Act. |
| | • | | Futures contracts traded on exchanges are valued at their last sale price. |
| | | | |
| NOTESTO FINANCIAL STATEMENTS | | | 15 | |
Notes to Financial Statements (continued)
If events (e.g., a company announcement, market volatility or a natural disaster) occur that are expected to materially affect the value of such instruments, or in the event that the application of these methods of valuation results in a price for an investment that is deemed not to be representative of the market value of such investment, or if a price is not available, the investment will be valued by the Global Valuation Committee, or its delegate, in accordance with a policy approved by the Board as reflecting fair value (“Fair Valued Investments”). The fair valuation approaches that may be used by the Global Valuation Committee will include market approach, income approach and the cost approach. Valuation techniques such as discounted cash flow, use of market comparables and matrix pricing are types of valuation approaches and are typically used in determining fair value. When determining the price for Fair Valued Investments, the Global Valuation Committee, or its delegate, seeks to determine the price that the Fund might reasonably expect to receive or pay from the current sale or purchase of that asset or liability in an arm’s-length transaction. Fair value determinations shall be based upon all available factors that the Global Valuation Committee, or its delegate, deems relevant and consistent with the principles of fair value measurement. The pricing of all Fair Valued Investments is subsequently reported to the Board or a committee thereof on a quarterly basis.
Fair Value Hierarchy: Various inputs are used in determining the fair value of investments and derivative financial instruments. These inputs to valuation techniques are categorized into a fair value hierarchy consisting of three broad levels for financial statement purposes as follows:
| | • | | Level 1 — Unadjusted price quotations in active markets/exchanges for identical assets or liabilities that the Fund has the ability to access |
| | • | | Level 2 — Other observable inputs (including, but not limited to, quoted prices for similar assets or liabilities in markets that are active, quoted prices for identical or similar assets or liabilities in markets that are not active, inputs other than quoted prices that are observable for the assets or liabilities (such as interest rates, yield curves, volatilities, prepayment speeds, loss severities, credit risks and default rates) or other market– corroborated inputs) |
| | • | | Level 3 — Unobservable inputs based on the best information available in the circumstances, to the extent observable inputs are not available (including the Fund’s own assumptions used in determining the fair value of investments and derivative financial instruments) |
The hierarchy gives the highest priority to unadjusted quoted prices in active markets for identical assets or liabilities (Level 1 measurements) and the lowest priority to unobservable inputs (Level 3 measurements). Accordingly, the degree of judgment exercised in determining fair value is greatest for instruments categorized in Level 3. The inputs used to measure fair value may fall into different levels of the fair value hierarchy. In such cases, for disclosure purposes, the fair value hierarchy classification is determined based on the lowest level input that is significant to the fair value measurement in its entirety. Investments classified within Level 3 have significant unobservable inputs used by the Global Valuation Committee in determining the price for Fair Valued investments. Level 3 investments include equity or debt issued by privately held companies or funds. There may not be a secondary market, and/or there are a limited number of investors. Level 3 investments may also be adjusted to reflect illiquidity and/or non-transferability, with the amount of such discount estimated by the Global Valuation Committee in the absence of market information.
Changes in valuation techniques may result in transfers into or out of an assigned level within the hierarchy. In accordance with the Fund’s policy, transfers between different levels of the fair value hierarchy are deemed to have occurred as of the beginning of the reporting period. The categorization of a value determined for investments and derivative financial instruments is based on the pricing transparency of the investments and derivative financial instruments and is not necessarily an indication of the risks associated with investing in those securities.
As of December 31, 2017, certain investments of the Fund were valued using NAV as no quoted market value is available and therefore have been excluded from the fair value hierarchy.
| 4. | SECURITIES AND OTHER INVESTMENTS |
Securities Lending: The Fund may lend its securities to approved borrowers, such as brokers, dealers and other financial institutions. The borrower pledges and maintains with the Fund collateral consisting of cash, an irrevocable letter of credit issued by a bank, or securities issued or guaranteed by the U.S. Government. The initial collateral received by the Fund is required to have a value of at least 102% of the current value of the loaned securities for securities traded on U.S. exchanges and a value of at least 105% for all other securities. The collateral is maintained thereafter, at a value equal to at least 100% of the current market value of the securities on loan. The market value of the loaned securities is determined at the close of each business day of the Fund and any additional required collateral is delivered to the Fund, or excess collateral returned by the Fund, on the next business day. During the term of the loan, the Fund is entitled to all distributions made on or in respect of the loaned securities, but does not receive interest income on securities received as collateral. Loans of securities are terminable at any time and the borrower, after notice, is required to return borrowed securities within the standard time period for settlement of securities transactions.
The market value of any securities on loan, all of which were classified as common stocks in the Fund’s Schedule of Investments, and the value of any related collateral are shown separately in the Statement of Assets and Liabilities as a component of investments at value — unaffiliated, and collateral on securities loaned at value, respectively. As of period end, any securities on loan were collateralized by cash and/or U.S. Government obligations. Cash collateral invested by the securities lending agent, BlackRock Investment Management, LLC (“BIM”), if any, is disclosed in the Schedule of Investments.
Securities lending transactions are entered into by the Fund under Master Securities Lending Agreements (each, an “MSLA”), which provide the right, in the event of default (including bankruptcy or insolvency), for the non-defaulting party to liquidate the collateral and calculate a net exposure to the defaulting party or request additional collateral. In the event that a borrower defaults, the Fund, as lender, would offset the market value of the collateral received against the market value of the securities loaned. When the value of the collateral is greater than that of the market value of the securities loaned, the lender is left with a net amount payable to the defaulting party. However, bankruptcy or insolvency laws of a particular jurisdiction may impose restrictions on or prohibitions against such a right of offset in the event of an MSLA counterparty’s bankruptcy or insolvency. Under the MSLA, absent an event of default, the borrower can resell or re-pledge the loaned securities, and the Fund can reinvest cash collateral received in connection with loaned securities. Upon an event of default, the parties’ obligations to return the securities or collateral to the other party are extinguished, and the parties can resell or re-pledge the loaned securities or the collateral received in connection with the loaned securities in order to satisfy the defaulting party’s net payment obligation for all transactions under the MSLA. The defaulting party remains liable for any deficiency.
| | |
| 16 | | 2017 BLACKROCK ANNUAL REPORTTO SHAREHOLDERS |
Notes to Financial Statements (continued)
As of period end, the following table is a summary of the Fund’s securities lending agreements by counterparty which are subject to offset under an MSLA:
Securities Lending Agreements
| | | | | | | | | | | | |
| Counterparty | | Securities
Loaned at Value | | | Cash Collateral
Received (a) | | | Net
Amount | |
Citigroup Global Markets, Inc. | | $ | 3,060,773 | | | $ | (3,060,773 | ) | | $ | — | |
Deutsche Bank Securities Inc. | | | 574 | | | | (574 | ) | | | — | |
JP Morgan Securities LLC | | | 412,323 | | | | (412,323 | ) | | | — | |
Morgan Stanley | | | 37,101 | | | | (37,101 | ) | | | — | |
| | | | | | | | | | | | |
| | $ | 3,510,771 | | | $ | (3,510,771 | ) | | $ | — | |
| | | | | | | | | | | | |
| | (a) | Cash collateral with a value of $3,613,881 has been received in connection with securities lending agreements. Collateral received in excess of the value of securities loaned from the individual counterparty is not shown for financial reporting purposes in the table above. | |
The risks of securities lending include the risk that the borrower may not provide additional collateral when required or may not return the securities when due. To mitigate these risks, the Fund benefits from a borrower default indemnity provided by BIM. BIM’s indemnity allows for full replacement of the securities loaned if the collateral received does not cover the value on the securities loaned in the event of borrower default. The Fund could incur a loss if the value of an investment purchased with cash collateral falls below the market value of loaned securities or if the value of an investment purchased with cash collateral falls below the value of the original cash collateral received.
| 5. | DERIVATIVE FINANCIAL INSTRUMENTS |
The Fund engages in various portfolio investment strategies using derivative contracts both to increase the returns of the Fund and/or to manage its exposure to certain risks such as credit risk, equity risk, interest rate risk, foreign currency exchange rate risk, commodity price risk or other risks (e.g., inflation risk). Derivative financial instruments categorized by risk exposure are included in the Schedule of Investments. These contracts may be transacted on an exchange or over-the-counter (“OTC”).
Futures Contracts: The Fund invests in long and/or short positions in futures and options on futures contracts to gain exposure to, or manage exposure to changes in interest rates (interest rate risk), changes in the value of equity securities (equity risk) or foreign currencies (foreign currency exchange rate risk).
Futures contracts are agreements between the Fund and a counterparty to buy or sell a specific quantity of an underlying instrument at a specified price and on a specified date. Depending on the terms of a contract, it is settled either through physical delivery of the underlying instrument on the settlement date or by payment of a cash amount on the settlement date. Upon entering into a futures contract, the Fund is required to deposit initial margin with the broker in the form of cash or securities in an amount that varies depending on a contract’s size and risk profile. The initial margin deposit must then be maintained at an established level over the life of the contract.
Securities deposited as initial margin are designated in the Schedule of Investments and cash deposited, if any, is shown as cash pledged for futures contracts in the Statement of Assets and Liabilities. Pursuant to the contract, the Fund agrees to receive from or pay to the broker an amount of cash equal to the daily fluctuation in market value of the contract (“variation margin”). Variation margin is recorded as unrealized appreciation (depreciation) and, if any, shown as variation margin receivable (or payable) on futures contracts in the Statement of Assets and Liabilities. When the contract is closed, a realized gain or loss is recorded in the Statement of Operations equal to the difference between the notional amount of the contract at the time it was opened and the notional amount at the time it was closed. The use of futures contracts involves the risk of an imperfect correlation in the movements in the price of futures contracts and interest, foreign currency exchange rates or underlying assets.
| 6. | INVESTMENT ADVISORY AGREEMENT AND OTHER TRANSACTIONS WITH AFFILIATES |
The PNC Financial Services Group, Inc. is the largest stockholder and an affiliate of BlackRock, Inc. (“BlackRock”) for 1940 Act purposes.
Investment Advisory: The Company, on behalf of the Fund, entered into an Investment Advisory Agreement with the Manager, the Fund’s investment adviser, an indirect, wholly-owned subsidiary of BlackRock, to provide investment advisory and administrative services. The Manager is responsible for the management of the Fund’s portfolio and provides the personnel, facilities, equipment and certain other services necessary to the operations of the Fund.
For such services, the Fund pays the Manager a monthly fee at an annual rate equal to the following percentages of the average daily value of the Fund’s net assets:
| | | | |
| Average Daily Net Assets | | Investment
Advisory Fees | |
First $1 Billion | | | 0.75 | % |
$1 Billion — $3 Billion | | | 0.71 | |
$3 Billion — $5 Billion | | | 0.68 | |
$5 Billion — $10 Billion | | | 0.65 | |
Greater than $10 Billion | | | 0.64 | |
| | | | |
| NOTESTO FINANCIAL STATEMENTS | | | 17 | |
Notes to Financial Statements (continued)
Distribution Fees: The Company, on behalf of the Fund, entered into a Distribution Agreement and a Distribution Plan with BlackRock Investments, LLC (“BRIL”), an affiliate of the Manager. Pursuant to the Distribution Plan and in accordance with Rule 12b-1 under the 1940 Act, the Fund pays BRIL ongoing distribution fees. The fees are accrued daily and paid monthly at annual rates based upon the average daily net assets of the relevant share class of the Fund as follows:
| | | | | | | | | | | | |
| | | Class II | | | | | | Class III | |
Distribution Fees | | | 0.15 | % | | | | | | | 0.25 | % |
For the year ended December 31, 2017, the following table shows the class specific distribution fees borne directly by each share class of the Fund:
| | | | | | | | | | | | |
| | | Class II | | | Class III | | | Total | |
Distribution Fees | | $ | 9,796 | | | $ | 6,011 | | | $ | 15,807 | |
Transfer Agent: On behalf of the Fund, the Manager entered into agreements with insurance companies and other financial intermediaries (“Service Organizations”), some of which may be affiliates. Pursuant to these agreements, the Service Organizations provide the Fund with administrative, networking, recordkeeping, sub-transfer agency and shareholder services to sub-accounts they service. For these services, the Service Organizations receive an annual fee per shareholder account, which will vary depending on share class and/or net assets of Fund shareholders serviced by the Service Organizations, which is shown as transfer agent — class specific. For the year ended December 31, 2017, the Fund did not pay any amounts to affiliates in return for these services.
In addition, the Fund pays the transfer agent, which is not an affiliate, a fee for the issuance, transfer and redemption of shares and the opening and maintenance of shareholder accounts, which is included in transfer agent in the Statement of Operations.
For the year ended December 31, 2017, the following table shows the class specific transfer agent fees borne directly by each share class of the Fund:
| | | | | | | | | | | | | | | | | | | | |
| Class I | | | | | Class II | | | | | Class III | | | | | Total | |
| $ | 194,520 | | | | | $ | 13,299 | | | | | $ | 4,888 | | | | | $ | 212,707 | |
Expense Limitations, Waivers and Reimbursements: The Manager has agreed to voluntarily waive 0.05% of its investment advisory fee payable by the Fund. This voluntary waiver may be reduced or discontinued at any time without notice. This amount is included in fees waived and/or reimbursed by the Manager in the Statement of Operations. For the year ended December 31, 2017, the amount waived and/or reimbursed was $52,207.
With respect to the Fund, the Manager voluntarily agreed to waive its investment advisory fees by the amount of investment advisory fees the Fund pays to the Manager indirectly through its investment in affiliated money market funds (the “affiliated money market fund waiver”). The amount of waivers and/or reimbursements of fees and expenses made pursuant to the expense limitation caps will be reduced by the amount of the affiliated money market fund waiver. This amount is included in fees waived and/or reimbursed by the Manager in the Statement of Operations. For the year ended December 31, 2017, the amount waived was $1,867.
The Manager has contractually agreed to waive its investment advisory fee with respect to any portion of the Fund’s assets invested in affiliated equity and fixed-income mutual funds and affiliated exchange-traded funds that have a contractual management fee through April 30, 2019. The contractual agreement may be terminated upon 90 days’ notice by a majority of the independent directors who are not “interested persons” of the Fund, as defined in the 1940 Act (“Independent Directors”) or by a vote of a majority of the outstanding voting securities of the Fund. For the year ended December 31, 2017, there were no fees waived by the Manager.
For the year ended December 31, 2017, the Fund reimbursed the Manager $1,065 for certain accounting services, which is included in accounting services in the Statement of Operations.
The Manager has contractually agreed to reimburse transfer agent fees in order to limit such expenses to a percentage of average daily net assets as follows:
| | | | |
Class I | | | 0.00 | % |
Class II | | | 0.05 | % |
Class III | | | 0.11 | % |
The Manager has agreed not to reduce or discontinue this contractual reimbursement through April 30, 2019 unless approved by the Board, including a majority of the Independent Directors or by a vote of a majority of the outstanding voting securities of the Fund.
These amounts waived and/or reimbursed are shown as transfer agent fees reimbursed — class specific in the Statement of Operations. For the year ended December 31, 2017, class specific expense waivers and/or reimbursements were as follows:
| | | | | | | | | | | | | | | | |
| | | Class I | | | Class II | | | Class III | | | Total | |
Transfer Agent Fees Reimbursed | | $ | 194,496 | | | $ | 10,518 | | | $ | 2,673 | | | $ | 207,687 | |
With respect to the Fund, the Manager contractually agreed to waive and/or reimburse fees or expenses in order to limit expenses, excluding interest expense, dividend expense, tax expense, acquired fund fees and expenses, and certain other fund expenses, which constitute extraordinary expenses not incurred in the ordinary course of the Fund’s business (“expense limitation”). The expense limitations as a percentage of average daily net assets are as follows:
| | | | | | | | | | | | | | |
| Class I | | | | | Class II | | | | | Class III | |
| | 0.60% | | | | | | 0.75% | | | | | | 0.85% | |
| | |
| 18 | | 2017 BLACKROCK ANNUAL REPORTTO SHAREHOLDERS |
Notes to Financial Statements (continued)
Prior to June 12, 2017, the Fund expense limitations as a percentage of average daily net assets were as follows:
| | | | |
Class I | | | 1.25% | |
Class II | | | 1.40% | |
Class III | | | 1.50% | |
The Manager has agreed not to reduce or discontinue this contractual expense limitation through April 30, 2019, unless approved by the Board, including a majority of the Independent Directors or by a vote of a majority of outstanding voting securities of the Fund. For the year ended December 31, 2017, the Manager waived and/or reimbursed $264,430, which is included in fees waived and/or reimbursed by the Manager in the Statement of Operations.
Securities Lending: The U.S. Securities and Exchange Commission (“SEC”) has issued an exemptive order which permits BIM, an affiliate of the Manager, to serve as securities lending agent for the Fund, subject to applicable conditions. As securities lending agent, BIM bears all operational costs directly related to securities lending. The Fund is responsible for expenses in connection with the investment of cash collateral received for securities on loan (the “collateral investment expenses”). The cash collateral is invested in a private investment company managed by the Manager or its affiliates. However, BIM has agreed to cap the collateral investment expenses of the private investment company to an annual rate of 0.04%. The investment adviser to the private investment company will not charge any advisory fees with respect to shares purchased by the Fund. The private investment company in which the cash collateral has been invested may, under certain circumstances, impose a liquidity fee of up to 2% of the value withdrawn or temporarily restrict withdrawals for up to 10 business days during a 90 day period, in the event that the private investment company’s weekly liquid assets fall below certain thresholds.
Securities lending income is equal to the total of income earned from the reinvestment of cash collateral, net of fees and other payments to and from borrowers of securities, and less the collateral investment expenses. The Fund retains a portion of securities lending income and remits a remaining portion to BIM as compensation for its services as securities lending agent.
Pursuant to a securities lending agreement, the Fund retains 71.5% of securities lending income, and this amount retained can never be less than 65% of the total of securities lending income plus the collateral investment expenses.
In addition, commencing the business day following the date that the aggregate securities lending income earned across the Equity-Bond Complex in a calendar year exceeds a specified threshold, the Fund, pursuant to the securities lending agreement, will retain for the remainder of that calendar year securities lending income as follows: 75% of securities lending income, and this amount retained can never be less than 65% of the total of securities lending income plus the collateral investment expenses.
The share of securities lending income earned by the Fund is shown as securities lending income — affiliated — net in the Statement of Operations. For the year ended December 31, 2017, the Fund paid BIM $4,765 for securities lending agent services.
Interfund Lending: In accordance with an exemptive order (the “Order”) from the SEC, the Fund may participate in a joint lending and borrowing facility for temporary purposes (the “Interfund Lending Program”), subject to compliance with the terms and conditions of the Order, and to the extent permitted by the Fund’s investment policies and restrictions. The Fund is currently permitted to borrow under the Interfund Lending Program.
A lending BlackRock fund may lend in aggregate up to 15% of its net assets, but may not lend more than 5% of its net assets, to any one borrowing fund through the Interfund Lending Program. A borrowing BlackRock fund may not borrow through the Interfund Lending Program or from any other source more than 33 1/3% of its total assets (or any lower threshold provided for by the fund’s investment restrictions). If a borrowing BlackRock fund’s total outstanding borrowings exceed 10% of its total assets, each of its outstanding interfund loans will be subject to collateralization of at least 102% of the outstanding principal value of the loan. All interfund loans are for temporary or emergency purposes and the interest rate to be charged will be the average of the highest current overnight repurchase agreement rate available to a lending fund and the bank loan rate, as calculated according to a formula established by the Board.
During the year ended December 31, 2017, the Fund did not participate in the Interfund Lending Program.
Officers and Directors: Certain directors and/or officers of the Company are directors and/or officers of BlackRock or its affiliates. The Fund reimburses the Manager for a portion of the compensation paid to the Company’s Chief Compliance Officer, which is included in Directors and Officer in the Statement of Operations.
Other Transactions: The Fund may purchase securities from, or sell securities to, an affiliated fund provided the affiliation is due solely to having a common investment adviser, common officers, or common directors. For the year ended December 31, 2017, the purchase and sale transactions and any net realized gains (losses) with an affiliated fund in compliance with Rule 17a-7 under the 1940 Act were as follows:
| | | | |
Purchases | | $ | 7,304,471 | |
Sales | | | 11,790,622 | |
Net Realized Gain | | | 2,941,625 | |
For the year ended December 31, 2017, purchases and sales of investments, excluding short-term securities, were $171,214,434 and $176,469,284, respectively.
It is the Fund’s policy to comply with the requirements of the Internal Revenue Code of 1986, as amended, applicable to regulated investment companies, and to distribute substantially all of its taxable income to its shareholders. Therefore, no U.S. federal income tax provision is required.
| | | | |
| NOTESTO FINANCIAL STATEMENTS | | | 19 | |
Notes to Financial Statements (continued)
The Fund files U.S. federal and various state and local tax returns. No income tax returns are currently under examination. The statute of limitations on the Fund’s U.S. federal tax returns generally remains open for each of the four years ended December 31, 2017. The statutes of limitations on the Fund’s state and local tax returns may remain open for an additional year depending upon the jurisdiction.
Management has analyzed tax laws and regulations and their application to the Fund as of December 31, 2017, inclusive of the open tax return years, and does not believe that there are any uncertain tax positions that require recognition of a tax liability in the Fund’s financial statements.
U.S. GAAP requires that certain components of net assets be adjusted to reflect permanent differences between financial and tax reporting. These reclassifications have no effect on net assets or net asset values per share. As of period end, the following permanent differences attributable to the reclassification of distributions were reclassified to the following accounts:
| | | | |
Undistributed net investment income | | $ | 5,939 | |
Accumulated net realized gain | | $ | (5,939 | ) |
The tax character of distributions paid was as follows:
| | | | | | | | |
| | | 12/31/17 | | | 12/31/16 | |
Ordinary income | | $ | 4,512,661 | | | $ | 1,216,636 | |
Long-Term capital gains | | | 23,127,048 | | | | 6,487,794 | |
| | | | | | | | |
| | $ | 27,639,709 | | | $ | 7,704,430 | |
| | | | | | | | |
As of December 31, 2017, the tax components of accumulated net earnings (losses) were as follows:
| | | | |
Undistributed ordinary income | | $ | 830,526 | |
Undistributed long-term capital gains | | | 317,043 | |
Net unrealized gains1 | | | 11,810,935 | |
| | | | |
| | $ | 12,958,504 | |
| | | | |
| | 1 | The difference between book-basis and tax-basis net unrealized gains was attributable primarily to the tax deferral of losses on wash sales, the realization for tax purposes unrealized of gains/losses on certain futures contracts and the timing and recognition of partnership income. | |
As of December 31, 2017, gross unrealized appreciation and depreciation for investments and derivatives based on cost for U.S. federal income tax purposes were as follows:
| | | | |
Tax cost | | $ | 101,206,626 | |
| | | | |
Gross unrealized appreciation | | $ | 12,766,201 | |
Gross unrealized depreciation | | | (955,265 | ) |
| | | | |
Net unrealized appreciation (depreciation) | | $ | 11,810,936 | |
| | | | |
The Company, on behalf of the Fund, along with certain other funds managed by the Manager and its affiliates (“Participating Funds”), is a party to a 364-day, $2.1 billion credit agreement with a group of lenders. Under this agreement, the Fund may borrow to fund shareholder redemptions. Excluding commitments designated for certain individual funds, the Participating Funds, including the Fund, can borrow up to an aggregate commitment amount of $1.6 billion at any time outstanding, subject to asset coverage and other limitations as specified in the agreement. The credit agreement has the following terms: a fee of 0.12% per annum on unused commitment amounts and interest at a rate equal to the higher of (a) one-month LIBOR (but, in any event, not less than 0.00%) on the date the loan is made plus 0.80% per annum or (b) the Fed Funds rate (but, in any event, not less than 0.00%) in effect from time to time plus 0.80% per annum on amounts borrowed. The agreement expires in April 2018 unless extended or renewed. Participating Funds paid administration, legal and arrangement fees, which, if applicable, are included in miscellaneous expenses in the Statement of Operations. These fees were allocated among such funds based upon portions of the aggregate commitment available to them and relative net assets of Participating Funds. During the year ended December 31, 2017, the Fund did not borrow under the credit agreement.
In the normal course of business, the Fund invests in securities or other instruments and may enter into certain transactions, and such activities subject the Fund to various risks, including among others, fluctuations in the market (market risk) or failure of an issuer to meet all of its obligations. The value of securities or other instruments may also be affected by various factors, including, without limitation: (i) the general economy; (ii) the overall market as well as local, regional or global political and/or social instability; (iii) regulation, taxation or international tax treaties between various countries; or (iv) currency, interest rate and price fluctuations. The Fund’s prospectus provides details of the risks to which the Fund is subject.
The Fund may be exposed to additional risks when reinvesting cash collateral in money market funds that do not seek to maintain a stable NAV per share of $1.00 and which may be subject to redemption gates or liquidity fees under certain circumstances.
| | |
| 20 | | 2017 BLACKROCK ANNUAL REPORTTO SHAREHOLDERS |
Notes to Financial Statements (continued)
Valuation Risk: The market values of equities, such as common stocks and preferred securities or equity related investments, such as futures and options, may decline due to general market conditions which are not specifically related to a particular company. They may also decline due to factors which affect a particular industry or industries. The Fund may invest in illiquid investments and may experience difficulty in selling those investments in a timely manner at the price that it believes the investments are worth. Prices may fluctuate widely over short or extended periods in response to company, market or economic news. Markets also tend to move in cycles, with periods of rising and falling prices. This volatility may cause the Fund’s NAV to experience significant increases or decreases over short periods of time. If there is a general decline in the securities and other markets, the NAV of the Fund may lose value, regardless of the individual results of the securities and other instruments in which the Fund invests.
Counterparty Credit Risk: The Fund may be exposed to counterparty credit risk, or the risk that an entity may fail to or be unable to perform on its commitments related to unsettled or open transactions. The Fund manages counterparty credit risk by entering into transactions only with counterparties that the Manager believes have the financial resources to honor their obligations and by monitoring the financial stability of those counterparties. Financial assets, which potentially expose the Fund to market, issuer and counterparty credit risks, consist principally of financial instruments and receivables due from counterparties. The extent of the Fund’s exposure to market, issuer and counterparty credit risks with respect to these financial assets is approximately their value recorded in the Statement of Assets and Liabilities, less any collateral held by the Fund.
With exchange-traded futures, there is less counterparty credit risk to the Fund since the exchange or clearinghouse, as counterparty to such instruments, guarantees against a possible default. The clearinghouse stands between the buyer and the seller of the contract; therefore, credit risk is limited to failure of the clearinghouse. While offset rights may exist under applicable law, the Fund does not have a contractual right of offset against a clearing broker or clearinghouse in the event of a default (including the bankruptcy or insolvency). Additionally, credit risk exists in exchange-traded futures with respect to initial and variation margin that is held in a clearing broker’s customer accounts. While clearing brokers are required to segregate customer margin from their own assets, in the event that a clearing broker becomes insolvent or goes into bankruptcy and at that time there is a shortfall in the aggregate amount of margin held by the clearing broker for all its clients, typically the shortfall would be allocated on a pro rata basis across all the clearing broker’s customers, potentially resulting in losses to the Fund.
Concentration Risk: As of period end, the Fund invested a significant portion of its assets in securities in the financial sector. Changes in economic conditions affecting such sector would have a greater impact on the Fund and could affect the value, income and/or liquidity of positions in such securities.
| 11. | CAPITAL SHARE TRANSACTIONS |
Transactions in capital shares for each class were as follows:
| | | | | | | | | | | | | | | | |
| | | Year Ended
12/31/2017 | | | Year Ended
12/31/2016 | |
| | | Shares | | | Amount | | | Shares | | | Amount | |
Class I | | | | | | | | | | | | | | | | |
Shares sold | | | 365,201 | | | $ | 4,677,279 | | | | 214,822 | | | $ | 2,473,890 | |
Shares issued in reinvestment of distributions | | | 2,324,002 | | | | 25,114,786 | | | | 588,001 | | | | 7,113,227 | |
Shares redeemed | | | (1,056,648 | ) | | | (13,532,267 | ) | | | (1,286,398 | ) | | | (14,879,343 | ) |
| | | | | | | | | | | | | | | | |
Net increase (decrease) | | | 1,632,555 | | | $ | 16,259,798 | | | | (483,575 | ) | | $ | (5,292,226 | ) |
| | | | | | | | | | | | | | | | |
| | | | |
Class II | | | | | | | | | | | | | | | | |
Shares sold | | | 110,054 | | | $ | 1,387,115 | | | | 194,495 | | | $ | 2,194,408 | |
Shares issued in reinvestment of distributions | | | 162,376 | | | | 1,760,796 | | | | 37,157 | | | | 450,535 | |
Shares redeemed | | | (111,932 | ) | | | (1,430,159 | ) | | | (223,479 | ) | | | (2,574,630 | ) |
| | | | | | | | | | | | | | | | |
Net increase | | | 160,498 | | | $ | 1,717,752 | | | | 8,173 | | | $ | 70,313 | |
| | | | | | | | | | | | | | | | |
| | | | |
Class III | | | | | | | | | | | | | | | | |
Shares sold | | | 120,811 | | | $ | 1,549,360 | | | | 46,118 | | | $ | 529,587 | |
Shares issued in reinvestment of distributions | | | 71,929 | | | | 764,127 | | | | 11,767 | | | | 140,668 | |
Shares redeemed | | | (66,112 | ) | | | (833,333 | ) | | | (55,137 | ) | | | (657,095 | ) |
| | | | | | | | | | | | | | | | |
Net increase | | | 126,628 | | | $ | 1,480,154 | | | | 2,748 | | | $ | 13,160 | |
| | | | | | | | | | | | | | | | |
Total Net Increase (Decrease) | | | 1,919,681 | | | $ | 19,457,704 | | | | (472,654 | ) | | $ | (5,208,753 | ) |
| | | | | | | | | | | | | | | | |
Management has evaluated the impact of all subsequent events on the Fund through the date the financial statements were issued and has determined that there were no subsequent events requiring adjustment or additional disclosure in the financial statements.
| | | | |
| NOTESTO FINANCIAL STATEMENTS | | | 21 | |
Report of the Independent Registered Public Accounting Firm
To the Shareholders of BlackRock Advantage Large Cap Value V.I. Fund and the Board of Directors of BlackRock Variable Series Funds, Inc.:
Opinion on the Financial Statements and Financial Highlights
We have audited the accompanying statement of assets and liabilities, including the schedule of investments, of BlackRock Advantage Large Cap Value V.I. Fund (formerly BlackRock Large Cap Value V.I. Fund) of BlackRock Variable Series Funds, Inc. (the “Fund”), as of December 31, 2017, the related statement of operations for the year then ended, the statements of changes in net assets for each of the two years in the period then ended, the financial highlights for each of the five years in the period then ended, and the related notes. In our opinion, the financial statements and financial highlights present fairly, in all material respects, the financial position of the Fund as of December 31, 2017, and the results of its operations for the year then ended, the changes in its net assets for each of the two years in the period then ended, and the financial highlights for each of the five years in the period then ended, in conformity with accounting principles generally accepted in the United States of America.
Basis for Opinion
These financial statements and financial highlights are the responsibility of the Fund’s management. Our responsibility is to express an opinion on the Fund’s financial statements and financial highlights based on our audits. We are a public accounting firm registered with the Public Company Accounting Oversight Board (United States) (PCAOB) and are required to be independent with respect to the Fund in accordance with the U.S. federal securities laws and the applicable rules and regulations of the Securities and Exchange Commission and the PCAOB.
We conducted our audits in accordance with the standards of the PCAOB. Those standards require that we plan and perform the audit to obtain reasonable assurance about whether the financial statements and financial highlights are free of material misstatement, whether due to error or fraud. The Fund is not required to have, nor were we engaged to perform, an audit of its internal control over financial reporting. As part of our audits we are required to obtain an understanding of internal control over financial reporting but not for the purpose of expressing an opinion on the effectiveness of the Fund’s internal control over financial reporting. Accordingly, we express no such opinion.
Our audits included performing procedures to assess the risks of material misstatement of the financial statements and financial highlights, whether due to error or fraud, and performing procedures that respond to those risks. Such procedures included examining, on a test basis, evidence regarding the amounts and disclosures in the financial statements and financial highlights. Our audits also included evaluating the accounting principles used and significant estimates made by management, as well as evaluating the overall presentation of the financial statements and financial highlights. Our procedures included confirmation of securities owned as of December 31, 2017, by correspondence with the custodian and brokers; when replies were not received from brokers, we performed other auditing procedures. We believe that our audits provide a reasonable basis for our opinion.
Deloitte & Touche LLP
Boston, Massachusetts
February 19, 2018
We have served as the auditor of one or more BlackRock investment companies since 1992.
| | |
| 22 | | 2017 BLACKROCK ANNUAL REPORTTO SHAREHOLDERS |
DECEMBER 31, 2017
| | |
ANNUAL REPORT | |  |
BlackRock Variable Series Funds, Inc.
| Ø | | BlackRock Advantage U.S. Total Market V.I. Fund |
|
| Not FDIC Insured • May Lose Value • No Bank Guarantee |
| | |
| Fund Summary as of December 31, 2017 | | BlackRock Advantage U.S. Total Market V.I. Fund |
Investment Objective
BlackRock Advantage U.S. Total Market V.I. Fund’s (the “Fund”) investment objective is to seek long-term growth of capital.
On June 12, 2017, BlackRock Value Opportunities V.I. Fund changed its name to BlackRock Advantage US Total Market V.I. Fund. Its benchmark changed from the S&P SmallCap 600® Value Index to the Russell 3000 Index on the same date. Concurrently, there were changes to the Fund’s investment strategy.
Portfolio Management Commentary
How did the Fund perform?
For the 12-month period ended December 31, 2017, the Fund underperformed its new benchmark, the Russell 3000® Index, and outperformed its former benchmark, the S&P SmallCap 600® Value Index.
Following the conversion, the Fund was managed by BlackRock’s Systematic Active Equity (SAE) team, which incorporates a research-driven, systematic approach to identifying differentiated performance opportunities across markets. Performance prior to that date is attributable to the previous portfolio management team.
What factors influenced performance?
From January 1, 2017 through June 12, 2017, selection in the consumer discretionary sector was the largest contributor relative to the S&P 600® Value Index. Performance was especially strong in the hotels, restaurants & leisure industry, where positions in Bob Evans Farms, Inc. and ILG Inc. contributed to outperformance. Stock selection in the energy sector was an additional positive. Here, the Fund benefitted from its zero weightings in a number of the laggards within the energy equipment & services industry. Selection in the financials sector, where the Fund was helped by its investments in banking stocks, was an additional plus. Lastly, the Fund was aided by its effective stock selection in the healthcare sector.
From January 1, 2017 through June 12, 2017, stock selection in the materials sector was the largest detractor relative to the S&P SmallCap 600® Value Index. Performance was weakest in the metals & mining industry, where key detractors included AK Steel Holding Corp. and Haynes International, Inc. Stock selection in real estate, industrials and consumer staples also detracted from performance.
From June 12, 2017 through the end of the period, signals that seek to capture sentiment and trends from market participants generated strong performance relative to the Russell 3000® Index. Specifically, sentiment-based measures that evaluate investor flow, such as hedge funds, added value. Additionally, proprietary text-based analyses of company executive conference calls and sell-side analyst reports performed well. Fundamental signals that focus on company quality and value were also additive to performance. Notably, an insight that evaluates stocks based on key corporate events such as initial public offerings, CEO changes and revisions to forward guidance proved beneficial. Fundamental insights that identify value across cash flows and top-line sales further contributed to performance.
Despite broad strength across the stock selection model, there were a few notable detractors from June 12, 2017 onward relative to the Russell 3000® Index. Given a market backdrop in which momentum strategies outperformed, select signals that reward stocks through a more cautionary lens struggled. Specifically, a quality-based insight that identifies strong cash flow generation through efficient asset use experienced weak performance. As investors focused on tax reform as a primary driver of stock returns, the market’s focus shifted away from balance sheet strength. Additionally, a signal that seeks to identify lower-risk stocks lagged amid investors’ preference for the growth style.
Describe portfolio positioning at period end.
Relative to the Russell 3000® Index, the Fund was positioned neutrally form a sector perspective. The Fund had slight overweight positions in utilities and industrials and slight underweight positions in energy and financials.
The views expressed reflect the opinions of BlackRock as of the date of this report and are subject to change based on changes in market, economic or other conditions. These views are not intended to be a forecast of future events and are no guarantee of future results.
Portfolio Information
SECTOR ALLOCATION
| | | | |
| Sector | | Percent of
Net Assets | |
Information Technology | | | 23 | % |
Financials | | | 15 | |
Health Care | | | 13 | |
Consumer Discretionary | | | 12 | |
Industrials | | | 11 | |
Consumer Staples | | | 7 | |
Energy | | | 5 | |
Real Estate | | | 4 | |
Utilities | | | 4 | |
Materials | | | 3 | |
Telecommunication Services | | | 2 | |
Short-Term Securities | | | 4 | |
Liabilities in Excess of Other Assets | | | (3 | ) |
For Fund compliance purposes, the Fund’s sector classifications refer to one or more of the sector sub-classifications used by one or more widely recognized market indexes or ratings group indexes, and/or as defined by the investment adviser. These definitions may not apply for purposes of this report, which may combine sector sub classifications for reporting ease.
| | |
| 2 | | 2017 BLACKROCK ANNUAL REPORTTO SHAREHOLDERS |
| | |
| Fund Summary as of December 31, 2017 (continued) | | BlackRock Advantage U.S. Total Market V.I. Fund |
TOTAL RETURN BASED ON A $10,000 INVESTMENT

| (a) | Assuming transaction costs, if any, and other operating expenses, including investment advisory fees. Does not include insurance-related fees and expenses. |
| (b) | Under normal circumstances, the Fund seeks to invest at least 80% of its net assets (plus the amount of any borrowings for investment purposes) in equity securities of U.S. issuers and derivatives that have similar economic characteristics to such securities. The Fund’s total returns prior to June 12, 2017 are the returns of the Fund when it followed different investment strategies under the name “BlackRock Value Opportunities V.I. Fund”. |
| (c) | An index that measures the performance of the largest 3,000 U.S. companies representing approximately 98% of the investable U.S. equity market. |
| (d) | An unmanaged index that is a subset of the S&P 600® Index and consists of those stocks in the S&P 600® Index exhibiting the strongest value characteristics. |
Performance Summary for the Period Ended December 31, 2017
| | | | | | | | | | | | | | | | | | | | | | | | | | | | |
| | | 6-Month
Total Returns (b) | | | | | | Average Annual Total Returns | |
| | | | | | | 1 Year (b) | | | | | | 5 Years (b) | | | | | | 10 Years (b) | |
Class I(a) | | | 12.40 | % | | | | | | | 14.05 | % | | | | | | | 14.56 | % | | | | | | | 8.03 | % |
Class II(a) | | | 12.32 | | | | | | | | 13.85 | | | | | | | | 14.38 | | | | | | | | 7.86 | |
Class III(a) | | | 12.29 | | | | | | | | 13.83 | | | | | | | | 14.35 | | | | | | | | 7.80 | |
Russell 3000® Index | | | 11.20 | | | | | | | | 21.13 | | | | | | | | 15.58 | | | | | | | | 8.60 | |
S&P SmallCap 600® Value Index | | | 10.56 | | | | | | | | 11.51 | | | | | | | | 15.52 | | | | | | | | 9.99 | |
| | (a) | Average annual and cumulative total returns are based on changes in net asset value for the periods shown, and assume reinvestment of all distributions at net asset value on the ex-dividend date. Insurance-related fees and expenses are not reflected in these returns. The Fund’s total returns prior to June 12, 2017 are the returns of the Fund when it followed different investment strategies under the name “BlackRock Value Opportunities V.I. Fund”. | |
| | (b) | For the portion of the period, the Fund’s investment adviser waived a portion of its fee. Without such waiver, the Fund’s performance would have been lower. | |
Past performance is not indicative of future results. Performance results do not reflect the deduction of taxes that a shareholder would pay on Fund distributions or the redemption of Fund shares.
Performance results may include adjustment made for financial reporting purposes in accordance with U.S. generally accepted accounting principles.
Expense Example
| | | | | | | | | | | | | | | | | | | | | | | | | | | | | | | | |
| | | Actual | | | | | | Hypothetical (a) | | | | |
| | | Beginning
Account Value
(07/01/17) | | | Ending
Account Value
(12/31/17) | | | Expenses
Paid During
the Period (b) | | | | | | Beginning
Account Value
(07/01/17) | | | Ending
Account Value
(12/31/17) | | | Expenses
Paid During
the Period (b) | | | Annualized
Expense
Ratio | |
Class I | | $ | 1,000.00 | | | $ | 1,124.00 | | | $ | 2.94 | | | | | | | $ | 1,000.00 | | | $ | 1,022.40 | | | $ | 2.80 | | | | 0.55 | % |
Class II | | | 1,000.00 | | | | 1,123.20 | | | | 3.75 | | | | | | | | 1,000.00 | | | | 1,021.70 | | | | 3.57 | | | | 0.70 | |
Class III | | | 1,000.00 | | | | 1,123.90 | | | | 4.28 | | | | | | | | 1,000.00 | | | | 1,021.20 | | | | 4.08 | | | | 0.80 | |
| | (a) | Hypothetical 5% annual return before expenses is calculated by prorating the number of days in the most recent fiscal half year divided by 365. | |
| | (b) | For each class of the Fund, expenses are equal to the annualized expense ratio for the class, multiplied by the average account value over the period, multiplied by 184/365 (to reflect the one-half year period shown). | |
See “Disclosure of Expenses” on the following page for further information on how expenses were calculated.
| | |
| Disclosure of Expenses | | BlackRock Advantage U.S. Total Market V.I. Fund |
Shareholders of the Fund may incur the following charges: (a) transactional expenses, such as sales charges; and (b) operating expenses, including investment advisory fees, service and distribution fees, including 12b-1 fees, acquired fund fees and expenses, and other fund expenses. The expense example on the previous page (which is based on a hypothetical investment of $1,000 invested on July 1, 2017 and held through December 31, 2017) is intended to assist shareholders both in calculating expenses based on an investment in the Fund and in comparing these expenses with similar costs of investing in other mutual funds.
The expense example provides information about actual account values and actual expenses. In order to estimate the expenses a shareholder paid during the period covered by this report, shareholders can divide their account value by $1,000 and then multiply the result by the number corresponding to their share class under the heading entitled “Expenses Paid During the Period.”
The expense example also provides information about hypothetical account values and hypothetical expenses based on the Fund’s actual expense ratio and an assumed rate of return of 5% per year before expenses. In order to assist shareholders in comparing the ongoing expenses of investing in the Fund and other funds, compare the 5% hypothetical example with the 5% hypothetical examples that appear in shareholder reports of other funds.
The expenses shown in the expense example are intended to highlight shareholders’ ongoing costs only and do not reflect any transactional expenses, such as sales charges, if any. Therefore, the hypothetical example is useful in comparing ongoing expenses only, and will not help shareholders determine the relative total expenses of owning different funds. If these transactional expenses were included, shareholder expenses would have been higher.
Derivative Financial Instruments
The Fund may invest in various derivative financial instruments. These instruments are used to obtain exposure to a security, commodity, index, market and/or other asset without owning or taking physical custody of securities, commodities and/or other referenced assets or to manage market, equity, credit, interest rate, foreign currency exchange rate, commodity and/or other risks. Derivative financial instruments may give rise to a form of economic leverage and involve risks, including the imperfect correlation between the value of a derivative financial instrument and the underlying asset, possible default of the counterparty to the transaction or illiquidity of the instrument. The Fund’s successful use of a derivative financial instrument depends on the investment adviser’s ability to predict pertinent market movements accurately, which cannot be assured. The use of these instruments may result in losses greater than if they had not been used, may limit the amount of appreciation the Fund can realize on an investment and/or may result in lower distributions paid to shareholders. The Fund’s investments in these instruments, if any, are discussed in detail in the Notes to Financial Statements.
| | |
| 4 | | 2017 BLACKROCK ANNUAL REPORTTO SHAREHOLDERS |
| | |
Schedule of Investments December 31, 2017 | | BlackRock Advantage U.S. Total Market V.I. Fund (Percentages shown are based on Net Assets) |
| | | | | | | | |
| Security | | Shares | | | Value | |
Common Stocks — 99.0% | |
|
| Aerospace & Defense — 3.5% | |
Boeing Co. (The) | | | 10,394 | | | $ | 3,065,295 | |
Curtiss-Wright Corp. | | | 24,278 | | | | 2,958,274 | |
HEICO Corp., Class A | | | 27,932 | | | | 2,208,025 | |
KLX, Inc.(a) | | | 17,638 | | | | 1,203,793 | |
| | | | | | | | |
| | | | | | | 9,435,387 | |
| Airlines — 0.4% | | | | | | |
Hawaiian Holdings, Inc.(b) | | | 30,164 | | | | 1,202,035 | |
| | | | | | | | |
| Auto Components — 1.7% | | | | | | |
Lear Corp. | | | 17,235 | | | | 3,044,735 | |
Tenneco, Inc. | | | 26,743 | | | | 1,565,535 | |
| | | | | | | | |
| | | | | | | 4,610,270 | |
| Banks — 6.6% | | | | | | |
Bank of America Corp. | | | 131,516 | | | | 3,882,352 | |
Cadence BanCorp(a) | | | 13,626 | | | | 369,537 | |
Citigroup, Inc. | | | 53,483 | | | | 3,979,670 | |
Citizens Financial Group, Inc. | | | 1,548 | | | | 64,985 | |
CoBiz Financial, Inc. | | | 5,200 | | | | 103,948 | |
First Horizon National Corp.(b) | | | 149,958 | | | | 2,997,661 | |
JPMorgan Chase & Co. | | | 31,011 | | | | 3,316,316 | |
Sandy Spring Bancorp, Inc. | | | 3,594 | | | | 140,238 | |
Wintrust Financial Corp.(b) | | | 36,113 | | | | 2,974,628 | |
| | | | | | | | |
| | | | | | | 17,829,335 | |
| Beverages — 1.5% | | | | | | |
PepsiCo, Inc. | | | 33,537 | | | | 4,021,757 | |
| | | | | | | | |
| Biotechnology — 3.7% | | | | | | |
AbbVie, Inc. | | | 33,176 | | | | 3,208,451 | |
Alexion Pharmaceuticals, Inc.(a) | | | 17,808 | | | | 2,129,659 | |
Celgene Corp.(a) | | | 12,286 | | | | 1,282,167 | |
CytomX Therapeutics, Inc.(a) | | | 1,313 | | | | 27,717 | |
Exelixis, Inc.(a) | | | 6,577 | | | | 199,941 | |
Gilead Sciences, Inc. | | | 45,246 | | | | 3,241,423 | |
| | | | | | | | |
| | | | | | | 10,089,358 | |
| Building Products — 0.4% | | | | | | |
Trex Co., Inc.(a) | | | 3,659 | | | | 396,599 | |
Universal Forest Products, Inc. | | | 18,853 | | | | 709,250 | |
| | | | | | | | |
| | | | | | | 1,105,849 | |
| Capital Markets — 4.1% | | | | | �� | |
BGC Partners, Inc., Class A | | | 179,623 | | | | 2,714,103 | |
Evercore, Inc., Class A | | | 12,902 | | | | 1,161,180 | |
Intercontinental Exchange, Inc. | | | 27,946 | | | | 1,971,870 | |
Moelis & Co., Class A | | | 59,886 | | | | 2,904,471 | |
OM Asset Management plc | | | 33,304 | | | | 557,842 | |
S&P Global, Inc. | | | 10,380 | | | | 1,758,372 | |
| | | | | | | | |
| | | | | | | 11,067,838 | |
| Chemicals — 1.5% | | | | | | |
AdvanSix, Inc.(a) | | | 23,018 | | | | 968,367 | |
Air Products & Chemicals, Inc. | | | 10,027 | | | | 1,645,230 | |
Koppers Holdings, Inc.(a) | | | 1,394 | | | | 70,954 | |
LyondellBasell Industries NV, Class A | | | 6,449 | | | | 711,454 | |
Trinseo SA | | | 8,753 | | | | 635,468 | |
| | | | | | | | |
| | | | | | | 4,031,473 | |
| Commercial Services & Supplies — 1.1% | | | | | | |
Brink’s Co. (The) | | | 34,326 | | | | 2,701,456 | |
Interface, Inc. | | | 13,298 | | | | 334,445 | |
| | | | | | | | |
| | | | | | | 3,035,901 | |
| Communications Equipment — 0.9% | | | | | | |
Cisco Systems, Inc. | | | 17,789 | | | | 681,319 | |
InterDigital, Inc. | | | 24,104 | | | | 1,835,519 | |
| | | | | | | | |
| | | | | | | 2,516,838 | |
| | | | | | | | |
| Security | | Shares | | | Value | |
| Construction & Engineering — 0.4% | | | | | | |
Argan, Inc. | | | 4,423 | | | $ | 199,035 | |
Comfort Systems USA, Inc. | | | 8,565 | | | | 373,862 | |
MasTec, Inc.(a) | | | 8,759 | | | | 428,753 | |
| | | | | | | | |
| | | | | | | 1,001,650 | |
| Construction Materials — 0.1% | |
Summit Materials, Inc., Class A(a)(b) | | | 9,835 | | | | 309,212 | |
| | | | | | | | |
| Consumer Finance — 1.1%(a) | | | | | | |
Enova International, Inc. | | | 8,481 | | | | 128,911 | |
Green Dot Corp., Class A | | | 49,014 | | | | 2,953,584 | |
| | | | | | | | |
| | | | | | | 3,082,495 | |
| Diversified Consumer Services — 0.5% | | | | | | |
Grand Canyon Education, Inc.(a) | | | 14,932 | | | | 1,336,862 | |
| | | | | | | | |
| Diversified Financial Services — 0.6% | | | | | | |
Berkshire Hathaway, Inc., Class B(a) | | | 8,046 | | | | 1,594,878 | |
| | | | | | | | |
| Diversified Telecommunication Services — 1.8% | | | | | | |
Cogent Communications Holdings, Inc. | | | 27,166 | | | | 1,230,620 | |
Verizon Communications, Inc. | | | 70,089 | | | | 3,709,811 | |
| | | | | | | | |
| | | | | | | 4,940,431 | |
| Electric Utilities — 2.5% | | | | | | |
Duke Energy Corp. | | | 8,767 | | | | 737,392 | |
IDACORP, Inc. | | | 32,754 | | | | 2,992,406 | |
Portland General Electric Co. | | | 59,940 | | | | 2,732,065 | |
PPL Corp. | | | 10,154 | | | | 314,266 | |
| | | | | | | | |
| | | | | | | 6,776,129 | |
| Electronic Equipment, Instruments & Components — 1.0% | |
Fitbit, Inc., Class A(a) | | | 26,302 | | | | 150,184 | |
SYNNEX Corp. | | | 18,981 | | | | 2,580,467 | |
| | | | | | | | |
| | | | | | | 2,730,651 | |
| Energy Equipment & Services — 0.9% | | | | | | |
Exterran Corp.(a) | | | 5,157 | | | | 162,136 | |
Halliburton Co. | | | 22,607 | | | | 1,104,804 | |
ProPetro Holding Corp.(a)(b) | | | 53,309 | | | | 1,074,710 | |
| | | | | | | | |
| | | | | | | 2,341,650 | |
| Equity Real Estate Investment Trusts (REITs) — 4.0% | |
CoreSite Realty Corp. | | | 4,812 | | | | 548,087 | |
DCT Industrial Trust, Inc. | | | 39,560 | | | | 2,325,337 | |
DiamondRock Hospitality Co. | | | 23,936 | | | | 270,237 | |
EastGroup Properties, Inc. | | | 377 | | | | 33,319 | |
First Industrial Realty Trust, Inc. | | | 95,301 | | | | 2,999,123 | |
Ryman Hospitality Properties, Inc. | | | 7,132 | | | | 492,251 | |
Simon Property Group, Inc. | | | 15,372 | | | | 2,639,987 | |
Terreno Realty Corp. | | | 12,351 | | | | 433,026 | |
Ventas, Inc. | | | 17,046 | | | | 1,022,930 | |
Weingarten Realty Investors | | | 1,798 | | | | 59,100 | |
| | | | | | | | |
| | | | | | | 10,823,397 | |
| Food & Staples Retailing — 2.2% | | | | | | |
Performance Food Group Co.(a) | | | 48,682 | | | | 1,611,374 | |
Wal-Mart Stores, Inc. | | | 43,396 | | | | 4,285,355 | |
| | | | | | | | |
| | | | | | | 5,896,729 | |
| Food Products — 0.9% | | | | | | |
Archer-Daniels-Midland Co. | | | 18,002 | | | | 721,520 | |
Dean Foods Co.(b) | | | 67,919 | | | | 785,144 | |
Kellogg Co.(b) | | | 11,271 | | | | 766,203 | |
Tyson Foods, Inc., Class A | | | 1,907 | | | | 154,600 | |
| | | | | | | | |
| | | | | | | 2,427,467 | |
| Health Care Equipment & Supplies — 1.2% | | | | | | |
Masimo Corp.(a) | | | 31,581 | | | | 2,678,069 | |
Medtronic plc | | | 7,415 | | | | 598,761 | |
| | | | | | | | |
| | | | | | | 3,276,830 | |
| | | | |
| SCHEDULE OF INVESTMENTS | | | 5 | |
| | |
Schedule of Investments (continued) December 31, 2017 | | BlackRock Advantage U.S. Total Market V.I. Fund (Percentages shown are based on Net Assets) |
| | | | | | | | |
| Security | | Shares | | | Value | |
| Health Care Providers & Services — 2.7% | | | | | | |
AmerisourceBergen Corp. | | | 1,554 | | | $ | 142,688 | |
Humana, Inc. | | | 5,207 | | | | 1,291,701 | |
McKesson Corp. | | | 2,072 | | | | 323,128 | |
UnitedHealth Group, Inc. | | | 11,900 | | | | 2,623,474 | |
WellCare Health Plans, Inc.(a) | | | 15,022 | | | | 3,021,075 | |
| | | | | | | | |
| | | | | | | 7,402,066 | |
| Hotels, Restaurants & Leisure — 2.2% | | | | | | |
International Game Technology plc | | | 2,920 | | | | 77,409 | |
McDonald’s Corp. | | | 23,685 | | | | 4,076,662 | |
Papa John’s International, Inc.(b) | | | 11,890 | | | | 667,148 | |
Texas Roadhouse, Inc. | | | 23,702 | | | | 1,248,622 | |
| | | | | | | | |
| | | | | | | 6,069,841 | |
| Household Durables — 0.4%(a) | | | | | | |
iRobot Corp. | | | 5,627 | | | | 431,591 | |
William Lyon Homes, Class A | | | 18,501 | | | | 538,009 | |
| | | | | | | | |
| | | | | | | 969,600 | |
| Household Products — 0.7% | | | | | | |
Kimberly-Clark Corp. | | | 357 | | | | 43,076 | |
Procter & Gamble Co. (The) | | | 19,626 | | | | 1,803,237 | |
| | | | | | | | |
| | | | | | | 1,846,313 | |
| Independent Power and Renewable Electricity Producers — 0.1% | |
NRG Yield, Inc., Class A(b) | | | 9,749 | | | | 183,769 | |
| | | | | | | | |
| Industrial Conglomerates — 2.4% | | | | | | |
3M Co. | | | 18,102 | | | | 4,260,668 | |
General Electric Co. | | | 23,939 | | | | 417,736 | |
Honeywell International, Inc. | | | 12,123 | | | | 1,859,183 | |
| | | | | | | | |
| | | | | | | 6,537,587 | |
| Insurance — 0.8% | | | | | | |
Hartford Financial Services Group, Inc. (The) | | | 883 | | | | 49,695 | |
James River Group Holdings Ltd. | | | 44,187 | | | | 1,767,922 | |
Marsh & McLennan Cos., Inc. | | | 5,290 | | | | 430,553 | |
| | | | | | | | |
| | | | | | | 2,248,170 | |
| Internet & Direct Marketing Retail — 1.4% | | | | | | |
Amazon.com, Inc.(a) | | | 3,244 | | | | 3,793,761 | |
| | | | | | | | |
| Internet Software & Services — 4.0% | | | | | | |
Alphabet, Inc., Class A(a) | | | 2,963 | | | | 3,121,224 | |
Alphabet, Inc., Class C(a) | | | 2,953 | | | | 3,090,019 | |
Facebook, Inc., Class A(a) | | | 21,911 | | | | 3,866,415 | |
Yelp, Inc.(a) | | | 14,398 | | | | 604,140 | |
YuMe, Inc. | | | 596 | | | | 2,849 | |
| | | | | | | | |
| | | | | | | 10,684,647 | |
| IT Services — 4.5% | | | | | | |
CSG Systems International, Inc. | | | 296 | | | | 12,971 | |
EPAM Systems, Inc.(a) | | | 339 | | | | 36,419 | |
Euronet Worldwide, Inc.(a)(b) | | | 30,596 | | | | 2,578,325 | |
International Business Machines Corp. | | | 14,661 | | | | 2,249,290 | |
Mastercard, Inc., Class A | | | 18,454 | | | | 2,793,197 | |
Visa, Inc., Class A | | | 39,331 | | | | 4,484,521 | |
| | | | | | | | |
| | | | | | | 12,154,723 | |
| Leisure Products — 0.1% | | | | | | |
MCBC Holdings, Inc.(a) | | | 10,609 | | | | 235,732 | |
| | | | | | | | |
| Life Sciences Tools & Services — 0.9% | | | | | | |
PRA Health Sciences, Inc.(a) | | | 25,899 | | | | 2,358,622 | |
| | | | | | | | |
| Machinery — 1.4% | | | | | | |
Alamo Group, Inc. | | | 15,545 | | | | 1,754,564 | |
Illinois Tool Works, Inc. | | | 530 | | | | 88,431 | |
Kadant, Inc. | | | 4,715 | | | | 473,386 | |
PACCAR, Inc. | | | 17,014 | | | | 1,209,355 | |
Rexnord Corp.(a) | | | 5,221 | | | | 135,850 | |
| | | | | | | | |
| | | | | | | 3,661,586 | |
| | | | | | | | |
| Security | | Shares | | | Value | |
| Media — 3.7% | | | | | | |
Comcast Corp., Class A | | | 112,944 | | | $ | 4,523,407 | |
Entravision Communications Corp., Class A | | | 96,205 | | | | 687,866 | |
Time Warner, Inc. | | | 7,577 | | | | 693,068 | |
Walt Disney Co. (The) | | | 37,120 | | | | 3,990,771 | |
World Wrestling Entertainment, Inc., Class A | | | 1,522 | | | | 46,543 | |
| | | | | | | | |
| | | | | | | 9,941,655 | |
| Metals & Mining — 1.5% | | | | | | |
Materion Corp. | | | 7,761 | | | | 377,185 | |
Newmont Mining Corp. | | | 82,325 | | | | 3,088,834 | |
Schnitzer Steel Industries, Inc., Class A | | | 7,607 | | | | 254,834 | |
Worthington Industries, Inc. | | | 10,667 | | | | 469,988 | |
| | | | | | | | |
| | | | | | | 4,190,841 | |
| Multiline Retail — 0.7% | | | | | | |
Big Lots, Inc.(b) | | | 414 | | | | 23,246 | |
Target Corp. | | | 29,091 | | | | 1,898,188 | |
| | | | | | | | |
| | | | | | | 1,921,434 | |
| Multi-Utilities — 0.9% | | | | | | |
Avista Corp.(b) | | | 632 | | | | 32,542 | |
CMS Energy Corp. | | | 48,587 | | | | 2,298,165 | |
| | | | | | | | |
| | | | | | | 2,330,707 | |
| Oil, Gas & Consumable Fuels — 4.4% | | | | | | |
Anadarko Petroleum Corp. | | | 6,256 | | | | 335,572 | |
Chevron Corp. | | | 6,749 | | | | 844,907 | |
ConocoPhillips | | | 65,271 | | | | 3,582,725 | |
CONSOL Energy, Inc.(a) | | | 16,626 | | | | 656,893 | |
Exxon Mobil Corp. | | | 30,281 | | | | 2,532,703 | |
Occidental Petroleum Corp. | | | 3,560 | | | | 262,230 | |
Pacific Ethanol, Inc.(a)(b) | | | 63,271 | | | | 287,883 | |
Peabody Energy Corp.(a) | | | 48,543 | | | | 1,911,138 | |
Valero Energy Corp. | | | 14,550 | | | | 1,337,291 | |
Williams Cos., Inc. (The) | | | 1,872 | | | | 57,077 | |
| | | | | | | | |
| | | | | | | 11,808,419 | |
| Personal Products — 0.5% | | | | | | |
Estee Lauder Cos., Inc. (The), Class A | | | 9,185 | | | | 1,168,700 | |
Herbalife Ltd.(a) | | | 695 | | | | 47,065 | |
Inter Parfums, Inc. | | | 4,532 | | | | 196,915 | |
| | | | | | | | |
| | | | | | | 1,412,680 | |
| Pharmaceuticals — 4.6% | | | | | | |
Bristol-Myers Squibb Co. | | | 18,550 | | | | 1,136,744 | |
Catalent, Inc.(a) | | | 69,541 | | | | 2,856,744 | |
Corcept Therapeutics, Inc.(a)(b) | | | 2,070 | | | | 37,384 | |
Johnson & Johnson | | | 33,437 | | | | 4,671,818 | |
Merck & Co., Inc. | | | 66,354 | | | | 3,733,740 | |
| | | | | | | | |
| | | | | | | 12,436,430 | |
| Professional Services — 0.2% | | | | | | |
Insperity, Inc. | | | 292 | | | | 16,746 | |
WageWorks, Inc.(a) | | | 8,435 | | | | 522,970 | |
| | | | | | | | |
| | | | | | | 539,716 | |
| Road & Rail — 0.9% | | | | | | |
Union Pacific Corp. | | | 17,252 | | | | 2,313,493 | |
| | | | | | | | |
| Semiconductors & Semiconductor Equipment — 3.7% | |
Intel Corp. | | | 54,301 | | | | 2,506,534 | |
IXYS Corp.(a) | | | 246 | | | | 5,892 | |
Microsemi Corp.(a) | | | 52,009 | | | | 2,686,265 | |
QUALCOMM, Inc. | | | 14,432 | | | | 923,937 | |
Texas Instruments, Inc. | | | 38,108 | | | | 3,979,999 | |
| | | | | | | | |
| | | | | | | 10,102,627 | |
| Software — 5.6% | | | | | | |
Activision Blizzard, Inc. | | | 9,803 | | | | 620,726 | |
Microsoft Corp. | | | 38,856 | | | | 3,323,743 | |
Oracle Corp. | | | 86,033 | | | | 4,067,640 | |
| | |
| 6 | | 2017 BLACKROCK ANNUAL REPORTTO SHAREHOLDERS |
| | |
Schedule of Investments (continued) December 31, 2017 | | BlackRock Advantage U.S. Total Market V.I. Fund (Percentages shown are based on Net Assets) |
| | | | | | | | |
| Security | | Shares | | | Value | |
| Software (continued) | | | | | | |
RingCentral, Inc., Class A(a) | | | 54,955 | | | $ | 2,659,822 | |
Varonis Systems, Inc.(a) | | | 42,989 | | | | 2,087,116 | |
Verint Systems, Inc.(a) | | | 56,119 | | | | 2,348,580 | |
Zendesk, Inc.(a) | | | 2,006 | | | | 67,883 | |
| | | | | | | | |
| | | | | | | 15,175,510 | |
| Specialty Retail — 1.4% | | | | | | |
Aaron’s, Inc. | | | 19,648 | | | | 782,973 | |
Home Depot, Inc. (The) | | | 5,527 | | | | 1,047,532 | |
Lowe’s Cos., Inc. | | | 20,533 | | | | 1,908,337 | |
TJX Cos., Inc. (The) | | | 409 | | | | 31,272 | |
| | | | | | | | |
| | | | | | | 3,770,114 | |
| Technology Hardware, Storage & Peripherals — 3.2% | | | | | | |
Apple, Inc. | | | 48,789 | | | | 8,256,562 | |
Pure Storage, Inc., Class A(a) | | | 17,907 | | | | 284,005 | |
| | | | | | | | |
| | | | | | | 8,540,567 | |
| Textiles, Apparel & Luxury Goods — 0.1% | | | | | | |
NIKE, Inc., Class B | | | 3,238 | | | | 202,537 | |
| | | | | | | | |
| Thrifts & Mortgage Finance — 1.4% | | | | | | |
Essent Group Ltd.(a) | | | 63,474 | | | | 2,756,041 | |
Nationstar Mortgage Holdings, Inc.(a)(b) | | | 33,607 | | | | 621,730 | |
Riverview Bancorp, Inc. | | | 25,565 | | | | 221,649 | |
TFS Financial Corp. | | | 7,943 | | | | 118,668 | |
| | | | | | | | |
| | | | | | | 3,718,088 | |
| Tobacco — 1.6% | | | | | | |
Altria Group, Inc. | | | 59,735 | | | | 4,265,677 | |
Philip Morris International, Inc. | | | 1,871 | | | | 197,671 | |
| | | | | | | | |
| | | | | | | 4,463,348 | |
| | | | | | | | |
| Security | | Shares | | | Value | |
| Trading Companies & Distributors — 0.4% | | | | | | |
Applied Industrial Technologies, Inc. | | | 16,279 | | | $ | 1,108,600 | |
| | | | | | | | |
| Water Utilities — 0.0% | | | | | | |
SJW Group | | | 456 | | | | 29,106 | |
| | | | | | | | |
| Wireless Telecommunication Services — 0.0% | | | | | | |
Boingo Wireless, Inc.(a) | | | 4,539 | | | | 102,128 | |
| | | | | | | | |
| | |
Total Common Stocks — 99.0%
(Cost: $246,014,555) | | | | | | | 267,738,839 | |
| | | | | | | | |
| | |
Total Long-Term Investments — 99.0%
(Cost: $246,014,555) | | | | | | | 267,738,839 | |
| | | | | | | | |
|
Short-Term Securities — 3.7%(c)(e) | |
BlackRock Liquidity Funds, T-Fund, Institutional Class,
1.17% | | | 1,558,684 | | | | 1,558,684 | |
SL Liquidity Series, LLC, Money Market Series,
1.48%(d) | | | 8,368,069 | | | | 8,367,232 | |
| | | | | | | | |
| |
Total Short-Term Securities — 3.7%
(Cost: $9,925,986) | | | | 9,925,916 | |
| | | | | | | | |
| |
Total Investments — 102.7%
(Cost: $255,940,541) | | | | 277,664,755 | |
| | | | | | | | |
Liabilities in Excess of Other Assets — (2.7)% | | | | (7,338,122 | ) |
| | | | | | | | |
Net Assets — 100.0% | | | $ | 270,326,633 | |
| | | | | | | | |
| (a) | Non-income producing security. |
| (b) | Security, or a portion of the security, is on loan. |
| (c) | Annualized 7-day yield as of period end. |
| (d) | Security was purchased with the cash collateral from loaned securities. |
| (e) | During the year ended December 31, 2017, investments in issuers considered to be affiliates of the Fund for the purposes of Section 2(a)(3) of the Investment Company Act of 1940, as amended, were as follows: |
| | | | | | | | | | | | | | | | | | | | | | | | | | | | |
| Affiliate | | Shares
Held at
12/31/16 | | | Net
Activity | | | Shares
Held at
12/31/17 | | | Value at
12/31/17 | | | Income | | | Net Realized
Gain (Loss) (a) | | | Change in
Unrealized
Appreciation
(Depreciation) | |
BlackRock Liquidity Funds, T-Fund, Institutional Class | | | 8,781,802 | | | | (7,223,118 | ) | | | 1,558,684 | | | $ | 1,558,684 | | | $ | 24,634 | | | $ | 11 | | | $ | — | |
SL Liquidity Series, LLC, Money Market Series | | | 33,718,069 | | | | (25,350,000 | ) | | | 8,368,069 | | | | 8,367,232 | | | | 125,287 | (b) | | | (504 | ) | | | 1,450 | |
| | | | | | | | | | | | | | | | | | | | | | | | | | | | |
| | | | | | | | | | | | | | $ | 9,925,916 | | | $ | 149,921 | | | $ | (493 | ) | | $ | 1,450 | |
| | | | | | | | | | | | | | | | | | | | | | | | | | | | |
| | (a) | Including net capital gain distributions, if applicable. | |
| | (b) | Represents securities lending income earned from the reinvestment of cash collateral from loaned securities, net of fees and collateral investment expenses, and other payments to and from borrowers of securities. | |
| | | For Fund compliance purposes, the Fund’s industry classifications refer to one or more of the industry sub-classifications used by one or more widely recognized market indexes or ratings group indexes, and/or as defined by the investment advisor. These definitions may not apply for purposes of this report, which may combine such industry sub-classifications for reporting ease. | |
REIT — Real Estate Investment Trust
S&P — Standard & Poor’s
| | | | |
| SCHEDULE OF INVESTMENTS | | | 7 | |
| | |
Schedule of Investments (continued) December 31, 2017 | | BlackRock Advantage U.S. Total Market V.I. Fund |
Derivative Financial Instruments Outstanding as of Period End
Futures Contracts
| | | | | | | | | | | | | | | | |
| Description | | Number of
Contracts | | | Expiration
Date | | | Notional
Amount (000) | | | Value/ Unrealized
Appreciation
(Depreciation) | |
Long Contracts | | | | | | | | | | | | | | | | |
S&P 500 E-Mini Index | | | 22 | | | | 03/16/18 | | | $ | 2,944 | | | $ | (2,376 | ) |
| | | | | | | | | | | | | | | | |
Derivative Financial Instruments Categorized by Risk Exposure
As of period end, the fair values of derivative financial instruments located in the Statement of Assets and Liabilities were as follows:
| | | | | | | | | | | | | | | | | | | | | | | | | | | | |
| | | Commodity
Contracts | | | Credit
Contracts | | | Equity
Contracts | | | Foreign
Currency
Exchange
Contracts | | | Interest
Rate
Contracts | | | Other
Contracts | | | Total | |
Liabilities — Derivative Financial Instruments | |
Future Contracts | | | | | | | | | | | | | | | | | | | | | | | | | | | | |
Net unrealized depreciation(a) | | $ | — | | | $ | — | | | $ | 2,376 | | | $ | — | | | $ | — | | | $ | — | | | $ | 2,376 | |
| | | | | | | | | | | | | | | | | | | | | | | | | | | | |
| | (a) | Includes cumulative appreciation (depreciation) on futures contracts, if any, as reported in the Schedule of Investments. Only current day’s variation margin is reported within the Statement of Assets and Liabilities. | |
For the year ended December 31, 2017, the effect of derivative financial instruments in the Statement of Operations was as follows:
| | | | | | | | | | | | | | | | | | | | | | | | | | | | |
| | | Commodity
Contracts | | | Credit
Contracts | | | Equity
Contracts | | | Foreign
Currency
Exchange
Contracts | | | Interest
Rate
Contracts | | | Other
Contracts | | | Total | |
Net Realized Gain from: | | | | | | | | | | | | | | | | | | | | | | | | | | | | |
Futures contracts | | $ | — | | | $ | — | | | $ | 304,804 | | | $ | — | | | $ | — | | | $ | — | | | $ | 304,804 | |
| | | | | | | | | | | | | | | | | | | | | | | | | | | | |
Net Change in Unrealized Appreciation (Depreciation) On: | | | | | | | | | | | | | | | | | | | | | | | | | | | | |
Futures contracts | | $ | — | | | $ | — | | | $ | (2,376 | ) | | $ | — | | | $ | — | | | $ | — | | | $ | (2,376 | ) |
| | | | | | | | | | | | | | | | | | | | | | | | | | | | |
Average Quarterly Balances of Outstanding Derivative Financial Instruments
| | | | |
Futures contracts: | | | | |
Average notional value of contracts — long | | $ | 1,788,658 | |
For more information about the Fund’s investment risks regarding derivative financial instruments, refer to the Notes to Financial Statements.
| | |
| 8 | | 2017 BLACKROCK ANNUAL REPORTTO SHAREHOLDERS |
| | |
Schedule of Investments (continued) December 31, 2017 | | BlackRock Advantage U.S. Total Market V.I. Fund |
Fair Value Hierarchy as of Period End
Various inputs are used in determining the fair value of investments and derivative financial instruments. For information about the Fund’s policy regarding valuation of investments and derivative financial instruments, refer to the Notes to Financial Statements.
The following tables summarize the Fund’s investments and derivative financial instruments categorized in the disclosure hierarchy:
| | | | | | | | | | | | | | | | |
| | | Level 1 | | | Level 2 | | | Level 3 | | | Total | |
Investments: | | | | | | | | | | | | | | | | |
Assets: Long-Term Investments: | | | | | | | | | | | | | | | | |
Common Stocks(a) | | $ | 267,738,839 | | | $ | — | | | $ | — | | | $ | 267,738,839 | |
Short-Term Securities | | | 1,558,684 | | | | — | | | | — | | | | 1,558,684 | |
| | | | | | | | | | | | | | | | |
Subtotal | | $ | 269,297,523 | | | $ | — | | | $ | — | | | $ | 269,297,523 | |
| | | | | | | | | | | | | | | | |
Investments valued at NAV(b) | | | | | | | | | | | | | | $ | 8,367,232 | |
| | | | | | | | | | | | | | | | |
Total Investments | | | | | | | | | | | | | | $ | 277,664,755 | |
| | | | | | | | | | | | | | | | |
Derivative Financial Instruments(c) | | | | | | | | | | | | | | | | |
Liabilties: | | | | | | | | | | | | | | | | |
Equity contracts | | $ | (2,376 | ) | | | — | | | | — | | | $ | (2,376 | ) |
| | | | | | | | | | | | | | | | |
| | (a) | See above Schedule of Investments for values in each industry. | |
| | (b) | As of December 31, 2017, certain investments of the Fund were fair valued using NAV per share as no quoted market value is available and therefore have been excluded from the fair value hierarchy. | |
| | (c) | Derivative financial instruments are futures contracts which are valued at the unrealized appreciation (depreciation) on the instrument. | |
During the year ended December 31, 2017, there were no transfers between levels.
See notes to financial statements.
| | | | |
| SCHEDULE OF INVESTMENTS | | | 9 | |
Statement of Assets and Liabilities
December 31, 2017
| | | | |
| | | BlackRock Advantage
U.S. Total Market
V.I. Fund | |
|
ASSETS | |
Investments at value — unaffiliated (including securities loaned at value of $8,105,672) (cost — $246,014,555) | | $ | 267,738,839 | |
Investments at value — affiliated (cost — $9,925,986) | | | 9,925,916 | |
Cash pledged: | | | | |
Futures contracts | | | 96,000 | |
Foreign currency at value (cost — $785) | | | 776 | |
Receivables: | | | | |
Investments sold | | | 3,844,259 | |
Securities lending income — affiliated | | | 5,948 | |
Capital shares sold | | | 1,977 | |
Dividends — affiliated | | | 2,062 | |
Dividends — unaffiliated | | | 283,204 | |
Prepaid expenses | | | 1,249 | |
| | | | |
Total assets | | | 281,900,230 | |
| | | | |
|
LIABILITIES | |
Cash collateral on securities loaned at value | | | 8,361,996 | |
Payables: | | | | |
Capital shares redeemed | | | 174,437 | |
Investment advisory fees | | | 61,315 | |
Investments purchased | | | 2,787,478 | |
Officer’s and Directors’ fees | | | 8,929 | |
Other accrued expenses | | | 167,460 | |
Other affiliates | | | 483 | |
Distribution fees | | | 1,564 | |
Variation margin on futures contracts | | | 9,935 | |
| | | | |
Total liabilities | | | 11,573,597 | |
| | | | |
| |
NET ASSETS | | $ | 270,326,633 | |
| | | | |
|
NET ASSETS CONSIST OF | |
Paid-in capital | | $ | 246,556,983 | |
Undistributed net investment income | | | 35,495 | |
Accumulated net realized gain | | | 2,012,326 | |
Net unrealized appreciation (depreciation) | | | 21,721,829 | |
| | | | |
NET ASSETS | | $ | 270,326,633 | |
| | | | |
|
NET ASSET VALUE | |
Class I — Based on net assets of $261,871,845 and 10,216,680 shares outstanding, 100 million shares authorized, $0.10 par value. | | $ | 25.63 | |
| | | | |
Class II — Based on net assets of $3,131,119 and 122,443 shares outstanding, 100 million shares authorized, $0.10 par value. | | $ | 25.57 | |
| | | | |
Class III — Based on net assets of $5,323,669 and 284,097 shares outstanding, 10 million shares authorized, $0.10 par value. | | $ | 18.74 | |
| | | | |
See notes to financial statements.
| | |
| 10 | | 2017 BLACKROCK ANNUAL REPORTTO SHAREHOLDERS |
Statement of Operations
Year Ended December 31, 2017
| | | | |
| | | BlackRock
Advantage
U.S. Total Market
V.I. Fund | |
| |
INVESTMENT INCOME | | | | |
Dividends — affiliated | | $ | 24,634 | |
Dividends — unaffiliated(a) | | | 3,993,529 | |
Securities lending income — affiliated — net | | | 125,287 | |
Foreign taxes withheld | | | (3,567 | ) |
| | | | |
Total investment income | | | 4,139,883 | |
| | | | |
| |
EXPENSES | | | | |
Investment advisory | | | 1,934,577 | |
Transfer agent — class specific | | | 465,308 | |
Printing | | | 71,337 | |
Professional | | | 70,682 | |
Accounting services | | | 49,271 | |
Custodian | | | 38,184 | |
Directors and Officer | | | 28,338 | |
Distribution — class specific | | | 18,612 | |
Transfer agent | | | 4,992 | |
Miscellaneous | | | 46,863 | |
| | | | |
Total expenses | | | 2,728,164 | |
Less: | | | | |
Fees waived and/or reimbursed by the Manager | | | (587,216 | ) |
Transfer agent fees reimbursed — class specific | | | (322,623 | ) |
| | | | |
Total expenses after fees waived and/or reimbursed | | | 1,818,325 | |
| | | | |
Net investment income | | | 2,321,558 | |
| | | | |
| |
REALIZED AND UNREALIZED GAIN (LOSS) | | | | |
Net realized gain (loss) from: | | | | |
Investments — affiliated | | | (504 | ) |
Investments — unaffiliated | | | 47,360,544 | |
Capital gain distributions from investment companies — affiliated | | | 11 | |
Foreign currency transactions | | | (17 | ) |
Futures contracts | | | 304,804 | |
| | | | |
| | | 47,664,838 | |
| | | | |
Net change in unrealized appreciation (depreciation) on: | | | | |
Investments — affiliated | | | 1,450 | |
Investments — unaffiliated | | | (15,718,242 | ) |
Foreign currency translations | | | 50 | |
Futures contracts | | | (2,376 | ) |
| | | | |
| | | (15,719,118 | ) |
| | | | |
Net realized and unrealized gain | | | 31,945,720 | |
| | | | |
NET INCREASE IN NET ASSETS RESULTING FROM OPERATIONS | | $ | 34,267,278 | |
| | | | |
| (a) | Includes non-recurring dividends in the amount of $464,138 |
See notes to financial statements.
Statements of Changes in Net Assets
| | | | | | | | |
| | | BlackRock Advantage U.S. Total
Market V.I. Fund | |
| | | Year Ended December 31, | |
| | | 2017 | | | 2016 | |
| | |
INCREASE (DECREASE) IN NET ASSETS | | | | | | | | |
| | |
OPERATIONS | | | | | | | | |
Net investment income | | $ | 2,321,558 | | | $ | 626,144 | |
Net realized gain | | | 47,664,838 | | | | 18,083,477 | |
Net change in unrealized appreciation (depreciation) | | | (15,719,118 | ) | | | 32,110,679 | |
| | | | | | | | |
Net increase in net assets resulting from operations | | | 34,267,278 | | | | 50,820,300 | |
| | | | | | | | |
| | |
DISTRIBUTIONS TO SHAREHOLDERS(a) | | | | | | | | |
From net investment income: | | | | | | | | |
Class I | | | (2,278,683 | ) | | | (628,029 | ) |
Class II | | | (22,476 | ) | | | (3,111 | ) |
Class III | | | (48,843 | ) | | | (8,867 | ) |
From net realized gain: | | | | | | | | |
Class I | | | (50,143,967 | ) | | | (6,427,714 | ) |
Class II | | | (616,770 | ) | | | (86,226 | ) |
Class III | | | (1,323,283 | ) | | | (201,410 | ) |
| | | | | | | | |
Decrease in net assets resulting from distributions to shareholders | | | (54,434,022 | ) | | | (7,355,357 | ) |
| | | | | | | | |
| | |
CAPITAL SHARE TRANSACTIONS | | | | | | | | |
Net increase (decrease) in net assets derived from capital share transactions | | | 30,391,828 | | | | (13,315,761 | ) |
| | | | | | | | |
| | |
NET ASSETS | | | | | | | | |
Total increase in net assets | | | 10,225,084 | | | | 30,149,182 | |
Beginning of year | | | 260,101,549 | | | | 229,952,367 | |
| | | | | | | | |
End of year | | $ | 270,326,633 | | | $ | 260,101,549 | |
| | | | | | | | |
Undistributed net investment income, end of year | | $ | 35,495 | | | $ | 63,956 | |
| | | | | | | | |
| (a) | Distributions for annual periods determined in accordance with U.S. federal income tax regulations. |
See notes to financial statements.
| | |
| 12 | | 2017 BLACKROCK ANNUAL REPORTTO SHAREHOLDERS |
Financial Highlights
(For a share outstanding throughout each period)
| | | | | | | | | | | | | | | | | | | | |
| | | BlackRock Advantage U.S. Total Market V.I. Fund | |
| | | Class I | |
| | | Year Ended December 31, | |
| | | 2017 | | | 2016 | | | 2015 | | | 2014 | | | 2013 | |
Net asset value, beginning of year | | $ | 27.93 | | | $ | 23.24 | | | $ | 26.96 | | | $ | 27.48 | | | $ | 19.39 | |
| | | | | | | | | | | | | | | | | | | | |
Net investment income(a) | | | 0.26 | (b) | | | 0.07 | | | | 0.07 | | | | 0.10 | | | | 0.09 | |
Net realized and unrealized gain (loss) | | | 3.60 | | | | 5.43 | | | | (1.80 | ) | | | 1.35 | | | | 8.13 | |
| | | | | | | | | | | | | | | | | | | | |
Net increase (decrease) from investment operations | | | 3.86 | | | | 5.50 | | | | (1.73 | ) | | | 1.45 | | | | 8.22 | |
| | | | | | | | | | | | | | | | | | | | |
| Distributions:(c) | | | | | | | | | | | | | | | |
From net investment income | | | (0.27 | ) | | | (0.07 | ) | | | (0.07 | ) | | | (0.08 | ) | | | (0.13 | ) |
From net realized gain | | | (5.89 | ) | | | (0.74 | ) | | | (1.92 | ) | | | (1.89 | ) | | | — | |
From return of capital | | | — | | | | — | | | | (0.00 | )(d) | | | — | | | | — | |
| | | | | | | | | | | | | | | | | | | | |
Total distributions | | | (6.16 | ) | | | (0.81 | ) | | | (1.99 | ) | | | (1.97 | ) | | | (0.13 | ) |
| | | | | | | | | | | | | | | | | | | | |
Net asset value, end of year | | $ | 25.63 | | | $ | 27.93 | | | $ | 23.24 | | | $ | 26.96 | | | $ | 27.48 | |
| | | | | | | | | | | | | | | | | | | | |
| | | | | |
Total Return:(e) | | | | | | | | | | | | | | | | | | | | |
Based on net asset value | | | 14.05 | % | | | 23.65 | % | | | (6.61 | )% | | | 5.22 | % | | | 42.40 | % |
| | | | | | | | | | | | | | | | | | | | |
| | | | | |
Ratios to Average Net Assets: | | | | | | | | | | | | | | | | | | | | |
Total expenses | | | 1.05 | % | | | 1.01 | % | | | 1.01 | % | | | 1.02 | % | | | 1.00 | % |
| | | | | | | | | | | | | | | | | | | | |
Total expenses after fees waived and/or reimbursed | | | 0.71 | % | | | 0.92 | % | | | 0.90 | % | | | 0.90 | % | | | 0.90 | % |
| | | | | | | | | | | | | | | | | | | | |
Net investment income | | | 0.91 | %(b) | | | 0.28 | % | | | 0.26 | % | | | 0.37 | % | | | 0.37 | % |
| | | | | | | | | | | | | | | | | | | | |
| | | | | |
Supplemental Data: | | | | | | | | | | | | | | | | | | | | |
Net assets, end of year (000) | | $ | 261,872 | | | $ | 250,567 | | | $ | 220,681 | | | $ | 260,860 | | | $ | 279,345 | |
| | | | | | | | | | | | | | | | | | | | |
Portfolio turnover rate | | | 179 | % | | | 78 | % | | | 61 | % | | | 57 | % | | | 66 | % |
| | | | | | | | | | | | | | | | | | | | |
| (a) | Based on average shares outstanding. |
| (b) | Net investment income per share and the ratio of net investment income to average net assets includes $0.05 per share and 0.18%, respectively, resulting from a special dividend. |
| (c) | Distributions for annual periods determined in accordance with U.S. federal income tax regulations. |
| (d) | Amount is greater than $(0.005) per share. |
| (e) | Where applicable, excludes insurance-related fees and expenses and assumes the reinvestment of distributions. |
See notes to financial statements.
Financial Highlights (continued)
(For a share outstanding throughout each period)
| | | | | | | | | | | | | | | | | | | | |
| | | BlackRock Advantage U.S. Total Market V.I. Fund | |
| | | Class II | |
| | | Year Ended December 31, | |
| | | 2017 | | | 2016 | | | 2015 | | | 2014 | | | 2013 | |
Net asset value, beginning of year | | $ | 27.88 | | | $ | 23.21 | | | $ | 26.91 | | | $ | 27.43 | | | $ | 19.35 | |
| | | | | | | | | | | | | | | | | | | | |
Net investment income(a) | | | 0.20 | (b) | | | 0.03 | | | | 0.02 | | | | 0.05 | | | | 0.05 | |
Net realized and unrealized gain (loss) | | | 3.60 | | | | 5.41 | | | | (1.77 | ) | | | 1.34 | | | | 8.12 | |
| | | | | | | | | | | | | | | | | | | | |
Net increase (decrease) from investment operations | | | 3.80 | | | | 5.44 | | | | (1.75 | ) | | | 1.39 | | | | 8.17 | |
| | | | | | | | | | | | | | | | | | | | |
| Distributions:(c) | | | | | | | | | | | | | | | |
From net investment income | | | (0.22 | ) | | | (0.03 | ) | | | (0.03 | ) | | | (0.02 | ) | | | (0.09 | ) |
From net realized gain | | | (5.89 | ) | | | (0.74 | ) | | | (1.92 | ) | | | (1.89 | ) | | | — | |
From return of capital | | | — | | | | — | | | | (0.00 | )(d) | | | — | | | | — | |
| | | | | | | | | | | | | | | | | | | | |
Total distributions | | | (6.11 | ) | | | (0.77 | ) | | | (1.95 | ) | | | (1.91 | ) | | | (0.09 | ) |
| | | | | | | | | | | | | | | | | | | | |
Net asset value, end of year | | $ | 25.57 | | | $ | 27.88 | | | $ | 23.21 | | | $ | 26.91 | | | $ | 27.43 | |
| | | | | | | | | | | | | | | | | | | | |
| | | | | |
Total Return:(e) | | | | | | | | | | | | | | | | | | | | |
Based on net asset value | | | 13.85 | % | | | 23.40 | % | | | (6.76 | )% | | | 5.03 | % | | | 42.25 | % |
| | | | | | | | | | | | | | | | | | | | |
| | | | | |
Ratios to Average Net Assets: | | | | | | | | | | | | | | | | | | | | |
Total expenses | | | 1.22 | % | | | 1.20 | % | | | 1.18 | % | | | 1.19 | % | | | 1.14 | % |
| | | | | | | | | | | | | | | | | | | | |
Total expenses after fees waived and/or reimbursed | | | 0.88 | % | | | 1.09 | % | | | 1.07 | % | | | 1.07 | % | | | 1.04 | % |
| | | | | | | | | | | | | | | | | | | | |
Net investment income | | | 0.72 | %(b) | | | 0.10 | % | | | 0.08 | % | | | 0.20 | % | | | 0.22 | % |
| | | | | | | | | | | | | | | | | | | | |
| | | | | |
Supplemental Data: | | | | | | | | | | | | | | | | | | | | |
Net assets, end of year (000) | | $ | 3,131 | | | $ | 3,351 | | | $ | 3,120 | | | $ | 3,764 | | | $ | 4,701 | |
| | | | | | | | | | | | | | | | | | | | |
Portfolio turnover rate | | | 179 | % | | | 78 | % | | | 61 | % | | | 57 | % | | | 66 | % |
| | | | | | | | | | | | | | | | | | | | |
| (a) | Based on average shares outstanding. |
| (b) | Net investment income per share and the ratio of net investment income to average net assets includes $0.05 per share and 0.17%, respectively, resulting from a special dividend. |
| (c) | Distributions for annual periods determined in accordance with U.S. federal income tax regulations. |
| (d) | Amount is greater than $(0.005) per share. |
| (e) | Where applicable, excludes insurance-related fees and expenses and assumes the reinvestment of distributions. |
See notes to financial statements.
| | |
| 14 | | 2017 BLACKROCK ANNUAL REPORTTO SHAREHOLDERS |
Financial Highlights (continued)
(For a share outstanding throughout each period)
| | | | | | | | | | | | | | | | | | | | |
| | | BlackRock Advantage U.S. Total Market V.I. Fund | |
| | | Class III | |
| | | Year Ended December 31, | |
| | | 2017 | | | 2016 | | | 2015 | | | 2014 | | | 2013 | |
Net asset value, beginning of year | | $ | 21.89 | | | $ | 18.36 | | | $ | 21.73 | | | $ | 22.50 | | | $ | 15.90 | |
| | | | | | | | | | | | | | | | | | | | |
Net investment income(a) | | | 0.14 | (b) | | | 0.01 | | | | 0.01 | | | | 0.04 | | | | 0.02 | |
Net realized and unrealized gain (loss) | | | 2.82 | | | | 4.29 | | | | (1.43 | ) | | | 1.11 | | | | 6.67 | |
| | | | | | | | | | | | | | | | | | | | |
Net increase (decrease) from investment operations | | | 2.96 | | | | 4.30 | | | | (1.42 | ) | | | 1.15 | | | | 6.69 | |
| | | | | | | | | | | | | | | | | | | | |
| Distributions:(c) | | | | | | | | | | | | | | | |
From net investment income | | | (0.22 | ) | | | (0.03 | ) | | | (0.03 | ) | | | (0.03 | ) | | | (0.09 | ) |
From net realized gain | | | (5.89 | ) | | | (0.74 | ) | | | (1.92 | ) | | | (1.89 | ) | | | — | |
From return of capital | | | — | | | | — | | | | (0.00 | )(d) | | | — | | | | — | |
| | | | | | | | | | | | | | | | | | | | |
Total distributions | | | (6.11 | ) | | | (0.77 | ) | | | (1.95 | ) | | | (1.92 | ) | | | (0.09 | ) |
| | | | | | | | | | | | | | | | | | | | |
Net asset value, end of year | | $ | 18.74 | | | $ | 21.89 | | | $ | 18.36 | | | $ | 21.73 | | | $ | 22.50 | |
| | | | | | | | | | | | | | | | | | | | |
| | | | | |
Total Return:(e) | | | | | | | | | | | | | | | | | | | | |
Based on net asset value | | | 13.83 | % | | | 23.41 | % | | | (6.78 | )% | | | 5.07 | % | | | 42.08 | % |
| | | | | | | | | | | | | | | | | | | | |
| | | | | |
Ratios to Average Net Assets: | | | | | | | | | | | | | | | | | | | | |
Total expenses | | | 1.32 | % | | | 1.29 | % | | | 1.29 | % | | | 1.25 | % | | | 1.32 | % |
| | | | | | | | | | | | | | | | | | | | |
Total expenses after fees waived and/or reimbursed | | | 0.95 | % | | | 1.11 | % | | | 1.09 | % | | | 1.09 | % | | | 1.09 | % |
| | | | | | | | | | | | | | | | | | | | |
Net investment income | | | 0.65 | %(b) | | | 0.08 | % | | | 0.06 | % | | | 0.18 | % | | | 0.13 | % |
| | | | | | | | | | | | | | | | | | | | |
| | | | | |
Supplemental Data: | | | | | | | | | | | | | | | | | | | | |
Net assets, end of year (000) | | $ | 5,324 | | | $ | 6,184 | | | $ | 6,152 | | | $ | 8,002 | | | $ | 8,764 | |
| | | | | | | | | | | | | | | | | | | | |
Portfolio turnover rate | | | 179 | % | | | 78 | % | | | 61 | % | | | 57 | % | | | 66 | % |
| | | | | | | | | | | | | | | | | | | | |
| (a) | Based on average shares outstanding. |
| (b) | Net investment income per share and the ratio of net investment income to average net assets includes $0.04 per share and 0.17%, respectively, resulting from a special dividend. |
| (c) | Distributions for annual periods determined in accordance with U.S. federal income tax regulations. |
| (d) | Amount is greater than $(0.005) per share. |
| (e) | Where applicable, excludes insurance-related fees and expenses and assumes the reinvestment of distributions. |
See notes to financial statements.
Notes to Financial Statements
BlackRock Variable Series Funds, Inc. (the “Company”) is registered under the Investment Company Act of 1940, as amended (the “1940 Act”), as an open-end management investment company. The Company is organized as a Maryland corporation that is comprised of 20 separate funds. The funds offer shares to insurance companies for their separate accounts to fund benefits under certain variable annuity and variable life insurance contracts. The financial statements presented are for BlackRock Advantage U.S. Total Market V.I. Fund (the “Fund”) (formerly known as BlackRock Value Opportunities V.I. Fund). The Fund is classified as diversified. Class I, Class II and Class III Shares have equal voting, dividend, liquidation and other rights, except that only shares of the respective classes are entitled to vote on matters concerning only that class. In addition, Class II and Class III Shares bear certain expenses related to the distribution of such shares.
The Fund, together with certain other registered investment companies advised by BlackRock Advisors, LLC (the “Manager”) or its affiliates, is included in a complex of open-end funds referred to as the Equity-Bond Complex.
| 2. | SIGNIFICANT ACCOUNTING POLICIES |
The financial statements are prepared in conformity with accounting principles generally accepted in the United States of America (“U.S. GAAP”), which may require management to make estimates and assumptions that affect the reported amounts of assets and liabilities in the financial statements, disclosure of contingent assets and liabilities at the date of the financial statements and the reported amounts of increases and decreases in net assets from operations during the reporting period. Actual results could differ from those estimates. The Fund is considered an investment company under U.S. GAAP and follows the accounting and reporting guidance applicable to investment companies. Below is a summary of significant accounting policies:
Investment Transactions and Income Recognition: For financial reporting purposes, investment transactions are recorded on the dates the transactions are entered into (the “trade dates”). Realized gains and losses on investment transactions are determined on the identified cost basis. Dividend income is recorded on the ex-dividend date. Dividends from foreign securities where the ex-dividend date may have passed are subsequently recorded when the Fund are informed of the ex-dividend date. Under the applicable foreign tax laws, a withholding tax at various rates may be imposed on capital gains, dividends and interest. Upon notification from issuers, some of the dividend income received from a real estate investment trust may be redesignated as a reduction of cost of the related investment and/or realized gain. Interest income, including amortization and accretion of premiums and discounts on debt securities are recognized on the accrual basis.
Foreign Currency Translation: The Fund’s books and records are maintained in U.S. dollars. Securities and other assets and liabilities denominated in foreign currencies are translated into U.S. dollars using exchange rates determined as of the close of trading on the New York Stock Exchange (“NYSE”). Purchases and sales of investments are recorded at the rates of exchange prevailing on the respective dates of such transactions. Generally, when the U.S. dollar rises in value against a foreign currency, the investments denominated in that currency will lose value; the opposite effect occurs if the U.S. dollar falls in relative value.
The Fund does not isolate the portion of the results of operations arising as a result of changes in the exchange rates from the changes in the market prices of investments held or sold for financial reporting purposes. Accordingly, the effects of changes in exchange rates on investments are not segregated in the Statement of Operations from the effects of changes in market prices of those investments, but are included as a component of net realized and unrealized gain (loss) from investments. The Fund reports realized currency gains (losses) on foreign currency related transactions as components of net realized gain (loss) for financial reporting purposes, whereas such components are generally treated as ordinary income for U.S. federal income tax purposes.
Distributions: Distributions paid by the Fund are recorded on the ex-dividend date. Distribution of capital gains are recorded on the ex-dividend date and made at least annually. The character and timing of distributions are determined in accordance with U.S. federal income tax regulations, which may differ from U.S. GAAP.
Indemnifications: In the normal course of business, the Fund enters into contracts that contain a variety of representations that provide general indemnification. The Fund’s maximum exposure under these arrangements is unknown because it involves future potential claims against the Fund, which cannot be predicted with any certainty.
Other: Expenses directly related to the Fund or its classes are charged to the Fund or the applicable class. Other operating expenses shared by several funds, including other funds managed by the Manager, are prorated among those funds on the basis of relative net assets or other appropriate methods. Expenses directly related to the Fund and other shared expenses prorated to the Fund are allocated daily to each class based on its relative net assets or other appropriate methods.
The Fund has an arrangement with its custodian whereby credits are earned on uninvested cash balances, which could be used to reduce custody fees and/or overdraft charges. The Fund may incur charges on certain uninvested cash balances and overdrafts, subject to certain conditions.
| 3. | INVESTMENT VALUATION AND FAIR VALUE MEASUREMENTS |
Investment Valuation Policies: The Fund’s investments are valued at fair value (also referred to as “market value” within the financial statements) as of the close of trading on the NYSE (generally 4:00 p.m., Eastern time) (or, if the reporting date falls on a day the NYSE is closed, investments are valued as of the period end). U.S. GAAP defines fair value as the price the Fund would receive to sell an asset or pay to transfer a liability in an orderly transaction between market participants at the measurement date. The Fund determines the fair values of its financial instruments using various independent dealers or pricing services under policies approved by the Board of Directors of the Company (the “Board”). The BlackRock Global Valuation Methodologies Committee (the “Global Valuation Committee”) is the committee formed by management to develop global pricing policies and procedures and to oversee the pricing function for all financial instruments.
Fair Value Inputs and Methodologies: The following methods and inputs are used to establish the fair value of the Fund’s assets and liabilities:
| | • | | Equity investments traded on a recognized securities exchange are valued at the official closing price each day, if available. For equity investments traded on more than one exchange, the official closing price on the exchange where the stock is primarily traded is used. Equity investments traded on a recognized exchange for which there were no sales on that day may be valued at the last available bid (long positions) or ask (short positions) price. |
| | |
| 16 | | 2017 BLACKROCK ANNUAL REPORTTO SHAREHOLDERS |
Notes to Financial Statements (continued)
Generally, trading in foreign instruments is substantially completed each day at various times prior to the close of trading on the NYSE. Occasionally, events affecting the values of such instruments may occur between the foreign market close and the close of trading on the NYSE that may not be reflected in the computation of the Fund’s net assets. Each business day, the Fund uses a pricing service to assist with the valuation of certain foreign exchange-traded equity securities and foreign exchange-traded and over-the-counter (“OTC”) options (the “Systematic Fair Value Price”). Using current market factors, the Systematic Fair Value Price is designed to value such foreign securities and foreign options at fair value as of the close of trading on the NYSE, which follows the close of the local markets.
| | • | | Investments in open-end U.S. mutual funds are valued at net asset value (“NAV”) each business day. |
| | • | | The Fund values its investment in SL Liquidity Series, LLC, Money Market Series (the “Money Market Series”) at fair value, which is ordinarily based upon its pro rata ownership in the underlying fund’s net assets. The Money Market Series seeks current income consistent with maintaining liquidity and preserving capital. Although the Money Market Series is not registered under the 1940 Act, its investments may follow the parameters of investments by a money market fund that is subject to Rule 2a-7 under the 1940 Act. |
| | • | | Securities and other assets and liabilities denominated in foreign currencies are translated into U.S. dollars using exchange rates determined as of the close of trading on the NYSE. Forward foreign currency exchange contracts are valued at the mean between the bid and ask prices and are determined as of the close of trading on the NYSE. Interpolated values are derived when the settlement date of the contract is an interim date for which quotations are not available. |
If events (e.g., a company announcement, market volatility or a natural disaster) occur that are expected to materially affect the value of such instruments, or in the event that the application of these methods of valuation results in a price for an investment that is deemed not to be representative of the market value of such investment, or if a price is not available, the investment will be valued by the Global Valuation Committee, or its delegate, in accordance with a policy approved by the Board as reflecting fair value (“Fair Valued Investments”). The fair valuation approaches that may be used by the Global Valuation Committee will include market approach, income approach and cost approach. Valuation techniques such as discounted cash flow, use of market comparables and matrix pricing are types of valuation approaches and are typically used in determining fair value. When determining the price for Fair Valued Investments, the Global Valuation Committee, or its delegate, seeks to determine the price that the Fund might reasonably expect to receive or pay from the current sale or purchase of that asset or liability in an arm’s-length transaction. Fair value determinations shall be based upon all available factors that the Global Valuation Committee, or its delegate, deems relevant and consistent with the principles of fair value measurement. The pricing of all Fair Valued Investments is subsequently reported to the Board or a committee thereof on a quarterly basis.
Fair Value Hierarchy: Various inputs are used in determining the fair value of investments. These inputs to valuation techniques are categorized into a fair value hierarchy consisting of three broad levels for financial statement purposes as follows:
| | • | | Level 1 — Unadjusted price quotations in active markets/exchanges for identical assets or liabilities that the Fund has the ability to access |
| | • | | Level 2 — Other observable inputs (including, but not limited to, quoted prices for similar assets or liabilities in markets that are active, quoted prices for identical or similar assets or liabilities in markets that are not active, inputs other than quoted prices that are observable for the assets or liabilities (such as interest rates, yield curves, volatilities, prepayment speeds, loss severities, credit risks and default rates) or other market–corroborated inputs) |
| | • | | Level 3 — Unobservable inputs based on the best information available in the circumstances, to the extent observable inputs are not available (including the Fund’s own assumptions used in determining the fair value of investments) |
The hierarchy gives the highest priority to unadjusted quoted prices in active markets for identical assets or liabilities (Level 1 measurements) and the lowest priority to unobservable inputs (Level 3 measurements). Accordingly, the degree of judgment exercised in determining fair value is greatest for instruments categorized in Level 3. The inputs used to measure fair value may fall into different levels of the fair value hierarchy. In such cases, for disclosure purposes, the fair value hierarchy classification is determined based on the lowest level input that is significant to the fair value measurement in its entirety. Investments classified within Level 3 have significant unobservable inputs used by the Global Valuation Committee in determining the price for Fair Valued Investments. Level 3 investments include equity or debt issued by privately held companies or funds. There may not be a secondary market, and/or there are a limited number of investors. Level 3 investments may also be adjusted to reflect illiquidity and/or non-transferability, with the amount of such discount estimated by the Global Valuation Committee in the absence of market information.
Changes in valuation techniques may result in transfers into or out of an assigned level within the hierarchy. In accordance with the Fund’s policy, transfers between different levels of the fair value hierarchy are deemed to have occurred as of the beginning of the reporting period. The categorization of a value determined for investments is based on the pricing transparency of the investments and is not necessarily an indication of the risks associated with investing in those securities.
As of December 31, 2017, certain investments of the Fund were valued using NAV per share as no quoted market value is available and therefore have been excluded from the fair value hierarchy.
| 4. | SECURITIES AND OTHER INVESTMENTS |
Securities Lending: The Fund may lend its securities to approved borrowers, such as brokers, dealers and other financial institutions. The borrower pledges and maintains with the Fund collateral consisting of cash, an irrevocable letter of credit issued by a bank, or securities issued or guaranteed by the U.S. Government. The initial collateral received by the Fund is required to have a value of at least 102% of the current value of the loaned securities for securities traded on U.S. exchanges and a value of at least 105% for all other securities. The collateral is maintained thereafter at a value equal to at least 100% of the current market value of the securities on loan. The market value of the loaned securities is determined at the close of each business day of the Fund and any additional required collateral is delivered to the Fund, or excess collateral returned by the Fund, on the next business day. During the term of the loan, the Fund is entitled to all distributions made on or in respect of the loaned securities, but does not receive interest income on securities received as collateral. Loans of securities are terminable at any time and the borrower, after notice, is required to return borrowed securities within the standard time period for settlement of securities transactions.
| | | | |
| NOTESTO FINANCIAL STATEMENTS | | | 17 | |
Notes to Financial Statements (continued)
The market value of any securities on loan, all of which were classified as common stocks in the Fund’s Schedule of Investments, and the value of any related collateral are shown separately in the Statement of Assets and Liabilities as a component of investments at value — unaffiliated, and collateral on securities loaned at value, respectively. As of period end, any securities on loan were collateralized by cash and/or U.S. Government obligations. Cash collateral invested by the securities lending agent, BlackRock Investment Management, LLC (“BIM”), if any, is disclosed in the Schedule of Investments.
Securities lending transactions are entered into by the Fund under Master Securities Lending Agreements (each, an “MSLA”), which provide the right, in the event of default (including bankruptcy or insolvency), for the non-defaulting party to liquidate the collateral and calculate a net exposure to the defaulting party or request additional collateral. In the event that a borrower defaults, the Fund, as lender, would offset the market value of the collateral received against the market value of the securities loaned. When the value of the collateral is greater than that of the market value of the securities loaned, the lender is left with a net amount payable to the defaulting party. However, bankruptcy or insolvency laws of a particular jurisdiction may impose restrictions on or prohibitions against such a right of offset in the event of an MSLA counterparty’s bankruptcy or insolvency. Under the MSLA, absent an event of default, the borrower can resell or re-pledge the loaned securities, and the Fund can reinvest cash collateral received in connection with loaned securities. Upon an event of default, the parties’ obligations to return the securities or collateral to the other party are extinguished, and the parties can resell or re-pledge the loaned securities or the collateral received in connection with the loaned securities in order to satisfy the defaulting party’s net payment obligation for all transactions under the MSLA. The defaulting party remains liable for any deficiency.
As of period end, the following table is a summary of the Fund’s securities lending agreements by counterparty which are subject to offset under an MSLA:
| | | | | | | | | | | | |
| Counterparty | | Securities
Loaned at Value | | | Cash Collateral
Received (a) | | | Net
Amount | |
BNP Paribas S.A. | | $ | 1,034,516 | | | $ | (1,034,516 | ) | | $ | — | |
Citigroup Global Markets, Inc. | | | 4,891,252 | | | | (4,891,252 | ) | | | — | |
Deutsche Bank Securities Inc. | | | 18,473 | | | | (18,473 | ) | | | — | |
JP Morgan Securities LLC | | | 932,907 | | | | (932,907 | ) | | | — | |
Morgan Stanley | | | 788,512 | | | | (788,512 | ) | | | — | |
State Street Bank & Trust Co. | | | 440,012 | | | | (440,012 | ) | | | — | |
| | | | | | | | | | | | |
| | $ | 8,105,672 | | | $ | (8,105,672 | ) | | $ | — | |
| | | | | | | | | | | | |
| | (a) | Cash collateral with a value of $8,361,996 has been received in connection with securities lending agreements. Collateral received in excess of the value of securities loaned from the individual counterparty is not shown for financial reporting purposes in the table above. | |
The risks of securities lending include the risk that the borrower may not provide additional collateral when required or may not return the securities when due. To mitigate these risks, the Fund benefits from a borrower default indemnity provided by BIM. BIM’s indemnity allows for full replacement of the securities loaned if the collateral received does not cover the value on the securities loaned in the event of borrower default. The Fund could incur a loss if the value of an investment purchased with cash collateral falls below the market value of loaned securities or if the value of an investment purchased with cash collateral falls below the value of the original cash collateral received.
| 5. | DERIVATIVE FINANCIAL INSTRUMENTS |
The Fund engages in various portfolio investment strategies using derivative contracts both to increase the returns of the Fund and/or to manage its exposure to certain risks such as credit risk, equity risk, interest rate risk, foreign currency exchange rate risk, commodity price risk or other risks (e.g., inflation risk). Derivative financial instruments categorized by risk exposure are included in the Schedule of Investments. These contracts may be transacted on an exchange or over-the-counter (“OTC”).
Futures Contracts: Futures contracts are purchased or sold to gain exposure to, or manage exposure to, changes in interest rates (interest rate risk), changes in the value of equity securities (equity risk) or foreign currencies (foreign currency exchange rate risk).
Futures contracts are agreements between the Fund and a counterparty to buy or sell a specific quantity of an underlying instrument at a specified price and on a specified date. Depending on the terms of a contract, it is settled either through physical delivery of the underlying instrument on the settlement date or by payment of a cash amount on the settlement date. Upon entering into a futures contract, the Fund is required to deposit initial margin with the broker in the form of cash or securities in an amount that varies depending on a contract’s size and risk profile. The initial margin deposit must then be maintained at an established level over the life of the contract.
Securities deposited as initial margin are designated in the Schedule of Investments and cash deposited, if any, is shown as cash pledged for futures contracts in the Statement of Assets and Liabilities. Pursuant to the contract, the Fund agrees to receive from or pay to the broker an amount of cash equal to the daily fluctuation in market value of the contract (“variation margin”). Variation margin is recorded as unrealized appreciation (depreciation) and, if any, shown as variation margin receivable (or payable) on futures contracts in the Statement of Assets and Liabilities. When the contract is closed, a realized gain or loss is recorded in the Statement of Operations equal to the difference between the notional amount of the contract at the time it was opened and the notional amount at the time it was closed. The use of futures contracts involves the risk of an imperfect correlation in the movements in the price of futures contracts and interest, foreign currency exchange rates or underlying assets.
| 6. | INVESTMENT ADVISORY AGREEMENT AND OTHER TRANSACTIONS WITH AFFILIATES |
The PNC Financial Services Group, Inc. is the largest stockholder and an affiliate of BlackRock, Inc. (“BlackRock”) for 1940 Act purposes.
Investment Advisory: The Company, on behalf of the Fund, entered into an Investment Advisory Agreement with the Manager, the Fund’s investment adviser, an indirect, wholly-owned subsidiary of BlackRock, to provide investment advisory and administrative services. The Manager is responsible for the management of the Fund’s portfolio and provides the personnel, facilities, equipment and certain other services necessary to the operations of the Fund.
| | |
| 18 | | 2017 BLACKROCK ANNUAL REPORTTO SHAREHOLDERS |
Notes to Financial Statements (continued)
For such services, the Fund pays the Manager a monthly fee at an annual rate equal to the following percentages of the average daily value of Fund’s net assets:
| | | | |
| Average Daily Net Assets | | Investment
Advisory Fees | |
First $1 Billion | | | 0.75 | % |
$1 Billion — $3 Billion | | | 0.71 | |
$3 Billion — $5 Billion | | | 0.68 | |
$5 Billion — $10 Billion | | | 0.65 | |
Greater than $10 Billion | | | 0.64 | |
Distribution Fees: The Company, on behalf of the Fund, entered into a Distribution Agreement and a Distribution Plan with BlackRock Investments, LLC (“BRIL”), an affiliate of the Manager. Pursuant to the Distribution Plan and in accordance with Rule 12b-1 under the 1940 Act, the Fund pays BRIL ongoing distribution fees. The fees are accrued daily and paid monthly at annual rates of 0.15% and 0.25% based upon the average daily net assets attributable to Class II and Class III, respectively.
For the year ended December 31, 2017, the following table shows the class specific distribution fees borne directly by each share class of the Fund:
| | | | | | | | | | | | |
| | | Class II | | | Class III | | | Total | |
Distribution Fees | | $ | 4,759 | | | $ | 13,853 | | | $ | 18,612 | |
Transfer Agent: On behalf of the Fund, the Manager entered into agreements with insurance companies and other financial intermediaries (“Service Organizations”), some of which may be affiliates. Pursuant to these agreements, the Service Organizations provide the Fund with administrative, networking, recordkeeping, sub-transfer agency and shareholder services to sub-accounts they service. For these services, the Service Organizations receive an annual fee per shareholder account, which will vary depending on share class and/or net assets of Fund shareholders serviced by the Service Organizations, which is shown as transfer agent — class specific. For the year ended December 31, 2017, the Fund did not pay any amounts to affiliates in return for these services.
In addition, the Fund pays the transfer agent, which is not an affiliate, a fee for issuance, transfer and redemption of shares and the opening and maintenance of shareholder accounts, which is included in transfer agent in the Statement of Operations.
For the year ended December 31, 2017, the following table shows the class specific transfer agent fees borne directly by each share class of the Fund:
| | | | | | | | | | | | | | | | | | | | |
| Class I | | | | | Class II | | | | | Class III | | | | | Total | |
| $ | 447,523 | | | | | $ | 6,474 | | | | | $ | 11,311 | | | | | $ | 465,308 | |
Expense Limitations, Waivers and Reimbursements: With respect to the Fund, the Manager voluntarily agreed to waive its investment advisory fees by the amount of investment advisory fees the Fund pays to the Manager indirectly through its investment in affiliated money market funds (the “affiliated money market fund waiver”). The amount of waivers and/or reimbursements of fees and expenses made pursuant to the expense limitation caps will be reduced by the amount of the affiliated money market fund waiver. This amount is included in fees waived and/or reimbursed by the Manager in the Statement of Operations. For the year ended December 31, 2017, the amount waived was $2,258.
The Manager has contractually agreed to waive its investment advisory fee with respect to any portion of the Fund’s assets invested in affiliated equity and fixed-income mutual funds and affiliated exchange-traded funds that have a contractual management fee through April 30, 2019. The contractual agreement may be terminated upon 90 days’ notice by a majority of the independent directors who are not “interested persons” of the Fund, as defined in the 1940 Act (“Independent Directors”) of the Fund or by a vote of a majority of the outstanding voting securities of the Fund. For the year ended December 31, 2017, there were no fees waived by the Manager.
For the year ended December 31, 2017, the Fund reimbursed the Manager $2,681 for certain accounting services, which is included in accounting services in the Statement of Operations.
The Manager has contractually agreed to reimburse transfer agent fees in order to limit such expenses to a percentage of average daily net assets as follows:
| | | | |
Class I | | | 0.07 | % |
Class II | | | 0.09 | % |
Class III | | | 0.01 | % |
The Manager has agreed not to reduce or discontinue this contractual expense limitation through April 30, 2019, unless approved by the Board, including a majority of the Independent Directors or by a vote of a majority of the outstanding voting securities of the Fund.
These amounts waived and/or reimbursed are shown as transfer agent fees reimbursed — class specific in the Statement of Operations. For the year ended December 31, 2017, class specific expense waivers and/or reimbursements are as follows:
| | | | | | | | | | | | | | | | |
| | | Class I | | | Class II | | | Class III | | | Total | |
Transfer Agent Fees Reimbursed | | $ | 307,766 | | | $ | 4,023 | | | $ | 10,834 | | | $ | 322,623 | |
| | | | |
| NOTESTO FINANCIAL STATEMENTS | | | 19 | |
Notes to Financial Statements (continued)
With respect to the Fund, the Manager contractually agreed to waive and/or reimburse fees or expenses in order to limit expenses, excluding interest expense, dividend expense, tax expense, acquired fund fees and expenses, and certain other fund expenses, which constitute extraordinary expenses not incurred in the ordinary course of the Fund’s business (“expense limitation”). The expense limitations as a percentage of average daily net assets are as follows:
| | | | | | | | | | | | | | |
| Class I | | | | | Class II | | | | | Class III | |
| | 0.55% | | | | | | 0.70% | | | | | | 0.80% | |
Prior to June 12, 2017, the expense limitations as a percentage of average daily net assets are as follows:
| | | | |
Class I | | | 1.25 | % |
Class II | | | 1.40 | % |
Class III | | | 1.50 | % |
The Manager has agreed not to reduce or discontinue this contractual expense limitation through April 30, 2019, unless approved by the Board, including a majority of the Independent Directors or by a majority of the outstanding voting securities of the Fund. For the year ended December 31, 2017, the Manager waived $584,958, which is included in fees waived and/or reimbursed by the Manager in the Statement of Operations.
Securities Lending: The U.S. Securities and Exchange Commission (“SEC”) has issued an exemptive order which permits BIM, an affiliate of the Manager, to serve as securities lending agent for the Fund, subject to applicable conditions. As securities lending agent, BIM bears all operational costs directly related to securities lending. The Fund is responsible for expenses in connection with the investment of cash collateral received for securities on loan (the “collateral investment expenses”). The cash collateral is invested in a private investment company managed by the Manager or its affiliates. However, BIM has agreed to cap the collateral investment expenses of the private investment company to an annual rate of 0.04%. The investment adviser to the private investment company will not charge any advisory fees with respect to shares purchased by the Fund. The private investment company in which the cash collateral has been invested may, under certain circumstances, impose a liquidity fee of up to 2% of the value withdrawn or temporarily restrict withdrawals for up to 10 business days during a 90 day period, in the event that the private investment company’s weekly liquid assets fall below certain thresholds.
Securities lending income is equal to the total of income earned from the reinvestment of cash collateral, net of fees and other payments to and from borrowers of securities, and less the collateral investment expenses. The Fund retains a portion of securities lending income and remits a remaining portion to BIM as compensation for its services as securities lending agent.
Pursuant to a securities lending agreement, the Fund retains 71.5% of securities lending income, and this amount retained can never be less than 65% of the total of securities lending income plus the collateral investment expenses.
In addition, commencing the business day following the date that the aggregate securities lending income earned across the Equity-Bond Complex in a calendar year exceeds a specified threshold, the Fund, pursuant to the securities lending agreement, will retain for the remainder of that calendar year securities lending income in an amount equal to 75% of securities lending income, and this amount retained can never be less than 65% of the total of securities lending income plus the collateral investment expenses.
The share of securities lending income earned by the Fund is shown as securities lending income — affiliated — net in the Statement of Operations. For the year ended December 31, 2017, the Fund paid BIM $45,936 for securities lending agent services.
Interfund Lending: In accordance with an exemptive order (the “Order”) from the SEC, the Fund may participate in a joint lending and borrowing facility for temporary purposes (the “Interfund Lending Program”), subject to compliance with the terms and conditions of the Order, and to the extent permitted by the Fund’s investment policies and restrictions. The Fund is currently permitted to borrow under the Interfund Lending Program.
A lending BlackRock fund may lend in aggregate up to 15% of its net assets, but may not lend more than 5% of its net assets to any one borrowing fund through the Interfund Lending Program. A borrowing BlackRock fund may not borrow through the Interfund Lending Program or from any other source more than 33 1/3% of its total assets (or any lower threshold provided for by the fund’s investment restrictions). If a borrowing BlackRock fund’s total outstanding borrowings exceed 10% of its total assets, each of its outstanding interfund loans will be subject to collateralization of at least 102% of the outstanding principal value of the loan. All interfund loans are for temporary or emergency purposes and the interest rate to be charged will be the average of the highest current overnight repurchase agreement rate available to a lending fund and the bank loan rate, as calculated according to a formula established by the Board.
During the year ended December 31, 2017, the Fund did not participate in the Interfund Lending Program.
Officers and Directors: Certain directors and/or officers of the Company are directors and/or officers of BlackRock or its affiliates. The Fund reimburses the Manager for a portion of the compensation paid to the Company’s Chief Compliance Officer, which is included in Directors and Officer in the Statement of Operations.
Other Transactions: The Fund may purchase securities from, or sell securities to, an affiliated fund provided the affiliation is due solely to having a common investment adviser, common officers, or common directors. For the year ended December 31, 2017, the purchase transactions with affiliated funds in compliance with Rule 17a-7 under the 1940 Act were $65,341,107.
For the year ended December 31, 2017, purchases and sales of investments, excluding short-term securities, were $458,831,594 and $476,092,877, respectively.
| | |
| 20 | | 2017 BLACKROCK ANNUAL REPORTTO SHAREHOLDERS |
Notes to Financial Statements (continued)
It is the Fund’s policy to comply with the requirements of the Internal Revenue Code of 1986, as amended, applicable to regulated investment companies, and to distribute substantially all of its taxable income to its shareholders. Therefore, no U.S. federal income tax provision is required.
The Fund files U.S. federal and various state and local tax returns. No income tax returns are currently under examination. The statute of limitations on the Fund’s U.S. federal tax returns generally remains open for each of the four years ended December 31, 2017. The statutes of limitations on the Fund’s state and local tax returns may remain open for an additional year depending upon the jurisdiction.
Management has analyzed tax laws and regulations and their application to the Fund as of December 31, 2017, inclusive of the open tax return years, and does not believe there are any uncertain tax positions that require recognition of a tax liability in the Fund’s financial statements.
U.S. GAAP requires that certain components of net assets be adjusted to reflect permanent differences between financial and tax reporting. These reclassifications have no effect on net assets or net asset values per share. As of period end, the following permanent differences attributable to foreign currency transactions was reclassified to the following accounts:
| | | | |
Undistributed net investment income | | $ | (17 | ) |
Undistributed net realized gain | | $ | 17 | |
The tax character of distributions paid was as follows:
| | | | | | | | |
| | | 12/31/17 | | | 12/31/16 | |
Ordinary income | | $ | 20,827,050 | | | $ | 640,007 | |
Long term capital gains | | | 33,606,972 | | | | 6,715,350 | |
Tax Return of Capital | | | — | | | | — | |
| | | | | | | | |
| | $ | 54,434,022 | | | $ | 7,355,357 | |
| | | | | | | | |
As of period end, the tax components of accumulated net earnings (losses) were as follows:
| | | | |
Undistributed ordinary income | | $ | 2,349,618 | |
Undistributed long-term capital gains | | | 166,043 | |
Net unrealized gains(a) | | | 21,253,989 | |
| | | | |
| | $ | 23,769,650 | |
| | | | |
| | (a) | The difference between book-basis and tax-basis net unrealized gains was attributable primarily to the tax deferral of losses on wash sales, the realization for tax purposes of unrealized gains/losses on certain futures contracts and the timing and recognition of partnership income. | |
As of December 31, 2017, gross unrealized appreciation and depreciation for investments and derivatives based on cost for U.S. federal income tax purposes were as follows:
| | | | |
Tax cost | | $ | 256,410,757 | |
| | | | |
Gross unrealized appreciation | | $ | 24,514,211 | |
Gross unrealized depreciation | | | (3,260,213 | ) |
| | | | |
Net unrealized appreciation (depreciation) | | $ | 21,253,998 | |
| | | | |
The Company, on behalf of the Fund, along with certain other funds managed by the Manager and its affiliates (“Participating Funds”), is a party to a 364-day, $2.1 billion credit agreement with a group of lenders. Under this agreement, the Fund may borrow to fund shareholder redemptions. Excluding commitments designated for certain individual funds, the Participating Funds, including the Fund, can borrow up to an aggregate commitment amount of $1.6 billion at any time outstanding, subject to asset coverage and other limitations as specified in the agreement. The credit agreement has the following terms: a fee of 0.12% per annum on unused commitment amounts and interest at a rate equal to the higher of (a) one-month LIBOR (but, in any event, not less than 0.00%) on the date the loan is made plus 0.80% per annum or (b) the Fed Funds rate (but, in any event, not less than 0.00%) in effect from time to time plus 0.80% per annum on amounts borrowed. The agreement expires in April 2018 unless extended or renewed. Participating Funds paid administration, legal and arrangement fees, which, if applicable, are included in miscellaneous expenses in the Statement of Operations. These fees were allocated among such funds based upon portions of the aggregate commitment available to them and relative net assets of Participating Funds. During the year ended December 31, 2017, the Fund did not borrow under the credit agreement.
In the normal course of business, the Fund invests in securities or other instruments and may enter into certain transactions, and such activities subject the Fund to various risks, including among others, fluctuations in the market (market risk) or failure of an issuer to meet all of its obligations. The value of securities or other instruments may also be affected by various factors, including, without limitation: (i) the general economy; (ii) the overall market as well as local, regional or global political and/or social instability; (iii) regulation, taxation or international tax treaties between various countries; or (iv) currency, interest rate and price fluctuations. The Fund’s prospectus provides details of the risks to which the Fund is subject.
| | | | |
| NOTESTO FINANCIAL STATEMENTS | | | 21 | |
Notes to Financial Statements (continued)
The Fund may be exposed to additional risks when reinvesting cash collateral in money market funds that do not seek to maintain a stable NAV per share of $1.00 and which may be subject to redemption gates or liquidity fees under certain circumstances.
Valuation Risk: The market values of equities, such as common stocks and preferred securities or equity related investments, such as futures and options, may decline due to general market conditions which are not specifically related to a particular company. They may also decline due to factors which affect a particular industry or industries. The Fund may invest in illiquid investments and may experience difficulty in selling those investments in a timely manner at the price that it believes the investments are worth. Prices may fluctuate widely over short or extended periods in response to company, market or economic news. Markets also tend to move in cycles, with periods of rising and falling prices. This volatility may cause the Fund’s NAV to experience significant increases or decreases over short periods of time. If there is a general decline in the securities and other markets, the NAV of the Fund may lose value, regardless of the individual results of the securities and other instruments in which the Fund invests.
Counterparty Credit Risk: The Fund may be exposed to counterparty credit risk, or the risk that an entity may fail to or be unable to perform on its commitments related to unsettled or open transactions. The Fund manages counterparty credit risk by entering into transactions only with counterparties that the Manager believes have the financial resources to honor their obligations and by monitoring the financial stability of those counterparties. Financial assets, which potentially expose the Fund to market, issuer and counterparty credit risks, consist principally of financial instruments and receivables due from counterparties. The extent of the Fund’s exposure to market, issuer and counterparty credit risks with respect to these financial assets is approximately their value recorded in the Statement of Assets and Liabilities, less any collateral held by the Fund.
| 11. | CAPITAL SHARE TRANSACTIONS |
Transactions in capital shares for each class were as follows:
| | | | | | | | | | | | | | | | |
| | | Year Ended
12/31/2017 | | | Year Ended
12/31/2016 | |
| | | Shares | | | Amount | | | Shares | | | Amount | |
Class I | | | | | | | | | | | | | | | | |
Shares sold | | | 289,177 | | | $ | 8,303,261 | | | | 327,636 | | | $ | 7,975,556 | |
Shares issued in reinvestment of distributions | | | 2,015,232 | | | | 52,422,649 | | | | 251,991 | | | | 7,055,742 | |
Shares redeemed | | | (1,058,658 | ) | | | (30,166,900 | ) | | | (1,102,731 | ) | | | (26,953,529 | ) |
| | | | | | | | | | | | | | | | |
Net increase (decrease) | | | 1,245,751 | | | $ | 30,559,010 | | | | (523,104 | ) | | $ | (11,922,231 | ) |
| | | | | | | | | | | | | | | | |
| | | | |
Class II | | | | | | | | | | | | | �� | | | |
Shares sold | | | 836 | | | $ | 22,989 | | | | 1,234 | | | $ | 31,358 | |
Shares issued in reinvestment of distributions | | | 24,627 | | | | 639,247 | | | | 3,196 | | | | 89,337 | |
Shares redeemed | | | (23,204 | ) | | | (646,382 | ) | | | (18,686 | ) | | | (468,111 | ) |
| | | | | | | | | | | | | | | | |
Net increase (decrease) | | | 2,259 | | | $ | 15,854 | | | | (14,256 | ) | | $ | (347,416 | ) |
| | | | | | | | | | | | | | | | |
| | | | |
Class III | | | | | | | | | | | | | | | | |
Shares sold | | | 20,673 | | | $ | 458,121 | | | | 16,572 | | | $ | 323,624 | |
Shares issued in reinvestment of distributions | | | 71,553 | | | | 1,372,125 | | | | 9,584 | | | | 210,277 | |
Shares redeemed | | | (90,639 | ) | | | (2,013,282 | ) | | | (78,719 | ) | | | (1,580,015 | ) |
| | | | | | | | | | | | | | | | |
Net increase (decrease) | | | 1,587 | | | $ | (183,036 | ) | | | (52,563 | ) | | $ | (1,046,114 | ) |
| | | | | | | | | | | | | | | | |
Total Net Increase (Decrease) | | | 1,249,597 | | | $ | 30,391,828 | | | | (589,923 | ) | | $ | (13,315,761 | ) |
| | | | | | | | | | | | | | | | |
Management has evaluated the impact of all subsequent events on the Fund through the date the financial statements were issued and has determined that there were no subsequent events requiring adjustment or additional disclosure in the financial statements.
| | |
| 22 | | 2017 BLACKROCK ANNUAL REPORTTO SHAREHOLDERS |
Report of the Independent Registered Public Accounting Firm
To the Shareholders of BlackRock Advantage U.S. Total Market V.I. Fund and the Board of Directors of BlackRock Variable Series Funds, Inc.:
Opinion on the Financial Statements and Financial Highlights
We have audited the accompanying statement of assets and liabilities, including the schedule of investments, of BlackRock Advantage U.S. Total Market V.I. Fund (formerly, BlackRock Value Opportunities V.I. Fund) of BlackRock Variable Series Funds, Inc. (the “Fund”), as of December 31, 2017, the related statement of operations for the year then ended, the statements of changes in net assets for each of the two years in the period then ended, the financial highlights for each of the five years in the period then ended, and the related notes. In our opinion, the financial statements and financial highlights present fairly, in all material respects, the financial position of the Fund as of December 31, 2017, and the results of its operations for the year then ended, the changes in its net assets for each of the two years in the period then ended, and the financial highlights for each of the five years in the period then ended, in conformity with accounting principles generally accepted in the United States of America.
Basis for Opinion
These financial statements and financial highlights are the responsibility of the Fund’s management. Our responsibility is to express an opinion on the Fund’s financial statements and financial highlights based on our audits. We are a public accounting firm registered with the Public Company Accounting Oversight Board (United States) (PCAOB) and are required to be independent with respect to the Fund in accordance with the U.S. federal securities laws and the applicable rules and regulations of the Securities and Exchange Commission and the PCAOB.
We conducted our audits in accordance with the standards of the PCAOB. Those standards require that we plan and perform the audit to obtain reasonable assurance about whether the financial statements and financial highlights are free of material misstatement, whether due to error or fraud. The Fund is not required to have, nor were we engaged to perform, an audit of its internal control over financial reporting. As part of our audits we are required to obtain an understanding of internal control over financial reporting but not for the purpose of expressing an opinion on the effectiveness of the Fund’s internal control over financial reporting. Accordingly, we express no such opinion.
Our audits included performing procedures to assess the risks of material misstatement of the financial statements and financial highlights, whether due to error or fraud, and performing procedures that respond to those risks. Such procedures included examining, on a test basis, evidence regarding the amounts and disclosures in the financial statements and financial highlights. Our audits also included evaluating the accounting principles used and significant estimates made by management, as well as evaluating the overall presentation of the financial statements and financial highlights. Our procedures included confirmation of securities owned as of December 31, 2017, by correspondence with the custodian and brokers; when replies were not received from brokers, we performed other auditing procedures. We believe that our audits provide a reasonable basis for our opinion.
Deloitte & Touche LLP
Boston, Massachusetts
February 19, 2018
We have served as the auditor of one or more BlackRock investment companies since 1992.
| | | | |
| REPORTOFTHE INDEPENDENT REGISTERED PUBLIC ACCOUNTING FIRM | | | 23 | |
DECEMBER 31, 2017
| | |
ANNUAL REPORT | |  |
BlackRock Variable Series Funds, Inc.
| Ø | | BlackRock Basic Value V.I. Fund |
|
| Not FDIC Insured • May Lose Value • No Bank Guarantee |
| | |
| Fund Summary as of December 31, 2017 | | BlackRock Basic Value V.I. Fund |
Investment Objective
BlackRock Basic Value V.I. Fund’s (the “Fund”) investment objective is to seek capital appreciation and, secondarily, income.
Portfolio Management Commentary
How did the Fund perform?
For the 12-month period ended December 31, 2017, the Fund underperformed its benchmark, the Russell 1000® Value Index.
What factors influenced performance?
Stock selection in the consumer staples sector was the largest detractor from performance relative to the benchmark over the 12-month period, particularly the Fund’s overweight position in grocery store retailer Kroger Co., which reacted excessively negatively to Amazon.com’s entry into the grocery industry.
Stock selection in energy also weighed on relative performance, as the Fund’s valuation-based preference for smaller oil producers over major integrated oil companies underperformed due to falling oil prices early in the year. Among individual stock detractors in energy were Apache Corp., Devon Energy Corp., and Gulfport Energy Corp.
Finally, the Fund’s holding in payment services operator Discover Financial Services drove underperformance among financials after the company reported higher loss provisions than expected, prompting the Fund to shift exposure from credit card companies to banks within the sector.
On the positive side, stock selection in the health care sector was the leading contributor to relative performance during the period. The Fund’s overweight allocation to health care also contributed positively, particularly due to an overweight position in hospital products specialist Baxter International Inc.
An underweight allocation to the real estate sector on the basis of stretched valuations and tepid growth prospects also added value during the period. Within the telecommunication services (“telecom”) sector, the Fund’s decision not to own AT&T Inc. also contributed to performance, as the telecom giant’s earnings results revealed increasingly competitive conditions in the industry domestically.
Describe recent portfolio activity.
During the period, a combination of market movement and trading activity increased the Fund’s allocation to the health care and consumer staples sectors, while reducing the Fund’s weights in energy and financials.
Describe portfolio positioning at period end.
Relative to the Russell 1000® Value Index, the Fund ended the period with overweight exposures to the health care, information technology, telecom, and financials sectors. The Fund maintained underweight exposures to real estate, industrials, consumer discretionary, and consumer staples.
The views expressed reflect the opinions of BlackRock as of the date of this report and are subject to change based on changes in market, economic or other conditions. These views are not intended to be a forecast of future events and are no guarantee of future results.
Portfolio Information
SECTOR ALLOCATION
| | | | |
| Sector | | Percent of Net Assets | |
Financials | | | 27 | % |
Health Care | | | 18 | |
Information Technology | | | 12 | |
Energy | | | 11 | |
Consumer Staples | | | 8 | |
Utilities | | | 7 | |
Industrials | | | 5 | |
Telecommunication Services | | | 4 | |
Consumer Discretionary | | | 4 | |
Materials | | | 3 | |
Real Estate | | | — | (a) |
Short-Term Securities | | | 7 | |
Liabilities in Excess of Other Assets | | | (6 | ) |
| | (a) | Representing less than 0.5% of the Fund’s net assets. | |
| | For | Fund compliance purposes, the Fund’s sector classifications refer to one or more of the sector sub-classifications used by one or more widely recognized market indexes or ratings group indexes, and/or as defined by the investment adviser. These definitions may not apply for purposes of this report, which may combine sector sub classifications for reporting ease. | |
| | |
| 2 | | 2017 BLACKROCK ANNUAL REPORTTO SHAREHOLDERS |
| | |
| Fund Summary as of December 31, 2017 (continued) | | BlackRock Basic Value V.I. Fund |
TOTAL RETURN BASED ON A $10,000 INVESTMENT
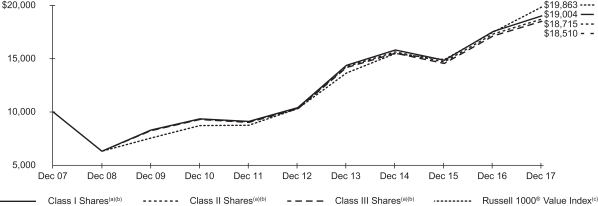
| (a) | Assuming transaction costs, if any, and other operating expenses, including investment advisory fees. Does not include insurance-related fees and expenses. |
| (b) | The Fund invests primarily in equity securities that Fund management believes are undervalued, which means that their prices are less than Fund management believes they are worth. |
| (c) | An unmanaged index that is a subset of the Russell 1000® Index that consists of those Russell 1000® securities with lower price-to-book ratios and lower expected growth values. |
Performance Summary for the Period Ended December 31, 2017
| | | | | | | | | | | | | | | | | | | | | | | | | | | | |
| | | 6-Month
Total Returns (b) | | | | | | Average Annual Total Returns | |
| | | | | | | 1 Year (b) | | | | | | 5.Years (b) | | | | | | 10 Years (b) | |
Class I(a) | | | 9.10 | % | | | | | | | 8.24 | % | | | | | | | 12.80 | % | | | | | | | 6.63 | % |
Class II(a) | | | 9.08 | | | | | | | | 8.15 | | | | | | | | 12.62 | | | | | | | | 6.47 | |
Class III(a) | | | 9.03 | | | | | | | | 8.01 | | | | | | | | 12.48 | | | | | | | | 6.35 | |
Russell 1000® Value Index | | | 8.61 | | | | | | | | 13.66 | | | | | | | | 14.04 | | | | | | | | 7.10 | |
| | (a) | Average annual and cumulative total returns are based on changes in net asset value for the periods shown, and assume reinvestment of all distributions at net asset value on the ex-dividend date. Insurance-related fees and expenses are not reflected in these returns. | |
| | (b) | For a portion of the period, the Fund’s investment adviser waived a portion of its fee. Without such waiver, the Fund’s performance would have been lower. | |
Past performance is not indicative of future results. Performance results do not reflect the deduction of taxes that a shareholder would pay on Fund distributions or the redemption of Fund shares.
Performance results may include adjustments made for financial reporting purposes in accordance with U.S. generally accepted accounting principles.
Expense Example
| | | | | | | | | | | | | | | | | | | | | | | | | | | | | | | | |
| | | Actual | | | | | | Hypothetical (a) | | | | |
| | | Beginning Account Value (07/01/17) | | | Ending Account Value (12/31/17) | | | Expenses Paid During the Period (b) | | | | | | Beginning Account Value (07/01/17) | | | Ending Account Value (12/31/17) | | | Expenses Paid During the Period (b) | | | Annualized Expense Ratio | |
Class I | | $ | 1,000.00 | | | $ | 1,091.00 | | | $ | 3.85 | | | | | | | $ | 1,000.00 | | | $ | 1,021.53 | | | $ | 3.72 | | | | 0.73 | % |
Class II | | | 1,000.00 | | | | 1,090.80 | | | | 4.74 | | | | | | | | 1,000.00 | | | | 1,020.67 | | | | 4.58 | | | | 0.90 | |
Class III | | | 1,000.00 | | | | 1,090.30 | | | | 5.32 | | | | | | | | 1,000.00 | | | | 1,020.11 | | | | 5.14 | | | | 1.01 | |
| | (a) | Hypothetical 5% annual return before expenses is calculated by prorating the number of days in the most recent fiscal half year divided by 365. | |
| | (b) | For each class of the Fund, expenses are equal to the annualized expense ratio for the class, multiplied by the average account value over the period, multiplied by 184/365 (to reflect the one-half year period shown). | |
See “Disclosure of Expenses” on the following page for further information on how expenses were calculated.
| | |
| Disclosure of Expenses | | BlackRock Basic Value V.I. Fund |
Shareholders of the Fund may incur the following charges: (a) transactional expenses, such as sales charges; and (b) operating expenses, including investment advisory fees, service and distribution fees, including 12b-1 fees, acquired fund fees and expenses, and other fund expenses. The expense example on the previous page (which is based on a hypothetical investment of $1,000 invested on July 1, 2017 and held through December 31, 2017) is intended to assist shareholders both in calculating expenses based on an investment in the Fund and in comparing these expenses with similar costs of investing in other mutual funds.
The expense example provides information about actual account values and actual expenses. In order to estimate the expenses a shareholder paid during the period covered by this report, shareholders can divide their account value by $1,000 and then multiply the result by the number corresponding to their share class under the heading entitled “Expenses Paid During the Period.”
The expense example also provides information about hypothetical account values and hypothetical expenses based on the Fund’s actual expense ratio and an assumed rate of return of 5% per year before expenses. In order to assist shareholders in comparing the ongoing expenses of investing in the Fund and other funds, compare the 5% hypothetical examples with the 5% hypothetical examples that appear in shareholder reports of other funds.
The expenses shown in the expense example are intended to highlight shareholders’ ongoing costs only and do not reflect any transactional expenses, such as sales charges, if any. Therefore, the hypothetical example is useful in comparing ongoing expenses only, and will not help shareholders determine the relative total expenses of owning different funds. If these transactional expenses were included, shareholder expenses would have been higher.
| | |
| 4 | | 2017 BLACKROCK ANNUAL REPORTTO SHAREHOLDERS |
| | |
Schedule of Investments December 31, 2017 | | BlackRock Basic Value V.I. Fund (Percentages shown are based on Net Assets) |
| | | | | | | | |
| Security | | Shares | | | Value | |
Common Stocks — 99.4% | |
|
| Airlines — 0.3% | |
Delta Air Lines, Inc. | | | 21,974 | | | $ | 1,230,544 | |
| | | | | | | | |
| Auto Components — 1.1% | |
Lear Corp. | | | 29,966 | | | | 5,293,794 | |
| | | | | | | | |
| Banks — 15.2% | |
Bank of America Corp. | | | 320,895 | | | | 9,472,820 | |
Citigroup, Inc. | | | 233,150 | | | | 17,348,692 | |
JPMorgan Chase & Co. | | | 245,637 | | | | 26,268,421 | |
Regions Financial Corp. | | | 360,188 | | | | 6,224,049 | |
Wells Fargo & Co. | | | 226,720 | | | | 13,755,102 | |
| | | | | | | | |
| | | | | | | 73,069,084 | |
| Biotechnology — 2.2% | |
Gilead Sciences, Inc. | | | 150,661 | | | | 10,793,354 | |
| | | | | | | | |
| Capital Markets — 4.2% | |
E*TRADE Financial Corp.(a) | | | 66,997 | | | | 3,321,041 | |
Morgan Stanley | | | 183,748 | | | | 9,641,258 | |
Nasdaq, Inc. | | | 93,541 | | | | 7,186,755 | |
| | | | | | | | |
| | | | | | | 20,149,054 | |
| Chemicals — 0.7% | |
Akzo Nobel NV, ADR | | | 112,178 | | | | 3,268,867 | |
| | | | | | | | |
| Communications Equipment — 5.0% | | | | | | |
Cisco Systems, Inc. | | | 623,961 | | | | 23,897,706 | |
| | | | | | | | |
| Consumer Finance — 3.1% | |
Capital One Financial Corp. | | | 71,698 | | | | 7,139,687 | |
Discover Financial Services | | | 54,020 | | | | 4,155,218 | |
SLM Corp.(a) | | | 327,196 | | | | 3,697,315 | |
| | | | | | | | |
| | | | | | | 14,992,220 | |
| Containers & Packaging — 0.8% | |
Avery Dennison Corp. | | | 13,402 | | | | 1,539,354 | |
Owens-Illinois, Inc.(a) | | | 94,274 | | | | 2,090,054 | |
| | | | | | | | |
| | | | | | | 3,629,408 | |
| Diversified Telecommunication Services — 2.5% | |
Verizon Communications, Inc. | | | 226,248 | | | | 11,975,307 | |
| | | | | | | | |
| Electric Utilities — 4.3% | |
Edison International | | | 10,690 | | | | 676,036 | |
Exelon Corp. | | | 238,217 | | | | 9,388,132 | |
FirstEnergy Corp.(b) | | | 195,865 | | | | 5,997,386 | |
PG&E Corp. | | | 98,936 | | | | 4,435,301 | |
| | | | | | | | |
| | | | | | | 20,496,855 | |
| Electrical Equipment — 1.4% | |
ABB Ltd., ADR(b) | | | 244,713 | | | | 6,563,203 | |
| | | | | | | | |
| Equity Real Estate Investment Trusts (REITs) — 0.2% | |
Brixmor Property Group, Inc. | | | 55,630 | | | | 1,038,056 | |
| | | | | | | | |
| Food & Staples Retailing — 2.2% | |
Kroger Co. (The)(b) | | | 134,242 | | | | 3,684,943 | |
Walgreens Boots Alliance, Inc. | | | 93,533 | | | | 6,792,366 | |
| | | | | | | | |
| | | | | | | 10,477,309 | |
| Food Products — 4.8% | |
General Mills, Inc.(b) | | | 167,747 | | | | 9,945,719 | |
JM Smucker Co. (The)(b) | | | 38,241 | | | | 4,751,062 | |
Kellogg Co.(b) | | | 82,694 | | | | 5,621,538 | |
Tyson Foods, Inc., Class A | | | 36,812 | | | | 2,984,349 | |
| | | | | | | | |
| | | | | | | 23,302,668 | |
| Health Care Equipment & Supplies — 8.5% | |
Baxter International, Inc. | | | 209,102 | | | | 13,516,353 | |
Koninklijke Philips NV, NYRS | | | 139,112 | | | | 5,258,434 | |
| | | | | | | | |
| Security | | Shares | | | Value | |
| Health Care Equipment & Supplies (continued) | |
Medtronic plc | | | 66,326 | | | $ | 5,355,824 | |
Zimmer Biomet Holdings, Inc. | | | 137,294 | | | | 16,567,267 | |
| | | | | | | | |
| | | | | | | 40,697,878 | |
| Health Care Providers & Services — 0.3% | |
DaVita, Inc.(a) | | | 20,050 | | | | 1,448,613 | |
| | | | | | | | |
| Independent Power and Renewable Electricity Producers — 2.3% | |
AES Corp. | | | 1,037,272 | | | | 11,233,656 | |
| | | | | | | | |
| Industrial Conglomerates — 1.7% | |
General Electric Co. | | | 365,799 | | | | 6,383,192 | |
Honeywell International, Inc. | | | 11,469 | | | | 1,758,886 | |
| | | | | | | | |
| | | | | | | 8,142,078 | |
| Insurance — 4.9% | |
American International Group, Inc. | | | 88,539 | | | | 5,275,154 | |
Hartford Financial Services Group, Inc. (The) | | | 127,055 | | | | 7,150,655 | |
Lincoln National Corp. | | | 62,643 | | | | 4,815,367 | |
Prudential Financial, Inc. | | | 28,465 | | | | 3,272,906 | |
XL Group Ltd. | | | 88,153 | | | | 3,099,460 | |
| | | | | | | | |
| | | | | | | 23,613,542 | |
| Internet Software & Services — 0.8% | |
eBay, Inc.(a) | | | 104,425 | | | | 3,941,000 | |
| | | | | | | | |
| Media — 2.8% | |
Comcast Corp., Class A | | | 192,419 | | | | 7,706,381 | |
Interpublic Group of Cos., Inc. (The)(b) | | | 298,134 | | | | 6,010,381 | |
| | | | | | | | |
| | | | | | | 13,716,762 | |
| Metals & Mining — 1.3% | |
Nucor Corp.(b) | | | 57,546 | | | | 3,658,775 | |
Reliance Steel & Aluminum Co. | | | 31,636 | | | | 2,714,052 | |
| | | | | | | | |
| | | | | | | 6,372,827 | |
| Oil, Gas & Consumable Fuels — 11.2% | |
ConocoPhillips | | | 238,080 | | | | 13,068,211 | |
Devon Energy Corp. | | | 271,487 | | | | 11,239,562 | |
Marathon Oil Corp. | | | 226,647 | | | | 3,837,134 | |
Marathon Petroleum Corp. | | | 65,333 | | | | 4,310,671 | |
Royal Dutch Shell plc, ADR, Class A(b) | | | 167,992 | | | | 11,206,746 | |
Suncor Energy, Inc. | | | 157,393 | | | | 5,779,471 | |
Valero Energy Corp. | | | 46,247 | | | | 4,250,562 | |
| | | | | | | | |
| | | | | | | 53,692,357 | |
| Personal Products — 0.2% | |
Unilever NV, NYRS | | | 21,576 | | | | 1,215,160 | |
| | | | | | | | |
| Pharmaceuticals — 7.3% | |
Novartis AG, ADR(b) | | | 131,450 | | | | 11,036,542 | |
Pfizer, Inc. | | | 669,876 | | | | 24,262,909 | |
| | | | | | | | |
| | | | | | | 35,299,451 | |
| Professional Services — 0.9% | |
Nielsen Holdings plc(b) | | | 125,573 | | | | 4,570,857 | |
| | | | | | | | |
| Road & Rail — 0.9% | |
Norfolk Southern Corp. | | | 30,319 | | | | 4,393,223 | |
| | | | | | | | |
| Semiconductors & Semiconductor Equipment — 3.3% | |
NXP Semiconductors NV(a) | | | 15,247 | | | | 1,785,271 | |
QUALCOMM, Inc. | | | 218,040 | | | | 13,958,921 | |
| | | | | | | | |
| | | | | | | 15,744,192 | |
| Software — 1.2% | |
Oracle Corp. | | | 122,630 | | | | 5,797,946 | |
| | | | | | | | |
| Technology Hardware, Storage & Peripherals — 1.5% | |
Apple, Inc. | | | 41,994 | | | | 7,106,645 | |
| | | | | | | | |
| Tobacco — 0.5% | |
Philip Morris International, Inc. | | | 20,992 | | | | 2,217,805 | |
| | | | | | | | |
| | | | |
| SCHEDULE OF INVESTMENTS | | | 5 | |
| | |
Schedule of Investments (continued) December 31, 2017 | | BlackRock Basic Value V.I. Fund (Percentages shown are based on Net Assets) |
| | | | | | | | |
| Security | | Shares | | | Value | |
| Wireless Telecommunication Services — 1.8% | |
Telephone & Data Systems, Inc. | | | 286,623 | | | $ | 7,968,119 | |
United States Cellular Corp.(a) | | | 21,130 | | | | 795,122 | |
| | | | | | | | |
| | | | | | | 8,763,241 | |
Total Common Stocks — 99.4%
(Cost: $392,228,206) | | | | 478,144,662 | |
| | | | | | | | |
Total Long-Term Investments — 99.4%
(Cost: $392,228,206) | | | | 478,144,662 | |
| | | | | | | | |
|
Short-Term Securities — 6.7%(c)(e) | |
BlackRock Liquidity Funds, T-Fund, Institutional Class,
1.17% | | | 3,156,745 | | | | 3,156,745 | |
SL Liquidity Series, LLC, Money Market Series,
1.48%(d) | | | 28,837,798 | | | | 28,834,914 | |
| | | | | | | | |
Total Short-Term Securities — 6.7%
(Cost: $31,992,266) | | | | 31,991,659 | |
| | | | | | | | |
| |
Total Investments — 106.1%
(Cost: $424,220,472) | | | | 510,136,321 | |
Liabilities in Excess of Other Assets — (6.1)% | | | | (29,132,070 | ) |
| | | | | | | | |
Net Assets — 100.0% | | | $ | 481,004,251 | |
| | | | | | | | |
| (a) | Non-income producing security. |
| (b) | Security, or a portion of the security, is on loan. |
| (c) | Annualized 7-day yield as of period end. |
| (d) | Security was purchased with the cash collateral from loaned securities. |
| (e) | During the year ended December 31, 2017, investments in issuers considered to be affiliates of the Fund for the purposes of Section 2(a)(3) of the Investment Company Act of 1940, as amended, were as follows: |
| | | | | | | | | | | | | | | | | | | | | | | | | | | | |
| Affiliate | | Shares Held at
12/31/16 | | | Net Activity | | | Shares Held at 12/31/17 | | | Value at
12/31/17 | | | Income | | | Net Realized
Gain (Loss) (a) | | | Change in
Unrealized
Appreciation
(Depreciation) | |
BlackRock Liquidity Funds, T-Fund, Institutional Class | | | 9,004,744 | | | | (5,847,999 | ) | | | 3,156,745 | | | $ | 3,156,745 | | | $ | 69,311 | | | $ | 9 | | | $ | — | |
SL Liquidity Series, LLC, Money Market Series | | | 15,486,989 | | | | 13,350,809 | | | | 28,837,798 | | | | 28,834,914 | | | | 66,168 | (b) | | | (6,511 | ) | | | 332 | |
| | | | | | | | | | | | | | | | | | | | | | | | | | | | |
| | | | | | | | | | | | | | $ | 31,991,659 | | | $ | 135,479 | | | $ | (6,502 | ) | | $ | 332 | |
| | | | | | | | | | | | | | | | | | | | | | | | | | | | |
| | (a) | Includes net capital gain distributions, if applicable. | |
| | (b) | Represents securities lending income earned from the reinvestment of cash collateral from loaned securities, net of fees and collateral investment expenses, and other payments to and from borrowers of securities. | |
For Fund compliance purposes, the Fund’s industry classifications refer to one or more of the industry sub-classifications used by one or more widely recognized market indexes or ratings group indexes, and/or as defined by the investment advisor. These definitions may not apply for purposes of this report, which may combine such industry sub-classifications for reporting ease.
Portfolio Abbreviations
ADR — American Depositary Receipts
NYRS — New York Registered Shares
Fair Value Hierarchy as of Period End
Various inputs are used in determining the fair value of investments. For information about the Fund’s policy regarding valuation of investments, refer to the Notes to Financial Statements.
The following table summarizes the Fund’s investments categorized in the disclosure hierarchy:
| | | | | | | | | | | | | | | | |
| | | Level 1 | | | Level 2 | | | Level 3 | | | Total | |
Investments: | | | | | | | | | | | | | | | | |
Assets: | | | | | | | | | | | | | | | | |
Long-Term Investments | | | | | | | | | | | | | | | | |
Common Stocks(a) | | $ | 478,144,662 | | | $ | — | | | $ | — | | | $ | 478,144,662 | |
Short-Term Securities | | | 3,156,745 | | | | — | | | | — | | | | 3,156,745 | |
| | | | | | | | | | | | | | | | |
Subtotal | | $ | 481,301,407 | | | $ | — | | | $ | — | | | $ | 481,301,407 | |
| | | | | | | | | | | | | | | | |
Investments valued at NAV(b) | | | | | | | | | | | | | | | 28,834,914 | |
| | | | | | | | | | | | | | | | |
Total Investments | | | | | | | | | | | | | | $ | 510,136,321 | |
| | | | | | | | | | | | | | | | |
| | (a) | See above Schedule of Investments for values in each Industry. | |
| | (b) | As of December 31, 2017, certain investments of the Fund were fair valued using NAV per share as no quoted market value is available and therefore have been excluded from the fair value hierarchy. | |
During the year ended December 31, 2017, there were no transfers between levels.
See notes to financial statements.
| | |
| 6 | | 2017 BLACKROCK ANNUAL REPORTTO SHAREHOLDERS |
Statement of Assets and Liabilities
December 31, 2017
| | | | |
| | | BlackRock Basic
Value V.I. Fund | |
| |
ASSETS | | | | |
Investments at value — unaffiliated (including securities loaned at value of $28,186,018) (cost — $392,228,206) | | $ | 478,144,662 | |
Investments at value — affiliated (cost — $31,992,266) | | | 31,991,659 | |
Cash | | | 132,076 | |
Receivables: | | | | |
Securities lending income — affiliated | | | 3,613 | |
Capital shares sold | | | 5,483 | |
Dividends — affiliated | | | 3,853 | |
Dividends — unaffiliated | | | 304,622 | |
Prepaid expenses | | | 2,130 | |
| | | | |
Total assets | | | 510,588,098 | |
| | | | |
| |
LIABILITIES | | | | |
Cash collateral on securities loaned at value | | | 28,837,484 | |
Payables: | | | | |
Capital shares redeemed | | | 254,993 | |
Investment advisory fees | | | 286,812 | |
Officer’s and Directors’ fees | | | 4,805 | |
Other accrued expenses | | | 84,113 | |
Other affiliates | | | 1,515 | |
Professional fees | | | 41,436 | |
Distribution fees | | | 17,247 | |
Transfer agent fees | | | 55,442 | |
| | | | |
Total liabilities | | | 29,583,847 | |
| | | | |
| |
NET ASSETS | | $ | 481,004,251 | |
| | | | |
| |
NET ASSETS CONSIST OF | | | | |
Paid-in capital | | $ | 392,597,592 | |
Undistributed net investment income | | | 98,753 | |
Accumulated net realized gain | | | 2,392,057 | |
Net unrealized appreciation (depreciation) | | | 85,915,849 | |
| | | | |
NET ASSETS | | $ | 481,004,251 | |
| | | | |
|
NET ASSET VALUE | |
Class I — Based on net assets of $397,179,745 and 25,454,793 shares outstanding, 300 million shares authorized, $0.10 par value | | $ | 15.60 | |
| | | | |
Class II — Based on net assets of $4,928,343 and 316,812 shares outstanding, 100 million shares authorized, $0.10 par value | | $ | 15.56 | |
| | | | |
Class III — Based on net assets of $78,896,163 and 5,096,392 shares outstanding, 100 million shares authorized, $0.10 par value | | $ | 15.48 | |
| | | | |
See notes to financial statements.
Statement of Operations
Year Ended December 31, 2017
| | | | |
| | | BlackRock Basic
Value V.I. Fund | |
| |
INVESTMENT INCOME | | | | |
Dividends — affiliated | | $ | 69,311 | |
Dividends — unaffiliated | | | 10,689,334 | |
Securities lending income — affiliated — net | | | 66,168 | |
Foreign taxes withheld | | | (47,523 | ) |
| | | | |
Total investment income | | | 10,777,290 | |
| | | | |
| |
EXPENSES | | | | |
Investment advisory | | | 2,954,622 | |
Transfer agent — class specific | | | 954,127 | |
Distribution — class specific | | | 240,466 | |
Accounting services | | | 90,196 | |
Printing | | | 84,338 | |
Professional | | | 69,211 | |
Custodian | | | 30,017 | |
Directors and Officer | | | 26,564 | |
Transfer agent | | | 5,001 | |
Miscellaneous | | | 32,752 | |
| | | | |
Total expenses | | | 4,487,294 | |
Less: | | | | |
Transfer agent fees reimbursed — class specific | | | (630,576 | ) |
Fees waived and/or reimbursed by the Manager | | | (5,233 | ) |
| | | | |
Total expenses after fees waived and/or reimbursed | | | 3,851,485 | |
| | | | |
Net investment income | | | 6,925,805 | |
| | | | |
| |
REALIZED AND UNREALIZED GAIN (LOSS) | | | | |
Net realized gain (loss) from: | | | | |
Investments — affiliated | | | (6,511 | ) |
Investments — unaffiliated | | | 20,237,023 | |
Capital gain distributions from investment companies — affiliated | | | 9 | |
| | | | |
| | | 20,230,521 | |
| | | | |
Net change in unrealized appreciation (depreciation) on: | | | | |
Investments — affiliated | | | 332 | |
Investments — unaffiliated | | | 10,057,317 | |
| | | | |
| | | 10,057,649 | |
| | | | |
Net realized and unrealized gain | | | 30,288,170 | |
| | | | |
NET INCREASE IN NET ASSETS RESULTING FROM OPERATIONS | | $ | 37,213,975 | |
| | | | |
See notes to financial statements.
| | |
| 8 | | 2017 BLACKROCK ANNUAL REPORTTO SHAREHOLDERS |
Statements of Changes in Net Assets
| | | | | | | | |
| | | BlackRock Basic Value V.I. Fund | |
| | | Year Ended December 31, | |
| | | 2017 | | | 2016 | |
| | |
INCREASE (DECREASE) IN NET ASSETS | | | | | | | | |
| | |
OPERATIONS | | | | | | | | |
Net investment income | | $ | 6,925,805 | | | $ | 7,398,267 | |
Net realized gain | | | 20,230,521 | | | | 11,127,761 | |
Net change in unrealized appreciation (depreciation) | | | 10,057,649 | | | | 62,151,962 | |
| | | | | | | | |
Net increase in net assets resulting from operations | | | 37,213,975 | | | | 80,677,990 | |
| | | | | | | | |
| | |
DISTRIBUTIONS TO SHAREHOLDERS(a) | | | | | | | | |
From net investment income: | | | | | | | | |
Class I | | | (5,893,355 | ) | | | (5,872,962 | ) |
Class II | | | (64,132 | ) | | | (67,020 | ) |
Class III | | | (909,408 | ) | | | (1,460,033 | ) |
From net realized gain: | | | | | | | | |
Class I | | | (15,171,206 | ) | | | (9,240,298 | ) |
Class II | | | (189,626 | ) | | | (121,410 | ) |
Class III | | | (3,173,178 | ) | | | (2,595,104 | ) |
| | | | | | | | |
Decrease in net assets resulting from distributions to shareholders | | | (25,400,905 | ) | | | (19,356,827 | ) |
| | | | | | | | |
| | |
CAPITAL SHARE TRANSACTIONS | | | | | | | | |
Net increase (decrease) in net assets derived from capital share transactions | | | (59,465,107 | ) | | | 23,301,671 | |
| | | | | | | | |
| | |
NET ASSETS | | | | | | | | |
Total increase (decrease) in net assets | | | (47,652,037 | ) | | | 84,622,834 | |
Beginning of year | | | 528,656,288 | | | | 444,033,454 | |
| | | | | | | | |
End of year | | $ | 481,004,251 | | | $ | 528,656,288 | |
| | | | | | | | |
Undistributed net investment income, end of year | | $ | 98,753 | | | $ | 34,308 | |
| | | | | | | | |
| (a) | Distributions for annual periods determined in accordance with U.S. federal income tax regulations |
See notes to financial statements.
Financial Highlights
(For a share outstanding throughout each period)
| | | | | | | | | | | | | | | | | | | | |
| | | BlackRock Basic Value V.I. Fund | |
| | | Class I | |
| | | Year Ended December 31, | |
| | | 2017 | | | 2016 | | | 2015 | | | 2014 | | | 2013 | |
Net asset value, beginning of year | | $ | 15.21 | | | $ | 13.36 | | | $ | 16.42 | | | $ | 17.44 | | | $ | 12.80 | |
| | | | | | | | | | | | | | | | | | | | |
Net investment income(a) | | | 0.22 | | | | 0.23 | | | | 0.24 | | | | 0.25 | | | | 0.22 | |
Net realized and unrealized gain (loss) | | | 1.03 | | | | 2.19 | | | | (1.20 | ) | | | 1.51 | | | | 4.65 | |
| | | | | | | | | | | | | | | | | | | | |
Net increase (decrease) from investment operations | | | 1.25 | | | | 2.42 | | | | (0.96 | ) | | | 1.76 | | | | 4.87 | |
| | | | | | | | | | | | | | | | | | | | |
| Distributions:(b) | | | | | | | | | | | | | | | |
From net investment income | | | (0.25 | ) | | | (0.22 | ) | | | (0.25 | ) | | | (0.27 | ) | | | (0.23 | ) |
From net realized gain | | | (0.61 | ) | | | (0.35 | ) | | | (1.85 | ) | | | (2.51 | ) | | | — | |
| | | | | | | | | | | | | | | | | | | | |
Total distributions | | | (0.86 | ) | | | (0.57 | ) | | | (2.10 | ) | | | (2.78 | ) | | | (0.23 | ) |
| | | | | | | | | | | | | | | | | | | | |
Net asset value, end of year | | $ | 15.60 | | | $ | 15.21 | | | $ | 13.36 | | | $ | 16.42 | | | $ | 17.44 | |
| | | | | | | | | | | | | | | | | | | | |
| | | | | |
Total Return:(c) | | | | | | | | | | | | | | | | | | | | |
Based on net asset value | | | 8.24 | % | | | 18.19 | % | | | (5.95 | )% | | | 9.93 | % | | | 38.07 | % |
| | | | | | | | | | | | | | | | | | | | |
| | | | | |
Ratios to Average Net Assets: | | | | | | | | | | | | | | | | | | | | |
Total expenses | | | 0.85 | %(d) | | | 0.84 | % | | | 0.86 | % | | | 0.85 | % | | | 0.84 | % |
| | | | | | | | | | | | | | | | | | | | |
Total expenses after fees waived and/or reimbursed | | | 0.73 | %(d) | | | 0.73 | % | | | 0.73 | % | | | 0.72 | % | | | 0.72 | % |
| | | | | | | | | | | | | | | | | | | | |
Net investment income | | | 1.47 | %(d) | | | 1.63 | % | | | 1.47 | % | | | 1.40 | % | | | 1.41 | % |
| | | | | | �� | | | | | | | | | | | | | | |
| | | | | |
Supplemental Data: | | | | | | | | | | | | | | | | | | | | |
Net assets, end of year (000) | | $ | 397,180 | | | $ | 409,216 | | | $ | 393,370 | | | $ | 468,876 | | | $ | 448,299 | |
| | | | | | | | | | | | | | | | | | | | |
Portfolio turnover rate | | | 41 | % | | | 45 | % | | | 50 | % | | | 39 | % | | | 47 | % |
| | | | | | | | | | | | | | | | | | | | |
| (a) | Based on average shares outstanding. |
| (b) | Distributions for annual periods determined in accordance with U.S. federal income tax regulations. |
| (c) | Where applicable, excludes insurance-related fees and expenses and assumes the reinvestment of distributions. |
| (d) | Excludes expenses incurred indirectly as a result of investments in underlying funds of 0.01%. |
See notes to financial statements.
| | |
| 10 | | 2017 BLACKROCK ANNUAL REPORTTO SHAREHOLDERS |
Financial Highlights (continued)
(For a share outstanding throughout each period)
| | | | | | | | | | | | | | | | | | | | |
| | | BlackRock Basic Value V.I. Fund | |
| | | Class II | |
| | | Year Ended December 31, | |
| | | 2017 | | | 2016 | | | 2015 | | | 2014 | | | 2013 | |
Net asset value, beginning of year | | $ | 15.16 | | | $ | 13.33 | | | $ | 16.38 | | | $ | 17.40 | | | $ | 12.77 | |
| | | | | | | | | | | | | | | | | | | | |
Net investment income(a) | | | 0.20 | | | | 0.20 | | | | 0.21 | | | | 0.22 | | | | 0.19 | |
Net realized and unrealized gain (loss) | | | 1.03 | | | | 2.18 | | | | (1.18 | ) | | | 1.51 | | | | 4.64 | |
| | | | | | | | | | | | | | | | | | | | |
Net increase (decrease) from investment operations | | | 1.23 | | | | 2.38 | | | | (0.97 | ) | | | 1.73 | | | | 4.83 | |
| | | | | | | | | | | | | | | | | | | | |
| Distributions:(b) | | | | | | | | | | | | | | | |
From net investment income | | | (0.22 | ) | | | (0.20 | ) | | | (0.23 | ) | | | (0.24 | ) | | | (0.20 | ) |
From net realized gain | | | (0.61 | ) | | | (0.35 | ) | | | (1.85 | ) | | | (2.51 | ) | | | — | |
| | | | | | | | | | | | | | | | | | | | |
Total distributions | | | (0.83 | ) | | | (0.55 | ) | | | (2.08 | ) | | | (2.75 | ) | | | (0.20 | ) |
| | | | | | | | | | | | | | | | | | | | |
Net asset value, end of year | | $ | 15.56 | | | $ | 15.16 | | | $ | 13.33 | | | $ | 16.38 | | | $ | 17.40 | |
| | | | | | | | | | | | | | | | | | | | |
| | | | | |
Total Return:(c) | | | | | | | | | | | | | | | | | | | | |
Based on net asset value | | | 8.15 | % | | | 17.88 | % | | | (6.07 | )% | | | 9.75 | % | | | 37.85 | % |
| | | | | | | | | | | | | | | | | | | | |
| | | | | |
Ratios to Average Net Assets: | | | | | | | | | | | | | | | | | | | | |
Total expenses | | | 1.02 | %(d) | | | 1.02 | % | | | 1.02 | % | | | 1.02 | % | | | 1.01 | % |
| | | | | | | | | | | | | | | | | | | | |
Total expenses after fees waived and/or reimbursed | | | 0.90 | %(d) | | | 0.90 | % | | | 0.90 | % | | | 0.89 | % | | | 0.89 | % |
| | | | | | | | | | | | | | | | | | | | |
Net investment income | | | 1.29 | %(d) | | | 1.47 | % | | | 1.30 | % | | | 1.23 | % | | | 1.24 | % |
| | | | | | | | | | | | | | | | | | | | |
| | | | | |
Supplemental Data: | | | | | | | | | | | | | | | | | | | | |
Net assets, end of year (000) | | $ | 4,928 | | | $ | 5,280 | | | $ | 5,466 | | | $ | 6,233 | | | $ | 6,715 | |
| | | | | | | | | | | | | | | | | | | | |
Portfolio turnover rate | | | 41 | % | | | 45 | % | | | 50 | % | | | 39 | % | | | 47 | % |
| | | | | | | | | | | | | | | | | | | | |
| (a) | Based on average shares outstanding. |
| (b) | Distributions for annual periods determined in accordance with U.S. federal income tax regulations. |
| (c) | Where applicable, excludes insurance-related fees and expenses and assumes the reinvestment of distributions. |
| (d) | Excludes expenses incurred indirectly as a result of investments in underlying funds of 0.01%. |
See notes to financial statements.
Financial Highlights (continued)
(For a share outstanding throughout each period)
| | | | | | | | | | | | | | | | | | | | |
| | | BlackRock Basic Value V.I. Fund | |
| | | Class III | |
| | | Year Ended December 31, | |
| | | 2017 | | | 2016 | | | 2015 | | | 2014 | | | 2013 | |
Net asset value, beginning of year | | $ | 15.08 | | | $ | 13.28 | | | $ | 16.32 | | | $ | 17.35 | | | $ | 12.74 | |
| | | | | | | | | | | | | | | | | | | | |
Net investment income(a) | | | 0.18 | | | | 0.18 | | | | 0.19 | | | | 0.20 | | | | 0.17 | |
Net realized and unrealized gain (loss) | | | 1.02 | | | | 2.17 | | | | (1.17 | ) | | | 1.50 | | | | 4.62 | |
| | | | | | | | | | | | | | | | | | | | |
Net increase (decrease) from investment operations | | | 1.20 | | | | 2.35 | | | | (0.98 | ) | | | 1.70 | | | | 4.79 | |
| | | | | | | | | | | | | | | | | | | | |
| Distributions:(b) | | | | | | | | | | | | | | | |
From net investment income | | | (0.19 | ) | | | (0.20 | ) | | | (0.21 | ) | | | (0.22 | ) | | | (0.18 | ) |
From net realized gain | | | (0.61 | ) | | | (0.35 | ) | | | (1.85 | ) | | | (2.51 | ) | | | — | |
| | | | | | | | | | | | | | | | | | | | |
Total distributions | | | (0.80 | ) | | | (0.55 | ) | | | (2.06 | ) | | | (2.73 | ) | | | (0.18 | ) |
| | | | | | | | | | | | | | | | | | | | |
Net asset value, end of year | | $ | 15.48 | | | $ | 15.08 | | | $ | 13.28 | | | $ | 16.32 | | | $ | 17.35 | |
| | | | | | | | | | | | | | | | | | | | |
| | | | | |
Total Return:(c) | | | | | | | | | | | | | | | | | | | | |
Based on net asset value | | | 8.01 | % | | | 17.72 | % | | | (6.15 | )% | | | 9.63 | % | | | 37.65 | % |
| | | | | | | | | | | | | | | | | | | | |
| | | | | |
Ratios to Average Net Assets: | | | | | | | | | | | | | | | | | | | | |
Total expenses | | | 1.16 | %(d) | | | 1.04 | % | | | 1.13 | % | | | 1.11 | % | | | 1.12 | % |
| | | | | | | | | | | | | | | | | | | | |
Total expenses after fees waived and/or reimbursed | | | 1.01 | %(d) | | | 1.00 | % | | | 1.01 | % | | | 1.00 | % | | | 1.00 | % |
| | | | | | | | | | | | | | | | | | | | |
Net investment income | | | 1.16 | %(d) | | | 1.25 | % | | | 1.19 | % | | | 1.11 | % | | | 1.14 | % |
| | | | | | | | | | | | | | | | | | | | |
| | | | | |
Supplemental Data: | | | | | | | | | | | | | | | | | | | | |
Net assets, end of year (000) | | $ | 78,896 | | | $ | 114,160 | | | $ | 45,197 | | | $ | 54,394 | | | $ | 47,184 | |
| | | | | | | | | | | | | | | | | | | | |
Portfolio turnover rate | | | 41 | % | | | 45 | % | | | 50 | % | | | 39 | % | | | 47 | % |
| | | | | | | | | | | | | | | | | | | | |
| (a) | Based on average shares outstanding. |
| (b) | Distributions for annual periods determined in accordance with U.S. federal income tax regulations. |
| (c) | Where applicable, excludes insurance-related fees and expenses and assumes the reinvestment of distributions. |
| (d) | Excludes expenses incurred indirectly as a result of investments in underlying funds of 0.01%. |
See notes to financial statements.
| | |
| 12 | | 2017 BLACKROCK ANNUAL REPORTTO SHAREHOLDERS |
Notes to Financial Statements
BlackRock Variable Series Funds, Inc. (the “Company”) is registered under the Investment Company Act of 1940, as amended (the “1940 Act”), as an open-end management investment company. The Company is organized as a Maryland corporation that is comprised of 20 separate funds. The funds offer shares to insurance companies for their separate accounts to fund benefits under certain variable annuity and variable life insurance contracts. The financial statements presented are for BlackRock Basic Value V.I. Fund (the “Fund”). The Fund is classified as diversified. Class I, Class II and Class III Shares have equal voting, dividend, liquidation and other rights, except that only shares of the respective classes are entitled to vote on matters concerning only that class. In addition, Class II and Class III Shares bear certain expenses related to the distribution of such shares.
The Fund, together with certain other registered investment companies advised by BlackRock Advisors, LLC (the “Manager”) or its affiliates, is included in a complex of open-end funds referred to as the Equity-Bond Complex.
| 2. | SIGNIFICANT ACCOUNTING POLICIES |
The financial statements are prepared in conformity with accounting principles generally accepted in the United States of America (“U.S. GAAP”), which may require management to make estimates and assumptions that affect the reported amounts of assets and liabilities in the financial statements, disclosure of contingent assets and liabilities at the date of the financial statements and the reported amounts of increases and decreases in net assets from operations during the reporting period. Actual results could differ from those estimates. The Fund is considered an investment company under U.S. GAAP and follows the accounting and reporting guidance applicable to investment companies. Below is a summary of significant accounting policies:
Investment Transactions and Income Recognition: For financial reporting purposes, investment transactions are recorded on the dates the transactions are entered into (the “trade dates”). Realized gains and losses on investment transactions are determined on the identified cost basis. Dividend income is recorded on the ex-dividend date. Dividends from foreign securities where the ex-dividend date may have passed are subsequently recorded when the Fund is informed of the ex-dividend date. Under the applicable foreign tax laws, a withholding tax at various rates may be imposed on capital gains, dividends and interest. Upon notification from issuers, some of the dividend income received from a real estate investment trust may be redesignated as a reduction of cost of the related investment and/or realized gain. Income, expenses and realized and unrealized gains and losses are allocated daily to each class based on its relative net assets.
Distributions: Distributions paid by the Fund are recorded on the ex-dividend date. The character and timing of distributions are determined in accordance with U.S. federal income tax regulations, which may differ from U.S. GAAP.
Indemnifications: In the normal course of business, the Fund enters into contracts that contain a variety of representations that provide general indemnification. The Fund’s maximum exposure under these arrangements is unknown because it involves future potential claims against the Fund, which cannot be predicted with any certainty.
Other: Expenses directly related to the Fund or its classes are charged to the Fund or the applicable class. Other operating expenses shared by several funds, including other funds managed by the Manager, are prorated among those funds on the basis of relative net assets or other appropriate methods. Expenses directly related to the Fund and other shared expenses prorated to the Fund are allocated daily to each class based on its relative net assets or other appropriate methods.
| 3. | INVESTMENT VALUATION AND FAIR VALUE MEASUREMENTS |
Investment Valuation Policies: The Fund’s investments are valued at fair value (also referred to as “market value” within the financial statements) as of the close of trading on the New York Stock Exchange (“NYSE”) (generally 4:00 p.m., Eastern time) (or if the reporting date falls on a day the NYSE is closed, investments are valued at fair value as of the period end). U.S. GAAP defines fair value as the price the Fund would receive to sell an asset or pay to transfer a liability in an orderly transaction between market participants at the measurement date. The Fund determines the fair values of its financial instruments using various independent dealers or pricing services under policies approved by the Board of Directors of the Company (the “Board”). The BlackRock Global Valuation Methodologies Committee (the “Global Valuation Committee”) is the committee formed by management to develop global pricing policies and procedures and to oversee the pricing function for all financial instruments.
Fair Value Inputs and Methodologies: The following methods and inputs are used to establish the fair value of the Fund’s assets and liabilities:
| | • | | Equity investments traded on a recognized securities exchange are valued at the official closing price each day, if available. For equity investments traded on more than one exchange, the official closing price on the exchange where the stock is primarily traded is used. Equity investments traded on a recognized exchange for which there were no sales on that day may be valued at the last available bid (long positions) or ask (short positions) price. |
| | • | | Investments in open-end U.S. mutual funds are valued at net asset value (“NAV”) each business day. |
| | • | | The Fund values its investment in SL Liquidity Series, LLC, Money Market Series (the “Money Market Series”) at fair value, which is ordinarily based upon its pro rata ownership in the underlying fund’s net assets. The Money Market Series seeks current income consistent with maintaining liquidity and preserving capital. Although the Money Market Series is not registered under the 1940 Act, its investments may follow the parameters of investments by a money market fund that is subject to Rule 2a-7 under the 1940 Act. |
If events (e.g., a company announcement, market volatility or a natural disaster) occur that are expected to materially affect the value of such investments, or in the event that the application of these methods of valuation results in a price for an investment that is deemed not to be representative of the market value of such investment, or if a price is not available, the investment will be valued by the Global Valuation Committee, or its delegate, in accordance with a policy approved by the Board as reflecting fair value (“Fair Valued Investments”). The fair valuation approaches that may be used by the Global Valuation Committee will include market approach, income approach and
| | | | |
| NOTESTO FINANCIAL STATEMENTS | | | 13 | |
Notes to Financial Statements (continued)
cost approach. Valuation techniques such as discounted cash flow, use of market comparables and matrix pricing are types of valuation approaches and are typically used in determining fair value. When determining the price for Fair Valued Investments, the Global Valuation Committee, or its delegate, seeks to determine the price that the Fund might reasonably expect to receive or pay from the current sale or purchase of that asset or liability in an arm’s-length transaction. Fair value determinations shall be based upon all available factors that the Global Valuation Committee, or its delegate, deems relevant and consistent with the principles of fair value measurement. The pricing of all Fair Valued Investments is subsequently reported to the Board or a committee thereof on a quarterly basis.
Fair Value Hierarchy: Various inputs are used in determining the fair value of investments. These inputs to valuation techniques are categorized into a fair value hierarchy consisting of three broad levels for financial statement purposes as follows:
| | • | | Level 1 — Unadjusted price quotations in active markets/exchanges for identical assets or liabilities that the Fund has the ability to access |
| | • | | Level 2 — Other observable inputs (including, but not limited to, quoted prices for similar assets or liabilities in markets that are active, quoted prices for identical or similar assets or liabilities in markets that are not active, inputs other than quoted prices that are observable for the assets or liabilities (such as interest rates, yield curves, volatilities, prepayment speeds, loss severities, credit risks and default rates) or other market-corroborated inputs) |
| | • | | Level 3 — Unobservable inputs based on the best information available in the circumstances, to the extent observable inputs are not available (including the Fund’s own assumptions used in determining the fair value of investments) |
The hierarchy gives the highest priority to unadjusted quoted prices in active markets for identical assets or liabilities (Level 1 measurements) and the lowest priority to unobservable inputs (Level 3 measurements). Accordingly, the degree of judgment exercised in determining fair value is greatest for instruments categorized in Level 3. The inputs used to measure fair value may fall into different levels of the fair value hierarchy. In such cases, for disclosure purposes, the fair value hierarchy classification is determined based on the lowest level input that is significant to the fair value measurement in its entirety. There may not be a secondary market, and/or there are a limited number of investors. Level 3 investments may also be adjusted to reflect illiquidity and/or non-transferability, with the amount of such discount estimated by the Global Valuation Committee in the absence of market information.
Changes in valuation techniques may result in transfers into or out of an assigned level within the hierarchy. In accordance with the Fund’s policy, transfers between different levels of the fair value hierarchy are deemed to have occurred as of the beginning of the reporting period. The categorization of a value determined for investments is based on the pricing transparency of the investments and is not necessarily an indication of the risks associated with investing in those securities.
As of December 31, 2017, certain investments of the Fund were valued using NAV per share as no quoted market value is available and therefore have been excluded from the fair value hierarchy.
| 4. | SECURITIES AND OTHER INVESTMENTS |
Securities Lending: The Fund may lend its securities to approved borrowers, such as brokers, dealers and other financial institutions. The borrower pledges and maintains with the Fund collateral consisting of cash, an irrevocable letter of credit issued by a bank, or securities issued or guaranteed by the U.S. Government. The initial collateral received by the Fund is required to have a value of at least 102% of the current value of the loaned securities for securities traded on U.S. exchanges and a value of at least 105% for all other securities. The collateral is maintained thereafter at a value equal to at least 100% of the current market value of the securities on loan. The market value of the loaned securities is determined at the close of each business day of the Fund and any additional required collateral is delivered to the Fund, or excess collateral returned by the Fund, on the next business day. During the term of the loan, the Fund is entitled to all distributions made on or in respect of the loaned securities, but does not receive interest income on securities received as collateral. Loans of securities are terminable at any time and the borrower, after notice, is required to return borrowed securities within the standard time period for settlement of securities transactions.
The market value of any securities on loan, all of which were classified as common stocks in the Fund’s Schedule of Investments, and the value of any related collateral are shown separately in the Statement of Assets and Liabilities as a component of investments at value — unaffiliated, and collateral on securities loaned at value, respectively. As of period end, any securities on loan were collateralized by cash and/or U.S. Government obligations. Cash collateral invested by the securities lending agent, BlackRock Investment Management, LLC (“BIM”), if any, is disclosed in the Schedule of Investments.
Securities lending transactions are entered into by the Fund under Master Securities Lending Agreements (each, an “MSLA”), which provide the right, in the event of default (including bankruptcy or insolvency), for the non-defaulting party to liquidate the collateral and calculate a net exposure to the defaulting party or request additional collateral. In the event that a borrower defaults, the Fund, as lender, would offset the market value of the collateral received against the market value of the securities loaned. When the value of the collateral is greater than that of the market value of the securities loaned, the lender is left with a net amount payable to the defaulting party. However, bankruptcy or insolvency laws of a particular jurisdiction may impose restrictions on or prohibitions against such a right of offset in the event of an MSLA counterparty’s bankruptcy or insolvency. Under the MSLA, absent an event of default, the borrower can resell or re-pledge the loaned securities, and the Fund can reinvest cash collateral received in connection with loaned securities. Upon an event of default, the parties’ obligations to return the securities or collateral to the other party are extinguished, and the parties can resell or re-pledge the loaned securities or the collateral received in connection with the loaned securities in order to satisfy the defaulting party’s net payment obligation for all transactions under the MSLA. The defaulting party remains liable for any deficiency.
| | |
| 14 | | 2017 BLACKROCK ANNUAL REPORTTO SHAREHOLDERS |
Notes to Financial Statements (continued)
As of period end, the following table is a summary of the Fund’s securities lending agreements by counterparty which are subject to offset under an MSLA:
| | | | | | | | | | | | |
| Counterparty | | Securities Loaned at Value | | | Cash Collateral
Recieved (a) | | | Net
Amount | |
Citigroup Global Markets, Inc. | | $ | 22,263,014 | | | $ | (22,263,014 | ) | | $ | — | |
Deutsche Bank Securities Inc. | | | 934,706 | | | | (934,706 | ) | | | — | |
Morgan Stanley | | | 4,988,298 | | | | (4,988,298 | ) | | | — | |
| | | | | | | | | | | | |
| | $ | 28,186,018 | | | $ | (28,186,018 | ) | | $ | — | |
| | | | | | | | | | | | |
| | (a) | Cash collateral with a value of $28,837,484 has been received in connection with securities lending agreements. Collateral received in excess of the value of securities loaned from the individual counterparty is not shown for financial reporting purposes. | |
The risks of securities lending include the risk that the borrower may not provide additional collateral when required or may not return the securities when due. To mitigate these risks, the Fund benefits from a borrower default indemnity provided by BIM. BIM’s indemnity allows for full replacement of the securities loaned if the collateral received does not cover the value on the securities loaned in the event of borrower default. The Fund could incur a loss if the value of an investment purchased with cash collateral falls below the market value of loaned securities or if the value of an investment purchased with cash collateral falls below the value of the original cash collateral received.
| 5. | INVESTMENT ADVISORY AGREEMENT AND OTHER TRANSACTIONS WITH AFFILIATES |
The PNC Financial Services Group, Inc. is the largest stockholder and an affiliate of BlackRock, Inc. (“BlackRock”) for 1940 Act purposes.
Investment Advisory: The Company, on behalf of the Fund, entered into an Investment Advisory Agreement with the Manager, the Fund’s investment adviser, an indirect, wholly-owned subsidiary of BlackRock, to provide investment advisory and administrative services. The Manager is responsible for the management of the Fund’s portfolio and provides the personnel, facilities, equipment and certain other services necessary to the operations of the Fund.
For such services, the Fund pays the Manager a monthly fee at an annual rate equal to the following percentages of the average daily value of the Fund’s net assets:
| | | | |
| Average Daily Net Assets | | Investment Advisory Fees | |
First $1 Billion | | | 0.60 | % |
$1 Billion — $3 Billion | | | 0.56 | |
$3 Billion — $5 Billion | | | 0.54 | |
$5 Billion — $10 Billion | | | 0.52 | |
Greater than $10 Billion | | | 0.51 | |
Distribution Fees: The Company, on behalf of the Fund, entered into a Distribution Agreement and a Distribution Plan with BlackRock Investments, LLC (“BRIL”), an affiliate of the Manager. Pursuant to the Distribution Plan and in accordance with Rule 12b-1 under the 1940 Act, the Fund pays BRIL ongoing distribution fees. The fees are accrued daily and paid monthly at annual rates based upon the average daily net assets of the relevant share class of the Fund as follows:
| | | | | | | | |
| | | Class II | | | Class III | |
Distribution Fees | | | 0.15 | % | | | 0.25 | % |
For the year ended December 31, 2017, the following table shows the class specific distribution fees borne directly by each share class of the Fund:
| | | | | | | | | | | | |
| | | Class II | | | Class III | | | Total | |
Distribution Fees | | $ | 7,542 | | | $ | 232,924 | | | $ | 240,466 | |
Transfer Agent: On behalf of the Fund, the Manager entered into agreements with insurance companies and other financial intermediaries (“Service Organizations”), some of which may be affiliates. Pursuant to these agreements, the Service Organizations provide the Fund with administrative, networking, recordkeeping, sub-transfer agency and shareholder services to sub-accounts they service. For these services, the Service Organizations receive an annual fee per shareholder account, which will vary depending on share class and/or net assets of Fund shareholders serviced by the Service Organizations which is shown as transfer agent — class specific. For the year ended December 31, 2017, the Fund did not pay any amounts to affiliates in return for these services.
In addition, the Fund pays the transfer agent, which is not an affiliate, a fee for the issuance, transfer and redemption of shares and the opening and maintenance of shareholder accounts, which is included in transfer agent in the Statement of Operations.
For the year ended December 31, 2017, the following table shows the class specific transfer agent fees borne directly by each share class of the Fund:
| | | | | | | | | | | | | | | | | | | | |
| Class I | | | | | Class II | | | | | Class III | | | | | Total | |
| $ | 713,087 | | | | | $ | 10,229 | | | | | $ | 230,811 | | | | | $ | 954,127 | |
Expense Limitations, Waivers and Reimbursements: With respect to the Fund, the Manager voluntarily agreed to waive its investment advisory fees by the amount of investment advisory fees the Fund pays to the Manager indirectly through its investment in affiliated money market funds (the “affiliated money market fund waiver”). The amount of waivers and/or reimbursements of fees and expenses made pursuant to the expense limitation caps will be reduced by the amount of the affiliated money
| | | | |
| NOTESTO FINANCIAL STATEMENTS | | | 15 | |
Notes to Financial Statements (continued)
market fund waiver. This amount is included in fees waived and/or reimbursed by the Manager in the Statement of Operations. For the year ended December 31, 2017, the amount waived was $5,233.
The Manager has contractually agreed to waive its investment advisory fee with respect to any portion of the Fund’s assets invested in affiliated equity and fixed-income mutual funds and affiliated exchange-traded funds that have a contractual management fee through April 30, 2018. The contractual agreement may be terminated upon 90 days’ notice by a majority of the independent directors who are not “interested persons” of the Fund, as defined in the 1940 Act (“Independent Directors”) or by a vote of a majority of the outstanding voting securities of the Fund. For the year ended December 31, 2017, there were no fees waived by the Manager.
For the year ended December 31, 2017, the Fund reimbursed the Manager $5,749 for certain accounting services, which is included in accounting services in the Statement of Operations.
The Manager has contractually agreed to reimburse transfer agent fees in order to limit such expenses to a percentage of average daily net assets as follows:
| | | | |
Class I | | | 0.06 | % |
Class II | | | 0.08 | % |
Class III | | | 0.09 | % |
The Manager has agreed not to reduce or discontinue this contractual expense limitation through April 30, 2018, unless approved by the Board, including a majority of Independent Directors or by a vote of a majority of the outstanding voting securities of the Fund.
These amounts waived and/or reimbursed are shown as transfer agent fees reimbursed — class specific in the Statement of Operations. For the year ended December 31, 2017, class specific expense waivers and/or reimbursements were as follows:
| | | | | | | | | | | | | | | | |
| | | Class I | | | Class II | | | Class III | | | Total | |
Transfer Agent Fees Reimbursed | | $ | 477,549 | | | $ | 6,206 | | | $ | 146,821 | | | $ | 630,576 | |
With respect to the Fund, the Manager contractually agreed to waive and/or reimburse fees or expenses in order to limit expenses, excluding interest expense, dividend expense, tax expense, acquired fund fees and expenses, and certain other fund expenses, which constitute extraordinary expenses not incurred in the ordinary course of the Fund’s business (“expense limitation”). The expense limitations as a percentage of average daily net assets are as follows:
| | | | | | | | | | | | | | |
| Class I | | | | | Class II | | | | | Class III | |
| | 1.25% | | | | | | 1.40% | | | | | | 1.50% | |
The Manager has agreed not to reduce or discontinue this contractual expense limitation through April 30, 2018, unless approved by the Board, including a majority of the Independent Directors or by a vote of a majority of the outstanding voting securities of the Fund. For the year ended December 31, 2017, there were no fees waived and/or reimbursed by the Manager.
Securities Lending: The U.S. Securities and Exchange Commission (“SEC”) has issued an exemptive order which permits BIM, an affiliate of the Manager, to serve as securities lending agent for the Fund, subject to applicable conditions. As securities lending agent, BIM bears all operational costs directly related to securities lending. The Fund is responsible for expenses in connection with the investment of cash collateral received for securities on loan (the “collateral investment expenses”). The cash collateral is invested in a private investment company managed by the Manager or its affiliates. However, BIM has agreed to cap the collateral investment expenses of the private investment company to an annual rate of 0.04%. The investment adviser to the private investment company will not charge any advisory fees with respect to shares purchased by the Fund. The private investment company in which the cash collateral has been invested may, under certain circumstances, impose a liquidity fee of up to 2% of the value withdrawn or temporarily restrict withdrawals for up to 10 business days during a 90 day period, in the event that the private investment company’s weekly liquid assets fall below certain thresholds.
Securities lending income is equal to the total of income earned from the reinvestment of cash collateral, net of fees and other payments to and from borrowers of securities, and less the collateral investment expenses. The Fund retains a portion of securities lending income and remits a remaining portion to BIM as compensation for its services as securities lending agent.
Pursuant to a securities lending agreement, the Fund retains 71.5% of securities lending income, and this amount retained can never be less than 65% of the total of securities lending income plus the collateral investment expenses.
In addition, commencing the business day following the date that the aggregate securities lending income earned across the Equity-Bond Complex in a calendar year exceeds a specified threshold, the Fund, pursuant to the securities lending agreement, will retain for the remainder of that calendar year securities lending income as follows: 75% of securities lending income, and this amount retained can never be less than 65% of the total of securities lending income plus the collateral investment expenses.
The share of securities lending income earned by the Fund is shown as securities lending income — affiliated — net in the Statement of Operations. For the year ended December 31, 2017, the Fund paid BIM $22,664 for securities lending agent services.
Interfund Lending: In accordance with an exemptive order (the “Order”) from the SEC, the Fund may participate in a joint lending and borrowing facility for temporary purposes (the “Interfund Lending Program”), subject to compliance with the terms and conditions of the Order, and to the extent permitted by the Fund’s investment policies and restrictions. The Fund is currently permitted to borrow under the Interfund Lending Program.
| | |
| 16 | | 2017 BLACKROCK ANNUAL REPORTTO SHAREHOLDERS |
Notes to Financial Statements (continued)
A lending BlackRock fund may lend in aggregate up to 15% of its net assets, but may not lend more than 5% of its net assets to any one borrowing fund through the Interfund Lending Program. A borrowing BlackRock fund may not borrow through the Interfund Lending Program or from any other source more than 33 1⁄3% of its total assets (or any lower threshold provided for by the fund’s investment restrictions). If a borrowing BlackRock fund’s total outstanding borrowings exceed 10% of its total assets, each of its outstanding interfund loans will be subject to collateralization of at least 102% of the outstanding principal value of the loan. All interfund loans are for temporary or emergency purposes and the interest rate to be charged will be the average of the highest current overnight repurchase agreement rate available to a lending fund and the bank loan rate, as calculated according to a formula established by the Board.
During the year ended December 31, 2017, the Fund did not participate in the Interfund Lending Program.
Officers and Directors: Certain directors and/or officers of the Company are directors and/or officers of BlackRock or its affiliates. The Fund reimburses the Manager for a portion of the compensation paid to the Company’s Chief Compliance Officer, which is included in Directors and Officer in the Statement of Operations.
For the year ended December 31, 2017, purchases and sales of investments, excluding short-term securities, were $196,333,906 and $265,590,370, respectively.
It is the Fund’s policy to comply with the requirements of the Internal Revenue Code of 1986, as amended, applicable to regulated investment companies, and to distribute substantially all of its taxable income to its shareholders. Therefore, no U.S. federal income tax provision is required.
The Fund files U.S. federal and various state and local tax returns. No income tax returns are currently under examination. The statute of limitations on the Fund’s U.S. federal tax returns generally remains open for each of the four years ended December 31, 2017. The statutes of limitations on the Fund’s state and local tax returns may remain open for an additional year depending upon the jurisdiction.
Management has analyzed tax laws and regulations and their application to the Fund as of December 31, 2017, inclusive of the open tax return years, and does not believe that there are any uncertain tax positions that require recognition of a tax liability in the Fund’s financial statements.
U.S. GAAP requires that certain components of net assets be adjusted to reflect permanent differences between financial and tax reporting. These reclassifications have no effect on net assets or net asset values per share. As of period end, the following permanent differences attributable to the timing and recognition of partnership income were reclassified to the following accounts:
| | | | |
Undistributed net investment income | | $ | 5,535 | |
Accumulated net realized gain | | $ | (5,535 | ) |
The tax character of distributions paid was as follows:
| | | | | | | | |
| | | 12/31/17 | | | 12/31/16 | |
Ordinary income | | $ | 10,837,279 | | | $ | 9,681,536 | |
Long term capital gains | | | 14,563,626 | | | | 9,675,291 | |
| | | | | | | | |
| | $ | 25,400,905 | | | $ | 19,356,827 | |
| | | | | | | | |
As of period end, the tax components of accumulated net earnings (losses) were as follows:
| | | | |
Undistributed long-term capital gains | | $ | 5,529,932 | |
Net unrealized gains(a) | | | 82,876,727 | |
| | | | |
| | $ | 88,406,659 | |
| | | | |
| | (a) | The difference between book-basis and tax-basis net unrealized gains was attributable primarily to the tax deferral of losses on wash sales and the timing and recognition of partnership income. | |
As of December 31, 2017, gross unrealized appreciation and depreciation for investments based on cost for U.S. federal income tax purposes were as follows:
| | | | |
Tax cost | | $ | 427,259,594 | |
| | | | |
Gross unrealized appreciation | | $ | 91,430,370 | |
Gross unrealized depreciation | | | (8,553,643 | ) |
| | | | |
Net unrealized appreciation (depreciation) | | $ | 82,876,727 | |
| | | | |
The Company, on behalf of the Fund, along with certain other funds managed by the Manager and its affiliates (“Participating Funds”), is a party to a 364-day, $2.1 billion credit agreement with a group of lenders. Under this agreement, the Fund may borrow to fund shareholder redemptions. Excluding commitments designated for certain individual funds, the Participating Funds, including the Fund, can borrow up to an aggregate commitment amount of $1.6 billion at any time outstanding, subject to asset coverage and other limitations as specified in the agreement. The credit agreement has the following terms: a fee of 0.12% per annum on unused commitment amounts and interest at a rate equal to the higher of (a) one-month LIBOR (but, in any event, not less than 0.00%) on the date the loan is made plus 0.80% per annum or (b) the
| | | | |
| NOTESTO FINANCIAL STATEMENTS | | | 17 | |
Notes to Financial Statements (continued)
Fed Funds rate (but, in any event, not less than 0.00%) in effect from time to time plus 0.80% per annum on amounts borrowed. The agreement expires in April 2018 unless extended or renewed. Participating Funds paid administration, legal and arrangement fees, which, if applicable, are included in miscellaneous expenses in the Statement of Operations. These fees were allocated among such funds based upon portions of the aggregate commitment available to them and relative net assets of Participating Funds. During the year ended December 31, 2017, the Fund did not borrow under the credit agreement.
In the normal course of business, the Fund invests in securities or other instruments and may enter into certain transactions, and such activities subject the Fund to various risks, including among others, fluctuations in the market (market risk) or failure of an issuer to meet all of its obligations. The value of securities or other instruments may also be affected by various factors, including, without limitation: (i) the general economy; (ii) the overall market as well as local, regional or global political and/or social instability; (iii) regulation, taxation or international tax treaties between various countries; or (iv) currency, interest rate and price fluctuations. The Fund’s prospectus provides details of the risks to which the Fund is subject.
The Fund may be exposed to additional risks when reinvesting cash collateral in money market funds that do not seek to maintain a stable NAV per share of $1.00 and which may be subject to redemption gates or liquidity fees under certain circumstances.
Valuation Risk: The market values of equities, such as common stocks and preferred securities or equity related investments, such as futures and options, may decline due to general market conditions which are not specifically related to a particular company. They may also decline due to factors which affect a particular industry or industries. The Fund may invest in illiquid investments and may experience difficulty in selling those investments in a timely manner at the price that it believes the investments are worth. Prices may fluctuate widely over short or extended periods in response to company, market or economic news. Markets also tend to move in cycles, with periods of rising and falling prices. This volatility may cause the Fund’s NAV to experience significant increases or decreases over short periods of time. If there is a general decline in the securities and other markets, the NAV of the Fund may lose value, regardless of the individual results of the securities and other instruments in which the Fund invests.
Counterparty Credit Risk: The Fund may be exposed to counterparty credit risk, or the risk that an entity may fail to or be unable to perform on its commitments related to unsettled or open transactions. The Fund manages counterparty credit risk by entering into transactions only with counterparties that the Manager believes have the financial resources to honor their obligations and by monitoring the financial stability of those counterparties. Financial assets, which potentially expose the Fund to market, issuer and counterparty credit risks, consist principally of financial instruments and receivables due from counterparties. The extent of the Fund’s exposure to market, issuer and counterparty credit risks with respect to these financial assets is approximately their value recorded in the Statement of Assets and Liabilities, less any collateral held by the Fund.
Concentration Risk: As of period end, the Fund invested a significant portion of its assets in securities in the financials sector. Changes in economic conditions affecting such sector would have a greater impact on the Fund and could affect the value, income and/or liquidity of positions in such securities.
| 10. | CAPITAL SHARE TRANSACTIONS |
Transactions in capital shares for each class were as follows:
| | | | | | | | | | | | | | | | |
| | | Year Ended
12/31/2017 | | | Year Ended
12/31/2016 | |
| Share Class | | Shares | | | Amount | | | Shares | | | Amount | |
Class I | | | | | | | | | | | | | | | | |
Shares sold | | | 654,115 | | | $ | 9,987,597 | | | | 513,208 | | | $ | 7,180,733 | |
Shares issued in reinvestment of distributions | | | 1,355,509 | | | | 21,064,561 | | | | 997,564 | | | | 15,113,260 | |
Shares redeemed | | | (3,465,286 | ) | | | (53,113,894 | ) | | | (4,036,476 | ) | | | (56,435,698 | ) |
| | | | | | | | | | | | | | | | |
Net decrease | | | (1,455,662 | ) | | $ | (22,061,736 | ) | | | (2,525,704 | ) | | $ | (34,141,705 | ) |
| | | | | | | | | | | | | | | | |
| | | | |
Class II | | | | | | | | | | | | | | | | |
Shares sold | | | 5,727 | | | $ | 86,583 | | | | — | | | $ | — | |
Shares issued in reinvestment of distributions | | | 16,392 | | | | 253,758 | | | | 12,491 | | | | 188,430 | |
Shares redeemed | | | (53,552 | ) | | | (815,043 | ) | | | (74,442 | ) | | | (1,035,844 | ) |
| | | | | | | | | | | | | | | | |
Net decrease | | | (31,433 | ) | | $ | (474,702 | ) | | | (61,951 | ) | | $ | (847,414 | ) |
| | | | | | | | | | | | | | | | |
| | | | |
Class III | | | | | | | | | | | | | | | | |
Shares sold | | | 805,717 | | | $ | 12,136,647 | | | | 5,548,659 | | | $ | 78,156,015 | |
Shares issued in reinvestment of distributions | | | 265,245 | | | | 4,082,586 | | | | 269,920 | | | | 4,055,137 | |
Shares redeemed | | | (3,542,663 | ) | | | (53,147,902 | ) | | | (1,655,158 | ) | | | (23,920,362 | ) |
| | | | | | | | | | | | | | | | |
Net increase (decrease) | | | (2,471,701 | ) | | $ | (36,928,669 | ) | | | 4,163,421 | | | $ | 58,290,790 | |
| | | | | | | | | | | | | | | | |
Total Net Increase (Decrease) | | | (3,958,796 | ) | | $ | (59,465,107 | ) | | | 1,575,766 | | | $ | 23,301,671 | |
| | | | | | | | | | | | | | | | |
Management has evaluated the impact of all subsequent events on the Fund through the date the financial statements were issued and has determined that there were no subsequent events requiring adjustment or additional disclosure in the financial statements.
| | |
| 18 | | 2017 BLACKROCK ANNUAL REPORTTO SHAREHOLDERS |
Report of the Independent Registered Public Accounting Firm
To the Shareholders of BlackRock Basic Value V.I. Fund and the Board of Directors of BlackRock Variable Series Funds, Inc.:
Opinion on the Financial Statements and Financial Highlights
We have audited the accompanying statement of assets and liabilities, including the schedule of investments, of BlackRock Basic Value V.I. Fund of BlackRock Variable Series Funds, Inc. (the “Fund”), as of December 31, 2017, the related statement of operations for the year then ended, the statements of changes in net assets for each of the two years in the period then ended, the financial highlights for each of the five years in the period then ended, and the related notes. In our opinion, the financial statements and financial highlights present fairly, in all material respects, the financial position of the Fund as of December 31, 2017, and the results of its operations for the year then ended, the changes in its net assets for each of the two years in the period then ended, and the financial highlights for each of the five years in the period then ended, in conformity with accounting principles generally accepted in the United States of America.
Basis for Opinion
These financial statements and financial highlights are the responsibility of the Fund’s management. Our responsibility is to express an opinion on the Fund’s financial statements and financial highlights based on our audits. We are a public accounting firm registered with the Public Company Accounting Oversight Board (United States) (PCAOB) and are required to be independent with respect to the Fund in accordance with the U.S. federal securities laws and the applicable rules and regulations of the Securities and Exchange Commission and the PCAOB.
We conducted our audits in accordance with the standards of the PCAOB. Those standards require that we plan and perform the audit to obtain reasonable assurance about whether the financial statements and financial highlights are free of material misstatement, whether due to error or fraud. The Fund is not required to have, nor were we engaged to perform, an audit of its internal control over financial reporting. As part of our audits we are required to obtain an understanding of internal control over financial reporting but not for the purpose of expressing an opinion on the effectiveness of the Fund’s internal control over financial reporting. Accordingly, we express no such opinion.
Our audits included performing procedures to assess the risks of material misstatement of the financial statements and financial highlights, whether due to error or fraud, and performing procedures that respond to those risks. Such procedures included examining, on a test basis, evidence regarding the amounts and disclosures in the financial statements and financial highlights. Our audits also included evaluating the accounting principles used and significant estimates made by management, as well as evaluating the overall presentation of the financial statements and financial highlights. Our procedures included confirmation of securities owned as of December 31, 2017, by correspondence with the custodian and brokers; when replies were not received from brokers, we performed other auditing procedures. We believe that our audits provide a reasonable basis for our opinion.
Deloitte & Touche LLP
Boston, Massachusetts
February 19, 2018
We have served as the auditor of one or more BlackRock investment companies since 1992.
| | | | |
| REPORTOFTHE INDEPENDENT REGISTERED PUBLIC ACCOUNTING FIRM | | | 19 | |
DECEMBER 31, 2017
| | |
ANNUAL REPORT | |  |
BlackRock Variable Series Funds, Inc.
| Ø | | BlackRock Capital Appreciation V.I. Fund |
|
| Not FDIC Insured • May Lose Value • No Bank Guarantee |
| | |
| Fund Summary as of December 31, 2017 | | BlackRock Capital Appreciation V.I. Fund |
Investment Objective
BlackRock Capital Appreciation V.I. Fund’s (the “Fund”) investment objective is to seek long-term growth of capital.
Portfolio Management Commentary
How did the Fund perform?
For the 12-month period ended December 31, 2017, the Fund outperformed the benchmark Russell 1000® Growth Index and the broad-market S&P 500® Index. The following discussion of relative performance pertains to the Russell 1000® Growth Index.
What factors influenced performance?
On a sector basis, information technology (“IT”) and consumer discretionary were the prime contributors to relative performance in the 12 months. Internet software & services accounted for the majority of the outperformance in IT, while internet & direct marketing retail holdings and an underweight to media drove gains within consumer discretionary. Stock selection and an underweight to the consumer staples sector also proved advantageous. Conversely, industrials and financials detracted from performance during the one-year period. Weakness among electrical equipment and professional services holdings, coupled with selection and an underweight to aerospace & defense, hindered returns in industrials. Within financials, banks were the main drag.
In stock specifics, the top individual contributors were Tencent Holdings Ltd. and Amazon.com Inc. Tencent outperformed after several quarters of accelerating revenue growth. The company exceeded expectations in almost every segment (payments, mobile games, advertising and cloud). The investment adviser maintains a material overweight in the shares. Amazon outperformed as continued underperformance among traditional retailers focused investors on its share gain opportunities. The company delivered a series of strong earnings reports, with notable acceleration in North America, International, Prime and Advertising. Further, Amazon Web Services continued its impressive growth.
Additional contributions came from positions in Activision Blizzard Inc., Netflix Inc. and Alibaba Group Holding Ltd.
Detractors over the annual period included Acuity Brands Inc. and Alexion Pharmaceuticals Inc. LED-lighting specialist Acuity underperformed after a series of earnings disappointments due to an industry slowing in short-cycle projects and a stock and flow business under pressure (weak volume and pricing trends/outlook). The stock was sold by the end of the reporting period. Alexion underperformed during the year amid a host of negative headlines, including executive management departures, an investigation into the sales practices used to sell its flagship product Soliris, and ongoing concerns as it relates to the company’s dependence on and durability of Soliris. Notwithstanding the year’s controversies, the investment adviser maintains its position as it continues to believe consensus expectations for Soliris’s revenue duration are unreasonably bearish; new management is making progress at stabilizing the operations environment; and, the valuation reflects extreme investor pessimism.
Underweights to Apple Inc. and Boeing Co. also weighed, as did the investment in private technology firm Palantir Technologies.
Describe recent portfolio activity.
Due to a combination of portfolio trading activity and market movement during the 12-month period, the portfolio’s weighting in IT substantially increased, particularly within software and internet software & services. Materials exposure also increased, namely within construction materials and chemicals. Exposure to financials and health care decreased, largely with respect to banks, diversified financials and biotechnology. Consumer discretionary saw declines as well.
Describe portfolio positioning at period end.
As of period end, the Fund’s largest sector overweight relative to the Russell 1000® Growth Index was financials, followed by consumer discretionary, energy and materials. Industrials and consumer staples were the largest portfolio underweights.
The views expressed reflect the opinions of BlackRock as of the date of this report and are subject to change based on changes in market, economic or other conditions. These views are not intended to be a forecast of future events and are no guarantee of future results.
| | |
| 2 | | 2017 BLACKROCK ANNUAL REPORTTO SHAREHOLDERS |
| | |
| Fund Summary as of December 31, 2017 (continued) | | BlackRock Capital Appreciation V.I. Fund |
TOTAL RETURN BASED ON A $10,000 INVESTMENT
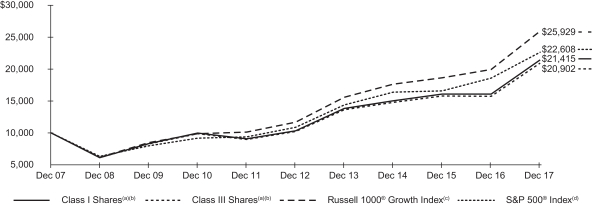
| (a) | Assuming transaction costs, if any, and other operating expenses, including investment advisory fees. Does not include insurance-related fees and expenses. The returns for Class III Shares prior to June 15, 2010, the recommencement of operations of Class III Shares, are based upon the performance of the Fund’s Class I Shares, as adjusted to reflect the distribution and/or service (12b-1) fees applicable to the Class III Shares. |
| (b) | The Fund invests primarily in a diversified portfolio consisting primarily of common stock of U.S. companies that the investment adviser believes have exhibited above-average growth rates in earnings over the long-term. |
| (c) | An unmanaged index that measures the performance of the large cap growth segment of the U.S. equity universe and consists of those Russell 1000® securities with higher price-to-book ratios and higher forecasted growth values. |
| (d) | An unmanaged index that covers 500 leading companies and captures approximately 80% coverage of available market capitalization. |
Performance Summary for the Period Ended December 31, 2017
| | | | | | | | | | | | | | | | | | | | | | | | | | | | |
| | | 6-Month
Total Returns (b) | | | | | | Average Annual Total Returns | |
| | | | | | | 1 Year (b) | | | | | | 5 Years (b) | | | | | | 10 Years (b) | |
Class I(a) | | | 13.39 | % | | | | | | | 33.22 | % | | | | | | | 15.73 | % | | | | | | | 7.91 | % |
Class III(a) | | | 13.35 | | | | | | | | 32.94 | | | | | | | | 15.43 | | | | | | | | 7.65 | (c) |
Russell 1000® Growth Index | | | 14.23 | | | | | | | | 30.21 | | | | | | | | 17.33 | | | | | | | | 10.00 | |
S&P 500® Index | | | 11.42 | | | | | | | | 21.83 | | | | | | | | 15.79 | | | | | | | | 8.50 | |
| | (a) | Average annual and cumulative total returns are based on changes in net asset value for the periods shown, and assume reinvestment of all distributions at net asset value on the ex-dividend date. Insurance-related fees and expenses are not reflected in these returns. | |
| | (b) | For a portion of the period, the Fund’s investment adviser waived a portion of its fee. Without such waiver, the Fund’s performance would have been lower. | |
| | (c) | The returns for Class III Shares prior to June 15, 2010, the recommencement of operations of Class III Shares, are based upon the performance of the Fund’s Class I Shares, as adjusted to reflect the distribution (12b-1) fees applicable to Class III Shares. | |
Past performance is not indicative of future results. Performance results do not reflect the deduction of taxes that a shareholder would pay on Fund distributions or the redemption of Fund shares.
Performance results may include adjustments made for financial reporting purposes in accordance with U.S. generally accepted accounting principles.
Expense Example
| | | | | | | | | | | | | | | | | | | | | | | | | | | | | | | | |
| | | Actual | | | | | | Hypothetical (a) | | | | |
| | | Beginning
Account Value
(07/01/17) | | | Ending
Account Value
(12/31/17) | | | Expenses
Paid During
the Period (b) | | | | | | Beginning
Account Value
(07/01/17) | | | Ending
Account Value
(12/31/17) | | | Expenses
Paid During
the Period (b) | | | Annualized
Expense
Ratio | |
Class I | | $ | 1,000.00 | | | $ | 1,133.90 | | | $ | 4.20 | | | | | | | $ | 1,000.00 | | | $ | 1,021.27 | | | $ | 3.97 | | | | 0.78 | % |
Class III | | | 1,000.00 | | | | 1,133.50 | | | | 5.59 | | | | | | | | 1,000.00 | | | | 1,019.96 | | | | 5.30 | | | | 1.04 | |
| | (a) | Hypothetical 5% annual return before expenses is calculated by prorating the number of days in the most recent fiscal half year divided by 365. | |
| | (b) | For each class of the Fund, expenses are equal to the annualized expense ratio for the class, multiplied by the average account value over the period, multiplied by 184/365 (to reflect the one-half year period shown). | |
See “Disclosure of Expenses” on the following page for further information on how expenses were calculated.
| | |
| Fund Summary as of December 31, 2017 (continued) | | BlackRock Capital Appreciation V.I. Fund |
Portfolio Information
SECTOR ALLOCATION
| | | | |
| Sector | | Percent of
Net Assets | |
Information Technology | | | 38 | % |
Consumer Discretionary | | | 20 | |
Health Care | | | 13 | |
Financials | | | 8 | |
Industrials | | | 8 | |
Materials | | | 5 | |
Consumer Staples | | | 4 | |
Energy | | | 2 | |
Real Estate | | | 1 | |
Software | | | 1 | |
Telecommunication Services | | | — | (a) |
Short-Term Securities | | | 4 | |
Liabilities in Excess of Other Assets | | | (4 | ) |
| | (a) | Representing less than 1% of the Fund’s net assets. | |
For Fund compliance purposes, the Fund’s sector classifications refer to one or more of the sector sub-classifications used by one or more widely recognized market indexes or ratings group indexes, and/or as defined by the investment adviser. These definitions may not apply for purposes of this report, which may combine sector sub classifications for reporting ease.
Disclosure of Expenses
Shareholders of the Fund may incur the following charges: (a) transactional expenses, such as sales charges; and (b) operating expenses, including investment advisory fees, service and distribution fees, including 12b-1 fees, acquired fund fees and expenses, and other fund expenses. The expense example on the previous page (which is based on a hypothetical investment of $1,000 invested on July 1, 2017 and held through December 31, 2017) is intended to assist shareholders both in calculating expenses based on an investment in the Fund and in comparing these expenses with similar costs of investing in other mutual funds.
The expense example provides information about actual account values and actual expenses. In order to estimate the expenses a shareholder paid during the period covered by this report, shareholders can divide their account value by $1,000 and then multiply the result by the number corresponding to their share class under the heading entitled “Expenses Paid During the Period.”
The expense example also provides information about hypothetical account values and hypothetical expenses based on the Fund’s actual expense ratio and an assumed rate of return of 5% per year before expenses. In order to assist shareholders in comparing the ongoing expenses of investing in the Fund and other funds, compare the 5% hypothetical example with the 5% hypothetical examples that appear in shareholder reports of other funds.
The expenses shown in the expense example are intended to highlight shareholders’ ongoing costs only and do not reflect any transactional expenses, such as sales charges, if any. Therefore, the hypothetical example is useful in comparing ongoing expenses only, and will not help shareholders determine the relative total expenses of owning different funds. If these transactional expenses were included, shareholder expenses would have been higher.
| | |
| 4 | | 2017 BLACKROCK ANNUAL REPORTTO SHAREHOLDERS |
| | |
Schedule of Investments December 31, 2017 | | BlackRock Capital Appreciation V.I. Fund (Percentages shown are based on Net Assets) |
| | | | | | | | |
| Security | | Shares | | | Value | |
Common Stocks — 98.9% | |
|
| Aerospace & Defense — 1.0% | |
TransDigm Group, Inc. | | | 15,194 | | | $ | 4,172,576 | |
| | | | | | | | |
| Airlines — 0.5% | | | | | | |
Southwest Airlines Co. | | | 31,307 | | | | 2,049,043 | |
| | | | | | | | |
| Banks — 5.2% | | | | | | |
Bank of America Corp. | | | 370,368 | | | | 10,933,263 | |
First Republic Bank | | | 63,412 | | | | 5,494,016 | |
Wells Fargo & Co. | | | 73,847 | | | | 4,480,298 | |
| | | | | | | | |
| | | | | | | 20,907,577 | |
| Beverages — 3.8% | | | | | | |
Constellation Brands, Inc., Class A | | | 47,962 | | | | 10,962,674 | |
Dr Pepper Snapple Group, Inc. | | | 44,168 | | | | 4,286,946 | |
| | | | | | | | |
| | | | | | | 15,249,620 | |
| Biotechnology — 3.5%(a) | | | | | | |
Alexion Pharmaceuticals, Inc. | | | 48,298 | | | | 5,775,958 | |
Biogen, Inc. | | | 14,532 | | | | 4,629,459 | |
Vertex Pharmaceuticals, Inc. | | | 24,455 | | | | 3,664,826 | |
| | | | | | | | |
| | | | | | | 14,070,243 | |
| Capital Markets — 1.0% | | | | | | |
S&P Global, Inc. | | | 23,735 | | | | 4,020,709 | |
| | | | | | | | |
| Chemicals — 3.1% | | | | | | |
DowDuPont, Inc. | | | 95,118 | | | | 6,774,304 | |
Sherwin-Williams Co. (The) | | | 13,568 | | | | 5,563,423 | |
| | | | | | | | |
| | | | | | | 12,337,727 | |
| Construction Materials — 1.7% | | | | | | |
Vulcan Materials Co. | | | 53,861 | | | | 6,914,137 | |
| | | | | | | | |
| Diversified Financial Services — 1.5% | | | | | | |
Berkshire Hathaway, Inc., Class B(a) | | | 30,605 | | | | 6,066,523 | |
| | | | | | | | |
| Diversified Telecommunication Services — 0.5% | | | | |
Zayo Group Holdings, Inc.(a) | | | 49,281 | | | | 1,813,541 | |
| | | | | | | | |
| Energy Equipment & Services — 1.5% | | | | | | |
Halliburton Co. | | | 127,455 | | | | 6,228,726 | |
| | | | | | | | |
| Equity Real Estate Investment Trusts (REITs) — 1.0% | | | | | | |
Equinix, Inc. | | | 6,601 | | | | 2,991,705 | |
SBA Communications Corp.(a) | | | 7,013 | | | | 1,145,644 | |
| | | | | | | | |
| | | | | | | 4,137,349 | |
| Health Care Equipment & Supplies — 2.9% | | | | | | |
Becton Dickinson and Co. | | | 30,538 | | | | 6,536,964 | |
Boston Scientific Corp.(a) | | | 208,981 | | | | 5,180,639 | |
| | | | | | | | |
| | | | | | | 11,717,603 | |
| Health Care Providers & Services — 4.8% | | | | | | |
UnitedHealth Group, Inc. | | | 87,236 | | | | 19,232,049 | |
| | | | | | | | |
| Hotels, Restaurants & Leisure — 1.3% | | | | | | |
Domino’s Pizza, Inc.(b) | | | 28,591 | | | | 5,402,555 | |
| | | | | | | | |
| Industrial Conglomerates — 2.3% | | | | | | |
Honeywell International, Inc. | | | 33,996 | | | | 5,213,627 | |
Roper Technologies, Inc. | | | 15,565 | | | | 4,031,335 | |
| | | | | | | | |
| | | | | | | 9,244,962 | |
| Internet & Direct Marketing Retail — 12.7%(a) | | | | | | |
Amazon.com, Inc. | | | 25,733 | | | | 30,093,971 | |
Netflix, Inc. | | | 47,681 | | | | 9,152,845 | |
Priceline Group, Inc. (The) | | | 6,721 | | | | 11,679,351 | |
| | | | | | | | |
| | | | | | | 50,926,167 | |
| | | | | | | | |
| Security | | Shares | | | Value | |
| Internet Software & Services — 14.3% | | | | | | |
Alibaba Group Holding Ltd., ADR(a)(b) | | | 17,189 | | | $ | 2,963,899 | |
Alphabet, Inc., Class A(a) | | | 20,447 | | | | 21,538,870 | |
Facebook, Inc., Class A(a) | | | 77,796 | | | | 13,727,882 | |
MercadoLibre, Inc.(b) | | | 13,067 | | | | 4,111,662 | |
Tencent Holdings Ltd. | | | 289,500 | | | | 14,983,928 | |
| | | | | | | | |
| | | | | | | 57,326,241 | |
| IT Services — 6.3% | | | | | | |
PayPal Holdings, Inc.(a) | | | 89,167 | | | | 6,564,474 | |
Visa, Inc., Class A | | | 164,634 | | | | 18,771,569 | |
| | | | | | | | |
| | | | | | | 25,336,043 | |
| Life Sciences Tools & Services — 1.2% | | | | | | |
Illumina, Inc.(a) | | | 21,561 | | | | 4,710,863 | |
| | | | | | | | |
| Machinery — 0.6% | | | | | | |
Caterpillar, Inc. | | | 16,093 | | | | 2,535,935 | |
| | | | | | | | |
| Oil, Gas & Consumable Fuels — 0.4% | | | | | | |
Pioneer Natural Resources Co. | | | 10,109 | | | | 1,747,341 | |
| | | | | | | | |
| Pharmaceuticals — 0.9% | | | | | | |
Zoetis, Inc. | | | 50,356 | | | | 3,627,646 | |
| | | | | | | | |
| Professional Services — 1.7% | | | | | | |
Equifax, Inc. | | | 57,193 | | | | 6,744,199 | |
| | | | | | | | |
| Road & Rail — 1.9% | | | | | | |
Union Pacific Corp. | | | 57,838 | | | | 7,756,076 | |
| | | | | | | | |
| Semiconductors & Semiconductor Equipment — 4.9% | | | | | | |
ASML Holding NV, NYRS(b) | | | 33,908 | | | | 5,893,888 | |
Broadcom Ltd. | | | 22,861 | | | | 5,872,991 | |
NVIDIA Corp. | | | 26,892 | | | | 5,203,602 | |
Teradyne, Inc. | | | 67,703 | | | | 2,834,725 | |
| | | | | | | | |
| | | | | | | 19,805,206 | |
| Software — 11.4% | | | | | | |
Activision Blizzard, Inc. | | | 51,542 | | | | 3,263,639 | |
Adobe Systems, Inc.(a) | | | 43,374 | | | | 7,600,860 | |
Autodesk, Inc.(a) | | | 70,915 | | | | 7,434,020 | |
Electronic Arts, Inc.(a) | | | 38,123 | | | | 4,005,202 | |
Microsoft Corp. | | | 274,482 | | | | 23,479,190 | |
| | | | | | | | |
| | | | | | | 45,782,911 | |
| Specialty Retail — 4.2% | | | | | | |
Home Depot, Inc. (The) | | | 47,328 | | | | 8,970,076 | |
Ulta Beauty, Inc.(a) | | | 35,401 | | | | 7,917,787 | |
| | | | | | | | |
| | | | | | | 16,887,863 | |
| Technology Hardware, Storage & Peripherals — 1.4% | | | | |
Apple, Inc. | | | 32,516 | | | | 5,502,683 | |
| | | | | | | | |
| Textiles, Apparel & Luxury Goods — 1.4% | | | | | | |
NIKE, Inc., Class B | | | 89,451 | | | | 5,595,160 | |
| | | | | | | | |
| |
Total Common Stocks — 98.9%
(Cost: $288,228,553) | | | | 397,849,274 | |
| | | | | | | | |
|
Preferred Stocks — 0.6% | |
| |
| Software — 0.6% | | | | |
Palantir Technologies, Inc., Series I
(Acquired 2/07/2014, cost $2,858,020), 0.00%(a)(c)(d) | | | 466,235 | | | | 2,643,552 | |
| | | | | | | | |
Total Preferred Stocks — 0.6%
(Cost: $2,858,020) | | | | 2,643,552 | |
| | | | | | | | |
Total Long-Term Investments — 99.5%
(Cost: $291,086,573) | | | | 400,492,826 | |
| | | | | | | | |
| | | | |
| SCHEDULE OF INVESTMENTS | | | 5 | |
| | |
Schedule of Investments (continued) December 31, 2017 | | BlackRock Capital Appreciation V.I. Fund (Percentages shown are based on Net Assets) |
| | | | | | | | |
| Security | | Shares | | | Value | |
Short-Term Securities — 4.5%(e)(g) | |
BlackRock Liquidity Funds, T-Fund, Institutional Class, 1.17% | | | 2,708,926 | | | $ | 2,708,926 | |
SL Liquidity Series, LLC, Money Market Series,
1.48%(f) | | | 15,258,256 | | | | 15,256,731 | |
| | | | | | | | |
Total Short-Term Securities — 4.5%
(Cost: $17,965,657) | | | | 17,965,657 | |
| | | | | | | | |
| |
Total Investments — 104.0%
(Cost: $309,052,230) | | | | 418,458,483 | |
Liabilities in Excess of Other Assets — (4.0)% | | | | (16,243,530 | ) |
| | | | | | | | |
Net Assets — 100.0% | | | $ | 402,214,953 | |
| | | | | | | | |
| (a) | Non-income producing security. |
| (b) | Security, or a portion of the security, is on loan. |
| (c) | Restricted security as to resale, excluding 144A securities. The Fund held restricted securities with a current value of $2,643,552, representing 0.70% of its net assets as of period end, and an original cost of $2,858,020. |
| (d) | Security is valued using significant unobservable inputs and is classified as Level 3 in the fair value hierarchy. |
| (e) | Annualized 7-day yield as of period end. |
| (f) | Security was purchased with the cash collateral from loaned securities. |
| (g) | During the year ended December 31, 2017, investments in issuers considered to be affiliates of the Fund for the purposes of Section 2(a)(3) of the Investment Company Act of 1940, as amended, were as follows: |
| | | | | | | | | | | | | | | | | | | | | | | | | | | | |
| Affiliate | | Shares
Held at
12/31/16 | | | Net
Activity | | | Shares
Held at
12/31/17 | | | Value at
12/31/17 | | | Income | | | Net
Realized
Gain (Loss) (a) | | | Change in
Unrealized
Appreciation
(Depreciation) | |
BlackRock Liquidity Funds, T-Fund, Institutional Class | | | 3,707,694 | | | | (998,768 | ) | | | 2,708,926 | | | $ | 2,708,926 | | | $ | 19,473 | | | $ | 7 | | | $ | — | |
SL Liquidity Series, LLC, Money Market Series | | | 4,725,932 | | | | 10,532,324 | | | | 15,258,256 | | | | 15,256,731 | | | | 143,268 | (b) | | | (8,169 | ) | | | 419 | |
| | | | | | | | | | | | | | | | | | | | | | | | | | | | |
| | | | | | | | | | | | | | $ | 17,965,657 | | | $ | 162,741 | | | $ | (8,162 | ) | | $ | 419 | |
| | | | | | | | | | | | | | | | | | | | | | | | | | | | |
| | (a) | Includes net capital gain distributions, if applicable. | |
| | (b) | Represents securities lending income earned from the reinvestment of cash collateral from loaned securities, net of fees and collateral investment expenses, and other payments to and from borrowers of securities. | |
| | For Fund compliance purposes, the Fund’s industry classifications refer to one or more of the industry sub-classifications used by one or more widely recognized market indexes or ratings group indexes, and/or as defined by the investment adviser. These definitions may not apply for purposes of this report, which may combine such industry sub-classifications for reporting ease. |
Portfolio Abbreviations
ADR — American Depositary Receipts
NYRS — New York Registered Shares
REIT — Real Estate Investment Trust
Fair Value Hierarchy as of Period End
Various inputs are used in determining the fair value of investments. For information about the Fund’s policy regarding valuation of investments, refer to the Notes to Financial Statements.
The following table summarizes the Fund’s investments categorized in the disclosure hierarchy:
| | | | | | | | | | | | | | | | |
| | | Level 1 | | | Level 2 | | | Level 3 | | | Total | |
Assets: | | | | | | | | | | | | | | | | |
Investments: | | | | | | | | | | | | | | | | |
Long-Term Investments: | | | | | | | | | | | | | | | | |
Common Stocks: | | | | | | | | | | | | | | | | |
Aerospace & Defense | | $ | 4,172,576 | | | $ | — | | | $ | — | | | $ | 4,172,576 | |
Airlines | | | 2,049,043 | | | | — | | | | — | | | | 2,049,043 | |
Banks | | | 20,907,577 | | | | — | | | | — | | | | 20,907,577 | |
Beverages | | | 15,249,620 | | | | — | | | | — | | | | 15,249,620 | |
Biotechnology | | | 14,070,243 | | | | — | | | | — | | | | 14,070,243 | |
Capital Markets | | | 4,020,709 | | | | — | | | | — | | | | 4,020,709 | |
Chemicals | | | 12,337,727 | | | | — | | | | — | | | | 12,337,727 | |
Construction Materials | | | 6,914,137 | | | | — | | | | — | | | | 6,914,137 | |
Diversified Financial Services | | | 6,066,523 | | | | — | | | | — | | | | 6,066,523 | |
Diversified Telecommunication Services | | | 1,813,541 | | | | — | | | | — | | | | 1,813,541 | |
Energy Equipment & Services | | | 6,228,726 | | | | — | | | | — | | | | 6,228,726 | |
| | |
| 6 | | 2017 BLACKROCK ANNUAL REPORTTO SHAREHOLDERS |
| | |
Schedule of Investments (continued) December 31, 2017 | | BlackRock Capital Appreciation V.I. Fund (Percentages shown are based on Net Assets) |
| | | | | | | | | | | | | | | | |
| | | Level 1 | | | Level 2 | | | Level 3 | | | Total | |
Equity Real Estate Investment Trusts (REITs) | | $ | 4,137,349 | | | $ | — | | | $ | — | | | $ | 4,137,349 | |
Health Care Equipment & Supplies | | | 11,717,603 | | | | — | | | | — | | | | 11,717,603 | |
Health Care Providers & Services | | | 19,232,049 | | | | — | | | | — | | | | 19,232,049 | |
Hotels, Restaurants & Leisure | | | 5,402,555 | | | | — | | | | — | | | | 5,402,555 | |
Industrial Conglomerates | | | 9,244,962 | | | | — | | | | — | | | | 9,244,962 | |
Internet & Direct Marketing Retail | | | 50,926,167 | | | | — | | | | — | | | | 50,926,167 | |
Internet Software & Services | | | 42,342,313 | | | | 14,983,928 | | | | — | | | | 57,326,241 | |
IT Services | | | 25,336,043 | | | | — | | | | — | | | | 25,336,043 | |
Life Sciences Tools & Services | | | 4,710,863 | | | | — | | | | — | | | | 4,710,863 | |
Machinery | | | 2,535,935 | | | | — | | | | — | | | | 2,535,935 | |
Oil, Gas & Consumable Fuels | | | 1,747,341 | | | | — | | | | — | | | | 1,747,341 | |
Pharmaceuticals | | | 3,627,646 | | | | — | | | | — | | | | 3,627,646 | |
Professional Services | | | 6,744,199 | | | | — | | | | — | | | | 6,744,199 | |
Road & Rail | | | 7,756,076 | | | | — | | | | — | | | | 7,756,076 | |
Semiconductors & Semiconductor Equipment | | | 19,805,206 | | | | — | | | | — | | | | 19,805,206 | |
Software | | | 45,782,911 | | | | — | | | | — | | | | 45,782,911 | |
Specialty Retail | | | 16,887,863 | | | | — | | | | — | | | | 16,887,863 | |
Technology Hardware, Storage & Peripherals | | | 5,502,683 | | | | — | | | | — | | | | 5,502,683 | |
Textiles, Apparel & Luxury Goods | | | 5,595,160 | | | | — | | | | — | | | | 5,595,160 | |
Preferred Stocks | | | — | | | | — | | | | 2,643,552 | | | | 2,643,552 | |
Short-Term Securities | | | 2,708,926 | | | | — | | | | — | | | | 2,708,926 | |
| | | | | | | | | | | | | | | | |
Subtotal | | $ | 385,574,272 | | | $ | 14,983,928 | | | $ | 2,643,552 | | | $ | 403,201,752 | |
| | | | | | | | | | | | | | | | |
Investments valued at NAV(a) | | | | | | | | | | | | | | $ | 15,256,731 | |
| | | | | | | | | | | | | | | | |
Total Investments | | | | | | | | | | | | | | $ | 418,458,483 | |
| | | | | | | | | | | | | | | | |
| | (a) | As of December 31, 2017, certain investments of the Fund were fair valued using NAV per share, as no quoted market value was available, and therefore have been excluded from the fair value hierarchy. | |
During the year ended December 31, 2017, there were no transfers between Level 1 and Level 2.
A reconciliation of Level 3 investments is presented when the Fund had a significant amount of Level 3 investments at the beginning and/or end of the year in relation to net assets. The following table is a reconciliation of Level 3 investments for which significant unobservable inputs were used in determining fair value:
| | | | |
| | | Preferred Securities | |
Investments: | | | | |
Assets: | | | | |
Opening Balance, as of December 31, 2016 | | $ | 3,771,841 | |
Transfers into Level 3 | | | — | |
Transfers out of Level 3 | | | — | |
Accrued discounts/premiums | | | — | |
Net realized gain (loss) | | | — | |
Net change in unrealized appreciation (depreciation)(a)(b) | | | (1,128,289 | ) |
Purchases | | | — | |
Sales | | | — | |
| | | | |
Closing Balance, as of December 31, 2017 | | $ | 2,643,552 | |
| | | | |
Net change in unrealized appreciation (depreciation) on investments still held at December 31, 2017(b) | | $ | (1,128,289 | ) |
| | | | |
| | (a) | Included in the related net change in unrealized appreciation (depreciation) in the Statement of Operations. | |
| | (b) | Any difference between net change in unrealized appreciation (depreciation) and net change in unrealized appreciation (depreciation) on investments still held at December 31, 2017 is generally due to investments no longer held or categorized as Level 3 at period end. | |
The Fund’s investments that are categorized as Level 3 were valued utilizing third party pricing information without adjustment. Such valuations are based on unobservable inputs. A significant change in third party information could result in a significantly lower or higher value of such Level 3 investments.
See notes to financial statements.
| | | | |
| SCHEDULE OF INVESTMENTS | | | 7 | |
Statement of Assets and Liabilities
December 31, 2017
| | | | |
| | | BlackRock Capital
Appreciation
V.I. Fund | |
|
ASSETS | |
Investments at value — unaffiliated (including securities loaned at value of $14,904,951) (cost — $291,086,573) | | $ | 400,492,826 | |
Investments at value — affiliated (cost — $17,965,657) | | | 17,965,657 | |
Foreign currency at value (cost — $83) | | | 83 | |
Receivables: | | | | |
Securities lending income — affiliated | | | 2,160 | |
Capital shares sold | | | 14,023 | |
Dividends — affiliated | | | 2,284 | |
Dividends — unaffiliated | | | 45,468 | |
Prepaid expenses | | | 1,895 | |
| | | | |
Total assets | | | 418,524,396 | |
| | | | |
|
LIABILITIES | |
Bank overdraft | | | 177,483 | |
Cash collateral on securities loaned at value | | | 15,261,552 | |
Payables: | | | | |
Capital shares redeemed | | | 369,247 | |
Investment advisory fees | | | 252,576 | |
Officer’s and Directors’ fees | | | 4,486 | |
Other accrued expenses | | | 94,411 | |
Other affiliates | | | 867 | |
Distribution fees | | | 54,862 | |
Transfer agent fees | | | 93,959 | |
| | | | |
Total liabilities | | | 16,309,443 | |
| | | | |
| |
NET ASSETS | | $ | 402,214,953 | |
| | | | |
|
NET ASSETS CONSIST OF | |
Paid-in capital | | $ | 282,192,962 | |
Undistributed net investment income | | | 62,282 | |
Accumulated net realized gain | | | 10,553,456 | |
Net unrealized appreciation (depreciation) | | | 109,406,253 | |
| | | | |
NET ASSETS | | $ | 402,214,953 | |
| | | | |
|
NET ASSET VALUE | |
Class I — Based on net assets of $142,246,394 and 13,861,449 shares outstanding, 100 million shares authorized, $0.10 par value | | $ | 10.26 | |
| | | | |
Class III — Based on net assets of $259,968,559 and 25,573,448 shares outstanding, 100 million shares authorized, $0.10 par value | | $ | 10.17 | |
| | | | |
See notes to financial statements.
| | |
| 8 | | 2017 BLACKROCK ANNUAL REPORTTO SHAREHOLDERS |
Statement of Operations
Year Ended December 31, 2017
| | | | |
| | | BlackRock Capital
Appreciation
V.I. Fund | |
| |
INVESTMENT INCOME | | | | |
Dividends — affiliated | | $ | 19,473 | |
Dividends — unaffiliated(a) | | | 2,881,195 | |
Securities lending income — affiliated — net | | | 143,268 | |
Foreign taxes withheld | | | (10,566 | ) |
| | | | |
Total investment income | | | 3,033,370 | |
| | | | |
| | | | |
| |
EXPENSES | | | | |
Investment advisory | | | 2,526,195 | |
Transfer agent — class specific | | | 791,950 | |
Distribution — class specific | | | 630,068 | |
Accounting services | | | 71,162 | |
Printing | | | 61,156 | |
Professional | | | 55,658 | |
Custodian | | | 33,659 | |
Directors and Officer | | | 25,213 | |
Transfer agent | | | 5,001 | |
Registration | | | 31 | |
Miscellaneous | | | 14,733 | |
| | | | |
Total expenses | | | 4,214,826 | |
| | | | |
Less: | | | | |
Transfer agent fees reimbursed — class specific | | | (494,679 | ) |
Fees waived and/or reimbursed by the Manager | | | (1,369 | ) |
| | | | |
Total expenses after fees waived and/or reimbursed | | | 3,718,778 | |
| | | | |
Net investment loss | | | (685,408 | ) |
| | | | |
| |
REALIZED AND UNREALIZED GAIN (LOSS) | | | | |
Net realized gain (loss) from: | | | | |
Investments — affiliated | | | (8,169 | ) |
Investments — unaffiliated | | | 48,217,787 | |
Capital gain distributions from investment companies — affiliated | | | 7 | |
Foreign currency transactions | | | 447 | |
| | | | |
| | | 48,210,072 | |
| | | | |
Net change in unrealized appreciation (depreciation) on: | | | | |
Investments — affiliated | | | 419 | |
Investments — unaffiliated | | | 62,728,324 | |
| | | | |
| | | 62,728,743 | |
| | | | |
Net realized and unrealized gain | | | 110,938,815 | |
| | | | |
NET INCREASE IN NET ASSETS RESULTING FROM OPERATIONS | | $ | 110,253,407 | |
| | | | |
| (a) | Includes non-recurring dividends in the amount of $356,796. |
See notes to financial statements.
Statements of Changes in Net Assets
| | | | | | | | |
| | | BlackRock Capital
Appreciation V.I. Fund | |
| | | Year Ended December 31, | |
| | | 2017 | | | 2016 | |
| | |
INCREASE (DECREASE) IN NET ASSETS | | | | | | | | |
| | |
OPERATIONS | | | | | | | | |
Net investment loss | | $ | (685,408 | ) | | $ | (803,733 | ) |
Net realized gain | | | 48,210,072 | | | | 11,433,518 | |
Net change in unrealized appreciation (depreciation) | | | 62,728,743 | | | | (9,402,200 | ) |
| | | | | | | | |
Net increase in net assets resulting from operations | | | 110,253,407 | | | | 1,227,585 | |
| | | | | | | | |
| | |
DISTRIBUTIONS TO SHAREHOLDERS(a) | | | | | | | | |
From net realized gain: | | | | | | | | |
Class I | | | (15,570,061 | ) | | | (3,477,222 | ) |
Class III | | | (28,079,992 | ) | | | (6,437,188 | ) |
| | | | | | | | |
Decrease in net assets resulting from distributions to shareholders | | | (43,650,053 | ) | | | (9,914,410 | ) |
| | | | | | | | |
| | |
CAPITAL SHARE TRANSACTIONS | | | | | | | | |
Net decrease in net assets derived from capital share transactions | | | (20,276,483 | ) | | | (8,176,154 | ) |
| | | | | | | | |
| | |
NET ASSETS | | | | | | | | |
Total increase (decrease) in net assets | | | 46,326,871 | | | | (16,862,979 | ) |
Beginning of year | | | 355,888,082 | | | | 372,751,061 | |
| | | | | | | | |
End of year | | $ | 402,214,953 | | | $ | 355,888,082 | |
| | | | | | | | |
Undistributed net investment income, end of year | | $ | 62,282 | | | $ | 20,528 | |
| | | | | | | | |
| (a) | Distributions for annual periods determined in accordance with U.S. federal income tax regulations. |
See notes to financial statements.
| | |
| 10 | | 2017 BLACKROCK ANNUAL REPORTTO SHAREHOLDERS |
Financial Highlights
(For a share outstanding throughout each period)
| | | | | | | | | | | | | | | | | | | | |
| | | BlackRock Capital Appreciation V.I. Fund | |
| | | Class I | |
| | | Year Ended December 31, | |
| | | 2017 | | | 2016 | | | 2015 | | | 2014 | | | 2013 | |
Net asset value, beginning of year | | $ | 8.63 | | | $ | 8.86 | | | $ | 9.02 | | | $ | 9.80 | | | $ | 8.50 | |
| | | | | | | | | | | | | | | | | | | | |
Net investment (loss)(a) | | | (0.00 | )(b)(c) | | | (0.00 | )(b)(d) | | | (0.01 | ) | | | (0.01 | ) | | | (0.00 | )(b) |
Net realized and unrealized gain | | | 2.86 | | | | 0.01 | | | | 0.63 | | | | 0.87 | | | | 2.86 | |
| | | | | | | | | | | | | | | | | | | | |
Net increase from investment operations | | | 2.86 | | | | 0.01 | | | | 0.62 | | | | 0.86 | | | | 2.86 | |
| | | | | | | | | | | | | | | | | | | | |
| Distributions:(e) | | | | | | | | | | | | | | | |
From net investment income | | | — | | | | — | | | | — | | | | — | | | | (0.00 | )(b) |
From net realized gain | | | (1.23 | ) | | | (0.24 | ) | | | (0.78 | ) | | | (1.64 | ) | | | (1.56 | ) |
| | | | | | | | | | | | | | | | | | | | |
Total distributions | | | (1.23 | ) | | | (0.24 | ) | | | (0.78 | ) | | | (1.64 | ) | | | (1.56 | ) |
| | | | | | | | | | | | | | | | | | | | |
Net asset value, end of year | | $ | 10.26 | | | $ | 8.63 | | | $ | 8.86 | | | $ | 9.02 | | | $ | 9.80 | |
| | | | | | | | | | | | | | | | | | | | |
| | | | | |
Total Return:(f) | | | | | | | | | | | | | | | | | | | | |
Based on net asset value | | | 33.22 | % | | | 0.10 | % | | | 6.73 | % | | | 9.02 | % | | | 33.82 | % |
| | | | | | | | | | | | | | | | | | | | |
| | | | | |
Ratios to Average Net Assets: | | | | | | | | | | | | | | | | | | | | |
Total expenses | | | 0.92 | % | | | 0.92 | % | | | 0.93 | % | | | 0.91 | % | | | 0.93 | % |
| | | | | | | | | | | | | | | | | | | | |
Total expenses after fees waived and/or reimbursed | | | 0.79 | % | | | 0.80 | % | | | 0.79 | % | | | 0.79 | % | | | 0.80 | % |
| | | | | | | | | | | | | | | | | | | | |
Net investment loss | | | (0.00 | )(b)(c) | | | (0.06 | )%(d) | | | (0.15 | )% | | | (0.10 | )% | | | (0.00 | )%(b) |
| | | | | | | | | | | | | | | | | | | | |
| | | | | |
Supplemental Data: | | | | | | | | | | | | | | | | | | | | |
Net assets, end of year (000) | | $ | 142,246 | | | $ | 124,752 | | | $ | 139,045 | | | $ | 166,586 | | | $ | 180,580 | |
| | | | | | | | | | | | | | | | | | | | |
Portfolio turnover rate | | | 48 | % | | | 89 | % | | | 70 | % | | | 102 | % | | | 158 | % |
| | | | | | | | | | | | | | | | | | | | |
| (a) | Based on average shares outstanding. |
| (b) | Amount is greater than $(0.005) per share. |
| (c) | Net Investment Income per share and the ratio of net investment income to average net assets include $0.01 per share and 0.09%, respectively, resulting from a special dividend from TransDigm Group, Inc. in August 2017. |
| (d) | Net investment income per share and the ratio of net investment income to average net assets include $0.01 per share and 0.07%, respectively, resulting from a special dividend from TransDigm Group, Inc. in October 2016. |
| (e) | Distributions for annual periods determined in accordance with U.S. federal income tax regulations. |
| (f) | Where applicable, excludes insurance-related fees and expenses and assumes the reinvestment of distributions. |
See notes to financial statements.
Financial Highlights (continued)
(For a share outstanding throughout each period)
| | | | | | | | | | | | | | | | | | | | |
| | | BlackRock Capital Appreciation V.I. Fund | |
| | | Class III | |
| | | Year Ended December 31, | |
| | | 2017 | | | 2016 | | | 2015 | | | 2014 | | | 2013 | |
Net asset value, beginning of year | | $ | 8.56 | | | $ | 8.81 | | | $ | 8.97 | | | $ | 9.76 | | | $ | 8.48 | |
| | | | | | | | | | | | | | | | | | | | |
Net investment (loss)(a) | | | (0.03 | )(b) | | | (0.03 | )(c) | | | (0.04 | ) | | | (0.03 | ) | | | (0.03 | ) |
Net realized and unrealized gain | | | 2.84 | | | | 0.02 | | | | 0.63 | | | | 0.86 | | | | 2.84 | |
| | | | | | | | | | | | | | | | | | | | |
Net increase (decrease) from investment operations | | | 2.81 | | | | (0.01 | ) | | | 0.59 | | | | 0.83 | | | | 2.81 | |
| | | | | | | | | | | | | | | | | | | | |
| Distributions:(d) | | | | | | | | | | | | | | | |
From net investment income | | | — | | | | — | | | | — | | | | — | | | | (0.00 | )(e) |
From net realized gain | | | (1.20 | ) | | | (0.24 | ) | | | (0.75 | ) | | | (1.62 | ) | | | (1.53 | ) |
| | | | | | | | | | | | | | | | | | | | |
Total distributions | | | (1.20 | ) | | | (0.24 | ) | | | (0.75 | ) | | | (1.62 | ) | | | (1.53 | ) |
| | | | | | | | | | | | | | | | | | | | |
Net asset value, end of year | | $ | 10.17 | | | $ | 8.56 | | | $ | 8.81 | | | $ | 8.97 | | | $ | 9.76 | |
| | | | | | | | | | | | | | | | | | | | |
| | | | | |
Total Return:(f) | | | | | | | | | | | | | | | | | | | | |
Based on net asset value | | | 32.94 | % | | | (0.13 | )% | | | 6.49 | % | | | 8.68 | % | | | 33.40 | % |
| | | | | | | | | | | | | | | | | | | | |
| | | | | |
Ratios to Average Net Assets: | | | | | | | | | | | | | | | | | | | | |
Total expenses | | | 1.17 | % | | | 1.18 | % | | | 1.17 | % | | | 1.18 | % | | | 1.19 | % |
| | | | | | | | | | | | | | | | | | | | |
Total expenses after fees waived and/or reimbursed | | | 1.05 | % | | | 1.06 | % | | | 1.05 | % | | | 1.05 | % | | | 1.06 | % |
| | | | | | | | | | | | | | | | | | | | |
Net investment loss | | | (0.27 | )%(b) | | | (0.32 | )%(c) | | | (0.40 | )% | | | (0.35 | )% | | | (0.27 | )% |
| | | | | | | | | | | | | | | | | | | | |
| | | | | |
Supplemental Data: | | | | | | | | | | | | | | | | | | | | |
Net assets, end of year (000) | | $ | 259,969 | | | $ | 231,136 | | | $ | 233,706 | | | $ | 233,723 | | | $ | 207,582 | |
| | | | | | | | | | | | | | | | | | | | |
Portfolio turnover rate | | | 48 | % | | | 89 | % | | | 70 | % | | | 102 | % | | | 158 | % |
| | | | | | | | | | | | | | | | | | | | |
| (a) | Based on average shares outstanding. |
| (b) | Net investment income per share and the ratio of net investment income to average net assets include $0.01 per share and 0.09%, respectively, resulting from a special dividend from TransDigm Group, Inc. in August 2017. |
| (c) | Net investment income per share and the ratio of net investment income to average net assets include $0.00 per share and 0.07%, respectively, resulting from a special dividend from TransDigm Group, Inc. in October 2016. |
| (d) | Distributions for annual periods determined in accordance with U.S. federal income tax regulations. |
| (e) | Amount is greater than $(0.005) per share. |
| (f) | Where applicable, excludes insurance-related fees and expenses and assumes the reinvestment of distributions. |
See notes to financial statements.
| | |
| 12 | | 2017 BLACKROCK ANNUAL REPORTTO SHAREHOLDERS |
Notes to Financial Statements
BlackRock Variable Series Funds, Inc. (the “Company”) is registered under the Investment Company Act of 1940, as amended (the “1940 Act”), as an open-end management investment company. The Company is organized as a Maryland corporation that is comprised of 20 separate funds.
The funds offer shares to insurance companies for their separate accounts to fund benefits under certain variable annuity and variable life insurance contracts. The financial statements presented are for BlackRock Capital Appreciation V.I. Fund (the “Fund”). The Fund is classified as diversified. Class I and Class III Shares have equal voting, dividend, liquidation and other rights, except that only shares of the respective classes are entitled to vote on matters concerning only that class. In addition, Class III Shares bear certain expenses related to the distribution of such shares. Class III Shares were redeemed on December 31, 2007 and sales of Class III Shares recommenced on June 15, 2010.
The Fund, together with certain other registered investment companies advised by BlackRock Advisors, LLC (the “Manager”) or its affiliates, is included in a complex of open-end funds referred to as the Equity-Bond Complex.
| 2. | SIGNIFICANT ACCOUNTING POLICIES |
The financial statements are prepared in conformity with accounting principles generally accepted in the United States of America (“U.S. GAAP”), which may require management to make estimates and assumptions that affect the reported amounts of assets and liabilities in the financial statements, disclosure of contingent assets and liabilities at the date of the financial statements and the reported amounts of increases and decreases in net assets from operations during the reporting period. Actual results could differ from those estimates. The Fund is considered an investment company under U.S. GAAP and follows the accounting and reporting guidance applicable to investment companies. Below is a summary of significant accounting policies:
Investment Transactions and Income Recognition: For financial reporting purposes, investment transactions are recorded on the dates the transactions are entered into (the “trade dates”). Realized gains and losses on investment transactions are determined on the identified cost basis. Dividend income is recorded on the ex-dividend date. Dividends from foreign securities where the ex-dividend date may have passed are subsequently recorded when the Fund is informed of the ex-dividend date. Under the applicable foreign tax laws, a withholding tax at various rates may be imposed on capital gains, dividends and interest. Upon notification from issuers, some of the dividend income received from a real estate investment trust may be redesignated as a reduction of cost of the related investment and/or realized gain. Income, expenses and realized and unrealized gains and losses are allocated daily to each class based on its relative net assets.
Foreign Currency Translation: The Fund’s books and records are maintained in U.S. dollars. Securities and other assets and liabilities denominated in foreign currencies are translated into U.S. dollars using exchange rates determined as of the close of trading on the New York Stock Exchange (“NYSE”). Purchases and sales of investments are recorded at the rates of exchange prevailing on the respective dates of such transactions. Generally, when the U.S. dollar rises in value against a foreign currency, the investments denominated in that currency will lose value; the opposite effect occurs if the U.S. dollar falls in relative value.
The Fund does not isolate the portion of the results of operations arising as a result of changes in the exchange rates from the changes in the market prices of investments held or sold for financial reporting purposes. Accordingly, the effects of changes in exchange rates on investments are not segregated in the Statement of Operations from the effects of changes in market prices of those investments, but are included as a component of net realized and unrealized gain (loss) from investments. The Fund reports realized currency gains (losses) on foreign currency related transactions as components of net realized gain (loss) for financial reporting purposes, whereas such components are generally treated as ordinary income for U.S. federal income tax purposes.
Distributions: Distributions paid by the Fund are recorded on the ex-dividend date. The character and timing of distributions are determined in accordance with U.S. federal income tax regulations, which may differ from U.S. GAAP.
Indemnifications: In the normal course of business, the Fund enters into contracts that contain a variety of representations that provide general indemnification. The Fund’s maximum exposure under these arrangements is unknown because it involves future potential claims against the Fund, which cannot be predicted with any certainty.
Other: Expenses directly related to the Fund or its classes are charged to the Fund or the applicable class. Other operating expenses shared by several funds, including other funds managed by the Manager, are prorated among those funds on the basis of relative net assets or other appropriate methods. Expenses directly related to the Fund and other shared expenses prorated to the Fund are allocated daily to each class based on its relative net assets or other appropriate methods.
| 3. | INVESTMENT VALUATION AND FAIR VALUE MEASUREMENTS |
Investment Valuation Policies: The Fund’s investments are valued at fair value (also referred to as “market value” within the financial statements) as of the close of trading on the NYSE (generally 4:00 p.m., Eastern time) (or, if the reporting date falls on a day the NYSE is closed, investments are valued at fair value as of the period end). U.S. GAAP defines fair value as the price the Fund would receive to sell an asset or pay to transfer a liability in an orderly transaction between market participants at the measurement date. The Fund determines the fair values of its financial instruments using various independent dealers or pricing services under policies approved by the Board of Directors of the Company (the “Board”). The BlackRock Global Valuation Methodologies Committee (the “Global Valuation Committee”) is the committee formed by management to develop global pricing policies and procedures and to oversee the pricing function for all financial instruments.
| | | | |
| NOTESTO FINANCIAL STATEMENTS | | | 13 | |
Notes to Financial Statements (continued)
Fair Value Inputs and Methodologies: The following methods and inputs are used to establish the fair value of the Fund’s assets and liabilities:
| | • | | Equity investments traded on a recognized securities exchange are valued at the official closing price each day, if available. For equity investments traded on more than one exchange, the official closing price on the exchange where the stock is primarily traded is used. Equity investments traded on a recognized exchange for which there were no sales on that day may be valued at the last available bid (long positions) or ask (short positions) price. |
| | • | | Generally, trading in foreign instruments is substantially completed each day at various times prior to the close of trading on the NYSE. Occasionally, events affecting the values of such instruments may occur between the foreign market close and the close of trading on the NYSE that may not be reflected in the computation of the Fund’s net assets. Each business day, the Fund uses a pricing service to assist with the valuation of certain foreign exchange-traded equity securities and foreign exchange-traded and over-the-counter (“OTC”) options (the “Systematic Fair Value Price”). Using current market factors, the Systematic Fair Value Price is designed to value such foreign securities and foreign options at fair value as of the close of trading on the NYSE, which follows the close of the local markets. |
| | • | | Investments in open-end U.S. mutual funds are valued at net asset value (“NAV”) each business day. |
If events (e.g., a company announcement, market volatility or a natural disaster) occur that are expected to materially affect the value of such investments, or in the event that the application of these methods of valuation results in a price for an investment that is deemed not to be representative of the market value of such investment, or if a price is not available, the investment will be valued by the Global Valuation Committee, or its delegate, in accordance with a policy approved by the Board as reflecting fair value (“Fair Valued Investments”). The fair valuation approaches that may be used by the Global Valuation Committee will include market approach, income approach and cost approach. Valuation techniques such as discounted cash flow, use of market comparables and matrix pricing are types of valuation approaches and are typically used in determining fair value. When determining the price for Fair Valued Investments, the Global Valuation Committee, or its delegate, seeks to determine the price that the Fund might reasonably expect to receive or pay from the current sale or purchase of that asset or liability in an arm’s-length transaction. Fair value determinations shall be based upon all available factors that the Global Valuation Committee, or its delegate, deems relevant and consistent with the principles of fair value measurement.
The Global Valuation Committee, or its delegate, employs various methods for calibrating valuation approaches for investments where an active market does not exist, including regular due diligence of the Fund’s pricing vendors, regular reviews of key inputs and assumptions, transactional back-testing or disposition analysis to compare unrealized gains and losses to realized gains and losses, reviews of missing or stale prices and large movements in market values and reviews of any market related activity. The pricing of all Fair Valued Investments is subsequently reported to the Board or a committee thereof on a quarterly basis. As a result of the inherent uncertainty in valuation of these investments, the fair values may differ from the values that would have been used had an active market existed.
For investments in equity or debt issued by privately held companies or funds (“Private Company” or collectively, the “Private Companies”) and other Fair Valued Investments, the fair valuation approaches that are used by third party pricing services utilize one or a combination of, but not limited to, the following inputs.
| | |
| | | Standard Inputs Generally Considered By Third Party Pricing Services |
Market approach | | (i) recent market transactions, including subsequent rounds of financing, in the underlying investment or comparable issuers; (ii) recapitalizations and other transactions across the capital structure; and (iii) market multiples of comparable issuers. |
Income approach | | (i) future cash flows discounted to present and adjusted as appropriate for liquidity, credit, and/or market risks; (ii) quoted prices for similar investments or assets in active markets; and (iii) other risk factors, such as interest rates, yield curves, volatilities, prepayment speeds, loss severities, credit risks, recovery rates, liquidation amounts and/or default rates. |
Cost approach | | (i) audited or unaudited financial statements, investor communications and financial or operational metrics issued by the Private Company; (ii) changes in the valuation of relevant indices or publicly traded companies comparable to the Private Company; (iii) relevant news and other public sources; and (iv) known secondary market transactions in the Private Company’s interests and merger or acquisition activity in companies comparable to the Private Company. |
Investments in series of preferred stock issued by Private Companies are typically valued utilizing market approach in determining the enterprise value of the company. Such investments often contain rights and preferences that differ from other series of preferred and common stock of the same issuer. Valuation techniques such as an option pricing model (“OPM”), a probability weighted expected return model (“PWERM”) or a hybrid of those techniques are used in allocating enterprise value of the company, as deemed appropriate under the circumstances. The use of OPM and PWERM techniques involve a determination of the exit scenarios of the investment in order to appropriately allocate the enterprise value of the company among the various parts of its capital structure.
The Private Companies are not subject to the public company disclosure, timing, and reporting standards as other investments held by the Fund. Typically, the most recently available information by a Private Company is as of a date that is earlier than the date the Fund is calculating its NAV. This factor may result in a difference between the value of the investment and the price the Fund could receive upon the sale of the investment.
Fair Value Hierarchy: Various inputs are used in determining the fair value of investments. These inputs to valuation techniques are categorized into a fair value hierarchy consisting of three broad levels for financial statement purposes as follows:
| | • | | Level 1 — Unadjusted price quotations in active markets/exchanges for identical assets or liabilities that the Fund has the ability to access |
| | • | | Level 2 — Other observable inputs (including, but not limited to, quoted prices for similar assets or liabilities in markets that are active, quoted prices for identical or similar assets or liabilities in markets that are not active, inputs other than quoted prices that are observable for the assets or liabilities (such as interest rates, yield curves, volatilities, prepayment speeds, loss severities, credit risks and default rates) or other market — corroborated inputs) |
| | |
| 14 | | 2017 BLACKROCK ANNUAL REPORTTO SHAREHOLDERS |
Notes to Financial Statements (continued)
| | • | | Level 3 — Unobservable inputs based on the best information available in the circumstances, to the extent observable inputs are not available (including the Fund’s own assumptions used in determining the fair value of investments) |
The hierarchy gives the highest priority to unadjusted quoted prices in active markets for identical assets or liabilities (Level 1 measurements) and the lowest priority to unobservable inputs (Level 3 measurements). Accordingly, the degree of judgment exercised in determining fair value is greatest for instruments categorized in Level 3. The inputs used to measure fair value may fall into different levels of the fair value hierarchy. In such cases, for disclosure purposes, the fair value hierarchy classification is determined based on the lowest level input that is significant to the fair value measurement in its entirety. Investments classified within Level 3 have significant unobservable inputs used by the Global Valuation Committee in determining the price for Fair Valued Investments. Level 3 investments include equity or debt issued by Private Companies. There may not be a secondary market, and/or there are a limited number of investors. Level 3 investments may also be adjusted to reflect illiquidity and/or non-transferability, with the amount of such discount estimated by the Global Valuation Committee in the absence of market information.
Changes in valuation techniques may result in transfers into or out of an assigned level within the hierarchy. In accordance with the Fund’s policy, transfers between different levels of the fair value hierarchy are deemed to have occurred as of the beginning of the reporting period. The categorization of a value determined for investments is based on the pricing transparency of the investments and is not necessarily an indication of the risks associated with investing in those securities.
As of December 31, 2017, certain investments of the Fund were valued using NAV per share as no quoted market value is available and therefore have been excluded from the fair value hierarchy.
| 4. | SECURITIES AND OTHER INVESTMENTS |
Preferred Stocks: Preferred stock has a preference over common stock in liquidation (and generally in receiving dividends as well), but is subordinated to the liabilities of the issuer in all respects. As a general rule, the market value of preferred stock with a fixed dividend rate and no conversion element varies inversely with interest rates and perceived credit risk, while the market price of convertible preferred stock generally also reflects some element of conversion value. Because preferred stock is junior to debt securities and other obligations of the issuer, deterioration in the credit quality of the issuer will cause greater changes in the value of a preferred stock than in a more senior debt security with similar stated yield characteristics. Unlike interest payments on debt securities, preferred stock dividends are payable only if declared by the issuer’s board of directors. Preferred stock also may be subject to optional or mandatory redemption provisions.
Securities Lending: The Fund may lend its securities to approved borrowers, such as brokers, dealers and other financial institutions. The borrower pledges and maintains with the Fund collateral consisting of cash, an irrevocable letter of credit issued by a bank, or securities issued or guaranteed by the U.S. Government. The initial collateral received by the Fund is required to have a value of at least 102% of the current value of the loaned securities for securities traded on U.S. exchanges and a value of at least 105% for all other securities. The collateral is maintained thereafter at a value equal to at least 100% of the current market value of the securities on loan. The market value of the loaned securities is determined at the close of each business day of the Fund and any additional required collateral is delivered to the Fund, or excess collateral returned by the Fund, on the next business day. During the term of the loan, the Fund is entitled to all distributions made on or in respect of the loaned securities, but does not receive interest income on securities received as collateral. Loans of securities are terminable at any time and the borrower, after notice, is required to return borrowed securities within the standard time period for settlement of securities transactions.
The market value of any securities on loan, all of which were classified as common stocks in the Fund’s Schedule of Investments, and the value of any related collateral are shown separately in the Statement of Assets and Liabilities as a component of investments at value — unaffiliated, and collateral on securities loaned at value, respectively. As of period end, any securities on loan were collateralized by cash and/or U.S. Government obligations. Cash collateral invested by the securities lending agent, BlackRock Investment Management, LLC (“BIM”), if any, is disclosed in the Schedule of Investments.
Securities lending transactions are entered into by the Fund under Master Securities Lending Agreements (each, an “MSLA”), which provide the right, in the event of default (including bankruptcy or insolvency), for the non-defaulting party to liquidate the collateral and calculate a net exposure to the defaulting party or request additional collateral. In the event that a borrower defaults, the Fund, as lender, would offset the market value of the collateral received against the market value of the securities loaned. When the value of the collateral is greater than that of the market value of the securities loaned, the lender is left with a net amount payable to the defaulting party. However, bankruptcy or insolvency laws of a particular jurisdiction may impose restrictions on or prohibitions against such a right of offset in the event of an MSLA counterparty’s bankruptcy or insolvency. Under the MSLA, absent an event of default, the borrower can resell or re-pledge the loaned securities, and the Fund can reinvest cash collateral received in connection with loaned securities. Upon an event of default, the parties’ obligations to return the securities or collateral to the other party are extinguished, and the parties can resell or re-pledge the loaned securities or the collateral received in connection with the loaned securities in order to satisfy the defaulting party’s net payment obligation for all transactions under the MSLA. The defaulting party remains liable for any deficiency.
As of period end, the following table is a summary of the Fund’s securities lending agreements by counterparty which are subject to offset under an MSLA:
| | | | | | | | | | | | |
| Counterparty | | Securities
Loaned at Value | | | Cash Collateral
Recieved (a) | | | Net
Amount | |
BNP Paribas S.A. | | $ | 603,505 | | | $ | (603,505 | ) | | $ | — | |
JP Morgan Securities LLC | | | 4,073,903 | | | | (4,073,903 | ) | | | — | |
Morgan Stanley | | | 10,227,543 | | | | (10,227,543 | ) | | | — | |
| | | | | | | | | | | | |
| | $ | 14,904,951 | | | $ | (14,904,951 | ) | | $ | — | |
| | | | | | | | | | | | |
| | (a) | Cash collateral with a value of $15,261,552 has been received in connection with securities lending agreements. Collateral received in excess of the value of securities loaned from the individual counterparty is not shown for financial reporting purposes. | |
The risks of securities lending include the risk that the borrower may not provide additional collateral when required or may not return the securities when due. To mitigate these risks, the Fund benefits from a borrower default indemnity provided by BIM. BIM’s indemnity allows for full replacement of the securities loaned if the collateral
| | | | |
| NOTESTO FINANCIAL STATEMENTS | | | 15 | |
Notes to Financial Statements (continued)
received does not cover the value on the securities loaned in the event of borrower default. The Fund could incur a loss if the value of an investment purchased with cash collateral falls below the market value of loaned securities or if the value of an investment purchased with cash collateral falls below the value of the original cash collateral received.
| 5. | INVESTMENT ADVISORY AGREEMENT AND OTHER TRANSACTIONS WITH AFFILIATES |
The PNC Financial Services Group, Inc. is the largest stockholder and an affiliate of BlackRock, Inc. (“BlackRock”) for 1940 Act purposes.
Investment Advisory: The Company, on behalf of the Fund, entered into an Investment Advisory Agreement with the Manager, the Fund’s investment adviser, an indirect, wholly-owned subsidiary of BlackRock, to provide investment advisory and administrative services. The Manager is responsible for the management of the Fund’s portfolio and provides the personnel, facilities, equipment and certain other services necessary to the operations of the Fund.
For such services, the Fund pays the Manager a monthly fee at an annual rate equal to the following percentages of the average daily value of the Fund’s net assets:
| | | | |
| Average Daily Net Assets | | Investment
Advisory Fees | |
First $1 Billion | | | 0.65 | % |
$1 Billion — $3 Billion | | | 0.61 | |
$3 Billion — $5 Billion | | | 0.59 | |
$5 Billion — $10 Billion | | | 0.57 | |
Greater than $10 Billion | | | 0.55 | |
Distribution Fees: The Company, on behalf of the Fund, entered into a Distribution Agreement and a Distribution Plan with BlackRock Investments, LLC (“BRIL”), an affiliate of the Manager. Pursuant to the Distribution Plan and in accordance with Rule 12b-1 under the 1940 Act, the Fund pays BRIL ongoing distribution fees. The fees are accrued daily and paid monthly at an annual rate of 0.25% based upon the average daily net assets attributable to Class III.
For the year ended December 31, 2017, the class specific distribution fees borne directly by Class III were $630,068.
Transfer Agent: On behalf of the Fund, the Manager entered into agreements with insurance companies and other financial intermediaries (“Service Organizations”), some of which may be affiliates. Pursuant to these agreements, the Service Organizations provide the Fund with administrative, networking, recordkeeping, sub-transfer agency and shareholder services to sub-accounts they service. For these services, the Service Organizations receive an annual fee per shareholder account, which will vary depending on share class and/or net assets of Fund shareholders serviced by the Service Organizations, which is shown as transfer agent — class specific. For the year ended December 31, 2017, the Fund did not pay any amounts to affiliates in return for these services.
In addition, the Fund pays the transfer agent, which is not an affiliate, a fee for the issuance, transfer and redemption of shares and the opening and maintenance of shareholder accounts, which is included in transfer agent in the Statement of Operations.
For the year ended December 31, 2017, the following table shows the class specific transfer agent fees borne directly by each share class of the Fund:
| | | | | | | | | | | | | | |
| Class I | | | | | Class III | | | | | Total | |
| $ | 276,421 | | | | | $ | 515,529 | | | | | $ | 791,950 | |
Expense Limitations, Waivers and Reimbursements: With respect to the Fund, the Manager voluntarily agreed to waive its investment advisory fees by the amount of investment advisory fees the Fund pays to the Manager indirectly through its investment in affiliated money market funds (the “affiliated money market fund waiver”). The amount of waivers and/or reimbursements of fees and expenses made pursuant to the expense limitation will be reduced by the amount of the affiliated money market fund waiver. This amount is shown as fees waived and/or reimbursed by the Manager in the Statement of Operations. For the year ended December 31, 2017, the amount waived was $1,369.
The Manager has contractually agreed to waive its investment advisory fee with respect to any portion of the Fund’s assets invested in affiliated equity and fixed-income mutual funds and affiliated exchange-traded funds that have a contractual management fee through April 30, 2018. The contractual agreement may be terminated upon 90 days’ notice by a majority of the independent directors who are not “interested persons” of the Fund, as defined in the 1940 Act (“Independent Directors”) or by a vote of a majority of the outstanding voting securities of the Fund. For the year ended December 31, 2017, there were no fees waived by the Manager.
For the year ended December 31, 2017, the Fund reimbursed the Manager $4,121 for certain accounting services, which is included in accounting services in the Statement of Operations.
The Manager has contractually agreed to reimburse transfer agent fees in order to limit such expenses to a percentage of average daily net assets as follows:
| | | | |
Class I | | | 0.07 | % |
Class III | | | 0.08 | |
The Manager has agreed not to reduce or discontinue this contractual expense limitation through April 30, 2018, unless approved by the Board, including a majority of the Independent Directors or by a vote of a majority of the outstanding voting securities of the Fund.
| | |
| 16 | | 2017 BLACKROCK ANNUAL REPORTTO SHAREHOLDERS |
Notes to Financial Statements (continued)
These amounts waived and/or reimbursed are shown as transfer agent fees reimbursed — class specific in the Statement of Operations. For the year ended December 31, 2017, class specific expense waivers and/or reimbursements were as follows:
| | | | | | | | | | | | |
| | | Class I | | | Class III | | | Total | |
Transfer Agent Fees Reimbursed | | $ | 180,765 | | | $ | 313,914 | | | $ | 494,679 | |
With respect to the Fund, the Manager contractually agreed to waive and/or reimburse fees or expenses in order to limit expenses, excluding interest expense, dividend expense, tax expense, acquired fund fees and expenses, and certain other fund expenses, which constitute extraordinary expenses not incurred in the ordinary course of the Fund’s business (“expense limitation”). The expense limitations as a percentage of average daily net assets are as follows:
| | | | | | | | | | | | | | |
| Class I | | | | | Class III | | | | | | |
| | 1.25% | | | | | | 1.50% | | | | | | | |
The Manager has agreed not to reduce or discontinue this contractual expense limitation through April 30, 2018, unless approved by the Board, including a majority of the Independent Directors or by a majority of the outstanding voting securities of the Fund. For the year ended December 31, 2017, there were no fees waived and/or reimbursed by the Manager.
Securities Lending: The U.S. Securities and Exchange Commission (“SEC”) has issued an exemptive order which permits BIM, an affiliate of the Manager, to serve as securities lending agent for the Fund, subject to applicable conditions. As securities lending agent, BIM bears all operational costs directly related to securities lending. The Fund is responsible for expenses in connection with the investment of cash collateral received for securities on loan (the “collateral investment expenses”). The cash collateral is invested in a private investment company managed by the Manager or its affiliates. However, BIM has agreed to cap the collateral investment expenses of the private investment company to an annual rate of 0.04%. The investment adviser to the private investment company will not charge any advisory fees with respect to shares purchased by the Fund. The private investment company in which the cash collateral has been invested may, under certain circumstances, impose a liquidity fee of up to 2% of the value withdrawn or temporarily restrict withdrawals for up to 10 business days during a 90 day period, in the event that the private investment company’s weekly liquid assets fall below certain thresholds.
Securities lending income is equal to the total of income earned from the reinvestment of cash collateral, net of fees and other payments to and from borrowers of securities, and less the collateral investment expenses. The Fund retains a portion of securities lending income and remits a remaining portion to BIM as compensation for its services as securities lending agent.
Pursuant to a securities lending agreement, the Fund retains 71.5% of securities lending income, and this amount retained can never be less than 65% of the total of securities lending income plus the collateral investment expenses.
In addition, commencing the business day following the date that the aggregate securities lending income earned across the Equity-Bond Complex in a calendar year exceeds a specified threshold, the Fund, pursuant to the securities lending agreement, will retain for the remainder of that calendar year securities lending income in an amount equal to 75% of securities lending income, and this amount retained can never be less than 65% of the total of securities lending income plus the collateral investment expenses.
The share of securities lending income earned by the Fund is shown as securities lending income — affiliated — net in the Statement of Operations. For the year ended December 31, 2017, the Fund paid BIM $53,231 for securities lending agent services.
lnterfund Lending: In accordance with an exemptive order (the “Order”) from the SEC, the Fund may participate in a joint lending and borrowing facility for temporary purposes (the “lnterfund Lending Program”), subject to compliance with the terms and conditions of the Order, and to the extent permitted by the Fund’s investment policies and restrictions. The Fund is currently permitted to borrow under the lnterfund Lending Program.
A lending BlackRock fund may lend in aggregate up to 15% of its net assets, but may not lend more than 5% of its net assets, to any one borrowing fund through the lnterfund Lending Program. A borrowing BlackRock fund may not borrow through the lnterfund Lending Program or from any other source more than 33 1⁄3% of its total assets (or any lower threshold provided for by the fund’s investment restrictions). If a borrowing BlackRock fund’s total outstanding borrowings exceed 10% of its total assets, each of its outstanding interfund loans will be subject to collateralization of at least 102% of the outstanding principal value of the loan. All interfund loans are for temporary or emergency purposes and the interest rate to be charged will be the average of the highest current overnight repurchase agreement rate available to a lending fund and the bank loan rate, as calculated according to a formula established by the Board.
During the year ended December 31, 2017, the Fund did not participate in the lnterfund Lending Program.
Officers and Directors: Certain directors and/or officers of the Company are directors and/or officers of BlackRock or its affiliates. The Fund reimburses the Manager for a portion of the compensation paid to the Company’s Chief Compliance Officer, which is included in Directors and Officer in the Statement of Operations.
Other Transactions: The Fund may purchase securities from, or sell securities to, an affiliated fund provided the affiliation is due solely to having a common investment adviser, common officers, or common directors. For the year ended December 31, 2017, the purchase and sale transactions and any net realized gains (losses) with an affiliated fund in compliance with Rule 17a-7 under the 1940 Act were as follows:
| | | | |
Purchases | | $ | — | |
Sales | | | 655,543 | |
Net Realized Gain | | | 145,995 | |
| | | | |
| NOTESTO FINANCIAL STATEMENTS | | | 17 | |
Notes to Financial Statements (continued)
For the year ended December 31, 2017, purchases and sales of investments, excluding short-term securities, were $186,614,650 and $252,147,161, respectively.
It is the Fund’s policy to comply with the requirements of the Internal Revenue Code of 1986, as amended, applicable to regulated investment companies, and to distribute substantially all of its taxable income to its shareholders. Therefore, no U.S. federal income tax provision is required.
The Fund files U.S. federal and various state and local tax returns. No income tax returns are currently under examination. The statute of limitations on the Fund’s U.S. federal tax returns generally remains open for each of the four years ended December 31, 2017. The statutes of limitations on the Fund’s state and local tax returns may remain open for an additional year depending upon the jurisdiction.
Management has analyzed tax laws and regulations and their application to the Fund as of December 31, 2017, inclusive of the open tax return years, and does not believe there are any uncertain tax positions that require recognition of a tax liability in the Fund’s financial statements.
U.S. GAAP requires that certain components of net assets be adjusted to reflect permanent differences between financial and tax reporting. These reclassifications have no effect on net assets or net asset values per share. As of period end, the following permanent differences attributable to foreign currency transactions and net operating losses were reclassified to the following accounts:
| | | | |
Undistributed net investment income | | $ | 727,162 | |
Accumulated net realized gain | | $ | (727,162 | ) |
The tax character of distributions paid was as follows:
| | | | | | | | |
| | | 12/31/17 | | | 12/31/16 | |
Ordinary income | | $ | 8,773,659 | | | $ | — | |
Long-term capital gains | | | 34,876,394 | | | | 9,914,410 | |
| | | | | | | | |
| | $ | 43,650,053 | | | $ | 9,914,410 | |
| | | | | | | | |
As of December 31, 2017, the tax components of accumulated net earnings (losses) were as follows:
| | | | |
Undistributed ordinary income | | $ | 2,313,767 | |
Undistributed long-term capital gains | | | 8,387,081 | |
Net unrealized gains(a) | | | 109,321,143 | |
| | | | |
| | $ | 120,021,991 | |
| | | | |
| | (a) | The difference between book-basis and tax-basis net unrealized gains was attributable primarily to the tax deferral of losses on wash sales and the timing and recognition of partnership income. | |
As of December 31, 2017, gross unrealized appreciation and depreciation for investments based on cost for U.S. federal income tax purposes were as follows:
| | | | |
Tax cost | | $ | 309,137,340 | |
| | | | |
Gross unrealized appreciation | | $ | 111,464,970 | |
Gross unrealized depreciation | | | (2,143,827 | ) |
| | | | |
Net unrealized appreciation | | $ | 109,321,143 | |
| | | | |
The Company, on behalf of the Fund, along with certain other funds managed by the Manager and its affiliates (“Participating Funds”), is a party to a 364-day, $2.1 billion credit agreement with a group of lenders. Under this agreement, the Fund may borrow to fund shareholder redemptions. Excluding commitments designated for certain individual funds, the Participating Funds, including the Fund, can borrow up to an aggregate commitment amount of $1.6 billion at any time outstanding, subject to asset coverage and other limitations as specified in the agreement. The credit agreement has the following terms: a fee of 0.12% per annum on unused commitment amounts and interest at a rate equal to the higher of (a) one-month LIBOR (but, in any event, not less than 0.00%) on the date the loan is made plus 0.80% per annum or (b) the Fed Funds rate (but, in any event, not less than 0.00%) in effect from time to time plus 0.80% per annum on amounts borrowed. The agreement expires in April 2018 unless extended or renewed. Participating Funds paid administration, legal and arrangement fees, which, if applicable, are included in miscellaneous expenses in the Statement of Operations. These fees were allocated among such funds based upon portions of the aggregate commitment available to them and relative net assets of Participating Funds. During the year ended December 31, 2017, the Fund did not borrow under the credit agreement.
In the normal course of business, the Fund invests in securities or other instruments and may enter into certain transactions, and such activities subject the Fund to various risks, including among others, fluctuations in the market (market risk) or failure of an issuer to meet all of its obligations. The value of securities or other instruments may also be affected by various factors, including, without limitation: (i) the general economy; (ii) the overall market as well as local, regional or global political
| | |
| 18 | | 2017 BLACKROCK ANNUAL REPORTTO SHAREHOLDERS |
Notes to Financial Statements (continued)
and/or social instability; (iii) regulation, taxation or international tax treaties between various countries; or (iv) currency, interest rate and price fluctuations. The Fund’s prospectus provides details of the risks to which the Fund is subject.
The Fund may be exposed to additional risks when reinvesting cash collateral in money market funds that do not seek to maintain a stable NAV per share of $1.00 and which may be subject to redemption gates or liquidity fees under certain circumstances.
Valuation Risk: The market values of equities, such as common stocks and preferred securities or equity related investments, such as futures and options, may decline due to general market conditions which are not specifically related to a particular company. They may also decline due to factors which affect a particular industry or industries. The Fund may invest in illiquid investments and may experience difficulty in selling those investments in a timely manner at the price that it believes the investments are worth. Prices may fluctuate widely over short or extended periods in response to company, market or economic news. Markets also tend to move in cycles, with periods of rising and falling prices. This volatility may cause the Fund’s NAV to experience significant increases or decreases over short periods of time. If there is a general decline in the securities and other markets, the NAV of the Fund may lose value, regardless of the individual results of the securities and other instruments in which the Fund invests.
The price the Fund could receive upon the sale of any particular portfolio investment may differ from the Fund’s valuation of the investment, particularly for securities that trade in thin or volatile markets or that are valued using a fair valuation technique or a price provided by an independent pricing service. Changes to significant unobservable inputs and assumptions (i.e., publicly traded company multiples, growth rate, time to exit) due to the lack of observable inputs may significantly impact the resulting fair value and therefore the Fund’s results of operations. As a result, the price received upon the sale of an investment may be less than the value ascribed by the Fund, and the Fund could realize a greater than expected loss or lesser than expected gain upon the sale of the investment. The Fund’s ability to value its investments may also be impacted by technological issues and/or errors by pricing services or other third party service providers.
Counterparty Credit Risk: The Fund may be exposed to counterparty credit risk, or the risk that an entity may fail to or be unable to perform on its commitments related to unsettled or open transactions. The Fund manages counterparty credit risk by entering into transactions only with counterparties that the Manager believes have the financial resources to honor their obligations and by monitoring the financial stability of those counterparties. Financial assets, which potentially expose the Fund to market, issuer and counterparty credit risks, consist principally of financial instruments and receivables due from counterparties. The extent of the Fund’s exposure to market, issuer and counterparty credit risks with respect to these financial assets is approximately their value recorded in the Statement of Assets and Liabilities, less any collateral held by the Fund.
Concentration Risk: As of period end, the Fund invested a significant portion of its assets in securities in the information technology sector. Changes in economic conditions affecting such sector would have a greater impact on the Fund and could affect the value, income and/or liquidity of positions in such securities.
| 10. | CAPITAL SHARE TRANSACTIONS |
Transactions in capital shares for each class were as follows:
| | | | | | | | | | | | | | | | |
| | | Year Ended
12/31/2017 | | | Year Ended
12/31/2016 | |
| Share Class | | Shares | | | Amount | | | Shares | | | Amount | |
Class I | | | | | | | | | | | | | | | | |
Shares sold | | | 334,343 | | | $ | 3,268,914 | | | | 777,970 | | | $ | 6,572,821 | |
Shares issued in reinvestment of distributions | | | 1,510,157 | | | | 15,570,061 | | | | 401,138 | | | | 3,477,222 | |
Shares redeemed | | | (2,438,122 | ) | | | (24,590,116 | ) | | | (2,421,144 | ) | | | (20,728,474 | ) |
| | | | | | | | | | | | | | | | |
Net decrease | | | (593,622 | ) | | $ | (5,751,141 | ) | | | (1,242,036 | ) | | $ | (10,678,431 | ) |
| | | | | | | | | | | | | | | | |
| | | | |
Class III | | | | | | | | | | | | | | | | |
Shares sold | | | 608,475 | | | $ | 5,912,633 | | | | 2,536,670 | | | $ | 20,090,081 | |
Shares issued in reinvestment of distributions | | | 2,750,278 | | | | 28,079,992 | | | | 748,085 | | | | 6,437,188 | |
Shares redeemed | | | (4,789,157 | ) | | | (48,517,967 | ) | | | (2,810,719 | ) | | | (24,024,992 | ) |
| | | | | | | | | | | | | | | | |
Net increase (decrease) | | | (1,430,404 | ) | | $ | (14,525,342 | ) | | | 474,036 | | | $ | 2,502,277 | |
| | | | | | | | | | | | | | | | |
Total Net Decrease | | | (2,024,026 | ) | | $ | (20,276,483 | ) | | | (768,000 | ) | | $ | (8,176,154 | ) |
| | | | | | | | | | | | | | | | |
Management has evaluated the impact of all subsequent events on the Fund through the date the financial statements were issued and has determined that there were no subsequent events requiring adjustment or additional disclosure in the financial statements.
| | | | |
| NOTESTO FINANCIAL STATEMENTS | | | 19 | |
Report of Independent Registered Public Accounting Firm
To the Shareholders of BlackRock Capital Appreciation V.I. Fund and the Board of Directors of BlackRock Variable Series Funds, Inc.:
Opinion on the Financial Statements and Financial Highlights
We have audited the accompanying statement of assets and liabilities, including the schedule of investments, of BlackRock Capital Appreciation V.I. Fund of BlackRock Variable Series Funds, Inc. (the “Fund”), as of December 31, 2017, the related statement of operations for the year then ended, the statements of changes in net assets for each of the two years in the period then ended, the financial highlights for each of the five years in the period then ended, and the related notes. In our opinion, the financial statements and financial highlights present fairly, in all material respects, the financial position of the Fund as of December 31, 2017, and the results of its operations for the year then ended, the changes in its net assets for each of the two years in the period then ended, and the financial highlights for each of the five years in the period then ended, in conformity with accounting principles generally accepted in the United States of America.
Basis for Opinion
These financial statements and financial highlights are the responsibility of the Fund’s management. Our responsibility is to express an opinion on the Fund’s financial statements and financial highlights based on our audits. We are a public accounting firm registered with the Public Company Accounting Oversight Board (United States) (PCAOB) and are required to be independent with respect to the Fund in accordance with the U.S. federal securities laws and the applicable rules and regulations of the Securities and Exchange Commission and the PCAOB.
We conducted our audits in accordance with the standards of the PCAOB. Those standards require that we plan and perform the audit to obtain reasonable assurance about whether the financial statements and financial highlights are free of material misstatement, whether due to error or fraud. The Fund is not required to have, nor were we engaged to perform, an audit of its internal control over financial reporting. As part of our audits we are required to obtain an understanding of internal control over financial reporting but not for the purpose of expressing an opinion on the effectiveness of the Fund’s internal control over financial reporting. Accordingly, we express no such opinion.
Our audits included performing procedures to assess the risks of material misstatement of the financial statements and financial highlights, whether due to error or fraud, and performing procedures that respond to those risks. Such procedures included examining, on a test basis, evidence regarding the amounts and disclosures in the financial statements and financial highlights. Our audits also included evaluating the accounting principles used and significant estimates made by management, as well as evaluating the overall presentation of the financial statements and financial highlights. Our procedures included confirmation of securities owned as of December 31, 2017, by correspondence with the custodian and brokers; when replies were not received from brokers, we performed other auditing procedures. We believe that our audits provide a reasonable basis for our opinion.
Deloitte & Touche LLP
Boston, Massachusetts
February 19, 2018
We have served as the auditor of one or more BlackRock investment companies since 1992.
| | |
| 20 | | 2017 BLACKROCK ANNUAL REPORTTO SHAREHOLDERS |
DECEMBER 31, 2017
| | |
ANNUAL REPORT | |  |
BlackRock Variable Series Funds, Inc.
| Ø | | BlackRock Equity Dividend V.I. Fund |
|
| Not FDIC Insured • May Lose Value • No Bank Guarantee |
| | |
| Fund Summary as of December 31, 2017 | | BlackRock Equity Dividend V.I. Fund |
Investment Objective
BlackRock Equity Dividend V.I. Fund’s (the “Fund”) investment objective is to seek long-term total return and current income.
Portfolio Management Commentary
How did the Fund perform?
For the 12-month period ended December 31, 2017, the Fund outperformed its benchmark, the Russell 1000® Value Index, and underperformed the broad-market S&P 500® Index. The following discussion of relative performance pertains to the Russell 1000® Value Index.
What factors influenced performance?
The largest contribution to performance for the 12-month period came from a combination of stock selection and allocation decisions within the energy sector. Notably, an underweight to U.S. integrated oil & gas operators and an overweight to their non-U.S.-domiciled peers proved beneficial within the oil, gas & consumable fuels industry. An underweight to the energy equipment & services industry also contributed. In health care, stock selection and an overweight to the health care providers & services industry and stock selection in pharmaceuticals added to relative performance. Lastly, a combination of stock selection within and an underweight to telecommunication services (“telecom”) contributed positively, as did an underweight to the real estate sector.
The largest detractor from relative return derived from the portfolio’s cash position, as the period saw rising U.S. stock prices. Within utilities, a combination of stock selection within and an underweight to the electric utilities industry negatively impacted returns. In financials, stock selection in the insurance segment and an underweight to the diversified financial services industry detracted. At the industry level, stock selection within food & staples retailing was unfavorable.
Describe recent portfolio activity.
During the 12-month period, the Fund significantly boosted exposure to the health care sector. Holdings within telecom and utilities also were increased. Conversely, the Fund significantly reduced its holdings in the industrials sector. The Fund also reduced exposure to information technology (“IT”) and consumer discretionary.
Describe portfolio positioning at period end.
The Fund’s largest allocations were in the financials, health care and energy sectors. Relative to the benchmark, the Fund’s largest overweight positions were in the health care, financials and IT sectors. The Fund’s largest relative underweights were in the real estate, consumer discretionary and consumer staples segments.
The views expressed reflect the opinions of BlackRock as of the date of this report and are subject to change based on changes in market, economic or other conditions. These views are not intended to be a forecast of future events and are no guarantee of future results.
Portfolio Information
SECTOR ALLOCATION
| | | | |
| Sector | | Percent of
Net Assets | |
Financials | | | 28 | % |
Health Care | | | 18 | |
Energy | | | 11 | |
Information Technology | | | 9 | |
Industrials | | | 8 | |
Consumer Staples | | | 7 | |
Utilities | | | 5 | |
Consumer Discretionary | | | 4 | |
Materials | | | 3 | |
Telecommunication Services | | | 3 | |
Short-Term Securities | | | 5 | |
Liabilities in Excess of Other Assets | | | (1 | ) |
For Fund compliance purposes, the Fund’s sector classifications refer to one or more of the sector sub-classifications used by one or more widely recognized market indexes or ratings group indexes, and/or as defined by the investment adviser. These definitions may not apply for purposes of this report, which may combine sector sub-classifications for reporting ease.
| | |
| 2 | | 2017 BLACKROCK ANNUAL REPORTTO SHAREHOLDERS |
| | |
| Fund Summary as of December 31, 2017 (continued) | | BlackRock Equity Dividend V.I. Fund |
TOTAL RETURN BASED ON A $10,000 INVESTMENT
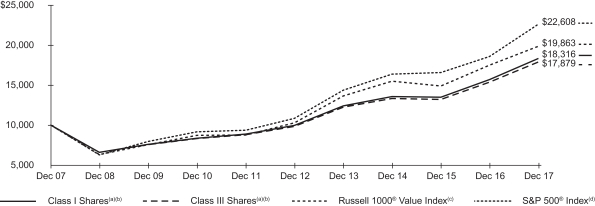
| (a) | Assuming transaction costs, if any, and other operating expenses, including investment advisory fees. Does not include insurance-related fees and expenses. The returns for Class III Shares prior to July 1, 2011, the recommencement of operations of Class III Shares, are based upon the performance of the Fund’s Class I Shares, as adjusted to reflect the distribution (12b-1) fees applicable to Class III Shares. |
| (b) | The Fund seeks to achieve its objective by investing primarily in a diversified portfolio of equity securities. Under normal circumstances, the Fund will invest in at least 80% of its assets in equity securities and at least 80% of its assets in dividend paying securities. The Fund’s total returns prior to October 1, 2010 are the returns of the Fund when it followed a different objective and different investment strategies under the name BlackRock Utilities & Telecommunications V.I. Fund. |
| (c) | An unmanaged index that is a subset of the Russell 1000® Index that consists of those Russell 1000® securities with lower price-to-book ratios and lower expected growth values. |
| (d) | An unmanaged index that covers 500 leading companies and captures approximately 80% coverage of available market capitalization. |
Performance Summary for the Period Ended December 31, 2017
| | | | | | | | | | | | | | | | | | | | | | | | | | | | |
| | | 6-Month
Total Returns (b) | | | | | | Average Annual Total Returns | |
| | | | | | | 1 Year (b) | | | | | | 5 Years (b) | | | | | | 10 Years (b) | |
Class I(a) | | | 9.77 | % | | | | | | | 16.74 | % | | | | | | | 12.95 | % | | | | | | | 6.24 | % |
Class III(a) | | | 9.68 | | | | | | | | 16.49 | | | | | | | | 12.66 | | | | | | | | 5.98 | (c) |
Russell 1000® Value Index | | | 8.61 | | | | | | | | 13.66 | | | | | | | | 14.04 | | | | | | | | 7.10 | |
S&P 500® Index | | | 11.42 | | | | | | | | 21.83 | | | | | | | | 15.79 | | | | | | | | 8.50 | |
| | (a) | Average annual and cumulative total returns are based on changes in net asset value for the periods shown, and assume reinvestment of all distributions at net asset value on the ex-dividend date. Insurance-related fees and expenses are not reflected in these returns. The Fund’s total returns prior to October 1, 2010 are the returns of the Fund when it followed a different objective and different investment strategies under the name BlackRock Utilities & Telecommunications V.I. Fund. | |
| | (b) | For a portion of the period, the Fund’s investment adviser waived a portion of its fee. Without such waiver, the Fund’s performance would have been lower. | |
| | (c) | The returns for Class III Shares prior to July 1, 2011, the recommencement of operations of Class III Shares, are based upon the performance of the Fund’s Class I Shares, as adjusted to reflect the distribution (12b-1) fees applicable to Class III Shares. | |
Past performance is not indicative of future results. Performance results do not reflect the deduction of taxes that a shareholder would pay on Fund distributions or the redemption of Fund shares.
Performance results may include adjustment made for financial reporting purposes in accordance with U.S. generally accepted accounting principles.
Expense Example
| | | | | | | | | | | | | | | | | | | | | | | | | | | | | | | | |
| | | Actual | | | | | | Hypothetical (a) | | | | |
| | | Beginning
Account Value
(07/01/17) | | | Ending
Account Value
(12/31/17) | | | Expenses
Paid During
the Period (b) | | | | | | Beginning
Account Value
(07/01/17) | | | Ending
Account Value
(12/31/17) | | | Expenses
Paid During
the Period (b) | | | Annualized
Expense
Ratio | |
Class I | | $ | 1,000.00 | | | $ | 1,097.70 | | | $ | 3.65 | | | | | | | $ | 1,000.00 | | | $ | 1,021.73 | | | $ | 3.52 | | | | 0.69 | % |
Class III | | | 1,000.00 | | | | 1,096.80 | | | | 4.97 | | | | | | | | 1,000.00 | | | | 1,020.47 | | | | 4.79 | | | | 0.94 | |
| | (a) | Hypothetical 5% annual return before expenses is calculated by prorating the number of days in the most recent fiscal half year divided by 365. | |
| | (b) | For each class of the Fund, expenses are equal to the annualized expense ratio for the class, multiplied by the average account value over the period, multiplied by 184/365(to reflect the one-half year period shown). | |
See “Disclosure of Expenses” on the following page for further information on how expenses were calculated.
| | |
| Disclosure of Expenses | | BlackRock Equity Dividend V.I. Fund |
Shareholders of the Fund may incur the following charges: (a) transactional expenses, such as sales charges; and (b) operating expenses, including investment advisory fees, service and distribution fees, including 12b-1 fees, acquired fund fees and expenses, and other fund expenses. The expense example on the previous page (which is based on a hypothetical investment of $1,000 invested on July 1, 2017 and held through December 31, 2017) is intended to assist shareholders both in calculating expenses based on an investment in the Fund and in comparing these expenses with similar costs of investing in other mutual funds.
The expense example provides information about actual account values and actual expenses. In order to estimate the expenses a shareholder paid during the period covered by this report, shareholders can divide their account value by $1,000 and then multiply the result by the number corresponding to their share class under the heading entitled “Expenses Paid During the Period.”
The expense example also provides information about hypothetical account values and hypothetical expenses based on the Fund’s actual expense ratio and an assumed rate of return of 5% per year before expenses. In order to assist shareholders in comparing the ongoing expenses of investing in the Fund and other funds, compare the 5% hypothetical example with the 5% hypothetical examples that appear in shareholder reports of other funds.
The expenses shown in the expense example are intended to highlight shareholders’ ongoing costs only and do not reflect any transactional expenses, such as sales charges, if any. Therefore, the hypothetical example is useful in comparing ongoing expenses only, and will not help shareholders determine the relative total expenses of owning different funds. If these transactional expenses were included, shareholder expenses would have been higher.
| | |
| 4 | | 2017 BLACKROCK ANNUAL REPORTTO SHAREHOLDERS |
| | |
Schedule of Investments December 31, 2017 | | BlackRock Equity Dividend V.I. Fund (Percentages shown are based on Net Assets) |
| | | | | | | | |
| Security | | Shares | | | Value | |
Common Stocks — 95.7% | |
| |
| Aerospace & Defense — 2.1% | | | | |
Lockheed Martin Corp. | | | 8,080 | | | $ | 2,594,084 | |
Northrop Grumman Corp. | | | 14,174 | | | | 4,350,142 | |
| | | | | | | | |
| | | | | | | 6,944,226 | |
| Air Freight & Logistics — 0.3% | | | | |
United Parcel Service, Inc., Class B | | | 8,848 | | | | 1,054,239 | |
| | | | | | | | |
| Banks — 17.9% | | | | |
Bank of America Corp. | | | 442,840 | | | | 13,072,637 | |
Citigroup, Inc. | | | 159,510 | | | | 11,869,139 | |
JPMorgan Chase & Co. | | | 123,410 | | | | 13,197,465 | |
KeyCorp | | | 91,990 | | | | 1,855,438 | |
Regions Financial Corp. | | | 18,820 | | | | 325,210 | |
SunTrust Banks, Inc. | | | 51,767 | | | | 3,343,631 | |
US Bancorp | | | 82,350 | | | | 4,412,313 | |
Wells Fargo & Co. | | | 167,575 | | | | 10,166,775 | |
| | | | | | | | |
| | | | | | | 58,242,608 | |
| Beverages — 2.4% | | | | |
Diageo plc | | | 118,500 | | | | 4,343,541 | |
Dr Pepper Snapple Group, Inc. | | | 34,980 | | | | 3,395,159 | |
| | | | | | | | |
| | | | | | | 7,738,700 | |
| Capital Markets — 4.0% | | | | |
Charles Schwab Corp. (The) | | | 34,770 | | | | 1,786,135 | |
Goldman Sachs Group, Inc. (The) | | | 16,790 | | | | 4,277,420 | |
Invesco Ltd. | | | 28,348 | | | | 1,035,836 | |
Morgan Stanley | | | 110,780 | | | | 5,812,627 | |
| | | | | | | | |
| | | | | | | 12,912,018 | |
| Chemicals — 2.1% | | | | |
DowDuPont, Inc. | | | 83,495 | | | | 5,946,514 | |
Praxair, Inc. | | | 6,485 | | | | 1,003,100 | |
| | | | | | | | |
| | | | | | | 6,949,614 | |
| Communications Equipment — 0.7% | | | | |
Motorola Solutions, Inc. | | | 26,350 | | | | 2,380,459 | |
| | | | | | | | |
| Construction Materials — 0.5% | | | | |
CRH plc | | | 48,010 | | | | 1,723,079 | |
| | | | | | | | |
| Containers & Packaging — 0.4% | | | | |
International Paper Co. | | | 20,450 | | | | 1,184,873 | |
| | | | | | | | |
| Diversified Telecommunication Services — 2.3% | | | | |
BCE, Inc. | | | 19,235 | | | | 923,472 | |
Verizon Communications, Inc. | | | 125,560 | | | | 6,645,891 | |
| | | | | | | | |
| | | | | | | 7,569,363 | |
| Electric Utilities — 3.9% | | | | |
Edison International | | | 11,860 | | | | 750,027 | |
Exelon Corp. | | | 35,450 | | | | 1,397,085 | |
FirstEnergy Corp. | | | 110,670 | | | | 3,388,715 | |
NextEra Energy, Inc. | | | 21,065 | | | | 3,290,142 | |
PG&E Corp. | | | 83,300 | | | | 3,734,339 | |
| | | | | | | | |
| | | | | | | 12,560,308 | |
| Electronic Equipment, Instruments & Components — 0.4% | | | | |
CDW Corp. | | | 17,210 | | | | 1,195,923 | |
| | | | | | | | |
| Energy Equipment & Services — 0.4% | | | | |
Halliburton Co. | | | 27,510 | | | | 1,344,414 | |
| | | | | | | | |
| Food & Staples Retailing — 0.8% | | | | |
Kroger Co. (The) | | | 98,540 | | | | 2,704,923 | |
| | | | | | | | |
| Food Products — 1.2% | | | | |
General Mills, Inc. | | | 33,290 | | | | 1,973,764 | |
Kellogg Co. | | | 28,320 | | | | 1,925,194 | |
| | | | | | | | |
| | | | | | | 3,898,958 | |
| | | | | | | | |
| Security | | Shares | | | Value | |
| Health Care Equipment & Supplies — 3.0% | | | | |
Koninklijke Philips NV | | | 123,230 | | | $ | 4,653,002 | |
Medtronic plc | | | 49,740 | | | | 4,016,505 | |
Smith & Nephew plc | | | 68,318 | | | | 1,182,114 | |
| | | | | | | | |
| | | | | | | 9,851,621 | |
| Health Care Providers & Services — 7.3% | | | | |
Aetna, Inc. | | | 34,793 | | | | 6,276,309 | |
Anthem, Inc. | | | 36,121 | | | | 8,127,586 | |
Cardinal Health, Inc. | | | 26,660 | | | | 1,633,458 | |
McKesson Corp. | | | 19,030 | | | | 2,967,729 | |
Quest Diagnostics, Inc. | | | 16,695 | | | | 1,644,291 | |
UnitedHealth Group, Inc. | | | 13,552 | | | | 2,987,674 | |
| | | | | | | | |
| | | | | | | 23,637,047 | |
| Household Products — 0.9% | �� | | | |
Procter & Gamble Co. (The) | | | 32,345 | | | | 2,971,859 | |
| | | | | | | | |
| Industrial Conglomerates — 3.1% | | | | |
3M Co. | | | 8,305 | | | | 1,954,748 | |
General Electric Co. | | | 204,195 | | | | 3,563,203 | |
Honeywell International, Inc. | | | 29,310 | | | | 4,494,981 | |
| | | | | | | | |
| | | | | | | 10,012,932 | |
| Insurance — 5.6% | | | | |
American International Group, Inc. | | | 108,390 | | | | 6,457,876 | |
Brighthouse Financial, Inc.(a) | | | 6,994 | | | | 410,128 | |
Marsh & McLennan Cos., Inc. | | | 29,460 | | | | 2,397,749 | |
MetLife, Inc. | | | 92,914 | | | | 4,697,732 | |
Prudential Financial, Inc. | | | 11,003 | | | | 1,265,125 | |
Travelers Cos., Inc. (The) | | | 22,868 | | | | 3,101,816 | |
| | | | | | | | |
| | | | | | | 18,330,426 | |
| Leisure Products — 0.5% | | | | |
Mattel, Inc.(b) | | | 99,316 | | | | 1,527,480 | |
| | | | | | | | |
| Machinery — 0.4% | | | | |
Pentair plc | | | 19,480 | | | | 1,375,678 | |
| | | | | | | | |
| Media — 2.2% | | | | |
Comcast Corp., Class A | | | 131,710 | | | | 5,274,985 | |
Interpublic Group of Cos., Inc. (The) | | | 48,130 | | | | 970,301 | |
Publicis Groupe SA | | | 14,620 | | | | 991,050 | |
| | | | | | | | |
| | | | | | | 7,236,336 | |
| Multiline Retail — 0.5% | | | | |
Dollar General Corp. | | | 18,210 | | | | 1,693,712 | |
| | | | | | | | |
| Multi-Utilities — 1.1% | | | | |
Public Service Enterprise Group, Inc. | | | 70,540 | | | | 3,632,810 | |
| | | | | | | | |
| Oil, Gas & Consumable Fuels — 10.9% | | | | |
Chevron Corp. | | | 47,073 | | | | 5,893,069 | |
Enbridge, Inc. | | | 29,497 | | | | 1,153,628 | |
Hess Corp. | | | 64,609 | | | | 3,066,989 | |
Marathon Oil Corp. | | | 160,570 | | | | 2,718,450 | |
Marathon Petroleum Corp. | | | 34,830 | | | | 2,298,083 | |
Pioneer Natural Resources Co. | | | 7,890 | | | | 1,363,787 | |
Royal Dutch Shell plc, ADR, Class A | | | 113,080 | | | | 7,543,567 | |
Suncor Energy, Inc. | | | 176,070 | | | | 6,465,290 | |
TOTAL SA, ADR | | | 88,118 | | | | 4,871,163 | |
| | | | | | | | |
| | | | | | | 35,374,026 | |
| Personal Products — 0.8% | | | | |
Unilever NV, NYRS | | | 42,825 | | | | 2,411,904 | |
| | | | | | | | |
| Pharmaceuticals — 8.0% | | | | |
AstraZeneca plc | | | 87,786 | | | | 6,057,726 | |
Merck & Co., Inc. | | | 93,940 | | | | 5,286,004 | |
Novo Nordisk A/S, ADR | | | 51,090 | | | | 2,742,000 | |
Pfizer, Inc. | | | 330,350 | | | | 11,965,277 | |
| | | | | | | | |
| | | | | | | 26,051,007 | |
| | | | |
| SCHEDULE OF INVESTMENTS | | | 5 | |
| | |
Schedule of Investments (continued) December 31, 2017 | | BlackRock Equity Dividend V.I. Fund (Percentages shown are based on Net Assets) |
| | | | | | | | |
| Security | | Shares | | | Value | |
| Professional Services — 1.3% | | | | |
Equifax, Inc. | | | 3,840 | | | $ | 452,813 | |
Experian plc | | | 74,710 | | | | 1,646,809 | |
Nielsen Holdings plc | | | 54,660 | | | | 1,989,624 | |
| | | | | | | | |
| | | | | | | 4,089,246 | |
| Road & Rail — 0.6% | | | | |
Union Pacific Corp. | | | 14,845 | | | | 1,990,714 | |
| | | | | | | | |
| Semiconductors & Semiconductor Equipment — 1.6% | | | | |
QUALCOMM, Inc. | | | 52,980 | | | | 3,391,780 | |
Taiwan Semiconductor Manufacturing Co. Ltd., ADR | | | 41,390 | | | | 1,641,113 | |
| | | | | | | | |
| | | | | | | 5,032,893 | |
| Software — 5.6% | | | | |
Constellation Software, Inc. | | | 2,614 | | | | 1,584,662 | |
Microsoft Corp. | | | 84,095 | | | | 7,193,486 | |
Oracle Corp. | | | 198,180 | | | | 9,369,951 | |
| | | | | | | | |
| | | | | | | 18,148,099 | |
| Specialty Retail — 0.6% | | | | |
Lowe’s Cos., Inc. | | | 19,580 | | | | 1,819,765 | |
| | | | | | | | |
| Technology Hardware, Storage & Peripherals — 0.9% | | | | |
Lenovo Group Ltd. | | | 2,040,000 | | | | 1,148,750 | |
Samsung Electronics Co. Ltd., GDR(c) | | | 1,399 | | | | 1,676,002 | |
| | | | | | | | |
| | | | | | | 2,824,752 | |
| Tobacco — 1.0% | | | | |
Altria Group, Inc. | | | 30,675 | | | | 2,190,501 | |
Philip Morris International, Inc. | | | 10,775 | | | | 1,138,379 | |
| | | | | | | | |
| | | | | | | 3,328,880 | |
| Wireless Telecommunication Services — 0.4% | | | | | | |
SK Telecom Co. Ltd., ADR(b) | | | 51,160 | | | | 1,427,876 | |
| | | | | | | | |
| | |
Total Common Stocks — 95.7%
(Cost: $258,350,052) | | | | | | | 311,172,768 | |
| | | | | | | | |
| | |
Total Long-Term Investments — 95.7%
(Cost: $258,350,052) | | | | | | | 311,172,768 | |
| | | | | | | | |
| | | | | | | | |
| Security | | Shares | | | Value | |
Short-Term Securities — 4.8%(d)(f) | |
BlackRock Liquidity Funds, T-Fund, Institutional Class,
1.17% | | | 14,132,925 | | | $ | 14,132,925 | |
SL Liquidity Series, LLC, Money Market Series,
1.48%(e) | | | 1,608,659 | | | | 1,608,498 | |
| | | | | | | | |
Total Short-Term Securities — 4.8%
(Cost: $15,741,678) | | | | | | | 15,741,423 | |
| | | | | | | | |
| | |
Total Investments — 100.5%
(Cost: $274,091,730) | | | | | | | 326,914,191 | |
Liabilities in Excess of Other Assets — (0.5)% | | | | | | | (1,774,913 | ) |
| | | | | | | | |
Net Assets — 100.0% | | | | | | $ | 325,139,278 | |
| | | | | | | | |
| (a) | Non-income producing security. |
| (b) | Security, or a portion of the security, is on loan. |
| (c) | Security exempt from registration pursuant to Rule 144A under the Securities Act of 1933, as amended. These securities may be resold in transactions exempt from registration to qualified institutional investors. |
| (d) | Annualized 7-day yield as of period end. |
| (e) | Security was purchased with the cash collateral from loaned securities. |
| (f) | During the year ended December 31, 2017, investments in issuers considered to be affiliates of the Fund for the purposes of Section 2(a)(3) of the Investment Company Act of 1940, as amended, were as follows: |
| | | | | | | | | | | | | | | | | | | | | | | | | | | | |
| Affiliate | | Shares
Held at
12/31/16 | | | Net
Activity | | | Shares
Held at
12/31/17 | | | Value at
12/31/17 | | | Income | | | Net
Realized
Gain (Loss) (a) | | | Change in
Unrealized
Appreciation
(Depreciation) | |
BlackRock Liquidity Funds, T-Fund, Institutional Class | | | 11,807,360 | | | | 2,325,565 | | | | 14,132,925 | | | $ | 14,132,925 | | | $ | 104,826 | | | $ | 58 | | | $ | — | |
SL Liquidity Series, LLC, Money Market Series | | | 5,710,743 | | | | (4,102,084 | ) | | | 1,608,659 | | | | 1,608,498 | | | | 33,615 | (b) | | | (2,041 | ) | | | (188 | ) |
| | | | | | | | | | | | | | | | | | | | | | | | | | | | |
| | | | | | | | | | | | | | $ | 15,741,423 | | | $ | 138,441 | | | $ | (1,983 | ) | | $ | (188 | ) |
| | | | | | | | | | | | | | | | | | | | | | | | | | | | |
| | (a) | Includes net capital gain distributions, if applicable. | |
| | (b) | Represents securities lending income earned from the reinvestment of cash collateral from loaned securities, net of fees and collateral investment expenses, and other payments to and from borrowers of securities. | |
For Fund compliance purposes, the Fund’s industry classifications refer to one or more of the industry sub-classifications used by one or more widely recognized market indexes or ratings group indexes, and/or as defined by the investment advisor. These definitions may not apply for purposes of this report, which may combine such industry sub-classifications for reporting ease.
Portfolio Abbreviations
ADR — American Depositary Receipts
GDR — Global Depositary Receipts
NYRS — New York Registered Shares
| | |
| 6 | | 2017 BLACKROCK ANNUAL REPORTTO SHAREHOLDERS |
| | |
Schedule of Investments (continued) December 31, 2017 | | BlackRock Equity Dividend V.I. Fund |
Fair Value Hierarchy as of Period End
Various inputs are used in determining the fair value of investments. For information about the Fund’s policy regarding valuation of investments, refer to the Notes to Financial Statements.
The following table summarizes the Fund’s investments categorized in the disclosure hierarchy:
| | | | | | | | | | | | | | | | |
| | | Level 1 | | | Level 2 | | | Level 3 | | | Total | |
Assets: | | | | | | | | | | | | | | | | |
Investments: | | | | | | | | | | | | | | | | |
Long-Term Investments: | | | | | | | | | | | | | | | | |
Common Stocks: | | | | | | | | | | | | | | | | |
Aerospace & Defense | | $ | 6,944,226 | | | $ | — | | | $ | — | | | $ | 6,944,226 | |
Air Freight & Logistics | | | 1,054,239 | | | | — | | | | — | | | | 1,054,239 | |
Banks | | | 58,242,608 | | | | — | | | | — | | | | 58,242,608 | |
Beverages | | | 3,395,159 | | | | 4,343,541 | | | | — | | | | 7,738,700 | |
Capital Markets | | | 12,912,018 | | | | — | | | | — | | | | 12,912,018 | |
Chemicals | | | 6,949,614 | | | | — | | | | — | | | | 6,949,614 | |
Communications Equipment | | | 2,380,459 | | | | — | | | | — | | | | 2,380,459 | |
Construction Materials | | | — | | | | 1,723,079 | | | | — | | | | 1,723,079 | |
Containers & Packaging | | | 1,184,873 | | | | — | | | | — | | | | 1,184,873 | |
Diversified Telecommunication Services | | | 7,569,363 | | | | — | | | | — | | | | 7,569,363 | |
Electric Utilities | | | 12,560,308 | | | | — | | | | — | | | | 12,560,308 | |
Electronic Equipment, Instruments & Components | | | 1,195,923 | | | | — | | | | — | | | | 1,195,923 | |
Energy Equipment & Services | | | 1,344,414 | | | | — | | | | — | | | | 1,344,414 | |
Food & Staples Retailing | | | 2,704,923 | | | | — | | | | — | | | | 2,704,923 | |
Food Products | | | 3,898,958 | | | | — | | | | — | | | | 3,898,958 | |
Health Care Equipment & Supplies | | | 4,016,505 | | | | 5,835,116 | | | | — | | | | 9,851,621 | |
Health Care Providers & Services | | | 23,637,047 | | | | — | | | | — | | | | 23,637,047 | |
Household Products | | | 2,971,859 | | | | — | | | | — | | | | 2,971,859 | |
Industrial Conglomerates | | | 10,012,932 | | | | — | | | | — | | | | 10,012,932 | |
Insurance | | | 18,330,426 | | | | — | | | | — | | | | 18,330,426 | |
Leisure Products | | | 1,527,480 | | | | — | | | | — | | | | 1,527,480 | |
Machinery | | | 1,375,678 | | | | — | | | | — | | | | 1,375,678 | |
Media | | | 6,245,286 | | | | 991,050 | | | | — | | | | 7,236,336 | |
Multiline Retail | | | 1,693,712 | | | | — | | | | — | | | | 1,693,712 | |
Multi-Utilities | | | 3,632,810 | | | | — | | | | — | | | | 3,632,810 | |
Oil, Gas & Consumable Fuels | | | 35,374,026 | | | | — | | | | — | | | | 35,374,026 | |
Personal Products | | | 2,411,904 | | | | — | | | | — | | | | 2,411,904 | |
Pharmaceuticals | | | 19,993,281 | | | | 6,057,726 | | | | — | | | | 26,051,007 | |
Professional Services | | | 2,442,437 | | | | 1,646,809 | | | | — | | | | 4,089,246 | |
Road & Rail | | | 1,990,714 | | | | — | | | | — | | | | 1,990,714 | |
Semiconductors & Semiconductor Equipment | | | 5,032,893 | | | | — | | | | — | | | | 5,032,893 | |
Software | | | 18,148,099 | | | | — | | | | — | | | | 18,148,099 | |
Specialty Retail | | | 1,819,765 | | | | — | | | | — | | | | 1,819,765 | |
Technology Hardware, Storage & Peripherals | | | — | | | | 2,824,752 | | | | — | | | | 2,824,752 | |
Tobacco | | | 3,328,880 | | | | — | | | | — | | | | 3,328,880 | |
Wireless Telecommunication Services | | | 1,427,876 | | | | — | | | | — | | | | 1,427,876 | |
Short-Term Securities | | | 14,132,925 | | | | — | | | | — | | | | 14,132,925 | |
| | | | | | | | | | | | | | | | |
Subtotal | | $ | 301,883,620 | | | $ | 23,422,073 | | | $ | — | | | $ | 325,305,693 | |
| | | | | | | | | | | | | | | | |
Investments valued at NAV(a) | | | | | | | | | | | | | | $ | 1,608,498 | |
| | | | | | | | | | | | | | | | |
Total Investments | | | | | | | | | | | | | | $ | 326,914,191 | |
| | | | | | | | | | | | | | | | |
| | (a) | As of December 31, 2017, certain investments of the Fund were fair valued using NAV per share as no quoted market value is available and therefore have been excluded from the fair value hierarchy. | |
During the year ended December 31, 2017, there were no transfers between levels.
See notes to financial statements.
| | | | |
| SCHEDULE OF INVESTMENTS | | | 7 | |
Statement of Assets and Liabilities
December 31, 2017
| | | | |
| | | BlackRock Equity Dividend V.I. Fund | |
| |
ASSETS | | | | |
Investments at value — unaffiliated (including securities loaned at value of $1,551,881) (cost — $258,350,052) | | $ | 311,172,768 | |
Investments at value — affiliated (cost — $15,741,678) | | | 15,741,423 | |
Foreign currency at value (cost — $1,667) | | | 1,692 | |
Receivables: | | | | |
Investments sold | | | 40,575 | |
Securities lending income — affiliated | | | 683 | |
Capital shares sold | | | 67,281 | |
Dividends — affiliated | | | 13,482 | |
Dividends — unaffiliated | | | 352,486 | |
From the Manager | | | 5,504 | |
Prepaid expenses | | | 1,553 | |
| | | | |
Total assets | | | 327,397,447 | |
| | | | |
| |
LIABILITIES | | | | |
Cash collateral on securities loaned at value | | | 1,609,373 | |
Payables: | | | | |
Capital shares redeemed | | | 73,377 | |
Investment advisory fees | | | 211,565 | |
Investments purchased | | | 96,390 | |
Officer’s and Directors’ fees | | | 4,293 | |
Other accrued expenses | | | 78,994 | |
Other affiliates | | | 734 | |
Distribution fees | | | 59,396 | |
Transfer agent fees | | | 124,047 | |
| | | | |
Total liabilities | | | 2,258,169 | |
| | | | |
| |
NET ASSETS | | $ | 325,139,278 | |
| | | | |
| |
NET ASSETS CONSIST OF | | | | |
Paid-in capital | | $ | 268,781,483 | |
Undistributed net investment income | | | 12,724 | |
Accumulated net realized gain | | | 3,522,520 | |
Net unrealized appreciation (depreciation) | | | 52,822,551 | |
| | | | |
NET ASSETS | | $ | 325,139,278 | |
| | | | |
| |
NET ASSET VALUE | | | | |
Class I — Based on net assets of $37,524,652 and 3,091,229 shares outstanding, 100 million shares authorized, $0.10 par value. | | $ | 12.14 | |
| | | | |
Class III — Based on net assets of $287,614,626 and 23,738,134 shares outstanding, 100 million shares authorized, $0.10 par value. | | $ | 12.12 | |
| | | | |
See notes to financial statements.
| | |
| 8 | | 2017 BLACKROCK ANNUAL REPORTTO SHAREHOLDERS |
Statement of Operations
Year Ended December 31, 2017
| | | | |
| | | BlackRock
Equity Dividend V.I. Fund | |
| |
INVESTMENT INCOME | | | | |
Dividends — affiliated | | $ | 104,826 | |
Dividends — unaffiliated | | | 7,458,226 | |
Securities lending income — affiliated — net | | | 33,615 | |
Foreign taxes withheld | | | (149,915 | ) |
| | | | |
Total investment income | | | 7,446,752 | |
| | | | |
| |
EXPENSES | | | | |
Investment advisory | | | 1,784,983 | |
Distribution — class specific | | | 652,834 | |
Transfer agent — class specific | | | 652,213 | |
Printing | | | 65,270 | |
Accounting services | | | 59,460 | |
Professional | | | 48,087 | |
Custodian | | | 35,790 | |
Directors and Officer | | | 24,641 | |
Transfer agent | | | 4,999 | |
Miscellaneous | | | 13,917 | |
| | | | |
Total expenses | | | 3,342,194 | |
Less: | | | | |
Transfer agent fees reimbursed — class specific | | | (652,213 | ) |
Fees waived and/or reimbursed by the Manager | | | (8,593 | ) |
| | | | |
Total expenses after fees waived and/or reimbursed | | | 2,681,388 | |
| | | | |
Net investment income | | | 4,765,364 | |
| | | | |
| |
REALIZED AND UNREALIZED GAIN (LOSS) | | | | |
Net realized gain (loss) from: | | | | |
Investments — affiliated | | | (2,041 | ) |
Investments — unaffiliated | | | 18,275,157 | |
Capital gain distributions from investment companies — affiliated | | | 58 | |
Foreign currency transactions | | | 1,564 | |
| | | | |
| | | 18,274,738 | |
| | | | |
Net change in unrealized appreciation (depreciation) on: | | | | |
Investments — affiliated | | | (188 | ) |
Investments — unaffiliated | | | 22,925,812 | |
Foreign currency translations | | | 88 | |
| | | | |
| | | 22,925,712 | |
| | | | |
Net realized and unrealized gain | | | 41,200,450 | |
| | | | |
NET INCREASE IN NET ASSETS RESULTING FROM OPERATIONS | | $ | 45,965,814 | |
| | | | |
See notes to financial statements.
Statements of Changes in Net Assets
| | | | | | | | |
| | | BlackRock Equity
Dividend V.I. Fund | |
| | | Year Ended December 31, | |
| | | 2017 | | | 2016 | |
| | |
INCREASE (DECREASE) IN NET ASSETS | | | | | | | | |
| | |
OPERATIONS | | | | | | | | |
Net investment income | | $ | 4,765,364 | | | $ | 3,253,492 | |
Net realized gain | | | 18,274,738 | | | | 8,682,192 | |
Net change in unrealized appreciation (depreciation) | | | 22,925,712 | | | | 20,643,955 | |
| | | | | | | | |
Net increase in net assets resulting from operations | | | 45,965,814 | | | | 32,579,639 | |
| | | | | | | | |
| | |
DISTRIBUTIONS TO SHAREHOLDERS(a) | | | | | | | | |
From net investment income: | | | | | | | | |
Class I | | | (645,417 | ) | | | (572,333 | ) |
Class III | | | (4,129,646 | ) | | | (2,692,740 | ) |
From net realized gain: | | | | | | | | |
Class I | | | (1,906,002 | ) | | | (1,013,606 | ) |
Class III | | | (14,552,840 | ) | | | (6,297,460 | ) |
| | | | | | | | |
Decrease in net assets resulting from distributions to shareholders | | | (21,233,905 | ) | | | (10,576,139 | ) |
| | | | | | | | |
| | |
CAPITAL SHARE TRANSACTIONS | | | | | | | | |
Net increase in net assets derived from capital share transactions | | | 41,813,020 | | | | 120,900,587 | |
| | | | | | | | |
| | |
NET ASSETS | | | | | | | | |
Total increase in net assets | | | 66,544,929 | | | | 142,904,087 | |
Beginning of year | | | 258,594,349 | | | | 115,690,262 | |
| | | | | | | | |
End of year | | $ | 325,139,278 | | | $ | 258,594,349 | |
| | | | | | | | |
Undistributed net investment income, end of year | | $ | 12,724 | | | $ | 11,132 | |
| | | | | | | | |
| (a) | Distributions for annual periods determined in accordance with U.S. federal income tax regulations. |
See notes to financial statements.
| | |
| 10 | | 2017 BLACKROCK ANNUAL REPORTTO SHAREHOLDERS |
Financial Highlights
(For a share outstanding throughout each period)
| | | | | | | | | | | | | | | | | | | | |
| | | BlackRock Equity Dividend V.I. Fund | |
| | | Class I | |
| | | Year Ended December 31, | |
| �� | | 2017 | | | 2016 | | | 2015 | | | 2014 | | | 2013 | |
Net asset value, beginning of year | | $ | 11.15 | | | $ | 10.04 | | | $ | 10.90 | | | $ | 10.78 | | | $ | 8.95 | |
| | | | | | | | | | | | | | | | | | | | |
Net investment income(a) | | | 0.22 | | | | 0.21 | | | | 0.19 | | | | 0.20 | | | | 0.19 | |
Net realized and unrealized gain (loss) | | | 1.62 | | | | 1.42 | | | | (0.25 | ) | | | 0.80 | | | | 1.99 | |
| | | | | | | | | | | | | | | | | | | | |
Net increase (decrease) from investment operations | | | 1.84 | | | | 1.63 | | | | (0.06 | ) | | | 1.00 | | | | 2.18 | |
| | | | | | | | | | | | | | | | | | | | |
| Distributions:(b) | | | | | | | | | | | | | | | |
From net investment income | | | (0.21 | ) | | | (0.19 | ) | | | (0.18 | ) | | | (0.20 | ) | | | (0.20 | ) |
From net realized gain | | | (0.64 | ) | | | (0.33 | ) | | | (0.62 | ) | | | (0.68 | ) | | | (0.15 | ) |
| | | | | | | | | | | | | | | | | | | | |
Total distributions | | | (0.85 | ) | | | (0.52 | ) | | | (0.80 | ) | | | (0.88 | ) | | | (0.35 | ) |
| | | | | | | | | | | | | | | | | | | | |
Net asset value, end of year | | $ | 12.14 | | | $ | 11.15 | | | $ | 10.04 | | | $ | 10.90 | | | $ | 10.78 | |
| | | | | | | | | | | | | | | | | | | | |
| | | | | |
Total Return:(c) | | | | | | | | | | | | | | | | | | | | |
Based on net asset value | | | 16.74 | % | | | 16.40 | % | | | (0.61 | )% | | | 9.34 | % | | | 24.52 | % |
| | | | | | | | | | | | | | | | | | | | |
| | | | | |
Ratios to Average Net Assets: | | | | | | | | | | | | | | | | | | | | |
Total expenses | | | 0.89 | %(d) | | | 0.89 | %(d) | | | 1.00 | % | | | 0.99 | % | | | 1.04 | % |
| | | | | | | | | | | | | | | | | | | | |
Total expenses after fees waived and/or reimbursed | | | 0.68 | %(d) | | | 0.70 | %(d) | | | 0.79 | % | | | 0.78 | % | | | 0.84 | % |
| | | | | | | | | | | | | | | | | | | | |
Net investment income | | | 1.82 | %(d) | | | 1.98 | %(d) | | | 1.79 | % | | | 1.81 | % | | | 1.95 | % |
| | | | | | | | | | | | | | | | | | | �� | |
| | | | | |
Supplemental Data: | | | | | | | | | | | | | | | | | | | | |
Net assets, end of year (000) | | $ | 37,525 | | | $ | 35,256 | | | $ | 30,527 | | | $ | 35,694 | | | $ | 36,658 | |
| | | | | | | | | | | | | | | | | | | | |
Portfolio turnover rate | | | 37 | % | | | 23 | % | | | 25 | % | | | 18 | % | | | 18 | % |
| | | | | | | | | | | | | | | | | | | | |
| (a) | Based on average shares outstanding. |
| (b) | Distributions for annual periods determined in accordance with U.S. federal income tax regulations. |
| (c) | Where applicable, excludes insurance-related fees and expenses and assumes the reinvestment of distributions. |
| (d) | Excludes expenses incurred indirectly as a result of investments in underlying funds of 0.01%. |
See notes to financial statements.
Financial Highlights (continued)
(For a share outstanding throughout each period)
| | | | | | | | | | | | | | | | | | | | |
| | | BlackRock Equity Dividend V.I. Fund | |
| | | Class III | |
| | | Year Ended December 31, | |
| | | 2017 | | | 2016 | | | 2015 | | | 2014 | | | 2013 | |
Net asset value, beginning of year | | $ | 11.13 | | | $ | 10.03 | | | $ | 10.89 | | | $ | 10.77 | | | $ | 8.95 | |
| | | | | | | | | | | | | | | | | | | | |
Net investment income(a) | | | 0.19 | | | | 0.18 | | | | 0.17 | | | | 0.17 | | | | 0.17 | |
Net realized and unrealized gain (loss) | | | 1.62 | | | | 1.42 | | | | (0.25 | ) | | | 0.80 | | | | 1.97 | |
| | | | | | | | | | | | | | | | | | | | |
Net increase (decrease) from investment operations | | | 1.81 | | | | 1.60 | | | | (0.08 | ) | | | 0.97 | | | | 2.14 | |
| | | | | | | | | | | | | | | | | | | | |
| Distributions:(b) | | | | | | | | | | | | | | | |
From net investment income | | | (0.18 | ) | | | (0.17 | ) | | | (0.16 | ) | | | (0.17 | ) | | | (0.17 | ) |
From net realized gain | | | (0.64 | ) | | | (0.33 | ) | | | (0.62 | ) | | | (0.68 | ) | | | (0.15 | ) |
| | | | | | | | | | | | | | | | | | | | |
Total distributions | | | (0.82 | ) | | | (0.50 | ) | | | (0.78 | ) | | | (0.85 | ) | | | (0.32 | ) |
| | | | | | | | | | | | | | | | | | | | |
Net asset value, end of year | | $ | 12.12 | | | $ | 11.13 | | | $ | 10.03 | | | $ | 10.89 | | | $ | 10.77 | |
| | | | | | | | | | | | | | | | | | | | |
| | | | | |
Total Return:(c) | | | | | | | | | | | | | | | | | | | | |
Based on net asset value | | | 16.49 | % | | | 16.06 | % | | | (0.82 | )% | | | 9.07 | % | | | 24.12 | % |
| | | | | | | | | | | | | | | | | | | | |
| | | | | |
Ratios to Average Net Assets: | | | | | | | | | | | | | | | | | | | | |
Total expenses | | | 1.16 | %(d) | | | 1.13 | %(d) | | | 1.16 | % | | | 1.24 | % | | | 1.28 | % |
| | | | | | | | | | | | | | | | | | | | |
Total expenses after fees waived and/or reimbursed | | | 0.93 | %(d) | | | 0.95 | %(d) | | | 1.03 | % | | | 1.03 | % | | | 1.09 | % |
| | | | | | | | | | | | | | | | | | | | |
Net investment income | | | 1.57 | %(d) | | | 1.73 | %(d) | | | 1.59 | % | | | 1.56 | % | | | 1.71 | % |
| | | | | | | | | | | | | | | | | | | | |
| | | | | |
Supplemental Data: | | | | | | | | | | | | | | | | | | | | |
Net assets, end of year (000) | | $ | 287,615 | | | $ | 223,338 | | | $ | 85,163 | | | $ | 22,619 | | | $ | 20,567 | |
| | | | | | | | | | | | | | | | | | | | |
Portfolio turnover rate | | | 37 | % | | | 23 | % | | | 25 | % | | | 18 | % | | | 18 | % |
| | | | | | | | | | | | | | | | | | | | |
| (a) | Based on average shares outstanding. |
| (b) | Distributions for annual periods determined in accordance with U.S. federal income tax regulations. |
| (c) | Where applicable, excludes insurance-related fees and expenses and assumes the reinvestment of distributions. |
| (d) | Excludes expenses incurred indirectly as a result of investments in underlying funds of 0.01%. |
See notes to financial statements.
| | |
| 12 | | 2017 BLACKROCK ANNUAL REPORTTO SHAREHOLDERS |
Notes to Financial Statements
BlackRock Variable Series Funds, Inc. (the “Company”) is registered under the Investment Company Act of 1940, as amended (the “1940 Act”), as an open-end management investment company. The Company is organized as a Maryland corporation that is comprised of 20 separate funds. The funds offer shares to insurance companies for their separate accounts to fund benefits under certain variable annuity and variable life insurance contracts. The financial statements presented are for BlackRock Equity Dividend V.I. Fund (the “Fund”). The Fund is classified as diversified. Class I and Class III Shares have equal voting, dividend, liquidation and other rights, except that only shares of the respective classes are entitled to vote on matters concerning only that class. In addition, Class III Shares bear certain expenses related to the distribution of such shares. Class III Shares were redeemed on December 31, 2007 and sales of Class III Shares recommenced on July 1, 2011.
The Fund, together with certain other registered investment companies advised by BlackRock Advisors, LLC (the “Manager”) or its affiliates, is included in a complex of open-end funds referred to as the Equity-Bond Complex.
| 2. | SIGNIFICANT ACCOUNTING POLICIES |
The financial statements are prepared in conformity with accounting principles generally accepted in the United States of America (“U.S. GAAP”), which may require management to make estimates and assumptions that affect the reported amounts of assets and liabilities in the financial statements, disclosure of contingent assets and liabilities at the date of the financial statements and the reported amounts of increases and decreases in net assets from operations during the reporting period. Actual results could differ from those estimates. The Fund is considered an investment company under U.S. GAAP and follows the accounting and reporting guidance applicable to investment companies. Below is a summary of significant accounting policies:
Investment Transactions and Income Recognition: For financial reporting purposes, investment transactions are recorded on the dates the transactions are entered into (the “trade dates”). Realized gains and losses on investment transactions are determined on the identified cost basis. Dividend income is recorded on the ex-dividend date. Dividends from foreign securities where the ex-dividend date may have passed are subsequently recorded when the Fund is informed of the ex-dividend date. Under the applicable foreign tax laws, a withholding tax at various rates may be imposed on capital gains, dividends and interest. Upon notification from issuers, some of the dividend income received from a real estate investment trust may be redesignated as a reduction of cost of the related investment and/or realized gain. Income, expenses and realized and unrealized gains and losses are allocated daily to each class based on its relative net assets.
Foreign Currency Translation: The Fund’s books and records are maintained in U.S. dollars. Securities and other assets and liabilities denominated in foreign currencies are translated into U.S. dollars using exchange rates determined as of the close of trading on the New York Stock Exchange (“NYSE”). Purchases and sales of investments are recorded at the rates of exchange prevailing on the respective dates of such transactions. Generally, when the U.S. dollar rises in value against a foreign currency, the investments denominated in that currency will lose value; the opposite effect occurs if the U.S. dollar falls in relative value.
The Fund does not isolate the portion of the results of operations arising as a result of changes in the exchange rates from the changes in the market prices of investments held or sold for financial reporting purposes. Accordingly, the effects of changes in exchange rates on investments are not segregated in the Statement of Operations from the effects of changes in market prices of those investments, but are included as a component of net realized and unrealized gain (loss) from investments. The Fund reports realized currency gains (losses) on foreign currency related transactions as components of net realized gain (loss) for financial reporting purposes, whereas such components are generally treated as ordinary income for U.S. federal income tax purposes.
Distributions: Distributions paid by the Fund are recorded on the ex-dividend date. The character and timing of distributions are determined in accordance with U.S. federal income tax regulations, which may differ from U.S. GAAP.
Indemnifications: In the normal course of business, the Fund enters into contracts that contain a variety of representations that provide general indemnification. The Fund’s maximum exposure under these arrangements is unknown because it involves future potential claims against the Fund, which cannot be predicted with any certainty.
Other: Expenses directly related to the Fund or its classes are charged to the Fund or the applicable class. Other operating expenses shared by several funds, including other funds managed by the Manager, are prorated among those funds on the basis of relative net assets or other appropriate methods. Expenses directly related to the Fund and other shared expenses prorated to the Fund are allocated daily to each class based on its relative net assets or other appropriate methods.
| 3. | INVESTMENT VALUATION AND FAIR VALUE MEASUREMENTS |
Investment Valuation Policies: The Fund’s investments are valued at fair value (also referred to as “market value” within the financial statements) as of the close of trading on the NYSE (generally 4:00 p.m., Eastern time) (or, if the reporting date falls on a day the NYSE is closed, investments are valued at fair value as of the period end). U.S. GAAP defines fair value as the price the Fund would receive to sell an asset or pay to transfer a liability in an orderly transaction between market participants at the measurement date. The Fund determines the fair values of its financial instruments using various independent dealers or pricing services under policies approved by the Board of Directors of the Company (the “Board”). The BlackRock Global Valuation Methodologies Committee (the “Global Valuation Committee”) is the committee formed by management to develop global pricing policies and procedures and to oversee the pricing function for all financial instruments.
Fair Value Inputs and Methodologies: The following methods and inputs are used to establish the fair value of the Fund’s assets and liabilities:
| | • | | Equity investments traded on a recognized securities exchange are valued at the official closing price each day, if available. For equity investments traded on more than one exchange, the official closing price on the exchange where the stock is primarily traded is used. Equity investments traded on a recognized exchange for which there were no sales on that day may be valued at the last available bid (long positions) or ask (short positions) price. |
| | | | |
| NOTESTO FINANCIAL STATEMENTS | | | 13 | |
Notes to Financial Statements (continued)
Generally, trading in foreign instruments is substantially completed each day at various times prior to the close of trading on the NYSE. Occasionally, events affecting the values of such instruments may occur between the foreign market close and the close of trading on the NYSE that may not be reflected in the computation of the Fund’s net assets. Each business day, the Fund uses a pricing service to assist with the valuation of certain foreign exchange-traded equity securities and foreign exchange-traded and over-the-counter (“OTC”) options (the “Systematic Fair Value Price”). Using current market factors, the Systematic Fair Value Price is designed to value such foreign securities and foreign options at fair value as of the close of trading on the NYSE, which follows the close of the local markets.
| | • | | Investments in open-end U.S. mutual funds are valued at net asset value (“NAV”) each business day. |
| | • | | The Fund values its investment in SL Liquidity Series, LLC, Money Market Series (the “Money Market Series”) at fair value, which is ordinarily based upon its pro rata ownership in the underlying fund’s net assets. The Money Market Series seeks current income consistent with maintaining liquidity and preserving capital. Although the Money Market Series is not registered under the 1940 Act, its investments may follow the parameters of investments by a money market fund that is subject to Rule 2a-7 under the 1940 Act. |
If events (e.g., a company announcement, market volatility or a natural disaster) occur that are expected to materially affect the value of such investments, or in the event that the application of these methods of valuation results in a price for an investment that is deemed not to be representative of the market value of such investment, or if a price is not available, the investment will be valued by the Global Valuation Committee, or its delegate, in accordance with a policy approved by the Board as reflecting fair value (“Fair Valued Investments”). The fair valuation approaches that may be used by the Global Valuation Committee will include market approach, income approach and cost approach. Valuation techniques such as discounted cash flow, use of market comparables and matrix pricing are types of valuation approaches and are typically used in determining fair value. When determining the price for Fair Valued Investments, the Global Valuation Committee, or its delegate, seeks to determine the price that the Fund might reasonably expect to receive or pay from the current sale or purchase of that asset or liability in an arm’s-length transaction. Fair value determinations shall be based upon all available factors that the Global Valuation Committee, or its delegate, deems relevant and consistent with the principles of fair value measurement. The pricing of all Fair Valued Investments is subsequently reported to the Board or a committee thereof on a quarterly basis.
Fair Value Hierarchy: Various inputs are used in determining the fair value of investments. These inputs to valuation techniques are categorized into a fair value hierarchy consisting of three broad levels for financial statement purposes as follows:
| | • | | Level 1 — Unadjusted price quotations in active markets/exchanges for identical assets or liabilities that the Fund has the ability to access |
| | • | | Level 2 — Other observable inputs (including, but not limited to, quoted prices for similar assets or liabilities in markets that are active, quoted prices for identical or similar assets or liabilities in markets that are not active, inputs other than quoted prices that are observable for the assets or liabilities (such as interest rates, yield curves, volatilities, prepayment speeds, loss severities, credit risks and default rates) or other market–corroborated inputs) |
| | • | | Level 3 — Unobservable inputs based on the best information available in the circumstances, to the extent observable inputs are not available (including the Fund’s own assumptions used in determining the fair value of investments) |
The hierarchy gives the highest priority to unadjusted quoted prices in active markets for identical assets or liabilities (Level 1 measurements) and the lowest priority to unobservable inputs (Level 3 measurements). Accordingly, the degree of judgment exercised in determining fair value is greatest for instruments categorized in Level 3. The inputs used to measure fair value may fall into different levels of the fair value hierarchy. In such cases, for disclosure purposes, the fair value hierarchy classification is determined based on the lowest level input that is significant to the fair value measurement in its entirety. Investments classified within Level 3 have significant unobservable inputs used by the Global Valuation Committee in determining the price for Fair Valued Investments. Level 3 investments include equity or debt issued by privately held companies or funds. There may not be a secondary market, and/or there are a limited number of investors. Level 3 investments may also be adjusted to reflect illiquidity and/or non-transferability, with the amount of such discount estimated by the Global Valuation Committee in the absence of market information.
Changes in valuation techniques may result in transfers into or out of an assigned level within the hierarchy. In accordance with the Fund’s policy, transfers between different levels of the fair value hierarchy are deemed to have occurred as of the beginning of the reporting period. The categorization of a value determined for investments is based on the pricing transparency of the investments and is not necessarily an indication of the risks associated with investing in those securities.
As of December 31, 2017, certain investments of the Fund were valued using NAV per share as no quoted market value is available and therefore have been excluded from the fair value hierarchy.
| 4. | SECURITIES AND OTHER INVESTMENTS |
Securities Lending: The Fund may lend its securities to approved borrowers, such as brokers, dealers and other financial institutions. The borrower pledges and maintains with the Fund collateral consisting of cash, an irrevocable letter of credit issued by a bank, or securities issued or guaranteed by the U.S. Government. The initial collateral received by the Fund is required to have a value of at least 102% of the current value of the loaned securities for securities traded on U.S. exchanges and a value of at least 105% for all other securities. The collateral is maintained thereafter at a value equal to at least 100% of the current market value of the securities on loan. The market value of the loaned securities is determined at the close of each business day of the Fund and any additional required collateral is delivered to the Fund, or excess collateral returned by the Fund, on the next business day. During the term of the loan, the Fund is entitled to all distributions made on or in respect of the loaned securities, but does not receive interest income on securities received as collateral. Loans of securities are terminable at any time and the borrower, after notice, is required to return borrowed securities within the standard time period for settlement of securities transactions.
The market value of any securities on loan, all of which were classified as common stocks in the Fund’s Schedule of Investments, and the value of any related collateral are shown separately in the Statement of Assets and Liabilities as a component of investments at value — unaffiliated, and collateral on securities loaned at value, respectively. As of period end, any securities on loan were collateralized by cash and/or U.S. Government obligations. Cash collateral invested by the securities lending agent, BlackRock Investment Management, LLC (“BIM”), if any, is disclosed in the Schedule of Investments.
| | |
| 14 | | 2017 BLACKROCK ANNUAL REPORTTO SHAREHOLDERS |
Notes to Financial Statements (continued)
Securities lending transactions are entered into by the Fund under Master Securities Lending Agreements (each, an “MSLA”), which provide the right, in the event of default (including bankruptcy or insolvency), for the non-defaulting party to liquidate the collateral and calculate a net exposure to the defaulting party or request additional collateral. In the event that a borrower defaults, the Fund, as lender, would offset the market value of the collateral received against the market value of the securities loaned. When the value of the collateral is greater than that of the market value of the securities loaned, the lender is left with a net amount payable to the defaulting party. However, bankruptcy or insolvency laws of a particular jurisdiction may impose restrictions on or prohibitions against such a right of offset in the event of an MSLA counterparty’s bankruptcy or insolvency. Under the MSLA, absent an event of default, the borrower can resell or re-pledge the loaned securities, and the Fund can reinvest cash collateral received in connection with loaned securities. Upon an event of default, the parties’ obligations to return the securities or collateral to the other party are extinguished, and the parties can resell or re-pledge the loaned securities or the collateral received in connection with the loaned securities in order to satisfy the defaulting party’s net payment obligation for all transactions under the MSLA. The defaulting party remains liable for any deficiency.
As of period end, the following table is a summary of the Fund’s securities lending agreements by counterparty which are subject to offset under an MSLA:
| | | | | | | | | | | | |
| Counterparty | | Securities Loaned at Value | | | Cash Collateral Received (a) | | | Net Amount | |
JP Morgan Securities LLC | | $ | 1,551,881 | | | $ | (1,551,881 | ) | | $ | — | |
| | (a) | Cash collateral with a value of $1,609,373 has been received in connection with securities lending agreements. Collateral received in excess of the value of securities loaned from the individual counterparty is not shown for financial reporting purposes. | |
The risks of securities lending include the risk that the borrower may not provide additional collateral when required or may not return the securities when due. To mitigate these risks, the Fund benefits from a borrower default indemnity provided by BIM. BIM’s indemnity allows for full replacement of the securities loaned if the collateral received does not cover the value on the securities loaned in the event of borrower default. The Fund could incur a loss if the value of an investment purchased with cash collateral falls below the market value of loaned securities or if the value of an investment purchased with cash collateral falls below the value of the original cash collateral received.
| 5. | INVESTMENT ADVISORY AGREEMENT AND OTHER TRANSACTIONS WITH AFFILIATES |
The PNC Financial Services Group, Inc. is the largest stockholder and an affiliate of BlackRock, Inc. (“BlackRock”) for 1940 Act purposes.
Investment Advisory: The Company, on behalf of the Fund, entered into an Investment Advisory Agreement with the Manager, the Fund’s investment adviser, an indirect, wholly-owned subsidiary of BlackRock, to provide investment advisory and administrative services. The Manager is responsible for the management of the Fund’s portfolio and provides the personnel, facilities, equipment and certain other services necessary to the operations of the Fund.
For such services, the Fund pays the Manager a monthly fee at an annual rate equal to the following percentages of the average daily value of the Fund’s net assets:
| | |
| Average Daily Net Assets | | Investment Advisory Fees |
First $1 Billion | | 0.60% |
$1 Billion — $3 Billion | | 0.56 |
$3 Billion — $5 Billion | | 0.54 |
$5 Billion — $10 Billion | | 0.52 |
Greater than $10 Billion | | 0.51 |
Distribution Fees: The Company, on behalf of the Fund, entered into a Distribution Agreement and a Distribution Plan with BlackRock Investments, LLC (“BRIL”), an affiliate of the Manager. Pursuant to the Distribution Plan and in accordance with Rule 12b-1 under the 1940 Act, the Fund pays BRIL ongoing distribution fees. The fees are accrued daily and paid monthly at an annual rate of 0.25% based upon the average daily net assets attributable to Class III.
For the year ended December 31, 2017, the class specific distribution fees borne directly by Class III were $652,834.
Transfer Agent: On behalf of the Fund, the Manager entered into agreements with insurance companies and other financial intermediaries (“Service Organizations”), some of which may be affiliates. Pursuant to these agreements, the Service Organizations provide the Fund with administrative, networking, recordkeeping, sub-transfer agency and shareholder services to sub-accounts they service. For these services, the Service Organizations receive an annual fee per shareholder account, which will vary depending on share class and/or net assets of Fund shareholders serviced by the Service Organizations, which is shown as transfer agent — class specific. For the year ended December 31, 2017, the Fund did not pay any amounts to affiliates in return for these services.
In addition, the Fund pays the transfer agent, which is not an affiliate, a fee for the issuance, transfer and redemption of shares and the opening and maintenance of shareholder accounts, which is included in transfer agent in the Statement of Operations.
For the year ended December 31, 2017, the following table shows the class specific transfer agent fees borne directly by each share class of the Fund:
| | | | | | | | | | | | | | |
| Class I | | | | | | Class III | | | | Total | |
| $ | 75,822 | | | | | | | $576,391 | | | | $ | 652,213 | |
Expense Limitations, Waivers and Reimbursements: With respect to the Fund, the Manager voluntarily agreed to waive its investment advisory fees by the amount of investment advisory fees the Fund pays to the Manager indirectly through its investment in affiliated money market funds (the “affiliated money market fund waiver”). The
| | | | |
| NOTESTO FINANCIAL STATEMENTS | | | 15 | |
Notes to Financial Statements (continued)
amount of waivers and/or reimbursements of fees and expenses made pursuant to the expense limitation caps will be reduced by the amount of the affiliated money market fund waiver. This amount is shown as fees waived and/or reimbursed by the Manager in the Statement of Operations. For the year ended December 31, 2017, the amount waived was $8,593.
The Manager has contractually agreed to waive its investment advisory fee with respect to any portion of the Fund’s assets invested in affiliated equity and fixed-income mutual funds and affiliated exchange-traded funds that have a contractual management fee through April 30, 2018. The contractual agreement may be terminated upon 90 days’ notice by a majority of the independent directors who are not “interested persons” of the Fund, as defined in the 1940 Act (“Independent Directors”) or by a vote of a majority of the outstanding voting securities of the Fund. For the year ended December 31, 2017, there were no fees waived by the Manager.
For the year ended December 31, 2017, the Fund reimbursed the Manager $3,346 for certain accounting services, which is included in accounting services in the Statement of Operations.
The Manager has contractually agreed to reimburse all transfer agent fees for Class I and III. The Manager has agreed not to reduce or discontinue this contractual expense limitation through April 30, 2018, unless approved by the Board, including a majority of the Independent Directors or by a vote of a majority of the outstanding voting securities of the Fund. These amounts waived and/or reimbursed are shown as transfer agent fees reimbursed — class specific in the Statement of Operations. For the year ended December 31, 2017, class specific waivers and/or reimbursements were as follows:
| | | | | | | | | | | | |
| | | Class I | | | Class III | | | Total | |
Transfer Agent Fees Reimbursed | | $ | 75,822 | | | $ | 576,391 | | | $ | 652,213 | |
With respect to the Fund, the Manager contractually agreed to waive and/or reimburse fees or expenses in order to limit expenses, excluding interest expense, dividend expense, tax expense, acquired fund fees and expenses, and certain other fund expenses, which constitute extraordinary expenses not incurred in the ordinary course of the Fund’s business (“expense limitation”). The expense limitations as a percentage of average daily net assets are as follows:
| | | | | | | | | | | | |
| | | | | | Class I | | | | Class III | |
| | | | | | | 1.25% | | | | | 1.50% | |
The Manager has agreed not to reduce or discontinue this contractual expense limitation through April 30, 2018, unless approved by the Board, including a majority of the Independent Directors or by vote of a majority of the outstanding voting securities of the Fund. For the year ended December 31, 2017, there were no fees waived and/or reimbursed by the Manager.
Securities Lending: The U.S. Securities and Exchange Commission (“SEC”) has issued an exemptive order which permits BIM, an affiliate of the Manager, to serve as securities lending agent for the Fund, subject to applicable conditions. As securities lending agent, BIM bears all operational costs directly related to securities lending. The Fund is responsible for expenses in connection with the investment of cash collateral received for securities on loan (the “collateral investment expenses”). The cash collateral is invested in a private investment company managed by the Manager or its affiliates. However, BIM has agreed to cap the collateral investment expenses of the private investment company to an annual rate of 0.04%. The investment adviser to the private investment company will not charge any advisory fees with respect to shares purchased by the Fund. The private investment company in which the cash collateral has been invested may, under certain circumstances, impose a liquidity fee of up to 2% of the value withdrawn or temporarily restrict withdrawals for up to 10 business days during a 90 day period, in the event that the private investment company’s weekly liquid assets fall below certain thresholds.
Securities lending income is equal to the total of income earned from the reinvestment of cash collateral, net of fees and other payments to and from borrowers of securities, and less the collateral investment expenses. The Fund retains a portion of securities lending income and remits a remaining portion to BIM as compensation for its services as securities lending agent.
Pursuant to a securities lending agreement, the Fund retains 71.5% of securities lending income, and this amount retained can never be less than 65% of the total of securities lending income plus the collateral investment expenses.
In addition, commencing the business day following the date that the aggregate securities lending income earned across the Equity-Bond Complex in a calendar year exceeds a specified threshold, the Fund, pursuant to the securities lending agreement, will retain for the remainder of that calendar year securities lending income as follows: 75% of securities lending income, and this amount retained can never be less than 65% of the total of securities lending income plus the collateral investment expenses.
The share of securities lending income earned by the Fund is shown as securities lending income — affiliated — net in the Statement of Operations. For the year ended December 31, 2017, the Fund paid BIM $11,782 for securities lending agent services.
Interfund Lending: In accordance with an exemptive order (the “Order”) from the SEC, the Fund may participate in a joint lending and borrowing facility for temporary purposes (the “Interfund Lending Program”), subject to compliance with the terms and conditions of the Order, and to the extent permitted by the Fund’s investment policies and restrictions. The Fund is currently permitted to borrow under the Interfund Lending Program.
A lending BlackRock fund may lend in aggregate up to 15% of its net assets, but may not lend more than 5% of its net assets to any one borrowing fund through the Interfund Lending Program. A borrowing BlackRock fund may not borrow through the Interfund Lending Program or from any other source more than 33 1⁄3% of its total assets (or any lower threshold provided for by the fund’s investment restrictions). If a borrowing BlackRock fund’s total outstanding borrowings exceed 10% of its total assets, each of its outstanding interfund loans will be subject to collateralization of at least 102% of the outstanding principal value of the loan. All interfund loans are for temporary or emergency purposes and the interest rate to be charged will be the average of the highest current overnight repurchase agreement rate available to a lending fund and the bank loan rate, as calculated according to a formula established by the Board.
| | |
| 16 | | 2017 BLACKROCK ANNUAL REPORTTO SHAREHOLDERS |
Notes to Financial Statements (continued)
During the year ended December 31, 2017, the Fund did not participate in the Interfund Lending Program.
Officers and Directors: Certain directors and/or officers of the Company are directors and/or officers of BlackRock or its affiliates. The Fund reimburses the Manager for a portion of the compensation paid to the Company’s Chief Compliance Officer, which is included in Directors and Officer in the Statement of Operations.
For the year ended December 31, 2017, purchases and sales of investments, excluding short-term securities, were $127,900,683 and $104,096,465, respectively.
It is the Fund’s policy to comply with the requirements of the Internal Revenue Code of 1986, as amended, applicable to regulated investment companies, and to distribute substantially all of its taxable income to its shareholders. Therefore, no U.S. federal income tax provision is required.
The Fund files U.S. federal and various state and local tax returns. No income tax returns are currently under examination. The statute of limitations on the Fund’s U.S. federal tax returns generally remains open for each of the four years ended December 31, 2017. The statutes of limitations on the Fund’s state and local tax returns may remain open for an additional year depending upon the jurisdiction.
Management has analyzed tax laws and regulations and their application to the Fund as of December 31, 2017, inclusive of the open tax return years, and does not believe there are any uncertain tax positions that require recognition of a tax liability in the Fund’s financial statements.
U.S. GAAP requires that certain components of net assets be adjusted to reflect permanent differences between financial and tax reporting. These reclassifications have no effect on net assets or net asset values per share. As of period end, the following permanent differences attributable to foreign currency transactions and the reclassification of distributions were reclassified to the following accounts:
| | | | |
Undistributed net investment income | | $ | 11,291 | |
Accumulated net realized gain | | $ | (11,291 | ) |
The tax character of distributions paid was as follows:
| | | | | | | | |
| | | 12/31/17 | | | 12/31/16 | |
Ordinary income | | $ | 7,150,173 | | | $ | 4,212,059 | |
Long term capital gains | | | 14,083,732 | | | | 6,364,080 | |
| | | | | | | | |
| | $ | 21,233,905 | | | $ | 10,576,139 | |
| | | | | | | | |
As of December 31, 2017, the tax components of accumulated net earnings (losses) were as follows:
| | | | |
Undistributed ordinary income | | $ | 622,664 | |
Undistributed long-term capital gains | | | 3,254,853 | |
Net unrealized gains1 | | | 52,480,278 | |
| | | | |
| | $ | 56,357,795 | |
| | | | |
| | 1 | The difference between book-basis and tax-basis net unrealized gains was attributable primarily to the tax deferral of losses on wash sales and the timing and recognition of partnership income. | |
As of December 31, 2017, gross unrealized appreciation and depreciation for investments based on cost for U.S. federal income tax purposes were as follows:
| | | | |
Tax cost | | $ | 274,434,003 | |
| | | | |
Gross unrealized appreciation | | $ | 57,933,956 | |
Gross unrealized depreciation | | | (5,453,768 | ) |
| | | | |
Net unrealized appreciation | | $ | 52,480,188 | |
| | | | |
The Company, on behalf of the Fund, along with certain other funds managed by the Manager and its affiliates (“Participating Funds”), is a party to a 364-day, $2.1 billion credit agreement with a group of lenders. Under this agreement, the Fund may borrow to fund shareholder redemptions. Excluding commitments designated for certain individual funds, the Participating Funds, including the Fund, can borrow up to an aggregate commitment amount of $1.6 billion at any time outstanding, subject to asset coverage and other limitations as specified in the agreement. The credit agreement has the following terms: a fee of 0.12% per annum on unused commitment amounts and interest at a rate equal to the higher of (a) one-month LIBOR (but, in any event, not less than 0.00%) on the date the loan is made plus 0.80% per annum or (b) the Fed Funds rate (but, in any event, not less than 0.00%) in effect from time to time plus 0.80% per annum on amounts borrowed. The agreement expires in April 2018 unless extended or renewed. Participating Funds paid administration, legal and arrangement fees, which, if applicable, are included in miscellaneous expenses in the Statement of Operations. These fees were allocated among such funds based upon portions of the aggregate commitment available to them and relative net assets of Participating Funds. During the year ended December 31, 2017, the Fund did not borrow under the credit agreement.
| | | | |
| NOTESTO FINANCIAL STATEMENTS | | | 17 | |
Notes to Financial Statements (continued)
In the normal course of business, the Fund invests in securities or other instruments and may enter into certain transactions, and such activities subject the Fund to various risks, including among others, fluctuations in the market (market risk) or failure of an issuer to meet all of its obligations. The value of securities or other instruments may also be affected by various factors, including, without limitation: (i) the general economy; (ii) the overall market as well as local, regional or global political and/or social instability; (iii) regulation, taxation or international tax treaties between various countries; or (iv) currency, interest rate and price fluctuations. The Fund’s prospectus provides details of the risks to which the Fund is subject.
The Fund may be exposed to additional risks when reinvesting cash collateral in money market funds that do not seek to maintain a stable NAV per share of $1.00 and which may be subject to redemption gates or liquidity fees under certain circumstances.
Valuation Risk: The market values of equities, such as common stocks and preferred securities or equity related investments, such as futures and options, may decline due to general market conditions which are not specifically related to a particular company. They may also decline due to factors which affect a particular industry or industries. The Fund may invest in illiquid investments and may experience difficulty in selling those investments in a timely manner at the price that it believes the investments are worth. Prices may fluctuate widely over short or extended periods in response to company, market or economic news. Markets also tend to move in cycles, with periods of rising and falling prices. This volatility may cause the Fund’s NAV to experience significant increases or decreases over short periods of time. If there is a general decline in the securities and other markets, the NAV of the Fund may lose value, regardless of the individual results of the securities and other instruments in which the Fund invests.
Counterparty Credit Risk: Similar to issuer credit risk, the Fund may be exposed to counterparty credit risk, or the risk that an entity may fail to or be unable to perform on its commitments related to unsettled or open transactions. The Fund manages counterparty credit risk by entering into transactions only with counterparties that the Manager believes have the financial resources to honor their obligations and by monitoring the financial stability of those counterparties. Financial assets, which potentially expose the Fund to market, issuer and counterparty credit risks, consist principally of financial instruments and receivables due from counterparties. The extent of the Fund’s exposure to market, issuer and counterparty credit risks with respect to these financial assets is approximately their value recorded in the Statement of Assets and Liabilities, less any collateral held by the Fund.
Concentration Risk: As of period end, the Fund invested a significant portion of its assets in securities in the financials sector. Changes in economic conditions affecting such sector would have a greater impact on the Fund and could affect the value, income and/or liquidity of positions in such securities.
| 10. | CAPITAL SHARE TRANSACTIONS |
Transactions in capital shares for each class were as follows:
| | | | | | | | | | | | | | | | |
| | | Year Ended
12/31/2017 | | | Year Ended
12/31/2016 | |
| | | Shares | | | Amount | | | Shares | | | Amount | |
Class I | | | | | | | | | | | | | | | | |
Shares sold | | | 305,267 | | | $ | 3,599,163 | | | | 508,947 | | | $ | 5,352,774 | |
Shares issued in reinvestment of distributions | | | 211,779 | | | | 2,551,419 | | | | 144,726 | | | | 1,585,939 | |
Shares redeemed | | | (588,300 | ) | | | (6,980,961 | ) | | | (530,755 | ) | | | (5,460,031 | ) |
| | | | | | | | | | | | | | | | |
Net increase (decrease) | | | (71,254 | ) | | $ | (830,379 | ) | | | 122,918 | | | $ | 1,478,682 | |
| | | | | | | | | | | | | | | | |
| | | | |
Class III | | | | | | | | | | | | | | | | |
Shares sold | | | 4,790,801 | | | $ | 55,321,887 | | | | 11,932,893 | | | $ | 122,634,261 | |
Shares issued in reinvestment of distributions | | | 1,552,013 | | | | 18,682,485 | | | | 818,081 | | | | 8,990,200 | |
Shares redeemed | | | (2,671,545 | ) | | | (31,360,973 | ) | | | (1,174,386 | ) | | | (12,202,556 | ) |
| | | | | | | | | | | | | | | | |
Net increase | | | 3,671,269 | | | $ | 42,643,399 | | | | 11,576,588 | | | $ | 119,421,905 | |
| | | | | | | | | | | | | | | | |
Total Net Increase | | | 3,600,015 | | | $ | 41,813,020 | | | | 11,699,506 | | | $ | 120,900,587 | |
| | | | | | | | | | | | | | | | |
Management has evaluated the impact of all subsequent events on the Fund through the date the financial statements were issued and has determined that there were no subsequent events requiring adjustment or additional disclosure in the financial statements.
| | |
| 18 | | 2017 BLACKROCK ANNUAL REPORTTO SHAREHOLDERS |
Report of the Independent Registered Public Accounting Firm
To the Shareholders of BlackRock Equity Dividend V.I. Fund and the Board of Directors of BlackRock Variable Series Funds, Inc.:
Opinion on the Financial Statements and Financial Highlights
We have audited the accompanying statement of assets and liabilities, including the schedule of investments, of BlackRock Equity Dividend V.I. Fund of BlackRock Variable Series Funds, Inc. (the “Fund”), as of December 31, 2017, the related statement of operations for the year then ended, the statements of changes in net assets for each of the two years in the period then ended, the financial highlights for each of the five years in the period then ended, and the related notes. In our opinion, the financial statements and financial highlights present fairly, in all material respects, the financial position of the Fund as of December 31, 2017, and the results of its operations for the year then ended, the changes in its net assets for each of the two years in the period then ended, and the financial highlights for each of the five years in the period then ended, in conformity with accounting principles generally accepted in the United States of America.
Basis for Opinion
These financial statements and financial highlights are the responsibility of the Fund’s management. Our responsibility is to express an opinion on the Fund’s financial statements and financial highlights based on our audits. We are a public accounting firm registered with the Public Company Accounting Oversight Board (United States) (PCAOB) and are required to be independent with respect to the Fund in accordance with the U.S. federal securities laws and the applicable rules and regulations of the Securities and Exchange Commission and the PCAOB.
We conducted our audits in accordance with the standards of the PCAOB. Those standards require that we plan and perform the audit to obtain reasonable assurance about whether the financial statements and financial highlights are free of material misstatement, whether due to error or fraud. The Fund is not required to have, nor were we engaged to perform, an audit of its internal control over financial reporting. As part of our audits we are required to obtain an understanding of internal control over financial reporting but not for the purpose of expressing an opinion on the effectiveness of the Fund’s internal control over financial reporting. Accordingly, we express no such opinion.
Our audits included performing procedures to assess the risks of material misstatement of the financial statements and financial highlights, whether due to error or fraud, and performing procedures that respond to those risks. Such procedures included examining, on a test basis, evidence regarding the amounts and disclosures in the financial statements and financial highlights. Our audits also included evaluating the accounting principles used and significant estimates made by management, as well as evaluating the overall presentation of the financial statements and financial highlights. Our procedures included confirmation of securities owned as of December 31, 2017, by correspondence with the custodian and brokers; when replies were not received from brokers, we performed other auditing procedures. We believe that our audits provide a reasonable basis for our opinion.
Deloitte & Touche LLP
Boston, Massachusetts
February 19, 2018
We have served as the auditor of one or more BlackRock investment companies since 1992.
| | | | |
| REPORTOFTHE INDEPENDENT REGISTERED PUBLIC ACCOUNTING FIRM | | | 19 | |
DECEMBER 31, 2017
| | |
ANNUAL REPORT | |  |
BlackRock Variable Series Funds, Inc.
| Ø | | BlackRock Global Allocation V.I. Fund |
|
| Not FDIC Insured • May Lose Value • No Bank Guarantee |
| | |
| Fund Summary as of December 31, 2017 | | BlackRock Global Allocation V.I. Fund |
Investment Objective
BlackRock Global Allocation V.I. Fund’s (the “Fund”) investment objective is to seek high total investment return.
Portfolio Management Commentary
How did the Fund perform?
For the 12-month period ended December 31, 2017, the Fund underperformed both its Reference Benchmark and the broad based all-equity benchmark, the FTSE World Index. The Reference Benchmark is comprised as follows: 36% S&P 500® Index; 24% FTSE World (ex-U.S.) Index; 24% ICE BofAML Current 5-Year U.S. Treasury Index; and 16% Citigroup Non-US Dollar World Government Bond Index. The Fund invests in both equities and bonds, and therefore, the Reference Benchmark provides a more accurate representation of the Fund’s composition and is a more comparable means for measurement. The following discussion of relative performance pertains to the Reference Benchmark. The following commentary (and referenced allocation percentages) are based on the economic exposures of the Fund, which reflect adjustments for futures, swaps and options (except with respect to fixed income securities), and convertible bonds, and may vary relative to the market value.
What factors influenced performance?
Within equities, an overweight to Japan and underweight to the United States detracted from performance. From a sector perspective, an underweight and stock selection in information technology (“IT”), as well as stock selection within industrials, financials and health care weighed on returns. Exposure to commodity-related securities and cash and cash equivalents detracted. Currency management, notably an overweight to the U.S. dollar and an underweight to the euro, negatively impacted returns.
Within equities, an overweight to India positively impacted performance. From a sector perspective, stock selection within consumer discretionary and utilities contributed to returns. Stock selection within energy and telecommunication services (“telecom”) was additive, but the benefit to performance was partially offset by overweights to both sectors. An underweight to consumer staples positively contributed to performance, but this was partially offset by stock selection within the sector. More broadly, an underweight to fixed income and exposure to corporate credit within that allocation positively contributed to performance.
The Fund uses derivatives, which may include options, futures, swaps and forward contracts both to seek to enhance returns of the Fund and to hedge (or protect) against adverse movements in currency exchange rates, interest rates and movements in the securities markets. During the period, the Fund’s use of derivatives detracted from the Fund’s performance.
Describe recent portfolio activity.
During the 12-month period, the Fund’s overall equity allocation increased from 57% to 62% of net assets. Within equities, the Fund increased exposure to the United States and Europe, and decreased exposure to Japan. From a sector perspective, the Fund increased exposure to IT, energy, materials, utilities, telecom, and consumer discretionary, and decreased exposure to financials, industrials, real estate and health care.
The Fund’s overall allocation to fixed income increased from 25% to 30% of net assets. Within fixed income, the Fund increased exposure to government bonds and decreased exposure to corporate bonds.
The Fund’s allocation to commodity-related securities increased from 3% to 4% of net assets.
Reflecting the above changes, the Fund’s cash and cash equivalents holdings decreased from 14% to 4% of net assets. During the 12-month period, the Fund’s cash position helped mitigate portfolio volatility and served as a source of funds for new investments and redemptions.
Describe portfolio positioning at period end.
Relative to its Reference Benchmark, the Fund was overweight equities, commodity-related securities and cash, and was underweight fixed income. Within equities, the Fund was overweight Japan and Europe, and underweight the United States. Within Europe, the Fund was overweight the Netherlands and France, and underweight Ireland. From a sector perspective, the Fund was overweight energy, consumer discretionary, telecom, IT, utilities and materials, and was underweight financials, consumer staples, industrials and healthcare. Within fixed income, the Fund was underweight developed market government bonds, and overweight corporate and convertible bonds. With respect to currency exposure, the Fund was overweight the U.S. dollar, Indian rupee and Brazilian real, and underweight the Canadian dollar and British pound sterling.
The views expressed reflect the opinions of BlackRock as of the date of this report and are subject to change based on changes in market, economic or other conditions. These views are not intended to be a forecast of future events and are no guarantee of future results.
| | |
| 2 | | 2017 BLACKROCK ANNUAL REPORTTO SHAREHOLDERS |
| | |
| Fund Summary as of December 31, 2017 (continued) | | BlackRock Global Allocation V.I. Fund |
TOTAL RETURN BASED ON A $10,000 INVESTMENT
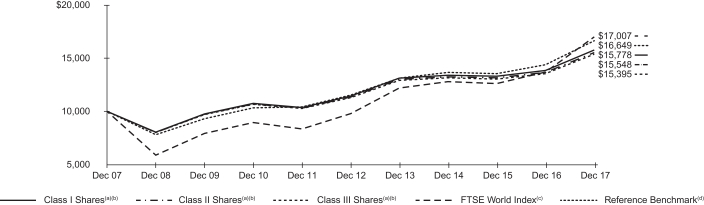
| (a) | Assuming transaction costs, if any, and other operating expenses, including investment advisory fees. Does not include insurance-related fees and expenses. |
| (b) | The Fund invests in a portfolio of U.S. and foreign equity securities, debt and money market securities, the combination of which will be varied from time to time with respect to types of securities and markets in response to changing markets and economic trends. |
| (c) | This unmanaged capitalization-weighted index is comprised of 2,582 equities from 35 countries in 4 regions, including the United States. |
| (d) | The Reference Benchmark is an unmanaged weighted index comprised as follows: 36% S&P 500® Index; 24% FTSE World (ex U.S.) Index; 24% ICE BofAML Current 5-Year U.S. Treasury Index; and 16% Citigroup Non-U.S. Dollar World Government Bond Index. |
Performance Summary for the Period Ended December 31, 2017
| | | | | | | | | | | | | | | | | | | | | | | | | | | | |
| | | 6-Month Total Returns (b) | | | | | | Average Annual Total Returns | |
| | | | | | | 1 Year (b) | | | | | | 5 Years (b) | | | | | | 10 Years (b) | |
Class I(a) | | | 5.68 | % | | | | | | | 13.86 | % | | | | | | | 6.64 | % | | | | | | | 4.67 | % |
Class II(a) | | | 5.61 | | | | | | | | 13.74 | | | | | | | | 6.49 | | | | | | | | 4.51 | |
Class III(a) | | | 5.65 | | | | | | | | 13.71 | | | | | | | | 6.39 | | | | | | | | 4.41 | |
FTSE World Index | | | 11.19 | | | | | | | | 24.09 | | | | | | | | 11.67 | | | | | | | | 5.45 | |
Reference Benchmark | | | 7.21 | | | | | | | | 15.69 | | | | | | | | 7.59 | | | | | | | | 5.23 | |
U.S. Stocks: S&P 500® Index(c) | | | 11.42 | | | | | | | | 21.83 | | | | | | | | 15.79 | | | | | | | | 8.50 | |
Non-U.S. Stocks: FTSE World (ex-U.S.) Index(d) | | | 10.92 | | | | | | | | 26.57 | | | | | | | | 7.52 | | | | | | | | 2.52 | |
U.S. Bonds: ICE BofAML Current 5-year U.S. Treasury Index(e) | | | (0.46 | ) | | | | | | | 0.72 | | | | | | | | 0.64 | | | | | | | | 3.23 | |
Non-U.S. Bonds: Citigroup Non-U.S. Dollar World Government Bond Index(f) | | | 4.18 | | | | | | | | 10.33 | | | | | | | | (0.29 | ) | | | | | | | 2.44 | |
| | (a) | Average annual and cumulative total returns are based on changes in net asset value for the periods shown and assume reinvestment of all distributions at net asset value on the ex-dividend date. Insurance-related fees and expenses are not reflected in these returns. | |
| | (b) | For a portion of the period, the Fund’s investment adviser waived a portion of its fees. Without such waiver, the Fund’s performance would have been lower. | |
| | (c) | This unmanaged index covers 500 leading companies and captures approximately 80% coverage of available market capitalization. | |
| | (d) | This unmanaged capitalization-weighted index is comprised of 1,969 equities from 34 countries, excluding the United States. | |
| | (e) | This unmanaged index is designed to track the total return of the current coupon five-year U.S. Treasury bond. | |
| | (f) | This unmanaged market capitalization-weighted index tracks 22 government bond indexes, excluding the United States. | |
Past performance is not indicative of future results. Performance results do not reflect the deduction of taxes that a shareholder would pay on Fund distributions or the redemption of Fund shares.
Performance results may include adjustments made for financial reporting purposes in accordance with U.S. generally accepted accounting principles.
| | |
| Fund Summary as of December 31, 2017 (continued) | | BlackRock Global Allocation V.I. Fund |
Expense Example
| | | | | | | | | | | | | | | | | | | | | | | | | | | | | | | | | | | | | | | | |
| | | Actual | | | | | | Hypothetical (a) | |
| | | | | | | | | Including Dividend
Expense and
Broker Fees and
Expenses on
Short Sales | | | Excluding Dividend
Expense and
Broker Fees and
Expenses on Short
Sales | | | | | | | | | Including Dividend Expense
and Broker Fees and
Expenses on Short Sales | | | Excluding Dividend Expense
and Broker Fees and
Expenses on Short Sales | |
| | | | | | | | | | |
| | | Beginning
Account Value
(07/01/17) | | | Ending
Account Value
(12/31/17) | | | Expenses
Paid During
the Period (b) | | | Expenses
Paid During
the Period (c) | | | | | | Beginning
Account Value
(07/01/17) | | | Ending
Account Value
(12/31/17) | | | Expenses
Paid During
the Period (b) | | | Ending
Account Value
(12/31/17) | | | Expenses
Paid During
the Period (c) | |
Class I | | $ | 1,000.00 | | | $ | 1,056.80 | | | $ | 3.53 | | | $ | 3.47 | | | | | | | $ | 1,000.00 | | | $ | 1,021.78 | | | $ | 3.47 | | | $ | 1,021.83 | | | $ | 3.61 | |
Class II | | | 1,000.00 | | | | 1,056.10 | | | | 4.30 | | | | 4.25 | | | | | | | | 1,000.00 | | | | 1,021.02 | | | | 4.23 | | | | 1,021.07 | | | | 4.41 | |
Class III | | | 1,000.00 | | | | 1,056.50 | | | | 5.18 | | | | 5.13 | | | | | | | | 1,000.00 | | | | 1,020.16 | | | | 5.09 | | | | 1,020.21 | | | | 4.91 | |
| | (a) | Hypothetical 5% annual return before expenses is calculated by prorating the number of days in the most recent fiscal half year divided by 365. | |
| | (b) | For each class of the Fund, expenses are equal to the annualized expense ratio for the class (0.68% for Class I, 0.83% for Class II and 1.00% for Class III), multiplied by the average account value over the period, multiplied by 184/365 (to reflect the one-half year period shown). | |
| | (c) | For each class of the Fund, expenses are equal to the annualized expense ratio for the class (0.67% for Class I, 0.82% for Class II and 0.99% for Class III), multiplied by the average account value over the period, multiplied by 184/365 (to reflect the one-half year period shown). | |
See “Disclosure of Expenses” on the following page for further information on how expenses were calculated.
OVERALL ASSET EXPOSURE
| | | | | | | | | | | | |
| | | Percent of Fund’s
Net Assets (a) | | | Reference
Benchmark (b) Percentage | |
| Portfolio Composition | | 12/31/2017 | | | 12/31/2016 | | |
US Equities | | | 32 | % | | | 28 | % | | | 35 | % |
European Equities | | | 15 | | | | 14 | | | | 12 | |
Asia Pacific Equities | | | 14 | | | | 14 | | | | 9 | |
Other Equities | | | 1 | | | | 1 | | | | 3 | |
| | | | | | | | | | | | |
Total Equities | | | 62 | | | | 57 | | | | 60 | |
| | | | | | | | | | | | |
US Dollar Denominated Fixed Income Securities | | | 21 | | | | 16 | | | | 24 | |
U.S. Issuers | | | 18 | | | | 12 | | | | — | |
Non-U.S. Issuers | | | 3 | | | | 4 | | | | — | |
Non-U.S. Dollar Denominated Fixed Income Securities | | | 8 | | | | 9 | | | | 16 | |
| | | | | | | | | | | | |
Total Fixed Income Securities | | | 30 | | | | 25 | | | | 40 | |
| | | | | | | | | | | | |
Commodity-Related | | | 4 | | | | 3 | | | | — | |
| | | | | | | | | | | | |
Cash & Short-Term Securities | | | 4 | | | | 15 | | | | — | |
| | | | | | | | | | | | |
| | (a) | Exposure based on market value and adjusted for the economic value of futures, swaps and options (except with respect to fixed income securities), and convertible bonds. | |
| | (b) | The Reference Benchmark is an unmanaged weighted index comprised as follows: 36% of the S&P 500 Index®; 24% FTSE World (ex U.S.) Index; 24% BofA Merrill Lynch Current 5-Year U.S. Treasury Index; and 16% Citigroup Non-U.S. Dollar World Government Bond Index. Descriptions of these indexes are found on page 5 of this report to shareholders in the “Performance Summary” section. | |
| | |
| 4 | | 2017 BLACKROCK ANNUAL REPORTTO SHAREHOLDERS |
Shareholders of the Fund may incur the following charges: (a) transactional expenses, such as sales charges; and (b) operating expenses, including investment advisory fees, service and distribution fees, including 12b-1 fees, acquired fund fees and expenses, and other fund expenses. The expense example shown on the previous page (which is based on a hypothetical investment of $1,000 invested on July 1, 2017 and held through December 31, 2017) is intended to assist shareholders both in calculating expenses based on an investment in the Fund and in comparing these expenses with similar costs of investing in other mutual funds.
The expense example provides information about actual account values and actual expenses. In order to estimate the expenses a shareholder paid during the period covered by this report, shareholders can divide their account value by $1,000 and then multiply the result by the number corresponding to their share class under the heading entitled “Expenses Paid During the Period.”
The expense example also provides information about hypothetical account values and hypothetical expenses based on the Fund’s actual expense ratio and an assumed rate of return of 5% per year before expenses. In order to assist shareholders in comparing the ongoing expenses of investing in the Fund and other funds, compare the 5% hypothetical example with the 5% hypothetical examples that appear in shareholder reports of other funds.
The expenses shown in the expense example are intended to highlight shareholders’ ongoing costs only and do not reflect any transactional expenses, such as sales charges, if any. Therefore, the hypothetical example is useful in comparing ongoing expenses only, and will not help shareholders determine the relative total expenses of owning different funds. If these transactional expenses were included, shareholder expenses would have been higher.
Derivative Financial Instruments
The Fund may invest in various derivative financial instruments. These instruments are used to obtain exposure to a security, commodity, index, market, and/or other asset without owning or taking physical custody of securities, commodities and/or other referenced assets or to manage market, equity, credit, interest rate, foreign currency exchange rate, commodity and/or other risks. Derivative financial instruments may give rise to a form of economic leverage and involve risks, including the imperfect correlation between the value of a derivative financial instrument and the underlying asset, possible default of the counterparty to the transaction or illiquidity of the instrument. The Fund’s successful use of a derivative financial instrument depends on the investment adviser’s ability to predict pertinent market movements accurately, which cannot be assured. The use of these instruments may result in losses greater than if they had not been used, may limit the amount of appreciation the Fund can realize on an investment and/or may result in lower distributions paid to shareholders. The Fund’s investments in these instruments, if any, are discussed in detail in the Notes to Consolidated Financial Statements.
| | | | |
| DISCLOSUREOF EXPENSES / DERIVATIVE FINANCIAL INSTRUMENTS | | | 5 | |
| | |
Consolidated Schedule of Investments December 31, 2017 | | BlackRock Global Allocation V.I. Fund (Percentages shown are based on Net Assets) |
| | | | | | | | |
| Security | |
Shares | | | Value | |
Common Stocks — 55.1% | |
|
| Australia — 0.0% | |
AGL Energy Ltd. | | | 1,889 | | | $ | 35,797 | |
Amcor Ltd.(a) | | | 2,435 | | | | 29,177 | |
AMP Ltd.(a) | | | 9,415 | | | | 38,004 | |
BHP Billiton Ltd. | | | 7,243 | | | | 166,378 | |
National Australia Bank Ltd. | | | 3,156 | | | | 72,478 | |
Rio Tinto Ltd. | | | 2,415 | | | | 141,990 | |
Rio Tinto plc(a) | | | 2,652 | | | | 139,117 | |
Stockland | | | 21,585 | | | | 75,296 | |
Telstra Corp. Ltd. | | | 10,555 | | | | 29,837 | |
Wesfarmers Ltd. | | | 1,784 | | | | 61,687 | |
Woolworths Group Ltd. | | | 8,630 | | | | 183,356 | |
| | | | | | | | |
| | | | | | | 973,117 | |
| Belgium — 0.4% | |
Anheuser-Busch InBev SA | | | 389,183 | | | | 43,448,950 | |
UCB SA | | | 269 | | | | 21,330 | |
| | | | | | | | |
| | | | | | | 43,470,280 | |
| Brazil — 0.2% | |
Azul SA, ADR(a) | | | 892,637 | | | | 21,271,540 | |
Banco Bradesco SA(a) | | | 909 | | | | 8,785 | |
Banco do Brasil SA(a) | | | 13,591 | | | | 130,375 | |
JBS SA | | | 30,216 | | | | 89,361 | |
Vale SA(a) | | | 8,429 | | | | 102,307 | |
| | | | | | | | |
| | | | | | | 21,602,368 | |
| Canada — 0.4% | |
Agrium, Inc. | | | 824 | | | | 94,776 | |
Bank of Montreal | | | 99 | | | | 7,922 | |
Bank of Nova Scotia (The) | | | 2,910 | | | | 187,796 | |
Barrick Gold Corp. | | | 3,313 | | | | 47,916 | |
Canadian National Railway Co. | | | 2,023 | | | | 166,813 | |
Encana Corp. | | | 3,460,483 | | | | 46,128,238 | |
Magna International, Inc. | | | 4,942 | | | | 280,086 | |
Platinum Group Metals Ltd.(a)(b) | | | 2,151,915 | | | | 653,695 | |
Royal Bank of Canada | | | 3,304 | | | | 269,814 | |
Suncor Energy, Inc.(a) | | | 161 | | | | 5,911 | |
Teck Resources Ltd., Class B | | | 6,429 | | | | 168,116 | |
Thomson Reuters Corp. | | | 6,298 | | | | 274,517 | |
Toronto-Dominion Bank (The) | | | 1,180 | | | | 69,138 | |
| | | | | | | | |
| | | | | | | 48,354,738 | |
| China — 0.3% | |
Agricultural Bank of China Ltd., Class H | | | 391,000 | | | | 181,713 | |
Alibaba Group Holding Ltd., ADR(a)(b) | | | 112,062 | | | | 19,322,851 | |
Bank of China Ltd., Class H | | | 305,000 | | | | 149,370 | |
Bank of Communications Co. Ltd., Class H | | | 73,000 | | | | 54,031 | |
Brilliance China Automotive Holdings Ltd. | | | 3,616,000 | | | | 9,609,170 | |
China Communications Construction Co. Ltd., Class H | | | 7,000 | | | | 7,941 | |
China Construction Bank Corp., Class H | | | 315,000 | | | | 289,974 | |
China Mobile Ltd. | | | 32,000 | | | | 323,585 | |
China Resources Power Holdings Co. Ltd. | | | 82,000 | | | | 152,516 | |
China Telecom Corp. Ltd., Class H | | | 128,000 | | | | 60,712 | |
CNOOC Ltd. | | | 176,000 | | | | 252,669 | |
Country Garden Holdings Co. Ltd. | | | 6,000 | | | | 11,399 | |
Dongfeng Motor Group Co. Ltd., Class H | | | 66,000 | | | | 79,664 | |
Guangzhou Automobile Group Co. Ltd., Class H | | | 14,000 | | | | 33,068 | |
Industrial & Commercial Bank of China Ltd., Class H | | | 198,000 | | | | 158,724 | |
Longfor Properties Co. Ltd.(a) | | | 21,500 | | | | 53,882 | |
New Oriental Education & Technology Group, Inc., ADR | | | 2,328 | | | | 218,832 | |
PICC Property & Casualty Co. Ltd., Class H | | | 4,000 | | | | 7,663 | |
Tencent Holdings Ltd. | | | 1,800 | | | | 93,164 | |
Want Want China Holdings Ltd. | | | 3,213,000 | | | | 2,689,747 | |
| | | | | | | | |
| Security | |
Shares | | | Value | |
| China (continued) | |
Wilmar International Ltd. | | | 23,500 | | | $ | 54,155 | |
| | | | | | | | |
| | | | | | | 33,804,830 | |
| Czech Republic — 0.0% | |
CEZ A/S(b) | | | 190,490 | | | | 4,441,567 | |
| | | | | | | | |
| Denmark — 0.0% | |
AP Moller - Maersk A/S, Class A | | | 36 | | | | 59,977 | |
AP Moller - Maersk A/S, Class B | | | 72 | | | | 125,495 | |
Carlsberg A/S, Class B | | | 81 | | | | 9,715 | |
Danske Bank A/S | | | 5,094 | | | | 198,269 | |
| | | | | | | | |
| | | | | | | 393,456 | |
| Finland — 0.2% | |
Nokia OYJ | | | 5,526,699 | | | | 25,822,620 | |
| | | | | | | | |
| France — 2.7% | |
AXA SA | | | 850,055 | | | | 25,189,885 | |
BNP Paribas SA | | | 2,328 | | | | 173,177 | |
Cie de Saint-Gobain | | | 282,791 | | | | 15,563,758 | |
Cie Generale des Etablissements Michelin | | | 108,921 | | | | 15,581,725 | |
Danone SA | | | 1,002,947 | | | | 84,037,846 | |
Dassault Aviation SA | | | 11,640 | | | | 18,098,690 | |
Engie SA | | | 1,144 | | | | 19,667 | |
LVMH Moet Hennessy Louis Vuitton SE | | | 116 | | | | 34,047 | |
Safran SA | | | 248,264 | | | | 25,607,344 | |
Sanofi | | | 334,485 | | | | 28,796,478 | |
Societe Generale SA | | | 2,543 | | | | 131,106 | |
Sodexo SA | | | 134,588 | | | | 18,042,683 | |
Thales SA(a) | | | 488 | | | | 52,518 | |
TOTAL SA | | | 438,546 | | | | 24,207,713 | |
TOTAL SA, ADR | | | 17,306 | | | | 956,675 | |
Unibail-Rodamco SE | | | 66,851 | | | | 16,823,188 | |
Vinci SA | | | 165,609 | | | | 16,907,298 | |
Vivendi SA | | | 1,218 | | | | 32,690 | |
| | | | | | | | |
| | | | | | | 290,256,488 | |
| Germany — 1.9% | |
adidas AG | | | 403 | | | | 80,596 | |
Allianz SE (Registered) | | | 1,244 | | | | 284,687 | |
BASF SE(a) | | | 2,460 | | | | 269,693 | |
Bayer AG (Registered) | | | 517,993 | | | | 64,367,487 | |
Deutsche Post AG (Registered) | | | 6,276 | | | | 298,321 | |
Deutsche Telekom AG (Registered) | | | 878,298 | | | | 15,525,183 | |
E.ON SE | | | 20,770 | | | | 225,067 | |
Evonik Industries AG | | | 380,722 | | | | 14,299,602 | |
GEA Group AG | | | 265,476 | | | | 12,701,480 | |
Innogy SE(b)(c) | | | 1,588,148 | | | | 62,154,906 | |
Muenchener Rueckversicherungs-Gesellschaft AG in Muenchen (Registered) | | | 63 | | | | 13,605 | |
SAP SE | | | 2,873 | | | | 321,418 | |
Siemens AG (Registered) | | | 95,896 | | | | 13,277,540 | |
Vonovia SE(a) | | | 376,287 | | | | 18,644,007 | |
| | | | | | | | |
| | | | | | | 202,463,592 | |
| Hong Kong — 0.8% | |
AIA Group Ltd. | | | 2,400 | | | | 20,414 | |
CK Infrastructure Holdings Ltd. | | | 377,000 | | | | 3,235,098 | |
CLP Holdings Ltd. | | | 391,000 | | | | 4,001,158 | |
Galaxy Entertainment Group Ltd. | | | 7,000 | | | | 55,886 | |
Hang Lung Properties Ltd. | | | 783,000 | | | | 1,907,368 | |
HKT Trust & HKT Ltd.(d) | | | 2,089,000 | | | | 2,663,105 | |
Hong Kong Exchanges & Clearing Ltd. | | | 2,600 | | | | 79,529 | |
Hongkong Land Holdings Ltd. | | | 15,300 | | | | 107,618 | |
I-CABLE Communications Ltd.(a) | | | 379,342 | | | | 11,119 | |
Jardine Matheson Holdings Ltd. | | | 52,700 | | | | 3,197,441 | |
Link REIT | | | 481,000 | | | | 4,450,123 | |
| | |
| 6 | | 2017 BLACKROCK ANNUAL REPORTTO SHAREHOLDERS |
| | |
Consolidated Schedule of Investments (continued) December 31, 2017 | | BlackRock Global Allocation V.I. Fund (Percentages shown are based on Net Assets) |
| | | | | | | | |
| Security | |
Shares | | | Value | |
| Hong Kong (continued) | |
Power Assets Holdings Ltd. | | | 344,000 | | | $ | 2,899,548 | |
Sino Land Co. Ltd. | | | 1,440,000 | | | | 2,547,516 | |
Sun Hung Kai Properties Ltd. | | | 2,889,083 | | | | 48,100,511 | |
Swire Pacific Ltd., Class A | | | 310,000 | | | | 2,868,221 | |
Swire Properties Ltd. | | | 17,800 | | | | 57,413 | |
WH Group Ltd.(c) | | | 169,000 | | | | 190,786 | |
Wharf Holdings Ltd. (The) | | | 488,000 | | | | 1,682,864 | |
Wharf Real Estate Investment Co. Ltd.(a) | | | 503,000 | | | | 3,347,818 | |
| | | | | | | | |
| | | | | | | 81,423,536 | |
| India — 1.5% | |
Coal India Ltd. | | | 662,134 | | | | 2,724,884 | |
GAIL India Ltd. | | | 8,385 | | | | 65,531 | |
HCL Technologies Ltd.(a) | | | 5,100 | | | | 71,154 | |
Hero MotoCorp Ltd.(a) | | | 67,802 | | | | 4,016,020 | |
Hindustan Petroleum Corp. Ltd. | | | 10,700 | | | | 70,167 | |
Hindustan Unilever Ltd. | | | 5,862 | | | | 125,625 | |
Housing Development Finance Corp. Ltd. | | | 206,144 | | | | 5,520,258 | |
Indian Oil Corp. Ltd. | | | 8,332 | | | | 50,638 | |
Infosys Ltd. | | | 2,302,495 | | | | 37,423,403 | |
Kotak Mahindra Bank Ltd. | | | 1,235,542 | | | | 19,534,927 | |
Maruti Suzuki India Ltd. | | | 112,149 | | | | 17,076,862 | |
Oil & Natural Gas Corp. Ltd. | | | 960,743 | | | | 2,928,715 | |
Reliance Industries Ltd. | | | 3,281,302 | | | | 47,297,875 | |
SBI Life Insurance Co. Ltd.(a)(c) | | | 122,880 | | | | 1,338,680 | |
State Bank of India | | | 2,486,178 | | | | 12,043,591 | |
Tata Motors Ltd.(a) | | | 2,233 | | | | 15,067 | |
Tata Motors Ltd., Class A(a) | | | 12,916 | | | | 49,243 | |
Tech Mahindra Ltd. | | | 8,485 | | | | 67,007 | |
Vedanta Ltd. | | | 14,052 | | | | 72,390 | |
Yes Bank Ltd. | | | 1,257,964 | | | | 6,197,697 | |
| | | | | | | | |
| | | | | | | 156,689,734 | |
| Indonesia — 0.1% | |
Siloam International Hospitals Tbk. PT(a) | | | 15,609,442 | | | | 11,016,061 | |
| | | | | | | | |
| Ireland — 0.0% | |
Experian plc | | | 735 | | | | 16,201 | |
Medtronic plc | | | 39,012 | | | | 3,150,219 | |
| | | | | | | | |
| | | | | | | 3,166,420 | |
| Israel — 0.0% | |
Check Point Software Technologies Ltd.(a) | | | 2,757 | | | | 285,680 | |
| | | | | | | | |
| Italy — 1.0% | |
Atlantia SpA | | | 1,179 | | | | 37,170 | |
Ei Towers SpA | | | 316,602 | | | | 20,323,308 | |
Enel SpA | | | 4,396,388 | | | | 27,034,591 | |
Luxottica Group SpA | | | 327,114 | | | | 20,075,747 | |
RAI Way SpA(c) | | | 2,173,792 | | | | 13,236,738 | |
Snam SpA | | | 387,263 | | | | 1,896,614 | |
Telecom Italia SpA(a)(b) | | | 30,679,349 | | | | 26,376,319 | |
| | | | | | | | |
| | | | | | | 108,980,487 | |
| Japan — 8.3% | |
Aisin Seiki Co. Ltd. | | | 239,439 | | | | 13,413,994 | |
Ajinomoto Co., Inc. | | | 1,201,600 | | | | 22,607,173 | |
Alfresa Holdings Corp. | | | 104,700 | | | | 2,452,333 | |
Alpine Electronics, Inc. | | | 72,900 | | | | 1,505,706 | |
Asahi Glass Co. Ltd. | | | 3,500 | | | | 151,286 | |
Asahi Kasei Corp. | | | 1,352,300 | | | | 17,403,285 | |
Astellas Pharma, Inc. | | | 1,837,765 | | | | 23,345,634 | |
Bridgestone Corp. | | | 877,632 | | | | 40,618,777 | |
Canon Marketing Japan, Inc. | | | 88,700 | | | | 2,394,199 | |
COMSYS Holdings Corp. | | | 106,600 | | | | 3,090,619 | |
Daicel Corp. | | | 397,000 | | | | 4,505,277 | |
Dai-ichi Life Holdings, Inc. | | | 800 | | | | 16,442 | |
| | | | | | | | |
| Security | |
Shares | | | Value | |
| Japan (continued) | |
Daikin Industries Ltd. | | | 122,000 | | | $ | 14,415,883 | |
Denso Corp. | | | 575,420 | | | | 34,472,708 | |
Dowa Holdings Co. Ltd.(a) | | | 50,300 | | | | 2,042,813 | |
East Japan Railway Co. | | | 530,551 | | | | 51,738,399 | |
Exedy Corp. | | | 62,900 | | | | 1,937,880 | |
Fujitsu Ltd. | | | 50,000 | | | | 354,477 | |
GS Yuasa Corp.(a)(b) | | | 426,000 | | | | 2,114,661 | |
Hino Motors Ltd.(b) | | | 185,000 | | | | 2,389,527 | |
Hitachi Chemical Co. Ltd. | | | 400,700 | | | | 10,260,295 | |
Hitachi Ltd. | | | 49,000 | | | | 380,152 | |
Hoya Corp. | | | 464,574 | | | | 23,137,268 | |
Japan Airlines Co. Ltd. | | | 1,055,900 | | | | 41,253,865 | |
Japan Aviation Electronics Industry Ltd. | | | 126,000 | | | | 2,124,379 | |
Japan Tobacco, Inc. | | | 2,500 | | | | 80,508 | |
Kamigumi Co. Ltd. | | | 96,700 | | | | 2,137,008 | |
Kao Corp. | | | 1,900 | | | | 128,382 | |
KDDI Corp. | | | 143,400 | | | | 3,561,989 | |
Keyence Corp. | | | 8,000 | | | | 4,469,051 | |
Kinden Corp. | | | 323,100 | | | | 5,260,648 | |
Kintetsu Group Holdings Co. Ltd. | | | 1,900 | | | | 72,713 | |
Kirin Holdings Co. Ltd.(a) | | | 3,300 | | | | 83,165 | |
Koito Manufacturing Co. Ltd. | | | 130,000 | | | | 9,101,738 | |
Komatsu Ltd. | | | 724,900 | | | | 26,197,682 | |
Kubota Corp. | | | 759,496 | | | | 14,855,317 | |
Kuraray Co. Ltd.(b) | | | 133,300 | | | | 2,509,764 | |
Kyudenko Corp. | | | 52,600 | | | | 2,540,007 | |
Kyushu Railway Co. | | | 310,200 | | | | 9,601,417 | |
Mabuchi Motor Co. Ltd. | | | 76,700 | | | | 4,145,979 | |
Maeda Road Construction Co. Ltd. | | | 128,000 | | | | 2,932,771 | |
Marubeni Corp. | | | 17,900 | | | | 129,411 | |
Mazda Motor Corp. | | | 15,100 | | | | 201,787 | |
Medipal Holdings Corp. | | | 119,900 | | | | 2,340,880 | |
Mitsubishi Electric Corp. | | | 2,409,300 | | | | 39,928,322 | |
Mitsubishi Tanabe Pharma Corp. | | | 3,100 | | | | 63,891 | |
Mitsubishi UFJ Financial Group, Inc. | | | 15,500 | | | | 112,808 | |
MS&AD Insurance Group Holdings, Inc. | | | 900 | | | | 30,357 | |
Murata Manufacturing Co. Ltd.(b) | | | 168,628 | | | | 22,577,284 | |
Nichias Corp.(a) | | | 136,000 | | | | 1,807,268 | |
Nippo Corp.(b) | | | 125,000 | | | | 2,920,263 | |
Nippon Telegraph & Telephone Corp. | | | 74,260 | | | | 3,491,268 | |
Nippon Television Holdings, Inc. | | | 241,900 | | | | 4,138,578 | |
Nitto Denko Corp. | | | 208,600 | | | | 18,450,404 | |
NTT DOCOMO, Inc. | | | 900 | | | | 21,280 | |
Okumura Corp. | | | 118,050 | | | | 4,850,350 | |
Olympus Corp. | | | 2,700 | | | | 103,289 | |
Otsuka Holdings Co. Ltd. | | | 53,700 | | | | 2,355,132 | |
Panasonic Corp.(a) | | | 9,600 | | | | 140,102 | |
Rakuten, Inc. | | | 4,200 | | | | 38,391 | |
Renesas Electronics Corp.(a) | | | 742,300 | | | | 8,608,778 | |
Resona Holdings, Inc. | | | 19,200 | | | | 114,408 | |
Rohm Co. Ltd. | | | 299,753 | | | | 33,021,320 | |
Seino Holdings Co. Ltd. | | | 136,800 | | | | 2,170,265 | |
Seven & i Holdings Co. Ltd. | | | 35,300 | | | | 1,462,352 | |
Shimamura Co. Ltd. | | | 18,500 | | | | 2,032,403 | |
Shin-Etsu Chemical Co. Ltd. | | | 474,634 | | | | 48,091,343 | |
Shionogi & Co. Ltd. | | | 5,600 | | | | 302,595 | |
Sony Corp. | | | 6,300 | | | | 282,762 | |
Stanley Electric Co. Ltd. | | | 62,900 | | | | 2,545,092 | |
Subaru Corp. | | | 479,864 | | | | 15,215,450 | |
Sumitomo Electric Industries Ltd. | | | 787,948 | | | | 13,282,676 | |
Sumitomo Mitsui Financial Group, Inc. | | | 1,069,047 | | | | 46,080,752 | |
Suzuken Co. Ltd. | | | 54,000 | | | | 2,217,043 | |
Suzuki Motor Corp. | | | 957,689 | | | | 55,434,540 | |
Taisei Corp. | | | 900 | | | | 44,758 | |
| | | | |
| CONSOLIDATED SCHEDULE OF INVESTMENTS | | | 7 | |
| | |
Consolidated Schedule of Investments (continued) December 31, 2017 | | BlackRock Global Allocation V.I. Fund (Percentages shown are based on Net Assets) |
| | | | | | | | |
| Security | |
Shares | | | Value | |
| Japan (continued) | |
Toagosei Co. Ltd.(a) | | | 128,900 | | | $ | 1,636,256 | |
Toda Corp.(b) | | | 578,896 | | | | 4,633,357 | |
Toho Co. Ltd. | | | 81,500 | | | | 2,821,116 | |
Tokio Marine Holdings, Inc. | | | 503,223 | | | | 22,888,117 | |
Tokyo Electron Ltd. | | | 700 | | | | 126,273 | |
Tokyo Gas Co. Ltd. | | | 1,535,714 | | | | 35,088,671 | |
Tokyo Steel Manufacturing Co. Ltd. | | | 366,200 | | | | 3,281,337 | |
Toray Industries, Inc. | | | 1,457,300 | | | | 13,716,561 | |
Toshiba Corp.(a) | | | 113,000 | | | | 317,914 | |
Toyota Industries Corp. | | | 649,577 | | | | 41,637,214 | |
TV Asahi Holdings Corp. | | | 175,900 | | | | 3,528,493 | |
Ube Industries Ltd. | | | 370,434 | | | | 10,851,316 | |
Unicharm Corp. | | | 4,800 | | | | 124,642 | |
West Japan Railway Co. | | | 203,100 | | | | 14,816,962 | |
Yamato Kogyo Co. Ltd.(b) | | | 74,700 | | | | 2,163,710 | |
| | | | | | | | |
| | | | | | | 898,044,712 | |
| Mexico — 0.0% | |
Cemex SAB de CV(a) | | | 415,945 | | | | 311,179 | |
Grupo Financiero Banorte SAB de CV, Class O | | | 4,942 | | | | 27,127 | |
| | | | | | | | |
| | | | | | | 338,306 | |
| Netherlands — 2.1% | |
ABN AMRO Group NV, CVA(a)(c) | | | 767,504 | | | | 24,745,007 | |
ING Groep NV | | | 1,945,463 | | | | 35,712,354 | |
Koninklijke Ahold Delhaize NV(a) | | | 305 | | | | 6,705 | |
Koninklijke Philips NV | | | 1,942,024 | | | | 73,328,266 | |
Randstad Holding NV | | | 214,905 | | | | 13,186,371 | |
Royal Dutch Shell plc, Class A | | | 984,743 | | | | 32,816,721 | |
Royal Dutch Shell plc, Class B | | | 10,955 | | | | 368,899 | |
Royal Dutch Shell plc, ADR, Class A(b) | | | 630,245 | | | | 42,043,644 | |
Unilever NV, CVA(a) | | | 4,176 | | | | 235,121 | |
| | | | | | | | |
| | | | | | | 222,443,088 | |
| Norway — 0.0% | |
DNB ASA | | | 5,201 | | | | 96,278 | |
Telenor ASA | | | 2,686 | | | | 57,499 | |
| | | | | | | | |
| | | | | | | 153,777 | |
| Peru — 0.0% | |
Credicorp Ltd. | | | 161 | | | | 33,396 | |
| | | | | | | | |
| Poland — 0.0% | |
PGE Polska Grupa Energetyczna SA(a) | | | 45,235 | | | | 156,343 | |
Polski Koncern Naftowy ORLEN SA | | | 1,110 | | | | 33,738 | |
Polskie Gornictwo Naftowe i Gazownictwo SA | | | 31,030 | | | | 56,071 | |
| | | | | | | | |
| | | | | | | 246,152 | |
| Portugal — 0.1% | |
Jeronimo Martins SGPS SA | | | 75,422 | | | | 1,465,568 | |
NOS SGPS SA | | | 1,392,756 | | | | 9,159,290 | |
| | | | | | | | |
| | | | | | | 10,624,858 | |
| Singapore — 0.3% | |
CapitaLand Ltd. | | | 7,783,950 | | | | 20,477,152 | |
ComfortDelGro Corp. Ltd. | | | 1,724,500 | | | | 2,547,937 | |
Genting Singapore plc | | | 263,300 | | | | 257,149 | |
Singapore Telecommunications Ltd. | | | 1,714,700 | | | | 4,571,607 | |
| | | | | | | | |
| | | | | | | 27,853,845 | |
| South Africa — 0.0% | |
Barclays Africa Group Ltd.(b) | | | 6,517 | | | | 95,470 | |
MTN Group Ltd. | | | 664 | | | | 7,331 | |
RMB Holdings Ltd. | | | 8,953 | | | | 57,144 | |
Tiger Brands Ltd. | | | 3,541 | | | | 131,652 | |
| | | | | | | | |
| | | | | | | 291,597 | |
| | | | | | | | |
| Security | |
Shares | | | Value | |
| South Korea — 0.6% | |
Amorepacific Corp.(a)(b) | | | 34,612 | | | $ | 9,844,803 | |
Coway Co. Ltd. | | | 38,250 | | | | 3,485,694 | |
Doosan Bobcat, Inc.(a)(b) | | | 521,724 | | | | 17,417,139 | |
Hana Financial Group, Inc. | | | 2,442 | | | | 113,508 | |
Hotel Shilla Co. Ltd.(a)(b) | | | 43,135 | | | | 3,420,823 | |
KT&G Corp.(b) | | | 131,610 | | | | 14,199,201 | |
LG Chem Ltd.(b) | | | 14,300 | | | | 5,409,836 | |
LG Display Co. Ltd. | | | 1,540 | | | | 42,865 | |
LG Household & Health Care Ltd.(a) | | | 4,673 | | | | 5,190,040 | |
Lotte Chemical Corp.(a) | | | 153 | | | | 52,536 | |
POSCO | | | 13,737 | | | | 4,272,910 | |
Samsung Electronics Co. Ltd. | | | 225 | | | | 534,580 | |
SK Hynix, Inc. | | | 1,880 | | | | 133,530 | |
SK Innovation Co. Ltd. | | | 808 | | | | 154,143 | |
SK Telecom Co. Ltd. | | | 16,630 | | | | 4,147,597 | |
Woori Bank | | | 3,680 | | | | 54,097 | |
| | | | | | | | |
| | | | | | | 68,473,302 | |
| Spain — 0.4% | |
Aena SME SA(c) | | | 1,683 | | | | 340,605 | |
Amadeus IT Group SA(a) | | | 305 | | | | 21,949 | |
CaixaBank SA(a) | | | 27,145 | | | | 126,192 | |
Cellnex Telecom SA(c) | | | 1,327,829 | | | | 33,973,088 | |
Gas Natural SDG SA(b) | | | 328,310 | | | | 7,576,898 | |
Repsol SA | | | 1,361 | | | | 24,030 | |
Telefonica SA | | | 13,078 | | | | 127,350 | |
| | | | | | | | |
| | | | | | | 42,190,112 | |
| Sweden — 0.2% | |
Nordea Bank AB | | | 6,732 | | | | 81,511 | |
Sandvik AB(a) | | | 4,279 | | | | 74,903 | |
Skandinaviska Enskilda Banken AB, Class A | | | 8,416 | | | | 98,824 | |
SKF AB, Class B(a)(b) | | | 856,569 | | | | 19,029,342 | |
Swedbank AB, Class A(a) | | | 353 | | | | 8,516 | |
Volvo AB, Class B(a) | | | 11,701 | | | | 217,895 | |
| | | | | | | | |
| | | | | | | 19,510,991 | |
| Switzerland — 1.2% | |
ABB Ltd. (Registered) | | | 3,984 | | | | 106,709 | |
Nestle SA (Registered) | | | 828,154 | | | | 71,201,587 | |
Novartis AG (Registered) | | | 2,600 | | | | 218,796 | |
Roche Holding AG | | | 1,777 | | | | 449,324 | |
SGS SA (Registered) | | | 72 | | | | 187,707 | |
Swatch Group AG (The) (Registered)(a) | | | 2,009 | | | | 153,233 | |
Swiss Re AG | | | 385 | | | | 36,005 | |
UBS Group AG (Registered)(a) | | | 3,286,601 | | | | 60,383,925 | |
Zurich Insurance Group AG | | | 904 | | | | 274,855 | |
| | | | | | | | |
| | | | | | | 133,012,141 | |
| Taiwan — 0.6% | |
Catcher Technology Co. Ltd. | | | 4,000 | | | | 43,831 | |
Cathay Financial Holding Co. Ltd. | | | 1,948,000 | | | | 3,489,930 | |
Cheng Shin Rubber Industry Co. Ltd. | | | 1,338,323 | | | | 2,361,072 | |
Chunghwa Telecom Co. Ltd. | | | 5,156,000 | | | | 18,340,537 | |
Far EasTone Telecommunications Co. Ltd. | | | 2,871,000 | | | | 7,091,033 | |
Formosa Chemicals & Fibre Corp. | | | 823,000 | | | | 2,839,354 | |
Formosa Petrochemical Corp. | | | 588,000 | | | | 2,274,356 | |
Formosa Plastics Corp. | | | 878,000 | | | | 2,905,195 | |
Fubon Financial Holding Co. Ltd. | | | 2,024,000 | | | | 3,440,730 | |
Hon Hai Precision Industry Co. Ltd. | | | 1,047,200 | | | | 3,329,666 | |
Innolux Corp. | | | 167,000 | | | | 69,323 | |
Nan Ya Plastics Corp. | | | 1,101,000 | | | | 2,876,600 | |
Pegatron Corp. | | | 95,000 | | | | 228,894 | |
Taiwan Mobile Co. Ltd.(a) | | | 2,539,000 | | | | 9,171,917 | |
Taiwan Semiconductor Manufacturing Co. Ltd. | | | 446,000 | | | | 3,415,055 | |
| | |
| 8 | | 2017 BLACKROCK ANNUAL REPORTTO SHAREHOLDERS |
| | |
Consolidated Schedule of Investments (continued) December 31, 2017 | | BlackRock Global Allocation V.I. Fund (Percentages shown are based on Net Assets) |
| | | | | | | | |
| Security | |
Shares | | | Value | |
| Taiwan (continued) | |
Uni-President Enterprises Corp. | | | 2,189,000 | | | $ | 4,847,831 | |
| | | | | | | | |
| | | | | | | 66,725,324 | |
| Thailand — 0.2% | |
Advanced Info Service PCL | | | 861,500 | | | | 5,048,988 | |
Intouch Holdings PCL, Class F | | | 2,192,500 | | | | 3,749,528 | |
PTT Global Chemical PCL | | | 1,824,300 | | | | 4,754,776 | |
Siam Cement PCL (The) | | | 279,900 | | | | 4,150,598 | |
Thai Oil PCL | | | 831,400 | | | | 2,640,377 | |
| | | | | | | | |
| | | | | | | 20,344,267 | |
| Turkey — 0.0% | |
Eregli Demir ve Celik Fabrikalari TAS | | | 14,659 | | | | 38,678 | |
Tupras Turkiye Petrol Rafinerileri A/S | | | 6,025 | | | | 193,079 | |
| | | | | | | | |
| | | | | | | 231,757 | |
| United Arab Emirates — 0.4% | |
NMC Health plc | | | 1,026,768 | | | | 39,994,489 | |
| | | | | | | | |
| United Kingdom — 2.7% | |
Anglo American plc | | | 904 | | | | 18,802 | |
Aon plc | | | 2,011 | | | | 269,474 | |
Associated British Foods plc | | | 2,390 | | | | 90,997 | |
Aviva plc | | | 7,114 | | | | 48,520 | |
BAE Systems plc | | | 1,904,803 | | | | 14,717,129 | |
Barclays plc | | | 51,773 | | | | 141,722 | |
Berkeley Group Holdings plc | | | 285,242 | | | | 16,163,464 | |
BP plc(a) | | | 1,377,853 | | | | 9,666,033 | |
BP plc, ADR(b) | | | 854,785 | | | | 35,926,613 | |
Centrica plc | | | 46,058 | | | | 85,380 | |
Compass Group plc | | | 456 | | | | 9,832 | |
Diageo plc | | | 1,135 | | | | 41,603 | |
GlaxoSmithKline plc | | | 1,660,552 | | | | 29,407,032 | |
GW Pharmaceuticals plc, ADR(a)(b) | | | 62,805 | | | | 8,290,888 | |
HSBC Holdings plc | | | 5,601,576 | | | | 57,853,480 | |
Imperial Brands plc | | | 4,455 | | | | 190,026 | |
Legal & General Group plc | | | 44,110 | | | | 162,395 | |
Liberty Global plc, Class A(a)(b) | | | 290,277 | | | | 10,403,528 | |
Liberty Global plc, Class C(a) | | | 1,657 | | | | 56,073 | |
Lloyds Banking Group plc | | | 375,513 | | | | 344,339 | |
Meggitt plc | | | 1,869,168 | | | | 12,137,178 | |
National Grid plc | | | 93,494 | | | | 1,102,156 | |
Prudential plc | | | 1,348 | | | | 34,523 | |
Reckitt Benckiser Group plc | | | 808 | | | | 75,381 | |
Smiths Group plc | | | 766,202 | | | | 15,377,285 | |
SSE plc(a) | | | 7,579 | | | | 134,738 | |
Vodafone Group plc | | | 19,340,599 | | | | 61,135,544 | |
Vodafone Group plc, ADR | | | 518,385 | | | | 16,536,482 | |
| | | | | | | | |
| | | | | | | 290,420,617 | |
| United States — 28.5% | |
3M Co. | | | 6,208 | | | | 1,461,177 | |
AbbVie, Inc. | | | 21,259 | | | | 2,055,958 | |
Acadia Healthcare Co., Inc.(a)(b) | | | 467,272 | | | | 15,247,085 | |
Accenture plc, Class A | | | 13,280 | | | | 2,033,035 | |
Activision Blizzard, Inc. | | | 257,451 | | | | 16,301,797 | |
Adobe Systems, Inc.(a) | | | 14,152 | | | | 2,479,996 | |
Aetna, Inc. | | | 13,474 | | | | 2,430,575 | |
Agilent Technologies, Inc. | | | 1,386 | | | | 92,820 | |
Air Products & Chemicals, Inc. | | | 393,358 | | | | 64,542,181 | |
Allergan plc | | | 206 | | | | 33,697 | |
Alliance Data Systems Corp. | | | 4,025 | | | | 1,020,257 | |
Allstate Corp. (The) | | | 269,787 | | | | 28,249,397 | |
Ally Financial, Inc. | | | 27,785 | | | | 810,211 | |
Alphabet, Inc., Class A(a) | | | 628 | | | | 661,535 | |
Alphabet, Inc., Class C(a) | | | 106,418 | | | | 111,355,795 | |
| | | | | | | | |
| Security | |
Shares | | | Value | |
| United States (continued) | |
Amazon.com, Inc.(a) | | | 93,759 | | | $ | 109,648,338 | |
Amdocs Ltd. | | | 27,552 | | | | 1,804,105 | |
American Express Co. | | | 2,310 | | | | 229,406 | |
American International Group, Inc. | | | 1,327 | | | | 79,063 | |
American Tower Corp. | | | 15,995 | | | | 2,282,007 | |
Ameriprise Financial, Inc. | | | 8,102 | | | | 1,373,046 | |
Amgen, Inc. | | | 14,203 | | | | 2,469,902 | |
Anadarko Petroleum Corp. | | | 900,272 | | | | 48,290,590 | |
Anthem, Inc. | | | 142,580 | | | | 32,081,926 | |
Apple, Inc. | | | 846,403 | | | | 143,236,780 | |
Applied Materials, Inc. | | | 6,706 | | | | 342,811 | |
AT&T, Inc. | | | 4,888 | | | | 190,045 | |
Autodesk, Inc.(a) | | | 206 | | | | 21,595 | |
Automatic Data Processing, Inc. | | | 439 | | | | 51,446 | |
Axalta Coating Systems Ltd.(a) | | | 664,189 | | | | 21,493,156 | |
Bank of America Corp. | | | 3,792,118 | | | | 111,943,323 | |
Bank of New York Mellon Corp. (The) | | | 21,957 | | | | 1,182,604 | |
Baxter International, Inc. | | | 81,532 | | | | 5,270,228 | |
Berkshire Hathaway, Inc., Class B(a) | | | 23,206 | | | | 4,599,893 | |
Biogen, Inc.(a) | | | 15,453 | | | | 4,922,862 | |
Boeing Co. (The) | | | 9,273 | | | | 2,734,700 | |
Boston Scientific Corp.(a) | | | 3,939 | | | | 97,648 | |
Bristol-Myers Squibb Co. | | | 601 | | | | 36,829 | |
Broadcom Ltd. | | | 45 | | | | 11,561 | |
Brown-Forman Corp., Class B | | | 260 | | | | 17,854 | |
CA, Inc. | | | 8,644 | | | | 287,672 | |
Capital One Financial Corp. | | | 14,946 | | | | 1,488,323 | |
Carnival Corp. | | | 5,819 | | | | 386,207 | |
Caterpillar, Inc. | | | 6,598 | | | | 1,039,713 | |
Celgene Corp.(a) | | | 2,901 | | | | 302,748 | |
CenterPoint Energy, Inc. | | | 21,538 | | | | 610,818 | |
Charles Schwab Corp. (The) | | | 744,257 | | | | 38,232,482 | |
Charter Communications, Inc., Class A(a) | | | 112,048 | | | | 37,643,646 | |
Chevron Corp. | | | 8,719 | | | | 1,091,532 | |
Chubb Ltd. | | | 204,285 | | | | 29,852,167 | |
Cisco Systems, Inc. | | | 3,411 | | | | 130,641 | |
Citigroup, Inc. | | | 829,488 | | | | 61,722,202 | |
Cloudera, Inc.(a)(b) | | | 1,436,239 | | | | 23,726,668 | |
Coca-Cola Co. (The) | | | 6,911 | | | | 317,077 | |
Cognizant Technology Solutions Corp., Class A | | | 1,182 | | | | 83,946 | |
Colgate-Palmolive Co. | | | 38,757 | | | | 2,924,216 | |
Comcast Corp., Class A | | | 2,519,407 | | | | 100,902,250 | |
CommScope Holding Co., Inc.(a)(b) | | | 852,069 | | | | 32,233,770 | |
Conagra Brands, Inc. | | | 9,030 | | | | 340,160 | |
ConocoPhillips | | | 2,762 | | | | 151,606 | |
Constellation Brands, Inc., Class A | | | 9,296 | | | | 2,124,787 | |
Corning, Inc. | | | 3,107 | | | | 99,393 | |
Costco Wholesale Corp. | | | 913 | | | | 169,928 | |
Crown Holdings, Inc.(a) | | | 20,649 | | | | 1,161,506 | |
CSX Corp. | | | 839 | | | | 46,153 | |
Cummins, Inc. | | | 5,408 | | | | 955,269 | |
CVS Health Corp. | | | 467,992 | | | | 33,929,420 | |
Dell Technologies, Inc., Class V(a) | | | 2,605 | | | | 211,734 | |
Delta Air Lines, Inc. | | | 18,236 | | | | 1,021,216 | |
Discover Financial Services | | | 18,739 | | | | 1,441,404 | |
DISH Network Corp., Class A(a) | | | 220,796 | | | | 10,543,009 | |
Dominion Energy, Inc. | | | 53,991 | | | | 4,376,510 | |
DowDuPont, Inc. | | | 1,187,391 | | | | 84,565,987 | |
DXC Technology Co. | | | 1,517 | | | | 143,963 | |
Eaton Corp. plc | | | 3,436 | | | | 271,478 | |
eBay, Inc.(a) | | | 7,628 | | | | 287,881 | |
Edgewell Personal Care Co.(a)(b) | | | 499,799 | | | | 29,683,063 | |
Electronic Arts, Inc.(a) | | | 156,892 | | | | 16,483,074 | |
| | | | |
| CONSOLIDATED SCHEDULE OF INVESTMENTS | | | 9 | |
| | |
Consolidated Schedule of Investments (continued) December 31, 2017 | | BlackRock Global Allocation V.I. Fund (Percentages shown are based on Net Assets) |
| | | | | | | | |
| Security | |
Shares | | | Value | |
| United States (continued) | |
Emerson Electric Co. | | | 627 | | | $ | 43,696 | |
EQT Corp. | | | 250,815 | | | | 14,276,390 | |
Equity Residential | | | 3,662 | | | | 233,526 | |
Expedia, Inc. | | | 3,850 | | | | 461,115 | |
Express Scripts Holding Co.(a) | | | 5,622 | | | | 419,626 | |
Exxon Mobil Corp. | | | 8,869 | | | | 741,803 | |
Facebook, Inc., Class A(a) | | | 394,957 | | | | 69,694,112 | |
Fifth Third Bancorp | | | 38,742 | | | | 1,175,432 | |
FirstEnergy Corp. | | | 331 | | | | 10,135 | |
FleetCor Technologies, Inc.(a) | | | 242,500 | | | | 46,664,275 | |
Ford Motor Co. | | | 6,115 | | | | 76,376 | |
Fortune Brands Home & Security, Inc. | | | 277,052 | | | | 18,961,439 | |
Franklin Resources, Inc. | | | 826 | | | | 35,791 | |
General Dynamics Corp. | | | 8,184 | | | | 1,665,035 | |
General Electric Co. | | | 2,406,220 | | | | 41,988,539 | |
General Motors Co. | | | 1,871 | | | | 76,692 | |
Gilead Sciences, Inc. | | | 632,999 | | | | 45,348,048 | |
Global Payments, Inc. | | | 170,354 | | | | 17,076,285 | |
Goldman Sachs Group, Inc. (The) | | | 141,855 | | | | 36,138,980 | |
Goodyear Tire & Rubber Co. (The) | | | 19,273 | | | | 622,711 | |
Halliburton Co. | | | 2,176 | | | | 106,341 | |
Hartford Financial Services Group, Inc. (The) | | | 58,597 | | | | 3,297,839 | |
HCA Healthcare, Inc.(a) | | | 638,577 | | | | 56,092,604 | |
HCP, Inc. | | | 5,040 | | | | 131,443 | |
Helmerich & Payne, Inc.(b) | | | 15,823 | | | | 1,022,799 | |
Hewlett Packard Enterprise Co. | | | 11,078 | | | | 159,080 | |
Hilton Worldwide Holdings, Inc. | | | 1,549 | | | | 123,703 | |
Home Depot, Inc. (The) | | | 16,010 | | | | 3,034,375 | |
HP, Inc. | | | 17,055 | | | | 358,326 | |
Huntsman Corp. | | | 19,839 | | | | 660,440 | |
Illinois Tool Works, Inc. | | | 8,604 | | | | 1,435,577 | |
Illumina, Inc.(a) | | | 350 | | | | 76,472 | |
Ingersoll-Rand plc | | | 2,197 | | | | 195,950 | |
Intel Corp. | | | 43,740 | | | | 2,019,038 | |
International Business Machines Corp. | | | 197,694 | | | | 30,330,213 | |
International Paper Co. | | | 27,690 | | | | 1,604,359 | |
Intuit, Inc. | | | 15,054 | | | | 2,375,220 | |
IQVIA Holdings, Inc.(a) | | | 349 | | | | 34,167 | |
Jawbone Health Hub, Inc.
(Acquired 01/24/17, cost $0)(a)(e)(f) | | | 333,860 | | | | 455,251 | |
Johnson & Johnson | | | 34,036 | | | | 4,755,510 | |
JPMorgan Chase & Co. | | | 358,620 | | | | 38,350,823 | |
Kansas City Southern | | | 322,081 | | | | 33,889,363 | |
Kimberly-Clark Corp. | | | 985 | | | | 118,850 | |
Kinder Morgan, Inc. | | | 5,388 | | | | 97,361 | |
KLA-Tencor Corp. | | | 14,265 | | | | 1,498,824 | |
Kohl’s Corp. | | | 11,318 | | | | 613,775 | |
Lam Research Corp. | | | 1,173 | | | | 215,914 | |
Las Vegas Sands Corp. | | | 5,539 | | | | 384,905 | |
Lear Corp. | | | 8,124 | | | | 1,435,186 | |
Liberty Broadband Corp., Class A(a) | | | 67,564 | | | | 5,746,318 | |
Liberty Broadband Corp., Class C(a) | | | 213,686 | | | | 18,197,500 | |
Liberty Media Corp.-Liberty SiriusXM, Class A(a) | | | 242,277 | | | | 9,608,706 | |
Liberty Media Corp.-Liberty SiriusXM, Class C(a) | | | 405,971 | | | | 16,100,810 | |
Lookout, Inc. (Acquired 03/04/15, cost $936,169), 0.00%(a)(e)(f) | | | 81,954 | | | | 17,210 | |
Lowe’s Cos., Inc. | | | 57,712 | | | | 5,363,753 | |
LyondellBasell Industries NV, Class A | | | 2,047 | | | | 225,825 | |
ManpowerGroup, Inc. | | | 7,705 | | | | 971,678 | |
Marathon Petroleum Corp. | | | 504,938 | | | | 33,315,809 | |
Marsh & McLennan Cos., Inc. | | | 265,887 | | | | 21,640,543 | |
Masco Corp. | | | 49,548 | | | | 2,177,139 | |
Mastercard, Inc., Class A | | | 142,448 | | | | 21,560,929 | |
| | | | | | | | |
| Security | |
Shares | | | Value | |
| United States (continued) | |
McDonald’s Corp. | | | 15,228 | | | $ | 2,621,043 | |
McKesson Corp. | | | 4,846 | | | | 755,734 | |
Merck & Co., Inc. | | | 2,301 | | | | 129,477 | |
MetLife, Inc. | | | 644,058 | | | | 32,563,572 | |
MGM Resorts International | | | 739,168 | | | | 24,680,820 | |
Micron Technology, Inc.(a) | | | 4,244 | | | | 174,513 | |
Microsoft Corp. | | | 2,240,289 | | | | 191,634,321 | |
Mohawk Industries, Inc.(a) | | | 136,126 | | | | 37,557,163 | |
Mondelez International, Inc., Class A | | | 78,244 | | | | 3,348,843 | |
Monsanto Co. | | | 3,177 | | | | 371,010 | |
Moody’s Corp. | | | 987 | | | | 145,691 | |
Morgan Stanley | | | 1,388,516 | | | | 72,855,435 | |
Motorola Solutions, Inc. | | | 458 | | | | 41,376 | |
NextEra Energy Partners LP(b) | | | 362,276 | | | | 15,617,718 | |
NextEra Energy, Inc. | | | 341,274 | | | | 53,303,586 | |
Norfolk Southern Corp. | | | 539 | | | | 78,101 | |
Northern Trust Corp. | | | 1,385 | | | | 138,348 | |
Northrop Grumman Corp. | | | 6,789 | | | | 2,083,612 | |
NVIDIA Corp. | | | 179 | | | | 34,637 | |
ONEOK, Inc. | | | 1,271 | | | | 67,935 | |
Oracle Corp. | | | 7,963 | | | | 376,491 | |
O’Reilly Automotive, Inc.(a)(b) | | | 203,061 | | | | 48,844,293 | |
PACCAR, Inc. | | | 3,214 | | | | 228,451 | |
Packaging Corp. of America | | | 17,342 | | | | 2,090,578 | |
PepsiCo, Inc. | | | 39,341 | | | | 4,717,773 | |
Pfizer, Inc. | | | 2,028,426 | | | | 73,469,590 | |
PG&E Corp. | | | 2,668 | | | | 119,606 | |
Philip Morris International, Inc. | | | 3,483 | | | | 367,979 | |
Phillips 66 | | | 15,116 | | | | 1,528,983 | |
Pioneer Natural Resources Co. | | | 249,512 | | | | 43,128,149 | |
Praxair, Inc. | | | 574 | | | | 88,786 | |
Priceline Group, Inc. (The)(a) | | | 170 | | | | 295,416 | |
Procter & Gamble Co. (The) | | | 6,625 | | | | 608,705 | |
Progressive Corp. (The) | | | 304 | | | | 17,121 | |
Prudential Financial, Inc. | | | 12,983 | | | | 1,492,785 | |
Pure Storage, Inc., Class A(a) | | | 1,171,166 | | | | 18,574,693 | |
PVH Corp. | | | 6,366 | | | | 873,479 | |
QUALCOMM, Inc. | | | 1,390,267 | | | | 89,004,893 | |
Raytheon Co. | | | 7,734 | | | | 1,452,832 | |
Reinsurance Group of America, Inc. | | | 9,407 | | | | 1,466,834 | |
Republic Services, Inc. | | | 707 | | | | 47,800 | |
Rockwell Automation, Inc. | | | 7,228 | | | | 1,419,218 | |
Ross Stores, Inc. | | | 8,346 | | | | 669,767 | |
Royal Caribbean Cruises Ltd. | | | 8,334 | | | | 994,080 | |
Schlumberger Ltd. | | | 238,455 | | | | 16,069,482 | |
Sempra Energy | | | 178,828 | | | | 19,120,290 | |
Snap, Inc., Class A(a)(b) | | | 1,007,997 | | | | 14,726,836 | |
St Joe Co. (The)(a) | | | 1,098,976 | | | | 19,836,517 | |
State Street Corp. | | | 8,685 | | | | 847,743 | |
Stryker Corp. | | | 21,346 | | | | 3,305,215 | |
SunTrust Banks, Inc. | | | 266,713 | | | | 17,226,993 | |
Symantec Corp. | | | 859 | | | | 24,104 | |
Sysco Corp. | | | 170 | | | | 10,324 | |
Target Corp. | | | 329,444 | | | | 21,496,221 | |
Tenet Healthcare Corp.(a)(b) | | | 806,383 | | | | 12,224,766 | |
TESARO, Inc.(a)(b) | | | 106,652 | | | | 8,838,251 | |
Texas Instruments, Inc. | | | 3,456 | | | | 360,945 | |
Thermo Fisher Scientific, Inc. | | | 18,588 | | | | 3,529,489 | |
Time Warner, Inc. | | | 1,862 | | | | 170,317 | |
TJX Cos., Inc. (The) | | | 218,242 | | | | 16,686,783 | |
Travelers Cos., Inc. (The) | | | 31,254 | | | | 4,239,293 | |
TripAdvisor, Inc.(a)(b) | | | 432,780 | | | | 14,913,599 | |
Tyson Foods, Inc., Class A | | | 13,483 | | | | 1,093,067 | |
| | |
| 10 | | 2017 BLACKROCK ANNUAL REPORTTO SHAREHOLDERS |
| | |
Consolidated Schedule of Investments (continued) December 31, 2017 | | BlackRock Global Allocation V.I. Fund (Percentages shown are based on Net Assets) |
| | | | | | | | | | | | |
| Security | | | | |
Shares | | | Value | |
| United States (continued) | |
Union Pacific Corp. | | | | | | | 716 | | | $ | 96,016 | |
United Continental Holdings, Inc.(a) | | | | | | | 719,907 | | | | 48,521,732 | |
United Rentals, Inc.(a) | | | | | | | 11,147 | | | | 1,916,281 | |
United Technologies Corp. | | | | | | | 394 | | | | 50,263 | |
UnitedHealth Group, Inc. | | | | | | | 25,339 | | | | 5,586,236 | |
Valero Energy Corp. | | | | | | | 34,599 | | | | 3,179,994 | |
VeriSign, Inc.(a)(b) | | | | | | | 16,996 | | | | 1,945,022 | |
Verizon Communications, Inc. | | | | | | | 586,679 | | | | 31,052,919 | |
Visa, Inc., Class A | | | | | | | 183,099 | | | | 20,876,948 | |
Vistra Energy Corp.(a)(b) | | | | | | | 275,021 | | | | 5,038,385 | |
VMware, Inc., Class A(a)(b) | | | | | | | 138,966 | | | | 17,415,219 | |
Vornado Realty Trust | | | | | | | 1,280 | | | | 100,070 | |
WABCO Holdings, Inc.(a) | | | | | | | 8,893 | | | | 1,276,146 | |
Walgreens Boots Alliance, Inc. | | | | | | | 3,859 | | | | 280,241 | |
Wal-Mart Stores, Inc. | | | | | | | 2,972 | | | | 293,485 | |
Waste Management, Inc. | | | | | | | 1,486 | | | | 128,242 | |
Wells Fargo & Co. | | | | | | | 673 | | | | 40,831 | |
Western Digital Corp. | | | | | | | 13,351 | | | | 1,061,805 | |
WestRock Co. | | | | | | | 290,774 | | | | 18,379,825 | |
Weyerhaeuser Co. | | | | | | | 3,818 | | | | 134,623 | |
Williams Cos., Inc. (The) | | | | | | | 2,449,234 | | | | 74,677,145 | |
Williams-Sonoma, Inc.(b) | | | | | | | 302,693 | | | | 15,649,228 | |
Wyndham Worldwide Corp. | | | | | | | 17,042 | | | | 1,974,657 | |
Wynn Resorts Ltd. | | | | | | | 10,204 | | | | 1,720,292 | |
Yum China Holdings, Inc. | | | | | | | 1,813 | | | | 72,556 | |
Zimmer Biomet Holdings, Inc. | | | | | | | 328,302 | | | | 39,616,202 | |
| | | | | | | | | | | | |
| | | | | | | | | | | 3,075,566,622 | |
| | | | | | | | | | | | |
Total Common Stocks — 55.1%
(Cost: $4,900,942,057) | | | | 5,949,644,327 | |
| | | | | | | | | | | | |
| | |
| | | Par
(000) | | | | |
Corporate Bonds — 3.1% | |
|
| Australia — 0.2% | |
Quintis Ltd., 8.75%, 08/01/23(c)(g) | | | USD | | | | 28,698 | | | | 20,088,600 | |
Quintis Ltd. (Acquired 11/13/17, cost $2,077,220), 12.00%, 05/31/18(e)(f)(g) | | | | | | | 2,159 | | | | 2,075,584 | |
| | | | | | | | | | | | |
| | | | | | | | | | | 22,164,184 | |
| Brazil — 0.0% | | | | | | |
Odebrecht Finance Ltd., 4.38%, 04/25/25(c) | | | | | | | 5,283 | | | | 1,558,485 | |
| | | | | | | | | | | | |
| Chile — 0.0% | | | | | | |
Inversiones Alsacia SA, 8.00%, 12/31/18(c)(g) | | | | | | | 7,809 | | | | 195,219 | |
| | | | | | | | | | | | |
| China — 0.0% | | | | | | |
China Milk Products Group Ltd., 0.00%, 01/05/12(f)(g)(h)(i)(j) | | | | | | | 4,800 | | | | 24,000 | |
| | | | | | | | | | | | |
| France — 0.1% | | | | | | |
Danone SA, 2.59%, 11/02/23(c) | | | | | | | 8,441 | | | | 8,231,719 | |
| | | | | | | | | | | | |
| Germany — 0.2% | | | | |
Bayer Capital Corp. BV, 5.63%, 11/22/19(c)(i) | | | EUR | | | | 16,000 | | | | 21,574,455 | |
| | | | | | | | | | | | |
| India — 0.0% | | | | |
REI Agro Ltd.(f)(g)(i): | | | | | | | | | | | | |
5.50%, 11/13/14(c) | | | USD | | | | 6,148 | | | | 1 | |
5.50%, 11/13/14 | | | | | | | 2,291 | | | | — | |
| | | | | | | | | | | | |
| | | | | | | | | | | 1 | |
| Italy — 0.1% | | | | |
Telecom Italia SpA, 5.30%, 05/30/24(c) | | | | | | | 7,219 | | | | 7,706,282 | |
| | | | | | | | | | | | |
| | | | | | | | | | | | |
| | |
Security | | Par
(000) | | | Value | |
| Luxembourg — 0.1% | | | | | | |
Intelsat Jackson Holdings SA: | | | | | | | | | | | | |
7.50%, 04/01/21 | | | USD | | | | 6,671 | | | $ | 6,070,610 | |
8.00%, 02/15/24(c) | | | | | | | 2,264 | | | | 2,382,860 | |
| | | | | | | | | | | | |
| | | | | | | | | | | 8,453,470 | |
| Mexico — 0.0% | | | | | | |
Trust F/1401, 5.25%, 12/15/24(c) | | | | | | | 3,282 | | | | 3,483,022 | |
| | | | | | | | | | | | |
| Netherlands — 0.0% | | | | | | |
Cooperatieve Rabobank UA, 3.95%, 11/09/22 | | | | | | | 2,236 | | | | 2,331,251 | |
| | | | | | | | | | | | |
| Singapore — 0.1% | | | | |
CapitaLand Ltd., 1.95%, 10/17/23(c)(i) | | | SGD | | | | 8,750 | | | | 6,591,368 | |
| | | | | | | | | | | | |
| Switzerland — 0.1% | | | | |
UBS Group Funding Switzerland AG, 4.13%, 09/24/25(c) | | | USD | | | | 5,294 | | | | 5,555,808 | |
| | | | | | | | | | | | |
| Turkey — 0.1% | | | | |
Bio City Development Co. BV, 8.00%, 07/06/18(c)(f)(g)(i) | | | | | | | 21,400 | | | | 5,604,660 | |
| | | | | | | | | | | | |
| United Arab Emirates — 0.1% | | | | | | |
Dana Gas Sukuk Ltd., 7.00%, 10/31/17(a)(c)(g)(i)(j) | | | | | | | 17,922 | | | | 14,695,917 | |
| | | | | | | | | | | | |
| United States — 2.0% | | | | |
Activision Blizzard, Inc., 2.30%, 09/15/21 | | | USD | | | | 2,004 | | | | 1,977,697 | |
AliphCom (Acquired 04/27/15-07/21/15, cost $44,105,789), 15.00%, 04/28/20(a)(e)(f)(g)(i)(k) | | | | | | | 44,575 | | | | 655,253 | |
AliphCom (Acquired 11/11/15, cost $3,000,000), 15.00%, 04/28/20(a)(e)(f)(g)(i)(k) | | | | | | | 3,000 | | | | 44,100 | |
Allergan Funding SCS, 3.45%, 03/15/22 | | | | | | | 7,672 | | | | 7,795,167 | |
Ally Financial, Inc., 3.50%, 01/27/19 | | | | | | | 5,076 | | | | 5,101,380 | |
Apple, Inc.: | | | | | | | | | | | | |
3.35%, 02/09/27 | | | | | | | 13,596 | | | | 13,927,384 | |
3.20%, 05/11/27 | | | | | | | 13,065 | | | | 13,230,928 | |
AT&T, Inc.: | | | | | | | | | | | | |
3.00%, 06/30/22 | | | | | | | 12,198 | | | | 12,219,669 | |
2.85%, 02/14/23 | | | | | | | 12,040 | | | | 12,087,739 | |
4.45%, 04/01/24 | | | | | | | 1,939 | | | | 2,051,097 | |
3.40%, 08/14/24 | | | | | | | 21,444 | | | | 21,554,100 | |
Bank of America Corp.: | | | | | | | | | | | | |
3.30%, 01/11/23 | | | | | | | 8,853 | | | | 9,056,619 | |
4.00%, 01/22/25 | | | | | | | 4,152 | | | | 4,319,582 | |
Becton Dickinson and Co.: | | | | | | | | | | | | |
3.13%, 11/08/21 | | | | | | | 7,784 | | | | 7,849,635 | |
2.89%, 06/06/22 | | | | | | | 6,370 | | | | 6,330,153 | |
3.36%, 06/06/24 | | | | | | | 3,461 | | | | 3,470,669 | |
Citigroup, Inc.: | | | | | | | | | | | | |
2.70%, 03/30/21 | | | | | | | 7,992 | | | | 8,016,276 | |
2.90%, 12/08/21 | | | | | | | 3,808 | | | | 3,833,059 | |
eBay, Inc., 2.75%, 01/30/23 | | | | | | | 4,090 | | | | 4,050,151 | |
Edgewell Personal Care Co.: | | | | | | | | | | | | |
4.70%, 05/19/21 - 05/24/22 | | | | | | | 8,214 | | | | 8,452,305 | |
Forest Laboratories LLC, 5.00%, 12/15/21(c) | | | | | | | 3,723 | | | | 3,981,660 | |
General Motors Financial Co., Inc., 3.45%, 04/10/22 | | | | | | | 3,200 | | | | 3,242,660 | |
Hughes Satellite Systems Corp., 7.63%, 06/15/21 | | | | | | | 1,337 | | | | 1,477,385 | |
JPMorgan Chase & Co.: | | | | | | | | | | | | |
4.35%, 08/15/21 | | | | | | | 3,482 | | | | 3,693,065 | |
(LIBOR USD 3 Month + 1.00%), 2.36%, 01/15/23(j) | | | | | | | 9,000 | | | | 9,121,098 | |
Santander Holdings USA, Inc., 3.70%, 03/28/22(c) | | | | | | | 2,205 | | | | 2,231,535 | |
Sherwin-Williams Co. (The), 2.75%, 06/01/22 | | | | | | | 2,965 | | | | 2,953,490 | |
| | | | |
| CONSOLIDATED SCHEDULE OF INVESTMENTS | | | 11 | |
| | |
Consolidated Schedule of Investments (continued) December 31, 2017 | | BlackRock Global Allocation V.I. Fund (Percentages shown are based on Net Assets) |
| | | | | | | | | | | | |
Security | | Par
(000) | | | Value | |
| United States (continued) | | | | |
Synchrony Financial, 3.75%, 08/15/21 | | | USD | | | | 2,199 | | | $ | 2,254,877 | |
Verizon Communications, Inc.: | | | | | | | | | | | | |
3.13%, 03/16/22 | | | | | | | 38,930 | | | | 39,471,356 | |
2.63%, 08/15/26 | | | | | | | 3,830 | | | | 3,607,434 | |
| | | | | | | | | | | | |
| | | | | | | | | | | 218,057,523 | |
| | | | | | | | | | | | |
Total Corporate Bonds — 3.1%
(Cost: $417,370,932) | | | 326,227,364 | |
| | | | | |
|
Floating Rate Loan Interests — 0.4%(l) | |
|
| United States — 0.4% | |
Fieldwood Energy LLC, 2nd Lien Term Loan, (LIBOR USD 3 Month + 7.13%), 8.82%, 09/30/20 | | | | | | | 4,979 | | | | 1,597,446 | |
Fieldwood Energy LLC, Term Loan: | | | | | | | | | | | | |
(LIBOR USD 3 Month + 7.00%), 8.69%, 08/31/20(g) | | | | | | | 2,191 | | | | 1,972,277 | |
(LIBOR USD 3 Month + 7.13%), 8.82%, 12/31/2100(g) | | | | | | | 2,958 | | | | 2,031,456 | |
Hilton Worldwide Finance LLC, Term Loan B-2, (LIBOR USD 3 Month + 2.00%), 3.55%, 10/25/23 | | | | | | | 14,413 | | | | 14,479,903 | |
Seadrill Operating LP, Term Loan, (LIBOR USD 3 Month + 3.00%), 4.69%, 02/21/21 | | | | | | | 13,985 | | | | 11,258,035 | |
Sheridan Investment Partners II LP, Term Loan, (LIBOR USD 3 Month + 3.50%), 4.98%, 12/16/20 | | | | | | | 11,649 | | | | 10,057,317 | |
Sheridan Investment Partners II-A LP, Term Loan, (LIBOR USD 3 Month + 3.50%), 4.98%, 12/16/20 | | | | | | | 1,621 | | | | 1,399,129 | |
Sheridan Investment Partners II-M LP, Term Loan, (LIBOR USD 3 Month + 3.50%), 4.98%, 12/16/20 | | | | | | | 604 | | | | 521,839 | |
| | | | | | | | | | | | |
| | | | | | | 43,317,402 | |
| | | | | | | | |
Total Floating Rate Loan Interests — 0.4%
(Cost: $50,617,950) | | | | 43,317,402 | |
|
Foreign Agency Obligations — 0.5% | |
|
| Brazil — 0.1% | |
Petrobras Global Finance BV: | | | | | | | | |
6.13%, 01/17/22 | | | | | | | 7,510 | | | | 7,969,988 | |
7.38%, 01/17/27 | | | | | | | 8,682 | | | | 9,558,882 | |
| | | | | | | | | | | | |
| | | | | | | | | | | 17,528,870 | |
| Mexico — 0.3% | | | | | | |
Petroleos Mexicanos: | | | | | | | | | | | | |
(LIBOR USD 3 Month + 3.65%), 5.19%, 03/11/22(c)(j) | | | | | | | 8,570 | | | | 9,409,800 | |
4.63%, 09/21/23 | | | | | | | 19,444 | | | | 20,003,015 | |
| | | | | | | | | | | | |
| | | | | | | | | | | 29,412,815 | |
| South Korea — 0.1% | | | | | | |
Export-Import Bank of Korea: | | | | | | | | | | | | |
2.88%, 09/17/18 | | | | | | | 3,344 | | | | 3,352,521 | |
2.63%, 12/30/20 | | | | | | | 6,819 | | | | 6,758,781 | |
| | | | | | | | | | | | |
| | | | | | | | | | | 10,111,302 | |
| | | | | | | | | | | | |
Total Foreign Agency Obligations — 0.5%
(Cost: $55,589,417) | | | | 57,052,987 | |
| | | | | | | | | |
| | | | | | | | | | | | |
Security | | Par
(000) | | | Value | |
Foreign Government Obligations — 9.4% | |
|
| Argentina — 0.8% | |
Republic of Argentina: | | | | | | | | | | | | |
6.88%, 04/22/21 | | | USD | | | | 9,941 | | | $ | 10,825,749 | |
3.88%, 01/15/22 | | | EUR | | | | 5,376 | | | | 6,789,233 | |
5.63%, 01/26/22 | | | USD | | | | 20,152 | | | | 21,260,360 | |
3.38%, 01/15/23 | | | EUR | | | | 10,510 | | | | 12,855,570 | |
7.50%, 04/22/26 | | | USD | | | | 18,591 | | | | 21,047,801 | |
6.88%, 01/26/27 | | | | | | | 12,979 | | | | 14,179,557 | |
| | | | | | | | | | | | |
| | | | | | | | | | | 86,958,270 | |
| Australia — 2.0% | | | | |
Commonwealth of Australia: | | | | | | | | | | | | |
5.75%, 05/15/21 | | | AUD | | | | 48,801 | | | | 42,455,908 | |
5.50%, 04/21/23 | | | | | | | 54,568 | | | | 49,147,199 | |
2.75%, 04/21/24 | | | | | | | 129,045 | | | | 102,328,562 | |
3.00%, 03/21/47 | | | | | | | 32,794 | | | | 23,874,741 | |
| | | | | | | | | | | | |
| | | | | | | | | | | 217,806,410 | |
| Brazil — 1.6% | | | | |
Federative Republic of Brazil: | | | | | | | | | | | | |
6.00%, 08/15/22 | | | BRL | | | | 89 | | | | 28,634,495 | |
10.00%, 01/01/23 | | | | | | | 179 | | | | 54,533,028 | |
10.00%, 01/01/27 | | | | | | | 128 | | | | 38,111,396 | |
4.63%, 01/13/28 | | | USD | | | | 27,695 | | | | 27,819,628 | |
5.00%, 01/27/45 | | | | | | | 20,006 | | | | 18,645,592 | |
5.63%, 02/21/47 | | | | | | | 7,600 | | | | 7,763,400 | |
| | | | | | | | | | | | |
| | | | | | | 175,507,539 | |
| Canada — 0.9% | |
Canadian Government Bond: | | | | | | | | |
0.50%, 08/01/18 | | | CAD | | | | 103,555 | | | | 81,984,749 | |
0.75%, 03/01/21 | | | | | | | 26,087 | | | | 20,101,102 | |
| | | | | | | | | | | | |
| | | | | | | 102,085,851 | |
|
| Germany — 0.5% | |
Federal Republic of Germany, 0.00%, 08/15/26 | | | EUR | | | | 45,299 | | | | 53,019,736 | |
| | | | | | | | |
|
| Hungary — 0.2% | |
Republic of Hungary, 6.38%, 03/29/21 | | | USD | | | | 22,384 | | | | 24,848,031 | |
| | | | | | | | |
|
| Indonesia — 0.1% | |
Republic of Indonesia: | | | | | | | | | | | | |
4.88%, 05/05/21 | | | | | | | 2,427 | | | | 2,588,405 | |
3.70%, 01/08/22(c) | | | | | | | 3,549 | | | | 3,647,545 | |
| | | | | | | | |
| | | | | | | | | | | 6,235,950 | |
| Italy — 0.2% | |
Republic of Italy, 1.85%, 05/15/24 | | | EUR | | | | 13,627 | | | | 16,916,928 | |
| | | | | | | | |
| Japan — 1.1% | |
Government of Japan (2 Year), 0.10%, 03/15/18 | | | JPY | | | | 6,086,800 | | | | 54,046,786 | |
Government of Japan (2 Year), 0.10%, 10/15/18 | | | | | | | 7,006,100 | | | | 62,299,727 | |
| | | | | | | | |
| | | | | | | | | | | 116,346,513 | |
| Mexico — 0.7% | |
United Mexican States: | | | | | | | | | | | | |
8.50%, 12/13/18 | | | MXN | | | | 7,488 | | | | 38,353,866 | |
6.50%, 06/09/22 | | | | | | | 7,337 | | | | 35,718,117 | |
| | | | | | | | |
| | | | | | | | | | | 74,071,983 | |
| Poland — 1.3% | |
Republic of Poland: | | | | | | | | | | | | |
5.00%, 03/23/22 | | | USD | | | | 3,654 | | | | 4,001,130 | |
3.25%, 07/25/25 | | | PLN | | | | 95,041 | | | | 27,532,525 | |
| | |
| 12 | | 2017 BLACKROCK ANNUAL REPORTTO SHAREHOLDERS |
| | |
Consolidated Schedule of Investments (continued) December 31, 2017 | | BlackRock Global Allocation V.I. Fund (Percentages shown are based on Net Assets) |
| | | | | | | | | | | | |
Security | | Par
(000) | | | Value | |
| Poland (continued) | |
Republic of Poland (continued): | | | | | | | | | | | | |
2.50%, 07/25/26 | | | PLN | | | | 95,635 | | | $ | 25,984,741 | |
2.50%, 07/25/27 | | | | | | | 316,102 | | | | 84,957,742 | |
| | | | | | | | |
| | | | | | | | | | | 142,476,138 | |
| | | | | | | | | | | | |
Total Foreign Government Obligations — 9.4%
(Cost: $997,561,965) | | | | 1,016,273,349 | |
| | | | | | | | |
| | |
Shares | | | | |
Investment Companies — 3.8%(a)(m) | |
ETFS Physical Platinum Shares | | | | | | | 67,020 | | | | 5,929,259 | |
ETFS Physical Swiss Gold Shares | | | | | | | 230,215 | | | | 29,037,018 | |
ETFS Physical Palladium Shares | | | | | | | 80,940 | | | | 8,219,457 | |
iShares Gold Trust(t) | | | | | | | 2,098,037 | | | | 26,246,443 | |
SPDR Gold Shares | | | | | | | 2,724,874 | | | | 336,930,670 | |
| | | | | | | | |
Total Investment Companies — 3.8%
(Cost: $398,057,183) | | | | 406,362,847 | |
| | | | | | | | |
| | | |
| | | | | | Par
(000) | | | | |
Non-Agency Mortgage-Backed Securities — 0.1% | |
|
| Commercial Mortgage-Backed Securities — 0.1% | |
| United Kingdom — 0.1% | |
Logistics UK plc, Series 2015-1A, Class F, 4.13%, 08/20/25(c)(n) | | | GBP | | | | 6,637 | | | | 8,970,802 | |
| | | | | | | | |
Total Non-Agency Mortgage-Backed Securities — 0.1%
(Cost: $10,174,225) | | | | 8,970,802 | |
| | | | | | | | |
|
Preferred Securities — 2.9% | |
|
| Capital Trusts — 0.8% | |
|
| Netherlands — 0.0% | |
ING Groep NV, 6.00%(a)(k)(n) | | | USD | | | | 3,944 | | | | 4,087,956 | |
| | | | | | | | |
| United Kingdom — 0.3%(k) | | | | | | | | | |
HSBC Holdings plc, (USD Swap Rate 5 Year + 3.71%), 6.38%(j) | | | | | | | 14,896 | | | | 15,864,240 | |
Lloyds Bank plc, (U.K. Government Bonds 5 Year Note Generic Bid Yield + 13.40%), 13.00%(j) | | | GBP | | | | 8,180 | | | | 20,691,359 | |
| | | | | | | | |
| | | | | | | | | | | 36,555,599 | |
| United States — 0.5%(a) | |
American Express Co., Series C, 4.90%(k)(n) | | | | | | | 5,135 | | | | 5,237,700 | |
Citigroup, Inc., Series O, 5.87%(k)(n) | | | | | | | 9,567 | | | | 9,925,762 | |
General Electric Co., (LIBOR USD 3 Month + 3.33%), 5.00%(j)(k) | | | | | | | 8,146 | | | | 8,395,268 | |
Goldman Sachs Group, Inc. (The), Series M, 5.38%(k)(n) | | | | | | | 8,271 | | | | 8,519,130 | |
Morgan Stanley, Series H,
5.45%(k)(n) | | | | | | | 5,940 | | | | 6,097,410 | |
NBCUniversal Enterprise, Inc., 5.25%(c)(k) | | | | | | | 6,235 | | | | 6,624,687 | |
Prudential Financial, Inc.:(n) | | | | | | | | | | | | |
5.63%, 06/15/43 | | | | | | | 2,954 | | | | 3,199,182 | |
5.87%, 09/15/42 | | | | | | | 4,447 | | | | 4,858,348 | |
USB Capital IX, 3.50%(k)(n) | | | | | | | 2,096 | | | | 1,896,880 | |
| | | | | | | | |
| | | | | | | | | | | 54,754,367 | |
Total Capital Trusts — 0.8%
(Cost: $86,871,864) | | | | 95,397,922 | |
| | | | | | | | |
| | | | | | | | | | | | |
Security | | | | | Shares | | | Value | |
Preferred Stocks — 1.6% | |
|
| Brazil — 0.0% | |
Banco Bradesco SA (Preference), 0.00%(a) | | | | | | | 5,864 | | | $ | 59,841 | |
Itau Unibanco Holding SA (Preference), 0.00% | | | | | | | 8,128 | | | | 104,335 | |
Petroleo Brasileiro SA (Preference), 0.00%(a) | | | | | | | 9,168 | | | | 44,498 | |
| | | | | | | | |
| | | | | | | | | | | 208,674 | |
| South Korea — 0.0% | | | | |
Samsung Electronics Co. Ltd. (Preference), 0.00% | | | | | | | 116 | | | | 225,900 | |
| | | | | | | | |
| United States — 1.6% | | | | |
Anthem, Inc., 5.25%(i) | | | | | | | 407,836 | | | | 22,838,816 | |
Crown Castle International Corp., Series A, 6.88%(b)(i) | | | | | | | 13,602 | | | | 14,276,523 | |
Dominion Energy, Inc., Series A, 6.75%(i) | | | | | | | 328,925 | | | | 16,992,266 | |
Domo, Inc., Series D-2 (Acquired 04/01/15-04/12/17, cost $23,596,895), 0.00%(a)(e)(f) | | | | | | | 2,798,626 | | | | 17,547,385 | |
Dropbox, Inc., Series C (Acquired 01/28/14, cost $28,835,783), 0.00%(a)(e)(f) | | | | | | | 1,509,632 | | | | 21,436,774 | |
Grand Rounds, Inc., Series C (Acquired 03/31/15, cost $5,939,231), 0.00%(a)(e)(f) | | | | | | | 2,139,107 | | | | 6,096,455 | |
Lookout, Inc. (Acquired 09/19/14-10/22/14, cost $10,936,522),
0.00%(a)(e)(f) | | | | | | | 957,404 | | | | 8,932,579 | |
Palantir Technologies, Inc., Series I (Acquired 03/27/14, cost $11,447,321),
0.00%(a)(e)(f) | | | | | | | 1,867,426 | | | | 10,588,306 | |
Uber Technologies, Inc., Series D (Acquired 06/10/14, cost $17,574,548), 0.00%(a)(e)(f) | | | | | | | 1,132,888 | | | | 37,351,317 | |
Wells Fargo & Co., Series L, 7.50%(i) | | | | | | | 3,211 | | | | 4,206,378 | |
Welltower, Inc., Series I,
6.50%(i)(k) | | | | | | | 154,397 | | | | 9,243,748 | |
| | | | | | | | |
| | | | | | | | | | | 169,510,547 | |
| | | | | | | | | | | | |
Total Preferred Stocks — 1.6%
(Cost: $159,327,908) | | | | 169,945,121 | |
| | | | | | | | |
| |
Trust Preferreds — 0.5% | | | | | |
| |
| China — 0.3% | | | | |
Mandatory Exchangeable Trust, 5.75%, 06/03/19(c)(i) | | | | | | | 159,574 | | | | 31,078,632 | |
| | | | | | | | |
| United States — 0.2% | | | | |
Citigroup Capital XIII, 7.75%, 10/30/40(b)(n) | | | | | | | 362,772 | | | | 9,968,975 | |
GMAC Capital Trust I, Series 2, 7.20%, 02/15/40(b)(n) | | | | | | | 405,551 | | | | 10,524,049 | |
| | | | | | | | |
| | | | | | | | | | | 20,493,024 | |
Total Trust Preferreds — 0.5%
(Cost: $35,835,157) | | | | 51,571,656 | |
| | | | | | | | |
Total Preferred Securities — 2.9%
(Cost: $282,034,929) | | | | 316,914,699 | |
| | | | | | | | |
| | | |
| | | | | | Par
(000) | | | | |
U.S. Treasury Obligations — 15.0% | |
| | | |
| U.S. Treasury Notes: | | | | | | | | | |
1.25%, 12/15/18(m) | | | USD | | | | 30,000 | | | | 29,842,969 | |
1.13%, 07/31/21 | | | | | | | 22,358 | | | | 21,620,401 | |
2.00%, 10/31/22 - 11/30/22 | | | | | | | 702,447 | | | | 696,187,062 | |
2.13%, 09/30/24(p) | | | | | | | 261,200 | | | | 257,914,595 | |
2.25%, 10/31/24 - 11/15/27 | | | | | | | 625,603 | | | | 619,355,676 | |
| | | | | | | | |
Total U.S. Treasury Obligations — 15.0%
(Cost: $1,634,363,138) | | | | 1,624,920,703 | |
| | | | | | | | |
| | | | |
| CONSOLIDATED SCHEDULE OF INVESTMENTS | | | 13 | |
| | |
Consolidated Schedule of Investments (continued) December 31, 2017 | | BlackRock Global Allocation V.I. Fund (Percentages shown are based on Net Assets) |
| | | | | | | | | | | | |
Security | | | | | Shares | | | Value | |
Warrants — 0.0% | |
|
| Australia — 0.0%(a)(f) | |
Quintis Ltd. (issued/exercisable 01/08/2011, 2 share for 1 warrant, Expires 07/15/2018, Strike Price AUD 1.28) | | | 3,767,700 | | | $ | 29 | |
| | | | | | | | |
Total Warrants — 0.0% | | | | | | | 29 | |
| | | | | | | | |
Total Long-Term Investments — 90.3% (Cost: $8,746,711,796) | | | | | | | 9,749,684,509 | |
| | | | | | | | |
|
Short-Term Securities — 11.5% | |
| | | |
| | | | | | Shares | | | | |
Money Market Funds — 2.3%(q)(t) | |
BlackRock Liquidity Funds, T-Fund, Institutional Class, 1.17% | | | USD | | | | 10,574,106 | | | | 10,574,106 | |
SL Liquidity Series, LLC, Money Market Series, 1.48%(r) | | | | | | | 235,838,442 | | | | 235,814,858 | |
| | | | | | | | |
Total Money Market Funds — 2.3%
(Cost: $246,403,657) | | | | 246,388,964 | |
| | | | | | | | |
| | | |
| | | | | | Par
(000) | | | | |
Time Deposits — 0.0% | |
|
| Canada — 0.0% | |
Brown Brothers Harriman & Co., 0.33%, 01/02/18 | | | CAD | | | | 3 | | | | 2,377 | |
| | | | | | | | |
| United Kingdom — 0.0% | |
Citibank NA, 0.16%, 01/02/18 | | | GBP | | | | 104 | | | | 140,667 | |
| | | | | | | | |
Total Time Deposits — 0.0%
(Cost: $143,044) | | | | 143,044 | |
| | | | | | | | |
U.S. Treasury Obligations — 9.2% | |
|
| U.S. Treasury Bills: | |
1.15%, 01/02/18 | | | USD | | | | 198,000 | | | | 198,000,000 | |
1.13%, 01/04/18 | | | | | | | 205,000 | | | | 204,987,087 | |
1.21%, 01/11/18(p) | | | | | | | 33,000 | | | | 32,990,285 | |
1.17%, 01/18/18 | | | | | | | 115,000 | | | | 114,936,686 | |
1.14%, 01/25/18 | | | | | | | 165,000 | | | | 164,870,338 | |
1.24%, 02/01/18 | | | | | | | 80,000 | | | | 79,915,638 | |
1.23%, 02/08/18 | | | | | | | 75,000 | | | | 74,903,549 | |
1.25%, 02/15/18 | | | | | | | 119,000 | | | | 118,820,013 | |
| | | | | | | | |
Total U.S. Obligations — 9.2%
(Cost $989,404,918) | | | | 989,423,596 | |
| | | | | | | | |
Total Short-Term Securities — 11.5%
(Cost: $1,235,951,619) | | | | 1,235,955,604 | |
| | | | | | | | |
Total Options Purchased — 0.3%
(Cost: $36,800,490) | | | | 43,312,386 | |
| | | | | | | | |
Total Investments — 102.1%
(Cost: $10,019,463,905) | | | | 11,028,952,499 | |
Liabilities in Excess of Other Assets — (2.1)% | | | | (230,739,311 | ) |
| | | | | | | | |
Net Assets — 100.0% | | | $ | 10,798,213,188 | |
| | | | | | | | |
| (a) | Non-income producing security. |
| (b) | Security, or a portion of the security, is on loan. |
| (c) | Security exempt from registration pursuant to Rule 144A under the Securities Act of 1933, as amended. These securities may be resold in transactions exempt from registration to qualified institutional investors. |
| (d) | A security contractually bound to one or more other securities to form a single saleable unit which cannot be sold separately. |
| (e) | Restricted security as to resale, excluding 144A securities. The Fund held restricted securities with a current value of $105,200,214 , representing 1.00% of its net assets as of period end, and an original cost of $148,417,899. |
| (f) | Security is valued using significant unobservable inputs and is classified as Level 3 in the fair value hierarchy. |
| (g) | Issuer filed for bankruptcy and/or is in default. |
| (i) | Convertible security. |
| (j) | Variable rate security. Security may be issued at a fixed coupon rate, which converts to a variable rate at a specified date. Rate shown is the rate in effect as of period end. |
| (k) | Perpetual security with no stated maturity date. |
| (l) | Variable rate security. Rate shown is the rate in effect as of period end. |
| (m) | All or a portion of the security is held by a wholly-owned subsidiary. See Note 1 of the Notes to Consolidated Financial Statements for details on the wholly-owned subsidiary. |
| (n) | Variable or floating rate security, which interest rate adjusts periodically based on changes in current interest rates and prepayments on the underlying pool of assets. Rate shown is the rate in effect as of period end. |
| (o) | Rates are discount rates or a range of discount rates at the time of purchase. |
| (p) | All or a portion of security has been pledged as collateral in connection with outstanding OTC derivatives. |
| (q) | Annualized 7-day yield as of period end. |
| (r) | Security was purchased with the cash collateral from loaned securities. |
For Fund compliance purposes, the Fund’s industry classifications refer to one or more widely recognized market indexes or ratings group indexes, and/or as defined by the investment advisor. These definitions may not apply for purposes of this report, which may combine such industry sub-classifications for reporting ease.
| | |
| 14 | | 2017 BLACKROCK ANNUAL REPORTTO SHAREHOLDERS |
| | |
Consolidated Schedule of Investments (continued) December 31, 2017 | | BlackRock Global Allocation V.I. Fund |
| (t) | During the year ended December 31, 2017, investments in issuers considered to be affiliates of the Fund for the purposes of Section 2(a)(3) of the Investment Company Act of 1940, as amended, and/or related parties of the fund were as follows: |
| | | | | | | | | | | | | | | | | | | | | | | | | | | | | | | | |
| Affiliates | | Shares
Held at
12/31/16 | | | Shares
Purchased | | | Shares
Sold | | | Shares
Held at
12/31/17 | | | Value at
12/31/17 | | | Income | | | Net
Realized
Gain (Loss) (a) | | | Change in
Unrealized
(Depreciation) | |
BlackRock Liquidity Funds, T-Fund, Institutional Class | | | 3,489,583 | | | | 7,084,523 | (b) | | | — | | | | 10,574,106 | | | $ | 10,574,106 | | | $ | 51,448 | | | $ | — | | | $ | — | |
SL Liquidity Series, LLC, Money Market Series | | | 304,751,698 | | | | — | | | | (68,913,256 | )(c) | | | 235,838,442 | | | | 235,814,858 | | | | 2,573,563 | (d) | | | (30,958 | ) | | | 222 | |
iShares Gold Trust | | | 2,098,037 | | | | — | | | | — | | | | 2,098,037 | | | | 26,246,443 | | | | — | | | | — | | | | 3,000,193 | |
iShares iBoxx $ High Yield Corporate Bond ETF | | | 122,665 | | | | — | | | | (122,665 | ) | | | — | | | | — | | | | 93,976 | | | | 368,124 | | | | (353,624 | ) |
| | | | | | | | | | | | | | | | | | | | | | | | | | | | | | | | |
| | | | | | | | | | | | | | | | | | $ | 272,635,407 | | | $ | 2,718,987 | | | $ | 337,166 | | | $ | 2,646,791 | |
| | | | | | | | | | | | | | | | | | | | | | | | | | | | | | | | |
| | (a) | Includes net capital gain distributions, if applicable. | |
| | (b) | Represents net shares purchased. | |
| | (c) | Represents net shares sold. | |
| | (d) | Represents securities lending income earned from the reinvestment of cash collateral from loaned securities, net of fees and collateral investment expenses, and other payments to and from borrowers of securities. | |
Derivative Financial Instruments Outstanding as of Period End
Futures Contracts
| | | | | | | | | | | | | | | | |
| Description | | Number of
Contracts | | | Expiration
Date | | | Notional
Amount (000) | | | Value/
Unrealized
Appreciation/
(Depreciation) | |
Short Contracts | | | | | | | | | | | | | | | | |
Yen Denominated Nikkei 225 Index | | | 138 | | | | 03/08/18 | | | $ | 13,901 | | | $ | (118,210 | ) |
EURO STOXX 50 Index | | | 89 | | | | 03/16/18 | | | | 3,730 | | | | 76,458 | |
NASDAQ 100 E-Mini Index | | | 168 | | | | 03/16/18 | | | | 21,533 | | | | (70,135 | ) |
S&P 500 E-Mini Index | | | 210 | | | | 03/16/18 | | | | 28,098 | | | | (279,124 | ) |
| | | | | | | | | | | | | | | | |
| | | | | | | | | | | | | | $ | (391,011 | ) |
| | | | | | | | | | | | | | | | |
Forward Foreign Currency Exchange Contracts
| | | | | | | | | | | | | | | | | | | | |
| Currency Purchased | | | Currency Sold | | | Counterparty | | Settlement Date | | | Unrealized
Appreciation
(Depreciation) | |
| JPY | | | 131,108,687 | | | USD | | | 1,161,951 | | | BNP Paribas SA | | | 01/04/18 | | | $ | 1,709 | |
| USD | | | 76,642 | | | JPY | | | 8,624,999 | | | Barclays Bank plc | | | 01/04/18 | | | | 90 | |
| USD | | | 26,525,000 | | | MXN | | | 492,932,643 | | | UBS AG | | | 01/11/18 | | | | 1,493,650 | |
| USD | | | 21,261,000 | | | MXN | | | 405,957,534 | | | Deutsche Bank AG | | | 01/18/18 | | | | 676,421 | |
| USD | | | 62,453,233 | | | AUD | | | 79,763,000 | | | Goldman Sachs International | | | 01/25/18 | | | | 217,513 | |
| GBP | | | 20,413,000 | | | USD | | | 26,846,157 | | | JP Morgan Chase Bank NA | | | 02/08/18 | | | | 748,544 | |
| GBP | | | 20,413,000 | | | USD | | | 26,852,281 | | | JP Morgan Chase Bank NA | | | 02/16/18 | | | | 748,816 | |
| NZD | | | 34,135,000 | | | USD | | | 23,523,282 | | | JP Morgan Chase Bank NA | | | 02/22/18 | | | | 652,374 | |
| USD | | | 24,413,693 | | | NZD | | | 34,135,000 | | | JP Morgan Chase Bank NA | | | 02/22/18 | | | | 238,037 | |
| GBP | | | 20,345,000 | | | USD | | | 26,768,425 | | | JP Morgan Chase Bank NA | | | 02/23/18 | | | | 746,304 | |
| EUR | | | 42,096,000 | | | USD | | | 49,698,538 | | | UBS AG | | | 03/15/18 | | | | 1,025,521 | |
| JPY | | | 3,573,985,000 | | | USD | | | 31,654,013 | | | Goldman Sachs International | | | 03/15/18 | | | | 178,896 | |
| EUR | | | 32,446,000 | | | USD | | | 38,417,524 | | | UBS AG | | | 03/16/18 | | | | 681,300 | |
| SEK | | | 225,145,264 | | | EUR | | | 22,773,000 | | | Deutsche Bank AG | | | 03/22/18 | | | | 124,269 | |
| SEK | | | 225,224,970 | | | EUR | | | 22,773,000 | | | BNP Paribas SA | | | 03/29/18 | | | | 133,536 | |
| EUR | | | 42,213,000 | | | USD | | | 49,933,758 | | | UBS AG | | | 04/12/18 | | | | 1,027,462 | |
| | | | | | | | | | | | | | | | | | | | |
| | | | | | | | | | | | | | | | | | | 8,694,442 | |
| | | | | | | | | | | | | | | | | | | | |
| JPY | | | 184,203,375 | | | USD | | | 1,636,912 | | | Barclays Bank plc | | | 01/05/18 | | | | (1,926 | ) |
| NOK | | | 171,746,000 | | | USD | | | 21,520,976 | | | Morgan Stanley & Co., Inc. | | | 01/26/18 | | | | (588,300 | ) |
| USD | | | 17,172,294 | | | EUR | | | 14,481,000 | | | UBS AG | | | 02/26/18 | | | | (258,152 | ) |
| JPY | | | 2,982,565,000 | | | USD | | | 26,572,510 | | | Barclays Bank plc | | | 03/08/18 | | | | (19,098 | ) |
| EUR | | | 22,639,000 | | | PLN | | | 95,959,929 | | | Deutsche Bank AG | | | 03/16/18 | | | | (292,141 | ) |
| USD | | | 10,109,060 | | | AUD | | | 13,000,000 | | | Citibank NA | | | 04/06/18 | | | | (32,261 | ) |
| USD | | | 27,396,612 | | | AUD | | | 36,024,000 | | | Deutsche Bank AG | | | 04/13/18 | | | | (705,489 | ) |
| | | | | | | | | | | | | | | | | | | | |
| | | | | | | | | | | | | | | | | | | (1,897,367 | ) |
| | | | | | | | | | | | | | | | | | | | |
| | | Net Unrealized Appreciation | | | $ | 6,797,075 | |
| | | | | | | | | | | | | | | | | | | | |
| | | | |
| CONSOLIDATED SCHEDULE OF INVESTMENTS | | | 15 | |
| | |
Consolidated Schedule of Investments (continued) December 31, 2017 | | BlackRock Global Allocation V.I. Fund |
OTC Options Purchased
| | | | | | | | | | | | | | | | | | | | | | | | | | | | | | |
| Description | | Counterparty | | Number of
Contracts | | | Expiration
Date | | | Exercise
Price | | | Notional
Amount (000) | | | Value | |
Call | | | | | | | | | | | | | | | | | | | | | | | | | | | | | | |
Tokyo Stock Price Index | | Morgan Stanley & Co. International plc | | | 3,384,276 | | | | 01/12/18 | | | | JPY | | | | 1,785.00 | | | | JPY | | | | 6,151,125 | | | $ | 1,183,646 | |
Franklin Resources, Inc. | | Goldman Sachs International | | | 267,940 | | | | 01/19/18 | | | | USD | | | | 45.00 | | | | USD | | | | 11,610 | | | | 46,889 | |
S&P 500 Index | | Deutsche Bank AG | | | 34,284 | | | | 01/19/18 | | | | USD | | | | 2,685.00 | | | | USD | | | | 91,662 | | | | 443,978 | |
SPDR Gold Shares(a) | | Morgan Stanley & Co. International plc | | | 138,888 | | | | 01/19/18 | | | | USD | | | | 126.00 | | | | USD | | | | 17,174 | | | | 55,555 | |
SPDR Gold Shares(a) | | Morgan Stanley & Co. International plc | | | 138,890 | | | | 01/19/18 | | | | USD | | | | 125.00 | | | | USD | | | | 17,174 | | | | 88,195 | |
Synchrony Financial | | Goldman Sachs International | | | 296,775 | | | | 01/19/18 | | | | USD | | | | 35.00 | | | | USD | | | | 11,458 | | | | 1,142,584 | |
Travelers Cos., Inc. (The) | | Goldman Sachs International | | | 106,866 | | | | 01/19/18 | | | | USD | | | | 135.00 | | | | USD | | | | 14,495 | | | | 237,777 | |
Tokyo Stock Price Index | | Citibank NA | | | 2,460,020 | | | | 02/09/18 | | | | JPY | | | | 1,785.00 | | | | JPY | | | | 4,471,234 | | | | 1,178,602 | |
S&P 500 Index | | BNP Paribas SA | | | 41,080 | | | | 02/16/18 | | | | USD | | | | 2,690.00 | | | | USD | | | | 109,832 | | | | 944,840 | |
SPDR Gold Shares(a) | | Morgan Stanley & Co. International plc | | | 345,955 | | | | 02/16/18 | | | | USD | | | | 130.00 | | | | USD | | | | 42,777 | | | | 119,354 | |
Tokyo Stock Price Index | | Morgan Stanley & Co. International plc | | | 2,733,462 | | | | 03/09/18 | | | | JPY | | | | 1,800.00 | | | | JPY | | | | 4,968,231 | | | | 1,491,972 | |
S&P 500 Index | | Bank of America NA | | | 23,291 | | | | 03/16/18 | | | | USD | | | | 2,675.00 | | | | USD | | | | 62,271 | | | | 1,038,779 | |
S&P 500 Index | | UBS AG | | | 23,293 | | | | 03/16/18 | | | | USD | | | | 2,670.00 | | | | USD | | | | 62,276 | | | | 1,115,735 | |
SPDR Gold Shares(a) | | Morgan Stanley & Co. International plc | | | 345,988 | | | | 03/16/18 | | | | USD | | | | 127.00 | | | | USD | | | | 42,781 | | | | 413,456 | |
EUR Currency | | UBS AG | | | — | | | | 03/27/18 | | | | USD | | | | 1.20 | | | | EUR | | | | 268,091 | | | | 5,599,965 | |
S&P 500 Index | | Societe Generale SA | | | 16,433 | | | | 03/29/18 | | | | USD | | | | 2,675.00 | | | | USD | | | | 43,935 | | | | 903,629 | |
S&P 500 Index | | Citibank NA | | | 13,681 | | | | 04/20/18 | | | | USD | | | | 2,700.00 | | | | USD | | | | 36,578 | | | | 682,012 | |
S&P 500 Index | | Morgan Stanley & Co. International plc | | | 11,982 | | | | 04/20/18 | | | | USD | | | | 2,695.00 | | | | USD | | | | 32,035 | | | | 633,595 | |
EUR Currency | | Barclays Bank plc | | | — | | | | 05/18/18 | | | | USD | | | | 1.19 | | | | EUR | | | | 135,126 | | | | 4,552,691 | |
EURO STOXX 50 Index | | Deutsche Bank AG | | | 3,336 | | | | 09/21/18 | | | | EUR | | | | 3,426.55 | | | | EUR | | | | 11,689 | | | | 658,198 | |
BP plc | | UBS AG | | | 869,910 | | | | 01/18/19 | | | | USD | | | | 40.00 | | | | USD | | | | 36,562 | | | | 3,088,181 | |
Chevron Corp. | | UBS AG | | | 275,840 | | | | 01/18/19 | | | | USD | | | | 125.00 | | | | USD | | | | 34,532 | | | | 2,475,664 | |
ConocoPhillips | | UBS AG | | | 458,581 | | | | 01/18/19 | | | | USD | | | | 52.50 | | | | USD | | | | 25,172 | | | | 2,717,092 | |
Exxon Mobil Corp. | | UBS AG | | | 187,537 | | | | 01/18/19 | | | | USD | | | | 95.00 | | | | USD | | | | 15,686 | | | | 213,792 | |
Occidental Petroleum Corp. | | UBS AG | | | 403,026 | | | | 01/18/19 | | | | USD | | | | 75.00 | | | | USD | | | | 29,687 | | | | 2,146,113 | |
Royal Dutch Shell plc | | UBS AG | | | 496,555 | | | | 01/18/19 | | | | USD | | | | 60.00 | | | | USD | | | | 33,125 | | | | 3,798,646 | |
Schlumberger Ltd. | | UBS AG | | | 271,460 | | | | 01/18/19 | | | | USD | | | | 90.00 | | | | USD | | | | 18,294 | | | | 145,231 | |
Schneider Electric SE | | UBS AG | | | 585,698 | | | | 01/18/19 | | | | USD | | | | 35.00 | | | | USD | | | | 21,507 | | | | 2,416,004 | |
TOTAL SA | | UBS AG | | | 598,145 | | | | 01/18/19 | | | | USD | | | | 60.00 | | | | USD | | | | 33,065 | | | | 1,001,893 | |
| | | | | | | | | | | | | | | | | | | | | | | | | | | | | | |
| | | | | | | | | | | | | | | | | | | | | | | | | | | | | 40,534,068 | |
| | | | | | | | | | | | | | | | | | | | | | | | | | | | | | |
Put | | | | | | | | | | | | | | | | | | | | | | | | | | | | | | |
USD Currency | | BNP Paribas SA | | | — | | | | 01/12/18 | | | | JPY | | | | 111.75 | | | | USD | | | | 137,396 | | | | 272,686 | |
SPDR Gold Shares(a) | | Morgan Stanley & Co. International plc | | | 277,778 | | | | 01/19/18 | | | | USD | | | | 117.00 | | | | USD | | | | 34,347 | | | | 17,959 | |
| | | | | | | | | | | | | | | | | | | | | | | | | | | | | | |
| | | | | | | | | | | | | | | | | | | | | | | | | | | | | 290,645 | |
| | | | | | | | | | | | | | | | | | | | | | | | | | | | | | |
| | | | | | | | | | | | | | | | | | | | | | | | | | | | $ | 40,824,713 | |
| | | | | | | | | | | | | | | | | | | | | | | | | | | | | | |
| | (a) | All or a portion of the security is held by a wholly-owned subsidiary. See Note 1 of the Notes to Consolidated Financial Statements for details on the wholly-owned subsidiary. | |
OTC Interest Rate Swaptions Purchased
| | | | | | | | | | | | | | | | | | | | | | | | | | | | |
| | | Paid by
the Fund | | Received by
the Fund | | Counterparty | | Expiration
Date | | | Exercise
Rate | | | Notional
Amount (000) | | Value | |
| Description | | Rate | | | Frequency | | Rate | | Frequency | | | | | |
Call | | | | | | | | | | | | | | | | | | | | | | | | | | | | |
5-Year Interest Rate Swap, 04/24/18 | | | 3 month LIBOR | | | Quarterly | | 2.15% | | Semi Annual | | Goldman Sachs International | | | 04/24/18 | | | | 2.15 | % | | USD | | 692,291 | | $ | 1,903,807 | |
Put | | | | | | | | | | | | | | | | | | | | | | | | | | | | |
10-Year Interest Rate Swap, 01/04/18 | | | 2.46% | | | Semi Annual | | 3 month LIBOR | | Quarterly | | Goldman Sachs International | | | 01/04/18 | | | | 2.46 | % | | USD | | 138,646 | | | 55,056 | |
5-Year Interest Rate Swap, 04/04/18 | | | 1.07% | | | Semi Annual | | 3 month LIBOR | | Quarterly | | Deutsche Bank AG | | | 04/04/18 | | | | 1.07 | % | | JPY | | 2,370,178 | | | 55 | |
30-Year Interest Rate Swap, 05/02/18 | | | 2.75% | | | Semi Annual | | 3 month LIBOR | | Quarterly | | Goldman Sachs International | | | 05/02/18 | | | | 2.75 | % | | USD | | 31,963 | | | 406,086 | |
| | | | | | | | | | | | | | | | | | | | | | | | | | | | |
| | | | | | | | | | | | | | | | | | | | | | | | | | | 461,197 | |
| | | | | | | | | | | | | | | | | | | | | | | | | | | | |
| | $ | 2,365,004 | |
| | | | | | | | | | | | | | | | | | | | | | | | | | | | |
OTC Interest Rate Caps Purchased
| | | | | | | | | | | | | | | | | | | | | | | | |
| Description | | Exercise
Rate | | Counterparty | | Expiration
Date | | Notional
Amount (000) | | | Value | | | Premiums
Paid | | | Unrealized
Appreciation/
(Depreciation) | |
| 5Y-30Y CMS Index Cap | | 0.60% | | Goldman Sachs International | | 11/06/18 | | USD | | | 215,050 | | | $ | 122,669 | | | $ | 659,487 | | | $ | (536,818 | ) |
| | | | | | | | | | | | | | | | | | | | | | | | |
| | |
| 16 | | 2017 BLACKROCK ANNUAL REPORTTO SHAREHOLDERS |
| | |
Consolidated Schedule of Investments (continued) December 31, 2017 | | BlackRock Global Allocation V.I. Fund |
OTC Barrier Options Written
| | | | | | | | | | | | | | | | | | | | | | | | | | | | | | | | | | | | |
| Description | | Type of Option | | Counterparty | | Number of
Contracts | | | Expiration
Date | | | Exercise Price | | | Barrier
Price/Range | | | Notional
Amount (000) | | | Value | |
Put | | | | | | | | | | | | | | | | | | | | | | | | | | | | | | | | | | | | |
EURO STOXX 50 Index | | Down-and-In | | Deutsche Bank AG | | | (3,336 | ) | | | 09/21/18 | | | | EUR 2,586.07 | | | | EUR | | | | 2,165.83 | | | | EUR | | | | (11,689 | ) | | $ | (76,447 | ) |
| | | | | | | | | | | | | | | | | | | | | | | | | | | | | | | | | | | | |
OTC Options Written
| | | | | | | | | | | | | | | | | | | | | | | | | | | | | | |
| Description | | Counterparty | | Number of
Contracts | | | Expiration
Date | | | Exercise
Price | | | Notional
Amount (000) | | | Value | |
Call | | | | | | | | | | | | | | | | | | | | | | | | | | | | | | |
USD Currency | | BNP Paribas SA | | | — | | | | 01/12/18 | | | | JPY | | | | 115.00 | | | | USD | | | | 137,396 | | | $ | (26,112 | ) |
Synchrony Financial | | Bank of America NA | | | 296,775 | | | | 01/19/18 | | | | USD | | | | 35.00 | | | | USD | | | | 11,458 | | | | (1,142,584 | ) |
USD Currency | | BNP Paribas SA | | | — | | | | 01/26/18 | | | | ZAR | | | | 15.25 | | | | USD | | | | 34,324 | | | | (15 | ) |
SPDR Gold Shares(a) | | Morgan Stanley & Co. International plc | | | 345,988 | | | | 03/16/18 | | | | USD | | | | 140.00 | | | | USD | | | | 42,781 | | | | (41,519 | ) |
Flight Centre Travel Group Ltd. | | Barclays Bank plc | | | 34,069 | | | | 01/18/19 | | | | USD | | | | 180.00 | | | | USD | | | | 6,556 | | | | (1,008,442 | ) |
Pioneer Natural Resources Co. | | UBS AG | | | 72,530 | | | | 01/18/19 | | | | USD | | | | 165.00 | | | | USD | | | | 12,537 | | | | (2,063,479 | ) |
United Continental Holdings, Inc. | | Deutsche Bank AG | | | 90,361 | | | | 01/18/19 | | | | USD | | | | 75.00 | | | | USD | | | | 6,090 | | | | (582,828 | ) |
| | | | | | | | | | | | | | | | | | | | | | | | | | | | | | |
| | | | | | | | | | | | | | | | | | | | | | | | | | | | | (4,864,979 | ) |
| | | | | | | | | | | | | | | | | | | | | | | | | | | | | | |
Put | | | | | | | | | | | | | | | | | | | | | | | | | | | | | | |
USD Currency | | BNP Paribas SA | | | — | | | | 01/12/18 | | | | JPY | | | | 108.00 | | | | USD | | | | 137,396 | | | | (1,334 | ) |
S&P 500 Index | | Deutsche Bank AG | | | 17,142 | | | | 01/19/18 | | | | USD | | | | 2,500.00 | | | | USD | | | | 45,831 | | | | (48,426 | ) |
SPDR Gold Shares(a) | | Morgan Stanley & Co. International plc | | | 277,778 | | | | 01/19/18 | | | | USD | | | | 120.00 | | | | USD | | | | 34,347 | | | | (44,217 | ) |
Tokyo Stock Price Index | | Citibank NA | | | 2,460,020 | | | | 02/09/18 | | | | JPY | | | | 1,675.00 | | | | JPY | | | | 4,471,234 | | | | (97,213 | ) |
S&P 500 Index | | BNP Paribas SA | | | 20,540 | | | | 02/16/18 | | | | USD | | | | 2,450.00 | | | | USD | | | | 54,916 | | | | (117,078 | ) |
SPDR Gold Shares(a) | | Morgan Stanley & Co. International plc | | | 241,806 | | | | 02/16/18 | | | | USD | | | | 115.00 | | | | USD | | | | 29,899 | | | | (25,092 | ) |
Tokyo Stock Price Index | | Morgan Stanley & Co. International plc | | | 2,733,462 | | | | 03/09/18 | | | | JPY | | | | 1,650.00 | | | | JPY | | | | 4,968,231 | | | | (131,002 | ) |
SPDR Gold Shares(a) | | Morgan Stanley & Co. International plc | | | 145,105 | | | | 03/16/18 | | | | USD | | | | 115.00 | | | | USD | | | | 17,942 | | | | (10,440 | ) |
BP plc | | UBS AG | | | 869,910 | | | | 01/18/19 | | | | USD | | | | 25.00 | | | | USD | | | | 36,562 | | | | (173,982 | ) |
Chevron Corp. | | UBS AG | | | 275,840 | | | | 01/18/19 | | | | USD | | | | 80.00 | | | | USD | | | | 34,532 | | | | (205,501 | ) |
ConocoPhillips | | UBS AG | | | 458,581 | | | | 01/18/19 | | | | USD | | | | 35.00 | | | | USD | | | | 25,172 | | | | (311,835 | ) |
Exxon Mobil Corp. | | UBS AG | | | 187,537 | | | | 01/18/19 | | | | USD | | | | 60.00 | | | | USD | | | | 15,686 | | | | (128,463 | ) |
Occidental Petroleum Corp. | | UBS AG | | | 403,026 | | | | 01/18/19 | | | | USD | | | | 45.00 | | | | USD | | | | 29,687 | | | | (253,906 | ) |
Royal Dutch Shell plc | | UBS AG | | | 496,555 | | | | 01/18/19 | | | | USD | | | | 40.00 | | | | USD | | | | 33,125 | | | | (86,897 | ) |
Schlumberger Ltd. | | UBS AG | | | 271,460 | | | | 01/18/19 | | | | USD | | | | 60.00 | | | | USD | | | | 18,294 | | | | (916,178 | ) |
Schneider Electric SE | | UBS AG | | | 585,698 | | | | 01/18/19 | | | | USD | | | | 25.00 | | | | USD | | | | 21,507 | | | | (307,492 | ) |
TOTAL SA | | UBS AG | | | 598,145 | | | | 01/18/19 | | | | USD | | | | 40.00 | | | | USD | | | | 33,065 | | | | (284,119 | ) |
| | | | | | | | | | | | | | | | | | | | | | | | | | | | | | |
| | | | | | | | | | | | | | | | | | | | | | | | | | | | | (3,143,175 | ) |
| | | | | | | | | | | | | | | | | | | | | | | | | | | | | | |
| | | | | | | | | | | | | | | | | | | | | | | | | | | | $ | (8,008,154 | ) |
| | | | | | | | | | | | | | | | | | | | | | | | | | | | | | |
| (a) | All or a portion of the security is held by a wholly-owned subsidiary. See Note 1 of the Notes to Consolidated Financial Statements for details on the wholly-owned subsidiary. |
OTC Interest Rate Swaptions Written
| | | | | | | | | | | | | | | | | | | | | | | | | | | | | | | | | | |
| | | Paid by
the Fund | | Received by
the Fund | | Counterparty | | Expiration
Date | | | Exercise
Rate | | | | | | Notional
Amount
(000) | | | Value | |
| Description | | Rate | | | Frequency | | Rate | | | Frequency | | | | | | | | |
Call | | | | | | | | | | | | | | | | | | | | | | | | | | | | | | | | | | |
5-Year Interest Rate Swap, 04/24/18 | | | 1.90 | % | | Semi Annual | | | 3 month LIBOR | | | Quarterly | | Goldman Sachs International | | | 04/26/23 | | | | 1.90 | % | | | USD | | | | 692,291 | | | $ | (466,743 | ) |
Put | | | | | | | | | | | | | | | | | | | | | | | | | | | | | | | | | | |
10-Year Interest Rate Swap, 01/04/18 | | | 2.61 | % | | Semi Annual | | | 3 month LIBOR | | | Quarterly | | Goldman Sachs International | | | 01/08/28 | | | | 2.61 | | | | USD | | | | 138,646 | | | | (61 | ) |
5-Year Interest Rate Swap, 04/24/18 | | | 2.40 | % | | Semi Annual | | | 3 month LIBOR | | | Quarterly | | Goldman Sachs International | | | 04/26/23 | | | | 2.40 | | | | USD | | | | 346,146 | | | | (1,127,344 | ) |
5-Year Interest Rate Swap, 05/02/18 | | | 2.50 | % | | Semi Annual | | | 3 month LIBOR | | | Quarterly | | Goldman Sachs International | | | 05/04/23 | | | | 2.50 | | | | USD | | | | 146,213 | | | | (317,831 | ) |
| | | | | | | | | | | | | | | | | | | | | | | | | | | | | | | | | | |
| | | | | | | | | | | | | | | | | | | | | | | | | | | | | | | | | (1,445,236 | ) |
| | | | | | | | | | | | | | | | | | | | | | | | | | | | | | | | | | |
| | | $ | (1,911,979 | ) |
| | | | | | | | | | | | | | | | | | | | | | | | | | | | | | | | | | |
| | | | |
| CONSOLIDATED SCHEDULE OF INVESTMENTS | | | 17 | |
| | |
Consolidated Schedule of Investments (continued) December 31, 2017 | | BlackRock Global Allocation V.I. Fund |
Centrally Cleared Credit Default Swaps — Buy Protection
| | | | | | | | | | | | | | | | | | | | | | | | | | |
| Reference Obligation/Index | | Financing
Rate Paid
by the Fund | | | Payment
Frequency | | | Termination
Date | | Notional
Amount (000) | | | Value | | Upfront
Premium
Paid
(Received) | | | Unrealized
Appreciation
(Depreciation) | |
CDX.NA.HY.29.V1 | | | 5.00 | % | | | Quarterly | | | 12/20/22 | | USD | | | 8,975 | | | $(756,013) | | $ | — | | | $ | (756,013 | ) |
| | | | | | | | | | | | | | | | | | | | | | | | | | |
Centrally Cleared Interest Rate Swaps
| | | | | | | | | | | | | | | | | | | | | | | | | | | | | | | | |
| Paid by the Fund | | Received by the Fund | | Effective
Date | | | Termination
Date | | | Notional
Amount (000) | | | Value | | | Upfront
Premium
Paid
(Received) | | | Unrealized
Appreciation
(Depreciation) | |
| Rate | | Frequency | | Rate | | Frequency | | | | | | |
| 3 month LIBOR | | Quarterly | | 2.40% | | Semi-Annual | | | 03/07/2018 | (a) | | | 03/07/23 | | | USD | | | 134,710 | | | $ | 850,507 | | | $ | — | | | $ | 850,507 | |
| 0.42% | | Annual | | 6 month EURIBOR | | Semi-Annual | | | 03/07/2018 | (a) | | | 03/07/23 | | | EUR | | | 119,219 | | | | (380,044 | ) | | | — | | | | (380,044 | ) |
| 0.34% | | Annual | | 6 month EURIBOR | | Semi-Annual | | | 06/14/2018 | (a) | | | 06/14/23 | | | EUR | | | 118,086 | | | | 651,804 | | | | — | | | | 651,804 | |
| 3 month LIBOR | | Quarterly | | 2.33% | | Semi-Annual | | | 06/14/2018 | (a) | | | 06/14/23 | | | USD | | | 147,260 | | | | 167,932 | | | | — | | | | 167,932 | |
| 0.37% | | Annual | | 6 month EURIBOR | | Semi-Annual | | | N/A | | | | 08/15/26 | | | EUR | | | 45,313 | | | | 1,590,492 | | | | — | | | | 1,590,492 | |
| | | | | | | | | | | | | | | | | | | | | | | | | | | | | | | | |
| | | | | | | | | | | | | | | | | | | | | | $ | 2,880,691 | | | $ | — | | | $ | 2,880,691 | |
| | | | | | | | | | | | | | | | | | | | | | | | | | | | | | | | |
OTC Credit Default Swaps — Buy Protection
| | | | | | | | | | | | | | | | | | | | | | | | | | | | | | | | |
| Reference Obligation/Index | | Financing
Rate Paid
by the Fund | | | Payment
Frequency | | | Counterparty | | Termination
Date | | | Notional
Amount (000) | | Value | | | Upfront
Premium
Paid (Received) | | | Unrealized
Appreciation
(Depreciation) | |
Airbus SE | | | 1.00 | % | | | Quarterly | | | Barclays Bank plc | | | 06/20/22 | | | | EUR | | | 3,449 | | $ | (134,857 | ) | | $ | (122,411 | ) | | $ | (12,446 | ) |
Airbus SE | | | 1.00 | % | | | Quarterly | | | Barclays Bank plc | | | 06/20/22 | | | | EUR | | | 6,893 | | | (269,510 | ) | | | (229,159 | ) | | | (40,351 | ) |
Akzo Nobel NV | | | 1.00 | % | | | Quarterly | | | Barclays Bank plc | | | 06/20/22 | | | | EUR | | | 6,893 | | | (200,378 | ) | | | (156,127 | ) | | | (44,251 | ) |
BASF SE | | | 1.00 | % | | | Quarterly | | | Barclays Bank plc | | | 06/20/22 | | | | EUR | | | 6,893 | | | (285,049 | ) | | | (247,605 | ) | | | (37,444 | ) |
Bayer AG | | | 1.00 | % | | | Quarterly | | | Barclays Bank plc | | | 06/20/22 | | | | EUR | | | 6,893 | | | (253,717 | ) | | | (221,802 | ) | | | (31,915 | ) |
BP plc | | | 1.00 | % | | | Quarterly | | | Barclays Bank plc | | | 06/20/22 | | | | EUR | | | 6,893 | | | (227,497 | ) | | | (156,214 | ) | | | (71,283 | ) |
Compagnie de Saint-Gobain SA | | | 1.00 | % | | | Quarterly | | | Barclays Bank plc | | | 06/20/22 | | | | EUR | | | 6,893 | | | (239,866 | ) | | | (192,494 | ) | | | (47,372 | ) |
Royal Dutch Shell plc | | | 1.00 | % | | | Quarterly | | | Barclays Bank plc | | | 06/20/22 | | | | EUR | | | 3,449 | | | (136,598 | ) | | | (109,308 | ) | | | (27,290 | ) |
Royal Dutch Shell plc | | | 1.00 | % | | | Quarterly | | | Barclays Bank plc | | | 06/20/22 | | | | EUR | | | 6,893 | | | (272,987 | ) | | | (199,803 | ) | | | (73,184 | ) |
Statoil ASA | | | 1.00 | % | | | Quarterly | | | Barclays Bank plc | | | 06/20/22 | | | | EUR | | | 6,893 | | | (324,888 | ) | | | (251,303 | ) | | | (73,585 | ) |
Volkswagen AG | | | 1.00 | % | | | Quarterly | | | Barclays Bank plc | | | 06/20/22 | | | | EUR | | | 6,893 | | | (204,200 | ) | | | (134,448 | ) | | | (69,752 | ) |
| | | | | | | | | | | | | | | | | | | | | | | | | | | | | | | | |
| | | | | | | | | | | | | | | | | | | | | | $ | (2,549,547 | ) | | $ | (2,020,674 | ) | | $ | (528,873 | ) |
| | | | | | | | | | | | | | | | | | | | | | | | | | | | | | | | |
OTC Currency Swaps
| | | | | | | | | | | | | | | | | | | | | | | | | | | | | | | | | | | | | | | | | | | | | | | | |
| Paid by the Fund | | | Received by the Fund | | | Notional Amount (000) | | | Counterparty | | Termination
Date (a) | | | Value | | | Upfront
Premium
Paid
(Received) | | | Unrealized
Appreciation
(Depreciation) | |
| Rate | | Frequency | | | Rate | | | Frequency | | | Delivered | | | Received | | | | | | |
| 0.10 | | JPY | | | Semi-Annual | | | | 1.96% | | | | Semi-Annual | | | | JPY | | | | 3,652,350 | | | | USD | | | | 32,208 | | | Bank of America NA | | | 03/15/18 | | | $ | (40,406 | ) | | $ | — | | | $ | (40,406 | ) |
| 0.10 | | JPY | | | Semi-Annual | | | | 1.84% | | | | Semi-Annual | | | | JPY | | | | 2,434,450 | | | | USD | | | | 21,624 | | | Bank of America NA | | | 03/15/18 | | | | 116,351 | | | | — | | | | 116,351 | |
| 0.10 | | JPY | | | Semi-Annual | | | | 2.01% | | | | Semi-Annual | | | | JPY | | | | 7,006,100 | | | | USD | | | | 67,725 | | | Bank of America NA | | | 10/15/18 | | | | 5,666,874 | | | | — | | | | 5,666,874 | |
| | | | | | | | | | | | | | | | | | | | | | | | | | | | | | | | | | | | | | | | | | | | | | | | |
| | | | | | | | | | | | | | | | | | | | | | | | | | | | | | | | | | | | | | $ | 5,742,819 | | | $ | — | | | | 5,742,819 | |
| | | | | | | | | | | | | | | | | | | | | | | | | | | | | | | | | | | | | | | | | | | | | | | | |
| (a) | At expiration date, the notional amount delivered will be exchanged for the notional amount received. |
| | |
| 18 | | 2017 BLACKROCK ANNUAL REPORTTO SHAREHOLDERS |
| | |
Consolidated Schedule of Investments (continued) December 31, 2017 | | BlackRock Global Allocation V.I. Fund |
OTC Total Return Swaps
| | | | | | | | | | | | | | | | | | | | | | | | | | | | | | | | | | |
| Reference Entity | | Fixed Amount
Paid / (Received)
by the Fund (a) | | | Counterparty | | Termination
Date | | | Notional
Amount
(000) | | | Value | | | Upfront
Premium
Paid
(Received) | | | Unrealized
Appreciation
(Depreciation) | |
Nikkei Dividend Future December 2017 | | | JPY | | | | 600,750,000 | | | BNP Paribas SA | | | 04/02/18 | | | | JPY | | | | 600,750 | | | $ | 583,892 | | | $ | — | | | $ | 583,892 | |
Nikkei Dividend Future December 2017 | | | JPY | | | | 594,918,000 | | | BNP Paribas SA | | | 04/02/18 | | | | JPY | | | | 594,918 | | | | 635,651 | | | | — | | | | 635,651 | |
S&P 500 Index Annual Dividend Future December 2018 | | | USD | | | | 7,094,313 | | | BNP Paribas SA | | | 12/21/18 | | | | USD | | | | 7,094 | | | | 842,212 | | | | — | | | | 842,212 | |
Nikkei Dividend Future December 2018 | | | JPY | | | | 316,800,000 | | | BNP Paribas SA | | | 04/01/19 | | | | JPY | | | | 316,800 | | | | 619,836 | | | | — | | | | 619,836 | |
Nikkei Dividend Future December 2018 | | | JPY | | | | 618,839,000 | | | BNP Paribas SA | | | 04/01/19 | | | | JPY | | | | 618,839 | | | | 1,408,804 | | | | — | | | | 1,408,804 | |
Nikkei Dividend Future December 2018 | | | JPY | | | | 309,375,000 | | | BNP Paribas SA | | | 04/01/19 | | | | JPY | | | | 309,375 | | | | 685,733 | | | | — | | | | 685,733 | |
Euro Stoxx 50 Index Dividend Future December 2019 | | | EUR | | | | 3,589,050 | | | BNP Paribas SA | | | 12/20/19 | | | | EUR | | | | 3,589 | | | | 1,137,278 | | | | — | | | | 1,137,278 | |
Euro Stoxx 50 Index Dividend Future December 2019 | | | EUR | | | | 1,688,400 | | | BNP Paribas SA | | | 12/20/19 | | | | EUR | | | | 1,688 | | | | 550,299 | | | | — | | | | 550,299 | |
Euro Stoxx 50 Index Dividend Future December 2019 | | | EUR | | | | 3,305,250 | | | BNP Paribas SA | | | 12/20/19 | | | | EUR | | | | 3,305 | | | | 1,017,773 | | | | — | | | | 1,017,773 | |
Euro Stoxx 50 Index Dividend Future December 2019 | | | EUR | | | | 2,608,580 | | | BNP Paribas SA | | | 12/20/19 | | | | EUR | | | | 2,609 | | | | 764,952 | | | | — | | | | 764,952 | |
Nikkei Dividend Future December 2019 | | | JPY | | | | 314,640,000 | | | BNP Paribas SA | | | 04/01/20 | | | | JPY | | | | 314,640 | | | | 943,333 | | | | — | | | | 943,333 | |
Nikkei Dividend Future December 2019 | | | JPY | | | | 510,000,000 | | | BNP Paribas SA | | | 04/01/20 | | | | JPY | | | | 510,000 | | | | 1,700,022 | | | | — | | | | 1,700,022 | |
Nikkei Dividend Future December 2019 | | | JPY | | | | 418,800,000 | | | BNP Paribas SA | | | 04/01/20 | | | | JPY | | | | 418,800 | | | | 1,264,167 | | | | — | | | | 1,264,167 | |
Euro Stoxx 50 Index Dividend Future December 2020 | | | EUR | | | | 2,800,780 | | | BNP Paribas SA | | | 12/18/20 | | | | EUR | | | | 2,801 | | | | 619,291 | | | | — | | | | 619,291 | |
Euro Stoxx 50 Index Dividend Future December 2020 | | | EUR | | | | 720,000 | | | BNP Paribas SA | | | 12/18/20 | | | | EUR | | | | 720 | | | | 275,366 | | | | — | | | | 275,366 | |
Euro Stoxx 50 Index Dividend Future December 2020 | | | EUR | | | | 970,000 | | | BNP Paribas SA | | | 12/18/20 | | | | EUR | | | | 970 | | | | 355,156 | | | | — | | | | 355,156 | |
Euro Stoxx 50 Index Dividend Future December 2020 | | | EUR | | | | 1,810,440 | | | BNP Paribas SA | | | 12/18/20 | | | | EUR | | | | 1,810 | | | | 683,483 | | | | — | | | | 683,483 | |
Euro Stoxx 50 Index Dividend Future December 2020 | | | EUR | | | | 836,940 | | | BNP Paribas SA | | | 12/18/20 | | | | EUR | | | | 837 | | | | 317,336 | | | | — | | | | 317,336 | |
Euro Stoxx 50 Index Dividend Future December 2020 | | | EUR | | | | 964,000 | | | BNP Paribas SA | | | 12/18/20 | | | | EUR | | | | 964 | | | | 362,355 | | | | — | | | | 362,355 | |
Euro Stoxx 50 Index Dividend Future December 2020 | | | EUR | | | | 2,919,700 | | | BNP Paribas SA | | | 12/18/20 | | | | EUR | | | | 2,920 | | | | 1,069,018 | | | | — | | | | 1,069,018 | |
S&P 500 Index Annual Dividend Future December 2020 | | | USD | | | | 2,914,481 | | | Goldman Sachs International | | | 12/18/20 | | | | USD | | | | 2,914 | | | | 621,169 | | | | — | | | | 621,169 | |
Nikkei Dividend Future December 2020 | | | JPY | | | | 104,085,000 | | | BNP Paribas SA | | | 04/01/21 | | | | JPY | | | | 104,085 | | | | 234,835 | | | | — | | | | 234,835 | |
Nikkei Dividend Future December 2020 | | | JPY | | | | 89,240,000 | | | BNP Paribas SA | | | 04/01/21 | | | | JPY | | | | 89,240 | | | | 194,941 | | | | — | | | | 194,941 | |
Nikkei Dividend Future December 2020 | | | JPY | | | | 143,310,000 | | | BNP Paribas SA | | | 04/01/21 | | | | JPY | | | | 143,310 | | | | 187,087 | | | | — | | | | 187,087 | |
Nikkei Dividend Future December 2020 | | | JPY | | | | 191,375,000 | | | BNP Paribas SA | | | 04/01/21 | | | | JPY | | | | 191,375 | | | | 447,082 | | | | — | | | | 447,082 | |
Nikkei Dividend Future December 2020 | | | JPY | | | | 384,120,000 | | | BNP Paribas SA | | | 04/01/21 | | | | JPY | | | | 384,120 | | | | 839,095 | | | | — | | | | 839,095 | |
Euro Stoxx 50 Index Dividend Future December 2021 | | | EUR | | | | 1,524,150 | | | BNP Paribas SA | | | 12/17/21 | | | | EUR | | | | 1,524 | | | | 168,459 | | | | — | | | | 168,459 | |
Euro Stoxx 50 Index Dividend Future December 2021 | | | EUR | | | | 1,353,230 | | | BNP Paribas SA | | | 12/17/21 | | | | EUR | | | | 1,353 | | | | 314,361 | | | | — | | | | 314,361 | |
Euro Stoxx 50 Index Dividend Future December 2021 | | | EUR | | | | 1,637,150 | | | BNP Paribas SA | | | 12/17/21 | | | | EUR | | | | 1,637 | | | | 62,464 | | | | — | | | | 62,464 | |
Euro Stoxx 50 Index Dividend Future December 2021 | | | EUR | | | | 833,520 | | | BNP Paribas SA | | | 12/17/21 | | | | EUR | | | | 834 | | | | 20,697 | | | | — | | | | 20,697 | |
Euro Stoxx 50 Index Dividend Future December 2021 | | | EUR | | | | 1,409,760 | | | BNP Paribas SA | | | 12/17/21 | | | | EUR | | | | 1,410 | | | | 261,327 | | | | — | | | | 261,327 | |
S&P 500 Index Annual Dividend Future December 2021 | | | USD | | | | 3,726,213 | | | BNP Paribas SA | | | 12/17/21 | | | | USD | | | | 3,726 | | | | 936,350 | | | | — | | | | 936,350 | |
Nikkei Dividend Future December 2021 | | | JPY | | | | 199,250,000 | | | BNP Paribas SA | | | 04/01/22 | | | | JPY | | | | 199,250 | | | | 411,360 | | | | — | | | | 411,360 | |
Nikkei Dividend Future December 2021 | | | JPY | | | | 198,750,000 | | | BNP Paribas SA | | | 04/01/22 | | | | JPY | | | | 198,750 | | | | 415,798 | | | | — | | | | 415,798 | |
Nikkei Dividend Future December 2021 | | | JPY | | | | 144,840,000 | | | BNP Paribas SA | | | 04/01/22 | | | | JPY | | | | 144,840 | | | | 196,743 | | | | — | | | | 196,743 | |
Nikkei Dividend Future December 2021 | | | JPY | | | | 389,070,000 | | | BNP Paribas SA | | | 04/01/22 | | | | JPY | | | | 389,070 | | | | 862,818 | | | | — | | | | 862,818 | |
Euro Stoxx 50 Index Dividend Future December 2022 | | | EUR | | | | 744,600 | | | BNP Paribas SA | | | 12/16/22 | | | | EUR | | | | 745 | | | | 81,590 | | | | — | | | | 81,590 | |
Euro Stoxx 50 Index Dividend Future December 2022 | | | EUR | | | | 3,130,720 | | | BNP Paribas SA | | | 12/16/22 | | | | EUR | | | | 3,131 | | | | 143,598 | | | | — | | | | 143,598 | |
Euro Stoxx 50 Index Dividend Future December 2022 | | | EUR | | | | 1,495,800 | | | BNP Paribas SA | | | 12/16/22 | | | | EUR | | | | 1,496 | | | | 140,922 | | | | — | | | | 140,922 | |
Euro Stoxx 50 Index Dividend Future December 2022 | | | EUR | | | | 1,481,040 | | | BNP Paribas SA | | | 12/16/22 | | | | EUR | | | | 1,481 | | | | 172,970 | | | | — | | | | 172,970 | |
Nikkei Dividend Future December 2022 | | | JPY | | | | 143,820,000 | | | BNP Paribas SA | | | 04/03/23 | | | | JPY | | | | 143,820 | | | | 227,823 | | | | — | | | | 227,823 | |
Nikkei Dividend Future December 2022 | | | JPY | | | | 145,520,000 | | | JP Morgan Chase Bank NA | | | 04/03/23 | | | | JPY | | | | 145,520 | | | | 212,736 | | | | — | | | | 212,736 | |
Euro Stoxx 50 Index Dividend Future December 2023 | | | EUR | | | | 2,147,040 | | | BNP Paribas SA | | | 12/15/23 | | | | EUR | | | | 2,147 | | | | 29,480 | | | | — | | | | 29,480 | |
| | | | | | | | | | | | | | | | | | | | | | | | | | | | | | | | | | |
| | | | | | | | | | | | | | | | | | | | | | | | $ | 23,019,662 | | | $ | — | | | $ | 23,019,662 | |
| | | | | | | | | | | | | | | | | | | | | | | | | | | | | | | | | | |
| | (a) | At termination, the fixed amount paid (received) will be exchanged for the total return of the reference entity. | |
Balances reported in the Statement of Assets and Liabilities for Centrally Cleared Swaps and OTC Derivatives
| | | | | | | | | | | | | | | | |
| | | Swap Premiums
Paid | | | Swap Premiums
Received | | | Unrealized
Appreciation | | | Unrealized
Depreciation | |
Centrally Cleared Swaps(a) | | $ | — | | | $ | — | | | $ | 3,260,735 | | | $ | (1,136,057 | ) |
OTC Derivatives | | | — | | | | (2,020,674 | ) | | | 28,802,887 | | | | (569,279 | ) |
| | (a) | Includes cumulative appreciation (depreciation) on centrally cleared swaps, as reported in the Consolidated Schedule of Investments. Only current day’s variation margin is reported within the Consolidated Statement of Assets and Liabilities and is net of any previously paid (received) swap premium amounts. | |
| | | | |
| CONSOLIDATED SCHEDULE OF INVESTMENTS | | | 19 | |
| | |
Consolidated Schedule of Investments (continued) December 31, 2017 | | BlackRock Global Allocation V.I. Fund |
Derivative Financial Instruments Categorized by Risk Exposure
As of period end, the fair values of derivative financial instruments located in the Consolidated Statement of Assets and Liabilities were as follows:
| | | | | | | | | | | | | | | | | | | | | | | | | | | | |
| | | Commodity
Contracts | | | Credit
Contracts | | | Equity
Contracts | | | Foreign
Currency
Exchange
Contracts | | | Interest
Rate
Contracts | | | Other
Contracts | | | Total | |
Assets — Derivative Financial Instruments | | | | | | | | | | | | | | | | | | | | | | | | | | | | |
Futures Contracts | | | | | | | | | | | | | | | | | | | | | | | | | | | | |
Net unrealized appreciation(a) | | $ | — | | | $ | — | | | $ | 76,458 | | | $ | — | | | $ | — | | | $ | — | | | $ | 76,458 | |
Forward foreign currency exchange contracts | | | | | | | | | | | | | | | | | | | | | | | | | | | | |
Unrealized appreciation on forward foreign currency exchange contracts | | | — | | | | — | | | | — | | | | 8,694,442 | | | | — | | | | — | | | | 8,694,442 | |
Options purchased | | | | | | | | | | | | | | | | | | | | | | | | | | | | |
Investments at value — unaffiliated(b) | | | — | | | | — | | | | 30,399,371 | | | | 10,425,342 | | | | 2,487,673 | | | | — | | | | 43,312,386 | |
Swaps — centrally cleared | | | | | | | | | | | | | | | | | | | | | | | | | | | | |
Net unrealized appreciation(a) | | | — | | | | — | | | | — | | | | — | | | | 3,260,735 | | | | — | | | | 3,260,735 | |
Swaps — OTC | | | | | | | | | | | | | | | | | | | | | | | | | | | | |
Net unrealized appreciation on OTC swaps; Swap premiums paid | | | — | | | | — | | | | 23,019,662 | | | | — | | | | 5,783,225 | | | | — | | | | 28,802,887 | |
| | | | | | | | | | | | | | | | | | | | | | | | | | | | |
| | $ | — | | | $ | — | | | $ | 53,495,491 | | | $ | 19,119,784 | | | $ | 11,531,633 | | | $ | — | | | $ | 84,146,908 | |
| | | | | | | | | | | | | | | | | | | | | | | | | | | | |
| Liabilities — Derivative Financial Instruments | | | | | | | | | | | | | | | | | | | | | |
Futures Contracts | | | | | | | | | | | | | | | | | | | | | | | | | | | | |
Net unrealized depreciation(a) | | $ | — | | | $ | — | | | $ | 467,469 | | | $ | — | | | $ | — | | | $ | — | | | $ | 467,469 | |
Forward foreign currency exchange contracts | | | | | | | | | | | | | | | | | | | | | | | | | | | | |
Unrealized depreciation on forward foreign currency exchange contracts | | | — | | | | — | | | | — | | | | 1,897,367 | | | | — | | | | — | | | | 1,897,367 | |
Options written | | | | | | | | | | | | | | | | | | | | | | | | | | | | |
Options written, at value | | | — | | | | — | | | | 8,057,140 | | | | 27,461 | | | | 1,911,979 | | | | — | | | | 9,996,580 | |
Swaps — centrally cleared | | | | | | | | | | | | | | | | | | | | | | | | | | | | |
Net unrealized depreciation(a) | | | — | | | | 756,013 | | | | — | | | | — | | | | 380,044 | | | | — | | | | 1,136,057 | |
Swaps — OTC | | | | | | | | | | | | | | | | | | | | | | | | | | | | |
Net unrealized depreciation on OTC swaps; Swap premiums received | | | — | | | | 2,549,547 | | | | — | | | | — | | | | 40,406 | | | | — | | | | 2,589,953 | |
| | | | | | | | | | | | | | | | | | | | | | | | | | | | |
| | $ | — | | | $ | 3,305,560 | | | $ | 8,524,609 | | | $ | 1,924,828 | | | $ | 2,332,429 | | | $ | — | | | $ | 16,087,426 | |
| | | | | | | | | | | | | | | | | | | | | | | | | | | | |
| | (a) | Includes cumulative appreciation (depreciation) on futures contracts and centrally cleared swaps, if any, as reported in the Consolidated Schedule of Investments. Only current day’s variation margin is reported within the Statement of Assets and Liabilities. | |
| | (b) | Includes options purchased at value as reported in the Consolidated Schedule of Investments. | |
For the year ended 31 December, 2017, the effect of derivative financial instruments in the Consolidated Statement of Operations was as follows:
| | | | | | | | | | | | | | | | | | | | | | | | | | | | |
| | | Commodity
Contracts | | | Credit
Contracts | | | Equity
Contracts | | | Foreign
Currency
Exchange
Contracts | | | Interest
Rate
Contracts | | | Other
Contracts | | | Total | |
Net realized Gain (Loss) from: | | | | | | | | | | | | | | | | | | | | | | | | | | | | |
Futures Contracts | | $ | — | | | $ | — | | | $ | (42,141,232 | ) | | $ | — | | | $ | — | | | $ | — | | | $ | (42,141,232 | ) |
Forward foreign currency exchange contracts | | | — | | | | — | | | | — | | | | 30,891,297 | | | | — | | | | — | | | | 30,891,297 | |
Options purchased(a) | | | — | | | | — | | | | 26,002,437 | | | | (7,072,173 | ) | | | (1,774,993 | ) | | | — | | | | 17,155,271 | |
Options written | | | — | | | | — | | | | 6,779,692 | | | | 16,894,630 | | | | (3,570,758 | ) | | | — | | | | 20,103,564 | |
Swaps | | | — | | | | 1,741,429 | | | | 3,943,981 | | | | 688,831 | | | | (6,081,676 | ) | | | — | | | | 292,565 | |
| | | | | | | | | | | | | | | | | | | | | | | | | | | | |
| | $ | — | | | $ | 1,741,429 | | | $ | (5,415,122 | ) | | $ | 41,402,585 | | | $ | (11,427,427 | ) | | $ | — | | | $ | 26,301,465 | |
| | | | | | | | | | | | | | | | | | | | | | | | | | | | |
| Net Change in Unrealized Appreciation (Depreciation) | | | | | | | | | | | | | | | | | | | |
Futures Contracts | | $ | — | | | $ | — | | | $ | 107,675 | | | $ | — | | | $ | — | | | $ | — | | | $ | 107,675 | |
Forward foreign currency exchange contracts | | | — | | | | — | | | | — | | | | (62,539,435 | ) | | | — | | | | — | | | | (62,539,435 | ) |
Options purchased(b) | | | — | | | | — | | | | (51,079,760 | ) | | | (2,972,692 | ) | | | (12,343,564 | ) | | | — | | | | (66,396,016 | ) |
Options written | | | — | | | | — | | | | 3,223,314 | | | | 3,774,150 | | | | 12,822,488 | | | | — | | | | 19,819,952 | |
Swaps | | | — | | | | (3,187,077 | ) | | | 14,719,447 | | | | — | | | | 8,318,460 | | | | — | | | | 19,850,830 | |
| | | | | | | | | | | | | | | | | | | | | | | | | | | | |
| | $ | — | | | $ | (3,187,077 | ) | | $ | (33,029,324 | ) | | $ | (61,737,977 | ) | | $ | 8,797,384 | | | $ | — | | | $ | (89,156,994 | ) |
| | | | | | | | | | | | | | | | | | | | | | | | | | | | |
| | (a) | Options purchased are included in net realized gain (loss) from investments — unaffiliated. | |
| | (b) | Options purchased are included in net change in unrealized appreciation (depreciation) on investments — unaffiliated. | |
| | |
| 20 | | 2017 BLACKROCK ANNUAL REPORTTO SHAREHOLDERS |
| | |
Consolidated Schedule of Investments (continued) December 31, 2017 | | BlackRock Global Allocation V.I. Fund |
Average Quarterly Balances of Outstanding Derivative Financial Instruments
| | | | |
Futures contracts: | | | | |
Average notional value of contracts — long | | $ | 8,740,606 | |
Average notional value of contracts — short | | $ | 131,867,584 | |
Forward foreign currency exchange contracts: | | | | |
Average amounts purchased — in USD | | $ | 307,112,927 | |
Average amounts sold — in USD | | $ | 257,297,493 | |
Options: | | | | |
Average value of option contracts purchased | | $ | 47,788,652 | |
Average value of option contracts written | | $ | 11,166,837 | |
Average notional value of swaption contracts purchased | | $ | 1,128,088,207 | |
Average notional value of swaption contracts written | | $ | 1,394,399,196 | |
Credit default swaps: | | | | |
Average notional value — buy protection | | $ | 46,271,989 | |
Interest rate swaps: | | | | |
Average notional value — pays fixed rate | | $ | 355,446,735 | |
Average notional value — receives fixed rate | | $ | 322,428,750 | |
Currency swaps: | | | | |
Average notional value — pays | | $ | 60,778,500 | |
Average notional value — receives | | $ | 119,281,405 | |
Total return swaps: | | | | |
Average notional value | | $ | 114,336,691 | |
Derivative Financial Instruments — Offsetting as of Period End
The Fund’s derivative assets and liabilities (by type) were as follows
| | | | | | | | |
| | | Assets | | | Liabilities | |
Derivative Financial Instruments: | | | | | | | | |
Futures contracts | | $ | 402,371 | | | $ | — | |
Forward foreign currency exchange contracts | | | 8,694,442 | | | | 1,897,367 | |
Options(a) | | | 43,189,717 | | | | 10,533,398 | |
Swaps — Centrally cleared | | | 904,629 | | | | — | |
Swaps — OTC(b) | | | 28,802,887 | | | | 2,589,953 | |
| | | | | | | | |
Total derivative assets and liabilities in the Consolidated Statement of Assets and Liabilities | | $ | 81,994,046 | | | $ | 15,020,718 | |
Derivatives not subject to a Master Netting Agreement or similar agreement (“MNA”) | | | (1,307,000 | ) | | | — | |
| | | | | | | | |
Total derivative assets and liabilities subject to an MNA | | $ | 80,687,046 | | | $ | 15,020,718 | |
| | | | | | | | |
| | (a) | Includes options purchased at value which is included in Investments at value — unaffiliated in the Consolidated Statements of Assets and Liabilities and reported in the Consolidated Schedule of Investments. | |
| | (b) | Includes unrealized appreciation (depreciation) on OTC swaps and swap premiums (paid/received) in the Consolidated Statement of Assets and Liabilities. | |
The following tables present the Fund’s derivative assets and liabilities by counterparty net of amounts available for offset under an MNA and net of the related collateral received and pledged by the Fund:
| | | | | | | | | | | | | | | | | | | | |
| Counterparty | | Derivative
Assets
Subject to
MNA by
Counterparty | | | Derivatives
Available
for Offset (a) | | | Non-cash
Collateral
Received | | | Cash
Collateral
Received (b) | | | Net Amount
of Derivative
Assets (c) | |
Bank of America NA | | $ | 6,822,004 | | | $ | (1,182,990 | ) | | $ | — | | | $ | (5,639,014 | ) | | $ | — | |
Barclays Bank plc | | | 4,552,781 | | | | (3,579,013 | ) | | | — | | | | — | | | | 973,768 | |
BNP Paribas SA | | | 23,538,527 | | | | (144,539 | ) | | | — | | | | (23,380,000 | ) | | | 13,988 | |
Citibank NA | | | 1,860,614 | | | | (129,474 | ) | | | — | | | | (1,731,140 | ) | | | — | |
Deutsche Bank AG | | | 1,902,921 | | | | (1,705,331 | ) | | | — | | | | (197,590 | ) | | | — | |
Goldman Sachs International | | | 4,809,777 | | | | (2,448,797 | ) | | | — | | | | (2,360,980 | ) | | | — | |
JP Morgan Chase Bank NA | | | 3,346,811 | | | | — | | | | — | | | | — | | | | 3,346,811 | |
Morgan Stanley & Co. International plc(e) | | | 4,003,732 | | | | (840,570 | ) | | | — | | | | (3,163,162 | ) | | | — | |
Societe Generale SA | | | 903,629 | | | | — | | | | — | | | | (903,629 | ) | | | — | |
UBS AG | | | 28,946,249 | | | | (4,990,004 | ) | | $ | (15,857,675 | ) | | | (4,050,000 | ) | | | 4,048,570 | |
| | | | | | | | | | | | | | | | | | | | |
| | $ | 80,687,045 | | | $ | (15,020,718 | ) | | $ | (15,857,675 | ) | | $ | (41,425,515 | ) | | $ | 8,383,137 | |
| | | | | | | | | | | | | | | | | | | | |
| | | | |
| CONSOLIDATED SCHEDULE OF INVESTMENTS | | | 21 | |
| | |
Consolidated Schedule of Investments (continued) December 31, 2017 | | BlackRock Global Allocation V.I. Fund |
| | | | | | | | | | | | | | | | | | | | |
| | | | | | |
| Counterparty | | Derivative
Liabilities
Subject to
MNA by
Counterparty | | | Derivatives
Available
for Offset (a) | | | Non-cash
Collateral
Pledged | | | Cash
Collateral
Pledged | | | Net Amount
of Derivative
Liabilities (d) | |
Bank of America NA | | $ | 1,182,990 | | | $ | (1,182,990 | ) | | $ | — | | | $ | — | | | $ | — | |
Barclays Bank plc | | | 3,579,013 | | | | (3,579,013 | ) | | | — | | | | — | | | | — | |
BNP Paribas SA | | | 144,539 | | | | (144,539 | ) | | | — | | | | — | | | | — | |
Citibank NA | | | 129,474 | | | | (129,474 | ) | | | — | | | | — | | | | — | |
Deutsche Bank AG | | | 1,705,331 | | | | (1,705,331 | ) | | | — | | | | — | | | | — | |
Goldman Sachs International | | | 2,448,797 | | | | (2,448,797 | ) | | | — | | | | — | | | | — | |
Morgan Stanley & Co. International plc(e) | | | 840,570 | | | | (840,570 | ) | | | — | | | | — | | | | — | |
UBS AG | | | 4,990,004 | | | | (4,990,004 | ) | | | — | | | | — | | | | — | |
| | | | | | | | | | | | | | | | | | | | |
| | $ | 15,020,718 | | | $ | (15,020,718 | ) | | $ | — | | | $ | — | | | $ | — | |
| | | | | | | | | | | | | | | | | | | | |
| | (a) | The amount of derivatives available for offset is limited to the amount of assets and/or liabilities that are subject to an MNA. | |
| | (b) | Excess of collateral received from the individual counterparty is not shown for financial reporting purposes. | |
| | (c) | Net amount represents the net amount receivable from the counterparty in the event of default. | |
| | (d) | Net amount represents the net amount payable from the counterparty in the event of default. | |
| | (e) | Includes derivatives owned by the BlackRock Cayman Global Allocation V.I. Fund I, Ltd., a wholly owned subsidiary of the Fund. See Note 1. | |
Fair Value Hierarchy as of Period End
Various inputs are used in determining the fair value of investments and derivative financial instruments. For information about the Fund’s policy regarding valuation of investments and derivative financial instruments, refer to the Notes to Consolidated Financial Statements.
The following table summarizes the Fund’s investments and derivative instruments categorized in the disclosure hierarchy.
| | | | | | | | | | | | | | | | |
| | | Level 1 | | | Level 2 | | | Level 3 | | | Total | |
Assets: | | | | | | | | | | | | | | | | |
Investments: | | | | | | | | | | | | | | | | |
Long-Term Investments: | | | | | | | | | | | | | | | | |
Common Stocks: | | | | | | | | | | | | | | | | |
Australia | | $ | — | | | $ | 973,117 | | | $ | — | | | $ | 973,117 | |
Belgium | | | — | | | | 43,470,280 | | | | — | | | | 43,470,280 | |
Brazil | | | 21,602,368 | | | | — | | | | — | | | | 21,602,368 | |
Canada | | | 48,354,738 | | | | — | | | | — | | | | 48,354,738 | |
China | | | 19,595,565 | | | | 14,209,265 | | | | — | | | | 33,804,830 | |
Czech Republic | | | 4,441,567 | | | | — | | | | — | | | | 4,441,567 | |
Denmark | | | — | | | | 393,456 | | | | — | | | | 393,456 | |
Finland | | | — | | | | 25,822,620 | | | | — | | | | 25,822,620 | |
France | | | 956,675 | | | | 289,299,813 | | | | — | | | | 290,256,488 | |
Germany | | | — | | | | 202,463,592 | | | | — | | | | 202,463,592 | |
Hong Kong | | | 10,271,399 | | | | 71,152,137 | | | | — | | | | 81,423,536 | |
India | | | 1,602,466 | | | | 155,087,268 | | | | — | | | | 156,689,734 | |
Indonesia | | | 11,016,061 | | | | — | | | | — | | | | 11,016,061 | |
Ireland | | | 3,150,219 | | | | 16,201 | | | | — | | | | 3,166,420 | |
Israel | | | 285,680 | | | | — | | | | — | | | | 285,680 | |
Italy | | | 53,635,793 | | | | 55,344,694 | | | | — | | | | 108,980,487 | |
Japan | | | 317,914 | | | | 897,726,798 | | | | — | | | | 898,044,712 | |
Mexico | | | 338,306 | | | | — | | | | — | | | | 338,306 | |
Netherlands | | | 42,043,644 | | | | 180,399,444 | | | | — | | | | 222,443,088 | |
Norway | | | — | | | | 153,777 | | | | — | | | | 153,777 | |
Peru | | | 33,396 | | | | — | | | | — | | | | 33,396 | |
Poland | | | 56,071 | | | | 190,081 | | | | — | | | | 246,152 | |
Portugal | | | 10,624,858 | | | | — | | | | — | | | | 10,624,858 | |
Singapore | | | — | | | | 27,853,845 | | | | — | | | | 27,853,845 | |
South Africa | | | 131,652 | | | | 159,945 | | | | — | | | | 291,597 | |
South Korea | | | 42,212,300 | | | | 26,261,002 | | | | — | | | | 68,473,302 | |
Spain | | | — | | | | 42,190,112 | | | | — | | | | 42,190,112 | |
Sweden | | | — | | | | 19,510,991 | | | | — | | | | 19,510,991 | |
Switzerland | | | — | | | | 133,012,141 | | | | — | | | | 133,012,141 | |
Taiwan | | | 18,624,022 | | | | 48,101,302 | | | | — | | | | 66,725,324 | |
Thailand | | | 7,689,365 | | | | 12,654,902 | | | | — | | | | 20,344,267 | |
Turkey | | | — | | | | 231,757 | | | | — | | | | 231,757 | |
United Arab Emirates | | | 39,994,489 | | | | — | | | | — | | | | 39,994,489 | |
United Kingdom | | | 87,822,899 | | | | 202,597,718 | | | | — | | | | 290,420,617 | |
United States | | | 3,075,094,161 | | | | — | | | | 472,461 | | | | 3,075,566,622 | |
| | |
| 22 | | 2017 BLACKROCK ANNUAL REPORTTO SHAREHOLDERS |
| | |
Consolidated Schedule of Investments (continued) December 31, 2017 | | BlackRock Global Allocation V.I. Fund |
| | | | | | | | | | | | | | | | |
| | | Level 1 | | | Level 2 | | | Level 3 | | | Total | |
Corporate Bonds: | | | | | | | | | | | | | | | | |
Australia | | $ | — | | | $ | 20,088,600 | | | $ | 2,075,584 | | | $ | 22,164,184 | |
Brazil | | | — | | | | 1,558,485 | | | | — | | | | 1,558,485 | |
Chile | | | — | | | | 195,219 | | | | — | | | | 195,219 | |
China | | | — | | | | — | | | | 24,000 | | | | 24,000 | |
France | | | — | | | | 8,231,719 | | | | — | | | | 8,231,719 | |
Germany | | | — | | | | 21,574,455 | | | | — | | | | 21,574,455 | |
India | | | — | | | | — | | | | 1 | | | | 1 | |
Italy | | | — | | | | 7,706,282 | | | | — | | | | 7,706,282 | |
Luxembourg | | | — | | | | 8,453,470 | | | | — | | | | 8,453,470 | |
Mexico | | | — | | | | 3,483,022 | | | | — | | | | 3,483,022 | |
Netherlands | | | — | | | | 2,331,251 | | | | — | | | | 2,331,251 | |
Singapore | | | — | | | | 6,591,368 | | | | — | | | | 6,591,368 | |
Switzerland | | | — | | | | 5,555,808 | | | | — | | | | 5,555,808 | |
Turkey | | | — | | | | — | | | | 5,604,660 | | | | 5,604,660 | |
United Arab Emirates | | | — | | | | 14,695,917 | | | | — | | | | 14,695,917 | |
United States | | | — | | | | 217,358,170 | | | | 699,353 | | | | 218,057,523 | |
Floating Rate Loan Interests | | | — | | | | 43,317,402 | | | | — | | | | 43,317,402 | |
Foreign Agency Obligations | | | — | | | | 57,052,987 | | | | — | | | | 57,052,987 | |
Foreign Government Obligations | | | — | | | | 1,016,273,349 | | | | — | | | | 1,016,273,349 | |
Investment Companies | | | 406,362,847 | | | | — | | | | — | | | | 406,362,847 | |
Non-Agency Mortgage-Backed Securities | | | — | | | | 8,970,802 | | | | — | | | | 8,970,802 | |
Preferred Securities | | | 88,259,429 | | | | 126,702,454 | | | | 101,952,816 | | | | 316,914,699 | |
U.S. Treasury Obligations | | | — | | | | 1,624,920,703 | | | | — | | | | 1,624,920,703 | |
Warrants | | | — | | | | — | | | | 29 | | | | 29 | |
Short-Term Securities: | | | | | | | | | | | | | | | | |
Money Market Funds | | | 10,574,106 | | | | — | | | | — | | | | 10,574,106 | |
Time Deposits | | | — | | | | 143,044 | | | | — | | | | 143,044 | |
U.S. Treasury Obligations | | | — | | | | 989,423,596 | | | | — | | | | 989,423,596 | |
Options Purchased: | | | | | | | | | | | | | | | | |
Equity contracts | | | — | | | | 30,399,371 | | | | — | | | | 30,399,371 | |
Foreign currency exchange contracts | | | — | | | | 10,425,342 | | | | — | | | | 10,425,342 | |
Interest rate contracts | | | — | | | | 2,365,004 | | | | — | | | | 2,365,004 | |
| | | | | | | | | | | | | | | | |
Subtotal | | $ | 4,005,091,990 | | | $ | 6,677,094,078 | | | $ | 110,828,904 | | | $ | 10,793,014,972 | |
| | | | | | | | | | | | | | | | |
Investments valued at NAV(a) | | | | | | | | | | | | | | $ | 235,814,858 | |
| | | | | | | | | | | | | | | | |
Total Investments | | | | | | | | | | | | | | $ | 11,028,829,830 | |
| | | | | | | | | | | | | | | | |
Derivative Financial Instruments(b) | | | | | | | | | | | | | | | | |
Assets: | | | | | | | | | | | | | | | | |
Equity contracts | | $ | 76,458 | | | $ | 23,019,662 | | | $ | — | | | $ | 23,096,120 | |
Foreign currency exchange contracts | | | — | | | | 8,694,442 | | | | — | | | | 8,694,442 | |
Interest rate contracts | | | — | | | | 9,043,960 | | | | — | | | | 9,043,960 | |
| | | | |
Liabilities: | | | | | | | | | | | | | | | | |
Credit contracts | | | — | | | | (1,284,886 | ) | | | — | | | | (1,284,886 | ) |
Equity contracts | | | (467,469 | ) | | | (8,057,140 | ) | | | — | | | | (8,524,609 | ) |
Foreign currency exchange contracts | | | — | | | | (1,924,828 | ) | | | — | | | | (1,924,828 | ) |
Interest rate contracts | | | — | | | | (2,332,429 | ) | | | — | | | | (2,332,429 | ) |
| | | | | | | | | | | | | | | | |
| | $ | (391,011 | ) | | $ | 27,158,781 | | | $ | — | | | $ | 26,767,770 | |
| | | | | | | | | | | | | | | | |
| | (a) | As of December 31, 2017, certain investments of the Fund were fair valued using NAV per share as no quoted market value is available and therefore have been excluded from the fair value hierarchy. | |
| | (b) | Derivative financial instruments are swaps, futures contracts, forward foreign currency exchange contracts, and options written. Swaps, futures contracts, and forward foreign currency exchange contracts are valued at the unrealized appreciation (depreciation) on the instrument and options written are shown at value. | |
During the year ended December 31, 2017, there were no transfers between Levels 1 and Level 2.
A reconciliation of Level 3 investments is presented when the Fund had a significant amount of Level 3 investments at the beginning and/or end of the year in relation to net assets. The following table is a reconciliation of Level 3 investments for which significant unobservable inputs were used in determining fair value:
| | | | |
| CONSOLIDATED SCHEDULE OF INVESTMENTS | | | 23 | |
| | |
Consolidated Schedule of Investments (continued) December 31, 2017 | | BlackRock Global Allocation V.I. Fund |
The Fund’s investments that are categorized as Level 3 were valued utilizing third party pricing information without adjustment. Such valuations are based on unobservable inputs. A significant change in third party information could result in a significantly lower or higher value of such Level 3 investments.
| | | | | | | | | | | | | | | | | | | | | | | | | | | | |
| | | Common
Stocks | | | Corporate
Bonds | | | Floating Rate Loan Interests | | | Preferred Securities | | | Rights | | | Warrants | | | Total | |
Investments: | | | | | | | | | | | | | | | | | | | | | | | | | | | | |
Assets: | | | | | | | | | | | | | | | | | | | | | | | | | | | | |
Opening Balance, as of December 31, 2016 | | $ | 1,126,894 | | | $ | 24,183,817 | | | $ | 16,176,802 | | | $ | 119,783,830 | | | $ | 3 | | | $ | — | | | $ | 161,271,346 | |
Transfers into Level 3 | | | — | | | | 25 | | | | — | | | | — | | | | — | | | | — | | | | 25 | |
Transfers out of Level 3 | | | — | | | | — | | | | (3,485,372 | ) | | | — | | | | — | | | | — | | | | (3,485,372 | ) |
Other1 | | | — | | | | (29 | ) | | | — | | | | — | | | | — | | | | 29 | | | | — | |
Accrued discounts/premiums | | | — | | | | (65 | ) | | | 1,367 | | | | — | | | | — | | | | — | | | | 1,302 | |
Net realized gain (loss) | | | (5,538,430 | ) | | | (8,953,056 | ) | | | 60,673 | | | | — | | | | — | | | | — | | | | (14,430,813 | ) |
Net change in unrealized appreciation (depreciation)1,2 | | | 7,640,913 | | | | 2,391,520 | | | | 29,690 | | | | (23,603,480 | ) | | | — | | | | — | | | | (13,541,357 | ) |
Purchases | | | — | | | | 50,600,834 | | | | — | | | | 5,772,466 | | | | — | | | | — | | | | 56,373,300 | |
Sales | | | (2,756,916 | ) | | | (59,819,448 | ) | | | (12,783,160 | ) | | | — | | | | (3 | ) | | | — | | | | (75,359,527 | ) |
| | | | | | | | | | | | | | | | | | | | | | | | | | | | |
Closing Balance, as of December 31, 2017 | | $ | 472,461 | | | $ | 8,403,598 | | | $ | — | | | $ | 101,952,816 | | | $ | — | | | $ | 29 | | | $ | 110,828,904 | |
| | | | | | | | | | | | | | | | | | | | | | | | | | | | |
Net change in unrealized appreciation (depreciation) on investments still held at December 31, 20172 | | $ | 17,616 | | | $ | (3,240,605 | ) | | $ | — | | | $ | (23,603,481 | ) | | $ | — | | | $ | 5 | | | $ | (26,826,465 | ) |
| | | | | | | | | | | | | | | | | | | | | | | | | | | | |
| | (1) | Included in the related net change in unrealized appreciation (depreciation) in the Consolidated Statement of Operations. | |
| | (2) | Any difference between net change in unrealized appreciation (depreciation) and net change in unrealized appreciation (depreciation) on investments still held at December 31, 2017 is generally due to investments no longer held or categorized as Level 3 at period end. | |
The following table summarizes the valuation approaches used and unobservable inputs utilized by the BlackRock Global Valuation Methodologies Committee (“Global Valuation Committee”) to determine the value of certain of the Fund’s Level 3 investments as of period end. The table does not include Level 3 investments with values based upon unadjusted third party pricing information in the amount of $24,030. A significant change in such third party pricing information could result in significantly lower or higher value of such Level 3 investments.
| | | | | | | | | | | | | | | | | | | | |
| | | Value | | | Valuation
Approach | | | Unobservable Inputs | | | Range of
Unobservable
Inputs Utilized | | | Weighted
Average of
Unobservable
Inputs | |
Common Stocksc | | $ | 472,461 | | | | Market | | | | Revenue Multiplea | | | | 5.75x | | | | — | |
| | | | | | | | | | | Time to Exita | | | | 1 year | | | | — | |
| | | | | | | | | | | Volatilitya | | | | 24% | | | | — | |
| | | | | | | | | | | Estimated Recovery Valuea | | | | — | | | | — | |
Corporate Bonds | | | 8,379,597 | | | | Income | | | | Discount Rateb | | | | 19%-24% | | | | 20.35 | % |
| | | | | | | Market | | | | Estimated Recovery Valuea | | | | — | | | | — | |
Preferred Stocksc | | | 101,952,816 | | | | Market | | | | Discount Rateb | | | | 20% | | | | — | |
| | | | | | | | | | | | | | | | | | | | |
| | | | | | | | | | | Revenue Multiplea | | |
| 5.75x-
12.25x |
| | | 9.11x | |
| | | | | | | | | | | Time to Exita,b | | | | 1-2 years | | | | — | |
| | | | | | | | | | | Volatilitya,b | | | | 24%-43% | | | | 29.71 | % |
| | | | | | | | | | | Recent Transactionsa | | | | — | | | | — | |
| | $ | 110,804,874 | | | | | | | | | | | | | | | | | |
| | | | | | | | | | | | | | | | | | | | |
| | (a) | Increase in unobservable input may result in a significant increase to value, while a decrease in unobservable input may result in a significant decrease to value. | |
| | (b) | Decrease in unobservable input may result in a significant increase to value, while an increase in unobservable input may result in a significant decrease to value. | |
| | (c) | For the year ended December 31, 2017, the valuation technique changed for certain investments in common stocks and preferred stocks with a total value of $8,949,789 from a hybrid model using Probability-Weighted Expected Return Model (“PWERM”) and Option Pricing Model (“OPM”) to using only OPM. The change was due to consideration of liquidation preferences and exit strategy. | |
See notes to consolidated financial statements.
| | |
| 24 | | 2017 BLACKROCK ANNUAL REPORTTO SHAREHOLDERS |
Consolidated Statement of Assets and Liabilities
December 31, 2017
| | | | |
| | | BlackRock Global
Allocation V.I. Fund | |
| |
ASSETS | | | | |
Investments at value — unaffiliated (including securities loaned at value of $224,291,034) (cost — $9,744,056,799) | | $ | 10,756,317,092 | |
Investments at value — affiliated (cost — $275,407,106) | | | 272,635,407 | |
Cash | | | 3,427,024 | |
Cash pledged: | | | | |
Futures contracts | | | 2,285,000 | |
Centrally cleared swaps | | | 4,926,000 | |
Foreign currency at value (cost — $3,470,317) | | | 3,470,345 | |
Receivables: | | | | |
Investments sold | | | 8,017,662 | |
Securities lending income — affiliated | | | 93,638 | |
Capital shares sold | | | 1,280,029 | |
Tax reclaims | | | 1,847,703 | |
Dividends — affiliated | | | 7,074 | |
Dividends — unaffiliated | | | 5,055,277 | |
Interest — unaffiliated | | | 21,168,847 | |
Variation margin on futures contracts | | | 402,371 | |
Variation margin on centrally cleared swaps | | | 904,629 | |
Unrealized appreciation on: | | | | |
Forward foreign currency exchange contracts | | | 8,694,442 | |
OTC swaps | | | 28,802,887 | |
Prepaid expenses | | | 49,256 | |
| | | | |
Total assets | | | 11,119,384,683 | |
| | | | |
| |
LIABILITIES | | | | |
Cash received: | | | | |
Collateral — OTC derivatives | | | 43,255,796 | |
Cash collateral on securities loaned at value | | | 235,809,728 | |
Options written at value (premium received $21,822,116) | | | 9,996,580 | |
Payables: | | | | |
Investments purchased | | | 10,244,223 | |
Capital shares redeemed | | | 5,218,351 | |
Deferred foreign capital gain tax | | | 1,123,280 | |
Distribution fees | | | 1,790,069 | |
Transfer agent fees | | | 2,124,038 | |
Investment advisory fees | | | 5,566,339 | |
Officer’s and Directors’ fees | | | 37,783 | |
Other affiliates | | | 60,477 | |
Other accrued expenses | | | 1,457,511 | |
Swap premiums received | | | 2,020,674 | |
Unrealized depreciation on: | | | | |
Forward foreign currency exchange contracts | | | 1,897,367 | |
OTC swaps | | | 569,279 | |
| | | | |
Total liabilities | | | 321,171,495 | |
| | | | |
| |
NET ASSETS | | $ | 10,798,213,188 | |
| | | | |
| |
NET ASSETS CONSIST OF | | | | |
Paid-in capital | | $ | 9,759,088,792 | |
Distributions in excess of net investment income | | | (47,766,850 | ) |
Accumulated net realized gain | | | 29,857,028 | |
Net unrealized appreciation (depreciation) | | | 1,057,034,218 | |
| | | | |
NET ASSETS | | $ | 10,798,213,188 | |
| | | | |
| |
NET ASSET VALUE | | | | |
Class I — Based on net assets of $2,306,033,946 and 133,569,869 shares outstanding, 400 million shares authorized, $0.10 par value. | | $ | 17.26 | |
| | | | |
Class II — Based on net assets of $258,564,202 and 15,026,467 shares outstanding, 200 million shares authorized, $0.10 par value. | | $ | 17.21 | |
| | | | |
Class III — Based on net assets of $8,233,615,040 and 554,721,124 shares outstanding, 1.5 billion shares authorized, $0.10 par value. | | $ | 14.84 | |
| | | | |
See notes to consolidated financial statements.
| | | | |
| CONSOLIDATED FINANCIAL STATEMENTS | | | 25 | |
Consolidated Statements of Operations
Year Ended December 31, 2017
| | | | |
| | | BlackRock Global
Allocation V.I. Fund | |
| |
INVESTMENT INCOME | | | | |
Dividends — affiliated | | $ | 145,424 | |
Dividends — unaffiliated | | | 133,429,157 | |
Interest — unaffiliated | | | 98,860,427 | |
Securities lending income — affiliated — net | | | 2,573,563 | |
Foreign taxes withheld | | | (7,426,746 | ) |
| | | | |
Total investment income | | | 227,581,825 | |
| | | | |
| |
EXPENSES | | | | |
Investment advisory | | | 66,867,241 | |
Distribution — class specific | | | 20,927,743 | |
Transfer agent — class specific | | | 18,350,616 | |
Custodian | | | 1,439,871 | |
Accounting services | | | 691,746 | |
Professional | | | 550,479 | |
Printing | | | 287,873 | |
Directors and Officer | | | 161,827 | |
Transfer agent | | | 5,687 | |
Registration | | | 386 | |
Miscellaneous | | | 295,541 | |
| | | | |
Total expenses excluding dividend expense | | | 109,579,010 | |
| | | | |
Dividends expense — unaffiliated | | | 2,230,034 | |
| | | | |
Total expenses | | | 111,809,044 | |
Less: | | | | |
Fees waived and/or reimbursed by the Manager | | | (279,705 | ) |
Transfer agent fees reimbursed — class specific | | | (10,930,117 | ) |
| | | | |
Total expenses after fees waived and/or reimbursed | | | 100,599,222 | |
| | | | |
Net investment income | | | 126,982,603 | |
| | | | |
| |
REALIZED AND UNREALIZED GAIN (LOSS) | | | | |
Net realized gain (loss) from: | | | | |
Investments — affiliated | | | 337,166 | |
Investments — unaffiliated | | | 414,616,611 | |
Forward foreign currency exchange contracts | | | 30,891,297 | |
Foreign currency transactions | | | 5,788,473 | |
Futures contracts | | | (42,141,232 | ) |
Options written | | | 20,103,564 | |
Short sales — unaffiliated | | | (15,814,184 | ) |
Swaps . . . . . | | | 292,565 | |
| | | | |
| | | 414,074,260 | |
| | | | |
Net change in unrealized appreciation (depreciation) on: | | | | |
Investments — affiliated | | | 2,646,791 | |
Investments — unaffiliated (net of $(734,576) foreign capital gain tax) | | | 850,215,516 | |
Forward foreign currency exchange contracts | | | (62,539,435 | ) |
Foreign currency translations | | | (1,496,782 | ) |
Futures contracts | | | 107,675 | |
Options written | | | 19,819,952 | |
Short sales — unaffiliated | | | 3,050,449 | |
Swaps . . . . . | | | 19,850,830 | |
| | | | |
| | | 831,654,996 | |
| | | | |
Net realized and unrealized gain | | | 1,245,729,256 | |
| | | | |
NET INCREASE IN NET ASSETS RESULTING FROM OPERATIONS | | $ | 1,372,711,859 | |
| | | | |
See notes to consolidated financial statements.
| | |
| 26 | | 2017 BLACKROCK ANNUAL REPORTTO SHAREHOLDERS |
Consolidated Statements of Changes in Net Assets
| | | | | | | | |
| | | BlackRock Global Allocation V.I. Fund | |
| | | Year Ended December 31, | |
| | 2017 | | | 2016 | |
| | |
INCREASE (DECREASE) IN NET ASSETS | | | | | | | | |
| | |
OPERATIONS | | | | | | | | |
Net investment income | | $ | 126,982,603 | | | $ | 136,433,324 | |
Net realized gain (loss) | | | 414,074,260 | | | | (175,975,483 | ) |
Net change in unrealized appreciation (depreciation) | | | 831,654,996 | | | | 445,816,308 | |
| | | | | | | | |
Net increase in net assets resulting from operations | | | 1,372,711,859 | | | | 406,274,149 | |
| | | | | | | | |
| | |
DISTRIBUTIONS TO SHAREHOLDERS(a) | | | | | | | | |
From net investment income: | | | | | | | | |
Class I | | | (29,375,286 | ) | | | (26,933,124 | ) |
Class II | | | (2,933,651 | ) | | | (2,573,765 | ) |
Class III | | | (102,989,429 | ) | | | (99,994,504 | ) |
From net realized gain: | | | | | | | | |
Class I | | | (22,847,673 | ) | | | — | |
Class II | | | (2,565,922 | ) | | | — | |
Class III | | | (94,602,394 | ) | | | — | |
| | | | | | | | |
Decrease in net assets resulting from distributions to shareholders | | | (255,314,355 | ) | | | (129,501,393 | ) |
| | | | | | | | |
| | |
CAPITAL SHARE TRANSACTIONS | | | | | | | | |
Net decrease in net assets derived from capital share transactions | | | (795,038,529 | ) | | | (921,542,124 | ) |
| | | | | | | | |
| | |
NET ASSETS | | | | | | | | |
Total increase (decrease) in net assets | | | 322,358,975 | | | | (644,769,368 | ) |
Beginning of year | | | 10,475,854,213 | | | | 11,120,623,581 | |
| | | | | | | | |
End of year | | $ | 10,798,213,188 | | | $ | 10,475,854,213 | |
| | | | | | | | |
Distributions in excess of net investment income, end of year | | $ | (47,766,850 | ) | | $ | (54,431,232 | ) |
| | | | | | | | |
| (a) | Distributions for annual periods determined in accordance with U.S. federal income tax regulations. |
See notes to consolidated financial statements.
| | | | |
| CONSOLIDATED FINANCIAL STATEMENTS | | | 27 | |
Consolidated Financial Highlights
(For a share outstanding throughout each period)
| | | | | | | | | | | | | | | | | | | | |
| | | BlackRock Global Allocation V.I. Fund | |
| | | Class I | |
| | | Year Ended December 31, | |
| | | 2017 | | | 2016 | | | 2015 | | | 2014 | | | 2013 | |
Net asset value, beginning of year | | $ | 15.51 | | | $ | 15.09 | | | $ | 16.26 | | | $ | 17.61 | | | $ | 16.10 | |
| | | | | | | | | | | | | | | | | | | | |
Net investment income(a) | | | 0.22 | | | | 0.22 | | | | 0.22 | | | | 0.29 | | | | 0.22 | |
Net realized and unrealized gain (loss) | | | 1.92 | | | | 0.40 | | | | (0.35 | ) | | | 0.12 | | | | 2.14 | |
| | | | | | | | | | | | | | | | | | | | |
Net increase (decrease) from investment operations | | | 2.14 | | | | 0.62 | | | | (0.13 | ) | | | 0.41 | | | | 2.36 | |
| | | | | | | | | | | | | | | | | | | | |
| Distributions:(b) | | | | | | | | | | | | | | | |
From net investment income | | | (0.22 | ) | | | (0.20 | ) | | | (0.19 | ) | | | (0.39 | ) | | | (0.20 | ) |
From net realized gain | | | (0.17 | ) | | | — | | | | (0.84 | ) | | | (1.37 | ) | | | (0.65 | ) |
From return of capital | | | — | | | | — | | | | (0.01 | ) | | | — | | | | — | |
| | | | | | | | | | | | | | | | | | | | |
Total distributions | | | (0.39 | ) | | | (0.20 | ) | | | (1.04 | ) | | | (1.76 | ) | | | (0.85 | ) |
| | | | | | | | | | | | | | | | | | | | |
Net asset value, end of year | | $ | 17.26 | | | $ | 15.51 | | | $ | 15.09 | | | $ | 16.26 | | | $ | 17.61 | |
| | | | | | | | | | | | | | | | | | | | |
| | | | | |
Total Return:(c) | | | | | | | | | | | | | | | | | | | | |
Based on net asset value | | | 13.86 | % | | | 4.11 | % | | | (0.89 | )% | | | 2.30 | % | | | 14.76 | % |
| | | | | | | | | | | | | | | | | | | | |
| | | | | |
Ratios to Average Net Assets: | | | | | | | | | | | | | | | | | | | | |
Total expenses | | | 0.72 | %(d) | | | 0.74 | % | | | 0.75 | % | | | 0.74 | % | | | 0.72 | % |
| | | | | | | | | | | | | | | | | | | | |
Total expenses after fees waived and/or reimbursed | | | 0.72 | %(d) | | | 0.74 | % | | | 0.73 | % | | | 0.72 | % | | | 0.72 | % |
| | | | | | | | | | | | | | | | | | | | |
Total expenses after fees waived and/or reimbursed and excluding dividend expense, interest expense and broker fees and expenses on short sales | | | 0.70 | %(d) | | | 0.73 | % | | | 0.73 | % | | | 0.72 | % | | | 0.72 | % |
| | | | | | | | | | | | | | | | | | | | |
Net investment income | | | 1.32 | %(d) | | | 1.47 | % | | | 1.32 | % | | | 1.64 | % | | | 1.26 | % |
| | | | | | | | | | | | | | | | | | | | |
| | | | | |
Supplemental Data: | | | | | | | | | | | | | | | | | | | | |
Net assets, end of year (000) | | $ | 2,306,034 | | | $ | 2,107,145 | | | $ | 1,994,371 | | | $ | 1,708,903 | | | $ | 2,426,154 | |
| | | | | | | | | | | | | | | | | | | | |
Portfolio turnover rate | | | 118 | % | | | 135 | % | | | 90 | %(e) | | | 72 | % | | | 53 | % |
| | | | | | | | | | | | | | | | | | | | |
| (a) | Based on average shares outstanding. |
| (b) | Distributions for annual periods determined in accordance with U.S. federal income tax regulations. |
| (c) | Where applicable, excludes insurance-related fees and expenses and assumes the reinvestment of distributions. |
| (d) | Excludes expenses incurred indirectly as a result of investments in underlying funds of 0.01%. |
| (e) | Includes mortgage dollar roll transactions (“MDRs”). Excluding these transactions the portfolio turnover would have been 88%. |
See notes to consolidated financial statements.
| | |
| 28 | | 2017 BLACKROCK ANNUAL REPORTTO SHAREHOLDERS |
Consolidated Financial Highlights (continued)
(For a share outstanding throughout each period)
| | | | | | | | | | | | | | | | | | | | |
| | | BlackRock Global Allocation V.I. Fund | |
| | | Class II | |
| | | Year Ended December 31, | |
| | | 2017 | | | 2016 | | | 2015 | | | 2014 | | | 2013 | |
Net asset value, beginning of year | | $ | 15.46 | | | $ | 15.04 | | | $ | 16.21 | | | $ | 17.56 | | | $ | 16.07 | |
| | | | | | | | | | | | | | | | | | | | |
Net investment income(a) | | | 0.19 | | | | 0.20 | | | | 0.19 | | | | 0.25 | | | | 0.19 | |
Net realized and unrealized gain (loss) | | | 1.93 | | | | 0.40 | | | | (0.35 | ) | | | 0.14 | | | | 2.14 | |
| | | | | | | | | | | | | | | | | | | | |
Net increase (decrease) from investment operations | | | 2.12 | | | | 0.60 | | | | (0.16 | ) | | | 0.39 | | | | 2.33 | |
| | | | | | | | | | | | | | | | | | | | |
| Distributions:(b) | | | | | | | | | | | | | | | |
From net investment income | | | (0.20 | ) | | | (0.18 | ) | | | (0.16 | ) | | | (0.37 | ) | | | (0.19 | ) |
From net realized gain | | | (0.17 | ) | | | — | | | | (0.84 | ) | | | (1.37 | ) | | | (0.65 | ) |
From return of capital | | | — | | | | — | | | | (0.01 | ) | | | — | | | | — | |
| | | | | | | | | | | | | | | | | | | | |
Total distributions | | | (0.37 | ) | | | (0.18 | ) | | | (1.01 | ) | | | (1.74 | ) | | | (0.84 | ) |
| | | | | | | | | | | | | | | | | | | | |
Net asset value, end of year | | $ | 17.21 | | | $ | 15.46 | | | $ | 15.04 | | | $ | 16.21 | | | $ | 17.56 | |
| | | | | | | | | | | | | | | | | | | | |
| | | | | |
Total Return:(c) | | | | | | | | | | | | | | | | | | | | |
Based on net asset value | | | 13.74 | % | | | 3.96 | % | | | (1.05 | )% | | | 2.16 | % | | | 14.55 | % |
| | | | | | | | | | | | | | | | | | | | |
| | | | | |
Ratios to Average Net Assets: | | | | | | | | | | | | | | | | | | | | |
Total expenses | | | 1.00 | %(d) | | | 1.02 | % | | | 1.02 | % | | | 1.01 | % | | | 1.00 | % |
| | | | | | | | | | | | | | | | | | | | |
Total expenses after fees waived and/or reimbursed | | | 0.87 | %(d) | | | 0.89 | % | | | 0.88 | % | | | 0.88 | % | | | 0.87 | % |
| | | | | | | | | | | | | | | | | | | | |
Total expenses after fees waived and/or reimbursed and excluding dividend expense, interest expense and broker fees and expenses on short sales | | | 0.85 | %(d) | | | 0.88 | % | | | 0.88 | % | | | 0.87 | % | | | 0.87 | % |
| | | | | | | | | | | | | | | | | | | | |
Net investment income | | | 1.17 | %(d) | | | 1.33 | % | | | 1.17 | % | | | 1.39 | % | | | 1.07 | % |
| | | | | | | | | | | | | | | | | | | | |
| | | | | |
Supplemental Data: | | | | | | | | | | | | | | | | | | | | |
Net assets, end of year (000) | | $ | 258,564 | | | $ | 229,492 | | | $ | 256,964 | | | $ | 260,312 | | | $ | 216,395 | |
| | | | | | | | | | | | | | | | | | | | |
Portfolio turnover rate | | | 118 | % | | | 135 | % | | | 90 | %(e) | | | 72 | % | | | 53 | % |
| | | | | | | | | | | | | | | | | | | | |
| (a) | Based on average shares outstanding. |
| (b) | Distributions for annual periods determined in accordance with U.S. federal income tax regulations. |
| (c) | Where applicable, excludes insurance-related fees and expenses and assumes the reinvestment of distributions. |
| (d) | Excludes expenses incurred indirectly as a result of investments in underlying funds of 0.01%. |
| (e) | Includes mortgage dollar roll transactions (“MDRs”). Excluding these transactions the portfolio turnover would have been 88%. |
See notes to consolidated financial statements.
| | | | |
| CONSOLIDATED FINANCIAL HIGHLIGHTS | | | 29 | |
Consolidated Financial Highlights (continued)
(For a share outstanding throughout each period)
| | | | | | | | | | | | | | | | | | | | |
| | | BlackRock Global Allocation V.I. Fund | |
| | | Class III | |
| | | Year Ended December 31, | |
| | | 2017 | | | 2016 | | | 2015 | | | 2014 | | | 2013 | |
Net asset value, beginning of year | | $ | 13.37 | | | $ | 13.04 | | | $ | 14.19 | | | $ | 15.58 | | | $ | 14.34 | |
| | | | | | | | | | | | | | | | | | | | |
Net investment income(a) | | | 0.17 | | | | 0.16 | | | | 0.15 | | | | 0.21 | | | | 0.16 | |
Net realized and unrealized gain (loss) | | | 1.66 | | | | 0.34 | | | | (0.30 | ) | | | 0.12 | | | | 1.89 | |
| | | | | | | | | | | | | | | | | | | | |
Net increase (decrease) from investment operations | | | 1.83 | | | | 0.50 | | | | (0.15 | ) | | | 0.33 | | | | 2.05 | |
| | | | | | | | | | | | | | | | | | | | |
| Distributions:(b) | | | | | | | | | | | | | | | |
From net investment income | | | (0.19 | ) | | | (0.17 | ) | | | (0.15 | ) | | | (0.35 | ) | | | (0.16 | ) |
From net realized gain | | | (0.17 | ) | | | — | | | | (0.84 | ) | | | (1.37 | ) | | | (0.65 | ) |
From return of capital | | | — | | | | — | | | | (0.01 | ) | | | — | | | | — | |
| | | | | | | | | | | | | | | | | | | | |
Total distributions | | | (0.36 | ) | | | (0.17 | ) | | | (1.00 | ) | | | (1.72 | ) | | | (0.81 | ) |
| | | | | | | | | | | | | | | | | | | | |
Net asset value, end of year | | $ | 14.84 | | | $ | 13.37 | | | $ | 13.04 | | | $ | 14.19 | | | $ | 15.58 | |
| | | | | | | | | | | | | | | | | | | | |
| | | | | |
Total Return:(c) | | | | | | | | | | | | | | | | | | | | |
Based on net asset value | | | 13.71 | % | | | 3.81 | % | | | (1.14 | )% | | | 2.08 | % | | | 14.42 | % |
| | | | | | | | | | | | | | | | | | | | |
| | | | | |
Ratios to Average Net Assets: | | | | | | | | | | | | | | | | | | | | |
Total expenses | | | 1.13 | %(d) | | | 1.12 | % | | | 1.12 | % | | | 1.11 | % | | | 1.11 | % |
| | | | | | | | | | | | | | | | | | | | |
Total expenses after fees waived and/or reimbursed | | | 1.00 | %(d) | | | 0.99 | % | | | 0.98 | % | | | 0.98 | % | | | 0.97 | % |
| | | | | | | | | | | | | | | | | | | | |
Total expenses after fees waived and/or reimbursed and excluding dividend expense, interest expense and broker fees and expenses on short sales | | | 0.98 | %(d) | | | 0.98 | % | | | 0.98 | % | | | 0.97 | % | | | 0.97 | % |
| | | | | | | | | | | | | | | | | | | | |
Net investment income | | | 1.15 | %(d) | | | 1.22 | % | | | 1.07 | % | | | 1.32 | % | | | 1.02 | % |
| | | | | | | | | | | | | | | | | | | | |
| | | | | |
Supplemental Data: | | | | | | | | | | | | | | | | | | | | |
Net assets, end of year (000) | | $ | 8,233,615 | | | $ | 8,139,218 | | | $ | 8,869,288 | | | $ | 9,780,007 | | | $ | 10,014,301 | |
| | | | | | | | | | | | | | | | | | | | |
Portfolio turnover rate(e) | | | 118 | % | | | 135 | % | | | 90 | %(e) | | | 72 | % | | | 53 | % |
| | | | | | | | | | | | | | | | | | | | |
| (a) | Based on average shares outstanding. |
| (b) | Distributions for annual periods determined in accordance with U.S. federal income tax regulations. |
| (c) | Where applicable, excludes insurance-related fees and expenses and assumes the reinvestment of distributions. |
| (d) | Excludes expenses incurred indirectly as a result of investments in underlying funds of 0.01%. |
| (e) | Includes mortgage dollar roll transactions (“MDRs”). Excluding these transactions the portfolio turnover would have been 88%. |
See notes to consolidated financial statements.
| | |
| 30 | | 2017 BLACKROCK ANNUAL REPORTTO SHAREHOLDERS |
Notes to Consolidated Financial Statements
BlackRock Variable Series Funds, Inc. (the “Company”) is registered under the Investment Company Act of 1940, as amended (the “1940 Act”), as an open-end management investment company. The Company is organized as a Maryland corporation that is comprised of 20 separate funds. The funds offer shares to insurance companies for their separate accounts to fund benefits under certain variable annuity and variable life insurance contracts. The consolidated financial statements presented are for BlackRock Global Allocation V.I. Fund (the “Fund”). The Fund is classified as diversified. Class I, Class II and Class III Shares have equal voting, dividend, liquidation and other rights, except that only shares of the respective classes are entitled to vote on matters concerning only that class. In addition, Class II and Class III Shares bear certain expenses related to the distribution of such shares.
The Fund, together with certain other registered investment companies advised by BlackRock Advisors, LLC (the “Manager”) or its affiliates, is included in a complex of open-end funds referred to as the Equity-Bond Complex.
Basis of Consolidation: The accompanying consolidated financial statements of the Fund include the accounts of BlackRock Cayman Global Allocation V.I. Fund I, Ltd. (the “Subsidiary”), which is a wholly-owned subsidiary of the Fund and primarily invests in commodity-related instruments. The Subsidiary enables the Fund to hold these commodity-related instruments while allowing its investors to satisfy regulated investment company tax requirements. The Fund may invest up to 25% of its total assets in the Subsidiary. The net assets of the Subsidiary as of period end were $436,796,581, which is 4.1% of the Fund’s consolidated net assets. Intercompany accounts and transactions, if any, have been eliminated. The Subsidiary is subject to the same investment policies and restrictions that apply to the Fund, except that the Subsidiary may invest without limitation in commodity-related instruments.
| 2. | SIGNIFICANT ACCOUNTING POLICIES |
The consolidated financial statements are prepared in conformity with accounting principles generally accepted in the United States of America (“U.S. GAAP”), which may require management to make estimates and assumptions that affect the reported amounts of assets and liabilities in the consolidated financial statements, disclosure of contingent assets and liabilities at the date of the consolidated financial statements and the reported amounts of increases and decreases in net assets from operations during the reporting period. Actual results could differ from those estimates. The Fund is considered an investment company under U.S. GAAP and follows the accounting and reporting guidance applicable to investment companies. Below is a summary of significant accounting policies:
Investment Transactions and Income Recognition: For financial reporting purposes, investment transactions are recorded on the dates the transactions are entered into (the “trade dates”). Realized gains and losses on investment transactions are determined on the identified cost basis. Dividend income is recorded on the ex-dividend date. Dividends from foreign securities where the ex-dividend date may have passed are subsequently recorded when the Fund is informed of the ex-dividend date. Under the applicable foreign tax laws, a withholding tax at various rates may be imposed on capital gains, dividends and interest. Upon notification from issuers, some of the dividend income received from a real estate investment trust may be redesignated as a reduction of cost of the related investment and/or realized gain. Interest income, including amortization and accretion of premiums and discounts on debt securities, is recognized on an accrual basis. Income, expenses and realized and unrealized gains and losses are allocated daily to each class based on its relative net assets.
Foreign Currency Translation: The Fund’s books and records are maintained in U.S. dollars. Securities and other assets and liabilities denominated in foreign currencies are translated into U.S. dollars using exchange rates determined as of the close of trading on the New York Stock Exchange (“NYSE”). Purchases and sales of investments are recorded at the rates of exchange prevailing on the respective dates of such transactions. Generally, when the U.S. dollar rises in value against a foreign currency, the investments denominated in that currency will lose value; the opposite effect occurs if the U.S. dollar falls in relative value.
The Fund does not isolate the portion of the results of operations arising as a result of changes in the exchange rates from the changes in the market prices of investments held or sold for financial reporting purposes. Accordingly, the effects of changes in exchange rates on investments are not segregated in the Consolidated Statement of Operations from the effects of changes in market prices of those investments, but are included as a component of net realized and unrealized gain (loss) from investments. The Fund reports realized currency gains (losses) on foreign currency related transactions as components of net realized gain (loss) for financial reporting purposes, whereas such components are generally treated as ordinary income for U.S. federal income tax purposes.
Segregation and Collateralization: In cases where the Fund enters into certain investments (e.g., futures contracts, forward foreign currency exchange contracts, options written, swaps and short sales) that would be treated as “senior securities” for 1940 Act purposes, the Fund may segregate or designate on its books and records cash or liquid assets having a market value at least equal to the amount of its future obligations under such investments. Doing so allows the investment to be excluded from treatment as a “senior security.” Furthermore, if required by an exchange or counterparty agreement, the Fund may be required to deliver/deposit cash and/or securities to/with an exchange, or broker-dealer or custodian as collateral for certain investments or obligations.
Distributions: Distributions paid by the Fund are recorded on the ex-dividend date. The character and timing of distributions are determined in accordance with U.S. federal income tax regulations, which may differ from U.S. GAAP.
Net income and realized gains from investments held by the Subsidiary are treated as ordinary income for tax purposes. If a net loss is realized by the Subsidiary in any taxable year, the loss will generally not be available to offset the Fund’s ordinary income and/or capital gains for that year.
Recent Accounting Standards: In March 2017, the Financial Accounting Standards Board issued Accounting Standards Update “Premium Amortization of Purchased Callable Debt Securities”, which amends the amortization period for certain purchased callable debt securities. Under the new guidance, the premium amortization of purchased callable debt securities that have explicit, non-contingent call features and are callable at fixed prices will be amortized to the earliest call date. The guidance will be applied on a modified retrospective basis and is effective for fiscal years, and their interim periods, beginning after December 15, 2018. Management is currently evaluating the impact of this guidance to the Fund.
| | | | |
| NOTESTO CONSOLIDATED FINANCIAL STATEMENTS | | | 31 | |
Notes to Consolidated Financial Statements (continued)
Indemnifications: In the normal course of business, the Fund enters into contracts that contain a variety of representations that provide general indemnification. The Fund’s maximum exposure under these arrangements is unknown because it involves future potential claims against the Fund, which cannot be predicted with any certainty.
Other: Expenses directly related to the Fund or its classes are charged to the Fund or the applicable class. Other operating expenses shared by several funds, including other funds managed by the Manager, are prorated among those funds on the basis of relative net assets or other appropriate methods. Expenses directly related to the Fund and other shared expenses prorated to the Fund are allocated daily to each class based on its relative net assets or other appropriate methods.
The Fund has an arrangement with its custodian whereby credits are earned on uninvested cash balances, which could be used to reduce custody fees and/or overdraft charges. The Fund may incur charges on certain uninvested cash balances and overdrafts, subject to certain conditions.
| 3. | INVESTMENT VALUATION AND FAIR VALUE MEASUREMENTS |
Investment Valuation Policies: The Fund’s investments are valued at fair value (also referred to as “market value” within the consolidated financial statements) as of the close of trading on the NYSE (generally 4:00 p.m., Eastern time) (or, if the reporting date falls on a day the NYSE is closed, investments are valued at fair value as of the period end). U.S. GAAP defines fair value as the price the Fund would receive to sell an asset or pay to transfer a liability in an orderly transaction between market participants at the measurement date. The Fund determines the fair values of its financial instruments using various independent dealers or pricing services under policies approved by the Board of Directors of the Company (the “Board”). The BlackRock Global Valuation Methodologies Committee (the “Global Valuation Committee”) is the committee formed by management to develop global pricing policies and procedures and to oversee the pricing function for all financial instruments.
Fair Value Inputs and Methodologies: The following methods and inputs are used to establish the fair value of the Fund’s assets and liabilities:
| | • | | Equity investments traded on a recognized securities exchange are valued at the official closing price each day, if available. For equity investments traded on more than one exchange, the official closing price on the exchange where the stock is primarily traded is used. Equity investments traded on a recognized exchange for which there were no sales on that day may be valued at the last available bid (long positions) or ask (short positions) price. |
| | • | | Fixed-income securities for which market quotations are readily available are generally valued using the last available bid prices or current market quotations provided by independent dealers or third party pricing services. Floating rate loan interests are valued at the mean of the bid prices from one or more independent brokers or dealers as obtained from a third party pricing service. Pricing services generally value fixed-income securities assuming orderly transactions of an institutional round lot size, but a fund may hold or transact in such securities in smaller, odd lot sizes. Odd lots may trade at lower prices than institutional round lots. The pricing services may use matrix pricing or valuation models that utilize certain inputs and assumptions to derive values, including transaction data (e.g., recent representative bids and offers), credit quality information, perceived market movements, news, and other relevant information. Certain fixed-income securities, including asset-backed and mortgage related securities may be valued based on valuation models that consider the estimated cash flows of each tranche of the entity, establish a benchmark yield and develop an estimated tranche specific spread to the benchmark yield based on the unique attributes of the tranche. The amortized cost method of valuation may be used with respect to debt obligations with sixty days or less remaining to maturity unless the Manager determines such method does not represent fair value. |
| | • | | Generally, trading in foreign instruments is substantially completed each day at various times prior to the close of trading on the NYSE. Occasionally, events affecting the values of such instruments may occur between the foreign market close and the close of trading on the NYSE that may not be reflected in the computation of the Fund’s net assets. Each business day, the Fund uses a pricing service to assist with the valuation of certain foreign exchange-traded equity securities and foreign exchange-traded over-the-counter (“OTC”) options (the “Systematic Fair Value Price”). Using current market factors, the Systematic Fair Value Price is designed to value such foreign securities and foreign options at fair value as of the close of trading on the NYSE, which follows the close of the local markets. |
| | • | | Investments in open-end U.S. mutual funds are valued at net asset value (“NAV”) each business day. |
| | • | | The Fund values its investment in SL Liquidity Series, LLC, Money Market Series (the “Money Market Series”) at fair value, which is ordinarily based upon its pro rata ownership in the underlying fund’s net assets. The Money Market Series seeks current income consistent with maintaining liquidity and preserving capital. Although the Money Market Series is not registered under the 1940 Act, its investments may follow the parameters of investments by a money market fund that is subject to Rule 2a-7 under the 1940 Act. |
| | • | | Futures contracts traded on exchanges are valued at their last sale price. |
| | • | | Forward foreign currency exchange contracts are valued at the mean between the bid and ask prices and are determined as of the close of trading on the NYSE. Interpolated values are derived when the settlement date of the contract is an interim date for which quotations are not available. |
| | • | | Exchange-traded options are valued at the mean between the last bid and ask prices at the close of the options market in which the options trade. An exchange-traded option for which there is no mean price is valued at the last bid (long positions) or ask (short positions) price. If no bid or ask price is available, the prior day’s price will be used, unless it is determined that the prior day’s price no longer reflects the fair value of the option. OTC options and options on swaps (“swaptions”) are valued by an independent pricing service using a mathematical model, which incorporates a number of market data factors, such as the trades and prices of the underlying instruments. |
| | • | | Swap agreements are valued utilizing quotes received daily by the Fund’s pricing service or through brokers, which are derived using daily swap curves and models that incorporate a number of market data factors, such as discounted cash flows, trades and values of the underlying reference instruments. |
| | |
| 32 | | 2017 BLACKROCK ANNUAL REPORTTO SHAREHOLDERS |
Notes to Consolidated Financial Statements (continued)
If events (e.g., a company announcement, market volatility or a natural disaster) occur that are expected to materially affect the value of such investments, or in the event that the application of these methods of valuation results in a price for an investment that is deemed not to be representative of the market value of such investment, or if a price is not available, the investment will be valued by the Global Valuation Committee, or its delegate, in accordance with a policy approved by the Board as reflecting fair value (“Fair Valued Investments”). The fair valuation approaches that may be used by the Global Valuation Committee will include market approach, income approach and cost approach. Valuation techniques such as discounted cash flow, use of market comparables and matrix pricing are types of valuation approaches and are typically used in determining fair value. When determining the price for Fair Valued Investments, the Global Valuation Committee, or its delegate, seeks to determine the price that the Fund might reasonably expect to receive or pay from the current sale or purchase of that asset or liability in an arm’s-length transaction. Fair value determinations shall be based upon all available factors that the Global Valuation Committee, or its delegate, deems relevant and consistent with the principles of fair value measurement.
The Global Valuation Committee, or its delegate, employs various methods for calibrating valuation approaches for investments where an active market does not exist, including regular due diligence of the Fund’s pricing vendors, regular reviews of key inputs and assumptions, transactional back-testing or disposition analysis to compare unrealized gains and losses to realized gains and losses, reviews of missing or stale prices and large movements in market values and reviews of any market related activity. The pricing of all Fair Valued Investments is subsequently reported to the Board or a committee thereof on a quarterly basis. As a result of the inherent uncertainty in valuation of these investments, the fair values may differ from the values that would have been used had an active market existed.
For investments in equity or debt issued by privately held companies or funds (“Private Company” or collectively, the “Private Companies”) and other Fair Valued Investments, the fair valuation approaches that are used by third party pricing services utilize one or a combination of, but not limited to, the following inputs.
| | |
| | | Standard Inputs Generally Considered By Third Party Pricing Services |
Market approach. | | (i) recent market transactions, including subsequent rounds of financing, in the underlying investment or comparable issuers; (ii) recapitalizations and other transactions across the capital structure; and (iii) market multiples of comparable issuers. |
Income approach. | | (i) future cash flows discounted to present and adjusted as appropriate for liquidity, credit, and/or market risks; (ii) quoted prices for similar investments or assets in active markets; and (iii) other risk factors, such as interest rates, yield curves, volatilities, prepayment speeds, loss severities, credit risks, recovery rates, liquidation amounts and/or default rates. |
Cost approach. | | (i) audited or unaudited financial statements, investor communications and financial or operational metrics issued by the Private Company; (ii) changes in the valuation of relevant indices or publicly traded companies comparable to the Private Company; (iii) relevant news and other public sources; and (iv) known secondary market transactions in the Private Company’s interests and merger or acquisition activity in companies comparable to the Private Company. |
Investments in series of preferred stock issued by Private Companies are typically valued utilizing market approach in determining the enterprise value of the company. Such investments often contain rights and preferences that differ from other series of preferred and common stock of the same issuer. Valuation techniques such as an option pricing model (“OPM”), a probability weighted expected return model (“PWERM”) or a hybrid of those techniques are used in allocating enterprise value of the company, as deemed appropriate under the circumstances. The use of OPM and PWERM techniques involve a determination of the exit scenarios of the investment in order to appropriately allocate the enterprise value of the company among the various parts of its capital structure.
The Private Companies are not subject to the public company disclosure, timing, and reporting standards as other investments held by the Fund. Typically, the most recently available information by a Private Company is as of a date that is earlier than the date the Fund is calculating its NAV. This factor may result in a difference between the value of the investment and the price the Fund could receive upon the sale of the investment.
Fair Value Hierarchy: Various inputs are used in determining the fair value of investments and derivative financial instruments. These inputs to valuation techniques are categorized into a fair value hierarchy consisting of three broad levels for financial statement purposes as follows:
| | • | | Level 1 — Unadjusted price quotations in active markets/exchanges for identical assets or liabilities that the Fund has the ability to access |
| | • | | Level 2 — Other observable inputs (including, but not limited to, quoted prices for similar assets or liabilities in markets that are active, quoted prices for identical or similar assets or liabilities in markets that are not active, inputs other than quoted prices that are observable for the assets or liabilities (such as interest rates, yield curves, volatilities, prepayment speeds, loss severities, credit risks and default rates) or other market–corroborated inputs) |
| | • | | Level 3 — Unobservable inputs based on the best information available in the circumstances, to the extent observable inputs are not available (including the Fund’s own assumptions used in determining the fair value of investments and derivative financial instruments) |
The hierarchy gives the highest priority to unadjusted quoted prices in active markets for identical assets or liabilities (Level 1 measurements) and the lowest priority to unobservable inputs (Level 3 measurements). Accordingly, the degree of judgment exercised in determining fair value is greatest for instruments categorized in Level 3. The inputs used to measure fair value may fall into different levels of the fair value hierarchy. In such cases, for disclosure purposes, the fair value hierarchy classification is determined based on the lowest level input that is significant to the fair value measurement in its entirety. Investments classified within Level 3 have significant unobservable inputs used by the Global Valuation Committee in determining the price for Fair Valued Investments. Level 3 investments include equity or debt issued by Private Companies. There may not be a secondary market, and/or there are a limited number of investors. Level 3 investments may also be adjusted to reflect illiquidity and/or non-transferability, with the amount of such discount estimated by the Global Valuation Committee in the absence of market information.
Changes in valuation techniques may result in transfers into or out of an assigned level within the hierarchy. In accordance with the Fund’s policy, transfers between different levels of the fair value hierarchy are deemed to have occurred as of the beginning of the reporting period. The categorization of a value determined for
| | | | |
| NOTESTO CONSOLIDATED FINANCIAL STATEMENTS | | | 33 | |
Notes to Consolidated Financial Statements (continued)
investments and derivative financial instruments is based on the pricing transparency of the investments and derivative financial instruments and is not necessarily an indication of the risks associated with investing in those securities.
As of December 31, 2017, certain investments of the Fund were valued using NAV per share as no quoted market value is available and therefore have been excluded from the fair value hierarchy.
| 4. | SECURITIES AND OTHER INVESTMENTS |
Asset-Backed and Mortgage-Backed Securities: Asset-backed securities are generally issued as pass-through certificates or as debt instruments. Asset-backed securities issued as pass-through certificates represent undivided fractional ownership interests in an underlying pool of assets. Asset-backed securities issued as debt instruments, which are also known as collateralized obligations, are typically issued as the debt of a special purpose entity organized solely for the purpose of owning such assets and issuing such debt. Asset-backed securities are often backed by a pool of assets representing the obligations of a number of different parties. The yield characteristics of certain asset-backed securities may differ from traditional debt securities. One such major difference is that all or a principal part of the obligations may be prepaid at any time because the underlying assets (i.e., loans) may be prepaid at any time. As a result, a decrease in interest rates in the market may result in increases in the level of prepayments as borrowers, particularly mortgagors, refinance and repay their loans. An increased prepayment rate with respect to an asset-backed security will have the effect of shortening the maturity of the security. In addition, a fund may subsequently have to reinvest the proceeds at lower interest rates. If a fund has purchased such an asset-backed security at a premium, a faster than anticipated prepayment rate could result in a loss of principal to the extent of the premium paid.
For mortgage pass-through securities (the “Mortgage Assets”) there are a number of important differences among the agencies and instrumentalities of the U.S. Government that issue mortgage-related securities and among the securities that they issue. For example, mortgage-related securities guaranteed by Ginnie Mae are guaranteed as to the timely payment of principal and interest by Ginnie Mae and such guarantee is backed by the full faith and credit of the United States. However, mortgage-related securities issued by Freddie Mac and Fannie Mae, including Freddie Mac and Fannie Mae guaranteed mortgage pass-through certificates, which are solely the obligations of Freddie Mac and Fannie Mae, are not backed by or entitled to the full faith and credit of the United States, but are supported by the right of the issuer to borrow from the U.S. Treasury.
Non-agency mortgage-backed securities are securities issued by non-governmental issuers and have no direct or indirect government guarantees of payment and are subject to various risks. Non-agency mortgage loans are obligations of the borrowers thereunder only and are not typically insured or guaranteed by any other person or entity. The ability of a borrower to repay a loan is dependent upon the income or assets of the borrower. A number of factors, including a general economic downturn, acts of God, terrorism, social unrest and civil disturbances, may impair a borrower’s ability to repay its loans.
Inflation-Indexed Bonds: Inflation-indexed bonds (other than municipal inflation-indexed and certain corporate inflation-indexed bonds) are fixed- income securities whose principal value is periodically adjusted according to the rate of inflation. If the index measuring inflation rises or falls, the principal value of inflation-indexed bonds (other than municipal inflation-indexed and certain corporate inflation-indexed bonds) will be adjusted upward or downward, and consequently the interest payable on these securities (calculated with respect to a larger or smaller principal amount) will be increased or reduced, respectively. Any upward or downward adjustment in the principal amount of an inflation-indexed bond will be included as interest income in the Consolidated Statement of Operations, even though investors do not receive their principal until maturity. Repayment of the original bond principal upon maturity (as adjusted for inflation) is guaranteed in the case of U.S. Treasury inflation-indexed bonds. For bonds that do not provide a similar guarantee, the adjusted principal value of the bond repaid at maturity may be less than the original principal. With regard to municipal inflation-indexed bonds and certain corporate inflation-indexed bonds, the inflation adjustment is typically reflected in the semi-annual coupon payment. As a result, the principal value of municipal inflation-indexed bonds and such corporate inflation-indexed bonds does not adjust according to the rate of inflation.
Multiple Class Pass-Through Securities: Multiple class pass-through securities, including collateralized mortgage obligations (“CMOs”) and commercial mortgage-backed securities, may be issued by Ginnie Mae, U.S. Government agencies or instrumentalities or by trusts formed by private originators of, or investors in, mortgage loans. In general, CMOs are debt obligations of a legal entity that are collateralized by a pool of residential or commercial mortgage loans or Mortgage Assets. The payments on these are used to make payments on the CMOs or multiple pass-through securities. Multiple class pass-through securities represent direct ownership interests in the Mortgage Assets. Classes of CMOs include interest only (“IOs”), principal only (“POs”), planned amortization classes and targeted amortization classes. IOs and POs are stripped mortgage-backed securities representing interests in a pool of mortgages, the cash flow from which has been separated into interest and principal components. IOs receive the interest portion of the cash flow while POs receive the principal portion. IOs and POs can be extremely volatile in response to changes in interest rates. As interest rates rise and fall, the value of IOs tends to move in the same direction as interest rates. POs perform best when prepayments on the underlying mortgages rise since this increases the rate at which the principal is returned and the yield to maturity on the PO. When payments on mortgages underlying a PO are slower than anticipated, the life of the PO is lengthened and the yield to maturity is reduced. If the underlying Mortgage Assets experience greater than anticipated prepayments of principal, a fund’s initial investment in the IOs may not fully recoup.
Zero-Coupon Bonds: Zero-coupon bonds are normally issued at a significant discount from face value and do not provide for periodic interest payments. These bonds may experience greater volatility in market value than other debt obligations of similar maturity which provide for regular interest payments.
Capital Securities and Trust Preferred Securities: Capital securities, including trust preferred securities, are typically issued by corporations, generally in the form of interest-bearing notes with preferred securities characteristics. In the case of trust preferred securities, an affiliated business trust of a corporation issues these securities, generally in the form of beneficial interests in subordinated debentures or similarly structured securities. The securities can be structured with either a fixed or adjustable coupon that can have either a perpetual or stated maturity date. For trust preferred securities, the issuing bank or corporation pays interest to the trust, which is then distributed to holders of these securities as a dividend. Dividends can be deferred without creating an event of default or acceleration, although maturity cannot take place unless all cumulative payment obligations have been met. The deferral of payments does not affect the purchase or sale of these securities in the open market. These securities generally are rated below that of the issuing company’s senior debt securities and are freely callable at the issuer’s option.
| | |
| 34 | | 2017 BLACKROCK ANNUAL REPORTTO SHAREHOLDERS |
Notes to Consolidated Financial Statements (continued)
Preferred Stocks: Preferred stock has a preference over common stock in liquidation (and generally in receiving dividends as well) but is subordinated to the liabilities of the issuer in all respects. As a general rule, the market value of preferred stock with a fixed dividend rate and no conversion element varies inversely with interest rates and perceived credit risk, while the market price of convertible preferred stock generally also reflects some element of conversion value. Because preferred stock is junior to debt securities and other obligations of the issuer, deterioration in the credit quality of the issuer will cause greater changes in the value of a preferred stock than in a more senior debt security with similar stated yield characteristics. Unlike interest payments on debt securities, preferred stock dividends are payable only if declared by the issuer’s board of directors. Preferred stock also may be subject to optional or mandatory redemption provisions.
Warrants: Warrants entitle a fund to purchase a specified number of shares of common stock and are non-income producing. The purchase price and number of shares are subject to adjustment under certain conditions until the expiration date of the warrants, if any. If the price of the underlying stock does not rise above the strike price before the warrant expires, the warrant generally expires without any value and a fund will lose any amount it paid for the warrant. Thus, investments in warrants may involve more risk than investments in common stock. Warrants may trade in the same markets as their underlying stock; however, the price of the warrant does not necessarily move with the price of the underlying stock.
Floating Rate Loan Interests: Floating rate loan interests are typically issued to companies (the “borrower”) by banks, other financial institutions, or privately and publicly offered corporations (the “lender”). Floating rate loan interests are generally non-investment grade, often involve borrowers whose financial condition is troubled or uncertain and companies that are highly leveraged or in bankruptcy proceedings. In addition, transactions in floating rate loan interests may settle on a delayed basis, which may result in proceeds from the sale not being readily available for a fund to make additional investments or meet its redemption obligations. Floating rate loan interests may include fully funded term loans or revolving lines of credit. Floating rate loan interests are typically senior in the corporate capital structure of the borrower. Floating rate loan interests generally pay interest at rates that are periodically determined by reference to a base lending rate plus a premium. Since the rates reset only periodically, changes in prevailing interest rates (and particularly sudden and significant changes) can be expected to cause some fluctuations in the NAV of a fund to the extent that it invests in floating rate loan interests. The base lending rates are generally the lending rate offered by one or more European banks, such as the London Interbank Offered Rate (“LIBOR”), the prime rate offered by one or more U.S. banks or the certificate of deposit rate. Floating rate loan interests may involve foreign borrowers, and investments may be denominated in foreign currencies. These investments are treated as investments in debt securities for purposes of a fund’s investment policies.
When a fund purchases a floating rate loan interest, it may receive a facility fee and when it sells a floating rate loan interest, it may pay a facility fee. On an ongoing basis, a fund may receive a commitment fee based on the undrawn portion of the underlying line of credit amount of a floating rate loan interest. Facility and commitment fees are typically amortized to income over the term of the loan or term of the commitment, respectively. Consent and amendment fees are recorded to income as earned. Prepayment penalty fees, which may be received by a fund upon the prepayment of a floating rate loan interest by a borrower, are recorded as realized gains. A fund may invest in multiple series or tranches of a loan. A different series or tranche may have varying terms and carry different associated risks.
Floating rate loan interests are usually freely callable at the borrower’s option. A fund may invest in such loans in the form of participations in loans (“Participations”) or assignments (“Assignments”) of all or a portion of loans from third parties. Participations typically will result in a fund having a contractual relationship only with the lender, not with the borrower. A fund has the right to receive payments of principal, interest and any fees to which it is entitled only from the lender selling the Participation and only upon receipt by the lender of the payments from the borrower. In connection with purchasing Participations, a fund generally will have no right to enforce compliance by the borrower with the terms of the loan agreement, nor any rights of offset against the borrower. A fund may not benefit directly from any collateral supporting the loan in which it has purchased the Participation. As a result, a fund assumes the credit risk of both the borrower and the lender that is selling the Participation. A fund’s investment in loan participation interests involves the risk of insolvency of the financial intermediaries who are parties to the transactions. In the event of the insolvency of the lender selling the Participation, a fund may be treated as a general creditor of the lender and may not benefit from any offset between the lender and the borrower. Assignments typically result in a fund having a direct contractual relationship with the borrower, and a fund may enforce compliance by the borrower with the terms of the loan agreement.
Forward Commitments and When-Issued Delayed Delivery Securities: A fund may purchase securities on a when-issued basis and may purchase or sell securities on a forward commitment basis. Settlement of such transactions normally occurs within a month or more after the purchase or sale commitment is made. A fund may purchase securities under such conditions with the intention of actually acquiring them, but may enter into a separate agreement to sell the securities before the settlement date. Since the value of securities purchased may fluctuate prior to settlement, a fund may be required to pay more at settlement than the security is worth. In addition, a fund is not entitled to any of the interest earned prior to settlement. When purchasing a security on a delayed delivery basis, a fund assumes the rights and risks of ownership of the security, including the risk of price and yield fluctuations. In the event of default by the counterparty, a fund’s maximum amount of loss is the unrealized appreciation of unsettled when-issued transactions.
TBA Commitments: TBA commitments are forward agreements for the purchase or sale of mortgage-backed securities for a fixed price, with payment and delivery on an agreed upon future settlement date. The specific securities to be delivered are not identified at the trade date. However, delivered securities must meet specified terms, including issuer, rate and mortgage terms. When entering into TBA commitments, a fund may take possession of or deliver the underlying mortgage-backed securities but can extend the settlement or roll the transaction. TBA commitments involve a risk of loss if the value of the security to be purchased or sold declines or increases, respectively, prior to settlement date.
In order to better define contractual rights and to secure rights that will help a fund mitigate their counterparty risk, TBA commitments may be entered into by a fund under Master Securities Forward Transaction Agreements (each, an “MSFTA”). An MSFTA typically contains, among other things, collateral posting terms and netting provisions in the event of default and/or termination event. The collateral requirements are typically calculated by netting the mark-to-market amount for each transaction under such agreement and comparing that amount to the value of the collateral currently pledged by a fund and the counterparty. Cash collateral that has been pledged to cover the obligations of a fund and cash collateral received from the counterparty, if any, is reported separately on the Consolidated Statement of Assets and Liabilities as cash pledged as collateral for TBA commitments or cash received as collateral for TBA commitments, respectively. Non-cash collateral pledged by a fund, if any, is noted in the Consolidated Schedule of Investments. Typically, a fund is permitted to sell, re-pledge or use the collateral it receives; however, the counterparty is not permitted to do so. To the extent amounts due to a fund is not fully collateralized, contractually or otherwise, a fund bears the risk of loss from counterparty non-performance.
| | | | |
| NOTESTO CONSOLIDATED FINANCIAL STATEMENTS | | | 35 | |
Notes to Consolidated Financial Statements (continued)
Mortgage Dollar Roll Transactions: A fund may sell TBA mortgage-backed securities and simultaneously contract to repurchase substantially similar (i.e., same type, coupon and maturity) securities on a specific future date at an agreed upon price. During the period between the sale and repurchase, a fund is not entitled to receive interest and principal payments on the securities sold. Mortgage dollar roll transactions are treated as purchases and sales and realizes gains and losses on these transactions. Mortgage dollar rolls involve the risk that the market value of the securities that a fund is required to purchase may decline below the agreed upon repurchase price of those securities.
Short Sale Transactions: In short sale transactions, a fund sells a security it does not hold in anticipation of a decline in the market price of that security. When a fund makes a short sale, it will borrow the security sold short from a broker/counterparty and deliver the security to the purchaser. To close out a short position, a fund delivers the same security to the broker and records a liability to reflect the obligation to return the security to the broker. The amount of the liability is subsequently marked-to-market to reflect the market value of the short sale. A fund maintains a segregated account of securities or deposits cash with the broker-dealer as collateral for the short sales. Cash deposited with the broker is recorded as an asset in the Consolidated Statement of Assets and Liabilities. Securities segregated as collateral are denoted in the Consolidated Schedule of Investments. A fund may pay a financing fee for the difference between the market value of the short position and the cash collateral deposited with the broker which would be recorded as interest expense. A fund is required to repay the counterparty any dividends received on the security sold short, which, if applicable, is shown as dividend expense in the Consolidated Statement of Operations. A fund may pay a fee on the assets borrowed from the counterparty, which, if applicable, is shown as broker fees and expenses on short sales in the Consolidated Statement of Operations. A fund is exposed to market risk based on the amount, if any, that the market value of the security increases beyond the market value at which the position was sold. Thus, a short sale of a security involves the risk that instead of declining, the price of the security sold short will rise. The short sale of securities involves the possibility of an unlimited loss since there is an unlimited potential for the market price of the security sold short to increase. A gain is limited to the price at which a fund sold the security short. A realized gain or loss is recognized upon the termination of a short sale if the market price is either less than or greater than the proceeds originally received. There is no assurance that a fund will be able to close out a short position at a particular time or at an acceptable price.
Securities Lending: The Fund may lend its securities to approved borrowers, such as brokers, dealers and other financial institutions. The borrower pledges and maintains with the Fund collateral consisting of cash, an irrevocable letter of credit issued by a bank, or securities issued or guaranteed by the U.S. Government. The initial collateral received by the Fund is required to have a value of at least 102% of the current value of the loaned securities for securities traded on U.S. exchanges and a value of at least 105% for all other securities. The collateral is maintained thereafter at a value equal to at least 100% of the current market value of the securities on loan. The market value of the loaned securities is determined at the close of each business day of the Fund and any additional required collateral is delivered to the Fund, or excess collateral returned by the Fund, on the next business day. During the term of the loan, the Fund is entitled to all distributions made on or in respect of the loaned securities, but does not receive interest income on securities received as collateral. Loans of securities are terminable at any time and the borrower, after notice, is required to return borrowed securities within the standard time period for settlement of securities transactions.
The market value of any securities on loan, all of which were classified as common or preferred stocks in the Fund’s Consolidated Schedule of Investments, and the value of any related collateral are shown separately in the Consolidated Statement of Assets and Liabilities as a component of investments at value — unaffiliated, and collateral on securities loaned at value, respectively. As of period end, any securities on loan were collateralized by cash and/or U.S. Government obligations. Cash collateral invested by the securities lending agent, BlackRock Investment Management, LLC (“BIM”), if any, is disclosed in the Consolidated Schedule of Investments.
Securities lending transactions are entered into by the Fund under Master Securities Lending Agreements (each, an “MSLA”), which provide the right, in the event of default (including bankruptcy or insolvency), for the non-defaulting party to liquidate the collateral and calculate a net exposure to the defaulting party or request additional collateral. In the event that a borrower defaults, the Fund, as lender, would offset the market value of the collateral received against the market value of the securities loaned. When the value of the collateral is greater than that of the market value of the securities loaned, the lender is left with a net amount payable to the defaulting party. However, bankruptcy or insolvency laws of a particular jurisdiction may impose restrictions on or prohibitions against such a right of offset in the event of an MSLA counterparty’s bankruptcy or insolvency. Under the MSLA, absent an event of default, the borrower can resell or re-pledge the loaned securities, and the Fund can reinvest cash collateral received in connection with loaned securities. Upon an event of default, the parties’ obligations to return the securities or collateral to the other party are extinguished, and the parties can resell or re-pledge the loaned securities or the collateral received in connection with the loaned securities in order to satisfy the defaulting party’s net payment obligation for all transactions under the MSLA. The defaulting party remains liable for any deficiency.
As of period end, the following table is a summary of the Fund’s securities lending agreements by counterparty which are subject to offset under an MSLA:
| | | | | | | | | | | | |
| Counterparty | | Securities
Loaned at Value | | | Cash Collateral
Received (a) | | | Net
Amount | |
Barclays Capital, Inc. | | $ | 202,891 | | | $ | (202,891 | ) | | $ | — | |
BNP Paribas S.A. | | | 40,122,900 | | | | (40,122,900 | ) | | | — | |
Citigroup Global Markets, Inc. | | | 48,083,210 | | | | (48,083,210 | ) | | | — | |
Credit Suisse Securities (USA) LLC | | | 18,726 | | | | (18,726 | ) | | | — | |
Deutsche Bank Securities Inc. | | | 10,324,923 | | | | (10,324,923 | ) | | | — | |
Goldman Sachs & Co. | | | 8,861,141 | | | | (8,861,141 | ) | | | — | |
JP Morgan Securities LLC | | | 5,850,381 | | | | (5,850,381 | ) | | | — | |
Merrill Lynch, Pierce, Fenner & Smith | | | 4,692,321 | | | | (4,692,321 | ) | | | — | |
Morgan Stanley | | | 78,254,303 | | | | (78,254,303 | ) | | | — | |
State Street Bank & Trust Co. | | | 1,732,622 | | | | (1,732,622 | ) | | | — | |
UBS Securities LLC | | | 26,147,616 | | | | (26,147,616 | ) | | | — | |
| | | | | | | | | | | | |
| | $ | 224,291,034 | | | $ | (224,291,034 | ) | | $ | — | |
| | | | | | | | | | | | |
| | (a) | Cash collateral with a value of $235,809,728 has been received in connection with securities lending agreements. Collateral received in excess of the value of securities loaned from the individual counterparty is not shown for financial reporting purposes. | |
| | |
| 36 | | 2017 BLACKROCK ANNUAL REPORTTO SHAREHOLDERS |
Notes to Consolidated Financial Statements (continued)
The risks of securities lending include the risk that the borrower may not provide additional collateral when required or may not return the securities when due. To mitigate these risks, the Fund benefits from a borrower default indemnity provided by BIM. BIM’s indemnity allows for full replacement of the securities loaned if the collateral received does not cover the value on the securities loaned in the event of borrower default. The Fund could incur a loss if the value of an investment purchased with cash collateral falls below the market value of loaned securities or if the value of an investment purchased with cash collateral falls below the value of the original cash collateral received.
| 5. | DERIVATIVE FINANCIAL INSTRUMENTS |
The Fund engages in various portfolio investment strategies using derivative contracts both to increase the returns of the Fund and/or to manage its exposure to certain risks such as credit risk, equity risk, interest rate risk, foreign currency exchange rate risk, commodity price risk or other risks (e.g. inflation risk). Derivative financial instruments categorized by risk exposure are included in the Consolidated Schedule of Investments. These contracts may be transacted on an exchange or OTC.
Futures Contracts: Futures contracts are purchased or sold to gain exposure to, or manage exposure to, changes in interest rates (interest rate risk), changes in the value of equity securities (equity risk) or foreign currencies (foreign currency exchange rate risk).
Futures contracts are agreements between the Fund and a counterparty to buy or sell a specific quantity of an underlying instrument at a specified price and on a specified date. Depending on the terms of a contract, it is settled either through physical delivery of the underlying instrument on the settlement date or by payment of a cash amount on the settlement date. Upon entering into a futures contract, the Fund is required to deposit initial margin with the broker in the form of cash or securities in an amount that varies depending on a contract’s size and risk profile. The initial margin deposit must then be maintained at an established level over the life of the contract.
Securities deposited as initial margin are designated in the Consolidated Schedule of Investments and cash deposited, if any, are shown as cash pledged for futures contracts in the Consolidated Statement of Assets and Liabilities. Pursuant to the contract, the Fund agrees to receive from or pay to the broker an amount of cash equal to the daily fluctuation in market value of the contract (“variation margin”). Variation margin is recorded as unrealized appreciation (depreciation) and, if any, shown as variation margin receivable (or payable) on futures contracts in the Consolidated Statement of Assets and Liabilities. When the contract is closed, a realized gain or loss is recorded in the Consolidated Statement of Operations equal to the difference between the notional amount of the contract at the time it was opened and the notional amount at the time it was closed. The use of futures contracts involves the risk of an imperfect correlation in the movements in the price of futures contracts and interest, foreign currency exchange rates or underlying assets.
Forward Foreign Currency Exchange Contracts: Forward foreign currency exchange contracts are entered into to gain or reduce exposure to foreign currencies (foreign currency exchange rate risk).
A forward foreign currency exchange contract is an agreement between two parties to buy and sell a currency at a set exchange rate on a specified date. These contracts help to manage the overall exposure to the currencies in which some of the investments held by the Fund are denominated and in some cases, may be used to obtain exposure to a particular market.
The contract is marked-to-market daily and the change in market value is recorded as unrealized appreciation (depreciation) in the Consolidated Statement of Assets and Liabilities. When a contract is closed, a realized gain or loss is recorded in the Consolidated Statement of Operations equal to the difference between the value at the time it was opened and the value at the time it was closed. Non-deliverable forward foreign currency exchange contracts are settled with the counterparty in cash without the delivery of foreign currency. The use of forward foreign currency exchange contracts involves the risk that the value of a forward foreign currency exchange contract changes unfavorably due to movements in the value of the referenced foreign currencies.
Options: The Fund purchases and writes call and put options to increase or decrease its exposure to the risks of underlying instruments, including equity risk, interest rate risk and/or commodity price risk and/or, in the case of options written, to generate gains from options premiums.
A call option gives the purchaser (holder) of the option the right (but not the obligation) to buy, and obligates the seller (writer) to sell (when the option is exercised) the underlying instrument at the exercise or strike price at any time or at a specified time during the option period. A put option gives the holder the right to sell and obligates the writer to buy the underlying instrument at the exercise or strike price at any time or at a specified time during the option period.
Premiums paid on options purchased and premiums received on options written, as well as the daily fluctuation in market value, are included in investments at value — unaffiliated and options written at value, respectively, in the Consolidated Statement of Assets and Liabilities. When an instrument is purchased or sold through the exercise of an option, the premium is offset against the cost or proceeds of the underlying instrument. When an option expires, a realized gain or loss is recorded in the Consolidated Statement of Operations to the extent of the premiums received or paid. When an option is closed or sold, a gain or loss is recorded in the Consolidated Statement of Operations to the extent the cost of the closing transaction exceeds the premiums received or paid. When the Fund writes a call option, such option is typically “covered,” meaning that it holds the underlying instrument subject to being called by the option counterparty. When the Fund writes a put option, such option is covered by cash in an amount sufficient to cover the obligation. As of period end, the value of portfolio securities subject to covered call options written was $67,964,456.
| | • | | Swaptions — The Fund purchases and writes options on swaps (“swaptions”) primarily to preserve a return or spread on a particular investment or portion of the Fund’s holdings, as a duration management technique or to protect against an increase in the price of securities it anticipates purchasing at a later date. The purchaser and writer of a swaption is buying or granting the right to enter into a previously agreed upon interest rate or credit default swap agreement (interest rate risk and/or credit risk) at any time before the expiration of the option. |
| | • | | Interest rate caps and floors — Interest rate caps and floors are entered into to gain or reduce exposure to interest rates (interest rate risk and/or other risk). Caps are agreements whereby one party agrees to make payments to the other, in return for a premium, to the extent that interest rate indexes exceed a specified rate, or “cap.” Floors are agreements whereby one party agrees to make payments to the other, in return for a premium, to the extent that interest rate indexes fall below a specified rate, or “floor.” |
| | | | |
| NOTESTO CONSOLIDATED FINANCIAL STATEMENTS | | | 37 | |
Notes to Consolidated Financial Statements (continued)
| | • | | Foreign currency options — The Fund purchases and writes foreign currency options, foreign currency futures and options on foreign currency futures to gain or reduce exposure to foreign currencies (foreign currency exchange rate risk). Foreign currency options give the purchaser the right to buy from or sell to the writer a foreign currency at any time before the expiration of the option. |
| | • | | Barrier options — The Fund may purchase and write a variety of options with non-standard payout structures or other features (“barrier options”) that are generally traded OTC. |
The Fund may invest in various types of barrier options, including down-and-out options, down-and-in options, double no-touch options, one-touch options, up-and-out options and up-and-in options. Down-and-out options expire worthless to the purchaser if the price of the underlying instrument falls below a specific barrier price level prior to the expiration date. Down-and-in options expire worthless to the purchaser unless the price of the underlying instrument falls below a specific barrier price level prior to the expiration date. Double no-touch options provide the purchaser an agreed-upon payout if the price of the underlying instrument does not reach or surpass predetermined barrier price levels prior to the option’s expiration date. One-touch options provide the purchaser an agreed-upon payout if the price of the underlying instrument reaches or surpasses predetermined barrier price levels prior to the expiration date. Up-and-out options expire worthless to the purchaser if the price of the underlying instrument increases beyond a predetermined barrier price level prior to the expiration date. Up-and-in options can only be exercised when the price of the underlying instrument increases beyond a predetermined barrier price level.
In purchasing and writing options, the Fund bears the risk of an unfavorable change in the value of the underlying instrument or the risk that it may not be able to enter into a closing transaction due to an illiquid market. Exercise of a written option could result in the Fund purchasing or selling a security when it otherwise would not, or at a price different from the current market value.
Swaps: Swap contracts are entered into to manage exposure to issuers, markets and securities. Such contracts are agreements between the Fund and a counterparty to make periodic net payments on a specified notional amount or a net payment upon termination. Swap agreements are privately negotiated in the OTC market and may be entered into as a bilateral contract (“OTC swaps”) or centrally cleared (“centrally cleared swaps”).
For OTC swaps, any upfront premiums paid and any upfront fees received are shown as swap premiums paid and swap premiums received, respectively, in the Consolidated Statement of Assets and Liabilities and amortized over the term of the contract. The daily fluctuation in market value is recorded as unrealized appreciation (depreciation) on OTC Swaps in the Consolidated Statement of Assets and Liabilities. Payments received or paid are recorded in the Consolidated Statement of Operations as realized gains or losses, respectively. When an OTC swap is terminated, a realized gain or loss is recorded in the Consolidated Statement of Operations equal to the difference between the proceeds from (or cost of) the closing transaction and the Fund’s basis in the contract, if any. Generally, the basis of the contract is the premium received or paid.
In a centrally cleared swap, immediately following execution of the swap contract, the swap contract is novated to a central counterparty (the “CCP”) and the Fund’s counterparty on the swap agreement becomes the CCP. The Fund is required to interface with the CCP through the broker. Upon entering into a centrally cleared swap, the Fund is required to deposit initial margin with the broker in the form of cash or securities in an amount that varies depending on the size and risk profile of the particular swap. Securities deposited as initial margin are designated in the Consolidated Schedule of Investments and cash deposited is shown as cash pledged for centrally cleared swaps in the Consolidated Statement of Assets and Liabilities. Pursuant to the contract, the Fund agrees to receive from or pay to the broker an amount of cash equal to the daily fluctuation in market value of the contract (“variation margin”). Variation margin is recorded as unrealized appreciation (depreciation) and shown as variation margin receivable (or payable) on centrally cleared swaps in the Consolidated Statement of Assets and Liabilities. Payments received from (paid to) the counterparty, including at termination, are recorded as realized gains (losses) in the Consolidated Statement of Operations.
| | • | | Credit default swaps — Credit default swaps are entered into to manage exposure to the market or certain sectors of the market, to reduce its risk exposure to defaults of corporate and/or sovereign issuers or to create exposure to corporate and/or sovereign issuers to which a fund is not otherwise exposed (credit risk). |
The Fund may either buy or sell (write) credit default swaps on single-name issuers (corporate or sovereign), a combination or basket of single-name issuers or traded indexes. Credit default swaps are agreements in which the protection buyer pays fixed periodic payments to the seller in consideration for a promise from the protection seller to make a specific payment should a negative credit event take place with respect to the referenced entity (e.g., bankruptcy, failure to pay, obligation acceleration, repudiation, moratorium or restructuring). As a buyer, if an underlying credit event occurs, the Fund will either (i) receive from the seller an amount equal to the notional amount of the swap and deliver the referenced security or underlying securities comprising the index, or (ii) receive a net settlement of cash equal to the notional amount of the swap less the recovery value of the security or underlying securities comprising the index. As a seller (writer), if an underlying credit event occurs, the Fund will either pay the buyer an amount equal to the notional amount of the swap and take delivery of the referenced security or underlying securities comprising the index or pay a net settlement of cash equal to the notional amount of the swap less the recovery value of the security or underlying securities comprising the index.
| | • | | Total return swaps — Total return swaps are entered into to obtain exposure to a security or market without owning such security or investing directly in such market or to exchange the risk/return of one market (e.g., fixed-income) with another market (e.g., equity or commodity prices) (equity risk, commodity price risk and/or interest rate risk). |
Total return swaps are agreements in which there is an exchange of cash flows whereby one party commits to make payments based on the total return (distributions plus capital gains/losses) of an underlying instrument in exchange for fixed or floating rate interest payments. If the total return of the instrument or index underlying the transaction exceeds or falls short of the offsetting fixed or floating interest rate obligation, the Fund receives payment from or makes a payment to the counterparty.
| | • | | Interest rate swaps — Interest rate swaps are entered into to gain or reduce exposure to interest rates or to manage duration, the yield curve or interest rate (interest rate risk). |
| | |
| 38 | | 2017 BLACKROCK ANNUAL REPORTTO SHAREHOLDERS |
Notes to Consolidated Financial Statements (continued)
Interest rate swaps are agreements in which one party pays a stream of interest payments, either fixed or floating, in exchange for another party’s stream of interest payments, either fixed or floating, on the same notional amount for a specified period of time. In more complex interest rate swaps, the notional principal amount may decline (or amortize) over time.
| | • | | Currency swaps — Currency swaps are entered into to gain or reduce exposure to foreign currencies (foreign currency exchange rate risk). |
Currency swaps are interest rate swaps in which one party pays a stream of interest payments, either fixed or floating, in exchange for another party’s stream of interest payments, either fixed or floating, based on the notional amounts of two different currencies. The notional amounts are typically determined based on the spot exchange rates at the inception of the trade. Currency swaps may also involve an exchange of notional amounts at the start, during and/or at expiration of the contract, either at the current spot rate or another specified rate.
| | • | | Forward swaps — The Fund enters into forward interest rate swaps and forward total return swaps. In a forward swap, the Fund and the counterparty agree to make periodic net payments beginning on a specified date or a net payment at termination. |
Swap transactions involve, to varying degrees, elements of interest rate, credit and market risk in excess of the amounts recognized in the Consolidated Statement of Assets and Liabilities. Such risks involve the possibility that there will be no liquid market for these agreements, that the counterparty to the agreements may default on its obligation to perform or disagree as to the meaning of the contractual terms in the agreements, and that there may be unfavorable changes in interest rates and/or market values associated with these transactions.
Master Netting Arrangements: In order to define its contractual rights and to secure rights that will help it mitigate its counterparty risk, the Fund may enter into an International Swaps and Derivatives Association, Inc. Master Agreement (“ISDA Master Agreement”) or similar agreement with its counterparties. An ISDA Master Agreement is a bilateral agreement between the Fund and a counterparty that governs certain OTC derivatives and typically contains, among other things, collateral posting terms and netting provisions in the event of a default and/or termination event. Under an ISDA Master Agreement, the Fund may, under certain circumstances, offset with the counterparty certain derivative financial instruments’ payables and/or receivables with collateral held and/or posted and create one single net payment. The provisions of the ISDA Master Agreement typically permit a single net payment in the event of default including the bankruptcy or insolvency of the counterparty. Bankruptcy or insolvency laws of a particular jurisdiction may restrict or prohibit the right of offset in bankruptcy, insolvency or other events.
Collateral Requirements: For derivatives traded under an ISDA Master Agreement, the collateral requirements are typically calculated by netting the mark-to-market amount for each transaction under such agreement and comparing that amount to the value of any collateral currently pledged by the Fund and the counterparty.
Cash collateral that has been pledged to cover obligations of the Fund and cash collateral received from the counterparty, if any, is reported separately on the Consolidated Statement of Assets and Liabilities as cash pledged as collateral and cash received as collateral, respectively. Non-cash collateral pledged by the Fund, if any, is noted in the Consolidated Schedule of Investments. Generally, the amount of collateral due from or to a counterparty is subject to a certain minimum transfer amount threshold before a transfer is required, which is determined at the close of business of the Fund. Any additional required collateral is delivered to/pledged by the Fund on the next business day. Typically, the counterparty is not permitted to sell, re-pledge or use cash and non-cash collateral it receives. The Fund generally agrees not to use non-cash collateral that it receives but may, absent default or certain other circumstances defined in the underlying ISDA Master Agreement, be permitted to use cash collateral received. In such cases, interest may be paid pursuant to the collateral arrangement with the counterparty. To the extent amounts due to the Fund from its counterparties are not fully collateralized, it bears the risk of loss from counterparty non-performance. Likewise, to the extent the Fund has delivered collateral to a counterparty and stands ready to perform under the terms of its agreement with such counterparty, it bears the risk of loss from a counterparty in the amount of the value of the collateral in the event the counterparty fails to return such collateral. Based on the terms of agreements, collateral may not be required for all derivative contracts.
For financial reporting purposes, the Fund does not offset derivative assets and derivative liabilities that are subject to netting arrangements, if any, in the Consolidated Statement of Assets and Liabilities.
| 6. | INVESTMENT ADVISORY AGREEMENT AND OTHER TRANSACTIONS WITH AFFILIATES |
The PNC Financial Services Group, Inc. is the largest stockholder and an affiliate of BlackRock, Inc. (“BlackRock”) for 1940 Act purposes.
Investment Advisory: The Company, on behalf of the Fund, entered into an Investment Advisory Agreement with the Manager, the Fund’s investment adviser, an indirect, wholly-owned subsidiary of BlackRock, to provide investment advisory and administrative services. The Manager is responsible for the management of the Fund’s portfolio and provides the personnel, facilities, equipment and certain other services necessary to the operations of the Fund.
For such services, the Fund pays the Manager a monthly fee at an annual rate equal to the following percentages of the average daily value of the Fund’s net assets:
| | | | |
| Average Daily Net Assets | | Investment
Advisory Fees | |
First $6 Billion | | | 0.65 | % |
$6 Billion — $8 Billion | | | 0.61 | |
$8 Billion — $10 Billion | | | 0.59 | |
$10 Billion — $15 Billion | | | 0.57 | |
Greater than $15 Billion | | | 0.55 | |
The Manager provides investment management and other services to the Subsidiary. The Manager does not receive separate compensation from the Subsidiary for providing investment management or administrative services. However, the Fund pays the Manager based on the Fund’s net assets, which includes the assets of the Subsidiary.
| | | | |
| NOTESTO CONSOLIDATED FINANCIAL STATEMENTS | | | 39 | |
Notes to Consolidated Financial Statements (continued)
Distribution Fees: The Company, on behalf of the Fund, entered into a Distribution Agreement and a Distribution Plan with BlackRock Investments, LLC (“BRIL”), an affiliate of the Manager. Pursuant to the Distribution Plan and in accordance with Rule 12b-1 under the 1940 Act, the Fund pays BRIL ongoing distribution fees. The fees are accrued daily and paid monthly at annual rates based upon the average daily net assets of the relevant share class of the Fund as follows:
| | | | | | | | |
| | | Class II | | | Class III | |
Distribution Fee | | | 0.15 | % | | | 0.25 | % |
For the year ended December 31, 2017, the following table shows the class specific distribution fees borne directly by each share class of the Fund:
| | | | | | | | | | | | |
| | | Class II | | | Class III | | | Total | |
Distribution Fees | | $ | 367,328 | | | $ | 20,560,415 | | | $ | 20,927,743 | |
Transfer Agent: On behalf of the Fund, the Manager entered into agreements with insurance companies and other financial intermediaries (“Service Organizations”), some of which may be affiliates. Pursuant to these agreements, the Service Organizations provide the Fund with administrative, networking, recordkeeping, sub-transfer agency and shareholder services to sub-accounts they service. For these services, the Service Organizations receive an annual fee per shareholder account, which will vary depending on share class and/or net assets of Fund shareholders serviced by the Service Organizations, which is shown as transfer agent — class specific. For the year ended December 31, 2017, the Fund did not pay any amounts to affiliates in return for these services.
In addition, the Fund pays the transfer agent, which is not an affiliate, a fee for the issuance, transfer and redemption of shares and the opening and maintenance of shareholder accounts, which is included in transfer agent in the Consolidated Statement of Operations.
For the year ended December 31, 2017, the following table shows the class specific transfer agent fees borne directly by each share class of the Fund:
| | | | | | |
| Class I | | Class II | | Class III | | Total |
$1,577,420 | | $479,436 | | $16,293,760 | | $18,350,616 |
Expense Limitations, Waivers and Reimbursements: With respect to the Fund, the Manager voluntarily agreed to waive its investment advisory fees by the amount of investment advisory fees the Fund pays to the Manager indirectly through its investment in affiliated money market funds (the “affiliated money market fund waiver”). The amount of waivers and/or reimbursements of fees and expenses made pursuant to the expense limitation will be reduced by the amount of the affiliated money market fund waiver. This amount is included in fees waived by the Manager in the Consolidated Statement of Operations. For the year ended December 31, 2017, the amount waived was $4,908.
The Manager has contractually agreed to waive its investment advisory fee with respect to any portion of the Fund’s assets invested in affiliated equity and fixed-income mutual funds and affiliated exchange-traded funds that have a contractual management fee through April 30, 2018. The contractual agreement may be terminated upon 90 days’ notice by a majority of the independent directors who are not “interested persons” of the Fund, as defined in the 1940 Act (“Independent Directors”) or by a vote of a majority of the outstanding voting securities of the Fund. This amount is included in fees waived by the Manager in the Consolidated Statement of Operations. For the year ended December 31, 2017, the Fund waived $274,797 in investment advisory fees pursuant to these arrangements.
For the year ended December 31, 2017, the Fund reimbursed the Manager $120,595 for certain accounting services, which is included in accounting services in the Consolidated Statement of Operations.
The Manager has contractually agreed to reimburse transfer agent fees in order to limit such expenses to a percentage of average daily net assets as follows:
| | | | |
Class I | | | 0.07 | % |
Class II | | | 0.07 | |
Class III | | | 0.07 | |
The Manager has agreed not to reduce or discontinue this contractual expense limitation through April 30, 2018, unless approved by the Board, including a majority of the Independent Directors or by a vote of a majority of the outstanding voting securities of the Fund.
These amounts waived and/or reimbursed are shown as transfer agent fees reimbursed—class specific in the Consolidated Statement of Operations. For the year ended December 31, 2017, class specific expense waivers and/or reimbursements are as follows:
| | | | | | | | | | | | | | | | |
| | | Class I | | | Class II | | | Class III | | | Total | |
Transfer Agent Fees Reimbursed | | $ | 70,182 | | | $ | 308,213 | | | $ | 10,551,722 | | | $ | 10,930,117 | |
With respect to the Fund, the Manager contractually agreed to waive and/or reimburse fees or expenses in order to limit expenses, excluding interest expense, dividend expense, tax expense, acquired fund fees and expenses, and certain other fund expenses, which constitute extraordinary expenses not incurred in the ordinary course of the Fund’s business (“expense limitation”). The expense limitations as a percentage of average daily net assets are as follows:
| | | | | | | | |
| Class I | | | | Class II | | | | Class III |
| 1.25% | | | | 1.40% | | | | 1.50% |
The Manager has agreed not to reduce or discontinue this contractual expense limitation through April 30, 2018, unless approved by the Board, including a majority of the Independent Directors or by a vote of a majority of the outstanding voting securities of the Fund. For the twelve months ended December 31, 2017, there were no fees waived and/or reimbursed by the Manager.
| | |
| 40 | | 2017 BLACKROCK ANNUAL REPORTTO SHAREHOLDERS |
Notes to Consolidated Financial Statements (continued)
Securities Lending: The U.S. Securities and Exchange Commission (“SEC”) has issued an exemptive order which permits BIM, an affiliate of the Manager, to serve as securities lending agent for the Fund, subject to applicable conditions. As securities lending agent, BIM bears all operational costs directly related to securities lending. The Fund is responsible for expenses in connection with the investment of cash collateral received for securities on loan (the “collateral investment expenses”). The cash collateral is invested in a private investment company managed by the Manager or its affiliates. However, BIM has agreed to cap the collateral investment expenses of the private investment company to an annual rate of 0.04%. The investment adviser to the private investment company will not charge any advisory fees with respect to shares purchased by the Fund. The private investment company in which the cash collateral has been invested may, under certain circumstances, impose a liquidity fee of up to 2% of the value withdrawn or temporarily restrict withdrawals for up to 10 business days during a 90 day period, in the event that the private investment company’s weekly liquid assets fall below certain thresholds.
Securities lending income is equal to the total of income earned from the reinvestment of cash collateral, net of fees and other payments to and from borrowers of securities, and less the collateral investment expenses. The Fund retains a portion of securities lending income and remits a remaining portion to BIM as compensation for its services as securities lending agent.
Pursuant to a securities lending agreement, the Fund retains 80% of securities lending income, and this amount retained can never be less than 70% of the total of securities lending income plus the collateral investment expenses.
In addition, commencing the business day following the date that the aggregate securities lending income earned across the Equity-Bond Complex in a calendar year exceeds a specified threshold, the Fund, pursuant to the securities lending agreement, will retain for the remainder of that calendar year securities lending income as follows: to 85% of securities lending income, and this amount retained can never be less than 70% of the total of securities lending income plus the collateral investment expenses.
The share of securities lending income earned by the Fund is shown as securities lending income — affiliated — net in the Consolidated Statement of Operations. For the year ended December 31, 2017, the Fund paid BIM $546,844 for securities lending agent services.
Interfund Lending: In accordance with an exemptive order (the “Order”) from the SEC, the Fund may participate in a joint lending and borrowing facility for temporary purposes (the “Interfund Lending Program”), subject to compliance with the terms and conditions of the Order, and to the extent permitted by the Fund’s investment policies and restrictions. The Fund is currently permitted to borrow under the Interfund Lending Program. A lending BlackRock fund may lend in aggregate up to 15% of its net assets, but may not lend more than 5% of its net assets to any one borrowing fund through the Interfund Lending Program. A borrowing BlackRock fund may not borrow through the Interfund Lending Program or from any other source more than 33 1/3% of its total assets or any lower threshold provided for by the fund’s investment restrictions. If a borrowing BlackRock fund’s total outstanding borrowings exceed 10% of its total assets, each of its outstanding interfund loans will be subject to collateralization of at least 102% of the outstanding principal value of the loan. All interfund loans are for temporary or emergency purposes and the interest rate to be charged will be the average of the highest current overnight repurchase agreement rate available to a lending fund and the bank loan rate, as calculated according to a formula established by the Board.
During the year ended December 31, 2017, the Fund did not participate in the Interfund Lending Program.
Officers and Directors: Certain directors and/or officers of the Company are directors and/or officers of BlackRock or its affiliates. The Fund reimburses the Manager for a portion of the compensation paid to the Company’s Chief Compliance Officer, which is included in Directors and Officer in the Consolidated Statement of Operations.
Other Transactions: The Fund may purchase securities from, or sell securities to, an affiliated fund provided the affiliation is due solely to having a common investment adviser, common officers, or common directors. For the year ended December 31, 2017, the purchase and sale transactions and any net realized gains (losses) with affiliated funds in compliance with Rule 17a-7 under the 1940 Act were as follows:
| | | | |
Purchases | | $ | 3,674,765 | |
Sales | | | 31,783 | |
Net Realized Gain | | | 5,712 | |
For the year ended December 31, 2017, purchases and sales of investments, including paydowns and excluding short-term securities, were as follows:
| | | | | | | | |
| | | Purchases | | | Sales | |
Non-U.S. Government Securities | | $ | 4,076,350,513 | | | $ | 5,290,478,317 | |
U.S. Government Securities | | | 7,391,337,262 | | | | 6,468,911,414 | |
It is the Fund’s policy to comply with the requirements of the Internal Revenue Code of 1986, as amended, applicable to regulated investment companies and to distribute substantially all of its taxable income to its shareholders. Therefore, no U.S. federal income tax provision is required.
The Fund files U.S. federal and various state and local tax returns. No income tax returns are currently under examination. The statute of limitations on the Fund’s U.S. federal tax returns generally remains open for each of the four years ended December 31, 2017. The statutes of limitations on the Fund’s state and local tax returns may remain open for an additional year depending upon the jurisdiction.
| | | | |
| NOTESTO CONSOLIDATED FINANCIAL STATEMENTS | | | 41 | |
Notes to Consolidated Financial Statements (continued)
Management has analyzed tax laws and regulations and their application to the Fund as of December 31, 2017, inclusive of the open tax return years, and does not believe that there are any uncertain tax positions that require recognition of a tax liability in the Fund’s financial statements.
U.S. GAAP requires that certain components of net assets be adjusted to reflect permanent differences between financial and tax reporting. These reclassifications have no effect on net assets or net asset values per share. As of period end, the following permanent differences attributable to the accounting for swap agreements, amortization methods on fixed income securities, the classification of investments, foreign currency transactions, the sale of stock of passive foreign investment companies, net paydown gains, the characterization of expenses and income recognized from a wholly owned subsidiary and dividends recognized for tax purposes were reclassified to the following accounts:
| | | | |
Paid-in capital | | $ | 1,087,651 | |
Distributions in excess of net investment income | | $ | 14,980,145 | |
Accumulated net realized gain | | $ | (16,067,796 | ) |
The tax character of distributions paid was as follows:
| | | | | | | | |
| | | 12/31/2017 | | | 12/31/2016 | |
Ordinary income | | $ | 237,849,708 | | | $ | 129,501,393 | |
Long-term capital gains | | | 17,464,647 | | | | — | |
| | | | | | | | |
Total | | $ | 255,314,355 | | | $ | 129,501,393 | |
As of December 31, 2017, the tax components of accumulated net earnings (losses) were as follows:
| | | | |
Undistributed ordinary income | | $ | 13,450,130 | |
Undistributed long-term capital gains | | | 76,679,275 | |
Net unrealized gains* | | | 948,994,991 | |
| | | | |
Total | | $ | 1,039,124,396 | |
| | * | The difference between book-basis and tax-basis net unrealized gains was attributable primarily to the tax deferral of losses on wash sales and straddles, the realization for tax purposes of unrealized gains on investments in passive foreign investment companies, the realization for tax purposes of unrealized gains / losses on certain futures and foreign currency contracts, the timing and recognition of partnership income, the accounting for swap agreements, the classification of investments, investment in a wholly owned subsidiary and dividends recognized for tax purposes. | |
During the year ended December 31, 2017, the Fund utilized $174,593,093 of its capital loss carryforward.
As of December 31, 2017, gross unrealized appreciation and depreciation for investments and derivatives based on cost for U.S. federal income tax purposes were as follows:
| | | | |
Tax cost | | $ | 10,075,866,909 | |
Gross unrealized appreciation | | | 1,270,603,176 | |
Gross unrealized depreciation | | | (276,181,309 | ) |
| | | | |
Net unrealized depreciation | | $ | 994,421,867 | |
The Company, on behalf of the Fund, along with certain other funds managed by the Manager and its affiliates (“Participating Funds”), is a party to a 364-day, $2.1 billion credit agreement with a group of lenders. Under this agreement, the Fund may borrow to fund shareholder redemptions. Excluding commitments designated for certain individual funds, the Participating Funds, including the Fund, can borrow up to an aggregate commitment amount of $1.6 billion at any time outstanding, subject to asset coverage and other limitations as specified in the agreement. The credit agreement has the following terms: a fee of 0.12% per annum on unused commitment amounts and interest at a rate equal to the higher of (a) one-month LIBOR (but, in any event, not less than 0.00%) on the date the loan is made plus 0.80% per annum or (b) the Fed Funds rate (but, in any event, not less than 0.00%) in effect from time to time plus 0.80% per annum on amounts borrowed. The agreement expires in April 2018 unless extended or renewed. Participating Funds paid administration, legal and arrangement fees, which, if applicable, are included in miscellaneous expenses in the Consolidated Statement of Operations. These fees were allocated among such funds based upon portions of the aggregate commitment available to them and relative net assets of Participating Funds. During the year ended December 31, 2017, the Fund did not borrow under the credit agreement.
In the normal course of business, the Fund invests in securities or other instruments and may enter into certain transactions, and such activities subject the Fund to various risks, including among others, fluctuations in the market (market risk) or failure of an issuer to meet all of its obligations. The value of securities or other instruments may also be affected by various factors, including, without limitation: (i) the general economy; (ii) the overall market as well as local, regional or global political and/or social instability; (iii) regulation, taxation or international tax treaties between various countries; or (iv) currency, interest rate and price fluctuations. The Fund’s prospectus provides details of the risks to which the Fund is subject.
The Fund may be exposed to prepayment risk, which is the risk that borrowers may exercise their option to prepay principal earlier than scheduled during periods of declining interest rates, which would force the Fund to reinvest in lower yielding securities. The Fund may also be exposed to reinvestment risk, which is the risk that
| | |
| 42 | | 2017 BLACKROCK ANNUAL REPORTTO SHAREHOLDERS |
Notes to Consolidated Financial Statements (continued)
income from the Fund’s portfolio will decline if the Fund invests the proceeds from matured, traded or called fixed- income securities at market interest rates that are below the Fund portfolio’s current earnings rate.
The Fund may be exposed to additional risks when reinvesting cash collateral in money market funds that do not seek to maintain a stable NAV per share of $1.00 and which may be subject to redemption gates or liquidity fees under certain circumstances.
Valuation Risk: The market values of equities, such as common stocks and preferred securities or equity related investments, such as futures and options, may decline due to general market conditions which are not specifically related to a particular company. They may also decline due to factors which affect a particular industry or industries. The Fund may invest in illiquid investments and may experience difficulty in selling those investments in a timely manner at the price that it believes the investments are worth. Prices may fluctuate widely over short or extended periods in response to company, market or economic news. Markets also tend to move in cycles, with periods of rising and falling prices. This volatility may cause the Fund’s NAV to experience significant increases or decreases over short periods of time. If there is a general decline in the securities and other markets, the NAV of the Fund may lose value, regardless of the individual results of the securities and other instruments in which the Fund invests.
The price the Fund could receive upon the sale of any particular portfolio investment may differ from the Fund’s valuation of the investment, particularly for securities that trade in thin or volatile markets or that are valued using a fair valuation technique or a price provided by an independent pricing service. Changes to significant unobservable inputs and assumptions (i.e., publicly traded company multiples, growth rate, time to exit) due to the lack of observable inputs may significantly impact the resulting fair value and therefore the Fund’s results of operations. As a result, the price received upon the sale of an investment may be less than the value ascribed by the Fund, and the Fund could realize a greater than expected loss or lesser than expected gain upon the sale of the investment. The Fund’s ability to value its investments may also be impacted by technological issues and/or errors by pricing services or other third party service providers.
Counterparty Credit Risk: The Fund may be exposed to counterparty credit risk, or the risk that an entity may fail to or be unable to perform on its commitments related to unsettled or open transactions. The Fund manages counterparty credit risk by entering into transactions only with counterparties that the Manager believes have the financial resources to honor their obligations and by monitoring the financial stability of those counterparties. Financial assets, which potentially expose the Fund to market, issuer and counterparty credit risks, consist principally of financial instruments and receivables due from counterparties. The extent of the Fund’s exposure to market, issuer and counterparty credit risks with respect to these financial assets is approximately their value recorded in the Consolidated Statement of Assets and Liabilities, less any collateral held by the Fund.
A derivative contract may suffer a mark-to-market loss if the value of the contract decreases due to an unfavorable change in the market rates or values of the underlying instrument. Losses can also occur if the counterparty does not perform under the contract.
The Fund’s risk of loss from counterparty credit risk on OTC derivatives is generally limited to the aggregate unrealized gain less the value of any collateral held by the Fund.
For OTC options purchased, the Fund bears the risk of loss of the amount of the premiums paid plus the positive change in market values net of any collateral held by such Fund should the counterparty fail to perform under the contracts. Options written by the Fund do not typically give rise to counterparty credit risk, as options written generally obligate the Fund, and not the counterparty, to perform. The Fund may be exposed to counterparty credit risk with respect to options written to the extent the Fund deposits collateral with its counterparty to a written option.
With exchange-traded options purchased and futures and centrally cleared swaps, there is less counterparty credit risk to the Fund since the exchange or clearinghouse, as counterparty to such instruments, guarantees against a possible default. The clearinghouse stands between the buyer and the seller of the contract; therefore, credit risk is limited to failure of the clearinghouse. While offset rights may exist under applicable law, the Fund does not have a contractual right of offset against a clearing broker or clearinghouse in the event of a default (including the bankruptcy or insolvency). Additionally, credit risk exists in exchange-traded futures and centrally cleared swaps with respect to initial and variation margin that is held in a clearing broker’s customer accounts. While clearing brokers are required to segregate customer margin from their own assets, in the event that a clearing broker becomes insolvent or goes into bankruptcy and at that time there is a shortfall in the aggregate amount of margin held by the clearing broker for all its clients, typically the shortfall would be allocated on a pro rata basis across all the clearing broker’s customers, potentially resulting in losses to the Fund.
Concentration Risk: The Fund invests a significant portion of its assets in fixed-income securities and/or uses derivatives tied to the fixed-income markets. Changes in market interest rates or economic conditions may affect the value and/or liquidity of such investments. Interest rate risk is the risk that prices of bonds and other fixed-income securities will increase as interest rates fall and decrease as interest rates rise. The Fund may be subject to a greater risk of rising interest rates due to the current period of historically low rates.
The Fund invests a significant portion of its assets in securities of issuers located in Europe or with significant exposure to European issuers or countries. The European financial markets have recently experienced volatility and adverse trends due to concerns about economic downturns in, or rising government debt levels of, several European countries. These events may spread to other countries in Europe and may affect the value and liquidity of certain of the Fund’s investments.
The United Kingdom voted on June 23, 2016 to withdraw from the European Union, which may introduce significant new uncertainties and instability in the financial markets across Europe.
| | | | |
| NOTESTO CONSOLIDATED FINANCIAL STATEMENTS | | | 43 | |
Notes to Consolidated Financial Statements (continued)
| 11. | CAPITAL SHARE TRANSACTIONS |
Transactions in capital shares for each class were as follows:
| | | | | | | | | | | | | | | | |
| | | Year Ended
12/31/2017 | | | Year Ended
12/31/2016 | |
| | | Shares | | | Amount | | | Shares | | | Amount | |
Class I | | | | | | | | | | | | | | | | |
Shares sold | | | 8,584,248 | | | $ | 143,679,674 | | | | 16,192,343 | | | $ | 244,305,933 | |
Shares issued in reinvestment of distributions | | | 2,672,740 | | | | 46,050,926 | | | | 1,521,201 | | | | 23,578,615 | |
Shares redeemed | | | (13,573,580 | ) | | | (224,416,668 | ) | | | (14,033,328 | ) | | | (214,313,552 | ) |
| | | | | | | | | | | | | | | | |
Net increase (decrease) | | | (2,316,592 | ) | | $ | (34,686,068 | ) | | | 3,680,216 | | | $ | 53,570,996 | |
| | | | | | | | | | | | | | | | |
| | | | |
Class II | | | | | | | | | | | | | | | | |
Shares sold | | | 1,384,696 | | | $ | 23,128,223 | | | | 789,548 | | | $ | 11,986,829 | |
Shares issued in reinvestment of distributions | | | 320,419 | | | | 5,499,573 | | | | 166,479 | | | | 2,573,765 | |
Shares redeemed | | | (1,525,356 | ) | | | (25,239,075 | ) | | | (3,198,273 | ) | | | (48,293,049 | ) |
| | | | | | | | | | | | | | | | |
Net increase (decrease) | | | 179,759 | | | $ | 3,388,721 | | | | (2,242,246 | ) | | $ | (33,732,455 | ) |
| | | | | | | | | | | | | | | | |
| | | | |
Class III | | | | | | | | | | | | | | | | |
Shares sold | | | 10,049,191 | | | $ | 144,899,286 | | | | 13,153,930 | | | $ | 171,434,340 | |
Shares issued in reinvestment of distributions | | | 13,347,588 | | | | 197,591,823 | | | | 7,479,020 | | | | 99,994,504 | |
Shares redeemed | | | (77,304,864 | ) | | | (1,106,232,291 | ) | | | (92,373,623 | ) | | | (1,212,809,509 | ) |
| | | | | | | | | | | | | | | | |
Net decrease | | | (53,908,085 | ) | | $ | (763,741,182 | ) | | | (71,740,673 | ) | | $ | (941,380,665 | ) |
| | | | | | | | | | | | | | | | |
Total Net Decrease | | | (56,044,918 | ) | | $ | (795,038,529 | ) | | | (70,302,703 | ) | | $ | (921,542,124 | ) |
| | | | | | | | | | | | | | | | |
Management has evaluated the impact of all subsequent events on the Fund through the date the financial statements were issued and has determined that there were no subsequent events requiring adjustment or additional disclosure in the financial statements.
| | |
| 44 | | 2017 BLACKROCK ANNUAL REPORTTO SHAREHOLDERS |
Report of the Independent Registered Public Accounting Firm
To the Shareholders of BlackRock Global Allocation V.I. Fund and the Board of Directors of
BlackRock Variable Series Funds, Inc.:
Opinion on the Financial Statements and Financial Highlights
We have audited the accompanying consolidated statement of assets and liabilities, including the consolidated schedule of investments, of BlackRock Global Allocation V.I. Fund of BlackRock Variable Series Funds, Inc. (the “Fund”), as of December 31, 2017, the related consolidated statement of operations for the year then ended, the consolidated statements of changes in net assets for each of the two years in the period then ended, the consolidated financial highlights for each of the five years in the period then ended, and the related notes. In our opinion, the consolidated financial statements and consolidated financial highlights present fairly, in all material respects, the financial position of the Fund as of December 31, 2017, and the results of its operations for the year then ended, the changes in its net assets for each of the two years in the period then ended, and the financial highlights for each of the five years in the period then ended, in conformity with accounting principles generally accepted in the United States of America.
Basis for Opinion
These financial statements and financial highlights are the responsibility of the Fund’s management. Our responsibility is to express an opinion on the Fund’s financial statements and financial highlights based on our audits. We are a public accounting firm registered with the Public Company Accounting Oversight Board (United States) (PCAOB) and are required to be independent with respect to the Fund in accordance with the U.S. federal securities laws and the applicable rules and regulations of the Securities and Exchange Commission and the PCAOB.
We conducted our audits in accordance with the standards of the PCAOB. Those standards require that we plan and perform the audit to obtain reasonable assurance about whether the financial statements and financial highlights are free of material misstatement, whether due to error or fraud. The Fund is not required to have, nor were we engaged to perform, an audit of its internal control over financial reporting. As part of our audits we are required to obtain an understanding of internal control over financial reporting but not for the purpose of expressing an opinion on the effectiveness of the Fund’s internal control over financial reporting. Accordingly, we express no such opinion.
Our audits included performing procedures to assess the risks of material misstatement of the financial statements and financial highlights, whether due to error or fraud, and performing procedures that respond to those risks. Such procedures included examining, on a test basis, evidence regarding the amounts and disclosures in the financial statements and financial highlights. Our audits also included evaluating the accounting principles used and significant estimates made by management, as well as evaluating the overall presentation of the financial statements and financial highlights. Our procedures included confirmation of securities owned as of December 31, 2017, by correspondence with the custodian and brokers; when replies were not received from brokers, we performed other auditing procedures. We believe that our audits provide a reasonable basis for our opinion.
Deloitte & Touche LLP
Boston, Massachusetts
February 19, 2018
We have served as the auditor of one or more BlackRock investment companies since 1992.
| | | | |
| REPORTOFTHE INDEPENDENT REGISTERED PUBLIC ACCOUNTING FIRM | | | 45 | |
Glossary of Terms Used in this Report
| | |
| Currency |
| |
| AUD | | Australian Dollar |
| BRL | | Brazilian Real |
| CAD | | Canadian Dollar |
| EUR | | Euro |
| GBP | | British Pound |
| JPY | | Japanese Yen |
| MXN | | Mexican Peso |
| NOK | | Norwegian Krone |
| NZD | | New Zealand Dollar |
| PLN | | Polish Zloty |
| SEK | | Swedish Krona |
| USD | | United States Dollar |
| ZAR | | South African Rand |
| | |
| Portfolio Abbreviations |
| |
| ADR | | American Depositary Receipts |
| CDX | | Credit Default Swap Index |
| CVA | | Certification Van Aandelon (Dutch Certificate) |
| ETF | | Exchange Traded Fund |
| LIBOR | | London Interbank Offered Rate |
| NASDAQ | | National Association of Securities Dealers Automated Quotations |
| OTC | | Over-The-Counter |
| PCL | | Public Company Limited |
| REIT | | Real Estate Investment Trust |
| S&P | | Standard & Poor’s |
| SPDR | | S&P Depository Receipt |
| | |
| 46 | | 2017 BLACKROCK ANNUAL REPORTTO SHAREHOLDERS |
DECEMBER 31, 2017
| | |
ANNUAL REPORT | |  |
BlackRock Variable Series Funds, Inc.
| | ▶ | | BlackRock Global Opportunities V.I. Fund |
| | |
| | Not FDIC Insured • May Lose Value • No Bank Guarantee |
| | |
| Fund Summary as of December 31, 2017 | | BlackRock Global Opportunities V.I. Fund |
Investment Objective
BlackRock Global Opportunities V.I. Fund’s (the “Fund”) investment objective is to seek long-term growth of capital.
On March 27, 2017, the Board of Directors of BlackRock Variable Series Funds, Inc. (the “Company”) approved a proposal to close the Fund to new investors and thereafter to liquidate the Fund. Effective May 30, 2017, the Fund no longer accepts purchase orders from new investors. The liquidation is expected to occur on or about March 30, 2018.
Portfolio Management Commentary
How did the Fund perform?
For the 12-month period ended December 31, 2017, the Fund outperformed its benchmark, the MSCI All Country World Index.
What factors influenced performance?
Strong relative performance for the 12-month period was seen within six of the 11 market sectors, led by the information technology (“IT”) and financials sectors. Within IT, stock selection in the internet software and services sub-industry contributed as the Fund’s position in Alibaba Group Holding Ltd. (China) performed well based on healthy earnings momentum, driven by the company’s aggressive expansion of users and increased commerce revenue. Within the financials sector, stock selection within the insurance sub-industry helped performance after shares of Ping An Insurance Group Co. of China Ltd. traded higher. The company has made additional investments in online services and has seen insurance demand rise along with China’s expanding middle class.
Conversely, stock selection in private holdings weighed on performance as the e-commerce firm Snapdeal (India) was hurt by its failure to maintain growth and control costs, as well as by declining sales volume. Similarly, the Fund’s position in Uber Technologies, Inc. also a private holding, detracted as the company dealt with turmoil in its upper management along with regulatory challenges.
Describe recent portfolio activity.
During the 12-month period, the Fund’s holdings in the financials and industrials sectors were increased, while exposure to consumer discretionary and materials was reduced. These sector decisions resulted in increased exposure to the emerging markets and Asia, and decreased exposure to North America and Europe.
Describe portfolio positioning at period end.
At period end, from a sector perspective, the Fund was most overweight in the financials and health care sectors, funded by underweights in the consumer staples and consumer discretionary sectors. Regionally, the Fund was most overweight in Europe and the emerging markets, with underweights to North America and the Pacific Basin.
The views expressed reflect the opinions of BlackRock as of the date of this report and are subject to change based on changes in market, economic or other conditions. These views are not intended to be a forecast of future events and are no guarantee of future results.
Portfolio Information
GEOGRAPHIC ALLOCATION
| | | | |
| Country | | Percent of
Net Assets | |
United States | | | 47 | % |
China | | | 7 | |
Japan | | | 6 | |
United Kingdom | | | 6 | |
France | | | 4 | |
India | | | 3 | |
South Korea | | | 3 | |
Switzerland | | | 3 | |
Italy | | | 3 | |
Netherlands | | | 2 | |
Other(a) | | | 13 | |
Short-Term Securities | | | 10 | |
Liabilities in Excess of Other Assets | | | (7 | ) |
| | (a) | Includes holdings within countries that are 1% or less of net assets. Please refer to the Schedule of Investments for such countries. | |
| | |
| 2 | | 2017 BLACKROCK ANNUAL REPORTTO SHAREHOLDERS |
| | |
| Fund Summary as of December 31, 2017 (continued) | | BlackRock Global Opportunities V.I. Fund |
TOTAL RETURN BASED ON A $10,000 INVESTMENT
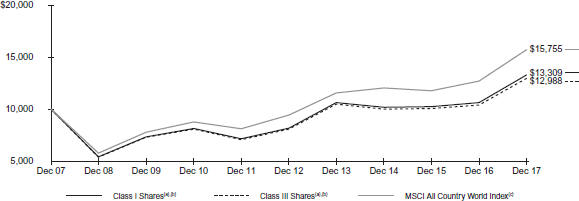
| (a) | Assuming transaction costs, if any, and other operating expenses, including investment advisory fees. Does not include insurance-related fees and expenses. The returns for Class III Shares prior to June 23, 2008, the recommencement of operations of Class III Shares, are based upon the performance of the Fund’s Class I Shares, as adjusted to reflect the distribution (12b-1) fees applicable to Class III Shares. |
| (b) | Under normal conditions, the Fund will invest at least 75% of its total assets in global equity securities of any market capitalization, selected for their above-average return potential. The returns prior to October 1, 2011 are the returns of the Fund when it followed different investment strategies. |
| (c) | A free float-adjusted market capitalization weighted index that is designed to measure the equity market performance of developed and emerging markets. The index consists of 47 country indexes comprising 23 developed and 24 emerging market country indexes. |
Performance Summary for the Period Ended December 31, 2017
| | | | | | | | | | | | | | | | | | | | | | | | | | | | | | | | | | | | | |
| | | | | | | | | Average Annual Total Returns |
| | | | | 6-Month
Total Returns(e) | | | | 1 Year(e) | | | | 5 Years(e) | | | | 10 Years(e) |
Class I(d) | | | | | | 10.12 | % | | | | | | | | | 25.19 | % | | | | | | | | | 10.21 | % | | | | | | | | | 2.90 | % |
| Class III(d) | | | | 9.98 | | | | 24.89 | | | | 9.93 | | | | 2.65(f) |
MSCI All Country World Index | | | | | | 11.21 | | | | | | | | | | 23.97 | | | | | | | | | | 10.80 | | | | | | | | | | 4.65 | |
| | (d) | Average annual and cumulative total returns are based on changes in net asset value (“NAV”) for the periods shown, and assume reinvestment of all distributions at NAV on the ex-dividend date. Insurance-related fees and expenses are not reflected in these returns. The returns prior to October 1, 2011 are the returns of the Fund when it followed different investment strategies. | |
| | (e) | For a portion of the period, the Fund’s investment adviser waived a portion of its fee. Without such waiver, the Fund’s performance would have been lower. | |
| | (f) | The returns for Class III Shares prior to June 23, 2008, the recommencement of operations of Class III Shares, are based upon performance of the Fund’s Class I Shares, as adjusted to reflect the distribution (12b-1) fees applicable to Class III Shares. | |
Past performance is not indicative of future results. Performance results do not reflect the deduction of taxes that a shareholder would pay on Fund distributions or the redemption of Fund shares.
Performance results may include adjustments made for financial reporting purposes in accordance with U.S. generally accepted accounting principles.
Expense Example
| | | | | | | | | | | | | | | | | | | | | | | | | | | | | | | | | | | | | | | | |
| | | Actual | | | | Hypothetical(b) | | |
| | | Beginning
Account Value
(07/01/17) | | Ending
Account Value
(12/31/17) | | Expenses Paid
During the Period(a) | | | | Beginning
Account Value
(07/01/17) | | Ending
Account Value
(12/31/17) | | Expenses Paid
During the Period(a) | | Annualized
Expense
Ratio |
| | | | | | | | | | | | | | | | | |
Class I | | | $ | 1,000.00 | | | | $ | 1,101.20 | | | | $ | 5.14 | | | | | | | | | $ | 1,000.00 | | | | $ | 1,020.32 | | | | $ | 4.94 | | | | | 0.97 | % |
Class III | | | | 1,000.00 | | | | | 1,100.40 | | | | | 6.46 | | | | | | | | | | 1,000.00 | | | | | 1,019.06 | | | | | 6.21 | | | | | 1.22 | |
| | (a) | For each class of the Fund, expenses are equal to the annualized expense ratio for the class, multiplied by the average account value over the period, multiplied by 184/365 (to reflect the one-half year period shown). | |
| | (b) | Hypothetical 5% annual return before expenses is calculated by prorating the number of days in the most recent fiscal half year divided by 365. | |
See “Disclosure of Expenses” on the following page for further information on how expenses were calculated.
| | |
| Disclosure of Expenses | | BlackRock Global Opportunities V.I. Fund |
Shareholders of the Fund may incur the following charges: (a) transactional expenses, such as sales charges; and (b) operating expenses, including investment advisory fees, service and distribution fees, including 12b-1 fees, acquired fund fees and expenses, and other fund expenses. The expense example on the previous page (which is based on a hypothetical investment of $1,000 invested on July 1, 2017 and held through December 31, 2017) is intended to assist shareholders both in calculating expenses based on an investment in the Fund and in comparing these expenses with similar costs of investing in other mutual funds.
The expense example provides information about actual account values and actual expenses. In order to estimate the expenses a shareholder paid during the period covered by this report, shareholders can divide their account value by $1,000 and then multiply the result by the number corresponding to their share class under the heading entitled “Expenses Paid During the Period.”
The expense example also provides information about hypothetical account values and hypothetical expenses based on the Fund’s actual expense ratio and an assumed rate of return of 5% per year before expenses. In order to assist shareholders in comparing the ongoing expenses of investing in the Fund and other funds, compare the 5% hypothetical example with the 5% hypothetical examples that appear in shareholder reports of other funds.
The expenses shown in the expense example are intended to highlight shareholders’ ongoing costs only and do not reflect any transactional expenses, such as sales charges, if any. Therefore, the hypothetical example is useful in comparing ongoing expenses only, and will not help shareholders determine the relative total expenses of owning different funds. If these transactional expenses were included, shareholder expenses would have been higher.
Derivative Financial Instruments
The Fund may invest in various derivative financial instruments. These instruments are used to obtain exposure to a security, commodity, index, market, and/or other assets without owning or taking physical custody of securities, commodities and/or other referenced assets or to manage market, equity, credit, interest rate, foreign currency exchange rate, commodity and/or other risks. Derivative financial instruments may give rise to a form of economic leverage and involve risks, including the imperfect correlation between the value of a derivative financial instrument and the underlying asset, possible default of the counterparty to the transaction or illiquidity of the instrument. The Fund’s successful use of a derivative financial instrument depends on the investment adviser’s ability to predict pertinent market movements accurately, which cannot be assured. The use of these instruments may result in losses greater than if they had not been used, may limit the amount of appreciation the Fund can realize on an investment and/or may result in lower distributions paid to shareholders. The Fund’s investments in these instruments, if any, are discussed in detail in the Notes to Financial Statements.
| | |
| 4 | | 2017 BLACKROCK ANNUAL REPORTTO SHAREHOLDERS |
| | |
Schedule of Investments December 31, 2017 | | BlackRock Global Opportunities V.I. Fund (Percentages shown are based on Net Assets) |
| | | | | | | | |
| Security | | Shares | | | Value | |
Common Stocks — 92.5% | | | | | | | | |
| | |
| Australia — 0.0% | | | | | | |
Ensogo Ltd. (a)(b) | | | 18,821 | | | $ | — | |
| Belgium — 1.2% | | | | | | |
Anheuser-Busch InBev SA | | | 3,208 | | | | 358,145 | |
| Brazil — 0.6% | | | | | | |
Embraer SA — ADR | | | 7,347 | | | | 175,814 | |
| Canada — 0.6% | | | | | | |
Encana Corp. | | | 12,878 | | | | 171,809 | |
| China — 6.5% | | | | | | |
AIA Group Ltd. | | | 40,089 | | | | 340,983 | |
Alibaba Group Holding Ltd. — ADR (a)(c) | | | 1,189 | | | | 205,019 | |
Anhui Conch Cement Co. Ltd., H Shares | | | 42,500 | | | | 199,484 | |
Baidu, Inc. — ADR (a) | | | 902 | | | | 211,257 | |
China Construction Bank Corp., H Shares | | | 255,000 | | | | 234,741 | |
Ping An Insurance Group Co. of China Ltd., H Shares | | | 45,500 | | | | 471,929 | |
Weichai Power Co. Ltd., H Shares | | | 281,000 | | | | 306,982 | |
| | | | | | | | |
| | | | | | | 1,970,395 | |
| France — 4.0% | | | | | | |
AXA SA | | | 11,682 | | | | 346,174 | |
Dassault Aviation SA | | | 174 | | | | 270,547 | |
Iliad SA | | | 1,302 | | | | 311,980 | |
Renault SA | | | 2,856 | | | | 286,679 | |
| | | | | | | | |
| | | | | | | 1,215,380 | |
| Germany — 0.9% | | | | | | |
KION Group AG (c) | | | 3,054 | | | | 262,891 | |
| Hong Kong — 0.5% | | | | | | |
Melco Resorts & Entertainment Ltd. — ADR (c) | | | 4,938 | | | | 143,399 | |
| India — 3.3% | | | | | | |
Dish TV India Ltd. (a) | | | 72,147 | | | | 92,479 | |
Federal Bank Ltd. | | | 85,884 | | | | 145,690 | |
HDFC Bank Ltd. (b) | | | 9,443 | | | | 279,417 | |
ICICI Bank Ltd. | | | 82,758 | | | | 405,602 | |
Srei Infrastructure Finance Ltd. | | | 38,989 | | | | 60,852 | |
| | | | | | | | |
| | | | | | | 984,040 | |
| Indonesia — 1.4% | | | | | | |
Bank Negara Indonesia Persero Tbk PT | | | 418,400 | | | | 305,300 | |
Matahari Department Store Tbk PT | | | 173,289 | | | | 127,304 | |
| | | | | | | | |
| | | | | | | 432,604 | |
| Ireland — 0.5% | | | | | | |
Medtronic PLC | | | 1,767 | | | | 142,685 | |
| Italy — 2.6% | | | | | | |
Azimut Holding SpA (c) | | | 14,128 | | | | 270,284 | |
Eni SpA | | | 14,348 | | | | 237,429 | |
UniCredit SpA (a) | | | 14,438 | | | | 269,329 | |
| | | | | | | | |
| | | | | | | 777,042 | |
| Japan — 6.0% | | | | | | |
Alps Electric Co. Ltd. | | | 5,718 | | | | 162,651 | |
FANUC Corp. | | | 1,264 | | | | 303,229 | |
Nintendo Co. Ltd. | | | 937 | | | | 337,410 | |
Nippon Yusen KK (a)(c) | | | 7,700 | | | | 187,353 | |
SMC Corp. | | | 500 | | | | 205,192 | |
SoftBank Group Corp. | | | 3,035 | | | | 240,283 | |
Sumitomo Mitsui Financial Group, Inc. | | | 8,781 | | | | 378,501 | |
| | | | | | | | |
| | | | | | | 1,814,619 | |
| Mexico — 0.8% | | | | | | |
Fomento Economico Mexicano SAB de CV — ADR | | | 2,454 | | | | 230,431 | |
| Netherlands — 1.6% | | | | | | |
Aalberts Industries NV | | | 5,241 | | | | 266,272 | |
| | | | | | | | |
| Security | | Shares | | | Value | |
| Netherlands (continued) | | | | | | |
Euronext NV (d) | | | 3,740 | | | $ | 231,987 | |
| | | | | | | | |
| | | | | | | 498,259 | |
| New Zealand — 0.5% | | | | | | |
Xero Ltd. (a) | | | 7,540 | | | | 167,957 | |
| Norway — 1.0% | | | | | | |
Statoil ASA | | | 14,682 | | | | 314,319 | |
| Peru — 1.5% | | | | | | |
Credicorp Ltd. | | | 2,152 | | | | 446,389 | |
| Portugal — 1.0% | | | | | | |
Galp Energia SGPS SA | | | 16,410 | | | | 301,496 | |
| South Korea — 2.7% | | | | | | |
Amorepacific Corp. | | | 634 | | | | 180,331 | |
LG Chem Ltd. | | | 898 | | | | 339,723 | |
Samsung SDI Co. Ltd. (a) | | | 1,597 | | | | 304,461 | |
| | | | | | | | |
| | | | | | | 824,515 | |
| Spain — 0.9% | | | | | | |
Cellnex Telecom SAU (d) | | | 11,202 | | | | 286,607 | |
| Sweden — 1.3% | | | | | | |
Atlas Copco AB, A Shares | | | 9,019 | | | | 389,225 | |
| Switzerland — 2.6% | | | | | | |
Nestle SA, Registered Shares | | | 4,816 | | | | 414,062 | |
UBS Group AG, Registered Shares (a) | | | 20,044 | | | | 368,264 | |
| | | | | | | | |
| | | | | | | 782,326 | |
| Taiwan — 0.9% | | | | | | |
Taiwan Semiconductor Manufacturing Co. Ltd. | | | 34,577 | | | | 264,759 | |
| United Kingdom — 6.4% | | | | | | |
Aptiv PLC | | | 3,145 | | | | 266,790 | |
AstraZeneca PLC | | | 2,525 | | | | 174,239 | |
CNH Industrial NV (c) | | | 26,871 | | | | 359,494 | |
Delphi Technologies PLC | | | 1,048 | | | | 54,988 | |
GlaxoSmithKline PLC | | | 8,129 | | | | 143,958 | |
Imperial Brands PLC | | | 6,404 | | | | 273,160 | |
Metro Bank PLC (a) | | | 4,017 | | | | 193,918 | |
Unilever PLC | | | 8,199 | | | | 454,766 | |
| | | | | | | | |
| | | | | | | 1,921,313 | |
| United States — 43.2% | | | | | | |
Adobe Systems, Inc. (a) | | | 2,233 | | | | 391,311 | |
Allergan PLC | | | 711 | | | | 116,305 | |
Alphabet, Inc., Class C (a) | | | 433 | | | | 453,091 | |
Amazon.com, Inc. (a) | | | 489 | | | | 571,871 | |
American International Group, Inc. | | | 5,112 | | | | 304,573 | |
Amgen, Inc. | | | 1,093 | | | | 190,073 | |
Apple Inc. | | | 5,125 | | | | 867,304 | |
Assured Guaranty Ltd. | | | 4,297 | | | | 145,539 | |
Biogen, Inc. (a) | | | 496 | | | | 158,011 | |
Boston Scientific Corp. (a) | | | 10,302 | | | | 255,387 | |
Calpine Corp. (a) | | | 15,420 | | | | 233,305 | |
Centene Corp. (a) | | | 2,784 | | | | 280,850 | |
Cigna Corp. | | | 1,241 | | | | 252,035 | |
Comcast Corp., Class A | | | 4,357 | | | | 174,498 | |
Concho Resources, Inc. (a) | | | 1,913 | | | | 287,371 | |
Crown Holdings, Inc. (a) | | | 3,500 | | | | 196,875 | |
Duke Energy Corp. | | | 3,097 | | | | 260,489 | |
E*TRADE Financial Corp. (a)(c) | | | 3,574 | | | | 177,163 | |
Eastman Chemical Co. | | | 2,894 | | | | 268,100 | |
Eli Lilly & Co. | | | 3,237 | | | | 273,397 | |
EOG Resources, Inc. | | | 3,651 | | | | 393,979 | |
Facebook, Inc., Class A (a) | | | 2,871 | | | | 506,617 | |
Humana, Inc. | | | 1,275 | | | | 316,289 | |
Intercontinental Exchange, Inc. | | | 2,716 | | | | 191,641 | |
Kennedy-Wilson Holdings, Inc. (c) | | | 9,179 | | | | 159,256 | |
Lowe’s Cos., Inc. | | | 2,883 | | | | 267,946 | |
Mastercard, Inc., Class A | | | 3,063 | | | | 463,616 | |
| | | | |
| SCHEDULE OF INVESTMENTS | | | 5 | |
| | |
Schedule of Investments (continued) December 31, 2017 | | BlackRock Global Opportunities V.I. Fund (Percentages shown are based on Net Assets) |
| | | | | | | | |
| Security | | Shares | | | Value | |
| United States (continued) | | | | | | |
Merck & Co., Inc. | | | 3,880 | | | $ | 218,328 | |
Mosaic Co. | | | 12,631 | | | | 324,111 | |
PayPal Holdings, Inc. (a) | | | 3,593 | | | | 264,517 | |
Pfizer, Inc. | | | 5,025 | | | | 182,005 | |
Pioneer Natural Resources Co. | | | 1,403 | | | | 242,508 | |
PPL Corp. | | | 4,503 | | | | 139,368 | |
RSP Permian, Inc. (a) | | | 3,895 | | | | 158,449 | |
salesforce.com, Inc. (a) | | | 2,118 | | | | 216,523 | |
ServiceMaster Global Holdings, Inc. (a) | | | 5,673 | | | | 290,855 | |
Skyworks Solutions, Inc. | | | 1,736 | | | | 164,833 | |
Starbucks Corp. | | | 4,446 | | | | 255,334 | |
Summit Materials, Inc., Class A (a)(c) | | | 7,405 | | | | 232,813 | |
SVB Financial Group (a) | | | 1,275 | | | | 298,057 | |
Union Pacific Corp. | | | 2,022 | | | | 271,150 | |
UnitedHealth Group, Inc. | | | 1,174 | | | | 258,820 | |
VEREIT, Inc. | | | 19,425 | | | | 151,321 | |
Walt Disney Co. | | | 2,842 | | | | 305,543 | |
Wells Fargo & Co. | | | 9,270 | | | | 562,411 | |
WestRock Co. | | | 3,350 | | | | 211,753 | |
Wynn Resorts Ltd. | | | 797 | | | | 134,366 | |
| | | | | | | | |
| | | | | | | 13,039,957 | |
Total Common Stocks — 92.5%
(Cost: $21,086,352) | | | | | | | 27,916,376 | |
| | | | | | | | |
| | |
Investment Companies — 3.0% | | | | | | | | |
WisdomTree Japan Hedged Equity Fund (c) | | | 15,386 | | | | 912,851 | |
| | | | | | | | |
(Cost: $903,120) | | | | | | | 912,851 | |
| | | | | | | | |
| | | | | | | | |
| Security | | Shares | | | Value | |
Preferred Stocks — 1.3% | | | | | | | | |
| | |
| India — 0.1% | | | | | | |
Jasper Infotech Private Ltd., Series F (Acquired 5/07/14, cost $85,441) (a)(b)(e) | | | 12 | | | $ | 18,913 | |
Jasper Infotech Private Ltd., Series G (Acquired 10/29/14, cost $33,723) (a)(b)(e) | | | 4 | | | | 7,674 | |
| | | | | | | | |
| | | | | | | 26,587 | |
| | | | | | | | |
| United States — 1.2% | | | | | | |
Uber Technologies, Inc., Series D (Acquired 6/10/14, cost $172,691) (a)(b)(e) | | | 11,132 | | | | 367,022 | |
| | | | | | | | |
Total Preferred Stocks — 1.3%
(Cost: $291,855) | | | | | | | 393,609 | |
| | | | | | | | |
| | |
Total Long-Term Investments — 96.8%
(Cost: $22,281,327) | | | | | | | 29,222,836 | |
| | | | | | | | |
| | |
Short-Term Securities — 10.4% | | | | | | | | |
BlackRock Liquidity Funds, T-Fund, Institutional Class, 1.17% (f)(h) | | | 1,060,023 | | | | 1,060,023 | |
SL Liquidity Series, LLC, Money Market Series, 1.53% (f)(g)(h) | | | 2,057,187 | | | | 2,056,981 | |
| | | | | | | | |
Total Short-Term Securities — 10.4%
(Cost: $3,117,004) | | | | | | | 3,117,004 | |
| | | | | | | | |
| | |
Total Investments — 107.2%
(Cost: $25,398,331) | | | | | | | 32,339,840 | |
Liabilities in Excess of Other Assets — (7.2)% | | | | (2,158,707) | |
| | | | | | | | |
Net Assets — 100.0% | | | $ | 30,181,133 | |
| | | | | | | | |
| (a) | Non-income producing security. | |
| (b) | Security is valued using significant unobservable inputs and is classified as Level 3 in the fair value hierarchy. | |
| (c) | Security, or a portion of the security, is on loan. | |
| (d) | Security exempt from registration pursuant to Rule 144A under the Securities Act of 1933, as amended. These securities may be resold in transactions exempt from registration to qualified institutional investors. | |
| (e) | Restricted security as to resale, excluding 144A securities. As of period end, the Fund held restricted securities with a current value of $393,609 and an original cost of $291,855, which was 1.3% of its net assets. | |
| (f) | Annualized 7-day yield as of period end. | |
| (g) | Security was purchased with the cash collateral from loaned securities. | |
| (h) | During the period ended December 31, 2017, investments in issuers considered to be affiliates of the Fund for purposes of Section 2(a)(3) of the Investment Company Act of 1940, as amended, were as follows: | |
| | | | | | | | | | | | | | | | | | | | | | | | | | | | |
| Affiliate | | Shares Held at
12/31/16 | | | Net
Activity | | | Shares Held at
12/31/17 | | | Value at
12/31/17 | | | Income | | | Net
Realized
Gain (Loss) | | | Change in
Unrealized
Appreciation
(Depreciation) | |
BlackRock Liquidity Funds, T-Fund, Institutional Class | | | 705,384 | | | | 354,639 | | | | 1,060,023 | | | $ | 1,060,023 | | | $ | 5,485 | | | | $ 3 | | | | $— | |
SL Liquidity Series, LLC, Money Market Series | | | 1,399,283 | | | | 657,904 | | | | 2,057,187 | | | | 2,056,981 | | | | 17,526 | (a) | | | (73 | ) | | | 83 | |
| | | | | | | | | | | | | | | | | | | | | | | | | | | | |
| | | | | | | | | | | | | | $ | 3,117,004 | | | $ | 23,011 | | | | $(70 | ) | | | $83 | |
| | | | | | | | | | | | | | | | | | | | | | | | | | | | |
| | (a) | Represents securities lending income earned from the reinvestment of cash collateral from loaned securities, net of fees and collateral investment expenses, and other payments to and from borrowers of securities. | |
| | |
| 6 | | 2017 BLACKROCK ANNUAL REPORTTO SHAREHOLDERS |
| | |
Schedule of Investments (continued) December 31, 2017 | | BlackRock Global Opportunities V.I. Fund |
Derivative Financial Instruments Outstanding as of Period End
Forward Foreign Currency Exchange Contracts
| | | | | | | | | | | | | | | | | | | | | | |
Currency Purchased | | | Currency Sold | | | Counterparty | | Settlement
Date | | | Unrealized
Appreciation
(Depreciation) | |
| AUD | | | 1,006,300 | | | | USD | | | | 773,602 | | | Australia & New Zealand Bank Group | | | 01/11/18 | | | $ | 11,570 | |
| CAD | | | 977,000 | | | | USD | | | | 763,383 | | | Australia & New Zealand Bank Group | | | 01/11/18 | | | | 14,023 | |
| CHF | | | 81,400 | | | | USD | | | | 82,728 | | | Northern Trust Corp. | | | 01/11/18 | | | | 886 | |
| DKK | | | 1,344,900 | | | | USD | | | | 214,358 | | | Barclays Bank PLC | | | 01/11/18 | | | | 2,583 | |
| GBP | | | 497,600 | | | | USD | | | | 661,320 | | | National Australia Bank Ltd. | | | 01/11/18 | | | | 10,822 | |
| NZD | | | 21,000 | | | | USD | | | | 14,522 | | | Australia & New Zealand Bank Group | | | 01/11/18 | | | | 358 | |
| RUB | | | 7,635,800 | | | | USD | | | | 130,515 | | | BNP Paribas S.A. | | | 01/11/18 | | | | 1,799 | |
| SGD | | | 201,600 | | | | USD | | | | 148,204 | | | HSBC Bank PLC | | | 01/11/18 | | | | 2,564 | |
| USD | | | 5,316 | | | | NOK | | | | 42,600 | | | Credit Suisse International | | | 01/11/18 | | | | 125 | |
| USD | | | 248,526 | | | | NOK | | | | 1,991,200 | | | Standard Chartered Bank | | | 01/11/18 | | | | 5,912 | |
| ZAR | | | 2,441,000 | | | | USD | | | | 178,500 | | | Goldman Sachs International | | | 01/11/18 | | | | 18,365 | |
| ZAR | | | 768,500 | | | | USD | | | | 53,844 | | | National Australia Bank Ltd. | | | 01/11/18 | | | | 8,135 | |
| | | | | | | | | | | | | | | | | | | | | | |
| | | | | | | | | | | | | | | | | | | | | 77,142 | |
| | | | | | | | | | | | | | | | | | | | | | |
| NOK | | | 80,000 | | | | USD | | | | 9,807 | | | Goldman Sachs International | | | 01/11/18 | | | | (59 | ) |
| USD | | | 142,005 | | | | CAD | | | | 181,500 | | | Goldman Sachs International | | | 01/11/18 | | | | (2,416 | ) |
| USD | | | 753,608 | | | | EUR | | | | 635,500 | | | Royal Bank of Canada | | | 01/11/18 | | | | (9,521 | ) |
| USD | | | 136,192 | | | | GBP | | | | 103,300 | | | Royal Bank of Canada | | | 01/11/18 | | | | (3,342 | ) |
| USD | | | 129,815 | | | | NZD | | | | 189,200 | | | HSBC Bank PLC | | | 01/11/18 | | | | (4,248 | ) |
| USD | | | 45,213 | | | | NZD | | | | 65,900 | | | National Australia Bank Ltd. | | | 01/11/18 | | | | (1,482 | ) |
| USD | | | 111,990 | | | | SEK | | | | 936,000 | | | Royal Bank of Canada | | | 01/11/18 | | | | (2,209 | ) |
| | | | | | | | | | | | | | | | | | | | | | |
| | | | | | | | | | | | | | | | | | | | | | (23,277 | ) |
Net Unrealized Appreciation | | | | | | $ | 53,865 | |
| | | | | | | | | | | | | | | | | | | | | | |
| | | | |
| SCHEDULE OF INVESTMENTS | | | 7 | |
| | |
Schedule of Investments (continued) December 31, 2017 | | BlackRock Global Opportunities V.I. Fund |
Derivative Financial Instruments Categorized by Risk Exposure
As of period end, the fair values of derivative financial instruments located in the Statement of Assets and Liabilities were as follows:
| | | | | | | | | | | | | | | | | | | | | | | | | | | | | | |
| Assets — Derivative Financial Instruments | | Commodity
Contracts | | | Credit
Contracts | | | Equity
Contracts | | | Foreign
Currency
Exchange
Contracts | | | Interest
Rate
Contracts | | | Other
Contracts | | | Total | |
Forward foreign currency exchange contracts | | Unrealized appreciation on forward foreign currency exchange contracts | | | — | | | | — | | | | — | | | | $77,142 | | | | — | | | | — | | | | $77,142 | |
| | | | | | | | | | | | | | | | | | | | | | | | |
| Liabilities — Derivative Financial Instruments | | | | | | | | | | | | | | | | | | | | | |
Forward foreign currency exchange contracts | | Unrealized depreciation on forward foreign currency exchange contracts | | | — | | | | — | | | | — | | | | $23,277 | | | | — | | | | — | | | | $23,277 | |
For the year ended December 31, 2017, the effect of derivative financial instruments in the Statement of Operations was as follows:
| | | | | | | | | | | | | | | | | | | | | | | | | | | | | | |
| | | | | Commodity
Contracts | | | Credit
Contracts | | | Equity
Contracts | | | Foreign
Currency
Exchange
Contracts | | | Interest
Rate
Contracts | | | Other
Contracts | | | Total | |
Net Realized Gain from: | | | | | | | | | | | | | | | | | | | | | | | | | | | | | | |
Forward foreign currency exchange contracts | | | — | | | | — | | | | — | | | $ | 58,221 | | | | — | | | | — | | | $ | 58,221 | |
Options written | | | | | — | | | | — | | | $ | 15,170 | | | | — | | | | — | | | | — | | | | 15,170 | |
| | | | | — | | | | — | | | $ | 15,170 | | | $ | 58,221 | | | | — | | | | — | | | $ | 73,391 | |
| | | | | | | | | | | | | | | | | | | | | | | | | | | | | | |
| | | | | | | | | | | | | | | | | | | | | | | | | | | | | | |
Net Change in Unrealized Appreciation (Depreciation) on: | | | | | | | | | | | | | | | | | | | | | | | | | |
Forward foreign currency exchange contracts | | | — | | | | — | | | | — | | | $ | 117,569 | | | | — | | | | — | | | $ | 117,569 | |
Options written | | | | | — | | | | — | | | $ | 58 | | | | — | | | | — | | | | | | | | 58 | |
| | | | | — | | | | — | | | $ | 58 | | | $ | 117,569 | | | | — | | | | — | | | $ | 117,627 | |
| | | | | | | | | | | | | | | | | | | | | | | | | | | | | | |
Average Quarterly Balances of Outstanding Derivative Financial Instruments
| | | | |
Forward foreign currency exchange contracts: | | | | |
Average amounts purchased — in USD | | $ | 2,119,069 | |
Average amounts sold — in USD | | | 4,190,205 | |
Options: | | | | |
Average value of option contracts written | | | 1,846 | |
For more information about the Fund’s investment risks regarding derivative financial instruments, refer to the Notes to Financial Statements.
| | |
| 8 | | 2017 BLACKROCK ANNUAL REPORTTO SHAREHOLDERS |
| | |
Schedule of Investments (continued) December 31, 2017 | | BlackRock Global Opportunities V.I. Fund |
Derivative Financial Instruments — Offsetting as of Period End
The Fund’s derivative assets and liabilities (by type) were as follows:
| | | | | | | | |
| | | Assets | | | Liabilities | |
Derivative Financial Instruments: | | | | | | | | |
Forward foreign currency exchange contracts | | $ | 77,142 | | | $ | 23,277 | |
| | | | | | | | |
Total derivative assets and liabilities in the Statement of Assets and Liabilities | | | 77,142 | | | | 23,277 | |
| | | | | | | | |
Derivatives not subject to a Master Netting Agreement or similar agreement (“MNA”) | | | — | | | | — | |
| | | | | | | | |
Total derivative assets and liabilities subject to an MNA | | $ | 77,142 | | | $ | 23,277 | |
| | | | | | | | |
The following table presents the Fund’s derivative assets and liabilities by counterparty net of amounts available for offset under an MNA and net of the related collateral received and pledged by the Fund:
| | | | | | | | | | | | | | | | | | | | | | | | | |
| Counterparty | | Derivative Assets
Subject to an MNA
by Counterparty | | Derivatives
Available for Offset(a) | | Non-cash Collateral
Received | | Cash Collateral
Received | | Net Amount of
Derivative Assets(b) |
Australia & New Zealand Bank Group | | | $ | 25,951 | | | | | $— | | | | | $— | | | | | $— | | | | $ | 25,951 | |
Barclays Bank PLC | | | | 2,583 | | | | | — | | | | | — | | | | | — | | | | | 2,583 | |
BNP Paribas S.A. | | | | 1,799 | | | | | — | | | | | — | | | | | — | | | | | 1,799 | |
Credit Suisse International | | | | 125 | | | | | — | | | | | — | | | | | — | | | | | 125 | |
Goldman Sachs International | | | | 18,365 | | | | | (2,475 | ) | | | | — | | | | | — | | | | | 15,890 | |
HSBC Bank PLC | | | | 2,564 | | | | | (2,564 | ) | | | | — | | | | | — | | | | | — | |
National Australia Bank Ltd. | | | | 18,957 | | | | | (1,482 | ) | | | | — | | | | | — | | | | | 17,475 | |
Northern Trust Corp. | | | | 886 | | | | | — | | | | | — | | | | | — | | | | | 886 | |
Standard Chartered Bank | | | | 5,912 | | | | | — | | | | | — | | | | | — | | | | | 5,912 | |
| | | | | | | | | | | | | | | | | | | | | | | | | |
| | | $ | 77,142 | | | | $ | (6,521 | ) | | | | — | | | | | — | | | | $ | 70,621 | |
| | | | | | | | | | | | | | | | | | | | | | | | | |
| | | | | | | | | | | | | | | | | | | | | | | | | |
| Counterparty | | Derivative Liabilities
Subject to an MNA
by Counterparty | | Derivatives
Available for Offset(a) | | Non-cash Collateral
Pledged | | Cash Collateral
Pledged | | Net Amount of
Derivative Liabilities(c) |
Goldman Sachs International | | | $ | 2,475 | | | | $ | (2,475 | ) | | | $ | — | | | | $ | — | | | | | $— | |
HSBC Bank PLC | | | | 4,248 | | | | | (2,564 | ) | | | | — | | | | | — | | | | | 1,684 | |
National Australia Bank Ltd. | | | | 1,482 | | | | | (1,482 | ) | | | | — | | | | | — | | | | | — | |
Royal Bank of Canada | | | | 15,072 | | | | | — | | | | | — | | | | | — | | | | | 15,072 | |
| | | | | | | | | | | | | | | | | | | | | | | | | |
| | | $ | 23,277 | | | | $ | (6,521 | ) | | | | — | | | | | — | | | | $ | 16,756 | |
| | | | | | | | | | | | | | | | | | | | | | | | | |
| | (a) | The amount of derivatives available for offset is limited to the amount of derivative assets and/or liabilities that are subject to an MNA. | |
| | (b) | Net amount represents the net amount receivable from the counterparty in the event of default. | |
| | (c) | Net amount represents the net amount payable due to the counterparty in the event of default. | |
| | | | |
| SCHEDULE OF INVESTMENTS | | | 9 | |
| | |
Schedule of Investments (continued) December 31, 2017 | | BlackRock Global Opportunities V.I. Fund |
Fair Value Hierarchy as of Period End
Various inputs are used in determining the fair value of investments and derivative financial instruments. For information about the Fund’s policy regarding valuation of investments and derivative financial instruments, refer to the Notes to Financial Statements.
The following tables summarize the Fund’s investments and derivative financial instruments categorized in the disclosure hierarchy:
| | | | | | | | | | | | | | | | |
| | | Level 1 | | | Level 2 | | | Level 3 | | | Total | |
Assets: | | | | | | | | | | | | | | | | |
Investments: | | | | | | | | | | | | | | | | |
Long-Term Investments: | | | | | | | | | | | | | | | | |
Common Stocks: | | | | | | | | | | | | | | | | |
Australia | | $ | — | | | $ | — | | | $ | — | | | $ | — | |
Belgium | | | — | | | | 358,145 | | | | — | | | | 358,145 | |
Brazil | | | 175,814 | | | | — | | | | — | | | | 175,814 | |
Canada | | | 171,809 | | | | — | | | | — | | | | 171,809 | |
China | | | 416,276 | | | | 1,554,119 | | | | — | | | | 1,970,395 | |
France | | | — | | | | 1,215,380 | | | | — | | | | 1,215,380 | |
Germany | | | — | | | | 262,891 | | | | — | | | | 262,891 | |
Hong Kong | | | 143,399 | | | | — | | | | — | | | | 143,399 | |
India | | | — | | | | 704,623 | | | | 279,417 | | | | 984,040 | |
Indonesia | | | 305,300 | | | | 127,304 | | | | — | | | | 432,604 | |
Ireland | | | 142,685 | | | | — | | | | — | | | | 142,685 | |
Italy | | | — | | | | 777,042 | | | | — | | | | 777,042 | |
Japan | | | — | | | | 1,814,619 | | | | — | | | | 1,814,619 | |
Mexico | | | 230,431 | | | | — | | | | — | | | | 230,431 | |
Netherlands | | | — | | | | 498,259 | | | | — | | | | 498,259 | |
New Zealand | | | — | | | | 167,957 | | | | — | | | | 167,957 | |
Norway | | | — | | | | 314,319 | | | | — | | | | 314,319 | |
Peru | | | 446,389 | | | | — | | | | — | | | | 446,389 | |
Portugal | | | — | | | | 301,496 | | | | — | | | | 301,496 | |
South Korea | | | 520,054 | | | | 304,461 | | | | — | | | | 824,515 | |
Spain | | | — | | | | 286,607 | | | | — | | | | 286,607 | |
Sweden | | | — | | | | 389,225 | | | | — | | | | 389,225 | |
Switzerland | | | — | | | | 782,326 | | | | — | | | | 782,326 | |
Taiwan | | | — | | | | 264,759 | | | | — | | | | 264,759 | |
United Kingdom | | | 321,778 | | | | 1,599,535 | | | | — | | | | 1,921,313 | |
United States | | | 13,039,957 | | | | — | | | | — | | | | 13,039,957 | |
Investment Companies | | | 912,851 | | | | — | | | | — | | | | 912,851 | |
Preferred Stocks: | | | | | | | | | | | | | | | | |
India | | | — | | | | — | | | | 26,587 | | | | 26,587 | |
United States | | | — | | | | — | | | | 367,022 | | | | 367,022 | |
Short-Term Securities | | | 1,060,023 | | | | — | | | | — | | | | 1,060,023 | |
| | | | | | | | | | | | | | | | |
Subtotal | | $ | 17,886,766 | | | $ | 11,723,067 | | | $ | 673,026 | | | $ | 30,282,859 | |
| | | | | | | | | | | | | | | | |
Investments Valued at NAV(a) | | | | | | | | | | | | | | | 2,056,981 | |
| | | | | | | | | | | | | | | | |
Total Investments | | | | | | | | | | | | | | $ | 32,339,840 | |
| | | | | | | | | | | | | | | | |
| | | | |
Derivative Financial Instruments(b) | | | | | | | | | | | | | | | | |
Assets: | | | | | | | | | | | | | | | | |
Foreign currency exchange contracts | | $ | — | | | $ | 77,142 | | | $ | — | | | $ | 77,142 | |
Liabilities: | | | | | | | | | | | | | | | | |
Foreign currency exchange contracts | | | — | | | | (23,277 | ) | | | — | | | | (23,277 | ) |
| | | | | | | | | | | | | | | | |
| | $ | — | | | $ | 53,865 | | | $ | — | | | $ | 53,865 | |
| | | | | | | | | | | | | | | | |
| | (a) | As of December 31, 2017, certain of the Fund’s investments were valued using NAV per share (or its equivalent) as no quoted market value is available and therefore have been excluded from the fair value hierarchy. | |
| | (b) | Derivative financial instruments are forward foreign currency exchange contracts. Forward foreign currency exchange contracts are valued at the unrealized appreciation (depreciation) on the instrument. | |
| | |
| 10 | | 2017 BLACKROCK ANNUAL REPORTTO SHAREHOLDERS |
| | |
Schedule of Investments (continued) December 31, 2017 | | BlackRock Global Opportunities V.I. Fund |
Transfers between Level 1 and Level 2 were as follows:
| | | | | | | | | | | | | | | | |
| | | Transfers into
Level 1(a) | | | Transfers out
of Level 1(b) | | | Transfers into
Level 2(b) | | | Transfers out
of Level 2(a) | |
Assets: | | | | | | | | | | | | | | | | |
Long-Term Investments: | | | | | | | | | | | | | | | | |
Belgium | | $ | — | | | $ | 729,903 | | | $ | 729,903 | | | $ | — | |
India | | | | | | | | | | | | | | | 287,133 | |
South Korea | | | 529,279 | | | | | | | | | | | | 529,279 | |
| | | | | | | | | | | | | | | | |
| | $ | 529,279 | | | $ | 729,903 | | | $ | 729,903 | | | $ | 816,412 | |
| | | | | | | | | | | | | | | | |
| | (a) | Systematic Fair Value Prices were not utilized at period end for these investments. | |
| | (b) | External pricing service used to reflect any significant market movements between the time the Fund valued such foreign securities and the earlier closing of foreign markets. | |
A reconciliation of Level 3 investments is presented when the Fund had a significant amount of Level 3 investments at the beginning and/or end of the year in relation to net assets. The following table is a reconciliation of Level 3 investments for which significant unobservable inputs were used in determining fair value:
| | | | | | | | | | | | |
| | | Common
Stocks | | | Preferred
Stocks | | | Total | |
Assets: | | | | | | | | | | | | |
Opening balance, as of December 31, 2016 | | $ | 200,290 | | | $ | 1,123,247 | | | $ | 1,323,537 | |
Transfers into Level 3 | | | 287,133 | | | | — | | | | 287,133 | |
Transfers out of Level 3 | | | — | | | | — | | | | — | |
Accrued discounts/premiums | | | — | | | | — | | | | — | |
Net realized gain (loss) | | | (33,011 | ) | | | (14,267 | ) | | | (47,278 | ) |
Net change in unrealized appreciation (depreciation)(a)(b) | | | 89,792 | | | | (590,824 | ) | | | (501,032 | ) |
Purchases | | | 89,629 | | | | — | | | | 89,629 | |
Sales | | | (354,416 | ) | | | (124,547 | ) | | | (478,963 | ) |
| | | | | | | | | | | | |
Closing Balance, as of December 31, 2017 | | $ | 279,417 | | | $ | 393,609 | | | $ | 673,026 | |
| | | | | | | | | | | | |
Net change in unrealized appreciation (depreciation) on investments still held at December 31, 2017(b) | | $ | 42,700 | | | $ | (546,440 | ) | | $ | (503,740 | ) |
| | | | | | | | | | | | |
| | (a) | Included in the related net change in unrealized appreciation (depreciation) in the Statement of Operations. | |
| | (b) | Any difference between net change in unrealized appreciation (depreciation) and net change in unrealized appreciation (depreciation) on investments still held at December 31, 2017 is generally due to investments no longer held or categorized as Level 3 at year end. | |
The following table summarizes the valuation approaches used and unobservable inputs utilized by the BlackRock Global Valuation Methodologies Committee (“Global Valuation Committee”) to determine the value of certain of the Fund’s Level 3 investments as of period end. The table does not include Level 3 investments with values based upon unadjusted third party pricing information in the amount of $279,417. A significant change in such third party pricing information could result in significantly lower or higher value of such Level 3 investments.
| | | | | | | | | | | | | | |
| | | Value | | | Valuation Approach | | Unobservable
Inputs | | | Range of
Unobservable Inputs
Utilized | |
Assets: | | | | | | | | | | | | | | |
| | | | |
Preferred Stocks(c) | | $ | 393,609 | | | Market | | | Revenue Multiple(a) | | | | 7.75x | |
| | | | | | | | | Time to Exit(b) | | | | 3 years | |
| | | | | | | | | Volatility(b) | | | | 41% | |
| | | | | | | | | Recent Transactions(a) | | | | — | |
| | | | | | | | | | | | | | | |
| | $ | 393,609 | | | | | | | | | | | |
| | | | | | | | | | | | | | |
| | (a) | Increase in unobservable input may result in a significant increase to value, while a decrease in unobservable input may result in a significant decrease to value. | |
| | (b) | Decrease in unobservable input may result in a significant increase to value, while an increase in unobservable input may result in a significant decrease to value. | |
| | (c) | For the year ended December 31, 2017, the valuation technique for investments classified as preferred stocks with a total value of $26,587 changed to an Option Pricing Model. The investments were previously valued utilizing Probability-Weighted Expected Return Model. The change was due to consideration of liquidation preferences and exit strategy. | |
See notes to financial statements.
| | | | |
| SCHEDULE OF INVESTMENTS | | | 11 | |
Statement of Assets and Liabilities
December 31, 2017
| | | | |
| | | BlackRock
Global Opportunities
V.I. Fund | |
ASSETS | | | | |
Investments at value — unaffiliated (including securities loaned at value of $2,000,580) (cost — $22,281,327) | | $ | 29,222,836 | |
Investments at value — affiliated (cost — $3,117,004) | | | 3,117,004 | |
Foreign currency at value (cost — $6,961) | | | 7,039 | |
Receivables: | | | | |
Securities lending income — affiliated | | | 220 | |
Capital shares sold | | | 3,754 | |
Dividends — affiliated | | | 1,085 | |
Dividends — unaffiliated | | | 47,991 | |
From the Manager | | | 13,998 | |
Unrealized appreciation on forward foreign currency exchange contracts | | | 77,142 | |
Prepaid expenses | | | 190 | |
| | | | |
Total assets | | | 32,491,259 | |
| | | | |
| |
LIABILITIES | | | | |
Cash collateral on securities loaned at value | | | 2,056,900 | |
Payables: | | | | |
Capital shares redeemed | | | 32,905 | |
Distribution fees | | | 743 | |
Investment advisory fees | | | 29,214 | |
Deferred foreign capital gain tax | | | 19,114 | |
Directors’ and Officer’s fees | | | 3,696 | |
Other accrued expenses | | | 144,041 | |
Other affiliates | | | 236 | |
Unrealized depreciation on forward foreign currency exchange contracts | | | 23,277 | |
| | | | |
Total liabilities | | | 2,310,126 | |
| | | | |
| |
NET ASSETS | | $ | 30,181,133 | |
| | | | |
| |
NET ASSETS CONSIST OF | | | | |
Paid-in capital | | $ | 22,506,238 | |
Distribution in excess of net investment income | | | (86,053 | ) |
Accumulated net realized gain | | | 783,387 | |
Net unrealized appreciation (depreciation) | | | 6,977,561 | |
| | | | |
NET ASSETS | | $ | 30,181,133 | |
| | | | |
| |
NET ASSET VALUE | | | | |
Class I — Based on net assets of $26,507,658 and 1,518,711 shares outstanding, 100 million shares authorized, $0.10 par value | | $ | 17.45 | |
| | | | |
Class III — Based on net assets of $3,673,475 and 211,430 shares outstanding, 100 million shares authorized, $0.10 par value | | $ | 17.37 | |
| | | | |
See notes to financial statements.
| | |
| 12 | | 2017 BLACKROCK ANNUAL REPORTTO SHAREHOLDERS |
Statement of Operations
Year Ended December 31, 2017
| | | | |
| | | BlackRock Global Opportunities V.I. Fund | |
| |
INVESTMENT INCOME | | | | |
Dividends — unaffiliated | | $ | 651,588 | |
Dividends — affiliated | | | 5,485 | |
Securities lending — affiliated — net | | | 17,526 | |
Foreign taxes withheld | | | (39,062 | ) |
| | | | |
Total investment income | | | 635,537 | |
| | | | |
| |
EXPENSES | | | | |
Investment advisory | | | 293,195 | |
Professional | | | 102,293 | |
Transfer agent | | | 5,012 | |
Transfer agent — class specific | | | 78,042 | |
Printing | | | 18,493 | |
Directors and Officer | | | 20,758 | |
Accounting services | | | 17,078 | |
Custodian | | | 37,988 | |
Distribution — class specific | | | 10,162 | |
Pricing | | | 24,390 | |
Miscellaneous | | | 8,772 | |
| | | | |
Total expenses | | | 616,183 | |
Less: | | | | |
Fees waived and/or reimbursed by the Manager | | | (148,702 | ) |
Transfer agent fees reimbursed — class specific | | | (78,042 | ) |
| | | | |
Total expenses after fees waived and/or reimbursed | | | 389,439 | |
| | | | |
Net investment income | | | 246,098 | |
| | | | |
| |
REALIZED AND UNREALIZED GAIN (LOSS) | | | | |
Net realized gain (loss) from: | | | | |
Investments — unaffiliated | | | 4,632,884 | |
Investments — affiliated | | | (73 | ) |
Capital gain distributions from investment companies — affiliated | | | 3 | |
Forward foreign currency exchange contracts | | | 58,221 | |
Foreign currency transactions | | | (3,370 | ) |
Options written | | | 15,170 | |
| | | | |
| | | 4,702,835 | |
| | | | |
Net change in unrealized appreciation (depreciation) on: | | | | |
Investments — unaffiliated(a) | | | 3,947,193 | |
Investments — affiliated | | | 83 | |
Forward foreign currency exchange contracts | | | 117,569 | |
Foreign currency translations | | | 3,348 | |
Options written | | | 58 | |
| | | | |
| | | 4,068,251 | |
| | | | |
Net realized and unrealized gain | | | 8,771,086 | |
| | | | |
NET INCREASE IN NET ASSETS RESULTING FROM OPERATIONS | | $ | 9,017,184 | |
| | | | |
| (a) | Net of $19,114 foreign capital gain tax. |
See notes to financial statements.
Statements of Changes in Net Assets
| | | | | | | | |
| | | BlackRock
Global Opportunities V.I. Fund | |
| | | Year Ended December 31, | |
| | | 2017 | | | 2016 | |
| | |
INCREASE (DECREASE) IN NET ASSETS: | | | | | | | | |
| | |
OPERATIONS | | | | | | | | |
Net investment income | | $ | 246,098 | | | $ | 447,233 | |
Net realized gain | | | 4,702,835 | | | | 618,110 | |
Net change in unrealized appreciation (depreciation) | | | 4,068,251 | | | | 266,548 | |
| | | | | | | | |
Net increase in net assets resulting from operations | | | 9,017,184 | | | | 1,331,891 | |
| | | | | | | | |
| | |
DISTRIBUTIONS TO SHAREHOLDERS(a) | | | | | | | | |
From net investment income: | | | | | | | | |
Class I | | | (405,685 | ) | | | (628,394 | ) |
Class III | | | (44,315 | ) | | | (62,238 | ) |
From net realized gain: | | | | | | | | |
Class I | | | (3,347,622 | ) | | | (135,347 | ) |
Class III | | | (448,415 | ) | | | (15,821 | ) |
| | | | | | | | |
Decrease in net assets resulting from distributions to shareholders | | | (4,246,037 | ) | | | (841,800 | ) |
| | | | | | | | |
| | |
CAPITAL SHARE TRANSACTIONS | | | | | | | | |
Net decrease in net assets derived from capital share transactions | | | (14,211,850 | ) | | | (3,367,104 | ) |
| | | | | | | | |
NET ASSETS | | | | | | | | |
Total decrease in net assets | | | (9,440,703 | ) | | | (2,877,013 | ) |
Beginning of year | | | 39,621,836 | | | | 42,498,849 | |
| | | | | | | | |
End of year | | $ | 30,181,133 | | | $ | 39,621,836 | |
| | | | | | | | |
Undistributed (distribution in excess of) net investment income | | $ | (86,053 | ) | | $ | 4,466 | |
| | | | | | | | |
| (a) | Distributions for annual periods determined in accordance with U.S. federal income tax regulations. |
See notes to financial statements.
| | |
| 14 | | 2017 BLACKROCK ANNUAL REPORTTO SHAREHOLDERS |
Financial Highlights
(For a share outstanding throughout each period)
| | | | | | | | | | | | | | | | | | | | |
| | | BlackRock Global Opportunities V.I. Fund | |
| | | Class I | |
| | | Year Ended December 31, | |
| | | 2017 | | | 2016 | | | 2015 | | | 2014 | | | 2013 | |
Net asset value, beginning of year | | $ | 16.22 | | | $ | 16.00 | | | $ | 16.35 | | | $ | 17.98 | | | $ | 13.89 | |
| | | | | | | | | | | | | | | | | | | | |
Net investment income(a) | | | 0.12 | | | | 0.18 | | | | 0.12 | | | | 0.14 | | | | 0.07 | |
Net realized and unrealized gain (loss) | | | 3.97 | | | | 0.40 | | | | (0.07 | ) | | | (0.81 | ) | | | 4.08 | |
| | | | | | | | | | | | | | | | | | | | |
Net increase (decrease) from investment operations | | | 4.09 | | | | 0.58 | | | | 0.05 | | | | (0.67 | ) | | | 4.15 | |
| | | | | | | | | | | | | | | | | | | | |
| Distributions:(b) | | | | | | | | | | | | | | | |
From net investment income | | | (0.31 | ) | | | (0.30 | ) | | | (0.17 | ) | | | (0.20 | ) | | | (0.06 | ) |
From net realized gain | | | (2.55 | ) | | | (0.06 | ) | | | (0.23 | ) | | | (0.76 | ) | | | — | |
| | | | | | | | | | | | | | | | | | | | |
Total distributions | | | (2.86 | ) | | | (0.36 | ) | | | (0.40 | ) | | | (0.96 | ) | | | (0.06 | ) |
| | | | | | | | | | | | | | | | | | | | |
| Net asset value, end of year | | $ 17.45 | | | $ 16.22 | | | $ 16.00 | | | $ 16.35 | | | $ 17.98 | |
| | | | | | | | | | | | | | | | | | | | |
Total Return(c) | | | | | | | | | | | | | | | | | | | | |
Based on net asset value | | | 25.19 | % | | | 3.59 | %(d) | | | 0.28 | % | | | (3.74 | )% | | | 29.87 | %(e) |
| | | | | | | | | | | | | | | | | | | | |
| Ratios to Average Net Assets | | | | | | | | | | | | | | | |
Total expenses | | | 1.55 | % | | | 1.42 | % | | | 1.35 | % | | | 1.33 | % | | | 1.33 | % |
| | | | | | | | | | | | | | | | | | | | |
Total expenses after fees waived and/or reimbursed | | | 0.97 | % | | | 0.97 | % | | | 1.03 | % | | | 1.12 | % | | | 1.14 | % |
| | | | | | | | | | | | | | | | | | | | |
Net investment income | | | 0.66 | % | | | 1.14 | % | | | 0.72 | % | | | 0.82 | % | | | 0.44 | % |
| | | | | | | | | | | | | | | | | | | | |
| Supplemental Data | | | | | | | | | | | | | | | |
Net assets, end of year (000) | | $ | 26,508 | | | $ | 35,524 | | | $ | 38,686 | | | $ | 44,136 | | | $ | 52,175 | |
| | | | | | | | | | | | | | | | | | | | |
Portfolio turnover rate | | | 33 | % | | | 65 | % | | | 69 | % | | | 87 | % | | | 135 | % |
| | | | | | | | | | | | | | | | | | | | |
| (a) | Based on average shares outstanding. |
| (b) | Distributions for annual periods determined in accordance with U.S. federal income tax regulations. |
| (c) | Where applicable, excludes insurance-related fees and expenses and assumes the reinvestment of distributions. |
| (d) | Includes the litigation settlement amount. Excluding this amount, the Fund’s total return is 3.27%. |
| (e) | Includes the litigation settlement amount. Excluding this amount, the Fund’s total return is 29.72%. |
See notes to financial statements.
Financial Highlights (continued)
(For a share outstanding throughout each period)
| | | | | | | | | | | | | | | | | | | | |
| | | BlackRock Global Opportunities V.I. Fund | |
| | | Class III | |
| | | Year Ended December 31, | |
| | | 2017 | | | 2016 | | | 2015 | | | 2014 | | | 2013 | |
Net asset value, beginning of year | | $ | 16.15 | | | $ | 15.93 | | | $ | 16.29 | | | $ | 17.93 | | | $ | 13.86 | |
| | | | | | | | | | | | | | | | | | | | |
Net investment income(a) | | | 0.08 | | | | 0.14 | | | | 0.08 | | | | 0.06 | | | | 0.03 | |
Net realized and unrealized gain (loss) | | | 3.94 | | | | 0.40 | | | | (0.08 | ) | | | (0.77 | ) | | | 4.06 | |
| | | | | | | | | | | | | | | | | | | | |
Net increase (decrease) from investment operations | | | 4.02 | | | | 0.54 | | | | — | | | | (0.71 | ) | | | 4.09 | |
| | | | | | | | | | | | | | | | | | | | |
| Distributions:(b) | | | | | | | | | | | | | | | |
From net investment income | | | (0.25 | ) | | | (0.26 | ) | | | (0.13 | ) | | | (0.17 | ) | | | (0.02 | ) |
From net realized gain | | | (2.55 | ) | | | (0.06 | ) | | | (0.23 | ) | | | (0.76 | ) | | | — | |
| | | | | | | | | | | | | | | | | | | | |
Total distributions | | | (2.80 | ) | | | (0.32 | ) | | | (0.36 | ) | | | (0.93 | ) | | | (0.02 | ) |
| | | | | | | | | | | | | | | | | | | | |
| Net asset value, end of year | | $ 17.37 | | | $ 16.15 | | | $ 15.93 | | | $ 16.29 | | | $ 17.93 | |
| | | | | | | | | | | | | | | | | | | | |
Total Return(c) | | | | | | | | | | | | | | | | | | | | |
Based on net asset value | | | 24.89 | % | | | 3.36 | %(d) | | | 0.02 | % | | | (4.00 | )% | | | 29.51 | %(e) |
| | | | | | | | | | | | | | | | | | | | |
| Ratios to Average Net Assets | | | | | | | | | | | | | | | |
Total expenses | | | 1.81 | % | | | 1.68 | % | | | 1.63 | % | | | 1.57 | % | | | 1.58 | % |
| | | | | | | | | | | | | | | | | | | | |
Total expenses after fees waived and/or reimbursed | | | 1.22 | % | | | 1.22 | % | | | 1.27 | % | | | 1.39 | % | | | 1.39 | % |
| | | | | | | | | | | | | | | | | | | | |
Net investment income | | | 0.41 | % | | | 0.89 | % | | | 0.45 | % | | | 0.32 | % | | | 0.16 | % |
| | | | | | | | | | | | | | | | | | | | |
| Supplemental Data | | | | | | | | | | | | | | | |
Net assets, end of year (000) | | $ | 3,673 | | | $ | 4,098 | | | $ | 3,813 | | | $ | 2,972 | | | $ | 1,404 | |
| | | | | | | | | | | | | | | | | | | | |
Portfolio turnover rate | | | 33 | % | | | 65 | % | | | 69 | % | | | 87 | % | | | 135 | % |
| | | | | | | | | | | | | | | | | | | | |
| (a) | Based on average shares outstanding. |
| (b) | Distributions for annual periods determined in accordance with U.S. federal income tax regulations. |
| (c) | Where applicable, excludes insurance-related fees and expenses and assumes the reinvestment of distributions. |
| (d) | Includes the litigation settlement amount. Excluding this amount, the Fund’s total return is 3.04%. |
| (e) | Includes the litigation settlement amount. Excluding this amount, the Fund’s total return is 29.37%. |
See notes to financial statements.
| | |
| 16 | | 2017 BLACKROCK ANNUAL REPORTTO SHAREHOLDERS |
| | | | |
| Notes to Financial Statements | | | BlackRock Global Opportunities V.I. Fund | |
BlackRock Variable Series Funds, Inc. (the “Company”) is registered under the Investment Company Act of 1940, as amended (the “1940 Act”), as an open-end management investment company. The Company is organized as a Maryland corporation that is comprised of 20 separate funds. The funds offer shares to insurance companies for their separate accounts to fund benefits under certain variable annuity and variable life insurance contracts. The financial statements presented are for BlackRock Global Opportunities V.I. Fund (the “Fund”). The Fund is classified as diversified. Class I and Class III Shares have equal voting, dividend, liquidation and other rights, except that only shares of the respective classes are entitled to vote on matters concerning only that class. In addition, Class III Shares also bear certain expenses related to the distribution of such shares.
On March 27, 2017, the Board of Directors of the Company (the “Board”) approved a proposal to close the Fund to new investors and thereafter to liquidate the Fund. Effective May 30, 2017, the Fund no longer accepts purchase orders from new investors. The liquidation is expected to occur on or about March 30, 2018.
The Fund, together with certain other registered investment companies advised by BlackRock Advisors, LLC (the “Manager”) or its affiliates, is included in a complex of open-end funds referred to as the Equity-Bond Complex.
| 2. | SIGNIFICANT ACCOUNTING POLICIES |
The financial statements are prepared in conformity with accounting principles generally accepted in the United States of America (“U.S. GAAP”), which may require management to make estimates and assumptions that affect the reported amounts of assets and liabilities in the financial statements, disclosure of contingent assets and liabilities at the date of the financial statements and the reported amounts of increases and decreases in net assets from operations during the reporting period. Actual results could differ from those estimates. The Fund is considered an investment company under U.S. GAAP and follows the accounting and reporting guidance applicable to investment companies. Below is a summary of significant accounting policies:
Investment Transactions and Income Recognition: For financial reporting purposes, investment transactions are recorded on the dates the transactions are entered into (the “trade dates”). Realized gains and losses on investment transactions are determined on the identified cost basis. Dividend income is recorded on the ex-dividend date. Dividends from foreign securities where the ex-dividend date may have passed are subsequently recorded when the Fund is informed of the ex-dividend date. Under the applicable foreign tax laws, a withholding tax at various rates may be imposed on capital gains, dividends and interest. Upon notification from issuers, some of the dividend income received from a real estate investment trust may be redesignated as a reduction of cost of the related investment and/or realized gain. Income, expenses and realized and unrealized gains and losses are allocated daily to each class based on its relative net assets.
Foreign Currency Translation: The Fund’s books and records are maintained in U.S. dollars. Securities and other assets and liabilities denominated in foreign currencies are translated into U.S. dollars using exchange rates determined as of the close of trading on the New York Stock Exchange (“NYSE”). Purchases and sales of investments are recorded at the rates of exchange prevailing on the respective dates of such transactions. Generally, when the U.S. dollar rises in value against a foreign currency, the investments denominated in that currency will lose value; the opposite effect occurs if the U.S. dollar falls in relative value.
The Fund does not isolate the portion of the results of operations arising as a result of changes in the exchange rates from the changes in the market prices of investments held or sold for financial reporting purposes. Accordingly, the effects of changes in exchange rates on investments are not segregated in the Statement of Operations from the effects of changes in market prices of those investments, but are included as a component of net realized and unrealized gain (loss) from investments. The Fund reports realized currency gains (losses) on foreign currency related transactions as components of net realized gain (loss) for financial reporting purposes, whereas such components are generally treated as ordinary income for U.S. federal income tax purposes.
Segregation and Collateralization: In cases where the Fund enters into certain investments (e.g., forward foreign currency exchange contracts) that would be treated as “senior securities” for 1940 Act purposes, the Fund may segregate or designate on its books and records cash or liquid assets having a market value at least equal to the amount of its future obligations under such investments. Doing so allows the investment to be excluded from treatment as a “senior security.” Furthermore, if required by an exchange or counterparty agreement, the Fund may be required to deliver/deposit cash and/or securities to/with an exchange, or broker-dealer or custodian as collateral for certain investments or obligations.
Distributions: Distributions paid by the Fund are recorded on the ex-dividend date. Distributions of capital gains are recorded on the ex-dividend date and made at least annually. The character and timing of distributions are determined in accordance with U.S. federal income tax regulations, which may differ from U.S. GAAP.
Indemnifications: In the normal course of business, the Fund enters into contracts that contain a variety of representations that provide general indemnification. The Fund’s maximum exposure under these arrangements is unknown because it involves future potential claims against the Fund, which cannot be predicted with any certainty.
Other: Expenses directly related to the Fund or its classes are charged to the Fund or the applicable class. Other operating expenses shared by several funds, including other funds managed by the Manager, are prorated among those funds on the basis of relative net assets or other appropriate methods. Expenses directly related to the Fund and other shared expenses prorated to the Fund are allocated daily to each class based on its relative net assets or other appropriate methods.
The Fund has an arrangement with its custodian whereby credits are earned on uninvested cash balances, which could be used to reduce custody fees and/or overdraft charges. The Fund may incur charges on certain uninvested cash balances and overdrafts, subject to certain conditions.
| 3. | INVESTMENT VALUATION AND FAIR VALUE MEASUREMENTS |
Investment Valuation Policies: The Fund’s investments are valued at fair value (also referred to as “market value” within the financial statements) as of the close of trading on the NYSE (generally 4:00 p.m., Eastern time) (or if the reporting date falls on a day the NYSE is closed, investments are valued at fair value as of the period end). U.S. GAAP defines fair value as the price the Fund would receive to sell an asset or pay to transfer a liability in an orderly transaction between market participants at the measurement date. The Fund determines the fair values of its financial instruments using various independent dealers or pricing services under policies approved by the Board.
| | | | |
| NOTESTO FINANCIAL STATEMENTS | | | 17 | |
| | | | |
| Notes to Financial Statements (continued) | | | BlackRock Global Opportunities V.I. Fund | |
The BlackRock Global Valuation Methodologies Committee (the “Global Valuation Committee”) is the committee formed by management to develop global pricing policies and procedures and to oversee the pricing function for all financial instruments.
Fair Value Inputs and Methodologies: The following methods and inputs are used to establish the fair value of the Fund’s assets and liabilities:
| | • | | Equity investments traded on a recognized securities exchange are valued at the official closing price each day, if available. For equity investments traded on more than one exchange, the official closing price on the exchange where the stock is primarily traded is used. Equity investments traded on a recognized exchange for which there were no sales on that day may be valued at the last available bid (long positions) or ask (short positions) price. |
| | • | | Generally, trading in foreign instruments is substantially completed each day at various times prior to the close of trading on the NYSE. Occasionally, events affecting the values of such instruments may occur between the foreign market close and the close of trading on the NYSE that may not be reflected in the computation of the Fund’s net assets. Each business day, the Fund uses a pricing service to assist with the valuation of certain foreign exchange-traded equity securities and foreign exchange-traded and over-the-counter (“OTC”) options (the “Systematic Fair Value Price”). Using current market factors, the Systematic Fair Value Price is designed to value such foreign securities and foreign options at fair value as of the close of business on the NYSE, which follows the close of the local markets. |
| | • | | Investments in open-end U.S. mutual funds are valued at NAV each business day. |
| | • | | The Fund values its investment in SL Liquidity Series, LLC, Money Market Series (the “Money Market Series”) at fair value, which is ordinarily based upon its pro rata ownership in the underlying fund’s net assets. The Money Market Series seeks current income consistent with maintaining liquidity and preserving capital. Although the Money Market Series is not registered under the 1940 Act, its investments may follow the parameters of investments by a money market fund that is subject to Rule 2a-7 under the 1940 Act. |
| | • | | Forward foreign currency exchange contracts are valued at the mean between the bid and ask prices and are determined as of the close of trading on the NYSE. Interpolated values are derived when the settlement date of the contract is an interim date for which quotations are not available. |
| | • | | Exchange-traded options are valued at the mean between the last bid and ask prices at the close of the options market in which the options trade. An exchange-traded option for which there is no mean price is valued at the last bid (long positions) or ask (short positions) price. If no bid or ask price is available, the prior day’s price will be used, unless it is determined that the prior day’s price no longer reflects the fair value of the option. OTC options are valued by an independent pricing service using a mathematical model, which incorporates a number of market data factors, such as the trades and prices of the underlying instruments. |
If events (e.g., a company announcement, market volatility or a natural disaster) occur that are expected to materially affect the value of such investments, or in the event that the application of these methods of valuation results in a price for an investment that is deemed not to be representative of the market value of such investment, or if a price is not available, the investment will be valued by the Global Valuation Committee, or its delegate, in accordance with a policy approved by the Board as reflecting fair value (“Fair Valued Investments”). The fair valuation approaches that may be used by the Global Valuation Committee will include market approach, income approach and cost approach. Valuation techniques such as discounted cash flow, use of market comparables and matrix pricing are types of valuation approaches and are typically used in determining fair value. When determining the price for Fair Valued Investments, the Global Valuation Committee, or its delegate, seeks to determine the price that the Fund might reasonably expect to receive or pay from the current sale or purchase of that asset or liability in an arm’s-length transaction. Fair value determinations shall be based upon all available factors that the Global Valuation Committee, or its delegate, deems relevant and consistent with the principles of fair value measurement.
The Global Valuation Committee, or its delegate, employs various methods for calibrating valuation approaches for investments where an active market does not exist, including regular due diligence of the Fund’s pricing vendors, regular reviews of key inputs and assumptions, transactional back-testing or disposition analysis to compare unrealized gains and losses to realized gains and losses, reviews of missing or stale prices and large movements in market values and reviews of any market related activity. The pricing of all Fair Valued Investments is subsequently reported to the Board or a committee thereof on a quarterly basis. As a result of the inherent uncertainty in valuation of these investments, the fair values may differ from the values that would have been used had an active market existed.
For investments in equity or debt issued by privately-held companies or funds (“Private Company” or collectively, the “Private Companies”) and other Fair Valued Investments, the fair valuation approaches that are used by third party pricing services utilize one or a combination of, but not limited to, the following inputs.
| | | | |
| | | Standard Inputs Generally Considered By Third Party Pricing Services |
Market approach | | (i) | | recent market transactions, including subsequent rounds of financing, in the underlying investment or comparable issuers; |
| | (ii) | | recapitalizations and other transactions across the capital structure; and |
| | (iii) | | market multiples of comparable issuers. |
Income approach | | (i) | | future cash flows discounted to present and adjusted as appropriate for liquidity, credit and/or market risks; |
| | (ii) | | quoted prices for similar investments or assets in active markets; and |
| | (iii) | | other risk factors, such as interest rates, yield curves, volatilities, prepayment speeds, loss severities, credit risks, recovery rates, liquidation amounts and/or default rates. |
Cost approach | | (i) | | audited or unaudited financial statements, investor communications and financial or operational metrics issued by the Private Company; |
| | (ii) | | changes in the valuation of relevant indices or publicly traded companies comparable to the Private Company; |
| | (iii) | | relevant news and other public sources; and |
| | | (iv) | | known secondary market transactions in the Private Company’s interests and merger or acquisition activity in companies comparable to the Private Company. |
| | |
| 18 | | 2017 BLACKROCK ANNUAL REPORTTO SHAREHOLDERS |
| | | | |
| Notes to Financial Statements (continued) | | | BlackRock Global Opportunities V.I. Fund | |
Investments in series of preferred stock issued by Private Companies are typically valued utilizing Market approach in determining the enterprise value of the company. Such investments often contain rights and preferences that differ from other series of preferred and common stock of the same issuer. Valuation techniques such as an option pricing model (“OPM”), a probability weighted expected return model (“PWERM”) or a hybrid of those techniques are used in allocating enterprise value of the company, as deemed appropriate under the circumstances. The use of OPM and PWERM techniques involve a determination of the exit scenarios of the investment in order to appropriately allocate the enterprise value of the company among the various parts of its capital structure.
The Private Companies are not subject to the public company disclosure, timing, and reporting standards as other investments held by the Fund. Typically, the most recently available information by a Private Company is as of a date that is earlier than the date the Fund is calculating its NAV. This factor may result in a difference between the value of the investment and the price the Fund could receive upon the sale of the investment.
Fair Value Hierarchy: Various inputs are used in determining the fair value of investments and derivative financial instruments. These inputs to valuation techniques are categorized into a fair value hierarchy consisting of three broad levels for financial statement purposes as follows:
| | • | | Level 1 – Unadjusted price quotations in active markets/exchanges for identical assets or liabilities that the Fund has the ability to access |
| | • | | Level 2 – Other observable inputs (including, but not limited to, quoted prices for similar assets or liabilities in markets that are active, quoted prices for identical or similar assets or liabilities in markets that are not active, inputs other than quoted prices that are observable for the assets or liabilities (such as interest rates, yield curves, volatilities, prepayment speeds, loss severities, credit risks and default rates) or other market–corroborated inputs) |
| | • | | Level 3 – Unobservable inputs based on the best information available in the circumstances, to the extent observable inputs are not available (including the Fund’s own assumptions used in determining the fair value of investments and derivative financial instruments) |
The hierarchy gives the highest priority to unadjusted quoted prices in active markets for identical assets or liabilities (Level 1 measurements) and the lowest priority to unobservable inputs (Level 3 measurements). Accordingly, the degree of judgment exercised in determining fair value is greatest for instruments categorized in Level 3. The inputs used to measure fair value may fall into different levels of the fair value hierarchy. In such cases, for disclosure purposes, the fair value hierarchy classification is determined based on the lowest level input that is significant to the fair value measurement in its entirety. Investments classified within Level 3 have significant unobservable inputs used by the Global Valuation Committee in determining the price for Fair Valued Investments. Level 3 investments include equity or debt issued by privately held companies. There may not be a secondary market, and/or there are a limited number of investors. Level 3 investments may also be adjusted to reflect illiquidity and/or non-transferability, with the amount of such discount estimated by the Global Valuation Committee in the absence of market information.
Changes in valuation techniques may result in transfers into or out of an assigned level within the hierarchy. In accordance with the Fund’s policy, transfers between different levels of the fair value hierarchy are deemed to have occurred as of the beginning of the reporting period. The categorization of a value determined for investments and derivative financial instruments is based on the pricing transparency of the investments and derivative financial instruments and is not necessarily an indication of the risks associated with investing in those securities.
| 4. | SECURITIES AND OTHER INVESTMENTS |
Preferred Stocks: Preferred stock has a preference over common stock in liquidation (and generally in receiving dividends as well), but is subordinated to the liabilities of the issuer in all respects. As a general rule, the market value of preferred stock with a fixed dividend rate and no conversion element varies inversely with interest rates and perceived credit risk, while the market price of convertible preferred stock generally also reflects some element of conversion value. Because preferred stock is junior to debt securities and other obligations of the issuer, deterioration in the credit quality of the issuer will cause greater changes in the value of a preferred stock than in a more senior debt security with similar stated yield characteristics. Unlike interest payments on debt securities, preferred stock dividends are payable only if declared by the issuer’s board of directors. Preferred stock also may be subject to optional or mandatory redemption provisions.
Securities Lending: The Fund may lend its securities to approved borrowers, such as brokers, dealers and other financial institutions. The borrower pledges and maintains with the Fund collateral consisting of cash, an irrevocable letter of credit issued by a bank, or securities issued or guaranteed by the U.S. Government. The initial collateral received by the Fund is required to have a value of at least 102% of the current value of the loaned securities for securities traded on U.S. exchanges and a value of at least 105% for all other securities. The collateral is maintained thereafter at a value equal to at least 100% of the current market value of the securities on loan. The market value of the loaned securities is determined at the close of each business day of the Fund and any additional required collateral is delivered to the Fund, or excess collateral returned by the Fund, on the next business day. During the term of the loan, the Fund is entitled to all distributions made on or in respect of the loaned securities, but does not receive interest income on securities received as collateral. Loans of securities are terminable at any time and the borrower, after notice, is required to return borrowed securities within the standard time period for settlement of securities transactions.
The market value of any securities on loan, all of which were classified as common stocks in the Fund’s Schedule of Investments, and the value of any related collateral are shown separately in the Statement of Assets and Liabilities as a component of investments at value — unaffiliated, and collateral on securities loaned at value, respectively. As of period end, any securities on loan were collateralized by cash and/or U.S. Government obligations. Cash collateral invested by the securities lending agent, BlackRock Investment Management, LLC (“BIM”), if any, is disclosed in the Schedule of Investments.
Securities lending transactions are entered into by the Fund under Master Securities Lending Agreements (each, an “MSLA”), which provide the right, in the event of default (including bankruptcy or insolvency), for the non-defaulting party to liquidate the collateral and calculate a net exposure to the defaulting party or request additional collateral. In the event that a borrower defaults, the Fund, as lender, would offset the market value of the collateral received against the market value of the securities loaned. When the value of the collateral is greater than that of the market value of the securities loaned, the lender is left with a net amount payable to the defaulting party. However, bankruptcy or insolvency laws of a particular jurisdiction may impose restrictions on or prohibitions against such a right of offset in the event of an MSLA counterparty’s bankruptcy or insolvency. Under the MSLA, absent an event of default, the borrower can resell or re-pledge the loaned securities, and the Fund can reinvest cash collateral received in connection with loaned securities. Upon an event of default, the parties’ obligations to return the securities or collateral to the other party are extinguished, and the parties can resell or re-pledge the loaned securities or the collateral received in connection with the loaned securities in order to satisfy the defaulting party’s net payment obligation for all transactions under the MSLA. The defaulting party remains liable for any deficiency.
| | | | |
| NOTESTO FINANCIAL STATEMENTS | | | 19 | |
| | | | |
| Notes to Financial Statements (continued) | | | BlackRock Global Opportunities V.I. Fund | |
As of period end, the following table is a summary of the Fund’s securities lending agreements by counterparty which are subject to offset under an MSLA:
| | | | | | | | | | | | |
| Counterparty | | Securities Loaned
at Value | | | Cash Collateral
Received(a) | | | Net
Amount | |
Citigroup Global Markets, Inc. | | | $ 198,613 | | | | $ (198,613) | | | | $— | |
Deutsche Bank Securities | | | 932,755 | | | | (932,755) | | | | — | |
Goldman Sachs & Co. | | | 433,958 | | | | (433,958) | | | | — | |
Morgan Stanley | | | 277,595 | | | | (277,595) | | | | — | |
State Street Bank & Trust Co. | | | 157,659 | | | | (157,659) | | | | — | |
| | | | | | | | | | | | |
| | | $2,000,580 | | | | $(2,000,580) | | | | $— | |
| | | | | | | | | | | | |
| | (a) | Cash collateral with a value of $2,056,900 has been received in connection with securities lending agreements. Collateral received in excess of the value of securities loaned from the individual counterparty is not shown for financial reporting purposes in the table above. |
The risks of securities lending include the risk that the borrower may not provide additional collateral when required or may not return the securities when due. To mitigate these risks, the Fund benefits from a borrower default indemnity provided by BIM. BIM’s indemnity allows for full replacement of the securities loaned if the collateral received does not cover the value on the securities loaned in the event of borrower default. The Fund could incur a loss if the value of an investment purchased with cash collateral falls below the market value of loaned securities or if the value of an investment purchased with cash collateral falls below the value of the original cash collateral received.
| 5. | DERIVATIVE FINANCIAL INSTRUMENTS |
The Fund engages in various portfolio investment strategies using derivative contracts both to increase the returns of the Fund and/or to manage its exposure to certain risks such as credit risk, equity risk, interest rate risk, foreign currency exchange rate risk, commodity price risk or other risks (e.g., inflation risk). Derivative financial instruments categorized by risk exposure are included in the Schedule of Investments. These contracts may be transacted on an exchange or OTC.
Forward Foreign Currency Exchange Contracts: Forward foreign currency exchange contracts are entered into to gain or reduce exposure to foreign currencies (foreign currency exchange rate risk).
A forward foreign currency exchange contract is an agreement between two parties to buy and sell a currency at a set exchange rate on a specified date. These contracts help to manage the overall exposure to the currencies in which some of the investments held by the Fund are denominated and in some cases, may be used to obtain exposure to a particular market.
The contract is marked to market daily and the change in market value is recorded as unrealized appreciation (depreciation) in the Statement of Assets and Liabilities. When a contract is closed, a realized gain or loss is recorded in the Statement of Operations equal to the difference between the value at the time it was opened and the value at the time it was closed. Non-deliverable forward foreign currency exchange contracts are settled with the counterparty in cash without the delivery of foreign currency. The use of forward foreign currency exchange contracts involves the risk that the value of a forward foreign currency exchange contract changes unfavorably due to movements in the value of the referenced foreign currencies.
Options: The Fund purchases and writes call and put options to increase or decrease its exposure to the risks of underlying instruments, including equity risk, interest rate risk and/or commodity price risk and/or, in the case of options written, to generate gains from options premiums.
A call option gives the purchaser (holder) of the option the right (but not the obligation) to buy, and obligates the seller (writer) to sell (when the option is exercised) the underlying instrument at the exercise or strike price at any time or at a specified time during the option period. A put option gives the holder the right to sell and obligates the writer to buy the underlying instrument at the exercise or strike price at any time or at a specified time during the option period.
Premiums paid on options purchased and premiums received on options written, as well as the daily fluctuation in market value, are included in investments at value — unaffiliated and options written at value, respectively, in the Statement of Assets and Liabilities. When an instrument is purchased or sold through the exercise of an option, the premium is offset against the cost or proceeds of the underlying instrument. When an option expires, a realized gain or loss is recorded in the Statement of Operations to the extent of the premiums received or paid. When an option is closed or sold, a gain or loss is recorded in the Statement of Operations to the extent the cost of the closing transaction exceeds the premiums received or paid. When the Fund writes a call option, such option is typically “covered,” meaning that it holds the underlying instrument subject to being called by the option counterparty. When the Fund writes a put option, such option is covered by cash in an amount sufficient to cover the obligation.
In purchasing and writing options, the Fund bears the risk of an unfavorable change in the value of the underlying instrument or the risk that it may not be able to enter into a closing transaction due to an illiquid market. Exercise of a written option could result in the Fund purchasing or selling a security when it otherwise would not, or at a price different from the current market value.
Master Netting Arrangements: In order to define its contractual rights and to secure rights that will help it mitigate its counterparty risk, the Fund may enter into an International Swaps and Derivatives Association, Inc. Master Agreement (“ISDA Master Agreement”) or similar agreement with its counterparties. An ISDA Master Agreement is a bilateral agreement between the Fund and a counterparty that governs certain OTC derivatives and typically contains, among other things, collateral posting terms and netting provisions in the event of a default and/or termination event. Under an ISDA Master Agreement, the Fund may, under certain circumstances, offset with the counterparty certain derivative financial instruments’ payables and/or receivables with collateral held and/or posted and create one single net payment. The provisions of the ISDA Master Agreement typically permit a single net payment in the event of default including the bankruptcy or insolvency of the counterparty. Bankruptcy or insolvency laws of a particular jurisdiction may restrict or prohibit the right of offset in bankruptcy, insolvency or other events. In addition, certain ISDA Master Agreements allow counterparties to terminate derivative contracts prior to maturity in the event the Fund’s net assets decline by a stated percentage or the Fund fails to meet the terms of its ISDA Master Agreements. The result would cause the Fund to accelerate payment of any net liability owed to the counterparty.
| | |
| 20 | | 2017 BLACKROCK ANNUAL REPORTTO SHAREHOLDERS |
| | | | |
| Notes to Financial Statements (continued) | | | BlackRock Global Opportunities V.I. Fund | |
Collateral Requirements: For derivatives traded under an ISDA Master Agreement, the collateral requirements are typically calculated by netting the mark-to-market amount for each transaction under such agreement and comparing that amount to the value of any collateral currently pledged by the Fund and the counterparty.
Cash collateral that has been pledged to cover obligations of the Fund and cash collateral received from the counterparty, if any, is reported separately on the Statement of Assets and Liabilities as cash pledged as collateral and cash received as collateral, respectively. Non-cash collateral pledged by the Fund, if any, is noted in the Schedule of Investments. Generally, the amount of collateral due from or to a counterparty is subject to a certain minimum transfer amount threshold before a transfer is required, which is determined at the close of business of the Fund. Any additional required collateral is delivered to/pledged by the Fund on the next business day. Typically, the counterparty is not permitted to sell, re-pledge or use cash and non-cash collateral it receives. The Fund generally agrees not to use non-cash collateral that it receives but may, absent default or certain other circumstances defined in the underlying ISDA Master Agreement, be permitted to use cash collateral received. In such cases, interest may be paid pursuant to the collateral arrangement with the counterparty. To the extent amounts due to the Fund from its counterparties are not fully collateralized, it bears the risk of loss from counterparty non-performance. Likewise, to the extent the Fund has delivered collateral to a counterparty and stands ready to perform under the terms of its agreement with such counterparty, it bears the risk of loss from a counterparty in the amount of the value of the collateral in the event the counterparty fails to return such collateral. Based on the terms of agreements, collateral may not be required for all derivative contracts.
For financial reporting purposes, the Fund does not offset derivative assets and derivative liabilities that are subject to netting arrangements, if any, in the Statement of Assets and Liabilities.
| 6. | INVESTMENT ADVISORY AGREEMENT AND OTHER TRANSACTIONS WITH AFFILIATES |
The PNC Financial Services Group, Inc. is the largest stockholder and an affiliate of BlackRock, Inc. (“BlackRock”) for 1940 Act purposes.
Investment Advisory: The Company, on behalf of the Fund, entered into an Investment Advisory Agreement with the Manager, the Fund’s investment adviser, an indirect, wholly-owned subsidiary of BlackRock, to provide investment advisory and administrative services. The Manager is responsible for the management of the Fund’s portfolio and provides the personnel, facilities, equipment and certain other services necessary to the operations of the Fund.
For such services, the Fund pays the Manager a monthly fee at an annual rate equal to the following percentages of the average daily value of the Fund’s net assets:
| | | | |
| Average Daily Net Assets | | Investment
Advisory Fee | |
First $1 Billion | | | 0.75 | % |
$1 Billion - $3 Billion | | | 0.71 | |
$3 Billion - $5 Billion | | | 0.68 | |
$5 Billion - $10 Billion | | | 0.65 | |
Greater than $10 Billion | | | 0.64 | |
With respect to the Fund, the Manager entered into a separate sub-advisory agreement with BlackRock International Limited (“BIL”), an affiliate of the Manager. The Manager pays BIL, for services it provides, a monthly fee that is a percentage of the investment advisory fees paid by the Fund to the Manager.
Distribution Fees: The Company, on behalf of the Fund, entered into a Distribution Agreement and a Distribution Plan with BlackRock Investments, LLC (“BRIL”), an affiliate of the Manager. Pursuant to the Distribution Plan and in accordance with Rule 12b-1 under the 1940 Act, the Fund pays BRIL ongoing distribution fees. The fees are accrued daily and paid monthly at the annual rate of 0.25% based upon the average daily net assets attributable to Class III.
For the year ended December 31, 2017, the class specific distribution fees borne directly by Class III is $10,162.
Transfer Agent: On behalf of the Fund, the Manager entered into agreements with insurance companies and other financial intermediaries (“Service Organizations”), some of which may be affiliates. Pursuant to these agreements, the Service Organizations provide the Fund with administrative, networking, recordkeeping, sub-transfer agency and shareholder services to sub-accounts they service. For these services, the Service Organizations receive an annual fee per shareholder account, which will vary depending on share class and/or net assets of Fund shareholders serviced by the Service Organizations, which is shown as transfer agent — class specific. For the year ended December 31, 2017, the Fund did not pay any amounts to affiliates in return for these services.
In addition, the Fund pays the transfer agent, which is not an affiliate, a fee for the issuance, transfer and redemption of shares and the opening and maintenance of shareholder accounts, which is included in transfer agent in the Statement of Operations.
For the year ended December 31, 2017, the following table shows the class specific transfer agent fees borne directly by each class of the Fund:
| | | | |
| Class I | | Class III | | Total |
$69,766 | | $8,276 | | $78,042 |
Expense Limitations, Waivers and Reimbursements: With respect to the Fund, the Manager voluntarily agreed to waive its investment advisory fees by the amount of investment advisory fees the Fund pays to the Manager indirectly through its investment in affiliated money market funds (the “affiliated money market fund waiver”). The amount of waivers and/or reimbursements of fees and expenses made pursuant to the expense limitation caps, will be reduced by the amount of the affiliated money market fund waiver. This amount is included in fees waived and/or reimbursed by the Manager in the Statement of Operations. For the year ended December 31, 2017, the amount waived was $538.
The Manager has contractually agreed to waive its investment advisory fee with respect to any portion of the Fund’s assets invested in affiliated equity and fixed-income mutual funds and affiliated exchange-traded funds that have a contractual management fee through April 30, 2018. The contractual agreement may be terminated upon 90 days’ notice by a majority of the directors of the Fund who are not “interested persons” of the Fund, as defined in the 1940 Act (“Independent Directors”)or by a vote of a majority of the outstanding voting securities of the Fund. For the year ended December 31, 2017, there were no fees waived by the Manager.
| | | | |
| NOTESTO FINANCIAL STATEMENTS | | | 21 | |
| | | | |
| Notes to Financial Statements (continued) | | | BlackRock Global Opportunities V.I. Fund | |
For the year ended December 31, 2017, the Fund reimbursed the Manager $464 for certain accounting services, which is included in accounting services in the Statement of Operations.
The Manager has contractually agreed to reimburse all transfer agent fees for Class I and Class III. The Manager has agreed not to reduce or discontinue this contractual expense limitation through April 30, 2018, unless approved by the Board, including a majority of the Independent Directors, or by a vote of a majority of the outstanding voting securities of the Fund.
These amounts waived and/or reimbursed are shown as transfer agent fees reimbursed — class specific in the Statement of Operations. For the year ended December 31, 2017, class specific expense waivers and/or reimbursements are as follows:
| | | | | | | | | | | | |
| | | Class I | | | Class III | | | Total | |
Transfer agent fees reimbursed | | $ | 69,766 | | | | $8,276 | | | $ | 78,042 | |
With respect to the Fund, the Manager contractually agreed to waive and/or reimburse fees or expenses in order to limit expenses, excluding interest expense, dividend expense, tax expense, acquired fund fees and expenses, and certain other fund expenses, which constitute extraordinary expenses not incurred in the ordinary course of the Fund’s business (“expense limitation”). The expense limitations as a percentage of average daily net assets are as follows:
| | | | |
Class I | | | 0.97 | % |
Class III | | | 1.22 | % |
The Manager has agreed not to reduce or discontinue this contractual expense limitation through April 30, 2018 unless approved by the Board, including a majority of the Independent Directors, or by a vote of a majority of the outstanding voting securities of the Fund. For the year ended December 31, 2017, the Manager waived $148,164, which is included in fees waived and/or reimbursed by the Manager in the Statement of Operations.
Securities Lending: The U.S. Securities and Exchange Commission (“SEC”) has issued an exemptive order which permits BIM, an affiliate of the Manager, to serve as securities lending agent for the Fund, subject to applicable conditions. As securities lending agent, BIM bears all operational costs directly related to securities lending. The Fund is responsible for expenses in connection with the investment of cash collateral received for securities on loan (the “collateral investment expenses”). The cash collateral is invested in a private investment company managed by the Manager or its affiliates. However, BIM has agreed to cap the collateral investment expenses of the private investment company to an annual rate of 0.04%. The investment adviser to the private investment company will not charge any advisory fees with respect to shares purchased by the Fund. The private investment company in which the cash collateral has been invested may, under certain circumstances, impose a liquidity fee of up to 2% of the value withdrawn or temporarily restrict withdrawals for up to 10 business days during a 90 day period, in the event that the private investment company’s weekly liquid assets fall below certain thresholds.
Securities lending income is equal to the total of income earned from the reinvestment of cash collateral, net of fees and other payments to and from borrowers of securities, and less the collateral investment expenses. The Fund retains a portion of securities lending income and remits a remaining portion to BIM as compensation for its services as securities lending agent.
Pursuant to a securities lending agreement, the Fund retains 80% of securities lending income, and this amount retained can never be less than 70% of the total of securities lending income plus the collateral investment expenses.
In addition, commencing the business day following the date that the aggregate securities lending income earned across the Equity-Bond Complex in a calendar year exceeds a specified threshold, the Fund, pursuant to the securities lending agreement, will retain for the remainder of that calendar year securities lending income as follows: 85% of securities lending income, and this amount retained can never be less than 70% of the total of securities lending income plus the collateral investment expenses.
The share of securities lending income earned by the Fund is shown as securities lending income — affiliated — net in the Statement of Operations. For the year ended December 31, 2017, the Fund paid BIM $3,785 for securities lending agent services.
Officers and Directors: Certain directors and/or officers of the Company are directors and/or officers of BlackRock or its affiliates. The Fund reimburses the Manager for a portion of the compensation paid to the Company’s Chief Compliance Officer, which is included in Directors and Officer in the Statement of Operations.
For the year ended December 31, 2017, purchases and sales of investments, excluding short-term securities, were $12,470,552 and $30,828,262, respectively.
It is the Fund’s policy to comply with the requirements of the Internal Revenue Code of 1986, as amended, applicable to regulated investment companies, and to distribute substantially all of its taxable income to its shareholders. Therefore, no U.S. federal income tax provision is required.
The Fund files U.S. federal and various state and local tax returns. No income tax returns are currently under examination. The statute of limitations on the Fund’s U.S. federal tax returns generally remains open for each of the four years ended December 31, 2017. The statutes of limitations on the Fund’s state and local tax returns may remain open for an additional year depending upon the jurisdiction.
Management has analyzed tax laws and regulations and their application to the Fund as of December 31, 2017, inclusive of the open tax return years, and does not believe that there are any uncertain tax positions that require recognition of a tax liability in the Fund’s financial statements.
| | |
| 22 | | 2017 BLACKROCK ANNUAL REPORTTO SHAREHOLDERS |
| | | | |
| Notes to Financial Statements (continued) | | | BlackRock Global Opportunities V.I. Fund | |
U.S. GAAP requires that certain components of net assets be adjusted to reflect permanent differences between financial and tax reporting. These reclassifications have no effect on net assets or net asset values per share. As of period end, the following permanent differences attributable to foreign currency transactions, income recognition from pass-through entities, and the sale of stock of passive foreign investment companies were reclassified to the following accounts:
| | | | |
Paid-in Capital | | $ | (7 | ) |
Distribution in excess of net investment income | | | 113,383 | |
Accumulated net realized gain | | | (113,376 | ) |
The tax character of distributions paid was as follows:
| | | | | | | | |
| | | 12/31/17 | | | 12/31/16 | |
Ordinary income | | $ | 1,719,813 | | | $ | 690,632 | |
Long-term capital gains | | | 2,526,224 | | | | 151,168 | |
| | | | | | | | |
| | $ | 4,246,037 | | | $ | 841,800 | |
| | | | | | | | |
As of December 31, 2017, the tax components of accumulated net earnings (losses) were as follows:
| | | | |
Undistributed ordinary income | | $ | 112,101 | |
Undistributed long-term capital gains | | | 768,031 | |
Net unrealized gains(a) | | | 6,794,763 | |
| | | | |
| | $ | 7,674,895 | |
| | | | |
| (a) | The difference between book-basis and tax-basis net unrealized gains was attributable primarily to the tax deferral of losses on wash sales, the realization for tax purposes of unrealized gains on investments in passive foreign investment companies, income recognized from pass-through entities, and the realization for tax purposes of unrealized gains/losses on certain foreign currency contracts. |
As of December 31, 2017, gross unrealized appreciation and depreciation for investments and derivatives based on cost for U.S. federal income tax purposes were as follows:
| | | | |
Tax cost | | $ | 25,532,412 | |
| | | | |
Gross unrealized appreciation | | $ | 7,373,102 | |
Gross unrealized depreciation | | | (560,527 | ) |
| | | | |
Net unrealized appreciation | | $ | 6,812,575 | |
| | | | |
The Company, on behalf of the Fund, along with certain other funds managed by the Manager and its affiliates (“Participating Funds”), is a party to a 364-day, $2.1 billion credit agreement with a group of lenders. Under this agreement, the Fund may borrow to fund shareholder redemptions. Excluding commitments designated for certain individual funds, the Participating Funds, including the Fund, can borrow up to an aggregate commitment amount of $1.6 billion at any time outstanding, subject to asset coverage and other limitations as specified in the agreement. The credit agreement has the following terms: a fee of 0.12% per annum on unused commitment amounts and interest at a rate equal to the higher of (a) one-month LIBOR (but, in any event, not less than 0.00%) on the date the loan is made plus 0.80% per annum or (b) the Fed Funds rate (but, in any event, not less than 0.00%) in effect from time to time plus 0.80% per annum on amounts borrowed. The agreement expires in April 2018 unless extended or renewed. Participating Funds paid administration, legal and arrangement fees, which, if applicable, are included in miscellaneous expenses in the Statement of Operations. These fees were allocated among such funds based upon portions of the aggregate commitment available to them and relative net assets of Participating Funds. During the year ended December 31, 2017, the Fund did not borrow under the credit agreement.
In the normal course of business, the Fund invests in securities or other instruments and may enter into certain transactions where risks exist due to fluctuations in the market (market risk) or failure of the issuer to meet all its obligations, including the ability to pay principal and interest when due (issuer credit risk). The value of securities held by the Fund may decline in response to certain events, including those directly involving the issuers of securities owned by the Fund. Changes arising from the general economy, the overall market and local, regional or global political and/or social instability, as well as currency, interest rate and price fluctuations, may also affect the securities’ value.
The Fund may be exposed to additional risks when reinvesting cash collateral in money market funds that do not seek to maintain a stable NAV per share of $1.00 and which may be subject to redemption gates or liquidity fees under certain circumstances.
Valuation Risk: The market values of equities, such as common stocks and preferred securities or equity related investments, such as futures and options, may decline due to general market conditions which are not specifically related to a particular company. They may also decline due to factors which affect a particular industry or industries. The Fund may invest in illiquid investments and may experience difficulty in selling those investments in a timely manner at the price that it believes the investments are worth. Prices may fluctuate widely over short or extended periods in response to company, market or economic news. Markets also tend to move in cycles, with periods of rising and falling prices. This volatility may cause the Fund’s NAV to experience significant increases or decreases over short periods of time. If there is a general decline in the securities and other markets, the NAV of the Fund may lose value, regardless of the individual results of the securities and other instruments in which the Fund invests.
| | | | |
| NOTESTO FINANCIAL STATEMENTS | | | 23 | |
| | | | |
| Notes to Financial Statements (continued) | | | BlackRock Global Opportunities V.I. Fund | |
The price the Fund could receive upon the sale of any particular portfolio investment may differ from the Fund’s valuation of the investment, particularly for securities that trade in thin or volatile markets or that are valued using a fair valuation technique or a price provided by an independent pricing service. Changes to significant unobservable inputs and assumptions (i.e., publicly traded company multiples, growth rate, time to exit) due to the lack of observable inputs may significantly impact the resulting fair value and therefore the Fund’s results of operations. As a result, the price received upon the sale of an investment may be less than the value ascribed by the Fund, and the Fund could realize a greater than expected loss or lesser than expected gain upon the sale of the investment. The Fund’s ability to value its investments may also be impacted by technological issues and/or errors by pricing services or other third party service providers.
Counterparty Credit Risk: The Fund may be exposed to counterparty credit risk, or the risk that an entity may fail to or be unable to perform on its commitments related to unsettled or open transactions. The Fund manages counterparty credit risk by entering into transactions only with counterparties that the Manager believes have the financial resources to honor their obligations and by monitoring the financial stability of those counterparties. Financial assets, which potentially expose the Fund to market, issuer and counterparty credit risks, consist principally of financial instruments and receivables due from counterparties. The extent of the Fund’s exposure to market, issuer and counterparty credit risks with respect to these financial assets is approximately their value recorded in the Statement of Assets and Liabilities, less any collateral held by the Fund.
A derivative contract may suffer a mark-to-market loss if the value of the contract decreases due to an unfavorable change in the market rates or values of the underlying instrument. Losses can also occur if the counterparty does not perform under the contract.
The Fund’s risk of loss from counterparty credit risk on OTC derivatives is generally limited to the aggregate unrealized gain less the value of any collateral held by the Fund.
For OTC options purchased, the Fund bears the risk of loss in the amount of the premiums paid plus the positive change in market values net of any collateral held by the Fund should the counterparty fail to perform under the contracts. Options written by the Fund do not typically give rise to counterparty credit risk, as options written generally obligate the Fund, and not the counterparty, to perform. The Fund may be exposed to counterparty credit risk with respect to options written to the extent the Fund deposits collateral with its counterparty to a written option.
Concentration Risk: The Fund invests a substantial amount of its assets in issuers located in a single country or a limited number of countries. When the Fund concentrates its investments in this manner, it assumes the risk that economic, political and social conditions in those countries may have a significant impact on their investment performance. Foreign issuers may not be subject to the same uniform accounting, auditing and financial reporting standards and practices as used in the United States. Foreign securities markets may also be less liquid, more volatile, and less subject to governmental supervision not typically associated with investing in U.S. securities. Investment percentages in specific countries are presented in the Schedule of Investments.
| | |
| 24 | | 2017 BLACKROCK ANNUAL REPORTTO SHAREHOLDERS |
| | | | |
| Notes to Financial Statements (continued) | | | BlackRock Global Opportunities V.I. Fund | |
| 11. | CAPITAL SHARE TRANSACTIONS |
Transactions in capital shares for each class were as follows:
| | | | | | | | | | | | | | | | | | | | | | | | | | | | |
| | | Year Ended 12/31/2017 | | | | | | Year Ended 12/31/2016 | |
| | | | | | Shares | | | Amount | | | | | | | | | Shares | | | Amount | |
Class I | | | | | | | | | | | | | | | | | | | | | | | | | | | | |
Shares sold | | | | | | | 137,934 | | | $ | 2,490,496 | | | | | | | | | | | | 89,720 | | | $ | 1,430,156 | |
Shares issued in reinvestment of distributions | | | | | | | 214,809 | | | | 3,753,307 | | | | | | | | | | | | 47,029 | | | | 763,742 | |
Shares redeemed | | | | | | | (1,024,348 | ) | | | (19,601,826 | ) | | | | | | | | | | | (364,840 | ) | | | (5,759,871 | ) |
| | | | | | | | | | | | | | | | | | | | | | | | | | | | |
Net decrease | | | | | | | (671,605 | ) | | $ | (13,358,023 | ) | | | | | | | | | | | (228,091 | ) | | $ | (3,565,973 | ) |
| | | | | | | | | | | | | | | | | | | | | | | | | | | | |
Class III | | | | | | | | | | | | | | | | | | | | | | | | | | | | |
Shares sold | | | | | | | 90,354 | | | $ | 1,652,578 | | | | | | | | | | | | 95,967 | | | $ | 1,502,836 | |
Shares issued in reinvestment of distributions | | | | | | | 28,333 | | | | 492,731 | | | | | | | | | | | | 4,827 | | | | 78,060 | |
Shares redeemed | | | | | | | (161,003 | ) | | | (2,999,136 | ) | | | | | | | | | | | (86,426 | ) | | | (1,382,027 | ) |
| | | | | | | | | | | | | | | | | | | | | | | | | | | | |
Net increase (decrease) | | | | | | | (42,316 | ) | | $ | (853,827 | ) | | | | | | | | | | | 14,368 | | | $ | 198,869 | |
| | | | | | | | | | | | | | | | | | | | | | | | | | | | |
Total Net Decrease | | | | | | | (713,921 | ) | | $ | (14,211,850 | ) | | | | | | | | | | | (213,723 | ) | | $ | (3,367,104 | ) |
| | | | | | | | | | | | | | | | | | | | | | | | | | | | |
Management has evaluated the impact of all subsequent events on the Fund through the date the financial statements were issued and has determined that there were no subsequent events requiring adjustment or additional disclosure in the financial statements.
| | | | |
| NOTESTO FINANCIAL STATEMENTS | | | 25 | |
Report of Independent Registered Public Accounting Firm
To the Shareholders of BlackRock Global Opportunities V.I. Fund and the Board of Directors
of BlackRock Variable Series Funds, Inc.:
Opinion on the Financial Statements and Financial Highlights
We have audited the accompanying statement of assets and liabilities, including the schedule of investments, of BlackRock Global Opportunities V.I. Fund of BlackRock Variable Series Funds, Inc. (the “Fund”), as of December 31, 2017, the related statement of operations for the year then ended, the statements of changes in net assets for each of the two years in the period then ended, the financial highlights for each of the five years in the period then ended, and the related notes. In our opinion, the financial statements and financial highlights present fairly, in all material respects, the financial position of the Fund as of December 31, 2017, and the results of its operations for the year then ended, the changes in its net assets for each of the two years in the period then ended, and the financial highlights for each of the five years in the period then ended, in conformity with accounting principles generally accepted in the United States of America.
Emphasis of Matter
As discussed in Note 1 to the financial statements, on March 27, 2017, the Board of Directors approved a proposal to close the Fund to new investors and thereafter liquidate the Fund on or about March 30, 2018.
Basis for Opinion
These financial statements and financial highlights are the responsibility of the Fund’s management. Our responsibility is to express an opinion on the Fund’s financial statements and financial highlights based on our audits. We are a public accounting firm registered with the Public Company Accounting Oversight Board (United States) (PCAOB) and are required to be independent with respect to the Fund in accordance with the U.S. federal securities laws and the applicable rules and regulations of the Securities and Exchange Commission and the PCAOB.
We conducted our audits in accordance with the standards of the PCAOB. Those standards require that we plan and perform the audit to obtain reasonable assurance about whether the financial statements and financial highlights are free of material misstatement, whether due to error or fraud. The Fund is not required to have, nor were we engaged to perform, an audit of its internal control over financial reporting. As part of our audits we are required to obtain an understanding of internal control over financial reporting but not for the purpose of expressing an opinion on the effectiveness of the Fund’s internal control over financial reporting. Accordingly, we express no such opinion.
Our audits included performing procedures to assess the risks of material misstatement of the financial statements and financial highlights, whether due to error or fraud, and performing procedures that respond to those risks. Such procedures included examining, on a test basis, evidence regarding the amounts and disclosures in the financial statements and financial highlights. Our audits also included evaluating the accounting principles used and significant estimates made by management, as well as evaluating the overall presentation of the financial statements and financial highlights. Our procedures included confirmation of securities owned as of December 31, 2017, by correspondence with the custodian and brokers; when replies were not received from brokers, we performed other auditing procedures. We believe that our audits provide a reasonable basis for our opinion.
Deloitte & Touche LLP
Philadelphia, Pennsylvania
February 19, 2018
We have served as the auditor of one or more BlackRock investment companies since 1992.
| | |
| 26 | | 2017 BLACKROCK ANNUAL REPORTTO SHAREHOLDERS |
| | | | |
| Glossary of Terms Used in this Report | | | BlackRock Global Opportunities V.I. Fund | |
Currency Abbreviations
| | |
| |
| AUD | | Australian Dollar |
| CAD | | Canadian Dollar |
| CHF | | Swiss Franc |
| DKK | | Danish Krone |
| EUR | | EURO |
| GBP | | British Pound |
| NOK | | Norwegian Krone |
| NZD | | New Zealand Dollar |
| RUB | | Russian Ruble |
| SEK | | Swedish Krona |
| SGD | | Singapore Dollar |
| USD | | US Dollar |
| ZAR | | South African Rand |
|
| Portfolio Abbreviation |
| |
| ADR | | American Depositary Receipts |
DECEMBER 31, 2017
| | |
ANNUAL REPORT | |  |
BlackRock Variable Series Funds, Inc
| Ø | | BlackRock Government Money Market V.I. Fund |
|
| Not FDIC Insured • May Lose Value • No Bank Guarantee |
Money Market Overview For the 12-Month Period Ended December 31, 2017
Notable conditions during 2017 included the continued gradual removal of monetary accommodation by the Federal Open Market Committee (“FOMC”), the nomination of a new chairman of the FOMC, pronounced demand for U.S. dollar funding heading into year end, a series of short-term spending agreements to keep the government open, and the passage of U.S. tax reform. In December, the FOMC delivered on what was basically a foregone conclusion with a 0.25% increase in the federal funds target range to 1.25% — 1.50%. This was the fifth rate rise since “lifting off” of zero. It was also the first time that the FOMC delivered on the number of hikes penciled in at the beginning of the year (despite continued skepticism from market participants).
The impacts of a series of devastating storms during the third quarter of 2017 were generally viewed to be temporary. The FOMC upgraded its forecasts for growth and employment, while leaving its outlook for inflation — which is not expected to hit its 2% target until 2019 — unchanged. Despite the stronger prognosis for economic growth, the so-called ‘dot plot’ continued to reflect three interest rate hikes in 2018 (while the longer run forecast for the Federal Funds rate was unchanged at 2.8%). (The dot plot represents the Fed’s ongoing efforts to become more transparent with respect to its policies.) Summing this up, the underlying tone of the meeting was generally regarded as dovish. As of year end, the market-implied odds of a rate hike upcoming in March stood close to 70%, while futures contracts for federal funds were priced for about two hikes during 2018. As anticipated, the FOMC announced the commencement of its balance sheet normalization program in October at its September 20, 2017 meeting. A total of $10 billion of Treasury and agency mortgage-backed securities were initially allowed to mature each month, with the aggregate sum rising by a like amount each quarter until a “roll off” rate of $50 billion per month is achieved.
Credit spreads, as reflected in the differential between the three-month London Inter-Bank Offered Rate and overnight index swaps, widened heading into year end as fund managers generally maintained a defensive posture while certain banks appeared to limit the availability of U.S. dollar funding given balance sheet management concerns. The U.S. debt ceiling was a focus during the summer months. Volatility was manifested via an earlier-than-usual back up in yields on Treasury bills deemed most at risk of a potential delay in payment if the borrowing capacity was not addressed in a timely fashion. A respite was achieved in September when a bipartisan agreement to temporarily extend the debt limit along with a continuing resolution to keep the Federal government open until December 8, 2017 was attached to funding for hurricane relief.
Two ‘stopgap’ spending measures were put in place during the fourth quarter of 2017 to ensure that the government remained open. Extraordinary measures allowed the Treasury to continue borrowing during the latter part of the year. Jerome Powell was nominated as Chairman of the FOMC to replace Janet Yellen, who is expected to step down upon his confirmation. Vice-chairman Bill Dudley’s resignation in early 2018 will add to the number of vacancies on the FOMC (including various unfilled seats on the Federal Reserve’s Board of Governors). Finally, tax reform legislation was enacted and became effective January 1, 2018.
Past performance is no guarantee of future results. Index performance is shown for illustrative purposes only. You cannot invest directly in an index.
| | |
| 2 | | 2017 BLACKROCK ANNUAL REPORTTO SHAREHOLDERS |
| | |
| Fund Summary as of December 31, 2017 | | BlackRock Government Money Market V.I. Fund |
Investment Objective
BlackRock Government Money Market V.I. Fund’s (the “Fund”) investment objective is to seek to preserve capital, maintain liquidity, and achieve the highest possible current income consistent with the foregoing.
CURRENT SEVEN-DAY YIELDS
| | | | | | | | |
| | | 7-Day SEC Yields | | | 7-Day Yields | |
BlackRock Government Money Market V.I. Fund | | | 1.05 | % | | | 1.05 | % |
The 7-Day SEC Yield may differ from the 7-Day Yield shown above due to the fact that the 7-Day SEC Yield excludes distributed capital gains.
Past performance is not indicative of future results. Performance results do not reflect the deduction of taxes that a shareholder would pay on Fund distributions or the redemption of Fund shares.
PORTFOLIO COMPOSITION
| | | | |
| Asset Type | | Percent of Net Assets | |
Repurchase Agreements | | | 38 | % |
U.S. Government Sponsored Agency Securities | | | 35 | |
U.S. Treasury Obligations | | | 24 | |
Other Assets Less Liabilities | | | 3 | |
Disclosure of Expenses
Shareholders of the Fund may incur the following charges: (a) transactional expenses, and (b) operating expenses, including investment advisory fees, service and distribution fees, and other fund expenses. The expense example shown below (which is based on a hypothetical investment of $1,000 invested on July 1, 2017 and held through December 31, 2017) is intended to assist shareholders both in calculating expenses based on an investment in the Fund and in comparing these expenses with similar costs of investing in other mutual funds.
The expense example provides information about actual account values and actual expenses. In order to estimate the expenses a shareholder paid during the period covered by this report, shareholders can divide their account value by $1,000 and then multiply the result by the number corresponding to their share class under the heading entitled “Expenses Paid During the Period.”
The expense example also provides information about hypothetical account values and hypothetical expenses based on the Fund’s actual expense ratio and an assumed rate of return of 5% per year before expenses. In order to assist shareholders in comparing the ongoing expenses of investing in the Fund and other funds, compare the 5% hypothetical examples with the 5% hypothetical examples that appear in shareholder reports of other funds.
The expenses shown in the expense example are intended to highlight shareholders’ ongoing costs only and do not reflect any transactional expenses, such as sales charges, if any. Therefore, the hypothetical example is useful in comparing ongoing expenses only, and will not help shareholders determine the relative total expenses of owning different funds. If these transactional expenses were included, shareholder expenses would have been higher.
Expense Example
| | | | | | | | | | | | | | | | | | | | | | | | | | | | | | | | |
| | | Actual | | | | | | Hypothetical (a) | | | | |
| | | Beginning Account Value (07/01/17) | | | Ending Account Value (12/31/17) | | | Expenses
Paid During
the Period (b) | | | | | | Beginning Account Value (07/01/17) | | | Ending Account Value (12/31/17) | | | Expenses Paid During the Period (b) | | | Annualized Expense Ratio | |
Class I | | $ | 1,000.00 | | | $ | 1,004.20 | | | $ | 1.52 | | | | | | | $ | 1,000.00 | | | $ | 1,023.69 | | | $ | 1.53 | | | | 0.30 | % |
| | (a) | Hypothetical 5% annual return before expenses is calculated by prorating the number of days in the most recent fiscal half year divided by 365. | |
| | (b) | Expenses are equal to the annualized expense ratio, multiplied by the average account value over the period, multiplied by 184/365 (to reflect the one-half year period shown). | |
| | |
Schedule of Investments December 31, 2017 | | BlackRock Government Money Market V.I. Fund (Percentages shown are based on Net Assets) |
| | | | | | | | |
| Security | | Par
(000) | | | Value | |
U.S. Government Sponsored Agency Obligations — 35.0% | |
Federal Farm Credit Bank: | | | | | | | | |
1.00%, 01/19/18 | | | USD 500 | | | $ | 499,960 | |
0.75%, 04/18/18 | | | 1,500 | | | | 1,497,966 | |
Federal Farm Credit Bank Discount Notes(a): | | | | | | | | |
1.23%, 02/14/18 | | | 1,000 | | | | 998,424 | |
1.55%, 08/10/18 | | | 105 | | | | 104,020 | |
Federal Farm Credit Bank Variable Rate Notes(b): | | | | | | | | |
(LIBOR USD 3 Month - 0.08%), 1.28%, 01/23/18 | | | 575 | | | | 575,001 | |
(LIBOR USD 1 Month + 0.18%), 1.55%, 04/04/18 | | | 1,000 | | | | 999,974 | |
Federal Home Loan Bank: | | | | | | | | |
Series 1, 0.88%, 03/19/18 | | | 4,000 | | | | 3,997,457 | |
1.25%, 06/08/18 | | | 1,250 | | | | 1,249,535 | |
Federal Home Loan Bank Discount Notes(a): | | | | | | | | |
1.06%, 01/02/18 | | | 1,000 | | | | 999,971 | |
1.06%, 01/19/18 | | | 2,000 | | | | 1,998,866 | |
1.11%, 01/24/18 | | | 4,345 | | | | 4,341,671 | |
1.15%, 01/31/18 | | | 1,755 | | | | 1,753,328 | |
1.19%, 02/02/18 | | | 1,500 | | | | 1,498,400 | |
1.21%, 02/07/18 | | | 1,500 | | | | 1,498,127 | |
1.29%, 03/07/18 | | | 1,280 | | | | 1,276,986 | |
1.46%, 06/06/18 | | | 500 | | | | 496,817 | |
Federal Home Loan Bank Variable Rate Notes(b): | | | | | | | | |
(LIBOR USD 1 Month - 0.15%), 1.35%, 04/17/18 | | | 1,400 | | | | 1,400,000 | |
(LIBOR USD 1 Month - 0.14%), 1.35%, 04/17/18 | | | 2,500 | | | | 2,500,000 | |
(LIBOR USD 3 Month - 0.35%), 1.05%, 05/09/18 | | | 1,000 | | | | 1,000,000 | |
(LIBOR USD 3 Month - 0.16%), 1.36%, 06/08/18 | | | 500 | | | | 500,000 | |
(LIBOR USD 1 Month - 0.12%), 1.26%, 10/03/18 | | | 1,000 | | | | 1,000,000 | |
(LIBOR USD 1 Month - 0.10%), 1.47%, 11/01/18 | | | 3,000 | | | | 3,000,000 | |
(LIBOR USD 1 Month - 0.10%), 1.47%, 11/02/18 | | | 2,000 | | | | 2,000,000 | |
(LIBOR USD 1 Month - 0.13%), 1.35%, 11/15/18 | | | 3,000 | | | | 3,000,000 | |
(LIBOR USD 1 Month - 0.09%), 1.46%, 01/25/19 | | | 750 | | | | 750,000 | |
(LIBOR USD 3 Month - 0.16%), 1.39%, 06/12/19 | | | 420 | | | | 419,842 | |
(LIBOR USD 3 Month - 0.16%), 1.46%, 06/20/19 | | | 1,000 | | | | 1,000,000 | |
(LIBOR USD 1 Month - 0.06%), 1.37%, 09/11/19 | | | 1,200 | | | | 1,200,000 | |
(LIBOR USD 3 Month - 0.14%), 1.47%, 12/19/19 | | | 535 | | | | 535,000 | |
Federal Home Loan Mortgage Corp. Discount Notes, 1.23%, 02/16/18(a) | | | 285 | | | | 284,603 | |
Federal Home Loan Mortgage Corp. Notes: | | | | | | | | |
0.75%, 04/09/18 | | | 1,000 | | | | 998,739 | |
4.88%, 06/13/18 | | | 900 | | | | 914,123 | |
1.33%, 06/27/18 | | | 500 | | | | 499,988 | |
0.88%, 10/12/18 | | | 840 | | | | 835,139 | |
Federal National Mortgage Association Notes: | | | | | | | | |
0.88%, 02/08/18 | | | 1,000 | | | | 999,668 | |
0.88%, 05/21/18 | | | 870 | | | | 868,799 | |
| | | | | | | | |
Total U.S. Government Sponsored Agency Obligations — 35.0%
(Cost: $47,492,404) | | | | 47,492,404 | |
| | | | | | | | |
U.S. Treasury Obligations — 23.8% | |
U.S. Treasury Bills(a): | | | | | | | | |
1.31%, 03/22/18 | | | 1,820 | | | | 1,815,237 | |
1.33%, 03/29/18 | | | 13,200 | | | | 13,160,836 | |
1.35%, 04/05/18 | | | 1,230 | | | | 1,226,184 | |
1.38%, 05/03/18 | | | 2,000 | | | | 1,991,460 | |
1.44%, 05/31/18 | | | 1,305 | | | | 1,297,197 | |
1.46%, 06/07/18 | | | 2,445 | | | | 2,429,539 | |
1.51%, 06/28/18 | | | 4,000 | | | | 3,969,740 | |
U.S. Treasury Notes: | | | | | | | | |
0.75%, 02/28/18 | | | 1,955 | | | | 1,954,502 | |
1.38%, 07/31/18 | | | 685 | | | | 684,767 | |
| | | | | | | | |
| Security | | Par
(000) | | | Value | |
U.S. Treasury Obligations (continued) | |
U.S. Treasury Notes (continued): | | | | | | | | |
(U.S. Treasury 3 Month Bill Money Market Yield + 0.14%), 1.59%, 01/31/19(b) | | | 3,775 | | | $ | 3,775,000 | |
| | | | | | | | |
Total U.S. Treasury Obligations — 23.8%
(Cost: $32,304,462) | | | | 32,304,462 | |
| | | | | | | | |
Total Repurchase Agreements — 38.2%
(Cost: $51,777,000) | | | | 51,777,000 | |
| | | | | | | | |
| |
Total Investments — 97.0%
(Cost: $131,573,866)(c) | | | | 131,573,866 | |
Other Assets Less Liabilities — 3.0% | | | | 4,084,734 | |
| | | | | | | | |
Net Assets — 100.0% | | | $ | 135,658,600 | |
| | | | | | | | |
| (a) | Rates are discount rates or a range of discount rates at the time of purchase. |
| (b) | Variable rate security. Security may be issued at a fixed coupon rate, which converts to a variable rate at a specified date. Rate shown is the rate in effect as of period end. |
| (c) | Cost for U.S. federal income tax purposes. |
| | |
| 4 | | 2017 BLACKROCK ANNUAL REPORTTO SHAREHOLDERS |
| | |
Schedule of Investments (continued) December 31, 2017 | | BlackRock Government Money Market V.I. Fund |
Repurchase Agreements
| | | | | | | | | | | | | | | | | | | | | | | | | | | | | | |
| | | Repurchase Agreements | | | | Collateral |
| Counterparty | | Coupon
Rate | | | Purchase
Date | | | Maturity
Date | | | Par
(000) | | | At Value
(000) | | | Proceeds
Including
Interest | | | | Position | | Original Par | | Position
Received,
At Value |
Bank of Montreal | | | 1.36 | % | | | 12/29/17 | | | | 01/02/18 | | | $ | 5,600 | | | $ | 5,600 | | | $5,600,846 | | | | U.S. Government Sponsored Agency Obligations,
2.50% to 5.50%,
due 09/01/25 to 04/01/37 | | $15,735,512 | | $5,768,000 |
BNP Paribas SA | | | 1.25 | (a) | | | 12/29/17 | | | | 01/05/18 | | | | 677 | | | | 677 | | | 677,165 | | | | U.S. Treasury Obligations,
0.13% to 1.75%,
due 01/31/23 to 11/15/27 | | 691,014 | | 690,574 |
| | | 1.40 | | | | 12/29/17 | | | | 01/02/18 | | | | 10,000 | | | | 10,000 | | | 10,001,555 | | | | U.S. Government Sponsored Agency Obligations and U.S. Treasury Obligations,
0.63% to 4.00%,
due 03/31/19 to 06/20/47 | | 10,849,393 | | 10,200,006 |
| | | | | | | | | | | | | | | | | | | | | | | | | | | | | | |
Total BNP Paribas SA | | | | | | | $ | 10,677 | | | | | | | | | | | $10,890,580 |
| | | | | | | | | | | | | | | | | | | | | | | | | | | | | | |
Goldman Sachs & Co. LLC | | | 1.45 | | | | 12/27/17 | | | | 01/03/18 | | | | 2,500 | | | | 2,500 | | | 2,500,705 | | | | U.S. Government Sponsored Agency Obligations,
3.00% to 6.50%,
due 04/20/19 to 08/20/47 | | 13,014,279 | | 2,550,095 |
JP Morgan Securities LLC | | | 1.41 | | | | 12/29/17 | | | | 01/02/18 | | | | 6,000 | | | | 6,000 | | | 6,000,940 | | | | U.S. Treasury Obligation, 1.50%, due 03/31/19 | | 6,125,000 | | 6,120,460 |
| | | 1.73 | (a) | | | 12/29/17 | | | | 02/02/18 | | | | 3,500 | | | | 3,500 | | | 3,505,887 | | | | U.S. Treasury Obligation, 0.75%, due 07/31/18 | | 3,580,000 | | 3,573,187 |
| | | | | | | | | | | | | | | | | | | | | | | | | | | | | | |
Total JP Morgan Securities LLC | | | | | | | $ | 9,500 | | | | | | | | | | | $9,693,647 |
| | | | | | | | | | | | | | | | | | | | | | | | | | | | | | |
Merrill Lynch, Pierce, Fenner & Smith, Inc. | | | 1.42 | | | | 12/29/17 | | | | 01/02/18 | | | | 10,000 | | | | 10,000 | | | 10,001,578 | | | | U.S. Treasury Obligation, 2.38%, due 08/15/24 | | 10,094,500 | | 10,200,060 |
| | | 1.50 | | | | 12/27/17 | | | | 01/03/18 | | | | 1,000 | | | | 1,000 | | | 1,000,292 | | | | U.S. Government Sponsored Agency Obligation, 2.89%,
due 04/01/47 | | 1,039,984 | | 1,030,000 |
| | | | | | | | | | | | | | | | | | | | | | | | | | | | | | |
Total Merrill Lynch, Pierce, Fenner & Smith, Inc. | | | | | | | $ | 11,000 | | | | | | | | | | | $11,230,060 |
| | | | | | | | | | | | | | | | | | | | | | | | | | | | | | |
Mizuho Securities USA LLC | | | 1.37 | | | | 12/29/17 | | | | 01/02/18 | | | | 10,000 | | | | 10,000 | | | 10,001,522 | | | | U.S. Treasury Obligations, 0.13% to 3.63%,
due 04/15/19 to 11/15/45 | | 10,152,000 | | 10,200,026 |
Wells Fargo Securities LLC | | | 1.35 | | | | 12/27/17 | | | | 01/03/18 | | | | 1,500 | | | | 1,500 | | | 1,500,394 | | | | U.S. Government Sponsored Agency Obligations, 4.00%
due 11/01/46 to 06/01/47 | | 1,480,259 | | 1,545,000 |
| | | 1.42 | | | | 12/29/17 | | | | 01/05/18 | | | | 1,000 | | | | 1,000 | | | 1,000,276 | | | | U.S. Government Sponsored Agency Obligation, 4.00%,
due 11/01/47 | | 984,169 | | 1,030,000 |
| | | | | | | | | | | | | | | | | | | | | | | | | | | | | | |
Total Wells Fargo Securities LLC | | | | | | | $ | 2,500 | | | | | | | | | | | $ 2,575,000 |
| | | | | | | | | | | | | | | | | | | | | | | | | | | | | | |
Total | | | | | | | | | | | | | | | | | | $ | 51,777 | | | | | | | | | | | $52,907,408 |
| | | | | | | | | | | | | | | | | | | | | | | | | | | | | | |
| | (a) | Variable rate security. Rate as of period end and maturity is the date the principal owed can be recovered through demand. | |
| | | | |
| SCHEDULES OF INVESTMENTS | | | 5 | |
| | |
Schedule of Investments (continued) December 31, 2017 | | BlackRock Government Money Market V.I. Fund |
Fair Value Hierarchy as of Period End
Various inputs are used in determining the fair value of investments. For information about the Fund’s policy regarding valuation of investments, refer to the Notes to Financial Statements.
The following table summarizes the Fund’s investments categorized in the disclosure hierarchy:
| | | | | | | | | | | | | | | | |
| | | Level 1 | | | Level 2 | | | Level 3 | | | Total | |
Investments: | | | | | | | | | | | | | | | | |
Assets: | | | | | | | | | | | | | | | | |
Short-Term Securities(a) | | $ | — | | | $ | 131,573,866 | | | $ | — | | | $ | 131,573,866 | |
| | | | | | | | | | | | | | | | |
| | $ | — | | | $ | 131,573,866 | | | $ | — | | | $ | 131,573,866 | |
| | | | | | | | | | | | | | | | |
| | (a) | See above Schedule of Investments for values in each security type. | |
During the year ended December 31, 2017, there were no transfers between levels.
See notes to financial statements.
| | |
| 6 | | 2017 BLACKROCK ANNUAL REPORTTO SHAREHOLDERS |
Statement of Assets and Liabilities
December 31, 2017
| | | | |
| | | BlackRock Government Money Market V.I. Fund | |
| |
ASSETS | | | | |
Investments at value — unaffiliated (cost — $79,796,866) | | $ | 79,796,866 | |
Cash | | | 4,400,232 | |
Repurchase agreements at value (cost — $51,777,000) | | | 51,777,000 | |
Receivables: | | | | |
Capital shares sold | | | 3,365 | |
Interest — unaffiliated | | | 68,761 | |
Prepaid expenses | | | 653 | |
Other assets | | | 20,766 | |
| | | | |
Total assets | | | 136,067,643 | |
| | | | |
| |
LIABILITIES | | | | |
Payables: | | | | |
Capital shares redeemed | | | 301,906 | |
Printing fees | | | 27,479 | |
Professional fees | | | 40,080 | |
Investment advisory fees | | | 34,310 | |
Officer’s and Directors’ fees | | | 4,736 | |
Other affiliates | | | 532 | |
| | | | |
Total liabilities | | | 409,043 | |
| | | | |
| |
NET ASSETS | | $ | 135,658,600 | |
| | | | |
| |
NET ASSETS CONSIST OF | | | | |
Paid-in capital | | $ | 135,658,453 | |
Accumulated net realized gain | | | 147 | |
| | | | |
NET ASSETS | | $ | 135,658,600 | |
| | | | |
Class I — Based on net assets of $135,658,600 and 135,662,592 shares outstanding, 3.3 billion shares authorized, $0.10 par value. | | $ | 1.00 | |
| | | | |
See notes to financial statements.
Statement of Operations
December 31, 2017
| | | | |
| | | BlackRock Government Money Market V.I. Fund | |
| |
INVESTMENT INCOME | | | | |
Interest — unaffiliated | | $ | 1,349,240 | |
| | | | |
Total investment income | | | 1,349,240 | |
| | | | |
| |
EXPENSES | | | | |
Investment advisory | | | 722,858 | |
Transfer agent — class specific | | | 153,326 | |
Professional | | | 59,111 | |
Printing | | | 32,899 | |
Custodian | | | 25,265 | |
Directors and Officer | | | 22,719 | |
Accounting services | | | 19,680 | |
Transfer agent | | | 4,999 | |
Miscellaneous | | | 4,829 | |
| | | | |
Total expenses | | | 1,045,686 | |
Less: | | | | |
Fees waived and/or reimbursed by the Manager | | | (458,573 | ) |
Transfer agent fees reimbursed | | | (153,321 | ) |
| | | | |
Total expenses after fees waived and/or reimbursed | | | 433,792 | |
| | | | |
Net investment income | | | 915,448 | |
| | | | |
| |
REALIZED GAIN | | | | |
Net realized gain from investments | | | 475 | |
| | | | |
NET INCREASE IN NET ASSETS RESULTING FROM OPERATIONS | | $ | 915,923 | |
| | | | |
See notes to financial statements.
| | |
| 8 | | 2017 BLACKROCK ANNUAL REPORTTO SHAREHOLDERS |
Statements of Changes in Net Assets
| | | | | | | | |
| | | BlackRock Government
Money Market V.I. Fund | |
| | | Year Ended | |
| | | 12/31/2017 | | | 12/31/2016 | |
| | |
INCREASE (DECREASE) IN NET ASSETS | | | | | | | | |
| | |
OPERATIONS | | | | | | | | |
Net investment income | | $ | 915,448 | | | $ | 198,934 | |
Net realized gain | | | 475 | | | | 279 | |
| | | | | | | | |
Net increase in net assets resulting from operations | | | 915,923 | | | | 199,213 | |
| | | | | | | | |
| | |
DISTRIBUTIONS TO SHAREHOLDERS(a) | | | | | | | | |
From net investment income | | | (915,448 | ) | | | (198,934 | ) |
From net realized gain | | | (477 | ) | | | (1,077 | ) |
| | | | | | | | |
Decrease in net assets resulting from distributions to shareholders | | | (915,925 | ) | | | (200,011 | ) |
| | | | | | | | |
| | |
CAPITAL SHARE TRANSACTIONS | | | | | | | | |
Net proceeds from sale of shares | | | 110,014,964 | | | | 85,450,151 | |
Reinvestments of distributions | | | 916,673 | | | | 202,247 | |
Cost of shares redeemed | | | (126,795,881 | ) | | | (86,246,950 | ) |
| | | | | | | | |
Net decrease in net assets derived from capital share transactions | | | (15,864,244 | ) | | | (594,552 | ) |
| | | | | | | | |
| | |
NET ASSETS | | | | | | | | |
Total decrease in net assets | | | (15,864,246 | ) | | | (595,350 | ) |
Beginning of year | | | 151,522,846 | | | | 152,118,196 | |
| | | | | | | | |
End of year | | $ | 135,658,600 | | | $ | 151,522,846 | |
| | | | | | | | |
| (a) | Distributions for annual periods determined in accordance with U.S. federal income tax regulations. |
See notes to financial statements.
Financial Highlights
(For a share outstanding throughout each period)
| | | | | | | | | | | | | | | | | | | | |
| | | BlackRock Government Money Market V.I. Fund | |
| | | Class I | |
| | | Year Ended December 31, | |
| | 2017 | | | 2016 | | | 2015 | | | 2014 | | | 2013 | |
Net asset value, beginning of year | | $ | 1.00 | | | $ | 1.00 | | | $ | 1.00 | | | $ | 1.00 | | | $ | 1.00 | |
| | | | | | | | | | | | | | | | | | | | |
Net investment income | | | 0.0064 | | | | 0.0013 | | | | 0.0000 | (a) | | | 0.0000 | (a) | | | 0.0000 | (a) |
Net realized gain | | | 0.0000 | (a) | | | 0.0000 | (a) | | | 0.0001 | | | | 0.0001 | | | | 0.0000 | (a) |
| | | | | | | | | | | | | | | | | | | | |
Net increase from investment operations | | | 0.0064 | | | | 0.0013 | | | | 0.0001 | | | | 0.0001 | | | | 0.0000 | |
| | | | | | | | | | | | | | | | | | | | |
| Distributions:(b) | | | | | | | | | | | | | | | |
From net investment income | | | (0.0064 | ) | | | (0.0013 | ) | | | (0.0000 | )(c) | | | (0.0000 | )(c) | | | (0.0000 | )(c) |
From net realized gain | | | (0.0000 | )(c) | | | (0.0000 | )(c) | | | (0.0001 | ) | | | (0.0001 | ) | | | (0.0000 | )(c) |
| | | | | | | | | | | | | | | | | | | | |
Total distributions | | | (0.0064 | ) | | | (0.0013 | ) | | | (0.0001 | ) | | | (0.0001 | ) | | | (0.0000 | ) |
| | | | | | | | | | | | | | | | | | | | |
Net asset value, end of year | | $ | 1.00 | | | $ | 1.00 | | | $ | 1.00 | | | $ | 1.00 | | | $ | 1.00 | |
| | | | | | | | | | | | | | | | | | | | |
| | | | | |
Total Return:(d) | | | | | | | | | | | | | | | | | | | | |
Based on net asset value | | | 0.65 | % | | | 0.13 | % | | | 0.01 | % | | | 0.01 | % | | | 0.00 | % |
| | | | | | | | | | | | | | | | | | | | |
| | | | | |
Ratios to Average Net Assets: | | | | | | | | | | | | | | | | | | | | |
Total expenses | | | 0.72 | % | | | 0.62 | % | | | 0.61 | % | | | 0.61 | % | | | 0.63 | % |
| | | | | | | | | | | | | | | | | | | | |
Total expenses after fees waived and/or reimbursed | | | 0.30 | % | | | 0.30 | % | | | 0.18 | % | | | 0.17 | % | | | 0.20 | % |
| | | | | | | | | | | | | | | | | | | | |
Net investment income | | | 0.63 | % | | | 0.13 | % | | | 0.00 | % | | | 0.00 | % | | | 0.00 | % |
| | | | | | | | | | | | | | | | | | | | |
| | | | | |
Supplemental Data: | | | | | | | | | | | | | | | | | | | | |
Net assets, end of year (000) | | $ | 135,659 | | | $ | 151,523 | | | $ | 152,118 | | | $ | 228,241 | | | $ | 179,570 | |
| | | | | | | | | | | | | | | | | | | | |
| (a) | Amount is less than $0.00005 per share. |
| (b) | Distributions for annual periods determined in accordance with U.S. federal income tax regulations. |
| (c) | Amount is greater than $(0.00005) per share. |
| (d) | Where applicable, excludes insurance-related fees and expenses and assumes the reinvestment of distributions. |
| | |
| 10 | | 2017 BLACKROCK ANNUAL REPORTTO SHAREHOLDERS |
Notes to Financial Statements
BlackRock Variable Series Funds, Inc. (the “Company”) is registered under the Investment Company Act of 1940, as amended (the “1940 Act”), as an open-end management investment company. The Company is organized as a Maryland corporation that is comprised of 20 separate funds. The funds offer shares to insurance companies for their separate accounts to fund benefits under certain variable annuity and variable life insurance contracts. The financial statements presented are for BlackRock Government Money Market Fund V.I. Fund (the “Fund”). The Fund is classified as diversified.
The Fund operates as a “government money market fund” under Rule 2a-7 under the 1940 Act. The Fund is not subject to liquidity fees or temporary suspensions of redemptions due to declines in the Fund’s weekly liquid assets.
The Fund, together with certain other registered investment companies advised by BlackRock Advisors, LLC (the “Manager”) or its affiliates, is included in a complex of open-end funds referred to as the Equity-Bond Complex.
| 2. | SIGNIFICANT ACCOUNTING POLICIES |
The financial statements are prepared in conformity with accounting principles generally accepted in the United States of America (“U.S. GAAP”), which may require management to make estimates and assumptions that affect the reported amounts of assets and liabilities in the financial statements, disclosure of contingent assets and liabilities at the date of the financial statements and the reported amounts of increases and decreases in net assets from operations during the reporting period. Actual results could differ from those estimates. The Fund is considered an investment company under U.S. GAAP and follows the accounting and reporting guidance applicable to investment companies. Below is a summary of significant accounting policies:
Investment Transactions and Income Recognition: For financial reporting purposes, investment transactions are recorded on the dates the transactions are entered into (the “trade dates”). Realized gains and losses on investment transactions are determined on the identified cost basis. Interest income, including amortization and accretion of premiums and discounts on debt securities are recognized on an accrual basis.
Distributions: Distributions from net investment income are declared daily and paid monthly. Distributions of capital gains are recorded on the ex-dividend date and made at least annually. The character and timing of distributions are determined in accordance with U.S. federal income tax regulations, which may differ from U.S. GAAP.
Recent Accounting Standards: In November 2016, the Financial Accounting Standards Board issued Accounting Standards Update “Restricted Cash” which will require entities to include the total of cash, cash equivalents, restricted cash, and restricted cash equivalents in the beginning and ending cash balances in the Statement of Cash Flows. The guidance will be applied retrospectively and is effective for fiscal years beginning after December 15, 2017, and interim periods within those years. Management is evaluating the impact, if any, of this guidance on the Fund’s presentation in the Statement of Cash Flows.
In March 2017, the Financial Accounting Standards Board issued Accounting Standards Update “Premium Amortization of Purchased Callable Debt Securities” which amends the amortization period for certain purchased callable debt securities. Under the new guidance, the premium amortization of purchased callable debt securities that have explicit, non-contingent call features and are callable at fixed prices will be amortized to the earliest call date. The guidance will be applied on a modified retrospective basis and is effective for fiscal years, and their interim periods, beginning after December 15, 2018. Management is currently evaluating the impact of this guidance to the Fund.
Indemnifications: In the normal course of business, the Fund enters into contracts that contain a variety of representations that provide general indemnification. The Fund’s maximum exposure under these arrangements is unknown because it involves future potential claims against the Fund, which cannot be predicted with any certainty.
Other: Expenses directly related to the Fund are charged to the Fund. Other operating expenses shared by several funds, including other funds managed by the Manager, are prorated among those funds on the basis of relative net assets or other appropriate methods.
The Fund has an arrangement with its custodian whereby credits are earned on uninvested cash balances, which could be used to reduce custody fees and/or overdraft charges. The Fund may incur charges on certain uninvested cash balances and overdrafts, subject to certain conditions.
| 3. | INVESTMENT VALUATION AND FAIR VALUE MEASUREMENTS |
Investment Valuation Policies: U.S. GAAP defines fair value as the price the Fund would receive to sell an asset or pay to transfer a liability in an orderly transaction between market participants at the measurement date. The Fund’s investments are valued under the amortized cost method which approximates current market value in accordance with Rule 2a-7 under the 1940 Act. Under this method, investments are valued at cost when purchased and, thereafter, a constant proportionate accretion of discounts and amortization of premiums are recorded until the maturity of the security. The Fund seeks to maintain its net asset value (“NAV”) per share at $1.00, although there is no assurance that it will be able to do so on a continuing basis.
Fair Value Hierarchy: Various inputs are used in determining the fair value of investments. These inputs to valuation techniques are categorized into a fair value hierarchy consisting of three broad levels for financial statement purposes as follows:
| | • | | Level 1 — Unadjusted price quotations in active markets/exchanges for identical assets or liabilities that the Fund has the ability to access |
| | • | | Level 2 — Other observable inputs (including, but not limited to, quoted prices for similar assets or liabilities in markets that are active, quoted prices for identical or similar assets or liabilities in markets that are not active, inputs other than quoted prices that are observable for the assets or liabilities (such as interest rates, yield curves, volatilities, prepayment speeds, loss severities, credit risks and default rates) or other market–corroborated inputs) |
| | | | |
| NOTESTO FINANCIAL STATEMENTS | | | 11 | |
Notes to Financial Statements (continued)
| | • | | Level 3 — Unobservable inputs based on the best information available in the circumstances, to the extent observable inputs are not available (including the Fund’s own assumptions used in determining the fair value of investments) |
The hierarchy gives the highest priority to unadjusted quoted prices in active markets for identical assets or liabilities (Level 1 measurements) and the lowest priority to unobservable inputs (Level 3 measurements). Accordingly, the degree of judgment exercised in determining fair value is greatest for instruments categorized in Level 3. The inputs used to measure fair value may fall into different levels of the fair value hierarchy. In such cases, for disclosure purposes, the fair value hierarchy classification is determined based on the lowest level input that is significant to the fair value measurement in its entirety.
Changes in valuation techniques may result in transfers into or out of an assigned level within the hierarchy. In accordance with the Fund’s policy, transfers between different levels of the fair value hierarchy are deemed to have occurred as of the beginning of the reporting period. The categorization of a value determined for investments is based on the pricing transparency of the investments is not necessarily an indication of the risks associated with investing in those securities.
| 4. | SECURITIES AND OTHER INVESTMENTS |
Repurchase Agreements: Repurchase agreements are commitments to purchase a security from a counterparty who agrees to repurchase the same security at a mutually agreed upon date and price. On a daily basis, the counterparty is required to maintain collateral subject to the agreement and in value no less than the agreed upon repurchase amount. Pursuant to the custodial undertaking associated with a tri-party repurchase arrangement, an unaffiliated third party custodian maintains accounts to hold collateral for a fund and its counterparties. Typically, a fund and counterparty are not permitted to sell, re-pledge or use the collateral absent a default by the counterparty or a fund, respectively.
In the event the counterparty defaults and the fair value of the collateral declines, a fund could experience losses, delays and costs in liquidating the collateral.
Repurchase agreements are entered into by a fund under Master Repurchase Agreements (each, an “MRA”). The MRA permits a fund, under certain circumstances including an event of default (such as bankruptcy or insolvency), to offset payables and/or receivables with collateral held by and/or posted to the counterparty. As a result, one single net payment is created. Bankruptcy or insolvency laws of a particular jurisdiction may impose restrictions on or prohibitions against such a right of offset in the event of the MRA counterparty’s bankruptcy or insolvency. Based on the terms of the MRA, a fund receives securities as collateral with a market value in excess of the repurchase price at maturity. Upon a bankruptcy or insolvency of the MRA counterparty, a fund would recognize a liability with respect to such excess collateral. The liability reflects a fund’s obligation under bankruptcy law to return the excess to the counterparty.
| 5. | INVESTMENT ADVISORY AGREEMENT AND OTHER TRANSACTIONS WITH AFFILIATES |
The PNC Financial Services Group, Inc. is the largest stockholder and an affiliate of BlackRock, Inc. (“BlackRock”) for 1940 Act purposes.
Investment Advisory: The Company, on behalf of the Fund, entered into an Investment Advisory Agreement with the Manager, the Fund’s investment adviser, an indirect, wholly-owned subsidiary of BlackRock, to provide investment advisory and administrative services. The Manager is responsible for the management of the Fund’s portfolio and provides the personnel, facilities, equipment and certain other services necessary to the operations of the Fund.
For such services, the Fund pays the Manager a monthly fee at an annual rate equal to the following percentages of the average daily value of the Fund’s net assets.
| | | | |
| Average Daily Net Assets | | Investment
Advisory Fee | |
First $1 Billion | | | 0.500 | % |
$1 Billion — $2 Billion | | | 0.450 | |
$2 Billion — $3 Billion | | | 0.400 | |
$3 Billion — $4 Billion | | | 0.375 | |
$4 Billion — $7 Billion | | | 0.350 | |
$7 Billion — $10 Billion | | | 0.325 | |
$10 Billion — $15 Billion | | | 0.300 | |
Greater than $15 Billion | | | 0.290 | |
Distribution Fees: The Company, on behalf of the Fund, entered into a Distribution Agreement with BlackRock Investments, LLC (“BRIL”), an affiliate of the Manager.
Transfer Agent: On behalf of the Fund, the Manager entered into agreements with insurance companies and other financial intermediaries (“Service Organizations”), some of which may be affiliates. Pursuant to these agreements, the Service Organizations provide the Fund with administrative, networking, recordkeeping, sub-transfer agency and shareholder services to sub-accounts they service. For these services, the Service Organizations receive an annual fee per shareholder account, which will vary depending on share class and/or net assets of Fund shareholders serviced by the Service Organizations, which is shown as transfer agent — class specific. For the year ended December 31, 2017, the Fund did not pay any amounts to affiliates in return for these services.
Expense Limitations, Waivers and Reimbursements: The Manager voluntarily agreed to waive a portion of the investment advisory fees to enable the Fund to maintain minimum levels of daily net investment income. The Manager may discontinue this waiver and/or reimbursement at any time without notice. For the year ended December 31, 2017, there were no fees waived and/or reimbursed by the Manager. However, the Manager does not waive its investment advisory fees by the amount of investment advisory fees paid in connection with the Fund’s investments in other affiliated investment companies, if any.
For the year ended December 31, 2017, the Fund reimbursed the Manager $1,756 for certain accounting services, which is included in accounting services in the Statement of Operations.
| | |
| 12 | | 2017 BLACKROCK ANNUAL REPORTTO SHAREHOLDERS |
Notes to Financial Statements (continued)
With respect to the Fund, the Manager contractually agreed to waive and/or reimburse fees or expenses in order to limit expenses, excluding interest expense, dividend expense, tax expense, acquired fund fees and expenses, and certain other fund expenses, which constitute extraordinary expenses not incurred in the ordinary course of the Fund’s business (“expense limitation”), to 0.30% of average daily net assets of Class I. The Manager has agreed not to reduce or discontinue this contractual expense limitation through April 30, 2018, unless approved by the Board, including a majority of the Independent Directors who are not “interested persons” of the Fund, as defined in the 1940 (“Independent Directors”) or by a vote of a majority of the outstanding voting securities of the Fund. For the year ended December 31, 2017, the Manager waived $458,573 and reimbursed $153,321, which is shown as fees waived and/or reimbursed by the Manager and transfer agent fees reimbursed, respectively, in the Statement of Operations.
Officers and Directors: Certain directors and/or officers of the Company are directors and/or officers of BlackRock or its affiliates. The Fund reimburses the Manager for a portion of the compensation paid to the Company’s Chief Compliance Officer, which is included in Directors and Officer in the Statement of Operations.
It is the Fund’s policy to comply with the requirements of the Internal Revenue Code of 1986, as amended, applicable to regulated investment companies, and to distribute substantially all of its taxable income to its shareholders. Therefore, no U.S. federal income tax provision is required.
The Fund files U.S. federal and various state and local tax returns. No income tax returns are currently under examination. The statute of limitations on the Fund’s U.S. federal tax returns generally remains open for each of the four years ended December 31, 2017. The statutes of limitations on the Fund’s state and local tax returns may remain open for an additional year depending upon the jurisdiction.
Management has analyzed tax laws and regulations and their application to the Fund as of December 31, 2017, inclusive of the open tax return years, and does not believe that there are any uncertain tax positions that require recognition of a tax liability in the Fund’s financial statements.
The tax character of distributions paid was as follows:
| | | | | | | | |
| | | 12/31/2017 | | | 12/31/2016 | |
Ordinary income | | $ | 915,604 | | | $ | 199,088 | |
Long-term capital gains | | | 321 | | | | 923 | |
| | | | | | | | |
| | $ | 915,925 | | | $ | 200,011 | |
| | | | | | | | |
As of period end, the tax components of accumulated net earnings (losses) were as follows:
| | | | |
Undistributed ordinary income | | $ | 147 | |
Undistributed long-term capital gains | | | — | |
| | | | |
| | $ | 147 | |
| | | | |
In the normal course of business, the Fund invests in securities or other instruments and may enter into certain transactions, and such activities subject the Fund to various risks, including among others, fluctuations in the market (market risk) or failure of an issuer to meet all of its obligations. The value of securities or other instruments may also be affected by various factors, including, without limitation: (i) the general economy; (ii) the overall market as well as local, regional or global political and/or social instability; (iii) regulation, taxation or international tax treaties between various countries; or (iv) currency, interest rate and price fluctuations. The Fund’s prospectus provides details of the risks to which the Fund is subject.
Counterparty Credit Risk: Similar to issuer credit risk, the Fund may be exposed to counterparty credit risk, or the risk that an entity may fail to or be unable to perform on its commitments related to unsettled or open transactions. The Fund manages counterparty credit risk by entering into transactions only with counterparties that the Manager believes have the financial resources to honor their obligations and by monitoring the financial stability of those counterparties. Financial assets, which potentially expose the Fund to market, issuer and counterparty credit risks, consist principally of financial instruments and receivables due from counterparties. The extent of the Fund’s exposure to market, issuer and counterparty credit risks with respect to these financial assets is approximately their value recorded in the Statement of Assets and Liabilities, less any collateral held by the Fund.
| 8. | CAPITAL SHARE TRANSACTIONS |
The number of shares sold, reinvested and redeemed corresponds to the net proceeds from the sale of shares, reinvestment of all distributions and cost of shares redeemed, respectively, since shares are sold and redeemed at $1.00 per share.
Management has evaluated the impact of all subsequent events on the Fund through the date the financial statements were issued and has determined that there were no subsequent events requiring adjustment or additional disclosure in the financial statements.
| | | | |
| NOTESTO FINANCIAL STATEMENTS | | | 13 | |
Report of the Independent Registered Public Accounting Firm
To the Shareholders of BlackRock Government Money Market V.I. Fund and the Board of Directors of BlackRock Variable Series Funds, Inc.:
Opinion on the Financial Statements and Financial Highlights
We have audited the accompanying statement of assets and liabilities, including the schedule of investments, of BlackRock Government Money Market V.I. Fund of BlackRock Variable Series Funds, Inc. (the “Fund”), as of December 31, 2017, the related statement of operations for the year then ended, the statements of changes in net assets for each of the two years in the period then ended, the financial highlights for each of the five years in the period then ended, and the related notes. In our opinion, the financial statements and financial highlights present fairly, in all material respects, the financial position of the Fund as of December 31, 2017, and the results of its operations for the year then ended, the changes in its net assets for each of the two years in the period then ended, and the financial highlights for each of the five years in the period then ended, in conformity with accounting principles generally accepted in the United States of America.
Basis for Opinion
These financial statements and financial highlights are the responsibility of the Fund’s management. Our responsibility is to express an opinion on the Fund’s financial statements and financial highlights based on our audits. We are a public accounting firm registered with the Public Company Accounting Oversight Board (United States) (PCAOB) and are required to be independent with respect to the Fund in accordance with the U.S. federal securities laws and the applicable rules and regulations of the Securities and Exchange Commission and the PCAOB.
We conducted our audits in accordance with the standards of the PCAOB. Those standards require that we plan and perform the audit to obtain reasonable assurance about whether the financial statements and financial highlights are free of material misstatement, whether due to error or fraud. The Fund is not required to have, nor were we engaged to perform, an audit of its internal control over financial reporting. As part of our audits we are required to obtain an understanding of internal control over financial reporting but not for the purpose of expressing an opinion on the effectiveness of the Fund’s internal control over financial reporting. Accordingly, we express no such opinion.
Our audits included performing procedures to assess the risks of material misstatement of the financial statements and financial highlights, whether due to error or fraud, and performing procedures that respond to those risks. Such procedures included examining, on a test basis, evidence regarding the amounts and disclosures in the financial statements and financial highlights. Our audits also included evaluating the accounting principles used and significant estimates made by management, as well as evaluating the overall presentation of the financial statements and financial highlights. Our procedures included confirmation of securities owned as of December 31, 2017, by correspondence with the custodian and brokers; when replies were not received from brokers, we performed other auditing procedures. We believe that our audits provide a reasonable basis for our opinion.
Deloitte & Touche LLP
Boston, Massachusetts
February 19, 2018
We have served as the auditor of one or more BlackRock investment companies since 1992.
| | |
| 14 | | 2017 BLACKROCK ANNUAL REPORTTO SHAREHOLDERS |
DECEMBER 31, 2017
| | |
ANNUAL REPORT | |  |
BlackRock Variable Series Funds, Inc.
| Ø | | BlackRock High Yield V.I. Fund |
|
| Not FDIC Insured • May Lose Value • No Bank Guarantee |
| | |
| Fund Summary as of December 31, 2017 | | BlackRock High Yield V.I. Fund |
Investment Objective
BlackRock High Yield V.I. Fund’s (the “Fund”) investment objective is to seek to maximize total return, consistent with income generation and prudent investment management.
Portfolio Management Commentary
How did the Fund perform?
For the 12-month period ended December 31, 2017, the Fund underperformed its benchmark, the Bloomberg Barclays U.S. Corporate High Yield 2% Issuer Capped Index.
What factors influenced performance?
A sustained global economic expansion fueled another strong year for high yield bonds—and for risk assets more broadly—in 2017.
The Fund’s positioning in the electric utilities, automotive and oil field services sectors detracted from performance. The effect was largely from sector allocation rather than security selection. The Fund’s underweight in BB rated securities and slight underweight in bonds rated CC and below also detracted from performance. However, the investment adviser remained comfortable with both of these underweights.
The drivers of the Fund’s positive relative performance included security selection in the gaming, technology, and metals & mining sectors. From an asset allocation perspective, out-of-benchmark positions in bank loans and preferred stocks contributed positively. From a credit rating perspective, the Fund’s allocations to the B and CCC tiers were the largest contributors.
Describe recent portfolio activity.
The Fund actively managed risk throughout the year, and it ended with a slightly lower risk profile than the Bloomberg Barclays U.S. Corporate High Yield 2% Issuer Capped Index. From an asset allocation perspective, the Fund added to its allocations in bank loans and preferred stocks while reducing its weightings in common stocks and cash.
Describe portfolio positioning at period end.
The Fund’s general investment themes and core positions reflected the investment adviser’s views regarding issuer cash flows, firm or industry catalysts, and idiosyncratic factors.
The Fund’s credit-rating positioning remained consistent over the annual period, with an underweight in BB rated issues, an overweight in B rated bonds, and an overweight in select CCC rated issues with improving credit positions or attractive yields. Importantly, the Fund maintained underweights to the market’s “tails”: both the higher-yielding segment that contained a larger concentration of stressed assets, as well as the lower-yielding portion where narrow spreads indicated an unattractive level of income.
The Fund’s largest overweights were in the gaming, metals & mining and independent energy areas. Conversely, it was underweight in the retail, automotive and consumer products sectors. From an asset allocation perspective, the Fund had an approximate 7.5% weighting in bank loans at period end, coupled with smaller positions in preferred and common stocks.
The views expressed reflect the opinions of BlackRock as of the date of this report and are subject to change based on changes in market, economic or other conditions. These views are not intended to be a forecast of future events and are no guarantee of future results.
| | |
| 2 | | 2017 BLACKROCK ANNUAL REPORTTO SHAREHOLDERS |
| | |
| Fund Summary as of December 31, 2017 (continued) | | BlackRock High Yield V.I. Fund |
TOTAL RETURN BASED ON A $10,000 INVESTMENT
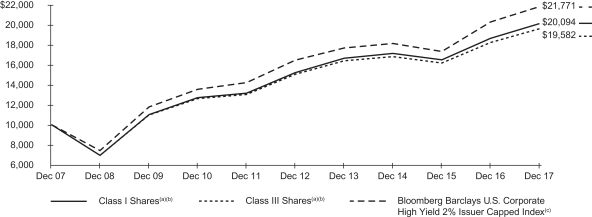
| (a) | Assuming transaction costs, if any, and other operating expenses, including investment advisory fees. Does not include insurance-related fees and expenses. The returns for Class III Shares, prior to February 15, 2012, the recommencement of Class III Shares, are based upon performance of the Fund’s Class I Shares, as adjusted to reflect the distribution and/or service (12b-1) fees applicable to Class III Shares. |
| (b) | The Fund invests primarily in non-investment grade bonds with maturities of ten years or less. The Fund’s total returns prior to October 1, 2011 are the returns of the Fund that followed different investment objectives and investment strategies under the name “BlackRock High Income V.I. Fund”. |
| (c) | An unmanaged index comprised of issues that meet the following criteria: at least $150 million par value outstanding; maximum credit rating of Ba1; at least one year to maturity; and no issuer represents more than 2% of the index. |
Performance Summary for the Period Ended December 31, 2017
| | | | | | | | | | | | | | | | | | | | | | | | | | | | | | | | |
| | | Standardized
30-Day Yield (b) | | | Unsubsidized
30-Day Yield (b) | | | 6-Month
Total Returns (c) | | | | | | Average Annual Total Returns | |
| | | | | | | 1 Year (c) | | | 5 Years (c) | | | | | | 10 Years (c) | |
Class I(a) | | | 4.50 | % | | | 4.41 | % | | | 2.67 | % | | | | | | | 7.48 | % | | | 5.65 | % | | | | | | | 7.23 | % |
Class III(a) | | | 4.27 | | | | 4.16 | | | | 2.55 | | | | | | | | 7.08 | | | | 5.37 | | | | | | | | 6.95 | (d) |
Bloomberg Barclays U.S. Corporate High Yield 2% Issuer Capped Index | | | — | | | | — | | | | 2.46 | | | | | | | | 7.50 | | | | 5.78 | | | | | | | | 8.09 | |
| | (a) | Average annual and cumulative total returns are based on changes in net asset value for the periods shown, and assume reinvestment of all distributions at net asset value on the ex-dividend/payable date. Insurance-related fees and expenses are not reflected in these returns. The Fund’s total returns prior to October 1, 2011 are the returns of the Fund that followed different investment objectives and investment strategies under the name “BlackRock High Income V.I. Fund”. | |
| | (b) | The standardized 30-day yield includes the effects of any waivers and/or reimbursements. The unsubsidized 30-day yield excludes the effects of any waivers and/or reimbursements. | |
| | (c) | For a portion of the period, the Fund’s investment adviser waived a portion of its fee. Without such waiver, the Fund’s performance would have been lower. | |
| | (d) | The returns for Class III Shares prior to February 15, 2012, the recommencement of operations of Class III Shares, are based upon the performance of the Fund’s Class I Shares, as adjusted to reflect the distribution and/or service (12b-1) fees applicable to Class III Shares. | |
Past performance is not indicative of future results. Performance results do not reflect the deduction of taxes that a shareholder would pay on Fund distributions or the redemption of Fund shares.
Performance results may include adjustments made for financial reporting purposes in accordance with U.S. generally accepted accounting principles.
Expense Example
| | | | | | | | | | | | | | | | | | | | | | | | | | | | | | | | |
| | | Actual | | | | | | Hypothetical (a) | | | | |
| | | Beginning
Account Value
(07/01/17) | | | Ending
Account Value
(12/31/17) | | | Expenses
Paid During
the Period (b) | | | | | | Beginning
Account Value
(07/01/17) | | | Ending
Account Value
(12/31/17) | | | Expenses
Paid During
the Period (b) | | | Annualized
Expense
Ratio | |
Class I | | $ | 1,000.00 | | | $ | 1,026.70 | | | $ | 3.47 | | | | | | | $ | 1,000.00 | | | $ | 1,021.78 | | | $ | 3.47 | | | | 0.68 | % |
Class III | | | 1,000.00 | | | | 1,025.50 | | | | 4.80 | | | | | | | | 1,000.00 | | | | 1,020.47 | | | | 4.79 | | | | 0.94 | |
| | (a) | Hypothetical 5% annual return before expenses is calculated by prorating the number of days in the most recent fiscal half year divided by 365. | |
| | (b) | For each class of the Fund, expenses are equal to the annualized expense ratio for the class, multiplied by the average account value over the period, multiplied by 184/365 (to reflect the one-half year period shown). | |
See “Disclosure of Expenses” on the following page for further information on how expenses were calculated.
| | |
| Fund Summary as of December 31, 2017 (continued) | | BlackRock High Yield V.I. Fund |
Portfolio Information
CREDIT QUALITY ALLOCATION (a)
| | | | |
| | | Percent of
Total Investments (b) | |
AA/Aa | | | — | (c) |
BBB/Baa | | | 5 | % |
BB/Ba | | | 82 | % |
CCC/Caa | | | 10 | % |
CC/Ca | | | — | (c) |
DD/Da | | | — | (c) |
NR | | | 3 | % |
| | (a) | For financial reporting purposes, credit quality ratings shown above reflect the highest rating assigned by either Standard & Poor’s or Moody’s Investors Service if ratings differ. These rating agencies are independent, nationally recognized statistical rating organizations and are widely used. Investment grade ratings are credit ratings of BBB/Baa or higher. Below investment grade ratings are credit ratings of BB/Ba or lower. Investments designated N/R are not rated by either rating agency. Unrated investments do not necessarily indicate low credit quality. Credit quality ratings are subject to change. | |
| | (b) | Total investments exclude short-term securities. | |
| | (c) | Representing less than 0.5% of Total Investments. | |
| | |
| 4 | | 2017 BLACKROCK ANNUAL REPORTTO SHAREHOLDERS |
Disclosure of Expenses
Shareholders of the Fund may incur the following charges: (a) transactional expenses, such as sales charges; and (b) operating expenses, including investment advisory fees, service and distribution fees, including 12b-1 fees, acquired fund fees and expenses, and other fund expenses. The expense example on the previous page (which is based on a hypothetical investment of $1,000 invested on July 1, 2017 and held through December 31, 2017) is intended to assist shareholders both in calculating expenses based on an investment in the Fund and in comparing these expenses with similar costs of investing in other mutual funds.
The expense example provides information about actual account values and actual expenses. In order to estimate the expenses a shareholder paid during the period covered by this report, shareholders can divide their account value by $1,000 and then multiply the result by the number corresponding to their share class under the heading entitled “Expenses Paid During the Period.”
The expense example also provides information about hypothetical account values and hypothetical expenses based on the Fund’s actual expense ratio and an assumed rate of return of 5% per year before expenses. In order to assist shareholders in comparing the ongoing expenses of investing in the Fund and other funds, compare the 5% hypothetical example with the 5% hypothetical examples that appear in shareholder reports of other funds.
The expenses shown in the expense example are intended to highlight shareholders’ ongoing costs only and do not reflect any transactional expenses, such as sales charges, if any. Therefore, the hypothetical example is useful in comparing ongoing expenses only, and will not help shareholders determine the relative total expenses of owning different funds. If these transactional expenses were included, shareholder expenses would have been higher.
Derivative Financial Instruments
The Fund may invest in various derivative financial instruments. These instruments are used to obtain exposure to a security, commodity, index, market, and/or other assets without owning or taking physical custody of securities, commodities and/or other referenced assets or to manage market, equity, credit, interest rate, foreign currency exchange rate, commodity and/or other risks. Derivative financial instruments may give rise to a form of economic leverage and involve risks, including the imperfect correlation between the value of a derivative financial instrument and the underlying asset, possible default of the counterparty to the transaction or illiquidity of the instrument. The Fund’s successful use of a derivative financial instrument depends on the investment adviser’s ability to predict pertinent market movements accurately, which cannot be assured. The use of these instruments may result in losses greater than if they had not been used, may limit the amount of appreciation the Fund can realize on an investment and/or may result in lower distributions paid to shareholders. The Fund’s investments in these instruments, if any, are discussed in detail in the Notes to Financial Statements.
| | | | |
| DISCLOSUREOF EXPENSES / DERIVATIVE FINANCIAL INSTRUMENTS | | | 5 | |
| | |
Schedule of Investments December 31, 2017 | | BlackRock High Yield V.I. Fund (Percentages shown are based on Net Assets) |
| | | | | | | | | | | | |
| Security | | Par
(000) | | | Value | |
Asset-Backed Securities — 0.1% | |
Continental Airlines Pass-Through Trust, Series 2012-3, Class C, 6.13%, 04/29/18 | | | USD | | | | 365 | | | $ | 368,833 | |
Virgin Australia Pass-Through Trust, Series 2013-1C, 7.13%, 10/23/18(a) | | | | | | | 103 | | | | 104,320 | |
| | | | | | | | |
Total Asset-Backed Securities — 0.1%
(Cost: $467,555) | | | | | | | | | | | 473,153 | |
| | | | | | | | |
| | | |
| | | | | | Shares | | | | |
Common Stocks — 0.7% | |
|
| Chemicals — 0.1% | |
Advanced Emissions Solutions, Inc. | | | | | | | 1,644 | | | | 15,881 | |
Platform Speciality Products Corp.(b) | | | | | | | 65,870 | | | | 653,430 | |
| | | | | | | | |
| | | | | | | | | | | 669,311 | |
| Construction & Engineering — 0.2% | |
Star Group, Inc. (The)(b) | | | | | | | 39,643 | | | | 922,480 | |
| | | | | | | | |
| Media — 0.1% | |
Altice USA, Inc., Class A(b) | | | | | | | 20,929 | | | | 444,323 | |
| | | | | | | | |
| Metals & Mining — 0.1% | |
Constellium NV, Class A(b) | | | | | | | 31,378 | | | | 349,865 | |
| | | | | | | | |
| Wireless Telecommunication Services — 0.2% | |
T-Mobile US, Inc.(b) | | | | | | | 11,157 | | | | 708,581 | |
| | | | | | | | |
Total Common Stocks — 0.7%
(Cost: $2,818,881) | | | | | | | | | | | 3,094,560 | |
| | | | | | | | |
| | | Par
(000) | | | | |
Corporate Bonds — 88.1% | |
|
| Aerospace & Defense — 2.4% | |
Arconic, Inc.: | | | | | | | | | | | | |
6.15%, 08/15/20 | | | USD | | | | 595 | | | | 639,684 | |
5.13%, 10/01/24 | | | | | | | 1,321 | | | | 1,409,947 | |
5.90%, 02/01/27 | | | | | | | 129 | | | | 144,892 | |
6.75%, 01/15/28 | | | | | | | 330 | | | | 388,842 | |
5.95%, 02/01/37 | | | | | | | 128 | | | | 139,200 | |
Bombardier, Inc.(a): | | | | | | | | | | | | |
8.75%, 12/01/21 | | | | | | | 1,185 | | | | 1,300,538 | |
5.75%, 03/15/22 | | | | | | | 70 | | | | 68,600 | |
6.00%, 10/15/22 | | | | | | | 24 | | | | 23,580 | |
6.13%, 01/15/23 | | | | | | | 555 | | | | 543,900 | |
7.50%, 12/01/24 | | | | | | | 672 | | | | 682,080 | |
7.50%, 03/15/25 | | | | | | | 565 | | | | 569,407 | |
7.45%, 05/01/34 | | | | | | | 210 | | | | 206,325 | |
KLX, Inc., 5.88%, 12/01/22(a) | | | | | | | 1,791 | | | | 1,875,535 | |
Kratos Defense & Security Solutions, Inc., 6.50%, 11/30/25(a) | | | | | | | 221 | | | | 229,840 | |
Pioneer Holdings LLC, 9.00%, 11/01/22(a) | | | | | | | 224 | | | | 231,560 | |
TransDigm, Inc.: | | | | | | | | | | | | |
6.00%, 07/15/22 | | | | | | | 992 | | | | 1,011,840 | |
6.50%, 07/15/24 | | | | | | | 728 | | | | 746,200 | |
6.50%, 05/15/25 | | | | | | | 100 | | | | 102,250 | |
6.38%, 06/15/26 | | | | | | | 167 | | | | 168,670 | |
| | | | | | | | |
| | | | | | | | | | | 10,482,890 | |
| Air Freight & Logistics — 0.3%(a) | | | | | | | | | |
CEVA Group plc, 7.00%, 03/01/21 | | | | | | | 80 | | | | 77,600 | |
XPO Logistics, Inc.: | | | | | | | | | | | | |
6.50%, 06/15/22 | | | | | | | 1,020 | | | | 1,064,625 | |
6.13%, 09/01/23 | | | | | | | 43 | | | | 45,473 | |
| | | | | | | | |
| | | | | | | | | | | 1,187,698 | |
| | | | | | | | | | | | |
| Security | | Par
(000) | | | Value | |
| Airlines — 0.0% | |
American Airlines Group, Inc.,
5.50%, 10/01/19(a) | | | USD | | | | 30 | | | $ | 30,825 | |
| | | | | | | | |
|
| Auto Components — 0.8% | |
Allison Transmission, Inc., 5.00%, 10/01/24(a) | | | | | | | 16 | | | | 16,500 | |
Icahn Enterprises LP: | | | | | | | | | | | | |
4.88%, 03/15/19 | | | | | | | 475 | | | | 475,095 | |
6.00%, 08/01/20 | | | | | | | 67 | | | | 68,904 | |
6.25%, 02/01/22 | | | | | | | 1,147 | | | | 1,172,807 | |
6.75%, 02/01/24 | | | | | | | 583 | | | | 599,033 | |
6.38%, 12/15/25(a) | | | | | | | 198 | | | | 198,020 | |
IHO Verwaltungs GmbH(a)(c): | | | | | | | | | | | | |
4.12% ( 4.12% Cash or 4.88% PIK), 09/15/21 | | | | | | | 201 | | | | 204,517 | |
4.50% ( 4.50% Cash or 5.25% PIK), 09/15/23 | | | | | | | 515 | | | | 524,981 | |
4.75% ( 4.75% Cash or 5.50% PIK), 09/15/26 | | | | | | | 300 | | | | 304,500 | |
ZF North America Capital, Inc., 4.75%, 04/29/25(a) | | | | | | | 164 | | | | 173,635 | |
| | | | | | | | |
| | | | | | | | | | | 3,737,992 | |
| Automobiles — 0.2%(a) | |
Jaguar Land Rover Automotive plc, 5.63%, 02/01/23 | | | | | | | 150 | | | | 153,563 | |
Tesla, Inc., 5.30%, 08/15/25 | | | | | | | 682 | | | | 651,310 | |
| | | | | | | | |
| | | | | | | | | | | 804,873 | |
| Banks — 2.5% | |
Banco Espirito Santo SA(d): | | | | | | | | | | | | |
2.63%, 05/08/17(e) | | | EUR | | | | 100 | | | | 35,995 | |
4.75%, 01/15/18 | | | | | | | 100 | | | | 35,096 | |
4.00%, 01/21/19(e) | | | | | | | 100 | | | | 35,995 | |
Bank of America Corp.(e)(f): | | | | | | | | | | | | |
(LIBOR USD 3 Month + 3.71%), 6.25% | | | USD | | | | 558 | | | | 616,618 | |
(LIBOR USD 3 Month + 4.17%), 6.50% | | | | | | | 201 | | | | 228,386 | |
(LIBOR USD 3 Month + 3.90%), 6.10% | | | | | | | 1,423 | | | | 1,561,743 | |
CIT Group, Inc.: | | | | | | | | | | | | |
(LIBOR USD 3 Month + 3.97%), 5.80%(e)(f) | | | | | | | 595 | | | | 612,850 | |
5.00%, 08/15/22 | | | | | | | 30 | | | | 31,800 | |
5.00%, 08/01/23 | | | | | | | 1,466 | | | | 1,561,290 | |
Citigroup, Inc.(e)(f): | | | | | | | | | | | | |
(LIBOR USD 3 Month + 4.09%), 5.80% | | | | | | | 460 | | | | 476,675 | |
(LIBOR USD 3 Month + 4.48%), 6.13% | | | | | | | 175 | | | | 186,156 | |
(LIBOR USD 3 Month + 4.07%), 5.95% | | | | | | | 302 | | | | 321,253 | |
(LIBOR USD 3 Month + 3.91%), 5.95% | | | | | | | 210 | | | | 223,650 | |
HSBC Holdings plc, (USD Swap Rate 5 Year + 3.75%), 6.00%(e)(f) | | | | | | | 465 | | | | 488,831 | |
JPMorgan Chase & Co.(e)(f): | | | | | | | | | | | | |
(LIBOR USD 3 Month + 3.32%), 5.00% | | | | | | | 640 | | | | 651,123 | |
(LIBOR USD 3 Month + 3.25%), 5.15% | | | | | | | 190 | | | | 196,422 | |
(LIBOR USD 3 Month + 3.33%), 6.12% | | | | | | | 99 | | | | 108,405 | |
(LIBOR USD 3 Month + 3.33%), 6.10% | | | | | | | 1,486 | | | | 1,632,817 | |
Wells Fargo & Co.(e)(f): | | | | | | | | | | | | |
(LIBOR USD 3 Month + 3.11%), 5.90% | | | | | | | 580 | | | | 620,426 | |
(LIBOR USD 3 Month + 3.99%), 5.88% | | | | | | | 1,185 | | | | 1,312,447 | |
| | | | | | | | |
| | | | | | | | | | | 10,937,978 | |
| Building Products — 0.7% | | | | | | | | | |
CPG Merger Sub LLC, 8.00%, 10/01/21(a) | | | | | | | 396 | | | | 408,870 | |
James Hardie International Finance DAC, 4.75%, 01/15/25(a) | | | | | | | 30 | | | | 30,225 | |
Jeld-Wen, Inc.(a): | | | | | | | | | | | | |
4.63%, 12/15/25 | | | | | | | 137 | | | | 138,027 | |
4.88%, 12/15/27 | | | | | | | 123 | | | | 124,230 | |
Masonite International Corp., 5.63%, 03/15/23(a) | | | | | | | 852 | | | | 890,596 | |
Ply Gem Industries, Inc., 6.50%, 02/01/22 | | | | | | | 284 | | | | 293,230 | |
Standard Industries, Inc.(a): | | | | | | | | | | | | |
5.50%, 02/15/23 | | | | | | | 10 | | | | 10,425 | |
5.38%, 11/15/24 | | | | | | | 240 | | | | 250,872 | |
6.00%, 10/15/25 | | | | | | | 352 | | | | 375,760 | |
| | |
| 6 | | 2017 BLACKROCK ANNUAL REPORTTO SHAREHOLDERS |
| | |
Schedule of Investments (continued) December 31, 2017 | | BlackRock High Yield V.I. Fund (Percentages shown are based on Net Assets) |
| | | | | | | | | | | | |
| Security | | Par
(000) | | | Value | |
| Building Products (continued) | | | | | | | | | |
USG Corp.(a): | | | | | | | | | | | | |
5.50%, 03/01/25 | | | USD | | | | 37 | | | $ | 39,313 | |
4.88%, 06/01/27 | | | | | | | 686 | | | | 711,073 | |
| | | | | | | | |
| | | | | | | | | | | 3,272,621 | |
| Capital Markets — 0.3% | | | | | | | | | |
Eagle Holding Co. II LLC, 7.63% (7.63% Cash or 8.38% PIK), 05/15/22(a)(c) | | | | | | | 324 | | | | 327,240 | |
Goldman Sachs Group, Inc. (The), (LIBOR USD 3 Month + 2.87%),
5.00%(e)(f) | | | | | | | 1,195 | | | | 1,175,880 | |
| | | | | | | | |
| | | | | | | | | | | 1,503,120 | |
| Chemicals — 3.5% | | | | | | | | | |
Alpha 3 BV, 6.25%, 02/01/25(a) | | | | | | | 1,100 | | | | 1,127,500 | |
Axalta Coating Systems LLC, 4.88%, 08/15/24(a) | | | | | | | 253 | | | | 265,650 | |
Blue Cube Spinco, Inc.: | | | | | | | | | | | | |
9.75%, 10/15/23 | | | | | | | 377 | | | | 444,860 | |
10.00%, 10/15/25 | | | | | | | 677 | | | | 812,400 | |
CF Industries, Inc.: | | | | | | | | | | | | |
7.13%, 05/01/20 | | | | | | | 71 | | | | 77,411 | |
5.15%, 03/15/34 | | | | | | | 105 | | | | 107,100 | |
4.95%, 06/01/43 | | | | | | | 175 | | | | 165,375 | |
Chemours Co. (The): | | | | | | | | | | | | |
6.63%, 05/15/23 | | | | | | | 280 | | | | 296,100 | |
7.00%,��05/15/25 | | | | | | | 108 | | | | 117,180 | |
5.38%, 05/15/27 | | | | | | | 622 | | | | 643,770 | |
Gates Global LLC, 6.00%, 07/15/22(a) | | | | | | | 1,871 | | | | 1,913,097 | |
Hexion, Inc., 10.38%, 02/01/22(a) | | | | | | | 222 | | | | 206,599 | |
Huntsman International LLC: | | | | | | | | | | | | |
4.88%, 11/15/20 | | | | | | | 376 | | | | 391,040 | |
5.13%, 11/15/22 | | | | | | | 755 | | | | 805,019 | |
Koppers, Inc., 6.00%, 02/15/25(a) | | | | | | | 278 | | | | 294,680 | |
MPM Escrow LLC(d)(g) | | | | | | | 334 | | | | — | |
Momentive Performance Materials, Inc.,
3.88%, 10/24/21 | | | | | | | 1,330 | | | | 1,389,850 | |
NOVA Chemicals Corp., 4.88%, 06/01/24(a) | | | | | | | 338 | | | | 337,155 | |
Platform Specialty Products Corp.(a): | | | | | | | | | | | | |
6.50%, 02/01/22 | | | | | | | 3,186 | | | | 3,293,528 | |
5.88%, 12/01/25 | | | | | | | 872 | | | | 865,460 | |
PQ Corp.(a): | | | | | | | | | | | | |
6.75%, 11/15/22 | | | | | | | 439 | | | | 468,632 | |
5.75%, 12/15/25 | | | | | | | 503 | | | | 511,803 | |
Tronox Finance plc, 5.75%, 10/01/25(a) | | | | | | | 228 | | | | 234,270 | |
Venator Finance Sarl, 5.75%, 07/15/25(a) | | | | | | | 194 | | | | 204,670 | |
W.R. Grace & Co.-Conn., 5.13%, 10/01/21(a) | | | | | | | 729 | | | | 766,361 | |
| | | | | | | | |
| | | | | | | | | | | 15,739,510 | |
| Commercial Services & Supplies — 2.6% | | | | | | | | | |
ACCO Brands Corp., 5.25%, 12/15/24(a) | | | | | | | 108 | | | | 110,970 | |
ADT Corp. (The): | | | | | | | | | | | | |
6.25%, 10/15/21 | | | | | | | 310 | | | | 339,450 | |
3.50%, 07/15/22 | | | | | | | 38 | | | | 37,430 | |
4.13%, 06/15/23 | | | | | | | 1,282 | | | | 1,282,000 | |
4.88%, 07/15/32(a) | | | | | | | 700 | | | | 661,500 | |
Advanced Disposal Services, Inc., 5.63%, 11/15/24(a) | | | | | | | 257 | | | | 262,782 | |
APX Group, Inc.: | | | | | | | | | | | | |
6.38%, 12/01/19 | | | | | | | 120 | | | | 121,800 | |
8.75%, 12/01/20 | | | | | | | 368 | | | | 375,360 | |
7.88%, 12/01/22 | | | | | | | 217 | | | | 232,461 | |
Aramark Services, Inc.: | | | | | | | | | | | | |
5.13%, 01/15/24 | | | | | | | 891 | | | | 935,104 | |
5.00%, 04/01/25(a) | | | | | | | 506 | | | | 534,488 | |
GW Honos Security Corp., 8.75%, 05/15/25(a) | | | | | | | 108 | | | | 116,100 | |
| | | | | | | | | | | | |
| Security | | Par
(000) | | | Value | |
| Commercial Services & Supplies (continued) | | | | | | | | | |
Harland Clarke Holdings Corp., 8.38%, 08/15/22(a) | | | USD | | | | 182 | | | $ | 188,998 | |
KAR Auction Services, Inc.,
5.13%, 06/01/25(a) | | | | | | | 360 | | | | 369,000 | |
Matthews International Corp.,
5.25%, 12/01/25(a) | | | | | | | 90 | | | | 90,900 | |
Mobile Mini, Inc., 5.88%, 07/01/24 | | | | | | | 1,055 | | | | 1,107,750 | |
Nielsen Co. Luxembourg SARL (The), 5.00%, 02/01/25(a) | | | | | | | 441 | | | | 457,538 | |
Prime Security Services Borrower LLC,
9.25%, 05/15/23(a) | | | | | | | 2,923 | | | | 3,244,530 | |
Ritchie Bros Auctioneers, Inc.,
5.38%, 01/15/25(a) | | | | | | | 382 | | | | 394,415 | |
Tervita Escrow Corp., 7.63%, 12/01/21(a) | | | | | | | 460 | | | | 461,150 | |
Wrangler Buyer Corp., 6.00%, 10/01/25(a) | | | | | | | 149 | | | | 153,470 | |
| | | | | | | | |
| | | | | | | | | | | 11,477,196 | |
| Communications Equipment — 0.4% | | | | | | | | | |
CommScope Technologies LLC(a): | | | | | | | | | | | | |
6.00%, 06/15/25 | | | | | | | 2 | | | | 2,125 | |
5.00%, 03/15/27 | | | | | | | 500 | | | | 500,000 | |
CommScope, Inc., 5.00%, 06/15/21(a) | | | | | | | 165 | | | | 168,093 | |
Nokia OYJ: | | | | | | | | | | | | |
3.38%, 06/12/22 | | | | | | | 133 | | | | 132,175 | |
4.38%, 06/12/27 | | | | | | | 187 | | | | 184,850 | |
6.63%, 05/15/39 | | | | | | | 373 | | | | 412,165 | |
Riverbed Technology, Inc., 8.88%, 03/01/23(a) | | | | | | | 229 | | | | 216,119 | |
| | | | | | | | |
| | | | | | | | | | | 1,615,527 | |
| Construction & Engineering — 0.4% | | | | | | | | | |
Brand Energy & Infrastructure Services, Inc., 8.50%, 07/15/25(a) | | | | | | | 801 | | | | 841,050 | |
Engility Corp., 8.88%, 09/01/24 | | | | | | | 287 | | | | 306,731 | |
New Enterprise Stone & Lime Co., Inc., 10.13%, 04/01/22(a) | | | | | | | 200 | | | | 216,000 | |
Tutor Perini Corp., 6.88%, 05/01/25(a) | | | | | | | 298 | | | | 320,350 | |
Weekley Homes LLC, 6.63%, 08/15/25(a) | | | | | | | 82 | | | | 81,590 | |
| | | | | | | | |
| | | | | | | | | | | 1,765,721 | |
| Consumer Finance — 1.6% | | | | | | | | | |
Ally Financial, Inc.: | | | | | | | | | | | | |
5.13%, 09/30/24 | | | | | | | 1,032 | | | | 1,115,850 | |
8.00%, 11/01/31 | | | | | | | 1,621 | | | | 2,107,300 | |
General Motors Financial Co., Inc., (LIBOR USD 3 Month + 3.60%), 5.75%(e)(f) | | | | | | | 482 | | | | 496,378 | |
Navient Corp.: | | | | | | | | | | | | |
6.63%, 07/26/21 | | | | | | | 527 | | | | 555,985 | |
6.50%, 06/15/22 | | | | | | | 76 | | | | 79,762 | |
5.50%, 01/25/23 | | | | | | | 1,165 | | | | 1,162,087 | |
7.25%, 09/25/23 | | | | | | | 154 | | | | 164,010 | |
6.13%, 03/25/24 | | | | | | | 41 | | | | 41,513 | |
5.88%, 10/25/24 | | | | | | | 122 | | | | 121,085 | |
6.75%, 06/25/25 | | | | | | | 208 | | | | 213,720 | |
5.63%, 08/01/33 | | | | | | | 100 | | | | 87,250 | |
OneMain Financial Holdings LLC(a): | | | | | | | | | | | | |
6.75%, 12/15/19 | | | | | | | 241 | | | | 249,001 | |
7.25%, 12/15/21 | | | | | | | 263 | | | | 273,310 | |
Springleaf Finance Corp.: | | | | | | | | | | | | |
6.13%, 05/15/22 | | | | | | | 90 | | | | 93,375 | |
5.63%, 03/15/23 | | | | | | | 338 | | | | 338,743 | |
| | | | | | | | |
| | | | | | | | | | | 7,099,369 | |
| Containers & Packaging — 2.5% | | | | | | | | | |
Ardagh Packaging Finance plc(a): | | | | | | | | | | | | |
6.00%, 06/30/21 | | | | | | | 550 | | | | 564,437 | |
4.25%, 09/15/22 | | | | | | | 296 | | | | 301,180 | |
4.63%, 05/15/23 | | | | | | | 374 | | | | 381,592 | |
7.25%, 05/15/24 | | | | | | | 1,512 | | | | 1,646,190 | |
6.00%, 02/15/25 | | | | | | | 967 | | | | 1,017,768 | |
4.75%, 07/15/27 | | | GBP | | | | 100 | | | | 135,825 | |
| | | | |
| SCHEDULE OF INVESTMENTS | | | 7 | |
| | |
Schedule of Investments (continued) December 31, 2017 | | BlackRock High Yield V.I. Fund (Percentages shown are based on Net Assets) |
| | | | | | | | | | | | |
| Security | | Par
(000) | | | Value | |
| Containers & Packaging (continued) | | | | | | | | | |
Ball Corp.: | | | | | | | | | | | | |
5.00%, 03/15/22 | | | USD | | | | 279 | | | $ | 297,832 | |
4.00%, 11/15/23 | | | | | | | 182 | | | | 185,640 | |
BWAY Holding Co., 5.50%, 04/15/24(a) | | | | | | | 1,073 | | | | 1,115,920 | |
Crown Americas LLC, 4.25%, 09/30/26 | | | | | | | 272 | | | | 267,920 | |
OI European Group BV, 4.00%, 03/15/23(a) | | | | | | | 325 | | | | 325,439 | |
Reynolds Group Issuer, Inc.: | | | | | | | | | | | | |
5.75%, 10/15/20 | | | | | | | 1,057 | | | | 1,073,156 | |
6.88%, 02/15/21 | | | | | | | 142 | | | | 143,893 | |
(LIBOR USD 3 Month + 3.50%), 4.86%, 07/15/21(a)(e) | | | | | | | 620 | | | | 629,300 | |
5.13%, 07/15/23(a) | | | | | | | 552 | | | | 571,320 | |
7.00%, 07/15/24(a) | | | | | | | 1,768 | | | | 1,891,760 | |
Sealed Air Corp.(a): | | | | | | | | | | | | |
4.88%, 12/01/22 | | | | | | | 536 | | | | 566,150 | |
6.88%, 07/15/33 | | | | | | | 31 | | | | 36,038 | |
| | | | | | | | |
| | | | | | | | | | | 11,151,360 | |
| Distributors — 0.2%(a) | | | | | | | | | |
American Builders & Contractors Supply Co., Inc., 5.75%, 12/15/23 | | | | | | | 363 | | | | 382,057 | |
American Tire Distributors, Inc., 10.25%, 03/01/22 | | | | | | | 420 | | | | 432,600 | |
| | | | | | | | |
| | | | | | | | | | | 814,657 | |
| Diversified Consumer Services — 0.3% | | | | | | | | | |
Laureate Education, Inc., 8.25%, 05/01/25(a) | | | | | | | 319 | | | | 338,140 | |
Service Corp. International: | | | | | | | | | | | | |
4.50%, 11/15/20 | | | | | | | 240 | | | | 242,100 | |
5.38%, 01/15/22 | | | | | | | 166 | | | | 169,942 | |
4.63%, 12/15/27 | | | | | | | 38 | | | | 38,556 | |
ServiceMaster Co. LLC (The), 5.13%, 11/15/24(a) | | | | | | | 324 | | | | 328,050 | |
Sotheby’s, 5.25%, 10/01/22(a) | | | | | | | 390 | | | | 400,335 | |
| | | | | | | | |
| | | | | | | | | | | 1,517,123 | |
| Diversified Financial Services — 0.5%(a) | | | | | | | | | |
FBM Finance, Inc., 8.25%, 08/15/21 | | | | | | | 355 | | | | 377,187 | |
Infinity Acquisition LLC, 7.25%, 08/01/22 | | | | | | | 46 | | | | 46,345 | |
Jefferies Finance LLC: | | | | | | | | | | | | |
7.38%, 04/01/20 | | | | | | | 200 | | | | 205,750 | |
6.88%, 04/15/22 | | | | | | | 451 | | | | 456,638 | |
Tempo Acquisition LLC, 6.75%, 06/01/25 | | | | | | | 649 | | | | 655,490 | |
Vantiv LLC, 4.38%, 11/15/25 | | | | | | | 263 | | | | 266,335 | |
| | | | | | | | |
| | | | | | | | | | | 2,007,745 | |
| Diversified Telecommunication Services — 5.2% | | | | | | | |
CCO Holdings LLC(a): | | | | | | | | | | | | |
4.00%, 03/01/23 | | | | | | | 331 | | | | 327,690 | |
5.13%, 05/01/23 | | | | | | | 719 | | | | 733,380 | |
5.13%, 05/01/27 | | | | | | | 3,240 | | | | 3,191,400 | |
5.00%, 02/01/28 | | | | | | | 695 | | | | 675,887 | |
CenturyLink, Inc.: | | | | | | | | | | | | |
6.45%, 06/15/21 | | | | | | | 919 | | | | 928,190 | |
5.80%, 03/15/22 | | | | | | | 71 | | | | 69,537 | |
6.75%, 12/01/23 | | | | | | | 250 | | | | 245,000 | |
5.63%, 04/01/25 | | | | | | | 255 | | | | 232,050 | |
7.60%, 09/15/39 | | | | | | | 21 | | | | 18,060 | |
7.65%, 03/15/42 | | | | | | | 160 | | | | 141,000 | |
Cincinnati Bell, Inc., 7.00%, 07/15/24(a) | | | | | | | 858 | | | | 851,565 | |
Frontier Communications Corp.: | | | | | | | | | | | | |
7.13%, 03/15/19 | | | | | | | 349 | | | | 335,040 | |
7.13%, 01/15/23 | | | | | | | 249 | | | | 165,585 | |
7.63%, 04/15/24 | | | | | | | 405 | | | | 268,312 | |
6.88%, 01/15/25 | | | | | | | 1,119 | | | | 724,553 | |
Intelsat Jackson Holdings SA: | | | | | | | | | | | | |
7.25%, 10/15/20 | | | | | | | 323 | | | | 303,620 | |
5.50%, 08/01/23 | | | | | | | 516 | | | | 421,830 | |
9.75%, 07/15/25(a) | | | | | | | 905 | | | | 871,062 | |
| | | | | | | | | | | | |
| Security | | Par
(000) | | | Value | |
| Diversified Telecommunication Services (continued) | | | | | | | |
Level 3 Financing, Inc.: | | | | | | | | | | | | |
5.38%, 08/15/22 | | | USD | | | | 395 | | | $ | 400,056 | |
5.63%, 02/01/23 | | | | | | | 405 | | | | 408,038 | |
5.13%, 05/01/23 | | | | | | | 96 | | | | 96,240 | |
5.38%, 01/15/24 | | | | | | | 877 | | | | 875,904 | |
5.38%, 05/01/25 | | | | | | | 363 | | | | 362,546 | |
5.25%, 03/15/26 | �� | | | | | | 1,451 | | | | 1,424,229 | |
Qwest Corp., 6.75%, 12/01/21 | | | | | | | 160 | | | | 172,301 | |
SFR Group SA(a): | | | | | | | | | | | | |
6.00%, 05/15/22 | | | | | | | 865 | | | | 875,813 | |
7.38%, 05/01/26 | | | | | | | 2,204 | | | | 2,261,855 | |
Sprint Capital Corp.: | | | | | | | | | | | | |
6.90%, 05/01/19 | | | | | | | 375 | | | | 392,344 | |
8.75%, 03/15/32 | | | | | | | 1,127 | | | | 1,279,145 | |
Telecom Italia Capital SA: | | | | | | | | | | | | |
6.38%, 11/15/33 | | | | | | | 230 | | | | 267,375 | |
6.00%, 09/30/34 | | | | | | | 1,579 | | | | 1,772,428 | |
7.20%, 07/18/36 | | | | | | | 140 | | | | 173,950 | |
Telecom Italia SpA, 5.30%, 05/30/24(a) | | | | | | | 200 | | | | 213,500 | |
Telesat Canada, 8.88%, 11/15/24(a) | | | | | | | 325 | | | | 364,000 | |
Virgin Media Finance plc, 5.75%, 01/15/25(a) | | | | | | | 1,280 | | | | 1,305,600 | |
| | | | | | | | |
| | | | | | | | | | | 23,149,085 | |
| Electric Utilities — 0.1% | | | | | | | | | |
DPL, Inc., 7.25%, 10/15/21 | | | | | | | 39 | | | | 43,290 | |
NextEra Energy Operating Partners LP, 4.25%, 09/15/24(a) | | | | | | | 239 | | | | 243,183 | |
| | | | | | | | |
| | | | | | | | | | | 286,473 | |
| Electrical Equipment — 0.6% | | | | | | | | | |
GrafTech International Ltd., 6.38%, 11/15/20 | | | | | | | 103 | | | | 102,743 | |
Sensata Technologies BV(a): | | | | | | | | | | | | |
5.63%, 11/01/24 | | | | | | | 202 | | | | 221,947 | |
5.00%, 10/01/25 | | | | | | | 837 | | | | 885,128 | |
Vertiv Group Corp., 9.25%, 10/15/24(a) | | | | | | | 1,246 | | | | 1,330,105 | |
| | | | | | | | |
| | | | | | | | | | | 2,539,923 | |
| Electronic Equipment, Instruments & Components — 0.5% | |
Anixter, Inc., 5.63%, 05/01/19 | | | | | | | 55 | | | | 56,719 | |
CDW LLC: | | | | | | | | | | | | |
5.00%, 09/01/23 | | | | | | | 514 | | | | 531,348 | |
5.50%, 12/01/24 | | | | | | | 1,307 | | | | 1,421,362 | |
5.00%, 09/01/25 | | | | | | | 132 | | | | 136,620 | |
| | | | | | | | |
| | | | | | | | | | | 2,146,049 | |
| Energy Equipment & Services — 1.7% | | | | | | | | | |
Diamond Offshore Drilling, Inc., 7.88%, 08/15/25 | | | | | | | 124 | | | | 129,735 | |
Ensco plc, 5.20%, 03/15/25 | | | | | | | 45 | | | | 38,250 | |
Noble Holding International Ltd.: | | | | | | | | | | | | |
4.63%, 03/01/21 | | | | | | | 12 | | | | 11,220 | |
7.75%, 01/15/24 | | | | | | | 200 | | | | 172,000 | |
7.70%, 04/01/25 | | | | | | | 106 | | | | 88,775 | |
Noble Holding US LLC, 7.50%, 03/15/19 | | | | | | | 130 | | | | 133,087 | |
Parker Drilling Co., 7.50%, 08/01/20 | | | | | | | 159 | | | | 144,690 | |
Pioneer Energy Services Corp., 6.13%, 03/15/22 | | | | | | | 516 | | | | 422,965 | |
Precision Drilling Corp.: | | | | | | | | | | | | |
6.50%, 12/15/21 | | | | | | | 44 | | | | 44,825 | |
7.75%, 12/15/23 | | | | | | | 110 | | | | 115,500 | |
5.25%, 11/15/24 | | | | | | | 168 | | | | 158,340 | |
7.13%, 01/15/26(a) | | | | | | | 157 | | | | 160,140 | |
Rowan Cos., Inc.: | | | | | | | | | | | | |
4.88%, 06/01/22 | | | | | | | 90 | | | | 84,825 | |
4.75%, 01/15/24 | | | | | | | 227 | | | | 199,760 | |
7.38%, 06/15/25 | | | | | | | 923 | | | | 939,152 | |
SESI LLC: | | | | | | | | | | | | |
7.13%, 12/15/21 | | | | | | | 110 | | | | 112,750 | |
7.75%, 09/15/24(a) | | | | | | | 281 | | | | 298,563 | |
| | |
| 8 | | 2017 BLACKROCK ANNUAL REPORTTO SHAREHOLDERS |
| | |
Schedule of Investments (continued) December 31, 2017 | | BlackRock High Yield V.I. Fund (Percentages shown are based on Net Assets) |
| | | | | | | | | | | | |
| Security | | Par
(000) | | | Value | |
| Energy Equipment & Services (continued) | | | | | | | | | |
Transocean, Inc.: | | | | | | | | | | | | |
5.80%, 10/15/22 | | | USD | | | | 259 | | | $ | 255,115 | |
9.00%, 07/15/23(a) | | | | | | | 1,306 | | | | 1,412,113 | |
7.50%, 01/15/26(a) | | | | | | | 362 | | | | 370,706 | |
6.80%, 03/15/38 | | | | | | | 117 | | | | 93,892 | |
Trinidad Drilling Ltd., 6.63%, 02/15/25(a) | | | | | | | 455 | | | | 432,250 | |
Weatherford International LLC, 6.80%, 06/15/37 | | | | | | | 107 | | | | 88,810 | |
Weatherford International Ltd.: | | | | | | | | | | | | |
7.75%, 06/15/21 | | | | | | | 399 | | | | 406,731 | |
8.25%, 06/15/23 | | | | | | | 670 | | | | 676,700 | |
9.88%, 02/15/24 | | | | | | | 136 | | | | 144,500 | |
6.50%, 08/01/36 | | | | | | | 218 | | | | 179,305 | |
7.00%, 03/15/38 | | | | | | | 183 | | | | 153,720 | |
5.95%, 04/15/42 | | | | | | | 190 | | | | 148,200 | |
| | | | | | | | |
| | | | | | | | | | | 7,616,619 | |
| Equity Real Estate Investment Trusts (REITs) — 2.2% | |
CoreCivic, Inc., 4.75%, 10/15/27 | | | | | | | 186 | | | | 183,675 | |
CyrusOne LP: | | | | | | | | | | | | |
5.00%, 03/15/24 | | | | | | | 729 | | | | 756,337 | |
5.38%, 03/15/27(a) | | | | | | | 68 | | | | 71,400 | |
Equinix, Inc.: | | | | | | | | | | | | |
5.38%, 04/01/23 | | | | | | | 70 | | | | 72,380 | |
5.88%, 01/15/26 | | | | | | | 785 | | | | 842,894 | |
ESH Hospitality, Inc., 5.25%, 05/01/25(a) | | | | | | | 577 | | | | 582,770 | |
GEO Group, Inc. (The): | | | | | | | | | | | | |
5.13%, 04/01/23 | | | | | | | 348 | | | | 348,000 | |
5.88%, 10/15/24 | | | | | | | 220 | | | | 226,050 | |
6.00%, 04/15/26 | | | | | | | 70 | | | | 71,925 | |
iStar, Inc.: | | | | | | | | | | | | |
4.63%, 09/15/20 | | | | | | | 154 | | | | 156,310 | |
6.00%, 04/01/22 | | | | | | | 37 | | | | 38,295 | |
5.25%, 09/15/22 | | | | | | | 155 | | | | 155,969 | |
MGM Growth Properties Operating Partnership LP: | | | | | | | | | | | | |
5.63%, 05/01/24 | | | | | | | 2,029 | | | | 2,160,885 | |
4.50%, 09/01/26 | | | | | | | 1,164 | | | | 1,158,180 | |
4.50%, 01/15/28(a) | | | | | | | 425 | | | | 416,500 | |
SBA Communications Corp.: | | | | | | | | | | | | |
4.00%, 10/01/22(a) | | | | | | | 922 | | | | 923,153 | |
4.88%, 09/01/24 | | | | | | | 505 | | | | 518,887 | |
Uniti Group LP, 8.25%, 10/15/23 | | | | | | | 572 | | | | 549,835 | |
VICI Properties 1 LLC, 8.00%, 10/15/23 | | | | | | | 393 | | | | 438,616 | |
| | | | | | | | |
| | | | | | | | | | | 9,672,061 | |
| Food & Staples Retailing — 0.1% | | | | | | | | | |
Albertsons Cos. LLC: | | | | | | | | | | | | |
6.63%, 06/15/24 | | | | | | | 163 | | | | 154,442 | |
5.75%, 03/15/25 | | | | | | | 152 | | | | 137,104 | |
Rite Aid Corp., 6.13%, 04/01/23(a) | | | | | | | 299 | | | | 269,848 | |
| | | | | | | | |
| | | | | | | | | | | 561,394 | |
| Food Products — 1.1% | | | | | | | | | |
B&G Foods, Inc., 5.25%, 04/01/25 | | | | | | | 746 | | | | 758,794 | |
Chobani LLC, 7.50%, 04/15/25(a) | | | | | | | 554 | | | | 587,240 | |
JBS USA LUX SA(a): | | | | | | | | | | | | |
5.88%, 07/15/24 | | | | | | | 470 | | | | 454,137 | |
5.75%, 06/15/25 | | | | | | | 791 | | | | 761,338 | |
Lamb Weston Holdings, Inc.,
4.63%, 11/01/24(a) | | | | | | | 22 | | | | 22,660 | |
Pilgrim’s Pride Corp.(a): | | | | | | | | | | | | |
5.75%, 03/15/25 | | | | | | | 233 | | | | 240,864 | |
5.88%, 09/30/27 | | | | | | | 201 | | | | 207,030 | |
Post Holdings, Inc.(a): | | | | | | | | | | | | |
5.50%, 03/01/25 | | | | | | | 442 | | | | 457,470 | |
5.00%, 08/15/26 | | | | | | | 1,323 | | | | 1,301,501 | |
5.63%, 01/15/28 | | | | | | | 80 | | | | 80,424 | |
TreeHouse Foods, Inc., 6.00%, 02/15/24(a) | | | | | | | 21 | | | | 21,840 | |
| | | | | | | | |
| | | | | | | | | | | 4,893,298 | |
| | | | | | | | | | | | |
| Security | | Par
(000) | | | Value | |
| Health Care Equipment & Supplies — 1.7% | |
Avantor, Inc.(a): | | | | | | | | | | | | |
6.00%, 10/01/24 | | | USD | | | | 2,413 | | | $ | 2,403,951 | |
9.00%, 10/01/25 | | | | | | | 532 | | | | 524,020 | |
DJO Finco, Inc., 8.13%, 06/15/21(a) | | | | | | | 1,126 | | | | 1,052,810 | |
Fresenius US Finance II, Inc., 4.50%, 01/15/23(a) | | | | | | | 127 | | | | 133,350 | |
Mallinckrodt International Finance SA(a): | | | | | | | | | | | | |
4.88%, 04/15/20 | | | | | | | 155 | | | | 148,800 | |
5.75%, 08/01/22 | | | | | | | 1,161 | | | | 1,053,607 | |
5.63%, 10/15/23 | | | | | | | 99 | | | | 84,150 | |
5.50%, 04/15/25 | | | | | | | 43 | | | | 35,045 | |
Ortho-Clinical Diagnostics, Inc.,
6.63%, 05/15/22(a) | | | | | | | 1,761 | | | | 1,769,805 | |
Sterigenics-Nordion Holdings LLC, 6.50%, 05/15/23(a) | | | | | | | 70 | | | | 72,975 | |
Teleflex, Inc., 4.88%, 06/01/26 | | | | | | | 273 | | | | 281,873 | |
| | | | | | | | |
| | | | | | | | | | | 7,560,386 | |
| Health Care Providers & Services — 4.7% | | | | | | | | | |
Acadia Healthcare Co., Inc.: | | | | | | | | | | | | |
5.13%, 07/01/22 | | | | | | | 31 | | | | 31,077 | |
5.63%, 02/15/23 | | | | | | | 279 | | | | 283,185 | |
6.50%, 03/01/24 | | | | | | | 237 | | | | 246,480 | |
Centene Corp.: | | | | | | | | | | | | |
5.63%, 02/15/21 | | | | | | | 330 | | | | 339,075 | |
4.75%, 05/15/22 | | | | | | | 448 | | | | 464,800 | |
6.13%, 02/15/24 | | | | | | | 73 | | | | 77,197 | |
4.75%, 01/15/25 | | | | | | | 594 | | | | 604,395 | |
Community Health Systems, Inc.: | | | | | | | | | | | | |
8.00%, 11/15/19 | | | | | | | 396 | | | | 334,620 | |
5.13%, 08/01/21 | | | | | | | 6 | | | | 5,400 | |
6.25%, 03/31/23 | | | | | | | 302 | | | | 271,800 | |
DaVita, Inc., 5.13%, 07/15/24 | | | | | | | 337 | | | | 340,370 | |
Envision Healthcare Corp.: | | | | | | | | | | | | |
5.13%, 07/01/22(a) | | | | | | | 261 | | | | 253,170 | |
5.63%, 07/15/22 | | | | | | | 727 | | | | 734,270 | |
6.25%, 12/01/24(a) | | | | | | | 223 | | | | 229,690 | |
HCA, Inc.: | | | | | | | | | | | | |
6.50%, 02/15/20 | | | | | | | 294 | | | | 311,640 | |
7.50%, 02/15/22 | | | | | | | 289 | | | | 325,125 | |
5.88%, 03/15/22 | | | | | | | 380 | | | | 406,600 | |
4.75%, 05/01/23 | | | | | | | 130 | | | | 133,900 | |
5.88%, 05/01/23 | | | | | | | 821 | | | | 876,418 | |
5.00%, 03/15/24 | | | | | | | 2,164 | | | | 2,250,560 | |
5.38%, 02/01/25 | | | | | | | 197 | | | | 203,895 | |
5.25%, 04/15/25 | | | | | | | 575 | | | | 608,063 | |
5.88%, 02/15/26 | | | | | | | 559 | | | | 591,142 | |
5.25%, 06/15/26 | | | | | | | 1,249 | | | | 1,323,940 | |
4.50%, 02/15/27 | | | | | | | 129 | | | | 129,645 | |
5.50%, 06/15/47 | | | | | | | 1,358 | | | | 1,354,605 | |
HealthSouth Corp., 5.75%, 11/01/24 | | | | | | | 445 | | | | 455,569 | |
MEDNAX, Inc., 5.25%, 12/01/23(a) | | | | | | | 144 | | | | 146,520 | |
Molina Healthcare, Inc., 4.88%, 06/15/25(a) | | | | | | | 134 | | | | 133,665 | |
MPH Acquisition Holdings LLC,
7.13%, 06/01/24(a) | | | | | | | 734 | | | | 781,710 | |
Polaris Intermediate Corp., 8.50% (8.50% Cash or 9.25% PIK), 12/01/22(a)(c) | | | | | | | 870 | | | | 902,625 | |
RegionalCare Hospital Partners Holdings, Inc., 8.25%, 05/01/23(a) | | | | | | | 187 | | | | 197,285 | |
Surgery Center Holdings, Inc.(a): | | | | | | | | | | | | |
8.88%, 04/15/21 | | | | | | | 145 | | | | 150,075 | |
6.75%, 07/01/25 | | | | | | | 421 | | | | 397,845 | |
Team Health Holdings, Inc., 6.38%, 02/01/25(a) | | | | | | | 393 | | | | 350,753 | |
Tenet Healthcare Corp.: | | | | | | | | | | | | |
6.75%, 02/01/20 | | | | | | | 85 | | | | 85,850 | |
4.75%, 06/01/20 | | | | | | | 167 | | | | 169,922 | |
6.00%, 10/01/20 | | | | | | | 172 | | | | 181,856 | |
| | | | |
| SCHEDULE OF INVESTMENTS | | | 9 | |
| | |
Schedule of Investments (continued) December 31, 2017 | | BlackRock High Yield V.I. Fund (Percentages shown are based on Net Assets) |
| | | | | | | | | | | | |
| Security | | Par
(000) | | | Value | |
| Health Care Providers & Services (continued) | | | | | | | | | |
Tenet Healthcare Corp. (continued): | | | | | | | | | | | | |
7.50%, 01/01/22(a) | | | USD | | | | 184 | | | $ | 193,200 | |
8.13%, 04/01/22 | | | | | | | 1,414 | | | | 1,438,745 | |
6.75%, 06/15/23 | | | | | | | 640 | | | | 620,800 | |
4.63%, 07/15/24(a) | | | | | | | 497 | | | | 484,575 | |
5.13%, 05/01/25(a) | | | | | | | 587 | | | | 572,325 | |
7.00%, 08/01/25(a) | | | | | | | 270 | | | | 253,800 | |
Vizient, Inc., 10.38%, 03/01/24(a) | | | | | | | 444 | | | | 498,390 | |
WellCare Health Plans, Inc., 5.25%, 04/01/25 | | | | | | | 136 | | | | 143,480 | |
| | | | | | | | | | | | |
| | | | | | | | | | | 20,890,052 | |
| Hotels, Restaurants & Leisure — 3.9% | | | | | | | | | |
1011778 BC ULC/New Red Finance, Inc.(a): | | | | | | | | | | | | |
4.25%, 05/15/24 | | | | | | | 399 | | | | 398,002 | |
5.00%, 10/15/25 | | | | | | | 2,255 | | | | 2,271,913 | |
Caesars Entertainment Resort Properties LLC, 8.00%, 10/01/20 | | | | | | | 946 | | | | 967,285 | |
CRC Escrow Issuer LLC, 5.25%, 10/15/25(a) | | | | | | | 1,119 | | | | 1,127,392 | |
Eldorado Resorts, Inc., 6.00%, 04/01/25 | | | | | | | 151 | | | | 157,795 | |
GLP Capital LP: | | | | | | | | | | | | |
5.38%, 11/01/23 | | | | | | | 66 | | | | 70,455 | |
5.38%, 04/15/26 | | | | | | | 123 | | | | 131,918 | |
Hilton Domestic Operating Co., Inc.,
4.25%, 09/01/24 | | | | | | | 113 | | | | 114,130 | |
Jacobs Entertainment, Inc.,
7.88%, 02/01/24(a) | | | | | | | 70 | | | | 74,900 | |
KFC Holding Co.(a): | | | | | | | | | | | | |
5.00%, 06/01/24 | | | | | | | 35 | | | | 36,094 | |
5.25%, 06/01/26 | | | | | | | 262 | | | | 275,755 | |
Melco Resorts Finance Ltd.,
4.88%, 06/06/25(a) | | | | | | | 265 | | | | 267,905 | |
MGM Resorts International: | | | | | | | | | | | | |
5.25%, 03/31/20 | | | | | | | 180 | | | | 186,300 | |
6.75%, 10/01/20 | | | | | | | 547 | | | | 590,760 | |
6.63%, 12/15/21 | | | | | | | 1,988 | | | | 2,181,234 | |
7.75%, 03/15/22 | | | | | | | 541 | | | | 616,740 | |
Sabre GLBL, Inc.(a): | | | | | | | | | | | | |
5.38%, 04/15/23 | | | | | | | 65 | | | | 66,950 | |
5.25%, 11/15/23 | | | | | | | 278 | | | | 284,338 | |
Scientific Games International, Inc.: | | | | | | | | | | | | |
7.00%, 01/01/22(a) | | | | | | | 2,217 | | | | 2,336,164 | |
10.00%, 12/01/22 | | | | | | | 1,406 | | | | 1,543,085 | |
5.00%, 10/15/25(a) | | | | | | | 413 | | | | 414,032 | |
Six Flags Entertainment Corp., 4.88%, 07/31/24(a) | | | | | | | 1,918 | | | | 1,946,770 | |
Station Casinos LLC, 5.00%, 10/01/25(a) | | | | | | | 601 | | | | 604,005 | |
Viking Cruises Ltd.(a): | | | | | | | | | | | | |
6.25%, 05/15/25 | | | | | | | 186 | | | | 191,580 | |
5.88%, 09/15/27 | | | | | | | 278 | | | | 282,865 | |
Wyndham Worldwide Corp., 4.15%, 04/01/24 | | | | | | | 158 | | | | 158,739 | |
Yum Brands, Inc., 3.88%, 11/01/23 | | | | | | | 97 | | | | 97,606 | |
| | | | | | | | | | | | |
| | | | | | | | | | | 17,394,712 | |
| Household Durables — 1.7% | | | | | | | | | |
Brookfield Residential Properties, Inc.(a): | | | | | | | | | | | | |
6.50%, 12/15/20 | | | | | | | 20 | | | | 20,400 | |
6.38%, 05/15/25 | | | | | | | 93 | | | | 98,580 | |
CalAtlantic Group, Inc.: | | | | | | | | | | | | |
6.63%, 05/01/20 | | | | | | | 255 | | | | 274,176 | |
8.38%, 01/15/21 | | | | | | | 488 | | | | 562,420 | |
5.38%, 10/01/22 | | | | | | | 20 | | | | 21,450 | |
5.25%, 06/01/26 | | | | | | | 170 | | | | 179,775 | |
K. Hovnanian Enterprises, Inc.(a): | | | | | | | | | | | | |
10.00%, 07/15/22 | | | | | | | 264 | | | | 290,400 | |
10.50%, 07/15/24 | | | | | | | 134 | | | | 153,765 | |
Lennar Corp.: | | | | | | | | | | | | |
4.50%, 11/15/19 | | | | | | | 64 | | | | 65,680 | |
2.95%, 11/29/20(a) | | | | | | | 82 | | | | 81,385 | |
| | | | | | | | | | | | |
| Security | | Par
(000) | | | Value | |
| Household Durables (continued) | | | | | | | | | |
Lennar Corp. (continued): | | | | | | | | | | | | |
4.75%, 04/01/21 | | | USD | | | | 51 | | | $ | 53,040 | |
4.13%, 01/15/22 | | | | | | | 684 | | | | 697,680 | |
4.75%, 11/15/22 | | | | | | | 880 | | | | 924,000 | |
4.88%, 12/15/23 | | | | | | | 450 | | | | 472,500 | |
4.75%, 11/29/27(a) | | | | | | | 465 | | | | 478,857 | |
Mattamy Group Corp.(a): | | | | | | | | | | | | |
6.88%, 12/15/23 | | | | | | | 234 | | | | 247,455 | |
6.50%, 10/01/25 | | | | | | | 241 | | | | 254,857 | |
MDC Holdings, Inc., 6.00%, 01/15/43 | | | | | | | 290 | | | | 282,750 | |
Meritage Homes Corp.: | | | | | | | | | | | | |
7.15%, 04/15/20 | | | | | | | 70 | | | | 76,125 | |
5.13%, 06/06/27 | | | | | | | 320 | | | | 325,600 | |
PulteGroup, Inc.: | | | | | | | | | | | | |
5.50%, 03/01/26 | | | | | | | 161 | | | | 175,088 | |
6.38%, 05/15/33 | | | | | | | 473 | | | | 529,760 | |
6.00%, 02/15/35 | | | | | | | 244 | | | | 262,300 | |
Springs Industries, Inc., 6.25%, 06/01/21 | | | | | | | 53 | | | | 54,060 | |
Tempur Sealy International, Inc., 5.50%, 06/15/26 | | | | | | | 241 | | | | 247,073 | |
TRI Pointe Group, Inc.: | | | | | | | | | | | | |
4.38%, 06/15/19 | | | | | | | 165 | | | | 168,300 | |
4.88%, 07/01/21 | | | | | | | 115 | | | | 119,312 | |
5.88%, 06/15/24 | | | | | | | 170 | | | | 181,475 | |
5.25%, 06/01/27 | | | | | | | 178 | | | | 182,575 | |
William Lyon Homes, Inc., 5.88%, 01/31/25 | | | | | | | 76 | | | | 77,615 | |
Williams Scotsman International, Inc., 7.88%, 12/15/22(a) | | | | | | | 140 | | | | 144,200 | |
| | | | | | | | |
| | | | | | | | | | | 7,702,653 | |
| Household Products — 0.1% | | | | | | | | | |
Spectrum Brands, Inc., 6.63%, 11/15/22 | | | | | | | 460 | | | | 476,100 | |
| | | | | | | | |
| Independent Power and Renewable Electricity Producers — 1.7% | | | | |
AES Corp.: | | | | | | | | | | | | |
8.00%, 06/01/20 | | | | | | | 36 | | | | 40,320 | |
4.88%, 05/15/23 | | | | | | | 365 | | | | 371,844 | |
5.50%, 03/15/24 | | | | | | | 195 | | | | 202,800 | |
5.50%, 04/15/25 | | | | | | | 120 | | | | 126,000 | |
6.00%, 05/15/26 | | | | | | | 177 | | | | 191,160 | |
5.13%, 09/01/27 | | | | | | | 163 | | | | 171,150 | |
Calpine Corp.: | | | | | | | | | | | | |
5.88%, 01/15/24(a) | | | | | | | 272 | | | | 276,760 | |
5.75%, 01/15/25 | | | | | | | 450 | | | | 425,250 | |
5.25%, 06/01/26(a) | | | | | | | 1,230 | | | | 1,205,412 | |
Dynegy, Inc.: | | | | | | | | | | | | |
7.38%, 11/01/22 | | | | | | | 605 | | | | 638,275 | |
7.63%, 11/01/24 | | | | | | | 117 | | | | 125,482 | |
8.00%, 01/15/25(a) | | | | | | | 232 | | | | 251,140 | |
8.13%, 01/30/26(a) | | | | | | | 228 | | | | 249,090 | |
NRG Energy, Inc.: | | | | | | | | | | | | |
6.25%, 07/15/22 | | | | | | | 335 | | | | 348,400 | |
6.63%, 01/15/27 | | | | | | | 1,518 | | | | 1,605,285 | |
5.75%, 01/15/28(a) | | | | | | | 616 | | | | 622,160 | |
NRG Yield Operating LLC, 5.38%, 08/15/24 | | | | | | | 279 | | | | 288,765 | |
Pattern Energy Group, Inc., 5.88%, 02/01/24(a) | | | | | | | 276 | | | | 289,800 | |
Talen Energy Supply LLC, 6.50%, 06/01/25 | | | | | | | 231 | | | | 186,533 | |
| | | | | | | | |
| | | | | | | | | | | 7,615,626 | |
| Insurance — 1.0%(a) | | | | | | | | | |
Acrisure LLC, 7.00%, 11/15/25 | | | | | | | 283 | | | | 272,744 | |
Alliant Holdings Intermediate LLC, 8.25%, 08/01/23 | | | | | | | 2,169 | | | | 2,277,450 | |
Ardonagh Midco 3 plc, 8.63%, 07/15/23 | | | | | | | 546 | | | | 565,110 | |
AssuredPartners, Inc., 7.00%, 08/15/25 | | | | | | | 69 | | | | 68,655 | |
HUB International Ltd., 7.88%, 10/01/21 | | | | | | | 800 | | | | 833,000 | |
NFP Corp., 6.88%, 07/15/25 | | | | | | | 127 | | | | 127,953 | |
USIS Merger Sub, Inc., 6.88%, 05/01/25 | | | | | | | 80 | | | | 80,800 | |
| | | | | | | | |
| | | | | | | | | | | 4,225,712 | |
| | |
| 10 | | 2017 BLACKROCK ANNUAL REPORTTO SHAREHOLDERS |
| | |
Schedule of Investments (continued) December 31, 2017 | | BlackRock High Yield V.I. Fund (Percentages shown are based on Net Assets) |
| | | | | | | | | | | | |
| Security | | Par
(000) | | | Value | |
| Internet & Direct Marketing Retail — 0.5% | |
Netflix, Inc.: | | | | | | | | | | | | |
5.38%, 02/01/21 | | | USD | | | | 60 | | | $ | 63,375 | |
5.50%, 02/15/22 | | | | | | | 446 | | | | 468,858 | |
4.38%, 11/15/26 | | | | | | | 886 | | | | 866,065 | |
4.88%, 04/15/28(a) | | | | | | | 699 | | | | 685,020 | |
| | | | | | | | |
| | | | | | | | | | | 2,083,318 | |
| Internet Software & Services — 0.8% | | | | | | | | | |
GTT Communications, Inc., 7.88%, 12/31/24(a) | | | | | | | 284 | | | | 299,620 | |
Match Group, Inc., 5.00%, 12/15/27(a) | | | | | | | 123 | | | | 124,845 | |
Rackspace Hosting, Inc., 8.63%, 11/15/24(a) | | | | | | | 270 | | | | 288,225 | |
Zayo Group LLC: | | | | | | | | | | | | |
6.00%, 04/01/23 | | | | | | | 1,860 | | | | 1,937,283 | |
6.38%, 05/15/25 | | | | | | | 60 | | | | 63,450 | |
5.75%, 01/15/27(a) | | | | | | | 1,030 | | | | 1,050,600 | |
| | | | | | | | |
| | | | | | | | | | | 3,764,023 | |
| IT Services — 1.5%(a) | | | | | | | | | |
Alliance Data Systems Corp.: | | | | | | | | | | | | |
5.88%, 11/01/21 | | | | | | | 490 | | | | 502,250 | |
5.38%, 08/01/22 | | | | | | | 860 | | | | 866,450 | |
First Data Corp.: | | | | | | | | | | | | |
7.00%, 12/01/23 | | | | | | | 1,128 | | | | 1,192,860 | |
5.75%, 01/15/24 | | | | | | | 2,738 | | | | 2,833,830 | |
Gartner, Inc., 5.13%, 04/01/25 | | | | | | | 401 | | | | 419,045 | |
WEX, Inc., 4.75%, 02/01/23 | | | | | | | 874 | | | | 892,573 | |
| | | | | | | | |
| | | | | | | | | | | 6,707,008 | |
| Leisure Products — 0.1% | | | | | | | | | |
Mattel, Inc.: | | | | | | | | | | | | |
6.75%, 12/31/25(a) | | | | | | | 436 | | | | 441,864 | |
6.20%, 10/01/40 | | | | | | | 101 | | | | 90,774 | |
5.45%, 11/01/41 | | | | | | | 59 | | | | 48,822 | |
| | | | | | | | |
| | | | | | | | | | | 581,460 | |
| Machinery — 2.0% | | | | | | | | | |
BlueLine Rental Finance Corp., 9.25%, 03/15/24(a) | | | | | | | 1,773 | | | | 1,892,677 | |
Cleaver-Brooks, Inc., 7.88%, 03/01/23(a) | | | | | | | 122 | | | | 125,050 | |
EnPro Industries, Inc., 5.88%, 09/15/22 | | | | | | | 160 | | | | 166,600 | |
Grinding Media, Inc., 7.38%, 12/15/23(a) | | | | | | | 906 | | | | 972,772 | |
Navistar International Corp., 6.63%, 11/01/25(a) | | | | | | | 370 | | | | 386,051 | |
Novelis Corp.(a): | | | | | | | | | | | | |
6.25%, 08/15/24 | | | | | | | 1,981 | | | | 2,075,097 | |
5.88%, 09/30/26 | | | | | | | 1,452 | | | | 1,481,040 | |
RBS Global, Inc., 4.88%, 12/15/25(a) | | | | | | | 283 | | | | 285,830 | |
SPX FLOW, Inc., 5.63%, 08/15/24(a) | | | | | | | 332 | | | | 349,430 | |
Terex Corp., 5.63%, 02/01/25(a) | | | | | | | 854 | | | | 892,430 | |
Wabash National Corp., 5.50%, 10/01/25(a) | | | | | | | 303 | | | | 305,273 | |
| | | | | | | | |
| | | | | | | | | | | 8,932,250 | |
| Media — 7.2% | | | | | | | | | |
Acosta, Inc., 7.75%, 10/01/22(a) | | | | | | | 261 | | | | 190,530 | |
Altice Financing SA(a): | | | | | | | | | | | | |
6.63%, 02/15/23 | | | | | | | 200 | | | | 209,420 | |
7.50%, 05/15/26 | | | | | | | 1,128 | | | | 1,201,320 | |
Altice Luxembourg SA, 7.75%, 05/15/22(a) | | | | | | | 2,199 | | | | 2,166,015 | |
Altice US Finance I Corp.(a): | | | | | | | | | | | | |
5.38%, 07/15/23 | | | | | | | 1,331 | | | | 1,360,947 | |
5.50%, 05/15/26 | | | | | | | 254 | | | | 258,763 | |
AMC Networks, Inc.: | | | | | | | | | | | | |
5.00%, 04/01/24 | | | | | | | 238 | | | | 240,975 | |
4.75%, 08/01/25 | | | | | | | 318 | | | | 315,217 | |
Cablevision Systems Corp.: | | | | | | | | | | | | |
7.75%, 04/15/18 | | | | | | | 492 | | | | 498,150 | |
8.00%, 04/15/20 | | | | | | | 125 | | | | 133,437 | |
CBS Radio, Inc., 7.25%, 11/01/24(a) | | | | | | | 93 | | | | 98,057 | |
| | | | | | | | | | | | |
| Security | | Par
(000) | | | Value | |
| Media (continued) | | | | | | | | | |
Cequel Communications Holdings I LLC: | | | | | | | | | | | | |
6.38%, 09/15/20(a) | | | USD | | | | 180 | | | $ | 182,700 | |
5.13%, 12/15/21 | | | | | | | 1,149 | | | | 1,151,872 | |
7.75%, 07/15/25(a) | | | | | | | 1,284 | | | | 1,367,460 | |
Charter Communications Operating LLC, 4.91%, 07/23/25 | | | | | | | 10 | | | | 10,632 | |
Clear Channel International BV, 8.75%, 12/15/20(a) | | | | | | | 1,189 | | | | 1,227,643 | |
Clear Channel Worldwide Holdings, Inc.: | | | | | | | | | | | | |
7.63%, 03/15/20 | | | | | | | 981 | | | | 961,380 | |
6.50%, 11/15/22 | | | | | | | 4,089 | | | | 4,143,488 | |
CSC Holdings LLC: | | | | | | | | | | | | |
10.13%, 01/15/23(a) | | | | | | | 2,610 | | | | 2,939,513 | |
5.25%, 06/01/24 | | | | | | | 499 | | | | 491,515 | |
10.88%, 10/15/25(a) | | | | | | | 1,916 | | | | 2,280,040 | |
DISH DBS Corp.: | | | | | | | | | | | | |
5.88%, 07/15/22 | | | | | | | 1,150 | | | | 1,155,750 | |
5.00%, 03/15/23 | | | | | | | 273 | | | | 257,985 | |
5.88%, 11/15/24 | | | | | | | 321 | | | | 312,574 | |
7.75%, 07/01/26 | | | | | | | 1,490 | | | | 1,566,362 | |
DISH Network Corp., 3.38%, 08/15/26(h) | | | | | | | 497 | | | | 540,798 | |
iHeartCommunications, Inc.: | | | | | | | | | | | | |
9.00%, 12/15/19 | | | | | | | 111 | | | | 82,417 | |
9.00%, 03/01/21 | | | | | | | 321 | | | | 229,515 | |
9.00%, 09/15/22 | | | | | | | 213 | | | | 152,828 | |
10.63%, 03/15/23 | | | | | | | 330 | | | | 232,650 | |
Lions Gate Entertainment Corp., 5.88%, 11/01/24(a) | | | | | | | 92 | | | | 97,175 | |
McGraw-Hill Global Education Holdings LLC, 7.88%, 05/15/24(a) | | | | | | | 95 | | | | 93,813 | |
MDC Partners, Inc., 6.50%, 05/01/24(a) | | | | | | | 440 | | | | 442,200 | |
Midcontinent Communications, 6.88%, 08/15/23(a) | | | | | | | 293 | | | | 310,946 | |
Outfront Media Capital LLC: | | | | | | | | | | | | |
5.63%, 02/15/24 | | | | | | | 54 | | | | 57,105 | |
5.88%, 03/15/25 | | | | | | | 240 | | | | 253,800 | |
Radiate Holdco LLC, 6.63%, 02/15/25(a) | | | | | | | 293 | | | | 276,885 | |
Sirius XM Radio, Inc., 5.00%, 08/01/27(a) | | | | | | | 401 | | | | 402,003 | |
Sterling Entertainment Enterprises LLC, 9.75%, 12/15/19(a)(g) | | | | | | | 475 | | | | 470,250 | |
TEGNA, Inc., 5.50%, 09/15/24(a) | | | | | | | 83 | | | | 87,046 | |
Telenet Finance Luxembourg Notes Sarl, 5.50%, 03/01/28(a) | | | | | | | 200 | | | | 199,500 | |
Townsquare Media, Inc., 6.50%, 04/01/23(a) | | | | | | | 262 | | | | 256,105 | |
Tribune Media Co., 5.88%, 07/15/22 | | | | | | | 172 | | | | 176,730 | |
Univision Communications, Inc.(a): | | | | | | | | | | | | |
5.13%, 05/15/23 | | | | | | | 1,138 | | | | 1,135,155 | |
5.13%, 02/15/25 | | | | | | | 23 | | | | 22,396 | |
Urban One, Inc., 7.38%, 04/15/22(a) | | | | | | | 60 | | | | 59,850 | |
Videotron Ltd., 5.13%, 04/15/27(a) | | | | | | | 479 | | | | 500,555 | |
WaveDivision Escrow LLC, 8.13%, 09/01/20(a) | | | | | | | 794 | | | | 809,880 | |
Ziggo Bond Finance BV, 5.88%, 01/15/25(a) | | | | | | | 600 | | | | 589,500 | |
| | | | | | | | |
| | | | | | | | | | | 32,200,847 | |
| Metals & Mining — 4.8% | | | | | | | | | |
Big River Steel LLC, 7.25%, 09/01/25(a) | | | | | | | 234 | | | | 247,455 | |
Cleveland-Cliffs, Inc., 4.88%, 01/15/24(a) | | | | | | | 273 | | | | 272,317 | |
Constellium NV(a): | | | | | | | | | | | | |
5.75%, 05/15/24 | | | | | | | 512 | | | | 522,240 | |
6.63%, 03/01/25 | | | | | | | 337 | | | | 355,114 | |
5.88%, 02/15/26 | | | | | | | 378 | | | | 385,087 | |
First Quantum Minerals Ltd.(a): | | | | | | | | | | | | |
7.00%, 02/15/21 | | | | | | | 1,058 | | | | 1,097,675 | |
7.25%, 05/15/22 | | | | | | | 187 | | | | 196,032 | |
7.50%, 04/01/25 | | | | | | | 229 | | | | 248,465 | |
FMG Resources August 2006 Pty. Ltd., 9.75%, 03/01/22(a) | | | | | | | 160 | | | | 177,040 | |
| | | | |
| SCHEDULE OF INVESTMENTS | | | 11 | |
| | |
Schedule of Investments (continued) December 31, 2017 | | BlackRock High Yield V.I. Fund (Percentages shown are based on Net Assets) |
| | | | | | | | | | | | |
| Security | | Par
(000) | | | Value | |
| Metals & Mining (continued) | | | | | | | | | |
Freeport-McMoRan, Inc.: | | | | | | | | | | | | |
2.38%, 03/15/18 | | | USD | | | | 1,205 | | | $ | 1,203,494 | |
3.10%, 03/15/20 | | | | | | | 2,145 | | | | 2,131,594 | |
4.00%, 11/14/21 | | | | | | | 215 | | | | 215,000 | |
3.55%, 03/01/22 | | | | | | | 1,620 | | | | 1,601,775 | |
3.88%, 03/15/23 | | | | | | | 1,483 | | | | 1,475,585 | |
4.55%, 11/14/24 | | | | | | | 67 | | | | 68,119 | |
5.40%, 11/14/34 | | | | | | | 130 | | | | 132,275 | |
5.45%, 03/15/43 | | | | | | | 1,642 | | | | 1,639,947 | |
Joseph T Ryerson & Son, Inc., 11.00%, 05/15/22(a) | | | | | | | 177 | | | | 198,019 | |
Kaiser Aluminum Corp., 5.88%, 05/15/24 | | | | | | | 81 | | | | 86,063 | |
Kinross Gold Corp.: | | | | | | | | | | | | |
4.50%, 07/15/27(a) | | | | | | | 154 | | | | 154,963 | |
6.88%, 09/01/41 | | | | | | | 101 | | | | 114,256 | |
Mountain Province Diamonds, Inc., 8.00%, 12/15/22(a) | | | | | | | 122 | | | | 120,628 | |
Signode Industrial Group Lux SA, 6.38%, 05/01/22(a) | | | | | | | 739 | | | | 772,255 | |
Steel Dynamics, Inc.: | | | | | | | | | | | | |
5.13%, 10/01/21 | | | | | | | 475 | | | | 486,875 | |
5.25%, 04/15/23 | | | | | | | 673 | | | | 693,190 | |
5.50%, 10/01/24 | | | | | | | 57 | | | | 60,562 | |
4.13%, 09/15/25(a) | | | | | | | 258 | | | | 259,935 | |
5.00%, 12/15/26 | | | | | | | 45 | | | | 47,588 | |
SunCoke Energy Partners LP, 7.50%, 06/15/25(a) | | | | | | | 387 | | | | 404,415 | |
Teck Resources Ltd.: | | | | | | | | | | | | |
4.50%, 01/15/21 | | | | | | | 106 | | | | 109,307 | |
4.75%, 01/15/22 | | | | | | | 77 | | | | 80,373 | |
3.75%, 02/01/23 | | | | | | | 653 | | | | 654,632 | |
8.50%, 06/01/24(a) | | | | | | | 2,658 | | | | 3,003,540 | |
6.00%, 08/15/40 | | | | | | | 76 | | | | 84,550 | |
5.20%, 03/01/42 | | | | | | | 1,093 | | | | 1,082,070 | |
5.40%, 02/01/43 | | | | | | | 362 | | | | 363,810 | |
United States Steel Corp.: | | | | | | | | | | | | |
8.38%, 07/01/21(a) | | | | | | | 384 | | | | 416,832 | |
6.88%, 08/15/25 | | | | | | | 243 | | | | 253,643 | |
| | | | | | | | |
| | | | | | | | | | | 21,416,720 | |
| Mortgage Real Estate Investment Trusts (REITs) — 0.1% | | | | | | | |
Starwood Property Trust, Inc.: | | | | | | | | | | | | |
5.00%, 12/15/21 | | | | | | | 267 | | | | 277,013 | |
4.75%, 03/15/25(a) | | | | | | | 124 | | | | 123,070 | |
| | | | | | | | |
| | | | | | | | | | | 400,083 | |
| Multiline Retail — 0.3% | | | | | | | | | |
Dollar Tree, Inc.: | | | | | | | | | | | | |
5.25%, 03/01/20 | | | | | | | 24 | | | | 24,415 | |
5.75%, 03/01/23 | | | | | | | 1,103 | | | | 1,155,393 | |
JC Penney Corp., Inc.: | | | | | | | | | | | | |
8.13%, 10/01/19 | | | | | | | 52 | | | | 53,040 | |
6.38%, 10/15/36 | | | | | | | 61 | | | | 36,295 | |
7.40%, 04/01/37 | | | | | | | 50 | | | | 32,250 | |
Neiman Marcus Group Ltd. LLC, 8.00%, 10/15/21(a) | | | | | | | 257 | | | | 147,826 | |
| | | | | | | | |
| | | | | | | | | | | 1,449,219 | |
| Oil, Gas & Consumable Fuels — 11.0% | | | | | | | | | |
Alta Mesa Holdings LP, 7.88%, 12/15/24 | | | | | | | 129 | | | | 141,416 | |
Andeavor Logistics LP, (LIBOR USD 3 Month + 4.65%), 6.87%, 02/15/23(e)(f) | | | | | | | 426 | | | | 432,475 | |
Antero Midstream Partners LP, 5.38%, 09/15/24 | | | | | | | 60 | | | | 61,800 | |
Antero Resources Corp.: | | | | | | | | | | | | |
5.13%, 12/01/22 | | | | | | | 115 | | | | 117,300 | |
5.63%, 06/01/23 | | | | | | | 745 | | | | 774,800 | |
Ascent Resources Utica Holdings LLC, 10.00%, 04/01/22(a) | | | | | | | 232 | | | | 248,820 | |
| | | | | | | | | | | | |
| Security | | Par
(000) | | | Value | |
| Oil, Gas & Consumable Fuels (continued) | | | | | | | | | |
California Resources Corp.,
8.00%, 12/15/22(a) | | | USD | | | | 399 | | | $ | 329,175 | |
Callon Petroleum Co., 6.13%, 10/01/24 | | | | | | | 483 | | | | 497,490 | |
Carrizo Oil & Gas, Inc.: | | | | | | | | | | | | |
6.25%, 04/15/23 | | | | | | | 207 | | | | 214,762 | |
8.25%, 07/15/25 | | | | | | | 173 | | | | 190,084 | |
Cheniere Corpus Christi Holdings LLC: | | | | | | | | | | | | |
7.00%, 06/30/24 | | | | | | | 172 | | | | 195,757 | |
5.88%, 03/31/25 | | | | | | | 1,197 | | | | 1,297,249 | |
5.13%, 06/30/27 | | | | | | | 1,092 | | | | 1,129,565 | |
Cheniere Energy Partners LP,
5.25%, 10/01/25(a) | | | | | | | 511 | | | | 519,942 | |
Chesapeake Energy Corp., 8.00%, 06/15/27(a) | | | | | | | 1,393 | | | | 1,337,280 | |
CNX Resources Corp.: | | | | | | | | | | | | |
5.88%, 04/15/22 | | | | | | | 4,478 | | | | 4,573,157 | |
8.00%, 04/01/23 | | | | | | | 29 | | | | 31,088 | |
CONSOL Energy, Inc., 11.00%, 11/15/25(a) | | | | | | | 456 | | | | 478,800 | |
Continental Resources, Inc.: | | | | | | | | | | | | |
3.80%, 06/01/24 | | | | | | | 139 | | | | 137,436 | |
4.38%, 01/15/28(a) | | | | | | | 16 | | | | 15,795 | |
4.90%, 06/01/44 | | | | | | | 487 | | | | 465,085 | |
Covey Park Energy LLC, 7.50%, 05/15/25(a) | | | | | | | 568 | | | | 591,970 | |
Crestwood Midstream Partners LP, 6.25%, 04/01/23 | | | | | | | 260 | | | | 270,192 | |
CrownRock LP, 5.63%, 10/15/25(a) | | | | | | | 1,060 | | | | 1,065,300 | |
DCP Midstream Operating LP(a): | | | | | | | | | | | | |
4.75%, 09/30/21 | | | | | | | 150 | | | | 154,875 | |
6.45%, 11/03/36 | | | | | | | 198 | | | | 212,355 | |
6.75%, 09/15/37 | | | | | | | 262 | | | | 285,580 | |
Denbury Resources, Inc., 9.25%, 03/31/22(a) | | | | | | | 693 | | | | 701,662 | |
Diamondback Energy, Inc., 5.38%, 05/31/25 | | | | | | | 242 | | | | 248,957 | |
Eclipse Resources Corp., 8.88%, 07/15/23 | | | | | | | 85 | | | | 87,231 | |
Endeavor Energy Resources LP(a): | | | | | | | | | | | | |
5.50%, 01/30/26 | | | | | | | 160 | | | | 162,800 | |
5.75%, 01/30/28 | | | | | | | 293 | | | | 300,911 | |
Energy Transfer Equity LP: | | | | | | | | | | | | |
7.50%, 10/15/20 | | | | | | | 158 | | | | 173,800 | |
4.25%, 03/15/23 | | | | | | | 239 | | | | 237,207 | |
5.88%, 01/15/24 | | | | | | | 992 | | | | 1,044,080 | |
5.50%, 06/01/27 | | | | | | | 608 | | | | 620,160 | |
EP Energy LLC: | | | | | | | | | | | | |
9.38%, 05/01/20 | | | | | | | 430 | | | | 363,350 | |
8.00%, 11/29/24(a) | | | | | | | 613 | | | | 632,922 | |
Extraction Oil & Gas, Inc.(a): | | | | | | | | | | | | |
7.88%, 07/15/21 | | | | | | | 714 | | | | 755,055 | |
7.38%, 05/15/24 | | | | | | | 546 | | | | 582,855 | |
Genesis Energy LP: | | | | | | | | | | | | |
6.50%, 10/01/25 | | | | | | | 195 | | | | 197,925 | |
6.25%, 05/15/26 | | | | | | | 232 | | | | 231,130 | |
Great Western Petroleum LLC,
9.00%, 09/30/21(a) | | | | | | | 582 | | | | 605,280 | |
Gulfport Energy Corp.: | | | | | | | | | | | | |
6.63%, 05/01/23 | | | | | | | 304 | | | | 310,080 | |
6.00%, 10/15/24 | | | | | | | 79 | | | | 79,000 | |
6.38%, 05/15/25 | | | | | | | 88 | | | | 88,440 | |
6.38%, 01/15/26(a) | | | | | | | 425 | | | | 426,062 | |
Halcon Resources Corp., 6.75%, 02/15/25(a) | | | | | | | 658 | | | | 684,320 | |
Hess Infrastructure Partners LP,
5.63%, 02/15/26(a) | | | | | | | 546 | | | | 563,745 | |
Matador Resources Co., 6.88%, 04/15/23 | | | | | | | 1,019 | | | | 1,072,498 | |
MEG Energy Corp.(a): | | | | | | | | | | | | |
6.38%, 01/30/23 | | | | | | | 247 | | | | 209,950 | |
7.00%, 03/31/24 | | | | | | | 761 | | | | 642,094 | |
6.50%, 01/15/25 | | | | | | | 986 | | | | 973,675 | |
Murphy Oil Corp.: | | | | | | | | | | | | |
4.45%, 12/01/22 | | | | | | | 127 | | | | 127,476 | |
5.88%, 12/01/42 | | | | | | | 81 | | | | 79,129 | |
Newfield Exploration Co., 5.63%, 07/01/24 | | | | | | | 788 | | | | 847,100 | |
| | |
| 12 | | 2017 BLACKROCK ANNUAL REPORTTO SHAREHOLDERS |
| | |
Schedule of Investments (continued) December 31, 2017 | | BlackRock High Yield V.I. Fund (Percentages shown are based on Net Assets) |
| | | | | | | | | | | | |
| Security | | Par
(000) | | | Value | |
| Oil, Gas & Consumable Fuels (continued) | | | | | | | | | |
NGL Energy Partners LP: | | | | | | | | | | | | |
5.13%, 07/15/19 | | | USD | | | | 193 | | | $ | 196,378 | |
6.88%, 10/15/21 | | | | | | | 828 | | | | 844,560 | |
NGPL PipeCo LLC(a): | | | | | | | | | | | | |
4.38%, 08/15/22 | | | | | | | 250 | | | | 254,219 | |
4.88%, 08/15/27 | | | | | | | 91 | | | | 94,413 | |
7.77%, 12/15/37 | | | | | | | 713 | | | | 878,772 | |
Oasis Petroleum, Inc.: | | | | | | | | | | | | |
6.50%, 11/01/21 | | | | | | | 176 | | | | 179,740 | |
6.88%, 03/15/22 | | | | | | | 312 | | | | 320,190 | |
6.88%, 01/15/23 | | | | | | | 65 | | | | 66,463 | |
Parsley Energy LLC(a): | | | | | | | | | | | | |
6.25%, 06/01/24 | | | | | | | 74 | | | | 77,885 | |
5.38%, 01/15/25 | | | | | | | 656 | | | | 662,560 | |
5.25%, 08/15/25 | | | | | | | 94 | | | | 94,235 | |
5.63%, 10/15/27 | | | | | | | 340 | | | | 347,650 | |
PBF Holding Co. LLC, 7.25%, 06/15/25 | | | | | | | 263 | | | | 276,150 | |
PDC Energy, Inc., 5.75%, 05/15/26(a) | | | | | | | 225 | | | | 230,625 | |
QEP Resources, Inc.: | | | | | | | | | | | | |
5.38%, 10/01/22 | | | | | | | 160 | | | | 163,600 | |
5.25%, 05/01/23 | | | | | | | 60 | | | | 60,712 | |
Range Resources Corp.: | | | | | | | | | | | | |
5.88%, 07/01/22 | | | | | | | 494 | | | | 503,880 | |
5.00%, 08/15/22 | | | | | | | 37 | | | | 36,815 | |
5.00%, 03/15/23 | | | | | | | 387 | | | | 385,065 | |
4.88%, 05/15/25 | | | | | | | 122 | | | | 117,730 | |
Resolute Energy Corp., 8.50%, 05/01/20 | | | | | | | 1,012 | | | | 1,029,710 | |
Rockies Express Pipeline LLC(a): | | | | | | | | | | | | |
5.63%, 04/15/20 | | | | | | | 765 | | | | 801,338 | |
6.88%, 04/15/40 | | | | | | | 709 | | | | 797,625 | |
RSP Permian, Inc.: | | | | | | | | | | | | |
6.63%, 10/01/22 | | | | | | | 499 | | | | 523,326 | |
5.25%, 01/15/25 | | | | | | | 177 | | | | 181,425 | |
Sanchez Energy Corp.: | | | | | | | | | | | | |
7.75%, 06/15/21 | | | | | | | 228 | | | | 214,320 | |
6.13%, 01/15/23 | | | | | | | 1,244 | | | | 1,051,180 | |
Seven Generations Energy Ltd.(a): | | | | | | | | | | | | |
6.88%, 06/30/23 | | | | | | | 179 | | | | 190,188 | |
5.38%, 09/30/25 | | | | | | | 852 | | | | 860,520 | |
SM Energy Co.: | | | | | | | | | | | | |
6.50%, 11/15/21 | | | | | | | 75 | | | | 75,938 | |
6.13%, 11/15/22 | | | | | | | 371 | | | | 377,956 | |
6.50%, 01/01/23 | | | | | | | 169 | | | | 172,380 | |
5.63%, 06/01/25 | | | | | | | 63 | | | | 61,110 | |
6.75%, 09/15/26 | | | | | | | 119 | | | | 122,570 | |
Southern Star Central Corp.,
5.13%, 07/15/22(a) | | | | | | | 47 | | | | 48,763 | |
Southwestern Energy Co.: | | | | | | | | | | | | |
6.70%, 01/23/25 | | | | | | | 225 | | | | 233,719 | |
7.50%, 04/01/26 | | | | | | | 550 | | | | 584,375 | |
7.75%, 10/01/27 | | | | | | | 169 | | | | 180,407 | |
Tallgrass Energy Partners LP(a): | | | | | | | | | | | | |
5.50%, 09/15/24 | | | | | | | 718 | | | | 736,848 | |
5.50%, 01/15/28 | | | | | | | 420 | | | | 425,124 | |
Targa Resources Partners LP: | | | | | | | | | | | | |
5.25%, 05/01/23 | | | | | | | 15 | | | | 15,337 | |
5.13%, 02/01/25 | | | | | | | 107 | | | | 109,541 | |
5.38%, 02/01/27 | | | | | | | 42 | | | | 43,103 | |
5.00%, 01/15/28(a) | | | | | | | 775 | | | | 773,063 | |
TerraForm Power Operating LLC(a): | | | | | | | | | | | | |
4.25%, 01/31/23 | | | | | | | 237 | | | | 235,223 | |
6.63%, 06/15/25(i) | | | | | | | 75 | | | | 81,750 | |
5.00%, 01/31/28 | | | | | | | 237 | | | | 234,630 | |
| | | | | | | | | | | | |
| Security | | Par
(000) | | | Value | |
| Oil, Gas & Consumable Fuels (continued) | | | | | | | | | |
Whiting Petroleum Corp.: | | | | | | | | | | | | |
5.00%, 03/15/19 | | | USD | | | | 782 | | | $ | 801,941 | |
6.63%, 01/15/26(a) | | | | | | | 818 | | | | 834,360 | |
WildHorse Resource Development Corp., 6.88%, 02/01/25 | | | | | | | 186 | | | | 190,185 | |
Williams Cos., Inc. (The): | | | | | | | | | | | | |
4.55%, 06/24/24 | | | | | | | 107 | | | | 111,013 | |
5.75%, 06/24/44 | | | | | | | 1,344 | | | | 1,434,720 | |
WPX Energy, Inc.: | | | | | | | | | | | | |
7.50%, 08/01/20 | | | | | | | 47 | | | | 50,877 | |
6.00%, 01/15/22 | | | | | | | 282 | | | | 294,690 | |
8.25%, 08/01/23 | | | | | | | 83 | | | | 94,205 | |
5.25%, 09/15/24 | | | | | | | 496 | | | | 494,289 | |
| | | | | | | | |
| | | | | | | | | | | 49,077,833 | |
| Paper & Forest Products — 0.2% | | | | | | | | | |
Mercer International, Inc.: | | | | | | | | | | | | |
7.75%, 12/01/22 | | | | | | | 214 | | | | 226,840 | |
6.50%, 02/01/24 | | | | | | | 188 | | | | 199,750 | |
5.50%, 01/15/26(a) | | | | | | | 172 | | | | 174,580 | |
Norbord, Inc., 6.25%, 04/15/23(a) | | | | | | | 261 | | | | 284,816 | |
PH Glatfelter Co., 5.38%, 10/15/20 | | | | | | | 34 | | | | 34,425 | |
| | | | | | | | |
| | | | | | | | | | | 920,411 | |
| Personal Products — 0.1% | | | | | | | | | |
Prestige Brands, Inc., 6.38%, 03/01/24(a) | | | | | | | 434 | | | | 449,733 | |
| | | | | | | | |
| Pharmaceuticals — 1.9%(a) | | | | | | | | | |
Catalent Pharma Solutions, Inc., 4.88%, 01/15/26 | | | | | | | 445 | | | | 446,669 | |
Endo Dac: | | | | | | | | | | | | |
6.00%, 07/15/23 | | | | | | | 360 | | | | 282,600 | |
5.88%, 10/15/24 | | | | | | | 205 | | | | 207,562 | |
Endo Finance LLC, 7.25%, 01/15/22 | | | | | | | 211 | | | | 182,515 | |
inVentiv Group Holdings, Inc., 7.50%, 10/01/24 | | | | | | | 306 | | | | 330,480 | |
Valeant Pharmaceuticals International, Inc.: | | | | | | | | | | | | |
7.50%, 07/15/21 | | | | | | | 1,017 | | | | 1,034,798 | |
6.75%, 08/15/21 | | | | | | | 1,127 | | | | 1,135,452 | |
5.63%, 12/01/21 | | | | | | | 251 | | | | 245,352 | |
6.50%, 03/15/22 | | | | | | | 486 | | | | 510,300 | |
7.25%, 07/15/22 | | | | | | | 98 | | | | 99,103 | |
5.50%, 03/01/23 | | | | | | | 142 | | | | 129,930 | |
5.88%, 05/15/23 | | | | | | | 923 | | | | 856,082 | |
7.00%, 03/15/24 | | | | | | | 594 | | | | 635,580 | |
6.13%, 04/15/25 | | | | | | | 828 | | | | 757,620 | |
5.50%, 11/01/25 | | | | | | | 1,044 | | | | 1,062,270 | |
9.00%, 12/15/25 | | | | | | | 418 | | | | 435,640 | |
| | | | | | | | |
| | | | | | | | | | | 8,351,953 | |
| Professional Services — 0.8%(a) | | | | | | | | | |
Booz Allen Hamilton, Inc., 5.13%, 05/01/25 | | | | | | | 876 | | | | 878,190 | |
Ceridian HCM Holding, Inc., 11.00%, 03/15/21 | | | | | | | 398 | | | | 415,910 | |
IHS Markit Ltd.: | | | | | | | | | | | | |
4.75%, 02/15/25 | | | | | | | 305 | | | | 321,775 | |
4.00%, 03/01/26 | | | | | | | 161 | | | | 160,799 | |
Jaguar Holding Co. II, 6.38%, 08/01/23 | | | | | | | 1,843 | | | | 1,861,430 | |
Michael Baker International LLC, 8.75%, 03/01/23 | | | | | | | 62 | | | | 59,985 | |
| | | | | | | | |
| | | | | | | | | | | 3,698,089 | |
| Real Estate Management & Development — 0.4%(a) | |
Five Point Operating Co. LP, 7.88%, 11/15/25 | | | | | | | 213 | | | | 216,727 | |
Greystar Real Estate Partners LLC, 5.75%, 12/01/25 | | | | | | | 242 | | | | 249,260 | |
Howard Hughes Corp. (The), 5.38%, 03/15/25 | | | | | | | 452 | | | | 463,300 | |
Realogy Group LLC: | | | | | | | | | | | | |
4.50%, 04/15/19 | | | | | | | 127 | | | | 128,746 | |
5.25%, 12/01/21 | | | | | | | 85 | | | | 88,188 | |
4.88%, 06/01/23 | | | | | | | 732 | | | | 722,850 | |
| | | | | | | | |
| | | | | | | | | | | 1,869,071 | |
| | | | |
| SCHEDULE OF INVESTMENTS | | | 13 | |
| | |
Schedule of Investments (continued) December 31, 2017 | | BlackRock High Yield V.I. Fund (Percentages shown are based on Net Assets) |
| | | | | | | | | | | | |
| Security | | Par
(000) | | | Value | |
| Road & Rail — 0.7%(a) | |
Avis Budget Car Rental LLC, 5.13%, 06/01/22 | | | USD | | | | 601 | | | $ | 608,513 | |
Herc Rentals, Inc.: | | | | | | | | | | | | |
7.50%, 06/01/22 | | | | | | | 962 | | | | 1,036,555 | |
7.75%, 06/01/24 | | | | | | | 146 | | | | 160,235 | |
Hertz Corp. (The), 7.63%, 06/01/22 | | | | | | | 400 | | | | 419,000 | |
Park Aerospace Holdings Ltd.: | | | | | | | | | | | | |
3.63%, 03/15/21 | | | | | | | 310 | | | | 296,825 | |
5.25%, 08/15/22 | | | | | | | 612 | | | | 608,175 | |
Watco Cos. LLC, 6.38%, 04/01/23 | | | | | | | 99 | | | | 102,465 | |
| | | | | | | | |
| | | | | | | | | | | 3,231,768 | |
| Semiconductors & Semiconductor Equipment — 0.7% | |
Advanced Micro Devices, Inc., 7.50%, 08/15/22 | | | | | | | 83 | | | | 91,092 | |
Entegris, Inc., 4.63%, 02/10/26(a) | | | | | | | 261 | | | | 264,915 | |
Micron Technology, Inc.: | | | | | | | | | | | | |
5.25%, 01/15/24(a) | | | | | | | 53 | | | | 55,054 | |
5.50%, 02/01/25 | | | | | | | 11 | | | | 11,509 | |
3.00%, 11/15/43(h) | | | | | | | 240 | | | | 346,050 | |
Microsemi Corp., 9.13%, 04/15/23(a) | | | | | | | 21 | | | | 23,625 | |
NXP BV(a): | | | | | | | | | | | | |
4.13%, 06/15/20 | | | | | | | 245 | | | | 250,887 | |
4.63%, 06/15/22 | | | | | | | 430 | | | | 449,888 | |
3.88%, 09/01/22 | | | | | | | 200 | | | | 202,250 | |
4.63%, 06/01/23 | | | | | | | 767 | | | | 802,282 | |
Sensata Technologies UK Financing Co. plc, 6.25%, 02/15/26(a) | | | | | | | 500 | | | | 543,750 | |
Versum Materials, Inc., 5.50%, 09/30/24(a) | | | | | | | 128 | | | | 136,960 | |
| | | | | | | | |
| | | | | | | | | | | 3,178,262 | |
| Software — 3.6% | | | | | | | | | |
Ascend Learning LLC, 6.88%, 08/01/25(a) | | | | | | | 413 | | | | 426,422 | |
BMC Software Finance, Inc.,
8.13%, 07/15/21(a) | | | | | �� | | 626 | | | | 629,912 | |
CDK Global, Inc., 4.88%, 06/01/27(a) | | | | | | | 414 | | | | 419,175 | |
Genesys Telecommunications Laboratories, Inc., 10.00%, 11/30/24(a) | | | | | | | 546 | | | | 596,505 | |
Infor Software Parent LLC, 7.13% ( 7.13% Cash or 7.88% PIK), 05/01/21(a)(c) | | | | | | | 372 | | | | 380,370 | |
Infor US, Inc., 6.50%, 05/15/22 | | | | | | | 2,904 | | | | 3,005,640 | |
Informatica LLC, 7.13%, 07/15/23(a) | | | | | | | 1,075 | | | | 1,099,188 | |
Nuance Communications, Inc.: | | | | | | | | | | | | |
5.38%, 08/15/20(a) | | | | | | | 33 | | | | 33,454 | |
6.00%, 07/01/24 | | | | | | | 148 | | | | 158,730 | |
5.63%, 12/15/26 | | | | | | | 459 | | | | 477,934 | |
PTC, Inc., 6.00%, 05/15/24 | | | | | | | 249 | | | | 263,940 | |
RP Crown Parent LLC, 7.38%, 10/15/24(a) | | | | | | | 374 | | | | 391,765 | |
Solera LLC, 10.50%, 03/01/24(a) | | | | | | | 2,280 | | | | 2,564,954 | |
Sophia LP, 9.00%, 09/30/23(a) | | | | | | | 290 | | | | 306,675 | |
SS&C Technologies Holdings, Inc., 5.88%, 07/15/23 | | | | | | | 1,595 | | | | 1,682,725 | |
Symantec Corp., 5.00%, 04/15/25(a) | | | | | | | 230 | | | | 239,200 | |
TIBCO Software, Inc., 11.38%, 12/01/21(a) | | | | | | | 1,189 | | | | 1,295,273 | |
Veritas US, Inc.(a): | | | | | | | | | | | | |
7.50%, 02/01/23 | | | | | | | 1,000 | | | | 1,047,500 | |
10.50%, 02/01/24 | | | | | | | 811 | | | | 843,440 | |
| | | | | | | | |
| | | | | | | | | | | 15,862,802 | |
| Specialty Retail — 0.6% | | | | | | | | | |
Asbury Automotive Group, Inc., 6.00%, 12/15/24 | | | | | | | 441 | | | | 459,169 | |
Beacon Escrow Corp., 4.88%, 11/01/25(a) | | | | | | | 797 | | | | 799,989 | |
Group 1 Automotive, Inc.: | | | | | | | | | | | | |
5.00%, 06/01/22 | | | | | | | 80 | | | | 82,400 | |
5.25%, 12/15/23(a) | | | | | | | 45 | | | | 46,462 | |
L Brands, Inc., 6.88%, 11/01/35 | | | | | | | 444 | | | | 448,440 | |
Penske Automotive Group, Inc., 5.50%, 05/15/26 | | | | | | | 476 | | | | 482,997 | |
PetSmart, Inc., 5.88%, 06/01/25(a) | | | | | | | 165 | | | | 126,638 | |
Staples, Inc., 8.50%, 09/15/25(a) | | | | | | | 236 | | | | 218,300 | |
| | | | | | | | |
| | | | | | | | | | | 2,664,395 | |
| | | | | | | | | | | | |
| Security | | Par
(000) | | | Value | |
| Technology Hardware, Storage & Peripherals — 0.4% | |
Dell International LLC, 7.13%, 06/15/24(a) | | | USD | | | | 901 | | | $ | 986,473 | |
Western Digital Corp.: | | | | | | | | | | | | |
7.38%, 04/01/23(a) | | | | | | | 494 | | | | 532,902 | |
10.50%, 04/01/24 | | | | | | | 296 | | | | 342,990 | |
| | | | | | | | |
| | | | | | | | | | | 1,862,365 | |
| Thrifts & Mortgage Finance — 0.2% | | | | | | | | | |
Ladder Capital Finance Holdings LLLP(a): | | | | | | | | | | | | |
5.25%, 03/15/22 | | | | | | | 44 | | | | 45,375 | |
5.25%, 10/01/25 | | | | | | | 256 | | | | 254,720 | |
MGIC Investment Corp., 5.75%, 08/15/23 | | | | | | | 175 | | | | 191,406 | |
Radian Group, Inc.: | | | | | | | | | | | | |
5.25%, 06/15/20 | | | | | | | 42 | | | | 44,257 | |
4.50%, 10/01/24 | | | | | | | 381 | | | | 390,335 | |
| | | | | | | | |
| | | | | | | | | | | 926,093 | |
| Trading Companies & Distributors — 1.4% | | | | |
Aircastle Ltd.: | | | | | | | | | | | | |
6.25%, 12/01/19 | | | | | | | 125 | | | | 131,875 | |
7.63%, 04/15/20 | | | | | | | 12 | | | | 13,110 | |
5.50%, 02/15/22 | | | | | | | 398 | | | | 426,357 | |
4.13%, 05/01/24 | | | | | | | 585 | | | | 593,775 | |
Beacon Roofing Supply, Inc., 6.38%, 10/01/23 | | | | | | | 169 | | | | 179,774 | |
Fortress Transportation & Infrastructure Investors LLC, 6.75%, 03/15/22(a) | | | | | | | 58 | | | | 60,030 | |
HD Supply, Inc., 5.75%, 04/15/24(a) | | | | | | | 2,377 | | | | 2,525,563 | |
United Rentals North America, Inc.: | | | | | | | | | | | | |
4.63%, 07/15/23 | | | | | | | 78 | | | | 80,642 | |
5.75%, 11/15/24 | | | | | | | 328 | | | | 345,220 | |
5.50%, 07/15/25 | | | | | | | 539 | | | | 571,340 | |
4.63%, 10/15/25 | | | | | | | 861 | | | | 867,457 | |
5.88%, 09/15/26 | | | | | | | 362 | | | | 387,340 | |
| | | | | | | | |
| | | | | | | | | | | 6,182,483 | |
| Water Utilities — 0.1% | | | | | | | | | |
Core & Main LP, 6.13%, 08/15/25(a) | | | | | | | 481 | | | | 488,215 | |
| | | | | | | | |
| Wireless Telecommunication Services — 3.3% | | | | |
Digicel Ltd., 6.00%, 04/15/21(a) | | | | | | | 1,305 | | | | 1,284,459 | |
Hughes Satellite Systems Corp.: | | | | | | | | | | | | |
7.63%, 06/15/21 | | | | | | | 162 | | | | 179,010 | |
5.25%, 08/01/26 | | | | | | | 614 | | | | 626,280 | |
6.63%, 08/01/26 | | | | | | | 257 | | | | 269,208 | |
SoftBank Group Corp.(e)(f): | | | | | | | | | | | | |
(USD Swap Rate 5 Year + 4.23%), 6.00% | | | | | | | 790 | | | | 780,378 | |
(USD Swap Rate 5 Year + 4.85%), 6.87% | | | | | | | 385 | | | | 389,427 | |
Sprint Communications, Inc.: | | | | | | | | | | | | |
7.00%, 03/01/20(a) | | | | | | | 938 | | | | 1,003,660 | |
6.00%, 11/15/22 | | | | | | | 1,532 | | | | 1,532,000 | |
Sprint Corp.: | | | | | | | | | | | | |
7.88%, 09/15/23 | | | | | | | 858 | | | | 913,770 | |
7.13%, 06/15/24 | | | | | | | 3,320 | | | | 3,378,100 | |
7.63%, 02/15/25 | | | | | | | 648 | | | | 678,780 | |
T-Mobile USA, Inc.: | | | | | | | | | | | | |
6.13%, 01/15/22 | | | | | | | 38 | | | | 39,197 | |
4.00%, 04/15/22 | | | | | | | 239 | | | | 245,124 | |
6.00%, 03/01/23 | | | | | | | 365 | | | | 382,155 | |
6.63%, 04/01/23 | | | | | | | 630 | | | | 656,775 | |
6.00%, 04/15/24 | | | | | | | 111 | | | | 117,660 | |
6.38%, 03/01/25 | | | | | | | 68 | | | | 72,760 | |
5.13%, 04/15/25 | | | | | | | 1,548 | | | | 1,607,985 | |
5.38%, 04/15/27 | | | | | | | 146 | | | | 155,673 | |
Xplornet Communications, Inc., 9.63%
(9.63% Cash or 10.63% PIK),
06/01/22(a)(c) | | | | | | | 156 | | | | 161,885 | |
| | | | | | | | |
| | | | | | | | | | | 14,474,286 | |
Total Corporate Bonds — 88.1%
(Cost: $388,750,162) | | | | | | | | 392,649,035 | |
| | | | | | | | |
| | |
| 14 | | 2017 BLACKROCK ANNUAL REPORTTO SHAREHOLDERS |
| | |
Schedule of Investments (continued) December 31, 2017 | | BlackRock High Yield V.I. Fund (Percentages shown are based on Net Assets) |
| | | | | | | | | | | | |
| Security | | Par
(000) | | | Value | |
Floating Rate Loan Interests — 7.5%(j) | |
|
| Aerospace & Defense — 0.2% | |
Accudyne Industries LLC, Term Loan, (LIBOR USD 3 Month + 3.75%), 5.32%, 08/18/24 | | | USD | | | | 653 | | | $ | 657,551 | |
Sequa Corp., 1st Lien Term Loan, (LIBOR USD 3 Month + 5.00%), 6.55%, 11/28/21 | | | | | | | 212 | | | | 213,128 | |
Sequa Mezzanine Holdings LLC, Term Loan, (LIBOR USD + 9.00%), 10.37%, 04/28/22 | | | | | | | 75 | | | | 75,656 | |
| | | | | | | | |
| | | | | | | | | | | 946,335 | |
| Air Freight & Logistics — 0.1% | | | | | | | | | |
Ceva Group plc, Term Loan, (LIBOR USD 3 Month + 1.23%), 1.23%, 03/19/21(g) | | | | | | | 119 | | | | 111,765 | |
Ceva Logistics Canada ULC, Canadian Term Loan,
(LIBOR USD 3 Month + 5.50%), 6.88%, 03/19/21 | | | | | | | 18 | | | | 17,281 | |
Ceva Logistics US Holdings, Inc., US Term Loan,
(LIBOR USD 3 Month + 5.50%), 6.88%, 03/19/21 | | | | | | | 173 | | | | 162,864 | |
| | | | | | | | |
| | | | | | | | | | | 291,910 | |
| Chemicals — 0.3% | | | | | | | | | |
Alpha 3 BV, Term Loan, (LIBOR USD 3 Month + 3.00%), 4.69%, 01/31/24 | | | | | | | 144 | | | | 145,057 | |
Ascend Performance Materials Operations LLC, Term Loan B, (LIBOR USD 3 Month + 5.25%), 6.94%, 08/23/22(g) | | | | | | | 523 | | | | 525,507 | |
Gates Global LLC, Term Loan B, (LIBOR USD 3 Month + 3.00%), 4.69%, 04/01/24 | | | | | | | 196 | | | | 197,070 | |
HB Fuller Co., 1st Lien Term Loan, (LIBOR USD 3 Month + 2.25%), 3.75%, 10/20/24 | | | | | | | 362 | | | | 363,049 | |
Tronox Blocked Borrower LLC, 1st Lien Term Loan, (LIBOR USD 3 Month + 3.00%), 4.69%, 09/23/24 | | | | | | | 43 | | | | 42,871 | |
Tronox Finance LLC, 1st Lien Term Loan, (LIBOR USD 3 Month + 3.00%), 4.69%, 09/23/24 | | | | | | | 98 | | | | 98,934 | |
| | | | | | | | |
| | | | | | | | | | | 1,372,488 | |
| Commercial Services & Supplies — 0.4% | | | | | | | | | |
Sedgwick Claims Management Services, 1st Lien Term Loan, (LIBOR USD 3 Month + 2.75%), 4.32%, 03/01/21(k) | | | | | | | 688 | | | | 687,566 | |
Sedgwick Claims Management Services, 2nd Lien Term Loan, (LIBOR USD 3 Month + 5.75%), 7.32%, 02/28/22 | | | | | | | 201 | | | | 201,754 | |
West Corp., Term Loan, (LIBOR USD + 4.00%), 5.35%, 10/03/24 | | | | | | | 675 | | | | 676,811 | |
| | | | | | | | |
| | | | | | | | | | | 1,566,131 | |
| Construction & Engineering — 0.5% | | | | | | | | | |
Brand Industrial Services, Inc., Term Loan, (LIBOR USD 3 Month + 4.25%), 5.61% - 5.63%, 06/21/24 | | | | | | | 2,205 | | | | 2,211,763 | |
| | | | | | | | |
| Diversified Consumer Services — 0.1% | | | | | | | | | |
Belron Finance Ltd., Term Loan B, (LIBOR USD 3 Month + 2.50%), 3.89%, 10/25/24 | | | | | | | 166 | | | | 167,557 | |
Laureate Education, Inc., Term Loan B,
(LIBOR USD 3 Month + 4.50%), 6.07%, 04/26/24 | | | | | | | 149 | | | | 149,992 | |
| | | | | | | | |
| | | | | | | | | | | 317,549 | |
| Diversified Financial Services — 0.0% | | | | | | | | | |
TCW Group, Inc., Term Loan, (LIBOR USD 3 Month + 2.00%), 3.50%, 12/13/24(k) | | | | | | | 119 | | | | 119,099 | |
| | | | | | | | |
| Diversified Telecommunication Services — 1.4% | | | | |
Centurylink, Inc., 1st Lien Term Loan, (LIBOR USD 1 Month + 2.75%), 4.32%, 01/31/25 | | | | | | | 947 | | | | 912,378 | |
Digicel International Finance Ltd., Term Loan,
(LIBOR USD 3 Month + 3.75%), 5.31%, 05/27/24 | | | | | | | 512 | | | | 513,636 | |
| | | | | | | | | | | | |
| Security | | Par
(000) | | | Value | |
| Diversified Telecommunication Services — 1.4% | | | | |
Intelsat Jackson Holdings SA, Term Loan, (LIBOR USD 3 Month + 3.25%), 3.25%, 01/15/24(k) | | | USD | | | | 336 | | | $ | 339,709 | |
Intelsat Jackson Holdings SA, Term Loan B2, (LIBOR USD 3 Month + 2.75%), 4.21%, 06/30/19(k) | | | | | | | 1,070 | | | | 1,065,993 | |
Intelsat Jackson Holdings SA, Term Loan B5, (LIBOR 6 Month + 6.63%), 6.63%, 01/14/24(k) | | | | | | | 2,166 | | | | 2,185,862 | |
Ligado Networks LLC, 1st Lien Term Loan, (LIBOR USD 3 Month + 12.50%), 14.02%, 12/07/20 | | | | | | | 530 | | | | 320,082 | |
Lumos Networks Operators, Term Loan, (LIBOR USD 3 Month + 3.25%), 4.82%, 11/15/24 | | | | | | | 80 | | | | 80,475 | |
Spirit Communication, Term Loan, 10/27/24(k) | | | | | | | 79 | | | | 78,414 | |
Virgin Media, Term Loan, (LIBOR USD 3 Month + 2.50%), 3.98%, 01/30/26 | | | | | | | 728 | | | | 727,629 | |
| | | | | | | | |
| | | | | | | | | | | 6,224,178 | |
| Electrical Equipment — 0.3% | | | | | | | | | |
Generac Power Systems, Inc., Term Loan B, (LIBOR USD + 2.00%), 3.41%, 05/31/23(k) | | | | | | | 491 | | | | 491,859 | |
Vertiv Group Corp., Term Loan B, (LIBOR USD 3 Month + 4.00%), 5.35%, 11/30/23 | | | | | | | 625 | | | | 624,304 | |
| | | | | | | | |
| | | | | | | | | | | 1,116,163 | |
| Energy Equipment & Services — 0.3% | | | | | | | | | |
ExGen Renewables I LLC, Term Loan, (LIBOR USD 3 Month + 3.00%), 4.47%, 11/28/24(g) | | | | | | | 106 | | | | 107,060 | |
Pioneer Energy Services Corp., Term Loan, (LIBOR USD 3 Month + 1.41%), 9.16%, 11/17/22(g) | | | | | | | 819 | | | | 833,332 | |
Weatherford International Ltd., Term Loan, (LIBOR USD 1 Month + 2.30%), 3.87%, 07/13/20 | | | | | | | 264 | | | | 257,462 | |
| | | | | | | | |
| | | | | | | | | | | 1,197,854 | |
| Food Products — 0.0% | | | | | | | | | |
Chobani LLC, Term Loan, (LIBOR USD + 3.50%), 5.07%, 10/07/23 | | | | | | | 69 | | | | 69,967 | |
| | | | | | | | |
| Health Care Equipment & Supplies — 0.4% | | | | | | | | | |
DJO Finance LLC, Term Loan, (LIBOR USD 3 Month + 3.25%), 4.59% - 4.82%, 06/08/20 | | | | | | | 596 | | | | 587,410 | |
Immucor, Inc., Term Loan, (LIBOR USD 3 Month + 5.00%), 6.57%, 06/15/21 | | | | | | | 997 | | | | 1,011,480 | |
Ortho-Clinical Diagnostics, Term Loan, (LIBOR USD 3 Month + 3.75%), 5.44%, 06/30/21 | | | | | | | 40 | | | | 39,650 | |
| | | | | | | | |
| | | | | | | | | | | 1,638,540 | |
| Health Care Providers & Services — 0.0% | | | | | | | | | |
Superior Vision, Term Loan, (LIBOR USD 3 Month + 3.00%), 4.49%, 12/02/24(k) | | | | | | | 113 | | | | 113,495 | |
Team Health Holdings, Inc., Term Loan B, (LIBOR USD 3 Month + 2.75%), 4.32%, 02/06/24 | | | | | | | 57 | | | | 55,052 | |
| | | | | | | | |
| | | | | | | | | | | 168,547 | |
| Hotels, Restaurants & Leisure — 0.3% | | | | | | | | | |
Aristocrat International, Term Loan B, (LIBOR USD 3 Month + 2.00%), 3.36%, 10/19/24(k) | | | | | | | 460 | | | | 460,575 | |
Caesars Resort Collection LLC, Term Loan, (LIBOR USD 1 Month + 2.75%), 4.34%, 09/30/24 | | | | | | | 718 | | | | 720,821 | |
Four Seaons Holding, Inc., Term Loan, (LIBOR USD 3 Month + 2.50%), 4.07%, 11/30/23 | | | | | | | 44 | | | | 43,785 | |
| | | | | | | | |
| | | | | | | | | | | 1,225,181 | |
| Household Products — 0.0% | | | | | | | | | |
Diamond BC BV, Term Loan, (LIBOR USD 3 Month + 3.00%), 4.42%, 09/06/24 | | | | | | | 151 | | | | 151,091 | |
| | | | | | | | |
| Insurance — 0.1% | | | | | | | | | |
Alliant Holdings Intermediate LLC, Term Loan B, (LIBOR USD 3 Month + 3.25%), 4.80%, 08/12/22 | | | | | | | 127 | | | | 127,227 | |
| | | | |
| SCHEDULE OF INVESTMENTS | | | 15 | |
| | |
Schedule of Investments (continued) December 31, 2017 | | BlackRock High Yield V.I. Fund (Percentages shown are based on Net Assets) |
| | | | | | | | | | | | |
| Security | | Par
(000) | | | Value | |
| Insurance (continued) | | | | | | | | | |
Asurion LLC, 2nd Lien Term Loan B-2, (LIBOR USD 3 Month + 6.00%), 7.57%, 08/04/25 | | | USD | | | | 181 | | | $ | 185,807 | |
USI, Inc., 1st Lien Term Loan B, (LIBOR USD 3 Month + 3.00%), 4.69%, 05/16/24 | | | | | | | 105 | | | | 104,520 | |
| | | | | | | | |
| | | | | | | | | | | 417,554 | |
| IT Services — 0.2% | |
CCC Information Services, Inc., Term Loan: | | | | | | | | | | | | |
(LIBOR USD 3 Month + 3.00%), 4.57%, 04/29/24 | | | | | | | 132 | | | | 131,923 | |
(LIBOR USD 3 Month + 6.75%), 8.32%, 04/28/25 | | | | | | | 40 | | | | 40,775 | |
Information Resources, Inc., 1st Lien Term B, (LIBOR USD 3 Month + 4.25%), 5.62%, 01/18/24 | | | | | | | 85 | | | | 85,711 | |
Peak 10, Inc., 2nd Lien Term Loan, (LIBOR USD 3 Month + 7.25%), 8.63%, 08/01/25 | | | | | | | 83 | | | | 83,311 | |
Peak 10, Inc., Term Loan B, (LIBOR USD 3 Month + 3.50%), 5.19%, 08/01/24 | | | | | | | 195 | | | | 194,209 | |
Tempo Acquisition LLC, Term Loan B, (LIBOR USD 3 Month + 3.00%), 4.57%, 05/01/24 | | | | | | | 320 | | | | 319,156 | |
| | | | | | | | |
| | | | | | | | | | | 855,085 | |
| Leisure Products — 0.0% | | | | | | | | | |
Hayward Industries, Inc., 1st Lien Term Loan B, (LIBOR USD 3 Month + 3.50%), 5.07%, 08/05/24 | | | | | | | 74 | | | | 73,907 | |
| | | | | | | | |
| Life Sciences Tools & Services — 0.1% | | | | | | | | | |
Albany Molecular Research, Inc., 1st Lien Term Loan, (LIBOR USD 3 Month + 3.25%), 4.82%, 08/30/24 | | | | | | | 199 | | | | 195,029 | |
Albany Molecular Research, Inc., 2nd Lien Term Loan, (LIBOR USD 3 Month + 7.00%), 8.57%, 08/30/25 | | | | | | | 33 | | | | 32,216 | |
| | | | | | | | |
| | | | | | | | | | | 227,245 | |
| Media — 0.5% | | | | | | | | | |
Cablevision CSC Holdings, Term Loan, (LIBOR USD 3 Month + 2.25%), 3.74%, 07/17/25 | | | | | | | 66 | | | | 66,120 | |
Charter Communications Operating LLC, Term Loan, (LIBOR USD 3 Month + 2.00%), 3.57%, 04/13/25(k) | | | | | | | 583 | | | | 583,077 | |
iHeartCommunications, Inc., Term Loan, (LIBOR USD 3 Month + 6.75%), 8.44%, 01/30/19 | | | | | | | 683 | | | | 510,905 | |
Sinclair Television Group, Inc., Term Loan B, (LIBOR USD + 2.50%), 3.91%, 12/12/24(k) | | | | | | | 396 | | | | 395,260 | |
Unitymedia Finance LLC, Term Loan, (LIBOR USD 3 Month + 2.25%), 2.25%, 01/20/26(k) | | | | | | | 555 | | | | 553,457 | |
| | | | | | | | |
| | | | | | | | | | | 2,108,819 | |
| Metals & Mining — 0.0% | | | | | | | | | |
Signode Industrial Group, 1st Lien Term Loan B, (LIBOR USD 3 Month + 2.75%), 4.32% - 4.44%, 05/01/21 | | | | | | | 136 | | | | 136,152 | |
| | | | | | | | |
| Oil, Gas & Consumable Fuels — 0.9% | | | | | | | | | |
California Resources Corp., Term Loan, (LIBOR USD 3 Month + 4.75%), 6.24%, 12/31/22(k) | | | | | | | 743 | | | | 739,285 | |
Chesapeake Energy Corp., Term Loan, (LIBOR USD 3 Month + 7.50%), 8.95%, 08/23/21 | | | | | | | 1,524 | | | | 1,619,789 | |
CITGO Holding, Inc., 1st Lien Term Loan B, (LIBOR USD 3 Month + 8.50%), 9.84%, 05/12/18 | | | | | | | 123 | | | | 123,960 | |
CONSOL Energy, Inc., Term Loan, (LIBOR USD 3 Month + 6.00%), 7.47%, 10/30/22 | | | | | | | 39 | | | | 39,422 | |
Gavilan Resources LLC, 2nd Lien Term Loan, (LIBOR USD 3 Month + 6.00%), 7.46%, 03/01/24 | | | | | | | 404 | | | | 399,625 | |
Medallian Midland Acquisition LLC, Term Loan B, (LIBOR USD 3 Month + 3.25%), 4.82%, 10/30/24(g)(k) | | | | | | | 255 | | | | 255,319 | |
Rover BCP Renaissance, Term Loan B, (LIBOR USD 3 Month + 4.00%), 5.38%, 10/31/24 | | | | | | | 356 | | | | 360,094 | |
Vine Oil & Gas LP, 1st Lien Term Loan B, (LIBOR USD + 6.88%), 8.44%, 11/26/21(g) | | | | | | | 367 | | | | 361,495 | |
| | | | | | | | |
| | | | | | | | | | | 3,898,989 | |
| | | | | | | | | | | | |
| Security | | Par
(000) | | | Value | |
| Professional Services — 0.0% | | | | | | | | | |
CPA Global Ltd., Term Loan, (LIBOR USD 3 Month + 3.25%), 4.63%, 10/15/24 | | | USD | | | | 136 | | | $ | 135,830 | |
Greenrock Element Materials, Term Loan, (LIBOR USD 3 Month + 3.50%), 5.19%, 06/28/24 | | | | | | | 64 | | | | 64,187 | |
| | | | | | | | |
| | | | | | | | | | | 200,017 | |
| Real Estate Management & Development — 0.2% | | | | | | | | | |
VICI Properties, Inc., Term Loan, (LIBOR USD 3 Month + 2.25%),
3.78%, 12/13/24(k) | | | | | | | 675 | | | | 675,000 | |
| | | | | | | | |
| Road & Rail — 0.0% | | | | | | | | | |
Ceva Intercompany BV, Term Loan, (LIBOR USD 3 Month + 5.50%), 6.88%, 03/19/21 | | | | | | | 121 | | | | 114,355 | |
| | | | | | | | |
| Software — 0.7% | | | | | | | | | |
Applied Systems, Inc., 1st Lien Term Loan B, (LIBOR USD 3 Month + 3.25%), 4.94%, 09/19/24(k) | | | | | | | 164 | | | | 165,180 | |
Applied Systems, Inc., 2nd Lien Term Loan, (LIBOR USD 3 Month + 7.00%), 8.69%, 12/19/18 | | | | | | | 38 | | | | 39,283 | |
Ascend Learning LLC, Term Loan B, (LIBOR USD + 3.00%), 4.57%, 07/12/24 | | | | | | | 77 | | | | 77,192 | |
BMC Software Finance, Inc., Term Loan B, (LIBOR USD 3 Month + 3.25%), 4.82%, 09/10/22(k) | | | | | | | 675 | | | | 674,938 | |
Kronos, Inc., 2nd Lien Term Loan B, (LIBOR USD + 8.25%), 9.63%, 11/01/24 | | | | | | | 569 | | | | 589,768 | |
McAfee Holdings LLC, 1st Lien Term Loan, (LIBOR USD 3 Month + 4.50%), 6.07%, 09/27/24(k) | | | | | | | 365 | | | | 363,650 | |
Mitchell International, Inc., 1st Lien Term Loan, (LIBOR USD 3 Month + 3.25%), 4.94%, 11/20/24 | | | | | | | 329 | | | | 329,124 | |
Mitchell International, Inc., 2nd Lien Term Loan, (LIBOR USD 3 Month + 7.25%), 8.94%, 12/01/25 | | | | | | | 184 | | | | 185,196 | |
Veritas US, Inc., Term Loan, (LIBOR USD 3 Month + 4.50%), 6.19%, 01/27/23 | | | | | | | 868 | | | | 869,093 | |
| | | | | | | | |
| | | | | | | | | | | 3,293,424 | |
| Specialty Retail — 0.1% | | | | | | | �� | | |
Neiman Marcus Group, Inc., Other Term Loan, (LIBOR USD 3 Month + 3.25%), 4.64%, 10/25/20 | | | | | | | 336 | | | | 273,490 | |
| | | | | | | | |
| Trading Companies & Distributors — 0.0% | | | | | | | | | |
Beacon Roofing Supply, Inc., Term Loan B, (LIBOR USD 3 Month + 2.25%), 3.94%, 01/02/25(k) | | | | | | | 178 | | | | 178,370 | |
| | | | | | | | |
| Transportation Infrastructure — 0.0% | | | | | | | | | |
Deck Chassis Acquisition, Inc., Term Loan, (LIBOR USD 3 Month + 6.50%), 6.50%, 06/15/23(g)(k) | | | | | | | 68 | | | | 69,020 | |
| | | | | | | | |
| Water Utilities — 0.0% | | | | | | | | | |
HD Supply Waterworks Ltd., 1st Lien Term Loan B,
(LIBOR USD 3 Month + 3.00%), 4.69%, 08/01/24 | | | | | | | 169 | | | | 170,163 | |
| | | | | | | | |
| Wireless Telecommunication Services — 0.4% | | | | |
New Lightsquared LLC, 1st Lien Term Loan, (LIBOR USD + 8.75%), 10.29%, 12/07/20 | | | | | | | 2,165 | | | | 2,005,476 | |
| | | | | | | | |
Total Floating Rate Loan Interests — 7.5%
(Cost: $33,392,696) | | | | | | | | | | | 33,313,862 | |
| | | | | | | | |
Foreign Agency Obligations — 0.0% | | | | | |
| | | |
| Mexico — 0.0% | | | | | | | | | |
Petroleos Mexicanos, 5.38%, 03/13/22(a) | | | | | | | 44 | | | | 46,640 | |
| | | | | | | | |
Total Foreign Agency Obligations — 0.0%
(Cost: $43,756) | | | | | | | | | | | 46,640 | |
| | | | | | | | |
| | |
| 16 | | 2017 BLACKROCK ANNUAL REPORTTO SHAREHOLDERS |
| | |
Schedule of Investments (continued) December 31, 2017 | | BlackRock High Yield V.I. Fund (Percentages shown are based on Net Assets) |
| | | | | | | | | | | | |
| Security | | Par
(000) | | | Value | |
Preferred Securities — 0.8% | | | | | | | | | | | | |
| | | |
| Capital Trusts — 0.1% | | | | | | | | | |
| Banks — 0.1% | | | | | | | | | |
Citigroup, Inc., Series O, 5.87%(b)(f) | | | USD | | | | 315 | | | $ | 326,812 | |
| | | | | | | | |
| Capital Markets — 0.0% | | | | | | | | | |
Morgan Stanley, Series H,
5.45%(b)(f) | | | | | | | 162 | | | | 166,293 | |
| | | | | | | | |
Total Capital Trusts — 0.1%
(Cost: $480,033) | | | | | | | | 493,105 | |
| | | | | | | | |
| | | | | | Shares | | | | |
Preferred Stocks — 0.5% | | | | | | | | | | | | |
| |
| Hotels, Restaurants & Leisure — 0.5% | | | | |
Stars Group, Inc. (The),
0.00%(b)(f)(g)(h) | | | | | | | 1,516 | | | | 1,972,247 | |
| | | | | | | | |
| Machinery — 0.0% | | | | | | | | | |
Rexnord Corp., Series A, 5.75%, 11/15/19(h) | | | | | | | 2,562 | | | | 149,314 | |
| | | | | | | | |
Total Preferred Stocks — 0.5%
(Cost: $1,438,297) | | | | | | | | 2,121,561 | |
| | | | | | | | | | | | |
|
Trust Preferreds — 0.2% | |
GMAC Capital Trust I, Series 2, 7.20%, 02/15/40(l) | | | | | | | 32,966 | | | | 855,468 | |
| | | | | | | | |
Total Trust Preferreds — 0.2%
(Cost: $862,505) | | | | 855,468 | |
| | | | | | | | |
Total Preferred Securities — 0.8%
(Cost: $2,780,835) | | | | 3,470,134 | |
| | | | | | | | |
Total Long-Term Investments — 97.2%
(Cost: $428,253,885) | | | | 433,047,384 | |
| | | | | | | | |
| |
Short-Term Securities — 3.6%(m) | | | | | |
BlackRock Liquidity Funds, T-Fund, Institutional Class,
1.17%(n) | | | | | | | 15,856,054 | | | | 15,856,054 | |
JPMorgan US Treasury Plus Money Market Fund,
Agency Class,
1.14% | | | | | | | 82,985 | | | | 82,985 | |
| | | | | | | | |
Total Short-Term Securities — 3.6%
(Cost: $15,939,039) | | | | 15,939,039 | |
| | | | | | | | |
Total Investments — 100.8%
(Cost: $444,192,924) | | | | 448,986,423 | |
Liabilities in Excess of Other Assets — (0.8)% | | | | (3,562,060 | ) |
| | | | | | | | |
Net Assets — 100.0% | | | $ | 445,424,363 | |
| | | | | | | | |
| (a) | Security exempt from registration pursuant to Rule 144A under the Securities Act of 1933, as amended. These securities may be resold in transactions exempt from registration to qualified institutional investors. |
| (b) | Non-income producing security. |
| (c) | Payment-in-kind security which may pay interest/dividends in additional par/shares and/or in cash. Rates shown are the current rate and possible payment rates. |
| (d) | Issuer filed for bankruptcy and/or is in default. |
| (e) | Variable rate security. Security may be issued at a fixed coupon rate, which converts to a variable rate at a specified date. Rate shown is the rate in effect as of period end. |
| (f) | Perpetual security with no stated maturity date. |
| (g) | Security is valued using significant unobservable inputs and is classified as Level 3 in the fair value hierarchy. |
| (h) | Convertible security. |
| (i) | Step-up bond that pays an initial coupon rate for the first period and then a higher coupon rate for the following periods. Rate as of period end. |
| (j) | Variable rate security. Rate shown is the rate in effect as of period end. |
| (k) | Represents an unsettled loan commitment at period end. Certain details associated with this purchase are not known prior to the settlement date, including coupon rate. |
| (l) | Variable or floating rate security, which interest rate adjusts periodically based on changes in current interest rates and prepayments on the underlying pool of assets. Rate shown is the rate in effect as of period end. |
| (m) | Annualized 7-day yield as of period end. |
| (n) | During the year ended December 31, 2017, investments in issuers considered to be an affiliate of the Fund for the purposes of Section 2(a)(3) of the Investment Company Act of 1940, as amended, were as follows: |
| | | | | | | | | | | | | | | | | | | | | | | | | | | | |
Affiliate | | Shares
Held at
12/31/16 | | | Net
Activity | | | Shares
Held at
12/31/17 | | | Value at
12/31/17 | | | Income | | | Net
Realized
Gain (Loss)(a) | | | Change in
Unrealized
Appreciation
(Depreciation) | |
BlackRock Liquidity Funds, T-Fund, Institutional Class | | | 13,620,548 | | | | 2,235,506 | | | | 15,856,054 | | | $ | 15,856,054 | | | $ | 117,495 | | | $ | 107 | | | $ | — | |
| | | | | | | | | | | | | | | | | | | | | | | | | | | | |
| | (a) | Includes net capital gain distributions, if applicable. | |
For Fund compliance purposes, the Fund’s industry classifications refer to one or more of the industry sub-classifications used by one or more widely recognized market indexes or ratings group indexes, and/or as defined by the investment advisor. These definitions may not apply for purposes of this report, which may combine such industry sub-classifications for reporting ease.
| | | | |
| SCHEDULE OF INVESTMENTS | | | 17 | |
| | |
Schedule of Investments (continued) December 31, 2017 | | BlackRock High Yield V.I. Fund |
Derivative Financial Instruments Outstanding as of Period End
Futures Contracts
| | | | | | | | | | | | | | | | |
| Description | | Number of
Contracts | | | Expiration
Date | | | Notional
Amount (000) | | | Value/
Unrealized
Appreciation
(Depreciation) | |
Short Contracts | | | | | | | | | | | | | | | | |
U.S. Treasury 10 Year Note | | | 50 | | | | 03/20/18 | | | $ | 6,202 | | | $ | 11,264 | |
| | | | | | | | | | | | | | | | |
Forward Foreign Currency Exchange Contracts
| | | | | | | | | | | | | | | | | | | | |
Currency Purchased | | | Currency Sold | | | Counterparty | | Settlement Date | | | Unrealized
Appreciation
(Depreciation) | |
| USD | | | 135,049 | | | GBP | | | 100,000 | | | Royal Bank of Scotland | | | 01/04/18 | | | $ | 31 | |
| | | | | | |
| USD | | | 1,995,808 | | | CAD | | | 2,570,000 | | | Westpac Banking Corp. | | | 01/04/18 | | | | (48,795 | ) |
| USD | | | 93,092 | | | EUR | | | 78,000 | | | Deutsche Bank AG | | | 01/04/18 | | | | (502 | ) |
| | | | | | | | | | | | | | | | | | | | |
| | | | | | | | | | | | | | | | | | $ | (49,297 | ) |
| | | | | | | | | | | | | | | | | | | | |
| | | Net Unrealized Depreciation | | | $ | (49,266 | ) |
| | | | | | | | | | | | | | | | | | | | |
Centrally Cleared Credit Default Swaps — Sell Protection
| | | | | | | | | | | | | | | | | | | | | | | | | | | | | | | | | | | | |
| Reference Obligation/Index | | Financing
Rate Received
by the Fund | | | Payment
Frequency | | | Termination
Date | | | Credit
Rating (a) | | | Notional
Amount (000) (b) | | | Value | | | Upfront
Premium
Paid
(Received) | | | Unrealized
Appreciation
(Depreciation) | |
Chesapeake Energy Corp. | | | 5.00 | % | | | Quarterly | | | | 12/20/21 | | | | CCC | | | | USD | | | | 245 | | | $ | (9,405 | ) | | $ | (8,036 | ) | | $ | (1,369 | ) |
CDX.NA.HY.29.V1 | | | 5.00 | | | | Quarterly | | | | 12/20/22 | | | | B+ | | | | USD | | | | 10,275 | | | | 865,504 | | | | 810,243 | | | | 55,261 | |
| | | | | | | | | | | | | | | | | | | | | | | | | | | | | | | | | | | | |
| | | | | | | | | | | | | | | | | | | | | | | | | | $ | 856,099 | | | $ | 802,207 | | | $ | 53,892 | |
| | | | | | | | | | | | | | | | | | | | | | | | | | | | | | | | | | | | |
| | (a) | Using Standard & Poor’s rating of the issuer or the underlying securities of the index, as applicable. | |
| | (b) | The maximum potential amount the Fund may pay should a negative credit event take place as defined under the terms of the agreement. | |
Balances reported in the Statement of Assets and Liabilities for Centrally Cleared Swaps
| | | | | | | | | | | | | | | | |
| | | Swap Premiums
Paid | | | Swap Premiums
Received | | | Unrealized
Appreciation | | | Unrealized
Depreciation | |
Centrally Cleared Swaps(a) | | $ | 810,243 | | | $ | (8,036 | ) | | $ | 55,261 | | | $ | (1,369 | ) |
| | (a) | Includes cumulative appreciation (depreciation) on centrally cleared swaps, as reported in the Schedule of Investments. Only current day’s variation margin is reported within the Statement of Assets and Liabilities and is net of any previously paid (received) swap premium amounts. | |
| | |
| 18 | | 2017 BLACKROCK ANNUAL REPORTTO SHAREHOLDERS |
| | |
Schedule of Investments (continued) December 31, 2017 | | BlackRock High Yield V.I. Fund |
Derivative Financial Instruments Categorized by Risk Exposure
As of period end, the fair values of derivative financial instruments located in the Statement of Assets and Liabilities were as follows:
| | | | | | | | | | | | | | | | | | | | | | | | | | | | |
| | | Commodity
Contracts | | | Credit
Contracts | | | Equity
Contracts | | | Foreign
Currency
Exchange
Contracts | | | Interest
Rate
Contracts | | | Other
Contracts | | | Total | |
Assets — Derivative Financial Instruments | | | | | | | | | | | | | | | | | | | | | | | | | | | | |
Futures contracts | | | | | | | | | | | | | | | | | | | | | | | | | | | | |
Net unrealized appreciation(a) | | $ | — | | | $ | — | | | $ | — | | | $ | — | | | $ | 11,264 | | | $ | — | | | $ | 11,264 | |
Forward foreign currency exchange contracts | | | | | | | | | | | | | | | | | | | | | | | | | | | | |
Unrealized appreciation on forward foreign currency exchange contracts | | | — | | | | — | | | | — | | | | 31 | | | | — | | | | — | | | | 31 | |
Swaps — centrally cleared | | | | | | | | | | | | | | | | | | | | | | | | | | | | |
Net unrealized appreciation(a) | | | — | | | | 55,261 | | | | — | | | | — | | | | — | | | | — | | | | 55,261 | |
| | | | | | | | | | | | | | | | | | | | | | | | | | | | |
Total | | $ | — | | | $ | 55,261 | | | $ | — | | | $ | 31 | | | $ | 11,264 | | | $ | — | | | $ | 66,556 | |
| | | | | | | | | | | | | | | | | | | | | | | | | | | | |
| Liabilities — Derivative Financial Instruments | | | | | | | | | | | | | | | | | | | | | |
Forward foreign currency exchange contracts | | | | | | | | | | | | | | | | | | | | | | | | | | | | |
Unrealized depreciation on forward foreign currency exchange contracts | | $ | — | | | $ | — | | | $ | — | | | $ | 49,297 | | | $ | — | | | $ | — | | | $ | 49,297 | |
Swaps — centrally cleared | | | | | | | | | | | | | | | | | | | | | | | | | | | | |
Net unrealized depreciation(a) | | | — | | | | 1,369 | | | | — | | | | — | | | | — | | | | — | | | | 1,369 | |
| | | | | | | | | | | | | | | | | | | | | | | | | | | | |
| | $ | — | | | $ | 1,369 | | | $ | — | | | $ | 49,297 | | | $ | — | | | $ | — | | | $ | 50,666 | |
| | | | | | | | | | | | | | | | | | | | | | | | | | | | |
| | (a) | Includes cumulative appreciation (depreciation) on futures contracts and centrally cleared swaps, if any, as reported in the Schedule of Investments. Only current day’s variation margin is reported within the Statement of Assets and Liabilities. | |
For the year ended December 31, 2017, the effect of derivative financial instruments in the Statement of Operations was as follows:
| | | | | | | | | | | | | | | | | | | | | | | | | | | | |
| | | Commodity
Contracts | | | Credit
Contracts | | | Equity
Contracts | | | Foreign
Currency
Exchange
Contracts | | | Interest
Rate
Contracts | | | Other
Contracts | | | Total | |
Net Realized Gain (Loss) from: | | | | | | | | | | | | | | | | | | | | | | | | | | | | |
Futures contracts | | $ | — | | | $ | — | | | $ | (331,063 | ) | | $ | — | | | $ | 8,081 | | | $ | — | | | $ | (322,982 | ) |
Forward foreign currency exchange contracts | | | — | | | | — | | | | — | | | | (85,878 | ) | | | — | | | | — | | | | (85,878 | ) |
Swaps | | | — | | | | 681,210 | | | | — | | | | — | | | | — | | | | — | | | | 681,210 | |
| | | | | | | | | | | | | | | | | | | | | | | | | | | | |
Total | | $ | — | | | $ | 681,210 | | | $ | (331,063 | ) | | $ | (85,878 | ) | | $ | 8,081 | | | $ | — | | | $ | 272,350 | |
| | | | | | | | | | | | | | | | | | | | | | | | | | | | |
| Net Change in Unrealized Appreciation (Depreciation) on: | | | | | | | | | | | | | | | | | | | | | |
Futures contracts | | $ | — | | | $ | — | | | $ | (7,974 | ) | | $ | — | | | $ | 11,264 | | | $ | — | | | $ | 3,290 | |
Forward foreign currency exchange contracts | | | — | | | | — | | | | — | | | | (48,330 | ) | | | — | | | | — | | | | (48,330 | ) |
Swaps | | | — | | | | (210,566 | ) | | | — | | | | — | | | | — | | | | — | | | | (210,566 | ) |
| | | | | | | | | | | | | | | | | | | | | | | | | | | | |
| | $ | — | | | $ | (210,566 | ) | | $ | (7,974 | ) | | $ | (48,330 | ) | | $ | 11,264 | | | $ | — | | | $ | (255,606 | ) |
| | | | | | | | | | | | | | | | | | | | | | | | | | | | |
Average Quarterly Balances of Outstanding Derivative Financial Instruments
| | | | |
Futures contracts: | | | | |
Average notional value of contracts — short | | $ | 3,538,089 | |
Forward foreign currency exchange contracts: | | | | |
Average amounts purchased — in USD | | $ | 2,786,667 | |
Average amounts sold — in USD | | $ | 56,534 | |
Credit default swaps: | | | | |
Average notional value—sell protection | | $ | 4,690,500 | |
For more information about the Fund’s investment risks regarding derivative financial instruments, refer to the Notes to Financial Statements.
| | | | |
| SCHEDULE OF INVESTMENTS | | | 19 | |
| | |
Schedule of Investments (continued) December 31, 2017 | | BlackRock High Yield V.I. Fund |
Derivative Financial Instruments — Offsetting as of Period End
The Fund’s derivative assets and liabilities (by type) were as follows:
| | | | | | | | |
| | | Assets | | | Liabilities | |
Derivative Financial Instruments: | | | | | | | | |
Futures contracts | | $ | — | | | $ | 10,156 | |
Forward foreign currency exchange contracts | | | 31 | | | | 49,297 | |
Swaps — Centrally cleared | | | 11,677 | | | | — | |
| | | | | | | | |
Total derivative assets and liabilities in the Statement of Assets and Liabilities | | $ | 11,708 | | | $ | 59,453 | |
Derivatives not subject to a Master Netting Agreement or similar agreement (“MNA”) | | | (11,677 | ) | | | (10,156 | ) |
| | | | | | | | |
Total derivative assets and liabilities subject to an MNA | | $ | 31 | | | $ | 49,297 | |
| | | | | | | | |
The following tables present the Fund’s derivative assets and liabilities by counterparty net of amounts available for offset under an MNA and net of the related collateral received and pledged by the Fund.
| | | | | | | | | | | | | | | | | | | | |
| Counterparty | | Derivative
Assets
Subject to
MNA by
Counterparty | | | Derivatives
Available
for Offset | | | Non-cash
Collateral
Received | | | Cash
Collateral
Received | | | Net Amount
of Derivative
Assets (a) | |
Royal Bank of Scotland | | $ | 31 | | | $ | — | | | $ | — | | | $ | — | | | $ | 31 | |
| | | | | | | | | | | | | | | | | | | | |
| | | | | | | | | | | | | | | | | | | | |
| Counterparty | | Derivative
Liabilities
Subject to
MNA by
Counterparty | | | Derivatives
Available
for Offset | | | Non-cash
Collateral
Pledged | | | Cash
Collateral
Pledged | | | Net Amount
of Derivative
Liabilities (b) | |
Westpac Banking Corp. | | $ | 48,795 | | | $ | — | | | $ | — | | | $ | — | | | $ | 48,795 | |
Deutsche Bank AG | | | 502 | | | | — | | | | — | | | | — | | | | 502 | |
| | | | | | | | | | | | | | | | | | | | |
| | $ | 49,297 | | | $ | — | | | | — | | | $ | — | | | $ | 49,297 | |
| | | | | | | | | | | | | | | | | | | | |
| | (a) | Net amount represents the net amount receivable from the counterparty in the event of default. | |
| | (b) | Net amount represents the net amount payable due to the counterparty in the event of default. | |
Fair Value Hierarchy as of Period End
Various inputs are used in determining the fair value of investments and derivative financial instruments. For information about the Fund’s policy regarding valuation of investments and derivative financial instruments, refer to the Notes to Financial Statements.
The following tables summarize the Fund’s investments and derivative financial instruments categorized in the disclosure hierarchy:
| | | | | | | | | | | | | | | | |
| | | Level 1 | | | Level 2 | | | Level 3 | | | Total | |
Assets: | | | | | | | | | | | | | | | | |
Investments: | | | | | | | | | | | | | | | | |
Long-Term Investments: | | | | | | | | | | | | | | | | |
Asset-Backed Securities | | $ | — | | | $ | 473,153 | | | $ | — | | | $ | 473,153 | |
Common Stocks(a) | | | 3,094,560 | | | | — | | | | — | | | | 3,094,560 | |
Corporate Bonds: | | | | | | | | | | | | | | | | |
Aerospace & Defense | | | — | | | | 10,482,890 | | | | — | | | | 10,482,890 | |
Air Freight & Logistics | | | — | | | | 1,187,698 | | | | — | | | | 1,187,698 | |
Airlines | | | — | | | | 30,825 | | | | — | | | | 30,825 | |
Auto Components | | | — | | | | 3,737,992 | | | | — | | | | 3,737,992 | |
Automobiles | | | — | | | | 804,873 | | | | — | | | | 804,873 | |
Banks | | | — | | | | 10,937,978 | | | | — | | | | 10,937,978 | |
Building Products | | | — | | | | 3,272,621 | | | | — | | | | 3,272,621 | |
Capital Markets | | | — | | | | 1,503,120 | | | | — | | | | 1,503,120 | |
Chemicals | | | — | | | | 15,739,510 | | | | — | | | | 15,739,510 | |
Commercial Services & Supplies | | | — | | | | 11,477,196 | | | | — | | | | 11,477,196 | |
Communications Equipment | | | — | | | | 1,615,527 | | | | — | | | | 1,615,527 | |
Construction & Engineering | | | — | | | | 1,765,721 | | | | — | | | | 1,765,721 | |
Consumer Finance | | | — | | | | 7,099,369 | | | | — | | | | 7,099,369 | |
Containers & Packaging | | | — | | | | 11,151,360 | | | | — | | | | 11,151,360 | |
Distributors | | | — | | | | 814,657 | | | | — | | | | 814,657 | |
Diversified Consumer Services | | | — | | | | 1,517,123 | | | | — | | | | 1,517,123 | |
| | |
| 20 | | 2017 BLACKROCK ANNUAL REPORTTO SHAREHOLDERS |
| | |
Schedule of Investments (continued) December 31, 2017 | | BlackRock High Yield V.I. Fund |
| | | | | | | | | | | | | | | | |
| | | Level 1 | | | Level 2 | | | Level 3 | | | Total | |
Diversified Financial Services | | $ | — | | | $ | 2,007,745 | | | $ | — | | | $ | 2,007,745 | |
Diversified Telecommunication Services | | | — | | | | 23,149,085 | | | | — | | | | 23,149,085 | |
Electric Utilities | | | — | | | | 286,473 | | | | — | | | | 286,473 | |
Electrical Equipment | | | — | | | | 2,539,923 | | | | — | | | | 2,539,923 | |
Electronic Equipment, Instruments & Components | | | — | | | | 2,146,049 | | | | — | | | | 2,146,049 | |
Energy Equipment & Services | | | — | | | | 7,616,619 | | | | — | | | | 7,616,619 | |
Equity Real Estate Investment Trusts (REITs) | | | — | | | | 9,672,061 | | | | — | | | | 9,672,061 | |
Food & Staples Retailing | | | — | | | | 561,394 | | | | — | | | | 561,394 | |
Food Products | | | — | | | | 4,893,298 | | | | — | | | | 4,893,298 | |
Health Care Equipment & Supplies | | | — | | | | 7,560,386 | | | | — | | | | 7,560,386 | |
Health Care Providers & Services | | | — | | | | 20,890,052 | | | | — | | | | 20,890,052 | |
Hotels, Restaurants & Leisure | | | — | | | | 17,394,712 | | | | — | | | | 17,394,712 | |
Household Durables | | | — | | | | 7,702,653 | | | | — | | | | 7,702,653 | |
Household Products | | | — | | | | 476,100 | | | | — | | | | 476,100 | |
Independent Power and Renewable Electricity Producers | | | — | | | | 7,615,626 | | | | — | | | | 7,615,626 | |
Insurance | | | — | | | | 4,225,712 | | | | — | | | | 4,225,712 | |
Internet & Direct Marketing Retail | | | — | | | | 2,083,318 | | | | — | | | | 2,083,318 | |
Internet Software & Services | | | — | | | | 3,764,023 | | | | — | | | | 3,764,023 | |
IT Services | | | — | | | | 6,707,008 | | | | — | | | | 6,707,008 | |
Leisure Products | | | — | | | | 581,460 | | | | — | | | | 581,460 | |
Machinery | | | — | | | | 8,932,250 | | | | — | | | | 8,932,250 | |
Media | | | — | | | | 31,730,597 | | | | 470,250 | | | | 32,200,847 | |
Metals & Mining | | | — | | | | 21,416,720 | | | | — | | | | 21,416,720 | |
Mortgage Real Estate Investment Trusts (REITs) | | | — | | | | 400,083 | | | | — | | | | 400,083 | |
Multiline Retail | | | — | | | | 1,449,219 | | | | — | | | | 1,449,219 | |
Oil, Gas & Consumable Fuels | | | — | | | | 49,077,833 | | | | — | | | | 49,077,833 | |
Paper & Forest Products | | | — | | | | 920,411 | | | | — | | | | 920,411 | |
Personal Products | | | — | | | | 449,733 | | | | — | | | | 449,733 | |
Pharmaceuticals | | | — | | | | 8,351,953 | | | | — | | | | 8,351,953 | |
Professional Services | | | — | | | | 3,698,089 | | | | — | | | | 3,698,089 | |
Real Estate Management & Development | | | — | | | | 1,869,071 | | | | — | | | | 1,869,071 | |
Road & Rail | | | — | | | | 3,231,768 | | | | — | | | | 3,231,768 | |
Semiconductors & Semiconductor Equipment | | | — | | | | 3,178,262 | | | | — | | | | 3,178,262 | |
Software | | | — | | | | 15,862,802 | | | | — | | | | 15,862,802 | |
Specialty Retail | | | — | | | | 2,664,395 | | | | — | | | | 2,664,395 | |
Technology Hardware, Storage & Peripherals | | | — | | | | 1,862,365 | | | | — | | | | 1,862,365 | |
Thrifts & Mortgage Finance | | | — | | | | 926,093 | | | | — | | | | 926,093 | |
Trading Companies & Distributors | | | — | | | | 6,182,483 | | | | — | | | | 6,182,483 | |
Water Utilities | | | — | | | | 488,215 | | | | — | | | | 488,215 | |
Wireless Telecommunication Services | | | — | | | | 14,474,286 | | | | — | | | | 14,474,286 | |
Floating Rate Loan Interests | | | — | | | | 31,050,364 | | | | 2,263,498 | | | | 33,313,862 | |
Foreign Agency Obligations | | | — | | | | 46,640 | | | | — | | | | 46,640 | |
Preferred Securities | | | 1,004,782 | | | | 493,105 | | | | 1,972,247 | | | | 3,470,134 | |
Short-Term Securities | | | 15,939,039 | | | | — | | | | — | | | | 15,939,039 | |
Unfunded Floating Rate Loan Interests(b) | | | — | | | | — | | | | 110 | | | | 110 | |
| | | | | | | | | | | | | | | | |
| | $ | 20,038,381 | | | $ | 424,242,047 | | | $ | 4,706,105 | | | $ | 448,986,533 | |
| | | | | | | | | | | | | | | | |
Derivative Financial Instruments(c) | | | | | | | | | | | | | | | | |
Assets: | | | | | | | | | | | | | | | | |
Credit contracts | | $ | — | | | $ | 55,261 | | | $ | — | | | $ | 55,261 | |
Foreign currency exchange contracts | | | — | | | | 31 | | | | — | | | | 31 | |
Interest rate contracts | | | 11,264 | | | | — | | | | — | | | | 11,264 | |
Liabilities: | | | | | | | | | | | | | | | | |
Credit contracts | | | — | | | | (1,369 | ) | | | — | | | | (1,369 | ) |
Foreign currency exchange contracts | | | — | | | | (49,297 | ) | | | — | | | | (49,297 | ) |
| | | | | | | | | | | | | | | | |
| | $ | 11,264 | | | $ | 4,626 | | | $ | — | | | $ | 15,890 | |
| | | | | | | | | | | | | | | | |
| | (a) | See above Schedule of Investments for values in each industry. | |
| | (b) | Unfunded floating rate loan interests are valued at the unrealized appreciation (depreciation) on the commitment. | |
| | (c) | Derivative financial instruments are swaps, futures contracts, and forward foreign currency exchange contracts. Swaps, futures contracts, and forward foreign currency exchange contracts are valued at the unrealized appreciation (depreciation) on the instrument. | |
During the year ended December 31, 2017, there were no transfers between Level 1 and Level 2.
| | | | |
| SCHEDULE OF INVESTMENTS | | | 21 | |
| | |
Schedule of Investments (continued) December 31, 2017 | | BlackRock High Yield V.I. Fund |
A reconciliation of Level 3 investments is presented when the Fund had a significant amount of Level 3 investments at the beginning and/or end of the year in relation to net assets. The following table is a reconciliation of Level 3 investments for which significant unobservable inputs were used in determining fair value:
| | | | | | | | | | | | | | | | | | | | | | | | | | | | |
| | | Common
Stocks | | | Corporate
Bonds | | | Floating Rate Loan Interests | | | Other
Interests | | | Preferred Securities | | | Unfunded
Floating
Rate Loan
Interests | | | Total | |
Investments: | | | | | | | | | | | | | | | | | | | | | | | | | | | | |
Assets: | | | | | | | | | | | | | | | | | | | | | | | | | | | | |
Opening Balance, as of December 31, 2016 | | $ | 1,200 | | | $ | 571,167 | | | $ | 933,953 | | | $ | 451,771 | | | $ | 1,209,842 | | | $ | — | | | $ | 3,167,933 | |
Transfers into Level 3 | | | — | | | | — | | | | 643,267 | | | | — | | | | — | | | | — | | | | 643,267 | |
Transfers out of Level 3 | | | — | | | | — | | | | (156,859 | ) | | | — | | | | — | | | | — | | | | (156,859 | ) |
Accrued discounts/premiums | | | — | | | | 2 | | | | 1,108 | | | | — | | | | — | | | | — | | | | 1,110 | |
Net realized gain (loss) | | | 1,583 | | | | 287 | | | | 25,984 | | | | 312,411 | | | | — | | | | — | | | | 340,265 | |
Net change in unrealized appreciation (depreciation)(a)(b) | | | — | | | | 13 | | | | (5,157 | ) | | | (327,069 | ) | | | 762,405 | | | | — | | | | 430,192 | |
Purchases | | | — | | | | — | | | | 1,595,070 | | | | — | | | | — | | | | 110 | | | | 1,595,180 | |
Sales | | | (2,783 | ) | | | (101,219 | ) | | | (773,868 | ) | | | (437,113 | ) | | | — | | | | — | | | | (1,314,983 | ) |
| | | | | | | | | | | | | | | | | | | | | | | | | | | | |
Closing Balance, as of December 31, 2017 | | $ | — | | | $ | 470,250 | | | $ | 2,263,498 | | | $ | — | | | $ | 1,972,247 | | | $ | 110 | | | $ | 4,706,105 | |
| | | | | | | | | | | | | | | | | | | | | | | | | | | | |
Net change in unrealized appreciation (depreciation) on investments still held at December 31, 2017(b) | | $ | — | | | $ | — | | | $ | (27,331 | ) | | $ | — | | | $ | 762,405 | | | $ | 110 | | | $ | 735,184 | |
| | | | | | | | | | | | | | | | | | | | | | | | | | | | |
| | (a) | Included in the related net change in unrealized appreciation (depreciation) in the Statement of Operations. | |
| | (b) | Any difference between net change in unrealized appreciation (depreciation) and net change in unrealized appreciation (depreciation) on investments still held at December 31, 2017 is generally due to investments no longer held or categorized as Level 3 at period end. | |
The Fund’s investments that are categorized as Level 3 were valued utilizing third party pricing information without adjustment. Such valuations are based on unobservable inputs. A significant change in third party information could result in a significantly lower or higher value of such Level 3 investments.
See notes to financial statements.
| | |
| 22 | | 2017 BLACKROCK ANNUAL REPORTTO SHAREHOLDERS |
Statement of Assets and Liabilities
December 31, 2017
| | | | |
| | | BlackRock High Yield V.I. Fund | |
| |
ASSETS | | | | |
Investments at value — unaffiliated (cost — $428,336,870) | | $ | 433,130,369 | |
Investments at value — affiliated (cost — $15,856,054) | | | 15,856,054 | |
Cash | | | 138,694 | |
Cash pledged: | | | | |
Futures contracts | | | 54,000 | |
Centrally cleared swaps | | | 715,000 | |
Foreign currency at value (cost — $904) | | | 913 | |
Receivables: | | | | |
Investments sold | | | 115,794 | |
Capital shares sold | | | 464,891 | |
Dividends — affiliated | | | 22,904 | |
Interest — unaffiliated | | | 6,319,776 | |
Variation margin on centrally cleared swaps | | | 11,677 | |
Unrealized appreciation on: | | | | |
Forward foreign currency exchange contracts | | | 31 | |
Unfunded floating rate loan interests | | | 110 | |
Prepaid expenses | | | 2,030 | |
| | | | |
Total assets | | | 456,832,243 | |
| | | | |
| |
LIABILITIES | | | | |
Payables: | | | | |
Investments purchased | | | 9,152,067 | |
Capital shares redeemed | | | 45,880 | |
Income dividends | | | 1,657,602 | |
Distribution fees | | | 50,114 | |
Variation margin on futures contracts | | | 10,156 | |
Investment advisory fees | | | 176,635 | |
Officer’s and Directors’ fees | | | 4,711 | |
Other affiliates | | | 2,162 | |
Other accrued expenses | | | 259,256 | |
Unrealized depreciation on forward foreign currency exchange contracts | | | 49,297 | |
| | | | |
Total liabilities | | | 11,407,880 | |
| | | | |
| |
NET ASSETS | | $ | 445,424,363 | |
| | | | |
| |
NET ASSETS CONSIST OF | | | | |
Paid-in capital | | $ | 445,923,369 | |
Distributions in excess of net investment income | | | (533,776 | ) |
Accumulated net realized loss | | | (4,774,827 | ) |
Net unrealized appreciation (depreciation) | | | 4,809,597 | |
| | | | |
NET ASSETS | | $ | 445,424,363 | |
| | | | |
| |
NET ASSET VALUE | | | | |
Class I — Based on net assets of $201,945,097 and 27,345,175 shares outstanding, 200 million shares authorized, $0.10 par value | | $ | 7.39 | |
| | | | |
Class III — Based on net assets of $243,479,266 and 32,988,448 shares outstanding, 100 million shares authorized, $0.10 par value | | $ | 7.38 | |
| | | | |
See notes to financial statements.
Statement of Operations
Year Ended December 31, 2017
| | | | |
| | | BlackRock High Yield V.I. Fund | |
| |
INVESTMENT INCOME | | | | |
Dividends — affiliated | | $ | 117,495 | |
Dividends — unaffiliated | | | 122,598 | |
Interest — unaffiliated | | | 22,234,634 | |
Foreign taxes withheld | | | (2,280 | ) |
| | | | |
Total investment income | | | 22,472,447 | |
| | | | |
| |
EXPENSES | | | | |
Investment advisory | | | 1,926,095 | |
Transfer agent — class specific | | | 611,882 | |
Distribution — class specific | | | 564,262 | |
Pricing | | | 112,328 | |
Printing | | | 101,655 | |
Accounting services | | | 95,965 | |
Professional | | | 69,296 | |
Custodian | | | 42,020 | |
Directors and Officer | | | 25,872 | |
Transfer agent | | | 5,488 | |
Miscellaneous | | | 18,880 | |
| | | | |
Total expenses | | | 3,573,743 | |
Less: | | | | |
Transfer agent fees reimbursed — class specific | | | (399,502 | ) |
Fees waived and/or reimbursed by the Manager | | | (10,861 | ) |
| | | | |
Total expenses after fees waived and/or reimbursed | | | 3,163,380 | |
| | | | |
Net investment income | | | 19,309,067 | |
| | | | |
| |
REALIZED AND UNREALIZED GAIN (LOSS) | | | | |
Net realized gain (loss) from: | | | | |
Investments — unaffiliated | | | 7,621,144 | |
Capital gain distributions from investment companies — affiliated | | | 107 | |
Forward foreign currency exchange contracts | | | (85,878 | ) |
Foreign currency transactions | | | 9,435 | |
Futures contracts | | | (322,982 | ) |
Swaps | | | 681,210 | |
| | | | |
| | | 7,903,036 | |
| | | | |
Net change in unrealized appreciation (depreciation) on: | | | | |
Investments — unaffiliated | | | (1,095,188 | ) |
Forward foreign currency exchange contracts | | | (48,330 | ) |
Foreign currency translations | | | 2,404 | |
Futures contracts | | | 3,290 | |
Swaps | | | (210,566 | ) |
Unfunded floating rate loan interests | | | 110 | |
| | | | |
| | | (1,348,280 | ) |
| | | | |
Net realized and unrealized gain | | | 6,554,756 | |
| | | | |
NET INCREASE IN NET ASSETS RESULTING FROM OPERATIONS | | $ | 25,863,823 | |
| | | | |
See notes to financial statements.
| | |
| 24 | | 2017 BLACKROCK ANNUAL REPORTTO SHAREHOLDERS |
Statements of Changes in Net Assets
| | | | | | | | |
| | | BlackRock High Yield V.I. Fund | |
| | | Year Ended December 31, | |
| | 2017 | | | 2016 | |
| | |
INCREASE (DECREASE) IN NET ASSETS | | | | | | | | |
| | |
OPERATIONS | | | | | | | | |
Net investment income | | $ | 19,309,067 | | | $ | 14,558,815 | |
Net realized gain (loss) | | | 7,903,036 | | | | (4,596,317 | ) |
Net change in unrealized appreciation (depreciation) | | | (1,348,280 | ) | | | 24,405,937 | |
| | | | | | | | |
Net increase in net assets resulting from operations | | | 25,863,823 | | | | 34,368,435 | |
| | | | | | | | |
| | |
DISTRIBUTIONS TO SHAREHOLDERS(a) | | | | | | | | |
From net investment income: | | | | | | | | |
Class I | | | (8,390,075 | ) | | | (7,326,634 | ) |
Class III | | | (11,127,344 | ) | | | (7,724,511 | ) |
| | | | | | | | |
Decrease in net assets resulting from distributions to shareholders | | | (19,517,419 | ) | | | (15,051,145 | ) |
| | | | | | | | |
| | |
CAPITAL SHARE TRANSACTIONS | | | | | | | | |
Net increase in net assets derived from capital share transactions | | | 96,093,493 | | | | 100,786,505 | |
| | | | | | | | |
| | |
NET ASSETS | | | | | | | | |
Total increase in net assets | | | 102,439,897 | | | | 120,103,795 | |
Beginning of year | | | 342,984,466 | | | | 222,880,671 | |
| | | | | | | | |
End of year | | $ | 445,424,363 | | | $ | 342,984,466 | |
| | | | | | | | |
Distributions in excess of net investment income, end of year | | $ | (533,776 | ) | | $ | (695,400 | ) |
| | | | | | | | |
| (a) | Distributions for annual periods determined in accordance with U.S. federal income tax regulations. |
See notes to financial statements.
Financial Highlights
(For a share outstanding throughout each period)
| | | | | | | | | | | | | | | | | | | | |
| | | BlackRock High Yield V.I. Fund | |
| | | Class I | |
| | | Year Ended December 31, | |
| | 2017 | | | 2016 | | | 2015 | | | 2014 | | | 2013 | |
Net asset value, beginning of year | | $ | 7.24 | | | $ | 6.77 | | | $ | 7.44 | | | $ | 7.67 | | | $ | 7.44 | |
| | | | | | | | | | | | | | | | | | | | |
Net investment income(a) | | | 0.38 | | | | 0.37 | | | | 0.36 | | | | 0.40 | | | | 0.43 | |
Net realized and unrealized gain (loss) | | | 0.15 | | | | 0.48 | | | | (0.61 | ) | | | (0.18 | ) | | | 0.24 | |
| | | | | | | | | | | | | | | | | | | | |
Net increase (decrease) from investment operations | | | 0.53 | | | | 0.85 | | | | (0.25 | ) | | | 0.22 | | | | 0.67 | |
| | | | | | | | | | | | | | | | | | | | |
| Distributions:(b) | | | | | | | | | | | | | | | |
From net investment income | | | (0.38 | ) | | | (0.38 | ) | | | (0.42 | ) | | | (0.45 | ) | | | (0.44 | ) |
| | | | | | | | | | | | | | | | | | | | |
Net asset value, end of year | | $ | 7.39 | | | $ | 7.24 | | | $ | 6.77 | | | $ | 7.44 | | | $ | 7.67 | |
| | | | | | | | | | | | | | | | | | | | |
| | | | | |
Total Return:(c) | | | | | | | | | | | | | | | | | | | | |
Based on net asset value | | | 7.48 | % | | | 12.92 | % | | | (3.60 | )% | | | 2.89 | % | | | 9.33 | % |
| | | | | | | | | | | | | | | | | | | | |
| | | | | |
Ratios to Average Net Assets:(d) | | | | | | | | | | | | | | | | | | | | |
Total expenses | | | 0.78 | % | | | 0.80 | % | | | 0.84 | % | | | 0.87 | % | | | 0.85 | % |
| | | | | | | | | | | | | | | | | | | | |
Total expenses after fees waived and/or reimbursed | | | 0.67 | % | | | 0.68 | % | | | 0.70 | % | | | 0.73 | % | | | 0.73 | % |
| | | | | | | | | | | | | | | | | | | | |
Net investment income | | | 5.13 | % | | | 5.29 | % | | | 4.86 | % | | | 5.23 | % | | | 5.65 | % |
| | | | | | | | | | | | | | | | | | | | |
| | | | | |
Supplemental Data: | | | | | | | | | | | | | | | | | | | | |
Net assets, end of year (000) | | $ | 201,945 | | | $ | 152,835 | | | $ | 127,742 | | | $ | 139,729 | | | $ | 150,691 | |
| | | | | | | | | | | | | | | | | | | | |
Portfolio turnover rate | | | 75 | % | | | 89 | % | | | 73 | % | | | 87 | % | | | 101 | % |
| | | | | | | | | | | | | | | | | | | | |
| (a) | Based on average shares outstanding. |
| (b) | Distributions for annual periods determined in accordance with U.S. federal income tax regulations. |
| (c) | Where applicable, excludes insurance-related fees and expenses and assumes the reinvestment of distributions. |
| (d) | Excludes expenses incurred indirectly as a result of investments in underlying funds as follows: |
| | | | | | | | | | | | | | | | | | | | | | | | | | | | | | | | | | | | | | | | |
| | | Year Ended December 31, | | | | |
| | 2017 | | | | | | 2016 | | | | | | 2015 | | | | | | 2014 | | | | | | 2013 | | | | |
Investments in underlying funds | | | 0.01 | % | | | | | | | 0.01 | % | | | | | | | 0.01 | % | | | | | | | — | | | | | | | | — | | | | | |
| | | | | | | | | | | | | | | | | | | | | | | | | | | | | | | | | | | | | | | | |
See notes to financial statements.
| | |
| 26 | | 2017 BLACKROCK ANNUAL REPORTTO SHAREHOLDERS |
Financial Highlights (continued)
(For a share outstanding throughout each period)
| | | | | | | | | | | | | | | | | | | | |
| | | BlackRock High Yield V.I. Fund | |
| | | Class III | |
| | | Year Ended December 31, | |
| | 2017 | | | 2016 | | | 2015 | | | 2014 | | | 2013 | |
Net asset value, beginning of year | | $ | 7.24 | | | $ | 6.76 | | | $ | 7.43 | | | $ | 7.67 | | | $ | 7.44 | |
| | | | | | | | | | | | | | | | | | | | |
Net investment income(a) | | | 0.36 | | | | 0.36 | | | | 0.34 | | | | 0.38 | | | | 0.40 | |
Net realized and unrealized gain (loss) | | | 0.14 | | | | 0.48 | | | | (0.61 | ) | | | (0.18 | ) | | | 0.25 | |
| | | | | | | | | | | | | | | | | | | | |
Net increase (decrease) from investment operations | | | 0.50 | | | | 0.84 | | | | (0.27 | ) | | | 0.20 | | | | 0.65 | |
| | | | | | | | | | | | | | | | | | | | |
| Distributions:(b) | | | | | | | | | | | | | | | |
From net investment income | | | (0.36 | ) | | | (0.36 | ) | | | (0.40 | ) | | | (0.44 | ) | | | (0.42 | ) |
| | | | | | | | | | | | | | | | | | | | |
Net asset value, end of year | | $ | 7.38 | | | $ | 7.24 | | | $ | 6.76 | | | $ | 7.43 | | | $ | 7.67 | |
| | | | | | | | | | | | | | | | | | | | |
| | | | | |
Total Return:(c) | | | | | | | | | | | | | | | | | | | | |
Based on net asset value | | | 7.08 | % | | | 12.82 | % | | | (3.85 | )% | | | 2.51 | % | | | 9.07 | % |
| | | | | | | | | | | | | | | | | | | | |
| | | | | |
Ratios to Average Net Assets:(d) | | | | | | | | | | | | | | | | | | | | |
Total expenses | | | 1.03 | % | | | 1.00 | % | | | 1.06 | % | | | 1.07 | % | | | 1.07 | % |
| | | | | | | | | | | | | | | | | | | | |
Total expenses after fees waived and/or reimbursed | | | 0.92 | % | | | 0.92 | % | | | 0.94 | % | | | 0.98 | % | | | 0.96 | % |
| | | | | | | | | | | | | | | | | | | | |
Net investment income | | | 4.87 | % | | | 5.05 | % | | | 4.63 | % | | | 4.86 | % | | | 5.23 | % |
| | | | | | | | | | | | | | | | | | | | |
| | | | | |
Supplemental Data: | | | | | | | | | | | | | | | | | | | | |
Net assets, end of year (000) | | $ | 243,479 | | | $ | 190,149 | | | $ | 95,139 | | | $ | 51,524 | | | $ | 18,567 | |
| | | | | | | | | | | | | | | | | | | | |
Portfolio turnover rate | | | 75 | % | | | 89 | % | | | 73 | % | | | 87 | % | | | 101 | % |
| | | | | | | | | | | | | | | | | | | | |
| (a) | Based on average shares outstanding. |
| (b) | Distributions for annual periods determined in accordance with U.S. federal income tax regulations. |
| (c) | Where applicable, excludes insurance-related fees and expenses and assumes the reinvestment of distributions. |
| (d) | Excludes expenses incurred indirectly as a result of investments in underlying funds as follows: |
| | | | | | | | | | | | | | | | | | | | | | | | | | | | | | | | | | | | | | | | |
| | | Year Ended December 31, | | | | |
| | 2017 | | | | | | 2016 | | | | | | 2015 | | | | | | 2014 | | | | | | 2013 | | | | |
Investments in underlying funds | | | 0.01 | % | | | | | | | 0.01 | % | | | | | | | 0.01 | % | | | | | | | — | | | | | | | | — | | | | | |
| | | | | | | | | | | | | | | | | | | | | | | | | | | | | | | | | | | | | | | | |
See notes to financial statements.
Notes to Financial Statements
BlackRock Variable Series Funds, Inc. (the “Company”) is registered under the Investment Company Act of 1940, as amended (the “1940 Act”), as an open-end management investment company. The Company is organized as a Maryland corporation that is comprised of 20 separate funds. The funds offer shares to insurance companies for their separate accounts to fund benefits under certain variable annuity and variable life insurance contracts. The financial statements presented are for BlackRock High Yield V.I. Fund (the “Fund”). The Fund is classified as diversified. Class I and Class III Shares have equal voting, dividend, liquidation and other rights, except that only shares of the respective classes are entitled to vote on matters concerning only that class. In addition, Class III Shares bear certain expenses related to the distribution of such shares.
The Fund, together with certain other registered investment companies advised by BlackRock Advisors, LLC (the “Manager”) or its affiliates, is included in a complex of open-end funds referred to as the Equity-Bond Complex.
| 2. | SIGNIFICANT ACCOUNTING POLICIES |
The financial statements are prepared in conformity with accounting principles generally accepted in the United States of America (“U.S. GAAP”), which may require management to make estimates and assumptions that affect the reported amounts of assets and liabilities in the financial statements, disclosure of contingent assets and liabilities at the date of the financial statements and the reported amounts of increases and decreases in net assets from operations during the reporting period. Actual results could differ from those estimates. The Fund is considered an investment company under U.S. GAAP and follows the accounting and reporting guidance applicable to investment companies. Below is a summary of significant accounting policies:
Investment Transactions and Income Recognition: For financial reporting purposes, investment transactions are recorded on the dates the transactions are entered into (the “trade dates”). Realized gains and losses on investment transactions are determined on the identified cost basis. Dividend income is recorded on the ex-dividend date. Dividends from foreign securities where the ex-dividend date may have passed are subsequently recorded when the Fund is informed of the ex-dividend date. Under the applicable foreign tax laws, a withholding tax at various rates may be imposed on capital gains, dividends and interest. Upon notification from issuers, some of the dividend income received from a real estate investment trust may be redesignated as a reduction of cost of the related investment and/or realized gain. Interest income, including amortization and accretion of premiums and discounts on debt securities, is recognized on an accrual basis. Income, expenses and realized and unrealized gains and losses are allocated daily to each class based on its relative net assets.
Foreign Currency Translation: The Fund’s books and records are maintained in U.S. dollars. Securities and other assets and liabilities denominated in foreign currencies are translated into U.S. dollars using exchange rates determined as of the close of trading on the New York Stock Exchange (“NYSE”). Purchases and sales of investments are recorded at the rates of exchange prevailing on the respective dates of such transactions. Generally, when the U.S. dollar rises in value against a foreign currency, the investments denominated in that currency will lose value; the opposite effect occurs if the U.S. dollar falls in relative value.
The Fund does not isolate the portion of the results of operations arising as a result of changes in the exchange rates from the changes in the market prices of investments held or sold for financial reporting purposes. Accordingly, the effects of changes in exchange rates on investments are not segregated in the Statement of Operations from the effects of changes in market prices of those investments, but are included as a component of net realized and unrealized gain (loss) from investments. The Fund reports realized currency gains (losses) on foreign currency related transactions as components of net realized gain (loss) for financial reporting purposes, whereas such components are generally treated as ordinary income for U.S. federal income tax purposes.
Segregation and Collateralization: In cases where the Fund enters into certain investments (e.g., futures contracts, forward foreign currency exchange contracts and swaps) that would be treated as “senior securities” for 1940 Act purposes, the Fund may segregate or designate on its books and records cash or liquid assets having a market value at least equal to the amount of its future obligations under such investments. Doing so allows the investment to be excluded from treatment as a “senior security.” Furthermore, if required by an exchange or counterparty agreement, the Fund may be required to deliver/deposit cash and/or securities to/with an exchange, or broker-dealer or custodian as collateral for certain investments or obligations.
Distributions: Distributions from net investment income are declared daily and paid monthly. Distributions of capital gains are recorded on the ex-dividend date and made at least annually. The character and timing of distributions are determined in accordance with U.S. federal income tax regulations, which may differ from U.S. GAAP.
Recent Accounting Standards: In March 2017, the Financial Accounting Standards Board issued Accounting Standards Update “Premium Amortization of Purchased Callable Debt Securities” which amends the amortization period for certain purchased callable debt securities. Under the new guidance, the premium amortization of purchased callable debt securities that have explicit, non-contingent call features and are callable at fixed prices will be amortized to the earliest call date. The guidance will be applied on a modified retrospective basis and is effective for fiscal years, and their interim periods, beginning after December 15, 2018. Management is currently evaluating the impact of this guidance to the Fund.
Indemnifications: In the normal course of business, the Fund enters into contracts that contain a variety of representations that provide general indemnification. The Fund’s maximum exposure under these arrangements is unknown because it involves future potential claims against the Fund, which cannot be predicted with any certainty.
Other: Expenses directly related to the Fund or its classes are charged to the Fund or the applicable class. Other operating expenses shared by several funds, including other funds managed by the Manager, are prorated among those funds on the basis of relative net assets or other appropriate methods. Expenses directly related to the Fund and other shared expenses prorated to the Fund are allocated daily to each class based on its relative net assets or other appropriate methods.
| 3. | INVESTMENT VALUATION AND FAIR VALUE MEASUREMENTS |
Investment Valuation Policies: The Fund’s investments are valued at fair value (also referred to as “market value” within the financial statements) as of the close of trading on the NYSE (generally 4:00 p.m., Eastern time) (or, if the reporting date falls on a day the NYSE is closed, investments are valued at fair value as of the period
| | |
| 28 | | 2017 BLACKROCK ANNUAL REPORTTO SHAREHOLDERS |
Notes to Financial Statements (continued)
end). U.S. GAAP defines fair value as the price the Fund would receive to sell an asset or pay to transfer a liability in an orderly transaction between market participants at the measurement date. The Fund determines the fair values of its financial instruments using various independent dealers or pricing services under policies approved by the Board of Directors of the Company (the “Board”). The BlackRock Global Valuation Methodologies Committee (the “Global Valuation Committee”) is the committee formed by management to develop global pricing policies and procedures and to oversee the pricing function for all financial instruments.
Fair Value Inputs and Methodologies: The following methods and inputs are used to establish the fair value of the Fund’s assets and liabilities:
| | • | | Equity investments traded on a recognized securities exchange are valued at the official closing price each day, if available. For equity investments traded on more than one exchange, the official closing price on the exchange where the stock is primarily traded is used. Equity investments traded on a recognized exchange for which there were no sales on that day may be valued at the last available bid (long positions) or ask (short positions) price. |
| | • | | Fixed-income securities for which market quotations are readily available are generally valued using the last available bid prices or current market quotations provided by independent dealers or third party pricing services. Floating rate loan interests are valued at the mean of the bid prices from one or more independent brokers or dealers as obtained from a third party pricing service. Pricing services generally value fixed-income securities assuming orderly transactions of an institutional round lot size, but a fund may hold or transact in such securities in smaller, odd lot sizes. Odd lots may trade at lower prices than institutional round lots. The pricing services may use matrix pricing or valuation models that utilize certain inputs and assumptions to derive values, including transaction data (e.g., recent representative bids and offers), credit quality information, perceived market movements, news, and other relevant information. Certain fixed-income securities, including asset-backed and mortgage related securities may be valued based on valuation models that consider the estimated cash flows of each tranche of the entity, establish a benchmark yield and develop an estimated tranche specific spread to the benchmark yield based on the unique attributes of the tranche. The amortized cost method of valuation may be used with respect to debt obligations with sixty days or less remaining to maturity unless the Manager determines such method does not represent fair value. |
Generally, trading in foreign instruments is substantially completed each day at various times prior to the close of trading on the NYSE. Occasionally, events affecting the values of such instruments may occur between the foreign market close and the close of trading on the NYSE that may not be reflected in the computation of the Fund’s net assets. Each business day, the Fund uses a pricing service to assist with the valuation of certain foreign exchange-traded equity securities and foreign exchange-traded over-the-counter (“OTC”) options (the “Systematic Fair Value Price”). Using current market factors, the Systematic Fair Value Price is designed to value such foreign securities and foreign options at fair value as of the close of trading on the NYSE, which follows the close of the local markets.
| | • | | Investments in open-end U.S. mutual funds are valued at net asset value (“NAV”) each business day. |
| | • | | Futures contracts traded on exchanges are valued at their last sale price. |
| | • | | Forward foreign currency exchange contracts are valued at the mean between the bid and ask prices and are determined as of the close of trading on the NYSE. Interpolated values are derived when the settlement date of the contract is an interim date for which quotations are not available. |
| | • | | Swap agreements are valued utilizing quotes received daily by the Fund’s pricing service or through brokers, which are derived using daily swap curves and models that incorporate a number of market data factors, such as discounted cash flows, trades and values of the underlying reference instruments. |
If events (e.g., a company announcement, market volatility or a natural disaster) occur that are expected to materially affect the value of such investments, or in the event that the application of these methods of valuation results in a price for an investment that is deemed not to be representative of the market value of such investment, or if a price is not available, the investment will be valued by the Global Valuation Committee, or its delegate, in accordance with a policy approved by the Board as reflecting fair value (“Fair Valued Investments”). The fair valuation approaches that may be used by the Global Valuation Committee will include market approach, income approach and cost approach. Valuation techniques such as discounted cash flow, use of market comparables and matrix pricing are types of valuation approaches and are typically used in determining fair value. When determining the price for Fair Valued Investments, the Global Valuation Committee, or its delegate, seeks to determine the price that the Fund might reasonably expect to receive or pay from the current sale or purchase of that asset or liability in an arm’s-length transaction. Fair value determinations shall be based upon all available factors that the Global Valuation Committee, or its delegate, deems relevant and consistent with the principles of fair value measurement.
The Global Valuation Committee, or its delegate, employs various methods for calibrating valuation approaches for investments where an active market does not exist, including regular due diligence of the Fund’s pricing vendors, regular reviews of key inputs and assumptions, transactional back-testing or disposition analysis to compare unrealized gains and losses to realized gains and losses, reviews of missing or stale prices and large movements in market values and reviews of any market related activity. The pricing of all Fair Valued Investments is subsequently reported to the Board or a committee thereof on a quarterly basis. As a result of the inherent uncertainty in valuation of these investments, the fair values may differ from the values that would have been used had an active market existed.
| | | | |
| NOTESTO FINANCIAL STATEMENTS | | | 29 | |
Notes to Financial Statements (continued)
For investments in equity or debt issued by privately held companies or funds (“Private Company” or collectively, the “Private Companies”) and other Fair Valued Investments, the fair valuation approaches that are used by third party pricing services utilize one or a combination of, but not limited to, the following inputs.
| | |
| | | Standard Inputs Generally Considered By Third Party Pricing Services |
Market approach | | (i) recent market transactions, including subsequent rounds of financing, in the underlying investment or comparable issuers; (ii) recapitalizations and other transactions across the capital structure; and (iii) market multiples of comparable issuers. |
Income approach | | (i) future cash flows discounted to present and adjusted as appropriate for liquidity, credit and/or market risks; (ii) quoted prices for similar investments or assets in active markets; and (iii) other risk factors, such as interest rates, yield curves, volatilities, prepayment speeds, loss severities, credit risks, recovery rates, liquidation amounts and/or default rates. |
Cost approach | | (i) audited or unaudited financial statements, investor communications and financial or operational metrics issued by the Private Company; (ii) changes in the valuation of relevant indices or publicly traded companies comparable to the Private Company; (iii) relevant news and other public sources; and (iv) known secondary market transactions in the Private Company’s interests and merger or acquisition activity in companies comparable to the Private Company. |
Investments in series of preferred stock issued by Private Companies are typically valued utilizing market approach in determining the enterprise value of the company. Such investments often contain rights and preferences that differ from other series of preferred and common stock of the same issuer. Valuation techniques such as an option pricing model (“OPM”), a probability weighted expected return model (“PWERM”) or a hybrid of those techniques are used in allocating enterprise value of the company, as deemed appropriate under the circumstances. The use of OPM and PWERM techniques involve a determination of the exit scenarios of the investment in order to appropriately allocate the enterprise value of the company among the various parts of its capital structure.
The Private Companies are not subject to the public company disclosure, timing, and reporting standards as other investments held by the Fund. Typically, the most recently available information by a Private Company is as of a date that is earlier than the date the Fund is calculating its NAV. This factor may result in a difference between the value of the investment and the price the Fund could receive upon the sale of the investment.
Fair Value Hierarchy: Various inputs are used in determining the fair value of investments and derivative financial instruments. These inputs to valuation techniques are categorized into a fair value hierarchy consisting of three broad levels for financial statement purposes as follows:
| | • | | Level 1 — Unadjusted price quotations in active markets/exchanges for identical assets or liabilities that the Fund has the ability to access |
| | • | | Level 2 — Other observable inputs (including, but not limited to, quoted prices for similar assets or liabilities in markets that are active, quoted prices for identical or similar assets or liabilities in markets that are not active, inputs other than quoted prices that are observable for the assets or liabilities (such as interest rates, yield curves, volatilities, prepayment speeds, loss severities, credit risks and default rates) or other market–corroborated inputs) |
| | • | | Level 3 — Unobservable inputs based on the best information available in the circumstances, to the extent observable inputs are not available (including the Fund’s own assumptions used in determining the fair value of investments and derivative financial instruments) |
The hierarchy gives the highest priority to unadjusted quoted prices in active markets for identical assets or liabilities (Level 1 measurements) and the lowest priority to unobservable inputs (Level 3 measurements). Accordingly, the degree of judgment exercised in determining fair value is greatest for instruments categorized in Level 3. The inputs used to measure fair value may fall into different levels of the fair value hierarchy. In such cases, for disclosure purposes, the fair value hierarchy classification is determined based on the lowest level input that is significant to the fair value measurement in its entirety. Investments classified within Level 3 have significant unobservable inputs used by the Global Valuation Committee in determining the price for Fair Valued Investments. Level 3 investments include equity or debt issued by Private Companies. There may not be a secondary market, and/or there are a limited number of investors. Level 3 investments may also be adjusted to reflect illiquidity and/or non-transferability, with the amount of such discount estimated by the Global Valuation Committee in the absence of market information.
Changes in valuation techniques may result in transfers into or out of an assigned level within the hierarchy. In accordance with the Fund’s policy, transfers between different levels of the fair value hierarchy are deemed to have occurred as of the beginning of the reporting period. The categorization of a value determined for investments and derivative financial instruments is based on the pricing transparency of the investments and derivative financial instruments and is not necessarily an indication of the risks associated with investing in those securities.
| 4. | SECURITIES AND OTHER INVESTMENTS |
Asset-Backed and Mortgage-Backed Securities: Asset-backed securities are generally issued as pass-through certificates or as debt instruments. Asset-backed securities issued as pass-through certificates represent undivided fractional ownership interests in an underlying pool of assets. Asset- backed securities issued as debt instruments, which are also known as collateralized obligations, are typically issued as the debt of a special purpose entity organized solely for the purpose of owning such assets and issuing such debt. Asset-backed securities are often backed by a pool of assets representing the obligations of a number of different parties. The yield characteristics of certain asset-backed securities may differ from traditional debt securities. One such major difference is that all or a principal part of the obligations may be prepaid at any time because the underlying assets (i.e., loans) may be prepaid at any time. As a result, a decrease in interest rates in the market may result in increases in the level of prepayments as borrowers, particularly mortgagors, refinance and repay their loans. An increased prepayment rate with respect to an asset-backed security will have the effect of shortening the maturity of the security. In addition, a fund may subsequently have to reinvest the proceeds at lower interest rates. If a fund has purchased such an asset-backed security at a premium, a faster than anticipated prepayment rate could result in a loss of principal to the extent of the premium paid.
| | |
| 30 | | 2017 BLACKROCK ANNUAL REPORTTO SHAREHOLDERS |
Notes to Financial Statements (continued)
For mortgage pass-through securities (the “Mortgage Assets”) there are a number of important differences among the agencies and instrumentalities of the U.S. Government that issue mortgage-related securities and among the securities that they issue. For example, mortgage-related securities guaranteed by Ginnie Mae are guaranteed as to the timely payment of principal and interest by Ginnie Mae and such guarantee is backed by the full faith and credit of the United States. However, mortgage-related securities issued by Freddie Mac and Fannie Mae, including Freddie Mac and Fannie Mae guaranteed mortgage pass-through certificates, which are solely the obligations of Freddie Mac and Fannie Mae, are not backed by or entitled to the full faith and credit of the United States, but are supported by the right of the issuer to borrow from the U.S. Treasury.
Non-agency mortgage-backed securities are securities issued by non-governmental issuers and have no direct or indirect government guarantees of payment and are subject to various risks. Non-agency mortgage loans are obligations of the borrowers thereunder only and are not typically insured or guaranteed by any other person or entity. The ability of a borrower to repay a loan is dependent upon the income or assets of the borrower. A number of factors, including a general economic downturn, acts of God, terrorism, social unrest and civil disturbances, may impair a borrower’s ability to repay its loans.
Zero-Coupon Bonds: Zero-coupon bonds are normally issued at a significant discount from face value and do not provide for periodic interest payments. These bonds may experience greater volatility in market value than other debt obligations of similar maturity which provide for regular interest payments.
Capital Securities and Trust Preferred Securities: Capital securities, including trust preferred securities, are typically issued by corporations, generally in the form of interest-bearing notes with preferred securities characteristics. In the case of trust preferred securities, an affiliated business trust of a corporation issues these securities, generally in the form of beneficial interests in subordinated debentures or similarly structured securities. The securities can be structured with either a fixed or adjustable coupon that can have either a perpetual or stated maturity date. For trust preferred securities, the issuing bank or corporation pays interest to the trust, which is then distributed to holders of these securities as a dividend. Dividends can be deferred without creating an event of default or acceleration, although maturity cannot take place unless all cumulative payment obligations have been met. The deferral of payments does not affect the purchase or sale of these securities in the open market. These securities generally are rated below that of the issuing company’s senior debt securities and are freely callable at the issuer’s option.
Preferred Stocks: Preferred stock has a preference over common stock in liquidation (and generally in receiving dividends as well), but is subordinated to the liabilities of the issuer in all respects. As a general rule, the market value of preferred stock with a fixed dividend rate and no conversion element varies inversely with interest rates and perceived credit risk, while the market price of convertible preferred stock generally also reflects some element of conversion value. Because preferred stock is junior to debt securities and other obligations of the issuer, deterioration in the credit quality of the issuer will cause greater changes in the value of a preferred stock than in a more senior debt security with similar stated yield characteristics. Unlike interest payments on debt securities, preferred stock dividends are payable only if declared by the issuer’s board of directors. Preferred stock also may be subject to optional or mandatory redemption provisions.
Floating Rate Loan Interests: Floating rate loan interests are typically issued to companies (the “borrower”) by banks, other financial institutions, or privately and publicly offered corporations (the “lender”). Floating rate loan interests are generally non-investment grade, often involve borrowers whose financial condition is troubled or uncertain and companies that are highly leveraged or in bankruptcy proceedings. In addition, transactions in floating rate loan interests may settle on a delayed basis, which may result in proceeds from the sale not being readily available for a fund to make additional investments or meet its redemption obligations. Floating rate loan interests may include fully funded term loans or revolving lines of credit. Floating rate loan interests are typically senior in the corporate capital structure of the borrower. Floating rate loan interests generally pay interest at rates that are periodically determined by reference to a base lending rate plus a premium. Since the rates reset only periodically, changes in prevailing interest rates (and particularly sudden and significant changes) can be expected to cause some fluctuations in the NAV of a fund to the extent that it invests in floating rate loan interests. The base lending rates are generally the lending rate offered by one or more European banks, such as the London Interbank Offered Rate (“LIBOR”), the prime rate offered by one or more U.S. banks or the certificate of deposit rate. Floating rate loan interests may involve foreign borrowers, and investments may be denominated in foreign currencies. These investments are treated as investments in debt securities for purposes of a fund’s investment policies.
When a fund purchases a floating rate loan interest, it may receive a facility fee and when it sells a floating rate loan interest, it may pay a facility fee. On an ongoing basis, a fund may receive a commitment fee based on the undrawn portion of the underlying line of credit amount of a floating rate loan interest. Facility and commitment fees are typically amortized to income over the term of the loan or term of the commitment, respectively. Consent and amendment fees are recorded to income as earned. Prepayment penalty fees, which may be received by a fund upon the prepayment of a floating rate loan interest by a borrower, are recorded as realized gains. A fund may invest in multiple series or tranches of a loan. A different series or tranche may have varying terms and carry different associated risks.
Floating rate loan interests are usually freely callable at the borrower’s option. A fund may invest in such loans in the form of participations in loans (“Participations”) or assignments (“Assignments”) of all or a portion of loans from third parties. Participations typically will result in a fund having a contractual relationship only with the lender, not with the borrower. A fund has the right to receive payments of principal, interest and any fees to which it is entitled only from the lender selling the Participation and only upon receipt by the lender of the payments from the borrower. In connection with purchasing Participations, a fund generally will have no right to enforce compliance by the borrower with the terms of the loan agreement, nor any rights of offset against the borrower. A fund may not benefit directly from any collateral supporting the loan in which it has purchased the Participation. As a result, a fund assumes the credit risk of both the borrower and the lender that is selling the Participation. A fund’s investment in loan participation interests involves the risk of insolvency of the financial intermediaries who are parties to the transactions. In the event of the insolvency of the lender selling the Participation, a fund may be treated as a general creditor of the lender and may not benefit from any offset between the lender and the borrower. Assignments typically result in a fund having a direct contractual relationship with the borrower, and a fund may enforce compliance by the borrower with the terms of the loan agreement.
In connection with floating rate loan interests, the Fund may also enter into unfunded floating rate loan interests (“commitments”). In connection with these commitments, the Fund earns a commitment fee, typically set as a percentage of the commitment amount. Such fee income, which is included in interest income in the Statement of
| | | | |
| NOTESTO FINANCIAL STATEMENTS | | | 31 | |
Notes to Financial Statements (continued)
Operations, is recognized ratably over the commitment period. Unfunded floating rate loan interests are marked-to-market daily, and any unrealized appreciation (depreciation) is included in the Statement of Assets and Liabilities and Statement of Operations. As of period end, the Fund had the following unfunded floating rate loan interests:
| | | | | | | | | | | | | | | | |
| Borrower | | Par | | | Commitment
Amount | | | Value | | | Unrealized
Appreciation
(Depreciation) | |
Mitchell International, Inc. | | $ | 26,708 | | | $ | 26,575 | | | $ | 26,685 | | | $ | 110 | |
| 5. | DERIVATIVE FINANCIAL INSTRUMENTS |
The Fund engages in various portfolio investment strategies using derivative contracts both to increase the returns of the Fund and/or to manage its exposure to certain risks such as credit risk, equity risk, interest rate risk, foreign currency exchange rate risk, commodity price risk or other risks (e.g., inflation risk). Derivative financial instruments categorized by risk exposure are included in the Schedule of Investments. These contracts may be transacted on an exchange or OTC.
Futures Contracts: Futures contracts are purchased or sold to gain exposure to, or manage exposure to, changes in interest rates (interest rate risk), changes in the value of equity securities (equity risk) or foreign currencies (foreign currency exchange rate risk).
Futures contracts are agreements between the Fund and a counterparty to buy or sell a specific quantity of an underlying instrument at a specified price and on a specified date. Depending on the terms of a contract, it is settled either through physical delivery of the underlying instrument on the settlement date or by payment of a cash amount on the settlement date. Upon entering into a futures contract, the Fund are required to deposit initial margin with the broker in the form of cash or securities in an amount that varies depending on a contract’s size and risk profile. The initial margin deposit must then be maintained at an established level over the life of the contract.
Securities deposited as initial margin are designated in the Schedule of Investments and cash deposited, if any, is shown as cash pledged for futures contracts in the Statement of Assets and Liabilities. Pursuant to the contract, the Fund agrees to receive from or pay to the broker an amount of cash equal to the daily fluctuation in market value of the contract (“variation margin”). Variation margin is recorded as unrealized appreciation (depreciation) and, if any, shown as variation margin receivable (or payable) on futures contracts in the Statement of Assets and Liabilities. When the contract is closed, a realized gain or loss is recorded in the Statement of Operations equal to the difference between the notional amount of the contract at the time it was opened and the notional amount at the time it was closed. The use of futures contracts involves the risk of an imperfect correlation in the movements in the price of futures contracts and interest, foreign currency exchange rates or underlying assets.
Forward Foreign Currency Exchange Contracts: Forward foreign currency exchange contracts are entered into to gain or reduce exposure to foreign currencies (foreign currency exchange rate risk).
A forward foreign currency exchange contract is an agreement between two parties to buy and sell a currency at a set exchange rate on a specified date. These contracts help to manage the overall exposure to the currencies in which some of the investments held by the Fund are denominated and in some cases, may be used to obtain exposure to a particular market.
The contract is marked-to-market daily and the change in market value is recorded as unrealized appreciation (depreciation) in the Statement of Assets and Liabilities. When a contract is closed, a realized gain or loss is recorded in the Statement of Operations equal to the difference between the value at the time it was opened and the value at the time it was closed. Non-deliverable forward foreign currency exchange contracts are settled with the counterparty in cash without the delivery of foreign currency. The use of forward foreign currency exchange contracts involves the risk that the value of a forward foreign currency exchange contract changes unfavorably due to movements in the value of the referenced foreign currencies.
Swaps: Swap contracts are entered into to manage exposure to issuers, markets and securities. Such contracts are agreements between the Fund and a counterparty to make periodic net payments on a specified notional amount or a net payment upon termination. Swap agreements are privately negotiated in the OTC market and may be entered into as a bilateral contract (“OTC swaps”) or centrally cleared (“centrally cleared swaps”).
For OTC swaps, any upfront premiums paid and any upfront fees received are shown as swap premiums paid and swap premiums received, respectively, in the Statement of Assets and Liabilities and amortized over the term of the contract. The daily fluctuation in market value is recorded as unrealized appreciation (depreciation) on OTC Swaps in the Statement of Assets and Liabilities. Payments received or paid are recorded in the Statement of Operations as realized gains or losses, respectively. When an OTC swap is terminated, a realized gain or loss is recorded in the Statement of Operations equal to the difference between the proceeds from (or cost of) the closing transaction and the Fund’s basis in the contract, if any. Generally, the basis of the contract is the premium received or paid.
In a centrally cleared swap, immediately following execution of the swap contract, the swap contract is novated to a central counterparty (the “CCP”) and the Fund’s counterparty on the swap agreement becomes the CCP. The Fund is required to interface with the CCP through the broker. Upon entering into a centrally cleared swap, the Fund is required to deposit initial margin with the broker in the form of cash or securities in an amount that varies depending on the size and risk profile of the particular swap. Securities deposited as initial margin are designated in the Schedule of Investments and cash deposited is shown as cash pledged for centrally cleared swaps in the Statement of Assets and Liabilities. Pursuant to the contract, the Fund agrees to receive from or pay to the broker an amount of cash equal to the daily fluctuation in market value of the contract (“variation margin”). Variation margin is recorded as unrealized appreciation (depreciation) and shown as variation margin receivable (or payable) on centrally cleared swaps in the Statement of Assets and Liabilities. Payments received from (paid to) the counterparty, including at termination, are recorded as realized gains (losses) in the Statement of Operations.
| | • | | Credit default swaps — Credit default swaps are entered into to manage exposure to the market or certain sectors of the market, to reduce risk exposure to defaults of corporate and/or sovereign issuers or to create exposure to corporate and/or sovereign issuers to which a fund is not otherwise exposed (credit risk). |
| | |
| 32 | | 2017 BLACKROCK ANNUAL REPORTTO SHAREHOLDERS |
Notes to Financial Statements (continued)
The Fund may either buy or sell (write) credit default swaps on single-name issuers (corporate or sovereign), a combination or basket of single-name issuers or traded indexes. Credit default swaps are agreements in which the protection buyer pays fixed periodic payments to the seller in consideration for a promise from the protection seller to make a specific payment should a negative credit event take place with respect to the referenced entity (e.g., bankruptcy, failure to pay, obligation acceleration, repudiation, moratorium or restructuring). As a buyer, if an underlying credit event occurs, the Fund will either (i) receive from the seller an amount equal to the notional amount of the swap and deliver the referenced security or underlying securities comprising the index, or (ii) receive a net settlement of cash equal to the notional amount of the swap less the recovery value of the security or underlying securities comprising the index. As a seller (writer), if an underlying credit event occurs, the Fund will either pay the buyer an amount equal to the notional amount of the swap and take delivery of the referenced security or underlying securities comprising the index or pay a net settlement of cash equal to the notional amount of the swap less the recovery value of the security or underlying securities comprising the index.
Swap transactions involve, to varying degrees, elements of interest rate, credit and market risk in excess of the amounts recognized in the Statement of Assets and Liabilities. Such risks involve the possibility that there will be no liquid market for these agreements, that the counterparty to the agreements may default on its obligation to perform or disagree as to the meaning of the contractual terms in the agreements, and that there may be unfavorable changes in interest rates and/or market values associated with these transactions.
Master Netting Arrangements: In order to define its contractual rights and to secure rights that will help it mitigate its counterparty risk, the Fund may enter into an International Swaps and Derivatives Association, Inc. Master Agreement (“ISDA Master Agreement”) or similar agreement with its counterparties. An ISDA Master Agreement is a bilateral agreement between the Fund and a counterparty that governs certain OTC derivatives and typically contains, among other things, collateral posting terms and netting provisions in the event of a default and/or termination event. Under an ISDA Master Agreement, the Fund may, under certain circumstances, offset with the counterparty certain derivative financial instruments’ payables and/or receivables with collateral held and/or posted and create one single net payment. The provisions of the ISDA Master Agreement typically permit a single net payment in the event of default including the bankruptcy or insolvency of the counterparty. Bankruptcy or insolvency laws of a particular jurisdiction may restrict or prohibit the right of offset in bankruptcy, insolvency or other events.
Collateral Requirements: For derivatives traded under an ISDA Master Agreement, the collateral requirements are typically calculated by netting the mark-to-market amount for each transaction under such agreement and comparing that amount to the value of any collateral currently pledged by the Fund and the counterparty.
Cash collateral that has been pledged to cover obligations of the Fund and cash collateral received from the counterparty, if any, is reported separately on the Statement of Assets and Liabilities as cash pledged as collateral and cash received as collateral, respectively. Non-cash collateral pledged by the Fund, if any, is noted in the Schedule of Investments. Generally, the amount of collateral due from or to a counterparty is subject to a certain minimum transfer amount threshold before a transfer is required, which is determined at the close of business of the Fund. Any additional required collateral is delivered to/pledged by the Fund on the next business day. Typically, the counterparty is not permitted to sell, re-pledge or use cash and non-cash collateral it receives. The Fund generally agrees not to use non-cash collateral that it receives but may, absent default or certain other circumstances defined in the underlying ISDA Master Agreement, be permitted to use cash collateral received. In such cases, interest may be paid pursuant to the collateral arrangement with the counterparty. To the extent amounts due to the Fund from its counterparties are not fully collateralized, it bears the risk of loss from counterparty non-performance. Likewise, to the extent the Fund has delivered collateral to a counterparty and stands ready to perform under the terms of its agreement with such counterparty, it bears the risk of loss from a counterparty in the amount of the value of the collateral in the event the counterparty fails to return such collateral. Based on the terms of agreements, collateral may not be required for all derivative contracts.
For financial reporting purposes, the Fund does not offset derivative assets and derivative liabilities that are subject to netting arrangements, if any, in the Statement of Assets and Liabilities.
| 6. | INVESTMENT ADVISORY AGREEMENT AND OTHER TRANSACTIONS WITH AFFILIATES |
The PNC Financial Services Group, Inc. is the largest stockholder and an affiliate of BlackRock, Inc. (“BlackRock”) for 1940 Act purposes.
Investment Advisory: The Company, on behalf of the Fund, entered into an Investment Advisory Agreement with the Manager, the Fund’s investment adviser, an indirect, wholly-owned subsidiary of BlackRock, to provide investment advisory and administrative services. The Manager is responsible for the management of the Fund’s portfolio and provides the personnel, facilities, equipment and certain other services necessary to the operations of the Fund.
For such services, the Fund pays the Manager a monthly fee based on a percentage of the Fund’s and BlackRock Total Return V.I. Fund’s, a series of the Company, aggregate average daily net assets at the following annual rates:
| | | | |
| Average Daily Net Assets | | Investment
Advisory Fees | |
First $250 Million | | | 0.55 | % |
$250 Million — $500 Million | | | 0.50 | |
$500 Million — $750 Million | | | 0.45 | |
Greater than $750 Million | | | 0.40 | |
For the year ended December 31, 2017, the aggregate average daily net assets of the Fund and the Company’s BlackRock Total Return V.I. Fund were approximately $766,491,695.
Distribution Fees: The Company, on behalf of the Fund, entered into a Distribution Agreement and a Distribution Plan with BlackRock Investments, LLC (“BRIL”), an affiliate of the Manager. Pursuant to the Distribution Plan and in accordance with Rule 12b-1 under the 1940 Act, the Fund pays BRIL ongoing distribution fees. The fees are accrued daily and paid monthly at an annual rate of 0.25% based upon the average daily net assets attributable to Class III.
For the year ended December 31, 2017, the class specific distribution fees borne directly by Class III were $564,262.
| | | | |
| NOTESTO FINANCIAL STATEMENTS | | | 33 | |
Notes to Financial Statements (continued)
Transfer Agent: On behalf of the Fund, the Manager entered into agreements with insurance companies and other financial intermediaries (“Service Organizations”), some of which may be affiliates. Pursuant to these agreements, the Service Organizations provide the Fund with administrative, networking, recordkeeping, sub-transfer agency and shareholder services to sub-accounts they service. For these services, the Service Organizations receive an annual fee per shareholder account, which will vary depending on share class and/or net assets of Fund shareholders serviced by the Service Organizations, which is shown as transfer agent — class specific. For the year ended December 31, 2017, the Fund did not pay any amounts to affiliates in return for these services.
In addition, the Fund pays the transfer agent, which is not an affiliate, a fee for the issuance, transfer and redemption of shares and the opening and maintenance of shareholder accounts, which is included in transfer agent in the Statement of Operations.
For the year ended December 31, 2017, the following table shows the class specific transfer agent fees borne directly by each share class of the Fund:
| | | | | | | | | | | | | | |
| Class I | | | | | Class III | | | | | Total | |
| $ | 261,408 | | | | | $ | 350,474 | | | | | $ | 611,882 | |
Expense Limitations, Waivers and Reimbursements: With respect to the Fund, the Manager voluntarily agreed to waive its investment advisory fees by the amount of investment advisory fees the Fund pays to the Manager indirectly through its investment in affiliated money market funds (the “affiliated money market fund waiver”). The amount of waivers and/or reimbursements of fees and expenses made pursuant to the expense limitation will be reduced by the amount of the affiliated money market fund waiver. This amount is shown as fees waived and/or reimbursed by the Manager in the Statement of Operations. For the year ended December 31, 2017, the amount waived was $10,861.
The Manager has contractually agreed to waive its investment advisory fee with respect to any portion of the Fund’s assets invested in affiliated equity and fixed-income mutual funds and affiliated exchange-traded funds that have a contractual management fee through April 30, 2018. The contractual agreement may be terminated upon 90 days’ notice by a majority of the independent directors who are not “interested persons” of the Fund, as defined in the 1940 Act (“Independent Directors”) or by a vote of a majority of the outstanding voting securities of the Fund. For the year ended December 31, 2017, there were no fees waived by the Manager.
For the year ended December 31, 2017, the Fund reimbursed the Manager $4,428 for certain accounting services, which is included in accounting services in the Statement of Operations.
The Manager has contractually agreed to reimburse transfer agent fees in order to limit such expenses to a percentage of average daily net assets as follows:
| | | | |
Class I | | | 0.06 | % |
Class III | | | 0.05 | |
The Manager has agreed not to reduce or discontinue this contractual expense limitation through April 30, 2018, unless approved by the Board, including a majority of the Independent Directors or by a vote of a majority of the outstanding voting securities of the Fund.
These amounts waived and/or reimbursed are shown as transfer agent fees reimbursed — class specific in the Statement of Operations. For the year ended December 31, 2017, class specific expense waivers and/or reimbursements were as follows:
| | | | | | | | | | | | |
| | | Class I | | | Class III | | | Total | |
Transfer Agent Fees Reimbursed | | $ | 163,129 | | | $ | 236,373 | | | $ | 399,502 | |
With respect to the Fund, the Manager contractually agreed to waive and/or reimburse fees or expenses in order to limit expenses, excluding interest expense, dividend expense, tax expense, acquired fund fees and expenses, and certain other fund expenses, which constitute extraordinary expenses not incurred in the ordinary course of the Fund’s business (“expense limitation”). The expense limitation as a percentage of average daily net assets are as follows:
| | | | | | | | | | | | | | | | |
| | | | Class I | | | | | Class III | | | | |
| | | | | | 1.25% | | | | | | 1.50% | | | | | |
The Manager has agreed not to reduce or discontinue this contractual expense limitation through April 30, 2018, unless approved by the Board, including a majority of the Independent Directors or by a vote of a majority of the outstanding voting securities of the Fund. For the year ended December 31, 2017, there were no fees waived and/or reimbursed by the Manager.
Officers and Directors: Certain directors and/or officers of the Company are directors and/or officers of BlackRock or its affiliates. The Fund reimburses the Manager for a portion of the compensation paid to the Company’s Chief Compliance Officer, which is included in Directors and Officer in the Statement of Operations.
Other Transactions: The Fund may purchase securities from, or sell securities to, an affiliated fund provided the affiliation is due solely to having a common investment adviser, common officers, or common directors. For the year ended December 31, 2017, the purchase and sale transactions and any net realized gains (losses) with an affiliated fund in compliance with Rule 17a-7 under the 1940 Act were as follows:
| | | | |
Purchases | | $
| 2,613,557
|
|
Sales | |
| —
|
|
Net Realized Gain | |
| —
|
|
| | |
| 34 | | 2017 BLACKROCK ANNUAL REPORTTO SHAREHOLDERS |
Notes to Financial Statements (continued)
For the year ended December 31, 2017, purchases and sales of investments, including paydowns and excluding short-term securities, were $377,321,931 and $278,747,931, respectively.
It is the Fund’s policy to comply with the requirements of the Internal Revenue Code of 1986, as amended, applicable to regulated investment companies, and to distribute substantially all of its taxable income to its shareholders. Therefore, no U.S. federal income tax provision is required.
The Fund files U.S. federal and various state and local tax returns. No income tax returns are currently under examination. The statute of limitations on the Fund’s U.S. federal tax returns generally remains open for each of the four years ended December 31, 2017. The statutes of limitations on the Fund’s state and local tax returns may remain open for an additional year depending upon the jurisdiction.
Management has analyzed tax laws and regulations and their application to the Fund as of December 31, 2017, inclusive of the open tax return years, and does not believe that there are any uncertain tax positions that require recognition of a tax liability in the Fund’s financial statements.
U.S. GAAP requires that certain components of net assets be adjusted to reflect permanent differences between financial and tax reporting. These reclassifications have no effect on net assets or net asset values per share. As of period end, the following permanent differences attributable to the accounting for swap agreements, the classification of investments, foreign currency transactions, income recognized from pass-through entities, expiration of capital loss carryforwards and net paydown gains(losses) were reclassified to the following accounts:
| | | | |
Paid-in capital | | $ | (11,211,061 | ) |
Distributions in excess of net investment income | | | 369,976 | |
Accumulated net realized loss | | | 10,841,085 | |
The tax character of distributions paid was as follows:
| | | | | | | | | | |
| | | | | 12/31/17 | | | 12/31/16 | |
Ordinary income | | $ | 19,517,419 | | | $ | 15,051,145 | |
As of December 31, 2017, the tax components of accumulated net earnings (losses) were as follows:
| | | | |
Capital loss carryforward | | $ | (4,232,859 | ) |
Net unrealized gains(a) | | | 3,733,853 | |
| | | | |
Total | | $ | (499,006 | ) |
| | | | |
| | (a) | The difference between book-basis and tax-basis net unrealized gains was attributable primarily to the tax deferral of losses on wash sales and straddles, the realization for tax purposes of unrealized gains/losses on certain futures and foreign currency contracts, the accounting for swap agreements and the classification of investments. | |
As of December 31, 2017, the Fund had a capital loss carryforward, with no expiration date, available to offset future realized capital gains of $4,232,859.
During the year ended December 31, 2017, the fund utilized $6,602,609 of its capital loss carryforward.
As of December 31, 2017, gross unrealized appreciation and depreciation for investments and derivatives based on cost for U.S. federal income tax purposes were as follows:
| | | | |
Tax cost | | $ | 444,617,440 | |
| | | | |
Gross unrealized appreciation | | $ | 8,862,316 | |
Gross unrealized depreciation | | | (4,218,704 | ) |
| | | | |
Net unrealized appreciation(depreciation) | | $ | 4,463,612 | |
| | | | |
The Company, on behalf of the Fund, along with certain other funds managed by the Manager and its affiliates (“Participating Funds”), is a party to a 364-day, $2.1 billion credit agreement with a group of lenders. Under this agreement, the Fund may borrow to fund shareholder redemptions. Excluding commitments designated for certain individual funds, the Participating Funds, including the Fund, can borrow up to an aggregate commitment amount of $1.6 billion at any time outstanding, subject to asset coverage and other limitations as specified in the agreement. The credit agreement has the following terms: a fee of 0.12% per annum on unused commitment amounts and interest at a rate equal to the higher of (a) one-month LIBOR (but, in any event, not less than 0.00%) on the date the loan is made plus 0.80% per annum or (b) the Fed Funds rate (but, in any event, not less than 0.00%) in effect from time to time plus 0.80% per annum on amounts borrowed. The agreement expires in April 2018 unless extended or renewed. Participating Funds paid administration, legal and arrangement fees, which, if applicable, are included in miscellaneous expenses in the Statement of Operations. These fees were allocated among such funds based upon portions of the aggregate commitment available to them and relative net assets of Participating Funds. During the year ended December 31, 2017, the Fund did not borrow under the credit agreement.
| | | | |
| NOTESTO FINANCIAL STATEMENTS | | | 35 | |
Notes to Financial Statements (continued)
In the normal course of business, the Fund invests in securities or other instruments and may enter into certain transactions, and such activities subject the Fund to various risks, including among others, fluctuations in the market (market risk) or failure of an issuer to meet all of its obligations. The value of securities or other instruments may also be affected by various factors, including, without limitation: (i) the general economy; (ii) the overall market as well as local, regional or global political and/or social instability; (iii) regulation, taxation or international tax treaties between various countries; or (iv) currency, interest rate and price fluctuations. The Fund’s prospectus provides details of the risks to which the Fund is subject.
The Fund may be exposed to prepayment risk, which is the risk that borrowers may exercise their option to prepay principal earlier than scheduled during periods of declining interest rates, which would force the Fund to reinvest in lower yielding securities. The Fund may also be exposed to reinvestment risk, which is the risk that income from the Fund’s portfolio will decline if the Fund invests the proceeds from matured, traded or called fixed-income securities at market interest rates that are below the Fund portfolio’s current earnings rate.
Valuation Risk: The market values of equities, such as common stocks and preferred securities or equity related investments, such as futures and options, may decline due to general market conditions which are not specifically related to a particular company. They may also decline due to factors which affect a particular industry or industries. The Fund may invest in illiquid investments and may experience difficulty in selling those investments in a timely manner at the price that it believes the investments are worth. Prices may fluctuate widely over short or extended periods in response to company, market or economic news. Markets also tend to move in cycles, with periods of rising and falling prices. This volatility may cause the Fund’s NAV to experience significant increases or decreases over short periods of time. If there is a general decline in the securities and other markets, the NAV of the Fund may lose value, regardless of the individual results of the securities and other instruments in which the Fund invests.
The price the Fund could receive upon the sale of any particular portfolio investment may differ from the Fund’s valuation of the investment, particularly for securities that trade in thin or volatile markets or that are valued using a fair valuation technique or a price provided by an independent pricing service. Changes to significant unobservable inputs and assumptions (i.e., publicly traded company multiples, growth rate, time to exit) due to the lack of observable inputs may significantly impact the resulting fair value and therefore the Fund’s results of operations. As a result, the price received upon the sale of an investment may be less than the value ascribed by the Fund, and the Fund could realize a greater than expected loss or lesser than expected gain upon the sale of the investment. The Fund’s ability to value its investments may also be impacted by technological issues and/or errors by pricing services or other third party service providers.
Counterparty Credit Risk: The Fund may be exposed to counterparty credit risk, or the risk that an entity may fail to or be unable to perform on its commitments related to unsettled or open transactions. The Fund manages counterparty credit risk by entering into transactions only with counterparties that the Manager believes have the financial resources to honor their obligations and by monitoring the financial stability of those counterparties. Financial assets, which potentially expose the Fund to market, issuer and counterparty credit risks, consist principally of financial instruments and receivables due from counterparties. The extent of the Fund’s exposure to market, issuer and counterparty credit risks with respect to these financial assets is approximately their value recorded in the Statement of Assets and Liabilities, less any collateral held by the Fund.
A derivative contract may suffer a mark-to-market loss if the value of the contract decreases due to an unfavorable change in the market rates or values of the underlying instrument. Losses can also occur if the counterparty does not perform under the contract.
The Fund’s risk of loss from counterparty credit risk on OTC derivatives is generally limited to the aggregate unrealized gain less the value of any collateral held by the Fund.
With exchange-traded futures and centrally cleared swaps, there is less counterparty credit risk to the Fund since the exchange or clearinghouse, as counterparty to such instruments, guarantees against a possible default. The clearinghouse stands between the buyer and the seller of the contract; therefore, credit risk is limited to failure of the clearinghouse. While offset rights may exist under applicable law, the Fund does not have a contractual right of offset against a clearing broker or clearinghouse in the event of a default (including the bankruptcy or insolvency). Additionally, credit risk exists in exchange-traded futures and centrally cleared swaps with respect to initial and variation margin that is held in a clearing broker’s customer accounts. While clearing brokers are required to segregate customer margin from their own assets, in the event that a clearing broker becomes insolvent or goes into bankruptcy and at that time there is a shortfall in the aggregate amount of margin held by the clearing broker for all its clients, typically the shortfall would be allocated on a pro rata basis across all the clearing broker’s customers, potentially resulting in losses to the Fund.
Concentration Risk: The Fund invests a significant portion of its assets in fixed income securities and/or uses derivatives tied to the fixed income markets. Changes in market interest rates or economic conditions may affect the value and/or liquidity of such investments. Interest rate risk is the risk that prices of bonds and other fixed income securities will increase as interest rates fall and decrease as interest rates rise. The Fund may be subject to a greater risk of rising interest rates due to the current period of historically low rates.
Certain Funds may invest in securities that are rated below investment grade quality (sometimes called “junk bonds”), which are predominantly speculative, have greater credit risk and generally are less liquid and have more volatile prices than higher quality securities.
| | |
| 36 | | 2017 BLACKROCK ANNUAL REPORTTO SHAREHOLDERS |
Notes to Financial Statements (continued)
| 11. | CAPITAL SHARE TRANSACTIONS |
Transactions in capital shares for each class were as follows:
| | | | | | | | | | | | | | | | |
| | | Year Ended
12/31/2017 | | | Year Ended
12/31/2016 | |
| Share Class | | Shares | | | Amount | | | Shares | | | Amount | |
Class I | | | | | | | | | | | | | | | | |
Shares sold | | | 8,305,552 | | | $ | 61,351,404 | | | | 4,252,978 | | | $ | 30,397,964 | |
Shares issued in reinvestment of distributions | | | 1,123,883 | | | | 8,293,740 | | | | 1,033,368 | | | | 7,206,037 | |
Shares redeemed | | | (3,183,322 | ) | | | (23,471,934 | ) | | | (3,064,338 | ) | | | (21,335,572 | ) |
| | | | | | | | | | | | | | | | |
Net increase | | | 6,246,113 | | | $ | 46,173,210 | | | | 2,222,008 | | | $ | 16,268,429 | |
| | | | | | | | | | | | | | | | |
Class III | | | | | | | | | | | | | | | | |
Shares sold | | | 27,190,401 | | | $ | 200,516,323 | | | | 38,213,690 | | | $ | 266,471,599 | |
Shares issued in reinvestment of distributions | | | 1,490,839 | | | | 11,005,500 | | | | 1,051,175 | | | | 7,357,157 | |
Shares redeemed | | | (21,963,775 | ) | | | (161,601,540 | ) | | | (27,060,956 | ) | | | (189,310,680 | ) |
| | | | | | | | | | | | | | | | |
Net increase | | | 6,717,465 | | | $ | 49,920,283 | | | | 12,203,909 | | | $ | 84,518,076 | |
| | | | | | | | | | | | | | | | |
Total Net Increase | | | 12,963,578 | | | $ | 96,093,493 | | | | 14,425,917 | | | $ | 100,786,505 | |
| | | | | | | | | | | | | | | | |
Management has evaluated the impact of all subsequent events on the Fund through the date the financial statements were issued and has determined that there were no subsequent events requiring adjustment or additional disclosure in the financial statements.
| | | | |
| NOTESTO FINANCIAL STATEMENTS | | | 37 | |
Report of the Independent Registered Public Accounting Firm
To the Shareholders of BlackRock High Yield V.I. Fund and the Board of Directors of BlackRock Variable Series Funds, Inc.:
Opinion on the Financial Statements and Financial Highlights
We have audited the accompanying statement of assets and liabilities, including the schedule of investments, of BlackRock High Yield V.I. Fund of BlackRock Variable Series Funds, Inc. (the “Fund”), as of December 31, 2017, the related statement of operations for the year then ended, the statements of changes in net assets for each of the two years in the period then ended, the financial highlights for each of the five years in the period then ended, and the related notes. In our opinion, the financial statements and financial highlights present fairly, in all material respects, the financial position of the Fund as of December 31, 2017, and the results of its operations for the year then ended, the changes in its net assets for each of the two years in the period then ended, and the financial highlights for each of the five years in the period then ended, in conformity with accounting principles generally accepted in the United States of America.
Basis for Opinion
These financial statements and financial highlights are the responsibility of the Fund’s management. Our responsibility is to express an opinion on the Fund’s financial statements and financial highlights based on our audits. We are a public accounting firm registered with the Public Company Accounting Oversight Board (United States) (PCAOB) and are required to be independent with respect to the Fund in accordance with the U.S. federal securities laws and the applicable rules and regulations of the Securities and Exchange Commission and the PCAOB.
We conducted our audits in accordance with the standards of the PCAOB. Those standards require that we plan and perform the audit to obtain reasonable assurance about whether the financial statements and financial highlights are free of material misstatement, whether due to error or fraud. The Fund is not required to have, nor were we engaged to perform, an audit of its internal control over financial reporting. As part of our audits we are required to obtain an understanding of internal control over financial reporting but not for the purpose of expressing an opinion on the effectiveness of the Fund’s internal control over financial reporting. Accordingly, we express no such opinion.
Our audits included performing procedures to assess the risks of material misstatement of the financial statements and financial highlights, whether due to error or fraud, and performing procedures that respond to those risks. Such procedures included examining, on a test basis, evidence regarding the amounts and disclosures in the financial statements and financial highlights. Our audits also included evaluating the accounting principles used and significant estimates made by management, as well as evaluating the overall presentation of the financial statements and financial highlights. Our procedures included confirmation of securities owned as of December 31, 2017, by correspondence with the custodian and brokers; when replies were not received from brokers, we performed other auditing procedures. We believe that our audits provide a reasonable basis for our opinion.
Deloitte & Touche LLP
Boston, Massachusetts
February 19, 2018
We have served as the auditor of one or more BlackRock investment companies since 1992.
| | |
| 38 | | 2017 BLACKROCK ANNUAL REPORTTO SHAREHOLDERS |
Glossary of Terms Used in this Report
| | |
| Currency |
| |
| CAD | | Canadian Dollar |
| EUR | | Euro |
| GBP | | British Pound |
| USD | | United States Dollar |
|
| Portfolio Abbreviations |
| |
| LIBOR | | London Interbank Offered Rate |
| REIT | | Real Estate Investment Trust |
| | | | |
| GLOSSARYOF TERMS USEDINTHIS REPORT | | | 39 | |
DECEMBER 31, 2017
| | |
ANNUAL REPORT | |  |
BlackRock Variable Series Funds, Inc.
| Ø | | BlackRock International V.I. Fund |
|
| Not FDIC Insured • May Lose Value • No Bank Guarantee |
| | |
| Fund Summary as of December 31, 2017 | | BlackRock International V.I. Fund |
Investment Objective
BlackRock International V.I. Fund’s (the “Fund”) investment objective is long-term capital growth.
Portfolio Management Commentary
How did the Fund perform?
For the 12-month period ended December 31, 2017, the Fund outperformed its benchmark, the MSCI All Country World (ACWI) ex-USA Index.
What factors influenced performance?
From a sector perspective, positive stock selection in financials was the primary contributor to the Fund’s relative performance for the period, particularly among banks. Positive stock selection and an overweight allocation to information technology (“IT”) also contributed to performance. The most significant individual contributor was Japanese consumer discretionary company Sony Corp., whose shares jumped after its operating profit beat expectations by a substantial margin in its second-quarter financial report. Sony’s management ultimately upgraded its operating profit guidance for the full year. IT cybersecurity solutions provider Trend Micro Inc. and sensing and control products specialist Omron Corp. also were notable individual contributors to performance.
Negative stock selection in telecommunication services (“telecom”) detracted the most from performance for the period, while the Fund’s cash balance and negative stock selection in consumer staples also detracted. The main individual detractors included U.K. telecom BT Group PLC, which issued a profit warning following a sharp downturn in public-sector contracts and accounting irregularities in its Italian operations. U.K. tobacco company Imperial Brands PLC and home improvement retailer Kingfisher PLC were also among the primary detractors from relative performance.
Describe recent portfolio activity.
The largest change to the Fund’s positioning in the period was a significant increase in exposure to consumer staples, moving from underweight the sector to meaningfully overweight through new positions in the tobacco, beverages, and household products industries. The Fund fully exited the industrials sector through the sale of its sole remaining positions within the machinery and professional services industries. The Fund’s overweight exposure to health care was reduced to a modest underweight following the sales of positions in two pharmaceutical companies and one health care equipment business.
Describe portfolio positioning at period end.
The Fund’s largest sector overweight positions were to consumer staples, financials, and energy, driven by investments in the tobacco, banks, and energy equipment & supplies industry groups. The largest underweight exposures were to industrials, materials, and real estate. On a regional basis, the largest overweight exposures were to the United Kingdom and the United States, while the largest underweight allocations were to Canada and Australia.
The views expressed reflect the opinions of BlackRock as of the date of this report and are subject to change based on changes in market, economic or other conditions. These views are not intended to be a forecast of future events and are no guarantee of future results.
Portfolio Information
GEOGRAPHIC ALLOCATION
| | | | |
| Country | | Percent of
Net Assets | |
United Kingdom | | | 23 | % |
Japan | | | 13 | |
China | | | 9 | |
Netherlands | | | 8 | |
Spain | | | 6 | |
United States | | | 5 | |
Brazil | | | 4 | |
Switzerland | | | 4 | |
Germany | | | 4 | |
France | | | 4 | |
India | | | 4 | |
Norway | | | 3 | |
Italy | | | 3 | |
Portugal | | | 3 | |
Hong Kong | | | 2 | |
Indonesia | | | 2 | |
Singapore | | | 1 | |
Short-Term Securities | | | 8 | |
Liabilities in Excess of Other Assets | | | (6 | ) |
| | |
| 2 | | 2017 BLACKROCK ANNUAL REPORTTO SHAREHOLDERS |
| | |
| Fund Summary as of December 31, 2017 (continued) | | BlackRock International V.I. Fund |
TOTAL RETURN BASED ON A $10,000 INVESTMENT
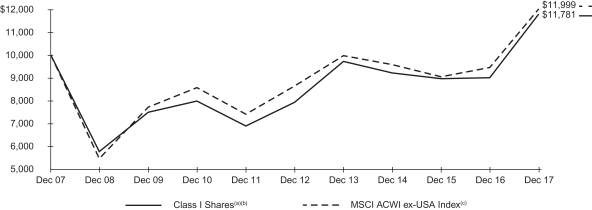
| (a) | Assuming transaction costs, if any, and other operating expenses, including investment advisory fees. Does not include insurance-related fees and expenses. |
| (b) | The Fund invests primarily in stocks of companies located outside the U.S. The Fund’s total returns prior to October 1, 2011 are the returns of the Fund when it followed different investment strategies under the name “BlackRock International Value V.I. Fund.” |
| (c) | A free float-adjusted market capitalization index designed to measure the combined equity market performance of developed and emerging countries, excluding the United States. |
Performance Summary for the Period Ended December 31, 2017
| | | | | | | | | | | | | | | | | | | | |
| | | 6-Month
Total Returns (b) | | | | | | Average Annual Total Returns | |
| | | | | | | 1 Year (b) | | | 5 Years (b) | | | 10 Years (b) | |
Class I(a) | | | 12.44 | % | | | | | | | 31.11 | % | | | 8.30 | % | | | 1.65 | % |
MSCI ACWI ex-USA Index | | | 11.48 | | | | | | | | 27.19 | | | | 6.80 | | | | 1.84 | |
| | (a) | Average annual and cumulative total returns are based on changes in net asset value (“NAV”) for the periods shown, and assume reinvestment of all distributions at NAV on the ex-dividend date. Insurance-related fees and expenses are not reflected in these returns. The Fund’s total returns prior to October 1, 2011 are the returns of the Fund when it followed different investment strategies under the name “BlackRock International Value V.I. Fund.” | |
| | (b) | For the portion of the period, the Fund’s investment adviser waived a portion of its fee. Without such waiver, the Fund’s performance would have been lower. | |
Past performance is not indicative of future results. Performance results do not reflect the deduction of taxes that a shareholder would pay on Fund distributions or the redemption of Fund shares.
Performance results may include adjustments made for financial reporting purposes in accordance with U.S. generally accepted accounting principles.
Expense Example
| | | | | | | | | | | | | | | | | | | | | | | | | | | | | | | | |
| | | Actual | | | | | | Hypothetical (a) | | | | |
| | | Beginning
Account Value
(07/01/17) | | | Ending
Account Value
(12/31/17) | | | Expenses
Paid During
the Period (b) | | | | | | Beginning
Account Value
(07/01/17) | | | Ending
Account Value
(12/31/17) | | | Expenses
Paid During
the Period (b) | | | Annualized
Expense
Ratio | |
Class I | | $ | 1,000.00 | | | $ | 1,124.40 | | | $ | 5.94 | | | | | | | $ | 1,000.00 | | | $ | 1,019.61 | | | $ | 5.65 | | | | 1.11 | % |
| | (a) | Hypothetical 5% annual return before expenses is calculated by prorating the number of days in the most recent fiscal half year divided by 365. | |
| | (b) | Expenses are equal to the annualized expense ratio, multiplied by the average account value over the period, multiplied by 184/365 (to reflect the one-half year period shown). | |
See “Disclosure of Expenses” on the following page for further information on how expenses were calculated.
Disclosure of Expenses
Shareholders of the Fund may incur the following charges: (a) transactional expenses, such as sales charges; and (b) operating expenses, including investment advisory fees, service and distribution fees, including 12b-1 fees, acquired fund fees and expenses and other fund expenses. The expense example on the previous page (which is based on a hypothetical investment of $1,000 invested on July 1, 2017 and held through December 31, 2017) is intended to assist shareholders both in calculating expenses based on an investment in the Fund and in comparing these expenses with similar costs of investing in other mutual funds.
The expense example provides information about actual account values and actual expenses. In order to estimate the expenses a shareholder paid during the period covered by this report, shareholders can divide their account value by $1,000 and then multiply the result by the number corresponding to their share class under the heading entitled “Expenses Paid During the Period.”
The expense example also provides information about hypothetical account values and hypothetical expenses based on the Fund’s actual expense ratio and an assumed rate of return of 5% per year before expenses. In order to assist shareholders in comparing the ongoing expenses of investing in the Fund and other funds, compare the 5% hypothetical example with the 5% hypothetical example that appears in shareholder reports of other funds.
The expenses shown in the expense example are intended to highlight shareholders’ ongoing costs only and do not reflect any transactional expenses, such as sales charges, if any. Therefore, the hypothetical example is useful in comparing ongoing expenses only, and will not help shareholders determine the relative total expenses of owning different funds. If these transactional expenses were included, shareholder expenses would have been higher.
Derivative Financial Instruments
The Fund may invest in various derivative financial instruments. These instruments are used to obtain exposure to a security, commodity, index, market, and/or other asset without owning or taking physical custody of securities, commodities and/or other referenced assets or to manage market, equity, credit, interest rate, foreign currency exchange rate, commodity and/or other risks. Derivative financial instruments may give rise to a form of economic leverage and involve risks, including the imperfect correlation between the value of a derivative financial instrument and the underlying asset, possible default of the counterparty to the transaction or illiquidity of the instrument. The Fund’s successful use of a derivative financial instrument depends on the investment adviser’s ability to predict pertinent market movements accurately, which cannot be assured. The use of these instruments may result in losses greater than if they had not been used, may limit the amount of appreciation the Fund can realize on an investment and/or may result in lower distributions paid to shareholders. The Fund’s investments in these instruments, if any, are discussed in detail in the Notes to Financial Statements.
| | |
| 4 | | 2017 BLACKROCK ANNUAL REPORTTO SHAREHOLDERS |
| | |
Schedule of Investments December 31, 2017 | | BlackRock International V.I. Fund (Percentages shown are based on Net Assets) |
| | | | | | | | |
| Security | | Shares
| | | Value | |
Common Stocks — 95.5% | |
|
| Brazil — 2.1% | |
Vale SA, ADR(a)(b) | | | 202,417 | | | $ | 2,475,560 | |
| | | | | | | | |
| China — 8.6% | |
Bank of China Ltd., Class H | | | 10,654,000 | | | | 5,217,650 | |
NetEase, Inc., ADR | | | 7,738 | | | | 2,670,152 | |
Ping An Insurance Group Co. of China Ltd., Class H(a) | | | 190,500 | | | | 1,975,879 | |
| | | | | | | | |
| | | | | | | 9,863,681 | |
| France — 3.6% | |
Engie SA | | | 244,221 | | | | 4,198,529 | |
| | | | | | | | |
| Germany — 3.7% | |
Bayer AG (Registered) | | | 34,123 | | | | 4,240,234 | |
| | | | | | | | |
| Hong Kong — 2.4% | |
AIA Group Ltd. | | | 329,400 | | | | 2,801,760 | |
| | | | | | | | |
| India — 3.6% | |
ICICI Bank Ltd. | | | 835,036 | | | | 4,092,568 | |
| | | | | | | | |
| Indonesia — 2.2% | |
Bank Mandiri Persero Tbk. PT(a) | | | 4,392,000 | | | | 2,586,258 | |
| | | | | | | | |
| Italy — 2.9% | |
Intesa Sanpaolo SpA | | | 996,875 | | | | 3,307,493 | |
| | | | | | | | |
| Japan — 13.4% | |
Japan Tobacco, Inc. | | | 82,100 | | | | 2,643,876 | |
Omron Corp. | | | 41,800 | | | | 2,486,220 | |
Sony Corp. | | | 122,000 | | | | 5,475,710 | |
Trend Micro, Inc. | | | 85,800 | | | | 4,856,547 | |
| | | | | | | | |
| | | | | | | 15,462,353 | |
| Netherlands — 7.9% | |
Aegon NV(a) | | | 381,206 | | | | 2,422,171 | |
ASML Holding NV | | | 9,425 | | | | 1,638,616 | |
Heineken NV | | | 28,513 | | | | 2,972,403 | |
Koninklijke Philips NV | | | 53,985 | | | | 2,038,402 | |
| | | | | | | | |
| | | | | | | 9,071,592 | |
| Norway — 3.3% | |
Statoil ASA | | | 180,329 | | | | 3,860,561 | |
| | | | | | | | |
| Portugal — 2.6% | |
Banco Comercial Portugues SA, Class R(a) | | | 9,085,284 | | | | 2,957,206 | |
| | | | | | | | |
| Singapore — 1.5% | |
Sea Ltd., ADR(a)(b) | | | 130,606 | | | | 1,740,978 | |
| | | | | | | | |
| Spain — 6.0% | |
Banco Bilbao Vizcaya Argentaria SA(b) | | | 559,119 | | | | 4,751,513 | |
CaixaBank SA(a) | | | 461,882 | | | | 2,147,208 | |
| | | | | | | | |
| | | | | | | 6,898,721 | |
| Switzerland — 3.7% | |
Cie Financiere Richemont SA (Registered) | | | 47,495 | | | | 4,301,521 | |
| | | | | | | | |
| United Kingdom — 23.0% | |
British American Tobacco plc | | | 52,467 | | | | 3,546,705 | |
BT Group plc | | | 996,823 | | | | 3,656,703 | |
Burberry Group plc(a) | | | 90,218 | | | | 2,175,142 | |
Diageo plc | | | 124,000 | | | | 4,545,141 | |
Imperial Brands plc | | | 110,118 | | | | 4,697,043 | |
ITV plc | | | 1,118,371 | | | | 2,498,998 | |
Reckitt Benckiser Group plc | | | 25,160 | | | | 2,347,264 | |
TechnipFMC plc | | | 99,748 | | | | 3,123,110 | |
| | | | | | | | |
| | | | | | | 26,590,106 | |
| | | | | | | | |
| Security | | Shares/
Par (000) | | | Value | |
| United States — 5.0% | |
BioMarin Pharmaceutical, Inc.(a) | | | 27,594 | | | $ | 2,460,557 | |
Schlumberger Ltd. | | | 48,804 | | | | 3,288,902 | |
| | | | | | | | |
| | | | | | | 5,749,459 | |
| | | | | | | | |
Total Common Stocks — 95.5%
(Cost: $93,769,747) | | | | | | | 110,198,580 | |
| | | | | | | | |
|
Preferred Stocks — 1.9% | |
|
| Brazil — 1.9% | |
Itau Unibanco Holding SA (Preference), 0.00% | | | 176,259 | | | | 2,262,551 | |
| | | | | | | | |
Total Preferred Stocks — 1.9%
(Cost: $2,249,119) | | | | | | | 2,262,551 | |
| | | | | | | | |
Total Long-Term Investments — 97.4%
(Cost: $96,018,866) | | | | | | | 112,461,131 | |
| | | | | | | | |
|
Short-Term Securities — 8.2% | |
|
| Money Market Funds — 8.1%(c)(e) | |
BlackRock Liquidity Funds, T-Fund, Institutional Class, 1.17% | | | 3,135,204 | | | | 3,135,204 | |
SL Liquidity Series, LLC, Money Market Series, 1.48%(d) | | | 6,216,364 | | | | 6,215,742 | |
| | | | | | | | |
| | |
Total Money Market Funds — 8.1%
(Cost: $9,351,220) | | | | | | | 9,350,946 | |
| | | | | | | | |
|
| Time Deposits — 0.1% | |
|
| Norway — 0.0% | |
Brown Brothers Harriman & Co., (1.50)%, 01/02/18 | | | NOK 321 | | | | 39,117 | |
| | | | | | | | |
| United Kingdom — 0.1% | |
Citibank NA, 0.16%, 01/02/18 | | | GBP 66 | | | | 88,477 | |
| | | | | | | | |
Total Time Deposits — 0.1%
(Cost: $127,594) | | | | | | | 127,594 | |
| | | | | | | | |
Total Short-Term Securities — 8.2%
(Cost: $9,478,814) | | | | | | | 9,478,540 | |
| | | | | | | | |
| | |
Total Investments — 105.6%
(Cost: $105,497,680) | | | | | | | 121,939,671 | |
Liabilities in Excess of Other Assets — (5.6)% | | | | | | | (6,507,055 | ) |
| | | | | | | | |
Net Assets — 100.0% | | | | | | $ | 115,432,616 | |
| | | | | | | | |
| (a) | Non-income producing security. |
| (b) | Security, or a portion of the security, is on loan. |
| (c) | Annualized 7-day yield as of period end. |
| (d) | Security was purchased with the cash collateral from loaned securities. |
| | | | |
| SCHEDULE OF INVESTMENTS | | | 5 | |
| | |
Schedule of Investments (continued) December 31, 2017 | | BlackRock International V.I. Fund |
| (e) | During the year ended December 31, 2017, investments in issuers considered to be affiliates of the Fund for the purposes of Section 2(a)(3) of the Investment Company Act of 1940, as amended, were as follows: |
| | | | | | | | | | | | | | | | | | | | | | | | | | | | |
| Affiliate | | Shares
Held at
12/31/16 | | | Net
Activity | | | Shares
Held at
12/31/17 | | | Value at
12/31/17 | | | Income | | | Net
Realized
Gain (Loss) (a) | | | Change in
Unrealized
Appreciation
(Depreciation) | |
BlackRock Liquidity Funds, T-Fund, Institutional Class | | | 4,486,922 | | | | (1,351,718 | ) | | | 3,135,204 | | | $ | 3,135,204 | | | $ | 29,835 | | | $ | 15 | | | $ | — | |
SL Liquidity Series, LLC, Money Market Series | | | 167,612 | | | | 6,048,752 | | | | 6,216,364 | | | | 6,215,742 | | | | 36,920 | (b) | | | (2,471 | ) | | | (273 | ) |
| | | | | | | | | | | | | | | | | | | | | | | | | | | | |
| | | | | | | | | | | | | | $ | 9,350,946 | | | $ | 66,755 | | | $ | (2,456 | ) | | $ | (273 | ) |
| | | | | | | | | | | | | | | | | | | | | | | | | | | | |
| | (a) | Includes net capital gain distributions, if applicable. | |
| | (b) | Represents securities lending income earned from the reinvestment of cash collateral from loaned securities, net of fees and collateral investment expenses, and other payments to and from borrowers of securities. | |
Portfolio Abbreviations
ADR — American Depositary Receipts
GBP — British Pound
NOK — Norwegian Krone
USD — United States Dollar
Derivative Financial Instruments Categorized by Risk Exposure
For the year ended December 31, 2017, the effect of derivative financial instruments in the Statement of Operations was as follows:
| | | | | | | | | | | | | | | | | | | | | | | | | | | | |
| | | Commodity
Contracts | | | Credit
Contracts | | | Equity
Contracts | | | Foreign
Currency
Exchange
Contracts | | | Interest
Rate
Contracts | | | Other
Contracts | | | Total | |
Net Realized Gain (Loss) from: | | | | | | | | | | | | | | | | | | | | | | | | | | | | |
Forward foreign currency exchange contracts | | $ | — | | | $ | — | | | $ | — | | | $ | (169,292 | ) | | $ | — | | | $ | — | | | $ | (169,292 | ) |
| | | | | | | | | | | | | | | | | | | | | | | | | | | | |
Total | | $ | — | | | $ | — | | | $ | — | | | $ | (169,292 | ) | | $ | — | | | $ | — | | | $ | (169,292 | ) |
| | | | | | | | | | | | | | | | | | | | | | | | | | | | |
Average Quarterly Balances of Outstanding Derivative Financial Instruments
| | | | |
Forward foreign currency exchange contracts: | | | | |
Average amounts purchased — in USD | | $ | 1,614,491 | |
Average amounts sold — in USD | | $ | 526,280 | |
For more information about the Fund’s investment risks regarding derivative financial instruments, refer to the Notes to Financial Statements.
Fair Value Hierarchy as of Period End
Various inputs are used in determining the fair value of investments. For information about the Fund’s policy regarding valuation of investments, refer to the Notes to Financial Statements.
The following table summarizes the Fund’s investments categorized in the disclosure hierarchy:
| | | | | | | | | | | | | | | | |
| | | Level 1 | | | Level 2 | | | Level 3 | | | Total | |
Investments: | | | | | | | | | | | | | | | | |
Assets: | | | | | | | | | | | | | | | | |
Long-Term Investments: | | | | | | | | | | | | | | | | |
Common Stocks: | | | | | | | | | | | | | | | | |
Brazil | | $ | 2,475,560 | | | $ | — | | | $ | — | | | $ | 2,475,560 | |
China | | | 2,670,152 | | | | 7,193,529 | | | | — | | | | 9,863,681 | |
France | | | — | | | | 4,198,529 | | | | — | | | | 4,198,529 | |
Germany | | | — | | | | 4,240,234 | | | | — | | | | 4,240,234 | |
Hong Kong | | | — | | | | 2,801,760 | | | | — | | | | 2,801,760 | |
India | | | — | | | | 4,092,568 | | | | — | | | | 4,092,568 | |
Indonesia | | | — | | | | 2,586,258 | | | | — | | | | 2,586,258 | |
Italy | | | — | | | | 3,307,493 | | | | — | | | | 3,307,493 | |
Japan | | | — | | | | 15,462,353 | | | | — | | | | 15,462,353 | |
Netherlands | | | — | | | | 9,071,592 | | | | — | | | | 9,071,592 | |
Norway | | | — | | | | 3,860,561 | | | | — | | | | 3,860,561 | |
Portugal | | | — | | | | 2,957,206 | | | | — | | | | 2,957,206 | |
Singapore | | | 1,740,978 | | | | — | | | | — | | | | 1,740,978 | |
Spain | | | — | | | | 6,898,721 | | | | — | | | | 6,898,721 | |
Switzerland | | | — | | | | 4,301,521 | | | | — | | | | 4,301,521 | |
United Kingdom | | | 9,278,811 | | | | 17,311,295 | | | | — | | | | 26,590,106 | |
United States | | | 5,749,459 | | | | — | | | | — | | | | 5,749,459 | |
Preferred Securities | | | 2,262,551 | | | | — | | | | — | | | | 2,262,551 | |
| | |
| 6 | | 2017 BLACKROCK ANNUAL REPORTTO SHAREHOLDERS |
| | |
Schedule of Investments (continued) December 31, 2017 | | BlackRock International V.I. Fund |
| | | | | | | | | | | | | | | | |
| | | Level 1 | | | Level 2 | | | Level 3 | | | Total | |
Short-Term Securities: | | | | | | | | | | | | | | | | |
Money Market Funds | | $ | 3,135,204 | | | $ | — | | | $ | — | | | $ | 3,135,204 | |
Time Deposits | | | — | | | | 127,594 | | | | — | | | | 127,594 | |
| | | | | | | | | | | | | | | | |
Subtotal | | $ | 27,312,715 | | | $ | 88,411,214 | | | $ | — | | | $ | 115,723,929 | |
| | | | | | | | | | | | | | | | |
Investments valued at NAV(a) | | | | | | | | | | | | | | $ | 6,215,742 | |
| | | | | | | | | | | | | | | | |
Total Investments | | | | | | | | | | | | | | $ | 121,939,671 | |
| | | | | | | | | | | | | | | | |
| | (a) | As of December 31, 2017, certain investments of the Fund were fair valued using NAV per share as no quoted market value is available and therefore have been excluded from the fair value hierarchy. | |
Transfers between Level 1 and Level 2 were as follows:
| | | | | | | | |
| | | Transfers Into
Level 1 (a) | | | Transfers Out
of Level 2 (a) | |
Assets: | | | | | | | | |
Investments: | | | | | | | | |
Common Stocks: | | | | | | | | |
United Kingdom | | $ | 3,656,703 | | | $ | 3,656,703 | |
| | (a) | Systematic Fair Value Prices were not utilized at period end for these investments. | |
See notes to financial statements.
| | | | |
| SCHEDULE OF INVESTMENTS | | | 7 | |
Statement of Assets and Liabilities
December 31, 2017
| | | | |
| | | BlackRock
International V.I. Fund | |
|
ASSETS | |
Investments at value — unaffiliated (including securities loaned at value of $5,088,701) (cost — $96,146,460) | | $ | 112,588,725 | |
Investments at value — affiliated (cost — $9,351,220) | | | 9,350,946 | |
Cash | | | 15 | |
Receivables: | | | | |
Securities lending income — affiliated | | | 1,344 | |
Dividends — affiliated | | | 3,540 | |
Dividends — unaffiliated | | | 279,135 | |
From the Manager | | | 46,530 | |
Prepaid expenses | | | 516 | |
| | | | |
Total assets | | | 122,270,751 | |
| | | | |
|
LIABILITIES | |
Foreign bank overdraft (cost — $(5,282)) | | | 4,561 | |
Cash collateral on securities loaned at value | | | 6,218,182 | |
Payables: | | | | |
Capital shares redeemed | | | 205,112 | |
Deferred foreign capital gain tax | | | 125,570 | |
Investment advisory fees | | | 72,861 | |
Officer’s and Directors’ fees | | | 3,735 | |
Other accrued expenses | | | 74,457 | |
Other affiliates | | | 543 | |
Professional fees | | | 80,618 | |
Transfer agent fees | | | 52,496 | |
| | | | |
Total liabilities | | | 6,838,135 | |
| | | | |
| |
NET ASSETS | | $ | 115,432,616 | |
| | | | |
|
NET ASSETS CONSIST OF | |
Paid-in capital | | $ | 97,874,970 | |
Undistributed net investment income | | | 1,301,053 | |
Accumulated net realized loss | | | (63,153 | ) |
Net unrealized appreciation (depreciation) | | | 16,319,746 | |
| | | | |
NET ASSETS | | $ | 115,432,616 | |
| | | | |
Class I — Based on net assets of $115,432,616 and 9,193,573 shares outstanding, 100 million shares authorized, $0.10 par value. | | $ | 12.56 | |
| | | | |
See notes to financial statements.
| | |
| 8 | | 2017 BLACKROCK ANNUAL REPORTTO SHAREHOLDERS |
Statement of Operations
Year Ended December 31, 2017
| | | | |
| | | BlackRock
International V.I. Fund | |
| |
INVESTMENT INCOME | | | | |
Dividends — affiliated | | $ | 29,835 | |
Dividends — unaffiliated | | | 2,730,830 | |
Securities lending income — affiliated — net | | | 36,920 | |
Foreign taxes withheld | | | (204,693 | ) |
| | | | |
Total investment income | | | 2,592,892 | |
| | | | |
| |
EXPENSES | | | | |
Investment advisory | | | 782,412 | |
Transfer agent | | | 199,997 | |
Professional | | | 146,419 | |
Custodian | | | 46,697 | |
Accounting services | | | 38,012 | |
Printing | | | 37,071 | |
Directors and Officer | | | 21,673 | |
Miscellaneous | | | 20,234 | |
| | | | |
Total expenses | | | 1,292,515 | |
Less: | | | | |
Transfer agent fees reimbursed — class specific | | | (112,367 | ) |
Fees waived and/or reimbursed by the Manager | | | (21,521 | ) |
| | | | |
Total expenses after fees waived and/or reimbursed | | | 1,158,627 | |
| | | | |
Net investment income | | | 1,434,265 | |
| | | | |
| |
REALIZED AND UNREALIZED GAIN (LOSS) | | | | |
Net realized gain (loss) from: | | | | |
Investments — affiliated | | | (2,471 | ) |
Investments — unaffiliated (net of $34,542 foreign capital gain tax) | | | 9,339,824 | |
Capital gain distributions from investment companies — affiliated | | | 15 | |
Forward foreign currency exchange contracts | | | (169,292 | ) |
Foreign currency transactions | | | 5,849 | |
| | | | |
| | | 9,173,925 | |
| | | | |
Net change in unrealized appreciation (depreciation) on: | | | | |
Investments — affiliated | | | (273 | ) |
Investments — unaffiliated (net of $55,722 foreign capital gain tax) | | | 17,275,573 | |
Foreign currency translations | | | (64,644 | ) |
| | | | |
| | | 17,210,656 | |
| | | | |
Net realized and unrealized gain | | | 26,384,581 | |
| | | | |
NET INCREASE IN NET ASSETS RESULTING FROM OPERATIONS | | $ | 27,818,846 | |
| | | | |
See notes to financial statements.
Statements of Changes in Net Assets
| | | | | | | | |
| | | BlackRock International V.I. Fund | |
| | | Year Ended December 31, | |
| | | 2017 | | | 2016 | |
| | |
INCREASE (DECREASE) IN NET ASSETS | | | | | | | | |
| | |
OPERATIONS | | | | | | | | |
Net investment income | | $ | 1,434,265 | | | $ | 1,553,479 | |
Net realized gain (loss) | | | 9,173,925 | | | | (3,236,168 | ) |
Net change in unrealized appreciation (depreciation) | | | 17,210,656 | | | | 1,738,672 | |
| | | | | | | | |
Net increase in net assets resulting from operations | | | 27,818,846 | | | | 55,983 | |
| | | | | | | | |
| | |
DISTRIBUTIONS TO SHAREHOLDERS(a) | | | | | | | | |
From net investment income | | | — | | | | (1,638,966 | ) |
Return of capital | | | — | | | | (9,671 | ) |
| | | | | | | | |
Decrease in net assets resulting from distributions to shareholders | | | — | | | | (1,648,637 | ) |
| | | | | | | | |
| | |
CAPITAL SHARE TRANSACTIONS | | | | | | | | |
Net decrease in net assets derived from capital share transactions | | | (8,586,936 | ) | | | (10,148,958 | ) |
| | | | | | | | |
| | |
NET ASSETS | | | | | | | | |
Total increase (decrease) in net assets | | | 19,231,910 | | | | (11,741,612 | ) |
Beginning of year | | | 96,200,706 | | | | 107,942,318 | |
| | | | | | | | |
End of year | | $ | 115,432,616 | | | $ | 96,200,706 | |
| | | | | | | | |
Undistributed (distributions in excess of) net investment income, end of year | | $ | 1,301,053 | | | $ | (4,310 | ) |
| | | | | | | | |
| (a) | Distributions for annual periods determined in accordance with U.S. federal income tax regulations. |
See notes to financial statements.
| | |
| 10 | | 2017 BLACKROCK ANNUAL REPORTTO SHAREHOLDERS |
Financial Highlights
(For a share outstanding throughout each period)
| | | | | | | | | | | | | | | | | | | | |
| | | BlackRock International V.I. Fund | |
| | | Class I | |
| | | Year Ended December 31, | |
| | | 2017 | | | 2016 | | | 2015 | | | 2014 | | | 2013 | |
Net asset value, beginning of year | | $ | 9.58 | | | $ | 9.71 | | | $ | 10.10 | | | $ | 10.87 | | | $ | 9.04 | |
| | | | | | | | | | | | | | | | | | | | |
Net investment income(a) | | | 0.15 | | | | 0.15 | | | | 0.14 | | | | 0.13 | | | | 0.19 | |
Net realized and unrealized gain (loss) | | | 2.83 | | | | (0.11 | ) | | | (0.42 | ) | | | (0.69 | ) | | | 1.86 | |
| | | | | | | | | | | | | | | | | | | | |
Net increase (decrease) from investment operations | | | 2.98 | | | | 0.04 | | | | (0.28 | ) | | | (0.56 | ) | | | 2.05 | |
| | | | | | | | | | | | | | | | | | | | |
| Distributions:(b) | | | | | | | | | | | | | | | |
From net investment income | | | — | | | | (0.17 | ) | | | (0.11 | ) | | | (0.21 | ) | | | (0.22 | ) |
From return of capital | | | — | | | | (0.00 | )(c) | | | — | | | | — | | | | — | |
| | | | | | | | | | | | | | | | | | | | |
Total distributions | | | — | | | | (0.17 | ) | | | (0.11 | ) | | | (0.21 | ) | | | (0.22 | ) |
| | | | | | | | | | | | | | | | | | | | |
Net asset value, end of year | | $ | 12.56 | | | $ | 9.58 | | | $ | 9.71 | | | $ | 10.10 | | | $ | 10.87 | |
| | | | | | | | | | | | | | | | | | | | |
| | | | | |
Total Return:(d) | | | | | | | | | | | | | | | | | | | | |
Based on net asset value | | | 31.11 | % | | | 0.39 | % | | | (2.76 | )% | | | (5.19 | )% | | | 22.75 | % |
| | | | | | | | | | | | | | | | | | | | |
| | | | | |
Ratios to Average Net Assets: | | | | | | | | | | | | | | | | | | | | |
Total expenses | | | 1.24 | %(e) | | | 1.15 | % | | | 1.09 | % | | | 1.11 | % | | | 1.08 | % |
| | | | | | | | | | | | | | | | | | | | |
Total expenses after fees waived and/or reimbursed | | | 1.11 | %(e) | | | 1.04 | % | | | 0.98 | % | | | 0.99 | % | | | 0.97 | % |
| | | | | | | | | | | | | | | | | | | | |
Net investment income | | | 1.37 | %(e) | | | 1.57 | % | | | 1.35 | % | | | 1.21 | % | | | 1.92 | % |
| | | | | | | | | | | | | | | | | | | | |
| | | | | |
Supplemental Data: | | | | | | | | | | | | | | | | | | | | |
Net assets, end of year (000) | | $ | 115,433 | | | $ | 96,201 | | | $ | 107,942 | | | $ | 125,144 | | | $ | 150,314 | |
| | | | | | | | | | | | | | | | | | | | |
Portfolio turnover rate | | | 103 | % | | | 82 | % | | | 112 | % | | | 129 | % | | | 121 | % |
| | | | | | | | | | | | | | | | | | | | |
| (a) | Based on average shares outstanding. |
| (b) | Distributions for annual periods determined in accordance with U.S. federal income tax regulations. |
| (c) | Amount is greater than $(0.005) per share. |
| (d) | Where applicable, excludes insurance-related fees and expenses and assumes the reinvestment of distributions. |
| (e) | Excludes expenses incurred indirectly as a result of investments in underlying funds of 0.01%. |
See notes to financial statements.
Notes to Financial Statements
BlackRock Variable Series Funds, Inc. (the “Company”) is registered under the Investment Company Act of 1940, as amended (the “1940 Act”), as an open-end management investment company. The Company is organized as a Maryland corporation that is comprised of 20 separate funds. The funds offer shares to insurance companies for their separate accounts to fund benefits under certain variable annuity and variable life insurance contracts. The financial statements presented are for BlackRock International V.I. Fund (the “Fund”). The Fund is classified as diversified.
The Fund, together with certain other registered investment companies advised by BlackRock Advisors, LLC (the “Manager”) or its affiliates, is included in a complex of open-end funds referred to as the Equity-Bond Complex.
| 2. | SIGNIFICANT ACCOUNTING POLICIES |
The financial statements are prepared in conformity with accounting principles generally accepted in the United States of America (“U.S. GAAP”), which may require management to make estimates and assumptions that affect the reported amounts of assets and liabilities in the financial statements, disclosure of contingent assets and liabilities at the date of the financial statements and the reported amounts of increases and decreases in net assets from operations during the reporting period. Actual results could differ from those estimates. The Fund is considered an investment company under U.S. GAAP and follows the accounting and reporting guidance applicable to investment companies. Below is a summary of significant accounting policies:
Investment Transactions and Income Recognition: For financial reporting purposes, investment transactions are recorded on the dates the transactions are entered into (the “trade dates”). Realized gains and losses on investment transactions are determined on the identified cost basis. Dividend income is recorded on the ex-dividend date. Dividends from foreign securities where the ex-dividend date may have passed are subsequently recorded when the Fund is informed of the ex-dividend date. Under the applicable foreign tax laws, a withholding tax at various rates may be imposed on capital gains, dividends and interest.
Foreign Currency Translation: The Fund’s books and records are maintained in U.S. dollars. Securities and other assets and liabilities denominated in foreign currencies are translated into U.S. dollars using exchange rates determined as of the close of trading on the New York Stock Exchange (“NYSE”). Purchases and sales of investments are recorded at the rates of exchange prevailing on the respective dates of such transactions. Generally, when the U.S. dollar rises in value against a foreign currency, the investments denominated in that currency will lose value; the opposite effect occurs if the U.S. dollar falls in relative value.
The Fund does not isolate the portion of the results of operations arising as a result of changes in the exchange rates from the changes in the market prices of investments held or sold for financial reporting purposes. Accordingly, the effects of changes in exchange rates on investments are not segregated in the Statement of Operations from the effects of changes in market prices of those investments, but are included as a component of net realized and unrealized gain (loss) from investments. The Fund reports realized currency gains (losses) on foreign currency related transactions as components of net realized gain (loss) for financial reporting purposes, whereas such components are generally treated as ordinary income for U.S. federal income tax purposes.
Segregation and Collateralization: In cases where the Fund enters into certain investments (e.g., forward foreign currency exchange contracts) that would be treated as “senior securities” for 1940 Act purposes, the Fund may segregate or designate on its books and records cash or liquid assets having a market value at least equal to the amount of its future obligations under such investments. Doing so allows the investment to be excluded from treatment as a “senior security.” Furthermore, if required by an exchange or counterparty agreement, the Fund may be required to deliver/deposit cash and/or securities to/with an exchange, or broker-dealer or custodian as collateral for certain investments or obligations.
Distributions: Distributions paid by the Fund are recorded on the ex-dividend date. Distributions of capital gains are recorded on the ex-dividend date and made at least annually. Portions of return of capital distributions under U.S. GAAP may be taxed at ordinary income rates. The character of distributions is determined in accordance with U.S. federal income tax regulations, which may differ from U.S. GAAP. The portion of distributions that exceeds a Trust’s current and accumulated earnings and profits, as measured on a tax basis, constitute a non-taxable return of capital. Realized net capital gains can be offset by capital losses carried forward from prior years. However, certain Funds have capital loss carryforwards from pre-2012 tax years that offset realized net capital gains but do not offset current earnings and profits. Consequently, if distributions in any tax year are less than the Fund’s current earnings and profits but greater than net investment income and net realized capital gains (taxable income), distributions in excess of taxable income are not treated as non-taxable return of capital, but rather may be taxable to shareholders at ordinary income rates. Under certain circumstances, taxable excess distributions could be significant.
Indemnifications: In the normal course of business, the Fund enters into contracts that contain a variety of representations that provide general indemnification. The Fund’s maximum exposure under these arrangements is unknown because it involves future potential claims against the Fund, which cannot be predicted with any certainty.
Other: Expenses directly related to the Fund are charged to the Fund. Other operating expenses shared by several funds, including other funds managed by the Manager, are prorated among those funds on the basis of relative net assets or other appropriate methods.
The Fund has an arrangement with its custodian whereby credits are earned on uninvested cash balances, which could be used to reduce custody fees and/or overdraft charges. The Fund may incur charges on certain uninvested cash balances and overdrafts, subject to certain conditions.
| 3. | INVESTMENT VALUATION AND FAIR VALUE MEASUREMENTS |
Investment Valuation Policies: The Fund’s investments are valued at fair value (also referred to as “market value” within the financial statements) as of the close of trading on the NYSE (generally 4:00 p.m., Eastern time) (or, if the reporting date falls on a day the NYSE is closed, investments are valued at fair value as of the period end). U.S. GAAP defines fair value as the price the Fund would receive to sell an asset or pay to transfer a liability in an orderly transaction between market participants at the measurement date. The Fund determines the fair values of its financial instruments using various independent dealers or pricing services under policies approved by
| | |
| 12 | | 2017 BLACKROCK ANNUAL REPORTTO SHAREHOLDERS |
Notes to Financial Statements (continued)
the Board of Directors of the Company (the “Board”). The BlackRock Global Valuation Methodologies Committee (the “Global Valuation Committee”) is the committee formed by management to develop global pricing policies and procedures and to oversee the pricing function for all financial instruments.
Fair Value Inputs and Methodologies: The following methods and inputs are used to establish the fair value of the Fund’s assets and liabilities:
| | • | | Equity investments traded on a recognized securities exchange are valued at the official closing price each day, if available. For equity investments traded on more than one exchange, the official closing price on the exchange where the stock is primarily traded is used. Equity investments traded on a recognized exchange for which there were no sales on that day may be valued at the last available bid (long positions) or ask (short positions) price. |
| | • | | Generally, trading in foreign instruments is substantially completed each day at various times prior to the close of trading on the NYSE. Occasionally, events affecting the values of such instruments may occur between the foreign market close and the close of trading on the NYSE that may not be reflected in the computation of the Fund’s net assets. Each business day, the Fund uses a pricing service to assist with the valuation of certain foreign exchange-traded equity securities and foreign exchange-traded and over-the-counter (“OTC”) options (the “Systematic Fair Value Price”). Using current market factors, the Systematic Fair Value Price is designed to value such foreign securities and foreign options at fair value as of the close of trading on the NYSE, which follows the close of the local markets. |
| | • | | Investments in open-end U.S. mutual funds are valued at net asset value (“NAV”) each business day. |
| | • | | The Fund values its investment in SL Liquidity Series, LLC, Money Market Series (the “Money Market Series”) at fair value, which is ordinarily based upon its pro rata ownership in the underlying fund’s net assets. The Money Market Series seeks current income consistent with maintaining liquidity and preserving capital. Although the Money Market Series is not registered under the 1940 Act, its investments may follow the parameters of investments by a money market fund that is subject to Rule 2a-7 under the 1940 Act. |
| | • | | Forward foreign currency exchange contracts are valued at the mean between the bid and ask prices and are determined as of the close of trading on the NYSE. Interpolated values are derived when the settlement date of the contract is an interim date for which quotations are not available. |
If events (e.g., a company announcement, market volatility or a natural disaster) occur that are expected to materially affect the value of such investments, or in the event that the application of these methods of valuation results in a price for an investment that is deemed not to be representative of the market value of such investment, or if a price is not available, the investment will be valued by the Global Valuation Committee, or its delegate, in accordance with a policy approved by the Board as reflecting fair value (“Fair Valued Investments”). The fair valuation approaches that may be used by the Global Valuation Committee will include market approach, income approach and the cost approach. Valuation techniques such as discounted cash flow, use of market comparables and matrix pricing are types of valuation approaches and are typically used in determining fair value. When determining the price for Fair Valued Investments, the Global Valuation Committee, or its delegate, seeks to determine the price that the Fund might reasonably expect to receive or pay from the current sale or purchase of that asset or liability in an arm’s-length transaction. Fair value determinations shall be based upon all available factors that the Global Valuation Committee, or its delegate, deems relevant and consistent with the principles of fair value measurement. The pricing of all Fair Valued Investments is subsequently reported to the Board or a committee thereof on a quarterly basis.
Fair Value Hierarchy: Various inputs are used in determining the fair value of investments and derivative financial instruments. These inputs to valuation techniques are categorized into a fair value hierarchy consisting of three broad levels for financial statement purposes as follows:
| | • | | Level 1 — Unadjusted price quotations in active markets/exchanges for identical assets or liabilities that the Fund has the ability to access |
| | • | | Level 2 — Other observable inputs (including, but not limited to, quoted prices for similar assets or liabilities in markets that are active, quoted prices for identical or similar assets or liabilities in markets that are not active, inputs other than quoted prices that are observable for the assets or liabilities (such as interest rates, yield curves, volatilities, prepayment speeds, loss severities, credit risks and default rates) or other market–corroborated inputs) |
| | • | | Level 3 — Unobservable inputs based on the best information available in the circumstances, to the extent observable inputs are not available (including the Fund’s own assumptions used in determining the fair value of investments and derivative financial instruments) |
The hierarchy gives the highest priority to unadjusted quoted prices in active markets for identical assets or liabilities (Level 1 measurements) and the lowest priority to unobservable inputs (Level 3 measurements). Accordingly, the degree of judgment exercised in determining fair value is greatest for instruments categorized in Level 3. The inputs used to measure fair value may fall into different levels of the fair value hierarchy. In such cases, for disclosure purposes, the fair value hierarchy classification is determined based on the lowest level input that is significant to the fair value measurement in its entirety. Investments classified within Level 3 have significant unobservable inputs used by the Global Valuation Committee in determining the price for Fair Valued Investments. Level 3 investments include equity or debt issued by privately held companies or funds. There may not be a secondary market, and/or there are a limited number of investors. Level 3 investments may also be adjusted to reflect illiquidity and/or non-transferability, with the amount of such discount estimated by the Global Valuation Committee in the absence of market information.
Changes in valuation techniques may result in transfers into or out of an assigned level within the hierarchy. In accordance with the Fund’s policy, transfers between different levels of the fair value hierarchy are deemed to have occurred as of the beginning of the reporting period. The categorization of a value determined for investments and derivative financial instruments is based on the pricing transparency of the investments and derivative financial instruments and is not necessarily an indication of the risks associated with investing in those securities.
As of December 31, 2017, certain investments of the Fund were valued using NAV as no quoted market value is available and therefore have been excluded from the fair value hierarchy.
| | | | |
| NOTESTO FINANCIAL STATEMENTS | | | 13 | |
Notes to Financial Statements (continued)
| 4. | SECURITIES AND OTHER INVESTMENTS |
Preferred Stocks: Preferred stock has a preference over common stock in liquidation (and generally in receiving dividends as well), but is subordinated to the liabilities of the issuer in all respects. As a general rule, the market value of preferred stock with a fixed dividend rate and no conversion element varies inversely with interest rates and perceived credit risk, while the market price of convertible preferred stock generally also reflects some element of conversion value. Because preferred stock is junior to debt securities and other obligations of the issuer, deterioration in the credit quality of the issuer will cause greater changes in the value of a preferred stock than in a more senior debt security with similar stated yield characteristics. Unlike interest payments on debt securities, preferred stock dividends are payable only if declared by the issuer’s board of directors. Preferred stock also may be subject to optional or mandatory redemption provisions.
Securities Lending: The Fund may lend its securities to approved borrowers, such as brokers, dealers and other financial institutions. The borrower pledges and maintains with the Fund collateral consisting of cash, an irrevocable letter of credit issued by a bank, or securities issued or guaranteed by the U.S. Government. The initial collateral received by the Fund is required to have a value of at least 102% of the current value of the loaned securities for securities traded on U.S. exchanges and a value of at least 105% for all other securities. The collateral is maintained thereafter at a value equal to at least 100% of the current market value of the securities on loan. The market value of the loaned securities is determined at the close of each business day of the Fund and any additional required collateral is delivered to the Fund, or excess collateral returned by the Fund, on the next business day. During the term of the loan, the Fund is entitled to all distributions made on or in respect of the loaned securities but does not receive interest income on securities received as collateral. Loans of securities are terminable at any time and the borrower, after notice, is required to return borrowed securities within the standard time period for settlement of securities transactions.
The market value of any securities on loan, all of which were classified as common stocks in the Fund’s Schedule of Investments, and the value of any related collateral are shown separately in the Statement of Assets and Liabilities as a component of investments at value — unaffiliated, and collateral on securities loaned at value, respectively. As of period end, any securities on loan were collateralized by cash and/or U.S. Government obligations. Cash collateral invested by the securities lending agent, BlackRock Investment Management, LLC (“BIM”), if any, is disclosed in the Schedule of Investments.
Securities lending transactions are entered into by the Fund under Master Securities Lending Agreements (each, an “MSLA”), which provide the right, in the event of default (including bankruptcy or insolvency), for the non-defaulting party to liquidate the collateral and calculate a net exposure to the defaulting party or request additional collateral. In the event that a borrower defaults, the Fund, as lender, would offset the market value of the collateral received against the market value of the securities loaned. When the value of the collateral is greater than that of the market value of the securities loaned, the lender is left with a net amount payable to the defaulting party. However, bankruptcy or insolvency laws of a particular jurisdiction may impose restrictions on or prohibitions against such a right of offset in the event of an MSLA counterparty’s bankruptcy or insolvency. Under the MSLA, absent an event of default the borrower can resell or re-pledge the loaned securities, and the Fund can reinvest cash collateral received in connection with loaned securities. Upon an event of default, the parties’ obligations to return the securities or collateral to the other party are extinguished, and the parties can resell or re-pledge the loaned securities or the collateral received in connection with the loaned securities in order to satisfy the defaulting party’s net payment obligation for all transactions under the MSLA. The defaulting party remains liable for any deficiency.
As of period end, the following table is a summary of the Fund’s securities lending agreements by counterparty which are subject to offset under an MSLA:
| | | | | | | | | | | | |
| Counterparty | | Securities
Loaned at Value | | | Cash Collateral
Received (a) | | | Net
Amount | |
Goldman Sachs & Co. | | $ | 4,746,261 | | | $ | (4,746,261 | ) | | $ | — | |
State Street Bank & Trust Co. | | | 342,440 | | | | (342,440 | ) | | | — | |
| | | | | | | | | | | | |
| | $ | 5,088,701 | | | $ | (5,088,701 | ) | | $ | — | |
| | | | | | | | | | | | |
| | (a) | Cash collateral with a value of $6,218,182 has been received in connection with securities lending agreements. Collateral received in excess of the value of securities loaned from the individual counterparty is not shown for financial reporting purposes in the table above. | |
The risks of securities lending include the risk that the borrower may not provide additional collateral when required or may not return the securities when due. To mitigate these risks, the Fund benefits from a borrower default indemnity provided by BIM. BIM’s indemnity allows for full replacement of the securities loaned if the collateral received does not cover the value on the securities loaned in the event of borrower default. The Fund could incur a loss if the value of an investment purchased with cash collateral falls below the market value of loaned securities or if the value of an investment purchased with cash collateral falls below the value of the original cash collateral received.
| 5. | DERIVATIVE FINANCIAL INSTRUMENTS |
The Fund engages in various portfolio investment strategies using derivative contracts both to increase the returns of the Fund and/or to manage its exposure to certain risks such as credit risk, equity risk, interest rate risk, foreign currency exchange rate risk, commodity price risk or other risks (e.g., inflation risk). Derivative financial instruments categorized by risk exposure are included in the Schedule of Investments. These contracts may be transacted on an exchange or OTC.
Forward Foreign Currency Exchange Contracts: Forward foreign currency exchange contracts are entered into to gain or reduce exposure to foreign currencies (foreign currency exchange rate risk).
A forward foreign currency exchange contract is an agreement between two parties to buy and sell a currency at a set exchange rate on a specified date. These contracts help to manage the overall exposure to the currencies in which some of the investments held by the Fund are denominated and in some cases, may be used to obtain exposure to a particular market.
The contract is marked to market daily and the change in market value is recorded as unrealized appreciation (depreciation) in the Statement of Assets and Liabilities. When a contract is closed, a realized gain or loss is recorded in the Statement of Operations equal to the difference between the value at the time it was opened and the
| | |
| 14 | | 2017 BLACKROCK ANNUAL REPORTTO SHAREHOLDERS |
Notes to Financial Statements (continued)
value at the time it was closed. Non-deliverable forward foreign currency exchange contracts are settled with the counterparty in cash without the delivery of foreign currency. The use of forward foreign currency exchange contracts involves the risk that the value of a forward foreign currency exchange contract changes unfavorably due to movements in the value of the referenced foreign currencies.
Master Netting Arrangements: In order to define its contractual rights and to secure rights that will help it mitigate its counterparty risk, the Fund may enter into an International Swaps and Derivatives Association, Inc. Master Agreement (“ISDA Master Agreement”) or similar agreement with its counterparties. An ISDA Master Agreement is a bilateral agreement between the Fund and a counterparty that governs certain OTC derivatives and typically contains, among other things, collateral posting terms and netting provisions in the event of a default and/or termination event. Under an ISDA Master Agreement, the Fund may, under certain circumstances, offset with the counterparty certain derivative financial instruments’ payables and/or receivables with collateral held and/or posted and create one single net payment. The provisions of the ISDA Master Agreement typically permit a single net payment in the event of default including the bankruptcy or insolvency of the counterparty. Bankruptcy or insolvency laws of a particular jurisdiction may restrict or prohibit the right of offset in bankruptcy, insolvency or other events.
Collateral Requirements: For derivatives traded under an ISDA Master Agreement, the collateral requirements are typically calculated by netting the mark-to-market amount for each transaction under such agreement and comparing that amount to the value of any collateral currently pledged by the Fund and the counterparty.
Cash collateral that has been pledged to cover obligations of the Fund and cash collateral received from the counterparty, if any, is reported separately on the Statement of Assets and Liabilities as cash pledged as collateral and cash received as collateral, respectively. Non-cash collateral pledged by the Fund, if any, is noted in the Schedule of Investments. Generally, the amount of collateral due from or to a counterparty is subject to a certain minimum transfer amount threshold before a transfer is required, which is determined at the close of business of the Fund. Any additional required collateral is delivered to/pledged by the Fund on the next business day. Typically, the counterparty is not permitted to sell, re-pledge or use cash and non-cash collateral it receives. The Fund generally agrees not to use non-cash collateral that it receives but may, absent default or certain other circumstances defined in the underlying ISDA Master Agreement, be permitted to use cash collateral received. In such cases, interest may be paid pursuant to the collateral arrangement with the counterparty. To the extent amounts due to the Fund from its counterparties are not fully collateralized, it bears the risk of loss from counterparty non-performance. Likewise, to the extent the Fund has delivered collateral to a counterparty and stands ready to perform under the terms of its agreement with such counterparty, it bears the risk of loss from a counterparty in the amount of the value of the collateral in the event the counterparty fails to return such collateral. Based on the terms of agreements, collateral may not be required for all derivative contracts.
For financial reporting purposes, the Fund does not offset derivative assets and derivative liabilities that are subject to netting arrangements, if any, in the Statement of Assets and Liabilities.
| 6. | INVESTMENT ADVISORY AGREEMENT AND OTHER TRANSACTIONS WITH AFFILIATES |
The PNC Financial Services Group, Inc. is the largest stockholder and an affiliate of BlackRock, Inc. (“BlackRock”) for 1940 Act purposes.
Investment Advisory: The Company, on behalf of the Fund, entered into an Investment Advisory Agreement with the Manager, the Fund’s investment adviser, an indirect, wholly-owned subsidiary of BlackRock, to provide investment advisory and administrative services. The Manager is responsible for the management of the Fund’s portfolio and provides the personnel, facilities, equipment and certain other services necessary to the operations of the Fund.
For such services, the Fund pays the Manager a monthly fee at an annual rate equal to the following percentages of the average daily value of the Fund’s net assets:
| | | | |
| Average Daily Net Assets | | Investment
Advisory Fees | |
First $1 Billion | | | 0.75 | % |
$1 Billion — $3 Billion | | | 0.71 | |
$3 Billion — $5 Billion | | | 0.68 | |
$5 Billion — $10 Billion | | | 0.65 | |
Greater than $10 Billion | | | 0.64 | |
With respect to the Fund, the Manager entered into a sub-advisory agreement with BlackRock International Limited (“BIL”), an affiliate of the Manager. The Manager pays BIL, for services it provides, a monthly fee that is a percentage of the investment advisory fees paid by the Fund to the Manager.
Distribution Fees: The Company, on behalf of the Fund, entered into a Distribution Agreement and a Distribution Plan with BlackRock Investments, LLC (“BRIL”), an affiliate of the Manager. Pursuant to the Distribution Plan and in accordance with Rule 12b-1 under the 1940 Act, the Fund pays BRIL ongoing distribution fees. The fees are accrued daily and paid monthly at annual rates based upon the average daily net assets of the relevant share class of the Fund. For the year ended December 31, 2017, the Fund had no distribution fees.
Transfer Agent: On behalf of the Fund, the Manager entered into agreements with insurance companies and other financial intermediaries (“Service Organizations”), some of which may be affiliates. Pursuant to these agreements, the Service Organizations provide the Fund with administrative, networking, recordkeeping, sub-transfer agency and shareholder services to sub-accounts they service. For these services, the Service Organizations receive an annual fee per shareholder account, which will vary depending on share class and/or net assets of Fund shareholders serviced by the Service Organizations, which is shown as transfer agent — class specific. For the year ended December 31, 2017, the Fund did not pay any amounts to affiliates in return for these services.
In addition, the Fund pays the transfer agent, which is not an affiliate, a fee for the issuance, transfer and redemption of shares and the opening and maintenance of shareholder accounts, which is included in transfer agent in the Statement of Operations.
Expense Limitations, Waivers and Reimbursements: With respect to the Fund, the Manager voluntarily agreed to waive its investment advisory fees by the amount of investment advisory fees the Fund pays to the Manager indirectly through its investment in affiliated money market funds (the “affiliated money market fund waiver”). The
| | | | |
| NOTESTO FINANCIAL STATEMENTS | | | 15 | |
Notes to Financial Statements (continued)
amount of waivers and/or reimbursements of fees and expenses made pursuant to the expense limitation caps will be reduced by the amount of the affiliated money market fund waiver. This amount is included in fees waived and/or reimbursed by the Manager in the Statement of Operations. For the year ended December 31, 2017, the amount waived was $2,305.
The Manager has contractually agreed to waive its investment advisory fee with respect to any portion of the Fund’s assets invested in affiliated equity and fixed-income mutual funds and affiliated exchange-traded funds that have a contractual management fee through April 30, 2018. The contractual agreement may be terminated upon 90 days’ notice by a majority of the independent directors who are not “interested persons” of the Fund, as defined in the 1940 Act (“Independent Directors”) or by a vote of a majority of the outstanding voting securities of the Fund. For the year ended December 31, 2017, there were no fees waived by the Manager.
For the year ended December 31, 2017, the Fund reimbursed the Manager $1,113 for certain accounting services, which is included in accounting services in the Statement of Operations.
The Manager contractually agreed to reimburse transfer agent fees in order to limit such expenses at 0.08% of average daily net assets. The Manager has agreed not to reduce or discontinue this contractual expense limitation through April 30, 2018, unless approved by the Board, including a majority of the Independent Directors, or by a vote of a majority of the outstanding voting securities of the Fund. This amount is shown as transfer agent fees reimbursed — class specific in the Statement of Operations. For the year ended December 31, 2017, class specific waivers and/or reimbursements were $112,367.
With respect to the Fund, the Manager contractually agreed to waive and/or reimburse fees or expenses in order to limit expenses, excluding interest expense, dividend expense, tax expense, acquired fund fees and expenses, and certain other fund expenses, which constitute extraordinary expenses not incurred in the ordinary course of the Fund’s business (“expense limitation”). The expense limitation as a percentage of average daily net assets is 1.25% for Class I.
The Manager has agreed not to reduce or discontinue this contractual expense limitation through April 30, 2018, unless approved by the Board, including a majority of the Independent Directors or by a vote of a majority of the outstanding voting securities of the Fund. For the year ended December 31, 2017, the Manager waived $19,216, which is included in fee waived and/or reimbursed by the Manager in the Statement of Operations.
Securities Lending: The U.S. Securities and Exchange Commission (“SEC”) has issued an exemptive order which permits BIM, an affiliate of the Manager, to serve as securities lending agent for the Fund, subject to applicable conditions. As securities lending agent, BIM bears all operational costs directly related to securities lending. The Fund is responsible for expenses in connection with the investment of cash collateral received for securities on loan (the “collateral investment expenses”). The cash collateral is invested in a private investment company managed by the Manager or its affiliates. However, BIM has agreed to cap the collateral investment expenses of the private investment company to an annual rate of 0.04%. The investment adviser to the private investment company will not charge any advisory fees with respect to shares purchased by the Fund. The private investment company in which the cash collateral has been invested may, under certain circumstances, impose a liquidity fee of up to 2% of the value withdrawn or temporarily restrict withdrawals for up to 10 business days during a 90 day period, in the event that the private investment company’s weekly liquid assets fall below certain thresholds.
Securities lending income is equal to the total of income earned from the reinvestment of cash collateral, net of fees and other payments to and from borrowers of securities, and less the collateral investment expenses. The Fund retains a portion of securities lending income and remits a remaining portion to BIM as compensation for its services as securities lending agent.
Pursuant to a securities lending agreement, the Fund retains 80% of securities lending income, and this amount retained can never be less than 70% of the total of securities lending income plus the collateral investment expenses.
In addition, commencing the business day following the date that the aggregate securities lending income earned across the Equity-Bond Complex in a calendar year exceeds a specified threshold, the Fund, pursuant to the securities lending agreement, will retain for the remainder of that calendar year securities lending income as follows: 85% of securities lending income, and this amount retained can never be less than 70% of the total of securities lending income plus the collateral investment expenses.
The share of securities lending income earned by the Fund is shown as securities lending income — affiliated — net in the Statement of Operations. For the year ended December 31, 2017, the Fund paid BIM $7,364 for securities lending agent services.
Interfund Lending: In accordance with an exemptive order (the “Order”) from the SEC, the Fund may participate in a joint lending and borrowing facility for temporary purposes (the “Interfund Lending Program”), subject to compliance with the terms and conditions of the Order, and to the extent permitted by the Fund’s investment policies and restrictions. The Fund is currently permitted to lend under the Interfund Lending Program.
A lending BlackRock fund may lend in aggregate up to 15% of its net assets, but may not lend more than 5% of its net assets to any one borrowing fund through the Interfund Lending Program. A borrowing BlackRock fund may not borrow through the Interfund Lending Program or from any other source more than 33 1/3% of its total assets (or any lower threshold provided for by the fund’s investment restrictions). If a borrowing BlackRock fund’s total outstanding borrowings exceed 10% of its total assets, each of its outstanding interfund loans will be subject to collateralization of at least 102% of the outstanding principal value of the loan. All interfund loans are for temporary or emergency purposes and the interest rate to be charged will be the average of the highest current overnight repurchase agreement rate available to a lending fund and the bank loan rate, as calculated according to a formula established by the Board.
During the year ended December 31, 2017, the Fund did not participate in the Interfund Lending Program.
Officers and Directors: Certain directors and/or officers of the Company are directors and/or officers of BlackRock or its affiliates. The Fund reimburses the Manager for a portion of the compensation paid to the Company’s Chief Compliance Officer, which is included in Directors and Officer in the Statement of Operations.
| | |
| 16 | | 2017 BLACKROCK ANNUAL REPORTTO SHAREHOLDERS |
Notes to Financial Statements (continued)
For the year ended December 31, 2017, purchases and sales of investments, excluding short-term securities, were $103,567,285 and $109,278,349, respectively.
It is the Fund’s policy to comply with the requirements of the Internal Revenue Code of 1986, as amended, applicable to regulated investment companies, and to distribute substantially all of its taxable income to its shareholders. Therefore, no U.S. federal income tax provision is required.
The Fund files U.S. federal and various state and local tax returns. No income tax returns are currently under examination. The statute of limitations on the Fund’s U.S. federal tax returns generally remains open for each of the four years ended December 31, 2017. The statutes of limitations on the Fund’s state and local tax returns may remain open for an additional year depending upon the jurisdiction.
Management has analyzed tax laws and regulations and their application to the Fund as of December 31, 2017, inclusive of the open tax return years, and does not believe that there are any uncertain tax positions that require recognition of a tax liability in the Fund’s financial statements.
U.S. GAAP requires that certain components of net assets be adjusted to reflect permanent differences between financial and tax reporting. These reclassifications have no effect on net assets or net asset values per share. As of period end, the following permanent differences attributable to foreign currency transactions, the expiration of capital loss carryforwards and the characterization of expenses were reclassified to the following accounts:
| | | | |
Paid-in capital | | $ | (20,828,634 | ) |
Undistributed net investment income | | | (128,902 | ) |
Accumulated net realized loss | | | 20,957,536 | |
The tax character of distributions paid was as follows:
| | | | | | | | |
| | | 12/31/2017 | | | 12/31/2016 | |
Ordinary income | | $ | — | | | $ | 1,638,966 | |
Return of Capital | | | — | | | | 9,671 | |
| | | | | | | | |
| | $ | — | | | $ | 1,648,637 | |
| | | | | | | | |
As of period end, the tax components of accumulated net earnings (losses) were as follows:
| | | | |
Undistributed ordinary income | | $ | 1,274,770 | |
Net unrealized gains(a) | | | 16,282,876 | |
| | | | |
| | $ | 17,557,646 | |
| | | | |
| | (a) | The difference between book-basis and tax-basis net unrealized gains was attributable primarily to the tax deferral of losses on wash sales and the timing and recognition of partnership income. | |
During the year ended December 31, 2017, the Fund utilized $9,218,250 of their respective capital loss carryforward:
As of December 31, 2017, gross unrealized appreciation and depreciation for investments based on cost for U.S. federal income tax purposes were as follows:
| | | | |
Tax cost | | $ | 105,534,550 | |
| | | | |
Gross unrealized appreciation | | $ | 18,295,542 | |
Gross unrealized depreciation | | | (1,890,421 | ) |
| | | | |
Net unrealized appreciation (depreciation) | | $ | 16,405,121 | |
| | | | |
The Company, on behalf of the Fund, along with certain other funds managed by the Manager and its affiliates (“Participating Funds”), is a party to a 364-day, $2.1 billion credit agreement with a group of lenders. Under this agreement, the Fund may borrow to fund shareholder redemptions. Excluding commitments designated for certain individual funds, the Participating Funds, including the Fund, can borrow up to an aggregate commitment amount of $1.6 billion at any time outstanding, subject to asset coverage and other limitations as specified in the agreement. The credit agreement has the following terms: a fee of 0.12% per annum on unused commitment amounts and interest at a rate equal to the higher of (a) one-month LIBOR (but, in any event, not less than 0.00%) on the date the loan is made plus 0.80% per annum or (b) the Fed Funds rate (but, in any event, not less than 0.00%) in effect from time to time plus 0.80% per annum on amounts borrowed. The agreement expires in April 2018 unless extended or renewed. Participating Funds paid administration, legal and arrangement fees, which, if applicable, are included in miscellaneous expenses in the Statement of Operations. These fees were allocated among such funds based upon portions of the aggregate commitment available to them and relative net assets of Participating Funds. During the year ended December 31, 2017, the Fund did not borrow under the credit agreement.
| | | | |
| NOTESTO FINANCIAL STATEMENTS | | | 17 | |
Notes to Financial Statements (continued)
In the normal course of business, the Fund invests in securities or other instruments and may enter into certain transactions, and such activities subject the Fund to various risks, including among others, fluctuations in the market (market risk) or failure of an issuer to meet all of its obligations. The value of securities or other instruments may also be affected by various factors, including, without limitation: (i) the general economy; (ii) the overall market as well as local, regional or global political and/or social instability; (iii) regulation, taxation or international tax treaties between various countries; or (iv) currency, interest rate and price fluctuations. The Fund’s prospectus provides details of the risks to which the Fund is subject.
The Fund may be exposed to additional risks when reinvesting cash collateral in money market funds that do not seek to maintain a stable NAV per share of $1.00 and which may be subject to redemption gates or liquidity fees under certain circumstances.
Valuation Risk: The market values of equities, such as common stocks and preferred securities or equity related investments, such as futures and options, may decline due to general market conditions which are not specifically related to a particular company. They may also decline due to factors which affect a particular industry or industries. The Fund may invest in illiquid investments and may experience difficulty in selling those investments in a timely manner at the price that it believes the investments are worth. Prices may fluctuate widely over short or extended periods in response to company, market or economic news. Markets also tend to move in cycles, with periods of rising and falling prices. This volatility may cause the Fund’s NAV to experience significant increases or decreases over short periods of time. If there is a general decline in the securities and other markets, the NAV of the Fund may lose value, regardless of the individual results of the securities and other instruments in which the Fund invests.
Counterparty Credit Risk: The Fund may be exposed to counterparty credit risk, or the risk that an entity may fail to or be unable to perform on its commitments related to unsettled or open transactions. The Fund manages counterparty credit risk by entering into transactions only with counterparties that the Manager believes have the financial resources to honor their obligations and by monitoring the financial stability of those counterparties. Financial assets, which potentially expose the Fund to market, issuer and counterparty credit risks, consist principally of financial instruments and receivables due from counterparties. The extent of the Fund’s exposure to market, issuer and counterparty credit risks with respect to these financial assets is approximately their value recorded in the Statement of Assets and Liabilities, less any collateral held by the Fund.
A derivative contract may suffer a mark-to-market loss if the value of the contract decreases due to an unfavorable change in the market rates or values of the underlying instrument. Losses can also occur if the counterparty does not perform under the contract.
The Fund’s risk of loss from counterparty credit risk on OTC derivatives is generally limited to the aggregate unrealized gain less the value of any collateral held by the Fund.
Concentration Risk: As of period end, the Fund invested a significant portion of its assets in securities in the financials sector. Changes in economic conditions affecting such sector would have a greater impact on the Fund and could affect the value, income and/or liquidity of positions in such securities.
The Fund invests a substantial amount of its assets in issuers located in a single country or a limited number of countries. When the Fund concentrates its investments in this manner, it assumes the risk that economic, political and social conditions in those countries may have a significant impact on their investment performance. Foreign issuers may not be subject to the same uniform accounting, auditing and financial reporting standards and practices as used in the United States. Foreign securities markets may also be less liquid, more volatile, and less subject to governmental supervision not typically associated with investing in U.S. securities. Investment percentages in specific countries are presented in the Schedule of Investments.
The Fund invests a significant portion of its assets in securities of issuers located in Europe or with significant exposure to European issuers or countries. The European financial markets have recently experienced volatility and adverse trends due to concerns about economic downturns in, or rising government debt levels of, several European countries. These events may spread to other countries in Europe and may affect the value and liquidity of certain of the Fund’s investments.
The United Kingdom voted on June 23, 2016 to withdraw from the European Union, which may introduce significant new uncertainties and instability in the financial markets across Europe.
As of period end, the Fund’s investments had the following industry classifications:
| | | | |
| Industry | | Percent of
Long-Term
Investments | |
Banks | | | 25 | % |
Tobacco | | | 10 | |
Beverages | | | 7 | |
Energy Equipment & Services | | | 6 | |
Insurance | | | 6 | |
Textiles, Apparel & Luxury Goods | | | 6 | |
Software | | | 5 | |
Other1 | | | 35 | |
| | 1 | All other industries held were each less than 5% of long-term investments. | |
| | |
| 18 | | 2017 BLACKROCK ANNUAL REPORTTO SHAREHOLDERS |
Notes to Financial Statements (continued)
| 11. | CAPITAL SHARE TRANSACTIONS |
Transactions in capital shares were as follows:
| | | | | | | | | | | | | | | | |
| | | Year Ended
12/31/2017 | | | Year Ended
12/31/2016 | |
| | | Shares | | | Amount | | | Shares | | | Amount | |
Class I | | | | | | | | | | | | | | | | |
Shares sold | | | 766,286 | | | $ | 8,733,286 | | | | 153,174 | | | $ | 1,431,855 | |
Shares issued in reinvestment of distributions | | | — | | | | — | | | | 173,208 | | | | 1,648,637 | |
Shares redeemed | | | (1,613,860 | ) | | | (17,320,222 | ) | | | (1,405,110 | ) | | | (13,229,450 | ) |
| | | | | | | | | | | | | | | | |
Net decrease | | | (847,574 | ) | | $ | (8,586,936 | ) | | | (1,078,728 | ) | | $ | (10,148,958 | ) |
| | | | | | | | | | | | | | | | |
Management has evaluated the impact of all subsequent events on the Fund through the date the financial statements were issued and has determined that there were no subsequent events requiring adjustment or additional disclosure in the financial statements.
| | | | |
| NOTESTO FINANCIAL STATEMENTS | | | 19 | |
Report of the Independent Registered Public Accounting Firm
To the Shareholders of BlackRock International V.I. Fund and the Board of Directors of BlackRock Variable Series Funds, Inc.:
Opinion on the Financial Statements and Financial Highlights
We have audited the accompanying statement of assets and liabilities, including the schedule of investments, of BlackRock International V.I. Fund of BlackRock Variable Series Funds, Inc. (the “Fund”), as of December 31, 2017, the related statement of operations for the year then ended, the statements of changes in net assets for each of the two years in the period then ended, the financial highlights for each of the five years in the period then ended, and the related notes. In our opinion, the financial statements and financial highlights present fairly, in all material respects, the financial position of the Fund as of December 31, 2017, and the results of its operations for the year then ended, the changes in its net assets for each of the two years in the period then ended, and the financial highlights for each of the five years in the period then ended, in conformity with accounting principles generally accepted in the United States of America.
Basis for Opinion
These financial statements and financial highlights are the responsibility of the Fund’s management. Our responsibility is to express an opinion on the Fund’s financial statements and financial highlights based on our audits. We are a public accounting firm registered with the Public Company Accounting Oversight Board (United States) (PCAOB) and are required to be independent with respect to the Fund in accordance with the U.S. federal securities laws and the applicable rules and regulations of the Securities and Exchange Commission and the PCAOB.
We conducted our audits in accordance with the standards of the PCAOB. Those standards require that we plan and perform the audit to obtain reasonable assurance about whether the financial statements and financial highlights are free of material misstatement, whether due to error or fraud. The Fund is not required to have, nor were we engaged to perform, an audit of its internal control over financial reporting. As part of our audits we are required to obtain an understanding of internal control over financial reporting but not for the purpose of expressing an opinion on the effectiveness of the Fund’s internal control over financial reporting. Accordingly, we express no such opinion.
Our audits included performing procedures to assess the risks of material misstatement of the financial statements and financial highlights, whether due to error or fraud, and performing procedures that respond to those risks. Such procedures included examining, on a test basis, evidence regarding the amounts and disclosures in the financial statements and financial highlights. Our audits also included evaluating the accounting principles used and significant estimates made by management, as well as evaluating the overall presentation of the financial statements and financial highlights. Our procedures included confirmation of securities owned as of December 31, 2017, by correspondence with the custodian and brokers; when replies were not received from brokers, we performed other auditing procedures. We believe that our audits provide a reasonable basis for our opinion.
Deloitte & Touche LLP
Boston, Massachusetts
February 19, 2018
We have served as the auditor of one or more BlackRock investment companies since 1992.
| | |
| 20 | | 2017 BLACKROCK ANNUAL REPORTTO SHAREHOLDERS |
DECEMBER 31, 2017
| | |
ANNUAL REPORT | |  |
BlackRock Variable Series Funds, Inc.
| Ø | | BlackRock iShares® Alternative Strategies V.I. Fund |
|
| Not FDIC Insured • May Lose Value • No Bank Guarantee |
| | |
| Fund Summary as of December 31, 2017 | | BlackRock iShares® Alternative Strategies V.I. Fund |
Investment Objective
BlackRock iShares® Alternative Strategies V.I. Fund’s (the “Fund”) investment objective is to seek to achieve long-term growth of capital and risk adjusted returns.
Portfolio Management Commentary
How did the Fund perform?
For the 12-month period ended December 31, 2017, the Fund underperformed its blended benchmark, the 60% MSCI All Country World Index / 40% Bloomberg Barclays U.S. Aggregate Bond Index.
What factors influenced performance?
There were no significant detractors from absolute returns during the period. Relative to the benchmark, the Fund’s exposure to precious metals detracted from performance as metals underperformed equities.
The largest contributor to Fund performance was exposure to the iShares Edge MSCI Minimum Volatility Global ETF. This was followed by exposure to the iShares Commodities Select Strategy ETF.
Describe recent portfolio activity.
In the reporting period, the Fund reduced exposure to the iShares U.S. Preferred Stock ETF and the iShares Gold and Silver Trust ETFs. The Fund added to the iShares J.P. Morgan USD Emerging Markets Bond ETF.
Describe portfolio positioning at period end.
At period end, the Fund was underweight U.S. equities relative to international market equities. The Fund’s top holdings included minimum volatility global equities, preferred stock and global infrastructure. In addition, the Fund maintained exposure to U.S. dollar-denominated emerging market debt, real estate, broad commodities and precious metals.
The views expressed reflect the opinions of BlackRock as of the date of this report and are subject to change based on changes in market, economic or other conditions. These views are not intended to be a forecast of future events and are no guarantee of future results.
Portfolio Information
PORTFOLIO COMPOSITION
| | | | |
| Asset Type | | Percent of
Affiliated Investment
Companies | |
Equity Funds | | | 50 | % |
Fixed Income Funds | | | 27 | |
Commodity Funds | | | 14 | |
Short-Term Securities | | | 9 | |
| | |
| 2 | | 2017 BLACKROCK ANNUAL REPORTTO SHAREHOLDERS |
| | |
| Fund Summary as of December 31, 2017 (continued) | | BlackRock iShares® Alternative Strategies V.I. Fund |
TOTAL RETURN BASED ON A $10,000 INVESTMENT

| (a) | Assuming transaction costs, if any, and other operating expenses, including investment advisory fees. Does not include insurance-related fees and expenses. |
| (b) | The Fund invests in a portfolio of underlying exchange-traded funds that seek to track alternative indices. |
| (c) | A customized weighted index comprised of 60% MSCI All Country World Index and 40% Bloomberg Barclays U.S. Aggregate Bond Index. |
| (d) | A free float-adjusted market capitalization weighted index that is designed to measure the equity market performance of developed and emerging markets. The MSCI All Country World Index consists of 46 country indexes comprising 23 developed and 23 emerging market country indexes. |
| (e) | A widely recognized unmanaged market-weighted index, comprised of investment-grade corporate bonds rated BBB or better, mortgages and U.S. Treasury and U.S. Government agency issues with at least one year to maturity. |
| (f) | Commencement of operations. |
Performance Summary for the Period Ended December 31, 2017
| | | | | | | | | | | | | | | | | | | | |
| | | | | | | | | Average Annual Total Returns | |
| | | 6-Month
Total Returns (b) | | | | | | 1 Year (b) | | | | | | Since
Inception (b)(c) | |
Class I(a) | | | 4.98 | % | | | | | | | 12.74 | % | | | | | | | 5.77 | % |
Class III(a) | | | 4.88 | | | | | | | | 12.45 | | | | | | | | 5.52 | |
60% MSCI All Country World Index / 40% Bloomberg Barclays U.S. Aggregate Bond Index | | | 7.14 | | | | | | | | 15.41 | | | | | | | | 6.07 | |
MSCI All Country World Index | | | 11.21 | | | | | | | | 23.97 | | | | | | | | 8.15 | |
Bloomberg Barclays U.S. Aggregate Bond Index | | | 1.24 | | | | | | | | 3.54 | | | | | | | | 2.70 | |
| | (a) | Average annual and cumulative total returns are based on changes in net asset value for the periods shown, and assume reinvestment of all distributions at net asset value on the ex-dividend date. Insurance-related fees and expenses are not reflected in these returns. | |
| | (b) | For the portion of the period, the Fund’s investment adviser waived a portion of its fee. Without such waiver, the Fund’s performance would have been lower. | |
| | (c) | The Fund commenced operations on April 30, 2014. | |
Past performance is not indicative of future results. Performance results do not reflect the deduction of taxes that a shareholder would pay on Fund distributions or the redemption of Fund shares.
Performance results may include adjustments made for financial reporting purposes in accordance with U.S. generally accepted accounting principles.
Expense Example
| | | | | | | | | | | | | | | | | | | | | | | | | | | | | | | | |
| | | Actual | | | | | | Hypothetical (a) | | | | |
| | | Beginning
Account Value
(07/01/17) | | | Ending
Account Value
(12/31/17) | | | Expenses
Paid During
the Period (b) | | | | | | Beginning
Account Value
(07/01/17) | | | Ending
Account Value
(12/31/17) | | | Expenses
Paid During
the Period (b) | | | Annualized
Expense
Ratio | |
Class I | | $ | 1,000.00 | | | $ | 1,049.80 | | | $ | 3.31 | | | | | | | $ | 1,000.00 | | | $ | 1,021.98 | | | $ | 3.26 | | | | 0.65 | % |
Class III | | | 1,000.00 | | | | 1,049.80 | | | | 4.60 | | | | | | | | 1,000.00 | | | | 1,020.72 | | | | 4.53 | | | | 0.90 | |
| | (a) | Hypothetical 5% annual return before expenses is calculated by prorating the number of days in the most recent fiscal half year divided by 365. | |
| | (b) | For each class of the Fund, expenses are equal to the annualized expense ratio for the class, multiplied by the average account value over the period, multiplied by 184/365 (to reflect the one-half year period shown). | |
See “Disclosure of Expenses” on the following page for further information on how expenses were calculated.
| | |
| Disclosure of Expenses | | BlackRock iShares® Alternative Strategies V.I. Fund |
Shareholders of the Fund may incur the following charges: (a) transactional expenses, such as sales charges; and (b) operating expenses, including investment advisory fees, service and distribution fees, including 12b-1 fees, acquired fund fees and expenses, and other fund expenses. The expense example on the previous page (which is based on a hypothetical investment of $1,000 invested on July 1, 2017 and held through December 31, 2017) is intended to assist shareholders both in calculating expenses based on an investment in the Fund and in comparing these expenses with similar costs of investing in other mutual funds.
The expense example provides information about actual account values and actual expenses. In order to estimate the expenses a shareholder paid during the period covered by this report, shareholders can divide their account value by $1,000 and then multiply the result by the number corresponding to their share class under the heading entitled “Expenses Paid During the Period.”
The expense example also provides information about hypothetical account values and hypothetical expenses based on the Fund’s actual expense ratio and an assumed rate of return of 5% per year before expenses. In order to assist shareholders in comparing the ongoing expenses of investing in the Fund and other funds, compare the 5% hypothetical example with the 5% hypothetical examples that appear in shareholder reports of other funds.
The expenses shown in the expense example are intended to highlight shareholders’ ongoing costs only and do not reflect any transactional expenses, such as sales charges, if any. Therefore, the hypothetical example is useful in comparing ongoing expenses only, and will not help shareholders determine the relative total expenses of owning different funds. If these transactional expenses were included, shareholder expenses would have been higher.
| | |
| 4 | | 2017 BLACKROCK ANNUAL REPORTTO SHAREHOLDERS |
| | |
Consolidated Schedule of Investments December 31, 2017 | | BlackRock iShares® Alternative Strategies V.I. Fund (Percentages shown are based on Net Assets) |
| | | | | | | | |
| Security | | Shares | | | Value | |
Affiliated Investment Companies — 109.7%(f) | |
|
| Commodity Funds — 15.7% | |
iShares Commodities Select Strategy ETF | | | 62,033 | | | $ | 2,254,279 | |
iShares Gold Trust(a)(b) | | | 105,748 | | | | 1,322,908 | |
iShares Silver Trust(a)(b) | | | 56,107 | | | | 897,151 | |
| | | | | | | | |
| | | | | | | 4,474,338 | |
| Equity Funds — 55.0% | | | | | | |
iShares Edge MSCI Minimum Volatility Global ETF | | | 88,203 | | | | 7,437,277 | |
iShares Edge MSCI USA Momentum Factor ETF | | | 14,300 | | | | 1,474,759 | |
iShares Global Infrastructure ETF | | | 86,765 | | | | 3,923,513 | |
iShares U.S. Real Estate ETF(c) | | | 35,364 | | | | 2,864,838 | |
| | | | | | | | |
| | | | | | | 15,700,387 | |
| Fixed Income Funds — 29.4% | | | | | | |
iShares J.P. Morgan USD Emerging Markets Bond ETF | | | 31,319 | | | | 3,636,136 | |
iShares U.S. Preferred Stock ETF | | | 125,328 | | | | 4,771,237 | |
| | | | | | | | |
| | | | | | | 8,407,373 | |
| | | | | | | | |
| Security | | Shares | | | Value | |
|
| Short-Term Securities — 9.6%(d) | |
BlackRock Liquidity Funds, T-Fund, Institutional Class, 1.17% | | | 88,209 | | | $ | 88,209 | |
SL Liquidity Series, LLC, Money Market Series, 1.48%(e) | | | 2,666,376 | | | | 2,666,109 | |
| | | | | | | | |
| | | | 2,754,318 | |
| | | | | | | | |
Total Affiliated Investment Companies — 109.7%
(Cost: $29,341,896) | | | | 31,336,416 | |
Liabilities in Excess of Other Assets — (9.7)% | | | | (2,770,063 | ) |
| | | | | | | | |
Net Assets — 100.0% | | | $ | 28,566,353 | |
| | | | | | | | |
| (a) | Non-income producing security. |
| (b) | All or a portion of the security is held by a wholly-owned subsidiary. See Note 1 of the Notes to Consolidated Financial Statements for details on the wholly-owned subsidiary. |
| (c) | Security, or a portion of the security, is on loan. |
| (d) | Annualized 7-day yield as of period end. |
| (e) | Security was purchased with the cash collateral from loaned securities. |
| (f) | During the year ended December 31, 2017, investments in issuers considered to be affiliates of the Fund for the purposes of Section 2(a)(3) of the Investment Company Act of 1940, as amended, were as follows: |
| | | | | | | | | | | | | | | | | | | | | | | | | | | | | | | | |
| Affiliate | | Shares
Held at
12/31/16 | | | Shares
Purchased | | | Shares
Sold | | | Shares
Held at
12/31/17 | | | Value at
12/31/17 | | | Income | | | Net
Realized
Gain (Loss) (a) | | | Change in
Unrealized
Appreciation
(Depreciation) | |
BlackRock Liquidity Funds, T-Fund, Institutional Class | | | 139,845 | | | | — | | | | (51,636 | )(b) | | | 88,209 | | | $ | 88,209 | | | $ | 653 | | | $ | — | | | $ | — | |
SL Liquidity Series, LLC, Money Market Series | | | 99,233 | | | | 2,567,143 | (c) | | | — | | | | 2,666,376 | | | | 2,666,109 | | | | 16,344 | (d) | | | (1,032 | ) | | | 7 | |
iShares Commodities Select Strategy ETF | | | 20,963 | | | | 45,130 | | | | (4,060 | ) | | | 62,033 | | | | 2,254,279 | | | | 112,838 | | | | 11,337 | | | | 98,245 | |
iShares Edge MSCI Minimum Volatility Global ETF | | | 77,765 | | | | 21,863 | | | | (11,425 | ) | | | 88,203 | | | | 7,437,277 | | | | 139,748 | | | | (34,981 | ) | | | 885,068 | |
iShares Edge MSCI USA Momentum Factor ETF | | | 9,528 | | | | 14,741 | | | | (9,969 | ) | | | 14,300 | | | | 1,474,759 | | | | 4,343 | | | | 14,590 | | | | 83,992 | |
iShares Global Infrastructure ETF | | | — | | | | 91,065 | | | | (4,300 | ) | | | 86,765 | | | | 3,923,513 | | | | 107,229 | | | | 8,786 | | | | 399,352 | |
iShares Gold Trust | | | 86,001 | | | | 53,300 | | | | (33,553 | ) | | | 105,748 | | | | 1,322,908 | | | | — | | | | 48,004 | | | | 121,502 | |
iShares J.P. Morgan USD Emerging Markets Bond ETF | | | 39,361 | | | | 15,938 | | | | (23,980 | ) | | | 31,319 | | | | 3,636,136 | | | | 125,203 | | | | 40,284 | | | | 138,320 | |
iShares Silver Trust | | | 37,235 | | | | 19,872 | | | | (1,000 | ) | | | 56,107 | | | | 897,151 | | | | — | | | | (547 | ) | | | 32,297 | |
iShares U.S. Preferred Stock ETF | | | 170,216 | | | | 39,101 | | | | (83,989 | ) | | | 125,328 | | | | 4,771,237 | | | | 319,362 | | | | (52,762 | ) | | | 224,202 | |
iShares U.S. Real Estate ETF | | | 28,544 | | | | 19,490 | | | | (12,670 | ) | | | 35,364 | | | | 2,864,838 | | | | 104,971 | | | | (14,852 | ) | | | 126,478 | |
| | | | | | | | | | | | | | | | | | | | | | | | | | | | | | | | |
| | | | | | | | | | | | | | | | | | $ | 31,336,416 | | | $ | 930,691 | | | $ | 18,827 | | | $ | 2,109,463 | |
| | | | | | | | | | | | | | | | | | | | | | | | | | | | | | | | |
| | (a) | Includes net capital gain distributions, if applicable. | |
| | (b) | Represents net shares sold. | |
| | (c) | Represents net shares purchased. | |
| | (d) | Represents securities lending income earned from the reinvestment of cash collateral from loaned securities, net of fees and collateral investment expenses, and other payments to and from borrowers of securities. | |
| | |
| Portfolio Abbreviation |
| |
ETF | | Exchange-Traded Fund |
| | | | |
| CONSOLIDATED SCHEDULE OF INVESTMENTS | | | 5 | |
| | |
Consolidated Schedule of Investments (continued) December 31, 2017 | | BlackRock IShares® Alternative Strategies V.I. Fund |
Fair Value Hierarchy as of Period End
Various inputs are used in determining the fair value of investments. For information about the Fund’s policy regarding valuation of investments, refer to the Notes to Consolidated Financial Statements.
The following table summarizes the Fund’s investments categorized in the disclosure hierarchy:
| | | | | | | | | | | | | | | | |
| | | Level 1 | | | Level 2 | | | Level 3 | | | Total | |
Assets: | | | | | | | | | | | | | | | | |
Investments: | | | | | | | | | | | | | | | | |
Affiliated Investment Companies | | $ | 28,670,307 | | | $ | — | | | $ | — | | | $ | 28,670,307 | |
Investments valued at NAV(a) | | | | | | | | | | | | | | | 2,666,109 | |
| | | | | | | | | | | | | | | | |
Total Investments | | | | | | | | | | | | | | $ | 31,336,416 | |
| | | | | | | | | | | | | | | | |
| | (a) | As of December 31, 2017, certain investments of the Fund were fair valued using NAV per share as no quoted market value is available and therefore have been excluded from the fair value hierarchy. | |
During the year ended December 31, 2017, there were no transfers between levels.
See notes to consolidated financial statements.
| | |
| 6 | | 2017 BLACKROCK ANNUAL REPORTTO SHAREHOLDERS |
Consolidated Statement of Assets and Liabilities
December 31, 2017
| | | | |
| | | BlackRock iShares®
Alternative Strategies V.I. Fund | |
| |
ASSETS | | | | |
Investments at value — affiliated (including securities loaned at value of $2,603,580) (cost — $29,341,896) | | $ | 31,336,416 | |
Cash | | | 14,978 | |
Receivables: | | | | |
Securities lending income — affiliated | | | 881 | |
Capital shares sold | | | 12,194 | |
Dividends — affiliated | | | 66 | |
From the Manager | | | 1,605 | |
Investment adviser | | | 2,726 | |
Prepaid expenses | | | 130 | |
| | | | |
Total assets | | | 31,368,996 | |
| | | | |
| |
LIABILITIES | | | | |
Cash collateral on securities loaned at value | | | 2,667,537 | |
Payables: | | | | |
Capital shares redeemed | | | 17,460 | |
Investments purchased | | | 37,177 | |
Officer’s and Directors’ fees | | | 3,207 | |
Other accrued expenses | | | 39,659 | |
Other affiliates | | | 14 | |
Professional fees | | | 35,049 | |
Distribution fees | | | 2,540 | |
| | | | |
Total liabilities | | | 2,802,643 | |
| | | | |
| |
NET ASSETS | | $ | 28,566,353 | |
| | | | |
| |
NET ASSETS CONSIST OF | | | | |
Paid-in capital | | $ | 26,992,299 | |
Undistributed net investment income | | | 22,396 | |
Accumulated net realized loss | | | (442,862 | ) |
Net unrealized appreciation (depreciation) | | | 1,994,520 | |
| | | | |
NET ASSETS | | $ | 28,566,353 | |
| | | | |
| |
NET ASSET VALUE | | | | |
Class I — Based on net assets of $16,000,317 and 1,435,983 shares outstanding, 100 million shares authorized, $0.10 par value. | | $ | 11.14 | |
| | | | |
Class III — Based on net assets of $12,566,036 and 1,132,459 shares outstanding, 100 million shares authorized, $0.10 par value. | | $ | 11.10 | |
| | | | |
See notes to consolidated financial statements.
| | | | |
| CONSOLIDATED FINANCIAL STATEMENTS | | | 7 | |
Consolidated Statement of Operations
Year Ended December 31, 2017
| | | | |
| | | BlackRock iShares®
Alternative
Strategies V.I. Fund | |
| |
INVESTMENT INCOME | | | | |
Dividends — affiliated | | $ | 914,347 | |
Securities lending income — affiliated — net | | | 16,344 | |
| | | | |
Total investment income | | | 930,691 | |
| | | | |
| |
EXPENSES | | | | |
Professional | | | 63,130 | |
Investment advisory | | | 62,282 | |
Transfer agent — class specific | | | 56,450 | |
Accounting services | | | 26,326 | |
Distribution — class specific | | | 24,741 | |
Directors and Officer | | | 12,582 | |
Transfer agent | | | 5,001 | |
Custodian | | | 4,964 | |
Printing | | | 2,141 | |
Miscellaneous | | | 4,961 | |
| | | | |
Total expenses | | | 262,578 | |
Less: | | | | |
Fees waived and/or reimbursed by the Manager | | | (49,157 | ) |
Transfer agent fees reimbursed — class specific | | | (30,079 | ) |
| | | | |
Total expenses after fees waived and/or reimbursed | | | 183,342 | |
| | | | |
Net investment income | | | 747,349 | |
| | | | |
| |
REALIZED AND UNREALIZED GAIN (LOSS) | | | | |
Net realized loss from investments — affiliated | | | 18,827 | |
Net change in unrealized appreciation on investments — affiliated | | | 2,109,463 | |
| | | | |
Net realized and unrealized gain | | | 2,128,290 | |
| | | | |
NET INCREASE IN NET ASSETS RESULTING FROM OPERATIONS | | $ | 2,875,639 | |
| | | | |
See notes to consolidated financial statements.
| | |
| 8 | | 2017 BLACKROCK ANNUAL REPORTTO SHAREHOLDERS |
Consolidated Statements of Changes in Net Assets
| | | | | | | | |
| | | BlackRock iShares® Alternative
Strategies V.I. Fund | |
| | | Year Ended December 31, | |
| | | 2017 | | | 2016 | |
| | |
INCREASE (DECREASE) IN NET ASSETS | | | | | | | | |
| | |
OPERATIONS | | | | | | | | |
Net investment income | | $ | 747,349 | | | $ | 574,680 | |
Net realized loss | | | 18,827 | | | | (272,382 | ) |
Net change in unrealized appreciation (depreciation) | | | 2,109,463 | | | | 342,360 | |
| | | | | | | | |
Net increase in net assets resulting from operations | | $ | 2,875,639 | | | | 644,658 | |
| | | | | | | | |
| | |
DISTRIBUTIONS TO SHAREHOLDERS(a) | | | | | | | | |
From net investment income: | | | | | | | | |
Class I | | | (422,009 | ) | | | (374,610 | ) |
Class III | | | (307,726 | ) | | | (197,011 | ) |
From return of capital: | | | | | | | | |
Class I | | | (1,366 | ) | | | (1,529 | ) |
Class III | | | (900 | ) | | | (853 | ) |
| | | | | | | | |
Decrease in net assets resulting from distributions to shareholders | | | (732,001 | ) | | | (574,003 | ) |
| | | | | | | | |
| | |
CAPITAL SHARE TRANSACTIONS | | | | | | | | |
Net increase in net assets derived from capital share transactions | | | 4,937,220 | | | | 9,547,597 | |
| | | | | | | | |
| | |
NET ASSETS | | | | | | | | |
Total increase in net assets | | | 7,080,858 | | | | 9,618,252 | |
Beginning of year | | | 21,485,495 | | | | 11,867,243 | |
| | | | | | | | |
End of year | | $ | 28,566,353 | | | $ | 21,485,495 | |
| | | | | | | | |
Undistributed net investment income, end of year | | $ | 22,396 | | | $ | 4,777 | |
| | | | | | | | |
| (a) | Distributions for annual periods determined in accordance with U.S. federal income tax regulations. |
See notes to consolidated financial statements.
| | | | |
| CONSOLIDATED FINANCIAL STATEMENTS | | | 9 | |
Consolidated Financial Highlights
(For a share outstanding throughout each period)
| | | | | | | | | | | | | | | | | | | | |
| | | BlackRock iShares® Alternative Strategies V.I. Fund | |
| | | Class I | |
| | | Year Ended December 31, | | | | | | Period
04/30/2014 (a) to 12/31/2014 | |
| | | 2017 | | | 2016 | | | 2015 | | | |
Net asset value, beginning of period | | $ | 10.15 | | | $ | 9.79 | | | $ | 10.20 | | | | | | | $ | 10.00 | |
| | | | | | | | | | | | | | | | | | | | |
Net investment income(b) | | | 0.33 | | | | 0.35 | | | | 0.37 | | | | | | | | 0.31 | |
Net realized and unrealized gain (loss) | | | 0.96 | | | | 0.30 | | | | (0.47 | ) | | | | | | | 0.03 | |
| | | | | | | | | | | | | | | | | | | | |
Net increase (decrease) from investment operations | | | 1.29 | | | | 0.65 | | | | (0.10 | ) | | | | | | | 0.34 | |
| | | | | | | | | | | | | | | | | | | | |
| Distributions:(c) | | | | | | | | | | | | | | | |
From net investment income | | | (0.30 | ) | | | (0.29 | ) | | | (0.30 | ) | | | | | | | (0.13 | ) |
From net realized capital gains | | | — | | | | — | | | | — | | | | | | | | (0.01 | ) |
From return of capital | | | (0.00 | )(d) | | | (0.00 | )(d) | | | (0.01 | ) | | | | | | | (0.00 | )(d) |
| | | | | | | | | | | | | | | | | | | | |
Total distributions | | | (0.30 | ) | | | (0.29 | ) | | | (0.31 | ) | | | | | | | (0.14 | ) |
| | | | | | | | | | | | | | | | | | | | |
Net asset value, end of period | | $ | 11.14 | | | $ | 10.15 | | | $ | 9.79 | | | | | | | $ | 10.20 | |
| | | | | | | | | | | | | | | | | | | | |
| | | | | |
Total Return:(e) | | | | | | | | | | | | | | | | | | | | |
Based on net asset value | | | 12.74 | % | | | 6.59 | % | | | (1.02 | )% | | | | | | | 3.32 | %(f) |
| | | | | | | | | | | | | | | | | | | | |
| | | | | |
Ratios to Average Net Assets:(g) | | | | | | | | | | | | | | | | | | | | |
Total expenses | | | 0.94 | % | | | 1.10 | % | | | 2.15 | % | | | | | | | 8.81 | %(h),(i) |
| | | | | | | | | | | | | | | | | | | | |
Total expenses after fees waived and/or reimbursed | | | 0.65 | % | | | 0.65 | % | | | 0.71 | % | | | | | | | 0.75 | %(h) |
| | | | | | | | | | | | | | | | | | | | |
Net investment income | | | 3.04 | % | | | 3.30 | % | | | 3.59 | % | | | | | | | 4.36 | %(h) |
| | | | | | | | | | | | | | | | | | | | |
| | | | | |
Supplemental Data: | | | | | | | | | | | | | | | | | | | | |
Net assets, end of period (000) | | $ | 16,000 | | | $ | 13,800 | | | $ | 9,707 | | | | | | | $ | 5,116 | |
| | | | | | | | | | | | | | | | | | | | |
Portfolio turnover rate | | | 37 | % | | | 47 | % | | | 37 | % | | | | | | | 34 | % |
| | | | | | | | | | | | | | | | | | | | |
| (a) | Commencement of operations. |
| (b) | Based on average shares outstanding. |
| (c) | Distributions for annual periods determined in accordance with U.S. federal income tax regulations. |
| (d) | Amount is greater than $(0.005) per share. |
| (e) | Where applicable, excludes insurance-related fees and expenses and assumes the reinvestment of distributions. |
| (f) | Aggregate total return. |
| (g) | Excludes expenses incurred indirectly as a result of investments in underlying funds as follows: |
| | | | | | | | | | | | | | | | | | | | |
| | | Year Ended December 31, | | | | | | Period 04/30/2014 (a) to 12/31/2014 | |
| | 2017 | | | 2016 | | | 2015 | | | |
Investments in underlying funds | | | 0.38 | % | | | 0.34 | % | | | 0.37 | % | | | | | | | 0.41 | % |
| | | | | | | | | | | | | | | | | | | | |
| (i) | Organization and/or offering costs were not annualized in the calculation of the expense ratios. If these expenses were annualized, the total expenses for Class I and Class III would have been 9.60% and 9.03%, respectively. |
See notes to consolidated financial statements.
| | |
| 10 | | 2017 BLACKROCK ANNUAL REPORTTO SHAREHOLDERS |
Consolidated Financial Highlights (continued)
(For a share outstanding throughout each period)
| | | | | | | | | | | | | | | | | | | | |
| | | BlackRock iShares® Alternative Strategies V.I. Fund | |
| | | Class III | |
| | | Year Ended December 31, | | | | | | Period
04/30/2014 (a) to 12/31/2014 | |
| | | 2017 | | | 2016 | | | 2015 | | | |
Net asset value, beginning of period | | $ | 10.12 | | | $ | 9.77 | | | $ | 10.20 | | | | | | | $ | 10.00 | |
| | | | | | | | | | | | | | | | | | | | |
Net investment income(b) | | | 0.32 | | | | 0.36 | | | | 0.39 | | | | | | | | 0.36 | |
Net realized and unrealized gain (loss) | | | 0.94 | | | | 0.26 | | | | (0.52 | ) | | | | | | | (0.03 | ) |
| | | | | | | | | | | | | | | | | | | | |
Net increase (decrease) from investment operations | | | 1.26 | | | | 0.62 | | | | (0.13 | ) | | | | | | | 0.33 | |
| | | | | | | | | | | | | | | | | | | | |
| Distributions:(c) | | | | | | | | | | | | | | | |
From net investment income | | | (0.28 | ) | | | (0.27 | ) | | | (0.29 | ) | | | | | | | (0.12 | ) |
From net realized capital gains | | | — | | | | — | | | | — | | | | | | | | (0.01 | ) |
From return of capital | | | (0.00 | )(d) | | | (0.00 | )(d) | | | (0.01 | ) | | | | | | | (0.00 | )(d) |
| | | | | | | | | | | | | | | | | | | | |
Total distributions | | | (0.28 | ) | | | (0.27 | ) | | | (0.30 | ) | | | | | | | (0.13 | ) |
| | | | | | | | | | | | | | | | | | | | |
Net asset value, end of period | | $ | 11.10 | | | $ | 10.12 | | | $ | 9.77 | | | | | | | $ | 10.20 | |
| | | | | | | | | | | | | | | | | | | | |
| | | | | |
Total Return:(e) | | | | | | | | | | | | | | | | | | | | |
Based on net asset value | | | 12.45 | % | | | 6.33 | % | | | (1.24 | )% | | | | | | | 3.26 | %(f) |
| | | | | | | | | | | | | | | | | | | | |
| | | | | |
Ratios to Average Net Assets:(g) | | | | | | | | | | | | | | | | | | | | |
Total expenses | | | 1.22 | % | | | 1.29 | % | | | 2.26 | % | | | | | | | 8.54 | %(h),(i) |
| | | | | | | | | | | | | | | | | | | | |
Total expenses after fees waived and/or reimbursed | | | 0.90 | % | | | 0.90 | % | | | 0.94 | % | | | | | | | 1.00 | %(h) |
| | | | | | | | | | | | | | | | | | | | |
Net investment income | | | 2.94 | % | | | 3.38 | % | | | 3.81 | % | | | | | | | 5.05 | %(h) |
| | | | | | | | | | | | | | | | | | | | |
| | | | | |
Supplemental Data: | | | | | | | | | | | | | | | | | | | | |
Net assets, end of period (000) | | $ | 12,566 | | | $ | 7,685 | | | $ | 2,160 | | | | | | | $ | 334 | |
| | | | | | | | | | | | | | | | | | | | |
Portfolio turnover rate | | | 37 | % | | | 47 | % | | | 37 | % | | | | | | | 34 | % |
| | | | | | | | | | | | | | | | | | | | |
| (a) | Commencement of operations. |
| (b) | Based on average shares outstanding. |
| (c) | Distributions for annual periods determined in accordance with U.S. federal income tax regulations. |
| (d) | Amount is greater than $(0.005) per share. |
| (e) | Where applicable, excludes insurance-related fees and expenses and assumes the reinvestment of distributions. |
| (f) | Aggregate total return. |
| (g) | Excludes expenses incurred indirectly as a result of investments in underlying funds as follows: |
| | | | | | | | | | | | | | | | | | | | |
| | | Year Ended December 31, | | | | | | Period 04/30/2014 (a) to 12/31/2014 | |
| | 2017 | | | 2016 | | | 2015 | | | |
Investments in underlying funds | | | 0.38 | % | | | 0.34 | % | | | 0.37 | % | | | | | | | 0.41 | % |
| | | | | | | | | | | | | | | | | | | | |
| (i) | Organization and/or offering costs were not annualized in the calculation of the expense ratios. If these expenses were annualized, the total expenses for Class I and Class III would have been 9.60% and 9.03%, respectively. |
See notes to consolidated financial statements.
| | | | |
| CONSOLIDATED FINANCIAL HIGHLIGHTS | | | 11 | |
Notes to Consolidated Financial Statements
BlackRock Variable Series Funds, Inc. (the “Company”) is registered under the Investment Company Act of 1940, as amended (the “1940 Act”), as an open-end management investment company. The Company is organized as a Maryland corporation that is comprised of 20 separate funds. The funds offer shares to insurance companies for their separate accounts to fund benefits under certain variable annuity and variable life insurance contracts. The consolidated financial statements presented are for BlackRock iShares® Alternative Strategies V.I. Fund (the “Fund”). The Fund is classified as diversified. Class I and Class III Shares have equal voting, dividend, liquidation and other rights, except that only shares of the respective classes are entitled to vote on matters concerning only that class. In addition, Class III Shares bear certain expenses related to the distribution of such shares.
The Fund, together with certain other registered investment companies advised by BlackRock Advisors, LLC (the “Manager”) or its affiliates, is included in a complex of open-end funds referred to as the Equity-Bond Complex.
Basis of Consolidation: The accompanying consolidated financial statements of the Fund include the accounts of iShares® Alternative Strategies V.I. Fund (Cayman) (the “Subsidiary”), which is a wholly-owned subsidiary of the Fund and primarily invests in commodity-related instruments. The Subsidiary enables the Fund to hold these commodity-related instruments and satisfy regulated investment company tax requirements. The Fund may invest up to 25% of its total assets in the Subsidiary. The net assets of the Subsidiary as of December 31, 2017 were $2,234,460, which is 7.8% of the Fund’s consolidated net assets. Intercompany accounts and transactions, if any, have been eliminated. The Subsidiary is subject to the same investment policies and restrictions that apply to the iShares® Alternative Strategies V.I. Fund, except that the Subsidiary may invest without limitation in commodity-related instruments.
| 2. | SIGNIFICANT ACCOUNTING POLICIES |
The consolidated financial statements are prepared in conformity with accounting principles generally accepted in the United States of America (“U.S. GAAP”), which may require management to make estimates and assumptions that affect the reported amounts of assets and liabilities in the consolidated financial statements, disclosure of contingent assets and liabilities at the date of the consolidated financial statements and the reported amounts of increases and decreases in net assets from operations during the reporting period. Actual results could differ from those estimates. The Fund is considered an investment company under U.S. GAAP and follows the accounting and reporting guidance applicable to investment companies. Below is a summary of significant accounting policies:
Investment Transactions and Income Recognition: For financial reporting purposes, investment transactions are recorded on the dates the transactions are entered into (the “trade dates”). Realized gains and losses on investment transactions are determined on the identified cost basis. Dividend income is recorded on the ex-dividend date. Dividends from foreign securities where the ex-dividend date may have passed are subsequently recorded when the Fund is informed of the ex-dividend date. Under the applicable foreign tax laws, a withholding tax at various rates may be imposed on capital gains, dividends and interest. Upon notification from issuers, some of the dividend income received from a real estate investment trust may be redesignated as a reduction of cost of the related investment and/or realized gain. Income, expenses and realized and unrealized gains and losses are allocated daily to each class based on its relative net assets.
Distributions: Distributions paid by the Fund are recorded on the ex-dividend date. Distributions of capital gains are recorded on the ex-dividend date and made at least annually. The portion of distributions, if any, that exceeds the Fund’s current and accumulated earnings and profits, as measured on a tax basis, constitute a non-taxable return of capital. The character and timing of distributions are determined in accordance with U.S. federal income tax regulations, which may differ from U.S. GAAP.
Net income and realized gains from investments held by the Subsidiary are treated as ordinary income for tax purposes. If a net loss is realized by the Subsidiary in any taxable year, the loss will generally not be available to offset the Fund’s ordinary income and/or capital gains for that year.
Indemnifications: In the normal course of business, the Fund enters into contracts that contain a variety of representations that provide general indemnification. The Fund’s maximum exposure under these arrangements is unknown because it involves future potential claims against the Fund, which cannot be predicted with any certainty.
Other: Expenses directly related to the Fund or its classes are charged to the Fund or the applicable class. Other operating expenses shared by several funds, including other funds managed by the Manager, are prorated among those funds on the basis of relative net assets or other appropriate methods. Expenses directly related to the Fund and other shared expenses prorated to the Fund are allocated daily to each class based on its relative net assets or other appropriate methods.
| 3. | INVESTMENT VALUATION AND FAIR VALUE MEASUREMENTS |
Investment Valuation Policies: The Fund’s investments are valued at fair value (also referred to as “market value” within the consolidated financial statements) as of the close of trading on the New York Stock Exchange (“NYSE”) (generally 4:00 p.m., Eastern time) (or, if the reporting date falls on a day the NYSE is closed, investments are valued at fair value as of the period end). U.S. GAAP defines fair value as the price the Fund would receive to sell an asset or pay to transfer a liability in an orderly transaction between market participants at the measurement date. The Fund determines the fair values of its financial instruments using various independent dealers or pricing services under policies approved by the Board of Directors of the Company (the “Board”). The BlackRock Global Valuation Methodologies Committee (the “Global Valuation Committee”) is the committee formed by management to develop global pricing policies and procedures and to oversee the pricing function for all financial instruments.
Fair Value Inputs and Methodologies: The following methods and inputs are used to establish the fair value of the Fund’s assets and liabilities:
| | • | | Exchange-traded funds (“ETFs”) traded on a recognized securities exchange are valued at the official closing price each day, if available. For ETFs traded on more than one exchange, the official closing price on the exchange where the stock is primarily traded is used. ETFs traded on a recognized exchange for which there were no sales on that day may be valued at the last available bid (long positions) or ask (short positions) price. |
| | |
| 12 | | 2017 BLACKROCK ANNUAL REPORTTO SHAREHOLDERS |
Notes to Consolidated Financial Statements (continued)
| | • | | Investments in open-end U.S. mutual funds are valued at net asset value (“NAV”) each business day. |
| | • | | The Fund values its investment in SL Liquidity Series, LLC, Money Market Series (the “Money Market Series”) at fair value, which is ordinarily based upon its pro rata ownership in the underlying fund’s net assets. The Money Market Series seeks current income consistent with maintaining liquidity and preserving capital. Although the Money Market Series is not registered under the 1940 Act, its investments may follow the parameters of investments by a money market fund that is subject to Rule 2a-7 under the 1940 Act. |
If events (e.g., a company announcement, market volatility or a natural disaster) occur that are expected to materially affect the value of such investments, or in the event that the application of these methods of valuation results in a price for an investment that is deemed not to be representative of the market value of such investment, or if a price is not available, the investment will be valued by the Global Valuation Committee, or its delegate, in accordance with a policy approved by the Board as reflecting fair value (“Fair Valued Investments”). The fair valuation approaches that may be used by the Global Valuation Committee will include market approach, income approach and cost approach. Valuation techniques such as discounted cash flow, use of market comparables and matrix pricing are types of valuation approaches and are typically used in determining fair value. When determining the price for Fair Valued Investments, the Global Valuation Committee, or its delegate, seeks to determine the price that the Fund might reasonably expect to receive or pay from the current sale or purchase of that asset or liability in an arm’s-length transaction. Fair value determinations shall be based upon all available factors that the Global Valuation Committee, or its delegate, deems relevant and consistent with the principles of fair value measurement. The pricing of all Fair Valued Investments is subsequently reported to the Board or a committee thereof on a quarterly basis.
Fair Value Hierarchy: Various inputs are used in determining the fair value of investments. These inputs to valuation techniques are categorized into a fair value hierarchy consisting of three broad levels for consolidated financial statement purposes as follows:
| | • | | Level 1 — Unadjusted price quotations in active markets/exchanges for identical assets or liabilities that the Fund has the ability to access |
| | • | | Level 2 — Other observable inputs (including, but not limited to, quoted prices for similar assets or liabilities in markets that are active, quoted prices for identical or similar assets or liabilities in markets that are not active, inputs other than quoted prices that are observable for the assets or liabilities (such as interest rates, yield curves, volatilities, prepayment speeds, loss severities, credit risks and default rates) or other market- corroborated inputs) |
| | • | | Level 3 — Unobservable inputs based on the best information available in the circumstances, to the extent observable inputs are not available (including the Fund’s own assumptions used in determining the fair value of investments) |
The hierarchy gives the highest priority to unadjusted quoted prices in active markets for identical assets or liabilities (Level 1 measurements) and the lowest priority to unobservable inputs (Level 3 measurements). Accordingly, the degree of judgment exercised in determining fair value is greatest for instruments categorized in Level 3. The inputs used to measure fair value may fall into different levels of the fair value hierarchy. In such cases, for disclosure purposes, the fair value hierarchy classification is determined based on the lowest level input that is significant to the fair value measurement in its entirety. Investments classified within Level 3 have significant unobservable inputs used by the Global Valuation Committee in determining the price for Fair Valued Investments. Level 3 investments include equity or debt issued by privately held companies or funds (“Private Company” or collectively, the “Private Companies”). There may not be a secondary market, and/or there are a limited number of investors. Level 3 investments may also be adjusted to reflect illiquidity and/or non-transferability, with the amount of such discount estimated by the Global Valuation Committee in the absence of market information.
Changes in valuation techniques may result in transfers into or out of an assigned level within the hierarchy. In accordance with the Fund’s policy, transfers between different levels of the fair value hierarchy are deemed to have occurred as of the beginning of the reporting period. The categorization of a value determined for investments is based on the pricing transparency of the investments and is not necessarily an indication of the risks associated with investing in those securities.
As of December 31, 2017, certain investments of the Fund were valued using NAV per share as no quoted market value is available and therefore have been excluded from the fair value hierarchy.
| 4. | SECURITIES AND OTHER INVESTMENTS |
Securities Lending: The Fund may lend its securities to approved borrowers, such as brokers, dealers and other financial institutions. The borrower pledges and maintains with the Fund collateral consisting of cash, an irrevocable letter of credit issued by a bank, or securities issued or guaranteed by the U.S. Government. The initial collateral received by the Fund is required to have a value of at least 102% of the current value of the loaned securities for securities traded on U.S. exchanges and a value of at least 105% for all other securities. The collateral is maintained thereafter at a value equal to at least 100% of the current market value of the securities on loan. The market value of the loaned securities is determined at the close of each business day of the Fund and any additional required collateral is delivered to the Fund, or excess collateral returned by the Fund, on the next business day. During the term of the loan, the Fund is entitled to all distributions made on or in respect of the loaned securities but does not receive interest income on securities received as collateral. Loans of securities are terminable at any time and the borrower, after notice, is required to return borrowed securities within the standard time period for settlement of securities transactions.
The market value of any securities on loan, all of which were classified as affiliated investment companies in the Fund’s Consolidated Schedule of Investments, and the value of any related collateral are shown separately in the Consolidated Statement of Assets and Liabilities as a component of investments at value — unaffiliated, and collateral on securities loaned at value, respectively. As of period end, any securities on loan were collateralized by cash and/or U.S. Government obligations. Cash collateral invested by the securities lending agent, BlackRock Investment Management, LLC (“BIM”), if any, is disclosed in the Consolidated Schedule of Investments.
Securities lending transactions are entered into by the Fund under Master Securities Lending Agreements (each, an “MSLA”), which provide the right, in the event of default (including bankruptcy or insolvency), for the non-defaulting party to liquidate the collateral and calculate a net exposure to the defaulting party or request additional collateral. In the event that a borrower defaults, the Fund, as lender, would offset the market value of the collateral received against the market value of the securities loaned. When the value of the collateral is greater than that of the market value of the securities loaned, the lender is left with a net amount payable to the defaulting party.
| | | | |
| NOTESTO CONSOLIDATED FINANCIAL STATEMENTS | | | 13 | |
Notes to Consolidated Financial Statements (continued)
However, bankruptcy or insolvency laws of a particular jurisdiction may impose restrictions on or prohibitions against such a right of offset in the event of an MSLA counterparty’s bankruptcy or insolvency. Under the MSLA, absent an event of default, the borrower can resell or re-pledge the loaned securities, and the Fund can reinvest cash collateral received in connection with loaned securities. Upon an event of default, the parties’ obligations to return the securities or collateral to the other party are extinguished, and the parties can resell or re-pledge the loaned securities or the collateral received in connection with the loaned securities in order to satisfy the defaulting party’s net payment obligation for all transactions under the MSLA. The defaulting party remains liable for any deficiency.
As of period end, the following table is a summary of the Fund’s securities lending agreements by counterparty which are subject to offset under an MSLA:
Securities Lending Agreements
| | | | | | | | | | | | |
| Counterparty | | Securities
Loaned at Value | | | Cash Collateral
Received (a) | | | Net
Amount | |
JP Morgan Securities LLC | | $ | 2,603,580 | | | $ | (2,603,580 | ) | | $ | — | |
| | (a) | Cash collateral with a value of $2,667,537 has been received in connection with securities lending agreements. Collateral received in excess of the value of securities loaned from the individual counterparty is not shown for financial reporting purposes in the table above. | |
The risks of securities lending include the risk that the borrower may not provide additional collateral when required or may not return the securities when due. To mitigate these risks, the Fund benefits from a borrower default indemnity provided by BIM. BIM’s indemnity allows for full replacement of the securities loaned if the collateral received does not cover the value on the securities loaned in the event of borrower default. The Fund could incur a loss if the value of an investment purchased with cash collateral falls below the market value of loaned securities or if the value of an investment purchased with cash collateral falls below the value of the original cash collateral received.
| 5. | INVESTMENT ADVISORY AGREEMENT AND OTHER TRANSACTIONS WITH AFFILIATES |
The PNC Financial Services Group, Inc. is the largest stockholder and an affiliate of BlackRock, Inc. (“BlackRock”) for 1940 Act purposes.
Investment Advisory: The Company, on behalf of the Fund, entered into an Investment Advisory Agreement with the Manager, the Fund’s investment adviser, an indirect, wholly-owned subsidiary of BlackRock, to provide investment advisory and administrative services. The Manager is responsible for the management of the Fund’s portfolio and provides the personnel, facilities, equipment and certain other services necessary to the operations of the Fund.
For such services, the Fund pays the Manager a monthly fee at an annual rate equal to the following percentages of the average daily value of the Fund’s net assets:
| | | | |
| Average Daily Net Assets | | Investment
Advisory Fee | |
First $1 Billion | | | 0.250 | % |
$1 Billion — $3 Billion | | | 0.240 | |
$3 Billion — $5 Billion | | | 0.225 | |
$5 Billion — $10 Billion | | | 0.220 | |
Greater than $10 Billion | | | 0.210 | |
The Manager provides investment management and other services to the Subsidiary. The Manager does not receive separate compensation from the Subsidiary for providing investment management or administrative services. However, the Fund pays the Manager based on the Fund’s net assets which includes the assets of the Subsidiary.
Distribution Fees: The Company, on behalf of the Fund, entered into a Distribution Agreement and a Distribution Plan with BlackRock Investments, LLC (“BRIL”), an affiliate of the Manager. Pursuant to the Distribution Plan and in accordance with Rule 12b-1 under the 1940 Act, the Fund pays BRIL ongoing distribution fees. The fees are accrued daily and paid monthly at an annual rate of 0.25% based upon the average daily net assets attributable to Class III.
For the year ended December 31, 2017, the class specific distribution fees borne directly by Class III is $24,741.
Transfer Agent: On behalf of the Fund, the Manager entered into agreements with insurance companies and other financial intermediaries (“Service Organizations”), some of which may be affiliates. Pursuant to these agreements, the Service Organizations provide the Fund with administrative, net- working, recordkeeping, sub-transfer agency and shareholder services to sub-accounts they service. For these services, the Service Organizations receive an annual fee per shareholder account, which will vary depending on share class and/or net assets of Fund shareholders serviced by the Service Organizations, which is shown as transfer agent — class specific. For the year ended December 31, 2017, the Fund did not pay any amounts to affiliates in return for these services.
In addition, the Fund pays the transfer agent, which is not an affiliate, a fee for the issuance, transfer and redemption of shares and the opening and maintenance of shareholder accounts, which is included in transfer agent in the Consolidated Statement of Operations.
For the year ended December 31, 2017, the following table shows the class specific transfer agent fees borne directly by each share class of the Fund:
| | | | | | | | | | | | | | | | | | |
| | | Class I | | | | | Class III | | | | | Total | | | |
| | | $ | 32,465 | | | | | $ | 23,985 | | | | | $ | 56,450 | | | |
Expense Limitations, Waivers, Reimbursements and Recoupments: With respect to the Fund, the Manager voluntarily agreed to waive its investment advisory fees by the amount of investment advisory fees the Fund pays to the Manager indirectly through its investment in affiliated money market funds. In addition, the Manager has
| | |
| 14 | | 2017 BLACKROCK ANNUAL REPORTTO SHAREHOLDERS |
Notes to Consolidated Financial Statements (continued)
contractually agreed to waive the management fee on assets estimated to be attributable to the Fund’s investments in other equity and fixed-income mutual funds managed by BlackRock or its affiliates, if any. This amount is included in fees waived and/or reimbursed by the Manager in the Consolidated Statement of Operations. For the year ended December 31, 2017, the amount waived was $62.
For the year ended December 31, 2017, the Fund reimbursed the Manager $226 for certain accounting services, which is included in accounting services in the Consolidated Statement of Operations.
With respect to the Fund, the Manager contractually agreed to waive and/or reimburse fees or expenses in order to limit expenses, excluding interest expense, dividend expense, tax expense, acquired fund fees and expenses, and certain other fund expenses, which constitute extraordinary expenses not incurred in the ordinary course of the Fund’s business (“expense limitation”). The expense limitations as a percentage of average daily net assets are as follows:
| | | | | | | | | | | | |
| | | Class I | | | | | Class III | | | |
| | | | 0.65% | | | | | | 0.90% | | | |
The Manager has agreed not to reduce or discontinue this contractual expense limitation through April 30, 2018, unless approved by the Board, including a majority of the independent directors who are not “interested persons” of the Fund, as defined in the 1940 Act (“Independent Directors”) or by a vote of a majority of the outstanding voting securities of the Fund. For the year ended December 31, 2017, the Manager waived and/or reimbursed $49,095, which is included in fees waived and/or reimbursed by the Manager in the Consolidated Statement of Operations.
These amounts waived and/or reimbursed are shown as transfer agent fees reimbursed—class specific in the Consolidated Statement of Operations. For the year ended December 31, 2017, class specific expense waivers and/or reimbursements are as follows:
| | | | | | | | | | | | |
| | | Class I | | | Class III | | | Total | |
Transfer Agent Fees Reimbursed | | $ | 18,123 | | | $ | 11,956 | | | $ | 30,079 | |
With respect to the contractual expense limitation, if during the Fund’s fiscal year the operating expenses of a share class, that at any time during the prior two fiscal years received a waiver and/or reimbursement from the Manager, are less than the current expense limitation for that share class, the Manager is entitled to be reimbursed by such share class up to the lesser of: (a) the amount of fees waived and/or expenses reimbursed during those prior two fiscal years under the agreement and (b) an amount not to exceed either the current expense limitation of that share class or the expense limitation of the share class in effect at the time that the share class received the applicable waiver and/or reimbursement, provided that:
(1) the Fund, of which the share class is a part, has more than $50 million in assets for the fiscal year, and
(2) the Manager or an affiliate continues to serve as the Fund’s investment adviser or administrator.
This repayment applies only to the contractual expense limitation on net expenses and does not apply to any voluntary waivers that may be in effect from time to time.
On December 31, 2017, the Fund level and class specific waivers and/or reimbursements subject to possible future recoupment under the expense limitation agreement are as follows:
| | | | | | | | |
| | | Expiring December 31, | |
| | | 2018 | | | 2019 | |
Fund Level | | $ | 46,338 | | | $ | 49,095 | |
Class I | | | 22,342 | | | $ | 18,123 | |
Class III | | | 6,323 | | | $ | 11,956 | |
The following fund level and class specific waivers and/or reimbursements previously recorded by the fund, which were subject to recoupment by the Manager, expired on December 31, 2017:
| | | | |
Fund Level | | $ | 116,781 | |
Class I | | | 17,186 | |
Class III | | | 1,013 | |
Securities Lending: The U.S. Securities and Exchange Commission (“SEC”) has issued an exemptive order which permits BIM, an affiliate of the Manager, to serve as securities lending agent for the Fund, subject to applicable conditions. As securities lending agent, BIM bears all operational costs directly related to securities lending. The Fund is responsible for expenses in connection with the investment of cash collateral received for securities on loan (the “collateral investment expenses”). The cash collateral is invested in a private investment company managed by the Manager or its affiliates. However, BIM has agreed to cap the collateral investment expenses of the private investment company to an annual rate of 0.04%. The investment adviser to the private investment company will not charge any advisory fees with respect to shares purchased by the Fund. The private investment company in which the cash collateral has been invested may, under certain circumstances, impose a liquidity fee of up to 2% of the value withdrawn or temporarily restrict withdrawals for up to 10 business days during a 90 day period, in the event that the private investment company’s weekly liquid assets fall below certain thresholds.
Securities lending income is equal to the total of income earned from the reinvestment of cash collateral, net of fees and other payments to and from borrowers of securities, and less the collateral investment expenses. The Fund retains a portion of securities lending income and remits a remaining portion to BIM as compensation for its services as securities lending agent.
| | | | |
| NOTESTO CONSOLIDATED FINANCIAL STATEMENTS | | | 15 | |
Notes to Consolidated Financial Statements (continued)
Pursuant to a securities lending agreement, the Fund retains 80% of securities lending income, and this amount retained can never be less than 70% of the total of securities lending income plus the collateral investment expenses.
In addition, commencing the business day following the date that the aggregate securities lending income earned across the Equity-Bond Complex in a calendar year exceeds a specified threshold, the Fund, pursuant to the securities lending agreement, will retain for the remainder of that calendar year securities lending income in an amount equal to 85% of securities lending income, and this amount retained can never be less than 70% of the total of securities lending income plus the collateral investment expenses.
The share of securities lending income earned by the Fund is shown as securities lending income — affiliated — net in the Consolidated Statement of Operations. For the year ended December 31, 2017, the Fund paid BIM $3,440 for securities lending agent services.
Interfund Lending: In accordance with an exemptive order (the “Order”) from the SEC, the Fund may participate in a joint lending and borrowing facility for temporary purposes (the “Interfund Lending Program”), subject to compliance with the terms and conditions of the Order, and to the extent permitted by the Fund’s investment policies and restrictions. The Fund is currently permitted to borrow and lend under the Interfund Lending Program.
A lending BlackRock fund may lend in aggregate up to 15% of its net assets, but may not lend more than 5% of its net assets to any one borrowing fund through the Interfund Lending Program. A borrowing BlackRock fund may not borrow through the Interfund Lending Program or from any other source more than 33 1/3% of its total assets (or any lower threshold provided for by the fund’s investment restrictions). If a borrowing BlackRock fund’s total outstanding borrowings exceed 10% of its total assets, each of its outstanding interfund loans will be subject to collateralization of at least 102% of the outstanding principal value of the loan. All interfund loans are for temporary or emergency purposes and the interest rate to be charged will be the average of the highest current overnight repurchase agreement rate available to a lending fund and the bank loan rate, as calculated according to a formula established by the Board.
During the year ended December 31, 2017, the Fund did not participate in the Interfund Lending Program.
Officers and Directors: Certain directors and/or officers of the Company are directors and/or officers of BlackRock or its affiliates. The Fund reimburses the Manager for a portion of the compensation paid to the Company’s Chief Compliance Officer, which is included in Directors and Officer in the Consolidated Statement of Operations.
For the year ended December 31, 2017, purchases and sales of investments, excluding short-term securities, were $14,329,658 and $9,346,595, respectively.
It is the Fund’s policy to comply with the requirements of the Internal Revenue Code of 1986, as amended, applicable to regulated investment companies, and to distribute substantially all of its taxable income to its shareholders. Therefore, no U.S. federal income tax provision is required.
The Fund files U.S. federal and various state and local tax returns. No income tax returns are currently under examination. The statute of limitations on the Fund’s U.S. federal tax returns generally remains open for the period ended December 31, 2014 and each of the three years ended December 31, 2017. The statutes of limitations on the Fund’s state and local tax returns may remain open for an additional year depending upon the jurisdiction.
Management has analyzed tax laws and regulations and their application to the Fund as of December 31, 2017, inclusive of the open tax return years, and does not believe that there are any uncertain tax positions that require recognition of a tax liability in the Fund’s consolidated financial statements.
U.S. GAAP requires that certain components of net assets be adjusted to reflect permanent differences between financial and tax reporting. These reclassifications have no effect on net assets or net asset values per share. As of period end, the following permanent differences attributable to characterization of income/losses from a wholly owned subsidiary, were reclassified to the following accounts:
| | | | |
Paid-in capital | | $ | (20,141 | ) |
Undistributed net investment income | | | 5 | |
Accumulated net realized loss | | | 20,136 | |
The tax character of distributions paid was as follows:
| | | | | | | | |
| | | 12/31/17 | | | 12/31/16 | |
Ordinary income | | $ | 729,735 | | | $ | 571,621 | |
Tax return of capital | | | 2,266 | | | | 2,383 | |
| | | | | | | | |
| | $ | 732,001 | | | $ | 574,004 | |
| | | | | | | | |
As of period end, the tax components of accumulated net earnings (losses) were as follows:
| | | | |
Capital loss carryforward | | $ | (172,012 | ) |
Net unrealized gains1 | | | 1,746,066 | |
| | | | |
| | $ | 1,574,054 | |
| | | | |
| | 1 | The difference between book-basis and tax-basis net unrealized gains was attributable primarily to the tax deferral of losses on wash sales and the timing and recognition of partnership income. | |
| | |
| 16 | | 2017 BLACKROCK ANNUAL REPORTTO SHAREHOLDERS |
Notes to Consolidated Financial Statements (continued)
As of December 31, 2017, the Fund had a capital loss carryforward with no expiration date, available to offset future realized capital gains of $172,012.
During the year ended December 31, 2017, the Fund utilized $30,192 of its capital loss carryforward.
As of December 31, 2017, gross unrealized appreciation and depreciation for investments based on cost for U.S. federal income tax purposes were as follows:
As of period end, gross unrealized appreciation and depreciation for investment based on cost for U.S. federal income tax purposes were as follows:
| | | | |
Tax cost | | $ | 29,590,350 | |
| | | | |
Gross unrealized appreciation | | $ | 1,773,767 | |
Gross unrealized depreciation | | | (27,701 | ) |
| | | | |
Net unrealized appreciation (depreciation) | | $ | 1,746,066 | |
| | | | |
The Company, on behalf of the Fund, along with certain other funds managed by the Manager and its affiliates (“Participating Funds”), is a party to a 364-day, $2.1 billion credit agreement with a group of lenders. Under this agreement, the Fund may borrow to fund shareholder redemptions. Excluding commitments designated for certain individual funds, the Participating Funds, including the Fund, can borrow up to an aggregate commitment amount of $1.6 billion at any time outstanding, subject to asset coverage and other limitations as specified in the agreement. The credit agreement has the following terms: a fee of 0.12% per annum on unused commitment amounts and interest at a rate equal to the higher of (a) one-month LIBOR (but, in any event, not less than 0.00%) on the date the loan is made plus 0.80% per annum or (b) the Fed Funds rate (but, in any event, not less than 0.00%) in effect from time to time plus 0.80% per annum on amounts borrowed. The agreement expires in April 2018 unless extended or renewed. Participating Funds paid administration, legal and arrangement fees, which, if applicable, are included in miscellaneous expenses in the Consolidated Statement of Operations. These fees were allocated among such funds based upon portions of the aggregate commitment available to them and relative net assets of Participating Funds. During the year ended December 31, 2017, the Fund did not borrow under the credit agreement.
In the normal course of business, the Fund invests in securities or other instruments and may enter into certain transactions, and such activities subject the Fund to various risks, including among others, fluctuations in the market (market risk) or failure of an issuer to meet all of its obligations. The value of securities or other instruments may also be affected by various factors, including, without limitation: (i) the general economy; (ii) the overall market as well as local, regional or global political and/or social instability; (iii) regulation, taxation or international tax treaties between various countries; or (iv) currency, interest rate and price fluctuations. The Fund’s prospectus provides details of the risks to which the Fund is subject.
The Fund may be exposed to additional risks when reinvesting cash collateral in money market funds that do not seek to maintain a stable NAV per share of $1.00 and which may be subject to redemption gates or liquidity fees under certain circumstances.
Valuation Risk: The market values of equities, such as common stocks and preferred securities or equity related investments, such as futures and options, may decline due to general market conditions which are not specifically related to a particular company. They may also decline due to factors which affect a particular industry or industries. The Fund may invest in illiquid investments and may experience difficulty in selling those investments in a timely manner at the price that it believes the investments are worth. Prices may fluctuate widely over short or extended periods in response to company, market or economic news. Markets also tend to move in cycles, with periods of rising and falling prices. This volatility may cause the Fund’s NAV to experience significant increases or decreases over short periods of time. If there is a general decline in the securities and other markets, the NAV of the Fund may lose value, regardless of the individual results of the securities and other instruments in which the Fund invests.
Counterparty Credit Risk: The Fund may be exposed to counterparty credit risk, or the risk that an entity may fail to or be unable to perform on its commitments related to unsettled or open transactions. The Fund manages counterparty credit risk by entering into transactions only with counterparties that the Manager believes have the financial resources to honor their obligations and by monitoring the financial stability of those counterparties. Financial assets, which potentially expose the Fund to market, issuer and counterparty credit risks, consist principally of financial instruments and receivables due from counterparties. The extent of the Fund’s exposure to market, issuer and counterparty credit risks with respect to these financial assets approximated by their value recorded in the Consolidated Statement of Assets and Liabilities, less any collateral held by the Fund.
Concentration Risk: The Fund invests a significant portion of its assets in fixed-income securities and/or uses derivatives tied to the fixed-income markets. Changes in market interest rates or economic conditions may affect the value and/or liquidity of such investments. Interest rate risk is the risk that prices of bonds and other fixed-income securities will increase as interest rates fall and decrease as interest rates rise. The Fund may be subject to a greater risk of rising interest rates due to the current period of historically low rates.
| | | | |
| NOTESTO CONSOLIDATED FINANCIAL STATEMENTS | | | 17 | |
Notes to Consolidated Financial Statements (continued)
| 10. | CAPITAL SHARE TRANSACTIONS |
Transactions in capital shares for each class were as follows:
| | | | | | | | | | | | | | | | |
| | | Year Ended
12/31/2017 | | | Year Ended
12/31/2016 | |
| | | Shares | | | Amount | | | Shares | | | Amount | |
Class I | | | | | | | | | | | | | | | | |
Shares sold | | | 267,737 | | | $ | 2,911,781 | | | | 601,734 | | | $ | 6,360,317 | |
Shares issued in reinvestment of distributions | | | 38,005 | | | | 423,375 | | | | 37,058 | | | | 376,139 | |
Shares redeemed | | | (228,855 | ) | | | (2,485,980 | ) | | | (270,838 | ) | | | (2,840,041 | ) |
| | | | | | | | | | | | | | | | |
Net increase | | | 76,887 | | | $ | 849,176 | | | | 367,954 | | | $ | 3,896,415 | |
| | | | | | | | | | | | | | | | |
| | | | |
Class III | | | | | | | | | | | | | | | | |
Shares sold | | | 533,162 | | | $ | 5,813,619 | | | | 773,886 | | | $ | 8,159,220 | |
Shares issued in reinvestment of distributions | | | 27,804 | | | | 308,626 | | | | 19,552 | | | | 197,864 | |
Shares redeemed | | | (188,023 | ) | | | (2,034,201 | ) | | | (255,008 | ) | | | (2,705,902 | ) |
| | | | | | | | | | | | | | | | |
Net increase | | | 372,943 | | | $ | 4,088,044 | | | | 538,430 | | | $ | 5,651,182 | |
| | | | | | | | | | | | | | | | |
Total Net Increase | | | 449,830 | | | $ | 4,937,220 | | | | 906,384 | | | $ | 9,547,597 | |
| | | | | | | | | | | | | | | | |
Management has evaluated the impact of all subsequent events on the Fund through the date the consolidated financial statements were issued and has determined that there were no subsequent events requiring adjustment or additional disclosure in the consolidated financial statements.
| | |
| 18 | | 2017 BLACKROCK ANNUAL REPORTTO SHAREHOLDERS |
Report of Independent Registered Public Accounting Firm
To the Shareholders of BlackRock iShares Alternative Strategies V.I. Fund and the Board of Directors of BlackRock Variable Series Funds, Inc.:
Opinion on the Financial Statements and Financial Highlights
We have audited the accompanying consolidated statement of assets and liabilities, including the consolidated schedule of investments, of BlackRock iShares Alternative Strategies V.I. Fund, of BlackRock Variable Series Funds, Inc. (the “Fund”), as of December 31, 2017, the related consolidated statement of operations for the year then ended, the consolidated statements of changes in net assets for each of the two years in the period then ended, the consolidated financial highlights for each of the periods presented, and the related notes. In our opinion, the consolidated financial statements and consolidated financial highlights present fairly, in all material respects, the financial position of the Fund as of December 31, 2017, and the results of its operations for the year then ended, the changes in its net assets for each of the two years in the period then ended, and the financial highlights for each of the periods presented, in conformity with accounting principles generally accepted in the United States of America.
Basis for Opinion
These financial statements and financial highlights are the responsibility of the Fund’s management. Our responsibility is to express an opinion on the Fund’s financial statements and financial highlights based on our audits. We are a public accounting firm registered with the Public Company Accounting Oversight Board (United States) (PCAOB) and are required to be independent with respect to the Fund in accordance with the U.S. federal securities laws and the applicable rules and regulations of the Securities and Exchange Commission and the PCAOB.
We conducted our audits in accordance with the standards of the PCAOB. Those standards require that we plan and perform the audit to obtain reasonable assurance about whether the financial statements and financial highlights are free of material misstatement, whether due to error or fraud. The Fund is not required to have, nor were we engaged to perform, an audit of its internal control over financial reporting. As part of our audits we are required to obtain an understanding of internal control over financial reporting but not for the purpose of expressing an opinion on the effectiveness of the Fund’s internal control over financial reporting. Accordingly, we express no such opinion.
Our audits included performing procedures to assess the risks of material misstatement of the financial statements and financial highlights, whether due to error or fraud, and performing procedures that respond to those risks. Such procedures included examining, on a test basis, evidence regarding the amounts and disclosures in the financial statements and financial highlights. Our audits also included evaluating the accounting principles used and significant estimates made by management, as well as evaluating the overall presentation of the financial statements and financial highlights. Our procedures included confirmation of securities owned as of December 31, 2017, by correspondence with the custodian and brokers; when replies were not received from brokers, we performed other auditing procedures. We believe that our audits provide a reasonable basis for our opinion.
Deloitte & Touche LLP
Boston, Massachusetts
February 19, 2018
We have served as the auditor of one or more BlackRock investment companies since 1992.
| | | | |
| REPORTOF INDEPENDENT REGISTERED PUBLIC ACCOUNTING FIRM | | | 19 | |
DECEMBER 31, 2017
| | |
ANNUAL REPORT | |  |
BlackRock Variable Series Funds, Inc.
| Ø | | BlackRock iShares® Dynamic Allocation V.I. Fund |
|
| Not FDIC Insured • May Lose Value • No Bank Guarantee |
| | |
| Fund Summary as of December 31, 2017 | | BlackRock iShares® Dynamic Allocation V.I. Fund |
Investment Objective
BlackRock iShares® Dynamic Allocation V.I. Fund’s (the “Fund”) investment objective is to seek to provide total return.
Portfolio Management Commentary
How did the Fund perform?
For the 12-month period ended December 31, 2017, the Fund underperformed its blended benchmark (60% MSCI All Country World Index / 40% Bloomberg Barclays U.S. Aggregate Bond Index).
What factors influenced performance?
The largest detractor from Fund performance was exposure to the iShares 1-3 Year Treasury Bond ETF.
The largest contributor to Fund performance came from exposure to the iShares Core S&P 500 ETF and the iShares Core MSCI Emerging Markets ETF.
Describe recent portfolio activity.
During the 12-month period, the Fund increased exposure to U.S. and emerging market equities, while reducing international developed exposure. In addition, the Fund reduced its holdings within real estate and agency mortgage-backed securities in favor of high yield and short-term U.S. Treasuries.
Describe portfolio positioning at period end.
At period end, the Fund was underweight in developed international market equity exposure in favor of U.S. equities. The Fund’s top holdings included exposure to U.S. developed market equities. Within U.S. equities, the Fund maintained exposure to U.S. large-, mid- and small-cap, minimum volatility and preferred stocks. Within fixed income, the Fund was overweight to credit versus rates. The Fund’s top fixed-income holdings included exposure to investment grade U.S. corporate credit. In addition, the Fund ended the period with small allocations to U.S. real estate, broad commodities and precious metals.
The views expressed reflect the opinions of BlackRock as of the date of this report and are subject to change based on changes in market, economic or other conditions. These views are not intended to be a forecast of future events and are no guarantee of future results.
Portfolio Information
PORTFOLIO COMPOSITION
| | | | |
Asset Type | | Percent of
Affiliated Investment
Companies | |
Equity Funds | | | 61 | % |
Fixed Income Funds | | | 31 | |
Short-Term Securities | | | 7 | |
Commodity Funds | | | 1 | |
| | |
| 2 | | 2017 BLACKROCK ANNUAL REPORTTO SHAREHOLDERS |
| | |
| Fund Summary as of December 31, 2017 (continued) | | BlackRock iShares® Dynamic Allocation V.I. Fund |
TOTAL RETURN BASED ON A $10,000 INVESTMENT
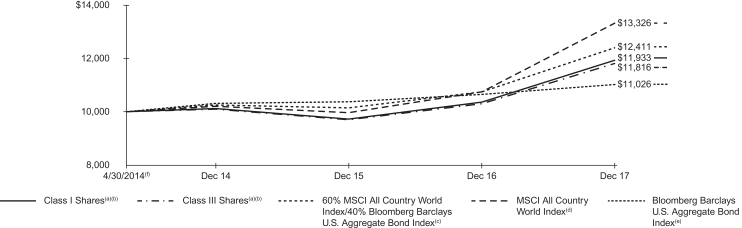
| (a) | Assuming transaction costs, if any, and other operating expenses, including investment advisory fees. Does not include insurance-related fees and expenses. |
| (b) | The Fund invests in a portfolio of underlying exchange-traded funds that seek to track equity, fixed income and alternative indices. |
| (c) | A customized weighted index comprised of 60% MSCI All Country World Index and 40% Bloomberg Barclays U.S. Aggregate Bond Index. |
| (d) | A free float-adjusted market capitalization weighted index that is designed to measure the equity market performance of developed and emerging markets. The MSCI All Country World Index consists of 46 country indexes comprising 23 developed and 23 emerging market country indexes. |
| (e) | A widely recognized unmanaged market-weighted index, comprised of investment-grade corporate bonds rated BBB or better, mortgages and U.S. Treasury and U.S. Government agency issues with at least one year to maturity. |
| (f) | Commencement of operations. |
Performance Summary for the Period Ended December 31, 2017
| | | | | | | | | | | | | | | | |
| | | | | | | | | Average Annual Total Returns | |
| | | 6-Month
Total Returns (b) | | | | | | 1 Year (b) | | | Since Inception (b)(c) | |
Class I(a) | | | 7.37 | % | | | | | | | 15.11 | % | | | 4.93 | % |
Class III(a) | | | 7.10 | | | | | | | | 14.72 | | | | 4.65 | |
60% MSCI All Country World Index / 40% Bloomberg Barclays U.S. Aggregate Bond Index | | | 7.14 | | | | | | | | 15.41 | | | | 6.07 | |
MSCI All Country World Index | | | 11.21 | | | | | | | | 23.97 | | | | 8.15 | |
Bloomberg Barclays U.S. Aggregate Bond Index | | | 1.24 | | | | | | | | 3.54 | | | | 2.70 | |
| | (a) | Average annual and cumulative total returns are based on changes in net asset value for the periods shown, and assume reinvestment of all distributions at net asset value on the ex-dividend date. Insurance-related fees and expenses are not reflected in these returns. | |
| | (b) | For a portion of the period, the Fund’s investment adviser waived a portion of its fee. Without such waiver, the Fund’s performance would have been lower. | |
| | (c) | The Fund commenced operations on April 30, 2014. | |
Past performance is not indicative of future results. Performance results do not reflect the deduction of taxes that a shareholder would pay on Fund distributions or the redemption of Fund shares.
Performance results may include adjustments made for financial reporting purposes in accordance with U.S. generally accepted accounting principles.
Expense Example
| | | | | | | | | | | | | | | | | | | | | | | | | | | | | | | | |
| | | Actual | | | | | | Hypothetical (a) | | | | |
| | | Beginning
Account Value
(07/01/17) | | | Ending
Account Value
(12/31/17) | | | Expenses
Paid During
the Period (b) | | | | | | Beginning
Account Value
(07/01/17) | | | Ending
Account Value
(12/31/17) | | | Expenses
Paid During
the Period (b) | | | Annualized
Expense
Ratio | |
Class I | | $ | 1,000.00 | | | $ | 1,073.70 | | | $ | 2.77 | | | | | | | $ | 1,000.00 | | | $ | 1,022.53 | | | $ | 2.70 | | | | 0.53 | % |
Class III | | | 1,000.00 | | | | 1,071.00 | | | | 4.07 | | | | | | | | 1,000.00 | | | | 1,021.27 | | | | 3.97 | | | | 0.78 | |
| | (a) | Hypothetical 5% annual return before expenses is calculated by prorating the number of days in the most recent fiscal half year divided by 365. | |
| | (b) | For each class of the Fund, expenses are equal to the annualized expense ratio for the class, multiplied by the average account value over the period, multiplied by 184/365 (to reflect the one-half year period shown). | |
See “Disclosure of Expenses” on the following page for further information on how expenses were calculated.
| | |
| Disclosure of Expenses | | BlackRock iShares® Dynamic Allocation V.I. Fund |
Shareholders of the Fund may incur the following charges: (a) transactional expenses, such as sales charges; and (b) operating expenses, including investment advisory fees, service and distribution fees, including 12b-1 fees, acquired fund fees and expenses, and other fund expenses. The expense example on the previous page (which is based on a hypothetical investment of $1,000 invested on July 1, 2017 and held through December 31, 2017) is intended to assist shareholders both in calculating expenses based on an investment in the Fund and in comparing these expenses with similar costs of investing in other mutual funds.
The expense example provides information about actual account values and actual expenses. In order to estimate the expenses a shareholder paid during the period covered by this report, shareholders can divide their account value by $1,000 and then multiply the result by the number corresponding to their share class under the heading entitled “Expenses Paid During the Period.”
The expense example also provides information about hypothetical account values and hypothetical expenses based on the Fund’s actual expense ratio and an assumed rate of return of 5% per year before expenses. In order to assist shareholders in comparing the ongoing expenses of investing in the Fund and other funds, compare the 5% hypothetical example with the 5% hypothetical examples that appear in shareholder reports of other funds.
The expenses shown in the expense example are intended to highlight shareholders’ ongoing costs only and do not reflect any transactional expenses, such as sales charges, if any. Therefore, the hypothetical example is useful in comparing ongoing expenses only, and will not help shareholders determine the relative total expenses of owning different funds. If these transactional expenses were included, shareholder expenses would have been higher.
| | |
| 4 | | 2017 BLACKROCK ANNUAL REPORTTO SHAREHOLDERS |
| | |
Consolidated Schedule of Investments December 31, 2017 | | BlackRock iShares® Dynamic Allocation V.I. Fund (Percentages shown are based on Net Assets) |
| | | | | | | | |
| Security | | Shares | | | Value | |
Affiliated Investment Companies — 107.1%(f) | |
|
| Commodity Funds — 1.6% | |
iShares Commodities Select Strategy ETF | | | 6,561 | | | $ | 238,427 | |
iShares Gold Trust(a)(b) | | | 10,379 | | | | 129,841 | |
iShares Silver Trust(a)(b) | | | 4,905 | | | | 78,431 | |
| | | | | | | | |
| | | | | | | 446,699 | |
| Equity Funds — 65.4% | |
iShares Core MSCI Emerging Markets ETF | | | 50,350 | | | | 2,864,915 | |
iShares Core S&P 500 ETF | | | 15,804 | | | | 4,248,905 | |
iShares Core S&P Mid-Cap ETF | | | 12,423 | | | | 2,357,637 | |
iShares Core S&P Small-Cap ETF | | | 19,736 | | | | 1,515,922 | |
iShares Edge MSCI Min Vol Global ETF | | | 8,397 | | | | 708,035 | |
iShares Edge MSCI Min Vol USA ETF(c) | | | 18,450 | | | | 973,791 | |
iShares Edge MSCI USA Momentum Factor ETF | | | 1,400 | | | | 144,382 | |
iShares Global Infrastructure ETF | | | 8,277 | | | | 374,286 | |
iShares MSCI Canada ETF(c) | | | 21,075 | | | | 624,663 | |
iShares MSCI EAFE ETF | | | 56,073 | | | | 3,942,493 | |
iShares MSCI EAFE Small-Cap ETF | | | 13,600 | | | | 877,200 | |
iShares U.S. Real Estate ETF(c) | | | 3,900 | | | | 315,939 | |
| | | | | | | | |
| | | | | | | 18,948,168 | |
| Fixed Income Funds — 33.0% | |
iShares 1-3 Year Treasury Bond ETF | | | 23,797 | | | | 1,995,379 | |
iShares Agency Bond ETF | | | 11,079 | | | | 1,252,946 | |
iShares iBoxx $ High Yield Corporate Bond ETF | | | 14,263 | | | | 1,244,589 | |
iShares iBoxx $ Investment Grade Corporate Bond ETF | | | 15,740 | | | | 1,913,354 | |
iShares J.P. Morgan USD Emerging Markets Bond ETF | | | 3,140 | | | | 364,554 | |
iShares U.S. Credit Bond ETF | | | 20,159 | | | | 2,258,413 | |
iShares U.S. Preferred Stock ETF(c) | | | 13,613 | | | | 518,247 | |
| | | | | | | | |
| | | | | | | 9,547,482 | |
| | | | | | | | |
| | | | | | | | |
| Security | | Shares | | | Value | |
|
| Short-Term Securities — 7.1%(d) | |
BlackRock Liquidity Funds, T-Fund, Institutional Class,
1.17% | | | 57,845 | | | $ | 57,845 | |
SL Liquidity Series, LLC, Money Market Series,
1.48%(e) | | | 2,016,002 | | | | 2,015,801 | |
| | | | | | | | |
| | | | | | | 2,073,646 | |
| | | | | | | | |
| |
Total Affiliated Investment Companies — 107.1%
(Cost: $27,883,376) | | | | 31,015,995 | |
Liabilities in Excess of Other Assets — (7.1)% | | | | (2,068,941 | ) |
| | | | | | | | |
Net Assets — 100.0% | | | $ | 28,947,054 | |
| | | | | | | | |
| (a) | Non-income producing security. |
| (b) | All or a portion of the security is held by a wholly-owned subsidiary. See Note 1 of the Notes to Consolidated Financial Statements for details on the wholly-owned subsidiary. |
| (c) | Security, or a portion of the security, is on loan. |
| (d) | Annualized 7-day yield as of period end. |
| (e) | Security was purchased with the cash collateral from loaned securities. |
| (f) | During the year ended December 31, 2017, investments in issuers considered to be affiliates of the Fund for the purposes of Section 2(a)(3) of the Investment Company Act of 1940, as amended, and/or related party of the fund were as follows: |
| | | | | | | | | | | | | | | | | | | | | | | | | | | | | | | | |
| Affiliate | | Shares
Held at
12/31/16 | | | Shares
Purchased | | | Shares
Sold | | | Shares
Held at
12/31/17 | | | Value at
12/31/17 | | | Income | | | Net
Realized
Gain (Loss) (a) | | | Change in
Unrealized
Appreciation
(Depreciation) | |
BlackRock Liquidity Funds, T-Fund, Institutional Class | | | 64,554 | | | | — | | | | (6,709 | )(b) | | | 57,845 | | | $ | 57,845 | | | $ | 812 | | | $ | — | | | $ | — | |
SL Liquidity Series, LLC, Money Market Series | | | 5,525,311 | | | | — | | | | (3,509,309 | )(b) | | | 2,016,002 | | | | 2,015,801 | | | | 21,706 | (c) | | | 143 | | | | (94 | ) |
iShares 10+ Year Credit Bond ETF | | | 1,867 | | | | — | | | | (1,867 | ) | | | — | | | | — | | | | — | | | | (212 | ) | | | 1,094 | |
iShares 1-3 Year Treasury Bond ETF | | | 4,800 | | | | 20,237 | | | | (1,240 | ) | | | 23,797 | | | | 1,995,379 | | | | 16,349 | | | | (546 | ) | | | (14,947 | ) |
iShares Agency Bond ETF | | | 9,129 | | | | 2,950 | | | | (1,000 | ) | | | 11,079 | | | | 1,252,946 | | | | 16,822 | | | | (1,865 | ) | | | 4,902 | |
iShares CMBS ETF | | | 1,490 | | | | — | | | | (1,490 | ) | | | — | | | | — | | | | 555 | | | | (655 | ) | | | 1,297 | |
iShares Commodities Select Strategy ETF | | | 2,800 | | | | 3,761 | | | | — | | | | 6,561 | | | | 238,427 | | | | 10,233 | | | | — | | | | 12,817 | |
iShares Core MSCI Emerging Markets ETF | | | — | | | | 52,550 | | | | (2,200 | ) | | | 50,350 | | | | 2,864,915 | | | | 62,576 | | | | 12,561 | | | | 409,864 | |
iShares Core S&P 500 ETF | | | 10,569 | | | | 5,835 | | | | (600 | ) | | | 15,804 | | | | 4,248,905 | | | | 66,549 | | | | 5,563 | | | | 600,805 | |
iShares Core S&P Mid-Cap ETF | | | 6,644 | | | | 9,914 | | | | (4,135 | ) | | | 12,423 | | | | 2,357,637 | | | | 25,705 | | | | 12,803 | | | | 251,165 | |
iShares Core S&P Small-Cap ETF | | | 6,328 | | | | 13,898 | | | | (490 | ) | | | 19,736 | | | | 1,515,922 | | | | 17,113 | | | | 6,369 | | | | 148,913 | |
iShares Core S&P U.S. Value ETF | | | — | | | | 28,712 | | | | (28,712 | ) | | | — | | | | — | | | | 6,270 | | | | 11,105 | | | | — | |
iShares Edge MSCI Min Vol Emerging Markets ETF | | | 3,300 | | | | — | | | | (3,300 | ) | | | — | | | | — | | | | — | | | | — | | | | 14,309 | |
iShares Edge MSCI Min Vol Global ETF | | | 14,267 | | | | 1,200 | | | | (7,070 | ) | | | 8,397 | | | | 708,035 | | | | 21,769 | | | | (13,468 | ) | | | 99,862 | |
iShares Edge MSCI Min Vol USA ETF | | | — | | | | 18,650 | | | | (200 | ) | | | 18,450 | | | | 973,791 | | | | 6,350 | | | | 6,865 | | | | 104,454 | |
iShares Edge MSCI USA Momentum Factor ETF | | | 5,100 | | | | 1,400 | | | | (5,100 | ) | | | 1,400 | | | | 144,382 | | | | — | | | | — | | | | 22,310 | |
iShares Global Infrastructure ETF | | | — | | | | 8,277 | | | | — | | | | 8,277 | | | | 374,286 | | | | 10,266 | | | | — | | | | 37,044 | |
iShares Gold Trust | | | 15,184 | | | | 5,775 | | | | (10,580 | ) | | | 10,379 | | | | 129,841 | | | | — | | | | 12,700 | | | | 21,153 | |
iShares iBoxx $ High Yield Corporate Bond ETF | | | 5,548 | | | | 8,815 | | | | (100 | ) | | | 14,263 | | | | 1,244,589 | | | | 49,041 | | | | 632 | | | | 770 | |
iShares iBoxx $ Investment Grade Corporate Bond ETF | | | 7,540 | | | | 9,600 | | | | (1,400 | ) | | | 15,740 | | | | 1,913,354 | | | | 48,271 | | | | (1,343 | ) | | | 50,784 | |
iShares J.P. Morgan USD Emerging Markets Bond ETF | | | 7,270 | | | | 1,170 | | | | (5,300 | ) | | | 3,140 | | | | 364,554 | | | | 12,597 | | | | (1,349 | ) | | | 24,251 | |
iShares MBS ETF | | | 9,464 | | | | 200 | | | | (9,664 | ) | | | — | | | | — | | | | 4,162 | | | | (13,782 | ) | | | 19,396 | |
iShares MSCI Canada ETF | | | 7,625 | | | | 13,450 | | | | — | | | | 21,075 | | | | 624,663 | | | | 12,114 | | | | — | | | | 63,572 | |
iShares MSCI EAFE ETF | | | 35,923 | | | | 39,650 | | | | (19,500 | ) | | | 56,073 | | | | 3,942,493 | | | | 112,551 | | | | 63,314 | | | | 603,334 | |
iShares MSCI EAFE Small-Cap ETF | | | — | | | | 13,600 | | | | — | | | | 13,600 | | | | 877,200 | | | | 20,189 | | | | — | | | | 135,709 | |
iShares Russell 1000 ETF | | | 17,587 | | | | 300 | | | | (17,887 | ) | | | — | | | | — | | | | 5,045 | | | | 308,297 | | | | (237,361 | ) |
| | | | |
| CONSOLIDATED SCHEDULE OF INVESTMENTS | | | 5 | |
| | |
Consolidated Schedule of Investments (continued) December 31, 2017 | | BlackRock iShares® Dynamic Allocation V.I. Fund |
| | | | | | | | | | | | | | | | | | | | | | | | | | | | | | | | |
| Affiliate | | Shares
Held at
12/31/16 | | | Shares
Purchased | | | Shares
Sold | | | Shares
Held at
12/31/17 | | | Value at
12/31/17 | | | Income | | | Net
Realized
Gain (Loss) (a) | | | Change in
Unrealized
Appreciation
(Depreciation) | |
iShares Silver Trust | | | 6,506 | | | | 1,664 | | | | (3,265 | ) | | | 4,905 | | | $ | 78,431 | | | $ | — | | | $ | (2,087 | ) | | $ | 8,558 | |
iShares TIPS Bond ETF | | | 1,894 | | | | 1,630 | | | | (3,524 | ) | | | — | | | | — | | | | 547 | | | | 7,091 | | | | (1,427 | ) |
iShares U.S. Credit Bond ETF | | | 16,517 | | | | 5,542 | | | | (1,900 | ) | | | 20,159 | | | | 2,258,413 | | | | 57,167 | | | | (4,909 | ) | | | 50,297 | |
iShares U.S. Preferred Stock ETF | | | 30,613 | | | | 1,000 | | | | (18,000 | ) | | | 13,613 | | | | 518,247 | | | | 32,667 | | | | (26,507 | ) | | | 52,118 | |
iShares U.S. Real Estate ETF | | | 5,100 | | | | 900 | | | | (2,100 | ) | | | 3,900 | | | | 315,939 | | | | 11,317 | | | | (4,998 | ) | | | 8,098 | |
iShares U.S. Treasury Bond ETF | | | 35,580 | | | | 1,600 | | | | (37,180 | ) | | | — | | | | — | | | | — | | | | 3,476 | | | | 892 | |
| | | | | | | | | | | | | | | | | | | | | | | | | | | | | | | | |
Total | | | | | | | | | | | | | | | | | | $ | 31,015,995 | | | $ | 648,743 | | | $ | 379,198 | | | $ | 2,493,939 | |
| | | | | | | | | | | | | | | | | | | | | | | | | | | | | | | | |
| | (a) | Includes net capital gain distributions, if applicable. | |
| | (b) | Represents net shares sold. | |
| | (c) | Represents securities lending income earned from the reinvestment of cash collateral from loaned securities, net of fees and collateral investment expenses, and other payments to and from borrowers of securities. | |
Portfolio Abbreviation
ETF — Exchange-Traded Fund
Fair Value Hierarchy as of Period End
Various inputs are used in determining the fair value of investments. For information about the Fund’s policy regarding valuation of investments, refer to the Notes to Consolidated Financial Statements.
The following table summarizes the Fund’s investments categorized in the disclosure hierarchy:
| | | | | | | | | | | | | | | | |
| | | Level 1 | | | Level 2 | | | Level 3 | | | Total | |
Assets: | | | | | | | | | | | | | | | | |
Investments: | | | | | | | | | | | | | | | | |
Affiliated investment Companies | | $ | 29,000,194 | | | $ | — | | | $ | — | | | $ | 29,000,194 | |
| | | | | | | | | | | | | | | | |
Investments valued at NAV(a) | | | | | | | | | | | | | | $ | 2,015,801 | |
| | | | | | | | | | | | | | | | |
Total Investments | | | | | | | | | | | | | | $ | 31,015,995 | |
| | | | | | | | | | | | | | | | |
| | (a) | As of December 31, 2017, certain investments of the Fund were fair valued using NAV per share as no quoted market value is available and therefore have been excluded from the fair value hierarchy. | |
During the year ended December 31, 2017, there were no transfers between levels.
See notes to consolidated financial statements.
| | |
| 6 | | 2017 BLACKROCK ANNUAL REPORTTO SHAREHOLDERS |
Consolidated Statement of Assets and Liabilities
December 31, 2017
| | | | |
| | | BlackRock iShares®
Dynamic Allocation
V.I. Fund | |
| |
ASSETS | | | | |
Investments at value — affiliated (including securities loaned at value of $1,971,355) (cost — $27,883,376) | | $ | 31,015,995 | |
Cash | | | 1,209 | |
Receivables: | | | | |
Investments sold | | | 15 | |
Securities lending income — affiliated | | | 641 | |
Capital shares sold | | | 5,688 | |
Dividends — affiliated | | | 62 | |
From the Manager | | | 28,599 | |
Prepaid expenses | | | 137 | |
| | | | |
Total assets | | | 31,052,346 | |
| | | | |
| |
LIABILITIES | | | | |
Cash collateral on securities loaned at value | | | 2,015,501 | |
Payables: | | | | |
Capital shares redeemed | | | 1,713 | |
Officer’s and Directors’ fees | | | 3,284 | |
Other accrued expenses | | | 31,224 | |
Other affiliates | | | 14 | |
Professional fees | | | 37,490 | |
Distribution fees | | | 715 | |
Transfer agent fees | | | 15,351 | |
| | | | |
Total liabilities | | | 2,105,292 | |
| | | | |
| |
NET ASSETS | | $ | 28,947,054 | |
| | | | |
| |
NET ASSETS CONSIST OF | | | | |
Paid-in capital | | $ | 26,372,202 | |
Undistributed net investment income | | | 16,399 | |
Accumulated net realized loss | | | (574,166 | ) |
Net unrealized appreciation (depreciation) | | | 3,132,619 | |
| | | | |
NET ASSETS | | $ | 28,947,054 | |
| | | | |
| |
NET ASSET VALUE | | | | |
Class I — Based on net assets of $25,332,007 and 2,276,825 shares outstanding, 100 million shares authorized, $0.10 par value | | $ | 11.13 | |
| | | | |
Class III — Based on net assets of $3,615,047 and 325,847 shares outstanding, 100 million shares authorized, $0.10 par value | | $ | 11.09 | |
| | | | |
See notes to consolidated financial statements.
| | | | |
| CONSOLIDATED FINANCIAL STATEMENTS | | | 7 | |
Consolidated Statement of Operations
Year Ended December 31, 2017
| | | | |
| | | BlackRock iShares®
Dynamic Allocation
V.I. Fund | |
| |
INVESTMENT INCOME | | | | |
Dividends — affiliated | | $ | 627,037 | |
Securities lending income — affiliated — net | | | 21,706 | |
| | | | |
Total investment income | | | 648,743 | |
| | | | |
| |
EXPENSES | | | | |
Professional | | | 74,211 | |
Transfer agent — class specific | | | 52,399 | |
Investment advisory | | | 36,621 | |
Accounting services | | | 26,145 | |
Printing | | | 14,555 | |
Directors and Officer | | | 12,657 | |
Distribution — class specific | | | 6,467 | |
Transfer agent | | | 5,001 | |
Custodian | | | 4,532 | |
Miscellaneous | | | 5,667 | |
| | | | |
Total expenses | | | 238,255 | |
Less: | | | | |
Fees waived and/or reimbursed by the Manager | | | (79,521 | ) |
Transfer agent fees reimbursed — class specific | | | (28,369 | ) |
| | | | |
Total expenses after fees waived and/or reimbursed | | | 130,365 | |
| | | | |
Net investment income | | | 518,378 | |
| | | | |
| |
REALIZED AND UNREALIZED GAIN | | | | |
Net realized gain from investments — affiliated | | | 379,198 | |
Net change in unrealized appreciation on investments — affiliated | | | 2,493,939 | |
| | | | |
Net realized and unrealized gain | | | 2,873,137 | |
| | | | |
NET INCREASE IN NET ASSETS RESULTING FROM OPERATIONS | | $ | 3,391,515 | |
| | | | |
See notes to consolidated financial statements.
| | |
| 8 | | 2017 BLACKROCK ANNUAL REPORTTO SHAREHOLDERS |
Consolidated Statements of Changes in Net Assets
| | | | | | | | |
| | | BlackRock iShares® Dynamic
Allocation V.I. Fund | |
| | | Year Ended December 31, | |
| | | 2017 | | | 2016 | |
| | |
INCREASE (DECREASE) IN NET ASSETS | | | | | | | | |
| | |
OPERATIONS | | | | | | | | |
Net investment income | | $ | 518,378 | | | $ | 413,686 | |
Net realized gain (loss) | | | 379,198 | | | | (270,823 | ) |
Net change in unrealized appreciation (depreciation) | | | 2,493,939 | | | | 1,069,860 | |
| | | | | | | | |
Net increase in net assets resulting from operations | | | 3,391,515 | | | | 1,212,723 | |
| | | | | | | | |
| | |
DISTRIBUTIONS TO SHAREHOLDERS(a) | | | | | | | | |
From net investment income: | | | | | | | | |
Class I | | | (452,727 | ) | | | (374,605 | ) |
Class III | | | (56,728 | ) | | | (33,466 | ) |
From return of capital: | | | | | | | | |
Class I | | | (13,367 | ) | | | (9,940 | ) |
Class III | | | (3,178 | ) | | | (992 | ) |
| | | | | | | | |
Decrease in net assets resulting from distributions to shareholders | | | (526,000 | ) | | | (419,003 | ) |
| | | | | | | | |
| | |
CAPITAL SHARE TRANSACTIONS | | | | | | | | |
Net increase in net assets derived from capital share transactions | | | 6,142,899 | | | | 3,334,801 | |
| | | | | | | | |
| | |
NET ASSETS | | | | | | | | |
Total increase in net assets | | | 9,008,414 | | | | 4,128,521 | |
Beginning of year | | | 19,938,640 | | | | 15,810,119 | |
| | | | | | | | |
End of year | | $ | 28,947,054 | | | $ | 19,938,640 | |
| | | | | | | | |
Undistributed net investment income, end of year | | $ | 16,399 | | | $ | 7,476 | |
| | | | | | | | |
| (a) | Distributions for annual periods determined in accordance with U.S. federal income tax regulations. |
See notes to consolidated financial statements.
| | | | |
| CONSOLIDATED FINANCIAL STATEMENTS | | | 9 | |
Consolidated Financial Highlights
(For a share outstanding throughout each period)
| | | | | | | | | | | | | | | | |
| | | BlackRock iShares® Dynamic Allocation V.I. Fund | |
| | | Class I | |
| | | Year Ended December 31, | | | Period
04/30/2014 (a) to 12/31/2014 | |
| | 2017 | | | 2016 | | | 2015 | | |
Net asset value, beginning of period | | $ | 9.85 | | | $ | 9.45 | | | $ | 10.02 | | | $ | 10.00 | |
| | | | | | | | | | | | | | | | |
Net investment income(b) | | | 0.23 | | | | 0.22 | | | | 0.24 | | | | 0.20 | |
Net realized and unrealized gain (loss) | | | 1.26 | | | | 0.39 | | | | (0.63 | ) | | | (0.07 | ) |
| | | | | | | | | | | | | | | | |
Net increase (decrease) from investment operations | | | 1.49 | | | | 0.61 | | | | (0.39 | ) | | | 0.13 | |
| | | | | | | | | | | | | | | | |
| Distributions:(c) | | | | | | | | | | | | |
From net investment income | | | (0.20 | ) | | | (0.20 | ) | | | (0.17 | ) | | | (0.10 | ) |
From net realized gain | | | — | | | | — | | | | — | | | | (0.01 | ) |
From return of capital | | | (0.01 | ) | | | (0.01 | ) | | | (0.01 | ) | | | — | |
| | | | | | | | | | | | | | | | |
Total distributions | | | (0.21 | ) | | | (0.21 | ) | | | (0.18 | ) | | | (0.11 | ) |
| | | | | | | | | | | | | | | | |
Net asset value, end of period | | $ | 11.13 | | | $ | 9.85 | | | $ | 9.45 | | | $ | 10.02 | |
| | | | | | | | | | | | | | | | |
| | | | |
Total Return:(d) | | | | | | | | | | | | | | | | |
Based on net asset value | | | 15.11 | % | | | 6.49 | % | | | (3.88 | )% | | | 1.27 | %(e) |
| | | | | | | | | | | | | | | | |
| | | | |
Ratios to Average Net Assets:(f) | | | | | | | | | | | | | | | | |
Total expenses | | | 0.94 | % | | | 0.83 | % | | | 1.90 | % | | | 6.47 | %(g),(h) |
| | | | | | | | | | | | | | | | |
Total expenses after fees waived and/or reimbursed | | | 0.53 | % | | | 0.53 | % | | | 0.64 | % | | | 0.75 | %(g) |
| | | | | | | | | | | | | | | | |
Net investment income | | | 2.14 | % | | | 2.27 | % | | | 2.41 | % | | | 2.85 | %(g) |
| | | | | | | | | | | | | | | | |
| | | | |
Supplemental Data: | | | | | | | | | | | | | | | | |
Net assets, end of period (000) | | $ | 25,332 | | | $ | 18,135 | | | $ | 14,636 | | | $ | 6,092 | |
| | | | | | | | | | | | | | | | |
Portfolio turnover rate | | | 48 | % | | | 54 | % | | | 54 | % | | | 25 | % |
| | | | | | | | | | | | | | | | |
| (a) | Commencement of operations. |
| (b) | Based on average shares outstanding. |
| (c) | Distributions for annual periods determined in accordance with U.S. federal income tax regulations. |
| (d) | Where applicable, excludes insurance-related fees and expenses and assumes the reinvestment of distributions. |
| (e) | Aggregate total return. |
| (f) | Excludes expenses incurred indirectly as a result of investments in underlying funds as follows: |
| | | | | | | | | | | | | | | | | | | | | | | | | | | | |
| | | Year Ended December 31, | | | Period
04/30/2014 (a)
to 12/31/2014 | |
| | 2017 | | | | | | 2016 | | | | | | 2015 | | | | | |
Investments in underlying funds | | | 0.21 | % | | | | | | | 0.23 | % | | | | | | | 0.29 | % | | | | | | | 0.27 | % |
| | | | | | | | | | | | | | | | | | | | | | | | | | | | |
| (h) | Organization and/or offering costs were not annualized in the calculation of the expense ratios. If these expenses were annualized, the total expenses for Class I and Class III would have been 7.00% and 9.13%, respectively. |
See notes to consolidated financial statements.
| | |
| 10 | | 2017 BLACKROCK ANNUAL REPORTTO SHAREHOLDERS |
Consolidated Financial Highlights (continued)
(For a share outstanding throughout each period)
| | | | | | | | | | | | | | | | |
| | | BlackRock iShares® Dynamic Allocation V.I. Fund | |
| | | Class III | |
| | | Year Ended December 31, | | | Period
04/30/2014 (a) to 12/31/2014 | |
| | 2017 | | | 2016 | | | 2015 | | |
Net asset value, beginning of period | | $ | 9.83 | | | $ | 9.44 | | | $ | 10.01 | | | $ | 10.00 | |
| | | | | | | | | | | | | | | | |
Net investment income(b) | | | 0.21 | | | | 0.21 | | | | 0.26 | | | | 0.17 | |
Net realized and unrealized gain (loss) | | | 1.24 | | | | 0.37 | | | | (0.66 | ) | | | (0.06 | ) |
| | | | | | | | | | | | | | | | |
Net increase (decrease) from investment operations | | | 1.45 | | | | 0.58 | | | | (0.40 | ) | | | 0.11 | |
| | | | | | | | | | | | | | | | |
| Distributions:(c) | | | | | | | | | | | | |
From net investment income | | | (0.18 | ) | | | (0.18 | ) | | | (0.16 | ) | | | (0.09 | ) |
From net realized gain | | | — | | | | — | | | | — | | | | (0.01 | ) |
From return of capital | | | (0.01 | ) | | | (0.01 | ) | | | (0.01 | ) | | | — | |
| | | | | | | | | | | | | | | | |
Total distributions | | | (0.19 | ) | | | (0.19 | ) | | | (0.17 | ) | | | (0.10 | ) |
| | | | | | | | | | | | | | | | |
Net asset value, end of period | | $ | 11.09 | | | $ | 9.83 | | | $ | 9.44 | | | $ | 10.01 | |
| | | | | | | | | | | | | | | | |
| | | | |
Total Return:(d) | | | | | | | | | | | | | | | | |
Based on net asset value | | | 14.72 | % | | | 6.16 | % | | | (3.99 | )% | | | 1.05 | %(e) |
| | | | | | | | | | | | | | | | |
| | | | |
Ratios to Average Net Assets:(f) | | | | | | | | | | | | | | | | |
Total expenses | | | 1.25 | % | | | 1.02 | % | | | 1.87 | % | | | 8.32 | %(g),(h) |
| | | | | | | | | | | | | | | | |
Total expenses after fees waived and/or reimbursed | | | 0.78 | % | | | 0.78 | % | | | 0.86 | % | | | 1.00 | %(g) |
| | | | | | | | | | | | | | | | |
Net investment income | | | 1.97 | % | | | 2.08 | % | | | 2.56 | % | | | 2.54 | %(g) |
| | | | | | | | | | | | | | | | |
| | | | |
Supplemental Data: | | | | | | | | | | | | | | | | |
Net assets, end of period (000) | | $ | 3,615 | | | $ | 1,804 | | | $ | 1,174 | | | $ | 20 | |
| | | | | | | | | | | | | | | | |
Portfolio turnover rate | | | 48 | % | | | 54 | % | | | 54 | % | | | 25 | % |
| | | | | | | | | | | | | | | | |
| (a) | Commencement of operations. |
| (b) | Based on average shares outstanding. |
| (c) | Distributions for annual periods determined in accordance with U.S. federal income tax regulations. |
| (d) | Where applicable, excludes insurance-related fees and expenses and assumes the reinvestment of distributions. |
| (e) | Aggregate total return. |
| (f) | Excludes expenses incurred indirectly as a result of investments in underlying funds as follows: |
| | | | | | | | | | | | | | | | | | | | | | | | | | | | |
| | | Year Ended December 31, | | | Period
04/30/2014 (a)
to 12/31/2014 | |
| | 2017 | | | | | | 2016 | | | | | | 2015 | | | | | |
Investments in underlying funds | | | 0.21 | % | | | | | | | 0.23 | % | | | | | | | 0.29 | % | | | | | | | 0.27 | % |
| | | | | | | | | | | | | | | | | | | | | | | | | | | | |
| (h) | Organization and/or offering costs were not annualized in the calculation of the expense ratios. If these expenses were annualized, the total expenses for Class I and Class III would have been 7.00% and 9.13%, respectively. |
See notes to consolidated financial statements.
| | | | |
| CONSOLIDATED FINANCIAL HIGHLIGHTS | | | 11 | |
Notes to Consolidated Financial Statements
BlackRock Variable Series Funds, Inc. (the “Company”) is registered under the Investment Company Act of 1940, as amended (the “1940 Act”), as an open-end management investment company. The Company is organized as a Maryland corporation that is comprised of 20 separate funds.
The funds offer shares to insurance companies for their separate accounts to fund benefits under certain variable annuity and variable life insurance contracts. The consolidated financial statements presented are for BlackRock iShares® Dynamic Allocation V.I. Fund (the “Fund”). The Fund is classified as diversified. Class I and Class III Shares have equal voting, dividend, liquidation and other rights, except that only shares of the respective classes are entitled to vote on matters concerning only that class. In addition, Class III Shares bear certain expenses related to the distribution of such shares.
The Fund, together with certain other registered investment companies advised by BlackRock Advisors, LLC (the “Manager”) or its affiliates, is included in a complex of open-end funds referred to as the Equity-Bond Complex.
Basis of Consolidation: The accompanying consolidated financial statements of the Fund include the accounts of iShares® Dynamic Allocation V.I. Fund (Cayman) (the “Subsidiary”), which is a wholly-owned subsidiary of the Fund and primarily invests in commodity-related instruments. The Subsidiary enables the Fund to hold these commodity-related instruments and satisfy regulated investment company tax requirements. The Fund may invest up to 25% of its total assets in the Subsidiary. The net assets of the Subsidiary as of December 31, 2017 were $208,457, which is 0.72% of the Fund’s consolidated net assets. Intercompany accounts and transactions, if any, have been eliminated. The Subsidiary is subject to the same investment policies and restrictions that apply to the iShares® Dynamic Allocation V.I. Fund, except that the Subsidiary may invest without limitation in commodity-related instruments.
| 2. | SIGNIFICANT ACCOUNTING POLICIES |
The consolidated financial statements are prepared in conformity with accounting principles generally accepted in the United States of America (“U.S. GAAP”), which may require management to make estimates and assumptions that affect the reported amounts of assets and liabilities in the consolidated financial statements, disclosure of contingent assets and liabilities at the date of the consolidated financial statements and the reported amounts of increases and decreases in net assets from operations during the reporting period. Actual results could differ from those estimates. The Fund is considered an investment company under U.S. GAAP and follows the accounting and reporting guidance applicable to investment companies. Below is a summary of significant accounting policies:
Investment Transactions and Income Recognition: For financial reporting purposes, investment transactions are recorded on the dates the transactions are entered into (the “trade dates”). Realized gains and losses on investment transactions are determined on the identified cost basis. Dividend income is recorded on the ex-dividend date. Dividends from foreign securities where the ex-dividend date may have passed are subsequently recorded when the Fund is informed of the ex-dividend date. Under the applicable foreign tax laws, a withholding tax at various rates may be imposed on capital gains, dividends and interest. Upon notification from issuers, some of the dividend income received from a real estate investment trust may be redesignated as a reduction of cost of the related investment and/or realized gain. Income, expenses and realized and unrealized gains and losses are allocated daily to each class based on its relative net assets.
Distributions: Distributions paid by the Fund are recorded on the ex-dividend date. Distributions of capital gains are recorded on the ex-dividend date and made at least annually. The portion of distributions, if any, that exceeds the Fund’s current and accumulated earnings and profits, as measured on a tax basis, constitute a non-taxable return of capital. The character and timing of distributions are determined in accordance with U.S. federal income tax regulations, which may differ from U.S. GAAP.
Net income and realized gains from investments held by the Subsidiary are treated as ordinary income for tax purposes. If a net loss is realized by the Subsidiary in any taxable year, the loss will generally not be available to offset the Fund’s ordinary income and/or capital gains for that year.
Indemnifications: In the normal course of business, the Fund enters into contracts that contain a variety of representations that provide general indemnification. The Fund’s maximum exposure under these arrangements is unknown because it involves future potential claims against the Fund, which cannot be predicted with any certainty.
Other: Expenses directly related to the Fund or its classes are charged to the Fund or the applicable class. Other operating expenses shared by several funds, including other funds managed by the Manager, are prorated among those funds on the basis of relative net assets or other appropriate methods. Expenses directly related to the Fund and other shared expenses prorated to the Fund are allocated daily to each class based on its relative net assets or other appropriate methods.
| 3. | INVESTMENT VALUATION AND FAIR VALUE MEASUREMENTS |
Investment Valuation Policies: The Fund’s investments are valued at fair value (also referred to as “market value” within the consolidated financial statements) as of the close of trading on the New York Stock Exchange (“NYSE”) (generally 4:00 p.m., Eastern time) (or, if the reporting date falls on a day the NYSE is closed, investments are valued at fair value as of period end). U.S. GAAP defines fair value as the price the Fund would receive to sell an asset or pay to transfer a liability in an orderly transaction between market participants at the measurement date. The Fund determines the fair values of its financial instruments using various independent dealers or pricing services under policies approved by the Board of Directors of the Company (the “Board”). The BlackRock Global Valuation Methodologies Committee (the “Global Valuation Committee”) is the committee formed by management to develop global pricing policies and procedures and to oversee the pricing function for all financial instruments.
Fair Value Inputs and Methodologies: The following methods and inputs are used to establish the fair value of the Fund’s assets and liabilities:
| | • | | Exchange-traded funds (“ETFs”) traded on a recognized securities exchange are valued at the official closing price each day, if available. For ETFs traded on more than one exchange, the official closing price on the exchange where the stock is primarily traded is used. ETFs traded on a recognized exchange for which there were no sales on that day may be valued at the last available bid (long positions) or ask (short positions) price. |
| | |
| 12 | | 2017 BLACKROCK ANNUAL REPORTTO SHAREHOLDERS |
Notes to Consolidated Financial Statements (continued)
| | • | | Investments in open-end U.S. mutual funds are valued at net asset value (“NAV”) each business day. |
| | • | | The Fund values its investment in SL Liquidity Series, LLC, Money Market Series (the “Money Market Series”) at fair value, which is ordinarily based upon its pro rata ownership in the underlying fund’s net assets. The Money Market Series seeks current income consistent with maintaining liquidity and preserving capital. Although the Money Market Series is not registered under the 1940 Act, its investments may follow the parameters of investments by a money market fund that is subject to Rule 2a-7 under the 1940 Act. |
If events (e.g., a company announcement, market volatility or a natural disaster) occur that are expected to materially affect the value of such investments, or in the event that the application of these methods of valuation results in a price for an investment that is deemed not to be representative of the market value of such investment, or if a price is not available, the investment will be valued by the Global Valuation Committee, or its delegate, in accordance with a policy approved by the Board as reflecting fair value (“Fair Valued Investments”). The fair valuation approaches that may be used by the Global Valuation Committee will include market approach, income approach and cost approach. Valuation techniques such as discounted cash flow, use of market comparables and matrix pricing are types of valuation approaches and are typically used in determining fair value. When determining the price for Fair Valued Investments, the Global Valuation Committee, or its delegate, seeks to determine the price that the Fund might reasonably expect to receive or pay from the current sale or purchase of that asset or liability in an arm’s-length transaction. Fair value determinations shall be based upon all available factors that the Global Valuation Committee, or its delegate, deems relevant and consistent with the principles of fair value measurement. The pricing of all Fair Valued Investments is subsequently reported to the Board or a committee thereof on a quarterly basis.
Fair Value Hierarchy: Various inputs are used in determining the fair value of investments. These inputs to valuation techniques are categorized into a fair value hierarchy consisting of three broad levels for consolidated financial statement purposes as follows:
| | • | | Level 1 — Unadjusted price quotations in active markets/exchanges for identical assets or liabilities that the Fund has the ability to access |
| | • | | Level 2 — Other observable inputs (including, but not limited to, quoted prices for similar assets or liabilities in markets that are active, quoted prices for identical or similar assets or liabilities in markets that are not active, inputs other than quoted prices that are observable for the assets or liabilities (such as interest rates, yield curves, volatilities, prepayment speeds, loss severities, credit risks and default rates) or other market-corroborated inputs) |
| | • | | Level 3 — Unobservable inputs based on the best information available in the circumstances, to the extent observable inputs are not available (including the Fund’s own assumptions used in determining the fair value of investments) |
The hierarchy gives the highest priority to unadjusted quoted prices in active markets for identical assets or liabilities (Level 1 measurements) and the lowest priority to unobservable inputs (Level 3 measurements). Accordingly, the degree of judgment exercised in determining fair value is greatest for instruments categorized in Level 3. The inputs used to measure fair value may fall into different levels of the fair value hierarchy. In such cases, for disclosure purposes, the fair value hierarchy classification is determined based on the lowest level input that is significant to the fair value measurement in its entirety. Investments classified within Level 3 have significant unobservable inputs used by the Global Valuation Committee in determining the price for Fair Valued Investments. Level 3 investments include equity or debt issued by privately held companies or funds. There may not be a secondary market, and/or there are a limited number of investors. Level 3 investments may also be adjusted to reflect illiquidity and/or non-transferability, with the amount of such discount estimated by the Global Valuation Committee in the absence of market information.
Changes in valuation techniques may result in transfers into or out of an assigned level within the hierarchy. In accordance with the Fund’s policy, transfers between different levels of the fair value hierarchy are deemed to have occurred as of the beginning of the reporting period. The categorization of a value determined for investments is based on the pricing transparency of the investments and is not necessarily an indication of the risks associated with investing in those securities.
As of December 31, 2017, certain investments of the Fund were valued using NAV per share as no quoted market value is available and therefore have been excluded from the fair value hierarchy.
| 4. | SECURITIES AND OTHER INVESTMENTS |
Securities Lending: The Fund may lend its securities to approved borrowers, such as brokers, dealers and other financial institutions. The borrower pledges and maintains with the Fund collateral consisting of cash, an irrevocable letter of credit issued by a bank, or securities issued or guaranteed by the U.S. Government. The initial collateral received by the Fund is required to have a value of at least 102% of the current value of the loaned securities for securities traded on U.S. exchanges and a value of at least 105% for all other securities. The collateral is maintained thereafter at a value equal to at least 100% of the current market value of the securities on loan. The market value of the loaned securities is determined at the close of each business day of the Fund and any additional required collateral is delivered to the Fund, or excess collateral returned by the Fund, on the next business day. During the term of the loan, the Fund is entitled to all distributions made on or in respect of the loaned securities, but does not receive interest income on securities received as collateral. Loans of securities are terminable at any time and the borrower, after notice, is required to return borrowed securities within the standard time period for settlement of securities transactions.
The market value of any securities on loan, all of which were classified as affiliated investment companies in the Fund’s Consolidated Schedule of Investments, and the value of any related collateral are shown separately in the Consolidated Statement of Assets and Liabilities as a component of investments at value — unaffiliated, and collateral on securities loaned at value, respectively. As of period end, any securities on loan were collateralized by cash and/or U.S. Government obligations. Cash collateral invested by the securities lending agent, BlackRock Investment Management, LLC (“BIM”), if any, is disclosed in the Consolidated Schedule of Investments.
Securities lending transactions are entered into by the Fund under Master Securities Lending Agreements (each, an “MSLA”), which provide the right, in the event of default (including bankruptcy or insolvency), for the non-defaulting party to liquidate the collateral and calculate a net exposure to the defaulting party or request additional collateral. In the event that a borrower defaults, the Fund, as lender, would offset the market value of the collateral received against the market value of the securities loaned. When the value of the collateral is greater than that of the market value of the securities loaned, the lender is left with a net amount payable to the defaulting party. However, bankruptcy or insolvency laws of a particular jurisdiction may impose restrictions on or prohibitions against such a right of offset in the event of an MSLA
| | | | |
| NOTESTO CONSOLIDATED FINANCIAL STATEMENTS | | | 13 | |
Notes to Consolidated Financial Statements (continued)
counterparty’s bankruptcy or insolvency. Under the MSLA, absent an event of default, the borrower can resell or re-pledge the loaned securities, and the Fund can reinvest cash collateral received in connection with loaned securities. Upon an event of default, the parties’ obligations to return the securities or collateral to the other party are extinguished, and the parties can resell or re-pledge the loaned securities or the collateral received in connection with the loaned securities in order to satisfy the defaulting party’s net payment obligation for all transactions under the MSLA. The defaulting party remains liable for any deficiency.
As of period end, the following table is a summary of the Fund’s securities lending agreements by counterparty which are subject to offset under an MSLA:
| | | | | | | | | | | | |
| Counterparty | | Securities Loaned at Value | | | Cash Collateral
Received (a) | | | Net
Amount | |
JP Morgan Securities LLC | | $ | 1,971,355 | | | $ | (1,971,355 | ) | | $ | — | |
| | | | | | | | | | | | |
| | (a) | Cash collateral with a value of $2,015,501 has been received in connection with securities lending agreements. Collateral received in excess of the value of securities loaned from the individual counterparty is not shown for financial reporting purposes in the table above. | |
The risks of securities lending include the risk that the borrower may not provide additional collateral when required or may not return the securities when due. To mitigate these risks, the Fund benefits from a borrower default indemnity provided by BIM. BIM’s indemnity allows for full replacement of the securities loaned if the collateral received does not cover the value on the securities loaned in the event of borrower default. The Fund could incur a loss if the value of an investment purchased with cash collateral falls below the market value of loaned securities or if the value of an investment purchased with cash collateral falls below the value of the original cash collateral received.
| 5. | INVESTMENT ADVISORY AGREEMENT AND OTHER TRANSACTIONS WITH AFFILIATES |
The PNC Financial Services Group, Inc. is the largest stockholder and an affiliate of BlackRock, Inc. (“BlackRock”) for 1940 Act purposes.
Investment Advisory: The Company, on behalf of the Fund, entered into an Investment Advisory Agreement with the Manager, the Fund’s investment adviser, an indirect, wholly-owned subsidiary of BlackRock, to provide investment advisory and administrative services. The Manager is responsible for the management of the Fund’s portfolio and provides the personnel, facilities, equipment and certain other services necessary to the operations of the Fund.
For such services, the Fund pays the Manager a monthly fee at an annual rate equal to the following percentages of the average daily value of the Fund’s net assets:
| | | | |
| Average Daily Net Assets | | Investment
Advisory Fee | |
First $1 Billion | | | 0.150 | % |
$1 Billion — $3 Billion | | | 0.140 | |
$3 Billion — $5 Billion | | | 0.135 | |
Greater than $5 Billion | | | 0.130 | |
The Manager provides investment management and other services to the Subsidiary. The Manager does not receive separate compensation from the Subsidiary for providing investment management or administrative services. However, the Fund pays the Manager based on the Fund’s net assets which includes the assets of the Subsidiary.
Distribution Fees: The Company, on behalf of the Fund, entered into a Distribution Agreement and a Distribution Plan with BlackRock Investments, LLC (“BRIL”), an affiliate of the Manager. Pursuant to the Distribution Plan and in accordance with Rule 12b-1 under the 1940 Act, the Fund pays BRIL ongoing distribution fees. The fees are accrued daily and paid monthly at an annual rate of 0.25% based upon the average daily net assets attributable to Class III.
For the year ended December 31, 2017, the class specific distribution fees borne directly by Class III were $6,467.
Transfer Agent: On behalf of the Fund, the Manager entered into agreements with insurance companies and other financial intermediaries (“Service Organizations”), some of which may be affiliates. Pursuant to these agreements, the Service Organizations provide the Fund with administrative, networking, recordkeeping, sub-transfer agency and shareholder services to sub-accounts they service. For these services, the Service Organizations receive an annual fee per shareholder account, which will vary depending on share class and/or net assets of Fund shareholders serviced by the Service Organizations, which is shown as transfer agent — class specific. For the year ended December 31, 2017, the Fund did not pay any amounts to affiliates in return for these services.
In addition, the Fund pays the transfer agent, which is not an affiliate, a fee for the issuance, transfer and redemption of shares and the opening and maintenance of shareholder accounts, which is included in transfer agent in the Consolidated Statement of Operations.
For the year ended December 31, 2017, the following table shows the class specific transfer agent fees borne directly by each share class of the Fund:
| | | | | | | | | | | | | | |
| Class I | | | | | Class III | | | | | Total | |
| $ | 45,747 | | | | | $ | 6,652 | | | | | $ | 52,399 | |
Expense Limitations, Waivers and Reimbursements: With respect to the Fund, the Manager voluntarily agreed to waive its investment advisory fees by the amount of investment advisory fees the Fund pays to the Manager indirectly through its investment in affiliated money market funds. In addition, the Manager has contractually agreed to waive the management fee on assets estimated to be attributable to the Fund’s investments in other equity and fixed-income mutual funds managed by BlackRock or its affiliates, if any. This amount is included in fees waived and/or reimbursed by the Manager in the Consolidated Statement of Operations. For the year ended December 31, 2017, the amount waived was $70.
| | |
| 14 | | 2017 BLACKROCK ANNUAL REPORTTO SHAREHOLDERS |
Notes to Consolidated Financial Statements (continued)
For the year ended December 31, 2017, the Fund reimbursed the Manager $216 for certain accounting services, which is included in accounting services in the Consolidated Statement of Operations.
With respect to the Fund, the Manager contractually agreed to waive and/or reimburse fees or expenses in order to limit expenses, excluding interest expense, dividend expense, tax expense, acquired fund fees and expenses, and certain other fund expenses, which constitute extraordinary expenses not incurred in the ordinary course of the Fund’s business (“expense limitation”). The expense limitations as a percentage of average daily net assets are as follows:
| | | | |
Class I | | | 0.53 | % |
Class III | | | 0.78 | % |
The Manager has agreed not to reduce or discontinue this contractual expense limitation through April 30, 2018, unless approved by the Board, including a majority of the independent directors who are not “interested persons” of the Fund, as defined in the 1940 Act (“Independent Directors”) or by a vote of a majority of the outstanding voting securities of the Fund. For the year ended December 31, 2017, the Manager waived and/or reimbursed $79,451 which is included in fees waived and/or reimbursed by the Manager in the Consolidated Statement of Operations.
These amounts waived and/or reimbursed are shown as transfer agent fees reimbursed — class specific in the Consolidated Statement of Operations. For the year ended December 31, 2017, class specific expense waivers and/or reimbursements were as follows:
| | | | | | | | | | | | |
| | | Class I | | | Class III | | | Total | |
Transfer Agent Fees Reimbursed | | $ | 25,064 | | | $ | 3,305 | | | $ | 28,369 | |
With respect to the contractual expense limitation, if during the Fund’s fiscal year the operating expenses of a share class, that at any time during the prior two fiscal years received a waiver and/or reimbursement from the Manager, are less than the current expense limitation for that share class, the Manager is entitled to be reimbursed by such share class up to the lesser of: (a) the amount of fees waived and/or expenses reimbursed during those prior two fiscal years under the agreement and (b) an amount not to exceed either the current expense limitation of that share class or the expense limitation of the share class in effect at the time that the share class received the applicable waiver and/or reimbursement, provided that:
| | (1) | the Fund, of which the share class is a part, has more than $50 million in assets for the fiscal year, and |
| | (2) | the Manager or an affiliate continues to serve as the Fund’s investment adviser or administrator. |
This repayment applies only to the contractual expense limitation on net expenses and does not apply to any voluntary waivers that may be in effect from time to time.
On December 31, 2017, the Fund level and class specific waivers and/or reimbursements subject to possible future recoupment under the expense limitation agreement were as follows:
| | | | | | | | |
| | | Expiring December 31, | |
| | | 2018 | | | 2019 | |
Fund Level | | $ | 21,999 | | | $ | 79,451 | |
Class I | | | 29,259 | | | | 25,064 | |
Class III | | | 2,053 | | | | 3,305 | |
The following fund level and class specific waivers and/or reimbursements previously recorded by the fund, which were subject to recoupment by the Manager, expired on December 31, 2017:
| | | | |
Fund Level | | $ | 122,310 | |
Class I | | | 21,925 | |
Class III | | | 265 | |
Securities Lending: The U.S. Securities and Exchange Commission (“SEC”) has issued an exemptive order which permits BIM, an affiliate of the Manager, to serve as securities lending agent for the Fund, subject to applicable conditions. As securities lending agent, BIM bears all operational costs directly related to securities lending. The Fund is responsible for expenses in connection with the investment of cash collateral received for securities on loan (the “collateral investment expenses”). The cash collateral is invested in a private investment company managed by the Manager or its affiliates. However, BIM has agreed to cap the collateral investment expenses of the private investment company to an annual rate of 0.04%. The investment adviser to the private investment company will not charge any advisory fees with respect to shares purchased by the Fund. The private investment company in which the cash collateral has been invested may, under certain circumstances, impose a liquidity fee of up to 2% of the value withdrawn or temporarily restrict withdrawals for up to 10 business days during a 90 day period, in the event that the private investment company’s weekly liquid assets fall below certain thresholds.
Securities lending income is equal to the total of income earned from the reinvestment of cash collateral, net of fees and other payments to and from borrowers of securities, and less the collateral investment expenses. The Fund retains a portion of securities lending income and remits a remaining portion to BIM as compensation for its services as securities lending agent.
Pursuant to a securities lending agreement, the Fund retains 80% of securities lending income, and this amount retained can never be less than 70% of the total of securities lending income plus the collateral investment expenses.
In addition, commencing the business day following the date that the aggregate securities lending income earned across the Equity-Bond Complex in a calendar year exceeds a specified threshold, the Fund, pursuant to the securities lending agreement, will retain for the remainder of that calendar year securities lending income in an
| | | | |
| NOTESTO CONSOLIDATED FINANCIAL STATEMENTS | | | 15 | |
Notes to Consolidated Financial Statements (continued)
amount equal to 85% of securities lending income, and this amount retained can never be less than 70% of the total of securities lending income plus the collateral investment expenses.
The share of securities lending income earned by the Fund is shown as securities lending income — affiliated — net in the Consolidated Statement of Operations. For the year ended December 31, 2017, the Fund paid BIM $4,820 for securities lending agent services.
Interfund Lending: In accordance with an exemptive order (the “Order”) from the SEC, the Fund may participate in a joint lending and borrowing facility for temporary purposes (the “Interfund Lending Program”), subject to compliance with the terms and conditions of the Order, and to the extent permitted by the Fund’s investment policies and restrictions. The Fund is currently permitted to borrow and lend under the Interfund Lending Program.
A lending BlackRock fund may lend in aggregate up to 15% of its net assets, but may not lend more than 5% of its net assets to any one borrowing fund through the Interfund Lending Program. A borrowing BlackRock fund may not borrow through the Interfund Lending Program or from any other source more than 33 1/3% of its total assets or any lower threshold provided for by the fund’s investment restrictions. If a borrowing BlackRock fund’s total outstanding borrowings exceed 10% of its total assets, each of its outstanding interfund loans will be subject to collateralization of at least 102% of the outstanding principal value of the loan. All interfund loans are for temporary or emergency purposes and the interest rate to be charged will be the average of the highest current overnight repurchase agreement rate available to a lending fund and the bank loan rate, as calculated according to a formula established by the Board.
During the year ended December 31, 2017, the Fund did not participate in the Interfund Lending Program.
Officers and Directors: Certain directors and/or officers of the Company are directors and/or officers of BlackRock or its affiliates. The Fund reimburses the Manager for a portion of the compensation paid to the Company’s Chief Compliance Officer, which is included in Directors and Officer in the Consolidated Statement of Operations.
For the year ended December 31, 2017, purchases and sales of investments, excluding short-term securities, were $17,963,413 and $11,874,905, respectively.
It is the Fund’s policy to comply with the requirements of the Internal Revenue Code of 1986, as amended, applicable to regulated investment companies, and to distribute substantially all of its taxable income to its shareholders. Therefore, no U.S. federal income tax provision is required.
The Fund files U.S. federal and various state and local tax returns. No income tax returns are currently under examination. The statute of limitations on the Fund’s U.S. federal tax returns generally remains open for the period ended December 31, 2014 and each of the three years ended December 31, 2017. The statutes of limitations on the Fund’s state and local tax returns may remain open for an additional year depending upon the jurisdiction.
Management has analyzed tax laws and regulations and their application to the Fund as of December 31, 2017, inclusive of the open tax return years and does not believe there are any uncertain tax positions that require recognition of a tax liability in the Fund’s consolidated financial statements.
U.S. GAAP requires that certain components of net assets be adjusted to reflect permanent differences between financial and tax reporting. These reclassifications have no effect on net assets or net asset values per share. As of period end, the following permanent difference attributable to the characterization of income/losses from a wholly owned subsidiary was reclassified to the following accounts:
| | | | |
Paid-in capital | | $ | (8,924 | ) |
Accumulated net realized loss | | $ | 8,924 | |
The tax character of distributions paid was as follows:
| | | | | | | | |
| | | 12/31/17 | | | 12/31/16 | |
Ordinary income | | $ | 509,455 | | | $ | 408,071 | |
Tax return of capital | | $ | 16,545 | | | | 10,932 | |
| | | | | | | | |
| | $ | 526,000 | | | $ | 419,003 | |
| | | | | | | | |
As of December 31, 2017, the tax components of accumulated net earnings (losses) were as follows:
| | | | |
Capital loss carryforward | | $ | (458,729 | ) |
Net unrealized gains(a) | | | 3,033,581 | |
| | | | |
| | $ | 2,574,852 | |
| | | | |
| | (a) | The difference between book-basis and tax-basis net unrealized gains was attributable primarily to the tax deferral of losses on wash sales and the timing and recognition of partnership income. | |
As of December 31, 2017, the Fund had a capital loss carryforward, with no expiration date, available to offset future realized capital gains of $458,729.
During the year ended December 31, 2017, the Fund utilized $296,115 of its capital loss carryforward.
| | |
| 16 | | 2017 BLACKROCK ANNUAL REPORTTO SHAREHOLDERS |
Notes to Consolidated Financial Statements (continued)
As of December 31, 2017, gross unrealized appreciation and depreciation for investments based on cost for U.S. federal income tax purposes were as follows:
| | | | |
Tax cost | | $ | 27,998,813 | |
| | | | |
Gross unrealized appreciation | | $ | 3,050,649 | |
Gross unrealized depreciation | | | (17,068 | ) |
| | | | |
Net unrealized appreciation | | $ | 3,033,581 | |
| | | | |
The Company, on behalf of the Fund, along with certain other funds managed by the Manager and its affiliates (“Participating Funds”), is a party to a 364-day, $2.1 billion credit agreement with a group of lenders. Under this agreement, the Fund may borrow to fund shareholder redemptions. Excluding commitments designated for certain individual funds, the Participating Funds, including the Fund, can borrow up to an aggregate commitment amount of $1.6 billion at any time outstanding, subject to asset coverage and other limitations as specified in the agreement. The credit agreement has the following terms: a fee of 0.12% per annum on unused commitment amounts and interest at a rate equal to the higher of (a) one-month LIBOR (but, in any event, not less than 0.00%) on the date the loan is made plus 0.80% per annum or (b) the Fed Funds rate (but, in any event, not less than 0.00%) in effect from time to time plus 0.80% per annum on amounts borrowed. The agreement expires in April 2018 unless extended or renewed. Participating Funds paid administration, legal and arrangement fees, which, if applicable, are included in miscellaneous expenses in the Consolidated Statement of Operations. These fees were allocated among such funds based upon portions of the aggregate commitment available to them and relative net assets of Participating Funds. During the year ended December 31, 2017, the Fund did not borrow under the credit agreement.
In the normal course of business, the Fund invests in securities or other instruments and may enter into certain transactions, and such activities subject the Fund to various risks, including among others, fluctuations in the market (market risk) or failure of an issuer to meet all of its obligations. The value of securities or other instruments may also be affected by various factors, including, without limitation: (i) the general economy; (ii) the overall market as well as local, regional or global political and/or social instability; (iii) regulation, taxation or international tax treaties between various countries; or (iv) currency, interest rate and price fluctuations. The Fund’s prospectus provides details of the risks to which the Fund is subject.
The Fund may be exposed to additional risks when reinvesting cash collateral in money market funds that do not seek to maintain a stable NAV per share of $1.00 and which may be subject to redemption gates or liquidity fees under certain circumstances.
Valuation Risk: The market values of equities, such as common stocks and preferred securities or equity related investments, such as futures and options, may decline due to general market conditions which are not specifically related to a particular company. They may also decline due to factors which affect a particular industry or industries. The Fund may invest in illiquid investments and may experience difficulty in selling those investments in a timely manner at the price that it believes the investments are worth. Prices may fluctuate widely over short or extended periods in response to company, market or economic news. Markets also tend to move in cycles, with periods of rising and falling prices. This volatility may cause the Fund’s NAV to experience significant increases or decreases over short periods of time. If there is a general decline in the securities and other markets, the NAV of the Fund may lose value, regardless of the individual results of the securities and other instruments in which the Fund invests.
Counterparty Credit Risk: The Fund may be exposed to counterparty credit risk, or the risk that an entity may fail to or be unable to perform on its commitments related to unsettled or open transactions. The Fund manages counterparty credit risk by entering into transactions only with counterparties that the Manager believes have the financial resources to honor their obligations and by monitoring the financial stability of those counterparties. Financial assets, which potentially expose the Fund to market, issuer and counterparty credit risks, consist principally of financial instruments and receivables due from counterparties. The extent of the Fund’s exposure to market, issuer and counterparty credit risks with respect to these financial assets approximated by their value recorded in the Consolidated Statement of Assets and Liabilities, less any collateral held by the Fund.
Concentration Risk: The Fund invests a significant portion of its assets in fixed-income securities and/or uses derivatives tied to the fixed-income markets. Changes in market interest rates or economic conditions may affect the value and/or liquidity of such investments. Interest rate risk is the risk that prices of bonds and other fixed-income securities will increase as interest rates fall and decrease as interest rates rise. The Fund may be subject to a greater risk of rising interest rates due to the current period of historically low rates.
| | | | |
| NOTESTO CONSOLIDATED FINANCIAL STATEMENTS | | | 17 | |
Notes to Consolidated Financial Statements (continued)
| 10. | CAPITAL SHARE TRANSACTIONS |
Transactions in capital shares for each class were as follows:
| | | | | | | | | | | | | | | | |
| | | Year Ended
12/31/2017 | | | Year Ended
12/31/2016 | |
| Share Class | | Shares | | | Amount | | | Shares | | | Amount | |
Class I | | | | | | | | | | | | | | | | |
Shares sold | | | 583,027 | | | $ | 6,150,100 | | | | 523,146 | | | $ | 4,986,995 | |
Shares issued in reinvestment of distributions | | | 41,877 | | | | 466,094 | | | | 39,040 | | | | 384,545 | |
Shares redeemed | | | (189,522 | ) | | | (1,993,433 | ) | | | (269,060 | ) | | | (2,597,902 | ) |
| | | | | | | | | | | | | | | | |
Net increase | | | 435,382 | | | $ | 4,622,761 | | | | 293,126 | | | $ | 2,773,638 | |
| | | | | | | | | | | | | | | | |
| | | | |
Class III | | | | | | | | | | | | | | | | |
Shares sold | | | 176,888 | | | $ | 1,880,454 | | | | 83,719 | | | $ | 801,538 | |
Shares issued in reinvestment of distributions | | | 5,402 | | | | 59,907 | | | | 3,505 | | | | 34,458 | |
Shares redeemed | | | (39,950 | ) | | | (420,223 | ) | | | (28,150 | ) | | | (274,833 | ) |
| | | | | | | | | | | | | | | | |
Net increase | | | 142,340 | | | $ | 1,520,138 | | | | 59,074 | | | $ | 561,163 | |
| | | | | | | | | | | | | | | | |
Total Net Increase | | | 577,722 | | | $ | 6,142,899 | | | | 352,200 | | | $ | 3,334,801 | |
| | | | | | | | | | | | | | | | |
Management has evaluated the impact of all subsequent events on the Fund through the date the consolidated financial statements were issued and has determined that there were no subsequent events requiring adjustment or additional disclosure in the consolidated financial statements.
| | |
| 18 | | 2017 BLACKROCK ANNUAL REPORTTO SHAREHOLDERS |
Report of Independent Registered Public Accounting Firm
To the Shareholders of BlackRock iShares Dynamic Allocation V.I. Fund and the Board of Directors of BlackRock Variable Series Funds, Inc.:
Opinion on the Financial Statements and Financial Highlights
We have audited the accompanying consolidated statement of assets and liabilities, including the consolidated schedule of investments, of BlackRock iShares Dynamic Allocation V.I. Fund, of BlackRock Variable Series Funds, Inc. (the “Fund”), as of December 31, 2017, the related consolidated statement of operations for the year then ended, the consolidated statements of changes in net assets for each of the two years in the period then ended, the consolidated financial highlights for each of the periods presented, and the related notes. In our opinion, the consolidated financial statements and consolidated financial highlights present fairly, in all material respects, the financial position of the Fund as of December 31, 2017, and the results of its operations for the year then ended, the changes in its net assets for each of the two years in the period then ended, and the financial highlights for each of the periods presented, in conformity with accounting principles generally accepted in the United States of America.
Basis for Opinion
These financial statements and financial highlights are the responsibility of the Fund’s management. Our responsibility is to express an opinion on the Fund’s financial statements and financial highlights based on our audits. We are a public accounting firm registered with the Public Company Accounting Oversight Board (United States) (PCAOB) and are required to be independent with respect to the Fund in accordance with the U.S. federal securities laws and the applicable rules and regulations of the Securities and Exchange Commission and the PCAOB.
We conducted our audits in accordance with the standards of the PCAOB. Those standards require that we plan and perform the audit to obtain reasonable assurance about whether the financial statements and financial highlights are free of material misstatement, whether due to error or fraud. The Fund is not required to have, nor were we engaged to perform, an audit of its internal control over financial reporting. As part of our audits we are required to obtain an understanding of internal control over financial reporting but not for the purpose of expressing an opinion on the effectiveness of the Fund’s internal control over financial reporting. Accordingly, we express no such opinion.
Our audits included performing procedures to assess the risks of material misstatement of the financial statements and financial highlights, whether due to error or fraud, and performing procedures that respond to those risks. Such procedures included examining, on a test basis, evidence regarding the amounts and disclosures in the financial statements and financial highlights. Our audits also included evaluating the accounting principles used and significant estimates made by management, as well as evaluating the overall presentation of the financial statements and financial highlights. Our procedures included confirmation of securities owned as of December 31, 2017, by correspondence with the custodian and brokers; when replies were not received from brokers, we performed other auditing procedures. We believe that our audits provide a reasonable basis for our opinion.
Deloitte & Touche LLP
Boston, Massachusetts
February 19, 2018
We have served as the auditor of one or more BlackRock investment companies since 1992.
| | | | |
| REPORTOF INDEPENDENT REGISTERED PUBLIC ACCOUNTING FIRM | | | 19 | |
DECEMBER 31, 2017
| | |
ANNUAL REPORT | |  |
BlackRock Variable Series Funds, Inc.
| Ø | | BlackRock iShares® Dynamic Fixed Income V.I. Fund |
|
| Not FDIC Insured • May Lose Value • No Bank Guarantee |
| | |
| Fund Summary as of December 31, 2017 | | BlackRock iShares® Dynamic Fixed Income V.I. Fund |
Investment Objective
BlackRock iShares® Dynamic Fixed Income V.I. Fund’s (the “Fund”) investment objective is to seek to provide total return.
On November 15, 2017, the Board of Directors of BlackRock Variable Series Funds, Inc. (the “Company”) approved a proposal to close the Fund to new investors and thereafter to liquidate the Fund. Effective December 19, 2017, the Fund is no longer accepting purchase orders from new investors. The liquidation is expected to occur on or about March 29, 2018.
Portfolio Management Commentary
How did the Fund perform?
For the 12-month period ended December 31, 2017, the Fund outperformed its benchmark, the Bloomberg Barclays U.S. Aggregate Bond Index.
What factors influenced performance?
The largest contributor to Fund performance was exposure to the iShares iBoxx $ Investment Grade Corporate Bond ETF. This was followed by exposure to the iShares U.S. Credit Bond ETF.
The largest detractor from performance was exposure to the iShares 1-3 Year Treasury Bond ETF.
Describe recent portfolio activity.
During the reporting period, the Fund reduced exposure to Treasury Inflation-Protected Securities and agency mortgage-backed securities in favor of investment grade corporate credit, high yield and short-term U.S. Treasuries.
Describe portfolio positioning at period end.
At period end, the Fund maintained an overweight to credit versus rates. The Fund’s top holdings included U.S. credit and Treasuries. The Fund also maintained exposure to high yield and agency bonds.
The views expressed reflect the opinions of BlackRock as of the date of this report and are subject to change based on changes in market, economic or other conditions. These views are not intended to be a forecast of future events and are no guarantee of future results.
Portfolio Information
PORTFOLIO COMPOSITION
| | | | |
| Asset Type | | Percent of
Affiliated Investment
Companies | |
Fixed Income Funds | | | 91 | % |
Short-Term Securities | | | 9 | % |
| | |
| 2 | | 2017 BLACKROCK ANNUAL REPORTTO SHAREHOLDERS |
| | |
| Fund Summary as of December 31, 2017 (continued) | | BlackRock iShares® Dynamic Fixed Income V.I. Fund |
TOTAL RETURN BASED ON A $10,000 INVESTMENT
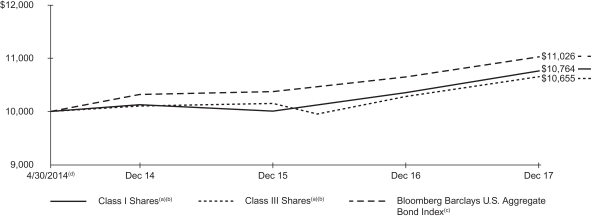
| | (a) | Assuming transaction costs, if any, and other operating expenses, including investment advisory fees. Does not include insurance-related fees and expenses. | |
| | (b) | The Fund invests in a portfolio of underlying exchange-traded funds that seek to track fixed income indices. | |
| | (c) | A widely recognized unmanaged market-weighted index, comprised of investment-grade corporate bonds rated BBB or better, mortgages and U.S. Treasury and U.S. Government agency issues with at least one year to maturity. | |
| | (d) | Commencement of operations. | |
Performance Summary for the Period Ended December 31, 2017
| | | | | | | | | | | | | | | | |
| | | | | | | | | Average Annual Total Returns | |
| | | 6-Month
Total Returns (b) | | | | | | 1 Year (b) | | | Since
Inception (b)(c) | |
Class I(a) | | | 1.25 | % | | | | | | | 3.91 | % | | | 2.03 | % |
Class III(a) | | | 1.13 | | | | | | | | 3.60 | | | | 1.74 | |
Bloomberg Barclays U.S. Aggregate Bond Index | | | 1.24 | | | | | | | | 3.54 | | | | 2.70 | |
| | (a) | Average annual and cumulative total returns are based on changes in net asset value for the periods shown, and assume reinvestment of all distributions at net asset value on the ex-dividend date. Insurance-related fees and expenses are not reflected in these returns. | |
| | (b) | For the portion of the period, the Fund’s investment adviser waived a portion of its fee. Without such waiver, the Fund’s performance would have been lower. | |
| | (c) | The Fund commenced operations on April 30, 2014. | |
Past performance is not indicative of future results. Performance results do not reflect the deduction of taxes that a shareholder would pay on Fund distributions or the redemption of Fund shares.
Performance results may include adjustments made for financial reporting purposes in accordance with U.S. generally accepted accounting principles.
Expense Example
| | | | | | | | | | | | | | | | | | | | | | | | | | | | | | | | |
| | | Actual | | | | | | Hypothetical (a) | | | | |
| | | Beginning
Account Value
(07/01/17) | | | Ending
Account Value
(12/31/17) | | | Expenses
Paid During
the Period (b) | | | | | | Beginning
Account Value
(07/01/17) | | | Ending
Account Value
(12/31/17) | | | Expenses
Paid During
the Period (b) | | | Annualized
Expense
Ratio | |
Class I | | $ | 1,000.00 | | | $ | 1,012.50 | | | $ | 2.54 | | | | | | | $ | 1,000.00 | | | $ | 1,022.70 | | | $ | 2.55 | | | | 0.50 | % |
Class III | | | 1,000.00 | | | | 1,011.30 | | | | 3.80 | | | | | | | | 1,000.00 | | | | 1,021.40 | | | | 3.82 | | | | 0.75 | |
| | (a) | Hypothetical 5% annual return before expenses is calculated by prorating the number of days in the most recent fiscal half year divided by 365. | |
| | (b) | For each class of the Fund, expenses are equal to the annualized expense ratio for the class, multiplied by the average account value over the period, multiplied by 184/365 (to reflect the one-half year period shown). | |
See “Disclosure of Expenses” on the following page for further information on how expenses were calculated.
| | |
| Disclosure of Expenses | | BlackRock iShares® Dynamic Fixed Income V.I. Fund |
Shareholders of the Fund may incur the following charges: (a) transactional expenses, such as sales charges; and (b) operating expenses, including investment advisory fees, service and distribution fees, including 12b-1 fees, acquired fund fees and expenses, and other fund expenses. The expense example on the previous page (which is based on a hypothetical investment of $1,000 invested on July 1, 2017 and held through December 31, 2017) is intended to assist shareholders both in calculating expenses based on an investment in the Fund and in comparing these expenses with similar costs of investing in other mutual funds.
The expense example provides information about actual account values and actual expenses. In order to estimate the expenses a shareholder paid during the period covered by this report, shareholders can divide their account value by $1,000 and then multiply the result by the number corresponding to their share class under the heading entitled “Expenses Paid During the Period.”
The expense example also provides information about hypothetical account values and hypothetical expenses based on the Fund’s actual expense ratio and an assumed rate of return of 5% per year before expenses. In order to assist shareholders in comparing the ongoing expenses of investing in the Fund and other funds, compare the 5% hypothetical example with the 5% hypothetical examples that appear in shareholder reports of other funds.
The expenses shown in the expense example are intended to highlight shareholders’ ongoing costs only and do not reflect any transactional expenses, such as sales charges, if any. Therefore, the hypothetical example is useful in comparing ongoing expenses only, and will not help shareholders determine the relative total expenses of owning different funds. If these transactional expenses were included, shareholder expenses would have been higher.
| | |
| 4 | | 2017 BLACKROCK ANNUAL REPORTTO SHAREHOLDERS |
| | |
Schedule of Investments December 31, 2017 | | BlackRock iShares® Dynamic Fixed Income V.I. Fund (Percentages shown are based on Net Assets) |
| | | | | | | | |
| Security | | Shares | | | Value | |
Affiliated Investment Companies — 109.9%(d) | |
|
| Fixed Income Funds — 100.0% | |
iShares 1-3 Year Treasury Bond ETF | | | 57,352 | | | $ | 4,808,965 | |
iShares Agency Bond ETF | | | 27,445 | | | | 3,103,810 | |
iShares iBoxx $ High Yield Corporate Bond ETF | | | 33,438 | | | | 2,917,800 | |
iShares iBoxx $ Investment Grade Corporate Bond ETF | | | 38,053 | | | | 4,625,722 | |
iShares U.S. Credit Bond ETF(a) | | | 47,857 | | | | 5,361,420 | |
| | | | | | | | |
| | | | | | | 20,817,717 | |
| | | | | | | | |
| | | | | | | | |
| Security | | Shares | | | Value | |
| Short-Term Securities — 9.9%(b) | |
BlackRock Liquidity Funds, T-Fund, Institutional Class,
1.17% | | | 37,990 | | | $ | 37,990 | |
SL Liquidity Series, LLC, Money Market Series,
1.48%(c) | | | 2,015,402 | | | | 2,015,200 | |
| | | | | | | | |
| | | | 2,053,190 | |
| | | | | | | | |
| |
Total Affiliated Investment Companies — 109.9%
(Cost: $22,673,238) | | | | 22,870,907 | |
| | | | | | | | |
Liabilities in Excess of Other Assets — (9.9)% | | | | (2,059,453 | ) |
| | | | | | | | |
Net Assets — 100.0% | | | $ | 20,811,454 | |
| | | | | | | | |
| (a) | Security, or a portion of the security, is on loan. |
| (b) | Annualized 7-day yield as of period end. |
| (c) | Security was purchased with the cash collateral from loaned securities. |
| (d) | During the year ended December 31, 2017, investments in issuers considered to be affiliates of the Fund for the purposes of Section 2(a)(3) of the Investment Company Act of 1940, as amended, and/or related parties of the Fund were as follows: |
| | | | | | | | | | | | | | | | | | | | | | | | | | | | | | | | |
| Affiliate | | Shares
Held at
12/31/16 | | | Shares
Purchased | | | Shares
Sold | | | Shares
Held at
12/31/17 | | | Value at 12/31/17 | | | Income | | | Net
Realized Gain (Loss) (a) | | | Change in Unrealized Appreciation (Depreciation) | |
BlackRock Liquidity Funds, T-Fund, Institutional Class | | | 50,671 | | | | — | | | | (12,681 | )(b) | | | 37,990 | | | $ | 37,990 | | | $ | 650 | | | $ | — | | | $ | — | |
SL Liquidity Series, LLC, Money Market Series | | | 3,328,792 | | | | — | | | | (1,313,390 | )(b) | | | 2,015,402 | | | | 2,015,200 | | | | 25,239 | (c) | | | (212 | ) | | | (24 | ) |
iShares 1-3 Year Treasury Bond ETF | | | 11,043 | | | | 58,589 | | | | (12,280 | ) | | | 57,352 | | | | 4,808,965 | | | | 40,190 | | | | (4,721 | ) | | | (32,771 | ) |
iShares 10+ Year Credit Bond ETF | | | 2,644 | | | | — | | | | (2,644 | ) | | | — | | | | — | | | | — | | | | (300 | ) | | | 1,549 | |
iShares Agency Bond ETF | | | 20,567 | | | | 8,178 | | | | (1,300 | ) | | | 27,445 | | | | 3,103,810 | | | | 42,866 | | | | 17 | | | | 8,348 | |
iShares CMBS ETF | | | 3,017 | | | | — | | | | (3,017 | ) | | | — | | | | — | | | | 990 | | | | (1,356 | ) | | | 2,751 | |
iShares iBoxx $ High Yield Corporate Bond ETF | | | 12,948 | | | | 25,230 | | | | (4,740 | ) | | | 33,438 | | | | 2,917,800 | | | | 122,130 | | | | 10,698 | | | | (4,061 | ) |
iShares iBoxx $ Investment Grade Corporate Bond ETF | | | 17,126 | | | | 33,644 | | | | (12,717 | ) | | | 38,053 | | | | 4,625,722 | | | | 111,475 | | | | 37,206 | | | | 86,374 | |
iShares MBS ETF | | | 21,583 | | | | — | | | | (21,583 | ) | | | — | | | | — | | | | 10,214 | | | | (32,706 | ) | | | 51,711 | |
iShares TIPS Bond ETF | | | 4,125 | | | | — | | | | (4,125 | ) | | | — | | | | — | | | | 1,417 | | | | 14,081 | | | | (171 | ) |
iShares U.S. Credit Bond ETF | | | 36,344 | | | | 13,268 | | | | (1,755 | ) | | | 47,857 | | | | 5,361,420 | | | | 143,319 | | | | (4,279 | ) | | | 121,867 | |
iShares U.S. Treasury Bond ETF | | | 80,879 | | | | — | | | | (80,879 | ) | | | — | | | | — | | | | — | | | | (14,746 | ) | | | 24,286 | |
| | | | | | | | | | | | | | | | | | | | | | | | | | | | | | | | |
| | | | | | | | | | | | | | | | | | $ | 22,870,907 | | | $ | 498,490 | | | $ | 3,682 | | | $ | 259,859 | |
| | | | | | | | | | | | | | | | | | | | | | | | | | | | | | | | |
| | (a) | Includes net capital gain distributions, if applicable. | |
| | (b) | Represents net shares sold. | |
| | (c) | Represents securities lending income earned from the reinvestment of cash collateral from loaned securities, net of fees and collateral investment expenses, and other payments to and from borrowers of securities. | |
Portfolio Abbreviation
ETF — Exchange-Traded Fund
| | | | |
| SCHEDULE OF INVESTMENTS | | | 5 | |
| | |
Schedule of Investments (continued) December 31, 2017 | | BlackRock iShares® Dynamic Fixed Income V.I. Fund |
Fair Value Hierarchy as of Period End
Various inputs are used in determining the fair value of investments. For information about the Fund’s policy regarding valuation of investments, refer to the Notes to Financial Statements.
The following table summarizes the Fund’s investments categorized in the disclosure hierarchy:
| | | | | | | | | | | | | | | | |
| | | Level 1 | | | Level 2 | | | Level 3 | | | Total | |
Assets: | | | | | | | | | | | | | | | | |
Investments: | | | | | | | | | | | | | | | | |
Affiliated Investment Companies | | $ | 20,855,707 | | | $ | — | | | $ | — | | | $ | 20,855,707 | |
| | | | | | | | | | | | | | | | |
Investments valued at NAV(a) | | | | | | | | | | | | | | | 2,015,200 | |
| | | | | | | | | | | | | | | | |
Total Investments | | | | | | | | | | | | | | $ | 22,870,907 | |
| | | | | | | | | | | | | | | | |
| | (a) | As of December 31, 2017, certain investments of the Fund were fair valued using NAV per share as no quoted market value is available and therefore have been excluded from the fair value hierarchy. | |
During the year ended December 31, 2017, there were no transfers between levels.
See notes to financial statements.
| | |
| 6 | | 2017 BLACKROCK ANNUAL REPORTTO SHAREHOLDERS |
Statement of Assets and Liabilities
December 31, 2017
| | | | |
| | | BlackRock
iShares® Dynamic
Fixed Income V.I.
Fund | |
| |
ASSETS | | | | |
Investments at value — affiliated (including securities loaned at value of $1,971,728) (cost — $22,673,238) | | $ | 22,870,907 | |
Receivables: | | | | |
Securities lending income — affiliated | | | 1,170 | |
Capital shares sold | | | 4,611 | |
Dividends — affiliated | | | 99 | |
From the Manager | | | 13,671 | |
Prepaid expenses | | | 94 | |
| | | | |
Total assets | | | 22,890,552 | |
| | | | |
| |
LIABILITIES | | | | |
Bank overdraft | | | 95 | |
Cash collateral on securities loaned at value | | | 2,015,199 | |
Payables: | | | | |
Capital shares redeemed | | | 309 | |
Officer’s and Directors’ fees | | | 1,513 | |
Other accrued expenses | | | 24,898 | |
Other affiliates | | | 15 | |
Professional fees | | | 29,061 | |
Distribution fees | | | 924 | |
Transfer agent fees | | | 7,084 | |
| | | | |
Total liabilities | | | 2,079,098 | |
| | | | |
| |
NET ASSETS | | $ | 20,811,454 | |
| | | | |
| |
NET ASSETS CONSIST OF | | | | |
Paid-in capital | | $ | 20,864,996 | |
Undistributed net investment income | | | 2,323 | |
Accumulated net realized loss | | | (253,534 | ) |
Net unrealized appreciation (depreciation) | | | 197,669 | |
| | | | |
NET ASSETS | | $ | 20,811,454 | |
| | | | |
| |
NET ASSET VALUE | | | | |
Class I — Based on net assets of $16,222,205 and 1,611,209 shares outstanding, 100 million shares authorized, $0.10 par value. | | $ | 10.07 | |
| | | | |
Class III — Based on net assets of $4,589,249 and 458,054 shares outstanding, 100 million shares authorized, $0.10 par value. | | $ | 10.02 | |
| | | | |
See notes to financial statements.
Statement of Operations
Year Ended December 31, 2017
| | | | |
| | | BlackRock
iShares® Dynamic Fixed Income V.I. Fund | |
| |
INVESTMENT INCOME | | | | |
Dividends — affiliated | | $ | 473,251 | |
Securities lending income — affiliated — net | | | 25,239 | |
| | | | |
Total investment income | | | 498,490 | |
| | | | |
| |
EXPENSES | | | | |
Professional | | | 54,201 | |
Transfer agent | | | 5,001 | |
Transfer agent — class specific | | | 30,919 | |
Investment advisory | | | 27,234 | |
Accounting services | | | 21,302 | |
Printing | | | 11,561 | |
Distribution — class specific | | | 8,718 | |
Directors and Officer | | | 8,572 | |
Custodian | | | 4,856 | |
Miscellaneous | | | 4,147 | |
| | | | |
Total expenses | | | 176,511 | |
Less: | | | | |
Transfer agent fees reimbursed — class specific | | | (19,382 | ) |
Fees waived and/or reimbursed by the Manager | | | (64,773 | ) |
| | | | |
Total expenses after fees waived and/or reimbursed | | | 92,356 | |
| | | | |
Net investment income | | | 406,134 | |
| | | | |
| |
REALIZED AND UNREALIZED GAIN (LOSS) | | | | |
Net realized gain (loss) from investments — affiliated | | | 3,682 | |
Net change in unrealized appreciation (depreciation) on investments — affiliated | | | 259,859 | |
| | | | |
Net realized and unrealized gain | | | 263,541 | |
| | | | |
NET INCREASE IN NET ASSETS RESULTING FROM OPERATIONS | | $ | 669,675 | |
| | | | |
See notes to financial statements.
| | |
| 8 | | 2017 BLACKROCK ANNUAL REPORTTO SHAREHOLDERS |
Statements of Changes in Net Assets
| | | | | | | | |
| | | BlackRock iShares® Dynamic
Fixed Income V.I. Fund | |
| | | Year Ended December 31, | |
| | | 2017 | | | 2016 | |
| | |
INCREASE (DECREASE) IN NET ASSETS | | | | | | | | |
| | |
OPERATIONS | | | | | | | | |
Net investment income | | $ | 406,134 | | | $ | 284,384 | |
Net realized gain (loss) | | | 3,682 | | | | (37,207 | ) |
Net change in unrealized appreciation (depreciation) | | | 259,859 | | | | 48,035 | |
| | | | | | | | |
Net increase in net assets resulting from operations | | | 669,675 | | | | 295,212 | |
| | | | | | | | |
| | |
DISTRIBUTIONS TO SHAREHOLDERS(a) | | | | | | | | |
From net investment income: | | | | | | | | |
Class I | | | (327,096 | ) | | | (227,289 | ) |
Class III | | | (82,905 | ) | | | (53,934 | ) |
From return of capital: | | | | | | | | |
Class I | | | — | | | | (4,176 | ) |
Class III | | | — | | | | (1,103 | ) |
| | | | | | | | |
Decrease in net assets resulting from distributions to shareholders | | | (410,001 | ) | | | (286,502 | ) |
| | | | | | | | |
| | |
CAPITAL SHARE TRANSACTIONS | | | | | | | | |
Net increase in net assets derived from capital share transactions | | | 5,137,641 | | | | 5,913,447 | |
| | | | | | | | |
| | |
NET ASSETS | | | | | | | | |
Total increase in net assets | | | 5,397,315 | | | | 5,922,157 | |
Beginning of year | | | 15,414,139 | | | | 9,491,982 | |
| | | | | | | | |
End of year | | $ | 20,811,454 | | | $ | 15,414,139 | |
| | | | | | | | |
Undistributed net investment income, end of year | | $ | 2,323 | | | $ | 6,190 | |
| | | | | | | | |
| (a) | Distributions for annual periods determined in accordance with U.S. federal income tax regulations. |
See notes to financial statements.
Financial Highlights
(For a share outstanding throughout each period)
| | | | | | | | | | | | | | | | | | | | |
| | | BlackRock iShares® Dynamic Fixed Income V.I. Fund | |
| | | Class I | |
| | | Year Ended December 31, | | | Period
04/30/2014 (a) to 12/31/2014 | |
| | | 2017 | | | 2016 | | | 2015 | | | | | |
Net asset value, beginning of period | | $ | 9.89 | | | $ | 9.74 | | | $ | 10.05 | | | | | | | $ | 10.00 | |
| | | | | | | | | | | | | | | | | | | | |
Net investment income(b) | | | 0.23 | | | | 0.22 | | | | 0.24 | | | | | | | | 0.12 | |
Net realized and unrealized gain (loss) | | | 0.16 | | | | 0.12 | | | | (0.36 | ) | | | | | | | 0.01 | |
| | | | | | | | | | | | | | | | | | | | |
Net increase (decrease) from investment operations | | | 0.39 | | | | 0.34 | | | | (0.12 | ) | | | | | | | 0.13 | |
| | | | | | | | | | | | | | | | | | | | |
| Distributions:(c) | | | | | | | | | | | | | | | |
From net investment income | | | (0.21 | ) | | | (0.19 | ) | | | (0.19 | ) | | | | | | | (0.08 | ) |
From net realized gain | | | — | | | | — | | | | — | | | | | | | | (0.00 | )(d) |
From return of capital | | | — | | | | (0.00 | )(d) | | | (0.00 | )(d) | | | | | | | (0.00 | )(d) |
| | | | | | | | | | | | | | | | | | | | |
Total distributions | | | (0.21 | ) | | | (0.19 | ) | | | (0.19 | ) | | | | | | | (0.08 | ) |
| | | | | | | | | | | | | | | | | | | | |
Net asset value, end of period | | $ | 10.07 | | | $ | 9.89 | | | $ | 9.74 | | | | | | | $ | 10.05 | |
| | | | | | | | | | | | | | | | | | | | |
| | | | | |
Total Return:(e) | | | | | | | | | | | | | | | | | | | | |
Based on net asset value | | | 3.91 | % | | | 3.50 | % | | | (1.20 | )% | | | | | | | 1.30 | %(f) |
| | | | | | | | | | | | | | | | | | | | |
| | | | | |
Ratios to Average Net Assets:(g) | | | | | | | | | | | | | | | | | | | | |
Total expenses | | | 0.92 | % | | | 1.00 | % | | | 1.91 | % | | | | | | | 7.16 | %(h),(i) |
| | | | | | | | | | | | | | | | | | | | |
Total expenses after fees waived and/or reimbursed | | | 0.50 | % | | | 0.50 | % | | | 0.63 | % | | | | | | | 0.75 | %(h) |
| | | | | | | | | | | | | | | | | | | | |
Net investment income | | | 2.29 | % | | | 2.19 | % | | | 2.33 | % | | | | | | | 1.83 | %(h) |
| | | | | | | | | | | | | | | | | | | | |
| | | | | |
Supplemental Data: | | | | | | | | | | | | | | | | | | | | |
Net assets, end of period (000) | | $ | 16,222 | | | $ | 12,208 | | | $ | 8,346 | | | | | | | $ | 3,624 | |
| | | | | | | | | | | | | | | | | | | | |
Portfolio turnover rate | | | 52 | % | | | 38 | % | | | 58 | % | | | | | | | 61 | % |
| | | | | | | | | | | | | | | | | | | | |
| (a) | Commencement of operations. |
| (b) | Based on average shares outstanding. |
| (c) | Distributions for annual periods determined in accordance with U.S. federal income tax regulations. |
| (d) | Amount is greater than $(0.005) per share. |
| (e) | Where applicable, excludes insurance-related fees and expenses and assumes the reinvestment of distributions. |
| (f) | Aggregate total return. |
| (g) | Excludes expenses incurred indirectly as a result of investments in underlying funds as follows: |
| | | | | | | | | | | | | | | | | | | | | | | | | | | | | | | | |
| | | Year Ended December 31, | | | Period
04/30/2014 (a)
to 12/31/2014 | | | | |
| | 2017 | | | | | | 2016 | | | | | | 2015 | | | | | | |
Investments in underlying funds | | | 0.22 | % | | | | | | | 0.20 | % | | | | | | | 0.26 | % | | | | | | | 0.25 | % | | | | |
| | | | | | | | | | | | | | | | | | | | | | | | | | | | | | | | |
| (i) | Organization and/or offering costs were not annualized in the calculation of the expense ratios. If these expenses were annualized, the total expenses for Class I and Class III would have been 7.71% and 8.93%, respectively. |
See notes to financial statements.
| | |
| 10 | | 2017 BLACKROCK ANNUAL REPORTTO SHAREHOLDERS |
Financial Highlights (continued)
(For a share outstanding throughout each period)
| | | | | | | | | | | | | | | | | | | | |
| | | BlackRock iShares® Dynamic Fixed Income V.I. Fund | |
| | | Class III | |
| | | Year Ended December 31, | | | Period
04/30/2014 (a) to 12/31/2014 | |
| | | 2017 | | | 2016 | | | 2015 | | | | | |
Net asset value, beginning of period | | $ | 9.85 | | | $ | 9.70 | | | $ | 10.03 | | | | | | | $ | 10.00 | |
| | | | | | | | | | | | | | | | | | | | |
Net investment income(b) | | | 0.21 | | | | 0.20 | | | | 0.27 | | | | | | | | 0.14 | |
Net realized and unrealized gain (loss) | | | 0.14 | | | | 0.12 | | | | (0.42 | ) | | | | | | | (0.04 | ) |
| | | | | | | | | | | | | | | | | | | | |
Net increase (decrease) from investment operations | | | 0.35 | | | | 0.32 | | | | (0.15 | ) | | | | | | | 0.10 | |
| | | | | | | | | | | | | | | | | | | | |
| Distributions:(c) | | | | | | | | | | | | | | | |
From net investment income | | | (0.18 | ) | | | (0.17 | ) | | | (0.18 | ) | | | | | | | (0.07 | ) |
From net realized gain | | | — | | | | — | | | | — | | | | | | | | (0.00 | )(d) |
From return of capital | | | — | | | | (0.00 | )(d) | | | (0.00 | )(d) | | | | | | | (0.00 | )(d) |
| | | | | | | | | | | | | | | | | | | | |
Total distributions | | | (0.18 | ) | | | (0.17 | ) | | | (0.18 | ) | | | | | | | (0.07 | ) |
| | | | | | | | | | | | | | | | | | | | |
Net asset value, end of period | | $ | 10.02 | | | $ | 9.85 | | | $ | 9.70 | | | | | | | $ | 10.03 | |
| | | | | | | | | | | | | | | | | | | | |
| | | | | |
Total Return:(e) | | | | | | | | | | | | | | | | | | | | |
Based on net asset value | | | 3.60 | % | | | 3.32 | % | | | (1.47 | )% | | | | | | | 1.03 | %(f) |
| | | | | | | | | | | | | | | | | | | | |
| | | | | |
Ratios to Average Net Assets:(g) | | | | | | | | | | | | | | | | | | | | |
Total expenses | | | 1.22 | % | | | 1.15 | % | | | 2.06 | % | | | | | | | 8.57 | %(h),(i) |
| | | | | | | | | | | | | | | | | | | | |
Total expenses after fees waived and/or reimbursed | | | 0.75 | % | | | 0.75 | % | | | 0.84 | % | | | | | | | 1.00 | %(h) |
| | | | | | | | | | | | | | | | | | | | |
Net investment income | | | 2.04 | % | | | 2.00 | % | | | 2.71 | % | | | | | | | 1.98 | %(h) |
| | | | | | | | | | | | | | | | | | | | |
| | | | | |
Supplemental Data: | | | | | | | | | | | | | | | | | | | | |
Net assets, end of period (000) | | $ | 4,589 | | | $ | 3,206 | | | $ | 1,146 | | | | | | | $ | 78 | |
| | | | | | | | | | | | | | | | | | | | |
Portfolio turnover rate | | | 52 | % | | | 38 | % | | | 58 | % | | | | | | | 61 | % |
| | | | | | | | | | | | | | | | | | | | |
| (a) | Commencement of operations. |
| (b) | Based on average shares outstanding. |
| (c) | Distributions for annual periods determined in accordance with U.S. federal income tax regulations. |
| (d) | Amount is greater than $(0.005) per share. |
| (e) | Where applicable, excludes insurance-related fees and expenses and assumes the reinvestment of distributions. |
| (f) | Aggregate total return. |
| (g) | Excludes expenses incurred indirectly as a result of investments in underlying funds as follows: |
| | | | | | | | | | | | | | | | | | | | | | | | | | | | | | | | |
| | | Year Ended December 31, | | | Period
04/30/2014 (a)
to 12/31/2014 | | | | |
| | 2017 | | | | | | 2016 | | | | | | 2015 | | | | | | |
Investments in underlying funds | | | 0.22 | % | | | | | | | 0.20 | % | | | | | | | 0.26 | % | | | | | | | 0.25 | % | | | | |
| | | | | | | | | | | | | | | | | | | | | | | | | | | | | | | | |
| (i) | Organization and/or offering costs were not annualized in the calculation of the expense ratios. If these expenses were annualized, the total expenses for Class I and Class III would have been 7.71% and 8.93%, respectively. |
See notes to financial statements.
Notes to Financial Statements
BlackRock Variable Series Funds, Inc. (the “Company”) is registered under the Investment Company Act of 1940, as amended (the “1940 Act”), as an open-end management investment company. The Company is organized as a Maryland corporation that is comprised of 20 separate funds. The funds offer shares to insurance companies for their separate accounts to fund benefits under certain variable annuity and variable life insurance contracts. The financial statements presented are for BlackRock iShares® Dynamic Fixed Income V.I. Fund (the “Fund”). The Fund is classified as diversified. Class I and Class III Shares have equal voting, dividend, liquidation and other rights, except that only shares of the respective classes are entitled to vote on matters concerning only that class. In addition, Class III Shares bear certain expenses related to the distribution of such shares.
The Fund, together with certain other registered investment companies advised by BlackRock Advisors, LLC (the “Manager”) or its affiliates, is included in a complex of open-end funds referred to as the Equity-Bond Complex.
On November 15, 2017, the Board of Directors the Company approved a proposal to close the Fund to new investors and thereafter to liquidate the Fund. Effective December 19, 2017, the Fund is no longer accepting purchase orders from new investors. The liquidation is expected to occur on or about March 29, 2018.
| 2. | SIGNIFICANT ACCOUNTING POLICIES |
The financial statements are prepared in conformity with accounting principles generally accepted in the United States of America (“U.S. GAAP”), which may require management to make estimates and assumptions that affect the reported amounts of assets and liabilities in the financial statements, disclosure of contingent assets and liabilities at the date of the financial statements and the reported amounts of increases and decreases in net assets from operations during the reporting period. Actual results could differ from those estimates. The Fund is considered an investment company under U.S. GAAP and follows the accounting and reporting guidance applicable to investment companies. Below is a summary of significant accounting policies:
Investment Transactions and Income Recognition: For financial reporting purposes, investment transactions are recorded on the dates the transactions are entered into (the “trade dates”). Realized gains and losses on investment transactions are determined on the identified cost basis. Dividend income are recorded on the ex-dividend date. Dividends from foreign securities where the ex-dividend date may have passed are subsequently recorded when the Fund is informed of the ex-dividend date. Under the applicable foreign tax laws, a withholding tax at various rates may be imposed on capital gains, dividends and interest. Upon notification from issuers, some of the dividend income received from a real estate investment trust may be redesignated as a reduction of cost of the related investment and/or realized gain. Income, expenses and realized and unrealized gains and losses are allocated daily to each class based on its relative net assets.
Distributions: Distributions paid by the Fund are recorded on the ex-dividend date. Distributions of capital gains are recorded on the ex-dividend date and made at least annually. The portion of distributions, if any, that exceeds the Fund’s current and accumulated earnings and profits, as measured on a tax basis, constitute a non-taxable return of capital. The character and timing of distributions are determined in accordance with U.S. federal income tax regulations, which may differ from U.S. GAAP.
Indemnifications: In the normal course of business, the Fund enters into contracts that contain a variety of representations that provide general indemnification. The Fund’s maximum exposure under these arrangements is unknown because it involves future potential claims against the Fund, which cannot be predicted with any certainty.
Other: Expenses directly related to the Fund or its classes are charged to the Fund or the applicable class. Other operating expenses shared by several funds, including other funds managed by the Manager, are prorated among those funds on the basis of relative net assets or other appropriate methods. Expenses directly related to the Fund and other shared expenses prorated to the Fund are allocated daily to each class based on its relative net assets or other appropriate methods.
| 3. | INVESTMENT VALUATION AND FAIR VALUE MEASUREMENTS |
Investment Valuation Policies: The Fund’s investments are valued at fair value (also referred to as “market value” within the financial statements) as of the close of trading on the New York Stock Exchange (“NYSE”) (generally 4:00 p.m., Eastern time). U.S. GAAP defines fair value as the price the Fund would receive to sell an asset or pay to transfer a liability in an orderly transaction between market participants at the measurement date. The Fund determines the fair values of its financial instruments using various independent dealers or pricing services under policies approved by the Board of Directors of the Company (the “Board”). The BlackRock Global Valuation Methodologies Committee (the “Global Valuation Committee”) is the committee formed by management to develop global pricing policies and procedures and to oversee the pricing function for all financial instruments.
Fair Value Inputs and Methodologies: The following methods and inputs are used to establish the fair value of the Fund’s assets and liabilities:
| | • | | Exchange-traded funds (“ETFs”) traded on a recognized securities exchange are valued at the official closing price each day, if available. For ETFs traded on more than one exchange, the official closing price on the exchange where the stock is primarily traded is used. ETFs traded on a recognized exchange for which there were no sales on that day may be valued at the last available bid (long positions) or ask (short positions) price. |
| | • | | Investments in open-end U.S. mutual funds are valued at net asset value (“NAV”) each business day. |
| | • | | The Fund values its investment in SL Liquidity Series, LLC, Money Market Series (the “Money Market Series”) at fair value, which is ordinarily based upon its pro rata ownership in the underlying fund’s net assets. The Money Market Series seeks current income consistent with maintaining liquidity and preserving capital. Although the Money Market Series is not registered under the 1940 Act, its investments may follow the parameters of investments by a money market fund that is subject to Rule 2a-7 under the 1940 Act. |
| | |
| 12 | | 2017 BLACKROCK ANNUAL REPORTTO SHAREHOLDERS |
Notes to Financial Statements (continued)
If events (e.g., a company announcement, market volatility or a natural disaster) occur that are expected to materially affect the value of such investments, or in the event that the application of these methods of valuation results in a price for an investment that is deemed not to be representative of the market value of such investment, or if a price is not available, the investment will be valued by the Global Valuation Committee, or its delegate, in accordance with a policy approved by the Board as reflecting fair value (“Fair Valued Investments”). The fair valuation approaches that may be used by the Global Valuation Committee will include market approach, income approach and cost approach. Valuation techniques such as discounted cash flow, use of market comparables and matrix pricing are types of valuation approaches and are typically used in determining fair value. When determining the price for Fair Valued Investments, the Global Valuation Committee, or its delegate, seeks to determine the price that the Fund might reasonably expect to receive or pay from the current sale or purchase of that asset or liability in an arm’s-length transaction. Fair value determinations shall be based upon all available factors that the Global Valuation Committee, or its delegate, deems relevant and consistent with the principles of fair value measurement. The pricing of all Fair Valued Investments is subsequently reported to the Board or a committee thereof on a quarterly basis.
Fair Value Hierarchy: Various inputs are used in determining the fair value of investments. These inputs to valuation techniques are categorized into a fair value hierarchy consisting of three broad levels for financial statement purposes as follows:
| | • | | Level 1 — Unadjusted price quotations in active markets/exchanges for identical assets or liabilities that the Fund has the ability to access |
| | • | | Level 2 — Other observable inputs (including, but not limited to, quoted prices for similar assets or liabilities in markets that are active, quoted prices for identical or similar assets or liabilities in markets that are not active, inputs other than quoted prices that are observable for the assets or liabilities (such as interest rates, yield curves, volatilities, prepayment speeds, loss severities, credit risks and default rates) or other market–corroborated inputs) |
| | • | | Level 3 — Unobservable inputs based on the best information available in the circumstances, to the extent observable inputs are not available (including the Fund’s own assumptions used in determining the fair value of investments) |
The hierarchy gives the highest priority to unadjusted quoted prices in active markets for identical assets or liabilities (Level 1 measurements) and the lowest priority to unobservable inputs (Level 3 measurements). Accordingly, the degree of judgment exercised in determining fair value is greatest for instruments categorized in Level 3. The inputs used to measure fair value may fall into different levels of the fair value hierarchy. In such cases, for disclosure purposes, the fair value hierarchy classification is determined based on the lowest level input that is significant to the fair value measurement in its entirety. Investments classified within Level 3 have significant unobservable inputs used by the Global Valuation Committee in determining the price for Fair Valued Investments. Level 3 investments include equity or debt issued by privately held companies or funds. There may not be a secondary market, and/or there are a limited number of investors. Level 3 investments may also be adjusted to reflect illiquidity and/or non-transferability, with the amount of such discount estimated by the Global Valuation Committee in the absence of market information.
Changes in valuation techniques may result in transfers into or out of an assigned level within the hierarchy. In accordance with the Fund’s policy, transfers between different levels of the fair value hierarchy are deemed to have occurred as of the beginning of the reporting period. The categorization of a value determined for investments is based on the pricing transparency of the investments and is not necessarily an indication of the risks associated with investing in those securities.
As of December 31, 2017, certain investments of the Fund were valued using NAV per share as no quoted market value is available and therefore have been excluded from the fair value hierarchy.
| 4. | SECURITIES AND OTHER INVESTMENTS |
Securities Lending: The Fund may lend its securities to approved borrowers, such as brokers, dealers and other financial institutions. The borrower pledges and maintains with the Fund collateral consisting of cash, an irrevocable letter of credit issued by a bank, or securities issued or guaranteed by the U.S. Government. The initial collateral received by the Fund is required to have a value of at least 102% of the current value of the loaned securities for securities traded on U.S. exchanges and a value of at least 105% for all other securities. The collateral is maintained thereafter at a value equal to at least 100% of the current market value of the securities on loan. The market value of the loaned securities is determined at the close of each business day of the Fund and any additional required collateral is delivered to the Fund, or excess collateral returned by the Fund, on the next business day. During the term of the loan, the Fund is entitled to all distributions made on or in respect of the loaned securities but does not receive interest income on securities received as collateral. Loans of securities are terminable at any time and the borrower, after notice, is required to return borrowed securities within the standard time period for settlement of securities transactions.
The market value of any securities on loan, all of which were classified as affiliated investment companies in the Fund’s Schedule of Investments, and the value of any related collateral are shown separately in the Statement of Assets and Liabilities as a component of investments at value — unaffiliated, and collateral on securities loaned at value, respectively. As of period end, any securities on loan were collateralized by cash and/or U.S. Government obligations. Cash collateral invested by the securities lending agent, BlackRock Investment Management, LLC (“BIM”), if any, is disclosed in the Schedule of Investments.
Securities lending transactions are entered into by the Fund under Master Securities Lending Agreements (each, an “MSLA”), which provide the right, in the event of default (including bankruptcy or insolvency), for the non-defaulting party to liquidate the collateral and calculate a net exposure to the defaulting party or request additional collateral. In the event that a borrower defaults, the Fund, as lender, would offset the market value of the collateral received against the market value of the securities loaned. When the value of the collateral is greater than that of the market value of the securities loaned, the lender is left with a net amount payable to the defaulting party. However, bankruptcy or insolvency laws of a particular jurisdiction may impose restrictions on or prohibitions against such a right of offset in the event of an MSLA counterparty’s bankruptcy or insolvency. Under the MSLA, absent an event of default, the borrower can resell or re-pledge the loaned securities, and the Fund can reinvest cash collateral received in connection with loaned securities. Upon an event of default, the parties’ obligations to return the securities or collateral to the other party are extinguished, and the parties can resell or re-pledge the loaned securities or the collateral received in connection with the loaned securities in order to satisfy the defaulting party’s net payment obligation for all transactions under the MSLA. The defaulting party remains liable for any deficiency.
| | | | |
| NOTESTO FINANCIAL STATEMENTS | | | 13 | |
Notes to Financial Statements (continued)
As of period end, the following table is a summary of the Fund’s securities lending agreements by counterparty which are subject to offset under an MSLA:
Securities Lending Agreements
| | | | | | | | | | | | |
| Counterparty | | Securities Loaned at Value | | | Cash Collateral
Received (a) | | | Net
Amount | |
JP Morgan Securities LLC | | $ | 1,971,728 | | | $ | (1,971,728 | ) | | $ | — | |
| | (a) | Cash collateral with a value of $2,015,199 has been received in connection with securities lending agreements. Collateral received in excess of the value of securities loaned from the individual counterparty is not shown for financial reporting purposes in the table above. | |
The risks of securities lending include the risk that the borrower may not provide additional collateral when required or may not return the securities when due. To mitigate these risks, the Fund benefits from a borrower default indemnity provided by BIM. BIM’s indemnity allows for full replacement of the securities loaned if the collateral received does not cover the value on the securities loaned in the event of borrower default. The Fund could incur a loss if the value of an investment purchased with cash collateral falls below the market value of loaned securities or if the value of an investment purchased with cash collateral falls below the value of the original cash collateral received.
| 5. | INVESTMENT ADVISORY AGREEMENT AND OTHER TRANSACTIONS WITH AFFILIATES |
The PNC Financial Services Group, Inc. is the largest stockholder and an affiliate of BlackRock, Inc. (“BlackRock”) for 1940 Act purposes.
Investment Advisory: The Company, on behalf of the Fund, entered into an Investment Advisory Agreement with the Manager, the Fund’s investment adviser, an indirect, wholly-owned subsidiary of BlackRock, to provide investment advisory and administrative services. The Manager is responsible for the management of the Fund’s portfolio and provides the personnel, facilities, equipment and certain other services necessary to the operations of the Fund.
For such services, the Fund pays the Manager a monthly fee at an annual rate equal to the following percentages of the average daily value of the Fund’s net assets:
| | | | |
| Average Daily Net Assets | | Investment
Advisory Fee | |
First $1 Billion | | | 0.150 | % |
$1 Billion — $3 Billion | | | 0.140 | |
$3 Billion — $5 Billion | | | 0.135 | |
Greater than $5 Billion | | | 0.130 | |
Distribution Fees: The Company, on behalf of the Fund, entered into a Distribution Agreement and a Distribution Plan with BlackRock Investments, LLC (“BRIL”), an affiliate of the Manager. Pursuant to the Distribution Plan and in accordance with Rule 12b-1 under the 1940 Act, the Fund pays BRIL ongoing distribution fees. The fees are accrued daily and paid monthly at an annual rate of 0.25% based upon the average daily net assets attributable to Class III.
For the year ended December 31, 2017, the class specific distribution fees borne directly by Class III were $8,718.
Transfer Agent: On behalf of the Fund, the Manager entered into agreements with insurance companies and other financial intermediaries (“Service Organizations”), some of which may be affiliates. Pursuant to these agreements, the Service Organizations provide the Fund with administrative, networking, recordkeeping, sub-transfer agency and shareholder services to sub-accounts they service. For these services, the Service Organizations receive an annual fee per shareholder account, which will vary depending on share class and/or net assets of Fund shareholders serviced by the Service Organizations, which is shown as transfer agent — class specific. For the year ended December 31, 2017, the Fund did not pay any amounts to affiliates in return for these services.
In addition, the Fund pays the transfer agent, which is not an affiliate, a fee for the issuance, transfer and redemption of shares and the opening and maintenance of shareholder accounts, which is included in transfer agent in the Statement of Operations.
For the year ended December 31, 2017, the following table shows the class specific transfer agent fees borne directly by each share class of the Fund:
| | | | | | | | | | | | |
| | | Class I | | | Class III | | | Total | |
Transfer Agent Fees | | $ | 23,470 | | | $ | 7,449 | | | $ | 30,919 | |
Expense Limitations, Waivers, Reimbursements and Recoupments: With respect to the Fund, the Manager voluntarily agreed to waive its investment advisory fees by the amount of investment advisory fees the Fund pays to the Manager indirectly through its investment in affiliated money market funds. In addition, the Manager has contractually agreed to waive the management fee on assets estimated to be attributable to the Fund’s investments in other equity and fixed-income mutual funds managed by BlackRock or its affiliates, if any. This amount is included in fees waived and/or reimbursed by the Manager in the Consolidated Statement of Operations. For the year ended December 31, 2017, the amount waived was $64.
For the year ended December 31, 2017, the Fund reimbursed the Manager $169 for certain accounting services, which is included in accounting services in the Statement of Operations.
| | |
| 14 | | 2017 BLACKROCK ANNUAL REPORTTO SHAREHOLDERS |
Notes to Financial Statements (continued)
With respect to the Fund, the Manager contractually agreed to waive and/or reimburse fees or expenses in order to limit expenses, excluding interest expense, dividend expense, tax expense, acquired fund fees and expenses, and certain other fund expenses, which constitute extraordinary expenses not incurred in the ordinary course of the Fund’s business (“expense limitation”). The expense limitations as a percentage of average daily net assets are as follows:
| | | | | | | | |
| Class I | | | | | Class III | |
| | 0.50% | | | | | | 0.75% | |
The Manager has agreed not to reduce or discontinue this contractual expense limitation through April 30, 2018, unless approved by the Board, including a majority of the independent directors who are not “interested persons” of the Fund, as defined in the 1940 Act (“Independent Directors”) or by a vote of a majority of the outstanding voting securities of the Fund. For the year ended December 31, 2017, the Manager waived and/or reimbursed $64,709, which is included in fees waived and/or reimbursed by the Manager in the Statement of Operations.
These amounts waived and/or reimbursed are shown as transfer agent fees reimbursed — class specific in the Statement of Operations. For the year ended December 31, 2017, class specific expense waivers and/or reimbursements are as follows:
| | | | | | | | | | | | |
| | | Class I | | | Class III | | | Total | |
Transfer Agent Fees Reimbursed | | $ | 15,638 | | | $ | 3,744 | | | $ | 19,382 | |
With respect to the contractual expense limitation, if during the Fund’s fiscal year the operating expenses of a share class, that at any time during the prior two fiscal years received a waiver and/or reimbursement from the Manager, are less than the current expense limitation for that share class, the Manager is entitled to be reimbursed by such share class up to the lesser of: (a) the amount of fees waived and/or expenses reimbursed during those prior two fiscal years under the agreement and (b) an amount not to exceed either the current expense limitation of that share class or the expense limitation of the share class in effect at the time that the share class received the applicable waiver and/or reimbursement, provided that:
(1) The Fund, of which the share class is a part, has more than $50 million in assets for the fiscal year, and
(2) The Manager or an affiliate continues to serve as the Fund’s investment adviser or administrator.
This repayment applies only to the contractual expense limitation on net expenses and does not apply to any voluntary waivers that may be in effect from time to time.
On December 31, 2017, the Fund level and class specific waivers and/or reimbursements subject to possible future recoupment under the expense limitation agreement are as follows:
| | | | | | | | |
| | | Expires December 31, | |
| | | 2018 | | | 2019 | |
Fund Level . . . . . . . . . . . . . . . . . . . | | $ | 46,758 | | | $ | 64,709 | |
Class I . . . . . . . . . . . . . . . . . . . . . . . | | | 15,057 | | | | 15,638 | |
Class III . . . . . . . . . . . . . . . . . . . . . . | | | 1,390 | | | | 3,744 | |
The following fund level and class specific waivers and/or reimbursements previously recorded by the Fund, which were subject to recoupment by the Manager, expired on December 31, 2017:
| | | | |
Fund Level . . . . . . . . . . . . . . . . . . . | | $ | 80,571 | |
Class I . . . . . . . . . . . . . . . . . . . . . . . | | | 9,548 | |
Class III . . . . . . . . . . . . . . . . . . . . . . | | | 282 | |
Securities Lending: The U.S. Securities and Exchange Commission (“SEC”) has issued an exemptive order which permits BIM, an affiliate of the Manager, to serve as securities lending agent for the Fund, subject to applicable conditions. As securities lending agent, BIM bears all operational costs directly related to securities lending. The Fund is responsible for expenses in connection with the investment of cash collateral received for securities on loan (the “collateral investment expenses”). The cash collateral is invested in a private investment company managed by the Manager or its affiliates. However, BIM has agreed to cap the collateral investment expenses of the private investment company to an annual rate of 0.04%. The investment adviser to the private investment company will not charge any advisory fees with respect to shares purchased by the Fund. The private investment company in which the cash collateral has been invested may, under certain circumstances, impose a liquidity fee of up to 2% of the value withdrawn or temporarily restrict withdrawals for up to 10 business days during a 90 day period, in the event that the private investment company’s weekly liquid assets fall below certain thresholds.
Securities lending income is equal to the total of income earned from the reinvestment of cash collateral, net of fees and other payments to and from borrowers of securities, and less the collateral investment expenses. The Fund retains a portion of securities lending income and remits a remaining portion to BIM as compensation for its services as securities lending agent.
Pursuant to a securities lending agreement, the Fund retains 80% of securities lending income, and this amount retained can never be less than 70% of the total of securities lending income plus the collateral investment expenses.
In addition, commencing the business day following the date that the aggregate securities lending income earned across the Equity-Bond Complex in a calendar year exceeds a specified threshold, the Fund, pursuant to the securities lending agreement, will retain for the remainder of that calendar year securities lending income in an amount equal to 85% of securities lending income, and this amount retained can never be less than 70% of the total of securities lending income plus the collateral investment expenses.
| | | | |
| NOTESTO FINANCIAL STATEMENTS | | | 15 | |
Notes to Financial Statements (continued)
The share of securities lending income earned by the Fund is shown as securities lending income — affiliated — net in the Statement of Operations. For the year ended December 31, 2017, the Fund paid BIM $5,556 for securities lending agent services.
Interfund Lending: In accordance with an exemptive order (the “Order”) from the SEC, the Fund may participate in a joint lending and borrowing facility for temporary purposes (the “Interfund Lending Program”), subject to compliance with the terms and conditions of the Order, and to the extent permitted by the Fund’s investment policies and restrictions. The Fund is currently permitted to borrow and lend under the Interfund Lending Program.
A lending BlackRock fund may lend in aggregate up to 15% of its net assets, but may not lend more than 5% of its net assets to any one borrowing fund through the Interfund Lending Program. A borrowing BlackRock fund may not borrow through the Interfund Lending Program or from any other source more than 33 1/3% of its total assets or any lower threshold provided for by the fund’s investment restrictions. If a borrowing BlackRock fund’s total outstanding borrowings exceed 10% of its total assets, each of its outstanding interfund loans will be subject to collateralization of at least 102% of the outstanding principal value of the loan. All interfund loans are for temporary or emergency purposes and the interest rate to be charged will be the average of the highest current overnight repurchase agreement rate available to a lending fund and the bank loan rate, as calculated according to a formula established by the Board.
During the year ended December 31, 2017, the Fund did not participate in the Interfund Lending Program.
Officers and Directors: Certain directors and/or officers of the Company are directors and/or officers of BlackRock or its affiliates. The Fund reimburses the Manager for a portion of the compensation paid to the Company’s Chief Compliance Officer, which is included in Directors and Officer in the Statement of Operations.
For the year ended December 31, 2017, purchases and sales of investments, excluding short-term securities, were $14,482,679 and $9,357,120, respectively.
It is the Fund’s policy to comply with the requirements of the Internal Revenue Code of 1986, as amended, applicable to regulated investment companies, and to distribute substantially all of its taxable income to its shareholders. Therefore, no U.S. federal income tax provision is required.
The Fund files U.S. federal and various state and local tax returns. No income tax returns are currently under examination. The statute of limitations on the Fund’s U.S. federal tax returns generally remains open for the period ended December 31, 2014 and for each of the three years ended December 31, 2017. The statutes of limitations on the Fund’s state and local tax returns may remain open for an additional year depending upon the jurisdiction.
Management has analyzed tax laws and regulations and their application to the Fund as of December 31, 2017, inclusive of the open tax return years, and does not believe that there are any uncertain tax positions that require recognition of a tax liability in the Fund’s financial statements.
The tax character of distributions paid was as follows:
| | | | | | | | |
| | | 12/31/17 | | | 12/31/16 | |
Ordinary income | | $ | 410,001 | | | $ | 281,223 | |
Tax return of capital | | | — | | | | 5,279 | |
| | | | | | | | |
| | $ | 410,001 | | | $ | 286,502 | |
| | | | | | | | |
As of period end, the tax components of accumulated net earnings (losses) were as follows:
| | | | |
Undistributed ordinary income | | | 1,343 | |
Capital loss carryforward | | $ | (135,005 | ) |
Net unrealized gains1 | | | 80,120 | |
| | | | |
| | $ | (53,542 | ) |
| | | | |
| | 1 | The difference between book-basis and tax-basis net unrealized gains was attributable primarily to the tax deferral of losses on wash sales and the timing and recognition of partnership income. | |
As of December 31, 2017, the Fund had capital loss carryforwards, with no expiration dates, available to offset future realized capital gains of $135,005.
During the year ended December 31, 2017, the Fund utilized $1,649 of its capital loss carryforward.
As of December 31, 2017, gross unrealized appreciation and depreciation for investments based on cost for U.S. federal income tax purposes were as follows:
| | | | |
Tax cost | | $ | 22,790,787 | |
| | | | |
Gross unrealized appreciation | | $ | 132,926 | |
Gross unrealized depreciation | | | (52,806 | ) |
| | | | |
Net unrealized appreciation (depreciation) | | $ | 80,120 | |
| | | | |
| | |
| 16 | | 2017 BLACKROCK ANNUAL REPORTTO SHAREHOLDERS |
Notes to Financial Statements (continued)
The Company, on behalf of the Fund, along with certain other funds managed by the Manager and its affiliates (“Participating Funds”), is a party to a 364-day, $2.1 billion credit agreement with a group of lenders. Under this agreement, the Fund may borrow to fund shareholder redemptions. Excluding commitments designated for certain individual funds, the Participating Funds, including the Fund, can borrow up to an aggregate commitment amount of $1.6 billion at any time outstanding, subject to asset coverage and other limitations as specified in the agreement. The credit agreement has the following terms: a fee of 0.12% per annum on unused commitment amounts and interest at a rate equal to the higher of (a) one-month LIBOR (but, in any event, not less than 0.00%) on the date the loan is made plus 0.80% per annum or (b) the Fed Funds rate (but, in any event, not less than 0.00%) in effect from time to time plus 0.80% per annum on amounts borrowed. The agreement expires in April 2018 unless extended or renewed.
Participating Funds paid administration, legal and arrangement fees, which, if applicable, are included in miscellaneous expenses in the Statement of Operations. These fees were allocated among such funds based upon portions of the aggregate commitment available to them and relative net assets of Participating Funds. During the year ended December 31, 2017, the Fund did not borrow under the credit agreement.
In the normal course of business, the Fund invests in securities or other instruments and may enter into certain transactions, and such activities subject the Fund to various risks, including among others, fluctuations in the market (market risk) or failure of an issuer to meet all of its obligations. The value of securities or other instruments may also be affected by various factors, including, without limitation: (i) the general economy; (ii) the overall market as well as local, regional or global political and/or social instability; (iii) regulation, taxation or international tax treaties between various countries; or (iv) currency, interest rate and price fluctuations. The Fund’s prospectus provides details of the risks to which the Fund is subject.
On October 11, 2016, BlackRock implemented certain changes required by amendments to Rule 2a-7 under the 1940 Act, which governs the operations of U.S. money market funds. The Fund may be exposed to additional risks when reinvesting cash collateral in money market funds that do not seek to maintain a stable NAV per share of $1.00 and which may be subject to redemption gates or liquidity fees under certain circumstances.
The Fund may be exposed to additional risks when reinvesting cash collateral in money market funds that do not seek to maintain a stable NAV per share of $1.00 and which may be subject to redemption gates or liquidity fees under certain circumstances.
Valuation Risk: The market values of equities, such as common stocks and preferred securities or equity related investments, such as futures and options, may decline due to general market conditions which are not specifically related to a particular company. They may also decline due to factors which affect a particular industry or industries. The Fund may invest in illiquid investments and may experience difficulty in selling those investments in a timely manner at the price that it believes the investments are worth. Prices may fluctuate widely over short or extended periods in response to company, market or economic news. Markets also tend to move in cycles, with periods of rising and falling prices. This volatility may cause the Fund’s NAV to experience significant increases or decreases over short periods of time. If there is a general decline in the securities and other markets, the NAV of the Fund may lose value, regardless of the individual results of the securities and other instruments in which the Fund invests.
Counterparty Credit Risk: Similar to issuer credit risk, the Fund may be exposed to counterparty credit risk, or the risk that an entity may fail to or be unable to perform on its commitments related to unsettled or open transactions. The Fund manages counterparty credit risk by entering into transactions only with counterparties that the Manager believes have the financial resources to honor their obligations and by monitoring the financial stability of those counterparties. Financial assets, which potentially expose the Fund to market, issuer and counterparty credit risks, consist principally of financial instruments and receivables due from counterparties. The extent of the Fund’s exposure to market, issuer and counterparty credit risks with respect to these financial assets approximated by their value recorded in the Statement of Assets and Liabilities, less any collateral held by the Fund.
Concentration Risk: The Fund invests a significant portion of its assets in fixed-income securities and/or uses derivatives tied to the fixed-income markets. Changes in market interest rates or economic conditions may affect the value and/or liquidity of such investments. Interest rate risk is the risk that prices of bonds and other fixed-income securities will increase as interest rates fall and decrease as interest rates rise. The Fund may be subject to a greater risk of rising interest rates due to the current period of historically low rates.
| | | | |
| NOTESTO FINANCIAL STATEMENTS | | | 17 | |
Notes to Financial Statements (continued)
| 10. | CAPITAL SHARE TRANSACTIONS |
Transactions in capital shares for each class were as follows:
| | | | | | | | | | | | | | | | |
| | | Year Ended
12/31/2017 | | | Year Ended
12/31/2016 | |
| Class I | | Shares | | | Amount | | | Shares | | | Amount | |
Shares sold | | | 621,660 | | | $ | 6,262,804 | | | | 699,521 | | | $ | 7,089,699 | |
Shares issued in reinvestment of distributions | | | 32,482 | | | | 327,096 | | | | 23,404 | | | | 231,465 | |
Shares redeemed | | | (277,052 | ) | | | (2,798,626 | ) | | | (346,095 | ) | | | (3,495,708 | ) |
| | | | | | | | | | | | | | | | |
Net increase | | | 377,090 | | | $ | 3,791,274 | | | | 376,830 | | | $ | 3,825,456 | |
| | | | | | | | | | | | | | | | |
Class III | | | | | | | | | | | | | | | | |
Shares sold | | | 268,698 | | | $ | 2,711,309 | | | | 250,040 | | | $ | 2,520,285 | |
Shares issued in reinvestment of distributions | | | 8,274 | | | | 82,901 | | | | 5,587 | | | | 55,037 | |
Shares redeemed | | | (144,397 | ) | | | (1,447,843 | ) | | | (48,249 | ) | | | (487,331 | ) |
| | | | | | | | | | | | | | | | |
Net increase | | | 132,575 | | | $ | 1,346,367 | | | | 207,378 | | | $ | 2,087,991 | |
| | | | | | | | | | | | | | | | |
Total Net Increase | | | 509,665 | | | $ | 5,137,641 | | | | 584,208 | | | $ | 5,913,447 | |
| | | | | | | | | | | | | | | | |
Management has evaluated the impact of all subsequent events on the Fund through the date the financial statements were issued and has determined that there were no subsequent events requiring adjustment or additional disclosure in the financial statements.
| | |
| 18 | | 2017 BLACKROCK ANNUAL REPORTTO SHAREHOLDERS |
Report of Independent Registered Public Accounting Firm
To the Shareholders of BlackRock iShares Dynamic Fixed Income V.I. Fund and the Board of Directors of BlackRock Variable Series Funds, Inc.:
Opinion on the Financial Statements and Financial Highlights
We have audited the accompanying statement of assets and liabilities, including the schedule of investments, of BlackRock iShares Dynamic Fixed Income V.I. Fund, of BlackRock Variable Series Funds, Inc. (the “Fund”), as of December 31, 2017, the related statement of operations for the year then ended, the statements of changes in net assets for each of the two years in the period then ended, the financial highlights for each of the periods presented, and the related notes. In our opinion, the financial statements and financial highlights present fairly, in all material respects, the financial position of the Fund as of December 31, 2017, and the results of its operations for the year then ended, the changes in its net assets for each of the two years in the period then ended, and the financial highlights for each of the periods presented, in conformity with accounting principles generally accepted in the United States of America.
Emphasis of Matter
As discussed in Note 1 to the financial statements, on November 15, 2017, the Board of Directors approved a proposal to close the Fund to new investors and thereafter liquidate the Fund on or about March 29, 2018.
Basis for Opinion
These financial statements and financial highlights are the responsibility of the Fund’s management. Our responsibility is to express an opinion on the Fund’s financial statements and financial highlights based on our audits. We are a public accounting firm registered with the Public Company Accounting Oversight Board (United States) (PCAOB) and are required to be independent with respect to the Fund in accordance with the U.S. federal securities laws and the applicable rules and regulations of the Securities and Exchange Commission and the PCAOB.
We conducted our audits in accordance with the standards of the PCAOB. Those standards require that we plan and perform the audit to obtain reasonable assurance about whether the financial statements and financial highlights are free of material misstatement, whether due to error or fraud. The Fund is not required to have, nor were we engaged to perform, an audit of its internal control over financial reporting. As part of our audits we are required to obtain an understanding of internal control over financial reporting but not for the purpose of expressing an opinion on the effectiveness of the Fund’s internal control over financial reporting. Accordingly, we express no such opinion.
Our audits included performing procedures to assess the risks of material misstatement of the financial statements and financial highlights, whether due to error or fraud, and performing procedures that respond to those risks. Such procedures included examining, on a test basis, evidence regarding the amounts and disclosures in the financial statements and financial highlights. Our audits also included evaluating the accounting principles used and significant estimates made by management, as well as evaluating the overall presentation of the financial statements and financial highlights. Our procedures included confirmation of securities owned as of December 31, 2017, by correspondence with the custodian and brokers; when replies were not received from brokers, we performed other auditing procedures. We believe that our audits provide a reasonable basis for our opinion.
Deloitte & Touche LLP
Boston, Massachusetts
February 19, 2018
We have served as the auditor of one or more BlackRock investment companies since 1992.
| | | | |
| REPORTOF INDEPENDENT REGISTERED PUBLIC ACCOUNTING FIRM | | | 19 | |
DECEMBER 31, 2017
| | |
ANNUAL REPORT | |  |
BlackRock Variable Series Funds, Inc.
| Ø | | BlackRock iShares® Equity Appreciation V.I. Fund |
|
| Not FDIC Insured • May Lose Value • No Bank Guarantee |
| | |
| Fund Summary as of December 31, 2017 | | BlackRock iShares® Equity Appreciation V.I. Fund |
Investment Objective
BlackRock iShares® Equity Appreciation V.I. Fund’s (the “Fund”) investment objective is to seek to provide growth of capital.
On November 15, 2017, the Board of Directors of BlackRock Variable Series Funds, Inc. (the “Company”) approved a proposal to close the Fund to new investors and thereafter to liquidate the Fund. Effective December 19, 2017, the Fund is no longer accepting purchase orders from new investors. The liquidation is expected to occur on or about March 29, 2018.
Portfolio Management Commentary
How did the Fund perform?
For the 12-month period ended December 31, 2017, the Fund underperformed its benchmark, the MSCI All Country World Index.
What factors influenced performance?
There were no significant detractors from absolute performance during the period. Relative to the benchmark, the Fund’s overweight exposure to iShares Core S&P Small-Cap and Mid-Cap ETFs were the primary detractors, as both underperformed U.S. large-cap stocks.
The largest contributor to Fund performance was exposure to the iShares Core S&P 500 ETF. This was followed by exposure to the iShares Core MSCI Emerging Markets ETF.
Describe recent portfolio activity.
During the period, the Fund increased exposure to international developed and emerging market equities, while reducing U.S. equity exposure to neutral relative to the Fund’s benchmark.
Describe portfolio positioning at period end.
At period end, the Fund was overweight U.S. equities relative to international developed stocks. The Fund’s top holdings included exposure to U.S. large-cap stocks. The Fund maintained exposure to emerging markets and U.S. large-, mid-, small-cap and minimum volatility stocks.
The views expressed reflect the opinions of BlackRock as of the date of this report and are subject to change based on changes in market, economic or other conditions. These views are not intended to be a forecast of future events and are no guarantee of future results.
Portfolio Information
PORTFOLIO COMPOSITION
| | | | |
| Asset Type | | Percent of
Affiliated Investment
Companies | |
Equity Funds | | | 91 | % |
Short-Term Securities | | | 9 | |
| | |
| 2 | | 2017 BLACKROCK ANNUAL REPORTTO SHAREHOLDERS |
| | |
| Fund Summary as of December 31, 2017 (continued) | | BlackRock iShares® Equity Appreciation V.I. Fund |
TOTAL RETURN BASED ON A $10,000 INVESTMENT
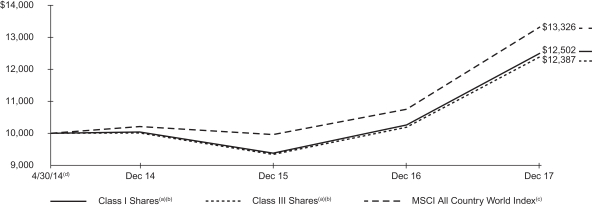
| (a) | Assuming transaction costs, if any, and other operating expenses, including investment advisory fees. Does not include insurance-related fees and expenses. |
| (b) | The Fund invests in a portfolio of underlying exchange-traded funds that seek to track fixed income indices. |
| (c) | This unmanaged index is a free float-adjusted market capitalization weighted index that is designed to measure the equity market performance of developed and emerging markets. The MSCI All Country World Index consists of 46 country indexes comprising 23 developed and 23 emerging market country indexes. |
| (d) | Commencement of operations. |
Performance Summary for the Period Ended December 31, 2017
| | | | | | | | | | | | | | | | |
| | | 6-Month | | | | | | Average Annual Total Returns | |
| | | Total Returns (b) | | | | | | 1 Year (b) | | | Since Inception (b)(c) | |
Class I(a) | | | 10.91 | % | | | | | | | 21.87 | % | | | 6.27 | % |
Class III(a) | | | 10.80 | | | | | | | | 21.56 | | | | 6.01 | |
MSCI All Country World Index | | | 11.21 | | | | | | | | 23.97 | | | | 8.15 | |
| | (a) | Average annual and cumulative total returns are based on changes in net asset value for the periods shown, and assume reinvestment of all distributions at net asset value on the ex-dividend date. Insurance-related fees and expenses are not reflected in these returns. | |
| | (b) | For a portion of the period, the Fund’s investment adviser waived a portion of its fee. Without such waiver, the Fund’s performance would have been lower. | |
| | (c) | The Fund commenced operations on April 30, 2014. | |
Past performance is not indicative of future results. Performance results do not reflect the deduction of taxes that a shareholder would pay on Fund distributions or the redemption of Fund shares.
Performance results may include adjustments made for financial reporting purposes in accordance with U.S. generally accepted accounting principles.
Expense Example
| | | | | | | | | | | | | | | | | | | | | | | | | | | | | | | | |
| | | Actual | | | | | | Hypothetical (a) | | | | |
| | | Beginning
Account Value
(07/01/17) | | | Ending
Account Value
(12/31/17) | | | Expenses
Paid During
the Period (b) | | | | | | Beginning
Account Value
(07/01/17) | | | Ending
Account Value
(12/31/17) | | | Expenses
Paid During
the Period (b) | | | Annualized
Expense
Ratio | |
Class I | | $ | 1,000.00 | | | $ | 1,109.10 | | | $ | 2.39 | | | | | | | $ | 1,000.00 | | | $ | 1,022.90 | | | $ | 2.29 | | | | 0.45 | % |
Class III | | | 1,000.00 | | | | 1,108.00 | | | | 3.72 | | | | | | | | 1,000.00 | | | | 1,021.70 | | | | 3.57 | | | | 0.70 | |
| | (a) | Hypothetical 5% annual return before expenses is calculated by prorating the number of days in the most recent fiscal half year divided by 365. | |
| | (b) | For each class of the Fund, expenses are equal to the annualized expense ratio for the class, multiplied by the average account value over the period, multiplied by 184/365 (to reflect the one-half year period shown). | |
See “Disclosure of Expenses” on the following page for further information on how expenses were calculated.
| | |
| Disclosure of Expenses | | BlackRock iShares® Equity Appreciation V.I. Fund |
Shareholders of the Fund may incur the following charges: (a) transactional expenses, such as sales charges; and (b) operating expenses, including investment advisory fees, service and distribution fees, including 12b-1 fees, acquired fund fees and expenses, and other fund expenses. The expense example on the previous page (which is based on a hypothetical investment of $1,000 invested on July 1, 2017 and held through December 31, 2017) is intended to assist shareholders both in calculating expenses based on an investment in the Fund and in comparing these expenses with similar costs of investing in other mutual funds.
The expense example provides information about actual account values and actual expenses. In order to estimate the expenses a shareholder paid during the period covered by this report, shareholders can divide their account value by $1,000 and then multiply the result by the number corresponding to their share class under the heading entitled “Expenses Paid During the Period.”
The expense example also provides information about hypothetical account values and hypothetical expenses based on the Fund’s actual expense ratio and an assumed rate of return of 5% per year before expenses. In order to assist shareholders in comparing the ongoing expenses of investing in the Fund and other funds, compare the 5% hypothetical example with the 5% hypothetical examples that appear in shareholder reports of other funds.
The expenses shown in the expense example are intended to highlight shareholders’ ongoing costs only and do not reflect any transactional expenses, such as sales charges, if any. Therefore, the hypothetical example is useful in comparing ongoing expenses only, and will not help shareholders determine the relative total expenses of owning different funds. If these transactional expenses were included, shareholder expenses would have been higher.
| | |
| 4 | | 2017 BLACKROCK ANNUAL REPORTTO SHAREHOLDERS |
| | |
Schedule of Investments December 31, 2017 | | BlackRock iShares® Equity Appreciation V.I. Fund (Percentages shown are based on Net Assets) |
| | | | | | | | |
| Security | | Shares | | | Value | |
Affiliated Investment Companies — 109.7%(d) | |
|
| Equity Funds — 100.1% | |
iShares Core MSCI Emerging Markets ETF | | | 56,058 | | | $ | 3,189,700 | |
iShares Core S&P 500 ETF | | | 17,905 | | | | 4,813,759 | |
iShares Core S&P Mid-Cap ETF | | | 14,217 | | | | 2,698,102 | |
iShares Core S&P Small-Cap ETF | | | 22,507 | | | | 1,728,763 | |
iShares Edge MSCI Min Vol USA ETF(a) | | | 21,034 | | | | 1,110,175 | |
iShares MSCI Canada ETF(a) | | | 23,957 | | | | 710,085 | |
iShares MSCI EAFE ETF | | | 62,697 | | | | 4,408,226 | |
iShares MSCI EAFE Small-Cap ETF | | | 15,600 | | | | 1,006,200 | |
| | | | | | | | |
| | | | | | | 19,665,010 | |
| | | | | | | | |
| Security | | Shares | | | Value | |
|
| Short-Term Securities — 9.6%(b) | |
BlackRock Liquidity Funds, T-Fund, Institutional Class,
1.17% | | | 64,669 | | | $ | 64,669 | |
SL Liquidity Series, LLC, Money Market Series,
1.48%(c) | | | 1,823,613 | | | | 1,823,430 | |
| | | | | | | | |
| | | | 1,888,099 | |
| |
Total Affiliated Investment Companies — 109.7%
(Cost: $18,451,329) | | | | 21,553,109 | |
Liabilities in Excess of Other Assets — (9.7)% | | | | (1,911,120 | ) |
| | | | | | | | |
Net Assets — 100.0% | | | $ | 19,641,989 | |
| | | | | | | | |
| (a) | Security, or a portion of the security, is on loan. |
| (b) | Annualized 7-day yield as of period end. |
| (c) | Security was purchased with the cash collateral from loaned securities. |
| (d) | During the year ended December 31, 2017, investments in issuers considered to be affiliate of the Fund for the purposes of Section 2(a)(3) of the Investment Company Act of 1940, as amended, and/or related parties of the Fund were as follows: |
| | | | | | | | | | | | | | | | | | | | | | | | | | | | | | | | |
| Affiliates | | Shares
Held at
12/31/16 | | | Shares
Purchased | | | Shares Sold | | | Shares
Held at
12/31/17 | | | Value at
12/31/17 | | | Income | | | Net
Realized Gain (Loss) (a) | | | Change in Unrealized Appreciation (Depreciation) | |
BlackRock Liquidity Funds, T-Fund, Institutional Class | | | 167,372 | | | | — | | | | (102,703 | )(b) | | | 64,669 | | | $ | 64,669 | | | $ | 560 | | | $ | — | | | $ | — | |
SL Liquidity Series, LLC, Money Market Series | | | 4,742,241 | | | | — | | | | (2,918,628 | )(b) | | | 1,823,613 | | | | 1,823,430 | | | | 9,990 | (c) | | | 938 | | | | 31 | |
iShares Core MSCI Emerging Markets ETF | | | 13,608 | | | | 48,250 | | | | (5,800 | ) | | | 56,058 | | | | 3,189,700 | | | | 70,599 | | | | 57,411 | | | | 462,697 | |
iShares Core S&P 500 ETF | | | 12,333 | | | | 7,652 | | | | (2,080 | ) | | | 17,905 | | | | 4,813,759 | | | | 76,999 | | | | 58,584 | | | | 635,744 | |
iShares Core S&P Mid-Cap ETF | | | 8,825 | | | | 10,852 | | | | (5,460 | ) | | | 14,217 | | | | 2,698,102 | | | | 29,658 | | | | 32,484 | | | | 270,775 | |
iShares Core S&P Small-Cap ETF | | | 8,312 | | | | 15,725 | | | | (1,530 | ) | | | 22,507 | | | | 1,728,763 | | | | 19,707 | | | | 12,307 | | | | 165,855 | |
iShares Core S&P U.S. Value ETF | | | — | | | | 34,518 | | | | (34,518 | ) | | | — | | | | — | | | | 7,178 | | | | 10,326 | | | | — | |
iShares Edge MSCI Min Vol Emerging Markets ETF | | | 5,315 | | | | — | | | | (5,315 | ) | | | — | | | | — | | | | — | | | | (11,204 | ) | | | 20,361 | |
iShares Edge MSCI Min Vol USA ETF | | | — | | | | 22,134 | | | | (1,100 | ) | | | 21,034 | | | | 1,110,175 | | | | 16,888 | | | | 4,441 | | | | 117,628 | |
iShares Edge MSCI USA Momentum Factor ETF | | | 4,774 | | | | — | | | | (4,774 | ) | | | — | | | | — | | | | — | | | | 6,422 | | | | 1,226 | |
iShares MSCI Canada ETF | | | 11,257 | | | | 15,600 | | | | (2,900 | ) | | | 23,957 | | | | 710,085 | | | | 13,987 | | | | 11,023 | | | | 68,419 | |
iShares MSCI EAFE ETF | | | 51,124 | | | | 39,423 | | | | (27,850 | ) | | | 62,697 | | | | 4,408,226 | | | | 130,425 | | | | 112,152 | | | | 699,381 | |
iShares MSCI EAFE Small-Cap ETF | | | — | | | | 16,300 | | | | (700 | ) | | | 15,600 | | | | 1,006,200 | | | | 23,187 | | | | 5,591 | | | | 152,129 | |
iShares Russell 1000 ETF | | | 24,511 | | | | 1,386 | | | | (25,897 | ) | | | — | | | | — | | | | 5,884 | | | | 343,149 | | | | (271,256 | ) |
| | | | | | | | | | | | | | | | | | | | | | | | | | | | | | | | |
| | | | | | | | | | | | | | | | | | $ | 21,553,109 | | | $ | 405,062 | | | $ | 643,624 | | | $ | 2,322,990 | |
| | | | | | | | | | | | | | | | | | | | | | | | | | | | | | | | |
| | (a) | Includes net capital gain distributions, if applicable. | |
| | (b) | Represents net shares sold. | |
| | (c) | Represents securities lending income earned from the reinvestment of cash collateral from loaned securities, net of fees and collateral investment expenses, and other payments to and from borrowers of securities. | |
| | |
| Portfolio Abbreviation |
| |
ETF | | Exchange-Traded Fund |
Fair Value Hierarchy as of Period End
Various inputs are used in determining the fair value of investments. For information about the Fund’s policy regarding valuation of investments, refer to the Notes to Financial Statements.
The following table summarizes the Fund’s investments categorized in the disclosure hierarchy:
| | | | | | | | | | | | | | | | |
| | | Level 1 | | | Level 2 | | | Level 3 | | | Total | |
Assets: | | | | | | | | | | | | | | | | |
Investments: | | | | | | | | | | | | | | | | |
Affiliated Investment Companies | | $ | 19,729,679 | | | $ | — | | | $ | — | | | $ | 19,729,679 | |
| | | | | | | | | | | | | | | | |
Investments valued at NAV(a) | | | | | | | | | | | | | | $ | 1,823,430 | |
| | | | | | | | | | | | | | | | |
Total Investments | | | | | | | | | | | | | | $ | 21,553,109 | |
| | | | | | | | | | | | | | | | |
| | (a) | As of December 31, 2017, certain investments of the Fund were fair valued using NAV per share as no quoted market value is available and therefore have been excluded from the fair value hierarchy. | |
During the year ended December 31, 2017, there were no transfers between levels.
See notes to financial statements.
| | | | |
| SCHEDULE OF INVESTMENTS | | | 5 | |
Statement of Assets and Liabilities
December 31, 2017
| | | | |
| | | BlackRock
iShares® Equity
Appreciation
V.I. Fund | |
| |
ASSETS | | | | |
Investments at value — affiliated (including securities loaned at value of $1,784,408) (cost — $18,451,329) | | $ | 21,553,109 | |
Cash | | | 49 | |
Receivables: | | | | |
Securities lending income — affiliated | | | 262 | |
Capital shares sold | | | 4,377 | |
Dividends — affiliated | | | 47 | |
From the Manager | | | 18,775 | |
Prepaid expenses | | | 96 | |
| | | | |
Total assets | | | 21,576,715 | |
| | | | |
| |
LIABILITIES | | | | |
Cash collateral on securities loaned at value | | | 1,823,575 | |
Payables: | | | | |
Accounting Fees | | | 13,150 | |
Capital shares redeemed | | | 19,209 | |
Investments purchased | | | 26,015 | |
Officer’s and Directors’ fees | | | 1,478 | |
Other accrued expenses | | | 1,585 | |
Printing fees | | | 9,545 | |
Professional fees | | | 29,137 | |
Distribution fees | | | 463 | |
Transfer agent fees | | | 10,569 | |
| | | | |
Total liabilities | | | 1,934,726 | |
| | | | |
| |
NET ASSETS | | $ | 19,641,989 | |
| | | | |
| |
NET ASSETS CONSIST OF | | | | |
Paid-in capital | | $ | 16,762,936 | |
Undistributed net investment income | | | 11,260 | |
Accumulated net realized loss | | | (233,987 | ) |
Net unrealized appreciation (depreciation) | | | 3,101,780 | |
| | | | |
NET ASSETS | | $ | 19,641,989 | |
| | | | |
| |
NET ASSET VALUE | | | | |
Class I — Based on net assets of $17,352,607 and 1,476,470 shares outstanding, 100 million shares authorized, $0.10 par value. | | $ | 11.75 | |
| | | | |
Class III — Based on net assets of $2,289,382 and 195,535 shares outstanding, 100 million shares authorized, $0.10 par value. | | $ | 11.71 | |
| | | | |
See notes to financial statements.
| | |
| 6 | | 2017 BLACKROCK ANNUAL REPORTTO SHAREHOLDERS |
Statement of Operations
Year Ended December 31, 2017
| | | | |
| | | BlackRock
iShares® Equity
Appreciation
V.I. Fund | |
| |
INVESTMENT INCOME | | | | |
Dividends — affiliated | | $ | 395,072 | |
Securities lending income — affiliated — net | | | 9,990 | |
| | | | |
Total investment income | | | 405,062 | |
| | | | |
| |
EXPENSES | | | | |
Professional | | | 54,050 | |
Transfer agent — class specific | | | 37,510 | |
Investment advisory | | | 25,320 | |
Accounting services | | | 21,157 | |
Printing | | | 12,295 | |
Directors and Officer | | | 8,542 | |
Transfer agent | | | 5,001 | |
Distribution — class specific | | | 4,731 | |
Custodian | | | 4,431 | |
Miscellaneous | | | 4,866 | |
| | | | |
Total expenses | | | 177,903 | |
Less: | | | | |
Fees waived and/or reimbursed by the Manager | | | (82,207 | ) |
Transfer agent fees reimbursed — class specific | | | (20,036 | ) |
| | | | |
Total expenses after fees waived and/or reimbursed | | | 75,660 | |
| | | | |
Net investment income | | | 329,402 | |
| | | | |
| |
REALIZED AND UNREALIZED GAIN | | | | |
Net realized gain from investments — affiliated | | | 643,624 | |
Net change in unrealized appreciation on investments — affiliated | | | 2,322,990 | |
| | | | |
Net realized and unrealized gain | | | 2,966,614 | |
| | | | |
NET INCREASE IN NET ASSETS RESULTING FROM OPERATIONS | | $ | 3,296,016 | |
| | | | |
See notes to financial statements.
Statements of Changes in Net Assets
| | | | | | | | |
| | | BlackRock iShares® Equity
Appreciation V.I. Fund | |
| | | Year Ended December 31, | |
| | | 2017 | | | 2016 | |
| | |
INCREASE (DECREASE) IN NET ASSETS | | | | | | | | |
| | |
OPERATIONS | | | | | | | | |
Net investment income | | $ | 329,402 | | | $ | 202,833 | |
Net realized gain (loss) | | | 643,624 | | | | (209,490 | ) |
Net change in unrealized appreciation (depreciation) | | | 2,322,990 | | | | 979,801 | |
| | | | | | | | |
Net increase in net assets resulting from operations | | | 3,296,016 | | | | 973,144 | |
| | | | | | | | |
| | |
DISTRIBUTIONS TO SHAREHOLDERS(a) | | | | | | | | |
From net investment income: | | | | | | | | |
Class I | | | (289,582 | ) | | | (176,891 | ) |
Class III | | | (33,311 | ) | | | (21,981 | ) |
From return of capital: | | | | | | | | |
Class I | | | (8,974 | ) | | | (3,409 | ) |
Class III | | | (1,133 | ) | | | (470 | ) |
| | | | | | | | |
Decrease in net assets resulting from distributions to shareholders | | | (333,000 | ) | | | (202,751 | ) |
| | | | | | | | |
| | |
CAPITAL SHARE TRANSACTIONS | | | | | | | | |
Net increase in net assets derived from capital share transactions | | | 3,825,864 | | | | 4,632,288 | |
| | | | | | | | |
| | |
NET ASSETS | | | | | | | | |
Total increase in net assets | | | 6,788,880 | | | | 5,402,681 | |
Beginning of year | | | 12,853,109 | | | | 7,450,428 | |
| | | | | | | | |
End of year | | $ | 19,641,989 | | | $ | 12,853,109 | |
| | | | | | | | |
Undistributed net investment income, end of year | | $ | 11,260 | | | $ | 4,751 | |
| | | | | | | | |
| (a) | Distributions for annual periods determined in accordance with U.S. federal income tax regulations. |
See notes to financial statements.
| | |
| 8 | | 2017 BLACKROCK ANNUAL REPORTTO SHAREHOLDERS |
Financial Highlights
(For a share outstanding throughout each period)
| | | | | | | | | | | | | | | | | | | | |
| | | BlackRock iShares® Equity Appreciation V.I. Fund | |
| | | Class I | |
| | | Year Ended December 31, | | | Period
04/30/2014 (a) to 12/31/2014 | |
| | | 2017 | | | 2016 | | | 2015 | | | | | |
Net asset value, beginning of period | | $ | 9.81 | | | $ | 9.12 | | | $ | 9.93 | | | | | | | $ | 10.00 | |
| | | | | | | | | | | | | | | | | | | | |
Net investment income(b) | | | 0.22 | | | | 0.19 | | | | 0.20 | | | | | | | | 0.21 | |
Net realized and unrealized gain (loss) | | | 1.93 | | | | 0.66 | | | | (0.84 | ) | | | | | | | (0.17 | ) |
| | | | | | | | | | | | | | | | | | | | |
Net increase (decrease) from investment operations | | | 2.15 | | | | 0.85 | | | | (0.64 | ) | | | | | | | 0.04 | |
| | | | | | | | | | | | | | | | | | | | |
| Distributions:(c) | | | | | | | | | | | | | | | |
From net investment income | | | (0.21 | ) | | | (0.16 | ) | | | (0.16 | ) | | | | | | | (0.11 | ) |
From return of capital | | | (0.00 | )(d) | | | (0.00 | )(d) | | | (0.01 | ) | | | | | | | — | |
| | | | | | | | | | | | | | | | | | | | |
Total distributions | | | (0.21 | ) | | | (0.16 | ) | | | (0.17 | ) | | | | | | | (0.11 | ) |
| | | | | | | | | | | | | | | | | | | | |
Net asset value, end of period | | $ | 11.75 | | | $ | 9.81 | | | $ | 9.12 | | | | | | | $ | 9.93 | |
| | | | | | | | | | | | | | | | | | | | |
| | | | | |
Total Return:(e) | | | | | | | | | | | | | | | | | | | | |
Based on net asset value | | | 21.87 | % | | | 9.31 | % | | | (6.50 | )% | | | | | | | 0.37 | %(f) |
| | | | | | | | | | | | | | | | | | | | |
| | | | | |
Ratios to Average Net Assets:(g) | | | | | | | | | | | | | | | | | | | | |
Total expenses | | | 1.02 | % | | | 1.29 | % | | | 2.08 | % | | | | | | | 7.84 | %(h),(i) |
| | | | | | | | | | | | | | | | | | | | |
Total expenses after fees waived and/or reimbursed | | | 0.45 | % | | | 0.45 | % | | | 0.62 | % | | | | | | | 0.75 | %(h) |
| | | | | | | | | | | | | | | | | | | | |
Net investment income | | | 1.99 | % | | | 2.06 | % | | | 1.98 | % | | | | | | | 3.04 | %(h) |
| | | | | | | | | | | | | | | | | | | | |
| | | | | |
Supplemental Data: | | | | | | | | | | | | | | | | | | | | |
Net assets, end of period (000) | | $ | 17,353 | | | $ | 11,305 | | | $ | 6,948 | | | | | | | $ | 3,749 | |
| | | | | | | | | | | | | | | | | | | | |
Portfolio turnover rate | | | 57 | % | | | 59 | % | | | 76 | % | | | | | | | 16 | % |
| | | | | | | | | | | | | | | | | | | | |
| (a) | Commencement of operations. |
| (b) | Based on average shares outstanding. |
| (c) | Distributions for annual periods determined in accordance with U.S. federal income tax regulations. |
| (d) | Amount is greater than $(0.005) per share. |
| (e) | Where applicable, excludes insurance-related fees and expenses and assumes the reinvestment of distributions. |
| (f) | Aggregate total return. |
| (g) | Excludes expenses incurred indirectly as a result of investments in underlying funds as follows: |
| | | | | | | | | | | | | | | | | | | | | | | | | | | | |
| | | Year Ended December 31, | | | Period
04/30/2014 (a)
to 12/31/2014 | |
| | 2017 | | | | | | 2016 | | | | | | 2015 | | | | | |
Investments in underlying funds | | | 0.18 | % | | | | | | | 0.20 | % | | | | | | | 0.30 | % | | | | | | | 0.27 | % |
| | | | | | | | | | | | | | | | | | | | | | | | | | | | |
| (i) | Organization and/or offering costs were not annualized in the calculation of the expense ratios. If these expenses were annualized, the total expenses for Class I would have been 8.47%. |
See notes to financial statements.
Financial Highlights (continued)
(For a share outstanding throughout each period)
| | | | | | | | | | | | | | | | | | | | |
| | | BlackRock iShares® Equity Appreciation V.I. Fund | |
| | | Class III | |
| | | Year Ended December 31, | | | Period
04/30/2014 (a) to 12/31/2014 | |
| | | 2017 | | | 2016 | | | 2015 | | | | | |
Net asset value, beginning of period | | $ | 9.78 | | | $ | 9.10 | | | $ | 9.92 | | | | | | | $ | 10.00 | |
| | | | | | | | | | | | | | | | | | | | |
Net investment income(b) | | | 0.18 | | | | 0.19 | | | | 0.25 | | | | | | | | 0.21 | |
Net realized and unrealized gain (loss) | | | 1.93 | | | | 0.63 | | | | (0.91 | ) | | | | | | | (0.19 | ) |
| | | | | | | | | | | | | | | | | | | | |
Net increase (decrease) from investment operations | | | 2.11 | | | | 0.82 | | | | (0.66 | ) | | | | | | | 0.02 | |
| | | | | | | | | | | | | | | | | | | | |
| Distributions:(c) | | | | | | | | | | | | | | | |
From net investment income | | | (0.18 | ) | | | (0.14 | ) | | | (0.15 | ) | | | | | | | (0.10 | ) |
From return of capital | | | (0.00 | )(d) | | | (0.00 | )(d) | | | (0.01 | ) | | | | | | | — | |
| | | | | | | | | | | | | | | | | | | | |
Total distributions | | | (0.18 | ) | | | (0.14 | ) | | | (0.16 | ) | | | | | | | (0.10 | ) |
| | | | | | | | | | | | | | | | | | | | |
Net asset value, end of period | | $ | 11.71 | | | $ | 9.78 | | | $ | 9.10 | | | | | | | $ | 9.92 | |
| | | | | | | | | | | | | | | | | | | | |
| | | | | |
Total Return:(e) | | | | | | | | | | | | | | | | | | | | |
Based on net asset value | | | 21.56 | % | | | 9.05 | % | | | (6.70 | )% | | | | | | | 0.16 | %(f) |
| | | | | | | | | | | | | | | | | | | | |
| | | | | |
Ratios to Average Net Assets:(g) | | | | | | | | | | | | | | | | | | | | |
Total expenses | | | 1.32 | % | | | 1.44 | % | | | 2.18 | % | | | | | | | 10.67 | %(h),(i) |
| | | | | | | | | | | | | | | | | | | | |
Total expenses after fees waived and/or reimbursed | | | 0.70 | % | | | 0.70 | % | | | 0.81 | % | | | | | | | 1.00 | %(h) |
| | | | | | | | | | | | | | | | | | | | |
Net investment income | | | 1.67 | % | | | 2.06 | % | | | 2.58 | % | | | | | | | 3.01 | %(h) |
| | | | | | | | | | | | | | | | | | | | |
| | | | | |
Supplemental Data: | | | | | | | | | | | | | | | | | | | | |
Net assets, end of period (000) | | $ | 2,289 | | | $ | 1,548 | | | $ | 502 | | | | | | | $ | 22 | |
| | | | | | | | | | | | | | | | | | | | |
Portfolio turnover rate | | | 57 | % | | | 59 | % | | | 76 | % | | | | | | | 16 | % |
| | | | | | | | | | | | | | | | | | | | |
| (a) | Commencement of operations. |
| (b) | Based on average shares outstanding. |
| (c) | Distributions for annual periods determined in accordance with U.S. federal income tax regulations. |
| (d) | Amount is greater than $(0.005) per share. |
| (e) | Where applicable, excludes insurance-related fees and expenses and assumes the reinvestment of distributions. |
| (f) | Aggregate total return. |
| (g) | Excludes expenses incurred indirectly as a result of investments in underlying funds as follows: |
| | | | | | | | | | | | | | | | | | | | | | | | | | | | |
| | | Year Ended December 31, | | | Period
04/30/2014 (a)
to 12/31/2014 | |
| | 2017 | | | | | | 2016 | | | | | | 2015 | | | | | |
Investments in underlying funds | | | 0.18 | % | | | | | | | 0.20 | % | | | | | | | 0.30 | % | | | | | | | 0.27 | % |
| | | | | | | | | | | | | | | | | | | | | | | | | | | | |
| (i) | Organization and/or offering costs were not annualized in the calculation of the expense ratios. If these expenses were annualized, the total expenses for Class III would have been 11.83%. |
See notes to financial statements.
| | |
| 10 | | 2017 BLACKROCK ANNUAL REPORTTO SHAREHOLDERS |
Notes to Financial Statements
BlackRock Variable Series Funds, Inc. (the “Company”) is registered under the Investment Company Act of 1940, as amended (the “1940 Act”), as an open-end management investment company. The Company is organized as a Maryland corporation that is comprised of 20 separate funds. The funds offer shares to insurance companies for their separate accounts to fund benefits under certain variable annuity and variable life insurance contracts. The financial statements presented are for BlackRock iShares® Equity Appreciation V.I. Fund (the “Fund”). The Fund is classified as diversified. Class I and Class III Shares have equal voting, dividend, liquidation and other rights, except that only shares of the respective classes are entitled to vote on matters concerning only that class. In addition, Class III Shares bear certain expenses related to the distribution of such shares.
The Fund, together with certain other registered investment companies advised by BlackRock Advisors, LLC (the “Manager”) or its affiliates, is included in a complex of open-end funds referred to as the Equity-Bond Complex.
On November 15, 2017, the Board of Directors the Company approved a proposal to close the Fund to new investors and thereafter to liquidate the Fund. Effective December 19, 2017, the Fund is no longer accepting purchase orders from new investors. The liquidation is expected to occur on or about March 29, 2018.
| 2. | SIGNIFICANT ACCOUNTING POLICIES |
The financial statements are prepared in conformity with accounting principles generally accepted in the United States of America (“U.S. GAAP”), which may require management to make estimates and assumptions that affect the reported amounts of assets and liabilities in the financial statements, disclosure of contingent assets and liabilities at the date of the financial statements and the reported amounts of increases and decreases in net assets from operations during the reporting period. Actual results could differ from those estimates. The Fund is considered an investment company under U.S. GAAP and follows the accounting and reporting guidance applicable to investment companies. Below is a summary of significant accounting policies:
Investment Transactions and Income Recognition: For financial reporting purposes, investment transactions are recorded on the dates the transactions are entered into (the “trade dates”). Realized gains and losses on investment transactions are determined on the identified cost basis. Dividend income is recorded on the ex-dividend date. Dividends from foreign securities where the ex-dividend date may have passed are subsequently recorded when the Fund is informed of the ex-dividend date. Under the applicable foreign tax laws, a withholding tax at various rates may be imposed on capital gains, dividends and interest. Upon notification from issuers, some of the dividend income received from a real estate investment trust may be redesignated as a reduction of cost of the related investment and/or realized gain. Income, expenses and realized and unrealized gains and losses are allocated daily to each class based on its relative net assets.
Distributions: Distributions paid by the Fund are recorded on the ex-dividend date. Distributions of capital gains are recorded on the ex-dividend date and made at least annually. The portion of distributions, if any, that exceeds a fund’s current and accumulated earnings and profits, as measured on a tax basis, constitute a non-taxable return of capital. The character and timing of distributions are determined in accordance with U.S. federal income tax regulations, which may differ from U.S. GAAP.
Indemnifications: In the normal course of business, the Fund enters into contracts that contain a variety of representations that provide general indemnification. The Fund’s maximum exposure under these arrangements is unknown because it involves future potential claims against the Fund, which cannot be predicted with any certainty.
Other: Expenses directly related to the Fund or its classes are charged to the Fund or the applicable class. Other operating expenses shared by several funds, including other funds managed by the Manager, are prorated among those funds on the basis of relative net assets or other appropriate methods. Expenses directly related to the Fund and other shared expenses prorated to the Fund are allocated daily to each class based on its relative net assets or other appropriate methods.
| 3. | INVESTMENT VALUATION AND FAIR VALUE MEASUREMENTS |
Investment Valuation Policies: The Fund’s investments are valued at fair value (also referred to as “market value” within the financial statements) as of the close of trading on the New York Stock Exchange (“NYSE”) (generally 4:00 p.m., Eastern time) (or, if the reporting date falls on a day the NYSE is closed, investments are valued at fair value as of the period end). U.S. GAAP defines fair value as the price the Fund would receive to sell an asset or pay to transfer a liability in an orderly transaction between market participants at the measurement date. The Fund determines the fair values of its financial instruments using various independent dealers or pricing services under policies approved by the Board of Directors of the Company (the “Board”). The BlackRock Global Valuation Methodologies Committee (the “Global Valuation Committee”) is the committee formed by management to develop global pricing policies and procedures and to oversee the pricing function for all financial instruments.
Fair Value Inputs and Methodologies: The following methods and inputs are used to establish the fair value of the Fund’s assets and liabilities:
| | • | | Exchange-traded funds (“ETFs”) traded on a recognized securities exchange are valued at the official closing price each day, if available. For ETFs traded on more than one exchange, the official closing price on the exchange where the stock is primarily traded is used. ETFs traded on a recognized exchange for which there were no sales on that day may be valued at the last available bid (long positions) or ask (short positions) price. |
| | • | | Investments in open-end U.S. mutual funds are valued at net asset value (“NAV”) each business day. |
| | • | | The Fund values its investment in SL Liquidity Series, LLC, Money Market Series (the “Money Market Series”) at fair value, which is ordinarily based upon its pro rata ownership in the underlying fund’s net assets. The Money Market Series seeks current income consistent with maintaining liquidity and preserving capital. Although the Money Market Series is not registered under the 1940 Act, its investments may follow the parameters of investments by a money market fund that is subject to Rule 2a-7 under the 1940 Act. |
If events (e.g., a company announcement, market volatility or a natural disaster) occur that are expected to materially affect the value of such investments, or in the event that the application of these methods of valuation results in a price for an investment that is deemed not to be representative of the market value of such investment, or if a price is not available, the investment will be valued by the Global Valuation Committee, or its delegate, in accordance with a policy approved by the Board as reflecting fair
| | | | |
| NOTESTO FINANCIAL STATEMENTS | | | 11 | |
Notes to Financial Statements (continued)
value (“Fair Valued Investments”). The fair valuation approaches that may be used by the Global Valuation Committee will include market approach, income approach and cost approach. Valuation techniques such as discounted cash flow, use of market comparables and matrix pricing are types of valuation approaches and are typically used in determining fair value. When determining the price for Fair Valued Investments, the Global Valuation Committee, or its delegate, seeks to determine the price that the Fund might reasonably expect to receive or pay from the current sale or purchase of that asset or liability in an arm’s-length transaction. Fair value determinations shall be based upon all available factors that the Global Valuation Committee, or its delegate, deems relevant and consistent with the principles of fair value measurement. The pricing of all Fair Valued Investments is subsequently reported to the Board or a committee thereof on a quarterly basis.
Fair Value Hierarchy: Various inputs are used in determining the fair value of investments. These inputs to valuation techniques are categorized into a fair value hierarchy consisting of three broad levels for financial statement purposes as follows:
| | • | | Level 1 — Unadjusted price quotations in active markets/exchanges for identical assets or liabilities that the Fund has the ability to access |
| | • | | Level 2 — Other observable inputs (including, but not limited to, quoted prices for similar assets or liabilities in markets that are active, quoted prices for identical or similar assets or liabilities in markets that are not active, inputs other than quoted prices that are observable for the assets or liabilities (such as interest rates, yield curves, volatilities, prepayment speeds, loss severities, credit risks and default rates) or other market–corroborated inputs) |
| | • | | Level 3 — Unobservable inputs based on the best information available in the circumstances, to the extent observable inputs are not available (including the Fund’s own assumptions used in determining the fair value of investments) |
The hierarchy gives the highest priority to unadjusted quoted prices in active markets for identical assets or liabilities (Level 1 measurements) and the lowest priority to unobservable inputs (Level 3 measurements). Accordingly, the degree of judgment exercised in determining fair value is greatest for instruments categorized in Level 3. The inputs used to measure fair value may fall into different levels of the fair value hierarchy. In such cases, for disclosure purposes, the fair value hierarchy classification is determined based on the lowest level input that is significant to the fair value measurement in its entirety. Investments classified within Level 3 have significant unobservable inputs used by the Global Valuation Committee in determining the price for Fair Valued Investments. Level 3 investments include equity or debt issued by privately held companies or funds. There may not be a secondary market, and/or there are a limited number of investors. Level 3 investments may also be adjusted to reflect illiquidity and/or non-transferability, with the amount of such discount estimated by the Global Valuation Committee in the absence of market information.
Changes in valuation techniques may result in transfers into or out of an assigned level within the hierarchy. In accordance with the Fund’s policy, transfers between different levels of the fair value hierarchy are deemed to have occurred as of the beginning of the reporting period. The categorization of a value determined for investments is based on the pricing transparency of the investments and is not necessarily an indication of the risks associated with investing in those securities.
As of December 31, 2017, certain investments of the Fund were valued using NAV per share as no quoted market value is available and therefore have been excluded from the fair value hierarchy.
| 4. | SECURITIES AND OTHER INVESTMENTS |
Securities Lending: The Fund may lend its securities to approved borrowers, such as brokers, dealers and other financial institutions. The borrower pledges and maintains with the Fund collateral consisting of cash, an irrevocable letter of credit issued by a bank, or securities issued or guaranteed by the U.S. Government. The initial collateral received by the Fund is required to have a value of at least 102% of the current value of the loaned securities for securities traded on U.S. exchanges and a value of at least 105% for all other securities. The collateral is maintained thereafter at a value equal to at least 100% of the current market value of the securities on loan. The market value of the loaned securities is determined at the close of each business day of the Fund and any additional required collateral is delivered to the Fund, or excess collateral returned by the Fund, on the next business day. During the term of the loan, the Fund is entitled to all distributions made on or in respect of the loaned securities, but does not receive interest income on securities received as collateral. Loans of securities are terminable at any time and the borrower, after notice, is required to return borrowed securities within the standard time period for settlement of securities transactions.
The market value of any securities on loan, all of which were classified as affiliated investment companies in the Fund’s Schedule of Investments, and the value of any related collateral are shown separately in the Statement of Assets and Liabilities as a component of investments at value — unaffiliated, and collateral on securities loaned at value, respectively. As of period end, any securities on loan were collateralized by cash and/or U.S. Government obligations. Cash collateral invested by the securities lending agent, BlackRock Investment Management, LLC (“BIM”), if any, is disclosed in the Schedule of Investments.
Securities lending transactions are entered into by the Fund under Master Securities Lending Agreements (each, an “MSLA”), which provide the right, in the event of default (including bankruptcy or insolvency), for the non-defaulting party to liquidate the collateral and calculate a net exposure to the defaulting party or request additional collateral. In the event that a borrower defaults, the Fund, as lender, would offset the market value of the collateral received against the market value of the securities loaned. When the value of the collateral is greater than that of the market value of the securities loaned, the lender is left with a net amount payable to the defaulting party. However, bankruptcy or insolvency laws of a particular jurisdiction may impose restrictions on or prohibitions against such a right of offset in the event of an MSLA counterparty’s bankruptcy or insolvency. Under the MSLA, absent an event of default, the borrower can resell or re-pledge the loaned securities, and the Fund can reinvest cash collateral received in connection with loaned securities. Upon an event of default, the parties’ obligations to return the securities or collateral to the other party are extinguished, and the parties can resell or re-pledge the loaned securities or the collateral received in connection with the loaned securities in order to satisfy the defaulting party’s net payment obligation for all transactions under the MSLA. The defaulting party remains liable for any deficiency.
| | |
| 12 | | 2017 BLACKROCK ANNUAL REPORTTO SHAREHOLDERS |
Notes to Financial Statements (continued)
As of December 31, 2017, the following table is a summary of the Fund’s securities lending agreements by counterparty which are subject to offset under an MSLA:
| | | | | | | | | | | | |
| Counterparty | | Securities Loaned at Value | | | Cash Collateral Received (a) | | | Net Amount | |
JP Morgan Securities LLC | | $ | 1,784,408 | | | $ | (1,784,408 | ) | | $ | — | |
| | (a) | Cash collateral with a value of $1,823,575 has been received in connection with securities lending agreements. Collateral received in excess of the value of securities loaned from the individual counterparty is not shown for financial reporting purposes in the table above. | |
The risks of securities lending include the risk that the borrower may not provide additional collateral when required or may not return the securities when due. To mitigate these risks, the Fund benefits from a borrower default indemnity provided by BIM. BIM’s indemnity allows for full replacement of the securities loaned if the collateral received does not cover the value on the securities loaned in the event of borrower default. The Fund could incur a loss if the value of an investment purchased with cash collateral falls below the market value of loaned securities or if the value of an investment purchased with cash collateral falls below the value of the original cash collateral received.
| 5. | INVESTMENT ADVISORY AGREEMENT AND OTHER TRANSACTIONS WITH AFFILIATES |
The PNC Financial Services Group, Inc. is the largest stockholder and an affiliate of BlackRock, Inc. (“BlackRock”) for 1940 Act purposes.
Investment Advisory: The Company, on behalf of the Fund, entered into an Investment Advisory Agreement with the Manager, the Fund’s investment adviser, an indirect, wholly-owned subsidiary of BlackRock, to provide investment advisory and administrative services. The Manager is responsible for the management of the Fund’s portfolio and provides the personnel, facilities, equipment and certain other services necessary to the operations of the Fund.
For such services, the Fund pays the Manager a monthly fee at an annual rate equal to the following percentages of the average daily value of the Fund’s net assets:
| | | | |
| Average Daily Net Assets | | Investment
Advisory Fee | |
First $1 Billion | | | 0.150 | % |
$1 Billion — $3 Billion | | | 0.140 | |
$3 Billion — $5 Billion | | | 0.135 | |
Greater than $5 Billion | | | 0.130 | |
Distribution Fees: The Company, on behalf of the Fund, entered into a Distribution Agreement and a Distribution Plan with BlackRock Investments, LLC (“BRIL”), an affiliate of the Manager. Pursuant to the Distribution Plan and in accordance with Rule 12b-1 under the 1940 Act, the Fund pays BRIL ongoing distribution fees. The fees are accrued daily and paid monthly at an annual rate of 0.25% based upon the average daily net assets attributable to Class III.
For the year ended December 31, 2017, the class specific distribution fees borne directly by Class III were $4,731.
Transfer Agent: On behalf of the Fund, the Manager entered into agreements with insurance companies and other financial intermediaries (“Service Organizations”), some of which may be affiliates. Pursuant to these agreements, the Service Organizations provide the Fund with administrative, networking, recordkeeping, sub-transfer agency and shareholder services to sub-accounts they service. For these services, the Service Organizations receive an annual fee per shareholder account, which will vary depending on share class and/or net assets of Fund shareholders serviced by the Service Organizations, which is shown as transfer agent — class specific. For the year ended December 31, 2017, the Fund did not pay any amounts to affiliates in return for these services.
In addition, the Fund pays the transfer agent, which is not an affiliate, a fee for the issuance, transfer and redemption of shares and the opening and maintenance of shareholder accounts, which is included in transfer agent in the Statement of Operations.
For the year ended December 31, 2017, the following table shows the class specific transfer agent fees borne directly by each share class of the Fund:
| | | | | | | | | | | | | | |
| Class I | | | | | Class III | | | | | Total | |
| $ | 32,524 | | | | | $ | 4,986 | | | | | $ | 37,510 | |
Expense Limitations, Waivers, Reimbursements and Recoupments: With respect to the Fund, the Manager voluntarily agreed to waive its investment advisory fees by the amount of investment advisory fees the Fund pays to the Manager indirectly through its investment in affiliated money market funds (the “affiliated money market fund waiver”). The amount of waivers and/or reimbursements of fees and expenses made pursuant to the expense limitation caps will be reduced by the amount of the affiliated money market fund waiver. In addition, the Manager has contractually agreed to waive the management fee on assets estimated to be attributable to the Fund’s investments in other equity and fixed-income mutual funds managed by BlackRock or its affiliates, if any. This amount is shown as fees waived and/or reimbursed by the Manager in the Statement of Operations. For the year ended December 31, 2017, the amount waived was $55.
For the year ended December 31, 2017, the Fund reimbursed the Manager $122 for certain accounting services, which is included in accounting services in the Statement of Operations.
With respect to the Fund, the Manager has contractually agreed to waive and/or reimburse fees or expenses in order to limit expenses, excluding interest expense, dividend expense, tax expense, acquired fund fees and expenses, and certain other fund expenses, which constitute extraordinary expenses not incurred in the ordinary course of the Fund’s business (“expense limitation”). The expense limitations as a percentage of average daily net assets are as follows:
| | | | | | | | | | | | | | |
| | | | | | Class I | | | | | Class III | |
| | | | | | | | 0.45% | | | | | | 0.70% | |
| | | | |
| NOTESTO FINANCIAL STATEMENTS | | | 13 | |
Notes to Financial Statements (continued)
The Manager has agreed not to reduce or discontinue this contractual expense limitation through April 30, 2018, unless approved by the Board, including a majority of the independent directors who are not “interested persons” of the Fund, as defined in the 1940 Act (“Independent Directors”) or by a vote of a majority of the outstanding voting securities of the Fund. For the year ended December 31, 2017, the Manager waived and/or reimbursed $82,152, which is included in fees waived and/or reimbursed by the Manager in the Statement of Operations.
These amounts waived and/or reimbursed are shown as transfer agent fees reimbursed — class specific in the Statement of Operations. For the year ended December 31, 2017, class specific expense waivers and/or reimbursements were as follows:
| | | | | | | | | | | | |
| | | Class I | | | Class III | | | Total | |
Transfer Agent Fees Reimbursed | | $ | 17,509 | | | | $2,527 | | | $ | 20,036 | |
With respect to the contractual expense limitation, if during the Fund’s fiscal year the operating expenses of a share class, that at any time during the prior two fiscal years received a waiver and/or reimbursement from the Manager, are less than the current expense limitation for that share class, the Manager is entitled to be reimbursed by such share class up to the lesser of: (a) the amount of fees waived and/or expenses reimbursed during those prior two fiscal years under the agreement and (b) an amount not to exceed either the current expense limitation of that share class or the expense limitation of the share class in effect at the time that the share class received the applicable waiver and/or reimbursement, provided that:
(1) the Fund, of which the share class is a part, has more than $50 million in assets for the fiscal year, and
(2) the Manager or an affiliate continues to serve as the Fund’s investment adviser or administrator.
This repayment applies only to the contractual expense limitation on net expenses and does not apply to any voluntary waivers that may be in effect from time to time.
On December 31, 2017, the Fund level and class specific waivers and/or reimbursements subject to possible future recoupment under the expense limitation agreement were as follows:
| | | | | | | | |
| | | Expiring December 31, | |
| | | 2018 | | | 2019 | |
Fund Level | | $ | 65,572 | | | $ | 82,152 | |
Class I | | $ | 15,434 | | | $ | 17,509 | |
Class III | | $ | 759 | | | $ | 2,527 | |
The following fund level and class specific waivers and/or reimbursements previously recorded by the fund, which were subject to recoupment by the Manager, expired on December 31, 2017:
| | | | |
Fund Level | | $ | 79,049 | |
Class I | | $ | 12,427 | |
Class III | | $ | 168 | |
Securities Lending: The U.S. Securities and Exchange Commission (“SEC”) has issued an exemptive order which permits BIM, an affiliate of the Manager, to serve as securities lending agent for the Fund, subject to applicable conditions. As securities lending agent, BIM bears all operational costs directly related to securities lending. The Fund is responsible for expenses in connection with the investment of cash collateral received for securities on loan (the “collateral investment expenses”). The cash collateral is invested in a private investment company managed by the Manager or its affiliates. However, BIM has agreed to cap the collateral investment expenses of the private investment company to an annual rate of 0.04%. The investment adviser to the private investment company will not charge any advisory fees with respect to shares purchased by the Fund. The private investment company in which the cash collateral has been invested may, under certain circumstances, impose a liquidity fee of up to 2% of the value withdrawn or temporarily restrict withdrawals for up to 10 business days during a 90 day period, in the event that the private investment company’s weekly liquid assets fall below certain thresholds.
Securities lending income is equal to the total of income earned from the reinvestment of cash collateral, net of fees and other payments to and from borrowers of securities, and less the collateral investment expenses. The Fund retains a portion of securities lending income and remits a remaining portion to BIM as compensation for its services as securities lending agent.
Pursuant to a securities lending agreement, the Fund retains 80% of securities lending income, and this amount retained can never be less than 70% of the total of securities lending income plus the collateral investment expenses.
In addition, commencing the business day following the date that the aggregate securities lending income earned across the Equity-Bond Complex in a calendar year exceeds a specified threshold, the Fund, pursuant to the securities lending agreement, will retain for the remainder of that calendar year securities lending income as follows: 85% of securities lending income, and this amount retained can never be less than 70% of the total of securities lending income plus the collateral investment expenses.
The share of securities lending income earned by the Fund is shown as securities lending income — affiliated — net in the Statement of Operations. For the year ended December 31, 2017, the Fund paid BIM $2,172 for securities lending agent services.
Interfund Lending: In accordance with an exemptive order (the “Order”) from the SEC, the Fund may participate in a joint lending and borrowing facility for temporary purposes (the “Interfund Lending Program”), subject to compliance with the terms and conditions of the Order, and to the extent permitted by the Fund’s investment policies and restrictions. The Fund is currently permitted to borrow and lend under the Interfund Lending Program.
| | |
| 14 | | 2017 BLACKROCK ANNUAL REPORTTO SHAREHOLDERS |
Notes to Financial Statements (continued)
A lending BlackRock fund may lend in aggregate up to 15% of its net assets, but may not lend more than 5% of its net assets to any one borrowing fund through the Interfund Lending Program. A borrowing BlackRock fund may not borrow through the Interfund Lending Program or from any other source more than 33 1/3% of its total assets (or any lower threshold provided for by the fund’s investment restrictions). If a borrowing BlackRock fund’s total outstanding borrowings exceed 10% of its total assets, each of its outstanding interfund loans will be subject to collateralization of at least 102% of the outstanding principal value of the loan. All interfund loans are for temporary or emergency purposes and the interest rate to be charged will be the average of the highest current overnight repurchase agreement rate available to a lending fund and the bank loan rate, as calculated according to a formula established by the Board.
During the year ended December 31, 2017, the Fund did not participate in the Interfund Lending Program.
Officers and Directors: Certain directors and/or officers of the Company are directors and/or officers of BlackRock or its affiliates. The Fund reimburses the Manager for a portion of the compensation paid to the Company’s Chief Compliance Officer, which is included in Directors and Officer in the Statement of Operations.
For the year ended December 31, 2017, purchases and sales of investments, excluding short-term securities, were $13,367,436 and $9,541,236, respectively.
It is the Fund’s policy to comply with the requirements of the Internal Revenue Code of 1986, as amended, applicable to regulated investment companies, and to distribute substantially all of its taxable income to its shareholders. Therefore, no U.S. federal income tax provision is required.
The Fund files U.S. federal and various state and local tax returns. No income tax returns are currently under examination. The statute of limitations on the Fund’s U.S. federal tax returns generally remains open for the period ended December 31, 2014 and for each of the three years ended December 31, 2017. The statutes of limitations on the Fund’s state and local tax returns may remain open for an additional year depending upon the jurisdiction.
Management has analyzed tax laws and regulations and their application to the Fund as of December 31, 2017, inclusive of the open tax return years, and does not believe that there are any uncertain tax positions that require recognition of a tax liability in the Fund’s financial statements.
The tax character of distributions paid was as follows:
| | | | | | | | |
| | | 12/31/17 | | | 12/31/16 | |
Ordinary income | | $ | 322,893 | | | $ | 198,872 | |
Tax return of capital | | | 10,107 | | | | 3,879 | |
| | | | | | | | |
| | $ | 333,000 | | | $ | 202,751 | |
| | | | | | | | |
As of December 31, 2017, the tax components of accumulated net earnings (losses) were as follows:
| | | | |
Capital loss carryforward | | $ | (115,656 | ) |
Net unrealized gains1 | | | 2,994,709 | |
| | | | |
| | $ | 2,879,053 | |
| | | | |
| | 1 | The difference between book-basis and tax-basis net unrealized gains was attributable primarily to the tax deferral of losses on wash sales and the timing and recognition of partnership income. | |
As of December 31, 2017, the Fund had capital loss carryforwards, with no expiration dates, available to offset future realized capital gains $115,656.
During the year ended December 31, 2017, the Fund utilized $558,008 of its capital loss carryforward.
As of December 31, 2017, gross unrealized appreciation and depreciation for investments based on cost for U.S. federal income tax purposes were as follows:
| | | | |
Tax cost | | $ | 18,558,400 | |
| | | | |
Gross unrealized appreciation | | $ | 2,994,709 | |
Gross unrealized depreciation | | | — | |
| | | | |
Net unrealized appreciation | | $ | 2,994,709 | |
| | | | |
The Company, on behalf of the Fund, along with certain other funds managed by the Manager and its affiliates (“Participating Funds”), is a party to a 364-day, $2.1 billion credit agreement with a group of lenders. Under this agreement, the Fund may borrow to fund shareholder redemptions. Excluding commitments designated for certain individual funds, the Participating Funds, including the Fund, can borrow up to an aggregate commitment amount of $1.6 billion at any time outstanding, subject to asset coverage and other limitations as specified in the agreement. The credit agreement has the following terms: a fee of 0.12% per annum on unused commitment amounts and interest at a rate equal to the higher of (a) one-month LIBOR (but, in any event, not less than 0.00%) on the date the loan is made plus 0.80% per annum or (b) the Fed Funds rate (but, in any event, not less than 0.00%) in effect from time to time plus 0.80% per annum on amounts borrowed. The agreement expires in April 2018 unless extended or renewed. Participating Funds paid administration, legal and arrangement fees, which, if applicable, are included in miscellaneous expenses in the
| | | | |
| NOTESTO FINANCIAL STATEMENTS | | | 15 | |
Notes to Financial Statements (continued)
Statement of Operations. These fees were allocated among such funds based upon portions of the aggregate commitment available to them and relative net assets of Participating Funds. During the year ended December 31, 2017, the Fund did not borrow under the credit agreement.
In the normal course of business, the Fund invests in securities or other instruments and may enter into certain transactions, and such activities subject the Fund to various risks, including among others, fluctuations in the market (market risk) or failure of an issuer to meet all of its obligations. The value of securities or other instruments may also be affected by various factors, including, without limitation: (i) the general economy; (ii) the overall market as well as local, regional or global political and/or social instability; (iii) regulation, taxation or international tax treaties between various countries; or (iv) currency, interest rate and price fluctuations. The Fund’s prospectus provides details of the risks to which the Fund is subject.
The Fund may be exposed to additional risks when reinvesting cash collateral in money market funds that do not seek to maintain a stable NAV per share of $1.00 and which may be subject to redemption gates or liquidity fees under certain circumstances.
Valuation Risk: The market values of equities, such as common stocks and preferred securities or equity related investments, such as futures and options, may decline due to general market conditions which are not specifically related to a particular company. They may also decline due to factors which affect a particular industry or industries. The Fund may invest in illiquid investments and may experience difficulty in selling those investments in a timely manner at the price that it believes the investments are worth. Prices may fluctuate widely over short or extended periods in response to company, market or economic news. Markets also tend to move in cycles, with periods of rising and falling prices. This volatility may cause the Fund’s NAV to experience significant increases or decreases over short periods of time. If there is a general decline in the securities and other markets, the NAV of the Fund may lose value, regardless of the individual results of the securities and other instruments in which the Fund invests.
Counterparty Credit Risk: Similar to issuer credit risk, the Fund may be exposed to counterparty credit risk, or the risk that an entity may fail to or be unable to perform on its commitments related to unsettled or open transactions. The Fund manages counterparty credit risk by entering into transactions only with counterparties that the Manager believes have the financial resources to honor their obligations and by monitoring the financial stability of those counterparties. Financial assets, which potentially expose the Fund to market, issuer and counterparty credit risks, consist principally of financial instruments and receivables due from counterparties. The extent of the Fund’s exposure to market, issuer and counterparty credit risks with respect to these financial assets is approximately their value recorded in the Statement of Assets and Liabilities, less any collateral held by the Fund.
| 10. | CAPITAL SHARE TRANSACTIONS |
Transactions in capital shares for each class were as follows:
| | | | | | | | | | | | | | | | |
| | | Year Ended
12/31/2017 | | | Year Ended
12/31/2016 | |
| Class I | | Shares | | | Amount | | | Shares | | | Amount | |
Shares sold | | | 522,549 | | | $ | 5,562,805 | | | | 491,275 | | | $ | 4,630,793 | |
Shares issued in reinvestment of distributions | | | 25,409 | | | | 298,556 | | | | 18,379 | | | | 180,300 | |
Shares redeemed | | | (223,469 | ) | | | (2,447,280 | ) | | | (119,440 | ) | | | (1,139,978 | ) |
| | | | | | | | | | | | | | | | |
Net increase | | | 324,489 | | | $ | 3,414,081 | | | | 390,214 | | | $ | 3,671,115 | |
| | | | | | | | | | | | | | | | |
Class III | | | | | | | | | | | | | | | | |
Shares sold | | | 64,223 | | | $ | 689,644 | | | | 119,182 | | | $ | 1,115,318 | |
Shares issued in reinvestment of distributions | | | 2,941 | | | | 34,444 | | | | 2,295 | | | | 22,451 | |
Shares redeemed | | | (29,859 | ) | | | (312,305 | ) | | | (18,438 | ) | | | (176,596 | ) |
| | | | | | | | | | | | | | | | |
Net increase | | | 37,305 | | | $ | 411,783 | | | | 103,039 | | | $ | 961,173 | |
| | | | | | | | | | | | | | | | |
Total Net Increase | | | 361,794 | | | $ | 3,825,864 | | | | 493,253 | | | $ | 4,632,288 | |
| | | | | | | | | | | | | | | | |
Management has evaluated the impact of all subsequent events on the Fund through the date the financial statements were issued and has determined that there were no subsequent events requiring adjustment or additional disclosure in the financial statements.
| | |
| 16 | | 2017 BLACKROCK ANNUAL REPORTTO SHAREHOLDERS |
Report of Independent Registered Public Accounting Firm
To the Shareholders of BlackRock iShares Equity Appreciation V.I. Fund and the Board of Directors of BlackRock Variable Series Funds, Inc.:
Opinion on the Financial Statements and Financial Highlights
We have audited the accompanying statement of assets and liabilities, including the schedule of investments, of BlackRock iShares Equity Appreciation V.I. Fund, of BlackRock Variable Series Funds, Inc. (the “Fund”), as of December 31, 2017, the related statement of operations for the year then ended, the statements of changes in net assets for each of the two years in the period then ended, the financial highlights for each of the periods presented, and the related notes. In our opinion, the financial statements and financial highlights present fairly, in all material respects, the financial position of the Fund as of December 31, 2017, and the results of its operations for the year then ended, the changes in its net assets for each of the two years in the period then ended, and the financial highlights for each of the periods presented, in conformity with accounting principles generally accepted in the United States of America.
Emphasis of Matter
As discussed in Note 1 to the financial statements, on November 15, 2017, the Board of Directors approved a proposal to close the Fund to new investors and thereafter liquidate the Fund on or about March 29, 2018.
Basis for Opinion
These financial statements and financial highlights are the responsibility of the Fund’s management. Our responsibility is to express an opinion on the Fund’s financial statements and financial highlights based on our audits. We are a public accounting firm registered with the Public Company Accounting Oversight Board (United States) (PCAOB) and are required to be independent with respect to the Fund in accordance with the U.S. federal securities laws and the applicable rules and regulations of the Securities and Exchange Commission and the PCAOB.
We conducted our audits in accordance with the standards of the PCAOB. Those standards require that we plan and perform the audit to obtain reasonable assurance about whether the financial statements and financial highlights are free of material misstatement, whether due to error or fraud. The Fund is not required to have, nor were we engaged to perform, an audit of its internal control over financial reporting. As part of our audits we are required to obtain an understanding of internal control over financial reporting but not for the purpose of expressing an opinion on the effectiveness of the Fund’s internal control over financial reporting. Accordingly, we express no such opinion.
Our audits included performing procedures to assess the risks of material misstatement of the financial statements and financial highlights, whether due to error or fraud, and performing procedures that respond to those risks. Such procedures included examining, on a test basis, evidence regarding the amounts and disclosures in the financial statements and financial highlights. Our audits also included evaluating the accounting principles used and significant estimates made by management, as well as evaluating the overall presentation of the financial statements and financial highlights. Our procedures included confirmation of securities owned as of December 31, 2017, by correspondence with the custodian and brokers; when replies were not received from brokers, we performed other auditing procedures. We believe that our audits provide a reasonable basis for our opinion.
Deloitte & Touche LLP
Boston, Massachusetts
February 19, 2018
We have served as the auditor of one or more BlackRock investment companies since 1992.
| | | | |
| REPORTOF INDEPENDENT REGISTERED PUBLIC ACCOUNTING FIRM | | | 17 | |
DECEMBER 31, 2017
| | |
ANNUAL REPORT | |  |
BlackRock Variable Series Funds, Inc.
| Ø | | BlackRock Large Cap Focus Growth V.I. Fund |
|
| Not FDIC Insured • May Lose Value • No Bank Guarantee |
| | |
| Fund Summary as of December 31, 2017 | | BlackRock Large Cap Focus Growth V.I. Fund |
Investment Objective
BlackRock Large Cap Focus Growth V.I. Fund’s (the “Fund”) investment objective is to seek long-term capital growth.
On March 27, 2017, the Fund’s Board approved a proposal to change the name of BlackRock Large Cap Growth V.I. Fund to BlackRock Large Cap Focus Growth V.I. Fund. The Board also approved certain changes to the Fund’s investment strategies. These changes were effective on June 12, 2017.
Portfolio Management Commentary
How did the Fund perform?
For the 12-month period ended December 31, 2017, the Fund underperformed its benchmark, the Russell 1000® Growth Index.
What factors influenced performance?
In sector terms, industrials and financials detracted from relative performance during the annual period. Weakness among professional services and electrical equipment holdings, coupled with an underweight to aerospace & defense, hindered returns in industrials. Within financials, banks were the main drag. Conversely, information technology (IT) was the prime contributor to performance due to strength among internet software & services and semiconductor holdings. Stock selection and an underweight to the consumer staples sector also proved advantageous.
On a stock-specific basis, Equifax Inc. and First Republic Bank were top detractors. Equifax shares declined after the company disclosed that data (social security numbers and birthdays) of 145 million Americans had been stolen by criminals due to failure by Equifax to properly maintain its software. In the investment adviser’s view, it is likely that the long-term ongoing impact of this breach on the majority of Equifax’s B2B businesses will be minimal; however, it is unclear what the more near-term costs will be (e.g. litigation and remediation). First Republic Bank had a strong 2017 third quarter, but the stock underperformed as cost growth was higher than expectations due to investments the company is making in its franchise (better technology), and net interest income margin was modestly lower than expected. Concerns that President Trump’s tax policy on the deductibility of mortgage interest would dampen demand for loans also weighed on sentiment. None of these factors alter the investment adviser’s long-term expectations that First Republic Bank will continue to take share in the high net worth retail banking segment with its unique model and very low market share.
Positions in Domino’s Pizza Inc. and Boston Scientific Corp. also weighed on returns, as did an underweight to Boeing Co.
The top individual contributors in the reporting period were IT holdings Tencent Holdings Ltd. and Activision Blizzard Inc. Tencent outperformed after several quarters of accelerating revenue growth. The company exceeded expectations in almost every segment (payments, mobile games, advertising and cloud). The investment adviser maintains a material overweight in the shares. Activision shares gained, most notably during the first half of the year, following strong earnings performance and increased investor confidence in video game secular growth.
Additional contributions came from positions in Lam Research Corp. and Centene Corp., as well as an underweight to Celgene Corp.
Describe recent portfolio activity.
During the 12-month period, the Fund’s exposure to the IT sector substantially increased, particularly within internet software & services, software and IT services. Exposure to financials increased as well, notably banks and diversified financial services. The largest reduction was in the health care sector, where biotechnology and health care providers & services exposure declined. The weighting in consumer staples also decreased, largely with respect to tobacco and food & staples retailing.
Describe portfolio positioning at period end.
Relative to the Russell 1000® Growth Index, the Fund ended the period with its largest sector overweight in financials, followed by consumer discretionary and IT. The most notable underweights were in industrials and consumer staples.
The views expressed reflect the opinions of BlackRock as of the date of this report and are subject to change based on changes in market, economic or other conditions. These views are not intended to be a forecast of future events and are no guarantee of future results.
| | |
| 2 | | 2017 BLACKROCK ANNUAL REPORTTO SHAREHOLDERS |
| | |
| Fund Summary as of December 31, 2017 (continued) | | BlackRock Large Cap Focus Growth V.I. Fund |
TOTAL RETURN BASED ON A $10,000 INVESTMENT
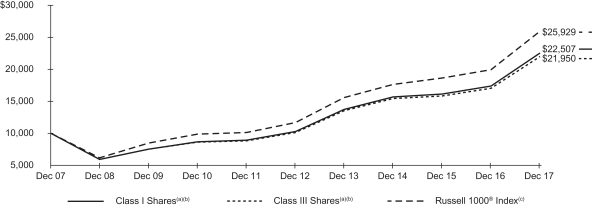
| (a) | Assuming transaction costs, if any, and other operating expenses, including investment advisory fees. Does not include insurance related fees and expenses. |
| (b) | Under normal circumstances, the Fund seeks to invest at least 80% of its net assets, plus the amount of any borrowings for investment purposes, in large cap equity securities and derivatives that have similar economic characteristics to such securities. The Fund’s total returns prior to June 12, 2017 are the returns of the Fund when it followed different investment strategies under the name BlackRock Large Cap Growth V.I. Fund. |
| (c) | An unmanaged index that measures the performance of the large cap growth segment of the U.S. equity universe and consists of those Russell 1000® securities with higher price-to-book ratios and higher forecasted growth values. |
Performance Summary for the Period Ended December 31, 2017
| | | | | | | | | | | | | | | | | | | | |
| | | 6-Month | | | | | | Average Annual Total Returns | |
| | | Total Returns (b) | | | | | | 1 Year (b) | | | 5 Years (b) | | | 10 Years (b) | |
Class I(a) | | | 12.97 | % | | | | | | | 29.56 | % | | | 17.03 | % | | | 8.45 | % |
Class III(a) | | | 12.86 | | | | | | | | 29.23 | | | | 16.75 | | | | 8.18 | |
Russell 1000® Growth Index | | | 14.23 | | | | | | | | 30.21 | | | | 17.33 | | | | 10.00 | |
| | (a) | Average annual and cumulative total returns are based on changes in net asset value for the periods shown, and assume reinvestment of all distributions at net asset value on the ex-dividend date. Insurance-related fees and expenses are not reflected in these returns. The Fund’s total returns prior to June 12, 2017 are the returns of the Fund when it followed different investment strategies under the name BlackRock Large Cap Growth V.I. Fund. | |
| | (b) | For the portion of the period, the Fund’s investment adviser waived a portion of its fee. Without such waiver, the Fund’s performance would have been lower. | |
Past performance is not indicative of future results. Performance results do not reflect the deduction of taxes that a shareholder would pay on Fund distributions or the redemption of Fund shares.
Performance results may include adjustments made for financial reporting purposes in accordance with U.S. generally accepted accounting principles.
Expense Example
| | | | | | | | | | | | | | | | | | | | | | | | | | | | | | | | |
| | | Actual | | | | | | Hypothetical (a) | | | | |
| | | Beginning
Account Value
(07/01/17) | | | Ending
Account Value
(12/31/17) | | | Expenses
Paid During
the Period (b) | | | | | | Beginning
Account Value
(07/01/17) | | | Ending
Account Value
(12/31/17) | | | Expenses
Paid During
the Period (b) | | | Annualized
Expense
Ratio | |
Class I | | $ | 1,000.00 | | | $ | 1,129.70 | | | $ | 4.99 | | | | | | | $ | 1,000.00 | | | $ | 1,020.52 | | | $ | 4.74 | | | | 0.93 | % |
Class III | | | 1,000.00 | | | | 1,128.60 | | | | 6.38 | | | | | | | | 1,000.00 | | | | 1,019.21 | | | | 6.06 | | | | 1.19 | |
| | (a) | Hypothetical 5% annual return before expenses is calculated by prorating the number of days in the most recent fiscal half year divided by 365. | |
| | (b) | For each class of the Fund, expenses are equal to the annualized expense ratio for the class, multiplied by the average account value over the period, multiplied by 184/365 (to reflect the one-half year period shown). | |
See “Disclosure of Expenses” on the following page for further information on how expenses were calculated.
| | |
| Fund Summary as of December 31, 2017 (continued) | | BlackRock Large Cap Focus Growth V.I. Fund |
Portfolio Information as of December 31, 2017
SECTOR ALLOCATION
| | | | |
| Sector | | Percent of
Net Assets | |
Information Technology | | | 40 | % |
Consumer Discretionary | | | 22 | |
Health Care | | | 13 | |
Financials | | | 7 | |
Industrials | | | 7 | |
Consumer Staples | | | 4 | |
Materials | | | 3 | |
Energy | | | 2 | |
Real Estate | | | 1 | |
Short-Term Securities | | | 2 | |
Liabilities in Excess of Other Assets | | | (1 | ) |
For Fund compliance purposes, the Fund’s sector classifications refer to one or more of the sector sub-classifications used by one or more widely recognized market indexes or ratings group indexes, and/or as defined by the investment adviser. These definitions may not apply for purposes of this report, which may combine sector sub classifications for reporting ease.
Disclosure of Expenses
Shareholders of the Fund may incur the following charges: (a) transactional expenses, such as sales charges; and (b) operating expenses, including investment advisory fees, service and distribution fees, including 12b-1 fees, acquired fund fees and expenses, and other fund expenses. The expense example on the previous page (which is based on a hypothetical investment of $1,000 invested on July 1, 2017 and held through December 31, 2017) is intended to assist shareholders both in calculating expenses based on an investment in the Fund and in comparing these expenses with similar costs of investing in other mutual funds.
The expense example provides information about actual account values and actual expenses. In order to estimate the expenses a shareholder paid during the period covered by this report, shareholders can divide their account value by $1,000 and then multiply the result by the number corresponding to their share class under the heading entitled “Expenses Paid During the Period.”
The expense example also provides information about hypothetical account values and hypothetical expenses based on the Fund’s actual expense ratio and an assumed rate of return of 5% per year before expenses. In order to assist shareholders in comparing the ongoing expenses of investing in the Fund and other funds, compare the 5% hypothetical example with the 5% hypothetical examples that appear in shareholder reports of other funds.
The expenses shown in the expense example are intended to highlight shareholders’ ongoing costs only and do not reflect any transactional expenses, such as sales charges, if any. Therefore, the hypothetical example is useful in comparing ongoing expenses only, and will not help shareholders determine the relative total expenses of owning different funds. If these transactional expenses were included, shareholder expenses would have been higher.
| | |
| 4 | | 2017 BLACKROCK ANNUAL REPORTTO SHAREHOLDERS |
Derivative Financial Instruments
The Fund may invest in various derivative financial instruments. These instruments are used to obtain exposure to a security, commodity, index, market and/or other assets without owning or taking physical custody of securities, commodities and/or other referenced assets or to manage market, equity, credit, interest rate, foreign currency exchange rate, commodity and/or other risks. Derivative financial instruments may give rise to a form of economic leverage and involve risks, including the imperfect correlation between the value of a derivative financial instrument and the underlying asset, possible default of the counterparty to the transaction or illiquidity of the instrument. The Fund’s successful use of a derivative financial instrument depends on the investment adviser’s ability to predict pertinent market movements accurately, which cannot be assured. The use of these instruments may result in losses greater than if they had not been used, may limit the amount of appreciation the Fund can realize on an investment and/or may result in lower distributions paid to shareholders. The Fund’s investments in these instruments, if any, are discussed in detail in the Notes to Financial Statements.
| | | | |
| DERIVATIVE FINANCIAL INSTRUMENTS | | | 5 | |
| | |
Schedule of Investments December 31, 2017 | | BlackRock Large Cap Focus Growth V.I. Fund (Percentages shown are based on Net Assets) |
| | | | | | | | |
| Security | | Shares | | | Value | |
Common Stocks — 99.8% | |
|
| Airlines — 1.1% | |
Southwest Airlines Co. | | | 25,561 | | | $ | 1,672,968 | |
| | | | | | | | |
| Banks — 5.4% | |
Bank of America Corp. | | | 104,027 | | | | 3,070,877 | |
First Republic Bank | | | 24,773 | | | | 2,146,333 | |
US Bancorp | | | 22,888 | | | | 1,226,339 | |
Wells Fargo & Co. | | | 31,617 | | | | 1,918,203 | |
| | | | | | | | |
| | | | | | | 8,361,752 | |
| Beverages — 4.3% | |
Constellation Brands, Inc., Class A | | | 19,744 | | | | 4,512,886 | |
Dr Pepper Snapple Group, Inc. | | | 21,851 | | | | 2,120,858 | |
| | | | | | | | |
| | | | | | | 6,633,744 | |
| Biotechnology — 3.1%(a) | |
Alexion Pharmaceuticals, Inc. | | | 22,990 | | | | 2,749,374 | |
Vertex Pharmaceuticals, Inc. | | | 14,082 | | | | 2,110,329 | |
| | | | | | | | |
| | | | | | | 4,859,703 | |
| Chemicals — 1.4% | |
DowDuPont, Inc. | | | 30,714 | | | | 2,187,451 | |
| | | | | | | | |
| Construction Materials — 1.9% | |
Vulcan Materials Co. | | | 23,387 | | | | 3,002,189 | |
| | | | | | | | |
| Diversified Financial Services — 2.0% | |
Berkshire Hathaway, Inc., Class B(a) | | | 15,956 | | | | 3,162,798 | |
| | | | | | | | |
| Energy Equipment & Services — 2.1% | |
Halliburton Co. | | | 66,514 | | | | 3,250,539 | |
| | | | | | | | |
| Equity Real Estate Investment Trusts (REITs) — 0.8% | |
Equinix, Inc. | | | 2,750 | | | | 1,246,355 | |
| | | | | | | | |
| Health Care Equipment & Supplies — 1.4% | |
Boston Scientific Corp.(a) | | | 90,513 | | | | 2,243,817 | |
| | | | | | | | |
| Health Care Providers & Services — 5.3% | |
Centene Corp.(a) | | | 6,825 | | | | 688,506 | |
UnitedHealth Group, Inc. | | | 34,079 | | | | 7,513,056 | |
| | | | | | | | |
| | | | | | | 8,201,562 | |
| Hotels, Restaurants & Leisure — 1.8% | |
Domino’s Pizza, Inc. | | | 14,443 | | | | 2,729,149 | |
| | | | | | | | |
| Industrial Conglomerates — 1.3% | |
Honeywell International, Inc. | | | 13,078 | | | | 2,005,642 | |
| | | | | | | | |
| Internet & Direct Marketing Retail — 13.7%(a) | |
Amazon.com, Inc. | | | 10,642 | | | | 12,445,500 | |
Netflix, Inc. | | | 20,084 | | | | 3,855,325 | |
Priceline Group, Inc. (The) | | | 2,841 | | | | 4,936,919 | |
| | | | | | | | |
| | | | | | | 21,237,744 | |
| Internet Software & Services — 13.8% | |
Alibaba Group Holding Ltd., ADR(a)(b) | | | 6,663 | | | | 1,148,901 | |
Alphabet, Inc., Class A(a) | | | 5,367 | | | | 5,653,598 | |
Alphabet, Inc., Class C(a) | | | 2,078 | | | | 2,174,419 | |
Facebook, Inc., Class A(a) | | | 31,746 | | | | 5,601,899 | |
MercadoLibre, Inc.(b) | | | 3,774 | | | | 1,187,527 | |
Tencent Holdings Ltd. | | | 109,046 | | | | 5,643,998 | |
| | | | | | | | |
| | | | | | | 21,410,342 | |
| IT Services — 6.7% | |
PayPal Holdings, Inc.(a) | | | 35,469 | | | | 2,611,228 | |
Visa, Inc., Class A | | | 67,957 | | | | 7,748,457 | |
| | | | | | | | |
| | | | | | | 10,359,685 | |
| Life Sciences Tools & Services — 1.3% | |
Illumina, Inc.(a) | | | 9,393 | | | | 2,052,277 | |
| | | | | | | | |
| | | | | | | | |
| Security | | Shares | | | Value | |
| Machinery — 1.0% | |
Caterpillar, Inc. | | | 10,006 | | | $ | 1,576,746 | |
| | | | | | | | |
| Media — 1.4% | |
Comcast Corp., Class A | | | 53,480 | | | | 2,141,874 | |
| | | | | | | | |
| Pharmaceuticals — 1.3% | |
Zoetis, Inc. | | | 28,528 | | | | 2,055,157 | |
| | | | | | | | |
| Professional Services — 1.7% | |
Equifax, Inc. | | | 22,404 | | | | 2,641,880 | |
| | | | | | | | |
| Road & Rail — 2.1% | |
Union Pacific Corp. | | | 24,254 | | | | 3,252,461 | |
| | | | | | | | |
| Semiconductors & Semiconductor Equipment — 5.2% | |
ASML Holding NV, NYRS(b) | | | 12,399 | | | | 2,155,194 | |
Broadcom Ltd. | | | 6,039 | | | | 1,551,419 | |
NVIDIA Corp.(b) | | | 13,885 | | | | 2,686,748 | |
Teradyne, Inc. | | | 38,064 | | | | 1,593,740 | |
| | | | | | | | |
| | | | | | | 7,987,101 | |
| Software — 12.4% | |
Activision Blizzard, Inc. | | | 22,640 | | | | 1,433,565 | |
Adobe Systems, Inc.(a) | | | 17,040 | | | | 2,986,090 | |
Autodesk, Inc.(a) | | | 28,445 | | | | 2,981,889 | |
Electronic Arts, Inc.(a) | | | 17,987 | | | | 1,889,714 | |
Microsoft Corp. | | | 115,904 | | | | 9,914,428 | |
| | | | | | | | |
| | | | | | | 19,205,686 | |
| Specialty Retail — 4.9% | |
Home Depot, Inc. (The) | | | 20,058 | | | | 3,801,593 | |
Ulta Beauty, Inc.(a) | | | 17,296 | | | | 3,868,423 | |
| | | | | | | | |
| | | | | | | 7,670,016 | |
| Technology Hardware, Storage & Peripherals — 2.4% | |
Apple, Inc. | | | 21,726 | | | | 3,676,691 | |
| | | | | | | | |
Total Common Stocks — 99.8%
(Cost: $120,545,766) | | | | 154,825,329 | |
| | | | | | | | |
Total Long-Term Investments — 99.8%
(Cost: $120,545,766) | | | | 154,825,329 | |
| | | | | | | | |
|
Short-Term Securities — 1.5%(c)(e) | |
BlackRock Liquidity Funds, T-Fund, Institutional Class,
1.17% | | | 82,464 | | | | 82,464 | |
SL Liquidity Series, LLC, Money Market Series,
1.48%(d) | | | 2,198,635 | | | | 2,198,415 | |
| | | | | | | | |
Total Short-Term Securities — 1.5%
(Cost: $2,280,879) | | | | 2,280,879 | |
| | | | | | | | |
| |
Total Investments — 101.3%
(Cost: $122,826,645) | | | | 157,106,208 | |
Liabilities in Excess of Other Assets — (1.3)% | | | | (1,978,331 | ) |
| | | | | | | | |
Net Assets — 100.0% | | | $ | 155,127,877 | |
| | | | | | | | |
| (a) | Non-income producing security. |
| (b) | Security, or a portion of the security, is on loan. |
| (c) | Annualized 7-day yield as of period end. |
| (d) | Security was purchased with the cash collateral from loaned securities. |
| | |
| 6 | | 2017 BLACKROCK ANNUAL REPORTTO SHAREHOLDERS |
| | |
Schedule of Investments (continued) December 31, 2017 | | BlackRock Large Cap Focus Growth V.I. Fund |
| (e) | During the year ended December 31, 2017, investments in issuers considered to be affiliates of the Fund for the purposes of Section 2(a)(3) of the Investment Company Act of 1940, as amended, were as follows: |
| | | | | | | | | | | | | | | | | | | | | | | | | | | | |
| Affiliate | | Shares
Held at
12/31/16 | | | Net
Activity | | | Shares
Held at
12/31/17 | | | Value at
12/31/17 | | | Income | | | Net
Realized
Gain (Loss) (a) | | | Change in
Unrealized
Appreciation
(Depreciation) | |
BlackRock Liquidity Funds, T-Fund, Institutional Class | | | 4,472,371 | | | | (4,389,907 | ) | | | 82,464 | | | $ | 82,464 | | | $ | 19,776 | | | $ | 9 | | | $ | — | |
SL Liquidity Series, LLC, Money Market Series | | | 1,044,082 | | | | 1,154,553 | | | | 2,198,635 | | | | 2,198,415 | | | | 32,745 | (b) | | | (1,070 | ) | | | 16 | |
| | | | | | | | | | | | | | | | | | | | | | | | | | | | |
| | | | | | | | | | | | | | $ | 2,280,879 | | | $ | 52,521 | | | $ | (1,061 | ) | | $ | 16 | |
| | | | | | | | | | | | | | | | | | | | | | | | | | | | |
| | (a) | Includes net capital gain distributions, if applicable. | |
| | (b) | Represents securities lending income earned from the reinvestment of cash collateral from loaned securities, net of fees and collateral investment expenses, and other payments to and from borrowers of securities. | |
For Fund compliance purposes, the Fund’s industry classifications refer to one or more of the industry sub-classifications used by one or more widely recognized market indexes or ratings group indexes, and/or as defined by the investment adviser. These definitions may not apply for purposes of this report, which may combine such industry sub-classifications for reporting ease.
Portfolio Abbreviations
ADR — American Depositary Receipts
NYRS — New York Registered Shares
REIT — Real Estate Investment Trust
Derivative Financial Instruments Categorized by Risk Exposure
For the year ended December 31, 2017, the effect of derivative financial instruments in the Statement of Operations was as follows:
| | | | | | | | | | | | | | | | | | | | | | | | | | | | |
| | | Commodity
Contracts | | | Credit
Contracts | | | Equity
Contracts | | | Foreign
Currency
Exchange
Contracts | | | Interest
Rate
Contracts | | | Other
Contracts | | | Total | |
Net Realized Gain from: | | | | | | | | | | | | | | | | | | | | | | | | | | | | |
Futures contracts | | $ | — | | | $ | — | | | $ | 117,316 | | | $ | — | | | $ | — | | | $ | — | | | $ | 117,316 | |
| | | | | | | | | | | | | | | | | | | | | | | | | | | | |
Total | | $ | — | | | $ | — | | | $ | 117,316 | | | $ | — | | | $ | — | | | $ | — | | | $ | 117,316 | |
| | | | | | | | | | | | | | | | | | | | | | | | | | | | |
Net Change in Unrealized Appreciation (Depreciation) on: | | | | | | | | | | | | | | | | | | | | | |
Future Contracts | | $ | — | | | $ | — | | | $ | 19,346 | | | $ | — | | | $ | — | | | $ | — | | | $ | 19,346 | |
| | | | | | | | | | | | | | | | | | | | | | | | | | | | |
| | $ | — | | | $ | — | | | $ | 19,346 | | | $ | — | | | $ | — | | | $ | — | | | $ | 19,346 | |
| | | | | | | | | | | | | | | | | | | | | | | | | | | | |
Average Quarterly Balances of Outstanding Derivative Financial Instruments
| | | | |
Futures contracts: | | | | |
Average notional value of contracts — long | | $ | 530,820 | |
For more information about the Fund’s investment risks regarding derivative financial instruments, refer to the Notes to Financial Statements.
Fair Value Hierarchy as of Period End
Various inputs are used in determining the fair value of investments. For information about the Fund’s policy regarding valuation of investments, refer to the Notes to Financial Statements.
The following table summarizes the Fund’s investments categorized in the disclosure hierarchy:
| | | | | | | | | | | | | | | | |
| | | Level 1 | | | Level 2 | | | Level 3 | | | Total | |
Assets: | | | | | | | | | | | | | | | | |
Investments: | | | | | | | | | | | | | | | | |
Long-Term Investments: | | | | | | | | | | | | | | | | |
Common Stocks: | | | | | | | | | | | | | | | | |
Airlines | | $ | 1,672,968 | | | $ | — | | | $ | — | | | $ | 1,672,968 | |
Banks | | | 8,361,752 | | | | — | | | | — | | | | 8,361,752 | |
Beverages | | | 6,633,744 | | | | — | | | | — | | | | 6,633,744 | |
Biotechnology | | | 4,859,703 | | | | — | | | | — | | | | 4,859,703 | |
Chemicals | | | 2,187,451 | | | | — | | | | — | | | | 2,187,451 | |
Construction Materials | | | 3,002,189 | | | | — | | | | — | | | | 3,002,189 | |
Diversified Financial Services | | | 3,162,798 | | | | — | | | | — | | | | 3,162,798 | |
Energy Equipment & Services | | | 3,250,539 | | | | — | | | | — | | | | 3,250,539 | |
Equity Real Estate Investment Trusts (REITs) | | | 1,246,355 | | | | — | | | | — | | | | 1,246,355 | |
| | | | |
| SCHEDULE OF INVESTMENTS | | | 7 | |
| | |
Schedule of Investments (continued) December 31, 2017 | | BlackRock Large Cap Focus Growth V.I. Fund |
| | | | | | | | | | | | | | | | |
| | | Level 1 | | | Level 2 | | | Level 3 | | | Total | |
Health Care Equipment & Supplies | | $ | 2,243,817 | | | $ | — | | | $ | — | | | $ | 2,243,817 | |
Health Care Providers & Services | | | 8,201,562 | | | | — | | | | — | | | | 8,201,562 | |
Hotels, Restaurants & Leisure | | | 2,729,149 | | | | — | | | | — | | | | 2,729,149 | |
Industrial Conglomerates | | | 2,005,642 | | | | — | | | | — | | | | 2,005,642 | |
Internet & Direct Marketing Retail | | | 21,237,744 | | | | — | | | | — | | | | 21,237,744 | |
Internet Software & Services | | | 15,766,344 | | | | 5,643,998 | | | | — | | | | 21,410,342 | |
IT Services | | | 10,359,685 | | | | — | | | | — | | | | 10,359,685 | |
Life Sciences Tools & Services | | | 2,052,277 | | | | — | | | | — | | | | 2,052,277 | |
Machinery | | | 1,576,746 | | | | — | | | | — | | | | 1,576,746 | |
Media | | | 2,141,874 | | | | — | | | | — | | | | 2,141,874 | |
Pharmaceuticals | | | 2,055,157 | | | | — | | | | — | | | | 2,055,157 | |
Professional Services | | | 2,641,880 | | | | — | | | | — | | | | 2,641,880 | |
Road & Rail | | | 3,252,461 | | | | — | | | | — | | | | 3,252,461 | |
Semiconductors & Semiconductor Equipment | | | 7,987,101 | | | | — | | | | — | | | | 7,987,101 | |
Software | | | 19,205,686 | | | | — | | | | — | | | | 19,205,686 | |
Specialty Retail | | | 7,670,016 | | | | — | | | | — | | | | 7,670,016 | |
Technology Hardware, Storage & Peripherals | | | 3,676,691 | | | | — | | | | — | | | | 3,676,691 | |
Short-Term Securities | | | 82,464 | | | | — | | | | — | | | | 82,464 | |
| | | | | | | | | | | | | | | | |
Subtotal | | $ | 149,263,795 | | | $ | 5,643,998 | | | $ | — | | | $ | 154,907,793 | |
| | | | | | | | | | | | | | | | |
Investments valued at NAV(a) | | | | | | | | | | | | | | $ | 2,198,415 | |
| | | | | | | | | | | | | | | | |
Total Investments | | | | | | | | | | | | | | $ | 157,106,208 | |
| | | | | | | | | | | | | | | | |
| | (a) | As of December 31, 2017, certain investments of the Fund were fair valued using NAV per share as no quoted market value is available and therefore have been excluded from the fair value hierarchy. | |
During the year ended December 31, 2017, there were no transfers between levels.
See notes to financial statements.
| | |
| 8 | | 2017 BLACKROCK ANNUAL REPORTTO SHAREHOLDERS |
Statement of Assets and Liabilities
December 31, 2017
| | | | |
| | | BlackRock
Large Cap
Focus Growth
V.I. Fund | |
|
ASSETS | |
Investments at value — unaffiliated (including securities loaned at value of $2,152,824) (cost — $120,545,766) | | $ | 154,825,329 | |
Investments at value — affiliated (cost — $2,280,879) | | | 2,280,879 | |
Foreign currency at value (cost — $344) | | | 350 | |
Receivables: | | | | |
Securities lending income — affiliated | | | 475 | |
Capital shares sold | | | 435,546 | |
Dividends — affiliated | | | 970 | |
Dividends — unaffiliated | | | 25,903 | |
Prepaid expenses | | | 732 | |
| | | | |
Total assets | | | 157,570,184 | |
| | | | |
|
LIABILITIES | |
Bank overdraft | | | 1,383 | |
Cash collateral on securities loaned at value | | | 2,197,034 | |
Payables: | | | | |
Capital shares redeemed | | | 3,815 | |
Custodian fees | | | 23,279 | |
Investment advisory fees | | | 85,068 | |
Officer’s and Directors’ fees | | | 4,144 | |
Other accrued expenses | | | 69,072 | |
Other affiliates | | | 602 | |
Professional fees | | | 13,683 | |
Distribution fees | | | 11,268 | |
Transfer agent fees | | | 32,959 | |
| | | | |
Total liabilities | | | 2,442,307 | |
| | | | |
| |
NET ASSETS | | $ | 155,127,877 | |
| | | | |
|
NET ASSETS CONSIST OF | |
Paid-in capital | | $ | 117,437,051 | |
Undistributed net investment income | | | 17,082 | |
Accumulated net realized gain | | | 3,394,175 | |
Net unrealized appreciation (depreciation) | | | 34,279,569 | |
| | | | |
NET ASSETS | | $ | 155,127,877 | |
| | | | |
|
NET ASSET VALUE | |
Class I — Based on net assets of $100,307,973 and 6,912,462 shares outstanding, 100 million shares authorized, $0.10 par value | | $ | 14.51 | |
| | | | |
Class III — Based on net assets of $54,819,904 and 3,816,732 shares outstanding, 100 million shares authorized, $0.10 par value | | $ | 14.36 | |
| | | | |
See notes to financial statements.
Statement of Operations
Year Ended December 31, 2017
| | | | |
| | | BlackRock
Large Cap
Focus Growth
V.I. Fund | |
| |
INVESTMENT INCOME | | | | |
Dividends — affiliated | | $ | 19,776 | |
Dividends — unaffiliated | | | 1,365,676 | |
Securities lending income — affiliated — net | | | 32,745 | |
Foreign taxes withheld | | | (3,105 | ) |
| | | | |
Total investment income | | | 1,415,092 | |
| | | | |
| | | | |
| |
EXPENSES | | | | |
Investment advisory | | | 929,466 | |
Transfer agent — class specific | | | 283,717 | |
Distribution — class specific | | | 118,762 | |
Professional | | | 57,191 | |
Printing | | | 43,203 | |
Accounting services | | | 40,675 | |
Custodian | | | 30,252 | |
Directors and Officer | | | 22,336 | |
Transfer agent | | | 5,000 | |
Miscellaneous | | | 44,929 | |
| | | | |
Total expenses | | | 1,575,531 | |
Less: | | | | |
Transfer agent fees reimbursed — class specific | | | (182,871 | ) |
Fees waived and/or reimbursed by the Manager | | | (1,935 | ) |
| | | | |
Total expenses after fees waived and/or reimbursed | | | 1,390,725 | |
| | | | |
Net investment income | | | 24,367 | |
| | | | |
| |
REALIZED AND UNREALIZED GAIN (LOSS) | | | | |
Net realized gain (loss) from: | | | | |
Investments — affiliated | | | (1,070 | ) |
Investments — unaffiliated | | | 27,091,042 | |
Capital gain distributions from investment companies — affiliated | | | 9 | |
Foreign currency transactions | | | 1,255 | |
Futures contracts | | | 117,316 | |
| | | | |
| | | 27,208,552 | |
| | | | |
Net change in unrealized appreciation (depreciation) on: | | | | |
Investments — affiliated | | | 16 | |
Investments — unaffiliated | | | 9,213,751 | |
Foreign currency translations | | | 6 | |
Futures contracts | | | 19,346 | |
| | | | |
| | | 9,233,119 | |
| | | | |
Net realized and unrealized gain | | | 36,441,671 | |
| | | | |
NET INCREASE IN NET ASSETS RESULTING FROM OPERATIONS | | $ | 36,466,038 | |
| | | | |
See notes to financial statements.
| | |
| 10 | | 2017 BLACKROCK ANNUAL REPORTTO SHAREHOLDERS |
Statements of Changes in Net Assets
| | | | | | | | |
| | | BlackRock Large Cap Focus
Growth V.I. Fund | |
| | | Year Ended December 31, | |
| | | 2017 | | | 2016 | |
| | |
INCREASE (DECREASE) IN NET ASSETS | | | | | | | | |
| | |
OPERATIONS | | | | | | | | |
Net investment income | | $ | 24,367 | | | $ | 764,185 | |
Net realized gain | | | 27,208,552 | | | | 12,038,187 | |
Net change in unrealized appreciation (depreciation) | | | 9,233,119 | | | | (3,672,031 | ) |
| | | | | | | | |
Net increase in net assets resulting from operations | | | 36,466,038 | | | | 9,130,341 | |
| | | | | | | | |
| | |
DISTRIBUTIONS TO SHAREHOLDERS(a) | | | | | | | | |
From net investment income: | | | | | | | | |
Class I | | | (39,574 | ) | | | (578,884 | ) |
Class III | | | (2,263 | ) | | | (173,673 | ) |
From net realized gain: | | | | | | | | |
Class I | | | (16,352,959 | ) | | | (7,321,271 | ) |
Class III | | | (8,778,098 | ) | | | (3,320,713 | ) |
| | | | | | | | |
Decrease in net assets resulting from distributions to shareholders | | | (25,172,894 | ) | | | (11,394,541 | ) |
| | | | | | | | |
| | |
CAPITAL SHARE TRANSACTIONS | | | | | | | | |
Net increase (decrease) in net assets derived from capital share transactions | | | 17,142,344 | | | | (7,345,802 | ) |
| | | | | | | | |
| | |
NET ASSETS | | | | | | | | |
Total increase (decrease) in net assets | | | 28,435,488 | | | | (9,610,002 | ) |
Beginning of year | | | 126,692,389 | | | | 136,302,391 | |
| | | | | | | | |
End of year | | $ | 155,127,877 | | | $ | 126,692,389 | |
| | | | | | | | |
Undistributed net investment income, end of year | | $ | 17,082 | | | $ | 16,427 | |
| | | | | | | | |
| (a) | Distributions for annual periods determined in accordance with U.S. federal income tax regulations. |
See notes to financial statements.
Financial Highlights
(For a share outstanding throughout each period)
| | | | | | | | | | | | | | | | | | | | |
| | | BlackRock Large Cap Focus Growth V.I. Fund | |
| | | Class I | |
| | | Year Ended December 31, | |
| | | 2017 | | | 2016 | | | 2015 | | | 2014 | | | 2013 | |
Net asset value, beginning of year | | $ | 13.35 | | | $ | 13.59 | | | $ | 14.08 | | | $ | 14.22 | | | $ | 11.54 | |
| | | | | | | | | | | | | | | | | | | | |
Net investment income(a) | | | 0.02 | | | | 0.09 | | | | 0.08 | | | | 0.09 | | | | 0.09 | |
Net realized and unrealized gain | | | 3.92 | | | | 0.99 | | | | 0.31 | | | | 1.92 | | | | 3.82 | |
| | | | | | | | | | | | | | | | | | | | |
Net increase from investment operations | | | 3.94 | | | | 1.08 | | | | 0.39 | | | | 2.01 | | | | 3.91 | |
| | | | | | | | | | | | | | | | | | | | |
| Distributions:(b) | | | | | | | | | | | | | | | |
From net investment income | | | (0.01 | ) | | | (0.10 | ) | | | (0.09 | ) | | | (0.08 | ) | | | (0.10 | ) |
From net realized gain | | | (2.77 | ) | | | (1.22 | ) | | | (0.79 | ) | | | (2.07 | ) | | | (1.13 | ) |
| | | | | | | | | | | | | | | | | | | | |
Total distributions | | | (2.78 | ) | | | (1.32 | ) | | | (0.88 | ) | | | (2.15 | ) | | | (1.23 | ) |
| | | | | | | | | | | | | | | | | | | | |
Net asset value, end of year | | $ | 14.51 | | | $ | 13.35 | | | $ | 13.59 | | | $ | 14.08 | | | $ | 14.22 | |
| | | | | | | | | | | | | | | | | | | | |
| | | | | |
Total Return:(c) | | | | | | | | | | | | | | | | | | | | |
Based on net asset value | | | 29.56 | % | | | 7.89 | % | | | 2.73 | % | | | 14.16 | % | | | 33.92 | % |
| | | | | | | | | | | | | | | | | | | | |
| | | | | |
Ratios to Average Net Assets: | | | | | | | | | | | | | | | | | | | | |
Total expenses | | | 1.01 | %(d) | | | 0.96 | %(d) | | | 0.95 | % | | | 0.96 | % | | | 0.97 | % |
| | | | | | | | | | | | | | | | | | | | |
Total expenses after fees waived and/or reimbursed | | | 0.89 | %(d) | | | 0.84 | %(d) | | | 0.82 | % | | | 0.83 | % | | | 0.84 | % |
| | | | | | | | | | | | | | | | | | | | |
Net investment income | | | 0.10 | %(d) | | | 0.68 | %(d) | | | 0.59 | % | | | 0.57 | % | | | 0.70 | % |
| | | | | | | | | | | | | | | | | | | | |
| | | | | |
Supplemental Data: | | | | | | | | | | | | | | | | | | | | |
Net assets, end of year (000) | | $ | 100,308 | | | $ | 87,346 | | | $ | 98,485 | | | $ | 108,329 | | | $ | 107,378 | |
| | | | | | | | | | | | | | | | | | | | |
Portfolio turnover rate | | | 95 | % | | | 37 | % | | | 35 | % | | | 51 | % | | | 36 | % |
| | | | | | | | | | | | | | | | | | | | |
| (a) | Based on average shares outstanding. |
| (b) | Distributions for annual periods determined in accordance with U.S. federal income tax regulations. |
| (c) | Where applicable, excludes insurance-related fees and expenses and assumes the reinvestment of distributions. |
| (d) | Excludes expenses incurred indirectly as a result of investments in underlying funds of 0.01%. |
See notes to financial statements.
| | |
| 12 | | 2017 BLACKROCK ANNUAL REPORTTO SHAREHOLDERS |
Financial Highlights (continued)
(For a share outstanding throughout each period)
| | | | | | | | | | | | | | | | | | | | |
| | | BlackRock Large Cap Focus Growth V.I. Fund | |
| | | Class III | |
| | | Year Ended December 31, | |
| | | 2017 | | | 2016 | | | 2015 | | | 2014 | | | 2013 | |
Net asset value, beginning of year | | $ | 13.24 | | | $ | 13.50 | | | $ | 13.99 | | | $ | 14.14 | | | $ | 11.49 | |
| | | | | | | | | | | | | | | | | | | | |
Net investment income (loss)(a) | | | (0.02 | ) | | | 0.06 | | | | 0.05 | | | | 0.05 | | | | 0.06 | |
Net realized and unrealized gain | | | 3.88 | | | | 0.96 | | | | 0.30 | | | | 1.92 | | | | 3.79 | |
| | | | | | | | | | | | | | | | | | | | |
Net increase from investment operations | | | 3.86 | | | | 1.02 | | | | 0.35 | | | | 1.97 | | | | 3.85 | |
| | | | | | | | | | | | | | | | | | | | |
| Distributions:(b) | | | | | | | | | | | | | | | |
From net investment income | | | (0.00 | )(c) | | | (0.06 | ) | | | (0.05 | ) | | | (0.05 | ) | | | (0.07 | ) |
From net realized gain | | | (2.74 | ) | | | (1.22 | ) | | | (0.79 | ) | | | (2.07 | ) | | | (1.13 | ) |
| | | | | | | | | | | | | | | | | | | | |
Total distributions | | | (2.74 | ) | | | (1.28 | ) | | | (0.84 | ) | | | (2.12 | ) | | | (1.20 | ) |
| | | | | | | | | | | | | | | | | | | | |
Net asset value, end of year | | $ | 14.36 | | | $ | 13.24 | | | $ | 13.50 | | | $ | 13.99 | | | $ | 14.14 | |
| | | | | | | | | | | | | | | | | | | | |
| | | | | |
Total Return:(d) | | | | | | | | | | | | | | | | | | | | |
Based on net asset value | | | 29.23 | % | | | 7.54 | % | | | 2.51 | % | | | 13.96 | % | | | 33.58 | % |
| | | | | | | | | | | | | | | | | | | | |
| | | | | |
Ratios to Average Net Assets: | | | | | | | | | | | | | | | | | | | | |
Total expenses | | | 1.28 | %(e) | | | 1.22 | %(e) | | | 1.21 | % | | | 1.22 | % | | | 1.22 | % |
| | | | | | | | | | | | | | | | | | | | |
Total expenses after fees waived and/or reimbursed | | | 1.14 | %(e) | | | 1.09 | %(e) | | | 1.07 | % | | | 1.09 | % | | | 1.09 | % |
| | | | | | | | | | | | | | | | | | | | |
Net investment income (loss) | | | (0.16 | )%(e) | | | 0.42 | %(e) | | | 0.35 | % | | | 0.32 | % | | | 0.45 | % |
| | | | | | | | | | | | | | | | | | | | |
| | | | | |
Supplemental Data: | | | | | | | | | | | | | | | | | | | | |
Net assets, end of year (000) | | $ | 54,820 | | | $ | 39,346 | | | $ | 37,818 | | | $ | 32,090 | | | $ | 20,864 | |
| | | | | | | | | | | | | | | | | | | | |
Portfolio turnover rate | | | 95 | % | | | 37 | % | | | 35 | % | | | 51 | % | | | 36 | % |
| | | | | | | | | | | | | | | | | | | | |
| (a) | Based on average shares outstanding. |
| (b) | Distributions for annual periods determined in accordance with U.S. federal income tax regulations. |
| (c) | Amount is greater than $(0.005) per share. |
| (d) | Where applicable, excludes insurance-related fees and expenses and assumes the reinvestment of distributions. |
| (e) | Excludes expenses incurred indirectly as a result of investments in underlying funds of 0.01%. |
See notes to financial statements.
Notes to Financial Statements
BlackRock Variable Series Funds, Inc. (the “Company”) is registered under the Investment Company Act of 1940, as amended (the “1940 Act”), as an open-end management investment company. The Company is organized as a Maryland corporation that is comprised of 20 separate funds. The funds offer shares to insurance companies for their separate accounts to fund benefits under certain variable annuity and variable life insurance contracts. The financial statements presented are for BlackRock Large Cap Focus Growth V.I. Fund (the “Fund”) (formerly known as BlackRock Large Cap Growth V.I. Fund). The Fund is classified as diversified. Class I and Class III Shares have equal voting, dividend, liquidation and other rights, except that only shares of the respective classes are entitled to vote on matters concerning only that class. In addition, Class III Shares bear certain expenses related to the distribution of such shares.
The Fund, together with certain other registered investment companies advised by BlackRock Advisors, LLC (the “Manager”) or its affiliates, is included in a complex of open-end funds referred to as the Equity-Bond Complex.
| 2. | SIGNIFICANT ACCOUNTING POLICIES |
The financial statements are prepared in conformity with accounting principles generally accepted in the United States of America (“U.S. GAAP”), which may require management to make estimates and assumptions that affect the reported amounts of assets and liabilities in the financial statements, disclosure of contingent assets and liabilities at the date of the financial statements and the reported amounts of increases and decreases in net assets from operations during the reporting period. Actual results could differ from those estimates. The Fund is considered an investment company under U.S. GAAP and follows the accounting and reporting guidance applicable to investment companies. Below is a summary of significant accounting policies:
Foreign Currency: The Fund’s books and records are maintained in U.S. dollars. Purchases and sales of investments are recorded at the rates of exchange prevailing on the respective dates of such transactions. Generally, when the U.S. dollar rises in value against a foreign currency, the investments denominated in that currency will lose value; the opposite effect occurs if the U.S. dollar falls in relative value.
The Fund does not isolate the portion of the results of operations arising as a result of changes in the exchange rates from the changes in the market prices of investments held or sold for financial reporting purposes. Accordingly, the effects of changes in exchange rates on investments are not segregated in the Statements of Operations from the effects of changes in market prices of those investments, but are included as a component of net realized and unrealized gain (loss) from investments. The Fund reports realized currency gains (losses) on foreign currency related transactions as components of net realized gain (loss) for financial reporting purposes, whereas such components are generally treated as ordinary income for U.S. federal income tax purposes.
Segregation and Collateralization: In cases where the Fund enters into certain investments (e.g., futures contracts) that would be treated as “senior securities” for 1940 Act purposes, the Fund may segregate or designate on its books and records cash or liquid assets having a market value at least equal to the amount of the Fund’s future obligations under such investments. Doing so allows the investment to be excluded from treatment as a “senior security.” Furthermore, if required by an exchange or counterparty agreement, the Fund may be required to deliver/deposit cash and/or securities to/with an exchange, or broker-dealer or custodian as collateral for certain investments or obligations.
Investment Transactions and Income Recognition: For financial reporting purposes, investment transactions are recorded on the dates the transactions are entered into (the trade dates). Realized gains and losses on investment transactions are determined on the identified cost basis. Dividend income is recorded on the ex-dividend date. Dividends from foreign securities where the ex-dividend date may have passed are subsequently recorded when the Fund is informed of the ex-dividend date. Under the applicable foreign tax laws, a withholding tax at various rates may be imposed on capital gains, dividends and interest. Income, expenses and realized and unrealized gains and losses are allocated daily to each class based on its relative net assets.
Distributions: Distributions paid by the Fund are recorded on the ex-dividend date. Distributions of capital gains are recorded on the ex-dividend date and made at least annually. The character and timing of distributions are determined in accordance with U.S. federal income tax regulations, which may differ from U.S. GAAP.
Indemnifications: In the normal course of business, the Fund enters into contracts that contain a variety of representations that provide general indemnification. The Fund’s maximum exposure under these arrangements is unknown because it involves future potential claims against the Fund, which cannot be predicted with any certainty.
Other: Expenses directly related to the Fund or its classes are charged to the Fund or the applicable class. Other operating expenses shared by several funds, including other funds managed by the Manager, are prorated among those funds on the basis of relative net assets or other appropriate methods. Expenses directly related to the Fund and other shared expenses prorated to the Fund are allocated daily to each class based on its relative net assets or other appropriate methods.
The Fund has an arrangement with its custodian whereby credits are earned on uninvested cash balances, which could be used to reduce custody fees and/or overdraft charges. The Fund may incur charges on certain uninvested cash balances and overdrafts, subject to certain conditions.
| 3. | INVESTMENT VALUATION AND FAIR VALUE MEASUREMENTS |
Investment Valuation Policies: The Fund’s investments are valued at fair value (also referred to as “market value” within the financial statements) as of the close of trading on the New York Stock Exchange (“NYSE”) (generally 4:00 p.m., Eastern time) (or if the reporting date falls on a day the NYSE is closed, investments are valued at fair value as of the period end). U.S. GAAP defines fair value as the price the Fund would receive to sell an asset or pay to transfer a liability in an orderly transaction between market participants at the measurement date. The Fund determines the fair values of its financial instruments using various independent dealers or pricing services under policies approved by the Board of Directors of the Company (the “Board”). The BlackRock Global Valuation Methodologies Committee (the “Global Valuation Committee”) is the committee formed by management to develop global pricing policies and procedures and to oversee the pricing function for all financial instruments.
| | |
| 14 | | 2017 BLACKROCK ANNUAL REPORTTO SHAREHOLDERS |
Notes to Financial Statements (continued)
Fair Value Inputs and Methodologies: The following methods and inputs are used to establish the fair value of the Fund’s assets and liabilities:
| | • | | Equity investments traded on a recognized securities exchange are valued at the official closing price each day, if available. For equity investments traded on more than one exchange, the official closing price on the exchange where the stock is primarily traded is used. Equity investments traded on a recognized exchange for which there were no sales on that day may be valued at the last available bid (long positions) or ask (short positions) price. |
| | • | | Investments in open-end U.S. mutual funds are valued at NAV each business day. |
| | • | | The Fund values its investment in SL Liquidity Series, LLC, Money Market Series (the “Money Market Series”) at fair value, which is ordinarily based upon its pro rata ownership in the underlying fund’s net assets. The Money Market Series seeks current income consistent with maintaining liquidity and preserving capital. Although the Money Market Series is not registered under the 1940 Act, its investments may follow the parameters of investments by a money market fund that is subject to Rule 2a-7 under the 1940 Act. |
| | • | | Futures contracts traded on exchanges are valued at their last sale price. |
If events (e.g., a company announcement, market volatility or a natural disaster) occur that are expected to materially affect the value of such instruments, or in the event that the application of these methods of valuation results in a price for an investment that is deemed not to be representative of the market value of such investment, or if a price is not available, the investment will be valued by the Global Valuation Committee, or its delegate, in accordance with a policy approved by the Board as reflecting fair value (“Fair Valued Investments”). The fair valuation approaches that may be used by the Global Valuation Committee will include market approach, income approach and the cost approach. Valuation techniques such as discounted cash flow, use of market comparables and matrix pricing are types of valuation approaches and are typically used in determining fair value. When determining the price for Fair Valued Investments, the Global Valuation Committee, or its delegate, seeks to determine the price that the Fund might reasonably expect to receive or pay from the current sale or purchase of that asset or liability in an arm’s-length transaction. Fair value determinations shall be based upon all available factors that the Global Valuation Committee, or its delegate, deems relevant and consistent with the principles of fair value measurement. The pricing of all Fair Valued Investments is subsequently reported to the Board or a committee thereof on a quarterly basis.
Fair Value Hierarchy: Various inputs are used in determining the fair value of investments and derivative financial instruments. These inputs to valuation techniques are categorized into a fair value hierarchy consisting of three broad levels for financial statement purposes as follows:
| | • | | Level 1 — Unadjusted price quotations in active markets/exchanges for identical assets or liabilities that the Fund has the ability to access |
| | • | | Level 2 — Other observable inputs (including, but not limited to, quoted prices for similar assets or liabilities in markets that are active, quoted prices for identical or similar assets or liabilities in markets that are not active, inputs other than quoted prices that are observable for the assets or liabilities (such as interest rates, yield curves, volatilities, prepayment speeds, loss severities, credit risks and default rates) or other market — corroborated inputs) |
| | • | | Level 3 — Unobservable inputs based on the best information available in the circumstances, to the extent observable inputs are not available (including the Fund’s own assumptions used in determining the fair value of investments and derivative financial instruments) |
The hierarchy gives the highest priority to unadjusted quoted prices in active markets for identical assets or liabilities (Level 1 measurements) and the lowest priority to unobservable inputs (Level 3 measurements). Accordingly, the degree of judgment exercised in determining fair value is greatest for instruments categorized in Level 3. The inputs used to measure fair value may fall into different levels of the fair value hierarchy. In such cases, for disclosure purposes, the fair value hierarchy classification is determined based on the lowest level input that is significant to the fair value measurement in its entirety. Investments classified within Level 3 have significant unobservable inputs used by the Global Valuation Committee in determining the price for Fair Valued investments. Level 3 investments include equity or debt issued by privately held companies or funds. There may not be a secondary market, and/or there are a limited number of investors. Level 3 investments may also be adjusted to reflect illiquidity and/or non-transferability, with the amount of such discount estimated by the Global Valuation Committee in the absence of market information.
Changes in valuation techniques may result in transfers into or out of an assigned level within the hierarchy. In accordance with the Fund’s policy, transfers between different levels of the fair value hierarchy are deemed to have occurred as of the beginning of the reporting period. The categorization of a value determined for investments and derivative financial instruments is based on the pricing transparency of the investments and derivative financial instruments and is not necessarily an indication of the risks associated with investing in those securities.
As of December 31, 2017, certain investments of the Fund were valued using NAV as no quoted market value is available and therefore have been excluded from the fair value hierarchy.
| 4. | SECURITIES AND OTHER INVESTMENTS |
Securities Lending: The Fund may lend its securities to approved borrowers, such as brokers, dealers and other financial institutions. The borrower pledges and maintains with the Fund collateral consisting of cash, an irrevocable letter of credit issued by a bank, or securities issued or guaranteed by the U.S. Government. The initial collateral received by the Fund is required to have a value of at least 102% of the current value of the loaned securities for securities traded on U.S. exchanges and a value of at least 105% for all other securities. The collateral is maintained thereafter at a value equal to at least 100% of the current market value of the securities on loan. The market value of the loaned securities is determined at the close of each business day of the Fund and any additional required collateral is delivered to the Fund, or excess collateral returned by the Fund, on the next business day. During the term of the loan, the Fund is entitled to all distributions made on or in respect of the loaned securities but does not receive interest income on securities received as collateral. Loans of securities are terminable at any time and the borrower, after notice, is required to return borrowed securities within the standard time period for settlement of securities transactions.
| | | | |
| NOTESTO FINANCIAL STATEMENTS | | | 15 | |
Notes to Financial Statements (continued)
The market value of any securities on loan, all of which were classified as common stocks in the Fund’s Schedule of Investments, and the value of any related collateral are shown separately in the Statement of Assets and Liabilities as a component of investments at value — unaffiliated, and collateral on securities loaned at value, respectively. As of period end, any securities on loan were collateralized by cash and/or U.S. Government obligations. Cash collateral invested by the securities lending agent, BlackRock Investment Management, LLC (“BIM”), if any, is disclosed in the Schedule of Investments.
Securities lending transactions are entered into by the Fund under Master Securities Lending Agreements (each, an “MSLA”), which provide the right, in the event of default (including bankruptcy or insolvency), for the non-defaulting party to liquidate the collateral and calculate a net exposure to the defaulting party or request additional collateral. In the event that a borrower defaults, the Fund, as lender, would offset the market value of the collateral received against the market value of the securities loaned. When the value of the collateral is greater than that of the market value of the securities loaned, the lender is left with a net amount payable to the defaulting party. However, bankruptcy or insolvency laws of a particular jurisdiction may impose restrictions on or prohibitions against such a right of offset in the event of an MSLA counterparty’s bankruptcy or insolvency. Under the MSLA, absent an event of default, the borrower can resell or re-pledge the loaned securities, and the Fund can reinvest cash collateral received in connection with loaned securities. Upon an event of default, the parties’ obligations to return the securities or collateral to the other party are extinguished, and the parties can resell or re-pledge the loaned securities or the collateral received in connection with the loaned securities in order to satisfy the defaulting party’s net payment obligation for all transactions under the MSLA. The defaulting party remains liable for any deficiency.
As of period end, the following table is a summary of the Fund’s securities lending agreements by counterparty which are subject to offset under an MSLA:
| | | | | | | | | | | | |
| Counterparty | | Securities
Loaned at Value | | | Cash Collateral
Received (a) | | | Net
Amount | |
Deutsche Bank Securities Inc. | | $ | 19,350 | | | $ | (19,350 | ) | | $ | — | |
JP Morgan Securities LLC | | | 943,980 | | | | (943,980 | ) | | | — | |
Merrill Lynch, Pierce, Fenner & Smith | | | 1,137,348 | | | | (1,137,348 | ) | | | — | |
Morgan Stanley | | | 52,146 | | | | (52,146 | ) | | | — | |
| | | | | | | | | | | | |
| | $ | 2,152,824 | | | $ | (2,152,824 | ) | | $ | — | |
| | | | | | | | | | | | |
| | (a) | Collateral with a value of $2,197,034 has been received in connection with securities lending agreements. Collateral received in excess of the value of securities loaned from the individual counterparty is not shown for financial reporting purposes in the table above. | |
The risks of securities lending include the risk that the borrower may not provide additional collateral when required or may not return the securities when due. To mitigate these risks, the Fund benefits from a borrower default indemnity provided by BIM. BIM’s indemnity allows for full replacement of the securities loaned if the collateral received does not cover the value on the securities loaned in the event of borrower default. The Fund could incur a loss if the value of an investment purchased with cash collateral falls below the market value of loaned securities or if the value of an investment purchased with cash collateral falls below the value of the original cash collateral received.
| 5. | DERIVATIVE FINANCIAL INSTRUMENTS |
The Fund engages in various portfolio investment strategies using derivative contracts both to increase the returns of the Fund and/or to manage its exposure to certain risks such as credit risk, equity risk, interest rate risk, foreign currency exchange rate risk, commodity price risk or other risks (e.g., inflation risk). Derivative financial instruments categorized by risk exposure are included in the Schedule of Investments. These contracts may be transacted on an exchange or over-the-counter (“OTC”).
Futures Contracts: Futures contracts are purchased or sold to gain exposure to, or manage exposure to changes in interest rates (interest rate risk), changes in the value of equity securities (equity risk) or foreign currencies (foreign currency exchange rate risk).
Futures contracts are agreements between the Fund and a counterparty to buy or sell a specific quantity of an underlying instrument at a specified price and on a specified date. Depending on the terms of a contract, it is settled either through physical delivery of the underlying instrument on the settlement date or by payment of a cash amount on the settlement date. Upon entering into a futures contract, the Fund is required to deposit initial margin with the broker in the form of cash or securities in an amount that varies depending on a contract’s size and risk profile. The initial margin deposit must then be maintained at an established level over the life of the contract.
Securities deposited as initial margin are designated in the Schedule of Investments and cash deposited, if any, is shown as cash pledged for futures contracts in the Statement of Assets and Liabilities. Pursuant to the contract, the Fund agrees to receive from or pay to the broker an amount of cash equal to the daily fluctuation in market value of the contract (“variation margin”). Variation margin is recorded as unrealized appreciation (depreciation) and, if any, shown as variation margin receivable (or payable) on futures contracts in the Statement of Assets and Liabilities. When the contract is closed, a realized gain or loss is recorded in the Statement of Operations equal to the difference between the value of the contract at the time it was opened and the value at the time it was closed. The use of futures contracts involves the risk of an imperfect correlation in the movements in the price of futures contracts and interest, foreign currency exchange rates or underlying assets.
| 6. | INVESTMENT ADVISORY AGREEMENT AND OTHER TRANSACTIONS WITH AFFILIATES |
The PNC Financial Services Group, Inc. is the largest stockholder and an affiliate of BlackRock, Inc. (“BlackRock”) for 1940 Act purposes.
Investment Advisory: The Company, on behalf of the Fund, entered into an Investment Advisory Agreement with the Manager, the Fund’s investment adviser, an indirect, wholly-owned subsidiary of BlackRock, to provide investment advisory and administrative services. The Manager is responsible for the management of the Fund’s portfolio and provides the personnel, facilities, equipment and certain other services necessary to the operations of the Fund.
| | |
| 16 | | 2017 BLACKROCK ANNUAL REPORTTO SHAREHOLDERS |
Notes to Financial Statements (continued)
For such services, the Fund pays the Manager a monthly fee at an annual rate equal to the following percentages of the average daily value of the Fund’s net assets:
| | | | |
| Average Daily Net Assets | | Investment
Advisory Fees | |
First $1 Billion | | | 0.65 | % |
$1 Billion — $3 Billion | | | 0.61 | |
$3 Billion — $5 Billion | | | 0.59 | |
$5 Billion — $10 Billion | | | 0.57 | |
Greater than $10 Billion | | | 0.55 | |
Distribution Fees: The Company, on behalf of the Fund, entered into a Distribution Agreement and a Distribution Plan with BlackRock Investments, LLC (“BRIL”), an affiliate of the Manager. Pursuant to the Distribution Plan and in accordance with Rule 12b-1 under the 1940 Act, the Fund pays BRIL ongoing distribution fees. The fees are accrued daily and paid monthly at an annual rate of 0.25% based upon the average daily net assets attributable to Class III.
For the year ended December 31, 2017, the class specific distribution fees borne directly by Class III were $118,762.
Transfer Agent: On behalf of the Fund, the Manager entered into agreements with insurance companies and other financial intermediaries (“Service Organizations”), some of which may be affiliates. Pursuant to these agreements, the Service Organizations provide the Fund with administrative, networking, recordkeeping, sub-transfer agency and shareholder services to sub-accounts they service. For these services, the Service Organizations receive an annual fee per shareholder account, which will vary depending on share class and/or net assets of Fund shareholders serviced by the Service Organizations, which is shown as transfer agent — class specific. For the year ended December 31, 2017, the Fund did not pay any amounts to affiliates in return for these services.
In addition, the Fund pays the transfer agent, which is not an affiliate, a fee for the issuance, transfer and redemption of shares and the opening and maintenance of shareholder accounts, which is included in transfer agent in the Statement of Operations.
For the year ended December 31, 2017, the following table shows the class specific transfer agent fees borne directly by each share class of the Fund:
| | | | | | | | | | | | | | |
| Class I | | | | | | Class III | | | | Total | |
| $ | 188,299 | | | | | | | $95,418 | | | | $ | 283,717 | |
Expense Limitations, Waivers and Reimbursements: With respect to the Fund, the Manager voluntarily agreed to waive its investment advisory fees by the amount of investment advisory fees the Fund pays to the Manager indirectly through its investment in affiliated money market funds (the “affiliated money market fund waiver”). The amount of waivers and/or reimbursements of fees and expenses made pursuant to the expense limitation caps will be reduced by the amount of the affiliated money market fund waiver. This amount is shown as fees waived and/or reimbursed by the Manager in the Statement of Operations. For the year ended December 31, 2017, the amount waived was $1,935.
The Manager has contractually agreed to waive its investment advisory fee with respect to any portion of the Fund’s assets invested in affiliated equity and fixed-income mutual funds and affiliated exchange-traded funds that have a contractual management fee through April 30, 2019. The contractual agreement may be terminated upon 90 days’ notice by a majority of the independent directors who are not “interested persons” of the Fund, as defined in the 1940 Act (“Independent Directors”) or by a vote of a majority of the outstanding voting securities of the Fund. For the year ended December 31, 2017, there were no fees waived by the Manager.
For the year ended December 31, 2017, the Fund reimbursed the Manager $1,398 for certain accounting services, which is included in accounting services in the Statement of Operations.
The Manager has contractually agreed to reimburse transfer agent fees in order to limit such expenses to a percentage of average daily net assets as follows:
| | | | |
Class I | | | 0.07 | % |
Class III | | | 0.07 | |
The Manager has agreed not to reduce or discontinue this contractual reimbursement through April 30, 2019 unless approved by the Board, including a majority of the Independent Directors or by a vote of a majority of the outstanding voting securities of the Fund.
These amounts waived and/or reimbursed are shown as transfer agent fees reimbursed — class specific in the Statement of Operations. For the year ended December 31, 2017, class specific expense waivers and/or reimbursements are as follows:
| | | | | | | | | | | | |
| | | Class I | | | Class III | | | Total | |
Transfer Agent Fees Reimbursed | | $ | 120,899 | | | $ | 61,972 | | | $ | 182,871 | |
With respect to the Fund, the Manager contractually agreed to waive and/or reimburse fees or expenses in order to limit expenses, excluding interest expense, dividend expense, tax expense, acquired fund fees and expenses, and certain other fund expenses, which constitute extraordinary expenses not incurred in the ordinary course of the Fund’s business (“expense limitation”). The expense limitations as a percentage of average daily net assets are as follows:
| | | | | | | | | | | | |
| Class I | | | | | | Class III | | | | |
| | 1.25% | | | | | | | 1.50% | | | | |
| | | | |
| NOTESTO FINANCIAL STATEMENTS | | | 17 | |
Notes to Financial Statements (continued)
The Manager has agreed not to reduce or discontinue this contractual expense limitation through April 30, 2019, unless approved by the Board, including a majority of the Independent Directors or by a vote of a majority of the outstanding voting securities of the Fund. For the year ended December 31, 2017, there were no fees waived and/or reimbursed by the Manager.
Securities Lending: The U.S. Securities and Exchange Commission (“SEC”) has issued an exemptive order which permits BIM, an affiliate of the Manager, to serve as securities lending agent for the Fund, subject to applicable conditions. As securities lending agent, BIM bears all operational costs directly related to securities lending. The Fund is responsible for expenses in connection with the investment of cash collateral received for securities on loan (the “collateral investment expenses”). The cash collateral is invested in a private investment company managed by the Manager or its affiliates. However, BIM has agreed to cap the collateral investment expenses of the private investment company to an annual rate of 0.04%. The investment adviser to the private investment company will not charge any advisory fees with respect to shares purchased by the Fund. The private investment company in which the cash collateral has been invested may, under certain circumstances, impose a liquidity fee of up to 2% of the value withdrawn or temporarily restrict withdrawals for up to 10 business days during a 90 day period, in the event that the private investment company’s weekly liquid assets fall below certain thresholds.
Securities lending income is equal to the total of income earned from the reinvestment of cash collateral, net of fees and other payments to and from borrowers of securities, and less the collateral investment expenses. The Fund retains a portion of securities lending income and remits a remaining portion to BIM as compensation for its services as securities lending agent.
Pursuant to a securities lending agreement, the Fund retains 71.5% of securities lending income, and this amount retained can never be less than 65% of the total of securities lending income plus the collateral investment expenses.
In addition, commencing the business day following the date that the aggregate securities lending income earned across the Equity-Bond Complex in a calendar year exceeds a specified threshold, the Fund, pursuant to the securities lending agreement, will retain for the remainder of that calendar year securities lending income as follows: 75% of securities lending income, and this amount retained can never be less than 65% of the total of securities lending income plus the collateral investment expenses.
The share of securities lending income earned by the Fund is shown as securities lending income — affiliated — net in the Statement of Operations. For the year ended December 31, 2017, the Fund paid BIM $11,992 for securities lending agent services.
Interfund Lending: In accordance with an exemptive order (the “Order”) from the SEC, the Fund may participate in a joint lending and borrowing facility for temporary purposes (the “Interfund Lending Program”), subject to compliance with the terms and conditions of the Order, and to the extent permitted by the Fund’s investment policies and restrictions. The Fund is currently permitted to lend under the Interfund Lending Program.
A lending BlackRock fund may lend in aggregate up to 15% of its net assets, but may not lend more than 5% of its net assets, to any one borrowing fund through the Interfund Lending Program. A borrowing BlackRock fund may not borrow through the Interfund Lending Program or from any other source more than 33 1/3% of its total assets (or any lower threshold provided for by the fund’s investment restrictions). If a borrowing BlackRock fund’s total outstanding borrowings exceed 10% of its total assets, each of its outstanding interfund loans will be subject to collateralization of at least 102% of the outstanding principal value of the loan. All interfund loans are for temporary or emergency purposes and the interest rate to be charged will be the average of the highest current overnight repurchase agreement rate available to a lending fund and the bank loan rate, as calculated according to a formula established by the Board.
During the period ended December 31, 2017, the Fund did not participate in the Interfund Lending Program.
Officers and Directors: Certain directors and/or officers of the Company are directors and/or officers of BlackRock or its affiliates. The Fund reimburses the Manager for a portion of the compensation paid to the Company’s Chief Compliance Officer, which is included in Directors and Officer in the Statement of Operations.
Other Transactions: The Fund may purchase securities from, or sell securities to, an affiliated fund provided the affiliation is due solely to having a common investment adviser, common officers, or common directors. For the year ended December 31, 2017, the purchase and sale transactions and any net realized gains (losses) with an affiliated fund in compliance with Rule 17a-7 under the 1940 Act were as follows:
| | | | |
Purchases | | $ | 12,147,796 | |
Sales | | | 12,312,319 | |
Net realized gain | | | 3,017,278 | |
For the year ended December 31, 2017, purchases and sales of investments, excluding short-term securities, were $133,607,135 and $137,247,500, respectively.
It is the Fund’s policy to comply with the requirements of the Internal Revenue Code of 1986, as amended, applicable to regulated investment companies, and to distribute substantially all of its taxable income to its shareholders. Therefore, no U.S. federal income tax provision is required.
The Fund files U.S. federal and various state and local tax returns. No income tax returns are currently under examination. The statute of limitations on the Fund’s U.S. federal tax returns generally remains open for each of the four years ended December 31, 2017. The statutes of limitations on the Fund’s state and local tax returns may remain open for an additional year depending upon the jurisdiction.
| | |
| 18 | | 2017 BLACKROCK ANNUAL REPORTTO SHAREHOLDERS |
Notes to Financial Statements (continued)
Management has analyzed tax laws and regulations and their application to the Fund as of December 31, 2017, inclusive of the open tax return years, and does not believe that there are any uncertain tax positions that require recognition of a tax liability in the Fund’s financial statements.
U.S. GAAP requires that certain components of net assets be adjusted to reflect permanent differences between financial and tax reporting. These reclassifications have no effect on net assets or net asset values per share. As of period end, the following permanent differences attributable to foreign currency transactions and the reclassification of distributions were reclassified to the following accounts:
| | | | |
Undistributed net investment income | | $ | 18,125 | |
Accumulated net realized gain | | $ | (18,125 | ) |
The tax character of distributions paid was as follows:
| | | | | | | | |
| | | 12/31/17 | | | 12/31/16 | |
Ordinary income | | $ | 2,327,022 | | | $ | 752,557 | |
Long-term capital gains | | | 22,845,872 | | | | 10,641,984 | |
| | | | | | | | |
| | $ | 25,172,894 | | | $ | 11,394,541 | |
| | | | | | | | |
As of period end, the tax components of accumulated net earnings (losses) were as follows:
| | | | |
Undistributed ordinary income | | $ | 513,489 | |
Undistributed long-term capital gains | | | 2,891,852 | |
Net unrealized gains(a) | | | 34,285,485 | |
| | | | |
| | $ | 37,690,826 | |
| | | | |
| | (a) | The difference between book-basis and tax-basis net unrealized gains was attributable primarily to the tax deferral of losses on wash sales and timing and recognition of partnership income. | |
As of December 31, 2017, gross unrealized appreciation and depreciation for investments and derivatives based on cost for U.S. federal income tax purposes were as follows:
| | | | |
Tax cost | | $ | 122,820,729 | |
| | | | |
Gross unrealized appreciation | | $ | 36,437,545 | |
Gross unrealized depreciation | | | (2,152,066 | ) |
| | | | |
Net unrealized appreciation (depreciation) | | $ | 34,285,479 | |
| | | | |
The Company, on behalf of the Fund, along with certain other funds managed by the Manager and its affiliates (“Participating Funds”), is a party to a 364-day, $2.1 billion credit agreement with a group of lenders. Under this agreement, the Fund may borrow to fund shareholder redemptions. Excluding commitments designated for certain individual funds, the Participating Funds, including the Fund, can borrow up to an aggregate commitment amount of $1.6 billion at any time outstanding, subject to asset coverage and other limitations as specified in the agreement. The credit agreement has the following terms: a fee of 0.12% per annum on unused commitment amounts and interest at a rate equal to the higher of (a) one-month LIBOR (but, in any event, not less than 0.00%) on the date the loan is made plus 0.80% per annum or (b) the Fed Funds rate (but, in any event, not less than 0.00%) in effect from time to time plus 0.80% per annum on amounts borrowed. The agreement expires in April 2018 unless extended or renewed. Participating Funds paid administration, legal and arrangement fees, which, if applicable, are included in miscellaneous expenses in the Statement of Operations. These fees were allocated among such funds based upon portions of the aggregate commitment available to them and relative net assets of Participating Funds. During the year ended December 31, 2017, the Fund did not borrow under the credit agreement.
In the normal course of business, the Fund invests in securities or other instruments and may enter into certain transactions, and such activities subject the Fund to various risks, including among others, fluctuations in the market (market risk) or failure of an issuer to meet all of its obligations. The value of securities or other instruments may also be affected by various factors, including, without limitation: (i) the general economy; (ii) the overall market as well as local, regional or global political and/or social instability; (iii) regulation, taxation or international tax treaties between various countries; or (iv) currency, interest rate and price fluctuations. The Fund’s prospectus provides details of the risks to which the Fund is subject.
The Fund may be exposed to additional risks when reinvesting cash collateral in money market funds that do not seek to maintain a stable NAV per share of $1.00 and which may be subject to redemption gates or liquidity fees under certain circumstances.
Valuation Risk: The market values of equities, such as common stocks and preferred securities or equity related investments, such as futures and options, may decline due to general market conditions which are not specifically related to a particular company. They may also decline due to factors which affect a particular industry or industries. The Fund may invest in illiquid investments and may experience difficulty in selling those investments in a timely manner at the price that it believes the investments are worth. Prices may fluctuate widely over short or extended periods in response to company, market or economic news. Markets also tend to move in cycles, with periods of rising and falling prices. This volatility may cause the Fund’s NAV to experience significant increases or decreases over short periods of time. If there is a general decline in the securities and other markets, the NAV of the Fund may lose value, regardless of the individual results of the securities and other instruments in which the Fund invests.
| | | | |
| NOTESTO FINANCIAL STATEMENTS | | | 19 | |
Notes to Financial Statements (continued)
Counterparty Credit Risk: The Fund may be exposed to counterparty credit risk, or the risk that an entity may fail to or be unable to perform on its commitments related to unsettled or open transactions. The Fund manages counterparty credit risk by entering into transactions only with counterparties that the Manager believes have the financial resources to honor their obligations and by monitoring the financial stability of those counterparties. Financial assets, which potentially expose the Fund to market, issuer and counterparty credit risks, consist principally of financial instruments and receivables due from counterparties. The extent of the Fund’s exposure to market, issuer and counterparty credit risks with respect to these financial assets is approximately their value recorded in the Statement of Assets and Liabilities, less any collateral held by the Fund.
A derivative contract may suffer a mark-to-market loss if the value of the contract decreases due to an unfavorable change in the market rates or values of the underlying instrument. Losses can also occur if the counterparty does not perform under the contract.
With exchange-traded futures, there is less counterparty credit risk to the Fund since the exchange or clearinghouse, as counterparty to such instruments, guarantees against a possible default. The clearinghouse stands between the buyer and the seller of the contract; therefore, credit risk is limited to failure of the clearinghouse. While offset rights may exist under applicable law, the Fund does not have a contractual right of offset against a clearing broker or clearinghouse in the event of a default (including the bankruptcy or insolvency). Additionally, credit risk exists in exchange-traded futures with respect to initial and variation margin that is held in a clearing broker’s customer accounts. While clearing brokers are required to segregate customer margin from their own assets, in the event that a clearing broker becomes insolvent or goes into bankruptcy and at that time there is a shortfall in the aggregate amount of margin held by the clearing broker for all its clients, typically the shortfall would be allocated on a pro rata basis across all the clearing broker’s customers, potentially resulting in losses to the Fund.
Concentration Risk: As of period end, the Fund invested a significant portion of its assets in securities in the information technology sector. Changes in economic conditions affecting such sector would have a greater impact on the Fund and could affect the value, income and/or liquidity of positions in such securities.
| 11. | CAPITAL SHARE TRANSACTIONS |
Transactions in capital shares for each class were as follows:
| | | | | | | | | | | | | | | | |
| | | Year Ended
12/31/2017 | | | Year Ended
12/31/2016 | |
| | | Shares | | | Amount | | | Shares | | | Amount | |
Class I | | | | | | | | | | | | | | | | |
Shares sold | | | 299,156 | | | $ | 4,606,186 | | | | 218,881 | | | $ | 2,963,754 | |
Shares issued in reinvestment of distributions | | | 1,121,874 | | | | 16,392,533 | | | | 586,592 | | | | 7,900,155 | |
Shares redeemed | | | (1,052,862 | ) | | | (16,192,812 | ) | | | (1,505,534 | ) | | | (20,544,211 | ) |
| | | | | | | | | | | | | | | | |
Net increase (decrease) | | | 368,168 | | | $ | 4,805,907 | | | | (700,061 | ) | | $ | (9,680,302 | ) |
| | | | | | | | | | | | | | | | |
| | | | |
Class III | | | | | | | | | | | | | | | | |
Shares sold | | | 722,465 | | | $ | 10,907,398 | | | | 529,948 | | | $ | 6,982,045 | |
Shares issued in reinvestment of distributions | | | 607,374 | | | | 8,780,361 | | | | 261,607 | | | | 3,494,386 | |
Shares redeemed | | | (485,328 | ) | | | (7,351,322 | ) | | | (621,016 | ) | | | (8,141,931 | ) |
| | | | | | | | | | | | | | | | |
Net increase | | | 844,511 | | | $ | 12,336,437 | | | | 170,539 | | | $ | 2,334,500 | |
| | | | | | | | | | | | | | | | |
Total Net Increase (Decrease) | | | 1,212,679 | | | $ | 17,142,344 | | | | (529,522 | ) | | $ | (7,345,802 | ) |
| | | | | | | | | | | | | | | | |
Management has evaluated the impact of all subsequent events on the Fund through the date the financial statements were issued and has determined that there were no subsequent events requiring adjustment or additional disclosure in the financial statements.
| | |
| 20 | | 2017 BLACKROCK ANNUAL REPORTTO SHAREHOLDERS |
Report of the Independent Registered Public Accounting Firm
To the Shareholders of BlackRock Large Cap Focus Growth V.I. Fund and the Board of Directors of BlackRock Variable Series Funds, Inc.:
Opinion on the Financial Statements and Financial Highlights
We have audited the accompanying statement of assets and liabilities, including the schedule of investments, of BlackRock Large Cap Focus Growth V.I. Fund (formerly, BlackRock Large Cap Growth V.I. Fund) of BlackRock Variable Series Funds, Inc. (the “Fund”), as of December 31, 2017, the related statement of operations for the year then ended, the statements of changes in net assets for each of the two years in the period then ended, the financial highlights for each of the five years in the period then ended, and the related notes. In our opinion, the financial statements and financial highlights present fairly, in all material respects, the financial position of the Fund as of December 31, 2017, and the results of its operations for the year then ended, the changes in its net assets for each of the two years in the period then ended, and the financial highlights for each of the five years in the period then ended, in conformity with accounting principles generally accepted in the United States of America.
Basis for Opinion
These financial statements and financial highlights are the responsibility of the Fund’s management. Our responsibility is to express an opinion on the Fund’s financial statements and financial highlights based on our audits. We are a public accounting firm registered with the Public Company Accounting Oversight Board (United States) (PCAOB) and are required to be independent with respect to the Fund in accordance with the U.S. federal securities laws and the applicable rules and regulations of the Securities and Exchange Commission and the PCAOB.
We conducted our audits in accordance with the standards of the PCAOB. Those standards require that we plan and perform the audit to obtain reasonable assurance about whether the financial statements and financial highlights are free of material misstatement, whether due to error or fraud. The Fund is not required to have, nor were we engaged to perform, an audit of its internal control over financial reporting. As part of our audits we are required to obtain an understanding of internal control over financial reporting but not for the purpose of expressing an opinion on the effectiveness of the Fund’s internal control over financial reporting. Accordingly, we express no such opinion.
Our audits included performing procedures to assess the risks of material misstatement of the financial statements and financial highlights, whether due to error or fraud, and performing procedures that respond to those risks. Such procedures included examining, on a test basis, evidence regarding the amounts and disclosures in the financial statements and financial highlights. Our audits also included evaluating the accounting principles used and significant estimates made by management, as well as evaluating the overall presentation of the financial statements and financial highlights. Our procedures included confirmation of securities owned as of December 31, 2017, by correspondence with the custodian and brokers; when replies were not received from brokers, we performed other auditing procedures. We believe that our audits provide a reasonable basis for our opinion.
Deloitte & Touche LLP
Boston, Massachusetts
February 19, 2018
We have served as the auditor of one or more BlackRock investment companies since 1992.
| | | | |
| REPORTOFTHE INDEPENDENT REGISTERED PUBLIC ACCOUNTING FIRM | | | 21 | |
DECEMBER 31, 2017
| | |
ANNUAL REPORT | |  |
BlackRock Variable Series Funds, Inc.
| Ø | | BlackRock Managed Volatility V.I. Fund |
|
| Not FDIC Insured • May Lose Value • No Bank Guarantee |
| | |
| Fund Summary as of December 31, 2017 | | BlackRock Managed Volatility V.I. Fund |
Investment Objective
BlackRock Managed Volatility V.I. Fund’s (the “Fund”) investment objective is to seek a level of current income and degree of stability of principal not normally available from an investment solely in equity securities, as well as the opportunity for capital appreciation greater than is normally available from an investment solely in debt securities.
At a meeting held on November 15, 2017, the Board of Directors of BlackRock Variable Series Funds, Inc. (the “Company”) and, at a meeting held on December 1, 2017, the Board of Trustees of HIMCO VIT Portfolio Diversifier Fund (the “Target Fund”) approved a reorganization of the Target Fund with and into the Fund. The reorganization is subject to shareholder approval by the Target Fund’s shareholders and certain other conditions.
Portfolio Management Commentary
How did the Fund perform?
For the 12-month period ended December 31, 2017, the Fund underperformed its blended benchmark (50% MSCI All Country World Index/50% Citi World Government Bond Index (hedged into USD) and outperformed its performance benchmark, the ICE BofAML 3-Month U.S. Treasury Bill Index.
The Fund held less overall exposure to broad stocks and bonds than the blended benchmark over the period. While this helped the Fund retain a lower correlation to broad markets (and enabled the Fund to maintain relatively low levels of risk), it also meant that the Fund’s return underperformed that of the blended benchmark over the period.
What factors influenced performance?
A cautious view on the Canadian dollar detracted from returns as the Bank of Canada looked past weakness in inflation and moved toward a more hawkish monetary policy stance over the 12-month period. Meanwhile, a tilt away from European fixed income acted as an additional headwind, as a persistent dovish stance by the European Central Bank and ongoing softness in inflation data supported the asset class.
The Fund’s overall exposure to equities supported returns as global stocks advanced against a backdrop of strong global growth, benign inflationary trends and supportive financial conditions. Within equities, a tilt to Japanese stocks boosted returns, particularly during the second half of the period, as market participants were encouraged by persistent strength in Japanese economic data and a convincing election victory for incumbent Prime Minister Shinzo Abe. Currency positioning was also a key contributor to returns during the 12 months. Specifically, a cautious view on the U.S. dollar boosted performance as core inflation softened during the first half of the year and optimistic expectations around fiscal stimulus failed to materialize. In addition, a constructive view on the euro boosted returns early in the period as European growth accelerated strongly. Within fixed income, an allocation to Australian bonds added to performance as inflation data disappointed and the Reserve Bank of Australia lagged the shift toward monetary tightening across other developed economies.
Describe recent portfolio activity.
The Fund adopted a more cautious stance on broad fixed income as the 12-month period progressed. The combination of disappointing inflation data and a moderation in global growth momentum supported a move lower in bond yields during the first half of the year. Entering the third quarter of 2017, signs of a recovery in economic activity and inflation globally led the Fund to adopt a more conservative view on government bonds, particularly given the outperformance of the asset class early in the year. Within equities, the Fund steadily increased its allocation to Japanese equities throughout the first half of the year on the view that investors were underestimating the strength of Japanese economic data. Japanese stocks performed very strongly during the early part of the fourth quarter of 2017 and the Fund reduced its allocation toward the end of the year. In terms of currencies, the Fund held sizable exposure to the euro against the U.S. dollar during the first half of the year as the European economy was strongly accelerating. This exposure supported returns and the Fund took profits on the position entering the second half of the year.
The Fund held a relatively high allocation to cash as a means of reducing overall portfolio volatility and in conjunction with less directional positioning with respect to both equities and fixed income. The cash position did not have a material impact on performance.
Describe portfolio positioning at period end.
The Fund held a preference for stocks relative to bonds at the end of the period, on the view that the expansion of the global economy has become increasingly broad-based. Within equities, the Fund favored exposure to U.S. and Japanese stocks given strength in economic activity across these two economies. Within fixed income, the Fund maintained a cautious stance on U.S. bonds given expectations for further monetary tightening.
The views expressed reflect the opinions of BlackRock as of the date of this report and are subject to change based on changes in market, economic or other conditions. These views are not intended to be a forecast of future events and are no guarantee of future results.
Portfolio Information
PORTFOLIO COMPOSITION
| | | | |
| Asset Type | | Percent of
Net Assets | |
Investment Companies | | | 67 | % |
Money Market Funds | | | 37 | |
Non-Agency Mortgage-Backed Securities | | | — | (a) |
Asset-Backed Securities | | | — | (a) |
Other Interests | | | — | (a) |
Liabilities in Excess of Other Assets | | | (4 | ) |
| | (a) | Representing less than 0.5% of the Fund’s net assets. | |
For Fund compliance purposes, the Fund’s sector classifications refer to one or more of the sector sub-classifications used by one or more widely recognized market indexes or rating group indexes, and/or as defined by the investment adviser. These definitions may not apply for purposes of this report, which may combine sector sub-classifications for reporting ease.
| | |
| 2 | | 2017 BLACKROCK ANNUAL REPORTTO SHAREHOLDERS |
| | |
| Fund Summary as of December 31, 2017 (continued) | | BlackRock Managed Volatility V.I. Fund |
TOTAL RETURN BASED ON A $10,000 INVESTMENT
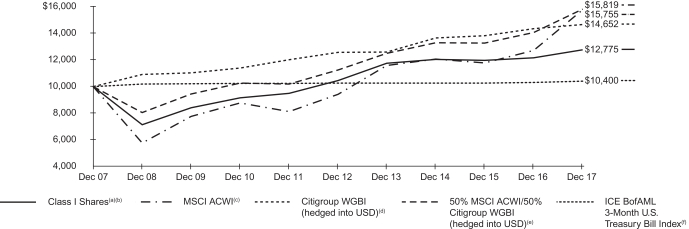
| (a) | Assuming transaction costs, if any, and other operating expenses, including investment advisory fees. Does not include insurance-related fees and expenses. |
| (b) | The Fund uses an asset allocation strategy, investing various percentages of its portfolio in three major categories: stocks, bonds and money market investments. The Fund’s total returns prior to January 22, 2013 are the returns of the Fund when it followed different investment strategies under the name BlackRock Balanced Capital V.I. Fund. |
| (c) | A free float-adjusted market capitalization weighted index that is designed to measure the equity market performance of developed and emerging markets. The MSCI All Country World Index consists of 46 country indexes comprising of 23 developed and 23 emerging market country indexes. |
| (d) | A market capitalization weighted bond index consisting of government bond markets of 23 countries, including the United States. |
| (e) | A customized weighted index comprised of the returns of 50% MSCI ACWI/50% Citigroup WGBI (hedged into USD). |
| (f) | An unmanaged index that tracks 3-month U.S. Treasury securities. Effective June 2, 2014, the ICE BofAML 3-Month U.S. Treasury Bill Index was added to the performance benchmarks against which the Fund measures its performance. |
Performance Summary for the Period Ended December 31, 2017
| | | | | | | | | | | | | | | | | | | | | | | | | | | | |
| | | 6-Month
Total Returns (b) | | | | | | Average Annual Total Returns | |
| | | | | | | 1 Year (b) | | | | | | 5 Years (b) | | | | | | 10 Years (b) | |
Class I(a) | | | 2.42 | % | | | | | | | 4.98 | % | | | | | | | 4.11 | % | | | | | | | 2.48 | % |
50% MSCI ACWI/50% Citigroup WGBI (hedged into USD) | | | 6.18 | | | | | | | | 12.59 | | | | | | | | 7.04 | | | | | | | | 4.69 | |
MSCI ACWI | | | 11.21 | | | | | | | | 23.97 | | | | | | | | 10.80 | | | | | | | | 4.65 | |
Citigroup WGBI (hedged into USD) | | | 1.33 | | | | | | | | 2.14 | | | | | | | | 3.11 | | | | | | | | 3.89 | |
ICE BofAML 3-Month U.S. Treasury Bill Index | | | 0.55 | | | | | | | | 0.86 | | | | | | | | 0.27 | | | | | | | | 0.39 | |
| | (a) | Average annual and cumulative total returns are based on changes in net asset value for the periods shown, and assume reinvestment of all distributions at net asset value on the ex-dividend date. Insurance-related fees and expenses are not reflected in these returns. The Fund’s total returns prior to January 22, 2013 are the returns of the Fund when it followed different investment strategies under the name BlackRock Balanced Capital V.I. Fund. | |
| | (b) | For a portion of the period, the Fund’s investment adviser waived a portion of its fee. Without such waiver, the Fund’s performance would have been lower. | |
Past performance is not indicative of future results. Performance results do not reflect the deduction of taxes that a shareholder would pay on Fund distributions or the
redemption of Fund shares.
Performance results may include adjustments made for financial reporting purposes in accordance with U.S. generally accepted accounting principles.
Expense Example
| | | | | | | | | | | | | | | | | | | | | | | | | | | | | | | | |
| | | Actual | | | | | | Hypothetical (a) | | | | |
| | | Beginning
Account Value
(07/01/17) | | | Ending
Account Value
(12/31/17) | | | Expenses
Paid During
the Period (b) | | | | | | Beginning
Account Value
(07/01/17) | | | Ending
Account Value
(12/31/17) | | | Expenses
Paid During
the Period (b) | | | Annualized
Expense
Ratio | |
Class I | | $ | 1,000.00 | | | $ | 1,024.20 | | | $ | 5.00 | | | | | | | $ | 1,000.00 | | | $ | 1,020.27 | | | $ | 4.99 | | | | 0.98 | % |
| | (a) | Hypothetical 5% annual return before expenses is calculated by prorating the number of days in the most recent fiscal half year divided by 365. | |
| | (b) | Expenses are equal to the annualized expense ratio, multiplied by the average account value over the period, multiplied by 184/365 (to reflect the one-half year period shown). | |
See “Disclosure of Expenses” on the following page for further information on how expenses were calculated
| | |
| Disclosure of Expenses | | BlackRock Managed Volatility V.I. Fund |
Shareholders of the Fund may incur the following charges: (a) transactional expenses, such as sales charges; and (b) operating expenses, including investment advisory fees, service and distribution fees, including 12b-1 fees, acquired fund fees and expenses, and other fund expenses. The expense example on the previous page (which is based on a hypothetical investment of $1,000 invested on July 1, 2017 and held through December 31, 2017) is intended to assist shareholders both in calculating expenses based on an investment in the Fund and in comparing these expenses with similar costs of investing in other mutual funds.
The expense example provides information about actual account values and actual expenses. In order to estimate the expenses a shareholder paid during the period covered by this report, shareholders can divide their account value by $1,000 and then multiply the result by the number corresponding to their share class under the heading entitled “Expenses Paid During the Period.”
The expense example also provides information about hypothetical account values and hypothetical expenses based on the Fund’s actual expense ratio and an assumed rate of return of 5% per year before expenses. In order to assist shareholders in comparing the ongoing expenses of investing in the Fund and other funds, compare the 5% hypothetical example with the 5% hypothetical examples that appear in shareholder reports of other funds.
The expenses shown in the expense example are intended to highlight shareholders’ ongoing costs only and do not reflect any transactional expenses, such as sales charges, if any. Therefore, the hypothetical example is useful in comparing ongoing expenses only, and will not help shareholders determine the relative total expenses of owning different funds. If these transactional expenses were included, shareholder expenses would have been higher.
Derivative Financial Instruments
The Fund may invest in various derivative financial instruments. These instruments are used to obtain exposure to a security, commodity, index, market, and/or other assets without owning or taking physical custody of securities, commodities and/or other referenced assets or to manage market, equity, credit, interest rate, foreign currency exchange rate, commodity and/or other risks. Derivative financial instruments may give rise to a form of economic leverage and involve risks, including the imperfect correlation between the value of a derivative financial instrument and the underlying asset, possible default of the counterparty to the transaction or illiquidity of the instrument. The Fund’s successful use of a derivative financial instrument depends on the investment adviser’s ability to predict pertinent market movements accurately, which cannot be assured. The use of these instruments may result in losses greater than if they had not been used, may limit the amount of appreciation the Fund can realize on an investment and/or may result in lower distributions paid to shareholders. The Fund’s investments in these instruments, if any, are discussed in detail in the Notes to Financial Statements.
| | |
| 4 | | 2017 BLACKROCK ANNUAL REPORTTO SHAREHOLDERS |
| | |
Schedule of Investments December 31, 2017 | | BlackRock Managed Volatility V.I. Fund (Percentages shown are based on Net Assets) |
| | | | | | | | | | | | |
| Security | | | | | Par
(000) | | | Value | |
Asset-Backed Securities — 0.2%(a) | |
CWABS, Inc. Asset-Backed Certificates Trust, Series 2004-5, Class A, 2.45%, 10/25/34 | | | USD | | | | 7 | | | $ | 6,861 | |
Morgan Stanley ABS Capital I, Inc. Trust, Series 2005-HE1, Class A2MZ, 2.15%, 12/25/34 | | | | | | | 8 | | | | 7,518 | |
Structured Asset Investment Loan Trust, Series 2004-8, Class M4, 3.05%, 09/25/34 | | | | | | | 9 | | | | 9,031 | |
Structured Asset Securities Corp. Mortgage Pass-Through Certificates, Series 2004-23XS, Class 2A1, 1.85%, 01/25/35 | | | | | | | 7 | | | | 6,953 | |
| | | | | | | | | | | | |
Total Asset-Backed Securities — 0.2%
(Cost: $30,958) | | | | 30,363 | |
| | | | | | | | | | | | |
| | | |
| | | | | | Shares | | | | |
Investment Companies — 66.9% | |
iShares 1-3 Year Credit Bond ETF(j) | | | | | | | 15,923 | | | | 1,664,590 | |
iShares 3-7 Year Treasury Bond ETF(j) | | | | | | | 6,491 | | | | 792,941 | |
iShares Core U.S. Aggregate Bond ETF(b)(j) | | | | | | | 17,278 | | | | 1,889,004 | |
iShares MSCI EAFE ETF(j) | | | | | | | 21,263 | | | | 1,495,002 | |
SPDR Bloomberg Barclays International Treasury Bond ETF(b) | | | | | | | 136,622 | | | | 3,884,163 | |
| | | | | | | | | | | | |
Total Investment Companies — 66.9%
(Cost: $9,884,516) | | | | 9,725,700 | |
| | | | | | | | | | | | |
| | | |
| | | | | | Par
(000) | | | | |
Non-Agency Mortgage-Backed Securities — 0.3% | |
| | | |
| Collateralized Mortgage Obligations — 0.3% | | | | | | | | | |
Alternative Loan Trust, Series 2007-22, Class 2A16, 6.50%, 09/25/37 | | | USD | | | | 23 | | | | 16,095 | |
CSMC Trust, Series 2011-5R, Class 2A1, 3.40%, 08/27/46(a)(c) | | | | | | | 15 | | | | 15,263 | |
Impac Secured Assets Corp., Series 2004-3, Class 1A4, 2.35%, 11/25/34(a) | | | | | | | 1 | | | | 1,371 | |
| | | | | | | | | | | | |
| | | | 32,729 | |
| | | | | | | | | | | | |
Total Non-Agency Mortgage-Backed Securities — 0.3%
(Cost: $33,237) | | | | 32,729 | |
| | | | | | | | | | | | |
| | | |
| | | | | | Beneficial
Interest
(000) | | | | |
Other Interests — (0.0)%(d) | | | | | | | | | | | | |
|
| Capital Markets — (0.0)% | |
Lehman Brothers Holdings, Inc.(e)(f)(g) | | | USD | | | | 25 | | | | — | |
| | | | | | | | | | | | |
Total Other Interests — (0.0)% | | | | — | |
| | | | | | | | | | | | |
| |
Total Long-Term Investments — 67.4%
(Cost: $9,948,711) | | | | 9,788,792 | |
| | | | | | | | | | | | |
| | | | | | | | | | | | |
| Security | | | | |
Shares | | | Value | |
Short-Term Securities — 36.6%(h)(j) | | | | | | | | | | | | |
BlackRock Liquidity Funds, T-Fund, Institutional Class, 1.17% | | | | | | | 3,387,049 | | | $ | 3,387,049 | |
SL Liquidity Series, LLC, Money Market Series, 1.48%(i) | | | | | | | 1,935,844 | | | | 1,935,650 | |
| | | | | | | | | | | | |
Total Short-Term Securities — 36.6%
(Cost: $5,322,699) | | | | 5,322,699 | |
| | | | | | | | | | | | |
Total Investments — 104.0%
(Cost: $15,271,410) | | | | 15,111,491 | |
Liabilities in Excess of Other Assets — (4.0)% | | | | (575,461 | ) |
| | | | | | | | | | | | |
Net Assets — 100.0% | | | $ | 14,536,030 | |
| | | | | | | | | | | | |
| (a) | Variable or floating rate security, which interest rate adjusts periodically based on changes in current interest rates and prepayments on the underlying pool of assets. Rate shown is the rate in effect as of period end. |
| (b) | Security, or a portion of the security, is on loan. |
| (c) | Security exempt from registration pursuant to Rule 144A under the Securities Act of 1933, as amended. These securities may be resold in transactions exempt from registration to qualified institutional investors. |
| (d) | Other interests represent beneficial interests in liquidation trusts and other reorganizational or private entities. |
| (e) | Non-income producing security. |
| (f) | Issuer filed for bankruptcy and/or is in default. |
| (g) | Security is valued using significant unobservable inputs and is classified as Level 3 in the fair value hierarchy. |
| (h) | Annualized 7-day yield as of period end. |
| (i) | Security was purchased with the cash collateral from loaned securities. |
| | | | |
| SCHEDULE OF INVESTMENTS | | | 5 | |
| | |
Schedule of Investments (continued) December 31, 2017 | | BlackRock Managed Volatility V.I. Fund |
| (j) | During the year ended December 31, 2017, investments in issuers considered to be affiliates of the Fund for the purposes of Section 2(a)(3) of the Investment Company Act of 1940, as amended, and/or related parties of the Fund were as follows: |
| | | | | | | | | | | | | | | | | | | | | | | | | | | | | | | | |
| Affiliate | | Shares
Held at
12/31/16 | | | Shares
Purchased | | | Shares
Sold | | | Shares
Held at
12/31/17 | | | Value at
12/31/17 | | | Income | | | Net
Realized
Gain (Loss) (a) | | | Change in
Unrealized
Appreciation
(Depreciation) | |
BlackRock Liquidity Funds, T-Fund, Institutional Class | | | 5,383,858 | | | | — | | | | (1,996,809 | )(b) | | | 3,387,049 | | | $ | 3,387,049 | | | $ | 28,605 | | | $ | 13 | | | $ | — | |
SL Liquidity Series, LLC, Money Market Series | | | 3,789,314 | | | | — | | | | (1,853,470 | )(b) | | | 1,935,844 | | | | 1,935,650 | | | | 4,635 | (c) | | | (440 | ) | | | 379 | |
iShares 1-3 Year Credit Bond ETF | | | 15,923 | | | | — | | | | — | | | | 15,923 | | | | 1,664,590 | | | | 27,519 | | | | — | | | | (6,369 | ) |
iShares 3-7 Year Treasury Bond ETF | | | 6,491 | | | | — | | | | — | | | | 6,491 | | | | 792,941 | | | | 11,975 | | | | — | | | | (2,271 | ) |
iShares Core U.S. Aggregate Bond ETF | | | 17,278 | | | | — | | | | — | | | | 17,278 | | | | 1,889,004 | | | | 43,839 | | | | — | | | | 21,943 | |
iShares MSCI EAFE ETF | | | 21,263 | | | | — | | | | — | | | | 21,263 | | | | 1,495,002 | | | | 38,365 | | | | — | | | | 267,489 | |
| | | | | | | | | | | | | | | | | | | | | | | | | | | | | | | | |
| | | $ | 11,164,236 | | | $ | 154,938 | | | $ | (427 | ) | | $ | 281,171 | |
| | | | | | | | | | | | | | | | | | | | | | | | | | | | | | | | |
| | (a) | Includes net capital gain distributions, if applicable. | |
| | (b) | Represents net shares sold. | |
| | (c) | Represents securities lending income earned from the reinvestment of cash collateral from loaned securities, net of fees and collateral investment expenses, and other payments to and from borrowers of securities. | |
For Fund compliance purposes, the Fund’s industry classifications refer to one or more of the industry sub-classifications used by one or more widely recognized market indexes or ratings group indexes, and/or as defined by the investment advisor. These definitions may not apply for purposes of this report, which may combine such industry sub-classifications for reporting ease.
Derivative Financial Instruments Outstanding as of Period End
Futures Contracts
| | | | | | | | | | | | | | | | |
| Description | | Number of
Contracts | | | Expiration
Date | | | Notional
Amount (000) | | | Value/
Unrealized
Appreciation
(Depreciation) | |
Long Contracts | | | | | | | | | | | | | | | | |
Nikkei 225 Index | | | 2 | | | | 03/08/18 | | | $ | 404 | | | $ | 3,274 | |
S&P 500 E-Mini Index | | | 7 | | | | 03/16/18 | | | | 937 | | | | 7,751 | |
| | | | | | | | | | | | | | | | |
| | | | | | | | | | | | | | | 11,025 | |
| | | | | | | | | | | | | | | | |
Short Contracts | | | | | | | | | | | | | | | | |
Euro-Buxl | | | 2 | | | | 03/08/18 | | | | 393 | | | | 6,685 | |
EURO STOXX 50 Index | | | 18 | | | | 03/16/18 | | | | 754 | | | | 15,706 | |
U.S. Treasury 10 Year Note | | | 11 | | | | 03/20/18 | | | | 1,365 | | | | 4,280 | |
U.S. Treasury Ultra Bond | | | 11 | | | | 03/20/18 | | | | 1,844 | | | | (4,427 | ) |
| | | | | | | | | | | | | | | | |
| | | | | | | | | | | | | | | 22,244 | |
| | | | | | | | | | | | | | | | |
| | | $ | 33,269 | |
| | | | | | | | | | | | | | | | |
Forward Foreign Currency Exchange Contracts
| | | | | | | | | | | | | | | | | | | | |
| Currency Purchased | | | Currency Sold | | | Counterparty | | Settlement Date | | | Unrealized Appreciation (Depreciation) | |
| AUD | | | 61,582 | | | USD | | | 47,240 | | | Deutsche Bank AG | | | 03/21/18 | | | $ | 802 | |
| EUR | | | 64,295 | | | USD | | | 76,317 | | | National Australia Bank Ltd. | | | 03/21/18 | | | | 1,187 | |
| USD | | | 45,224 | | | HKD | | | 352,493 | | | Bank of America NA | | | 03/21/18 | | | | 38 | |
| USD | | | 36,580 | | | MXN | | | 710,000 | | | State Street Bank and Trust Co. | | | 03/21/18 | | | | 969 | |
| USD | | | 2,261,533 | | | JPY | | | 253,148,000 | | | Morgan Stanley & Co., Inc. | | | 03/22/18 | | | | 5,781 | |
| | | | | | | | | | | | | | | | | | | | |
| | | | | | | | | | | | | | | | | | | 8,777 | |
| | | | | | | | | | | | | | | | | | | | |
| USD | | | 230,132 | | | AUD | | | 300,000 | | | Deutsche Bank AG | | | 03/21/18 | | | | (3,908 | ) |
| USD | | | 360,540 | | | CAD | | | 458,000 | | | Deutsche Bank AG | | | 03/21/18 | | | | (4,189 | ) |
| USD | | | 128,659 | | | CHF | | | 126,000 | | | Morgan Stanley & Co., Inc. | | | 03/21/18 | | | | (1,369 | ) |
| USD | | | 49,134 | | | DKK | | | 307,846 | | | Deutsche Bank AG | | | 03/21/18 | | | | (726 | ) |
| USD | | | 2,602,681 | | | EUR | | | 2,192,000 | | | Morgan Stanley & Co., Inc. | | | 03/21/18 | | | | (39,666 | ) |
| USD | | | 674,158 | | | GBP | | | 500,000 | | | Deutsche Bank AG | | | 03/21/18 | | | | (2,653 | ) |
| USD | | | 55,762 | | | SEK | | | 467,000 | | | Credit Suisse International | | | 03/21/18 | | | | (1,437 | ) |
| | | | | | | | | | | | | | | | | | | | |
| | | | | | | | | | | | | | | | | | | (53,948 | ) |
| | | | | | | | | | | | | | | | | | | | |
| | | Net Unrealized Depreciation | | | $ | (45,171 | ) |
| | | | | | | | | | | | | | | | | | | | |
| | |
| 6 | | 2017 BLACKROCK ANNUAL REPORTTO SHAREHOLDERS |
| | |
Schedule of Investments (continued) December 31, 2017 | | BlackRock Managed Volatility V.I. Fund |
Derivative Financial Instruments Categorized by Risk Exposure
As of period end, the fair values of derivative financial instruments located in the Statement of Assets and Liabilities were as follows:
| | | | | | | | | | | | | | | | | | | | | | | | | | | | |
| | | Commodity
Contracts | | | Credit
Contracts | | | Equity
Contracts | | | Foreign
Currency
Exchange
Contracts | | | Interest
Rate
Contracts | | | Other
Contracts | | | Total | |
Assets — Derivative Financial Instruments | | | | | | | | | | | | | | | | | | | | | | | | | | | | |
Futures contracts | | | | | | | | | | | | | | | | | | | | | | | | | | | | |
Net unrealized appreciation(a) | | $ | — | | | $ | — | | | $ | 26,731 | | | $ | — | | | $ | 10,965 | | | $ | — | | | $ | 37,696 | |
Forward foreign currency exchange contracts | | | | | | | | | | | | | | | | | | | | | | | | | | | | |
Unrealized appreciation on forward foreign currency exchange contracts | | | — | | | | — | | | | — | | | | 8,777 | | | | — | | | | — | | | | 8,777 | |
| | | | | | | | | | | | | | | | | | | | | | | | | | | | |
Total | | $ | — | | | $ | — | | | $ | 26,731 | | | $ | 8,777 | | | $ | 10,965 | | | $ | — | | | $ | 46,473 | |
| | | | | | | | | | | | | | | | | | | | | | | | | | | | |
| Liabilities — Derivative Financial Instruments | | | | | | | | | | | | | | | | | | | | | |
Futures contracts | | | | | | | | | | | | | | | | | | | | | | | | | | | | |
Net unrealized depreciation(a) | | $ | — | | | $ | — | | | $ | — | | | $ | — | | | $ | 4,427 | | | $ | — | | | $ | 4,427 | |
Forward foreign currency exchange contracts | | | | | | | | | | | | | | | | | | | | | | | | | | | | |
Unrealized depreciation on forward foreign currency exchange contracts | | | — | | | | — | | | | — | | | | 53,948 | | | | — | | | | — | | | | 53,948 | |
| | | | | | | | | | | | | | | | | | | | | | | | | | | | |
| | $ | — | | | $ | — | | | $ | — | | | $ | 53,948 | | | $ | 4,427 | | | $ | — | | | $ | 58,375 | |
| | | | | | | | | | | | | | | | | | | | | | | | | | | | |
| | (a) | Includes cumulative appreciation (depreciation) on futures contracts, if any, as reported in the Schedule of Investments. Only current day’s variation margin is reported within the Statement of Assets and Liabilities. | |
For the year ended December 31, 2017, the effect of derivative financial instruments in the Statement of Operations was as follows:
| | | | | | | | | | | | | | | | | | | | | | | | | | | | |
| | | Commodity
Contracts | | | Credit
Contracts | | | Equity
Contracts | | | Foreign
Currency
Exchange
Contracts | | | Interest
Rate
Contracts | | | Other
Contracts | | | Total | |
Net Realized Gain (Loss) from: | | | | | | | | | | | | | | | | | | | | | | | | | | | | |
Futures contracts | | $ | — | | | $ | — | | | $ | 232,878 | | | $ | (138,417 | ) | | $ | (28,559 | ) | | $ | | | | $ | 65,902 | |
Forward foreign currency exchange contracts | | | — | | | | — | | | | — | | | | (36,230 | ) | | | — | | | | — | | | | (36,230 | ) |
Swaps | | | — | | | | — | | | | (20,358 | ) | | | — | | | | — | | | | — | | | | (20,358 | ) |
| | | | | | | | | | | | | | | | | | | | | | | | | | | | |
Total | | $ | — | | | $ | — | | | $ | 212,520 | | | $ | (174,647 | ) | | $ | (28,559 | ) | | $ | | | | $ | 9,314 | |
| | | | | | | | | | | | | | | | | | | | | | | | | | | | |
Net Change in Unrealized Appreciation (Depreciation) On: | | | | | | | | | | | | | | | | | | | | | | | | | | | | |
Futures contracts | | $ | — | | | $ | — | | | $ | 49,650 | | | $ | (87,072 | ) | | $ | 24,117 | | | $ | | | | $ | (13,305 | ) |
Forward foreign currency exchange contracts | | | — | | | | — | | | | — | | | | (45,969 | ) | | | — | | | | | | | | (45,969 | ) |
| | | | | | | | | | | | | | | | | | | | | | | | | | | | |
| | $ | — | | | $ | — | | | $ | 49,650 | | | $ | (133,041 | ) | | $ | 24,117 | | | $ | | | | $ | (59,274 | ) |
| | | | | | | | | | | | | | | | | | | | | | | | | | | | |
Average Quarterly Balances of Outstanding Derivative Financial Instruments
| | | | |
Futures contracts: | | | | |
Average notional value of contracts — long | | $ | 7,827,617 | |
Average notional value of contracts — short | | $ | 8,437,541 | |
Forward foreign currency exchange contracts: | | | | |
Average amounts purchased — in USD | | $ | 4,992,639 | |
Average amounts sold — in USD | | $ | 169,573 | (a) |
Total Return Swaps | | | | |
Average notional value | | $ | 60,061,079 | |
| | (a) | Actual amounts for the period are shown due to limited outstanding derivative financial instruments as of each quarter end. | |
For more information about the Fund’s investment risks regarding derivative financial instruments, refer to the Notes to Financial Statements.
| | | | |
| SCHEDULE OF INVESTMENTS | | | 7 | |
| | |
Schedule of Investments (continued) December 31, 2017 | | BlackRock Managed Volatility V.I. Fund |
Derivative Financial Instruments — Offsetting as of Period End
The Fund’s derivative assets and liabilities (by type) were as follows:
| | | | | | | | |
| | | Assets | | | Liabilities | |
Derivative Financial Instruments: | | | | | | | | |
Future contracts | | $ | — | | | $ | 8,299 | |
Forward foreign currency exchange contracts | | | 8,777 | | | | 53,948 | |
| | | | | | | | |
Total derivative assets and liabilities in the Statement of Assets and Liabilities | | $ | 8,777 | | | $ | 62,247 | |
Derivatives not subject to a Master Netting Agreement or similar agreement (“MNA”) | | | — | | | | (8,299 | ) |
| | | | | | | | |
Total derivative assets and liabilities subject to an MNA | | $ | 8,777 | | | $ | 53,948 | |
| | | | | | | | |
The following tables present the Fund’s derivative assets and liabilities by counterparty net of amounts available for offset under an MNA and net of the related collateral received and pledged by the Fund:
| | | | | | | | | | | | | | | | | | | | |
| Counterparty | | Derivative
Assets
Subject to
MNA by
Counterparty | | | Derivatives
Available
for Offset (a) | | | Non-cash
Collateral
Received | | | Cash
Collateral
Received (b) | | | Net Amount
of Derivative
Assets (b) | |
Bank of America NA | | $ | 38 | | | $ | — | | | $ | — | | | $ | — | | | $ | 38 | |
Deutsche Bank AG | | | 802 | | | | (802 | ) | | | — | | | | — | | | | — | |
Morgan Stanley & Co., Inc. | | | 5,781 | | | | (5,781 | ) | | | — | | | | — | | | | — | |
National Australia Bank Ltd. | | | 1,187 | | | | — | | | | — | | | | — | | | | 1,187 | |
State Street Bank and Trust Co. | | | 969 | | | | — | | | | — | | | | — | | | | 969 | |
| | | | | | | | | | | | | | | | | | | | |
| | $ | 8,777 | | | $ | (6,583 | ) | | $ | — | | | $ | — | | | $ | 2,194 | |
| | | | | | | | | | | | | | | | | | | | |
| | | | | | | | | | | | | | | | | | | | |
| Counterparty | | Derivative
Liabilities
Subject to
MNA by
Counterparty | | | Derivatives
Available
for Offset (a) | | | Non-cash
Collateral
Pledged | | | Cash
Collateral
Pledged | | | Net Amount
of Derivative
Liabilities (c) | |
Credit Suisse International | | $ | 1,437 | | | $ | — | | | $ | — | | | $ | — | | | $ | 1,437 | |
Deutsche Bank AG | | | 11,476 | | | | (802 | ) | | | — | | | | — | | | | 10,674 | |
Morgan Stanley & Co., Inc. | | | 41,035 | | | | (5,781 | ) | | | — | | | | — | | | | 35,254 | |
| | | | | | | | | | | | | | | | | | | | |
| | $ | 53,948 | | | $ | (6,583 | ) | | $ | — | | | $ | — | | | $ | 47,365 | |
| | | | | | | | | | | | | | | | | | | | |
| | (a) | The amount of derivatives available for offset is limited to the amount of assets and/or liabilities that are subject to an MNA. | |
| | (b) | Net amount represents the net amount receivable from the counterparty in the event of default. | |
| | (c) | Net amount represents the net amount payable from the counterparty in the event of default. | |
| | |
| 8 | | 2017 BLACKROCK ANNUAL REPORTTO SHAREHOLDERS |
| | |
Schedule of Investments (continued) December 31, 2017 | | BlackRock Managed Volatility V.I. Fund |
Fair Value Hierarchy as of Period End
Various inputs are used in determining the fair value of investments and derivative financial instruments. For information about the Fund’s policy regarding valuation of investments and derivative financial instruments, refer to the Notes to Financial Statements.
The following tables summarize the Fund’s investments and derivative financial instruments categorized in the disclosure hierarchy:
| | | | | | | | | | | | | | | | |
| | | Level 1 | | | Level 2 | | | Level 3 | | | Total | |
Assets: | | | | | | | | | | | | | | | | |
Investments: | | | | | | | | | | | | | | | | |
Long-Term Investments: | | | | | | | | | | | | | | | | |
Asset-Backed Securities | | $ | — | | | $ | 30,363 | | | $ | — | | | $ | 30,363 | |
Investment Companies | | | 9,725,700 | | | | — | | | | — | | | | 9,725,700 | |
Non-Agency Mortgage-Backed Securities | | | — | | | | 32,729 | | | | — | | | | 32,729 | |
Short-Term Securities | | | 3,387,049 | | | | — | | | | — | | | | 3,387,049 | |
| | | | | | | | | | | | | | | | |
Subtotal | | $ | 13,112,749 | | | $ | 63,092 | | | $ | — | | | $ | 13,175,841 | |
| | | | | | | | | | | | | | | | |
Investments valued at NAV(a) | | | | | | | | | | | | | | | 1,935,650 | |
| | | | | | | | | | | | | | | | |
Total Investments | | | | | | | | | | | | | | $ | 15,111,491 | |
| | | | | | | | | | | | | | | | |
Derivative Financial Instruments(b) | | | | | | | | | | | | | | | | |
Assets: | | | | | | | | | | | | | | | | |
Equity contracts | | $ | 26,731 | | | $ | — | | | $ | — | | | $ | 26,731 | |
Foreign currency exchange contracts | | | — | | | | 8,777 | | | | — | | | | 8,777 | |
Interest rate contracts | | | 10,965 | | | | — | | | | — | | | | 10,965 | |
Liabilities: | | | | | | | | | | | | | | | | |
Foreign currency exchange contracts | | | — | | | | (53,948 | ) | | | — | | | | (53,948 | ) |
Interest rate contracts | | | (4,427 | ) | | | — | | | | — | | | | (4,427 | ) |
| | | | | | | | | | | | | | | | |
| | $ | 33,269 | | | $ | (45,171 | ) | | $ | — | | | $ | (11,902 | ) |
| | | | | | | | | | | | | | | | |
| | (a) | As of December 31, 2017, certain investments of the Fund were fair valued using NAV per share as no quoted market value is available and therefore have been excluded from the fair value hierarchy. | |
| | (b) | Derivative financial instruments are futures contracts and forward foreign currency exchange contracts. Futures contracts and forward foreign currency exchange contracts are valued at the unrealized appreciation (depreciation) on the instrument. | |
During the year ended December 31, 2017, there were no transfers between levels.
See notes to financial statements.
| | | | |
| SCHEDULE OF INVESTMENTS | | | 9 | |
Statement of Assets and Liabilities
December 31, 2017
| | | | |
| | | BlackRock Managed
Volatility V.I. Fund | |
| |
ASSETS | | | | |
Investments at value — unaffiliated (including securities loaned at value of $1,897,973) (cost — $4,173,894) | | $ | 3,947,255 | |
Investments at value — affiliated (cost — $11,097,516) | | | 11,164,236 | |
Cash | | | 592 | |
Cash pledged for futures contracts | | | 181,750 | |
Foreign currency at value (cost — $1,326,950) | | | 1,341,636 | |
Receivables: | | | | |
Securities lending income — affiliated | | | 1,866 | |
Dividends — affiliated | | | 3,015 | |
Unrealized appreciation on: | | | | |
Forward foreign currency exchange contracts | | | 8,777 | |
Prepaid expenses | | | 64 | |
Other assets | | | 159 | |
| | | | |
Total assets | | | 16,649,350 | |
| | | | |
| |
LIABILITIES | | | | |
Cash collateral on securities loaned at value | | | 1,935,650 | |
Payables: | | | | |
Accounting Fees | | | 15,854 | |
Capital shares redeemed | | | 8,944 | |
Printing fees | | | 30,375 | |
Professional fees | | | 46,355 | |
Variation margin on futures contracts | | | 8,299 | |
Investment advisory fees | | | 2,837 | |
Officer’s and Directors’ fees | | | 1,479 | |
Other affiliates | | | 53 | |
Other accrued expenses | | | 9,526 | |
Unrealized depreciation on: | | | | |
Forward foreign currency exchange contracts | | | 53,948 | |
| | | | |
Total liabilities | | | 2,113,320 | |
| | | | |
| |
NET ASSETS | | $ | 14,536,030 | |
| | | | |
| |
NET ASSETS CONSIST OF | | | | |
Paid-in capital | | $ | 14,733,410 | |
Distributions in excess of net investment income | | | (31,377 | ) |
Accumulated net realized loss | | | (9,100 | ) |
Net unrealized appreciation (depreciation) | | | (156,903 | ) |
| | | | |
NET ASSETS | | $ | 14,536,030 | |
| | | | |
| |
Class I — Based on net assets of $14,536,030 and 1,060,101 shares outstanding, 100 million shares authorized, $0.10 par value | | $ | 13.71 | |
| | | | |
| | | | |
See notes to financial statements.
| | |
| 10 | | 2017 BLACKROCK ANNUAL REPORTTO SHAREHOLDERS |
Statement of Operations
Year Ended December 31, 2017
| | | | |
| | | BlackRock Managed
Volatility V.I. Fund | |
| |
INVESTMENT INCOME | | | | |
Dividends — affiliated | | $ | 150,303 | |
Dividends — unaffiliated | | | 17,706 | |
Interest — unaffiliated | | | 314 | |
Securities lending income — affiliated — net | | | 4,635 | |
| | | | |
Total investment income | | | 172,958 | |
| | | | |
| |
EXPENSES | | | | |
Investment advisory | | | 83,633 | |
Professional | | | 34,616 | |
Printing | | | 30,289 | |
Transfer agent — class specific | | | 29,416 | |
Accounting services | | | 20,977 | |
Directors and Officer | | | 8,528 | |
Transfer agent | | | 5,001 | |
Custodian | | | 4,112 | |
Miscellaneous | | | 7,836 | |
| | | | |
Total expenses | | | 224,408 | |
Less: | | | | |
Fees waived and/or reimbursed by the Manager | | | (65,994 | ) |
Transfer agent fees reimbursed — class specific | | | (29,416 | ) |
| | | | |
Total expenses after fees waived and/or reimbursed | | | 128,998 | |
| | | | |
Net investment income | | | 43,960 | |
| | | | |
| |
REALIZED AND UNREALIZED GAIN (LOSS) | | | | |
Net realized gain (loss) from: | | | | |
Investments — affiliated | | | (440 | ) |
Investments — unaffiliated | | | 5,813 | |
Capital gain distributions from investment companies — affiliated | | | 13 | |
Forward foreign currency exchange contracts | | | (36,230 | ) |
Foreign currency transactions | | | 33,109 | |
Futures contracts | | | 65,902 | |
Swaps . . . . . | | | (20,358 | ) |
| | | | |
| | | 47,809 | |
| | | | |
Net change in unrealized appreciation (depreciation) on: | | | | |
Investments — affiliated | | | 281,171 | |
Investments — unaffiliated | | | 336,300 | |
Forward foreign currency exchange contracts | | | (45,969 | ) |
Foreign currency translations | | | 85,887 | |
Futures contracts | | | (13,305 | ) |
| | | | |
| | | 644,084 | |
| | | | |
Net realized and unrealized gain | | | 691,893 | |
| | | | |
NET INCREASE IN NET ASSETS RESULTING FROM OPERATIONS | | $ | 735,853 | |
| | | | |
See notes to financial statements.
Statements of Changes in Net Assets
| | | | | | | | |
| | | BlackRock Managed
Volatility V.I. Fund | |
| | | Year Ended December 31, | |
| | | | | | | | |
| | | 2017 | | | 2016 | |
| | |
INCREASE (DECREASE) IN NET ASSETS | | | | | | | | |
| | |
OPERATIONS | | | | | | | | |
Net investment income | | $ | 43,960 | | | $ | 29,723 | |
Net realized gain | | | 47,809 | | | | 58,388 | |
Net change in unrealized appreciation (depreciation) | | | 644,084 | | | | 172,795 | |
| | | | | | | | |
Net increase in net assets resulting from operations | | | 735,853 | | | | 260,906 | |
| | | | | | | | |
| | |
DISTRIBUTIONS TO SHAREHOLDERS(a) | | | | | | | | |
From net investment income | | | (50,000 | ) | | | (135,000 | ) |
From net realized gain | | | (98,699 | ) | | | — | |
| | | | | | | | |
Decrease in net assets resulting from distributions to shareholders | | | (148,699 | ) | | | (135,000 | ) |
| | | | | | | | |
| | |
CAPITAL SHARE TRANSACTIONS | | | | | | | | |
Shares sold | | | 563,708 | | | | 402,215 | |
Shares issued in reinvestment of distributions | | | 148,699 | | | | 135,000 | |
Shares redeemed | | | (2,658,517 | ) | | | (2,947,752 | ) |
| | | | | | | | |
Net decrease in net assets derived from capital share transactions | | | (1,946,110 | ) | | | (2,410,537 | ) |
| | | | | | | | |
| | |
NET ASSETS | | | | | | | | |
Total decrease in net assets | | | (1,358,956 | ) | | | (2,284,631 | ) |
Beginning of year | | | 15,894,986 | | | | 18,179,617 | |
| | | | | | | | |
End of year | | $ | 14,536,030 | | | $ | 15,894,986 | |
| | | | | | | | |
Distributions in excess of net investment income, end of year | | $ | (31,377 | ) | | $ | (31,273 | ) |
| | | | | | | | |
| (a) | Distributions for annual periods determined in accordance with U.S. federal income tax regulations. |
See notes to financial statements.
| | |
| 12 | | 2017 BLACKROCK ANNUAL REPORTTO SHAREHOLDERS |
Financial Highlights
(For a share outstanding throughout each period)
| | | | | | | | | | | | | | | | | | | | |
| | | BlackRock Managed Volatility V.I. Fund | |
| | | Class I | |
| | | Year Ended December 31, | |
| | | | | | | | | | | | | | | | | | | | |
| | | 2017 | | | 2016 | | | 2015 | | | 2014 | | | 2013 | |
Net asset value, beginning of year | | $ | 13.19 | | | $ | 13.08 | | | $ | 13.70 | | | $ | 14.41 | | | $ | 13.28 | |
| | | | | | | | | | | | | | | | | | | | |
Net investment income (loss)(a) | | | 0.04 | | | | 0.02 | (b) | | | (0.06 | ) | | | 0.04 | | | | 0.07 | |
Net realized and unrealized gain (loss) | | | 0.62 | | | | 0.20 | | | | (0.01 | ) | | | 0.29 | | | | 1.60 | |
| | | | | | | | | | | | | | | | | | | | |
Net increase (decrease) from investment operations | | | 0.66 | | | | 0.22 | | | | (0.07 | ) | | | 0.33 | | | | 1.67 | |
| | | | | | | | | | | | | | | | | | | | |
| Distributions:(c) | | | | | | | | | | | | | | | |
From net investment income | | | (0.05 | ) | | | (0.11 | ) | | | — | | | | — | | | | (0.13 | ) |
From net realized gain | | | (0.09 | ) | | | — | | | | (0.55 | ) | | | (1.04 | ) | | | (0.41 | ) |
| | | | | | | | | | | | | | | | | | | | |
Total distributions | | | (0.14 | ) | | | (0.11 | ) | | | (0.55 | ) | | | (1.04 | ) | | | (0.54 | ) |
| | | | | | | | | | | | | | | | | | | | |
Net asset value, end of year | | $ | 13.71 | | | $ | 13.19 | | | $ | 13.08 | | | $ | 13.70 | | | $ | 14.41 | |
| | | | | | | | | | | | | | | | | | | | |
| | | | | |
Total Return:(d) | | | | | | | | | | | | | | | | | | | | |
Based on net asset value | | | 4.98 | % | | | 1.71 | %(e) | | | (0.57 | )% | | | 2.28 | % | | | 12.62 | % |
| | | | | | | | | | | | | | | | | | | | |
| | | | | |
Ratios to Average Net Assets:(f) | | | | | | | | | | | | | | | | | | | | |
Total expenses | | | 1.48 | % | | | 1.39 | % | | | 1.47 | % | | | 1.60 | % | | | 1.78 | % |
| | | | | | | | | | | | | | | | | | | | |
Total expenses after fees waived and/or reimbursed | | | 0.89 | % | | | 0.94 | % | | | 1.00 | % | | | 1.07 | % | | | 1.23 | % |
| | | | | | | | | | | | | | | | | | | | |
Net investment income (loss) | | | 0.29 | % | | | 0.18 | %(b) | | | (0.46 | )% | | | 0.25 | % | | | 0.47 | % |
| | | | | | | | | | | | | | | | | | | | |
| | | | | |
Supplemental Data: | | | | | | | | | | | | | | | | | | | | |
Net assets, end of year (000) | | $ | 14,536 | | | $ | 15,895 | | | $ | 18,180 | | | $ | 21,283 | | | $ | 24,092 | |
| | | | | | | | | | | | | | | | | | | | |
Portfolio turnover rate(g) | | | 0 | % | | | 1 | % | | | 13 | % | | | 64 | % | | | 241 | % |
| | | | | | | | | | | | | | | | | | | | |
| (a) | Based on average shares outstanding. |
| (b) | Net investment income per share the ratio of net investment income to average net assets includes $0.02 per share and 0.19%, respectively, resulting from a one time payment from a third party administrator. |
| (c) | Distributions for annual periods determined in accordance with U.S. federal income tax regulations. |
| (d) | Where applicable, excludes insurance-related fees and expenses and assumes the reinvestment of distributions. |
| (e) | Includes reimbursements of out of pocket expenses from a third party administrator. Excluding this amount, the Fund’s total return is 1.48%. |
| (f) | Excludes expenses incurred indirectly as a result of investments in underlying funds as follows: |
| | | | | | | | | | | | | | | | | | | | | | | | | | | | | | | | | | | | | | | | |
| | | Year Ended December 31, | |
| | 2017 | | | | | | 2016 | | | | | | 2015 | | | | | | 2014 | | | | | | 2013 | | | | |
Investments in underlying funds | | | 0.23 | % | | | | | | | 0.25 | % | | | | | | | 0.23 | % | | | | | | | 0.23 | % | | | | | | | 0.22 | % | | | | |
| | | | | | | | | | | | | | | | | | | | | | | | | | | | | | | | | | | | | | | | |
| (g) | Includes mortgage dollar roll transactions (“MDRs”). Additional information regarding portfolio turnover rate is as follows: |
| | | | | | | | | | | | | | | | | | | | | | | | | | | | | | | | | | | | | | | | |
| | | Year Ended December 31, | |
| | 2017 | | | | | | 2016 | | | | | | 2015 | | | | | | 2014 | | | | | | 2013 | | | | |
Portfolio turnover rate (excluding MDRs) | | | 0 | % | | | | | | | 1 | % | | | | | | | 13 | % | | | | | | | 64 | % | | | | | | | 229 | % | | | | |
| | | | | | | | | | | | | | | | | | | | | | | | | | | | | | | | | | | | | | | | |
See notes to financial statements.
Notes to Financial Statements
BlackRock Variable Series Funds, Inc. (the “Company”) is registered under the Investment Company Act of 1940, as amended (the “1940 Act”), as an open-end management investment company. The Company is organized as a Maryland corporation that is comprised of 20 separate funds. The funds offer shares to insurance companies for their separate accounts to fund benefits under certain variable annuity and variable life insurance contracts. The financial statements presented are for BlackRock Managed Volatility V.I. Fund (the “Fund”). The Fund is classified as diversified.
The Fund, together with certain other registered investment companies advised by BlackRock Advisors, LLC (the “Manager”) or its affiliates, is included in a complex of open-end funds referred to as the Equity-Bond Complex.
Reorganization: At a meeting held on November 15, 2017, the Board of Directors of BlackRock Variable Series Funds, Inc. (the “Company”) and, at a meeting held on December 1, 2017, the Board of Trustees of HIMCO VIT Portfolio Diversifier Fund (the “Target Fund”) approved a reorganization of the Target Fund with and into the Fund. The reorganization is subject to shareholder approval by the Target Fund’s shareholders and certain other conditions.
| 2. | SIGNIFICANT ACCOUNTING POLICIES |
The financial statements are prepared in conformity with accounting principles generally accepted in the United States of America (“U.S. GAAP”), which may require management to make estimates and assumptions that affect the reported amounts of assets and liabilities in the financial statements, disclosure of contingent assets and liabilities at the date of the financial statements and the reported amounts of increases and decreases in net assets from operations during the reporting period. Actual results could differ from those estimates. The Fund is considered an investment company under U.S. GAAP and follows the accounting and reporting guidance applicable to investment companies. Below is a summary of significant accounting policies:
Investment Transactions and Income Recognition: For financial reporting purposes, investment transactions are recorded on the dates the transactions are entered into (the “trade dates”). Realized gains and losses on investment transactions are determined on the identified cost basis. Dividend income is recorded on the ex-dividend date. Dividends from foreign securities where the ex-dividend date may have passed are subsequently recorded when the Fund is informed of the ex-dividend date. Under the applicable foreign tax laws, a withholding tax at various rates may be imposed on capital gains, dividends and interest. Interest income, including amortization and accretion of premiums and discounts on debt securities, is recognized on an accrual basis.
Foreign Currency Translation: The Fund’s books and records are maintained in U.S. dollars. Securities and other assets and liabilities denominated in foreign currencies are translated into U.S. dollars using exchange rates determined as of the close of trading on the New York Stock Exchange (“NYSE”). Purchases and sales of investments are recorded at the rates of exchange prevailing on the respective dates of such transactions. Generally, when the U.S. dollar rises in value against a foreign currency, the investments denominated in that currency will lose value; the opposite effect occurs if the U.S. dollar falls in relative value.
The Fund does not isolate the portion of the results of operations arising as a result of changes in the exchange rates from the changes in the market prices of investments held or sold for financial reporting purposes. Accordingly, the effects of changes in exchange rates on investments are not segregated in the Statement of Operations from the effects of changes in market prices of those investments, but are included as a component of net realized and unrealized gain (loss) from investments. The Fund reports realized currency gains (losses) on foreign currency related transactions as components of net realized gain (loss) for financial reporting purposes, whereas such components are generally treated as ordinary income for U.S. federal income tax purposes.
Defensive Positions: Investment policies may vary for temporary defensive purposes during periods in which the investment adviser believes that conditions in the securities markets or other economic, financial or political conditions warrant. Under such conditions, the Fund may invest up to 100% of its total assets in U.S. Government securities, certificates of deposit, repurchase agreements that involve purchases of debt securities, bankers’ acceptances and other bank obligations, commercial paper, money market funds and/or other debt securities, or may hold its assets in cash. The investment adviser applies this defensive position as applicable and is consistent with the Fund’s investment policies.
Segregation and Collateralization: In cases where the Fund enters into certain investments (e.g., futures contracts), that would be treated as “senior securities” for 1940 Act purposes, the Fund may segregate or designate on its books and records cash or liquid assets having a market value at least equal to the amount of its future obligations under such investments. Doing so allows the investment to be excluded from treatment as a “senior security.” Furthermore, if required by an exchange or counterparty agreement, the Fund may be required to deliver/deposit cash and/or securities to/with an exchange, or broker-dealer or custodian as collateral for certain investments or obligations.
Distributions: Distributions paid by the Fund are recorded on the ex-dividend date. Distribution of capital gains are recorded on the ex-dividend date and made at least annually. The character and timing of distributions are determined in accordance with federal income tax regulations, which may differ from U.S. GAAP.
Recent Accounting Standards: In March 2017, the Financial Accounting Standards Board issued Accounting Standards Update “Premium Amortization of Purchased Callable Debt Securities” which amends the amortization period for certain purchased callable debt securities. Under the new guidance, the premium amortization of purchased callable debt securities that have explicit, non-contingent call features and are callable at fixed prices will be amortized to the earliest call date. The guidance will be applied on a modified retrospective basis and is effective for fiscal years, and their interim periods, beginning after December 15, 2018. Management is currently evaluating the impact of this guidance to the Fund.
Indemnifications: In the normal course of business, the Fund enters into contracts that contain a variety of representations that provide general indemnification. The Fund’s maximum exposure under these arrangements is unknown because it involves future potential claims against the Fund, which cannot be predicted with any certainty.
Other: Expenses directly related to the Fund are charged to the Fund. Other operating expenses shared by several funds, including other funds managed by the Manager, are prorated among those funds on the basis of relative net assets or other appropriate methods.
| | |
| 14 | | 2017 BLACKROCK ANNUAL REPORTTO SHAREHOLDERS |
Notes to Financial Statements (continued)
| 3. | INVESTMENT VALUATION AND FAIR VALUE MEASUREMENTS |
Investment Valuation Policies: The Fund’s investments are valued at fair value (also referred to as “market value” within the financial statements) as of the close of trading on the NYSE (generally 4:00 p.m., Eastern time) (or, if the reporting date falls on a day the NYSE is closed, investments are valued at fair value as of the period end). U.S. GAAP defines fair value as the price the Fund would receive to sell an asset or pay to transfer a liability in an orderly transaction between market participants at the measurement date. The Fund determines the fair values of its financial instruments using various independent dealers or pricing services under policies approved by the Board of Directors of the Company (the “Board”). The BlackRock Global Valuation Methodologies Committee (the “Global Valuation Committee”) is the committee formed by management to develop global pricing policies and procedures and to oversee the pricing function for all financial instruments.
Fair Value Inputs and Methodologies: The following methods and inputs are used to establish the fair value of the Fund’s assets and liabilities:
| | • | | Fixed-income securities for which market quotations are readily available are generally valued using the last available bid prices or current market quotations provided by independent dealers or third party pricing services. Floating rate loan interests are valued at the mean of the bid prices from one or more independent brokers or dealers as obtained from a third party pricing service. Pricing services generally value fixed-income securities assuming orderly transactions of an institutional round lot size, but the Fund may hold or transact in such securities in smaller, odd lot sizes. Odd lots may trade at lower prices than institutional round lots. The pricing services may use matrix pricing or valuation models that utilize certain inputs and assumptions to derive values, including transaction data (e.g., recent representative bids and offers), credit quality information, perceived market movements, news, and other relevant information. Certain fixed-income securities, including asset-backed and mortgage related securities may be valued based on valuation models that consider the estimated cash flows of each tranche of the entity, establish a benchmark yield and develop an estimated tranche specific spread to the benchmark yield based on the unique attributes of the tranche. The amortized cost method of valuation may be used with respect to debt obligations with sixty days or less remaining to maturity unless the Manager determines such method does not represent fair value. |
Generally, trading in foreign instruments is substantially completed each day at various times prior to the close of trading on the NYSE. Occasionally, events affecting the values of such instruments may occur between the foreign market close and the close of trading on the NYSE that may not be reflected in the computation of the Fund’s net assets.
| | • | | Exchange-traded funds (“ETFs”) traded on a recognized securities exchange are valued at the official closing price each day, if available. For ETFs traded on more than one exchange, the official closing price on the exchange where the stock is primarily traded is used. ETFs traded on a recognized exchange for which there were no sales on that day may be valued at the last available bid (long positions) or ask (short positions) price. |
| | • | | Investments in open-end U.S. mutual funds are valued at net asset value (“NAV”) each business day. |
| | • | | The Fund values its investment in SL Liquidity Series, LLC, Money Market Series (the “Money Market Series”) at fair value, which is ordinarily based upon its pro rata ownership in the underlying fund’s net assets. The Money Market Series seeks current income consistent with maintaining liquidity and preserving capital. Although the Money Market Series is not registered under the 1940 Act, its investments may follow the parameters of investments by a money market fund that is subject to Rule 2a-7 under the 1940 Act. |
| | • | | Futures contracts traded on exchanges are valued at their last sale price. |
| | • | | Forward foreign currency exchange contracts are valued at the mean between the bid and ask prices and are determined as of the close of trading on the NYSE. Interpolated values are derived when the settlement date of the contract is an interim date for which quotations are not available. |
If events (e.g., a company announcement, market volatility or a natural disaster) occur that are expected to materially affect the value of such investments, or in the event that the application of these methods of valuation results in a price for an investment that is deemed not to be representative of the market value of such investment, or if a price is not available, the investment will be valued by the Global Valuation Committee, or its delegate, in accordance with a policy approved by the Board as reflecting fair value (“Fair Valued Investments”). The fair valuation approaches that may be used by the Global Valuation Committee will include market approach, income approach and the cost approach. Valuation techniques such as discounted cash flow, use of market comparables and matrix pricing are types of valuation approaches and are typically used in determining fair value. When determining the price for Fair Valued Investments, the Global Valuation Committee, or its delegate, seeks to determine the price that the Fund might reasonably expect to receive or pay from the current sale or purchase of that asset or liability in an arm’s-length transaction. Fair value determinations shall be based upon all available factors that the Global Valuation Committee, or its delegate, deems relevant and consistent with the principles of fair value measurement. The pricing of all Fair Valued Investments is subsequently reported to the Board or a committee thereof on a quarterly basis.
Fair Value Hierarchy: Various inputs are used in determining the fair value of investments and derivative financial instruments. These inputs to valuation techniques are categorized into a fair value hierarchy consisting of three broad levels for financial statement purposes as follows:
| | • | | Level 1 — Unadjusted price quotations in active markets/exchanges for identical assets or liabilities that the Fund has the ability to access |
| | • | | Level 2 — Other observable inputs (including, but not limited to, quoted prices for similar assets or liabilities in markets that are active, quoted prices for identical or similar assets or liabilities in markets that are not active, inputs other than quoted prices that are observable for the assets or liabilities (such as interest rates, yield curves, volatilities, prepayment speeds, loss severities, credit risks and default rates) or other market–corroborated inputs) |
| | • | | Level 3 — Unobservable inputs based on the best information available in the circumstances, to the extent observable inputs are not available (including the Fund’s own assumptions used in determining the fair value of investments and derivative instruments) |
The hierarchy gives the highest priority to unadjusted quoted prices in active markets for identical assets or liabilities (Level 1 measurements) and the lowest priority to unobservable inputs (Level 3 measurements). Accordingly, the degree of judgment exercised in determining fair value is greatest for instruments categorized in Level 3.
| | | | |
| NOTESTO FINANCIAL STATEMENTS | | | 15 | |
Notes to Financial Statements (continued)
The inputs used to measure fair value may fall into different levels of the fair value hierarchy. In such cases, for disclosure purposes, the fair value hierarchy classification is determined based on the lowest level input that is significant to the fair value measurement in its entirety. Investments classified within Level 3 have significant unobservable inputs used by the Global Valuation Committee in determining the price for Fair Valued Investments. Level 3 investments include equity or debt issued by privately held companies or funds. There may not be a secondary market, and/or there are a limited number of investors. Level 3 investments may also be adjusted to reflect illiquidity and/or non-transferability, with the amount of such discount estimated by the Global Valuation Committee in the absence of market information.
Changes in valuation techniques may result in transfers into or out of an assigned level within the hierarchy. In accordance with the Fund’s policy, transfers between different levels of the fair value hierarchy are deemed to have occurred as of the beginning of the reporting period. The categorization of a value determined for investments and derivative financial instruments is based on the pricing transparency of the investments and derivative financial instruments and is not necessarily an indication of the risks associated with investing in those securities.
As of December 31, 2017, certain investments of the Fund were valued using NAV per share as no quoted market value is available and therefore have been excluded from the fair value hierarchy.
| 4. | SECURITIES AND OTHER INVESTMENTS |
Asset-Backed and Mortgage-Backed Securities: Asset-backed securities are generally issued as pass-through certificates or as debt instruments. Asset-backed securities issued as pass-through certificates represent undivided fractional ownership interests in an underlying pool of assets. Asset-backed securities issued as debt instruments, which are also known as collateralized obligations, are typically issued as the debt of a special purpose entity organized solely for the purpose of owning such assets and issuing such debt. Asset-backed securities are often backed by a pool of assets representing the obligations of a number of different parties. The yield characteristics of certain asset-backed securities may differ from traditional debt securities. One such major difference is that all or a principal part of the obligations may be prepaid at any time because the underlying assets (i.e., loans) may be prepaid at any time. As a result, a decrease in interest rates in the market may result in increases in the level of prepayments as borrowers, particularly mortgagors, refinance and repay their loans. An increased prepayment rate with respect to an asset-backed security will have the effect of shortening the maturity of the security. In addition, a fund may subsequently have to reinvest the proceeds at lower interest rates. If a fund has purchased such an asset-backed security at a premium, a faster than anticipated prepayment rate could result in a loss of principal to the extent of the premium paid.
For mortgage pass through securities (the “Mortgage Assets”) there are a number of important differences among the agencies and instrumentalities of the U.S. Government that issue mortgage-related securities and among the securities that they issue. For example, mortgage-related securities guaranteed by Ginnie Mae are guaranteed as to the timely payment of principal and interest by Ginnie Mae and such guarantee is backed by the full faith and credit of the United States. However, mortgage-related securities issued by Freddie Mac and Fannie Mae, including Freddie Mac and Fannie Mae guaranteed mortgage pass-through certificates, which are solely the obligations of Freddie Mac and Fannie Mae, are not backed by or entitled to the full faith and credit of the United States, but are supported by the right of the issuer to borrow from the U.S. Treasury.
Non-agency mortgage-backed securities are securities issued by non-governmental issuers and have no direct or indirect government guarantees of payment and are subject to various risks. Non-agency mortgage loans are obligations of the borrowers thereunder only and are not typically insured or guaranteed by any other person or entity. The ability of a borrower to repay a loan is dependent upon the income or assets of the borrower. A number of factors, including a general economic downturn, acts of God, terrorism, social unrest and civil disturbances, may impair a borrower’s ability to repay its loans.
Multiple Class Pass-Through Securities: Multiple class pass-through securities, including collateralized mortgage obligations (“CMOs”) and commercial mortgage-backed securities may be issued by Ginnie Mae, U.S. Government agencies or instrumentalities or by trusts formed by private originators of, or investors in, mortgage loans. In general, CMOs are debt obligations of a legal entity that are collateralized by, a pool of residential or commercial mortgage loans or Mortgage Assets. The payments on these are used to make payments on the CMOs or multiple pass-through securities. Multiple class pass-through securities represent direct ownership interests in the Mortgage Assets. Classes of CMOs include interest only (“IOs”), principal only (“POs”), planned amortization classes and targeted amortization classes. IOs and POs are stripped mortgage-backed securities representing interests in a pool of mortgages, the cash flow from which has been separated into interest and principal components. IOs receive the interest portion of the cash flow while POs receive the principal portion. IOs and POs can be extremely volatile in response to changes in interest rates. As interest rates rise and fall, the value of IOs tends to move in the same direction as interest rates. POs perform best when prepayments on the underlying mortgages rise since this increases the rate at which the principal is returned and the yield to maturity on the PO. When payments on mortgages underlying a PO are slower than anticipated, the life of the PO is lengthened and the yield to maturity is reduced. If the underlying Mortgage Assets experience greater than anticipated prepayments of principal, a fund’s initial investment in the IOs may not fully recoup.
Securities Lending: A fund may lend its securities to approved borrowers, such as brokers, dealers and other financial institutions. The borrower pledges and maintains with a fund collateral consisting of cash, an irrevocable letter of credit issued by a bank, or securities issued or guaranteed by the U.S. Government. The initial collateral received by a fund is required to have a value of at least 102% of the current value of the loaned securities for securities traded on U.S. exchanges and a value of at least 105% for all other securities. The collateral is maintained thereafter, at a value equal to at least 100% of the current market value of the securities on loan. The market value of the loaned securities is determined at the close of each business day of a fund and any additional required collateral is delivered to a fund, or excess collateral returned by a fund, on the next business day. During the term of the loan, a fund is entitled to all distributions made on or in respect of the loaned securities, but does not receive interest income on securities received as collateral. Loans of securities are terminable at any time and the borrower, after notice, is required to return borrowed securities within the standard time period for settlement of securities transactions.
The market value of any securities on loan, all of which were classified as investment companies in a fund’s Schedule of Investments, and the value of any related collateral are shown separately in the Statement of Assets and Liabilities as a component of investments at value-unaffiliated, and collateral on securities loaned at value, respectively. As of period end, any securities on loan were collateralized by cash and/or U.S. Government obligations. Cash collateral invested by the securities lending agent, BlackRock Investment Management, LLC (“BIM”), if any, is disclosed in the Schedule of Investments.
| | |
| 16 | | 2017 BLACKROCK ANNUAL REPORTTO SHAREHOLDERS |
Notes to Financial Statements (continued)
Securities lending transactions are entered into by a fund under Master Securities Lending Agreements (each, an “MSLA”), which provide the right, in the event of default (including bankruptcy or insolvency), for the non-defaulting party to liquidate the collateral and calculate a net exposure to the defaulting party or request additional collateral. In the event that a borrower defaults, a fund, as lender, would offset the market value of the collateral received against the market value of the securities loaned. When the value of the collateral is greater than that of the market value of the securities loaned, the lender is left with a net amount payable to the defaulting party. However, bankruptcy or insolvency laws of a particular jurisdiction may impose restrictions on or prohibitions against such a right of offset in the event of an MSLA counterparty’s bankruptcy or insolvency. Under the MSLA, absent an event of default, the borrower can resell or re-pledge the loaned securities, and a fund can reinvest cash collateral received in connection with loaned securities. Upon an event of default, the parties’ obligations to return the securities or collateral to the other party are extinguished, and the parties can resell or re-pledge the loaned securities or the collateral received in connection with the loaned securities in order to satisfy the defaulting party’s net payment obligation for all transactions under the MSLA. The defaulting party remains liable for any deficiency.
As of period end, the following table is a summary of the Fund’s securities lending agreements by counterparty which are subject to offset under an MSLA:
| | | | | | | | | | | | |
| Counterparty | | Securities
Loaned at Value | | | Cash Collateral
Received (a) | | | Net
Amount | |
Deutsche Bank Securities Inc. | | $ | 28,430 | | | $ | (28,430 | ) | | $ | — | |
JP Morgan Securities LLC | | | 1,869,543 | | | | (1,869,543 | ) | | | — | |
| | | | | | | | | | | | |
| | $ | 1,897,973 | | | $ | (1,897,973 | ) | | $ | — | |
| | | | | | | | | | | | |
| | (a) | Cash collateral with a value of $1,935,650 has been received in connection with securities lending agreements. Collateral received in excess of the value of securities loaned from the individual counterparty is not shown for financial reporting purposes in the table above. | |
The risks of securities lending include the risk that the borrower may not provide additional collateral when required or may not return the securities when due. To mitigate these risks, the Fund benefits from a borrower default indemnity provided by BIM. BIM’s indemnity allows for full replacement of the securities loaned if the collateral received does not cover the value on the securities loaned in the event of borrower default. The Fund could incur a loss if the value of an investment purchased with cash collateral falls below the market value of loaned securities or if the value of an investment purchased with cash collateral falls below the value of the original cash collateral received.
| 5. | DERIVATIVE FINANCIAL INSTRUMENTS |
The Fund engages in various portfolio investment strategies using derivative contracts both to increase the returns of the Fund and/or to manage its exposure to certain risks such as credit risk, equity risk, interest rate risk, foreign currency exchange rate risk, commodity price risk or other risks (e.g., inflation risk). Derivative financial instruments categorized by risk exposure are included in the Schedule of Investments. These contracts may be transacted on an exchange or over-the-counter (“OTC”).
Futures Contracts: Futures contracts are purchased or sold to gain exposure to, or manage exposure to changes in interest rates (interest rate risk), changes in the value of equity securities (equity risk) or foreign currencies (foreign currency exchange rate risk).
Futures contracts are agreements between the Fund and a counterparty to buy or sell a specific quantity of an underlying instrument at a specified price and on a specified date. Depending on the terms of a contract, it is settled either through physical delivery of the underlying instrument on the settlement date or by payment of a cash amount on the settlement date. Upon entering into a futures contract, the Fund is required to deposit initial margin with the broker in the form of cash or securities in an amount that varies depending on a contract’s size and risk profile. The initial margin deposit must then be maintained at an established level over the life of the contract.
Securities deposited as initial margin are designated in the Schedule of Investments and cash deposited, if any, is shown as cash pledged for futures contracts in the Statement of Assets and Liabilities. Pursuant to the contract, the Fund agrees to receive from or pay to the broker an amount of cash equal to the daily fluctuation in market value of the contract (“variation margin”). Variation margin is recorded as unrealized appreciation (depreciation) and, if any, shown as variation margin receivable (or payable) on futures contracts in the Statement of Assets and Liabilities. When the contract is closed, a realized gain or loss is recorded in the Statement of Operations equal to the difference between the notional amount of the contract at the time it was opened and the notional amount at the time it was closed. The use of futures contracts involves the risk of an imperfect correlation in the movements in the price of futures contracts and interest, foreign currency exchange rates or underlying assets.
Forward Foreign Currency Exchange Contracts: The Fund enters into forward foreign currency exchange contracts to gain or reduce exposure, to foreign currencies (foreign currency exchange rate risk).
A forward foreign currency exchange contract is an agreement between two parties to buy and sell a currency at a set exchange rate on a specified date. These contracts help to manage the overall exposure to the currencies in which some of the investments held by the Fund are denominated and in some cases, may be used to obtain exposure to a particular market.
The contract is marked-to-market daily and the change in market value is recorded as unrealized appreciation (depreciation) in the Statement of Assets and Liabilities. When a contract is closed, a realized gain or loss is recorded in the Statement of Operations equal to the difference between the value at the time it was opened and the value at the time it was closed. Non-deliverable forward foreign currency exchange contracts are settled with the counterparty in cash without the delivery of foreign currency. The use of forward foreign currency exchange contracts involves the risk that the value of a forward foreign currency exchange contract changes unfavorably due to movements in the value of the referenced foreign currencies.
| 6. | INVESTMENT ADVISORY AGREEMENT AND OTHER TRANSACTIONS WITH AFFILIATES |
The PNC Financial Services Group, Inc. is the largest stockholder and an affiliate of BlackRock, Inc. (“BlackRock”) for 1940 Act purposes.
| | | | |
| NOTESTO FINANCIAL STATEMENTS | | | 17 | |
Notes to Financial Statements (continued)
Investment Advisory: The Company, on behalf of the Fund, entered into an Investment Advisory Agreement with the Manager, the Fund’s investment adviser, an indirect, wholly-owned subsidiary of BlackRock, to provide investment advisory and administrative services. The Manager is responsible for the management of the Fund’s portfolio and provides the personnel, facilities, equipment and certain other services necessary to the operations of the Fund.
For such services, the Fund pays the Manager a monthly fee at an annual rate equal to the following percentages of the average daily value of the Fund’s net assets:
| | | | |
| Average Daily Net Assets | | Investment
Advisory Fees | |
First $1 Billion | | | 0.55 | % |
$1 Billion — $3 Billion | | | 0.52 | |
$3 Billion — $5 Billion | | | 0.50 | |
$5 Billion — $10 Billion | | | 0.48 | |
Greater than $10 Billion | | | 0.47 | |
With respect to the Fund, the Manager entered into sub-advisory agreements with BlackRock International Limited (“BIL”), BlackRock Asset Management North Asia Limited (“BNA”) and BlackRock (Singapore) Limited (“BSL”), each an affiliate of the Manager. The Manager pays BIL, BNA and BSL, for services they provide, a monthly fee that is a percentage of the investment advisory fees paid by the Fund to the Manager.
Distribution Fees: The Company, on behalf of the Fund, entered into a Distribution Agreement and a Distribution Plan with BlackRock Investments, LLC (“BRIL”), an affiliate of the Manager. Pursuant to the Distribution Plan and in accordance with Rule 12b-1 under the 1940 Act, the Fund pays BRIL ongoing distribution fees. The fees are accrued daily and paid monthly at annual rates based upon the average daily net assets of the relevant share class of the Fund. For the year ended December 31, 2017, the Fund had no distribution fees.
Transfer Agent: On behalf of the Fund, the Manager entered into agreements with insurance companies and other financial intermediaries (“Service Organizations”), some of which may be affiliates. Pursuant to these agreements, the Service Organizations provide the Fund with administrative, networking, recordkeeping, sub-transfer agency and shareholder services to sub-accounts they service. For these services, the Service Organizations receive an annual fee per shareholder account, which will vary depending on share class and/or net assets of Fund shareholders serviced by the Service Organizations, which is shown as transfer agent — class specific. For the year ended December 31, 2017, the Fund did not pay any amounts to affiliates in return for these services.
In addition, the Fund pays the transfer agent, which is not an affiliate, a fee for issuance, transfer and redemption of shares and the opening and maintenance of shareholder accounts, which is included in transfer agent in the Statement of Operations.
Expense Limitations, Waivers and Reimbursements: With respect to the Fund, the Manager voluntarily agreed to waive its investment advisory fees by the amount of investment advisory fees the Fund pays to the Manager indirectly through its investment in affiliated money market funds (the “affiliated money market fund waiver”). The amount of waivers and/or reimbursements of fees and expenses made pursuant to the expense limitation will be reduced by the amount of the affiliated money market fund waiver. This amount is included in fees waived and/or reimbursed by the Manager in the Statement of Operations. For the year ended December 31, 2017, the amount waived was $2,563.
The Manager has contractually agreed to waive its investment advisory fee with respect to any portion of the Fund’s assets invested in affiliated equity and fixed-income mutual funds and affiliated exchange-traded funds that have a contractual management fee through April 30, 2018. The contractual agreement may be terminated upon 90 days’ notice by a majority of the independent directors who are not “interested persons” of the Fund, as defined in the 1940 Act (“Independent Directors”) or by a vote of a majority of the outstanding voting securities of the Fund. This amount is included in fees waived and/or reimbursed by the Manager in the Statement of Operations. For the year ended December 31, 2017, the Fund waived $27,947 in investment advisory fees pursuant to these arrangements.
For the year ended December 31, 2017, the Fund reimbursed the Manager $183 for certain accounting services, which is included in accounting services in the Statement of Operations.
The Manager has contractually agreed to reimburse all transfer agent fees for Class I Shares.
The Manager has agreed not to reduce or discontinue this contractual expense limitation through April 30, 2018, unless approved by the Board, including a majority of the Independent Directors or by a vote of a majority of the outstanding voting securities of the Fund.
These amounts waived and/or reimbursed are shown as transfer agent fees reimbursed — class specific in the Statement of Operations. For the year ended December 31, 2017, class specific expense waivers and/or reimbursements were $29,416.
With respect to the Fund, the Manager contractually agreed to waive and/or reimburse fees or expenses in order to limit expenses, excluding interest expense, dividend expense, tax expense, acquired fund fees and expenses, and certain other fund expenses, which constitute extraordinary expenses not incurred in the ordinary course of the Fund’s business (“expense limitation”). The expense limitation as a percentage of average daily net assets is 1.00% for Class I.
The Manager has agreed not to reduce or discontinue this contractual expense limitation through April 30, 2018 unless approved by the Board, including a majority of the Independent Directors or by a vote of a majority of the outstanding voting securities of the Fund. This amount is included in fees waived and/or reimbursed by the Manager in the Statement of Operations. For the year ended December 31, 2017, the amount waived was $35,484.
Securities Lending: The U.S. Securities and Exchange Commission (“SEC”) has issued an exemptive order which permits BIM, an affiliate of the Manager, to serve as securities lending agent for the Fund, subject to applicable conditions. As securities lending agent, BIM bears all operational costs directly related to securities lending. The Fund is responsible for expenses in connection with the investment of cash collateral received for securities on loan (the “collateral investment expenses”). The cash
| | |
| 18 | | 2017 BLACKROCK ANNUAL REPORTTO SHAREHOLDERS |
Notes to Financial Statements (continued)
collateral is invested in a private investment company managed by the Manager or its affiliates. However, BIM has agreed to cap the collateral investment expenses of the private investment company to an annual rate of 0.04%. The investment adviser to the private investment company will not charge any advisory fees with respect to shares purchased by the Fund. The private investment company in which the cash collateral has been invested may, under certain circumstances, impose a liquidity fee of up to 2% of the value withdrawn or temporarily restrict withdrawals for up to 10 business days during a 90 day period, in the event that the private investment company’s weekly liquid assets fall below certain thresholds.
Securities lending income is equal to the total of income earned from the reinvestment of cash collateral, net of fees and other payments to and from borrowers of securities, and less the collateral investment expenses. The Fund retains a portion of securities lending income and remits a remaining portion to BIM as compensation for its services as securities lending agent.
Pursuant to a securities lending agreement, the Fund retains 80% of securities lending income, and this amount retained can never be less than 70% of the total of securities lending income plus the collateral investment expenses.
In addition, commencing the business day following the date that the aggregate securities lending income earned across the Equity-Bond Complex in a calendar year exceeds a specified threshold, the Fund, pursuant to the securities lending agreement, will retain for the remainder of that calendar year securities lending income in an amount equal to 85% of securities lending income, and this amount retained can never be less than 70% of the total of securities lending income plus the collateral investment expenses.
The share of securities lending income earned by the Fund is shown as securities lending income — affiliated — net in the Statement of Operations. For the year ended December 31, 2017, the Fund paid BIM $871 for securities lending agent services.
Officers and Directors: Certain directors and/or officers of the Company are directors and/or officers of BlackRock or its affiliates. The Fund reimburses the Manager for a portion of the compensation paid to the Company’s Chief Compliance Officer, which is included in Directors and Officer in the Statement of Operations.
For the year ended December 31, 2017, sales of investments, including paydowns and excluding short-term securities, were $19,528. For the year ended December 31, 2017, there were no purchases.
It is the Fund’s policy to comply with the requirements of the Internal Revenue Code of 1986, as amended, applicable to regulated investment companies, and to distribute substantially all of its taxable income to its shareholders. Therefore, no federal income tax provision is required.
The Fund files U.S. federal and various state and local tax returns. No income tax returns are currently under examination. The statute of limitations on the Fund’s U.S. federal tax returns generally remains open for each of the four years ended December 31, 2017. The statutes of limitations on the Fund’s state and local tax returns may remain open for an additional year depending upon the jurisdiction.
Management has analyzed tax laws and regulations and their application to the Fund as of December 31, 2017, inclusive of the open tax return years, and does not believe that there are any uncertain tax positions that require recognition of a tax liability in the Fund’s financial statements.
U.S. GAAP requires that certain components of net assets be adjusted to reflect permanent differences between financial and tax reporting. These reclassifications have no effect on net assets or net asset values per share. As of period end, the following permanent differences attributable to foreign currency transactions were reclassified to the following accounts:
| | | | |
Distributions in excess of net investment income | | $ | 5,936 | |
Accumulated net realized loss | | $ | (5,936 | ) |
The tax character of distributions paid was as follows:
| | | | | | | | |
| | | 12/31/2017 | | | 12/31/2016 | |
Ordinary income | | $ | 93,042 | | | $ | 135,000 | |
Long-term capital gains | | | 55,657 | | | | — | |
| | | | | | | | |
| | $ | 148,699 | | | $ | 135,000 | |
| | | | | | | | |
As of December 31, 2017, the tax components of accumulated net earnings (losses) were as follows:
| | | | |
Undistributed ordinary income | | $ | 20,935 | |
Net unrealized losses(a) | | | (139,992 | ) |
Qualified late-year losses(b) | | | (78,323 | ) |
| | | | |
| | $ | (197,380 | ) |
| | | | |
| | (a) | The difference between book-basis and tax-basis net unrealized losses was attributable primarily to the realization for tax purposes of unrealized gains/losses on certain futures and forward contracts and the timing and recognition of partnership income. | |
| | (b) | The Fund has elected to defer certain qualified late-year losses and recognize such losses in the tax taxable year. | |
| | | | |
| NOTESTO FINANCIAL STATEMENTS | | | 19 | |
Notes to Financial Statements (continued)
As of December 31, 2017, gross unrealized appreciation and depreciation for investments and derivatives based on cost for U.S. federal income tax purposes were as follows:
| | | | |
Tax cost | | $ | 15,268,988 | |
| | | | |
Gross unrealized appreciation | | $ | 181,488 | |
Gross unrealized depreciation | | | (336,398 | ) |
| | | | |
Net unrealized appreciation(depreciation) | | $ | (154,910 | ) |
| | | | |
The Company, on behalf of the Fund, along with certain other funds managed by the Manager and its affiliates (“Participating Funds”), is a party to a 364-day, $2.1 billion credit agreement with a group of lenders. Under this agreement, the Fund may borrow to fund shareholder redemptions. Excluding commitments designated for certain individual funds, the Participating Funds, including the Fund, can borrow up to an aggregate commitment amount of $1.6 billion at any time outstanding, subject to asset coverage and other limitations as specified in the agreement. The credit agreement has the following terms: a fee of 0.12% per annum on unused commitment amounts and interest at a rate equal to the higher of (a) one-month LIBOR (but, in any event, not less than 0.00%) on the date the loan is made plus 0.80% per annum or (b) the Fed Funds rate (but, in any event, not less than 0.00%) in effect from time to time plus 0.80% per annum on amounts borrowed. The agreement expires in April 2018 unless extended or renewed. Participating Funds paid administration, legal and arrangement fees, which, if applicable, are included in miscellaneous expenses in the Statement of Operations. These fees were allocated among such funds based upon portions of the aggregate commitment available to them and relative net assets of Participating Funds. During the year ended December 31, 2017, the Fund did not borrow under the credit agreement.
In the normal course of business, the Fund invests in securities or other instruments and may enter into certain transactions, and such activities subject the Fund to various risks, including among others, fluctuations in the market (market risk) or failure of an issuer to meet all of its obligations. The value of securities or other instruments may also be affected by various factors, including, without limitation: (i) the general economy; (ii) the overall market as well as local, regional or global political and/or social instability; (iii) regulation, taxation or international tax treaties between various countries; or (iv) currency, interest rate and price fluctuations. The Fund’s prospectus provides details of the risks to which the Fund is subject.
The Fund may be exposed to prepayment risk, which is the risk that borrowers may exercise their option to prepay principal earlier than scheduled during periods of declining interest rates, which would force the Fund to reinvest in lower yielding securities. The Fund may also be exposed to reinvestment risk, which is the risk that income from the Fund’s portfolio will decline if the Fund invests the proceeds from matured, traded or called fixed income securities at market interest rates that are below the Fund portfolio’s current earnings rate.
Valuation Risk: The market values of equities, such as common stocks and preferred securities or equity related investments, such as futures and options, may decline due to general market conditions which are not specifically related to a particular company. They may also decline due to factors which affect a particular industry or industries. The Fund may invest in illiquid investments and may experience difficulty in selling those investments in a timely manner at the price that it believes the investments are worth. Prices may fluctuate widely over short or extended periods in response to company, market or economic news. Markets also tend to move in cycles, with periods of rising and falling prices. This volatility may cause the Fund’s NAV to experience significant increases or decreases over short periods of time. If there is a general decline in the securities and other markets, the NAV of the Fund may lose value, regardless of the individual results of the securities and other instruments in which the Fund invests.
Counterparty Credit Risk: The Fund may be exposed to counterparty credit risk, or the risk that an entity may fail to or be unable to perform on its commitments related to unsettled or open transactions. The Fund manages counterparty credit risk by entering into transactions only with counterparties that the Manager believes have the financial resources to honor their obligations and by monitoring the financial stability of those counterparties. Financial assets, which potentially expose the Fund to market, issuer and counterparty credit risks, consist principally of financial instruments and receivables due from counterparties. The extent of the Fund’s exposure to market, issuer and counterparty credit risks with respect to these financial assets is approximately their value recorded in the Statement of Assets and Liabilities, less any collateral held by the Fund.
A derivative contract may suffer a mark-to-market loss if the value of the contract decreases due to an unfavorable change in the market rates or values of the underlying instrument. Losses can also occur if the counterparty does not perform under the contract.
The Fund’s risk of loss from counterparty credit risk on OTC derivatives is generally limited to the aggregate unrealized gain less the value of any collateral held by the Fund.
With exchange-traded futures, there is less counterparty credit risk to the Fund since the exchange or clearinghouse, as counterparty to such instruments, guarantees against a possible default. The clearinghouse stands between the buyer and the seller of the contract; therefore, credit risk is limited to failure of the clearinghouse. While offset rights may exist under applicable law, the Fund does not have a contractual right of offset against a clearing broker or clearinghouse in the event of a default (including the bankruptcy or insolvency). Additionally, credit risk exists in exchange-traded futures with respect to initial and variation margin that is held in a clearing broker’s customer accounts. While clearing brokers are required to segregate customer margin from their own assets, in the event that a clearing broker becomes insolvent or goes into bankruptcy and at that time there is a shortfall in the aggregate amount of margin held by the clearing broker for all its clients, typically the shortfall would be allocated on a pro rata basis across all the clearing broker’s customers, potentially resulting in losses to the Fund.
| | |
| 20 | | 2017 BLACKROCK ANNUAL REPORTTO SHAREHOLDERS |
Notes to Financial Statements (continued)
| 11. | CAPITAL SHARE TRANSACTIONS |
Transactions in capital shares were as follows:
| | | | | | | | | | | | | | | | |
| | | Year Ended
12/31/2017 | | | Year Ended
12/31/2016 | |
| Share Class | | Shares | | | Amount | | | Shares | | | Amount | |
Class I | | | | | | | | | | | | | | | | |
Shares sold | | | 41,987 | | | $ | 563,708 | | | | 30,752 | | | $ | 402,215 | |
Shares issued in reinvestment of distributions | | | 10,985 | | | | 148,699 | | | | 10,251 | | | | 135,000 | |
Shares redeemed | | | (197,978 | ) | | | (2,658,517 | ) | | | (226,177 | ) | | | (2,947,752 | ) |
| | | | | | | | | | | | | | | | |
Net decrease | | | (145,006 | ) | | $ | (1,946,110 | ) | | | (185,174 | ) | | $ | (2,410,537 | ) |
| | | | | | | | | | | | | | | | |
Management has evaluated the impact of all subsequent events on the Fund through the date the financial statements were issued and has determined that there were no subsequent events requiring adjustment or additional disclosure in the financial statements.
| | | | |
| NOTESTO FINANCIAL STATEMENTS | | | 21 | |
Report of the Independent Registered Public Accounting Firm
To the Shareholders of BlackRock Managed Volatility V.I. Fund and the Board of Directors of BlackRock Variable Series Funds, Inc.:
Opinion on the Financial Statements and Financial Highlights
We have audited the accompanying statement of assets and liabilities, including the schedule of investments, of BlackRock Managed Volatility V.I. Fund of BlackRock Variable Series Funds, Inc. (the “Fund”), as of December 31, 2017, the related statement of operations for the year then ended, the statements of changes in net assets for each of the two years in the period then ended, the financial highlights for each of the five years in the period then ended, and the related notes. In our opinion, the financial statements and financial highlights present fairly, in all material respects, the financial position of the Fund as of December 31, 2017, and the results of its operations for the year then ended, the changes in its net assets for each of the two years in the period then ended, and the financial highlights for each of the five years in the period then ended, in conformity with accounting principles generally accepted in the United States of America.
Basis for Opinion
These financial statements and financial highlights are the responsibility of the Fund’s management. Our responsibility is to express an opinion on the Fund’s financial statements and financial highlights based on our audits. We are a public accounting firm registered with the Public Company Accounting Oversight Board (United States) (PCAOB) and are required to be independent with respect to the Fund in accordance with the U.S. federal securities laws and the applicable rules and regulations of the Securities and Exchange Commission and the PCAOB.
We conducted our audits in accordance with the standards of the PCAOB. Those standards require that we plan and perform the audit to obtain reasonable assurance about whether the financial statements and financial highlights are free of material misstatement, whether due to error or fraud. The Fund is not required to have, nor were we engaged to perform, an audit of its internal control over financial reporting. As part of our audits we are required to obtain an understanding of internal control over financial reporting but not for the purpose of expressing an opinion on the effectiveness of the Fund’s internal control over financial reporting. Accordingly, we express no such opinion.
Our audits included performing procedures to assess the risks of material misstatement of the financial statements and financial highlights, whether due to error or fraud, and performing procedures that respond to those risks. Such procedures included examining, on a test basis, evidence regarding the amounts and disclosures in the financial statements and financial highlights. Our audits also included evaluating the accounting principles used and significant estimates made by management, as well as evaluating the overall presentation of the financial statements and financial highlights. Our procedures included confirmation of securities owned as of December 31, 2017, by correspondence with the custodian and brokers; when replies were not received from brokers, we performed other auditing procedures. We believe that our audits provide a reasonable basis for our opinion.
Deloitte & Touche LLP
Boston, Massachusetts
February 19, 2018
We have served as the auditor of one or more BlackRock investment companies since 1992.
| | |
| 22 | | 2017 BLACKROCK ANNUAL REPORTTO SHAREHOLDERS |
Glossary of Terms Used in this Report
| | |
| Currency |
| |
| AUD | | Australian Dollar |
| CAD | | Canadian Dollar |
| CHF | | Swiss Franc |
| DKK | | Danish Krone |
| EUR | | Euro |
| GBP | | British Pound |
| HKD | | Hong Kong Dollar |
| JPY | | Japanese Yen |
| MXN | | Mexican Peso |
| SEK | | Swedish Krona |
| USD | | United States Dollar |
|
| Portfolio Abbreviations |
| |
| ABS | | Asset-Backed Security |
| CWABS | | Countrywide Asset-Backed Certificates |
| CSMC | | Credit Suisse Mortgage Capital |
| ETF | | Exchange-Traded Fund |
| | | | |
| GLOSSARYOF TERMS USEDINTHIS REPORT | | | 23 | |
DECEMBER 31, 2017
| | |
ANNUAL REPORT | |  |
BlackRock Variable Series Funds, Inc.
| Ø | | BlackRock S&P 500 Index V.I. Fund |
|
| Not FDIC Insured • May Lose Value • No Bank Guarantee |
| | |
| Fund Summary as of December 31, 2017 | | BlackRock S&P 500 Index V.I. Fund |
Investment Objective
BlackRock S&P 500 Index V.I. Fund’s (the “Fund”) investment objective is to seek investment results that, before expenses, correspond to the aggregate price and yield performance of the Standard and Poor’s (“S&P”) 500® Index.
At a meeting held on November 15, 2017, the Board of Directors of BlackRock Variable Series Funds, Inc. (the “Company”) and, at a meeting held on December 1, 2017, the Board of Trustees of HIMCO VIT Index Fund (the “Target Fund”) approved a reorganization of the Target Fund with and into the Fund. The reorganization is subject to shareholder approval by the Target Fund’s shareholders and certain other conditions.
Portfolio Management Commentary
How did the Fund perform?
For the 12-month period ended December 31, 2017, the Fund’s Class I and Class II Shares returned 21.50% and 21.31%, respectively, while the benchmark S&P 500® Index returned 21.83% for the same period.
Returns for the Fund’s respective share classes differ from the benchmark index based on individual share-class expenses.
Describe the market environment.
The reflation trade in the United States continued to gain steam in the first quarter of the year. Macro data highlighted continued economic growth and a strengthening labor market, which supported the U.S. Federal Reserve’s (the “Fed”) decision to increase the federal funds rate by 25 basis points (0.25%) in March, marking the second rate hike in the past six months. The Fed’s summary of economic projections indicated that they will maintain a gradual pace of tightening should current economic trends continue.
Expectations of the new administration’s policies also boosted market sentiment, sending several U.S. equity indices to record highs. The inauguration of President Trump in late January stoked risk-on appetite, as pledges of tax relief and increased fiscal spending were supportive of cyclical stocks. However, the final weeks of the first quarter saw some profit taking as investor optimism waned after the failed attempt to repeal the Affordable Care Act called into question whether the new administration will be able to push through further reforms in 2017. Despite these setbacks, U.S. equities in the first quarter finished strong and the 10-year Treasury yield added 31 basis points in the quarter.
In the second quarter of 2017, political risk was a headwind to U.S. equities. President Trump’s firing of FBI Director James Comey on May 9 and the subsequent developments regarding the investigation of pre-election correspondence between Trump administration members and Russian officials was an enduring source of negative market sentiment. The largest single day fall of the S&P 500® in the quarter came in the wake of the House Oversight Committee’s request for all documents from the meetings between President Trump and Comey on May 17.
Although the Fed continued their monetary policy normalization, the yield on the 10-year U.S. Treasury compressed by nine basis points to 2.31% in the second quarter. The Fed increased the federal funds rate by 25 basis points at the June meeting, to between 1% and 1.25%, citing strength in the labor market and business spending, despite relatively weak inflation trends throughout the quarter.
Investors focused on sustained corporate earnings expansion, a subdued interest rate environment, and a healthy economic backdrop over threats from an increasingly hostile North Korea and a damaging hurricane season in the third quarter. This backdrop pushed volatility to the lowest levels in recorded history, with the Chicago Board Options Exchange Volatility Index averaging a record low of 10.94 in the quarter.
Domestic rates moved modestly higher as investors’ balanced news on the monetary, fiscal, and geopolitical fronts. In the September Federal Open Market Committee (“FOMC”) announcement, the committee revealed they would keep interest rates unchanged and initiate their balance sheet normalization in October. Additionally, amid short term hurricane related inflationary and economic growth pressures, the FOMC found inflation to remain somewhat below 2% in the near term, but expects it to stabilize around 2% by 2019. Real gross domestic product (“GDP”) growth was revised higher for 2017, from 2.2% to 2.4%. The 10-year U.S. Treasury yield ended the third quarter 2 basis points higher, to 2.33%.
The U.S. economy continued to demonstrate strength throughout the fourth quarter. Unemployment fell to 4.1%, the lowest level since 2000. Additional highlights that helped strengthen investor confidence in the macro picture included that nominal third quarter GDP surged 4.1% year-over-year, real GDP increased 2.3% year-over-year, and broad aggregate S&P 500® earnings growth was 6.6%. This optimism was expressed throughout many soft indicators. For example, both the University of Michigan Consumer Sentiment Survey and the National Federation of Independent Business Small Business Optimism Index reached 13-year highs in the quarter.
The strongest returns in the S&P 500® Index as of December 31 came from information technology (+38.84%). Increases were seen across most sectors, with notable results in materials (+23.84%) and consumer discretionary (+22.97%). In contrast, telecommunication services (-1.25%) and energy (-0.99%) experienced negative returns for the year.
Describe recent portfolio activity.
During the period, as changes were made to the composition of the S&P 500® Index, the Fund purchased and sold securities to maintain its objective of replicating the risks and return of the benchmark index.
Describe portfolio positioning at period end.
The Fund is positioned to match the risk characteristics of its benchmark index, irrespective of the market’s future direction.
The views expressed reflect the opinions of BlackRock as of the date of this report and are subject to change based on changes in market, economic or other conditions. These views are not intended to be a forecast of future events and are no guarantee of future results.
| | |
| 2 | | 2017 BLACKROCK ANNUAL REPORTTO SHAREHOLDERS |
| | |
| Fund Summary as of December 31, 2017 (continued) | | BlackRock S&P 500 Index V.I. Fund |
TOTAL RETURN BASED ON A $10,000 INVESTMENT
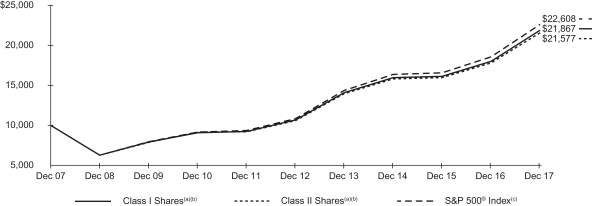
| | (a) | Assuming transaction costs, if any, and other operating expenses, including investment advisory fees. Does not include insurance-related fees and expenses. | |
| | (b) | Under normal circumstances, the Fund invests at least 80% of its assets in the common stocks represented in the S&P 500® Index and in derivative instruments linked to the S&P 500® Index. | |
| | (c) | An unmanaged index that covers 500 leading companies and captures approximately 80% coverage of available market capitalization. | |
Performance Summary for the Period Ended December 31, 2017
| | | | | | | | | | | | | | | | | | | | | | | | | | | | |
| | | 6-Month
Total Returns (b) | | | | | | Average Annual Total Returns | |
| | | | | | | 1 Year (b) | | | | | | 5 Years (b) | | | | | | 10 Years (b) | |
Class I(a) | | | 11.32 | % | | | | | | | 21.50 | % | | | | | | | 15.40 | % | | | | | | | 8.14 | % |
Class II(a) | | | 11.23 | | | | | | | | 21.31 | | | | | | | | 15.23 | | | | | | | | 7.99 | |
S&P 500® Index | | | 11.42 | | | | | | | | 21.83 | | | | | | | | 15.79 | | | | | | | | 8.50 | |
| | (a) | Average annual and cumulative total returns are based on changes in net asset value for the periods shown, and assume reinvestment of all distributions at net asset value on the ex-dividend date. Insurance-related fees and expenses are not reflected in these returns. | |
| | (b) | For a portion of the period, the Fund’s investment adviser waived a portion of its fee. Without such waiver, the Fund’s performance would have been lower. | |
Past performance is not indicative of future results. Performance results do not reflect the deduction of taxes that a shareholder would pay on Fund distributions or the redemption of Fund shares.
Performance results may include adjustments made for financial reporting purposes in accordance with U.S. generally accepted accounting principles.
Expense Example
| | | | | | | | | | | | | | | | | | | | | | | | | | | | | | | | |
| | | Actual | | | | | | Hypothetical (a) | | | | |
| | | Beginning
Account Value
(07/01/17) | | | Ending
Account Value
(12/31/17) | | | Expenses
Paid During
the Period (b) | | | | | | Beginning
Account Value
(07/01/17) | | | Ending Account Value
(12/31/17) | | | Expenses
Paid During
the Period (b) | | | Annualized
Expense Ratio | |
Class I | | $ | 1,000.00 | | | $ | 1,113.20 | | | $ | 1.60 | | | | | | | $ | 1,000.00 | | | $ | 1,023.69 | | | $ | 1.53 | | | | 0.30 | % |
Class II | | | 1,000.00 | | | | 1,112.30 | | | | 2.40 | | | | | | | | 1,000.00 | | | | 1,022.94 | | | | 2.29 | | | | 0.45 | |
| | (a) | Hypothetical 5% annual return before expenses is calculated by prorating the number of days in the most recent fiscal half year divided by 365. | |
| | (b) | For each class of the Fund, expenses are equal to the annualized expense ratio for the class, multiplied by the average account value over the period, multiplied by 184/365 (to reflect the one-half year period shown). | |
See “Disclosure of Expenses” on the following page for further information on how expenses were calculated
| | |
| Fund Summary as of December 31, 2017 (continued) | | BlackRock S&P 500 Index V.I. Fund |
Portfolio Information
SECTOR ALLOCATION
| | | | |
| Sector | | Percent of
Net Assets | |
Information Technology | | | 24 | % |
Financials | | | 15 | |
Health Care | | | 14 | |
Consumer Discretionary | | | 12 | |
Industrials | | | 10 | |
Consumer Staples | | | 8 | |
Energy | | | 6 | |
Materials | | | 3 | |
Utilities | | | 3 | |
Real Estate | | | 3 | |
Telecommunication Services | | | 2 | |
Short-Term Securities | | | 2 | |
Liabilities in Excess of Other Assets | | | (2 | ) |
For Fund compliance purposes, the Fund’s sector classifications refer to one or more of the sector sub-classifications used by one or more widely recognized market indexes or ratings group indexes, and/or as defined by the investment adviser. These definitions may not apply for purposes of this report, which may combine sector sub classifications for reporting ease.
| | |
| 4 | | 2017 BLACKROCK ANNUAL REPORTTO SHAREHOLDERS |
Shareholders of the Fund may incur the following charges: (a) transactional expenses, such as sales charges; and (b) operating expenses, including investment advisory fees, service and distribution fees, including 12b-1 fees, acquired fund fees and expenses, and other fund expenses. The expense example on the previous page (which is based on a hypothetical investment of $1,000 invested on July 1, 2017 and held through December 31, 2017) is intended to assist shareholders both in calculating expenses based on an investment in the Fund and in comparing these expenses with similar costs of investing in other mutual funds.
The expense example provides information about actual account values and actual expenses. In order to estimate the expenses a shareholder paid during the period covered by this report, shareholders can divide their account value by $1,000 and then multiply the result by the number corresponding to their share class under the heading entitled “Expenses Paid During the Period.”
The expense example also provides information about hypothetical account values and hypothetical expenses based on the Fund’s actual expense ratio and an assumed rate of return of 5% per year before expenses. In order to assist shareholders in comparing the ongoing expenses of investing in the Fund and other funds, compare the 5% hypothetical example with the 5% hypothetical examples that appear in shareholder reports of other funds.
The expenses shown in the expense example are intended to highlight shareholders’ ongoing costs only and do not reflect any transactional expenses, such as sales charges, if any. Therefore, the hypothetical example is useful in comparing ongoing expenses only, and will not help shareholders determine the relative total expenses of owning different funds. If these transactional expenses were included, shareholder expenses would have been higher.
Derivative Financial Instruments
The Fund may invest in various derivative financial instruments. These instruments are used to obtain exposure to a security, commodity, index, market, and/or other asset without owning or taking physical custody of securities, commodities and/or other referenced assets or to manage market, equity, credit, interest rate, foreign currency exchange rate, commodity and/or other risks. Derivative financial instruments may give rise to a form of economic leverage and involve risks, including the imperfect correlation between the value of a derivative financial instrument and the underlying asset, possible default of the counterparty to the transaction or illiquidity of the instrument. The Fund’s successful use of a derivative financial instrument depends on the investment adviser’s ability to predict pertinent market movements accurately, which cannot be assured. The use of these instruments may result in losses greater than if they had not been used, may limit the amount of appreciation the Fund can realize on an investment and/or may result in lower distributions paid to shareholders. The Fund’s investments in these instruments, if any, are discussed in detail in the Notes to Financial Statements.
| | | | |
DISCLOSUREOF EXPENSES / DERIVATIVE FINANCIAL INSTRUMENTS | | | 5 | |
| | |
Schedule of Investments December 31, 2017 | | BlackRock S&P 500 Index V.I. Fund (Percentages shown are based on Net Assets) |
| | | | | | | | |
| Security | | Shares | | | Value | |
Common Stocks — 99.5% | |
| |
| Aerospace & Defense — 2.5% | | | | |
Arconic, Inc. | | | 4,058 | | | $ | 110,580 | |
Boeing Co. (The) | | | 5,360 | | | | 1,580,718 | |
General Dynamics Corp. | | | 2,660 | | | | 541,177 | |
L3 Technologies, Inc. | | | 754 | | | | 149,179 | |
Lockheed Martin Corp. | | | 2,390 | | | | 767,309 | |
Northrop Grumman Corp. | | | 1,668 | | | | 511,926 | |
Raytheon Co. | | | 2,770 | | | | 520,344 | |
Rockwell Collins, Inc. | | | 1,552 | | | | 210,482 | |
Textron, Inc. | | | 2,528 | | | | 143,060 | |
TransDigm Group, Inc. | | | 459 | | | | 126,051 | |
United Technologies Corp. | | | 7,115 | | | | 907,661 | |
| | | | | | | | |
| | | | | | | 5,568,487 | |
| Air Freight & Logistics — 0.7% | | | | |
CH Robinson Worldwide, Inc.(a) | | | 1,323 | | | | 117,866 | |
Expeditors International of Washington, Inc. | | | 1,706 | | | | 110,361 | |
FedEx Corp. | | | 2,364 | | | | 589,913 | |
United Parcel Service, Inc., Class B | | | 6,583 | | | | 784,364 | |
| | | | | | | | |
| | | | | | | 1,602,504 | |
| Airlines — 0.5% | | | | |
Alaska Air Group, Inc. | | | 1,177 | | | | 86,521 | |
American Airlines Group, Inc. | | | 4,080 | | | | 212,282 | |
Delta Air Lines, Inc. | | | 6,284 | | | | 351,904 | |
Southwest Airlines Co. | | | 5,230 | | | | 342,304 | |
United Continental Holdings, Inc.(b) | | | 2,413 | | | | 162,636 | |
| | | | | | | | |
| | | | | | | 1,155,647 | |
| Auto Components — 0.2% | | | | |
Aptiv plc | | | 2,547 | | | | 216,062 | |
BorgWarner, Inc. | | | 1,915 | | | | 97,837 | |
Goodyear Tire & Rubber Co. (The) | | | 2,394 | | | | 77,350 | |
| | | | | | | | |
| | | | | | | 391,249 | |
| Automobiles — 0.5% | | | | |
Ford Motor Co. | | | 37,379 | | | | 466,864 | |
General Motors Co. | | | 12,248 | | | | 502,045 | |
Harley-Davidson, Inc.(a) | | | 1,612 | | | | 82,019 | |
| | | | | | | | |
| | | | | | | 1,050,928 | |
| Banks — 6.6% | | | | |
Bank of America Corp. | | | 92,939 | | | | 2,743,559 | |
BB&T Corp. | | | 7,559 | | | | 375,834 | |
Citigroup, Inc. | | | 25,332 | | | | 1,884,954 | |
Citizens Financial Group, Inc. | | | 4,714 | | | | 197,894 | |
Comerica, Inc. | | | 1,666 | | | | 144,625 | |
Fifth Third Bancorp | | | 6,760 | | | | 205,098 | |
Huntington Bancshares, Inc. | | | 10,329 | | | | 150,390 | |
JPMorgan Chase & Co. | | | 33,243 | | | | 3,555,006 | |
KeyCorp | | | 10,303 | | | | 207,812 | |
M&T Bank Corp. | | | 1,442 | | | | 246,568 | |
People’s United Financial, Inc. | | | 3,317 | | | | 62,028 | |
PNC Financial Services Group, Inc. (The)(e) | | | 4,559 | | | | 657,818 | |
Regions Financial Corp. | | | 11,114 | | | | 192,050 | |
SunTrust Banks, Inc. | | | 4,561 | | | | 294,595 | |
US Bancorp | | | 15,104 | | | | 809,272 | |
Wells Fargo & Co. | | | 42,461 | | | | 2,576,109 | |
Zions BanCorp. | | | 1,914 | | | | 97,289 | |
| | | | | | | | |
| | | | | | | 14,400,901 | |
| Beverages — 2.0% | | | | |
Brown-Forman Corp., Class B | | | 1,876 | | | | 128,825 | |
Coca-Cola Co. (The) | | | 36,739 | | | | 1,685,585 | |
Constellation Brands, Inc., Class A | | | 1,651 | | | | 377,369 | |
Dr Pepper Snapple Group, Inc. | | | 1,742 | | | | 169,079 | |
Molson Coors Brewing Co., Class B | | | 1,763 | | | | 144,689 | |
| | | | | | | | |
| Security | | Shares | | | Value | |
| Beverages (continued) | | | | |
Monster Beverage Corp.(b) | | | 3,942 | | | $ | 249,489 | |
PepsiCo, Inc. | | | 13,625 | | | | 1,633,910 | |
| | | | | | | | |
| | | | | | | 4,388,946 | |
| Biotechnology — 2.8% | | | | |
AbbVie, Inc. | | | 15,273 | | | | 1,477,052 | |
Alexion Pharmaceuticals, Inc.(b) | | | 2,136 | | | | 255,444 | |
Amgen, Inc. | | | 6,955 | | | | 1,209,474 | |
Biogen, Inc.(b) | | | 2,026 | | | | 645,423 | |
Celgene Corp.(b) | | | 7,550 | | | | 787,918 | |
Gilead Sciences, Inc. | | | 12,515 | | | | 896,575 | |
Incyte Corp.(b) | | | 1,678 | | | | 158,923 | |
Regeneron Pharmaceuticals, Inc.(b) | | | 736 | | | | 276,707 | |
Vertex Pharmaceuticals, Inc.(b) | | | 2,418 | | | | 362,361 | |
| | | | | | | | |
| | | | | | | 6,069,877 | |
| Building Products — 0.3% | | | | |
Allegion plc | | | 910 | | | | 72,400 | |
AO Smith Corp. | | | 1,405 | | | | 86,099 | |
Fortune Brands Home & Security, Inc. | | | 1,457 | | | | 99,717 | |
Johnson Controls International plc | | | 8,866 | | | | 337,883 | |
Masco Corp. | | | 3,027 | | | | 133,006 | |
| | | | | | | | |
| | | | | | | 729,105 | |
| Capital Markets — 3.0% | | | | |
Affiliated Managers Group, Inc. | | | 536 | | | | 110,014 | |
Ameriprise Financial, Inc. | | | 1,417 | | | | 240,139 | |
Bank of New York Mellon Corp. (The) | | | 9,811 | | | | 528,421 | |
BlackRock, Inc.(e) | | | 1,183 | | | | 607,719 | |
CBOE Holdings, Inc. | | | 1,070 | | | | 133,311 | |
Charles Schwab Corp. (The) | | | 11,431 | | | | 587,211 | |
CME Group, Inc. | | | 3,274 | | | | 478,168 | |
E*TRADE Financial Corp.(b) | | | 2,626 | | | | 130,171 | |
Franklin Resources, Inc. | | | 3,145 | | | | 136,273 | |
Goldman Sachs Group, Inc. (The) | | | 3,361 | | | | 856,248 | |
Intercontinental Exchange, Inc. | | | 5,605 | | | | 395,489 | |
Invesco Ltd. | | | 3,915 | | | | 143,054 | |
Moody’s Corp. | | | 1,593 | | | | 235,143 | |
Morgan Stanley | | | 13,337 | | | | 699,792 | |
Nasdaq, Inc. | | | 1,105 | | | | 84,897 | |
Northern Trust Corp. | | | 2,054 | | | | 205,174 | |
Raymond James Financial, Inc. | | | 1,217 | | | | 108,678 | |
S&P Global, Inc. | | | 2,443 | | | | 413,844 | |
State Street Corp. | | | 3,548 | | | | 346,320 | |
T. Rowe Price Group, Inc. | | | 2,327 | | | | 244,172 | |
| | | | | | | | |
| | | | | | | 6,684,238 | |
| Chemicals — 2.2% | | | | |
Air Products & Chemicals, Inc. | | | 2,087 | | | | 342,435 | |
Albemarle Corp. | | | 1,057 | | | | 135,180 | |
CF Industries Holdings, Inc. | | | 2,227 | | | | 94,737 | |
DowDuPont, Inc. | | | 22,419 | | | | 1,596,681 | |
Eastman Chemical Co. | | | 1,379 | | | | 127,751 | |
Ecolab, Inc. | | | 2,491 | | | | 334,242 | |
FMC Corp. | | | 1,272 | | | | 120,407 | |
International Flavors & Fragrances, Inc. | | | 763 | | | | 116,441 | |
LyondellBasell Industries NV, Class A | | | 3,099 | | | | 341,882 | |
Monsanto Co. | | | 4,209 | | | | 491,527 | |
Mosaic Co. (The) | | | 3,363 | | | | 86,295 | |
PPG Industries, Inc. | | | 2,438 | | | | 284,807 | |
Praxair, Inc. | | | 2,743 | | | | 424,287 | |
Sherwin-Williams Co. (The) | | | 790 | | | | 323,932 | |
| | | | | | | | |
| | | | | | | 4,820,604 | |
| Commercial Services & Supplies — 0.3% | | | | |
Cintas Corp. | | | 823 | | | | 128,248 | |
Republic Services, Inc. | | | 2,192 | | | | 148,201 | |
| | |
| 6 | | 2017 BLACKROCK ANNUAL REPORTTO SHAREHOLDERS |
| | |
Schedule of Investments (continued) December 31, 2017 | | BlackRock S&P 500 Index V.I. Fund (Percentages shown are based on Net Assets) |
| | | | | | | | |
| Security | | Shares | | | Value | |
| Commercial Services & Supplies (continued) | | | | |
Stericycle, Inc.(b) | | | 799 | | | $ | 54,324 | |
Waste Management, Inc. | | | 3,827 | | | | 330,270 | |
| | | | | | | | |
| | | | | | | 661,043 | |
| Communications Equipment — 1.0% | | | | |
Cisco Systems, Inc. | | | 47,364 | | | | 1,814,041 | |
F5 Networks, Inc.(b) | | | 600 | | | | 78,732 | |
Harris Corp. | | | 1,148 | | | | 162,614 | |
Juniper Networks, Inc. | | | 3,585 | | | | 102,173 | |
Motorola Solutions, Inc. | | | 1,552 | | | | 140,208 | |
| | | | | | | | |
| | | | | | | 2,297,768 | |
| Construction & Engineering — 0.1% | | | | |
Fluor Corp. | | | 1,309 | | | | 67,610 | |
Jacobs Engineering Group, Inc. | | | 1,154 | | | | 76,118 | |
Quanta Services, Inc.(b) | | | 1,515 | | | | 59,251 | |
| | | | | | | | |
| | | | | | | 202,979 | |
| Construction Materials — 0.1% | | | | |
Martin Marietta Materials, Inc. | | | 598 | | | | 132,182 | |
Vulcan Materials Co. | | | 1,267 | | | | 162,645 | |
| | | | | | | | |
| | | | | | | 294,827 | |
| Consumer Finance — 0.8% | | | | |
American Express Co. | | | 6,902 | | | | 685,438 | |
Capital One Financial Corp. | | | 4,637 | | | | 461,753 | |
Discover Financial Services | | | 3,482 | | | | 267,835 | |
Navient Corp. | | | 2,520 | | | | 33,566 | |
Synchrony Financial | | | 7,048 | | | | 272,123 | |
| | | | | | | | |
| | | | | | | 1,720,715 | |
| Containers & Packaging — 0.4% | | | | |
Avery Dennison Corp. | | | 856 | | | | 98,320 | |
Ball Corp. | | | 3,353 | | | | 126,911 | |
International Paper Co.(a) | | | 3,949 | | | | 228,805 | |
Packaging Corp. of America | | | 909 | | | | 109,580 | |
Sealed Air Corp. | | | 1,728 | | | | 85,190 | |
WestRock Co. | | | 2,428 | | | | 153,474 | |
| | | | | | | | |
| | | | | | | 802,280 | |
| Distributors — 0.1% | | | | |
Genuine Parts Co. | | | 1,411 | | | | 134,059 | |
LKQ Corp.(b) | | | 2,961 | | | | 120,424 | |
| | | | | | | | |
| | | | | | | 254,483 | |
| Diversified Consumer Services — 0.0% | | | | |
H&R Block, Inc.(a) | | | 2,021 | | | | 52,991 | |
| | | | | | | | |
| Diversified Financial Services — 1.7% | | | | |
Berkshire Hathaway, Inc., Class B(b) | | | 18,437 | | | | 3,654,582 | |
Leucadia National Corp. | | | 3,004 | | | | 79,576 | |
| | | | | | | | |
| | | | | | | 3,734,158 | |
| Diversified Telecommunication Services — 2.1% | | | | |
AT&T, Inc. | | | 58,827 | | | | 2,287,194 | |
CenturyLink, Inc.(a) | | | 9,315 | | | | 155,374 | |
Verizon Communications, Inc. | | | 39,084 | | | | 2,068,716 | |
| | | | | | | | |
| | | | | | | 4,511,284 | |
| Electric Utilities — 1.8% | | | | |
Alliant Energy Corp. | | | 2,215 | | | | 94,381 | |
American Electric Power Co., Inc. | | | 4,704 | | | | 346,073 | |
Duke Energy Corp. | | | 6,706 | | | | 564,042 | |
Edison International | | | 3,137 | | | | 198,384 | |
Entergy Corp. | | | 1,721 | | | | 140,072 | |
Eversource Energy | | | 3,050 | | | | 192,699 | |
Exelon Corp. | | | 9,198 | | | | 362,493 | |
FirstEnergy Corp. | | | 4,262 | | | | 130,502 | |
NextEra Energy, Inc. | | | 4,500 | | | | 702,855 | |
PG&E Corp. | | | 4,900 | | | | 219,667 | |
| | | | | | | | |
| Security | | Shares | | | Value | |
| Electric Utilities (continued) | | | | |
Pinnacle West Capital Corp. | | | 1,070 | | | $ | 91,143 | |
PPL Corp. | | | 6,578 | | | | 203,589 | |
Southern Co. (The) | | | 9,619 | | | | 462,578 | |
Xcel Energy, Inc. | | | 4,846 | | | | 233,141 | |
| | | | | | | | |
| | | | | | | 3,941,619 | |
| Electrical Equipment — 0.6% | | | | |
Acuity Brands, Inc. | | | 404 | | | | 71,104 | |
AMETEK, Inc. | | | 2,227 | | | | 161,391 | |
Eaton Corp. plc | | | 4,221 | | | | 333,501 | |
Emerson Electric Co. | | | 6,158 | | | | 429,151 | |
Rockwell Automation, Inc. | | | 1,225 | | | | 240,529 | |
| | | | | | | | |
| | | | | | | 1,235,676 | |
| Electronic Equipment, Instruments & Components — 0.4% | | | | |
Amphenol Corp., Class A | | | 2,925 | | | | 256,815 | |
Corning, Inc. | | | 8,326 | | | | 266,349 | |
FLIR Systems, Inc. | | | 1,328 | | | | 61,911 | |
TE Connectivity Ltd. | | | 3,369 | | | | 320,190 | |
| | | | | | | | |
| | | | | | | 905,265 | |
| Energy Equipment & Services — 0.8% | | | | |
Baker Hughes a GE Co. | | | 4,101 | | | | 129,756 | |
Halliburton Co. | | | 8,385 | | | | 409,775 | |
Helmerich & Payne, Inc.(a) | | | 1,041 | | | | 67,290 | |
National Oilwell Varco, Inc. | | | 3,672 | | | | 132,265 | |
Schlumberger Ltd. | | | 13,272 | | | | 894,400 | |
TechnipFMC plc | | | 4,167 | | | | 130,469 | |
| | | | | | | | |
| | | | | | | 1,763,955 | |
| Equity Real Estate Investment Trusts (REITs) — 2.8% | | | | |
Alexandria Real Estate Equities, Inc. | | | 917 | | | | 119,751 | |
American Tower Corp. | | | 4,109 | | | | 586,231 | |
Apartment Investment & Management Co., Class A | | | 1,496 | | | | 65,390 | |
AvalonBay Communities, Inc. | | | 1,321 | | | | 235,679 | |
Boston Properties, Inc. | | | 1,487 | | | | 193,355 | |
Crown Castle International Corp. | | | 3,892 | | | | 432,051 | |
Digital Realty Trust, Inc. | | | 1,979 | | | | 225,408 | |
Duke Realty Corp. | | | 3,418 | | | | 93,004 | |
Equinix, Inc. | | | 749 | | | | 339,462 | |
Equity Residential | | | 3,510 | | | | 223,833 | |
Essex Property Trust, Inc. | | | 633 | | | | 152,787 | |
Extra Space Storage, Inc. | | | 1,197 | | | | 104,678 | |
Federal Realty Investment Trust | | | 696 | | | | 92,436 | |
GGP, Inc. | | | 5,982 | | | | 139,919 | |
HCP, Inc. | | | 4,501 | | | | 117,386 | |
Host Hotels & Resorts, Inc. | | | 7,090 | | | | 140,736 | |
Iron Mountain, Inc.(a) | | | 2,557 | | | | 96,476 | |
Kimco Realty Corp. | | | 4,078 | | | | 74,016 | |
Macerich Co. (The) | | | 1,041 | | | | 68,373 | |
Mid-America Apartment Communities, Inc. | | | 1,090 | | | | 109,610 | |
Prologis, Inc. | | | 5,098 | | | | 328,872 | |
Public Storage | | | 1,432 | | | | 299,288 | |
Realty Income Corp. | | | 2,700 | | | | 153,954 | |
Regency Centers Corp. | | | 1,418 | | | | 98,097 | |
SBA Communications Corp.(b) | | | 1,126 | | | | 183,943 | |
Simon Property Group, Inc. | | | 2,978 | | | | 511,442 | |
SL Green Realty Corp. | | | 931 | | | | 93,966 | |
UDR, Inc. | | | 2,600 | | | | 100,152 | |
Ventas, Inc. | | | 3,396 | | | | 203,794 | |
Vornado Realty Trust | | | 1,662 | | | | 129,935 | |
Welltower, Inc. | | | 3,548 | | | | 226,256 | |
Weyerhaeuser Co. | | | 7,217 | | | | 254,471 | |
| | | | | | | | |
| | | | | | | 6,194,751 | |
| Food & Staples Retailing — 1.8% | | | | |
Costco Wholesale Corp. | | | 4,187 | | | | 779,284 | |
| | | | |
| SCHEDULE OF INVESTMENTS | | | 7 | |
| | |
Schedule of Investments (continued) December 31, 2017 | | BlackRock S&P 500 Index V.I. Fund (Percentages shown are based on Net Assets) |
| | | | | | | | |
| Security | | Shares | | | Value | |
| Food & Staples Retailing (continued) | | | | |
CVS Health Corp. | | | 9,705 | | | $ | 703,613 | |
Kroger Co. (The) | | | 8,522 | | | | 233,929 | |
Sysco Corp. | | | 4,593 | | | | 278,933 | |
Walgreens Boots Alliance, Inc. | | | 8,318 | | | | 604,053 | |
Wal-Mart Stores, Inc.(a) | | | 14,024 | | | | 1,384,870 | |
| | | | | | | | |
| | | | | | | 3,984,682 | |
| Food Products — 1.2% | | | | |
Archer-Daniels-Midland Co. | | | 5,358 | | | | 214,749 | |
Campbell Soup Co.(a) | | | 1,841 | | | | 88,571 | |
Conagra Brands, Inc. | | | 3,914 | | | | 147,440 | |
General Mills, Inc. | | | 5,445 | | | | 322,834 | |
Hershey Co. (The) | | | 1,353 | | | | 153,579 | |
Hormel Foods Corp.(a) | | | 2,579 | | | | 93,850 | |
JM Smucker Co. (The)(a) | | | 1,076 | | | | 133,682 | |
Kellogg Co. | | | 2,380 | | | | 161,793 | |
Kraft Heinz Co. (The) | | | 5,720 | | | | 444,787 | |
McCormick & Co., Inc. (Non-Voting)(a) | | | 1,163 | | | | 118,521 | |
Mondelez International, Inc., Class A | | | 14,318 | | | | 612,810 | |
Tyson Foods, Inc., Class A | | | 2,851 | | | | 231,131 | |
| | | | | | | | |
| | | | | | | 2,723,747 | |
| Health Care Equipment & Supplies — 2.7% | | | | |
Abbott Laboratories | | | 16,677 | | | | 951,756 | |
Align Technology, Inc.(b) | | | 687 | | | | 152,645 | |
Baxter International, Inc. | | | 4,797 | | | | 310,078 | |
Becton Dickinson and Co. | | | 2,541 | | | | 543,908 | |
Boston Scientific Corp.(b) | | | 13,156 | | | | 326,137 | |
Cooper Cos., Inc. (The) | | | 467 | | | | 101,750 | |
Danaher Corp. | | | 5,865 | | | | 544,389 | |
DENTSPLY SIRONA, Inc. | | | 2,183 | | | | 143,707 | |
Edwards Lifesciences Corp.(b) | | | 2,023 | | | | 228,012 | |
Hologic, Inc.(b) | | | 2,647 | | | | 113,159 | |
IDEXX Laboratories, Inc.(b) | | | 832 | | | | 130,108 | |
Intuitive Surgical, Inc.(b) | | | 1,074 | | | | 391,946 | |
Medtronic plc | | | 12,969 | | | | 1,047,247 | |
ResMed, Inc. | | | 1,368 | | | | 115,856 | |
Stryker Corp. | | | 3,089 | | | | 478,301 | |
Varian Medical Systems, Inc.(b) | | | 869 | | | | 96,589 | |
Zimmer Biomet Holdings, Inc. | | | 1,936 | | | | 233,617 | |
| | | | | | | | |
| | | | | | | 5,909,205 | |
| Health Care Providers & Services — 2.8% | | | | |
Aetna, Inc. | | | 3,124 | | | | 563,538 | |
AmerisourceBergen Corp. | | | 1,545 | | | | 141,862 | |
Anthem, Inc. | | | 2,460 | | | | 553,525 | |
Cardinal Health, Inc. | | | 3,014 | | | | 184,668 | |
Centene Corp.(b) | | | 1,646 | | | | 166,048 | |
Cigna Corp. | | | 2,362 | | | | 479,699 | |
DaVita, Inc.(b) | | | 1,445 | | | | 104,401 | |
Envision Healthcare Corp.(b) | | | 1,175 | | | | 40,608 | |
Express Scripts Holding Co.(b) | | | 5,426 | | | | 404,997 | |
HCA Healthcare, Inc.(b) | | | 2,714 | | | | 238,398 | |
Henry Schein, Inc.(b) | | | 1,504 | | | | 105,099 | |
Humana, Inc. | | | 1,369 | | | | 339,608 | |
Laboratory Corp. of America Holdings(b) | | | 975 | | | | 155,522 | |
McKesson Corp. | | | 1,997 | | | | 311,432 | |
Patterson Cos., Inc.(a) | | | 815 | | | | 29,446 | |
Quest Diagnostics, Inc. | | | 1,296 | | | | 127,643 | |
UnitedHealth Group, Inc. | | | 9,285 | | | | 2,046,971 | |
Universal Health Services, Inc., Class B | | | 840 | | | | 95,214 | |
| | | | | | | | |
| | | | | | | 6,088,679 | |
| Health Care Technology — 0.1% | | | | |
Cerner Corp.(b) | | | 3,026 | | | | 203,922 | |
| | | | | | | | |
| | | | | | | | |
| Security | | Shares | | | Value | |
| Hotels, Restaurants & Leisure — 1.8% | | | | |
Carnival Corp. | | | 3,899 | | | $ | 258,777 | |
Chipotle Mexican Grill, Inc.(b) | | | 238 | | | | 68,789 | |
Darden Restaurants, Inc. | | | 1,176 | | | | 112,919 | |
Hilton Worldwide Holdings, Inc. | | | 1,950 | | | | 155,727 | |
Marriott International, Inc., Class A | | | 2,934 | | | | 398,232 | |
McDonald’s Corp. | | | 7,638 | | | | 1,314,652 | |
MGM Resorts International | | | 4,882 | | | | 163,010 | |
Norwegian Cruise Line Holdings Ltd.(b) | | | 1,716 | | | | 91,377 | |
Royal Caribbean Cruises Ltd. | | | 1,641 | | | | 195,738 | |
Starbucks Corp. | | | 13,632 | | | | 782,886 | |
Wyndham Worldwide Corp. | | | 971 | | | | 112,510 | |
Wynn Resorts Ltd. | | | 768 | | | | 129,477 | |
Yum Brands, Inc. | | | 3,229 | | | | 263,519 | |
| | | | | | | | |
| | | | | | | 4,047,613 | |
| Household Durables — 0.4% | | | | |
DR Horton, Inc. | | | 3,271 | | | | 167,050 | |
Garmin Ltd. | | | 1,053 | | | | 62,727 | |
Leggett & Platt, Inc. | | | 1,262 | | | | 60,235 | |
Lennar Corp., Class A | | | 1,955 | | | | 123,634 | |
Mohawk Industries, Inc.(b) | | | 606 | | | | 167,195 | |
Newell Brands, Inc. | | | 4,716 | | | | 145,725 | |
PulteGroup, Inc. | | | 2,591 | | | | 86,151 | |
Whirlpool Corp. | | | 695 | | | | 117,205 | |
| | | | | | | | |
| | | | | | | 929,922 | |
| Household Products — 1.6% | | | | |
Church & Dwight Co., Inc. | | | 2,365 | | | | 118,652 | |
Clorox Co. (The) | | | 1,243 | | | | 184,884 | |
Colgate-Palmolive Co. | | | 8,413 | | | | 634,761 | |
Kimberly-Clark Corp. | | | 3,370 | | | | 406,624 | |
Procter & Gamble Co. (The) | | | 24,413 | | | | 2,243,066 | |
| | | | | | | | |
| | | | | | | 3,587,987 | |
| Independent Power and Renewable Electricity Producers — 0.1% | | | | |
AES Corp. | | | 6,327 | | | | 68,522 | |
NRG Energy, Inc. | | | 2,882 | | | | 82,079 | |
| | | | | | | | |
| | | | | | | 150,601 | |
| Industrial Conglomerates — 1.9% | | | | |
3M Co. | | | 5,718 | | | | 1,345,846 | |
General Electric Co. | | | 83,086 | | | | 1,449,851 | |
Honeywell International, Inc. | | | 7,299 | | | | 1,119,374 | |
Roper Technologies, Inc. | | | 979 | | | | 253,561 | |
| | | | | | | | |
| | | | | | | 4,168,632 | |
| Insurance — 2.6% | | | | |
Aflac, Inc. | | | 3,767 | | | | 330,667 | |
Allstate Corp. (The) | | | 3,438 | | | | 359,993 | |
American International Group, Inc. | | | 8,613 | | | | 513,163 | |
Aon plc | | | 2,394 | | | | 320,796 | |
Arthur J Gallagher & Co. | | | 1,727 | | | | 109,285 | |
Assurant, Inc. | | | 518 | | | | 52,235 | |
Brighthouse Financial, Inc.(b) | | | 909 | | | | 53,304 | |
Chubb Ltd. | | | 4,448 | | | | 649,986 | |
Cincinnati Financial Corp. | | | 1,437 | | | | 107,732 | |
Everest Re Group Ltd. | | | 393 | | | | 86,955 | |
Hartford Financial Services Group, Inc. (The) | | | 3,418 | | | | 192,365 | |
Lincoln National Corp. | | | 2,125 | | | | 163,349 | |
Loews Corp. | | | 2,644 | | | | 132,279 | |
Marsh & McLennan Cos., Inc. | | | 4,890 | | | | 397,997 | |
MetLife, Inc. | | | 10,082 | | | | 509,746 | |
Principal Financial Group, Inc. | | | 2,567 | | | | 181,127 | |
Progressive Corp. (The) | | | 5,572 | | | | 313,815 | |
Prudential Financial, Inc. | | | 4,062 | | | | 467,049 | |
Torchmark Corp. | | | 1,029 | | | | 93,341 | |
Travelers Cos., Inc. (The) | | | 2,622 | | | | 355,648 | |
| | |
| 8 | | 2017 BLACKROCK ANNUAL REPORTTO SHAREHOLDERS |
| | |
Schedule of Investments (continued) December 31, 2017 | | BlackRock S&P 500 Index V.I. Fund (Percentages shown are based on Net Assets) |
| | | | | | | | |
| Security | | Shares | | | Value | |
| Insurance (continued) | | | | |
Unum Group | | | 2,150 | | | $ | 118,013 | |
Willis Towers Watson plc | | | 1,265 | | | | 190,623 | |
XL Group Ltd. | | | 2,453 | | | | 86,247 | |
| | | | | | | | |
| | | | | | | 5,785,715 | |
| Internet & Direct Marketing Retail — 2.9% | | | | |
Amazon.com, Inc.(b) | | | 3,832 | | | | 4,481,409 | |
Expedia, Inc. | | | 1,174 | | | | 140,610 | |
Netflix, Inc.(b) | | | 4,146 | | | | 795,866 | |
Priceline Group, Inc. (The)(b) | | | 467 | | | | 811,525 | |
TripAdvisor, Inc.(b) | | | 1,081 | | | | 37,251 | |
| | | | | | | | |
| | | | | | | 6,266,661 | |
| Internet Software & Services — 4.8%(b) | | | | |
Akamai Technologies, Inc. | | | 1,621 | | | | 105,430 | |
Alphabet, Inc., Class A | | | 2,856 | | | | 3,008,510 | |
Alphabet, Inc., Class C | | | 2,892 | | | | 3,026,189 | |
eBay, Inc. | | | 9,307 | | | | 351,246 | |
Facebook, Inc., Class A | | | 22,848 | | | | 4,031,758 | |
VeriSign, Inc.(a) | | | 812 | | | | 92,926 | |
| | | | | | | | |
| | | | | | | 10,616,059 | |
| IT Services — 4.0% | | | | |
Accenture plc, Class A | | | 5,921 | | | | 906,446 | |
Alliance Data Systems Corp. | | | 461 | | | | 116,854 | |
Automatic Data Processing, Inc. | | | 4,249 | | | | 497,940 | |
Cognizant Technology Solutions Corp., Class A | | | 5,649 | | | | 401,192 | |
CSRA, Inc. | | | 1,569 | | | | 46,944 | |
DXC Technology Co. | | | 2,731 | | | | 259,172 | |
Fidelity National Information Services, Inc. | | | 3,213 | | | | 302,311 | |
Fiserv, Inc.(b) | | | 1,997 | | | | 261,867 | |
Gartner, Inc.(b) | | | 867 | | | | 106,771 | |
Global Payments, Inc. | | | 1,525 | | | | 152,866 | |
International Business Machines Corp. | | | 8,249 | | | | 1,265,562 | |
Mastercard, Inc., Class A | | | 8,899 | | | | 1,346,953 | |
Paychex, Inc. | | | 3,052 | | | | 207,780 | |
PayPal Holdings, Inc.(b) | | | 10,824 | | | | 796,863 | |
Total System Services, Inc. | | | 1,600 | | | | 126,544 | |
Visa, Inc., Class A | | | 17,375 | | | | 1,981,097 | |
Western Union Co. (The) | | | 4,400 | | | | 83,644 | |
| | | | | | | | |
| | | | | | | 8,860,806 | |
| Leisure Products — 0.1% | | | | |
Hasbro, Inc. | | | 1,080 | | | | 98,161 | |
Mattel, Inc.(a) | | | 3,313 | | | | 50,954 | |
| | | | | | | | |
| | | | | | | 149,115 | |
| Life Sciences Tools & Services — 0.8% | | | | |
Agilent Technologies, Inc. | | | 3,074 | | | | 205,866 | |
Illumina, Inc.(b) | | | 1,399 | | | | 305,667 | |
IQVIA Holdings, Inc.(b) | | | 1,385 | | | | 135,591 | |
Mettler-Toledo International, Inc.(b) | | | 246 | | | | 152,402 | |
PerkinElmer, Inc. | | | 1,056 | | | | 77,215 | |
Thermo Fisher Scientific, Inc. | | | 3,842 | | | | 729,519 | |
Waters Corp.(b) | | | 761 | | | | 147,018 | |
| | | | | | | | |
| | | | | | | 1,753,278 | |
| Machinery — 1.7% | | | | |
Caterpillar, Inc. | | | 5,698 | | | | 897,891 | |
Cummins, Inc. | | | 1,495 | | | | 264,077 | |
Deere & Co. | | | 3,065 | | | | 479,703 | |
Dover Corp. | | | 1,503 | | | | 151,788 | |
Flowserve Corp. | | | 1,246 | | | | 52,494 | |
Fortive Corp. | | | 2,910 | | | | 210,538 | |
Illinois Tool Works, Inc. | | | 2,954 | | | | 492,875 | |
Ingersoll-Rand plc | | | 2,394 | | | | 213,521 | |
PACCAR, Inc. | | | 3,387 | | | | 240,748 | |
| | | | | | | | |
| Security | | Shares | | | Value | |
| Machinery (continued) | | | | |
Parker-Hannifin Corp. | | | 1,272 | | | $ | 253,866 | |
Pentair plc | | | 1,592 | | | | 112,427 | |
Snap-on, Inc.(a) | | | 546 | | | | 95,168 | |
Stanley Black & Decker, Inc. | | | 1,474 | | | | 250,123 | |
Xylem, Inc. | | | 1,720 | | | | 117,304 | |
| | | | | | | | |
| | | | | | | 3,832,523 | |
| Media — 2.7% | | | | |
CBS Corp. (Non-Voting), Class B | | | 3,474 | | | | 204,966 | |
Charter Communications, Inc., Class A(b) | | | 1,858 | | | | 624,213 | |
Comcast Corp., Class A | | | 44,688 | | | | 1,789,754 | |
Discovery Communications, Inc., Class A(b) | | | 1,376 | | | | 30,795 | |
Discovery Communications, Inc., Class C(a)(b) | | | 2,012 | | | | 42,594 | |
DISH Network Corp., Class A(b) | | | 2,184 | | | | 104,286 | |
Interpublic Group of Cos., Inc. (The) | | | 3,723 | | | | 75,056 | |
News Corp., Class A | | | 3,669 | | | | 59,475 | |
News Corp., Class B | | | 1,142 | | | | 18,957 | |
Omnicom Group, Inc.(a) | | | 2,218 | | | | 161,537 | |
Scripps Networks Interactive, Inc., Class A | | | 915 | | | | 78,123 | |
Time Warner, Inc. | | | 7,460 | | | | 682,366 | |
Twenty-First Century Fox, Inc., Class A | | | 10,098 | | | | 348,684 | |
Twenty-First Century Fox, Inc., Class B | | | 4,208 | | | | 143,577 | |
Viacom, Inc., Class B | | | 3,396 | | | | 104,631 | |
Walt Disney Co. (The) | | | 14,470 | | | | 1,555,670 | |
| | | | | | | | |
| | | | | | | 6,024,684 | |
| Metals & Mining — 0.3% | | | | |
Freeport-McMoRan, Inc.(b) | | | 12,864 | | | | 243,901 | |
Newmont Mining Corp. | | | 5,141 | | | | 192,890 | |
Nucor Corp. | | | 3,046 | | | | 193,665 | |
| | | | | | | | |
| | | | | | | 630,456 | |
| Multiline Retail — 0.5% | | | | |
Dollar General Corp. | | | 2,496 | | | | 232,153 | |
Dollar Tree, Inc.(b) | | | 2,270 | | | | 243,594 | |
Kohl’s Corp. | | | 1,585 | | | | 85,955 | |
Macy’s, Inc.(a) | | | 2,918 | | | | 73,504 | |
Nordstrom, Inc. | | | 1,117 | | | | 52,923 | |
Target Corp. | | | 5,208 | | | | 339,822 | |
| | | | | | | | |
| | | | | | | 1,027,951 | |
| Multi-Utilities — 1.0% | | | | |
Ameren Corp. | | | 2,316 | | | | 136,621 | |
CenterPoint Energy, Inc. | | | 4,147 | | | | 117,609 | |
CMS Energy Corp. | | | 2,710 | | | | 128,183 | |
Consolidated Edison, Inc. | | | 2,978 | | | | 252,981 | |
Dominion Energy, Inc. | | | 6,162 | | | | 499,492 | |
DTE Energy Co. | | | 1,729 | | | | 189,256 | |
NiSource, Inc. | | | 3,209 | | | | 82,375 | |
Public Service Enterprise Group, Inc. | | | 4,865 | | | | 250,548 | |
SCANA Corp. | | | 1,364 | | | | 54,260 | |
Sempra Energy | | | 2,399 | | | | 256,501 | |
WEC Energy Group, Inc. | | | 3,008 | | | | 199,821 | |
| | | | | | | | |
| | | | | | | 2,167,647 | |
| Oil, Gas & Consumable Fuels — 5.2% | | | | |
Anadarko Petroleum Corp. | | | 5,242 | | | | 281,181 | |
Andeavor | | | 1,381 | | | | 157,904 | |
Apache Corp.(a) | | | 3,689 | | | | 155,750 | |
Cabot Oil & Gas Corp. | | | 4,431 | | | | 126,727 | |
Chesapeake Energy Corp.(b) | | | 8,706 | | | | 34,476 | |
Chevron Corp. | | | 18,198 | | | | 2,278,208 | |
Cimarex Energy Co. | | | 909 | | | | 110,907 | |
Concho Resources, Inc.(b) | | | 1,425 | | | | 214,063 | |
ConocoPhillips | | | 11,454 | | | | 628,710 | |
Devon Energy Corp. | | | 5,035 | | | | 208,449 | |
EOG Resources, Inc. | | | 5,540 | | | | 597,821 | |
| | | | |
| SCHEDULE OF INVESTMENTS | | | 9 | |
| | |
Schedule of Investments (continued) December 31, 2017 | | BlackRock S&P 500 Index V.I. Fund (Percentages shown are based on Net Assets) |
| | | | | | | | |
| Security | | Shares | | | Value | |
| Oil, Gas & Consumable Fuels (continued) | | | | |
EQT Corp. | | | 2,312 | | | $ | 131,599 | |
Exxon Mobil Corp. | | | 40,597 | | | | 3,395,533 | |
Hess Corp. | | | 2,588 | | | | 122,852 | |
Kinder Morgan, Inc. | | | 18,401 | | | | 332,506 | |
Marathon Oil Corp. | | | 8,245 | | | | 139,588 | |
Marathon Petroleum Corp. | | | 4,679 | | | | 308,720 | |
Newfield Exploration Co.(b) | | | 1,908 | | | | 60,159 | |
Noble Energy, Inc. | | | 4,662 | | | | 135,851 | |
Occidental Petroleum Corp. | | | 7,332 | | | | 540,075 | |
ONEOK, Inc. | | | 3,671 | | | | 196,215 | |
Phillips 66 | | | 4,117 | | | | 416,435 | |
Pioneer Natural Resources Co. | | | 1,630 | | | | 281,745 | |
Range Resources Corp. | | | 2,163 | | | | 36,901 | |
Valero Energy Corp. | | | 4,192 | | | | 385,287 | |
Williams Cos., Inc. (The) | | | 7,909 | | | | 241,145 | |
| | | | | | | | |
| | | | | | | 11,518,807 | |
| Personal Products — 0.2% | | | | |
Coty, Inc., Class A | | | 4,524 | | | | 89,982 | |
Estee Lauder Cos., Inc. (The), Class A | | | 2,141 | | | | 272,421 | |
| | | | | | | | |
| | | | | | | 362,403 | |
| Pharmaceuticals — 4.6% | | | | |
Allergan plc | | | 3,186 | | | | 521,166 | |
Bristol-Myers Squibb Co. | | | 15,681 | | | | 960,931 | |
Eli Lilly & Co. | | | 9,283 | | | | 784,042 | |
Johnson & Johnson | | | 25,739 | | | | 3,596,253 | |
Merck & Co., Inc. | | | 26,205 | | | | 1,474,555 | |
Mylan NV(b) | | | 5,154 | | | | 218,066 | |
Perrigo Co. plc | | | 1,255 | | | | 109,386 | |
Pfizer, Inc. | | | 57,109 | | | | 2,068,488 | |
Zoetis, Inc. | | | 4,669 | | | | 336,355 | |
| | | | | | | | |
| | | | | | | 10,069,242 | |
| Professional Services — 0.3% | | | | |
Equifax, Inc. | | | 1,158 | | | | 136,551 | |
IHS Markit Ltd.(b) | | | 3,480 | | | | 157,122 | |
Nielsen Holdings plc | | | 3,183 | | | | 115,861 | |
Robert Half International, Inc. | | | 1,201 | | | | 66,704 | |
Verisk Analytics, Inc.(b) | | | 1,499 | | | | 143,904 | |
| | | | | | | | |
| | | | | | | 620,142 | |
| Real Estate Management & Development — 0.1% | | | | |
CBRE Group, Inc., Class A(b) | | | 2,865 | | | | 124,083 | |
| | | | | | | | |
| Road & Rail — 1.0% | | | | |
CSX Corp. | | | 8,563 | | | | 471,051 | |
JB Hunt Transport Services, Inc. | | | 820 | | | | 94,284 | |
Kansas City Southern | | | 997 | | | | 104,904 | |
Norfolk Southern Corp. | | | 2,742 | | | | 397,316 | |
Union Pacific Corp. | | | 7,542 | | | | 1,011,382 | |
| | | | | | | | |
| | | | | | | 2,078,937 | |
| Semiconductors & Semiconductor Equipment — 3.9% | | | | |
Advanced Micro Devices, Inc.(a)(b) | | | 7,722 | | | | 79,382 | |
Analog Devices, Inc. | | | 3,528 | | | | 314,098 | |
Applied Materials, Inc. | | | 10,218 | | | | 522,344 | |
Broadcom Ltd. | | | 3,896 | | | | 1,000,882 | |
Intel Corp. | | | 44,839 | | | | 2,069,768 | |
KLA-Tencor Corp. | | | 1,510 | | | | 158,656 | |
Lam Research Corp. | | | 1,552 | | | | 285,677 | |
Microchip Technology, Inc.(a) | | | 2,257 | | | | 198,345 | |
Micron Technology, Inc.(b) | | | 11,049 | | | | 454,335 | |
NVIDIA Corp. | | | 5,806 | | | | 1,123,461 | |
Qorvo, Inc.(a)(b) | | | 1,233 | | | | 82,118 | |
QUALCOMM, Inc.(a) | | | 14,124 | | | | 904,219 | |
Skyworks Solutions, Inc. | | | 1,756 | | | | 166,732 | |
| | | | | | | | |
| Security | | Shares | | | Value | |
| Semiconductors & Semiconductor Equipment (continued) | | | | |
Texas Instruments, Inc. | | | 9,443 | | | $ | 986,227 | |
Xilinx, Inc. | | | 2,405 | | | | 162,145 | |
| | | | | | | | |
| | | | | | | 8,508,389 | |
| Software — 5.2% | | | | |
Activision Blizzard, Inc. | | | 7,244 | | | | 458,690 | |
Adobe Systems, Inc.(b) | | | 4,723 | | | | 827,659 | |
ANSYS, Inc.(b) | | | 813 | | | | 119,991 | |
Autodesk, Inc.(b) | | | 2,096 | | | | 219,724 | |
CA, Inc. | | | 3,001 | | | | 99,873 | |
Cadence Design Systems, Inc.(b) | | | 2,705 | | | | 113,123 | |
Citrix Systems, Inc.(b) | | | 1,371 | | | | 120,648 | |
Electronic Arts, Inc.(b) | | | 2,950 | | | | 309,927 | |
Intuit, Inc. | | | 2,327 | | | | 367,154 | |
Microsoft Corp. | | | 73,913 | | | | 6,322,518 | |
Oracle Corp. | | | 29,190 | | | | 1,380,103 | |
Red Hat, Inc.(b) | | | 1,694 | | | | 203,449 | |
salesforce.com, Inc.(b) | | | 6,566 | | | | 671,242 | |
Symantec Corp. | | | 5,930 | | | | 166,396 | |
Synopsys, Inc.(b) | | | 1,454 | | | | 123,939 | |
| | | | | | | | |
| | | | | | | 11,504,436 | |
| Specialty Retail — 2.3% | | | | |
Advance Auto Parts, Inc. | | | 700 | | | | 69,783 | |
AutoZone, Inc.(b) | | | 263 | | | | 187,090 | |
Best Buy Co., Inc. | | | 2,437 | | | | 166,862 | |
CarMax, Inc.(b) | | | 1,749 | | | | 112,163 | |
Foot Locker, Inc. | | | 1,202 | | | | 56,350 | |
Gap, Inc. (The) | | | 2,086 | | | | 71,049 | |
Home Depot, Inc. (The) | | | 11,188 | | | | 2,120,462 | |
L Brands, Inc.(a) | | | 2,366 | | | | 142,481 | |
Lowe’s Cos., Inc. | | | 7,979 | | | | 741,568 | |
O’Reilly Automotive, Inc.(b) | | | 815 | | | | 196,040 | |
Ross Stores, Inc. | | | 3,694 | | | | 296,444 | |
Signet Jewelers Ltd.(a) | | | 557 | | | | 31,498 | |
Tiffany & Co. | | | 978 | | | | 101,663 | |
TJX Cos., Inc. (The) | | | 6,092 | | | | 465,794 | |
Tractor Supply Co.(a) | | | 1,203 | | | | 89,924 | |
Ulta Beauty, Inc.(b) | | | 563 | | | | 125,921 | |
| | | | | | | | |
| | | | | | | 4,975,092 | |
| Technology Hardware, Storage & Peripherals — 4.3% | | | | |
Apple, Inc. | | | 49,191 | | | | 8,324,593 | |
Hewlett Packard Enterprise Co. | | | 15,282 | | | | 219,450 | |
HP, Inc. | | | 16,003 | | | | 336,223 | |
NetApp, Inc. | | | 2,597 | | | | 143,666 | |
Seagate Technology plc(a) | | | 2,772 | | | | 115,980 | |
Western Digital Corp. | | | 2,843 | | | | 226,104 | |
Xerox Corp. | | | 2,045 | | | | 59,612 | |
| | | | | | | | |
| | | | | | | 9,425,628 | |
| Textiles, Apparel & Luxury Goods — 0.7% | | | | |
Hanesbrands, Inc.(a) | | | 3,493 | | | | 73,039 | |
Michael Kors Holdings Ltd.(b) | | | 1,462 | | | | 92,033 | |
NIKE, Inc., Class B(a) | | | 12,589 | | | | 787,442 | |
PVH Corp. | | | 745 | | | | 102,221 | |
Ralph Lauren Corp. | | | 531 | | | | 55,059 | |
Tapestry, Inc. | | | 2,713 | | | | 119,996 | |
Under Armour, Inc., Class A(b) | | | 1,793 | | | | 25,873 | |
Under Armour, Inc., Class C(b) | | | 1,805 | | | | 24,043 | |
VF Corp. | | | 3,136 | | | | 232,064 | |
| | | | | | | | |
| | | | | | | 1,511,770 | |
| Tobacco — 1.3% | | | | |
Altria Group, Inc. | | | 18,282 | | | | 1,305,518 | |
Philip Morris International, Inc. | | | 14,880 | | | | 1,572,072 | |
| | | | | | | | |
| | | | | | | 2,877,590 | |
| | |
| 10 | | 2017 BLACKROCK ANNUAL REPORTTO SHAREHOLDERS |
| | |
Schedule of Investments (continued) December 31, 2017 | | BlackRock S&P 500 Index V.I. Fund (Percentages shown are based on Net Assets) |
| | | | | | | | |
| Security | | Shares | | | Value | |
| Trading Companies & Distributors — 0.2% | | | | |
Fastenal Co.(a) | | | 2,741 | | | $ | 149,905 | |
United Rentals, Inc.(b) | | | 818 | | | | 140,623 | |
WW Grainger, Inc.(a) | | | 497 | | | | 117,416 | |
| | | | | | | | |
| | | | | | | 407,944 | |
| Water Utilities — 0.1% | | | | |
American Water Works Co., Inc. | | | 1,708 | | | | 156,265 | |
| | | | | | | | |
Total Common Stocks — 99.5%
(Cost: $66,887,273) | | | | 218,486,893 | |
| | | | | |
Total Long-Term Investments — 99.5%
(Cost: $66,887,273) | | | | 218,486,893 | |
| | | | | |
|
Short-Term Securities — 2.6%(c)(e) | |
BlackRock Liquidity Funds, T-Fund, Institutional Class,
1.17% | | | 2,592,667 | | | | 2,592,667 | |
SL Liquidity Series, LLC, Money Market Series,
1.48%(d) | | | 3,040,710 | | | | 3,040,406 | |
| | | | | | | | |
Total Short-Term Securities — 2.6%
(Cost: $5,633,073) | | | | 5,633,073 | |
| | | | | | | | |
| |
Total Investments — 102.1%
(Cost: $72,520,346) | | | | 224,119,966 | |
Liabilities in Excess of Other Assets — (2.1)% | | | | (4,528,499 | ) |
| | | | | | | | |
Net Assets — 100.0% | | | $ | 219,591,467 | |
| | | | | | | | |
| (a) | Security, or a portion of the security, is on loan. |
| (b) | Non-income producing security. |
| (c) | Annualized 7-day yield as of period end. |
| (d) | Security was purchased with the cash collateral from loaned securities. |
| (e) | During the year ended December 31, 2017, investments in issuers considered to be affiliates of the Fund for the purposes of Section 2(a)(3) of the Investment Company Act of 1940, as amended, and/or related parties of the Fund were as follows: |
| | | | | | | | | | | | | | | | | | | | | | | | | | | | | | | | |
| Affiliate | | Shares
Held at
12/31/16 | | | Shares
Purchased | | | Shares
Sold | | | Shares
Held at
12/31/17 | | | Value at
12/31/17 | | | Income | | | Net Realized
Gain (Loss) (a) | | | Change in
Unrealized
Appreciation
(Depreciation) | |
BlackRock Liquidity Funds, T-Fund, Institutional Class | | | 3,269,017 | | | | — | | | | (676,350 | )(b) | | | 2,592,667 | | | $ | 2,592,667 | | | $ | 26,018 | | | $ | 1 | | | $ | — | |
SL Liquidity Series, LLC, Money Market Series | | | 4,528,572 | | | | — | | | | (1,487,862 | )(b) | | | 3,040,710 | | | | 3,040,406 | | | | 16,850 | (c) | | | (1,800 | ) | | | (226 | ) |
BlackRock, Inc. | | | 1,224 | | | | — | | | | (41 | ) | | | 1,183 | | | | 607,719 | | | | 12,172 | | | | 11,037 | | | | 150,237 | |
PNC Financial Services Group, Inc. (The) | | | 4,925 | | | | — | | | | (366 | ) | | | 4,559 | | | | 657,818 | | | | 12,576 | | | | 34,211 | | | | 96,249 | |
| | | | | | | | | | | | | | | | | | | | | | | | | | | | | | | | |
| | | | | | | | | | | | | | | | | | $ | 6,898,610 | | | $ | 67,616 | | | $ | 43,449 | | | $ | 246,260 | |
| | | | | | | | | | | | | | | | | | | | | | | | | | | | | | | | |
| | (a) | Includes net capital gains distributions, if applicable. | |
| | (b) | Represents net shares sold. | |
| | (c) | Represents securities lending income earned from the reinvestment of cash collateral from loaned securities, net of fees and collateral investment expenses, and other payments to and from borrowers of securities. | |
For Fund compliance purposes, the Fund’s industry classifications refer to one or more of the industry sub-classifications used by one or more widely recognized market indexes or ratings group indexes, and/or as defined by the investment advisor. These definitions may not apply for purposes of this report, which may combine such industry sub-classifications for reporting ease.
Portfolio Abbreviations
REIT—Real Estate Investment Trust
S&P—Standard & Poor’s
Derivative Financial Instruments Outstanding as of Period End
Futures Contracts
| | | | | | | | | | | | | | | | |
| Description | | Number of
Contracts | | | Expiration
Date | | | Notional
Amount (000) | | | Value/
Unrealized
Appreciation (Depreciation) | |
Long Contracts | | | | | | | | | | | | | | | | |
S&P 500 E-Mini Index | | | 21 | | | | 03/16/18 | | | $ | 2,810 | | | $ | (3,655 | ) |
| | | | | | | | | | | | | | | | |
| | | | |
| SCHEDULE OF INVESTMENTS | | | 11 | |
| | |
Schedule of Investments (continued) December 31, 2017 | | BlackRock S&P 500 Index V.I. Fund |
Derivative Financial Instruments Categorized by Risk Exposure
As of period end, the fair values of derivative financial instruments located in the Statement of Assets and Liabilities were as follows:
| | | | | | | | | | | | | | | | | | | | | | | | | | | | |
| | | Commodity
Contracts | | | Credit
Contracts | | | Equity
Contracts | | | Foreign
Currency
Exchange
Contracts | | | Interest
Rate
Contracts | | | Other
Contracts | | | Total | |
Liabilities — Derivative Financial Instruments | | | | | | | | | | | | | | | | | | | | | | | | | | | | |
Futures contracts | | | | | | | | | | | | | | | | | | | | | | | | | | | | |
Net unrealized depreciation(a) | | $ | — | | | $ | — | | | $ | 3,655 | | | $ | — | | | $ | — | | | $ | — | | | $ | 3,655 | |
| | | | | | | | | | | | | | | | | | | | | | | | | | | | |
| | (a) | Includes cumulative appreciation (depreciation) on futures, if any, as reported in the Schedule of Investments. Only current day’s variation margin is reported within the Statement of Assets and Liabilities. | |
For the year ended 31 December, 2017, the effect of derivative financial instruments in the Statement of Operations was as follows:
| | | | | | | | | | | | | | | | | | | | | | | | | | | | |
| | | Commodity
Contracts | | | Credit
Contracts | | | Equity
Contracts | | | Foreign
Currency
Exchange
Contracts | | | Interest
Rate
Contracts | | | Other
Contracts | | | Total | |
Net Realized Gain (Loss) from: | | | | | | | | | | | | | | | | | | | | | | | | | | | | |
Futures contracts | | $ | — | | | $ | — | | | $ | 606,203 | | | $ | — | | | $ | — | | | $ | — | | | $ | 606,203 | |
| | | | | | | | | | | | | | | | | | | | | | | | | | | | |
Net Change in Unrealized Appreciation (Depreciation) on: | | | | | | | | | | | | | | | | | | | | | | | | | | | | |
Futures contracts | | $ | — | | | $ | — | | | $ | 3,472 | | | $ | — | | | $ | — | | | $ | — | | | $ | 3,472 | |
| | | | | | | | | | | | | | | | | | | | | | | | | | | | |
Average Quarterly Balances of Outstanding Derivative Financial Instruments
| | | | |
Futures contracts: | | | | |
Average notional value of contracts — long | | $ | 2,986,010 | |
| | | | |
For more information about the Fund’s investment risks regarding derivative financial instruments, refer to the Notes to Financial Statements.
Fair Value Hierarchy as of Period End
Various inputs are used in determining the fair value of investments and derivative financial instruments. For information about the Fund’s policy regarding valuation of investments and derivative financial instruments, refer to the Notes to Financial Statements.
The following tables summarize the Fund’s investments and derivative financial instruments categorized in the disclosure hierarchy:
| | | | | | | | | | | | | | | | |
| | | Level 1 | | | Level 2 | | | Level 3 | | | Total | |
Investments: | | | | | | | | | | | | | | | | |
Assets: | | | | | | | | | | | | | | | | |
Long-Term Investments | | | | | | | | | | | | | | | | |
Common Stocks(a) | | $ | 218,486,893 | | | $ | — | | | $ | — | | | $ | 218,486,893 | |
Short-Term Securities | | | 2,592,667 | | | | — | | | | — | | | | 2,592,667 | |
| | | | | | | | | | | | | | | | |
Subtotal | | $ | 221,079,560 | | | $ | — | | | $ | — | | | $ | 221,079,560 | |
| | | | | | | | | | | | | | | | |
Investments valued at NAV(b) | | | | | | | | | | | | | | | 3,040,406 | |
| | | | | | | | | | | | | | | | |
Total Investments | | | | | | | | | | | | | | $ | 224,119,966 | |
| | | | | | | | | | | | | | | | |
Derivative Financial Instruments(c) | | | | | | | | | | | | | | | | |
Liabilities: | | | | | | | | | | | | | | | | |
Equity contracts | | $ | (3,655 | ) | | $ | — | | | $ | — | | | $ | (3,655 | ) |
| | | | | | | | | | | | | | | | |
| | (a) | See above Schedule of Investments for values in each industry. | |
| | (b) | As of December 31, 2017, certain investments of the Fund were fair valued using NAV per share as no quoted market value is available and therefore have been excluded from the fair value hierarchy. | |
| | (c) | Derivative financial instruments are futures contracts, which are valued at the unrealized appreciation (depreciation) on the instrument. | |
During the year ended December 31, 2017, there were no transfers between levels.
See notes to financial statements.
| | |
| 12 | | 2017 BLACKROCK ANNUAL REPORTTO SHAREHOLDERS |
Statement of Assets and Liabilities
December 31, 2017
| | | | |
| | | BlackRock
S&P 500 Index
V.I. Fund | |
|
ASSETS | |
Investments at value — unaffiliated (including securities loaned at value of $2,951,673) (cost — $66,472,564) | | $ | 217,221,356 | |
Investments at value — affiliated (cost — $6,047,782) | | | 6,898,610 | |
Cash pledged for futures contracts | | | 91,000 | |
Receivables: | | | | |
Investments sold | | | 156,720 | |
Securities lending income — affiliated | | | 456 | |
Dividends — affiliated | | | 1,337 | |
Dividends — unaffiliated | | | 222,360 | |
From the Manager | | | 904 | |
Prepaid expenses | | | 11,031 | |
| | | | |
Total assets | | | 224,603,774 | |
| | | | |
|
LIABILITIES | |
Bank overdraft | | | 5 | |
Cash collateral on securities loaned at value | | | 3,041,765 | |
Payables: | | | | |
Capital shares redeemed | | | 1,815,228 | |
Distribution fees | | | 417 | |
Variation margin on futures contracts | | | 10,200 | |
Investment advisory fees | | | 30,388 | |
Officer’s and Directors’ fees | | | 3,877 | |
Other affiliates | | | 330 | |
Other accrued expenses | | | 110,097 | |
| | | | |
Total liabilities | | | 5,012,307 | |
| | | | |
| |
NET ASSETS | | $ | 219,591,467 | |
| | | | |
|
NET ASSETS CONSIST OF | |
Paid-in capital | | $ | 70,949,643 | |
Undistributed net investment income | | | 15,576 | |
Accumulated net realized loss | | | (2,969,717 | ) |
Net unrealized appreciation (depreciation) | | | 151,595,965 | |
| | | | |
NET ASSETS | | $ | 219,591,467 | |
| | | | |
|
NET ASSET VALUE | |
Class I — Based on net assets of $216,250,992 and 9,478,333 shares outstanding, 100 million shares authorized, $0.10 par value | | $ | 22.82 | |
| | | | |
Class II — Based on net assets of $3,340,475 and 147,642 shares outstanding, 100 million shares authorized, $0.10 par value | | $ | 22.63 | |
| | | | |
See notes to financial statements.
Statement of Operations
Year Ended December 31, 2017
| | | | |
| | | BlackRock
S&P 500 Index
V.I. Fund | |
| |
INVESTMENT INCOME | | | | |
Dividends — affiliated | | $ | 50,766 | |
Dividends — unaffiliated | | | 4,157,073 | |
Securities lending income — affiliated — net | | | 16,850 | |
| | | | |
Total investment income | | | 4,224,689 | |
| | | | |
| |
EXPENSES | | | | |
Investment advisory | | | 638,136 | |
Transfer agent — class specific | | | 111,636 | |
Professional | | | 68,187 | |
Accounting services | | | 46,806 | |
Printing | | | 36,104 | |
Directors and Officer | | | 22,872 | |
Custodian | | | 19,667 | |
Transfer agent | | | 5,001 | |
Distribution — class specific | | | 4,157 | |
Miscellaneous | | | 21,541 | |
| | | | |
Total expenses | | | 974,107 | |
Less: | | | | |
Fees waived and/or reimbursed by the Manager | | | (214,951 | ) |
Transfer agent fees reimbursed — class specific | | | (111,636 | ) |
| | | | |
Total expenses after fees waived and/or reimbursed | | | 647,520 | |
| | | | |
Net investment income | | | 3,577,169 | |
| | | | |
| |
REALIZED AND UNREALIZED GAIN | | | | |
Net realized gain from: | | | | |
Investments — affiliated | | | 43,448 | |
Investments — unaffiliated | | | 10,334,133 | |
Capital gain distributions from investment companies — affiliated | | | 1 | |
Futures contracts | | | 606,203 | |
| | | | |
| | | 10,983,785 | |
| | | | |
Net change in unrealized appreciation (depreciation) on: | | | | |
Investments — affiliated | | | 246,260 | |
Investments — unaffiliated | | | 26,412,574 | |
Futures contracts | | | 3,472 | |
| | | | |
| | | 26,662,306 | |
| | | | |
Net realized and unrealized gain | | | 37,646,091 | |
| | | | |
NET INCREASE IN NET ASSETS RESULTING FROM OPERATIONS | | $ | 41,223,260 | |
| | | | |
See notes to financial statements.
| | |
| 14 | | 2017 BLACKROCK ANNUAL REPORTTO SHAREHOLDERS |
Statements of Changes in Net Assets
| | | | | | | | |
| | | BlackRock S&P 500 Index V.I. Fund | |
| | | Year Ended December 31, | |
| | | 2017 | | | 2016 | |
| | |
INCREASE (DECREASE) IN NET ASSETS | | | | | | | | |
| | |
OPERATIONS | | | | | | | | |
Net investment income | | $ | 3,577,169 | | | $ | 3,478,726 | |
Net realized gain | | | 10,983,785 | | | | 8,754,845 | |
Net change in unrealized appreciation (depreciation) | | | 26,662,306 | | | | 8,499,712 | |
| | | | | | | | |
Net increase in net assets resulting from operations | | | 41,223,260 | | | | 20,733,283 | |
| | | | | | | | |
| | |
DISTRIBUTIONS TO SHAREHOLDERS(a) | | | | | | | | |
From net investment income: | | | | | | | | |
Class I | | | (3,518,974 | ) | | | (3,462,212 | ) |
Class II | | | (50,068 | ) | | | (37,791 | ) |
From net realized gain: | | | | | | | | |
Class I | | | (8,765,237 | ) | | | (9,370,529 | ) |
Class II | | | (134,609 | ) | | | (114,078 | ) |
| | | | | | | | |
Decrease in net assets resulting from distributions to shareholders | | | (12,468,888 | ) | | | (12,984,610 | ) |
| | | | | | | | |
| | |
CAPITAL SHARE TRANSACTIONS | | | | | | | | |
Net increase (decrease) in net assets derived from capital share transactions | | | (6,721,848 | ) | | | 981,987 | |
| | | | | | | | |
| | |
NET ASSETS | | | | | | | | |
Total increase in net assets | | | 22,032,524 | | | | 8,730,660 | |
Beginning of year | | | 197,558,943 | | | | 188,828,283 | |
| | | | | | | | |
End of year | | $ | 219,591,467 | | | $ | 197,558,943 | |
| | | | | | | | |
Undistributed net investment income, end of year | | $ | 15,576 | | | $ | 7,449 | |
| | | | | | | | |
| (a) | Distributions for annual periods determined in accordance with U.S. federal income tax regulations. |
See notes to financial statements.
Financial Highlights
(For a share outstanding throughout each period)
| | | | | | | | | | | | | | | | | | | | |
| | | BlackRock S&P 500 Index V.I. Fund | |
| | | Class I | |
| | | Year Ended December 31, | |
| | | 2017 | | | 2016 | | | 2015 | | | 2014 | | | 2013 | |
Net asset value, beginning of year | | $ | 19.90 | | | $ | 19.08 | | | $ | 20.63 | | | $ | 19.43 | | | $ | 15.43 | |
| | | | | | | | | | | | | | | | | | | | |
Net investment income(a) | | | 0.37 | | | | 0.37 | | | | 0.37 | | | | 0.35 | | | | 0.30 | |
Net realized and unrealized gain (loss) | | | 3.91 | | | | 1.85 | | | | (0.14 | ) | | | 2.25 | | | | 4.61 | |
| | | | | | | | | | | | | | | | | | | | |
Net increase from investment operations | | | 4.28 | | | | 2.22 | | | | 0.23 | | | | 2.60 | | | | 4.91 | |
| | | | | | | | | | | | | | | | | | | | |
| Distributions:(b) | | | | | | | | | | | | | | | |
From net investment income | | | (0.39 | ) | | | (0.38 | ) | | | (0.42 | ) | | | (0.36 | ) | | | (0.31 | ) |
From net realized gain | | | (0.97 | ) | | | (1.02 | ) | | | (1.36 | ) | | | (1.04 | ) | | | (0.60 | ) |
| | | | | | | | | | | | | | | | | | | | |
Total distributions | | | (1.36 | ) | | | (1.40 | ) | | | (1.78 | ) | | | (1.40 | ) | | | (0.91 | ) |
| | | | | | | | | | | | | | | | | | | | |
Net asset value, end of year | | $ | 22.82 | | | $ | 19.90 | | | $ | 19.08 | | | $ | 20.63 | | | $ | 19.43 | |
| | | | | | | | | | | | | | | | | | | | |
| | | | | |
Total Return:(c) | | | | | | | | | | | | | | | | | | | | |
Based on net asset value | | | 21.50 | % | | | 11.60 | % | | | 1.05 | % | | | 13.30 | % | | | 31.87 | % |
| | | | | | | | | | | | | | | | | | | | |
| | | | | |
Ratios to Average Net Assets: | | | | | | | | | | | | | | | | | | | | |
Total expenses | | | 0.46 | % | | | 0.46 | % | | | 0.46 | % | | | 0.46 | % | | | 0.46 | % |
| | | | | | | | | | | | | | | | | | | | |
Total expenses after fees waived and/or reimbursed | | | 0.30 | % | | | 0.31 | % | | | 0.31 | % | | | 0.34 | % | | | 0.41 | % |
| | | | | | | | | | | | | | | | | | | | |
Net investment income | | | 1.68 | % | | | 1.87 | % | | | 1.76 | % | | | 1.70 | % | | | 1.69 | % |
| | | | | | | | | | | | | | | | | | | | |
| | | | | |
Supplemental Data: | | | | | | | | | | | | | | | | | | | | |
Net assets, end of year (000) | | $ | 216,251 | | | $ | 195,261 | | | $ | 187,048 | | | $ | 204,029 | | | $ | 199,825 | |
| | | | | | | | | | | | | | | | | | | | |
Portfolio turnover rate | | | 3 | % | | | 4 | % | | | 4 | % | | | 3 | % | | | 4 | % |
| | | | | | | | | | | | | | | | | | | | |
| (a) | Based on average shares outstanding. |
| (b) | Distributions for annual periods determined in accordance with U.S. federal income tax regulations. |
| (c) | Where applicable, excludes insurance-related fees and expenses and assumes the reinvestment of distributions. |
See notes to financial statements.
| | |
| 16 | | 2017 BLACKROCK ANNUAL REPORTTO SHAREHOLDERS |
Financial Highlights (continued)
(For a share outstanding throughout each period)
| | | | | | | | | | | | | | | | | | | | |
| | | BlackRock S&P 500 Index V.I. Fund | |
| | | Class II | |
| | | Year Ended December 31, | |
| | | 2017 | | | 2016 | | | 2015 | | | 2014 | | | 2013 | |
Net asset value, beginning of year | | $ | 19.75 | | | $ | 18.94 | | | $ | 20.49 | | | $ | 19.31 | | | $ | 15.34 | |
| | | | | | | | | | | | | | | | | | | | |
Net investment income(a) | | | 0.34 | | | | 0.33 | | | | 0.33 | | | | 0.32 | | | | 0.27 | |
Net realized and unrealized gain (loss) | | | 3.87 | | | | 1.85 | | | | (0.13 | ) | | | 2.22 | | | | 4.58 | |
| | | | | | | | | | | | | | | | | | | | |
Net increase from investment operations | | | 4.21 | | | | 2.18 | | | | 0.20 | | | | 2.54 | | | | 4.85 | |
| | | | | | | | | | | | | | | | | | | | |
| Distributions:(b) | | | | | | | | | | | | | | | |
From net investment income | | | (0.36 | ) | | | (0.35 | ) | | | (0.39 | ) | | | (0.32 | ) | | | (0.28 | ) |
From net realized gain | | | (0.97 | ) | | | (1.02 | ) | | | (1.36 | ) | | | (1.04 | ) | | | (0.60 | ) |
| | | | | | | | | | | | | | | | | | | | |
Total distributions | | | (1.33 | ) | | | (1.37 | ) | | | (1.75 | ) | | | (1.36 | ) | | | (0.88 | ) |
| | | | | | | | | | | | | | | | | | | | |
Net asset value, end of year | | $ | 22.63 | | | $ | 19.75 | | | $ | 18.94 | | | $ | 20.49 | | | $ | 19.31 | |
| | | | | | | | | | | | | | | | | | | | |
| | | | | |
Total Return:(c) | | | | | | | | | | | | | | | | | | | | |
Based on net asset value | | | 21.31 | % | | | 11.47 | % | | | 0.89 | % | | | 13.11 | % | | | 31.67 | % |
| | | | | | | | | | | | | | | | | | | | |
| | | | | |
Ratios to Average Net Assets: | | | | | | | | | | | | | | | | | | | | |
Total expenses | | | 0.60 | % | | | 0.62 | % | | | 0.61 | % | | | 0.60 | % | | | 0.60 | % |
| | | | | | | | | | | | | | | | | | | | |
Total expenses after fees waived and/or reimbursed | | | 0.45 | % | | | 0.46 | % | | | 0.46 | % | | | 0.48 | % | | | 0.56 | % |
| | | | | | | | | | | | | | | | | | | | |
Net investment income | | | 1.54 | % | | | 1.71 | % | | | 1.61 | % | | | 1.55 | % | | | 1.54 | % |
| | | | | | | | | | | | | | | | | | | | |
| | | | | |
Supplemental Data: | | | | | | | | | | | | | | | | | | | | |
Net assets, end of year (000) | | $ | 3,340 | | | $ | 2,298 | | | $ | 1,780 | | | $ | 1,962 | | | $ | 1,828 | |
| | | | | | | | | | | | | | | | | | | | |
Portfolio turnover rate | | | 3 | % | | | 4 | % | | | 4 | % | | | 3 | % | | | 4 | % |
| | | | | | | | | | | | | | | | | | | | |
| (a) | Based on average shares outstanding. |
| (b) | Distributions for annual periods determined in accordance with U.S. federal income tax regulations. |
| (c) | Where applicable, excludes insurance-related fees and expenses and assumes the reinvestment of distributions. |
See notes to financial statements.
Notes to Financial Statements
BlackRock Variable Series Funds, Inc. (the “Company”) is registered under the Investment Company Act of 1940, as amended (the “1940 Act”), as an open-end management investment company. The Company is organized as a Maryland corporation that is comprised of 20 separate funds. The funds offer shares to insurance companies for their separate accounts to fund benefits under certain variable annuity and variable life insurance contracts. The financial statements presented are for BlackRock S&P 500 Index V.I. Fund (the “Fund”). The Fund’s classification changed from non-diversified to diversified during the reporting period. Class I and Class II Shares have equal voting, dividend, liquidation and other rights, except that only shares of the respective classes are entitled to vote on matters concerning only that class. In addition, Class II Shares bear certain expenses related to the distribution of such shares.
The Fund, together with certain other registered investment companies advised by BlackRock Advisors, LLC (the “Manager”) or its affiliates, is included in a complex of open-end funds referred to as the Equity-Bond Complex.
Reorganization: At a meeting held on November 15, 2017, the Board of Directors of BlackRock Variable Series Funds, Inc. (the “Company”) and, at a meeting held on December 1, 2017, the Board of Trustees of HIMCO VIT Portfolio Diversifier Fund (the “Target Fund”) approved a reorganization of the Target Fund with and into the Fund. The reorganization is subject to shareholder approval by the Target Fund’s shareholders and certain other conditions.
| 2. | SIGNIFICANT ACCOUNTING POLICIES |
The financial statements are prepared in conformity with accounting principles generally accepted in the United States of America (“U.S. GAAP”), which may require management to make estimates and assumptions that affect the reported amounts of assets and liabilities in the financial statements, disclosure of contingent assets and liabilities at the date of the financial statements and the reported amounts of increases and decreases in net assets from operations during the reporting period. Actual results could differ from those estimates. The Fund is considered an investment company under U.S. GAAP and follows the accounting and reporting guidance applicable to investment companies. Below is a summary of significant accounting policies:
Investment Transactions and Investment Income: For financial reporting purposes, investment transactions are recorded on the dates the transactions are entered into (the “trade dates”). Realized gains and losses on investment transactions are determined on the identified cost basis. Dividend income is recorded on the ex-dividend date. Dividends from foreign securities where the ex-dividend date may have passed are subsequently recorded when the Fund is informed of the ex-dividend date. Under the applicable foreign tax laws, a withholding tax at various rates may be imposed on capital gains, dividends and interest. Upon notification from issuers, some of the dividend income received from a real estate investment trust may be redesignated as a reduction of cost of the related investment and/or realized gain. Interest income, including amortization and accretion of premiums and discounts on debt securities are recognized on the accrual basis.
Foreign Currency Translation: The Fund’s books and records are maintained in U.S. dollars. Securities and other assets and liabilities denominated in foreign currencies are translated into U.S. dollars using exchange rates determined as of the close of trading on the New York Stock Exchange (“NYSE”). Purchases and sales of investments are recorded at the rates of exchange prevailing on the respective dates of such transactions. Generally, when the U.S. dollar rises in value against a foreign currency, the investments denominated in that currency will lose value; the opposite effect occurs if the U.S. dollar falls in relative value.
The Fund does not isolate the portion of the results of operations arising as a result of changes in the exchange rates from the changes in the market prices of investments held or sold for financial reporting purposes. Accordingly, the effects of changes in exchange rates on investments are not segregated in the Statement of Operations from the effects of changes in market prices of those investments, but are included as a component of net realized and unrealized gain (loss) from investments. The Fund reports realized currency gains (losses) on foreign currency related transactions as components of net realized gain (loss) for financial reporting purposes, whereas such components are generally treated as ordinary income for federal income tax purposes.
Segregation and Collateralization: In cases where the Fund enters into certain investments (e.g., futures contracts) that would be treated as “senior securities” for 1940 Act purposes, the Fund may segregate or designate on its books and records cash or liquid assets having a market value at least equal to the amount of its future obligations under such investments. Doing so allows the investment to be excluded from treatment as a “senior security.” Furthermore, if required by an exchange or counterparty agreement, the Fund may be required to deliver/deposit cash and/or securities to/with an exchange, or broker-dealer or custodian as collateral for certain investments or obligations.
Distributions: Distributions paid by the Fund are recorded on the ex-dividend date. The character and timing of distributions are determined in accordance with U.S. federal income tax regulations, which may differ from U.S. GAAP.
Indemnifications: In the normal course of business, the Fund enters into contracts that contain a variety of representations that provide general indemnification. The Fund’s maximum exposure under these arrangements is unknown because it involves future potential claims against the Fund, which cannot be predicted with any certainty.
Other: Expenses directly related to the Fund or its classes are charged to the Fund or the applicable class. Other operating expenses shared by several funds, including other funds managed by the Manager, are prorated among those funds on the basis of relative net assets or other appropriate methods. Expenses directly related to the Fund and other shared expenses prorated to the Fund are allocated daily to each class based on its relative net assets or other appropriate methods.
| 3. | INVESTMENT VALUATION AND FAIR VALUE MEASUREMENTS |
Investment Valuation Policies: The Fund’s investments are valued at fair value (also referred to as “market value” within the financial statements) as of the close of trading on the NYSE (generally 4:00 p.m., Eastern time). U.S. GAAP defines fair value as the price the Fund would receive to sell an asset or pay to transfer a liability in an orderly transaction between market participants at the measurement date. The Fund determines the fair values of its financial instruments using various independent dealers or pricing services under policies approved by the Board of Directors of the Company (the “Board”). The BlackRock Global Valuation Methodologies Committee (the “Global Valuation Committee”) is the committee formed by management to develop global pricing policies and procedures and to oversee the pricing function for all financial instruments.
| | |
| 18 | | 2017 BLACKROCK ANNUAL REPORTTO SHAREHOLDERS |
Notes to Financial Statements (continued)
Fair Value Inputs and Methodologies: The following methods and inputs are used to establish the fair value of the Fund’s assets and liabilities:
| | • | | Equity investments traded on a recognized securities exchange are valued at the official closing price each day, if available. For equity investments traded on more than one exchange, the official closing price on the exchange where the stock is primarily traded is used. Equity investments traded on a recognized exchange for which there were no sales on that day may be valued at the last available bid (long positions) or ask (short positions) price. |
| | • | | Investments in open-end U.S. mutual funds are valued at net asset value (“NAV”) each business day. |
| | • | | The Fund values its investment in SL Liquidity Series, LLC, Money Market Series (the “Money Market Series”) at fair value, which is ordinarily based upon its pro rata ownership in the underlying fund’s net assets. The Money Market Series seeks current income consistent with maintaining liquidity and preserving capital. Although the Money Market Series is not registered under the 1940 Act, its investments may follow the parameters of investments by a money market fund that is subject to Rule 2a-7 under the 1940 Act. |
| | • | | Futures contracts traded on exchanges are valued at their last sale price. |
If events (e.g., a company announcement, market volatility or a natural disaster) occur that are expected to materially affect the value of such investments, or in the event that the application of these methods of valuation results in a price for an investment that is deemed not to be representative of the market value of such investment, or if a price is not available, the investment will be valued by the Global Valuation Committee, or its delegate, in accordance with a policy approved by the Board as reflecting fair value (“Fair Valued Investments”). The fair valuation approaches that may be used by the Global Valuation Committee will include market approach, income approach and cost approach. Valuation techniques such as discounted cash flow, use of market comparables and matrix pricing are types of valuation approaches and are typically used in determining fair value. When determining the price for Fair Valued Investments, the Global Valuation Committee, or its delegate, seeks to determine the price that the Fund might reasonably expect to receive or pay from the current sale or purchase of that asset or liability in an arm’s-length transaction. Fair value determinations shall be based upon all available factors that the Global Valuation Committee, or its delegate, deems relevant and consistent with the principles of fair value measurement. The pricing of all Fair Valued Investments is subsequently reported to the Board or a committee thereof on a quarterly basis.
Fair Value Hierarchy: Various inputs are used in determining the fair value of investments and derivative financial instruments. These inputs to valuation techniques are categorized into a fair value hierarchy consisting of three broad levels for financial statement purposes as follows:
| | • | | Level 1 — Unadjusted price quotations in active markets/exchanges for identical assets or liabilities that the Fund has the ability to access |
| | • | | Level 2 — Other observable inputs (including, but not limited to, quoted prices for similar assets or liabilities in markets that are active, quoted prices for identical or similar assets or liabilities in markets that are not active, inputs other than quoted prices that are observable for the assets or liabilities (such as interest rates, yield curves, volatilities, prepayment speeds, loss severities, credit risks and default rates) or other market–corroborated inputs) |
| | • | | Level 3 — Unobservable inputs based on the best information available in the circumstances, to the extent observable inputs are not available (including the Fund’s own assumptions used in determining the fair value of investments and derivative financial instruments) |
The hierarchy gives the highest priority to unadjusted quoted prices in active markets for identical assets or liabilities (Level 1 measurements) and the lowest priority to unobservable inputs (Level 3 measurements). Accordingly, the degree of judgment exercised in determining fair value is greatest for instruments categorized in Level 3. The inputs used to measure fair value may fall into different levels of the fair value hierarchy. In such cases, for disclosure purposes, the fair value hierarchy classification is determined based on the lowest level input that is significant to the fair value measurement in its entirety. Investments classified within Level 3 have significant unobservable inputs used by the Global Valuation Committee in determining the price for Fair Valued Investments. Level 3 investments include equity or debt issued by privately held companies or funds. There may not be a secondary market, and/or there are a limited number of investors. Level 3 investments may also be adjusted to reflect illiquidity and/or non-transferability, with the amount of such discount estimated by the Global Valuation Committee in the absence of market information.
Changes in valuation techniques may result in transfers into or out of an assigned level within the hierarchy. In accordance with the Fund’s policy, transfers between different levels of the fair value hierarchy are deemed to have occurred as of the beginning of the reporting period. The categorization of a value determined for investments and derivative financial instruments is based on the pricing transparency of the investments and derivative financial instruments and is not necessarily an indication of the risks associated with investing in those securities.
As of December 31, 2017, certain investments of the Fund were valued using NAV per share as no quoted market value is available and therefore have been excluded from the fair value hierarchy.
| 4. | SECURITIES AND OTHER INVESTMENTS |
Securities Lending: The Fund may lend its securities to approved borrowers, such as brokers, dealers and other financial institutions. The borrower pledges and maintains with the Fund collateral consisting of cash, an irrevocable letter of credit issued by a bank, or securities issued or guaranteed by the U.S. Government. The initial collateral received by the Fund is required to have a value of at least 102% of the current value of the loaned securities for securities traded on U.S. exchanges and a value of at least 105% for all other securities. The collateral is maintained thereafter, at a value equal to at least 100% of the current market value of the securities on loan. The market value of the loaned securities is determined at the close of each business day of the Fund and any additional required collateral is delivered to the Fund, or excess collateral returned by the Fund, on the next business day. During the term of the loan, the Fund is entitled to all distributions made on or in respect of the loaned securities, but does not receive interest income on securities received as collateral. Loans of securities are terminable at any time and the borrower, after notice, is required to return borrowed securities within the standard time period for settlement of securities transactions.
| | | | |
| NOTESTO FINANCIAL STATEMENTS | | | 19 | |
Notes to Financial Statements (continued)
The market value of any securities on loan, all of which were classified as common stocks in the Fund’s Schedule of Investments, and the value of any related collateral are shown separately in the Statement of Assets and Liabilities as a component of investments at value — unaffiliated, and collateral on securities loaned at value, respectively. As of period end, any securities on loan were collateralized by cash and/or U.S. Government obligations. Cash collateral invested by the securities lending agent, BlackRock Investment Management, LLC (“BIM”), if any, is disclosed in the Schedule of Investments.
Securities lending transactions are entered into by the Fund under Master Securities Lending Agreements (each, an “MSLA”), which provide the right, in the event of default (including bankruptcy or insolvency), for the non-defaulting party to liquidate the collateral and calculate a net exposure to the defaulting party or request additional collateral. In the event that a borrower defaults, the Fund, as lender, would offset the market value of the collateral received against the market value of the securities loaned. When the value of the collateral is greater than that of the market value of the securities loaned, the lender is left with a net amount payable to the defaulting party. However, bankruptcy or insolvency laws of a particular jurisdiction may impose restrictions on or prohibitions against such a right of offset in the event of an MSLA counterparty’s bankruptcy or insolvency. Under the MSLA, absent an event of default, the borrower can resell or re-pledge the loaned securities, and the Fund can reinvest cash collateral received in connection with loaned securities. Upon an event of default, the parties’ obligations to return the securities or collateral to the other party are extinguished, and the parties can resell or re-pledge the loaned securities or the collateral received in connection with the loaned securities in order to satisfy the defaulting party’s net payment obligation for all transactions under the MSLA. The defaulting party remains liable for any deficiency.
As of period end, the following table is a summary of the Fund’s securities lending agreements by counterparty which are subject to offset under an MSLA:
| | | | | | | | | | | | |
| Counterparty | | Securities
Loaned at Value | | | Cash Collateral
Received (a) | | | Net
Amount | |
Citigroup Global Markets, Inc. | | $ | 1,046,061 | | | $ | (1,046,061 | ) | | $ | — | |
Deutsche Bank Securities Inc. | | | 370,780 | | | | (370,780 | ) | | | — | |
Goldman Sachs & Co. | | | 46,140 | | | | (46,140 | ) | | | — | |
JP Morgan Securities LLC | | | 324,497 | | | | (324,497 | ) | | | — | |
Morgan Stanley | | | 1,164,195 | | | | (1,164,195 | ) | | | — | |
| | | | | | | | | | | | |
| | $ | 2,951,673 | | | $ | (2,951,673 | ) | | $ | — | |
| | | | | | | | | | | | |
| | (a) | Cash collateral with a value of $3,041,765 has been received in connection with securities lending agreements. Collateral received in excess of the value of securities loaned from the individual counterparty is not shown for financial reporting purposes in the table above. | |
The risks of securities lending include the risk that the borrower may not provide additional collateral when required or may not return the securities when due. To mitigate these risks, the Fund benefits from a borrower default indemnity provided by BIM. BIM’s indemnity allows for full replacement of the securities loaned if the collateral received does not cover the value on the securities loaned in the event of borrower default. The Fund could incur a loss if the value of an investment purchased with cash collateral falls below the market value of loaned securities or if the value of an investment purchased with cash collateral falls below the value of the original cash collateral received.
| 5. | DERIVATIVE FINANCIAL INSTRUMENTS |
The Fund engages in various portfolio investment strategies using derivative contracts both to increase the returns of the Fund and/or to manage its exposure to certain risks such as credit risk, equity risk, interest rate risk, foreign currency exchange rate risk, commodity price risk or other risks (e.g., inflation risk). Derivative financial instruments categorized by risk exposure are included in the Schedule of Investments. These contracts may be transacted on an exchange or over-the-counter (“OTC”).
Futures Contracts: Futures contracts are purchased or sold to gain exposure to, or manage exposure to, changes in interest rates (interest rate risk), changes in the value of equity securities (equity risk) or foreign currencies (foreign currency exchange rate risk).
Futures contracts are agreements between the Fund and a counterparty to buy or sell a specific quantity of an underlying instrument at a specified price and on a specified date. Depending on the terms of a contract, it is settled either through physical delivery of the underlying instrument on the settlement date or by payment of a cash amount on the settlement date. Upon entering into a futures contract, the Fund is required to deposit initial margin with the broker in the form of cash or securities in an amount that varies depending on a contract’s size and risk profile. The initial margin deposit must then be maintained at an established level over the life of the contract.
Securities deposited as initial margin are designated in the Schedule of Investments and cash deposited, if any, is shown as cash pledged for futures contracts in the Statement of Assets and Liabilities. Pursuant to the contract, the Fund agrees to receive from or pay to the broker an amount of cash equal to the daily fluctuation in market value of the contract (“variation margin”). Variation margin is recorded as unrealized appreciation (depreciation) and, if any, shown as variation margin receivable (or payable) on futures contracts in the Statement of Assets and Liabilities. When the contract is closed, a realized gain or loss is recorded in the Statement of Operations equal to the difference between the value of the contract at the time it was opened and the value at the time it was closed. The use of futures contracts involves the risk of an imperfect correlation in the movements in the price of futures contracts and interest, foreign currency exchange rates or underlying assets.
| 6. | INVESTMENT ADVISORY AGREEMENT AND OTHER TRANSACTIONS WITH AFFILIATES |
The PNC Financial Services Group, Inc. is the largest stockholder and an affiliate of BlackRock, Inc. (“BlackRock”) for 1940 Act purposes.
Investment Advisory: The Company, on behalf of the Fund, entered into an Investment Advisory Agreement with the Manager, the Fund’s investment advisor, an indirect, wholly-owned subsidiary of BlackRock, to provide investment advisory and administrative services. The Manager is responsible for the management of the Fund’s portfolio and provides the personnel, facilities, equipment and certain other services necessary to the operations of the Fund.
| | |
| 20 | | 2017 BLACKROCK ANNUAL REPORTTO SHAREHOLDERS |
Notes to Financial Statements (continued)
For such services, the Fund pays the Manager a monthly fee at an annual rate equal to 0.30% of the average daily value of the Fund’s net assets.
Distribution Fees: The Company, on behalf of the Fund, entered into a Distribution Agreement and a Distribution Plan with BlackRock Investments, LLC (“BRIL”), an affiliate of the Manager. Pursuant to the Distribution Plan and in accordance with Rule 12b-1 under the 1940 Act, the Fund pays BRIL ongoing distribution fees. The fees are accrued daily and paid monthly at an annual rate of 0.15% based upon the average daily net assets attributable to Class II.
For the year ended December 31, 2017, the class specific distribution fees borne directly by Class II was $4,157.
Transfer Agent: On behalf of the Fund, the Manager entered into agreements with insurance companies and other financial intermediaries (“Service Organizations”), some of which may be affiliates. Pursuant to these agreements, the Service Organizations provide the Fund with administrative, networking, recordkeeping, sub-transfer agency and shareholder services to sub-accounts they service. For these services, the Service Organizations receive an annual fee per shareholder account, which will vary depending on share class and/or net assets of Fund shareholders serviced by the Service Organizations, which is shown as transfer agent — class specific. For the year ended December 31, 2017, the Fund did not pay any amounts to affiliates in return for these services.
In addition, the Fund pays the transfer agent, which is not an affiliate, a fee for the issuance, transfer and redemption of shares and the opening and maintenance of shareholder accounts, which is included in transfer agent in the Statement of Operations.
For the year ended December 31, 2017, the following table shows the class specific transfer agent fees borne directly by each share class of the Fund:
| | | | | | | | | | | | | | |
| Class I | | | | | Class II | | | | | Total | |
| $ | 110,368 | | | | | $ | 1,268 | | | | | $ | 111,636 | |
Expense Limitations, Waivers and Reimbursements: BlackRock has contractually agreed to waive 0.10% of its management fee through April 30, 2019. The contractual agreement may be terminated upon 90 days’ notice by a majority of the independent directors who are not “interested persons” of the Fund, as defined in the 1940 Act (“Independent Directors”) or by a vote of the outstanding voting securities of the Fund. This amount is included in fees waived and/or reimbursed by the Manager in the Statement of Operations. For the year ended December 31, 2017, the amount waived was $212,711.
With respect to the Fund, the Manager voluntarily agreed to waive its investment advisory fees by the amount of investment advisory fees the Fund pays to the Manager indirectly through its investment in affiliated money market funds (the “affiliated money market fund waiver”). The amount of waivers and/or reimbursements of fees and expenses made pursuant to the expense limitation caps will be reduced by the amount of the affiliated money market fund waiver. This amount is included in fees waived and/or reimbursed by the Manager in the Statement of Operations. For the year ended December 31, 2017, the amount waived was $2,240.
The Manager has contractually agreed to waive its investment advisory fee with respect to any portion of the Fund’s assets invested in affiliated equity and fixed-income mutual funds and affiliated exchange-traded funds that have a contractual management fee through April 30, 2019. The contractual agreement may be terminated upon 90 days’ notice by a majority of Independent Directors or by a vote of a majority of the outstanding voting securities of the Fund. For the year ended December 31, 2017, there were no fees waived by the Manager.
For the year ended December 31, 2017, the Fund reimbursed the Manager $2,131 for certain accounting services, which is included in accounting services in the Statement of Operations.
The Manager has contractually agreed to reimburse all transfer agent fees for Class I and Class II.
The Manager has agreed not to reduce or discontinue this contractual expense limitation through April 30, 2019, unless approved by the Board, including a majority of the Independent Directors or by a vote of a majority of the outstanding voting securities of the Fund.
These amounts are shown as transfer agent fees reimbursed — class specific in the Statement of Operations. For the year ended December 31, 2017, class specific expense waivers and/or reimbursements were as follows:
| | | | | | | | | | | | |
| | | Class I | | | Class II | | | Total | |
Transfer Agent Fees Reimbursed | | $ | 110,368 | | | $ | 1,268 | | | $ | 111,636 | |
With respect to the Fund, the Manager contractually agreed to waive and/or reimburse fees or expenses in order to limit expenses, excluding interest expense, dividend expense, tax expense, acquired fund fees and expenses, and certain other fund expenses, which constitute extraordinary expenses not incurred in the ordinary course of the Fund’s business (“expense limitation”). The expense limitations as a percentage of average daily net assets are as follows:
| | | | | | | | |
| Class I | | | | | Class II | |
| | 1.25% | | | | | | 1.40% | |
The Manager has agreed not to reduce or discontinue this contractual expense limitation through April 30, 2019, unless approved by the Board, including a majority of the Independent Directors or by a vote of a majority of the outstanding voting securities of the Fund. For the year ended December 31, 2017, there were no fees waived and/or reimbursed by the Manager.
Securities Lending: The U.S. Securities and Exchange Commission (“SEC”) has issued an exemptive order which permits BIM, an affiliate of the Manager, to serve as securities lending agent for the Fund, subject to applicable conditions. As securities lending agent, BIM bears all operational costs directly related to securities lending. The Fund is responsible for expenses in connection with the investment of cash collateral received for securities on loan (the “collateral investment expenses”). The cash
| | | | |
| NOTESTO FINANCIAL STATEMENTS | | | 21 | |
Notes to Financial Statements (continued)
collateral is invested in a private investment company managed by the Manager or its affiliates. However, BIM has agreed to cap the collateral investment expenses of the private investment company to an annual rate of 0.04%. The investment adviser to the private investment company will not charge any advisory fees with respect to shares purchased by the Fund. The private investment company in which the cash collateral has been invested may, under certain circumstances, impose a liquidity fee of up to 2% of the value withdrawn or temporarily restrict withdrawals for up to 10 business days during a 90 day period, in the event that the private investment company’s weekly liquid assets fall below certain thresholds.
Securities lending income is equal to the total of income earned from the reinvestment of cash collateral, net of fees and other payments to and from borrowers of securities, and less the collateral investment expenses. The Fund retains a portion of securities lending income and remits a remaining portion to BIM as compensation for its services as securities lending agent.
Pursuant to a securities lending agreement, the Fund retains 71.5% of securities lending income, and this amount retained can never be less than 65% of the total of securities lending income plus the collateral investment expenses.
In addition, commencing the business day following the date that the aggregate securities lending income earned across the Equity-Bond Complex in a calendar year exceeds a specified threshold, the Fund, pursuant to the securities lending agreement, will retain for the remainder of that calendar year securities lending income as follows: 75% of securities lending income, and this amount retained can never be less than 65% of the total of securities lending income plus the collateral investment expenses.
The share of securities lending income earned by the Fund is shown as securities lending income — affiliated — net in the Statement of Operations. For the year ended December 31, 2017, the Fund paid BIM $5,942 for securities lending agent services.
Officers and Directors: Certain directors and/or officers of the Company are directors and/or officers of BlackRock or its affiliates. The Fund reimburses the Manager for a portion of the compensation paid to the Company’s Chief Compliance Officer, which is included in Directors and Officer in the Statement of Operations.
Other Transactions: The Fund may purchase securities from, or sell securities to, an affiliated fund provided the affiliation is due solely to having a common investment adviser, common officers, or common directors. For the year ended December 31, 2017, the purchase and sale transactions and any net realized gains (losses) with an affiliated fund in compliance with Rule 17a-7 under the 1940 Act were as follows:
| | | | |
Purchases | | $ | 2,751,821 | |
Sales | | | 3,482,241 | |
Net Realized Gain | | | 1,387,501 | |
For the year ended December 31, 2017, purchases and sales of investments, excluding short-term securities, were $5,350,498 and $17,412,201, respectively.
It is the Fund’s policy to comply with the requirements of the Internal Revenue Code of 1986, as amended, applicable to regulated investment companies, and to distribute substantially all of its taxable income to its shareholders. Therefore, no U.S. federal income tax provision is required.
The Fund files U.S. federal and various state and local tax returns. No income tax returns are currently under examination. The statute of limitations on the Fund’s U.S. federal tax returns generally remains open for each of the four years ended December 31, 2017. The statutes of limitations on the Fund’s state and local tax returns may remain open for an additional year depending upon the jurisdiction.
Management has analyzed tax laws and regulations and their application to the Fund as of December 31, 2017, inclusive of the open tax return years, and does not believe there are any uncertain tax positions that require recognition of a tax liability in the Fund’s financial statements.
The tax character of distributions paid was as follows:
| | | | | | | | |
| | | 12/31/2017 | | | 12/31/2016 | |
Ordinary income | | $ | 3,811,505 | | | $ | 3,831,956 | |
Long term capital gains | | | 8,657,383 | | | | 9,152,654 | |
| | | | | | | | |
| | $ | 12,468,888 | | | $ | 12,984,610 | |
| | | | | | | | |
As of December 31, 2017, the tax components of accumulated net earnings (losses) were as follows:
| | | | |
Undistributed ordinary income | | $ | 32,743 | |
Undistributed long-term capital gains | | | 1,789,749 | |
Net unrealized gains(a) | | | 146,819,332 | |
| | | | |
| | $ | 148,641,824 | |
| | | | |
| | (a) | The difference between book-basis and tax-basis net unrealized gains was attributable primarily to the tax deferral of losses on wash sales, the realization for tax purposes of unrealized gains/losses on certain futures contracts and the timing and recognition of partnership income. | |
| | |
| 22 | | 2017 BLACKROCK ANNUAL REPORTTO SHAREHOLDERS |
Notes to Financial Statements (continued)
As of December 31, 2017, gross unrealized appreciation and depreciation for investments and derivatives based on cost for U.S. federal income tax purposes were as follows:
| | | | |
Tax cost | | $ | 77,300,635 | |
| | | | |
Gross unrealized appreciation | | $ | 148,303,475 | |
Gross unrealized depreciation | | | (1,484,144 | ) |
| | | | |
Net unrealized appreciation(depreciation) | | $ | 146,819,331 | |
| | | | |
The Company, on behalf of the Fund, along with certain other funds managed by the Manager and its affiliates (“Participating Funds”), is a party to a 364-day, $2.1 billion credit agreement with a group of lenders. Under this agreement, the Fund may borrow to fund shareholder redemptions. Excluding commitments designated for certain individual funds, the Participating Funds, including the Fund, can borrow up to an aggregate commitment amount of $1.6 billion at any time outstanding, subject to asset coverage and other limitations as specified in the agreement. The credit agreement has the following terms: a fee of 0.12% per annum on unused commitment amounts and interest at a rate equal to the higher of (a) one-month LIBOR (but, in any event, not less than 0.00%) on the date the loan is made plus 0.80% per annum or (b) the Fed Funds rate (but, in any event, not less than 0.00%) in effect from time to time plus 0.80% per annum on amounts borrowed. The agreement expires in April 2018 unless extended or renewed. Participating Funds paid administration, legal and arrangement fees, which, if applicable, are included in miscellaneous expenses in the Statement of Operations. These fees were allocated among such funds based upon portions of the aggregate commitment available to them and relative net assets of Participating Funds. During the year ended December 31, 2017, the Fund did not borrow under the credit agreement.
In the normal course of business, the Fund invests in securities or other instruments and may enter into certain transactions, and such activities subject the Fund to various risks, including among others, fluctuations in the market (market risk) or failure of an issuer to meet all of its obligations. The value of securities or other instruments may also be affected by various factors, including, without limitation: (i) the general economy; (ii) the overall market as well as local, regional or global political and/or social instability; (iii) regulation, taxation or international tax treaties between various countries; or (iv) currency, interest rate and price fluctuations. The Fund’s prospectus provides details of the risks to which the Fund is subject.
The Fund may be exposed to additional risks when reinvesting cash collateral in money market funds that do not seek to maintain a stable NAV per share of $1.00 and which may be subject to redemption gates or liquidity fees under certain circumstances.
Valuation Risk: The market values of equities, such as common stocks and preferred securities or equity related investments, such as futures and options, may decline due to general market conditions which are not specifically related to a particular company. They may also decline due to factors which affect a particular industry or industries. The Fund may invest in illiquid investments and may experience difficulty in selling those investments in a timely manner at the price that it believes the investments are worth. Prices may fluctuate widely over short or extended periods in response to company, market or economic news. Markets also tend to move in cycles, with periods of rising and falling prices. This volatility may cause the Fund’s NAV to experience significant increases or decreases over short periods of time. If there is a general decline in the securities and other markets, the NAV of the Fund may lose value, regardless of the individual results of the securities and other instruments in which the Fund invests.
Counterparty Credit Risk: The Fund may be exposed to counterparty credit risk, or the risk that an entity may fail to or be unable to perform on its commitments related to unsettled or open transactions. The Fund manages counterparty credit risk by entering into transactions only with counterparties that the Manager believes have the financial resources to honor their obligations and by monitoring the financial stability of those counterparties. Financial assets, which potentially expose the Fund to market, issuer and counterparty credit risks, consist principally of financial instruments and receivables due from counterparties. The extent of the Fund’s exposure to market, issuer and counterparty credit risks with respect to these financial assets is approximately their value recorded in the Statement of Assets and Liabilities, less any collateral held by the Fund.
A derivative contract may suffer a mark-to-market loss if the value of the contract decreases due to an unfavorable change in the market rates or values of the underlying instrument. Losses can also occur if the counterparty does not perform under the contract.
With exchange-traded futures, there is less counterparty credit risk to the Fund since the exchange or clearinghouse, as counterparty to such instruments, guarantees against a possible default. The clearinghouse stands between the buyer and the seller of the contract; therefore, credit risk is limited to failure of the clearinghouse. While offset rights may exist under applicable law, the Fund does not have a contractual right of offset against a clearing broker or clearinghouse in the event of a default (including the bankruptcy or insolvency). Additionally, credit risk exists in exchange-traded futures with respect to initial and variation margin that is held in a clearing broker’s customer accounts. While clearing brokers are required to segregate customer margin from their own assets, in the event that a clearing broker becomes insolvent or goes into bankruptcy and at that time there is a shortfall in the aggregate amount of margin held by the clearing broker for all its clients, typically the shortfall would be allocated on a pro rata basis across all the clearing broker’s customers, potentially resulting in losses to the Fund.
| | | | |
| NOTESTO FINANCIAL STATEMENTS | | | 23 | |
Notes to Financial Statements (continued)
| 11. | CAPITAL SHARE TRANSACTIONS |
Transactions in capital shares for each class were as follows:
| | | | | | | | | | | | | | | | |
| | | Year Ended
12/31/2017 | | | Year Ended
12/31/2016 | |
| Share Class | | Shares | | | Amount | | | Shares | | | Amount | |
Class I | | | | | | | | | | | | | | | | |
Shares sold | | | 853,159 | | | $ | 18,530,628 | | | | 1,196,731 | | | $ | 23,140,247 | |
Shares issued in reinvestment of distributions | | | 537,342 | | | | 12,284,211 | | | | 640,814 | | | | 12,832,741 | |
Shares redeemed | | | (1,723,846 | ) | | | (38,229,011 | ) | | | (1,829,715 | ) | | | (35,366,872 | ) |
| | | | | | | | | | | | | | | | |
Net increase (decrease) | | | (333,345 | ) | | $ | (7,414,172 | ) | | | 7,830 | | | $ | 606,116 | |
| | | | | | | | | | | | | | | | |
Class II | | | | | | | | | | | | | | | | |
Shares sold | | | 133,824 | | | $ | 2,754,443 | | | | 53,129 | | | $ | 1,004,364 | |
Shares issued in reinvestment of distributions | | | 8,145 | | | | 184,677 | | | | 7,643 | | | | 151,869 | |
Shares redeemed | | | (110,703 | ) | | | (2,246,796 | ) | | | (38,371 | ) | | | (780,362 | ) |
| | | | | | | | | | | | | | | | |
Net increase | | | 31,266 | | | $ | 692,324 | | | | 22,401 | | | $ | 375,871 | |
| | | | | | | | | | | | | | | | |
Total Net Increase (Decrease) | | | (302,079 | ) | | $ | (6,721,848 | ) | | | 30,231 | | | $ | 981,987 | |
| | | | | | | | | | | | | | | | |
Management has evaluated the impact of all subsequent events on the Fund through the date the financial statements were issued and has determined that there were no subsequent events requiring adjustment or additional disclosure in the financial statements.
| | |
| 24 | | 2017 BLACKROCK ANNUAL REPORTTO SHAREHOLDERS |
Report of the Independent Registered Public Accounting Firm
To the Shareholders of BlackRock S&P 500 Index V.I. Fund and the Board of Directors of BlackRock Variable Series Funds, Inc.:
Opinion on the Financial Statements and Financial Highlights
We have audited the accompanying statement of assets and liabilities, including the schedule of investments, of BlackRock S&P 500 Index V.I. Fund of BlackRock Variable Series Funds, Inc. (the “Fund”), as of December 31, 2017, the related statement of operations for the year then ended, the statements of changes in net assets for each of the two years in the period then ended, the financial highlights for each of the five years in the period then ended, and the related notes. In our opinion, the financial statements and financial highlights present fairly, in all material respects, the financial position of the Fund as of December 31, 2017, and the results of its operations for the year then ended, the changes in its net assets for each of the two years in the period then ended, and the financial highlights for each of the five years in the period then ended, in conformity with accounting principles generally accepted in the United States of America.
Basis for Opinion
These financial statements and financial highlights are the responsibility of the Fund’s management. Our responsibility is to express an opinion on the Fund’s financial statements and financial highlights based on our audits. We are a public accounting firm registered with the Public Company Accounting Oversight Board (United States) (PCAOB) and are required to be independent with respect to the Fund in accordance with the U.S. federal securities laws and the applicable rules and regulations of the Securities and Exchange Commission and the PCAOB.
We conducted our audits in accordance with the standards of the PCAOB. Those standards require that we plan and perform the audit to obtain reasonable assurance about whether the financial statements and financial highlights are free of material misstatement, whether due to error or fraud. The Fund is not required to have, nor were we engaged to perform, an audit of its internal control over financial reporting. As part of our audits we are required to obtain an understanding of internal control over financial reporting but not for the purpose of expressing an opinion on the effectiveness of the Fund’s internal control over financial reporting. Accordingly, we express no such opinion.
Our audits included performing procedures to assess the risks of material misstatement of the financial statements and financial highlights, whether due to error or fraud, and performing procedures that respond to those risks. Such procedures included examining, on a test basis, evidence regarding the amounts and disclosures in the financial statements and financial highlights. Our audits also included evaluating the accounting principles used and significant estimates made by management, as well as evaluating the overall presentation of the financial statements and financial highlights. Our procedures included confirmation of securities owned as of December 31, 2017, by correspondence with the custodian and brokers; when replies were not received from brokers, we performed other auditing procedures. We believe that our audits provide a reasonable basis for our opinion.
Deloitte & Touche LLP
Boston, Massachusetts
February 19, 2018
We have served as the auditor of one or more BlackRock investment companies since 1992.
| | | | |
| REPORTOFTHE INDEPENDENT REGISTERED PUBLIC ACCOUNTING FIRM | | | 25 | |
DECEMBER 31, 2017
| | |
ANNUAL REPORT | |  |
BlackRock Variable Series Funds, Inc.
| Ø | | BlackRock Total Return V.I. Fund |
|
| Not FDIC Insured • May Lose Value • No Bank Guarantee |
| | |
| Fund Summary as of December 31, 2017 | | BlackRock Total Return V.I. Fund |
Investment Objective
BlackRock Total Return V.I. Fund’s (the “Fund”) investment objective is to maximize total return, consistent with income generation and prudent investment management.
Portfolio Management Commentary
How did the Fund perform?
For the 12-month period ended December 31, 2017, the Fund’s Class I Shares outperformed its benchmark, the Bloomberg Barclays U.S. Aggregate Bond Index, while the Fund’s Class III Shares underperformed.
What factors influenced performance?
Positive contributions to performance for the period came from allocations to U.S. securitized assets including non-agency mortgage-backed securities (“MBS”) and collateralized loan obligations (“CLOs”). Out-of-benchmark exposure to emerging market bonds and municipal bonds contributed positively as well.
The Fund’s positioning with respect to duration (and corresponding interest rate sensitivity) and macro strategies modestly detracted from performance relative to the benchmark.
Describe recent portfolio activity.
The Fund began 2017 positioned to benefit from reflation driven by firming global growth, with an underweight duration stance and an emphasis on carry-oriented (income) opportunities to be found lower in the capital structure. Within these overall themes, the Fund held an allocation to high yield credit and overweight exposure to securitized assets including commercial mortgage-backed securities (“CMBS”), asset-backed securities (“ABS”), CLO’s and non-agency MBS, as well as emerging markets. In addition, the Fund maintained exposure to Treasury inflation-protected securities (“TIPS”) to capture any benefit from rising market expectations for inflation. As the period progressed, the Fund reduced its duration underweight as volatility remained low, global growth started to plateau following a strong recovery, and inflation expectations declined. This shift was designed to increase the Fund’s income generation given the lack of any catalyst for rate volatility to increase substantially, and made with the view that the market should favor strategies designed to generate income given the large demand for fixed income assets and low supply.
In the second half of the year, the Fund maintained an underweight duration on the belief that strong, synchronized global growth alongside less accommodative monetary policy from developed market central banks would push rates higher into year end. The Fund maintained a preference for income-oriented opportunities in areas such as securitized assets and emerging markets as the demand for yield kept valuations rich in credit sectors. Given these valuation concerns, the Fund held a preference for idiosyncratic stories with less broad market sensitivity within its investment grade and high yield corporate credit allocations.
Describe portfolio positioning at period end.
At the close of the period, the Fund remained underweight to duration as accelerating global growth, the prospect of tax reform, and low market volatility drove risk assets and rates higher into year end. The Fund was also positioned in anticipation of a steeper yield curve. Further, the Fund was positioned with a focus on generating income through overweight positions to securitized assets as well as allocations to select investment grade and high yield corporate bonds, with a continued preference for idiosyncratic stories given overall rich valuations. In addition, the Fund maintained its overweight position in emerging markets.
The views expressed reflect the opinions of BlackRock as of the date of this report and are subject to change based on changes in market, economic or other conditions. These views are not intended to be a forecast of future events and are no guarantee of future results.
| | |
| 2 | | 2017 BLACKROCK ANNUAL REPORTTO SHAREHOLDERS |
| | |
| Fund Summary as of December 31, 2017 (continued) | | BlackRock Total Return V.I. Fund |
TOTAL RETURN BASED ON A $10,000 INVESTMENT

| (a) | Assuming transaction costs, if any, and other operating expenses, including investment advisory fees. Does not include insurance-related fees and expenses. The returns for Class III Shares prior to August 14, 2012, the recommencement of operations of Class III Shares, are based upon the performance of the Fund’s Class I Shares, as adjusted to reflect the distribution and/or service (12b-1) fees applicable to Class III Shares. |
| (b) | Under normal circumstances, the Fund invests at least 80%, and typically invests 90% or more, of its assets in fixed income securities, such as corporate bonds and notes, mortgage-backed securities, asset-backed securities, convertible securities, preferred securities, government obligations and money market securities. |
| (c) | A widely recognized unmanaged market-weighted index, comprised of investment-grade corporate bonds rated BBB or better, mortgages and U.S Treasury and U.S. Government agency issues with at least one year to maturity. |
Performance Summary for the Period Ended December 31, 2017
| | | | | | | | | | | | | | | | | | | | | | | | | | | | | | | | | | | | |
| | | Standardized
30-Day Yield (b) | | | | | | Unsubsidized
30-Day Yield (b) | | | 6-Month
Total Returns (c) | | | | | | Average Annual Total Returns | |
| | | | | | | | | | | | 1 Year (c) | | | 5 Years (c) | | | | | | 10 Years (c) | |
Class I(a) | | | 2.68 | % | | | | | | | 2.49 | % | | | 1.08 | % | | | | | | | 3.60 | % | | | 2.39 | % | | | | | | | 3.91 | % |
Class III(a) | | | 2.37 | | | | | | | | 2.28 | | | | 0.84 | | | | | | | | 3.21 | | | | 2.08 | | | | | | | | 3.61 | (d) |
Bloomberg Barclays U.S. Aggregate Bond Index | | | — | | | | | | | | — | | | | 1.24 | | | | | | | | 3.54 | | | | 2.10 | | | | | | | | 4.01 | |
| | (a) | Average annual and cumulative total returns are based on changes in net asset value for the periods shown, and assume reinvestment of all distributions at net asset value on the ex-dividend/payable date. Insurance-related fees and expenses are not reflected in these returns. | |
| | (b) | The standardized 30-day yield includes the effects of any waivers and/or reimbursements. The unsubsidized 30-day yield excludes the effects of any waivers and/or reimbursements. | |
| | (c) | For the portion of the period, the Fund’s investment adviser waived a portion of its fee. Without such waiver, the Fund’s performance would have been lower. | |
| | (d) | The returns for Class III Shares prior to August 14, 2012, the recommencement of operations of Class III Shares, are based upon the performance of the Fund’s Class I Shares, as adjusted to reflect the distribution and/or service (12b-1) fees applicable to Class III Shares. | |
Past performance is not indicative of future results. Performance results do not reflect the deduction of taxes that a shareholder would pay on Fund distributions or the redemption of Fund shares.
Performance results may include adjustments made for financial reporting purposes in accordance with U.S. generally accepted accounting principles.
Expense Example
| | | | | | | | | | | | | | | | | | | | | | | | | | | | | | | | | | | | | | | | |
| | | Actual | | | | | | Hypothetical (a) | | | | |
| | | | | | | | | Including Interest
Expense and Fees | | | Excluding Interest
Expense and Fees | | | | | | | | | Including Interest Expense and Fees | | | Excluding Interest Expense and Fees | | | | |
| | | Beginning
Account Value
(07/01/17) | | | Ending
Account Value
(12/31/17) | | | Expenses Paid During
the Period (b) | | | Expenses
Paid During
the Period (c) | | | | | | Beginning
Account Value
(07/01/17) | | | Ending
Account Value
(12/31/17) | | | Expenses
Paid During
the Period (b) | | | Ending
Account Value
12/31/17 | | | Expenses
Paid During
the Period (c) | |
Class I | | $ | 1,000.00 | | | $ | 1,010.80 | | | $ | 3.41 | | | $ | 3.45 | | | | | | | $ | 1,000.00 | | | $ | 1,020.92 | | | $ | 4.33 | | | $ | 1,021.78 | | | $ | 3.47 | |
Class III | | | 1,000.00 | | | | 1,008.40 | | | | 5.67 | | | | 5.01 | | | | | | | | 1,000.00 | | | | 1,019.56 | | | | 5.70 | | | | 1,020.21 | | | | 5.04 | |
| | (a) | Hypothetical 5% annual return before expenses is calculated by prorating the number of days in the most recent fiscal half year divided by 365. | |
| | (b) | For each class of the Fund, expenses are equal to the annualized expense ratio for the class (0.85% for Class I and 1.12% for Class III), multiplied by the average account value over the period, multiplied by 184/365 (to reflect the one-half year period shown). | |
| | (c) | For each class of the Fund, expenses are equal to the annualized expense ratio for the class (0.68% for Class I and 0.99% for Class III), multiplied by the average account value over the period, multiplied by 184/365 (to reflect the one-half year period shown). | |
See “Disclosure of Expenses” on page 6 for further information on how expenses were calculated.
| | |
| Fund Summary as of December 31, 2017 (continued) | | BlackRock Total Return V.I. Fund |
Portfolio Information
PORTFOLIO COMPOSITION
| | | | |
| Asset Type | | Percent of
Net Assets | |
U.S. Government Sponsored Agency Securities | | | 44 | % |
U.S. Treasury Obligations | | | 33 | |
Corporate Bonds | | | 27 | |
Asset-Backed Securities | | | 12 | |
Non-Agency Mortgage-Backed Securities | | | 7 | |
Municipal Bonds | | | 6 | |
Foreign Government Obligations | | | 4 | |
Borrowed Bond Agreements | | | — | (a) |
Floating Rate Loan Interests | | | — | (a) |
Borrowed Bonds | | | — | (a) |
Money Market Funds | | | — | (a) |
Options Purchased | | | — | (a) |
Preferred Securities | | | — | (a) |
Foreign Agency Obligations | | | — | (a) |
Other Interests | | | — | (a) |
TBA Sale Commitments | | | (17 | ) |
Liabilities in Excess of Other Assets | | | (16 | ) |
| | (a) | Representing less than 0.5% of the Fund’s net assets. | |
CREDIT QUALITY ALLOCATION (a)
| | | | |
| Credit Rating | | Percent of Total
Investments (b) | |
AAA/Aaa (c) | | | 62 | % |
AA/Aa | | | 4 | |
A | | | 8 | |
BBB/Baa | | | 13 | |
BB/Ba | | | 1 | |
B | | | 1 | |
CCC/Caa | | | 1 | |
DD/Da | | | 1 | |
N/R | | | 9 | |
| | (a) | For financial reporting purposes, credit quality ratings shown above reflect the highest rating assigned by either Standard & Poor’s or Moody’s Investors Service if ratings differ. These rating agencies are independent, nationally recognized statistical rating organizations and are widely used. Investment grade ratings are credit ratings of BBB/Baa or higher. Below investment grade ratings are credit ratings of BB/Ba or lower. Investments designated N/R are not rated by either rating agency. Unrated investments do not necessarily indicate low credit quality. Credit quality ratings are subject to change. | |
| | (b) | Total investments exclude short-term securities and options purchased. | |
| | (c) | The investment adviser evaluates the credit quality of unrated investments based upon certain factors including, but not limited to, credit ratings for similar investments and financial analysis of sectors, individual investments and/or issuers. Using this approach, the investment adviser has deemed unrated U.S. Government Sponsored Agency Securities and U.S. Treasury Obligations to be of similar credit quality as investments rated AAA/Aaa. | |
| | |
| 4 | | 2017 BLACKROCK ANNUAL REPORTTO SHAREHOLDERS |
| | |
| Disclosure of Expenses | | BlackRock Total Return V.I. Fund |
Shareholders of the Fund may incur the following charges: (a) transactional expenses, such as sales charges; and (b) operating expenses, including investment advisory fees, service and distribution fees, including 12b-1 fees, acquired fund fees and expenses, and other fund expenses. The expense example on the previous page (which is based on a hypothetical investment of $1,000 invested on July 1, 2017 and held through December 31, 2017) is intended to assist shareholders both in calculating expenses based on an investment in the Fund and in comparing these expenses with similar costs of investing in other mutual funds.
The expense example provides information about actual account values and actual expenses. In order to estimate the expenses a shareholder paid during the period covered by this report, shareholders can divide their account value by $1,000 and then multiply the result by the number corresponding to their share class under the heading entitled “Expenses Paid During the Period.”
The expense example also provides information about hypothetical account values and hypothetical expenses based on the Fund’s actual expense ratio and an assumed rate of return of 5% per year before expenses. In order to assist shareholders in comparing the ongoing expenses of investing in the Fund and other funds, compare the 5% hypothetical example with the 5% hypothetical examples that appear in shareholder reports of other funds.
The expenses shown in the expense example are intended to highlight shareholders’ ongoing costs only and do not reflect any transactional expenses, such as sales charges, if any. Therefore, the hypothetical example is useful in comparing ongoing expenses only, and will not help shareholders determine the relative total expenses of owning different funds. If these transactional expenses were included, shareholder expenses would have been higher.
The Benefits and Risks of Leveraging
The Fund may utilize leverage to seek to enhance returns and net asset value (“NAV”). However, these objectives cannot be achieved in all interest rate environments.
The Fund may utilize leverage by entering into reverse repurchase agreements.
In general, the concept of leveraging is based on the premise that the financing cost of leverage, which is based on short-term interest rates, is normally lower than the income earned by the Fund on its longer-term portfolio investments purchased with the proceeds from leverage. To the extent that the total assets of the Fund (including the assets obtained from leverage) are invested in higher-yielding portfolio investments, the Fund’s shareholders benefit from the incremental net income.
The interest earned on securities purchased with the proceeds from leverage is distributed to the Fund’s shareholders, and the value of these portfolio holdings is reflected in the Fund’s per share NAV. However, in order to benefit shareholders, the return on assets purchased with leverage proceeds must exceed the ongoing costs associated with the leverage. If interest and other ongoing costs of leverage exceed the Fund’s return on assets purchased with leverage proceeds, income to shareholders is lower than if the Fund had not used leverage.
Furthermore, the value of the Fund’s portfolio investments generally varies inversely with the direction of long-term interest rates, although other factors can also influence the value of portfolio investments. As a result, changes in interest rates can influence the Fund’s NAV positively or negatively in addition to the impact on the Fund’s performance from leverage. Changes in the direction of interest rates are difficult to predict accurately, and there is no assurance that the Fund’s leveraging strategy will be successful.
The use of leverage also generally causes greater changes in the Fund’s NAV and dividend rates than comparable portfolios without leverage. In a declining market, leverage is likely to cause a greater decline in the NAV of the Fund’s shares than if the Fund were not leveraged. In addition, the Fund may be required to sell portfolio securities at inopportune times or at distressed values in order to comply with regulatory requirements applicable to the use of leverage or as required by the terms of the leverage instruments, which may cause the Fund to incur losses. The use of leverage may limit the Fund’s ability to invest in certain types of securities or use certain types of hedging strategies. The Fund incurs expenses in connection with the use of leverage, all of which are borne by the Fund’s shareholders and may reduce income.
Derivative Financial Instruments
The Fund may invest in various derivative financial instruments. These instruments are used to obtain exposure to a security, commodity, index, market, and/or other assets without owning or taking physical custody of securities, commodities and/or other referenced assets or to manage market, equity, credit, interest rate, foreign currency exchange rate, commodity and/or other risks. Derivative financial instruments may give rise to a form of economic leverage and involve risks, including the imperfect correlation between the value of a derivative financial instrument and the underlying asset, possible default of the counterparty to the transaction or illiquidity of the instrument. The Fund’s successful use of a derivative financial instrument depends on the investment adviser’s ability to predict pertinent market movements accurately, which cannot be assured. The use of these instruments may result in losses greater than if they had not been used, may limit the amount of appreciation the Fund can realize on an investment and/or may result in lower distributions paid to shareholders. The Fund’s investments in these instruments, if any, are discussed in detail in the Notes to Financial Statements.
| | | | |
| DISCLOSURE OF EXPENSES / THE BENEFITSAND RISKSOF LEVERAGING / DERIVATIVE FINANCIAL INSTRUMENTS | | | 5 | |
| | |
Schedule of Investments December 31, 2017 | | BlackRock Total Return V.I. Fund (Percentages shown are based on Net Assets) |
| | | | | | | | | | | | |
| Security | | Par
(000) | | | Value | |
Asset-Backed Securities — 12.2% | |
Accredited Mortgage Loan Trust, Series 2006-1, Class M2, 1.89%, 04/25/36(a) | | | USD | | | | 190 | | | $ | 98,383 | |
ACE Securities Corp. Home Equity Loan Trust(a): | | | | | | | | | | | | |
Series 2003-OP1, Class A2, 2.27%, 12/25/33 | | | | | | | 122 | | | | 117,945 | |
Series 2007-HE4, Class A2A, 1.68%, 05/25/37 | | | | | | | 106 | | | | 35,047 | |
Adams Mill CLO Ltd., Series 2014-1A, Class A2R, 2.46%, 07/15/26(a)(b) | | | | | | | 250 | | | | 250,757 | |
Ajax Mortgage Loan Trust(b)(c): | | | | | | | | | | | | |
Series 2016-B, Class A, 4.00%, 09/25/65 | | | | | | | 93 | | | | 92,848 | |
Series 2016-C, Class A, 4.00%, 10/25/57 | | | | | | | 86 | | | | 86,791 | |
Series 2017-A, Class A, 3.47%, 04/25/57 | | | | | | | 342 | | | | 342,258 | |
Allegro CLO II Ltd., Series 2014-1A, Class A1R, 2.67%, 01/21/27(a)(b) | | | | | | | 500 | | | | 502,268 | |
Allegro CLO V Ltd., Series 2017-1A, Class A, 2.61%, 10/16/30(a)(b) | | | | | | | 250 | | | | 249,896 | |
ALM V Ltd.(a)(b): | | | | | | | | | | | | |
Series 2012-5A, Class A1R3, 2.26%, 10/18/27 | | | | | | | 290 | | | | 290,187 | |
Series 2012-5A, Class A2R3, 2.60%, 10/18/27 | | | | | | | 250 | | | | 250,220 | |
Series 2012-5A, Class BR3, 3.00%, 10/18/27 | | | | | | | 250 | | | | 250,309 | |
ALM XII Ltd., Series 2015-12A, Class A1R, 2.41%, 04/16/27(a)(b) | | | | | | | 250 | | | | 250,562 | |
ALM XIV Ltd., Series 2014-14A, Class A1R, 2.53%, 07/28/26(a)(b) | | | | | | | 1,250 | | | | 1,250,288 | |
American Airlines Pass-Through Trust, Series 2015-1, Class A, 3.38%, 05/01/27(a) | | | | | | | 235 | | | | 235,230 | |
AMMC CLO 18 Ltd., Series 2016-18A, Class AL1, 3.03%, 05/26/28(a)(b) | | | | | | | 170 | | | | 171,104 | |
AMMC CLO 19 Ltd., Series 2016-19A, Class C, 4.16%, 10/15/28(a)(b) | | | | | | | 100 | | | | 101,602 | |
Anchorage Capital CLO 5 Ltd., Series 2014-5A, Class CR, 3.56%, 10/15/26(a)(b) | | | | | | | 250 | | | | 250,005 | |
Anchorage Capital CLO 6 Ltd., Series 2015-6A, Class AR, 2.63%, 07/15/30(a)(b) | | | | | | | 250 | | | | 251,769 | |
Anchorage Capital CLO 7 Ltd., Series 2015-7A, Class AR, 2.32%, 10/15/27(a)(b) | | | | | | | 750 | | | | 750,356 | |
Anchorage Capital CLO Ltd.(a)(b): | | | | | | | | | | | | |
Series 2014-5RA, Class B, 0.00%, 01/15/30(d) | | | | | | | 250 | | | | 250,000 | |
Series 2014-5RA, Class C, 0.00%, 01/15/30 | | | | | | | 250 | | | | 250,000 | |
Apidos CLO XII, Series 2013-12A, Class A, 2.46%, 04/15/25(a)(b) | | | | | | | 353 | | | | 353,264 | |
Apidos CLO XV, Series 2013-15A, Class A1R, 2.46%, 10/20/25(a)(b) | | | | | | | 500 | | | | 500,723 | |
APS Resecuritization Trust, Series 2016-1, Class 1MZ, 6.00%, 07/31/57(a)(b) | | | | | | | 225 | | | | 72,712 | |
Arbor Realty Collateralized Loan Obligation Ltd.(a)(b): | | | | | | | | | | | | |
Series 2015-FL2A, Class A, 3.23%, 09/15/25 | | | | | | | 250 | | | | 252,027 | |
Series 2017-FL3, Class A, 2.23%, 12/15/27(d) | | | | | | | 130 | | | | 130,082 | |
Arbor Realty Commercial Real Estate Notes Ltd.(a)(b): | | | | | | | | | | | | |
Series 2016-FL1A, Class A, 3.18%, 09/15/26 | | | | | | | 130 | | | | 132,066 | |
Series 2017-FL2, Class A, 2.40%, 08/15/27 | | | | | | | 250 | | | | 250,340 | |
Ares XXVIII CLO Ltd., Series 2013-3A, Class B1R, 2.85%, 10/17/24(a)(b) | | | | | | | 250 | | | | 250,844 | |
Ares XXXIII CLO Ltd., Series 2015-1A, Class B2R, 4.29%, 12/05/25(a)(b) | | | | | | | 250 | | | | 255,576 | |
Ares XXXVII CLO Ltd., Series 2015-4A, Class A1R, 2.54%, 10/15/30(a)(b) | | | | | | | 250 | | | | 251,676 | |
Argent Mortgage Loan Trust, Series 2005-W1, Class A2, 1.79%, 05/25/35(a)(d) | | | | | | | 61 | | | | 46,394 | |
Atlas Senior Loan Fund IV Ltd., Series 2013-2A, Class A1LR, 2.40%, 02/17/26(a)(b) | | | | | | | 250 | | | | 250,241 | |
Avery Point V CLO Ltd., Series 2014-5A, Class AR, 2.33%, 07/17/26(a)(b) | | | | | | | 250 | | | | 250,765 | |
| | | | | | | | | | | | |
| Security | | Par
(000) | | | Value | |
B2R Mortgage Trust(a)(b): | | | | | | | | | | | | |
Series 2015-1, Class A1, 2.52%, 05/15/48 | | | USD | | | | 75 | | | $ | 74,364 | |
Series 2015-2, Class A, 3.34%, 11/15/48 | | | | | | | 91 | | | | 92,298 | |
Babson CLO Ltd., Series 2015-2A, Class AR, 2.55%, 10/20/30(a)(b) | | | | | | | 260 | | | | 262,158 | |
BankAmerica Manufactured Housing Contract Trust, Series 1998-2, Class B1, 7.93%, 12/10/25(a) | | | | | | | 300 | | | | 218,147 | |
Battalion CLO IV Ltd., Series 2013-4A, Class A1R, 2.50%, 10/22/25(a)(b) | | | | | | | 250 | | | | 250,196 | |
Bayview Financial Revolving Asset Trust(a)(b): | | | | | | | | | | | | |
Series 2004-B, Class A1, 2.56%, 05/28/39 | | | | | | | 152 | | | | 139,477 | |
Series 2005-A, Class A1, 2.56%, 02/28/40 | | | | | | | 223 | | | | 199,320 | |
Series 2005-E, Class A1, 2.56%, 12/28/40 | | | | | | | 98 | | | | 88,702 | |
BCMSC Trust(a): | | | | | | | | | | | | |
Series 2000-A, Class A2, 7.57%, 06/15/30 | | | | | | | 40 | | | | 16,392 | |
Series 2000-A, Class A3, 7.83%, 06/15/30 | | | | | | | 37 | | | | 15,733 | |
Series 2000-A, Class A4, 8.29%, 06/15/30 | | | | | | | 63 | | | | 28,616 | |
Bear Stearns Asset-Backed Securities I Trust(a): | | | | | | | | | | | | |
Series 2007-FS1, Class 1A3, 1.72%, 05/25/35 | | | | | | | 84 | | | | 85,633 | |
Series 2007-HE2, Class 23A, 1.69%, 03/25/37 | | | | | | | 61 | | | | 59,166 | |
Series 2007-HE3, Class 1A4, 1.90%, 04/25/37 | | | | | | | 206 | | | | 161,755 | |
Bear Stearns Asset-Backed Securities Trust, Series 2005-4, Class M2, 2.53%, 01/25/36(a) | | | | | | | 20 | | | | 19,810 | |
Bear Stearns Mortgage Funding Trust, Series 2006-SL1, Class A1, 1.83%, 08/25/36(a) | | | | | | | 83 | | | | 83,618 | |
BlueMountain CLO Ltd.(a)(b): | | | | | | | | | | | | |
Series 2013-2A, Class A1R, 2.54%, 10/22/30 | | | | | | | 250 | | | | 251,418 | |
Series 2013-3A, Class AR, 2.27%, 10/29/25 | | | | | | | 250 | | | | 250,051 | |
Series 2013-4A, Class AR, 2.37%, 04/15/25 | | | | | | | 250 | | | | 250,693 | |
Bsprt Issuer Ltd., Series 2017-FL1, Class A, 2.83%, 06/15/27(a)(b) | | | | | | | 130 | | | | 130,446 | |
Canyon Capital CLO Ltd., Series 2006-1A, Class A1, 1.84%, 12/15/20(a)(b) | | | | | | | 106 | | | | 106,176 | |
Carlyle Global Market Strategies CLO Ltd.(a)(b): | | | | | | | | | | | | |
Series 2012-4A, Class AR, 2.81%, 01/20/29 | | | | | | | 300 | | | | 304,341 | |
Series 2014-1A, Class CR, 4.10%, 04/17/25 | | | | | | | 250 | | | | 250,515 | |
Carrington Mortgage Loan Trust(a): | | | | | | | | | | | | |
Series 2005-FRE1, Class M1, 2.02%, 12/25/35 | | | | | | | 160 | | | | 158,965 | |
Series 2006-FRE2, Class A2, 1.67%, 10/25/36 | | | | | | | 81 | | | | 53,618 | |
Series 2006-FRE2, Class A3, 1.71%, 10/25/36 | | | | | | | 161 | | | | 107,540 | |
Series 2006-FRE2, Class A5, 1.63%, 10/25/36 | | | | | | | 27 | | | | 17,977 | |
Series 2006-NC2, Class A3, 1.70%, 06/25/36 | | | | | | | 287 | | | | 283,849 | |
Series 2006-NC4, Class A3, 1.71%, 10/25/36 | | | | | | | 100 | | | | 89,146 | |
Series 2006-NC5, Class A5, 1.61%, 01/25/37 | | | | | | | 70 | | | | 64,389 | |
Series 2007-HE1, Class A2, 1.70%, 06/25/37 | | | | | | | 367 | | | | 362,626 | |
Series 2007-RFC1, Class A4, 1.77%, 10/25/36 | | | | | | | 100 | | | | 70,288 | |
CBAM Ltd., Series 2017-1A, Class A1, 2.58%, 07/20/30(a)(b) | | | | | | | 250 | | | | 252,173 | |
C-BASS Trust: | | | | | | | | | | | | |
Series 2006-CB7, Class A4, 1.71%, 10/25/36(a) | | | | | | | 67 | | | | 47,948 | |
Series 2006-CB9, Class A2, 1.66%, 11/25/36(a) | | | | | | | 37 | | | | 24,174 | |
Series 2006-CB9, Class A4, 1.78%, 11/25/36(a) | | | | | | | 17 | | | | 11,193 | |
Series 2007-CB1, Class AF2, 3.71%, 01/25/37(c) | | | | | | | 184 | | | | 90,770 | |
Series 2007-CB1, Class AF4, 3.71%, 01/25/37(c) | | | | | | | 76 | | | | 37,653 | |
Series 2007-CB5, Class A2, 1.50%, 04/25/37(a) | | | | | | | 63 | | | | 47,536 | |
Cedar Funding VIII CLO Ltd., Series 2017-8A, Class A1, 2.62%, 10/17/30(a)(b) | | | | | | | 510 | | | | 512,569 | |
CIFC Funding Ltd.(a): | | | | | | | | | | | | |
Series 2013-2A, Class A1LR, 2.56%, 10/18/30(b) | | | | | | | 230 | | | | 231,918 | |
Series 2014-2A, Class A1LR, 2.65%, 05/24/26(b) | | | | | | | 500 | | | | 502,546 | |
Series 2014-3A, Class C1R, 3.26%, 07/22/26(b) | | | | | | | 250 | | | | 251,029 | |
Series 2014-4A, Class A1R, 2.73%, 10/17/26(b) | | | | | | | 250 | | | | 250,507 | |
Series 2014-V, 2.75%, 01/17/27 | | | | | | | 890 | | | | 893,146 | |
Series 2015-2A, Class AR, 2.42%, 04/15/27(b) | | | | | | | 250 | | | | 249,749 | |
| | |
| 6 | | 2017 BLACKROCK ANNUAL REPORTTO SHAREHOLDERS |
| | |
Schedule of Investments (continued) December 31, 2017 | | BlackRock Total Return V.I. Fund (Percentages shown are based on Net Assets) |
| | | | | | | | | | | | |
| Security | | Par
(000) | | | Value | |
Citicorp Residential Mortgage Trust, Series 2007-2, Class M1, 5.24%, 06/25/37(c) | | | USD | | | | 100 | | | $ | 96,228 | |
Citigroup Mortgage Loan Trust(a): | | | | | | | | | | | | |
Series 2006-NC1, Class A2D, 1.80%, 08/25/36 | | | | | | | 100 | | | | 81,327 | |
Series 2007-AHL2, Class A3B, 1.75%, 05/25/37 | | | | | | | 271 | | | | 201,782 | |
Series 2007-AHL2, Class A3C, 1.82%, 05/25/37 | | | | | | | 123 | | | | 92,285 | |
Citigroup Mortgage Loan Trust, Inc., Series 2006-WFH4, Class M3, 1.87%, 11/25/36(a) | | | | | | | 100 | | | | 84,881 | |
Colony American Homes, Series 2015-1A, Class A, 2.63%, 07/17/32(a)(b) | | | | | | | 95 | | | | 95,162 | |
Conseco Finance Corp.(a): | | | | | | | | | | | | |
Series 1997-3, Class M1, 7.53%, 03/15/28 | | | | | | | 64 | | | | 63,512 | |
Series 1997-6, Class M1, 7.21%, 01/15/29 | | | | | | | 42 | | | | 41,549 | |
Series 1998-8, Class M1, 6.98%, 09/01/30 | | | | | | | 118 | | | | 98,059 | |
Series 1999-5, Class A5, 7.86%, 03/01/30 | | | | | | | 50 | | | | 39,868 | |
Series 1999-5, Class A6, 7.50%, 03/01/30 | | | | | | | 36 | | | | 27,745 | |
Series 2001-D, Class B1, 3.98%, 11/15/32 | | | | | | | 74 | | | | 73,787 | |
Conseco Finance Securitizations Corp.: | | | | | | | | | | | | |
Series 2000-1, Class A5, 8.06%, 09/01/29(a) | | | | | | | 58 | | | | 31,587 | |
Series 2000-4, Class A6, 8.31%, 05/01/32(a) | | | | | | | 153 | | | | 82,191 | |
Series 2000-5, Class A7, 8.20%, 05/01/31 | | | | | | | 152 | | | | 103,374 | |
Countrywide Asset-Backed Certificates(a): | | | | | | | | | | | | |
Series 2003-BC3, Class A2, 2.17%, 09/25/33 | | | | | | | 125 | | | | 122,404 | |
Series 2006-S10, Class A3, 1.87%, 10/25/36 | | | | | | | 52 | | | | 49,251 | |
Series 2006-SPS1, Class A, 1.77%, 12/25/25 | | | | | | | 3 | | | | 3,087 | |
Series 2007-S3, Class A3, 1.93%, 05/25/37 | | | | | | | 91 | | | | 82,589 | |
Credit-Based Asset Servicing & Securitization LLC: | | | | | | | | | | | | |
Series 2006-CB2, Class AF4, 3.43%, 12/25/36(c) | | | | | | | 17 | | | | 13,818 | |
Series 2006-MH1, Class B1, 6.25%, 10/25/36(b)(c) | | | | | | | 100 | | | | 102,856 | |
Series 2006-SL1, Class A2, 5.56%, 09/25/36(b)(c) | | | | | | | 91 | | | | 18,632 | |
Series 2007-CB6, Class A4, 1.58%, 07/25/37(a)(b) | | | | | | | 65 | | | | 43,910 | |
Series 2007-RP1, Class A, 1.86%, 05/25/46(a)(b) | | | | | | | 48 | | | | 42,155 | |
CSMC Trust, Series 2017-1, 4.50%, 03/25/21(a) | | | | | | | 665 | | | | 670,747 | |
CWABS Asset-Backed Certificates Trust(a): | | | | | | | | | | | | |
Series 2005-16, Class 1AF, 5.07%, 05/25/36 | | | | | | | 169 | | | | 209,488 | |
Series 2005-16, Class 2AF3, 4.59%, 05/25/36 | | | | | | | 39 | | | | 48,785 | |
Series 2006-11, Class 3AV2, 1.49%, 09/25/46 | | | | | | | 11 | | | | 10,914 | |
CWABS Revolving Home Equity Loan Trust, Series 2004-U, Class 2A, 1.75%, 03/15/34(a) | | | | | | | 35 | | | | 31,002 | |
CWABS, Inc. Asset-Backed Certificates Trust, Series 2004-5, Class A, 2.45%, 10/25/34(a) | | | | | | | 137 | | | | 138,942 | |
CWHEQ Home Equity Loan Trust: | | | | | | | | | | | | |
Series 2006-S5, Class A4, 5.84%, 06/25/35 | | | | | | | 9 | | | | 11,020 | |
Series 2006-S5, Class A5, 6.16%, 06/25/35 | | | | | | | 16 | | | | 17,394 | |
Series 2007-S1, Class A3, 5.81%, 11/25/36(a) | | | | | | | 35 | | | | 35,032 | |
CWHEQ Revolving Home Equity Loan Resuritization Trust(a)(b): | | | | | | | | | | | | |
Series 2006-RES, Class 4Q1B, 1.78%, 12/15/33(d) | | | | | | | 27 | | | | 24,445 | |
Series 2006-RES, Class 5B1B, 1.67%, 05/15/35(d) | | | | | | | 17 | | | | 14,789 | |
Series 2006-RES, Class 5F1A, 1.72%, 12/15/35 | | | | | | | 271 | | | | 246,835 | |
CWHEQ Revolving Home Equity Loan Trust(a): | | | | | | | | | | | | |
Series 2005-B, Class 2A, 1.66%, 05/15/35 | | | | | | | 30 | | | | 27,677 | |
Series 2006-H, Class 1A, 1.63%, 11/15/36 | | | | | | | 96 | | | | 76,684 | |
DCP Rights LLC, Series 2014-1A, Class A, 5.46%, 10/25/44(b) | | | | | | | 216 | | | | 222,170 | |
Dryden 41 Senior Loan Fund, Series 2015-41A, Class A, 2.86%, 01/15/28(a)(b) | | | | | | | 250 | | | | 251,334 | |
Dryden 53 CLO Ltd., Series 2017-53A, Class A, 0.00%, 01/15/31(a)(b) | | | | | | | 800 | | | | 800,000 | |
Dryden XXV Senior Loan Fund, Series 2012-25A, Class ARR, 2.26%, 10/15/27(a)(b) | | | | | | | 250 | | | | 250,507 | |
| | | | | | | | | | | | |
| Security | | Par
(000) | | | Value | |
First Franklin Mortgage Loan Trust(a): | | | | | | | | | | | | |
Series 2004-FFH3, Class M3, 2.60%, 10/25/34 | | | USD | | | | 33 | | | $ | 28,841 | |
Series 2006-FF5, Class 2A3, 1.71%, 04/25/36 | | | | | | | 37 | | | | 34,570 | |
Series 2006-FF16, Class 2A3, 1.69%, 12/25/36 | | | | | | | 823 | | | | 512,623 | |
Series 2006-FF17, Class A5, 1.70%, 12/25/36 | | | | | | | 708 | | | | 586,558 | |
Series 2006-FFH1, Class M2, 1.95%, 01/25/36 | | | | | | | 122 | | | | 75,191 | |
Flatiron CLO Ltd., Series 2015-1A, Class AR, 2.25%, 04/15/27(a)(b) | | | | | | | 250 | | | | 250,358 | |
Fremont Home Loan Trust, Series 2006-3, Class 1A1, 1.69%, 02/25/37(a) | | | | | | | 283 | | | | 227,799 | |
GE-WMC Asset-Backed Pass-Through Certificates(a): | | | | | | | | | | | | |
Series 2005-2, Class A2C, 1.80%, 12/25/35 | | | | | | | 30 | | | | 29,747 | |
Series 2005-2, Class M1, 1.99%, 12/25/35 | | | | | | | 184 | | | | 109,555 | |
GE-WMC Mortgage Securities Trust, Series 2006-1, Class A2B, 1.70%, 08/25/36(a) | | | | | | | 718 | | | | 457,665 | |
GMACM Home Equity Loan Trust, Series 2006-HE4, Class A2, 1.51%, 12/25/36(a) | | | | | | | 94 | | | | 90,753 | |
GSAA Home Equity Trust(a): | | | | | | | | | | | | |
Series 2007-2, Class AF3, 5.92%, 03/25/37 | | | | | | | 30 | | | | 12,415 | |
Series 2007-4, Class A3B, 1.90%, 03/25/37 | | | | | | | 120 | | | | 16,643 | |
GSAMP Trust(a): | | | | | | | | | | | | |
Series 2006-FM2, Class A2B, 1.67%, 09/25/36 | | | | | | | 84 | | | | 40,201 | |
Series 2007-H1, Class A1B, 1.75%, 01/25/47 | | | | | | | 32 | | | | 21,698 | |
Series 2007-HS1, Class M6, 3.80%, 02/25/47 | | | | | | | 40 | | | | 40,853 | |
GT Loan Financing I Ltd., Series 2013-1A, Class A, 2.65%, 10/28/24(a)(b) | | | | | | | 250 | | | | 250,419 | |
Highbridge Loan Management Ltd., Series 6A-2015, Class A, 2.84%, 05/05/27(a)(b) | | | | | | | 250 | | | | 250,373 | |
Home Equity Asset Trust, Series 2007-1, Class 2A3, 1.70%, 05/25/37(a) | | | | | | | 90 | | | | 74,212 | |
Home Equity Mortgage Loan Asset-Backed Trust(a): | | | | | | | | | | | | |
Series 2004-A, Class M2, 3.58%, 07/25/34 | | | | | | | 30 | | | | 30,597 | |
Series 2007-B, Class 2A3, 1.75%, 07/25/37 | | | | | | | 130 | | | | 87,806 | |
Home Equity Mortgage Trust, Series 2006-2, Class 1A1, 5.87%, 07/25/36(c) | | | | | | | 80 | | | | 31,055 | |
Home Loan Mortgage Loan Trust, Series 2005-1, Class A3, 2.20%, 04/15/36(a) | | | | | | | 32 | | | | 29,632 | |
Invitation Homes Trust(a)(b): | | | | | | | | | | | | |
Series 2015-SFR3, Class A, 2.76%, 08/17/32 | | | | | | | 95 | | | | 95,573 | |
Series 2015-SFR3, Class E, 5.21%, 08/17/32 | | | | | | | 100 | | | | 101,502 | |
Irwin Home Equity Loan Trust, Series 2006-3, Class 2A3, 6.03%, 09/25/37(b)(c) | | | | | | | 90 | | | | 87,794 | |
JPMorgan Mortgage Acquisition Trust: | | | | | | | | | | | | |
Series 2006-CW1, Class M1, 1.82%, 05/25/36(a) | | | | | | | 100 | | | | 94,496 | |
Series 2006-WF1, Class A3A, 5.83%, 07/25/36(c) | | | | | | | 282 | | | | 153,710 | |
Series 2006-WF1, Class A5, 6.41%, 07/25/36(c) | | | | | | | 62 | | | | 33,743 | |
Series 2006-WF1, Class A6, 6.00%, 07/25/36(c) | | | | | | | 56 | | | | 30,757 | |
LCM 26 Ltd., Series 26A, Class A1, 0.00%, 01/20/31(a)(b)(d) | | | | | | | 280 | | | | 280,000 | |
LCM XVIII LP, Series 18A, Class B1, 3.66%, 04/20/27(a)(b) | | | | | | | 250 | | | | 250,341 | |
LCM Xxiv Ltd., Series 24A, Class A, 2.67%, 03/20/30(a)(b) | | | | | | | 250 | | | | 251,066 | |
Lehman ABS Manufactured Housing Contract Trust, Series 2001-B, Class M1, 6.63%, 04/15/40(a) | | | | | | | 90 | | | | 93,792 | |
Lendmark Funding Trust, Series 2017-1A, Class A, 2.83%, 01/22/24(b) | | | | | | | 510 | | | | 508,814 | |
Litigation Fee Residual Funding LLC, Series 2015-1, Class A, 4.00%, 10/30/27(d) | | | | | | | 103 | | | | 102,912 | |
Long Beach Mortgage Loan Trust(a): | | | | | | | | | | | | |
Series 2006-2, Class 2A3, 1.74%, 03/25/46 | | | | | | | 830 | | | | 423,677 | |
Series 2006-2, Class 2A4, 1.84%, 03/25/46 | | | | | | | 251 | | | | 130,903 | |
Series 2006-3, Class 2A3, 1.73%, 05/25/46 | | | | | | | 394 | | | | 183,704 | |
Series 2006-4, Class 2A3, 1.71%, 05/25/36 | | | | | | | 435 | | | | 224,169 | |
| | | | |
| SCHEDULE OF INVESTMENTS | | | 7 | |
| | |
Schedule of Investments (continued) December 31, 2017 | | BlackRock Total Return V.I. Fund (Percentages shown are based on Net Assets) |
| | | | | | | | | | | | |
| Security | | Par
(000) | | | Value | |
Long Beach Mortgage Loan Trust(a) (continued): | | | | | | | | | | | | |
Series 2006-4, Class 2A4, 1.81%, 05/25/36 | | | USD | | | | 483 | | | $ | 253,563 | |
Series 2006-9, Class 2A2, 1.66%, 10/25/36 | | | | | | | 61 | | | | 30,281 | |
Series 2006-9, Class 2A3, 1.71%, 10/25/36 | | | | | | | 374 | | | | 186,594 | |
Series 2006-9, Class 2A4, 1.78%, 10/25/36 | | | | | | | 139 | | | | 69,722 | |
Series 2006-10, Class 2A3, 1.71%, 11/25/36 | | | | | | | 97 | | | | 48,214 | |
Series 2006-10, Class 2A4, 1.77%, 11/25/36 | | | | | | | 73 | | | | 36,489 | |
Madison Avenue Manufactured Housing Contract Trust, Series 2002-A, Class B2, 4.80%, 03/25/32(a) | | | | | | | 40 | | | | 41,070 | |
Madison Park Funding XIV Ltd., Series 2014-14A, Class A2R, 2.48%, 07/20/26(a)(b) | | | | | | | 830 | | | | 832,995 | |
Madison Park Funding XVIII Ltd., Series 2015-18A, Class A1R, 2.55%, 10/21/30(a)(b) | | | | | | | 510 | | | | 512,831 | |
Madison Park Funding XXVI Ltd., Series 2017-26A, Class AR, 2.52%, 07/29/30(a)(b) | | | | | | | 250 | | | | 251,950 | |
Marble Point CLO XI Ltd., Series 2017-2A, Class A, 2.79%, 12/18/30(a)(b) | | | | | | | 250 | | | | 250,193 | |
MASTR Asset Backed Securities Trust, Series 2006-HE2, Class A3, 1.70%, 06/25/36(a) | | | | | | | 225 | | | | 131,342 | |
MASTR Resecuritization Trust, Series 2008-3, Class A1, 1.71%, 08/25/37(a)(b) | | | | | | | 38 | | | | 28,743 | |
MASTR Specialized Loan Trust, Series 2006-3, Class A, 1.81%, 06/25/46(a)(b) | | | | | | | 21 | | | | 19,458 | |
Merrill Lynch Mortgage Investors Trust(a): | | | | | | | | | | | | |
Series 2006-OPT1, Class M1, 1.81%, 08/25/37 | | | | | | | 47 | | | | 12,796 | |
Series 2006-RM3, Class A2B, 1.64%, 06/25/37 | | | | | | | 29 | | | | 8,685 | |
Morgan Stanley ABS Capital I, Inc. Trust(a): | | | | | | | | | | | | |
Series 2005-HE1, Class A2MZ, 2.15%, 12/25/34 | | | | | | | 155 | | | | 151,613 | |
Series 2005-HE5, Class M4, 2.42%, 09/25/35 | | | | | | | 148 | | | | 67,986 | |
Series 2007-NC1, Class A1, 1.68%, 11/25/36 | | | | | | | 506 | | | | 323,037 | |
Morgan Stanley IXIS Real Estate Capital Trust, Series 2006-2, Class A2, 1.66%, 11/25/36(a) | | | | | | | 35 | | | | 17,385 | |
Mountain Hawk I CLO Ltd., Series 2013-1A, Class B1, 3.54%, 01/20/24(a)(b) | | | | | | | 250 | | | | 252,974 | |
MP CLO III Ltd., Series 2013-1A, Class AR, 2.61%, 10/20/30(a)(b) | | | | | | | 250 | | | | 251,117 | |
Navient Private Education Loan Trust(a)(b): | | | | | | | | | | | | |
Series 2014-AA, Class A2B, 2.73%, 02/15/29 | | | | | | | 515 | | | | 523,855 | |
Series 2014-CTA, Class B, 3.23%, 10/17/44 | | | | | | | 200 | | | | 203,072 | |
Series 2016-AA, Class B, 3.50%, 12/16/58 | | | | | | | 100 | | | | 96,671 | |
Neuberger Berman CLO XVI Ltd., Series 2014-16A, Class B2R, 3.53%, 04/15/26(a)(b) | | | | | | | 250 | | | | 250,244 | |
Neuberger Berman Loan Advisers CLO, Series 2017-26A, Class A, 2.56%, 10/18/30(a)(b) | | | | | | | 250 | | | | 251,115 | |
Oakwood Mortgage Investors, Inc.(a): | | | | | | | | | | | | |
Series 2001-D, Class A2, 5.26%, 01/15/19 | | | | | | | 26 | | | | 20,159 | |
Series 2001-D, Class A4, 6.93%, 09/15/31 | | | | | | | 15 | | | | 13,023 | |
Series 2002-B, Class M1, 7.62%, 06/15/32 | | | | | | | 81 | | | | 67,520 | |
OCP CLO Ltd.(a)(b): | | | | | | | | | | | | |
Series 2017-13A, Class A1A, 2.56%, 07/15/30 | | | | | | | 300 | | | | 302,432 | |
Series 2017-14A, Class B, 3.56%, 11/20/30(d) | | | | | | | 250 | | | | 250,000 | |
Octagon Investment Partners 24 Ltd.(a)(b): | | | | | | | | | | | | |
Series 2015-1A, Class A1R, 2.34%, 05/21/27 | | | | | | | 470 | | | | 470,229 | |
Series 2015-1A, Class A2AR, 2.79%, 05/21/27 | | | | | | | 310 | | | | 310,210 | |
Octagon Investment Partners XIX Ltd., Series 2014-1A, Class AR, 2.46%, 04/15/26(a)(b) | | | | | | | 457 | | | | 457,339 | |
Octagon Investment Partners XVI Ltd., Series 2013-1A, Class A, 2.47%, 07/17/25(a)(b) | | | | | | | 451 | | | | 451,779 | |
Octagon Investment Partners XVII Ltd., Series 2013-1A, Class A2R, 3.05%, 10/25/25(a)(b) | | | | | | | 250 | | | | 250,716 | |
OFSI Fund VI Ltd., Series 2014-6A, Class A2, 3.26%, 03/20/25(a)(b) | | | | | | | 101 | | | | 101,138 | |
OHA Loan Funding Ltd., Series 2013-2A, Class A, 2.58%, 08/23/24(a)(b) | | | | | | | 212 | | | | 212,053 | |
| | | | | | | | | | | | |
| Security | | Par
(000) | | | Value | |
OneMain Financial Issuance Trust(b): | | | | | | | | | | | | |
Series 2014-2A, Class B, 3.02%, 09/18/24 | | | USD | | | | 100 | | | $ | 100,044 | |
Series 2014-2A, Class D, 5.31%, 09/18/24 | | | | | | | 200 | | | | 201,904 | |
Series 2016-2A, Class A, 4.10%, 03/20/28 | | | | | | | 200 | | | | 202,584 | |
Option One Mortgage Accep Corp. Asset-Backed Certificates, Series 2003-4, Class A2, 2.19%, 07/25/33(a) | | | | | | | 199 | | | | 197,330 | |
Option One Mortgage Loan Trust: | | | | | | | | | | | | |
Series 2007-CP1, Class 2A3, 1.76%, 03/25/37(a) | | | | | | | 90 | | | | 63,092 | |
Series 2007-FXD2, Class 1A1, 5.82%, 03/25/37(c) | | | | | | | 504 | | | | 495,534 | |
Origen Manufactured Housing Contract Trust, Series 2007-B, Class A1, 2.68%, 10/15/37(a)(b) | | | | | | | 116 | | | | 113,721 | |
Ownit Mortgage Loan Trust, Series 2006-2, Class A2C, 6.00%, 01/25/37(c) | | | | | | | 70 | | | | 64,708 | |
OZLM Funding II Ltd., Series 2012-2A, Class A1R, 2.82%, 10/30/27(a)(b) | | | | | | | 1,043 | | | | 1,045,484 | |
OZLM Funding III Ltd., Series 2013-3A, Class BR, 4.36%, 01/22/29(a)(b) | | | | | | | 320 | | | | 326,331 | |
OZLM Funding IV Ltd., Series 2013-4A, Class A1R, 2.61%, 10/22/30(a)(b) | | | | | | | 390 | | | | 392,553 | |
OZLM Funding V Ltd., Series 2013-5A, Class BR, 3.70%, 01/17/26(a)(b) | | | | | | | 250 | | | | 250,388 | |
OZLM IX Ltd., Series 2014-9A, Class CR, 4.91%, 01/20/27(a)(b) | | | | | | | 250 | | | | 250,796 | |
Palmer Square CLO Ltd., Series 2013-1A, Class A2R, 2.92%, 05/15/25(a)(b) | | | | | | | 400 | | | | 400,079 | |
Palmer Square Loan Funding Ltd., Series 2017-1A, Class A1, 2.06%, 10/15/25(a)(b) | | | | | | | 420 | | | | 420,061 | |
Park Avenue Institutional Advisers CLO Ltd.(a)(b): | | | | | | | | | | | | |
Series 2017-1A, Class A1, 2.63%, 11/14/29 | | | | | | | 280 | | | | 280,965 | |
Series 2017-1A, Class A2, 3.11%, 11/14/29 | | | | | | | 300 | | | | 301,019 | |
Progress Residential Trust(b): | | | | | | | | | | | | |
Series 2016-SFR1, Class A, 2.96%, 09/17/33(a) | | | | | | | 198 | | | | 200,436 | |
Series 2016-SFR1, Class E, 5.31%, 09/17/33(a) | | | | | | | 100 | | | | 102,644 | |
Series 2016-SFR2, Class E, 5.01%, 01/17/34(a) | | | | | | | 100 | | | | 102,599 | |
Series 2017-SFR1, Class A, 2.77%, 08/17/34 | | | | | | | 100 | | | | 99,057 | |
PRPM LLC, Series 2017-1A, Class A1, 4.25%, 01/25/22(b)(c)(d) | | | | | | | 120 | | | | 119,805 | |
Race Point IX CLO Ltd., Series 2015-9A, Class A1AR, 2.57%, 10/15/30(a)(b) | | | | | | | 250 | | | | 251,220 | |
Race Point X CLO Ltd., Series 2016-10A, Class A, 2.97%, 07/25/28(a)(b) | | | | | | | 250 | | | | 252,322 | |
RAMP Trust(a): | | | | | | | | | | | | |
Series 2006-RS6, Class A4, 1.82%, 11/25/36 | | | | | | | 239 | | | | 199,817 | |
Series 2007-RS1, Class A3, 1.72%, 02/25/37 | | | | | | | 180 | | | | 99,562 | |
RCO Mortgage LLC, Series 2015-NQM1, Class A, 5.05%, 11/25/45(a)(b) | | | | | | | 5 | | | | 4,597 | |
Rockford Tower CLO Ltd.(a)(b): | | | | | | | | | | | | |
Series 2017-1A, Class A, 2.73%, 04/15/29 | | | | | | | 250 | | | | 251,796 | |
Series 2017-1A, Class B, 3.16%, 04/15/29 | | | | | | | 250 | | | | 251,508 | |
Series 2017-2A, Class C, 3.54%, 10/15/29 | | | | | | | 250 | | | | 250,554 | |
Series 2017-3A, Class A, 2.80%, 10/20/30 | | | | | | | 250 | | | | 249,711 | |
Securitized Asset Backed Receivables LLC Trust, | | | | | | | | | | | | |
Series 2006-WM4, Class A1, 1.74%, 11/25/36(a)(b) | | | | | | | 110 | | | | 68,658 | |
SG Mortgage Securities Trust, Series 2006-OPT2, Class A3D, 1.76%, 10/25/36(a) | | | | | | | 100 | | | | 69,314 | |
Silver Creek CLO Ltd., Series 2014-1A, Class AR, 2.60%, 07/20/30(a)(b) | | | | | | | 250 | | | | 251,697 | |
SLM Private Credit Student Loan Trust, Series 2004-B, Class A3, 1.92%, 03/15/24(a) | | | | | | | 373 | | | | 371,862 | |
SMB Private Education Loan Trust, Series 2015-B, Class B, 3.50%, 12/17/40(b) | | | | | | | 100 | | | | 100,098 | |
Sound Point CLO XI Ltd., Series 2016-1A, Class A, 3.01%, 07/20/28(a)(b) | | | | | | | 250 | | | | 252,097 | |
| | |
| 8 | | 2017 BLACKROCK ANNUAL REPORTTO SHAREHOLDERS |
| | |
Schedule of Investments (continued) December 31, 2017 | | BlackRock Total Return V.I. Fund (Percentages shown are based on Net Assets) |
| | | | | | | | | | | | |
| Security | | Par
(000) | | | Value | |
Sound Point CLO XII Ltd., Series 2016-2A, Class A, 3.02%, 10/20/28(a)(b) | | | USD | | | | 250 | | | $ | 252,537 | |
Sound Point CLO XIV Ltd., Series 2016-3A, Class A, 2.89%, 01/23/29(a)(b) | | | | | | | 260 | | | | 262,346 | |
Sound Point CLO XV Ltd., Series 2017-1A, Class A, 2.75%, 01/23/29(a)(b) | | | | | | | 250 | | | | 251,776 | |
Soundview Home Loan Trust, Series 2004-WMC1, Class M2, 2.35%, 01/25/35(a) | | | | | | | 4 | | | | 3,974 | |
SpringCastle America Funding LLC, Series 2016-AA, Class A, 3.05%, 04/25/29(b) | | | | | | | 331 | | | | 332,763 | |
Stanwich Mortgage Loan Co. LLC(b)(c)(d): | | | | | | | | | | | | |
Series 2016-NPL2, Class NOTE, 3.72%, 08/16/46 | | | | | | | 273 | | | | 272,964 | |
Series 2017-NPB1, Class A1, 3.60%, 05/17/22 | | | | | | | 559 | | | | 560,259 | |
Structured Asset Securities Corp. Mortgage Pass-Through Certificates, Series 2004-23XS, Class 2A1, 1.85%, 01/25/35(a) | | | | | | | 139 | | | | 135,580 | |
Symphony CLO XII Ltd., Series 2013-12A, Class AR, 2.39%, 10/15/25(a)(b) | | | | | | | 255 | | | | 255,383 | |
TCI-Flatiron CLO Ltd., Series 2017-1A, Class A, 2.15%, 11/17/30(a)(b) | | | | | | | 250 | | | | 251,318 | |
THL Credit Wind River CLO Ltd., Series 2014-2A, Class A2, 2.81%, 07/15/26(a)(b) | | | | | | | 250 | | | | 250,147 | |
TICP CLO III Ltd., Series 2014-3A, Class AR, 2.54%, 01/20/27(a)(b) | | | | | | | 250 | | | | 251,104 | |
Turkish Airlines Pass-Through Trust, Series 2015-1, Class A, 4.20%, 03/15/27(b) | | | | | | | 36 | | | | 34,974 | |
Union Pacific Railroad Co. Pass-Through Trust, Series 14-1, 3.23%, 05/14/26 | | | | | | | 102 | | | | 104,253 | |
United Airlines Pass-Through Trust, Series B, Class B, 4.75%, 04/11/22 | | | | | | | 15 | | | | 15,131 | |
Velocity Commercial Capital Loan Trust(a): | | | | | | | | | | | | |
Series 2016-2, Class AFL, 3.13%, 10/25/46 | | | | | | | 94 | | | | 95,148 | |
Series 2016-2, Class M4, 7.23%, 10/25/46 | | | | | | | 100 | | | | 107,404 | |
Series 2017-1, Class AFL, 2.80%, 05/25/47(b) | | | | | | | 140 | | | | 140,714 | |
Venture XIX CLO Ltd.(a)(b): | | | | | | | | | | | | |
2.58%, 10/15/29 | | | | | | | 315 | | | | 315,427 | |
Series 2014-19A, Class AR, 2.73%, 01/15/27 | | | | | | | 250 | | | | 250,334 | |
Vibrant CLO III Ltd., Series 2015-3A, Class A1R, 2.84%, 04/20/26(a)(b) | | | | | | | 250 | | | | 250,730 | |
Voya CLO Ltd.(a)(b): | | | | | | | | | | | | |
Series 2013-2A, Class A1, 2.52%, 04/25/25 | | | | | | | 225 | | | | 225,462 | |
Series 2014-3A, Class A1R, 2.24%, 07/25/26(d) | | | | | | | 250 | | | | 250,000 | |
Wachovia Asset Securitization Issuance II LLC Trust, | | | | | | | | | | | | |
Series 2007-HE2A, Class A, 1.68%, 07/25/37(a)(b) | | | | | | | 109 | | | | 99,880 | |
WaMu Asset-Backed Certificates WaMu Trust(a): | | | | | | | | | | | | |
Series 2007-HE2, Class 2A3, 1.80%, 04/25/37 | | | | | | | 578 | | | | 324,128 | |
Series 2007-HE2, Class 2A4, 1.91%, 04/25/37 | | | | | | | 36 | | | | 20,504 | |
Washington Mutural Asset-Backed Certificates WMABS Trust(a): | | | | | | | | | | | | |
Series 2006-HE4, Class 2A2, 1.73%, 09/25/36 | | | | | | | 171 | | | | 86,484 | |
Series 2006-HE5, Class 1A, 1.71%, 10/25/36 | | | | | | | 198 | | | | 163,939 | |
Series 2007-HE2, Class 2A2, 1.77%, 02/25/37 | | | | | | | 218 | | | | 95,613 | |
Wellfleet CLO Ltd., Series 2017-1A, Class A1, 2.68%, 04/20/29(a)(b) | | | | | | | 250 | | | | 251,660 | |
WVUE, Series 2015-1A, Class A, 4.50%, 09/25/20(b)(c)(d) | | | | | | | 25 | | | | 24,753 | |
Yale Mortgage Loan Trust, Series 2007-1, Class A, 1.95%, 06/25/37(a)(b) | | | | | | | 100 | | | | 44,588 | |
York CLO-2 Ltd., Series 2015-1A, Class AR, 2.61%, 01/22/31(a)(b)(d) | | | | | | | 250 | | | | 250,000 | |
| | | | | | | | | | | | |
Total Asset-Backed Securities — 12.2%
(Cost: $50,902,965) | | | | 51,289,007 | |
| | | | | | | | | | | | |
| | | | | | | | | | | | |
| Security | | Par
(000) | | | Value | |
Corporate Bonds — 26.3% | |
|
| Aerospace & Defense — 0.4% | |
BAE Systems Holdings, Inc.(b): | | | | | | | | | | | | |
2.85%, 12/15/20 | | | USD | | | | 39 | | | $ | 39,176 | |
4.75%, 10/07/44 | | | | | | | 8 | | | | 8,932 | |
Lockheed Martin Corp.: | | | | | | | | | | | | |
3.55%, 01/15/26 | | | | | | | 44 | | | | 45,688 | |
3.60%, 03/01/35 | | | | | | | 139 | | | | 140,120 | |
4.50%, 05/15/36 | | | | | | | 18 | | | | 20,183 | |
4.07%, 12/15/42 | | | | | | | 94 | | | | 98,958 | |
4.09%, 09/15/52 | | | | | | | 56 | | | | 58,621 | |
Northrop Grumman Corp.: | | | | | | | | | | | | |
2.93%, 01/15/25 | | | | | | | 360 | | | | 357,861 | |
3.85%, 04/15/45 | | | | | | | 100 | | | | 100,791 | |
United Technologies Corp.: | | | | | | | | | | | | |
1.78%, 05/04/18(c) | | | | | | | 284 | | | | 283,565 | |
4.15%, 05/15/45 | | | | | | | 98 | | | | 104,396 | |
4.05%, 05/04/47 | | | | | | | 265 | | | | 277,370 | |
| | | | | | | | | | | | |
| | | | | | | | | | | 1,535,661 | |
| Air Freight & Logistics — 0.1% | |
FedEx Corp.: | | | | | | | | | | | | |
4.90%, 01/15/34 | | | | | | | 185 | | | | 209,708 | |
3.90%, 02/01/35 | | | | | | | 194 | | | | 197,082 | |
| | | | | | | | | | | | |
| | | | | | | | | | | 406,790 | |
| Airlines — 0.2% | |
American Airlines Group, Inc., 4.63%, 03/01/20(b) | | | | | | | 69 | | | | 70,121 | |
Delta Air Lines, Inc., 2.88%, 03/13/20 | | | | | | | 871 | | | | 876,054 | |
Gol Finance, Inc., 7.00%, 01/31/25(b) | | | | | | | 66 | | | | 64,879 | |
| | | | | | | | | | | | |
| | | | | | | | | | | 1,011,054 | |
| Auto Components — 0.1% | |
Aptiv plc: | | | | | | | | | | | | |
4.25%, 01/15/26 | | | | | | | 115 | | | | 122,041 | |
4.40%, 10/01/46 | | | | | | | 111 | | | | 114,338 | |
| | | | | | | | | | | | |
| | | | | | | | | | | 236,379 | |
| Automobiles — 0.2% | |
Hyundai Capital America, 2.55%, 04/03/20(b) | | | | | | | 786 | | | | 779,585 | |
| | | | | | | | | | | | |
| Banks — 6.1% | | | | |
Bank of America Corp.: | | | | | | | | | | | | |
2.25%, 04/21/20 | | | | | | | 290 | | | | 290,203 | |
(LIBOR USD 3 Month + 0.66%), 2.37%, 07/21/21(e) | | | | | | | 935 | | | | 933,362 | |
(LIBOR USD 3 Month + 0.63%), 2.33%, 10/01/21(e) | | | | | | | 1,735 | | | | 1,730,109 | |
3.30%, 01/11/23 | | | | | | | 202 | | | | 206,646 | |
3.88%, 08/01/25 | | | | | | | 460 | | | | 485,221 | |
3.50%, 04/19/26 | | | | | | | 376 | | | | 384,424 | |
3.25%, 10/21/27 | | | | | | | 174 | | | | 172,664 | |
4.18%, 11/25/27 | | | | | | | 460 | | | | 480,362 | |
(LIBOR USD 3 Month + 1.37%), 3.59%, 07/21/28(e) | | | | | | | 75 | | | | 76,234 | |
Barclays plc, 4.95%, 01/10/47 | | | | | | | 200 | | | | 221,933 | |
BB&T Corp., 2.45%, 01/15/20 | | | | | | | 96 | | | | 96,318 | |
BNP Paribas SA(b): | | | | | | | | | | | | |
2.95%, 05/23/22 | | | | | | | 565 | | | | 566,229 | |
3.80%, 01/10/24 | | | | | | | 200 | | | | 206,925 | |
Citigroup, Inc.: | | | | | | | | | | | | |
1.80%, 02/05/18 | | | | | | | 142 | | | | 141,985 | |
2.50%, 07/29/19 | | | | | | | 453 | | | | 454,390 | |
2.90%, 12/08/21 | | | | | | | 620 | | | | 624,080 | |
3.50%, 05/15/23 | | | | | | | 114 | | | | 116,039 | |
3.88%, 03/26/25 | | | | | | | 135 | | | | 138,193 | |
| | | | |
| SCHEDULE OF INVESTMENTS | | | 9 | |
| | |
Schedule of Investments (continued) December 31, 2017 | | BlackRock Total Return V.I. Fund (Percentages shown are based on Net Assets) |
| | | | | | | | | | | | |
| Security | | Par
(000) | | | Value | |
| Banks (continued) | | | | |
Citigroup, Inc. (continued): | | | | | | | | | | | | |
(LIBOR USD 3 Month + 1.56%), 3.89%, 01/10/28(e) | | | USD | | | | 145 | | | $ | 150,087 | |
(LIBOR USD 3 Month + 1.39%), 3.67%, 07/24/28(e) | | | | | | | 555 | | | | 563,075 | |
4.13%, 07/25/28 | | | | | | | 637 | | | | 656,527 | |
Citizens Bank NA: | | | | | | | | | | | | |
2.25%, 03/02/20 | | | | | | | 544 | | | | 541,409 | |
2.65%, 05/26/22 | | | | | | | 555 | | | | 549,925 | |
Credit Agricole SA, 3.25%, 10/04/24(b) | | | | | | | 495 | | | | 491,670 | |
Credit Suisse Group Funding Guernsey Ltd., 2.75%, 03/26/20 | | | | | | | 250 | | | | 250,975 | |
Fifth Third Bank, 2.25%, 06/14/21 | | | | | | | 216 | | | | 213,935 | |
HSBC Holdings plc: | | | | | | | | | | | | |
2.65%, 01/05/22 | | | | | | | 928 | | | | 921,840 | |
(USD Swap Rate 5 Year + 3.75%), 6.00%(e)(f) | | | | | | | 380 | | | | 399,475 | |
(LIBOR USD 3 Month + 1.55%), 4.04%, 03/13/28(e) | | | | | | | 124 | | | | 129,226 | |
Intesa Sanpaolo SpA(b): | | | | | | | | | | | | |
3.13%, 07/14/22 | | | | | | | 465 | | | | 461,647 | |
5.02%, 06/26/24 | | | | | | | 611 | | | | 625,617 | |
JPMorgan Chase & Co.: | | | | | | | | | | | | |
2.97%, 01/15/23 | | | | | | | 1,140 | | | | 1,149,560 | |
3.90%, 07/15/25 | | | | | | | 196 | | | | 205,475 | |
(LIBOR USD 3 Month + 1.38%), 3.54%, 05/01/28(e) | | | | | | | 220 | | | | 223,816 | |
(LIBOR USD 3 Month + 1.36%), 3.88%, 07/24/38(e) | | | | | | | 1,060 | | | | 1,089,646 | |
Lloyds Banking Group plc, 3.75%, 01/11/27 | | | | | | | 214 | | | | 217,324 | |
Mitsubishi UFJ Financial Group, Inc., 3.00%, 02/22/22 | | | | | | | 455 | | | | 457,890 | |
Mizuho Financial Group, Inc., 2.95%, 02/28/22 | | | | | | | 1,338 | | | | 1,339,309 | |
Royal Bank of Scotland Group plc(e): | | | | | | | | | | | | |
(LIBOR USD 3 Month + 1.47%), 2.89%, 05/15/23 | | | | | | | 645 | | | | 652,066 | |
(LIBOR USD 3 Month + 1.48%), 3.50%, 05/15/23 | | | | | | | 495 | | | | 496,079 | |
Santander Holdings USA, Inc.(b): | | | | | | | | | | | | |
3.70%, 03/28/22 | | | | | | | 115 | | | �� | 116,384 | |
3.40%, 01/18/23 | | | | | | | 410 | | | | 408,402 | |
Santander UK Group Holdings plc, 2.88%, 08/05/21 | | | | | | | 635 | | | | 633,444 | |
Sumitomo Mitsui Trust Bank Ltd.(b): | | | | | | | | | | | | |
2.05%, 03/06/19 | | | | | | | 1,634 | | | | 1,629,766 | |
1.95%, 09/19/19 | | | | | | | 555 | | | | 550,567 | |
UBS Group Funding Switzerland AG(b): | | | | | | | | | | | | |
4.13%, 09/24/25 | | | | | | | 200 | | | | 209,891 | |
4.25%, 03/23/28 | | | | | | | 500 | | | | 526,844 | |
UniCredit SpA, (USD Swap Rate 5 Year + 3.70%), 5.86%, 06/19/32(b)(e) | | | | | | | 655 | | | | 697,940 | |
US Bancorp: | | | | | | | | | | | | |
2.95%, 07/15/22 | | | | | | | 190 | | | | 192,562 | |
3.10%, 04/27/26 | | | | | | | 70 | | | | 69,507 | |
3.15%, 04/27/27 | | | | | | | 160 | | | | 160,293 | |
Washington Mutual Bank(d)(g)(h): | | | | | | | | | | | | |
1.40%, 11/06/09 | | | | | | | 300 | | | | — | |
0.00%, 09/19/17(i) | | | | | | | 250 | | | | — | |
Washington Mutual, Inc., 1.40%, 09/29/17(a)(d)(g)(h) | | | | | | | 500 | | | | — | |
Wells Fargo & Co.: | | | | | | | | | | | | |
2.60%, 07/22/20 | | | | | | | 77 | | | | 77,474 | |
2.55%, 12/07/20 | | | | | | | 95 | | | | 95,385 | |
2.10%, 07/26/21 | | | | | | | 180 | | | | 176,986 | |
2.63%, 07/22/22 | | | | | | | 830 | | | | 825,536 | |
| | | | | | | | | | | | |
| | | | | | | | | | | 25,482,871 | |
| | | | | | | | | | | | |
| Security | | Par
(000) | | | Value | |
| Beverages — 0.5% | |
Anheuser-Busch InBev Finance, Inc.: | | | | | | | | | | | | |
2.65%, 02/01/21 | | | USD | | | | 516 | | | $ | 518,589 | |
3.30%, 02/01/23 | | | | | | | 185 | | | | 189,309 | |
3.65%, 02/01/26 | | | | | | | 1,120 | | | | 1,155,815 | |
4.70%, 02/01/36 | | | | | | | 135 | | | | 150,950 | |
| | | | | | | | | | | | |
| | | | | | | | | | | 2,014,663 | |
| Biotechnology — 0.9% | |
AbbVie, Inc.: | | | | | | | | | | | | |
2.50%, 05/14/20 | | | | | | | 439 | | | | 440,353 | |
2.90%, 11/06/22 | | | | | | | 106 | | | | 106,308 | |
4.50%, 05/14/35 | | | | | | | 1,230 | | | | 1,350,961 | |
Amgen, Inc.: | | | | | | | | | | | | |
2.13%, 05/01/20 | | | | | | | 107 | | | | 106,431 | |
4.40%, 05/01/45 | | | | | | | 222 | | | | 241,544 | |
Baxalta, Inc., 4.00%, 06/23/25 | | | | | | | 310 | | | | 320,409 | |
Gilead Sciences, Inc.: | | | | | | | | | | | | |
2.35%, 02/01/20 | | | | | | | 20 | | | | 20,093 | |
2.50%, 09/01/23 | | | | | | | 117 | | | | 115,505 | |
4.60%, 09/01/35 | | | | | | | 27 | | | | 30,423 | |
4.00%, 09/01/36 | | | | | | | 650 | | | | 687,654 | |
4.50%, 02/01/45 | | | | | | | 105 | | | | 116,700 | |
4.15%, 03/01/47 | | | | | | | 48 | | | | 51,056 | |
| | | | | | | | | | | | |
| | | | | | | | | | | 3,587,437 | |
| Building Products — 0.2% | |
CRH America Finance, Inc., 3.40%, 05/09/27(b) | | | | | | | 210 | | | | 209,952 | |
Johnson Controls International plc, 5.13%, 09/14/45 | | | | | | | 180 | | | | 211,297 | |
LafargeHolcim Finance US LLC, 4.75%, 09/22/46(b) | | | | | | | 240 | | | | 254,262 | |
| | | | | | | | | | | | |
| | | | | | | | | | | 675,511 | |
| Capital Markets — 1.4% | | | | |
Bank of New York Mellon Corp. (The), (LIBOR USD 3 Month + 3.13%), 4.62%(e)(f) | | | | | | | 270 | | | | 274,388 | |
Blackstone Holdings Finance Co. LLC, 4.00%, 10/02/47(b) | | | | | | | 240 | | | | 239,047 | |
Credit Suisse AG, 3.00%, 10/29/21 | | | | | | | 259 | | | | 261,658 | |
Credit Suisse Group AG, 4.28%, 01/09/28(b) | | | | | | | 250 | | | | 260,650 | |
Goldman Sachs Group, Inc. (The): | | | | | | | | | | | | |
2.63%, 01/31/19 | | | | | | | 263 | | | | 264,136 | |
2.00%, 04/25/19 | | | | | | | 68 | | | | 67,795 | |
2.60%, 04/23/20 | | | | | | | 138 | | | | 138,188 | |
2.75%, 09/15/20 | | | | | | | 65 | | | | 65,325 | |
2.63%, 04/25/21 | | | | | | | 143 | | | | 142,900 | |
2.35%, 11/15/21 | | | | | | | 498 | | | | 490,450 | |
(LIBOR USD 3 Month + 1.37%), 4.02%, 10/31/38(e) | | | | | | | 140 | | | | 143,975 | |
Moody’s Corp., 2.75%, 12/15/21 | | | | | | | 230 | | | | 230,288 | |
Morgan Stanley: | | | | | | | | | | | | |
2.80%, 06/16/20 | | | | | | | 239 | | | | 241,156 | |
2.75%, 05/19/22 | | | | | | | 1,190 | | | | 1,185,632 | |
3.75%, 02/25/23 | | | | | | | 193 | | | | 200,018 | |
3.70%, 10/23/24 | | | | | | | 126 | | | | 130,199 | |
(LIBOR USD 3 Month + 1.34%), 3.59%, 07/22/28(e) | | | | | | | 860 | | | | 867,915 | |
(LIBOR USD 3 Month + 1.46%), 3.97%, 07/22/38(e) | | | | | | | 250 | | | | 258,874 | |
Northern Trust Corp., (LIBOR USD 3 Month + 1.13%), 3.37%, 05/08/32(e) | | | | | | | 195 | | | | 194,277 | |
State Street Corp., 2.65%, 05/19/26 | | | | | | | 103 | | | | 100,200 | |
| | | | | | | | | | | | |
| | | | | | | | | | | 5,757,071 | |
| Chemicals — 0.1% | |
Agrium, Inc., 4.13%, 03/15/35(j) | | | | | | | 46 | | | | 47,522 | |
| | |
| 10 | | 2017 BLACKROCK ANNUAL REPORTTO SHAREHOLDERS |
| | |
Schedule of Investments (continued) December 31, 2017 | | BlackRock Total Return V.I. Fund (Percentages shown are based on Net Assets) |
| | | | | | | | | | | | |
| Security | | Par
(000) | | | Value | |
| Chemicals (continued) | |
Dow Chemical Co. (The): | | | | | | | | | | | | |
4.38%, 11/15/42 | | | USD | | | | 23 | | | $ | 24,200 | |
4.63%, 10/01/44 | | | | | | | 103 | | | | 112,599 | |
Eastman Chemical Co., 4.80%, 09/01/42 | | | | | | | 59 | | | | 64,872 | |
EI du Pont de Nemours & Co., 2.20%, 05/01/20 | | | | | | | 105 | | | | 104,908 | |
Monsanto Co., 3.60%, 07/15/42 | | | | | | | 107 | | | | 98,035 | |
Sherwin-Williams Co. (The): | | | | | | | | | | | | |
4.00%, 12/15/42 | | | | | | | 20 | | | | 20,054 | |
4.50%, 06/01/47 | | | | | | | 75 | | | | 82,001 | |
| | | | | | | | | | | | |
| | | | | | | | | | | 554,191 | |
| Commercial Services & Supplies — 0.2% | |
Catholic Health Initiatives, 4.35%, 11/01/42 | | | | | | | 30 | | | | 28,961 | |
Pitney Bowes, Inc., 4.13%, 05/15/22 | | | | | | | 340 | | | | 312,375 | |
Waste Management, Inc., 3.90%, 03/01/35 | | | | | | | 336 | | | | 352,251 | |
| | | | | | | | | | | | |
| | | | | | | | | | | 693,587 | |
| Communications Equipment — 0.0% | |
Harris Corp., 2.70%, 04/27/20 | | | | | | | 28 | | | | 28,113 | |
Juniper Networks, Inc., 3.30%, 06/15/20 | | | | | | | 63 | | | | 63,817 | |
| | | | | | | | | | | | |
| | | | | | | | | | | 91,930 | |
| Construction & Engineering — 0.0% | |
Mexico City Airport Trust, 5.50%, 07/31/47(b) | | | | | | | 200 | | | | 197,500 | |
| | | | | | | | | | | | |
| Consumer Finance — 1.0% | | | | |
AerCap Ireland Capital DAC: | | | | | | | | | | | | |
4.63%, 10/30/20 | | | | | | | 462 | | | | 484,306 | |
3.50%, 05/26/22 | | | | | | | 531 | | | | 538,891 | |
American Express Credit Corp.: | | | | | | | | | | | | |
2.25%, 08/15/19 | | | | | | | 177 | | | | 177,370 | |
3.30%, 05/03/27 | | | | | | | 100 | | | | 101,477 | |
Discover Financial Services, 4.10%, 02/09/27 | | | | | | | 104 | | | | 106,531 | |
Ford Motor Credit Co. LLC, 3.22%, 01/09/22 | | | | | | | 1,070 | | | | 1,076,592 | |
General Motors Financial Co., Inc.: | | | | | | | | | | | | |
3.10%, 01/15/19 | | | | | | | 41 | | | | 41,219 | |
3.70%, 11/24/20 | | | | | | | 117 | | | | 120,110 | |
3.20%, 07/06/21 | | | | | | | 600 | | | | 605,857 | |
3.15%, 06/30/22 | | | | | | | 630 | | | | 629,510 | |
4.00%, 01/15/25 | | | | | | | 151 | | | | 155,148 | |
Synchrony Financial: | | | | | | | | | | | | |
2.60%, 01/15/19 | | | | | | | 94 | | | | 94,178 | |
2.70%, 02/03/20 | | | | | | | 48 | | | | 48,120 | |
4.50%, 07/23/25 | | | | | | | 105 | | | | 109,725 | |
Tarjeta Naranja SA, (Argentina Deposit Rates Badlar Private Banks ARS 30 to 35 Days + 3.50%, 15.00% Floor), 24.71%, 04/11/22(b)(e) | | | | | | | 108 | | | | 105,030 | |
| | | | | | | | | | | | |
| | | | | | | | | | | 4,394,064 | |
| Containers & Packaging — 0.2% | |
International Paper Co., 4.35%, 08/15/48 | | | | | | | 470 | | | | 490,698 | |
Reynolds Group Issuer, Inc., 5.75%, 10/15/20 | | | | | | | 204 | | | | 206,565 | |
| | | | | | | | | | | | |
| | | | | | | | | | | 697,263 | |
| Diversified Consumer Services — 0.1% | |
Northwestern University, 3.66%, 12/01/57 | | | | | | | 288 | | | | 296,006 | |
University of Notre Dame du Lac, 3.39%, 02/15/48 | | | | | | | 160 | | | | 159,574 | |
University of Southern California, 3.03%, 10/01/39 | | | | | | | 96 | | | | 91,637 | |
Wesleyan University, 4.78%, 07/01/2116 | | | | | | | 79 | | | | 83,862 | |
| | | | | | | | | | | | |
| | | | | | | | | | | 631,079 | |
| Diversified Financial Services — 0.6% | |
ARI Investments LLC, (LIBOR USD 3 Month + 0.00%), 0.00%, 01/06/25(d)(e) | | | | | | | 1,000 | | | | 1,000,000 | |
GE Capital International Funding Co. Unlimited Co., 4.42%, 11/15/35 | | | | | | | 545 | | | | 589,830 | |
| | | | | | | | | | | | |
| Security | | Par
(000) | | | Value | |
| Diversified Financial Services (continued) | |
Nationwide Building Society, (USD Swap Rate 5 Year + 1.85%), 4.12%, 10/18/32(b)(e) | | | USD | | | | 300 | | | $ | 300,101 | |
ORIX Corp., 2.90%, 07/18/22 | | | | | | | 155 | | | | 154,458 | |
Shell International Finance BV: | | | | | | | | | | | | |
4.13%, 05/11/35 | | | | | | | 291 | | | | 317,439 | |
3.63%, 08/21/42 | | | | | | | 44 | | | | 43,442 | |
3.75%, 09/12/46 | | | | | | | 245 | | | | 249,881 | |
Woodside Finance Ltd., 3.65%, 03/05/25(b) | | | | | | | 16 | | | | 16,097 | |
| | | | | | | | | | | | |
| | | | | | | | | | | 2,671,248 | |
| Diversified Telecommunication Services — 1.3% | |
AT&T, Inc.: | | | | | | | | | | | | |
4.25%, 03/01/27 | | | | | | | 240 | | | | 244,660 | |
3.90%, 08/14/27 | | | | | | | 330 | | | | 332,205 | |
5.25%, 03/01/37 | | | | | | | 254 | | | | 268,636 | |
5.15%, 02/14/50 | | | | | | | 810 | | | | 820,096 | |
Deutsche Telekom International Finance BV, 3.60%, 01/19/27(b) | | | | | | | 150 | | | | 150,728 | |
Verizon Communications, Inc.: | | | | | | | | | | | | |
(LIBOR USD 3 Month + 0.55%), 2.00%, 05/22/20(e) | | | | | | | 2,640 | | | | 2,655,350 | |
4.13%, 03/16/27 | | | | | | | 500 | | | | 521,356 | |
4.50%, 08/10/33 | | | | | | | 400 | | | | 419,532 | |
4.40%, 11/01/34 | | | | | | | 75 | | | | 76,428 | |
| | | | | | | | | | | | |
| | | | | | | | | | | 5,488,991 | |
| Electric Utilities — 1.4% | |
Baltimore Gas & Electric Co., 3.50%, 08/15/46 | | | | | | | 77 | | | | 75,443 | |
Duke Energy Corp.: | | | | | | | | | | | | |
4.80%, 12/15/45 | | | | | | | 220 | | | | 254,251 | |
3.75%, 09/01/46 | | | | | | | 240 | | | | 237,339 | |
Emera US Finance LP: | | | | | | | | | | | | |
2.15%, 06/15/19 | | | | | | | 147 | | | | 146,428 | |
2.70%, 06/15/21 | | | | | | | 222 | | | | 221,459 | |
Enel Finance International NV(b): | | | | | | | | | | | | |
2.88%, 05/25/22 | | | | | | | 420 | | | | 418,858 | |
3.63%, 05/25/27 | | | | | | | 440 | | | | 437,164 | |
3.50%, 04/06/28 | | | | | | | 710 | | | | 694,471 | |
Entergy Corp., 2.95%, 09/01/26 | | | | | | | 210 | | | | 204,318 | |
Eversource Energy, 2.90%, 10/01/24 | | | | | | | 305 | | | | 302,679 | |
Exelon Corp.: | | | | | | | | | | | | |
2.85%, 06/15/20 | | | | | | | 161 | | | | 162,501 | |
2.45%, 04/15/21 | | | | | | | 38 | | | | 37,828 | |
4.95%, 06/15/35 | | | | | | | 48 | | | | 54,737 | |
4.45%, 04/15/46 | | | | | | | 465 | | | | 505,326 | |
FirstEnergy Corp., 4.85%, 07/15/47 | | | | | | | 235 | | | | 262,257 | |
Genneia SA, 8.75%, 01/20/22(b) | | | | | | | 65 | | | | 71,434 | |
MidAmerican Energy Co., 4.40%, 10/15/44 | | | | | | | 91 | | | | 103,604 | |
Northern States Power Co., 3.40%, 08/15/42 | | | | | | | 170 | | | | 168,247 | |
Oncor Electric Delivery Co. LLC, 4.55%, 12/01/41 | | | | | | | 120 | | | | 138,698 | |
Pampa Energia SA, 7.38%, 07/21/23(b) | | | | | | | 53 | | | | 57,770 | |
Southern Co. (The), 4.40%, 07/01/46 | | | | | | | 235 | | | | 250,269 | |
Stoneway Capital Corp., 10.00%, 03/01/27(b) | | | | | | | 150 | | | | 159,494 | |
Trans-Allegheny Interstate Line Co., 3.85%, 06/01/25(b) | | | | | | | 250 | | | | 259,334 | |
Virginia Electric & Power Co.: | | | | | | | | | | | | |
3.50%, 03/15/27 | | | | | | | 291 | | | | 300,863 | |
4.45%, 02/15/44 | | | | | | | 44 | | | | 49,642 | |
4.20%, 05/15/45 | | | | | | | 143 | | | | 155,337 | |
4.00%, 11/15/46 | | | | | | | 110 | | | | 117,728 | |
| | | | | | | | | | | | |
| | | | | | | | | | | 5,847,479 | |
| Electrical Equipment — 0.0% | |
Eaton Corp., 2.75%, 11/02/22 | | | | | | | 118 | | | | 118,345 | |
| | | | | | | | | | | | |
| | | | |
| SCHEDULE OF INVESTMENTS | | | 11 | |
| | |
Schedule of Investments (continued) December 31, 2017 | | BlackRock Total Return V.I. Fund (Percentages shown are based on Net Assets) |
| | | | | | | | | | | | |
| Security | | Par
(000) | | | Value | |
| Electronic Equipment, Instruments & Components — 0.0% | |
Amphenol Corp., 3.20%, 04/01/24 | | | USD | | | | 114 | | | $ | 114,771 | |
Tyco Electronics Group SA: | | | | | | | | | | | | |
3.45%, 08/01/24 | | | | | | | 30 | | | | 30,840 | |
3.13%, 08/15/27 | | | | | | | 65 | | | | 64,866 | |
| | | | | | | | | | | | |
| | | | | | | | | | | 210,477 | |
| Energy Equipment & Services — 0.2% | |
Halliburton Co., 3.80%, 11/15/25 | | | | | | | 760 | | | | 789,843 | |
Schlumberger Holdings Corp., 3.00%, 12/21/20(b) | | | | | | | 164 | | | | 166,124 | |
| | | | | | | | | | | | |
| | | | | | | | | | | 955,967 | |
| Equity Real Estate Investment Trusts (REITs) — 0.5% | | | | |
American Tower Corp.: | | | | | | | | | | | | |
3.30%, 02/15/21 | | | | | | | 81 | | | | 82,485 | |
3.45%, 09/15/21 | | | | | | | 77 | | | | 78,701 | |
3.00%, 06/15/23 | | | | | | | 1,040 | | | | 1,037,277 | |
4.40%, 02/15/26 | | | | | | | 16 | | | | 16,825 | |
Boston Properties LP, 3.65%, 02/01/26 | | | | | | | 280 | | | | 284,448 | |
Crown Castle International Corp.: | | | | | | | | | | | | |
3.40%, 02/15/21 | | | | | | | 48 | | | | 49,019 | |
2.25%, 09/01/21 | | | | | | | 197 | | | | 193,677 | |
3.20%, 09/01/24 | | | | | | | 405 | | | | 400,801 | |
| | | | | | | | | | | | |
| | | | | | | | | | | 2,143,233 | |
| Food & Staples Retailing — 0.2% | |
CVS Health Corp.: | | | | | | | | | | | | |
4.00%, 12/05/23 | | | | | | | 235 | | | | 244,333 | |
5.13%, 07/20/45 | | | | | | | 125 | | | | 143,262 | |
Walgreens Boots Alliance, Inc.: | | | | | | | | | | | | |
4.80%, 11/18/44 | | | | | | | 387 | | | | 416,662 | |
4.65%, 06/01/46 | | | | | | | 8 | | | | 8,427 | |
| | | | | | | | | | | | |
| | | | | | | | | | | 812,684 | |
| Food Products — 0.1% | |
Arcor SAIC, 6.00%, 07/06/23(b) | | | | | | | 23 | | | | 24,409 | |
Kraft Heinz Foods Co., 4.38%, 06/01/46 | | | | | | | 270 | | | | 267,448 | |
Tyson Foods, Inc., 3.95%, 08/15/24 | | | | | | | 185 | | | | 194,559 | |
| | | | | | | | | | | | |
| | | | | | | | | | | 486,416 | |
| Gas Utilities — 0.0% | |
Dominion Energy Gas Holdings LLC, 4.60%, 12/15/44 | | | | | | | 97 | | | | 106,718 | |
| | | | | | | | | | | | |
| Health Care Equipment & Supplies — 0.7% | |
Abbott Laboratories: | | | | | | | | | | | | |
2.80%, 09/15/20 | | | | | | | 75 | | | | 75,504 | |
3.88%, 09/15/25 | | | | | | | 25 | | | | 25,858 | |
3.75%, 11/30/26 | | | | | | | 1,025 | | | | 1,052,538 | |
Becton Dickinson and Co.: | | | | | | | | | | | | |
2.13%, 06/06/19 | | | | | | | 600 | | | | 598,652 | |
2.68%, 12/15/19 | | | | | | | 114 | | | | 114,412 | |
2.89%, 06/06/22 | | | | | | | 425 | | | | 422,341 | |
4.69%, 12/15/44 | | | | | | | 30 | | | | 32,805 | |
Boston Scientific Corp., 2.65%, 10/01/18 | | | | | | | 82 | | | | 82,324 | |
Medtronic, Inc., 4.38%, 03/15/35 | | | | | | | 270 | | | | 304,375 | |
Stryker Corp., 4.63%, 03/15/46 | | | | | | | 69 | | | | 78,357 | |
| | | | | | | | | | | | |
| | | | | | | | | | | 2,787,166 | |
| Health Care Providers & Services — 0.8% | |
Aetna, Inc.: | | | | | | | | | | | | |
4.50%, 05/15/42 | | | | | | | 88 | | | | 94,247 | |
4.13%, 11/15/42 | | | | | | | 32 | | | | 32,409 | |
4.75%, 03/15/44 | | | | | | | 60 | | | | 66,984 | |
3.88%, 08/15/47 | | | | | | | 260 | | | | 256,235 | |
AHS Hospital Corp., 5.02%, 07/01/45 | | | | | | | 49 | | | | 59,301 | |
| | | | | | | | | | | | |
| Security | | Par
(000) | | | Value | |
| Health Care Providers & Services (continued) | |
Anthem, Inc.: | | | | | | | | | | | | |
1.88%, 01/15/18 | | | USD | | | | 276 | | | $ | 275,981 | |
2.30%, 07/15/18 | | | | | | | 457 | | | | 457,998 | |
3.70%, 08/15/21 | | | | | | | 161 | | | | 165,958 | |
Baylor Scott & White Holdings, 4.19%, 11/15/45 | | | | | | | 40 | | | | 42,876 | |
Cigna Corp., 3.25%, 04/15/25 | | | | | | | 281 | | | | 282,370 | |
HCA, Inc., 3.75%, 03/15/19 | | | | | | | 210 | | | | 211,837 | |
Kaiser Foundation Hospitals, 4.15%, 05/01/47 | | | | | | | 320 | | | | 345,773 | |
Laboratory Corp. of America Holdings, 2.63%, 02/01/20 | | | | | | | 63 | | | | 63,166 | |
New York and Presbyterian Hospital (The), 3.56%, 08/01/36 | | | | | | | 40 | | | | 40,313 | |
Northwell Healthcare, Inc., 4.26%, 11/01/47 | | | | | | | 59 | | | | 60,335 | |
Ochsner Clinic Foundation, 5.90%, 05/15/45 | | | | | | | 35 | | | | 45,699 | |
RWJ Barnabas Health, Inc., 3.95%, 07/01/46 | | | | | | | 29 | | | | 29,564 | |
Southern Baptist Hospital of Florida, Inc., 4.86%, 07/15/45 | | | | | | | 35 | | | | 40,305 | |
SSM Health Care Corp., 3.82%, 06/01/27 | | | | | | | 297 | | | | 307,994 | |
Trinity Health Corp., 4.13%, 12/01/45 | | | | | | | 119 | | | | 126,177 | |
UnitedHealth Group, Inc.: | | | | | | | | | | | | |
2.70%, 07/15/20 | | | | | | | 46 | | | | 46,532 | |
4.63%, 07/15/35 | | | | | | | 16 | | | | 18,633 | |
4.20%, 01/15/47 | | | | | | | 123 | | | | 132,539 | |
| | | | | | | | | | | | |
| | | | | | | | | | | 3,203,226 | |
| Hotels, Restaurants & Leisure — 0.1% | |
Caesars Growth Properties Holdings LLC, 9.38%, 05/01/22 | | | | | | | 190 | | | | 203,300 | |
McDonald’s Corp.: | | | | | | | | | | | | |
4.70%, 12/09/35 | | | | | | | 270 | | | | 306,685 | |
4.88%, 12/09/45 | | | | | | | 27 | | | | 31,278 | |
| | | | | | | | | | | | |
| | | | | | | | | | | 541,263 | |
| Household Durables — 0.1% | |
Newell Brands, Inc.: | | | | | | | | | | | | |
2.88%, 12/01/19 | | | | | | | 164 | | | | 165,317 | |
5.38%, 04/01/36 | | | | | | | 85 | | | | 99,483 | |
| | | | | | | | | | | | |
| | | | | | | | | | | 264,800 | |
| Industrial Conglomerates — 0.1% | |
Cia Latinoamericana de Infraestructura & Servicios SA, 9.50%, 07/20/23(b) | | | | | | | 4 | | | | 4,260 | |
General Electric Co., 4.50%, 03/11/44 | | | | | | | 216 | | | | 239,278 | |
Honeywell International, Inc., 3.81%, 11/21/47(b) | | | | | | | 55 | | | | 57,192 | |
Ingersoll-Rand Luxembourg Finance SA, 4.65%, 11/01/44 | | | | | | | 16 | | | | 17,715 | |
| | | | | | | | | | | | |
| | | | | | | | | | | 318,445 | |
| Insurance — 0.4% | |
Allstate Corp. (The), 4.20%, 12/15/46 | | | | | | | 134 | | | | 146,205 | |
American International Group, Inc., 3.88%, 01/15/35 | | | | | | | 89 | | | | 89,336 | |
Aon plc, 4.75%, 05/15/45 | | | | | | | 50 | | | | 55,594 | |
Marsh & McLennan Cos., Inc.: | | | | | | | | | | | | |
3.75%, 03/14/26 | | | | | | | 18 | | | | 18,799 | |
4.35%, 01/30/47 | | | | | | | 28 | | | | 31,015 | |
MetLife, Inc., 4.60%, 05/13/46 | | | | | | | 165 | | | | 188,209 | |
Principal Financial Group, Inc., 4.30%, 11/15/46 | | | | | | | 300 | | | | 320,880 | |
Travelers Cos., Inc. (The): | | | | | | | | | | | | |
4.60%, 08/01/43 | | | | | | | 120 | | | | 138,546 | |
4.00%, 05/30/47 | | | | | | | 170 | | | | 181,023 | |
Willis North America, Inc., 3.60%, 05/15/24 | | | | | | | 546 | | | | 555,065 | |
| | | | | | | | | | | | |
| | | | | | | | | | | 1,724,672 | |
| Internet & Direct Marketing Retail — 0.1% | |
Amazon.com, Inc., 3.88%, 08/22/37(b) | | | | | | | 575 | | | | 610,132 | |
| | | | | | | | | | | | |
| | |
| 12 | | 2017 BLACKROCK ANNUAL REPORTTO SHAREHOLDERS |
| | |
Schedule of Investments (continued) December 31, 2017 | | BlackRock Total Return V.I. Fund (Percentages shown are based on Net Assets) |
| | | | | | | | | | | | |
| Security | | Par
(000) | | | Value | |
| IT Services — 0.2% | | | | | | | | | |
DXC Technology Co., 2.88%, 03/27/20 | | | USD | | | | 124 | | | $ | 124,603 | |
Fidelity National Information Services, Inc.: | | | | | | | | | | | | |
3.63%, 10/15/20 | | | | | | | 7 | | | | 7,192 | |
4.50%, 08/15/46 | | | | | | | 38 | | | | 39,611 | |
Total System Services, Inc., 4.80%, 04/01/26 | | | | | | | 235 | | | | 254,245 | |
Visa, Inc., 4.15%, 12/14/35 | | | | | | | 198 | | | | 219,831 | |
| | | | | | | | | | | | |
| | | | | | | | | | | 645,482 | |
| Life Sciences Tools & Services — 0.2% | |
Thermo Fisher Scientific, Inc.: | | | | | | | | | | | | |
4.15%, 02/01/24 | | | | | | | 359 | | | | 380,811 | |
3.65%, 12/15/25 | | | | | | | 398 | | | | 408,436 | |
| | | | | | | | | | | | |
| | | | | | | | | | | 789,247 | |
| Media — 1.1% | |
CBS Corp., 2.30%, 08/15/19 | | | | | | | 96 | | | | 95,933 | |
Charter Communications Operating LLC: | | | | | | | | | | | | |
4.46%, 07/23/22 | | | | | | | 405 | | | | 422,556 | |
4.91%, 07/23/25 | | | | | | | 79 | | | | 83,992 | |
3.75%, 02/15/28 | | | | | | | 410 | | | | 392,865 | |
6.38%, 10/23/35 | | | | | | | 99 | | | | 115,595 | |
6.48%, 10/23/45 | | | | | | | 150 | | | | 174,889 | |
5.38%, 05/01/47 | | | | | | | 385 | | | | 394,760 | |
Comcast Corp.: | | | | | | | | | | | | |
3.38%, 08/15/25 | | | | | | | 279 | | | | 286,333 | |
4.25%, 01/15/33 | | | | | | | 35 | | | | 38,149 | |
4.40%, 08/15/35 | | | | | | | 196 | | | | 214,286 | |
3.20%, 07/15/36 | | | | | | | 380 | | | | 361,348 | |
4.75%, 03/01/44 | | | | | | | 380 | | | | 435,772 | |
4.60%, 08/15/45 | | | | | | | 45 | | | | 50,475 | |
3.40%, 07/15/46 | | | | | | | 65 | | | | 61,500 | |
Cox Communications, Inc., 3.15%, 08/15/24(b) | | | | | | | 335 | | | | 329,936 | |
CSC Holdings LLC, 7.63%, 07/15/18 | | | | | | | 190 | | | | 194,275 | |
Discovery Communications LLC, 3.80%, 03/13/24 | | | | | | | 151 | | | | 153,182 | |
Interpublic Group of Cos., Inc. (The), 4.00%, 03/15/22 | | | | | | | 62 | | | | 64,082 | |
NBCUniversal Media LLC, 4.45%, 01/15/43 | | | | | | | 76 | | | | 82,933 | |
Time Warner Cable LLC: | | | | | | | | | | | | |
5.00%, 02/01/20 | | | | | | | 58 | | | | 60,529 | |
4.13%, 02/15/21 | | | | | | | 160 | | | | 164,765 | |
4.00%, 09/01/21 | | | | | | | 22 | | | | 22,659 | |
5.50%, 09/01/41 | | | | | | | 63 | | | | 65,664 | |
4.50%, 09/15/42 | | | | | | | 9 | | | | 8,444 | |
Time Warner, Inc.: | | | | | | | | | | | | |
2.10%, 06/01/19 | | | | | | | 260 | | | | 259,497 | |
3.60%, 07/15/25 | | | | | | | 50 | | | | 50,112 | |
4.85%, 07/15/45 | | | | | | | 156 | | | | 163,836 | |
Viacom, Inc.: | | | | | | | | | | | | |
2.75%, 12/15/19 | | | | | | | 9 | | | | 8,987 | |
4.50%, 03/01/21 | | | | | | | 69 | | | | 71,829 | |
| | | | | | | | | | | | |
| | | | | | | | | | | 4,829,183 | |
| Metals & Mining — 0.4% | |
Anglo American Capital plc, 3.63%, 09/11/24(b) | | | | | | | 270 | | | | 268,707 | |
Barrick Gold Corp., 5.25%, 04/01/42 | | | | | | | 190 | | | | 219,051 | |
BHP Billiton Finance USA Ltd., 5.00%, 09/30/43 | | | | | | | 180 | | | | 220,688 | |
Glencore Funding LLC, 4.00%, 03/27/27(b) | | | | | | | 440 | | | | 441,768 | |
Newmont Mining Corp.: | | | | | | | | | | | | |
3.50%, 03/15/22 | | | | | | | 250 | | | | 255,219 | |
4.88%, 03/15/42 | | | | | | | 175 | | | | 194,198 | |
Nucor Corp., 5.20%, 08/01/43 | | | | | | | 40 | | | | 48,461 | |
Rio Tinto Finance USA plc, 4.13%, 08/21/42 | | | | | | | 110 | | | | 117,712 | |
Steel Dynamics, Inc., 5.13%, 10/01/21 | | | | | | | 96 | | | | 98,400 | |
| | | | | | | | | | | | |
| | | | | | | | | | | 1,864,204 | |
| | | | | | | | | | | | |
| Security | | Par
(000) | | | Value | |
| Multiline Retail — 0.1% | |
Target Corp., 2.50%, 04/15/26 | | | USD | | | | 235 | | | $ | 225,944 | |
| | | | | | | | | | | | |
| Multi-Utilities — 0.1% | | | | | | | | | |
Dominion Energy, Inc., 2.58%, 07/01/20 | | | | | | | 245 | | | | 245,102 | |
NiSource Finance Corp., 3.49%, 05/15/27 | | | | | | | 210 | | | | 213,747 | |
| | | | | | | | | | | | |
| | | | | | | | | | | 458,849 | |
| Oil, Gas & Consumable Fuels — 1.9% | |
Andeavor Logistics LP, 5.50%, 10/15/19 | | | | | | | 210 | | | | 217,984 | |
Apache Corp.: | | | | | | | | | | | | |
2.63%, 01/15/23 | | | | | | | 181 | | | | 177,495 | |
4.25%, 01/15/44 | | | | | | | 555 | | | | 537,670 | |
BP Capital Markets plc, 3.22%, 04/14/24 | | | | | | | 470 | | | | 481,578 | |
Cenovus Energy, Inc., 4.25%, 04/15/27 | | | | | | | 260 | | | | 259,374 | |
Concho Resources, Inc.: | | | | | | | | | | | | |
3.75%, 10/01/27 | | | | | | | 590 | | | | 597,703 | |
4.88%, 10/01/47 | | | | | | | 70 | | | | 76,120 | |
Enbridge, Inc.: | | | | | | | | | | | | |
2.90%, 07/15/22 | | | | | | | 205 | | | | 203,759 | |
3.70%, 07/15/27 | | | | | | | 165 | | | | 165,696 | |
Endeavor Energy Resources LP, 7.00%, 08/15/21(b) | | | | | | | 210 | | | | 217,497 | |
Enterprise Products Operating LLC: | | | | | | | | | | | | |
5.10%, 02/15/45 | | | | | | | 38 | | | | 43,360 | |
4.90%, 05/15/46 | | | | | | | 177 | | | | 195,018 | |
EOG Resources, Inc.: | | | | | | | | | | | | |
2.45%, 04/01/20 | | | | | | | 343 | | | | 343,981 | |
4.15%, 01/15/26 | | | | | | | 85 | | | | 90,466 | |
Exxon Mobil Corp.: | | | | | | | | | | | | |
1.82%, 03/15/19 | | | | | | | 529 | | | | 528,155 | |
4.11%, 03/01/46 | | | | | | | 118 | | | | 132,070 | |
Hess Corp., 5.80%, 04/01/47 | | | | | | | 400 | | | | 445,117 | |
Kinder Morgan Energy Partners LP: | | | | | | | | | | | | |
4.30%, 05/01/24 | | | | | | | 288 | | | | 299,854 | |
4.25%, 09/01/24 | | | | | | | 397 | | | | 411,165 | |
Kinder Morgan, Inc., 5.05%, 02/15/46 | | | | | | | 520 | | | | 539,727 | |
Marathon Petroleum Corp., 5.85%, 12/15/45 | | | | | | | 125 | | | | 143,984 | |
MPLX LP: | | | | | | | | | | | | |
4.13%, 03/01/27 | | | | | | | 210 | | | | 215,090 | |
5.20%, 03/01/47 | | | | | | | 68 | | | | 74,625 | |
Pioneer Natural Resources Co., 4.45%, 01/15/26 | | | | | | | 50 | | | | 53,592 | |
Resolute Energy Corp., 8.50%, 05/01/20 | | | | | | | 210 | | | | 213,675 | |
Spectra Energy Partners LP, 4.50%, 03/15/45 | | | | | | | 230 | | | | 237,159 | |
Sunoco Logistics Partners Operations LP, 5.40%, 10/01/47 | | | | | | | 275 | | | | 276,857 | |
TransCanada PipeLines Ltd.: | | | | | | | | | | | | |
1.88%, 01/12/18 | | | | | | | 48 | | | | 47,999 | |
2.50%, 08/01/22 | | | | | | | 44 | | | | 43,720 | |
Valero Energy Corp., 3.65%, 03/15/25 | | | | | | | 305 | | | | 313,192 | |
Williams Partners LP, 4.00%, 09/15/25 | | | | | | | 310 | | | | 317,196 | |
| | | | | | | | | | | | |
| | | | | | | | | | | 7,900,878 | |
| Paper & Forest Products — 0.0% | |
Georgia-Pacific LLC, 7.38%, 12/01/25 | | | | | | | 97 | | | | 123,457 | |
| | | | | | | | | | | | |
| Pharmaceuticals — 0.4% | | | | | | | | | |
Allergan Funding SCS: | | | | | | | | | | | | |
2.35%, 03/12/18 | | | | | | | 354 | | | | 354,281 | |
3.80%, 03/15/25 | | | | | | | 500 | | | | 509,023 | |
Merck & Co., Inc., 3.60%, 09/15/42 | | | | | | | 165 | | | | 168,446 | |
Pfizer, Inc., 4.00%, 12/15/36 | | | | | | | 510 | | | | 558,696 | |
| | | | | | | | | | | | |
| | | | | | | | | | | 1,590,446 | |
| Road & Rail — 0.3% | |
Burlington Northern Santa Fe LLC: | | | | | | | | | | | | |
4.15%, 04/01/45 | | | | | | | 80 | | | | 86,936 | |
4.70%, 09/01/45 | | | | | | | 35 | | | | 41,005 | |
4.13%, 06/15/47 | | | | | | | 120 | | | | 131,487 | |
CSX Corp., 4.25%, 11/01/66 | | | | | | | 124 | | | | 123,899 | |
Norfolk Southern Corp., 4.05%, 08/15/52(b) | | | | | | | 112 | | | | 116,084 | |
Penske Truck Leasing Co. LP, 3.40%, 11/15/26(b) | | | | | | | 273 | | | | 269,554 | |
| | | | |
| SCHEDULE OF INVESTMENTS | | | 13 | |
| | |
Schedule of Investments (continued) December 31, 2017 | | BlackRock Total Return V.I. Fund (Percentages shown are based on Net Assets) |
| | | | | | | | | | | | |
| Security | | Par
(000) | | | Value | |
| Road & Rail (continued) | |
Union Pacific Corp.: | | | | | | | | | | | | |
3.38%, 02/01/35 | | | USD | | | | 27 | | | $ | 27,347 | |
3.60%, 09/15/37 | | | | | | | 230 | | | | 238,295 | |
3.88%, 02/01/55 | | | | | | | 134 | | | | 136,142 | |
| | | | | | | | | | | | |
| | | | | | | | | | | 1,170,749 | |
| Semiconductors & Semiconductor Equipment — 1.0% | |
Analog Devices, Inc.: | | | | | | | | | | | | |
3.90%, 12/15/25 | | | | | | | 20 | | | | 20,908 | |
3.50%, 12/05/26 | | | | | | | 450 | | | | 455,390 | |
5.30%, 12/15/45 | | | | | | | 20 | | | | 23,770 | |
Applied Materials, Inc.: | | | | | | | | | | | | |
3.30%, 04/01/27 | | | | | | | 218 | | | | 221,727 | |
4.35%, 04/01/47 | | | | | | | 129 | | | | 144,711 | |
Broadcom Corp.(b): | | | | | | | | | | | | |
2.38%, 01/15/20 | | | | | | | 1,073 | | | | 1,065,743 | |
3.00%, 01/15/22 | | | | | | | 1,165 | | | | 1,155,132 | |
3.63%, 01/15/24 | | | | | | | 270 | | | | 268,484 | |
Lam Research Corp.: | | | | | | | | | | | | |
2.75%, 03/15/20 | | | | | | | 121 | | | | 121,857 | |
2.80%, 06/15/21 | | | | | | | 116 | | | | 116,728 | |
QUALCOMM, Inc.: | | | | | | | | | | | | |
2.60%, 01/30/23 | | | | | | | 290 | | | | 282,871 | |
4.80%, 05/20/45 | | | | | | | 78 | | | | 83,892 | |
Xilinx, Inc., 2.95%, 06/01/24 | | | | | | | 125 | | | | 124,220 | |
| | | | | | | | | | | | |
| | | | | | | | | | | 4,085,433 | |
| Software — 0.8% | |
Autodesk, Inc., 3.50%, 06/15/27 | | | | | | | 425 | | | | 416,893 | |
Microsoft Corp.: | | | | | | | | | | | | |
3.50%, 02/12/35 | | | | | | | 231 | | | | 240,347 | |
3.45%, 08/08/36 | | | | | | | 540 | | | | 556,734 | |
4.25%, 02/06/47 | | | | | | | 495 | | | | 565,919 | |
Oracle Corp.: | | | | | | | | | | | | |
3.25%, 05/15/30 | | | | | | | 151 | | | | 152,643 | |
3.90%, 05/15/35 | | | | | | | 181 | | | | 191,732 | |
4.00%, 07/15/46 | | | | | | | 183 | | | | 194,714 | |
4.38%, 05/15/55 | | | | | | | 47 | | | | 52,533 | |
VMware, Inc., 2.30%, 08/21/20 | | | | | | | 1,190 | | | | 1,183,253 | |
| | | | | | | | | | | | |
| | | | | | | | | | | 3,554,768 | |
| Specialty Retail — 0.1% | |
Home Depot, Inc. (The), 5.88%, 12/16/36 | | | | | | | 120 | | | | 162,385 | |
Lowe’s Cos., Inc., 4.38%, 09/15/45 | | | | | | | 150 | | | | 165,791 | |
| | | | | | | | | | | | |
| | | | | | | | | | | 328,176 | |
| Technology Hardware, Storage & Peripherals — 0.7% | |
Apple, Inc.: | | | | | | | | | | | | |
3.00%, 02/09/24 | | | | | | | 276 | | | | 279,503 | |
2.85%, 05/11/24 | | | | | | | 1,040 | | | | 1,044,659 | |
3.45%, 02/09/45 | | | | | | | 39 | | | | 38,061 | |
4.65%, 02/23/46 | | | | | | | 509 | | | | 596,057 | |
Hewlett Packard Enterprise Co.: | | | | | | | | | | | | |
2.85%, 10/05/18 | | | | | | | 470 | | | | 472,265 | |
2.10%, 10/04/19(b) | | | | | | | 445 | | | | 441,954 | |
3.60%, 10/15/20 | | | | | | | 228 | | | | 232,788 | |
HP, Inc., 3.75%, 12/01/20 | | | | | | | 16 | | | | 16,511 | |
| | | | | | | | | | | | |
| | | | | | | | | | | 3,121,798 | |
| Thrifts & Mortgage Finance — 0.1% | |
BPCE SA, 3.00%, 05/22/22(b) | | | | | | | 330 | | | | 329,817 | |
| | | | | | | | | | | | |
| Tobacco — 0.3% | | | | | | | | | |
BAT Capital Corp., 4.39%, 08/15/37(b) | | | | | | | 355 | | | | 372,786 | |
Reynolds American, Inc.: | | | | | | | | | | | | |
2.30%, 06/12/18 | | | | | | | 60 | | | | 60,070 | |
3.25%, 06/12/20 | | | | | | | 25 | | | | 25,403 | |
4.45%, 06/12/25 | | | | | | | 590 | | | | 629,085 | |
| | | | | | | | | | | | |
| | | | | | | | | | | 1,087,344 | |
| Trading Companies & Distributors — 0.2% | |
Air Lease Corp., 2.63%, 07/01/22 | | | | | | | 415 | | | | 409,403 | |
Aviation Capital Group LLC, 2.88%, 09/17/18(b) | | | | | | | 160 | | | | 160,537 | |
| | | | | | | | | | | | |
| Security | | Par
(000) | | | Value | |
| Trading Companies & Distributors (continued) | |
GATX Corp.: | | | | | | | | | | | | |
2.60%, 03/30/20 | | | USD | | | | 59 | | | $ | 58,985 | |
3.85%, 03/30/27 | | | | | | | 86 | | | | 87,437 | |
| | | | | | | | | | | | |
| | | | | | | | | | | 716,362 | |
| Wireless Telecommunication Services — 0.1% | |
Rogers Communications, Inc., 5.00%, 03/15/44 | | | | | | | 22 | | | | 25,408 | |
Sprint Spectrum Co. LLC, 3.36%, 09/20/21(b) | | | | | | | 526 | | | | 529,225 | |
| | | | | | | | | | | | |
| | | | | | | | | | | 554,633 | |
| | | | | | | | | | | | |
Total Corporate Bonds — 26.3%
(Cost: $108,982,347) | | | | | | | | | | | 110,414,668 | |
| | | | | | | | | | | | |
Floating Rate Loan Interests — 0.4%(k) | |
| |
| Capital Markets — 0.4%(d) | | | | |
LSTAR Securities Financing Vehicle I, 1st Lien Term Loan, (LIBOR USD 1 Month + 2.50%), 3.86%, 04/07/20 | | | | | | | 1,115 | | | | 1,105,619 | |
LSTAR Securities Financing Vehicle II LLC, Term Loan, (LIBOR USD 1 Month + 2.00%), 3.36%, 06/01/20 | | | | | | | 500 | | | | 494,357 | |
| | | | | | | | | | | | |
| | | | | | | | | | | 1,599,976 | |
| | | | | | | | | | | | |
Total Floating Rate Loan Interests — 0.4%
(Cost: $1,604,826) | | | | | | | | | | | 1,599,976 | |
| | | | | | | | | | | | |
|
Foreign Agency Obligations — 0.4% | |
| |
| Argentina — 0.1% | | | | |
YPF SA: | | | | | | | | | | | | |
8.88%, 12/19/18(b) | | | | | | | 69 | | | | 72,864 | |
8.50%, 03/23/21(b) | | | | | | | 12 | | | | 13,572 | |
8.75%, 04/04/24 | | | | | | | 68 | | | | 78,098 | |
6.95%, 07/21/27(b) | | | | | | | 65 | | | | 68,997 | |
| | | | | | | | | | | | |
| | | | | | | | | | | 233,531 | |
| Brazil — 0.2% | |
Petrobras Global Finance BV: | | | | | | | | | | | | |
5.38%, 01/27/21 | | | | | | | 155 | | | | 161,200 | |
8.38%, 05/23/21 | | | | | | | 145 | | | | 165,373 | |
6.13%, 01/17/22 | | | | | | | 545 | | | | 578,381 | |
5.30%, 01/27/25(b) | | | | | | | 26 | | | | 26,078 | |
7.38%, 01/17/27 | | | | | | | 27 | | | | 29,727 | |
6.00%, 01/27/28(b) | | | | | | | 26 | | | | 26,065 | |
| | | | | | | | | | | | |
| | | | | | | | | | | 986,824 | |
| Mexico — 0.1% | | | | | | | | | |
Petroleos Mexicanos, 6.50%, 03/13/27(b) | | | | | | | 264 | | | | 288,552 | |
| | | | | | | | | | | | |
Total Foreign Agency Obligations — 0.4%
(Cost: $1,484,472) | | | | | | | | | | | 1,508,907 | |
| | | | | | | | | | | | |
|
Foreign Government Obligations — 4.2% | |
| |
| Argentina — 0.3% | | | | |
Republic of Argentina: | | | | | | | | | | | | |
6.25%, 04/22/19 | | | | | | | 680 | | | | 709,580 | |
8.00%, 10/08/20 | | | | | | | 28 | | | | 31,371 | |
8.75%, 05/07/24 | | | | | | | 349 | | | | 403,496 | |
7.82%, 12/31/33 | | | EUR | | | | 48 | | | | 67,078 | |
6.25%, 11/09/47 | | | | | | | 108 | | | | 131,292 | |
| | | | | | | | | | | | |
| | | | | | | | | | | 1,342,817 | |
| Brazil — 0.0% | |
Federative Republic of Brazil, 0.00%, 01/01/19(i) | | | BRL | | | | 362 | | | | 102,170 | |
| | | | | | | | | | | | |
| Colombia — 0.2% | | | | | | | | | |
Republic of Colombia, 3.88%, 04/25/27 | | | USD | | | | 850 | | | | 865,300 | |
| | | | | | | | | | | | |
| | |
| 14 | | 2017 BLACKROCK ANNUAL REPORTTO SHAREHOLDERS |
| | |
Schedule of Investments (continued) December 31, 2017 | | BlackRock Total Return V.I. Fund (Percentages shown are based on Net Assets) |
| | | | | | | | | | | | |
| Security | | Par
(000) | | | Value | |
| Egypt — 0.2% | | | | | | | | | |
Arab Republic of Egypt: | | | | | | | | | | | | |
0.00%, 10/16/18(i) | | | EGP | | | | 8,675 | | | $ | 427,775 | |
0.00%, 11/13/18(i) | | | | | | | 5,400 | | | | 263,341 | |
0.00%, 11/27/18(i) | | | | | | | 2,550 | | | | 123,466 | |
5.75%, 04/29/20 | | | USD | | | | 145 | | | | 151,610 | |
| | | | | |
| | | | | | | | | | | 966,192 | |
| Hungary — 0.1% | |
Republic of Hungary, 5.38%, 03/25/24 | | | | | | | 280 | | | | 316,742 | |
| | | | | |
| Indonesia — 0.7% | |
Republic of Indonesia: | | | | | | | | | | | | |
8.38%, 03/15/24 | | | IDR | | | | 319,000 | | | | 26,141 | |
4.75%, 01/08/26 | | | USD | | | | 400 | | | | 434,537 | |
8.38%, 09/15/26 | | | IDR | | | | 2,856,000 | | | | 237,838 | |
4.35%, 01/08/27 | | | USD | | | | 200 | | | | 211,676 | |
7.00%, 05/15/27 | | | IDR | | | | 1,073,000 | | | | 82,882 | |
7.50%, 08/15/32 | | | | | | | 7,218,000 | | | | 562,482 | |
8.38%, 03/15/34 | | | | | | | 2,667,000 | | | | 219,179 | |
8.25%, 05/15/36 | | | | | | | 10,493,000 | | | | 862,332 | |
7.50%, 05/15/38 | | | | | | | 3,525,000 | | | | 272,153 | |
| | | | | |
| | | | | | | | | | | 2,909,220 | |
| Lebanon — 0.2% | |
Lebanese Republic: | | | | | | | | | | | | |
6.10%, 10/04/22 | | | USD | | | | 218 | | | | 211,856 | |
6.65%, 04/22/24 | | | | | | | 75 | | | | 73,244 | |
6.25%, 11/04/24 | | | | | | | 236 | | | | 226,647 | |
6.85%, 03/23/27 | | | | | | | 251 | | | | 242,294 | |
| | | | | |
| | | | | | | | | | | 754,041 | |
| Mexico — 1.3% | |
United Mexican States: | | | | | | | | | | | | |
4.75%, 06/14/18 | | | MXN | | | | 2,300 | | | | 115,433 | |
5.00%, 12/11/19 | | | | | | | 62,700 | | | | 3,035,302 | |
4.15%, 03/28/27 | | | USD | | | | 2,204 | | | | 2,285,548 | |
| | | | | |
| | | | | | | | | | | 5,436,283 | |
| Panama — 0.1% | |
Republic of Panama, 3.75%, 03/16/25 | | | | | | | 280 | | | | 292,040 | |
| | | | | |
| Peru — 0.0% | |
Republic of Peru, 7.35%, 07/21/25 | | | | | | | 100 | | | | 129,550 | |
| | | | | |
| Philippines — 0.2% | |
Republic of the Philippines, 5.50%, 03/30/26 | | | | | | | 720 | | | | 849,953 | |
| | | | | |
| Russia — 0.3% | |
Russian Federation: | | | | | | | | | | | | |
6.40%, 05/27/20 | | | RUB | | | | 11,861 | | | | 203,772 | |
7.50%, 08/18/21 | | | | | | | 17,179 | | | | 303,483 | |
7.40%, 12/07/22 | | | | | | | 3,666 | | | | 64,490 | |
7.75%, 09/16/26 | | | | | | | 6,899 | | | | 122,488 | |
8.15%, 02/03/27 | | | | | | | 17,737 | | | | 324,114 | |
4.25%, 06/23/27 | | | USD | | | | 200 | | | | 205,900 | |
7.05%, 01/19/28 | | | RUB | | | | 7,314 | | | | 123,396 | |
| | | | | |
| | | | | | | | | | | 1,347,643 | |
| South Africa — 0.3% | |
Republic of South Africa: | | | | | | | | | | | | |
5.50%, 03/09/20 | | | USD | | | | 444 | | | | 466,076 | |
5.88%, 05/30/22 | | | | | | | 100 | | | | 109,200 | |
6.25%, 03/31/36 | | | ZAR | | | | 5,016 | | | | 291,680 | |
6.50%, 02/28/41 | | | | | | | 2,224 | | | | 126,882 | |
8.75%, 02/28/48 | | | | | | | 2,410 | | | | 176,613 | |
| | | | | |
| | | | | | | | | | | 1,170,451 | |
| | | | | | | | | | | | |
| Security | | Par
(000) | | | Value | |
| Tunisia — 0.0% | |
Banque Centrale de Tunisie, 4.50%, 06/22/20 | | | EUR | | | | 50 | | | $ | 62,755 | |
| | | | | |
| Turkey — 0.2% | |
Republic of Turkey: | | | | | | | | | | | | |
7.00%, 06/05/20 | | | USD | | | | 276 | | | | 297,754 | |
5.63%, 03/30/21 | | | | | | | 100 | | | | 105,260 | |
7.38%, 02/05/25 | | | | | | | 208 | | | | 239,521 | |
6.00%, 03/25/27 | | | | | | | 200 | | | | 212,943 | |
| | | | | |
| | | | | | | | | | | 855,478 | |
| Uruguay — 0.1% | |
Republic of Uruguay, 4.38%, 10/27/27 | | | | | | | 270 | | | | 289,130 | |
| | | | | |
Total Foreign Government Obligations — 4.2%
(Cost: $17,851,220) | | | | | | | | | | | 17,689,765 | |
| | | | | |
|
Municipal Bonds — 5.5% | |
Adams & Weld Counties School District No 27J Brighton, Series 2017, GO, 5.00%, 12/01/42 | | | | | | | 60 | | | | 71,929 | |
Alamo Community College District; | | | | | | | | | | | | |
Series 2017, GO, 5.00%, 08/15/30 | | | | | | | 40 | | | | 49,230 | |
Series 2017, GO, 5.00%, 08/15/31 | | | | | | | 40 | | | | 48,998 | |
Series 2017, GO, 5.00%, 08/15/34 | | | | | | | 40 | | | | 48,500 | |
Series 2017, GO, 5.00%, 08/15/35 | | | | | | | 40 | | | | 48,386 | |
Series 2017, GO, 5.00%, 08/15/36 | | | | | | | 60 | | | | 72,465 | |
Series 2017, GO, 5.00%, 08/15/37 | | | | | | | 60 | | | | 72,295 | |
Series 2017, GO, 5.00%, 08/15/38 | | | | | | | 50 | | | | 60,151 | |
American Municipal Power, Inc.,
Series 2009B, RB, 6.45%, 02/15/44 | | | | | | | 30 | | | | 41,214 | |
Arizona Health Facilities Authority (Banner Health),
Series 2007B, RB, VRDN, 1.71%, 01/01/37(a) | | | | | | | 35 | | | | 31,505 | |
Bay Area Toll Authority; | | | | | | | | | | | | |
Series 2010S-1, RB, 6.92%, 04/01/40 | | | | | | | 90 | | | | 129,854 | |
Series 2010S-1, RB, 7.04%, 04/01/50 | | | | | | | 190 | | | | 300,166 | |
Buckeye Tobacco Settlement Financing Authority, Series 2007A-2, RB, 5.88%, 06/01/47 | | | | | | | 180 | | | | 173,439 | |
California Health Facilities Financing Authority
(Cedars- Sinai Medical Center),
Series 2016A, RB, 5.00%, 08/15/33 | | | | | | | 40 | | | | 47,810 | |
California State Public Works Board
(Various Capital Projects),
Series 2009G, Sub-series G-2, RB, 8.36%, 10/01/34 | | | | | | | 35 | | | | 53,603 | |
Central Texas Regional Mobility Authority; | | | | | | | | | | | | |
Series 2015A, RB, 5.00%, 01/01/45 | | | | | | | 30 | | | | 33,829 | |
Series 2016, RB, 5.00%, 01/01/46 | | | | | | | 30 | | | | 33,918 | |
Chesapeake Bay Bridge & Tunnel District
(Parallel Thimble Shoal Tunnel Project); | | | | | | | | | | | | |
Series 2016, RB, 5.00%, 07/01/41 | | | | | | | 30 | | | | 34,860 | |
Series 2016, RB, 5.00%, 07/01/51 | | | | | | | 25 | | | | 28,086 | |
Chino Valley Unified School District
(San Bernardino County),
Series 2017A, GO, 5.25%, 08/01/47 | | | | | | | 90 | | | | 110,533 | |
City & County of Denver Airport System;(l) | | | | | | | | | | | | |
Series 2017A, RB, 5.00%, 11/15/28 | | | | | | | 40 | | | | 48,617 | |
Series 2017A, RB, 5.00%, 11/15/29 | | | | | | | 40 | | | | 48,384 | |
Series 2017A, RB, 5.00%, 11/15/30 | | | | | | | 30 | | | | 36,114 | |
Series 2017B, RB, 5.00%, 11/15/33 | | | | | | | 15 | | | | 18,086 | |
City and County of Honolulu, Hawaii,
Series 2017A, GO, 5.00%, 09/01/41 | | | | | | | 30 | | | | 36,002 | |
City of Aurora, Series 2016, RB, 5.00%, 08/01/46 | | | | | | | 60 | | | | 70,804 | |
City of Houston Combined Utility System,
Series 2016B, RB, 5.00%, 11/15/35 | | | | | | | 40 | | | | 47,557 | |
City of Long Beach, Series 2016, 5.00%, 05/15/47 | | | | | | | 80 | | | | 96,459 | |
City of Los Angeles Department of Airports,
Series 2017A, RB, 5.00%, 05/15/47 | | | | | | | 50 | | | | 58,916 | |
City of Miami Beach Water & Sewer,
Series 2017C, 5.00%, 09/01/47 | | | | | | | 40 | | | | 47,254 | |
| | | | |
| SCHEDULE OF INVESTMENTS | | | 15 | |
| | |
Schedule of Investments (continued) December 31, 2017 | | BlackRock Total Return V.I. Fund (Percentages shown are based on Net Assets) |
| | | | | | | | | | | | |
| Security | | Par
(000) | | | Value | |
City of Philadelphia; | | | | | | | | | | | | |
Series 2017B, 5.00%, 07/01/42 | | | USD | | | | 70 | | | $ | 80,991 | |
Series 2017B, 5.00%, 07/01/47 | | | | | | | 90 | | | | 103,731 | |
City of Phoenix Civic Improvement Corp.,
Series 2017A, 5.00%, 07/01/47 | | | | | | | 30 | | | | 34,979 | |
City of Riverside, Series 2010A, RB, 7.61%, 10/01/40 | | | | | | | 50 | | | | 76,129 | |
Clark County School District; | | | | | | | | | | | | |
Series 2015C, GO, 5.00%, 06/15/27 | | | | | | | 5 | | | | 5,992 | |
Series 2015C, GO, 5.00%, 06/15/28 | | | | | | | 15 | | | | 17,891 | |
Colorado Health Facilities Authority
(Catholic Health Initiatives),
Series 2011A, RB, 5.25%, 02/01/31 | | | | | | | 25 | | | | 26,801 | |
Commonwealth Financing Authority,
Series 2016A, RB, 4.14%, 06/01/38 | | | | | | | 60 | | | | 63,606 | |
Commonwealth of Massachusetts
(Rail Enhancement & Accelerated Bridge Programs); | | | | | | | | | | | | |
Series 2017F, GO, 5.00%, 11/01/39 | | | | | | | 70 | | | | 84,283 | |
Series 2017A, RB, 5.00%, 06/01/40 | | | | | | | 50 | | | | 60,424 | |
Series 2017F, GO, 5.00%, 11/01/40 | | | | | | | 130 | | | | 156,276 | |
Series 2017A, RB, 5.00%, 06/01/41 | | | | | | | 60 | | | | 72,451 | |
Series 2017F, GO, 5.00%, 11/01/41 | | | | | | | 70 | | | | 84,081 | |
Series 2017F, GO, 5.00%, 11/01/42 | | | | | | | 70 | | | | 83,947 | |
Series 2017A, RB, 5.00%, 06/01/43 | | | | | | | 60 | | | | 72,334 | |
Series 2017F, GO, 5.00%, 11/01/44 | | | | | | | 130 | | | | 155,654 | |
Series 2017F, GO, 5.00%, 11/01/45 | | | | | | | 70 | | | | 83,747 | |
Series 2017F, GO, 5.00%, 11/01/46 | | | | | | | 90 | | | | 107,503 | |
Commonwealth of Puerto Rico, Series 2014A, GO, 8.00%, 07/01/35(g)(h) | | | | | | | 820 | | | | 194,750 | |
Connecticut State Health & Educational Facilities Authority
(Hartford Healthcare Corporation); | | | | | | | | | | | | |
Series 2015F, RB, 5.00%, 07/01/45 | | | | | | | 60 | | | | 66,353 | |
Series 2015L, RB, 5.00%, 07/01/45 | | | | | | | 90 | | | | 102,519 | |
Contra Costa Community College District,
Series 2010B, GO, 6.50%, 08/01/34 | | | | | | | 10 | | | | 13,009 | |
County of Clark Department of Aviation,
Series 2017C, RB, 5.00%, 07/01/21 | | | | | | | 60 | | | | 65,770 | |
County of Fairfax, Series 2017, RB, 5.00%, 07/15/44 | | | | | | | 30 | | | | 36,242 | |
County of Miami-Dade; | | | | | | | | | | | | |
Series 2016B, RB, 2.50%, 10/01/24 | | | | | | | 80 | | | | 77,283 | |
Series 2017D, RB, 3.35%, 10/01/29 | | | | | | | 20 | | | | 19,731 | |
Series 2017D, RB, 3.45%, 10/01/30 | | | | | | | 35 | | | | 35,381 | |
Series 2017D, RB, 3.50%, 10/01/31 | | | | | | | 30 | | | | 30,357 | |
Series 2016A, GO, 5.00%, 07/01/35 | | | | | | | 30 | | | | 35,431 | |
Series 2015A, RB, 5.00%, 10/01/38 | | | | | | | 10 | | | | 11,477 | |
Dallas Area Rapid Transit; | | | | | | | | | | | | |
Series 2016A, RB, 5.00%, 12/01/41 | | | | | | | 60 | | | | 70,002 | |
Series 2016A, RB, 5.00%, 12/01/46 | | | | | | | 90 | | | | 104,655 | |
District of Columbia, Series 2009E, RB, 5.59%, 12/01/34 | | | | | | | 95 | | | | 117,410 | |
Dutchess County Local Development Corp.
(Health Quest Systems, Inc. Project),
Series 2016B, RB, 5.00%, 07/01/46 | | | | | | | 100 | | | | 114,737 | |
East Bay Municipal Utility District
(Alameda and Contra Costa Counties),
Series 2017A, RB, 5.00%, 06/01/45 | | | | | | | 30 | | | | 36,226 | |
Eastern Municipal Water District Financing Authority,
Series 2017D, 5.00%, 07/01/47 | | | | | | | 30 | | | | 36,191 | |
Florida State Board of Administration Finance Corp.,
Series 2016A, RB, 2.64%, 07/01/21 | | | | | | | 150 | | | | 150,154 | |
Golden State Tobacco Securitization Corp.,
Series 2007A-1, RB, 5.13%, 06/01/47 | | | | | | | 140 | | | | 139,888 | |
Grant County Public Utility District No. 2
(The Priest Rapids Project),
Series 2015M, RB, 4.58%, 01/01/40 | | | | | | | 15 | | | | 15,758 | |
| | | | | | | | | | | | |
| Security | | Par
(000) | | | Value | |
Great Lakes Water Authority
Michigan Water Supply System,
Series 2016C, RB, 5.25%, 07/01/33 | | | USD | | | | 20 | | | $ | 24,203 | |
Health & Educational Facilities Authority of the State of Missouri (Saint Luke’s Health System, Inc.); | | | | | | | | | | | | |
Series 2016, RB, 5.00%, 11/15/29 | | | | | | | 25 | | | | 29,488 | |
Series 2017A, RB, 3.65%, 08/15/57 | | | | | | | 100 | | | | 101,635 | |
Kentucky Economic Development Finance Authority
(Owensboro Health, Inc.),
Series 2015A, RB, 5.25%, 06/01/50 | | | | | | | 30 | | | | 33,071 | |
Lexington County Health Services District, Inc.,
Series 2016, 5.00%, 11/01/41 | | | | | | | 60 | | | | 67,511 | |
Los Angeles Community College District,
Series 2010E, GO, 6.60%, 08/01/42 | | | | | | | 145 | | | | 213,298 | |
Los Angeles County Metropolitan Transportation Authority; | | | | | | | | | | | | |
Series 2017A, RB, 5.00%, 07/01/32 | | | | | | | 70 | | | | 86,509 | |
Series 2017A, RB, 5.00%, 07/01/40 | | | | | | | 130 | | | | 158,175 | |
Series 2017A, RB, 5.00%, 07/01/41 | | | | | | | 90 | | | | 109,421 | |
Series 2017A, RB, 5.00%, 07/01/42 | | | | | | | 280 | | | | 339,590 | |
Los Angeles Department of Water & Power,
Series 2010A, RB, 6.60%, 07/01/50 | | | | | | | 30 | | | | 46,602 | |
Los Angeles Unified School District,
Series 2010I, GO, 6.76%, 07/01/34 | | | | | | | 150 | | | | 207,168 | |
Massachusetts Bay Transportation Authority; | | | | | | | | | | | | |
Series 2017A, Sub-Series A-1, RB, 5.00%, 07/01/39 | | | | | | | 30 | | | | 35,967 | |
Series 2017A, Sub-Series A-1, RB, 5.00%, 07/01/40 | | | | | | | 30 | | | | 35,939 | |
Series 2017A, Sub-Series A-1, RB, 5.00%, 07/01/41 | | | | | | | 40 | | | | 47,882 | |
Series 2017A, Sub-Series A-2, RB, 5.00%, 07/01/41 | | | | | | | 30 | | | | 35,911 | |
Series 2017A, Sub-Series A-1, RB, 5.00%, 07/01/42 | | | | | | | 40 | | | | 47,845 | |
Series 2017A, Sub-Series A-2, RB, 5.00%, 07/01/42 | | | | | | | 30 | | | | 35,884 | |
Series 2017A, Sub-Series A-2, RB, 5.00%, 07/01/43 | | | | | | | 30 | | | | 35,856 | |
Series 2017A, Sub-Series A-2, RB, 5.00%, 07/01/44 | | | | | | | 30 | | | | 35,828 | |
Series 2017A, Sub-Series A-2, RB, 5.00%, 07/01/45 | | | | | | | 30 | | | | 35,800 | |
Massachusetts Clean Water Trust (The); | | | | | | | | | | | | |
Series 19, RB, 5.00%, 02/01/27 | | | | | | | 15 | | | | 18,416 | |
Series 19, RB, 5.00%, 02/01/28 | | | | | | | 35 | | | | 42,825 | |
Massachusetts Development Finance Agency
(Partners Healthcare System Issue),
Series 2016Q, RB, 5.00%, 07/01/47 | | | | | | | 50 | | | | 57,774 | |
Mesquite Independent School District,
Series 2017B, GO, 5.00%, 08/15/42 | | | | | | | 60 | | | | 71,102 | |
Metropolitan Government Nashville & Davidson County Health & Educational Facilities Board (Vanderbilt University Medical Center), Series 2016A, RB, 5.00%, 07/01/46 | | | | | | | 60 | | | | 68,073 | |
Metropolitan St. Louis Sewer District,
Series 2017A, 5.00%, 05/01/42 | | | | | | | 80 | | | | 96,250 | |
Metropolitan Transportation Authority; | | | | | | | | | | | | |
Series 2017C-1, RB, 5.00%, 11/15/25 | | | | | | | 60 | | | | 72,458 | |
Series 2017C-1, RB, 5.00%, 11/15/26 | | | | | | | 160 | | | | 195,906 | |
Series 2010A, RB, 6.67%, 11/15/39 | | | | | | | 55 | | | | 77,849 | |
Series 2010C-1, RB, 6.69%, 11/15/40 | | | | | | | 30 | | | | 42,443 | |
Series 2017A, RB, 5.00%, 11/15/42 | | | | | | | 60 | | | | 71,461 | |
Series 2017A, Sub-Series A-1, RB, 5.25%, 11/15/57 | | | | | | | 80 | | | | 95,394 | |
| | |
| 16 | | 2017 BLACKROCK ANNUAL REPORTTO SHAREHOLDERS |
| | |
Schedule of Investments (continued) December 31, 2017 | | BlackRock Total Return V.I. Fund (Percentages shown are based on Net Assets) |
| | | | | | | | | | | | |
| Security | | Par
(000) | | | Value | |
Metropolitan Washington Airports Authority
(Dulles Metrorail and Capital Improvement Project); | | | | | | | | | | | | |
Series 2016A, RB, 5.00%, 10/01/32 | | | USD | | | | 90 | | | $ | 106,100 | |
Series 2009B, RB, 0.00%, 10/01/39(i) | | | | | | | 30 | | | | 13,663 | |
Series 2009D, RB, 7.46%, 10/01/46 | | | | | | | 30 | | | | 46,029 | |
Miami-Dade County Educational Facilities Authority
(University of Miami Issue),
Series 2015B, RB, 5.07%, 04/01/50 | | | | | | | 30 | | | | 33,612 | |
Michigan Finance Authority (Henry Ford Health System); | | | | | | | | | | | | |
Series 2016, RB, 5.00%, 11/15/41 | | | | | | | 30 | | | | 33,941 | |
Series 2017A-MI, RB, 5.00%, 12/01/47 | | | | | | | 190 | | | | 209,418 | |
Mississippi Hospital Equipment & Facilities Authority
(Baptist Memorial Health Corporation),
Series 2016A, RB, 5.00%, 09/01/46 | | | | | | | 60 | | | | 66,013 | |
Municipal Electric Authority of Georgia (General Resolution Projects); | | | | | | | | | | | | |
Series 2009B, RB, 5.00%, 01/01/20 | | | | | | | 60 | | | | 63,587 | |
Series 2010A, RB, 6.64%, 04/01/57 | | | | | | | 40 | | | | 51,274 | |
New Jersey Educational Facilities Authority; | | | | | | | | | | | | |
Series 2017I, 5.00%, 07/01/26 | | | | | | | 40 | | | | 49,791 | |
Series 2017I, 5.00%, 07/01/34 | | | | | | | 40 | | | | 49,050 | |
Series 2017I, 5.00%, 07/01/35 | | | | | | | 70 | | | | 85,637 | |
New Jersey Transportation Trust Fund Authority,
Series 2016A, Sub-Series A-1, RB, 5.00%, 06/15/29 | | | | | | | 30 | | | | 34,089 | |
New Jersey Turnpike Authority, Series 2009F, RB, 7.41%, 01/01/40 | | | | | | | 60 | | | | 92,611 | |
New Orleans Aviation Board (North Terminal Project),
Series 2015B, RB, 5.00%, 01/01/40 | | | | | | | 50 | | | | 56,334 | |
New York City Municipal Water Finance Authority; | | | | | | | | | | | | |
Series 2010AA, RB, 5.75%, 06/15/41 | | | | | | | 35 | | | | 47,781 | |
Series 2010EE, RB, 6.01%, 06/15/42 | | | | | | | 25 | | | | 35,176 | |
Series 2011EE, RB, 5.38%, 06/15/43 | | | | | | | 200 | | | | 219,966 | |
Series 2011EE, RB, 5.50%, 06/15/43 | | | | | | | 240 | | | | 265,910 | |
Series 2011CC, RB, 5.88%, 06/15/44 | | | | | | | 40 | | | | 55,336 | |
Series 2017DD, RB, 5.00%, 06/15/47 | | | | | | | 270 | | | | 319,313 | |
New York City Transitional Finance Authority; | | | | | |
Series 2017A, RB, 2.28%, 05/01/26 | | | | | | | 45 | | | | 42,216 | |
Series 2017F, Sub-Series F-2, RB, 3.05%, 05/01/27 | | | | | | | 160 | | | | 157,810 | |
Series 2017B, RB, 5.00%, 08/01/31 | | | | | | | 20 | | | | 24,147 | |
Series 2016E, Sub-Series E-1, RB, 5.00%, 02/01/35 | | | | | | | 40 | | | | 47,305 | |
Series 2017A, Sub-Series A-1, RB, 5.00%, 05/01/36 | | | | | | | 40 | | | | 47,442 | |
Series 2015S-2, RB, 5.00%, 07/15/40 | | | | | | | 30 | | | | 35,482 | |
New York Convention Center Development Corp.; | | | | | | | | | | | | |
Series 2015, RB, 5.00%, 11/15/40 | | | | | | | 30 | | | | 34,493 | |
Series 2016A, RB, 5.00%, 11/15/46 | | | | | | | 90 | | | | 105,602 | |
New York Liberty Development Corp., Series 2005, RB, 5.25%, 10/01/35 | | | | | | | 40 | | | | 52,441 | |
New York State Dormitory Authority; | | | | | | | | | | | | |
Series 2016D, RB, 5.00%, 02/15/27 | | | | | | | 30 | | | | 36,824 | |
Series 2016D, RB, 5.00%, 02/15/28 | | | | | | | 30 | | | | 36,665 | |
Series 2016A, RB, 5.00%, 03/15/29 | | | | | | | 90 | | | | 110,571 | |
Series 2016A, RB, 5.00%, 02/15/31 | | | | | | | 30 | | | | 36,116 | |
Series 2015B, RB, 5.00%, 03/15/32 | | | | | | | 40 | | | | 47,923 | |
Series 2017B, RB, 5.00%, 02/15/34 | | | | | | | 60 | | | | 72,522 | |
Series 2017B, RB, 5.00%, 02/15/35 | | | | | | | 60 | | | | 72,351 | |
Series 2017B, RB, 5.00%, 02/15/36 | | | | | | | 60 | | | | 72,238 | |
Series 2017B, RB, 5.00%, 02/15/37 | | | | | | | 60 | | | | 72,068 | |
Series 2017B, RB, 5.00%, 02/15/38 | | | | | | | 60 | | | | 71,955 | |
Series 2017B, RB, 5.00%, 02/15/39 | | | | | | | 60 | | | | 71,899 | |
Series 2017B, RB, 5.00%, 02/15/40 | | | | | | | 130 | | | | 155,658 | |
Series 2010H, RB, 5.39%, 03/15/40 | | | | | | | 30 | | | | 37,852 | |
| | | | | | | | | | | | |
| Security | | Par
(000) | | | Value | |
New York State Dormitory Authority (continued); | | | | | | | | | | | | |
Series 2017B, RB, 5.00%, 02/15/41 | | | USD | | | | 60 | | | $ | 71,786 | |
Series 2017B, RB, 5.00%, 02/15/42 | | | | | | | 110 | | | | 131,505 | |
Series 2017B, RB, 5.00%, 02/15/43 | | | | | | | 110 | | | | 131,402 | |
New York State Urban Development Corp.; | | | | | | | | | | | | |
Series 2017B, RB, 2.86%, 03/15/24 | | | | | | | 190 | | | | 188,645 | |
Series 2017B, RB, 3.12%, 03/15/25 | | | | | | | 100 | | | | 100,355 | |
Series 2017D, 3.32%, 03/15/29 | | | | | | | 140 | | | | 139,675 | |
New York Transportation Development Corp. (LaGuardia Airport Terminal B Redevelopment Project); | | | | | | | | | | | | |
Series 2016A, RB, 5.00%, 07/01/46 | | | | | | | 30 | | | | 32,941 | |
Series 2016A, RB, 5.25%, 01/01/50 | | | | | | | 280 | | | | 310,646 | |
North Texas Tollway Authority; | | | | | | | | | | | | |
Series 2017A, RB, 5.00%, 01/01/35 | | | | | | | 50 | | | | 58,954 | |
Series 2017A, RB, 5.00%, 01/01/39 | | | | | | | 40 | | | | 47,357 | |
Series 2017B, RB, 5.00%, 01/01/39 | | | | | | | 40 | | | | 46,746 | |
Series 2017A, RB, 5.00%, 01/01/43 | | | | | | | 110 | | | | 129,604 | |
Series 2017B, RB, 5.00%, 01/01/43 | | | | | | | 30 | | | | 34,905 | |
Northwest Independent School District, Series 2017, GO, 5.00%, 02/15/42 | | | | | | | 80 | | | | 94,030 | |
Orange County Local Transportation Authority, Series 2010A, RB, 6.91%, 02/15/41 | | | | | | | 75 | | | | 105,744 | |
Oregon School Boards Association; | | | | | | | | | | | | |
Series 2002B, GO, 5.48%, 06/30/22 | | | | | | | 170 | | | | 191,061 | |
Series 2002B, GO, 5.49%, 06/30/23 | | | | | | | 245 | | | | 279,557 | |
Series 2005A, GO, 4.76%, 06/30/28 | | | | | | | 160 | | | | 176,189 | |
Oxnard School District, Series 2016A, GO, 5.00%, 08/01/45 | | | | | | | 40 | | | | 47,237 | |
Palm Beach County School District, Series 2017A, COP, 5.00%, 08/01/26 | | | | | | | 170 | | | | 207,616 | |
Pennsylvania Turnpike Commission; | | | | | | | | | | | | |
Series 2017B, Sub-Series B-1, RB, 5.00%, 06/01/42 | | | | | | | 30 | | | | 34,096 | |
Series 2017B, Sub-Series B-1, RB, 5.25%, 06/01/47 | | | | | | | 30 | | | | 34,830 | |
Port Authority of New York & New Jersey; | | | | | | | | | | | | |
Series 181, RB, 4.96%, 08/01/46 | | | | | | | 80 | | | | 99,150 | |
Series 180-1, RB, 5.00%, 11/15/47 | | | | | | | 30 | | | | 35,202 | |
Series 174, RB, 4.46%, 10/01/62 | | | | | | | 115 | | | | 132,794 | |
Series 192, RB, 4.81%, 10/15/65 | | | | | | | 60 | | | | 73,090 | |
Public Power Generation Agency, Series 2016A, RB, 5.00%, 01/01/35 | | | | | | | 40 | | | | 46,480 | |
Richardson Independent School District, Series 2017, GO, 5.00%, 02/15/42 | | | | | | | 60 | | | | 70,331 | |
Royal Oak Hospital Finance Authority (William Beaumont Hospital Obligated Group), Series 2014D, RB, 5.00%, 09/01/39 | | | | | | | 40 | | | | 44,619 | |
Salt Lake City Corp.; | | | | | | | | | | | | |
Series 2017A, RB, 5.00%, 07/01/47 | | | | | | | 105 | | | | 121,768 | |
Series 2017B, RB, 5.00%, 07/01/47 | | | | | | | 50 | | | | 58,841 | |
Salt River Project Agricultural Improvement & Power District (Arizona Salt River Project); | | | | | | | | | | | | |
Series 2017A, RB, 5.00%, 01/01/30 | | | | | | | 30 | | | | 37,469 | |
Series 2017A, RB, 5.00%, 01/01/31 | | | | | | | 10 | | | | 12,388 | |
Series 2017A, RB, 5.00%, 01/01/34 | | | | | | | 30 | | | | 36,775 | |
Series 2017A, RB, 5.00%, 01/01/35 | | | | | | | 20 | | | | 24,457 | |
Series 2017A, RB, 5.00%, 01/01/36 | | | | | | | 40 | | | | 48,835 | |
Series 2015A, RB, 5.00%, 12/01/36 | | | | | | | 40 | | | | 47,141 | |
Series 2017A, RB, 5.00%, 01/01/37 | | | | | | | 90 | | | | 109,612 | |
Series 2017A, RB, 5.00%, 01/01/38 | | | | | | | 50 | | | | 60,796 | |
Series 2017A, RB, 5.00%, 01/01/39 | | | | | | | 30 | | | | 36,448 | |
San Antonio Education Facilities Corp. (Trinity University Project), Series 2017, 5.00%, 06/01/47 | | | | | | | 70 | | | | 82,408 | |
| | | | |
| SCHEDULE OF INVESTMENTS | | | 17 | |
| | |
Schedule of Investments (continued) December 31, 2017 | | BlackRock Total Return V.I. Fund (Percentages shown are based on Net Assets) |
| | | | | | | | | | | | |
| Security | | Par
(000) | | | Value | |
San Antonio Electric & Gas, Series 2010A, RB, 5.81%, 02/01/41 | | | USD | | | | 90 | | | $ | 119,629 | |
San Diego Public Facilities Financing Authority, Series 2016A, RB, 5.00%, 05/15/39 | | | | | | | 50 | | | | 59,508 | |
San Diego Unified School District; | | | | | | | | | | | | |
Series 2017I, GO, 5.00%, 07/01/41 | | | | | | | 80 | | | | 96,886 | |
Series 2012I, 5.00%, 07/01/47 | | | | | | | 50 | | | | 60,319 | |
San Francisco City & County Airport Comm-San Francisco International Airport; | | | | | | | | | | | | |
Series 2016B, RB, 5.00%, 05/01/41 | | | | | | | 60 | | | | 69,452 | |
Series 2016B, RB, 5.00%, 05/01/46 | | | | | | | 30 | | | | 34,606 | |
Series 2017A, RB, 5.00%, 05/01/47 | | | | | | | 70 | | | | 81,811 | |
San Jose Redevelopment Agency Successor Agency, Series 2017A-T, 2.96%, 08/01/24 | | | | | | | 250 | | | | 249,570 | |
South Carolina Public Service Authority; | | | | | | | | | | | | |
Series 2016D, RB, 2.39%, 12/01/23 | | | | | | | 292 | | | | 277,975 | |
Series 2012E, RB, 3.72%, 12/01/23 | | | | | | | 80 | | | | 80,605 | |
Series 2015B, RB, 5.00%, 12/01/24 | | | | | | | 30 | | | | 35,253 | |
Series 2015A, RB, 5.00%, 12/01/25 | | | | | | | 50 | | | | 59,000 | |
Series 2015A, RB, 5.00%, 12/01/26 | | | | | | | 20 | | | | 23,466 | |
Series 2016A, RB, 5.00%, 12/01/27 | | | | | | | 20 | | | | 23,638 | |
Series 2015A, RB, 5.00%, 12/01/28 | | | | | | | 40 | | | | 46,550 | |
Series 2016A, RB, 5.00%, 12/01/28 | | | | | | | 20 | | | | 23,457 | |
Series 2016A, RB, 5.00%, 12/01/29 | | | | | | | 40 | | | | 46,716 | |
Series 2016B, RB, 5.00%, 12/01/31 | | | | | | | 10 | | | | 11,673 | |
Series 2016B, RB, 5.00%, 12/01/32 | | | | | | | 20 | | | | 23,260 | |
Series 2014C, RB, 5.00%, 12/01/46 | | | | | | | 30 | | | | 33,739 | |
Series 2014A, RB, 5.00%, 12/01/49 | | | | | | | 60 | | | | 66,765 | |
Series 2010C, RB, 6.45%, 01/01/50 | | | | | | | 136 | | | | 184,590 | |
Series 2015A, RB, 5.00%, 12/01/50 | | | | | | | 60 | | | | 67,369 | |
State Board of Administration Finance Corp., Series 2013A, RB, 3.00%, 07/01/20(l) | | | | | | | 130 | | | | 131,702 | |
State of California; | | | | | | | | | | | | |
Series 2016, GO, 5.00%, 09/01/27 | | | | | | | 5 | | | | 6,196 | |
Series 2009, GO, 7.50%, 04/01/34 | | | | | | | 60 | | | | 88,849 | |
Series 2009, GO, 7.55%, 04/01/39 | | | | | | | 265 | | | | 417,007 | |
Series 2009, GO, 7.30%, 10/01/39 | | | | | | | 25 | | | | 37,296 | |
Series 2009, GO, 7.35%, 11/01/39 | | | | | | | 40 | | | | 60,029 | |
Series 2010, GO, 7.60%, 11/01/40 | | | | | | | 40 | | | | 63,877 | |
State of Delaware, Series 2017A, GO, 5.00%, 01/01/24 | | | | | | | 40 | | | | 47,442 | |
State of Georgia, Series 2016C-1, GO, 5.00%, 07/01/26 | | | | | | | 25 | | | | 31,075 | |
State of Illinois, Series 2003, GO, 5.10%, 06/01/33 | | | | | | | 220 | | | | 219,635 | |
State of Kansas Department of Transportation, Series 2015B, RB, 5.00%, 09/01/35 | | | | | | | 30 | | | | 35,451 | |
State of Maryland; | | | | | | | | | |
Series 2017B, GO, 5.00%, 08/01/24 | | | | | | | 160 | | | | 191,624 | |
Series 2017B, GO, 5.00%, 08/01/26 | | | | | | | 50 | | | | 62,125 | |
State of Ohio; | | | | | | | | | | | | |
Series 2017A, GO, 5.00%, 05/01/27(m) | | | | | | | 60 | | | | 72,211 | |
Series 2017A, GO, 5.00%, 05/01/30 | | | | | | | 40 | | | | 47,930 | |
Series 2017A, GO, 5.00%, 03/15/32 | | | | | | | 90 | | | | 104,811 | |
Series 2017A, GO, 5.00%, 05/01/32 | | | | | | | 60 | | | | 71,311 | |
Series 2017A, GO, 5.00%, 05/01/34 | | | | | | | 40 | | | | 47,303 | |
Series 2017A, GO, 5.00%, 05/01/35 | | | | | | | 40 | | | | 47,214 | |
Series 2017A, GO, 5.00%, 05/01/36 | | | | | | | 90 | | | | 106,098 | |
Series 2017A, GO, 5.00%, 05/01/37 | | | | | | | 70 | | | | 82,366 | |
State of Texas; | | | | | | | | | | | | |
Series 2017, RB, TAN, 4.00%, 08/30/18 | | | | | | | 320 | | | | 325,280 | |
Series 2015B, GO, 5.00%, 10/01/36 | | | | | | | 170 | | | | 202,785 | |
| | | | | | | | | | | | |
| Security | | Par
(000) | | | Value | |
State of Washington; | | | | | | | | | | | | |
Series R-2015C, GO, 5.00%, 07/01/28 | | | USD | | | | 5 | | | $ | 5,964 | |
Series R-2017A, GO, 5.00%, 08/01/28 | | | | | | | 30 | | | | 36,586 | |
Series R-2017A, GO, 5.00%, 08/01/29 | | | | | | | 30 | | | | 36,455 | |
Series R-2015C, GO, 5.00%, 07/01/30 | | | | | | | 180 | | | | 213,406 | |
Series R-2017A, GO, 5.00%, 08/01/30 | | | | | | | 30 | | | | 36,272 | |
Series 2018B, GO, 5.00%, 08/01/40 | | | | | | | 40 | | | | 47,606 | |
Series 2018A, GO, 5.00%, 08/01/40 | | | | | | | 80 | | | | 95,213 | |
Series 2016A-1, GO, 5.00%, 08/01/40 | | | | | | | 100 | | | | 118,067 | |
Series 2017D, GO, 5.00%, 02/01/41 | | | | | | | 60 | | | | 70,831 | |
Series 2018A, GO, 5.00%, 08/01/41 | | | | | | | 90 | | | | 107,031 | |
Series 2018B, GO, 5.00%, 08/01/41 | | | | | | | 40 | | | | 47,569 | |
Series 2018A, GO, 5.00%, 08/01/42 | | | | | | | 100 | | | | 118,830 | |
Series 2018B, GO, 5.00%, 08/01/42 | | | | | | | 40 | | | | 47,532 | |
State of Wisconsin; | | | | | | | | | | | | |
Series 2017C, RB, 3.15%, 05/01/27 | | | | | | | 165 | | | | 167,307 | |
Series 2017-3, 5.00%, 11/01/29 | | | | | | | 90 | | | | 111,058 | |
Series 2017-3, 5.00%, 11/01/31 | | | | | | | 80 | | | | 97,812 | |
Series 2017B, GO, 5.00%, 05/01/32 | | | | | | | 40 | | | | 47,392 | |
Series 2017B, GO, 5.00%, 05/01/33 | | | | | | | 30 | | | | 35,455 | |
Series 2017-3, 5.00%, 11/01/33 | | | | | | | 50 | | | | 60,712 | |
Series 2017B, GO, 5.00%, 05/01/34 | | | | | | | 40 | | | | 47,155 | |
Series 2017B, GO, 5.00%, 05/01/36 | | | | | | | 50 | | | | 58,760 | |
Series 2017B, GO, 5.00%, 05/01/38 | | | | | | | 50 | | | | 58,576 | |
Sumter Landing Community Development District, Series 2016, RB, 4.17%, 10/01/47 | | | | | | | 100 | | | | 108,418 | |
Texas A&M University; | | | | | | | | | | | | |
Series 2017B, RB, 2.76%, 05/15/26 | | | | | | | 175 | | | | 171,470 | |
Series 2017B, RB, 2.84%, 05/15/27 | | | | | | | 75 | | | | 73,689 | |
Texas Municipal Gas Acquisition & Supply Corp., Series 2008D, RB, 6.25%, 12/15/26 | | | | | | | 30 | | | | 36,038 | |
Texas Water Development Board (Master Trust); | | | | | | | | | | | | |
Series 2015A, RB, 5.00%, 10/15/40 | | | | | | | 50 | | | | 58,867 | |
Series 2017A, RB, 5.00%, 10/15/42 | | | | | | | 100 | | | | 120,514 | |
Series 2015A, RB, 5.00%, 10/15/45 | | | | | | | 50 | | | | 58,558 | |
Tobacco Settlement Finance Authority, Series 2007A, RB, 7.47%, 06/01/47 | | | | | | | 130 | | | | 126,361 | |
Tobacco Settlement Financing Corp., Series 20071A, RB, 5.00%, 06/01/41 | | | | | | | 120 | | | | 116,450 | |
TSASC, Inc., Series 2017A, RB, 5.00%, 06/01/41 | | | | | | | 60 | | | | 67,418 | |
United Independent School District, Series 2017, GO, 5.00%, 08/15/47 | | | | | | | 50 | | | | 59,542 | |
University of California; | | | | | | | | | | | | |
Series 2017, RB, 3.06%, 07/01/25 | | | | | | | 100 | | | | 101,089 | |
Series 2013AJ, RB, 4.60%, 05/15/31 | | | | | | | 65 | | | | 72,245 | |
Series 2010H, RB, 6.40%, 05/15/31 | | | | | | | 70 | | | | 88,560 | |
Series 2017M, RB, 5.00%, 05/15/47 | | | | | | | 80 | | | | 95,648 | |
Series 2009F, RB, 6.58%, 05/15/49 | | | | | | | 75 | | | | 105,505 | |
Series 2012AD, RB, 4.86%, 05/15/2112 | | | | | | | 20 | | | | 22,325 | |
University of Houston; | | | | | |
Series 2017A, RB, 5.00%, 02/15/33 | | | | | | | 30 | | | | 35,333 | |
Series 2017A, RB, 5.00%, 02/15/34 | | | | | | | 30 | | | | 35,237 | |
Series 2017A, RB, 5.00%, 02/15/35 | | | | | | | 70 | | | | 82,053 | |
Series 2017A, RB, 5.00%, 02/15/36 | | | | | | | 90 | | | | 105,352 | |
University of Massachusetts Building Authority (Project Revenue Bonds), Series 2015-1, RB, 5.00%, 11/01/31 | | | | | | | 40 | | | | 47,727 | |
University of Virginia; | | | | | | | | | | | | |
Series 2017B, RB, 5.00%, 04/01/44 | | | | | | | 70 | | | | 84,298 | |
Series 2017B, RB, 5.00%, 04/01/46 | | | | | | | 60 | | | | 72,146 | |
Series 2017C, RB, 4.18%, 09/01/2117 | | | | | | | 85 | | | | 88,640 | |
| | |
| 18 | | 2017 BLACKROCK ANNUAL REPORTTO SHAREHOLDERS |
| | |
Schedule of Investments (continued) December 31, 2017 | | BlackRock Total Return V.I. Fund (Percentages shown are based on Net Assets) |
| | | | | | | | | | | | |
| Security | | Par
(000) | | | Value | |
Virginia Commonwealth Transportation Board; | | | | | | | | | | | | |
Series 2017, RB, 5.00%, 03/15/25 | | | USD | | | | 60 | | | $ | 72,236 | |
Series 2017, RB, 5.00%, 03/15/26 | | | | | | | 80 | | | | 97,862 | |
Series 2017, RB, 5.00%, 09/15/26 | | | | | | | 100 | | | | 123,215 | |
Virginia Small Business Financing Authority (Transform 66 P3 Project), Series 2017, RB, 5.00%, 12/31/56 | | | | | | | 80 | | | | 89,414 | |
Weld County School District No. 4, Series 2016, GO, 5.25%, 12/01/41 | | | | | | | 50 | | | | 60,522 | |
West Virginia Hospital Finance Authority (West Virginia United Health System Obligated Group); | | | | | | | | | | | | |
Series 2016A, RB, 5.00%, 06/01/19 | | | | | | | 25 | | | | 26,109 | |
Series 2016A, RB, 5.00%, 06/01/20 | | | | | | | 30 | | | | 32,132 | |
Series 2016A, RB, 5.00%, 06/01/21 | | | | | | | 30 | | | | 32,891 | |
Series 2016A, RB, 5.00%, 06/01/22 | | | | | | | 30 | | | | 33,639 | |
Series 2016A, RB, 5.00%, 06/01/23 | | | | | | | 25 | | | | 28,559 | |
Series 2016A, RB, 5.00%, 06/01/24 | | | | | | | 25 | | | | 29,084 | |
Wisconsin Health & Educational Facilities Authority (Thedacare, Inc.), Series 2015, RB, 5.00%, 12/15/44 | | | | | | | 30 | | | | 33,227 | |
| | | | | |
Total Municipal Bonds — 5.5%
(Cost: $23,124,509) | | | | | | | | | | | 23,299,754 | |
| | | | | |
|
Non-Agency Mortgage-Backed Securities — 6.8% | |
|
| Collateralized Mortgage Obligations — 2.8% | |
Ajax Mortgage Loan Trust: | | | | | | | | | | | | |
Series 2016-A, Class A, 4.25%, 08/25/64(b)(c) | | | | | | | 114 | | | | 115,722 | |
Series 2017-D, 3.75%, 12/01/27(d) | | | | | | | 490 | | | | 490,000 | |
Alternative Loan Trust: | | | | | | | | | | | | |
Series 2005-22T1, Class A1, 1.90%, 06/25/35(a) | | | | | | | 182 | | | | 164,757 | |
Series 2005-72, Class A3, 1.85%, 01/25/36(a) | | | | | | | 97 | | | | 78,689 | |
Series 2005-76, Class 2A1, 2.06%, 02/25/36(a) | | | | | | | 31 | | | | 28,252 | |
Series 2006-11CB, Class 3A1, 6.50%, 05/25/36 | | | | | | | 81 | | | | 62,996 | |
Series 2006-15CB, Class A1, 6.50%, 06/25/36 | | | | | | | 13 | | | | 10,119 | |
Series 2006-OA14, Class 1A1, 2.79%, 11/25/46(a) | | | | | | | 119 | | | | 103,652 | |
Series 2006-OA16, Class A4C, 1.89%, 10/25/46(a) | | | | | | | 163 | | | | 95,260 | |
Series 2006-OA6, Class 1A2, 1.76%, 07/25/46(a) | | | | | | | 51 | | | | 47,365 | |
Series 2006-OA8, Class 1A1, 1.74%, 07/25/46(a) | | | | | | | 18 | | | | 16,938 | |
Series 2006-OC10, Class 2A3, 1.78%, 11/25/36(a) | | | | | | | 59 | | | | 47,097 | |
Series 2006-OC7, Class 2A3, 1.80%, 07/25/46(a) | | | | | | | 90 | | | | 71,570 | |
Series 2007-3T1, Class 1A1, 6.00%, 04/25/37 | | | | | | | 17 | | | | 12,609 | |
Series 2007-OA2, Class 1A1, 1.90%, 03/25/47(a) | | | | | | | 374 | | | | 306,854 | |
Series 2007-OA3, Class 1A1, 1.69%, 04/25/47(a) | | | | | | | 30 | | | | 26,157 | |
American Home Mortgage Assets Trust(a): | | | | | | | | | | | | |
Series 2006-3, Class 2A11, 2.00%, 10/25/46 | | | | | | | 79 | | | | 68,761 | |
Series 2006-4, Class 1A12, 1.76%, 10/25/46 | | | | | | | 97 | | | | 71,204 | |
Series 2006-5, Class A1, 1.98%, 11/25/46 | | | | | | | 142 | | | | 80,665 | |
Series 2007-1, Class A1, 1.76%, 02/25/47 | | | | | | | 76 | | | | 48,692 | |
Angel Oak Mortgage Trust I LLC, Series 2016-1, Class A1, 3.50%, 07/25/46(b)(c) | | | | | | | 55 | | | | 54,842 | |
Angel Oak Mortgage Trust LLC, Series 2015-1, Class A, 4.50%, 11/25/45(b)(c) | | | | | | | 10 | | | | 9,876 | |
APS Resecuritization Trust(a)(b)(d): | | | | | | | | | | | | |
Series 2016-3, Class 3A, 4.40%, 09/27/46 | | | | | | | 274 | | | | 276,586 | |
Series 2016-3, Class 4A, 4.15%, 04/27/47 | | | | | | | 76 | | | | 77,188 | |
Banc of America Funding Trust(a)(b)(d): | | | | | |
Series 2014-R2, Class 1C, 0.00%, 11/26/36 | | | | | | | 160 | | | | 30,968 | |
Series 2016-R2, Class 1A1, 4.70%, 05/01/33 | | | | | | | 102 | | | | 104,343 | |
Bear Stearns ALT-A Trust II, Series 2007-1, Class 1A1, 3.42%, 09/25/47(a) | | | | | | | 113 | | | | 92,901 | |
Bear Stearns Mortgage Funding Trust(a): | | | | | | | | | | | | |
Series 2007-AR2, Class A1, 1.72%, 03/25/37 | | | | | | | 201 | | | | 179,343 | |
Series 2007-AR3, Class 1A1, 1.69%, 03/25/37 | | | | | | | 22 | | | | 20,487 | |
Series 2007-AR4, Class 1A1, 1.75%, 09/25/47 | | | | | | | 87 | | | | 81,090 | |
Series 2007-AR4, Class 2A1, 1.76%, 06/25/37 | | | | | | | 29 | | | | 27,370 | |
Chase Mortgage Finance Trust, Series 2007-S6, Class 1A1, 6.00%, 12/25/37 | | | | | | | 1,099 | | | | 918,075 | |
| | | | | | | | | | | | |
| Security | | Par
(000) | | | Value | |
| Collateralized Mortgage Obligations (continued) | |
CHL Mortgage Pass-Through Trust: | | | | | | | | | | | | |
Series 2006-OA4, Class A1, 2.02%, 04/25/46(a) | | | USD | | | | 170 | | | $ | 89,709 | |
Series 2006-OA5, Class 3A1, 1.75%, 04/25/46(a) | | | | | | | 32 | | | | 29,024 | |
Series 2007-15, Class 2A2, 6.50%, 09/25/37 | | | | | | | 295 | | | | 229,409 | |
CIM Trust, Series 2017-6, Class A1, 3.02%, 06/25/57(a)(b) | | | | | | | 652 | | | | 645,266 | |
Citicorp Mortgage Securities Trust, Series 2008-2, Class 1A1, 6.50%, 06/25/38 | | | | | | | 141 | | | | 121,459 | |
COLT LLC, Series 2015-1, Class A1V, 4.55%, 12/26/45(a)(b) | | | | | | | 12 | | | | 11,737 | |
Credit Suisse Mortgage Capital Certificates, Series 2009-12R, Class 3A1, 6.50%, 10/27/37(b) | | | | | | | 283 | | | | 187,041 | |
CSFB Mortgage-Backed Pass-Through Certificates, Series 2005-10, Class 10A1, 2.90%, 11/25/35(a) | | | | | | | 53 | | | | 21,786 | |
CSMC Trust(a)(b): | | | | | | | | | | | | |
Series 2013-5R, Class 1A6, 1.63%, 02/27/36 | | | | | | | 45 | | | | 41,568 | |
Series 2014-11R, Class 16A1, 3.17%, 09/27/47 | | | | | | | 69 | | | | 69,381 | |
Series 2015-6R, Class 5A1, 1.51%, 03/27/36 | | | | | | | 22 | | | | 20,938 | |
Series 2015-6R, Class 5A2, 1.51%, 03/27/36 | | | | | | | 60 | | | | 32,809 | |
Deephaven Residential Mortgage Trust, Series 2016-1A, Class A1, 4.00%, 07/25/46(b) | | | | | | | 90 | | | | 91,562 | |
Deutsche Alt-A Securities Mortgage Loan Trust(a): | | | | | | | | | | | | |
Series 2007-OA4, Class A2A, 1.72%, 08/25/47 | | | | | | | 254 | | | | 179,674 | |
Series 2007-RMP1, Class A2, 1.70%, 12/25/36 | | | | | | | 149 | | | | 136,130 | |
Deutsche Alt-B Securities Mortgage Loan Trust, Series 2006-AB3, Class A8, 6.36%, 07/25/36(a) | | | | | | | 18 | | | | 15,116 | |
Federal Home Loan Mortgage Corp. Structured Agency Credit Risk Debt Notes(a): | | | | | | | | | | | | |
Series 2016-DNA4, Class M3, 5.35%, 03/25/29 | | | | | | | 250 | | | | 279,041 | |
Series 2017-DNA1, Class M2, 4.80%, 07/25/29 | | | | | | | 250 | | | | 267,911 | |
Series 2017-DNA2, Class M2, 5.00%, 10/25/29 | | | | | | | 250 | | | | 271,954 | |
Series 2017-DNA3, Class B1, 6.00%, 03/25/30 | | | | | | | 250 | | | | 267,834 | |
Series 2017-DNA3, Class M2, 4.05%, 03/25/30 | | | | | | | 280 | | | | 289,995 | |
Series 2017-HQA2, Class M2, 4.20%, 12/25/29 | | | | | | | 270 | | | | 279,217 | |
Federal National Mortgage Association(a): | | | | | | | | | | | | |
Series 2016-C02, Class 1M2, 7.55%, 09/25/28(n) | | | | | | | 20 | | | | 23,742 | |
Series 2016-C04, Class 1M2, 5.80%, 01/25/29 | | | | | | | 142 | | | | 161,034 | |
Series 2017-C01, Class 1B1, 7.30%, 07/25/29 | | | | | | | 62 | | | | 71,749 | |
Series 2017-C01, Class 1M2, 5.10%, 07/25/29 | | | | | | | 117 | | | | 126,611 | |
Series 2017-C04, Class 2M2, 4.40%, 11/25/29 | | | | | | | 57 | | | | 58,836 | |
Series 2017-C05, Class 1B1, 5.15%, 01/25/30 | | | | | | | 130 | | | | 129,505 | |
Series 2017-C05, Class 1M2, 3.75%, 01/25/30 | | | | | | | 76 | | | | 76,514 | |
Series 2017-C07, Class 1B1, 5.55%, 05/25/30 | | | | | | | 120 | | | | 124,430 | |
GreenPoint Mortgage Funding Trust, Series 2006-AR2, Class 4A1, 3.06%, 03/25/36(a) | | | | | | | 30 | | | | 28,098 | |
GSMPS Mortgage Loan Trust(a)(b): | | | | | | | | | | | | |
Series 2005-RP1, Class 1AF, 1.90%, 01/25/35 | | | | | | | 60 | | | | 53,744 | |
Series 2005-RP2, Class 1AF, 1.90%, 03/25/35 | | | | | | | 72 | | | | 65,784 | |
Series 2006-RP1, Class 1AF1, 1.90%, 01/25/36 | | | | | | | 54 | | | | 46,479 | |
HarborView Mortgage Loan Trust(a): | | | | | | | | | | | | |
Series 2007-3, Class 2A1B, 1.73%, 05/19/47 | | | | | | | 241 | | | | 189,382 | |
Series 2007-4, Class 2A2, 1.74%, 07/19/47 | | | | | | | 226 | | | | 196,983 | |
Impac Secured Assets Corp., Series 2004-3, Class 1A4, 2.35%, 11/25/34(a) | | | | | | | 34 | | | | 34,003 | |
IndyMac IMJA Mortgage Loan Trust, Series 2007-A2, Class 3A1, 7.00%, 10/25/37 | | | | | | | 163 | | | | 117,617 | |
IndyMac INDX Mortgage Loan Trust(a): | | | | | | | | | | | | |
Series 2007-AR19, Class 3A1, 3.42%, 09/25/37 | | | | | | | 99 | | | | 69,903 | |
Series 2007-FLX5, Class 2A2, 1.79%, 08/25/37 | | | | | | | 205 | | | | 180,823 | |
JPMorgan Mortgage Trust, Series 2017-2, Class A6, 3.00%, 05/25/47(a)(b) | | | | | | | 80 | | | | 80,239 | |
Lehman XS Trust, Series 2007-20N, Class A1, 2.70%, 12/25/37(a) | | | | | | | 44 | | | | 42,859 | |
| | | | |
| SCHEDULE OF INVESTMENTS | | | 19 | |
| | |
Schedule of Investments (continued) December 31, 2017 | | BlackRock Total Return V.I. Fund (Percentages shown are based on Net Assets) |
| | | | | | | | | | | | |
| Security | | Par
(000) | | | Value | |
| Collateralized Mortgage Obligations (continued) | |
LSTAR Securities Investment Ltd.(a)(b): | | | | | | | | | | | | |
Series 2017-2, Class A1, 3.36%, 02/01/22 | | | USD | | | | 207 | | | $ | 207,113 | |
Series 2017-3, Class A1, 3.36%, 04/01/22(d) | | | | | | | 297 | | | | 298,619 | |
Merrill Lynch Alternative Note Asset Trust,
Series 2007-OAR2, Class A2, 1.76%, 04/25/37(a) | | | | | | | 224 | | | | 186,989 | |
Morgan Stanley Resecuritization Trust, Series 2014-R8, Class 3B1, 1.75%, 06/26/47(a)(b)(d) | | | | | | | 84 | | | | 78,616 | |
Mortgage Loan Resecuritization Trust, Series 2009-RS1, Class A85, 1.59%, 04/16/36(a)(b) | | | | | | | 487 | | | | 413,286 | |
Nomura Asset Acceptance Corp. Alternative Loan Trust, Series 2007-2, Class A4, 1.97%, 04/25/47(a) | | | | | | | 22 | | | | 17,729 | |
Nomura Resecuritization Trust, Series 2014-3R, Class 3A9, 1.85%, 11/26/35(a)(b) | | | | | | | 100 | | | | 91,452 | |
RALI Trust(a): | | | | | | | | | | | | |
Series 2006-QO6, Class A2, 1.78%, 06/25/46 | | | | | | | 57 | | | | 26,906 | |
Series 2007-QH1, Class A1, 1.71%, 02/25/37 | | | | | | | 89 | | | | 81,457 | |
Series 2007-QH6, Class A1, 1.74%, 07/25/37 | | | | | | | 50 | | | | 46,725 | |
Series 2007-QH9, Class A1, 2.39%, 11/25/37 | | | | | | | 51 | | | | 44,327 | |
RBSSP Resecuritization Trust, Series 2013-2, Class 1A2, 1.54%, 12/26/36(a)(b) | | | | | | | 258 | | | | 245,687 | |
Reperforming Loan REMIC Trust, Series 2005-R3, Class AF, 1.95%, 09/25/35(a)(b) | | | | | | | 8 | | | | 7,448 | |
Seasoned Credit Risk Transfer Trust(b)(d): | | | | | | | | | | | | |
Series 2017-3, Class B, 0.00%, 07/25/56(i) | | | | | | | 120 | | | | 8,023 | |
Series 2017-3, Class M2, 4.75%, 07/25/56(a) | | | | | | | 100 | | | | 97,553 | |
Structured Adjustable Rate Mortgage Loan Trust, Series 2006-3, Class 4A, 3.46%, 04/25/36(a) | | | | | | | 99 | | | | 85,650 | |
Structured Asset Mortgage Investments II Trust(a): | | | | | | | | | | | | |
Series 2006-AR4, Class 3A1, 1.74%, 06/25/36 | | | | | | | 119 | | | | 111,284 | |
Series 2006-AR5, Class 2A1, 1.76%, 05/25/46 | | | | | | | 74 | | | | 62,834 | |
Structured Asset Securities Corp. Mortgage Loan Trust, Series 2006-RF4, Class 2A1, 6.00%, 10/25/36(b) | | | | | | | 50 | | | | 43,510 | |
WaMu Mortgage Pass-Through Certificates Trust(a): | | | | | | | | | | | | |
Series 2005-AR2, Class B1, 2.08%, 01/25/45 | | | | | | | 106 | | | | 73,195 | |
Series 2006-AR15, Class 2A, 2.24%, 11/25/46 | | | | | | | 26 | | | | 24,988 | |
Washington Mutual Mortgage Pass-Through Certificates: | | | | | | | | | | | | |
Series 2006-4, Class 1A1, 6.00%, 04/25/36 | | | | | | | 105 | | | | 95,559 | |
Series 2006-4, Class 3A1, 6.50%, 05/25/36(c) | | | | | | | 58 | | | | 48,368 | |
Series 2006-8, Class A4, 4.51%, 10/25/36(c) | | | | | | | 73 | | | | 47,097 | |
Wells Fargo Mortgage Backed Securities Trust, Series 2005-AR16, Class CRB1, 3.53%, 10/25/35(a) | | | | | | | 36 | | | | 31,204 | |
| | | | | |
| | | | 11,752,943 | |
| Commercial Mortgage-Backed Securities — 3.6% | |
245 Park Avenue Trust, Series 2017-245P, Class E, 3.66%, 06/05/37(a)(b) | | | | | | | 500 | | | | 469,877 | |
280 Park Avenue Mortgage Trust, Series 2017-280P, Class E, 3.60%, 09/15/34(a)(b) | | | | | | | 190 | | | | 189,526 | |
AOA Mortgage Trust, Series 2015-1177, Class C, 3.01%, 12/13/29(a)(b) | | | | | | | 100 | | | | 99,245 | |
BAMLL Commercial Mortgage Securities Trust(a)(b): | | | | | | | | | | | | |
Series 2013-DSNY, Class A, 2.53%, 09/15/26 | | | | | | | 550 | | | | 551,104 | |
Series 2013-DSNY, Class E, 4.08%, 09/15/26 | | | | | | | 100 | | | | 100,055 | |
Series 2013-DSNY, Class F, 4.98%, 09/15/26 | | | | | | | 104 | | | | 103,893 | |
Series 2015-200P, Class F, 3.60%, 04/14/33 | | | | | | | 300 | | | | 287,707 | |
Series 2015-ASHF, Class B, 3.19%, 01/15/28 | | | | | | | 100 | | | | 100,211 | |
Series 2016-ISQ, Class E, 3.61%, 08/14/34(d) | | | | | | | 200 | | | | 180,391 | |
Series 2017-SCH, Class CL, 2.75%, 11/15/32 | | | | | | | 100 | | | | 100,028 | |
Series 2017-SCH, Class DL, 3.25%, 11/15/32 | | | | | | | 100 | | | | 100,000 | |
Banc of America Commercial Mortgage Trust(a): | | | | | | | | | | | | |
Series 2007-1, Class AMFX, 5.48%, 01/15/49 | | | | | | | 15 | | | | 15,535 | |
Series 2007-5, Class AM, 5.77%, 02/10/51 | | | | | | | 7 | | | | 6,550 | |
Bank of America NA, Series 2017-BNK9, Class A4, 3.54%, 11/15/54 | | | | | | | 50 | | | | 51,523 | |
| | | | | | | | | | | | |
| Security | | Par
(000) | | | Value | |
| Commercial Mortgage-Backed Securities (continued) | |
Bayview Commercial Asset Trust(a)(b): | | | | | | | | | | | | |
Series 2005-2A, Class A1, 1.86%, 08/25/35 | | | USD | | | | 69 | | | $ | 65,573 | |
Series 2005-4A, Class A1, 1.85%, 01/25/36 | | | | | | | 64 | | | | 59,707 | |
Series 2005-4A, Class M1, 2.00%, 01/25/36 | | | | | | | 47 | | | | 43,502 | |
Series 2006-1A, Class A2, 1.91%, 04/25/36 | | | | | | | 17 | | | | 16,293 | |
Series 2006-3A, Class A1, 1.80%, 10/25/36 | | | | | | | 30 | | | | 28,528 | |
Series 2006-3A, Class A2, 1.85%, 10/25/36 | | | | | | | 25 | | | | 23,826 | |
Series 2007-2A, Class A1, 1.82%, 07/25/37 | | | | | | | 44 | | | | 42,167 | |
Series 2007-4A, Class A1, 2.00%, 09/25/37 | | | | | | | 240 | | | | 227,703 | |
Series 2007-5A, Class A3, 2.55%, 10/25/37 | | | | | | | 64 | | | | 61,656 | |
BBCMS Trust, Series 2015-SRCH, Class A1, 3.31%, 08/10/35(b) | | | | | | | 100 | | | | 101,625 | |
BHMS Mortgage Trust, Series 2014-ATLS, Class AFL, 2.86%, 07/05/33(a)(b) | | | | | | | 581 | | | | 584,101 | |
BWAY Mortgage Trust(b): | | | | | | | | | | | | |
Series 2013-1515, Class A2, 3.45%, 03/10/33 | | | | | | | 150 | | | | 153,339 | |
Series 2013-1515, Class C, 3.45%, 03/10/33 | | | | | | | 105 | | | | 104,748 | |
Series 2013-1515, Class F, 3.93%, 03/10/33(a) | | | | | | | 100 | | | | 98,083 | |
BXP Trust(b): | | | | | | | | | | | | |
Series 2017-CC, Class D, 3.55%, 08/13/37(a)(d) | | | | | | | 60 | | | | 57,376 | |
Series 2017-CC, Class E, 3.55%, 08/13/37(a)(d) | | | | | | | 110 | | | | 97,488 | |
Series 2017-GM, Class A, 3.38%, 06/13/39 | | | | | | | 110 | | | | 112,369 | |
Series 2017-GM, Class D, 3.42%, 06/13/39(a) | | | | | | | 310 | | | | 297,325 | |
Series 2017-GM, Class E, 3.42%, 06/13/39(a) | | | | | | | 80 | | | | 74,821 | |
Caesars Palace Las Vegas Trust, Series 2017-VICI, Class D, 4.35%, 10/15/34(a)(b) | | | | | | | 100 | | | | 102,047 | |
CCRESG Commercial Mortgage Trust,
Series 2016-HEAT, Class D, 5.49%, 04/10/29(a)(b) | | | | | | | 20 | | | | 20,091 | |
CCUBS Commercial Mortgage Trust,
Series 2017-C1, Class A4, 3.54%, 11/15/50(a) | | | | | | | 92 | | | | 94,614 | |
CD Mortgage Trust: | | | | | | | | | | | | |
Series 2006-CD3, Class AM, 5.65%, 10/15/48 | | | | | | | 30 | | | | 30,172 | |
Series 2017-CD3, Class A4, 3.63%, 02/10/50 | | | | | | | 30 | | | | 31,313 | |
CFCRE Commercial Mortgage Trust,
Series 2016-C3, Class A3, 3.87%, 01/10/48 | | | | | | | 10 | | | | 10,478 | |
CGBAM Commercial Mortgage Trust,
Series 2015-SMRT, Class E, 3.79%, 04/10/28(a)(b) | | | | | | | 100 | | | | 99,817 | |
CGDBB Commercial Mortgage Trust(a)(b): | | | | | | | | | | | | |
Series 2017-BIOC, Class A, 2.27%, 07/15/28 | | | | | | | 190 | | | | 190,236 | |
Series 2017-BIOC, Class D, 3.08%, 07/15/28 | | | | | | | 110 | | | | 110,000 | |
Series 2017-BIOC, Class E, 3.63%, 07/15/28 | | | | | | | 170 | | | | 170,000 | |
CGGS Commercial Mortgage Trust,
Series 2016-RNDA, Class AFX, 2.76%, 02/10/33(b) | | | | | | | 95 | | | | 95,593 | |
CGMS Commercial Mortgage Trust,
Series 2017-B1, Class A4, 3.46%, 08/15/50 | | | | | | | 100 | | | | 102,702 | |
Chicago Skyscraper Trust(a)(b): | | | | | | | | | | | | |
Series 2017-SKY, Class D, 3.73%, 02/15/30 | | | | | | | 100 | | | | 100,621 | |
Series 2017-SKY, Class E, 4.78%, 02/15/30 | | | | | | | 130 | | | | 130,807 | |
CHT 2017-COSMO Mortgage Trust,
Series 2017-CSMO, Class A, 2.31%, 11/15/36(a)(b) | | | | | | | 100 | | | | 100,156 | |
Citigroup Commercial Mortgage Trust: | | | | | | | | | | | | |
Series 2016-C1, Class C, 4.95%, 05/10/49(a) | | | | | | | 40 | | | | 42,240 | |
Series 2016-GC37, Class AS, 3.57%, 04/10/49 | | | | | | | 20 | | | | 21,156 | |
Series 2016-P3, Class C, 4.84%, 04/15/49(a) | | | | | | | 10 | | | | 10,579 | |
CLNS Trust, Series 2017-IKPR, Class E, 4.93%, 06/11/32(a)(b) | | | | | | | 125 | | | | 125,273 | |
Commercial Mortgage Pass-Through Certificates,
Series 2014-CR14, Class A4, 4.24%, 02/10/47(a) | | | | | | | 30 | | | | 32,086 | |
Commercial Mortgage Trust: | | | | | | | | | | | | |
Series 2005-C6, Class F, 5.65%, 06/10/44(a)(b) | | | | | | | 100 | | | | 102,422 | |
Series 2014-CR16, Class A4, 4.05%, 04/10/47 | | | | | | | 177 | | | | 187,658 | |
| | |
| 20 | | 2017 BLACKROCK ANNUAL REPORTTO SHAREHOLDERS |
| | |
Schedule of Investments (continued) December 31, 2017 | | BlackRock Total Return V.I. Fund (Percentages shown are based on Net Assets) |
| | | | | | | | | | | | |
| Security | | Par
(000) | | | Value | |
| Commercial Mortgage-Backed Securities (continued) | |
Commercial Mortgage Trust (continued): | | | | | | | | | | | | |
Series 2014-CR17, Class A5, 3.98%, 05/10/47 | | | USD | | | | 169 | | | $ | 178,666 | |
Series 2014-CR19, Class A5, 3.80%, 08/10/47 | | | | | | | 50 | | | | 52,452 | |
Series 2014-TWC, Class E, 4.68%, 02/13/32(a)(b) | | | | | | | 150 | | | | 150,878 | |
Series 2015-CR23, Class CMD, 3.69%, 05/10/48(a)(b) | | | | | | | 350 | | | | 346,048 | |
Series 2015-CR25, Class A4, 3.76%, 08/10/48 | | | | | | | 100 | | | | 104,764 | |
Series 2015-LC19, Class C, 4.26%, 02/10/48(a) | | | | | | | 20 | | | | 20,374 | |
Series 2015-LC19, Class D, 2.87%, 02/10/48(b) | | | | | | | 50 | | | | 41,312 | |
Series 2015-LC21, Class C, 4.31%, 07/10/48(a) | | | | | | | 150 | | | | 148,047 | |
Series 2016-667M, Class D, 3.18%, 10/10/36(a)(b) | | | | | | | 100 | | | | 93,972 | |
Series 2017-DLTA, Class E, 3.44%, 08/15/35(a)(b) | | | | | | | 110 | | | | 108,555 | |
Series 2017-DLTA, Class F, 4.06%, 08/15/35(a)(b) | | | | | | | 100 | | | | 98,486 | |
Core Industrial Trust, Series 2015-TEXW, Class A, 3.08%, 02/10/34(b) | | | | | | | 100 | | | | 101,610 | |
Countrywide Commercial Mortgage Trust, Series 2007-MF1, Class A, 6.29%, 11/12/43(a)(b) | | | | | | | 1 | | | | 1,371 | |
Credit Suisse First Boston Mortgage Securities Corp., Series 2004-C4, Class F, 5.23%, 10/15/39(a)(b) | | | | | | | 330 | | | | 336,459 | |
Credit Suisse Mortgage Capital Certificates, Series 2015-GLPB, Class A, 3.64%, 11/15/34(b) | | | | | | | 100 | | | | 104,060 | |
CSMC Trust(b): | | | | | | | | | | | | |
Series 2015-DEAL, Class D, 4.58%, 04/15/29(a) | | | | | | | 100 | | | | 100,000 | |
Series 2017-PFHP, Class A, 2.43%, 12/15/20(a) | | | | | | | 60 | | | | 60,000 | |
Series 2017-TIME, Class A, 3.65%, 11/13/39 | | | | | | | 100 | | | | 102,960 | |
DBJPM Mortgage Trust, Series 2016-C3, Class D, 3.49%, 09/10/49(a)(b) | | | | | | | 89 | | | | 73,214 | |
DBUBS Mortgage Trust(b): | | | | | | | | | | | | |
Series 2017-BRBK, Class A, 3.45%, 10/10/34 | | | | | | | 140 | | | | 143,037 | |
Series 2017-BRBK, Class E, 3.53%, 10/10/34(a)(d) | | | | | | | 410 | | | | 389,243 | |
Series 2017-BRBK, Class F, 3.53%, 10/10/34(a)(d) | | | | | | | 80 | | | | 72,844 | |
Eleven Madison Trust Mortgage Trust,
Series 2015-11MD, Class A, 3.55%, 09/10/35(a)(b) | | | | | | | 100 | | | | 103,298 | |
GAHR Commercial Mortgage Trust(a)(b): | | | | | | | | | | | | |
Series 2015-NRF, Class AFL1, 2.78%, 12/15/34 | | | | | | | 14 | | | | 14,340 | |
Series 2015-NRF, Class EFX, 3.38%, 12/15/34 | | | | | | | 210 | | | | 208,684 | |
Series 2015-NRF, Class FFX, 3.38%, 12/15/34 | | | | | | | 160 | | | | 157,962 | |
GS Mortgage Securities Corp. II(a)(b): | | | | | | | | | | | | |
Series 2013-KING, Class D, 3.44%, 12/10/27 | | | | | | | 124 | | | | 124,012 | |
Series 2013-KING, Class E, 3.44%, 12/10/27 | | | | | | | 460 | | | | 455,129 | |
GS Mortgage Securities Corp. Trust(a)(b): | | | | | | | | | | | | |
Series 2017-500K, Class D, 2.78%, 07/15/32 | | | | | | | 10 | | | | 10,010 | |
Series 2017-500K, Class E, 2.98%, 07/15/32 | | | | | | | 20 | | | | 20,017 | |
Series 2017-500K, Class F, 3.28%, 07/15/32 | | | | | | | 10 | | | | 10,015 | |
GS Mortgage Securities Trust: | | | | | | | | | | | | |
Series 2014-GC22, Class D, 4.65%, 06/10/47(a)(b) | | | | | | | 110 | | | | 92,728 | |
Series 2015-GC32, Class C, 4.41%, 07/10/48(a)(d) | | | | | | | 30 | | | | 30,489 | |
Series 2015-GC32, Class D, 3.35%, 07/10/48 | | | | | | | 90 | | | | 74,467 | |
Series 2017-GS7, Class A4, 3.43%, 08/10/50 | | | | | | | 30 | | | | 30,559 | |
Series 2017-GS7, Class D, 3.00%, 08/10/50(b) | | | | | | | 20 | | | | 17,242 | |
HMH Trust, Series 2017-NSS, Class A, 3.06%, 07/05/31(b) | | | | | | | 110 | | | | 109,460 | |
IMT Trust(b): | | | | | | | | | | | | |
Series 2017-APTS, Class AFX, 3.48%, 06/15/34 | | | | | | | 100 | | | | 102,053 | |
Series 2017-APTS, Class EFX, 3.50%, 06/15/34(a) | | | | | | | 100 | | | | 96,140 | |
JPMBB Commercial Mortgage Securities Trust: | | | | | | | | | | | | |
Series 2014-C21, Class A5, 3.77%, 08/15/47 | | | | | | | 50 | | | | 52,363 | |
Series 2015-C28, Class B, 3.99%, 10/15/48 | | | | | | | 80 | | | | 79,793 | |
Series 2015-C33, Class D1, 4.12%, 12/15/48(a)(b) | | | | | | | 100 | | | | 95,420 | |
JPMCC Commercial Mortgage Securities Trust: | | | | | | | | | | | | |
Series 2017-JP5, Class D, 4.65%, 03/15/50(a)(b) | | | | | | | 100 | | | | 98,749 | |
Series 2017-JP7, Class B, 4.05%, 09/15/50 | | | | | | | 10 | | | | 10,228 | |
| | | | | | | | | | | | |
| Security | | Par
(000) | | | Value | |
| Commercial Mortgage-Backed Securities (continued) | |
JPMorgan Chase Commercial Mortgage Securities Trust(a): | | | | | | | | | | | | |
Series 2015-JP1, Class C, 4.74%, 01/15/49 | | | USD | | | | 140 | | | $ | 147,116 | |
Series 2015-JP1, Class D, 4.24%, 01/15/49 | | | | | | | 50 | | | | 47,074 | |
Series 2015-SGP, Class A, 3.18%, 07/15/36(b) | | | | | | | 230 | | | | 231,331 | |
Series 2015-UES, Class D, 3.62%, 09/05/32(b) | | | | | | | 130 | | | | 131,351 | |
Series 2015-UES, Class E, 3.62%, 09/05/32(b) | | | | | | | 100 | | | | 99,751 | |
Series 2016-NINE, Class A, 2.85%, 10/06/38(b) | | | | | | | 150 | | | | 146,927 | |
Series 2016-WPT, Class A, 2.93%, 10/15/33(b) | | | | | | | 100 | | | | 100,250 | |
Series 2017-MAUI, Class E, 4.43%, 07/15/34(b) | | | | | | | 100 | | | | 100,032 | |
Lehman Brothers Small Balance Commercial Mortgage Trust, Series 2007-1A, Class 1A, 1.80%, 03/25/37(a)(b) | | | | | | | 68 | | | | 63,224 | |
Lone Star Portfolio Trust, Series 2015-LSP, Class A1A2, 3.28%, 09/15/28(a)(b) | | | | | | | 46 | | | | 46,078 | |
Madison Avenue Trust, Series 2013-650M, Class D, 4.03%, 10/12/32(a)(b) | | | | | | | 101 | | | | 102,409 | |
Merrill Lynch Mortgage Trust, Series 2005-MKB2, Class F, 6.32%, 09/12/42(a)(b) | | | | | | | 100 | | | | 106,085 | |
Morgan Stanley Bank of America Merrill Lynch Trust: | | | | | | | | | | | | |
Series 2014-C16, Class A5, 3.89%, 06/15/47 | | | | | | | 90 | | | | 94,761 | |
Series 2015-C26, Class D, 3.06%, 10/15/48(b) | | | | | | | 110 | | | | 88,769 | |
Morgan Stanley Capital I Trust: | | | | | | | | | | | | |
Series 2015-MS1, Class D, 4.03%, 05/15/48(a)(b) | | | | | | | 100 | | | | 85,846 | |
Series 2017-CLS, Class F, 3.85%, 11/15/34(a)(b) | | | | | | | 211 | | | | 211,199 | |
Series 2017-H1, Class A5, 3.53%, 06/15/50 | | | | | | | 100 | | | | 103,269 | |
Series 2017-H1, Class C, 4.28%, 06/15/50(a) | | | | | | | 100 | | | | 101,201 | |
Series 2017-H1, Class D, 2.55%, 06/15/50(b) | | | | | | | 140 | | | | 113,802 | |
Series 2017-PRME, Class D, 4.88%, 02/15/34(a)(b) | | | | | | | 30 | | | | 30,000 | |
Morgan Stanley Capital I, Inc.: | | | | | | | | | | | | |
Series 2017-HR2, Class A4, 3.59%, 12/15/50 | | | | | | | 100 | | | | 103,124 | |
Series 2017-JWDR, Class D, 3.20%, 11/15/34(a)(b) | | | | | | | 30 | | | | 30,010 | |
Series 2017-JWDR, Class E, 4.30%, 11/15/34(a)(b) | | | | | | | 60 | | | | 60,038 | |
Olympic Tower Mortgage Trust, Series 2017-OT, Class E, 3.95%, 05/10/39(a)(b) | | | | | | | 190 | | | | 181,512 | |
Resource Capital Corp. Ltd.(a)(b): | | | | | | | | | | | | |
Series 2017-CRE5, Class A, 2.28%, 07/15/34 | | | | | | | 96 | | | | 96,453 | |
Series 2017-CRE5, Class B, 3.48%, 07/15/34 | | | | | | | 40 | | | | 40,000 | |
STRIPs Ltd., Series 2012-1A, Class B, 0.50%, 12/25/44(b)(d) | | | | | | | 20 | | | | 20,130 | |
Velocity Commercial Capital Loan Trust(a)(b): | | | | | | | | | | | | |
Series 2015-1, Class AFL, 3.98%, 06/25/45 | | | | | | | 47 | | | | 47,898 | |
Series 2017-2, Class M3, 4.24%, 11/25/47 | | | | | | | 99 | | | | 99,098 | |
Series 2017-2, Class M4, 5.00%, 11/25/47 | | | | | | | 99 | | | | 99,149 | |
Wachovia Bank Commercial Mortgage Trust, Series 2006-C28, Class AJ, 5.63%, 10/15/48(a) | | | | | | | 6 | | | | 5,631 | |
Waldorf Astoria Boca Raton Trust, Series 2016-BOCA, Class A, 2.83%, 06/15/29(a)(b) | | | | | | | 120 | | | | 120,185 | |
Wells Fargo Commercial Mortgage Trust: | | | | | | | | | | | | |
Series 2015-C27, Class C, 3.89%, 02/15/48 | | | | | | | 20 | | | | 18,881 | |
Series 2015-C31, Class A4, 3.70%, 11/15/48 | | | | | | | 140 | | | | 146,081 | |
Series 2015-NXS2, Class A5, 3.77%, 07/15/58(a) | | | | | | | 110 | | | | 115,270 | |
Series 2017-C38, Class A5, 3.45%, 07/15/50 | | | | | | | 42 | | | | 42,944 | |
Series 2017-C39, Class C, 4.12%, 09/15/50 | | | | | | | 20 | | | | 19,839 | |
Series 2017-C39, Class D, 4.36%, 09/15/50(a)(b) | | | | | | | 20 | | | | 19,022 | |
Series 2017-HSDB, Class A, 2.31%, 12/13/31(a)(b) | | | | | | | 151 | | | | 151,321 | |
WFRBS Commercial Mortgage Trust, Series 2014-C21, Class A5, 3.68%, 08/15/47 | | | | | | | 60 | | | | 62,478 | |
Worldwide Plaza Trust, Series 2017-WWP, Class E, 3.60%, 11/10/36(a)(b) | | | | | | | 100 | | | | 92,459 | |
| | | | | |
| | | | 15,059,444 | |
| | | | |
| SCHEDULE OF INVESTMENTS | | | 21 | |
| | |
Schedule of Investments (continued) December 31, 2017 | | BlackRock Total Return V.I. Fund (Percentages shown are based on Net Assets) |
| | | | | | | | | | | | |
| Security | | Par
(000) | | | Value | |
| Interest Only Commercial Mortgage-Backed Securities — 0.4%(a) | |
Banc of America Commercial Mortgage Trust, Series 2017-BNK3, Class XB, 0.63%, 02/15/50 | | | USD | | | | 1,000 | | | $ | 49,720 | |
BBCMS Trust, Series 2015-SRCH, Class XA, 0.96%, 08/10/35(b) | | | | | | | 1,030 | | | | 69,700 | |
BB-UBS Trust, Series 2012-SHOW, Class XA, 0.60%, 11/05/36(b) | | | | | | | 3,475 | | | | 134,516 | |
CD Mortgage Trust, Series 2017-CD3, Class XA, 1.04%, 02/10/50 | | | | | | | 498 | | | | 36,742 | |
CFCRE Commercial Mortgage Trust: | | | | | | | | | | | | |
Series 2016-C4, Class XA, 1.75%, 05/10/58 | | | | | | | 180 | | | | 19,128 | |
Series 2016-C4, Class XB, 0.73%, 05/10/58 | | | | | | | 170 | | | | 8,840 | |
Citigroup Commercial Mortgage Trust, Series 2016-P3, Class XA, 1.71%, 04/15/49 | | | | | | | 995 | | | | 99,206 | |
Commercial Mortgage Trust: | | | | | | | | | | | | |
Series 2015-3BP, Class XA, 0.06%, 02/10/35(b) | | | | | | | 1,916 | | | | 12,224 | |
Series 2015-CR23, Class XA, 0.98%, 05/10/48 | | | | | | | 606 | | | | 28,566 | |
Series 2015-CR24, Class XA, 0.81%, 08/10/48 | | | | | | | 1,028 | | | | 49,784 | |
Series 2015-CR25, Class XA, 0.95%, 08/10/48 | | | | | | | 981 | | | | 53,320 | |
Series 2016-DC2, Class XA, 1.06%, 02/10/49 | | | | | | | 325 | | | | 20,420 | |
Series 2017-COR2, Class XA, 1.19%, 09/10/50 | | | | | | | 270 | | | | 23,906 | |
CSAIL Commercial Mortgage Trust, Series 2017-CX10, Class XB, 0.14%, 11/15/50 | | | | | | | 1,430 | | | | 25,454 | |
JPMBB Commercial Mortgage Securities Trust: | | | | | | | | | | | | |
Series 2014-C22, Class XA, 0.92%, 09/15/47 | | | | | | | 1,292 | | | | 59,783 | |
Series 2014-C23, Class XA, 0.83%, 09/15/47 | | | | | | | 1,684 | | | | 51,069 | |
Series 2016-C1, Class XA, 1.39%, 03/15/49 | | | | | | | 992 | | | | 76,456 | |
JPMDB Commercial Mortgage Securities Trust, Series 2016-C4, Class XC, 0.75%, 12/15/49(b) | | | | | | | 1,800 | | | | 95,688 | |
JPMorgan Chase Commercial Mortgage Securities Trust, Series 2016-JP3, Class XC, 0.75%, 08/15/49(b) | | | | | | | 900 | | | | 37,953 | |
Morgan Stanley Bank of America Merrill Lynch Trust: | | | | | | | | | | | | |
Series 2014-C19, Class XF, 1.19%, 12/15/47(b)(d) | | | | | | | 130 | | | | 7,834 | |
Series 2015-C22, Class XA, 1.14%, 04/15/48 | | | | | | | 39 | | | | 2,232 | |
Series 2015-C26, Class XD, 1.35%, 10/15/48(b) | | | | | | | 120 | | | | 10,748 | |
Series 2016-C28, Class XA, 1.28%, 01/15/49 | | | | | | | 991 | | | | 74,258 | |
Series 2016-C29, Class XB, 0.96%, 05/15/49 | | | | | | | 1,020 | | | | 72,203 | |
Series 2016-C31, Class XA, 1.46%, 11/15/49 | | | | | | | 989 | | | | 88,882 | |
Morgan Stanley Capital I Trust(b): | | | | | | | | | | | | |
Series 2016-UBS9, Class XD, 1.54%, 03/15/49 | | | | | | | 1,000 | | | | 100,310 | |
Series 2017-H1, Class XD, 2.20%, 06/15/50 | | | | | | | 110 | | | | 16,898 | |
One Market Plaza Trust(b): | | | | | | | | | | | | |
Series 2017-1MKT, Class XCP, 0.09%, 02/10/32 | | | | | | | 1,880 | | | | 10,566 | |
Series 2017-1MKT, Class XNCP, 0.00%, 02/10/32(d) | | | | | | | 376 | | | | 2,256 | |
Wells Fargo Commercial Mortgage Trust: | | | | | | | | | | | | |
Series 2016-BNK1, Class XD, 1.27%, 08/15/49(b) | | | | | | | 1,000 | | | | 84,420 | |
Series 2016-C33, Class XA, 1.80%, 03/15/59 | | | | | | | 394 | | | | 39,734 | |
Series 2017-C41, Class XA, 1.24%, 11/15/50 | | | | | | | 999 | | | | 91,505 | |
| | | | | |
| | | | 1,554,321 | |
| | | | | |
Total Non-Agency Mortgage-Backed Securities — 6.8%
(Cost: $27,870,955) | | | | 28,366,708 | |
| | | | | |
| | | |
| | | | | | Beneficial Interest
(000) | | | | |
Other Interests — (0.0)%(o) | | | | | | | | | | | | |
| | | |
| Capital Markets — (0.0)%(d)(g)(h) | | | | | | | | | |
Lehman Brothers Holdings Capital Trust VII | | | | | | | 185 | | | | — | |
Lehman Brothers Holdings, Inc. | | | | | | | 1,365 | | | | — | |
| | | | | | | | | | | | |
| | | | | | | | | | | — | |
| | | | | | | | |
| |
Total Other Interests — (0.0)% | | | | — | |
| | | | | |
| | | | | | | | | | | | |
| Security | | | | | Par
(000) | | | Value | |
Preferred Securities | |
Capital Trusts — 0.0% | |
| | | |
| Media — 0.0% | | | | | | | | | |
NBCUniversal Enterprise, Inc., 5.25%(b)(f)(h) | | | USD | | | | 200 | | | $ | 212,500 | |
| | | | | | | | | | | | |
Total Capital Trusts — 0.0%
(Cost: $200,000) | | | | 212,500 | |
| | | | | |
| | | |
| | | | | | Shares | | | | |
Trust Preferreds — 0.1% | |
| | | |
| Banks — 0.1% | | | | | | | | | |
Citigroup Capital XIII, 7.75%, 10/30/40(a) | | | | | | | 13,971 | | | | 383,923 | |
| | | | | |
Total Trust Preferreds — 0.1%
(Cost: $381,375) | | | | 383,923 | |
| | | | | |
Total Preferred Securities — 0.1%
(Cost: $581,375) | | | | 596,423 | |
| | | | | | | | | | | | |
| | | |
| | | | | | Par
(000) | | | | |
U.S. Government Sponsored Agency Securities — 44.0% | |
|
| Commercial Mortgage-Backed Securities — 0.2% | |
Federal Home Loan Mortgage Corp.: | | | | | | | | | | | | |
Series K058, Class A2, 2.65%, 08/25/26 | | | USD | | | | 40 | | | | 39,530 | |
Series KPLB, Class A, 2.77%, 05/25/25 | | | | | | | 90 | | | | 89,723 | |
Series K060, Class A2, 3.30%, 10/25/26 | | | | | | | 40 | | | | 41,444 | |
Federal Home Loan Mortgage Corp. Variable Rate Notes(a): | | | | | | | | | | | | |
Series K059, Class A2, 3.12%, 09/25/26 | | | | | | | 90 | | | | 91,993 | |
Series K069, Class A2, 3.19%, 09/25/27 | | | | | | | 40 | | | | 41,017 | |
Series K061, Class A2, 3.35%, 11/25/26 | | | | | | | 50 | | | | 51,989 | |
Series K034, Class A2, 3.53%, 07/25/23 | | | | | | | 40 | | | | 42,015 | |
Series 2015-K48, Class B, 3.64%, 08/25/48(b) | | | | | | | 30 | | | | 30,328 | |
Series 2017-K725, Class B, 3.88%, 02/25/24(b) | | | | | | | 170 | | | | 173,045 | |
Series 2017-K64, Class B, 3.98%, 03/25/27(b) | | | | | | | 60 | | | | 60,674 | |
Federal National Mortgage Association ACES Variable Rate Notes, Series 2017-M8, Class A2, 3.06%, 05/25/27(a) | | | | | | | 34 | | | | 34,402 | |
| | | | | |
| | | | 696,160 | |
| Interest Only Commercial Mortgage-Backed Securities — 0.1% | |
Federal Home Loan Mortgage Corp. Variable Rate Notes(a): | | | | | | | | | | | | |
Series K721, Class X1, 0.34%, 08/25/22 | | | | | | | 356 | | | | 4,661 | |
Series K045, Class X1, 0.46%, 01/25/25 | | | | | | | 475 | | | | 13,065 | |
Series K064, Class X1, 0.61%, 03/25/27 | | | | | | | 918 | | | | 43,687 | |
Series K065, Class X1, 0.68%, 04/25/27 | | | | | | | 719 | | | | 38,144 | |
Series KW03, Class X1, 0.85%, 06/25/27 | | | | | | | 270 | | | | 16,173 | |
Series KIR1, Class X, 1.09%, 03/25/26 | | | | | | | 312 | | | | 22,136 | |
Series K056, Class X1, 1.27%, 05/25/26 | | | | | | | 317 | | | | 27,293 | |
Federal National Mortgage Association ACES Variable Rate Notes(a): | | | | | | | | | | | | |
Series 2014-M13, Class X2, 0.13%, 08/25/24 | | | | | | | 3,560 | | | | 28,814 | |
Series 2017-M12, Class X, 0.33%, 06/25/27 | | | | | | | 568 | | | | 12,600 | |
Series 2013-M5, Class X2, 2.18%, 01/25/22 | | | | | | | 465 | | | | 23,065 | |
Government National Mortgage Association Variable Rate Notes: | | | | | | | | | | | | |
Series 2015-48, 0.68%, 02/16/50(a) | | | | | | | 207 | | | | 10,454 | |
Series 2017-151, 0.71%, 09/16/57(a) | | | | | | | 479 | | | | 33,413 | |
Series 2017-111(LIBOR USD 1 Month + 0.00%), 0.74%, 02/16/59(e) | | | | | | | 729 | | | | 54,063 | |
Series 2013-191, 0.76%, 11/16/53(a) | | | | | | | 102 | | | | 3,681 | |
| | |
| 22 | | 2017 BLACKROCK ANNUAL REPORTTO SHAREHOLDERS |
| | |
Schedule of Investments (continued) December 31, 2017 | | BlackRock Total Return V.I. Fund (Percentages shown are based on Net Assets) |
| | | | | | | | | | | | |
| Security | | | | | Par
(000) | | | Value | |
| Interest Only Commercial Mortgage-Backed Securities (continued) | |
Government National Mortgage Association Variable Rate Notes (continued): | | | | | | | | | | | | |
Series 2012-120, 0.79%, 02/16/53(a) | | | USD | | | | 762 | | | $ | 33,912 | |
Series 2017-100, 0.81%, 05/16/59(a) | | | | | | | 308 | | | | 21,169 | |
Series 2015-173, 0.90%, 09/16/55(a) | | | | | | | 234 | | | | 15,484 | |
Series 2016-152, 0.98%, 08/15/58(a) | | | | | | | 1,117 | | | | 86,630 | |
Series 2016-87, 1.01%, 08/16/58(a) | | | | | | | 274 | | | | 20,930 | |
Series 2016-110, 1.04%, 05/16/58(a) | | | | | | | 200 | | | | 16,220 | |
Series 2016-125, 1.06%, 12/16/57(a) | | | | | | | 302 | | | | 22,709 | |
Series 2016-119(LIBOR USD 1 Month + 0.00%), 1.13%, 04/16/58(e) | | | | | | | 334 | | | | 27,568 | |
Series 2017-173, 1.37%, 09/16/57(a) | | | | | | | 200 | | | | 19,109 | |
| | | | | |
| | | | 594,980 | |
| Mortgage-Backed Securities — 43.7% | |
Federal Home Loan Mortgage Corp.: | | | | | | | | | | | | |
2.50%, 02/01/24 - 09/01/30 | | | | | | | 457 | | | | 456,858 | |
2.50%, 01/15/33(n) | | | | | | | 516 | | | | 515,113 | |
3.00%, 01/01/30 - 12/01/46 | | | | | | | 5,416 | | | | 5,447,676 | |
3.00%, 01/15/33 - 01/15/48(n) | | | | | | | 12,770 | | | | 12,800,804 | |
3.50%, 09/01/30 - 10/01/47 | | | | | | | 9,452 | | | | 9,799,907 | |
3.50%, 01/15/48(n) | | | | | | | 5,003 | | | | 5,137,500 | |
4.00%, 01/15/33 - 01/15/48(n) | | | | | | | 1,684 | | | | 1,756,398 | |
4.00%, 08/01/40 - 08/01/47 | | | | | | | 3,775 | | | | 3,989,892 | |
4.50%, 02/01/39 - 11/01/47 | | | | | | | 1,478 | | | | 1,576,054 | |
4.50%, 01/15/48(n) | | | | | | | 285 | | | | 302,945 | |
5.00%, 10/01/41 - 11/01/41 | | | | | | | 233 | | | | 254,366 | |
5.50%, 02/01/35 - 06/01/41 | | | | | | | 276 | | | | 305,486 | |
Federal National Mortgage Association: | | | | | | | | | | | | |
2.50%, 04/01/30 - 03/01/32 | | | | | | | 2,914 | | | | 2,913,442 | |
2.50%, 01/25/33(n) | | | | | | | 368 | | | | 367,725 | |
3.00%, 04/01/28 - 03/01/47 | | | | | | | 15,824 | | | | 15,972,152 | |
3.00%, 01/25/48(n) | | | | | | | 37,316 | | | | 37,315,620 | |
3.50%, 03/01/29 - 11/01/47 | | | | | | | 10,321 | | | | 10,675,364 | |
3.50%, 01/25/33 - 02/25/48(n) | | | | | | | 8,913 | | | | 9,146,076 | |
4.00%, 02/01/25 - 10/01/47 | | | | | | | 16,433 | | | | 17,297,778 | |
4.00%, 01/25/48(n) | | | | | | | 4,221 | | | | 4,414,063 | |
4.50%, 02/01/25 - 12/01/47 | | | | | | | 4,267 | | | | 4,588,561 | |
4.50%, 01/25/48(n) | | | | | | | 1,007 | | | | 1,071,354 | |
5.00%, 02/01/35 - 12/01/43 | | | | | | | 1,585 | | | | 1,716,383 | |
5.00%, 01/25/48(n) | | | | | | | 710 | | | | 763,097 | |
5.50%, 02/01/35 - 03/01/40 | | | | | | | 788 | | | | 871,731 | |
5.50%, 01/25/48(n) | | | | | | | 654 | | | | 716,612 | |
6.00%, 04/01/35 - 06/01/41 | | | | | | | 661 | | | | 742,062 | |
6.00%, 01/25/48(n) | | | | | | | 172 | | | | 192,365 | |
6.50%, 05/01/40 | | | | | | | 184 | | | | 206,022 | |
Government National Mortgage Association: | | | | | | | | | | | | |
3.00%, 01/15/48(n) | | | | | | | 9,561 | | | | 9,647,646 | |
3.50%, 12/20/41 - 10/20/46 | | | | | | | 894 | | | | 928,638 | |
3.50%, 01/15/48(n) | | | | | | | 12,112 | | | | 12,521,194 | |
4.00%, 04/20/39 - 02/20/47 | | | | | | | 1,470 | | | | 1,542,010 | |
4.00%, 01/15/48 - 02/15/48(n) | | | | | | | 4,429 | | | | 4,616,604 | |
4.50%, 12/20/39 - 11/20/44 | | | | | | | 1,578 | | | | 1,674,386 | |
4.50%, 01/15/48(n) | | | | | | | 832 | | | | 872,690 | |
5.00%, 12/15/38 - 07/20/44 | | | | | | | 250 | | | | 271,212 | |
| | | | | |
| | | | 183,387,786 | |
| | | | | | | | | | | | |
| |
Total U.S. Government Sponsored Agency Securities — 44.0%
(Cost: $185,144,139) | | | | 184,678,926 | |
| | | | | |
| | | | | | | | | | | | |
| Security | | | | | Par
(000) | | | Value | |
U.S. Treasury Obligations — 32.9% | |
U.S. Treasury Bonds: | | | | | | | | | | | | |
4.25%, 05/15/39 | | | USD | | | | 725 | | | $ | 916,360 | |
4.50%, 08/15/39 | | | | | | | 703 | | | | 918,321 | |
4.38%, 11/15/39 | | | | | | | 706 | | | | 908,396 | |
3.13%, 02/15/43 | | | | | | | 2,783 | | | | 2,989,877 | |
2.88%, 05/15/43 - 11/15/46 | | | | | | | 3,593 | | | | 3,692,624 | |
3.63%, 08/15/43 | | | | | | | 2,657 | | | | 3,101,010 | |
3.75%, 11/15/43 | | | | | | | 3,128 | | | | 3,727,085 | |
3.00%, 02/15/47 | | | | | | | 506 | | | | 532,150 | |
2.75%, 11/15/47(p) | | | | | | | 629 | | | | 630,032 | |
U.S. Treasury Notes: | | | | | | | | | | | | |
1.25%, 04/30/19 - 05/31/19 | | | | | | | 16,804 | | | | 16,667,886 | |
1.75%, 11/30/19 - 09/30/22(p) | | | | | | | 33,894 | | | | 33,659,281 | |
1.50%, 04/15/20 - 03/31/23 | | | | | | | 12,460 | | | | 12,310,363 | |
2.63%, 08/15/20 - 11/15/20 | | | | | | | 12,773 | | | | 13,001,875 | |
1.88%, 12/15/20 - 04/30/22 | | | | | | | 7,502 | | | | 7,435,645 | |
1.63%, 11/15/22 - 04/30/23 | | | | | | | 3,654 | | | | 3,555,516 | |
2.00%, 11/30/22 - 11/15/26(p) | | | | | | | 22,608 | | | | 22,217,728 | |
2.13%, 11/30/24 - 05/15/25 | | | | | | | 5,066 | | | | 4,996,658 | |
2.25%, 11/15/25 - 11/15/27(p) | | | | | | | 6,745 | | | | 6,660,270 | |
| | | | | |
Total U.S. Treasury Obligations — 32.9%
(Cost: $138,289,811) | | | | 137,921,077 | |
| | | | | | | | | | | | |
| |
Total Long-Term Investments — 132.8%
(Cost: $555,836,630) | | | | 557,365,211 | |
| | | | | | | | | | | | |
| | | |
Short-Term Securities — 0.6% | | | | | | | | | | | | |
|
| Borrowed Bond Agreements — 0.1% | |
Barclays Bank plc, 0.20%, Open (Purchased on 06/09/17 to be repurchased at GBP 476,049, collateralized by United Kingdom Gilt Inflation Linked Bonds, 0.13%, due at 03/22/26, par and fair value of GBP 403,000 and $640,326 respectively)(q)(r) | | | GBP | | | | 476 | | | | 642,402 | |
| | | | | |
Total Borrowed Bond Agreements — 0.1%
(Cost: $606,239) | | | | | | | | | | | 642,402 | |
| | | | | |
| | | |
| | | | | | Shares | | | | |
| Money Market Funds — 0.5%(s) | |
BlackRock Liquidity Funds, T-Fund, Institutional Class, 1.17%(t) | | | | | | | 1,809,877 | | | | 1,809,877 | |
JPMorgan US Treasury Plus Money Market Fund, Agency Class, 1.14% | | | | | | | 167,969 | | | | 167,969 | |
| | | | | |
Total Money Market Funds — 0.5%
(Cost: $1,977,846) | | | | 1,977,846 | |
| | | | | |
Total Short-Term Securities — 0.6%
(Cost: $2,584,085) | | | | 2,620,248 | |
| | | | | |
Total Options Purchased — 0.0%
(Cost: $777,222) | | | | 267,001 | |
| | | | | |
Total Investments Before Borrowed Bonds and TBA Sale Commitments — 133.4%
(Cost: $559,197,937) | | | | 560,252,460 | |
| | | | | |
| | | | |
| SCHEDULE OF INVESTMENTS | | | 23 | |
| | |
Schedule of Investments (continued) December 31, 2017 | | BlackRock Total Return V.I. Fund (Percentages shown are based on Net Assets) |
| | | | | | | | | | | | |
| Security | | | | | Par
(000) | | | Value | |
Borrowed Bonds — (0.1)% | |
| |
| Foreign Government Obligations — (0.1)% | | | | |
United Kingdom Gilt Inflation Linked Bonds, 0.13%, 03/22/26 | | | GBP | | | | 403 | | | $ | (640,326 | ) |
| | | | | | | | | | | | |
Total Borrowed Bonds — (0.1)%
(Proceeds: $595,127) | | | | (640,326 | ) |
| | | | | |
|
TBA Sale Commitments — (17.5)%(n) | |
| | | |
| Mortgage-Backed Securities — (17.5)% | | | | | | | | | |
Federal Home Loan Mortgage Corp.: | |
3.00%, 01/15/48 | | | | | | | 9,194 | | | | (9,192,206 | ) |
3.50%, 01/15/33 - 01/15/48 | | | | | | | 4,892 | | | | (5,048,392 | ) |
Federal National Mortgage Association: | |
3.00%, 01/25/33 - 02/25/48 | | | | | | | 40,267 | | | | (40,255,123 | ) |
3.50%, 01/25/48 | | | | | | | 4,454 | | | | (4,573,006 | ) |
4.00%, 01/25/33 - 02/25/48 | | | | | | | 11,404 | | | | (11,913,858 | ) |
4.50%, 01/25/48 - 02/25/48 | | | | | | | 2,014 | | | | (2,141,448 | ) |
Government National Mortgage Association: | |
4.00%, 01/15/48 | | | | | | | 100 | | | | (104,242 | ) |
4.50%, 01/15/48 | | | | | | | 100 | | | | (105,203 | ) |
| | | | | |
Total TBA Sale Commitments — (17.5)%
(Proceeds: $73,392,818) | | | | (73,333,478 | ) |
| | | | | |
| |
Total Investments Net of Borrowed Bonds and TBA Sale Commitments — 115.8%
(Cost: $485,209,992) | | | | 486,278,656 | |
Liabilities in Excess of Other Assets — (15.8)% | | | | (66,489,338 | ) |
| | | | | | | | | | | | |
Net Assets — 100.0% | | | $ | 419,789,318 | |
| | | | | | | | | | | | |
| (a) | Variable or floating rate security, which interest rate adjusts periodically based on changes in current interest rates and prepayments on the underlying pool of assets. Rate shown is the rate in effect as of period end. |
| (b) | Security exempt from registration pursuant to Rule 144A under the Securities Act of 1933, as amended. These securities may be resold in transactions exempt from registration to qualified institutional investors. |
| (c) | Step-up bond that pays an initial coupon rate for the first period and then a higher coupon rate for the following periods. Rate as of period end. |
| (d) | Security is valued using significant unobservable inputs and is classified as Level 3 in the fair value hierarchy. |
| (e) | Variable rate security. Security may be issued at a fixed coupon rate, which converts to a variable rate at a specified date. Rate shown is the rate in effect as of period end. |
| (f) | Perpetual security with no stated maturity date. |
| (g) | Issuer filed for bankruptcy and/or is in default. |
| (h) | Non-income producing security. |
| (j) | Issuer is a U.S. branch of a foreign domiciled bank. |
| (k) | Variable rate security. Rate shown is the rate in effect as of period end. |
| (l) | When-issued security. |
| (m) | U.S. Government securities, held in escrow, are used to pay interest on this security, as well as to retire the bond in full at the date indicated, typically at a premium to par. |
| (n) | Represents or includes a TBA transaction. As of period end, unsettled TBA transactions were as follows: |
| | | | | | | | |
| Counterparty | | Value | | | Unrealized
Appreciation
(Depreciation) | |
Bank of America Securities LLC | | $ | 1,835,491 | | | $ | (768 | ) |
Barclays Capital, Inc. | | | 669,718 | | | | (1,254 | ) |
BNP Paribas SA | | | 1,292,506 | | | | (13,648 | ) |
Citigroup Global Markets Inc. | | | 2,214,323 | | | | (6,032 | ) |
Credit Suisse Securities USA LLC | | | 5,271,036 | | | | 251 | |
Daiwa Capital Markets America, Inc. | | | 9,972,000 | | | | 6,233 | |
Deutsche Bank Securities, Inc. | | | (731,243 | ) | | | (1,427 | ) |
Goldman Sachs International | | | 1,203,214 | | | | (1,675 | ) |
JP Morgan Chase Bank | | | (19,609,695 | ) | | | 26,758 | |
Mizuho Securities USA, Inc. | | | 410,492 | | | | 7,035 | |
Morgan Stanley & Co., Inc. | | | 6,613,166 | | | | (6,110 | ) |
Nomura Securities International, Inc. | | | 2,739,705 | | | | 414 | |
RBC Dain Rauscher, Inc. | | | 5,934,792 | | | | 566 | |
Wells Fargo Securities LLC | | | 11,008,824 | | | | (4,524 | ) |
| (o) | Other interests represent beneficial interests in liquidation trusts and other reorganizational or private entities. |
| (p) | All or a portion of security has been pledged as collateral in connection with outstanding reverse repurchase agreements. |
| (q) | Certain agreements have no stated maturity and can be terminated by either party at any time. |
| (r) | The amount to be repurchased assumes the maturity will be the day after the period end. |
| (s) | Annualized 7-day yield as of period end. |
| (t) | During the year ended December 31, 2017, investments in issuers considered to be an affiliate of the Fund for the purposes of Section 2(a)(3) of the Investment Company Act of 1940, as amended, were as follows: |
| | | | | | | | | | | | | | | | | | | | | | | | | | | | |
| Affiliate | | Shares
Held at
12/31/16 | | | Net
Activity | | | Shares
Held at
12/31/17 | | | Value at
12/31/17 | | | Income | | | Net
Realized
Gain (Loss) (a) | | | Change in
Unrealized
Appreciation
(Depreciation) | |
BlackRock Liquidity Funds, T-Fund, Institutional Class | | | 3,798,256 | | | | (1,988,379 | ) | | | 1,809,877 | | | $ | 1,809,877 | | | $ | 34,705 | | | $ | 10 | | | $ | — | |
| | | | | | | | | | | | | | | | | | | | | | | | | | | | |
| | (a) | Includes net capital gain distributions, if applicable. | |
For Fund compliance purposes, the Fund’s industry classifications refer to one or more of the industry sub-classifications used by one or more widely recognized market indexes or ratings group indexes, and/or as defined by the investment advisor. These definitions may not apply for purposes of this report, which may combine such industry sub-classifications for reporting ease.
| | |
| 24 | | 2017 BLACKROCK ANNUAL REPORTTO SHAREHOLDERS |
| | |
Schedule of Investments (continued) December 31, 2017 | | BlackRock Total Return V.I. Fund |
Reverse Repurchase Agreements
| | | | | | | | | | | | | | | | | | | | | | | | |
| Counterparty | | Interest
Rate | | | Trade
Date | | | Maturity
Date | | | Face Value | | | Face Value
Including
Accrued Interest | | | Type of Underlying Collateral | | Remaining Contractual
Maturity of the Agreements |
Barclays Capital, Inc. | | | 0.75 | % | | | 12/29/2017 | | | | 01/02/18 | | | $ | 2,397,650 | | | $ | 2,397,800 | | | U.S. Treasury Obligations | | Overnight |
BNP Paribas SA | | | 1.15 | % | | | 12/29/2017 | | | | 01/02/18 | | | | 16,777,002 | | | | 16,778,610 | | | U.S. Treasury Obligations | | Overnight |
Deutsche Bank Securities, Inc. | | | 0.75 | % | | | 12/29/2017 | | | | 01/02/18 | | | | 9,555,034 | | | | 9,555,631 | | | U.S. Treasury Obligations | | Overnight |
Merrill Lynch, Pierce, Fenner & Smith, Inc. | | | 0.45 | % | | | 12/29/2017 | | | | 01/02/18 | | | | 8,706,210 | | | | 8,706,536 | | | U.S. Treasury Obligations | | Overnight |
| | | | | | | | | | | | | | | | | | | | | | | | |
| | | | | | | | | | | | | | $ | 37,435,896 | | | $ | 37,438,577 | | | | | |
| | | | | | | | | �� | | | | | | | | | | | | | | | |
Derivative Financial Instruments Outstanding as of Period End
Futures Contracts
| | | | | | | | | | | | | | | | |
| Description | | Number of
Contracts | | | Expiration
Date | | | Notional
Amount (000) | | | Value/
Unrealized
Appreciation
(Depreciation) | |
Long Contracts | | | | | | | | | | | | | | | | |
U.S. Treasury Ultra Bond | | | 48 | | | | 03/20/18 | | | $ | 8,048 | | | $ | 68,958 | |
U.S. Treasury 5 Year Note | | | 73 | | | | 03/29/18 | | | | 8,480 | | | | (16,200 | ) |
Bank Acceptance | | | 109 | | | | 12/17/18 | | | | 21,203 | | | | 127 | |
| | | | | | | | | | | | | | | | |
| | | | | | | | | | | | | | | 52,885 | |
| | | | | | | | | | | | | | | | |
Short Contracts | | | | | | | | | | | | | | | | |
Euro-Bund | | | 34 | | | | 03/08/18 | | | | 6,596 | | | | 67,951 | |
U.S. Treasury 10 Year Note | | | 385 | | | | 03/20/18 | | | | 47,758 | | | | (18,636 | ) |
U.S. Treasury Long Bond | | | 12 | | | | 03/20/18 | | | | 1,836 | | | | 2,473 | |
Long Gilt | | | 25 | | | | 03/27/18 | | | | 4,225 | | | | (55,381 | ) |
90-Day Eurodollar | | | 86 | | | | 12/17/18 | | | | 21,038 | | | | (2,823 | ) |
90-Day Eurodollar | | | 21 | | | | 03/18/19 | | | | 5,134 | | | | 3,245 | |
| | | | | | | | | | | | | | | | |
| | | | | | | | | | | | | | | (3,171 | ) |
| | | | | | | | | | | | | | | | |
| | | | | | | | | | | | | | $ | 49,714 | |
| | | | | | | | | | | | | | | | |
Forward Foreign Currency Exchange Contracts
| | | | | | | | | | | | | | | | | | | | |
| Currency Purchased | | | Currency Sold | | | Counterparty | | Settlement Date | | | Unrealized
Appreciation
(Depreciation) | |
| USD | | | 130,500 | | | BRL | | | 426,866 | | | Barclays Bank plc | | | 01/04/18 | | | $ | 1,828 | |
| USD | | | 810,160 | | | BRL | | | 2,671,464 | | | BNP Paribas SA | | | 01/04/18 | | | | 4,889 | |
| COP | | | 525,026,250 | | | USD | | | 175,000 | | | Barclays Bank plc | | | 01/05/18 | | | | 889 | |
| USD | | | 175,000 | | | MXN | | | 3,372,842 | | | Barclays Bank plc | | | 01/05/18 | | | | 3,528 | |
| RUB | | | 10,432,533 | | | EUR | | | 149,000 | | | Bank of America NA | | | 01/12/18 | | | | 1,915 | |
| RUB | | | 27,400,803 | | | USD | | | 463,000 | | | Bank of America NA | | | 01/12/18 | | | | 11,841 | |
| USD | | | 208,000 | | | JPY | | | 23,371,687 | | | BNP Paribas SA | | | 01/12/18 | | | | 480 | |
| USD | | | 122,390 | | | MXN | | | 2,332,866 | | | Bank of America NA | | | 01/12/18 | | | | 3,950 | |
| ZAR | | | 561,540 | | | USD | | | 43,800 | | | Barclays Bank plc | | | 01/12/18 | | | | 1,521 | |
| CLP | | | 72,053,300 | | | USD | | | 110,000 | | | Credit Suisse International | | | 01/16/18 | | | | 7,084 | |
| JPY | | | 2,361,290,705 | | | USD | | | 20,890,000 | | | Goldman Sachs International | | | 01/16/18 | | | | 80,436 | |
| USD | | | 20,890,000 | | | JPY | | | 2,347,095,950 | | | Bank of America NA | | | 01/16/18 | | | | 45,626 | |
| USD | | | 109,500 | | | MXN | | | 2,147,646 | | | Barclays Bank plc | | | 01/17/18 | | | | 578 | |
| ZAR | | | 538,287 | | | USD | | | 42,272 | | | Goldman Sachs International | | | 01/17/18 | | | | 1,135 | |
| USD | | | 322,715 | | | MXN | | | 6,182,731 | | | Barclays Bank plc | | | 01/22/18 | | | | 9,474 | |
| IDR | | | 406,087,022 | | | USD | | | 29,923 | | | JP Morgan Chase Bank NA | | | 01/26/18 | | | | 55 | |
| CAD | | | 109,500 | | | MXN | | | 1,664,761 | | | Morgan Stanley & Co. International plc | | | 01/29/18 | | | | 2,929 | |
| IDR | | | 8,971,753,000 | | | USD | | | 661,000 | | | Deutsche Bank AG | | | 01/29/18 | | | | 1,196 | |
| IDR | | | 1,919,856,000 | | | USD | | | 141,000 | | | JP Morgan Chase Bank NA | | | 01/29/18 | | | | 703 | |
| INR | | | 9,973,810 | | | USD | | | 154,000 | | | Barclays Bank plc | | | 01/29/18 | | | | 1,943 | |
| RUB | | | 7,467,600 | | | USD | | | 127,000 | | | Credit Suisse International | | | 01/29/18 | | | | 1,879 | |
| RUB | | | 12,199,285 | | | USD | | | 203,000 | | | Bank of America NA | | | 01/30/18 | | | | 7,489 | |
| EUR | | | 91,877 | | | USD | | | 107,750 | | | Deutsche Bank AG | | | 02/02/18 | | | | 2,697 | |
| EUR | | | 49,958 | | | USD | | | 58,396 | | | Barclays Bank plc | | | 02/12/18 | | | | 1,692 | |
| CAD | | | 112,388 | | | USD | | | 87,500 | | | Barclays Bank plc | | | 02/22/18 | | | | 1,972 | |
| | | | |
| SCHEDULE OF INVESTMENTS | | | 25 | |
| | |
Schedule of Investments (continued) December 31, 2017 | | BlackRock Total Return V.I. Fund |
| | | | | | | | | | | | | | | | | | | | |
| Currency Purchased | | | Currency Sold | | | Counterparty | | Settlement Date | | | Unrealized
Appreciation
(Depreciation) | |
| NOK | | | 1,462,071 | | | USD | | | 175,000 | | | Bank of America NA | | | 02/22/18 | | | $ | 3,327 | |
| CAD | | | 64,259 | | | USD | | | 50,000 | | | BNP Paribas SA | | | 03/21/18 | | | | 1,173 | |
| EUR | | | 80,000 | | | CAD | | | 120,446 | | | Deutsche Bank AG | | | 03/21/18 | | | | 519 | |
| EUR | | | 80,000 | | | USD | | | 95,073 | | | HSBC Bank plc | | | 03/21/18 | | | | 1,363 | |
| NOK | | | 524,720 | | | CAD | | | 80,000 | | | Bank of America NA | | | 03/21/18 | | | | 337 | |
| NOK | | | 502,362 | | | USD | | | 60,000 | | | JP Morgan Chase Bank NA | | | 03/21/18 | | | | 1,317 | |
| SEK | | | 901,375 | | | GBP | | | 80,000 | | | Morgan Stanley & Co. International plc | | | 03/21/18 | | | | 2,112 | |
| USD | | | 50,000 | | | BRL | | | 165,600 | | | BNP Paribas SA | | | 03/21/18 | | | | 498 | |
| USD | | | 2,005,000 | | | MXN | | | 39,039,696 | | | Barclays Bank plc | | | 03/21/18 | | | | 46,885 | |
| USD | | | 30,000 | | | MXN | | | 579,450 | | | Citibank NA | | | 03/21/18 | | | | 937 | |
| USD | | | 25,000 | | | MXN | | | 482,401 | | | Deutsche Bank AG | | | 03/21/18 | | | | 804 | |
| JPY | | | 7,006,640 | | | AUD | | | 80,000 | | | Bank of America NA | | | 03/22/18 | | | | 24 | |
| USD | | | 60,000 | | | ZAR | | | 747,420 | | | BNP Paribas SA | | | 03/22/18 | | | | 288 | |
| USD | | | 1,254,764 | | | TRY | | | 4,871,628 | | | BNP Paribas SA | | | 06/25/18 | | | | 34,739 | |
| USD | | | 493,399 | | | TRY | | | 1,962,372 | | | Citibank NA | | | 06/25/18 | | | | 1,953 | |
| USD | | | 1,322 | | | TRY | | | 5,000 | | | BNP Paribas SA | | | 08/20/18 | | | | 91 | |
| USD | | | 586,100 | | | TRY | | | 2,362,137 | | | Citibank NA | | | 08/20/18 | | | | 4,640 | |
| | | | | | | | | | | | | | | | | | | | |
| | | | | | | | | | | | | | | | | | | 298,736 | |
| | | | | | | | | | | | | | | | | | | | |
| BRL | | | 363,146 | | | USD | | | 111,600 | | | Bank of America NA | | | 01/04/18 | | | | (2,135 | ) |
| BRL | | | 578,160 | | | USD | | | 175,200 | | | Barclays Bank plc | | | 01/04/18 | | | | (923 | ) |
| BRL | | | 1,905,980 | | | USD | | | 583,000 | | | BNP Paribas SA | | | 01/04/18 | | | | (8,472 | ) |
| BRL | | | 508,872 | | | USD | | | 156,000 | | | Goldman Sachs International | | | 01/04/18 | | | | (2,608 | ) |
| USD | | | 85,140 | | | BRL | | | 284,129 | | | BNP Paribas SA | | | 01/04/18 | | | | (506 | ) |
| MXN | | | 3,352,460 | | | USD | | | 175,000 | | | HSBC Bank plc | | | 01/05/18 | | | | (4,564 | ) |
| USD | | | 15,000 | | | COP | | | 45,277,500 | | | BNP Paribas SA | | | 01/05/18 | | | | (168 | ) |
| USD | | | 160,000 | | | COP | | | 483,616,250 | | | Royal Bank of Scotland | | | 01/05/18 | | | | (2,016 | ) |
| USD | | | 63,500 | | | TRY | | | 244,654 | | | Goldman Sachs International | | | 01/10/18 | | | | (907 | ) |
| USD | | | 209,141 | | | AUD | | | 273,000 | | | BNP Paribas SA | | | 01/12/18 | | | | (3,867 | ) |
| USD | | | 250,446 | | | EUR | | | 212,000 | | | Royal Bank of Scotland | | | 01/12/18 | | | | (4,060 | ) |
| USD | | | 80,000 | | | RUB | | | 4,734,480 | | | Bank of America NA | | | 01/12/18 | | | | (2,046 | ) |
| USD | | | 872,480 | | | RUB | | | 52,163,427 | | | Credit Suisse International | | | 01/12/18 | | | | (31,482 | ) |
| USD | | | 146,000 | | | ZAR | | | 1,990,580 | | | Goldman Sachs International | | | 01/12/18 | | | | (14,658 | ) |
| MXN | | | 358,930 | | | USD | | | 18,250 | | | BNP Paribas SA | | | 01/17/18 | | | | (46 | ) |
| MXN | | | 1,793,821 | | | USD | | | 91,250 | | | UBS AG | | | 01/17/18 | | | | (273 | ) |
| USD | | | 435,678 | | | ZAR | | | 6,327,740 | | | BNP Paribas SA | | | 01/17/18 | | | | (74,593 | ) |
| MXN | | | 3,810,363 | | | USD | | | 202,767 | | | Citibank NA | | | 01/22/18 | | | | (9,720 | ) |
| USD | | | 180,018 | | | IDR | | | 2,455,619,647 | | | Barclays Bank plc | | | 01/26/18 | | | | (1,264 | ) |
| USD | | | 309,774 | | | IDR | | | 4,227,479,412 | | | Citibank NA | | | 01/26/18 | | | | (2,312 | ) |
| USD | | | 1,161,282 | | | IDR | | | 15,857,545,421 | | | Deutsche Bank AG | | | 01/26/18 | | | | (9,370 | ) |
| USD | | | 441,351 | | | IDR | | | 6,012,034,309 | | | JP Morgan Chase Bank NA | | | 01/26/18 | | | | (2,475 | ) |
| USD | | | 146,000 | | | MXN | | | 2,894,935 | | | Bank of America NA | | | 01/26/18 | | | | (546 | ) |
| USD | | | 154,000 | | | INR | | | 10,098,242 | | | JP Morgan Chase Bank NA | | | 01/29/18 | | | | (3,889 | ) |
| BRL | | | 2,365,928 | | | USD | | | 715,560 | | | BNP Paribas SA | | | 02/02/18 | | | | (4,943 | ) |
| USD | | | 368,152 | | | EUR | | | 315,681 | | | Bank of America NA | | | 02/02/18 | | | | (11,335 | ) |
| USD | | | 168,113 | | | IDR | | | 2,294,240,023 | | | Deutsche Bank AG | | | 02/08/18 | | | | (1,112 | ) |
| USD | | | 93,681 | | | EUR | | | 79,445 | | | Barclays Bank plc | | | 02/09/18 | | | | (1,858 | ) |
| USD | | | 63,512 | | | EUR | | | 53,551 | | | Citibank NA | | | 02/21/18 | | | | (929 | ) |
| USD | | | 87,500 | | | CAD | | | 112,303 | | | Bank of America NA | | | 02/22/18 | | | | (1,904 | ) |
| GBP | | | 80,000 | | | SEK | | | 898,932 | | | JP Morgan Chase Bank NA | | | 03/21/18 | | | | (1,813 | ) |
| MXN | | | 1,070,410 | | | USD | | | 55,000 | | | Deutsche Bank AG | | | 03/21/18 | | | | (1,311 | ) |
| MXN | | | 5,585,472 | | | USD | | | 288,000 | | | JP Morgan Chase Bank NA | | | 03/21/18 | | | | (7,849 | ) |
| NOK | | | 790,000 | | | SEK | | | 790,706 | | | Deutsche Bank AG | | | 03/21/18 | | | | (422 | ) |
| USD | | | 50,000 | | | CAD | | | 63,554 | | | Citibank NA | | | 03/21/18 | | | | (611 | ) |
| USD | | | 50,000 | | | CHF | | | 48,705 | | | Deutsche Bank AG | | | 03/21/18 | | | | (262 | ) |
| USD | | | 95,215 | | | EUR | | | 80,000 | | | Deutsche Bank AG | | | 03/21/18 | | | | (1,221 | ) |
| USD | | | 55,505 | | | NZD | | | 80,000 | | | Citibank NA | | | 03/21/18 | | | | (1,136 | ) |
| JPY | | | 6,579,349 | | | SEK | | | 480,000 | | | Deutsche Bank AG | | | 03/22/18 | | | | (168 | ) |
| TRY | | | 6,834,000 | | | USD | | | 1,767,725 | | | BNP Paribas SA | | | 06/25/18 | | | | (56,255 | ) |
| TRY | | | 4,091,000 | | | USD | | | 1,052,307 | | | BNP Paribas SA | | | 08/20/18 | | | | (45,271 | ) |
| USD | | | 424,335 | | | TRY | | | 1,723,863 | | | BNP Paribas SA | | | 08/20/18 | | | | (8 | ) |
| | | | | | | | | | | | | | | | | | | | |
| | | | | | | | | | | | | | | | | | | (321,308 | ) |
| | | | | | | | | | | | | | | | | | | | |
| | | Net Unrealized Depreciation | | | $ | (22,572 | ) |
| | | | | | | | | | | | | | | | | | | | |
| | |
| 26 | | 2017 BLACKROCK ANNUAL REPORTTO SHAREHOLDERS |
| | |
Schedule of Investments (continued) December 31, 2017 | | BlackRock Total Return V.I. Fund |
Exchange-Traded Options Purchased
| | | | | | | | | | | | | | | | | | | | | | | | | | |
| Description | | Number of
Contracts | | | Expiration
Date | | Exercise
Price | | | Notional
Amount (000) | | | Value | |
Call | | | | | | | | | | | | | | | | | | | | | | | | | | |
90-day Eurodollar Jun 19 Futures | | | 1,787 | | | 06/15/18 | | | USD | | | | 98.13 | | | | USD | | | | 438,373 | | | $ | 134,025 | |
Put | | | | | | | | | | | | | | | | | | | | | | | | | | |
U.S. Treasury 10 Year Note Mar 18 Futures | | | 240 | | | 01/26/18 | | | USD | | | | 123.00 | | | | USD | | | | 29,520 | | | | 30,000 | |
| | | | | | | | | | | | | | | | | | | | | | | | | | |
| | | | | | | | | | | | | | | | | | | | | | | | $ | 164,025 | |
| | | | | | | | | | | | | | | | | | | | | | | | | | |
OTC Barrier Options Purchased
| | | | | | | | | | | | | | | | | | | | | | | | | | | | | | | | | | | | |
| Description | | Type of Option | | Counterparty | | Expiration
Date | | | Exercise
Price | | | Barrier
Price/Range | | | Notional
Amount (000) | | | Value | |
Put | | | | | | | | | | | | | | | | | | | | | | | | | | | | | | | | | | | | |
EUR Currency | | One-Touch | | Morgan Stanley & Co. International plc | | | 06/07/18 | | | | EUR | | | | 4.35 | | | | EUR | | | | 4.35 | | | | EUR | | | | 13 | | | $ | 1,527 | |
| | | | | | | | | | | | | | | | | | | | | | | | | | | | | | | | | | | | |
OTC Options Purchased
| | | | | | | | | | | | | | | | | | | | | | | | | | |
| Description | | Counterparty | | Expiration
Date | | | Exercise
Price | | | Notional
Amount (000) | | | Value | |
Call: | | | | | | | | | | | | | | | | | | | | | | | | | | |
USD Currency | | Morgan Stanley & Co. International plc | | | 01/11/18 | | | | CLP | | | | 660.00 | | | | USD | | | | 146 | | | $ | — | |
USD Currency | | Morgan Stanley & Co. International plc | | | 01/25/18 | | | | ZAR | | | | 14.00 | | | | USD | | | | 110 | | | | 15 | |
USD Currency | | Goldman Sachs International | | | 02/16/18 | | | | TRY | | | | 4.20 | | | | USD | | | | 146 | | | | 248 | |
USD Currency | | Royal Bank of Scotland | | | 02/16/18 | | | | JPY | | | | 114.00 | | | | USD | | | | 175 | | | | 752 | |
USD Currency | | Goldman Sachs International | | | 03/05/18 | | | | KRW | | | | 1,303.00 | | | | USD | | | | 8,177 | | | | 17 | |
USD Currency | | Goldman Sachs International | | | 03/05/18 | | | | KRW | | | | 1,156.00 | | | | USD | | | | 8,177 | | | | 11,186 | |
USD Currency | | HSBC Bank plc | | | 03/05/18 | | | | KRW | | | | 1,190.00 | | | | USD | | | | 8,177 | | | | 3,721 | |
USD Currency | | Deutsche Bank AG | | | 05/16/18 | | | | MXN | | | | 20.00 | | | | USD | | | | 146 | | | | 5,255 | |
USD Currency | | Bank of America NA | | | 06/13/18 | | | | CHF | | | | 1.00 | | | | USD | | | | 275 | | | | 1,774 | |
USD Currency | | BNP Paribas SA | | | 06/13/18 | | | | CAD | | | | 1.29 | | | | USD | | | | 515 | | | | 4,566 | |
USD Currency | | Citibank NA | | | 06/13/18 | | | | SEK | | | | 8.53 | | | | USD | | | | 255 | | | | 1,922 | |
USD Currency | | Deutsche Bank AG | | | 06/13/18 | | | | JPY | | | | 113.40 | | | | USD | | | | 770 | | | | 10,723 | |
USD Currency | | JP Morgan Chase Bank NA | | | 07/19/18 | | | | MXN | | | | 20.00 | | | | USD | | | | 146 | | | | 7,375 | |
| | | | | | | | | | | | | | | | | | | | | | | | | | |
| | | | | | | | | | | | | | | | | | | | | | | | | 47,554 | |
| | | | | | | | | | | | | | | | | | | | | | | | | | |
Put: | | | | | | | | | | | | | | | | | | | | | | | | | | |
USD Currency | | JP Morgan Chase Bank NA | | | 01/12/18 | | | | ZAR | | | | 13.50 | | | | USD | | | | 146 | | | | 12,712 | |
USD Currency | | Deutsche Bank AG | | | 01/31/18 | | | | RUB | | | | 59.00 | | | | USD | | | | 127 | | | | 3,249 | |
USD Currency | | Morgan Stanley & Co. International plc | | | 02/08/18 | | | | BRL | | | | 3.30 | | | | USD | | | | 183 | | | | 2,181 | |
EUR Currency | | Deutsche Bank AG | | | 02/15/18 | | | | TRY | | | | 4.32 | | | | EUR | | | | 181 | | | | 149 | |
USD Currency | | Goldman Sachs International | | | 02/16/18 | | | | TRY | | | | 3.86 | | | | USD | | | | 146 | | | | 2,930 | |
AUD Currency | | Citibank NA | | | 02/19/18 | | | | USD | | | | 0.76 | | | | AUD | | | | 146 | | | | 191 | |
AUD Currency | | HSBC Bank plc | | | 06/13/18 | | | | USD | | | | 0.76 | | | | AUD | | | | 850 | | | | 7,370 | |
EUR Currency | | HSBC Bank plc | | | 06/13/18 | | | | USD | | | | 1.17 | | | | EUR | | | | 3,245 | | | | 25,113 | |
| | | | | | | | | | | | | | | | | | | | | | | | | | |
| | | | | | | | | | | | | | | | | | | | | | | | | 53,895 | |
| | | | | | | | | | | | | | | | | | | | | | | | | | |
| | | | | | | | | | | | | | | | | | | | | | | | $ | 101,449 | |
| | | | | | | | | | | | | | | | | | | | | | | | | | |
| | | | |
| SCHEDULE OF INVESTMENTS | | | 27 | |
| | |
Schedule of Investments (continued) December 31, 2017 | | BlackRock Total Return V.I. Fund |
Exchange-Traded Options Written
| | | | | | | | | | | | | | | | | | | | | | | | | | |
| Description | | Number of
Contracts | | | Expiration
Date | | Exercise
Price | | | Notional
Amount (000) | | | Value | |
Call | | | | | | | | | | | | | | | | | | | | | | | | | | |
90-day Eurodollar Jun 21 Futures | | | 1,192 | | | 06/15/18 | | | USD | | | | 97.88 | | | | USD | | | | 291,668 | | | | $(216,050) | |
| | | | | | | | | | | | | | | | | | | | | | | | | | |
OTC Options Written
| | | | | | | | | | | | | | | | | | | | | | | | | | |
| Description | | Counterparty | | Expiration
Date | | | Exercise Price | | | Notional
Amount (000) | | | Value | |
Call | | | | | | | | | | | | | | | | | | | | | | | | | | |
USD Currency | | Morgan Stanley & Co. International plc | | | 01/11/18 | | | | CLP | | | | 675.00 | | | | USD | | | | 146 | | | $ | — | |
CAD Currency | | JP Morgan Chase Bank NA | | | 01/18/18 | | | | MXN | | | | 15.00 | | | | CAD | | | | 73 | | | | (2,694 | ) |
USD Currency | | Bank of America NA | | | 01/25/18 | | | | ZAR | | | | 14.12 | | | | USD | | | | 146 | | | | (13 | ) |
USD Currency | | Deutsche Bank AG | | | 01/31/18 | | | | RUB | | | | 61.00 | | | | USD | | | | 127 | | | | (144 | ) |
USD Currency | | Morgan Stanley & Co. International plc | | | 02/08/18 | | | | BRL | | | | 3.45 | | | | USD | | | | 90 | | | | (495 | ) |
EUR Currency | | Deutsche Bank AG | | | 02/15/18 | | | | TRY | | | | 4.50 | | | | EUR | | | | 127 | | | | (5,133 | ) |
USD Currency | | Goldman Sachs International | | | 02/16/18 | | | | TRY | | | | 4.04 | | | | USD | | | | 146 | | | | (723 | ) |
AUD Currency | | Citibank NA | | | 02/19/18 | | | | USD | | | | 0.79 | | | | AUD | | | | 146 | | | | (897 | ) |
USD Currency | | Goldman Sachs International | | | 03/05/18 | | | | KRW | | | | 1,190.00 | | | | USD | | | | 8,177 | | | | (3,734 | ) |
USD Currency | | Goldman Sachs International | | | 03/05/18 | | | | KRW | | | | 1,212.00 | | | | USD | | | | 8,177 | | | | (1,580 | ) |
USD Currency | | HSBC Bank plc | | | 03/05/18 | | | | KRW | | | | 1,303.00 | | | | USD | | | | 8,177 | | | | (17 | ) |
USD Currency | | Bank of America NA | | | 06/13/18 | | | | CHF | | | | 1.05 | | | | USD | | | | 275 | | | | (331 | ) |
USD Currency | | BNP Paribas SA | | | 06/13/18 | | | | CAD | | | | 1.36 | | | | USD | | | | 515 | | | | (1,191 | ) |
USD Currency | | Citibank NA | | | 06/13/18 | | | | SEK | | | | 8.95 | | | | USD | | | | 255 | | | | (565 | ) |
USD Currency | | Deutsche Bank AG | | | 06/13/18 | | | | JPY | | | | 119.00 | | | | USD | | | | 770 | | | | (2,229 | ) |
USD Currency | | JP Morgan Chase Bank NA | | | 07/19/18 | | | | MXN | | | | 22.50 | | | | USD | | | | 146 | | | | (2,396 | ) |
| | | | | | | | | | | | | | | | | | | | | | | | | | |
| | | | | | | | | | | | | | | | | | | | | | | | | (22,142 | ) |
| | | | | | | | | | | | | | | | | | | | | | | | | | |
Put | | | | | | | | | | | | | | | | | | | | | | | | | | |
USD Currency | | JP Morgan Chase Bank NA | | | 01/12/18 | | | | ZAR | | | | 13.00 | | | | USD | | | | 146 | | | | (6,801 | ) |
CAD Currency | | JP Morgan Chase Bank NA | | | 01/18/18 | | | | MXN | | | | 15.00 | | | | CAD | | | | 73 | | | | (40 | ) |
USD Currency | | Credit Suisse International | | | 01/26/18 | | | | RUB | | | | 58.50 | | | | USD | | | | 127 | | | | (2,302 | ) |
EUR Currency | | Deutsche Bank AG | | | 02/15/18 | | | | TRY | | | | 4.10 | | | | EUR | | | | 127 | | | | (3 | ) |
AUD Currency | | HSBC Bank plc | | | 06/13/18 | | | | USD | | | | 0.72 | | | | AUD | | | | 850 | | | | (2,026 | ) |
EUR Currency | | HSBC Bank plc | | | 06/13/18 | | | | USD | | | | 1.11 | | | | EUR | | | | 3,245 | | | | (4,804 | ) |
| | | | | | | | | | | | | | | | | | | | | | | | | | |
| | | | | | | | | | | | | | | | | | | | | | | | | (15,976 | ) |
| | | | | | | | | | | | | | | | | | | | | | | | | | |
| | | | | | | | | | | | | | | | | | | | | | | | $ | (38,118 | ) |
| | | | | | | | | | | | | | | | | | | | | | | | | | |
Centrally Cleared Credit Default Swaps — Sell Protection
| | | | | | | | | | | | | | | | | | | | | | | | | | | | | | | | | | | | |
| Reference Obligation/Index | | Financing
Rate Received
by the Fund | | | Payment
Frequency | | | Termination
Date | | | Credit
Rating (a) | | | Notional
Amount (000) (b) | | | Value | | | Upfront
Premium
Paid
(Received) | | | Unrealized
Appreciation
(Depreciation) | |
CDX.NA.IG.29.V1 | | | 1.00 | % | | | Quarterly | | | | 12/20/22 | | | | A | | | | USD | | | | 1,842 | | | $ | 44,420 | | | $ | 42,449 | | | $ | 1,971 | |
| | | | | | | | | | | | | | | | | | | | | | | | | | | | | | | | | | | | |
| | (a) | Using S&P’s rating of the issuer or the underlying securities of the index, as applicable. | |
| | (b) | The maximum potential amount the Fund may pay should a negative credit event take place as defined under the terms of the agreement. | |
Centrally Cleared Interest Rate Swaps
| | | | | | | | | | | | | | | | | | | | | | | | | | | | | | | | |
| Paid by the Fund | | Received by the Fund | | Effective
Date | | | Termination
Date | | | Notional
Amount (000) | | | Value | | | Upfront
Premium
Paid
(Received) | | | Unrealized
Appreciation
(Depreciation) | |
| Rate | | Frequency | | Rate | | Frequency | | | | | | |
| 28 day MXIBTIIE | | Monthly | | 7.81% | | Monthly | | | N/A | | | | 06/07/18 | | | MXN | | | 21,900 | | | $ | (71 | ) | | $ | — | | | $ | (71 | ) |
| 28 day MXIBTIIE | | Monthly | | 7.85% | | Monthly | | | N/A | | | | 06/12/18 | | | MXN | | | 21,900 | | | | (5 | ) | | | — | | | | (5 | ) |
| 7.36% | | Monthly | | 28 day MXIBTIIE | | Monthly | | | N/A | | | | 01/28/19 | | | MXN | | | 25,421 | | | | 9,575 | | | | — | | | | 9,575 | |
| 3 month LIBOR | | Quarterly | | 2.05% | | Semi-Annual | | | 11/19/18 | (a) | | | 11/19/19 | | | USD | | | 103,670 | | | | (179,919 | ) | | | — | | | | (179,919 | ) |
| 3 month LIBOR | | Quarterly | | 2.05% | | Semi-Annual | | | 11/19/18 | (a) | | | 11/19/19 | | | USD | | | 53,830 | | | | (96,035 | ) | | | — | | | | (96,035 | ) |
| 3 month LIBOR | | Quarterly | | 2.16% | | Semi-Annual | | | 12/06/18 | (a) | | | 12/06/19 | | | USD | | | 53,490 | | | | (40,271 | ) | | | — | | | | (40,271 | ) |
| 28 day MXIBTIIE | | Monthly | | 7.32% | | Monthly | | | N/A | | | | 02/20/20 | | | MXN | | | 24,364 | | | | (16,750 | ) | | | — | | | | (16,750 | ) |
| | |
| 28 | | 2017 BLACKROCK ANNUAL REPORTTO SHAREHOLDERS |
| | |
Schedule of Investments (continued) December 31, 2017 | | BlackRock Total Return V.I. Fund |
| | | | | | | | | | | | | | | | | | | | | | | | | | | | | | | | |
| Paid by the Fund | | Received by the Fund | | Effective
Date | | | Termination
Date | | | Notional
Amount (000) | | | Value | | | Upfront
Premium
Paid
(Received) | | | Unrealized
Appreciation
(Depreciation) | |
| Rate | | Frequency | | Rate | | Frequency | | | | | | |
| 28 day MXIBTIIE | | Monthly | | 7.16% | | Monthly | | | N/A | | | | 04/29/20 | | | MXN | | | 24,200 | | | $ | (21,550 | ) | | $ | — | | | $ | (21,550 | ) |
| 3 month LIBOR | | Quarterly | | 2.24% | | Semi-Annual | | | 11/01/19 | (a) | | | 11/01/21 | | | USD | | | 10,860 | | | | (20,762 | ) | | | — | | | | (20,762 | ) |
| 2.27% | | Semi-Annual | | 3 month LIBOR | | Quarterly | | | 11/19/20 | (a) | | | 11/19/21 | | | USD | | | 108,170 | | | | 87,325 | | | | — | | | | 87,325 | |
| 2.28% | | Semi-Annual | | 3 month LIBOR | | Quarterly | | | 11/19/20 | (a) | | | 11/19/21 | | | USD | | | 56,000 | | | | 40,642 | | | | — | | | | 40,642 | |
| 2.34% | | Semi-Annual | | 3 month LIBOR | | Quarterly | | | 12/07/20 | (a) | | | 12/07/21 | | | USD | | | 55,990 | | | | 12,517 | | | | — | | | | 12,517 | |
| 3 month LIBOR | | Quarterly | | 2.31% | | Semi-Annual | | | 12/09/19 | (a) | | | 12/08/21 | | | USD | | | 22,150 | | | | (15,808 | ) | | | — | | | | (15,808 | ) |
| 3 month LIBOR | | Quarterly | | 2.39% | | Semi-Annual | | | 12/19/19 | (a) | | | 12/19/21 | | | USD | | | 11,070 | | | | 7,829 | | | | — | | | | 7,829 | |
| 28 day MXIBTIIE | | Monthly | | 7.47% | | Monthly | | | N/A | | | | 03/07/22 | | | MXN | | | 4,159 | | | | (2,997 | ) | | | — | | | | (2,997 | ) |
| 28 day MXIBTIIE | | Monthly | | 7.45% | | Monthly | | | N/A | | | | 03/07/22 | | | MXN | | | 8,319 | | | | (6,378 | ) | | | — | | | | (6,378 | ) |
| 28 day MXIBTIIE | | Monthly | | 7.48% | | Monthly | | | N/A | | | | 03/07/22 | | | MXN | | | 4,159 | | | | (2,920 | ) | | | — | | | | (2,920 | ) |
| 7.13% | | Monthly | | 28 day MXIBTIIE | | Monthly | | | N/A | | | | 10/07/22 | | | MXN | | | 3,789 | | | | 5,559 | | | | — | | | | 5,559 | |
| 7.14% | | Monthly | | 28 day MXIBTIIE | | Monthly | | | N/A | | | | 10/10/22 | | | MXN | | | 1,532 | | | | 2,216 | | | | — | | | | 2,216 | |
| 7.11% | | Monthly | | 28 day MXIBTIIE | | Monthly | | | N/A | | | | 10/14/22 | | | MXN | | | 5,081 | | | | 7,727 | | | | — | | | | 7,727 | |
| 7.11% | | Monthly | | 28 day MXIBTIIE | | Monthly | | | N/A | | | | 10/14/22 | | | MXN | | | 3,855 | | | | 5,822 | | | | — | | | | 5,822 | |
| 28 day MXIBTIIE | | Monthly | | 6.32% | | Monthly | | | N/A | | | | 07/17/25 | | | MXN | | | 1,733 | | | | (8,140 | ) | | | — | | | | (8,140 | ) |
| 3 month LIBOR | | Quarterly | | 2.13% | | Semi-Annual | | | N/A | | | | 08/25/25 | | | USD | | | 60 | | | | (458 | ) | | | — | | | | (458 | ) |
| 2.27% | | Semi-Annual | | 3 month LIBOR | | Quarterly | | | N/A | | | | 09/11/25 | | | USD | | | 91 | | | | (194 | ) | | | — | | | | (194 | ) |
| | | | | | | | | | | | | | | | | | | | | | | | | | | | | | | | |
| | | | | | | | | | | | | | | | | | | | | | $ | (233,046 | ) | | $ | — | | | $ | (233,046 | ) |
| | | | | | | | | | | | | | | | | | | | | | | | | | | | | | | | |
Centrally Cleared Inflation Swaps
| | | | | | | | | | | | | | | | | | | | | | | | | | | | |
Paid by the Fund | | Received by the Fund | | Termination
Date | | | Notional
Amount (000) | | Value | | | Upfront
Premium
Paid
(Received) | | | Unrealized
Appreciation
(Depreciation) | |
| Reference | | Frequency | | Rate | | Frequency | | | | | |
| UK Retail Price Index All Items Monthly | | At Termination | | 3.46% | | At Termination | | | 10/15/26 | | | | GBP | | | 742 | | $ | 8,903 | | | $ | — | | | $ | 8,903 | |
| | | | | | | | | | | | | | | | | | | | | | | | | | | | |
OTC Credit Default Swaps — Buy Protection
| | | | | | | | | | | | | | | | | | | | | | | | | | | | | | | | | | |
| Reference Obligation/Index | | Financing
Rate Paid
by the Fund | | | Payment
Frequency | | | Counterparty | | Termination
Date | | | Notional
Amount
(000) | | | Value | | | Upfront
Premium
Paid
(Received) | | | Unrealized
Appreciation
(Depreciation) | |
United Mexican States | | | 1.00 | % | | | Quarterly | | | JP Morgan Chase Bank NA | | | 06/20/20 | | | | USD | | | | 135 | | | $ | (1,477 | ) | | $ | 604 | | | $ | (2,081 | ) |
United Mexican States | | | 1.00 | % | | | Quarterly | | | Bank of America NA | | | 09/20/20 | | | | USD | | | | 135 | | | | (1,509 | ) | | | 942 | | | | (2,451 | ) |
Argentine Republic | | | 5.00 | % | | | Quarterly | | | Goldman Sachs International | | | 12/20/22 | | | | USD | | | | 195 | | | | (23,375 | ) | | | (16,509 | ) | | | (6,866 | ) |
Argentine Republic | | | 5.00 | % | | | Quarterly | | | Goldman Sachs International | | | 12/20/22 | | | | USD | | | | 350 | | | | (41,988 | ) | | | (29,170 | ) | | | (12,818 | ) |
Federative Republic of Brazil | | | 1.00 | % | | | Quarterly | | | Barclays Bank plc | | | 12/20/22 | | | | USD | | | | 165 | | | | 4,613 | | | | 5,963 | | | | (1,350 | ) |
Loews Corp. | | | 1.00 | % | | | Quarterly | | | Barclays Bank plc | | | 12/20/22 | | | | USD | | | | 120 | | | | (4,946 | ) | | | (3,903 | ) | | | (1,043 | ) |
Republic of South Africa | | | 1.00 | % | | | Quarterly | | | Bank of America NA | | | 12/20/22 | | | | USD | | | | 76 | | | | 1,989 | | | | 2,977 | | | | (988 | ) |
Republic of South Africa | | | 1.00 | % | | | Quarterly | | | Morgan Stanley & Co. International plc | | | 12/20/22 | | | | USD | | | | 132 | | | | 3,451 | | | | 5,165 | | | | (1,714 | ) |
Republic of the Philippines | | | 1.00 | % | | | Quarterly | | | JP Morgan Chase Bank NA | | | 12/20/22 | | | | USD | | | | 670 | | | | (12,918 | ) | | | (10,187 | ) | | | (2,731 | ) |
United Mexican States | | | 1.00 | % | | | Quarterly | | | Barclays Bank plc | | | 12/20/22 | | | | USD | | | | 154 | | | | 413 | | | | 675 | | | | (262 | ) |
United Mexican States | | | 1.00 | % | | | Quarterly | | | Morgan Stanley & Co. International plc | | | 12/20/22 | | | | USD | | | | 88 | | | | 236 | | | | 365 | | | | (129 | ) |
United Mexican States | | | 1.00 | % | | | Quarterly | | | Morgan Stanley & Co. International plc | | | 12/20/22 | | | | USD | | | | 88 | | | | 236 | �� | | | 386 | | | | (150 | ) |
CMBX.NA.9.AAA | | | 0.50 | % | | | Monthly | | | Credit Suisse International | | | 09/17/58 | | | | USD | | | | 150 | | | | (281 | ) | | | 1,818 | | | | (2,099 | ) |
CMBX.NA.9.AAA | | | 0.50 | % | | | Monthly | | | Deutsche Bank AG | | | 09/17/58 | | | | USD | | | | 120 | | | | (226 | ) | | | 1,474 | | | | (1,700 | ) |
CMBX.NA.9.AAA | | | 0.50 | % | | | Monthly | | | Morgan Stanley & Co. International plc | | | 09/17/58 | | | | USD | | | | 100 | | | | (187 | ) | | | 1,212 | | | | (1,399 | ) |
CMBX.NA.9.AAA | | | 0.50 | % | | | Monthly | | | Morgan Stanley & Co. International plc | | | 09/17/58 | | | | USD | | | | 90 | | | | (169 | ) | | | 1,091 | | | | (1,260 | ) |
CMBX.NA.9.AAA | | | 0.50 | % | | | Monthly | | | Morgan Stanley & Co. International plc | | | 09/17/58 | | | | USD | | | | 230 | | | | (432 | ) | | | 3,006 | | | | (3,438 | ) |
CMBX.NA.6.AAA | | | 0.50 | % | | | Monthly | | | Deutsche Bank AG | | | 05/11/63 | | | | USD | | | | 230 | | | | (1,485 | ) | | | — | | | | (1,485 | ) |
CMBX.NA.6.AAA | | | 0.50 | % | | | Monthly | | | Deutsche Bank AG | | | 05/11/63 | | | | USD | | | | 140 | | | | (904 | ) | | | (20 | ) | | | (884 | ) |
CMBX.NA.6.AAA | | | 0.50 | % | | | Monthly | | | Deutsche Bank AG | | | 05/11/63 | | | | USD | | | | 200 | | | | (1,292 | ) | | | (149 | ) | | | (1,143 | ) |
CMBX.NA.6.BBB- | | | 3.00 | % | | | Monthly | | | JPMorgan Securities LLC | | | 05/11/63 | | | | USD | | | | 30 | | | | 4,380 | | | | 2,911 | | | | 1,469 | |
| | | | | | | | | | | | | | | | | | | | | | | | | | | | | | | | | | |
| | | | | | | | | | | | | | | | | | | | | | | | $ | (75,871 | ) | | $ | (31,349 | ) | | $ | (44,522 | ) |
| | | | | | | | | | | | | | | | | | | | | | | | | | | | | | | | | | |
| | | | |
| SCHEDULE OF INVESTMENTS | | | 29 | |
| | |
Schedule of Investments (continued) December 31, 2017 | | BlackRock Total Return V.I. Fund |
OTC Credit Default Swaps — Sell Protection
| | | | | | | | | | | | | | | | | | | | | | | | | | | | | | | | | | | | | | |
| Reference Obligation/Index | | Financing
Rate Received
by the Fund | | | Payment
Frequency | | | Counterparty | | Termination
Date | | | Credit
Rating (a) | | | Notional
Amount (000) (b) | | | Value | | | Upfront
Premium
Paid
(Received) | | | Unrealized
Appreciation
(Depreciation) | |
Transocean, Inc. | | | 1.00 | % | | | Quarterly | | | Goldman Sachs International | | | 06/20/19 | | | | B | | | | USD | | | | 15 | | | $ | (50 | ) | | $ | (135 | ) | | $ | 85 | |
Transocean, Inc. | | | 1.00 | % | | | Quarterly | | | Goldman Sachs International | | | 06/20/19 | | | | B | | | | USD | | | | 95 | | | | (313 | ) | | | (855 | ) | | | 542 | |
United Mexican States | | | 1.00 | % | | | Quarterly | | | Bank of America NA | | | 06/20/20 | | | | BBB+ | | | | USD | | | | 135 | | | | 1,478 | | | | (697 | ) | | | 2,175 | |
United Mexican States | | | 1.00 | % | | | Quarterly | | | JP Morgan Chase Bank NA | | | 09/20/20 | | | | BBB+ | | | | USD | | | | 135 | | | | 1,510 | | | | (823 | ) | | | 2,333 | |
CMBX.NA.3.AM | | | 0.50 | % | | | Monthly | | | Credit Suisse International | | | 12/13/49 | | | | NR | | | | USD | | | | 390 | | | | (152 | ) | | | (3,256 | ) | | | 3,104 | |
CMBX.NA.4.AM | | | 0.50 | % | | | Monthly | | | Deutsche Bank AG | | | 02/17/51 | | | | NR | | | | USD | | | | 95 | | | | (58 | ) | | | (1,557 | ) | | | 1,499 | |
CMBX.NA.8.A | | | 2.00 | % | | | Monthly | | | Goldman Sachs International | | | 10/17/57 | | | | NR | | | | USD | | | | 60 | | | | (2,577 | ) | | | (3,325 | ) | | | 748 | |
CMBX.NA.8.A | | | 2.00 | % | | | Monthly | | | Goldman Sachs International | | | 10/17/57 | | | | NR | | | | USD | | | | 60 | | | | (2,577 | ) | | | (6,020 | ) | | | 3,443 | |
CMBX.NA.9.A | | | 2.00 | % | | | Monthly | | | Credit Suisse International | | | 09/17/58 | | | | NR | | | | USD | | | | 60 | | | | (2,145 | ) | | | (1,862 | ) | | | (283 | ) |
CMBX.NA.9.A | | | 2.00 | % | | | Monthly | | | Credit Suisse International | | | 09/17/58 | | | | NR | | | | USD | | | | 20 | | | | (715 | ) | | | (1,018 | ) | | | 303 | |
CMBX.NA.9.A | | | 2.00 | % | | | Monthly | | | JPMorgan Securities LLC | | | 09/17/58 | | | | NR | | | | USD | | | | 170 | | | | (6,076 | ) | | | (8,717 | ) | | | 2,641 | |
CMBX.NA.9.A | | | 2.00 | % | | | Monthly | | | JPMorgan Securities LLC | | | 09/17/58 | | | | NR | | | | USD | | | | 30 | | | | (1,072 | ) | | | (952 | ) | | | (120 | ) |
CMBX.NA.9.A | | | 2.00 | % | | | Monthly | | | JPMorgan Securities LLC | | | 09/17/58 | | | | NR | | | | USD | | | | 50 | | | | (1,787 | ) | | | (1,329 | ) | | | (458 | ) |
CMBX.NA.9.A | | | 2.00 | % | | | Monthly | | | JPMorgan Securities LLC | | | 09/17/58 | | | | NR | | | | USD | | | | 6 | | | | (209 | ) | | | (704 | ) | | | 495 | |
CMBX.NA.9.A | | | 2.00 | % | | | Monthly | | | Morgan Stanley & Co. International plc | | | 09/17/58 | | | | NR | | | | USD | | | | 30 | | | | (1,072 | ) | | | (1,440 | ) | | | 368 | |
CMBX.NA.9.A | | | 2.00 | % | | | Monthly | | | Morgan Stanley & Co. International plc | | | 09/17/58 | | | | NR | | | | USD | | | | 60 | | | | (2,145 | ) | | | (3,135 | ) | | | 990 | |
CMBX.NA.9.A | | | 2.00 | % | | | Monthly | | | Morgan Stanley & Co. International plc | | | 09/17/58 | | | | NR | | | | USD | | | | 90 | | | | (3,217 | ) | | | (1,936 | ) | | | (1,281 | ) |
CMBX.NA.9.A | | | 2.00 | % | | | Monthly | | | Morgan Stanley & Co. International plc | | | 09/17/58 | | | | NR | | | | USD | | | | 60 | | | | (2,145 | ) | | | (2,970 | ) | | | 825 | |
CMBX.NA.9.BBB- | | | 3.00 | % | | | Monthly | | | Credit Suisse International | | | 09/17/58 | | | | NR | | | | USD | | | | 19 | | | | (2,102 | ) | | | (1,942 | ) | | | (160 | ) |
CMBX.NA.9.BBB- | | | 3.00 | % | | | Monthly | | | Morgan Stanley & Co. International plc | | | 09/17/58 | | | | NR | | | | USD | | | | 45 | | | | (4,977 | ) | | | (4,701 | ) | | | (276 | ) |
CMBX.NA.9.BBB- | | | 3.00 | % | | | Monthly | | | Morgan Stanley & Co. International plc | | | 09/17/58 | | | | NR | | | | USD | | | | 100 | | | | (11,061 | ) | | | (9,924 | ) | | | (1,137 | ) |
CMBX.NA.9.BBB- | | | 3.00 | % | | | Monthly | | | Morgan Stanley & Co. International plc | | | 09/17/58 | | | | NR | | | | USD | | | | 2 | | | | (221 | ) | | | (241 | ) | | | 20 | |
CMBX.NA.10.A | | | 2.00 | % | | | Monthly | | | Deutsche Bank AG | | | 11/17/59 | | | | A- | | | | USD | | | | 60 | | | | (1,837 | ) | | | (2,677 | ) | | | 840 | |
CMBX.NA.10.A | | | 2.00 | % | | | Monthly | | | Deutsche Bank AG | | | 11/17/59 | | | | A- | | | | USD | | | | 120 | | | | (3,673 | ) | | | (5,262 | ) | | | 1,589 | |
CMBX.NA.10.BBB- | | | 3.00 | % | | | Monthly | | | JPMorgan Securities LLC | | | 11/17/59 | | | | NR | | | | USD | | | | 10 | | | | (1,006 | ) | | | (873 | ) | | | (133 | ) |
CMBX.NA.6.BBB- | | | 3.00 | % | | | Monthly | | | Credit Suisse International | | | 05/11/63 | | | | NR | | | | USD | | | | 30 | | | | (4,380 | ) | | | (2,408 | ) | | | (1,972 | ) |
| | | | | | | | | | | | | | | | | | | | | | | | | | | | | | | | | | | | | | |
| | | | | | | | | | | | | | | | | | | | | | | | | | | | $ | (52,579 | ) | | $ | (68,759 | ) | | $ | 16,180 | |
| | | | | | | | | | | | | | | | | | | | | | | | | | | | | | | | | | | | | | |
| | (a) | Using S&P’s rating of the issuer or the underlying securities of the index, as applicable. | |
| | (b) | The maximum potential amount the Fund may pay should a negative credit event take place as defined under the terms of the agreement. | |
OTC Interest Rate Swaps
| | | | | | | | | | | | | | | | | | | | | | | | | | | | | | | | | | |
| Paid by the Fund | | Received by the Fund | | Counterparty | | Termination
Date | | | Notional
Amount (000) | | | Value | | | Upfront
Premium
Paid
(Received) | | | Unrealized
Appreciation
(Depreciation) | |
| Rate | | Frequency | | Rate | | | Frequency | | | | | | |
| 8.98% | | At Termination | | | 1 day BZDIOVER | | | At Termination | | Citibank NA | | | 01/02/18 | | | | BRL | | | | 1,077 | | | $ | (388 | ) | | $ | — | | | $ | (388 | ) |
| 9.99% | | At Termination | | | 1 day BZDIOVER | | | At Termination | | Citibank NA | | | 01/02/18 | | | | BRL | | | | 3,321 | | | | (7,210 | ) | | | — | | | | (7,210 | ) |
| 9.98% | | At Termination | | | 1 day BZDIOVER | | | At Termination | | JP Morgan Chase Bank NA | | | 01/02/18 | | | | BRL | | | | 3,322 | | | | (5,242 | ) | | | — | | | | (5,242 | ) |
| 4.55% | | Monthly | | | 28 day MXIBTIIE | | | Monthly | | Barclays Bank plc | | | 03/21/18 | | | | MXN | | | | 826 | | | | 305 | | | | — | | | | 305 | |
| 4.85% | | Monthly | | | 28 day MXIBTIIE | | | Monthly | | Bank of America NA | | | 11/01/18 | | | | MXN | | | | 716 | | | | 959 | | | | — | | | | 959 | |
| 28 day MXIBTIIE | | Monthly | | | 7.07% | | | Monthly | | Citibank NA | | | 11/21/18 | | | | MXN | | | | 8,086 | | | | (3,580 | ) | | | — | | | | (3,580 | ) |
| 28 day MXIBTIIE | | Monthly | | | 7.06% | | | Monthly | | JP Morgan Chase Bank NA | | | 11/21/18 | | | | MXN | | | | 9,703 | | | | (4,341 | ) | | | — | | | | (4,341 | ) |
| 28 day MXIBTIIE | | Monthly | | | 6.98% | | | Monthly | | Citibank NA | | | 11/28/18 | | | | MXN | | | | 13,800 | | | | (6,753 | ) | | | — | | | | (6,753 | ) |
| 28 day MXIBTIIE | | Monthly | | | 6.98% | | | Monthly | | JP Morgan Chase Bank NA | | | 11/28/18 | | | | MXN | | | | 7,828 | | | | (3,831 | ) | | | — | | | | (3,831 | ) |
| 7.02% | | At Termination | | | 1 day BZDIOVER | | | At Termination | | Bank of America NA | | | 01/02/19 | | | | BRL | | | | 5,244 | | | | (2,404 | ) | | | — | | | | (2,404 | ) |
| 7.75% | | At Termination | | | 1 day BZDIOVER | | | At Termination | | Bank of America NA | | | 01/02/19 | | | | BRL | | | | 3,153 | | | | (8,124 | ) | | | — | | | | (8,124 | ) |
| 1 day BZDIOVER | | At Termination | | | 9.25% | | | At Termination | | Citibank NA | | | 01/02/19 | | | | BRL | | | | 2,921 | | | | 22,621 | | | | — | | | | 22,621 | |
| 1 day BZDIOVER | | At Termination | | | 9.28% | | | At Termination | | JP Morgan Chase Bank NA | | | 01/02/19 | | | | BRL | | | | 2,773 | | | | 21,766 | | | | — | | | | 21,766 | |
| 1 day BZDIOVER | | At Termination | | | 8.21% | | | At Termination | | Bank of America NA | | | 01/02/20 | | | | BRL | | | | 3,516 | | | | 4,103 | | | | — | | | | 4,103 | |
| 1 day BZDIOVER | | At Termination | | | 9.14% | | | At Termination | | Bank of America NA | | | 01/04/21 | | | | BRL | | | | 1,400 | | | | 3,950 | | | | — | | | | 3,950 | |
| 3.27% | | Semi-Annual | | | 3 month LIBOR | | | Quarterly | | Deutsche Bank AG | | | 05/16/21 | | | | USD | | | | 470 | | | | (17,928 | ) | | | — | | | | (17,928 | ) |
| 1 day BZDIOVER | | At Termination | | | 9.84% | | | At Termination | | Citibank NA | | | 01/02/23 | | | | BRL | | | | 1,378 | | | | 3,884 | | | | — | | | | 3,884 | |
| 5.73% | | Monthly | | | 28 day MXIBTIIE | | | Monthly | | Bank of America NA | | | 01/03/25 | | | | MXN | | | | 672 | | | | 4,078 | | | | — | | | | 4,078 | |
| 28 day MXIBTIIE | | Monthly | | | 6.43% | | | Monthly | | Bank of America NA | | | 06/06/25 | | | | MXN | | | | 541 | | | | (2,336 | ) | | | — | | | | (2,336 | ) |
| 28 day MXIBTIIE | | Monthly | | | 6.33% | | | Monthly | | Citibank NA | | | 06/09/25 | | | | MXN | | | | 271 | | | | (1,253 | ) | | | — | | | | (1,253 | ) |
| 28 day MXIBTIIE | | Monthly | | | 6.33% | | | Monthly | | Citibank NA | | | 07/17/25 | | | | MXN | | | | 864 | | | | (4,044 | ) | | | — | | | | (4,044 | ) |
| 6.31% | | Monthly | | | 28 day MXIBTIIE | | | Monthly | | Deutsche Bank AG | | | 08/11/25 | | | | MXN | | | | 3,395 | | | | 16,207 | | | | — | | | | 16,207 | |
| 28 day MXIBTIIE | | Monthly | | | 6.27% | | | Monthly | | Bank of America NA | | | 12/05/25 | | | | MXN | | | | 122 | | | | (613 | ) | | | — | | | | (613 | ) |
| | | | | | | | | | | | | | | | | | | | | | | | | | | | | | | | | | |
| | | | | | | | | | | | | | | | | | | | | | | | $ | 9,826 | | | $ | — | | | $ | 9,826 | |
| | | | | | | | | | | | | | | | | | | | | | | | | | | | | | | | | | |
| | |
| 30 | | 2017 BLACKROCK ANNUAL REPORTTO SHAREHOLDERS |
| | |
Schedule of Investments (continued) December 31, 2017 | | BlackRock Total Return V.I. Fund |
OTC Total Return Swaps
| | | | | | | | | | | | | | | | | | | | | | | | | | | | | | | | | | |
| Paid by the Fund | | Received by the Fund | | Counterparty | | Termination
Date | | | Notional
Amount (000) | | | Value | | | Upfront
Premium
Paid
(Received) | | | Unrealized
Appreciation
(Depreciation) | |
Rate/
Reference | | Frequency | | Rate /
Reference | | | Frequency | | | | | | |
iBoxx USD Liquid High
Yield Index March 2018 | | At Termination | | | 3 month LIBOR | | | Quarterly | | BNP Paribas SA | | | 03/20/18 | | | | USD | | | | 2,041 | | | $ | 21,014 | | | $ | (2,715 | ) | | $ | 23,729 | |
iBoxx USD Liquid High
Yield Index March 2018 | | At Termination | | | 3 month LIBOR | | | Quarterly | | Goldman Sachs International | | | 03/20/18 | | | | USD | | | | 2,050 | | | | 15,678 | | | | (2,309 | ) | | | 17,987 | |
| | | | | | | | | | | | | | | | | | | | | | | | | | | | | | | | | | |
| | | | | | | | | | | | | | | | | | | | | | | | $ | 36,692 | | | $ | (5,024 | ) | | $ | 41,716 | |
| | | | | | | | | | | | | | | | | | | | | | | | | | | | | | | | | | |
Balances Reported in the Statement of Assets and Liabilities for Centrally Cleared Swaps and OTC Derivatives
| | | | | | | | | | | | | | | | |
| | | Swap Premiums Paid | | | Swap Premiums Received | | | Unrealized Appreciation | | | Unrealized Depreciation | |
Centrally Cleared Swaps(a) | | $ | 42,449 | | | $ | — | | | $ | 190,086 | | | $ | (412,258 | ) |
OTC Derivatives | | | 28,589 | | | | (133,721 | ) | | | 143,058 | | | | (119,858 | ) |
| | (a) | Includes cumulative appreciation (depreciation) on centrally cleared swaps, as reported in the Schedule of Investments. Only current day’s variation margin is reported within the Statement of Assets and Liabilities and is net of any previously paid (received) swap premium amounts. | |
Derivative Financial Instruments Categorized by Risk Exposure
As of period end, the fair values of derivative financial instruments located in the Statement of Assets and Liabilities were as follows:
| | | | | | | | | | | | | | | | | | | | | | | | | | | | | | |
| | | | | Commodity
Contracts | | | Credit
Contracts | | | Equity
Contracts | | | Foreign
Currency
Exchange
Contracts | | | Interest
Rate
Contracts | | | Other
Contracts | | | Total | |
Assets — Derivative Financial Instruments | | | | | | | | | | | | | | | | | | | | | | | | | | | | |
Futures Contracts | | Net unrealized appreciation(a) | | $ | — | | | $ | — | | | $ | — | | | $ | — | | | $ | 142,627 | | | $ | 127 | | | $ | 142,754 | |
Forward foreign currency exchange contracts | | Unrealized appreciation on
forward foreign currency exchange contracts | | | — | | | | — | | | | — | | | | 298,736 | | | | — | | | | — | | | | 298,736 | |
Options purchased | | Investments at value — unaffiliated(b) | | | — | | | | — | | | | — | | | | 102,976 | | | | 164,025 | | | | — | | | | 267,001 | |
Swaps — centrally cleared | | Net unrealized appreciation(a) | | | — | | | | 1,971 | | | | — | | | | — | | | | 179,212 | | | | 8,903 | | | | 190,086 | |
Swaps — OTC | | Unrealized appreciation on OTC swaps;
Swap premiums paid | | | — | | | | 52,058 | | | | 41,716 | | | | — | | | | 77,873 | | | | — | | | | 171,647 | |
| | | | | | | | | | | | | | | | | | | | | | | | | | | | | | |
Total | | | | $ | — | | | $ | 54,029 | | | $ | 41,716 | | | $ | 401,712 | | | $ | 563,737 | | | $ | 9,030 | | | $ | 1,070,224 | |
| | | | | | | | | | | | | | | | | | | | | | | | | | | | | | |
Liabilities — Derivative Financial Instruments | | | | | | | | | | | | | | | | | | | | | | | | | | | | |
Futures Contracts | | Net unrealized depreciation(a) | | $ | — | | | $ | — | | | $ | — | | | $ | — | | | $ | 93,040 | | | $ | — | | | $ | 93,040 | |
Forward foreign currency exchange contracts | | Unrealized depreciation on forward foreign
currency exchange contracts | | | — | | | | — | | | | — | | | | 321,308 | | | | — | | | | — | | | | 321,308 | |
Options written | | Options written, at value | | | — | | | | — | | | | — | | | | 38,118 | | | | 216,050 | | | | — | | | | 254,168 | |
Swaps — centrally cleared | | Net unrealized depreciation(a) | | | — | | | | — | | | | — | | | | — | | | | 412,258 | | | | — | | | | 412,258 | |
Swaps — OTC | | Unrealized depreciation on OTC swaps;
Swap premiums received | | | — | | | | 180,508 | | | | 5,024 | | | | — | | | | 68,047 | | | | — | | | | 253,579 | |
| | | | | | | | | | | | | | | | | | | | | | | | | | | | | | |
| | | | $ | — | | | $ | 180,508 | | | $ | 5,024 | | | $ | 359,426 | | | $ | 789,395 | | | $ | — | | | $ | 1,334,353 | |
| | | | | | | | | | | | | | | | | | | | | | | | | | | | | | |
| | (a) | Includes cumulative appreciation (depreciation) on futures contracts and centrally cleared swaps, if any, as reported in the Schedule of Investments. Only current day’s variation margin is reported within the Statement of Assets and Liabilities. | |
| | (b) | Includes options purchased at value as reported in the Schedule of Investments | |
| | | | |
| SCHEDULE OF INVESTMENTS | | | 31 | |
| | |
Schedule of Investments (continued) December 31, 2017 | | BlackRock Total Return V.I. Fund (Percentages shown are based on Net Assets) |
For the year ended 31 December, 2017, the effect of derivative financial instruments in the Statement of Operations was as follows:
| | | | | | | | | | | | | | | | | | | | | | | | | | | | | | | | |
| | | | | | Commodity
Contracts | | | Credit
Contracts | | | Equity
Contracts | | | Foreign
Currency
Exchange
Contracts | | | Interest
Rate
Contracts | | | Other
Contracts | | | Total | |
Net realized Gain (Loss) from: | | | | | | | | | | | | | | | | | | | | | | | | | | | | | | | | |
Futures Contracts | | | | | | $ | — | | | $ | — | | | $ | — | | | $ | — | | | $ | 1,501,085 | | | $ | — | | | $ | 1,501,085 | |
Forward foreign currency exchange contracts | | | | | | | — | | | | — | | | | — | | | | 48,123 | | | | — | | | | — | | | | 48,123 | |
Options purchased(a) | | | | | | | — | | | | — | | | | — | | | | (323,441 | ) | | | (625,880 | ) | | | — | | | | (949,321 | ) |
Options written | | | | | | | — | | | | — | | | | — | | | | 148,304 | | | | 182,461 | | | | — | | | | 330,765 | |
Swaps | | | | | | | — | | | | 56,136 | | | | — | | | | (53,722 | ) | | | (128,233 | ) | | | — | | | | (125,819 | ) |
| | | | | | | | | | | | | | | | | | | | | | | | | | | | | | | | |
| | | | | | $ | — | | | $ | 56,136 | | | $ | — | | | $ | (180,736 | ) | | $ | 929,433 | | | $ | — | | | $ | 804,833 | |
| | | | | | | | | | | | | | | | | | | | | | | | | | | | | | | | |
Net Change in Unrealized Appreciation (Depreciation) on: | | | | | | | | | | | | | | | | | | | | | | | | | | | | | | | | |
Futures Contracts | | | | | | $ | — | | | $ | — | | | $ | — | | | $ | — | | | $ | 110,071 | | | $ | 127 | | | $ | 110,198 | |
Forward foreign currency exchange contracts | | | | | | | — | | | | — | | | | — | | | | (135,939 | ) | | | — | | | | — | | | | (135,939 | ) |
Options purchased(b) | | | | | | | — | | | | — | | | | — | | | | (275,746 | ) | | | (256,485 | ) | | | — | | | | (532,231 | ) |
Options written | | | | | | | — | | | | — | | | | — | | | | 134,967 | | | | 144,512 | | | | — | | | | 279,479 | |
Swaps | | | | | | | — | | | | (138,521 | ) | | | 41,716 | | | | — | | | | (125,685 | ) | | | 25,974 | | | | (196,516 | ) |
| | | | | | | | | | | | | | | | | | | | | | | | | | | | | | | | |
| | | | | | $ | — | | | $ | (138,521 | ) | | $ | 41,716 | | | $ | (276,718 | ) | | $ | (127,587 | ) | | $ | 26,101 | | | $ | (475,009 | ) |
| | | | | | | | | | | | | | | | | | | | | | | | | | | | | | | | |
| | (a) | Options purchased are included in net realized gain (loss) from investments — unaffiliated. | |
| | (b) | Options purchased are included in net change in unrealized appreciation (depreciation) on investments — unaffiliated. | |
Average Quarterly Balances of Outstanding Derivative Financial Instruments
| | | | |
Futures contracts: | | | | |
Average notional value of contracts — long | | $ | 48,639,197 | |
Average notional value of contracts — short | | $ | 57,758,045 | |
Forward foreign currency exchange contracts: | | | | |
Average amounts purchased — in USD | | $ | 17,366,163 | |
Average amounts sold — in USD | | $ | 13,832,715 | |
Options: | | | | |
Average value of option contracts purchased | | $ | 238,254 | |
Average value of option contracts written | | $ | 100,537 | |
Credit default swaps: | | | | |
Average notional value — buy protection | | $ | 6,477,665 | |
Average notional value — sell protection | | $ | 5,837,750 | |
Interest rate swaps: | | | | |
Average notional value — pays fixed rate | | $ | 66,660,838 | |
Average notional value — receives fixed rate | | $ | 88,698,621 | |
Inflation Swaps: | | | | |
Average notional value — receives fixed rate | | $ | 371,000 | |
Total return swaps: | | | | |
Average notional value | | $ | 4,844,029 | |
For more information about the Fund’s investment risks regarding derivative financial instruments, refer to the Notes to Financial Statements.
Derivative Financial Instruments — Offsetting as of Period End
The Fund’s derivative assets and liabilities (by type) were as follows:
| | | | | | | | |
| | | Assets | | | Liabilities | |
Derivative Financial Instruments: | | | | | | | | |
Futures contracts | | $ | — | | | $ | 58,835 | |
Forward foreign currency exchange contracts | | | 298,736 | | | | 321,308 | |
Options(a) | | | 267,001 | | | | 254,168 | |
Swaps — Centrally cleared | | | — | | | | 156,856 | |
Swaps — OTC(b) | | | 171,647 | | | | 253,579 | |
| | | | | | | | |
Total derivative assets and liabilities in the Statement of Assets and Liabilities | | $ | 737,384 | | | $ | 1,044,746 | |
Derivatives not subject to a Master Netting Agreement or similar agreement (“MNA”) | | | (164,025 | ) | | | (431,741 | ) |
| | | | | | | | |
Total derivative assets and liabilities subject to an MNA | | $ | 573,359 | | | $ | 613,005 | |
| | | | | | | | |
| | (a) | Includes options purchased at value which is included in Investments at value – unaffiliated in the Statements of Assets and Liabilities and reported in the Schedule of Investments. | |
| | (b) | Includes unrealized appreciation (depreciation) on OTC swaps and swap premiums (paid/received) in the Statement of Assets and Liabilities. | |
| | |
| 32 | | 2017 BLACKROCK ANNUAL REPORTTO SHAREHOLDERS |
| | |
Schedule of Investments (continued) December 31, 2017 | | BlackRock Total Return V.I. Fund |
The following table presents the Fund’s derivative assets (and liabilities) by counterparty net of amounts available for offset under a Master Netting Agreement (“MNA”)
| | | | | | | | | | | | | | | | | | | | |
| Counterparty | | Derivative
Assets
Subject to
MNA by
Counterparty | | | Derivatives
Available
for Offset (a) | | | Non-cash
Collateral
Received | | | Cash
Collateral
Received | | | Net Amount
of Derivative
Assets (b) | |
Bank of America NA | | $ | 95,467 | | | $ | (35,923 | ) | | $ | — | | | $ | — | | | $ | 59,544 | |
Barclays Bank plc | | | 77,253 | | | | (10,603 | ) | | | — | | | | — | | | | 66,650 | |
BNP Paribas SA | | | 70,453 | | | | (70,453 | ) | | | — | | | | — | | | | — | |
Citibank NA | | | 36,148 | | | | (36,148 | ) | | | — | | | | — | | | | — | |
Credit Suisse International | | | 14,188 | | | | (14,188 | ) | | | — | | | | — | | | | — | |
Deutsche Bank AG | | | 46,201 | | | | (46,201 | ) | | | — | | | | — | | | | — | |
Goldman Sachs International | | | 118,757 | | | | (102,217 | ) | | | — | | | | — | | | | 16,540 | |
HSBC Bank plc | | | 37,567 | | | | (11,411 | ) | | | — | | | | — | | | | 26,156 | |
JP Morgan Chase Bank NA | | | 46,865 | | | | (46,865 | ) | | | — | | | | — | | | | — | |
JPMorgan Securities LLC | | | 7,516 | | | | (7,516 | ) | | | — | | | | — | | | | — | |
Morgan Stanley & Co. International plc | | | 22,192 | | | | (22,192 | ) | | | — | | | | — | | | | — | |
Royal Bank of Scotland | | | 752 | | | | (752 | ) | | | — | | | | — | | | | — | |
| | | | | | | | | | | | | | | | | | | | |
| | $ | 573,359 | | | $ | (404,469 | ) | | $ | — | | | $ | — | | | $ | 168,890 | |
| | | | | | | | | | | | | | | | | | | | |
| | | | | | | | | | | | | | | | | | | | |
| Counterparty | | Derivative
Liabilities
Subject to
MNA by
Counterparty | | | Derivatives
Available
for Offset (a) | | | Non-cash
Collateral
Pledged | | | Cash
Collateral
Pledged | | | Net Amount
of Derivative
Liabilities (c) | |
Bank of America NA | | $ | 35,923 | | | $ | (35,923 | ) | | $ | — | | | $ | — | | | $ | — | |
Barclays Bank plc | | | 10,603 | | | | (10,603 | ) | | | — | | | | — | | | | — | |
BNP Paribas SA | | | 198,035 | | | | (70,453 | ) | | | — | | | | — | | | | 127,582 | |
Citibank NA | | | 39,398 | | | | (36,148 | ) | | | — | | | | — | | | | 3,250 | |
Credit Suisse International | | | 48,784 | | | | (14,188 | ) | | | — | | | | — | | | | 34,596 | |
Deutsche Bank AG | | | 54,180 | | | | (46,201 | ) | | | — | | | | — | | | | 7,979 | |
Goldman Sachs International | | | 102,217 | | | | (102,217 | ) | | | — | | | | — | | | | — | |
HSBC Bank plc | | | 11,411 | | | | (11,411 | ) | | | — | | | | — | | | | — | |
JP Morgan Chase Bank NA | | | 57,193 | | | | (46,865 | ) | | | — | | | | — | | | | 10,328 | |
JPMorgan Securities LLC | | | 13,286 | | | | (7,516 | ) | | | — | | | | — | | | | 5,770 | |
Morgan Stanley & Co. International plc | | | 35,626 | | | | (22,192 | ) | | | — | | | | — | | | | 13,434 | |
Royal Bank of Scotland | | | 6,076 | | | | (752 | ) | | | — | | | | — | | | | 5,324 | |
UBS AG | | | 273 | | | | — | | | | — | | | | — | | | | 273 | |
| | | | | | | | | | | | | | | | | | | | |
| | $ | 613,005 | | | $ | (404,469 | ) | | $ | — | | | $ | — | | | $ | 208,536 | |
| | | | | | | | | | | | | | | | | | | | |
| | (a) | The amount of derivatives available for offset is limited to the amount of assets and/or liabilities that are subject to an MNA. | |
| | (b) | Net amount represents the net amount receivable from the counterparty in the event of default. | |
| | (c) | Net amount represents the net amount payable from the counterparty in the event of default. | |
Fair Value Hierarchy as of Period End
Various inputs are used in determining the fair value of investments and derivative financial instruments. For information about the Fund’s policy regarding valuation of investments and derivative financial instruments, refer to the Notes to Financial Statements.
The following tables summarize the Fund’s investments and derivative financial instruments categorized in the disclosure hierarchy:
| | | | | | | | | | | | | | | | |
| | | Level 1 | | | Level 2 | | | Level 3 | | | Total | |
Assets: | | | | | | | | | | | | | | | | |
Investments: | | | | | | | | | | | | | | | | |
Long-Term Investments: | | | | | | | | | | | | | | | | |
Asset-Backed Securities | | $ | — | | | $ | 48,712,604 | | | $ | 2,576,403 | | | $ | 51,289,007 | |
Corporate Bonds: | | | | | | | | | | | | | | | | |
Aerospace & Defense | | | — | | | | 1,535,661 | | | | — | | | | 1,535,661 | |
Air Freight & Logistics | | | — | | | | 406,790 | | | | — | | | | 406,790 | |
Airlines | | | — | | | | 1,011,054 | | | | — | | | | 1,011,054 | |
Auto Components | | | — | | | | 236,379 | | | | — | | | | 236,379 | |
Automobiles | | | — | | | | 779,585 | | | | — | | | | 779,585 | |
Banks | | | — | | | | 25,482,871 | | | | — | | | | 25,482,871 | |
Beverages | | | — | | | | 2,014,663 | | | | — | | | | 2,014,663 | |
Biotechnology | | | — | | | | 3,587,437 | | | | — | | | | 3,587,437 | |
Building Products | | | — | | | | 675,511 | | | | — | | | | 675,511 | |
Capital Markets | | | — | | | | 5,757,071 | | | | — | | | | 5,757,071 | |
| | | | |
| SCHEDULE OF INVESTMENTS | | | 33 | |
| | |
Schedule of Investments (continued) December 31, 2017 | | BlackRock Total Return V.I. Fund |
| | | | | | | | | | | | | | | | |
| | | Level 1 | | | Level 2 | | | Level 3 | | | Total | |
Chemicals | | $ | — | | | $ | 554,191 | | | $ | — | | | $ | 554,191 | |
Commercial Services & Supplies | | | — | | | | 693,587 | | | | — | | | | 693,587 | |
Communications Equipment | | | — | | | | 91,930 | | | | — | | | | 91,930 | |
Construction & Engineering | | | — | | | | 197,500 | | | | — | | | | 197,500 | |
Consumer Finance | | | — | | | | 4,394,064 | | | | — | | | | 4,394,064 | |
Containers & Packaging | | | — | | | | 697,263 | | | | — | | | | 697,263 | |
Diversified Consumer Services | | | — | | | | 631,079 | | | | — | | | | 631,079 | |
Diversified Financial Services | | | — | | | | 1,671,248 | | | | 1,000,000 | | | | 2,671,248 | |
Diversified Telecommunication Services | | | — | | | | 5,488,991 | | | | — | | | | 5,488,991 | |
Electric Utilities | | | — | | | | 5,847,479 | | | | — | | | | 5,847,479 | |
Electrical Equipment | | | — | | | | 118,345 | | | | — | | | | 118,345 | |
Electronic Equipment, Instruments & Components | | | — | | | | 210,477 | | | | — | | | | 210,477 | |
Energy Equipment & Services | | | — | | | | 955,967 | | | | — | | | | 955,967 | |
Equity Real Estate Investment Trusts (REITs) | | | — | | | | 2,143,233 | | | | — | | | | 2,143,233 | |
Food & Staples Retailing | | | — | | | | 812,684 | | | | — | | | | 812,684 | |
Food Products | | | — | | | | 486,416 | | | | — | | | | 486,416 | |
Gas Utilities | | | — | | | | 106,718 | | | | — | | | | 106,718 | |
Health Care Equipment & Supplies | | | — | | | | 2,787,166 | | | | — | | | | 2,787,166 | |
Health Care Providers & Services | | | — | | | | 3,203,226 | | | | — | | | | 3,203,226 | |
Hotels, Restaurants & Leisure | | | — | | | | 541,263 | | | | — | | | | 541,263 | |
Household Durables | | | — | | | | 264,800 | | | | — | | | | 264,800 | |
Industrial Conglomerates | | | — | | | | 318,445 | | | | — | | | | 318,445 | |
Insurance | | | — | | | | 1,724,672 | | | | — | | | | 1,724,672 | |
Internet & Direct Marketing Retail | | | — | | | | 610,132 | | | | — | | | | 610,132 | |
IT Services | | | — | | | | 645,482 | | | | — | | | | 645,482 | |
Life Sciences Tools & Services | | | — | | | | 789,247 | | | | — | | | | 789,247 | |
Media | | | — | | | | 4,829,183 | | | | — | | | | 4,829,183 | |
Metals & Mining | | | — | | | | 1,864,204 | | | | — | | | | 1,864,204 | |
Multiline Retail | | | — | | | | 225,944 | | | | — | | | | 225,944 | |
Multi-Utilities | | | — | | | | 458,849 | | | | — | | | | 458,849 | |
Oil, Gas & Consumable Fuels | | | — | | | | 7,900,878 | | | | — | | | | 7,900,878 | |
Paper & Forest Products | | | — | | | | 123,457 | | | | — | | | | 123,457 | |
Pharmaceuticals | | | — | | | | 1,590,446 | | | | — | | | | 1,590,446 | |
Road & Rail | | | — | | | | 1,170,749 | | | | — | | | | 1,170,749 | |
Semiconductors & Semiconductor Equipment | | | — | | | | 4,085,433 | | | | — | | | | 4,085,433 | |
Software | | | — | | | | 3,554,768 | | | | — | | | | 3,554,768 | |
Specialty Retail | | | — | | | | 328,176 | | | | — | | | | 328,176 | |
Technology Hardware, Storage & Peripherals | | | — | | | | 3,121,798 | | | | — | | | | 3,121,798 | |
Thrifts & Mortgage Finance | | | — | | | | 329,817 | | | | — | | | | 329,817 | |
Tobacco | | | — | | | | 1,087,344 | | | | — | | | | 1,087,344 | |
Trading Companies & Distributors | | | — | | | | 716,362 | | | | — | | | | 716,362 | |
Wireless Telecommunication Services | | | — | | | | 554,633 | | | | — | | | | 554,633 | |
Floating Rate Loan Interests | | | — | | | | — | | | | 1,599,976 | | | | 1,599,976 | |
Foreign Agency Obligations | | | — | | | | 1,508,907 | | | | — | | | | 1,508,907 | |
Foreign Government Obligations | | | — | | | | 17,689,765 | | | | — | | | | 17,689,765 | |
Municipal Bonds | | | — | | | | 23,299,754 | | | | — | | | | 23,299,754 | |
Non-Agency Mortgage-Backed Securities | | | — | | | | 26,046,761 | | | | 2,319,947 | | | | 28,366,708 | |
Preferred Securities | | | 383,923 | | | | 212,500 | | | | — | | | | 596,423 | |
U.S. Government Sponsored Agency Securities | | | — | | | | 184,678,926 | | | | — | | | | 184,678,926 | |
U.S. Treasury Obligations | | | — | | | | 137,921,077 | | | | — | | | | 137,921,077 | |
Short-Term Securities: | | | | | | | | | | | | | | | | |
Borrowed Bond Agreements | | | — | | | | 642,402 | | | | — | | | | 642,402 | |
Money Market Funds | | | 1,977,846 | | | | — | | | | — | | | | 1,977,846 | |
Options Purchased: | | | | | | | | | | | | | | | | |
Foreign currency exchange contracts | | | — | | | | 102,976 | | | | — | | | | 102,976 | |
Interest rate contracts | | | 164,025 | | | | — | | | | — | | | | 164,025 | |
Liabilities: | | | | | | | | | | | | | | | | |
Borrowed Bonds | | | — | | | | (640,326 | ) | | | — | | | | (640,326 | ) |
TBA Sale Commitments | | | — | | | | (73,333,478 | ) | | | — | | | | (73,333,478 | ) |
| | | | | | | | | | | | | | | | |
| | $ | 2,525,794 | | | $ | 476,256,536 | | | $ | 7,496,326 | | | $ | 486,278,656 | |
| | | | | | | | | | | | | | | | |
| | |
| 34 | | 2017 BLACKROCK ANNUAL REPORTTO SHAREHOLDERS |
| | |
Schedule of Investments (continued) December 31, 2017 | | BlackRock Total Return V.I. Fund |
| | | | | | | | | | | | | | | | |
| | | Level 1 | | | Level 2 | | | Level 3 | | | Total | |
Derivative Financial Instruments(a) | | | | | | | | | | | | | | | | |
Assets: | | | | | | | | | | | | | | | | |
Equity contracts | | $ | — | | | $ | 41,716 | | | $ | — | | | $ | 41,716 | |
Credit contracts | | | — | | | | 25,440 | | | | — | | | | 25,440 | |
Foreign currency exchange contracts | | | — | | | | 298,736 | | | | — | | | | 298,736 | |
Interest rate contracts | | | 142,627 | | | | 257,085 | | | | — | | | | 399,712 | |
Other contracts | | | 127 | | | | 8,903 | | | | — | | | | 9,030 | |
Liabilities: | | | | | | | | | | | | | | | | |
Credit contracts | | | — | | | | (51,811 | ) | | | — | | | | (51,811 | ) |
Foreign currency exchange contracts | | | — | | | | (359,426 | ) | | | — | | | | (359,426 | ) |
Interest rate contracts | | | (309,090 | ) | | | (480,305 | ) | | | — | | | | (789,395 | ) |
| | | | | | | | | | | | | | | | |
| | $ | (166,336 | ) | | $ | (259,662 | ) | | $ | — | | | $ | (425,998 | ) |
| | | | | | | | | | | | | | | | |
| | (a) | Derivative financial instruments are swaps, futures contracts, forward foreign currency exchange contracts and options written. Swaps, futures contracts, and forward foreign currency exchange contracts are valued at the unrealized appreciation (depreciation) on the instrument and options written are shown at value. | |
A reconciliation of Level 3 investments is presented when the Fund had a significant amount of Level 3 investments at the beginning and/or end of the period in relation to net assets. The following table is a reconciliation of Level 3 investments for which significant unobservable inputs were used in determining fair value:
| | | | | | | | | | | | | | | | | | | | | | | | |
| | | Asset- Backed Securities | | | Corporate
Bonds | | | Floating
Rate Loan
Interests | | | Non-Agency Mortgage- Backed Securities | | | Options Purchased | | | Total | |
Investments: | | | | | | | | | | | | | | | | | | | | | | | | |
Assets: | | | | | | | | | | | | | | | | | | | | | | | | |
Opening Balance, as of December 31, 2016 | | $ | 9,595,248 | | | $ | — | | | $ | — | | | $ | 2,403,512 | | | $ | 1 | | | $ | 11,998,761 | |
Transfers into Level 3 | | | 46,394 | | | | — | | | | 494,357 | | | | 104,343 | | | | — | | | | 645,094 | |
Transfers out of Level 3(a) | | | (6,661,753 | ) | | | — | | | | — | | | | (674,375 | ) | | | — | | | | (7,336,128 | ) |
Other(b) | | | 324,433 | | | | — | | | | — | | | | (324,433 | ) | | | — | | | | — | |
Accrued discounts/premiums | | | 498 | | | | — | | | | — | | | | 4,398 | | | | — | | | | 4,896 | |
Net realized gain (loss) | | | (34,093 | ) | | | — | | | | — | | | | 9,367 | | | | — | | | | (24,726 | ) |
Net change in unrealized appreciation (depreciation)(c) (d) | | | (20,399 | ) | | | — | | | | (23,234 | ) | | | 1,608 | | | | (1 | ) | | | (42,026 | ) |
Purchases | | | 2,240,000 | | | | 1,000,000 | | | | 1,232,111 | | | | 1,762,051 | | | | — | | | | 6,234,162 | |
Sales | | | (2,913,925 | ) | | | — | | | | (103,258 | ) | | | (966,524 | ) | | | — | | | | (3,983,707 | ) |
| | | | | | | | | | | | | | | | | | | | | | | | |
Closing Balance, as of December 31, 2017 | | $ | 2,576,403 | | | $ | 1,000,000 | | | $ | 1,599,976 | | | $ | 2,319,947 | | | $ | — | | �� | $ | 7,496,326 | |
| | | | | | | | | | | | | | | | | | | | | | | | |
Net change in unrealized appreciation (depreciation) on investments still held at December 31, 2017(d) | | $ | (16,618 | ) | | $ | — | | | $ | (23,234 | ) | | $ | 9,008 | | | $ | — | | | $ | (30,845 | ) |
| | | | | | | | | | | | | | | | | | | | | | | | |
| | (a) | As of December 31, 2016, the Fund used significant unobservable inputs in determining the value of certain investments. As of December 31, 2017, the Fund used observable inputs in determining the value of the same investments. As a result, the investments at beginning of the period value were transferred from Level 3 to Level 2 in the disclosure hierarchy. | |
| | (b) | Certain Level 3 investments were re-classified between Asset-Backed Securities and Non-Agency Mortgage-Backed Securities. | |
| | (c) | Included in the related net change in unrealized appreciation (depreciation) in the Statement of Operations. | |
| | (d) | Any difference between net change in unrealized appreciation (depreciation) and net change in unrealized appreciation (depreciation) on investments still held at December 31, 2017 is generally due to investments no longer held or categorized as Level 3 at period end. | |
The Fund’s investments that are categorized as Level 3 were valued utilizing third party pricing information without adjustment. Such valuations are based on unobservable inputs. A significant change in third party information could result in a significantly lower or higher value of such Level 3 investments.
During the year ended December 31, 2017, there were no transfers between Level 1 and Level 2.
See notes to financial statements.
| | | | |
| SCHEDULE OF INVESTMENTS | | | 35 | |
Statement of Assets and Liabilities
December 31, 2017
| | | | |
| | | BlackRock Total
Return V.I. Fund | |
|
ASSETS | |
Investments at value — unaffiliated (cost — $557,388,060) | | $ | 558,442,583 | |
Investments at value — affiliated (cost — $1,809,877) | | | 1,809,877 | |
Cash | | | 56,145 | |
Cash pledged: | | | | |
Futures contracts | | | 750,050 | |
Centrally cleared swaps | | | 1,042,398 | |
Foreign currency at value (cost — $1,391,796) | | | 1,400,454 | |
Receivables: | | | | |
Investments sold | | | 5,961,271 | |
TBA sale commitments | | | 73,392,818 | |
Capital shares sold | | | 428,398 | |
Dividends — affiliated | | | 3,309 | |
Dividends — unaffiliated | | | 8,095 | |
Interest — unaffiliated | | | 2,564,085 | |
Swap premiums paid | | | 28,589 | |
Unrealized appreciation on: | | | | |
Forward foreign currency exchange contracts | | | 298,736 | |
OTC swaps | | | 143,058 | |
Prepaid expenses | | | 1,938 | |
Other assets | | | 18,765 | |
| | | | |
Total assets | | | 646,350,569 | |
| | | | |
| |
LIABILITIES | | | | |
Borrowed bonds at value (proceeds $595,127) | | | 640,326 | |
Options written at value (premium received $564,438) | | | 254,168 | |
TBA sale commitments at value (proceeds $73,392,818) | | | 73,333,478 | |
Reverse repurchase agreements at value | | | 37,438,577 | |
Payables: | | | | |
Investments purchased | | | 112,715,931 | |
Capital shares redeemed | | | 29,200 | |
Income dividends | | | 691,614 | |
Interest expense | | | 202 | |
Distribution fees | | | 53,449 | |
Variation margin on futures contracts | | | 58,835 | |
Variation margin on centrally cleared swaps | | | 156,856 | |
Investment advisory fees | | | 147,036 | |
Officer’s and Directors’ fees | | | 4,771 | |
Other affiliates | | | 1,354 | |
Other accrued expenses | | | 460,567 | |
Swap premiums received | | | 133,721 | |
Unrealized depreciation on: | | | | |
Forward foreign currency exchange contracts | | | 321,308 | |
OTC swaps | | | 119,858 | |
| | | | |
Total liabilities | | | 226,561,251 | |
| | | | |
| |
NET ASSETS | | $ | 419,789,318 | |
| | | | |
|
NET ASSETS CONSIST OF | |
Paid-in capital | | $ | 421,542,020 | |
Distributions in excess of net investment income | | | (437,435 | ) |
Accumulated net realized loss | | | (2,552,029 | ) |
Net unrealized appreciation (depreciation) | | | 1,236,762 | |
| | | | |
NET ASSETS | | $ | 419,789,318 | |
| | | | |
|
NET ASSET VALUE | |
Class I — Based on net assets of $152,138,371 and 12,778,791 shares outstanding, 600 million shares authorized, $0.10 par value. | | $ | 11.91 | |
| | | | |
Class III — Based on net assets of $267,650,947 and 22,749,980 shares outstanding, 100 million shares authorized, $0.10 par value. | | $ | 11.76 | |
| | | | |
See notes to financial statements.
| | |
| 36 | | 2017 BLACKROCK ANNUAL REPORTTO SHAREHOLDERS |
Statement of Operations
Year Ended December 31, 2017
| | | | |
| | | BlackRock Total
Return V.I. Fund | |
| |
INVESTMENT INCOME | | | | |
Dividends — affiliated | | $ | 34,705 | |
Dividends — unaffiliated | | | 66,795 | |
Interest — unaffiliated | | | 11,993,200 | |
Foreign taxes withheld | | | (4,343 | ) |
| | | | |
Total investment income | | | 12,090,357 | |
| | | | |
| |
EXPENSES | | | | |
Investment advisory | | | 1,692,511 | |
Transfer agent — class specific | | | 669,826 | |
Distribution — class specific | | | 557,875 | |
Pricing | | | 250,773 | |
Custodian | | | 121,920 | |
Printing | | | 116,205 | |
Accounting services | | | 84,688 | |
Professional | | | 78,958 | |
Directors and Officer | | | 25,866 | |
Transfer agent | | | 4,997 | |
Miscellaneous | | | 10,004 | |
| | | | |
Total expenses excluding interest expense | | | 3,613,623 | |
Interest expense | | | 439,065 | |
| | | | |
Total expenses | | | 4,052,688 | |
Less: | | | | |
Fees waived and/or reimbursed by the Manager | | | (3,471 | ) |
Transfer agent fees reimbursed — class specific | | | (535,927 | ) |
| | | | |
Total expenses after fees waived and/or reimbursed | | | 3,513,290 | |
| | | | |
Net investment income | | | 8,577,067 | |
| | | | |
| |
REALIZED AND UNREALIZED GAIN (LOSS) | | | | |
Net realized gain (loss) from: | | | | |
Investments — unaffiliated (net of $678 foreign capital gain tax) | | | (1,553,069 | ) |
Borrowed bonds | | | 138,962 | |
Capital gain distributions from investment companies — affiliated | | | 10 | |
Forward foreign currency exchange contracts | | | 48,123 | |
Foreign currency transactions | | | (173,247 | ) |
Futures contracts | | | 1,501,085 | |
Options written | | | 330,765 | |
Payment by affiliate | | | 19,241 | |
Swaps | | | (125,819 | ) |
| | | | |
| | | 186,051 | |
| | | | |
Net change in unrealized appreciation (depreciation) on: | | | | |
Investments — unaffiliated | | | 3,396,789 | |
Borrowed bonds | | | (89,354 | ) |
Forward foreign currency exchange contracts | | | (135,939 | ) |
Foreign currency translations | | | 867 | |
Futures contracts | | | 110,198 | |
Options written | | | 279,479 | |
Swaps | | | (196,516 | ) |
| | | | |
| | | 3,365,524 | |
| | | | |
Net realized and unrealized gain | | | 3,551,575 | |
| | | | |
NET INCREASE IN NET ASSETS RESULTING FROM OPERATIONS | | $ | 12,128,642 | |
| | | | |
See notes to financial statements.
Statements of Changes in Net Assets
| | | | | | | | |
| | | BlackRock Total Return V.I. Fund | |
| | | Year Ended December 31, | |
| | | 2017 | | | 2016 | |
| | |
INCREASE (DECREASE) IN NET ASSETS | | | | | | | | |
| | |
OPERATIONS | | | | | | | | |
Net investment income | | $ | 8,577,067 | | | $ | 5,122,678 | |
Net realized gain (loss) | | | 186,051 | | | | (111,898 | ) |
Net change in unrealized appreciation (depreciation) | | | 3,365,524 | | | | 53,330 | |
| | | | | | | | |
Net increase in net assets resulting from operations | | | 12,128,642 | | | | 5,064,110 | |
| | | | | | | | |
| | |
DISTRIBUTIONS TO SHAREHOLDERS(a) | | | | | | | | |
From net investment income: | | | | | | | | |
Class I | | | (3,931,362 | ) | | | (3,223,271 | ) |
Class III | | | (4,976,227 | ) | | | (2,293,347 | ) |
| | | | | | | | |
Decrease in net assets resulting from distributions to shareholders | | | (8,907,589 | ) | | | (5,516,618 | ) |
| | | | | | | | |
| | |
CAPITAL SHARE TRANSACTIONS | | | | | | | | |
Net increase in net assets derived from capital share transactions | | | 83,969,566 | | | | 110,161,750 | |
| | | | | | | | |
| | |
NET ASSETS | | | | | | | | |
Total increase in net assets | | | 87,190,619 | | | | 109,709,242 | |
Beginning of year | | | 332,598,699 | | | | 222,889,457 | |
| | | | | | | | |
End of year | | $ | 419,789,318 | | | $ | 332,598,699 | |
| | | | | | | | |
Undistributed (distributions in excess of) net investment income, end of year | | $ | (437,435 | ) | | $ | 34,849 | |
| | | | | | | | |
| (a) | Distributions for annual periods determined in accordance with U.S. federal income tax regulations. |
See notes to financial statements.
| | |
| 38 | | 2017 BLACKROCK ANNUAL REPORTTO SHAREHOLDERS |
Financial Highlights
(For a share outstanding throughout each period)
| | | | | | | | | | | | | | | | | | | | |
| | | BlackRock Total Return V.I. Fund | |
| | | Class I | |
| | | Year Ended December 31, | |
| | | 2017 | | | 2016 | | | 2015 | | | 2014 | | | 2013 | |
Net asset value, beginning of year | | $ | 11.79 | | | $ | 11.71 | | | $ | 11.93 | | | $ | 11.51 | | | $ | 12.01 | |
| | | | | | | | | | | | | | | | | | | | |
Net investment income(a) | | | 0.29 | | | | 0.23 | | | | 0.22 | | | | 0.32 | | | | 0.32 | |
Net realized and unrealized gain (loss) | | | 0.13 | | | | 0.09 | | | | (0.19 | ) | | | 0.44 | | | | (0.45 | ) |
| | | | | | | | | | | | | | | | | | | | |
Net increase (decrease) from investment operations | | | 0.42 | | | | 0.32 | | | | 0.03 | | | | 0.76 | | | | (0.13 | ) |
| | | | | | | | | | | | | | | | | | | | |
| Distributions:(b) | | | | | | | | | | | | | | | |
From net investment income | | | (0.30 | ) | | | (0.24 | ) | | | (0.25 | ) | | | (0.34 | ) | | | (0.37 | ) |
| | | | | | | | | | | | | | | | | | | | |
Net asset value, end of year | | $ | 11.91 | | | $ | 11.79 | | | $ | 11.71 | | | $ | 11.93 | | | $ | 11.51 | |
| | | | | | | | | | | | | | | | | | | | |
| | | | | |
Total Return:(c) | | | | | | | | | | | | | | | | | | | | |
Based on net asset value | | | 3.60 | %(d) | | | 2.76 | % | | | 0.26 | % | | | 6.66 | % | | | (1.14 | )% |
| | | | | | | | | | | | | | | | | | | | |
| | | | | |
Ratios to Average Net Assets:(e) | | | | | | | | | | | | | | | | | | | | |
Total expenses | | | 0.94 | % | | | 0.82 | % | | | 0.92 | % | | | 0.88 | % | | | 0.87 | % |
| | | | | | | | | | | | | | | | | | | | |
Total expenses after fees waived and/or reimbursed and paid indirectly | | | 0.74 | % | | | 0.62 | % | | | 0.74 | % | | | 0.69 | % | | | 0.67 | % |
| | | | | | | | | | | | | | | | | | | | |
Total expenses after fees waived and/or reimbursed and paid indirectly and excluding interest expense | | | 0.62 | % | | | 0.59 | % | | | 0.69 | % | | | 0.66 | % | | | 0.65 | % |
| | | | | | | | | | | | | | | | | | | | |
Net investment income | | | 2.43 | % | | | 1.92 | % | | | 1.89 | % | | | 2.68 | % | | | 2.75 | % |
| | | | | | | | | | | | | | | | | | | | |
| | | | | |
Supplemental Data: | | | | | | | | | | | | | | | | | | | | |
Net assets, end of year (000) | | $ | 152,138 | | | $ | 157,445 | | | $ | 154,046 | | | $ | 130,765 | | | $ | 135,943 | |
| | | | | | | | | | | | | | | | | | | | |
Portfolio turnover rate(f) | | | 627 | % | | | 590 | % | | | 900 | % | | | 772 | % | | | 724 | % |
| | | | | | | | | | | | | | | | | | | | |
| (a) | Based on average shares outstanding. |
| (b) | Distributions for annual periods determined in accordance with U.S. federal income tax regulations. |
| (c) | Where applicable, excludes insurance-related fees and expenses and assumes the reinvestment of distributions. |
| (d) | Includes payment received from an affiliate, which impacted the Fund’s total return. Excluding the payment from an affiliate, the Fund’s total return is 3.51%. |
| (e) | Excludes expenses incurred indirectly as a result of investments in underlying funds as follows: |
| | | | | | | | | | | | | | | | | | | | | | | | | | | | | | | | | | | | | | | | |
| | | Year Ended December 31, | |
| | | 2017 | | | | | | 2016 | | | | | | 2015 | | | | | | 2014 | | | | | | 2013 | | | | |
Investments in underlying funds | | | — | | | | | | | | 0.01 | % | | | | | | | 0.01 | % | | | | | | | — | | | | | | | | — | | | | | |
| | | | | | | | | | | | | | | | | | | | | | | | | | | | | | | | | | | | | | | | |
| (f) | Includes mortgage dollar roll transactions (“MDRs”). Additional information regarding portfolio turnover rate is as follows: |
| | | | | | | | | | | | | | | | | | | | | | | | | | | | | | | | | | | | | | | | |
| | | Year Ended December 31, | |
| | | 2017 | | | | | | 2016 | | | | | | 2015 | | | | | | 2014 | | | | | | 2013 | | | | |
Portfolio turnover rate (excluding MDRs) | | | 389 | % | | | | | | | 396 | % | | | | | | | 625 | % | | | | | | | 560 | % | | | | | | | 498 | % | | | | |
| | | | | | | | | | | | | | | | | | | | | | | | | | | | | | | | | | | | | | | | |
See notes to financial statements.
Financial Highlights (continued)
(For a share outstanding throughout each period)
| | | | | | | | | | | | | | | | | | | | |
| | | BlackRock Total Return V.I. Fund | |
| | | Class III | |
| | | Year Ended December 31, | |
| | | | | | | | | | | | | | | | | | | | |
| | | 2017 | | | 2016 | | | 2015 | | | 2014 | | | 2013 | |
Net asset value, beginning of year | | $ | 11.65 | | | $ | 11.57 | | | $ | 11.79 | | | $ | 11.38 | | | $ | 11.86 | |
| | | | | | | | | | | | | | | | | | | | |
Net investment income(a) | | | 0.25 | | | | 0.19 | | | | 0.18 | | | | 0.27 | | | | 0.28 | |
Net realized and unrealized gain (loss) | | | 0.12 | | | | 0.10 | | | | (0.19 | ) | | | 0.44 | | | | (0.42 | ) |
| | | | | | | | | | | | | | | | | | | | |
Net increase (decrease) from investment operations | | | 0.37 | | | | 0.29 | | | | (0.01 | ) | | | 0.71 | | | | (0.14 | ) |
| | | | | | | | | | | | | | | | | | | | |
| Distributions:(b) | | | | | | | | | | | | | | | |
From net investment income | | | (0.26 | ) | | | (0.21 | ) | | | (0.21 | ) | | | (0.30 | ) | | | (0.34 | ) |
| | | | | | | | | | | | | | | | | | | | |
Net asset value, end of year | | $ | 11.76 | | | $ | 11.65 | | | $ | 11.57 | | | $ | 11.79 | | | $ | 11.38 | |
| | | | | | | | | | | | | | | | | | | | |
| | | | | |
Total Return:(c) | | | | | | | | | | | | | | | | | | | | |
Based on net asset value | | | 3.21 | %(d) | | | 2.46 | % | | | (0.08 | )% | | | 6.28 | % | | | (1.30 | )% |
| | | | | | | | | | | | | | | | | | | | |
| | | | | |
Ratios to Average Net Assets:(e) | | | | | | | | | | | | | | | | | | | | |
Total expenses | | | 1.16 | % | | | 1.01 | % | | | 1.06 | % | | | 1.11 | % | | | 1.06 | % |
| | | | | | | | | | | | | | | | | | | | |
Total expenses after fees waived and/or reimbursed and paid indirectly | | | 1.06 | % | | | 0.93 | % | | | 1.04 | % | | | 1.01 | % | | | 0.96 | % |
| | | | | | | | | | | | | | | | | | | | |
Total expenses after fees waived and/or reimbursed and paid indirectly and excluding interest expense | | | 0.94 | % | | | 0.89 | % | | | 0.98 | % | | | 0.98 | % | | | 0.94 | % |
| | | | | | | | | | | | | | | | | | | | |
Net investment income | | | 2.15 | % | | | 1.61 | % | | | 1.54 | % | | | 2.31 | % | | | 2.45 | % |
| | | | | | | | | | | | | | | | | | | | |
| | | | | |
Supplemental Data: | | | | | | | | | | | | | | | | | | | | |
Net assets, end of year (000) | | $ | 267,651 | | | $ | 175,153 | | | $ | 68,844 | | | $ | 7,300 | | | $ | 2,750 | |
| | | | | | | | | | | | | | | | | | | | |
Portfolio turnover rate(f) | | | 627 | % | | | 590 | % | | | 900 | % | | | 772 | % | | | 724 | % |
| | | | | | | | | | | | | | | | | | | | |
| (a) | Based on average shares outstanding. |
| (b) | Distributions for annual periods determined in accordance with U.S. federal income tax regulations. |
| (c) | Where applicable, excludes insurance-related fees and expenses and assumes the reinvestment of distributions. |
| (d) | Includes payment received from an affiliate, which had no impact on the Fund’s total return. |
| (e) | Excludes expenses incurred indirectly as a result of investments in underlying funds as follows: |
| | | | | | | | | | | | | | | | | | | | | | | | | | | | | | | | | | | | | | | | |
| | | Year Ended December 31, | |
| | | 2017 | | | | | | 2016 | | | | | | 2015 | | | | | | 2014 | | | | | | 2013 | | | | |
Investments in underlying funds | | | — | | | | | | | | 0.01 | % | | | | | | | 0.01 | % | | | | | | | — | | | | | | | | — | | | | | |
| | | | | | | | | | | | | | | | | | | | | | | | | | | | | | | | | | | | | | | | |
| (f) | Includes mortgage dollar roll transactions (“MDRs”). Additional information regarding portfolio turnover rate is as follows: |
| | | | | | | | | | | | | | | | | | | | | | | | | | | | | | | | | | | | | | | | |
| | | Year Ended December 31, | |
| | | 2017 | | | | | | 2016 | | | | | | 2015 | | | | | | 2014 | | | | | | 2013 | | | | |
Portfolio turnover rate (excluding MDRs) | | | 389 | % | | | | | | | 396 | % | | | | | | | 625 | % | | | | | | | 560 | % | | | | | | | 498 | % | | | | |
| | | | | | | | | | | | | | | | | | | | | | | | | | | | | | | | | | | | | | | | |
See notes to financial statements.
| | |
| 40 | | 2017 BLACKROCK ANNUAL REPORTTO SHAREHOLDERS |
Notes to Financial Statements
BlackRock Variable Series Funds, Inc. (the “Company”) is registered under the Investment Company Act of 1940, as amended (the “1940 Act”), as an open-end management investment company. The Company is organized as a Maryland corporation that is comprised of 20 separate funds. The funds offer shares to insurance companies for their separate accounts to fund benefits under certain variable annuity and variable life insurance contracts. The financial statements presented are for BlackRock Total Return V.I. Fund (the “Fund”). The Fund is classified as diversified. Class I and Class III Shares have equal voting, dividend, liquidation and other rights, except that only shares of the respective classes are entitled to vote on matters concerning only that class. In addition, Class III Shares bear certain expenses related to the distribution of such shares.
The Fund, together with certain other registered investment companies advised by BlackRock Advisors, LLC (the “Manager”) or its affiliates, is included in a complex of open-end funds referred to as the Equity-Bond Complex.
| 2. | SIGNIFICANT ACCOUNTING POLICIES |
The financial statements are prepared in conformity with accounting principles generally accepted in the United States of America (“U.S. GAAP”), which may require management to make estimates and assumptions that affect the reported amounts of assets and liabilities in the financial statements, disclosure of contingent assets and liabilities at the date of the financial statements and the reported amounts of increases and decreases in net assets from operations during the reporting period. Actual results could differ from those estimates. The Fund is considered an investment company under U.S. GAAP and follows the accounting and reporting guidance applicable to investment companies. Below is a summary of significant accounting policies:
Investment Transactions and Income Recognition: For financial reporting purposes, investment transactions are recorded on the dates the transactions are entered into (the “trade dates”). Realized gains and losses on investment transactions are determined on the identified cost basis. Dividend income is recorded on the ex-dividend date. Dividends from foreign securities where the ex-dividend date may have passed are subsequently recorded when the Fund is informed of the ex-dividend date. Under the applicable foreign tax laws, a withholding tax at various rates may be imposed on capital gains, dividends and interest. Interest income, including amortization and accretion of premiums and discounts on debt securities, is recognized on an accrual basis. Income, expenses and realized and unrealized gains and losses are allocated daily to each class based on its relative net assets.
Foreign Currency Translation: The Fund’s books and records are maintained in U.S. dollars. Securities and other assets and liabilities denominated in foreign currencies are translated into U.S. dollars using exchange rates determined as of the close of trading on the New York Stock Exchange (“NYSE”). Purchases and sales of investments are recorded at the rates of exchange prevailing on the respective dates of such transactions. Generally, when the U.S. dollar rises in value against a foreign currency, the investments denominated in that currency will lose value; the opposite effect occurs if the U.S. dollar falls in relative value.
The Fund does not isolate the portion of the results of operations arising as a result of changes in the exchange rates from the changes in the market prices of investments held or sold for financial reporting purposes. Accordingly, the effects of changes in exchange rates on investments are not segregated in the Statement of Operations from the effects of changes in market prices of those investments, but are included as a component of net realized and unrealized gain (loss) from investments. The Fund reports realized currency gains (losses) on foreign currency related transactions as components of net realized gain (loss) for financial reporting purposes, whereas such components are generally treated as ordinary income for U.S. federal income tax purposes.
Segregation and Collateralization: In cases where the Fund enters into certain investments (e.g., dollar rolls, TBA sale commitments, futures contracts, forward foreign currency exchange contracts, options written and swaps), or certain borrowings (e.g., reverse repurchase agreements) that would be treated as “senior securities” for 1940 Act purposes, the Fund may segregate or designate on its books and records cash or liquid assets having a market value at least equal to the amount of its future obligations under such investments or borrowings. Doing so allows the investment or borrowing to be excluded from treatment as a “senior security.” Furthermore, if required by an exchange or counterparty agreement, the Fund may be required to deliver/deposit cash and/or securities to/with an exchange, or broker-dealer or custodian as collateral for certain investments or obligations.
Distributions: Distributions from net investment income are declared daily and paid monthly. Distributions of capital gains are recorded on the ex-dividend date and made at least annually. The character and timing of distributions are determined in accordance with U.S. federal income tax regulations, which may differ from U.S. GAAP.
Recent Accounting Standards: In March 2017, the Financial Accounting Standards Board issued Accounting Standards Update “Premium Amortization of Purchased Callable Debt Securities” which amends the amortization period for certain purchased callable debt securities. Under the new guidance, the premium amortization of purchased callable debt securities that have explicit, non-contingent call features and are callable at fixed prices will be amortized to the earliest call date. The guidance will be applied on a modified retrospective basis and is effective for fiscal years, and their interim periods, beginning after December 15, 2018. Management is currently evaluating the impact of this guidance to the Fund.
Indemnifications: In the normal course of business, the Fund enters into contracts that contain a variety of representations that provide general indemnification. The Fund’s maximum exposure under these arrangements is unknown because it involves future potential claims against the Fund, which cannot be predicted with any certainty.
Other: Expenses directly related to the Fund or its classes are charged to the Fund or the applicable class. Other operating expenses shared by several funds, including other funds managed by the Manager, are prorated among those funds on the basis of relative net assets or other appropriate methods. Expenses directly related to the Fund and other shared expenses prorated to the Fund are allocated daily to each class based on its relative net assets or other appropriate methods.
| | | | |
| NOTESTO FINANCIAL STATEMENTS | | | 41 | |
Notes to Financial Statements (continued)
| 3. | INVESTMENT VALUATION AND FAIR VALUE MEASUREMENTS |
Investment Valuation Policies: The Fund’s investments are valued at fair value (also referred to as “market value” within the financial statements) as of the close of trading on the NYSE (generally 4:00 p.m., Eastern time) (or, if the reporting date falls on a day the NYSE is closed, investments are valued at fair value as of the period end). U.S. GAAP defines fair value as the price the Fund would receive to sell an asset or pay to transfer a liability in an orderly transaction between market participants at the measurement date. The Fund determines the fair values of its financial instruments using various independent dealers or pricing services under policies approved by the Board of Directors of the Company (the “Board”). The BlackRock Global Valuation Methodologies Committee (the “Global Valuation Committee”) is the committee formed by management to develop global pricing policies and procedures and to oversee the pricing function for all financial instruments.
Fair Value Inputs and Methodologies: The following methods and inputs are used to establish the fair value of the Fund’s assets and liabilities:
| | • | | Equity investments traded on a recognized securities exchange are valued at the official closing price each day, if available. For equity investments traded on more than one exchange, the official closing price on the exchange where the stock is primarily traded is used. Equity investments traded on a recognized exchange for which there were no sales on that day may be valued at the last available bid (long positions) or ask (short positions) price. |
| | • | | Fixed-income securities for which market quotations are readily available are generally valued using the last available bid prices or current market quotations provided by independent dealers or third party pricing services. Floating rate loan interests are valued at the mean of the bid prices from one or more independent brokers or dealers as obtained from a third party pricing service. Pricing services generally value fixed-income securities assuming orderly transactions of an institutional round lot size, but a fund may hold or transact in such securities in smaller, odd lot sizes. Odd lots may trade at lower prices than institutional round lots. The pricing services may use matrix pricing or valuation models that utilize certain inputs and assumptions to derive values, including transaction data (e.g., recent representative bids and offers), credit quality information, perceived market movements, news, and other relevant information. Certain fixed-income securities, including asset-backed and mortgage related securities may be valued based on valuation models that consider the estimated cash flows of each tranche of the entity, establish a benchmark yield and develop an estimated tranche specific spread to the benchmark yield based on the unique attributes of the tranche. The amortized cost method of valuation may be used with respect to debt obligations with sixty days or less remaining to maturity unless the Manager determines such method does not represent fair value. |
| | • | | Generally, trading in foreign instruments is substantially completed each day at various times prior to the close of trading on the NYSE. Occasionally, events affecting the values of such instruments may occur between the foreign market close and the close of trading on the NYSE that may not be reflected in the computation of the Fund’s net assets. Each business day, the Fund uses a pricing service to assist with the valuation of certain foreign exchange-traded equity securities and foreign exchange-traded and over-the-counter (“OTC”) options (the “Systematic Fair Value Price”). Using current market factors, the Systematic Fair Value Price is designed to value such foreign securities and foreign options at fair value as of the close of trading on the NYSE, which follows the close of the local markets. |
| | • | | Municipal investments (including commitments to purchase such investments on a “when-issued” basis) are valued on the basis of prices provided by dealers or pricing services. In determining the value of a particular investment, pricing services may use certain information with respect to transactions in such investments, quotations from dealers, pricing matrixes, market transactions in comparable investments and information with respect to various relationships between investments. |
| | • | | Investments in open-end U.S. mutual funds are valued at net asset value (“NAV”) each business day. |
| | • | | Futures contracts traded on exchanges are valued at their last sale price. |
| | • | | Forward foreign currency exchange contracts are valued at the mean between the bid and ask prices and are determined as of the close of trading on the NYSE. Interpolated values are derived when the settlement date of the contract is an interim date for which quotations are not available. |
| | • | | Exchange-traded options are valued at the mean between the last bid and ask prices at the close of the options market in which the options trade. An exchange-traded option for which there is no mean price is valued at the last bid (long positions) or ask (short positions) price. If no bid or ask price is available, the prior day’s price will be used, unless it is determined that the prior day’s price no longer reflects the fair value of the option. OTC options and options on swaps (“swaptions”) are valued by an independent pricing service using a mathematical model, which incorporates a number of market data factors, such as the trades and prices of the underlying instruments. |
| | • | | Swap agreements are valued utilizing quotes received daily by the Fund’s pricing service or through brokers, which are derived using daily swap curves and models that incorporate a number of market data factors, such as discounted cash flows, trades and values of the underlying reference instruments. |
| | • | | To-be-announced (“TBA”) commitments are valued on the basis of last available bid prices or current market quotations provided by pricing services. |
If events (e.g., a company announcement, market volatility or a natural disaster) occur that are expected to materially affect the value of such investments, or in the event that the application of these methods of valuation results in a price for an investment that is deemed not to be representative of the market value of such investment, or if a price is not available, the investment will be valued by the Global Valuation Committee, or its delegate, in accordance with a policy approved by the Board as reflecting fair value (“Fair Valued Investments”). The fair valuation approaches that may be used by the Global Valuation Committee will include market approach, income approach and cost approach. Valuation techniques such as discounted cash flow, use of market comparables and matrix pricing are types of valuation approaches and are typically used in determining fair value. When determining the price for Fair Valued Investments, the Global Valuation Committee, or its delegate, seeks to determine the price that the Fund might reasonably expect to receive or pay from the current sale or purchase of that asset or liability in an arm’s-length transaction. Fair value determinations shall be based upon all available factors that the Global Valuation Committee, or its delegate, deems relevant and consistent with the principles of fair value measurement.
| | |
| 42 | | 2017 BLACKROCK ANNUAL REPORTTO SHAREHOLDERS |
Notes to Financial Statements (continued)
The Global Valuation Committee, or its delegate, employs various methods for calibrating valuation approaches for investments where an active market does not exist, including regular due diligence of the Fund’s pricing vendors, regular reviews of key inputs and assumptions, transactional back-testing or disposition analysis to compare unrealized gains and losses to realized gains and losses, reviews of missing or stale prices and large movements in market values and reviews of any market related activity. The pricing of all Fair Valued Investments is subsequently reported to the Board or a committee thereof on a quarterly basis. As a result of the inherent uncertainty in valuation of these investments, the fair values may differ from the values that would have been used had an active market existed.
For investments in equity or debt issued by privately held companies or funds (“Private Company” or collectively, the “Private Companies”) and other Fair Valued Investments, the fair valuation approaches that are used by third party pricing services utilize one or a combination of, but not limited to, the following inputs.
| | |
| | | Standard Inputs Generally Considered By Third Party Pricing Services |
Market approach | | (i) recent market transactions, including subsequent rounds of financing, in the underlying investment or comparable issuers; (ii) recapitalizations and other transactions across the capital structure; and (iii) market multiples of comparable issuers. |
Income approach | | (i) future cash flows discounted to present and adjusted as appropriate for liquidity, credit, and/or market risks; (ii) quoted prices for similar investments or assets in active markets; and (iii) other risk factors, such as interest rates, yield curves, volatilities, prepayment speeds, loss severities, credit risks, recovery rates, liquidation amounts and/or default rates. |
Cost approach | | (i) audited or unaudited financial statements, investor communications and financial or operational metrics issued by the Private Company; (ii) changes in the valuation of relevant indices or publicly traded companies comparable to the Private Company; (iii) relevant news and other public sources; and (iv) known secondary market transactions in the Private Company’s interests and merger or acquisition activity in companies comparable to the Private Company. |
Investments in series of preferred stock issued by Private Companies are typically valued utilizing market approach in determining the enterprise value of the company. Such investments often contain rights and preferences that differ from other series of preferred and common stock of the same issuer. Valuation techniques such as an option pricing model (“OPM”), a probability weighted expected return model (“PWERM”) or a hybrid of those techniques are used in allocating enterprise value of the company, as deemed appropriate under the circumstances. The use of OPM and PWERM techniques involve a determination of the exit scenarios of the investment in order to appropriately allocate the enterprise value of the company among the various parts of its capital structure.
The Private Companies are not subject to the public company disclosure, timing, and reporting standards as other investments held by the Fund. Typically, the most recently available information by a Private Company is as of a date that is earlier than the date the Fund is calculating its NAV. This factor may result in a difference between the value of the investment and the price the Fund could receive upon the sale of the investment.
Fair Value Hierarchy: Various inputs are used in determining the fair value of investments and derivative financial instruments. These inputs to valuation techniques are categorized into a fair value hierarchy consisting of three broad levels for financial statement purposes as follows:
| | • | | Level 1 — Unadjusted price quotations in active markets/exchanges for identical assets or liabilities that the Fund has the ability to access |
| | • | | Level 2 — Other observable inputs (including, but not limited to, quoted prices for similar assets or liabilities in markets that are active, quoted prices for identical or similar assets or liabilities in markets that are not active, inputs other than quoted prices that are observable for the assets or liabilities (such as interest rates, yield curves, volatilities, prepayment speeds, loss severities, credit risks and default rates) or other market–corroborated inputs) |
| | • | | Level 3 — Unobservable inputs based on the best information available in the circumstances, to the extent observable inputs are not available (including the Fund’s own assumptions used in determining the fair value of investments and derivative financial instruments) |
The hierarchy gives the highest priority to unadjusted quoted prices in active markets for identical assets or liabilities (Level 1 measurements) and the lowest priority to unobservable inputs (Level 3 measurements). Accordingly, the degree of judgment exercised in determining fair value is greatest for instruments categorized in Level 3. The inputs used to measure fair value may fall into different levels of the fair value hierarchy. In such cases, for disclosure purposes, the fair value hierarchy classification is determined based on the lowest level input that is significant to the fair value measurement in its entirety. Investments classified within Level 3 have significant unobservable inputs used by the Global Valuation Committee in determining the price for Fair Valued Investments. Level 3 investments include equity or debt issued by Private Companies. There may not be a secondary market, and/or there are a limited number of investors. Level 3 investments may also be adjusted to reflect illiquidity and/or non-transferability, with the amount of such discount estimated by the Global Valuation Committee in the absence of market information.
Changes in valuation techniques may result in transfers into or out of an assigned level within the hierarchy. In accordance with the Fund’s policy, transfers between different levels of the fair value hierarchy are deemed to have occurred as of the beginning of the reporting period. The categorization of a value determined for investments and derivative financial instruments is based on the pricing transparency of the investments and derivative financial instruments and is not necessarily an indication of the risks associated with investing in those securities.
| 4. | SECURITIES AND OTHER INVESTMENTS |
Asset-Backed and Mortgage-Backed Securities: Asset-backed securities are generally issued as pass-through certificates or as debt instruments. Asset-backed securities issued as pass-through certificates represent undivided fractional ownership interests in an underlying pool of assets. Asset-backed securities issued as debt instruments, which are also known as collateralized obligations, are typically issued as the debt of a special purpose entity organized solely for the purpose of owning such
| | | | |
| NOTESTO FINANCIAL STATEMENTS | | | 43 | |
Notes to Financial Statements (continued)
assets and issuing such debt. Asset-backed securities are often backed by a pool of assets representing the obligations of a number of different parties. The yield characteristics of certain asset-backed securities may differ from traditional debt securities. One such major difference is that all or a principal part of the obligations may be prepaid at any time because the underlying assets (i.e., loans) may be prepaid at any time. As a result, a decrease in interest rates in the market may result in increases in the level of prepayments as borrowers, particularly mortgagors, refinance and repay their loans. An increased prepayment rate with respect to an asset-backed security will have the effect of shortening the maturity of the security. In addition, a fund may subsequently have to reinvest the proceeds at lower interest rates. If a fund has purchased such an asset-backed security at a premium, a faster than anticipated prepayment rate could result in a loss of principal to the extent of the premium paid.
For mortgage pass-through securities (the “Mortgage Assets”) there are a number of important differences among the agencies and instrumentalities of the U.S. Government that issue mortgage-related securities and among the securities that they issue. For example, mortgage-related securities guaranteed by Ginnie Mae are guaranteed as to the timely payment of principal and interest by Ginnie Mae and such guarantee is backed by the full faith and credit of the United States. However, mortgage-related securities issued by Freddie Mac and Fannie Mae, including Freddie Mac and Fannie Mae guaranteed mortgage pass-through certificates, which are solely the obligations of Freddie Mac and Fannie Mae, are not backed by or entitled to the full faith and credit of the United States, but are supported by the right of the issuer to borrow from the U.S. Treasury.
Non-agency mortgage-backed securities are securities issued by non-governmental issuers and have no direct or indirect government guarantees of payment and are subject to various risks. Non-agency mortgage loans are obligations of the borrowers thereunder only and are not typically insured or guaranteed by any other person or entity. The ability of a borrower to repay a loan is dependent upon the income or assets of the borrower. A number of factors, including a general economic downturn, acts of God, terrorism, social unrest and civil disturbances, may impair a borrower’s ability to repay its loans.
Collateralized Debt Obligations: Collateralized debt obligations (“CDOs”), including collateralized bond obligations (“CBOs”) and collateralized loan obligations (“CLOs”), are types of asset-backed securities. A CDO is an entity that is backed by a diversified pool of debt securities (CBOs) or syndicated bank loans (CLOs). The cash flows of the CDO can be split into multiple segments, called “tranches,” which will vary in risk profile and yield. The riskiest segment is the subordinated or “equity” tranche. This tranche bears the greatest risk of defaults from the underlying assets in the CDO and serves to protect the other, more senior, tranches from default in all but the most severe circumstances. Since it is shielded from defaults by the more junior tranches, a “senior” tranche will typically have higher credit ratings and lower yields than their underlying securities, and often receive investment grade ratings from one or more of the nationally recognized rating agencies. Despite the protection from the more junior tranches, senior tranches can experience substantial losses due to actual defaults, increased sensitivity to future defaults and the disappearance of one or more protecting tranches as a result of changes in the credit profile of the underlying pool of assets.
Inflation-Indexed Bonds: Inflation-indexed bonds (other than municipal inflation-indexed and certain corporate inflation-indexed bonds) are fixed-income securities whose principal value is periodically adjusted according to the rate of inflation. If the index measuring inflation rises or falls, the principal value of inflation-indexed bonds (other than municipal inflation-indexed and certain corporate inflation-indexed bonds) will be adjusted upward or downward, and consequently the interest payable on these securities (calculated with respect to a larger or smaller principal amount) will be increased or reduced, respectively. Any upward or downward adjustment in the principal amount of an inflation-indexed bond will be included as interest income in the Statement of Operations, even though investors do not receive their principal until maturity. Repayment of the original bond principal upon maturity (as adjusted for inflation) is guaranteed in the case of U.S. Treasury inflation-indexed bonds. For bonds that do not provide a similar guarantee, the adjusted principal value of the bond repaid at maturity may be less than the original principal. With regard to municipal inflation-indexed bonds and certain corporate inflation-indexed bonds, the inflation adjustment is typically reflected in the semi-annual coupon payment. As a result, the principal value of municipal inflation-indexed bonds and such corporate inflation-indexed bonds does not adjust according to the rate of inflation.
Multiple Class Pass-Through Securities: Multiple class pass-through securities, including collateralized mortgage obligations (“CMOs”) and commercial mortgage-backed securities, may be issued by Ginnie Mae, U.S. Government agencies or instrumentalities or by trusts formed by private originators of, or investors in, mortgage loans. In general, CMOs are debt obligations of a legal entity that are collateralized by a pool of residential or commercial mortgage loans or Mortgage Assets. The payments on these are used to make payments on the CMOs or multiple pass-through securities. Multiple class pass-through securities represent direct ownership interests in the Mortgage Assets. Classes of CMOs include interest only (“IOs”), principal only (“POs”), planned amortization classes and targeted amortization classes. IOs and POs are stripped mortgage-backed securities representing interests in a pool of mortgages, the cash flow from which has been separated into interest and principal components. IOs receive the interest portion of the cash flow while POs receive the principal portion. IOs and POs can be extremely volatile in response to changes in interest rates. As interest rates rise and fall, the value of IOs tends to move in the same direction as interest rates. POs perform best when prepayments on the underlying mortgages rise since this increases the rate at which the principal is returned and the yield to maturity on the PO. When payments on mortgages underlying a PO are slower than anticipated, the life of the PO is lengthened and the yield to maturity is reduced. If the underlying Mortgage Assets experience greater than anticipated prepayments of principal, a fund’s initial investment in the IOs may not fully recoup.
Stripped Mortgage-Backed Securities: Stripped mortgage-backed securities are typically issued by the U.S. Government, its agencies and instrumentalities. Stripped mortgage-backed securities are usually structured with two classes that receive different proportions of the interest (IOs) and principal (POs) distributions on a pool of Mortgage Assets. Stripped mortgage-backed securities may be privately issued.
Zero-Coupon Bonds: Zero-coupon bonds are normally issued at a significant discount from face value and do not provide for periodic interest payments. These bonds may experience greater volatility in market value than other debt obligations of similar maturity which provide for regular interest payments.
Capital Securities and Trust Preferred Securities: Capital securities, including trust preferred securities, are typically issued by corporations, generally in the form of interest-bearing notes with preferred securities characteristics. In the case of trust preferred securities, an affiliated business trust of a corporation issues these securities, generally in the form of beneficial interests in subordinated debentures or similarly structured securities. The securities can be structured with either a fixed or adjustable coupon that can have either a perpetual or stated maturity date. For trust preferred securities, the issuing bank or corporation pays interest to the trust, which is then distributed to holders of these securities as a dividend. Dividends can be deferred without creating an event of default or acceleration, although maturity cannot take place unless all cumulative payment obligations have been met. The deferral of payments does not affect the purchase or sale of these securities in the open market. These securities generally are rated below that of the issuing company’s senior debt securities and are freely callable at the issuer’s option.
| | |
| 44 | | 2017 BLACKROCK ANNUAL REPORTTO SHAREHOLDERS |
Notes to Financial Statements (continued)
Preferred Stocks: Preferred stock has a preference over common stock in liquidation (and generally in receiving dividends as well), but is subordinated to the liabilities of the issuer in all respects. As a general rule, the market value of preferred stock with a fixed dividend rate and no conversion element varies inversely with interest rates and perceived credit risk, while the market price of convertible preferred stock generally also reflects some element of conversion value. Because preferred stock is junior to debt securities and other obligations of the issuer, deterioration in the credit quality of the issuer will cause greater changes in the value of a preferred stock than in a more senior debt security with similar stated yield characteristics. Unlike interest payments on debt securities, preferred stock dividends are payable only if declared by the issuer’s board of directors. Preferred stock also may be subject to optional or mandatory redemption provisions.
Floating Rate Loan Interests: Floating rate loan interests are typically issued to companies (the “borrower”) by banks, other financial institutions, or privately and publicly offered corporations (the “lender”). Floating rate loan interests are generally non-investment grade, often involve borrowers whose financial condition is troubled or uncertain and companies that are highly leveraged or in bankruptcy proceedings. In addition, transactions in floating rate loan interests may settle on a delayed basis, which may result in proceeds from the sale not being readily available for a fund to make additional investments or meet its redemption obligations. Floating rate loan interests may include fully funded term loans or revolving lines of credit. Floating rate loan interests are typically senior in the corporate capital structure of the borrower. Floating rate loan interests generally pay interest at rates that are periodically determined by reference to a base lending rate plus a premium. Since the rates reset only periodically, changes in prevailing interest rates (and particularly sudden and significant changes) can be expected to cause some fluctuations in the NAV of a fund to the extent that it invests in floating rate loan interest. The base lending rates are generally the lending rate offered by one or more European banks, such as the London Interbank Offered Rate (“LIBOR”), the prime rate offered by one or more U.S. banks or the certificate of deposit rate. Floating rate loan interests may involve foreign borrowers, and investments may be denominated in foreign currencies. These investments are treated as investments in debt securities for purposes of a fund’s investment policies.
When a fund purchases a floating rate loan interest, it may receive a facility fee and when it sells a floating rate loan interest, it may pay a facility fee. On an ongoing basis, a fund may receive a commitment fee based on the undrawn portion of the underlying line of credit amount of a floating rate loan interest. Facility and commitment fees are typically amortized to income over the term of the loan or term of the commitment, respectively. Consent and amendment fees are recorded to income as earned. Prepayment penalty fees, which may be received by a fund upon the prepayment of a floating rate loan interest by a borrower, are recorded as realized gains. A fund may invest in multiple series or tranches of a loan. A different series or tranche may have varying terms and carry different associated risks.
Floating rate loan interests are usually freely callable at the borrower’s option. A fund may invest in such loans in the form of participations in loans (“Participations”) or assignments (“Assignments”) of all or a portion of loans from third parties. Participations typically will result in a fund having a contractual relationship only with the lender, not with the borrower. A fund has the right to receive payments of principal, interest and any fees to which it is entitled only from the lender selling the Participation and only upon receipt by the lender of the payments from the borrower. In connection with purchasing Participations, a fund generally will have no right to enforce compliance by the borrower with the terms of the loan agreement, nor any rights of offset against the borrower. A fund may not benefit directly from any collateral supporting the loan in which it has purchased the Participation. As a result, a fund assumes the credit risk of both the borrower and the lender that is selling the Participation. A fund’s investment in loan participation interests involves the risk of insolvency of the financial intermediaries who are parties to the transactions. In the event of the insolvency of the lender selling the Participation, a fund may be treated as a general creditor of the lender and may not benefit from any offset between the lender and the borrower. Assignments typically result in a fund having a direct contractual relationship with the borrower, and a fund may enforce compliance by the borrower with the terms of the loan agreement.
Forward Commitments and When-Issued Delayed Delivery Securities: The fund may purchase securities on a when-issued basis and may purchase or sell securities on a forward commitment basis. Settlement of such transactions normally occurs within a month or more after the purchase or sale commitment is made. The fund may purchase securities under such conditions with the intention of actually acquiring them, but may enter into a separate agreement to sell the securities before the settlement date. Since the value of securities purchased may fluctuate prior to settlement, the fund may be required to pay more at settlement than the security is worth. In addition, the fund is not entitled to any of the interest earned prior to settlement. When purchasing a security on a delayed delivery basis, the fund assumes the rights and risks of ownership of the security, including the risk of price and yield fluctuations. In the event of default by the counterparty, the fund’s maximum amount of loss is the unrealized appreciation of unsettled when-issued transactions.
TBA Commitments: TBA commitments are forward agreements for the purchase or sale of mortgage-backed securities for a fixed price, with payment and delivery on an agreed upon future settlement date. The specific securities to be delivered are not identified at the trade date. However, delivered securities must meet specified terms, including issuer, rate and mortgage terms. When entering into TBA commitments, a fund may take possession of or deliver the underlying mortgage-backed securities but can extend the settlement or roll the transaction. TBA commitments involve a risk of loss if the value of the security to be purchased or sold declines or increases, respectively, prior to settlement date.
In order to better define contractual rights and to secure rights that will help a fund mitigate its counterparty risk, TBA commitments may be entered into by a fund under Master Securities Forward Transaction Agreements (each, an “MSFTA”). An MSFTA typically contains, among other things, collateral posting terms and netting provisions in the event of default and/or termination event. The collateral requirements are typically calculated by netting the mark-to-market amount for each transaction under such agreement and comparing that amount to the value of the collateral currently pledged by a fund and the counterparty. Cash collateral that has been pledged to cover the obligations of a fund and cash collateral received from the counterparty, if any, is reported separately on the Statement of Assets and Liabilities as cash pledged as collateral for TBA commitments or cash received as collateral for TBA commitments, respectively. Non-cash collateral pledged by a fund, if any, is noted in the Schedule of Investments. Typically, a fund is permitted to sell, re-pledge or use the collateral it receives; however, the counterparty is not permitted to do so. To the extent amounts due to a fund is not fully collateralized, contractually or otherwise, a fund bears the risk of loss from counterparty non-performance.
Mortgage Dollar Roll Transactions: A fund may sell TBA mortgage-backed securities and simultaneously contract to repurchase substantially similar (i.e., same type, coupon and maturity) securities on a specific future date at an agreed upon price. During the period between the sale and repurchase, a fund is not entitled to receive interest and principal payments on the securities sold. Mortgage dollar roll transactions are treated as purchases and sales and realizes gains and losses on these transactions. Mortgage dollar rolls involve the risk that the market value of the securities that a fund is required to purchase may decline below the agreed upon repurchase price of those securities.
Borrowed Bond Agreements: Repurchase agreements may be referred to as borrowed bond agreements when entered into in connection with short sales of bonds. In a borrowed bond agreement, a fund borrows a bond from a counterparty in exchange for cash collateral. The agreement contains a commitment that the security and the
| | | | |
| NOTESTO FINANCIAL STATEMENTS | | | 45 | |
Notes to Financial Statements (continued)
cash will be returned to the counterparty and a fund at a mutually agreed upon date. Certain agreements have no stated maturity and can be terminated by either party at any time. Earnings on cash collateral and compensation to the lender of the bond are based on agreed upon rates between a fund and the counterparty. The value of the underlying cash collateral approximates the market value and accrued interest of the borrowed bond. To the extent that a borrowed bond transaction exceeds one business day, the value of the cash collateral in the possession of the counterparty is monitored on a daily basis to ensure the adequacy of the collateral. As the market value of the borrowed bond changes, the cash collateral is periodically increased or decreased with a frequency and in amounts prescribed in the borrowed bond agreement. A fund may also experience delays in gaining access to the collateral.
Reverse Repurchase Agreements: Reverse repurchase agreements are agreements with qualified third party broker dealers in which a fund sells securities to a bank or broker-dealer and agrees to repurchase the same securities at a mutually agreed upon date and price. A fund receives cash from the sale to use for other investment purposes. During the term of the reverse repurchase agreement, a fund continues to receive the principal and interest payments on the securities sold. Certain agreements have no stated maturity and can be terminated by either party at any time. Interest on the value of the reverse repurchase agreements issued and outstanding is based upon competitive market rates determined at the time of issuance. A fund may utilize reverse repurchase agreements when it is anticipated that the interest income to be earned from the investment of the proceeds of the transaction is greater than the interest expense of the transaction. Reverse repurchase agreements involve leverage risk. If a fund suffers a loss on its investment of the transaction proceeds from a reverse repurchase agreement, a fund would still be required to pay the full repurchase price. Further, a fund remains subject to the risk that the market value of the securities repurchased declines below the repurchase price. In such cases, a fund would be required to return a portion of the cash received from the transaction or provide additional securities to the counterparty.
Cash received in exchange for securities delivered plus accrued interest due to the counterparty is recorded as a liability in the Statement of Assets and Liabilities at face value including accrued interest. Due to the short-term nature of the reverse repurchase agreements, face value approximates fair value. Interest payments made by a fund to the counterparties are recorded as a component of interest expense in the Statement of Operations. In periods of increased demand for the security, a fund may receive a fee for the use of the security by the counterparty, which may result in interest income to a fund.
For the year ended December 31, 2017, the average amount of reverse repurchase agreements outstanding and the daily weighted average interest rate for the Fund were $35,306,881 and 0.829%, respectively.
Borrowed bond agreements and reverse repurchase transactions are entered into by a fund under Master Repurchase Agreements (each, an “MRA”), which permit a fund, under certain circumstances, including an event of default (such as bankruptcy or insolvency), to offset payables and/or receivables under the MRA with collateral held and/or posted to the counterparty and create one single net payment due to or from a fund. With borrowed bond agreements and reverse repurchase transactions, typically a fund and counterparty under an MRA are permitted to sell, re-pledge, or use the collateral associated with the transaction. Bankruptcy or insolvency laws of a particular jurisdiction may impose restrictions on or prohibitions against such a right of offset in the event of the MRA counterparty’s bankruptcy or insolvency. Pursuant to the terms of the MRA, a fund receives or posts securities as collateral with a market value in excess of the repurchase price to be paid or received by a fund upon the maturity of the transaction. Upon a bankruptcy or insolvency of the MRA counterparty, a fund is considered an unsecured creditor with respect to excess collateral and, as such, the return of excess collateral may be delayed.
As of period end, the following table is a summary of the Fund’s open borrowed bond and reverse repurchase agreements by counterparty which are subject to offset under an MRA on a net basis:
Borrowed Bond Agreements and Reverse Repurchase Agreements
| | | | | | | | | | | | | | | | | | | | | | | | | | | | | | | | | | | | | | | | |
| Counterparty | | Borrowed Bond
Agreements(a) | | | Reverse
Repurchase
Agreements | | | Borrowed Bond
at Value
including
Accrued
Interest(b) | | | Exposure Due
(to) / from
Counterparty
before
Collateral | | | Non-cash
Collateral
Received | | | Cash Collateral
Received | | | Fair Value of
Non-cash
Collateral
Pledged
Including
Accrued
Interest(c) | | | Cash
Collateral
Pledged | | | Net Collateral
(Received) /
Pledged(c) | | | Net Exposure
Due (to) / from
Counterparty(d) | |
Barclays Bank plc | | $ | 642,402 | | | $ | — | | | $ | (642,737 | ) | | $ | (335 | ) | | $ | — | | | $ | — | | | $ | — | | | $ | — | | | $ | — | | | $ | (335 | ) |
Barclays Capital, Inc. | | | — | | | | (2,397,800 | ) | | | — | | | | (2,397,800 | ) | | | — | | | | — | | | | 2,397,800 | | | | — | | | | 2,397,800 | | | | — | |
BNP Paribas SA | | | — | | | | (16,778,610 | ) | | | — | | | | (16,778,610 | ) | | | — | | | | — | | | | 16,778,610 | | | | — | | | | 16,778,610 | | | | — | |
Deutsche Bank Securities, Inc. | | | — | | | | (9,555,631 | ) | | | — | | | | (9,555,631 | ) | | | — | | | | — | | | | 9,555,631 | | | | — | | | | 9,555,631 | | | | — | |
Merrill Lynch, Pierce, Fenner & Smith, Inc. | | | — | | | | (8,706,536 | ) | | | — | | | | (8,706,536 | ) | | | — | | | | — | | | | 8,706,536 | | | | — | | | | 8,706,536 | | | | — | |
| | $ | 642,402 | | | $ | (37,438,577 | ) | | $ | (642,737 | ) | | $ | (37,438,912 | ) | | $ | — | | | $ | — | | | $ | 37,438,577 | | | $ | — | | | $ | 37,438,577 | | | $ | (335 | ) |
| | | | | | | | | | | | | | | | | | | | | | | | | | | | | | | | | | | | | | | | |
| | (a) | Included in Investments at value-unaffiliated in the Statement of Assets and Liabilities. | |
| | (b) | Includes accrued interest on borrowed bonds in the amount of $202 which is included in interest expense payable in the Statement of Assets and Liabilities. | |
| | (c) | Net collateral with a value of $37,448,005 has been pledged/received in connection with open reverse repurchase agreements. Excess of net collateral pledged to the individual counterparty is not shown for financial reporting purposes. | |
| | (d) | Net exposure represents the net receivable (payable) that would be due from/to the counterparty in the event of default. | |
In the event the counterparty of securities under an MRA files for bankruptcy or becomes insolvent, a fund’s use of the proceeds from the agreement may be restricted while the counterparty, or its trustee or receiver, determines whether or not to enforce a fund’s obligation to repurchase the securities.
| | |
| 46 | | 2017 BLACKROCK ANNUAL REPORTTO SHAREHOLDERS |
Notes to Financial Statements (continued)
Short Sale Transactions: In short sale transactions, a fund sells a security it does not hold in anticipation of a decline in the market price of that security. When a fund makes a short sale, it will borrow the security sold short (borrowed bond) and deliver the fixed-income security to the counterparty to which it sold the security short. An amount equal to the proceeds received by a fund is reflected as an asset and an equivalent liability. The amount of the liability is subsequently marked-to-market to reflect the market value of the short sale. A fund is required to repay the counterparty interest on the security sold short, which, if applicable, is shown as interest expense in the Statement of Operations. A fund is exposed to market risk based on the amount, if any, that the market value of the security increases beyond the market value at which the position was sold. Thus, a short sale of a security involves the risk that instead of declining, the price of the security sold short will rise. The short sale of securities involves the possibility of an unlimited loss since there is an unlimited potential for the market price of the security sold short to increase. A gain is limited to the price at which a fund sold the security short. A realized gain or loss is recognized upon the termination of a short sale if the market price is either less than or greater than the proceeds originally received. There is no assurance that a fund will be able to close out a short position at a particular time or at an acceptable price.
| 5. | DERIVATIVE FINANCIAL INSTRUMENTS |
The Fund engages in various portfolio investment strategies using derivative contracts both to increase the returns of the Fund and/or to manage its exposure to certain risks such as credit risk, equity risk, interest rate risk, foreign currency exchange rate risk, commodity price risk or other risks (e.g., inflation risk). Derivative financial instruments categorized by risk exposure are included in the Schedule of Investments. These contracts may be transacted on an exchange or OTC.
Futures Contracts: Futures contracts are purchased or sold to gain exposure to, or manage exposure to, changes in interest rates (interest rate risk), changes in the value of equity securities (equity risk) or foreign currencies (foreign currency exchange rate risk).
Futures contracts are agreements between the Fund and a counterparty to buy or sell a specific quantity of an underlying instrument at a specified price and on a specified date. Depending on the terms of a contract, it is settled either through physical delivery of the underlying instrument on the settlement date or by payment of a cash amount on the settlement date. Upon entering into a futures contract, the Fund is required to deposit initial margin with the broker in the form of cash or securities in an amount that varies depending on a contract’s size and risk profile. The initial margin deposit must then be maintained at an established level over the life of the contract.
Securities deposited as initial margin are designated in the Schedule of Investments and cash deposited, if any, is shown as cash pledged for futures contracts in the Statement of Assets and Liabilities. Pursuant to the contract, the Fund agrees to receive from or pay to the broker an amount of cash equal to the daily fluctuation in market value of the contract (“variation margin”). Variation margin is recorded as unrealized appreciation (depreciation) and, if any, shown as variation margin receivable (or payable) on futures contracts in the Statement of Assets and Liabilities. When the contract is closed, a realized gain or loss is recorded in the Statement of Operations equal to the difference between the notional amount of the contract at the time it was opened and the notional amount at the time it was closed. The use of futures contracts involves the risk of an imperfect correlation in the movements in the price of futures contracts and interest, foreign currency exchange rates or underlying assets.
Forward Foreign Currency Exchange Contracts: Forward foreign currency exchange contracts are entered into to gain or reduce exposure, to foreign currencies (foreign currency exchange rate risk).
A forward foreign currency exchange contract is an agreement between two parties to buy and sell a currency at a set exchange rate on a specified date. These contracts help to manage the overall exposure to the currencies in which some of the investments held by the Fund are denominated and in some cases, may be used to obtain exposure to a particular market.
The contract is marked-to-market daily and the change in market value is recorded as unrealized appreciation (depreciation) in the Statement of Assets and Liabilities. When a contract is closed, a realized gain or loss is recorded in the Statement of Operations equal to the difference between the value at the time it was opened and the value at the time it was closed. Non-deliverable forward foreign currency exchange contracts are settled with the counterparty in cash without the delivery of foreign currency. The use of forward foreign currency exchange contracts involves the risk that the value of a forward foreign currency exchange contract changes unfavorably due to movements in the value of the referenced foreign currencies.
Options: The Fund purchases and writes call and put options to increase or decrease its exposure to the risks of underlying instruments, including equity risk, interest rate risk and/or commodity price risk and/or, in the case of options written, to generate gains from options premiums.
A call option gives the purchaser (holder) of the option the right (but not the obligation) to buy, and obligates the seller (writer) to sell (when the option is exercised) the underlying instrument at the exercise or strike price at any time or at a specified time during the option period. A put option gives the holder the right to sell and obligates the writer to buy the underlying instrument at the exercise or strike price at any time or at a specified time during the option period.
Premiums paid on options purchased and premiums received on options written, as well as the daily fluctuation in market value, are included in investments at value — unaffiliated and options written at value, respectively, in the Statement of Assets and Liabilities. When an instrument is purchased or sold through the exercise of an option, the premium is offset against the cost or proceeds of the underlying instrument. When an option expires, a realized gain or loss is recorded in the Statement of Operations to the extent of the premiums received or paid. When an option is closed or sold, a gain or loss is recorded in the Statement of Operations to the extent the cost of the closing transaction exceeds the premiums received or paid. When the Fund writes a call option, such option is typically “covered,” meaning that it holds the underlying instrument subject to being called by the option counterparty. When the Fund writes a put option, such option is covered by cash in an amount sufficient to cover the obligation:
| | • | | Swaptions — The Fund purchases and writes options on swaps (“swaptions”) primarily to preserve a return or spread on a particular investment or portion of the Fund’s holdings, as a duration management technique or to protect against an increase in the price of securities it anticipates purchasing at a later date. The purchaser and writer of a swaption is buying or granting the right to enter into a previously agreed upon interest rate or credit default swap agreement (interest rate risk and/or credit risk) at any time before the expiration of the option. |
| | | | |
| NOTESTO FINANCIAL STATEMENTS | | | 47 | |
Notes to Financial Statements (continued)
| | • | | Foreign currency options — The Fund purchases and writes foreign currency options, foreign currency futures and options on foreign currency futures to gain or reduce exposure to foreign currencies (foreign currency exchange rate risk). Foreign currency options give the purchaser the right to buy from or sell to the writer a foreign currency at any time before the expiration of the option. |
| | • | | Barrier options — The Fund may purchase and write a variety of options with non-standard payout structures or other features (“barrier options”) that are generally traded OTC. |
| | • | | The Fund may invest in various types of barrier options, including down-and-out options, down-and-in options, double no-touch options, one-touch options, up-and-out options and up-and-in options. Down-and-out options expire worthless to the purchaser if the price of the underlying instrument falls below a specific barrier price level prior to the expiration date. Down-and-in options expire worthless to the purchaser unless the price of the underlying instrument falls below a specific barrier price level prior to the expiration date. Double no-touch options provide the purchaser an agreed-upon payout if the price of the underlying instrument does not reach or surpass predetermined barrier price levels prior to the option’s expiration date. One-touch options provide the purchaser an agreed-upon payout if the price of the underlying instrument reaches or surpasses predetermined barrier price levels prior to the expiration date. Up-and-out options expire worthless to the purchaser if the price of the underlying instrument increases beyond a predetermined barrier price level prior to the expiration date. Up-and-in options can only be exercised when the price of the underlying instrument increases beyond a predetermined barrier price level. |
In purchasing and writing options, the Fund bears the risk of an unfavorable change in the value of the underlying instrument or the risk that it may not be able to enter into a closing transaction due to an illiquid market. Exercise of a written option could result in the Fund purchasing or selling a security when it otherwise would not, or at a price different from the current market value.
Swaps: Swap contracts are entered into to manage exposure to issuers, markets and securities. Such contracts are agreements between the Fund and a counterparty to make periodic net payments on a specified notional amount or a net payment upon termination. Swap agreements are privately negotiated in the OTC market and may be entered into as a bilateral contract (“OTC swaps”) or centrally cleared (“centrally cleared swaps”).
For OTC swaps, any upfront premiums paid and any upfront fees received are shown as swap premiums paid and swap premiums received, respectively, in the Statement of Assets and Liabilities and amortized over the term of the contract. The daily fluctuation in market value is recorded as unrealized appreciation (depreciation) on OTC Swaps in the Statement of Assets and Liabilities. Payments received or paid are recorded in the Statement of Operations as realized gains or losses, respectively. When an OTC swap is terminated, a realized gain or loss is recorded in the Statement of Operations equal to the difference between the proceeds from (or cost of) the closing transaction and the Fund’s basis in the contract, if any. Generally, the basis of the contract is the premium received or paid.
In a centrally cleared swap, immediately following execution of the swap contract, the swap contract is novated to a central counterparty (the “CCP”) and the Fund’s counterparty on the swap agreement becomes the CCP. The Fund is required to interface with the CCP through the broker. Upon entering into a centrally cleared swap, the Fund is required to deposit initial margin with the broker in the form of cash or securities in an amount that varies depending on the size and risk profile of the particular swap. Securities deposited as initial margin are designated in the Schedule of Investments and cash deposited is shown as cash pledged for centrally cleared swaps in the Statement of Assets and Liabilities. Pursuant to the contract, the Fund agrees to receive from or pay to the broker an amount of cash equal to the daily fluctuation in market value of the contract (“variation margin”). Variation margin is recorded as unrealized appreciation (depreciation) and shown as variation margin receivable (or payable) on centrally cleared swaps in the Statement of Assets and Liabilities. Payments received from (paid to) the counterparty, including at termination, are recorded as realized gains (losses) in the Statement of Operations.
| | • | | Credit default swaps — Credit default swaps are entered into to manage exposure to the market or certain sectors of the market, to reduce risk exposure to defaults of corporate and/or sovereign issuers or to create exposure to corporate and/or sovereign issuers to which a fund is not otherwise exposed (credit risk). |
The Fund may either buy or sell (write) credit default swaps on single-name issuers (corporate or sovereign), a combination or basket of single-name issuers or traded indexes. Credit default swaps are agreements in which the protection buyer pays fixed periodic payments to the seller in consideration for a promise from the protection seller to make a specific payment should a negative credit event take place with respect to the referenced entity (e.g., bankruptcy, failure to pay, obligation acceleration, repudiation, moratorium or restructuring). As a buyer, if an underlying credit event occurs, the Fund will either (i) receive from the seller an amount equal to the notional amount of the swap and deliver the referenced security or underlying securities comprising the index, or (ii) receive a net settlement of cash equal to the notional amount of the swap less the recovery value of the security or underlying securities comprising the index. As a seller (writer), if an underlying credit event occurs, the Fund will either pay the buyer an amount equal to the notional amount of the swap and take delivery of the referenced security or underlying securities comprising the index or pay a net settlement of cash equal to the notional amount of the swap less the recovery value of the security or underlying securities comprising the index.
| | • | | Total return swaps — Total return swaps are entered into to obtain exposure to a security or market without owning such security or investing directly in such market or to exchange the risk/return of one market (e.g., fixed-income) with another market (e.g., equity or commodity prices) (equity risk, commodity price risk and/or interest rate risk). |
Total return swaps are agreements in which there is an exchange of cash flows whereby one party commits to make payments based on the total return (distributions plus capital gains/losses) of an underlying instrument in exchange for fixed or floating rate interest payments. If the total return of the instrument or index underlying the transaction exceeds or falls short of the offsetting fixed or floating interest rate obligation, the Fund receives payment from or makes a payment to the counterparty.
| | • | | Interest rate swaps — Interest rate swaps are entered into to gain or reduce exposure to interest rates or to manage duration, the yield curve or interest rate (interest rate risk). |
Interest rate swaps are agreements in which one party pays a stream of interest payments, either fixed or floating, in exchange for another party’s stream of interest payments, either fixed or floating, on the same notional amount for a specified period of time. In more complex interest rate swaps, the notional principal amount may decline (or amortize) over time.
| | |
| 48 | | 2017 BLACKROCK ANNUAL REPORTTO SHAREHOLDERS |
Notes to Financial Statements (continued)
| | • | | Forward swaps — The Fund enters into forward interest rate swaps and forward total return swaps. In a forward swap, the Fund and the counterparty agree to make periodic net payments beginning on a specified date or a net payment at termination. |
Swap transactions involve, to varying degrees, elements of interest rate, credit and market risk in excess of the amounts recognized in the Statement of Assets and Liabilities. Such risks involve the possibility that there will be no liquid market for these agreements, that the counterparty to the agreements may default on its obligation to perform or disagree as to the meaning of the contractual terms in the agreements, and that there may be unfavorable changes in interest rates and/or market values associated with these transactions.
Master Netting Arrangements: In order to define its contractual rights and to secure rights that will help it mitigate its counterparty risk, the Fund may enter into an International Swaps and Derivatives Association, Inc. Master Agreement (“ISDA Master Agreement”) or similar agreement with its counterparties. An ISDA Master Agreement is a bilateral agreement between the Fund and a counterparty that governs certain OTC derivatives and typically contains, among other things, collateral posting terms and netting provisions in the event of a default and/or termination event. Under an ISDA Master Agreement, the Fund may, under certain circumstances, offset with the counterparty certain derivative financial instruments’ payables and/or receivables with collateral held and/or posted and create one single net payment. The provisions of the ISDA Master Agreement typically permit a single net payment in the event of default including the bankruptcy or insolvency of the counterparty. Bankruptcy or insolvency laws of a particular jurisdiction may restrict or prohibit the right of offset in bankruptcy, insolvency or other events.
Collateral Requirements: For derivatives traded under an ISDA Master Agreement, the collateral requirements are typically calculated by netting the mark-to-market amount for each transaction under such agreement and comparing that amount to the value of any collateral currently pledged by the Fund and the counterparty.
Cash collateral that has been pledged to cover obligations of the Fund and cash collateral received from the counterparty, if any, is reported separately on the Statement of Assets and Liabilities as cash pledged as collateral and cash received as collateral, respectively. Non-cash collateral pledged by the Fund, if any, is noted in the Schedule of Investments. Generally, the amount of collateral due from or to a counterparty is subject to a certain minimum transfer amount threshold before a transfer is required, which is determined at the close of business of the Fund. Any additional required collateral is delivered to/pledged by the Fund on the next business day. Typically, the counterparty is not permitted to sell, re-pledge or use cash and non-cash collateral it receives. The Fund generally agrees not to use non-cash collateral that it receives but may, absent default or certain other circumstances defined in the underlying ISDA Master Agreement, be permitted to use cash collateral received. In such cases, interest may be paid pursuant to the collateral arrangement with the counterparty. To the extent amounts due to the Fund from its counterparties are not fully collateralized, it bears the risk of loss from counterparty non-performance. Likewise, to the extent the Fund has delivered collateral to a counterparty and stands ready to perform under the terms of its agreement with such counterparty, it bears the risk of loss from a counterparty in the amount of the value of the collateral in the event the counterparty fails to return such collateral. Based on the terms of agreements, collateral may not be required for all derivative contracts.
For financial reporting purposes, the Fund does not offset derivative assets and derivative liabilities that are subject to netting arrangements, if any, in the Statement of Assets and Liabilities.
| 6. | INVESTMENT ADVISORY AGREEMENT AND OTHER TRANSACTIONS WITH AFFILIATES |
The PNC Financial Services Group, Inc. is the largest stockholder and an affiliate of BlackRock, Inc. (“BlackRock”) for 1940 Act purposes.
Investment Advisory: The Company, on behalf of the Fund, entered into an Investment Advisory Agreement with the Manager, the Fund’s investment adviser, an indirect, wholly-owned subsidiary of BlackRock, to provide investment advisory and administrative services. The Manager is responsible for the management of the Fund’s portfolio and provides the personnel, facilities, equipment and certain other services necessary to the operations of the Fund.
For such services, the Fund pays the Manager a monthly fee based on a percentage of the Fund’s and BlackRock High Yield V.I. Fund’s, a series of the Company, aggregate average daily net assets at the following annual rates:
| | | | |
| Average Daily Net Assets | | Investment
Advisory Fees | |
First $250 Million | | | 0.50 | % |
$250 Million — $500 Million | | | 0.45 | |
$500 Million — $750 Million | | | 0.40 | |
Greater than $750 Million | | | 0.35 | |
For the year ended December 31, 2017, the aggregate average daily net assets of the Fund and the Company’s BlackRock High Yield V.I. Fund were approximately $766,491,695.
Distribution Fees: The Company, on behalf of the Fund, entered into a Distribution Agreement and a Distribution Plan with BlackRock Investments, LLC (“BRIL”), an affiliate of the Manager. Pursuant to the Distribution Plan and in accordance with Rule 12b-1 under the 1940 Act, the Fund pays BRIL ongoing distribution fees. The fees are accrued daily and paid monthly at an annual rate of 0.25% based upon the average daily net assets attributable to Class III.
For the year ended December 31, 2017, the class specific distribution fees borne directly by Class III was $557,875.
Transfer Agent: On behalf of the Fund, the Manager entered into agreements with insurance companies and other financial intermediaries (“Service Organizations”), some of which may be affiliates. Pursuant to these agreements, the Service Organizations provide the Fund with administrative, networking, recordkeeping, sub-transfer agency and shareholder services to sub-accounts they service. For these services, the Service Organizations receive an annual fee per shareholder account, which will vary depending on share class and/or net assets of Fund shareholders serviced by the Service Organizations, which is shown as transfer agent — class specific. For the year ended December 31, 2017, the Fund did not pay any amounts to affiliates in return for these services.
| | | | |
| NOTESTO FINANCIAL STATEMENTS | | | 49 | |
Notes to Financial Statements (continued)
In addition, the Fund pays the transfer agent, which is not an affiliate, a fee for issuance, transfer and redemption of shares and the opening and maintenance of shareholder accounts, which is included in transfer agent in the Statement of Operations.
For the year ended December 31, 2017, the following table shows the class specific transfer agent fees borne directly by each share class of the Fund:
| | | | | | | | | | | | | | |
| Class I | | | | | Class III | | | | | Total | |
| $ | 309,667 | | | | | $ | 360,159 | | | | | $ | 669,826 | |
Expense Limitations, Waivers and Reimbursements: With respect to the Fund, the Manager voluntarily agreed to waive its investment advisory fees by the amount of investment advisory fees the Fund pays to the Manager indirectly through its investment in affiliated money market funds (the “affiliated money market fund waiver”). The amount of waivers and/or reimbursements of fees and expenses made pursuant to the expense limitation will be reduced by the amount of the affiliated money market fund waiver. This amount is shown as fees waived and/or reimbursed by the Manager in the Statement of Operations. For the year ended December 31, 2017, the amount waived was $3,471.
The Manager has contractually agreed to waive its investment advisory fee with respect to any portion of the Fund’s assets invested in affiliated equity and fixed-income mutual funds and affiliated exchange-traded funds that have a contractual management fee through April 30, 2018. The contractual agreement may be terminated upon 90 days’ notice by a majority of the independent directors who are not “interested persons” of the Fund, as defined in the 1940 Act (“Independent Directors”) or by a vote of a majority of the outstanding voting securities of the Fund. For the year ended December 31, 2017, there were no fees waived by the Manager.
For the year ended December 31, 2017, the Fund reimbursed the Manager $3,548 for certain accounting services, which is included in accounting services in the Statement of Operations.
The Manager has contractually agreed to reimburse transfer agent fees in order to limit such expenses to a percentage of average daily net assets as follows:
| | | | |
Class I | | | 0.00 | % |
Class III | | | 0.06 | |
The Manager has agreed not to reduce or discontinue this contractual reimbursement through April 30, 2018 unless approved by the Board, including a majority of Independent Directors or by a vote of a majority of the outstanding voting securities of the Fund.
These amounts waived and/or reimbursed are shown as transfer agent fees reimbursed — class specific in the Statement of Operations. For the year ended December 31, 2017, class specific waivers and/or reimbursements were as follows:
| | | | | | | | | | | | |
| | | Class I | | | Class III | | | Total | |
Transfer Agent Fees Reimbursed | | $ | 309,667 | | | $ | 226,260 | | | $ | 535,927 | |
With respect to the Fund, the Manager contractually agreed to waive and/or reimburse fees or expenses in order to limit expenses, excluding interest expense, dividend expense, tax expense, acquired fund fees and expenses, and certain other fund expenses, which constitute extraordinary expenses not incurred in the ordinary course of the Fund’s business (“expense limitation”). The expense limitations as a percentage of average daily net assets are as follows:
| | | | | | |
| Class I | | | | Class III | |
| 1.25% | | | | | 1.50% | |
The Manager has agreed not to reduce or discontinue this contractual expense limitation through April 30, 2018 unless approved by the Board, including a majority of the Independent Directors or by a vote of a majority of the outstanding voting securities of the Fund. For the year ended December 31, 2017, there were no fees waived and/or reimbursed by the Manager.
Officers and Directors: Certain directors and/or officers of the Company are directors and/or officers of BlackRock or its affiliates. The Fund reimburses the Manager for a portion of the compensation paid to the Company’s Chief Compliance Officer, which is included in Directors and Officer in the Statement of Operations.
Other Transactions: During the year ended December 31, 2017, the Fund received a reimbursement of $19,241 from an affiliate, which is included in payment by affiliate in the Statement of Operations, related to an operating error.
The Fund may purchase securities from, or sell securities to, an affiliated fund provided the affiliation is due solely to having a common investment adviser, common officers, or common directors. For the year ended December 31, 2017, the purchase and sale transactions and any net realized gains (losses) with an affiliated fund in compliance with Rule 17a-7 under the 1940 Act were as follows:
| | | | |
Purchases | | $ | 27,944,882 | |
Sales | | | 25,851,242 | |
Net Realized Gain | | | 17,584 | |
| | |
| 50 | | 2017 BLACKROCK ANNUAL REPORTTO SHAREHOLDERS |
Notes to Financial Statements (continued)
For the year ended December 31, 2017, purchases and sales of investments, including paydowns, mortgage dollar rolls and excluding short-term securities, were as follows:
| | | | | | | | |
| | | Purchases | | | Sales | |
Non-U.S Government Securities | | $ | 2,275,656,320 | | | $ | 2,074,344,197 | |
U.S Government Securities | | | 483,515,262 | | | | 430,080,546 | |
For the year ended December 31, 2017, purchases and sales related to mortgage dollar rolls were $952,490,704 and $952,394,168, respectively.
It is the Fund’s policy to comply with the requirements of the Internal Revenue Code of 1986, as amended, applicable to regulated investment companies, and to distribute substantially all of its taxable income to its shareholders. Therefore, no federal income tax provision is required.
The Fund files U.S. federal and various state and local tax returns. No income tax returns are currently under examination. The statute of limitations on the Fund’s U.S. federal tax returns generally remains open for each of the four years ended December 31, 2017. The statutes of limitations on the Fund’s state and local tax returns may remain open for an additional year depending upon the jurisdiction.
Management has analyzed tax laws and regulations and their application to the Fund as of December 31, 2017, inclusive of the open tax return years, and does not believe that there are any uncertain tax positions that require recognition of a tax liability in the Fund’s financial statements.
U.S. GAAP requires that certain components of net assets be adjusted to reflect permanent differences between financial and tax reporting. These reclassifications have no effect on net assets or net asset values per share. As of period end, the following permanent differences attributable to the accounting for swap agreements, the classification of investments, foreign currency transactions, the characterization of expenses, the expiration of capital loss carryforwards, net paydown losses and fees paid on trade settlements were reclassified to the following accounts:
| | | | |
Paid-in capital | | $ | (23,090,333 | ) |
Distributions in excess of net investment income | | | (141,762 | ) |
Accumulated net realized loss | | | 23,232,095 | |
The tax character of distributions paid was as follows:
| | | | | | | | |
| | | 12/31/17 | | | 12/31/16 | |
Ordinary income | | $ | 8,907,589 | | | $ | 5,516,618 | |
As of December 31, 2017, the tax components of accumulated net earnings (losses) were as follows:
| | | | |
Capital loss carryforward | | | (2,473,996 | ) |
Net unrealized gains(a) | | | 721,294 | |
| | | | |
Total | | $ | (1,752,702 | ) |
| | | | |
| | (a) | The difference between book-basis and tax-basis net unrealized losses was attributable primarily to the tax deferral of losses on wash sales, the realization for tax purposes of unrealized gains/losses on certain options, futures and foreign currency contracts, the accounting for swap agreements and the classification of investments. | |
As of December 31, 2017, the Fund had a capital loss carryforward, with no expiration date, available to offset future realized capital gains of $2,473,996.
As of December 31, 2017, gross unrealized appreciation and depreciation for investments and derivatives based on cost for U.S. federal income tax purposes were as follows:
| | | | |
Tax cost | | $ | 559,287,459 | |
| | | | |
Gross unrealized appreciation | | $ | 5,785,858 | |
Gross unrealized depreciation | | | (4,666,038 | ) |
| | | | |
Net unrealized appreciation (depreciation) | | | 1,119,820 | |
| | | | |
The Company, on behalf of the Fund, along with certain other funds managed by the Manager and its affiliates (“Participating Funds”), is a party to a 364-day, $2.1 billion credit agreement with a group of lenders. Under this agreement, the Fund may borrow to fund shareholder redemptions. Excluding commitments designated for certain individual funds, the Participating Funds, including the Fund, can borrow up to an aggregate commitment amount of $1.6 billion at any time outstanding, subject to asset coverage and other limitations as specified in the agreement. The credit agreement has the following terms: a fee of 0.12% per annum on unused commitment amounts and interest at a rate equal to the higher of (a) one-month LIBOR (but, in any event, not less than 0.00%) on the date the loan is made plus 0.80% per annum or (b) the Fed Funds rate (but, in any event, not less than 0.00%) in effect from time to time plus 0.80% per annum on amounts borrowed. The agreement expires in April 2018 unless extended or renewed. Participating Funds paid administration, legal and arrangement fees, which, if applicable, are included in miscellaneous expenses in the Statement of Operations. These fees were allocated among such funds based upon portions of the aggregate commitment available to them and relative net assets of Participating Funds. During the year ended December 31, 2017, the Fund did not borrow under the credit agreement.
| | | | |
| NOTESTO FINANCIAL STATEMENTS | | | 51 | |
Notes to Financial Statements (continued)
Many municipalities insure repayment of their bonds, which may reduce the potential for loss due to credit risk. The market value of these bonds may fluctuate for other reasons, including market perception of the value of such insurance, and there is no guarantee that the insurer will meet its obligation.
Inventories of municipal bonds held by brokers and dealers may decrease, which would lessen their ability to make a market in these securities. Such a reduction in market making capacity could potentially decrease the Fund’s ability to buy or sell bonds. As a result, the Fund may sell a security at a lower price, sell other securities to raise cash, or give up an investment opportunity, any of which could have a negative impact on performance. If the Fund needed to sell large blocks of bonds, those sales could further reduce the bonds’ prices and impact performance.
In the normal course of business, the Fund invests in securities or other instruments and may enter into certain transactions, and such activities subject the Fund to various risks, including among others, fluctuations in the market (market risk) or failure of an issuer to meet all of its obligations. The value of securities or other instruments may also be affected by various factors, including, without limitation: (i) the general economy; (ii) the overall market as well as local, regional or global political and/or social instability; (iii) regulation, taxation or international tax treaties between various countries; or (iv) currency, interest rate and price fluctuations. The Fund’s prospectus provides details of the risks to which the Fund is subject.
The Fund may be exposed to prepayment risk, which is the risk that borrowers may exercise their option to prepay principal earlier than scheduled during periods of declining interest rates, which would force the Fund to reinvest in lower yielding securities. The Fund may also be exposed to reinvestment risk, which is the risk that income from the Fund’s portfolio will decline if the Fund invests the proceeds from matured, traded or called fixed-income securities at market interest rates that are below the Fund portfolio’s current earnings rate.
Valuation Risk: The market values of equities, such as common stocks and preferred securities or equity related investments, such as futures and options, may decline due to general market conditions which are not specifically related to a particular company. They may also decline due to factors which affect a particular industry or industries. The Fund may invest in illiquid investments and may experience difficulty in selling those investments in a timely manner at the price that it believes the investments are worth. Prices may fluctuate widely over short or extended periods in response to company, market or economic news. Markets also tend to move in cycles, with periods of rising and falling prices. This volatility may cause the Fund’s NAV to experience significant increases or decreases over short periods of time. If there is a general decline in the securities and other markets, the NAV of the Fund may lose value, regardless of the individual results of the securities and other instruments in which the Fund invests.
The price the Fund could receive upon the sale of any particular portfolio investment may differ from the Fund’s valuation of the investment, particularly for securities that trade in thin or volatile markets or that are valued using a fair valuation technique or a price provided by an independent pricing service. Changes to significant unobservable inputs and assumptions (i.e., publicly traded company multiples, growth rate, time to exit) due to the lack of observable inputs may significantly impact the resulting fair value and therefore the Fund’s results of operations. As a result, the price received upon the sale of an investment may be less than the value ascribed by the Fund, and the Fund could realize a greater than expected loss or lesser than expected gain upon the sale of the investment. The Fund’s ability to value its investments may also be impacted by technological issues and/or errors by pricing services or other third party service providers.
Counterparty Credit Risk: The Fund may be exposed to counterparty credit risk, or the risk that an entity may fail to or be unable to perform on its commitments related to unsettled or open transactions. The Fund manages counterparty credit risk by entering into transactions only with counterparties that the Manager believes have the financial resources to honor their obligations and by monitoring the financial stability of those counterparties. Financial assets, which potentially expose the Fund to market, issuer and counterparty credit risks, consist principally of financial instruments and receivables due from counterparties. The extent of the Fund’s exposure to market, issuer and counterparty credit risks with respect to these financial assets is approximately their value recorded in the Statement of Assets and Liabilities, less any collateral held by the Fund.
A derivative contract may suffer a mark-to-market loss if the value of the contract decreases due to an unfavorable change in the market rates or values of the underlying instrument. Losses can also occur if the counterparty does not perform under the contract.
The Fund’s risk of loss from counterparty credit risk on OTC derivatives is generally limited to the aggregate unrealized gain less the value of any collateral held by the Fund.
For OTC options purchased, the Fund bears the risk of loss in the amount of the premiums paid plus the positive change in market values net of any collateral held by the Fund should the counterparty fail to perform under the contracts. Options written by the Fund do not typically give rise to counterparty credit risk, as options written generally obligate the Fund, and not the counterparty, to perform. The Fund may be exposed to counterparty credit risk with respect to options written to the extent the Fund deposits collateral with its counterparty to a written option.
With exchange-traded options purchased and futures and centrally cleared swaps, there is less counterparty credit risk to the Fund since the exchange or clearinghouse, as counterparty to such instruments, guarantees against a possible default. The clearinghouse stands between the buyer and the seller of the contract; therefore, credit risk is limited to failure of the clearinghouse. While offset rights may exist under applicable law, the Fund does not have a contractual right of offset against a clearing broker or clearinghouse in the event of a default (including the bankruptcy or insolvency). Additionally, credit risk exists in exchange-traded futures and centrally cleared swaps with respect to initial and variation margin that is held in a clearing broker’s customer accounts. While clearing brokers are required to segregate customer margin from their own assets, in the event that a clearing broker becomes insolvent or goes into bankruptcy and at that time there is a shortfall in the aggregate amount of margin held by the clearing broker for all its clients, typically the shortfall would be allocated on a pro rata basis across all the clearing broker’s customers, potentially resulting in losses to the Fund.
| | |
| 52 | | 2017 BLACKROCK ANNUAL REPORTTO SHAREHOLDERS |
Notes to Financial Statements (continued)
Concentration Risk: The Fund invests a significant portion of its assets in fixed-income securities and/or uses derivatives tied to the fixed-income markets. Changes in market interest rates or economic conditions may affect the value and/or liquidity of such investments. Interest rate risk is the risk that prices of bonds and other fixed-income securities will increase as interest rates fall and decrease as interest rates rise. The Fund may be subject to a greater risk of rising interest rates due to the current period of historically low rates.
The Fund invests a significant portion of its assets in securities backed by commercial or residential mortgage loans or in issuers that hold mortgage and other asset-backed securities. Investment percentages in these securities are presented in the Schedule of Investments. Changes in economic conditions, including delinquencies and/or defaults on assets underlying these securities, can affect the value, income and/or liquidity of such positions.
| 11. | CAPITAL SHARE TRANSACTIONS |
Transactions in capital shares for each class were as follows:
| | | | | | | | | | | | | | | | |
| | | Year Ended
12/31/2017 | | | Year Ended
12/31/2016 | |
| | | Shares | | | Amount | | | Shares | | | Amount | |
Class I | | | | | | | | | | | | | | | | |
Shares sold | | | 738,932 | | | $ | 8,778,869 | | | | 2,078,444 | | | $ | 25,204,731 | |
Shares issued in reinvestment of distributions | | | 330,876 | | | | 3,939,184 | | | | 267,271 | | | | 3,203,436 | |
Shares redeemed | | | (1,644,712 | ) | | | (19,574,644 | ) | | | (2,147,090 | ) | | | (25,786,780 | ) |
| | | | | | | | | | | | | | | | |
Net increase (decrease) | | | (574,904 | ) | | $ | (6,856,591 | ) | | | 198,625 | | | $ | 2,621,387 | |
| | | | | | | | | | | | | | | | |
| | | | |
Class III | | | | | | | | | | | | | | | | |
Shares sold | | | 7,912,809 | | | $ | 93,125,910 | | | | 9,823,253 | | | $ | 116,352,187 | |
Shares issued in reinvestment of distributions | | | 409,818 | | | | 4,824,507 | | | | 178,754 | | | | 2,121,457 | |
Shares redeemed | | | (606,082 | ) | | | (7,124,260 | ) | | | (918,301 | ) | | | (10,933,281 | ) |
| | | | | | | | | | | | | | | | |
Net increase | | | 7,716,545 | | | $ | 90,826,157 | | | | 9,083,706 | | | $ | 107,540,363 | |
| | | | | | | | | | | | | | | | |
Total Net Increase | | | 7,141,641 | | | $ | 83,969,566 | | | | 9,282,331 | | | $ | 110,161,750 | |
| | | | | | | | | | | | | | | | |
Management has evaluated the impact of all subsequent events on the Fund through the date the financial statements were issued and has determined that there were no subsequent events requiring adjustment or additional disclosure in the financial statements.
| | | | |
| NOTESTO FINANCIAL STATEMENTS | | | 53 | |
Report of the Independent Registered Public Accounting Firm
To the Shareholders of BlackRock Total Return V.I. Fund and the Board of Directors of BlackRock Variable Series Funds, Inc.:
Opinion on the Financial Statements and Financial Highlights
We have audited the accompanying statement of assets and liabilities, including the schedule of investments, of BlackRock Total Return V.I. Fund of BlackRock Variable Series Funds, Inc. (the “Fund”), as of December 31, 2017, the related statement of operations for the year then ended, the statements of changes in net assets for each of the two years in the period then ended, the financial highlights for each of the five years in the period then ended, and the related notes. In our opinion, the financial statements and financial highlights present fairly, in all material respects, the financial position of the Fund as of December 31, 2017, and the results of its operations for the year then ended, the changes in its net assets for each of the two years in the period then ended, and the financial highlights for each of the five years in the period then ended, in conformity with accounting principles generally accepted in the United States of America.
Basis for Opinion
These financial statements and financial highlights are the responsibility of the Fund’s management. Our responsibility is to express an opinion on the Fund’s financial statements and financial highlights based on our audits. We are a public accounting firm registered with the Public Company Accounting Oversight Board (United States) (PCAOB) and are required to be independent with respect to the Fund in accordance with the U.S. federal securities laws and the applicable rules and regulations of the Securities and Exchange Commission and the PCAOB.
We conducted our audits in accordance with the standards of the PCAOB. Those standards require that we plan and perform the audit to obtain reasonable assurance about whether the financial statements and financial highlights are free of material misstatement, whether due to error or fraud. The Fund is not required to have, nor were we engaged to perform, an audit of its internal control over financial reporting. As part of our audits we are required to obtain an understanding of internal control over financial reporting but not for the purpose of expressing an opinion on the effectiveness of the Fund’s internal control over financial reporting. Accordingly, we express no such opinion.
Our audits included performing procedures to assess the risks of material misstatement of the financial statements and financial highlights, whether due to error or fraud, and performing procedures that respond to those risks. Such procedures included examining, on a test basis, evidence regarding the amounts and disclosures in the financial statements and financial highlights. Our audits also included evaluating the accounting principles used and significant estimates made by management, as well as evaluating the overall presentation of the financial statements and financial highlights. Our procedures included confirmation of securities owned as of December 31, 2017, by correspondence with the custodian and brokers; when replies were not received from brokers, we performed other auditing procedures. We believe that our audits provide a reasonable basis for our opinion.
Deloitte & Touche LLP
Boston, Massachusetts
February 19, 2018
We have served as the auditor of one or more BlackRock investment companies since 1992.
| | |
| 54 | | 2017 BLACKROCK ANNUAL REPORTTO SHAREHOLDERS |
Glossary of Terms Used in this Report
| | |
| Currency |
| |
| AUD | | Australian Dollar |
| BRL | | Brazilian Real |
| CAD | | Canadian Dollar |
| CHF | | Swiss Franc |
| CLP | | Chilean Peso |
| COP | | Colombian Peso |
| EGP | | Egyptian Pound |
| EUR | | Euro |
| GBP | | British Pound |
| IDR | | Indonesian Rupiah |
| JPY | | Japanese Yen |
| KRW | | South Korean Won |
| MXN | | Mexican Peso |
| NZD | | New Zealand Dollar |
| RUB | | New Russian Ruble |
| SEK | | Swedish Krona |
| TRY | | Turkish Lira |
| USD | | United States Dollar |
| ZAR | | South African Rand |
| | |
| Portfolio Abbreviations |
| |
| CLO | | Collateralized Loan Obligation |
| ERS | | Extendible Reset Securities |
| GO | | General Obligation Bonds |
| LIBOR | | London Interbank Offered Rate |
| MXIBTIIE | | Mexican Equilibrium Interbank Interest Rate |
| OTC | | Over-the-counter |
| RB | | Revenue Bonds |
| TBA | | To-be-announced |
| | | | |
| GLOSSARYOF TERMS USEDINTHIS REPORT | | | 55 | |
DECEMBER 31, 2017
| | |
ANNUAL REPORT | |  |
BlackRock Variable Series Funds, Inc.
| Ø | | BlackRock U.S. Government Bond V.I. Fund |
|
| Not FDIC Insured • May Lose Value • No Bank Guarantee |
| | |
| Fund Summary as of December 31, 2017 | | BlackRock U.S. Government Bond V.I. Fund |
Investment Objective
BlackRock U.S. Government Bond V.I. Fund’s (the “Fund”) investment objective is to seek to maximize total return, consistent with income generation and prudent investment management.
Portfolio Management Commentary
How did the Fund perform?
For the 12-month period ended December 31, 2017, the Fund underperformed its benchmark, the Bloomberg Barclays U.S. Government/Mortgage Index.
What factors influenced performance?
Detractors from relative performance included interest rate swap-related strategies. The Fund’s underweight allocation to agency securities weighed on return, as did security selection within 30-year agency residential mortgage-backed securities (“MBS”). An underweight to U.S. agency securities constrained performance, as did positioning with respect to global interest rates and currency exposures.
The principal positive contributors to performance were allocation-based strategies within securitized assets such as commercial mortgage-backed securities (“CMBS”) and collateralized loan obligations (“CLOs”). These segments benefited as the global search for yield and limited supply created a favorable technical backdrop and the fundamentals around the U.S. consumer, housing and commercial real estate continued to strengthen. The Fund’s stance with respect to U.S. interest rates also added to performance. This included the Fund’s stance with respect to duration and corresponding interest rate sensitivity, as well as the Fund’s positioning along the Treasury yield curve. Overweight positioning with respect to both 15-year and 30-year agency MBS added value, as did security selection within 15-year MBS. Finally, the Fund’s positioning with respect to Treasury inflation-protected securities (“TIPS”) helped return.
Describe recent portfolio activity.
During the 12-month period, the Fund increased its exposure to U.S. Treasuries, while closing its position in TIPS. Exposure to agency MBS increased modestly over the period, with new purchases favoring collateralized mortgage obligations. The Fund also slightly reduced exposure to CMBS and CLOs.
Describe portfolio positioning at period end.
The Fund closed the period with modestly underweight exposure to U.S. duration, on the view that yields will continue to rise in the context of strong domestic economic growth and the Fed hiking cycle. The Fund had overweight exposure to the U.S. dollar with an eye toward helping to buffer any volatility in risk assets. Outside of the United States, the Fund held short positions in German and U.K interest rates and U.K. inflation forward contracts. The Fund maintained a modest overweight to agency mortgages versus the benchmark on favorable seasonal factors and the view that the segment has become attractively valued relative to credit assets.
The views expressed reflect the opinions of BlackRock as of the date of this report and are subject to change based on changes in market, economic or other conditions. These views are not intended to be a forecast of future events and are no guarantee of future results.
Portfolio Information
PORTFOLIO COMPOSITION
| | | | |
| Asset Type | | Percent of
Net Assets | |
U.S. Government Sponsored Agency Securities | | | 71 | % |
U.S. Treasury Obligations | | | 55 | |
Asset-Backed Securities | | | 5 | |
Non-Agency Mortgage-Backed Securities | | | 4 | |
Money Market Funds | | | 3 | |
Foreign Government Obligations | | | 1 | |
Options Purchased | | | – | (a) |
Liabilities in Excess of Other Assets | | | (16 | ) |
TBA Sale Commitments | | | (23 | ) |
| | (a) | Representing less than 0.5% of the Fund’s Net Assets. | |
| | |
| 2 | | 2017 BLACKROCK ANNUAL REPORTTO SHAREHOLDERS |
| | |
| Fund Summary as of December 31, 2017 (continued) | | BlackRock U.S. Government Bond V.I. Fund |
TOTAL RETURN BASED ON A $10,000 INVESTMENT

| (a) | Assuming transaction costs, if any, and other operating expenses, including investment advisory fees. Does not include insurance related fees and expenses. The returns for Class III Shares prior to July 15, 2013, the recommencement of operations of Class III Shares, are based upon the performance of the Fund’s Class I Shares. The returns for Class III Shares, however, are adjusted to reflect the distribution and/or service (12b-1) fees applicable to Class III Shares. |
| (b) | The Fund invests, under normal circumstances, at least 80% of its assets in fixed-income securities that are issued or guaranteed by the U.S. Government and its agencies. The Fund’s total returns prior to October 1, 2011 are the returns of the Fund when it followed a different investment objective and different investment strategies under the name “BlackRock Government Income V.I. Fund”. |
| (c) | An index that measures debt issued by the U.S. Government, and its agencies, as well as mortgage-backed pass-through securities of Ginnie Mae, Fannie Mae and Freddie Mac. |
| (d) | An unmanaged index that includes the mortgage-backed pass-through securities of Ginnie Mae, Fannie Mae and Freddie Mac that meet certain maturity and liquidity criteria. |
Performance Summary for the Period Ended December 31, 2017
| | | | | | | | | | | | | | | | | | | | | | | | | | | | |
| | | Standardized
30-Day Yield (b) | | | Unsubsidized
30-Day Yield (b) | | | 6-Month
Total Returns (c) | | | | | | Average Annual Total Returns | |
| | | | | | | | | 1 Year (c) | | | 5 Years (c) | | | 10 Years (c) | |
| Class I(a) | | | 1.90% | | | | 1.90% | | | | 0.06% | | | | | | | | 1.52% | | | | 1.14% | | | | 2.86% | |
Class III(a) | | | 1.78 | | | | 1.74 | | | | (0.10 | ) | | | | | | | 1.10 | | | | 0.85 | (d) | | | 2.59 | (d) |
Bloomberg Barclays U.S. Government/Mortgage Index | | | — | | | | — | | | | 0.72 | | | | | | | | 2.37 | | | | 1.59 | | | | 3.51 | |
Bloomberg Barclays U.S. Mortgage-Backed Securities Index | | | — | | | | — | | | | 1.11 | | | | | | | | 2.47 | | | | 2.04 | | | | 3.84 | |
| | (a) | Average annual and cumulative total returns are based on changes in net asset value for the periods shown, and assume reinvestment of all dividends and capital gains distributions at net asset value on the ex-dividend/payable date. Insurance-related fees and expenses are not reflected in these returns. The Fund’s total returns prior to October 1, 2011 are the returns of the Fund when it followed a different investment objective and different investment strategies under the name “BlackRock Government Income V.I. Fund”. | |
| | (b) | The standardized 30-day yield includes the effects of any waivers and/or reimbursements. The unsubsidized 30-day yield excludes the effects of any waivers and/or reimbursements. | |
| | (c) | For a portion of the period, the Fund’s investment adviser waived a portion of its fee. Without such waiver, the Fund’s performance would have been lower. | |
| | (d) | The returns for Class III Shares prior to July 15, 2013, the recommencement of operations of Class III Shares, are based upon the performance of the Fund’s Class I Shares. | |
The returns for Class III Shares, however, are adjusted to reflect the distribution and/or service (12b-1) fees applicable to Class III Shares.
| | | Past performance is not indicative of future results. Performance results do not reflect the deduction of taxes that a shareholder would pay on Fund distributions or the redemption of Fund shares. | |
| | | Performance results may include adjustments made for financial reporting purposes in accordance with U.S. generally accepted accounting principles. | |
Expense Example
| | | | | | | | | | | | | | | | | | | | | | | | | | | | | | | | | | | | | | | | |
| | | Actual | | | | | | Hypothetical (a) | |
| | | Beginning
Account Value
(07/01/17) | | | Ending
Account Value
(12/31/17) | | | Including
Interest
Expense
and Fees | | | Excluding
Interest
Expense
and Fees | | | | | | | | | Including Interest Expense
and Fees | | | Excluding Interest Expense
and Fees | |
| | | | | Expenses
Paid During
the Period (b) | | | Expenses
Paid During
the Period (c) | | | | | | Beginning
Account Value
(07/01/17) | | | Ending
Account Value
(12/31/17) | | | Expenses
Paid During
the Period (b) | | | Ending
Account Value
12/31/17 | | | Expenses
Paid During
the Period (c) | |
Class I | | $ | 1,000.00 | | | $ | 1,000.60 | | | $ | 6.05 | | | $ | 5.09 | | | | | | | $ | 1,000.00 | | | $ | 1,019.16 | | | $ | 6.11 | | | $ | 1,020.11 | | | $ | 5.14 | |
Class III | | | 1,000.00 | | | | 999.00 | | | | 7.96 | | | | 6.85 | | | | | | | | 1,000.00 | | | | 1,017.24 | | | | 8.03 | | | | 1,018.35 | | | | 6.92 | |
| | (a) | Hypothetical 5% annual return before expenses is calculated by prorating the number of days in the most recent fiscal half year divided by 365. | |
| | (b) | For each class of the Fund, expenses are equal to the annualized expense ratio for the class (1.20% for Class I and 1.58% for Class III), multiplied by the average account value over the period, multiplied by 184/365 (to reflect the one-half year period shown). | |
| | (c) | For each class of the Fund, expenses are equal to the annualized expense ratio for the class (1.01% for Class I and 1.36% for Class III), multiplied by the average account value over the period, multiplied by 184/365 (to reflect the one-half year period shown). | |
See “Disclosure of Expenses” on the following page for further information on how expenses were calculated.
| | |
| Disclosure of Expenses | | BlackRock U.S. Government Bond V.I. Fund |
Shareholders of the Fund may incur the following charges: (a) transactional expenses, such as sales charges; and (b) operating expenses, including investment advisory fees, service and distribution fees, including 12b-1 fees, acquired fund fees and expenses, and other fund expenses. The expense example shown on the previous page (which is based on a hypothetical investment of $1,000 invested on July 1, 2017 and held through December 31, 2017) is intended to assist shareholders both in calculating expenses based on an investment in the Fund and in comparing these expenses with similar costs of investing in other mutual funds.
The expense example provides information about actual account values and actual expenses. In order to estimate the expenses a shareholder paid during the period covered by this report, shareholders can divide their account value by $1,000 and then multiply the result by the number corresponding to their share class under the heading entitled “Expenses Paid During the Period.”
The expense example also provides information about hypothetical account values and hypothetical expenses based on the Fund’s actual expense ratio and an assumed rate of return of 5% per year before expenses. In order to assist shareholders in comparing the ongoing expenses of investing in the Fund and other funds, compare the 5% hypothetical example with the 5% hypothetical examples that appear in shareholder reports of other funds.
The expenses shown in the expense example are intended to highlight shareholders’ ongoing costs only and do not reflect any transactional expenses, such as sales charges, if any. Therefore, the hypothetical examples are useful in comparing ongoing expenses only, and will not help shareholders determine the relative total expenses of owning different funds. If these transactional expenses were included, shareholder expenses would have been higher.
The Benefits and Risks of Leveraging
The Fund may utilize leverage to seek to enhance returns and net asset value (“NAV”). However, these objectives cannot be achieved in all interest rate environments.
The Fund may utilize leverage by entering into reverse repurchase agreements.
In general, the concept of leveraging is based on the premise that the financing cost of leverage, which is based on short-term interest rates, is normally lower than the income earned by the Fund on its longer-term portfolio investments purchased with the proceeds from leverage. To the extent that the total assets of the Fund (including the assets obtained from leverage) are invested in higher-yielding portfolio investments, the Fund’s shareholders benefit from the incremental net income.
The interest earned on securities purchased with the proceeds from leverage is distributed to Fund’s shareholders, and the value of these portfolio holdings is reflected in the Fund’s per share NAV. However, in order to benefit shareholders, the return on assets purchased with leverage proceeds must exceed the ongoing costs associated with the leverage. If interest and other ongoing costs of leverage exceed the Fund’s return on assets purchased with leverage proceeds, income to shareholders is lower than if the Fund had not used leverage.
Furthermore, the value of the Fund’s portfolio investments generally varies inversely with the direction of long-term interest rates, although other factors can also influence the value of portfolio investments. As a result, changes in interest rates can influence the Fund’s NAV positively or negatively in addition to the impact on Fund’s performance from leverage. Changes in the direction of interest rates are difficult to predict accurately, and there is no assurance that the Fund’s leveraging strategy will be successful.
The use of leverage also generally causes greater changes in the Fund’s NAV and dividend rates than comparable portfolios without leverage. In a declining market, leverage is likely to cause a greater decline in the NAV of the Fund’s shares than if the Fund were not leveraged. In addition, the Fund may be required to sell portfolio securities at inopportune times or at distressed values in order to comply with regulatory requirements applicable to the use of leverage or as required by the terms of the leverage instruments, which may cause the Fund to incur losses. The use of leverage may limit the Fund’s ability to invest in certain types of securities or use certain types of hedging strategies. The Fund incurs expenses in connection with the use of leverage, all of which are borne by the Fund’s shareholders and may reduce income.
Derivative Financial Instruments
The Fund may invest in various derivative financial instruments. These instruments are used to obtain exposure to a security, commodity, index, market, and/or other assets without owning or taking physical custody of securities, commodities and/or other referenced assets or to manage market, equity, credit, interest rate, foreign currency exchange rate, commodity and/or other risks. Derivative financial instruments may give rise to a form of economic leverage and involve risks, including the imperfect correlation between the value of a derivative financial instrument and the underlying asset, possible default of the counterparty to the transaction or illiquidity of the instrument. The Fund’s successful use of a derivative financial instrument depends on the investment adviser’s ability to predict pertinent market movements accurately, which cannot be assured. The use of these instruments may result in losses greater than if they had not been used, may limit the amount of appreciation the Fund can realize on an investment and/or may result in lower distributions paid to shareholders. The Fund’s investments in these instruments, if any, are discussed in detail in the Notes to Financial Statements.
| | |
| 4 | | 2017 BLACKROCK ANNUAL REPORTTO SHAREHOLDERS |
| | |
Schedule of Investments December 31, 2017 | | BlackRock U.S. Government Bond V.I. Fund (Percentages shown are based on Net Assets) |
| | | | | | | | | | | | |
| Security | | | | | Par (000) | | | Value | |
Asset-Backed Securities — 5.0% | |
Arbor Realty Commercial Real Estate Notes Ltd.,
Series 2016-FL1A, Class A, 3.18%, 09/15/26(a)(b) | | | USD | | | | 210 | | | $ | 213,337 | |
Bsprt Issuer Ltd., Series 2017-FL1, Class A, 2.83%, 06/15/27(a)(b) | | | | | | | 200 | | | | 200,686 | |
CIFC Funding Ltd.(a): | | | | | | | | | | | | |
Series 2014-V, 2.75%, 01/17/27 | | | | | | | 400 | | | | 401,414 | |
Series 2015-3A, Class A, 2.78%, 10/19/27(b) | | | | | | | 250 | | | | 251,521 | |
Dryden XXVIII Senior Loan Fund, Series 2013-28A, Class A1LR, 2.62%, 08/15/30(a)(b) | | | | | | | 700 | | | | 705,344 | |
OCP CLO Ltd., Series 2012-2A, Class A1R, 2.85%, 11/22/25(a)(b) | | | | | | | 556 | | | | 559,802 | |
OHA Credit Partners VIII Ltd., Series 2013-8A, Class A, 2.48%, 04/20/25(a)(b) | | | | | | | 440 | | | | 440,597 | |
Progress Residential Trust, Series 2017-SFR1, Class A, 2.77%, 08/17/34(b) | | | | | | | 100 | | | | 99,058 | |
Washington Mill CLO Ltd., Series 2014-1A, Class A1R, 2.58%, 04/20/26(a)(b) | | | | | | | 500 | | | | 501,042 | |
| | | | | | | | | | | | |
Total Asset-Backed Securities — 5.0%
(Cost: $3,349,229) | | | | 3,372,801 | |
| | | | | | | | | | | | |
| | | |
Foreign Government Obligations — 0.9% | | | | | | | | | | | | |
| | | |
| Mexico — 0.9% | | | | | | | | | |
United Mexican States, 5.00%, 12/11/19 | | | MXN | | | | 11,800 | | | | 571,237 | |
| | | | | | | | |
| |
Non-Agency Mortgage-Backed Securities — 4.0% | | | | | |
| | | |
| Commercial Mortgage-Backed Securities — 3.1%(b) | | | | | | | | | |
BHMS Mortgage Trust, Series 2014-ATLS, Class AFL, 2.86%, 07/05/33(a) | | | USD | | | | 700 | | | | 703,252 | |
Commercial Mortgage Trust, Series 2017-PANW, Class A, 3.24%, 10/10/29 | | | | | | | 440 | | | | 443,974 | |
CSMC Trust: | | | | | | | | | | | | |
Series 2016-MFF, Class A, 3.08%, 11/15/33(a) | | | | | | | 100 | | | | 100,616 | |
Series 2017-CALI, Class A, 3.43%, 11/10/32 | | | | | | | 120 | | | | 122,834 | |
DBUBS Mortgage Trust, Series 2017-BRBK, Class A, 3.45%, 10/10/34 | | | | | | | 180 | | | | 183,904 | |
GAHR Commercial Mortgage Trust, Series 2015-NRF, Class AFL1, 2.78%, 12/15/34(a) | | | | | | | 143 | | | | 143,400 | |
LMREC, Inc., Series 2016-CRE2, Class A, 3.24%, 11/24/31(a) | | | | | | | 100 | | | | 101,000 | |
RAIT Trust, Series 2017-FL7, Class A, 2.43%, 06/15/37(a) | | | | | | | 250 | | | | 250,129 | |
| | | | | | | | |
| | | | | | | | | | | 2,049,109 | |
| Interest Only Commercial Mortgage-Backed Securities — 0.9%(a) | |
CFCRE Commercial Mortgage Trust, Series 2016-C4, Class XA, 1.75%, 05/10/58 | | | | | | | 849 | | | | 90,260 | |
Commercial Mortgage Trust, Series 2015-CR24, Class XA, 0.81%, 08/10/48 | | | | | | | 1,142 | | | | 55,316 | |
Core Industrial Trust(b): | | | | | | | | | | | | |
Series 2015-CALW, Class XA, 0.81%, 02/10/34 | | | | | | | 3,895 | | | | 113,723 | |
Series 2015-TEXW, Class XA, 0.77%, 02/10/34 | | | | | | | 3,300 | | | | 92,047 | |
Series 2015-WEST, Class XA, 0.93%, 02/10/37 | | | | | | | 1,600 | | | | 93,859 | |
Morgan Stanley Bank of America Merrill Lynch Trust, Series 2016-C29, Class XA, 1.64%, 05/15/49 | | | | | | | 986 | | | | 97,195 | |
Wells Fargo Commercial Mortgage Trust,
Series 2015-NXS4, Class XA, 0.95%, 12/15/48 | | | | | | | 1,480 | | | | 81,667 | |
| | | | | | | | |
| | | | | | | | | | | 624,067 | |
| | | | | | | | |
Total Non-Agency Mortgage-Backed Securities — 4.0%
(Cost: $2,688,944) | | | | 2,673,176 | |
| | | | | | | | | | | | |
| | | | | | | | | | | | |
| Security | | | | | Par (000) | | | Value | |
U.S. Government Sponsored Agency Securities — 71.4% | |
| | | |
| Agency Obligations — 0.8% | | | | | | | | | |
Federal Home Loan Bank, 4.00%, 04/10/28 | | | USD | | | | 500 | | | $ | 553,091 | |
| | | | | | | | | | | | |
| Collateralized Mortgage Obligations — 1.8% | | | | | | | | | |
Federal National Mortgage Association: | | | | | | | | | | | | |
Series 2017-69, Class HA, 3.00%, 06/25/46 | | | | | | | 681 | | | | 687,781 | |
Series 2011-8, Class ZA, 4.00%, 02/25/41 | | | | | | | 264 | | | | 276,456 | |
Government National Mortgage Association Variable Rate Notes, Series 2014-107, Class WX,
6.78%, 07/20/39(a) | | | | | | | 202 | | | | 230,360 | |
| | | | | | | | |
| | | | | | | | | | | 1,194,597 | |
| Interest Only Commercial Mortgage-Backed Securities — 1.5%(a) | | | | |
Federal Home Loan Mortgage Corp. Variable
Rate Notes: | | | | | | | | | | | | |
Series 2015-K718, Class X2A, 0.10%, 02/25/22(b) | | | | | | | 22,693 | | | | 74,505 | |
Series K064, Class X1, 0.61%, 03/25/27 | | | | | | | 1,397 | | | | 66,480 | |
Series K718, Class X1, 0.64%, 01/25/22 | | | | | | | 328 | | | | 7,284 | |
Federal National Mortgage Association ACES Variable Rate Notes: | | | | | | | | | | | | |
Series 2015-M1, Class X2, 0.55%, 09/25/24 | | | | | | | 5,106 | | | | 159,830 | |
Series 2016-M4, Class X2, 2.70%, 01/25/39 | | | | | | | 632 | | | | 71,734 | |
Government National Mortgage Association,
Series 2016-22, 0.81%, 11/16/55 | | | | | | | 2,698 | | | | 156,264 | |
Government National Mortgage Association Variable Rate Notes: | | | | | | | | | | | | |
Series 2003-17, Class IO, 0.00%, 03/16/43 | | | | | | | 2,265 | | | | — | |
Series 2003-109, Class IO, 0.00%, 11/16/43 | | | | | | | 2,034 | | | | 386 | |
Series 2002-83, Class IO, 0.00%, 10/16/42 | | | | | | | 957 | | | | 2 | |
Series 2017-168, Class IO, 0.66%, 12/16/59 | | | | | | | 739 | | | | 49,926 | |
Series 2017-72, Class IO, 0.68%, 04/16/57 | | | | | | | 1,357 | | | | 91,318 | |
Series 2017-54, Class IO, 0.68%, 12/16/58 | | | | | | | 193 | | | | 12,963 | |
Series 2017-53, Class IO, 0.69%, 11/16/56 | | | | | | | 2,076 | | | | 131,168 | |
Series 2017-44, Class IO, 0.70%, 04/17/51 | | | | | | | 770 | | | | 47,981 | |
Series 2017-64, Class IO, 0.72%, 11/16/57 | | | | | | | 361 | | | | 25,047 | |
Series 2017-30, Class IO, 0.76%, 08/16/58 | | | | | | | 770 | | | | 50,827 | |
Series 2017-61, Class IO, 0.77%, 05/16/59 | | | | | | | 516 | | | | 42,108 | |
| | | | | | | | |
| | | | | | | | | | | 987,823 | |
| Mortgage-Backed Securities — 67.3% | | | | | | | | | |
Federal Home Loan Mortgage Corp.: | | | | | | | | | | | | |
2.50%, 09/01/27 - 02/01/32 | | | | | | | 550 | | | | 551,093 | |
2.50%, 01/15/33(c) | | | | | | | 57 | | | | 56,902 | |
3.00%, 01/01/30 - 12/01/46 | | | | | | | 736 | | | | 743,111 | |
3.00%, 01/15/33 - 01/15/48(c) | | | | | | | 1,463 | | | | 1,468,365 | |
3.50%, 04/01/31 - 03/01/47 | | | | | | | 1,496 | | | | 1,552,034 | |
3.50%, 01/15/48(c) | | | | | | | 1,546 | | | | 1,587,412 | |
4.00%, 08/01/40 - 08/01/47 | | | | | | | 616 | | | | 651,820 | |
4.00%, 01/15/48(c) | | | | | | | 602 | | | | 629,513 | |
4.50%, 02/01/39 - 11/01/47 | | | | | | | 440 | | | | 468,467 | |
5.00%, 10/01/41 - 11/01/41 | | | | | | | 233 | | | | 254,366 | |
5.50%, 06/01/41 | | | | | | | 158 | | | | 174,061 | |
8.00%, 12/01/29 - 07/01/30 | | | | | | | 37 | | | | 42,965 | |
Federal National Mortgage Association: | | | | | | | | | | | | |
2.50%, 09/01/27 - 09/01/32 | | | | | | | 1,258 | | | | 1,258,347 | |
2.50%, 01/25/33 - 02/25/33(c) | | | | | | | 1,649 | | | | 1,646,316 | |
3.00%, 04/01/29 - 03/01/47 | | | | | | | 5,066 | | | | 5,111,262 | |
3.00%, 01/25/33 - 01/25/48(c) | | | | | | | 4,537 | | | | 4,537,965 | |
3.50%, 04/01/29 - 11/01/47 | | | | | | | 3,816 | | | | 3,950,957 | |
4.00%, 01/01/26 - 08/01/47 | | | | | | | 4,856 | | | | 5,115,187 | |
4.00%, 01/25/48(c) | | | | | | | 1,733 | | | | 1,812,265 | |
4.50%, 05/01/24 - 10/01/47 | | | | | | | 2,235 | | | | 2,390,661 | |
4.50%, 01/25/48(c) | | | | | | | 294 | | | | 312,789 | |
5.00%, 09/01/35 - 08/01/41 | | | | | | | 319 | | | | 345,696 | |
| | | | |
| SCHEDULE OF INVESTMENTS | | | 5 | |
| | |
Schedule of Investments (continued) December 31, 2017 | | BlackRock U.S. Government Bond V.I. Fund (Percentages shown are based on Net Assets) |
| | | | | | | | | | | | |
| Security | | | | | Par (000) | | | Value | |
| Mortgage-Backed Securities (continued) | | | | |
Federal National Mortgage Association (continued): | | | | | | | | | | | | |
5.50%, 05/01/34 - 12/01/39 | | | USD | | | | 298 | | | $ | 329,754 | |
6.00%, 04/01/35 - 06/01/41 | | | | | | | 352 | | | | 399,014 | |
6.50%, 05/01/40 | | | | | | | 65 | | | | 73,214 | |
Government National Mortgage Association: | | | | | | | | | | | | |
3.00%, 01/15/48(c) | | | | | | | 360 | | | | 363,262 | |
3.50%, 12/20/41 - 10/20/46 | | | | | | | 449 | | | | 466,721 | |
3.50%, 01/15/48(c) | | | | | | | 2,641 | | | | 2,730,377 | |
4.00%, 09/20/40 - 02/20/47 | | | | | | | 337 | | | | 354,696 | |
4.00%, 01/15/48 - 02/15/48(c) | | | | | | | 2,422 | | | | 2,524,579 | |
4.50%, 12/20/39 - 11/20/44 | | | | | | | 2,071 | | | | 2,197,378 | |
5.00%, 12/15/38 - 07/20/42 | | | | | | | 153 | | | | 165,890 | |
5.50%, 01/15/34 | | | | | | | 671 | | | | 750,940 | |
| | | | | | | | |
| | | | | | | | | | | 45,017,379 | |
| | | | | | | | |
Total U.S. Government Sponsored Agency Securities — 71.4%
(Cost: $47,789,908) | | | | 47,752,890 | |
| | | | | | | | |
|
U.S. Treasury Obligations — 55.3% | |
U.S. Treasury Bonds: | | | | | | | | |
4.25%, 05/15/39 | | | | | | | 181 | | | | 228,774 | |
4.50%, 08/15/39 | | | | | | | 176 | | | | 229,907 | |
4.38%, 11/15/39 | | | | | | | 176 | | | | 226,455 | |
3.13%, 02/15/43 | | | | | | | 773 | | | | 830,462 | |
2.88%, 05/15/43 - 11/15/46 | | | | | | | 997 | | | | 1,024,644 | |
3.63%, 08/15/43 | | | | | | | 738 | | | | 861,327 | |
3.75%, 11/15/43 | | | | | | | 868 | | | | 1,034,242 | |
3.00%, 02/15/47 | | | | | | | 141 | | | | 148,287 | |
2.75%, 11/15/47(d) | | | | | | | 1,022 | | | | 1,023,677 | |
U.S. Treasury Notes: | | | | | | | | | | | | |
1.25%, 04/30/19 - 05/31/19 | | | | | | | 4,666 | | | | 4,628,205 | |
1.75%, 11/30/19 - 09/30/22(d) | | | | | | | 7,112 | | | | 7,055,345 | |
1.50%, 04/15/20 - 03/31/23 | | | | | | | 3,461 | | | | 3,419,442 | |
2.63%, 08/15/20 - 11/15/20 | | | | | | | 3,548 | | | | 3,611,575 | |
1.88%, 12/15/20 - 04/30/22 | | | | | | | 1,940 | | | | 1,921,985 | |
1.63%, 11/15/22 - 04/30/23 | | | | | | | 1,015 | | | | 987,642 | |
2.00%, 11/30/22 - 11/15/26(d) | | | | | | | 6,605 | | | | 6,493,636 | |
2.13%, 11/30/24 - 05/15/25 | | | | | | | 1,762 | | | | 1,738,081 | |
2.25%, 11/15/25 - 11/15/27(d) | | | | | | | 1,547 | | | | 1,528,075 | |
| | | | | | | | |
Total U.S. Treasury Obligations — 55.3%
(Cost: $37,099,954) | | | | 36,991,761 | |
| | | | | | | | |
Total Long-Term Investments — 136.6%
(Cost: $91,559,729) | | | | 91,361,865 | |
| | | | | | | | |
| | | |
| | | | | | Shares | | | | |
Money Market Funds — 2.7%(e) | |
BlackRock Liquidity Funds, T-Fund, Institutional Class, 1.17%(f) | | | | | | | 1,793,803 | | | | 1,793,803 | |
JPMorgan US Treasury Plus Money Market Fund, Agency Class, 1.14% | | | | | | | 1,799 | | | | 1,799 | |
| | | | | | | | |
Total Money Market Funds — 2.7%
(Cost: $1,795,602) | | | | 1,795,602 | |
| | | | | | | | |
Total Options Purchased — 0.1%
(Cost: $143,336) | | | | 91,986 | |
| | | | | | | | |
Total Investments Before TBA Sale Commitments — 139.4%
(Cost: $93,498,667) | | | | 93,249,453 | |
| | | | | | | | |
| | | | | | | | | | | | |
| Security | | | | | Par
(000) | | | Value | |
TBA Sale Commitments — (23.4)%(c) | |
| |
| Mortgage-Backed Securities — (23.4)% | | | | |
Federal Home Loan Mortgage Corp.: | | | | | | | | | | | | |
3.00%, 01/15/48 | | | USD | | | | 12 | | | $ | (11,998 | ) |
3.50%, 01/15/33 - 01/15/48 | | | | | | | 753 | | | | (777,311 | ) |
4.50%, 01/15/48 | | | | | | | 8 | | | | (8,504 | ) |
Federal National Mortgage Association: | | | | | | | | | | | | |
2.50%, 01/25/33 | | | | | | | 42 | | | | (41,934 | ) |
3.00%, 01/25/33 - 02/25/48 | | | | | | | 6,121 | | | | (6,153,951 | ) |
3.50%, 01/25/33 - 01/25/48 | | | | | | | 1,595 | | | | (1,638,411 | ) |
4.00%, 01/25/33 - 02/25/48 | | | | | | | 4,465 | | | | (4,663,818 | ) |
5.00%, 01/25/48 | | | | | | | 156 | | | | (167,667 | ) |
5.50%, 01/25/48 | | | | | | | 787 | | | | (862,345 | ) |
6.00%, 01/25/48 | | | | | | | 160 | | | | (178,944 | ) |
Government National Mortgage Association: | | | | | | | | | | | | |
3.00%, 01/15/48 | | | | | | | 203 | | | | (204,840 | ) |
4.00%, 01/15/48 | | | | | | | 100 | | | | (104,242 | ) |
4.50%, 01/15/48 | | | | | | | 796 | | | | (834,929 | ) |
| | | | | | | | |
Total TBA Sale Commitments — (23.4)%
(Proceeds: $15,653,897) | | | | (15,648,894 | ) |
| | | | | | | | |
| |
Total Investments Net of TBA Sale Commitments — 116.0%
(Cost: $77,844,770) | | | | 77,600,559 | |
Liabilities in Excess of Other Assets — (16.0)% | | | | (10,715,755 | ) |
| | | | | | | | |
Net Assets — 100.0% | | | $ | 66,884,804 | |
| | | | | | | | |
| (a) | Variable or floating rate security, which interest rate adjusts periodically based on changes in current interest rates and prepayments on the underlying pool of assets. Rate shown is the rate in effect as of period end. |
| (b) | Security exempt from registration pursuant to Rule 144A under the Securities Act of 1933, as amended. These securities may be resold in transactions exempt from registration to qualified institutional investors. |
| | |
| 6 | | 2017 BLACKROCK ANNUAL REPORTTO SHAREHOLDERS |
| | |
Schedule of Investments (continued) December 31, 2017 | | BlackRock U.S. Government Bond V.I. Fund |
| (c) | Represents or includes a TBA transaction. As of period end, unsettled TBA transactions were as follows: |
| | | | | | | | |
| Counterparty | | Value | | | Unrealized
Appreciation
(Depreciation) | |
Bank of America Securities LLC | | $ | (43,505 | ) | | $ | (508 | ) |
Barclays Capital, Inc. | | | 181,599 | | | | (839 | ) |
BNP Paribas SA | | | 943,739 | | | | (1,211 | ) |
Citigroup Global Markets Inc. | | | 240,439 | | | | (2,298 | ) |
Credit Suisse Securities USA LLC | | | 397,488 | | | | 1,923 | |
Daiwa Capital Markets America, Inc. | | | 344,000 | | | | 215 | |
Deutsche Bank Securities, Inc. | | | (313,503 | ) | | | (383 | ) |
Goldman Sachs International | | | (677,673 | ) | | | 885 | |
JP Morgan Chase Bank | | | (1,348,999 | ) | | | 1,138 | |
Mizuho Securities USA, Inc. | | | (103,113 | ) | | | 2,340 | |
Morgan Stanley & Co., Inc. | | | 180,351 | | | | (1,057 | ) |
Nomura Securities International, Inc. | | | (98,583 | ) | | | (614 | ) |
RBC Dain Rauscher, Inc. | | | 1,553,808 | | | | (204 | ) |
Wells Fargo Securities LLC | | | 764,806 | | | | (167 | ) |
| (d) | All or a portion of security has been pledged as collateral in connection with outstanding reverse repurchase agreements. |
| (e) | Annualized 7-day yield as of period end. |
| (f) | During the year ended December 31, 2017, investments in issuers considered to be affiliates of the Fund for the purposes of Section 2(a)(3) of the Investment Company Act of 1940, as amended, were as follows: |
| | | | | | | | | | | | | | | | | | | | | | | | | | | | |
| Affiliate | | Shares
Held at
12/31/16 | | | Net Activity | | | Shares
Held at
12/31/17 | | | Value at
12/31/17 | | | Income | | | Net
Realized
Gain (Loss) (a) | | | Change in
Unrealized
Appreciation
(Depreciation) | |
BlackRock Liquidity Funds, T-Fund, Institutional Class | | | 701,543 | | | | 1,092,260 | | | | 1,793,803 | | | $ | 1,793,803 | | | $ | 11,627 | | | $ | 4 | | | $ | — | |
| | | | | | | | | | | | | | | | | | | | | | | | | | | | |
| | (a) | Includes net capital gain distributions, if applicable. | |
For Fund compliance purposes, the Fund’s industry classifications refer to one or more of the industry sub-classifications used by one or more widely recognized market indexes or ratings group indexes, and/or as defined by the investment advisor. These definitions may not apply for purposes of this report, which may combine such industry sub-classifications for reporting ease.
Reverse Repurchase Agreements
| | | | | | | | | | | | | | | | | | | | | | | | |
| Counterparty | | Interest
Rate | | | Trade Date | | | Maturity Date | | | Face
Value | | | Face Value Including
Accrued Interest | | | Type of Underlying Collateral | | Remaining Contractual
Maturity of the Agreements |
Barclays Capital, Inc. | | | 0.75 | % | | | 12/29/2017 | | | | 01/02/18 | | | $ | 342,663 | | | $ | 342,684 | | | U.S. Treasury Obligations | | Overnight |
BNP Paribas SA | | | 1.15 | % | | | 12/29/2017 | | | | 01/02/18 | | | | 3,215,975 | | | | 3,216,283 | | | U.S. Treasury Obligations | | Overnight |
Deutsche Bank Securities, Inc. | | | 0.75 | % | | | 12/29/2017 | | | | 01/02/18 | | | | 1,801,220 | | | | 1,801,332 | | | U.S. Treasury Obligations | | Overnight |
Deutsche Bank Securities, Inc. | | | 1.50 | % | | | 12/29/2017 | | | | 01/02/18 | | | | 1,022,000 | | | | 1,022,128 | | | U.S. Treasury Obligations | | Overnight |
Merrill Lynch, Pierce, Fenner & Smith, Inc. | | | 0.45 | % | | | 12/29/2017 | | | | 01/02/18 | | | | 2,741,285 | | | | 2,741,388 | | | U.S. Treasury Obligations | | Overnight |
| | | | | | | | | | | | | | | | | | | | | | | | |
| | | $ | 9,123,143 | | | $ | 9,123,815 | | | | | |
| | | | | | | | | | | | | | | | | | | | | | | | |
Derivative Financial Instruments Outstanding as of Period End
Futures Contracts
| | | | | | | | | | | | | | | | |
| Description | | Number of
Contracts | | | Expiration
Date | | | Notional
Amount (000) | | | Value/
Unrealized
Appreciation
(Depreciation) | |
Long Contracts | | | | | | | | | | | | | | | | |
U.S. Treasury Long Bond | | | 7 | | | | 03/20/18 | | | $ | 1,071 | | | $ | (2,138 | ) |
U.S. Treasury 5 Year Note | | | 4 | | | | 03/29/18 | | | | 465 | | | | 375 | |
90-Day Eurodollar | | | 14 | | | | 12/17/18 | | | | 3,425 | | | | (565 | ) |
Bank Acceptance | | | 17 | | | | 12/17/18 | | | | 3,307 | | | | 39 | |
90-Day Eurodollar | | | 12 | | | | 03/16/20 | | | | 2,930 | | | | (5,490 | ) |
| | | | | | | | | | | | | | | | |
| | | | | | | | | | | | | | | (7,779 | ) |
| | | | | | | | | | | | | | | | |
| | | | |
| SCHEDULE OF INVESTMENTS | | | 7 | |
| | |
Schedule of Investments (continued) December 31, 2017 | | BlackRock U.S. Government Bond V.I. Fund |
| | | | | | | | | | | | | | | | |
| Description | | Number of
Contracts | | | Expiration
Date | | | Notional
Amount (000) | | | Value/
Unrealized
Appreciation
(Depreciation) | |
Short Contracts | | | | | | | | | | | | | | | | |
Euro-Bund | | | 5 | | | | 03/08/18 | | | $ | 970 | | | $ | 10,001 | |
U.S. Treasury 10 Year Note | | | 63 | | | | 03/20/18 | | | | 7,815 | | | | (3,050 | ) |
Long Gilt | | | 5 | | | | 03/27/18 | | | | 845 | | | | (11,342 | ) |
U.S. Treasury 2 Year Note | | | 3 | | | | 03/29/18 | | | | 642 | | | | 293 | |
90-Day Eurodollar | | | 1 | | | | 03/18/19 | | | | 244 | | | | 424 | |
90-Day Eurodollar | | | 28 | | | | 12/16/19 | | | | 6,837 | | | | 1,060 | |
| | | | | | | | | | | | | | | | |
| | | | | | | | | | | | | | | (2,614 | ) |
| | | | | | | | | | | | | | | | |
| | | $ | (10,393 | ) |
| | | | | | | | | | | | | | | | |
Forward Foreign Currency Exchange Contracts
| | | | | | | | | | | | | | | | | | | | |
| Currency Purchased | | | Currency Sold | | | Counterparty | | Settlement Date | | | Unrealized
Appreciation
(Depreciation) | |
| USD | | | 11,000 | | | BRL | | | 35,981 | | | Barclays Bank plc | | | 01/04/18 | | | $ | 154 | |
| USD | | | 53,100 | | | BRL | | | 175,132 | | | BNP Paribas SA | | | 01/04/18 | | | | 308 | |
| USD | | | 160 | | | MXN | | | 3,000 | | | BNP Paribas SA | | | 01/04/18 | | | | 8 | |
| COP | | | 42,002,100 | | | USD | | | 14,000 | | | Barclays Bank plc | | | 01/05/18 | | | | 71 | |
| USD | | | 14,000 | | | MXN | | | 269,827 | | | Barclays Bank plc | | | 01/05/18 | | | | 282 | |
| RUB | | | 1,775,430 | | | USD | | | 30,000 | | | Bank of America NA | | | 01/12/18 | | | | 767 | |
| USD | | | 17,000 | | | JPY | | | 1,910,185 | | | BNP Paribas SA | | | 01/12/18 | | | | 39 | |
| USD | | | 19,924 | | | MXN | | | 379,776 | | | Bank of America NA | | | 01/12/18 | | | | 643 | |
| JPY | | | 379,795,920 | | | USD | | | 3,360,000 | | | Goldman Sachs International | | | 01/16/18 | | | | 12,938 | |
| USD | | | 3,360,000 | | | JPY | | | 377,512,800 | | | Bank of America NA | | | 01/16/18 | | | | 7,339 | |
| USD | | | 14,391 | | | MXN | | | 275,715 | | | Barclays Bank plc | | | 01/22/18 | | | | 422 | |
| IDR | | | 746,515,000 | | | USD | | | 55,000 | | | Deutsche Bank AG | | | 01/29/18 | | | | 99 | |
| IDR | | | 163,392,000 | | | USD | | | 12,000 | | | JP Morgan Chase Bank NA | | | 01/29/18 | | | | 60 | |
| INR | | | 841,945 | | | USD | | | 13,000 | | | Barclays Bank plc | | | 01/29/18 | | | | 164 | |
| RUB | | | 1,021,615 | | | USD | | | 17,000 | | | Bank of America NA | | | 01/30/18 | | | | 627 | |
| CAD | | | 8,991 | | | USD | | | 7,000 | | | Barclays Bank plc | | | 02/22/18 | | | | 158 | |
| NOK | | | 116,966 | | | USD | | | 14,000 | | | Bank of America NA | | | 02/22/18 | | | | 266 | |
| USD | | | 374,000 | | | MXN | | | 7,282,218 | | | Barclays Bank plc | | | 03/21/18 | | | | 8,746 | |
| USD | | | 161,333 | | | TRY | | | 602,000 | | | BNP Paribas SA | | | 06/25/18 | | | | 10,572 | |
| USD | | | 94,629 | | | TRY | | | 358,000 | | | BNP Paribas SA | | | 08/20/18 | | | | 6,504 | |
| | | | | | | | | | | | | | | | | | | | |
| | | | | | | | | | | | | 50,167 | |
| | | | | | | | | | | | | | | | | | | | |
| BRL | | | 30,262 | | | USD | | | 9,300 | | | Bank of America NA | | | 01/04/18 | | | | (178 | ) |
| BRL | | | 160,191 | | | USD | | | 49,000 | | | BNP Paribas SA | | | 01/04/18 | | | | (712 | ) |
| BRL | | | 42,406 | | | USD | | | 13,000 | | | Goldman Sachs International | | | 01/04/18 | | | | (217 | ) |
| USD | | | 7,200 | | | BRL | | | 24,028 | | | BNP Paribas SA | | | 01/04/18 | | | | (43 | ) |
| MXN | | | 268,197 | | | USD | | | 14,000 | | | HSBC Bank plc | | | 01/05/18 | | | | (365 | ) |
| USD | | | 14,000 | | | COP | | | 42,311,500 | | | Royal Bank of Scotland | | | 01/05/18 | | | | (175 | ) |
| USD | | | 16,854 | | | AUD | | | 22,000 | | | BNP Paribas SA | | | 01/12/18 | | | | (312 | ) |
| USD | | | 20,083 | | | EUR | | | 17,000 | | | Royal Bank of Scotland | | | 01/12/18 | | | | (326 | ) |
| MXN | | | 275,715 | | | USD | | | 14,672 | | | Citibank NA | | | 01/22/18 | | | | (703 | ) |
| USD | | | 13,000 | | | INR | | | 852,449 | | | JP Morgan Chase Bank NA | | | 01/29/18 | | | | (328 | ) |
| BRL | | | 149,119 | | | USD | | | 45,100 | | | BNP Paribas SA | | | 02/02/18 | | | | (311 | ) |
| USD | | | 7,000 | | | CAD | | | 8,984 | | | Bank of America NA | | | 02/22/18 | | | | (152 | ) |
| MXN | | | 969,700 | | | USD | | | 50,000 | | | JP Morgan Chase Bank NA | | | 03/21/18 | | | | (1,363 | ) |
| TRY | | | 602,000 | | | USD | | | 151,197 | | | Citibank NA | | | 06/25/18 | | | | (435 | ) |
| TRY | | | 358,000 | | | USD | | | 88,552 | | | HSBC Bank plc | | | 08/20/18 | | | | (427 | ) |
| | | | | | | | | | | | | | | | | | | | |
| | | | | | | | | | | | | (6,047 | ) |
| | | | | | | | | | | | | | | | | | | | |
| | | Net Unrealized Appreciation | | | | | | $ | 44,120 | |
| | | | | | | | | | | | | | | | | | | | |
| | |
| 8 | | 2017 BLACKROCK ANNUAL REPORTTO SHAREHOLDERS |
| | |
Schedule of Investments (continued) December 31, 2017 | | BlackRock U.S. Government Bond V.I. Fund |
Exchange-Traded Options Purchased
| | | | | | | | | | | | | | | | | | | | | | |
| Description | | Number of
Contracts | | | Expiration
Date | | | Exercise
Price | | Notional
Amount (000) | | | Value |
Call | | | | | | | | | | | | | | | | | | | | | | |
90-day Eurodollar June 19 Futures | | | 293 | | | | 06/15/18 | | | | USD | | | 98.13 | | USD | | | 71,877 | | | $21,975 |
Put | | | | | | | | | | | | | | | | | | | | | | |
U.S. Treasury 10 Year Note | | | 57 | | | | 01/26/18 | | | | USD | | | 123.00 | | USD | | | 7,011 | | | 7,125 |
90-day Eurodollar Mar 20 Futures | | | 51 | | | | 03/16/18 | | | | USD | | | 97.75 | | USD | | | 12,463 | | | 19,763 |
| | | | | | | | | | | | | | | | | | | | | | |
| | | | | | | | | | | | | | | | | | | | | | 26,888 |
| | | | | | | | | | | | | | | | | | | | | | |
| | | | | | | | | | | | | | | | | | | | | | $48,863 |
| | | | | | | | | | | | | | | | | | | | | | |
OTC Options Purchased
| | | | | | | | | | | | | | | | | | | | | | | | | | |
| Description | | Counterparty | | Expiration
Date | | | Exercise Price | | | Notional
Amount (000) | | | Value | |
Call | | | | | | | | | | | | | | | | | | | | | | | | | | |
USD Currency | | Royal Bank of Scotland | | | 02/16/18 | | | | JPY | | | | 114.00 | | | | USD | | | | 14 | | | $ | 60 | |
USD Currency | | Deutsche Bank AG | | | 03/05/18 | | | | KRW | | | | 1,156.00 | | | | USD | | | | 672 | | | | 919 | |
USD Currency | | Bank of America NA | | | 06/13/18 | | | | CHF | | | | 1.00 | | | | USD | | | | 34 | | | | 219 | |
USD Currency | | BNP Paribas SA | | | 06/13/18 | | | | CAD | | | | 1.29 | | | | USD | | | | 68 | | | | 603 | |
USD Currency | | Citibank NA | | | 06/13/18 | | | | SEK | | | | 8.53 | | | | USD | | | | 34 | | | | 256 | |
USD Currency | | Deutsche Bank AG | | | 06/13/18 | | | | JPY | | | | 113.40 | | | | USD | | | | 102 | | | | 1,421 | |
| | | | | | | | | | | | | | | | | | | | | | | | | | |
| | | | | | | | | | | | | | | | | | | | | | | | | 3,478 | |
| | | | | | | | | | | | | | | | | | | | | | | | | | |
Put | | | | | | | | | | | | | | | | | | | | | | | | | | |
AUD Currency | | HSBC Bank plc | | | 06/13/18 | | | | USD | | | | 0.76 | | | | AUD | | | | 102 | | | | 884 | |
EUR Currency | | HSBC Bank plc | | | 06/13/18 | | | | USD | | | | 1.17 | | | | EUR | | | | 425 | | | | 3,289 | |
| | | | | | | | | | | | | | | | | | | | | | | | | | |
| | | | | | | | | | | | | | | | | | | | | | | | | 4,173 | |
| | | | | | | | | | | | | | | | | | | | | | | | | | |
| | | | | | | | | | | | | | | | | | | | | | | | $ | 7,651 | |
| | | | | | | | | | | | | | | | | | | | | | | | | | |
OTC Barrier Options Purchased
| | | | | | | | | | | | | | | | | | | | | | | | | | | | | | | | | | | | |
| Description | | Type of Option | | Counterparty | | Expiration
Date | | | Exercise Price | | | Barrier
Price/Range | | | Notional
Amount (000) | | | Value | |
Put | | | | | | | | | | | | | | | | | | | | | | | | | | | | | | | | | | | | |
EUR Currency | | One-Touch | | Morgan Stanley & Co. International plc | | | 06/07/18 | | | | EUR | | | | 4.35 | | | | EUR | | | | 4.35 | | | | EUR | | | | 1 | | | $ | 117 | |
| | | | | | | | | | | | | | | | | | | | | | | | | | | | | | | | | | | | |
OTC Interest Rate Swaptions Purchased
| | | | | | | | | | | | | | | | | | | | | | | | | | | | | | | | | | |
| Description | | Paid by the Fund | | Received by the Fund | | Counterparty | | Expiration
Date | | | Exercise
Rate | | | Notional
Amount (000) | | | Value | |
| | Rate | | | Frequency | | Rate | | | Frequency | | | | | |
Put | | | | | | | | | | | | | | | | | | | | | | | | | | | | | | | | | | |
5-Year Interest Rate Swap, 10/16/18 | | | 2.50 | % | | Semi Annual | | | 3-month LIBOR | | | Quarterly | | Citibank NA | | | 10/18/23 | | | | 2.50 | % | | | USD | | | | 5,700 | | | $ | 35,355 | |
| | | | | | | | | | | | | | | | | | | | | | | | | | | | | | | | | | |
Exchange-Traded Options Written
| | | | | | | | | | | | | | | | | | | | | | | | |
| Description | | Number of
Contracts | | Expiration Date | | Exercise Price | | | Notional
Amount (000) | | | Value | |
Call | | | | | | | | | | | | | | | | | | | | | | | | |
90-day Eurodollar June 21 Futures | | 195 | | 06/15/18 | | | USD | | | | 97.88 | | | | USD | | | | 47,714 | | | $ | (35,344 | ) |
Put | | | | | | | | | | | | | | | | | | | | | | | | |
90-day Eurodollar Mar 20 Futures | | 51 | | 03/16/18 | | | USD | | | | 97.50 | | | | USD | | | | 12,431 | | | | (5,100 | ) |
| | | | | | | | | | | | | | | | | | | | | | | | |
| | | | | | | | | | | | | | | | | | | | | | $ | (40,444 | ) |
| | | | | | | | | | | | | | | | | | | | | | | | |
| | | | |
| SCHEDULE OF INVESTMENTS | | | 9 | |
| | |
Schedule of Investments (continued) December 31, 2017 | | BlackRock U.S. Government Bond V.I. Fund |
Centrally Cleared Credit Default Swaps — Buy Protection
| | | | | | | | | | | | | | | | | | | | | | | | | | | | | | | | |
| Reference Obligation/Index | | Financing Rate
Paid by the Fund | | | Payment
Frequency | | | Termination
Date | | | Notional
Amount (000) | | | Value | | | Upfront
Premium
Paid (Received) | | | Unrealized
Appreciation
(Depreciation) | |
CDX.NA.IG Series 29 Version 1 | | | 1.00 | % | | | Quarterly | | | | 12/20/22 | | | | USD | | | | 399 | | | $ | (9,622 | ) | | $ | (7,905 | ) | | $ | (1,717 | ) |
| | | | | | | | | | | | | | | | | | | | | | | | | | | | | | | | |
OTC Credit Default Swaps — Buy Protection
| | | | | | | | | | | | | | | | | | | | | | | | | | | | | | | | | | |
| Reference Obligation/Index | | Financing Rate Paid
by the Fund | | | Payment
Frequency | | | Counterparty | | | Termination
Date | | | Notional
Amount
(000) | | | Value | | | Upfront
Premium
Paid
(Received) | | | Unrealized
Appreciation
(Depreciation) | |
Republic of the Philippines | | | 1.00 | % | | | Quarterly | | | | JP Morgan Chase Bank NA | | | | 12/20/22 | | | USD | | | 295 | | | $ | (5,687 | ) | | $ | (4,484 | ) | | $ | (1,203 | ) |
United Mexican States | | | 1.00 | % | | | Quarterly | | | | Barclays Bank plc | | | | 12/20/22 | | | USD | | | 27 | | | | 73 | | | | 118 | | | | (45 | ) |
| | | | | | | | | | | | | | | | | | | | | | | | | | | | | | | | | | |
| | | | | | | | | | | | | | | | | | | | | | | | $ | (5,614 | ) | | $ | (4,366 | ) | | $ | (1,248 | ) |
| | | | | | | | | | | | | | | | | | | | | | | | | | | | | | | | | | |
Centrally Cleared Interest Rate Swaps
| | | | | | | | | | | | | | | | | | | | | | | | | | | | | | | | |
| Paid by the Fund | | Received by the Fund | | Effective
Date | | | Termination
Date | | | Notional
Amount
(000) | | | | | Upfront
Premium
Paid
(Received) | | | Unrealized
Appreciation
(Depreciation) | |
| Rate | | Frequency | | Rate | | Frequency | | | | | Value | | | |
| 7.36% | | Monthly | | 28 day MXIBTIIE | | Monthly | | | N/A | | | | 01/28/19 | | | | MXN | | | 2,947 | | $ | 1,110 | | | $ | — | | | $ | 1,110 | |
| 1.47% | | At Termination | | 1 day Fed Funds | | At Termination | | | 12/19/18 | (a) | | | 03/20/19 | | | | USD | | | 28,245 | | | 31,840 | | | | — | | | | 31,840 | |
| 1 day Fed Funds | | At Termination | | 1.47% | | At Termination | | | 12/19/18 | (a) | | | 03/20/19 | | | | USD | | | 28,245 | | | (31,840 | ) | | | (9,140 | ) | | | (22,700 | ) |
| 3 month LIBOR | | Quarterly | | 2.05% | | Semi-Annual | | | 11/19/18 | (a) | | | 11/19/19 | | | | USD | | | 17,100 | | | (29,677 | ) | | | — | | | | (29,677 | ) |
| 3 month LIBOR | | Quarterly | | 2.05% | | Semi-Annual | | | 11/19/18 | (a) | | | 11/19/19 | | | | USD | | | 8,880 | | | (15,842 | ) | | | — | | | | (15,842 | ) |
| 3 month LIBOR | | Quarterly | | 2.16% | | Semi-Annual | | | 12/06/18 | (a) | | | 12/06/19 | | | | USD | | | 8,640 | | | (6,505 | ) | | | — | | | | (6,505 | ) |
| 28 day MXIBTIIE | | Monthly | | 7.32% | | Monthly | | | N/A | | | | 02/20/20 | | | | MXN | | | 2,559 | | | (1,759 | ) | | | — | | | | (1,759 | ) |
| 28 day MXIBTIIE | | Monthly | | 7.16% | | Monthly | | | N/A | | | | 04/29/20 | | | | MXN | | | 2,380 | | | (2,120 | ) | | | — | | | | (2,120 | ) |
| 1.37% | | Semi-Annual | | 3 month LIBOR | | Quarterly | | | N/A | | | | 11/30/20 | | | | USD | | | 2,470 | | | 54,105 | | | | — | | | | 54,105 | |
| 3 month LIBOR | | Quarterly | | 1.37% | | Semi-Annual | | | N/A | | | | 11/30/20 | | | | USD | | | 1,350 | | | (29,570 | ) | | | 4,867 | | | | (34,437 | ) |
| 3 month LIBOR | | Quarterly | | 2.24% | | Semi-Annual | | | 11/01/19 | (a) | | | 11/01/21 | | | | USD | | | 1,805 | | | (3,451 | ) | | | — | | | | (3,451 | ) |
| 2.28% | | Semi-Annual | | 3 month LIBOR | | Quarterly | | | 11/19/20 | (a) | | | 11/19/21 | | | | USD | | | 9,230 | | | 6,699 | | | | — | | | | 6,699 | |
| 2.27% | | Semi-Annual | | 3 month LIBOR | | Quarterly | | | 11/19/20 | (a) | | | 11/19/21 | | | | USD | | | 17,840 | | | 14,402 | | | | — | | | | 14,402 | |
| 2.34% | | Semi-Annual | | 3 month LIBOR | | Quarterly | | | 12/07/20 | (a) | | | 12/07/21 | | | | USD | | | 9,040 | | | 2,021 | | | | — | | | | 2,021 | |
| 3 month LIBOR | | Quarterly | | 2.31% | | Semi-Annual | | | 12/09/19 | (a) | | | 12/08/21 | | | | USD | | | 3,580 | | | (2,555 | ) | | | — | | | | (2,555 | ) |
| 3 month LIBOR | | Quarterly | | 2.39% | | Semi-Annual | | | 12/19/19 | (a) | | | 12/19/21 | | | | USD | | | 1,780 | | | 1,259 | | | | — | | | | 1,259 | |
| 28 day MXIBTIIE | | Monthly | | 7.48% | | Monthly | | | N/A | | | | 03/07/22 | | | | MXN | | | 431 | | | (303 | ) | | | — | | | | (303 | ) |
| 28 day MXIBTIIE | | Monthly | | 7.47% | | Monthly | | | N/A | | | | 03/07/22 | | | | MXN | | | 431 | | | (311 | ) | | | — | | | | (311 | ) |
| 28 day MXIBTIIE | | Monthly | | 7.45% | | Monthly | | | N/A | | | | 03/07/22 | | | | MXN | | | 863 | | | (662 | ) | | | — | | | | (662 | ) |
| 3 month LIBOR | | Quarterly | | 1.84% | | Semi-Annual | | | N/A | | | | 08/23/22 | | | | USD | | | 500 | | | (6,033 | ) | | | — | | | | (6,033 | ) |
| 3 month LIBOR | | Quarterly | | 1.88% | | Semi-Annual | | | N/A | | | | 09/18/22 | | | | USD | | | 300 | | | (3,261 | ) | | | — | | | | (3,261 | ) |
| 3 month LIBOR | | Quarterly | | 1.98% | | Semi-Annual | | | N/A | | | | 09/22/22 | | | | USD | | | 750 | | | (4,915 | ) | | | — | | | | (4,915 | ) |
| 7.13% | | Monthly | | 28 day MXIBTIIE | | Monthly | | | N/A | | | | 10/07/22 | | | | MXN | | | 321 | | | 470 | | | | — | | | | 470 | |
| 7.14% | | Monthly | | 28 day MXIBTIIE | | Monthly | | | N/A | | | | 10/10/22 | | | | MXN | | | 130 | | | 188 | | | | — | | | | 188 | |
| 7.11% | | Monthly | | 28 day MXIBTIIE | | Monthly | | | N/A | | | | 10/14/22 | | | | MXN | | | 321 | | | 485 | | | | — | | | | 485 | |
| 7.11% | | Monthly | | 28 day MXIBTIIE | | Monthly | | | N/A | | | | 10/14/22 | | | | MXN | | | 424 | | | 644 | | | | — | | | | 644 | |
| 3 month LIBOR | | Quarterly | | 2.23% | | Semi-Annual | | | N/A | | | | 12/20/22 | | | | USD | | | 600 | | | (109 | ) | | | — | | | | (109 | ) |
| 3 month LIBOR | | Quarterly | | 2.13% | | Semi-Annual | | | N/A | | | | 08/25/25 | | | | USD | | | 15 | | | (114 | ) | | | — | | | | (114 | ) |
| | | | | | | | | | | | | | | | | | | | | | | | | | | | | | | | |
| | | | | | | | | | | | | | | | | | | | | | $ | (25,804 | ) | | $ | (4,273 | ) | | $ | (21,531 | ) |
| | | | | | | | | | | | | | | | | | | | | | | | | | | | | | | | |
| | |
| 10 | | 2017 BLACKROCK ANNUAL REPORTTO SHAREHOLDERS |
| | |
Schedule of Investments (continued) December 31, 2017 | | BlackRock U.S. Government Bond V.I. Fund |
OTC Interest Rate Swaps
| | | | | | | | | | | | | | | | | | | | | | | | | | | | | | | | | | |
| Paid by the Fund | | Received by the Fund | | Counterparty | | Effective
Date | | | Termination
Date | | | Notional
Amount
(000) | | | Value | | | Upfront
Premium
Paid
(Received) | | | Unrealized
Appreciation
(Depreciation) | |
| Rate | | Frequency | | Rate | | | Frequency | | | | | | | |
| 8.98% | | At Termination | | | 1 day BZDIOVER | | | At Termination | | Citibank NA | | | 01/02/18 | (a) | | | 01/02/18 | | | | BRL 105 | | | $ | (38 | ) | | $ | — | | | $ | (38 | ) |
| 9.99% | | At Termination | | | 1 day BZDIOVER | | | At Termination | | Citibank NA | | | N/A | | | | 01/02/18 | | | | BRL 340 | | | | (738 | ) | | | — | | | | (738 | ) |
| 9.98% | | At Termination | | | 1 day BZDIOVER | | | At Termination | | JP Morgan Chase Bank NA | | | N/A | | | | 01/02/18 | | | | BRL 340 | | | | (536 | ) | | | — | | | | (536 | ) |
| 28 day MXIBTIIE | | Monthly | | | 7.07% | | | Monthly | | Citibank NA | | | N/A | | | | 11/21/18 | | | | MXN 938 | | | | (415 | ) | | | — | | | | (415 | ) |
| 28 day MXIBTIIE | | Monthly | | | 7.06% | | | Monthly | | JP Morgan Chase Bank NA | | | N/A | | | | 11/21/18 | | | | MXN 1,125 | | | | (503 | ) | | | — | | | | (503 | ) |
| 28 day MXIBTIIE | | Monthly | | | 6.98% | | | Monthly | | Citibank NA | | | N/A | | | | 11/28/18 | | | | MXN 1,600 | | | | (783 | ) | | | — | | | | (783 | ) |
| 28 day MXIBTIIE | | Monthly | | | 6.98% | | | Monthly | | JP Morgan Chase Bank NA | | | N/A | | | | 11/28/18 | | | | MXN 908 | | | | (443 | ) | | | — | | | | (443 | ) |
| 7.02% | | At Termination | | | 1 day BZDIOVER | | | At Termination | | Bank of America NA | | | N/A | | | | 01/02/19 | | | | BRL 426 | | | | (195 | ) | | | — | | | | (195 | ) |
| 7.75% | | At Termination | | | 1 day BZDIOVER | | | At Termination | | Bank of America NA | | | N/A | | | | 01/02/19 | | | | BRL 275 | | | | (708 | ) | | | — | | | | (708 | ) |
| 1 day BZDIOVER | | At Termination | | | 9.25% | | | At Termination | | Citibank NA | | | N/A | | | | 01/02/19 | | | | BRL 288 | | | | 2,230 | | | | — | | | | 2,230 | |
| 8.00% | | At Termination | | | 1 day BZDIOVER | | | At Termination | | Citibank NA | | | N/A | | | | 01/02/19 | | | | BRL 274 | | | | (949 | ) | | | — | | | | (949 | ) |
| 1 day BZDIOVER | | At Termination | | | 9.28% | | | At Termination | | JP Morgan Chase Bank NA | | | N/A | | | | 01/02/19 | | | | BRL 273 | | | | 2,145 | | | | — | | | | 2,145 | |
| 1 day BZDIOVER | | At Termination | | | 8.21% | | | At Termination | | Bank of America NA | | | N/A | | | | 01/02/20 | | | | BRL 285 | | | | 333 | | | | — | | | | 333 | |
| 1 day BZDIOVER | | At Termination | | | 9.14% | | | At Termination | | Bank of America NA | | | N/A | | | | 01/04/21 | | | | BRL 122 | | | | 344 | | | | — | | | | 344 | |
| 1 day BZDIOVER | | At Termination | | | 9.61% | | | At Termination | | Bank of America NA | | | N/A | | | | 01/02/23 | | | | BRL 64 | | | | (46 | ) | | | — | | | | (46 | ) |
| 1 day BZDIOVER | | At Termination | | | 9.85% | | | At Termination | | Citibank NA | | | N/A | | | | 01/02/23 | | | | BRL 64 | | | | 188 | | | | — | | | | 188 | |
| 1 day BZDIOVER | | At Termination | | | 9.84% | | | At Termination | | Citibank NA | | | N/A | | | | 01/02/23 | | | | BRL 122 | | | | 343 | | | | — | | | | 343 | |
| 28 day MXIBTIIE | | Monthly | | | 6.32% | | | Monthly | | Goldman Sachs International | | | N/A | | | | 08/06/25 | | | | MXN 640 | | | | (3,030 | ) | | | — | | | | (3,030 | ) |
| 6.31% | | Monthly | | | 28 day MXIBTIIE | | | Monthly | | Deutsche Bank AG | | | N/A | | | | 08/11/25 | | | | MXN 810 | | | | 3,867 | | | | — | | | | 3,867 | |
| | | | | | | | | | | | | | | | | | | | | | | | | | | | | | | | | | |
| | | | | | | | | | | | | | | | | | | | | | | | $ | 1,066 | | | $ | — | | | $ | 1,066 | |
| | | | | | | | | | | | | | | | | | | | | | | | | | | | | | | | | | |
Centrally Cleared Inflation Swaps
| | | | | | | | | | | | | | | | | | | | | | | | |
| Paid by the Fund | | Received by the Fund | | Termination
Date | | Notional
Amount (000) | | | Value | | | Upfront
Premium
Paid
(Received) | | | Unrealized
Appreciation
(Depreciation) | |
| Reference | | Frequency | | Rate | | Frequency | | | | | |
| UK Retail Price Index All Items Monthly | | At Termination | | 3.46% | | At Termination | | 10/15/26 | | | GBP 180 | | | $ | 2,154 | | | $ | — | | | $ | 2,154 | |
| | | | | | | | | | | | | | | | | | | | | | | | |
Balances Reported in the Statement of Assets and Liabilities for Centrally Cleared Swaps and OTC Derivatives
| | | | | | | | | | | | | | | | |
| | | Swap Premiums Paid | | | Swap Premiums Received | | | Unrealized Appreciation | | | Unrealized Depreciation | |
Centrally Cleared Swaps(a) | | $ | 4,867 | | | $ | (17,045 | ) | | $ | 115,377 | | | $ | (136,471 | ) |
OTC Derivatives | | | 118 | | | | (4,484 | ) | | | 9,450 | | | | (9,632 | ) |
| | (a) | Includes cumulative appreciation (depreciation) on centrally cleared swaps, as reported in the Schedule of Investments. Only current day’s variation margin is reported within the Statement of Assets and Liabilities and is net of any previously paid (received) swap premium amounts. | |
| | | | |
| SCHEDULE OF INVESTMENTS | | | 11 | |
| | |
Schedule of Investments (continued) December 31, 2017 | | BlackRock U.S. Government Bond V.I. Fund |
Derivative Financial Instruments Categorized by Risk Exposure
As of period end, the fair values of derivative financial instruments located in the Statement of Assets and Liabilities were as follows:
| | | | | | | | | | | | | | | | | | | | | | | | | | | | |
| | | Commodity
Contracts | | | Credit
Contracts | | | Equity
Contracts | | | Foreign
Currency
Exchange
Contracts | | | Interest
Rate
Contracts | | | Other
Contracts | | | Total | |
Assets — Derivative Financial Instruments | | | | | | | | | | | | | | | | | | | | | | | | | | | | |
Futures Contracts
Net unrealized appreciation(a) | | $ | — | | | $ | — | | | $ | — | | | $ | — | | | $ | 12,153 | | | $ | 39 | | | $ | 12,192 | |
Forward foreign currency exchange contracts
Unrealized appreciation on forward foreign currency exchange contracts | | | — | | | | — | | | | — | | | | 50,167 | | | | — | | | | — | | | | 50,167 | |
Options purchased
Investments at value — unaffiliated(b) | | | — | | | | — | | | | — | | | | 7,768 | | | | 84,218 | | | | — | | | | 91,986 | |
Swaps — centrally cleared
Net unrealized appreciation(a) | | | — | | | | — | | | | — | | | | — | | | | 113,223 | | | | 2,154 | | | | 115,377 | |
Swaps — OTC
Net unrealized appreciation on OTC swaps; Swap premiums paid | | | — | | | | 118 | | | | — | | | | — | | | | 9,450 | | | | — | | | | 9,568 | |
| | | | | | | | | | | | | | | | | | | | | | | | | | | | |
| | $ | — | | | $ | 118 | | | $ | — | | | $ | 57,935 | | | $ | 219,044 | | | $ | 2,193 | | | $ | 279,290 | |
| | | | | | | | | | | | | | | | | | | | | | | | | | | | |
| | | | | | | | | | | | | | | | | | | | | | | | | | | | |
| | | Commodity
Contracts | | | Credit
Contracts | | | Equity
Contracts | | | Foreign
Currency
Exchange
Contracts | | | Interest
Rate
Contracts | | | Other
Contracts | | | Total | |
| Liabilities — Derivative Financial Instruments | | | | | | | | | | | | | | | | | | | | | |
Futures Contracts
Net unrealized depreciation(a) | | $ | — | | | $ | — | | | $ | — | | | $ | — | | | $ | 22,585 | | | $ | — | | | $ | 22,585 | |
Forward foreign currency exchange contracts
Unrealized depreciation on forward foreign currency exchange contracts | | | — | | | | — | | | | — | | | | 6,047 | | | | | | | | — | | | | 6,047 | |
Options written
Options written, at value | | | — | | | | — | | | | — | | | | — | | | | 40,444 | | | | — | | | | 40,444 | |
Swaps — centrally cleared
Net unrealized depreciation(a) | | | — | | | | 1,717 | | | | — | | | | — | | | | 134,754 | | | | — | | | | 136,471 | |
Swaps — OTC
Net unrealized depreciation on OTC swaps; Swap premiums received | | | — | | | | 5,732 | | | | — | | | | — | | | | 8,384 | | | | — | | | | 14,116 | |
| | | | | | | | | | | | | | | | | | | | | | | | | | | | |
| | $ | — | | | $ | 7,449 | | | $ | — | | | $ | 6,047 | | | $ | 206,167 | | | $ | — | | | $ | 219,663 | |
| | | | | | | | | | | | | | | | | | | | | | | | | | | | |
| | (a) | Includes cumulative appreciation (depreciation) on futures contracts and centrally cleared swaps, if any, as reported in the Schedule of Investments. Only current day’s variation margin is reported within the Statement of Assets and Liabilities. | |
| | (b) | Includes options purchased at value as reported in the Schedule of Investments. | |
For the year ended 31 December, 2017, the effect of derivative financial instruments in the Statement of Operations was as follows:
| | | | | | | | | | | | | | | | | | | | | | | | | | | | |
| | | Commodity
Contracts | | | Credit
Contracts | | | Equity
Contracts | | | Foreign
Currency
Exchange
Contracts | | | Interest
Rate
Contracts | | | Other
Contracts | | | Total | |
Net realized Gain (Loss) from: | | | | | | | | | | | | | | | | | | | | | | | | | | | | |
Futures Contracts | | | — | | | $ | — | | | $ | — | | | $ | — | | | $ | (24,103 | ) | | $ | — | | | $ | (24,103 | ) |
Forward foreign currency exchange contracts | | | — | | | | — | | | | — | | | | 37,619 | | | | — | | | | — | | | | 37,619 | |
Options purchased(a) | | | — | | | | — | | | | — | | | | (41,404 | ) | | | (116,739 | ) | | | — | | | | (158,143 | ) |
Options written | | | — | | | | — | | | | — | | | | (2,423 | ) | | | 74,721 | | | | — | | | | 72,298 | |
Swaps | | | — | | | | (28,248 | ) | | | — | | | | (11,654 | ) | | | (128,749 | ) | | | — | | | | (168,651 | ) |
| | | | | | | | | | | | | | | | | | | | | | | | | | | | |
| | $ | — | | | $ | (28,248 | ) | | $ | — | | | $ | (17,862 | ) | | $ | (194,870 | ) | | $ | — | | | $ | (240,980 | ) |
| | | | | | | | | | | | | | | | | | | | | | | | | | | | |
| Net Change in Unrealized Appreciation (Depreciation) on: | | | | | | | | | | | | | | | | | | | | | |
Futures Contracts | | $ | — | | | $ | — | | | $ | — | | | $ | — | | | $ | 87,402 | | | $ | 39 | | | $ | 87,441 | |
Forward foreign currency exchange contracts | | | — | | | | — | | | | — | | | | 38,591 | | | | — | | | | — | | | | 38,591 | |
Options purchased(b) | | | — | | | | — | | | | — | | | | (18,886 | ) | | | (41,900 | ) | | | — | | | | (60,786 | ) |
Options written | | | — | | | | — | | | | — | | | | — | | | | 14,180 | | | | — | | | | 14,180 | |
Swaps | | | — | | | | (2,920 | ) | | | — | | | | — | | | | 34,693 | | | | 6,295 | | | | 38,068 | |
| | | | | | | | | | | | | | | | | | | | | | | | | | | | |
| | $ | — | | | $ | (2,920 | ) | | $ | — | | | $ | 19,705 | | | $ | 94,375 | | | $ | 6,334 | | | $ | 117,494 | |
| | | | | | | | | | | | | | | | | | | | | | | | | | | | |
| | (a) | Options purchased are included in net realized gain (loss) from investments — unaffiliated. | |
| | (b) | Options purchased are included in net change in unrealized appreciation (depreciation) on investments — unaffiliated. | |
| | |
| 12 | | 2017 BLACKROCK ANNUAL REPORTTO SHAREHOLDERS |
| | |
Schedule of Investments (continued) December 31, 2017 | | BlackRock U.S. Government Bond V.I. Fund |
Average Quarterly Balances of Outstanding Derivative Financial Instruments
| | | | |
Futures contracts: | | | | |
Average notional value of contracts — long | | $ | 4,898,897 | |
Average notional value of contracts — short | | $ | 15,232,023 | |
Forward foreign currency exchange contracts: | | | | |
Average amounts purchased — in USD | | $ | 2,477,560 | |
Average amounts sold — in USD | | $ | 2,114,276 | |
Options: | | | | |
Average value of option contracts purchased | | $ | 44,209 | |
Average value of option contracts written | | $ | 13,378 | |
Average notional value of swaption contracts purchased | | $ | 2,350,000 | |
Average notional value of swaption contracts written | | $ | 7,720,000 | |
Credit default swaps: | | | | |
Average notional value — buy protection | | $ | 875,750 | |
Interest rate swaps: | | | | |
Average notional value — pays fixed rate | | $ | 28,585,400 | |
Average notional value — receives fixed rate | | $ | 32,451,857 | |
Inflation swaps: | | | | |
Average notional value — receives fixed rate | | $ | 121,248 | |
Total return swaps: | | | | |
Average notional value — pays fixed rate | | $ | 588,075 | |
For more information about the Fund’s investment risks regarding derivative financial instruments, refer to the Notes to Financial Statements.
Derivative Financial Instruments — Offsetting as of Period End
The Fund’s derivative assets and liabilities (by type) were as follows:
| | | | | | | | |
| | | Assets | | | Liabilities | |
Derivative Financial Instruments: | | | | | | | | |
Futures contracts | | $ | — | | | $ | 2,731 | |
Forward foreign currency exchange contracts | | | 50,167 | | | | 6,047 | |
Options | | | 91,986 | (a) | | | 40,444 | |
Swaps — Centrally cleared | | | 3,621 | | | | — | |
Swaps — OTC(b) | | | 9,568 | | | | 14,116 | |
| | | | | | | | |
Total derivative assets and liabilities in the Statement of Assets and Liabilities | | $ | 155,342 | | | $ | 63,338 | |
Derivatives not subject to a Master Netting Agreement or similar agreement (“MNA”) | | | (52,484 | ) | | | (43,175 | ) |
| | | | | | | | |
Total derivative assets and liabilities subject to an MNA | | $ | 102,858 | | | $ | 20,163 | |
| | | | | | | | |
| | (a) | Includes options purchased at value which is included in Investments at value — unaffiliated in the Statements of Assets and Liabilities and reported in the Schedule of Investments. | |
| | (b) | Includes unrealized appreciation (depreciation) on OTC swaps and swap premiums (paid/received) in the Statement of Assets and Liabilities. | |
The following tables present the Fund’s derivative assets and liabilities by counterparty net of amounts available for offset under an MNA and net of the related collateral received and pledged by the Fund:
| | | | | | | | | | | | | | | | | | | | |
| Counterparty | | Derivative
Assets
Subject to
MNA by
Counterparty | | | Derivatives
Available
for Offset (a) | | | Non-cash
Collateral
Received | | | Cash
Collateral
Received | | | Net Amount
of Derivative
Assets (b) | |
Bank of America NA | | $ | 10,538 | | | $ | (1,279 | ) | | $ | — | | | $ | — | | | $ | 9,259 | |
Barclays Bank plc | | | 10,115 | | | | (45 | ) | | | — | | | | — | | | | 10,070 | |
BNP Paribas SA | | | 18,034 | | | | (1,378 | ) | | | — | | | | — | | | | 16,656 | |
Citibank NA | | | 38,372 | | | | (4,061 | ) | | | — | | | | — | | | | 34,311 | |
Deutsche Bank AG | | | 6,306 | | | | — | | | | — | | | | — | | | | 6,306 | |
Goldman Sachs International | | | 12,938 | | | | (3,247 | ) | | | — | | | | — | | | | 9,691 | |
HSBC Bank plc | | | 4,173 | | | | (792 | ) | | | — | | | | — | | | | 3,381 | |
JP Morgan Chase Bank NA | | | 2,205 | | | | (2,205 | ) | | | — | | | | — | | | | — | |
Morgan Stanley & Co. International plc | | | 117 | | | | — | | | | — | | | | — | | | | 117 | |
Royal Bank of Scotland | | | 60 | | | | (60 | ) | | | — | | | | — | | | | — | |
| | | | | | | | | | | | | | | | | | | | |
| | $ | 102,858 | | | $ | (13,067 | ) | | $ | — | | | $ | — | | | $ | 89,791 | |
| | | | | | | | | | | | | | | | | | | | |
| | | | |
| SCHEDULE OF INVESTMENTS | | | 13 | |
| | |
Schedule of Investments (continued) December 31, 2017 | | BlackRock U.S. Government Bond V.I. Fund |
| | | | | | | | | | | | | | | | | | | | |
| Counterparty | | Derivative
Liabilities
Subject to
MNA by
Counterparty | | | Derivatives
Available
for Offset (a) | | | Non-cash
Collateral
Pledged | | | Cash
Collateral
Pledged | | | Net Amount
of Derivative
Liabilities (c) | |
Bank of America NA | | $ | 1,279 | | | $ | (1,279 | ) | | $ | — | | | $ | — | | | $ | — | |
Barclays Bank plc | | | 45 | | | | (45 | ) | | | — | | | | — | | | | — | |
BNP Paribas SA | | | 1,378 | | | | (1,378 | ) | | | — | | | | — | | | | — | |
Citibank NA | | | 4,061 | | | | (4,061 | ) | | | — | | | | — | | | | — | |
Goldman Sachs International | | | 3,247 | | | | (3,247 | ) | | | — | | | | — | | | | — | |
HSBC Bank plc | | | 792 | | | | (792 | ) | | | — | | | | — | | | | — | |
JP Morgan Chase Bank NA | | | 8,860 | | | | (2,205 | ) | | | — | | | | — | | | | 6,655 | |
Royal Bank of Scotland | | | 501 | | | | (60 | ) | | | — | | | | — | | | | 441 | |
| | | | | | | | | | | | | | | | | | | | |
| | $ | 20,163 | | | $ | (13,067 | ) | | $ | — | | | $ | — | | | $ | 7,096 | |
| | | | | | | | | | | | | | | | | | | | |
| | (a) | The amount of derivatives available for offset is limited to the amount of assets and/or liabilities that are subject to an MNA. | |
| | (b) | Net amount represents the net amount receivable from the counterparty in the event of default. | |
| | (c) | Net amount represents the net amount payable from the counterparty in the event of default. | |
Fair Value Hierarchy as of Period End
Various inputs are used in determining the fair value of investments and derivative financial instruments. For information about the Fund’s policy regarding valuation of investments and derivative financial instruments, refer to the Notes to Financial Statements.
The following tables summarize the Fund’s investments and derivative financial instruments categorized in the disclosure hierarchy:
| | | | | | | | | | | | | | | | |
| | | Level 1 | | | Level 2 | | | Level 3 | | | Total | |
Assets: | | | | | | | | | | | | | | | | |
Investments: | | | | | | | | | | | | | | | | |
Long-Term Investments(a) | | $ | — | | | $ | 91,361,865 | | | $ | — | | | $ | 91,361,865 | |
Money Market Funds | | | 1,795,602 | | | | — | | | | — | | | | 1,795,602 | |
Options Purchased: | | | | | | | | | | | | | | | | |
Interest rate contracts | | | 48,863 | | | | 35,355 | | | | — | | | | 84,218 | |
Foreign currency exchange contracts | | | — | | | | 7,768 | | | | — | | | | 7,768 | |
Liabilities: | | | | | | | | | | | | | | | | |
TBA Sale Commitments | | | — | | | | (15,648,894 | ) | | | — | | | | (15,648,894 | ) |
| | | | | | | | | | | | | | | | |
| | $ | 1,844,465 | | | $ | 75,756,094 | | | $ | — | | | $ | 77,600,559 | |
| | | | | | | | | | | | | | | | |
Derivative Financial Instruments(b) | | | | | | | | | | | | | | | | |
Assets: | | | | | | | | | | | | | | | | |
Foreign currency exchange contracts | | $ | — | | | $ | 50,167 | | | $ | — | | | $ | 50,167 | |
Interest rate contracts | | | 12,153 | | | | 122,673 | | | | — | | | | 134,826 | |
Other contracts | | | 39 | | | | 2,154 | | | | — | | | | 2,193 | |
Liabilities: | | | | | | | | | | | | | | | | |
Credit contracts | | | — | | | | (2,965 | ) | | | — | | | | (2,965 | ) |
Foreign currency exchange contracts | | | — | | | | (6,047 | ) | | | — | | | | (6,047 | ) |
Interest rate contracts | | | (63,029 | ) | | | (143,138 | ) | | | — | | | | (206,167 | ) |
| | | | | | | | | | | | | | | | |
| | $ | (50,837 | ) | | $ | 22,844 | | | $ | — | | | $ | (27,993 | ) |
| | | | | | | | | | | | | | | | |
| | (a) | See above Schedule of Investments for values in each security type. | |
| | (b) | Derivative financial instruments are swaps, futures contracts, forward foreign currency exchange contracts and options written. Swaps, futures contracts, and forward foreign currency exchange contracts are valued at the unrealized appreciation (depreciation) on the instrument and options written are shown at value. | |
The Fund may hold assets and/or liabilities in which the fair value approximates the carrying amount or face value, including accrued interest, for financial statement purposes. As of period end, reverse repurchase agreements of $9,123,815 are categorized as level 2 within the disclosure hierarchy.
During the year ended December 31, 2017, there were no transfers between Level 1 and Level 2.
| | |
| 14 | | 2017 BLACKROCK ANNUAL REPORTTO SHAREHOLDERS |
| | |
Schedule of Investments (continued) December 31, 2017 | | BlackRock U.S. Government Bond V.I. Fund |
A reconciliation of Level 3 investments is presented when the Fund had a significant amount of Level 3 investments at the beginning and/or end of the period in relation to net assets. The following table is a reconciliation of Level 3 investments for which significant unobservable inputs were used in determining fair value:
| | | | |
| | | Asset-Backed Securities | |
Investments: | | | | |
Assets: | | | | |
Opening Balance, as of December 31, 2016 | | $ | 1,360,300 | |
Transfers into Level 3 | | | — | |
Transfers out of Level 3(a) | | | (860,000 | ) |
Accrued discounts/premiums | | | 8 | |
Net realized gain (loss) | | | 381 | |
Net change in unrealized appreciation (depreciation)(b) | | | (689 | ) |
Purchases | | | — | |
Sales | | | (500,000 | ) |
| | | | |
Closing Balance, as of December 31, 2017 | | $ | — | |
| | | | |
Net change in unrealized appreciation (depreciation) on investments still held at December 31, 2017(b) | | $ | — | |
| | | | |
| | (a) | As of December 31, 2017, the Fund used significant unobservable inputs in determining the value of certain investments. As of December 31, 2017, the Fund used observable inputs in determining the value of the same investments. As a result, investments at beginning of period value were transferred from Level 3 to Level 2 in the disclosure hierarchy. | |
| | (b) | Any difference between net change in unrealized appreciation (depreciation) and net change in unrealized appreciation (depreciation) on investments still held at December 31, 2017 is generally due to investments no longer held or categorized as Level 3 at period end. | |
The Fund’s investments that are categorized as Level 3 were valued utilizing third party pricing information without adjustment. Such valuations are based on unobservable inputs. A significant change in third party information could result in a significantly lower or higher value of such Level 3 investments.
See notes to financial statements.
| | | | |
| SCHEDULE OF INVESTMENTS | | | 15 | |
Statement of Assets and Liabilities
December 31, 2017
| | | | |
| | | BlackRock U.S.
Government Bond
V.I. Fund | |
|
ASSETS | |
Investments at value — unaffiliated (cost — $91,704,864) | | $ | 91,455,650 | |
Investments at value — affiliated (cost — $1,793,803) | | | 1,793,803 | |
Cash | | | 1,256 | |
Cash pledged: | | | | |
Futures contracts | | | 118,710 | |
Centrally cleared swaps | | | 167,000 | |
Foreign currency at value (cost — $135,802) | | | 135,760 | |
Receivables: | | | | |
Investments sold | | | 5,459,350 | |
TBA sale commitments | | | 15,653,897 | |
Capital shares sold | | | 151,001 | |
Dividends — affiliated | | | 2,410 | |
Dividends — unaffiliated | | | 6,022 | |
Interest — unaffiliated | | | 285,343 | |
Variation margin on centrally cleared swaps | | | 3,621 | |
Swap premiums paid | | | 118 | |
Unrealized appreciation on: | | | | |
Forward foreign currency exchange contracts | | | 50,167 | |
OTC swaps | | | 9,450 | |
Prepaid expenses | | | 293 | |
Other assets | | | 15,653 | |
| | | | |
Total assets | | | 115,309,504 | |
| | | | |
|
LIABILITIES | |
Options written at value (premium received $63,472) | | | 40,444 | |
TBA sale commitments at value (proceeds $15,653,897) | | | 15,648,894 | |
Reverse repurchase agreements at value | | | 9,123,815 | |
Payables: | | | | |
Investments purchased | | | 23,282,962 | |
Capital shares redeemed | | | 180 | |
Income dividends | | | 86,234 | |
Distribution fees | | | 346 | |
Variation margin on futures contracts | | | 2,731 | |
Investment advisory fees | | | 45,348 | |
Officer’s and Directors’ fees | | | 3,966 | |
Other affiliates | | | 559 | |
Other accrued expenses | | | 169,058 | |
Swap premiums received | | | 4,484 | |
Unrealized depreciation on: | | | | |
Forward foreign currency exchange contracts | | | 6,047 | |
OTC swaps | | | 9,632 | |
| | | | |
Total liabilities | | | 48,424,700 | |
| | | | |
| |
NET ASSETS | | $ | 66,884,804 | |
| | | | |
|
NET ASSETS CONSIST OF | |
Paid-in capital | | $ | 71,404,783 | |
Undistributed net investment income | | | 108,200 | |
Accumulated net realized loss | | | (4,435,412 | ) |
Net unrealized appreciation (depreciation) | | | (192,767 | ) |
| | | | |
NET ASSETS | | $ | 66,884,804 | |
| | | | |
|
NET ASSET VALUE | |
Class I — Based on net assets of $65,100,220 and 6,434,695 shares outstanding, 300 million shares authorized, $0.10 par value. | | $ | 10.12 | |
| | | | |
Class III — Based on net assets of $1,784,584 and 176,523 shares outstanding, 100 million shares authorized, $0.10 par value. | | $ | 10.11 | |
| | | | |
See notes to financial statements.
| | |
| 16 | | 2017 BLACKROCK ANNUAL REPORTTO SHAREHOLDERS |
Statement of Operations
Year Ended December 31, 2017
| | | | |
| | | BlackRock U.S.
Government Bond
V.I. Fund | |
| |
INVESTMENT INCOME | | | | |
Dividends — affiliated | | $ | 11,627 | |
Dividends — unaffiliated | | | 176 | |
Interest — unaffiliated | | | 1,807,780 | |
| | | | |
Total investment income | | | 1,819,583 | |
| | | | |
| |
EXPENSES | | | | |
Investment advisory | | | 351,496 | |
Transfer agent — class specific | | | 135,971 | |
Pricing | | | 81,656 | |
Custodian | | | 78,152 | |
Professional | | | 70,076 | |
Printing | | | 42,405 | |
Accounting services | | | 31,908 | |
Directors and Officer | | | 21,263 | |
Transfer agent | | | 5,000 | |
Distribution — class specific | | | 4,767 | |
Registration | | | 1 | |
Miscellaneous | | | 1,127 | |
| | | | |
Total expenses excluding interest expense | | | 823,822 | |
Interest expense | | | 99,529 | |
| | | | |
Total expenses | | | 923,351 | |
Less: | | | | |
Fees waived and/or reimbursed by the Manager | | | (72,054 | ) |
Transfer agent fees reimbursed — class specific | | | (134,825 | ) |
| | | | |
Total expenses after fees waived and/or reimbursed | | | 716,472 | |
| | | | |
Net investment income | | | 1,103,111 | |
| | | | |
| |
REALIZED AND UNREALIZED GAIN (LOSS) | | | | |
Net realized gain (loss) from: | | | | |
Investments — unaffiliated | | | (1,138,288 | ) |
Borrowed bonds | | | (1,142 | ) |
Capital gain distributions from investment companies — affiliated | | | 4 | |
Forward foreign currency exchange contracts | | | 37,619 | |
Foreign currency transactions | | | (16,001 | ) |
Futures contracts | | | (24,103 | ) |
Options written | | | 72,298 | |
Swaps . . . . . | | | (168,651 | ) |
| | | | |
| | | (1,238,264 | ) |
| | | | |
Net change in unrealized appreciation (depreciation) on: | | | | |
Investments — unaffiliated | | | 1,016,674 | |
Borrowed bonds | | | 1,005 | |
Forward foreign currency exchange contracts | | | 38,591 | |
Foreign currency translations | | | 633 | |
Futures contracts | | | 87,441 | |
Options written | | | 14,180 | |
Swaps . . . . . | | | 38,068 | |
| | | | |
| | | 1,196,592 | |
| | | | |
Net realized and unrealized loss | | | (41,672 | ) |
| | | | |
NET INCREASE IN NET ASSETS RESULTING FROM OPERATIONS | | $ | 1,061,439 | |
| | | | |
See notes to financial statements.
Statements of Changes in Net Assets
| | | | | | | | |
| | | BlackRock U.S. Government
Bond V.I. Fund | |
| | | Year Ended December 31, | |
| | | 2017 | | | 2016 | |
| | |
INCREASE (DECREASE) IN NET ASSETS | | | | | | | | |
| | |
OPERATIONS | | | | | | | | |
Net investment income | | $ | 1,103,111 | | | $ | 1,191,810 | |
Net realized gain (loss) | | | (1,238,264 | ) | | | 1,294,260 | |
Net change in unrealized appreciation (depreciation) | | | 1,196,592 | | | | (1,045,699 | ) |
| | | | | | | | |
Net increase in net assets resulting from operations | | | 1,061,439 | | | | 1,440,371 | |
| | | | | | | | |
| | |
DISTRIBUTIONS TO SHAREHOLDERS(a) | | | | | | | | |
From net investment income: | | | | | | | | |
Class I | | | (1,434,556 | ) | | | (1,449,685 | ) |
Class III | | | (34,383 | ) | | | (67,977 | ) |
| | | | | | | | |
Decrease in net assets resulting from distributions to shareholders | | | (1,468,939 | ) | | | (1,517,662 | ) |
| | | | | | | | |
| | |
CAPITAL SHARE TRANSACTIONS | | | | | | | | |
Net decrease in net assets derived from capital share transactions | | | (7,899,331 | ) | | | (9,641,543 | ) |
| | | | | | | | |
| | |
NET ASSETS | | | | | | | | |
Total decrease in net assets | | | (8,306,831 | ) | | | (9,718,834 | ) |
Beginning of year | | | 75,191,635 | | | | 84,910,469 | |
| | | | | | | | |
End of year | | $ | 66,884,804 | | | $ | 75,191,635 | |
| | | | | | | | |
Undistributed net investment income, end of year | | $ | 108,200 | | | $ | 257,205 | |
| | | | | | | | |
| (a) | Distributions for annual periods determined in accordance with U.S. federal income tax regulations. |
See notes to financial statements.
| | |
| 18 | | 2017 BLACKROCK ANNUAL REPORTTO SHAREHOLDERS |
Financial Highlights
(For a share outstanding throughout each period)
| | | | | | | | | | | | | | | | | | | | |
| | | BlackRock U.S. Government Bond V.I. Fund | |
| | | Class I | |
| | | Year Ended December 31, | |
| | | 2017 | | | 2016 | | | 2015 | | | 2014 | | | 2013 | |
Net asset value, beginning of year | | $ | 10.18 | | | $ | 10.23 | | | $ | 10.39 | | | $ | 10.04 | | | $ | 10.71 | |
| | | | | | | | | | | | | | | | | | | | |
Net investment income(a) | | | 0.16 | | | | 0.15 | | | | 0.15 | | | | 0.19 | | | | 0.13 | |
Net realized and unrealized gain (loss) | | | (0.01 | ) | | | (0.01 | ) | | | (0.10 | ) | | | 0.39 | | | | (0.48 | ) |
| | | | | | | | | | | | | | | | | | | | |
Net increase (decrease) from investment operations | | | 0.15 | | | | 0.14 | | | | 0.05 | | | | 0.58 | | | | (0.35 | ) |
| | | | | | | | | | | | | | | | | | | | |
| Distributions:(b) | | | | | | | | | | | | | | | |
From net investment income | | | (0.21 | ) | | | (0.19 | ) | | | (0.21 | ) | | | (0.23 | ) | | | (0.25 | ) |
From net realized gain | | | — | | | | — | | | | — | | | | — | | | | (0.07 | ) |
| | | | | | | | | | | | | | | | | | | | |
Total distributions | | | (0.21 | ) | | | (0.19 | ) | | | (0.21 | ) | | | (0.23 | ) | | | (0.32 | ) |
| | | | | | | | | | | | | | | | | | | | |
Net asset value, end of year | | $ | 10.12 | | | $ | 10.18 | | | $ | 10.23 | | | $ | 10.39 | | | $ | 10.04 | |
| | | | | | | | | | | | | | | | | | | | |
| | | | | |
Total Return:(c) | | | | | | | | | | | | | | | | | | | | |
Based on net asset value | | | 1.52 | % | | | 1.33 | % | | | 0.45 | % | | | 5.87 | % | | | (3.25 | )% |
| | | | | | | | | | | | | | | | | | | | |
| | | | | |
Ratios to Average Net Assets: | | | | | | | | | | | | | | | | | | | | |
Total expenses | | | 1.31 | % | | | 1.02 | % | | | 0.96 | % | | | 0.89 | % | | | 0.90 | % |
| | | | | | | | | | | | | | | | | | | | |
Total expenses after fees waived and/or reimbursed | | | 1.01 | % | | | 0.76 | % | | | 0.73 | % | | | 0.69 | % | | | 0.69 | % |
| | | | | | | | | | | | | | | | | | | | |
Total expenses after fees waived and/or reimbursed excluding interest expense | | | 0.87 | % | | | 0.70 | % | | | 0.70 | % | | | 0.66 | % | | | 0.68 | % |
| | | | | | | | | | | | | | | | | | | | |
Net investment income | | | 1.58 | % | | | 1.43 | % | | | 1.41 | % | | | 1.88 | % | | | 1.24 | % |
| | | | | | | | | | | | | | | | | | | | |
| | | | | |
Supplemental Data: | | | | | | | | | | | | | | | | | | | | |
Net assets, end of year (000) | | $ | 65,100 | | | $ | 72,433 | | | $ | 83,016 | | | $ | 92,975 | | | $ | 103,218 | |
| | | | | | | | | | | | | | | | | | | | |
Portfolio turnover rate(d) | | | 1,052 | % | | | 1,140 | % | | | 1,581 | % | | | 1,388 | % | | | 1,956 | % |
| | | | | | | | | | | | | | | | | | | | |
| (a) | Based on average shares outstanding. |
| (b) | Distributions for annual periods determined in accordance with U.S. federal income tax regulations. |
| (c) | Where applicable, excludes insurance-related fees and expenses and assumes the reinvestment of distributions. |
| (d) | Includes mortgage dollar roll transactions (“MDRs”). Additional information regarding portfolio turnover rate is as follows: |
| | | | | | | | | | | | | | | | | | | | | | | | |
| | | Year Ended December 31, | |
| | | 2017 | | | 2016 | | | 2015 | | | 2014 | | | 2013 | | | | |
Portfolio turnover rate (excluding MDRs) | | | 681 | % | | | 705 | % | | | 991 | % | | | 956 | % | | | 1,415 | % | | | | |
| | | | | | | | | | | | | | | | | | | | | | | | |
See notes to financial statements.
Financial Highlights (continued)
(For a share outstanding throughout each period)
| | | | | | | | | | | | | | | | | | | | | | | | | | | | |
| | | BlackRock U.S. Government Bond V.I. Fund (continued) | |
| | | Class III | |
| | | Year Ended December 31, | | | | | | | | | Period
05/09/2012 (a) to 12/31/2012 | |
| | 2017 | | | 2016 | | | 2015 | | | 2014 | | | Period
07/15/2013 (a) to 12/31/2013 | | | Period
01/01/2013 to 07/09/2013 (b) | | |
Net asset value, beginning of period | | $ | 10.18 | | | $ | 10.22 | | | $ | 10.39 | | | $ | 10.04 | | | $ | 10.19 | | | $ | 10.71 | | | $ | 10.77 | |
| | | | | | | | | | | | | | | | | | | | | | | | | | | | |
Net investment income(c) | | | 0.13 | | | | 0.11 | | | | 0.13 | | | | 0.17 | | | | 0.11 | | | | 0.01 | | | | 0.08 | |
Net realized and unrealized gain (loss) | | | (0.02 | ) | | | — | | | | (0.12 | ) | | | 0.38 | | | | (0.09 | ) | | | (0.38 | ) | | | 0.05 | |
| | | | | | | | | | | | | | | | | | | | | | | | | | | | |
Net increase (decrease) from investment operations | | | 0.11 | | | | 0.11 | | | | 0.01 | | | | 0.55 | | | | 0.02 | | | | (0.37 | ) | | | 0.13 | |
| | | | | | | | | | | | | | | | | | | | | | | | | | | | |
| Distributions:(d) | | | | | | | | | | | | | | | | | | | | | |
From net investment income | | | (0.18 | ) | | | (0.15 | ) | | | (0.18 | ) | | | (0.20 | ) | | | (0.10 | ) | | | (0.15 | ) | | | (0.15 | ) |
From net realized gain | | | — | | | | — | | | | — | | | | — | | | | (0.07 | ) | | | — | | | | (0.04 | ) |
| | | | | | | | | | | | | | | | | | | | | | | | | | | | |
Total distributions | | | (0.18 | ) | | | (0.15 | ) | | | (0.18 | ) | | | (0.20 | ) | | | (0.17 | ) | | | (0.15 | ) | | | (0.19 | ) |
| | | | | | | | | | | | | | | | | | | | | | | | | | | | |
Net asset value, end of period | | $ | 10.11 | | | $ | 10.18 | | | $ | 10.22 | | | $ | 10.39 | | | $ | 10.04 | | | $ | 10.19 | | | | 10.71 | |
| | | | | | | | | | | | | | | | | | | | | | | | | | | | |
| | | | | | | |
Total Return:(e) | | | | | | | | | | | | | | | | | | | | | | | | | | | | |
Based on net asset value | | | 1.10 | % | | | 1.08 | % | | | 0.08 | % | | | 5.56 | % | | | 0.26 | %(f) | | | (3.60 | )%(f) | | | 1.24 | (f) |
| | | | | | | | | | | | | | | | | | | | | | | | | | | | |
| | | | | | | |
Ratios to Average Net Assets: | | | | | | | | | | | | | | | | | | | | | | | | | | | | |
Total expenses | | | 1.45 | % | | | 1.27 | % | | | 1.11 | % | | | 1.09 | % | | | 0.86 | %(g) | | | 1.66 | %(g) | | | 1.14 | %(g) |
| | | | | | | | | | | | | | | | | | | | | | | | | | | | |
Total expenses after fees waived and/or reimbursed | | | 1.30 | % | | | 1.08 | % | | | 1.00 | % | | | 1.00 | % | | | 0.85 | %(g) | | | 0.85 | %(g) | | | 1.01 | %(g) |
| | | | | | | | | | | | | | | | | | | | | | | | | | | | |
Total expenses after fees waived and/or reimbursed excluding interest expense | | | 1.17 | % | | | 1.01 | % | | | 0.97 | % | | | 0.98 | % | | | 0.84 | %(g) | | | 0.85 | %(g) | | | 0.99 | %(g) |
| | | | | | | | | | | | | | | | | | | | | | | | | | | | |
Net investment income | | | 1.30 | % | | | 1.09 | % | | | 1.27 | % | | | 1.63 | % | | | 2.30 | %(g) | | | 0.25 | %(g) | | | 1.20 | %(g) |
| | | | | | | | | | | | | | | | | | | | | | | | | | | | |
| | | | | | | |
Supplemental Data: | | | | | | | | | | | | | | | | | | | | | | | | | | | | |
Net assets, end of period (000) | | $ | 1,785 | | | $ | 2,758 | | | $ | 1,894 | | | $ | 750 | | | $ | 225 | | | $ | — | (b) | | $ | 29 | |
| | | | | | | | | | | | | | | | | | | | | | | | | | | | |
Portfolio turnover rate(h) | | | 1,052 | % | | | 1,140 | % | | | 1,581 | % | | | 1,388 | % | | | 1,956 | % | | | 1,956 | % | | | 1,529 | % |
| | | | | | | | | | | | | | | | | | | | | | | | | | | | |
| (a) | Recommencement of operations. |
| (b) | There were no Class III Shares outstanding from July 9,2013 to July 14, 2013. On July 15, 2013, operations recommenced. |
| (c) | Based on average shares outstanding. |
| (d) | Distributions for annual periods determined in accordance with U.S. federal income tax regulations. |
| (e) | Where applicable, excludes insurance-related fees and expenses and assumes the reinvestment of distributions. |
| (f) | Aggregate total return. |
| (h) | Includes mortgage dollar roll transactions (“MDRs”). Additional information regarding portfolio turnover rate is as follows: |
| | | | | | | | | | | | | | | | | | | | | | | | | | | | |
| | | Year Ended December 31, | | | Period
07/15/2013 to 12/31/2013 | | | Period
01/01/2013 to 07/09/2013 | | | Period
05/09/2012 to 12/31/2012 | |
| | 2017 | | | 2016 | | | 2015 | | | 2014 | | | | |
Portfolio turnover rate (excluding MDRs) | | | 681 | % | | | 705 | % | | | 991 | % | | | 956 | % | | | 1,415 | % | | | 1,415 | % | | | 1,119 | % |
| | | | |
See notes to financial statements.
| | |
| 20 | | 2017 BLACKROCK ANNUAL REPORTTO SHAREHOLDERS |
Notes to Financial Statements
BlackRock Variable Series Funds, Inc. (the “Company”) is registered under the Investment Company Act of 1940, as amended (the “1940 Act”), as an open-end management investment company. The Company is organized as a Maryland corporation that is comprised of 20 separate funds.
The funds offer shares to insurance companies for their separate accounts to fund benefits under certain variable annuity and variable life insurance contracts. The financial statements presented are for BlackRock U.S. Government Bond V.I. Fund (the “Fund”). The Fund is classified as diversified. Class I and Class III Shares have equal voting, dividend, liquidation and other rights, except that only shares of the respective classes are entitled to vote on matters concerning only that class. In addition, Class III Shares bear certain expenses related to the distribution of such shares. Class III Shares recommenced on May 9, 2012, were redeemed on July 9, 2013 and recommenced on July 15, 2013.
The Fund, together with certain other registered investment companies advised by BlackRock Advisors, LLC (the “Manager”) or its affiliates, is included in a complex of open-end funds referred to as the Equity-Bond Complex.
| 2. | SIGNIFICANT ACCOUNTING POLICIES |
The financial statements are prepared in conformity with accounting principles generally accepted in the United States of America (“U.S. GAAP”), which may require management to make estimates and assumptions that affect the reported amounts of assets and liabilities in the financial statements, disclosure of contingent assets and liabilities at the date of the financial statements and the reported amounts of increases and decreases in net assets from operations during the reporting period. Actual results could differ from those estimates. The Fund is considered an investment company under U.S. GAAP and follows the accounting and reporting guidance applicable to investment companies. Below is a summary of significant accounting policies:
Investment Transactions and Income Recognition: For financial reporting purposes, investment transactions are recorded on the dates the transactions are entered into (the “trade dates”). Realized gains and losses on investment transactions are determined on the identified cost basis. Interest income, including amortization and accretion of premiums and discounts on debt securities, is recognized on an accrual basis. Income, expenses and realized and unrealized gains and losses are allocated daily to each class based on its relative net assets.
Foreign Currency Translation: The Fund’s books and records are maintained in U.S. dollars. Securities and other assets and liabilities denominated in foreign currencies are translated into U.S. dollars using exchange rates determined as of the close of trading on the New York Stock Exchange (“NYSE”). Purchases and sales of investments are recorded at the rates of exchange prevailing on the respective dates of such transactions. Generally, when the U.S. dollar rises in value against a foreign currency, the investments denominated in that currency will lose value; the opposite effect occurs if the U.S. dollar falls in relative value.
The Fund does not isolate the portion of the results of operations arising as a result of changes in the exchange rates from the changes in the market prices of investments held or sold for financial reporting purposes. Accordingly, the effects of changes in exchange rates on investments are not segregated in the Statement of Operations from the effects of changes in market prices of those investments, but are included as a component of net realized and unrealized gain (loss) from investments. The Fund reports realized currency gains (losses) on foreign currency related transactions as components of net realized gain (loss) for financial reporting purposes, whereas such components are generally treated as ordinary income for U.S. federal income tax purposes.
Segregation and Collateralization: In cases where the Fund enters into certain investments (e.g., TBA commitments, futures contracts, forward foreign currency exchange contracts, options written and swaps), or certain borrowings (e.g., reverse repurchase transactions) that would be treated as “senior securities” for 1940 Act purposes, the Fund may segregate or designate on its books and records cash or liquid assets having a market value at least equal to the amount of its future obligations under such investments or borrowings. Doing so allows the investment or borrowing to be excluded from treatment as a “senior security.” Furthermore, if required by an exchange or counterparty agreement, the Fund may be required to deliver/deposit cash and/or securities to/with an exchange, or broker-dealer or custodian as collateral for certain investments or obligations.
Distributions: Distributions from net investment income are declared daily and paid monthly. Distributions of capital gains are recorded on the ex-dividend date and made at least annually. The character and timing of distributions are determined in accordance with federal income tax regulations, which may differ from U.S. GAAP.
Recent Accounting Standards: In November 2016, the Financial Accounting Standards Board issued Accounting Standards Update “Restricted Cash” which will require entities to include the total of cash, cash equivalents, restricted cash, and restricted cash equivalents in the beginning and ending cash balances in the Statement of Cash Flows. The guidance will be applied retrospectively and is effective for fiscal years beginning after December 15, 2017, and interim periods within those years. Management is evaluating the impact, if any, of this guidance on the Fund’s presentation in the Statement of Cash Flows.
In March 2017, the Financial Accounting Standards Board issued Accounting Standards Update “Premium Amortization of Purchased Callable Debt Securities” which amends the amortization period for certain purchased callable debt securities. Under the new guidance, the premium amortization of purchased callable debt securities that have explicit, non-contingent call features and are callable at fixed prices will be amortized to the earliest call date. The guidance will be applied on a modified retrospective basis and is effective for fiscal years, and their interim periods, beginning after December 15, 2018. Management is currently evaluating the impact of this guidance to the Fund.
Indemnifications: In the normal course of business, the Fund enters into contracts that contain a variety of representations that provide general indemnification. The Fund’s maximum exposure under these arrangements is unknown because it involves future potential claims against the Fund, which cannot be predicted with any certainty.
Other: Expenses directly related to the Fund or its classes are charged to the Fund or the applicable class. Other operating expenses shared by several funds, including other funds managed by the Manager, are prorated among those funds on the basis of relative net assets or other appropriate methods. Expenses directly related to the Fund and other shared expenses prorated to the Fund are allocated daily to each class based on its relative net assets or other appropriate methods.
| | | | |
| NOTESTO FINANCIAL STATEMENTS | | | 21 | |
Notes to Financial Statements (continued)
The Fund has an arrangement with its custodian whereby credits are earned on uninvested cash balances, which could be used to reduce custody fees and/or overdraft charges. The Fund may incur charges on certain uninvested cash balances and overdrafts, subject to certain conditions.
| 3. | INVESTMENT VALUATION AND FAIR VALUE MEASUREMENTS |
Investment Valuation Policies: The Fund’s investments are valued at fair value (also referred to as “market value” within the financial statements) as of the close of trading on the NYSE (generally 4:00 p.m., Eastern time) (or, if the reporting date falls on a day the NYSE is closed, investments are valued at fair value as of the period end). U.S. GAAP defines fair value as the price the Fund would receive to sell an asset or pay to transfer a liability in an orderly transaction between market participants at the measurement date. The Fund determines the fair values of its financial instruments using various independent dealers or pricing services under policies approved by the Board of Directors of the Company (the “Board”). The BlackRock Global Valuation Methodologies Committee (the “Global Valuation Committee”) is the committee formed by management to develop global pricing policies and procedures and to oversee the pricing function for all financial instruments.
Fair Value Inputs and Methodologies: The following methods and inputs are used to establish the fair value of the Fund’s assets and liabilities:
| | • | | Fixed-income securities for which market quotations are readily available are generally valued using the last available bid prices or current market quotations provided by independent dealers or third party pricing services. Floating rate loan interests are valued at the mean of the bid prices from one or more independent brokers or dealers as obtained from a third party pricing service. Pricing services generally value fixed-income securities assuming orderly transactions of an institutional round lot size, but the Fund may hold or transact in such securities in smaller, odd lot sizes. Odd lots may trade at lower prices than institutional round lots. The pricing services may use matrix pricing or valuation models that utilize certain inputs and assumptions to derive values, including transaction data (e.g., recent representative bids and offers), credit quality information, perceived market movements, news, and other relevant information. Certain fixed-income securities, including asset-backed and mortgage related securities may be valued based on valuation models that consider the estimated cash flows of each tranche of the entity, establish a benchmark yield and develop an estimated tranche specific spread to the benchmark yield based on the unique attributes of the tranche. The amortized cost method of valuation may be used with respect to debt obligations with sixty days or less remaining to maturity unless the Manager determines such method does not represent fair value. |
| | • | | Generally, trading in foreign instruments is substantially completed each day at various times prior to the close of trading on the NYSE. Occasionally, events affecting the values of such instruments may occur between the foreign market close and the close of trading on the NYSE that may not be reflected in the computation of the Fund’s net assets. Each business day, the Fund uses a pricing service to assist with the valuation of certain foreign exchange-traded equity securities and foreign exchange-traded over-the-counter (“OTC”) options (the “Systematic Fair Value Price”). Using current market factors, the Systematic Fair Value Price is designed to value such foreign securities and foreign options at fair value as of the close of trading on the NYSE, which follows the close of the local markets. |
| | • | | Investments in open-end U.S. mutual funds are valued at net asset value (“NAV”) each business day. |
| | • | | Futures contracts traded on exchanges are valued at their last sale price. |
| | • | | Forward foreign currency exchange contracts are valued at the mean between the bid and ask prices and are determined as of the close of trading on the NYSE. Interpolated values are derived when the settlement date of the contract is an interim date for which quotations are not available. |
| | • | | Exchange-traded options are valued at the mean between the last bid and ask prices at the close of the options market in which the options trade. An exchange-traded option for which there is no mean price is valued at the last bid (long positions) or ask (short positions) price. If no bid or ask price is available, the prior day’s price will be used, unless it is determined that the prior day’s price no longer reflects the fair value of the option. |
| | • | | OTC options and options on swaps (“swaptions”) are valued by an independent pricing service using a mathematical model, which incorporates a number of market data factors, such as the trades and prices of the underlying instruments. |
| | • | | Swap agreements are valued utilizing quotes received daily by the Fund’s pricing service or through brokers, which are derived using daily swap curves and models that incorporate a number of market data factors, such as discounted cash flows, trades and values of the underlying reference instruments. |
| | • | | To-be-announced (“TBA”) commitments are valued on the basis of last available bid prices or current market quotations provided by pricing services. |
If events (e.g., a company announcement, market volatility or a natural disaster) occur that are expected to materially affect the value of such investments, or in the event that the application of these methods of valuation results in a price for an investment that is deemed not to be representative of the market value of such investment, or if a price is not available, the investment will be valued by the Global Valuation Committee, or its delegate, in accordance with a policy approved by the Board as reflecting fair value (“Fair Valued Investments”). The fair valuation approaches that may be used by the Global Valuation Committee will include market approach, income approach and the cost approach. Valuation techniques such as discounted cash flow, use of market comparables and matrix pricing are types of valuation approaches and are typically used in determining fair value. When determining the price for Fair Valued Investments, the Global Valuation Committee, or its delegate, seeks to determine the price that the Fund might reasonably expect to receive or pay from the current sale or purchase of that asset or liability in an arm’s-length transaction. Fair value determinations shall be based upon all available factors that the Global Valuation Committee, or its delegate, deems relevant and consistent with the principles of fair value measurement.
The Global Valuation Committee, or its delegate, employs various methods for calibrating valuation approaches for investments where an active market does not exist, including regular due diligence of the Fund’s pricing vendors, regular reviews of key inputs and assumptions, transactional back-testing or disposition analysis to compare unrealized gains and losses to realized gains and losses, reviews of missing or stale prices and large movements in market values and reviews of any market related activity. The pricing of all Fair Valued Investments is subsequently reported to the Board or a committee thereof on a quarterly basis. As a result of the inherent uncertainty in valuation of these investments, the fair values may differ from the values that would have been used had an active market existed.
| | |
| 22 | | 2017 BLACKROCK ANNUAL REPORTTO SHAREHOLDERS |
Notes to Financial Statements (continued)
For investments in equity or debt issued by privately held companies or funds (“Private Company” or collectively, the “Private Companies”) and other Fair Valued Investments, the fair valuation approaches that are used by third party pricing services utilize one or a combination of, but not limited to, the following inputs.
| | |
| | | Standard Inputs Generally Considered By Third Party Pricing Services |
Market approach | | (i) recent market transactions, including subsequent rounds of financing, in the underlying investment or comparable issuers; (ii) recapitalizations and other transactions across the capital structure; and (iii) market multiples of comparable issuers. |
Income approach | | (i) future cash flows discounted to present and adjusted as appropriate for liquidity, credit and/or market risks; (ii) quoted prices for similar investments or assets in active markets; and (iii) other risk factors, such as interest rates, yield curves, volatilities, prepayment speeds, loss severities, credit risks, recovery rates, liquidation amounts and/or default rates. |
Cost approach. | | (i) audited or unaudited financial statements, investor communications and financial or operational metrics issued by the Private Company; (ii) changes in the valuation of relevant indices or publicly traded companies comparable to the Private Company; (iii) relevant news and other public sources; and (iv) known secondary market transactions in the Private Company’s interests and merger or acquisition activity in companies comparable to the Private Company. |
Investments in series of preferred stock issued by Private Companies are typically valued utilizing market approach in determining the enterprise value of the company. Such investments often contain rights and preferences that differ from other series of preferred and common stock of the same issuer. Valuation techniques such as an option pricing model (“OPM”), a probability weighted expected return model (“PWERM”) or a hybrid of those techniques are used in allocating enterprise value of the company, as deemed appropriate under the circumstances. The use of OPM and PWERM techniques involve a determination of the exit scenarios of the investment in order to appropriately allocate the enterprise value of the company among the various parts of its capital structure.
The Private Companies are not subject to the public company disclosure, timing, and reporting standards as other investments held by the Fund. Typically, the most recently available information by a Private Company is as of a date that is earlier than the date the Fund is calculating its NAV. This factor may result in a difference between the value of the investment and the price the Fund could receive upon the sale of the investment.
Fair Value Hierarchy: Various inputs are used in determining the fair value of investments and derivative financial instruments. These inputs to valuation techniques are categorized into a fair value hierarchy consisting of three broad levels for financial statement purposes as follows:
| | • | | Level 1 — Unadjusted price quotations in active markets/exchanges for identical assets or liabilities that the Fund has the ability to access |
| | • | | Level 2 — Other observable inputs (including, but not limited to, quoted prices for similar assets or liabilities in markets that are active, quoted prices for identical or similar assets or liabilities in markets that are not active, inputs other than quoted prices that are observable for the assets or liabilities (such as interest rates, yield curves, volatilities, prepayment speeds, loss severities, credit risks and default rates) or other market–corroborated inputs) |
| | • | | Level 3 — Unobservable inputs based on the best information available in the circumstances, to the extent observable inputs are not available (including the Fund’s own assumptions used in determining the fair value of investments and derivative financial instruments) |
The hierarchy gives the highest priority to unadjusted quoted prices in active markets for identical assets or liabilities (Level 1 measurements) and the lowest priority to unobservable inputs (Level 3 measurements). Accordingly, the degree of judgment exercised in determining fair value is greatest for instruments categorized in Level 3. The inputs used to measure fair value may fall into different levels of the fair value hierarchy. In such cases, for disclosure purposes, the fair value hierarchy classification is determined based on the lowest level input that is significant to the fair value measurement in its entirety. Investments classified within Level 3 have significant unobservable inputs used by the Global Valuation Committee in determining the price for Fair Valued Investments. Level 3 investments include equity or debt issued by Private Companies. There may not be a secondary market, and/or there are a limited number of investors. Level 3 investments may also be adjusted to reflect illiquidity and/or non-transferability, with the amount of such discount estimated by the Global Valuation Committee in the absence of market information.
Changes in valuation techniques may result in transfers into or out of an assigned level within the hierarchy. In accordance with the Fund’s policy, transfers between different levels of the fair value hierarchy are deemed to have occurred as of the beginning of the reporting period. The categorization of a value determined for investments and derivative financial instruments is based on the pricing transparency of the investments and derivative financial instruments and is not necessarily an indication of the risks associated with investing in those securities.
| 4. | SECURITIES AND OTHER INVESTMENTS |
Asset-Backed and Mortgage-Backed Securities: Asset-backed securities are generally issued as pass-through certificates or as debt instruments. Asset-backed securities issued as pass-through certificates represent undivided fractional ownership interests in an underlying pool of assets. Asset-backed securities issued as debt instruments, which are also known as collateralized obligations, are typically issued as the debt of a special purpose entity organized solely for the purpose of owning such assets and issuing such debt. Asset-backed securities are often backed by a pool of assets representing the obligations of a number of different parties. The yield characteristics of certain asset-backed securities may differ from traditional debt securities. One such major difference is that all or a principal part of the obligations may be prepaid at any time because the underlying assets (i.e., loans) may be prepaid at any time. As a result, a decrease in interest rates in the market may result in increases in the level of prepayments as borrowers, particularly mortgagors, refinance and repay their loans. An increased prepayment rate with respect to an asset-backed security will have the effect of shortening the maturity of the security. In addition, a fund may subsequently have to reinvest the proceeds at lower interest rates. If a fund has purchased such an asset-backed security at a premium, a faster than anticipated prepayment rate could result in a loss of principal to the extent of the premium paid.
| | | | |
| NOTESTO FINANCIAL STATEMENTS | | | 23 | |
Notes to Financial Statements (continued)
For mortgage pass-through securities (the “Mortgage Assets”) there are a number of important differences among the agencies and instrumentalities of the U.S. Government that issue mortgage-related securities and among the securities that they issue. For example, mortgage-related securities guaranteed by Ginnie Mae are guaranteed as to the timely payment of principal and interest by Ginnie Mae and such guarantee is backed by the full faith and credit of the United States. However, mortgage-related securities issued by Freddie Mac and Fannie Mae, including Freddie Mac and Fannie Mae guaranteed mortgage pass-through certificates, which are solely the obligations of Freddie Mac and Fannie Mae, are not backed by or entitled to the full faith and credit of the United States, but are supported by the right of the issuer to borrow from the U.S. Treasury.
Non-agency mortgage-backed securities are securities issued by non-governmental issuers and have no direct or indirect government guarantees of payment and are subject to various risks. Non-agency mortgage loans are obligations of the borrowers thereunder only and are not typically insured or guaranteed by any other person or entity. The ability of a borrower to repay a loan is dependent upon the income or assets of the borrower. A number of factors, including a general economic downturn, acts of God, terrorism, social unrest and civil disturbances, may impair a borrower’s ability to repay its loans.
Inflation-Indexed Bonds: Inflation-indexed bonds (other than municipal inflation-indexed and certain corporate inflation-indexed bonds) are fixed income securities whose principal value is periodically adjusted according to the rate of inflation. If the index measuring inflation rises or falls, the principal value of inflation-indexed bonds (other than municipal inflation-indexed and certain corporate inflation-indexed bonds) will be adjusted upward or downward, and consequently the interest payable on these securities (calculated with respect to a larger or smaller principal amount) will be increased or reduced, respectively. Any upward or downward adjustment in the principal amount of an inflation-indexed bond will be included as interest income in the Statement of Operations, even though investors do not receive their principal until maturity. Repayment of the original bond principal upon maturity (as adjusted for inflation) is guaranteed in the case of U.S. Treasury inflation-indexed bonds. For bonds that do not provide a similar guarantee, the adjusted principal value of the bond repaid at maturity may be less than the original principal. With regard to municipal inflation-indexed bonds and certain corporate inflation-indexed bonds, the inflation adjustment is typically reflected in the semi-annual coupon payment. As a result, the principal value of municipal inflation-indexed bonds and such corporate inflation-indexed bonds does not adjust according to the rate of inflation.
Multiple Class Pass-Through Securities: Multiple class pass-through securities, including collateralized mortgage obligations (“CMOs”) and commercial mortgage-backed securities, may be issued by Ginnie Mae, U.S. Government agencies or instrumentalities or by trusts formed by private originators of, or investors in, mortgage loans. In general, CMOs are debt obligations of a legal entity that are collateralized by a pool of residential or commercial mortgage loans or Mortgage Assets. The payments on these are used to make payments on the CMOs or multiple pass-through securities. Multiple class pass-through securities represent direct ownership interests in the Mortgage Assets. Classes of CMOs include interest only (“IOs”), principal only (“POs”), planned amortization classes and targeted amortization classes. IOs and POs are stripped mortgage-backed securities representing interests in a pool of mortgages, the cash flow from which has been separated into interest and principal components. IOs receive the interest portion of the cash flow while POs receive the principal portion. IOs and POs can be extremely volatile in response to changes in interest rates. As interest rates rise and fall, the value of IOs tends to move in the same direction as interest rates. POs perform best when prepayments on the underlying mortgages rise since this increases the rate at which the principal is returned and the yield to maturity on the PO. When payments on mortgages underlying a PO are slower than anticipated, the life of the PO is lengthened and the yield to maturity is reduced. If the underlying Mortgage Assets experience greater than anticipated prepayments of principal, a fund’s initial investment in the IOs may not fully recoup.
Stripped Mortgage-Backed Securities: Stripped mortgage-backed securities are typically issued by the U.S. Government, its agencies and instrumentalities. Stripped mortgage-backed securities are usually structured with two classes that receive different proportions of the interest (IOs) and principal (POs) distributions on a pool of Mortgage Assets. Stripped mortgage-backed securities may be privately issued.
Zero-Coupon Bonds: Zero-coupon bonds are normally issued at a significant discount from face value and do not provide for periodic interest payments. These bonds may experience greater volatility in market value than other debt obligations of similar maturity which provide for regular interest payments.
TBA Commitments: TBA commitments are forward agreements for the purchase or sale of mortgage-backed securities for a fixed price, with payment and delivery on an agreed upon future settlement date. The specific securities to be delivered are not identified at the trade date. However, delivered securities must meet specified terms, including issuer, rate and mortgage terms. When entering into TBA commitments, a fund may take possession of or deliver the underlying mortgage-backed securities but can extend the settlement or roll the transaction. TBA commitments involve a risk of loss if the value of the security to be purchased or sold declines or increases, respectively, prior to settlement date.
In order to better define contractual rights and to secure rights that will help a fund mitigate its counterparty risk, TBA commitments may be entered into by a fund under Master Securities Forward Transaction Agreements (each, an “MSFTA”). An MSFTA typically contains, among other things, collateral posting terms and netting provisions in the event of default and/or termination event. The collateral requirements are typically calculated by netting the mark-to-market amount for each transaction under such agreement and comparing that amount to the value of the collateral currently pledged by a fund and the counterparty. Cash collateral that has been pledged to cover the obligations of a fund and cash collateral received from the counterparty, if any, is reported separately on the Statement of Assets and Liabilities as cash pledged as collateral for TBA commitments or cash received as collateral for TBA commitments, respectively. Non-cash collateral pledged by a fund, if any, is noted in the Schedule of Investments.
Typically, a fund is permitted to sell, re-pledge or use the collateral it receives; however, the counterparty is not permitted to do so. To the extent amounts due to a fund are not fully collateralized, contractually or otherwise, a fund bears the risk of loss from counterparty non-performance.
Mortgage Dollar Roll Transactions: A fund may sell TBA mortgage-backed securities and simultaneously contract to repurchase substantially similar (i.e., same type, coupon and maturity) securities on a specific future date at an agreed upon price. During the period between the sale and repurchase, a fund is not entitled to receive interest and principal payments on the securities sold. Mortgage dollar roll transactions are treated as purchases and sales and realizes gains and losses on these transactions. Mortgage dollar rolls involve the risk that the market value of the securities that a fund is required to purchase may decline below the agreed upon repurchase price of those securities.
| | |
| 24 | | 2017 BLACKROCK ANNUAL REPORTTO SHAREHOLDERS |
Notes to Financial Statements (continued)
Borrowed Bond Agreements: Repurchase agreements may be referred to as borrowed bond agreements when entered into in connection with short sales of bonds. In a borrowed bond agreement, a fund borrows a bond from a counterparty in exchange for cash collateral. The agreement contains a commitment that the security and the cash will be returned to the counterparty and a fund at a mutually agreed upon date. Certain agreements have no stated maturity and can be terminated by either party at any time. Earnings on cash collateral and compensation to the lender of the bond are based on agreed upon rates between a fund and the counterparty. The value of the underlying cash collateral approximates the market value and accrued interest of the borrowed bond. To the extent that a borrowed bond transaction exceeds one business day, the value of the cash collateral in the possession of the counterparty is monitored on a daily basis to ensure the adequacy of the collateral. As the market value of the borrowed bond changes, the cash collateral is periodically increased or decreased with a frequency and in amounts prescribed in the borrowed bond agreement. A fund may also experience delays in gaining access to the collateral.
Reverse Repurchase Agreements: Reverse repurchase agreements are agreements with qualified third party broker-dealers in which a fund sells securities to a bank or broker-dealer and agrees to repurchase the same securities at a mutually agreed upon date and price. A fund receives cash from the sale to use for other investment purposes. During the term of the reverse repurchase agreement, a fund continues to receive the principal and interest payments on the securities sold. Certain agreements have no stated maturity and can be terminated by either party at any time. Interest on the value of the reverse repurchase agreements issued and outstanding is based upon competitive market rates determined at the time of issuance. A fund may utilize reverse repurchase agreements when it is anticipated that the interest income to be earned from the investment of the proceeds of the transaction is greater than the interest expense of the transaction. Reverse repurchase agreements involve leverage risk. If a fund suffers a loss on its investment of the transaction proceeds from a reverse repurchase agreement, a fund would still be required to pay the full repurchase price. Further, a fund remains subject to the risk that the market value of the securities repurchased declines below the repurchase price. In such cases, a fund would be required to return a portion of the cash received from the transaction or provide additional securities to the counterparty.
Cash received in exchange for securities delivered plus accrued interest due to the counterparty is recorded as a liability in the Statement of Assets and Liabilities at face value including accrued interest. Due to the short-term nature of the reverse repurchase agreements, face value approximates fair value. Interest payments made by a fund to the counterparties are recorded as a component of interest expense in the Statement of Operations. In periods of increased demand for the security, a fund may receive a fee for the use of the security by the counterparty, which may result in interest income to a fund.
For the year ended December 31, 2017, the average amount of reverse repurchase agreements outstanding and the daily weighted average interest rate for the Fund were $12,241,322 and 0.81%, respectively.
Borrowed bond agreements and reverse repurchase transactions are entered into by a fund under Master Repurchase Agreements (each, an “MRA”), which permit a fund, under certain circumstances, including an event of default (such as bankruptcy or insolvency), to offset payables and/or receivables under the MRA with collateral held and/or posted to the counterparty and create one single net payment due to or from a fund. With borrowed bond agreements and reverse repurchase transactions, typically a fund and the counterparty under the MRA are permitted to sell, re-pledge, or use the collateral associated with the transaction. Bankruptcy or insolvency laws of a particular jurisdiction may impose restrictions on or prohibitions against such a right of offset in the event of the MRA counterparty’s bankruptcy or insolvency. Pursuant to the terms of the MRA, a fund receives or posts securities as collateral with a market value in excess of the repurchase price to be paid or received by a fund upon the maturity of the transaction. Upon a bankruptcy or insolvency of the MRA counterparty, a fund is considered an unsecured creditor with respect to excess collateral and, as such, the return of excess collateral may be delayed.
As of period end, the following table is a summary of the Fund’s reverse repurchase agreements by counterparty which are subject to offset under an MRA on a net basis:
| | | | | | | | | | | | |
| Counterparty | | Reverse
Repurchase
Agreements | | | Fair Value of
Non-cash
Collateral
Pledged
Including
Accrued Interest (a) | | | Net Exposure
Due (to)/from
Counterparty (b) | |
Barclays Capital, Inc. | | $ | 342,684 | | | $ | (342,684 | ) | | $ | — | |
BNP Paribas S.A. | | | 3,216,283 | | | | (3,216,283 | ) | | | — | |
Deutsche Bank Securities, Inc. | | | 2,823,460 | | | | (2,823,460 | ) | | | — | |
Merrill Lynch, Pierce, Fenner & Smith, Inc. | | | 2,741,388 | | | | (2,741,388 | ) | | | — | |
| | | | | | | | | | | | |
| | $ | 9,123,815 | | | $ | (9,123,815 | ) | | $ | — | |
| | | | | | | | | | | | |
| | (a) | Net collateral with a value of $9,130,794 has been pledged/received in connection with open reverse repurchase agreements. Excess of net collateral pledged to the individual counterparty is not shown for financial reporting purposes. | |
| | (b) | Net exposure represents the net receivable (payable) that would be due from/to the counterparty in the event of a default. | |
In the event the counterparty of securities under an MRA files for bankruptcy or becomes insolvent, a fund’s use of the proceeds from the agreement may be restricted while the counterparty, or its trustee or receiver, determines whether or not to enforce a fund’s obligation to repurchase the securities.
| 5. | DERIVATIVE FINANCIAL INSTRUMENTS |
The Fund engages in various portfolio investment strategies using derivative contracts both to increase the returns of the Fund and/or to manage its exposure to certain risks such as credit risk, equity risk, interest rate risk, foreign currency exchange rate risk, commodity price risk or other risks (e.g., inflation risk). Derivative financial instruments categorized by risk exposure are included in the Schedule of Investments. These contracts may be transacted on an exchange or OTC.
Futures Contracts: Futures contracts are purchased or sold to gain exposure to, or manage exposure to changes in interest rates (interest rate risk), changes in the value of equity securities (equity risk) or foreign currencies (foreign currency exchange rate risk).
| | | | |
| NOTESTO FINANCIAL STATEMENTS | | | 25 | |
Notes to Financial Statements (continued)
Futures contracts are agreements between the Fund and a counterparty to buy or sell a specific quantity of an underlying instrument at a specified price and on a specified date. Depending on the terms of a contract, it is settled either through physical delivery of the underlying instrument on the settlement date or by payment of a cash amount on the settlement date. Upon entering into a futures contract, the Fund is required to deposit initial margin with the broker in the form of cash or securities in an amount that varies depending on a contract’s size and risk profile. The initial margin deposit must then be maintained at an established level over the life of the contract.
Securities deposited as initial margin are designated in the Schedule of Investments and cash deposited, if any, is shown as cash pledged for futures contracts in the Statement of Assets and Liabilities. Pursuant to the contract, the Fund agrees to receive from or pay to the broker an amount of cash equal to the daily fluctuation in market value of the contract (“variation margin”). Variation margin is recorded as unrealized appreciation (depreciation) and, if any, shown as variation margin receivable (or payable) on futures contracts in the Statement of Assets and Liabilities. When the contract is closed, a realized gain or loss is recorded in the Statement of Operations equal to the difference between the notional amount of the contract at the time it was opened and the notional amount at the time it was closed. The use of futures contracts involves the risk of an imperfect correlation in the movements in the price of futures contracts and interest, foreign currency exchange rates or underlying assets.
Forward Foreign Currency Exchange Contracts: The Fund enters into forward foreign currency exchange contracts to gain or reduce exposure, to foreign currencies (foreign currency exchange rate risk).
A forward foreign currency exchange contract is an agreement between two parties to buy and sell a currency at a set exchange rate on a specified date. These contracts help to manage the overall exposure to the currencies in which some of the investments held by the Fund are denominated and in some cases, may be used to obtain exposure to a particular market.
The contract is marked-to-market daily and the change in market value is recorded as unrealized appreciation (depreciation) in the Statement of Assets and Liabilities. When a contract is closed, a realized gain or loss is recorded in the Statement of Operations equal to the difference between the value at the time it was opened and the value at the time it was closed. Non-deliverable forward foreign currency exchange contracts are settled with the counterparty in cash without the delivery of foreign currency. The use of forward foreign currency exchange contracts involves the risk that the value of a forward foreign currency exchange contract changes unfavorably due to movements in the value of the referenced foreign currencies.
Options: The Fund purchases and writes call and put options to increase or decrease its exposure to the risks of underlying instruments, including equity risk, interest rate risk and/or commodity price risk and/or, in the case of options written, to generate gains from options premiums.
A call option gives the purchaser (holder) of the option the right (but not the obligation) to buy, and obligates the seller (writer) to sell (when the option is exercised) the underlying instrument at the exercise or strike price at any time or at a specified time during the option period. A put option gives the holder the right to sell and obligates the writer to buy the underlying instrument at the exercise or strike price at any time or at a specified time during the option period.
Premiums paid on options purchased and premiums received on options written, as well as the daily fluctuation in market value, are included in investments at value – unaffiliated and options written at value, respectively, in the Statement of Assets and Liabilities. When an instrument is purchased or sold through the exercise of an option, the premium is offset against the cost or proceeds of the underlying instrument. When an option expires, a realized gain or loss is recorded in the Statement of Operations to the extent of the premiums received or paid. When an option is closed or sold, a gain or loss is recorded in the Statement of Operations to the extent the cost of the closing transaction exceeds the premiums received or paid). When the Fund writes a call option, such option is typically “covered,” meaning that it holds the underlying instrument subject to being called by the option counterparty. When the Fund writes a put option, such option is covered by cash in an amount sufficient to cover the obligation.
| | • | | Swaptions — The Fund purchases and writes options on swaps (“swaptions”) primarily to preserve a return or spread on a particular investment or portion of the Fund’s holdings, as a duration management technique or to protect against an increase in the price of securities it anticipates purchasing at a later date. The purchaser and writer of a swaption is buying or granting the right to enter into a previously agreed upon interest rate or credit default swap agreement (interest rate risk and/or credit risk) at any time before the expiration of the option. |
| | • | | Foreign currency options — The Fund purchases and writes foreign currency options, foreign currency futures and options on foreign currency futures to gain or reduce exposure to foreign currencies (foreign currency exchange rate risk). Foreign currency options give the purchaser the right to buy from or sell to the writer a foreign currency at any time before the expiration of the option. |
In purchasing and writing options, the Fund bears the risk of an unfavorable change in the value of the underlying instrument or the risk that it may not be able to enter into a closing transaction due to an illiquid market. Exercise of a written option could result in the Fund purchasing or selling a security when it otherwise would not, or at a price different from the current market value.
Swaps: The Fund enters into swap contracts to manage exposure to issuers, markets and securities. Such contracts are agreements between the Fund and a counterparty to make periodic net payments on a specified notional amount or a net payment upon termination. Swap agreements are privately negotiated in the OTC market and may be entered into as a bilateral contract (“OTC swaps”) or centrally cleared (“centrally cleared swaps”).
For OTC swaps, any upfront premiums paid and any upfront fees received are shown as swap premiums paid and swap premiums received, respectively, in the Statement of Assets and Liabilities and amortized over the term of the contract. The daily fluctuation in market value is recorded as unrealized appreciation (depreciation) on OTC Swaps in the Statement of Assets and Liabilities. Payments received or paid are recorded in the Statement of Operations as realized gains or losses, respectively. When an OTC swap is terminated, a realized gain or loss is recorded in the Statement of Operations equal to the difference between the proceeds from (or cost of) the closing transaction and the Fund’s basis in the contract, if any. Generally, the basis of the contract is the premium received or paid.
In a centrally cleared swap, immediately following execution of the swap contract, the swap contract is novated to a central counterparty (the “CCP”) and the Fund’s counterparty on the swap agreement becomes the CCP. The Fund is required to interface with the CCP through the broker. Upon entering into a centrally cleared swap, the Fund is required to deposit initial margin with the broker in the form of cash or securities in an amount that varies depending on the size and risk profile of the particular
| | |
| 26 | | 2017 BLACKROCK ANNUAL REPORTTO SHAREHOLDERS |
Notes to Financial Statements (continued)
swap. Securities deposited as initial margin are designated in the Schedule of Investments and cash deposited is shown as cash pledged for centrally cleared swaps in the Statement of Assets and Liabilities. Pursuant to the contract, the Fund agrees to receive from or pay to the broker an amount of cash equal to the daily fluctuation in market value of the contract (“variation margin”). Variation margin is recorded as unrealized appreciation (depreciation) and shown as variation margin receivable (or payable) on centrally cleared swaps in the Statement of Assets and Liabilities. Payments received from (paid to) the counterparty, including at termination, are recorded as realized gains (losses) in the Statement of Operations.
| | • | | Credit default swaps — Credit default swaps are entered into credit default swaps to manage exposure to the market or certain sectors of the market, to reduce risk exposure to defaults of corporate and/or sovereign issuers or to create exposure to corporate and/or sovereign issuers to which a fund is not otherwise exposed (credit risk). |
The Fund may either buy or sell (write) credit default swaps on single-name issuers (corporate or sovereign), a combination or basket of single-name issuers or traded indexes. Credit default swaps are agreements in which the protection buyer pays fixed periodic payments to the seller in consideration for a promise from the protection seller to make a specific payment should a negative credit event take place with respect to the referenced entity (e.g., bankruptcy, failure to pay, obligation acceleration, repudiation, moratorium or restructuring). As a buyer, if an underlying credit event occurs, the Fund will either (i) receive from the seller an amount equal to the notional amount of the swap and deliver the referenced security or underlying securities comprising the index, or (ii) receive a net settlement of cash equal to the notional amount of the swap less the recovery value of the security or underlying securities comprising the index. As a seller (writer), if an underlying credit event occurs, the Fund will either pay the buyer an amount equal to the notional amount of the swap and take delivery of the referenced security or underlying securities comprising the index or pay a net settlement of cash equal to the notional amount of the swap less the recovery value of the security or underlying securities comprising the index.
| | • | | Total return swaps — The Fund enters into total return swaps to obtain exposure to a security or market without owning such security or investing directly in such market or to exchange the risk/return of one market (e.g., fixed income) with another market (e.g., equity or commodity prices) (equity risk, commodity price risk and/or interest rate risk). |
Total return swaps are agreements in which there is an exchange of cash flows whereby one party commits to make payments based on the total return (distributions plus capital gains/losses) of an underlying instrument in exchange for fixed or floating rate interest payments. If the total return of the instrument or index underlying the transaction exceeds or falls short of the offsetting fixed or floating interest rate obligation, the Fund receives payment from or makes a payment to the counterparty.
| | • | | Interest rate swaps — The Fund enters into interest rate swaps to gain or reduce exposure to interest rates or to manage duration, the yield curve or interest rate (interest rate risk). |
Interest rate swaps are agreements in which one party pays a stream of interest payments, either fixed or floating, in exchange for another party’s stream of interest payments, either fixed or floating, on the same notional amount for a specified period of time. In more complex interest rate swaps, the notional principal amount may decline (or amortize) over time.
| | • | | Forward swaps — The Fund enters into forward interest rate swaps and forward total return swaps. In a forward swap, the Fund and the counterparty agree to make periodic net payments beginning on a specified date or a net payment at termination. |
Swap transactions involve, to varying degrees, elements of interest rate, credit and market risk in excess of the amounts recognized in the Statement of Assets and Liabilities. Such risks involve the possibility that there will be no liquid market for these agreements, that the counterparty to the agreements may default on its obligation to perform or disagree as to the meaning of the contractual terms in the agreements, and that there may be unfavorable changes in interest rates and/or market values associated with these transactions.
Master Netting Arrangements: In order to define its contractual rights and to secure rights that will help it mitigate its counterparty risk, the Fund may enter into an International Swaps and Derivatives Association, Inc. Master Agreement (“ISDA Master Agreement”) or similar agreement with its counterparties. An ISDA Master Agreement is a bilateral agreement between the Fund and a counterparty that governs certain OTC derivatives and typically contains, among other things, collateral posting terms and netting provisions in the event of a default and/or termination event. Under an ISDA Master Agreement, the Fund may, under certain circumstances, offset with the counterparty certain derivative financial instruments’ payables and/or receivables with collateral held and/or posted and create one single net payment. The provisions of the ISDA Master Agreement typically permit a single net payment in the event of default including the bankruptcy or insolvency of the counterparty. Bankruptcy or insolvency laws of a particular jurisdiction may restrict or prohibit the right of offset in bankruptcy, insolvency or other events.
Collateral Requirements: For derivatives traded under an ISDA Master Agreement, the collateral requirements are typically calculated by netting the mark-to-market amount for each transaction under such agreement and comparing that amount to the value of any collateral currently pledged by the Fund and the counterparty.
Cash collateral that has been pledged to cover obligations of the Fund and cash collateral received from the counterparty, if any, is reported separately on the Statement of Assets and Liabilities as cash pledged as collateral and cash received as collateral, respectively. Non-cash collateral pledged by the Fund, if any, is noted in the Schedule of Investments. Generally, the amount of collateral due from or to a counterparty is subject to a certain minimum transfer amount threshold before a transfer is required, which is determined at the close of business of the Fund. Any additional required collateral is delivered to/pledged by the Fund on the next business day. Typically, the counterparty is not permitted to sell, re-pledge or use cash and non-cash collateral it receives. The Fund generally agrees not to use non-cash collateral that it receives but may, absent default or certain other circumstances defined in the underlying ISDA Master Agreement, be permitted to use cash collateral received. In such cases, interest may be paid pursuant to the collateral arrangement with the counterparty. To the extent amounts due to the Fund from its counterparties are not fully collateralized, it bears the risk of loss from counterparty non-performance. Likewise, to the extent the Fund has delivered collateral to a counterparty and stands ready to perform under the terms of its agreement with such counterparty, it bears the risk of loss from a counterparty in the amount of the value of the collateral in the event the counterparty fails to return such collateral. Based on the terms of agreements, collateral may not be required for all derivative contracts.
| | | | |
| NOTESTO FINANCIAL STATEMENTS | | | 27 | |
Notes to Financial Statements (continued)
For financial reporting purposes, the Fund does not offset derivative assets and derivative liabilities that are subject to netting arrangements, if any, in the Statement of Assets and Liabilities.
| 6. | INVESTMENT ADVISORY AGREEMENT AND OTHER TRANSACTIONS WITH AFFILIATES |
The PNC Financial Services Group, Inc. is the largest stockholder and an affiliate of BlackRock, Inc. (“BlackRock”) for 1940 Act purposes.
Investment Advisory: The Company, on behalf of the Fund, entered into an Investment Advisory Agreement with the Manager, the Fund’s investment adviser, an indirect, wholly-owned subsidiary of BlackRock, to provide investment advisory and administrative services. The Manager is responsible for the management of the Fund’s portfolio and provides the personnel, facilities, equipment and certain other services necessary to the operations of the Fund.
For such services, the Fund pays the Manager a monthly fee at an annual rate equal to the following percentages of the average daily value of the Fund’s net assets:
| | | | |
| Average Daily Net Assets | | Investment
Advisory Fees | |
First $1 Billion | | | 0.50 | % |
$1 Billion — $3 Billion | | | 0.47 | |
$3 Billion — $5 Billion | | | 0.45 | |
$5 Billion — $10 Billion | | | 0.44 | |
Greater than $10 Billion | | | 0.43 | |
Distribution Fees: The Company, on behalf of the Fund, entered into a Distribution Agreement and a Distribution Plan with BlackRock Investments, LLC (“BRIL”), an affiliate of the Manager. Pursuant to the Distribution Plan and in accordance with Rule 12b-1 under the 1940 Act, the Fund pays BRIL ongoing distribution fees. The fees are accrued daily and paid monthly at an annual rate of 0.25% based upon the average daily net assets attributable to Class III.
For the year ended December 31, 2017, the class specific distribution fees borne directly by Class III were $4,767.
Transfer Agent: The Manager, on behalf of the Fund, entered into agreements with insurance companies and other financial intermediaries (“Service Organizations”), some of which may be affiliates. Pursuant to these agreements, the Service Organizations provide the Fund with administrative, networking, recordkeeping, sub-transfer agency and shareholder services to sub-accounts they service. For these services, the Service Organizations receive an annual fee per shareholder account, which will vary depending on share class and/or net assets of Fund shareholders serviced by the Service Organizations, which is shown as transfer agent — class specific. For the year ended December 31, 2017, the Fund did not pay any amounts to affiliates in return for these services.
In addition, the Fund pays the transfer agent, which is not an affiliate, a fee for issuance, transfer and redemption of shares and the opening and maintenance of shareholder accounts, which is included in transfer agent in the Statement of Operations.
For the year ended December 31, 2017, the following table shows the class specific transfer agent fees borne directly by each share class of the Fund:
| | | | | | | | | | |
| Class I | | | Class III | | | | Total | |
| $ | 133,790 | | | $2,181 | | | | $ | 135,971 | |
Expense Limitations and Waivers: The Manager has agreed to voluntarily waive 0.10% of its investment advisory fee by the Fund. This voluntary waiver may be reduced or discontinued at any time without notice. This amount is included in fees waived and/or reimbursed by the Manager in the Statement of Operations. For the year ended December 31, 2017, the amount waived was $71,226.
With respect to the Fund, the Manager voluntarily agreed to waive its investment advisory fees by the amount of investment advisory fees the Fund pays to the Manager indirectly through its investment in affiliated money market funds (the “affiliated money market fund waiver”). The amount of waivers and/or reimbursements of fees and expenses made pursuant to the expense limitation will be reduced by the amount of the affiliated money market fund waiver. This amount is included in fees waived and/or reimbursed by the Manager in the Statement of Operations. For the year ended December 31, 2017, the amount waived was $828.
The Manager has contractually agreed to waive its investment advisory fee with respect to any portion of the Fund’s assets invested in affiliated equity and fixed-income mutual funds and affiliated exchange-traded funds that have a contractual management fee through April 30, 2018. The contractual agreement may be terminated upon 90 days’ notice by a majority of independent directors who are not “interested persons” of the Fund, as defined in the 1940 Act (“Independent Directors”) or by a vote of a majority of the outstanding voting securities of the Fund. For the year ended December 31, 2017, there were no fees waived by the Manager.
For the year ended December 31, 2017, the Fund reimbursed the Manager $943 for certain accounting services, which is included in accounting services in the Statement of Operations.
The Manager has contractually agreed to reimburse transfer agent fees in order to limit such expenses as a percentage of average daily net assets as follows:
| | | | |
Class I | | | 0.00 | % |
Class III | | | 0.06 | % |
The Manager has agreed not to reduce or discontinue this contractual expense limitation through April 30, 2018, unless approved by the Board, including a majority of the Independent Directors or by a vote of a majority of the outstanding voting securities of the Fund.
| | |
| 28 | | 2017 BLACKROCK ANNUAL REPORTTO SHAREHOLDERS |
Notes to Financial Statements (continued)
These amounts waived and/or reimbursed are shown as transfer agent fees reimbursed — class specific in the Statement of Operations. For the year ended December 31, 2017, class specific expense waivers and/or reimbursements were as follows:
| | | | | | | | | | | | |
| | | Class I | | | Class III | | | Total | |
Transfer Agent Fees Reimbursed | | $ | 133,790 | | | $ | 1,035 | | | $ | 134,825 | |
With respect to the Fund, the Manager contractually agreed to waive and/or reimburse fees or expenses in order to limit expenses, excluding interest expense, dividend expense, tax expense, acquired fund fees and expenses, and certain other fund expenses, which constitute extraordinary expenses not incurred in the ordinary course of the Fund’s business (“expense limitation”). The expense limitations as a percentage of average daily net assets are as follows:
| | | | |
| Class I | | Class III | |
1.25% | | | 1.50 | % |
The Manager has agreed not to reduce or discontinue this contractual expense limitation prior to April 30, 2018 unless approved by the Board, including a majority of the Independent Directors or by a vote of a majority of the outstanding voting securities of the Fund. For the year ended December 31, 2017, there were no fees waived and/or reimbursed by the Manager.
Interfund Lending: In accordance with an exemptive order (the “Order”) from the SEC, the Fund may participate in a joint lending and borrowing facility for temporary purposes (the “Interfund Lending Program”), subject to compliance with the terms and conditions of the Order, and to the extent permitted by the Fund’s investment policies and restrictions. The Fund is currently permitted to borrow under the Interfund Lending Program.
A lending BlackRock fund may lend in aggregate up to 15% of its net assets, but may not lend more than 5% of its net assets, to any one borrowing fund through the Interfund Lending Program. A borrowing BlackRock fund may not borrow through the Interfund Lending Program or from any other source more than 33 1/3% of its total assets (or any lower threshold provided for by the fund’s investment restrictions). If a borrowing BlackRock fund’s total outstanding borrowings exceed 10% of its total assets, each of its outstanding interfund loans will be subject to collateralization of at least 102% of the outstanding principal value of the loan. All interfund loans are for temporary or emergency purposes and the interest rate to be charged will be the average of the highest current overnight repurchase agreement rate available to a lending fund and the bank loan rate, as calculated according to a formula established by the Board.
During the year ended December 31, 2017, the Fund did not participate in the Interfund Lending Program.
Officers and Directors: Certain directors and/or officers of the Company are directors and/or officers of BlackRock or its affiliates. The Fund reimburses the Manager for a portion of the compensation paid to the Company’s Chief Compliance Officer, which is included in Directors and Officer in the Statement of Operations.
Other Transactions: The Fund may purchase securities from, or sell securities to, an affiliated fund provided the affiliation is due solely to having a common investment adviser, common officers, or common directors. For the year ended December 31, 2017, the purchase and sale transactions and any net realized gains (losses) with an affiliated fund in compliance with Rule 17a-7 under the 1940 Act were as follows:
| | | | |
Purchases | | $ | 4,949,423 | |
Sales | | | 5,080,267 | |
Net Realized Gain | | | (14,260 | ) |
For the year ended December 31, 2017, purchases and sales of investments, including paydowns and mortgage dollar rolls and excluding short-term securities, were as follows:
| | | | | | | | |
| | | Purchases | | | Sales | |
Non-U.S Government Securities | | $ | 637,385,184 | | | $ | 643,797,430 | |
U.S. Government Securities | | | 177,530,259 | | | | 176,858,654 | |
For the year ended December 31, 2017, purchases and sales related to mortgage dollar rolls were $287,555,890 and $287,536,428, respectively.
It is the Fund’s policy to comply with the requirements of the Internal Revenue Code of 1986, as amended, applicable to regulated investment companies, and to distribute substantially all of its taxable income to its shareholders. Therefore, no federal income tax provision is required.
The Fund files U.S. federal and various state and local tax returns. No income tax returns are currently under examination. The statute of limitations on the Fund’s U.S. federal tax returns generally remains open for each of the four years ended December 31, 2017. The statutes of limitations on the Fund’s state and local tax returns may remain open for an additional year depending upon the jurisdiction.
Management has analyzed tax laws and regulations and their application to the Fund as of December 31, 2017, inclusive of the open tax return years, and does not believe there are any uncertain tax positions that require recognition of a tax liability in the Fund’s financial statements.
| | | | |
| NOTESTO FINANCIAL STATEMENTS | | | 29 | |
Notes to Financial Statements (continued)
U.S. GAAP requires that certain components of net assets be adjusted to reflect permanent differences between financial and tax reporting. These reclassifications have no effect on net assets or net asset values per share. As of period end, the following permanent differences attributable to the accounting for swap agreements, net paydown losses and foreign currency transactions were reclassified to the following accounts:
| | | | |
Paid-in capital | | $ | 672 | |
Undistributed net investment income | | | 216,823 | |
Accumulated net realized loss | | | (217,495 | ) |
The tax character of distributions paid was as follows:
| | | | | | | | |
| | | 12/31/2017 | | | 12/31/2016 | |
Ordinary income | | $ | 1,468,939 | | | $ | 1,517,662 | |
As of December 31, 2017, the tax components of accumulated net earnings (losses) were as follows:
| | | | |
Undistributed ordinary income | | $ | 152,161 | |
Capital loss carryforward | | | (4,410,129 | ) |
Net unrealized losses(a) | | | (262,011 | ) |
| | | | |
| | $ | (4,519,979 | ) |
| | | | |
| | (a) | The difference between book-basis and tax-basis net unrealized losses was attributable primarily to the tax deferral of losses on wash sales, the realization for tax purposes of unrealized gains/losses on certain futures, options and foreign currency contracts and the accounting for swap agreements. | |
As of December 31, 2017, the Fund had capital loss carryforwards, with no expiration dates, available to offset future realized capital gains of $4,410,129.
As of December 31, 2017, gross unrealized appreciation and depreciation for investments and derivatives based on cost for U.S. federal income tax purposes were as follows:
| | | | |
Tax cost | | $ | 93,511,307 | |
| | | | |
Gross unrealized appreciation | | $ | 558,947 | |
Gross unrealized depreciation | | | (837,080 | ) |
| | | | |
Net unrealized depreciation | | $ | (278,133 | ) |
| | | | |
The Company, on behalf of the Fund, along with certain other funds managed by the Manager and its affiliates (“Participating Funds”), is a party to a 364-day, $2.1 billion credit agreement with a group of lenders. Under this agreement, the Fund may borrow to fund shareholder redemptions. Excluding commitments designated for certain individual funds, the Participating Funds, including the Fund, can borrow up to an aggregate commitment amount of $1.6 billion at any time outstanding, subject to asset coverage and other limitations as specified in the agreement. The credit agreement has the following terms: a fee of 0.12% per annum on unused commitment amounts and interest at a rate equal to the higher of (a) one-month LIBOR (but, in any event, not less than 0.00%) on the date the loan is made plus 0.80% per annum or (b) the Fed Funds rate (but, in any event, not less than 0.00%) in effect from time to time plus 0.80% per annum on amounts borrowed. The agreement expires in April 2018 unless extended or renewed. Participating Funds paid administration, legal and arrangement fees, which, if applicable, are included in miscellaneous expenses in the Statement of Operations. These fees were allocated among such funds based upon portions of the aggregate commitment available to them and relative net assets of Participating Funds. During the year ended December 31, 2017, the Fund did not borrow under the credit agreement.
In the normal course of business, the Fund invests in securities or other instruments and may enter into certain transactions, and such activities subject the Fund to various risks, including among others, fluctuations in the market (market risk) or failure of an issuer to meet all of its obligations. The value of securities or other instruments may also be affected by various factors, including, without limitation: (i) the general economy; (ii) the overall market as well as local, regional or global political and/or social instability; (iii) regulation, taxation or international tax treaties between various countries; or (iv) currency, interest rate and price fluctuations. The Fund’s prospectus provides details of the risks to which the Fund is subject.
The Fund may be exposed to prepayment risk, which is the risk that borrowers may exercise their option to prepay principal earlier than scheduled during periods of declining interest rates, which would force the Fund to reinvest in lower yielding securities. The Fund may also be exposed to reinvestment risk, which is the risk that income from the Fund’s portfolio will decline if the Fund invests the proceeds from matured, traded or called fixed income securities at market interest rates that are below the Fund portfolio’s current earnings rate.
Valuation Risk: The market values of equities, such as common stocks and preferred securities or equity related investments, such as futures and options, may decline due to general market conditions which are not specifically related to a particular company. They may also decline due to factors which affect a particular industry or industries. The Fund may invest in illiquid investments and may experience difficulty in selling those investments in a timely manner at the price that it believes the investments are worth. Prices may fluctuate widely over short or extended periods in response to company, market or economic news. Markets also tend to move in cycles, with periods of rising and falling prices. This volatility may cause the Fund’s NAV to experience significant increases or decreases over short periods of time. If there is a general decline in the securities and other markets, the NAV of the Fund may lose value, regardless of the individual results of the securities and other instruments in which the Fund invests.
| | |
| 30 | | 2017 BLACKROCK ANNUAL REPORTTO SHAREHOLDERS |
Notes to Financial Statements (continued)
The price the Fund could receive upon the sale of any particular portfolio investment may differ from the Fund’s valuation of the investment, particularly for securities that trade in thin or volatile markets or that are valued using a fair valuation methodology or a price provided by an independent pricing service. Changes to significant unobservable inputs and assumptions (i.e., publicly traded company multiples, growth rate, time to exit) due to the lack of observable inputs may significantly impact the resulting fair value and therefore the Fund’s results of operations. As a result, the price received upon the sale of an investment may be less than the value ascribed by the Fund, and the Fund could realize a greater than expected loss or lesser than expected gain upon the sale of the investment. The Fund’s ability to value its investments may also be impacted by technological issues and/or errors by pricing services or other third party service providers.
Counterparty Credit Risk: The Fund may be exposed to counterparty credit risk, or the risk that an entity may fail to or be unable to perform on its commitments related to unsettled or open transactions. The Fund manages counterparty credit risk by entering into transactions only with counterparties that the Manager believes have the financial resources to honor their obligations and by monitoring the financial stability of those counterparties. Financial assets, which potentially expose the Fund to market, issuer and counterparty credit risks, consist principally of financial instruments and receivables due from counterparties. The extent of the Fund’s exposure to market, issuer and counterparty credit risks with respect to these financial assets is approximately their value recorded in the Statement of Assets and Liabilities, less any collateral held by the Fund.
A derivative contract may suffer a mark-to-market loss if the value of the contract decreases due to an unfavorable change in the market rates or values of the underlying instrument. Losses can also occur if the counterparty does not perform under the contract.
The Fund’s risk of loss from counterparty credit risk on OTC derivatives is generally limited to the aggregate unrealized gain less the value of any collateral held by the Fund.
For OTC options purchased, the Fund bears the risk of loss of the amount in the premiums paid plus the positive change in market values net of any collateral held by the Fund should the counterparty fail to perform under the contracts. Options written by the Fund do not typically give rise to counterparty credit risk, as options written generally obligate the Fund, and not the counterparty, to perform. The Fund may be exposed to counterparty credit risk with respect to options written to the extent the Fund deposits collateral with its counterparty to a written option.
With exchange-traded options purchased, futures and centrally cleared swaps, there is less counterparty credit risk to the Fund since the exchange or clearinghouse, as counterparty to such instruments, guarantees against a possible default. The clearinghouse stands between the buyer and the seller of the contract; therefore, credit risk is limited to failure of the clearinghouse. While offset rights may exist under applicable law, the Fund does not have a contractual right of offset against a clearing broker or clearinghouse in the event of a default (including the bankruptcy or insolvency). Additionally, credit risk exists in exchange-traded futures and centrally cleared swaps with respect to initial and variation margin that is held in a clearing broker’s customer accounts. While clearing brokers are required to segregate customer margin from their own assets, in the event that a clearing broker becomes insolvent or goes into bankruptcy and at that time there is a shortfall in the aggregate amount of margin held by the clearing broker for all its clients, typically the shortfall would be allocated on a pro rata basis across all the clearing broker’s customers, potentially resulting in losses to the Fund.
Concentration Risk: The Fund invests a significant portion of its assets in fixed income securities and/or uses derivatives tied to the fixed income markets. Changes in market interest rates or economic conditions may affect the value and/or liquidity of such investments. Interest rate risk is the risk that prices of bonds and other fixed income securities will increase as interest rates fall and decrease as interest rates rise. The Fund may be subject to a greater risk of rising interest rates due to the current period of historically low rates.
| 11. | CAPITAL SHARE TRANSACTIONS |
Transactions in capital shares for each class were as follows:
| | | | | | | | | | | | | | | | |
| | | Year Ended
12/31/2017 | | | Year Ended
12/31/2016 | |
| Share Class | | Shares | | | Amount | | | Shares | | | Amount | |
Class I | | | | | | | | | | | | | | | | |
Shares sold | | | 191,307 | | | $ | 1,952,213 | | | | 298,687 | | | $ | 3,117,025 | |
Shares issued in reinvestment of distributions | | | 143,198 | | | | 1,460,104 | | | | 142,901 | | | | 1,488,883 | |
Shares redeemed | | | (1,014,221 | ) | | | (10,349,406 | ) | | | (1,443,563 | ) | | | (15,070,332 | ) |
| | | | | | | | | | | | | | | | |
Net decrease | | | (679,716 | ) | | $ | (6,937,089 | ) | | | (1,001,975 | ) | | $ | (10,464,424 | ) |
| | | | | | | | | | | | | | | | |
| | | | |
Class III | | | | | | | | | | | | | | | | |
Shares sold | | | 98,593 | | | $ | 1,004,254 | | | | 869,182 | | | $ | 9,025,554 | |
Shares issued in reinvestment of distributions | | | 3,378 | | | | 34,390 | | | | 6,710 | | | | 70,048 | |
Shares redeemed | | | (196,442 | ) | | | (2,000,886 | ) | | | (790,237 | ) | | | (8,272,721 | ) |
| | | | | | | | | | | | | | | | |
Net decrease/increase | | | (94,471 | ) | | $ | (962,242 | ) | | | 85,655 | | | $ | 822,881 | |
| | | | | | | | | | | | | | | | |
Total Net Decrease | | | (774,187 | ) | | $ | (7,899,331 | ) | | | (916,320 | ) | | $ | (9,641,543 | ) |
| | | | | | | | | | | | | | | | |
At December 31, 2017, 1,963 Class III Shares of the Fund were owned by BlackRock HoldCo 2, Inc., an affiliate of the Fund.
Management has evaluated the impact of all subsequent events on the Fund through the date the financial statements were issued and has determined that there were no subsequent events requiring adjustment or additional disclosure in the financial statements.
| | | | |
| NOTESTO FINANCIAL STATEMENTS | | | 31 | |
Report of the Independent Registered Public Accounting Firm
To the Shareholders of BlackRock U.S. Government Bond V.I. Fund and the Board of Directors of
BlackRock Variable Series Funds, Inc.:
Opinion on the Financial Statements and Financial Highlights
We have audited the accompanying statement of assets and liabilities, including the schedule of investments, of BlackRock U.S. Government Bond V.I. Fund of BlackRock Variable Series Funds, Inc. (the “Fund”), as of December 31, 2017, the related statement of operations for the year then ended, the statements of changes in net assets for each of the two years in the period then ended, the financial highlights for each of the five years in the period then ended, and the related notes. In our opinion, the financial statements and financial highlights present fairly, in all material respects, the financial position of the Fund as of December 31, 2017, and the results of its operations for the year then ended, the changes in its net assets for each of the two years in the period then ended, and the financial highlights for each of the five years in the period then ended, in conformity with accounting principles generally accepted in the United States of America.
Basis for Opinion
These financial statements and financial highlights are the responsibility of the Fund’s management. Our responsibility is to express an opinion on the Fund’s financial statements and financial highlights based on our audits. We are a public accounting firm registered with the Public Company Accounting Oversight Board (United States) (PCAOB) and are required to be independent with respect to the Fund in accordance with the U.S. federal securities laws and the applicable rules and regulations of the Securities and Exchange Commission and the PCAOB.
We conducted our audits in accordance with the standards of the PCAOB. Those standards require that we plan and perform the audit to obtain reasonable assurance about whether the financial statements and financial highlights are free of material misstatement, whether due to error or fraud. The Fund is not required to have, nor were we engaged to perform, an audit of its internal control over financial reporting. As part of our audits we are required to obtain an understanding of internal control over financial reporting but not for the purpose of expressing an opinion on the effectiveness of the Fund’s internal control over financial reporting. Accordingly, we express no such opinion.
Our audits included performing procedures to assess the risks of material misstatement of the financial statements and financial highlights, whether due to error or fraud, and performing procedures that respond to those risks. Such procedures included examining, on a test basis, evidence regarding the amounts and disclosures in the financial statements and financial highlights. Our audits also included evaluating the accounting principles used and significant estimates made by management, as well as evaluating the overall presentation of the financial statements and financial highlights. Our procedures included confirmation of securities owned as of December 31, 2017, by correspondence with the custodian and brokers; when replies were not received from brokers, we performed other auditing procedures. We believe that our audits provide a reasonable basis for our opinion.
Deloitte & Touche LLP
Boston, Massachusetts
February 19, 2018
We have served as the auditor of one or more BlackRock investment companies since 1992.
| | |
| 32 | | 2017 BLACKROCK ANNUAL REPORTTO SHAREHOLDERS |
Glossary of Terms Used in this Report
| | |
| Currency |
| |
| AUD | | Australian Dollar |
| BRL | | Brazilian Real |
| CAD | | Canadian Dollar |
| CLP | | Chilean Peso |
| CNY | | Chinese Yuan |
| COP | | Colombian Peso |
| EUR | | Euro |
| GBP | | British Pound |
| HUF | | Hungarian Forint |
| IDR | | Indonesian Rupiah |
| KRW | | South Korean Won |
| MXN | | Mexican Peso |
| MYR | | Malaysia Ringgit |
| RUB | | Russian Ruble |
| SEK | | Swedish Krona |
| TRY | | Turkish Lira |
| TWD | | Taiwan Dollar |
| USD | | United States Dollar |
| ZAR | | South African Rand |
| | |
| Portfolio Abbreviations |
| |
| CDI | | One-Day Brazil Interbank Deposit |
| CLO | | Collateralized Loan Obligation |
| LIBOR | | London Interbank Offered Rate |
| OTC | | Over-the-counter |
| TBA | | To-be-announced |
| TIIE | | Interbank Equilibrium Interest Rate |
| UK RPI | | United Kingdom Retail Price Index |
| | | | |
| GLOSSARYOF TERMS USEDINTHIS REPORT | | | 33 | |
Director and Officer Information
| | | | | | | | |
| Independent Directors (a) |
| | | | | |
Name (b)
Year of Birth | | Position(s) Held
(Length of Service) (c) | | Principal Occupation(s) During Past Five Years | | Number of BlackRock-Advised
Registered Investment Companies
(“RICs”) Consisting of
Investment Portfolios
(“Portfolios”) Overseen | | Public Company and Other
Investment Company
Directorships Held During
Past Five Years |
Robert M. Hernandez 1944 | | Chair of the Board and Director
(Since 2007) | | Director, Vice Chairman and Chief Financial Officer of USX Corporation (energy and steel business) from 1991 to 2001; Director and non-executive Chairman, RTI International Metals, Inc. from 1990 to 2015; Director, TE Connectivity (electronics) from 2006 to 2012. | | 27 RICs consisting of 98 Portfolios | | Chubb Limited (insurance company); Eastman Chemical Company |
James H. Bodurtha 1944 | | Director
(Since 2007) | | Director, The China Business Group, Inc. (consulting and investing firm) from 1996 to 2013 and Executive Vice President thereof from 1996 to 2003; Chairman of the Board, Berkshire Holding Corporation since 1980; Director, ICI Mutual since 2010. | | 27 RICs consisting of 98 Portfolios | | None |
Bruce R. Bond 1940 | | Director
(Since 2007) | | Trustee and Member of the Governance Committee, State Street Research Mutual Funds from 1997 to 2005; Board Member of Governance, Audit and Finance Committee, Avaya Inc. (computer equipment) from 2003 to 2007. | | 27 RICs consisting of 98 Portfolios | | None |
Donald W. Burton 1944 | | Director
(Since 2007) | | Managing General Partner, The Burton Partnership, LP (an investment partnership) from 1979 to 2017; Managing General Partner, The Burton Partnership (QP), LP (an investment partnership) since 2000; Managing General Partner, The South Atlantic Venture Funds from 1983 to 2012; Director, IDology, Inc. (technology solutions) since 2006; Director, Knology, Inc. (telecommunications) from 1996 to 2012; Director, Capital Southwest (financial) from 2006 to 2012; Director, Burton Grill (restaurant) since 2013; Director, PDQ South Texas (restaurant) since 2013; Director, ITC/Talon (data) since 2015. | | 27 RICs consisting of 98 Portfolios | | None |
Honorable Stuart E. Eizenstat 1943 | | Director
(Since 2007) | | Partner and Head of International Practice, Covington and Burling LLP (law firm) since 2001; International Advisory Board Member, The Coca-Cola Company from 2002 to 2011; Advisory Board Member, Veracity Worldwide, LLC (risk management) from 2007 to 2012; Member of the International Advisory Board GML Ltd. (energy) since 2003. | | 27 RICs consisting of 98 Portfolios | | Alcatel-Lucent (telecommunications); Global Specialty Metallurgical; UPS Corporation (delivery service); Ferroglobe (Metals) |
Henry Gabbay 1947 | | Director (Since 2007) | | Consultant, BlackRock, Inc. from 2007 to 2008; Managing Director, BlackRock, Inc. from 1989 to 2007; Chief Administrative Officer, BlackRock Advisors, LLC from 1998 to 2007; President of BlackRock Funds and BlackRock Allocation Target Shares (formerly, BlackRock Bond Allocation Target Shares) from 2005 to 2007 and Treasurer of certain closed-end funds in the BlackRock fund complex from 1989 to 2006. | | 27 RICs consisting of 98 Portfolios | | None |
Lena G. Goldberg 1949 | | Director (Since 2016) | | Senior Lecturer, Harvard Business School since 2008; Executive Vice President, FMR LLC/Fidelity Investments (financial services) from 2007 to 2008, Executive Vice President and General Counsel thereof from 2002 to 2007, Senior Vice President and General Counsel thereof from 1999 to 2002, Vice President and General Counsel thereof from 1997 to 1999, Senior Vice President and Deputy General Counsel thereof in 1997, and Vice President and Corporate Counsel thereof from 1996 to 1997; Partner, Sullivan & Worcester LLP from 1985 to 1996 and Associate thereof from 1979 to 1985. | | 27 RICs consisting of 98 Portfolios | | None |
| | | | |
| DIRECTORAND OFFICER INFORMATION | | | | |
Director and Officer Information (continued)
| | | | | | | | |
| Independent Directors (a) |
| | | | | |
Name (b)
Year of Birth | | Position(s) Held
(Length of Service) (c) | | Principal Occupation(s) During Past Five Years | | Number of BlackRock-Advised
Registered Investment Companies
(“RICs”) Consisting of
Investment Portfolios
(“Portfolios”) Overseen | | Public Company and Other
Investment Company
Directorships Held During
Past Five Years |
Henry R. Keizer 1956 | | Director (Since 2016) | | Director, Park Indemnity Ltd. (captive insurer) since 2010; Director, MUFG Americas Holdings Corporation and MUFG Union Bank, N.A. (financial and bank holding company) from 2014 to 2016; Director, Montpelier Re Holdings, Ltd. (publicly held property and casual reinsurance) from 2013 to 2015; Director, American Institute of Certified Public Accountants from 2009 to 2011; Director, KPMG LLP (audit, tax and advisory services) from 2004 to 2005 and 2010 to 2012; Director, KPMG International in 2012, Deputy Chairman and Chief Operating Officer thereof from 2010 to 2012 and U.S. Vice Chairman of Audit thereof from 2005 to 2010; Global Head of Audit, KPMGI (consortium of KPMG firms) from 2006 to 2010; Director, YMCA of Greater New York from 2006 to 2010. | | 27 RICs consisting of 98 Portfolios | | Hertz Global Holdings (car rental); WABCO (commercial vehicle safety systems) |
John F O’Brien 1947 | | Director (Since 2007) | | Trustee, Woods Hole Oceanographic Institute since 2003 and Chairman thereof from 2009 to 2015; Co-Founder and Managing Director, Board Leaders LLC (director education) since 2005. | | 27 RICs consisting of 98 Portfolios | | Cabot Corporation (chemicals); LKQ Corporation (auto parts manufacturing); TJX Companies, Inc. (retailer) |
Donald C. Opatrny 1952 | | Director (Since 2015) | | Trustee, Member of the Executive Committee and Chair of the Investment Committee, Cornell University since 2004; Member of the Board and Investment Committee, University School since 2007; Member of the Investment Committee, Mellon Foundation from 2009 to 2015; President and Trustee, the Center for the Arts, Jackson Hole since 2011; Director, Athena Capital Advisors LLC (investment management firm) since 2013; Trustee and Chair of the Investment Committee, Community Foundation of Jackson Hole since 2014; Trustee, Artst or (a Mellon Foundation affiliate) from 2010 to 2015; President, Trustee and Member of the Investment Committee, The Aldrich Contemporary Art Museum from 2007 to 2014. | | 27 RICs consisting of 98 Portfolios | | None |
Roberta Cooper Ramo 1942 | | Director (Since 2007) | | Shareholder and Attorney, Modrall, Sperling, Roehl, Harris & Sisk, P.A. (law firm) since 1993; Director, ECMC Group (service provider to students, schools and lenders) since 2001; President, The American Law Institute (non-profit) since 2008; Vice President, Santa Fe Opera (non-profit) since 2011; Chair, Think New Mexico (non-profit) since 2013; Chairman of the Board, Cooper’s Inc. (retail) from 1999 to 2011. | | 27 RICs consisting of 98 Portfolios | | None |
| | |
| | 2017 BLACKROCK ANNUAL REPORTTO SHAREHOLDERS |
Director and Officer Information (continued)
| | | | | | | | |
| Interested Directors (a)(d) |
| | | | | |
Name (b)
Year of Birth | | Position(s) Held
(Length of Service) (c) | | Principal Occupation(s) During Past Five Years | | Number of BlackRock-Advised
Registered Investment Companies
(“RICs”) Consisting of
Investment Portfolios
(“Portfolios”) Overseen | | Public Company and Other
Investment Company
Directorships Held During
Past Five Years |
Robert Fairbairn 1965 | | Director (Since 2015) | | Senior Managing Director of BlackRock, Inc. since 2010; oversees BlackRock’s Strategic Partner Program and Strategic Product Management Group; Member of BlackRock’s Global Executive and Global Operating Committees; Co-Chair of BlackRock’s Human Capital Committee; Global Head of BlackRock’s Retail and iShares® businesses from 2012 to 2016; Head of BlackRock’s Global Client Group from 2009 to 2012; Chairman of BlackRock’s international businesses from 2007 to 2010. | | 27 RICs consisting of 98 Portfolios | | None |
John M. Perlowski 1964 | | Director
(Since 2015), President and Chief Executive Officer
(Since 2010) | | Managing Director of BlackRock, Inc. since 2009; Head of BlackRock Global Accounting and Product Services since 2009; Managing Director and Chief Operating Officer of the Global Product Group at Goldman Sachs Asset Management, L.P. from 2003 to 2009; Treasurer of Goldman Sachs Mutual Funds from 2003 to 2009 and Senior Vice President thereof from 2007 to 2009; Director of Goldman Sachs Offshore Funds from 2002 to 2009; Advisory Director of Family Resource Network (charitable foundation) since 2009. | | 127 RICs consisting of 316 Portfolios | | None |
(a) The address of each Director is c/o BlackRock, Inc., 55 East 52nd Street, New York, NY 10055. |
(b) Each Independent Director holds office until his or her successor is duly elected and qualifies or until his or her earlier death, resignation, retirement or removal as provided by the Company’s by-laws or charter or statute, or until December 31 of the year in which he or she turns 75. The Board may determine to extend the terms of Independent Directors on a case-by-case basis, as appropriate. Interested Directors serve until their successor is duly elected and qualifies or until their earlier death, resignation, retirement or removal as provided by the Company’s by-laws or statute, or until December 31 of the year in which they turn 72. |
(c) Following the combination of Merrill Lynch Investment Managers, L.P. (“MLIM”) and BlackRock, Inc. in September 2006, the various legacy MLIM and legacy BlackRock fund boards were realigned and consolidated into three new fund boards in 2007. As a result, although the chart shows certain Independent Directors as joining the Corporation’s board in 2007, those Directors first became members of the boards of other legacy MLIM or legacy BlackRock funds as follows: James H. Bodurtha, 1995; Bruce R. Bond, 2005; Donald W. Burton, 2002; Honorable Stuart E. Eizenstat, 2001; Robert M. Hernandez, 1996; John F. O’Brien, 2005; and Roberta Cooper Ramo, 1999. |
(d) Messrs. Fairbairn and Perlowski are both “interested persons,” as defined in the 1940 Act, of the Company based on their positions with BlackRock, Inc. and its affiliates. Mr. Perlowski is also a board member of the BlackRock Closed-End Complex and the BlackRock Equity-Liquidity Complex. |
| | | | |
| DIRECTORAND OFFICER INFORMATION | | | | |
Director and Officer Information (continued)
| | | | |
| Officers Who Are Not Directors (a) |
| | | |
Name (b)
Year of Birth | | Position(s) Held (Length of Service) | | Principal Occupation(s) During Past Five Years |
Jennifer McGovern 1977 | | Vice President (Since 2014) | | Managing Director of BlackRock, Inc. since 2016; Director of BlackRock, Inc. from 2011 to 2015; Head of Product Structure and Oversight for BlackRock’s U.S. Wealth Advisory Group since 2013; Vice President of BlackRock, Inc. from 2008 to 2010. |
Neal J. Andrews 1966 | | Chief Financial Officer (Since 2007) | | Managing Director of BlackRock, Inc. since 2006; Senior Vice President and Line of Business Head of Fund Accounting and Administration at PNC Global Investment Servicing (U.S.) Inc. from 1992 to 2006. |
Jay M. Fife 1970 | | Treasurer (Since 2007) | | Managing Director of BlackRock, Inc. since 2007; Director of BlackRock, Inc. in 2006; Assistant Treasurer of the MLIM and Fund Asset Management, L.P. advised funds from 2005 to 2006; Director of MLIM Fund Services Group from 2001 to 2006. |
Charles Park 1967 | | Chief Compliance Officer (Since 2014) | | Anti-Money Laundering Compliance Officer for the BlackRock-advised Funds in the Equity-Bond Complex, the Equity-Liquidity Complex and the Closed-End Complex from 2014 to 2015; Chief Compliance Officer of BlackRock Advisors, LLC and the BlackRock-advised Funds in the Equity-Bond Complex, the Equity-Liquidity Complex and the Closed-End Complex since 2014; Principal of and Chief Compliance Officer for iShares® Delaware Trust Sponsor LLC since 2012 and BlackRock Fund Advisors (“BFA”) since 2006; Chief Compliance Officer for the BFA-advised iShares® exchange traded funds since 2006; Chief Compliance Officer for BlackRock Asset Management International Inc. since 2012. |
Fernanda Piedra 1969 | | Anti-Money Laundering Compliance Officer (Since 2015) | | Director of BlackRock, Inc. since 2014; Anti-Money Laundering Compliance Officer and Regional Head of Financial Crime for the Americas at BlackRock, Inc. since 2014; Head of Regulatory Changes and Remediation for the Asset Wealth Management Division of Deutsche Bank from 2010 to 2014; Vice President of Goldman Sachs (Anti-Money Laundering/Suspicious Activities Group) from 2004 to 2010. |
Benjamin Archibald 1975 | | Secretary (Since 2012) | | Managing Director of BlackRock, Inc. since 2014; Director of BlackRock, Inc. from 2010 to 2013; Secretary of the iShares® exchange traded funds since 2015; Secretary of the BlackRock-advised mutual funds since 2012. |
(a) The address of each Officer is c/o BlackRock, Inc., 55 East 52nd Street, New York, NY 10055. |
(b) Officers of the Company serve at the pleasure of the Board. |
Further information about the Company’s Officers and Directors is available in the Company’s Statement of Additional Information, which can be obtained without charge by calling 1-800-441-7762.
Effective December 31, 2017, Roberta Cooper Ramo retired and Donald W. Burton resigned as Directors of the Company.
| | |
| Investment Adviser | | Custodians |
BlackRock Advisors, LLC
Wilmington, DE 19809 | | JPMorgan Chase Bank, N.A.(c)
New York, NY 10179 The Bank of New York Mellon(c)
New York, NY 10286 |
| | |
| Sub-Advisers | | |
BlackRock International Limited(a) Edinburgh, United Kingdom | | Brown Brothers Harriman & Co.(d) Boston, MA 02109 |
| | |
| | Accounting Agent and Transfer Agent |
BlackRock Asset Management North Asia Limited(b) Hong Kong | | BNY Mellon Investment Servicing (US) Inc. Wilmington, DE 19809 |
| | |
| | Independent Registered Public Accounting Firm |
BlackRock (Singapore) Limited(b) 079912 Singapore | | Deloitte & Touche LLP Philadelphia, PA 19103 |
| | |
| | Distributor |
| | BlackRock Investments, LLC New York, NY 10022 |
| | |
| | Legal Counsel |
| | Willkie Farr & Gallagher LLP New York, NY 10019 |
| | |
| | Address of the Funds |
| | 100 Bellevue Parkway Wilmington, DE 19809 |
| (a) | For BlackRock International V.I. Fund and BlackRock Managed Volatility V.I Fund. |
| (b) | For BlackRock Managed Volatility V.I. Fund. |
| (c) | For all Funds except BlackRock Global Allocation V.I. Fund, BlackRock International V.I. Fund and BlackRock Large Cap Growth V.I. Fund. |
| (d) | For BlackRock Global Allocation V.I. Fund, BlackRock International V.I. Fund and BlackRock Large Cap Growth V.I. Fund. |
| | |
| | 2017 BLACKROCK ANNUAL REPORTTO SHAREHOLDERS |
Additional Information
General Information
Availability of Quarterly Schedule of Investments
The Funds file their complete schedule of portfolio holdings with the SEC for the first and third quarters of each fiscal year on Form N-Q. The Funds’ Forms N-Q are available on the SEC’s website at http://www.sec.gov and may also be reviewed and copied at the SEC’s Public Reference Room in Washington, DC. Information on the operation of the Public Reference Room or how to access documents on the SEC’s website without charge may be obtained by calling (800) SEC-0330. The Funds’ Forms N-Q may also be obtained upon request and without charge by calling (800) 441-7762.
Availability of Proxy Voting Policies and Procedures
A description of the policies and procedures that the Funds use to determine how to vote proxies relating to portfolio securities is available upon request and without charge (1) by calling (800) 441-7762; (2) at http://www.blackrock.com/prospectus/insurance; and (3) on the SEC’s website at http://www.sec.gov.
Availability of Proxy Voting Record
Information about how the Funds voted proxies relating to securities held in the Funds’ portfolios during the most recent 12-month period ended June 30 is available upon request and without charge (1) at http://www.blackrock.com/prospectus/insurance or by calling (800) 441-7762 and (2) on the SEC’s website at http://www.sec.gov.
BlackRock Privacy Principles
BlackRock is committed to maintaining the privacy of its current and former fund investors and individual clients (collectively, “Clients”) and to safe-guarding their non-public personal information. The following information is provided to help you understand what personal information BlackRock collects, how we protect that information and why in certain cases we share such information with select parties.
If you are located in a jurisdiction where specific laws, rules or regulations require BlackRock to provide you with additional or different privacy-related rights beyond what is set forth below, then BlackRock will comply with those specific laws, rules or regulations.
BlackRock obtains or verifies personal non-public information from and about you from different sources, including the following: (i) information we receive from you or, if applicable, your financial intermediary, on applications, forms or other documents; (ii) information about your transactions with us, our affiliates, or others; (iii) information we receive from a consumer reporting agency; and (iv) from visits to our websites.
BlackRock does not sell or disclose to non-affiliated third parties any non-public personal information about its Clients, except as permitted by lawor as is necessary to respond to regulatory requests or to service Client accounts. These non-affiliated third parties are required to protect the confidentiality and security of this information and to use it only for its intended purpose.
We may share information with our affiliates to service your account or to provide you with information about other BlackRock products or services that may be of interest to you. In addition, BlackRock restricts access to non-public personal information about its Clients to those BlackRock employees with a legitimate business need for the information. BlackRock maintains physical, electronic and procedural safeguards that are designed to protect the non-public personal information of its Clients, including procedures relating to the proper storage and disposal of such information.
| | | | |
| DIRECTORAND OFFICER INFORMATION | | | | |
This report is only for distribution to shareholders of the Funds of BlackRock Variable Series Funds, Inc. Past performance results shown in this report should not be considered a representation of future performance. Investment return and principal value of non-money market fund shares will fluctuate so that shares, when redeemed, may be worth more or less than their original cost. An investment in the BlackRock Government Money Market V.I. Fund is not insured or guaranteed by the Federal Deposit Insurance Corporation or any other government agency. Although the money market fund seeks to preserve the value of your investment at $1.00 per share, it is possible to lose money by investing in money market funds. Statements and other information herein are as dated and are subject to change.

| | |
| VS-12/17-AR | |  |
| Item 2 – | Code of Ethics – The registrant (or the “Fund”) has adopted a code of ethics, as of the end of the period covered by this report, applicable to the registrant’s principal executive officer, principal financial officer, principal accounting officer or controller, or persons performing similar functions. During the period covered by this report, the code of ethics was amended to clarify an inconsistency as to whom persons covered by the code should report suspected violations of the code. The amendment clarifies that such reporting should be made to BlackRock Advisors, LLC’s (“Investment Adviser” or “BlackRock”) General Counsel, and retains the alternative option of anonymous reporting following “whistleblower” policies. Other non-material changes were also made in connection with this amendment. During the period covered by this report, there have been no waivers granted under the code of ethics. The registrant undertakes to provide a copy of the code of ethics to any person upon request, without charge, who calls 1-800-441-7762. |
| Item 3 – | Audit Committee Financial Expert – The registrant’s board of directors (the “board of directors”), has determined that (i) the registrant has the following audit committee financial experts serving on its audit committee and (ii) each audit committee financial expert is independent: |
Robert M. Hernandez
Henry R. Keizer
Stuart E. Eizenstat
Bruce R. Bond
Under applicable securities laws, a person determined to be an audit committee financial expert will not be deemed an “expert” for any purpose, including without limitation for the purposes of Section 11 of the Securities Act of 1933, as a result of being designated or identified as an audit committee financial expert. The designation or identification of a person as an audit committee financial expert does not impose on such person any duties, obligations, or liabilities greater than the duties, obligations, and liabilities imposed on such person as a member of the audit committee and board of directors in the absence of such designation or identification.
| Item 4 – | Principal Accountant Fees and Services |
The following table presents fees billed by Deloitte & Touche LLP (“D&T”) in each of the last two fiscal years for the services rendered to the Fund:
| | | | | | | | | | | | | | | | |
| | (a) Audit Fees | | (b) Audit-Related Fees1 | | (c) Tax Fees2 | | (d) All Other Fees |
| Entity Name | | Current
Fiscal Year
End | | Previous
Fiscal Year
End | | Current
Fiscal Year
End | | Previous
Fiscal Year
End | | Current
Fiscal Year
End | | Previous
Fiscal Year
End | | Current
Fiscal Year
End | | Previous
Fiscal Year
End |
| BlackRock Advantage Large Cap Core V.I. Fund | | $30,826 | | $31,506 | | $0 | | $0 | | $13,107 | | $13,107 | | $0 | | $0 |
| BlackRock Advantage Large Cap Value V.I. Fund | | $22,024 | | $23,244 | | $0 | | $0 | | $13,107 | | $13,107 | | $0 | | $0 |
| BlackRock Advantage U.S. Total Market V.I. Fund | | $27,226 | | $28,446 | | $0 | | $0 | | $13,107 | | $13,107 | | $0 | | $0 |
BlackRock Basic Value V.I. Fund | | $37,528 | | $38,748 | | $0 | | $0 | | $13,107 | | $13,107 | | $0 | | $0 |
2
| | | | | | | | | | | | | | | | |
| BlackRock Capital Appreciation V.I. Fund | | $24,701 | | $25,921 | | $0 | | $0 | | $13,107 | | $13,107 | | $0 | | $0 |
| BlackRock Equity Dividend V.I. Fund | | $19,627 | | $20,847 | | $0 | | $0 | | $8,160 | | $8,160 | | $0 | | $0 |
| BlackRock Global Allocation V.I. Fund | | $51,332 | | $53,359 | | $0 | | $0 | | $20,000 | | $20,000 | | $0 | | $0 |
| BlackRock Global Opportunities V.I. Fund | | $35,870 | | $37,090 | | $0 | | $0 | | $9,690 | | $9,690 | | $0 | | $0 |
| BlackRock Government Money Market V.I. Fund | | $24,302 | | $23,652 | | $0 | | $0 | | $9,792 | | $9,792 | | $0 | | $0 |
| BlackRock High Yield V.I. Fund | | $39,959 | | $44,307 | | $0 | | $0 | | $14,025 | | $14,025 | | $0 | | $0 |
| BlackRock International V.I. Fund | | $30,107 | | $31,327 | | $0 | | $0 | | $14,127 | | $14,127 | | $0 | | $0 |
| BlackRock iShares Alternative Strategies V.I. Fund | | $29,006 | | $28,356 | | $0 | | $0 | | $13,850 | | $13,850 | | $0 | | $0 |
| BlackRock iShares Dynamic Allocation V.I. Fund | | $29,006 | | $28,356 | | $0 | | $0 | | $13,850 | | $13,850 | | $0 | | $0 |
| BlackRock iShares Dynamic Fixed Income V.I. Fund | | $25,859 | | $24,939 | | $0 | | $0 | | $13,107 | | $13,107 | | $0 | | $0 |
| BlackRock iShares Equity Appreciation V.I. Fund | | $25,859 | | $24,939 | | $0 | | $0 | | $13,107 | | $13,107 | | $0 | | $0 |
| BlackRock Large Cap Focus Growth V.I. Fund | | $22,024 | | $23,244 | | $0 | | $0 | | $13,107 | | $13,107 | | $0 | | $0 |
| BlackRock Managed Volatility V.I. Fund | | $29,427 | | $31,455 | | $0 | | $0 | | $8,976 | | $8,976 | | $0 | | $0 |
| BlackRock S&P 500 Index V.I. Fund | | $30,286 | | $31,506 | | $0 | | $0 | | $13,107 | | $13,107 | | $0 | | $0 |
| BlackRock Total Return V.I. Fund | | $50,924 | | $40,992 | | $0 | | $0 | | $15,402 | | $15,402 | | $0 | | $0 |
| BlackRock U.S. Government Bond V.I. Fund | | $38,352 | | $31,990 | | $0 | | $0 | | $15,402 | | $15,402 | | $0 | | $0 |
The following table presents fees billed by D&T that were required to be approved by the registrant’s audit committee (the “Committee”) for services that relate directly to the operations or financial reporting of the Fund and that are rendered on behalf of BlackRock and entities controlling, controlled by, or under common control with BlackRock (not including any sub-adviser whose role is primarily portfolio management and is subcontracted with or overseen by another investment adviser) that provide ongoing services to the Fund (“Affiliated Service Providers”):
3
| | | | |
| | | Current Fiscal Year End | | Previous Fiscal Year End |
| (b) Audit-Related Fees1 | | $0 | | $0 |
| (c) Tax Fees2 | | $0 | | $0 |
(d) All Other Fees3 | | $2,129,000 | | $2,154,000 |
1 The nature of the services includes assurance and related services reasonably related to the performance of the audit or review of financial statements not included in Audit Fees, including accounting consultations, agreed-upon procedure reports, attestation reports, comfort letters, out-of-pocket expenses and internal control reviews not required by regulators.
2 The nature of the services includes tax compliance and/or tax preparation, including services relating to the filing or amendment of federal, state or local income tax returns, regulated investment company qualification reviews, taxable income and tax distribution calculations.
3 Non-audit fees of $2,129,000 and $2,154,000 for the current fiscal year and previous fiscal year, respectively, were paid to the Fund’s principal accountant in their entirety by BlackRock, in connection with services provided to the Affiliated Service Providers of the Fund and of certain other funds sponsored and advised by BlackRock or its affiliates for a service organization review and an accounting research tool subscription. These amounts represent aggregate fees paid by BlackRock and were not allocated on a per fund basis.
(e)(1) Audit Committee Pre-Approval Policies and Procedures:
The Committee has adopted policies and procedures with regard to the pre-approval of services. Audit, audit-related and tax compliance services provided to the registrant on an annual basis require specific pre-approval by the Committee. The Committee also must approve other non-audit services provided to the registrant and those non-audit services provided to the Investment Adviser and Affiliated Service Providers that relate directly to the operations and the financial reporting of the registrant. Certain of these non-audit services that the Committee believes are (a) consistent with the SEC’s auditor independence rules and (b) routine and recurring services that will not impair the independence of the independent accountants may be approved by the Committee without consideration on a specific case-by-case basis (“general pre-approval”). The term of any general pre-approval is 12 months from the date of the pre-approval, unless the Committee provides for a different period. Tax or other non-audit services provided to the registrant which have a direct impact on the operations or financial reporting of the registrant will only be deemed pre-approved provided that any individual project does not exceed $10,000 attributable to the registrant or $50,000 per project. For this purpose, multiple projects will be aggregated to determine if they exceed the previously mentioned cost levels.
Any proposed services exceeding the pre-approved cost levels will require specific pre-approval by the Committee, as will any other services not subject to general pre-approval (e.g., unanticipated but permissible services). The Committee is informed of each service approved subject to general pre-approval at the next regularly scheduled in-person board meeting. At this meeting, an analysis of such services is presented to the Committee for ratification. The Committee may delegate to the Committee Chairman the authority to approve the provision of and fees for any specific engagement of permitted non-audit services, including services exceeding pre-approved cost levels.
(e)(2) None of the services described in each of Items 4(b) through (d) were approved by the Committee pursuant to the de minimis exception in paragraph (c)(7)(i)(C) of Rule 2-01 of Regulation S-X.
(f) Not Applicable
(g) The aggregate non-audit fees, defined as the sum of the fees shown under “Audit-Related Fees,” “Tax Fees” and “All Other Fees,” paid to the accountant for services rendered by the accountant to the registrant, the Investment Adviser and the Affiliated Service Providers were:
4
| | | | |
| | Current Fiscal Year | | Previous Fiscal Year |
| Entity Name | | End | | End |
| BlackRock Advantage Large Cap Core V.I. Fund | | $13,107 | | $13,107 |
| BlackRock Advantage Large Cap Growth V.I. Fund | | $13,107 | | $13,107 |
| BlackRock Advantage U.S. Total Market V.I. Fund | | $13,107 | | $13,107 |
| BlackRock Basic Value V.I. Fund | | $13,107 | | $13,107 |
| BlackRock Capital Appreciation V.I. Fund | | $13,107 | | $13,107 |
| BlackRock Equity Dividend V.I. Fund | | $8,160 | | $8,160 |
| BlackRock Global Allocation V.I. Fund | | $20,000 | | $20,000 |
| BlackRock Global Opportunities V.I. Fund | | $9,690 | | $9,690 |
| BlackRock Government Money Market V.I. Fund | | $9,792 | | $9,792 |
| BlackRock High Yield V.I. Fund | | $14,025 | | $14,025 |
| BlackRock International V.I. Fund | | $14,127 | | $14,127 |
| BlackRock iShares Alternative Strategies V.I. Fund | | $13,850 | | $13,850 |
| BlackRock iShares Dynamic Allocation V.I. Fund | | $13,850 | | $13,850 |
| BlackRock iShares Dynamic Fixed Income V.I. Fund | | $13,107 | | $13,107 |
| BlackRock iShares Equity Appreciation Fund | | $13,107 | | $13,107 |
| BlackRock Large Cap Focus Growth V.I. Fund | | $13,107 | | $13,107 |
| BlackRock Managed Volatility V.I. Fund | | $8,976 | | $8,976 |
| BlackRock S&P 500 Index V.I. Fund | | $13,107 | | $13,107 |
| BlackRock Total Return V.I. Fund | | $15,402 | | $15,402 |
BlackRock U.S. Government Bond V.I. Fund | | $15,402 | | $15,402 |
Additionally, the amounts billed by D&T in connection with services provided to the Affiliated Service Providers of the Fund and of other funds sponsored and advised by BlackRock or its affiliates during the current and previous fiscal years for a service organization review and an accounting research tool subscription were:
| | |
Current Fiscal Year | | Previous Fiscal Year |
| End | | End |
| $2,129,000 | | $2,154,000 |
These amounts represent aggregate fees paid by BlackRock and were not allocated on a per fund basis.
5
(h) The Committee has considered and determined that the provision of non-audit services that were rendered to the Investment Adviser and the Affiliated Service Providers that were not pre-approved pursuant to paragraph (c)(7)(ii) of Rule 2-01 of Regulation S-X is compatible with maintaining the principal accountant’s independence.
| Item 5 – | Audit Committee of Listed Registrants – Not Applicable |
(a) The registrant’s Schedule of Investments is included as part of the Report to Stockholders filed under Item 1 of this Form.
(b) Not Applicable due to no such divestments during the semi-annual period covered since the previous Form N-CSR filing.
| Item 7 – | Disclosure of Proxy Voting Policies and Procedures for Closed-End Management Investment Companies – Not Applicable |
| Item 8 – | Portfolio Managers of Closed-End Management Investment Companies – Not Applicable |
| Item 9 – | Purchases of Equity Securities by Closed-End Management Investment Company and Affiliated Purchasers – Not Applicable |
| Item 10 – | Submission of Matters to a Vote of Security Holders – There have been no material changes to these procedures. |
| Item 11 – | Controls and Procedures |
(a) The registrant’s principal executive and principal financial officers, or persons performing similar functions, have concluded that the registrant’s disclosure controls and procedures (as defined in Rule 30a-3(c) under the Investment Company Act of 1940, as amended (the “1940 Act”)) are effective as of a date within 90 days of the filing of this report based on the evaluation of these controls and procedures required by Rule 30a-3(b) under the 1940 Act and Rule 15d-15(b) under the Securities Exchange Act of 1934, as amended.
(b) There were no changes in the registrant’s internal control over financial reporting (as defined in
Rule 30a-3(d) under the 1940 Act) that occurred during the second fiscal quarter of the period covered by this report that have materially affected, or are reasonably likely to materially affect, the registrant’s internal control over financial reporting.
| Item 12 – | Disclosure of Securities Lending Activities for Closed-End Management Investment Companies – Not Applicable to the registrant. |
| Item 13 – | Exhibits attached hereto |
(a)(1) Code of Ethics – See Item 2
(a)(2) Certifications – Attached hereto
(a)(3) Not Applicable
6
(a)(4) Not Applicable
(b) Certifications – Attached hereto
7
Pursuant to the requirements of the Securities Exchange Act of 1934 and the Investment Company Act of 1940, the registrant has duly caused this report to be signed on its behalf by the undersigned, thereunto duly authorized.
| | |
| BlackRock Variable Series Funds, Inc. |
| |
| By: | | /s/ John M. Perlowski |
| | John M. Perlowski |
| | Chief Executive Officer (principal executive officer) of |
| | BlackRock Variable Series Funds, Inc. |
Date: February 28, 2018
Pursuant to the requirements of the Securities Exchange Act of 1934 and the Investment Company Act of 1940, this report has been signed below by the following persons on behalf of the registrant and in the capacities and on the dates indicated.
| | |
| By: | | /s/ John M. Perlowski |
| | John M. Perlowski |
| | Chief Executive Officer (principal executive officer) of |
| | BlackRock Variable Series Funds, Inc. |
Date: February 28, 2018
| | |
| By: | | /s/ Neal J. Andrews |
| | Neal J. Andrews |
| | Chief Financial Officer (principal financial officer) of |
| | BlackRock Variable Series Funds, Inc. |
Date: February 28, 2018
8