UNITED STATES
SECURITIES AND EXCHANGE COMMISSION
Washington, D.C. 20549
FORMN-CSR
CERTIFIED SHAREHOLDER REPORT OF REGISTERED MANAGEMENT
INVESTMENT COMPANIES
Investment Company Act file number:811-03290
Name of Fund: BlackRock Variable Series Funds, Inc.
BlackRock Advantage Large Cap Core V.I. Fund
BlackRock Advantage Large Cap Value V.I. Fund
BlackRock Advantage U.S. Total Market V.I. Fund
BlackRock Basic Value V.I. Fund
BlackRock Capital Appreciation V.I. Fund
BlackRock Equity Dividend V.I. Fund
BlackRock Global Allocation V.I. Fund
BlackRock Government Money Market V.I. Fund
BlackRock International V.I. Fund
BlackRock International Index V.I. Fund
BlackRock iShares Dynamic Allocation V.I Fund
BlackRock Large Cap Focus Growth V.I. Fund
BlackRock Managed Volatility V.I. Fund
BlackRock S&P 500 Index V.I. Fund
BlackRock Small Cap Index V.I. Fund
Fund Address: 100 Bellevue Parkway, Wilmington, DE 19809
Name and address of agent for service: John M. Perlowski, Chief Executive Officer, BlackRock Variable
Series Funds, Inc., 55 East 52nd Street, New York, NY 10055
Registrant’s telephone number, including area code: (800)441-7762
Date of fiscal year end: 12/31/2018
Date of reporting period: 12/31/2018
Item 1 – Report to Stockholders
DECEMBER 31, 2018
| | |
ANNUAL REPORT | |  |
BlackRock Variable Series Funds, Inc.
|
| Not FDIC Insured • May Lose Value • No Bank Guarantee |
The Markets in Review
Dear Shareholder,
In the 12 months ended December 31, 2018, concerns about a variety of political risks and a modest slowdown in global growth worked against the equity market despite solid corporate earnings, while rising interest rates constrained bond returns. Though the market’s appetite for risk remained healthy for most of the reporting period, risk-taking declined sharply later in the reporting period. As a result, bonds held their value better than stocks, which posted negative returns across the globe. Shorter-term, higher-quality securities led the bond market, and U.S. equities outperformed most international stock markets.
Volatility rose in emerging market stocks, as the rising U.S. dollar and higher interest rates in the U.S. disrupted economic growth abroad. U.S.-China trade relations and debt concerns adversely affected the Chinese stock market, while Turkey and Argentina became embroiled in currency crises, largely due to hyperinflation in both countries. An economic slowdown in Europe also led to negative performance for European equities.
In fixed income markets, short-term U.S. Treasury interest rates rose the fastest, while longer-term rates slightly increased. This led to a negative return for long-term U.S. Treasuries and a substantial flattening of the yield curve. Many investors are concerned with the flattening yield curve as a harbinger of recession. However, given the extraordinary monetary measures in the last decade, we believe a more accurate barometer for the economy is the returns along the risk spectrums in stock and bond markets. Although the fundamentals in credit markets remained relatively solid, investment-grade bonds posted flat returns, and high-yield bonds declined slightly. Recent sell-offs in risk assets have flattened asset returns along the risk spectrum somewhat, which bears further scrutiny in the months ahead.
In response to rising growth and inflation, the U.S. Federal Reserve (the “Fed”) increased short-term interest rates four times during the reporting period. The Fed also continued to reduce its balance sheet, gradually reversing the unprecedented stimulus measures it enacted after the financial crisis. By our estimation, the Fed’s neutral interest rate, or the theoretical rate that is neither stimulative nor restrictive to the economy, is approximately 3.0%. With that perspective, the Fed’s current policy is still mildly stimulative to the U.S. economy, which leaves room for further Fed rate hikes to arrive at monetary policy that is a neutral factor for economic growth.
Volatility in the U.S. equity market spiked in October, as a wide range of risks were brought to bear on markets, ranging from rising interest rates and slowing global growth to heightened trade tensions and political turmoil in several countries, including the United States. This was accompanied by a broad basedrisk-off in December — which was the worst December performance on record since 1931. Although fears of recession drove equity volatility higher at the end of 2018, we continue to believe the probability of recession in 2019 remains relatively low.
Economic growth and global earnings are likely to slow somewhat in 2019 — the tax cut stimulus will be less pronounced, and the Fed’s rate hikes in 2018 will gain traction in 2019. Trade frictions look more baked into asset prices than a year ago, but markets may be overlooking European political risks. Consequently, we are cautious on European equities, as European unity remains tenuous with a history offlare-ups. We continue to prefer to take risk in U.S. and emerging market equities. Within U.S. equities, we believe that companies with high-quality earnings and strong balance sheets offer the most attractive risk/rewardtrade-off. Going into 2019, we also favor short-term bonds over long-term bonds because they offer nearly equivalent yields with far lower volatility.
In this environment, investors need to think globally, extend their scope across a broad array of asset classes, and be nimble as market conditions change. We encourage you to talk with your financial advisor and visitblackrock.com for further insight about investing in today’s markets.
Sincerely,

Rob Kapito
President, BlackRock Advisors, LLC

Rob Kapito
President, BlackRock Advisors, LLC
| | | | |
| Total Returns as of December 31, 2018 |
| | | 6-month | | 12-month |
U.S. large cap equities
(S&P 500® Index) | | (6.85)% | | (4.38)% |
U.S. small cap equities
(Russell 2000® Index) | | (17.35) | | (11.01) |
International equities
(MSCI Europe, Australasia,
Far East Index) | | (11.35) | | (13.79) |
Emerging market equities
(MSCI Emerging Markets Index) | | (8.48) | | (14.57) |
3-month Treasury bills
(ICE BofAML3-Month
U.S. Treasury Bill Index) | | 1.06 | | 1.87 |
U.S. Treasury securities
(ICE BofAML10-Year
U.S. Treasury Index) | | 2.72 | | (0.03) |
U.S. investment grade bonds
(Bloomberg Barclays U.S.
Aggregate Bond Index) | | 1.65 | | 0.01 |
Tax-exempt municipal bonds
(S&P Municipal Bond Index) | | 1.38 | | 1.36 |
U.S. high yield bonds
(Bloomberg Barclays
U.S. Corporate High Yield
2% Issuer Capped Index) | | (2.24) | | (2.08) |
| Past performance is no guarantee of future results. Index performance is shown for illustrative purposes only. You cannot invest directly in an index. |
| | | | |
| THIS PAGEISNOT PARTOF YOUR FUND REPORT | | | | |
DECEMBER 31, 2018
| | |
ANNUAL REPORT | |  |
BlackRock Variable Series Funds, Inc.
| Ø | | BlackRock Advantage Large Cap Core V.I. Fund |
|
| Not FDIC Insured • May Lose Value • No Bank Guarantee |
| | |
| Fund Summary as of December 31, 2018 | | BlackRock Advantage Large Cap Core V.I. Fund |
Investment Objective
BlackRock Advantage Large Cap Core V.I. Fund’s (the “Fund”) investment objective is to seek high total investment return.
Portfolio Management Commentary
How did the Fund perform?
For the 12-month period ended December 31, 2018, the Fund underperformed its benchmark, the Russell 1000® Index.
What factors influenced performance?
After beginning the year favoring growth stocks and trend-based strategies, investors later reversed course and sold out of more expensive, growth-oriented areas of the market on fears of expensive valuations and of approaching the end of the market cycle. As the sell-off was often disconnected with the broader sentiment of management and market participants, it created a difficult environment for sentiment-based signals and resulted in sentiment insights detracting from relative performance for the period. A signal that gauges company sentiment based on trends in online job postings was the largest detractor for the period. Identifying sentiment based on short positions of hedge funds acted as a drag on performance as well, largely due to significant hedge fund de-risking toward the end of the year. A signal that uses geo-location data to determine consumer foot traffic patterns into various brick-and-mortar locations further detracted. Given a rotation out of growth positions, investors typically flock to pockets of attractive relative valuation. However, as value stocks showed some of the strongest earnings trends heading into the fourth quarter, they sold-off amid the rotation away from growth expectations. As a result, while fundamental signals held up well for the period, an insight that evaluates each stock based on forward sales relative to enterprise value hindered relative performance for the year.
As volatility and concerns about the approaching end of the current cycle increased, investors returned their focus to company fundamentals and to finding quality businesses offering sustainable growth prospects. In this vein, the Fund’s fundamental insights, particularly quality insights, were the primary drivers of positive relative return over the course of the year. Among the portfolio’s fundamental signals, identifying companies with attractive cash flow growth relative to operating assets was the top contributor. Identifying positive dividend growth trends as a measure of quality also proved beneficial. Although the portfolio’s sentiment insights overall were a drag on relative performance, sentiment insights that provide a more quality-based lens into companies contributed positively. Specifically, an insight that gauges sentiment from informed bond investors contributed significantly, given interest rate volatility. Text-based analyses of management conference calls to determine longer-term trends in company fundamentals proved beneficial as well. Both of these signals held up extremely well in the fourth quarter, in a market environment that was generally challenging for trend- and sentiment-based insights. Finally, thematic signals showed mixed results for the period, contributing marginally overall to relative performance.
Describe recent portfolio activity.
Over the course of the period, the portfolio maintained a balanced allocation of risk across all major return drivers. However, a number of new stock selection insights were added to the portfolio. Among these insights, a model that evaluates companies on the basis of governance and the ethics and sustainability of its business practices from a social and environmental perspective was added to the Fund’s bucket of quality signals. In addition, a new insight was added that captures the location of hotel booking trends and invests in related stocks most sensitive to those areas. A new macro thematic model that evaluates industries across various inputs such as labor costs and hiring activity was added as well.
Describe portfolio positioning at period end.
Relative to the Russell 1000® Index, the Fund was positioned essentially neutrally from a sector perspective. The Fund had slight overweight positions in health care and financials and slight underweight positions in communications services and consumer discretionary.
The views expressed reflect the opinions of BlackRock as of the date of this report and are subject to change based on changes in market, economic or other conditions. These views are not intended to be a forecast of future events and are no guarantee of future results.
| | |
| 2 | | 2018 BLACKROCK ANNUAL REPORTTO SHAREHOLDERS |
| | |
| Fund Summary as of December 31, 2018 (continued) | | BlackRock Advantage Large Cap Core V.I. Fund |
TOTAL RETURN BASED ON A $10,000 INVESTMENT
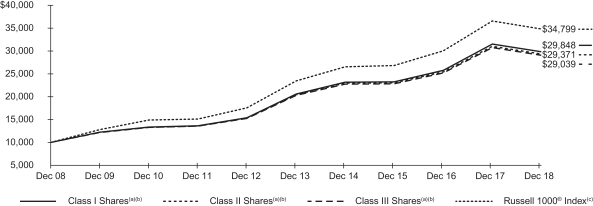
| (a) | Assuming transaction costs, if any, and other operating expenses, including investment advisory fees. Does not include insurance related fees and expenses. For a portion of the period, returns do not show the effects of distribution fees(12b-1 fees) applicable to Class II Shares. If such fees were included, returns shown would have been lower. The returns for Class III Shares prior to January 27, 2009, the recommencement of operations of Class III Shares, are based upon the performance of the Fund’s Class I Shares. The returns for Class III Shares, however, are adjusted to reflect the distribution(12b-1) fees applicable to Class III Shares. |
| (b) | Under normal circumstances, the Fund seeks to invest at least 80% of its net assets, plus the amount of any borrowings for investment purposes, in large cap equity securities and derivatives that have similar economic characteristics to such securities. The Fund’s total returns prior to June 12, 2017 are the returns of the Fund when it followed different investment strategies under the name “BlackRock Large Cap Core V.I. Fund”. |
| (c) | An index that measures the performance of the large cap segment of the U.S. equity universe. It is a subset of the Russell 3000® Index and includes approximately 1,000 of the largest securities based on a combination of their market capitalization and current index membership. The index represents approximately 92% of the total market capitalization of the Russell 3000® Index. |
Performance Summary for the Period Ended December 31, 2018
| | | | | | | | | | | | | | | | | | | | | | | | | | | | |
| | | 6-Month
Total Returns (b) | | | | | | Average Annual Total Returns | |
| | | 1 Year (b) | | | | | | 5 Years (b) | | | | | | 10 Years (b) | |
Class I(a) | | | (8.56 | )% | | | | | | | (5.22 | )% | | | | | | | 7.68 | % | | | | | | | 11.56 | % |
Class II(a) | | | (8.64 | ) | | | | | | | (5.37 | ) | | | | | | | 7.50 | | | | | | | | 11.38 | |
Class III(a) | | | (8.71 | ) | | | | | | | (5.51 | ) | | | | | | | 7.38 | | | | | | | | 11.25 | (c) |
Russell 1000® Index | | | (7.42 | ) | | | | | | | (4.78 | ) | | | | | | | 8.21 | | | | | | | | 13.28 | |
| | (a) | Average annual and cumulative total returns are based on changes in net asset value for the periods shown, and assume reinvestment of all distributions at net asset value on theex-dividend date. Insurance-related fees and expenses are not reflected in these returns. For the portion of the period, returns do not show the effects of distribution fees(12b-1 fees) applicable to Class II Shares. If such fees were included, returns shown would have been lower. The Fund’s total returns prior to June 12, 2017 are the returns of the Fund when it followed different investment strategies under the name “BlackRock Large Cap Core V.I. Fund”. | |
| | (b) | For a portion of the period, the Fund’s investment adviser waived a portion of its fee. Without such waiver, the Fund’s performance would have been lower. | |
| | (c) | The returns for Class III Shares prior to January 27, 2009, the recommencement of operations of Class III Shares, are based upon the performance of the Fund’s Class I Shares. The returns for Class III Shares, however, are adjusted to reflect the distribution(12b-1) fees applicable to Class III Shares. | |
Past performance is not indicative of future results. Performance results do not reflect the deduction of taxes that a shareholder would pay on Fund distributions or the redemption of Fund shares.
Performance results may include adjustments made for financial reporting purposes in accordance with U.S. generally accepted accounting principles.
Expense Example
| | | | | | | | | | | | | | | | | | | | | | | | | | | | | | | | |
| | | Actual | | | | | | Hypothetical (a) | | | | |
| | | Beginning
Account Value
(07/01/18) | | | Ending Account Value
(12/31/18) | | | Expenses
Paid During
the Period (b) | | | | | | Beginning
Account Value
(07/01/18) | | | Ending Account Value
(12/31/18) | | | Expenses
Paid During
the Period (b) | | | Annualized
Expense
Ratio | |
Class I | | $ | 1,000.00 | | | $ | 914.40 | | | $ | 2.80 | | | | | | | $ | 1,000.00 | | | $ | 1,022.28 | | | $ | 2.96 | | | | 0.58 | % |
Class II | | | 1,000.00 | | | | 913.60 | | | | 3.62 | | | | | | | | 1,000.00 | | | | 1,021.42 | | | | 3.82 | | | | 0.75 | |
Class III | | | 1,000.00 | | | | 912.90 | | | | 4.15 | | | | | | | | 1,000.00 | | | | 1,020.87 | | | | 4.38 | | | | 0.86 | |
| | (a) | Hypothetical 5% annual return before expenses is calculated by prorating the number of days in the most recent fiscal half year divided by 365. | |
| | (b) | For each class of the Fund, expenses are equal to annualized expense ratio for the class, multiplied by the average account value over the period, multiplied by 184/365 (to reflect theone-half year period shown). | |
See “Disclosure of Expenses” on the following page for further information on how expenses were calculated.
| | |
| Fund Summary as of December 31, 2018 (continued) | | BlackRock Advantage Large Cap Core V.I. Fund |
Portfolio Information
SECTOR ALLOCATION
| | | | |
| Sector | | Percent of
Net Assets | |
Information Technology | | | 20 | % |
Health Care | | | 15 | |
Financials | | | 14 | |
Industrials | | | 10 | |
Consumer Discretionary | | | 10 | |
Communication Services | | | 9 | |
Consumer Staples | | | 6 | |
Energy | | | 5 | |
Real Estate | | | 4 | |
Utilities | | | 4 | |
Materials | | | 2 | |
Short-Term Securities | | | 4 | |
Liabilities in Excess of Other Assets | | | (3 | ) |
For Fund compliance purposes, the Fund’s sector classifications refer to one or more of the sectorsub-classifications used by one or more widely recognized market indexes or ratings group indexes, and/or as defined by the investment adviser. These definitions may not apply for purposes of this report, which may combine sector sub classifications for reporting ease.
Disclosure of Expenses
Shareholders of the Fund may incur the following charges: (a) transactional expenses; and (b) operating expenses, including investment advisory fees, service and distribution fees, including12b-1 fees, acquired fund fees and expenses, and other fund expenses. The expense example on the previous page (which is based on a hypothetical investment of $1,000 invested on July 1, 2018 and held through December 31, 2018) is intended to assist shareholders both in calculating expenses based on an investment in the Fund and in comparing these expenses with similar costs of investing in other mutual funds.
The expense example provides information about actual account values and actual expenses. In order to estimate the expenses a shareholder paid during the period covered by this report, shareholders can divide their account value by $1,000 and then multiply the result by the number corresponding to their share class under the heading entitled “Expenses Paid During the Period.”
The expense example also provides information about hypothetical account values and hypothetical expenses based on the Fund’s actual expense ratio and an assumed rate of return of 5% per year before expenses. In order to assist shareholders in comparing the ongoing expenses of investing in the Fund and other funds, compare the 5% hypothetical example with the 5% hypothetical examples that appear in shareholder reports of other funds.
The expenses shown in the expense example are intended to highlight shareholders’ ongoing costs only and do not reflect transactional expenses, such as sales charges, if any. Therefore, the hypothetical example is useful in comparing ongoing expenses only, and will not help shareholders determine the relative total expenses of owning different funds. If these transactional expenses were included, shareholder expenses would have been higher.
Derivative Financial Instruments
The Fund may invest in various derivative financial instruments. These instruments are used to obtain exposure to a security, commodity, index, market, and/or other assets without owning or taking physical custody of securities, commodities and/or other referenced assets or to manage market, equity, credit, interest rate, foreign currency exchange rate, commodity and/or other risks. Derivative financial instruments may give rise to a form of economic leverage and involve risks, including the imperfect correlation between the value of a derivative financial instrument and the underlying asset, possible default of the counterparty to the transaction or illiquidity of the instrument. The Fund’s successful use of a derivative financial instrument depends on the investment adviser’s ability to predict pertinent market movements accurately, which cannot be assured. The use of these instruments may result in losses greater than if they had not been used, may limit the amount of appreciation the Fund can realize on an investment and/or may result in lower distributions paid to shareholders. The Fund’s investments in these instruments, if any, are discussed in detail in the Notes to Financial Statements.
| | |
| 4 | | 2018 BLACKROCK ANNUAL REPORTTO SHAREHOLDERS |
| | |
Schedule of Investments December 31, 2018 | | BlackRock Advantage Large Cap Core V.I. Fund (Percentages shown are based on Net Assets) |
| | | | | | | | |
| Security | | Shares | | | Value | |
|
Common Stocks — 98.7% | |
|
| Aerospace & Defense — 2.3% | |
Boeing Co. (The) | | | 11,008 | | | $ | 3,550,080 | |
General Dynamics Corp. | | | 3,629 | | | | 570,515 | |
Lockheed Martin Corp. | | | 4,858 | | | | 1,272,019 | |
Raytheon Co. | | | 31,271 | | | | 4,795,408 | |
| | | | | | | | |
| | | | | | | 10,188,022 | |
|
| Airlines — 0.4% | |
Delta Air Lines, Inc. | | | 9,590 | | | | 478,541 | |
Southwest Airlines Co. | | | 31,627 | | | | 1,470,023 | |
| | | | | | | | |
| | | | | | | 1,948,564 | |
|
| Auto Components — 0.1% | |
BorgWarner, Inc. | | | 8,248 | | | | 286,536 | |
| | | | | | | | |
|
| Automobiles — 0.1% | |
Ford Motor Co. | | | 21,778 | | | | 166,602 | |
General Motors Co. | | | 8,517 | | | | 284,893 | |
| | | | | | | | |
| | | | | | | 451,495 | |
|
| Banks — 5.7% | |
Bank of America Corp. | | | 347,325 | | | | 8,558,088 | |
BB&T Corp. | | | 47,378 | | | | 2,052,415 | |
Citigroup, Inc. | | | 39,512 | | | | 2,056,995 | |
Citizens Financial Group, Inc. | | | 67,573 | | | | 2,008,945 | |
Cullen/Frost Bankers, Inc. | | | 2,425 | | | | 213,254 | |
East West Bancorp, Inc. | | | 12,651 | | | | 550,698 | |
First Republic Bank(a) | | | 23,420 | | | | 2,035,198 | |
JPMorgan Chase & Co. | | | 45,790 | | | | 4,470,020 | |
Wells Fargo & Co. | | | 67,477 | | | | 3,109,340 | |
| | | | | | | | |
| | | | | | | 25,054,953 | |
|
| Beverages — 1.5% | |
Coca-Cola European Partners plc | | | 27,993 | | | | 1,283,479 | |
Constellation Brands, Inc., Class A | | | 5,452 | | | | 876,791 | |
Keurig Dr. Pepper, Inc. | | | 3,298 | | | | 84,561 | |
Molson Coors Brewing Co., Class B | | | 3,221 | | | | 180,891 | |
Monster Beverage Corp.(b) | | | 20,419 | | | | 1,005,023 | |
PepsiCo, Inc. | | | 27,166 | | | | 3,001,300 | |
| | | | | | | | |
| | | | | | | 6,432,045 | |
|
| Biotechnology — 4.0% | |
AbbVie, Inc. | | | 41,381 | | | | 3,814,914 | |
Amgen, Inc. | | | 18,019 | | | | 3,507,759 | |
Biogen, Inc.(b) | | | 2,900 | | | | 872,668 | |
Celgene Corp.(b) | | | 44,235 | | | | 2,835,021 | |
Genomic Health, Inc.(b) | | | 2,843 | | | | 183,118 | |
Gilead Sciences, Inc. | | | 76,975 | | | | 4,814,786 | |
Incyte Corp.(b) | | | 1,566 | | | | 99,582 | |
Regeneron Pharmaceuticals, Inc.(b) | | | 948 | | | | 354,078 | |
Vertex Pharmaceuticals, Inc.(b) | | | 5,103 | | | | 845,618 | |
| | | | | | | | |
| | | | | | | 17,327,544 | |
|
| Building Products — 0.3% | |
Allegion plc | | | 15,287 | | | | 1,218,527 | |
| | | | | | | | |
|
| Capital Markets — 3.4% | |
Charles Schwab Corp. (The) | | | 102,148 | | | | 4,242,207 | |
CME Group, Inc.(a) | | | 11,189 | | | | 2,104,875 | |
Evercore, Inc., Class A | | | 4,815 | | | | 344,561 | |
Moelis & Co., Class A | | | 23,265 | | | | 799,851 | |
Morgan Stanley | | | 142,175 | | | | 5,637,239 | |
S&P Global, Inc. | | | 10,264 | | | | 1,744,264 | |
SEI Investments Co. | | | 1,201 | | | | 55,486 | |
TD Ameritrade Holding Corp. | | | 868 | | | | 42,497 | |
| | | | | | | | |
| | | | | | | 14,970,980 | |
| | | | | | | | |
| Security | | Shares | | | Value | |
|
| Chemicals — 1.7% | |
Air Products & Chemicals, Inc. | | | 25,670 | | | $ | 4,108,483 | |
Celanese Corp.(a) | | | 12,482 | | | | 1,123,006 | |
Eastman Chemical Co. | | | 10,014 | | | | 732,124 | |
Ecolab, Inc. | | | 6,802 | | | | 1,002,275 | |
Huntsman Corp. | | | 2,646 | | | | 51,041 | |
Linde plc | | | 2,638 | | | | 411,634 | |
Mosaic Co. (The) | | | 1,750 | | | | 51,117 | |
| | | | | | | | |
| | | | | | | 7,479,680 | |
|
| Commercial Services & Supplies — 0.2% | |
Clean Harbors, Inc.(b) | | | 10,980 | | | | 541,863 | |
Waste Connections, Inc. | | | 1,916 | | | | 142,263 | |
| | | | | | | | |
| | | | | | | 684,126 | |
|
| Communications Equipment — 1.1% | |
Ciena Corp.(b) | | | 16,923 | | | | 573,859 | |
Cisco Systems, Inc. | | | 63,294 | | | | 2,742,529 | |
Motorola Solutions, Inc. | | | 8,791 | | | | 1,011,316 | |
Palo Alto Networks, Inc.(a)(b) | | | 1,905 | | | | 358,807 | |
| | | | | | | | |
| | | | | | | 4,686,511 | |
|
| Construction Materials — 0.1% | |
Martin Marietta Materials, Inc. | | | 893 | | | | 153,480 | |
Vulcan Materials Co. | | | 814 | | | | 80,423 | |
| | | | | | | | |
| | | | | | | 233,903 | |
|
| Consumer Finance — 0.8% | |
American Express Co. | | | 32,452 | | | | 3,093,325 | |
Capital One Financial Corp. | | | 4,011 | | | | 303,191 | |
| | | | | | | | |
| | | | | | | 3,396,516 | |
|
| Containers & Packaging — 0.3% | |
Packaging Corp. of America | | | 8,939 | | | | 746,049 | |
WestRock Co. | | | 20,304 | | | | 766,679 | |
| | | | | | | | |
| | | | | | | 1,512,728 | |
|
| Diversified Consumer Services — 0.2% | |
H&R Block, Inc. | | | 33,266 | | | | 843,958 | |
| | | | | | | | |
|
| Diversified Financial Services — 1.5% | |
Berkshire Hathaway, Inc., Class B(b) | | | 32,666 | | | | 6,669,744 | |
| | | | | | | | |
|
| Diversified Telecommunication Services — 1.4% | |
AT&T, Inc. | | | 68,535 | | | | 1,955,989 | |
Verizon Communications, Inc. | | | 72,987 | | | | 4,103,329 | |
| | | | | | | | |
| | | | | | | 6,059,318 | |
|
| Electric Utilities — 2.0% | |
IDACORP, Inc. | | | 12,489 | | | | 1,162,226 | |
OGE Energy Corp. | | | 36,658 | | | | 1,436,627 | |
Pinnacle West Capital Corp. | | | 43,096 | | | | 3,671,779 | |
Portland General Electric Co. | | | 52,571 | | | | 2,410,380 | |
Xcel Energy, Inc. | | | 1,598 | | | | 78,734 | |
| | | | | | | | |
| | | | | | | 8,759,746 | |
|
| Electrical Equipment — 0.9% | |
AMETEK, Inc. | | | 15,361 | | | | 1,039,940 | |
Rockwell Automation, Inc. | | | 19,252 | | | | 2,897,041 | |
| | | | | | | | |
| | | | | | | 3,936,981 | |
|
| Electronic Equipment, Instruments & Components — 0.9% | |
CDW Corp. | | | 19,797 | | | | 1,604,547 | |
Keysight Technologies, Inc.(b) | | | 1,114 | | | | 69,157 | |
National Instruments Corp. | | | 41,349 | | | | 1,876,418 | |
Zebra Technologies Corp., Class A(b) | | | 1,818 | | | | 289,480 | |
| | | | | | | | |
| | | | | | | 3,839,602 | |
|
| Energy Equipment & Services — 0.5% | |
Halliburton Co. | | | 73,965 | | | | 1,965,990 | |
Nabors Industries Ltd.(a) | | | 38,421 | | | | 76,842 | |
| | | | | | | | |
| | | | | | | 2,042,832 | |
| | | | |
| SCHEDULE OF INVESTMENTS | | | 5 | |
| | |
Schedule of Investments (continued) December 31, 2018 | | BlackRock Advantage Large Cap Core V.I. Fund (Percentages shown are based on Net Assets) |
| | | | | | | | |
| Security | | Shares | | | Value | |
|
| Entertainment — 1.1% | |
Activision Blizzard, Inc. | | | 2,485 | | | $ | 115,726 | |
Electronic Arts, Inc.(b) | | | 13,468 | | | | 1,062,760 | |
Netflix, Inc.(b) | | | 5,585 | | | | 1,494,881 | |
Twenty-First Century Fox, Inc., Class A | | | 6,278 | | | | 302,097 | |
Twenty-First Century Fox, Inc., Class B | | | 4,497 | | | | 214,867 | |
Viacom, Inc., Class B | | | 45,965 | | | | 1,181,301 | |
World Wrestling Entertainment, Inc., Class A | | | 4,449 | | | | 332,429 | |
| | | | | | | | |
| | | | | | | 4,704,061 | |
|
| Equity Real Estate Investment Trusts (REITs) — 3.8% | |
Apartment Investment & Management Co., Class A | | | 962 | | | | 42,212 | |
Equity LifeStyle Properties, Inc. | | | 4,883 | | | | 474,286 | |
Host Hotels & Resorts, Inc. | | | 100,640 | | | | 1,677,669 | |
Outfront Media, Inc. | | | 9,140 | | | | 165,617 | |
Park Hotels & Resorts, Inc. | | | 75,988 | | | | 1,974,168 | |
Prologis, Inc. | | | 92,260 | | | | 5,417,507 | |
Realty Income Corp. | | | 48,022 | | | | 3,027,307 | |
Simon Property Group, Inc. | | | 21,321 | | | | 3,581,715 | |
| | | | | | | | |
| | | | | | | 16,360,481 | |
|
| Food & Staples Retailing — 1.0% | |
Costco Wholesale Corp. | | | 18,364 | | | | 3,740,930 | |
Walmart, Inc. | | | 6,760 | | | | 629,694 | |
| | | | | | | | |
| | | | | | | 4,370,624 | |
|
| Food Products — 2.0% | |
Archer-Daniels-Midland Co. | | | 84,970 | | | | 3,481,221 | |
Hershey Co. (The) | | | 41,401 | | | | 4,437,359 | |
Kellogg Co. | | | 2,696 | | | | 153,699 | |
Lamb Weston Holdings, Inc. | | | 5,373 | | | | 395,238 | |
Tyson Foods, Inc., Class A | | | 4,114 | | | | 219,687 | |
| | | | | | | | |
| | | | | | | 8,687,204 | |
|
| Gas Utilities — 0.5% | |
Atmos Energy Corp.(a) | | | 20,596 | | | | 1,909,661 | |
UGI Corp. | | | 2,276 | | | | 121,425 | |
| | | | | | | | |
| | | | | | | 2,031,086 | |
|
| Health Care Equipment & Supplies — 3.0% | |
Abbott Laboratories | | | 18,988 | | | | 1,373,402 | |
Danaher Corp. | | | 31,557 | | | | 3,254,158 | |
DexCom, Inc.(b) | | | 1,390 | | | | 166,522 | |
IDEXX Laboratories, Inc.(b) | | | 2,358 | | | | 438,635 | |
Intuitive Surgical, Inc.(b) | | | 2,316 | | | | 1,109,179 | |
Masimo Corp.(b) | | | 6,742 | | | | 723,889 | |
Medtronic plc | | | 14,781 | | | | 1,344,480 | |
STERIS plc | | | 6,399 | | | | 683,733 | |
Stryker Corp. | | | 26,842 | | | | 4,207,483 | |
| | | | | | | | |
| | | | | | | 13,301,481 | |
|
| Health Care Providers & Services — 3.5% | |
AmerisourceBergen Corp. | | | 18,612 | | | | 1,384,733 | |
Anthem, Inc. | | | 1,021 | | | | 268,145 | |
Cardinal Health, Inc. | | | 37,392 | | | | 1,667,683 | |
CVS Health Corp. | | | 13,743 | | | | 900,441 | |
Halfmoon Parent, Inc. | | | 1,935 | | | | 367,588 | |
Humana, Inc. | | | 6,567 | | | | 1,881,314 | |
McKesson Corp. | | | 15,460 | | | | 1,707,866 | |
Quest Diagnostics, Inc. | | | 2,179 | | | | 181,445 | |
UnitedHealth Group, Inc. | | | 25,979 | | | | 6,471,889 | |
WellCare Health Plans, Inc.(b) | | | 2,666 | | | | 629,416 | |
| | | | | | | | |
| | | | | | | 15,460,520 | |
| | |
| Health Care Technology — 0.3%(b) | | | | | | |
athenahealth, Inc. | | | 681 | | | | 89,844 | |
Cerner Corp. | | | 1,179 | | | | 61,827 | |
Veeva Systems, Inc., Class A | | | 15,293 | | | | 1,365,971 | |
| | | | | | | | |
| | | | | | | 1,517,642 | |
| | | | | | | | |
| Security | | Shares | | | Value | |
|
| Hotels, Restaurants & Leisure — 2.2% | |
Boyd Gaming Corp.(a) | | | 3,394 | | | $ | 70,527 | |
Carnival Corp. | | | 22,856 | | | | 1,126,801 | |
Darden Restaurants, Inc. | | | 8,257 | | | | 824,544 | |
Domino’s Pizza, Inc. | | | 7,960 | | | | 1,974,001 | |
Dunkin’ Brands Group, Inc.(a) | | | 6,753 | | | | 433,002 | |
Extended Stay America, Inc. | | | 33,215 | | | | 514,833 | |
Hilton Worldwide Holdings, Inc. | | | 13,123 | | | | 942,232 | |
Las Vegas Sands Corp. | | | 7,166 | | | | 372,990 | |
McDonald’s Corp. | | | 13,902 | | | | 2,468,578 | |
Norwegian Cruise Line Holdings Ltd.(b) | | | 15,326 | | | | 649,669 | |
Yum! Brands, Inc. | | | 1,345 | | | | 123,632 | |
| | | | | | | | |
| | | | | | | 9,500,809 | |
|
| Household Durables — 0.3% | |
Garmin Ltd. | | | 22,797 | | | | 1,443,506 | |
| | | | | | | | |
|
| Household Products — 0.7% | |
Church & Dwight Co., Inc. | | | 36,543 | | | | 2,403,068 | |
Clorox Co. (The) | | | 2,795 | | | | 430,821 | |
Procter & Gamble Co. (The) | | | 4,365 | | | | 401,231 | |
| | | | | | | | |
| | | | | | | 3,235,120 | |
| | |
| Industrial Conglomerates — 0.8% | | | | | | |
3M Co.(a) | | | 14,398 | | | | 2,743,395 | |
General Electric Co. | | | 66,648 | | | | 504,525 | |
Honeywell International, Inc. | | | 1,998 | | | | 263,976 | |
Roper Technologies, Inc. | | | 625 | | | | 166,575 | |
| | | | | | | | |
| | | | | | | 3,678,471 | |
|
| Insurance — 2.3% | |
Allstate Corp. (The) | | | 32,004 | | | | 2,644,491 | |
American Financial Group, Inc. | | | 16,682 | | | | 1,510,221 | |
Arthur J Gallagher & Co. | | | 12,979 | | | | 956,552 | |
Athene Holding Ltd., Class A(b) | | | 16,159 | | | | 643,613 | |
First American Financial Corp. | | | 19,017 | | | | 848,919 | |
Hartford Financial Services Group, Inc. (The) | | | 22,110 | | | | 982,790 | |
Lincoln National Corp. | | | 6,359 | | | | 326,280 | |
Loews Corp. | | | 1,913 | | | | 87,080 | |
Progressive Corp. (The) | | | 12,036 | | | | 726,132 | |
Unum Group | | | 42,917 | | | | 1,260,901 | |
| | | | | | | | |
| | | | | | | 9,986,979 | |
|
| Interactive Media & Services — 4.4%(b) | |
Alphabet, Inc., Class A | | | 4,778 | | | | 4,992,819 | |
Alphabet, Inc., Class C | | | 5,623 | | | | 5,823,235 | |
Cargurus, Inc. | | | 8,051 | | | | 271,560 | |
Facebook, Inc., Class A | | | 52,098 | | | | 6,829,527 | |
Snap, Inc., Class A(a) | | | 11,073 | | | | 61,012 | |
TripAdvisor, Inc. | | | 2,675 | | | | 144,289 | |
Twitter, Inc. | | | 5,863 | | | | 168,503 | |
Yelp, Inc. | | | 26,045 | | | | 911,315 | |
| | | | | | | | |
| | | | | | | 19,202,260 | |
|
| Internet & Direct Marketing Retail — 2.9%(b) | |
Amazon.com, Inc. | | | 7,996 | | | | 12,009,752 | |
Booking Holdings, Inc. | | | 387 | | | | 666,577 | |
| | | | | | | | |
| | | | | | | 12,676,329 | |
|
| IT Services — 4.6% | |
Accenture plc, Class A | | | 9,011 | | | | 1,270,641 | |
Amdocs Ltd. | | | 671 | | | | 39,307 | |
Automatic Data Processing, Inc. | | | 26,925 | | | | 3,530,406 | |
Booz Allen Hamilton Holding Corp. | | | 41,891 | | | | 1,888,027 | |
Broadridge Financial Solutions, Inc. | | | 5,869 | | | | 564,891 | |
Cognizant Technology Solutions Corp., Class A | | | 1,512 | | | | 95,982 | |
Fidelity National Information Services, Inc. | | | 17,721 | | | | 1,817,289 | |
First Data Corp., Class A(b) | | | 14,039 | | | | 237,399 | |
GoDaddy, Inc., Class A(b) | | | 14,890 | | | | 977,082 | |
| | |
| 6 | | 2018 BLACKROCK ANNUAL REPORTTO SHAREHOLDERS |
| | |
Schedule of Investments (continued) December 31, 2018 | | BlackRock Advantage Large Cap Core V.I. Fund (Percentages shown are based on Net Assets) |
| | | | | | | | |
| Security | | Shares | | | Value | |
|
| IT Services (continued) | |
International Business Machines Corp. | | | 9,916 | | | $ | 1,127,152 | |
Mastercard, Inc., Class A | | | 23,822 | | | | 4,494,020 | |
Paychex, Inc. | | | 1,733 | | | | 112,905 | |
PayPal Holdings, Inc.(b) | | | 8,890 | | | | 747,560 | |
Square, Inc., Class A(b) | | | 3,529 | | | | 197,942 | |
Total System Services, Inc. | | | 638 | | | | 51,863 | |
Visa, Inc., Class A | | | 12,649 | | | | 1,668,909 | |
Western Union Co. (The) | | | 64,409 | | | | 1,098,818 | |
| | | | | | | | |
| | | | | | | 19,920,193 | |
|
| Life Sciences Tools & Services — 0.2% | |
Agilent Technologies, Inc. | | | 14,552 | | | | 981,678 | |
Thermo Fisher Scientific, Inc. | | | 487 | | | | 108,986 | |
| | | | | | | | |
| | | | | | | 1,090,664 | |
|
| Machinery — 3.3% | |
Crane Co. | | | 55,294 | | | | 3,991,121 | |
Illinois Tool Works, Inc. | | | 25,749 | | | | 3,262,141 | |
Ingersoll-Rand plc | | | 37,248 | | | | 3,398,135 | |
PACCAR, Inc.(a) | | | 50,808 | | | | 2,903,169 | |
Snap-on, Inc. | | | 6,852 | | | | 995,527 | |
| | | | | | | | |
| | | | | | | 14,550,093 | |
|
| Media — 1.9% | |
AMC Networks, Inc., Class A(b) | | | 19,373 | | | | 1,063,190 | |
CBS Corp.(Non-Voting), Class B | | | 21,980 | | | | 960,966 | |
Comcast Corp., Class A | | | 84,309 | | | | 2,870,721 | |
Interpublic Group of Cos., Inc. (The) | | | 44,255 | | | | 912,981 | |
Liberty Media Corp.-Liberty SiriusXM, Class A(b) | | | 27,917 | | | | 1,027,346 | |
Liberty Media Corp.-Liberty SiriusXM, Class C(b) | | | 33,827 | | | | 1,250,922 | |
Sinclair Broadcast Group, Inc., Class A | | | 3,524 | | | | 92,822 | |
Sirius XM Holdings, Inc. | | | 29,626 | | | | 169,165 | |
Tribune Media Co., Class A | | | 1,616 | | | | 73,334 | |
| | | | | | | | |
| | | | | | | 8,421,447 | |
|
| Metals & Mining — 0.3% | |
Newmont Mining Corp. | | | 24,723 | | | | 856,652 | |
Reliance Steel & Aluminum Co. | | | 5,115 | | | | 364,034 | |
Steel Dynamics, Inc. | | | 5,842 | | | | 175,494 | |
| | | | | | | | |
| | | | | | | 1,396,180 | |
|
| Multiline Retail — 0.9% | |
Target Corp. | | | 62,284 | | | | 4,116,350 | |
| | | | | | | | |
|
| Multi-Utilities — 0.4% | |
Consolidated Edison, Inc. | | | 20,102 | | | | 1,536,999 | |
| | | | | | | | |
|
| Oil, Gas & Consumable Fuels — 4.5% | |
Anadarko Petroleum Corp. | | | 53,469 | | | | 2,344,081 | |
Antero Resources Corp.(b) | | | 4,262 | | | | 40,020 | |
Chevron Corp. | | | 24,031 | | | | 2,614,332 | |
Concho Resources, Inc.(b) | | | 786 | | | | 80,793 | |
ConocoPhillips | | | 50,350 | | | | 3,139,323 | |
Continental Resources, Inc.(b) | | | 6,938 | | | | 278,838 | |
Exxon Mobil Corp. | | | 63,810 | | | | 4,351,204 | |
Kinder Morgan, Inc. | | | 111,448 | | | | 1,714,070 | |
Occidental Petroleum Corp. | | | 31,631 | | | | 1,941,511 | |
Phillips 66 | | | 22,288 | | | | 1,920,111 | |
Suncor Energy, Inc.(a) | | | 31,570 | | | | 883,013 | |
Williams Cos., Inc. (The) | | | 11,074 | | | | 244,182 | |
| | | | | | | | |
| | | | | | | 19,551,478 | |
|
| Personal Products — 0.5% | |
Estee Lauder Cos., Inc. (The), Class A | | | 15,787 | | | | 2,053,889 | |
| | | | | | | | |
|
| Pharmaceuticals — 4.2% | |
Bristol-Myers Squibb Co. | | | 53,269 | | | | 2,768,922 | |
Eli Lilly & Co. | | | 27,072 | | | | 3,132,772 | |
Johnson & Johnson | | | 46,073 | | | | 5,945,721 | |
| | | | | | | | |
| Security | | Shares | | | Value | |
|
| Pharmaceuticals (continued) | |
Merck & Co., Inc. | | | 62,365 | | | $ | 4,765,310 | |
Zoetis, Inc. | | | 18,666 | | | | 1,596,689 | |
| | | | | | | | |
| | | | | | | 18,209,414 | |
|
| Professional Services — 0.6% | |
Insperity, Inc. | | | 21,743 | | | | 2,029,927 | |
Robert Half International, Inc. | | | 10,366 | | | | 592,935 | |
| | | | | | | | |
| | | | | | | 2,622,862 | |
|
| Road & Rail — 0.9% | |
Landstar System, Inc. | | | 20,732 | | | | 1,983,430 | |
Norfolk Southern Corp. | | | 11,965 | | | | 1,789,246 | |
Schneider National, Inc., Class B | | | 4,456 | | | | 83,194 | |
| | | | | | | | |
| | | | | | | 3,855,870 | |
|
| Semiconductors & Semiconductor Equipment — 3.4% | |
Analog Devices, Inc. | | | 13,503 | | | | 1,158,962 | |
Applied Materials, Inc. | | | 41,276 | | | | 1,351,376 | |
Broadcom, Inc. | | | 745 | | | | 189,439 | |
Intel Corp. | | | 108,310 | | | | 5,082,988 | |
Maxim Integrated Products, Inc.(a) | | | 26,536 | | | | 1,349,356 | |
NVIDIA Corp. | | | 10,714 | | | | 1,430,319 | |
NXP Semiconductors NV(b) | | | 517 | | | | 37,886 | |
QUALCOMM, Inc. | | | 9,736 | | | | 554,076 | |
Skyworks Solutions, Inc. | | | 11,020 | | | | 738,560 | |
Texas Instruments, Inc. | | | 20,182 | | | | 1,907,199 | |
Xilinx, Inc. | | | 11,936 | | | | 1,016,589 | |
| | | | | | | | |
| | | | | | | 14,816,750 | |
|
| Software — 6.5% | |
Dropbox, Inc., Class A(b) | | | 23,231 | | | | 474,609 | |
Intuit, Inc. | | | 9,260 | | | | 1,822,831 | |
Microsoft Corp. | | | 138,635 | | | | 14,081,157 | |
New Relic, Inc.(b) | | | 3,297 | | | | 266,958 | |
Oracle Corp. | | | 86,214 | | | | 3,892,562 | |
salesforce.com, Inc.(b) | | | 37,825 | | | | 5,180,890 | |
Synopsys, Inc.(b) | | | 19,368 | | | | 1,631,560 | |
Ultimate Software Group, Inc. (The)(b) | | | 1,109 | | | | 271,561 | |
VMware, Inc., Class A(b) | | | 4,380 | | | | 600,630 | |
| | | | | | | | |
| | | | | | | 28,222,758 | |
|
| Specialty Retail — 1.8% | |
AutoNation, Inc.(b) | | | 5,444 | | | | 194,351 | |
Best Buy Co., Inc. | | | 857 | | | | 45,387 | |
Dick’s Sporting Goods, Inc. | | | 4,234 | | | | 132,101 | |
Five Below, Inc.(b) | | | 4,254 | | | | 435,269 | |
Home Depot, Inc. (The) | | | 19,674 | | | | 3,380,387 | |
Penske Automotive Group, Inc.(a) | | | 30,936 | | | | 1,247,339 | |
Ross Stores, Inc. | | | 5,294 | | | | 440,461 | |
TJX Cos., Inc. (The) | | | 40,883 | | | | 1,829,105 | |
| | | | | | | | |
| | | | | | | 7,704,400 | |
|
| Technology Hardware, Storage & Peripherals — 3.8% | |
Apple, Inc. | | | 86,175 | | | | 13,593,244 | |
Dell Technologies, Inc., Class C(b) | | | 13,609 | | | | 665,061 | |
Hewlett Packard Enterprise Co. | | | 11,052 | | | | 145,997 | |
HP, Inc. | | | 86,695 | | | | 1,773,780 | |
Pure Storage, Inc., Class A(b) | | | 36,324 | | | | 584,090 | |
| | | | | | | | |
| | | | | | | 16,762,172 | |
|
| Textiles, Apparel & Luxury Goods — 1.1% | |
NIKE, Inc., Class B | | | 52,446 | | | | 3,888,346 | |
VF Corp. | | | 9,793 | | | | 698,633 | |
| | | | | | | | |
| | | | | | | 4,586,979 | |
|
| Thrifts & Mortgage Finance — 0.1% | |
Essent Group Ltd.(b) | | | 7,964 | | | | 272,209 | |
| | | | | | | | |
| | | | |
| SCHEDULE OF INVESTMENTS | | | 7 | |
| | |
Schedule of Investments (continued) December 31, 2018 | | BlackRock Advantage Large Cap Core V.I. Fund (Percentages shown are based on Net Assets) |
| | | | | | | | |
| Security | | Shares | | | Value | |
| Tobacco — 0.7% | |
Altria Group, Inc. | | | 35,084 | | | $ | 1,732,799 | |
Philip Morris International, Inc. | | | 18,711 | | | | 1,249,146 | |
| | | | | | | | |
| | | | | | | 2,981,945 | |
| Water Utilities — 0.7% | |
American Water Works Co., Inc. | | | 34,083 | | | | 3,093,714 | |
| | | | | | | | |
| Wireless Telecommunication Services — 0.1% | |
Telephone & Data Systems, Inc. | | | 19,334 | | | | 629,128 | |
| | | | | | | | |
Total Common Stocks — 98.7%
(Cost: $452,555,247) | | | | 430,576,378 | |
| | | | | |
Total Long-Term Investments — 98.7%
(Cost: $452,555,247) | | | | 430,576,378 | |
| | | | | |
|
Short-Term Securities — 4.2%(c)(e) | |
BlackRock Liquidity Funds,T-Fund, Institutional Class,
2.32% | | | 4,753,078 | | | | 4,753,078 | |
SL Liquidity Series, LLC, Money Market Series,
2.57%(d) | | | 13,426,942 | | | | 13,425,600 | |
| | | | | | | | |
Total Short-Term Securities — 4.2%
(Cost: $18,179,509) | | | | 18,178,678 | |
| | | | | |
| |
Total Investments — 102.9%
(Cost: $470,734,756) | | | | 448,755,056 | |
Liabilities in Excess of Other Assets — (2.9)% | | | | (12,735,817 | ) |
| | | | | |
Net Assets — 100.0% | | | $ | 436,019,239 | |
| | | | | |
| (a) | Security, or a portion of the security, is on loan. |
| (b) | Non-income producing security. |
| (c) | Annualized7-day yield as of period end. |
| (d) | Security was purchased with the cash collateral from loaned securities. |
| (e) | During the year ended December 31, 2018, investments in issuers considered to be affiliates of the Fund for purposes of Section 2(a)(3) of the Investment Company Act of 1940, as amended, were as follows: |
| | | | | | | | | | | | | | | | | | | | | | | | | | | | |
| Affiliate | | Shares
Held at
12/31/17 | | | Net
Activity | | | Shares
Held at
12/31/18 | | | Value at
12/31/18 | | | Income | | | Net
Realized
Gain (Loss) (a) | | | Change in
Unrealized
Appreciation
(Depreciation) | |
BlackRock Liquidity Funds,T-Fund, Institutional Class | | | 4,977,061 | | | | (223,983 | ) | | | 4,753,078 | | | $ | 4,753,078 | | | $ | 76,446 | | | $ | — | | | $ | — | |
SL Liquidity Series, LLC, Money Market Series | | | 8,447,651 | | | | 4,979,291 | | | | 13,426,942 | | | | 13,425,600 | | | | 19,228 | (b) | | | 1,006 | | | | (810 | ) |
| | | | | | | | | | | | | | | | | | | | | | | | | | | | |
| | | | | | | | | | | | | | $ | 18,178,678 | | | $ | 95,674 | | | $ | 1,006 | | | $ | (810 | ) |
| | | | | | | | | | | | | | | | | | | | | | | | | | | | |
| | (a) | Includes net capital gain distributions, if applicable. | |
| | (b) | Represents securities lending income earned from the reinvestment of cash collateral from loaned securities, net of fees and collateral investment expenses, and other payments to and from borrowers of securities. | |
For Fund compliance purposes, the Fund’s industry classifications refer to one or more of the industrysub-classifications used by one or more widely recognized market indexes or ratings group indexes, and/or as defined by the investment adviser. These definitions may not apply for purposes of this report, which may combine such industrysub-classifications for reporting ease.
Derivative Financial Instruments Outstanding as of Period End
Futures Contracts
| | | | | | | | | | | | | | | | |
| Description | | Number of
Contracts | | | Expiration
Date | | | Notional
Amount (000) | | | Value/
Unrealized
Appreciation
(Depreciation) | |
Long Contracts | | | | | | | | | | | | | | | | |
S&P 500E-Mini Index | | | 50 | | | | 03/15/19 | | | $ | 6,263 | | | $ | (86,760 | ) |
| | | | | | | | | | | | | | | | |
| | |
| 8 | | 2018 BLACKROCK ANNUAL REPORTTO SHAREHOLDERS |
| | |
Schedule of Investments (continued) December 31, 2018 | | BlackRock Advantage Large Cap Core V.I. Fund |
Derivative Financial Instruments Categorized by Risk Exposure
As of period end, the fair values of derivative financial instruments located in the Statement of Assets and Liabilities were as follows:
| | | | | | | | | | | | | | | | | | | | | | | | | | | | |
| | | Commodity
Contracts | | | Credit
Contracts | | | Equity
Contracts | | | Foreign
Currency
Exchange
Contracts | | | Interest
Rate
Contracts | | | Other
Contracts | | | Total | |
Liabilities — Derivative Financial Instruments | | | | | | | | | | | | | | | | | | | | | | | | | | | | |
Futures contracts | | | | | | | | | | | | | | | | | | | | | | | | | | | | |
Net unrealized depreciation(a) | | $ | — | | | $ | — | | | $ | 86,760 | | | $ | — | | | $ | — | | | $ | — | | | $ | 86,760 | |
| | | | | | | | | | | | | | | | | | | | | | | | | | | | |
| | (a) | Includes cumulative depreciation on futures contracts, if any, as reported in the Schedule of Investments. Only current day’s variation margin is reported within the Statement of Assets and Liabilities. | |
For the year ended December 31, 2018, the effect of derivative financial instruments in the Statement of Operations were as follows:
| | | | | | | | | | | | | | | | | | | | | | | | | | | | |
| | | Commodity
Contracts | | | Credit
Contracts | | | Equity
Contracts | | | Foreign
Currency
Exchange
Contracts | | | Interest
Rate
Contracts | | | Other
Contracts | | | Total | |
Net Realized Gain (Loss) from: | | | | | | | | | | | | | | | | | | | | | | | | | | | | |
Futures contracts | | $ | — | | | $ | — | | | $ | (75,793 | ) | | $ | — | | | $ | — | | | $ | — | | | $ | (75,793 | ) |
| | | | | | | | | | | | | | | | | | | | | | | | | | | | |
| Net Change in Unrealized Appreciation (Depreciation) on: | | | | | | | | | | | | | | | | | | | | | |
Futures contracts | | $ | — | | | $ | — | | | $ | (122,486 | ) | | $ | — | | | $ | — | | | $ | — | | | $ | (122,486 | ) |
| | | | | | | | | | | | | | | | | | | | | | | | | | | | |
Average Quarterly Balances of Outstanding Derivative Financial Instruments
| | | | |
Futures contracts: | | | | |
Average notional value of contracts — long | | $ | 5,773,625 | |
For more information about the Fund’s investment risks regarding derivative financial instruments, refer to the Notes to Financial Statements.
Fair Value Hierarchy as of Period End
Various inputs are used in determining the fair value of investments and derivative financial instruments. For information about the Fund’s policy regarding valuation of investments and derivative financial instruments, refer to the Notes to Financial Statements.
The following tables summarize the Fund’s investments and derivative financial instruments categorized in the disclosure hierarchy:
| | | | | | | | | | | | | | | | |
| | | Level 1 | | | Level 2 | | | Level 3 | | | Total | |
Assets: | | | | | | | | | | | | | | | | |
Investments: | | | | | | | | | | | | | | | | |
Long-Term Investments: | | | | | | | | | | | | | | | | |
Common Stocks(a) | | $ | 430,576,378 | | | $ | — | | | $ | — | | | $ | 430,576,378 | |
Short-Term Securities | | | 4,753,078 | | | | — | | | | — | | | | 4,753,078 | |
| | | | | | | | | | | | | | | | |
| | $ | 435,329,456 | | | $ | — | | | $ | — | | | $ | 435,329,456 | |
| | | | | | | | | | | | | | | | |
Investments valued at NAV(b) | | | | | | | | | | | | | | | 13,425,600 | |
| | | | | | | | | | | | | | | | |
Total Investments | | | | | | | | | | | | | | $ | 448,755,056 | |
| | | | | | | | | | | | | | | | |
Derivative Financial Instruments(c) | | | | | | | | | | | | | | | | |
Liabilities: | | | | | | | | | | | | | | | | |
Equity contracts | | $ | (86,760 | ) | | $ | — | | | $ | — | | | $ | (86,760 | ) |
| | | | | | | | | | | | | | | | |
| | (a) | See above Schedule of Investments for values in each industry. | |
| | (b) | As of December 31, 2018, certain investments of the Fund were fair valued using NAV per share as no quoted market value is available and therefore have been excluded from the fair value hierarchy. | |
| | (c) | Derivative financial instruments are futures contracts, which are valued at the unrealized appreciation (depreciation) on the instrument. | |
During the year ended December 31, 2018, there were no transfers between levels.
See notes to financial statements.
| | | | |
| SCHEDULE OF INVESTMENTS | | | 9 | |
Statement of Assets and Liabilities
December 31, 2018
| | | | |
| | | BlackRock Advantage Large Cap Core V.I. Fund | |
| |
ASSETS | | | | |
Investments at value — unaffiliated (including securities loaned at value of $13,163,231) (cost — $452,555,247) | | $ | 430,576,378 | |
Investments at value — affiliated (cost — $18,179,509) | | | 18,178,678 | |
Cash pledged for futures contracts | | | 207,000 | |
Receivables: | | | | |
Investments sold | | | 5,191,119 | |
Securities lending income — affiliated | | | 2,577 | |
Capital shares sold | | | 23,228 | |
Dividends — affiliated | | | 7,845 | |
Dividends — unaffiliated | | | 697,442 | |
Variation margin on futures contracts | | | 28,982 | |
Prepaid expenses | | | 511 | |
| | | | |
Total assets | | | 454,913,760 | |
| | | | |
| |
LIABILITIES | | | | |
Bank overdraft | | | 849 | |
Cash collateral on securities loaned at value | | | 13,426,198 | |
Payables: | | | | |
Investments purchased | | | 4,567,236 | |
Capital shares redeemed | | | 98,777 | |
Distribution fees | | | 62,116 | |
Board realignment and consolidation | | | 38,554 | |
Investment advisory fees | | | 223,370 | |
Directors’ and Officer’s fees | | | 6,554 | |
Other affiliates | | | 1,121 | |
Other accrued expenses | | | 469,746 | |
| | | | |
Total liabilities | | | 18,894,521 | |
| | | | |
| |
NET ASSETS | | $ | 436,019,239 | |
| | | | |
| |
NET ASSETS CONSIST OF | | | | |
Paid-in capital | | $ | 463,747,711 | |
Accumulated loss | | | (27,728,472 | ) |
| | | | |
NET ASSETS | | $ | 436,019,239 | |
| | | | |
| |
NET ASSET VALUE | | | | |
Class I — Based on net assets of $152,716,640 and 6,699,050 shares outstanding, 200 million shares authorized, $0.10 par value. | | $ | 22.80 | |
| | | | |
Class II — Based on net assets of $4,390,013 and 192,328 shares outstanding, 100 million shares authorized, $0.10 par value. | | $ | 22.83 | |
| | | | |
Class III — Based on net assets of $278,912,586 and 12,340,300 shares outstanding, 100 million shares authorized, $0.10 par value. | | $ | 22.60 | |
| | | | |
See notes to financial statements.
| | |
| 10 | | 2018 BLACKROCK ANNUAL REPORTTO SHAREHOLDERS |
Statement of Operations
Year Ended December 31, 2018
| | | | |
| | | BlackRock Advantage Large Cap Core
V.I. Fund | |
| |
INVESTMENT INCOME | | | | |
Dividends — affiliated | | $ | 76,446 | |
Dividends — unaffiliated(a) | | | 10,329,163 | |
Securities lending income — affiliated — net | | | 19,228 | |
Foreign taxes withheld | | | (14,428 | ) |
| | | | |
Total investment income | | | 10,410,409 | |
| | | | |
| |
EXPENSES | | | | |
Investment advisory | | | 2,353,682 | |
Transfer agent — class specific | | | 1,057,929 | |
Distribution — class specific | | | 830,186 | |
Accounting services | | | 74,807 | |
Professional | | | 73,304 | |
Printing | | | 66,549 | |
Custodian | | | 52,568 | |
Board realignment and consolidation | | | 38,861 | |
Directors and Officer | | | 23,606 | |
Transfer agent | | | 5,000 | |
Miscellaneous | | | 41,177 | |
| | | | |
Total expenses | | | 4,617,669 | |
Less: | | | | |
Fees waived and/or reimbursed by the Manager | | | (3,633 | ) |
Transfer agent fees waived and/or reimbursed — class specific | | | (701,494 | ) |
| | | | |
Total expenses after fees waived and/or reimbursed | | | 3,912,542 | |
| | | | |
Net investment income | | | 6,497,867 | |
| | | | |
| |
REALIZED AND UNREALIZED GAIN (LOSS) | | | | |
Net realized gain (loss) from: | | | | |
Investments — affiliated | | | 1,006 | |
Investments — unaffiliated | | | 48,104,009 | |
Foreign currency transactions | | | 655 | |
Futures contracts | | | (75,793 | ) |
| | | | |
| | | 48,029,877 | |
| | | | |
Net change in unrealized appreciation (depreciation) on: | | | | |
Investments — affiliated | | | (810 | ) |
Investments — unaffiliated | | | (75,854,122 | ) |
Foreign currency translations | | | (611 | ) |
Futures contracts | | | (122,486 | ) |
| | | | |
| | | (75,978,029 | ) |
| | | | |
Net realized and unrealized loss | | | (27,948,152 | ) |
| | | | |
NET DECREASE IN NET ASSETS RESULTING FROM OPERATIONS | | $ | (21,450,285 | ) |
| | | | |
| (a) | Includesnon-recurring dividends in the amount of $300,804. |
See notes to financial statements.
Statements of Changes in Net Assets
| | | | | | | | |
| | | BlackRock Advantage
Large Cap Core V.I. Fund | |
| | | Year Ended December 31, | |
| | 2018 | | | 2017 | |
| | |
INCREASE (DECREASE) IN NET ASSETS | | | | | | | | |
| | |
OPERATIONS | | | | | | | | |
Net investment income | | $ | 6,497,867 | | | $ | 5,600,747 | |
Net realized gain | | | 48,029,877 | | | | 142,044,998 | |
Net change in unrealized appreciation (depreciation) | | | (75,978,029 | ) | | | (44,362,526 | ) |
| | | | | | | | |
Net increase (decrease) in net assets resulting from operations | | | (21,450,285 | ) | | | 103,283,219 | |
| | | | | | | | |
| | |
DISTRIBUTIONS TO SHAREHOLDERS(a)(b) | | | | | | | | |
Class I | | | (24,262,357 | ) | | | (51,545,511 | ) |
Class II | | | (685,736 | ) | | | (1,328,480 | ) |
Class III | | | (44,148,933 | ) | | | (94,394,118 | ) |
| | | | | | | | |
Decrease in net assets resulting from distributions to shareholders | | | (69,097,026 | ) | | | (147,268,109 | ) |
| | | | | | | | |
| | |
CAPITAL SHARE TRANSACTIONS | | | | | | | | |
Net increase (decrease) in net assets derived from capital share transactions | | | (5,862,992 | ) | | | 67,256,971 | |
| | | | | | | | |
| | |
NET ASSETS(b) | | | | | | | | |
Total increase (decrease) in net assets | | | (96,410,303 | ) | | | 23,272,081 | |
Beginning of year | | | 532,429,542 | | | | 509,157,461 | |
| | | | | | | | |
End of year | | $ | 436,019,239 | | | $ | 532,429,542 | |
| | | | | | | | |
| (a) | Distributions for annual periods determined in accordance with U.S. federal income tax regulations. |
| (b) | Prior year distribution character information and undistributed net investment income has been modified or removed to conform with current year RegulationS-X presentation changes. Refer to Note 12 for this prior year information. |
See notes to financial statements.
| | |
| 12 | | 2018 BLACKROCK ANNUAL REPORTTO SHAREHOLDERS |
Financial Highlights
(For a share outstanding throughout each period)
| | | | | | | | | | | | | | | | | | | | |
| | | BlackRock Advantage Large Cap Core V.I. Fund | |
| |
| | | Class I | |
| |
| | | Year Ended December 31, | |
| | | 2018 | | | 2017 | | | 2016 | | | 2015 | | | 2014 | |
| | | | | |
Net asset value, beginning of year | | $ | 28.45 | | | $ | 31.91 | | | $ | 31.40 | | | $ | 33.26 | | | $ | 33.80 | |
| | | | | | | | | | | | | | | | | | | | |
Net investment income(a) | | | 0.42 | (b) | | | 0.44 | | | | 0.39 | | | | 0.36 | | | | 0.34 | |
Net realized and unrealized gain (loss) | | | (1.90 | ) | | | 6.64 | | | | 2.91 | | | | (0.16 | ) | | | 3.86 | |
| | | | | | | | | | | | | | | | | | | | |
Net increase (decrease) from investment operations | | | (1.48 | ) | | | 7.08 | | | | 3.30 | | | | 0.20 | | | | 4.20 | |
| | | | | | | | | | | | | | | | | | | | |
| | | | | |
| Distributions(c) | | | | | | | | | | | | | | | |
From net investment income | | | (0.44 | ) | | | (0.47 | ) | | | (0.40 | ) | | | (0.39 | ) | | | (0.36 | ) |
From net realized gain | | | (3.73 | ) | | | (10.07 | ) | | | (2.39 | ) | | | (1.67 | ) | | | (4.38 | ) |
| | | | | | | | | | | | | | | | | | | | |
Total distributions | | | (4.17 | ) | | | (10.54 | ) | | | (2.79 | ) | | | (2.06 | ) | | | (4.74 | ) |
| | | | | | | | | | | | | | | | | | | | |
| | | | | |
Net asset value, end of year | | $ | 22.80 | | | $ | 28.45 | | | $ | 31.91 | | | $ | 31.40 | | | $ | 33.26 | |
| | | | | | | | | | | | | | | | | | | | |
| | | | | |
Total Return(d) | | | | | | | | | | | | | | | | | | | | |
Based on net asset value | | | (5.22 | )% | | | 22.33 | % | | | 10.55 | % | | | 0.52 | % | | | 12.36 | % |
| | | | | | | | | | | | | | | | | | | | |
| | | | | |
Ratios to Average Net Assets | | | | | | | | | | | | | | | | | | | | |
Total expenses | | | 0.74 | % | | | 0.73 | % | | | 0.72 | % | | | 0.71 | % | | | 0.73 | % |
| | | | | | | | | | | | | | | | | | | | |
Total expenses after fees waived and/or reimbursed | | | 0.58 | % | | | 0.58 | % | | | 0.58 | % | | | 0.56 | % | | | 0.57 | % |
| | | | | | | | | | | | | | | | | | | | |
Net investment income | | | 1.45 | %(b) | | | 1.27 | % | | | 1.26 | % | | | 1.08 | % | | | 0.97 | % |
| | | | | | | | | | | | | | | | | | | | |
| | | | | |
Supplemental Data | | | | | | | | | | | | | | | | | | | | |
Net assets, end of year (000) | | $ | 152,717 | | | $ | 185,938 | | | $ | 175,947 | | | $ | 184,151 | | | $ | 212,067 | |
| | | | | | | | | | | | | | | | | | | | |
Portfolio turnover rate | | | 149 | % | | | 149 | % | | | 50 | % | | | 31 | % | | | 48 | % |
| | | | | | | | | | | | | | | | | | | | |
| (a) | Based on average shares outstanding. |
| (b) | Net investment income per share and the ratio of net investment income to average net assets includes $0.02 per share and 0.06%, respectively, resulting from anon-recurring dividend. |
| (c) | Distributions for annual periods determined in accordance with U.S. federal income tax regulations. |
| (d) | Where applicable, excludes insurance-related fees and expenses and assumes the reinvestment of distributions. |
See notes to financial statements.
Financial Highlights (continued)
(For a share outstanding throughout each period)
| | | | | | | | | | | | | | | | | | | | |
| | | BlackRock Advantage Large Cap Core V.I. Fund (continued) | |
| |
| | | Class II | |
| |
| | | Year Ended December 31, | |
| | 2018 | | | 2017 | | | 2016 | | | 2015 | | | 2014 | |
| | | | | |
Net asset value, beginning of year | | $ | 28.47 | | | $ | 31.93 | | | $ | 31.42 | | | $ | 33.27 | | | $ | 33.79 | |
| | | | | | | | | | | | | | | | | | | | |
Net investment income(a) | | | 0.37 | (b) | | | 0.38 | | | | 0.34 | | | | 0.30 | | | | 0.28 | |
Net realized and unrealized gain (loss) | | | (1.89 | ) | | | 6.64 | | | | 2.90 | | | | (0.16 | ) | | | 3.87 | |
| | | | | | | | | | | | | | | | | | | | |
Net increase (decrease) from investment operations | | | (1.52 | ) | | | 7.02 | | | | 3.24 | | | | 0.14 | | | | 4.15 | |
| | | | | | | | | | | | | | | | | | | | |
| | | | | |
| Distributions(c) | | | | | | | | | | | | | | | |
From net investment income | | | (0.39 | ) | | | (0.41 | ) | | | (0.34 | ) | | | (0.32 | ) | | | (0.29 | ) |
From net realized gain | | | (3.73 | ) | | | (10.07 | ) | | | (2.39 | ) | | | (1.67 | ) | | | (4.38 | ) |
| | | | | | | | | | | | | | | | | | | | |
Total distributions | | | (4.12 | ) | | | (10.48 | ) | | | (2.73 | ) | | | (1.99 | ) | | | (4.67 | ) |
| | | | | | | | | | | | | | | | | | | | |
| | | | | |
Net asset value, end of year | | $ | 22.83 | | | $ | 28.47 | | | $ | 31.93 | | | $ | 31.42 | | | $ | 33.27 | |
| | | | | | | | | | | | | | | | | | | | |
| | | | | |
Total Return(d) | | | | | | | | | | | | | | | | | | | | |
Based on net asset value | | | (5.37 | )% | | | 22.12 | % | | | 10.37 | % | | | 0.34 | % | | | 12.23 | % |
| | | | | | | | | | | | | | | | | | | | |
| | | | | |
Ratios to Average Net Assets | | | | | | | | | | | | | | | | | | | | |
Total expenses | | | 0.89 | % | | | 0.88 | % | | | 0.88 | % | | | 0.85 | % | | | 0.89 | % |
| | | | | | | | | | | | | | | | | | | | |
Total expenses after fees waived and/or reimbursed | | | 0.75 | % | | | 0.75 | % | | | 0.75 | % | | | 0.73 | % | | | 0.74 | % |
| | | | | | | | | | | | | | | | | | | | |
Net investment income | | | 1.28 | %(b) | | | 1.08 | % | | | 1.09 | % | | | 0.91 | % | | | 0.81 | % |
| | | | | | | | | | | | | | | | | | | | |
| | | | | |
Supplemental Data | | | | | | | | | | | | | | | | | | | | |
Net assets, end of year (000) | | $ | 4,390 | | | $ | 4,862 | | | $ | 5,170 | | | $ | 5,333 | | | $ | 6,203 | |
| | | | | | | | | | | | | | | | | | | | |
Portfolio turnover rate | | | 149 | % | | | 149 | % | | | 50 | % | | | 31 | % | | | 48 | % |
| | | | | | | | | | | | | | | | | | | | |
| (a) | Based on average shares outstanding. |
| (b) | Net investment income per share and the ratio of net investment income to average net assets includes $0.02 per share and 0.06%, respectively, resulting from anon-recurring dividend. |
| (c) | Distributions for annual periods determined in accordance with U.S. federal income tax regulations. |
| (d) | Where applicable, excludes insurance-related fees and expenses and assumes the reinvestment of distributions. |
See notes to financial statements.
| | |
| 14 | | 2018 BLACKROCK ANNUAL REPORTTO SHAREHOLDERS |
Financial Highlights (continued)
(For a share outstanding throughout each period)
| | | | | | | | | | | | | | | | | | | | |
| | | BlackRock Advantage Large Cap Core V.I. Fund (continued) | |
| |
| | | Class III | |
| |
| | | Year Ended December 31, | |
| | | 2018 | | | 2017 | | | 2016 | | | 2015 | | | 2014 | |
| | | | | |
Net asset value, beginning of year | | $ | 28.23 | | | $ | 31.74 | | | $ | 31.25 | | | $ | 33.11 | | | $ | 33.66 | |
| | | | | | | | | | | | | | | | | | | | |
Net investment income(a) | | | 0.34 | (b) | | | 0.34 | | | | 0.31 | | | | 0.27 | | | | 0.24 | |
Net realized and unrealized gain (loss) | | | (1.89 | ) | | | 6.59 | | | | 2.88 | | | | (0.17 | ) | | | 3.84 | |
| | | | | | | | | | | | | | | | | | | | |
Net increase (decrease) from investment operations | | | (1.55 | ) | | | 6.93 | | | | 3.19 | | | | 0.10 | | | | 4.08 | |
| | | | | | | | | | | | | | | | | | | | |
| | | | | |
| Distributions(c) | | | | | | | | | | | | | | | |
From net investment income | | | (0.35 | ) | | | (0.37 | ) | | | (0.31 | ) | | | (0.29 | ) | | | (0.25 | ) |
From net realized gain | | | (3.73 | ) | | | (10.07 | ) | | | (2.39 | ) | | | (1.67 | ) | | | (4.38 | ) |
| | | | | | | | | | | | | | | | | | | | |
Total distributions | | | (4.08 | ) | | | (10.44 | ) | | | (2.70 | ) | | | (1.96 | ) | | | (4.63 | ) |
| | | | | | | | | | | | | | | | | | | | |
| | | | | |
Net asset value, end of year | | $ | 22.60 | | | $ | 28.23 | | | $ | 31.74 | | | $ | 31.25 | | | $ | 33.11 | |
| | | | | | | | | | | | | | | | | | | | |
| | | | | |
Total Return(d) | | | | | | | | | | | | | | | | | | | | |
Based on net asset value | | | (5.51 | )% | | | 21.97 | % | | | 10.26 | % | | | 0.23 | % | | | 12.07 | % |
| | | | | | | | | | | | | | | | | | | | |
| | | | | |
Ratios to Average Net Assets | | | | | | | | | | | | | | | | | | | | |
Total expenses | | | 0.99 | % | | | 0.99 | % | | | 0.97 | % | | | 0.96 | % | | | 0.98 | % |
| | | | | | | | | | | | | | | | | | | | |
Total expenses after fees waived and/or reimbursed | | | 0.86 | % | | | 0.86 | % | | | 0.86 | % | | | 0.84 | % | | | 0.85 | % |
| | | | | | | | | | | | | | | | | | | | |
Net investment income | | | 1.17 | %(b) | | | 0.98 | % | | | 0.98 | % | | | 0.80 | % | | �� | 0.69 | % |
| | | | | | | | | | | | | | | | | | | | |
| | | | | |
Supplemental Data | | | | | | | | | | | | | | | | | | | | |
Net assets, end of year (000) | | $ | 278,913 | | | $ | 341,630 | | | $ | 328,040 | | | $ | 306,567 | | | $ | 322,418 | |
| | | | | | | | | | | | | | | | | | | | |
Portfolio turnover rate | | | 149 | % | | | 149 | % | | | 50 | % | | | 31 | % | | | 48 | % |
| | | | | | | | | | | | | | | | | | | | |
| (a) | Based on average shares outstanding. |
| (b) | Net investment income per share and the ratio of net investment income to average net assets includes $0.02 per share and 0.06%, respectively, resulting from anon-recurring dividend. |
| (c) | Distributions for annual periods determined in accordance with U.S. federal income tax regulations. |
| (d) | Where applicable, excludes insurance-related fees and expenses and assumes the reinvestment of distributions. |
See notes to financial statements.
Notes to Financial Statements
BlackRock Variable Series Funds, Inc. (the “Company”) is registered under the Investment Company Act of 1940, as amended (the “1940 Act”), as anopen-end management investment company. The Company is organized as a Maryland corporation that is comprised of 15 separate portfolios. The funds offer shares to insurance companies for their separate accounts to fund benefits under certain variable annuity and variable life insurance contracts. The financial statements presented are for BlackRock Advantage Large Cap Core V.I. Fund (the “Fund”). The Fund is classified as diversified. Class I, Class II and Class III Shares have equal voting, dividend, liquidation and other rights, except that only shares of the respective classes are entitled to vote on matters concerning only that class. In addition, Class II and Class III Shares bear certain expenses related to the distribution of such shares.
The Fund, together with certain other registered investment companies advised by BlackRock Advisors, LLC (the “Manager”) or its affiliates, is included in a complex ofopen-end funds referred to as the Equity-Bond Complex.
| 2. | SIGNIFICANT ACCOUNTING POLICIES |
The financial statements are prepared in conformity with accounting principles generally accepted in the United States of America (“U.S. GAAP”), which may require management to make estimates and assumptions that affect the reported amounts of assets and liabilities in the financial statements, disclosure of contingent assets and liabilities at the date of the financial statements and the reported amounts of increases and decreases in net assets from operations during the reporting period. Actual results could differ from those estimates. The Fund is considered an investment company under U.S. GAAP and follows the accounting and reporting guidance applicable to investment companies. Below is a summary of significant accounting policies:
Investment Transactions and Income Recognition: For financial reporting purposes, investment transactions are recorded on the dates the transactions are entered into (the “trade dates”). Realized gains and losses on investment transactions are determined on the identified cost basis. Dividend income is recorded on theex-dividend date. Dividends from foreign securities where theex-dividend date may have passed are subsequently recorded when the Fund is informed of theex-dividend date. Under the applicable foreign tax laws, a withholding tax at various rates may be imposed on capital gains, dividends and interest. Income, expenses and realized and unrealized gains and losses are allocated daily to each class based on its relative net assets.
Foreign Currency Translation:The Fund’s books and records are maintained in U.S. dollars. Securities and other assets and liabilities denominated in foreign currencies are translated into U.S. dollars using exchange rates determined as of the close of trading on the New York Stock Exchange (“NYSE”). Purchases and sales of investments are recorded at the rates of exchange prevailing on the respective dates of such transactions. Generally, when the U.S. dollar rises in value against a foreign currency, the investments denominated in that currency will lose value; the opposite effect occurs if the U.S. dollar falls in relative value.
The Fund does not isolate the portion of the results of operations arising as a result of changes in the exchange rates from the changes in the market prices of investments held or sold for financial reporting purposes. Accordingly, the effects of changes in exchange rates on investments are not segregated in the Statement of Operations from the effects of changes in market prices of those investments, but are included as a component of net realized and unrealized gain (loss) from investments. The Fund reports realized currency gains (losses) on foreign currency related transactions as components of net realized gain (loss) for financial reporting purposes, whereas such components are generally treated as ordinary income for U.S. federal income tax purposes.
Segregation and Collateralization: In cases where the Fund enters into certain investments (e.g., futures contracts) that would be treated as “senior securities” for 1940 Act purposes, the Fund may segregate or designate on its books and records cash or liquid assets having a market value at least equal to the amount of its future obligations under such investments. Doing so allows the investment to be excluded from treatment as a “senior security.” Furthermore, if required by an exchange or counterparty agreement, the Fund may be required to deliver/deposit cash and/or securities to/with an exchange, or broker-dealer or custodian as collateral for certain investments or obligations.
Distributions: Distributions paid by the Fund are recorded on theex-dividend date. Distributions of capital gains are recorded on theex-dividend date and made at least annually. The character and timing of distributions are determined in accordance with U.S. federal income tax regulations, which may differ from U.S. GAAP.
Recent Accounting Standards: In August 2018, the Financial Accounting Standards Board issued Accounting Standards Update2018-13 “Changes to the Disclosure Requirements for Fair Value Measurement” which modifies disclosure requirements for fair value measurements. The guidance is effective for fiscal years beginning after December 15, 2019 and for interim periods within those fiscal years. Management is currently evaluating the impact of this guidance to the Fund.
Indemnifications: In the normal course of business, the Fund enters into contracts that contain a variety of representations that provide general indemnification. The Fund’s maximum exposure under these arrangements is unknown because it involves future potential claims against the Fund, which cannot be predicted with any certainty.
Other: Expenses directly related to the Fund or its classes are charged to the Fund or the applicable class. Other operating expenses shared by several funds, including other funds managed by the Manager, are prorated among those funds on the basis of relative net assets or other appropriate methods. Expenses directly related to the Fund and other shared expenses prorated to the Fund are allocated daily to each class based on its relative net assets or other appropriate methods.
| 3. | INVESTMENT VALUATION AND FAIR VALUE MEASUREMENTS |
Investment Valuation Policies: The Fund’s investments are valued at fair value (also referred to as “market value” within the financial statements) as of the close of trading on the NYSE (generally 4:00 p.m., Eastern time). U.S. GAAP defines fair value as the price the Fund would receive to sell an asset or pay to transfer a liability in an orderly transaction between market participants at the measurement date. The Fund determines the fair values of its financial instruments using various independent dealers or pricing services under policies approved by the Board of Directors of the Company (the “Board”). The BlackRock Global Valuation Methodologies Committee (the “Global Valuation Committee”) is the committee formed by management to develop global pricing policies and procedures and to oversee the pricing function for all financial instruments.
| | |
| 16 | | 2018 BLACKROCK ANNUAL REPORTTO SHAREHOLDERS |
Notes to Financial Statements (continued)
Fair Value Inputs and Methodologies: The following methods and inputs are used to establish the fair value of the Fund’s assets and liabilities:
| | • | | Equity investments traded on a recognized securities exchange are valued at the official closing price each day, if available. For equity investments traded on more than one exchange, the official closing price on the exchange where the stock is primarily traded is used. Equity investments traded on a recognized exchange for which there were no sales on that day may be valued at the last available bid (long positions) or ask (short positions) price. |
| | • | | Investments inopen-end U.S. mutual funds are valued at net asset value (“NAV”) each business day. |
| | • | | The Fund values its investment in SL Liquidity Series, LLC, Money Market Series (the “Money Market Series”) at fair value, which is ordinarily based upon its pro rata ownership in the underlying fund’s net assets. The Money Market Series seeks current income consistent with maintaining liquidity and preserving capital. Although the Money Market Series is not registered under the 1940 Act, its investments may follow the parameters of investments by a money market fund that is subject to Rule2a-7 under the 1940 Act. |
| | • | | Futures contracts traded on exchanges are valued at their last sale price. |
If events (e.g., a company announcement, market volatility or a natural disaster) occur that are expected to materially affect the value of such instruments, or in the event that the application of these methods of valuation results in a price for an investment that is deemed not to be representative of the market value of such investment, or if a price is not available, the investment will be valued by the Global Valuation Committee, or its delegate, in accordance with a policy approved by the Board as reflecting fair value (“Fair Valued Investments”). The fair valuation approaches that may be used by the Global Valuation Committee will include market approach, income approach and the cost approach. Valuation techniques such as discounted cash flow, use of market comparables and matrix pricing are types of valuation approaches and are typically used in determining fair value. When determining the price for Fair Valued Investments, the Global Valuation Committee, or its delegate, seeks to determine the price that the Fund might reasonably expect to receive or pay from the current sale or purchase of that asset or liability in anarm’s-length transaction. Fair value determinations shall be based upon all available factors that the Global Valuation Committee, or its delegate, deems relevant and consistent with the principles of fair value measurement. The pricing of all Fair Valued Investments is subsequently reported to the Board or a committee thereof on a quarterly basis.
Fair Value Hierarchy: Various inputs are used in determining the fair value of investments and derivative financial instruments. These inputs to valuation techniques are categorized into a fair value hierarchy consisting of three broad levels for financial statement purposes as follows:
| | • | | Level 1 — Unadjusted price quotations in active markets/exchanges for identical assets or liabilities that the Fund has the ability to access |
| | • | | Level 2 — Other observable inputs (including, but not limited to, quoted prices for similar assets or liabilities in markets that are active, quoted prices for identical or similar assets or liabilities in markets that are not active, inputs other than quoted prices that are observable for the assets or liabilities (such as interest rates, yield curves, volatilities, prepayment speeds, loss severities, credit risks and default rates) or other market-corroborated inputs) |
| | • | | Level 3 — Unobservable inputs based on the best information available in the circumstances, to the extent observable inputs are not available (including the Fund’s own assumptions used in determining the fair value of investments and derivative financial instruments) |
The hierarchy gives the highest priority to unadjusted quoted prices in active markets for identical assets or liabilities (Level 1 measurements) and the lowest priority to unobservable inputs (Level 3 measurements). Accordingly, the degree of judgment exercised in determining fair value is greatest for instruments categorized in Level 3. The inputs used to measure fair value may fall into different levels of the fair value hierarchy. In such cases, for disclosure purposes, the fair value hierarchy classification is determined based on the lowest level input that is significant to the fair value measurement in its entirety. Investments classified within Level 3 have significant unobservable inputs used by the Global Valuation Committee in determining the price for Fair Valued investments. Level 3 investments include equity or debt issued by privately held companies or funds. There may not be a secondary market, and/or there are a limited number of investors. Level 3 investments may also be adjusted to reflect illiquidity and/ornon-transferability, with the amount of such discount estimated by the Global Valuation Committee in the absence of market information.
Changes in valuation techniques may result in transfers into or out of an assigned level within the hierarchy. In accordance with the Fund’s policy, transfers between different levels of the fair value hierarchy are deemed to have occurred as of the beginning of the reporting period. The categorization of a value determined for investments and derivative financial instruments is based on the pricing transparency of the investments and derivative financial instruments and is not necessarily an indication of the risks associated with investing in those securities.
As of December 31, 2018, certain investments of the Fund were valued using NAV per share as no quoted market value is available and therefore have been excluded from the fair value hierarchy.
| 4. | SECURITIES AND OTHER INVESTMENTS |
Securities Lending: The Fund may lend its securities to approved borrowers, such as brokers, dealers and other financial institutions. The borrower pledges and maintains with the Fund collateral consisting of cash, an irrevocable letter of credit issued by a bank, or securities issued or guaranteed by the U.S. Government. The initial collateral received by the Fund is required to have a value of at least 102% of the current value of the loaned securities for securities traded on U.S. exchanges and a value of at least 105% for all other securities. The collateral is maintained thereafter at a value equal to at least 100% of the current market value of the securities on loan. The market value of the loaned securities is determined at the close of each business day of the Fund and any additional required collateral is delivered to the Fund, or excess collateral returned by the Fund, on the next business day. During the term of the loan, the Fund is entitled to all distributions made on or in respect of the loaned securities, but does not receive interest income on securities received as collateral. Loans of securities are terminable at any time and the borrower, after notice, is required to return borrowed securities within the standard time period for settlement of securities transactions.
The market value of any securities on loan, all of which were classified as common stocks in the Fund’s Schedule of Investments, and the value of any related collateral are shown separately in the Statement of Assets and Liabilities as a component of investments at value — unaffiliated, and collateral on securities loaned at value,
| | | | |
| NOTESTO FINANCIAL STATEMENTS | | | 17 | |
Notes to Financial Statements (continued)
respectively. As of period end, any securities on loan were collateralized by cash and/or U.S. Government obligations. Cash collateral invested by the securities lending agent, BlackRock Investment Management, LLC (“BIM”), if any, is disclosed in the Schedule of Investments.
Securities lending transactions are entered into by the Fund under Master Securities Lending Agreements (each, an “MSLA”), which provide the right, in the event of default (including bankruptcy or insolvency), for thenon-defaulting party to liquidate the collateral and calculate a net exposure to the defaulting party or request additional collateral. In the event that a borrower defaults, the Fund, as lender, would offset the market value of the collateral received against the market value of the securities loaned. When the value of the collateral is greater than that of the market value of the securities loaned, the lender is left with a net amount payable to the defaulting party. However, bankruptcy or insolvency laws of a particular jurisdiction may impose restrictions on or prohibitions against such a right of offset in the event of an MSLA counterparty’s bankruptcy or insolvency. Under the MSLA, absent an event of default, the borrower can resell orre-pledge the loaned securities, and the Fund can reinvest cash collateral received in connection with loaned securities. Upon an event of default, the parties’ obligations to return the securities or collateral to the other party are extinguished, and the parties can resell orre-pledge the loaned securities or the collateral received in connection with the loaned securities in order to satisfy the defaulting party’s net payment obligation for all transactions under the MSLA. The defaulting party remains liable for any deficiency.
As of period end, the following table is a summary of the Fund’s securities lending agreements by counterparty which are subject to offset under an MSLA:
| | | | | | | | | | | | |
| Counterparty | | Securities
Loaned at Value | | | Cash Collateral
Received (a) | | | Net
Amount | |
Citigroup Global Markets Inc. | | $ | 5,010,925 | | | $ | (5,010,925 | ) | | $ | — | |
Credit Suisse Securities (USA) LLC | | | 4,156 | | | | (4,156 | ) | | | — | |
Fidelity Investments | | | 69,821 | | | | (69,821 | ) | | | — | |
JP Morgan Securities LLC | | | 3,587,911 | | | | (3,587,911 | ) | | | — | |
Morgan Stanley & Co. LLC | | | 2,890,551 | | | | (2,890,551 | ) | | | — | |
State Street Bank & Trust Co. | | | 264,037 | | | | (264,037 | ) | | | — | |
UBS Securities LLC | | | 1,335,830 | | | | (1,335,830 | ) | | | — | |
| | | | | | | | | | | | |
| | $ | 13,163,231 | | | $ | (13,163,231 | ) | | $ | — | |
| | | | | | | | | | | | |
| | (a) | Cash collateral with a value of $13,426,198 has been received in connection with securities lending agreements. Collateral received in excess of the value of securities loaned from the individual counterparty, if any, is not shown for financial reporting purposes in the table above. | |
The risks of securities lending include the risk that the borrower may not provide additional collateral when required or may not return the securities when due. To mitigate these risks, the Fund benefits from a borrower default indemnity provided by BIM. BIM’s indemnity allows for full replacement of the securities loaned if the collateral received does not cover the value on the securities loaned in the event of borrower default. The Fund could incur a loss if the value of an investment purchased with cash collateral falls below the market value of loaned securities or if the value of an investment purchased with cash collateral falls below the value of the original cash collateral received.
| 5. | DERIVATIVE FINANCIAL INSTRUMENTS |
The Fund engages in various portfolio investment strategies using derivative contracts both to increase the returns of the Fund and/or to manage its exposure to certain risks such as credit risk, equity risk, interest rate risk, foreign currency exchange rate risk, commodity price risk or other risks (e.g., inflation risk). Derivative financial instruments categorized by risk exposure are included in the Schedule of Investments. These contracts may be transacted on an exchange orover-the-counter (“OTC”).
Futures Contracts: Futures contracts are purchased or sold to gain exposure to, or manage exposure to, changes in interest rates (interest rate risk) and changes in the value of equity securities (equity risk) or foreign currencies (foreign currency exchange rate risk).
Futures contracts are agreements between the Fund and a counterparty to buy or sell a specific quantity of an underlying instrument at a specified price and on a specified date. Depending on the terms of a contract, it is settled either through physical delivery of the underlying instrument on the settlement date or by payment of a cash amount on the settlement date. Upon entering into a futures contract, the Fund is required to deposit initial margin with the broker in the form of cash or securities in an amount that varies depending on a contract’s size and risk profile. The initial margin deposit must then be maintained at an established level over the life of the contract. Amounts pledged, which are considered restricted, are included in cash pledged for futures contracts in the Statement of Assets and Liabilities.
Securities deposited as initial margin are designated in the Schedule of Investments and cash deposited, if any, is shown as cash pledged for futures contracts in the Statement of Assets and Liabilities. Pursuant to the contract, the Fund agrees to receive from or pay to the broker an amount of cash equal to the daily fluctuation in market value of the contract (“variation margin”). Variation margin is recorded as unrealized appreciation (depreciation) and, if any, shown as variation margin receivable (or payable) on futures contracts in the Statement of Assets and Liabilities. When the contract is closed, a realized gain or loss is recorded in the Statement of Operations equal to the difference between the notional amount of the contract at the time it was opened and the notional amount at the time it was closed. The use of futures contracts involves the risk of an imperfect correlation in the movements in the price of futures contracts and interest, foreign currency exchange rates or underlying assets.
| 6. | INVESTMENT ADVISORY AGREEMENT AND OTHER TRANSACTIONS WITH AFFILIATES |
Investment Advisory: The Company, on behalf of the Fund, entered into an Investment Advisory Agreement with the Manager, the Fund’s investment adviser and an indirect, wholly-owned subsidiary of BlackRock, to provide investment advisory and administrative services. The Manager is responsible for the management of the Fund’s portfolio and provides the personnel, facilities, equipment and certain other services necessary to the operations of the Fund.
| | |
| 18 | | 2018 BLACKROCK ANNUAL REPORTTO SHAREHOLDERS |
Notes to Financial Statements (continued)
For such services, the Fund pays the Manager a monthly fee at an annual rate equal to the following percentages of the average daily value of the Fund’s net assets:
| | | | |
| Average Daily Net Assets | | Investment Advisory Fee | |
First $250 Million | | | 0.500 | % |
$250 Million — $300 Million | | | 0.450 | |
$300 Million — $400 Million | | | 0.425 | |
Greater than $400 Million | | | 0.400 | |
Distribution Fees: The Company, on behalf of the Fund, entered into a Distribution Agreement and a Distribution Plan with BlackRock Investments, LLC (“BRIL”), an affiliate of the Manager. Pursuant to the Distribution Plan and in accordance with Rule12b-1 under the 1940 Act, the Fund pays BRIL ongoing distribution fees. The fees are accrued daily and paid monthly at annual rates based upon the average daily net assets of the relevant share class of the Fund as follows:
| | | | | | | | |
| | | Class II | | | Class III | |
Distribution fees | | | 0.15 | % | | | 0.25 | % |
BRIL and broker-dealers, pursuant tosub-agreements with BRIL, provide shareholder servicing and distribution services to the Fund. The ongoing service and/or distribution fee compensates BRIL and each broker-dealer for providing shareholder servicing and/or distribution related services to shareholders.
For the year ended December 31, 2018, the following table shows the class specific distribution fees borne directly by each share class of the Fund:
| | | | | | | | | | | | |
| | | Class II | | | Class III | | | Total | |
Distribution fees | | $ | 7,481 | | | $ | 822,705 | | | $ | 830,186 | |
Transfer Agent: On behalf of the Fund, the Manager entered into agreements with insurance companies and other financial intermediaries (“Service Organizations”), some of which may be affiliates. Pursuant to these agreements, the Service Organizations provide the Fund with administrative, networking, recordkeeping,sub-transfer agency and shareholder services tosub-accounts they service. For these services, the Service Organizations receive an annual fee per shareholder account, which will vary depending on share class and/or net assets of Fund shareholders serviced by the Service Organizations, which is shown as transfer agent — class specific. For the year ended December 31, 2018, the Fund did not pay any amounts to affiliates in return for these services.
In addition, the Fund pays the transfer agent, which is not an affiliate, a fee for the issuance, transfer and redemption of shares and the opening and maintenance of shareholder accounts, which is included in transfer agent in the Statement of Operations.
For the year ended December 31, 2018, the following table shows the class specific transfer agent fees borne directly by each share class of the Fund:
| | | | | | | | | | | | | | | | |
| Class I | | | | | Class II | | | Class III | | | | Total | |
| $ | 373,603 | | | | | $ | 10,418 | | | $673,908 | | | | $ | 1,057,929 | |
Expense Limitations, Waivers and Reimbursements: With respect to the Fund, the Manager voluntarily agreed to waive its investment advisory fees by the amount of investment advisory fees the Fund pays to the Manager indirectly through its investment in affiliated money market funds (the “affiliated money market fund waiver”). The amount of waivers and/or reimbursements of fees and expenses made pursuant to the expense limitation described below will be reduced by the amount of the affiliated money market fund waiver. This amount is included in fees waived and/or reimbursed by the Manager in the Statement of Operations. For the year ended December 31, 2018, the amount waived was $3,633.
The Manager has contractually agreed to waive its investment advisory fee with respect to any portion of the Fund’s assets invested in affiliated equity and fixed-income mutual funds and affiliated exchange-traded funds that have a contractual management fee through April 30, 2019. The contractual agreement may be terminated upon 90 days’ notice by a majority of the directors who are not “interested persons” of the Fund, as defined in the 1940 Act (“Independent Directors”), or by a vote of a majority of the outstanding voting securities of the Fund. For the year ended December 31, 2018, there were no fees waived and/or reimbursed by the Manager pursuant to this arrangement.
For the year ended December 31, 2018, the Fund reimbursed the Manager $7,211 for certain accounting services, which is included in accounting services in the Statement of Operations.
The Manager has contractually agreed to reimburse transfer agent fees in order to limit such expenses to a percentage of average daily net assets as follows:
| | | | |
Class I | | | 0.05 | % |
Class II | | | 0.07 | % |
Class III | | | 0.08 | % |
The Manager has agreed not to reduce or discontinue this contractual expense limitation through April 30, 2019 unless approved by the Board, including a majority of the Independent Directors, or by a vote of a majority of the outstanding voting securities of the Fund.
These amounts waived and/or reimbursed are shown as transfer agent fees waived and/or reimbursed — class specific in the Statement of Operations. For the year ended December 31, 2018, class specific expense waivers and/or reimbursements were as follows:
| | | | | | | | | | | | | | | | |
| | | Class I | | | Class II | | | Class III | | | Total | |
Transfer agent fees waived and/or reimbursed | | $ | 283,927 | | | $ | 6,927 | | | $ | 410,640 | | | $ | 701,494 | |
| | | | |
| NOTESTO FINANCIAL STATEMENTS | | | 19 | |
Notes to Financial Statements (continued)
With respect to the Fund, the Manager contractually agreed to waive and/or reimburse fees or expenses in order to limit expenses, excluding interest expense, dividend expense, tax expense, acquired fund fees and expenses, and certain other fund expenses, which constitute extraordinary expenses not incurred in the ordinary course of the Fund’s business (“expense limitation”). The expense limitations as a percentage of average daily net assets are as follows:
| | | | | | | | | | | | | | |
| Class I | | | | | | Class II | | | | Class III | |
| | 1.25% | | | | | | | 1.40% | | | | | 1.50% | |
The Manager has agreed not to reduce or discontinue this contractual expense limitation through April 30, 2019, unless approved by the Board, including a majority of the Independent Directors, or by a vote of a majority of the outstanding voting securities of the Fund. For the year ended December 31, 2018, there were no fees waived and/or reimbursed by the Manager.
Securities Lending: The U.S. Securities and Exchange Commission (“SEC”) has issued an exemptive order which permits BIM, an affiliate of the Manager, to serve as securities lending agent for the Fund, subject to applicable conditions. As securities lending agent, BIM bears all operational costs directly related to securities lending. The Fund is responsible for expenses in connection with the investment of cash collateral received for securities on loan (the “collateral investment expenses”). The cash collateral is invested in a private investment company managed by the Manager or its affiliates. However, BIM has agreed to cap the collateral investment expenses of the private investment company to an annual rate of 0.04%. The investment adviser to the private investment company will not charge any advisory fees with respect to shares purchased by the Fund. The private investment company in which the cash collateral has been invested may, under certain circumstances, impose a liquidity fee of up to 2% of the value withdrawn or temporarily restrict withdrawals for up to 10 business days during a 90 day period, in the event that the private investment company’s weekly liquid assets fall below certain thresholds.
Securities lending income is equal to the total of income earned from the reinvestment of cash collateral, net of fees and other payments to and from borrowers of securities, and less the collateral investment expenses. The Fund retains a portion of securities lending income and remits a remaining portion to BIM as compensation for its services as securities lending agent.
Pursuant to a securities lending agreement, the Fund retains 71.5% of securities lending income, and this amount retained can never be less than 65% of the total of securities lending income plus the collateral investment expenses.
In addition, commencing the business day following the date that the aggregate securities lending income earned across the Equity-Bond Complex in a calendar year exceeds a specified threshold, the Fund, pursuant to the securities lending agreement, will retain for the remainder of that calendar year securities lending income in an amount equal to 75% of securities lending income, and this amount retained can never be less than 65% of the total of securities lending income plus the collateral investment expenses.
The share of securities lending income earned by the Fund is shown as securities lending income — affiliated — net in the Statement of Operations. For the year ended December 31, 2018, the Fund paid BIM $6,870 for securities lending agent services.
Interfund Lending: In accordance with an exemptive order (the “Order”) from the SEC, the Fund may participate in a joint lending and borrowing facility for temporary purposes (the “Interfund Lending Program”), subject to compliance with the terms and conditions of the Order, and to the extent permitted by the Fund’s investment policies and restrictions. The Fund is currently permitted to borrow under the Interfund Lending Program.
A lending BlackRock fund may lend in aggregate up to 15% of its net assets, but may not lend more than 5% of its net assets to any one borrowing fund through the Interfund Lending Program. A borrowing BlackRock fund may not borrow through the Interfund Lending Program or from any other source more than 33 1/3% of its total assets (or any lower threshold provided for by the fund’s investment restrictions). If a borrowing BlackRock fund’s total outstanding borrowings exceed 10% of its total assets, each of its outstanding interfund loans will be subject to collateralization of at least 102% of the outstanding principal value of the loan. All interfund loans are for temporary or emergency purposes and the interest rate to be charged will be the average of the highest current overnight repurchase agreement rate available to a lending fund and the bank loan rate, as calculated according to a formula established by the Board.
During the year ended December 31, 2018, the Fund did not participate in the Interfund Lending Program.
Directors and Officers: Certain directors and/or officers of the Company are directors and/or officers of BlackRock or its affiliates. The Fund reimburses the Manager for a portion of the compensation paid to the Company’s Chief Compliance Officer, which is included in Directors and Officer in the Statement of Operations.
For the year ended December 31, 2018, purchases and sales of investments, excluding short-term securities, were $756,706,339 and $824,897,218, respectively.
It is the Fund’s policy to comply with the requirements of the Internal Revenue Code of 1986, as amended, applicable to regulated investment companies, and to distribute substantially all of its taxable income to its shareholders. Therefore, no U.S. federal income tax provision is required.
The Fund files U.S. federal and various state and local tax returns. No income tax returns are currently under examination. The statute of limitations on the Fund’s U.S. federal tax returns generally remains open for each of the four years ended December 31, 2018. The statutes of limitations on the Fund’s state and local tax returns may remain open for an additional year depending upon the jurisdiction.
Management has analyzed tax laws and regulations and their application to the Fund as of December 31, 2018, inclusive of the open tax return years, and does not believe that there are any uncertain tax positions that require recognition of a tax liability in the Fund’s financial statements.
| | |
| 20 | | 2018 BLACKROCK ANNUAL REPORTTO SHAREHOLDERS |
Notes to Financial Statements (continued)
The tax character of distributions paid was as follows:
| | | | | | | | |
| | | 12/31/18 | | | 12/31/17 | |
Ordinary income | | $ | 43,577,979 | | | $ | 18,336,131 | |
Long term capital gains | | | 25,519,047 | | | | 128,931,978 | |
| | | | | | | | |
| | $ | 69,097,026 | | | $ | 147,268,109 | |
| | | | | | | | |
As of period end, the tax components of accumulated loss were as follows:
| | | | |
| | | | |
Undistributed ordinary income | | $ | 45,876 | |
Net unrealized losses(a) | | | (24,879,700 | ) |
Qualified late-year losses(b) | | | (2,894,648 | ) |
| | | | |
| | $ | (27,728,472 | ) |
| | | | |
| | (a) | The difference between book-basis and tax-basis net unrealized losses was attributable primarily to the tax deferral of losses on wash sales, the realization for tax purposes of unrealized gains/losses on certain futures contracts and the timing and recognition of partnership income. | |
| | (b) | The Fund has elected to defer certain qualified late-year losses and recognize such losses in the next taxable year. | |
As of December 31, 2018, gross unrealized appreciation and depreciation for investments and derivatives based on cost for U.S. federal income tax purposes were as follows:
| | | | |
Tax cost | | $ | 473,711,601 | |
| | | | |
Gross unrealized appreciation | | $ | 14,572,660 | |
Gross unrealized depreciation | | | (39,529,205 | ) |
| | | | |
Net unrealized depreciation | | $ | (24,956,545 | ) |
| | | | |
The Company, on behalf of the Fund, along with certain other funds managed by the Manager and its affiliates (“Participating Funds”), is a party to a364-day, $2.25 billion credit agreement with a group of lenders. Under this agreement, the Fund may borrow to fund shareholder redemptions. Excluding commitments designated for certain individual funds, the Participating Funds, including the Fund, can borrow up to an aggregate commitment amount of $1.75 billion at any time outstanding, subject to asset coverage and other limitations as specified in the agreement. The credit agreement has the following terms: a fee of 0.10% per annum on unused commitment amounts and interest at a rate equal to the higher of(a) one-month LIBOR (but, in any event, not less than 0.00%) on the date the loan is made plus 0.80% per annum or (b) the Fed Funds rate (but, in any event, not less than 0.00%) in effect from time to time plus 0.80% per annum on amounts borrowed. The agreement expires in April 2019 unless extended or renewed. Prior to April 19, 2018, the aggregate commitment amount was $2.1 billion and the fee was 0.12% per annum. Participating Funds paid an upfront commitment fee of 0.02% on the total commitment amounts, in addition to administration, legal and arrangement fees, which are included in miscellaneous expenses in the Statement of Operations. These fees were allocated among such funds based upon portions of the aggregate commitment available to them and relative net assets of Participating Funds. During the year ended December 31, 2018, the Fund did not borrow under the credit agreement.
In the normal course of business, the Fund invests in securities or other instruments and may enter into certain transactions, and such activities subject the Fund to various risks, including among others, fluctuations in the market (market risk) or failure of an issuer to meet all of its obligations. The value of securities or other instruments may also be affected by various factors, including, without limitation: (i) the general economy; (ii) the overall market as well as local, regional or global political and/or social instability; (iii) regulation, taxation or international tax treaties between various countries; or (iv) currency, interest rate and price fluctuations. The Fund’s prospectus provides details of the risks to which the Fund is subject.
The Fund may be exposed to additional risks when reinvesting cash collateral in money market funds that do not seek to maintain a stable NAV per share of $1.00, and which may be subject to redemption gates or liquidity fees under certain circumstances.
Valuation Risk: The market values of equities, such as common stocks and preferred securities or equity related investments, such as futures and options, may decline due to general market conditions which are not specifically related to a particular company. They may also decline due to factors which affect a particular industry or industries. The Fund may invest in illiquid investments and may experience difficulty in selling those investments in a timely manner at the price that it believes the investments are worth. Prices may fluctuate widely over short or extended periods in response to company, market or economic news. Markets also tend to move in cycles, with periods of rising and falling prices. This volatility may cause the Fund’s NAV to experience significant increases or decreases over short periods of time. If there is a general decline in the securities and other markets, the NAV of the Fund may lose value, regardless of the individual results of the securities and other instruments in which the Fund invests.
Counterparty Credit Risk: The Fund may be exposed to counterparty credit risk, or the risk that an entity may fail to or be unable to perform on its commitments related to unsettled or open transactions. The Fund manages counterparty credit risk by entering into transactions only with counterparties that the Manager believes have the financial resources to honor their obligations and by monitoring the financial stability of those counterparties. Financial assets, which potentially expose the Fund to market, issuer and counterparty credit risks, consist principally of financial instruments and receivables due from counterparties. The extent of the Fund’s exposure to market, issuer and counterparty credit risks with respect to these financial assets is approximately their value recorded in the Statement of Assets and Liabilities, less any collateral held by the Fund.
| | | | |
| NOTESTO FINANCIAL STATEMENTS | | | 21 | |
Notes to Financial Statements (continued)
A derivative contract may suffer amark-to-market loss if the value of the contract decreases due to an unfavorable change in the market rates or values of the underlying instrument. Losses can also occur if the counterparty does not perform under the contract.
With exchange-traded futures, there is less counterparty credit risk to the Fund since the exchange or clearinghouse, as counterparty to such instruments, guarantees against a possible default. The clearinghouse stands between the buyer and the seller of the contract; therefore, credit risk is limited to failure of the clearinghouse. While offset rights may exist under applicable law, the Fund does not have a contractual right of offset against a clearing broker or clearinghouse in the event of a default (including the bankruptcy or insolvency). Additionally, credit risk exists in exchange-traded futures with respect to initial and variation margin that is held in a clearing broker’s customer accounts. While clearing brokers are required to segregate customer margin from their own assets, in the event that a clearing broker becomes insolvent or goes into bankruptcy and at that time there is a shortfall in the aggregate amount of margin held by the clearing broker for all its clients, typically the shortfall would be allocated on a pro rata basis across all the clearing broker’s customers, potentially resulting in losses to the Fund.
| 11. | CAPITAL SHARE TRANSACTIONS |
Transactions in capital shares for each class were as follows:
| | | | | | | | | | | | | | | | |
| | | Year Ended
12/31/2018 | | | Year Ended
12/31/2017 | |
| | | Shares | | | Amount | | | Shares | | | Amount | |
Class I | | | | | | | | | | | | | | | | |
Shares sold | | | 77,175 | | | $ | 2,212,730 | | | | 53,694 | | | $ | 1,884,794 | |
Shares issued in reinvestment of distributions | | | 1,041,683 | | | | 24,262,358 | | | | 1,784,901 | | | | 51,545,512 | |
Shares redeemed | | | (956,268 | ) | | | (28,134,590 | ) | | | (815,802 | ) | | | (28,296,841 | ) |
| | | | | | | | | | | | | | | | |
Net increase (decrease) | | | 162,590 | | | $ | (1,659,502 | ) | | | 1,022,793 | | | $ | 25,133,465 | |
| | | | | | | | | | | | | | | | |
| | | | |
Class II | | | | | | | | | | | | | | | | |
Shares sold | | | 36,314 | | | $ | 1,069,473 | | | | 17,194 | | | $ | 592,585 | |
Shares issued in reinvestment of distributions | | | 29,415 | | | | 685,735 | | | | 45,977 | | | | 1,328,480 | |
Shares redeemed | | | (44,166 | ) | | | (1,311,866 | ) | | | (54,296 | ) | | | (1,841,122 | ) |
| | | | | | | | | | | | | | | | |
Net increase | | | 21,563 | | | $ | 443,342 | | | | 8,875 | | | $ | 79,943 | |
| | | | | | | | | | | | | | | | |
| | | | |
Class III | | | | | | | | | | | | | | | | |
Shares sold | | | 375,928 | | | $ | 10,947,281 | | | | 117,007 | | | $ | 4,065,534 | |
Shares issued in reinvestment of distributions | | | 1,909,440 | | | | 44,148,933 | | | | 3,293,938 | | | | 94,394,117 | |
Shares redeemed | | | (2,048,354 | ) | | | (59,743,046 | ) | | | (1,644,501 | ) | | | (56,416,088 | ) |
| | | | | | | | | | | | | | | | |
Net increase (decrease) | | | 237,014 | | | $ | (4,646,832 | ) | | | 1,766,444 | | | $ | 42,043,563 | |
| | | | | | | | | | | | | | | | |
Total Net Increase (Decrease) | | | 421,167 | | | $ | (5,862,992 | ) | | | 2,798,112 | | | $ | 67,256,971 | |
| | | | | | | | | | | | | | | | |
| 12. | RegulationS-X Amendments |
On August 17, 2018, the SEC adopted amendments to certain disclosure requirements in Securities Act ReleaseNo. 33-10532, Disclosure Update and Simplification. The Fund has adopted the amendments pertinent to RegulationS-X in this shareholder report. The amendments impacted certain disclosure presentation on the Statement of Assets and Liabilities, Statements of Changes in Net Assets and Notes to the Financial Statements.
Prior year distribution information and undistributed net investment income in the Statements of Changes in Net Assets has been modified to conform to the current year presentation in accordance with the RegulationS-X changes.
Distributions for the year ended December 31, 2017 were classified as follows:
| | | | | | | | |
| Share Class | | Net Investment Income | | | Net Realized Gain | |
Class I | | $ | (2,307,598 | ) | | $ | (49,237,913 | ) |
Class II | | | (51,894 | ) | | | (1,276,586 | ) |
Class III | | | (3,340,143 | ) | | | (91,053,975 | ) |
Undistributed net investment income as of December 31, 2017 was $36,205.
Management has evaluated the impact of all subsequent events on the Fund through the date the financial statements were issued and has determined that there were no subsequent events requiring adjustment or additional disclosure in the financial statements.
| | |
| 22 | | 2018 BLACKROCK ANNUAL REPORTTO SHAREHOLDERS |
Report of Independent Registered Public Accounting Firm
To the Shareholders of BlackRock Advantage Large Cap Core V.I. Fund and the Board of Directors of BlackRock Variable Series Funds, Inc.:
Opinion on the Financial Statements and Financial Highlights
We have audited the accompanying statement of assets and liabilities of BlackRock Advantage Large Cap Core V.I. Fund of BlackRock Variable Series Funds, Inc. (the “Fund”), including the schedule of investments, as of December 31, 2018, the related statement of operations for the year then ended, the statements of changes in net assets for each of the two years in the period then ended, the financial highlights for each of the five years in the period then ended, and the related notes. In our opinion, the financial statements and financial highlights present fairly, in all material respects, the financial position of the Fund as of December 31, 2018, and the results of its operations for the year then ended, the changes in its net assets for each of the two years in the period then ended, and the financial highlights for each of the five years in the period then ended, in conformity with accounting principles generally accepted in the United States of America.
Basis for Opinion
These financial statements and financial highlights are the responsibility of the Fund’s management. Our responsibility is to express an opinion on the Fund’s financial statements and financial highlights based on our audits. We are a public accounting firm registered with the Public Company Accounting Oversight Board (United States) (PCAOB) and are required to be independent with respect to the Fund in accordance with the U.S. federal securities laws and the applicable rules and regulations of the Securities and Exchange Commission and the PCAOB.
We conducted our audits in accordance with the standards of the PCAOB. Those standards require that we plan and perform the audit to obtain reasonable assurance about whether the financial statements and financial highlights are free of material misstatement, whether due to error or fraud. The Fund is not required to have, nor were we engaged to perform, an audit of its internal control over financial reporting. As part of our audits we are required to obtain an understanding of internal control over financial reporting but not for the purpose of expressing an opinion on the effectiveness of the Fund’s internal control over financial reporting. Accordingly, we express no such opinion.
Our audits included performing procedures to assess the risks of material misstatement of the financial statements and financial highlights, whether due to error or fraud, and performing procedures that respond to those risks. Such procedures included examining, on a test basis, evidence regarding the amounts and disclosures in the financial statements and financial highlights. Our audits also included evaluating the accounting principles used and significant estimates made by management, as well as evaluating the overall presentation of the financial statements and financial highlights. Our procedures included confirmation of securities owned as of December 31, 2018, by correspondence with the custodian and brokers; when replies were not received from brokers, we performed other auditing procedures. We believe that our audits provide a reasonable basis for our opinion.
Deloitte & Touche LLP
Boston, Massachusetts
February 15, 2019
We have served as the auditor of one or more BlackRock investment companies since 1992.
| | | | |
| NOTESTO FINANCIAL STATEMENTS | | | 23 | |
Glossary of Terms Used in this Report
| | |
| Portfolio Abbreviations |
| |
| S&P | | Standard & Poor’s |
| | |
| 24 | | 2018 BLACKROCK ANNUAL REPORTTO SHAREHOLDERS |
DECEMBER 31, 2018
| | |
ANNUAL REPORT | |  |
BlackRock Variable Series Funds, Inc.
| Ø | | BlackRock Advantage Large Cap Value V.I. Fund |
|
| Not FDIC Insured • May Lose Value • No Bank Guarantee |
| | |
| Fund Summary as of December 31, 2018 | | BlackRock Advantage Large Cap Value V.I. Fund |
Investment Objective
BlackRock Advantage Large Cap Value V.I. Fund’s (the “Fund”) investment objective is to seek long-term capital appreciation.
Portfolio Management Commentary
How did the Fund perform?
For the 12-month period ended December 31, 2018, the Fund’s Class I Shares outperformed its benchmark, the Russell 1000® Value Index, while the Fund’s Class II and Class III Shares underperformed.
What factors influenced performance?
In a year characterized by increased volatility and concerns about the approaching end of the current cycle, investors returned their focus to company fundamentals and to finding quality businesses that offer sustainable growth prospects. In this light, fundamental insights, particularly quality insights, were the primary drivers of positive relative return over the course of the year. Among the portfolio’s fundamental signals, identifying positive dividend growth trends as a measure of quality was the top contributor. Identifying companies with attractive cash flow growth relative to operating assets also proved beneficial. Although performance was mixed with respect to the portfolio’s sentiment insights, those that provide a more quality-based lens into companies added value. Specifically, an insight that gauges sentiment from informed bond investors contributed significantly, given interest rate volatility. Text-based analyses of management conference calls to determine longer-term trends in company fundamentals proved beneficial as well. Both of these signals held up extremely well in the fourth quarter, in a market environment that was generally challenging for trend- and sentiment-based insights. Results from thematic signals were mixed for the period, contributing marginally to the Fund’s relative performance.
After beginning the year favoring growth stocks and trend-based strategies, investors later reversed course and sold out of more expensive, growth-oriented areas of the market on fears of expensive valuations and of approaching the end of the market cycle. As the sell-off was often disconnected with the broader sentiment of management and market participants, it created a more difficult environment for sentiment-based signals. The result was that certain sentiment insights detracted markedly from relative performance for the period, although sentiment signals in aggregate were essentially flat. For example, a signal that gauges company sentiment based on trends in online job postings was the largest detractor for the period. Identifying sentiment based on short positions of hedge funds acted as a drag on performance as well, largely due to significant hedge fund de-risking toward the end of the year. A signal that evaluates the impact of seasonality effects on a company’s stock price further detracted. Given a rotation out of growth positions, investors typically flock to pockets of attractive relative valuation. However, as value stocks showed some of the strongest earnings trends heading into the fourth quarter, they sold-off amid the rotation away from growth expectations. As a result, while fundamental signals held up well for the period, an insight that evaluates each stock based on forward sales relative to enterprise value hindered relative performance for the year.
Describe recent portfolio activity.
Over the course of the period, the portfolio maintained a balanced allocation of risk across all major return drivers. However, a number of new stock selection insights were added to the portfolio. Among these insights, a model that evaluates companies on the basis of governance and the ethics and sustainability of its business practices from a social and environmental perspective was added to the Fund’s bucket of quality signals. In addition, a new insight was added that captures the location of hotel booking trends and invests in related stocks most sensitive to those areas. A new macro thematic model that evaluates industries across various inputs such as labor costs and hiring activity was added as well.
Describe portfolio positioning at period end.
Relative to the Russell 1000® Value Index, the Fund was positioned essentially neutrally from a sector perspective. The Fund ended the period with slight overweight positions in industrials and health care and slight underweights in communication services and materials.
The views expressed reflect the opinions of BlackRock as of the date of this report and are subject to change based on changes in market, economic or other conditions. These views are not intended to be a forecast of future events and are no guarantee of future results.
| | |
| 2 | | 2018 BLACKROCK ANNUAL REPORTTO SHAREHOLDERS |
| | |
| Fund Summary as of December 31, 2018 (continued) | | BlackRock Advantage Large Cap Value V.I. Fund |
TOTAL RETURN BASED ON A $10,000 INVESTMENT
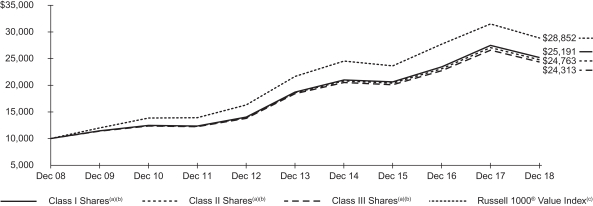
| (a) | Assuming transaction costs, if any, and other operating expenses, including investment advisory fees. Does not include insurance related fees and expenses. For a portion of the period, returns do not show the effects of distribution fees (12b-1 fees) applicable to Class II Shares. If such fees were included, returns shown would have been lower. The returns for Class III Shares prior to January 27, 2009, the recommencement of operations of Class III Shares, are based upon the performance of the Fund’s Class I Shares, as adjusted to reflect the distribution (12b-1) fees applicable to Class III Shares. |
| (b) | Under normal circumstances, the Fund seeks to invest at least 80% of its net assets, plus the amount of any borrowings for investment purposes, in large cap equity securities and derivatives that have similar economic characteristics to such securities. The Fund’s total returns prior to June 12, 2017 are the returns of the Fund when it followed a different investment objective and different investment strategies under the name “BlackRock Large Cap Value V.I. Fund”. |
| (c) | An unmanaged index that is a subset of the Russell 1000® Index that consists of those Russell 1000® securities with lower price-to book ratios and lower expected growth values. |
Performance Summary for the Period Ended December 31, 2018
| | | | | | | | | | | | | | | | | | | | | | | | |
| | | 6-Month
Total Returns (b) | | | | | | Average Annual Total Returns | |
| | | | | | 1 Year (b) | | | 5 Years (b) | | | | | | 10 Years (b) | |
Class I(a) | | | (7.60 | )% | | | | | | | (8.20 | )% | | | 6.14 | % | | | | | | | 9.68 | % |
Class II(a) | | | (7.68 | ) | | | | | | | (8.37 | ) | | | 5.93 | | | | | | | | 9.49 | |
Class III(a) | | | (7.67 | ) | | | | | | | (8.46 | ) | | | 5.77 | | | | | | | | 9.29 | (c) |
Russell 1000® Value Index | | | (6.69 | ) | | | | | | | (8.27 | ) | | | 5.95 | | | | | | | | 11.18 | |
| | (a) | Average annual and cumulative total returns are based on changes in net asset value for the periods shown, and assume reinvestment of all distributions at net asset value on the ex-dividend date. Insurance-related fees and expenses are not reflected in these returns. For the portion of the period, returns do not show the effects of distribution fees (12b-1 fees) applicable to Class II Shares. If such fees were included, returns shown would have been lower. The Fund’s total returns prior to June 12, 2017 are the returns of the Fund when it followed a different investment objective and different investment strategies under the name “BlackRock Large Cap Value V.I. Fund”. | |
| | (b) | For the portion of the period, the Fund’s investment adviser waived a portion of its fee. Without such waiver, the Fund’s performance would have been lower. | |
| | (c) | The returns for Class III Shares prior to January 27, 2009, the recommencement of operations of Class III Shares, are based upon the performance of the Fund’s Class I Shares, as adjusted to reflect the distribution (12b-1) fees applicable to Class III Shares. | |
Past performance is not indicative of future results. Performance results do not reflect the deduction of taxes that a shareholder would pay on Fund distributions or the redemption of Fund shares.
Performance results may include adjustments made for financial reporting purposes in accordance with U.S. generally accepted accounting principles.
Expense Example
| | | | | | | | | | | | | | | | | | | | | | | | | | | | | | | | |
| | | Actual | | | | | | Hypothetical (a) | | | | |
| | | Beginning
Account Value
(07/01/18) | | | Ending
Account Value
(12/31/18) | | | Expenses
Paid During
the Period (b) | | | | | | Beginning
Account Value
(07/01/18) | | | Ending
Account Value
(12/31/18) | | | Expenses
Paid During
the Period (b) | | | Annualized
Expense
Ratio | |
Class I | | $ | 1,000.00 | | | $ | 924.00 | | | $ | 2.96 | | | | | | | $ | 1,000.00 | | | $ | 1,022.13 | | | $ | 3.11 | | | | 0.61 | % |
Class II | | | 1,000.00 | | | | 923.20 | | | | 3.68 | | | | | | | | 1,000.00 | | | | 1,021.37 | | | | 3.87 | | | | 0.76 | |
Class III | | | 1,000.00 | | | | 923.30 | | | | 4.17 | | | | | | | | 1,000.00 | | | | 1,020.87 | | | | 4.38 | | | | 0.86 | |
| | (a) | Hypothetical 5% annual return before expenses is calculated by prorating the number of days in the most recent fiscal half year divided by 365. | |
| | (b) | For each class of the Fund, expenses are equal to annualized expense ratio for the class, multiplied by the average account value over the period, multiplied by 184/365 (to reflect the one-half year period shown). | |
See “Disclosure of Expenses” on the following page for further information on how expenses were calculated.
| | |
| Fund Summary as of December 31, 2018 (continued) | | BlackRock Advantage Large Cap Value V.I. Fund |
Portfolio Information
SECTOR ALLOCATION
| | | | |
| Sector | | Percent of
Net Assets | |
Financials | | | 23 | % |
Health Care | | | 16 | |
Information Technology | | | 9 | |
Energy | | | 9 | |
Industrials | | | 8 | |
Consumer Staples | | | 7 | |
Communication Services | | | 7 | |
Utilities | | | 7 | |
Real Estate | | | 5 | |
Consumer Discretionary | | | 5 | |
Materials | | | 3 | |
Short-Term Securities | | | 4 | |
Liabilities in Excess of Other Assets | | | (3 | ) |
For Fund compliance purposes, the Fund’s sector classifications refer to one or more of the sector sub-classifications used by one or more widely recognized market indexes or ratings group indexes, and/or as defined by the investment adviser. These definitions may not apply for purposes of this report, which may combine sector sub classifications for reporting ease.
Disclosure of Expenses
Shareholders of the Fund may incur the following charges: (a) transactional expenses; and (b) operating expenses, including investment advisory fees, service and distribution fees, including 12b-1 fees, acquired fund fees and expenses, and other fund expenses. The expense example on the previous page (which is based on a hypothetical investment of $1,000 invested on July 1, 2018 and held through December 31, 2018) is intended to assist shareholders both in calculating expenses based on an investment in the Fund and in comparing these expenses with similar costs of investing in other mutual funds.
The expense example provides information about actual account values and actual expenses. In order to estimate the expenses a shareholder paid during the period covered by this report, shareholders can divide their account value by $1,000 and then multiply the result by the number corresponding to their share class under the heading entitled “Expenses Paid During the Period.”
The expense example also provides information about hypothetical account values and hypothetical expenses based on the Fund’s actual expense ratio and an assumed rate of return of 5% per year before expenses. In order to assist shareholders in comparing the ongoing expenses of investing in the Fund and other funds, compare the 5% hypothetical example with the 5% hypothetical examples that appear in shareholder reports of other funds.
The expenses shown in the expense example are intended to highlight shareholders’ ongoing costs only and do not reflect any transactional expenses, such as sales charges, if any. Therefore, the hypothetical example is useful in comparing ongoing expenses only, and will not help shareholders determine the relative total expenses of owning different funds. If these transactional expenses were included, shareholder expenses would have been higher.
Derivative Financial Instruments
The Fund may invest in various derivative financial instruments. These instruments are used to obtain exposure to a security, commodity, index, market, and/or other assets without owning or taking physical custody of securities, commodities and/or other referenced assets or to manage market, equity, credit, interest rate, foreign currency exchange rate, commodity and/or other risks. Derivative financial instruments may give rise to a form of economic leverage and involve risks, including the imperfect correlation between the value of a derivative financial instrument and the underlying asset, possible default of the counterparty to the transaction or illiquidity of the instrument. The Fund’s successful use of a derivative financial instrument depends on the investment adviser’s ability to predict pertinent market movements accurately, which cannot be assured. The use of these instruments may result in losses greater than if they had not been used, may limit the amount of appreciation the Fund can realize on an investment and/or may result in lower distributions paid to shareholders. The Fund’s investments in these instruments, if any, are discussed in detail in the Notes to Financial Statements.
| | |
| 4 | | 2018 BLACKROCK ANNUAL REPORTTO SHAREHOLDERS |
| | |
Schedule of Investments December 31, 2018 | | BlackRock Advantage Large Cap Value V.I. Fund (Percentages shown are based on Net Assets) |
| | | | | | | | |
| Security | | Shares | | | Value | |
|
Common Stocks — 99.2% | |
|
Aerospace & Defense — 1.1% | |
Lockheed Martin Corp. | | | 461 | | | $ | 120,708 | |
Raytheon Co. | | | 5,243 | | | | 804,014 | |
United Technologies Corp. | | | 462 | | | | 49,194 | |
| | | | | | | | |
| | | | | | | 973,916 | |
|
| Airlines — 0.5% | |
Delta Air Lines, Inc. | | | 4,210 | | | | 210,079 | |
Southwest Airlines Co. | | | 5,015 | | | | 233,097 | |
| | | | | | | | |
| | | | | | | 443,176 | |
|
| Auto Components — 0.1% | |
BorgWarner, Inc. | | | 2,084 | | | | 72,398 | |
| | | | | | | | |
|
| Automobiles — 0.5% | |
Ford Motor Co. | | | 23,133 | | | | 176,968 | |
General Motors Co. | | | 7,398 | | | | 247,463 | |
| | | | | | | | |
| | | | | | | 424,431 | |
|
| Banks — 11.3% | |
Bank of America Corp. | | | 105,035 | | | | 2,588,062 | |
BB&T Corp. | | | 16,290 | | | | 705,683 | |
Citigroup, Inc. | | | 20,211 | | | | 1,052,185 | |
Citizens Financial Group, Inc. | | | 21,015 | | | | 624,776 | |
Cullen/Frost Bankers, Inc. | | | 2,801 | | | | 246,320 | |
East West Bancorp, Inc. | | | 9,967 | | | | 433,863 | |
First Republic Bank(a) | | | 5,470 | | | | 475,343 | |
Huntington Bancshares, Inc. | | | 8,693 | | | | 103,621 | |
JPMorgan Chase & Co. | | | 22,034 | | | | 2,150,959 | |
Synovus Financial Corp. | | | 795 | | | | 25,432 | |
US Bancorp | | | 1,362 | | | | 62,243 | |
Wells Fargo & Co. | | | 30,701 | | | | 1,414,702 | |
| | | | | | | | |
| | | | | | | 9,883,189 | |
|
| Beverages — 0.4% | |
Coca-Cola European Partners plc | | | 4,464 | | | | 204,674 | |
Constellation Brands, Inc., Class A | | | 220 | | | | 35,380 | |
Molson Coors Brewing Co., Class B | | | 1,263 | | | | 70,930 | |
Monster Beverage Corp.(b) | | | 857 | | | | 42,182 | |
PepsiCo, Inc. | | | 266 | | | | 29,388 | |
| | | | | | | | |
| | | | | | | 382,554 | |
|
| Biotechnology — 1.9% | |
AbbVie, Inc. | | | 2,123 | | | | 195,719 | |
Amgen, Inc. | | | 1,243 | | | | 241,975 | |
Celgene Corp.(b) | | | 6,632 | | | | 425,045 | |
Gilead Sciences, Inc. | | | 12,769 | | | | 798,701 | |
| | | | | | | | |
| | | | | | | 1,661,440 | |
|
| Building Products — 0.2% | |
Allegion plc | | | 2,715 | | | | 216,413 | |
| | | | | | | | |
|
| Capital Markets — 3.3% | |
Affiliated Managers Group, Inc. | | | 161 | | | | 15,688 | |
Charles Schwab Corp. (The) | | | 12,331 | | | | 512,106 | |
CME Group, Inc.(a) | | | 3,098 | | | | 582,796 | |
Evercore, Inc., Class A | | | 158 | | | | 11,307 | |
Goldman Sachs Group, Inc. (The) | | | 319 | | | | 53,289 | |
Invesco Ltd. | | | 7,414 | | | | 124,110 | |
Legg Mason, Inc. | | | 6,314 | | | | 161,070 | |
Moelis & Co., Class A | | | 2,585 | | | | 88,872 | |
Morgan Stanley | | | 32,707 | | | | 1,296,833 | |
SEI Investments Co. | | | 420 | | | | 19,404 | |
| | | | | | | | |
| | | | | | | 2,865,475 | |
|
| Chemicals — 2.3% | |
Air Products & Chemicals, Inc. | | | 7,444 | | | | 1,191,412 | |
Celanese Corp.(a) | | | 2,750 | | | | 247,418 | |
| | | | | | | | |
| Security | | Shares | | | Value | |
|
| Chemicals (continued) | |
Eastman Chemical Co. | | | 4,792 | | | $ | 350,343 | |
Ecolab, Inc. | | | 519 | | | | 76,475 | |
Huntsman Corp. | | | 5,270 | | | | 101,658 | |
Linde plc | | | 383 | | | | 59,763 | |
| | | | | | | | |
| | | | | | | 2,027,069 | |
|
| Commercial Services & Supplies — 0.2% | |
ADT, Inc. | | | 4,891 | | | | 29,395 | |
Clean Harbors, Inc.(a)(b) | | | 1,471 | | | | 72,594 | |
Republic Services, Inc. | | | 674 | | | | 48,588 | |
| | | | | | | | |
| | | | | | | 150,577 | |
|
| Communications Equipment — 1.9% | |
Ciena Corp.(b) | | | 1,454 | | | | 49,305 | |
Cisco Systems, Inc. | | | 31,081 | | | | 1,346,740 | |
CommScope Holding Co., Inc.(b) | | | 2,108 | | | | 34,550 | |
Motorola Solutions, Inc. | | | 1,700 | | | | 195,568 | |
| | | | | | | | |
| | | | | | | 1,626,163 | |
|
| Consumer Finance — 1.0% | |
Ally Financial, Inc. | | | 3,099 | | | | 70,223 | |
American Express Co. | | | 3,559 | | | | 339,244 | |
Capital One Financial Corp. | | | 6,196 | | | | 468,356 | |
Discover Financial Services | | | 300 | | | | 17,694 | |
| | | | | | | | |
| | | | | | | 895,517 | |
|
| Containers & Packaging — 0.4% | |
Packaging Corp. of America | | | 727 | | | | 60,676 | |
WestRock Co. | | | 8,124 | | | | 306,762 | |
| | | | | | | | |
| | | | | | | 367,438 | |
|
| Distributors — 0.1% | |
Genuine Parts Co. | | | 845 | | | | 81,137 | |
| | | | | | | | |
|
| Diversified Consumer Services — 0.2% | |
H&R Block, Inc. | | | 5,607 | | | | 142,250 | |
| | | | | | | | |
|
| Diversified Financial Services — 2.9% | |
AXA Equitable Holdings, Inc. | | | 9,469 | | | | 157,470 | |
Berkshire Hathaway, Inc., Class B(b) | | | 11,746 | | | | 2,398,298 | |
| | | | | | | | |
| | | | | | | 2,555,768 | |
|
| Diversified Telecommunication Services — 3.3% | |
AT&T, Inc. | | | 44,536 | | | | 1,271,057 | |
Verizon Communications, Inc. | | | 28,325 | | | | 1,592,432 | |
| | | | | | | | |
| | | | | | | 2,863,489 | |
|
| Electric Utilities — 3.3% | |
Alliant Energy Corp. | | | 829 | | | | 35,025 | |
Evergy, Inc. | | | 4,993 | | | | 283,453 | |
Eversource Energy | | | 3,688 | | | | 239,867 | |
OGE Energy Corp. | | | 17,635 | | | | 691,116 | |
Pinnacle West Capital Corp. | | | 9,909 | | | | 844,247 | |
Portland General Electric Co. | | | 11,150 | | | | 511,227 | |
Xcel Energy, Inc. | | | 6,277 | | | | 309,268 | |
| | | | | | | | |
| | | | | | | 2,914,203 | |
|
| Electrical Equipment — 0.8% | |
AMETEK, Inc. | | | 2,035 | | | | 137,770 | |
Rockwell Automation, Inc. | | | 3,771 | | | | 567,460 | |
| | | | | | | | |
| | | | | | | 705,230 | |
|
| Electronic Equipment, Instruments & Components — 0.8% | |
CDW Corp. | | | 2,851 | | | | 231,074 | |
National Instruments Corp. | | | 9,714 | | | | 440,821 | |
| | | | | | | | |
| | | | | | | 671,895 | |
|
| Energy Equipment & Services — 0.6% | |
Halliburton Co. | | | 12,866 | | | | 341,978 | |
Helmerich & Payne, Inc. | | | 1,168 | | | | 55,994 | |
| | | | |
| SCHEDULE OF INVESTMENTS | | | 5 | |
| | |
Schedule of Investments (continued) December 31, 2018 | | BlackRock Advantage Large Cap Value V.I. Fund (Percentages shown are based on Net Assets) |
| | | | | | | | |
| Security | | Shares | | | Value | |
|
| Energy Equipment & Services (continued) | |
Nabors Industries Ltd.(a) | | | 17,486 | | | $ | 34,972 | |
Schlumberger Ltd. | | | 1,690 | | | | 60,975 | |
TechnipFMC plc | | | 853 | | | | 16,702 | |
| | | | | | | | |
| | | | | | | 510,621 | |
|
| Entertainment — 0.7% | |
Cinemark Holdings, Inc. | | | 548 | | | | 19,618 | |
Electronic Arts, Inc.(b) | | | 148 | | | | 11,679 | |
Twenty-First Century Fox, Inc., Class A | | | 2,969 | | | | 142,868 | |
Twenty-First Century Fox, Inc., Class B | | | 2,316 | | | | 110,659 | |
Viacom, Inc., Class A | | | 2,740 | | | | 76,199 | |
Viacom, Inc., Class B | | | 10,374 | | | | 266,612 | |
| | | | | | | | |
| | | | | | | 627,635 | |
|
| Equity Real Estate Investment Trusts (REITs) — 4.9% | |
Apartment Investment & Management Co., Class A | | | 2,000 | | | | 87,760 | |
Brandywine Realty Trust | | | 8,943 | | | | 115,096 | |
Equity LifeStyle Properties, Inc. | | | 1,220 | | | | 118,499 | |
Highwoods Properties, Inc. | | | 8,149 | | | | 315,285 | |
Host Hotels & Resorts, Inc. | | | 26,354 | | | | 439,321 | |
Outfront Media, Inc. | | | 4,346 | | | | 78,750 | |
Park Hotels & Resorts, Inc. | | | 19,585 | | | | 508,818 | |
Prologis, Inc. | | | 20,805 | | | | 1,221,670 | |
Realty Income Corp. | | | 16,830 | | | | 1,060,963 | |
Simon Property Group, Inc. | | | 2,153 | | | | 361,682 | |
| | | | | | | | |
| | | | | | | 4,307,844 | |
|
| Food & Staples Retailing — 1.4% | |
Costco Wholesale Corp. | | | 1,936 | | | | 394,383 | |
Kroger Co. (The) | | | 2,907 | | | | 79,942 | |
Walmart, Inc. | | | 7,964 | | | | 741,847 | |
| | | | | | | | |
| | | | | | | 1,216,172 | |
|
| Food Products — 2.9% | |
Archer-Daniels-Midland Co. | | | 22,460 | | | | 920,186 | |
Hershey Co. (The) | | | 9,369 | | | | 1,004,169 | |
Hormel Foods Corp.(a) | | | 1,033 | | | | 44,088 | |
Kellogg Co. | | | 1,461 | | | | 83,292 | |
Lamb Weston Holdings, Inc. | | | 1,458 | | | | 107,251 | |
Tyson Foods, Inc., Class A | | | 6,230 | | | | 332,682 | |
| | | | | | | | |
| | | | | | | 2,491,668 | |
|
| Gas Utilities — 0.8% | |
Atmos Energy Corp. | | | 5,940 | | | | 550,757 | |
UGI Corp. | | | 2,644 | | | | 141,057 | |
| | | | | | | | |
| | | | | | | 691,814 | |
|
| Health Care Equipment & Supplies — 3.4% | |
Abbott Laboratories | | | 7,830 | | | | 566,344 | |
Danaher Corp. | | | 6,814 | | | | 702,659 | |
Medtronic plc | | | 9,248 | | | | 841,198 | |
STERIS plc | | | 2,102 | | | | 224,599 | |
Stryker Corp. | | | 3,941 | | | | 617,752 | |
| | | | | | | | |
| | | | | | | 2,952,552 | |
|
| Health Care Providers & Services — 3.2% | |
AmerisourceBergen Corp. | | | 3,317 | | | | 246,785 | |
Anthem, Inc. | | | 1,108 | | | | 290,994 | |
Cardinal Health, Inc.(a) | | | 9,954 | | | | 443,949 | |
CVS Health Corp. | | | 7,389 | | | | 484,127 | |
Halfmoon Parent, Inc. | | | 912 | | | | 173,257 | |
Humana, Inc. | | | 923 | | | | 264,421 | |
McKesson Corp.(a) | | | 3,625 | | | | 400,454 | |
Quest Diagnostics, Inc. | | | 1,970 | | | | 164,042 | |
UnitedHealth Group, Inc. | | | 877 | | | | 218,478 | |
WellCare Health Plans, Inc.(b) | | | 336 | | | | 79,326 | |
| | | | | | | | |
| | | | | | | 2,765,833 | |
| | | | | | | | |
| Security | | Shares | | | Value | |
|
| Health Care Technology — 0.1% | |
Veeva Systems, Inc., Class A(b) | | | 1,293 | | | $ | 115,491 | |
| | | | | | | | |
|
| Hotels, Restaurants & Leisure — 1.9% | |
Carnival Corp. | | | 3,578 | | | | 176,395 | |
Darden Restaurants, Inc. | | | 1,210 | | | | 120,831 | |
Domino’s Pizza, Inc. | | | 1,066 | | | | 264,357 | |
Extended Stay America, Inc. | | | 8,677 | | | | 134,494 | |
McDonald’s Corp. | | | 4,472 | | | | 794,093 | |
Norwegian Cruise Line Holdings Ltd.(b) | | | 3,657 | | | | 155,020 | |
| | | | | | | | |
| | | | | | | 1,645,190 | |
|
| Household Durables — 0.4% | |
Garmin Ltd. | | | 5,198 | | | | 329,137 | |
| | | | | | | | |
|
| Household Products — 1.8% | |
Church & Dwight Co., Inc. | | | 9,903 | | | | 651,221 | |
Colgate-Palmolive Co. | | | 1,404 | | | | 83,566 | |
Procter & Gamble Co. (The) | | | 9,390 | | | | 863,129 | |
| | | | | | | | |
| | | | | | | 1,597,916 | |
|
| Industrial Conglomerates — 0.8% | |
3M Co.(a) | | | 1,270 | | | | 241,986 | |
General Electric Co. | | | 50,440 | | | | 381,831 | |
Honeywell International, Inc. | | | 71 | | | | 9,380 | |
Roper Technologies, Inc. | | | 134 | | | | 35,714 | |
| | | | | | | | |
| | | | | | | 668,911 | |
|
| Insurance — 4.2% | |
Allstate Corp. (The) | | | 9,266 | | | | 765,650 | |
American Financial Group, Inc. | | | 4,867 | | | | 440,609 | |
Arthur J Gallagher & Co. | | | 4,983 | | | | 367,247 | |
Athene Holding Ltd., Class A(b) | | | 1,678 | | | | 66,835 | |
First American Financial Corp. | | | 8,486 | | | | 378,815 | |
Hartford Financial Services Group, Inc. (The) | | | 11,202 | | | | 497,929 | |
Lincoln National Corp. | | | 6,192 | | | | 317,712 | |
Loews Corp. | | | 8,081 | | | | 367,847 | |
Travelers Cos., Inc. (The) | | | 431 | | | | 51,612 | |
Unum Group | | | 15,088 | | | | 443,285 | |
| | | | | | | | |
| | | | | | | 3,697,541 | |
|
| Interactive Media & Services — 0.2%(b) | |
Cargurus, Inc. | | | 962 | | | | 32,448 | |
Facebook, Inc., Class A | | | 313 | | | | 41,031 | |
Yelp, Inc. | | | 3,008 | | | | 105,250 | |
| | | | | | | | |
| | | | | | | 178,729 | |
|
| IT Services — 1.2% | |
Automatic Data Processing, Inc. | | | 2,254 | | | | 295,545 | |
Booz Allen Hamilton Holding Corp. | | | 5,024 | | | | 226,432 | |
Fidelity National Information Services, Inc. | | | 1,784 | | | | 182,949 | |
International Business Machines Corp. | | | 788 | | | | 89,572 | |
Western Union Co. (The) | | | 16,139 | | | | 275,331 | |
| | | | | | | | |
| | | | | | | 1,069,829 | |
|
| Life Sciences Tools & Services — 0.4% | |
Agilent Technologies, Inc. | | | 2,529 | | | | 170,606 | |
Thermo Fisher Scientific, Inc. | | | 610 | | | | 136,512 | |
| | | | | | | | |
| | | | | | | 307,118 | |
|
| Machinery — 3.1% | |
Crane Co. | | | 11,745 | | | | 847,754 | |
Illinois Tool Works, Inc. | | | 2,589 | | | | 328,000 | |
Ingersoll-Rand plc | | | 7,568 | | | | 690,429 | |
PACCAR, Inc.(a) | | | 10,325 | | | | 589,971 | |
Parker-Hannifin Corp. | | | 100 | | | | 14,914 | |
Snap-on, Inc. | | | 1,807 | | | | 262,539 | |
| | | | | | | | |
| | | | | | | 2,733,607 | |
| | |
| 6 | | 2018 BLACKROCK ANNUAL REPORTTO SHAREHOLDERS |
| | |
Schedule of Investments (continued) December 31, 2018 | | BlackRock Advantage Large Cap Value V.I. Fund (Percentages shown are based on Net Assets) |
| | | | | | | | |
| Security | | Shares | | | Value | |
|
| Media — 2.4% | |
AMC Networks, Inc., Class A(b) | | | 4,609 | | | $ | 252,942 | |
CBS Corp. (Non-Voting), Class B | | | 1,856 | | | | 81,144 | |
Comcast Corp., Class A | | | 29,719 | | | | 1,011,932 | |
Interpublic Group of Cos., Inc. (The) | | | 9,211 | | | | 190,023 | |
Liberty Media Corp.-Liberty SiriusXM, Class A(b) | | | 6,792 | | | | 249,945 | |
Liberty Media Corp.-Liberty SiriusXM, Class C(b) | | | 7,063 | | | | 261,190 | |
Tribune Media Co., Class A | | | 636 | | | | 28,862 | |
| | | | | | | | |
| | | | | | | 2,076,038 | |
|
| Metals & Mining — 0.8% | |
Newmont Mining Corp. | | | 11,524 | | | | 399,307 | |
Reliance Steel & Aluminum Co. | | | 2,842 | | | | 202,265 | |
Steel Dynamics, Inc. | | | 2,838 | | | | 85,253 | |
| | | | | | | | |
| | | | | | | 686,825 | |
|
| Multiline Retail — 1.1% | |
Target Corp. | | | 14,284 | | | | 944,030 | |
| | | | | | | | |
| | |
| Multi-Utilities — 1.6% | | | | | | |
CenterPoint Energy, Inc. | | | 5,581 | | | | 157,552 | |
CMS Energy Corp. | | | 2,035 | | | | 101,038 | |
Consolidated Edison, Inc. | | | 9,942 | | | | 760,165 | |
Dominion Energy, Inc. | | | 2,886 | | | | 206,234 | |
DTE Energy Co. | | | 1,291 | | | | 142,397 | |
| | | | | | | | |
| | | | | | | 1,367,386 | |
|
| Oil, Gas & Consumable Fuels — 8.3% | |
Anadarko Petroleum Corp. | | | 11,303 | | | | 495,524 | |
Antero Resources Corp.(b) | | | 9,355 | | | | 87,843 | |
Apache Corp. | | | 3,415 | | | | 89,644 | |
Chevron Corp. | | | 12,375 | | | | 1,346,276 | |
Concho Resources, Inc.(b) | | | 714 | | | | 73,392 | |
ConocoPhillips | | | 16,377 | | | | 1,021,106 | |
Continental Resources, Inc.(b) | | | 3,720 | | | | 149,507 | |
EOG Resources, Inc. | | | 748 | | | | 65,233 | |
Exxon Mobil Corp. | | | 29,174 | | | | 1,989,375 | |
Kinder Morgan, Inc. | | | 37,798 | | | | 581,333 | |
Marathon Oil Corp. | | | 1,195 | | | | 17,136 | |
Newfield Exploration Co.(b) | | | 920 | | | | 13,487 | |
Occidental Petroleum Corp. | | | 7,928 | | | | 486,621 | |
Phillips 66 | | | 6,145 | | | | 529,392 | |
Plains GP Holdings LP, Class A(b) | | | 653 | | | | 13,125 | |
Suncor Energy, Inc.(a) | | | 1,478 | | | | 41,340 | |
Valero Energy Corp. | | | 1,397 | | | | 104,733 | |
Williams Cos., Inc. (The) | | | 7,837 | | | | 172,806 | |
| | | | | | | | |
| | | | | | | 7,277,873 | |
|
| Personal Products — 0.2% | |
Estee Lauder Cos., Inc. (The), Class A | | | 1,430 | | | | 186,043 | |
Herbalife Nutrition Ltd.(b) | | | 276 | | | | 16,270 | |
| | | | | | | | |
| | | | | | | 202,313 | |
|
| Pharmaceuticals — 7.1% | |
Allergan plc | | | 1,261 | | | | 168,545 | |
Bristol-Myers Squibb Co. | | | 10,149 | | | | 527,545 | |
Eli Lilly & Co. | | | 3,818 | | | | 441,819 | |
Johnson & Johnson | | | 19,103 | | | | 2,465,242 | |
Merck & Co., Inc. | | | 22,929 | | | | 1,752,005 | |
Pfizer, Inc. | | | 20,363 | | | | 888,845 | |
| | | | | | | | |
| | | | | | | 6,244,001 | |
|
| Professional Services — 0.4% | |
Insperity, Inc. | | | 3,445 | | | | 321,625 | |
| | | | | | | | |
| | |
| Road & Rail — 0.7% | | | | | | |
Landstar System, Inc. | | | 2,299 | | | | 219,945 | |
Norfolk Southern Corp. | | | 2,565 | | | | 383,570 | |
Schneider National, Inc., Class B | | | 637 | | | | 11,893 | |
| | | | | | | | |
| | | | | | | 615,408 | |
| | | | | | | | |
| Security | | Shares | | | Value | |
|
| Semiconductors & Semiconductor Equipment — 3.1% | |
Analog Devices, Inc. | | | 3,808 | | | $ | 326,840 | |
Applied Materials, Inc. | | | 1,112 | | | | 36,407 | |
Intel Corp. | | | 36,462 | | | | 1,711,162 | |
Maxim Integrated Products, Inc.(a) | | | 1,649 | | | | 83,852 | |
QUALCOMM, Inc. | | | 6,662 | | | | 379,134 | |
Skyworks Solutions, Inc. | | | 2,457 | | | | 164,668 | |
| | | | | | | | |
| | | | | | | 2,702,063 | |
|
| Software — 1.7% | |
Dropbox, Inc., Class A(b) | | | 3,126 | | | | 63,864 | |
Microsoft Corp. | | | 447 | | | | 45,402 | |
Oracle Corp. | | | 23,253 | | | | 1,049,873 | |
salesforce.com, Inc.(b) | | | 738 | | | | 101,084 | |
Synopsys, Inc.(b) | | | 2,954 | | | | 248,845 | |
| | | | | | | | |
| | | | | | | 1,509,068 | |
|
| Specialty Retail — 0.1% | |
AutoNation, Inc.(b) | | | 577 | | | | 20,599 | |
Dick’s Sporting Goods, Inc. | | | 674 | | | | 21,029 | |
Five Below, Inc.(b) | | | 122 | | | | 12,483 | |
Penske Automotive Group, Inc. | | | 358 | | | | 14,434 | |
| | | | | | | | |
| | | | | | | 68,545 | |
|
| Technology Hardware, Storage & Peripherals — 0.8% | |
Dell Technologies, Inc., Class C(b) | | | 1,248 | | | | 60,995 | |
Hewlett Packard Enterprise Co. | | | 9,214 | | | | 121,717 | |
HP, Inc. | | | 21,293 | | | | 435,655 | |
Pure Storage, Inc., Class A(b) | | | 4,616 | | | | 74,225 | |
| | | | | | | | |
| | | | | | | 692,592 | |
|
| Textiles, Apparel & Luxury Goods — 0.5% | |
NIKE, Inc., Class B | | | 3,728 | | | | 276,394 | |
Ralph Lauren Corp. | | | 312 | | | | 32,279 | |
VF Corp. | | | 1,238 | | | | 88,319 | |
| | | | | | | | |
| | | | | | | 396,992 | |
|
| Tobacco — 0.8% | |
Altria Group, Inc. | | | 615 | | | | 30,375 | |
Philip Morris International, Inc. | | | 9,904 | | | | 661,191 | |
| | | | | | | | |
| | | | | | | 691,566 | |
|
| Water Utilities — 1.0% | |
American Water Works Co., Inc. | | | 9,784 | | | | 888,094 | |
| | | | | | | | |
| | |
| Wireless Telecommunication Services — 0.1% | | | | | | |
Sprint Corp.(b) | | | 2,139 | | | | 12,449 | |
Telephone & Data Systems, Inc. | | | 3,482 | | | | 113,304 | |
| | | | | | | | |
| | | | | | | 125,753 | |
| |
Total Common Stocks — 99.2%
(Cost: $92,464,539) | | | | 86,641,508 | |
| | | | | | | | |
| | |
Total Long-Term Investments — 99.2%
(Cost: $92,464,539) | | | | | | | 86,641,508 | |
| | | | | | | | |
|
Short-Term Securities — 4.1%(c) | |
BlackRock Liquidity Funds, T-Fund, Institutional
Class, 2.32%(e) | | | 939,148 | | | | 939,148 | |
JPMorgan US Treasury Plus Money Market Fund, Agency
Class, 2.24% | | | 9,354 | | | | 9,354 | |
| | | | |
| SCHEDULE OF INVESTMENTS | | | 7 | |
| | |
Schedule of Investments (continued) December 31, 2018 | | BlackRock Advantage Large Cap Value V.I. Fund (Percentages shown are based on Net Assets) |
| | | | | | | | |
| Security | | Shares | | | Value | |
| | |
| Short-Term Securities (continued) | | | | | | |
SL Liquidity Series, LLC, Money Market
Series, 2.57%(d)(e) | | | 2,669,646 | | | $ | 2,669,379 | |
| | | | | | | | |
| |
Total Short-Term Securities — 4.1%
(Cost: $3,617,993) | | | | 3,617,881 | |
| | | | | | | | |
| | | | | | |
| Security | | | | Value | |
| |
Total Investments — 103.3%
(Cost: $96,082,532) | | $ | 90,259,389 | |
| |
Liabilities in Excess of Other Assets — (3.3)% | | | (2,885,535 | ) |
| | | | | | |
| |
Net Assets — 100.0% | | $ | 87,373,854 | |
| | | | | | |
| (a) | Security, or a portion of the security, is on loan. |
| (b) | Non-income producing security. |
| (c) | Annualized 7-day yield as of period end. |
| (d) | Security was purchased with the cash collateral from loaned securities |
| (e) | During the year ended December 31, 2018, investments in issuers considered to be affiliates of the Fund for the purposes of Section 2(a)(3) of the Investment Company Act of 1940, as amended, were as follows: |
| | | | | | | | | | | | | | | | | | | | | | | | | | | | |
| Affiliate | | Shares
Held at
12/31/17 | | | Net
Activity | | | Shares
Held at
12/31/18 | | | Value at
12/31/18 | | | Income | | | Net
Realized
Gain (Loss) (a) | | | Change in
Unrealized
Appreciation
(Depreciation) | |
BlackRock Liquidity Funds, T-Fund, Ins Class | | | 1,446,302 | | | | (507,154 | ) | | | 939,148 | | | $ | 939,148 | | | $ | 14,593 | | | $ | — | | | $ | — | |
SL Liquidity Series, LLC, Money Market Series | | | 3,613,873 | | | | (944,227 | ) | | | 2,669,646 | | | | 2,669,379 | | | | 4,390 | (b) | | | 1,231 | | | | (28 | ) |
| | | | | | | | | | | | | | | | | | | | | | | | | | | | |
| | | | | | | | | | | | | | $ | 3,608,527 | | | $ | 18,983 | | | $ | 1,231 | | | $ | (28 | ) |
| | | | | | | | | | | | | | | | | | | | | | | | | | | | |
| | (a) | Includes net capital gain distributions, if applicable. | |
| | (b) | Represents securities lending income earned from the reinvestment of cash collateral from loaned securities, net of fees and collateral investment expenses, and other payments to and from borrowers of securities. | |
For Fund compliance purposes, the Fund’s industry classifications refer to one or more of the industry sub-classifications used by one or more widely recognized market indexes or ratings group indexes, and/or as defined by the investment advisor. These definitions may not apply for purposes of this report, which may combine such industry sub-classifications for reporting ease.
Derivative Financial Instruments Outstanding as of Period End
Futures Contracts
| | | | | | | | | | | | | | | | |
| Description | | Number of
Contracts | | | Expiration
Date | | | Notional
Amount (000) | | | Value/
Unrealized
Appreciation (Depreciation) | |
Long Contracts | | | | | | | | | | | | | | | | |
S&P 500 E-Mini Index | | | 9 | | | | 03/15/19 | | | $ | 1,127 | | | $ | (11,755 | ) |
| | | | | | | | | | | | | | | | |
Derivative Financial Instruments Categorized by Risk Exposure
As of period end, the fair values of derivative financial instruments located in the Statement of Assets and Liabilities were as follows:
| | | | | | | | | | | | | | | | | | | | | | | | | | | | |
| | | Commodity
Contracts | | | Credit
Contracts | | | Equity
Contracts | | | Foreign
Currency
Exchange
Contracts | | | Interest
Rate
Contracts | | | Other
Contracts | | | Total | |
Liabilities — Derivative Financial Instruments | | | | | | | | | | | | | | | | | | | | | | | | | | | | |
Futures contracts | | | | | | | | | | | | | | | | | | | | | | | | | | | | |
Net unrealized depreciation(a) | | $ | — | | | $ | — | | | $ | 11,755 | | | $ | — | | | $ | — | | | $ | — | | | $ | 11,755 | |
| | | | | | | | | | | | | | | | | | | | | | | | | | | | |
| | (a) | Includes cumulative depreciation on futures contracts, if any, as reported in the Schedule of Investments. Only current day’s variation margin is reported within the Statement of Assets and Liabilities. | |
| | |
| 8 | | 2018 BLACKROCK ANNUAL REPORTTO SHAREHOLDERS |
| | |
Schedule of Investments (continued) December 31, 2018 | | BlackRock Advantage Large Cap Value V.I. Fund |
For the year ended December 31, 2018, the effect of derivative financial instruments in the Statement of Operations were as follows:
| | | | | | | | | | | | | | | | | | | | | | | | | | | | |
| | | Commodity
Contracts | | | Credit
Contracts | | | Equity
Contracts | | | Foreign
Currency
Exchange
Contracts | | | Interest
Rate
Contracts | | | Other
Contracts | | | Total | |
Net Realized Gain (Loss) from: | | | | | | | | | | | | | | | | | | | | | | | | | | | | |
Futures contracts | | $ | — | | | $ | — | | | $ | (45,163 | ) | | $ | — | | | $ | — | | | $ | — | | | $ | (45,163 | ) |
| | | | | | | | | | | | | | | | | | | | | | | | | | | | |
| | | | | | | |
| Net Change in Unrealized Appreciation (Depreciation) on: | | | | | | | | | | | | | | | | | | | | | |
Futures contracts | | $ | — | | | $ | — | | | $ | (19,989 | ) | | $ | — | | | $ | — | | | $ | — | | | $ | (19,989 | ) |
| | | | | | | | | | | | | | | | | | | | | | | | | | | | |
Average Quarterly Balances of Outstanding Derivative Financial Instruments
| | | | |
Futures contracts: | | | | |
Average notional value of contracts — long | | $ | 1,105,763 | |
For more information about the Fund’s investment risks regarding derivative financial instruments, refer to the Notes to Financial Statements.
Fair Value Hierarchy as of Period End
Various inputs are used in determining the fair value of investments and derivative financial instruments. For information about the Fund’s policy regarding valuation of investments and derivative financial instruments, refer to the Notes to Financial Statements.
The following tables summarize the Fund’s investments and derivative financial instruments categorized in the disclosure hierarchy:
| | | | | | | | | | | | | | | | |
| | | Level 1 | | | Level 2 | | | Level 3 | | | Total | |
Assets: | | | | | | | | | | | | | | | | |
Investments: | | | | | | | | | | | | | | | | |
Long-Term Investments | | | | | | | | | | | | | | | | |
Common Stocks(a) | | $ | 86,641,508 | | | $ | — | | | $ | — | | | $ | 86,641,508 | |
Short-Term Securities | | | 948,502 | | | | — | | | | — | | | | 948,502 | |
| | | | | | | | | | | | | | | | |
Subtotal | | $ | 87,590,010 | | | $ | — | | | $ | — | | | $ | 87,590,010 | |
| | | | | | | | | | | | | | | | |
Investments valued at NAV(b) | | | | | | | | | | | | | | | 2,669,379 | |
| | | | | | | | | | | | | | | | |
Total Investments | | | | | | | | | | | | | | $ | 90,259,389 | |
| | | | | | | | | | | | | | | | |
Derivative Financial Instruments(c) | | | | | | | | | | | | | | | | |
Liabilities: | | | | | | | | | | | | | | | | |
Equity contracts | | $ | (11,755 | ) | | $ | — | | | $ | — | | | $ | (11,755 | ) |
| | | | | | | | | | | | | | | | |
| | (a) | See above Schedule of Investments for values in each industry. | |
| | (b) | As of December 31, 2018, certain investments of the Fund were fair valued using NAV per share as no quoted market value is available and therefore have been excluded from the fair value hierarchy. | |
| | (c) | Derivative financial instruments are futures contracts, which are valued at the unrealized appreciation (depreciation) on the instrument. | |
During the year ended December 31, 2018, there were no transfers between levels.
See notes to financial statements.
| | | | |
| SCHEDULE OF INVESTMENTS | | | 9 | |
Statement of Assets and Liabilities
December 31, 2018
| | | | |
| | | BlackRock
Advantage
Large Cap
Value V.I. Fund | |
| |
ASSETS | | | | |
Investments at value — unaffiliated (including securities loaned at value of $2,612,432) (cost — $92,473,893) | | $ | 86,650,862 | |
Investments at value — affiliated (cost — $3,608,639) | | | 3,608,527 | |
Cash | | | 333 | |
Cash pledged for futures contracts | | | 55,000 | |
Receivables: | | | | |
Securities lending income — affiliated | | | 518 | |
Capital shares sold | | | 6,499 | |
Dividends — affiliated | | | 1,907 | |
Dividends — unaffiliated | | | 170,533 | |
From custodian | | | 9,354 | |
From the Manager | | | 1,633 | |
Variation margin on futures contracts | | | 7,432 | |
Prepaid expenses | | | 101 | |
| | | | |
Total assets | | | 90,512,699 | |
| | | | |
| |
LIABILITIES | | | | |
Cash collateral on securities loaned at value | | | 2,668,546 | |
Payables: | | | | |
Investments purchased | | | 78,710 | |
Capital shares redeemed | | | 131,936 | |
Printing fees | | | 32,687 | |
Professional fees | | | 69,907 | |
Distribution fees | | | 1,424 | |
Transfer agent fees | | | 81,218 | |
Board realignment and consolidation | | | 6,120 | |
Investment advisory fees | | | 41,325 | |
Directors’ and Officer’s fees | | | 5,274 | |
Other affiliates | | | 229 | |
Other accrued expenses | | | 21,469 | |
| | | | |
Total liabilities | | | 3,138,845 | |
| | | | |
| |
NET ASSETS | | $ | 87,373,854 | |
| | | | |
| |
NET ASSETS CONSIST OF | | | | |
Paid-in capital | | $ | 94,379,902 | |
Accumulated loss | | | (7,006,048 | ) |
| | | | |
NET ASSETS | | $ | 87,373,854 | |
| | | | |
| |
NET ASSET VALUE | | | | |
Class I — Based on net assets of $78,684,869 and 9,370,177 shares outstanding, 100 million shares authorized, $0.10 par value | | $ | 8.40 | |
| | | | |
Class II — Based on net assets of $4,812,991 and 570,315 shares outstanding, 100 million shares authorized, $0.10 par value | | $ | 8.44 | |
| | | | |
Class III — Based on net assets of $3,875,994 and 470,387 shares outstanding, 100 million shares authorized, $0.10 par value | | $ | 8.24 | |
| | | | |
See notes to financial statements.
| | |
| 10 | | 2018 BLACKROCK ANNUAL REPORTTO SHAREHOLDERS |
Statement of Operations
Year Ended December 31, 2018
| | | | |
| | | BlackRock
Advantage
Large Cap
Value V.I. Fund | |
| |
INVESTMENT INCOME | | | | |
Dividends — affiliated | | $ | 14,593 | |
Dividends — unaffiliated(a) | | | 2,567,583 | |
Securities lending income — affiliated — net | | | 4,390 | |
Foreign taxes withheld | | | (905 | ) |
| | | | |
Total investment income | | | 2,585,661 | |
| | | | |
| |
EXPENSES | | | | |
Investment advisory | | | 772,802 | |
Transfer agent — class specific | | | 214,374 | |
Professional | | | 59,494 | |
Accounting services | | | 47,721 | |
Custodian | | | 26,424 | |
Printing | | | 23,093 | |
Directors and Officer | | | 18,965 | |
Distribution — class specific | | | 18,554 | |
Board realignment and consolidation | | | 6,182 | |
Transfer agent | | | 5,001 | |
Miscellaneous | | | 31,618 | |
| | | | |
Total expenses | | | 1,224,228 | |
Less: | | | | |
Fees waived and/or reimbursed by the Manager | | | (366,925 | ) |
Transfer agent fees waived and/or reimbursed — class specific | | | (214,374 | ) |
| | | | |
Total expenses after fees waived and/or reimbursed | | | 642,929 | |
| | | | |
Net investment income | | | 1,942,732 | |
| | | | |
| |
REALIZED AND UNREALIZED GAIN (LOSS) | | | | |
Net realized gain (loss) from: | | | | |
Investments — affiliated | | | 1,231 | |
Investments — unaffiliated | | | 8,787,139 | |
Futures contracts | | | (45,163 | ) |
| | | | |
| | | 8,743,207 | |
| | | | |
Net change in unrealized appreciation (depreciation) on: | | | | |
Investments — affiliated | | | (28 | ) |
Investments — unaffiliated | | | (18,285,403 | ) |
Futures contracts | | | (19,989 | ) |
| | | | |
| | | (18,305,420 | ) |
| | | | |
Net realized and unrealized loss | | | (9,562,213 | ) |
| | | | |
NET DECREASE IN NET ASSETS RESULTING FROM OPERATIONS | | $ | (7,619,481 | ) |
| | | | |
| (a) | Includesnon-recurring dividends in the amount of $97,575. |
See notes to financial statements.
Statements of Changes in Net Assets
| | | | | | | | |
| | | BlackRock Advantage
Large Cap Value V.I. Fund | |
| | | Year Ended December 31, | |
| | 2018 | | | 2017 | |
| | |
INCREASE (DECREASE) IN NET ASSETS | | | | | | | | |
| | |
OPERATIONS | | | | | | | | |
Net investment income | | $ | 1,942,732 | | | $ | 1,617,399 | |
Net realized gain | | | 8,743,207 | | | | 25,548,122 | |
Net change in unrealized appreciation (depreciation) | | | (18,305,420 | ) | | | (10,474,117 | ) |
| | | | | | | | |
Net increase (decrease) in net assets resulting from operations | | | (7,619,481 | ) | | | 16,691,404 | |
| | | | | | | | |
| | |
DISTRIBUTIONS TO SHAREHOLDERS(a)(b) | | | | | | | | |
Class I | | | (11,110,415 | ) | | | (25,114,786 | ) |
Class II | | | (700,196 | ) | | | (1,760,796 | ) |
Class III | | | (534,460 | ) | | | (764,127 | ) |
| | | | | | | | |
Decrease in net assets resulting from distributions to shareholders | | | (12,345,071 | ) | | | (27,639,709 | ) |
| | | | | | | | |
| | |
CAPITAL SHARE TRANSACTIONS | | | | | | | | |
Net increase (decrease) in net assets derived from capital share transactions | | | (1,956,471 | ) | | | 19,457,704 | |
| | | | | | | | |
| | |
NET ASSETS(b) | | | | | | | | |
Total increase (decrease) in net assets | | | (21,921,023 | ) | | | 8,509,399 | |
Beginning of year | | | 109,294,877 | | | | 100,785,478 | |
| | | | | | | | |
End of year | | $ | 87,373,854 | | | $ | 109,294,877 | |
| | | | | | | | |
| (a) | Distributions for annual periods determined in accordance with U.S. federal income tax regulations. |
| (b) | Prior year distribution character information and undistributed net investment income has been modified or removed to conform with current year RegulationS-X presentation changes. Refer to Note 12 for this prior year information. |
See notes to financial statements.
| | |
| 12 | | 2018 BLACKROCK ANNUAL REPORTTO SHAREHOLDERS |
Financial Highlights
(For a share outstanding throughout each period)
| | | | | | | | | | | | | | | | | | | | |
| | | BlackRock Advantage Large Cap Value V.I. Fund | |
| |
| | | Class I | |
| |
| | | Year Ended December 31, | |
| | 2018 | | | 2017 | | | 2016 | | | 2015 | | | 2014 | |
| | | | | |
Net asset value, beginning of year | | $ | 10.63 | | | $ | 12.06 | | | $ | 11.49 | | | $ | 12.74 | | | $ | 13.22 | |
| | | | | | | | | | | | | | | | | | | | |
Net investment income(a) | | | 0.20 | (b) | | | 0.20 | | | | 0.15 | | | | 0.14 | | | | 0.15 | |
Net realized and unrealized gain (loss) | | | (1.08 | ) | | | 1.86 | | | | 1.41 | | | | (0.36 | ) | | | 1.47 | |
| | | | | | | | | | | | | | | | | | | | |
Net increase (decrease) from investment operations | | | (0.88 | ) | | | 2.06 | | | | 1.56 | | | | (0.22 | ) | | | 1.62 | |
| | | | | | | | | | | | | | | | | | | | |
| | | | | |
| Distributions:(c) | | | | | | | | | | | | | | | |
From net investment income | | | (0.21 | ) | | | (0.21 | ) | | | (0.16 | ) | | | (0.15 | ) | | | (0.16 | ) |
From net realized gain | | | (1.14 | ) | | | (3.28 | ) | | | (0.83 | ) | | | (0.88 | ) | | | (1.94 | ) |
| | | | | | | | | | | | | | | | | | | | |
Total distributions | | | (1.35 | ) | | | (3.49 | ) | | | (0.99 | ) | | | (1.03 | ) | | | (2.10 | ) |
| | | | | | | | | | | | | | | | | | | | |
| | | | | |
Net asset value, end of year | | $ | 8.40 | | | $ | 10.63 | | | $ | 12.06 | | | $ | 11.49 | | | $ | 12.74 | |
| | | | | | | | | | | | | | | | | | | | |
| | | | | |
Total Return(d) | | | | | | | | | | | | | | | | | | | | |
Based on net asset value | | | (8.20 | )% | | | 17.22 | % | | | 13.60 | % | | | (1.72 | )% | | | 12.22 | % |
| | | | | | | | | | | | | | | | | | | | |
| | | | | |
Ratios to Average Net Assets(e) | | | | | | | | | | | | | | | | | | | | |
Total expenses | | | 1.17 | % | | | 1.17 | % | | | 1.09 | % | | | 1.08 | % | | | 1.08 | % |
| | | | | | | | | | | | | | | | | | | | |
Total expenses after fees waived and/or reimbursed | | | 0.61 | % | | | 0.71 | % | | | 0.82 | % | | | 0.77 | % | | | 0.77 | % |
| | | | | | | | | | | | | | | | | | | | |
Net investment income | | | 1.90 | %(b) | | | 1.57 | % | | | 1.29 | % | | | 1.14 | % | | | 1.10 | % |
| | | | | | | | | | | | | | | | | | | | |
| | | | | |
Supplemental Data | | | | | | | | | | | | | | | | | | | | |
Net assets, end of year (000) | | $ | 78,685 | | | $ | 99,213 | | | $ | 92,795 | | | $ | 93,983 | | | $ | 109,570 | |
| | | | | | | | | | | | | | | | | | | | |
Portfolio turnover rate | | | 164 | % | | | 168 | % | | | 47 | % | | | 29 | % | | | 35 | % |
| | | | | | | | | | | | | | | | | | | | |
| (a) | Based on average shares outstanding. |
| (b) | Net investment income per share and the ratio of net investment income to average net assets includes $0.01 per share and 0.09%, respectively, resulting from anon-recurring dividend. |
| (c) | Distributions for annual periods determined in accordance with U.S. federal income tax regulations. |
| (d) | Where applicable, excludes insurance-related fees and expenses and assumes the reinvestment of distributions. |
| (e) | Excludes expenses incurred indirectly as a result of investments in underlying funds as follows: |
| | | | | | | | | | | | | | | | | | | | | | | | | | | | | | | | | | | | | | | | |
| | | Year Ended December 31, | |
| | | 2018 | | | | | | 2017 | | | | | | 2016 | | | | | | 2015 | | | | | | 2014 | | | | |
Investments in underlying funds | | | 0.00 | % | | | | | | | 0.01 | % | | | | | | | — | % | | | | | | | — | % | | | | | | | — | % | | | | |
| | | | | | | | | | | | | | | | | | | | | | | | | | | | | | | | | | | | | | | | |
See notes to financial statements.
Financial Highlights (continued)
(For a share outstanding throughout each period)
| | | | | | | | | | | | | | | | | | | | |
| | | BlackRock Advantage Large Cap Value V.I. Fund (continued) | |
| |
| | | Class II | |
| |
| | | Year Ended December 31, | |
| | 2018 | | | 2017 | | | 2016 | | | 2015 | | | 2014 | |
| | | | | |
Net asset value, beginning of year | | $ | 10.67 | | | $ | 12.09 | | | $ | 11.52 | | | $ | 12.77 | | | $ | 13.25 | |
| | | | | | | | | | | | | | | | | | | | |
Net investment income(a) | | | 0.19 | (b) | | | 0.18 | | | | 0.13 | | | | 0.12 | | | | 0.13 | |
Net realized and unrealized gain (loss) | | | (1.09 | ) | | | 1.86 | | | | 1.40 | | | | (0.36 | ) | | | 1.46 | |
| | | | | | | | | | | | | | | | | | | | |
Net increase (decrease) from investment operations | | | (0.90 | ) | | | 2.04 | | | | 1.53 | | | | (0.24 | ) | | | 1.59 | |
| | | | | | | | | | | | | | | | | | | | |
| | | | | |
| Distributions:(c) | | | | | | | | | | | | | | | |
From net investment income | | | (0.19 | ) | | | (0.18 | ) | | | (0.13 | ) | | | (0.13 | ) | | | (0.13 | ) |
From net realized gain | | | (1.14 | ) | | | (3.28 | ) | | | (0.83 | ) | | | (0.88 | ) | | | (1.94 | ) |
| | | | | | | | | | | | | | | | | | | | |
Total distributions | | | (1.33 | ) | | | (3.46 | ) | | | (0.96 | ) | | | (1.01 | ) | | | (2.07 | ) |
| | | | | | | | | | | | | | | | | | | | |
| | | | | |
Net asset value, end of year | | $ | 8.44 | | | $ | 10.67 | | | $ | 12.09 | | | $ | 11.52 | | | $ | 12.77 | |
| | | | | | | | | | | | | | | | | | | | |
| | | | | |
Total Return(d) | | | | | | | | | | | | | | | | | | | | |
Based on net asset value | | | (8.37 | )% | | | 17.06 | % | | | 13.35 | % | | | (1.96 | )% | | | 11.94 | % |
| | | | | | | | | | | | | | | | | | | | |
| | | | | |
Ratios to Average Net Assets(e) | | | | | | | | | | | | | | | | | | | | |
Total expenses | | | 1.32 | % | | | 1.32 | % | | | 1.27 | % | | | 1.19 | % | | | 1.23 | % |
| | | | | | | | | | | | | | | | | | | | |
Total expenses after fees waived and/or reimbursed | | | 0.76 | % | | | 0.88 | % | | | 1.03 | % | | | 0.96 | % | | | 0.97 | % |
| | | | | | | | | | | | | | | | | | | | |
Net investment income | | | 1.74 | %(b) | | | 1.38 | % | | | 1.10 | % | | | 0.95 | % | | | 0.92 | % |
| | | | | | | | | | | | | | | | | | | | |
| | | | | |
Supplemental Data | | | | | | | | | | | | | | | | | | | | |
Net assets, end of year (000) | | $ | 4,813 | | | $ | 7,063 | | | $ | 6,060 | | | $ | 5,680 | | | $ | 4,002 | |
| | | | | | | | | | | | | | | | | | | | |
Portfolio turnover rate | | | 164 | % | | | 168 | % | | | 47 | % | | | 29 | % | | | 35 | % |
| | | | | | | | | | | | | | | | | | | | |
| (a) | Based on average shares outstanding. |
| (b) | Net investment income per share and the ratio of net investment income to average net assets includes $0.01 per share and 0.10%, respectively, resulting from anon-recurring dividend. |
| (c) | Distributions for annual periods determined in accordance with U.S. federal income tax regulations. |
| (d) | Where applicable, excludes insurance-related fees and expenses and assumes the reinvestment of distributions. |
| (e) | Excludes expenses incurred indirectly as a result of investments in underlying funds as follows: |
| | | | | | | | | | | | | | | | | | | | | | | | | | | | | | | | | | | | | | | | |
| | | Year Ended December 31, | |
| | | 2018 | | | | | | 2017 | | | | | | 2016 | | | | | | 2015 | | | | | | 2014 | | | | |
Investments in underlying funds | | | 0.00 | % | | | | | | | 0.01 | % | | | | | | | — | % | | | | | | | — | % | | | | | | | — | % | | | | |
| | | | | | | | | | | | | | | | | | | | | | | | | | | | | | | | | | | | | | | | |
See notes to financial statements.
| | |
| 14 | | 2018 BLACKROCK ANNUAL REPORTTO SHAREHOLDERS |
Financial Highlights (continued)
(For a share outstanding throughout each period)
| | | | | | | | | | | | | | | | | | | | |
| | | BlackRock Advantage Large Cap Value V.I. Fund (continued) | |
| |
| | | Class III | |
| |
| | | Year Ended December 31, | |
| | 2018 | | | 2017 | | | 2016 | | | 2015 | | | 2014 | |
| | | | | |
Net asset value, beginning of year | | $ | 10.46 | | | $ | 11.92 | | | $ | 11.37 | | | $ | 12.61 | | | $ | 13.12 | |
| | | | | | | | | | | | | | | | | | | | |
Net investment income(a) | | | 0.18 | (b) | | | 0.16 | | | | 0.11 | | | | 0.10 | | | | 0.10 | |
Net realized and unrealized gain (loss) | | | (1.07 | ) | | | 1.83 | | | | 1.38 | | | | (0.36 | ) | | | 1.44 | |
| | | | | | | | | | | | | | | | | | | | |
Net increase (decrease) from investment operations | | | (0.89 | ) | | | 1.99 | | | | 1.49 | | | | (0.26 | ) | | | 1.54 | |
| | | | | | | | | | | | | | | | | | | | |
| | | | | |
| Distributions:(c) | | | | | | | | | | | | | | | |
From net investment income | | | (0.19 | ) | | | (0.17 | ) | | | (0.11 | ) | | | (0.10 | ) | | | (0.11 | ) |
From net realized gain | | | (1.14 | ) | | | (3.28 | ) | | | (0.83 | ) | | | (0.88 | ) | | | (1.94 | ) |
| | | | | | | | | | | | | | | | | | | | |
Total distributions | | | (1.33 | ) | | | (3.45 | ) | | | (0.94 | ) | | | (0.98 | ) | | | (2.05 | ) |
| | | | | | | | | | | | | | | | | | | | |
| | | | | |
Net asset value, end of year | | $ | 8.24 | | | $ | 10.46 | | | $ | 11.92 | | | $ | 11.37 | | | $ | 12.61 | |
| | | | | | | | | | | | | | | | | | | | |
| | | | | |
Total Return(d) | | | | | | | | | | | | | | | | | | | | |
Based on net asset value | | | (8.46 | )% | | | 16.86 | % | | | 13.17 | % | | | (2.11 | )% | | | 11.72 | % |
| | | | | | | | | | | | | | | | | | | | |
| | | | | |
Ratios to Average Net Assets(e) | | | | | | | | | | | | | | | | | | | | |
Total expenses | | | 1.42 | % | | | 1.43 | % | | | 1.35 | % | | | 1.34 | % | | | 1.32 | % |
| | | | | | | | | | | | | | | | | | | | |
Total expenses after fees waived and/or reimbursed | | | 0.86 | % | | | 0.99 | % | | | 1.18 | % | | | 1.13 | % | | | 1.13 | % |
| | | | | | | | | | | | | | | | | | | | |
Net investment income | | | 1.70 | %(b) | | | 1.26 | % | | | 0.92 | % | | | 0.78 | % | | | 0.73 | % |
| | | | | | | | | | | | | | | | | | | | |
| | | | | |
Supplemental Data | | | | | | | | | | | | | | | | | | | | |
Net assets, end of year (000) | | $ | 3,876 | | | $ | 3,019 | | | $ | 1,930 | | | $ | 1,810 | | | $ | 1,931 | |
| | | | | | | | | | | | | | | | | | | | |
Portfolio turnover rate | | | 164 | % | | | 168 | % | | | 47 | % | | | 29 | % | | | 35 | % |
| | | | | | | | | | | | | | | | | | | | |
| (a) | Based on average shares outstanding. |
| (b) | Net investment income per share and the ratio of net investment income to average net assets includes $0.01 per share and 0.09%, respectively, resulting from anon-recurring dividend. |
| (c) | Distributions for annual periods determined in accordance with U.S. federal income tax regulations. |
| (d) | Where applicable, excludes insurance-related fees and expenses and assumes the reinvestment of distributions. |
| (e) | Excludes expenses incurred indirectly as a result of investments in underlying funds as follows: |
| | | | | | | | | | | | | | | | | | | | | | | | | | | | | | | | | | | | | | | | |
| | | Year Ended December 31, | |
| | | 2018 | | | | | | 2017 | | | | | | 2016 | | | | | | 2015 | | | | | | 2014 | | | | |
Investments in underlying funds | | | 0.00 | % | | | | | | | 0.01 | % | | | | | | | — | % | | | | | | | — | % | | | | | | | — | % | | | | |
| | | | | | | | | | | | | | | | | | | | | | | | | | | | | | | | | | | | | | | | |
See notes to financial statements.
Notes to Financial Statements
BlackRock Variable Series Funds, Inc. (the “Company”) is registered under the Investment Company Act of 1940, as amended (the “1940 Act”), as an open-end management investment company. The Company is organized as a Maryland corporation that is comprised of 15 separate portfolios. The funds offer shares to insurance companies for their separate accounts to fund benefits under certain variable annuity and variable life insurance contracts. The financial statements presented are for BlackRock Advantage Large Cap Value V.I. Fund (the “Fund”). The Fund is classified as diversified. Class I, Class II and Class III Shares have equal voting, dividend, liquidation and other rights, except that only shares of the respective classes are entitled to vote on matters concerning only that class. In addition, Class II and Class III Shares bear certain expenses related to the distribution of such shares.
The Fund, together with certain other registered investment companies advised by BlackRock Advisors, LLC (the “Manager”) or its affiliates, is included in a complex of open-end funds referred to as the Equity-Bond Complex.
| 2. | SIGNIFICANT ACCOUNTING POLICIES |
The financial statements are prepared in conformity with accounting principles generally accepted in the United States of America (“U.S. GAAP”), which may require management to make estimates and assumptions that affect the reported amounts of assets and liabilities in the financial statements, disclosure of contingent assets and liabilities at the date of the financial statements and the reported amounts of increases and decreases in net assets from operations during the reporting period. Actual results could differ from those estimates. The Fund is considered an investment company under U.S. GAAP and follows the accounting and reporting guidance applicable to investment companies. Below is a summary of significant accounting policies:
Investment Transactions and Income Recognition: For financial reporting purposes, investment transactions are recorded on the dates the transactions are entered into (the “trade dates”). Realized gains and losses on investment transactions are determined on the identified cost basis. Dividend income is recorded on the ex-dividend date. Dividends from foreign securities where the ex-dividend date may have passed are subsequently recorded when the Fund is informed of the ex-dividend date. Under the applicable foreign tax laws, a withholding tax at various rates may be imposed on capital gains, dividends and interest. Upon notification from issuers, a portion of the dividend income received from a real estate investment trust may be redesignated as a reduction of cost of the related investment and/or realized gain. Income expenses and realized and unrealized gains and losses are allocated daily to each class based on its relative net assets.
Segregation and Collateralization: In cases where the Fund enters into certain investments (e.g., futures contracts) that would be treated as “senior securities” for 1940 Act purposes, the Fund may segregate or designate on its books and records cash or liquid assets having a market value at least equal to the amount of the Fund’s future obligations under such investments. Doing so allows the investment to be excluded from treatment as a “senior security.” Furthermore, if required by an exchange or counterparty agreement, the Fund may be required to deliver/deposit cash and/or securities to/with an exchange, or broker-dealer or custodian as collateral for certain investments or obligations.
Distributions: Distributions paid by the Fund are recorded on the ex-dividend date. Distributions of capital gains are recorded on the ex-dividend date and made at least annually. The character and timing of distributions are determined in accordance with U.S. federal income tax regulations, which may differ from U.S. GAAP.
Recent Accounting Standards:In August 2018, the Financial Accounting Standards Board issued Accounting Standards Update 2018-13 “Changes to the Disclosure Requirements for Fair Value Measurement” which modifies disclosure requirements for fair value measurements. The guidance is effective for fiscal years beginning after December 15, 2019 and for interim periods within those fiscal years. Management is currently evaluating the impact of this guidance to the Fund.
Indemnifications:In the normal course of business, the Fund enters into contracts that contain a variety of representations that provide general indemnification. The Fund’s maximum exposure under these arrangements is unknown because it involves future potential claims against the Fund, which cannot be predicted with any certainty.
Other: Expenses directly related to the Fund or its classes are charged to the Fund or the applicable class. Other operating expenses shared by several funds, including other funds managed by the Manager, are prorated among those funds on the basis of relative net assets or other appropriate methods. Expenses directly related to the Fund and other shared expenses prorated to the Fund are allocated daily to each class based on its relative net assets or other appropriate methods.
| 3. | INVESTMENT VALUATION AND FAIR VALUE MEASUREMENTS |
Investment Valuation Policies: The Fund’s investments are valued at fair value (also referred to as “market value” within the financial statements) as of the close of trading on the New York Stock Exchange (“NYSE”) (generally 4:00 p.m., Eastern time). U.S. GAAP defines fair value as the price the Fund would receive to sell an asset or pay to transfer a liability in an orderly transaction between market participants at the measurement date. The Fund determines the fair values of its financial instruments using various independent dealers or pricing services under policies approved by the Board of Directors of the Company (the “Board”). The BlackRock Global Valuation Methodologies Committee (the “Global Valuation Committee”) is the committee formed by management to develop global pricing policies and procedures and to oversee the pricing function for all financial instruments.
Fair Value Inputs and Methodologies: The following methods and inputs are used to establish the fair value of the Fund’s assets and liabilities:
| | • | | Equity investments traded on a recognized securities exchange are valued at the official closing price each day, if available. For equity investments traded on more than one exchange, the official closing price on the exchange where the stock is primarily traded is used. Equity investments traded on a recognized exchange for which there were no sales on that day may be valued at the last available bid (long positions) or ask (short positions) price. |
| | • | | Investments in open-end U.S. mutual funds are valued at net asset value (“NAV”) each business day. |
| | |
| 16 | | 2018 BLACKROCK ANNUAL REPORTTO SHAREHOLDERS |
Notes to Financial Statements (continued)
| | • | | The Fund values its investment in SL Liquidity Series, LLC, Money Market Series (the “Money Market Series”) at fair value, which is ordinarily based upon its pro rata ownership in the underlying fund’s net assets. The Money Market Series seeks current income consistent with maintaining liquidity and preserving capital. Although the Money Market Series is not registered under the 1940 Act, its investments may follow the parameters of investments by a money market fund that is subject to Rule 2a-7 under the 1940 Act. |
| | • | | Futures contracts traded on exchanges are valued at their last sale price. |
If events (e.g., a company announcement, market volatility or a natural disaster) occur that are expected to materially affect the value of such investments, or in the event that the application of these methods of valuation results in a price for an investment that is deemed not to be representative of the market value of such investment, or if a price is not available, the investment will be valued by the Global Valuation Committee, or its delegate, in accordance with a policy approved by the Board as reflecting fair value (“Fair Valued Investments”). The fair valuation approaches that may be used by the Global Valuation Committee will include market approach, income approach and cost approach. Valuation techniques such as discounted cash flow, use of market comparables and matrix pricing are types of valuation approaches and are typically used in determining fair value. When determining the price for Fair Valued Investments, the Global Valuation Committee, or its delegate, seeks to determine the price that the Fund might reasonably expect to receive or pay from the current sale or purchase of that asset or liability in an arm’s-length transaction. Fair value determinations shall be based upon all available factors that the Global Valuation Committee, or its delegate, deems relevant and consistent with the principles of fair value measurement. The pricing of all Fair Valued Investments is subsequently reported to the Board or a committee thereof on a quarterly basis.
Fair Value Hierarchy: Various inputs are used in determining the fair value of investments and derivative financial instruments. These inputs to valuation techniques are categorized into a fair value hierarchy consisting of three broad levels for financial statement purposes as follows:
| | • | | Level 1 — Unadjusted price quotations in active markets/exchanges for identical assets or liabilities that the Fund has the ability to access |
| | • | | Level 2 — Other observable inputs (including, but not limited to, quoted prices for similar assets or liabilities in markets that are active, quoted prices for identical or similar assets or liabilities in markets that are not active, inputs other than quoted prices that are observable for the assets or liabilities (such as interest rates, yield curves, volatilities, prepayment speeds, loss severities, credit risks and default rates) or other market-corroborated inputs) |
| | • | | Level 3 — Unobservable inputs based on the best information available in the circumstances, to the extent observable inputs are not available (including the Fund’s own assumptions used in determining the fair value of investments and derivative financial instruments) |
The hierarchy gives the highest priority to unadjusted quoted prices in active markets for identical assets or liabilities (Level 1 measurements) and the lowest priority to unobservable inputs (Level 3 measurements). Accordingly, the degree of judgment exercised in determining fair value is greatest for instruments categorized in Level 3. The inputs used to measure fair value may fall into different levels of the fair value hierarchy. In such cases, for disclosure purposes, the fair value hierarchy classification is determined based on the lowest level input that is significant to the fair value measurement in its entirety. Investments classified within Level 3 have significant unobservable inputs used by the Global Valuation Committee in determining the price for Fair Valued investments. Level 3 investments include equity or debt issued by privately held companies or funds. There may not be a secondary market, and/or there are a limited number of investors. Level 3 investments may also be adjusted to reflect illiquidity and/or non-transferability, with the amount of such discount estimated by the Global Valuation Committee in the absence of market information.
Changes in valuation techniques may result in transfers into or out of an assigned level within the hierarchy. In accordance with the Fund’s policy, transfers between different levels of the fair value hierarchy are deemed to have occurred as of the beginning of the reporting period. The categorization of a value determined for investments and derivative financial instruments is based on the pricing transparency of the investments and derivative financial instruments and is not necessarily an indication of the risks associated with investing in those securities.
As of December 31, 2018, certain investments of the Fund were valued using NAV as no quoted market value is available and therefore have been excluded from the fair value hierarchy.
| 4. | SECURITIES AND OTHER INVESTMENTS |
Securities Lending: The Fund may lend its securities to approved borrowers, such as brokers, dealers and other financial institutions. The borrower pledges and maintains with the Fund collateral consisting of cash, an irrevocable letter of credit issued by a bank, or securities issued or guaranteed by the U.S. Government. The initial collateral received by the Fund is required to have a value of at least 102% of the current value of the loaned securities for securities traded on U.S. exchanges and a value of at least 105% for all other securities. The collateral is maintained thereafter at a value equal to at least 100% of the current market value of the securities on loan. The market value of the loaned securities is determined at the close of each business day of the Fund and any additional required collateral is delivered to the Fund, or excess collateral returned by the Fund, on the next business day. During the term of the loan, the Fund is entitled to all distributions made on or in respect of the loaned securities, but does not receive interest income on securities received as collateral. Loans of securities are terminable at any time and the borrower, after notice, is required to return borrowed securities within the standard time period for settlement of securities transactions.
The market value of any securities on loan, all of which were classified as common stocks in the Fund’s Schedule of Investments, and the value of any related collateral are shown separately in the Statement of Assets and Liabilities as a component of investments at value — unaffiliated, and collateral on securities loaned at value, respectively. As of period end, any securities on loan were collateralized by cash and/or U.S. Government obligations. Cash collateral invested by the securities lending agent, BlackRock Investment Management, LLC (“BIM”), if any, is disclosed in the Schedule of Investments.
Securities lending transactions are entered into by the Fund under Master Securities Lending Agreements (each, an “MSLA”), which provide the right, in the event of default (including bankruptcy or insolvency), for the non-defaulting party to liquidate the collateral and calculate a net exposure to the defaulting party or request additional collateral. In the event that a borrower defaults, the Fund, as lender, would offset the market value of the collateral received against the market value of the securities loaned. When the value of the collateral is greater than that of the market value of the securities loaned, the lender is left with a net amount payable to the defaulting party.
| | | | |
| NOTESTO FINANCIAL STATEMENTS | | | 17 | |
Notes to Financial Statements (continued)
However, bankruptcy or insolvency laws of a particular jurisdiction may impose restrictions on or prohibitions against such a right of offset in the event of an MSLA counterparty’s bankruptcy or insolvency. Under the MSLA, absent an event of default, the borrower can resell or re-pledge the loaned securities, and the Fund can reinvest cash collateral received in connection with loaned securities. Upon an event of default, the parties’ obligations to return the securities or collateral to the other party are extinguished, and the parties can resell or re-pledge the loaned securities or the collateral received in connection with the loaned securities in order to satisfy the defaulting party’s net payment obligation for all transactions under the MSLA. The defaulting party remains liable for any deficiency.
As of period end, the following table is a summary of the Fund’s securities lending agreements by counterparty which are subject to offset under an MSLA:
| | | | | | | | | | | | |
| Counterparty | | Securities
Loaned at Value | | | Cash Collateral
Received (a) | | | Net
Amount | |
Citigroup Global Markets, Inc. | | $ | 1,059,527 | | | $ | (1,059,527 | ) | | $ | — | |
Credit Suisse Securities (USA) LLC | | | 34,592 | | | | (34,592 | ) | | | — | |
Fidelity Investments | | | 22,300 | | �� | | (22,300 | ) | | | — | |
JP Morgan Securities LLC | | | 880,752 | | | | (880,752 | ) | | | — | |
Morgan Stanley & Co. LLC | | | 504,274 | | | | (504,274 | ) | | | — | |
State Street Bank & Trust Co. | | | 28,000 | | | | (28,000 | ) | | | — | |
UBS Securities LLC | | | 82,987 | | | | (82,987 | ) | | | — | |
| | | | | | | | | | | | |
| | $ | 2,612,432 | | | $ | (2,612,432 | ) | | $ | — | |
| | | | | | | | | | | | |
| | (a) | Cash collateral with a value of $2,668,546 has been received in connection with securities lending agreements. Collateral received in excess of the value of securities loaned from the individual counterparty, if any, is not shown for financial reporting purposes in the table above. | |
The risks of securities lending include the risk that the borrower may not provide additional collateral when required or may not return the securities when due. To mitigate these risks, the Fund benefits from a borrower default indemnity provided by BIM. BIM’s indemnity allows for full replacement of the securities loaned if the collateral received does not cover the value on the securities loaned in the event of borrower default. The Fund could incur a loss if the value of an investment purchased with cash collateral falls below the market value of loaned securities or if the value of an investment purchased with cash collateral falls below the value of the original cash collateral received.
| 5. | DERIVATIVE FINANCIAL INSTRUMENTS |
The Fund engages in various portfolio investment strategies using derivative contracts both to increase the returns of the Fund and/or to manage its exposure to certain risks such as credit risk, equity risk, interest rate risk, foreign currency exchange rate risk, commodity price risk or other risks (e.g., inflation risk). Derivative financial instruments categorized by risk exposure are included in the Schedule of Investments. These contracts may be transacted on an exchange over-the-counter (“OTC”).
Futures Contracts:Futures contracts are purchased or sold to gain exposure to, or manage exposure to, changes in interest rates (interest rate risk) and changes in the value of equity securities (equity risk) or foreign currencies (foreign currency exchange rate risk).
Futures contracts are agreements between the Fund and a counterparty to buy or sell a specific quantity of an underlying instrument at a specified price and on a specified date. Depending on the terms of a contract, it is settled either through physical delivery of the underlying instrument on the settlement date or by payment of a cash amount on the settlement date. Upon entering into a futures contract, the Fund is required to deposit initial margin with the broker in the form of cash or securities in an amount that varies depending on a contract’s size and risk profile. The initial margin deposit must then be maintained at an established level over the life of the contract. Amounts pledged, which are considered restricted, are included in cash pledged for futures contracts on the Statement of Assets and Liabilities.
Securities deposited as initial margin are designated in the Schedule of Investments and cash deposited, if any, is shown as cash pledged for futures contracts in the Statement of Assets and Liabilities. Pursuant to the contract, the Fund agrees to receive from or pay to the broker an amount of cash equal to the daily fluctuation in market value of the contract (“variation margin”). Variation margin is recorded as unrealized appreciation (depreciation) and, if any, shown as variation margin receivable (or payable) on futures contracts in the Statement of Assets and Liabilities. When the contract is closed, a realized gain or loss is recorded in the Statement of Operations equal to the difference between the notional amount of the contract at the time it was opened and the notional amount at the time it was closed. The use of futures contracts involves the risk of an imperfect correlation in the movements in the price of futures contracts and interest, foreign currency exchange rates or underlying assets.
| 6. | INVESTMENT ADVISORY AGREEMENT AND OTHER TRANSACTIONS WITH AFFILIATES |
Investment Advisory: The Company, on behalf of the Fund, entered into an Investment Advisory Agreement with the Manager, the Fund’s investment adviser and an indirect, wholly-owned subsidiary of BlackRock, to provide investment advisory and administrative services. The Manager is responsible for the management of the Fund’s portfolio and provides the personnel, facilities, equipment and certain other services necessary to the operations of the Fund.
For such services, the Fund pays the Manager a monthly fee at an annual rate equal to the following percentages of the average daily value of the Fund’s net assets:
| | | | |
| Average Daily Net Assets | | Investment
Advisory Fees | |
First $1 Billion | | | 0.75 | % |
$1 Billion — $3 Billion | | | 0.71 | |
$3 Billion — $5 Billion | | | 0.68 | |
$5 Billion — $10 Billion | | | 0.65 | |
Greater than $10 Billion | | | 0.64 | |
| | |
| 18 | | 2018 BLACKROCK ANNUAL REPORTTO SHAREHOLDERS |
Notes to Financial Statements (continued)
Distribution Fees: The Company, on behalf of the Fund, entered into a Distribution Agreement and a Distribution Plan with BlackRock Investments, LLC (“BRIL”), an affiliate of the Manager. Pursuant to the Distribution Plan and in accordance with Rule 12b-1 under the 1940 Act, the Fund pays BRIL ongoing distribution fees. The fees are accrued daily and paid monthly at annual rates based upon the average daily net assets of the relevant share class of the Fund as follows:
| | | | | | | | | | | | |
| | | Class II | | | | | | Class III | |
Distribution fees | | | 0.15 | % | | | | | | | 0.25 | % |
BRIL and broker-dealers, pursuant to sub-agreements with BRIL, provide shareholder servicing and distribution services to the Fund. The ongoing service and/or distribution fee compensates BRIL and each broker-dealer for providing shareholder servicing and/or distribution related services to shareholders.
For the year ended December 31, 2018, the following table shows the class specific service and distribution fees borne directly by each share class of the Fund:
| | | | | | | | | | | | |
| | | Class II | | | Class III | | | Total | |
Distribution fees | | $ | 9,807 | | | $ | 8,747 | | | $ | 18,554 | |
Transfer Agent: On behalf of the Fund, the Manager entered into agreements with insurance companies and other financial intermediaries (“Service Organizations”), some of which may be affiliates. Pursuant to these agreements, the Service Organizations provide the Fund with administrative, networking, recordkeeping, sub-transfer agency and shareholder services to sub-accounts they service. For these services, the Service Organizations receive an annual fee per shareholder account, which will vary depending on share class and/or net assets of Fund shareholders serviced by the Service Organizations which is shown as transfer agent — class specific. For the year ended December 31, 2018, the Fund did not pay any amounts to affiliates in return for these services.
In addition, the Fund pays the transfer agent, which is not an affiliate, a fee for the issuance, transfer and redemption of shares and the opening and maintenance of shareholder accounts, which is included in transfer agent in the Statement of Operations. For the year ended December 31, 2018, the following table shows the class specific transfer agent fees borne directly by each share class of the Fund:
| | | | | | | | | | | | | | | | | | | | |
| Class I | | | | | Class II | | | | | Class III | | | | | Total | |
| $ | 193,336 | | | | | $ | 13,763 | | | | | $ | 7,275 | | | | | $ | 214,374 | |
Expense Limitations, Waivers and Reimbursements: The Manager has agreed to voluntarily waive 0.05% of its investment advisory fee payable by the Fund. This voluntary waiver may be reduced or discontinued at any time without notice. This amount is included in fees waived and/or reimbursed by the Manager in the Statement of Operations. For the year ended December 31, 2018, the amount waived and/or reimbursed was $51,522.
With respect to the Fund, the Manager voluntarily agreed to waive its investment advisory fees by the amount of investment advisory fees the Fund pays to the Manager indirectly through its investment in affiliated money market funds (the “affiliated money market fund waiver”). The amount of waivers and/or reimbursements of fees and expenses made pursuant to the expense limitation described below will be reduced by the amount of the affiliated money market fund waiver. This amount is included in fees waived and/or reimbursed by the Manager in the Statement of Operations. For the year ended December 31, 2018, the amount waived was $635.
The Manager has contractually agreed to waive its investment advisory fee with respect to any portion of the Fund’s assets invested in affiliated equity and fixed-income mutual funds and affiliated exchange-traded funds that have a contractual management fee through April 30, 2019. The contractual agreement may be terminated upon 90 days’ notice by a majority of the directors who are not “interested persons” of the Fund, as defined in the 1940 Act (“Independent Directors”), or by a vote of a majority of the outstanding voting securities of the Fund. For the year ended December 31, 2018, there were no fees waived by the Manager pursuant to this arrangement.
For the year ended December 31, 2018, the Fund reimbursed the Manager $1,483 for certain accounting services, which is included in accounting services in the Statement of Operations.
The Manager has contractually agreed to reimburse transfer agent fees in order to limit such expenses to a percentage of average daily net assets as follows:
| | | | |
Class I | | | 0.00 | % |
Class II | | | 0.05 | |
Class III | | | 0.11 | |
The Manager has agreed not to reduce or discontinue this contractual expense limitation through April 30, 2019 unless approved by the Board, including a majority of the Independent Directors, or by a vote of a majority of the outstanding voting securities of the Fund. These amounts waived and/or reimbursed are shown as transfer agent fees waived and/or reimbursed — class specific in the Statement of Operations. For the year ended December 31, 2018, class specific expense waivers and/or reimbursements were as follows:
| | | | | | | | | | | | | | | | |
| | | Class I | | | Class II | | | Class III | | | Total | |
Transfer Agent Fees Waived and/or Reimbursed | | $ | 193,336 | | | $ | 10,494 | | | $ | 3,427 | | | $ | 207,257 | |
With respect to the Fund, the Manager contractually agreed to waive and/or reimburse fees or expenses in order to limit expenses, excluding interest expense, dividend expense, tax expense, acquired fund fees and expenses, and certain other fund expenses, which constitute extraordinary expenses not incurred in the ordinary course of the Fund’s business (“expense limitation”). The expense limitations as a percentage of average daily net assets are as follows:
| | | | | | | | | | | | | | |
| Class I | | | | | Class II | | | | | Class III | |
| | 0.60 | % | | | | | 0.75 | % | | | | | 0.85 | % |
| | | | |
| NOTESTO FINANCIAL STATEMENTS | | | 19 | |
Notes to Financial Statements (continued)
The Manager has agreed not to reduce or discontinue this contractual expense limitation through April 30, 2019, unless approved by the Board, including a majority of the Independent Directors or by a vote of a majority of outstanding voting securities of the Fund. For the year ended December 31, 2018, the Manager waived and/or reimbursed $314,768 and $7,117, which is included in fees waived and/or reimbursed by the Manager and transfer agent fees waived and/or reimbursed — class specific, respectively, in the Statement of Operations.
Securities Lending: The U.S. Securities and Exchange Commission (“SEC”) has issued an exemptive order which permits BIM, an affiliate of the Manager, to serve as securities lending agent for the Fund, subject to applicable conditions. As securities lending agent, BIM bears all operational costs directly related to securities lending. The Fund is responsible for expenses in connection with the investment of cash collateral received for securities on loan (the “collateral investment expenses”). The cash collateral is invested in a private investment company managed by the Manager or its affiliates. However, BIM has agreed to cap the collateral investment expenses of the private investment company to an annual rate of 0.04%. The investment adviser to the private investment company will not charge any advisory fees with respect to shares purchased by the Fund. The private investment company in which the cash collateral has been invested may, under certain circumstances, impose a liquidity fee of up to 2% of the value withdrawn or temporarily restrict withdrawals for up to 10 business days during a 90 day period, in the event that the private investment company’s weekly liquid assets fall below certain thresholds.
Securities lending income is equal to the total of income earned from the reinvestment of cash collateral, net of fees and other payments to and from borrowers of securities, and less the collateral investment expenses. The Fund retains a portion of securities lending income and remits a remaining portion to BIM as compensation for its services as securities lending agent.
Pursuant to a securities lending agreement, the Fund retains 71.5% of securities lending income, and this amount retained can never be less than 65% of the total of securities lending income plus the collateral investment expenses.
In addition, commencing the business day following the date that the aggregate securities lending income earned across the Equity-Bond Complex in a calendar year exceeds a specified threshold, the Fund, pursuant to the securities lending agreement, will retain for the remainder of that calendar year securities lending income in an amount equal to 75% of securities lending income, and this amount retained can never be less than 65% of the total of securities lending income plus the collateral investment expenses.
The share of securities lending income earned by the Fund is shown as securities lending income — affiliated — net in the Statement of Operations. For the year ended December 31, 2018, the Fund paid BIM $1,554 for securities lending agent services.
Interfund Lending: In accordance with an exemptive order (the “Order”) from the SEC, the Fund may participate in a joint lending and borrowing facility for temporary purposes (the “Interfund Lending Program”), subject to compliance with the terms and conditions of the Order, and to the extent permitted by the Fund’s investment policies and restrictions. The Fund is currently permitted to borrow under the Interfund Lending Program.
A lending BlackRock fund may lend in aggregate up to 15% of its net assets, but may not lend more than 5% of its net assets to any one borrowing fund through the Interfund Lending Program. A borrowing BlackRock fund may not borrow through the Interfund Lending Program or from any other source more than 33 1/3% of its total assets (or any lower threshold provided for by the fund’s investment restrictions). If a borrowing BlackRock fund’s total outstanding borrowings exceed 10% of its total assets, each of its outstanding interfund loans will be subject to collateralization of at least 102% of the outstanding principal value of the loan. All interfund loans are for temporary or emergency purposes and the interest rate to be charged will be the average of the highest current overnight repurchase agreement rate available to a lending fund and the bank loan rate, as calculated according to a formula established by the Board.
During the year ended December 31, 2018, the Fund did not participate in the Interfund Lending Program.
Directors and Officers: Certain directors and/or officers of the Company are directors and/or officers of BlackRock or its affiliates. The Fund reimburses the Manager for a portion of the compensation paid to the Company’s Chief Compliance Officer, which is included in Directors and Officer in the Statement of Operations.
For the year ended December 31, 2018, purchases and sales of investments, excluding short-term securities, were $167,166,176 and $178,939,869, respectively.
It is the Fund’s policy to comply with the requirements of the Internal Revenue Code of 1986, as amended, applicable to regulated investment companies, and to distribute substantially all of its taxable income to its shareholders. Therefore, no U.S. federal income tax provision is required.
The Fund files U.S. federal and various state and local tax returns. No income tax returns are currently under examination. The statute of limitations on the Fund’s U.S. federal tax returns generally remains open for each of the four years ended December 31, 2018. The statutes of limitations on the Fund’s state and local tax returns may remain open for an additional year depending upon the jurisdiction.
Management has analyzed tax laws and regulations and their application to the Fund as December 31, 2018, inclusive of the open tax return years, and does not believe that there are any uncertain tax positions that require recognition of a tax liability in the Fund’s financial statements.
| | |
| 20 | | 2018 BLACKROCK ANNUAL REPORTTO SHAREHOLDERS |
Notes to Financial Statements (continued)
The tax character of distributions paid was as follows:
| | | | | | | | |
| | | 12/31/18 | | | 12/31/17 | |
Ordinary income | | $ | 5,903,454 | | | $ | 4,512,661 | |
Long term capital gains | | | 6,441,617 | | | | 23,127,048 | |
| | | | | | | | |
| | $ | 12,345,071 | | | $ | 27,639,709 | |
| | | | | | | | |
As of period end, the tax components of accumulated loss were as follows:
| | | | |
Undistributed ordinary income | | $ | 30,283 | |
Net unrealized losses(a) | | | (6,263,372 | ) |
Qualified late-year losses(b) | | | (772,959 | ) |
| | | | |
| | $ | (7,006,048 | ) |
| | | | |
| | (a) | The difference betweenbook-basis andtax-basis net unrealized losses was attributable primarily to the tax deferral of losses on wash sales, the realization for tax purposes of unrealized gains/losses on certain futures contracts and the timing and recognition of partnership income. | |
| | (b) | The Fund has elected to defer certain qualified late-year losses and recognize such losses in the next taxable year. | |
As of December 31, 2018, gross unrealized appreciation and depreciation for investments and derivatives based on cost for U.S. federal income tax purposes were as follows:
| | | | |
Tax cost . . . . . . . . . . . . . . . . . . . . .. . . . . . . . . . . .. . . . . . . . . . . . . . . . . . . . . . . . . . . . . . . | | $ | 96,540,704 | |
| | | | |
Gross unrealized appreciation . . . . . . . . . . . . . . . . . . . . . . . . . . . . . . . . . . . . . . . . .. . . | | $ | 2,649,576 | |
Gross unrealized depreciation . . . . . . . . . . . . . . . . . . . . . . . . . . . . . . . . . . . . . . . . .. . . . . | | | (8,930,891 | ) |
| | | | |
Net unrealized depreciation . . . . . . . . . . . . . . . . . . . . . . . . . . . . . . . . . . . . . . . . . .. . . . | | $ | (6,281,315 | ) |
| | | | |
The Company, on behalf of the Fund, along with certain other funds managed by the Manager and its affiliates (“Participating Funds”), is a party to a 364-day, $2.25 billion credit agreement with a group of lenders. Under this agreement, the Fund may borrow to fund shareholder redemptions. Excluding commitments designated for certain individual funds, the Participating Funds, including the Fund, can borrow up to an aggregate commitment amount of $1.75 billion at any time outstanding, subject to asset coverage and other limitations as specified in the agreement. The credit agreement has the following terms: a fee of 0.10% per annum on unused commitment amounts and interest at a rate equal to the higher of (a) one-month LIBOR (but, in any event, not less than 0.00%) on the date the loan is made plus 0.80% per annum or (b) the Fed Funds rate (but, in any event, not less than 0.00%) in effect from time to time plus 0.80% per annum on amounts borrowed. The agreement expires in April 2019 unless extended or renewed. Prior to April 19, 2018, the aggregate commitment amount was $2.1 billion and the fee was 0.12% per annum. Participating Funds paid an upfront commitment fee of 0.02% on the total commitment amounts, in addition to administration, legal and arrangement fees, which are included in miscellaneous expenses in the Statement of Operations. These fees were allocated among such funds based upon portions of the aggregate commitment available to them and relative net assets of Participating Funds. During the year ended December 31, 2018, the Fund did not borrow under the credit agreement.
In the normal course of business, the Fund invests in securities or other instruments and may enter into certain transactions, and such activities subject the Fund to various risks, including among others, fluctuations in the market (market risk) or failure of an issuer to meet all of its obligations. The value of securities or other instruments may also be affected by various factors, including, without limitation: (i) the general economy; (ii) the overall market as well as local, regional or global political and/or social instability; (iii) regulation, taxation or international tax treaties between various countries; or (iv) currency, interest rate and price fluctuations. The Fund’s prospectus provides details of the risks to which the Fund is subject.
The Fund may be exposed to additional risks when reinvesting cash collateral in money market funds that do not seek to maintain a stable NAV per share of $1.00, which may be subject to redemption gates or liquidity fees under certain circumstances.
Valuation Risk: The market values of equities, such as common stocks and preferred securities or equity related investments, such as futures and options, may decline due to general market conditions which are not specifically related to a particular company. They may also decline due to factors which affect a particular industry or industries. The Fund may invest in illiquid investments and may experience difficulty in selling those investments in a timely manner at the price that it believes the investments are worth. Prices may fluctuate widely over short or extended periods in response to company, market or economic news. Markets also tend to move in cycles, with periods of rising and falling prices. This volatility may cause the Fund’s NAV to experience significant increases or decreases over short periods of time. If there is a general decline in the securities and other markets, the NAV of the Fund may lose value, regardless of the individual results of the securities and other instruments in which the Fund invests.
Counterparty Credit Risk: The Fund may be exposed to counterparty credit risk, or the risk that an entity may fail to or be unable to perform on its commitments related to unsettled or open transactions. The Fund manages counterparty credit risk by entering into transactions only with counterparties that the Manager believes have the financial resources to honor their obligations and by monitoring the financial stability of those counterparties. Financial assets, which potentially expose the Fund to market, issuer and counterparty credit risks, consist principally of financial instruments and receivables due from counterparties. The extent of the Fund’s exposure to market,
| | | | |
| NOTESTO FINANCIAL STATEMENTS | | | 21 | |
Notes to Financial Statements (continued)
issuer and counterparty credit risks with respect to these financial assets is approximately their value recorded in the Statement of Assets and Liabilities, less any collateral held by the Fund.
A derivative contract may suffer a mark-to-market loss if the value of the contract decreases due to an unfavorable change in the market rates or values of the underlying instrument. Losses can also occur if the counterparty does not perform under the contract.
With exchange-traded futures, there is less counterparty credit risk to the Fund since the exchange or clearinghouse, as counterparty to such instruments, guarantees against a possible default. The clearinghouse stands between the buyer and the seller of the contract; therefore, credit risk is limited to failure of the clearinghouse. While offset rights may exist under applicable law, the Fund does not have a contractual right of offset against a clearing broker or clearinghouse in the event of a default (including the bankruptcy or insolvency). Additionally, credit risk exists in exchange-traded futures with respect to initial and variation margin that is held in a clearing broker’s customer accounts. While clearing brokers are required to segregate customer margin from their own assets, in the event that a clearing broker becomes insolvent or goes into bankruptcy and at that time there is a shortfall in the aggregate amount of margin held by the clearing broker for all its clients, typically the shortfall would be allocated on a pro rata basis across all the clearing broker’s customers, potentially resulting in losses to the Fund.
| 11. | CAPITAL SHARE TRANSACTIONS |
Transactions in capital shares for each class were as follows:
| | | | | | | | | | | | | | | | |
| | | Year Ended
12/31/2018 | | | Year Ended
12/31/2017 | |
| | | Shares | | | Amount | | | Shares | | | Amount | |
Class I | | | | | | | | | | | | | | | | |
Shares sold | | | 287,840 | | | $ | 3,023,352 | | | | 365,201 | | | $ | 4,677,279 | |
Shares issued in reinvestment of distributions | | | 1,312,428 | | | | 11,110,414 | | | | 2,324,002 | | | | 25,114,786 | |
Shares redeemed | | | (1,559,379 | ) | | | (16,653,694 | ) | | | (1,056,648 | ) | | | (13,532,267 | ) |
| | | | | | | | | | | | | | | | |
Net increase (decrease) | | | 40,889 | | | $ | (2,519,928 | ) | | | 1,632,555 | | | $ | 16,259,798 | |
| | | | | | | | | | | | | | | | |
| | | | |
Class II | | | | | | | | | | | | | | | | |
Shares sold | | | 246,535 | | | $ | 2,598,348 | | | | 110,054 | | | $ | 1,387,115 | |
Shares issued in reinvestment of distributions | | | 81,856 | | | | 700,197 | | | | 162,376 | | | | 1,760,796 | |
Shares redeemed | | | (419,810 | ) | | | (4,482,072 | ) | | | (111,932 | ) | | | (1,430,159 | ) |
| | | | | | | | | | | | | | | | |
Net increase (decrease) | | | (91,419 | ) | | $ | (1,183,527 | ) | | | 160,498 | | | $ | 1,717,752 | |
| | | | | | | | | | | | | | | | |
| | | | |
Class III | | | | | | | | | | | | | | | | |
Shares sold | | | 190,480 | | | $ | 1,969,290 | | | | 120,811 | | | $ | 1,549,360 | |
Shares issued in reinvestment of distributions | | | 64,588 | | | | 534,460 | | | | 71,929 | | | | 764,127 | |
Shares redeemed | | | (73,219 | ) | | | (756,766 | ) | | | (66,112 | ) | | | (833,333 | ) |
| | | | | | | | | | | | | | | | |
Net increase | | | 181,849 | | | $ | 1,746,984 | | | | 126,628 | | | $ | 1,480,154 | |
| | | | | | | | | | | | | | | | |
Total Net Increase (Decrease) | | | 131,319 | | | $ | (1,956,471 | ) | | | 1,919,681 | | | $ | 19,457,704 | |
| | | | | | | | | | | | | | | | |
| 12. | REGULATION S-X AMENDMENTS |
On August 17, 2018, the SEC adopted amendments to certain disclosure requirements in Securities Act Release No. 33-10532, Disclosure Update and Simplification. The Fund has adopted the amendments pertinent to Regulation S-X in this shareholder report. The amendments impacted certain disclosure presentation on the Statement of Assets and Liabilities, Statements of Changes in Net Assets and Notes to the Financial Statements.
Prior year distribution information and undistributed net investment income in the Statements of Changes in Net Assets has been modified to conform to the current year presentation in accordance with the Regulation S-X changes.
Distributions for the year ended December 31, 2017 were classified as follows:
| | | | | | | | |
| Share Class | | Net Investment Income | | | Net Realized Gain | |
Class I | | $ | (1,493,752 | ) | | $ | (23,621,034 | ) |
Class II | | | (93,118 | ) | | | (1,667,678 | ) |
Class III | | | (38,131 | ) | | | (725,996 | ) |
Undistributed net investment income as of December 31, 2017 was $5,506.
Management has evaluated the impact of all subsequent events on the Fund through the date the financial statements were issued and has determined that there were no subsequent events requiring adjustment or additional disclosure in the financial statements.
| | |
| 22 | | 2018 BLACKROCK ANNUAL REPORTTO SHAREHOLDERS |
Report of Independent Registered Public Accounting Firm
To the Shareholders of BlackRock Advantage Large Cap Value V.I. Fund and the Board of Directors of BlackRock Variable Series Funds, Inc.:
Opinion on the Financial Statements and Financial Highlights
We have audited the accompanying statement of assets and liabilities of BlackRock Advantage Large Cap Value V.I. Fund of BlackRock Variable Series Funds, Inc. (the “Fund”), including the schedule of investments, as of December 31, 2018, the related statement of operations for the year then ended, the statements of changes in net assets for each of the two years in the period then ended, the financial highlights for each of the five years in the period then ended, and the related notes. In our opinion, the financial statements and financial highlights present fairly, in all material respects, the financial position of the Fund as of December 31, 2018, and the results of its operations for the year then ended, the changes in its net assets for each of the two years in the period then ended, and the financial highlights for each of the five years in the period then ended, in conformity with accounting principles generally accepted in the United States of America.
Basis for Opinion
These financial statements and financial highlights are the responsibility of the Fund’s management. Our responsibility is to express an opinion on the Fund’s financial statements and financial highlights based on our audits. We are a public accounting firm registered with the Public Company Accounting Oversight Board (United States) (PCAOB) and are required to be independent with respect to the Fund in accordance with the U.S. federal securities laws and the applicable rules and regulations of the Securities and Exchange Commission and the PCAOB.
We conducted our audits in accordance with the standards of the PCAOB. Those standards require that we plan and perform the audit to obtain reasonable assurance about whether the financial statements and financial highlights are free of material misstatement, whether due to error or fraud. The Fund is not required to have, nor were we engaged to perform, an audit of its internal control over financial reporting. As part of our audits we are required to obtain an understanding of internal control over financial reporting but not for the purpose of expressing an opinion on the effectiveness of the Fund’s internal control over financial reporting. Accordingly, we express no such opinion.
Our audits included performing procedures to assess the risks of material misstatement of the financial statements and financial highlights, whether due to error or fraud, and performing procedures that respond to those risks. Such procedures included examining, on a test basis, evidence regarding the amounts and disclosures in the financial statements and financial highlights. Our audits also included evaluating the accounting principles used and significant estimates made by management, as well as evaluating the overall presentation of the financial statements and financial highlights. Our procedures included confirmation of securities owned as of December 31, 2018, by correspondence with the custodian and brokers; when replies were not received from brokers, we performed other auditing procedures. We believe that our audits provide a reasonable basis for our opinion.
Deloitte & Touche LLP
Boston, Massachusetts
February 15, 2019
We have served as the auditor of one or more BlackRock investment companies since 1992.
| | | | |
| REPORTOF INDEPENDENT REGISTERED PUBLIC ACCOUNTING FIRM | | | 23 | |
Glossary of Terms Used in this Report
| | |
| Portfolio Abbreviation |
| |
| S&P | | Standard & Poor’s |
| | |
| 24 | | 2018 BLACKROCK ANNUAL REPORTTO SHAREHOLDERS |
DECEMBER 31, 2018
| | |
ANNUAL REPORT | |  |
BlackRock Variable Series Funds, Inc.
| Ø | | BlackRock Advantage U.S. Total Market V.I. Fund |
|
| Not FDIC Insured • May Lose Value • No Bank Guarantee |
| | |
| Fund Summary as of December 31, 2018 | | BlackRock Advantage U.S. Total Market V.I. Fund |
Investment Objective
BlackRock Advantage U.S. Total Market V.I. Fund’s (the “Fund”)investment objective is to seek long-term growth of capital.
Portfolio Management Commentary
How did the Fund perform?
For the 12-month period ended December 31, 2018, the Fund underperformed its benchmark, the Russell 3000® Index.
What factors influenced performance?
After beginning the year favoring growth stocks and trend-based strategies, investors later reversed course and sold out of more expensive, growth-oriented areas of the market on fears of expensive valuations and of approaching the end of the market cycle. As the sell-off was often disconnected with the broader sentiment of management and market participants, it created a difficult environment for sentiment-based signals and resulted in sentiment insights detracting from relative performance for the period. For example, signals that perform text-based analysis of sell-side research reports to gauge broker sentiment were notable detractors for the period. A signal that evaluates stocks based on seasonality effects on the stock price further detracted. An insight that uses geo-location data to determine consumer foot traffic patterns into various brick-and-mortar locations detracted as well. Given a rotation out of growth positions, investors typically flock to pockets of attractive relative valuation. However, as value stocks showed some of the strongest earnings trends heading into the fourth quarter, they sold-off amid the rotation away from growth expectations. As a result, certain value signals struggled including an insight that evaluates each stock based on forward sales relative to enterprise value. Finally, although quality signals held up well during the period, a signal that rewards stocks whose volatility of returns is less easily explained by broad factors hindered relative performance for the period.
As volatility and concerns about the approaching end of the current cycle increased, investors returned their focus to company fundamentals and to finding quality businesses offering sustainable growth prospects. In this light, the portfolio’s quality insights were the primary drivers of positive relative return over the course of the year. Among the portfolio’s fundamental signals, identifying companies with attractive cash flow growth relative to operating assets was the top contributor. Identifying companies with superior total factor productivity, or asset efficiency, also proved beneficial. Although the portfolio’s sentiment insights overall were a drag on relative performance, sentiment insights that provide a more quality-based lens into companies contributed positively. Specifically, an insight that gauges sentiment from informed bond investors contributed significantly, given interest rate volatility. Text-based analyses of management conference calls to determine longer-term trends in company fundamentals proved beneficial as well. Both of these signals held up extremely well in the fourth quarter, in a market environment that was generally challenging for trend- and sentiment-based insights. Elsewhere, while results for thematic signals were mixed for the period, identifying companies with lower leverage profiles benefitted performance given the market turmoil.
Describe recent portfolio activity.
Over the course of the period, the portfolio maintained a balanced allocation of risk across all major return drivers. However, a number of new stock selection insights were added to the portfolio. Among these insights, a model that evaluates companies on the basis of governance and the ethics and sustainability of its business practices from a social and environmental perspective was added to the Fund’s bucket of quality signals. In addition, a new insight was added that captures the location of hotel booking trends and invests in related stocks most sensitive to those areas. A new macro thematic model that evaluates industries across various inputs such as labor costs and hiring activity was added as well.
Describe portfolio positioning at period end.
Relative to the Russell 3000® Index, the Fund was positioned essentially neutrally from a sector perspective. The Fund had slight overweight positions in utilities and health care and slight underweight positions in communications services and consumer discretionary.
The views expressed reflect the opinions of BlackRock as of the date of this report and are subject to change based on changes in market, economic or other conditions. These views are not intended to be a forecast of future events and are no guarantee of future results.
| | |
| 2 | | 2018 BLACKROCK ANNUAL REPORTTO SHAREHOLDERS |
| | |
| Fund Summary as of December 31, 2018 (continued) | | BlackRock Advantage U.S. Total Market V.I. Fund |
TOTAL RETURN BASED ON A $10,000 INVESTMENT

| (a) | Assuming transaction costs, if any, and other operating expenses, including investment advisory fees. Does not include insurance-related fees and expenses. |
| (b) | Under normal circumstances, the Fund seeks to invest at least 80% of its net assets, plus the amount of any borrowings for investment purposes, in equity securities of U.S. issuers and derivatives that have similar economic characteristics to such securities. The Fund’s total returns prior to June 12, 2017 are the returns of the Fund when it followed different investment strategies under the name “BlackRock Value Opportunities V.I. Fund”. |
| (c) | An index that measures the performance of the largest 3,000 U.S. companies representing approximately 98% of the investable U.S. equity market. |
Performance Summary for the Period Ended December 31, 2018
| | | | | | | | | | | | | | | | | | | | | | | | | | | | |
| | | 6-Month
Total Returns (b) | | | | | | Average Annual Total Returns | |
| | | | | | 1 Year (b) | | | | | | 5 Years (b) | | | | | | 10 Years (b) | |
Class I(a) | | | (8.64 | )% | | | | | | | (6.39 | )% | | | | | | | 5.34 | % | | | | | | | 12.95 | % |
Class II(a) | | | (8.71 | ) | | | | | | | (6.53 | ) | | | | | | | 5.18 | | | | | | | | 12.77 | |
Class III(a) | | | (8.75 | ) | | | | | | | (6.65 | ) | | | | | | | 5.13 | | | | | | | | 12.71 | |
Russell 3000® Index | | | (8.20 | ) | | | | | | | (5.24 | ) | | | | | | | 7.91 | | | | | | | | 13.18 | |
| | (a) | Average annual and cumulative total returns are based on changes in net asset value for the periods shown, and assume reinvestment of all distributions at net asset value on theex-dividend date. Insurance-related fees and expenses are not reflected in these returns. The Fund’s total returns prior to June 12, 2017 are the returns of the Fund when it followed different investment strategies under the name “BlackRock Value Opportunities V.I. Fund”. | |
| | (b) | For the portion of the period, the Fund’s investment adviser waived a portion of its fee. Without such waiver, the Fund’s performance would have been lower. | |
Past performance is not indicative of future results. Performance results do not reflect the deduction of taxes that a shareholder would pay on Fund distributions or the redemption of Fund shares.
Performance results may include adjustment made for financial reporting purposes in accordance with U.S. generally accepted accounting principles.
Expense Example
| | | | | | | | | | | | | | | | | | | | | | | | | | | | | | | | |
| | | Actual | | | | | | Hypothetical (a) | | | | |
| | | Beginning
Account Value
(07/01/18) | | | Ending
Account Value
(12/31/18) | | | Expenses
Paid During
the Period (b) | | | | | | Beginning
Account Value
(07/01/18) | | | Ending
Account Value
(12/31/18) | | | Expenses
Paid During
the Period (b) | | | Annualized
Expense
Ratio | |
Class I | | $ | 1,000.00 | | | $ | 913.60 | | | $ | 2.70 | | | | | | | $ | 1,000.00 | | | $ | 1,022.38 | | | $ | 2.85 | | | | 0.56 | % |
Class II | | | 1,000.00 | | | | 912.90 | | | | 3.42 | | | | | | | | 1,000.00 | | | | 1,021.63 | | | | 3.62 | | | | 0.71 | |
Class III | | | 1,000.00 | | | | 912.50 | | | | 3.90 | | | | | | | | 1,000.00 | | | | 1,021.12 | | | | 4.13 | | | | 0.81 | |
| | (a) | Hypothetical 5% annual return before expenses is calculated by prorating the number of days in the most recent fiscal half year divided by 365. | |
| | (b) | For each class of the Fund, expenses are equal to annualized expense ratio for the class, multiplied by the average account value over the period, multiplied by 184/365 (to reflect theone-half year period shown). | |
See “Disclosure of Expenses” on the following page for further information on how expenses were calculated.
| | |
| Fund Summary as of December 31, 2018 (continued) | | BlackRock Advantage U.S. Total Market V.I. Fund |
Portfolio Information
SECTOR ALLOCATION
| | | | |
| Sector | | Percent of
Net Assets | |
Information Technology | | | 20 | % |
Health Care | | | 15 | |
Financials | | | 14 | |
Industrials | | | 10 | |
Consumer Discretionary | | | 10 | |
Communication Services | | | 9 | |
Consumer Staples | | | 6 | |
Energy | | | 4 | |
Real Estate | | | 4 | |
Utilities | | | 4 | |
Materials | | | 3 | |
Short-Term Securities | | | 4 | |
Liabilities in Excess of Other Assets | | | (3 | ) |
| | | For Fund compliance purposes, the Fund’s sector classifications refer to one or more of the sectorsub-classifications used by one or more widely recognized market indexes or ratings group indexes, and/or as defined by the investment adviser. These definitions may not apply for purposes of this report, which may combine sector sub classifications for reporting ease. | |
Disclosure of Expenses
Shareholders of the Fund may incur the following charges: (a) transactional expenses; and (b) operating expenses, including investment advisory fees, service and distribution fees, including12b-1 fees, acquired fund fees and expenses, and other fund expenses. The expense example on the previous page (which is based on a hypothetical investment of $1,000 invested on July 1, 2018 and held through December 31, 2018) is intended to assist shareholders both in calculating expenses based on an investment in the Fund and in comparing these expenses with similar costs of investing in other mutual funds.
The expense example provides information about actual account values and actual expenses. In order to estimate the expenses a shareholder paid during the period covered by this report, shareholders can divide their account value by $1,000 and then multiply the result by the number corresponding to their share class under the heading entitled “Expenses Paid During the Period.”
The expense example also provides information about hypothetical account values and hypothetical expenses based on the Fund’s actual expense ratio and an assumed rate of return of 5% per year before expenses. In order to assist shareholders in comparing the ongoing expenses of investing in the Fund and other funds, compare the 5% hypothetical example with the 5% hypothetical examples that appear in shareholder reports of other funds.
The expenses shown in the expense example are intended to highlight shareholders’ ongoing costs only and do not reflect any transactional expenses, such as sales charges, if any. Therefore, the hypothetical example is useful in comparing ongoing expenses only, and will not help shareholders determine the relative total expenses of owning different funds. If these transactional expenses were included, shareholder expenses would have been higher.
Derivative Financial Instruments
The Funds may invest in various derivative financial instruments. These instruments are used to obtain exposure to a security, commodity, index, market, and/or other assets without owning or taking physical custody of securities, commodities and/or other referenced assets or to manage market, equity, credit, interest rate, foreign currency exchange rate, commodity and/or other risks. Derivative financial instruments may give rise to a form of economic leverage and involve risks, including the imperfect correlation between the value of a derivative financial instrument and the underlying asset, possible default of the counterparty to the transaction or illiquidity of the instrument. The Fund’s successful use of a derivative financial instrument depends on the investment adviser’s ability to predict pertinent market movements accurately, which cannot be assured. The use of these instruments may result in losses greater than if they had not been used, may limit the amount of appreciation the Fund can realize on an investment and/or may result in lower distributions paid to shareholders. The Fund’s investments in these instruments, if any, are discussed in detail in the Notes to Financial Statements.
| | |
| 4 | | 2018 BLACKROCK ANNUAL REPORTTO SHAREHOLDERS |
| | |
Schedule of Investments December 31, 2018 | | BlackRock Advantage U.S. Total Market V.I. Fund (Percentages shown are based on Net Assets) |
| | | | | | | | |
| Security | | Shares | | | Value | |
| | |
Common Stocks — 98.8% | | | | | | | | |
|
Aerospace & Defense — 2.3% | |
Boeing Co. (The) | | | 5,267 | | | $ | 1,698,608 | |
Curtiss-Wright Corp. | | | 1,433 | | | | 146,338 | |
General Dynamics Corp. | | | 4,681 | | | | 735,900 | |
Lockheed Martin Corp. | | | 1,131 | | | | 296,141 | |
Raytheon Co.(a) | | | 15,203 | | | | 2,331,380 | |
| | | | | | | | |
| | | | | | | 5,208,367 | |
| |
| Airlines — 0.4% | | | | |
American Airlines Group, Inc. | | | 1,469 | | | | 47,169 | |
Southwest Airlines Co. | | | 18,535 | | | | 861,507 | |
| | | | | | | | |
| | | | | | | 908,676 | |
| |
| Auto Components — 0.1% | | | | |
Dana, Inc. | | | 13,600 | | | | 185,368 | |
| | | | | | | | |
| |
| Automobiles — 0.3% | | | | |
Ford Motor Co. | | | 32,236 | | | | 246,605 | |
General Motors Co. | | | 10,997 | | | | 367,850 | |
| | | | | | | | |
| | | | | | | 614,455 | |
| |
| Banks — 6.1% | | | | |
Bank of America Corp. | | | 183,999 | | | | 4,533,735 | |
BB&T Corp. | | | 23,376 | | | | 1,012,648 | |
Citigroup, Inc. | | | 16,469 | | | | 857,376 | |
Citizens Financial Group, Inc. | | | 28,628 | | | | 851,111 | |
East West Bancorp, Inc. | | | 3,772 | | | | 164,195 | |
First Horizon National Corp. | | | 45,956 | | | | 604,781 | |
First Republic Bank(a) | | | 16,363 | | | | 1,421,945 | |
Independent Bank Corp. | | | 22,813 | | | | 479,529 | |
JPMorgan Chase & Co. | | | 20,329 | | | | 1,984,517 | |
Republic First Bancorp, Inc.(b) | | | 34,663 | | | | 206,938 | |
Shore Bancshares, Inc. | | | 4,547 | | | | 66,114 | |
Synovus Financial Corp. | | | 8,420 | | | | 269,356 | |
TriState Capital Holdings, Inc.(b) | | | 1,748 | | | | 34,016 | |
Wells Fargo & Co. | | | 28,341 | | | | 1,305,953 | |
| | | | | | | | |
| | | | | | | 13,792,214 | |
| |
| Beverages — 1.3% | | | | |
Brown-Forman Corp., Class B | | | 1,429 | | | | 67,992 | |
Coca-Cola European Partners plc | | | 10,990 | | | | 503,891 | |
Constellation Brands, Inc., Class A | | | 2,390 | | | | 384,360 | |
Molson Coors Brewing Co., Class B | | | 1,544 | | | | 86,711 | |
Monster Beverage Corp.(b) | | | 9,825 | | | | 483,587 | |
PepsiCo, Inc. | | | 13,304 | | | | 1,469,826 | |
| | | | | | | | |
| | | | | | | 2,996,367 | |
| |
| Biotechnology — 4.2% | | | | |
AbbVie, Inc. | | | 22,063 | | | | 2,033,988 | |
Amgen, Inc. | | | 9,764 | | | | 1,900,758 | |
Biogen, Inc.(b) | | | 1,174 | | | | 353,280 | |
Celgene Corp.(b) | | | 22,323 | | | | 1,430,681 | |
Genomic Health, Inc.(b) | | | 3,792 | | | | 244,243 | |
Gilead Sciences, Inc. | | | 37,889 | | | | 2,369,957 | |
Incyte Corp.(b) | | | 3,950 | | | | 251,180 | |
Regeneron Pharmaceuticals, Inc.(b) | | | 197 | | | | 73,579 | |
Vertex Pharmaceuticals, Inc.(b) | | | 5,042 | | | | 835,510 | |
| | | | | | | | |
| | | | | | | 9,493,176 | |
| |
| Building Products — 0.3% | | | | |
Allegion plc | | | 7,628 | | | | 608,028 | |
| | | | | | | | |
| |
| Capital Markets — 3.9% | | | | |
BrightSphere Investment Group plc | | | 9,722 | | | | 103,831 | |
Charles Schwab Corp. (The) | | | 62,063 | | | | 2,577,476 | |
CME Group, Inc.(a) | | | 7,795 | | | | 1,466,395 | |
Evercore, Inc., Class A | | | 355 | | | | 25,404 | |
| | | | | | | | |
| Security | | Shares | | | Value | |
| |
| Capital Markets (continued) | | | | |
Invesco Ltd. | | | 12,842 | | | $ | 214,975 | |
Moelis & Co., Class A | | | 14,909 | | | | 512,572 | |
Morgan Stanley | | | 72,341 | | | | 2,868,321 | |
S&P Global, Inc. | | | 3,495 | | | | 593,940 | |
TD Ameritrade Holding Corp. | | | 9,174 | | | | 449,159 | |
Westwood Holdings Group, Inc. | | | 3,542 | | | | 120,428 | |
| | | | | | | | |
| | | | | | | 8,932,501 | |
| |
| Chemicals — 1.7% | | | | |
Air Products & Chemicals, Inc. | | | 14,658 | | | | 2,346,013 | |
Celanese Corp. | | | 1,421 | | | | 127,847 | |
Eastman Chemical Co. | | | 5,968 | | | | 436,321 | |
Ecolab, Inc. | | | 4,537 | | | | 668,527 | |
Innospec, Inc. | | | 313 | | | | 19,331 | |
Linde plc | | | 2,087 | | | | 325,655 | |
| | | | | | | | |
| | | | | | | 3,923,694 | |
| |
| Commercial Services & Supplies — 0.3% | | | | |
McGrath RentCorp | | | 8,530 | | | | 439,125 | |
Steelcase, Inc., Class A | | | 11,993 | | | | 177,856 | |
| | | | | | | | |
| | | | | | | 616,981 | |
| |
| Communications Equipment — 1.2% | | | | |
Calix, Inc.(b) | | | 18,233 | | | | 177,772 | |
Ciena Corp.(b) | | | 5,299 | | | | 179,689 | |
Cisco Systems, Inc. | | | 36,292 | | | | 1,572,532 | |
Motorola Solutions, Inc. | | | 4,034 | | | | 464,071 | |
Palo Alto Networks, Inc.(a)(b) | | | 1,604 | | | | 302,114 | |
| | | | | | | | |
| | | | | | | 2,696,178 | |
| |
| Construction & Engineering — 0.3% | | | | |
Comfort Systems USA, Inc. | | | 16,068 | | | | 701,850 | |
| | | | | | | | |
| |
| Construction Materials — 0.1% | | | | |
Martin Marietta Materials, Inc. | | | 624 | | | | 107,247 | |
Vulcan Materials Co. | | | 313 | | | | 30,924 | |
| | | | | | | | |
| | | | | | | 138,171 | |
| |
| Consumer Finance — 0.3% | | | | |
American Express Co. | | | 5,070 | | | | 483,272 | |
Regional Management Corp.(b) | | | 8,254 | | | | 198,509 | |
| | | | | | | | |
| | | | | | | 681,781 | |
| |
| Containers & Packaging — 0.3% | | | | |
Packaging Corp. of America | | | 7,812 | | | | 651,989 | |
WestRock Co. | | | 3,472 | | | | 131,103 | |
| | | | | | | | |
| | | | | | | 783,092 | |
| |
| Diversified Consumer Services — 0.2% | | | | |
H&R Block, Inc. | | | 20,088 | | | | 509,633 | |
| | | | | | | | |
| |
| Diversified Financial Services — 1.4%(b) | | | | |
Berkshire Hathaway, Inc., Class B | | | 15,685 | | | | 3,202,563 | |
On Deck Capital, Inc. | | | 8,214 | | | | 48,463 | |
| | | | | | | | |
| | | | | | | 3,251,026 | |
| |
| Diversified Telecommunication Services — 1.2% | | | | |
AT&T, Inc. | | | 21,882 | | | | 624,513 | |
Cogent Communications Holdings, Inc. | | | 7,558 | | | | 341,697 | |
Verizon Communications, Inc. | | | 31,546 | | | | 1,773,516 | |
| | | | | | | | |
| | | | | | | 2,739,726 | |
| |
| Electric Utilities — 2.4% | | | | |
Eversource Energy | | | 4,964 | | | | 322,858 | |
IDACORP, Inc. | | | 18,129 | | | | 1,687,085 | |
OGE Energy Corp. | | | 21,454 | | | | 840,782 | |
Pinnacle West Capital Corp. | | | 13,620 | | | | 1,160,424 | |
Portland General Electric Co. | | | 26,715 | | | | 1,224,883 | |
Xcel Energy, Inc. | | | 2,315 | | | | 114,060 | |
| | | | | | | | |
| | | | | | | 5,350,092 | |
| | | | |
| SCHEDULE OF INVESTMENTS | | | 5 | |
| | |
Schedule of Investments (continued) December 31, 2018 | | BlackRock Advantage U.S. Total Market V.I. Fund (Percentages shown are based on Net Assets) |
| | | | | | | | |
| Security | | Shares | | | Value | |
| |
| Electrical Equipment — 1.1% | | | | |
AMETEK, Inc. | | | 10,071 | | | $ | 681,807 | |
Hubbell, Inc. | | | 796 | | | | 79,075 | |
Rockwell Automation, Inc. | | | 11,524 | | | | 1,734,131 | |
| | | | | | | | |
| | | | | | | 2,495,013 | |
| |
| Electronic Equipment, Instruments & Components — 0.8% | | | | |
CDW Corp. | | | 10,947 | | | | 887,255 | |
Fitbit, Inc., Class A(b) | | | 24,123 | | | | 119,891 | |
National Instruments Corp. | | | 18,106 | | | | 821,650 | |
| | | | | | | | |
| | | | | | | 1,828,796 | |
| |
| Energy Equipment & Services — 0.5% | | | | |
Archrock, Inc. | | | 7,412 | | | | 55,516 | |
Halliburton Co. | | | 36,745 | | | | 976,682 | |
Nabors Industries Ltd. | | | 41,356 | | | | 82,712 | |
ProPetro Holding Corp.(b) | | | 2,013 | | | | 24,800 | |
| | | | | | | | |
| | | | | | | 1,139,710 | |
| |
| Entertainment — 1.1% | | | | |
Activision Blizzard, Inc. | | | 3,563 | | | | 165,929 | |
Electronic Arts, Inc.(b) | | | 4,556 | | | | 359,514 | |
Netflix, Inc.(b) | | | 2,929 | | | | 783,976 | |
Twenty-First Century Fox, Inc., Class A | | | 4,413 | | | | 212,353 | |
Viacom, Inc., Class A | | | 2,896 | | | | 80,538 | |
Viacom, Inc., Class B | | | 24,774 | | | | 636,692 | |
World Wrestling Entertainment, Inc., Class A | | | 4,470 | | | | 333,998 | |
| | | | | | | | |
| | | | | | | 2,573,000 | |
| |
| Equity Real Estate Investment Trusts (REITs) — 4.0% | | | | |
EastGroup Properties, Inc. | | | 311 | | | | 28,528 | |
Highwoods Properties, Inc. | | | 12,622 | | | | 488,345 | |
Host Hotels & Resorts, Inc. | | | 72,591 | | | | 1,210,092 | |
Outfront Media, Inc. | | | 7,128 | | | | 129,159 | |
Park Hotels & Resorts, Inc. | | | 28,524 | | | | 741,054 | |
Prologis, Inc. | | | 47,471 | | | | 2,787,497 | |
Realty Income Corp. | | | 40,802 | | | | 2,572,158 | |
Ryman Hospitality Properties, Inc. | | | 307 | | | | 20,474 | |
Simon Property Group, Inc. | | | 5,497 | | | | 923,441 | |
SL Green Realty Corp. | | | 1,935 | | | | 153,020 | |
| | | | | | | | |
| | | | | | | 9,053,768 | |
| |
| Food & Staples Retailing — 0.9% | | | | |
Costco Wholesale Corp. | | | 9,226 | | | | 1,879,429 | |
Kroger Co. (The) | | | 984 | | | | 27,060 | |
Walmart, Inc. | | | 569 | | | | 53,002 | |
| | | | | | | | |
| | | | | | | 1,959,491 | |
| |
| Food Products — 2.1% | | | | |
Archer-Daniels-Midland Co. | | | 48,032 | | | | 1,967,871 | |
Hershey Co. (The) | | | 24,343 | | | | 2,609,083 | |
Hormel Foods Corp. | | | 919 | | | | 39,223 | |
Lamb Weston Holdings, Inc. | | | 1,957 | | | | 143,957 | |
| | | | | | | | |
| | | | | | | 4,760,134 | |
| |
| Gas Utilities — 0.5% | | | | |
Atmos Energy Corp. | | | 11,074 | | | | 1,026,781 | |
Chesapeake Utilities Corp.(a) | | | 1,709 | | | | 138,942 | |
| | | | | | | | |
| | | | | | | 1,165,723 | |
| |
| Health Care Equipment & Supplies — 3.2% | | | | |
Abbott Laboratories | | | 10,829 | | | | 783,262 | |
ABIOMED, Inc.(b) | | | 337 | | | | 109,539 | |
Danaher Corp. | | | 20,563 | | | | 2,120,457 | |
DexCom, Inc.(b) | | | 1,255 | | | | 150,349 | |
IDEXX Laboratories, Inc.(b) | | | 1,657 | | | | 308,235 | |
Intuitive Surgical, Inc.(b) | | | 1,447 | | | | 692,997 | |
Masimo Corp.(b) | | | 3,595 | | | | 385,995 | |
Medtronic plc | | | 4,420 | | | | 402,043 | |
| | | | | | | | |
| Security | | Shares | | | Value | |
| |
| Health Care Equipment & Supplies (continued) | | | | |
STERIS plc | | | 2,857 | | | $ | 305,270 | |
Stryker Corp. | | | 12,999 | | | | 2,037,593 | |
| | | | | | | | |
| | | | | | | 7,295,740 | |
| |
| Health Care Providers & Services — 3.4% | | | | |
AmerisourceBergen Corp. | | | 10,256 | | | | 763,046 | |
Cardinal Health, Inc. | | | 26,234 | | | | 1,170,036 | |
CVS Health Corp. | | | 6,933 | | | | 454,250 | |
Halfmoon Parent, Inc. | | | 785 | | | | 149,169 | |
Humana, Inc. | | | 3,471 | | | | 994,372 | |
McKesson Corp. | | | 8,029 | | | | 886,964 | |
Quest Diagnostics, Inc.(a) | | | 1,251 | | | | 104,171 | |
UnitedHealth Group, Inc. | | | 10,916 | | | | 2,719,394 | |
WellCare Health Plans, Inc.(b) | | | 2,104 | | | | 496,733 | |
| | | | | | | | |
| | | | | | | 7,738,135 | |
| | |
| Health Care Technology — 0.4%(b) | | | | | | |
athenahealth, Inc. | | | 220 | | | | 29,025 | |
Veeva Systems, Inc., Class A | | | 9,044 | | | | 807,810 | |
| | | | | | | | |
| | | | | | | 836,835 | |
| |
| Hotels, Restaurants & Leisure — 2.3% | | | | |
Carnival Corp. | | | 11,940 | | | | 588,642 | |
Darden Restaurants, Inc. | | | 5,354 | | | | 534,651 | |
Domino’s Pizza, Inc. | | | 4,202 | | | | 1,042,054 | |
Dunkin’ Brands Group, Inc.(a) | | | 6,628 | | | | 424,987 | |
Eldorado Resorts, Inc.(b) | | | 754 | | | | 27,302 | |
Extended Stay America, Inc. | | | 16,217 | | | | 251,364 | |
Hilton Worldwide Holdings, Inc. | | | 3,643 | | | | 261,567 | |
Las Vegas Sands Corp. | | | 4,517 | | | | 235,110 | |
Marriott International, Inc., Class A | | | 2,762 | | | | 299,843 | |
McDonald’s Corp. | | | 7,018 | | | | 1,246,186 | |
Norwegian Cruise Line Holdings Ltd.(b) | | | 4,767 | | | | 202,073 | |
| | | | | | | | |
| | | | | | | 5,113,779 | |
| |
| Household Durables — 0.4% | | | | |
DR Horton, Inc. | | | 1,196 | | | | 41,454 | |
Garmin Ltd. | | | 10,630 | | | | 673,092 | |
Meritage Homes Corp.(b) | | | 1,592 | | | | 58,458 | |
Roku, Inc.(b) | | | 1,027 | | | | 31,467 | |
William Lyon Homes, Class A(b) | | | 4,203 | | | | 44,930 | |
| | | | | | | | |
| | | | | | | 849,401 | |
| |
| Household Products — 0.9% | | | | |
Church & Dwight Co., Inc. | | | 29,895 | | | | 1,965,895 | |
Clorox Co. (The) | | | 397 | | | | 61,194 | |
| | | | | | | | |
| | | | | | | 2,027,089 | |
| | |
| Industrial Conglomerates — 0.7% | | | | | | |
3M Co. | | | 6,285 | | | | 1,197,544 | |
General Electric Co. | | | 40,348 | | | | 305,434 | |
Roper Technologies, Inc. | | | 477 | | | | 127,130 | |
| | | | | | | | |
| | | | | | | 1,630,108 | |
| |
| Insurance — 2.1% | | | | |
Allstate Corp. (The) | | | 19,522 | | | | 1,613,103 | |
American Financial Group, Inc. | | | 2,798 | | | | 253,303 | |
Arthur J Gallagher & Co. | | | 7,825 | | | | 576,702 | |
Athene Holding Ltd., Class A(b) | | | 8,174 | | | | 325,570 | |
First American Financial Corp. | | | 1,023 | | | | 45,667 | |
Hartford Financial Services Group, Inc. (The) | | | 20,290 | | | | 901,891 | |
Kinsale Capital Group, Inc. | | | 991 | | | | 55,060 | |
Lincoln National Corp. | | | 2,191 | | | | 112,420 | |
Progressive Corp. (The) | | | 936 | | | | 56,469 | |
Unum Group | | | 28,139 | | | | 826,724 | |
| | | | | | | | |
| | | | | | | 4,766,909 | |
| | |
| 6 | | 2018 BLACKROCK ANNUAL REPORTTO SHAREHOLDERS |
| | |
Schedule of Investments (continued) December 31, 2018 | | BlackRock Advantage U.S. Total Market V.I. Fund (Percentages shown are based on Net Assets) |
| | | | | | | | |
| Security | | Shares | | | Value | |
| |
| Interactive Media & Services — 4.1%(b) | | | | |
Alphabet, Inc., Class A | | | 1,864 | | | $ | 1,947,805 | |
Alphabet, Inc., Class C | | | 2,718 | | | | 2,814,788 | |
Care.com, Inc. | | | 12,001 | | | | 231,739 | |
Cargurus, Inc. | | | 7,994 | | | | 269,638 | |
Facebook, Inc., Class A | | | 24,921 | | | | 3,266,894 | |
TripAdvisor, Inc. | | | 3,301 | | | | 178,056 | |
Twitter, Inc. | | | 3,470 | | | | 99,728 | |
Yelp, Inc. | | | 12,244 | | | | 428,418 | |
| | | | | | | | |
| | | | | | | 9,237,066 | |
| |
| Internet & Direct Marketing Retail — 2.6%(b) | | | | |
Amazon.com, Inc. | | | 3,823 | | | | 5,742,031 | |
Booking Holdings, Inc. | | | 124 | | | | 213,580 | |
| | | | | | | | |
| | | | | | | 5,955,611 | |
| |
| IT Services — 4.7% | | | | |
Accenture plc, Class A | | | 1,140 | | | | 160,751 | |
Automatic Data Processing, Inc. | | | 18,286 | | | | 2,397,660 | |
Booz Allen Hamilton Holding Corp. | | | 19,208 | | | | 865,704 | |
Broadridge Financial Solutions, Inc. | | | 1,588 | | | | 152,845 | |
Fidelity National Information Services, Inc. | | | 14,202 | | | | 1,456,415 | |
First Data Corp., Class A(b) | | | 21,470 | | | | 363,058 | |
GoDaddy, Inc., Class A(b) | | | 14,527 | | | | 953,262 | |
Mastercard, Inc., Class A | | | 9,855 | | | | 1,859,146 | |
NIC, Inc. | | | 24,946 | | | | 311,326 | |
PayPal Holdings, Inc.(b) | | | 6,954 | | | | 584,762 | |
Square, Inc., Class A(b) | | | 5,140 | | | | 288,303 | |
Total System Services, Inc. | | | 1,665 | | | | 135,348 | |
Unisys Corp.(b) | | | 2,503 | | | | 29,110 | |
VeriSign, Inc.(b) | | | 6,005 | | | | 890,481 | |
Visa, Inc., Class A | | | 1,070 | | | | 141,176 | |
| | | | | | | | |
| | | | | | | 10,589,347 | |
| |
| Life Sciences Tools & Services — 0.4% | | | | |
Agilent Technologies, Inc. | | | 7,538 | | | | 508,513 | |
Medpace Holdings, Inc.(b) | | | 4,178 | | | | 221,142 | |
Thermo Fisher Scientific, Inc. | | | 1,198 | | | | 268,100 | |
| | | | | | | | |
| | | | | | | 997,755 | |
| |
| Machinery — 3.6% | | | | |
Crane Co. | | | 21,058 | | | | 1,519,966 | |
Illinois Tool Works, Inc. | | | 17,157 | | | | 2,173,620 | |
Ingersoll-Rand plc | | | 19,011 | | | | 1,734,374 | |
ITT, Inc. | | | 2,812 | | | | 135,735 | |
PACCAR, Inc. | | | 37,120 | | | | 2,121,037 | |
Snap-on, Inc. | | | 2,724 | | | | 395,770 | |
| | | | | | | | |
| | | | | | | 8,080,502 | |
| |
| Media — 1.8% | | | | |
Altice USA, Inc., Class A | | | 5,419 | | | | 89,522 | |
AMC Networks, Inc., Class A(b) | | | 3,172 | | | | 174,079 | |
CBS Corp.(Non-Voting), Class B | | | 7,654 | | | | 334,633 | |
Clear Channel Outdoor Holdings, Inc., Class A | | | 22,667 | | | | 117,642 | |
Comcast Corp., Class A | | | 34,403 | | | | 1,171,422 | |
Emerald Expositions Events, Inc. | | | 5,160 | | | | 63,674 | |
Gray Television, Inc.(b) | | | 26,584 | | | | 391,848 | |
Interpublic Group of Cos., Inc. (The) | | | 24,294 | | | | 501,185 | |
Liberty Media Corp.-Liberty SiriusXM, Class A(b) | | | 6,341 | | | | 233,349 | |
Liberty Media Corp.-Liberty SiriusXM, Class C(b) | | | 26,815 | | | | 991,619 | |
MSG Networks, Inc., Class A(b) | | | 2,741 | | | | 64,578 | |
Sinclair Broadcast Group, Inc., Class A | | | 1,790 | | | | 47,149 | |
| | | | | | | | |
| | | | | | | 4,180,700 | |
| |
| Metals & Mining — 0.4% | | | | |
Carpenter Technology Corp. | | | 1,719 | | | | 61,214 | |
Newmont Mining Corp. | | | 12,245 | | | | 424,289 | |
Reliance Steel & Aluminum Co. | | | 4,535 | | | | 322,756 | |
| | | | | | | | |
| | | | | | | 808,259 | |
| | | | | | | | |
| Security | | Shares | | | Value | |
| |
| Multiline Retail — 0.9% | | | | |
Target Corp. | | | 31,969 | | | $ | 2,112,831 | |
| | | | | | | | |
| |
| Multi-Utilities — 0.1% | | | | |
Avista Corp. | | | 588 | | | | 24,978 | |
Consolidated Edison, Inc. | | | 1,258 | | | | 96,187 | |
| | | | | | | | |
| | | | | | | 121,165 | |
| |
| Oil, Gas & Consumable Fuels — 4.0% | | | | |
Anadarko Petroleum Corp. | | | 27,233 | | | | 1,193,895 | |
Antero Resources Corp.(b) | | | 6,447 | | | | 60,537 | |
Apache Corp. | | | 3,213 | | | | 84,341 | |
Chevron Corp. | | | 6,978 | | | | 759,137 | |
Concho Resources, Inc.(b) | | | 1,952 | | | | 200,646 | |
ConocoPhillips | | | 24,052 | | | | 1,499,642 | |
CONSOL Energy, Inc.(b) | | | 1,758 | | | | 55,746 | |
Continental Resources, Inc.(b) | | | 4,624 | | | | 185,839 | |
Exxon Mobil Corp. | | | 26,054 | | | | 1,776,622 | |
Kinder Morgan, Inc. | | | 49,966 | | | | 768,477 | |
Newfield Exploration Co.(b) | | | 1,768 | | | | 25,919 | |
Occidental Petroleum Corp. | | | 11,928 | | | | 732,141 | |
Phillips 66 | | | 12,835 | | | | 1,105,735 | |
Plains GP Holdings LP, Class A(b) | | | 2,407 | | | | 48,381 | |
Whiting Petroleum Corp.(b) | | | 3,573 | | | | 81,071 | |
Williams Cos., Inc. (The) | | | 17,873 | | | | 394,100 | |
| | | | | | | | |
| | | | | | | 8,972,229 | |
| |
| Personal Products — 0.5% | | | | |
Estee Lauder Cos., Inc. (The), Class A | | | 7,400 | | | | 962,740 | |
USANA Health Sciences, Inc.(b) | | | 1,212 | | | | 142,689 | |
| | | | | | | | |
| | | | | | | 1,105,429 | |
| |
| Pharmaceuticals — 3.8% | | | | |
Bristol-Myers Squibb Co. | | | 21,394 | | | | 1,112,060 | |
Eli Lilly & Co. | | | 15,126 | | | | 1,750,381 | |
Johnson & Johnson | | | 19,402 | | | | 2,503,828 | |
Merck & Co., Inc. | | | 24,630 | | | | 1,881,978 | |
Zoetis, Inc. | | | 14,921 | | | | 1,276,343 | |
| | | | | | | | |
| | | | | | | 8,524,590 | |
| |
| Professional Services — 0.6% | | | | |
Insperity, Inc. | | | 10,555 | | | | 985,415 | |
Kforce, Inc. | | | 7,356 | | | | 227,448 | |
Robert Half International, Inc. | | | 2,327 | | | | 133,104 | |
| | | | | | | | |
| | | | | | | 1,345,967 | |
| |
| Real Estate Management & Development — 0.1% | | | | |
Marcus & Millichap, Inc.(b) | | | 8,720 | | | | 299,358 | |
| | | | | | | | |
| |
| Road & Rail — 0.6% | | | | |
Landstar System, Inc. | | | 5,005 | | | | 478,828 | |
Norfolk Southern Corp. | | | 4,195 | | | | 627,320 | |
Universal Logistics Holdings, Inc. | | | 9,808 | | | | 177,427 | |
| | | | | | | | |
| | | | | | | 1,283,575 | |
| |
| Semiconductors & Semiconductor Equipment — 3.1% | | | | |
Amkor Technology, Inc.(b) | | | 62,281 | | | | 408,563 | |
Analog Devices, Inc. | | | 6,956 | | | | 597,034 | |
Applied Materials, Inc. | | | 11,511 | | | | 376,870 | |
Broadcom, Inc. | | | 270 | | | | 68,656 | |
Cirrus Logic, Inc.(b) | | | 2,462 | | | | 81,689 | |
Intel Corp. | | | 43,069 | | | | 2,021,228 | |
Maxim Integrated Products, Inc.(a) | | | 14,934 | | | | 759,394 | |
NVIDIA Corp. | | | 6,838 | | | | 912,873 | |
NXP Semiconductors NV(b) | | | 1,168 | | | | 85,591 | |
Skyworks Solutions, Inc. | | | 2,924 | | | | 195,966 | |
Synaptics, Inc.(b) | | | 732 | | | | 27,238 | |
Texas Instruments, Inc. | | | 11,752 | | | | 1,110,564 | |
Xilinx, Inc. | | | 5,444 | | | | 463,665 | |
| | | | | | | | |
| | | | | | | 7,109,331 | |
| | | | |
| SCHEDULE OF INVESTMENTS | | | 7 | |
| | |
Schedule of Investments (continued) December 31, 2018 | | BlackRock Advantage U.S. Total Market V.I. Fund (Percentages shown are based on Net Assets) |
| | | | | | | | |
| Security | | Shares | | | Value | |
| Software — 6.2% | | | | |
Atlassian Corp. plc, Class A(a)(b) | | | 198 | | | $ | 17,618 | |
Dropbox, Inc., Class A(b) | | | 6,066 | | | | 123,928 | |
Intuit, Inc. | | | 5,008 | | | | 985,825 | |
Microsoft Corp. | | | 67,540 | | | | 6,860,038 | |
New Relic, Inc.(b) | | | 3,805 | | | | 308,091 | |
Oracle Corp. | | | 34,944 | | | | 1,577,722 | |
RingCentral, Inc., Class A(b) | | | 2,509 | | | | 206,842 | |
salesforce. com, Inc.(b) | | | 21,921 | | | | 3,002,519 | |
ServiceNow, Inc.(b) | | | 1,057 | | | | 188,199 | |
Ultimate Software Group, Inc. (The)(b) | | | 979 | | | | 239,728 | |
VMware, Inc., Class A(b) | | | 2,710 | | | | 371,622 | |
Workiva, Inc.(b) | | | 6,887 | | | | 247,174 | |
| | | | | | | | |
| | | | | | | 14,129,306 | |
| Specialty Retail — 2.0% | | | | |
Asbury Automotive Group, Inc.(b) | | | 8,258 | | | | 550,478 | |
AutoNation, Inc.(b) | | | 5,198 | | | | 185,569 | |
Best Buy Co., Inc. | | | 442 | | | | 23,408 | |
Dick’s Sporting Goods, Inc. | | | 3,540 | | | | 110,448 | |
Five Below, Inc.(b) | | | 2,677 | | | | 273,911 | |
Home Depot, Inc. (The) | | | 2,950 | | | | 506,869 | |
Lithia Motors, Inc., Class A(a) | | | 7,745 | | | | 591,176 | |
MarineMax, Inc.(b) | | | 6,294 | | | | 115,243 | |
Penske Automotive Group, Inc. | | | 16,556 | | | | 667,538 | |
Ross Stores, Inc. | | | 3,432 | | | | 285,542 | |
Sonic Automotive, Inc., Class A | | | 12,162 | | | | 167,349 | |
TJX Cos., Inc. (The) | | | 23,477 | | | | 1,050,361 | |
| | | | | | | | |
| | | | | | | 4,527,892 | |
| Technology Hardware, Storage & Peripherals — 3.8% | | | | |
Apple, Inc. | | | 43,111 | | | | 6,800,329 | |
Dell Technologies, Inc., Class C(b) | | | 6,905 | | | | 337,432 | |
Hewlett Packard Enterprise Co. | | | 2,975 | | | | 39,299 | |
HP, Inc. | | | 54,078 | | | | 1,106,436 | |
Pure Storage, Inc., Class A(b) | | | 24,397 | | | | 392,304 | |
| | | | | | | | |
| | | | | | | 8,675,800 | |
| Textiles, Apparel & Luxury Goods — 0.9% | | | | |
Lululemon Athletica, Inc.(b) | | | 272 | | | | 33,078 | |
NIKE, Inc., Class B | | | 21,617 | | | | 1,602,684 | |
Ralph Lauren Corp. | | | 584 | | | | 60,421 | |
VF Corp. | | | 4,765 | | | | 339,935 | |
| | | | | | | | |
| | | | | | | 2,036,118 | |
| Thrifts & Mortgage Finance — 0.3% | | | | |
Essent Group Ltd.(b) | | | 3,639 | | | | 124,381 | |
Meridian Bancorp, Inc. | | | 1,460 | | | | 20,907 | |
| | | | | | | | |
| Security | | Shares | | | Value | |
| Thrifts & Mortgage Finance (continued) | | | | |
Riverview Bancorp, Inc. | | | 14,015 | | | $ | 102,029 | |
United Community Financial Corp. | | | 46,814 | | | | 414,304 | |
| | | | | | | | |
| | | | | | | 661,621 | |
| Tobacco — 0.6% | | | | |
Altria Group, Inc. | | | 17,540 | | | | 866,301 | |
Philip Morris International, Inc. | | | 5,848 | | | | 390,412 | |
| | | | | | | | |
| | | | | | | 1,256,713 | |
| Trading Companies & Distributors — 0.0% | | | | |
GATX Corp.(a) | | | 1,133 | | | | 80,228 | |
| | | | | | | | |
| Water Utilities — 0.8% | | | | |
American Water Works Co., Inc. | | | 21,307 | | | | 1,934,036 | |
| | | | | | | | |
| Wireless Telecommunication Services — 0.2% | | | | |
Sprint Corp.(a)(b) | | | 15,969 | | | | 92,940 | |
Telephone & Data Systems, Inc. | | | 14,460 | | | | 470,528 | |
| | | | | | | | |
| | | | | | | 563,468 | |
| | | | | | | | |
Total Common Stocks — 98.8%
(Cost: $240,143,792) | | | | 223,953,904 | |
| | | | | | | | |
Total Long-Term Investments — 98.8%
(Cost: $240,143,792) | | | | 223,953,904 | |
| | | | | | | | |
|
Short-Term Securities — 3.9%(c)(e) | |
BlackRock Liquidity Funds,T-Fund, Institutional Class,
2.32% | | | 2,833,530 | | | | 2,833,530 | |
SL Liquidity Series, LLC, Money Market Series,
2.57%(d) | | | 6,092,861 | | | | 6,092,252 | |
| | | | | | | | |
Total Short-Term Securities — 3.9%
(Cost: $8,926,001) | | | | 8,925,782 | |
| | | | | | | | |
| |
Total Investments — 102.7%
(Cost: $249,069,793) | | | | 232,879,686 | |
Liabilities in Excess of Other Assets — (2.7)% | | | | (6,088,845 | ) |
| | | | | | | | |
Net Assets — 100.0% | | | $ | 226,790,841 | |
| | | | | | | | |
| (a) | Security, or a portion of the security, is on loan. |
| (b) | Non-income producing security. |
| (c) | Annualized7-day yield as of period end. |
| (d) | Security was purchased with the cash collateral from loaned securities. |
| (e) | During the year ended December 31, 2018, investments in issuers considered to be affiliates of the Fund for purposes of Section 2(a)(3) of the Investment Company Act of 1940, as amended, were as follows: |
| | | | | | | | | | | | | | | | | | | | | | | | | | | | |
| Affiliate | | Shares
Held at
12/31/17 | | | Net
Activity | | | Shares
Held at
12/31/18 | | | Value at
12/31/18 | | | Income | | | Net
Realized
Gain (Loss) (a) | | | Change in
Unrealized
Appreciation
(Depreciation) | |
BlackRock Liquidity Funds,T-Fund, Institutional Class | | | 1,558,684 | | | | 1,274,846 | | | | 2,833,530 | | | $ | 2,833,530 | | | $ | 40,259 | | | $ | — | | | $ | — | |
SL Liquidity Series, LLC, Money Market Series | | | 8,368,069 | | | | (2,275,208 | ) | | | 6,092,861 | | | | 6,092,252 | | | | 11,339 | (b) | | | (53 | ) | | | (149 | ) |
| | | | | | | | | | | | | | | | | | | | | | | | | | | | |
| | | | | | | | | | | | | | $ | 8,925,782 | | | $ | 51,598 | | | $ | (53 | ) | | $ | (149 | ) |
| | | | | | | | | | | | | | | | | | | | | | | | | | | | |
| | (a) | Includes net capital gain distributions, if applicable. | |
| | (b) | Represents securities lending income earned from the reinvestment of cash collateral from loaned securities, net of fees and collateral investment expenses, and other payments to and from borrowers of securities. | |
For Fund compliance purposes, the Fund’s industry classifications refer to one or more of the industrysub-classifications used by one or more widely recognized market indexes or ratings group indexes, and/or as defined by the investment adviser. These definitions may not apply for purposes of this report, which may combine such industrysub-classifications for reporting ease.
| | |
| 8 | | 2018 BLACKROCK ANNUAL REPORTTO SHAREHOLDERS |
| | |
Schedule of Investments (continued) December 31, 2018 | | BlackRock Advantage U.S. Total Market V.I. Fund |
Derivative Financial Instruments Outstanding as of Period End
Futures Contracts
| | | | | | | | | | | | | | | | |
| Description | | Number of
Contracts | | | Expiration
Date | | | Notional
Amount (000) | | | Value/
Unrealized
Appreciation
(Depreciation) | |
Long Contracts | | | | | | | | | | | | | | | | |
S&P 500E-Mini Index | | | 26 | | | | 03/15/19 | | | $ | 3,257 | | | $ | (48,471 | ) |
| | | | | | | | | | | | | | | | |
Derivative Financial Instruments Categorized by Risk Exposure
As of period end, the fair values of derivative financial instruments located in the Statement of Assets and Liabilities were as follows:
| | | | | | | | | | | | | | | | | | | | | | | | | | | | |
| | | Commodity
Contracts | | | Credit
Contracts | | | Equity
Contracts | | | Foreign
Currency
Exchange
Contracts | | | Interest
Rate
Contracts | | | Other
Contracts | | | Total | |
Liabilities — Derivative Financial Instruments | | | | | | | | | | | | | | | | | | | | | | | | | | | | |
Futures contracts | | | | | | | | | | | | | | | | | | | | | | | | | | | | |
Net unrealized depreciation(a) | | $ | — | | | $ | — | | | $ | 48,471 | | | $ | — | | | $ | — | | | $ | — | | | $ | 48,471 | |
| | | | | | | | | | | | | | | | | | | | | | | | | | | | |
| | (a) | Includes cumulative depreciation on futures contracts, if any, as reported in the Schedule of Investments. Only current day’s variation margin is reported within the Statement of Assets and Liabilities. | |
For the year ended December 31, 2018, the effect of derivative financial instruments in the Statement of Operations were as follows:
| | | | | | | | | | | | | | | | | | | | | | | | | | | | |
| | | Commodity
Contracts | | | Credit
Contracts | | | Equity
Contracts | | | Foreign
Currency
Exchange
Contracts | | | Interest
Rate
Contracts | | | Other
Contracts | | | Total | |
Net Realized Gain (Loss) from: | | | | | | | | | | | | | | | | | | | | | | | | | | | | |
Futures contracts | | $ | — | | | $ | — | | | $ | (26,076 | ) | | $ | — | | | $ | — | | | $ | — | | | $ | (26,076 | ) |
| | | | | | | | | | | | | | | | | | | | | | | | | | | | |
| | | | | | | |
| Net Change in Unrealized Appreciation (Depreciation) on: | | | | | | | | | | | | | | | | | | | | | |
Futures contracts | | $ | — | | | $ | — | | | $ | (46,095 | ) | | $ | — | | | $ | — | | | $ | — | | | $ | (46,095 | ) |
| | | | | | | | | | | | | | | | | | | | | | | | | | | | |
Average Quarterly Balances of Outstanding Derivative Financial Instruments
| | | | |
Futures contracts: | | | | |
Average notional value of contracts — long | | $ | 2,882,623 | |
For more information about the Fund’s investment risks regarding derivative financial instruments, refer to the Notes to Financial Statements.
| | | | |
| SCHEDULE OF INVESTMENTS | | | 9 | |
| | |
Schedule of Investments (continued) December 31, 2018 | | BlackRock Advantage U.S. Total Market V.I. Fund |
Fair Value Hierarchy as of Period End
Various inputs are used in determining the fair value of investments and derivative financial instruments. For information about the Fund’s policy regarding valuation of investments and derivative financial instruments, refer to the Notes to Financial Statements.
The following tables summarize the Fund’s investments and derivative financial instruments categorized in the disclosure hierarchy:
| | | | | | | | | | | | | | | | |
| | | Level 1 | | | Level 2 | | | Level 3 | | | Total | |
Assets: | | | | | | | | | | | | | | | | |
Investments: | | | | | | | | | | | | | | | | |
Long-Term Investments: | | | | | | | | | | | | | | | | |
Common Stocks(a) | | $ | 223,953,904 | | | $ | — | | | $ | — | | | $ | 223,953,904 | |
Short-Term Securities | | | 2,833,530 | | | | — | | | | — | | | | 2,833,530 | |
| | | | | | | | | | | | | | | | |
Subtotal | | $ | 226,787,434 | | | $ | — | | | $ | — | | | $ | 226,787,434 | |
| | | | | | | | | | | | | | | | |
Investments valued at NAV(b) | | | | | | | | | | | | | | | 6,092,252 | |
| | | | | | | | | | | | | | | | |
Total Investments | | | | | | | | | | | | | | $ | 232,879,686 | |
| | | | | | | | | | | | | | | | |
Derivative Financial Instruments(c) | | | | | | | | | | | | | | | | |
Liabilities: | | | | | | | | | | | | | | | | |
Equity contracts | | $ | (48,471 | ) | | $ | — | | | $ | — | | | $ | (48,471 | ) |
| | | | | | | | | | | | | | | | |
| | (a) | See above Schedule of Investments for values in each industry. | |
| | (b) | As of December 31, 2018, certain investments of the Fund were fair valued using NAV per share as no quoted market value is available and therefore have been excluded from the fair value hierarchy. | |
| | (c) | Derivative financial instruments are futures contracts which are valued at the unrealized appreciation (depreciation) on the instrument. | |
During the year ended December 31, 2018, there were no transfers between levels.
See notes to financial statements.
| | |
| 10 | | 2018 BLACKROCK ANNUAL REPORTTO SHAREHOLDERS |
Statement of Assets and Liabilities
December 31, 2018
| | | | |
| | | BlackRock Advantage
U.S. Total Market V.I.
Fund | |
| |
ASSETS | | | | |
Investments at value — unaffiliated (including securities loaned at value of $5,983,384) (cost — $240,143,792) | | $ | 223,953,904 | |
Investments at value — affiliated (cost — $8,926,001) | | | 8,925,782 | |
Cash pledged for futures contracts | | | 122,000 | |
Foreign currency at value (cost — $785) | | | 714 | |
Receivables: | | | | |
Investments sold | | | 2,389,273 | |
Securities lending income — affiliated | | | 1,053 | |
Capital shares sold | | | 13,517 | |
Dividends — affiliated | | | 4,268 | |
Dividends — unaffiliated | | | 394,169 | |
Variation margin on futures contracts | | | 17,831 | |
Prepaid expenses | | | 263 | |
| | | | |
Total assets | | | 235,822,774 | |
| | | | |
| |
LIABILITIES | | | | |
Bank overdraft | | | 4,479 | |
Cash collateral on securities loaned at value | | | 6,087,218 | |
Payables: | | | | |
Investments purchased | | | 2,444,175 | |
Capital shares redeemed | | | 63,262 | |
Distribution fees | | | 1,485 | |
Transfer agent fees | | | 157,719 | |
Board realignment and consolidation | | | 10,160 | |
Investment advisory fees | | | 104,168 | |
Directors’ and Officer’s fees | | | 5,780 | |
Other affiliates | | | 568 | |
Other accrued expenses | | | 152,919 | |
| | | | |
Total liabilities | | | 9,031,933 | |
| | | | |
| |
NET ASSETS | | $ | 226,790,841 | |
| | | | |
| |
NET ASSETS CONSIST OF | | | | |
Paid-in capital | | $ | 245,325,425 | |
Accumulated loss | | | (18,534,584 | ) |
| | | | |
NET ASSETS | | $ | 226,790,841 | |
| | | | |
| |
NET ASSET VALUE | | | | |
Class I — Based on net assets of $218,975,720 and 10,372,584 shares outstanding, 100 million shares authorized, $0.10 par value. | | $ | 21.11 | |
| | | | |
Class II — Based on net assets of $2,741,797 and 130,186 shares outstanding, 100 million shares authorized, $0.10 par value. | | $ | 21.06 | |
| | | | |
Class III — Based on net assets of $5,073,324 and 345,981 shares outstanding, 10 million shares authorized, $0.10 par value. | | $ | 14.66 | |
| | | | |
See notes to financial statements.
Statement of Operations
Year Ended December 31, 2018
| | | | |
| | | BlackRock Advantage
U.S. Total Market V.I.
Fund | |
| |
INVESTMENT INCOME | | | | |
Dividends — affiliated | | $ | 40,259 | |
Dividends — unaffiliated | | | 4,824,420 | |
Securities lending income — affiliated — net | | | 11,339 | |
Foreign taxes withheld | | | (87 | ) |
| | | | |
Total investment income | | | 4,875,931 | |
| | | | |
| |
EXPENSES | | | | |
Investment advisory | | | 1,967,503 | |
Transfer agent — class specific | | | 462,380 | |
Professional | | | 76,698 | |
Accounting services | | | 63,436 | |
Printing | | | 44,894 | |
Custodian | | | 37,048 | |
Distribution — class specific | | | 18,682 | |
Directors and Officer | | | 15,892 | |
Board realignment and consolidation | | | 10,316 | |
Transfer agent | | | 5,001 | |
Miscellaneous | | | 30,865 | |
| | | | |
Total expenses | | | 2,732,715 | |
Less: | | | | |
Fees waived and/or reimbursed by the Manager | | | (798,948 | ) |
Transfer agent fees waived and/or reimbursed — class specific | | | (462,378 | ) |
| | | | |
Total expenses after fees waived and/or reimbursed | | | 1,471,389 | |
| | | | |
Net investment income | | | 3,404,542 | |
| | | | |
| |
REALIZED AND UNREALIZED GAIN (LOSS) | | | | |
Net realized gain (loss) from: | | | | |
Investments — affiliated | | | (53 | ) |
Investments — unaffiliated | | | 19,944,299 | |
Futures contracts | | | (26,076 | ) |
| | | | |
| | | 19,918,170 | |
| | | | |
Net change in unrealized appreciation (depreciation) on: | | | | |
Investments — affiliated | | | (149 | ) |
Investments — unaffiliated | | | (37,914,172 | ) |
Foreign currency translations | | | (62 | ) |
Futures contracts | | | (46,095 | ) |
| | | | |
| | | (37,960,478 | ) |
| | | | |
Net realized and unrealized loss | | | (18,042,308 | ) |
| | | | |
NET DECREASE IN NET ASSETS RESULTING FROM OPERATIONS | | $ | (14,637,766 | ) |
| | | | |
See notes to financial statements.
| | |
| 12 | | 2018 BLACKROCK ANNUAL REPORTTO SHAREHOLDERS |
Statements of Changes in Net Assets
| | | | | | | | |
| | | BlackRock Advantage
U.S. Total Market V.I. Fund | |
| | | Year Ended December 31, | |
| | 2018 | | | 2017 | |
| | |
INCREASE (DECREASE) IN NET ASSETS | | | | | | | | |
| | |
OPERATIONS | | | | | | | | |
Net investment income | | $ | 3,404,542 | | | $ | 2,321,558 | |
Net realized gain | | | 19,918,170 | | | | 47,664,838 | |
Net change in unrealized appreciation (depreciation) | | | (37,960,478 | ) | | | (15,719,118 | ) |
| | | | | | | | |
Net increase (decrease) in net assets resulting from operations | | | (14,637,766 | ) | | | 34,267,278 | |
| | | | | | | | |
| | |
DISTRIBUTIONS TO SHAREHOLDERS(a)(b) | | | | | | | | |
Class I | | | (26,509,174 | ) | | | (52,422,650 | ) |
Class II | | | (326,810 | ) | | | (639,246 | ) |
Class III | | | (830,484 | ) | | | (1,372,126 | ) |
| | | | | | | | |
Decrease in net assets resulting from distributions to shareholders | | | (27,666,468 | ) | | | (54,434,022 | ) |
| | | | | | | | |
| | |
CAPITAL SHARE TRANSACTIONS | | | | | | | | |
Net increase (decrease) in net assets derived from capital share transactions | | | (1,231,558 | ) | | | 30,391,828 | |
| | | | | | | | |
| | |
NET ASSETS(b) | | | | | | | | |
Total increase (decrease) in net assets | | | (43,535,792 | ) | | | 10,225,084 | |
Beginning of year | | | 270,326,633 | | | | 260,101,549 | |
| | | | | | | | |
End of year | | $ | 226,790,841 | | | $ | 270,326,633 | |
| | | | | | | | |
| (a) | Distributions for annual periods determined in accordance with U.S. federal income tax regulations. |
| (b) | Prior year distribution character information and undistributed net investment income has been modified or removed to conform with current year RegulationS-X presentation changes. Refer to Note 12 for this prior year information. |
See notes to financial statements.
Financial Highlights
(For a share outstanding throughout each period)
| | | | | | | | | | | | | | | | | | | | |
| | | BlackRock Advantage U.S. Total Market V.I. Fund | |
| |
| | | Class I | |
| |
| | | Year Ended December 31, | |
| | 2018 | | | 2017 | | | 2016 | | | 2015 | | | 2014 | |
| | | | | |
Net asset value, beginning of year | | $ | 25.63 | | | $ | 27.93 | | | $ | 23.24 | | | $ | 26.96 | | | $ | 27.48 | |
| | | | | | | | | | | | | | | | | | | | |
Net investment income(a) | | | 0.34 | | | | 0.26 | (b) | | | 0.07 | | | | 0.07 | | | | 0.10 | |
Net realized and unrealized gain (loss) | | | (2.00 | ) | | | 3.60 | | | | 5.43 | | | | (1.80 | ) | | | 1.35 | |
| | | | | | | | | | | | | | | | | | | | |
Net increase (decrease) from investment operations | | | (1.66 | ) | | | 3.86 | | | | 5.50 | | | | (1.73 | ) | | | 1.45 | |
| | | | | | | | | | | | | | | | | | | | |
| | | | | |
| Distributions(c) | | | | | | | | | | | | | | | |
From net investment income | | | (0.34 | ) | | | (0.27 | ) | | | (0.07 | ) | | | (0.07 | ) | | | (0.08 | ) |
From net realized gain | | | (2.52 | ) | | | (5.89 | ) | | | (0.74 | ) | | | (1.92 | ) | | | (1.89 | ) |
From return of capital | | | — | | | | — | | | | — | | | | (0.00 | )(d) | | | — | |
| | | | | | | | | | | | | | | | | | | | |
Total distributions | | | (2.86 | ) | | | (6.16 | ) | | | (0.81 | ) | | | (1.99 | ) | | | (1.97 | ) |
| | | | | | | | | | | | | | | | | | | | |
| | | | | |
Net asset value, end of year | | $ | 21.11 | | | $ | 25.63 | | | $ | 27.93 | | | $ | 23.24 | | | $ | 26.96 | |
| | | | | | | | | | | | | | | | | | | | |
| | | | | |
Total Return(e) | | | | | | | | | | | | | | | | | | | | |
Based on net asset value | | | (6.39 | )% | | | 14.05 | % | | | 23.65 | % | | | (6.61 | )% | | | 5.22 | % |
| | | | | | | | | | | | | | | | | | | | |
| | | | | |
Ratios to Average Net Assets | | | | | | | | | | | | | | | | | | | | |
Total expenses | | | 1.03 | % | | | 1.05 | % | | | 1.01 | % | | | 1.01 | % | | | 1.02 | % |
| | | | | | | | | | | | | | | | | | | | |
Total expenses after fees waived and/or reimbursed | | | 0.55 | % | | | 0.71 | % | | | 0.92 | % | | | 0.90 | % | | | 0.90 | % |
| | | | | | | | | | | | | | | | | | | | |
Net investment income | | | 1.31 | % | | | 0.91 | %(b) | | | 0.28 | % | | | 0.26 | % | | | 0.37 | % |
| | | | | | | | | | | | | | | | | | | | |
| | | | | |
Supplemental Data | | | | | | | | | | | | | | | | | | | | |
Net assets, end of year (000) | | $ | 218,976 | | | $ | 261,872 | | | $ | 250,567 | | | $ | 220,681 | | | $ | 260,860 | |
| | | | | | | | | | | | | | | | | | | | |
Portfolio turnover rate | | | 150 | % | | | 179 | % | | | 78 | % | | | 61 | % | | | 57 | % |
| | | | | | | | | | | | | | | | | | | | |
| (a) | Based on average shares outstanding. |
| (b) | Net investment income per share and the ratio of net investment income to average net assets includes $0.05 per share and 0.18%, respectively, resulting from a non-recurring dividend. |
| (c) | Distributions for annual periods determined in accordance with U.S. federal income tax regulations. |
| (d) | Amount is greater than $(0.005) per share. |
| (e) | Where applicable, excludes insurance-related fees and expenses and assumes the reinvestment of distributions. |
See notes to financial statements.
| | |
| 14 | | 2018 BLACKROCK ANNUAL REPORTTO SHAREHOLDERS |
Financial Highlights (continued)
(For a share outstanding throughout each period)
| | | | | | | | | | | | | | | | | | | | |
| | | BlackRock Advantage U.S. Total Market V.I. Fund (continued) | |
| |
| | | Class II | |
| |
| | | Year Ended December 31, | |
| | 2018 | | | 2017 | | | 2016 | | | 2015 | | | 2014 | |
| | | | | |
Net asset value, beginning of year | | $ | 25.57 | | | $ | 27.88 | | | $ | 23.21 | | | $ | 26.91 | | | $ | 27.43 | |
| | | | | | | | | | | | | | | | | | | | |
Net investment income(a) | | | 0.30 | | | | 0.20 | (b) | | | 0.03 | | | | 0.02 | | | | 0.05 | |
Net realized and unrealized gain (loss) | | | (1.99 | ) | | | 3.60 | | | | 5.41 | | | | (1.77 | ) | | | 1.34 | |
| | | | | | | | | | | | | | | | | | | | |
Net increase (decrease) from investment operations | | | (1.69 | ) | | | 3.80 | | | | 5.44 | | | | (1.75 | ) | | | 1.39 | |
| | | | | | | | | | | | | | | | | | | | |
| | | | | |
| Distributions(c) | | | | | | | | | | | | | | | |
From net investment income | | | (0.30 | ) | | | (0.22 | ) | | | (0.03 | ) | | | (0.03 | ) | | | (0.02 | ) |
From net realized gain | | | (2.52 | ) | | | (5.89 | ) | | | (0.74 | ) | | | (1.92 | ) | | | (1.89 | ) |
From return of capital | | | — | | | | — | | | | — | | | | (0.00 | )(d) | | | — | |
| | | | | | | | | | | | | | | | | | | | |
Total distributions | | | (2.82 | ) | | | (6.11 | ) | | | (0.77 | ) | | | (1.95 | ) | | | (1.91 | ) |
| | | | | | | | | | | | | | | | | | | | |
| | | | | |
Net asset value, end of year | | $ | 21.06 | | | $ | 25.57 | | | $ | 27.88 | | | $ | 23.21 | | | $ | 26.91 | |
| | | | | | | | | | | | | | | | | | | | |
| | | | | |
Total Return(e) | | | | | | | | | | | | | | | | | | | | |
Based on net asset value | | | (6.53 | )% | | | 13.85 | % | | | 23.40 | % | | | (6.76 | )% | | | 5.03 | % |
| | | | | | | | | | | | | | | | | | | | |
| | | | | |
Ratios to Average Net Assets | | | | | | | | | | | | | | | | | | | | |
Total expenses | | | 1.22 | % | | | 1.22 | % | | | 1.20 | % | | | 1.18 | % | | | 1.19 | % |
| | | | | | | | | | | | | | | | | | | | |
Total expenses after fees waived and/or reimbursed | | | 0.70 | % | | | 0.88 | % | | | 1.09 | % | | | 1.07 | % | | | 1.07 | % |
| | | | | | | | | | | | | | | | | | | | |
Net investment income | | | 1.16 | % | | | 0.72 | %(b) | | | 0.10 | % | | | 0.08 | % | | | 0.20 | % |
| | | | | | | | | | | | | | | | | | | | |
| | | | | |
Supplemental Data | | | | | | | | | | | | | | | | | | | | |
Net assets, end of year (000) | | $ | 2,742 | | | $ | 3,131 | | | $ | 3,351 | | | $ | 3,120 | | | $ | 3,764 | |
| | | | | | | | | | | | | | | | | | | | |
Portfolio turnover rate | | | 150 | % | | | 179 | % | | | 78 | % | | | 61 | % | | | 57 | % |
| | | | | | | | | | | | | | | | | | | | |
| (a) | Based on average shares outstanding. |
| (b) | Net investment income per share and the ratio of net investment income to average net assets includes $0.05 per share and 0.17%, respectively, resulting from a non-recurring dividend. |
| (c) | Distributions for annual periods determined in accordance with U.S. federal income tax regulations. |
| (d) | Amount is greater than $(0.005) per share. |
| (e) | Where applicable, excludes insurance-related fees and expenses and assumes the reinvestment of distributions. |
See notes to financial statements.
Financial Highlights (continued)
(For a share outstanding throughout each period)
| | | | | | | | | | | | | | | | | | | | |
| | | BlackRock Advantage U.S. Total Market V.I. Fund (continued) | |
| |
| | | Class III | |
| |
| | | Year Ended December 31, | |
| | | 2018 | | | 2017 | | | 2016 | | | 2015 | | | 2014 | |
| | | | | |
Net asset value, beginning of year | | $ | 18.74 | | | $ | 21.89 | | | $ | 18.36 | | | $ | 21.73 | | | $ | 22.50 | |
| | | | | | | | | | | | | | | | | | | | |
Net investment income(a) | | | 0.20 | | | | 0.14 | (b) | | | 0.01 | | | | 0.01 | | | | 0.04 | |
Net realized and unrealized gain (loss) | | | (1.46 | ) | | | 2.82 | | | | 4.29 | | | | (1.43 | ) | | | 1.11 | |
| | | | | | | | | | | | | | | | | | | | |
Net increase (decrease) from investment operations | | | (1.26 | ) | | | 2.96 | | | | 4.30 | | | | (1.42 | ) | | | 1.15 | |
| | | | | | | | | | | | | | | | | | | | |
| | | | | |
| Distributions(c) | | | | | | | | | | | | | | | |
From net investment income | | | (0.30 | ) | | | (0.22 | ) | | | (0.03 | ) | | | (0.03 | ) | | | (0.03 | ) |
From net realized gain | | | (2.52 | ) | | | (5.89 | ) | | | (0.74 | ) | | | (1.92 | ) | | | (1.89 | ) |
From return of capital | | | — | | | | — | | | | — | | | | (0.00 | )(d) | | | — | |
| | | | | | | | | | | | | | | | | | | | |
Total distributions | | | (2.82 | ) | | | (6.11 | ) | | | (0.77 | ) | | | (1.95 | ) | | | (1.92 | ) |
| | | | | | | | | | | | | | | | | | | | |
| | | | | |
Net asset value, end of year | | $ | 14.66 | | | $ | 18.74 | | | $ | 21.89 | | | $ | 18.36 | | | $ | 21.73 | |
| | | | | | | | | | | | | | | | | | | | |
| | | | | |
Total Return(e) | | | | | | | | | | | | | | | | | | | | |
Based on net asset value | | | (6.65 | )% | | | 13.83 | % | | | 23.41 | % | | | (6.78 | )% | | | 5.07 | % |
| | | | | | | | | | | | | | | | | | | | |
| | | | | |
Ratios to Average Net Assets | | | | | | | | | | | | | | | | | | | | |
Total expenses | | | 1.32 | % | | | 1.32 | % | | | 1.29 | % | | | 1.29 | % | | | 1.25 | % |
| | | | | | | | | | | | | | | | | | | | |
Total expenses after fees waived and/or reimbursed | | | 0.80 | % | | | 0.95 | % | | | 1.11 | % | | | 1.09 | % | | | 1.09 | % |
| | | | | | | | | | | | | | | | | | | | |
Net investment income | | | 1.06 | % | | | 0.65 | %(b) | | | 0.08 | % | | | 0.06 | % | | | 0.18 | % |
| | | | | | | | | | | | | | | | | | | | |
| | | | | |
Supplemental Data | | | | | | | | | | | | | | | | | | | | |
Net assets, end of year (000) | | $ | 5,073 | | | $ | 5,324 | | | $ | 6,184 | | | $ | 6,152 | | | $ | 8,002 | |
| | | | | | | | | | | | | | | | | | | | |
Portfolio turnover rate | | | 150 | % | | | 179 | % | | | 78 | % | | | 61 | % | | | 57 | % |
| | | | | | | | | | | | | | | | | | | | |
| (a) | Based on average shares outstanding. |
| (b) | Net investment income per share and the ratio of net investment income to average net assets includes $0.04 per share and 0.17%, respectively, resulting from a non-recurring dividend. |
| (c) | Distributions for annual periods determined in accordance with U.S. federal income tax regulations. |
| (d) | Amount is greater than $(0.005) per share. |
| (e) | Where applicable, excludes insurance-related fees and expenses and assumes the reinvestment of distributions. |
See notes to financial statements.
| | |
| 16 | | 2018 BLACKROCK ANNUAL REPORTTO SHAREHOLDERS |
Notes to Financial Statements
BlackRock Variable Series Funds, Inc. (the “Company”) is registered under the Investment Company Act of 1940, as amended (the “1940 Act”), as anopen-end management investment company. The Company is organized as a Maryland corporation that is comprised of 15 separate portfolios. The funds offer shares to insurance companies for their separate accounts to fund benefits under certain variable annuity and variable life insurance contracts. The financial statements presented are for BlackRock Advantage U.S. Total Market V.I. Fund (the “Fund”). The Fund is classified as diversified. Class I, Class II and Class III Shares have equal voting, dividend, liquidation and other rights, except that only shares of the respective classes are entitled to vote on matters concerning only that class. In addition, Class II and Class III Shares bear certain expenses related to the distribution of such shares.
The Fund, together with certain other registered investment companies advised by BlackRock Advisors, LLC (the “Manager”) or its affiliates, is included in a complex ofopen-end funds referred to as the Equity-Bond Complex.
| 2. | SIGNIFICANT ACCOUNTING POLICIES |
The financial statements are prepared in conformity with accounting principles generally accepted in the United States of America (“U.S. GAAP”), which may require management to make estimates and assumptions that affect the reported amounts of assets and liabilities in the financial statements, disclosure of contingent assets and liabilities at the date of the financial statements and the reported amounts of increases and decreases in net assets from operations during the reporting period. Actual results could differ from those estimates. The Fund is considered an investment company under U.S. GAAP and follows the accounting and reporting guidance applicable to investment companies. Below is a summary of significant accounting policies:
Investment Transactions and Income Recognition: For financial reporting purposes, investment transactions are recorded on the dates the transactions are entered into (the “trade dates”). Realized gains and losses on investment transactions are determined on the identified cost basis. Dividend income is recorded on theex-dividend date. Dividends from foreign securities where theex-dividend date may have passed are subsequently recorded when the Fund is informed of theex-dividend date. Under the applicable foreign tax laws, a withholding tax at various rates may be imposed on capital gains, dividends and interest. Upon notification from issuers, a portion of the dividend income received from a real estate investment trust may be redesignated as a reduction of cost of the related investment and/or realized gain. Interest income, including amortization and accretion of premiums and discounts on debt securities, are recognized on an accrual basis.
Foreign Currency Translation: The Fund’s books and records are maintained in U.S. dollars. Securities and other assets and liabilities denominated in foreign currencies are translated into U.S. dollars using exchange rates determined as of the close of trading on the New York Stock Exchange (“NYSE”). Purchases and sales of investments are recorded at the rates of exchange prevailing on the respective dates of such transactions. Generally, when the U.S. dollar rises in value against a foreign currency, the investments denominated in that currency will lose value; the opposite effect occurs if the U.S. dollar falls in relative value.
The Fund does not isolate the portion of the results of operations arising as a result of changes in the exchange rates from the changes in the market prices of investments held or sold for financial reporting purposes. Accordingly, the effects of changes in exchange rates on investments are not segregated in the Statement of Operations from the effects of changes in market prices of those investments, but are included as a component of net realized and unrealized gain (loss) from investments. The Fund reports realized currency gains (losses) on foreign currency related transactions as components of net realized gain (loss) for financial reporting purposes, whereas such components are generally treated as ordinary income for U.S. federal income tax purposes.
Segregation and Collateralization: In cases where the Fund enters into certain investments (e.g., futures contracts) that would be treated as “senior securities” for 1940 Act purposes, the Fund may segregate or designate on its books and records cash or liquid assets having a market value at least equal to the amount of its future obligations under such investments. Doing so allows the investment to be excluded from treatment as a “senior security.” Furthermore, if required by an exchange or counterparty agreement, the Fund may be required to deliver/deposit cash and/or securities to/with an exchange, or broker-dealer or custodian as collateral for certain investments or obligations.
Distributions: Distributions paid by the Fund are recorded on theex-dividend date. Distribution of capital gains are recorded on theex-dividend date and made at least annually. The character and timing of distributions are determined in accordance with U.S. federal income tax regulations, which may differ from U.S. GAAP.
Recent Accounting Standards:In August 2018, the Financial Accounting Standards Board issued Accounting Standards Update2018-13 “Changes to the Disclosure Requirements for Fair Value Measurement” which modifies disclosure requirements for fair value measurements. The guidance is effective for fiscal years beginning after December 15, 2019 and for interim periods within those fiscal years. Management is currently evaluating the impact of this guidance to the Fund.
Indemnifications: In the normal course of business, the Fund enters into contracts that contain a variety of representations that provide general indemnification. The Fund’s maximum exposure under these arrangements is unknown because it involves future potential claims against the Fund, which cannot be predicted with any certainty.
Other: Expenses directly related to the Fund or its classes are charged to the Fund or the applicable class. Other operating expenses shared by several funds, including other funds managed by the Manager, are prorated among those funds on the basis of relative net assets or other appropriate methods. Expenses directly related to the Fund and other shared expenses prorated to the Fund are allocated daily to each class based on its relative net assets or other appropriate methods.
| 3. | INVESTMENT VALUATION AND FAIR VALUE MEASUREMENTS |
Investment Valuation Policies: The Fund’s investments are valued at fair value (also referred to as “market value” within the financial statements) as of the close of trading on the NYSE (generally 4:00 p.m., Eastern time). U.S. GAAP defines fair value as the price the Fund would receive to sell an asset or pay to transfer a liability in an orderly transaction between market participants at the measurement date. The Fund determines the fair values of its financial instruments using various independent
| | | | |
| NOTESTO FINANCIAL STATEMENTS | | | 17 | |
Notes to Financial Statements (continued)
dealers or pricing services under policies approved by the Board of Directors of the Company (the “Board”). The BlackRock Global Valuation Methodologies Committee (the “Global Valuation Committee”) is the committee formed by management to develop global pricing policies and procedures and to oversee the pricing function for all financial instruments.
Fair Value Inputs and Methodologies: The following methods and inputs are used to establish the fair value of the Fund’s assets and liabilities:
| | • | | Equity investments traded on a recognized securities exchange are valued at the official closing price each day, if available. For equity investments traded on more than one exchange, the official closing price on the exchange where the stock is primarily traded is used. Equity investments traded on a recognized exchange for which there were no sales on that day may be valued at the last available bid (long positions) or ask (short positions) price. |
Generally, trading in foreign instruments is substantially completed each day at various times prior to the close of trading on the NYSE. Occasionally, events affecting the values of such instruments may occur between the foreign market close and the close of trading on the NYSE that may not be reflected in the computation of the Fund’s net assets. Each business day, the Fund uses a pricing service to assist with the valuation of certain foreign exchange-traded equity securities and foreign exchange-traded andover-the-counter (“OTC”) options (the “Systematic Fair Value Price”). Using current market factors, the Systematic Fair Value Price is designed to value such foreign securities and foreign options at fair value as of the close of trading on the NYSE, which follows the close of the local markets.
| | • | | Investments inopen-end U.S. mutual funds are valued at net asset value (“NAV”) each business day. |
| | • | | The Fund values its investment in SL Liquidity Series, LLC, Money Market Series (the “Money Market Series”) at fair value, which is ordinarily based upon its pro rata ownership in the underlying fund’s net assets. The Money Market Series seeks current income consistent with maintaining liquidity and preserving capital. Although the Money Market Series is not registered under the 1940 Act, its investments may follow the parameters of investments by a money market fund that is subject to Rule2a-7 under the 1940 Act. |
| | • | | Futures contracts traded on exchanges are valued at their last sale price. |
If events (e.g., a company announcement, market volatility or a natural disaster) occur that are expected to materially affect the value of such investments, or in the event that the application of these methods of valuation results in a price for an investment that is deemed not to be representative of the market value of such investment, or if a price is not available, the investment will be valued by the Global Valuation Committee, or its delegate, in accordance with a policy approved by the Board as reflecting fair value (“Fair Valued Investments”). The fair valuation approaches that may be used by the Global Valuation Committee will include market approach, income approach and cost approach. Valuation techniques such as discounted cash flow, use of market comparables and matrix pricing are types of valuation approaches and are typically used in determining fair value. When determining the price for Fair Valued Investments, the Global Valuation Committee, or its delegate, seeks to determine the price that the Fund might reasonably expect to receive or pay from the current sale or purchase of that asset or liability in anarm’s-length transaction. Fair value determinations shall be based upon all available factors that the Global Valuation Committee, or its delegate, deems relevant and consistent with the principles of fair value measurement. The pricing of all Fair Valued Investments is subsequently reported to the Board or a committee thereof on a quarterly basis.
Fair Value Hierarchy: Various inputs are used in determining the fair value of investments and derivative financial instruments. These inputs to valuation techniques are categorized into a fair value hierarchy consisting of three broad levels for financial statement purposes as follows:
| | • | | Level 1 — Unadjusted price quotations in active markets/exchanges for identical assets or liabilities that the Fund has the ability to access |
| | • | | Level 2 — Other observable inputs (including, but not limited to, quoted prices for similar assets or liabilities in markets that are active, quoted prices for identical or similar assets or liabilities in markets that are not active, inputs other than quoted prices that are observable for the assets or liabilities (such as interest rates, yield curves, volatilities, prepayment speeds, loss severities, credit risks and default rates) or other market-corroborated inputs) |
| | • | | Level 3 — Unobservable inputs based on the best information available in the circumstances, to the extent observable inputs are not available (including the Fund’s own assumptions used in determining the fair value of investments and derivative financial instruments) |
The hierarchy gives the highest priority to unadjusted quoted prices in active markets for identical assets or liabilities (Level 1 measurements) and the lowest priority to unobservable inputs (Level 3 measurements). Accordingly, the degree of judgment exercised in determining fair value is greatest for instruments categorized in Level 3. The inputs used to measure fair value may fall into different levels of the fair value hierarchy. In such cases, for disclosure purposes, the fair value hierarchy classification is determined based on the lowest level input that is significant to the fair value measurement in its entirety. Investments classified within Level 3 have significant unobservable inputs used by the Global Valuation Committee in determining the price for Fair Valued Investments. Level 3 investments include equity or debt issued by privately held companies or funds. There may not be a secondary market, and/or there are a limited number of investors. Level 3 investments may also be adjusted to reflect illiquidity and/ornon-transferability, with the amount of such discount estimated by the Global Valuation Committee in the absence of market information.
Changes in valuation techniques may result in transfers into or out of an assigned level within the hierarchy. In accordance with the Fund’s policy, transfers between different levels of the fair value hierarchy are deemed to have occurred as of the beginning of the reporting period. The categorization of a value determined for investments and derivative financial instruments is based on the pricing transparency of the investments and derivative financial instruments and is not necessarily an indication of the risks associated with investing in those securities.
As of December 31, 2018, certain investments of the Fund were valued using NAV per share as no quoted market value is available and therefore have been excluded from the fair value hierarchy.
| | |
| 18 | | 2018 BLACKROCK ANNUAL REPORTTO SHAREHOLDERS |
Notes to Financial Statements (continued)
| 4. | SECURITIES AND OTHER INVESTMENTS |
Securities Lending: The Fund may lend its securities to approved borrowers, such as brokers, dealers and other financial institutions. The borrower pledges and maintains with the Fund collateral consisting of cash, an irrevocable letter of credit issued by a bank, or securities issued or guaranteed by the U.S. Government. The initial collateral received by the Fund is required to have a value of at least 102% of the current value of the loaned securities for securities traded on U.S. exchanges and a value of at least 105% for all other securities. The collateral is maintained thereafter at a value equal to at least 100% of the current market value of the securities on loan. The market value of the loaned securities is determined at the close of each business day of the Fund and any additional required collateral is delivered to the Fund, or excess collateral returned by the Fund, on the next business day. During the term of the loan, the Fund is entitled to all distributions made on or in respect of the loaned securities, but does not receive interest income on securities received as collateral. Loans of securities are terminable at any time and the borrower, after notice, is required to return borrowed securities within the standard time period for settlement of securities transactions.
The market value of any securities on loan, all of which were classified as common stocks in the Fund’s Schedule of Investments, and the value of any related collateral are shown separately in the Statement of Assets and Liabilities as a component of investments at value — unaffiliated, and collateral on securities loaned at value, respectively. As of period end, any securities on loan were collateralized by cash and/or U.S. Government obligations. Cash collateral invested by the securities lending agent, BlackRock Investment Management, LLC (“BIM”), if any, is disclosed in the Schedule of Investments.
Securities lending transactions are entered into by the Fund under Master Securities Lending Agreements (each, an “MSLA”), which provide the right, in the event of default (including bankruptcy or insolvency), for thenon-defaulting party to liquidate the collateral and calculate a net exposure to the defaulting party or request additional collateral. In the event that a borrower defaults, the Fund, as lender, would offset the market value of the collateral received against the market value of the securities loaned. When the value of the collateral is greater than that of the market value of the securities loaned, the lender is left with a net amount payable to the defaulting party. However, bankruptcy or insolvency laws of a particular jurisdiction may impose restrictions on or prohibitions against such a right of offset in the event of an MSLA counterparty’s bankruptcy or insolvency. Under the MSLA, absent an event of default, the borrower can resell orre-pledge the loaned securities, and the Fund can reinvest cash collateral received in connection with loaned securities. Upon an event of default, the parties’ obligations to return the securities or collateral to the other party are extinguished, and the parties can resell orre-pledge the loaned securities or the collateral received in connection with the loaned securities in order to satisfy the defaulting party’s net payment obligation for all transactions under the MSLA. The defaulting party remains liable for any deficiency.
As of period end, the following table is a summary of the Fund’s securities lending agreements by counterparty which are subject to offset under an MSLA:
| | | | | | | | | | | | |
| Counterparty | | Securities
Loaned at Value | | | Cash Collateral
Received (a) | | | Net
Amount | |
Citigroup Global Markets, Inc. | | $ | 4,194,316 | | | $ | (4,194,316 | ) | | $ | — | |
Credit Suisse Securities (USA) LLC | | | 56,648 | | | | (56,648 | ) | | | — | |
Deutsche Bank Securities Inc. | | | 496 | | | | (496 | ) | | | — | |
Fidelity Investments | | | 3,911 | | | | (3,911 | ) | | | — | |
Goldman Sachs & Co. | | | 19,968 | | | | (19,968 | ) | | | — | |
JP Morgan Securities LLC | | | 942,950 | | | | (942,950 | ) | | | — | |
State Street Bank & Trust Co. | | | 13,329 | | | | (13,329 | ) | | | — | |
UBS Securities LLC | | | 751,766 | | | | (751,766 | ) | | | — | |
| | | | | | | | | | | | |
| | $ | 5,983,384 | | | $ | (5,983,384 | ) | | $ | — | |
| | | | | | | | | | | | |
| | (a) | Cash collateral with a value of $6,087,218 has been received in connection with securities lending agreements. Collateral received in excess of the value of securities loaned from the individual counterparty, if any, is not shown for financial reporting purposes in the table above. | |
The risks of securities lending include the risk that the borrower may not provide additional collateral when required or may not return the securities when due. To mitigate these risks, the Fund benefits from a borrower default indemnity provided by BIM. BIM’s indemnity allows for full replacement of the securities loaned if the collateral received does not cover the value on the securities loaned in the event of borrower default. The Fund could incur a loss if the value of an investment purchased with cash collateral falls below the market value of loaned securities or if the value of an investment purchased with cash collateral falls below the value of the original cash collateral received.
| 5. | DERIVATIVE FINANCIAL INSTRUMENTS |
The Fund engages in various portfolio investment strategies using derivative contracts both to increase the returns of the Fund and/or to manage its exposure to certain risks such as credit risk, equity risk, interest rate risk, foreign currency exchange rate risk, commodity price risk or other risks (e.g., inflation risk). Derivative financial instruments categorized by risk exposure are included in the Schedule of Investments. These contracts may be transacted on an exchange or OTC.
Futures Contracts: Futures contracts are purchased or sold to gain exposure to, or manage exposure to, changes in interest rates (interest rate risk) and changes in the value of equity securities (equity risk) or foreign currencies (foreign currency exchange rate risk).
Futures contracts are agreements between the Fund and a counterparty to buy or sell a specific quantity of an underlying instrument at a specified price and on a specified date. Depending on the terms of a contract, it is settled either through physical delivery of the underlying instrument on the settlement date or by payment of a cash amount on the settlement date. Upon entering into a futures contract, the Fund is required to deposit initial margin with the broker in the form of cash or securities in an amount that varies depending on a contract’s size and risk profile. The initial margin deposit must then be maintained at an established level over the life of the contract. Amounts pledged, which are considered restricted, are included in cash pledged for futures contracts in the Statement of Assets and Liabilities.
| | | | |
| NOTESTO FINANCIAL STATEMENTS | | | 19 | |
Notes to Financial Statements (continued)
Securities deposited as initial margin are designated in the Schedule of Investments and cash deposited, if any, is shown as cash pledged for futures contracts in the Statement of Assets and Liabilities. Pursuant to the contract, the Fund agrees to receive from or pay to the broker an amount of cash equal to the daily fluctuation in market value of the contract (“variation margin”). Variation margin is recorded as unrealized appreciation (depreciation) and, if any, shown as variation margin receivable (or payable) on futures contracts in the Statement of Assets and Liabilities. When the contract is closed, a realized gain or loss is recorded in the Statement of Operations equal to the difference between the notional amount of the contract at the time it was opened and the notional amount at the time it was closed. The use of futures contracts involves the risk of an imperfect correlation in the movements in the price of futures contracts and interest, foreign currency exchange rates or underlying assets.
| 6. | INVESTMENT ADVISORY AGREEMENT AND OTHER TRANSACTIONS WITH AFFILIATES |
Investment Advisory: The Company, on behalf of the Fund, entered into an Investment Advisory Agreement with the Manager, the Fund’s investment adviser and an indirect, wholly-owned subsidiary of BlackRock, to provide investment advisory and administrative services. The Manager is responsible for the management of the Fund’s portfolio and provides the personnel, facilities, equipment and certain other services necessary to the operations of the Fund.
For such services, the Fund pays the Manager a monthly fee at an annual rate equal to the following percentages of the average daily value of Fund’s net assets:
| | | | |
| Average Daily Net Assets | | Investment
Advisory Fees | |
First $1 Billion | | | 0.75 | % |
$1 Billion — $3 Billion | | | 0.71 | |
$3 Billion — $5 Billion | | | 0.68 | |
$5 Billion — $10 Billion | | | 0.65 | |
Greater than $10 Billion | | | 0.64 | |
Distribution Fees: The Company, on behalf of the Fund, entered into a Distribution Agreement and a Distribution Plan with BlackRock Investments, LLC (“BRIL”), an affiliate of the Manager. Pursuant to the Distribution Plan and in accordance with Rule12b-1 under the 1940 Act, the Fund pays BRIL ongoing distribution fees. The fees are accrued daily and paid monthly at annual rates of 0.15% and 0.25% based based upon the average daily net assets attributable to Class II and Class III, respectively.
BRIL and broker-dealers, pursuant tosub-agreements with BRIL, provide shareholder servicing and distribution services to the Fund. The ongoing service and/or distribution fee compensates BRIL and each broker-dealer for providing shareholder servicing and/or distribution related services to shareholders.
For the year ended December 31, 2018, the following table shows the class specific distribution fees borne directly by each share class of the Fund:
| | | | | | | | | | | | |
| | | Class II | | | Class III | | | Total | |
Distribution Fees | | $ | 4,653 | | | $ | 14,029 | | | $ | 18,682 | |
Transfer Agent: On behalf of the Fund, the Manager entered into agreements with insurance companies and other financial intermediaries (“Service Organizations”), some of which may be affiliates. Pursuant to these agreements, the Service Organizations provide the Fund with administrative, networking, recordkeeping,sub-transfer agency and shareholder services tosub-accounts they service. For these services, the Service Organizations receive an annual fee per shareholder account, which will vary depending on share class and/or net assets of Fund shareholders serviced by the Service Organizations, which is shown as transfer agent — class specific. For the year ended December 31, 2018, the Fund did not pay any amounts to affiliates in return for these services.
In addition, the Fund pays the transfer agent, which is not an affiliate, a fee for issuance, transfer and redemption of shares and the opening and maintenance of shareholder accounts, which is included in transfer agent in the Statement of Operations.
For the year ended December 31, 2018, the following table shows the class specific transfer agent fees borne directly by each share class of the Fund:
| | | | | | | | | | | | | | | | |
| Class I | | | | | Class II | | | | | Class III | | | Total |
| $ | 444,162 | | | | | $ | 6,532 | | | | | $ | 11,686 | | | $462,380 |
Expense Limitations, Waivers and Reimbursements: With respect to the Fund, the Manager voluntarily agreed to waive its investment advisory fees by the amount of investment advisory fees the Fund pays to the Manager indirectly through its investment in affiliated money market funds (the “affiliated money market fund waiver”). The amount of waivers and/or reimbursements of fees and expenses made pursuant to the expense limitation described below will be reduced by the amount of the affiliated money market fund waiver. This amount is included in fees waived and/or reimbursed by the Manager in the Statement of Operations. For the year ended December 31, 2018, the amount waived was $1,683.
The Manager has contractually agreed to waive its investment advisory fee with respect to any portion of the Fund’s assets invested in affiliated equity and fixed-income mutual funds and affiliated exchange-traded funds that have a contractual management fee through April 30, 2019. The contractual agreement may be terminated upon 90 days’ notice by a majority of the directors who are not “interested persons” of the Fund, as defined in the 1940 Act (“Independent Directors”), or by a vote of a majority of the outstanding voting securities of the Fund. For the year ended December 31, 2018, there were no fees waived by the Manager pursuant to this arrangement.
For the year ended December 31, 2018, the Fund reimbursed the Manager $3,673 for certain accounting services, which is included in accounting services in the Statement of Operations.
| | |
| 20 | | 2018 BLACKROCK ANNUAL REPORTTO SHAREHOLDERS |
Notes to Financial Statements (continued)
The Manager has contractually agreed to reimburse transfer agent fees in order to limit such expenses to a percentage of average daily net assets as follows:
| | | | |
Class I | | | 0.07 | % |
Class II | | | 0.09 | % |
Class III | | | 0.01 | % |
The Manager has agreed not to reduce or discontinue this contractual reimbursement through April 30, 2019, unless approved by the Board, including a majority of the Independent Directors, or by a vote of a majority of the outstanding voting securities of the Fund.
These amounts waived and/or reimbursed are shown as transfer agent fees waived and/or reimbursed — class specific in the Statement of Operations. For the year ended December 31, 2018, class specific expense waivers and/or reimbursements are as follows:
| | | | | | | | | | | | | | | | |
| | | Class I | | | Class II | | | Class III | | | Total | |
Transfer Agent Fees Waived and/or Reimbursed | | $ | 266,746 | | | $ | 3,742 | | | $ | 11,130 | | | $ | 281,618 | |
With respect to the Fund, the Manager contractually agreed to waive and/or reimburse fees or expenses in order to limit expenses, excluding interest expense, dividend expense, tax expense, acquired fund fees and expenses, and certain other fund expenses, which constitute extraordinary expenses not incurred in the ordinary course of the Fund’s business (“expense limitation”). The expense limitations as a percentage of average daily net assets are as follows:
| | | | | | | | | | | | | | |
| Class I | | | | | Class II | | | | | Class III | |
| | 0.55% | | | | | | 0.70% | | | | | | 0.80% | |
The Manager has agreed not to reduce or discontinue this contractual expense limitation through April 30, 2019, unless approved by the Board, including a majority of the Independent Directors, or by a vote of a majority of the outstanding voting securities of the Fund. For the year ended December 31, 2018, the Manager waived $797,265 and $180,760, which is included in fees waived and/or reimbursed by the Manager and transfer agent fees waived and/or reimbursed — class specific, respectively, in the Statement of Operations.
Securities Lending: The U.S. Securities and Exchange Commission (“SEC”) has issued an exemptive order which permits BIM, an affiliate of the Manager, to serve as securities lending agent for the Fund, subject to applicable conditions. As securities lending agent, BIM bears all operational costs directly related to securities lending. The Fund is responsible for expenses in connection with the investment of cash collateral received for securities on loan (the “collateral investment expenses”). The cash collateral is invested in a private investment company managed by the Manager or its affiliates. However, BIM has agreed to cap the collateral investment expenses of the private investment company to an annual rate of 0.04%. The investment adviser to the private investment company will not charge any advisory fees with respect to shares purchased by the Fund. The private investment company in which the cash collateral has been invested may, under certain circumstances, impose a liquidity fee of up to 2% of the value withdrawn or temporarily restrict withdrawals for up to 10 business days during a 90 day period, in the event that the private investment company’s weekly liquid assets fall below certain thresholds.
Securities lending income is equal to the total of income earned from the reinvestment of cash collateral, net of fees and other payments to and from borrowers of securities, and less the collateral investment expenses. The Fund retains a portion of securities lending income and remits a remaining portion to BIM as compensation for its services as securities lending agent.
Pursuant to a securities lending agreement, the Fund retains 71.5% of securities lending income, and this amount retained can never be less than 65% of the total of securities lending income plus the collateral investment expenses.
In addition, commencing the business day following the date that the aggregate securities lending income earned across the Equity-Bond Complex in a calendar year exceeds a specified threshold, the Fund, pursuant to the securities lending agreement, will retain for the remainder of that calendar year securities lending income in an amount equal to 75% of securities lending income, and this amount retained can never be less than 65% of the total of securities lending income plus the collateral investment expenses.
The share of securities lending income earned by the Fund is shown as securities lending income — affiliated — net in the Statement of Operations. For the year ended December 31, 2018, the Fund paid BIM $4,062 for securities lending agent services.
lnterfund Lending: In accordance with an exemptive order (the “Order”) from the SEC, the Fund may participate in a joint lending and borrowing facility for temporary purposes (the “lnterfund Lending Program”), subject to compliance with the terms and conditions of the Order, and to the extent permitted by the Fund’s investment policies and restrictions. The Fund is currently permitted to borrow under the lnterfund Lending Program.
A lending BlackRock fund may lend in aggregate up to 15% of its net assets, but may not lend more than 5% of its net assets to any one borrowing fund through the lnterfund Lending Program. A borrowing BlackRock fund may not borrow through the lnterfund Lending Program or from any other source more than 33 1/3% of its total assets (or any lower threshold provided for by the fund’s investment restrictions). If a borrowing BlackRock fund’s total outstanding borrowings exceed 10% of its total assets, each of its outstanding interfund loans will be subject to collateralization of at least 102% of the outstanding principal value of the loan. All interfund loans are for temporary or emergency purposes and the interest rate to be charged will be the average of the highest current overnight repurchase agreement rate available to a lending fund and the bank loan rate, as calculated according to a formula established by the Board.
During the year ended December 31, 2018, the Fund did not participate in the lnterfund Lending Program
Directors and Officers: Certain directors and/or officers of the Company are directors and/or officers of BlackRock or its affiliates. The Fund reimburses the Manager for a portion of the compensation paid to the Company’s Chief Compliance Officer, which is included in Directors and Officer in the Statement of Operations.
| | | | |
| NOTESTO FINANCIAL STATEMENTS | | | 21 | |
Notes to Financial Statements (continued)
For the year ended December 31, 2018, purchases and sales of investments, excluding short-term securities, were $388,306,894 and $413,881,112, respectively.
It is the Fund’s policy to comply with the requirements of the Internal Revenue Code of 1986, as amended, applicable to regulated investment companies, and to distribute substantially all of its taxable income to its shareholders. Therefore, no U.S. federal income tax provision is required.
The Fund files U.S. federal and various state and local tax returns. No income tax returns are currently under examination. The statute of limitations on the Fund’s U.S. federal tax returns generally remains open for each of the four years ended December 31, 2018. The statutes of limitations on the Fund’s state and local tax returns may remain open for an additional year depending upon the jurisdiction.
Management has analyzed tax laws and regulations and their application to the Fund as of December 31, 2018, inclusive of the open tax return years, and does not believe there are any uncertain tax positions that require recognition of a tax liability in the Fund’s financial statements.
The tax character of distributions paid was as follows:
| | | | | | | | |
| | | 12/31/18 | | | 12/31/17 | |
Ordinary income | | $ | 20,324,901 | | | $ | 20,827,050 | |
Long term capital gains | | | 7,341,567 | | | | 33,606,972 | |
| | | | | | | | |
| | $ | 27,666,468 | | | $ | 54,434,022 | |
| | | | | | | | |
As of period end, the tax components of accumulated loss were as follows:
| | | | |
Undistributed ordinary income | | $ | 102,588 | |
Net unrealized losses(a) | | | (17,080,639 | ) |
Qualified late-year losses(b) | | | (1,556,533 | ) |
| | | | |
| | $ | (18,534,584 | ) |
| | | | |
| | (a) | The difference between book-basis and tax-basis net unrealized losses was attributable primarily to the tax deferral of losses on wash sales, the realization for tax purposes of unrealized gains/losses on certain futures contracts and the timing and recognition of partnership income. | |
| | (b) | The Fund has elected to defer certain qualified late-year losses and recognize such losses in the next taxable year. | |
As of December 31, 2018, gross unrealized appreciation and depreciation for investments and derivatives based on cost for U.S. federal income tax purposes were as follows:
| | | | |
Tax cost | | $ | 250,001,559 | |
| | | | |
Gross unrealized appreciation | | $ | 5,272,779 | |
Gross unrealized depreciation | | | (22,394,652 | ) |
| | | | |
Net unrealized depreciation | | $ | (17,121,873 | ) |
| | | | |
The Company, on behalf of the Fund, along with certain other funds managed by the Manager and its affiliates (“Participating Funds”), is a party to a364-day, $2.25 billion credit agreement with a group of lenders. Under this agreement, the Fund may borrow to fund shareholder redemptions. Excluding commitments designated for certain individual funds, the Participating Funds, including the Fund, can borrow up to an aggregate commitment amount of $1.75 billion at any time outstanding, subject to asset coverage and other limitations as specified in the agreement. The credit agreement has the following terms: a fee of 0.10% per annum on unused commitment amounts and interest at a rate equal to the higher of(a) one-month LIBOR (but, in any event, not less than 0.00%) on the date the loan is made plus 0.80% per annum or (b) the Fed Funds rate (but, in any event, not less than 0.00%) in effect from time to time plus 0.80% per annum on amounts borrowed. The agreement expires in April 2019 unless extended or renewed. Prior to April 19, 2018, the aggregate commitment amount was $2.1 billion and the fee was 0.12% per annum. Participating Funds paid an upfront commitment fee of 0.02% on the total commitment amounts, in addition to administration, legal and arrangement fees, which are included in miscellaneous expenses in the Statement of Operations. These fees were allocated among such funds based upon portions of the aggregate commitment available to them and relative net assets of Participating Funds. . During the year ended December 31, 2018, the Fund did not borrow under the credit agreement.
In the normal course of business, the Fund invests in securities or other instruments and may enter into certain transactions, and such activities subject the Fund to various risks, including among others, fluctuations in the market (market risk) or failure of an issuer to meet all of its obligations. The value of securities or other instruments may also be affected by various factors, including, without limitation: (i) the general economy; (ii) the overall market as well as local, regional or global political and/or social instability; (iii) regulation, taxation or international tax treaties between various countries; or (iv) currency, interest rate and price fluctuations. The Fund’s prospectus provides details of the risks to which the Fund is subject.
| | |
| 22 | | 2018 BLACKROCK ANNUAL REPORTTO SHAREHOLDERS |
Notes to Financial Statements (continued)
The Fund may be exposed to additional risks when reinvesting cash collateral in money market funds that do not seek to maintain a stable NAV per share of $1.00, and which may be subject to redemption gates or liquidity fees under certain circumstances.
Valuation Risk: The market values of equities, such as common stocks and preferred securities or equity related investments, such as futures and options, may decline due to general market conditions which are not specifically related to a particular company. They may also decline due to factors which affect a particular industry or industries. The Fund may invest in illiquid investments and may experience difficulty in selling those investments in a timely manner at the price that it believes the investments are worth. Prices may fluctuate widely over short or extended periods in response to company, market or economic news. Markets also tend to move in cycles, with periods of rising and falling prices. This volatility may cause the Fund’s NAV to experience significant increases or decreases over short periods of time. If there is a general decline in the securities and other markets, the NAV of the Fund may lose value, regardless of the individual results of the securities and other instruments in which the Fund invests.
Counterparty Credit Risk: The Fund may be exposed to counterparty credit risk, or the risk that an entity may fail to or be unable to perform on its commitments related to unsettled or open transactions. The Fund manages counterparty credit risk by entering into transactions only with counterparties that the Manager believes have the financial resources to honor their obligations and by monitoring the financial stability of those counterparties. Financial assets, which potentially expose the Fund to market, issuer and counterparty credit risks, consist principally of financial instruments and receivables due from counterparties. The extent of the Fund’s exposure to market, issuer and counterparty credit risks with respect to these financial assets is approximately their value recorded in the Statement of Assets and Liabilities, less any collateral held by the Fund.
A derivative contract may suffer amark-to-market loss if the value of the contract decreases due to an unfavorable change in the market rates or values of the underlying instrument. Losses can also occur if the counterparty does not perform under the contract.
With exchange-traded futures, there is less counterparty credit risk to the Fund since the exchange or clearinghouse, as counterparty to such instruments, guarantees against a possible default. The clearinghouse stands between the buyer and the seller of the contract; therefore, credit risk is limited to failure of the clearinghouse. While offset rights may exist under applicable law, the Fund does not have a contractual right of offset against a clearing broker or clearinghouse in the event of a default (including the bankruptcy or insolvency). Additionally, credit risk exists in exchange-traded futures with respect to initial and variation margin that is held in a clearing broker’s customer accounts. While clearing brokers are required to segregate customer margin from their own assets, in the event that a clearing broker becomes insolvent or goes into bankruptcy and at that time there is a shortfall in the aggregate amount of margin held by the clearing broker for all its clients, typically the shortfall would be allocated on a pro rata basis across all the clearing broker’s customers, potentially resulting in losses to the Fund.
| 11. | CAPITAL SHARE TRANSACTIONS |
Transactions in capital shares for each class were as follows:
| | | | | | | | | | | | | | | | |
| | | Year Ended
12/31/2018 | | | Year Ended
12/31/2017 | |
| | | Shares | | | Amount | | | Shares | | | Amount | |
Class I | | | | | | | | | | | | | | | | |
Shares sold | | | 305,871 | | | $ | 8,001,770 | | | | 289,177 | | | $ | 8,303,261 | |
Shares issued in reinvestment of distributions | | | 1,251,143 | | | | 26,509,174 | | | | 2,015,232 | | | | 52,422,649 | |
Shares redeemed | | | (1,401,110 | ) | | | (36,805,116 | ) | | | (1,058,658 | ) | | | (30,166,900 | ) |
| | | | | | | | | | | | | | | | |
Net increase (decrease) | | | 155,904 | | | $ | (2,294,172 | ) | | | 1,245,751 | | | $ | 30,559,010 | |
| | | | | | | | | | | | | | | | |
| | | | |
Class II | | | | | | | | | | | | | | | | |
Shares sold | | | 2,590 | | | $ | 64,883 | | | | 836 | | | $ | 22,989 | |
Shares issued in reinvestment of distributions | | | 15,465 | | | | 326,810 | | | | 24,627 | | | | 639,247 | |
Shares redeemed | | | (10,312 | ) | | | (273,819 | ) | | | (23,204 | ) | | | (646,382 | ) |
| | | | | | | | | | | | | | | | |
Net increase | | | 7,743 | | | $ | 117,874 | | | | 2,259 | | | $ | 15,854 | |
| | | | | | | | | | | | | | | | |
| | | | |
Class III | | | | | | | | | | | | | | | | |
Shares sold | | | 55,977 | | | $ | 1,051,459 | | | | 20,673 | | | $ | 458,121 | |
Shares issued in reinvestment of distributions | | | 56,279 | | | | 830,484 | | | | 71,553 | | | | 1,372,125 | |
Shares redeemed | | | (50,372 | ) | | | (937,203 | ) | | | (90,639 | ) | | | (2,013,282 | ) |
| | | | | | | | | | | | | | | | |
Net increase (decrease) | | | 61,884 | | | $ | 944,740 | | | | 1,587 | | | $ | (183,036 | ) |
| | | | | | | | | | | | | | | | |
Total Net Increase (Decrease) | | | 225,531 | | | $ | (1,231,558 | ) | | | 1,249,597 | | | $ | 30,391,828 | |
| | | | | | | | | | | | | | | | |
| 12. | REGULATIONS-X AMENDMENTS |
On August 17, 2018, the SEC adopted amendments to certain disclosure requirements in Securities Act ReleaseNo. 33-10532, Disclosure Update and Simplification. The Fund has adopted the amendments pertinent to RegulationS-X in this shareholder report. The amendments impacted certain disclosure presentation on the Statement of Assets and Liabilities, Statements of Changes in Net Assets and Notes to the Financial Statements.
Prior year distribution information and undistributed net investment income in the Statements of Changes in Net Assets has been modified to conform to the current year presentation in accordance with the RegulationS-X changes.
| | | | |
| NOTESTO FINANCIAL STATEMENTS | | | 23 | |
Notes to Financial Statements (continued)
Distributions for the year ended December 31, 2017 were classified as follows:
| | | | | | | | |
| Share Class | | Net Investment Income | | | Net Realized Gain | |
Class I | | $ | (2,278,683 | ) | | $ | (50,143,967 | ) |
Class II | | | (22,476 | ) | | | (616,770 | ) |
Class III | | | (48,843 | ) | | | (1,323,283 | ) |
Undistributed net investment income as of December 31, 2017 was $35,495.
Management has evaluated the impact of all subsequent events on the Fund through the date the financial statements were issued and has determined that there were no subsequent events requiring adjustment or additional disclosure in the financial statements.
| | |
| 24 | | 2018 BLACKROCK ANNUAL REPORTTO SHAREHOLDERS |
Report of Independent Registered Public Accounting Firm
To the Shareholders of BlackRock Advantage U.S. Total Market V.I. Fund and the Board of Directors of BlackRock Variable Series Funds, Inc.:
Opinion on the Financial Statements and Financial Highlights
We have audited the accompanying statement of assets and liabilities of BlackRock Advantage U.S. Total Market V.I. Fund of BlackRock Variable Series Funds, Inc. (the “Fund”), including the schedule of investments, as of December 31, 2018, the related statement of operations for the year then ended, the statements of changes in net assets for each of the two years in the period then ended, the financial highlights for each of the five years in the period then ended, and the related notes. In our opinion, the financial statements and financial highlights present fairly, in all material respects, the financial position of the Fund as of December 31, 2018, and the results of its operations for the year then ended, the changes in its net assets for each of the two years in the period then ended, and the financial highlights for each of the five years in the period then ended, in conformity with accounting principles generally accepted in the United States of America.
Basis for Opinion
These financial statements and financial highlights are the responsibility of the Fund’s management. Our responsibility is to express an opinion on the Fund’s financial statements and financial highlights based on our audits. We are a public accounting firm registered with the Public Company Accounting Oversight Board (United States) (PCAOB) and are required to be independent with respect to the Fund in accordance with the U.S. federal securities laws and the applicable rules and regulations of the Securities and Exchange Commission and the PCAOB.
We conducted our audits in accordance with the standards of the PCAOB. Those standards require that we plan and perform the audit to obtain reasonable assurance about whether the financial statements and financial highlights are free of material misstatement, whether due to error or fraud. The Fund is not required to have, nor were we engaged to perform, an audit of its internal control over financial reporting. As part of our audits we are required to obtain an understanding of internal control over financial reporting but not for the purpose of expressing an opinion on the effectiveness of the Fund’s internal control over financial reporting. Accordingly, we express no such opinion.
Our audits included performing procedures to assess the risks of material misstatement of the financial statements and financial highlights, whether due to error or fraud, and performing procedures that respond to those risks. Such procedures included examining, on a test basis, evidence regarding the amounts and disclosures in the financial statements and financial highlights. Our audits also included evaluating the accounting principles used and significant estimates made by management, as well as evaluating the overall presentation of the financial statements and financial highlights. Our procedures included confirmation of securities owned as of December 31, 2018, by correspondence with the custodian and brokers; when replies were not received from brokers, we performed other auditing procedures. We believe that our audits provide a reasonable basis for our opinion.
Deloitte & Touche LLP
Boston, Massachusetts
February 15, 2019
We have served as the auditor of one or more BlackRock investment companies since 1992.
| | | | |
| REPORTOF INDEPENDENT REGISTERED PUBLIC ACCOUNTING FIRM | | | 25 | |
Glossary of Terms Used in this Report
| | |
| Portfolio Abbreviations |
| |
| REIT | | Real Estate Investment Trust |
| |
| S&P | | Standard & Poor’s |
| | |
| 26 | | 2018 BLACKROCK ANNUAL REPORTTO SHAREHOLDERS |
DECEMBER 31, 2018
| | |
ANNUAL REPORT | |  |
BlackRock Variable Series Funds, Inc.
| Ø | | BlackRock Basic Value V.I. Fund |
|
| Not FDIC Insured • May Lose Value • No Bank Guarantee |
| | |
| Fund Summary as of December 31, 2018 | | BlackRock Basic Value V.I. Fund |
Investment Objective
BlackRock Basic Value V.I. Fund’s (the “Fund”) investment objective is to seek capital appreciation and, secondarily, income.
Portfolio Management Commentary
How did the Fund perform?
For the12-month period ended December 31, 2018, the Fund outperformed its benchmark, the Russell 1000® Value Index.
What factors influenced performance?
Stock selection in the communication services sector was the leading contributor to relative performance during the period. Notably within the sector, positioning in the wireless telecommunication services (“telecom”) and diversified telecom industry groups contributed positively.
Among other positive contributors to relative performance was stock selection in utilities, where positions in independent power and electric utilities made notable contributions. Stock selection in information technology also contributed positively, especially within the communications equipment and hardware industry groups.
The largest detractor from relative performance over the period was stock selection in the consumer staples sector. In particular, positions in the food products and beverages industries were notably weak.
Stock selection in the financial sector, particularly among positions in the banking and insurance industries, also weighed on relative performance. Although overweight exposure to health care stocks added to relative returns, stock selection within the sector detracted, especially because of overweight positions in health care services and medical device stocks.
Describe recent portfolio activity.
During the period, a combination of market movement and trading activity increased the Fund’s allocation to the communication services and consumer staples sectors modestly, while reducing the Fund’s weights to financials and energy.
Describe portfolio positioning at period end.
Relative to the Russell 1000® Value Index, the Fund ended the period with overweight exposures to the health care, communication services, consumer staples and utilities sectors. The Fund maintained underweight sector exposures to real estate, consumer discretionary, industrials and financials.
The views expressed reflect the opinions of BlackRock as of the date of this report and are subject to change based on changes in market, economic or other conditions. These views are not intended to be a forecast of future events and are no guarantee of future results.
Portfolio Information
SECTOR ALLOCATION
| | | | |
| Sector | | Percent of
Net Assets | |
Financials | | | 21 | % |
Health Care | | | 19 | |
Communication Services | | | 11 | |
Information Technology | | | 10 | |
Energy | | | 9 | |
Consumer Staples | | | 9 | |
Utilities | | | 7 | |
Industrials | | | 5 | |
Materials | | | 3 | |
Consumer Discretionary | | | 2 | |
Short-Term Securities | | | 9 | |
Liabilities in Excess of Other Assets | | | (5 | ) |
For Fund compliance purposes, the Fund’s sector classifications refer to one or more of the sectorsub-classifications used by one or more widely recognized market indexes or ratings group indexes, and/or as defined by the investment adviser. These definitions may not apply for purposes of this report, which may combine sector sub classifications for reporting ease.
| | |
| 2 | | 2018 BLACKROCK ANNUAL REPORTTO SHAREHOLDERS |
| | |
| Fund Summary as of December 31, 2018 (continued) | | BlackRock Basic Value V.I. Fund |
TOTAL RETURN BASED ON A $10,000 INVESTMENT
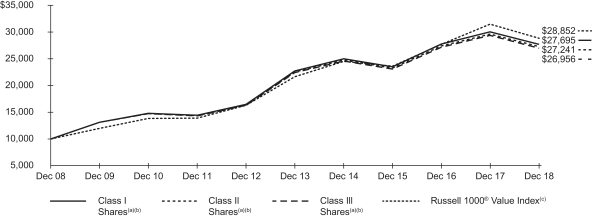
| (a) | Assuming transaction costs, if any, and other operating expenses, including investment advisory fees. Does not include insurance-related fees and expenses. |
| (b) | The Fund invests primarily in equity securities that Fund management believes are undervalued, which means that their prices are less than Fund management believes they are worth. |
| (c) | An unmanaged index that is a subset of the Russell 1000® Index that consists of those Russell 1000® securities with lowerprice-to-book ratios and lower expected growth values. |
Performance Summary for the Period Ended December 31, 2018
| | | | | | | | | | | | | | | | | | | | |
| | | 6-Month | | | | | | Average Annual Total Returns | |
| | | Total Returns (b) | | | | | | 1 Year (b) | | | 5 Years (b) | | | 10 Years (b) | |
Class I(a) | | | (8.08 | )% | | | | | | | (7.85 | )% | | | 4.04 | % | | | 10.72 | % |
Class II(a) | | | (8.18 | ) | | | | | | | (8.06 | ) | | | 3.86 | | | | 10.54 | |
Class III(a) | | | (8.17 | ) | | | | | | | (8.11 | ) | | | 3.75 | | | | 10.42 | |
Russell 1000® Value Index | | | (6.69 | ) | | | | | | | (8.27 | ) | | | 5.95 | | | | 11.18 | |
| | (a) | Average annual and cumulative total returns are based on changes in net asset value for the periods shown, and assume reinvestment of all distributions at net asset value on theex-dividend date. Insurance-related fees and expenses are not reflected in these returns. | |
| | (b) | For the portion of the period, the Fund’s investment adviser waived a portion of its fee. Without such waiver, the Fund’s performance would have been lower. | |
Past performance is not indicative of future results. Performance results do not reflect the deduction of taxes that a shareholder would pay on Fund distributions or the redemption of Fund shares.
Performance results may include adjustments made for financial reporting purposes in accordance with U.S. generally accepted accounting principles.
Expense Example
| | | | | | | | | | | | | | | | | | | | | | | | | | | | | | | | |
| | | Actual | | | | | | Hypothetical (a) | | | | |
| | | Beginning
Account Value
(07/01/18) | | | Ending
Account Value
(12/31/18) | | | Expenses
Paid During
the Period (b) | | | | | | Beginning
Account Value
(07/01/18) | | | Ending
Account Value
(12/31/18) | | | Expenses
Paid During
the Period (b) | | | Annualized
Expense
Ratio | |
Class I | | $ | 1,000.00 | | | $ | 919.20 | | | $ | 3.48 | | | | | | | $ | 1,000.00 | | | $ | 1,021.58 | | | $ | 3.67 | | | | 0.72 | % |
Class II | | | 1,000.00 | | | | 918.20 | | | | 4.30 | | | | | | | | 1,000.00 | | | | 1,020.72 | | | | 4.53 | | | | 0.89 | |
Class III | | | 1,000.00 | | | | 918.30 | | | | 4.84 | | | | | | | | 1,000.00 | | | | 1,020.16 | | | | 5.09 | | | | 1.00 | |
| | (a) | Hypothetical 5% annual return before expenses is calculated by prorating the number of days in the most recent fiscal half year divided by 365. | |
| | (b) | For each class of the Fund, expenses are equal to annualized expense ratio for the class, multiplied by the average account value over the period, multiplied by 184/365 (to reflect theone-half year period shown). | |
See “Disclosure of Expenses” on the following page for further information on how expenses were calculated.
| | |
| Disclosure of Expenses | | BlackRock Basic Value V.I. Fund |
Shareholders of the Fund may incur the following charges: (a) transactional expenses; and (b) operating expenses, including investment advisory fees, service and distribution fees, including12b-1 fees, acquired fund fees and expenses, and other fund expenses. The expense example on the previous page (which is based on a hypothetical investment of $1,000 invested on July 1, 2018 and held through December 31, 2018) is intended to assist shareholders both in calculating expenses based on an investment in the Fund and in comparing these expenses with similar costs of investing in other mutual funds.
The expense example provides information about actual account values and actual expenses. In order to estimate the expenses a shareholder paid during the period covered by this report, shareholders can divide their account value by $1,000 and then multiply the result by the number corresponding to their share class under the heading entitled “Expenses Paid During the Period.”
The expense example also provides information about hypothetical account values and hypothetical expenses based on the Fund’s actual expense ratio and an assumed rate of return of 5% per year before expenses. In order to assist shareholders in comparing the ongoing expenses of investing in the Fund and other funds, compare the 5% hypothetical examples with the 5% hypothetical examples that appear in shareholder reports of other funds.
The expenses shown in the expense example are intended to highlight shareholders’ ongoing costs only and do not reflect transactional expenses, such as sales charges, if any. Therefore, the hypothetical examples are useful in comparing ongoing expenses only, and will not help shareholders determine the relative total expenses of owning different funds. If these transactional expenses were included, shareholder expenses would have been higher.
| | |
| 4 | | 2018 BLACKROCK ANNUAL REPORTTO SHAREHOLDERS |
| | |
Schedule of Investments December 31, 2018 | | BlackRock Basic Value V.I. Fund (Percentages shown are based on Net Assets) |
| | | | | | | | |
| Security | | Shares | | | Value | |
|
Common Stocks — 95.6% | |
| |
| Auto Components — 0.7% | | | | |
Lear Corp. | | | 22,514 | | | $ | 2,766,070 | |
| | | | | | | | |
| |
| Banks — 11.8% | | | | |
Citigroup, Inc. | | | 161,094 | | | | 8,386,554 | |
JPMorgan Chase & Co. | | | 172,197 | | | | 16,809,871 | |
Regions Financial Corp. | | | 416,209 | | | | 5,568,876 | |
Wells Fargo & Co. | | | 329,338 | | | | 15,175,895 | |
| | | | | | | | |
| | | | | | | 45,941,196 | |
| |
| Beverages — 2.9% | | | | |
Molson Coors Brewing Co., Class B | | | 200,953 | | | | 11,285,520 | |
| | | | | | | | |
| |
| Biotechnology — 1.9% | | | | |
Biogen, Inc.(a) | | | 7,287 | | | | 2,192,804 | |
Gilead Sciences, Inc. | | | 83,705 | | | | 5,235,748 | |
| | | | | | | | |
| | | | | | | 7,428,552 | |
| |
| Building Products — 0.9% | | | | |
Masco Corp. | | | 117,340 | | | | 3,431,022 | |
| | | | | | | | |
| |
| Capital Markets — 3.1% | | | | |
E*TRADE Financial Corp.(a) | | | 75,088 | | | | 3,294,862 | |
Morgan Stanley | | | 129,176 | | | | 5,121,828 | |
Nasdaq, Inc. | | | 9,362 | | | | 763,658 | |
State Street Corp.(b) | | | 44,124 | | | | 2,782,901 | |
| | | | | | | | |
| | | | | | | 11,963,249 | |
| |
| Chemicals — 0.9% | | | | |
Akzo Nobel NV, ADR | | | 137,595 | | | | 3,664,843 | |
| | | | | | | | |
| |
| Communications Equipment — 4.3% | | | | |
Cisco Systems, Inc. | | | 389,007 | | | | 16,855,673 | |
| | | | | | | | |
| |
| Consumer Finance — 1.5% | | | | |
Ally Financial, Inc. | | | 80,655 | | | | 1,827,642 | |
Capital One Financial Corp. | | | 39,770 | | | | 3,006,214 | |
SLM Corp.(a)(b) | | | 114,808 | | | | 954,055 | |
| | | | | | | | |
| | | | | | | 5,787,911 | |
| |
| Diversified Telecommunication Services — 4.4% | | | | |
Verizon Communications, Inc. | | | 303,828 | | | | 17,081,210 | |
| | | | | | | | |
| |
| Electric Utilities — 4.7% | | | | |
Exelon Corp. | | | 212,930 | | | | 9,603,143 | |
FirstEnergy Corp. | | | 225,116 | | | | 8,453,106 | |
| | | | | | | | |
| | | | | | | 18,056,249 | |
| |
| Electrical Equipment — 2.3% | | | | |
ABB Ltd., ADR(b) | | | 306,394 | | | | 5,824,550 | |
Hubbell, Inc. | | | 29,083 | | | | 2,889,105 | |
| | | | | | | | |
| | | | | | | 8,713,655 | |
| |
| Food & Staples Retailing — 2.4% | | | | |
Kroger Co. (The) | | | 112,654 | | | | 3,097,985 | |
Walgreens Boots Alliance, Inc. | | | 92,391 | | | | 6,313,077 | |
| | | | | | | | |
| | | | | | | 9,411,062 | |
| |
| Food Products — 3.6% | | | | |
JM Smucker Co. (The) | | | 62,318 | | | | 5,826,110 | |
Kellogg Co.(b) | | | 144,382 | | | | 8,231,218 | |
| | | | | | | | |
| | | | | | | 14,057,328 | |
| |
| Health Care Equipment & Supplies — 7.5% | | | | |
Baxter International, Inc. | | | 82,549 | | | | 5,433,375 | |
Koninklijke Philips NV, NYRS(b) | | | 170,485 | | | | 5,985,728 | |
Medtronic plc(b) | | | 60,352 | | | | 5,489,618 | |
Zimmer Biomet Holdings, Inc. | | | 119,394 | | | | 12,383,546 | |
| | | | | | | | |
| | | | | | | 29,292,267 | |
| | | | | | | | |
| Security | | Shares | | | Value | |
| |
| Health Care Providers & Services — 1.6% | | | | |
Laboratory Corp. of America Holdings(a) | | | 48,225 | | | $ | 6,093,711 | |
| | | | | | | | |
| |
| Independent Power and Renewable Electricity Producers — 2.8% | | | | |
AES Corp. | | | 742,576 | | | | 10,737,649 | |
| | | | | | | | |
| |
| Industrial Conglomerates — 0.2% | | | | |
General Electric Co. | | | 119,776 | | | | 906,704 | |
| | | | | | | | |
| |
| Insurance — 4.2% | | | | |
American International Group, Inc.(b) | | | 62,180 | | | | 2,450,514 | |
Assured Guaranty Ltd. | | | 83,157 | | | | 3,183,250 | |
Brighthouse Financial, Inc.(a) | | | 54,964 | | | | 1,675,303 | |
Hartford Financial Services Group, Inc. (The) | | | 120,538 | | | | 5,357,914 | |
Lincoln National Corp. | | | 72,968 | | | | 3,743,988 | |
| | | | | | | | |
| | | | | | | 16,410,969 | |
| |
| Media — 4.8% | | | | |
Comcast Corp., Class A | | | 292,538 | | | | 9,960,919 | |
DISH Network Corp., Class A(a) | | | 110,590 | | | | 2,761,432 | |
Interpublic Group of Cos., Inc. (The) | | | 289,814 | | | | 5,978,863 | |
| | | | | | | | |
| | | | | | | 18,701,214 | |
| |
| Metals & Mining — 1.6% | | | | |
Freeport-McMoRan, Inc. | | | 269,700 | | | | 2,780,607 | |
Nucor Corp. | | | 64,223 | | | | 3,327,394 | |
| | | | | | | | |
| | | | | | | 6,108,001 | |
| |
| Multiline Retail — 0.9% | | | | |
Dollar Tree, Inc.(a) | | | 38,550 | | | | 3,481,836 | |
| | | | | | | | |
| |
| Oil, Gas & Consumable Fuels — 9.0% | | | | |
BP plc, ADR | | | 140,650 | | | | 5,333,448 | |
ConocoPhillips | | | 113,024 | | | | 7,047,046 | |
Devon Energy Corp. | | | 93,856 | | | | 2,115,514 | |
Marathon Oil Corp.(b) | | | 69,307 | | | | 993,862 | |
Marathon Petroleum Corp. | | | 47,474 | | | | 2,801,441 | |
Royal Dutch Shell plc, ADR, Class A(b) | | | 45,443 | | | | 2,647,964 | |
Suncor Energy, Inc. | | | 259,748 | | | | 7,265,152 | |
Williams Cos., Inc. (The) | | | 304,369 | | | | 6,711,336 | |
| | | | | | | | |
| | | | | | | 34,915,763 | |
| |
| Pharmaceuticals — 8.5% | | | | |
Elanco Animal Health, Inc.(a)(b) | | | 21,990 | | | | 693,345 | |
Novartis AG, ADR | | | 142,519 | | | | 12,229,555 | |
Pfizer, Inc. | | | 459,786 | | | | 20,069,659 | |
| | | | | | | | |
| | | | | | | 32,992,559 | |
| |
| Road & Rail — 1.3% | | | | |
Norfolk Southern Corp. | | | 32,480 | | | | 4,857,059 | |
| | | | | | | | |
| |
| Semiconductors & Semiconductor Equipment — 3.3% | | | | |
QUALCOMM, Inc.(b) | | | 225,537 | | | | 12,835,311 | |
| | | | | | | | |
| |
| Software — 1.0% | | | | |
Oracle Corp. | | | 89,580 | | | | 4,044,537 | |
| | | | | | | | |
| |
| Specialty Retail — 0.6% | | | | |
Lowe’s Cos., Inc. | | | 23,460 | | | | 2,166,765 | |
| | | | | | | | |
| |
| Technology Hardware, Storage & Peripherals — 1.2% | | | | |
Apple, Inc. | | | 28,934 | | | | 4,564,049 | |
| | | | | | | | |
| |
| Wireless Telecommunication Services — 1.7% | | | | |
Telephone & Data Systems, Inc. | | | 185,626 | | | | 6,040,270 | |
United States Cellular Corp.(a) | | | 12,647 | | | | 657,265 | |
| | | | | | | | |
| | | | | | | 6,697,535 | |
| |
Total Common Stocks — 95.6%
(Cost: $364,890,722) | | | | 371,249,469 | |
| | | | | |
| |
Total Long-Term Investments — 95.6%
(Cost: $364,890,722) | | | | 371,249,469 | |
| | | | | |
| | | | |
| SCHEDULE OF INVESTMENTS | | | 5 | |
| | |
Schedule of Investments (continued) December 31, 2018 | | BlackRock Basic Value V.I. Fund (Percentages shown are based on Net Assets) |
| | | | | | | | |
| Security | | Shares | | | Value | |
|
Short-Term Securities — 9.0%(c)(e) | |
BlackRock Liquidity Funds,T-Fund, Institutional Class,
2.32% | | | 16,423,075 | | | $ | 16,423,075 | |
SL Liquidity Series, LLC, Money Market Series,
2.57%(d) | | | 18,439,265 | | | | 18,437,421 | |
| | | | | | | | |
| |
Total Short-Term Securities — 9.0%
(Cost: $34,860,510) | | | | 34,860,496 | |
| | | | | |
| |
Total Investments — 104.6%
(Cost: $399,751,232) | | | | 406,109,965 | |
| |
Liabilities in Excess of Other Assets — (4.6)% | | | | (17,746,714 | ) |
| | | | | |
| |
Net Assets — 100.0% | | | $ | 388,363,251 | |
| | | | | |
| (a) | Non-income producing security. |
| (b) | Security, or a portion of the security, is on loan. |
| (c) | Annualized7-day yield as of period end. |
| (d) | Security was purchased with the cash collateral from loaned securities. |
| (e) | During the year ended December 31, 2018, investments in issuers considered to be affiliates of the Fund for purposes of Section 2(a)(3) of the Investment Company Act of 1940, as amended, were as follows: |
| | | | | | | | | | | | | | | | | | | | | | | | | | | | |
| Affiliate | | Shares
Held at
12/31/17 | | | Net
Activity | | | Shares
Held at
12/31/18 | | | Value at
12/31/18 | | | Income | | | Net
Realized
Gain (Loss) (a) | | | Change in
Unrealized
Appreciation
(Depreciation) | |
BlackRock Liquidity Funds,T-Fund, Institutional Class | | | 3,156,745 | | | | 13,266,330 | | | | 16,423,075 | | | $ | 16,423,075 | | | $ | 212,906 | | | $ | — | | | $ | — | |
SL Liquidity Series, LLC, Money Market Series | | | 28,837,798 | | | | (10,398,533 | ) | | | 18,439,265 | | | | 18,437,421 | | | | 57,231 | (b) | | | (6,581) | | | | 593 | |
| | | | | | | | | | | | | | | | | | | | | | | | | | | | |
| | | | | | | | | | | | | | $ | 34,860,496 | | | $ | 270,137 | | | $ | (6,581) | | | $ | 593 | |
| | | | | | | | | | | | | | | | | | | | | | | | | | | | |
| | (a) | Includes net capital gain distributions, if applicable. | |
| | (b) | Represents securities lending income earned from the reinvestment of cash collateral from loaned securities, net of fees and collateral investment expenses, and other payments to and from borrowers of securities. | |
For Fund compliance purposes, the Fund’s industry classifications refer to one or more of the industrysub-classifications used by one or more widely recognized market indexes or ratings group indexes, and/or as defined by the investment adviser. These definitions may not apply for purposes of this report, which may combine such industrysub-classifications for reporting ease.
Fair Value Hierarchy as of Period End
Various inputs are used in determining the fair value of investments. For information about the Fund’s policy regarding valuation of investments, refer to the Notes to Financial Statements. The following table summarizes the Fund’s investments categorized in the disclosure hierarchy:
| | | | | | | | | | | | | | | | |
| | | Level 1 | | | Level 2 | | | Level 3 | | | Total | |
Assets: | | | | | | | | | | | | | | | | |
Investments: | | | | | | | | | | | | | | | | |
Long-Term Investments | | | | | | | | | | | | | | | | |
Common Stocks(a) | | $ | 371,249,469 | | | $ | — | | | $ | — | | | $ | 371,249,469 | |
Short-Term Securities | | | 16,423,075 | | | | — | | | | — | | | | 16,423,075 | |
| | | | | | | | | | | | | | | | |
Subtotal | | $ | 387,672,544 | | | $ | — | | | $ | — | | | $ | 387,672,544 | |
| | | | | | | | | | | | | | | | |
Investments valued at NAV(b) | | | | | | | | | | | | | | | 18,437,421 | |
| | | | | | | | | | | | | | | | |
Total Investments | | | | | | | | | | | | | | $ | 406,109,965 | |
| | | | | | | | | | | | | | | | |
| | (a) | See above Schedule of Investments for values in each industry. | |
| | (b) | As of December 31, 2018 certain investments of the Fund were fair valued using NAV per share as no quoted market value is available and therefore have been excluded from the fair value hierarchy. | |
During the year ended December 31, 2018, there were no transfers between levels.
See notes to financial statements.
| | |
| 6 | | 2018 BLACKROCK ANNUAL REPORTTO SHAREHOLDERS |
Statement of Assets and Liabilities
December 31, 2018
| | | | |
| | | BlackRock
Basic Value V.I. Fund | |
| | | | |
| |
ASSETS | | | | |
Investments at value — unaffiliated (including securities loaned at value of $18,135,407) (cost — $364,890,722) | | $ | 371,249,469 | |
Investments at value — affiliated (cost — $34,860,510) | | | 34,860,496 | |
Cash | | | 47,499 | |
Receivables: | | | | |
Securities lending income — affiliated | | | 3,208 | |
Capital shares sold | | | 1,003,307 | |
Dividends — affiliated | | | 22,970 | |
Dividends — unaffiliated | | | 308,098 | |
Prepaid expenses | | | 464 | |
| | | | |
Total assets | | | 407,495,511 | |
| | | | |
| |
LIABILITIES | | | | |
Cash collateral on securities loaned at value | | | 18,445,979 | |
Payables: | | | | |
Capital shares redeemed | | | 18,537 | |
Distribution fees | | | 12,968 | |
Transfer agent fees | | | 296,519 | |
Board realignment and consolidation | | | 18,027 | |
Investment advisory fees | | | 244,675 | |
Directors’ and Officer’s fees | | | 6,379 | |
Other affiliates | | | 984 | |
Other accrued expenses | | | 88,192 | |
| | | | |
Total liabilities | | | 19,132,260 | |
| | | | |
| |
NET ASSETS | | $ | 388,363,251 | |
| | | | |
| |
NET ASSETS CONSIST OF | | | | |
Paid-in capital | | $ | 386,379,290 | |
Accumulated earnings | | | 1,983,961 | |
| | | | |
NET ASSETS | | $ | 388,363,251 | |
| | | | |
| |
NET ASSET VALUE | | | | |
Class I — Based on net assets of $326,873,430 and 26,386,682 shares outstanding, 300 million shares authorized, $0.10 par value. | | $ | 12.39 | |
| | | | |
Class II — Based on net assets of $3,828,707 and 310,035 shares outstanding, 100 million shares authorized, $0.10 par value. | | $ | 12.35 | |
| | | | |
Class III — Based on net assets of $57,661,114 and 4,692,961 shares outstanding, 100 million shares authorized, $0.10 par value. | | $ | 12.29 | |
| | | | |
See notes to financial statements.
Statement of Operations
Year Ended December 31, 2018
| | | | |
| | | BlackRock
Basic Value V.I. Fund | |
| |
INVESTMENT INCOME | | | | |
Dividends — affiliated | | $ | 212,906 | |
Dividends — unaffiliated | | | 11,315,119 | |
Securities lending income — affiliated — net | | | 57,231 | |
Foreign taxes withheld | | | (35,616 | ) |
| | | | |
Total investment income | | | 11,549,640 | |
| | | | |
| |
EXPENSES | | | | |
Investment advisory | | | 2,749,902 | |
Transfer agent — class specific | | | 879,194 | |
Distribution — class specific | | | 190,740 | |
Professional | | | 72,863 | |
Accounting services | | | 69,991 | |
Printing | | | 61,094 | |
Directors and Officer | | | 22,848 | |
Board realignment and consolidation | | | 18,302 | |
Custodian | | | 13,373 | |
Transfer agent | | | 5,834 | |
Miscellaneous | | | 21,340 | |
| | | | |
Total expenses | | | 4,105,481 | |
Less: | | | | |
Fees waived and/or reimbursed by the Manager | | | (9,130 | ) |
Transfer agent fees waived and/or reimbursed — class specific | | | (581,425 | ) |
| | | | |
Total expenses after fees waived and/or reimbursed | | | 3,514,926 | |
| | | | |
Net investment income | | | 8,034,714 | |
| | | | |
| |
REALIZED AND UNREALIZED GAIN (LOSS) | | | | |
Net realized gain (loss) from: | | | | |
Investments — affiliated | | | (6,581 | ) |
Investments — unaffiliated | | | 39,518,799 | |
| | | | |
| | | 39,512,218 | |
| | | | |
Net change in unrealized appreciation (depreciation) on: | | | | |
Investments — affiliated | | | 593 | |
Investments — unaffiliated | | | (79,557,709 | ) |
| | | | |
| | | (79,557,116 | ) |
| | | | |
Net realized and unrealized loss | | | (40,044,898 | ) |
| | | | |
NET DECREASE IN NET ASSETS RESULTING FROM OPERATIONS | | $ | (32,010,184 | ) |
| | | | |
See notes to financial statements.
| | |
| 8 | | 2018 BLACKROCK ANNUAL REPORTTO SHAREHOLDERS |
Statements of Changes in Net Assets
| | | | | | | | |
| | | BlackRock Basic Value V.I. Fund | |
| | | Year Ended December 31, | |
| | 2018 | | | 2017 | |
| | |
INCREASE (DECREASE) IN NET ASSETS | | | | | | | | |
| | |
OPERATIONS | | | | | | | | |
Net investment income | | $ | 8,034,714 | | | $ | 6,925,805 | |
Net realized gain | | | 39,512,218 | | | | 20,230,521 | |
Net change in unrealized appreciation (depreciation) | | | (79,557,116 | ) | | | 10,057,649 | |
| | | | | | | | |
Net increase (decrease) in net assets resulting from operations | | | (32,010,184 | ) | | | 37,213,975 | |
| | | | | | | | |
| | |
DISTRIBUTIONS TO SHAREHOLDERS(a)(b) | | | | | | | | |
Class I | | | (45,856,103 | ) | | | (21,064,561 | ) |
Class II | | | (533,180 | ) | | | (253,758 | ) |
Class III | | | (8,023,231 | ) | | | (4,082,586 | ) |
| | | | | | | | |
Decrease in net assets resulting from distributions to shareholders | | | (54,412,514 | ) | | | (25,400,905 | ) |
| | | | | | | | |
| | |
CAPITALSHARE TRANSACTIONS | | | | | | | | |
Net decrease in net assets derived from capital share transactions | | | (6,218,302 | ) | | | (59,465,107 | ) |
| | | | | | | | |
| | |
NET ASSETS(b) | | | | | | | | |
Total decrease in net assets | | | (92,641,000 | ) | | | (47,652,037 | ) |
Beginning of year | | | 481,004,251 | | | | 528,656,288 | |
| | | | | | | | |
End of year | | $ | 388,363,251 | | | $ | 481,004,251 | |
| | | | | | | | |
| (a) | Distributions for annual periods determined in accordance with U.S. federal income tax regulations. |
| (b) | Prior year distribution character information and undistributed net investment income has been modified or removed to conform with current year RegulationS-X presentation changes. Refer to Note 11 for this prior year information. |
See notes to financial statements.
Financial Highlights
(For a share outstanding throughout each period)
| | | | | | | | | | | | | | | | | | | | |
| | | BlackRock Basic Value V.I. Fund | |
| |
| | | Class I | |
| |
| | | Year Ended December 31, | |
| | 2018 | | | 2017 | | | 2016 | | | 2015 | | | 2014 | |
| | | | | |
Net asset value, beginning of year | | $ | 15.60 | | | $ | 15.21 | | | $ | 13.36 | | | $ | 16.42 | | | $ | 17.44 | |
| | | | | | | | | | | | | | | | | | | | |
Net investment income(a) | | | 0.28 | | | | 0.22 | | | | 0.23 | | | | 0.24 | | | | 0.25 | |
Net realized and unrealized gain (loss) | | | (1.51 | ) | | | 1.03 | | | | 2.19 | | | | (1.20 | ) | | | 1.51 | |
| | | | | | | | | | | | | | | | | | | | |
Net increase (decrease) from investment operations | | | (1.23 | ) | | | 1.25 | | | | 2.42 | | | | (0.96 | ) | | | 1.76 | |
| | | | | | | | | | | | | | | | | | | | |
| | | | | |
| Distributions(b) | | | | | | | | | | | | | | | |
From net investment income | | | (0.29 | ) | | | (0.25 | ) | | | (0.22 | ) | | | (0.25 | ) | | | (0.27 | ) |
From net realized gain | | | (1.69 | ) | | | (0.61 | ) | | | (0.35 | ) | | | (1.85 | ) | | | (2.51 | ) |
| | | | | | | | | | | | | | | | | | | | |
Total distributions | | | (1.98 | ) | | | (0.86 | ) | | | (0.57 | ) | | | (2.10 | ) | | | (2.78 | ) |
| | | | | | | | | | | | | | | | | | | | |
| | | | | |
Net asset value, end of year | | $ | 12.39 | | | $ | 15.60 | | | $ | 15.21 | | | $ | 13.36 | | | $ | 16.42 | |
| | | | | | | | | | | | | | | | | | | | |
| | | | | |
Total Return(c) | | | | | | | | | | | | | | | | | | | | |
Based on net asset value | | | (7.85 | )% | | | 8.24 | % | | | 18.19 | % | | | (5.95 | )% | | | 9.93 | % |
| | | | | | | | | | | | | | | | | | | | |
| | | | | |
Ratios to Average Net Assets(d) | | | | | | | | | | | | | | | | | | | | |
Total expenses | | | 0.85 | % | | | 0.85 | % | | | 0.84 | % | | | 0.86 | % | | | 0.85 | % |
| | | | | | | | | | | | | | | | | | | | |
Total expenses after fees waived and/or reimbursed | | | 0.72 | % | | | 0.73 | % | | | 0.73 | % | | | 0.73 | % | | | 0.72 | % |
| | | | | | | | | | | | | | | | | | | | |
Net investment income | | | 1.80 | % | | | 1.47 | % | | | 1.63 | % | | | 1.47 | % | | | 1.40 | % |
| | | | | | | | | | | | | | | | | | | | |
| | | | | |
Supplemental Data | | | | | | | | | | | | | | | | | | | | |
Net assets, end of year (000) | | $ | 326,873 | | | $ | 397,180 | | | $ | 409,216 | | | $ | 393,370 | | | $ | 468,876 | |
| | | | | | | | | | | | | | | | | | | | |
Portfolio turnover rate | | | 32 | % | | | 41 | % | | | 45 | % | | | 50 | % | | | 39 | % |
| | | | | | | | | | | | | | | | | | | | |
| (a) | Based on average shares outstanding. |
| (b) | Distributions for annual periods determined in accordance with U.S. federal income tax regulations. |
| (c) | Where applicable, excludes insurance-related fees and expenses and assumes the reinvestment of distributions. |
| (d) | Excludes expenses incurred indirectly as a result of investments in underlying funds as follows: |
| | | | | | | | | | | | | | | | | | | | | | | | | | | | | | | | | | | | | | | | |
| | | Year Ended December 31, | |
| | | 2018 | | | | | | 2017 | | | | | | 2016 | | | | | | 2015 | | | | | | 2014 | | | | |
Investments in underlying funds | | | 0.01 | % | | | | | | | 0.01 | % | | | | | | | — | % | | | | | | | — | % | | | | | | | — | % | | | | |
| | | | | | | | | | | | | | | | | | | | | | | | | | | | | | | | | | | | | | | | |
See notes to financial statements.
| | |
| 10 | | 2018 BLACKROCK ANNUAL REPORTTO SHAREHOLDERS |
Financial Highlights (continued)
(For a share outstanding throughout each period)
| | | | | | | | | | | | | | | | | | | | |
| | | BlackRock Basic Value V.I. Fund (continued) | |
| |
| | | Class II | |
| |
| | | Year Ended December 31, | |
| | | 2018 | | | 2017 | | | 2016 | | | 2015 | | | 2014 | |
| | | | | |
Net asset value, beginning of year | | $ | 15.56 | | | $ | 15.16 | | | $ | 13.33 | | | $ | 16.38 | | | $ | 17.40 | |
| | | | | | | | | | | | | | | | | | | | |
Net investment income(a) | | | 0.26 | | | | 0.20 | | | | 0.20 | | | | 0.21 | | | | 0.22 | |
Net realized and unrealized gain (loss) | | | (1.52 | ) | | | 1.03 | | | | 2.18 | | | | (1.18 | ) | | | 1.51 | |
| | | | | | | | | | | | | | | | | | | | |
Net increase (decrease) from investment operations | | | (1.26 | ) | | | 1.23 | | | | 2.38 | | | | (0.97 | ) | | | 1.73 | |
| | | | | | | | | | | | | | | | | | | | |
| | | | | |
| Distributions(b) | | | | | | | | | | | | | | | |
From net investment income | | | (0.26 | ) | | | (0.22 | ) | | | (0.20 | ) | | | (0.23 | ) | | | (0.24 | ) |
From net realized gain | | | (1.69 | ) | | | (0.61 | ) | | | (0.35 | ) | | | (1.85 | ) | | | (2.51 | ) |
| | | | | | | | | | | | | | | | | | | | |
Total distributions | | | (1.95 | ) | | | (0.83 | ) | | | (0.55 | ) | | | (2.08 | ) | | | (2.75 | ) |
| | | | | | | | | | | | | | | | | | | | |
| | | | | |
Net asset value, end of year | | $ | 12.35 | | | $ | 15.56 | | | $ | 15.16 | | | $ | 13.33 | | | $ | 16.38 | |
| | | | | | | | | | | | | | | | | | | | |
| | | | | |
Total Return(c) | | | | | | | | | | | | | | | | | | | | |
Based on net asset value | | | (8.06 | )% | | | 8.15 | % | | | 17.88 | % | | | (6.07 | )% | | | 9.75 | % |
| | | | | | | | | | | | | | | | | | | | |
| | | | | |
Ratios to Average Net Assets(d) | | | | | | | | | | | | | | | | | | | | |
Total expenses | | | 1.02 | % | | | 1.02 | % | | | 1.02 | % | | | 1.02 | % | | | 1.02 | % |
| | | | | | | | | | | | | | | | | | | | |
Total expenses after fees waived and/or reimbursed | | | 0.89 | % | | | 0.90 | % | | | 0.90 | % | | | 0.90 | % | | | 0.89 | % |
| | | | | | | | | | | | | | | | | | | | |
Net investment income | | | 1.63 | % | | | 1.29 | % | | | 1.47 | % | | | 1.30 | % | | | 1.23 | % |
| | | | | | | | | | | | | | | | | | | | |
| | | | | |
Supplemental Data | | | | | | | | | | | | | | | | | | | | |
Net assets, end of year (000) | | $ | 3,829 | | | $ | 4,928 | | | $ | 5,280 | | | $ | 5,466 | | | $ | 6,233 | |
| | | | | | | | | | | | | | | | | | | | |
Portfolio turnover rate | | | 32 | % | | | 41 | % | | | 45 | % | | | 50 | % | | | 39 | % |
| | | | | | | | | | | | | | | | | | | | |
| (a) | Based on average shares outstanding. |
| (b) | Distributions for annual periods determined in accordance with U.S. federal income tax regulations. |
| (c) | Where applicable, excludes insurance-related fees and expenses and assumes the reinvestment of distributions. |
| (d) | Excludes expenses incurred indirectly as a result of investments in underlying funds as follows: |
| | | | | | | | | | | | | | | | | | | | | | | | | | | | | | | | | | | | | | | | |
| | | Year Ended December 31, | |
| | | 2018 | | | | | | 2017 | | | | | | 2016 | | | | | | 2015 | | | | | | 2014 | | | | |
Investments in underlying funds | | | 0.01 | % | | | | | | | 0.01 | % | | | | | | | — | % | | | | | | | — | % | | | | | | | — | % | | | | |
| | | | | | | | | | | | | | | | | | | | | | | | | | | | | | | | | | | | | | | | |
See notes to financial statements.
Financial Highlights (continued)
(For a share outstanding throughout each period)
| | | | | | | | | | | | | | | | | | | | |
| | | BlackRock Basic Value V.I. Fund (continued) | |
| |
| | | Class III | |
| |
| | | Year Ended December 31, | |
| | 2018 | | | 2017 | | | 2016 | | | 2015 | | | 2014 | |
| | | | | |
Net asset value, beginning of year | | $ | 15.48 | | | $ | 15.08 | | | $ | 13.28 | | | $ | 16.32 | | | $ | 17.35 | |
| | | | | | | | | | | | | | | | | | | | |
Net investment income(a) | | | 0.24 | | | | 0.18 | | | | 0.18 | | | | 0.19 | | | | 0.20 | |
Net realized and unrealized gain (loss) | | | (1.50 | ) | | | 1.02 | | | | 2.17 | | | | (1.17 | ) | | | 1.50 | |
| | | | | | | | | | | | | | | | | | | | |
Net increase (decrease) from investment operations | | | (1.26 | ) | | | 1.20 | | | | 2.35 | | | | (0.98 | ) | | | 1.70 | |
| | | | | | | | | | | | | | | | | | | | |
| | | | | |
| Distributions(b) | | | | | | | | | | | | | | | |
From net investment income | | | (0.24 | ) | | | (0.19 | ) | | | (0.20 | ) | | | (0.21 | ) | | | (0.22 | ) |
From net realized gain | | | (1.69 | ) | | | (0.61 | ) | | | (0.35 | ) | | | (1.85 | ) | | | (2.51 | ) |
| | | | | | | | | | | | | | | | | | | | |
Total distributions | | | (1.93 | ) | | | (0.80 | ) | | | (0.55 | ) | | | (2.06 | ) | | | (2.73 | ) |
| | | | | | | | | | | | | | | | | | | | |
| | | | | |
Net asset value, end of year | | $ | 12.29 | | | $ | 15.48 | | | $ | 15.08 | | | $ | 13.28 | | | $ | 16.32 | |
| | | | | | | | | | | | | | | | | | | | |
| | | | | |
Total Return(c) | | | | | | | | | | | | | | | | | | | | |
Based on net asset value | | | (8.11 | )% | | | 8.01 | % | | | 17.72 | % | | | (6.15 | )% | | | 9.63 | % |
| | | | | | | | | | | | | | | | | | | | |
| | | | | |
Ratios to Average Net Assets(d) | | | | | | | | | | | | | | | | | | | | |
Total expenses | | | 1.15 | % | | | 1.16 | % | | | 1.04 | % | | | 1.13 | % | | | 1.11 | % |
| | | | | | | | | | | | | | | | | | | | |
Total expenses after fees waived and/or reimbursed | | | 1.00 | % | | | 1.01 | % | | | 1.00 | % | | | 1.01 | % | | | 1.00 | % |
| | | | | | | | | | | | | | | | | | | | |
Net investment income | | | 1.52 | % | | | 1.16 | % | | | 1.25 | % | | | 1.19 | % | | | 1.11 | % |
| | | | | | | | | | | | | | | | | | | | |
| | | | | |
Supplemental Data | | | | | | | | | | | | | | | | | | | | |
Net assets, end of year (000) | | $ | 57,661 | | | $ | 78,896 | | | $ | 114,160 | | | $ | 45,197 | | | $ | 54,394 | |
| | | | | | | | | | | | | | | | | | | | |
Portfolio turnover rate | | | 32 | % | | | 41 | % | | | 45 | % | | | 50 | % | | | 39 | % |
| | | | | | | | | | | | | | | | | | | | |
| (a) | Based on average shares outstanding. |
| (b) | Distributions for annual periods determined in accordance with U.S. federal income tax regulations. |
| (c) | Where applicable, excludes insurance-related fees and expenses and assumes the reinvestment of distributions. |
| (d) | Excludes expenses incurred indirectly as a result of investments in underlying funds as follows: |
| | | | | | | | | | | | | | | | | | | | | | | | | | | | | | | | | | | | | | | | |
| | | Year Ended December 31, | |
| | | 2018 | | | | | | 2017 | | | | | | 2016 | | | | | | 2015 | | | | | | 2014 | | | | |
Investments in underlying funds | | | 0.01 | % | | | | | | | 0.01 | % | | | | | | | — | % | | | | | | | — | % | | | | | | | — | % | | | | |
| | | | | | | | | | | | | | | | | | | | | | | | | | | | | | | | | | | | | | | | |
See notes to financial statements.
| | |
| 12 | | 2018 BLACKROCK ANNUAL REPORTTO SHAREHOLDERS |
Notes to Financial Statements
BlackRock Variable Series Funds, Inc. (the “Company”) is registered under the Investment Company Act of 1940, as amended (the “1940 Act”), as anopen-end management investment company. The Company is organized as a Maryland corporation that is comprised of 15 separate portfolios. The funds offer shares to insurance companies for their separate accounts to fund benefits under certain variable annuity and variable life insurance contracts. The financial statements presented are for BlackRock Basic Value V.I. Fund (the “Fund”). The Fund is classified as diversified. Class I, Class II and Class III Shares have equal voting, dividend, liquidation and other rights, except that only shares of the respective classes are entitled to vote on matters concerning only that class. In addition, Class II and Class III Shares bear certain expenses related to the distribution of such shares.
The Fund, together with certain other registered investment companies advised by BlackRock Advisors, LLC (the “Manager”) or its affiliates, is included in a complex ofopen-end funds referred to as the Equity-Bond Complex.
| 2. | SIGNIFICANT ACCOUNTING POLICIES |
The financial statements are prepared in conformity with accounting principles generally accepted in the United States of America (“U.S. GAAP”), which may require management to make estimates and assumptions that affect the reported amounts of assets and liabilities in the financial statements, disclosure of contingent assets and liabilities at the date of the financial statements and the reported amounts of increases and decreases in net assets from operations during the reporting period. Actual results could differ from those estimates. The Fund is considered an investment company under U.S. GAAP and follows the accounting and reporting guidance applicable to investment companies. Below is a summary of significant accounting policies:
Investment Transactions and Income Recognition: For financial reporting purposes, investment transactions are recorded on the dates the transactions are entered into (the “trade dates”). Realized gains and losses on investment transactions are determined on the identified cost basis. Dividend income is recorded on theex-dividend date. Dividends from foreign securities where theex-dividend date may have passed are subsequently recorded when the Fund is informed of theex-dividend date. Under the applicable foreign tax laws, a withholding tax at various rates may be imposed on capital gains, dividends and interest. Upon notification from issuers, a portion of the dividend income received from a real estate investment trust may be redesignated as a reduction of cost of the related investment and/or realized gain. Income, expenses and realized and unrealized gains and losses are allocated daily to each class based on its relative net assets.
Distributions:Distributions paid by the Fund are recorded on theex-dividend date. Distributions of capital gains are recorded on theex-dividend date and made at least annually. The character and timing of distributions are determined in accordance with U.S. federal income tax regulations, which may differ from U.S. GAAP.
Recent Accounting Standards: In August 2018, the Financial Accounting Standards Board issued Accounting Standards Update2018-13 “Changes to the Disclosure Requirements for Fair Value Measurement” which modifies disclosure requirements for fair value measurements. The guidance is effective for fiscal years beginning after December 15, 2019 and for interim periods within those fiscal years. Management is currently evaluating the impact of this guidance to the Fund.
Indemnifications:In the normal course of business, the Fund enters into contracts that contain a variety of representations that provide general indemnification. The Fund’s maximum exposure under these arrangements is unknown because it involves future potential claims against the Fund, which cannot be predicted with any certainty.
Other: Expenses directly related to the Fund or its classes are charged to the Fund or the applicable class. Other operating expenses shared by several funds, including other funds managed by the Manager, are prorated among those funds on the basis of relative net assets or other appropriate methods. Expenses directly related to the Fund and other shared expenses prorated to the Fund are allocated daily to each class based on its relative net assets or other appropriate methods.
| 3. | INVESTMENT VALUATION AND FAIR VALUE MEASUREMENTS |
Investment Valuation Policies: The Fund’s investments are valued at fair value (also referred to as “market value” within the financial statements) as of the close of trading on the New York Stock Exchange (“NYSE”) (generally 4:00 p.m., Eastern time). U.S. GAAP defines fair value as the price the Fund would receive to sell an asset or pay to transfer a liability in an orderly transaction between market participants at the measurement date. The Fund determines the fair values of its financial instruments using various independent dealers or pricing services under policies approved by the Board of Directors of the Company (the “Board”). The BlackRock Global Valuation Methodologies Committee (the “Global Valuation Committee”) is the committee formed by management to develop global pricing policies and procedures and to oversee the pricing function for all financial instruments.
Fair Value Inputs and Methodologies: The following methods and inputs are used to establish the fair value of the Fund’s assets and liabilities:
| | • | | Equity investments traded on a recognized securities exchange are valued at the official closing price each day, if available. For equity investments traded on more than one exchange, the official closing price on the exchange where the stock is primarily traded is used. Equity investments traded on a recognized exchange for which there were no sales on that day may be valued at the last available bid (long positions) or ask (short positions) price. |
| | • | | Investments inopen-end U.S. mutual funds are valued at net asset value (“NAV”) each business day. |
| | • | | The Fund values its investment in SL Liquidity Series, LLC, Money Market Series (the “Money Market Series”) at fair value, which is ordinarily based upon its pro rata ownership in the underlying fund’s net assets. The Money Market Series seeks current income consistent with maintaining liquidity and preserving capital. Although the Money Market Series is not registered under the 1940 Act, its investments may follow the parameters of investments by a money market fund that is subject to Rule2a-7 under the 1940 Act. |
| | | | |
| NOTESTO FINANCIAL STATEMENTS | | | 13 | |
Notes to Financial Statements (continued)
If events (e.g., a company announcement, market volatility or a natural disaster) occur that are expected to materially affect the value of such investments, or in the event that the application of these methods of valuation results in a price for an investment that is deemed not to be representative of the market value of such investment, or if a price is not available, the investment will be valued by the Global Valuation Committee, or its delegate, in accordance with a policy approved by the Board as reflecting fair value (“Fair Valued Investments”). The fair valuation approaches that may be used by the Global Valuation Committee will include market approach, income approach and cost approach. Valuation techniques such as discounted cash flow, use of market comparables and matrix pricing are types of valuation approaches and are typically used in determining fair value. When determining the price for Fair Valued Investments, the Global Valuation Committee, or its delegate, seeks to determine the price that the Fund might reasonably expect to receive or pay from the current sale or purchase of that asset or liability in anarm’s-length transaction. Fair value determinations shall be based upon all available factors that the Global Valuation Committee, or its delegate, deems relevant and consistent with the principles of fair value measurement. The pricing of all Fair Valued Investments is subsequently reported to the Board or a committee thereof on a quarterly basis.
Fair Value Hierarchy: Various inputs are used in determining the fair value of investments. These inputs to valuation techniques are categorized into a fair value hierarchy consisting of three broad levels for financial statement purposes as follows:
| | • | | Level 1 — Unadjusted price quotations in active markets/exchanges for identical assets or liabilities that the Fund has the ability to access |
| | • | | Level 2 — Other observable inputs (including, but not limited to, quoted prices for similar assets or liabilities in markets that are active, quoted prices for identical or similar assets or liabilities in markets that are not active, inputs other than quoted prices that are observable for the assets or liabilities (such as interest rates, yield curves, volatilities, prepayment speeds, loss severities, credit risks and default rates) or other market-corroborated inputs) |
| | • | | Level 3 — Unobservable inputs based on the best information available in the circumstances, to the extent observable inputs are not available (including the Fund’s own assumptions used in determining the fair value of investments) |
The hierarchy gives the highest priority to unadjusted quoted prices in active markets for identical assets or liabilities (Level 1 measurements) and the lowest priority to unobservable inputs (Level 3 measurements). Accordingly, the degree of judgment exercised in determining fair value is greatest for instruments categorized in Level 3. The inputs used to measure fair value may fall into different levels of the fair value hierarchy. In such cases, for disclosure purposes, the fair value hierarchy classification is determined based on the lowest level input that is significant to the fair value measurement in its entirety. Investments classified within Level 3 have significant unobservable inputs used by the Global Valuation Committee in determining the price for Fair Valued Investments. Level 3 investments include equity or debt issued by privately held companies or funds. There may not be a secondary market, and/or there are a limited number of investors. Level 3 investments may also be adjusted to reflect illiquidity and/ornon-transferability, with the amount of such discount estimated by the Global Valuation Committee in the absence of market information.
Changes in valuation techniques may result in transfers into or out of an assigned level within the hierarchy. In accordance with the Fund’s policy, transfers between different levels of the fair value hierarchy are deemed to have occurred as of the beginning of the reporting period. The categorization of a value determined for investments is based on the pricing transparency of the investments and is not necessarily an indication of the risks associated with investing in those securities.
As of December 31, 2018, certain investments of the Fund were valued using NAV per share as no quoted market value is available and therefore have been excluded from the fair value hierarchy.
| 4. | SECURITIES AND OTHER INVESTMENTS |
Securities Lending: The Fund may lend its securities to approved borrowers, such as brokers, dealers and other financial institutions. The borrower pledges and maintains with the Fund collateral consisting of cash, an irrevocable letter of credit issued by a bank, or securities issued or guaranteed by the U.S. Government. The initial collateral received by the Fund is required to have a value of at least 102% of the current value of the loaned securities for securities traded on U.S. exchanges and a value of at least 105% for all other securities. The collateral is maintained thereafter at a value equal to at least 100% of the current market value of the securities on loan. The market value of the loaned securities is determined at the close of each business day of the Fund and any additional required collateral is delivered to the Fund, or excess collateral returned by the Fund, on the next business day. During the term of the loan, the Fund is entitled to all distributions made on or in respect of the loaned securities, but does not receive interest income on securities received as collateral. Loans of securities are terminable at any time and the borrower, after notice, is required to return borrowed securities within the standard time period for settlement of securities transactions.
The market value of any securities on loan, all of which were classified as common stocks in the Fund’s Schedule of Investments, and the value of any related collateral are shown separately in the Statement of Assets and Liabilities as a component of investments at value — unaffiliated, and collateral on securities loaned at value, respectively. As of period end, any securities on loan were collateralized by cash and/or U.S. Government obligations. Cash collateral invested by the securities lending agent, BlackRock Investment Management, LLC (“BIM”), if any, is disclosed in the Schedule of Investments.
Securities lending transactions are entered into by the Fund under Master Securities Lending Agreements (each, an “MSLA”), which provide the right, in the event of default (including bankruptcy or insolvency), for thenon-defaulting party to liquidate the collateral and calculate a net exposure to the defaulting party or request additional collateral. In the event that a borrower defaults, the Fund, as lender, would offset the market value of the collateral received against the market value of the securities loaned. When the value of the collateral is greater than that of the market value of the securities loaned, the lender is left with a net amount payable to the defaulting party. However, bankruptcy or insolvency laws of a particular jurisdiction may impose restrictions on or prohibitions against such a right of offset in the event of an MSLA counterparty’s bankruptcy or insolvency. Under the MSLA, absent an event of default, the borrower can resell orre-pledge the loaned securities, and the Fund can reinvest cash collateral received in connection with loaned securities. Upon an event of default, the parties’ obligations to return the securities or collateral to the other party are extinguished, and the parties can resell orre-pledge the loaned securities or the collateral received in connection with the loaned securities in order to satisfy the defaulting party’s net payment obligation for all transactions under the MSLA. The defaulting party remains liable for any deficiency.
| | |
| 14 | | 2018 BLACKROCK ANNUAL REPORTTO SHAREHOLDERS |
Notes to Financial Statements (continued)
As of period end, the following table is a summary of the Fund’s securities lending agreements by counterparty which are subject to offset under an MSLA:
| | | | | | | | | | | | |
| Counterparty | | Securities
Loaned at Value | | | Cash Collateral
Received (a) | | | Net
Amount | |
Citigroup Global Markets, Inc. | | $ | 1,581,632 | | | $ | (1,581,632 | ) | | $ | — | |
Credit Suisse Securities (USA) LLC | | | 6,097,984 | | | | (6,097,984 | ) | | | — | |
JP Morgan Securities LLC | | | 7,914,537 | | | | (7,914,537 | ) | | | — | |
Morgan Stanley & Co. LLC | | | 2,434,005 | | | | (2,434,005 | ) | | | — | |
State Street Bank & Trust Co. | | | 107,249 | | | | (107,249 | ) | | | — | |
| | | | | | | | | | | | |
| | $ | 18,135,407 | | | $ | (18,135,407 | ) | | $ | — | |
| | | | | | | | | | | | |
| | (a) | Cash collateral with a value of $18,445,979 has been received in connection with securities lending agreements. . Collateral received in excess of the value of securities loaned from the individual counterparty, if any, is not shown for financial reporting purposes in the table above. | |
The risks of securities lending include the risk that the borrower may not provide additional collateral when required or may not return the securities when due. To mitigate these risks, the Fund benefits from a borrower default indemnity provided by BIM. BIM’s indemnity allows for full replacement of the securities loaned if the collateral received does not cover the value on the securities loaned in the event of borrower default. The Fund could incur a loss if the value of an investment purchased with cash collateral falls below the market value of loaned securities or if the value of an investment purchased with cash collateral falls below the value of the original cash collateral received.
| 5. | INVESTMENT ADVISORY AGREEMENT AND OTHER TRANSACTIONS WITH AFFILIATES |
Investment Advisory: The Company, on behalf of the Fund, entered into an Investment Advisory Agreement with the Manager, the Fund’s investment adviser and an indirect, wholly-owned subsidiary of BlackRock, to provide investment advisory and administrative services. The Manager is responsible for the management of the Fund’s portfolio and provides the personnel, facilities, equipment and certain other services necessary to the operations of the Fund.
For such services, the Fund pays the Manager a monthly fee at an annual rate equal to the following percentages of the average daily value of the Fund’s net assets:
| | | | |
| Average Daily Net Assets | | Investment Advisory Fees | |
First $1 Billion | | | 0.60 | % |
$1 Billion — $3 Billion | | | 0.56 | |
$3 Billion — $5 Billion | | | 0.54 | |
$5 Billion — $10 Billion | | | 0.52 | |
Greater than $10 Billion | | | 0.51 | |
Distribution Fees: The Company, on behalf of the Fund, entered into a Distribution Agreement and a Distribution Plan with BlackRock Investments, LLC (“BRIL”), an affiliate of the Manager. Pursuant to the Distribution Plan and in accordance with Rule12b-1 under the 1940 Act, the Fund pays BRIL ongoing distribution fees. The fees are accrued daily and paid monthly at annual rates based upon the average daily net assets of the relevant share class of the Fund as follows:
| | | | | | | | |
| | | Class II | | | Class III | |
Distribution Fees | | | 0.15 | % | | | 0.25 | % |
BRIL and broker-dealers, pursuant to sub-agreements with BRIL, provide shareholder servicing and distribution services to the Fund. The ongoing service and/or distribution fee compensates BRIL and each broker-dealer for providing shareholder servicing and/or distribution related services to shareholders.
For the year ended December 31, 2018, the following table shows the class specific distribution fees borne directly by each share class of the Fund:
| | | | | | | | | | | | |
| | | Class II | | | Class III | | | Total | |
Distribution Fees | | $ | 6,910 | | | $ | 183,830 | | | $ | 190,740 | |
Transfer Agent: On behalf of the Fund, the Manager entered into agreements with insurance companies and other financial intermediaries (“Service Organizations”), some of which may be affiliates. Pursuant to these agreements, the Service Organizations provide the Fund with administrative, networking, recordkeeping,sub-transfer agency and shareholder services tosub-accounts they service. For these services, the Service Organizations receive an annual fee per shareholder account, which will vary depending on share class and/or net assets of Fund shareholders serviced by the Service Organizations which is shown as transfer agent – class specific. For the year ended December 31, 2018, the Fund did not pay any amounts to affiliates in return for this services.
In addition, the Fund pays the transfer agent, which is not an affiliate, a fee for the issuance, transfer and redemption of shares and the opening and maintenance of shareholder accounts, which is included in transfer agent in the Statement of Operations.
For the year ended December 31, 2018, the following table shows the class specific transfer agent fees borne directly by each share class of the Fund:
| | | | | | | | | | | | | | | | | | | | |
| Class I | | | | | Class II | | | | | Class III | | | | | Total | |
| $ | 698,465 | | | | | $ | 9,639 | | | | | $ | 171,090 | | | | | $ | 879,194 | |
Expense Limitations, Waivers and Reimbursements:With respect to the Fund, the Manager voluntarily agreed to waive its investment advisory fees by the amount of investment advisory fees the Fund pays to the Manager indirectly through its investment in affiliated money market funds (the “affiliated money market fund waiver”). The
| | | | |
| NOTESTO FINANCIAL STATEMENTS | | | 15 | |
Notes to Financial Statements (continued)
amount of waivers and/or reimbursements of fees and expenses made pursuant to the expense limitation described below will be reduced by the amount of the affiliated money market fund waiver. This amount is included in fees waived and/or reimbursed by the Manager in the Statement of Operations. For the year ended December 31, 2018, the amount waived was $9,130.
The Manager has contractually agreed to waive its investment advisory fee with respect to any portion of the Fund’s assets invested in affiliated equity and fixed-income mutual funds and affiliated exchange-traded funds that have a contractual management fee through April 30, 2019. The contractual agreement may be terminated upon 90 days’ notice by a majority of the directors who are not “interested persons” of the Fund, as defined in the 1940 Act (“Independent Directors”), or by a vote of a majority of the outstanding voting securities of the Fund. For the year ended December 31, 2018, there were no fees waived and/or reimbursed by the Manager pursuant to this arrangement.
For the year ended December 31, 2018, the Fund reimbursed the Manager $5,886 for certain accounting services, which is included in accounting services in the Statement of Operations.
The Manager has contractually agreed to reimburse transfer agent fees in order to limit such expenses to a percentage of average daily net assets as follows:
| | | | |
Class I | | | 0.06 | % |
Class II | | | 0.08 | % |
Class III | | | 0.09 | % |
The Manager has agreed not to reduce or discontinue this contractual reimbursement through April 30, 2019, unless approved by the Board, including a majority of Independent Directors, or by a vote of a majority of the outstanding voting securities of the Fund.
These amounts waived and/or reimbursed are shown as transfer agent fees waived and/or reimbursed — class specific in the Statement of Operations. For the year ended December 31, 2018, class specific expense waivers and/or reimbursements were as follows:
| | | | | | | | | | | | | | | | |
| | | Class I | | | Class II | | | Class III | | | Total | |
Transfer Agent Fees Waived and/or Reimbursed | | $ | 470,527 | | | $ | 5,956 | | | $ | 104,942 | | | $ | 581,425 | |
With respect to the Fund, the Manager contractually agreed to waive and/or reimburse fees or expenses in order to limit expenses, excluding interest expense, dividend expense, tax expense, acquired fund fees and expenses, and certain other fund expenses, which constitute extraordinary expenses not incurred in the ordinary course of the Fund’s business (“expense limitation”). The expense limitations as a percentage of average daily net assets are as follows:
| | | | | | | | | | | | | | |
| Class I | | | | | Class II | | | | | Class III | |
| | 1.25% | | | | | | 1.40% | | | | | | 1.50% | |
The Manager has agreed not to reduce or discontinue this contractual expense limitation through April 30, 2019, unless approved by the Board, including a majority of Independent Directors, or by a vote of a majority of the outstanding voting securities of the Fund. For the year ended December 31, 2018, there were no fees waived and/or reimbursed by the Manager.
Securities Lending: The U.S. Securities and Exchange Commission (“SEC”) has issued an exemptive order which permits BIM, an affiliate of the Manager, to serve as securities lending agent for the Fund, subject to applicable conditions. As securities lending agent, BIM bears all operational costs directly related to securities lending. The Fund is responsible for expenses in connection with the investment of cash collateral received for securities on loan (the “collateral investment expenses”). The cash collateral is invested in a private investment company managed by the Manager or its affiliates. However, BIM has agreed to cap the collateral investment expenses of the private investment company to an annual rate of 0.04%. The investment adviser to the private investment company will not charge any advisory fees with respect to shares purchased by the Fund. The private investment company in which the cash collateral has been invested may, under certain circumstances, impose a liquidity fee of up to 2% of the value withdrawn or temporarily restrict withdrawals for up to 10 business days during a 90 day period, in the event that the private investment company’s weekly liquid assets fall below certain thresholds.
Securities lending income is equal to the total of income earned from the reinvestment of cash collateral, net of fees and other payments to and from borrowers of securities, and less the collateral investment expenses. The Fund retains a portion of securities lending income and remits a remaining portion to BIM as compensation for its services as securities lending agent.
Pursuant to a securities lending agreement, the Fund retains 71.5% of securities lending income, and this amount retained can never be less than 65% of the total of securities lending income plus the collateral investment expenses.
In addition, commencing the business day following the date that the aggregate securities lending income earned across the Equity-Bond Complex in a calendar year exceeds a specified threshold, the Fund, pursuant to the securities lending agreement, will retain for the remainder of that calendar year securities lending income in an amount equal to 75% of securities lending income, and this amount retained can never be less than 65% of the total of securities lending income plus the collateral investment expenses.
The share of securities lending income earned by the Fund is shown as securities lending income — affiliated — net in the Statement of Operations. For the year ended December 31, 2018, the Fund paid BIM $20,446 for securities lending agent services.
Interfund Lending: In accordance with an exemptive order (the “Order”) from the SEC, the Fund may participate in a joint lending and borrowing facility for temporary purposes (the “Interfund Lending Program”), subject to compliance with the terms and conditions of the Order, and to the extent permitted by the Fund’s investment policies and restrictions. The Fund is currently permitted to borrow under the Interfund Lending Program.
| | |
| 16 | | 2018 BLACKROCK ANNUAL REPORTTO SHAREHOLDERS |
Notes to Financial Statements (continued)
A lending BlackRock fund may lend in aggregate up to 15% of its net assets, but may not lend more than 5% of its net assets to any one borrowing fund through the Interfund Lending Program. A borrowing BlackRock fund may not borrow through the Interfund Lending Program or from any other source more than 33 1/3% of its total assets (or any lower threshold provided for by the fund’s investment restrictions). If a borrowing BlackRock fund’s total outstanding borrowings exceed 10% of its total assets, each of its outstanding interfund loans will be subject to collateralization of at least 102% of the outstanding principal value of the loan. All interfund loans are for temporary or emergency purposes and the interest rate to be charged will be the average of the highest current overnight repurchase agreement rate available to a lending fund and the bank loan rate, as calculated according to a formula established by the Board.
During the year ended December 31, 2018, the Fund did not participate in the Interfund Lending Program.
Directors and Officers: Certain directors and/or officers of the Company are directors and/or officers of BlackRock or its affiliates. The Fund reimburses the Manager for a portion of the compensation paid to the Company’s Chief Compliance Officer, which is included in Directors and Officer in the Statement of Operations.
For the year ended December 31, 2018, purchases and sales of investments, and excluding short-term securities, were $143,947,617 and $210,758,578, respectively.
It is the Fund’s policy to comply with the requirements of the Internal Revenue Code of 1986, as amended, applicable to regulated investment companies, and to distribute substantially all of its taxable income to its shareholders. Therefore, no U.S. federal income tax provision is required.
The Fund files U.S. federal and various state and local tax returns. No income tax returns are currently under examination. The statute of limitations on the Fund’s U.S. federal tax returns generally remains open for each of the four years ended December 31, 2018. The statutes of limitations on the Fund’s state and local tax returns may remain open for an additional year depending upon the jurisdiction.
Management has analyzed tax laws and regulations and their application to the Fund as of December 31, 2018, inclusive of the open tax return years, and does not believe that there are any uncertain tax positions that require recognition of a tax liability in the Fund’s financial statements.
The tax character of distributions paid was as follows:
| | | | | | | | |
| | | 12/31/18 | | | 12/31/17 | |
Ordinary income | | $ | 8,462,291 | | | $ | 10,837,279 | |
Long term capital gains | | | 45,950,223 | | | | 14,563,626 | |
| | | | | | | | |
| | $ | 54,412,514 | | | $ | 25,400,905 | |
| | | | | | | | |
As of period end, the tax components of accumulated earnings were as follows:
| | | | |
Undistributed ordinary income | | $ | 94,473 | |
Net unrealized gains(a) | | | 4,361,582 | |
Qualified late-year losses(b) | | | (2,472,094 | ) |
| | | | |
| | $ | 1,983,961 | |
| | | | |
| | (a) | The difference between book-basis and tax-basis net unrealized gains was attributable primarily to the tax deferral of losses on wash sales and the timing and recognition of partnership income. | |
| | (b) | The Fund has elected to defer certain qualified late-year losses and recognize such losses in the next taxable year. | |
As of December 31, 2018, gross unrealized appreciation and depreciation for investments based on cost for U.S. federal income tax purposes were as follows:
| | | | |
Tax cost | | $ | 401,987,684 | |
| | | | |
Gross unrealized appreciation | | $ | 35,675,769 | |
Gross unrealized depreciation | | | (31,553,488 | ) |
| | | | |
Net unrealized appreciation | | $ | 4,122,281 | |
| | | | |
The Company, on behalf of the Fund, along with certain other funds managed by the Manager and its affiliates (“Participating Funds”), is a party to a364-day, $2.25 billion credit agreement with a group of lenders. Under this agreement, the Fund may borrow to fund shareholder redemptions. Excluding commitments designated for certain individual funds, the Participating Funds, including the Fund, can borrow up to an aggregate commitment amount of $1.75 billion at any time outstanding, subject to asset coverage and other limitations as specified in the agreement. The credit agreement has the following terms: a fee of 0.10% per annum on unused commitment amounts and interest at a rate equal to the higher of(a) one-month LIBOR (but, in any event, not less than 0.00%) on the date the loan is made plus 0.80% per annum or (b) the Fed Funds rate (but, in any event, not less than 0.00%) in effect from time to time plus 0.80% per annum on amounts borrowed. The agreement expires in April 2019 unless extended or renewed. Prior to April 19, 2018, the aggregate commitment amount was $2.1 billion and the fee was 0.12% per annum. Participating Funds paid an upfront commitment fee of 0.02% on the total commitment amounts, in addition to administration, legal and arrangement fees, which are included in miscellaneous expenses in the Statement of Operations. These fees were allocated among such funds based upon portions of the aggregate commitment available to them and relative net assets of Participating Funds. During the year ended December 31, 2018, the Fund did not borrow under the credit agreement.
| | | | |
| NOTESTO FINANCIAL STATEMENTS | | | 17 | |
Notes to Financial Statements (continued)
In the normal course of business, the Fund invests in securities or other instruments and may enter into certain transactions, and such activities subject the Fund to various risks, including among others, fluctuations in the market (market risk) or failure of an issuer to meet all of its obligations. The value of securities or other instruments may also be affected by various factors, including, without limitation: (i) the general economy; (ii) the overall market as well as local, regional or global political and/or social instability; (iii) regulation, taxation or international tax treaties between various countries; or (iv) currency, interest rate and price fluctuations. The Fund’s prospectus provides details of the risks to which the Fund is subject.
The Fund may be exposed to additional risks when reinvesting cash collateral in money market funds that do not seek to maintain a stable NAV per share of $1.00, which may be subject to redemption gates or liquidity fees under certain circumstances.
Valuation Risk: The market values of equities, such as common stocks and preferred securities or equity related investments, such as futures and options, may decline due to general market conditions which are not specifically related to a particular company. They may also decline due to factors which affect a particular industry or industries. The Fund may invest in illiquid investments and may experience difficulty in selling those investments in a timely manner at the price that it believes the investments are worth. Prices may fluctuate widely over short or extended periods in response to company, market or economic news. Markets also tend to move in cycles, with periods of rising and falling prices. This volatility may cause the Fund’s NAV to experience significant increases or decreases over short periods of time. If there is a general decline in the securities and other markets, the NAV of the Fund may lose value, regardless of the individual results of the securities and other instruments in which the Fund invests.
Counterparty Credit Risk: The Fund may be exposed to counterparty credit risk, or the risk that an entity may fail to or be unable to perform on its commitments related to unsettled or open transactions. The Fund manages counterparty credit risk by entering into transactions only with counterparties that the Manager believes have the financial resources to honor their obligations and by monitoring the financial stability of those counterparties. Financial assets, which potentially expose the Fund to market, issuer and counterparty credit risks, consist principally of financial instruments and receivables due from counterparties. The extent of the Fund’s exposure to market, issuer and counterparty credit risks with respect to these financial assets is approximately their value recorded in the Statement of Assets and Liabilities, less any collateral held by the Fund.
| 10. | CAPITAL SHARE TRANSACTIONS |
Transactions in capital shares for each class were as follows:
| | | | | | | | | | | | | | | | |
| | | Year Ended
12/31/2018 | | | Year Ended
12/31/2017 | |
| | | Shares | | | Amount | | | Shares | | | Amount | |
Class I | | | | | | | | | | | | | | | | |
Shares sold | | | 687,102 | | | $ | 10,527,059 | | | | 654,115 | | | $ | 9,987,597 | |
Shares issued in reinvestment of distributions | | | 3,655,080 | | | | 45,856,103 | | | | 1,355,509 | | | | 21,064,561 | |
Shares redeemed | | | (3,410,293 | ) | | | (53,890,776 | ) | | | (3,465,286 | ) | | | (53,113,894 | ) |
| | | | | | | | | | | | | | | | |
Net increase (decrease) | | | 931,889 | | | $ | 2,492,386 | | | | (1,455,662 | ) | | $ | (22,061,736 | ) |
| | | | | | | | | | | | | | | | |
| | | | |
Class II | | | | | | | | | | | | | | | | |
Shares sold | | | 2,419 | | | $ | 34,701 | | | | 5,727 | | | $ | 86,583 | |
Shares issued in reinvestment of distributions | | | 42,597 | | | | 533,180 | | | | 16,392 | | | | 253,758 | |
Shares redeemed | | | (51,793 | ) | | | (824,168 | ) | | | (53,552 | ) | | | (815,043 | ) |
| | | | | | | | | | | | | | | | |
Net decrease | | | (6,777 | ) | | $ | (256,287 | ) | | | (31,433 | ) | | $ | (474,702 | ) |
| | | | | | | | | | | | | | | | |
| | | | |
Class III | | | | | | | | | | | | | | | | |
Shares sold | | | 275,061 | | | $ | 3,963,788 | | | | 805,717 | | | $ | 12,136,647 | |
Shares issued in reinvestment of distributions | | | 643,024 | | | | 8,023,231 | | | | 265,245 | | | | 4,082,586 | |
Shares redeemed | | | (1,321,516 | ) | | | (20,441,420 | ) | | | (3,542,663 | ) | | | (53,147,902 | ) |
| | | | | | | | | | | | | | | | |
Net decrease | | | (403,431 | ) | | $ | (8,454,401 | ) | | | (2,471,701 | ) | | $ | (36,928,669 | ) |
| | | | | | | | | | | | | | | | |
Total Net Increase (Decrease) | | | 521,681 | | | $ | (6,218,302 | ) | | | (3,958,796 | ) | | $ | (59,465,107 | ) |
| | | | | | | | | | | | | | | | |
| 11. | REGULATIONS-X AMENDMENTS |
On August 17, 2018, the SEC adopted amendments to certain disclosure requirements in Securities Act ReleaseNo. 33-10532, Disclosure Update and Simplification. The Fund has adopted the amendments pertinent to RegulationS-X in this shareholder report. The amendments impacted certain disclosure presentation on the Statement of Assets and Liabilities, Statements of Changes in Net Assets and Notes to the Financial Statements.
Prior year distribution information and undistributed net investment income in the Statements of Changes in Net Assets has been modified to conform to the current year presentation in accordance with the RegulationS-X changes.
| | |
| 18 | | 2018 BLACKROCK ANNUAL REPORTTO SHAREHOLDERS |
Notes to Financial Statements (continued)
Distributions for the year ended December 31, 2017 were classified as follows:
| | | | | | | | |
| Share Class | | Net Investment Income | | | Net Realized Gain | |
Class I | | $ | (5,893,355 | ) | | $ | (15,171,206 | ) |
Class II | | | (64,132 | ) | | | (189,626 | ) |
Class III | | | (909,408 | ) | | | (3,173,178 | ) |
Undistributed net investment income as of December 31, 2017 was $98,753.
Management has evaluated the impact of all subsequent events on the Funds through the date the financial statements were issued and has determined that there were no subsequent events requiring adjustment or additional disclosure in the financial statements.
| | | | |
| NOTESTO FINANCIAL STATEMENTS | | | 19 | |
Report of Independent Registered Public Accounting Firm
To the Shareholders of BlackRock Basic Value V.I. Fund and the Board of Directors of BlackRock Variable Series Funds, Inc.:
Opinion on the Financial Statements and Financial Highlights
We have audited the accompanying statement of assets and liabilities of BlackRock Basic Value V.I. Fund of BlackRock Variable Series Funds, Inc. (the “Fund”), including the schedule of investments, as of December 31, 2018, the related statement of operations for the year then ended, the statements of changes in net assets for each of the two years in the period then ended, the financial highlights for each of the five years in the period then ended, and the related notes. In our opinion, the financial statements and financial highlights present fairly, in all material respects, the financial position of the Fund as of December 31, 2018, and the results of its operations for the year then ended, the changes in its net assets for each of the two years in the period then ended, and the financial highlights for each of the five years in the period then ended, in conformity with accounting principles generally accepted in the United States of America.
Basis for Opinion
These financial statements and financial highlights are the responsibility of the Fund’s management. Our responsibility is to express an opinion on the Fund’s financial statements and financial highlights based on our audits. We are a public accounting firm registered with the Public Company Accounting Oversight Board (United States) (PCAOB) and are required to be independent with respect to the Fund in accordance with the U.S. federal securities laws and the applicable rules and regulations of the Securities and Exchange Commission and the PCAOB.
We conducted our audits in accordance with the standards of the PCAOB. Those standards require that we plan and perform the audit to obtain reasonable assurance about whether the financial statements and financial highlights are free of material misstatement, whether due to error or fraud. The Fund is not required to have, nor were we engaged to perform, an audit of its internal control over financial reporting. As part of our audits we are required to obtain an understanding of internal control over financial reporting but not for the purpose of expressing an opinion on the effectiveness of the Fund’s internal control over financial reporting. Accordingly, we express no such opinion.
Our audits included performing procedures to assess the risks of material misstatement of the financial statements and financial highlights, whether due to error or fraud, and performing procedures that respond to those risks. Such procedures included examining, on a test basis, evidence regarding the amounts and disclosures in the financial statements and financial highlights. Our audits also included evaluating the accounting principles used and significant estimates made by management, as well as evaluating the overall presentation of the financial statements and financial highlights. Our procedures included confirmation of securities owned as of December 31, 2018, by correspondence with the custodian and brokers; when replies were not received from brokers, we performed other auditing procedures. We believe that our audits provide a reasonable basis for our opinion.
Deloitte & Touche LLP
Boston, Massachusetts
February 15, 2019
We have served as the auditor of one or more BlackRock investment companies since 1992.
| | |
| 20 | | 2018 BLACKROCK ANNUAL REPORTTO SHAREHOLDERS |
Glossary of Terms Used in this Report
| | |
| Portfolio Abbreviations |
| |
| ADR | | American Depositary Receipt |
| |
| NYRS | | New York Registered Shares |
| | | | |
| GLOSSARYOF TERMS USEDINTHIS REPORT | | | 21 | |
DECEMBER 31, 2018
| | |
ANNUAL REPORT | |  |
BlackRock Variable Series Funds, Inc.
| Ø | | BlackRock Capital Appreciation V.I. Fund |
|
| Not FDIC Insured • May Lose Value • No Bank Guarantee |
| | |
| Fund Summary as of December 31, 2018 | | BlackRock Capital Appreciation V.I. Fund |
Investment Objective
BlackRock Capital Appreciation V.I. Fund’s (the “Fund”) investment objective is to seek long-term growth of capital.
Portfolio Management Commentary
How did the Fund perform?
For the 12-month period ended December 31, 2018, the Fund outperformed its benchmark, the Russell 1000® Growth Index, and the broad market S&P 500® Index. The following discussion of relative performance pertains to the Russell 1000® Growth Index.
What factors influenced performance?
On a sector basis, the largest contributor to relative performance was consumer discretionary where internet & direct marketing retail holdings had the most positive impact. Selection within hotels, restaurants & leisure and a lack of exposure to media also added value within the sector. Health care and industrials were additional sources of strength. Within health care, equipment & supplies and life sciences tools & services holdings drove gains, while positioning to machinery and zero exposure to air freight & logistics benefited performance in industrials.
The top individual contributors were Amazon.com Inc. and Netflix Inc. Amazon outperformed as the company delivered a series of strong earnings reports, with revenue acceleration in North America, International, Prime, Amazon Web Services (“AWS”) and advertising. In addition, Amazon’s operating margin expansion has been notable, driven by advertising, subscription services, AWS and shipping efficiencies. The investment adviser’s view remains that Amazon has many years of profitable growth ahead and, accordingly, the Fund maintains its overweight position. Netflix continued to outperform after a series of strong earnings reports. The company exceeded 23 million global net subscriber additions for 2017 and is on pace to exceed 28 million in 2018, ahead of our forecasts. Overall, the investment adviser’s thesis is playing out as the mutually reinforcing growth of content and subscribers is benefiting Netflix as it gains scale. The investment adviser continues to believe the stock is far from pricing in the company’s long-term growth and profitability potential.
Conversely, communication services detracted from performance with entertainment holdings hindering results. Consumer staples and materials also weighed on performance. Selection within beverages was a drag in consumer staples, while an overweight to construction materials was a weakness in materials (at period end the Fund had zero exposure to construction materials).
The top detractors over the annual period were Tencent Holdings Ltd. and Constellation Brands Inc. Tencent underperformed amid U.S./China trade tensions, weakness in the Chinese stock market, regulatory uncertainty and questions around timing of game launches and monetization. In addition, data showed a modest decline in Tencent’s share of mobile user time spent. The investment adviser’s view remains bullish as the company still dominates mobile time spent in China, enabling it to monetize along multiple channels, including gaming, advertising, payments and e-commerce among others. Constellation has underperformed on investor concerns over sales growth for its Mexican import beers and overall beer profit margin growth, as well over reinvestment risk in cannabis and hemp company Canopy Growth. Constellation announced a $4 billion investment in Canopy Growth during the second quarter. The investment adviser expects Constellation’s core fundamentals to stay on track, including high single digit volume growth for beer and continued beer margin expansion and are positive on the Canopy investment.
Describe recent portfolio activity.
Due to a combination of portfolio trading activity, market movement and sector reclassifications during the 12-month period, the portfolio’s weighting in the communication services sector increased, particularly within entertainment and interactive media & services. Health care exposure also increased, namely within equipment & supplies and pharmaceuticals. Exposure to information technology decreased, largely with respect to internet software & services. Consumer discretionary exposure, namely within specialty retail, declined as well.
Describe portfolio positioning at period end.
As of period end, the Fund’s largest overweight relative to the Russell 1000® Growth Index was the health care sector, followed by communication services. Industrials was the largest sector underweight, followed by consumer staples.
The views expressed reflect the opinions of BlackRock as of the date of this report and are subject to change based on changes in market, economic or other conditions. These views are not intended to be a forecast of future events and are no guarantee of future results.
| | |
| 2 | | 2018 BLACKROCK ANNUAL REPORTTO SHAREHOLDERS |
| | |
| Fund Summary as of December 31, 2018 (continued) | | BlackRock Capital Appreciation V.I. Fund |
TOTAL RETURN BASED ON A $10,000 INVESTMENT
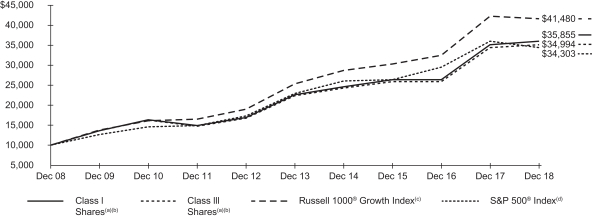
| (a) | Assuming transaction costs, if any, and other operating expenses, including investment advisory fees. Does not include insurance-related fees and expenses. The returns for Class III Shares prior to June 15, 2010, the recommencement of operations of Class III Shares, are based upon the performance of the Fund’s Class I Shares, as adjusted to reflect the distribution and/or service(12b-1) fees applicable to the Class III Shares. |
| (b) | The Fund invests primarily in a diversified portfolio consisting primarily of common stock of U.S. companies that the investment adviser believes have exhibited above-average growth rates in earnings over the long-term. |
| (c) | An unmanaged index that measures the performance of the large cap growth segment of the U.S. equity universe and consists of those Russell 1000® securities with higherprice-to-book ratios and higher forecasted growth values. |
| (d) | An unmanaged index that covers 500 leading companies and captures approximately 80% coverage of available market capitalization. |
Performance Summary for the Period Ended December 31, 2018
| | | | | | | | | | | | | | | | | | | | | | | | | | | | |
| | | 6-Month
Total Returns (b) | | | | | | Average Annual Total Returns | |
| | | | | | 1 Year (b) | | | | | | 5 Years (b) | | | | | | 10 Years (b) | |
Class I(a) | | | (10.97 | )% | | | | | | | 2.39 | % | | | | | | | 9.70 | % | | | | | | | 13.62 | % |
Class III(a) | | | (11.00 | ) | | | | | | | 2.13 | | | | | | | | 9.43 | | | | | | | | 13.34 | (c) |
Russell 1000® Growth Index | | | (8.17 | ) | | | | | | | (1.51 | ) | | | | | | | 10.40 | | | | | | | | 15.29 | |
S&P 500® Index | | | (6.85 | ) | | | | | | | (4.38 | ) | | | | | | | 8.49 | | | | | | | | 13.12 | |
| | (a) | Average annual and cumulative total returns are based on changes in net asset value for the periods shown, and assume reinvestment of all distributions at net asset value on theex-dividend date. Insurance-related fees and expenses are not reflected in these returns. | |
| | (b) | For the portion of the period, the Fund’s investment adviser waived a portion of its fee. Without such waiver, the Fund’s performance would have been lower. | |
| | (c) | The returns for Class III Shares prior to June 15, 2010, the recommencement of operations of Class III Shares, are based upon the performance of the Fund’s Class I Shares, as adjusted to reflect the distribution(12b-1) fees applicable to Class III Shares. | |
Past performance is not indicative of future results. Performance results do not reflect the deduction of taxes that a shareholder would pay on Fund distributions or the redemption of
Fund shares.
Performance results may include adjustment made for financial reporting purposes in accordance with U.S. generally accepted accounting principles.
Expense Example
| | | | | | | | | | | | | | | | | | | | | | | | | | | | | | | | |
| | | Actual | | | | | | Hypothetical (a) | | | | |
| | | Beginning
Account Value
(07/01/18) | | | Ending
Account Value
(12/31/18) | | | Expenses
Paid During
the Period (b) | | | | | | Beginning
Account Value
(07/01/18) | | | Ending
Account Value
(12/31/18) | | | Expenses
Paid During
the Period (b) | | | Annualized
Expense
Ratio | |
Class I | | $ | 1,000.00 | | | $ | 890.30 | | | $ | 3.91 | | | | | | | $ | 1,000.00 | | | $ | 1,021.07 | | | $ | 4.18 | | | | 0.82 | % |
Class III | | | 1,000.00 | | | | 890.00 | | | | 5.14 | | | | | | | | 1,000.00 | | | | 1,019.76 | | | | 5.50 | | | | 1.08 | |
| | (a) | Hypothetical 5% annual return before expenses is calculated by prorating the number of days in the most recent fiscal half year divided by 365. | |
| | (b) | For each class of the Fund, expenses are equal to annualized expense ratio for the class, multiplied by the average account value over the period, multiplied by 184/365 (to reflect theone-half year period shown). | |
See “Disclosure of Expenses” on the following page for further information on how expenses were calculated.
| | |
| Fund Summary as of December 31, 2018 (continued) | | BlackRock Capital Appreciation V.I. Fund |
Portfolio Information
SECTOR ALLOCATION
| | | | |
| Sector | | Percent of
Net Assets | |
Information Technology | | | 32 | % |
Health Care | | | 19 | |
Consumer Discretionary | | | 16 | |
Communication Services | | | 15 | |
Industrials | | | 6 | |
Financials | | | 5 | |
Consumer Staples | | | 2 | |
Real Estate | | | 2 | |
Materials | | | 1 | |
Short-Term Securities | | | 5 | |
Liabilities in Excess of Other Assets | | | (3 | ) |
| | | For Fund compliance purposes, the Fund’s sector classifications refer to one or more of the sectorsub-classifications used by one or more widely recognized market indexes or ratings group indexes, and/or as defined by the investment adviser. These definitions may not apply for purposes of this report, which may combine sector sub classifications for reporting ease. | |
Disclosure of Expenses
Shareholders of the Fund may incur the following charges: (a) transactional expenses; and (b) operating expenses, including investment advisory fees, service and distribution fees, including12b-1 fees, acquired fund fees and expenses, and other fund expenses. The expense example on the previous page (which is based on a hypothetical investment of $1,000 invested on July 1, 2018 and held through December 31, 2018) is intended to assist shareholders both in calculating expenses based on an investment in the Fund and in comparing these expenses with similar costs of investing in other mutual funds.
The expense example provides information about actual account values and actual expenses. In order to estimate the expenses a shareholder paid during the period covered by this report, shareholders can divide their account value by $1,000 and then multiply the result by the number corresponding to their share class under the heading entitled “Expenses Paid During the Period.”
The expense example also provides information about hypothetical account values and hypothetical expenses based on the Fund’s actual expense ratio and an assumed rate of return of 5% per year before expenses. In order to assist shareholders in comparing the ongoing expenses of investing in the Fund and other funds, compare the 5% hypothetical example with the 5% hypothetical examples that appear in shareholder reports of other funds.
The expenses shown in the expense example are intended to highlight shareholders’ ongoing costs only and do not reflect any transactional expenses, such as sales charges, if any. Therefore, the hypothetical example is useful in comparing ongoing expenses only, and will not help shareholders determine the relative total expenses of owning different funds. If these transactional expenses were included, shareholder expenses would have been higher.
| | |
| 4 | | 2018 BLACKROCK ANNUAL REPORTTO SHAREHOLDERS |
| | |
Schedule of Investments December 31, 2018 | | BlackRock Capital Appreciation V.I. Fund (Percentages shown are based on Net Assets) |
| | | | | | | | |
| Security | | Shares | | | Value | |
|
Common Stocks — 96.4% | |
|
Automobiles — 0.8% | |
Tesla, Inc.(a)(b) | | | 6,022 | | | $ | 2,004,122 | |
| | | | | | | | |
| | |
| Banks — 0.6% | | | | | | |
First Republic Bank(a) | | | 17,184 | | | | 1,493,290 | |
| | | | | | | | |
| | |
| Beverages — 1.8% | | | | | | |
Constellation Brands, Inc., Class A | | | 28,959 | | | | 4,657,186 | |
| | | | | | | | |
| | |
| Biotechnology — 1.7%(b) | | | | | | |
BioMarin Pharmaceutical, Inc. | | | 13,061 | | | | 1,112,144 | |
Vertex Pharmaceuticals, Inc. | | | 20,554 | | | | 3,406,003 | |
| | | | | | | | |
| | | | | | | 4,518,147 | |
| | |
| Capital Markets — 3.4% | | | | | | |
CME Group, Inc.(a) | | | 20,737 | | | | 3,901,045 | |
S&P Global, Inc. | | | 29,298 | | | | 4,978,902 | |
| | | | | | | | |
| | | | | | | 8,879,947 | |
| | |
| Chemicals — 1.5% | | | | | | |
Sherwin-Williams Co. (The) | | | 10,185 | | | | 4,007,390 | |
| | | | | | | | |
| | |
| Diversified Financial Services — 1.2% | | | | | | |
Berkshire Hathaway, Inc., Class B(b) | | | 15,896 | | | | 3,245,645 | |
| | | | | | | | |
| | |
| Entertainment — 5.3% | | | | | | |
Activision Blizzard, Inc. | | | 44,463 | | | | 2,070,642 | |
Electronic Arts, Inc.(b) | | | 60,078 | | | | 4,740,755 | |
Netflix, Inc.(b) | | | 27,358 | | | | 7,322,642 | |
| | | | | | | | |
| | | | | | | 14,134,039 | |
| | |
| Equity Real Estate Investment Trusts (REITs) — 1.7% | | | | | | |
SBA Communications Corp.(b) | | | 28,319 | | | | 4,584,563 | |
| | | | | | | | |
| | |
| Health Care Equipment & Supplies — 7.5% | | | | | | |
Align Technology, Inc.(b) | | | 19,113 | | | | 4,002,836 | |
Becton Dickinson and Co. | | | 24,784 | | | | 5,584,331 | |
Boston Scientific Corp.(a)(b) | | | 171,169 | | | | 6,049,112 | |
Intuitive Surgical, Inc.(b) | | | 8,993 | | | | 4,306,927 | |
| | | | | | | | |
| | | | | | | 19,943,206 | |
| | |
| Health Care Providers & Services — 5.3% | | | | | | |
Centene Corp.(b) | | | 32,073 | | | | 3,698,017 | |
UnitedHealth Group, Inc. | | | 41,321 | | | | 10,293,887 | |
| | | | | | | | |
| | | | | | | 13,991,904 | |
| | |
| Hotels, Restaurants & Leisure — 1.0% | | | | | | |
Domino’s Pizza, Inc. | | | 10,820 | | | | 2,683,252 | |
| | | | | | | | |
| | |
| Industrial Conglomerates — 1.0% | | | | | | |
Roper Technologies, Inc. | | | 9,933 | | | | 2,647,343 | |
| | | | | | | | |
| | |
| Interactive Media & Services — 9.3% | | | | | | |
Alphabet, Inc., Class A(b) | | | 10,098 | | | | 10,552,006 | |
Facebook, Inc., Class A(b) | | | 34,738 | | | | 4,553,804 | |
IAC/InterActiveCorp(b) | | | 12,481 | | | | 2,284,522 | |
Tencent Holdings Ltd. | | | 182,000 | | | | 7,294,624 | |
| | | | | | | | |
| | | | | | | 24,684,956 | |
|
| Internet & Direct Marketing Retail — 12.9% | |
Amazon.com, Inc.(b) | | | 15,454 | | | | 23,211,444 | |
Booking Holdings, Inc.(b) | | | 3,906 | | | | 6,727,773 | |
MercadoLibre, Inc. | | | 14,404 | | | | 4,218,211 | |
| | | | | | | | |
| | | | | | | 34,157,428 | |
| | |
| IT Services — 10.3% | | | | | | |
Mastercard, Inc., Class A | | | 46,486 | | | | 8,769,584 | |
PayPal Holdings, Inc.(b) | | | 57,148 | | | | 4,805,575 | |
Visa, Inc., Class A | | | 104,368 | | | | 13,770,314 | |
| | | | | | | | |
| | | | | | | 27,345,473 | |
| | | | | | | | |
| Security | | Shares | | | Value | |
| | |
| Life Sciences Tools & Services — 1.7% | | | | | | |
Illumina, Inc.(b) | | | 14,885 | | | $ | 4,464,458 | |
| | | | | | | | |
| | |
| Machinery — 0.9% | | | | | | |
Xylem, Inc.(a) | | | 36,939 | | | | 2,464,570 | |
| | | | | | | | |
| | |
| Pharmaceuticals — 2.6% | | | | | | |
Novartis AG, ADR | | | 50,394 | | | | 4,324,309 | |
Zoetis, Inc. | | | 29,120 | | | | 2,490,925 | |
| | | | | | | | |
| | | | | | | 6,815,234 | |
| | |
| Professional Services — 2.2% | | | | | | |
CoStar Group, Inc.(b) | | | 17,361 | | | | 5,856,560 | |
| | | | | | | | |
| | |
| Road & Rail — 1.6% | | | | | | |
Union Pacific Corp. | | | 30,768 | | | | 4,253,061 | |
| | | | | | | | |
| | |
| Semiconductors & Semiconductor Equipment — 3.0% | | | | | | |
ASML Holding NV (Registered), NYRS | | | 30,959 | | | | 4,817,840 | |
NVIDIA Corp. | | | 23,126 | | | | 3,087,321 | |
| | | | | | | | |
| | | | | | | 7,905,161 | |
| | |
| Software — 17.1% | | | | | | |
Adobe, Inc.(b) | | | 28,815 | | | | 6,519,106 | |
Autodesk, Inc.(b) | | | 31,269 | | | | 4,021,506 | |
Intuit, Inc. | | | 30,615 | | | | 6,026,563 | |
Microsoft Corp. | | | 165,791 | | | | 16,839,392 | |
salesforce.com, Inc.(b) | | | 57,698 | | | | 7,902,895 | |
ServiceNow, Inc.(b) | | | 22,124 | | | | 3,939,178 | |
| | | | | | | | |
| | | | | | | 45,248,640 | |
| | |
| Technology Hardware, Storage & Peripherals — 0.9% | | | | | | |
Apple, Inc. | | | 14,840 | | | | 2,340,862 | |
| | | | | | | | |
| | |
| Textiles, Apparel & Luxury Goods — 1.1% | | | | | | |
NIKE, Inc., Class B | | | 40,571 | | | | 3,007,934 | |
| | | | | | | | |
| |
Total Common Stocks — 96.4%
(Cost: $206,338,338) | | | | 255,334,371 | |
| | | | | | | | |
|
Preferred Stocks — 1.0% | |
| | |
Software — 1.0% | | | | | | | | |
Palantir Technologies, Inc., Series I (Acquired 02/07/14, cost $2,858,020)(b)(c)(d) | | | 466,235 | | | | 2,522,331 | |
| | | | | | | | |
| |
Total Preferred Stocks — 1.0%
(Cost: $2,858,021) | | | | 2,522,331 | |
| | | | | | | | |
| |
Total Long-Term Investments — 97.4%
(Cost: $209,196,359) | | | | 257,856,702 | |
| | | | | | | | |
|
Short-Term Securities — 5.4%(e) | |
BlackRock Liquidity Funds, T-Fund, Institutional Class, 2.32%(g) | | | 5,520,889 | | | | 5,520,889 | |
JPMorgan US Treasury Plus Money Market Fund, Agency Class, 2.24% | | | 145,721 | | | | 145,721 | |
SL Liquidity Series, LLC, Money Market Series,
2.57%(f)(g) | | | 8,638,158 | | | | 8,637,294 | |
| | | | | | | | |
| |
Total Short-Term Securities — 5.4%
(Cost: $14,303,940) | | | | 14,303,904 | |
| | | | | | | | |
| |
Total Investments — 102.8%
(Cost: $223,500,299) | | | | 272,160,606 | |
| |
Liabilities in Excess of Other Assets — (2.8)% | | | | (7,381,836 | ) |
| | | | | | | | |
| |
Net Assets — 100.0% | | | $ | 264,778,770 | |
| | | | | | | | |
| | | | |
| SCHEDULE OF INVESTMENTS | | | 5 | |
| | |
Schedule of Investments (continued) December 31, 2018 | | BlackRock Capital Appreciation V.I. Fund |
| (a) | Security, or a portion of the security, is on loan. |
| (b) | Non-income producing security. |
| (c) | Restricted security as to resale, excluding 144A securities. The Fund held restricted securities with a current value of $2,522,331, representing 0.95% of its net assets as of period end, and an original cost of $2,858,020. |
| (d) | Security is valued using significant unobservable inputs and is classified as Level 3 in the fair value hierarchy. |
| (e) | Annualized 7-day yield as of period end. |
| (f) | Security was purchased with the cash collateral from loaned securities. |
| (g) | During the year ended December 31, 2018, investments in issuers considered to be affiliates of the Fund for purposes of Section 2(a)(3) of the Investment Company Act of 1940, as amended, were as follows: |
| | | | | | | | | | | | | | | | | | | | | | | | | | | | |
| Affiliate | | Shares
Held at
12/31/17 | | | Net
Activity | | | Shares
Held at
12/31/18 | | | Value at
12/31/18 | | | Income | | | Net
Realized
Gain (Loss)(a) | | | Change in
Unrealized
Appreciation
(Depreciation) | |
BlackRock Liquidity Funds, T-Fund, Institutional Class | | | 2,708,926 | | | | 2,811,963 | | | | 5,520,889 | | | $ | 5,520,889 | | | $ | 44,192 | | | $ | — | | | $ | — | |
SL Liquidity Series, LLC, Money Market Series | | | 15,258,256 | | | | (6,620,098 | ) | | | 8,638,158 | | | | 8,637,294 | | | | 35,863 | (b) | | | (1,978 | ) | | | (36 | ) |
| | | | | | | | | | | | | | | | | | | | | | | | | | | | |
| | | | | | | | | | | | | | $ | 14,158,183 | | | $ | 80,055 | | | $ | (1,978 | ) | | $ | (36 | ) |
| | | | | | | | | | | | | | | | | | | | | | | | | | | | |
| | (a) | Includes net capital gain distributions, if applicable. | |
| | (b) | Represents securities lending income earned from the reinvestment of cash collateral from loaned securities, net of fees and collateral investment expenses, and other payments to and from borrowers of securities. | |
| | | For Fund compliance purposes, the Fund’s industry classifications refer to one or more of the industry sub-classifications used by one or more widely recognized market indexes or ratings group indexes, and/or as defined by the investment adviser. These definitions may not apply for purposes of this report, which may combine such industry sub-classifications for reporting ease. | |
Fair Value Hierarchy as of Period End
Various inputs are used in determining the fair value of investments. For information about the Fund’s policy regarding valuation of investments, refer to the Notes to Financial Statements.
The following table summarizes the Fund’s investments categorized in the disclosure hierarchy:
| | | | | | | | | | | | | | | | |
| | | Level 1 | | | Level 2 | | | Level 3 | | | Total | |
Assets: | | | | | | | | | | | | | | | | |
Investments: | | | | | | | | | | | | | | | | |
Long-Term Investments: | | | | | | | | | | | | | | | | |
Common Stocks: | | | | | | | | | | | | | | | | |
Automobiles | | $ | 2,004,122 | | | $ | — | | | $ | — | | | $ | 2,004,122 | |
Banks | | | 1,493,290 | | | | — | | | | — | | | | 1,493,290 | |
Beverages | | | 4,657,186 | | | | — | | | | — | | | | 4,657,186 | |
Biotechnology | | | 4,518,147 | | | | — | | | | — | | | | 4,518,147 | |
Capital Markets | | | 8,879,947 | | | | — | | | | — | | | | 8,879,947 | |
Chemicals | | | 4,007,390 | | | | — | | | | — | | | | 4,007,390 | |
Diversified Financial Services | | | 3,245,645 | | | | — | | | | — | | | | 3,245,645 | |
Entertainment | | | 14,134,039 | | | | — | | | | — | | | | 14,134,039 | |
Equity Real Estate Investment Trusts (REITs) | | | 4,584,563 | | | | — | | | | — | | | | 4,584,563 | |
Health Care Equipment & Supplies | | | 19,943,206 | | | | — | | | | — | | | | 19,943,206 | |
Health Care Providers & Services | | | 13,991,904 | | | | — | | | | — | | | | 13,991,904 | |
Hotels, Restaurants & Leisure | | | 2,683,252 | | | | — | | | | — | | | | 2,683,252 | |
Industrial Conglomerates | | | 2,647,343 | | | | — | | | | — | | | | 2,647,343 | |
Interactive Media & Services | | | 17,390,332 | | | | 7,294,624 | | | | — | | | | 24,684,956 | |
Internet & Direct Marketing Retail | | | 34,157,428 | | | | — | | | | — | | | | 34,157,428 | |
IT Services | | | 27,345,473 | | | | — | | | | — | | | | 27,345,473 | |
Life Sciences Tools & Services | | | 4,464,458 | | | | — | | | | — | | | | 4,464,458 | |
Machinery | | | 2,464,570 | | | | — | | | | — | | | | 2,464,570 | |
Pharmaceuticals | | | 6,815,234 | | | | — | | | | — | | | | 6,815,234 | |
Professional Services | | | 5,856,560 | | | | — | | | | — | | | | 5,856,560 | |
Road & Rail | | | 4,253,061 | | | | — | | | | — | | | | 4,253,061 | |
Semiconductors & Semiconductor Equipment | | | 7,905,161 | | | | — | | | | — | | | | 7,905,161 | |
Software | | | 45,248,640 | | | | — | | | | — | | | | 45,248,640 | |
Technology Hardware, Storage & Peripherals | | | 2,340,862 | | | | — | | | | — | | | | 2,340,862 | |
Textiles, Apparel & Luxury Goods | | | 3,007,934 | | | | — | | | | — | | | | 3,007,934 | |
Preferred Stocks | | | — | | | | — | | | | 2,522,331 | | | | 2,522,331 | |
Short-Term Securities | | | 5,666,610 | | | | — | | | | — | | | | 5,666,610 | |
| | | | | | | | | | | | | | | | |
Subtotal | | $ | 253,706,357 | | | $ | 7,294,624 | | | $ | 2,522,331 | | | $ | 263,523,312 | |
| | | | | | | | | | | | | | | | |
Investments valued at NAV(a) | | | | | | | | | | | | | | | 8,637,294 | |
| | | | | | | | | | | | | | | | |
Total Investments | | | | | | | | | | | | | | $ | 272,160,606 | |
| | | | | | | | | | | | | | | | |
| | (a) | As of December 31, 2018, certain investments of the Fund were fair valued using NAV per share as no quoted market value is available and therefore have been excluded from the fair value hierarchy. | |
During the year ended December 31, 2018, there were no transfers between levels.
See notes to financial statements.
| | |
| 6 | | 2018 BLACKROCK ANNUAL REPORTTO SHAREHOLDERS |
Statement of Assets and Liabilities
December 31, 2018
| | | | |
| | | BlackRock Capital
Appreciation V.I. Fund | |
| |
ASSETS | | | | |
Investments at value — unaffiliated (including securities loaned at value of $8,510,486) (cost — $209,342,080) | | $ | 258,002,423 | |
Investments at value — affiliated (cost — $14,158,219) | | | 14,158,183 | |
Foreign currency at value (cost — $101) | | | 101 | |
Receivables: | | | | |
Securities lending income — affiliated | | | 1,209 | |
Capital shares sold | | | 2,650,352 | |
Dividends — affiliated | | | 6,972 | |
Dividends — unaffiliated | | | 41,332 | |
From custodian | | | 145,721 | |
From the Manager | | | 3,528 | |
Prepaid expenses | | | 301 | |
| | | | |
Total assets | | | 275,010,122 | |
| | | | |
| |
LIABILITIES | | | | |
Cash collateral on securities loaned at value | | | 8,638,095 | |
Payables: | | | | |
Investments purchased | | | 1,064,978 | |
Capital shares redeemed | | | 12,546 | |
Distribution fees | | | 33,629 | |
Transfer agent fees | | | 184,182 | |
Board realignment and consolidation | | | 35,302 | |
Investment advisory fees | | | 179,952 | |
Directors’ and Officer’s fees | | | 5,926 | |
Other affiliates | | | 711 | |
Other accrued expenses | | | 76,031 | |
| | | | |
Total liabilities | | | 10,231,352 | |
| | | | |
| |
NET ASSETS | | $ | 264,778,770 | |
| | | | |
| |
NET ASSETS CONSIST OF | | | | |
Paid-in capital | | $ | 213,795,661 | |
Accumulated earnings | | | 50,983,109 | |
| | | | |
NET ASSETS | | $ | 264,778,770 | |
| | | | |
| |
NET ASSET VALUE | | | | |
Class I — Based on net assets of $119,220,254 and 16,439,386 shares outstanding, 100 million shares authorized, $0.10 par value. | | $ | 7.25 | |
| | | | |
Class III — Based on net assets of $145,558,516 and 20,420,825 shares outstanding, 100 million shares authorized, $0.10 par value. | | $ | 7.13 | |
| | | | |
See notes to financial statements.
Statement of Operations
Year Ended December 31, 2018
| | | | |
| | | BlackRock Capital
Appreciation V.I. Fund | |
| |
INVESTMENT INCOME | | | | |
Dividends — affiliated | | $ | 44,192 | |
Dividends — unaffiliated(a) | | | 2,584,886 | |
Securities lending income — affiliated — net | | | 35,863 | |
| | | | |
Total investment income | | | 2,664,941 | |
| | | | |
| |
EXPENSES | | | | |
Investment advisory | | | 2,176,724 | |
Transfer agent — class specific | | | 686,897 | |
Distribution — class specific | | | 484,131 | |
Printing | | | 71,228 | |
Accounting services | | | 61,142 | |
Professional | | | 54,307 | |
Board realignment and consolidation | | | 35,488 | |
Directors and Officer | | | 21,565 | |
Custodian | | | 18,767 | |
Transfer agent | | | 5,001 | |
Miscellaneous | | | 8,451 | |
| | | | |
Total expenses | | | 3,623,701 | |
Less: | | | | |
Fees waived and/or reimbursed by the Manager | | | (2,240 | ) |
Transfer agent fees waived and/or reimbursed — class specific | | | (433,119 | ) |
| | | | |
Total expenses after fees waived and/or reimbursed | | | 3,188,342 | |
| | | | |
Net investment loss | | | (523,401 | ) |
| | | | |
| |
REALIZED AND UNREALIZED GAIN (LOSS) | | | | |
Net realized gain (loss) from: | | | | |
Investments — affiliated | | | (1,978 | ) |
Investments — unaffiliated | | | 76,934,207 | |
Foreign currency transactions | | | (381 | ) |
| | | | |
| | | 76,931,848 | |
| | | | |
Net change in unrealized appreciation (depreciation) on: | | | | |
Investments — affiliated | | | (36 | ) |
Investments — unaffiliated | | | (60,745,910 | ) |
| | | | |
| | | (60,745,946 | ) |
| | | | |
Net realized and unrealized gain | | | 16,185,902 | |
| | | | |
NET INCREASE IN NET ASSETS RESULTING FROM OPERATIONS | | $ | 15,662,501 | |
| | | | |
| (a) | Includesnon-recurring dividends in the amount of $656,405. |
See notes to financial statements.
| | |
| 8 | | 2018 BLACKROCK ANNUAL REPORTTO SHAREHOLDERS |
Statements of Changes in Net Assets
| | | | | | | | |
| | | BlackRock Capital Appreciation
V.I. Fund | |
| | | Year Ended December 31, | |
| | | 2018 | | | 2017 | |
| | |
INCREASE (DECREASE) IN NET ASSETS | | | | | | | | |
| | |
OPERATIONS | | | | | | | | |
Net investment loss | | $ | (523,401 | ) | | $ | (685,408 | ) |
Net realized gain | | | 76,931,848 | | | | 48,210,072 | |
Net change in unrealized appreciation (depreciation) | | | (60,745,946 | ) | | | 62,728,743 | |
| | | | | | | | |
Net increase in net assets resulting from operations | | | 15,662,501 | | | | 110,253,407 | |
| | | | | | | | |
| | |
DISTRIBUTIONS TO SHAREHOLDERS(a)(b) | | | | | | | | |
Class I | | | (37,800,468 | ) | | | (15,570,061 | ) |
Class III | | | (46,900,915 | ) | | | (28,079,992 | ) |
| | | | | | | | |
Decrease in net assets resulting from distributions to shareholders | | | (84,701,383 | ) | | | (43,650,053 | ) |
| | | | | | | | |
| | |
CAPITAL SHARE TRANSACTIONS | | | | | | | | |
Net decrease in net assets derived from capital share transactions | | | (68,397,301 | ) | | | (20,276,483 | ) |
| | | | | | | | |
| | |
NET ASSETS(b) | | | | | | | | |
Total increase (decrease) in net assets | | | (137,436,183 | ) | | | 46,326,871 | |
Beginning of year | | | 402,214,953 | | | | 355,888,082 | |
| | | | | | | | |
End of year | | $ | 264,778,770 | | | $ | 402,214,953 | |
| | | | | | | | |
| (a) | Distributions for annual periods determined in accordance with U.S. federal income tax regulations. |
| (b) | Prior year distribution character information and undistributed net investment income has been modified or removed to conform with current year RegulationS-X presentation changes. Refer to Note 11 for this prior year information. |
See notes to financial statements.
Financial Highlights
(For a share outstanding throughout each period)
| | | | | | | | | | | | | | | | | | | | |
| | | BlackRock Capital Appreciation V.I. Fund | |
| |
| | | Class I | |
| |
| | | Year Ended December 31, | |
| | | 2018 | | | 2017 | | | 2016 | | | 2015 | | | 2014 | |
| | | | | |
Net asset value, beginning of year | | $ | 10.26 | | | $ | 8.63 | | | $ | 8.86 | | | $ | 9.02 | | | $ | 9.80 | |
| | | | | | | | | | | | | | | | | | | | |
Net investment income (loss)(a) | | | 0.00 | (b)(c) | | | (0.00 | )(d)(e) | | | (0.00 | )(d)(f) | | | (0.01 | ) | | | (0.01 | ) |
Net realized and unrealized gain | | | 0.23 | | | | 2.86 | | | | 0.01 | | | | 0.63 | | | | 0.87 | |
| | | | | | | | | | | | | | | | | | | | |
Net increase from investment operations | | | 0.23 | | | | 2.86 | | | | 0.01 | | | | 0.62 | | | | 0.86 | |
| | | | | | | | | | | | | | | | | | | | |
| | | | | |
Distributions from net realized gain(g) | | | (3.24 | ) | | | (1.23 | ) | | | (0.24 | ) | | | (0.78 | ) | | | (1.64 | ) |
| | | | | | | | | | | | | | | | | | | | |
| | | | | |
Net asset value, end of year | | $ | 7.25 | | | $ | 10.26 | | | $ | 8.63 | | | $ | 8.86 | | | $ | 9.02 | |
| | | | | | | | | | | | | | | | | | | | |
| | | | | |
Total Return(h) | | | | | | | | | | | | | | | | | | | | |
Based on net asset value | | | 2.39 | % | | | 33.22 | % | | | 0.10 | % | | | 6.73 | % | | | 9.02 | % |
| | | | | | | | | | | | | | | | | | | | |
| | | | | |
Ratios to Average Net Assets | | | | | | | | | | | | | | | | | | | | |
Total expenses | | | 0.94 | %(i) | | | 0.92 | % | | | 0.92 | % | | | 0.93 | % | | | 0.91 | % |
| | | | | | | | | | | | | | | | | | | | |
Total expenses after fees waived and/or reimbursed | | | 0.80 | %(i) | | | 0.79 | % | | | 0.80 | % | | | 0.79 | % | | | 0.79 | % |
| | | | | | | | | | | | | | | | | | | | |
Net investment income (loss) | | | 0.01 | %(c)(i) | | | (0.00 | )%(e)(j) | | | (0.06 | )%(f) | | | (0.15 | )% | | | (0.10 | )% |
| | | | | | | | | | | | | | | | | | | | |
| | | | | |
Supplemental Data | | | | | | | | | | | | | | | | | | | | |
Net assets, end of year (000) | | $ | 119,220 | | | $ | 142,246 | | | $ | 124,752 | | | $ | 139,045 | | | $ | 166,586 | |
| | | | | | | | | | | | | | | | | | | | |
Portfolio turnover rate | | | 45 | % | | | 48 | % | | | 89 | % | | | 70 | % | | | 102 | % |
| | | | | | | | | | | | | | | | | | | | |
| (a) | Based on average shares outstanding. |
| (b) | Amount is less than $0.005 per share. |
| (c) | Net investment income per share and the ratio of net investment income to average net assets includes $0.02 per share and 0.21%, respectively, resulting from a non-recurring dividend. |
| (d) | Amount is greater than $(0.005) per share. |
| (e) | Net investment income per share and the ratio of net investment income to average net assets includes $0.01 per share and 0.09%, respectively, resulting from a non-recurring dividend from TransDigm Group, Inc. in August 2017. |
| (f) | Net investment income per share and the ratio of net investment income to average net assets includes $0.01 per share and 0.07%, respectively, resulting from a non-recurring dividend from TransDigm Group, Inc. in October 2016. |
| (g) | Distributions for annual periods determined in accordance with U.S. federal income tax regulations. |
| (h) | Where applicable, excludes insurance-related fees and expenses and assumes the reinvestment of distributions. |
| (i) | Excludes expenses incurred indirectly as a result of investments in underlying funds of 0.01%. |
| (j) | Amount is greater than (0.005)%. |
See notes to financial statements.
| | |
| 10 | | 2018 BLACKROCK ANNUAL REPORTTO SHAREHOLDERS |
Financial Highlights (continued)
(For a share outstanding throughout each period)
| | | | | | | | | | | | | | | | | | | | |
| | | BlackRock Capital Appreciation V.I. Fund (continued) | |
| |
| | | Class III | |
| |
| | | Year Ended December 31, | |
| | | 2018 | | | 2017 | | | 2016 | | | 2015 | | | 2014 | |
| | | | | |
Net asset value, beginning of year | | $ | 10.17 | | | $ | 8.56 | | | $ | 8.81 | | | $ | 8.97 | | | $ | 9.76 | |
| | | | | | | | | | | | | | | | | | | | |
Net investment loss(a) | | | (0.03 | )(b) | | | (0.03 | )(c) | | | (0.03 | )(d) | | | (0.04 | ) | | | (0.03 | ) |
Net realized and unrealized gain | | | 0.23 | | | | 2.84 | | | | 0.02 | | | | 0.63 | | | | 0.86 | |
| | | | | | | | | | | | | | | | | | | | |
Net increase (decrease) from investment operations | | | 0.20 | | | | 2.81 | | | | (0.01 | ) | | | 0.59 | | | | 0.83 | |
| | | | | | | | | | | | | | | | | | | | |
| | | | | |
Distributions from net realized gain(e) | | | (3.24 | ) | | | (1.20 | ) | | | (0.24 | ) | | | (0.75 | ) | | | (1.62 | ) |
| | | | | | | | | | | | | | | | | | | | |
| | | | | |
Net asset value, end of year | | $ | 7.13 | | | $ | 10.17 | | | $ | 8.56 | | | $ | 8.81 | | | $ | 8.97 | |
| | | | | | | | | | | | | | | | | | | | |
| | | | | |
Total Return(f) | | | | | | | | | | | | | | | | | | | | |
Based on net asset value | | | 2.13 | % | | | 32.94 | % | | | (0.13 | )% | | | 6.49 | % | | | 8.68 | % |
| | | | | | | | | | | | | | | | | | | | |
| | | | | |
Ratios to Average Net Assets | | | | | | | | | | | | | | | | | | | | |
Total expenses | | | 1.19 | %(g) | | | 1.17 | % | | | 1.18 | % | | | 1.17 | % | | | 1.18 | % |
| | | | | | | | | | | | | | | | | | | | |
Total expenses after fees waived and/or reimbursed | | | 1.06 | %(g) | | | 1.05 | % | | | 1.06 | % | | | 1.05 | % | | | 1.05 | % |
| | | | | | | | | | | | | | | | | | | | |
Net investment loss | | | (0.28 | )%(b)(g) | | | (0.27 | )%(c) | | | (0.32 | )%(d) | | | (0.40 | )% | | | (0.35 | )% |
| | | | | | | | | | | | | | | | | | | | |
| | | | | |
Supplemental Data | | | | | | | | | | | | | | | | | | | | |
Net assets, end of year (000) | | $ | 145,559 | | | $ | 259,969 | | | $ | 231,136 | | | $ | 233,706 | | | $ | 233,723 | |
| | | | | | | | | | | | | | | | | | | | |
Portfolio turnover rate | | | 45 | % | | | 48 | % | | | 89 | % | | | 70 | % | | | 102 | % |
| | | | | | | | | | | | | | | | | | | | |
| (a) | Based on average shares outstanding. |
| (b) | Net investment income per share and the ratio of net investment income to average net assets includes $0.02 per share and 0.19%, respectively, resulting from a non-recurring dividend. |
| (c) | Net investment income per share and the ratio of net investment income to average net assets includes $0.01 per share and 0.09%, respectively, resulting from a non-recurring dividend from TransDigm Group, Inc. in August 2017. |
| (d) | Net investment income per share and the ratio of net investment income to average net assets includes $0.00 per share and 0.07%, respectively, resulting from a non-recurring dividend from TransDigm Group, Inc. in October 2016. |
| (e) | Distributions for annual periods determined in accordance with U.S. federal income tax regulations. |
| (f) | Where applicable, excludes insurance-related fees and expenses and assumes the reinvestment of distributions. |
| (g) | Excludes expenses incurred indirectly as a result of investments in underlying funds of 0.01%. |
See notes to financial statements.
Notes to Financial Statements
BlackRock Variable Series Funds, Inc. (the “Company”) is registered under the Investment Company Act of 1940, as amended (the “1940 Act”), as anopen-end management investment company. The Company is organized as a Maryland corporation that is comprised of 15 separate portfolios. The funds offer shares to insurance companies for their separate accounts to fund benefits under certain variable annuity and variable life insurance contracts. The financial statements presented are for BlackRock Capital Appreciation V.I. Fund (the “Fund”). The Fund is classified as diversified. Class I and Class III Shares have equal voting, dividend, liquidation and other rights, except that only shares of the respective classes are entitled to vote on matters concerning only that class. In addition, Class III Shares bear certain expenses related to the distribution of such shares.
The Fund, together with certain other registered investment companies advised by BlackRock Advisors, LLC (the “Manager”) or its affiliates, is included in a complex ofopen-end funds referred to as the Equity-Bond Complex.
| 2. | SIGNIFICANT ACCOUNTING POLICIES |
The financial statements are prepared in conformity with accounting principles generally accepted in the United States of America (“U.S. GAAP”), which may require management to make estimates and assumptions that affect the reported amounts of assets and liabilities in the financial statements, disclosure of contingent assets and liabilities at the date of the financial statements and the reported amounts of increases and decreases in net assets from operations during the reporting period. Actual results could differ from those estimates. The Fund is considered an investment company under U.S. GAAP and follows the accounting and reporting guidance applicable to investment companies. Below is a summary of significant accounting policies:
Investment Transactions and Income Recognition: For financial reporting purposes, investment transactions are recorded on the dates the transactions are entered into (the “trade dates”). Realized gains and losses on investment transactions are determined on the identified cost basis. Dividend income is recorded on theex-dividend date. Dividends from foreign securities where theex-dividend date may have passed are subsequently recorded when the Fund is informed of theex-dividend date. Under the applicable foreign tax laws, a withholding tax at various rates may be imposed on capital gains, dividends and interest. Upon notification from issuers, a portion of the dividend income received from a real estate investment trust may be redesignated as a reduction of cost of the related investment and/or realized gain. Income, expenses and realized and unrealized gains and losses are allocated daily to each class based on its relative net assets.
Foreign Currency Translation: The Fund’s books and records are maintained in U.S. dollars. Securities and other assets and liabilities denominated in foreign currencies are translated into U.S. dollars using exchange rates determined as of the close of trading on the New York Stock Exchange (“NYSE”). Purchases and sales of investments are recorded at the rates of exchange prevailing on the respective dates of such transactions. Generally, when the U.S. dollar rises in value against a foreign currency, the investments denominated in that currency will lose value; the opposite effect occurs if the U.S. dollar falls in relative value.
The Fund does not isolate the portion of the results of operations arising as a result of changes in the exchange rates from the changes in the market prices of investments held or sold for financial reporting purposes. Accordingly, the effects of changes in exchange rates on investments are not segregated in the Statement of Operations from the effects of changes in market prices of those investments, but are included as a component of net realized and unrealized gain (loss) from investments. The Fund reports realized currency gains (losses) on foreign currency related transactions as components of net realized gain (loss) for financial reporting purposes, whereas such components are generally treated as ordinary income for U.S. federal income tax purposes.
Distributions: Distributions paid by the Fund are recorded on theex-dividend date. Distributions of capital gains are recorded on the ex-divdend date and made at least annually. The character and timing of distributions are determined in accordance with U.S. federal income tax regulations, which may differ from U.S. GAAP.
Recent Accounting Standards:In August 2018, the Financial Accounting Standards Board issued Accounting Standards Update2018-13 “Changes to the Disclosure Requirements for Fair Value Measurement” which modifies disclosure requirements for fair value measurements. The guidance is effective for fiscal years beginning after December 15, 2019 and for interim periods within those fiscal years. Management is currently evaluating the impact of this guidance to the Fund.
Indemnifications: In the normal course of business, the Fund enters into contracts that contain a variety of representations that provide general indemnification. The Fund’s maximum exposure under these arrangements is unknown because it involves future potential claims against the Fund, which cannot be predicted with any certainty.
Other: Expenses directly related to the Fund or its classes are charged to the Fund or the applicable class. Other operating expenses shared by several funds, including other funds managed by the Manager, are prorated among those funds on the basis of relative net assets or other appropriate methods. Expenses directly related to the Fund and other shared expenses prorated to the Fund are allocated daily to each class based on its relative net assets or other appropriate methods.
| 3. | INVESTMENT VALUATION AND FAIR VALUE MEASUREMENTS |
Investment Valuation Policies: The Fund’s investments are valued at fair value (also referred to as “market value” within the financial statements) as of the close of trading on the NYSE (generally 4:00 p.m., Eastern time). U.S. GAAP defines fair value as the price the Fund would receive to sell an asset or pay to transfer a liability in an orderly transaction between market participants at the measurement date. The Fund determines the fair values of its financial instruments using various independent dealers or pricing services under policies approved by the Board of Directors of the Company (the “Board”). The BlackRock Global Valuation Methodologies Committee (the “Global Valuation Committee”) is the committee formed by management to develop global pricing policies and procedures and to oversee the pricing function for all financial instruments.
| | |
| 12 | | 2018 BLACKROCK ANNUAL REPORTTO SHAREHOLDERS |
Notes to Financial Statements (continued)
Fair Value Inputs and Methodologies: The following methods and inputs are used to establish the fair value of the Fund’s assets and liabilities:
| | • | | Equity investments traded on a recognized securities exchange are valued at the official closing price each day, if available. For equity investments traded on more than one exchange, the official closing price on the exchange where the stock is primarily traded is used. Equity investments traded on a recognized exchange for which there were no sales on that day may be valued at the last available bid (long positions) or ask (short positions) price. |
| | • | | Generally, trading in foreign instruments is substantially completed each day at various times prior to the close of trading on the NYSE. Occasionally, events affecting the values of such instruments may occur between the foreign market close and the close of trading on the NYSE that may not be reflected in the computation of the Fund’s net assets. Each business day, the Fund uses a pricing service to assist with the valuation of certain foreign exchange-traded equity securities and foreign exchange-traded andover-the-counter (“OTC”) options (the “Systematic Fair Value Price”). Using current market factors, the Systematic Fair Value Price is designed to value such foreign securities and foreign options at fair value as of the close of trading on the NYSE, which follows the close of the local markets. |
| | • | | Investments inopen-end U.S. mutual funds are valued at net asset value (“NAV”) each business day. |
If events (e.g., a company announcement, market volatility or a natural disaster) occur that are expected to materially affect the value of such investments, or in the event that the application of these methods of valuation results in a price for an investment that is deemed not to be representative of the market value of such investment, or if a price is not available, the investment will be valued by the Global Valuation Committee, or its delegate, in accordance with a policy approved by the Board as reflecting fair value (“Fair Valued Investments”). The fair valuation approaches that may be used by the Global Valuation Committee will include market approach, income approach and cost approach. Valuation techniques such as discounted cash flow, use of market comparables and matrix pricing are types of valuation approaches and are typically used in determining fair value. When determining the price for Fair Valued Investments, the Global Valuation Committee, or its delegate, seeks to determine the price that the Fund might reasonably expect to receive or pay from the current sale or purchase of that asset or liability in anarm’s-length transaction. Fair value determinations shall be based upon all available factors that the Global Valuation Committee, or its delegate, deems relevant and consistent with the principles of fair value measurement.
The Global Valuation Committee, or its delegate, employs various methods for calibrating valuation approaches for investments where an active market does not exist, including regular due diligence of the Fund’s pricing vendors, regular reviews of key inputs and assumptions, transactional back-testing or disposition analysis to compare unrealized gains and losses to realized gains and losses, reviews of missing or stale prices and large movements in market values and reviews of any market related activity. The pricing of all Fair Valued Investments is subsequently reported to the Board or a committee thereof on a quarterly basis. As a result of the inherent uncertainty in valuation of these investments, the fair values may differ from the values that would have been used had an active market existed.
For investments in equity or debt issued by privately held companies or funds (“Private Company” or collectively, the “Private Companies”) and other Fair Valued Investments, the fair valuation approaches that are used by third party pricing services utilize one or a combination of, but not limited to, the following inputs.
| | |
| | | Standard Inputs Generally Considered By Third Party Pricing Services |
Market approach | | (i) recent market transactions, including subsequent rounds of financing, in the underlying investment or comparable issuers; (ii) recapitalizations and other transactions across the capital structure; and (iii) market multiples of comparable issuers. |
Income approach | | (i) future cash flows discounted to present and adjusted as appropriate for liquidity, credit, and/or market risks; (ii) quoted prices for similar investments or assets in active markets; and (iii) other risk factors, such as interest rates, yield curves, volatilities, prepayment speeds, loss severities, credit risks, recovery rates, liquidation amounts and/or default rates. |
Cost approach | | (i) audited or unaudited financial statements, investor communications and financial or operational metrics issued by the Private Company; (ii) changes in the valuation of relevant indices or publicly traded companies comparable to the Private Company; (iii) relevant news and other public sources; and (iv) known secondary market transactions in the Private Company’s interests and merger or acquisition activity in companies comparable to the Private Company. |
Investments in series of preferred stock issued by Private Companies are typically valued utilizing market approach in determining the enterprise value of the company. Such investments often contain rights and preferences that differ from other series of preferred and common stock of the same issuer. Valuation techniques such as an option pricing model (“OPM”), a probability weighted expected return model (“PWERM”) or a hybrid of those techniques are used in allocating enterprise value of the company, as deemed appropriate under the circumstances. The use of OPM and PWERM techniques involve a determination of the exit scenarios of the investment in order to appropriately allocate the enterprise value of the company among the various parts of its capital structure.
The Private Companies are not subject to the public company disclosure, timing, and reporting standards as other investments held by the Fund. Typically, the most recently available information by a Private Company is as of a date that is earlier than the date the Fund is calculating its NAV. This factor may result in a difference between the value of the investment and the price the Fund could receive upon the sale of the investment.
Fair Value Hierarchy: Various inputs are used in determining the fair value of investments. These inputs to valuation techniques are categorized into a fair value hierarchy consisting of three broad levels for financial statement purposes as follows:
| | • | | Level 1 — Unadjusted price quotations in active markets/exchanges for identical assets or liabilities that the Fund has the ability to access |
| | • | | Level 2 — Other observable inputs (including, but not limited to, quoted prices for similar assets or liabilities in markets that are active, quoted prices for identical or similar assets or liabilities in markets that are not active, inputs other than quoted prices that are observable for the assets or liabilities (such as interest rates, yield curves, volatilities, prepayment speeds, loss severities, credit risks and default rates) or other market-corroborated inputs) |
| | | | |
| NOTESTO FINANCIAL STATEMENTS | | | 13 | |
Notes to Financial Statements (continued)
| | • | | Level 3 — Unobservable inputs based on the best information available in the circumstances, to the extent observable inputs are not available (including the Fund’s own assumptions used in determining the fair value of investments) |
The hierarchy gives the highest priority to unadjusted quoted prices in active markets for identical assets or liabilities (Level 1 measurements) and the lowest priority to unobservable inputs (Level 3 measurements). Accordingly, the degree of judgment exercised in determining fair value is greatest for instruments categorized in Level 3. The inputs used to measure fair value may fall into different levels of the fair value hierarchy. In such cases, for disclosure purposes, the fair value hierarchy classification is determined based on the lowest level input that is significant to the fair value measurement in its entirety. Investments classified within Level 3 have significant unobservable inputs used by the Global Valuation Committee in determining the price for Fair Valued Investments. Level 3 investments include equity or debt issued by Private Companies. There may not be a secondary market, and/or there are a limited number of investors. Level 3 investments may also be adjusted to reflect illiquidity and/ornon-transferability, with the amount of such discount estimated by the Global Valuation Committee in the absence of market information.
Changes in valuation techniques may result in transfers into or out of an assigned level within the hierarchy. In accordance with the Fund’s policy, transfers between different levels of the fair value hierarchy are deemed to have occurred as of the beginning of the reporting period. The categorization of a value determined for investments is based on the pricing transparency of the investments and is not necessarily an indication of the risks associated with investing in those securities.
As of December 31, 2018, certain investments of the Fund were valued using NAV per share as no quoted market value is available and therefore have been excluded from the fair value hierarchy.
| 4. | SECURITIES AND OTHER INVESTMENTS |
Preferred Stocks: Preferred stock has a preference over common stock in liquidation (and generally in receiving dividends as well), but is subordinated to the liabilities of the issuer in all respects. As a general rule, the market value of preferred stock with a fixed dividend rate and no conversion element varies inversely with interest rates and perceived credit risk, while the market price of convertible preferred stock generally also reflects some element of conversion value. Because preferred stock is junior to debt securities and other obligations of the issuer, deterioration in the credit quality of the issuer will cause greater changes in the value of a preferred stock than in a more senior debt security with similar stated yield characteristics. Unlike interest payments on debt securities, preferred stock dividends are payable only if declared by the issuer’s board of directors. Preferred stock also may be subject to optional or mandatory redemption provisions.
Securities Lending: The Fund may lend its securities to approved borrowers, such as brokers, dealers and other financial institutions. The borrower pledges and maintains with the Fund collateral consisting of cash, an irrevocable letter of credit issued by a bank, or securities issued or guaranteed by the U.S. Government. The initial collateral received by the Fund is required to have a value of at least 102% of the current value of the loaned securities for securities traded on U.S. exchanges and a value of at least 105% for all other securities. The collateral is maintained thereafter at a value equal to at least 100% of the current market value of the securities on loan. The market value of the loaned securities is determined at the close of each business day of the Fund and any additional required collateral is delivered to the Fund, or excess collateral returned by the Fund, on the next business day. During the term of the loan, the Fund is entitled to all distributions made on or in respect of the loaned securities, but does not receive interest income on securities received as collateral. Loans of securities are terminable at any time and the borrower, after notice, is required to return borrowed securities within the standard time period for settlement of securities transactions.
The market value of any securities on loan, all of which were classified as common stocks in the Fund’s Schedule of Investments, and the value of any related collateral are shown separately in the Statement of Assets and Liabilities as a component of investments at value — unaffiliated, and collateral on securities loaned at value, respectively. As of period end, any securities on loan were collateralized by cash and/or U.S. Government obligations. Cash collateral invested by the securities lending agent, BlackRock Investment Management, LLC (“BIM”), if any, is disclosed in the Schedule of Investments.
Securities lending transactions are entered into by the Fund under Master Securities Lending Agreements (each, an “MSLA”), which provide the right, in the event of default (including bankruptcy or insolvency), for thenon-defaulting party to liquidate the collateral and calculate a net exposure to the defaulting party or request additional collateral. In the event that a borrower defaults, the Fund, as lender, would offset the market value of the collateral received against the market value of the securities loaned. When the value of the collateral is greater than that of the market value of the securities loaned, the lender is left with a net amount payable to the defaulting party. However, bankruptcy or insolvency laws of a particular jurisdiction may impose restrictions on or prohibitions against such a right of offset in the event of an MSLA counterparty’s bankruptcy or insolvency. Under the MSLA, absent an event of default, the borrower can resell orre-pledge the loaned securities, and the Fund can reinvest cash collateral received in connection with loaned securities. Upon an event of default, the parties’ obligations to return the securities or collateral to the other party are extinguished, and the parties can resell orre-pledge the loaned securities or the collateral received in connection with the loaned securities in order to satisfy the defaulting party’s net payment obligation for all transactions under the MSLA. The defaulting party remains liable for any deficiency.
As of period end, the following table is a summary of the Fund’s securities lending agreements by counterparty which are subject to offset under an MSLA:
| | | | | | | | | | | | |
| Counterparty | | Securities
Loaned at Value | | | Cash Collateral
Received (a) | | | Net
Amount | |
Citigroup Global Markets, Inc. | | $ | 2,419,095 | | | $ | (2,419,095 | ) | | $ | — | |
Deutsche Bank Securities, Inc. | | | 1,769,165 | | | | (1,769,165 | ) | | | — | |
JP Morgan Securities LLC | | | 4,322,226 | | | | (4,322,226 | ) | | | — | |
| | | | | | | | | | | | |
| | $ | 8,510,486 | | | $ | (8,510,486 | ) | | $ | — | |
| | | | | | | | | | | | |
| | (a) | Cash collateral with a value of $ 8,638,095 has been received in connection with securities lending agreements. Collateral received in excess of the value of securities loaned from the individual counterparty, if any, is not shown for financial reporting purposes in the table above. | |
The risks of securities lending include the risk that the borrower may not provide additional collateral when required or may not return the securities when due. To mitigate these risks, the Fund benefits from a borrower default indemnity provided by BIM. BIM’s indemnity allows for full replacement of the securities loaned if the collateral
| | |
| 14 | | 2018 BLACKROCK ANNUAL REPORTTO SHAREHOLDERS |
Notes to Financial Statements (continued)
received does not cover the value on the securities loaned in the event of borrower default. The Fund could incur a loss if the value of an investment purchased with cash collateral falls below the market value of loaned securities or if the value of an investment purchased with cash collateral falls below the value of the original cash collateral received.
| 5. | INVESTMENT ADVISORY AGREEMENT AND OTHER TRANSACTIONS WITH AFFILIATES |
Investment Advisory: The Company, on behalf of the Fund, entered into an Investment Advisory Agreement with the Manager, the Fund’s investment adviser and an indirect, wholly-owned subsidiary of BlackRock, to provide investment advisory and administrative services. The Manager is responsible for the management of the Fund’s portfolio and provides the personnel, facilities, equipment and certain other services necessary to the operations of the Fund.
For such services, the Fund pays the Manager a monthly fee at an annual rate equal to the following percentages of the average daily value of the Fund’s net assets:
| | | | |
| Average Daily Net Assets | | Investment
Advisory Fees | |
First $1 Billion | | | 0.65 | % |
$1 Billion — $3 Billion | | | 0.61 | |
$3 Billion — $5 Billion | | | 0.59 | |
$5 Billion — $10 Billion | | | 0.57 | |
Greater than $10 Billion | | | 0.55 | |
Distribution Fees: The Company, on behalf of the Fund, entered into a Distribution Agreement and a Distribution Plan with BlackRock Investments, LLC (“BRIL”), an affiliate of the Manager. Pursuant to the Distribution Plan and in accordance with Rule12b-1 under the 1940 Act, the Fund pays BRIL ongoing distribution fees. The fees are accrued daily and paid monthly at an annual rate of 0.25% based upon the average daily net assets attributable to Class III.
BRIL and broker-dealers, pursuant tosub-agreements with BRIL, provide shareholder servicing and distribution services to the Fund. The ongoing service and/or distribution fee compensates BRIL and each broker-dealer for providing shareholder servicing and/or distribution related services to shareholders.
For the year ended December 31, 2018, the class specific distribution fees borne directly by Class III were $484,131.
Transfer Agent: On behalf of the Fund, the Manager entered into agreements with insurance companies and other financial intermediaries (“Service Organizations”), some of which may be affiliates. Pursuant to these agreements, the Service Organizations provide the Fund with administrative, networking, recordkeeping,sub-transfer agency and shareholder services tosub-accounts they service. For these services, the Service Organizations receive an annual fee per shareholder account, which will vary depending on share class and/or net assets of Fund shareholders serviced by the Service Organizations which is shown as transfer agent – class specific. For the year ended December 31, 2018, the Fund did not pay any amounts to affiliates in return for these services/paid the following amounts to affiliates in return for these services.
In addition, the Fund pays the transfer agent, which is not an affiliate, a fee for the issuance, transfer and redemption of shares and the opening and maintenance of shareholder accounts, which is included in transfer agent in the Statement of Operations. For the year ended December 31, 2018, the following table shows the class specific transfer agent fees borne directly by each share class of the Fund:
| | | | | | | | | | | | | | |
| Class I | | | | | Class III | | | | | Total | |
| $ | 290,882 | | | | | $ | 396,015 | | | | | $ | 686,897 | |
Expense Limitations, Waivers and Reimbursements:With respect to the Fund, the Manager voluntarily agreed to waive its investment advisory fees by the amount of investment advisory fees the Fund pays to the Manager indirectly through its investment in affiliated money market funds (the “affiliated money market fund waiver”). The amount of waivers and/or reimbursements of fees and expenses made pursuant to the expense limitation will be reduced by the amount of the affiliated money market fund waiver. This amount is shown as fees waived and/or reimbursed by the Manager in the Statement of Operations. For the year ended December 31, 2018, the amount waived was $2,240.
The Manager has contractually agreed to waive its investment advisory fee with respect to any portion of the Fund’s assets invested in affiliated equity and fixed-income mutual funds and affiliated exchange-traded funds that have a contractual management fee through April 30, 2019. The contractual agreement may be terminated upon 90 days’ notice by a majority of the directors who are not “interested persons” of the Fund, as defined in the 1940 Act (“Independent Directors”) or by a vote of a majority of the outstanding voting securities of the Fund. For the year ended December 31, 2018, there were no fees waived by the Manager pursuant to this arrangement.
For the year ended December 31, 2018, the Fund reimbursed the Manager $4,847 for certain accounting services, which is included in accounting services in the Statement of Operations.
The Manager has contractually agreed to reimburse transfer agent fees in order to limit such expenses to a percentage of average daily net assets as follows:
| | | | |
Class I | | | 0.07 | % |
Class III | | | 0.08 | |
The Manager has agreed not to reduce or discontinue this contractual expense limitation through April 30, 2019, unless approved by the Board, including a majority of the Independent Directors, or by a vote of a majority of the outstanding voting securities of the Fund.
| | | | |
| NOTESTO FINANCIAL STATEMENTS | | | 15 | |
Notes to Financial Statements (continued)
These amounts waived and/or reimbursed are shown as transfer agent fees waived and/or reimbursed — class specific in the Statement of Operations. For the year ended December 31, 2018, class specific expense waivers and/or reimbursements were as follows:
| | | | | | | | | | | | |
| | | Class I | | | Class III | | | Total | |
Transfer Agent Fees Waived and/or Reimbursed | | $ | 192,024 | | | $ | 241,095 | | | $ | 433,119 | |
With respect to the Fund, the Manager contractually agreed to waive and/or reimburse fees or expenses in order to limit expenses, excluding interest expense, dividend expense, tax expense, acquired fund fees and expenses, and certain other fund expenses, which constitute extraordinary expenses not incurred in the ordinary course of the Fund’s business (“expense limitation”). The expense limitations as a percentage of average daily net assets are as follows:
| | | | |
| Class I | | | Class III |
| | 1.25% | | | 1.50% |
The Manager has agreed not to reduce or discontinue this contractual expense limitation through April 30, 2019, unless approved by the Board, including a majority of the Independent Directors, or by a majority of the outstanding voting securities of the Fund. For the year ended December 31, 2018, there were no fees waived and/or reimbursed by the Manager.
Securities Lending: The U.S. Securities and Exchange Commission (“SEC”) has issued an exemptive order which permits BIM, an affiliate of the Manager, to serve as securities lending agent for the Fund, subject to applicable conditions. As securities lending agent, BIM bears all operational costs directly related to securities lending. The Fund is responsible for expenses in connection with the investment of cash collateral received for securities on loan (the “collateral investment expenses”). The cash collateral is invested in a private investment company managed by the Manager or its affiliates. However, BIM has agreed to cap the collateral investment expenses of the private investment company to an annual rate of 0.04%. The investment adviser to the private investment company will not charge any advisory fees with respect to shares purchased by the Fund. The private investment company in which the cash collateral has been invested may, under certain circumstances, impose a liquidity fee of up to 2% of the value withdrawn or temporarily restrict withdrawals for up to 10 business days during a 90 day period, in the event that the private investment company’s weekly liquid assets fall below certain thresholds.
Securities lending income is equal to the total of income earned from the reinvestment of cash collateral, net of fees and other payments to and from borrowers of securities, and less the collateral investment expenses. The Fund retains a portion of securities lending income and remits a remaining portion to BIM as compensation for its services as securities lending agent.
Pursuant to a securities lending agreement, the Fund retains 71.5% of securities lending income, and this amount retained can never be less than 65% of the total of securities lending income plus the collateral investment expenses.
In addition, commencing the business day following the date that the aggregate securities lending income earned across the Equity-Bond Complex in a calendar year exceeds a specified threshold, the Fund, pursuant to the securities lending agreement, will retain for the remainder of that calendar year securities lending income in an amount equal to 75% of securities lending income, and this amount retained can never be less than 65% of the total of securities lending income plus the collateral investment expenses.
The share of securities lending income earned by the Fund is shown as securities lending income — affiliated — net in the Statement of Operations. For the year ended December 31, 2018, the Fund paid BIM $13,641 for securities lending agent services.
lnterfund Lending: In accordance with an exemptive order (the “Order”) from the SEC, the Fund may participate in a joint lending and borrowing facility for temporary purposes (the “lnterfund Lending Program”), subject to compliance with the terms and conditions of the Order, and to the extent permitted by the Fund’s investment policies and restrictions. The Fund is currently permitted to borrow under the lnterfund Lending Program.
A lending BlackRock fund may lend in aggregate up to 15% of its net assets, but may not lend more than 5% of its net assets, to any one borrowing fund through the lnterfund Lending Program. A borrowing BlackRock fund may not borrow through the lnterfund Lending Program or from any other source more than 33 1/3% of its total assets (or any lower threshold provided for by the fund’s investment restrictions). If a borrowing BlackRock fund’s total outstanding borrowings exceed 10% of its total assets, each of its outstanding interfund loans will be subject to collateralization of at least 102% of the outstanding principal value of the loan. All interfund loans are for temporary or emergency purposes and the interest rate to be charged will be the average of the highest current overnight repurchase agreement rate available to a lending fund and the bank loan rate, as calculated according to a formula established by the Board.
During the year ended December 31, 2018, the Fund did not participate in the lnterfund Lending Program.
Directors and Officers: Certain directors and/or officers of the Company are directors and/or officers of BlackRock or its affiliates. The Fund reimburses the Manager for a portion of the compensation paid to the Company’s Chief Compliance Officer, which is included in Directors and Officer in the Statement of Operations.
For the year ended December 31, 2018, purchases and sales of investments, excluding short-term securities, were $150,067,841 and $307,240,124, respectively.
It is the Fund’s policy to comply with the requirements of the Internal Revenue Code of 1986, as amended, applicable to regulated investment companies, and to distribute substantially all of its taxable income to its shareholders. Therefore, no U.S. federal income tax provision is required.
| | |
| 16 | | 2018 BLACKROCK ANNUAL REPORTTO SHAREHOLDERS |
Notes to Financial Statements (continued)
The Fund files U.S. federal and various state and local tax returns. No income tax returns are currently under examination. The statute of limitations on the Fund’s U.S. federal tax returns generally remains open for each of the four years ended December 31, 2018. The statutes of limitations on the Fund’s state and local tax returns may remain open for an additional year depending upon the jurisdiction.
Management has analyzed tax laws and regulations and their application to the Fund as of December 31, 2018, inclusive of the open tax return years, and does not believe there are any uncertain tax positions that require recognition of a tax liability in the Fund’s financial statements.
The tax character of distributions paid was as follows:
| | | | | | | | |
| | | 12/31/18 | | | 12/31/17 | |
Ordinary income | | $ | 4,303,099 | | | $ | 8,773,659 | |
Long term capital gains | | | 80,398,284 | | | | 34,876,394 | |
| | | | | | | | |
| | $ | 84,701,383 | | | $ | 43,650,053 | |
| | | | | | | | |
As of period end, the tax components of accumulated earnings were as follows:
| | | | |
Undistributed long-term capital gains | | $ | 3,140,174 | |
Net unrealized gains(a) | | | 48,656,593 | |
Qualified late-year losses(b) | | | (813,658 | ) |
| | | | |
| | $ | 50,983,109 | |
| | | | |
| | (a) | The difference between book-basis and tax-basis net unrealized gains was attributable primarily to the tax deferral of losses on wash sales and straddles, and the timing and recognition of partnership income. | |
| | (b) | The Fund has elected to defer certain qualified late-year losses and recognize such losses in the next taxable year. | |
As of December 31, 2018, gross unrealized appreciation and depreciation for investments based on cost for U.S. federal income tax purposes were as follows:
| | | | |
Tax cost . . . . . . . . . . . . . . . . . . . . .. . . . . . . . . . . .. . . . . . . . . . . . . . . . . . . . . . . . . . . . . . | | $ | 223,556,209 | |
| | | | |
Gross unrealized appreciation . . . . . . . . . .. . . . . . . . . . . . . . . . . . . . . . . . . . . . . . .. . . . . | | $ | 56,124,708 | |
Gross unrealized depreciation . . . . . . . . . . . . . . . . . . . . . . . . . . . . . . . . . . . . . . . . .. . . . | | | (7,520,311 | ) |
| | | | |
Net unrealized appreciation | | $ | 48,604,397 | |
| | | | |
The Company, on behalf of the Fund, along with certain other funds managed by the Manager and its affiliates (“Participating Funds”), is a party to a364-day, $2.25 billion credit agreement with a group of lenders. Under this agreement, the Fund may borrow to fund shareholder redemptions. Excluding commitments designated for certain individual funds, the Participating Funds, including the Fund, can borrow up to an aggregate commitment amount of $1.75 billion at any time outstanding, subject to asset coverage and other limitations as specified in the agreement. The credit agreement has the following terms: a fee of 0.10% per annum on unused commitment amounts and interest at a rate equal to the higher of(a) one-month LIBOR (but, in any event, not less than 0.00%) on the date the loan is made plus 0.80% per annum or (b) the Fed Funds rate (but, in any event, not less than 0.00%) in effect from time to time plus 0.80% per annum on amounts borrowed. The agreement expires in April 2019 unless extended or renewed. Prior to April 19, 2018, the aggregate commitment amount was $2.1 billion and the fee was 0.12% per annum. Participating Funds paid an upfront commitment fee of 0.02% on the total commitment amounts, in addition to administration, legal and arrangement fees, which are included in miscellaneous expenses in the Statement of Operations. These fees were allocated among such funds based upon portions of the aggregate commitment available to them and relative net assets of Participating Funds. During the year ended December 31, 2018, the Fund did not borrow under the credit agreement.
In the normal course of business, the Fund invests in securities or other instruments and may enter into certain transactions, and such activities subject the Fund to various risks, including among others, fluctuations in the market (market risk) or failure of an issuer to meet all of its obligations. The value of securities or other instruments may also be affected by various factors, including, without limitation: (i) the general economy; (ii) the overall market as well as local, regional or global political and/or social instability; (iii) regulation, taxation or international tax treaties between various countries; or (iv) currency, interest rate and price fluctuations. The Fund’s prospectus provides details of the risks to which the Fund is subject.
The Fund may be exposed to additional risks when reinvesting cash collateral in money market funds that do not seek to maintain a stable NAV per share of $1.00, which may be subject to redemption gates or liquidity fees under certain circumstances.
Valuation Risk: The market values of equities, such as common stocks and preferred securities or equity related investments, such as futures and options, may decline due to general market conditions which are not specifically related to a particular company. They may also decline due to factors which affect a particular industry or industries. The Fund may invest in illiquid investments and may experience difficulty in selling those investments in a timely manner at the price that it believes the investments are worth. Prices may fluctuate widely over short or extended periods in response to company, market or economic news. Markets also tend to move in cycles, with periods of rising and falling prices. This volatility may cause the Fund’s NAV to experience significant increases or decreases over short periods of time. If there is a general decline in the securities and other markets, the NAV of the Fund may lose value, regardless of the individual results of the securities and other instruments in which the Fund invests.
| | | | |
| NOTESTO FINANCIAL STATEMENTS | | | 17 | |
Notes to Financial Statements (continued)
The price the Fund could receive upon the sale of any particular portfolio investment may differ from the Fund’s valuation of the investment, particularly for securities that trade in thin or volatile markets or that are valued using a fair valuation technique or a price provided by an independent pricing service. Changes to significant unobservable inputs and assumptions (i.e., publicly traded company multiples, growth rate, time to exit) due to the lack of observable inputs may significantly impact the resulting fair value and therefore the Fund’s results of operations. As a result, the price received upon the sale of an investment may be less than the value ascribed by the Fund, and the Fund could realize a greater than expected loss or lesser than expected gain upon the sale of the investment. The Fund’s ability to value its investments may also be impacted by technological issues and/or errors by pricing services or other third party service providers.
Counterparty Credit Risk: The Fund may be exposed to counterparty credit risk, or the risk that an entity may fail to or be unable to perform on its commitments related to unsettled or open transactions. The Fund manages counterparty credit risk by entering into transactions only with counterparties that the Manager believes have the financial resources to honor their obligations and by monitoring the financial stability of those counterparties. Financial assets, which potentially expose the Fund to market, issuer and counterparty credit risks, consist principally of financial instruments and receivables due from counterparties. The extent of the Fund’s exposure to market, issuer and counterparty credit risks with respect to these financial assets is approximately their value recorded in the Statement of Assets and Liabilities, less any collateral held by the Fund.
| 10. | CAPITAL SHARE TRANSACTIONS |
Transactions in capital shares for each class were as follows:
| | | | | | | | | | | | | | | | |
| | | Year Ended
12/31/2018 | | | Year Ended
12/31/2017 | |
| | | Shares | | | Amount | | | Shares | | | Amount | |
Class I | | | | | | | | | | | | | | | | |
Shares sold | | | 531,879 | | | $ | 5,009,652 | | | | 334,343 | | | $ | 3,268,914 | |
Shares issued in reinvestment of distributions | | | 5,066,937 | | | | 37,800,468 | | | | 1,510,157 | | | | 15,570,061 | |
Shares redeemed | | | (3,020,879 | ) | | | (33,854,433 | ) | | | (2,438,122 | ) | | | (24,590,116 | ) |
| | | | | | | | | | | | | | | | |
Net increase (decrease) | | | 2,577,937 | | | $ | 8,955,687 | | | | (593,622 | ) | | $ | (5,751,141 | ) |
| | | | | | | | | | | | | | | | |
| | | | |
Class III | | | | | | | | | | | | | | | | |
Shares sold | | | 745,740 | | | $ | 7,589,740 | | | | 608,475 | | | $ | 5,912,633 | |
Shares issued in reinvestment of distributions | | | 6,397,406 | | | | 46,900,915 | | | | 2,750,278 | | | | 28,079,992 | |
Shares redeemed | | | (12,295,769 | ) | | | (131,843,643 | ) | | | (4,789,157 | ) | | | (48,517,967 | ) |
| | | | | | | | | | | | | | | | |
Net decrease | | | (5,152,623 | ) | | $ | (77,352,988 | ) | | | (1,430,404 | ) | | $ | (14,525,342 | ) |
| | | | | | | | | | | | | | | | |
Total Net Decrease | | | (2,574,686 | ) | | $ | (68,397,301 | ) | | | (2,024,026 | ) | | $ | (20,276,483 | ) |
| | | | | | | | | | | | | | | | |
| 11. | REGULATIONS-X AMENDMENTS |
On August 17, 2018, the SEC adopted amendments to certain disclosure requirements in Securities Act ReleaseNo. 33-10532, Disclosure Update and Simplification. The Fund has adopted the amendments pertinent to RegulationS-X in this shareholder report. The amendments impacted certain disclosure presentation on the Statement of Assets and Liabilities, Statements of Changes in Net Assets and Notes to the Financial Statements.
Prior year distribution information and undistributed net investment income in the Statements of Changes in Net Assets has been modified to conform to the current year presentation in accordance with the RegulationS-X changes.
Distributions for the year ended December 31, 2017 were classified as follows:
| | | | |
| Share Class | | Net Realized Gain | |
Class I | | $ | (15,570,061 | ) |
Class III | | | (28,079,992 | ) |
Undistributed net investment income as of December 31, 2017 was $62,282.
Management has evaluated the impact of all subsequent events on the Fund through the date the financial statements were issued and has determined that there were no subsequent events requiring adjustment or additional disclosure in the financial statements.
| | |
| 18 | | 2018 BLACKROCK ANNUAL REPORTTO SHAREHOLDERS |
Report of Independent Registered Public Accounting Firm
To the Shareholders of BlackRock Capital Appreciation V.I. Fund and the Board of Directors of BlackRock Variable Series Funds, Inc.:
Opinion on the Financial Statements and Financial Highlights
We have audited the accompanying statement of assets and liabilities of BlackRock Capital Appreciation V.I. Fund of BlackRock Variable Series Funds, Inc. (the “Fund”), including the schedule of investments, as of December 31, 2018, the related statement of operations for the year then ended, the statements of changes in net assets for each of the two years in the period then ended, the financial highlights for each of the five years in the period then ended, and the related notes. In our opinion, the financial statements and financial highlights present fairly, in all material respects, the financial position of the Fund as of December 31, 2018, and the results of its operations for the year then ended, the changes in its net assets for each of the two years in the period then ended, and the financial highlights for each of the five years in the period then ended, in conformity with accounting principles generally accepted in the United States of America.
Basis for Opinion
These financial statements and financial highlights are the responsibility of the Fund’s management. Our responsibility is to express an opinion on the Fund’s financial statements and financial highlights based on our audits. We are a public accounting firm registered with the Public Company Accounting Oversight Board (United States) (PCAOB) and are required to be independent with respect to the Fund in accordance with the U.S. federal securities laws and the applicable rules and regulations of the Securities and Exchange Commission and the PCAOB.
We conducted our audits in accordance with the standards of the PCAOB. Those standards require that we plan and perform the audit to obtain reasonable assurance about whether the financial statements and financial highlights are free of material misstatement, whether due to error or fraud. The Fund is not required to have, nor were we engaged to perform, an audit of its internal control over financial reporting. As part of our audits we are required to obtain an understanding of internal control over financial reporting but not for the purpose of expressing an opinion on the effectiveness of the Fund’s internal control over financial reporting. Accordingly, we express no such opinion.
Our audits included performing procedures to assess the risks of material misstatement of the financial statements and financial highlights, whether due to error or fraud, and performing procedures that respond to those risks. Such procedures included examining, on a test basis, evidence regarding the amounts and disclosures in the financial statements and financial highlights. Our audits also included evaluating the accounting principles used and significant estimates made by management, as well as evaluating the overall presentation of the financial statements and financial highlights. Our procedures included confirmation of securities owned as of December 31, 2018, by correspondence with the custodian and brokers; when replies were not received from brokers, we performed other auditing procedures. We believe that our audits provide a reasonable basis for our opinion.
Deloitte & Touche LLP
Boston, Massachusetts
February 15, 2019
We have served as the auditor of one or more BlackRock investment companies since 1992.
| | | | |
| REPORTOF INDEPENDENT REGISTERED PUBLIC ACCOUNTING FIRM | | | 19 | |
Glossary of Terms Used in this Report
| | |
| Portfolio Abbreviations |
| |
| ADR | | American Depositary Receipt |
| NYRS | | New York Registered Shares |
| REITs | | Real Estate Investment Trusts |
| S&P | | Standard & Poor’s |
| | |
| 20 | | 2018 BLACKROCK ANNUAL REPORTTO SHAREHOLDERS |
DECEMBER 31, 2018
| | |
ANNUAL REPORT | |  |
BlackRock Variable Series Funds, Inc.
| Ø | | BlackRock Equity Dividend V.I. Fund |
|
| Not FDIC Insured • May Lose Value • No Bank Guarantee |
| | |
| Fund Summary as of December 31, 2018 | | BlackRock Equity Dividend V.I. Fund |
Investment Objective
BlackRock Equity Dividend V.I. Fund’s (the “Fund”) investment objective is to seek long-term total return and current income.
Portfolio Management Commentary
How did the Fund perform?
For the12-month period ended December 31, 2018, the Fund outperformed its benchmark, the Russell 1000® Value Index, and underperformed the broad-market S&P 500® Index. The following discussion of relative performance pertains to the Russell 1000® Value Index.
What factors influenced performance?
The largest contribution to relative performance for the12-month period came from an overweight position and stock selection within the health care sector. Notably, stock selection within and an overweight to the pharmaceuticals industry proved beneficial, as did an overweight to the health care providers & services industry. The Fund’s cash position, which averaged 5.6% during the12-month period, served as a mechanism to lower and control the Fund’s market risk relative to the Russell 1000® Value Index and proved favorable amid falling U.S. equity prices. Within information technology (“IT”), a combination of stock selection and an overweight to the software industry boosted relative return, as did stock selection in the electronic equipment industry. Lastly, stock selection in communication services added to relative performance during the period.
The largest detractor from relative performance derived from a combination of stock selection and allocation decisions within financials. In particular, stock selection in the insurance and capital markets industries detracted, as did an overweight to banks and an underweight to the diversified financial services industry. Within utilities, stock selection in the electric utilities segment was particularly weak due to negative impacts on portfolio holdings from severe California wildfires. The Fund’s lack of exposure to real estate also hindered relative return as the sector outperformed the broader U.S. equity market. Lastly, an overweight to construction materials as well as stock selection in the containers & packaging industry constrained relative results within the materials sector.
Describe recent portfolio activity.
During the12-month period, a combination of portfolio trading activity and market price changes resulted in increased exposure to the communication services, health care and IT sectors. Conversely, exposures to financials, industrials and utilities were reduced.
Describe portfolio positioning at period end.
In terms of portfolio positioning, the Fund’s largest allocations were in the financials, health care and IT sectors. Relative to the Russell 1000 Value benchmark, the Fund’s largest overweight positions were in the health care, IT and energy sectors. Conversely, the Fund’s largest underweights were in the real estate, utilities and consumer discretionary sectors.
The views expressed reflect the opinions of BlackRock as of the date of this report and are subject to change based on changes in market, economic or other conditions. These views are not intended to be a forecast of future events and are no guarantee of future results.
Portfolio Information
SECTOR ALLOCATION
| | | | |
| Sector | | Percent of
Net Assets | |
Financials | | | 23 | % |
Health Care | | | 21 | |
Information Technology | | | 11 | |
Energy | | | 11 | |
Consumer Staples | | | 7 | |
Communication Services | | | 6 | |
Industrials | | | 6 | |
Utilities | | | 4 | |
Consumer Discretionary | | | 2 | |
Materials | | | 2 | |
Short-Term Securities | | | 9 | |
Liabilities in Excess of Other Assets | | | (2 | ) |
For Fund compliance purposes, the Fund’s sector classifications refer to one or more of the sectorsub-classifications used by one or more widely recognized market indexes or ratings group indexes, and/or as defined by the investment adviser. These definitions may not apply for purposes of this report, which may combine sector sub classifications for reporting ease.
| | |
| 2 | | 2018 BLACKROCK ANNUAL REPORTTO SHAREHOLDERS |
| | |
| Fund Summary as of December 31, 2018 (continued) | | BlackRock Equity Dividend V.I. Fund |
TOTAL RETURN BASED ON A $10,000 INVESTMENT
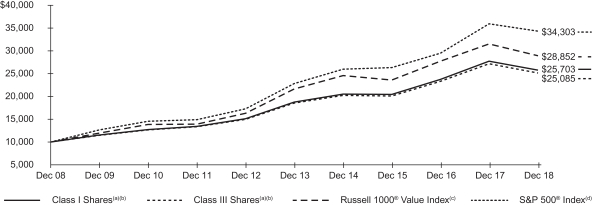
| (a) | Assuming transaction costs, if any, and other operating expenses, including investment advisory fees. Does not include insurance-related fees and expenses. The returns for Class III Shares prior to July 1, 2011, the recommencement of operations of Class III Shares, are based upon the performance of the Fund’s Class I Shares, as adjusted to reflect the distribution(12b-1) fees applicable to Class III Shares. |
| (b) | The Fund seeks to achieve its objective by investing primarily in a diversified portfolio of equity securities. Under normal circumstances, the Fund will invest in at least 80% of its assets in equity securities and at least 80% of its assets in dividend paying securities. The Fund’s total returns prior to October 1, 2010 are the returns of the Fund when it followed a different objective and different investment strategies under the name BlackRock Utilities & Telecommunications V.I. Fund. |
| (c) | An unmanaged index that is a subset of the Russell 1000® Index that consists of those Russell 1000® securities with lowerprice-to-book ratios and lower expected growth values. |
| (d) | An unmanaged index that covers 500 leading companies and captures approximately 80% coverage of available market capitalization. |
Performance Summary for the Period Ended December 31, 2018
| | | | | | | | | | | | | | | | | | | | | | | | | | | | |
| | | 6-Month
Total Returns (b) | | | | | | Average Annual Total Returns | |
| | | | | | 1 Year (b) | | | | | | 5 Years (b) | | | | | | 10 Years (b) | |
Class I(a) | | | (6.82 | )% | | | | | | | (7.16 | )% | | | | | | | 6.51 | % | | | | | | | 9.90 | % |
Class III(a) | | | (6.94 | ) | | | | | | | (7.42 | ) | | | | | | | 6.25 | | | | | | | | 9.63 | (c) |
Russell 1000® Value Index | | | (6.69 | ) | | | | | | | (8.27 | ) | | | | | | | 5.95 | | | | | | | | 11.18 | |
S&P 500® Index | | | (6.85 | ) | | | | | | | (4.38 | ) | | | | | | | 8.49 | | | | | | | | 13.12 | |
| | (a) | Average annual and cumulative total returns are based on changes in net asset value for the periods shown, and assume reinvestment of all distributions at net asset value on theex-dividend date. Insurance-related fees and expenses are not reflected in these returns. The Fund’s total returns prior to October 1, 2010 are the returns of the Fund when it followed a different objective and different investment strategies under the name BlackRock Utilities & Telecommunications V.I. Fund. | |
| | (b) | For the portion of the period, the Fund’s investment adviser waived a portion of its fee. Without such waiver, the Fund’s performance would have been lower. | |
| | (c) | The returns for Class III Shares prior to July 1, 2011, the recommencement of operations of Class III Shares, are based upon the performance of the Fund’s Class I Shares, as adjusted to reflect the distribution(12b-1) fees applicable to Class III Shares. | |
Past performance is not indicative of future results. Performance results do not reflect the deduction of taxes that a shareholder would pay on Fund distributions or the redemption of Fund shares.
Performance results may include adjustment made for financial reporting purposes in accordance with U.S. generally accepted accounting principles.
Expense Example
| | | | | | | | | | | | | | | | | | | | | | | | | | | | | | | | |
| | | Actual | | | | | | Hypothetical (a) | | | | |
| | | Beginning
Account Value
(07/01/18) | | | Ending
Account Value
(12/31/18) | | | Expenses
Paid During
the Period (b) | | | | | | Beginning
Account Value
(07/01/18) | | | Ending
Account Value
(12/31/18) | | | Expenses
Paid During
the Period (b) | | | Annualized
Expense
Ratio | |
Class I | | $ | 1,000.00 | | | $ | 931.80 | | | $ | 3.21 | | | | | | | $ | 1,000.00 | | | $ | 1,021.88 | | | $ | 3.36 | | | | 0.66 | % |
Class III | | | 1,000.00 | | | | 930.60 | | | | 4.43 | | | | | | | | 1,000.00 | | | | 1,020.62 | | | | 4.63 | | | | 0.91 | |
| | (a) | Hypothetical 5% annual return before expenses is calculated by prorating the number of days in the most recent fiscal half year divided by 365. | |
| | (b) | For each class of the Fund, expenses are equal to annualized expense ratio for the class, multiplied by the average account value over the period, multiplied by 184/365 (to reflect theone-half year period shown). | |
See “Disclosure of Expenses” on the following page for further information on how expenses were calculated.
| | |
| Disclosure of Expenses | | BlackRock Equity Dividend V.I. Fund |
Shareholders of the Fund may incur the following charges: (a) transactional expenses; and (b) operating expenses, including investment advisory fees, service and distribution fees, including12b-1 fees, acquired fund fees and expenses, and other fund expenses. The expense example on the previous page (which is based on a hypothetical investment of $1,000 invested on July 1, 2018 and held through December 31, 2018) is intended to assist shareholders both in calculating expenses based on an investment in the Fund and in comparing these expenses with similar costs of investing in other mutual funds.
The expense example provides information about actual account values and actual expenses. In order to estimate the expenses a shareholder paid during the period covered by this report, shareholders can divide their account value by $1,000 and then multiply the result by the number corresponding to their share class under the heading entitled “Expenses Paid During the Period.”
The expense example also provides information about hypothetical account values and hypothetical expenses based on the Fund’s actual expense ratio and an assumed rate of return of 5% per year before expenses. In order to assist shareholders in comparing the ongoing expenses of investing in the Fund and other funds, compare the 5% hypothetical example with the 5% hypothetical examples that appear in shareholder reports of other funds.
The expenses shown in the expense example are intended to highlight shareholders’ ongoing costs only and do not reflect any transactional expenses, such as sales charges, if any. Therefore, the hypothetical example is useful in comparing ongoing expenses only, and will not help shareholders determine the relative total expenses of owning different funds. If these transactional expenses were included, shareholder expenses would have been higher.
| | |
| 4 | | 2018 BLACKROCK ANNUAL REPORTTO SHAREHOLDERS |
| | |
Schedule of Investments December 31, 2018 | | BlackRock Equity Dividend V.I. Fund (Percentages shown are based on Net Assets) |
| | | | | | | | |
| Security | | Shares | | | Value | |
|
Common Stocks — 92.9% | |
| |
Aerospace & Defense — 1.5% | | | | | |
BAE Systems plc | | | 178,913 | | | $ | 1,046,437 | |
Lockheed Martin Corp. | | | 4,825 | | | | 1,263,378 | |
Northrop Grumman Corp. | | | 7,576 | | | | 1,855,362 | |
| | | | | | | | |
| | | | | | | 4,165,177 | |
| |
| Banks — 13.2% | | | | |
Bank of America Corp. | | | 321,521 | | | | 7,922,278 | |
Citigroup, Inc. | | | 148,653 | | | | 7,738,875 | |
JPMorgan Chase & Co. | | | 104,776 | | | | 10,228,233 | |
US Bancorp | | | 35,392 | | | | 1,617,414 | |
Wells Fargo & Co. | | | 208,370 | | | | 9,601,691 | |
| | | | | | | | |
| | | | | | | 37,108,491 | |
| |
| Beverages — 2.0% | | | | |
Diageo plc | | | 75,651 | | | | 2,703,344 | |
PepsiCo, Inc. | | | 26,870 | | | | 2,968,597 | |
| | | | | | | | |
| | | | | | | 5,671,941 | |
| |
| Building Products — 1.0% | | | | |
Johnson Controls International plc | | | 73,736 | | | | 2,186,272 | |
Masco Corp. | | | 24,612 | | | | 719,655 | |
| | | | | | | | |
| | | | | | | 2,905,927 | |
| |
| Capital Markets — 3.5% | | | | |
Charles Schwab Corp. (The) | | | 26,987 | | | | 1,120,770 | |
Goldman Sachs Group, Inc. (The) | | | 14,339 | | | | 2,395,330 | |
Morgan Stanley | | | 90,536 | | | | 3,589,752 | |
State Street Corp. | | | 41,879 | | | | 2,641,309 | |
| | | | | | | | |
| | | | | | | 9,747,161 | |
| |
| Chemicals — 0.9% | | | | |
DowDuPont, Inc.(a) | | | 49,655 | | | | 2,655,549 | |
| | | | | | | | |
| |
| Communications Equipment — 1.6% | | | | |
Cisco Systems, Inc. | | | 39,363 | | | | 1,705,599 | |
Motorola Solutions, Inc. | | | 24,619 | | | | 2,832,170 | |
| | | | | | | | |
| | | | | | | 4,537,769 | |
| |
| Construction Materials — 0.6% | | | | |
CRH plc | | | 62,233 | | | | 1,647,426 | |
| | | | | | | | |
| |
| Containers & Packaging — 0.3% | | | | |
International Paper Co. | | | 19,133 | | | | 772,208 | |
| | | | | | | | |
| |
| Diversified Financial Services — 0.6% | | | | |
AXA Equitable Holdings, Inc.(a) | | | 96,005 | | | | 1,596,563 | |
| | | | | | | | |
| |
| Diversified Telecommunication Services — 4.5% | | | | |
BCE, Inc. | | | 17,957 | | | | 709,840 | |
Verizon Communications, Inc. | | | 214,454 | | | | 12,056,604 | |
| | | | | | | | |
| | | | | | | 12,766,444 | |
| |
| Electric Utilities — 2.9% | | | | |
Edison International | | | 4,239 | | | | 240,648 | |
FirstEnergy Corp.(a) | | | 103,413 | | | | 3,883,158 | |
NextEra Energy, Inc. | | | 13,807 | | | | 2,399,933 | |
PG&E Corp.(b) | | | 67,524 | | | | 1,603,695 | |
| | | | | | | | |
| | | | | | | 8,127,434 | |
| |
| Electronic Equipment, Instruments & Components — 0.2% | | | | |
CDW Corp. | | | 8,042 | | | | 651,804 | |
| | | | | | | | |
| |
| Energy Equipment & Services — 0.2% | | | | |
Baker Hughes a GE Co. | | | 27,367 | | | | 588,391 | |
| | | | | | | | |
| |
| Food Products — 2.0% | | | | |
Kellogg Co. | | | 30,822 | | | | 1,757,162 | |
Mondelez International, Inc., Class A(a) | | | 26,477 | | | | 1,059,875 | |
Nestle SA (Registered) | | | 33,965 | | | | 2,756,694 | |
| | | | | | | | |
| | | | | | | 5,573,731 | |
| | | | | | | | |
| Security | | Shares | | | Value | |
| |
| Health Care Equipment & Supplies — 3.6% | | | | |
Koninklijke Philips NV | | | 164,195 | | | $ | 5,756,594 | |
Medtronic plc | | | 48,365 | | | | 4,399,281 | |
| | | | | | | | |
| | | | | | | 10,155,875 | |
| |
| Health Care Providers & Services — 6.6% | | | | |
Anthem, Inc. | | | 28,521 | | | | 7,490,470 | |
Cardinal Health, Inc. | | | 21,136 | | | | 942,666 | |
CVS Health Corp. | | | 40,320 | | | | 2,641,766 | |
Humana, Inc.(a) | | | 7,957 | | | | 2,279,521 | |
McKesson Corp. | | | 18,783 | | | | 2,074,958 | |
UnitedHealth Group, Inc. | | | 12,649 | | | | 3,151,119 | |
| | | | | | | | |
| | | | | | | 18,580,500 | |
| |
| Household Durables — 0.6% | | | | |
Newell Brands, Inc.(a) | | | 84,464 | | | | 1,570,186 | |
| | | | | | | | |
| |
| Household Products — 0.9% | | | | |
Procter & Gamble Co. (The) | | | 26,805 | | | | 2,463,916 | |
| | | | | | | | |
| | |
| Industrial Conglomerates — 2.6% | | | | | | |
3M Co. | | | 9,844 | | | | 1,875,676 | |
General Electric Co. | | | 180,255 | | | | 1,364,530 | |
Honeywell International, Inc. | | | 21,176 | | | | 2,797,773 | |
Siemens AG (Registered) | | | 10,575 | | | | 1,180,187 | |
| | | | | | | | |
| | | | | | | 7,218,166 | |
| |
| Insurance — 6.2% | | | | |
American International Group, Inc. | | | 104,204 | | | | 4,106,680 | |
Arthur J Gallagher & Co. | | | 31,069 | | | | 2,289,785 | |
Marsh & McLennan Cos., Inc. | | | 27,504 | | | | 2,193,444 | |
MetLife, Inc. | | | 136,787 | | | | 5,616,474 | |
Travelers Cos., Inc. (The) | | | 25,998 | | | | 3,113,261 | |
| | | | | | | | |
| | | | | | | 17,319,644 | |
| |
| IT Services — 0.7% | | | | |
Cognizant Technology Solutions Corp., Class A | | | 30,452 | | | | 1,933,093 | |
| | | | | | | | |
| |
| Leisure Products — 0.3% | | | | |
Mattel, Inc.(a)(b) | | | 74,683 | | | | 746,083 | |
| | | | | | | | |
| |
| Machinery — 0.2% | | | | |
Pentair plc | | | 18,197 | | | | 687,483 | |
| | | | | | | | |
| |
| Media — 1.5% | | | | |
Comcast Corp., Class A | | | 128,367 | | | | 4,370,896 | |
| | | | | | | | |
| |
| Multiline Retail — 0.8% | | | | |
Dollar General Corp. | | | 21,988 | | | | 2,376,463 | |
| | | | | | | | |
| |
| Multi-Utilities — 0.7% | | | | |
Public Service Enterprise Group, Inc. | | | 39,248 | | | | 2,042,858 | |
| | | | | | | | |
| |
| Oil, Gas & Consumable Fuels — 10.6% | | | | |
Anadarko Petroleum Corp. | | | 26,086 | | | | 1,143,610 | |
BP plc | | | 847,301 | | | | 5,356,373 | |
Devon Energy Corp. | | | 64,610 | | | | 1,456,309 | |
Enterprise Products Partners LP(a) | | | 157,596 | | | | 3,875,286 | |
Hess Corp.(a) | | | 34,137 | | | | 1,382,548 | |
Marathon Oil Corp. | | | 60,035 | | | | 860,902 | |
Marathon Petroleum Corp. | | | 53,609 | | | | 3,163,467 | |
ONEOK, Inc. | | | 35,481 | | | | 1,914,200 | |
Suncor Energy, Inc. | | | 205,487 | | | | 5,747,471 | |
TOTAL SA, ADR(a) | | | 21,609 | | | | 1,127,558 | |
Williams Cos., Inc. (The) | | | 164,873 | | | | 3,635,450 | |
| | | | | | | | |
| | | | | | | 29,663,174 | |
| |
| Personal Products — 0.6% | | | | |
Unilever NV, NYRS(a) | | | 34,073 | | | | 1,833,127 | |
| | | | | | | | |
| |
| Pharmaceuticals — 10.9% | | | | |
AstraZeneca plc | | | 77,751 | | | | 5,803,800 | |
| | | | |
| SCHEDULE OF INVESTMENTS | | | 5 | |
| | |
Schedule of Investments (continued) December 31, 2018 | | BlackRock Equity Dividend V.I. Fund (Percentages shown are based on Net Assets) |
| | | | | | | | |
| Security | | Shares | | | Value | |
| |
| Pharmaceuticals (continued) | | | | |
Bayer AG (Registered) | | | 29,539 | | | $ | 2,054,402 | |
Merck & Co., Inc. | | | 69,588 | | | | 5,317,219 | |
Novartis AG, ADR | | | 39,519 | | | | 3,391,125 | |
Novo Nordisk A/S, ADR(a) | | | 47,799 | | | | 2,202,100 | |
Pfizer, Inc. | | | 268,702 | | | | 11,728,842 | |
| | | | | | | | |
| | | | | | | 30,497,488 | |
| |
| Road & Rail — 0.4% | | | | |
Union Pacific Corp. | | | 8,774 | | | | 1,212,830 | |
| | | | | | | | |
| |
| Semiconductors & Semiconductor Equipment — 1.9% | | | | |
QUALCOMM, Inc. | | | 62,182 | | | | 3,538,778 | |
Taiwan Semiconductor Manufacturing Co. Ltd., ADR | | | 47,641 | | | | 1,758,429 | |
| | | | | | | | |
| | | | | | | 5,297,207 | |
| |
| Software — 5.5% | | | | |
Constellation Software, Inc. | | | 2,048 | | | | 1,310,918 | |
Microsoft Corp. | | | 66,615 | | | | 6,766,086 | |
Oracle Corp. | | | 162,316 | | | | 7,328,567 | |
| | | | | | | | |
| | | | | | | 15,405,571 | |
| |
| Specialty Retail — 0.8% | | | | |
Lowe’s Cos., Inc. | | | 23,529 | | | | 2,173,138 | |
| | | | | | | | |
| |
| Technology Hardware, Storage & Peripherals — 1.4% | | | | |
Apple, Inc. | | | 4,386 | | | | 691,848 | |
Lenovo Group Ltd. | | | 1,212,000 | | | | 818,752 | |
Samsung Electronics Co. Ltd., GDR(c) | | | 2,776 | | | | 2,406,113 | |
| | | | | | | | |
| | | | | | | 3,916,713 | |
| | | | | | | | |
| Security | | Shares | | | Value | |
| |
| Tobacco — 1.1% | | | | |
Altria Group, Inc. | | | 60,159 | | | $ | 2,971,253 | |
| | | | | | | | |
| |
Total Common Stocks — 92.9%
(Cost: $256,982,319) | | | | 260,951,680 | |
| | | | | | | | |
| |
Total Long-Term Investments — 92.9%
(Cost: $256,982,319) | | | | 260,951,680 | |
| | | | | | | | |
|
Short-Term Securities — 9.4%(d)(f) | |
BlackRock Liquidity Funds,T-Fund, Institutional Class,
2.32% | | | 20,001,000 | | | | 20,001,000 | |
SL Liquidity Series, LLC, Money Market Series,
2.57%(e) | | | 6,383,011 | | | | 6,382,373 | |
| | | | | | | | |
| |
Total Short-Term Securities — 9.4%
(Cost: $26,383,585) | | | | 26,383,373 | |
| | | | | | | | |
| |
Total Investments — 102.3%
(Cost: $283,365,904) | | | | 287,335,053 | |
| |
Liabilities in Excess of Other Assets — (2.3)% | | | | (6,425,704 | ) |
| | | | | | | | |
| |
Net Assets — 100.0% | | | $ | 280,909,349 | |
| | | | | | | | |
| (a) | Security, or a portion of the security, is on loan. |
| (b) | Non-income producing security. |
| (c) | Security exempt from registration pursuant to Rule 144A under the Securities Act of 1933, as amended. These securities may be resold in transactions exempt from registration to qualified institutional investors. |
| (d) | Annualized7-day yield as of period end. |
| (e) | Security was purchased with the cash collateral from loaned securities. |
| (f) | During the year ended December 31, 2018, investments in issuers considered to be affiliates of the Fund for purposes of Section 2(a)(3) of the Investment Company Act of 1940, as amended, were as follows: |
| | | | | | | | | | | | | | | | | | | | | | | | | | | | |
| Affiliate | | Shares
Held at
12/31/17 | | | Net
Activity | | | Shares
Held at
12/31/18 | | | Value at
12/31/18 | | | Income | | | Net
Realized
Gain (Loss) (a) | | | Change in
Unrealized
Appreciation
(Depreciation) | |
BlackRock Liquidity Funds,T-Fund, Institutional Class | | | 14,132,925 | | | | 5,868,075 | | | | 20,001,000 | | | $ | 20,001,000 | | | $ | 287,367 | | | $ | — | | | $ | — | |
SL Liquidity Series, LLC, Money Market Series | | | 1,608,659 | | | | 4,774,352 | | | | 6,383,011 | | | | 6,382,373 | | | | 8,704 | (b) | | | 2,727 | | | | 43 | |
| | | | | | | | | | | | | | | | | | | | | | | | | | | | |
| | | | | | | | | | | | | | $ | 26,383,373 | | | $ | 296,071 | | | $ | 2,727 | | | $ | 43 | |
| | | | | | | | | | | | | | | | | | | | | | | | | | | | |
| | (a) | Includes net capital gain distributions, if applicable. | |
| | (b) | Represents securities lending income earned from the reinvestment of cash collateral from loaned securities, net of fees and collateral investment expenses, and other payments to and from borrowers of securities. | |
For Fund compliance purposes, the Fund’s industry classifications refer to one or more of the industrysub-classifications used by one or more widely recognized market indexes or ratings group indexes, and/or as defined by the investment adviser. These definitions may not apply for purposes of this report, which may combine such industrysub-classifications for reporting ease.
| | |
| 6 | | 2018 BLACKROCK ANNUAL REPORTTO SHAREHOLDERS |
| | |
Schedule of Investments (continued) December 31, 2018 | | BlackRock Equity Dividend V.I. Fund |
Fair Value Hierarchy as of Period End
Various inputs are used in determining the fair value of investments. For information about the Fund’s policy regarding valuation of investments, refer to the Notes to Financial Statements.
The following table summarizes the Fund’s investments categorized in the disclosure hierarchy:
| | | | | | | | | | | | | | | | |
| | | Level 1 | | | Level 2 | | | Level 3 | | | Total | |
Assets: | | | | | | | | | | | | | | | | |
Investments: | | | | | | | | | | | | | | | | |
Long-Term Investments: | | | | | | | | | | | | | | | | |
Common Stocks: | | | | | | | | | | | | | | | | |
Aerospace & Defense | | $ | 3,118,740 | | | $ | 1,046,437 | | | $ | — | | | $ | 4,165,177 | |
Banks | | | 37,108,491 | | | | — | | | | — | | | | 37,108,491 | |
Beverages | | | 2,968,597 | | | | 2,703,344 | | | | — | | | | 5,671,941 | |
Building Products | | | 2,905,927 | | | | — | | | | — | | | | 2,905,927 | |
Capital Markets | | | 9,747,161 | | | | — | | | | — | | | | 9,747,161 | |
Chemicals | | | 2,655,549 | | | | — | | | | — | | | | 2,655,549 | |
Communications Equipment | | | 4,537,769 | | | | — | | | | — | | | | 4,537,769 | |
Construction Materials | | | — | | | | 1,647,426 | | | | — | | | | 1,647,426 | |
Containers & Packaging | | | 772,208 | | | | — | | | | — | | | | 772,208 | |
Diversified Financial Services | | | 1,596,563 | | | | — | | | | — | | | | 1,596,563 | |
Diversified Telecommunication Services | | | 12,766,444 | | | | — | | | | — | | | | 12,766,444 | |
Electric Utilities | | | 8,127,434 | | | | — | | | | — | | | | 8,127,434 | |
Electronic Equipment, Instruments & Components | | | 651,804 | | | | — | | | | — | | | | 651,804 | |
Energy Equipment & Services | | | 588,391 | | | | — | | | | — | | | | 588,391 | |
Food Products | | | 2,817,037 | | | | 2,756,694 | | | | — | | | | 5,573,731 | |
Health Care Equipment & Supplies | | | 4,399,281 | | | | 5,756,594 | | | | — | | | | 10,155,875 | |
Health Care Providers & Services | | | 18,580,500 | | | | — | | | | — | | | | 18,580,500 | |
Household Durables | | | 1,570,186 | | | | — | | | | — | | | | 1,570,186 | |
Household Products | | | 2,463,916 | | | | — | | | | — | | | | 2,463,916 | |
Industrial Conglomerates | | | 6,037,979 | | | | 1,180,187 | | | | — | | | | 7,218,166 | |
Insurance | | | 17,319,644 | | | | — | | | | — | | | | 17,319,644 | |
IT Services | | | 1,933,093 | | | | — | | | | — | | | | 1,933,093 | |
Leisure Products | | | 746,083 | | | | — | | | | — | | | | 746,083 | |
Machinery | | | 687,483 | | | | — | | | | — | | | | 687,483 | |
Media | | | 4,370,896 | | | | — | | | | — | | | | 4,370,896 | |
Multiline Retail | | | 2,376,463 | | | | — | | | | — | | | | 2,376,463 | |
Multi-Utilities | | | 2,042,858 | | | | — | | | | — | | | | 2,042,858 | |
Oil, Gas & Consumable Fuels | | | 24,306,801 | | | | 5,356,373 | | | | — | | | | 29,663,174 | |
Personal Products | | | 1,833,127 | | | | — | | | | — | | | | 1,833,127 | |
Pharmaceuticals | | | 22,639,286 | | | | 7,858,202 | | | | — | | | | 30,497,488 | |
Road & Rail | | | 1,212,830 | | | | — | | | | — | | | | 1,212,830 | |
Semiconductors & Semiconductor Equipment | | | 5,297,207 | | | | — | | | | — | | | | 5,297,207 | |
Software | | | 15,405,571 | | | | — | | | | — | | | | 15,405,571 | |
Specialty Retail | | | 2,173,138 | | | | — | | | | — | | | | 2,173,138 | |
Technology Hardware, Storage & Peripherals | | | 691,848 | | | | 3,224,865 | | | | — | | | | 3,916,713 | |
Tobacco | | | 2,971,253 | | | | — | | | | — | | | | 2,971,253 | |
Short-Term Securities | | | 20,001,000 | | | | — | | | | — | | | | 20,001,000 | |
| | | | | | | | | | | | | | | | |
Subtotal | | $ | 249,422,558 | | | $ | 31,530,122 | | | $ | — | | | $ | 280,952,680 | |
| | | | | | | | | | | | | | | | |
Investments valued at NAV(a) | | | | | | | | | | | | | | $ | 6,382,373 | |
| | | | | | | | | | | | | | | | |
Total Investments | | | | | | | | | | | | | | $ | 287,335,053 | |
| | | | | | | | | | | | | | | | |
| | (a) | As of December 31, 2018, certain investments of the Fund were fair valued using NAV per share as no quoted market value is available and therefore have been excluded from the fair value hierarchy. | |
During the year ended December 31, 2018, there were no transfers between levels.
See notes to financial statements.
| | | | |
| SCHEDULE OF INVESTMENTS | | | 7 | |
Statement of Assets and Liabilities
December 31, 2018
| | | | |
| | | BlackRock
Equity Dividend
V.I. Fund | |
|
ASSETS | |
Investments at value — unaffiliated (including securities loaned at value of $6,273,530) (cost — $256,982,319) | | $ | 260,951,680 | |
Investments at value — affiliated (cost — $26,383,585) | | | 26,383,373 | |
Foreign currency at value (cost — $1,713) | | | 1,665 | |
Receivables: | | | | |
Investments sold | | | 57,469 | |
Securities lending income — affiliated | | | 857 | |
Capital shares sold | | | 67,818 | |
Dividends — affiliated | | | 38,545 | |
Dividends — unaffiliated | | | 363,871 | |
From the Manager | | | 5,504 | |
Prepaid expenses | | | 325 | |
| | | | |
Total assets | | | 287,871,107 | |
| | | | |
|
LIABILITIES | |
Bank overdraft | | | 9,367 | |
Cash collateral on securities loaned at value | | | 6,381,287 | |
Payables: | | | | |
Investments purchased | | | 15,599 | |
Capital shares redeemed | | | 15,742 | |
Printing fees | | | 28,802 | |
Distribution fees | | | 53,364 | |
Transfer agent fees | | | 225,684 | |
Board realignment and consolidation | | | 2,860 | |
Investment advisory fees | | | 193,295 | |
Directors’ and Officer’s fees | | | 5,958 | |
Other affiliates | | | 710 | |
Other accrued expenses | | | 29,090 | |
| | | | |
Total liabilities | | | 6,961,758 | |
| | | | |
| |
NET ASSETS | | $ | 280,909,349 | |
| | | | |
| |
NET ASSETS CONSIST OF | | | | |
Paid-in capital | | $ | 274,674,630 | |
Accumulated earnings | | | 6,234,719 | |
| | | | |
NET ASSETS | | $ | 280,909,349 | |
| | | | |
|
NET ASSET VALUE | |
Class I — Based on net assets of $30,654,772 and 3,013,609 shares outstanding, 100 million shares authorized, $0.10 par value. | | $ | 10.17 | |
| | | | |
Class III — Based on net assets of $250,254,577 and 24,650,835 shares outstanding, 100 million shares authorized, $0.10 par value. | | $ | 10.15 | |
| | | | |
See notes to financial statements.
| | |
| 8 | | 2018 BLACKROCK ANNUAL REPORTTO SHAREHOLDERS |
Statement of Operations
Year Ended December 31, 2018
| | | | |
| | | BlackRock
Equity Dividend
V.I. Fund | |
| |
INVESTMENT INCOME | | | | |
Dividends — affiliated | | $ | 287,367 | |
Dividends — unaffiliated | | | 8,271,580 | |
Securities lending income — affiliated — net | | | 8,704 | |
Foreign taxes withheld | | | (76,017 | ) |
| | | | |
Total investment income | | | 8,491,634 | |
| | | | |
| |
EXPENSES | | | | |
Investment advisory | | | 1,915,442 | |
Distribution — class specific | | | 707,515 | |
Transfer agent — class specific | | | 654,406 | |
Accounting services | | | 59,954 | |
Professional | | | 44,211 | |
Printing | | | 40,908 | |
Directors and Officer | | | 21,328 | |
Custodian | | | 20,860 | |
Transfer agent | | | 5,001 | |
Board realignment and consolidation | | | 3,052 | |
Miscellaneous | | | 7,267 | |
| | | | |
Total expenses | | | 3,479,944 | |
Less: | | | | |
Fees waived and/or reimbursed by the Manager | | | (13,052 | ) |
Transfer agent fees waived and/or reimbursed — class specific | | | (654,406 | ) |
| | | | |
Total expenses after fees waived and/or reimbursed | | | 2,812,486 | |
| | | | |
Net investment income | | | 5,679,148 | |
| | | | |
| |
REALIZED AND UNREALIZED GAIN (LOSS) | | | | |
Net realized gain (loss) from: | | | | |
Investments — affiliated | | | 2,727 | |
Investments — unaffiliated | | | 21,328,525 | |
Foreign currency transactions | | | (4,327 | ) |
| | | | |
| | | 21,326,925 | |
| | | | |
Net change in unrealized appreciation (depreciation) on: | | | | |
Investments — affiliated | | | 43 | |
Investments — unaffiliated | | | (48,853,355 | ) |
Foreign currency translations | | | (563 | ) |
| | | | |
| | | (48,853,875 | ) |
| | | | |
Net realized and unrealized loss | | | (27,526,950 | ) |
| | | | |
NET DECREASE IN NET ASSETS RESULTING FROM OPERATIONS | | $ | (21,847,802 | ) |
| | | | |
See notes to financial statements.
Statements of Changes in Net Assets
| | | | | | | | |
| | | BlackRock Equity
Dividend V.I. Fund | |
| | | Year Ended December 31, | |
| | | 2018 | | | 2017 | |
| | |
INCREASE (DECREASE) IN NET ASSETS | | | | | | | | |
| | |
OPERATIONS | | | | | | | | |
Net investment income | | $ | 5,679,148 | | | $ | 4,765,364 | |
Net realized gain | | | 21,326,925 | | | | 18,274,738 | |
Net change in unrealized appreciation (depreciation) | | | (48,853,875 | ) | | | 22,925,712 | |
| | | | | | | | |
Net increase (decrease) in net assets resulting from operations | | | (21,847,802 | ) | | | 45,965,814 | |
| | | | | | | | |
| | |
DISTRIBUTIONS TO SHAREHOLDERS(a)(b) | | | | | | | | |
Class I | | | (3,195,948 | ) | | | (2,551,419 | ) |
Class III | | | (25,079,326 | ) | | | (18,682,486 | ) |
| | | | | | | | |
Decrease in net assets resulting from distributions to shareholders | | | (28,275,274 | ) | | | (21,233,905 | ) |
| | | | | | | | |
| | |
CAPITALSHARE TRANSACTIONS | | | | | | | | |
Net increase in net assets derived from capital share transactions | | | 5,893,147 | | | | 41,813,020 | |
| | | | | | | | |
| | |
NET ASSETS(b) | | | | | | | | |
Total increase (decrease) in net assets | | | (44,229,929 | ) | | | 66,544,929 | |
Beginning of year | | | 325,139,278 | | | | 258,594,349 | |
| | | | | | | | |
End of year | | $ | 280,909,349 | | | $ | 325,139,278 | |
| | | | | | | | |
| (a) | Distributions for annual periods determined in accordance with U.S. federal income tax regulations. |
| (b) | Prior year distribution character information and undistributed net investment income has been modified or removed to conform with current year RegulationS-X presentation changes. Refer to Note 11 for this prior year information. |
See notes to financial statements.
| | |
| 10 | | 2018 BLACKROCK ANNUAL REPORTTO SHAREHOLDERS |
Financial Highlights
(For a share outstanding throughout each period)
| | | | | | | | | | | | | | | | | | | | |
| | | BlackRock Equity Dividend V.I. Fund | |
| |
| | | Class I | |
| |
| | | Year Ended December 31, | |
| | | 2018 | | | 2017 | | | 2016 | | | 2015 | | | 2014 | |
| | | | | |
Net asset value, beginning of year | | $ | 12.14 | | | $ | 11.15 | | | $ | 10.04 | | | $ | 10.90 | | | $ | 10.78 | |
| | | | | | | | | | | | | | | | | | | | |
Net investment income(a) | | | 0.24 | | | | 0.22 | | | | 0.21 | | | | 0.19 | | | | 0.20 | |
Net realized and unrealized gain (loss) | | | (1.09 | ) | | | 1.62 | | | | 1.42 | | | | (0.25 | ) | | | 0.80 | |
| | | | | | | | | | | | | | | | | | | | |
Net increase (decrease) from investment operations | | | (0.85 | ) | | | 1.84 | | | | 1.63 | | | | (0.06 | ) | | | 1.00 | |
| | | | | | | | | | | | | | | | | | | | |
| | | | | |
| Distributions(b) | | | | | | | | | | | | | | | |
From net investment income | | | (0.24 | ) | | | (0.21 | ) | | | (0.19 | ) | | | (0.18 | ) | | | (0.20 | ) |
From net realized gain | | | (0.88 | ) | | | (0.64 | ) | | | (0.33 | ) | | | (0.62 | ) | | | (0.68 | ) |
| | | | | | | | | | | | | | | | | | | | |
Total distributions | | | (1.12 | ) | | | (0.85 | ) | | | (0.52 | ) | | | (0.80 | ) | | | (0.88 | ) |
| | | | | | | | | | | | | | | | | | | | |
| | | | | |
Net asset value, end of year | | $ | 10.17 | | | $ | 12.14 | | | $ | 11.15 | | | $ | 10.04 | | | $ | 10.90 | |
| | | | | | | | | | | | | | | | | | | | |
| | | | | |
Total Return(c) | | | | | | | | | | | | | | | | | | | | |
Based on net asset value | | | (7.16 | )% | | | 16.74 | % | | | 16.40 | % | | | (0.61 | )% | | | 9.34 | % |
| | | | | | | | | | | | | | | | | | | | |
| | | | | |
Ratios to Average Net Assets(d) | | | | | | | | | | | | | | | | | | | | |
Total expenses | | | 0.87 | % | | | 0.89 | % | | | 0.89 | % | | | 1.00 | % | | | 0.99 | % |
| | | | | | | | | | | | | | | | | | | | |
Total expenses after fees waived and/or reimbursed | | | 0.66 | % | | | 0.68 | % | | | 0.70 | % | | | 0.79 | % | | | 0.78 | % |
| | | | | | | | | | | | | | | | | | | | |
Net investment income | | | 2.00 | % | | | 1.82 | % | | | 1.98 | % | | | 1.79 | % | | | 1.81 | % |
| | | | | | | | | | | | | | | | | | | | |
| | | | | |
Supplemental Data | | | | | | | | | | | | | | | | | | | | |
Net assets, end of year (000) | | $ | 30,655 | | | $ | 37,525 | | | $ | 35,256 | | | $ | 30,527 | | | $ | 35,694 | |
| | | | | | | | | | | | | | | | | | | | |
Portfolio turnover rate | | | 37 | % | | | 37 | % | | | 23 | % | | | 25 | % | | | 18 | % |
| | | | | | | | | | | | | | | | | | | | |
| (a) | Based on average shares outstanding. |
| (b) | Distributions for annual periods determined in accordance with U.S. federal income tax regulations. |
| (c) | Where applicable, excludes insurance-related fees and expenses and assumes the reinvestment of distributions. |
| (d) | Excludes expenses incurred indirectly as a result of investments in underlying funds as follows: |
| | | | | | | | | | | | | | | | | | | | | | | | | | | | | | | | | | | | | | | | |
| | | Year Ended December 31, | |
| | | 2018 | | | | | | 2017 | | | | | | 2016 | | | | | | 2015 | | | | | | 2014 | | | | |
Investments in underlying funds | | | 0.01 | % | | | | | | | 0.01 | % | | | | | | | 0.01 | % | | | | | | | — | % | | | | | | | — | % | | | | |
| | | | | | | | | | | | | | | | | | | | | | | | | | | | | | | | | | | | | | | | |
See notes to financial statements.
Financial Highlights (continued)
(For a share outstanding throughout each period)
| | | | | | | | | | | | | | | | | | | | |
| | | BlackRock Equity Dividend V.I. Fund (continued) | |
| |
| | | Class III | |
| |
| | | Year Ended December 31, | |
| | | 2018 | | | 2017 | | | 2016 | | | 2015 | | | 2014 | |
| | | | | |
Net asset value, beginning of year | | $ | 12.12 | | | $ | 11.13 | | | $ | 10.03 | | | $ | 10.89 | | | $ | 10.77 | |
| | | | | | | | | | | | | | | | | | | | |
Net investment income(a) | | | 0.21 | | | | 0.19 | | | | 0.18 | | | | 0.17 | | | | 0.17 | |
Net realized and unrealized gain (loss) | | | (1.09 | ) | | | 1.62 | | | | 1.42 | | | | (0.25 | ) | | | 0.80 | |
| | | | | | | | | | | | | | | | | | | | |
Net increase (decrease) from investment operations | | | (0.88 | ) | | | 1.81 | | | | 1.60 | | | | (0.08 | ) | | | 0.97 | |
| | | | | | | | | | | | | | | | | | | | |
| | | | | |
| Distributions(b) | | | | | | | | | | | | | | | |
From net investment income | | | (0.21 | ) | | | (0.18 | ) | | | (0.17 | ) | | | (0.16 | ) | | | (0.17 | ) |
From net realized gain | | | (0.88 | ) | | | (0.64 | ) | | | (0.33 | ) | | | (0.62 | ) | | | (0.68 | ) |
| | | | | | | | | | | | | | | | | | | | |
Total distributions | | | (1.09 | ) | | | (0.82 | ) | | | (0.50 | ) | | | (0.78 | ) | | | (0.85 | ) |
| | | | | | | | | | | | | | | | | | | | |
| | | | | |
Net asset value, end of year | | $ | 10.15 | | | $ | 12.12 | | | $ | 11.13 | | | $ | 10.03 | | | $ | 10.89 | |
| | | | | | | | | | | | | | | | | | | | |
| | | | | |
Total Return(c) | | | | | | | | | | | | | | | | | | | | |
Based on net asset value | | | (7.42 | )% | | | 16.49 | % | | | 16.06 | % | | | (0.82 | )% | | | 9.07 | % |
| | | | | | | | | | | | | | | | | | | | |
| | | | | |
Ratios to Average Net Assets(d) | | | | | | | | | | | | | | | | | | | | |
Total expenses | | | 1.12 | % | | | 1.16 | % | | | 1.13 | % | | | 1.16 | % | | | 1.24 | % |
| | | | | | | | | | | | | | | | | | | | |
Total expenses after fees waived and/or reimbursed | | | 0.91 | % | | | 0.93 | % | | | 0.95 | % | | | 1.03 | % | | | 1.03 | % |
| | | | | | | | | | | | | | | | | | | | |
Net investment income | | | 1.75 | % | | | 1.57 | % | | | 1.73 | % | | | 1.59 | % | | | 1.56 | % |
| | | | | | | | | | | | | | | | | | | | |
| | | | | |
Supplemental Data | | | | | | | | | | | | | | | | | | | | |
Net assets, end of year (000) | | $ | 250,255 | | | $ | 287,615 | | | $ | 223,338 | | | $ | 85,163 | | | $ | 22,619 | |
| | | | | | | | | | | | | | | | | | | | |
Portfolio turnover rate | | | 37 | % | | | 37 | % | | | 23 | % | | | 25 | % | | | 18 | % |
| | | | | | | | | | | | | | | | | | | | |
| (a) | Based on average shares outstanding. |
| (b) | Distributions for annual periods determined in accordance with U.S. federal income tax regulations. |
| (c) | Where applicable, excludes insurance-related fees and expenses and assumes the reinvestment of distributions. |
| (d) | Excludes expenses incurred indirectly as a result of investments in underlying funds as follows: |
| | | | | | | | | | | | | | | | | | | | | | | | | | | | | | | | | | | | | | | | |
| | | Year Ended December 31, | |
| | | 2018 | | | | | | 2017 | | | | | | 2016 | | | | | | 2015 | | | | | | 2014 | | | | |
Investments in underlying funds | | | 0.01 | % | | | | | | | 0.01 | % | | | | | | | 0.01 | % | | | | | | | — | % | | | | | | | — | % | | | | |
| | | | | | | | | | | | | | | | | | | | | | | | | | | | | | | | | | | | | | | | |
See notes to financial statements.
| | |
| 12 | | 2018 BLACKROCK ANNUAL REPORTTO SHAREHOLDERS |
Notes to Financial Statements
BlackRock Variable Series Funds, Inc. (the “Company”) is registered under the Investment Company Act of 1940, as amended (the “1940 Act”), as anopen-end management investment company. The Company is organized as a Maryland corporation that is comprised of 15 separate portfolios. The funds offer shares to insurance companies for their separate accounts to fund benefits under certain variable annuity and variable life insurance contracts. The financial statements presented are for BlackRock Equity Dividend V.I. Fund (the “Fund”). The Fund is classified as diversified. Class I and Class III Shares have equal voting, dividend, liquidation and other rights, except that only shares of the respective classes are entitled to vote on matters concerning only that class. In addition, Class III Shares bear certain expenses related to the distribution of such shares.
The Fund, together with certain other registered investment companies advised by BlackRock Advisors, LLC (the “Manager”) or its affiliates, is included in a complex ofopen-end funds referred to as the Equity-Bond Complex.
| 2. | SIGNIFICANT ACCOUNTING POLICIES |
The financial statements are prepared in conformity with accounting principles generally accepted in the United States of America (“U.S. GAAP”), which may require management to make estimates and assumptions that affect the reported amounts of assets and liabilities in the financial statements, disclosure of contingent assets and liabilities at the date of the financial statements and the reported amounts of increases and decreases in net assets from operations during the reporting period. Actual results could differ from those estimates. The Fund is considered an investment company under U.S. GAAP and follows the accounting and reporting guidance applicable to investment companies. Below is a summary of significant accounting policies:
Investment Transactions and Income Recognition: For financial reporting purposes, investment transactions are recorded on the dates the transactions are entered into (the “trade dates”). Realized gains and losses on investment transactions are determined on the identified cost basis. Dividend income is recorded on theex-dividend date. Dividends from foreign securities where theex-dividend date may have passed are subsequently recorded when the Fund is informed of theex-dividend date. Under the applicable foreign tax laws, a withholding tax at various rates may be imposed on capital gains, dividends and interest. Upon notification from issuers, a portion of the dividend income received from a real estate investment trust may be redesignated as a reduction of cost of the related investment and/or realized gain. Income, expenses and realized and unrealized gains and losses are allocated daily to each class based on its relative net assets.
Foreign Currency Translation: The Fund’s books and records are maintained in U.S. dollars. Securities and other assets and liabilities denominated in foreign currencies are translated into U.S. dollars using exchange rates determined as of the close of trading on the New York Stock Exchange (“NYSE”). Purchases and sales of investments are recorded at the rates of exchange prevailing on the respective dates of such transactions. Generally, when the U.S. dollar rises in value against a foreign currency, the investments denominated in that currency will lose value; the opposite effect occurs if the U.S. dollar falls in relative value.
The Fund does not isolate the portion of the results of operations arising as a result of changes in the exchange rates from the changes in the market prices of investments held or sold for financial reporting purposes. Accordingly, the effects of changes in exchange rates on investments are not segregated in the Statement of Operations from the effects of changes in market prices of those investments, but are included as a component of net realized and unrealized gain (loss) from investments. The Fund reports realized currency gains (losses) on foreign currency related transactions as components of net realized gain (loss) for financial reporting purposes, whereas such components are generally treated as ordinary income for U.S. federal income tax purposes.
Distributions: Distributions paid by the Fund are recorded on theex-dividend date. Distributions of capital gains are recorded on the ex-dividend date and made at least annually. The character and timing of distributions are determined in accordance with U.S. federal income tax regulations, which may differ from U.S. GAAP.
Recent Accounting Standards:In August 2018, the Financial Accounting Standards Board issued Accounting Standards Update2018-13 “Changes to the Disclosure Requirements for Fair Value Measurement” which modifies disclosure requirements for fair value measurements. The guidance is effective for fiscal years beginning after December 15, 2019 and for interim periods within those fiscal years. Management is currently evaluating the impact of this guidance to the Fund.
Indemnifications: In the normal course of business, the Fund enters into contracts that contain a variety of representations that provide general indemnification. The Fund’s maximum exposure under these arrangements is unknown because it involves future potential claims against the Fund, which cannot be predicted with any certainty.
Other: Expenses directly related to the Fund or its classes are charged to the Fund or the applicable class. Other operating expenses shared by several funds, including other funds managed by the Manager, are prorated among those funds on the basis of relative net assets or other appropriate methods. Expenses directly related to the Fund and other shared expenses prorated to the Fund are allocated daily to each class based on its relative net assets or other appropriate methods.
| 3. | INVESTMENT VALUATION AND FAIR VALUE MEASUREMENTS |
Investment Valuation Policies: The Fund’s investments are valued at fair value (also referred to as “market value” within the financial statements) as of the close of trading on the NYSE (generally 4:00 p.m., Eastern time). U.S. GAAP defines fair value as the price the Fund would receive to sell an asset or pay to transfer a liability in an orderly transaction between market participants at the measurement date. The Fund determines the fair values of its financial instruments using various independent dealers or pricing services under policies approved by the Board of Directors of the Company (the “Board”). The BlackRock Global Valuation Methodologies Committee (the “Global Valuation Committee”) is the committee formed by management to develop global pricing policies and procedures and to oversee the pricing function for all financial instruments.
| | | | |
| NOTESTO FINANCIAL STATEMENTS | | | 13 | |
Notes to Financial Statements (continued)
Fair Value Inputs and Methodologies: The following methods and inputs are used to establish the fair value of the Fund’s assets and liabilities:
| | • | | Equity investments traded on a recognized securities exchange are valued at the official closing price each day, if available. For equity investments traded on more than one exchange, the official closing price on the exchange where the stock is primarily traded is used. Equity investments traded on a recognized exchange for which there were no sales on that day may be valued at the last available bid (long positions) or ask (short positions) price. |
Generally, trading in foreign instruments is substantially completed each day at various times prior to the close of trading on the NYSE. Occasionally, events affecting the values of such instruments may occur between the foreign market close and the close of trading on the NYSE that may not be reflected in the computation of the Fund’s net assets. Each business day, the Fund uses a pricing service to assist with the valuation of certain foreign exchange-traded equity securities and foreign exchange-traded andover-the-counter (“OTC”) options (the “Systematic Fair Value Price”). Using current market factors, the Systematic Fair Value Price is designed to value such foreign securities and foreign options at fair value as of the close of trading on the NYSE, which follows the close of the local markets.
| | • | | Investments inopen-end U.S. mutual funds are valued at net asset value (“NAV”) each business day. |
| | • | | The Fund values its investment in SL Liquidity Series, LLC, Money Market Series (the “Money Market Series”) at fair value, which is ordinarily based upon its pro rata ownership in the underlying fund’s net assets. The Money Market Series seeks current income consistent with maintaining liquidity and preserving capital. Although the Money Market Series is not registered under the 1940 Act, its investments may follow the parameters of investments by a money market fund that is subject to Rule2a-7 under the 1940 Act. |
If events (e.g., a company announcement, market volatility or a natural disaster) occur that are expected to materially affect the value of such investments, or in the event that the application of these methods of valuation results in a price for an investment that is deemed not to be representative of the market value of such investment, or if a price is not available, the investment will be valued by the Global Valuation Committee, or its delegate, in accordance with a policy approved by the Board as reflecting fair value (“Fair Valued Investments”). The fair valuation approaches that may be used by the Global Valuation Committee will include market approach, income approach and cost approach. Valuation techniques such as discounted cash flow, use of market comparables and matrix pricing are types of valuation approaches and are typically used in determining fair value. When determining the price for Fair Valued Investments, the Global Valuation Committee, or its delegate, seeks to determine the price that the Fund might reasonably expect to receive or pay from the current sale or purchase of that asset or liability in anarm’s-length transaction. Fair value determinations shall be based upon all available factors that the Global Valuation Committee, or its delegate, deems relevant and consistent with the principles of fair value measurement. The pricing of all Fair Valued Investments is subsequently reported to the Board or a committee thereof on a quarterly basis.
Fair Value Hierarchy: Various inputs are used in determining the fair value of investments. These inputs to valuation techniques are categorized into a fair value hierarchy consisting of three broad levels for financial statement purposes as follows:
| | • | | Level 1 — Unadjusted price quotations in active markets/exchanges for identical assets or liabilities that the Fund has the ability to access |
| | • | | Level 2 — Other observable inputs (including, but not limited to, quoted prices for similar assets or liabilities in markets that are active, quoted prices for identical or similar assets or liabilities in markets that are not active, inputs other than quoted prices that are observable for the assets or liabilities (such as interest rates, yield curves, volatilities, prepayment speeds, loss severities, credit risks and default rates) or other market–corroborated inputs) |
| | • | | Level 3 — Unobservable inputs based on the best information available in the circumstances, to the extent observable inputs are not available (including the Fund’s own assumptions used in determining the fair value of investments) |
The hierarchy gives the highest priority to unadjusted quoted prices in active markets for identical assets or liabilities (Level 1 measurements) and the lowest priority to unobservable inputs (Level 3 measurements). Accordingly, the degree of judgment exercised in determining fair value is greatest for instruments categorized in Level 3. The inputs used to measure fair value may fall into different levels of the fair value hierarchy. In such cases, for disclosure purposes, the fair value hierarchy classification is determined based on the lowest level input that is significant to the fair value measurement in its entirety. Investments classified within Level 3 have significant unobservable inputs used by the Global Valuation Committee in determining the price for Fair Valued Investments. Level 3 investments include equity or debt issued by privately held companies or funds. There may not be a secondary market, and/or there are a limited number of investors. Level 3 investments may also be adjusted to reflect illiquidity and/ornon-transferability, with the amount of such discount estimated by the Global Valuation Committee in the absence of market information.
Changes in valuation techniques may result in transfers into or out of an assigned level within the hierarchy. In accordance with the Fund’s policy, transfers between different levels of the fair value hierarchy are deemed to have occurred as of the beginning of the reporting period. The categorization of a value determined for investments is based on the pricing transparency of the investments and is not necessarily an indication of the risks associated with investing in those securities.
As of December 31, 2018, certain investments of the Fund were valued using NAV per share as no quoted market value is available and therefore have been excluded from the fair value hierarchy.
| 4. | SECURITIES AND OTHER INVESTMENTS |
Securities Lending: The Fund may lend its securities to approved borrowers, such as brokers, dealers and other financial institutions. The borrower pledges and maintains with the Fund collateral consisting of cash, an irrevocable letter of credit issued by a bank, or securities issued or guaranteed by the U.S. Government. The initial collateral received by the Fund is required to have a value of at least 102% of the current value of the loaned securities for securities traded on U.S. exchanges and a value of at least 105% for all other securities. The collateral is maintained thereafter at a value equal to at least 100% of the current market value of the securities on loan. The market value of the loaned securities is determined at the close of each business day of the Fund and any additional required collateral is delivered to the Fund, or excess collateral returned by the Fund, on the next business day. During the term of the loan, the Fund is entitled to all distributions made on or in respect of the loaned securities, but does not receive interest income on securities received as collateral. Loans of securities are terminable at any time and the borrower, after notice, is required to return borrowed securities within the standard time period for settlement of securities transactions.
| | |
| 14 | | 2018 BLACKROCK ANNUAL REPORTTO SHAREHOLDERS |
Notes to Financial Statements (continued)
The market value of any securities on loan, all of which were classified as common stocks in the Fund’s Schedule of Investments, and the value of any related collateral are shown separately in the Statement of Assets and Liabilities as a component of investments at value — unaffiliated, and collateral on securities loaned at value, respectively. As of period end, any securities on loan were collateralized by cash and/or U.S. Government obligations. Cash collateral invested by the securities lending agent, BlackRock Investment Management, LLC (“BIM”), if any, is disclosed in the Schedule of Investments.
Securities lending transactions are entered into by the Fund under Master Securities Lending Agreements (each, an “MSLA”), which provide the right, in the event of default (including bankruptcy or insolvency), for thenon-defaulting party to liquidate the collateral and calculate a net exposure to the defaulting party or request additional collateral. In the event that a borrower defaults, the Fund, as lender, would offset the market value of the collateral received against the market value of the securities loaned. When the value of the collateral is greater than that of the market value of the securities loaned, the lender is left with a net amount payable to the defaulting party. However, bankruptcy or insolvency laws of a particular jurisdiction may impose restrictions on or prohibitions against such a right of offset in the event of an MSLA counterparty’s bankruptcy or insolvency. Under the MSLA, absent an event of default, the borrower can resell orre-pledge the loaned securities, and the Fund can reinvest cash collateral received in connection with loaned securities. Upon an event of default, the parties’ obligations to return the securities or collateral to the other party are extinguished, and the parties can resell orre-pledge the loaned securities or the collateral received in connection with the loaned securities in order to satisfy the defaulting party’s net payment obligation for all transactions under the MSLA. The defaulting party remains liable for any deficiency.
As of period end, the following table is a summary of the Fund’s securities lending agreements by counterparty which are subject to offset under an MSLA:
| | | | | | | | | | | | |
| Counterparty | | Securities
Loaned at Value | | | Cash Collateral
Received (a) | | | Net
Amount | |
Citigroup Global Markets, Inc. | | $ | 698,984 | | | $ | (698,984 | ) | | $ | — | |
Credit Suisse Securities (USA) LLC | | | 486,340 | | | | (486,340 | ) | | | — | |
Deutsche Bank Securities Inc. | | | 629,460 | | | | (629,460 | ) | | | — | |
Fidelity Investments | | | 276,593 | | | | (276,593 | ) | | | — | |
JP Morgan Securities LLC | | | 2,556,545 | | | | (2,556,545 | ) | | | — | |
Morgan Stanley & Co. LLC | | | 1,000,350 | | | | (1,000,350 | ) | | | — | |
State Street Bank & Trust Co. | | | 625,258 | | | | (625,258 | ) | | | — | |
| | | | | | | | | | | | |
| | $ | 6,273,530 | | | $ | (6,273,530 | ) | | $ | — | |
| | | | | | | | | | | | |
| | (a) | Cash collateral with a value of $6,381,287 has been received in connection with securities lending agreements. Collateral received in excess of the value of securities loaned from the individual counterparty, if any, is not shown for financial reporting purposes in the table above. | |
The risks of securities lending include the risk that the borrower may not provide additional collateral when required or may not return the securities when due. To mitigate these risks, the Fund benefits from a borrower default indemnity provided by BIM. BIM’s indemnity allows for full replacement of the securities loaned if the collateral received does not cover the value on the securities loaned in the event of borrower default. The Fund could incur a loss if the value of an investment purchased with cash collateral falls below the market value of loaned securities or if the value of an investment purchased with cash collateral falls below the value of the original cash collateral received.
| 5. | INVESTMENT ADVISORY AGREEMENT AND OTHER TRANSACTIONS WITH AFFILIATES |
Investment Advisory: The Company, on behalf of the Fund, entered into an Investment Advisory Agreement with the Manager, the Fund’s investment adviser and an indirect, wholly-owned subsidiary of BlackRock, to provide investment advisory and administrative services. The Manager is responsible for the management of the Fund’s portfolio and provides the personnel, facilities, equipment and certain other services necessary to the operations of the Fund.
For such services, the Fund pays the Manager a monthly fee at an annual rate equal to the following percentages of the average daily value of the Fund’s net assets:
| | | | |
| Average Daily Net Assets | | Investment
Advisory Fees | |
First $1 Billion | | | 0.60 | % |
$1 Billion — $3 Billion | | | 0.56 | |
$3 Billion — $5 Billion | | | 0.54 | |
$5 Billion — $10 Billion | | | 0.52 | |
Greater than $10 Billion | | | 0.51 | |
Distribution Fees: The Company, on behalf of the Fund, entered into a Distribution Agreement and a Distribution Plan with BlackRock Investments, LLC (“BRIL”), an affiliate of the Manager. Pursuant to the Distribution Plan and in accordance with Rule12b-1 under the 1940 Act, the Fund pays BRIL ongoing distribution fees. The fees are accrued daily and paid monthly at annual rate 0.25% based upon the average daily net assets attributable to Class III.
BRIL and broker-dealers, pursuant tosub-agreements with BRIL, provide shareholder servicing and distribution services to the Fund. The ongoing service and/or distribution fee compensates BRIL and each broker-dealer for providing shareholder servicing and/or distribution related services to shareholders.
For the year ended December 31, 2018, the class specific distribution fees borne directly by class III were $707,515.
Transfer Agent: On behalf of the Fund, the Manager entered into agreements with insurance companies and other financial intermediaries (“Service Organizations”), some of which may be affiliates. Pursuant to these agreements, the Service Organizations provide the Fund with administrative, networking, recordkeeping,sub-transfer agency and shareholder services tosub-accounts they service. For these services, the Service Organizations receive an annual fee per shareholder account, which will vary depending on share class and/or net assets of Fund shareholders serviced by the Service Organizations which is shown as transfer agent – class specific. For the year ended December 31, 2018, the Fund did not pay any amounts to affiliates in return for these services.
| | | | |
| NOTESTO FINANCIAL STATEMENTS | | | 15 | |
Notes to Financial Statements (continued)
In addition, the Fund pays the transfer agent, which is not an affiliate, a fee for the issuance, transfer and redemption of shares and the opening and maintenance of shareholder accounts, which is included in transfer agent in the Statement of Operations.
For the year ended December 31, 2018, the following table shows the class specific transfer agent fees borne directly by each share class of the Fund:
| | | | | | | | | | | | | | |
| Class I | | | | | Class III | | | | | Total | |
| $ | 74,854 | | | | | $ | 579,552 | | | | | $ | 654,406 | |
Expense Limitations, Waivers and Reimbursements: With respect to the Fund, the Manager voluntarily agreed to waive its investment advisory fees by the amount of investment advisory fees the Fund pays to the Manager indirectly through its investment in affiliated money market funds (the “affiliated money market fund waiver”). The amount of waivers and/or reimbursements of fees and expenses made pursuant to the expense limitation described below will be reduced by the amount of the affiliated money market fund waiver. This amount is included in as fees waived and/or reimbursed by the Manager in the Statement of Operations. For the year ended December 31 2018, the amount waived was $13,052.
The Manager has contractually agreed to waive its investment advisory fee with respect to any portion of the Fund’s assets invested in affiliated equity and fixed-income mutual funds and affiliated exchange-traded funds that have a contractual management fee through April 30, 2019. The contractual agreement may be terminated upon 90 days’ notice by a majority of the directors who are not “interested persons” of the Fund, as defined in the 1940 Act (“Independent Directors”), or by a vote of a majority of the outstanding voting securities of the Fund. For the year ended December 31, 2018, there were no fees waived and/or reimbursed by the Manager pursuant to this arrangement.
For the year ended December 31, 2018, the Fund reimbursed the Manager $4,292 for certain accounting services, which is included in accounting services in the Statement of Operations.
The Manager has contractually agreed to reimburse all transfer agent fees for Class I and III. The Manager has agreed not to reduce or discontinue this contractual reimbursement through April 30, 2019, unless approved by the Board, including a majority of the Independent Directors, or by a vote of a majority of the outstanding voting securities of the Fund.
These amounts waived and/or reimbursed are shown as transfer agent fees waived and/or reimbursed — class specific in the Statement of Operations. For the year ended December 31, 2018, class specific waivers and/or reimbursements were as follows:
| | | | | | | | | | | | |
| | | Class I | | | Class III | | | Total | |
Transfer Agent Fees Waived and/or Reimbursed | | $ | 74,854 | | | $ | 579,552 | | | $ | 654,406 | |
With respect to the Fund, the Manager contractually agreed to waive and/or reimburse fees or expenses in order to limit expenses, excluding interest expense, dividend expense, tax expense, acquired fund fees and expenses, and certain other fund expenses, which constitute extraordinary expenses not incurred in the ordinary course of the Fund’s business (“expense limitation”). The expense limitations as a percentage of average daily net assets are as follows:
| | | | |
| Class I | | | Class III |
| | 1.25% | | | 1.50% |
The Manager has agreed not to reduce or discontinue this contractual expense limitation through April 30, 2019, unless approved by the Board, including a majority of the Independent Directors, or by a vote of a majority of the outstanding voting securities of the Fund. For the year ended December 31, 2018, there were no fees waived and/or reimbursed by the Manager.
Securities Lending: The U.S. Securities and Exchange Commission (“SEC”) has issued an exemptive order which permits BIM, an affiliate of the Manager, to serve as securities lending agent for the Fund, subject to applicable conditions. As securities lending agent, BIM bears all operational costs directly related to securities lending. The Fund is responsible for expenses in connection with the investment of cash collateral received for securities on loan (the “collateral investment expenses”). The cash collateral is invested in a private investment company managed by the Manager or its affiliates. However, BIM has agreed to cap the collateral investment expenses of the private investment company to an annual rate of 0.04%. The investment adviser to the private investment company will not charge any advisory fees with respect to shares purchased by the Fund. The private investment company in which the cash collateral has been invested may, under certain circumstances, impose a liquidity fee of up to 2% of the value withdrawn or temporarily restrict withdrawals for up to 10 business days during a 90 day period, in the event that the private investment company’s weekly liquid assets fall below certain thresholds.
Securities lending income is equal to the total of income earned from the reinvestment of cash collateral, net of fees and other payments to and from borrowers of securities, and less the collateral investment expenses. The Fund retains a portion of securities lending income and remits a remaining portion to BIM as compensation for its services as securities lending agent.
Pursuant to a securities lending agreement, the Fund retains 71.5% of securities lending income, and this amount retained can never be less than 65% of the total of securities lending income plus the collateral investment expenses.
In addition, commencing the business day following the date that the aggregate securities lending income earned across the Equity-Bond Complex in a calendar year exceeds a specified threshold, the Fund, pursuant to the securities lending agreement, will retain for the remainder of that calendar year securities lending income in an amount equal to 75% of securities lending income, and this amount retained can never be less than 65% of the total of securities lending income plus the collateral investment expenses.
The share of securities lending income earned by the Fund is shown as securities lending income — affiliated — net in the Statement of Operations. For the year ended December 31, 2018, the Fund paid BIM $3,186 for securities lending agent services.
| | |
| 16 | | 2018 BLACKROCK ANNUAL REPORTTO SHAREHOLDERS |
Notes to Financial Statements (continued)
Interfund Lending: In accordance with an exemptive order (the “Order”) from the SEC, the Fund may participate in a joint lending and borrowing facility for temporary purposes (the “Interfund Lending Program”), subject to compliance with the terms and conditions of the Order, and to the extent permitted by the Fund’s investment policies and restrictions. The Fund is currently permitted to borrow under the Interfund Lending Program.
A lending BlackRock fund may lend in aggregate up to 15% of its net assets, but may not lend more than 5% of its net assets to any one borrowing fund through the Interfund Lending Program. A borrowing BlackRock fund may not borrow through the Interfund Lending Program or from any other source more than 33 1/3% of its total assets (or any lower threshold provided for by the fund’s investment restrictions). If a borrowing BlackRock fund’s total outstanding borrowings exceed 10% of its total assets, each of its outstanding interfund loans will be subject to collateralization of at least 102% of the outstanding principal value of the loan. All interfund loans are for temporary or emergency purposes and the interest rate to be charged will be the average of the highest current overnight repurchase agreement rate available to a lending fund and the bank loan rate, as calculated according to a formula established by the Board.
During the year ended December 31, 2018, the Fund did not participate in the Interfund Lending Program.
Directors and Officers: Certain directors and/or officers of the Company are directors and/or officers of BlackRock or its affiliates. The Fund reimburses the Manager for a portion of the compensation paid to the Company’s Chief Compliance Officer, which is included in Directors and Officer in the Statement of Operations.
Other Transactions: The Fund may purchase securities from, or sell securities to, an affiliated fund provided the affiliation is due solely to having a common investment adviser, common officers, or common directors. For the year ended December 31, 2018, the purchase and sale transactions and any net realized gains (losses) with affiliated funds in compliance with Rule17a-7 under the 1940 Act were as follows:
| | | | |
Purchases | | $ | 662,262 | |
Sales | | | — | |
Net Realized Gain (Loss) | | | — | |
For the year ended December 31, 2018, purchases and sales of investments, excluding short-term securities, were $110,845,115 and $132,522,298, respectively.
It is the Fund’s policy to comply with the requirements of the Internal Revenue Code of 1986, as amended, applicable to regulated investment companies, and to distribute substantially all of its taxable income to its shareholders. Therefore, no U.S. federal income tax provision is required.
The Fund files U.S. federal and various state and local tax returns. No income tax returns are currently under examination. The statute of limitations on the Fund’s U.S. federal tax returns generally remains open for each of the four years ended December 31, 2018. The statutes of limitations on the Fund’s state and local tax returns may remain open for an additional year depending upon the jurisdiction.
Management has analyzed tax laws and regulations and their application to the Fund as of December 31, 2018, inclusive of the open tax return years, and does not believe that there are any uncertain tax positions that require recognition of a tax liability in the Fund’s financial statements.
The tax character of distributions paid was as follows:
| | | | | | | | |
| | | 12/31/18 | | | 12/31/17 | |
Ordinary income | | $ | 8,234,625 | | | $ | 7,150,173 | |
Long term capital gains | | | 20,040,649 | | | | 14,083,732 | |
| | | | | | | | |
| | $ | 28,275,274 | | | $ | 21,233,905 | |
| | | | | | | | |
As of period end, the tax components of accumulated earnings were as follows:
| | | | |
Undistributed long-term capital gains | | $ | 3,221,139 | |
Net unrealized gains(a) | | | 3,013,580 | |
| | | | |
| | $ | 6,234,719 | |
| | | | |
| | (a) | The difference between book-basis and tax-basis net unrealized gains was attributable primarily to the tax deferral of losses on wash sales and the timing and recognition of partnership income. | |
As of December 31, 2018, gross unrealized appreciation and depreciation for investments based on cost for U.S. federal income tax purposes were as follows:
| | | | |
Tax cost . . . . . . . . . . . . . . . . . . . . .. . . . . . . . . . . .. . . . . . . . . . . . . . . . . . . . . . . . . . . . . . | | $ | 284,359,997 | |
| | | | |
Gross unrealized appreciation . . . . . . . . . .. . . . . . . . . . . . . . . . . . . . . . . . . . . . . . .. . . . . | | $ | 26,550,315 | |
Gross unrealized depreciation . . . . . . . . . . . . . . . . . . . . . . . . . . . . . . . . . . . . . . . . .. . . . | | | (23,575,259 | ) |
| | | | |
Net unrealized appreciation . . . . . . . . . . . . . . . . . . . . . . . . . . . . . . . . . . | | $ | 2,975,056 | |
| | | | |
| | | | |
| NOTESTO FINANCIAL STATEMENTS | | | 17 | |
Notes to Financial Statements (continued)
The Company, on behalf of the Fund, along with certain other funds managed by the Manager and its affiliates (“Participating Funds”), is a party to a364-day, $2.25 billion credit agreement with a group of lenders. Under this agreement, the Fund may borrow to fund shareholder redemptions. Excluding commitments designated for certain individual funds, the Participating Funds, including the Fund, can borrow up to an aggregate commitment amount of $1.75 billion at any time outstanding, subject to asset coverage and other limitations as specified in the agreement. The credit agreement has the following terms: a fee of 0.10% per annum on unused commitment amounts and interest at a rate equal to the higher of(a) one-month LIBOR (but, in any event, not less than 0.00%) on the date the loan is made plus 0.80% per annum or (b) the Fed Funds rate (but, in any event, not less than 0.00%) in effect from time to time plus 0.80% per annum on amounts borrowed. The agreement expires in April 2019 unless extended or renewed. Prior to April 19, 2018, the aggregate commitment amount was $2.1 billion and the fee was 0.12% per annum. Participating Funds paid an upfront commitment fee of 0.02% on the total commitment amounts, in addition to administration, legal and arrangement fees, which are included in miscellaneous expenses in the Statement of Operations. These fees were allocated among such funds based upon portions of the aggregate commitment available to them and relative net assets of Participating Funds. During the year ended December 31, 2018, the Fund did not borrow under the credit agreement.
In the normal course of business, the Fund invests in securities or other instruments and may enter into certain transactions, and such activities subject the Fund to various risks, including among others, fluctuations in the market (market risk) or failure of an issuer to meet all of its obligations. The value of securities or other instruments may also be affected by various factors, including, without limitation: (i) the general economy; (ii) the overall market as well as local, regional or global political and/or social instability; (iii) regulation, taxation or international tax treaties between various countries; or (iv) currency, interest rate and price fluctuations. The Fund’s prospectus provides details of the risks to which the Fund is subject.
The Fund may be exposed to additional risks when reinvesting cash collateral in money market funds that do not seek to maintain a stable NAV per share of $1.00, which may be subject to redemption gates or liquidity fees under certain circumstances.
Valuation Risk: The market values of equities, such as common stocks and preferred securities or equity related investments, such as futures and options, may decline due to general market conditions which are not specifically related to a particular company. They may also decline due to factors which affect a particular industry or industries. The Fund may invest in illiquid investments and may experience difficulty in selling those investments in a timely manner at the price that it believes the investments are worth. Prices may fluctuate widely over short or extended periods in response to company, market or economic news. Markets also tend to move in cycles, with periods of rising and falling prices. This volatility may cause the Fund’s NAV to experience significant increases or decreases over short periods of time. If there is a general decline in the securities and other markets, the NAV of the Fund may lose value, regardless of the individual results of the securities and other instruments in which the Fund invests.
Counterparty Credit Risk: Similar to issuer credit risk, the Fund may be exposed to counterparty credit risk, or the risk that an entity may fail to or be unable to perform on its commitments related to unsettled or open transactions. The Fund manages counterparty credit risk by entering into transactions only with counterparties that the Manager believes have the financial resources to honor their obligations and by monitoring the financial stability of those counterparties. Financial assets, which potentially expose the Fund to market, issuer and counterparty credit risks, consist principally of financial instruments and receivables due from counterparties. The extent of the Fund’s exposure to market, issuer and counterparty credit risks with respect to these financial assets is approximately their value recorded in the Statement of Assets and Liabilities, less any collateral held by the Fund.
| 10. | CAPITAL SHARE TRANSACTIONS |
Transactions in capital shares for each class were as follows:
| | | | | | | | | | | | | | | | |
| | | Year Ended
12/31/2018 | | | Year Ended
12/31/2017 | |
| | | Shares | | | Amount | | | Shares | | | Amount | |
Class I | | | | | | | | | | | | | | | | |
Shares sold | | | 328,463 | | | $ | 3,936,049 | | | | 305,267 | | | $ | 3,599,163 | |
Shares issued in reinvestment of distributions | | | 301,112 | | | | 3,195,948 | | | | 211,779 | | | | 2,551,419 | |
Shares redeemed | | | (707,195 | ) | | | (8,566,862 | ) | | | (588,300 | ) | | | (6,980,961 | ) |
| | | | | | | | | | | | | | | | |
Net decrease | | | (77,620 | ) | | $ | (1,434,865 | ) | | | (71,254 | ) | | $ | (830,379 | ) |
| | | | | | | | | | | | | | | | |
Class III | | | | | | | | | | | | | | | | |
Shares sold | | | 2,172,331 | | | $ | 26,271,559 | | | | 4,790,801 | | | $ | 55,321,887 | |
Shares issued in reinvestment of distributions | | | 2,377,041 | | | | 25,079,326 | | | | 1,552,013 | | | | 18,682,485 | |
Shares redeemed | | | (3,636,671 | ) | | | (44,022,873 | ) | | | (2,671,545 | ) | | | (31,360,973 | ) |
| | | | | | | | | | | | | | | | |
Net increase | | | 912,701 | | | $ | 7,328,012 | | | | 3,671,269 | | | $ | 42,643,399 | |
| | | | | | | | | | | | | | | | |
Total Net Increase | | | 835,081 | | | $ | 5,893,147 | | | | 3,600,015 | | | $ | 41,813,020 | |
| | | | | | | | | | | | | | | | |
| 11. | REGULATIONS-X AMENDMENTS |
On August 17, 2018, the SEC adopted amendments to certain disclosure requirements in Securities Act ReleaseNo. 33-10532, Disclosure Update and Simplification. The Fund has adopted the amendments pertinent to RegulationS-X in this shareholder report. The amendments impacted certain disclosure presentation on the Statement of Assets and Liabilities, Statements of Changes in Net Assets and Notes to the Financial Statements.
| | |
| 18 | | 2018 BLACKROCK ANNUAL REPORTTO SHAREHOLDERS |
Notes to Financial Statements (continued)
Prior year distribution information and undistributed net investment income in the Statements of Changes in Net Assets has been modified to conform to the current year presentation in accordance with the RegulationS-X changes.
Distributions for the year ended December 31, 2017 were classified as follows:
| | | | | | | | |
| Share Class | | Net Investment Income | | | Net Realized Gain | |
Class I | | $ | (645,417 | ) | | $ | (1,906,002 | ) |
Class III | | | (4,129,646 | ) | | | (14,552,840 | ) |
Undistributed net investment income as of December 31, 2017 was $12,724.
Management has evaluated the impact of all subsequent events on the Fund through the date the financial statements were issued and has determined that there were no subsequent events requiring adjustment or additional disclosure in the financial statements.
| | | | |
| NOTESTO FINANCIAL STATEMENTS | | | 19 | |
Report of Independent Registered Public Accounting Firm
To the Shareholders of BlackRock Equity Dividend V.I. Fund and the Board of Directors of BlackRock Variable Series Funds, Inc.:
Opinion on the Financial Statements and Financial Highlights
We have audited the accompanying statement of assets and liabilities of BlackRock Equity Dividend V.I. Fund of BlackRock Variable Series Funds, Inc. (the “Fund”), including the schedule of investments, as of December 31, 2018, the related statement of operations for the year then ended, the statements of changes in net assets for each of the two years in the period then ended, the financial highlights for each of the five years in the period then ended, and the related notes. In our opinion, the financial statements and financial highlights present fairly, in all material respects, the financial position of the Fund as of December 31, 2018, and the results of its operations for the year then ended, the changes in its net assets for each of the two years in the period then ended, and the financial highlights for each of the five years in the period then ended, in conformity with accounting principles generally accepted in the United States of America.
Basis for Opinion
These financial statements and financial highlights are the responsibility of the Fund’s management. Our responsibility is to express an opinion on the Fund’s financial statements and financial highlights based on our audits. We are a public accounting firm registered with the Public Company Accounting Oversight Board (United States) (PCAOB) and are required to be independent with respect to the Fund in accordance with the U.S. federal securities laws and the applicable rules and regulations of the Securities and Exchange Commission and the PCAOB.
We conducted our audits in accordance with the standards of the PCAOB. Those standards require that we plan and perform the audit to obtain reasonable assurance about whether the financial statements and financial highlights are free of material misstatement, whether due to error or fraud. The Fund is not required to have, nor were we engaged to perform, an audit of its internal control over financial reporting. As part of our audits we are required to obtain an understanding of internal control over financial reporting but not for the purpose of expressing an opinion on the effectiveness of the Fund’s internal control over financial reporting. Accordingly, we express no such opinion.
Our audits included performing procedures to assess the risks of material misstatement of the financial statements and financial highlights, whether due to error or fraud, and performing procedures that respond to those risks. Such procedures included examining, on a test basis, evidence regarding the amounts and disclosures in the financial statements and financial highlights. Our audits also included evaluating the accounting principles used and significant estimates made by management, as well as evaluating the overall presentation of the financial statements and financial highlights. Our procedures included confirmation of securities owned as of December 31, 2018, by correspondence with the custodian and brokers; when replies were not received from brokers, we performed other auditing procedures. We believe that our audits provide a reasonable basis for our opinion.
Deloitte & Touche LLP
Boston, Massachusetts
February 15, 2019
We have served as the auditor of one or more BlackRock investment companies since 1992.
| | |
| 20 | | 2018 BLACKROCK ANNUAL REPORTTO SHAREHOLDERS |
Glossary of Terms Used in this Report
| | |
| Portfolio Abbreviations |
| |
| ADR | | American Depositary Receipt |
| |
| GDR | | Global Depositary Receipts |
| |
| NYRS | | New York Registered Shares |
| | | | |
| GLOSSARYOF TERMS USEDINTHIS REPORT | | | 21 | |
DECEMBER 31, 2018
| | |
ANNUAL REPORT | |  |
BlackRock Variable Series Funds, Inc.
| Ø | | BlackRock Global Allocation V.I. Fund |
|
| Not FDIC Insured • May Lose Value • No Bank Guarantee |
| | |
| Fund Summary as of December 31, 2018 | | BlackRock Global Allocation V.I. Fund |
Investment Objective
BlackRock Global Allocation V.I. Fund’s (the “Fund”) investment objective is to seek high total investment return.
Portfolio Management Commentary
How did the Fund perform?
For the12-month period ended December 31, 2018, the Fund underperformed its Reference Benchmark and outperformed the broad-basedall-equity benchmark, the FTSE World Index. The Reference Benchmark is comprised as follows: 36% S&P 500® Index; 24% FTSE World(ex-U.S.) Index; 24% ICE BofAML Current5-Year U.S. Treasury Index; and 16% FTSE Non-U.S. Dollar World Government Bond Index. The Fund invests in both equities and bonds, and therefore, Fund management believes that the Reference Benchmark provides a more accurate representation of the Fund’s composition and a more comparable means for measurement. The following discussion of relative performance pertains to the Reference Benchmark. The following commentary (and referenced allocation percentages) are based on the economic exposures of the Fund, which reflect adjustments for futures, swaps and options (except with respect to fixed income securities), and convertible bonds, and may vary relative to the market value.
What factors influenced performance?
Within equities, an overweight to Japan and underweight to the United States detracted from performance. In Europe, exposure to financials negatively influenced returns. From a sector perspective, an overweight to and stock selection within energy weighed on returns, as did stock selection within information technology (“IT”), health care, consumer discretionary, materials and real estate. Broadly speaking, an underweight to fixed income negatively impacted returns. Within fixed income, an overweight stance with respect to U.S. duration (and corresponding sensitivity to interest rate changes) weighed on performance, as did exposure to select emerging market government bonds. Exposure to commodity-related securities detracted as well. In terms of currency management, an overweight to the Indian rupee negatively impacted performance.
Within equities, an overweight to India positively impacted returns. From a sector perspective, overweights to health care and IT and underweights to consumer staples, financials and industrials contributed to performance. Stock selection within utilities and industrials was additive. The Fund’s performance also benefited from exposure to cash and cash equivalents. With respect to currency exposure, an underweight to the euro and an overweight to the U.S. dollar contributed to performance.
The Fund uses derivatives, which may include options, futures, swaps, and forward contracts both to seek to enhance returns of the Fund and to hedge (or protect) against adverse movements in currency exchange rates, interest rates, and movements in the securities markets. During the period, the Fund’s use of derivatives detracted from its performance.
Describe recent portfolio activity.
During the12-month period, the Fund’s overall equity allocation decreased from 62% to 58% of net assets. Within equities, the Fund decreased exposure to Europe, notably the United Kingdom, Germany and France, and increased exposure to Canada and Brazil. From a sector perspective, the Fund decreased exposure to IT, financials, industrials and consumer discretionary, and increased exposure to health care, consumer staples and communication services.
The Fund’s overall allocation to fixed income increased from 30% to 31% of net assets. Within fixed income, the Fund increased exposure to government bonds and corporate credit.
The Fund’s allocation to commodity-related securities decreased from 4% to 2% of net assets.
Reflecting the above changes, the Fund’s holdings of cash and cash equivalents increased from 4% to 9% of net assets. During the12-month period, the Fund’s cash position helped mitigate portfolio volatility and served as a source of funds for new investments and redemptions.
Describe portfolio positioning at period end.
Relative to its Reference Benchmark, the Fund was underweight in equities and fixed income, and overweight in commodity-related securities and cash equivalents. Within equities, the Fund was overweight in Asia and underweight in the United States and Europe. Within Asia, the Fund was overweight in Japan, China and India, and underweight in Australia. Within Europe, the Fund was overweight in the Netherlands and underweight in the United Kingdom, Germany and Switzerland. From a sector perspective, the Fund was overweight in communication services, energy and health care, and was underweight in financials, IT, industrials and consumer discretionary. Within fixed income, the Fund was underweight in developed market government bonds and overweight in corporate debt. With respect to currency exposure, the Fund was overweight in the U.S. dollar, Indian rupee and Hong Kong dollar, and underweight in the euro, Australian dollar, Swiss franc and British pound.
The views expressed reflect the opinions of BlackRock as of the date of this report and are subject to change based on changes in market, economic or other conditions. These views are not intended to be a forecast of future events and are no guarantee of future results.
| | |
| 2 | | 2018 BLACKROCK ANNUAL REPORTTO SHAREHOLDERS |
| | |
| Fund Summary as of December 31, 2018 (continued) | | BlackRock Global Allocation V.I. Fund |
TOTAL RETURN BASED ON A $10,000 INVESTMENT
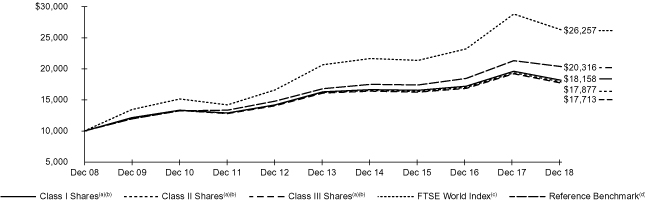
| (a) | Assuming transaction costs, if any, and other operating expenses, including investment advisory fees. Does not include insurance-related fees and expenses. |
| (b) | The Fund invests in a portfolio of U.S. and foreign equity securities, debt and money market securities, the combination of which will be varied from time to time with respect to types of securities and markets in response to changing markets and economic trends. |
| (c) | This unmanaged capitalization-weighted index is comprised of 2,602 equities from 35 countries in 4 regions, including the United States. |
| (d) | The Reference Benchmark is an unmanaged weighted index comprised as follows: 36% S&P 500® Index; 24% FTSE World (ex U.S.) Index; 24% ICE BofAML Current5-Year U.S. Treasury Index; and 16% FTSENon-U.S. Dollar World Government Bond Index. |
Performance Summary for the Period Ended December 31, 2018
| | | | | | | | | | | | | | | | | | | | |
| | | 6-Month
Total Returns (b) | | | | | | Average Annual Total Returns | |
| | | | | | 1 Year (b) | | | 5 Years (b) | | | 10 Years (b) | |
Class I(a) | | | (5.92 | )% | | | | | | | (7.34 | )% | | | 2.18 | % | | | 6.15 | % |
Class II(a) | | | (5.99 | ) | | | | | | | (7.52 | ) | | | 2.02 | | | | 5.98 | |
Class III(a) | | | (6.06 | ) | | | | | | | (7.58 | ) | | | 1.94 | | | | 5.88 | |
FTSE World Index | | | (8.72 | ) | | | | | | | (8.77 | ) | | | 4.91 | | | | 10.13 | |
Reference Benchmark | | | (4.47 | ) | | | | | | | (4.68 | ) | | | 3.87 | | | | 7.35 | |
U.S. Stocks: S&P 500® Index(c) | | | (6.85 | ) | | | | | | | (4.38 | ) | | | 8.49 | | | | 13.12 | |
Non-U.S. Stocks: FTSE World(ex-U.S.) Index(d) | | | (10.68 | ) | | | | | | | (13.81 | ) | | | 1.08 | | | | 7.05 | |
U.S. Bonds: ICE BofAML Current5-Year U.S. Treasury Index(e) | | | 2.56 | | | | | | | | 1.46 | | | | 1.42 | | | | 2.09 | |
Non U.S. Bonds: FTSENon-U.S. Dollar World Government Bond Index(f) | | | (0.91 | ) | | | | | | | (1.82 | ) | | | 0.28 | | | | 1.27 | |
| | (a) | Average annual and cumulative total returns are based on changes in net asset value for the periods shown and assume reinvestment of all distributions at net asset value on theex-dividend. Insurance-related fees and expenses are not reflected in these returns. | |
| | (b) | For a portion of the period, the Fund’s investment adviser waived a portion of its fees. Without such waiver, the Fund’s performance would have been lower. | |
| | (c) | This unmanaged index covers 500 leading companies and captures approximately 80% coverage of available market capitalization. | |
| | (d) | This unmanaged capitalization-weighted index is comprised of 1,979 equities from 34 countries, excluding the United States. | |
| | (e) | This unmanaged index is designed to track the total return of the current coupon five-year U.S. Treasury bond. | |
| | (f) | This unmanaged market capitalization-weighted index tracks 22 government bond indexes, excluding the United States. | |
Past performance is not indicative of future results. Performance results do not reflect the deduction of taxes that a shareholder would pay on Fund distributions or the redemption of Fund shares.
Performance results may include adjustments made for financial reporting purposes in accordance with U.S. generally accepted accounting principles.
| | |
| Fund Summary as of December 31, 2018 (continued) | | BlackRock Global Allocation V.I. Fund |
Expense Example
| | | | | | | | | | | | | | | | | | | | | | | | | | | | | | | | | | | | | | | | |
| | | Actual | | | | | | Hypothetical (a) | |
| | | | | | | | | Including
Dividend
Expense and
Broker Fees and
Expenses on
Short Sales | | | Excluding
Dividend
Expense and
Broker Fees and
Expenses on
Short Sales | | | | | | | | | Including
Dividend
Expense and
Broker Fees and
Expenses on
Short Sales | | | Excluding
Dividend
Expense and
Broker Fees and
Expenses on
Short Sales | |
| | | Beginning
Account Value
(07/01/18) | | | Ending
Account Value
(12/31/18) | | | Expenses Paid During the Period (b) | | | Expenses
Paid During
the Period (c) | | | | | | Beginning
Account Value
(07/01/18) | | | Ending
Account Value
(12/31/18) | | | Expenses
Paid During
the Period (b) | | | Ending
Account Value
(12/31/18) | | | Expenses
Paid During
the Period (c) | |
Class I | | $ | 1,000.00 | | | $ | 940.80 | | | $ | 3.67 | | | $ | 3.62 | | | | | | | $ | 1,000.00 | | | $ | 1,021.42 | | | $ | 3.82 | | | $ | 1,021.48 | | | $ | 3.77 | |
Class II | | | 1,000.00 | | | | 940.10 | | | | 4.40 | | | | 4.35 | | | | | | | | 1,000.00 | | | | 1,020.67 | | | | 4.58 | | | | 1,020.72 | | | | 4.53 | |
Class III | | | 1,000.00 | | | | 939.40 | | | | 4.89 | | | | 4.84 | | | | | | | | 1,000.00 | | | | 1,020.16 | | | | 5.09 | | | | 1,020.21 | | | | 5.04 | |
| | (a) | Hypothetical 5% annual return before expenses is calculated by prorating the number of days in the most recent fiscal half year divided by 365. | |
| | (b) | For each class of the Fund, expenses are equal to the annualized expense ratio for the class (0.75% for Class I, 0.90% for Class II and 1.00% for Class III), multiplied by the average account value over the period, multiplied by 184/365 (to reflect theone-half year period shown). | |
| | (c) | For each class of the Fund, expenses are equal to the annualized expense ratio for the class (0.74% for Class I, 0.89% for Class II and 0.99% for Class III), multiplied by the average account value over the period, multiplied by 184/365 (to reflect theone-half year period shown). | |
See “Disclosure of Expenses” on the following page for further information on how expenses were calculated.
Overall Asset Exposure
| | | | | | | | | | | | |
| | | Percent of Fund’s
Net Assets (a) | | | Reference
Benchmark (b) Percentage | |
| Portfolio Composition | | 12/31/2018 | | | 12/31/2017 | |
U.S. Equities | | | 32 | % | | | 32 | % | | | 35 | % |
European Equities | | | 9 | | | | 15 | | | | 12 | |
Asia Pacific Equities | | | 14 | | | | 14 | | | | 10 | |
Other Equities | | | 3 | | | | 1 | | | | 3 | |
| | | | | | | | | | | | |
Total Equities | | | 58 | | | | 62 | | | | 60 | |
| | | | | | | | | | | | |
U.S Dollar Denominated Fixed Income Securities | | | 29 | | | | 22 | | | | 24 | |
U.S. Issuers | | | 27 | | | | 19 | | | | — | |
Non-U.S. Issuers | | | 2 | | | | 3 | | | | — | |
Non-U.S Dollar Denominated Fixed Income Securities | | | 2 | | | | 8 | | | | 16 | |
| | | | | | | | | | | | |
Total Fixed Income Securities | | | 31 | | | | 30 | | | | 40 | |
| | | | | | | | | | | | |
Commodity-Related Securities | | | 2 | | | | 4 | | | | | |
| | | | | | | | | | | | |
Cash & Short-Term Securities | | | 9 | | | | 4 | | | | — | |
| | | | | | | | | | | | |
| | (a) | Exposure based on market value and adjusted for the economic value of futures, swaps and options (except with respect to fixed income securities), and convertible bonds. | |
| | (b) | The Reference Benchmark is an unmanaged weighted index comprised as follows: 36% of the S&P 500 Index®; 24% FTSE World (ex U.S.) Index; 24% ICE BofA Merrill Current5-Year U.S. Treasury Index; and 16% FTSENon-U.S. Dollar World Government Bond Index. Descriptions of these indexes are found on page 5 of this report to shareholders in the “Performance Summary” section. | |
| | |
| 4 | | 2018 BLACKROCK ANNUAL REPORTTO SHAREHOLDERS |
Shareholders of the Fund may incur the following charges: (a) transactional expenses; and (b) operating expenses, including investment advisory fees, service and distribution fees, including12b-1 fees, acquired fund fees and expenses, and other fund expenses. The expense example shown on the previous page (which is based on a hypothetical investment of $1,000 invested on July 1, 2018 and held through December 31, 2018 is intended to assist shareholders both in calculating expenses based on an investment in the Fund and in comparing these expenses with similar costs of investing in other mutual funds.
The expense example provides information about actual account values and actual expenses. In order to estimate the expenses a shareholder paid during the period covered by this report, shareholders can divide their account value by $1,000 and then multiply the result by the number corresponding to their share class under the heading entitled “Expenses Paid During the Period.”
The expense example also provides information about hypothetical account values and hypothetical expenses based on the Fund’s actual expense ratio and an assumed rate of return of 5% per year before expenses. In order to assist shareholders in comparing the ongoing expenses of investing in the Fund and other funds, compare the 5% hypothetical example with the 5% hypothetical examples that appear in shareholder reports of other funds.
The expenses shown in the expense example are intended to highlight shareholders’ ongoing costs only and do not reflect any transactional expenses, such as sales charges, if any. Therefore, the hypothetical example is useful in comparing ongoing expenses only, and will not help shareholders determine the relative total expenses of owning different funds. If these transactional expenses were included, shareholder expenses would have been higher.
Derivative Financial Instruments
The Fund may invest in various derivative financial instruments. These instruments are used to obtain exposure to a security, commodity, index, market, and/or other assets without owning or taking physical custody of securities, commodities and/or other referenced assets or to manage market, equity, credit, interest rate, foreign currency exchange rate, commodity and/or other risks. Derivative financial instruments may give rise to a form of economic leverage and involve risks, including the imperfect correlation between the value of a derivative financial instrument and the underlying asset, possible default of the counterparty to the transaction or illiquidity of the instrument. The Fund’s successful use of a derivative financial instrument depends on the investment adviser’s ability to predict pertinent market movements accurately, which cannot be assured. The use of these instruments may result in losses greater than if they had not been used, may limit the amount of appreciation the Fund can realize on an investment and/or may result in lower distributions paid to shareholders. The Fund’s investments in these instruments, if any, are discussed in detail in the Notes to Consolidated Financial Statements.
| | | | |
| DISCLOSUREOF EXPENSES / DERIVATIVE FINANCIAL INSTRUMENTS | | | 5 | |
| | |
Consolidated Schedule of Investments December 31, 2018 | | BlackRock Global Allocation V.I. Fund (Percentages shown are based on Net Assets) |
| | | | | | | | | | | | |
| Security | | | | | Shares | | | Value | |
|
Common Stocks — 58.2% | |
|
| Australia — 0.2% | |
AGL Energy Ltd. | | | | | | | 80,629 | | | $ | 1,170,912 | |
BHP Group Ltd. | | | | | | | 10,269 | | | | 248,213 | |
Coles Group Ltd.(a) | | | | | | | 11,952 | | | | 98,832 | |
Newcrest Mining Ltd. | | | | | | | 308,906 | | | | 4,747,599 | |
Quintis HoldCo Pty. Ltd. (Acquired 10/22/18, cost $5,761,227)(a)(b)(c)(t) | | | | | | | 10,892,000 | | | | 5,830,553 | |
Rio Tinto Ltd. | | | | | | | 7,796 | | | | 431,477 | |
Stockland | | | | | | | 135,455 | | | | 336,036 | |
Telstra Corp. Ltd. | | | | | | | 10,439 | | | | 20,950 | |
Woolworths Group Ltd. | | | | | | | 25,287 | | | | 524,554 | |
| | | | | | | | | | | | |
| | | | | | | | | | | 13,409,126 | |
|
| Belgium — 0.2% | |
Anheuser-Busch InBev SA | | | | | | | 319,046 | | | | 21,018,441 | |
| | | | | | | | | | | | |
|
| Brazil — 0.7% | |
Azul SA, ADR(a)(d) | | | | | | | 1,184,374 | | | | 32,795,316 | |
Banco do Brasil SA(a) | | | | | | | 49,947 | | | | 599,119 | |
Banco Santander Brasil SA | | | | | | | 14,265 | | | | 157,161 | |
Hapvida Participacoes e Investimentos
SA(a)(e) | | | | | | | 1,417,332 | | | | 11,409,600 | |
Notre Dame Intermedica Participacoes
SA(a) | | | | | | | 2,525,034 | | | | 18,945,492 | |
Petrobras Distribuidora SA | | | | | | | 15,751 | | | | 104,444 | |
Suzano Papel e Celulose SA | | | | | | | 13,612 | | | | 133,741 | |
TIM Participacoes SA(a) | | | | | | | 31,551 | | | | 96,466 | |
| | | | | | | | | | | | |
| | | | | | | | | | | 64,241,339 | |
|
| Canada — 1.5% | |
Canadian Natural Resources Ltd. | | | | | | | 6,822 | | | | 164,603 | |
Canadian Pacific Railway Ltd. | | | | | | | 1,978 | | | | 350,975 | |
Enbridge, Inc. | | | | | | | 1,312,870 | | | | 40,784,366 | |
Encana Corp.(d) | | | | | | | 1,583,747 | | | | 9,154,058 | |
Goldcorp, Inc. | | | | | | | 3,819 | | | | 37,401 | |
Husky Energy, Inc. | | | | | | | 41,674 | | | | 430,721 | |
Imperial Oil Ltd. | | | | | | | 17,560 | | | | 444,917 | |
Manulife Financial Corp. | | | | | | | 66,259 | | | | 940,109 | |
Nutrien Ltd.(d) | | | | | | | 17,479 | | | | 820,945 | |
Rogers Communications, Inc., Class B | | | | | | | 12,223 | | | | 626,371 | |
Suncor Energy, Inc. | | | | | | | 1,214,878 | | | | 33,931,510 | |
Teck Resources Ltd., Class B | | | | | | | 22,757 | | | | 489,912 | |
TransCanada Corp.(d) | | | | | | | 1,107,986 | | | | 39,565,131 | |
Wheaton Precious Metals Corp. | | | | | | | 145,186 | | | | 2,834,169 | |
| | | | | | | | | | | | |
| | | | | | | | | | | 130,575,188 | |
|
| China — 1.5% | |
Agile Group Holdings Ltd. | | | | | | | 312,000 | | | | 368,070 | |
Agricultural Bank of China Ltd., Class H | | | | | | | 579,000 | | | | 253,600 | |
Alibaba Group Holding Ltd., ADR(a) | | | | | | | 144,808 | | | | 19,848,833 | |
Angang Steel Co. Ltd., Class H | | | | | | | 364,000 | | | | 251,103 | |
Angel Yeast Co. Ltd., Class A | | | | | | | 1,053,512 | | | | 3,885,367 | |
Anhui Conch Cement Co. Ltd., Class H | | | | | | | 84,500 | | | | 408,623 | |
BAIC Motor Corp. Ltd., Class H(a)(e) | | | | | | | 40,000 | | | | 21,160 | |
Baidu, Inc., ADR(a) | | | | | | | 2,600 | | | | 412,360 | |
Bank of China Ltd., Class H | | | | | | | 168,000 | | | | 72,425 | |
Beijing Capital International Airport Co. Ltd., Class H | | | | | | | 4,212,000 | | | | 4,470,304 | |
Beijing Enterprises Holdings Ltd. | | | | | | | 86,000 | | | | 456,010 | |
China CITIC Bank Corp. Ltd., Class H | | | | | | | 687,000 | | | | 416,794 | |
China Communications Construction Co. Ltd., Class H | | | | | | | 22,000 | | | | 20,742 | |
China Construction Bank Corp., Class H | | | | | | | 284,000 | | | | 232,554 | |
China Mobile Ltd. | | | | | | | 104,500 | | | | 1,011,204 | |
China National Building Material Co. Ltd., Class H | | | | | | | 212,000 | | | | 145,063 | |
China Petroleum & Chemical Corp., Class H | | | | | | | 1,658,000 | | | | 1,181,839 | |
China Resources Beer Holdings Co. Ltd. | | | | | | | 84,000 | | | | 293,680 | |
China Resources Cement Holdings Ltd. | | | | | | | 814,000 | | | | 734,012 | |
China Resources Gas Group Ltd. | | | | | | | 84,000 | | | | 332,856 | |
China Shenhua Energy Co. Ltd., Class H | | | | | | | 282,000 | | | | 615,027 | |
| | | | | | | | | | | | |
| Security | | | | | Shares | | | Value | |
|
| China (continued) | |
CITIC Ltd. | | | | | | | 500,000 | | | $ | 784,590 | |
CNOOC Ltd. | | | | | | | 771,000 | | | | 1,187,589 | |
Country Garden Holdings Co. Ltd. | | | | | | | 190,000 | | | | 230,718 | |
Country Garden Services Holdings Co. Ltd.(a) | | | | | | | 147,321 | | | | 233,245 | |
Dongfeng Motor Group Co. Ltd., Class H | | | | | | | 140,000 | | | | 127,244 | |
Fosun International Ltd. | | | | | | | 473,000 | | | | 689,324 | |
Guangzhou Automobile Group Co. Ltd., Class H | | | | | | | 274,400 | | | | 273,568 | |
Industrial & Commercial Bank of China Ltd., Class H | | | | | | | 1,786,000 | | | | 1,270,310 | |
Jiangsu Expressway Co. Ltd., Class H | | | | | | | 64,000 | | | | 89,332 | |
Jiangsu Yanghe Brewery Joint-Stock Co. Ltd., Class A | | | | | | | 252,400 | | | | 3,496,490 | |
Kweichow Moutai Co. Ltd., Class A | | | | | | | 146,300 | | | | 12,632,424 | |
Luzhou Laojiao Co. Ltd., Class A | | | | | | | 638,200 | | | | 3,788,628 | |
Meituan Dianping, Class B(d) | | | | | | | 353,916 | | | | 1,983,587 | |
Momo, Inc., ADR(a) | | | | | | | 3,583 | | | | 85,096 | |
New Oriental Education & Technology Group, Inc., ADR(a) | | | | | | | 6,761 | | | | 370,570 | |
PetroChina Co. Ltd., Class H | | | | | | | 136,000 | | | | 84,388 | |
Ping An Healthcare and Technology Co. Ltd.(a)(d)(e) | | | | | | | 2,408,070 | | | | 8,466,531 | |
Ping An Insurance Group Co. of China Ltd., Class H | | | | | | | 12,500 | | | | 110,275 | |
SINA Corp.(a) | | | | | | | 14,102 | | | | 756,431 | |
Sinopec Shanghai Petrochemical Co. Ltd., Class H | | | | | | | 1,304,000 | | | | 570,812 | |
Tencent Holdings Ltd. | | | | | | | 1,257,000 | | | | 50,381,001 | |
Tingyi Cayman Islands Holding Corp. | | | | | | | 142,000 | | | | 190,182 | |
Tsingtao Brewery Co. Ltd., Class H | | | | | | | 28,000 | | | | 113,008 | |
Want Want China Holdings Ltd. | | | | | | | 4,399,000 | | | | 3,077,846 | |
Wuliangye Yibin Co. Ltd., Class A | | | | | | | 476,600 | | | | 3,542,784 | |
Yanzhou Coal Mining Co. Ltd., Class H | | | | | | | 232,000 | | | | 187,372 | |
Yum China Holdings, Inc. | | | | | | | 77,498 | | | | 2,598,508 | |
Zhejiang Expressway Co. Ltd., Class H | | | | | | | 308,000 | | | | 267,203 | |
Zijin Mining Group Co. Ltd., Class H | | | | | | | 406,000 | | | | 153,861 | |
| | | | | | | | | | | | |
| | | | | | | | | | | 133,174,543 | |
|
| Czech Republic — 0.0% | |
CEZ A/S | | | | | | | 162,870 | | | | 3,882,525 | |
| | | | | | | | | | | | |
|
| Denmark — 0.1% | |
Carlsberg A/S, Class B | | | | | | | 13,547 | | | | 1,441,118 | |
Danske Bank A/S | | | | | | | 21,774 | | | | 432,267 | |
Novo Nordisk A/S, Class B | | | | | | | 135,135 | | | | 6,206,356 | |
| | | | | | | | | | | | |
| | | | | | | | | | | 8,079,741 | |
|
| Finland — 0.0% | |
Nokia OYJ | | | | | | | 144,158 | | | | 836,855 | |
| | | | | | | | | | | | |
|
| France — 2.7% | |
AXA SA | | | | | | | 760,547 | | | | 16,414,057 | |
Cie de Saint-Gobain | | | | | | | 25,367 | | | | 842,096 | |
Cie Generale des Etablissements Michelin SCA | | | | | | | 8,041 | | | | 791,451 | |
Danone SA | | | | | | | 974,113 | | | | 68,658,039 | |
Dassault Aviation SA | | | | | | | 10,457 | | | | 14,497,140 | |
Eiffage SA | | | | | | | 76,232 | | | | 6,373,547 | |
Engie SA | | | | | | | 53,392 | | | | 767,133 | |
EssilorLuxottica SA | | | | | | | 201,986 | | | | 25,144,376 | |
Eutelsat Communications SA | | | | | | | 188,320 | | | | 3,710,122 | |
Kering SA | | | | | | | 3,604 | | | | 1,688,361 | |
L’Oreal SA | | | | | | | 4,126 | | | | 944,130 | |
Publicis Groupe SA | | | | | | | 14,516 | | | | 828,234 | |
Safran SA | | | | | | | 305,947 | | | | 36,693,756 | |
Sanofi | | | | | | | 66,211 | | | | 5,743,800 | |
Societe Generale SA | | | | | | | 40,545 | | | | 1,285,461 | |
Sodexo SA(d) | | | | | | | 443,696 | | | | 45,503,448 | |
TOTAL SA, ADR | | | | | | | 14,070 | | | | 734,173 | |
Unibail-Rodamco-Westfield | | | | | | | 81,678 | | | | 12,639,226 | |
| | | | | | | | | | | | |
| | | | | | | | | | | 243,258,550 | |
| | |
| 6 | | 2018 BLACKROCK ANNUAL REPORTTO SHAREHOLDERS |
| | |
Consolidated Schedule of Investments (continued) December 31, 2018 | | BlackRock Global Allocation V.I. Fund (Percentages shown are based on Net Assets) |
| | | | | | | | | | | | |
| Security | | | | | Shares | | | Value | |
|
| Germany — 1.3% | |
adidas AG | | | | | | | 807 | | | $ | 168,654 | |
Allianz SE (Registered) | | | | | | | 8,324 | | | | 1,672,752 | |
Bayer AG (Registered) | | | | | | | 556,561 | | | | 38,708,144 | |
Evonik Industries AG | | | | | | | 48,511 | | | | 1,210,891 | |
Fresenius SE & Co. KGaA | | | | | | | 894,308 | | | | 43,225,590 | |
Knorr-Bremse AG(a) | | | | | | | 317,212 | | | | 28,574,096 | |
Muenchener Rueckversicherungs-Gesellschaft AG in Muenchen (Registered) | | | | | | | 1,477 | | | | 322,132 | |
SAP SE | | | | | | | 8,485 | | | | 842,134 | |
Vonovia SE | | | | | | | 50,121 | | | | 2,259,401 | |
| | | | | | | | | | | | |
| | | | | | | | | | | 116,983,794 | |
|
| Hong Kong — 0.9% | |
CK Asset Holdings Ltd. | | | | | | | 18,500 | | | | 135,357 | |
CK Infrastructure Holdings Ltd. | | | | | | | 537,500 | | | | 4,067,641 | |
CLP Holdings Ltd. | | | | | | | 425,000 | | | | 4,802,881 | |
Hang Lung Properties Ltd. | | | | | | | 2,381,000 | | | | 4,525,626 | |
HKT Trust & HKT Ltd.(f) | | | | | | | 2,011,000 | | | | 2,896,907 | |
Hongkong Land Holdings Ltd. | | | | | | | 106,400 | | | | 670,760 | |
I-CABLE Communications Ltd.(a) | | | | | | | 379,342 | | | | 5,694 | |
Jardine Matheson Holdings Ltd. | | | | | | | 86,400 | | | | 6,015,924 | |
Link REIT | | | | | | | 447,500 | | | | 4,536,632 | |
Nine Dragons Paper Holdings Ltd. | | | | | | | 69,000 | | | | 63,739 | |
Power Assets Holdings Ltd. | | | | | | | 165,500 | | | | 1,149,795 | |
Sino Land Co. Ltd. | | | | | | | 1,338,000 | | | | 2,292,369 | |
Sun Hung Kai Properties Ltd. | | | | | | | 3,113,583 | | | | 44,435,890 | |
Swire Pacific Ltd., Class A | | | | | | | 288,000 | | | | 3,040,703 | |
WH Group Ltd.(e) | | | | | | | 1,404,500 | | | | 1,078,722 | |
Wharf Real Estate Investment Co. Ltd. | | | | | | | 440,000 | | | | 2,631,603 | |
| | | | | | | | | | | | |
| | | | | | | | | | | 82,350,243 | |
|
| India — 1.2% | |
Coal India Ltd. | | | | | | | 1,027,821 | | | | 3,543,394 | |
HCL Technologies Ltd. | | | | | | | 22,307 | | | | 308,246 | |
Hero MotoCorp Ltd. | | | | | | | 72,985 | | | | 3,243,117 | |
Hindustan Petroleum Corp. Ltd. | | | | | | | 173,877 | | | | 631,805 | |
Housing Development Finance Corp. Ltd. | | | | | | | 1,044,829 | | | | 29,437,316 | |
Infosys Ltd. | | | | | | | 37,055 | | | | 350,108 | |
JSW Steel Ltd. | | | | | | | 30,945 | | | | 135,838 | |
Maruti Suzuki India Ltd. | | | | | | | 100,753 | | | | 10,765,735 | |
Oil & Natural Gas Corp. Ltd. | | | | | | | 1,060,999 | | | | 2,277,610 | |
Reliance Industries Ltd. | | | | | | | 2,947,847 | | | | 47,310,159 | |
State Bank of India(a) | | | | | | | 2,249,243 | | | | 9,525,648 | |
Tata Consultancy Services Ltd. | | | | | | | 15,000 | | | | 406,723 | |
| | | | | | | | | | | | |
| | | | | | | | | | | 107,935,699 | |
|
| Indonesia — 0.0% | |
Bank Central Asia Tbk. PT | | | | | | | 1,819,300 | | | | 3,290,112 | |
| | | | | | | | | | | | |
|
| Italy — 0.5% | |
Enel SpA | | | | | | | 3,949,616 | | | | 22,896,897 | |
Eni SpA | | | | | | | 50,864 | | | | 803,509 | |
RAI Way SpA(e) | | | | | | | 1,952,885 | | | | 9,699,640 | |
Snam SpA | | | | | | | 1,667,970 | | | | 7,302,980 | |
Telecom Italia SpA(a) | | | | | | | 14,163,354 | | | | 7,840,963 | |
Telecom Italia SpA | | | | | | | 705,729 | | | | 338,483 | |
UniCredit SpA | | | | | | | 13,450 | | | | 152,347 | |
| | | | | | | | | | | | |
| | | | | | | | | | | 49,034,819 | |
|
| Japan — 7.7% | |
Aeon Co. Ltd. | | | | | | | 8,700 | | | | 170,051 | |
Ajinomoto Co., Inc. | | | | | | | 1,893,000 | | | | 33,636,892 | |
Alfresa Holdings Corp. | | | | | | | 103,500 | | | | 2,638,176 | |
Alps Electric Co. Ltd. | | | | | | | 52,632 | | | | 1,020,555 | |
Asahi Kasei Corp. | | | | | | | 1,010,000 | | | | 10,366,013 | |
Astellas Pharma, Inc. | | | | | | | 1,884,665 | | | | 24,079,668 | |
Canon Marketing Japan, Inc. | | | | | | | 91,500 | | | | 1,630,798 | |
| | | | | | | | | | | | |
| Security | | | | | Shares | | | Value | |
|
| Japan (continued) | |
Daicel Corp. | | | | | | | 369,100 | | | $ | 3,789,045 | |
Daikin Industries Ltd. | | | | | | | 134,800 | | | | 14,323,235 | |
Daiwa House Industry Co. Ltd. | | | | | | | 7,900 | | | | 251,998 | |
Denso Corp. | | | | | | | 930,020 | | | | 41,169,835 | |
Dowa Holdings Co. Ltd. | | | | | | | 52,600 | | | | 1,574,360 | |
East Japan Railway Co. | | | | | | | 549,451 | | | | 48,522,097 | |
Eisai Co. Ltd. | | | | | | | 10,700 | | | | 828,392 | |
Exedy Corp. | | | | | | | 63,400 | | | | 1,548,652 | |
Fujitsu Ltd. | | | | | | | 5,700 | | | | 355,316 | |
GS Yuasa Corp. | | | | | | | 122,800 | | | | 2,504,399 | |
Hino Motors Ltd. | | | | | | | 172,000 | | | | 1,619,642 | |
Hitachi Chemical Co. Ltd. | | | | | | | 135,500 | | | | 2,038,425 | |
Hitachi Ltd. | | | | | | | 52,600 | | | | 1,394,439 | |
Hoya Corp. | | | | | | | 468,974 | | | | 28,279,152 | |
Japan Airlines Co. Ltd. | | | | | | | 1,407,700 | | | | 49,890,408 | |
Japan Aviation Electronics Industry Ltd. | | | | | | | 176,800 | | | | 2,034,629 | |
JFE Holdings, Inc. | | | | | | | 10,600 | | | | 168,840 | |
Kajima Corp. | | | | | | | 17,200 | | | | 231,049 | |
Kamigumi Co. Ltd. | | | | | | | 89,900 | | | | 1,839,242 | |
KDDI Corp. | | | | | | | 136,500 | | | | 3,261,657 | |
Keyence Corp. | | | | | | | 6,700 | | | | 3,386,487 | |
Kinden Corp. | | | | | | | 360,500 | | | | 5,836,968 | |
Koito Manufacturing Co. Ltd. | | | | | | | 533,600 | | | | 27,530,317 | |
Kuraray Co. Ltd. | | | | | | | 136,200 | | | | 1,915,590 | |
Kyowa Hakko Kirin Co. Ltd. | | | | | | | 17,600 | | | | 332,571 | |
Kyudenko Corp. | | | | | | | 48,900 | | | | 1,853,212 | |
Mabuchi Motor Co. Ltd. | | | | | | | 97,600 | | | | 2,989,774 | |
Maeda Road Construction Co. Ltd. | | | | | | | 92,000 | | | | 1,905,961 | |
Medipal Holdings Corp. | | | | | | | 119,400 | | | | 2,554,467 | |
Mitsubishi Electric Corp. | | | | | | | 3,052,400 | | | | 33,660,636 | |
Mitsubishi Estate Co. Ltd. | | | | | | | 168,900 | | | | 2,657,390 | |
Mitsubishi Heavy Industries Ltd. | | | | | | | 18,900 | | | | 678,177 | |
Mitsubishi Tanabe Pharma Corp. | | | | | | | 5,500 | | | | 79,396 | |
Mitsubishi UFJ Financial Group, Inc. | | | | | | | 38,600 | | | | 189,435 | |
Mitsui & Co. Ltd. | | | | | | | 3,300 | | | | 50,699 | |
Mitsui Fudosan Co. Ltd. | | | | | | | 21,500 | | | | 477,556 | |
Murata Manufacturing Co. Ltd. | | | | | | | 228,228 | | | | 30,753,683 | |
Nexon Co. Ltd.(a) | | | | | | | 6,600 | | | | 85,203 | |
Nichias Corp. | | | | | | | 103,400 | | | | 1,763,317 | |
Nippo Corp.(d) | | | | | | | 85,200 | | | | 1,630,087 | |
Nippon Telegraph & Telephone Corp. | | | | | | | 69,660 | | | | 2,842,081 | |
Nippon Television Holdings, Inc. | | | | | | | 224,900 | | | | 3,310,922 | |
Nitto Denko Corp. | | | | | | | 694,800 | | | | 34,847,296 | |
NTT Docomo, Inc. | | | | | | | 8,100 | | | | 182,001 | |
Okumura Corp. | | | | | | | 109,750 | | | | 3,197,804 | |
Olympus Corp. | | | | | | | 3,800 | | | | 116,222 | |
Ono Pharmaceutical Co. Ltd. | | | | | | | 11,000 | | | | 224,628 | |
Oracle Corp. | | | | | | | 8,400 | | | | 533,214 | |
Otsuka Holdings Co. Ltd. | | | | | | | 5,800 | | | | 237,013 | |
Panasonic Corp. | | | | | | | 61,700 | | | | 554,277 | |
Rohm Co. Ltd. | | | | | | | 269,253 | | | | 17,185,076 | |
Seino Holdings Co. Ltd. | | | | | | | 127,200 | | | | 1,665,351 | |
Seven & i Holdings Co. Ltd. | | | | | | | 46,900 | | | | 2,038,045 | |
Shimamura Co. Ltd. | | | | | | | 19,200 | | | | 1,470,251 | |
Shin-Etsu Chemical Co. Ltd. | | | | | | | 427,834 | | | | 32,871,698 | |
Shionogi & Co. Ltd. | | | | | | | 1,000 | | | | 57,075 | |
Shiseido Co. Ltd. | | | | | | | 12,300 | | | | 770,324 | |
Sony Corp. | | | | | | | 20,000 | | | | 964,192 | |
Stanley Electric Co. Ltd. | | | | | | | 58,500 | | | | 1,636,512 | |
Subaru Corp. | | | | | | | 1,835,864 | | | | 39,220,252 | |
Sumitomo Chemical Co. Ltd. | | | | | | | 135,000 | | | | 653,766 | |
Suzuken Co. Ltd. | | | | | | | 49,300 | | | | 2,510,486 | |
Suzuki Motor Corp. | | | | | | | 884,089 | | | | 44,568,201 | |
Sysmex Corp. | | | | | | | 6,800 | | | | 322,939 | |
| | | | |
| CONSOLIDATED SCHEDULE OF INVESTMENTS | | | 7 | |
| | |
Consolidated Schedule of Investments (continued) December 31, 2018 | | BlackRock Global Allocation V.I. Fund (Percentages shown are based on Net Assets) |
| | | | | | | | | | | | |
| Security | | | | | Shares | | | Value | |
|
| Japan (continued) | |
Taisei Corp. | | | | | | | 3,300 | | | $ | 141,334 | |
Toagosei Co. Ltd. | | | | | | | 285,300 | | | | 3,144,407 | |
Toda Corp. | | | | | | | 459,796 | | | | 2,865,453 | |
Tokyo Gas Co. Ltd. | | | | | | | 1,279,114 | | | | 32,351,555 | |
Tokyo Steel Manufacturing Co. Ltd. | | | | | | | 472,100 | | | | 3,823,972 | |
Toray Industries, Inc. | | | | | | | 2,119,500 | | | | 14,985,116 | |
Toshiba Corp.(a) | | | | | | | 31,900 | | | | 900,758 | |
Toyota Industries Corp. | | | | | | | 500,377 | | | | 23,042,288 | |
TV Asahi Holdings Corp. | | | | | | | 163,600 | | | | 2,945,522 | |
Ube Industries Ltd. | | | | | | | 745,034 | | | | 15,067,084 | |
Unicharm Corp. | | | | | | | 13,700 | | | | 443,085 | |
Yamato Kogyo Co. Ltd. | | | | | | | 69,500 | | | | 1,624,406 | |
| | | | | | | | | | | | |
| | | | | | | | | | | 692,812,497 | |
|
| Macau — 0.0% | |
Galaxy Entertainment Group Ltd. | | | | | | | 40,000 | | | | 252,666 | |
Sands China Ltd. | | | | | | | 10,400 | | | | 45,355 | |
| | | | | | | | | | | | |
| | | | | | | | | | | 298,021 | |
|
| Malaysia — 0.0% | |
Malaysia Airports Holdings Bhd. | | | | | | | 765,900 | | | | 1,551,458 | |
| | | | | | | | | | | | |
|
| Mexico — 0.0% | |
America Movil SAB de CV | | | | | | | 540,174 | | | | 384,548 | |
Cemex SAB de CV(a) | | | | | | | 365,750 | | | | 176,810 | |
Grupo Financiero Banorte SAB de CV, Class O | | | | | | | 7,061 | | | | 34,468 | |
| | | | | | | | | | | | |
| | | | | | | | | | | 595,826 | |
|
| Netherlands — 2.3% | |
ABN AMRO Group NV, CVA(e) | | | | | | | 669,321 | | | | 15,750,365 | |
ASML Holding NV | | | | | | | 985 | | | | 154,310 | |
Koninklijke Ahold Delhaize NV | | | | | | | 21,564 | | | | 544,754 | |
Koninklijke Philips NV | | | | | | | 2,101,737 | | | | 73,685,844 | |
NXP Semiconductors NV(a) | | | | | | | 12,263 | | | | 898,633 | |
Royal Dutch Shell plc, Class A | | | | | | | 2,612,877 | | | | 77,013,297 | |
Royal Dutch Shell plc, Class B | | | | | | | 31,058 | | | | 928,556 | |
Royal Dutch Shell plc, ADR, Class A(d) | | | | | | | 578,766 | | | | 33,724,695 | |
| | | | | | | | | | | | |
| | | | | | | | | | | 202,700,454 | |
|
| Norway — 0.0% | |
Equinor ASA | | | | | | | 10,092 | | | | 214,073 | |
| | | | | | | | | | | | |
|
| Peru — 0.0% | |
Southern Copper Corp. | | | | | | | 2,236 | | | | 68,802 | |
| | | | | | | | | | | | |
|
| Poland — 0.0% | |
Polski Koncern Naftowy ORLEN SA | | | | | | | 5,059 | | | | 146,578 | |
Polskie Gornictwo Naftowe i Gazownictwo SA(a) | | | | | | | 56,756 | | | | 104,940 | |
| | | | | | | | | | | | |
| | | | | | | | | | | 251,518 | |
|
| Portugal — 0.1% | |
Jeronimo Martins SGPS SA | | | | | | | 169,406 | | | | 2,007,547 | |
NOS SGPS SA | | | | | | | 1,251,221 | | | | 7,587,327 | |
| | | | | | | | | | | | |
| | | | | | | | | | | 9,594,874 | |
|
| Singapore — 0.6% | |
CapitaLand Ltd. | | | | | | | 17,236,450 | | | | 39,306,504 | |
ComfortDelGro Corp. Ltd. | | | | | | | 1,958,200 | | | | 3,093,065 | |
Genting Singapore Ltd. | | | | | | | 1,154,900 | | | | 826,699 | |
Singapore Telecommunications Ltd. | | | | | | | 1,583,500 | | | | 3,408,064 | |
United Overseas Bank Ltd. | | | | | | | 155,300 | | | | 2,809,375 | |
| | | | | | | | | | | | |
| | | | | | | | | | | 49,443,707 | |
|
| South Africa — 0.0% | |
Anglo American plc(d) | | | | | | | 18,395 | | | | 411,325 | |
Aspen Pharmacare Holdings Ltd. | | | | | | | 26,347 | | | | 246,548 | |
Kumba Iron Ore Ltd. | | | | | | | 1,348 | | | | 26,510 | |
MTN Group Ltd. | | | | | | | 20,215 | | | | 124,954 | |
| | | | | | | | | | | | |
| Security | | | | | Shares | | | Value | |
|
| South Africa (continued) | |
Naspers Ltd., Class N | | | | | | | 213 | | | $ | 42,646 | |
Old Mutual Ltd. | | | | | | | 297,290 | | | | 461,914 | |
| | | | | | | | | | | | |
| | | | | | | | | | | 1,313,897 | |
|
| South Korea — 0.7% | |
Coway Co. Ltd. | | | | | | | 41,486 | | | | 2,755,075 | |
Doosan Bobcat, Inc.(a) | | | | | | | 281,238 | | | | 7,962,473 | |
E-MART, Inc. | | | | | | | 2,366 | | | | 386,392 | |
Hana Financial Group, Inc. | | | | | | | 20,713 | | | | 673,645 | |
Industrial Bank of Korea | | | | | | | 33,232 | | | | 418,526 | |
KB Financial Group, Inc. | | | | | | | 8,102 | | | | 337,990 | |
KT&G Corp. | | | | | | | 287,987 | | | | 26,220,237 | |
LG Chem Ltd.(d) | | | | | | | 14,168 | | | | 4,416,434 | |
LG Electronics, Inc. | | | | | | | 904 | | | | 50,690 | |
Lotte Chemical Corp. | | | | | | | 130 | | | | 32,322 | |
NCSoft Corp. | | | | | | | 6,948 | | | | 2,912,396 | |
POSCO | | | | | | | 19,030 | | | | 4,162,465 | |
Samsung Electro-Mechanics Co. Ltd.(a) | | | | | | | 250 | | | | 23,305 | |
Samsung Electronics Co. Ltd. | | | | | | | 38,336 | | | | 1,334,542 | |
Samsung SDS Co. Ltd. | | | | | | | 1,464 | | | | 267,926 | |
Shinhan Financial Group Co. Ltd. | | | | | | | 33,538 | | | | 1,189,127 | |
SK Innovation Co. Ltd. | | | | | | | 301 | | | | 48,315 | |
SK Telecom Co. Ltd. | | | | | | | 16,085 | | | | 3,880,986 | |
S-Oil Corp. | | | | | | | 30,950 | | | | 2,699,642 | |
Woori Bank | | | | | | | 28,424 | | | | 397,478 | |
| | | | | | | | | | | | |
| | | | | | | | | | | 60,169,966 | |
|
| Spain— 0.4% | |
Banco Bilbao Vizcaya Argentaria SA | | | | | | | 236,647 | | | | 1,257,026 | |
Cellnex Telecom SA(d)(e) | | | | | | | 1,192,892 | | | | 30,506,419 | |
| | | | | | | | | | | | |
| | | | | | | | | | | 31,763,445 | |
|
| Sweden— 0.0% | |
Sandvik AB | | | | | | | 33,984 | | | | 486,932 | |
Telefonaktiebolaget LM Ericsson, Class B | | | | | | | 104,967 | | | | 929,164 | |
| | | | | | | | | | | | |
| | | | | | | | | | | 1,416,096 | |
|
| Switzerland— 0.9% | |
Nestle SA (Registered) | | | | | | | 989,245 | | | | 80,289,881 | |
Roche Holding AG | | | | | | | 4,666 | | | | 1,158,376 | |
Swiss Re AG | | | | | | | 7,597 | | | | 698,926 | |
| | | | | | | | | | | | |
| | | | | | | | | | | 82,147,183 | |
|
| Taiwan— 0.9% | |
Cathay Financial Holding Co. Ltd. | | | | | | | 2,638,000 | | | | 4,038,332 | |
Cheng Shin Rubber Industry Co. Ltd. | | | | | | | 1,241,323 | | | | 1,651,147 | |
Chunghwa Telecom Co. Ltd. | | | | | | | 5,979,000 | | | | 21,830,313 | |
Far EasTone Telecommunications Co. Ltd.(a) | | | | | | | 3,621,000 | | | | 8,994,439 | |
Formosa Chemicals & Fibre Corp. | | | | | | | 848,000 | | | | 2,901,044 | |
Formosa Petrochemical Corp.(a) | | | | | | | 673,000 | | | | 2,388,156 | |
Formosa Plastics Corp. | | | | | | | 948,000 | | | | 3,116,069 | |
Fubon Financial Holding Co. Ltd. | | | | | | | 3,150,000 | | | | 4,833,035 | |
Globalwafers Co. Ltd. | | | | | | | 12,000 | | | | 110,010 | |
Hon Hai Precision Industry Co. Ltd.(a) | | | | | | | 1,551,960 | | | | 3,571,738 | |
MediaTek, Inc. | | | | | | | 29,000 | | | | 215,832 | |
Nan Ya Plastics Corp. | | | | | | | 1,190,000 | | | | 2,926,621 | |
Nanya Technology Corp. | | | | | | | 240,000 | | | | 429,796 | |
Taiwan Cooperative Financial Holding Co. Ltd. | | | | | | | 1,260 | | | | 724 | |
Taiwan Mobile Co. Ltd. | | | | | | | 2,890,000 | | | | 10,008,347 | |
Taiwan Semiconductor Manufacturing Co. Ltd. | | | | | | | 780,000 | | | | 5,663,762 | |
Uni-President Enterprises Corp. | | | | | | | 1,948,000 | | | | 4,419,345 | |
Yageo Corp. | | | | | | | 20,000 | | | | 207,157 | |
| | | | | | | | | | | | |
| | | | | | | | | | | 77,305,867 | |
|
| Thailand— 0.2% | |
Advanced Info Service PCL | | | | | | | 799,000 | | | | 4,237,084 | |
Intouch Holdings PCL, Class F | | | | | | | 2,181,800 | | | | 3,199,702 | |
| | |
| 8 | | 2018 BLACKROCK ANNUAL REPORTTO SHAREHOLDERS |
| | |
Consolidated Schedule of Investments (continued) December 31, 2018 | | BlackRock Global Allocation V.I. Fund (Percentages shown are based on Net Assets) |
| | | | | | | | | | | | |
| Security | | | | | Shares | | | Value | |
|
| Thailand (continued) | |
PTT Global Chemical PCL | | | | | | | 1,830,300 | | | $ | 4,010,362 | |
Siam Cement PCL (The) | | | | | | | 269,800 | | | | 3,614,357 | |
Thai Oil PCL | | | | | | | 1,225,700 | | | | 2,491,075 | |
| | | | | | | | | | | | |
| | | | | | | | | | | 17,552,580 | |
|
| Turkey— 0.0% | |
Eregli Demir ve Celik Fabrikalari TAS | | | | | | | 11,156 | | | | 15,167 | |
Turk Hava Yollari AO(a) | | | | | | | 103,169 | | | | 313,111 | |
Turkiye Is Bankasi A/S, Class C | | | | | | | 81,630 | | | | 69,667 | |
| | | | | | | | | | | | |
| | | | | | | | | | | 397,945 | |
|
| United Arab Emirates— 0.4% | |
NMC Health plc | | | | | | | 981,513 | | | | 34,256,024 | |
| | | | | | | | | | | | |
|
| United Kingdom— 1.6% | |
Barclays plc | | | | | | | 316,146 | | | | 604,873 | |
Berkeley Group Holdings plc | | | | | | | 69,594 | | | | 3,086,710 | |
Experian plc | | | | | | | 11,133 | | | | 269,885 | |
GlaxoSmithKline plc | | | | | | | 77,085 | | | | 1,469,088 | |
GW Pharmaceuticals plc, ADR(a) | | | | | | | 36,528 | | | | 3,557,462 | |
HSBC Holdings plc | | | | | | | 3,975,986 | | | | 32,800,840 | |
Kingfisher plc | | | | | | | 7,803,669 | | | | 20,518,124 | |
Liberty Global plc, Class A(a) | | | | | | | 810,731 | | | | 17,301,000 | |
Liberty Global plc, Class C(a) | | | | | | | 27,493 | | | | 567,455 | |
National Grid plc | | | | | | | 152,644 | | | | 1,493,366 | |
SSE plc | | | | | | | 30,324 | | | | 418,762 | |
Vodafone Group plc | | | | | | | 32,500,668 | | | | 63,190,727 | |
| | | | | | | | | | | | |
| | | | | | | | | | | 145,278,292 | |
|
| United States— 31.6% | |
Abbott Laboratories | | | | | | | 33,139 | | | | 2,396,944 | |
AbbVie, Inc. | | | | | | | 33,533 | | | | 3,091,407 | |
Accenture plc, Class A | | | | | | | 10,921 | | | | 1,539,970 | |
Adobe, Inc.(a) | | | | | | | 9,568 | | | | 2,164,664 | |
AES Corp. | | | | | | | 43,311 | | | | 626,277 | |
Agilent Technologies, Inc. | | | | | | | 8,090 | | | | 545,751 | |
Air Products & Chemicals, Inc. | | | | | | | 388,787 | | | | 62,225,359 | |
Allergan plc | | | | | | | 6,167 | | | | 824,281 | |
Alliance Data Systems Corp. | | | | | | | 2,297 | | | | 344,734 | |
Ally Financial, Inc. | | | | | | | 17,290 | | | | 391,791 | |
Alphabet, Inc., Class A(a) | | | | | | | 1,502 | | | | 1,569,530 | |
Alphabet, Inc., Class C(a) | | | | | | | 130,677 | | | | 135,330,408 | |
Altria Group, Inc. | | | | | | | 985,488 | | | | 48,673,252 | |
Amazon.com, Inc.(a) | | | | | | | 56,968 | | | | 85,564,227 | |
American Airlines Group, Inc. | | | | | | | 13,079 | | | | 419,967 | |
American International Group, Inc. | | | | | | | 3,076 | | | | 121,225 | |
American Tower Corp. | | | | | | | 14,871 | | | | 2,352,443 | |
Ameriprise Financial, Inc. | | | | | | | 14,662 | | | | 1,530,273 | |
Amgen, Inc. | | | | | | | 15,826 | | | | 3,080,847 | |
Anadarko Petroleum Corp. | | | | | | | 842,234 | | | | 36,923,539 | |
Anthem, Inc. | | | | | | | 326,348 | | | | 85,708,775 | |
Apple, Inc. | | | | | | | 826,962 | | | | 130,444,986 | |
AT&T, Inc. | | | | | | | 272,086 | | | | 7,765,334 | |
Autodesk, Inc.(a) | | | | | | | 2,713 | | | | 348,919 | |
Automatic Data Processing, Inc. | | | | | | | 3,666 | | | | 480,686 | |
Bank of America Corp. | | | | | | | 1,372,772 | | | | 33,825,102 | |
Bank of New York Mellon Corp. (The) | | | | | | | 16,137 | | | | 759,569 | |
Baxter International, Inc. | | | | | | | 34,662 | | | | 2,281,453 | |
Berkshire Hathaway, Inc., Class B(a) | | | | | | | 27,697 | | | | 5,655,173 | |
Biogen, Inc.(a) | | | | | | | 72,482 | | | | 21,811,283 | |
Boeing Co. (The) | | | | | | | 9,485 | | | | 3,058,912 | |
Booking Holdings, Inc.(a) | | | | | | | 541 | | | | 931,829 | |
Bristol-Myers Squibb Co. | | | | | | | 31,922 | | | | 1,659,306 | |
Capital One Financial Corp. | | | | | | | 7,404 | | | | 559,668 | |
Carnival Corp. | | | | | | | 2,075 | | | | 102,297 | |
Caterpillar, Inc. | | | | | | | 11,476 | | | | 1,458,255 | |
Celgene Corp.(a) | | | | | | | 6,272 | | | | 401,972 | |
| | | | | | | | | | | | |
| Security | | | | | Shares | | | Value | |
|
| United States (continued) | |
CenterPoint Energy, Inc. | | | | | | | 17,534 | | | $ | 494,985 | |
CH Robinson Worldwide, Inc. | | | | | | | 31,095 | | | | 2,614,779 | |
Charles Schwab Corp. (The)(d) | | | | | | | 889,469 | | | | 36,939,648 | |
Charter Communications, Inc., Class A(a) | | | | | | | 261,305 | | | | 74,464,086 | |
Chevron Corp.(d) | | | | | | | 18,010 | | | | 1,959,308 | |
Chubb Ltd.(d) | | | | | | | 204,285 | | | | 26,389,536 | |
Cisco Systems, Inc. | | | | | | | 67,226 | | | | 2,912,903 | |
Citigroup, Inc. | | | | | | | 512,311 | | | | 26,670,911 | |
Cloudera, Inc.(a) | | | | | | | 1,544,221 | | | | 17,079,084 | |
Cognizant Technology Solutions Corp., Class A | | | | | | | 17,390 | | | | 1,103,917 | |
Colgate-Palmolive Co. | | | | | | | 903,618 | | | | 53,783,343 | |
Comcast Corp., Class A(g) | | | | | | | 2,966,304 | | | | 101,002,651 | |
Conagra Brands, Inc. | | | | | | | 14,298 | | | | 305,405 | |
ConocoPhillips | | | | | | | 5,195 | | | | 323,908 | |
Constellation Brands, Inc., Class A | | | | | | | 2,559 | | | | 411,538 | |
Corning, Inc. | | | | | | | 36,476 | | | | 1,101,940 | |
Costco Wholesale Corp. | | | | | | | 4,329 | | | | 881,861 | |
CSX Corp. | | | | | | | 34,485 | | | | 2,142,553 | |
Cummins, Inc. | | | | | | | 3,297 | | | | 440,611 | |
CVS Health Corp. | | | | | | | 991,955 | | | | 64,992,892 | |
DaVita, Inc.(a) | | | | | | | 431,016 | | | | 22,180,083 | |
Dell Technologies, Inc., Class C(a)(d) | | | | | | | 2,771 | | | | 135,435 | |
Delta Air Lines, Inc. | | | | | | | 16,862 | | | | 841,414 | |
Discover Financial Services | | | | | | | 12,050 | | | | 710,709 | |
Dollar General Corp. | | | | | | | 7,815 | | | | 844,645 | |
Dollar Tree, Inc.(a) | | | | | | | 429,968 | | | | 38,834,710 | |
Domo, Inc., Class B(a) | | | | | | | 338,616 | | | | 6,647,032 | |
Domo, Inc., Class B (Acquired04/01/15-04/12/17, cost $469,893)(a)(b) | | | | | | | 186,575 | | | | 3,662,468 | |
Dover Corp. | | | | | | | 299,517 | | | | 21,250,731 | |
DowDuPont, Inc. | | | | | | | 747,408 | | | | 39,971,380 | |
Dropbox, Inc., Class A(a)(d) | | | | | | | 1,315,525 | | | | 26,876,184 | |
DXC Technology Co. | | | | | | | 10,334 | | | | 549,459 | |
Eaton Corp. plc | | | | | | | 18,843 | | | | 1,293,760 | |
eBay, Inc.(a) | | | | | | | 32,762 | | | | 919,629 | |
Edgewell Personal Care Co.(a)(d) | | | | | | | 372,817 | | | | 13,924,715 | |
Edwards Lifesciences Corp.(a) | | | | | | | 3,979 | | | | 609,463 | |
Eli Lilly & Co. | | | | | | | 3,568 | | | | 412,889 | |
Equity Residential | | | | | | | 235,435 | | | | 15,541,064 | |
Exelon Corp. | | | | | | | 23,104 | | | | 1,041,990 | |
Expedia Group, Inc. | | | | | | | 6,789 | | | | 764,781 | |
Exxon Mobil Corp. | | | | | | | 1,215,123 | | | | 82,859,237 | |
Facebook, Inc., Class A(a) | | | | | | | 428,834 | | | | 56,215,849 | |
Fieldwood Energy, Inc.(a)(c) | | | | | | | 86,636 | | | | 3,292,168 | |
Fifth Third Bancorp | | | | | | | 35,313 | | | | 830,915 | |
FleetCor Technologies, Inc.(a) | | | | | | | 209,148 | | | | 38,842,967 | |
Fortune Brands Home & Security, Inc. | | | | | | | 46,274 | | | | 1,757,949 | |
General Electric Co. | | | | | | | 86,401 | | | | 654,056 | |
General Motors Co. | | | | | | | 20,255 | | | | 677,530 | |
Gilead Sciences, Inc. | | | | | | | 668,904 | | | | 41,839,945 | |
Global Payments, Inc. | | | | | | | 17,244 | | | | 1,778,374 | |
Goldman Sachs Group, Inc. (The) | | | | | | | 11,779 | | | | 1,967,682 | |
Halfmoon Parent, Inc. | | | | | | | 3,860 | | | | 733,169 | |
Hartford Financial Services Group, Inc. (The) | | | | | | | 54,479 | | | | 2,421,592 | |
HCA Healthcare, Inc. | | | | | | | 195,351 | | | | 24,311,432 | |
Helmerich & Payne, Inc. | | | | | | | 12,474 | | | | 598,004 | |
Hewlett Packard Enterprise Co. | | | | | | | 61,075 | | | | 806,801 | |
Home Depot, Inc. (The) | | | | | | | 13,033 | | | | 2,239,330 | |
HP, Inc. | | | | | | | 29,010 | | | | 593,545 | |
Humana, Inc. | | | | | | | 2,537 | | | | 726,800 | |
Huntsman Corp. | | | | | | | 22,829 | | | | 440,371 | |
Illumina, Inc.(a) | | | | | | | 3,628 | | | | 1,088,146 | |
Intel Corp. | | | | | | | 77,217 | | | | 3,623,794 | |
International Business Machines Corp. | | | | | | | 15,803 | | | | 1,796,327 | |
Intuit, Inc. | | | | | | | 12,666 | | | | 2,493,302 | |
| | | | |
| CONSOLIDATED SCHEDULE OF INVESTMENTS | | | 9 | |
| | |
Consolidated Schedule of Investments (continued) December 31, 2018 | | BlackRock Global Allocation V.I. Fund (Percentages shown are based on Net Assets) |
| | | | | | | | | | | | |
| Security | | | | | Shares | | | Value | |
|
| United States (continued) | |
Intuitive Surgical, Inc.(a) | | | | | | | 1,263 | | | $ | 604,876 | |
Jawbone Health Hub, Inc. (Acquired 01/24/17,
cost $0)(a)(b)(c) | | | | | | | 333,860 | | | | 3 | |
Johnson & Johnson | | | | | | | 897,176 | | | | 115,780,563 | |
JPMorgan Chase & Co. | | | | | | | 327,142 | | | | 31,935,602 | |
Kinder Morgan, Inc. | | | | | | | 10,738 | | | | 165,150 | |
KLA-Tencor Corp. | | | | | | | 7,957 | | | | 712,072 | |
Kohl’s Corp. | | | | | | | 10,684 | | | | 708,777 | |
Kroger Co. (The) | | | | | | | 28,609 | | | | 786,747 | |
Las Vegas Sands Corp. | | | | | | | 18,383 | | | | 956,835 | |
Lear Corp. | | | | | | | 3,543 | | | | 435,293 | |
Liberty Broadband Corp., Class A(a) | | | | | | | 62,817 | | | | 4,510,889 | |
Liberty Broadband Corp., Class C(a) | | | | | | | 260,865 | | | | 18,790,106 | |
Liberty Media Corp.-Liberty SiriusXM, Class A(a) | | | | | | | 217,656 | | | | 8,009,741 | |
Liberty Media Corp.-Liberty SiriusXM, Class C(a) | | | | | | | 364,715 | | | | 13,487,160 | |
Lookout, Inc. (Acquired 03/04/15, cost $936,169)(a)(b)(c) | | | | | | | 81,954 | | | | 1,639 | |
Lowe’s Cos., Inc. | | | | | | | 53,526 | | | | 4,943,661 | |
Marathon Petroleum Corp. | | | | | | | 474,145 | | | | 27,979,296 | |
Marsh & McLennan Cos., Inc.(d) | | | | | | | 725,753 | | | | 57,878,802 | |
Masco Corp. | | | | | | | 157,330 | | | | 4,600,329 | |
Mastercard, Inc., Class A | | | | | | | 18,623 | | | | 3,513,229 | |
McDonald’s Corp. | | | | | | | 7,643 | | | | 1,357,167 | |
McKesson Corp. | | | | | | | 7,367 | | | | 813,832 | |
Medtronic plc | | | | | | | 34,739 | | | | 3,159,859 | |
Merck & Co., Inc. | | | | | | | 71,080 | | | | 5,431,223 | |
MetLife, Inc. | | | | | | | 31,510 | | | | 1,293,801 | |
MGM Resorts International(d) | | | | | | | 714,549 | | | | 17,334,959 | |
Micron Technology, Inc.(a) | | | | | | | 32,625 | | | | 1,035,191 | |
Microsoft Corp. | | | | | | | 1,275,282 | | | | 129,530,393 | |
Mondelez International, Inc., Class A | | | | | | | 67,856 | | | | 2,716,276 | |
Morgan Stanley | | | | | | | 928,860 | | | | 36,829,299 | |
Newmont Mining Corp.(d) | | | | | | | 753,832 | | | | 26,120,279 | |
NextEra Energy Partners LP(d) | | | | | | | 325,461 | | | | 14,011,096 | |
NextEra Energy, Inc. | | | | | | | 419,509 | | | | 72,919,054 | |
NIKE, Inc., Class B | | | | | | | 9,276 | | | | 687,723 | |
Norfolk Southern Corp. | | | | | | | 6,531 | | | | 976,646 | |
Northrop Grumman Corp. | | | | | | | 1,905 | | | | 466,534 | |
NRG Energy, Inc. | | | | | | | 17,859 | | | | 707,216 | |
Occidental Petroleum Corp. | | | | | | | 15,113 | | | | 927,636 | |
Omnicom Group, Inc.(d) | | | | | | | 45,898 | | | | 3,361,570 | |
Oracle Corp. | | | | | | | 227,710 | | | | 10,281,106 | |
Packaging Corp. of America | | | | | | | 8,294 | | | | 692,217 | |
Paychex, Inc. | | | | | | | 14,944 | | | | 973,602 | |
PayPal Holdings, Inc.(a) | | | | | | | 7,629 | | | | 641,523 | |
PepsiCo, Inc. | | | | | | | 39,164 | | | | 4,326,839 | |
Pfizer, Inc. | | | | | | | 1,780,495 | | | | 77,718,607 | |
PG&E Corp.(a) | | | | | | | 18,133 | | | | 430,659 | |
Philip Morris International, Inc. | | | | | | | 474,406 | | | | 31,671,345 | |
Phillips 66 | | | | | | | 24,720 | | | | 2,129,628 | |
Procter & Gamble Co. (The) | | | | | | | 426,285 | | | | 39,184,117 | |
Prudential Financial, Inc. | | | | | | | 7,906 | | | | 644,734 | |
Pure Storage, Inc., Class A(a)(d) | | | | | | | 783,496 | | | | 12,598,616 | |
PVH Corp. | | | | | | | 6,054 | | | | 562,719 | |
QUALCOMM, Inc. | | | | | | | 553,482 | | | | 31,498,661 | |
Raytheon Co. | | | | | | | 117,669 | | | | 18,044,541 | |
Red Hat, Inc.(a) | | | | | | | 4,965 | | | | 872,053 | |
Reinsurance Group of America, Inc. | | | | | | | 7,045 | | | | 987,920 | |
Rockwell Automation, Inc. | | | | | | | 9,358 | | | | 1,408,192 | |
Ross Stores, Inc. | | | | | | | 10,315 | | | | 858,208 | |
Royal Caribbean Cruises Ltd. | | | | | | | 6,579 | | | | 643,360 | |
Schlumberger Ltd. | | | | | | | 213,583 | | | | 7,706,075 | |
Sempra Energy(d) | | | | | | | 176,103 | | | | 19,052,584 | |
Sprint Corp.(a) | | | | | | | 4,037 | | | | 23,495 | |
St Joe Co. (The)(a) | | | | | | | 131,390 | | | | 1,730,406 | |
| | | | | | | | | | | | |
| Security | | | | | Shares | | | Value | |
|
| United States (continued) | |
Starbucks Corp. | | | | | | | 469,083 | | | $ | 30,208,945 | |
State Street Corp. | | | | | | | 5,738 | | | | 361,896 | |
Stryker Corp. | | | | | | | 19,293 | | | | 3,024,178 | |
SunTrust Banks, Inc. | | | | | | | 529,288 | | | | 26,697,287 | |
Symantec Corp. | | | | | | | 3,221 | | | | 60,861 | |
Sysco Corp. | | | | | | | 8,769 | | | | 549,466 | |
Target Corp. | | | | | | | 9,307 | | | | 615,100 | |
Tenet Healthcare Corp.(a) | | | | | | | 186,990 | | | | 3,205,009 | |
Thermo Fisher Scientific, Inc. | | | | | | | 14,365 | | | | 3,214,743 | |
Travelers Cos., Inc. (The) | | | | | | | 30,751 | | | | 3,682,432 | |
Union Pacific Corp. | | | | | | | 5,679 | | | | 785,008 | |
United Continental Holdings, Inc.(a) | | | | | | | 371,668 | | | | 31,119,762 | |
United Technologies Corp. | | | | | | | 264,696 | | | | 28,184,830 | |
UnitedHealth Group, Inc. | | | | | | | 41,147 | | | | 10,250,541 | |
US Bancorp | | | | | | | 19,827 | | | | 906,094 | |
Valero Energy Corp. | | | | | | | 22,830 | | | | 1,711,565 | |
VeriSign, Inc.(a) | | | | | | | 7,945 | | | | 1,178,164 | |
Verizon Communications, Inc. | | | | | | | 606,991 | | | | 34,125,034 | |
VF Corp. | | | | | | | 3,803 | | | | 271,306 | |
Visa, Inc., Class A | | | | | | | 31,217 | | | | 4,118,771 | |
Vistra Energy Corp.(a) | | | | | | | 188,730 | | | | 4,320,030 | |
VMware, Inc., Class A(a) | | | | | | | 6,555 | | | | 898,887 | |
Vornado Realty Trust | | | | | | | 12,685 | | | | 786,851 | |
Walgreens Boots Alliance, Inc. | | | | | | | 1,769 | | | | 120,876 | |
Walmart, Inc. | | | | | | | 24,880 | | | | 2,317,572 | |
Walt Disney Co. (The) | | | | | | | 9,984 | | | | 1,094,746 | |
Waste Management, Inc. | | | | | | | 4,694 | | | | 417,719 | |
Wells Fargo & Co. | | | | | | | 1,628,658 | | | | 75,048,561 | |
Western Digital Corp. | | | | | | | 634,141 | | | | 23,444,193 | |
Weyerhaeuser Co. | | | | | | | 33,432 | | | | 730,824 | |
Williams Cos., Inc. (The)(d) | | | | | | | 3,245,222 | | | | 71,557,145 | |
Wyndham Destinations, Inc. | | | | | | | 17,042 | | | | 610,785 | |
Xcel Energy, Inc. | | | | | | | 9,486 | | | | 467,375 | |
Yum! Brands, Inc. | | | | | | | 14,451 | | | | 1,328,336 | |
Zoetis, Inc. | | | | | | | 8,789 | | | | 751,811 | |
Zynga, Inc., Class A(a) | | | | | | | 4,748,402 | | | | 18,661,220 | |
| | | | | | | | | | | | |
| | | | | | | | | | | 2,839,577,747 | |
| |
Total Common Stocks— 58.2%
(Cost: $5,417,381,989) | | | | 5,226,781,247 | |
| | | | | | | | | | | | |
| | | |
| | | | | | Par
(000) | | | | |
|
| Corporate Bonds — 4.7% | |
|
| Australia— 0.4% | |
Quintis Australia Pty. Ltd.(c)(e)(h)(t): | | | | | | | | | | | | |
7.50% (7.50% Cash or 8.00% PIK), 10/01/26 | | | USD | | | | 17,908 | | | | 17,625,011 | |
12.00% (0.00% Cash or 0.00% PIK), 10/01/28 | | | USD | | | | 21,237 | | | | 21,236,520 | |
| | | | | | | | | | | | |
| | | | | | | | | | | 38,861,531 | |
|
| Belgium— 0.1% | |
Anheuser-Busch InBev Worldwide, Inc.: | | | | | | | | | | | | |
3.50%, 01/12/24 | | | USD | | | | 4,114 | | | | 4,024,091 | |
4.00%, 04/13/28 | | | USD | | | | 6,778 | | | | 6,483,384 | |
| | | | | | | | | | | | |
| | | | | | | | | | | 10,507,475 | |
|
| Chile— 0.0% | |
Inversiones Alsacia SA, 8.00%, 12/31/18(a)(e)(i) | | | USD | | | | 7,767 | | | | 155,734 | |
| | | | | | | | | | | | |
|
| China— 0.1% | |
Baidu, Inc., 4.38%, 05/14/24 | | | USD | | | | 5,410 | | | | 5,443,878 | |
China Milk Products Group Ltd., 0.00%, 01/05/12(a)(i)(j)(k) | | | USD | | | | 4,800 | | | | 48,000 | |
| | | | | | | | | | | | |
| | | | | | | | | | | 5,491,878 | |
| | |
| 10 | | 2018 BLACKROCK ANNUAL REPORTTO SHAREHOLDERS |
| | |
Consolidated Schedule of Investments (continued) December 31, 2018 | | BlackRock Global Allocation V.I. Fund (Percentages shown are based on Net Assets) |
| | | | | | | | | | | | |
| Security | | | | | Par
(000) | | | Value | |
|
| France — 0.1% | |
Danone SA, 2.59%, 11/02/23(e) | | | USD | | | | 7,310 | | | $ | 6,949,544 | |
| | | | | | | | |
|
| Germany — 0.1% | |
Bayer Capital Corp. BV, 5.63%, 11/22/19(e)(j) | | | EUR | | | | 14,600 | | | | 12,792,031 | |
| | | | | | | | |
|
| India — 0.0% | |
REI Agro Ltd.(a)(c)(i)(j): | | | | | | | | | | | | |
5.50%, 11/13/14(e) | | | USD | | | | 6,148 | | | | 1 | |
5.50%, 11/13/14 | | | USD | | | | 2,291 | | | | — | |
| | | | | | | | |
| | | | | | | | | | | 1 | |
|
| Italy — 0.1% | |
Telecom Italia SpA, 5.30%, 05/30/24(e) | | | USD | | | | 4,066 | | | | 3,862,700 | |
| | | | | | | | |
|
| Japan — 0.3% | |
Sumitomo Mitsui Financial Group, Inc., 3.94%, 10/16/23 | | | USD | | | | 21,106 | | | | 21,477,029 | |
Takeda Pharmaceutical Co. Ltd., 3.80%, 11/26/20(e) | | | USD | | | | 5,065 | | | | 5,095,555 | |
| | | | | | | | |
| | | | | | | | | | | 26,572,584 | |
|
| Luxembourg — 0.0% | |
Intelsat Jackson Holdings SA, 8.00%, 02/15/24(e) | | | USD | | | | 1,933 | | | | 1,990,990 | |
| | | | | | | | |
|
| Netherlands — 0.1% | |
Cooperatieve Rabobank UA, 3.95%, 11/09/22 | | | USD | | | | 1,986 | | | | 1,979,521 | |
ING Groep NV, 4.10%, 10/02/23 | | | USD | | | | 9,865 | | | | 9,859,007 | |
| | | | | | | | |
| | | | | | | | | | | 11,838,528 | |
|
| Singapore — 0.1% | |
CapitaLand Ltd., 1.95%, 10/17/23(e)(j) | | | SGD | | | | 7,250 | | | | 5,151,907 | |
| | | | | | | | |
|
| Switzerland — 0.1% | |
UBS Group Funding Switzerland AG, 4.13%, 09/24/25(e) | | | USD | | | | 4,688 | | | | 4,670,666 | |
| | | | | | | | |
|
| Turkey — 0.0% | |
Bio City Development Co. BV, 8.00%, 07/06/20(a)(c)(e)(i)(j) | | | USD | | | | 21,400 | | | | 3,317,000 | |
| | | | | | | | |
|
| United Kingdom — 0.1% | |
HSBC Holdings plc, (LIBOR USD 3 Month + 1.06%), 3.26%, 03/13/23(l) | | | USD | | | | 6,852 | | | | 6,705,761 | |
| | | | | | | | |
|
| United States — 3.1% | |
Allergan Funding SCS, 3.45%, 03/15/22 | | | USD | | | | 6,517 | | | | 6,413,006 | |
Allergan Sales LLC, 5.00%, 12/15/21(e) | | | USD | | | | 3,225 | | | | 3,318,200 | |
American Express Co., 3.70%, 08/03/23 | | | USD | | | | 14,692 | | | | 14,734,484 | |
Apple, Inc.: | | | | | | | | | | | | |
3.35%, 02/09/27 | | | USD | | | | 11,988 | | | | 11,681,001 | |
3.20%, 05/11/27 | | | USD | | | | 11,520 | | | | 11,117,711 | |
AT&T, Inc., 3.60%, 02/17/23 | | | USD | | | | 14,312 | | | | 14,223,312 | |
AvalonBay Communities, Inc., 3.50%, 11/15/24 | | | USD | | | | 1,436 | | | | 1,427,398 | |
Bank of America Corp.: | | | | | | | | | | | | |
(LIBOR USD 3 Month + 0.66%), 2.37%, 07/21/21(l) | | | USD | | | | 2,995 | | | | 2,941,403 | |
3.30%, 01/11/23 | | | USD | | | | 6,864 | | | | 6,760,073 | |
4.00%, 01/22/25 | | | USD | | | | 3,669 | | | | 3,574,142 | |
Becton Dickinson and Co.: | | | | | | | | | | | | |
3.13%, 11/08/21 | | | USD | | | | 6,655 | | | | 6,563,539 | |
2.89%, 06/06/22 | | | USD | | | | 5,486 | | | | 5,313,301 | |
3.36%, 06/06/24 | | | USD | | | | 2,924 | | | | 2,808,435 | |
BP Capital Markets America, Inc., 3.79%, 02/06/24 | | | USD | | | | 5,775 | | | | 5,837,309 | |
Capital One Financial Corp.: | | | | | | | | | | | | |
3.20%, 01/30/23 | | | USD | | | | 4,939 | | | | 4,806,245 | |
3.30%, 10/30/24 | | | USD | | | | 2,159 | | | | 2,041,867 | |
| | | | | | | | | | | | |
| Security | | | | | Par
(000) | | | Value | |
|
| United States (continued) | |
Citigroup, Inc., 2.45%, 01/10/20 | | | USD | | | | 6,616 | | | $ | 6,562,871 | |
Comcast Corp.: | | | | | | | | | | | | |
3.45%, 10/01/21 | | | USD | | | | 5,479 | | | | 5,534,552 | |
2.75%, 03/01/23 | | | USD | | | | 6,879 | | | | 6,695,142 | |
3.70%, 04/15/24 | | | USD | | | | 13,595 | | | | 13,677,996 | |
CVS Health Corp., 3.70%, 03/09/23 | | | USD | | | | 21,094 | | | | 20,868,191 | |
DowDuPont, Inc., 3.77%, 11/15/20 | | | USD | | | | 5,445 | | | | 5,497,202 | |
eBay, Inc., 2.75%, 01/30/23 | | | USD | | | | 3,683 | | | | 3,540,799 | |
Edgewell Personal Care Co.: | | | | | | | | | | | | |
4.70%, 05/19/21 | | | USD | | | | 3,352 | | | | 3,301,720 | |
4.70%, 05/24/22 | | | USD | | | | 3,367 | | | | 3,240,738 | |
Enterprise Products Operating LLC: | | | | | | | | | | | | |
3.35%, 03/15/23 | | | USD | | | | 3,673 | | | | 3,622,827 | |
3.90%, 02/15/24 | | | USD | | | | 2,154 | | | | 2,172,253 | |
Gilead Sciences, Inc., 3.25%, 09/01/22 | | | USD | | | | 6,868 | | | | 6,851,855 | |
Goldman Sachs Group, Inc. (The), (LIBOR USD 3 Month + 1.05%), 2.91%, 06/05/23(l) | | | USD | | | | 6,866 | | | | 6,591,292 | |
Halfmoon Parent, Inc.(e): | | | | | | | | | | | | |
3.40%, 09/17/21 | | | USD | | | | 9,310 | | | | 9,288,824 | |
3.75%, 07/15/23 | | | USD | | | | 7,927 | | | | 7,900,603 | |
Hughes Satellite Systems Corp., 7.63%, 06/15/21 | | | USD | | | | 1,213 | | | | 1,258,488 | |
Northrop Grumman Corp., 2.55%, 10/15/22 | | | USD | | | | 6,863 | | | | 6,641,002 | |
Philip Morris International, Inc.: | | | | | | | | | | | | |
2.50%, 11/02/22 | | | USD | | | | 1,324 | | | | 1,272,499 | |
3.60%, 11/15/23 | | | USD | | | | 2,753 | | | | 2,759,314 | |
QUALCOMM, Inc.: | | | | | | | | | | | | |
2.60%, 01/30/23 | | | USD | | | | 3,457 | | | | 3,326,751 | |
2.90%, 05/20/24 | | | USD | | | | 4,117 | | | | 3,920,195 | |
Sempra Energy, 2.88%, 10/01/22 | | | USD | | | | 1,932 | | | | 1,863,276 | |
Sherwin-Williams Co. (The), 2.25%, 05/15/20 | | | USD | | | | 1,289 | | | | 1,269,265 | |
Simon Property Group LP, 2.75%, 06/01/23 | | | USD | | | | 2,747 | | | | 2,661,962 | |
Starbucks Corp., 3.10%, 03/01/23 | | | USD | | | | 6,881 | | | | 6,777,460 | |
UnitedHealth Group, Inc.: | | | | | | | | | | | | |
3.50%, 06/15/23 | | | USD | | | | 6,857 | | | | 6,916,122 | |
3.50%, 02/15/24 | | | USD | | | | 4,175 | | | | 4,201,721 | |
Verizon Communications, Inc., 3.13%, 03/16/22 | | | USD | | | | 7,144 | | | | 7,096,379 | |
Walgreen Co., 3.10%, 09/15/22 | | | USD | | | | 7,007 | | | | 6,835,340 | |
Wells Fargo & Co., 3.07%, 01/24/23 | | | USD | | | | 1,431 | | | | 1,393,685 | |
Wells Fargo Bank NA, 3.55%, 08/14/23 | | | USD | | | | 9,002 | | | | 8,963,939 | |
Williams Cos., Inc. (The), 3.70%, 01/15/23 | | | USD | | | | 3,457 | | | | 3,372,339 | |
| | | | | | | | |
| | | | | | | | | | | 279,438,028 | |
| |
Total Corporate Bonds — 4.7%
(Cost: $464,883,361) | | | | 418,306,358 | |
| | | | | | | | |
|
Floating Rate Loan Interests — 0.2%(m) | |
|
| United States — 0.2% | |
Fieldwood Energy LLC, 2nd Lien Term Loan, (LIBOR USD 1 Month + 7.25%), 9.77%, 04/11/23 | | | USD | | | | 2,958 | | | | 2,570,864 | |
Fieldwood Energy LLC, Term Loan, (LIBOR USD 1 Month + 5.25%), 7.77%, 04/11/22 | | | USD | | | | 2,191 | | | | 2,042,140 | |
Hilton Worldwide Finance LLC, 1st Lien Term Loan B2, (LIBOR USD 1 Month + 1.75%), 4.26%, 10/25/23 | | | USD | | | | 11,442 | | | | 11,013,301 | |
| | | | | | | | |
| | | | | | | | | | | 15,626,305 | |
| |
Total Floating Rate Loan Interests — 0.2%
(Cost: $14,489,682) | | | | 15,626,305 | |
| | | | | | | | |
| | | | |
| CONSOLIDATED SCHEDULE OF INVESTMENTS | | | 11 | |
| | |
Consolidated Schedule of Investments (continued) December 31, 2018 | | BlackRock Global Allocation V.I. Fund (Percentages shown are based on Net Assets) |
| | | | | | | | | | | | |
| Security | | | | | Par
(000) | | | Value | |
|
Foreign Government Obligations — 2.8% | |
|
| Argentina — 0.8% | |
Republic of Argentina: | | | | | | | | | | | | |
3.38%, 01/15/23 | | | EUR | | | | 8,170 | | | $ | 7,418,416 | |
6.88%, 01/26/27 | | | USD | | | | 28,817 | | | | 21,900,920 | |
5.88%, 01/11/28 | | | USD | | | | 41,668 | | | | 29,844,705 | |
5.25%, 01/15/28 | | | EUR | | | | 1,282 | | | | 1,053,901 | |
7.82%, 12/31/33 | | | EUR | | | | 16,600 | | | | 15,871,442 | |
| | | | | | | | |
| | | | | | | | | | | 76,089,384 | |
|
| Australia — 0.2% | |
Commonwealth of Australia, 3.00%, 03/21/47 | | | AUD | | | | 29,274 | | | | 21,332,955 | |
| | | | | | | | |
|
| Canada — 0.2% | |
Canadian Government Bond, 0.75%, 03/01/21 | | | CAD | | | | 22,991 | | | | 16,443,314 | |
| | | | | | | | |
|
| Germany — 0.9% | |
Federal Republic of Germany, 0.50%, 02/15/28 | | | EUR | | | | 65,186 | | | | 76,872,495 | |
| | | | | | | | |
|
| Mexico — 0.7% | |
United Mexican States: | | | | | | | | | | | | |
6.50%, 06/10/21 | | | MXN | | | | 6,562 | | | | 31,854,750 | |
8.00%, 12/07/23 | | | MXN | | | | 6,274 | | | | 31,144,439 | |
| | | | | | | | |
| | | | | | | | | | | 62,999,189 | |
| |
Total Foreign Government Obligations — 2.8%
(Cost: $277,482,283) | | | | 253,737,337 | |
| | | | | | | | |
| | | |
| | | | | | Shares | | | | |
|
| Investment Companies — 1.3% | |
iShares Gold Trust(a)(n)(t) | | | | | | | 5,628,395 | | | | 69,172,974 | |
SPDR Gold Shares(a)(g)(n) | | | | | | | 297,007 | | | | 36,012,099 | |
VanEck Vectors Gold Miners ETF(d) | | | | | | | 520,099 | | | | 10,968,888 | |
| | | | | | | | |
| |
Total Investment Companies — 1.3%
(Cost: $120,982,118) | | | | 116,153,961 | |
| | | | | | | | |
|
Preferred Securities — 2.4% | |
| | | |
| | | | | | Par
(000) | | | | |
|
Capital Trusts — 1.0% | |
|
Netherlands — 0.0% | |
ING Groep NV, 6.00%(m)(o) | | | USD | | | | 3,377 | | | | 3,280,418 | |
| | | | | | | | |
|
| United Kingdom — 0.4%(m)(o) | |
HSBC Holdings plc, 6.37% | | | USD | | | | 13,297 | | | | 12,366,210 | |
Lloyds Bank plc, 13.00% | | | GBP | | | | 7,484 | | | | 15,313,566 | |
| | | | | | | | |
| | | | | | | | | | | 27,679,776 | |
|
| United States — 0.6% | |
American Express Co., Series C, 4.90%(m)(o) | | | USD | | | | 4,528 | | | | 4,335,560 | |
Citigroup, Inc.(m)(o): | | | | | | | | | | | | |
Series O, 5.87% | | | USD | | | | 15,431 | | | | 14,890,915 | |
Series Q, 5.95% | | | USD | | | | 6,252 | | | | 6,033,180 | |
Goldman Sachs Group, Inc. (The), Series M, 5.38%(m)(o) | | | USD | | | | 7,289 | | | | 7,043,142 | |
Morgan Stanley, Series H, 5.45%(m)(o) | | | USD | | | | 5,144 | | | | 5,003,157 | |
NBCUniversal Enterprise, Inc., 5.25%(e)(o) | | | USD | | | | 5,270 | | | | 5,335,875 | |
Prudential Financial, Inc.(m): | | | | | | | | | | | | |
5.63%, 06/15/43 | | | USD | | | | 2,604 | | | | 2,550,175 | |
5.87%, 09/15/42 | | | USD | | | | 3,919 | | | | 3,958,190 | |
USB Capital IX, 3.50%(m)(o) | | | USD | | | | 1,901 | | | | 1,406,740 | |
| | | | | | | | |
| | | | | | | | | | | 50,556,934 | |
| |
Total Capital Trusts — 1.0%
(Cost: $84,674,126) | | | | 81,517,128 | |
| | | | | | | | |
| | | | | | | | | | | | |
Security | | | | | Shares | | | Value | |
|
Preferred Stocks — 1.0% | |
|
| Brazil — 0.0% | |
Braskem SA (Preference), 0.00% | | | | | | | 8,921 | | | $ | 109,057 | |
Itau Unibanco Holding SA (Preference), 0.00% | | | | | | | 519,866 | | | | 4,761,717 | |
Petroleo Brasileiro SA (Preference), 0.00%(a) | | | | | | | 17,036 | | | | 99,691 | |
| | | | | | | | |
| | | | | | | | | | | 4,970,465 | |
|
| South Korea — 0.0% | |
Samsung Electronics Co. Ltd. (Preference), 0.00%(a) | | | | | | | 21,974 | | | | 627,878 | |
| | | | | | | | |
|
| United States — 1.0% | |
Grand Rounds, Inc., Series C (Acquired 03/31/15, cost $5,939,231), 0.00%(a)(b)(c) | | | | | | | 2,139,107 | | | | 5,240,812 | |
Grand Rounds, Inc., Series D (Acquired 05/01/18, cost $3,180,966), 0.00%(a)(b)(c) | | | | | | | 1,312,469 | | | | 3,176,175 | |
Lookout, Inc., Series F (Acquired09/19/14-10/22/14, cost $10,936,522), 0.00%(a)(b)(c) | | | | | | | 957,404 | | | | 5,782,720 | |
Palantir Technologies, Inc., Series I (Acquired 02/11/14, cost $11,447,321), 0.00%(a)(b)(c) | | | | | | | 1,867,426 | | | | 10,102,775 | |
Uber Technologies, Inc., Series D (Acquired 06/06/14, cost $17,574,548), 0.00%(a)(b)(c) | | | | | | | 1,132,888 | | | | 50,945,973 | |
Wells Fargo & Co., Series L, 7.50%(j)(o) | | | | | | | 2,965 | | | | 3,741,741 | |
Welltower, Inc., Series I, 6.50%(d)(j)(o) | | | | | | | 125,874 | | | | 7,948,943 | |
| | | | | | | | |
| | | | | | | | | | | 86,939,139 | |
| |
Total Preferred Stocks — 1.0%
(Cost: $63,624,365) | | | | 92,537,482 | |
| | | | | | | | |
|
Trust Preferreds — 0.4% | |
|
| China — 0.2% | |
Mandatory Exchangeable Trust, 5.75%, 06/01/19(e)(j) | | | | | | | 138,193 | | | | 21,327,326 | |
| | | | | | | | |
|
| United States — 0.2%(m) | |
Citigroup Capital XIII, 8.89%, 10/30/40 | | | | | | | 319,725 | | | | 8,450,332 | |
GMAC Capital Trust I, Series 2, 8.40%, 02/15/40 | | | | | | | 351,212 | | | | 8,903,224 | |
| | | | | | | | |
| | | | | | | | | | | 17,353,556 | |
| |
Total Trust Preferreds — 0.4%
(Cost: $30,358,349) | | | | 38,680,882 | |
| | | | | | | | |
| |
Total Preferred Securities — 2.4%
(Cost: $178,656,840) | | | | 212,735,492 | |
| | | | | | | | |
| | | |
| | | | | | Par
(000) | | | | |
|
| U.S. Treasury Obligations — 22.6% | |
U.S. Treasury Inflation Linked Notes, 0.63%, 04/15/23 | | | USD | | | | 74,231 | | | | 72,997,361 | |
U.S. Treasury Notes: | | | | | | | | | | | | |
1.50%, 11/30/19(n) | | | USD | | | | 22,253 | | | | 22,023,120 | |
2.75%, 08/31/23 | | | USD | | | | 221,786 | | | | 224,272,834 | |
2.88%, 09/30/23 - 11/30/25 | | | USD | | | | 775,424 | | | | 788,364,077 | |
2.88%, 10/31/23(p) | | | USD | | | | 614,853 | | | | 625,084,637 | |
3.00%, 10/31/25(p) | | | USD | | | | 289,851 | | | | 297,357,176 | |
| |
Total U.S. Treasury Obligations — 22.6%
(Cost: $1,987,445,134) | | | | 2,030,099,205 | |
| | | | | | | | |
| |
Total Long-Term Investments — 92.2%
(Cost: $8,461,321,407) | | | | 8,273,439,905 | |
| | | | | | | | |
| | |
| 12 | | 2018 BLACKROCK ANNUAL REPORTTO SHAREHOLDERS |
| | |
Consolidated Schedule of Investments (continued) December 31, 2018 | | BlackRock Global Allocation V.I. Fund (Percentages shown are based on Net Assets) |
| | | | | | | | | | | | |
|
Short-Term Securities — 10.1% | |
| | | |
| Security | | | | | Par
(000) | | | Value | |
|
Foreign Government Obligations — 2.0%(q) | |
|
Japan — 2.0% | |
Japan Treasury Bills: | | | | | | | | | | | | |
(0.32)%, 01/28/19 | | | JPY | | | | 5,673,500 | | | $ | 51,768,636 | |
(0.34)%, 02/04/19 | | | JPY | | | | 5,669,100 | | | | 51,730,247 | |
(0.25)%, 03/04/19 | | | JPY | | | | 5,857,950 | | | | 53,460,067 | |
(0.16)%, 03/25/19 | | | JPY | | | | 2,495,950 | | | | 22,780,312 | |
| | | | | | | | |
| | | | | | | | | | | 179,739,262 | |
| |
Total Foreign Government Obligations — 2.0%
(Cost: $175,441,056) | | | | 179,739,262 | |
| | | | | | | | |
| | | |
| | | | | | Shares | | | | |
|
| Money Market Funds — 2.6%(r)(t) | |
BlackRock Liquidity Funds,T-Fund, Institutional Class, 2.32% | | | USD | | | | 22,471,516 | | | | 22,471,516 | |
SL Liquidity Series, LLC, Money Market Series, 2.57%(s) | | | | | | | 209,527,510 | | | | 209,506,557 | |
| | | | | | | | |
| |
Total Money Market Funds — 2.6%
(Cost: $231,985,653) | | | | 231,978,073 | |
| | | | | | | | |
|
Time Deposits — 0.0% | |
| | | |
| Canada — 0.0% | | | | | | | | | |
Royal Bank Of Canada, 0.84%, 01/02/19 | | | CAD | | | | 322 | | | | 236,037 | |
| | | |
| Europe — 0.0% | | | | | | | | | |
Citibank NA, (0.57)%, 01/02/19 | | | EUR | | | | 1,309 | | | | 1,499,576 | |
| | | |
| Hong Kong — 0.0% | | | | | | | | | |
Brown Brothers Harriman & Co., 1.52%, 01/02/19 | | | HKD | | | | 107 | | | | 13,615 | |
| | | |
| United Kingdom — 0.0% | | | | | | | | | |
Brown Brothers Harriman & Co., 0.37%, 01/02/19 | | | GBP | | | | 12 | | | | 15,203 | |
| | | |
| United States — 0.0% | | | | | | | | | |
JPMorgan Chase & Co., 2.42%, 01/02/19 | | | USD | | | | 39 | | | | 38,774 | |
| |
Total Time Deposits — 0.0%
(Cost: $1,803,205) | | | | 1,803,205 | |
| | | | | | | | |
| | | |
| | | | | | Par
(000) | | | | |
|
| U.S. Treasury Obligations — 5.5% | |
U.S. Treasury Bills:(q) | | | | | | | | | | | | |
2.20%, 01/08/19 | | | USD | | | | 108,000 | | | | 107,959,545 | |
2.23%, 01/03/19 | | | USD | | | | 8,000 | | | | 7,999,500 | |
2.25%, 01/02/19 | | | USD | | | | 18,000 | | | | 18,000,000 | |
2.30%, 01/15/19 | | | USD | | | | 178,000 | | | | 177,853,848 | |
2.32%, 01/22/19 | | | USD | | | | 125,250 | | | | 125,089,958 | |
2.33%, 02/05/19 | | | USD | | | | 60,000 | | | | 59,864,496 | |
| |
Total U.S. Treasury Obligations — 5.5%
(Cost: $496,738,136) | | | | 496,767,347 | |
| | | | | | | | |
| |
Total Short-Term Securities — 10.1%
(Cost: $905,968,050) | | | | 910,287,887 | |
| | | | | | | | |
| |
Total Options Purchased — 0.2%
(Cost: $49,554,079) | | | | 21,948,987 | |
| | | | | | | | |
| |
Total Investments Before Options Written and
Investments Sold Short — 102.5%
(Cost: $9,416,843,536) | | | | 9,205,676,779 | |
| | | | | | | | |
| |
Total Options Written — (0.7)%
(Premiums Received — $44,813,654) | | | | (69,631,015 | ) |
| | | | | | | | |
| | | | | | | | | | | | |
|
Investments Sold Short — (0.2)% | |
| | | |
Security | | | | | Shares | | | Value | |
|
| Common Stocks — (0.2)% | |
|
| France — (0.1)% | |
Pernod Ricard SA | | | | | | | 30,757 | | | $ | (5,047,857 | ) |
| | | | | | | | |
Japan — (0.1)% | |
SUMCO Corp. | | | | | | | 502,000 | | | | (5,590,773 | ) |
Yaskawa Electric Corp. | | | | | | | 244,800 | | | | (5,983,933 | ) |
| | | | | | | | |
| | | | | | | | | | | (11,574,706 | ) |
United States — 0.0% | |
LyondellBasell Industries NV, Class A | | | | | | | 37,873 | | | | (3,149,519 | ) |
| | | | | | | | |
| |
Total Common Stocks — (0.2)%
(Proceeds: $25,194,044) | | | | (19,772,082 | ) |
| | | | | | | | |
| |
Total Investments Sold Short — (0.2)%
(Proceeds: $25,194,044) | | | | (19,772,082 | ) |
| | | | | | | | |
| |
Total Investments Net of Options Written and
Investments Sold Short — 101.6%
(Cost: $9,346,835,838) | | | | 9,116,273,682 | |
| | | | | | | | |
| |
Liabilities in Excess of Other Assets — (1.6)% | | | | (141,162,241 | ) |
| | | | | | | | |
| |
Net Assets — 100.0% | | | $ | 8,975,111,441 | |
| | | | | | | | |
| (a) | Non-income producing security. |
| (b) | Restricted security as to resale, excluding 144A securities. The Fund held restricted securities with a current value of $84,743,118, representing 0.94% of its net assets as of period end, and an original cost of $79,372,879. |
| (c) | Security is valued using significant unobservable inputs and is classified as Level 3 in the fair value hierarchy. |
| (d) | Security, or a portion of the security, is on loan. |
| (e) | Security exempt from registration pursuant to Rule 144A under the Securities Act of 1933, as amended. These securities may be resold in transactions exempt from registration to qualified institutional investors. |
| (f) | A security contractually bound to one or more other securities to form a single saleable unit which cannot be sold separately. |
| (g) | All or a portion of the security has been pledged and/or segregated as collateral in connection with outstanding exchange-traded options written. |
| (h) | Payment-in-kind security which may pay interest/dividends in additional par/shares and/or in cash. Rates shown are the current rate and possible payment rates. |
| (i) | Issuer filed for bankruptcy and/or is in default. |
| (l) | Variable rate security. Security may be issued at a fixed coupon rate, which converts to a variable rate at a specified date. Rate shown is the rate in effect as of period end. |
| (m) | Variable rate security. Rate shown is the rate in effect as of period end. |
| (n) | All or a portion of the security is held by a wholly-owned subsidiary. See Note 1 of the Notes to Consolidated Financial Statements for details on the wholly-owned subsidiary. |
| (o) | Perpetual security with no stated maturity date. |
| (p) | All or a portion of the security has been pledged in connection with outstanding centrally cleared swaps. |
| (q) | Rates are discount rates or a range of discount rates as of period end. |
| (r) | Annualized7-day yield as of period end. |
| (s) | Security was purchased with the cash collateral from loaned securities. |
| | | | |
| CONSOLIDATED SCHEDULE OF INVESTMENTS | | | 13 | |
| | |
Consolidated Schedule of Investments (continued) December 31, 2018 | | BlackRock Global Allocation V.I. Fund |
| (t) | During the year ended December 31, 2018, investments in issuers considered to be affiliates of the Fund for purposes of Section 2(a)(3) of the Investment Company Act of 1940, as amended, and /or related parties of the fund were as follows: |
| | | | | | | | | | | | | | | | | | | | | | | | | | | | | | | | |
| Affiliated Persons and/or Related Parties | | Shares
Held at
12/31/17 | | | Shares
Purchased | | | Shares
Sold | | | Shares
Held at
12/31/18 | | | Value at
12/31/18 | | | Income | | | Net Realized
Gain (Loss) (a) | | | Change in
Unrealized
(Depreciation) | |
BlackRock Liquidity Funds,T-Fund, Institutional Class | | | 10,574,106 | | | | 11,897,410 | (b) | | | — | | | | 22,471,516 | | | $ | 22,471,516 | | | $ | 183,739 | | | $ | 20 | | | $ | — | |
SL Liquidity Series, LLC, Money Market Series | | | 235,838,442 | | | | — | | | | (26,310,932 | )(c) | | | 209,527,510 | | | | 209,506,557 | | | | 1,088,546 | (d) | | | 24,463 | | | | 7,113 | |
iShares Gold Trust | | | 2,098,037 | | | | 3,530,358 | | | | — | | | | 5,628,395 | | | | 69,172,974 | | | | — | | | | — | | | | (2,635,865 | ) |
Quintis Australia Pty. Ltd. 12.00% 10/01/28 | | | — | | | | 21,236,520 | | | | — | | | | 21,236,520 | | | | 21,236,520 | | | | — | | | | — | | | | (2,196,211 | ) |
Quintis Australia Pty. Ltd. 7.50% 10/01/26 | | | — | | | | 17,907,552 | | | | — | | | | 17,907,552 | | | | 17,625,011 | | | | — | | | | — | | | | (251,901 | ) |
Quintis HoldCo Pty. Ltd. | | | — | | | | 10,892,000 | | | | — | | | | 10,892,000 | | | | 5,830,553 | | | | — | | | | — | | | | 69,326 | |
| | | | | | | | | | | | | | | | | | | | | | | | | | | | | | | | |
| | | | | | | | | | | | | | | | | | $ | 345,843,131 | | | $ | 1,272,285 | | | $ | 24,483 | | | $ | (5,007,538 | ) |
| | | | | | | | | | | | | | | | | | | | | | | | | | | | | | | | |
| | (a) | Includes net capital gain distributions, if applicable. | |
| | (b) | Represents net shares purchased. | |
| | (c) | Represents net shares sold. | |
| | (d) | Represents securities lending income earned from the reinvestment of cash collateral from loaned securities, net of fees and collateral investment expenses, and other payments to and from borrowers of securities. | |
Derivative Financial Instruments Outstanding as of Period End
Futures Contracts
| | | | | | | | | | | | | | | | |
| Description | | Number of
Contracts | | | Expiration
Date | | | Notional
Amount (000) | | | Value/
Unrealized
Appreciation
(Depreciation) | |
Short Contracts | | | | | | | | | | | | | | | | |
Yen Denominated Nikkei 225 Index | | | 164 | | | | 03/07/19 | | | | 14,824 | | | $ | 761,684 | |
EURO STOXX 50 Index | | | 5,362 | | | | 03/15/19 | | | | 182,708 | | | | 5,122,115 | |
NASDAQ 100E-mini Index | | | 178 | | | | 03/15/19 | | | | 22,546 | | | | 529,817 | |
S&P 500E-Mini Index | | | 227 | | | | 03/15/19 | | | | 28,434 | | | | (38,040 | ) |
Canada 10 Year Bond | | | 765 | | | | 03/20/19 | | | | 76,640 | | | | (929,678 | ) |
| | | | | | | | | | | | | | | | |
| | | | | | | | | | | | | | $ | 5,445,898 | |
| | | | | | | | | | | | | | | | |
Forward Foreign Currency Exchange Contracts
| | | | | | | | | | | | | | | | | | | | |
Currency
Purchased | | | Currency
Sold | | | Counterparty | | Settlement Date | | | Unrealized
Appreciation
(Depreciation) | |
| JPY | | | 820,000 | | | USD | | | 7,426 | | | UBS AG | | | 01/04/19 | | | $ | 57 | |
| JPY | | | 25,196,807 | | | USD | | | 228,224 | | | UBS AG | | | 01/07/19 | | | | 1,748 | |
| JPY | | | 5,271,036,592 | | | USD | | | 47,468,000 | | | JPMorgan Chase Bank NA | | | 01/25/19 | | | | 711,335 | |
| USD | | | 15,682,692 | | | AUD | | | 22,171,000 | | | JPMorgan Chase Bank NA | | | 01/25/19 | | | | 59,161 | |
| JPY | | | 5,253,071,000 | | | USD | | | 47,033,441 | | | Citibank NA | | | 01/31/19 | | | | 1,004,443 | |
| JPY | | | 8,022,490,000 | | | USD | | | 71,353,200 | | | JPMorgan Chase Bank NA | | | 02/14/19 | | | | 2,086,054 | |
| EUR | | | 20,772,000 | | | USD | | | 23,732,394 | | | Goldman Sachs International | | | 02/15/19 | | | | 154,796 | |
| EUR | | | 20,569,000 | | | USD | | | 23,405,212 | | | Morgan Stanley & Co. International plc | | | 02/28/19 | | | | 272,510 | |
| JPY | | | 3,200,699,453 | | | USD | | | 28,338,000 | | | Morgan Stanley & Co. International plc | | | 03/07/19 | | | | 1,008,583 | |
| EUR | | | 20,243,000 | | | USD | | | 23,024,864 | | | Morgan Stanley & Co. International plc | | | 03/14/19 | | | | 305,732 | |
| SEK | | | 421,527,639 | | | EUR | | | 40,783,000 | | | Goldman Sachs International | | | 03/21/19 | | | | 824,983 | |
| | | | | | | | | | | | | | | | | | | | |
| | | | | | | | | | | | | | | | 6,429,402 | |
| | | | | | | | | | | | | | | | | | | | |
| GBP | | | 32,502,000 | | | USD | | | 42,430,584 | | | JPMorgan Chase Bank NA | | | 01/11/19 | | | | (987,165 | ) |
| EUR | | | 20,625,000 | | | USD | | | 23,701,654 | | | Morgan Stanley & Co. International plc | | | 01/25/19 | | | | (24,769 | ) |
| USD | | | 51,186,127 | | | JPY | | | 5,673,500,000 | | | Morgan Stanley & Co. International plc | | | 01/28/19 | | | | (684,170 | ) |
| NOK | | | 155,980,000 | | | USD | | | 18,819,263 | | | JPMorgan Chase Bank NA | | | 02/01/19 | | | | (753,945 | ) |
| USD | | | 50,680,858 | | | JPY | | | 5,669,100,000 | | | Goldman Sachs International | | | 02/04/19 | | | | (1,177,251 | ) |
| GBP | | | 36,838,000 | | | USD | | | 48,222,592 | | | JPMorgan Chase Bank NA | | | 02/15/19 | | | | (1,167,194 | ) |
| USD | | | 23,883,966 | | | EUR | | | 20,772,000 | | | Morgan Stanley & Co. International plc | | | 02/15/19 | | | | (3,224 | ) |
| GBP | | | 19,207,000 | | | USD | | | 25,144,260 | | | JPMorgan Chase Bank NA | | | 02/21/19 | | | | (603,394 | ) |
| USD | | | 23,606,424 | | | EUR | | | 20,569,000 | | | Deutsche Bank AG | | | 02/28/19 | | | | (71,298 | ) |
| USD | | | 26,050,532 | | | BRL | | | 101,558,000 | | | Deutsche Bank AG | | | 03/01/19 | | | | (40,977 | ) |
| USD | | | 52,565,295 | | | JPY | | | 5,857,950,000 | | | Goldman Sachs International | | | 03/04/19 | | | | (1,129,706 | ) |
| USD | | | 23,212,278 | | | EUR | | | 20,243,000 | | | Morgan Stanley & Co. International plc | | | 03/14/19 | | | | (118,319 | ) |
| ZAR | | | 403,941,000 | | | USD | | | 28,202,918 | | | Bank of America NA | | | 03/14/19 | | | | (363,332 | ) |
| USD | | | 22,680,999 | | | JPY | | | 2,495,950,000 | | | JPMorgan Chase Bank NA | | | 03/25/19 | | | | (243,219 | ) |
| | | | | | | | | | | | | | | | | | | | |
| | | | | | | | | | | | | | | | (7,367,963 | ) |
| | | | | | | | | | | | | | | | | | | | |
| | | Net Unrealized Depreciation | | | $ | (938,561 | ) |
| | | | | | | | | | | | | | | | | | | | |
| | |
| 14 | | 2018 BLACKROCK ANNUAL REPORTTO SHAREHOLDERS |
| | |
Consolidated Schedule of Investments (continued) December 31, 2018 | | BlackRock Global Allocation V.I. Fund |
OTC Options Purchased
| | | | | | | | | | | | | | | | | | | | | | | | | | | | | | |
| Description | | Counterparty | | Number of
Contracts | | | Expiration
Date | | | Exercise
Price | | | Notional
Amount (000) | | | Value | |
| Call | | | | | | | | | | | | | | | | | | | | | | | |
Chevron Corp. | | UBS AG | | | 275,840 | | | | 01/18/19 | | | | USD | | | | 125.00 | | | | USD | | | | 30,009 | | | $ | 9,654 | |
Exxon Mobil Corp. | | UBS AG | | | 187,537 | | | | 01/18/19 | | | | USD | | | | 95.00 | | | | USD | | | | 12,788 | | | | 2,813 | |
Schlumberger Ltd. | | UBS AG | | | 271,460 | | | | 01/18/19 | | | | USD | | | | 90.00 | | | | USD | | | | 9,794 | | | | 1,357 | |
SPDR Gold Shares(a) | | JPMorgan Chase Bank NA | | | 146,449 | | | | 02/15/19 | | | | USD | | | | 120.00 | | | | USD | | | | 17,757 | | | | 418,112 | |
TOPIX Index | | Morgan Stanley & Co. International plc | | | 1,994,050 | | | | 03/08/19 | | | | JPY | | | | 1,785.00 | | | | JPY | | | | 2,979,290 | | | | 15,108 | |
KOSPI 200 Index | | Goldman Sachs International | | | 125 | | | | 03/14/19 | | | | USD | | | | 302.50 | | | | USD | | | | 256 | | | | 22,898 | |
Russell 2000 Index | | Bank of America NA | | | 27,781 | | | | 03/15/19 | | | | USD | | | | 1,700.00 | | | | USD | | | | 37,464 | | | | 7,640 | |
SPDR Gold Shares(a) | | Societe Generale SA | | | 261,876 | | | | 03/15/19 | | | | USD | | | | 121.00 | | | | USD | | | | 31,752 | | | | 831,323 | |
SPDR Gold Shares(a) | | Societe Generale SA | | | 274,300 | | | | 04/18/19 | | | | USD | | | | 123.00 | | | | USD | | | | 33,259 | | | | 836,615 | |
GBP Currency | | UBS AG | | | — | | | | 05/15/19 | | | | USD | | | | 1.32 | | | | GBP | | | | 145,768 | | | | 3,447,545 | |
SPDR Gold Shares(a) | | Morgan Stanley & Co. International plc | | | 148,146 | | | | 05/17/19 | | | | USD | | | | 120.00 | | | | USD | | | | 17,963 | | | | 629,355 | |
BP plc | | UBS AG | | | 886,818 | | | | 06/21/19 | | | | USD | | | | 52.00 | | | | USD | | | | 33,628 | | | | 75,371 | |
ConocoPhillips Co. | | UBS AG | | | 463,986 | | | | 06/21/19 | | | | USD | | | | 75.00 | | | | USD | | | | 28,930 | | | | 577,663 | |
Occidental Petroleum Corp. | | UBS AG | | | 412,376 | | | | 06/21/19 | | | | USD | | | | 92.50 | | | | USD | | | | 25,312 | | | | 83,077 | |
Royal Dutch Shell plc | | UBS AG | | | 506,206 | | | | 06/21/19 | | | | USD | | | | 77.00 | | | | USD | | | | 29,497 | | | | 81,003 | |
SPDR Gold Shares(a) | | Societe Generale SA | | | 261,876 | | | | 06/21/19 | | | | USD | | | | 124.00 | | | | USD | | | | 31,752 | | | | 1,063,267 | |
Suncor Energy, Inc. | | UBS AG | | | 598,975 | | | | 06/21/19 | | | | USD | | | | 45.00 | | | | USD | | | | 16,753 | | | | 14,974 | |
Facebook, Inc. | | UBS AG | | | 286,382 | | | | 09/20/19 | | | | USD | | | | 165.00 | | | | USD | | | | 37,542 | | | | 1,595,477 | |
TOTAL SA | | UBS AG | | | 619,803 | | | | 09/20/19 | | | | USD | | | | 70.00 | | | | USD | | | | 32,341 | | | | 79,360 | |
TOPIX Banks Index | | Bank of America NA | | | 6,922,824 | | | | 12/13/19 | | | | JPY | | | | 191.28 | | | | JPY | | | | 1,015,786 | | | | 93,669 | |
TOPIX Banks Index | | Morgan Stanley & Co. International plc | | | 13,094,289 | | | | 12/13/19 | | | | JPY | | | | 191.28 | | | | JPY | | | | 1,921,325 | | | | 177,167 | |
Alphabet, Inc. | | JPMorgan Chase Bank NA | | | 16,662 | | | | 01/17/20 | | | | USD | | | | 1,225.00 | | | | USD | | | | 17,255 | | | | 962,698 | |
Anadarko Petroleum Corp. | | Credit Suisse International | | | 175,142 | | | | 01/17/20 | | | | USD | | | | 67.50 | | | | USD | | | | 7,678 | | | | 278,476 | |
BP plc | | Nomura International plc | | | 802,900 | | | | 01/17/20 | | | | USD | | | | 43.50 | | | | USD | | | | 30,446 | | | | 1,254,804 | |
CVS Health Corp. | | JPMorgan Chase Bank NA | | | 123,179 | | | | 01/17/20 | | | | USD | | | | 78.50 | | | | USD | | | | 8,071 | | | | 456,466 | |
Halliburton Co. | | Citibank NA | | | 339,940 | | | | 01/17/20 | | | | USD | | | | 50.00 | | | | USD | | | | 9,036 | | | | 57,790 | |
Johnson & Johnson | | Bank of America NA | | | 124,966 | | | | 01/17/20 | | | | USD | | | | 155.00 | | | | USD | | | | 16,127 | | | | 323,037 | |
JPMorgan Chase & Co. | | Citibank NA | | | 123,264 | | | | 01/17/20 | | | | USD | | | | 114.50 | | | | USD | | | | 12,033 | | | | 410,261 | |
Schlumberger Ltd. | | UBS AG | | | 281,709 | | | | 01/17/20 | | | | USD | | | | 70.00 | | | | USD | | | | 10,164 | | | | 33,805 | |
Sumitomo Mitsui Financial Group, Inc. | | Morgan Stanley & Co. International plc | | | 360,617 | | | | 03/13/20 | | | | JPY | | | | 4,756.33 | | | | JPY | | | | 1,314,449 | | | | 148,633 | |
TOPIX Banks Index | | BNP Paribas SA | | | 9,345,369 | | | | 03/13/20 | | | | JPY | | | | 194.04 | | | | JPY | | | | 1,371,246 | | | | 151,515 | |
TOPIX Banks Index | | Morgan Stanley & Co. International plc | | | 8,316,020 | | | | 04/10/20 | | | | JPY | | | | 192.04 | | | | JPY | | | | 1,220,210 | | | | 155,991 | |
Sumitomo Mitsui Financial Group, Inc. | | Morgan Stanley & Co. International plc | | | 291,273 | | | | 09/11/20 | | | | JPY | | | | 4,816.24 | | | | JPY | | | | 1,061,690 | | | | 153,972 | |
Sumitomo Mitsui Financial Group, Inc. | | Morgan Stanley & Co. International plc | | | 291,267 | | | | 12/11/20 | | | | JPY | | | | 4,894.87 | | | | JPY | | | | 1,061,668 | | | | 153,169 | |
EURO STOXX Bank Index | | Barclays Bank plc | | | 162,397 | | | | 03/19/21 | | | | EUR | | | | 136.97 | | | | EUR | | | | 48,904 | | | | 161,783 | |
EURO STOXX Bank Index | | UBS AG | | | 167,445 | | | | 06/18/21 | | | | EUR | | | | 134.92 | | | | EUR | | | | 50,424 | | | | 171,715 | |
| | | | | | | | | | | | | | | | | | | | | | | | | | | | | | |
| | | | | | | | | | | | | | | | | | | | | | | | | | | | | 14,937,563 | |
| | | | | | | | | | | | | | | | | | | | | | | | | | | | | | |
| Put | | | | | | | | | | | | | | | | | | | | | | | |
S&P 500 Index | | Barclays Bank plc | | | 3,651 | | | | 01/18/19 | | | | USD | | | | 2,350.00 | | | | USD | | | | 9,153 | | | | 48,741 | |
S&P 500 Index | | Barclays Bank plc | | | 4,413 | | | | 01/18/19 | | | | USD | | | | 2,400.00 | | | | USD | | | | 11,063 | | | | 88,481 | |
S&P 500 Index | | Barclays Bank plc | | | 34,477 | | | | 01/18/19 | | | | USD | | | | 2,700.00 | | | | USD | | | | 86,429 | | | | 6,633,375 | |
S&P 500 Index | | Barclays Bank plc | | | 3,660 | | | | 01/31/19 | | | | USD | | | | 2,400.00 | | | | USD | | | | 9,175 | | | | 114,192 | |
| | | | | | | | | | | | | | | | | | | | | | | | | | | | | | |
| | | | | | | | | | | | | | | | | | | | | | | | | | | | | 6,884,789 | |
| | | | | | | | | | | | | | | | | | | | | | | | | | | | | | |
| | | | | | | | | | | | | | | | | | | | | | | | | | | | $ | 21,822,352 | |
| | | | | | | | | | | | | | | | | | | | | | | | | | | | | | |
| | (a) | All or a portion of the security is held by a wholly-owned subsidiary. See Note 1 of the Notes to Consolidated Financial Statements for details on the wholly-owned subsidiary. | |
OTC Interest Rate Swaptions Purchased
| | | | | | | | | | | | | | | | | | | | | | | | | | | | | | | | |
| Description | | Paid by the Fund | | Received by the Fund | | Counterparty | | Expiration
Date | | | Exercise
Rate | | | Notional
Amount (000) | | | Value | |
| | Rate | | | Frequency | | Rate | | | Frequency |
| Put | | | | | | | | | | | | | | | | | | | | | | | | | | |
5-Year Interest Rate Swap | | | 3.00 | % | | Semi-Annual | | | 3 month LIBOR | | | Quarterly | | Nomura International plc | | | 03/04/19 | | | | 3.00 | % | | USD | | | 292,589 | | | $ | 126,635 | |
| | | | | | | | | | | | | | | | | | | | | | | | | | | | | | | | |
| | | | |
| CONSOLIDATED SCHEDULE OF INVESTMENTS | | | 15 | |
| | |
Consolidated Schedule of Investments (continued) December 31, 2018 | | BlackRock Global Allocation V.I. Fund |
Exchange-Traded Options Written
| | | | | | | | | | | | | | | | | | | | | | | | |
| Description | | Number of
Contracts | | | Expiration
Date | | | Exercise Price | | | Notional
Amount (000) | | | Value | |
| Call | | | | | | | | | | | | | | | | | | | |
Adobe, Inc. | | | 8 | | | | 01/18/19 | | | USD | | | 260.00 | | | USD | | | 181 | | | $ | (372 | ) |
Intuit, Inc. | | | 8 | | | | 01/18/19 | | | USD | | | 220.00 | | | USD | | | 157 | | | | (220 | ) |
McDonald’s Corp. | | | 44 | | | | 01/18/19 | | | USD | | | 185.00 | | | USD | | | 781 | | | | (3,872 | ) |
VeriSign, Inc. | | | 16 | | | | 01/18/19 | | | USD | | | 170.00 | | | USD | | | 237 | | | | (624 | ) |
Amazon.com, Inc. | | | 81 | | | | 02/15/19 | | | USD | | | 1,790.00 | | | USD | | | 12,166 | | | | (124,335 | ) |
Amazon.com, Inc. | | | 81 | | | | 02/15/19 | | | USD | | | 1,800.00 | | | USD | | | 12,166 | | | | (112,185 | ) |
Amazon.com, Inc. | | | 81 | | | | 02/15/19 | | | USD | | | 1,780.00 | | | USD | | | 12,166 | | | | (140,130 | ) |
| | | | | | | | | | | | | | | | | | | | | | | | |
| | | | | | | | | | | | | | | | | | | | | | $ | (381,738 | ) |
| | | | | | | | | | | | | | | | | | | | | | | | |
OTC Options Written
| | | | | | | | | | | | | | | | | | | | | | | | | | | | | | |
| Description | | Counterparty | | Number of
Contracts | | | Expiration
Date | | | Exercise
Price | | | Notional
Amount (000) | | | Value | |
| Call | | | | | | | | | | | | | | | | | | | | | | | |
Apple, Inc. | | Barclays Bank plc | | | 69,668 | | | | 01/18/19 | | | | USD | | | | 160.00 | | | | USD | | | | 10,989 | | | $ | (294,347 | ) |
Microsoft Corp. | | Barclays Bank plc | | | 123,473 | | | | 01/18/19 | | | | USD | | | | 90.00 | | | | USD | | | | 12,541 | | | | (1,487,850 | ) |
United Continental Holdings, Inc. | | Deutsche Bank AG | | | 90,361 | | | | 01/18/19 | | | | USD | | | | 75.00 | | | | USD | | | | 7,566 | | | | (831,321 | ) |
TOPIX Index | | Morgan Stanley & Co. International plc | | | 1,994,050 | | | | 03/08/19 | | | | JPY | | | | 1,950.00 | | | | JPY | | | | 2,979,290 | | | | (3,639 | ) |
KOSPI 200 Index | | Goldman Sachs International | | | 125 | | | | 03/14/19 | | | | USD | | | | 327.50 | | | | USD | | | | 256 | | | | (1,639 | ) |
ConocoPhillips Co. | | UBS AG | | | 463,986 | | | | 06/21/19 | | | | USD | | | | 85.00 | | | | USD | | | | 28,930 | | | | (106,717 | ) |
TOTAL SA | | UBS AG | | | 619,803 | | | | 09/20/19 | | | | USD | | | | 75.00 | | | | USD | | | | 32,341 | | | | (118,444 | ) |
TOPIX Banks Index | | Bank of America NA | | | 6,922,824 | | | | 12/13/19 | | | | JPY | | | | 221.29 | | | | JPY | | | | 1,015,786 | | | | (26,746 | ) |
TOPIX Banks Index | | Morgan Stanley & Co. International plc | | | 13,094,289 | | | | 12/13/19 | | | | JPY | | | | 221.29 | | | | JPY | | | | 1,921,325 | | | | (50,598 | ) |
Alphabet, Inc. | | JPMorgan Chase Bank NA | | | 16,662 | | | | 01/17/20 | | | | USD | | | | 1,350.00 | | | | USD | | | | 17,255 | | | | (488,068 | ) |
Anadarko Petroleum Corp. | | Credit Suisse International | | | 175,142 | | | | 01/17/20 | | | | USD | | | | 76.00 | | | | USD | | | | 7,678 | | | | (150,277 | ) |
Comcast Corp. | | Citibank NA | | | 306,484 | | | | 01/17/20 | | | | USD | | | | 37.50 | | | | USD | | | | 10,436 | | | | (729,432 | ) |
CVS Health Corp. | | JPMorgan Chase Bank NA | | | 123,179 | | | | 01/17/20 | | | | USD | | | | 87.50 | | | | USD | | | | 8,071 | | | | (183,537 | ) |
Facebook, Inc. | | UBS AG | | | 669,867 | | | | 01/17/20 | | | | USD | | | | 220.00 | | | | USD | | | | 87,813 | | | | (887,574 | ) |
Johnson & Johnson | | Bank of America NA | | | 124,966 | | | | 01/17/20 | | | | USD | | | | 170.00 | | | | USD | | | | 16,127 | | | | (110,595 | ) |
JPMorgan Chase & Co. | | Citibank NA | | | 123,264 | | | | 01/17/20 | | | | USD | | | | 125.50 | | | | USD | | | | 12,033 | | | | (182,454 | ) |
Sumitomo Mitsui Financial Group, Inc. | | Morgan Stanley & Co. International plc | | | 360,617 | | | | 03/13/20 | | | | JPY | | | | 5,679.90 | | | | JPY | | | | 1,314,449 | | | | (37,766 | ) |
TOPIX Banks Index | | BNP Paribas SA | | | 9,345,369 | | | | 03/13/20 | | | | JPY | | | | 237.47 | | | | JPY | | | | 1,371,246 | | | | (33,128 | ) |
TOPIX Banks Index | | Morgan Stanley & Co. International plc | | | 8,316,020 | | | | 04/10/20 | | | | JPY | | | | 233.87 | | | | JPY | | | | 1,220,210 | | | | (37,028 | ) |
| | | | | | | | | | | | | | | | | | | | | | | | | | | | | | |
| | | | | | | | | | | | | | | | | | | | | | | | | | | | | (5,761,160 | ) |
| | | | | | | | | | | | | | | | | | | | | | | | | | | | | | |
| Put | | | | | | | | | | | | | | | | | | | | | | | |
S&P 500 Index | | Barclays Bank plc | | | 3,651 | | | | 01/18/19 | | | | USD | | | | 2,200.00 | | | | USD | | | | 9,153 | | | | (12,596 | ) |
S&P 500 Index | | Barclays Bank plc | | | 4,413 | | | | 01/18/19 | | | | USD | | | | 2,250.00 | | | | USD | | | | 11,063 | | | | (24,271 | ) |
S&P 500 Index | | Barclays Bank plc | | | 3,660 | | | | 01/31/19 | | | | USD | | | | 2,250.00 | | | | USD | | | | 9,175 | | | | (38,796 | ) |
TOPIX Index | | Morgan Stanley & Co. International plc | | | 1,994,050 | | | | 03/08/19 | | | | JPY | | | | 1,600.00 | | | | JPY | | | | 2,979,290 | | | | (2,283,229 | ) |
KOSPI 200 Index | | Goldman Sachs International | | | 125 | | | | 03/14/19 | | | | USD | | | | 270.00 | | | | USD | | | | 256 | | | | (1,717,209 | ) |
S&P 500 Index | | Bank of America NA | | | 14,617 | | | | 03/15/19 | | | | USD | | | | 2,600.00 | | | | USD | | | | 36,643 | | | | (2,067,575 | ) |
SPDR Gold Shares(a) | | Morgan Stanley & Co. International plc | | | 74,073 | | | | 05/17/19 | | | | USD | | | | 113.00 | | | | USD | | | | 8,981 | | | | (19,499 | ) |
TOPIX Banks Index | | Bank of America NA | | | 6,922,824 | | | | 12/13/19 | | | | JPY | | | | 156.59 | | | | JPY | | | | 1,015,786 | | | | (1,397,969 | ) |
TOPIX Banks Index | | Morgan Stanley & Co. International plc | | | 13,094,289 | | | | 12/13/19 | | | | JPY | | | | 156.59 | | | | JPY | | | | 1,921,325 | | | | (2,644,011 | ) |
Alphabet, Inc. | | JPMorgan Chase Bank NA | | | 16,662 | | | | 01/17/20 | | | | USD | | | | 860.00 | | | | USD | | | | 17,255 | | | | (755,622 | ) |
Anadarko Petroleum Corp. | | Credit Suisse International | | | 175,142 | | | | 01/17/20 | | | | USD | | | | 46.00 | | | | USD | | | | 7,678 | | | | (1,527,895 | ) |
BP plc | | Nomura International plc | | | 802,900 | | | | 01/17/20 | | | | USD | | | | 28.00 | | | | USD | | | | 30,446 | | | | (863,117 | ) |
CVS Health Corp. | | JPMorgan Chase Bank NA | | | 123,179 | | | | 01/17/20 | | | | USD | | | | 56.00 | | | | USD | | | | 8,071 | | | | (485,785 | ) |
Facebook, Inc. | | UBS AG | | | 669,867 | | | | 01/17/20 | | | | USD | | | | 155.00 | | | | USD | | | | 87,813 | | | | (20,581,664 | ) |
Halliburton Co. | | Citibank NA | | | 339,940 | | | | 01/17/20 | | | | USD | | | | 35.00 | | | | USD | | | | 9,036 | | | | (3,246,427 | ) |
Johnson & Johnson | | Bank of America NA | | | 124,966 | | | | 01/17/20 | | | | USD | | | | 109.00 | | | | USD | | | | 16,127 | | | | (576,091 | ) |
JPMorgan Chase & Co. | | Citibank NA | | | 123,264 | | | | 01/17/20 | | | | USD | | | | 87.25 | | | | USD | | | | 12,033 | | | | (775,954 | ) |
Schlumberger Ltd. | | UBS AG | | | 281,709 | | | | 01/17/20 | | | | USD | | | | 52.50 | | | | USD | | | | 10,164 | | | | (4,943,993 | ) |
Sumitomo Mitsui Financial Group, Inc. | | Morgan Stanley & Co. International plc | | | 360,617 | | | | 03/13/20 | | | | JPY | | | | 3,832.77 | | | | JPY | | | | 1,314,449 | | | | (1,768,609 | ) |
TOPIX Banks Index | | BNP Paribas SA | | | 9,345,369 | | | | 03/13/20 | | | | JPY | | | | 155.80 | | | | JPY | | | | 1,371,246 | | | | (2,024,026 | ) |
TOPIX Banks Index | | Morgan Stanley & Co. International plc | | | 8,316,020 | | | | 04/10/20 | | | | JPY | | | | 157.82 | | | | JPY | | | | 1,220,210 | | | | (1,956,302 | ) |
Sumitomo Mitsui Financial Group, Inc. | | Morgan Stanley & Co. International plc | | | 194,182 | | | | 09/11/20 | | | | JPY | | | | 3,820.96 | | | | JPY | | | | 707,793 | | | | (1,197,331 | ) |
Sumitomo Mitsui Financial Group, Inc. | | Morgan Stanley & Co. International plc | | | 194,178 | | | | 12/11/20 | | | | JPY | | | | 3,786.60 | | | | JPY | | | | 707,779 | | | | (1,155,278 | ) |
EURO STOXX Bank Index | | Barclays Bank plc | | | 108,265 | | | | 03/19/21 | | | | EUR | | | | 110.23 | | | | EUR | | | | 32,603 | | | | (4,424,188 | ) |
EURO STOXX Bank Index | | UBS AG | | | 110,158 | | | | 06/18/21 | | | | EUR | | | | 106.38 | | | | EUR | | | | 33,173 | | | | (4,422,605 | ) |
| | | | | | | | | | | | | | | | | | | | | | | | | | | | | | |
| | | | | | | | | | | | | | | | | | | | | | | | | | | | | (60,910,042 | ) |
| | | | | | | | | | | | | | | | | | | | | | | | | | | | | | |
| | | | | | | | | | | | | | | | | | | | | | | | | | | | $ | (66,671,202 | ) |
| | | | | | | | | | | | | | | | | | | | | | | | | | | | | | |
| | (a) | All or a portion of the security is held by a wholly-owned subsidiary. See Note 1 of the Notes to Consolidated Financial Statements for details on the wholly-owned subsidiary. | |
| | |
| 16 | | 2018 BLACKROCK ANNUAL REPORTTO SHAREHOLDERS |
| | |
Consolidated Schedule of Investments (continued) December 31, 2018 | | BlackRock Global Allocation V.I. Fund |
OTC Interest Rate Swaptions Written
| | | | | | | | | | | | | | | | | | | | | | | | | | | | | | | | |
| Description | | Paid by the Fund | | Received by the Fund | | Counterparty | | Expiration
Date | | | Exercise
Rate | | | Notional
Amount (000) | | | Value | |
| | Rate | | | Frequency | | Rate | | | Frequency |
| Call | | | | | | | | | | | | | | | | | | | | | | | | | | |
5-Year Interest Rate Swap | | | 3 month LIBOR | | | Quarterly | | | 2.70 | % | | Semi-Annual | | Nomura International plc | | | 03/04/19 | | | | 2.70 | % | | USD | | | 292,589 | | | $ | (2,578,075 | ) |
| | | | | | | | | | | | | | | | | | | | | | | | | | | | | | | | |
Centrally Cleared Credit Default Swaps — Buy Protection
| | | | | | | | | | | | | | | | | | | | | | | | | | | | |
| Reference Obligation/Index | | Financing
Rate Paid
by the Fund | | | Payment
Frequency | | | Termination
Date | | | Notional
Amount (000) | | | Value | | | Upfront
Premium
Paid
(Received) | | | Unrealized
Appreciation
(Depreciation) | |
CDX.NA.HY.30.V1 | | | 5.00 | % | | | Quarterly | | | | 06/20/23 | | | USD | 6,607 | | | $ | (214,019 | ) | | $ | (428,074 | ) | | $ | 214,055 | |
| | | | | | | | | | | | | | | | | | | | | | | | | | | | |
Centrally Cleared Interest Rate Swaps
| | | | | | | | | | | | | | | | | | | | | | | | | | | | | | | | |
| Paid by the Fund | | Received by the Fund | | Effective
Date | | | Termination
Date | | | Notional
Amount (000) | | | Value | | | Upfront
Premium
Paid
(Received) | | | Unrealized
Appreciation
(Depreciation) | |
| Rate | | Frequency | | Rate | | Frequency |
| 3 month LIBOR | | Quarterly | | 2.97% | | Semi-Annual | | | 07/20/20 | (a) | | | 07/18/25 | | | USD | | | 317,049 | | | $ | 5,433,869 | | | $ | — | | | $ | 5,433,869 | |
| 0.84% | | Annual | | 6 month EURIBOR | | Semi-Annual | | | N/A | | | | 02/15/28 | | | EUR | | | 34,348 | | | | (633,712 | ) | | | — | | | | (633,712 | ) |
| 0.84% | | Annual | | 6 month EURIBOR | | Semi-Annual | | | N/A | | | | 02/15/28 | | | EUR | | | 37,591 | | | | (694,362 | ) | | | — | | | | (694,362 | ) |
| 3 month LIBOR | | Quarterly | | 3.20% | | Semi-Annual | | | N/A | | | | 10/29/28 | | | USD | | | 248,165 | | | | 10,988,976 | | | | — | | | | 10,988,976 | |
| 0.99% | | Annual | | 6 month EURIBOR | | Semi-Annual | | | N/A | | | | 10/29/28 | | | EUR | | | 196,586 | | | | (4,682,054 | ) | | | — | | | | (4,682,054 | ) |
| 2.99% | | Semi-Annual | | 3 month LIBOR | | Quarterly | | | 07/20/20 | (a) | | | 07/18/50 | | | USD | | | 71,247 | | | | (1,718,255 | ) | | | — | | | | (1,718,255 | ) |
| | | | | | | | | | | | | | | | | | | | | | | | | | | | | | | | |
| | | | | | | | | | | | | | | | | | | | | | $ | 8,694,462 | | | $ | — | | | $ | 8,694,462 | |
| | | | | | | | | | | | | | | | | | | | | | | | | | | | | | | | |
OTC Total Return Swaps
| | | | | | | | | | | | | | | | | | | | | | | | | | | | | | | | | | | | |
| Reference Entity | | Fixed Amount
Paid / (Received)
by the Fund (a) | | | Counterparty | | | Termination
Date | | | Notional
Amount (000) | | | Value | | | Upfront
Premium
Paid
(Received) | | | Unrealized
Appreciation
(Depreciation) | |
EURO STOXX Banks Net Return Index | | | EUR | | | | (14,281,341 | ) | | | BNP Paribas SA | | | | 04/30/19 | | | | EUR | | | | 14,281 | | | $ | 1,520,142 | | | $ | — | | | $ | 1,520,142 | |
S&P 500 Index Annual Dividend Future December 2020 | | | USD | | | | 2,914,481 | | | | Goldman Sachs International | | | | 12/18/20 | | | | USD | | | | 2,914 | | | | 517,894 | | | | — | | | | 517,894 | |
Nikkei Dividend Future December 2020 | | | JPY | | | | 384,120,000 | | | | BNP Paribas SA | | | | 04/01/21 | | | | JPY | | | | 384,120 | | | | 406,460 | | | | — | | | | 406,460 | |
Nikkei Dividend Future December 2020 | | | JPY | | | | 143,310,000 | | | | BNP Paribas SA | | | | 04/01/21 | | | | JPY | | | | 143,310 | | | | 35,674 | | | | — | | | | 35,674 | |
Nikkei Dividend Future December 2020 | | | JPY | | | | 191,375,000 | | | | BNP Paribas SA | | | | 04/01/21 | | | | JPY | | | | 191,375 | | | | 229,232 | | | | — | | | | 229,232 | |
S&P 500 Index Annual Dividend Future December 2021 | | | USD | | | | 3,726,213 | | | | BNP Paribas SA | | | | 12/17/21 | | | | USD | | | | 3,726 | | | | 640,862 | | | | — | | | | 640,862 | |
Nikkei Dividend Future December 2021 | | | JPY | | | | 144,840,000 | | | | BNP Paribas SA | | | | 04/01/22 | | | | JPY | | | | 144,840 | | | | 25,127 | | | | — | | | | 25,127 | |
Nikkei Dividend Future December 2021 | | | JPY | | | | 199,250,000 | | | | BNP Paribas SA | | | | 04/01/22 | | | | JPY | | | | 199,250 | | | | 162,401 | | | | — | | | | 162,401 | |
Nikkei Dividend Future December 2021 | | | JPY | | | | 389,070,000 | | | | BNP Paribas SA | | | | 04/01/22 | | | | JPY | | | | 389,070 | | | | 371,233 | | | | — | | | | 371,233 | |
Nikkei Dividend Future December 2021 | | | JPY | | | | 198,750,000 | | | | BNP Paribas SA | | | | 04/01/22 | | | | JPY | | | | 198,750 | | | | 166,963 | | | | — | | | | 166,963 | |
| | | | | | | | | | | | | | | | | | | | | | | | | | | | | | | | | | | | |
| | | | | | | | | | | | | | | | | | | | | | | | | | $ | 4,075,988 | | | $ | — | | | $ | 4,075,988 | |
| | | | | | | | | | | | | | | | | | | | | | | | | | | | | | | | | | | | |
| | (a) | At termination, the fixed amount paid (received) will be exchanged for the total return of the reference entity. | |
| | | | |
| CONSOLIDATED SCHEDULE OF INVESTMENTS | | | 17 | |
| | |
Consolidated Schedule of Investments (continued) December 31, 2018 | | BlackRock Global Allocation V.I. Fund |
OTC Total Return Swaps (a)
| | | | | | | | | | | | | | | | | | | | | | | | |
| Reference Entity | | Counterparty | | | Expiration
Date | | | Net Notional
Amount | | | Unrealized
Appreciation
(Depreciation) | | | Net Value of
Reference
Entities | | | Gross
Notional
Amount
Net Asset
Percentage | |
Equity Securities Long/Short | | | Citibank NA | | | | 02/24/23 - 02/27/23 | | | $ | (17,068,123 | ) | | $ | (544,715 | )(b) | | $ | (17,644,584 | ) | | | 0.2 | % |
| | | JP Morgan Chase Bank NA | | | | 02/08/23 | | | | (22,487,970 | ) | | | 845,999 | (c) | | | (21,693,899 | ) | | | 0.3 | |
| | | | | | | | | | | | | | | | | | | | | | | | |
| | | | | | | | | | | | | | $ | 301,284 | | | $ | (39,338,483 | ) | | | | |
| | | | | | | | | | | | | | | | | | | | | | | | |
| | (a) | The Fund receives or pays the total return on a portfolio of long and short positions underlying the total return swap. In addition, the Fund pays or receives a variable rate of interest, based on a specified benchmark, plus or minus a spread in a range of18-245 basis points. The benchmark and spread are determined based upon the country and/or currency of the individual underlying positions. The following are the specified benchmarks used in determining the variable rate of interest: | |
Intercontinental Exchange LIBOR USD 1 Month
United States Overnight Bank Funding Rate
| | (b) | Amount includes $31,746 of net dividends and financing fees. | |
| | (c) | Amount includes $51,928 of net dividends and financing fees. | |
The following reference rates, and their values as of period end, are used for security descriptions:
| | | | | | |
| Reference Index | | | | Reference rate | |
3 month LIBOR | | London Interbank Offered Rate | | | 2.81 | % |
6 month EURIBOR | | Euro Interbank Offered Rate | | | (0.24 | %) |
Balances Reported in the Consolidated Statement of Assets and Liabilities for Centrally Cleared Swaps, OTC Swaps and Options Written
| | | | | | | | | | | | | | | | | | | | |
| | | Swap
Premiums
Paid | | | Swap
Premiums
Received | | | Unrealized
Appreciation | | | Unrealized
Depreciation | | | Value | |
Centrally Cleared Swaps(a) | | $ | — | | | $ | (428,074 | ) | | $ | 16,636,900 | | | $ | (7,728,383 | ) | | $ | — | |
OTC Swaps | | | — | | | | — | | | | 4,921,987 | | | | (544,715 | ) | | | — | |
Options Written | | | N/A | | | | N/A | | | | 16,014,973 | | | | (40,832,334 | ) | | | (69,631,015 | ) |
| | (a) | Includes cumulative appreciation (depreciation) on centrally cleared swaps, as reported in the Consolidated Schedule of Investments. Only current day’s variation margin is reported within the Consolidated Statement of Assets and Liabilities and is net of any previously paid (received) swap premium amounts. | |
Derivative Financial Instruments Categorized by Risk Exposure
As of period end, the fair values of derivative financial instruments located in the Consolidated Statement of Assets and Liabilities were as follows:
| | | | | | | | | | | | | | | | | | | | | | | | | | | | |
| | | Commodity
Contracts | | | Credit
Contracts | | | Equity
Contracts | | | Foreign
Currency
Exchange
Contracts | | | Interest
Rate
Contracts | | | Other
Contracts | | | Total | |
Assets — Derivative Financial Instruments | | | | | | | | | | | | | | | | | | | | | | | | | | | | |
Futures contracts | | | | | | | | | | | | | | | | | | | | | | | | | | | | |
Net unrealized appreciation(a) | | $ | — | | | $ | — | | | $ | 6,413,616 | | | $ | — | | | $ | — | | | $ | — | | | $ | 6,413,616 | |
Forward foreign currency exchange contracts | | | | | | | | | | | | | | | | | | | | | | | | | | | | |
Unrealized appreciation on forward foreign currency exchange contracts | | | — | | | | — | | | | — | | | | 6,429,402 | | | | — | | | | — | | | | 6,429,402 | |
Options purchased | | | | | | | | | | | | | | | | | | | | | | | | | | | | |
Investments at value — unaffiliated(b) | | | — | | | | — | | | | 18,374,807 | | | | 3,447,545 | | | | 126,635 | | | | — | | | | 21,948,987 | |
Swaps — centrally cleared | | | | | | | | | | | | | | | | | | | | | | | | | | | | |
Net unrealized appreciation(a) | | | — | | | | 214,055 | | | | — | | | | — | | | | 16,422,845 | | | | — | | | | 16,636,900 | |
Swaps — OTC | | | | | | | | | | | | | | | | | | | | | | | | | | | | |
Unrealized appreciation on OTC swaps; Swap premiums paid | | | — | | | | — | | | | 4,921,987 | | | | — | | | | — | | | | — | | | | 4,921,987 | |
| | | | | | | | | | | | | | | | | | | | | | | | | | | | |
| | $ | — | | | $ | 214,055 | | | $ | 29,710,410 | | | $ | 9,876,947 | | | $ | 16,549,480 | | | $ | — | | | $ | 56,350,892 | |
| | | | | | | | | | | | | | | | | | | | | | | | | | | | |
| | |
| 18 | | 2018 BLACKROCK ANNUAL REPORTTO SHAREHOLDERS |
| | |
Consolidated Schedule of Investments (continued) December 31, 2018 | | BlackRock Global Allocation V.I. Fund |
| | | | | | | | | | | | | | | | | | | | | | | | | | | | |
| | | Commodity
Contracts | | | Credit
Contracts | | | Equity
Contracts | | | Foreign
Currency
Exchange
Contracts | | | Interest
Rate
Contracts | | | Other
Contracts | | | Total | |
| | | | | | | |
| Liabilities — Derivative Financial Instruments | | | | | | | | | | | | | | | | | | | | | |
Futures contracts | | | | | | | | | | | | | | | | | | | | | | | | | | | | |
Net unrealized depreciation(a) | | $ | — | | | $ | — | | | $ | 38,040 | | | $ | — | | | $ | 929,678 | | | $ | — | | | $ | 967,718 | |
Forward foreign currency exchange contracts | | | | | | | | | | | | | | | | | | | | | | | | | | | | |
Unrealized depreciation on forward foreign currency exchange contracts | | | — | | | | — | | | | — | | | | 7,367,963 | | | | — | | | | — | | | | 7,367,963 | |
Options written | | | | | | | | | | | | | | | | | | | | | | | | | | | | |
Options written, at value | | | — | | | | — | | | | 67,052,940 | | | | — | | | | 2,578,075 | | | | — | | | | 69,631,015 | |
Swaps — centrally cleared | | | | | | | | | | | | | | | | | | | | | | | | | | | | |
Net unrealized depreciation(a) | | | — | | | | — | | | | — | | | | — | | | | 7,728,383 | | | | — | | | | 7,728,383 | |
Swaps — OTC | | | | | | | | | | | | | | | | | | | | | | | | | | | | |
Unrealized depreciation on OTC swaps; Swap premiums received | | | — | | | | — | | | | 544,715 | | | | — | | | | — | | | | — | | | | 544,715 | |
| | | | | | | | | | | | | | | | | | | | | | | | | | | | |
| | $ | — | | | $ | — | | | $ | 67,635,695 | | | $ | 7,367,963 | | | $ | 11,236,136 | | | $ | — | | | $ | 86,239,794 | |
| | | | | | | | | | | | | | | | | | | | | | | | | | | | |
| | (a) | Includes cumulative appreciation (depreciation) on futures contracts and centrally cleared swaps, if any, as reported in the Consolidated Schedule of Investments. Only current day’s variation margin is reported within the Consolidated Statement of Assets and Liabilities. | |
| | (b) | Includes options purchased at value as reported in the Consolidated Schedule of Investments. | |
For the year ended December 31, 2018, the effect of derivative financial instruments in the Consolidated Statement of Operations were as follows:
| | | | | | | | | | | | | | | | | | | | | | | | | | | | |
| | | Commodity
Contracts | | | Credit
Contracts | | | Equity
Contracts | | | Foreign
Currency
Exchange
Contracts | | | Interest
Rate
Contracts | | | Other
Contracts | | | Total | |
Net Realized Gain (Loss) from: | | | | | | | | | | | | | | | | | | | | | | | | | | | | |
Futures contracts | | $ | — | | | $ | — | | | $ | (1,357,682 | ) | | $ | — | | | $ | — | | | $ | — | | | $ | (1,357,682 | ) |
Forward foreign currency exchange contracts | | | — | | | | — | | | | — | | | | (13,975,279 | ) | | | — | | | | — | | | | (13,975,279 | ) |
Options purchased(a) | | | — | | | | — | | | | 10,272,037 | | | | (10,696,472 | ) | | | (5,726,882 | ) | | | — | | | | (6,151,317 | ) |
Options written | | | — | | | | — | | | | 11,728,438 | | | | 4,490,388 | | | | (4,657,759 | ) | | | — | | | | 11,561,067 | |
Swaps | | | — | | | | (1,679,419 | ) | | | 21,568,296 | | | | 2,860,184 | | | | (14,191,105 | ) | | | — | | | | 8,557,956 | |
| | | | | | | | | | | | | | | | | | | | | | | | | | | | |
| | $ | — | | | $ | (1,679,419 | ) | | $ | 42,211,089 | | | $ | (17,321,179 | ) | | $ | (24,575,746 | ) | | $ | — | | | $ | (1,365,255 | ) |
| | | | | | | | | | | | | | | | | | | | | | | | | | | | |
| | | | | | |
| Net Change in Unrealized Appreciation (Depreciation) on: | | | | | | | | | | | | | | | | | | | |
Futures contracts | | $ | — | | | $ | — | | | $ | 6,766,587 | | | $ | — | | | $ | (929,678 | ) | | $ | — | | | $ | 5,836,909 | |
Forward foreign currency exchange contracts | | | — | | | | — | | | | — | | | | (7,735,636 | ) | | | — | | | | — | | | | (7,735,636 | ) |
Options purchased(b) | | | — | | | | — | | | | (34,577,381 | ) | | | (4,078,197 | ) | | | 4,538,590 | | | | — | | | | (34,116,988 | ) |
Options written | | | — | | | | — | | | | (29,091,987 | ) | | | (2,426,159 | ) | | | (5,124,751 | ) | | | — | | | | (36,642,897 | ) |
Swaps | | | — | | | | 1,498,941 | | | | (18,642,390 | ) | | | — | | | | 70,952 | | | | — | | | | (17,072,497 | ) |
| | | | | | | | | | | | | | | | | | | | | | | | | | | | |
| | $ | — | | | $ | 1,498,941 | | | $ | (75,545,171 | ) | | $ | (14,239,992 | ) | | $ | (1,444,887 | ) | | $ | — | | | $ | (89,731,109 | ) |
| | | | | | | | | | | | | | | | | | | | | | | | | | | | |
| | (a) | Options purchased are included in net realized gain (loss) from investments — unaffiliated. | |
| | (b) | Options purchased are included in net change in unrealized appreciation (depreciation) on investments — unaffiliated. | |
| | | | |
| CONSOLIDATED SCHEDULE OF INVESTMENTS | | | 19 | |
| | |
Consolidated Schedule of Investments (continued) December 31, 2018 | | BlackRock Global Allocation V.I. Fund |
Average Quarterly Balances of Outstanding Derivative Financial Instruments
| | | | |
Futures contracts: | | | | |
Average notional value of contracts — long | | $ | 17,060,306 | |
Average notional value of contracts — short | | $ | 220,282,053 | |
Forward foreign currency exchange contracts: | | | | |
Average amounts purchased — in USD | | $ | 336,811,782 | |
Average amounts sold — in USD | | $ | 537,280,549 | |
Options: | | | | |
Average value of option contracts purchased | | $ | 27,921,728 | |
Average value of option contracts written | | $ | 44,397,518 | |
Average notional value of swaption contracts purchased | | $ | 1,199,406,863 | |
Average notional value of swaption contracts written | | $ | 759,110,351 | |
Credit default swaps: | | | | |
Average notional value — buy protection | | $ | 6,175,952 | |
Interest rate swaps: | | | | |
Average notional value — pays fixed rate | | $ | 467,934,385 | |
Average notional value — receives fixed rate | | $ | 491,718,746 | |
Currency swaps: | | | | |
Average notional value — pays | | $ | 47,643,700 | |
Average notional value — receives | | $ | 50,793,381 | |
Total return swaps: | | | | |
Average notional value | | $ | 66,127,226 | |
For more information about the Fund’s investment risks regarding derivative financial instruments, refer to the Notes to Consolidated Financial Statements.
Derivative Financial Instruments — Offsetting as of Period End
The Fund’s derivative assets and liabilities (by type) were as follows:
| | | | | | | | |
| | | Assets | | | Liabilities | |
Derivative Financial Instruments: | | | | | | | | |
Futures contracts | | $ | 192,609 | | | $ | 3,737,779 | |
Forward foreign currency exchange contracts | | | 6,429,402 | | | | 7,367,963 | |
Options(a) | | | 21,948,987 | | | | 69,631,015 | |
Swaps — Centrally cleared | | | 1,135,739 | | | | — | |
Swaps — OTC(b) | | | 4,921,987 | | | | 544,715 | |
| | | | | | | | |
Total derivative assets and liabilities in the Consolidated Statement of Assets and Liabilities | | $ | 34,628,724 | | | $ | 81,281,472 | |
Derivatives not subject to a Master Netting Agreement or similar agreement (“MNA”) | | | (1,328,348 | ) | | | (4,119,517 | ) |
| | | | | | | | |
Total derivative assets and liabilities subject to an MNA | | $ | 33,300,376 | | | $ | 77,161,955 | |
| | | | | | | | |
| | (a) | Includes options purchased at value which is included in Investments at value – unaffiliated in the Consolidated Statement of Assets and Liabilities and reported in the Consolidated Schedule of Investments. | |
| | (b) | Includes unrealized appreciation (depreciation) on OTC swaps and swap premiums (paid/received) in the Consolidated Statement of Assets and Liabilities. | |
| | |
| 20 | | 2018 BLACKROCK ANNUAL REPORTTO SHAREHOLDERS |
| | |
Consolidated Schedule of Investments (continued) December 31, 2018 | | BlackRock Global Allocation V.I. Fund |
The following tables present the Fund’s derivative assets and liabilities by counterparty net of amounts available for offset under an MNA and net of the related collateral received and pledged by the Fund:
| | | | | | | | | | | | | | | | | | | | |
| Counterparty | | Derivative
Assets
Subject to
an MNA by
Counterparty | | | Derivatives
Available
for Offset (a) | | | Non-cash
Collateral
Received (b) | | | Cash
Collateral
Received (b) | | | Net Amount
of Derivative
Assets (c)(f) | |
Bank of America NA | | $ | 424,346 | | | $ | (424,346 | ) | | $ | — | | | $ | — | | | $ | — | |
Barclays Bank plc | | | 7,046,572 | | | | (6,282,048 | ) | | | (764,524 | ) | | | — | | | | — | |
BNP Paribas SA | | | 3,709,609 | | | | (2,057,154 | ) | | | — | | | | (1,652,455 | ) | | | — | |
Citibank NA | | | 1,472,494 | | | | (1,472,494 | ) | | | — | | | | — | | | | — | |
Credit Suisse International | | | 278,476 | | | | (278,476 | ) | | | — | | | | — | | | | — | |
Goldman Sachs International | | | 1,520,571 | | | | (1,520,571 | ) | | | — | | | | — | | | | — | |
JPMorgan Chase Bank NA | | | 5,121,713 | | | | (5,121,713 | ) | | | — | | | | — | | | | — | |
JPMorgan Chase Bank NA(g) | | | 418,112 | | | | — | | | | — | | | | — | | | | 418,112 | |
Morgan Stanley & Co. International plc | | | 2,390,865 | | | | (2,390,865 | ) | | | — | | | | — | | | | — | |
Morgan Stanley & Co. International plc(g) | | | 629,355 | | | | (19,499 | ) | | | — | | | | (470,000 | ) | | | 139,856 | |
Nomura International plc | | | 1,381,439 | | | | (1,381,439 | ) | | | — | | | | — | | | | — | |
Societe Generale SA(g) | | | 2,731,205 | | | | — | | | | — | | | | (2,390,000 | ) | | | 341,205 | |
UBS AG | | | 6,175,619 | | | | (6,175,619 | ) | | | — | | | | — | | | | — | |
| | | | | | | | | | | | | | | | | | | | |
| | $ | 33,300,376 | | | $ | (27,124,224 | ) | | $ | (764,524 | ) | | $ | (4,512,455 | ) | | $ | 899,173 | |
| | | | | | | | | | | | | | | | | | | | |
| | | | | | | | | | | | | | | | | | | | |
| Counterparty | | Derivative
Liabilities
Subject to
an MNA by
Counterparty | | | Derivatives
Available
for Offset (a) | | | Non-cash
Collateral
Pledged (d) | | | Cash
Collateral
Pledged | | | Net Amount
of Derivative
Liabilities (e)(f) | |
Bank of America NA | | $ | 4,542,308 | | | $ | (424,346 | ) | | $ | (4,117,962 | ) | | $ | — | | | $ | — | |
Barclays Bank plc | | | 6,282,048 | | | | (6,282,048 | ) | | | — | | | | — | | | | — | |
BNP Paribas SA | | | 2,057,154 | | | | (2,057,154 | ) | | | — | | | | — | | | | — | |
Citibank NA | | | 5,478,982 | | | | (1,472,494 | ) | | | (4,006,488 | ) | | | — | | | | — | |
Credit Suisse International | | | 1,678,172 | | | | (278,476 | ) | | | (1,375,800 | ) | | | — | | | | 23,896 | |
Deutsche Bank AG | | | 943,596 | | | | — | | | | (789,107 | ) | | | — | | | | 154,489 | |
Goldman Sachs International | | | 4,025,805 | | | | (1,520,571 | ) | | | (1,301,832 | ) | | | — | | | | 1,203,402 | |
JPMorgan Chase Bank NA | | | 5,667,929 | | | | (5,121,713 | ) | | | — | | | | — | | | | 546,216 | |
Morgan Stanley & Co. International plc | | | 11,964,273 | | | | (2,390,865 | ) | | | (9,573,408 | ) | | | — | | | | — | |
Morgan Stanley & Co. International plc(g) | | | 19,499 | | | | (19,499 | ) | | | — | | | | — | | | | — | |
Nomura International plc | | | 3,441,192 | | | | (1,381,439 | ) | | | (1,254,493 | ) | | | — | | | | 805,260 | |
UBS AG | | | 31,060,997 | | | | (6,175,619 | ) | | | (24,543,876 | ) | | | — | | | | 341,502 | |
| | | | | | | | | | | | | | | | | | | | |
| | $ | 77,161,955 | | | $ | (27,124,224 | ) | | $ | (46,962,966 | ) | | $ | — | | | $ | 3,074,765 | |
| | | | | | | | | | | | | | | | | | | | |
| | (a) | The amount of derivatives available for offset is limited to the amount of derivative assets and/or liabilities that are subject to an MNA. | |
| | (b) | Excess of collateral received from the individual counterparty is not shown for financial reporting purposes. | |
| | (c) | Net amount represents the net amount receivable from the counterparty in the event of default. | |
| | (d) | Excess of collateral pledged to the individual counterparty is not shown for financial reporting purposes. | |
| | (e) | Net amount represents the net amount payable due to the counterparty in the event of default. | |
| | (f) | Net amount may also include forward foreign currency exchange contracts that are not required to be collateralized. | |
| | (g) | Represents derivatives owned by the BlackRock Cayman Global Allocation V.I. Fund I, Ltd., a wholly-owed subsidiary of the Fund. See Note 1. | |
| | | | |
| CONSOLIDATED SCHEDULE OF INVESTMENTS | | | 21 | |
| | |
Consolidated Schedule of Investments (continued) December 31, 2018 | | BlackRock Global Allocation V.I. Fund |
Fair Value Hierarchy as of Period End
Various inputs are used in determining the fair value of investments and derivative financial instruments. For information about the Fund’s policy regarding valuation of investments and derivative financial instruments, refer to the Notes to Consolidated Financial Statements.
The following tables summarize the Fund’s investments and derivative financial instruments categorized in the disclosure hierarchy:
| | | | | | | | | | | | | | | | |
| | | Level 1 | | | Level 2 | | | Level 3 | | | Total | |
Assets: | | | | | | | | | | | | | | | | |
Investments: | | | | | | | | | | | | | | | | |
Long-Term Investments: | | | | | | | | | | | | | | | | |
Common Stocks: | | | | | | | | | | | | | | | | |
Australia | | $ | 98,832 | | | $ | 7,479,741 | | | $ | 5,830,553 | | | $ | 13,409,126 | |
Belgium | | | — | | | | 21,018,441 | | | | — | | | | 21,018,441 | |
Brazil | | | 64,241,339 | | | | — | | | | — | | | | 64,241,339 | |
Canada | | | 130,575,188 | | | | — | | | | — | | | | 130,575,188 | |
China | | | 24,071,798 | | | | 109,102,745 | | | | — | | | | 133,174,543 | |
Czech Republic | | | — | | | | 3,882,525 | | | | — | | | | 3,882,525 | |
Denmark | | | — | | | | 8,079,741 | | | | — | | | | 8,079,741 | |
Finland | | | — | | | | 836,855 | | | | — | | | | 836,855 | |
France | | | 40,375,689 | | | | 202,882,861 | | | | — | | | | 243,258,550 | |
Germany | | | 28,574,096 | | | | 88,409,698 | | | | — | | | | 116,983,794 | |
Hong Kong | | | — | | | | 82,350,243 | | | | — | | | | 82,350,243 | |
India | | | — | | | | 107,935,699 | | | | — | | | | 107,935,699 | |
Indonesia | | | — | | | | 3,290,112 | | | | — | | | | 3,290,112 | |
Italy | | | 9,699,640 | | | | 39,335,179 | | | | — | | | | 49,034,819 | |
Japan | | | — | | | | 692,812,497 | | | | — | | | | 692,812,497 | |
Macau | | | — | | | | 298,021 | | | | — | | | | 298,021 | |
Malaysia | | | — | | | | 1,551,458 | | | | — | | | | 1,551,458 | |
Mexico | | | 595,826 | | | | — | | | | — | | | | 595,826 | |
Netherlands | | | 34,623,328 | | | | 168,077,126 | | | | — | | | | 202,700,454 | |
Norway | | | — | | | | 214,073 | | | | — | | | | 214,073 | |
Peru | | | 68,802 | | | | — | | | | — | | | | 68,802 | |
Poland | | | — | | | | 251,518 | | | | — | | | | 251,518 | |
Portugal | | | — | | | | 9,594,874 | | | | — | | | | 9,594,874 | |
Singapore | | | — | | | | 49,443,707 | | | | — | | | | 49,443,707 | |
South Africa | | | — | | | | 1,313,897 | | | | — | | | | 1,313,897 | |
South Korea | | | 2,755,075 | | | | 57,414,891 | | | | — | | | | 60,169,966 | |
Spain | | | — | | | | 31,763,445 | | | | — | | | | 31,763,445 | |
Sweden | | | — | | | | 1,416,096 | | | | — | | | | 1,416,096 | |
Switzerland | | | — | | | | 82,147,183 | | | | — | | | | 82,147,183 | |
Taiwan | | | — | | | | 77,305,867 | | | | — | | | | 77,305,867 | |
Thailand | | | — | | | | 17,552,580 | | | | — | | | | 17,552,580 | |
Turkey | | | — | | | | 397,945 | | | | — | | | | 397,945 | |
United Arab Emirates | | | — | | | | 34,256,024 | | | | — | | | | 34,256,024 | |
United Kingdom | | | 21,425,917 | | | | 123,852,375 | | | | — | | | | 145,278,292 | |
United States | | | 2,832,621,469 | | | | 3,662,468 | | | | 3,293,810 | | | | 2,839,577,747 | |
Corporate Bonds: | | | | | | | | | | | | | | | | |
Australia | | | — | | | | — | | | | 38,861,531 | | | | 38,861,531 | |
Belgium | | | — | | | | 10,507,475 | | | | — | | | | 10,507,475 | |
Chile | | | — | | | | 155,734 | | | | — | | | | 155,734 | |
China | | | — | | | | 5,491,878 | | | | — | | | | 5,491,878 | |
France | | | — | | | | 6,949,544 | | | | — | | | | 6,949,544 | |
Germany | | | — | | | | 12,792,031 | | | | — | | | | 12,792,031 | |
India | | | — | | | | — | | | | 1 | | | | 1 | |
Italy | | | — | | | | 3,862,700 | | | | — | | | | 3,862,700 | |
Japan | | | — | | | | 26,572,584 | | | | — | | | | 26,572,584 | |
Luxembourg | | | — | | | | 1,990,990 | | | | — | | | | 1,990,990 | |
Netherlands | | | — | | | | 11,838,528 | | | | — | | | | 11,838,528 | |
Singapore | | | — | | | | 5,151,907 | | | | — | | | | 5,151,907 | |
Switzerland | | | — | | | | 4,670,666 | | | | — | | | | 4,670,666 | |
Turkey | | | — | | | | — | | | | 3,317,000 | | | | 3,317,000 | |
United Kingdom | | | — | | | | 6,705,761 | | | | — | | | | 6,705,761 | |
United States | | | — | | | | 279,438,028 | | | | — | | | | 279,438,028 | |
Floating Rate Loan Interests | | | — | | | | 15,626,305 | | | | — | | | | 15,626,305 | |
Foreign Government Obligations | | | — | | | | 253,737,337 | | | | — | | | | 253,737,337 | |
Investment Companies | | | 116,153,961 | | | | — | | | | — | | | | 116,153,961 | |
| | |
| 22 | | 2018 BLACKROCK ANNUAL REPORTTO SHAREHOLDERS |
| | |
Consolidated Schedule of Investments (continued) December 31, 2018 | | BlackRock Global Allocation V.I. Fund |
| | | | | | | | | | | | | | | | |
| | | Level 1 | | | Level 2 | | | Level 3 | | | Total | |
Preferred Securities: | | | | | | | | | | | | | | | | |
Brazil | | $ | 4,970,465 | | | $ | — | | | $ | — | | | $ | 4,970,465 | |
China | | | — | | | | 21,327,326 | | | | — | | | | 21,327,326 | |
Netherlands | | | — | | | | 3,280,418 | | | | — | | | | 3,280,418 | |
South Korea | | | — | | | | 627,878 | | | | — | | | | 627,878 | |
United Kingdom | | | — | | | | 27,679,776 | | | | — | | | | 27,679,776 | |
United States | | | 29,044,240 | | | | 50,556,934 | | | | 75,248,455 | | | | 154,849,629 | |
U.S. Treasury Obligations | | | — | | | | 2,030,099,205 | | | | — | | | | 2,030,099,205 | |
Short-Term Securities: | | | | | | | | | | | | | | | | |
Foreign Government Obligations | | | — | | | | 179,739,262 | | | | — | | | | 179,739,262 | |
Money Market Funds | | | 22,471,516 | | | | — | | | | — | | | | 22,471,516 | |
Time Deposits | | | — | | | | 1,803,205 | | | | — | | | | 1,803,205 | |
U.S. Treasury Obligations | | | — | | | | 496,767,347 | | | | — | | | | 496,767,347 | |
Options Purchased: | | | | | | | | | | | | | | | | |
Equity contracts | | | — | | | | 18,374,807 | | | | — | | | | 18,374,807 | |
Foreign currency exchange contracts | | | — | | | | 3,447,545 | | | | — | | | | 3,447,545 | |
Interest rate contracts | | | — | | | | 126,635 | | | | — | | | | 126,635 | |
Liabilities: | | | | | | | | | | | | | | | | |
Investment Sold Short | | | | | | | | | | | | | | | | |
Common Stocks: | | | | | | | | | | | | | | | | |
France | | | — | | | | (5,047,857 | ) | | | — | | | | (5,047,857 | ) |
Japan | | | — | | | | (11,574,706 | ) | | | — | | | | (11,574,706 | ) |
United States | | | (3,149,519 | ) | | | — | | | | — | | | | (3,149,519 | ) |
| | | | | | | | | | | | | | | | |
Subtotal | | $ | 3,359,217,662 | | | $ | 5,490,629,128 | | | $ | 126,551,350 | | | $ | 8,976,398,140 | |
| | | | | | | | | | | | | | | | |
Investments valued at NAV(a) | | | | | | | | | | | | | | | 209,506,557 | |
| | | | | | | | | | | | | | | | |
Total Investments | | | | | | | | | | | | | | $ | 9,185,904,697 | |
| | | | | | | | | | | | | | | | |
Derivative Financial Instruments(b) | | | | | | | | | | | | | | | | |
Assets: | | | | | | | | | | | | | | | | |
Credit contracts | | $ | — | | | $ | 214,055 | | | $ | — | | | $ | 214,055 | |
Equity contracts | | | 6,413,616 | | | | 4,921,987 | | | | — | | | | 11,335,603 | |
Foreign currency exchange contracts | | | — | | | | 6,429,402 | | | | — | | | | 6,429,402 | |
Interest rate contracts | | | — | | | | 16,422,845 | | | | — | | | | 16,422,845 | |
Liabilities: | | | | | | | | | | | | | | | | |
Equity contracts | | | (419,778 | ) | | | (67,215,917 | ) | | | — | | | | (67,635,695 | ) |
Foreign currency exchange contracts | | | — | | | | (7,367,963 | ) | | | — | | | | (7,367,963 | ) |
Interest rate contracts | | | (929,678 | ) | | | (10,306,458 | ) | | | — | | | | (11,236,136 | ) |
| | | | | | | | | | | | | | | | |
| | $ | 5,064,160 | | | $ | (56,902,049 | ) | | $ | — | | | $ | (51,837,889 | ) |
| | | | | | | | | | | | | | | | |
| | (a) | Certain investments of the Fund were fair valued using NAV per share as no quoted market value is available and therefore have been excluded from the fair value hierarchy. | |
| | (b) | Derivative financial instruments are swaps, futures contracts, forward foreign currency exchange contracts and options written. Swaps, futures contracts and forward foreign currency exchange contracts are valued at the unrealized appreciation (depreciation) on the instrument and options written are shown at value. | |
Transfers between Level 1 and Level 2 were as follows:
| | | | | | | | |
| | | Transfers Out of
Level 1 (a) | | | Transfers Into
Level 2 (a) | |
Assets: | | | | | | | | |
Investments: | | | | | | | | |
Common Stocks: | | | | | | | | |
Czech Republic | | $ | 4,441,567 | | | $ | 4,441,567 | |
Hong Kong | | | 10,213,986 | | | | 10,213,986 | |
India | | | 71,154 | | | | 71,154 | |
Japan | | | 317,914 | | | | 317,914 | |
Poland | | | 56,071 | | | | 56,071 | |
Portugal | | | 10,624,858 | | | | 10,624,858 | |
South Korea | | | 23,756,634 | | | | 23,756,634 | |
Taiwan | | | 18,624,022 | | | | 18,624,022 | |
Thailand | | | 7,689,365 | | | | 7,689,365 | |
United Arab Emirates | | | 39,994,489 | | | | 39,994,489 | |
United Kingdom | | | 16,163,464 | | | | 16,163,464 | |
| | | | | | | | |
| | $ | 131,953,524 | | | $ | 131,953,524 | |
| | | | | | | | |
| | (a) | External pricing service used to reflect any significant market movements between the time the Fund valued such foreign securities and the earlier closing of foreign markets. See Notes to Consolidated Financial Statements. | |
| | | | |
| CONSOLIDATED SCHEDULE OF INVESTMENTS | | | 23 | |
| | |
Consolidated Schedule of Investments (continued) December 31, 2018 | | BlackRock Global Allocation V.I. Fund |
A reconciliation of Level 3 investments is presented when the Fund had a significant amount of Level 3 investments at the beginning and/or end of the year in relation to net assets. The following table is a reconciliation of Level 3 investments for which significant unobservable inputs were used in determining fair value:
| | | | | | | | | | | | | | | | | | | | |
| | | Common
Stocks | | | Corporate
Bonds | | | Preferred
Securities | | | Warrants | | | Total | |
Investments: | | | | | | | | | | | | | | | | | | | | |
Assets: | | | | | | | | | | | | | | | | | | | | |
Opening Balance, as of December 31, 2017 | | $ | 472,461 | | | $ | 8,403,598 | | | $ | 101,952,816 | | | $ | 29 | | | $ | 110,828,904 | |
Transfers into Level 3 | | | — | | | | — | | | | — | | | | — | | | | — | |
Transfers out of Level 3 | | | — | | | | (24,000 | ) | | | (38,984,160 | ) | | | — | | | | (39,008,160 | ) |
Accrued discounts/premiums | | | — | | | | (155,945 | ) | | | — | | | | — | | | | (155,945 | ) |
Net realized gain (loss) | | | — | | | | (46,910,658 | ) | | | — | | | | — | | | | (46,910,658 | ) |
Net change in unrealized appreciation (depreciation)(a)(b) | | | (3,530,581 | ) | | | 41,640,722 | | | | 9,098,833 | | | | (29 | ) | | | 47,208,945 | |
Purchases | | | 12,182,483 | | | | 41,439,419 | | | | 3,180,966 | | | | — | | | | 56,802,868 | |
Sales | | | — | | | | (2,214,604 | ) | | | — | | | | — | | | | (2,214,604 | ) |
| | | | | | | | | | | | | | | | | | | | |
Closing Balance, as of December 31, 2018 | | $ | 9,124,363 | | | $ | 42,178,532 | | | $ | 75,248,455 | | | $ | — | | | $ | 126,551,350 | |
| | | | | | | | | | | | | | | | | | | | |
Net change in unrealized appreciation (depreciation) on investments still held at December 31, 2018(b) | | $ | (3,530,581 | ) | | $ | (4,458,011 | ) | | $ | 9,098,833 | | | $ | — | | | $ | 1,110,241 | |
| | | | | | | | | | | | | | | | | | | | |
| | (a) | Included in the related net change in unrealized appreciation (depreciation) in the Consolidated Statement of Operations. | |
| | (b) | Any difference between net change in unrealized appreciation (depreciation) and net change in unrealized appreciation (depreciation) on investments still held at December 31, 2018 is generally due to investments no longer held or categorized as Level 3 at period end. | |
The Fund’s investments that are categorized as Level 3 were valued utilizing third party pricing information without adjustment. Such valuations are based on unobservable inputs. A significant change in third party information could result in a significantly lower or higher value of such Level 3 investments.
The following table summarizes the valuation approaches used and unobservable inputs utilized by the BlackRock Global Valuation Methodologies Committee (the “Global Valuation Committee”) to determine the value of certain of the Fund’s Level 3 investments as of period end. The table does not include Level 3 investments with values based upon unadjusted third party pricing information in the amount of $3,292,172. A significant change in the third party information could result in a significantly lower or higher value of such Level 3 investments.
| | | | | | | | | | | | | | | | | | |
| | | Value | | | Valuation
Approach | | | Unobservable Inputs | | Range of
Unobservable
Inputs Utilized | | | Weighted
Average of
Unobservable
Inputs | |
Common Stocks | | $ | 5,832,192 | | | | Market | | | Revenue Multiple(a) | | | 3.50x | | | | — | |
| | | | | | | | | | Time to Exit(a) | | | 0.5 years | | | | — | |
| | | | | | | | | | Volatility(a) | | | 44% | | | | — | |
| | | | | | | Income | | | Discount Rate(b) | | | 15% | | | | — | |
Corporate Bonds | | | 42,178,531 | | | | Income | | | Discount Rate(b) | | | 15%-38% | | | | 17 | % |
Preferred Stocks’(c) | | | 75,248,455 | | | | Market | | | Recent Transactions(a) | | | — | | | | — | |
| | | | | | | | | | Revenue Multiple(a) | | | 3.50x-14.25x | | | | 7.41x | |
| | | | | | | | | | Time to Exit(b) | | | 0.5 years | | | | — | |
| | | | | | | | | | Volatility(b) | | | 44% | | | | — | |
| | | | | | | | | | | | | | | | | | |
| | $ | 123,259,178 | | | | | | | | | | | | | | | |
| | | | | | | | | | | | | | | | | | |
| | (a) | Increase in unobservable input may result in a significant increase to value, while a decrease in unobservable input may result in a significant decrease to value. | |
| | (b) | Decrease in unobservable input may result in a significant increase to value, while an increase in unobservable input may result in a significant decrease to value. | |
| | (c) | For the year ended December 31, 2018, the valuation technique for investments classified as preferred stocks amounting to $50,945,973 changed to Current Value. The investments were previously valued utilizing Transaction Price. The change was due to consideration of the information that was available at the time the investments were valued. | |
See notes to consolidated financial statements.
| | |
| 24 | | 2018 BLACKROCK ANNUAL REPORTTO SHAREHOLDERS |
Consolidated Statement of Assets and Liabilities
December 31, 2018
| | | | |
| | | BlackRock Global
Allocation V.I. Fund | |
| |
ASSETS | | | | |
Investments at value — unaffiliated (including securities loaned at value of $205,459,274) (cost — $9,063,221,168) | | $ | 8,859,833,648 | |
Investments at value — affiliated (cost — $353,622,368) | | | 345,843,131 | |
Cash | | | 31,298,459 | |
Cash pledged: | | | | |
Futures contracts | | | 18,916,000 | |
Centrally cleared swaps | | | 12,226,000 | |
Foreign currency at value (cost — $1,193,490) | | | 1,195,877 | |
Receivables: | | | | |
Investments sold | | | 18,394,966 | |
Securities lending income — affiliated | | | 66,507 | |
Swaps | | | 1,022,303 | |
Capital shares sold | | | 10,043,281 | |
Dividends — affiliated | | | 30,722 | |
Dividends — unaffiliated | | | 9,238,458 | |
Interest — unaffiliated | | | 21,384,348 | |
Variation margin on futures contracts | | | 192,609 | |
Variation margin on centrally cleared swaps | | | 1,135,739 | |
Unrealized appreciation on: | | | | |
Forward foreign currency exchange contracts | | | 6,429,402 | |
OTC swaps | | | 4,921,987 | |
Prepaid expenses | | | 10,103 | |
| | | | |
Total assets | | | 9,342,183,540 | |
| | | | |
| |
LIABILITIES | | | | |
Investments sold short, at value (proceeds $25,194,044) | | | 19,772,082 | |
Cash received as collateral for OTC derivatives | | | 6,870,000 | |
Cash collateral on securities loaned at value | | | 209,469,852 | |
Options written at value (premium received $44,813,654) | | | 69,631,015 | |
Payables: | | | | |
Investments purchased | | | 29,517,035 | |
Capital shares redeemed | | | 5,461,896 | |
Deferred foreign capital gain tax | | | 728,665 | |
Distribution fees | | | 1,485,538 | |
Transfer agent fees | | | 4,780,400 | |
Variation margin on futures contracts | | | 3,737,779 | |
Board realignment and consolidation | | | 270,279 | |
Investment advisory fees | | | 4,862,376 | |
Directors’ and Officer’s fees | | | 35,711 | |
Other affiliates | | | 25,128 | |
Other accrued expenses | | | 2,511,665 | |
Unrealized depreciation on: | | | | |
Forward foreign currency exchange contracts | | | 7,367,963 | |
OTC swaps | | | 544,715 | |
| | | | |
Total liabilities | | | 367,072,099 | |
| | | | |
| |
NET ASSETS | | $ | 8,975,111,441 | |
| | | | |
| |
NET ASSETS CONSIST OF | | | | |
Paid-in capital | | $ | 9,168,250,066 | |
Accumulated loss | | | (193,138,625 | ) |
| | | | |
NET ASSETS | | $ | 8,975,111,441 | |
| | | | |
| |
NET ASSET VALUE | | | | |
Class I — Based on net assets of $2,091,196,784 and 137,678,992 shares outstanding, 400 million shares authorized, $0.10 par value. | | $ | 15.19 | |
| | | | |
Class II — Based on net assets of $213,919,086 and 14,129,808 shares outstanding, 200 million shares authorized, $0.10 par value. | | $ | 15.14 | |
| | | | |
Class III — Based on net assets of $6,669,995,571 and 514,907,688 shares outstanding, 1.5 billion shares authorized, $0.10 par value. | | $ | 12.95 | |
| | | | |
See notes to consolidated financial statements.
| | | | |
| CONSOLIDATED FINANCIAL STATEMENTS | | | 25 | |
Consolidated Statement of Operations
Year Ended December 31, 2018
| | | | |
| | | BlackRock Global
Allocation V.I. Fund | |
| |
INVESTMENT INCOME | | | | |
Dividends — affiliated | | $ | 183,739 | |
Dividends — unaffiliated | | | 137,581,514 | |
Interest — unaffiliated | | | 100,230,307 | |
Securities lending income — affiliated — net | | | 1,088,546 | |
Foreign taxes withheld | | | (7,508,404 | ) |
| | | | |
Total investment income | | | 231,575,702 | |
| | | | |
| |
EXPENSES | | | | |
Investment advisory | | | 64,073,510 | |
Distribution — class specific | | | 19,558,159 | |
Transfer agent — class specific | | | 18,525,655 | |
Custodian | | | 1,441,462 | |
Professional | | | 746,595 | |
Printing | | | 569,081 | |
Accounting services | | | 561,900 | |
Board realignment and consolidation | | | 276,370 | |
Directors and Officer | | | 127,406 | |
Transfer agent | | | 4,941 | |
Miscellaneous | | | 212,718 | |
| | | | |
Total expenses excluding dividend expense | | | 106,097,797 | |
Dividends expense — unaffiliated | | | 795,187 | |
| | | | |
Total expenses | | | 106,892,984 | |
Less: | | | | |
Fees waived and/or reimbursed by the Manager | | | (425,060 | ) |
Transfer agent fees waived and/or reimbursed — class specific | | | (11,392,661 | ) |
| | | | |
Total expenses after fees waived and/or reimbursed | | | 95,075,263 | |
| | | | |
Net investment income | | | 136,500,439 | |
| | | | |
| |
REALIZED AND UNREALIZED GAIN (LOSS) | | | | |
Net realized gain (loss) from: | | | | |
Investments — affiliated | | | 24,463 | |
Investments — unaffiliated (net of $501,091 foreign capital gain tax) | | | 369,737,006 | |
Capital gain distributions from investment companies — affiliated | | | 20 | |
Forward foreign currency exchange contracts | | | (13,975,279 | ) |
Foreign currency transactions | | | 11,407,034 | |
Futures contracts | | | (1,357,682 | ) |
Options written | | | 11,561,067 | |
Short sales — unaffiliated | | | 4,309,534 | |
Swaps . . . . . | | | 8,557,956 | |
| | | | |
| | | 390,264,119 | |
| | | | |
Net change in unrealized appreciation (depreciation) on: | | | | |
Investments — affiliated | | | (5,007,538 | ) |
Investments — unaffiliated (net of $394,615 foreign capital gain tax) | | | (1,215,253,198 | ) |
Forward foreign currency exchange contracts | | | (7,735,636 | ) |
Foreign currency translations | | | (111,161 | ) |
Futures contracts | | | 5,836,909 | |
Options written | | | (36,642,897 | ) |
Short sales — unaffiliated | | | 5,421,962 | |
Swaps . . . . . | | | (17,072,497 | ) |
| | | | |
| | | (1,270,564,056 | ) |
| | | | |
Net realized and unrealized loss | | | (880,299,937 | ) |
| | | | |
NET DECREASE IN NET ASSETS RESULTING FROM OPERATIONS | | $ | (743,799,498 | ) |
| | | | |
See notes to consolidated financial statements.
| | |
| 26 | | 2018 BLACKROCK ANNUAL REPORTTO SHAREHOLDERS |
Consolidated Statements of Changes in Net Assets
| | | | | | | | |
| | | BlackRock Global Allocation V.I. Fund | |
| | | Year Ended December 31, | |
| | 2018 | | | 2017 | |
| | |
INCREASE (DECREASE) IN NET ASSETS | | | | | | | | |
| | |
OPERATIONS | | | | | | | | |
Net investment income | | $ | 136,500,439 | | | $ | 126,982,603 | |
Net realized gain | | | 390,264,119 | | | | 414,074,260 | |
Net change in unrealized appreciation (depreciation) | | | (1,270,564,056 | ) | | | 831,654,996 | |
| | | | | | | | |
Net increase (decrease) in net assets resulting from operations | | | (743,799,498 | ) | | | 1,372,711,859 | |
| | | | | | | | |
| | |
DISTRIBUTIONS TO SHAREHOLDERS(a)(b) | | | | | | | | |
Class I | | | (107,089,999 | ) | | | (52,222,959 | ) |
Class II | | | (10,743,144 | ) | | | (5,499,573 | ) |
Class III | | | (383,334,181 | ) | | | (197,591,823 | ) |
| | | | | | | | |
Decrease in net assets resulting from distributions to shareholders | | | (501,167,324 | ) | | | (255,314,355 | ) |
| | | | | | | | |
| | |
CAPITALSHARE TRANSACTIONS | | | | | | | | |
Net decrease in net assets derived from capital share transactions | | | (578,134,925 | ) | | | (795,038,529 | ) |
| | | | | | | | |
| | |
NET ASSETS(b) | | | | | | | | |
Total increase (decrease) in net assets | | | (1,823,101,747 | ) | | | 322,358,975 | |
Beginning of year | | | 10,798,213,188 | | | | 10,475,854,213 | |
| | | | | | | | |
End of year | | $ | 8,975,111,441 | | | $ | 10,798,213,188 | |
| | | | | | | | |
| (a) | Distributions for annual periods determined in accordance with U.S. federal income tax regulations. |
| (b) | Prior year distribution character information and distributions in excess of net investment income has been modified or removed to conform with current year RegulationS-X presentation changes. Refer to Note 12 for this prior year information. |
See notes to consolidated financial statements.
| | | | |
| CONSOLIDATED FINANCIAL STATEMENTS | | | 27 | |
Consolidated Financial Highlights
(For a share outstanding throughout each period)
| | | | | | | | | | | | | | | | | | | | |
| | | BlackRock Global Allocation V.I. Fund | |
| |
| | | Class I | |
| |
| | | Year Ended December 31, | |
| | | 2018 | | | 2017 | | | 2016 | | | 2015 | | | 2014 | |
| | | | | | |
Net asset value, beginning of year | | $ | 17.26 | | | $ | 15.51 | | | $ | 15.09 | | | $ | 16.26 | | | $ | 17.61 | |
| | | | | | | | | | | | | | | | | | | | |
Net investment income(a) | | | 0.26 | | | | 0.22 | | | | 0.22 | | | | 0.22 | | | | 0.29 | |
Net realized and unrealized gain (loss) | | | (1.52 | ) | | | 1.92 | | | | 0.40 | | | | (0.35 | ) | | | 0.12 | |
| | | | | | | | | | | | | | | | | | | | |
Net increase (decrease) from investment operations | | | (1.26 | ) | | | 2.14 | | | | 0.62 | | | | (0.13 | ) | | | 0.41 | |
| | | | | | | | | | | | | | | | | | | | |
| | | | | |
| Distributions:(b) | | | | | | | | | | | | | | | |
From net investment income | | | (0.17 | ) | | | (0.22 | ) | | | (0.20 | ) | | | (0.19 | ) | | | (0.39 | ) |
From net realized gain | | | (0.64 | ) | | | (0.17 | ) | | | — | | | | (0.84 | ) | | | (1.37 | ) |
From return of capital | | | — | | | | — | | | | — | | | | (0.01 | ) | | | — | |
| | | | | | | | | | | | | | | | | | | | |
Total distributions | | | (0.81 | ) | | | (0.39 | ) | | | (0.20 | ) | | | (1.04 | ) | | | (1.76 | ) |
| | | | | | | | | | | | | | | | | | | | |
| | | | | |
Net asset value, end of year | | $ | 15.19 | | | $ | 17.26 | | | $ | 15.51 | | | $ | 15.09 | | | $ | 16.26 | |
| | | | | | | | | | | | | | | | | | | | |
| | | | | |
Total Return(c) | | | | | | | | | | | | | | | | | | | | |
Based on net asset value | | | (7.34 | )% | | | 13.86 | % | | | 4.11 | % | | | (0.89 | )% | | | 2.30 | % |
| | | | | | | | | | | | | | | | | | | | |
| | | | | |
Ratios to Average Net Assets(d) | | | | | | | | | | | | | | | | | | | | |
Total expenses | | | 0.75 | % | | | 0.72 | % | | | 0.74 | % | | | 0.75 | % | | | 0.74 | % |
| | | | | | | | | | | | | | | | | | | | |
Total expenses after fees waived and/or reimbursed | | | 0.74 | % | | | 0.72 | % | | | 0.74 | % | | | 0.73 | % | | | 0.72 | % |
| | | | | | | | | | | | | | | | | | | | |
Total expenses after fees waived and/or reimbursed and excluding dividend expense, interest expense and broker fees and expenses on short sales | | | 0.73 | % | | | 0.70 | % | | | 0.73 | % | | | 0.73 | % | | | 0.72 | % |
| | | | | | | | | | | | | | | | | | | | |
Net investment income | | | 1.53 | % | | | 1.32 | % | | | 1.47 | % | | | 1.32 | % | | | 1.64 | % |
| | | | | | | | | | | | | | | | | | | | |
| | | | | |
Supplemental Data | | | | | | | | | | | | | | | | | | | | |
Net assets, end of year (000) | | $ | 2,091,197 | | | $ | 2,306,034 | | | $ | 2,107,145 | | | $ | 1,994,371 | | | $ | 1,708,903 | |
| | | | | | | | | | | | | | | | | | | | |
Portfolio turnover rate | | | 144 | % | | | 118 | % | | | 135 | % | | | 90 | %(e) | | | 72 | % |
| | | | | | | | | | | | | | | | | | | | |
| (a) | Based on average shares outstanding. |
| (b) | Distributions for annual periods determined in accordance with U.S. federal income tax regulations. |
| (c) | Where applicable, excludes insurance-related fees and expenses and assumes the reinvestments of distributions. |
| (d) | Excludes expenses incurred indirectly as a result of investments in underlying funds as follows: |
| | | | | | | | | | | | | | | | | | | | | | | | | | | | | | | | | | | | | | | | |
| | | Year Ended December 31, | |
| | | 2018 | | | | | | 2017 | | | | | | 2016 | | | | | | 2015 | | | | | | 2014 | | | | |
Investments in underlying funds | | | 0.01 | % | | | | | | | 0.01 | % | | | | | | | — | % | | | | | | | — | % | | | | | | | — | % | | | | |
| | | | | | | | | | | | | | | | | | | | | | | | | | | | | | | | | | | | | | | | |
| (e) | Includes mortgage dollar roll transactions (“MDRs”). Excluding these transactions the portfolio turnover would have been 88%. |
See notes to consolidated financial statements.
| | |
| 28 | | 2018 BLACKROCK ANNUAL REPORTTO SHAREHOLDERS |
Consolidated Financial Highlights (continued)
(For a share outstanding throughout each period)
| | | | | | | | | | | | | | | | | | | | |
| | | BlackRock Global Allocation V.I. Fund (continued) | |
| | | Class II | |
| | | Year Ended December 31, | |
| | | 2018 | | | 2017 | | | 2016 | | | 2015 | | | 2014 | |
| | | | | | |
Net asset value, beginning of year | | $ | 17.21 | | | $ | 15.46 | | | $ | 15.04 | | | $ | 16.21 | | | $ | 17.56 | |
| | | | | | | | | | | | | | | | | | | | |
Net investment income(a) | | | 0.23 | | | | 0.19 | | | | 0.20 | | | | 0.19 | | | | 0.25 | |
Net realized and unrealized gain (loss) | | | (1.52 | ) | | | 1.93 | | | | 0.40 | | | | (0.35 | ) | | | 0.14 | |
| | | | | | | | | | | | | | | | | | | | |
Net increase (decrease) from investment operations | | | (1.29 | ) | | | 2.12 | | | | 0.60 | | | | (0.16 | ) | | | 0.39 | |
| | | | | | | | | | | | | | | | | | | | |
| | | | | |
| Distributions:(b) | | | | | | | | | | | | | | | |
From net investment income | | | (0.14 | ) | | | (0.20 | ) | | | (0.18 | ) | | | (0.16 | ) | | | (0.37 | ) |
From net realized gain | | | (0.64 | ) | | | (0.17 | ) | | | — | | | | (0.84 | ) | | | (1.37 | ) |
From return of capital | | | — | | | | — | | | | — | | | | (0.01 | ) | | | — | |
| | | | | | | | | | | | | | | | | | | | |
Total distributions | | | (0.78 | ) | | | (0.37 | ) | | | (0.18 | ) | | | (1.01 | ) | | | (1.74 | ) |
| | | | | | | | | | | | | | | | | | | | |
| | | | | |
Net asset value, end of year | | $ | 15.14 | | | $ | 17.21 | | | $ | 15.46 | | | $ | 15.04 | | | $ | 16.21 | |
| | | | | | | | | | | | | | | | | | | | |
| | | | | |
Total Return(c) | | | | | | | | | | | | | | | | | | | | |
Based on net asset value | | | (7.52 | )% | | | 13.74 | % | | | 3.96 | % | | | (1.05 | )% | | | 2.16 | % |
| | | | | | | | | | | | | | | | | | | | |
| | | | | |
Ratios to Average Net Assets(d) | | | | | | | | | | | | | | | | | | | | |
Total expenses | | | 1.04 | % | | | 1.00 | % | | | 1.02 | % | | | 1.02 | % | | | 1.01 | % |
| | | | | | | | | | | | | | | | | | | | |
Total expenses after fees waived and/or reimbursed | | | 0.89 | % | | | 0.87 | % | | | 0.89 | % | | | 0.88 | % | | | 0.88 | % |
| | | | | | | | | | | | | | | | | | | | |
Total expenses after fees waived and/or reimbursed and excluding dividend expense, interest expense and broker fees and expenses on short sales | | | 0.88 | % | | | 0.85 | % | | | 0.88 | % | | | 0.88 | % | | | 0.87 | % |
| | | | | | | | | | | | | | | | | | | | |
Net investment income | | | 1.34 | % | | | 1.17 | % | | | 1.33 | % | | | 1.17 | % | | | 1.39 | % |
| | | | | | | | | | | | | | | | | | | | |
| | | | | |
Supplemental Data | | | | | | | | | | | | | | | | | | | | |
Net assets, end of year (000) | | $ | 213,919 | | | $ | 258,564 | | | $ | 229,492 | | | $ | 256,964 | | | $ | 260,312 | |
| | | | | | | | | | | | | | | | | | | | |
Portfolio turnover rate | | | 144 | % | | | 118 | % | | | 135 | % | | | 90 | %(e) | | | 72 | % |
| | | | | | | | | | | | | | | | | | | | |
| (a) | Based on average shares outstanding. |
| (b) | Distributions for annual periods determined in accordance with U.S. federal income tax regulations. |
| (c) | Where applicable, excludes insurance-related fees and expenses and assumes the reinvestments of distributions. |
| (d) | Excludes expenses incurred indirectly as a result of investments in underlying funds as follows: |
| | | | | | | | | | | | | | | | | | | | | | | | | | | | | | | | | | | | | | | | |
| | | Year Ended December 31, | |
| | | 2018 | | | | | | 2017 | | | | | | 2016 | | | | | | 2015 | | | | | | 2014 | | | | |
Investments in underlying funds | | | 0.01 | % | | | | | | | 0.01 | % | | | | | | | — | % | | | | | | | — | % | | | | | | | — | % | | | | |
| | | | | | | | | | | | | | | | | | | | | | | | | | | | | | | | | | | | | | | | |
| (e) | Includes mortgage dollar roll transactions (“MDRs”). Excluding these transactions the portfolio turnover would have been 88%. |
See notes to consolidated financial statements.
| | | | |
| CONSOLIDATED FINANCIAL HIGHLIGHTS | | | 29 | |
Consolidated Financial Highlights (continued)
(For a share outstanding throughout each period)
| | | | | | | | | | | | | | | | | | | | |
| | | BlackRock Global Allocation V.I. Fund (continued) | |
| |
| | | Class III | |
| |
| | | Year Ended December 31, | |
| | | 2018 | | | 2017 | | | 2016 | | | 2015 | | | 2014 | |
| | | | | | |
Net asset value, beginning of year | | $ | 14.84 | | | $ | 13.37 | | | $ | 13.04 | | | $ | 14.19 | | | $ | 15.58 | |
| | | | | | | | | | | | | | | | | | | | |
Net investment income(a) | | | 0.19 | | | | 0.17 | | | | 0.16 | | | | 0.15 | | | | 0.21 | |
Net realized and unrealized gain (loss) | | | (1.31 | ) | | | 1.66 | | | | 0.34 | | | | (0.30 | ) | | | 0.12 | |
| | | | | | | | | | | | | | | | | | | | |
Net increase (decrease) from investment operations | | | (1.12 | ) | | | 1.83 | | | | 0.50 | | | | (0.15 | ) | | | 0.33 | |
| | | | | | | | | | | | | | | | | | | | |
| | | | | |
| Distributions:(b) | | | | | | | | | | | | | | | |
From net investment income | | | (0.13 | ) | | | (0.19 | ) | | | (0.17 | ) | | | (0.15 | ) | | | (0.35 | ) |
From net realized gain | | | (0.64 | ) | | | (0.17 | ) | | | — | | | | (0.84 | ) | | | (1.37 | ) |
From return of capital | | | — | | | | — | | | | — | | | | (0.01 | ) | | | — | |
| | | | | | | | | | | | | | | | | | | | |
Total distributions | | | (0.77 | ) | | | (0.36 | ) | | | (0.17 | ) | | | (1.00 | ) | | | (1.72 | ) |
| | | | | | | | | | | | | | | | | | | | |
| | | | | |
Net asset value, end of year | | $ | 12.95 | | | $ | 14.84 | | | $ | 13.37 | | | $ | 13.04 | | | $ | 14.19 | |
| | | | | | | | | | | | | | | | | | | | |
| | | | | |
Total Return(c) | | | | | | | | | | | | | | | | | | | | |
Based on net asset value | | | (7.58 | )% | | | 13.71 | % | | | 3.81 | % | | | (1.14 | )% | | | 2.08 | % |
| | | | | | | | | | | | | | | | | | | | |
| | | | | |
Ratios to Average Net Assets(d) | | | | | | | | | | | | | | | | | | | | |
Total expenses | | | 1.14 | % | | | 1.13 | % | | | 1.12 | % | | | 1.12 | % | | | 1.11 | % |
| | | | | | | | | | | | | | | | | | | | |
Total expenses after fees waived and/or reimbursed | | | 0.99 | % | | | 1.00 | % | | | 0.99 | % | | | 0.98 | % | | | 0.98 | % |
| | | | | | | | | | | | | | | | | | | | |
Total expenses after fees waived and/or reimbursed and excluding dividend expense, interest expense and broker fees and expenses on short sales | | | 0.98 | % | | | 0.98 | % | | | 0.98 | % | | | 0.98 | % | | | 0.97 | % |
| | | | | | | | | | | | | | | | | | | | |
Net investment income | | | 1.28 | % | | | 1.15 | % | | | 1.22 | % | | | 1.07 | % | | | 1.32 | % |
| | | | | | | | | | | | | | | | | | | | |
| | | | | |
Supplemental Data | | | | | | | | | | | | | | | | | | | | |
Net assets, end of year (000) | | $ | 6,669,996 | | | $ | 8,233,615 | | | $ | 8,139,218 | | | $ | 8,869,288 | | | $ | 9,780,007 | |
| | | | | | | | | | | | | | | | | | | | |
Portfolio turnover rate | | | 144 | % | | | 118 | % | | | 135 | % | | | 90 | %(e) | | | 72 | % |
| | | | | | | | | | | | | | | | | | | | |
| (a) | Based on average shares outstanding. |
| (b) | Distributions for annual periods determined in accordance with U.S. federal income tax regulations. |
| (c) | Where applicable, excludes insurance-related fees and expenses and assumes the reinvestments of distributions. |
| (d) | Excludes expenses incurred indirectly as a result of investments in underlying funds as follows: |
| | | | | | | | | | | | | | | | | | | | | | | | | | | | | | | | | | | | | | | | |
| | | Year Ended December 31, | |
| | | 2018 | | | | | | 2017 | | | | | | 2016 | | | | | | 2015 | | | | | | 2014 | | | | |
Investments in underlying funds | | | 0.01 | % | | | | | | | 0.01 | % | | | | | | | — | % | | | | | | | — | % | | | | | | | — | % | | | | |
| | | | | | | | | | | | | | | | | | | | | | | | | | | | | | | | | | | | | | | | |
| (e) | Includes mortgage dollar roll transactions (“MDRs”). Excluding these transactions the portfolio turnover would have been 88%. |
See notes to consolidated financial statements.
| | |
| 30 | | 2018 BLACKROCK ANNUAL REPORTTO SHAREHOLDERS |
Notes to Consolidated Financial Statements
BlackRock Variable Series Funds, Inc. (the “Company”) is registered under the Investment Company Act of 1940, as amended (the “1940 Act”), as anopen-end management investment company. The Company is organized as a Maryland corporation that is comprised of 15 separate portfolios. The portfolios offer shares to insurance companies for their separate accounts to fund benefits under certain variable annuity and variable life insurance contracts. The consolidated financial statements presented are for BlackRock Global Allocation V.I. Fund (the “Fund”). The Fund is classified as diversified. Class I, Class II and Class III Shares have equal voting, dividend, liquidation and other rights, except that only shares of the respective classes are entitled to vote on matters concerning only that class. In addition, Class II and Class III Shares bear certain expenses related to the distribution of such shares.
The Fund, together with certain other registered investment companies advised by BlackRock Advisors, LLC (the “Manager”) or its affiliates, is included in a complex ofopen-end funds referred to as the Equity-Bond Complex.
Basis of Consolidation: The accompanying consolidated financial statements of the Fund include the accounts of BlackRock Cayman Global Allocation V.I. Fund I, Ltd. (the “Subsidiary”), which is a wholly-owned subsidiary of the Fund and primarily invests in commodity-related instruments. The Subsidiary enables the Fund to hold these commodity-related instruments and satisfy regulated investment company tax requirements. The Fund may invest up to 25% of its total assets in the Subsidiary. The net assets of the Subsidiary as of period end were $128,137,378, which is 1.4% of the Fund’s consolidated net assets. Intercompany accounts and transactions, if any, have been eliminated. The Subsidiary is subject to the same investment policies and restrictions that apply to the Fund, except that the Subsidiary may invest without limitation in commodity-related instruments.
| 2. | SIGNIFICANT ACCOUNTING POLICIES |
The consolidated financial statements are prepared in conformity with accounting principles generally accepted in the United States of America (“U.S. GAAP”), which may require management to make estimates and assumptions that affect the reported amounts of assets and liabilities in the consolidated financial statements, disclosure of contingent assets and liabilities at the date of the consolidated financial statements and the reported amounts of increases and decreases in net assets from operations during the reporting period. Actual results could differ from those estimates. The Fund is considered an investment company under U.S. GAAP and follows the accounting and reporting guidance applicable to investment companies. Below is a summary of significant accounting policies:
Investment Transactions and Income Recognition: For financial reporting purposes, investment transactions are recorded on the dates the transactions are entered into (the “trade dates”). Realized gains and losses on investment transactions are determined on the identified cost basis. Dividend income is recorded on theex-dividend date. Dividends from foreign securities where theex-dividend date may have passed are subsequently recorded when the Fund is informed of theex-dividend date. Under the applicable foreign tax laws, a withholding tax at various rates may be imposed on capital gains, dividends and interest. Interest income, including amortization and accretion of premiums and discounts on debt securities, is recognized on an accrual basis. Income, expenses and realized and unrealized gains and losses are allocated daily to each class based on its relative net assets.
Foreign Currency Translation: The Fund’s books and records are maintained in U.S. dollars. Securities and other assets and liabilities denominated in foreign currencies are translated into U.S. dollars using exchange rates determined as of the close of trading on the New York Stock Exchange (“NYSE”). Purchases and sales of investments are recorded at the rates of exchange prevailing on the respective dates of such transactions. Generally, when the U.S. dollar rises in value against a foreign currency, the investments denominated in that currency will lose value; the opposite effect occurs if the U.S. dollar falls in relative value.
The Fund does not isolate the portion of the results of operations arising as a result of changes in the exchange rates from the changes in the market prices of investments held or sold for financial reporting purposes. Accordingly, the effects of changes in exchange rates on investments are not segregated in the Consolidated Statement of Operations from the effects of changes in market prices of those investments, but are included as a component of net realized and unrealized gain (loss) from investments. The Fund reports realized currency gains (losses) on foreign currency related transactions as components of net realized gain (loss) for financial reporting purposes, whereas such components are generally treated as ordinary income for U.S. federal income tax purposes.
Segregation and Collateralization: In cases where the Fund enters into certain investments (e.g., futures contracts, forward foreign currency exchange contracts, options written, swaps and short sales) that would be treated as “senior securities” for 1940 Act purposes, the Fund may segregate or designate on its books and records cash or liquid assets having a market value at least equal to the amount of its future obligations under such investments. Doing so allows the investment to be excluded from treatment as a “senior security.” Furthermore, if required by an exchange or counterparty agreement, the Fund may be required to deliver/deposit cash and/or securities to/with an exchange, or broker-dealer or custodian as collateral for certain investments or obligations.
Distributions: Distributions paid by the Fund are recorded on theex-dividend date. Distributions of capital gains are recorded on the ex-dividend date and made at least annually. Distributions of capital gains are recorded on the ex-dividend date and made at least annually. The character and timing of distributions are determined in accordance with U.S. federal income tax regulations, which may differ from U.S. GAAP.
Net income and realized gains from investments held by the Subsidiary are treated as ordinary income for tax purposes. If a net loss is realized by the Subsidiary in any taxable year, the loss will generally not be available to offset the Fund’s ordinary income and/or capital gains for that year.
Recent Accounting Standards: In March 2017, the Financial Accounting Standards Board issued Accounting Standards Update “Premium Amortization of Purchased Callable Debt Securities”, which amends the amortization period for certain purchased callable debt securities. Under the new guidance, the premium amortization of purchased callable debt securities that have explicit,non-contingent call features and are callable at fixed prices will be amortized to the earliest call date. The guidance will be applied on a modified retrospective basis and is effective for fiscal years, and their interim periods, beginning after December 15, 2018. Management is currently evaluating the impact of this guidance to the Fund.
In August 2018, the Financial Accounting Standards Board issued Accounting Standards Update2018-13 “Changes to the Disclosure Requirements for Fair Value Measurement” which modifies disclosure requirements for fair value measurements. The guidance is effective for fiscal years beginning after December 15, 2019 and for interim periods within those fiscal years. Management is currently evaluating the impact of this guidance to the Fund.
| | | | |
| NOTESTO CONSOLIDATED FINANCIAL STATEMENTS | | | 31 | |
Notes to Consolidated Financial Statements (continued)
Indemnifications: In the normal course of business, the Fund enters into contracts that contain a variety of representations that provide general indemnification. The Fund’s maximum exposure under these arrangements is unknown because it involves future potential claims against the Fund, which cannot be predicted with any certainty.
Other: Expenses directly related to the Fund or its classes are charged to the Fund or the applicable class. Other operating expenses shared by several funds, including other funds managed by the Manager, are prorated among those funds on the basis of relative net assets or other appropriate methods. Expenses directly related to the Fund and other shared expenses prorated to the Fund are allocated daily to each class based on its relative net assets or other appropriate methods.
The Fund has an arrangement with its custodian whereby credits are earned on uninvested cash balances, which could be used to reduce custody fees and/or overdraft charges. The Fund may incur charges on certain uninvested cash balances and overdrafts, subject to certain conditions.
| 3. | INVESTMENT VALUATION AND FAIR VALUE MEASUREMENTS |
Investment Valuation Policies: The Fund’s investments are valued at fair value (also referred to as “market value” within the consolidated financial statements) as of the close of trading on the NYSE (generally 4:00 p.m., Eastern time). U.S. GAAP defines fair value as the price the Fund would receive to sell an asset or pay to transfer a liability in an orderly transaction between market participants at the measurement date. The Fund determines the fair values of its financial instruments using various independent dealers or pricing services under policies approved by the Board of Directors of the Company (the “Board”). The BlackRock Global Valuation Methodologies Committee (the “Global Valuation Committee”) is the committee formed by management to develop global pricing policies and procedures and to oversee the pricing function for all financial instruments.
Fair Value Inputs and Methodologies: The following methods and inputs are used to establish the fair value of the Fund’s assets and liabilities:
| | • | | Equity investments traded on a recognized securities exchange are valued at the official closing price each day, if available. For equity investments traded on more than one exchange, the official closing price on the exchange where the stock is primarily traded is used. Equity investments traded on a recognized exchange for which there were no sales on that day may be valued at the last available bid (long positions) or ask (short positions) price. |
| | • | | Fixed-income securities for which market quotations are readily available are generally valued using the last available bid prices or current market quotations provided by independent dealers or third party pricing services. Floating rate loan interests are valued at the mean of the bid prices from one or more independent brokers or dealers as obtained from a third party pricing service. Pricing services generally value fixed-income securities assuming orderly transactions of an institutional round lot size, but a fund may hold or transact in such securities in smaller, odd lot sizes. Odd lots may trade at lower prices than institutional round lots. The pricing services may use matrix pricing or valuation models that utilize certain inputs and assumptions to derive values, including transaction data (e.g., recent representative bids and offers), credit quality information, perceived market movements, news, and other relevant information. Certain fixed-income securities, including asset-backed and mortgage related securities may be valued based on valuation models that consider the estimated cash flows of each tranche of the entity, establish a benchmark yield and develop an estimated tranche specific spread to the benchmark yield based on the unique attributes of the tranche. The amortized cost method of valuation may be used with respect to debt obligations with sixty days or less remaining to maturity unless the Manager determines such method does not represent fair value. |
| | • | | Generally, trading in foreign instruments is substantially completed each day at various times prior to the close of trading on the NYSE. Occasionally, events affecting the values of such instruments may occur between the foreign market close and the close of trading on the NYSE that may not be reflected in the computation of the Fund’s net assets. Each business day, the Fund uses a pricing service to assist with the valuation of certain foreign exchange-traded equity securities and foreign exchange-tradedover-the-counter (“OTC”) options (the “Systematic Fair Value Price”). Using current market factors, the Systematic Fair Value Price is designed to value such foreign securities and foreign options at fair value as of the close of trading on the NYSE, which follows the close of the local markets. |
| | • | | Investments inopen-end U.S. mutual funds are valued at net asset value (“NAV”) each business day. |
| | • | | The Fund values its investment in SL Liquidity Series, LLC, Money Market Series (the “Money Market Series”) at fair value, which is ordinarily based upon its pro rata ownership in the underlying fund’s net assets. The Money Market Series seeks current income consistent with maintaining liquidity and preserving capital. Although the Money Market Series is not registered under the 1940 Act, its investments may follow the parameters of investments by a money market fund that is subject to Rule2a-7 under the 1940 Act. |
| | • | | Futures contracts traded on exchanges are valued at their last sale price. |
| | • | | Forward foreign currency exchange contracts are valued at the mean between the bid and ask prices and are determined as of the close of trading on the NYSE. Interpolated values are derived when the settlement date of the contract is an interim date for which quotations are not available. |
| | • | | Exchange-traded options are valued at the mean between the last bid and ask prices at the close of the options market in which the options trade. An exchange-traded option for which there is no mean price is valued at the last bid (long positions) or ask (short positions) price. If no bid or ask price is available, the prior day’s price will be used, unless it is determined that the prior day’s price no longer reflects the fair value of the option. OTC options and options on swaps (“swaptions”) are valued by an independent pricing service using a mathematical model, which incorporates a number of market data factors, such as the trades and prices of the underlying instruments. |
| | • | | Swap agreements are valued utilizing quotes received daily by the Fund’s pricing service or through brokers, which are derived using daily swap curves and models that incorporate a number of market data factors, such as discounted cash flows, trades and values of the underlying reference instruments. |
| | |
| 32 | | 2018 BLACKROCK ANNUAL REPORTTO SHAREHOLDERS |
Notes to Consolidated Financial Statements (continued)
If events (e.g., a company announcement, market volatility or a natural disaster) occur that are expected to materially affect the value of such investments, or in the event that the application of these methods of valuation results in a price for an investment that is deemed not to be representative of the market value of such investment, or if a price is not available, the investment will be valued by the Global Valuation Committee, or its delegate, in accordance with a policy approved by the Board as reflecting fair value (“Fair Valued Investments”). The fair valuation approaches that may be used by the Global Valuation Committee will include market approach, income approach and cost approach. Valuation techniques such as discounted cash flow, use of market comparables and matrix pricing are types of valuation approaches and are typically used in determining fair value. When determining the price for Fair Valued Investments, the Global Valuation Committee, or its delegate, seeks to determine the price that the Fund might reasonably expect to receive or pay from the current sale or purchase of that asset or liability in anarm’s-length transaction. Fair value determinations shall be based upon all available factors that the Global Valuation Committee, or its delegate, deems relevant and consistent with the principles of fair value measurement.
The Global Valuation Committee, or its delegate, employs various methods for calibrating valuation approaches for investments where an active market does not exist, including regular due diligence of the Fund’s pricing vendors, regular reviews of key inputs and assumptions, transactional back-testing or disposition analysis to compare unrealized gains and losses to realized gains and losses, reviews of missing or stale prices and large movements in market values and reviews of any market related activity. The pricing of all Fair Valued Investments is subsequently reported to the Board or a committee thereof on a quarterly basis. As a result of the inherent uncertainty in valuation of these investments, the fair values may differ from the values that would have been used had an active market existed.
For investments in equity or debt issued by privately held companies or funds (“Private Company” or collectively, the “Private Companies”) and other Fair Valued Investments, the fair valuation approaches that are used by third party pricing services utilize one or a combination of, but not limited to, the following inputs.
| | |
| | | Standard Inputs Generally Considered By Third Party Pricing Services |
Market approach | | (i) recent market transactions, including subsequent rounds of financing, in the underlying investment or comparable issuers; (ii) recapitalizations and other transactions across the capital structure; and (iii) market multiples of comparable issuers. |
Income approach | | (i) future cash flows discounted to present and adjusted as appropriate for liquidity, credit, and/or market risks; (ii) quoted prices for similar investments or assets in active markets; and (iii) other risk factors, such as interest rates, yield curves, volatilities, prepayment speeds, loss severities, credit risks, recovery rates, liquidation amounts and/or default rates. |
Cost approach | | (i) audited or unaudited financial statements, investor communications and financial or operational metrics issued by the Private Company; (ii) changes in the valuation of relevant indices or publicly traded companies comparable to the Private Company; (iii) relevant news and other public sources; and (iv) known secondary market transactions in the Private Company’s interests and merger or acquisition activity in companies comparable to the Private Company. |
Investments in series of preferred stock issued by Private Companies are typically valued utilizing market approach in determining the enterprise value of the company. Such investments often contain rights and preferences that differ from other series of preferred and common stock of the same issuer. Valuation techniques such as an option pricing model (“OPM”), a probability weighted expected return model (“PWERM”) or a hybrid of those techniques are used in allocating enterprise value of the company, as deemed appropriate under the circumstances. The use of OPM and PWERM techniques involve a determination of the exit scenarios of the investment in order to appropriately allocate the enterprise value of the company among the various parts of its capital structure.
The Private Companies are not subject to the public company disclosure, timing, and reporting standards as other investments held by the Fund. Typically, the most recently available information by a Private Company is as of a date that is earlier than the date the Fund is calculating its NAV. This factor may result in a difference between the value of the investment and the price the Fund could receive upon the sale of the investment.
Fair Value Hierarchy: Various inputs are used in determining the fair value of investments and derivative financial instruments. These inputs to valuation techniques are categorized into a fair value hierarchy consisting of three broad levels for financial statement purposes as follows:
| | • | | Level 1 — Unadjusted price quotations in active markets/exchanges for identical assets or liabilities that the Fund has the ability to access |
| | • | | Level 2 — Other observable inputs (including, but not limited to, quoted prices for similar assets or liabilities in markets that are active, quoted prices for identical or similar assets or liabilities in markets that are not active, inputs other than quoted prices that are observable for the assets or liabilities (such as interest rates, yield curves, volatilities, prepayment speeds, loss severities, credit risks and default rates) or other market–corroborated inputs) |
| | • | | Level 3 — Unobservable inputs based on the best information available in the circumstances, to the extent observable inputs are not available (including the Fund’s own assumptions used in determining the fair value of investments and derivative financial instruments) |
The hierarchy gives the highest priority to unadjusted quoted prices in active markets for identical assets or liabilities (Level 1 measurements) and the lowest priority to unobservable inputs (Level 3 measurements). Accordingly, the degree of judgment exercised in determining fair value is greatest for instruments categorized in Level 3. The inputs used to measure fair value may fall into different levels of the fair value hierarchy. In such cases, for disclosure purposes, the fair value hierarchy classification is determined based on the lowest level input that is significant to the fair value measurement in its entirety. Investments classified within Level 3 have significant unobservable inputs used by the Global Valuation Committee in determining the price for Fair Valued Investments. Level 3 investments include equity or debt issued by Private Companies. There may not be a secondary market, and/or there are a limited number of investors. Level 3 investments may also be adjusted to reflect illiquidity and/ornon-transferability, with the amount of such discount estimated by the Global Valuation Committee in the absence of market information.
Changes in valuation techniques may result in transfers into or out of an assigned level within the hierarchy. In accordance with the Fund’s policy, transfers between different levels of the fair value hierarchy are deemed to have occurred as of the beginning of the reporting period. The categorization of a value determined for investments and derivative financial instruments is based on the pricing transparency of the investments and derivative financial instruments and is not necessarily an indication of the risks associated with investing in those securities.
| | | | |
| NOTESTO CONSOLIDATED FINANCIAL STATEMENTS | | | 33 | |
Notes to Consolidated Financial Statements (continued)
As of December 31, 2018, certain investments of the Fund were valued using NAV per share as no quoted market value is available and therefore have been excluded from the fair value hierarchy.
| 4. | SECURITIES AND OTHER INVESTMENTS |
Asset-Backed and Mortgage-Backed Securities: Asset-backed securities are generally issued as pass-through certificates or as debt instruments. Asset-backed securities issued as pass-through certificates represent undivided fractional ownership interests in an underlying pool of assets. Asset-backed securities issued as debt instruments, which are also known as collateralized obligations, are typically issued as the debt of a special purpose entity organized solely for the purpose of owning such assets and issuing such debt. Asset-backed securities are often backed by a pool of assets representing the obligations of a number of different parties. The yield characteristics of certain asset-backed securities may differ from traditional debt securities. One such major difference is that all or a principal part of the obligations may be prepaid at any time because the underlying assets (i.e., loans) may be prepaid at any time. As a result, a decrease in interest rates in the market may result in increases in the level of prepayments as borrowers, particularly mortgagors, refinance and repay their loans. An increased prepayment rate with respect to an asset-backed security will have the effect of shortening the maturity of the security. In addition, a fund may subsequently have to reinvest the proceeds at lower interest rates. If a fund has purchased such an asset-backed security at a premium, a faster than anticipated prepayment rate could result in a loss of principal to the extent of the premium paid.
For mortgage pass-through securities (the “Mortgage Assets”) there are a number of important differences among the agencies and instrumentalities of the U.S. Government that issue mortgage-related securities and among the securities that they issue. For example, mortgage-related securities guaranteed by Ginnie Mae are guaranteed as to the timely payment of principal and interest by Ginnie Mae and such guarantee is backed by the full faith and credit of the United States. However, mortgage-related securities issued by Freddie Mac and Fannie Mae, including Freddie Mac and Fannie Mae guaranteed mortgage pass-through certificates, which are solely the obligations of Freddie Mac and Fannie Mae, are not backed by or entitled to the full faith and credit of the United States, but are supported by the right of the issuer to borrow from the U.S. Treasury.
Non-agency mortgage-backed securities are securities issued bynon-governmental issuers and have no direct or indirect government guarantees of payment and are subject to various risks.Non-agency mortgage loans are obligations of the borrowers thereunder only and are not typically insured or guaranteed by any other person or entity. The ability of a borrower to repay a loan is dependent upon the income or assets of the borrower. A number of factors, including a general economic downturn, acts of God, terrorism, social unrest and civil disturbances, may impair a borrower’s ability to repay its loans.
Inflation-Indexed Bonds: Inflation-indexed bonds (other than municipal inflation-indexed and certain corporate inflation-indexed bonds) are fixed- income securities whose principal value is periodically adjusted according to the rate of inflation. If the index measuring inflation rises or falls, the principal value of inflation-indexed bonds (other than municipal inflation-indexed and certain corporate inflation-indexed bonds) will be adjusted upward or downward, and consequently the interest payable on these securities (calculated with respect to a larger or smaller principal amount) will be increased or reduced, respectively. Any upward or downward adjustment in the principal amount of an inflation-indexed bond will be included as interest income in the Consolidated Statement of Operations, even though investors do not receive their principal until maturity. Repayment of the original bond principal upon maturity (as adjusted for inflation) is guaranteed in the case of U.S. Treasury inflation-indexed bonds. For bonds that do not provide a similar guarantee, the adjusted principal value of the bond repaid at maturity may be less than the original principal. With regard to municipal inflation-indexed bonds and certain corporate inflation-indexed bonds, the inflation adjustment is typically reflected in the semi-annual coupon payment. As a result, the principal value of municipal inflation-indexed bonds and such corporate inflation-indexed bonds does not adjust according to the rate of inflation.
Multiple Class Pass-Through Securities: Multiple class pass-through securities, including collateralized mortgage obligations (“CMOs”) and commercial mortgage-backed securities, may be issued by Ginnie Mae, U.S. Government agencies or instrumentalities or by trusts formed by private originators of, or investors in, mortgage loans. In general, CMOs are debt obligations of a legal entity that are collateralized by a pool of residential or commercial mortgage loans or Mortgage Assets. The payments on these are used to make payments on the CMOs or multiple pass-through securities. Multiple class pass-through securities represent direct ownership interests in the Mortgage Assets. Classes of CMOs include interest only (“IOs”), principal only (“POs”), planned amortization classes and targeted amortization classes. IOs and POs are stripped mortgage-backed securities representing interests in a pool of mortgages, the cash flow from which has been separated into interest and principal components. IOs receive the interest portion of the cash flow while POs receive the principal portion. IOs and POs can be extremely volatile in response to changes in interest rates. As interest rates rise and fall, the value of IOs tends to move in the same direction as interest rates. POs perform best when prepayments on the underlying mortgages rise since this increases the rate at which the principal is returned and the yield to maturity on the PO. When payments on mortgages underlying a PO are slower than anticipated, the life of the PO is lengthened and the yield to maturity is reduced. If the underlying Mortgage Assets experience greater than anticipated prepayments of principal, a fund’s initial investment in the IOs may not fully recoup.
Zero-Coupon Bonds: Zero-coupon bonds are normally issued at a significant discount from face value and do not provide for periodic interest payments. These bonds may experience greater volatility in market value than other debt obligations of similar maturity which provide for regular interest payments.
Capital Securities and Trust Preferred Securities: Capital securities, including trust preferred securities, are typically issued by corporations, generally in the form of interest-bearing notes with preferred securities characteristics. In the case of trust preferred securities, an affiliated business trust of a corporation issues these securities, generally in the form of beneficial interests in subordinated debentures or similarly structured securities. The securities can be structured with either a fixed or adjustable coupon that can have either a perpetual or stated maturity date. For trust preferred securities, the issuing bank or corporation pays interest to the trust, which is then distributed to holders of these securities as a dividend. Dividends can be deferred without creating an event of default or acceleration, although maturity cannot take place unless all cumulative payment obligations have been met. The deferral of payments does not affect the purchase or sale of these securities in the open market. These securities generally are rated below that of the issuing company’s senior debt securities and are freely callable at the issuer’s option.
Preferred Stocks: Preferred stock has a preference over common stock in liquidation (and generally in receiving dividends as well) but is subordinated to the liabilities of the issuer in all respects. As a general rule, the market value of preferred stock with a fixed dividend rate and no conversion element varies inversely with interest rates and perceived credit risk, while the market price of convertible preferred stock generally also reflects some element of conversion value. Because preferred stock is junior
| | |
| 34 | | 2018 BLACKROCK ANNUAL REPORTTO SHAREHOLDERS |
Notes to Consolidated Financial Statements (continued)
to debt securities and other obligations of the issuer, deterioration in the credit quality of the issuer will cause greater changes in the value of a preferred stock than in a more senior debt security with similar stated yield characteristics. Unlike interest payments on debt securities, preferred stock dividends are payable only if declared by the issuer’s board of directors. Preferred stock also may be subject to optional or mandatory redemption provisions.
Floating Rate Loan Interests: Floating rate loan interests are typically issued to companies (the “borrower”) by banks, other financial institutions, or privately and publicly offered corporations (the “lender”). Floating rate loan interests are generallynon-investment grade, often involve borrowers whose financial condition is troubled or uncertain and companies that are highly leveraged or in bankruptcy proceedings. In addition, transactions in floating rate loan interests may settle on a delayed basis, which may result in proceeds from the sale not being readily available for a fund to make additional investments or meet its redemption obligations. Floating rate loan interests may include fully funded term loans or revolving lines of credit. Floating rate loan interests are typically senior in the corporate capital structure of the borrower. Floating rate loan interests generally pay interest at rates that are periodically determined by reference to a base lending rate plus a premium. Since the rates reset only periodically, changes in prevailing interest rates (and particularly sudden and significant changes) can be expected to cause some fluctuations in the NAV of a fund to the extent that it invests in floating rate loan interests. The base lending rates are generally the lending rate offered by one or more European banks, such as the London Interbank Offered Rate (“LIBOR”), the prime rate offered by one or more U.S. banks or the certificate of deposit rate. Floating rate loan interests may involve foreign borrowers, and investments may be denominated in foreign currencies. These investments are treated as investments in debt securities for purposes of a fund’s investment policies.
When a fund purchases a floating rate loan interest, it may receive a facility fee and when it sells a floating rate loan interest, it may pay a facility fee. On an ongoing basis, a fund may receive a commitment fee based on the undrawn portion of the underlying line of credit amount of a floating rate loan interest. Facility and commitment fees are typically amortized to income over the term of the loan or term of the commitment, respectively. Consent and amendment fees are recorded to income as earned. Prepayment penalty fees, which may be received by a fund upon the prepayment of a floating rate loan interest by a borrower, are recorded as realized gains. A fund may invest in multiple series or tranches of a loan. A different series or tranche may have varying terms and carry different associated risks.
Floating rate loan interests are usually freely callable at the borrower’s option. A fund may invest in such loans in the form of participations in loans (“Participations”) or assignments (“Assignments”) of all or a portion of loans from third parties. Participations typically will result in a fund having a contractual relationship only with the lender, not with the borrower. A fund has the right to receive payments of principal, interest and any fees to which it is entitled only from the lender selling the Participation and only upon receipt by the lender of the payments from the borrower. In connection with purchasing Participations, a fund generally will have no right to enforce compliance by the borrower with the terms of the loan agreement, nor any rights of offset against the borrower. A fund may not benefit directly from any collateral supporting the loan in which it has purchased the Participation. As a result, a fund assumes the credit risk of both the borrower and the lender that is selling the Participation. A fund’s investment in loan participation interests involves the risk of insolvency of the financial intermediaries who are parties to the transactions. In the event of the insolvency of the lender selling the Participation, a fund may be treated as a general creditor of the lender and may not benefit from any offset between the lender and the borrower. Assignments typically result in a fund having a direct contractual relationship with the borrower, and a fund may enforce compliance by the borrower with the terms of the loan agreement.
Short Sale Transactions: In short sale transactions, a fund sells a security it does not hold in anticipation of a decline in the market price of that security. When a fund makes a short sale, it will borrow the security sold short from a broker/counterparty and deliver the security to the purchaser. To close out a short position, a fund delivers the same security to the broker and records a liability to reflect the obligation to return the security to the broker. The amount of the liability is subsequentlymarked-to-market to reflect the market value of the short sale. A fund maintains a segregated account of securities or deposits cash with the broker-dealer as collateral for the short sales. Cash deposited with the broker is recorded as an asset in the Consolidated Statement of Assets and Liabilities. Securities segregated as collateral are denoted in the Consolidated Schedule of Investments. A fund may pay a financing fee for the difference between the market value of the short position and the cash collateral deposited with the broker which would be recorded as interest expense. A fund is required to repay the counterparty any dividends received on the security sold short, which, if applicable, is shown as dividend expense in the Consolidated Statement of Operations. A fund may pay a fee on the assets borrowed from the counterparty, which, if applicable, is shown as broker fees and expenses on short sales in the Consolidated Statement of Operations. A fund is exposed to market risk based on the amount, if any, that the market value of the security increases beyond the market value at which the position was sold. Thus, a short sale of a security involves the risk that instead of declining, the price of the security sold short will rise. The short sale of securities involves the possibility of an unlimited loss since there is an unlimited potential for the market price of the security sold short to increase. A gain is limited to the price at which a fund sold the security short. A realized gain or loss is recognized upon the termination of a short sale if the market price is either less than or greater than the proceeds originally received. There is no assurance that a fund will be able to close out a short position at a particular time or at an acceptable price.
Securities Lending: The Fund may lend its securities to approved borrowers, such as brokers, dealers and other financial institutions. The borrower pledges and maintains with the Fund collateral consisting of cash, an irrevocable letter of credit issued by a bank, or securities issued or guaranteed by the U.S. Government. The initial collateral received by the Fund is required to have a value of at least 102% of the current value of the loaned securities for securities traded on U.S. exchanges and a value of at least 105% for all other securities. The collateral is maintained thereafter at a value equal to at least 100% of the current market value of the securities on loan. The market value of the loaned securities is determined at the close of each business day of the Fund and any additional required collateral is delivered to the Fund, or excess collateral returned by the Fund, on the next business day. During the term of the loan, the Fund is entitled to all distributions made on or in respect of the loaned securities, but does not receive interest income on securities received as collateral. Loans of securities are terminable at any time and the borrower, after notice, is required to return borrowed securities within the standard time period for settlement of securities transactions.
The market value of any securities on loan, all of which were classified as common or preferred stocks in the Fund’s Consolidated Schedule of Investments, and the value of any related collateral are shown separately in the Consolidated Statement of Assets and Liabilities as a component of investments at value — unaffiliated, and collateral on securities loaned at value, respectively. As of period end, any securities on loan were collateralized by cash and/or U.S. Government obligations. Cash collateral invested by the securities lending agent, BlackRock Investment Management, LLC (“BIM”), if any, is disclosed in the Consolidated Schedule of Investments.
Securities lending transactions are entered into by the Fund under Master Securities Lending Agreements (each, an “MSLA”), which provide the right, in the event of default (including bankruptcy or insolvency), for thenon-defaulting party to liquidate the collateral and calculate a net exposure to the defaulting party or request additional
| | | | |
| NOTESTO CONSOLIDATED FINANCIAL STATEMENTS | | | 35 | |
Notes to Consolidated Financial Statements (continued)
collateral. In the event that a borrower defaults, the Fund, as lender, would offset the market value of the collateral received against the market value of the securities loaned. When the value of the collateral is greater than that of the market value of the securities loaned, the lender is left with a net amount payable to the defaulting party. However, bankruptcy or insolvency laws of a particular jurisdiction may impose restrictions on or prohibitions against such a right of offset in the event of an MSLA counterparty’s bankruptcy or insolvency. Under the MSLA, absent an event of default, the borrower can resell orre-pledge the loaned securities, and the Fund can reinvest cash collateral received in connection with loaned securities. Upon an event of default, the parties’ obligations to return the securities or collateral to the other party are extinguished, and the parties can resell orre-pledge the loaned securities or the collateral received in connection with the loaned securities in order to satisfy the defaulting party’s net payment obligation for all transactions under the MSLA. The defaulting party remains liable for any deficiency.
As of period end, the following table is a summary of the Fund’s securities lending agreements by counterparty which are subject to offset under an MSLA:
| | | | | | | | | | | | |
| Counterparty | | Securities
Loaned at Value | | | Cash Collateral
Received (a) | | | Net
Amount (b) | |
Citigroup Global Markets Inc. | | $ | 15,461,491 | | | $ | (15,461,491 | ) | | $ | — | |
Credit Suisse Securities (USA) LLC | | | 43,500,825 | | | | (43,500,825 | ) | | | — | |
Deutsche Bank Securities Inc. | | | 320,485 | | | | (320,485 | ) | | | — | |
Goldman Sachs & Co. | | | 3,582,871 | | | | (3,582,871 | ) | | | — | |
JP Morgan Securities LLC | | | 88,387,709 | | | | (88,387,709 | ) | | | — | |
Merrill Lynch, Pierce, Fenner & Smith | | | 8,243,881 | | | | (8,124,662 | ) | | | 119,219 | |
Morgan Stanley & Co. LLC | | | 24,607,058 | | | | (24,607,058 | ) | | | — | |
Nomura Securities International Inc. | | | 18,667,251 | | | | (18,667,251 | ) | | | — | |
State Street Bank & Trust Co. | | | 929,753 | | | | (929,753 | ) | | | — | |
UBS Securities LLC | | | 1,757,950 | | | | (1,757,950 | ) | | | — | |
| | | | | | | | | | | | |
| | $ | 205,459,274 | | | $ | (205,340,055 | ) | | $ | 119,219 | |
| | | | | | | | | | | | |
| | (a) | Cash collateral with a value of $209,469,852 has been received in connection with securities lending agreements. Collateral received in excess of the value of securities loaned from the individual counterparty, if any, is not shown for financial reporting purposes in the table above. | |
| | (b) | The market value of the loaned securities is determined as of December 31, 2018. Additional collateral is delivered to the Fund on the next business day in accordance with the MSLA. The net amount would be subject to the borrower default indemnity in the event of default by the counterparty. | |
The risks of securities lending include the risk that the borrower may not provide additional collateral when required or may not return the securities when due. To mitigate these risks, the Fund benefits from a borrower default indemnity provided by BIM. BIM’s indemnity allows for full replacement of the securities loaned if the collateral received does not cover the value on the securities loaned in the event of borrower default. The Fund could incur a loss if the value of an investment purchased with cash collateral falls below the market value of loaned securities or if the value of an investment purchased with cash collateral falls below the value of the original cash collateral received.
| 5. | DERIVATIVE FINANCIAL INSTRUMENTS |
The Fund engages in various portfolio investment strategies using derivative contracts both to increase the returns of the Fund and/or to manage its exposure to certain risks such as credit risk, equity risk, interest rate risk, foreign currency exchange rate risk, commodity price risk or other risks (e.g. inflation risk). Derivative financial instruments categorized by risk exposure are included in the Consolidated Schedule of Investments. These contracts may be transacted on an exchange or OTC.
Futures Contracts: Futures contracts are purchased or sold to gain exposure to, or manage exposure to, changes in interest rates (interest rate risk) and changes in the value of equity securities (equity risk) or foreign currencies (foreign currency exchange rate risk).
Futures contracts are agreements between the Fund and a counterparty to buy or sell a specific quantity of an underlying instrument at a specified price and on a specified date. Depending on the terms of a contract, it is settled either through physical delivery of the underlying instrument on the settlement date or by payment of a cash amount on the settlement date. Upon entering into a futures contract, the Fund is required to deposit initial margin with the broker in the form of cash or securities in an amount that varies depending on a contract’s size and risk profile. The initial margin deposit must then be maintained at an established level over the life of the contract. Amounts pledged, which are considered restricted, are included in cash pledged for futures contracts on the Consolidated Statement of Assets and Liabilities.
Securities deposited as initial margin are designated in the Consolidated Schedule of Investments and cash deposited, if any, are shown as cash pledged for futures contracts in the Consolidated Statement of Assets and Liabilities. Pursuant to the contract, the Fund agrees to receive from or pay to the broker an amount of cash equal to the daily fluctuation in market value of the contract (“variation margin”). Variation margin is recorded as unrealized appreciation (depreciation) and, if any, shown as variation margin receivable (or payable) on futures contracts in the Consolidated Statement of Assets and Liabilities. When the contract is closed, a realized gain or loss is recorded in the Consolidated Statement of Operations equal to the difference between the notional amount of the contract at the time it was opened and the notional amount at the time it was closed. The use of futures contracts involves the risk of an imperfect correlation in the movements in the price of futures contracts and interest, foreign currency exchange rates or underlying assets.
Forward Foreign Currency Exchange Contracts: Forward foreign currency exchange contracts are entered into to gain or reduce exposure to foreign currencies (foreign currency exchange rate risk).
A forward foreign currency exchange contract is an agreement between two parties to buy and sell a currency at a set exchange rate on a specified date. These contracts help to manage the overall exposure to the currencies in which some of the investments held by the Fund are denominated and in some cases, may be used to obtain exposure to a particular market.
| | |
| 36 | | 2018 BLACKROCK ANNUAL REPORTTO SHAREHOLDERS |
Notes to Consolidated Financial Statements (continued)
The contract ismarked-to-market daily and the change in market value is recorded as unrealized appreciation (depreciation) in the Consolidated Statement of Assets and Liabilities. When a contract is closed, a realized gain or loss is recorded in the Consolidated Statement of Operations equal to the difference between the value at the time it was opened and the value at the time it was closed.Non-deliverable forward foreign currency exchange contracts are settled with the counterparty in cash without the delivery of foreign currency. The use of forward foreign currency exchange contracts involves the risk that the value of a forward foreign currency exchange contract changes unfavorably due to movements in the value of the referenced foreign currencies. Cash amounts pledged for forward foreign currency exchange contracts are considered restricted and are included in cash pledged as collateral for OTC derivatives on the Consolidated Statement of Assets and Liabilities.
Options: The Fund purchases and writes call and put options to increase or decrease its exposure to the risks of underlying instruments, including equity risk, interest rate risk and/or commodity price risk and/or, in the case of options written, to generate gains from options premiums.
A call option gives the purchaser (holder) of the option the right (but not the obligation) to buy, and obligates the seller (writer) to sell (when the option is exercised) the underlying instrument at the exercise or strike price at any time or at a specified time during the option period. A put option gives the holder the right to sell and obligates the writer to buy the underlying instrument at the exercise or strike price at any time or at a specified time during the option period.
Premiums paid on options purchased and premiums received on options written, as well as the daily fluctuation in market value, are included in investments at value — unaffiliated and options written at value, respectively, in the Consolidated Statement of Assets and Liabilities. When an instrument is purchased or sold through the exercise of an option, the premium is offset against the cost or proceeds of the underlying instrument. When an option expires, a realized gain or loss is recorded in the Consolidated Statement of Operations to the extent of the premiums received or paid. When an option is closed or sold, a gain or loss is recorded in the Consolidated Statement of Operations to the extent the cost of the closing transaction exceeds the premiums received or paid. When the Fund writes a call option, such option is typically “covered,” meaning that it holds the underlying instrument subject to being called by the option counterparty. When the Fund writes a put option, such option is covered by cash in an amount sufficient to cover the obligation. These amounts, which are considered restricted, are included in cash pledged as collateral for options written on the Consolidated Statement of Assets and Liabilities.
| | • | | Swaptions — The Fund purchases and writes options on swaps (“swaptions”) primarily to preserve a return or spread on a particular investment or portion of the Fund’s holdings, as a duration management technique or to protect against an increase in the price of securities it anticipates purchasing at a later date. The purchaser and writer of a swaption is buying or granting the right to enter into a previously agreed upon interest rate or credit default swap agreement (interest rate risk and/or credit risk) at any time before the expiration of the option. |
| | • | | Foreign currency options — The Fund purchases and writes foreign currency options, foreign currency futures and options on foreign currency futures to gain or reduce exposure to foreign currencies (foreign currency exchange rate risk). Foreign currency options give the purchaser the right to buy from or sell to the writer a foreign currency at any time before the expiration of the option. |
In purchasing and writing options, the Fund bears the risk of an unfavorable change in the value of the underlying instrument or the risk that it may not be able to enter into a closing transaction due to an illiquid market. Exercise of a written option could result in the Fund purchasing or selling a security when it otherwise would not, or at a price different from the current market value.
Swaps: Swap contracts are entered into to manage exposure to issuers, markets and securities. Such contracts are agreements between the Fund and a counterparty to make periodic net payments on a specified notional amount or a net payment upon termination. Swap agreements are privately negotiated in the OTC market and may be entered into as a bilateral contract (“OTC swaps”) or centrally cleared (“centrally cleared swaps”).
For OTC swaps, any upfront premiums paid and any upfront fees received are shown as swap premiums paid and swap premiums received, respectively, in the Consolidated Statement of Assets and Liabilities and amortized over the term of the contract. The daily fluctuation in market value is recorded as unrealized appreciation (depreciation) on OTC Swaps in the Consolidated Statement of Assets and Liabilities. Payments received or paid are recorded in the Consolidated Statement of Operations as realized gains or losses, respectively. When an OTC swap is terminated, a realized gain or loss is recorded in the Consolidated Statement of Operations equal to the difference between the proceeds from (or cost of) the closing transaction and the Fund’s basis in the contract, if any. Generally, the basis of the contract is the premium received or paid.
In a centrally cleared swap, immediately following execution of the swap contract, the swap contract is novated to a central counterparty (the “CCP”) and the Fund’s counterparty on the swap agreement becomes the CCP. The Fund is required to interface with the CCP through the broker. Upon entering into a centrally cleared swap, the Fund is required to deposit initial margin with the broker in the form of cash or securities in an amount that varies depending on the size and risk profile of the particular swap. Securities deposited as initial margin are designated in the Consolidated Schedule of Investments and cash deposited is shown as cash pledged for centrally cleared swaps in the Consolidated Statement of Assets and Liabilities. Amounts pledged, which are considered restricted cash, are included in cash pledged for centrally cleared swaps on the Consolidated Statement of Assets and Liabilities. Pursuant to the contract, the Fund agrees to receive from or pay to the broker an amount of cash equal to the daily fluctuation in market value of the contract (“variation margin”). Variation margin is recorded as unrealized appreciation (depreciation) and shown as variation margin receivable (or payable) on centrally cleared swaps in the Consolidated Statement of Assets and Liabilities. Payments received from (paid to) the counterparty, including at termination, are recorded as realized gains (losses) in the Consolidated Statement of Operations.
| | • | | Credit default swaps — Credit default swaps are entered into to manage exposure to the market or certain sectors of the market, to reduce its risk exposure to defaults of corporate and/or sovereign issuers or to create exposure to corporate and/or sovereign issuers to which a fund is not otherwise exposed (credit risk). |
The Fund may either buy or sell (write) credit default swaps on single-name issuers (corporate or sovereign), a combination or basket of single-name issuers or traded indexes. Credit default swaps are agreements in which the protection buyer pays fixed periodic payments to the seller in consideration for a promise from the protection seller to make a specific payment should a negative credit event take place with respect to the referenced entity (e.g., bankruptcy, failure to pay, obligation acceleration, repudiation, moratorium or restructuring). As a buyer, if an underlying credit event occurs, the Fund will either (i) receive from the seller an amount equal to the notional amount of the swap and deliver the referenced security or underlying securities comprising the index, or (ii) receive a net settlement of
| | | | |
| NOTESTO CONSOLIDATED FINANCIAL STATEMENTS | | | 37 | |
Notes to Consolidated Financial Statements (continued)
cash equal to the notional amount of the swap less the recovery value of the security or underlying securities comprising the index. As a seller (writer), if an underlying credit event occurs, the Fund will either pay the buyer an amount equal to the notional amount of the swap and take delivery of the referenced security or underlying securities comprising the index or pay a net settlement of cash equal to the notional amount of the swap less the recovery value of the security or underlying securities comprising the index.
| | • | | Total return swaps — Total return swaps are entered into to obtain exposure to a security or market without owning such security or investing directly in such market or to exchange the risk/return of one market (e.g., fixed-income) with another market (e.g., equity or commodity prices) (equity risk, commodity price risk and/or interest rate risk). |
Total return swaps are agreements in which there is an exchange of cash flows whereby one party commits to make payments based on the total return (distributions plus capital gains/losses) of an underlying instrument in exchange for fixed or floating rate interest payments. If the total return of the instrument or index underlying the transaction exceeds or falls short of the offsetting fixed or floating interest rate obligation, the Fund receives payment from or makes a payment to the counterparty.
| | • | | Interest rate swaps — Interest rate swaps are entered into to gain or reduce exposure to interest rates or to manage duration, the yield curve or interest rate (interest rate risk). |
Interest rate swaps are agreements in which one party pays a stream of interest payments, either fixed or floating, in exchange for another party’s stream of interest payments, either fixed or floating, on the same notional amount for a specified period of time. In more complex interest rate swaps, the notional principal amount may decline (or amortize) over time.
| | • | | Forward swaps — The Fund enters into forward interest rate swaps and forward total return swaps. In a forward swap, the Fund and the counterparty agree to make periodic net payments beginning on a specified date or a net payment at termination. |
Swap transactions involve, to varying degrees, elements of interest rate, credit and market risk in excess of the amounts recognized in the Consolidated Statement of Assets and Liabilities. Such risks involve the possibility that there will be no liquid market for these agreements, that the counterparty to the agreements may default on its obligation to perform or disagree as to the meaning of the contractual terms in the agreements, and that there may be unfavorable changes in interest rates and/or market values associated with these transactions.
Master Netting Arrangements: In order to define its contractual rights and to secure rights that will help it mitigate its counterparty risk, the Fund may enter into an International Swaps and Derivatives Association, Inc. Master Agreement (“ISDA Master Agreement”) or similar agreement with its counterparties. An ISDA Master Agreement is a bilateral agreement between the Fund and a counterparty that governs certain OTC derivatives and typically contains, among other things, collateral posting terms and netting provisions in the event of a default and/or termination event. Under an ISDA Master Agreement, the Fund may, under certain circumstances, offset with the counterparty certain derivative financial instruments’ payables and/or receivables with collateral held and/or posted and create one single net payment. The provisions of the ISDA Master Agreement typically permit a single net payment in the event of default including the bankruptcy or insolvency of the counterparty. Bankruptcy or insolvency laws of a particular jurisdiction may restrict or prohibit the right of offset in bankruptcy, insolvency or other events.
Collateral Requirements: For derivatives traded under an ISDA Master Agreement, the collateral requirements are typically calculated by netting themark-to-market amount for each transaction under such agreement and comparing that amount to the value of any collateral currently pledged by the Fund and the counterparty.
Cash collateral that has been pledged to cover obligations of the Fund and cash collateral received from the counterparty, if any, is reported separately on the Consolidated Statement of Assets and Liabilities as cash pledged as collateral and cash received as collateral, respectively.Non-cash collateral pledged by the Fund, if any, is noted in the Consolidated Schedule of Investments. Generally, the amount of collateral due from or to a counterparty is subject to a certain minimum transfer amount threshold before a transfer is required, which is determined at the close of business of the Fund. Any additional required collateral is delivered to/pledged by the Fund on the next business day. Typically, the counterparty is not permitted to sell,re-pledge or use cash andnon-cash collateral it receives. The Fund generally agrees not to usenon-cash collateral that it receives but may, absent default or certain other circumstances defined in the underlying ISDA Master Agreement, be permitted to use cash collateral received. In such cases, interest may be paid pursuant to the collateral arrangement with the counterparty. To the extent amounts due to the Fund from its counterparties are not fully collateralized, it bears the risk of loss from counterpartynon-performance. Likewise, to the extent the Fund has delivered collateral to a counterparty and stands ready to perform under the terms of its agreement with such counterparty, it bears the risk of loss from a counterparty in the amount of the value of the collateral in the event the counterparty fails to return such collateral. Based on the terms of agreements, collateral may not be required for all derivative contracts.
For financial reporting purposes, the Fund does not offset derivative assets and derivative liabilities that are subject to netting arrangements, if any, in the Consolidated Statement of Assets and Liabilities.
| 6. | INVESTMENT ADVISORY AGREEMENT AND OTHER TRANSACTIONS WITH AFFILIATES |
Investment Advisory: The Company, on behalf of the Fund, entered into an Investment Advisory Agreement with the Manager, the Fund’s investment adviser and an indirect, wholly-owned subsidiary of BlackRock, to provide investment advisory and administrative services. The Manager is responsible for the management of the Fund’s portfolio and provides the personnel, facilities, equipment and certain other services necessary to the operations of the Fund.
| | |
| 38 | | 2018 BLACKROCK ANNUAL REPORTTO SHAREHOLDERS |
Notes to Consolidated Financial Statements (continued)
For such services, the Fund pays the Manager a monthly fee at an annual rate equal to the following percentages of the average daily value of the Fund’s net assets:
| | | | |
| Average Daily Net Assets | | Investment
Advisory Fees | |
First $6 Billion | | | 0.65 | % |
$6 Billion — $8 Billion | | | 0.61 | |
$8 Billion — $10 Billion | | | 0.59 | |
$10 Billion — $15 Billion | | | 0.57 | |
Greater than $15 Billion | | | 0.55 | |
The Manager provides investment management and other services to the Subsidiary. The Manager does not receive separate compensation from the Subsidiary for providing investment management or administrative services. However, the Fund pays the Manager based on the Fund’s net assets, which includes the assets of the Subsidiary.
Distribution Fees: The Company, on behalf of the Fund, entered into a Distribution Agreement and a Distribution Plan with BlackRock Investments, LLC (“BRIL”), an affiliate of the Manager. Pursuant to the Distribution Plan and in accordance with Rule12b-1 under the 1940 Act, the Fund pays BRIL ongoing distribution fees. The fees are accrued daily and paid monthly at annual rates based upon the average daily net assets of the relevant share class of the Fund as follows:
| | | | | | | | |
| | | Class II | | | Class III | |
Distribution Fees | | | 0.15 | % | | | 0.25 | % |
BRIL and broker-dealers, pursuant tosub-agreements with BRIL, provide shareholder servicing and distribution services to the Fund. The ongoing service and/or distribution fee compensates BRIL and each broker-dealer for providing shareholder servicing and/or distribution related services to shareholders.
For the year ended December 31, 2018, the following table shows the class specific distribution fees borne directly by each share class of the Fund:
| | | | | | | | | | | | |
| | | Class II | | | Class III | | | Total | |
Distribution Fees | | $ | 366,653 | | | $ | 19,191,506 | | | $ | 19,558,159 | |
Transfer Agent: On behalf of the Fund, the Manager entered into agreements with insurance companies and other financial intermediaries (“Service Organizations”), some of which may be affiliates. Pursuant to these agreements, the Service Organizations provide the Fund with administrative, networking, recordkeeping,sub-transfer agency and shareholder services tosub-accounts they service. For these services, the Service Organizations receive an annual fee per shareholder account, which will vary depending on share class and/or net assets of Fund shareholders serviced by the Service Organizations which is shown as transfer agent – class specific. For the year ended December 31, 2018, the Fund did not pay any amounts to affiliates in return for these services.
In addition, the Fund pays the transfer agent, which is not an affiliate, a fee for the issuance, transfer and redemption of shares and the opening and maintenance of shareholder accounts, which is included in transfer agent in the Consolidated Statement of Operations.
For the year ended December 31, 2018, the following table shows the class specific transfer agent fees borne directly by each share class of the Fund:
| | | | | | | | | | |
| Class I | | | Class II | | Class III | | Total | |
| $ | 1,742,824 | | | $520,894 | | $16,261,937 | | | $18,525,655 | |
Expense Limitations, Waivers and Reimbursements: With respect to the Fund, the Manager voluntarily agreed to waive its investment advisory fees by the amount of investment advisory fees the Fund pays to the Manager indirectly through its investment in affiliated money market funds (the “affiliated money market fund waiver”). The amount of waivers and/or reimbursements of fees and expenses made pursuant to the expense limitation described below will be reduced by the amount of the affiliated money market fund waiver. This amount is included in fees waived and/or reimbursed by the Manager in the Consolidated Statement of Operations. For the year ended December 31, 2018, the amount waived was $7,767.
The Manager has contractually agreed to waive its investment advisory fee with respect to any portion of the Fund’s assets invested in affiliated equity and fixed-income mutual funds and affiliated exchange-traded funds that have a contractual management fee through April 30, 2019. The contractual agreement may be terminated upon 90 days’ notice by a majority of the directors who are not “interested persons” of the Fund, as defined in the 1940 Act (“Independent Directors”), or by a vote of a majority of the outstanding voting securities of the Fund. This amount is included in fees waived and/or reimbursed by the Manager in the Consolidated Statement of Operations. For the year ended December 31, 2018, the Fund waived $417,293 in investment advisory fees pursuant to this arrangement.
For the year ended December 31, 2018, the Fund reimbursed the Manager $107,664 for certain accounting services, which is included in accounting services in the Consolidated Statement of Operations.
The Manager has contractually agreed to reimburse transfer agent fees in order to limit such expenses to a percentage of average daily net assets as follows:
| | | | |
Class I | | | 0.07 | % |
Class II | | | 0.07 | |
Class III | | | 0.07 | |
The Manager has agreed not to reduce or discontinue this contractual expense limitation through April 30, 2019, unless approved by the Board, including a majority of the Independent Directors, or by a vote of a majority of the outstanding voting securities of the Fund.
| | | | |
| NOTESTO CONSOLIDATED FINANCIAL STATEMENTS | | | 39 | |
Notes to Consolidated Financial Statements (continued)
These amounts waived and/or reimbursed are shown as transfer agent fees waived and/or reimbursed — class specific in the Consolidated Statement of Operations. For the year ended December 31, 2018, class specific expense waivers and/or reimbursements are as follows:
| | | | | | | | | | | | | | | | |
| | | Class I | | | Class II | | | Class III | | | Total | |
Transfer Agent Fees Waived and/or Reimbursed | | $ | 152,036 | | | $ | 349,849 | | | $ | 10,890,776 | | | $ | 11,392,661 | |
With respect to the Fund, the Manager contractually agreed to waive and/or reimburse fees or expenses in order to limit expenses, excluding interest expense, dividend expense, tax expense, acquired fund fees and expenses, and certain other fund expenses, which constitute extraordinary expenses not incurred in the ordinary course of the Fund’s business (“expense limitation”). The expense limitations as a percentage of average daily net assets are as follows:
| | | | | | | | | | | | | | |
| Class I | | | | | Class II | | | | | Class III | |
| | 1.25% | | | | | | 1.40% | | | | | | 1.50% | |
The Manager has agreed not to reduce or discontinue this contractual expense limitation through April 30, 2019, unless approved by the Board, including a majority of the Independent Directors, or by a vote of a majority of the outstanding voting securities of the Fund. For the year ended December 31, 2018, there were no fees waived and/or reimbursed by the Manager.
Securities Lending: The U.S. Securities and Exchange Commission (“SEC”) has issued an exemptive order which permits BIM, an affiliate of the Manager, to serve as securities lending agent for the Fund, subject to applicable conditions. As securities lending agent, BIM bears all operational costs directly related to securities lending. The Fund is responsible for expenses in connection with the investment of cash collateral received for securities on loan (the “collateral investment expenses”). The cash collateral is invested in a private investment company managed by the Manager or its affiliates. However, BIM has agreed to cap the collateral investment expenses of the private investment company to an annual rate of 0.04%. The investment adviser to the private investment company will not charge any advisory fees with respect to shares purchased by the Fund. The private investment company in which the cash collateral has been invested may, under certain circumstances, impose a liquidity fee of up to 2% of the value withdrawn or temporarily restrict withdrawals for up to 10 business days during a 90 day period, in the event that the private investment company’s weekly liquid assets fall below certain thresholds.
Securities lending income is equal to the total of income earned from the reinvestment of cash collateral, net of fees and other payments to and from borrowers of securities, and less the collateral investment expenses. The Fund retains a portion of securities lending income and remits a remaining portion to BIM as compensation for its services as securities lending agent.
Pursuant to a securities lending agreement, the Fund retains 80% of securities lending income, and this amount retained can never be less than 70% of the total of securities lending income plus the collateral investment expenses.
In addition, commencing the business day following the date that the aggregate securities lending income earned across the Equity-Bond Complex in a calendar year exceeds a specified threshold, the Fund, pursuant to the securities lending agreement, will retain for the remainder of that calendar year securities lending income in an amount equal to 85% of securities lending income, and this amount retained can never be less than 70% of the total of securities lending income plus the collateral investment expenses.
The share of securities lending income earned by the Fund is shown as securities lending income — affiliated — net in the Consolidated Statement of Operations. For the year ended December 31, 2018, the Fund paid BIM $245,137 for securities lending agent services.
Interfund Lending: In accordance with an exemptive order (the “Order”) from the SEC, the Fund may participate in a joint lending and borrowing facility for temporary purposes (the “Interfund Lending Program”), subject to compliance with the terms and conditions of the Order, and to the extent permitted by the Fund’s investment policies and restrictions. The Fund is currently permitted to borrow under the Interfund Lending Program.
A lending BlackRock fund may lend in aggregate up to 15% of its net assets, but may not lend more than 5% of its net assets to any one borrowing fund through the Interfund Lending Program. A borrowing BlackRock fund may not borrow through the Interfund Lending Program or from any other source more than 33 1/3% of its total assets (or any lower threshold provided for by the fund’s investment restrictions). If a borrowing BlackRock fund’s total outstanding borrowings exceed 10% of its total assets, each of its outstanding interfund loans will be subject to collateralization of at least 102% of the outstanding principal value of the loan. All interfund loans are for temporary or emergency purposes and the interest rate to be charged will be the average of the highest current overnight repurchase agreement rate available to a lending fund and the bank loan rate, as calculated according to a formula established by the Board.
During the year ended December 31, 2018, the Fund did not participate in the Interfund Lending Program.
Directors and Officers: Certain directors and/or officers of the Company are directors and/or officers of BlackRock or its affiliates. The Fund reimburses the Manager for a portion of the compensation paid to the Company’s Chief Compliance Officer, which is included in Directors and Officer in the Consolidated Statement of Operations.
Other Transactions: The Fund may purchase securities from, or sell securities to, an affiliated fund provided the affiliation is due solely to having a common investment adviser, common officers, or common directors. For the year ended December 31, 2018, the purchase and sale transactions and any net realized gains (losses) with affiliated funds in compliance with Rule17a-7 under the 1940 Act were as follows:
| | | | |
Purchases | | $ | 3,428,103 | |
Sales | | | 8,896,743 | |
Net Realized Gain | | | 227,062 | |
| | |
| 40 | | 2018 BLACKROCK ANNUAL REPORTTO SHAREHOLDERS |
Notes to Consolidated Financial Statements (continued)
For the year ended December 31, 2018, purchases and sales of investments, including paydowns and excluding short-term securities, were as follows:
| | | | | | | | |
| | | Purchases | | | Sales | |
Non-U.S. Government Securities | | $ | 4,626,472,232 | | | $ | 5,708,553,584 | |
U.S. Government Securities | | | 8,744,460,876 | | | | 8,298,293,914 | |
It is the Fund’s policy to comply with the requirements of the Internal Revenue Code of 1986, as amended, applicable to regulated investment companies, and to distribute substantially all of its taxable income to its shareholders. Therefore, no U.S. federal income tax provision is required.
The Fund files U.S. federal and various state and local tax returns. No income tax returns are currently under examination. The statute of limitations on the Fund’s U.S. federal tax returns generally remains open for each of the four years ended December 31, 2018. The statutes of limitations on the Fund’s state and local tax returns may remain open for an additional year depending upon the jurisdiction.
Management has analyzed tax laws and regulations and their application to the Fund as of December 31, 2018, inclusive of the open tax return years, and does not believe that there are any uncertain tax positions that require recognition of a tax liability in the Fund’s financial statements.
U.S. GAAP requires that certain components of net assets be adjusted to reflect permanent differences between financial and tax reporting. These reclassifications have no effect on net assets or net asset values per share. As of period end, the following permanent difference was attributable to the characterization of expenses and income recognized from a wholly owned subsidiary were reclassified to the following accounts:
| | | | |
Paid-in capital | | $ | (12,703,801 | ) |
Accumulated loss | | $ | 12,703,801 | |
The tax character of distributions paid was as follows:
| | | | | | | | |
| | | 12/31/2018 | | | 12/31/2017 | |
Ordinary income | | $ | 91,433,239 | | | $ | 237,849,708 | |
Long-term capital gains | | | 409,734,085 | | | | 17,464,647 | |
| | | | | | | | |
| | $ | 501,167,324 | | | $ | 255,314,355 | |
| | | | | | | | |
As of period end, the tax components of accumulated net earning (losses) were as follows:
| | | | |
Undistributed ordinary income | | $ | 6,395,417 | |
Undistributed long-term capital gains | | | 87,204,750 | |
Net unrealized losses(a) | | | (286,738,792 | ) |
| | | | |
| | $ | (193,138,625 | ) |
| | | | |
| | (a) | The difference between book-basis and tax-basis net unrealized gains was attributable primarily to the tax deferral of losses on wash sales and straddles, the realization for tax purposes of unrealized gains on investments in passive foreign investment companies, the realization for tax purposes of unrealized gains / losses on certain futures and foreign currency contracts, the timing and recognition of partnership income, the accounting for swap agreements, the classification of investments, investment in a wholly owned subsidiary and dividends recognized for tax purposes. | |
As of December 31, 2018, gross unrealized appreciation and depreciation for investments and derivatives based on cost for U.S. federal income tax purposes were as follows:
| | | | |
Tax cost | | $ | 9,456,779,853 | |
| | | | |
Gross unrealized appreciation | | $ | 509,377,710 | |
Gross unrealized depreciation | | | (766,199,172 | ) |
| | | | |
Net unrealized depreciation | | $ | (256,821,462 | ) |
| | | | |
The Company, on behalf of the Fund, along with certain other funds managed by the Manager and its affiliates (“Participating Funds”), is a party to a364-day, $2.25 billion credit agreement with a group of lenders. Under this agreement, the Fund may borrow to fund shareholder redemptions. Excluding commitments designated for certain individual funds, the Participating Funds, including the Fund, can borrow up to an aggregate commitment amount of $1.75 billion at any time outstanding, subject to asset coverage and other limitations as specified in the agreement. The credit agreement has the following terms: a fee of 0.10% per annum on unused commitment amounts and interest at a rate equal to the higher of(a) one-month LIBOR (but, in any event, not less than 0.00%) on the date the loan is made plus 0.80% per annum or (b) the Fed Funds rate (but, in any event, not less than 0.00%) in effect from time to time plus 0.80% per annum on amounts borrowed. The agreement expires in April 2019 unless extended or renewed. Prior to April 19, 2018, the aggregate commitment amount was $2.1 billion and the fee was 0.12% per annum. Participating Funds paid an upfront commitment fee of 0.02% on the total commitment amounts, in addition to administration, legal and arrangement fees, which are included in miscellaneous
| | | | |
| NOTESTO CONSOLIDATED FINANCIAL STATEMENTS | | | 41 | |
Notes to Consolidated Financial Statements (continued)
expenses in the Consolidated Statement of Operations. These fees were allocated among such funds based upon portions of the aggregate commitment available to them and relative net assets of Participating Funds. During the year ended December 31, 2018, the Fund did not borrow under the credit agreement.
In the normal course of business, the Fund invests in securities or other instruments and may enter into certain transactions, and such activities subject the Fund to various risks, including among others, fluctuations in the market (market risk) or failure of an issuer to meet all of its obligations. The value of securities or other instruments may also be affected by various factors, including, without limitation: (i) the general economy; (ii) the overall market as well as local, regional or global political and/or social instability; (iii) regulation, taxation or international tax treaties between various countries; or (iv) currency, interest rate and price fluctuations. The Fund’s prospectus provides details of the risks to which the Fund is subject.
The Fund may be exposed to prepayment risk, which is the risk that borrowers may exercise their option to prepay principal earlier than scheduled during periods of declining interest rates, which would force the Fund to reinvest in lower yielding securities. The Fund may also be exposed to reinvestment risk, which is the risk that income from the Fund’s portfolio will decline if the Fund invests the proceeds from matured, traded or called fixed-income securities at market interest rates that are below the Fund portfolio’s current earnings rate.
The Fund may be exposed to additional risks when reinvesting cash collateral in money market funds that do not seek to maintain a stable NAV per share of $1.00, which may be subject to redemption gates or liquidity fees under certain circumstances.
Valuation Risk: The market values of equities, such as common stocks and preferred securities or equity related investments, such as futures and options, may decline due to general market conditions which are not specifically related to a particular company. They may also decline due to factors which affect a particular industry or industries. The Fund may invest in illiquid investments and may experience difficulty in selling those investments in a timely manner at the price that it believes the investments are worth. Prices may fluctuate widely over short or extended periods in response to company, market or economic news. Markets also tend to move in cycles, with periods of rising and falling prices. This volatility may cause the Fund’s NAV to experience significant increases or decreases over short periods of time. If there is a general decline in the securities and other markets, the NAV of the Fund may lose value, regardless of the individual results of the securities and other instruments in which the Fund invests.
The price the Fund could receive upon the sale of any particular portfolio investment may differ from the Fund’s valuation of the investment, particularly for securities that trade in thin or volatile markets or that are valued using a fair valuation technique or a price provided by an independent pricing service. Changes to significant unobservable inputs and assumptions (i.e., publicly traded company multiples, growth rate, time to exit) due to the lack of observable inputs may significantly impact the resulting fair value and therefore the Fund’s results of operations. As a result, the price received upon the sale of an investment may be less than the value ascribed by the Fund, and the Fund could realize a greater than expected loss or lesser than expected gain upon the sale of the investment. The Fund’s ability to value its investments may also be impacted by technological issues and/or errors by pricing services or other third party service providers.
Counterparty Credit Risk:The Fund may be exposed to counterparty credit risk, or the risk that an entity may fail to or be unable to perform on its commitments related to unsettled or open transactions. The Fund manages counterparty credit risk by entering into transactions only with counterparties that the Manager believes have the financial resources to honor their obligations and by monitoring the financial stability of those counterparties. Financial assets, which potentially expose the Fund to market, issuer and counterparty credit risks, consist principally of financial instruments and receivables due from counterparties. The extent of the Fund’s exposure to market, issuer and counterparty credit risks with respect to these financial assets is approximately their value recorded in the Consolidated Statement of Assets and Liabilities, less any collateral held by the Fund.
A derivative contract may suffer amark-to-market loss if the value of the contract decreases due to an unfavorable change in the market rates or values of the underlying instrument. Losses can also occur if the counterparty does not perform under the contract.
The Fund’s risk of loss from counterparty credit risk on OTC derivatives is generally limited to the aggregate unrealized gain less the value of any collateral held by the Fund.
For OTC options purchased, the Fund bears the risk of loss of the amount of the premiums paid plus the positive change in market values net of any collateral held by the Fund should the counterparty fail to perform under the contracts. Options written by the Fund do not typically give rise to counterparty credit risk, as options written generally obligate the Fund, and not the counterparty, to perform. The Fund may be exposed to counterparty credit risk with respect to options written to the extent the Fund deposits collateral with its counterparty to a written option.
With exchange-traded options purchased and futures and centrally cleared swaps, there is less counterparty credit risk to the Fund since the exchange or clearinghouse, as counterparty to such instruments, guarantees against a possible default. The clearinghouse stands between the buyer and the seller of the contract; therefore, credit risk is limited to failure of the clearinghouse. While offset rights may exist under applicable law, the Fund does not have a contractual right of offset against a clearing broker or clearinghouse in the event of a default (including the bankruptcy or insolvency). Additionally, credit risk exists in exchange-traded futures and centrally cleared swaps with respect to initial and variation margin that is held in a clearing broker’s customer accounts. While clearing brokers are required to segregate customer margin from their own assets, in the event that a clearing broker becomes insolvent or goes into bankruptcy and at that time there is a shortfall in the aggregate amount of margin held by the clearing broker for all its clients, typically the shortfall would be allocated on a pro rata basis across all the clearing broker’s customers, potentially resulting in losses to the Fund.
Concentration Risk: The Fund invests a significant portion of its assets in fixed-income securities and/or uses derivatives tied to the fixed-income markets. Changes in market interest rates or economic conditions may affect the value and/or liquidity of such investments. Interest rate risk is the risk that prices of bonds and other fixed-income securities will increase as interest rates fall and decrease as interest rates rise. The Fund may be subject to a greater risk of rising interest rates due to the current
| | |
| 42 | | 2018 BLACKROCK ANNUAL REPORTTO SHAREHOLDERS |
Notes to Consolidated Financial Statements (continued)
period of historically low rates. The Federal Reserve has begun to raise the Federal Funds rate, and each increase results in more pronounced interest rate risk in the current market environment.
The Fund invests a significant portion of its assets in securities of issuers located in Europe or with significant exposure to European issuers or countries. The European financial markets have recently experienced volatility and adverse trends due to concerns about economic downturns in, or rising government debt levels of, several European countries. These events may spread to other countries in Europe and may affect the value and liquidity of certain of the Fund’s investments.
The United Kingdom is scheduled to withdraw from the European Union in March 2019, which may introduce significant new uncertainties and instability in the financial markets across Europe.
As of period end, the Fund’s investments had the following industry classifications:
| | | | |
| Industry | | Percent of
Long-Term
Investments | |
Diversified Financial Services | | | 27 | % |
Oil, Gas & Consumable Fuels | | | 7 | |
Banks | | | 6 | |
Health Care Providers & Services | | | 5 | |
Other(a) | | | 55 | |
| | (a) | All other industries held was less than 5% of long-term investments. | |
| 11. | CAPITAL SHARE TRANSACTIONS |
Transactions in capital shares for each class were as follows:
| | | | | | | | | | | | | | | | |
| | | Year Ended
12/31/2018 | | | Year Ended
12/31/2017 | |
| | | Shares | | | Amount | | | Shares | | | Amount | |
Class I | | | | | | | | | | | | | | | | |
Shares sold | | | 10,941,451 | | | $ | 185,931,630 | | | | 8,584,248 | | | $ | 143,679,674 | |
Shares issued in reinvestment of distributions | | | 6,174,089 | | | | 95,191,192 | | | | 2,672,740 | | | | 46,050,926 | |
Shares redeemed | | | (13,006,417 | ) | | | (221,542,400 | ) | | | (13,573,580 | ) | | | (224,416,668 | ) |
| | | | | | | | | | | | | | | | |
Net increase (decrease) | | | 4,109,123 | | | $ | 59,580,422 | | | | (2,316,592 | ) | | $ | (34,686,068 | ) |
| | | | | | | | | | | | | | | | |
| | | | |
Class II | | | | | | | | | | | | | | | | |
Shares sold | | | 764,329 | | | $ | 13,069,294 | | | | 1,384,696 | | | $ | 23,128,223 | |
Shares issued in reinvestment of distributions | | | 698,218 | | | | 10,743,143 | | | | 320,419 | | | | 5,499,573 | |
Shares redeemed | | | (2,359,206 | ) | | | (39,963,707 | ) | | | (1,525,356 | ) | | | (25,239,075 | ) |
| | | | | | | | | | | | | | | | |
Net increase (decrease) | | | (896,659 | ) | | $ | (16,151,270 | ) | | | 179,759 | | | $ | 3,388,721 | |
| | | | | | | | | | | | | | | | |
| | | | |
Class III | | | | | | | | | | | | | | | | |
Shares sold | | | 7,408,038 | | | $ | 108,800,864 | | | | 10,049,191 | | | $ | 144,899,286 | |
Shares issued in reinvestment of distributions | | | 29,081,385 | | | | 383,334,183 | | | | 13,347,588 | | | | 197,591,823 | |
Shares redeemed | | | (76,302,859 | ) | | | (1,113,699,124 | ) | | | (77,304,864 | ) | | | (1,106,232,291 | ) |
| | | | | | | | | | | | | | | | |
Net decrease | | | (39,813,436 | ) | | $ | (621,564,077 | ) | | | (53,908,085 | ) | | $ | (763,741,182 | ) |
| | | | | | | | | | | | | | | | |
Total Net Decrease | | | (36,600,972 | ) | | $ | (578,134,925 | ) | | | (56,044,918 | ) | | $ | (795,038,529 | ) |
| | | | | | | | | | | | | | | | |
| 12. | REGULATIONS-X AMENDMENTS |
On August 17, 2018, the SEC adopted amendments to certain disclosure requirements in Securities Act ReleaseNo. 33-10532, Disclosure Update and Simplification. The Fund has adopted the amendments pertinent to RegulationS-X in this shareholder report. The amendments impacted certain disclosure presentation on the Consolidated Statement of Assets and Liabilities, Consolidated Statements of Changes in Net Assets and Notes to Consolidated Financial Statements.
Prior year distribution information and distributions in excess of net investment income in the Consolidated Statements of Changes in Net Assets has been modified to conform to the current year presentation in accordance with the RegulationS-X changes.
| | | | |
| NOTESTO CONSOLIDATED FINANCIAL STATEMENTS | | | 43 | |
Notes to Consolidated Financial Statements (continued)
Distributions for the year ended December 31, 2017 were classified as follows:
| | | | | | | | |
| Share Class | | Net Investment Income | | | Net Realized Gain | |
I | | | (29,375,286 | ) | | | (22,847,673 | ) |
II | | | (2,933,651 | ) | | | (2,565,922 | ) |
III | | | (102,989,429 | ) | | | (94,602,394 | ) |
Distributions in excess of net investment income as of December 31, 2017 was $(47,766,850).
Management has evaluated the impact of all subsequent events on the Fund through the date the consolidated financial statements were issued and has determined that there were no subsequent events requiring adjustment or additional disclosure in the consolidated financial statements.
| | |
| 44 | | 2018 BLACKROCK ANNUAL REPORTTO SHAREHOLDERS |
| | |
| Report of Independent Registered Public Accounting Firm |
To the Shareholders of BlackRock Global Allocation V.I. Fund and the Board of Directors of BlackRock Variable Series Funds, Inc.:
Opinion on the Financial Statements and Financial Highlights
We have audited the accompanying consolidated statement of assets and liabilities of BlackRock Global Allocation V.I. Fund of BlackRock Variable Series Funds, Inc. and subsidiary (the “Fund”), including the consolidated schedule of investments, as of December 31, 2018, the related consolidated statement of operations for the year then ended, the consolidated statements of changes in net assets for each of the two years in the period then ended, the consolidated financial highlights for each of the five years in the period then ended, and the related notes. In our opinion, the financial statements and financial highlights present fairly, in all material respects, the financial position of the Fund as of December 31, 2018, and the results of its operations for the year then ended, the changes in its net assets for each of the two years in the period then ended, and the financial highlights for each of the five years in the period then ended, in conformity with accounting principles generally accepted in the United States of America.
Basis for Opinion
These financial statements and financial highlights are the responsibility of the Fund’s management. Our responsibility is to express an opinion on the Fund’s financial statements and financial highlights based on our audits. We are a public accounting firm registered with the Public Company Accounting Oversight Board (United States) (PCAOB) and are required to be independent with respect to the Fund in accordance with the U.S. federal securities laws and the applicable rules and regulations of the Securities and Exchange Commission and the PCAOB.
We conducted our audits in accordance with the standards of the PCAOB. Those standards require that we plan and perform the audit to obtain reasonable assurance about whether the financial statements and financial highlights are free of material misstatement, whether due to error or fraud. The Fund is not required to have, nor were we engaged to perform, an audit of its internal control over financial reporting. As part of our audits we are required to obtain an understanding of internal control over financial reporting but not for the purpose of expressing an opinion on the effectiveness of the Fund’s internal control over financial reporting. Accordingly, we express no such opinion.
Our audits included performing procedures to assess the risks of material misstatement of the financial statements and financial highlights, whether due to error or fraud, and performing procedures that respond to those risks. Such procedures included examining, on a test basis, evidence regarding the amounts and disclosures in the financial statements and financial highlights. Our audits also included evaluating the accounting principles used and significant estimates made by management, as well as evaluating the overall presentation of the financial statements and financial highlights. Our procedures included confirmation of securities owned as of December 31, 2018, by correspondence with the custodian, agent banks and brokers; when replies were not received from agent banks or brokers, we performed other auditing procedures. We believe that our audits provide a reasonable basis for our opinion.
Deloitte & Touche LLP
Boston, Massachusetts
February 15, 2019
We have served as the auditor of one or more BlackRock investment companies since 1992.
| | | | |
| REPORTOF INDEPENDENT REGISTERED PUBLIC ACCOUNTING FIRM | | | 45 | |
Glossary of Terms Used in this Report
| | |
| Currency |
| |
| AUD | | Australian Dollar |
| |
| BRL | | Brazilian Real |
| |
| CAD | | Canadian Dollar |
| |
| EUR | | Euro |
| |
| GBP | | British Pound |
| |
| JPY | | Japanese Yen |
| |
| MXN | | Mexican Peso |
| |
| NOK | | Norwegian Krone |
| |
| SEK | | Swedish Krona |
| |
| SGD | | Singapore Dollar |
| |
| USD | | United States Dollar |
| |
| ZAR | | South African Rand |
| | |
| Portfolio Abbreviations |
| |
| ADR | | American Depositary Receipt |
| |
| CDX | | Credit Default Swap Index |
| |
| CVA | | Certification Van Aandelon (Dutch Certificate) |
| |
| ETF | | Exchange-Traded Fund |
| |
| LIBOR | | London Interbank Offered Rate |
| |
| EURIBOR | | Euro Interbank Offered Rate |
| |
| NASDAQ | | National Association of Securities Dealers Automated |
| |
| OTC | | Over-The-Counter |
| |
| PCL | | Public Company Limited |
| |
| REIT | | Real Estate Investment Trust |
| |
| S&P | | Standard & Poor’s |
| |
| SPDR | | S&P Depository Receipt |
| | |
| 46 | | 2018 BLACKROCK ANNUAL REPORTTO SHAREHOLDERS |
DECEMBER 31, 2018
| | |
ANNUAL REPORT | |  |
BlackRock Variable Series Funds, Inc
| Ø | | BlackRock Government Money Market V.I. Fund |
|
| Not FDIC Insured • May Lose Value • No Bank Guarantee |
Money Market Overview For the12-Month Period Ended December 31, 2018
Noteworthy market conditions during 2018 included the continued steady removal of monetary accommodation by the Federal Open Market Committee (“FOMC”), the ongoing gradual reduction of the Fed’s balance sheet, increased Treasury bill issuance and various geopolitical events including trade-tariffs, the Italian elections, and Brexit uncertainty. 2018 was generally a strong year for cash as an asset class in terms of return and flows, but a volatile year for the overall financial markets.
The FOMC continued on their path to normalize monetary policy by hiking the federal funds rate four times during 2018, bringing the target range to 2.25-2.50%. In the final statement of the year released by the FOMC at their December meeting, the FOMC’s assessments of economic growth, labor market conditions, and inflation were largely unchanged. As was generally expected, the “forward guidance” part of their statement was altered to signifying greater emphasis on a more “data dependent” approach to monetary policy. In another significant change, at the last FOMC meeting of the year, the FOMC’s interest rate forecast was revised to reflect just two hikes in 2019 (as compared with three hikes projected in the prior forecast in September). The outlook included one additional hike for 2020, while the median “longer run” rate forecast came down 0.25% to 2.75%.
In an effort to promote trading in the federal funds market at rates that are comfortably within the target range, the interest on overnight excess reserves rate (“IOER”) was raised just 0.20% to 2.40% at the June 2018 meeting. This move was widely viewed as a “technical adjustment” by the FOMC. As was the case with the technical adjustment in June, the FOMC followed the same action in December when they hiked the IOER by 0.20% and the federal funds range by 0.25%. To conclude the year, the Fed’s Summary of Economic Projections was updated to reflect modest declines in the near-term outlook for economic growth, while the unemployment rate was left unchanged.
U.S. Treasury bill supply during the year was robust, hitting record levels for net new issuance of $384 billion. Furthermore in October, the U.S. Treasury introduced the two-month Treasury bill to the market with a $25 billion initial offering while moving the auctions for four-week and eight-week Treasury bills to Thursdays. This move helped the Treasury to ladder maturing debt. Also of note, government agencies issued floating rate notes indexed to the Secured Overnight Financing Rate (“SOFR”), which is a broad measure of the cost of borrowing cash overnight collateralized by Treasury securities, and is the reference rate eventually expected to replace the London Inter-Bank Offered Rate (“LIBOR”). In addition to the agency notes referenced to SOFR, some large financial institutions also issued certificates of deposit and commercial paper linked to this index, and demand for such obligations was generally strong.
Credit spreads were periodically elevated in 2018 for a multitude of reasons including the surge in Treasury bill issuance, a lack of clarity about repatriation related flows early in the year, and bank balance sheet and funding pressures toward the end of the period. For example, credit spreads as evidenced by the three-month LIBOR and overnight indexed swaps widened out to 0.60% in April. This measure later contracted to around 0.17% by early October, before subsequently rising to a high of 0.43% later in the fourth quarter.
In our view, the FOMC’s interest rate normalization campaign appears closer to winding down, although a few additional interest rate hikes remain possible in 2019, subject to further declines in the unemployment rate, upward pressure on inflation, and an easing in financial conditions. That said, we believe the bar for further action has materially risen. We also surmise that the timing of any additional hikes has become less certain and could occur outside of the quarterly meeting cycle that market participants have generally been accustomed to, given the FOMC’s emphasis on “data-dependence.” The implementation of a press conference after every FOMC meeting reinforces to us this possibility. The net new supply of Treasury bills is expected to contract during the first quarter of 2019 as the U.S. Treasury reduces its cash balance in advance of the expiration of the suspension of the debt ceiling in early March. In the event that Congress does not address the debt ceiling in a timely fashion, we anticipate that extraordinary measures would be used to provide additional borrowing authority until around the third quarter of 2019.
Past performance is no guarantee of future results. Index performance is shown for illustrative purposes only. You cannot invest directly in an index.
| | |
| 2 | | 2018 BLACKROCK ANNUAL REPORTTO SHAREHOLDERS |
| | |
| Fund Summary as of December 31, 2018 | | BlackRock Government Money Market V.I. Fund |
Investment Objective
BlackRock Government Money Market V.I. Fund’s (the “Fund”) investment objective is to seek to preserve capital, maintain liquidity and achieve the highest possible current income consistent with the foregoing.
On November 14, 2017, the Board of Directors of the Company (the “Board”) and, on May 23, 2018, the Board of Trustees of State Farm Variable Product Trust each approved a reorganization of the State Farm Money Market Fund (the “Target Fund”), with and into the Fund. At a special shareholder meeting on September 14, 2018, the shareholders of the Target Fund approved the reorganization, which was completed on October 29, 2018.
Fund Information
CURRENTSEVEN-DAY YIELDS
| | | | | | | | |
| | | 7-Day
SEC Yield | | | 7-Day
Yield | |
BlackRock Government Money Market V.I. Fund | | | 2.21 | % | | | 2.21 | % |
The7-Day SEC Yield may differ from the7-Day Yield shown above due to the fact that the7-Day SEC Yield excludes distributed capital gains.
Past performance is not indicative of future results. Performance results do not reflect the deduction of taxes that a shareholder would pay on Fund distributions or the redemption of Fund shares.
PORTFOLIO COMPOSITION
| | | | |
| Asset Type | | Percent of
Net Assets | |
Repurchase Agreements | | | 41 | % |
U.S. Government Sponsored Agency Obligations | | | 38 | |
U.S. Treasury Obligations | | | 18 | |
Other Assets Less Liabilities | | | 3 | |
Disclosure of Expenses
Shareholders of the Fund may incur the following charges: (a) transactional expenses, and (b) operating expenses, including investment advisory fees, service and distribution fees, and other fund expenses. The expense example shown below (which is based on a hypothetical investment of $1,000 invested on July 1, 2018 and held through December 31, 2018) is intended to assist shareholders both in calculating expenses based on an investment in the Fund and in comparing these expenses with similar costs of investing in other mutual funds.
The expense example provides information about actual account values and actual expenses. In order to estimate the expenses a shareholder paid during the period covered by this report, shareholders can divide their account value by $1,000 and then multiply the result by the number corresponding to their share class under the heading entitled “Expenses Paid During the Period.”
The expense example also provides information about hypothetical account values and hypothetical expenses based on the Fund’s actual expense ratio and an assumed rate of return of 5% per year before expenses. In order to assist shareholders in comparing the ongoing expenses of investing in the Fund and other funds, compare the 5% hypothetical examples with the 5% hypothetical examples that appear in shareholder reports of other funds.
The expenses shown in the expense example are intended to highlight shareholders’ ongoing costs only and do not reflect any transactional expenses, such as sales charges, if any. Therefore, the hypothetical example is useful in comparing ongoing expenses only, and will not help shareholders determine the relative total expenses of owning different funds. If these transactional expenses were included, shareholder expenses would have been higher.
Expense Example
| | | | | | | | | | | | | | | | | | | | | | | | | | | | | | | | |
| | | Actual | | | | | | Hypothetical (a) | | | | |
| | | Beginning
Account Value
(07/01/18) | | | Ending
Account Value
(12/31/18) | | | Expenses
Paid During
the Period (b) | | | | | | Beginning
Account Value
(07/01/18) | | | Ending
Account Value
(12/31/18) | | | Expenses
Paid During
the Period (b) | | | Annualized
Expense
Ratio | |
Class I | | $ | 1,000.00 | | | $ | 1,009.40 | | | $ | 1.52 | | | | | | | $ | 1,000.00 | | | $ | 1,023.69 | | | $ | 1.53 | | | | 0.30 | % |
| | (a) | Hypothetical 5% annual return before expenses is calculated by prorating the number of days in the most recent fiscal half year divided by 365. | |
| | (b) | Expenses are equal to the Fund’s annualized expense ratio, multiplied by the average account value over the period, multiplied by 184/365 (to reflect theone-half year period shown). | |
| | |
Schedule of Investments December 31, 2018 | | BlackRock Government Money Market V.I. Fund (Percentages shown are based on Net Assets) |
| | | | | | | | | | | | |
| Security | | Par
(000) | | | Value | |
|
| U.S. Government Sponsored Agency Obligations — 37.8% | |
Federal Farm Credit Bank Discount Notes(a): | | | | | | | | | | | | |
2.17%, 01/04/19 | | | USD | | | | 745 | | | $ | 744,867 | |
2.09%, 01/15/19 | | | | | | | 1,880 | | | | 1,878,333 | |
2.30%, 02/04/19 | | | | | | | 735 | | | | 733,466 | |
2.31%, 02/08/19 | | | | | | | 175 | | | | 174,607 | |
2.39%, 03/11/19 | | | | | | | 885 | | | | 881,234 | |
2.40%, 03/19/19 | | | | | | | 885 | | | | 880,779 | |
2.44%, 04/12/19 | | | | | | | 215 | | | | 213,661 | |
2.50%, 06/17/19 | | | | | | | 730 | | | | 721,873 | |
2.51%, 06/28/19 | | | | | | | 505 | | | | 498,982 | |
2.52%, 07/22/19 | | | | | | | 640 | | | | 630,950 | |
2.52%, 07/23/19 | | | | | | | 1,145 | | | | 1,128,774 | |
2.52%, 07/29/19 | | | | | | | 5,630 | | | | 5,545,483 | |
2.55%, 08/15/19 | | | | | | | 660 | | | | 650,056 | |
2.56%, 09/12/19 | | | | | | | 465 | | | | 456,437 | |
Federal Farm Credit Bank Variable Rate Notes(b): | | | | | | | | | | | | |
(LIBOR USD 1 Month - 0.05%), 2.33%, 02/07/20 | | | | | | | 1,900 | | | | 1,899,979 | |
(LIBOR USD 1 Month + 0.00%), 2.47%, 06/19/20 | | | | | | | 1,000 | | | | 1,000,683 | |
(LIBOR USD 1 Month + 0.00%), 2.51%, 06/26/20 | | | | | | | 1,000 | | | | 999,957 | |
(LIBOR USD 1 Month - 0.04%), 2.36%, 09/11/20 | | | | | | | 510 | | | | 509,974 | |
(LIBOR USD 1 Month + 0.03%), 2.47%, 12/14/20 | | | | | | | 1,025 | | | | 1,024,918 | |
Federal Home Loan Bank Discount Notes(a): | | | | | | | | | | | | |
2.15%, 01/04/19 | | | | | | | 485 | | | | 484,914 | |
2.29%, 01/09/19 | | | | | | | 1,785 | | | | 1,784,096 | |
2.31%, 01/11/19 | | | | | | | 2,430 | | | | 2,428,437 | |
2.11%, 01/16/19 | | | | | | | 4,750 | | | | 4,745,410 | |
2.21%, 01/23/19 | | | | | | | 640 | | | | 639,083 | |
2.30%, 02/05/19 | | | | | | | 650 | | | | 648,518 | |
2.31%, 02/06/19 | | | | | | | 965 | | | | 962,732 | |
2.32%, 02/11/19 | | | | | | | 1,975 | | | | 1,969,682 | |
2.33%, 02/12/19 | | | | | | | 480 | | | | 478,662 | |
2.33%, 02/13/19 | | | | | | | 2,700 | | | | 2,692,359 | |
2.33%, 02/15/19 | | | | | | | 1,200 | | | | 1,196,448 | |
2.35%, 02/20/19 | | | | | | | 555 | | | | 553,165 | |
2.40%, 03/20/19 | | | | | | | 1,250 | | | | 1,243,714 | |
2.41%, 03/27/19 | | | | | | | 7,750 | | | | 7,705,589 | |
2.50%, 06/21/19 | | | | | | | 1,145 | | | | 1,131,458 | |
Federal Home Loan Bank Variable Rate Notes(b): | | | | | | | | | | | | |
(LIBOR USD 1 Month - 0.09%), 2.42%, 01/25/19 | | | | | | | 750 | | | | 750,000 | |
(LIBOR USD 1 Month - 0.13%), 2.38%, 01/28/19 | | | | | | | 595 | | | | 595,000 | |
(LIBOR USD 1 Month - 0.13%), 2.22%, 02/01/19 | | | | | | | 795 | | | | 795,000 | |
(LIBOR USD 1 Month - 0.12%), 2.39%, 02/25/19 | | | | | | | 960 | | | | 960,000 | |
(LIBOR USD 1 Month - 0.12%), 2.39%, 03/25/19 | | | | | | | 1,800 | | | | 1,800,000 | |
(LIBOR USD 3 Month - 0.21%), 2.42%, 05/16/19 | | | | | | | 1,100 | | | | 1,100,000 | |
(LIBOR USD 3 Month - 0.16%), 2.62%, 06/12/19 | | | | | | | 420 | | | | 419,952 | |
(LIBOR USD 1 Month - 0.05%), 2.46%, 06/20/19 | | | | | | | 225 | | | | 225,000 | |
(LIBOR USD 3 Month - 0.16%), 2.63%, 06/20/19 | | | | | | | 1,000 | | | | 1,000,000 | |
(Secured Overnight Funding Rate + 0.4),
2.50%, 06/21/19 | | | | | | | 345 | | | | 345,000 | |
(LIBOR USD 1 Month - 0.05%), 2.46%, 06/24/19 | | | | | | | 1,355 | | | | 1,355,000 | |
(LIBOR USD 1 Month - 0.05%), 2.46%, 06/28/19 | | | | | | | 435 | | | | 435,000 | |
(LIBOR USD 1 Month - 0.05%), 2.46%, 06/28/19 | | | | | | | 225 | | | | 225,000 | |
(LIBOR USD 1 Month - 0.11%), 2.36%, 07/19/19 | | | | | | | 1,960 | | | | 1,960,000 | |
(LIBOR USD 1 Month - 0.08%), 2.43%, 08/27/19 | | | | | | | 1,190 | | | | 1,190,000 | |
(LIBOR USD 1 Month - 0.09%), 2.30%, 09/09/19 | | | | | | | 1,565 | | | | 1,565,000 | |
(LIBOR USD 1 Month - 0.07%), 2.39%, 09/17/19 | | | | | | | 2,000 | | | | 2,000,000 | |
(LIBOR USD 1 Month - 0.06%), 2.45%, 09/27/19 | | | | | | | 1,000 | | | | 1,000,000 | |
(LIBOR USD 3 Month - 0.14%), 2.66%, 12/19/19 | | | | | | | 535 | | | | 535,000 | |
(LIBOR USD 1 Month - 0.06%), 2.44%, 02/24/20 | | | | | | | 1,085 | | | | 1,085,000 | |
(LIBOR USD 1 Month - 0.04%), 2.41%, 04/17/20 | | | | | | | 1,940 | | | | 1,939,773 | |
(LIBOR USD 3 Month - 0.13%), 2.67%, 12/21/20 | | | | | | | 1,350 | | | | 1,350,000 | |
Federal Home Loan Mortgage Corp. Variable Rate Notes, (LIBOR USD 1 Month - 0.10%), 2.29%, 08/08/19(b) | | | | | | | 1,500 | | | | 1,499,554 | |
| | | | | | | | | | | | |
| Security | | Par
(000) | | | Value | |
|
| U.S. Government Sponsored Agency Obligations (continued) | |
Federal National Mortgage Association Discount Notes, 2.24%, 01/09/19(a) | | | USD | | | | 1,325 | | | $ | 1,324,340 | |
Federal National Mortgage Association Notes, 0.88%, 08/02/19 | | | | | | | 665 | | | | 658,319 | |
| | | | | | | | |
| |
Total U.S. Government Sponsored Agency Obligations — 37.8%
(Cost: $75,351,218) | | | | 75,351,218 | |
| | | | | | | | |
|
| U.S. Treasury Obligations — 18.1% | |
U.S. Treasury Bills(a): | | | | | | | | | | | | |
2.05%, 01/17/19 | | | | | | | 7,000 | | | | 6,993,342 | |
2.29%, 01/29/19 | | | | | | | 895 | | | | 893,361 | |
2.28%, 02/07/19 | | | | | | | 1,955 | | | | 1,950,620 | |
2.31%, 02/21/19 | | | | | | | 890 | | | | 887,245 | |
2.42%, 04/04/19 | | | | | | | 12,600 | | | | 12,522,531 | |
U.S. Treasury Notes: | | | | | | | | | | | | |
1.13%, 01/31/19 | | | | | | | 50 | | | | 49,957 | |
1.25%, 01/31/19 | | | | | | | 50 | | | | 49,962 | |
(US Treasury 3 Month Bill Money Market Yield + 0.14%), 2.57%, 01/31/19(b) | | | | | | | 3,775 | | | | 3,775,000 | |
1.50%, 02/28/19 | | | | | | | 3,000 | | | | 2,996,376 | |
(US Treasury 3 Month Bill Money Market Yield + 0.03%), 2.46%, 04/30/20(b) | | | | | | | 3,000 | | | | 2,999,893 | |
(US Treasury 3 Month Bill Money Market Yield + 0.05%), 2.47%, 10/31/20(b) | | | | | | | 3,000 | | | | 2,994,274 | |
| | | | | | | | |
| |
Total U.S. Treasury Obligations — 18.1%
(Cost: $36,112,561) | | | | 36,112,561 | |
| | | | | | | | |
| |
Total Repurchase Agreements — 41.2%
(Cost: $82,145,000) | | | | 82,145,000 | |
| | | | | | | | |
| |
Total Investments — 97.1%
(Cost: $193,608,779)(c) | | | | 193,608,779 | |
| |
Other Assets Less Liabilities — 2.9% | | | | 5,830,684 | |
| | | | | | | | |
| |
Net Assets — 100.0% | | | $ | 199,439,463 | |
| | | | | | | | |
| (a) | Rates are discount rates or a range of discount rates as of period end. |
| (b) | Variable rate security. Rate shown is the rate in effect as of period end. |
| (c) | Cost for U.S. federal income tax purposes. |
| | |
| 4 | | 2018 BLACKROCK ANNUAL REPORTTO SHAREHOLDERS |
| | |
Schedule of Investments (continued) December 31, 2018 | | BlackRock Government Money Market V.I. Fund |
Repurchase Agreements
| | | | | | | | | | | | | | | | | | | | | | | | | | | | | | |
| | | Repurchase Agreements | | | | Collateral |
| Counterparty | | Coupon
Rate | | | Purchase
Date | | | Maturity
Date | | | Par
(000) | | | At Value
(000) | | | Proceeds
Including
Interest | | | | Position | | Original Par | | Position
Received,
At Value |
Bank of Montreal | | | 2.90 | % | | | 12/31/18 | | | | 01/02/19 | | | $ | 8,300 | | | $ | 8,300 | | | $8,301,337 | | | | U.S. Government Sponsored Agency Obligations, 2.50% to 5.50%,
due 08/01/20 to 08/01/48 | | $46,213,406 | | $8,549,001 |
BNP Paribas SA | | | 3.00 | | | | 12/31/18 | | | | 01/02/19 | | | | 14,000 | | | | 14,000 | | | 14,002,333 | | | | U.S. Government Sponsored Agency Obligations, 3.00% to 6.00%,
due 01/15/29 to 11/20/48 | | 18,996,939 | | 14,280,000 |
Goldman Sachs & Co. LLC | | | 2.67 | | | | 12/31/18 | | | | 01/07/19 | | | | 4,000 | | | | 4,000 | | | 4,002,077 | | | | U.S. Government Sponsored Agency Obligations, 3.50% to 5.00%,
due 02/01/24 to 01/01/49 | | 6,644,754 | | 4,120,000 |
JP Morgan Securities LLC | | | 2.67 | (a) | | | 12/31/18 | | | | 02/06/19 | | | | 3,500 | | | | 3,500 | | | 3,509,614 | | | | U.S. Government Sponsored Agency Obligations, 0.44% to 4.19%,
due 06/25/22 to 03/16/53 | | 178,193,996 | | 3,675,000 |
| | | 2.95 | | | | 12/31/18 | | | | 01/02/19 | | | | 15,000 | | | | 15,000 | | | 15,002,458 | | | | U.S. Treasury Obligations,
0.00% to 1.38%,
due 02/15/19 to 02/15/42 | | 18,547,985 | | 15,300,000 |
| | | | | | | | | | | | | | | | | | | | | | | | | | | | | | |
Total JP Morgan Securities LLC | | | $ | 18,500 | | | | | | | | | | | $18,975,000 |
| | | | | | | | | | | | | | | | | | | | | | | | | | | | | | |
Merrill Lynch, Pierce, Fenner & Smith, Inc. | | | 2.65 | | | | 12/31/18 | | | | 01/07/19 | | | | 1,500 | | | | 1,500 | | | 1,500,773 | | | | U.S. Government Sponsored Agency Obligation,
4.00%, due 08/01/48 | | 1,539,963 | | 1,545,000 |
| | | 3.00 | | | | 12/31/18 | | | | 01/02/19 | | | | 10,000 | | | | 10,000 | | | 10,001,667 | | | | U.S. Government Sponsored Agency Obligation,
4.50%, due 08/20/48 | | 9,690,300 | | 10,200,000 |
| | | | | | | | | | | | | | | | | | | | | | | | | | | | | | |
Total Merrill Lynch, Pierce, Fenner & Smith, Inc. | | | $ | 11,500 | | | | | | | | | | | $11,745,000 |
| | | | | | | | | | | | | | | | | | | | | | | | | | | | | | |
Mizuho Securities USA LLC | | | 2.95 | | | | 12/31/18 | | | | 01/02/19 | | | | 10,000 | | | | 10,000 | | | 10,001,639 | | | | U.S. Treasury Obligation,
2.63%, due 12/31/23 | | 10,152,500 | | 10,200,095 |
Societe Generale SA | | | 2.95 | | | | 12/31/18 | | | | 01/02/19 | | | | 14,000 | | | | 14,000 | | | 14,002,295 | | | | U.S. Treasury Obligations,
0.00% to 2.00%,
due 02/15/22 to 02/15/23 | | 14,396,983 | | 14,280,000 |
Wells Fargo Securities LLC | | | 2.50 | | | | 12/26/18 | | | | 01/02/19 | | | | 1,845 | | | | 1,845 | | | 1,845,897 | | | | U.S. Government Sponsored Agency Obligations,
1.38% to 6.50%,
due 02/26/21 to 12/01/48 | | 3,180,505 | | 1,892,458 |
| | | | | | | | | | | | | | | | | | | | | | | | | | | | | | |
| | | $ | 82,145 | | | | | | | | | | | $84,041,554 |
| | | | | | | | | | | | | | | | | | | | | | | | | | | | | | |
| | (a) | Variable rate security. Rate as of period end and maturity is the date the principal owed can be recovered through demand. | |
Fair Value Hierarchy as of Period End
Various inputs are used in determining the fair value of investments. For information about the Fund’s policy regarding valuation of investments, refer to the Notes to Financial Statements.
The following table summarizes the Fund’s investments categorized in the disclosure hierarchy:
| | | | | | | | | | | | | | | | |
| | | Level 1 | | | Level 2 | | | Level 3 | | | Total | |
Assets: | | | | | | | | | | | | | | | | |
Investments: | | | | | | | | | | | | | | | | |
Short-Term Securities(a) | | $ | — | | | $ | 193,608,779 | | | $ | — | | | $ | 193,608,779 | |
| | | | | | | | | | | | | | | | |
| | (a) | See above Schedule of Investments for values in each security type. | |
During the year ended December 31, 2018, there were no transfers between levels.
See notes to financial statements.
| | | | |
| SCHEDULE OF INVESTMENTS | | | 5 | |
Statement of Assets and Liabilities
December 31, 2018
| | | | |
| | | BlackRock Government
Money Market V.I. Fund | |
| |
ASSETS | | | | |
Investments at value — unaffiliated (cost — $111,463,779) | | $ | 111,463,779 | |
Cash | | | 6,065,586 | |
Repurchase agreements at value (cost — $82,145,000) | | | 82,145,000 | |
Receivables: | | | | |
Capital shares sold | | | 89,272 | |
Interest — unaffiliated | | | 96,194 | |
From the Manager | | | 13,121 | |
Prepaid expenses | | | 203 | |
| | | | |
Total assets | | | 199,873,155 | |
| | | | |
| |
LIABILITIES | | | | |
Payables: | | | | |
Capital shares redeemed | | | 299,526 | |
Printing fees | | | 53,904 | |
Professional fees | | | 21,272 | |
Investment advisory fees | | | 29,576 | |
Board realignment and consideration | | | 13,121 | |
Directors’ and Officer’s fees | | | 5,338 | |
Other affiliates | | | 194 | |
Other accrued expenses | | | 10,761 | |
| | | | |
Total liabilities | | | 433,692 | |
| | | | |
| |
NET ASSETS | | $ | 199,439,463 | |
| | | | |
| |
NET ASSETS CONSIST OF | | | | |
Paid-in capital | | $ | 199,424,743 | |
Accumulated earnings | | | 14,720 | |
| | | | |
NET ASSETS | | $ | 199,439,463 | |
| | | | |
Class I — Based on net assets of $199,439,463 and 199,438,211 shares outstanding, 3.3 billion shares authorized, $0.10 par value. | | $ | 1.00 | |
| | | | |
See notes to financial statements.
| | |
| 6 | | 2018 BLACKROCK ANNUAL REPORTTO SHAREHOLDERS |
Statement of Operations
Year Ended December 31, 2018
| | | | |
| | | BlackRock Government
Money Market V.I. Fund | |
| |
INVESTMENT INCOME | | | | |
Interest — unaffiliated | | $ | 2,834,953 | |
| | | | |
Total investment income | | | 2,834,953 | |
| | | | |
| |
EXPENSES | | | | |
Investment advisory | | | 744,566 | |
Reorganization | | | 118,913 | |
Transfer agent | | | 110,856 | |
Professional | | | 80,385 | |
Printing | | | 39,723 | |
Accounting services | | | 38,935 | |
Directors and Officer | | | 18,154 | |
Board realignment and consolidation | | | 13,121 | |
Custodian | | | 11,877 | |
Registration | | | 2,512 | |
Miscellaneous | | | 6,709 | |
| | | | |
Total expenses | | | 1,185,751 | |
Less: | | | | |
Fees waived and/or reimbursed by the Manager | | | (633,155 | ) |
Transfer agent fees waived and/or reimbursed | | | (105,855 | ) |
| | | | |
Total expenses after fees waived and/or reimbursed | | | 446,741 | |
| | | | |
Net investment income | | | 2,388,212 | |
| | | | |
| |
REALIZED GAIN | | | | |
Net realized gain from investments | | | 6,346 | |
| | | | |
NET INCREASE IN NET ASSETS RESULTING FROM OPERATIONS | | $ | 2,394,558 | |
| | | | |
See notes to financial statements.
Statements of Changes in Net Assets
| | | | | | | | |
| | | BlackRock Government Money
Market V.I. Fund | |
| | | Year Ended December 31, | |
| | | 2018 | | | 2017 | |
| | |
INCREASE (DECREASE) IN NET ASSETS | | | | | | | | |
| | |
OPERATIONS | | | | | | | | |
Net investment income | | $ | 2,388,212 | | | $ | 915,448 | |
Net realized gain | | | 6,346 | | | | 475 | |
| | | | | | | | |
Net increase in net assets resulting from operations | | | 2,394,558 | | | | 915,923 | |
| | | | | | | | |
| | |
DISTRIBUTIONS TO SHAREHOLDERS(a)(b) | | | | | | | | |
Decrease in net assets resulting from distributions to shareholders | | | (2,388,212 | ) | | | (915,925 | ) |
| | | | | | | | |
| | |
CAPITAL SHARE TRANSACTIONS | | | | | | | | |
Net proceeds from sale of shares | | | 163,742,133 | | | | 110,014,964 | |
Reinvestments of distributions | | | 2,388,212 | | | | 916,673 | |
Cost of shares redeemed | | | (178,847,247 | ) | | | (126,795,881 | ) |
Shares issued in reorganization | | | 76,491,419 | | | | — | |
| | | | | | | | |
Net increase (decrease) in net assets derived from capital share transactions | | | 63,774,517 | | | | (15,864,244 | ) |
| | | | | | | | |
| | |
NET ASSETS | | | | | | | | |
Total increase (decrease) in net assets | | | 63,780,863 | | | | (15,864,246 | ) |
Beginning of year | | | 135,658,600 | | | | 151,522,846 | |
| | | | | | | | |
End of year | | $ | 199,439,463 | | | $ | 135,658,600 | |
| | | | | | | | |
| (a) | Distributions for annual periods determined in accordance with U.S. federal income tax regulations. |
| (b) | Prior year distribution character information has been modified or removed to conform with current year RegulationS-X presentation changes. Refer to Note 9 for this prior year information. |
See notes to financial statements.
| | |
| 8 | | 2018 BLACKROCK ANNUAL REPORTTO SHAREHOLDERS |
Financial Highlights
(For a share outstanding throughout each period)
| | | | | | | | | | | | | | | | | | | | |
| | | BlackRock Government Money Market V.I. Fund | |
| |
| | | Class I | |
| |
| | | Year Ended December 31, | |
| | | 2018 | | | 2017 | | | 2016 | | | 2015 | | | 2014 | |
| | | | | |
Net asset value, beginning of year | | $ | 1.00 | | | $ | 1.00 | | | $ | 1.00 | | | $ | 1.00 | | | $ | 1.00 | |
| | | | | | | | | | | | | | | | | | | | |
Net investment income | | | 0.0160 | | | | 0.0064 | | | | 0.0013 | | | | 0.0000 | (a) | | | 0.0000 | (a) |
Net realized gain (loss) | | | (0.0001 | ) | | | 0.0000 | (a) | | | 0.0000 | (a) | | | 0.0001 | | | | 0.0001 | |
| | | | | | | | | | | | | | | | | | | | |
Net increase from investment operations | | | 0.0159 | | | | 0.0064 | | | | 0.0013 | | | | 0.0001 | | | | 0.0001 | |
| | | | | | | | | | | | | | | | | | | | |
| | | | | |
| Distributions(b) | | | | | | | | | | | | | | | |
From net investment income | | | (0.0159 | ) | | | (0.0064 | ) | | | (0.0013 | ) | | | (0.0000 | )(c) | | | (0.0000 | )(c) |
From net realized gain | | | — | | | | (0.0000 | )(c) | | | (0.0000 | )(c) | | | (0.0001 | ) | | | (0.0001 | ) |
| | | | | | | | | | | | | | | | | | | | |
Total distributions | | | (0.0159 | ) | | | (0.0064 | ) | | | (0.0013 | ) | | | (0.0001 | ) | | | (0.0001 | ) |
| | | | | | | | | | | | | | | | | | | | |
| | | | | |
Net asset value, end of year | | $ | 1.00 | | | $ | 1.00 | | | $ | 1.00 | | | $ | 1.00 | | | $ | 1.00 | |
| | | | | | | | | | | | | | | | | | | | |
| | | | | |
Total Return(d) | | | | | | | | | | | | | | | | | | | | |
Based on net asset value | | | 1.61 | % | | | 0.65 | % | | | 0.13 | % | | | 0.01 | % | | | 0.01 | % |
| | | | | | | | | | | | | | | | | | | | |
| | | | | |
Ratios to Average Net Assets | | | | | | | | | | | | | | | | | | | | |
Total expenses | | | 0.80 | %(e) | | | 0.72 | % | | | 0.62 | % | | | 0.61 | % | | | 0.61 | % |
| | | | | | | | | | | | | | | | | | | | |
Total expenses after fees waived and/or reimbursed | | | 0.30 | %(e) | | | 0.30 | % | | | 0.30 | % | | | 0.18 | % | | | 0.17 | % |
| | | | | | | | | | | | | | | | | | | | |
Net investment income | | | 1.60 | % | | | 0.63 | % | | | 0.13 | % | | | 0.00 | % | | | 0.00 | % |
| | | | | | | | | | | | | | | | | | | | |
| | | | | |
Supplemental Data | | | | | | | | | | | | | | | | | | | | |
Net assets, end of year (000) | | $ | 199,439 | | | $ | 135,659 | | | $ | 151,523 | | | $ | 152,118 | | | $ | 228,241 | |
| | | | | | | | | | | | | | | | | | | | |
| (a) | Amount is less than $0.00005 per share. |
| (b) | Distributions for annual periods determined in accordance with U.S. federal income tax regulations. |
| (c) | Amount is greater than $(0.00005) per share. |
| (d) | Where applicable, excludes insurance-related fees and expenses and assumes the reinvestment of distributions. |
| (e) | Includes reorganization costs associated with the Fund’s reorganization. Without these costs, total expenses and total expenses after fees waived and/or reimbursed would have been 0.72% and 0.29%, respectively. |
See notes to financial statements.
Notes to Financial Statements
BlackRock Variable Series Funds, Inc. (the “Company”) is registered under the Investment Company Act of 1940, as amended (the “1940 Act”), as anopen-end management investment company. The Company is organized as a Maryland corporation that is comprised of 15 separate portfolios. The funds offer shares to insurance companies for their separate accounts to fund benefits under certain variable annuity and variable life insurance contracts. The financial statements presented are for BlackRock Government Money Market V.I. Fund (the “Fund”). The Fund is classified as diversified.
The Fund operates as a “government money market fund” under Rule2a-7 under the 1940 Act. The Fund is not subject to liquidity fees or temporary suspensions of redemptions due to declines in the Fund’s weekly liquid assets.
The Fund, together with certain other registered investment companies advised by BlackRock Advisors, LLC (the “Manager”) or its affiliates, is included in a complex ofopen-end funds referred to as the Equity-Bond Complex.
Reorganization:The Board of Directors of the Company and the Board of Trustees of State Farm Variable Product Trust and shareholders of the Target Fund approved the reorganization of the Target Fund into the Fund. As a result, the Fund acquired substantially all of the assets and assumed substantially all of the liabilities of the Target Fund in exchange for an equal aggregate value of newly-issued Class I Shares of the Fund.
Each shareholder of the Target Fund received shares of the Fund in an amount equal to the aggregate net asset value (“NAV”) of such shareholder’s Target Fund shares, as determined at the close of business on October 26, 2018, less the costs of the Target Fund’s reorganization.
The reorganization was accomplished by atax-free exchange of shares of the Fund in the following amount and at the following conversion ratio:
| | | | | | | | | | | | | | | | |
| Target Fund | | Shares Prior to
Reorganization | | | Conversion
Ratio | | | Government Money
Market V.I. Fund’s
Share Class | | | Shares of
Government Money
Market V.I. Fund | |
State Farm Money Market Fund | | | 76,492,521 | | | | 1.00 | | | | Class I | | | | 76,492,521 | |
The Target Fund’s net assets and composition of net assets on October 26, 2018, the valuation date of the reorganization were as follows:
| | | | | | | | | | | | |
| Target Fund | | Net Assets | | | Paid-In
Capital | | | Accumulated
Earnings | |
State Farm Money Market Fund | | $ | 76,491,419 | | | $ | 76,491,419 | | | $ | — | |
For financial reporting purposes, assets received and shares issued by the Fund were recorded at fair value. However, the cost basis of the investments received from the Target Fund was carried forward to align ongoing reporting of the Fund realized and unrealized gains and losses with amounts distributable to shareholders for tax purposes.
The net assets of the Fund before the acquisition were $124,850,847. The aggregate net assets of the Fund immediately after the acquisition amounted to $201,342,266. The Target Fund’s fair value and cost of investments prior to the reorganization were as follows:
| | | | | | | | |
| Target Fund | | Fair Value of
Investments | | | Cost of
Investments | |
State Farm Money Market Fund | | $ | 76,881,766 | | | $ | 76,881,766 | |
The purpose of the transaction was to combine the assets of the Target Fund with the assets of the Fund. The reorganization was a tax-free event and closed on October 29, 2018.
Assuming the acquisition had been completed on January 1, 2018, the beginning of the fiscal reporting period of the Fund, the pro forma results of operations for the year ended December 31, 2018, are as follows:
| | • | | Net investment income: $2,749,789 |
| | • | | Net realized gain on investments: $6,346 |
| | • | | Net increase in net assets resulting from operations: $2,756,135 |
Because the combined investment portfolios have been managed as a single integrated portfolio since the acquisition was completed, it is not practicable to separate the amounts of revenue and earnings of the Fund that have been included in the Fund’s Statement of Operations since October 29, 2018.
Reorganization costs incurred by the Fund in connection with the reorganization were expensed by the Fund. The Manager reimbursed the Fund $110,686, which is included in fees waived and/or reimbursed by the Manager in the Statement of Operations.
| 2. | SIGNIFICANT ACCOUNTING POLICIES |
The financial statements are prepared in conformity with accounting principles generally accepted in the United States of America (“U.S. GAAP”), which may require management to make estimates and assumptions that affect the reported amounts of assets and liabilities in the financial statements, disclosure of contingent assets and
| | |
| 10 | | 2018 BLACKROCK ANNUAL REPORTTO SHAREHOLDERS |
Notes to Financial Statements (continued)
liabilities at the date of the financial statements and the reported amounts of increases and decreases in net assets from operations during the reporting period. Actual results could differ from those estimates. The Fund is considered an investment company under U.S. GAAP and follows the accounting and reporting guidance applicable to investment companies. Below is a summary of significant accounting policies:
Investment Transactions and Income Recognition: For financial reporting purposes, investment transactions are recorded on the dates the transactions are entered into (the “trade dates”). Realized gains and losses on investment transactions are determined on the identified cost basis. Interest income, including amortization and accretion of premiums and discounts on debt securities are recognized on an accrual basis.
Distributions: Distributions from net investment income are declared daily and paid monthly. Distributions of capital gains are recorded on theex-dividend date and made at least annually. The character and timing of distributions are determined in accordance with U.S. federal income tax regulations, which may differ from U.S. GAAP.
Recent Accounting Standards: In March 2017, the Financial Accounting Standards Board issued Accounting Standards Update “Premium Amortization of Purchased Callable Debt Securities” which amends the amortization period for certain purchased callable debt securities. Under the new guidance, the premium amortization of purchased callable debt securities that have explicit,non-contingent call features and are callable at fixed prices will be amortized to the earliest call date. The guidance will be applied on a modified retrospective basis and is effective for fiscal years, and their interim periods, beginning after December 15, 2018. Management is currently evaluating the impact of this guidance to the Fund.
In August 2018, the Financial Accounting Standards Board issued Accounting Standards Update2018-13 “Changes to the Disclosure Requirements for Fair Value Measurement” which modifies disclosure requirements for fair value measurements. The guidance is effective for fiscal years beginning after December 15, 2019 and for interim periods within those fiscal years. Management is currently evaluating the impact of this guidance to the Fund.
Indemnifications: In the normal course of business, the Fund enters into contracts that contain a variety of representations that provide general indemnification. The Fund’s maximum exposure under these arrangements is unknown because it involves future potential claims against the Fund, which cannot be predicted with any certainty.
Other: Expenses directly related to the Fund are charged to the Fund. Other operating expenses shared by several funds, including other funds managed by the Manager, are prorated among those funds on the basis of relative net assets or other appropriate methods.
| 3. | INVESTMENT VALUATION AND FAIR VALUE MEASUREMENTS |
Investment Valuation Policies: U.S. GAAP defines fair value as the price the Fund would receive to sell an asset or pay to transfer a liability in an orderly transaction between market participants at the measurement date. The Fund’s investments are valued under the amortized cost method which approximates current market value in accordance with Rule2a-7 under the 1940 Act. Under this method, investments are valued at cost when purchased and, thereafter, a constant proportionate accretion of discounts and amortization of premiums are recorded until the maturity of the security. The Fund seeks to maintain its NAV per share at $1.00, although there is no assurance that it will be able to do so on a continuing basis.
Fair Value Hierarchy: Various inputs are used in determining the fair value of investments. These inputs to valuation techniques are categorized into a fair value hierarchy consisting of three broad levels for financial statement purposes as follows:
| | • | | Level 1 — Unadjusted price quotations in active markets/exchanges for identical assets or liabilities that the Fund has the ability to access |
| | • | | Level 2 — Other observable inputs (including, but not limited to, quoted prices for similar assets or liabilities in markets that are active, quoted prices for identical or similar assets or liabilities in markets that are not active, inputs other than quoted prices that are observable for the assets or liabilities (such as interest rates, yield curves, volatilities, prepayment speeds, loss severities, credit risks and default rates) or other market–corroborated inputs) |
| | • | | Level 3 — Unobservable inputs based on the best information available in the circumstances, to the extent observable inputs are not available (including the Fund’s own assumptions used in determining the fair value of investments) |
The hierarchy gives the highest priority to unadjusted quoted prices in active markets for identical assets or liabilities (Level 1 measurements) and the lowest priority to unobservable inputs (Level 3 measurements). Accordingly, the degree of judgment exercised in determining fair value is greatest for instruments categorized in Level 3. The inputs used to measure fair value may fall into different levels of the fair value hierarchy. In such cases, for disclosure purposes, the fair value hierarchy classification is determined based on the lowest level input that is significant to the fair value measurement in its entirety.
Changes in valuation techniques may result in transfers into or out of an assigned level within the hierarchy. In accordance with the Fund’s policy, transfers between different levels of the fair value hierarchy are deemed to have occurred as of the beginning of the reporting period. The categorization of a value determined for investments is based on the pricing transparency of the investments is not necessarily an indication of the risks associated with investing in those securities.
| 4. | SECURITIES AND OTHER INVESTMENTS |
Repurchase Agreements: Repurchase agreements are commitments to purchase a security from a counterparty who agrees to repurchase the same security at a mutually agreed upon date and price. On a daily basis, the counterparty is required to maintain collateral subject to the agreement and in value no less than the agreed upon repurchase amount. Pursuant to the custodial undertaking associated with atri-party repurchase arrangement, an unaffiliated third party custodian maintains accounts to hold collateral for a fund and its counterparties. Typically, a fund and counterparty are not permitted to sell,re-pledge or use the collateral absent a default by the counterparty or a fund, respectively.
| | | | |
| NOTESTO FINANCIAL STATEMENTS | | | 11 | |
Notes to Financial Statements (continued)
In the event the counterparty defaults and the fair value of the collateral declines, a fund could experience losses, delays and costs in liquidating the collateral.
Repurchase agreements are entered into by a fund under Master Repurchase Agreements (each, an “MRA”). The MRA permits a fund, under certain circumstances including an event of default (such as bankruptcy or insolvency), to offset payables and/or receivables with collateral held by and/or posted to the counterparty. As a result, one single net payment is created. Bankruptcy or insolvency laws of a particular jurisdiction may impose restrictions on or prohibitions against such a right of offset in the event of the MRA counterparty’s bankruptcy or insolvency. Based on the terms of the MRA, a fund receives securities as collateral with a market value in excess of the repurchase price at maturity. Upon a bankruptcy or insolvency of the MRA counterparty, a fund would recognize a liability with respect to such excess collateral. The liability reflects a fund’s obligation under bankruptcy law to return the excess to the counterparty.
| 5. | INVESTMENT ADVISORY AGREEMENT AND OTHER TRANSACTIONS WITH AFFILIATES |
Investment Advisory: The Company, on behalf of the Fund, entered into an Investment Advisory Agreement with the Manager, the Fund’s investment adviser and an indirect, wholly-owned subsidiary of BlackRock, to provide investment advisory and administrative services. The Manager is responsible for the management of the Fund’s portfolio and provides the personnel, facilities, equipment and certain other services necessary to the operations of the Fund.
For such services, the Fund pays the Manager a monthly fee at an annual rate equal to the following percentages of the average daily value of the Fund’s net assets.
| | | | |
| Average Daily Net Assets | | Investment
Advisory Fee | |
First $1 Billion | | | 0.500 | % |
$1 Billion — $2 Billion | | | 0.450 | |
$2 Billion — $3 Billion | | | 0.400 | |
$3 Billion — $4 Billion | | | 0.375 | |
$4 Billion — $7 Billion | | | 0.350 | |
$7 Billion — $10 Billion | | | 0.325 | |
$10 Billion — $15 Billion | | | 0.300 | |
Greater than $15 Billion | | | 0.290 | |
Distribution Fees: The Company, on behalf of the Fund, entered into a Distribution Agreement with BlackRock Investments, LLC (“BRIL”), an affiliate of the Manager.
Transfer Agent: On behalf of the Fund, the Manager entered into agreements with insurance companies and other financial intermediaries (“Service Organizations”), some of which may be affiliates. Pursuant to these agreements, the Service Organizations provide the Fund with administrative, networking, recordkeeping,sub-transfer agency and shareholder services tosub-accounts they service. For these services, the Service Organizations receive an annual fee per shareholder account, which will vary depending on share class and/or net assets of Fund shareholders serviced by the Service Organizations which is shown as transfer agent in the Statement of Operations. For the year ended December 31, 2018, the Fund did not pay any amounts to affiliates in return for these services.
Expense Limitations, Waivers and Reimbursements: The Manager voluntarily agreed to waive a portion of the investment advisory fees to enable the Fund to maintain minimum levels of daily net investment income. The Manager may discontinue this waiver and/or reimbursement at any time without notice. For the year ended December 31, 2018, there were no fees waived and/or reimbursed by the Manager.
For the year ended December 31, 2018, the Fund reimbursed the Manager $1,578 for certain accounting services, which is included in accounting services in the Statement of Operations.
With respect to the Fund, the Manager contractually agreed to waive and/or reimburse fees or expenses in order to limit expenses, excluding interest expense, dividend expense, tax expense, acquired fund fees and expenses, and certain other fund expenses, which constitute extraordinary expenses not incurred in the ordinary course of the Fund’s business (“expense limitation”), to 0.30% of average daily net assets of Class I Shares. The Manager has agreed not to reduce or discontinue this contractual expense limitation through April 30, 2021, unless approved by the Board, including a majority of the directors who are not “interested persons” of the Fund, as defined in the 1940 Act (“Independent Directors”), or by a vote of a majority of the outstanding voting securities of the Fund. For the year ended December 31, 2018, the Manager waived $509,348 and reimbursed $105,855, which is shown as fees waived and/or reimbursed by the Manager and transfer agent fees waived and/or reimbursed, respectively, in the Statement of Operations.
The Fund has begun to incur expenses in connection with a proposed realignment and consolidation of the boards of directors of certain BlackRock-advised funds, including the Fund. The Manager has voluntarily agreed to reimburse the Fund for all or a portion of such expenses, which amounts are included in fees waived and/or reimbursed by the Manager in the Statement of Operations. For the year ended December 31, 2018, the amount reimbursed was $13,121.
Directors and Officers: Certain directors and/or officers of the Company are directors and/or officers of BlackRock or its affiliates. The Fund reimburses the Manager for a portion of the compensation paid to the Company’s Chief Compliance Officer, which is included in Directors and Officer in the Statement of Operations.
It is the Fund’s policy to comply with the requirements of the Internal Revenue Code of 1986, as amended, applicable to regulated investment companies, and to distribute substantially all of its taxable income to its shareholders. Therefore, no U.S. federal income tax provision is required.
The Fund files U.S. federal and various state and local tax returns. No income tax returns are currently under examination. The statute of limitations on the Fund’s U.S. federal tax returns generally remains open for each of the four years ended December 31, 2018. The statutes of limitations on the Fund’s state and local tax returns may remain open for an additional year depending upon the jurisdiction.
| | |
| 12 | | 2018 BLACKROCK ANNUAL REPORTTO SHAREHOLDERS |
Notes to Financial Statements (continued)
Management has analyzed tax laws and regulations and their application to the Fund as of December 31, 2018, inclusive of the open tax return years, and does not believe that there are any uncertain tax positions that require recognition of a tax liability in the Fund’s financial statements.
U.S. GAAP requires that certain components of net assets be adjusted to reflect permanent differences between financial and tax reporting. These reclassifications have no effect on net assets or net asset values per share. As of period end, the following permanent differences attributable to non-deductible expenses were reclassified to the following accounts:
| | | | |
Paid-in capital | | $ | (8,227 | ) |
Accumulated earnings | | | 8,227 | |
The tax character of distributions paid was as follows:
| | | | | | | | |
| | | 12/31/2018 | | | 12/31/2017 | |
Ordinary income | | $ | 2,388,212 | | | $ | 915,604 | |
Long term capital gains | | | — | | | | 321 | |
| | | | | | | | |
| | $ | 2,388,212 | | | $ | 915,925 | |
| | | | | | | | |
As of period end, the tax components of accumulated net earnings were as follows:
| | | | |
Undistributed ordinary income | | $ | 14,720 | |
| | | | |
In the normal course of business, the Fund invests in securities or other instruments and may enter into certain transactions, and such activities subject the Fund to various risks, including among others, fluctuations in the market (market risk) or failure of an issuer to meet all of its obligations. The value of securities or other instruments may also be affected by various factors, including, without limitation: (i) the general economy; (ii) the overall market as well as local, regional or global political and/or social instability; (iii) regulation, taxation or international tax treaties between various countries; or (iv) currency, interest rate and price fluctuations. The Fund’s prospectus provides details of the risks to which the Fund is subject.
Counterparty Credit Risk: The Fund may be exposed to counterparty credit risk, or the risk that an entity may fail to or be unable to perform on its commitments related to unsettled or open transactions. The Fund manages counterparty credit risk by entering into transactions only with counterparties that the Manager believes have the financial resources to honor their obligations and by monitoring the financial stability of those counterparties. Financial assets, which potentially expose the Fund to market, issuer and counterparty credit risks, consist principally of financial instruments and receivables due from counterparties. The extent of the Fund’s exposure to market, issuer and counterparty credit risks with respect to these financial assets is approximately their value recorded in the Statement of Assets and Liabilities, less any collateral held by the Fund.
| 8. | CAPITAL SHARE TRANSACTIONS |
Transactions in capital shares were as follows:
| | | | | | | | | | | | | | | | |
| | | Year Ended
12/31/2018 | | | Year Ended
12/31/2017 | |
| | | Shares | | | Amount | | | Shares | | | Amount | |
Class I | | | | | | | | | | | | | | | | |
Shares sold | | | 163,742,133 | | | $ | 163,742,133 | | | | 110,014,964 | | | $ | 110,014,964 | |
Shares issued in reinvestment of distributions | | | 2,388,212 | | | | 2,388,212 | | | | 916,673 | | | | 916,673 | |
Shares redeemed | | | (178,847,247 | ) | | | (178,847,247 | ) | | | (126,795,881 | ) | | | (126,795,881 | ) |
Shares issued in reorganization | | | 76,492,521 | | | | 76,491,419 | | | | — | | | | — | |
| | | | | | | | | | | | | | | | |
Net increase (decrease) | | | 63,775,619 | | | $ | 63,774,517 | | | | (15,864,244 | ) | | $ | (15,864,244 | ) |
| | | | | | | | | | | | | | | | |
| 9. | REGULATIONS-X AMENDMENTS |
On August 17, 2018, the SEC adopted amendments to certain disclosure requirements in Securities Act ReleaseNo. 33-10532, Disclosure Update and Simplification. The Fund has adopted the amendments pertinent to RegulationS-X in this shareholder report. The amendments impacted certain disclosure presentation on the Statement of Assets and Liabilities, Statements of Changes in Net Assets and Notes to the Financial Statements.
Prior year distribution information in the Statements of Changes in Net Assets has been modified to conform to the current year presentation in accordance with the RegulationS-X changes.
Distributions for the year ended December 31, 2017 were classified as follows:
| | | | | | | | |
| Share Class | | Net Investment Income | | | Net Realized Gain | |
Class I | | $ | (915,448 | ) | | $ | (477 | ) |
Management has evaluated the impact of all subsequent events on the Fund through the date the financial statements were issued and has determined that there were no subsequent events requiring adjustment or additional disclosure in the financial statements.
| | | | |
| NOTESTO FINANCIAL STATEMENTS | | | 13 | |
Report of Independent Registered Public Accounting Firm
To the Shareholders of BlackRock Government Money Market V.I. Fund and the Board of Directors of BlackRock Variable Series Funds, Inc.:
Opinion on the Financial Statements and Financial Highlights
We have audited the accompanying statement of assets and liabilities of BlackRock Government Money Market V.I. Fund of BlackRock Variable Series Funds, Inc. (the “Fund”), including the schedule of investments, as of December 31, 2018, the related statement of operations for the year then ended, the statements of changes in net assets for each of the two years in the period then ended, the financial highlights for each of the five years in the period then ended, and the related notes. In our opinion, the financial statements and financial highlights present fairly, in all material respects, the financial position of the Fund as of December 31, 2018, and the results of its operations for the year then ended, the changes in its net assets for each of the two years in the period then ended, and the financial highlights for each of the five years in the period then ended, in conformity with accounting principles generally accepted in the United States of America.
Basis for Opinion
These financial statements and financial highlights are the responsibility of the Fund’s management. Our responsibility is to express an opinion on the Fund’s financial statements and financial highlights based on our audits. We are a public accounting firm registered with the Public Company Accounting Oversight Board (United States) (PCAOB) and are required to be independent with respect to the Fund in accordance with the U.S. federal securities laws and the applicable rules and regulations of the Securities and Exchange Commission and the PCAOB.
We conducted our audits in accordance with the standards of the PCAOB. Those standards require that we plan and perform the audit to obtain reasonable assurance about whether the financial statements and financial highlights are free of material misstatement, whether due to error or fraud. The Fund is not required to have, nor were we engaged to perform, an audit of its internal control over financial reporting. As part of our audits we are required to obtain an understanding of internal control over financial reporting but not for the purpose of expressing an opinion on the effectiveness of the Fund’s internal control over financial reporting. Accordingly, we express no such opinion.
Our audits included performing procedures to assess the risks of material misstatement of the financial statements and financial highlights, whether due to error or fraud, and performing procedures that respond to those risks. Such procedures included examining, on a test basis, evidence regarding the amounts and disclosures in the financial statements and financial highlights. Our audits also included evaluating the accounting principles used and significant estimates made by management, as well as evaluating the overall presentation of the financial statements and financial highlights. Our procedures included confirmation of securities owned as of December 31, 2018, by correspondence with the custodian and brokers; when replies were not received from brokers, we performed other auditing procedures. We believe that our audits provide a reasonable basis for our opinion.
Deloitte & Touche LLP
Boston, Massachusetts
February 15, 2019
We have served as the auditor of one or more BlackRock investment companies since 1992.
| | |
| 14 | | 2018 BLACKROCK ANNUAL REPORTTO SHAREHOLDERS |
Glossary of Terms Used in this Report
| | |
| Currency | | |
| |
| USD | | United States Dollar |
| | |
| Portfolio Abbreviations | | |
| |
| LIBOR | | London Interbank Offered Rate |
| | | | |
| GLOSSARYOF TERMS USEDINTHIS REPORT | | | 15 | |
DECEMBER 31, 2018
| | |
ANNUAL REPORT | |  |
BlackRock Variable Series Funds, Inc.
| Ø | | BlackRock International V.I. Fund |
|
| Not FDIC Insured • May Lose Value • No Bank Guarantee |
| | |
| Fund Summary as of December 31, 2018 | | BlackRock International V.I. Fund |
Investment Objective
BlackRock International V.I. Fund’s (the “Fund”) investment objective is long-term capital growth.
Portfolio Management Commentary
How did the Fund perform?
For the12-month period ended December 31, 2018, the Fund underperformed its benchmark, the MSCI All Country World (ACWI) ex-USA Index.
What factors influenced performance?
From a sector perspective, negative stock selection in the consumer staples sector detracted the most from the Fund’s performance during the period, particularly within the tobacco industry. Negative stock selection in the reconstituted communication services sector, specifically interactive home entertainment, also detracted. The largest individual detractors included U.K. tobacco company British American Tobacco PLC, Canadian aerospace manufacturer Bombardier Inc., and Chinese interactiveonline-game specialist NetEase, Inc. British American in particular performed poorly as investors have become less certain about the long-term value of tobacco businesses more broadly.
By contrast, positive stock selection in the consumer discretionary sector, particularly in consumer electronics, was the primary contributor to the Fund’s relative performance for the period. Positive stock selection in financials, such as banks, also contributed, as did the Fund’s cash allocation. The most significant individual contributor to performance was Japanese consumer discretionary company Sony Corp., which continued to deliver strong fundamental business performance that exceeded expectations. Other notable individual contributors were Brazil’s Itau Unibanco Holding S.A. and India’s ICICI Bank Ltd.
Describe recent portfolio activity.
The largest change to the Fund’s positioning in the period was a decrease in exposure to consumer staples, moving from significantly overweight to modestly underweight as all three tobacco positions were sold during the period. In contrast, the Fund increased its positioning in the materials sector from meaningfully underweight to modestly overweight following the purchase of two new chemicals companies. The Fund’s real estate exposure also increased, moving from meaningfully underweight to meaningfully overweight after the purchase of a data-center focused real estate investment trust and a Japanese real estate developer.
Describe portfolio positioning at period end.
As of period end, the Fund’s largest sector overweight positions were to real estate, materials and utilities. The largest underweight exposures were to industrials, energy and consumer staples. On a regional basis, the largest overweight exposures were to the United States, China and France, while the largest underweight allocations were to Japan, Australia and the United Kingdom.
The views expressed reflect the opinions of BlackRock as of the date of this report and are subject to change based on changes in market, economic or other conditions.
These views are not intended to be a forecast of future events and are no guarantee of future results.
Portfolio Information
GEOGRAPHIC ALLOCATION
| | | | |
| Country | | Percent of Net Assets | |
France | | | 13 | % |
China | | | 13 | |
Japan | | | 12 | |
Switzerland | | | 7 | |
Spain | | | 7 | |
United States | | | 7 | |
Netherlands | | | 6 | |
United Kingdom | | | 6 | |
Mexico | | | 5 | |
Canada | | | 4 | |
India | | | 3 | |
Italy | | | 3 | |
Germany | | | 3 | |
Russia | | | 3 | |
Thailand | | | 2 | |
Luxembourg | | | 2 | |
Portugal | | | 1 | |
Short-Term Securities | | | 3 | |
Liabilities in Excess of Other Assets | | | — | (a) |
| | (a) | Representing less than 1% of the Fund’s net assets. | |
| | |
| 2 | | 2018 BLACKROCK ANNUAL REPORTTO SHAREHOLDERS |
| | |
| Fund Summary as of December 31, 2018 (continued) | | BlackRock International V.I. Fund |
TOTAL RETURN BASED ON A $10,000 INVESTMENT
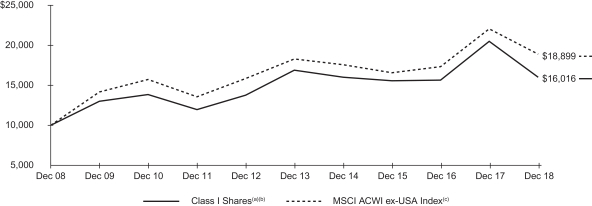
| (a) | Assuming transaction costs, if any, and other operating expenses, including investment advisory fees. Does not include insurance-related fees and expenses. |
| (b) | The Fund invests primarily in stocks of companies located outside the U.S. The Fund’s total returns prior to October 1, 2011 are the returns of the Fund when it followed different investment strategies under the name “BlackRock International Value V.I. Fund.” |
| (c) | A free float-adjusted market capitalization index designed to measure the combined equity market performance of developed and emerging countries, excluding the United States. |
Performance Summary for the Period Ended December 31, 2018
| | | | | | | | | | | | | | | | | | | | |
| | | 6-Month
Total Returns (b) | | | | | | Average Annual Total Returns | |
| | | | | | 1 Year (b) | | | 5 Years (b) | | | 10 Years (b) | |
Class I(a) | | | (17.21 | )% | | | | | | | (21.82 | )% | | | (1.05 | )% | | | 4.82 | % |
MSCI ACWI ex-USA Index | | | (10.84 | ) | | | | | | | (14.20 | ) | | | 0 .68 | | | | 6.57 | |
| | (a) | Average annual and cumulative total returns are based on changes in net asset value (“NAV”) for the periods shown, and assume reinvestment of all distributions at NAV on the ex-dividend date. Insurance-related fees and expenses are not reflected in these returns. The Fund’s total returns prior to October 1, 2011 are the returns of the Fund when it followed different investment strategies under the name “BlackRock International Value V.I. Fund.” | |
| | (b) | For a portion of the period, the Fund’s investment adviser waived a portion of its fee. Without such waiver, the Fund’s performance would have been lower. | |
Past performance is not indicative of future results. Performance results do not reflect the deduction of taxes that a shareholder would pay on Fund distributions or the redemption of Fund shares.
Performance results may include adjustments made for financial reporting purposes in accordance with U.S. generally accepted accounting principles.
Expense Example
| | | | | | | | | | | | | | | | | | | | | | | | | | | | | | | | |
| | | Actual | | | | | | Hypothetical (a) | | | | |
| | | Beginning
Account Value
(07/01/18) | | | Ending
Account Value
(12/31/18) | | | Expenses
Paid During
the Period (b) | | | | | | Beginning
Account Value
(07/01/18) | | | Ending
Account Value
(12/31/18) | | | Expenses
Paid During
the Period (b) | | | Annualized
Expense
Ratio | |
Class I | | $ | 1,000.00 | | | $ | 827.90 | | | $ | 4.98 | | | | | | | $ | 1,000.00 | | | $ | 1,019.76 | | | $ | 5.50 | | | | 1.08 | % |
| | (a) | Hypothetical 5% annual return before expenses is calculated by prorating the number of days in the most recent fiscal half year divided by 365. | |
| | (b) | Expenses are equal to the Fund’s annualized expense ratio, multiplied by the average account value over the period, multiplied by 184/365 (to reflect the one-half year period shown). | |
See “Disclosure of Expenses” on the following page for further information on how expenses were calculated.
| | |
| Disclosure of Expenses | | BlackRock International V.I. Fund |
Shareholders of the Fund may incur the following charges: (a) transactional expenses; and (b) operating expenses, including investment advisory fees, service and distribution fees, including 12b-1 fees, acquired fund fees and expenses and other fund expenses. The expense example on the previous page (which is based on a hypothetical investment of $1,000 invested on July 1,2018 and held through December 31, 2018) is intended to assist shareholders both in calculating expenses based on an investment in the Fund and in comparing these expenses with similar costs of investing in other mutual funds.
The expense example provides information about actual account values and actual expenses. In order to estimate the expenses a shareholder paid during the period covered by this report, shareholders can divide their account value by $1,000 and then multiply the result by the number corresponding to their share class under the heading entitled “Expenses Paid During the Period.”
The expense example also provides information about hypothetical account values and hypothetical expenses based on the Fund’s actual expense ratio and an assumed rate of return of 5% per year before expenses. In order to assist shareholders in comparing the ongoing expenses of investing in the Fund and other funds, compare the 5% hypothetical example with the 5% hypothetical example that appears in shareholder reports of other funds.
The expenses shown in the expense example are intended to highlight shareholders’ ongoing costs only and do not reflect any transactional expenses, such as sales charges, if any. Therefore, the hypothetical example is useful in comparing ongoing expenses only, and will not help shareholders determine the relative total expenses of owning different funds. If these transactional expenses were included, shareholder expenses would have been higher.
| | |
| 4 | | 2018 BLACKROCK ANNUAL REPORTTO SHAREHOLDERS |
| | |
Schedule of Investments December 31, 2018 | | BlackRock International V.I. Fund (Percentages shown are based on Net Assets) |
| | | | | | | | |
| Security | | Shares | | | Value | |
| | |
Common Stocks — 97.1% | | | | | | | | |
| | |
| Canada — 4.3% | | | | | | |
Suncor Energy, Inc. | | | 127,703 | | | $ | 3,566,742 | |
| | | | | | | | |
| | |
| China — 13.0% | | | | | | |
Baidu, Inc., ADR(a) | | | 20,355 | | | | 3,228,303 | |
Bank of China Ltd., Class H | | | 4,960,000 | | | | 2,138,268 | |
China Molybdenum Co. Ltd., Class H | | | 4,548,000 | | | | 1,674,818 | |
Ping An Insurance Group Co. of China Ltd., Class H | | | 413,500 | | | | 3,647,904 | |
| | | | | | | | |
| | | | | | | 10,689,293 | |
| | |
| France — 13.3% | | | | | | |
Arkema SA | | | 35,858 | | | | 3,078,345 | |
AXA SA | | | 139,660 | | | | 3,014,129 | |
Engie SA | | | 337,058 | | | | 4,842,828 | |
| | | | | | | | |
| | | | | | | 10,935,302 | |
| | |
| Germany — 2.8% | | | | | | |
Knorr-Bremse AG(a) | | | 25,616 | | | | 2,307,460 | |
| | | | | | | | |
| | |
| India — 3.2% | | | | | | |
ICICI Bank Ltd. | | | 500,242 | | | | 2,581,309 | |
| | | | | | | | |
| | |
| Italy — 3.0% | | | | | | |
Intesa Sanpaolo SpA | | | 1,087,945 | | | | 2,422,443 | |
| | | | | | | | |
| | |
| Japan — 11.8% | | | | | | |
Mitsui Fudosan Co. Ltd. | | | 110,400 | | | | 2,452,194 | |
Omron Corp. | | | 79,300 | | | | 2,874,775 | |
Sony Corp. | | | 53,200 | | | | 2,564,752 | |
Trend Micro, Inc. | | | 33,900 | | | | 1,831,805 | |
| | | | | | | | |
| | | | | | | 9,723,526 | |
| | |
| Luxembourg — 1.6% | | | | | | |
SES SA, FDR | | | 66,966 | | | | 1,282,139 | |
| | | | | | | | |
| | |
| Mexico — 4.6% | | | | | | |
Fomento Economico Mexicano SAB de CV | | | 434,456 | | | | 3,735,768 | |
| | | | | | | | |
| | |
| Netherlands — 6.1% | | | | | | |
ASML Holding NV | | | 7,850 | | | | 1,229,778 | |
Koninklijke DSM NV | | | 47,068 | | | | 3,818,427 | |
| | | | | | | | |
| | | | | | | 5,048,205 | |
| | |
| Portugal — 1.5% | | | | | | |
Banco Comercial Portugues SA, Class R(a) | | | 4,757,929 | | | | 1,251,477 | |
| | | | | | | | |
| | |
| Russia — 2.6% | | | | | | |
Sberbank of Russia PJSC, ADR | | | 196,888 | | | | 2,156,154 | |
| | | | | | | | |
| | |
| Spain — 7.1% | | | | | | |
Banco Bilbao Vizcaya Argentaria SA | | | 545,912 | | | | 2,899,785 | |
Industria de Diseno Textil SA | | | 114,285 | | | | 2,917,090 | |
| | | | | | | | |
| | | | | | | 5,816,875 | |
| | |
| Switzerland — 7.4% | | | | | | |
Cie Financiere Richemont SA (Registered) | | | 27,170 | | | | 1,752,129 | |
Roche Holding AG | | | 17,466 | | | | 4,336,089 | |
| | | | | | | | |
| | | | | | | 6,088,218 | |
| | |
| Thailand — 2.0% | | | | | | |
Sea Ltd., ADR(a)(b) | | | 141,604 | | | | 1,602,957 | |
| | | | | | | | |
| | |
| United Kingdom — 5.9% | | | | | | |
Associated British Foods plc | | | 90,785 | | | | 2,366,179 | |
Burberry Group plc | | | 114,457 | | | | 2,513,364 | |
| | | | | | | | |
| | | | | | | 4,879,543 | |
| | | | | | | | | | | | |
| Security | | Shares | | | Value | |
| | | |
| United States — 6.9% | | | | | | | | | |
BioMarin Pharmaceutical, Inc.(a) | | | | | | | 27,015 | | | $ | 2,300,327 | |
Equinix, Inc. | | | | | | | 9,617 | | | | 3,390,570 | |
| | | | | | | | |
| | | | | | | | | | | 5,690,897 | |
| | | | | | | | |
| |
Total Common Stocks — 97.1%
(Cost: $88,625,254) | | | | 79,778,308 | |
| | | | | | | | |
| |
Total Long-Term Investments — 97.1%
(Cost: $88,625,254) | | | | 79,778,308 | |
| | | | | | | | |
| | | |
Short-Term Securities — 3.3% | | | | | | | | | | | | |
| | | |
Money Market Funds — 3.3%(c)(f) | | | | | | | | | | | | |
BlackRock Liquidity Funds, T-Fund, Institutional Class, 2.32% | | | | | | | 2,487,119 | | | | 2,487,119 | |
SL Liquidity Series, LLC, Money Market Series, 2.57%(d) | | | | | | | 239,214 | | | | 239,190 | |
| | | | | | | | |
| |
Total Money Market Funds — 3.3%
(Cost: $2,726,309) | | | | 2,726,309 | |
| | | | | | | | |
| | |
| | | Par
(000) | | | | |
| | | |
Time Deposits — 0.0% | | | | | | | | | | | | |
| | | |
Canada — 0.0% | | | | | | | | | | | | |
Royal Bank Of Canada, 0.84%, 01/02/19 | | | CAD | | | | 39 | | | | 28,644 | |
| | | | | | | | |
| | | |
| Norway — 0.0% | | | | | | | | | |
Brown Brothers Harriman & Co., 0.24%, 01/02/19 | | | NOK | | | | — | (e) | | | 1 | |
| | | | | | | | |
| | | |
| South Africa — 0.0% | | | | | | | | | |
Brown Brothers Harriman & Co., 4.84%, 01/02/19 | | | ZAR | | | | — | (e) | | | — | |
| | | | | | | | |
| | | |
| Switzerland — 0.0% | | | | | | | | | |
Brown Brothers Harriman & Co., (1.46)%, 01/03/19 | | | CHF | | | | — | (e) | | | 15 | |
| | | | | | | | |
| | | |
| United Kingdom — 0.0% | | | | | | | | | |
Brown Brothers Harriman & Co., 0.37%, 01/02/19 | | | GBP | | | | — | (e) | | | 1 | |
| | | | | | | | |
| |
Total Time Deposits — 0.0%
(Cost: $28,661) | | | | 28,661 | |
| | | | | | | | |
| |
Total Short-Term Securities — 3.3%
(Cost: $2,754,970) | | | | 2,754,970 | |
| | | | | | | | |
| |
Total Investments — 100.4%
(Cost: $91,380,224) | | | | 82,533,278 | |
| |
Liabilities in Excess of Other Assets — (0.4)% | | | | (300,490 | ) |
| | | | | | | | |
| |
Net Assets — 100.0% | | | $ | 82,232,788 | |
| | | | | | | | | | | | |
| (a) | Non-income producing security. |
| (b) | Security, or a portion of the security, is on loan. |
| (c) | Annualized 7-day yield as of period end. |
| (d) | Security was purchased with the cash collateral from loaned securities. |
| (e) | Amount is less than $500. |
| | | | |
| SCHEDULE OF INVESTMENTS | | | 5 | |
| | |
Schedule of Investments (continued) December 31, 2018 | | BlackRock International V.I. Fund |
| (f) | During the year ended December 31, 2018, investments in issuers considered to be affiliates of the Fund for purposes of Section 2(a)(3) of the Investment Company Act of 1940, as amended, were as follows: |
| | | | | | | | | | | | | | | | | | | | | | | | | | | | |
| Affiliate | | Shares
Held at
12/31/17 | | | Net
Activity | | | Shares
Held at
12/31/18 | | | Value at
12/31/18 | | | Income | | | Net
Realized
Gain (Loss) (a) | | | Change in
Unrealized
Appreciation
(Depreciation)
| |
BlackRock Liquidity Funds, T-Fund, Institutional Class | | | 3,135,204 | | | | (648,085 | ) | | | 2,487,119 | | | $ | 2,487,119 | | | $ | 55,135 | | | $ | — | | | $ | — | |
SL Liquidity Series, LLC, Money Market Series | | | 6,216,364 | | | | (5,977,150 | ) | | | 239,214 | | | | 239,190 | | | | 14,652 | (b) | | | (335 | ) | | | 274 | |
| | | | | | | | | | | | | | | | | | | | | | | | | | | | |
| | | | | | | | | | | | | | $ | 2,726,309 | | | $ | 69,787 | | | $ | (335 | ) | | $ | 274 | |
| | | | | | | | | | | | | | | | | | | | | | | | | | | | |
| | (a) | Includes net capital gain distributions, if applicable. | |
| | (b) | Represents securities lending income earned from the reinvestment of cash collateral from loaned securities, net of fees and collateral investment expenses, and other payments to and from borrowers of securities. | |
For Fund compliance purposes, the Fund’s industry classifications refer to one or more of the industry sub-classifications used by one or more widely recognized market indexes or ratings group indexes, and/or as defined by the investment advisor. These definitions may not apply for purposes of this report, which may combine such industry sub-classifications for reporting ease.
Fair Value Hierarchy as of Period End
Various inputs are used in determining the fair value of investments. For information about the Fund’s policy regarding valuation of investments, refer to the Notes to Financial Statements.
The following table summarizes the Fund’s investments categorized in the disclosure hierarchy:
| | | | | | | | | | | | | | | | |
| | | Level 1 | | | Level 2 | | | Level 3 | | | Total | |
Assets: | | | | | | | | | | | | | | | | |
Investments: | | | | | | | | | | | | | | | | |
Long-Term Investments | | | | | | | | | | | | | | | | |
Common Stocks: | | | | | | | | | | | | | | | | |
Canada | | $ | 3,566,742 | | | $ | — | | | $ | — | | | $ | 3,566,742 | |
China | | | 3,228,303 | | | | 7,460,990 | | | | — | | | | 10,689,293 | |
France | | | — | | | | 10,935,302 | | | | — | | | | 10,935,302 | |
Germany | | | 2,307,460 | | | | — | | | | — | | | | 2,307,460 | |
India | | | — | | | | 2,581,309 | | | | — | | | | 2,581,309 | |
Italy | | | — | | | | 2,422,443 | | | | — | | | | 2,422,443 | |
Japan | | | — | | | | 9,723,526 | | | | — | | | | 9,723,526 | |
Luxembourg | | | — | | | | 1,282,139 | | | | — | | | | 1,282,139 | |
Mexico | | | 3,735,768 | | | | — | | | | — | | | | 3,735,768 | |
Netherlands | | | — | | | | 5,048,205 | | | | — | | | | 5,048,205 | |
Portugal | | | — | | | | 1,251,477 | | | | — | | | | 1,251,477 | |
Russia | | | — | | | | 2,156,154 | | | | — | | | | 2,156,154 | |
Spain | | | — | | | | 5,816,875 | | | | — | | | | 5,816,875 | |
Switzerland | | | — | | | | 6,088,218 | | | | — | | | | 6,088,218 | |
Thailand | | | 1,602,957 | | | | — | | | | — | | | | 1,602,957 | |
United Kingdom | | | — | | | | 4,879,543 | | | | — | | | | 4,879,543 | |
United States | | | 5,690,897 | | | | — | | | | — | | | | 5,690,897 | |
Short-Term Securities: | | | | | | | | | | | | | | | | |
Money Market Funds | | | 2,487,119 | | | | — | | | | — | | | | 2,487,119 | |
Time Deposits | | | — | | | | 28,661 | | | | — | | | | 28,661 | |
| | | | | | | | | | | | | | | | |
Subtotal | | $ | 22,619,246 | | | $ | 59,674,842 | | | $ | — | | | $ | 82,294,088 | |
| | | | | | | | | | | | | | | | |
Investments valued at NAV(a) | | | | | | | | | | | | | | | 239,190 | |
| | | | | | | | | | | | | | | | |
Total Investments | | | | | | | | | | | | | | $ | 82,533,278 | |
| | | | | | | | | | | | | | | | |
| | (a) | As of December 31, 2018, certain investments of the Fund were fair valued using NAV per share as no quoted market value is available and therefore have been excluded from the fair value hierarchy. | |
During the year ended December 31, 2018, there were no transfers between levels.
See notes to financial statements.
| | |
| 6 | | 2018 BLACKROCK ANNUAL REPORTTO SHAREHOLDERS |
Statement of Assets and Liabilities
December 31, 2018
| | | | |
| | | BlackRock
International V.I. Fund | |
| |
ASSETS | | | | |
Investments at value — unaffiliated (including securities loaned at value of $235,456) (cost — $88,653,915) | | $ | 79,806,969 | |
Investments at value — affiliated (cost — $2,726,309) | | | 2,726,309 | |
Foreign currency at value (cost — $154) | | | 18 | |
Receivables: | | | | |
Securities lending income — affiliated | | | 268 | |
Capital shares sold | | | 168,374 | |
Dividends — affiliated | | | 7,103 | |
Dividends — unaffiliated | | | 166,163 | |
Prepaid expenses | | | 97 | |
| | | | |
Total assets | | | 82,875,301 | |
| | | | |
| |
LIABILITIES | | | | |
Bank overdraft | | | 419 | |
Cash collateral on securities loaned at value | | | 241,690 | |
Payables: | | | | |
Capital shares redeemed | | | 29,507 | |
Deferred foreign capital gain tax | | | 51,486 | |
Printing fees | | | 30,408 | |
Professional fees | | | 79,251 | |
Transfer agent fees | | | 97,926 | |
Board realignment and consolidation | | | 8,811 | |
Investment advisory fees | | | 53,799 | |
Directors’ and Officer’s fees | | | 5,269 | |
Other affiliates | | | 269 | |
Other accrued expenses | | | 43,678 | |
| | | | |
Total liabilities | | | 642,513 | |
| | | | |
| |
NET ASSETS | | $ | 82,232,788 | |
| | | | |
| |
NET ASSETS CONSIST OF | | | | |
Paid-in capital | | $ | 93,857,758 | |
Accumulated loss | | | (11,624,970 | ) |
| | | | |
NET ASSETS | | $ | 82,232,788 | |
| | | | |
Class I — Based on net assets of $82,232,788 and 8,937,413 shares outstanding, 100 million shares authorized, $0.10 par value. | | $ | 9.20 | |
| | | | |
See notes to financial statements.
Statement of Operations
Year Ended December 31, 2018
| | | | |
| | | BlackRock
International V.I. Fund | |
| |
INVESTMENT INCOME | | | | |
Dividends — affiliated | | $ | 55,135 | |
Dividends — unaffiliated(a) | | | 2,865,109 | |
Securities lending income — affiliated — net | | | 14,652 | |
Foreign taxes withheld | | | (252,171 | ) |
| | | | |
Total investment income | | | 2,682,725 | |
| | | | |
| |
EXPENSES | | | | |
Investment advisory | | | 789,770 | |
Transfer agent | | | 224,619 | |
Professional | | | 105,167 | |
Accounting services | | | 45,300 | |
Custodian | | | 44,492 | |
Directors and Officer | | | 18,813 | |
Printing | | | 14,676 | |
Board realignment and consolidation | | | 8,874 | |
Miscellaneous | | | 10,490 | |
| | | | |
Total expenses | | | 1,262,201 | |
Less: | | | | |
Fees waived and/or reimbursed by the Manager | | | (2,508 | ) |
Transfer agent fees waived and/or reimbursed | | | (135,519 | ) |
| | | | |
Total expenses after fees waived and/or reimbursed | | | 1,124,174 | |
| | | | |
Net investment income | | | 1,558,551 | |
| | | | |
| |
REALIZED AND UNREALIZED GAIN (LOSS) | | | | |
Net realized gain (loss) from: | | | | |
Investments — affiliated | | | (335 | ) |
Investments — unaffiliated (net of $19 foreign capital gain tax) | | | 38,448 | |
Foreign currency transactions | | | (27,768 | ) |
| | | | |
| | | 10,345 | |
| | | | |
Net change in unrealized appreciation (depreciation) on: | | | | |
Investments — affiliated | | | 274 | |
Investments — unaffiliated (net of $74,084 foreign capital gain tax) | | | (25,215,127 | ) |
Foreign currency translations | | | (4,166 | ) |
| | | | |
| | | (25,219,019 | ) |
| | | | |
Net realized and unrealized loss | | | (25,208,674 | ) |
| | | | |
NET DECREASE IN NET ASSETS RESULTING FROM OPERATIONS | | $ | (23,650,123 | ) |
| | | | |
| (a) | Includes non-recurring dividends in the amount of $330,186. |
See notes to financial statements.
| | |
| 8 | | 2018 BLACKROCK ANNUAL REPORTTO SHAREHOLDERS |
Statement of Changes in Net Assets
| | | | | | | | |
| | | BlackRock International V.I. Fund | |
| | | Year Ended December 31, | |
| | | 2018 | | | 2017 | |
| | |
INCREASE (DECREASE) IN NET ASSETS | | | | | | | | |
| | |
OPERATIONS | | | | | | | | |
Net investment income | | $ | 1,558,551 | | | $ | 1,434,265 | |
Net realized gain | | | 10,345 | | | | 9,173,925 | |
Net change in unrealized appreciation (depreciation) | | | (25,219,019 | ) | | | 17,210,656 | |
| | | | | | | | |
Net increase (decrease) in net assets resulting from operations | | | (23,650,123 | ) | | | 27,818,846 | |
| | | | | | | | |
| | |
DISTRIBUTIONS TO SHAREHOLDERS(a)(b) | | | | | | | | |
Decrease in net assets resulting from distributions to shareholders | | | (5,532,493 | ) | | | — | |
| | | | | | | | |
| | |
CAPITAL SHARE TRANSACTIONS | | | | | | | | |
Shares sold | | | 7,398,984 | | | | 8,733,286 | |
Shares issued in reinvestment of distributions | | | 5,532,493 | | | | — | |
Shares redeemed | | | (16,948,689 | ) | | | (17,320,222 | ) |
| | | | | | | | |
Net decrease in net assets derived from capital share transactions | | | (4,017,212 | ) | | | (8,586,936 | ) |
| | | | | | | | |
| | |
NET ASSETS(b) | | | | | | | | |
Total increase (decrease) in net assets | | | (33,199,828 | ) | | | 19,231,910 | |
Beginning of year | | | 115,432,616 | | | | 96,200,706 | |
| | | | | | | | |
End of year | | $ | 82,232,788 | | | $ | 115,432,616 | |
| | | | | | | | |
| (a) | Distributions for annual periods determined in accordance with U.S. federal income tax regulations. |
| (b) | Prior year distribution character information and undistributed net investment income has been modified or removed to conform with current year Regulation S-X presentation changes. Refer to Note 11 for this prior year information. |
See notes to financial statements.
Financial Highlights
(For a share outstanding throughout each period)
| | | | | | | | | | | | | | | | | | | | |
| | | BlackRock International V.I. Fund | |
| |
| | | Class I | |
| |
| | | Year Ended December 31, | |
| | | 2018 | | | 2017 | | | 2016 | | | 2015 | | | 2014 | |
| | | | | |
Net asset value, beginning of year | | $ | 12.56 | | | $ | 9.58 | | | $ | 9.71 | | | $ | 10.10 | | | $ | 10.87 | |
| | | | | | | | | | | | | | | | | | | | |
Net investment income(a) | | | 0.17 | (b) | | | 0.15 | | | | 0.15 | | | | 0.14 | | | | 0.13 | |
Net realized and unrealized gain (loss) | | | (2.88 | ) | | | 2.83 | | | | (0.11 | ) | | | (0.42 | ) | | | (0.69 | ) |
| | | | | | | | | | | | | | | | | | | | |
Net increase (decrease) from investment operations | | | (2.71 | ) | | | 2.98 | | | | 0.04 | | | | (0.28 | ) | | | (0.56 | ) |
| | | | | | | | | | | | | | | | | | | | |
| | | | | |
| Distributions(c) | | | | | | | | | | | | | | | |
From net investment income | | | (0.32 | ) | | | — | | | | (0.17 | ) | | | (0.11 | ) | | | (0.21 | ) |
From net realized gain | | | (0.33 | ) | | | — | | | | — | | | | — | | | | — | |
From return of capital | | | — | | | | — | | | | (0.00 | )(d) | | | — | | | | — | |
| | | | | | | | | | | | | | | | | | | | |
Total distributions | | | (0.65 | ) | | | — | | | | (0.17 | ) | | | (0.11 | ) | | | (0.21 | ) |
| | | | | | | | | | | | | | | | | | | | |
| | | | | |
Net asset value, end of year | | $ | 9.20 | | | $ | 12.56 | | | $ | 9.58 | | | $ | 9.71 | | | $ | 10.10 | |
| | | | | | | | | | | | | | | | | | | | |
| | | | | |
Total Return(e) | | | | | | | | | | | | | | | | | | | | |
Based on net asset value | | | (21.82 | )% | | | 31.11 | % | | | 0.39 | % | | | (2.76 | )% | | | (5.19 | )% |
| | | | | | | | | | | | | | | | | | | | |
| | | | | |
Ratios to Average Net Assets(f) | | | | | | | | | | | | | | | | | | | | |
Total expenses | | | 1.20 | % | | | 1.24 | % | | | 1.15 | % | | | 1.09 | % | | | 1.11 | % |
| | | | | | | | | | | | | | | | | | | | |
Total expenses after fees waived and/or reimbursed | | | 1.07 | % | | | 1.11 | % | | | 1.04 | % | | | 0.98 | % | | | 0.99 | % |
| | | | | | | | | | | | | | | | | | | | |
Net investment income | | | 1.48 | %(b) | | | 1.37 | % | | | 1.57 | % | | | 1.35 | % | | | 1.21 | % |
| | | | | | | | | | | | | | | | | | | | |
| | | | | |
Supplemental Data | | | | | | | | | | | | | | | | | | | | |
Net assets, end of year (000) | | $ | 82,233 | | | $ | 115,433 | | | $ | 96,201 | | | $ | 107,942 | | | $ | 125,144 | |
| | | | | | | | | | | | | | | | | | | | |
Portfolio turnover rate | | | 100 | % | | | 103 | % | | | 82 | % | | | 112 | % | | | 129 | % |
| | | | | | | | | | | | | | | | | | | | |
| (a) | Based on average shares outstanding. |
| (b) | Net investment income per share and the ratio of net investment income to average net assets includes $0.04 per share and 0.31%, respectively, resulting from non-recurring dividends. |
| (c) | Distributions for annual periods determined in accordance with U.S. federal income tax regulations. |
| (d) | Amount is greater than $(0.005) per share. |
| (e) | Where applicable, excludes insurance-related fees and expenses and assumes the reinvestment of distributions. |
| (f) | Excludes expenses incurred indirectly as a result of investments in underlying funds as follows: |
| | | | | | | | | | | | | | | | | | | | | | | | | | | | | | | | | | | | | | | | |
| | | Year Ended December 31, | |
| | | 2018 | | | | | | 2017 | | | | | | 2016 | | | | | | 2015 | | | | | | 2014 | | | | |
Investments in underlying funds | | | 0.01 | % | | | | | | | 0.01 | % | | | | | | | — | % | | | | | | | — | % | | | | | | | — | % | | | | |
| | | | | | | | | | | | | | | | | | | | | | | | | | | | | | | | | | | | | | | | |
See notes to financial statements.
| | |
| 10 | | 2018 BLACKROCK ANNUAL REPORTTO SHAREHOLDERS |
Notes to Financial Statements
BlackRock Variable Series Funds, Inc. (the “Company”) is registered under the Investment Company Act of 1940, as amended (the “1940 Act”), as anopen-end management investment company. The Company is organized as a Maryland corporation that is comprised of 15 separate portfolios. The funds offer shares to insurance companies for their separate accounts to fund benefits under certain variable annuity and variable life insurance contracts. The financial statements presented are for BlackRock International V.I. Fund (the “Fund”). The Fund is classified as diversified.
The Fund, together with certain other registered investment companies advised by BlackRock Advisors, LLC (the “Manager”) or its affiliates, is included in a complex ofopen-end funds referred to as the Equity-Bond Complex.
| 2. | SIGNIFICANT ACCOUNTING POLICIES |
The financial statements are prepared in conformity with accounting principles generally accepted in the United States of America (“U.S. GAAP”), which may require management to make estimates and assumptions that affect the reported amounts of assets and liabilities in the financial statements, disclosure of contingent assets and liabilities at the date of the financial statements and the reported amounts of increases and decreases in net assets from operations during the reporting period. Actual results could differ from those estimates. The Fund is considered an investment company under U.S. GAAP and follows the accounting and reporting guidance applicable to investment companies. Below is a summary of significant accounting policies:
Investment Transactions and Income Recognition: For financial reporting purposes, investment transactions are recorded on the dates the transactions are entered into (the “trade dates”). Realized gains and losses on investment transactions are determined on the identified cost basis. Dividend income and is recorded on theex-dividend date. Dividends from foreign securities where theex-dividend date may have passed are subsequently recorded when the Fund is informed of theex-dividend date. Under the applicable foreign tax laws, a withholding tax at various rates may be imposed on capital gains, dividends and interest.
Foreign Currency Translation: The Fund’s books and records are maintained in U.S. dollars. Securities and other assets and liabilities denominated in foreign currencies are translated into U.S. dollars using exchange rates determined as of the close of trading on the New York Stock Exchange (“NYSE”). Purchases and sales of investments are recorded at the rates of exchange prevailing on the respective dates of such transactions. Generally, when the U.S. dollar rises in value against a foreign currency, the investments denominated in that currency will lose value; the opposite effect occurs if the U.S. dollar falls in relative value.
The Fund does not isolate the portion of the results of operations arising as a result of changes in the exchange rates from the changes in the market prices of investments held or sold for financial reporting purposes. Accordingly, the effects of changes in exchange rates on investments are not segregated in the Statement of Operations from the effects of changes in market prices of those investments, but are included as a component of net realized and unrealized gain (loss) from investments. The Fund reports realized currency gains (losses) on foreign currency related transactions as components of net realized gain (loss) for financial reporting purposes, whereas such components are generally treated as ordinary income for U.S. federal income tax purposes.
Distributions: Distributions paid by the Fund are recorded on theex-dividend date. Distributions of capital gains are recorded on theex-dividend date and made at least annually. The character and timing of distributions are determined in accordance with U.S. federal income tax regulations, which may differ from U.S. GAAP.
Recent Accounting Standards: In August 2018, the Financial Accounting Standards Board issued Accounting Standards Update2018-13 “Changes to the Disclosure Requirements for Fair Value Measurement” which modifies disclosure requirements for fair value measurements. The guidance is effective for fiscal years beginning after December 15, 2019 and for interim periods within those fiscal years. Management is currently evaluating the impact of this guidance to the Fund.
Indemnifications: In the normal course of business, the Fund enters into contracts that contain a variety of representations that provide general indemnification. The Fund’s maximum exposure under these arrangements is unknown because it involves future potential claims against the Fund, which cannot be predicted with any certainty.
Other: Expenses directly related to the Fund are charged to the Fund. Other operating expenses shared by several funds, including other funds managed by the Manager, are prorated among those funds on the basis of relative net assets or other appropriate methods.
The Fund has an arrangement with its custodian whereby credits are earned on uninvested cash balances, which could be used to reduce custody fees and/or overdraft charges. The Fund may incur charges on certain uninvested cash balances and overdrafts, subject to certain conditions.
| 3. | INVESTMENT VALUATION AND FAIR VALUE MEASUREMENTS |
Investment Valuation Policies: The Fund’s investments are valued at fair value (also referred to as “market value” within the financial statements) as of the close of trading on the NYSE (generally 4:00 p.m., Eastern time). U.S. GAAP defines fair value as the price the Fund would receive to sell an asset or pay to transfer a liability in an orderly transaction between market participants at the measurement date. The Fund determines the fair values of its financial instruments using various independent dealers or pricing services under policies approved by the Board of Directors of the Company (the “Board”). The BlackRock Global Valuation Methodologies Committee (the “Global Valuation Committee”) is the committee formed by management to develop global pricing policies and procedures and to oversee the pricing function for all financial instruments.
| | | | |
| NOTESTO FINANCIAL STATEMENTS | | | 11 | |
Notes to Financial Statements (continued)
Fair Value Inputs and Methodologies: The following methods and inputs are used to establish the fair value of the Fund’s assets and liabilities:
| | • | | Equity investments traded on a recognized securities exchange are valued at the official closing price each day, if available. For equity investments traded on more than one exchange, the official closing price on the exchange where the stock is primarily traded is used. Equity investments traded on a recognized exchange for which there were no sales on that day may be valued at the last available bid (long positions) or ask (short positions) price. |
| | • | | Generally, trading in foreign instruments is substantially completed each day at various times prior to the close of trading on the NYSE. Occasionally, events affecting the values of such instruments may occur between the foreign market close and the close of trading on the NYSE that may not be reflected in the computation of the Fund’s net assets. Each business day, the Fund uses a pricing service to assist with the valuation of certain foreign exchange-traded equity securities and foreign exchange-traded andover-the-counter (“OTC”) options (the “Systematic Fair Value Price”). Using current market factors, the Systematic Fair Value Price is designed to value such foreign securities and foreign options at fair value as of the close of trading on the NYSE, which follows the close of the local markets. |
| | • | | Investments inopen-end U.S. mutual funds are valued at net asset value (“NAV”) each business day. |
| | • | | The Fund values its investment in SL Liquidity Series, LLC, Money Market Series (the “Money Market Series”) at fair value, which is ordinarily based upon its pro rata ownership in the underlying fund’s net assets. The Money Market Series seeks current income consistent with maintaining liquidity and preserving capital. Although the Money Market Series is not registered under the 1940 Act, its investments may follow the parameters of investments by a money market fund that is subject to Rule2a-7 under the 1940 Act. |
If events (e.g., a company announcement, market volatility or a natural disaster) occur that are expected to materially affect the value of such investments, or in the event that the application of these methods of valuation results in a price for an investment that is deemed not to be representative of the market value of such investment, or if a price is not available, the investment will be valued by the Global Valuation Committee, or its delegate, in accordance with a policy approved by the Board as reflecting fair value (“Fair Valued Investments”). The fair valuation approaches that may be used by the Global Valuation Committee will include market approach, income approach and cost approach. Valuation techniques such as discounted cash flow, use of market comparables and matrix pricing are types of valuation approaches and are typically used in determining fair value. When determining the price for Fair Valued Investments, the Global Valuation Committee, or its delegate, seeks to determine the price that the Fund might reasonably expect to receive or pay from the current sale or purchase of that asset or liability in anarm’s-length transaction. Fair value determinations shall be based upon all available factors that the Global Valuation Committee, or its delegate, deems relevant and consistent with the principles of fair value measurement. The pricing of all Fair Valued Investments is subsequently reported to the Board or a committee thereof on a quarterly basis.
Fair Value Hierarchy: Various inputs are used in determining the fair value of investments and derivative financial instruments. These inputs to valuation techniques are categorized into a fair value hierarchy consisting of three broad levels for financial statement purposes as follows:
| | • | | Level 1 — Unadjusted price quotations in active markets/exchanges for identical assets or liabilities that the Fund has the ability to access |
| | • | | Level 2 — Other observable inputs (including, but not limited to, quoted prices for similar assets or liabilities in markets that are active, quoted prices for identical or similar assets or liabilities in markets that are not active, inputs other than quoted prices that are observable for the assets or liabilities (such as interest rates, yield curves, volatilities, prepayment speeds, loss severities, credit risks and default rates) or other market–corroborated inputs) |
| | • | | Level 3 — Unobservable inputs based on the best information available in the circumstances, to the extent observable inputs are not available (including the Fund’s own assumptions used in determining the fair value of investments) |
The hierarchy gives the highest priority to unadjusted quoted prices in active markets for identical assets or liabilities (Level 1 measurements) and the lowest priority to unobservable inputs (Level 3 measurements). Accordingly, the degree of judgment exercised in determining fair value is greatest for instruments categorized in Level 3. The inputs used to measure fair value may fall into different levels of the fair value hierarchy. In such cases, for disclosure purposes, the fair value hierarchy classification is determined based on the lowest level input that is significant to the fair value measurement in its entirety. Investments classified within Level 3 have significant unobservable inputs used by the Global Valuation Committee in determining the price for Fair Valued Investments. Level 3 investments include equity or debt issued by privately held companies or funds. There may not be a secondary market, and/or there are a limited number of investors. Level 3 investments may also be adjusted to reflect illiquidity and/ornon-transferability, with the amount of such discount estimated by the Global Valuation Committee in the absence of market information.
Changes in valuation techniques may result in transfers into or out of an assigned level within the hierarchy. In accordance with the Fund’s policy, transfers between different levels of the fair value hierarchy are deemed to have occurred as of the beginning of the reporting period. The categorization of a value determined for investments is based on the pricing transparency of the investments and is not necessarily an indication of the risks associated with investing in those securities.
As of December 31, 2018, certain investments of the Fund were valued using NAV per share as no quoted market value is available and therefore have been excluded from the fair value hierarchy.
| 4. | SECURITIES AND OTHER INVESTMENTS |
Securities Lending: The Fund may lend its securities to approved borrowers, such as brokers, dealers and other financial institutions. The borrower pledges and maintains with the Fund collateral consisting of cash, an irrevocable letter of credit issued by a bank, or securities issued or guaranteed by the U.S. Government. The initial collateral received by the Fund is required to have a value of at least 102% of the current value of the loaned securities for securities traded on U.S. exchanges and a value of at least 105% for all other securities. The collateral is maintained thereafter at a value equal to at least 100% of the current market value of the securities on loan. The market value of the loaned securities is determined at the close of each business day of the Fund and any additional required collateral is delivered to the Fund, or excess collateral returned by the Fund, on the next business day. During the term of the loan, the Fund is entitled to all distributions made on or in respect of the loaned
| | |
| 12 | | 2018 BLACKROCK ANNUAL REPORTTO SHAREHOLDERS |
Notes to Financial Statements (continued)
securities, but does not receive interest income on securities received as collateral. Loans of securities are terminable at any time and the borrower, after notice, is required to return borrowed securities within the standard time period for settlement of securities transactions.
The market value of any securities on loan, all of which were classified as common stocks in the Fund’s Schedule of Investments, and the value of any related collateral are shown separately in the Statement of Assets and Liabilities as a component of investments at value – unaffiliated, and collateral on securities loaned at value, respectively. As of period end, any securities on loan were collateralized by cash and/or U.S. Government obligations. Cash collateral invested by the securities lending agent, BlackRock Investment Management, LLC (“BIM”), if any, is disclosed in the Schedule of Investments.
Securities lending transactions are entered into by the Fund under Master Securities Lending Agreements (each, an “MSLA”), which provide the right, in the event of default (including bankruptcy or insolvency), for thenon-defaulting party to liquidate the collateral and calculate a net exposure to the defaulting party or request additional collateral. In the event that a borrower defaults, the Fund, as lender, would offset the market value of the collateral received against the market value of the securities loaned. When the value of the collateral is greater than that of the market value of the securities loaned, the lender is left with a net amount payable to the defaulting party. However, bankruptcy or insolvency laws of a particular jurisdiction may impose restrictions on or prohibitions against such a right of offset in the event of an MSLA counterparty’s bankruptcy or insolvency. Under the MSLA, absent an event of default, the borrower can resell orre-pledge the loaned securities, and the Fund can reinvest cash collateral received in connection with loaned securities. Upon an event of default, the parties’ obligations to return the securities or collateral to the other party are extinguished, and the parties can resell orre-pledge the loaned securities or the collateral received in connection with the loaned securities in order to satisfy the defaulting party’s net payment obligation for all transactions under the MSLA. The defaulting party remains liable for any deficiency.
As of period end, the following table is a summary of the Fund’s securities lending agreements by counterparty which are subject to offset under an MSLA:
| | | | | | | | | | | | |
| Counterparty | | Securities
Loaned at Value | | | Cash Collateral
Received (a) | | | Net
Amount | |
JP Morgan Securities LLC | | $ | 235,456 | | | $ | (235,456 | ) | | $ | — | |
| | | | | | | | | | | | |
| | (a) | Cash collateral with a value of $ 241,690 has been received in connection with securities lending agreements. Collateral received in excess of the value of securities loaned from the individual counterparty, if any, is not shown for financial reporting purposes in the table above. | |
The risks of securities lending include the risk that the borrower may not provide additional collateral when required or may not return the securities when due. To mitigate these risks, the Fund benefits from a borrower default indemnity provided by BIM. BIM’s indemnity allows for full replacement of the securities loaned if the collateral received does not cover the value on the securities loaned in the event of borrower default. The Fund could incur a loss if the value of an investment purchased with cash collateral falls below the market value of loaned securities or if the value of an investment purchased with cash collateral falls below the value of the original cash collateral received.
| 5. | INVESTMENT ADVISORY AGREEMENT AND OTHER TRANSACTIONS WITH AFFILIATES |
Investment Advisory: The Company, on behalf of the Fund, entered into an Investment Advisory Agreement with the Manager, the Fund’s investment adviser and an indirect, wholly-owned subsidiary of BlackRock, to provide investment advisory and administrative services. The Manager is responsible for the management of the Fund’s portfolio and provides the personnel, facilities, equipment and certain other services necessary to the operations of the Fund.
For such services, the Fund pays the Manager a monthly fee at an annual rate equal to the following percentages of the average daily value of the Fund’s net assets:
| | | | |
| Average Daily Net Assets | | Investment
Advisory Fees | |
First $1 Billion | | | 0.75 | % |
$1 Billion — $3 Billion | | | 0.71 | |
$3 Billion — $5 Billion | | | 0.68 | |
$5 Billion — $10 Billion | | | 0.65 | |
Greater than $10 Billion | | | 0.64 | |
With respect to the Fund, the Manager entered into asub-advisory agreement with BlackRock International Limited (“BIL”), an affiliate of the Manager. The Manager pays BIL, for services it provides, a monthly fee that is a percentage of the investment advisory fees paid by the Fund to the Manager.
Distribution Fees: The Company, on behalf of the Fund, entered into a Distribution Agreement and a Distribution Plan with BlackRock Investments, LLC (“BRIL”), an affiliate of the Manager. Pursuant to the Distribution Plan and in accordance with Rule12b-1 under the 1940 Act, the Fund pays BRIL ongoing service and distribution fees. The fees are accrued daily and paid monthly at annual rates based upon the average daily net assets of the relevant share class of the Fund. For the year ended December 31, 2018 the Fund had no distribution fees.
BRIL and broker-dealers, pursuant tosub-agreements with BRIL, provide shareholder servicing and distribution services to the Fund. The ongoing service and/or distribution fee compensates BRIL and each broker-dealer for providing shareholder servicing and/or distribution related services to shareholders.
Transfer Agent: On behalf of the Fund, the Manager entered into agreements with insurance companies and other financial intermediaries (“Service Organizations”), some of which may be affiliates. Pursuant to these agreements, the Service Organizations provide the Fund with administrative, networking, recordkeeping,sub-transfer agency and shareholder services tosub-accounts they service. For these services, the Service Organizations receive an annual fee per shareholder account, which will vary depending on share class and/or net assets of Fund shareholders serviced by the Service Organizations which is shown as transfer agent. For the year ended December 31, 2018, the Fund did not pay any amounts to affiliates in return for these services.
| | | | |
| NOTESTO FINANCIAL STATEMENTS | | | 13 | |
Notes to Financial Statements (continued)
In addition, the Fund pays the transfer agent, which is not an affiliate, a fee for the issuance, transfer and redemption of shares and the opening and maintenance of shareholder accounts, which is included in transfer agent in the Statement of Operations. For the year ended December 31, 2018, the Fund had no class specific transfer agent fees.
Expense Limitations, Waivers and Reimbursements: With respect to the Fund, the Manager voluntarily agreed to waive its investment advisory fees by the amount of investment advisory fees the Fund pays to the Manager indirectly through its investment in affiliated money market funds (the “affiliated money market fund waiver”). The amount of waivers and/or reimbursements of fees and expenses made pursuant to the expense limitation described below will be reduced by the amount of the affiliated money market fund waiver. This amount is included in fees waived and/or reimbursed by the Manager in the Statement of Operations. For the year ended December 31, 2018, the amount waived was $2,508.
The Manager has contractually agreed to waive its investment advisory fee with respect to any portion of the Fund’s assets invested in affiliated equity and fixed-income mutual funds and affiliated exchange-traded funds that have a contractual management fee through April 30, 2019. The contractual agreement may be terminated upon 90 days’ notice by a majority of the directors who are not “interested persons” of the Fund, as defined in the 1940 Act (“Independent Directors”), or by a vote of a majority of the outstanding voting securities of the Fund. For the year ended December 31, 2018, there were no fees waived by the Manager pursuant to this arrangement .
For the year ended December 31, 2018, the Fund reimbursed the Manager $1,202 for certain accounting services, which is included in accounting services in the Statement of Operations.
The Manager contractually agreed to reimburse transfer agent fees in order to limit such expenses at 0.08% of average daily net assets. The Manager has agreed not to reduce or discontinue this contractual expense limitation through April 30, 2019, unless approved by the Board, including a majority of the Independent Directors, or by a vote of a majority of the outstanding voting securities of the Fund. This amount is shown as transfer agent fees waived and/or reimbursed — class specific in the Statement of Operations. For the year ended December 31, 2018, class specific waivers and/or reimbursements were $135,519.
With respect to the Fund, the Manager contractually agreed to waive and/or reimburse fees or expenses in order to limit expenses, excluding interest expense, dividend expense, tax expense, acquired fund fees and expenses, and certain other fund expenses, which constitute extraordinary expenses not incurred in the ordinary course of the Fund’s business (“expense limitation”). The expense limitation as a percentage of average daily net assets is 1.25% for Class I.
The Manager has agreed not to reduce or discontinue this contractual expense limitation through April 30, 2019, unless approved by the Board, including a majority of the Independent Directors, or by a vote of a majority of the outstanding voting securities of the Fund. For the year ended December 31, 2018, there were no fees waived and/or reimbursed by the Manager.
Securities Lending:The U.S. Securities and Exchange Commission (“SEC”) has issued an exemptive order which permits BIM, an affiliate of the Manager, to serve as securities lending agent for the Fund, subject to applicable conditions. As securities lending agent, BIM bears all operational costs directly related to securities lending. The Fund is responsible for expenses in connection with the investment of cash collateral received for securities on loan (the “collateral investment expenses”). The cash collateral is invested in a private investment company managed by the Manager or its affiliates. However, BIM has agreed to cap the collateral investment expenses of the private investment company to an annual rate of 0.04%. The investment adviser to the private investment company will not charge any advisory fees with respect to shares purchased by the Fund. The private investment company in which the cash collateral has been invested may, under certain circumstances, impose a liquidity fee of up to 2% of the value withdrawn or temporarily restrict withdrawals for up to 10 business days during a 90 day period, in the event that the private investment company’s weekly liquid assets fall below certain thresholds.
Securities lending income is equal to the total of income earned from the reinvestment of cash collateral, net of fees and other payments to and from borrowers of securities, and less the collateral investment expenses. The Fund retains a portion of securities lending income and remits a remaining portion to BIM as compensation for its services as securities lending agent.
Pursuant to a securities lending agreement, the Fund retains 80% of securities lending income, and this amount retained can never be less than 70% of the total of securities lending income plus the collateral investment expenses.
In addition, commencing the business day following the date that the aggregate securities lending income earned across the Equity-Bond Complex in a calendar year exceeds a specified threshold, the Fund, pursuant to the securities lending agreement, will retain for the remainder of that calendar year securities lending income in an amount equal to 85% of securities lending income, and this amount retained can never be less than 70% of the total of securities lending income plus the collateral investment expenses.
The share of securities lending income earned by the Fund is shown as securities lending income — affiliated — net in the Statement of Operations. For the year ended December 31, 2018, the Fund paid BIM $3,288 for securities lending agent services.
Interfund Lending: In accordance with an exemptive order (the “Order”) from the SEC, the Fund may participate in a joint lending and borrowing facility for temporary purposes (the “Interfund Lending Program”), subject to compliance with the terms and conditions of the Order, and to the extent permitted by the Fund’s investment policies and restrictions. The Fund is currently permitted to borrow and lend under the Interfund Lending Program.
A lending BlackRock fund may lend in aggregate up to 15% of its net assets, but may not lend more than 5% of its net assets to any one borrowing fund through the Interfund Lending Program. A borrowing BlackRock fund may not borrow through the Interfund Lending Program or from any other source more than 33 1/3% of its total assets (or any lower threshold provided for by the fund’s investment restrictions). If a borrowing BlackRock fund’s total outstanding borrowings exceed 10% of its total assets, each of its outstanding interfund loans will be subject to collateralization of at least 102% of the outstanding principal value of the loan. All interfund loans are for temporary or emergency purposes and the interest rate to be charged will be the average of the highest current overnight repurchase agreement rate available to a lending fund and the bank loan rate, as calculated according to a formula established by the Board.
| | |
| 14 | | 2018 BLACKROCK ANNUAL REPORTTO SHAREHOLDERS |
Notes to Financial Statements (continued)
During the year ended December 31, 2018, the Fund did not participate in the Interfund Lending Program.
Directors and Officers: Certain directors and/or officers of the Company are directors and/or officers of BlackRock or its affiliates. The Fund reimburses the Manager for a portion of the compensation paid to the Company’s Chief Compliance Officer, which is included in Directors and Officer in the Statement of Operations.
For the year ended December 31, 2018, purchases and sales of investments, and excluding short-term securities, were $101,447,471 and $108,911,204, respectively.
It is the Fund’s policy to comply with the requirements of the Internal Revenue Code of 1986, as amended, applicable to regulated investment companies, and to distribute substantially all of its taxable income to its shareholders. Therefore, no U.S. federal income tax provision is required.
The Fund files U.S. federal and various state and local tax returns. No income tax returns are currently under examination. The statute of limitations on the Fund’s U.S. federal tax returns generally remains open for each of the four years ended December 31, 2018. The statutes of limitations on the Fund’s state and local tax returns may remain open for an additional year depending upon the jurisdiction.
Management has analyzed tax laws and regulations and their application to the Fund as of December 31, 2018, inclusive of the open tax return years, and does not believe that there are any uncertain tax positions that require recognition of a tax liability in the Fund’s financial statements.
The tax character of distributions paid was as follows:
| | | | | | | | |
| | | 12/31/2018 | | | 12/31/2017 | |
Ordinary income | | $ | 2,774,782 | | | $ | — | |
Long-term capital gains | | | 2,757,711 | | | | — | |
| | | | | | | | |
| | $ | 5,532,493 | | | $ | — | |
| | | | | | | | |
As of period end, the tax components of accumulated loss were as follows:
| | | | |
Undistributed ordinary income | | $ | 51,998 | |
Net unrealized losses(a) | | | (8,938,009 | ) |
Qualified late-year losses(b) | | | (2,738,959 | ) |
| | | | |
| | $ | (11,624,970 | ) |
| | | | |
| | (a) | The difference between book-basis and tax-basis net unrealized gains was attributable primarily to the tax deferral of losses on wash sales and the timing and recognition of partnership income. | |
| | (b) | The Fund has elected to defer certain qualified late-year losses and recognize such losses in the next taxable year. | |
As of December 31, 2018, gross unrealized appreciation and depreciation for investments based on cost for U.S. federal income tax purposes were as follows:
| | | | |
Tax cost | | $ | 91,424,028 | |
| | | | |
Gross unrealized appreciation | | $ | 1,885,822 | |
Gross unrealized depreciation | | | (10,776,572 | ) |
| | | | |
Net unrealized depreciation | | $ | (8,890,750 | ) |
| | | | |
The Company, on behalf of the Fund, along with certain other funds managed by the Manager and its affiliates (“Participating Funds”), is a party to a364-day, $2.25 billion credit agreement with a group of lenders. Under this agreement, the Fund may borrow to fund shareholder redemptions. Excluding commitments designated for certain individual funds, the Participating Funds, including the Fund, can borrow up to an aggregate commitment amount of $1.75 billion at any time outstanding, subject to asset coverage and other limitations as specified in the agreement. The credit agreement has the following terms: a fee of 0.10% per annum on unused commitment amounts and interest at a rate equal to the higher of(a) one-month LIBOR (but, in any event, not less than 0.00%) on the date the loan is made plus 0.80% per annum or (b) the Fed Funds rate (but, in any event, not less than 0.00%) in effect from time to time plus 0.80% per annum on amounts borrowed. The agreement expires in April 2019 unless extended or renewed. Prior to April 19, 2018, the aggregate commitment amount was $2.1 billion and the fee was 0.12% per annum. Participating Funds paid an upfront commitment fee of 0.02% on the total commitment amounts, in addition to administration, legal and arrangement fees, which are included in miscellaneous expenses in the Statement of Operations. These fees were allocated among such funds based upon portions of the aggregate commitment available to them and relative net assets of Participating Funds. During the year ended December 31, 2018, the Fund did not borrow under the credit agreement.
In the normal course of business, the Fund invests in securities or other instruments and may enter into certain transactions, and such activities subject the Fund to various risks, including among others, fluctuations in the market (market risk) or failure of an issuer to meet all of its obligations. The value of securities or other instruments may also be affected by various factors, including, without limitation: (i) the general economy; (ii) the overall market as well as local, regional or global political and/or social instability; (iii) regulation, taxation or international tax treaties between various countries; or (iv) currency, interest rate and price fluctuations. The Fund’s prospectus provides details of the risks to which the Fund is subject.
| | | | |
| NOTESTO FINANCIAL STATEMENTS | | | 15 | |
Notes to Financial Statements (continued)
The Fund may be exposed to additional risks when reinvesting cash collateral in money market funds that do not seek to maintain a stable NAV per share of $1.00, which may be subject to redemption gates or liquidity fees under certain circumstances.
Valuation Risk: The market values of equities, such as common stocks and preferred securities or equity related investments, such as futures and options, may decline due to general market conditions which are not specifically related to a particular company. They may also decline due to factors which affect a particular industry or industries. The Fund may invest in illiquid investments and may experience difficulty in selling those investments in a timely manner at the price that it believes the investments are worth. Prices may fluctuate widely over short or extended periods in response to company, market or economic news. Markets also tend to move in cycles, with periods of rising and falling prices. This volatility may cause the Fund’s NAV to experience significant increases or decreases over short periods of time. If there is a general decline in the securities and other markets, the NAV of the Fund may lose value, regardless of the individual results of the securities and other instruments in which the Fund invests.
Counterparty Credit Risk: The Fund may be exposed to counterparty credit risk, or the risk that an entity may fail to or be unable to perform on its commitments related to unsettled or open transactions. The Fund manages counterparty credit risk by entering into transactions only with counterparties that the Manager believes have the financial resources to honor their obligations and by monitoring the financial stability of those counterparties. Financial assets, which potentially expose the Fund to market, issuer and counterparty credit risks, consist principally of financial instruments and receivables due from counterparties. The extent of the Fund’s exposure to market, issuer and counterparty credit risks with respect to these financial assets is approximately their value recorded in the Statement of Assets and Liabilities, less any collateral held by the Fund.
Concentration Risk: As of period end, the Fund invested a significant portion of its assets in securities in the financials sector. Changes in economic conditions affecting such sector would have a greater impact on the Fund and could affect the value, income and/or liquidity of positions in such securities.
The Fund invests a substantial amount of its assets in issuers located in a single country or a limited number of countries. When the Fund concentrates its investments in this manner, it assumes the risk that economic, political and social conditions in those countries may have a significant impact on their investment performance. Foreign issuers may not be subject to the same uniform accounting, auditing and financial reporting standards and practices as used in the United States. Foreign securities markets may also be less liquid, more volatile, and less subject to governmental supervision not typically associated with investing in U.S. securities. Investment percentages in specific countries are presented in the Schedule of Investments.
The Fund invests a significant portion of its assets in securities of issuers located in Europe or with significant exposure to European issuers or countries. The European financial markets have recently experienced volatility and adverse trends due to concerns about economic downturns in, or rising government debt levels of, several European countries. These events may spread to other countries in Europe and may affect the value and liquidity of certain of the Fund’s investments.
The United Kingdom (the “UK”) is scheduled to withdraw from the European Union in March 2019, which may introduce significant new uncertainties and instability in the financial markets across Europe.
The Fund invest a significant portion of its assets in securities of issuers located in Asia or with significant exposure to Asian issuers or countries. The Asian financial markets have recently experienced volatility and adverse trends due to concerns in several Asian countries regarding monetary policy, government intervention in the markets, rising government debt levels or economic downturns. These events may spread to other countries in Asia and may affect the value and liquidity of certain of the Fund’s investments.
| 10. | CAPITAL SHARE TRANSACTIONS |
Transactions in capital shares were as follows:
| | | | | | | | | | | | | | | | |
| | | Year Ended 12/31/2018 | | | Year Ended 12/31/2017 | |
| | | Shares | | | Amount | | | Shares | | | Amount | |
Class I | | | | | | | | | | | | | | | | |
Shares sold | | | 604,450 | | | $ | 7,398,984 | | | | 766,286 | | | $ | 8,733,286 | |
Shares issued in reinvestment of distributions | | | 570,051 | | | | 5,532,493 | | | | — | | | | — | |
Shares redeemed | | | (1,430,661 | ) | | | (16,948,689 | ) | | | (1,613,860 | ) | | | (17,320,222 | ) |
| | | | | | | | | | | | | | | | |
Net decrease | | | (256,160 | ) | | $ | (4,017,212 | ) | | | (847,574 | ) | | $ | (8,586,936 | ) |
| | | | | | | | | | | | | | | | |
| 11. | REGULATIONS-X AMENDMENTS |
On August 17, 2018, the SEC adopted amendments to certain disclosure requirements in Securities Act ReleaseNo. 33-10532, Disclosure Update and Simplification. The Fund has adopted the amendments pertinent to RegulationS-X in this shareholder report. The amendments impacted certain disclosure presentation on the Statement of Assets and Liabilities, Statements of Changes in Net Assets and Notes to the Financial Statements.
Prior year distribution information and undistributed net investment income in the Statements of Changes in Net Assets has been modified to conform to the current year presentation in accordance with the RegulationS-X changes.
Undistributed net investment income as of December 31, 2017 was $1,301,053
Management has evaluated the impact of all subsequent events on the Fund through the date the financial statements were issued and has determined that there were no subsequent events requiring adjustment or additional disclosure in the financial statements.
| | |
| 16 | | 2018 BLACKROCK ANNUAL REPORTTO SHAREHOLDERS |
Report of Independent Registered Public Accounting Firm
To the Shareholders of BlackRock International V.I. Fund and the Board of Directors of BlackRock Variable Series Funds, Inc.:
Opinion on the Financial Statements and Financial Highlights
We have audited the accompanying statement of assets and liabilities of BlackRock International V.I. Fund of BlackRock Variable Series Funds, Inc. (the “Fund”), including the schedule of investments, as of December 31, 2018, the related statement of operations for the year then ended, the statements of changes in net assets for each of the two years in the period then ended, the financial highlights for each of the five years in the period then ended, and the related notes. In our opinion, the financial statements and financial highlights present fairly, in all material respects, the financial position of the Fund as of December 31, 2018, and the results of its operations for the year then ended, the changes in its net assets for each of the two years in the period then ended, and the financial highlights for each of the five years in the period then ended, in conformity with accounting principles generally accepted in the United States of America.
Basis for Opinion
These financial statements and financial highlights are the responsibility of the Fund’s management. Our responsibility is to express an opinion on the Fund’s financial statements and financial highlights based on our audits. We are a public accounting firm registered with the Public Company Accounting Oversight Board (United States) (PCAOB) and are required to be independent with respect to the Fund in accordance with the U.S. federal securities laws and the applicable rules and regulations of the Securities and Exchange Commission and the PCAOB.
We conducted our audits in accordance with the standards of the PCAOB. Those standards require that we plan and perform the audit to obtain reasonable assurance about whether the financial statements and financial highlights are free of material misstatement, whether due to error or fraud. The Fund is not required to have, nor were we engaged to perform, an audit of its internal control over financial reporting. As part of our audits we are required to obtain an understanding of internal control over financial reporting but not for the purpose of expressing an opinion on the effectiveness of the Fund’s internal control over financial reporting. Accordingly, we express no such opinion.
Our audits included performing procedures to assess the risks of material misstatement of the financial statements and financial highlights, whether due to error or fraud, and performing procedures that respond to those risks. Such procedures included examining, on a test basis, evidence regarding the amounts and disclosures in the financial statements and financial highlights. Our audits also included evaluating the accounting principles used and significant estimates made by management, as well as evaluating the overall presentation of the financial statements and financial highlights. Our procedures included confirmation of securities owned as of December 31, 2018, by correspondence with the custodian and brokers; when replies were not received from brokers, we performed other auditing procedures. We believe that our audits provide a reasonable basis for our opinion.
Deloitte & Touche LLP
Boston, Massachusetts
February 15, 2019
We have served as the auditor of one or more BlackRock investment companies since 1992.
| | | | |
| REPORTOF INDEPENDENT REGISTERED PUBLIC ACCOUNTING FIRM | | | 17 | |
Glossary of Terms Used in this Report
| | |
Currency |
| |
| CAD | | Canadian Dollar |
| |
| CHF | | Swiss Franc |
| |
| GBP | | British Pound |
| |
| NOK | | Norwegian Krone |
| |
| ZAR | | South African Rand |
| | |
| Portfolio Abbreviations |
| |
| ADR | | American Depositary Receipt |
| |
| FDR | | Fixed Deposit Receipt |
| | |
| 18 | | 2018 BLACKROCK ANNUAL REPORTTO SHAREHOLDERS |
DECEMBER 31, 2018
| | |
ANNUAL REPORT | |  |
BlackRock Variable Series Funds, Inc.
| Ø | | BlackRock International Index V.I. Fund |
|
| Not FDIC Insured • May Lose Value • No Bank Guarantee |
| | |
| Fund Summary as of December 31, 2018 | | BlackRock International Index V.I. Fund |
Investment Objective
The investment objective of theBlackRock International Index V.I. Fund (the “Fund”) is to seek to match the performance of the MSCI EAFE Index (Europe, Australasia, Far East) (the “MSCI EAFE Index” or the “Underlying Index”) in U.S. dollars with net dividends as closely as possible before the deduction of Fund expenses.
On November 14, 2017, the Board of Directors of the Company (the “Board”) and, on May 23, 2018, the Board of Trustees of State Farm Variable Product Trust each approved a reorganization of the International Equity Index Fund (the “Predecessor Fund”), with and into the Fund. At a special shareholder meeting on September 14, 2018, the shareholders of the Predecessor Fund approved the reorganization, which was completed on October 29, 2018.
Portfolio Management Commentary
How did the Fund perform?
For the 12-month period ended December 31, 2018, the Fund’s Class I Shares returned (13.70)%. The MSCI EAFE Index and the MSCI EAFE Free Index both returned (13.79)% for the same period. Both the MSCI EAFE Index and the MSCI EAFE Free Index, the benchmark for the Predecessor Fund, are free-float adjusted, market-capitalization weighted indexes designed to measure equity performance of developed markets, excluding the United States and Canada.
Describe the market environment.
In the first quarter of 2018, European equity markets fell in-line with the broader market amid increased market volatility and trade protectionism worries. From a single country standpoint, the United Kingdom detracted the most from the index’s total return. In the Eurozone, Italy contributed the highest amount to the MSCI EAFE Index’s total return out of other Eurozone members, after the Italian elections did not meaningfully impact risk-sentiment.
In Asia-Pacific, Japan contributed the most to the MSCI EAFE Index’s total return (in U.S. dollar terms) during the first quarter. However, this was due to local currency appreciation, as the yen rallied over 6% against the U.S. dollar amid a flurry of safe haven bids, and as the Bank of Japan announced a slight reduction in long-end bond purchasing. Internationally, U.S. protectionism weighed on Japanese sentiment, as fears of a slowdown in global trade weighed heavily on export sensitive names. Domestically, the Moritomo Gakuen land sale controversy resurfaced, pushing Prime Minister Abe’s approval rating to all-time lows.
Throughout the second quarter of 2018, the uncertainty stemming from U.S. trade protectionism weighed on developed market equity markets. The fluid headlines regarding the acrimonious G7 summit in Quebec, the U.S. imposition of steel and aluminum imports, and the U.S. withdrawal from the Iranian nuclear deal all increased trade war fears. Elsewhere, European fragmentation remained an important risk factor throughout the second quarter. Additionally, a stronger U.S. dollar — attributed to increased trade tensions, interest rate differentials, and favorable U.S. growth conditions — also weighed on unhedged developed market equity returns in the quarter.
From a sector standpoint, energy shares outperformed, as Brent crude remained in a high trading range throughout the second quarter. Commodities rallied approximately +13% in the quarter, as the U.S. announcement of their departure from the Iran nuclear deal and re-imposition of Iranian sanctions provided an upside surprise. Separately, shares of companies in the financial sector underperformed amid subdued European rates, uncertainty stemming from anti-eurozone populism, and regulatory concerns weighed on sentiment.
From a single country standpoint, Australia contributed the most to the index’s total return over the second quarter of 2018. Shares of the firms in the materials and energy sectors outperformed, as the country was spared from the U.S. steel and aluminum tariffs. The United Kingdom also contributed significantly to the index’s total return over the second quarter, with the energy sector in the lead. From a pure performance perspective, Israeli equities outperformed, as a large jump in shares of an Israeli multinational pharmaceutical company contributed meaningfully to the country’s equity market. Less positively, Japanese equities weighed the most on MSCI EAFE Index’s total return, as cyclicals and export sensitive names were particularly hit by U.S. protectionism headlines.
In the third quarter of 2018, risk sentiment was elevated, as steady corporate earnings and economic growth supported developed markets generally in the face of rising U.S. protectionism. In Japan, equities rallied 3.7% and added 0.9% to the MSCI EAFE Index’s total return, as a 2.5% depreciation in the yen helped export names. Switzerland provided the second largest boost to the MSCI EAFE Index, as the country rallied 6.2% and contributed +0.5% to the index’s total return. The impressive price action was the result of strength in Swiss biotech names. Elsewhere, the United Kingdom retracted the most from the MSCI EAFE Index’s total return in the third quarter, declining 1.7%, equating to a loss of 0.3% for the index. Continued Brexit uncertainty weighed on the market, influencing a-1.5% decline in sterling. Italy also weighed on the overall MSCI EAFE complex, as a rift between the populist government and the European Union regarding the country’s budget plans was a source of investor concern.
By the fourth quarter of 2018, developed markets faced considerable headwinds from tightening global financial conditions, slowing growth, and heightened macroeconomic uncertainty throughout the year. The Western European region fell 12.8% and contributed to 63% of the MSCI EAFE Index’s quarterly decline. Slowing economic activity, broad-market risk-off behavior, and political uncertainty marred the region.
In Asia-Pacific, Japan fell-14.3% in the fourth quarter of 2018. A roughly +3.5% jump in the yen against the dollar weighed on the export-orientated equity market broadly. Elsewhere, Australian equities fell-9.7% as the slowdown in China weighed on the country’s domestic growth prospects.
From a sector perspective, financials(-19.64%) had the most negative return in the MSCI EAFE Index in 2018. Decreases were seen across almost all sectors for the year (with the exception of utilities, which returned 1.60%), with notable detraction in materials(-17.17%) and consumer discretionary(-16.21%).
Describe recent portfolio activity.
During the 12-month period, as changes were made to the composition of the MSCI EAFE Index, the Fund purchased and sold securities to maintain its objective of matching the risks and return of the Underlying Index.
| | |
| 2 | | 2018 BLACKROCK ANNUAL REPORTTO SHAREHOLDERS |
| | |
| Fund Summary as of December 31, 2018 | | BlackRock International Index V.I. Fund |
Describe portfolio positioning at period end.
The Fund remains positioned to match the risk characteristics of the Underlying Index, irrespective of the market’s future direction.
The views expressed reflect the opinions of BlackRock as of the date of this report and are subject to change based on changes in market, economic or other conditions. These views are not intended to be a forecast of future events and are no guarantee of future results.
TOTAL RETURN BASED ON A $10,000 INVESTMENT
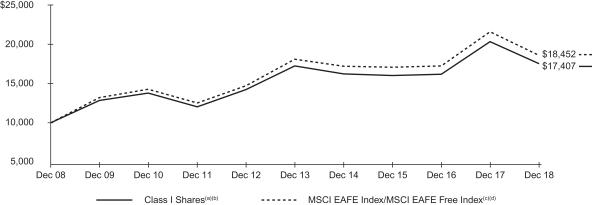
| (a) | Assuming transaction costs, if any, and other operating expenses, including investment advisory fees. Does not include insurance-related fees and expenses. |
| (b) | Under normal circumstances, the Fund invests at least 90% of its assets in securities or other financial instruments that are components of or have economic characteristics similar to the securities included in the MSCI EAFE Index. |
| (c) | Both the MSCI EAFE Index and the MSCI EAFE Free Index are free-float adjusted, market-capitalization weighted indexes designed to measure equity performance of developed markets, excluding the United States and Canada. |
| (d) | The MSCI EAFE Index has replaced the MSCI EAFE Free Index, which was the Predecessor Fund’s benchmark, as the Fund’s benchmark. During the 10-year period ending December 31, 2018, the total return and performance for the MSCI EAFE Index and the MSCI EAFE Free Index are identical. |
Performance Summary for the Period Ended December 31, 2018
| | | | | | | | | | | | | | | | | | | | | | | | | | | | |
| | | 6-Month
Total Returns (b) | | | | | | Average Annual Total Returns | |
| | | | | | 1 Year (b) | | | | | | 5 Years (b) | | | | | | 10 Years (b) | |
Class I(a) | | | (11.21 | )% | | | | | | | (13.70 | )% | | | | | | | 0.32 | % | | | | | | | 5.70 | % |
MSCI EAFE Index | | | (11.35 | ) | | | | | | | (13.79 | ) | | | | | | | 0.53 | | | | | | | | 6.32 | |
| | (a) | Average annual and cumulative total returns are based on changes in net asset value (“NAV”) for the periods shown, and assume reinvestment of all distributions at NAV on theex-dividend date. Insurance-related fees and expenses are not reflected in these returns. | |
| | (b) | For a portion of the period, the Fund’s investment adviser waived a portion of its fee. Without such waiver, the Fund’s performance would have been lower. | |
On October 29, 2018, the Fund acquired all of the assets and assumed certain stated liabilities of the International Equity Index Fund (the “Predecessor Fund”), a series of State Farm Variable Product Trust, through a tax-free reorganization (the “Reorganization”). The Predecessor Fund is the performance and accounting survivor of the Reorganization; accordingly, the Fund assumed the performance and financial history of the Predecessor Fund upon completion of the Reorganization.
Past performance is not indicative of future results. Performance results do not reflect the deduction of taxes that a shareholder would pay on Fund distributions or the redemption of Fund shares.
Performance results may include adjustments made for financial reporting purposes in accordance with U.S. generally accepted accounting principles.
Expense Example
| | | | | | | | | | | | | | | | | | | | | | | | | | | | | | | | |
| | | Actual | | | | | | Hypothetical (a) | | | | |
| | | Beginning
Account Value
(07/01/18) | | | Ending
Account Value
(12/31/18) | | | Expenses
Paid During
the Period (b) | | | | | | Beginning
Account Value
(07/01/18) | | | Ending
Account Value
(12/31/18) | | | Expenses
Paid During
the Period (b) | | | Annualized
Expense
Ratio | |
Class I | | $ | 1,000.00 | | | $ | 887.90 | | | $ | 1.19 | | | | | | | $ | 1,000.00 | | | $ | 1,023.95 | | | $ | 1.28 | | | | 0.25 | % |
| | (a) | Hypothetical 5% annual return before expenses is calculated by prorating the number of days in the most recent fiscal half year divided by 365. | |
| | (b) | Expenses are equal to the Fund’s annualized expense ratio, multiplied by the average account value over the period, multiplied by 184/365 (to reflect theone-half year period shown). | |
See “Disclosure of Expenses” on the following page for further information on how expenses were calculated.
| | |
| Fund Summary as of December 31, 2018 (continued) | | BlackRock International Index V.I. Fund |
Portfolio Information
GEOGRAPHIC ALLOCATION
| | | | |
| Country | | Percent of
Net Assets | |
Japan | | | 24 | % |
United Kingdom | | | 14 | |
France | | | 11 | |
Switzerland | | | 9 | |
Germany | | | 9 | |
Australia | | | 8 | |
Netherlands | | | 5 | |
Hong Kong | | | 3 | |
Spain | | | 3 | |
Sweden | | | 2 | |
Italy | | | 2 | |
Denmark | | | 2 | |
Singapore | | | 1 | |
Finland | | | 1 | |
Other(a) | | | 5 | |
Short-Term Securities | | | — | (b) |
Other Assets Less Liabilities | | | 1 | |
| | (a) | Includes holdings within countries that are 1% or less of net assets. Please refer to the Schedule of Investments for such countries. | |
| | (b) | Representing less than 1% of the Fund’s net assets. | |
Disclosure of Expenses
Shareholders of the Fund may incur the following charges: (a) transactional expenses; and (b) operating expenses, including investment advisory fees, service and distribution fees, including12b-1 fees, acquired fund fees and expenses, and other fund expenses. The expense example shown on the previous page (which is based on a hypothetical investment of $1,000 invested on July 1, 2018 and held through December 31, 2018) is intended to assist shareholders both in calculating expenses based on an investment in the Fund and in comparing these expenses with similar costs of investing in other mutual funds.
The expense example provides information about actual account values and actual expenses. In order to estimate the expenses a shareholder paid during the period covered by this report, shareholders can divide their account value by $1,000 and then multiply the result by the number corresponding to their share class under the heading entitled “Expenses Paid During the Period.”
The expense example also provides information about hypothetical account values and hypothetical expenses based on the Fund’s actual expense ratio and an assumed rate of return of 5% per year before expenses. In order to assist shareholders in comparing the ongoing expenses of investing in the Fund and other funds, compare the 5% hypothetical example with the 5% hypothetical examples that appear in shareholder reports of other funds.
The expenses shown in the expense example are intended to highlight shareholders’ ongoing costs only and do not reflect any transactional expenses, such as sales charges, if any. Therefore, the hypothetical example is useful in comparing ongoing expenses only, and will not help shareholders determine the relative total expenses of owning different funds. If these transactional expenses were included, shareholder expenses would have been higher.
Derivative Financial Instruments
The Fund may invest in various derivative financial instruments. These instruments are used to obtain exposure to a security, commodity, index, market, and/or other assets without owning or taking physical custody of securities, commodities and/or other referenced assets or to manage market, equity, credit, interest rate, foreign currency exchange rate, commodity and/or other risks. Derivative financial instruments may give rise to a form of economic leverage and involve risks, including the imperfect correlation between the value of a derivative financial instrument and the underlying asset, possible default of the counterparty to the transaction or illiquidity of the instrument. The Fund’s successful use of a derivative financial instrument depends on the investment adviser’s ability to predict pertinent market movements accurately, which cannot be assured. The use of these instruments may result in losses greater than if they had not been used, may limit the amount of appreciation the Fund can realize on an investment and/or may result in lower distributions paid to shareholders. The Fund’s investments in these instruments, if any, are discussed in detail in the Notes to Financial Statements.
| | |
| 4 | | 2018 BLACKROCK ANNUAL REPORTTO SHAREHOLDERS |
| | |
Schedule of Investments December 31, 2018 | | BlackRock International Index V.I. Fund (Percentages shown are based on Net Assets) |
| | | | | | | | |
| Security | | Shares | | | Value | |
|
Common Stocks— 98.3% | |
|
| Australia— 7.6% | |
AGL Energy Ltd. | | | 8,720 | | | $ | 126,634 | |
Alumina Ltd. | | | 32,547 | | | | 52,720 | |
Amcor Ltd. | | | 15,433 | | | | 144,105 | |
AMP Ltd. | | | 38,804 | | | | 66,986 | |
APA Group(a) | | | 15,688 | | | | 93,973 | |
Aristocrat Leisure Ltd. | | | 8,116 | | | | 124,936 | |
ASX Ltd. | | | 2,574 | | | | 108,764 | |
Aurizon Holdings Ltd. | | | 26,460 | | | | 79,830 | |
AusNet Services | | | 24,028 | | | | 26,333 | |
Australia & New Zealand Banking Group Ltd. | | | 38,689 | | | | 668,495 | |
Bank of Queensland Ltd. | | | 5,283 | | | | 36,110 | |
Bendigo & Adelaide Bank Ltd. | | | 6,467 | | | | 49,136 | |
BHP Group Ltd. | | | 39,702 | | | | 959,640 | |
BHP Group plc | | | 28,567 | | | | 603,650 | |
BlueScope Steel Ltd. | | | 7,315 | | | | 56,429 | |
Boral Ltd. | | | 15,587 | | | | 54,243 | |
Brambles Ltd. | | | 22,411 | | | | 160,343 | |
Caltex Australia Ltd. | | | 3,468 | | | | 62,221 | |
Challenger Ltd. | | | 7,310 | | | | 48,872 | |
CIMIC Group Ltd. | | | 1,293 | | | | 39,540 | |
Coca-Cola Amatil Ltd. | | | 6,738 | | | | 38,862 | |
Cochlear Ltd. | | | 765 | | | | 93,734 | |
Coles Group Ltd.(b) | | | 15,349 | | | | 126,922 | |
Commonwealth Bank of Australia | | | 23,803 | | | | 1,214,136 | |
Computershare Ltd. | | | 6,136 | | | | 74,364 | |
Crown Resorts Ltd. | | | 5,035 | | | | 42,079 | |
CSL Ltd. | | | 6,119 | | | | 799,251 | |
Dexus | | | 13,525 | | | | 101,229 | |
Domino’s Pizza Enterprises Ltd. | | | 795 | | | | 22,774 | |
Flight Centre Travel Group Ltd. | | | 739 | | | | 22,349 | |
Fortescue Metals Group Ltd. | | | 20,700 | | | | 61,040 | |
Goodman Group | | | 21,548 | | | | 161,413 | |
GPT Group (The) | | | 23,998 | | | | 90,305 | |
Harvey Norman Holdings Ltd. | | | 7,026 | | | | 15,639 | |
Incitec Pivot Ltd. | | | 22,086 | | | | 51,052 | |
Insurance Australia Group Ltd. | | | 30,864 | | | | 152,228 | |
LendLease Group(a) | | | 7,681 | | | | 62,924 | |
Macquarie Group Ltd. | | | 4,407 | | | | 337,559 | |
Medibank Pvt Ltd. | | | 36,617 | | | | 66,291 | |
Mirvac Group | | | 49,339 | | | | 77,922 | |
National Australia Bank Ltd. | | | 36,830 | | | | 624,981 | |
Newcrest Mining Ltd. | | | 10,261 | | | | 157,702 | |
Oil Search Ltd. | | | 18,232 | | | | 91,835 | |
Orica Ltd. | | | 5,028 | | | | 61,113 | |
Origin Energy Ltd.(b) | | | 23,388 | | | | 106,687 | |
QBE Insurance Group Ltd. | | | 18,031 | | | | 128,392 | |
Ramsay Health Care Ltd. | | | 1,881 | | | | 76,512 | |
REA Group Ltd. | | | 701 | | | | 36,573 | |
Rio Tinto Ltd. | | | 5,008 | | | | 277,173 | |
Rio Tinto plc | | | 15,810 | | | | 757,179 | |
Santos Ltd. | | | 23,541 | | | | 90,789 | |
Scentre Group | | | 70,831 | | | | 194,726 | |
SEEK Ltd. | | | 4,434 | | | | 52,898 | |
Sonic Healthcare Ltd. | | | 5,363 | | | | 83,663 | |
South32 Ltd. | | | 68,187 | | | | 162,204 | |
Stockland | | | 32,369 | | | | 80,301 | |
Suncorp Group Ltd. | | | 18,213 | | | | 162,091 | |
Sydney Airport(a) | | | 14,680 | | | | 69,610 | |
Tabcorp Holdings Ltd. | | | 25,426 | | | | 76,869 | |
Telstra Corp. Ltd. | | | 55,346 | | | | 111,072 | |
TPG Telecom Ltd. | | | 4,934 | | | | 22,381 | |
Transurban Group(a) | | | 35,985 | | | | 295,348 | |
| | | | | | | | |
| Security | | Shares | | | Value | |
|
| Australia (continued) | |
Treasury Wine Estates Ltd. | | | 9,555 | | | $ | 99,638 | |
Vicinity Centres | | | 43,755 | | | | 80,176 | |
Washington H Soul Pattinson & Co. Ltd. | | | 1,455 | | | | 25,516 | |
Wesfarmers Ltd. | | | 15,349 | | | | 348,709 | |
Westpac Banking Corp. | | | 46,304 | | | | 818,187 | |
Woodside Petroleum Ltd. | | | 12,801 | | | | 281,973 | |
Woolworths Group Ltd. | | | 17,947 | | | | 372,293 | |
WorleyParsons Ltd. | | | 4,337 | | | | 34,834 | |
| | | | | | | | |
| | | | | | | 12,956,458 | |
|
| Austria— 0.2% | |
ANDRITZ AG | | | 968 | | | | 44,457 | |
Erste Group Bank AG(b) | | | 4,000 | | | | 132,630 | |
OMV AG | | | 1,958 | | | | 85,512 | |
Raiffeisen Bank International AG | | | 1,968 | | | | 50,217 | |
Verbund AG | | | 920 | | | | 39,387 | |
voestalpine AG | | | 1,524 | | | | 45,452 | |
| | | | | | | | |
| | | | | | | 397,655 | |
|
| Belgium— 0.9% | |
Ageas | | | 2,429 | | | | 109,343 | |
Anheuser-Busch InBev SA | | | 10,306 | | | | 678,949 | |
Colruyt SA | | | 799 | | | | 56,986 | |
Groupe Bruxelles Lambert SA | | | 1,073 | | | | 93,504 | |
KBC Group NV | | | 3,339 | | | | 214,828 | |
Proximus SADP | | | 2,022 | | | | 54,713 | |
Solvay SA | | | 1,058 | | | | 105,802 | |
Telenet Group Holding NV | | | 704 | | | | 32,745 | |
UCB SA | | | 1,681 | | | | 137,298 | |
Umicore SA | | | 2,958 | | | | 118,039 | |
| | | | | | | | |
| | | | | | | 1,602,207 | |
|
| Chile— 0.0% | |
Antofagasta plc | | | 5,243 | | | | 52,438 | |
| | | | | | | | |
|
| China— 0.2% | |
BeiGene Ltd., ADR(b) | | | 441 | | | | 61,855 | |
BOC Hong Kong Holdings Ltd. | | | 49,000 | | | | 181,874 | |
Minth Group Ltd. | | | 10,000 | | | | 32,270 | |
Yangzijiang Shipbuilding Holdings Ltd. | | | 31,700 | | | | 29,127 | |
| | | | | | | | |
| | | | | | | 305,126 | |
|
| Colombia— 0.0% | |
Millicom International Cellular SA, SDR | | | 879 | | | | 55,619 | |
| | | | | | | | |
|
| Denmark— 1.7% | |
AP Moller — Maersk A/S, Class A | | | 50 | | | | 59,323 | |
AP Moller — Maersk A/S, Class B | | | 87 | | | | 109,440 | |
Carlsberg A/S, Class B | | | 1,422 | | | | 151,271 | |
Chr Hansen Holding A/S | | | 1,315 | | | | 116,728 | |
Coloplast A/S, Class B | | | 1,580 | | | | 146,965 | |
Danske Bank A/S | | | 9,895 | | | | 196,440 | |
DSV A/S | | | 2,608 | | | | 172,239 | |
Genmab A/S(b) | | | 817 | | | | 134,332 | |
H Lundbeck A/S | | | 927 | | | | 40,800 | |
ISS A/S | | | 2,222 | | | | 62,209 | |
Novo Nordisk A/S, Class B | | | 24,576 | | | | 1,128,704 | |
Novozymes A/S, Class B | | | 2,911 | | | | 130,070 | |
Orsted A/S(c) | | | 2,664 | | | | 178,269 | |
Pandora A/S | | | 1,463 | | | | 59,727 | |
Tryg A/S | | | 1,607 | | | | 40,530 | |
Vestas Wind Systems A/S | | | 2,598 | | | | 196,665 | |
William Demant Holding A/S(b) | | | 1,342 | | | | 38,209 | |
| | | | | | | | |
| | | | | | | 2,961,921 | |
|
| Finland— 1.2% | |
Elisa OYJ | | | 1,891 | | | | 78,324 | |
Fortum OYJ | | | 5,906 | | | | 129,279 | |
| | | | |
| SCHEDULE OF INVESTMENTS | | | 5 | |
| | |
Schedule of Investments (continued) December 31, 2018 | | BlackRock International Index V.I. Fund (Percentages shown are based on Net Assets) |
| | | | | | | | |
| Security | | Shares | | | Value | |
|
| Finland (continued) | |
Kone OYJ, Class B | | | 4,692 | | | $ | 224,003 | |
Metso OYJ | | | 1,399 | | | | 36,755 | |
Neste OYJ | | | 1,705 | | | | 132,005 | |
Nokia OYJ | | | 76,654 | | | | 444,986 | |
Nokian Renkaat OYJ | | | 1,554 | | | | 47,729 | |
Nordea Bank AB | | | 41,280 | | | | 347,503 | |
Orion OYJ, Class B | | | 1,385 | | | | 48,183 | |
Sampo OYJ, Class A | | | 5,893 | | | | 261,176 | |
Stora Enso OYJ, Class R | | | 7,327 | | | | 84,947 | |
UPM-Kymmene OYJ | | | 7,343 | | | | 185,879 | |
Wartsila OYJ Abp | | | 5,901 | | | | 94,197 | |
| | | | | | | | |
| | | | | | | 2,114,966 | |
|
| France— 10.7% | |
Accor SA | | | 2,501 | | | | 106,353 | |
Aeroports de Paris | | | 395 | | | | 74,903 | |
Air Liquide SA | | | 5,799 | | | | 720,095 | |
Airbus SE | | | 7,875 | | | | 750,801 | |
Alstom SA(b) | | | 2,068 | | | | 83,536 | |
Amundi SA(c) | | | 804 | | | | 42,508 | |
Arkema SA | | | 915 | | | | 78,551 | |
Atos SE | | | 1,264 | | | | 103,567 | |
AXA SA | | | 26,251 | | | | 566,547 | |
BioMerieux | | | 551 | | | | 36,344 | |
BNP Paribas SA | | | 15,203 | | | | 686,579 | |
Bollore SA | | | 11,639 | | | | 46,664 | |
Bouygues SA | | | 2,914 | | | | 104,638 | |
Bureau Veritas SA | | | 3,526 | | | | 71,851 | |
Capgemini SE | | | 2,208 | | | | 219,619 | |
Carrefour SA | | | 7,725 | | | | 131,996 | |
Casino Guichard Perrachon SA | | | 735 | | | | 30,608 | |
Cie de Saint-Gobain | | | 6,850 | | | | 227,396 | |
Cie Generale des Etablissements Michelin SCA | | | 2,270 | | | | 223,429 | |
CNP Assurances | | | 2,282 | | | | 48,439 | |
Covivio | | | 498 | | | | 48,049 | |
Credit Agricole SA | | | 15,172 | | | | 163,288 | |
Danone SA | | | 8,329 | | | | 587,050 | |
Dassault Aviation SA | | | 33 | | | | 45,750 | |
Dassault Systemes SE | | | 1,798 | | | | 213,566 | |
Edenred | | | 3,130 | | | | 115,275 | |
Eiffage SA | | | 1,063 | | | | 88,874 | |
Electricite de France SA | | | 7,785 | | | | 123,212 | |
Engie SA | | | 24,963 | | | | 358,667 | |
EssilorLuxottica SA | | | 3,873 | | | | 482,133 | |
Eurazeo SA | | | 622 | | | | 44,036 | |
Eutelsat Communications SA | | | 2,321 | | | | 45,726 | |
Faurecia SA | | | 1,009 | | | | 38,071 | |
Gecina SA | | | 601 | | | | 77,799 | |
Getlink SE | | | 6,216 | | | | 83,527 | |
Hermes International | | | 437 | | | | 242,780 | |
ICADE | | | 443 | | | | 33,762 | |
Iliad SA | | | 353 | | | | 49,541 | |
Imerys SA | | | 476 | | | | 22,875 | |
Ingenico Group SA | | | 788 | | | | 44,701 | |
Ipsen SA | | | 501 | | | | 64,823 | |
JCDecaux SA | | | 990 | | | | 27,814 | |
Kering SA | | | 1,026 | | | | 480,649 | |
Klepierre SA | | | 2,717 | | | | 83,966 | |
Legrand SA | | | 3,681 | | | | 208,096 | |
L’Oreal SA | | | 3,419 | | | | 782,351 | |
LVMH Moet Hennessy Louis Vuitton SE | | | 3,762 | | | | 1,101,423 | |
Natixis SA | | | 12,518 | | | | 59,041 | |
Orange SA | | | 27,138 | | | | 439,792 | |
Pernod Ricard SA | | | 2,884 | | | | 473,324 | |
Peugeot SA | | | 7,820 | | | | 166,783 | |
| | | | | | | | |
| Security | | Shares | | | Value | |
|
| France (continued) | |
Publicis Groupe SA | | | 2,776 | | | $ | 158,389 | |
Remy Cointreau SA | | | 300 | | | | 34,012 | |
Renault SA | | | 2,559 | | | | 159,408 | |
Rexel SA | | | 4,041 | | | | 43,045 | |
Safran SA | | | 4,513 | | | | 541,267 | |
Sanofi | | | 15,204 | | | | 1,318,946 | |
Sartorius Stedim Biotech | | | 374 | | | | 37,445 | |
Schneider Electric SE | | | 7,387 | | | | 501,070 | |
SCOR SE | | | 2,168 | | | | 97,465 | |
SEB SA | | | 300 | | | | 38,772 | |
Societe BIC SA | | | 341 | | | | 34,835 | |
Societe Generale SA | | | 10,426 | | | | 330,552 | |
Sodexo SA | | | 1,203 | | | | 123,374 | |
Suez | | | 4,957 | | | | 65,484 | |
Teleperformance | | | 768 | | | | 122,857 | |
Thales SA | | | 1,414 | | | | 165,236 | |
TOTAL SA | | | 32,216 | | | | 1,699,237 | |
Ubisoft Entertainment SA(b) | | | 1,039 | | | | 83,704 | |
Unibail-Rodamco-Westfield | | | 1,887 | | | | 292,003 | |
Valeo SA | | | 3,186 | | | | 92,922 | |
Veolia Environnement SA | | | 7,116 | | | | 145,730 | |
Vinci SA | | | 6,856 | | | | 563,783 | |
Vivendi SA | | | 14,202 | | | | 344,218 | |
Wendel SA | | | 369 | | | | 44,263 | |
| | | | | | | | |
| | | | | | | 18,189,185 | |
|
| Germany— 8.2% | |
1&1 Drillisch AG | | | 705 | | | | 36,005 | |
adidas AG | | | 2,547 | | | | 532,295 | |
Allianz SE (Registered) | | | 5,791 | | | | 1,163,732 | |
Aroundtown SA | | | 10,443 | | | | 86,635 | |
Axel Springer SE | | | 646 | | | | 36,600 | |
BASF SE | | | 12,423 | | | | 865,308 | |
Bayer AG (Registered) | | | 12,494 | | | | 868,943 | |
Bayerische Motoren Werke AG | | | 4,509 | | | | 365,703 | |
Beiersdorf AG | | | 1,340 | | | | 139,765 | |
Brenntag AG | | | 2,054 | | | | 89,655 | |
Commerzbank AG(b) | | | 13,321 | | | | 88,453 | |
Continental AG | | | 1,462 | | | | 203,563 | |
Covestro AG(c) | | | 2,547 | | | | 126,139 | |
Daimler AG (Registered) | | | 12,300 | | | | 648,394 | |
Delivery Hero AG(b)(c) | | | 1,223 | | | | 45,660 | |
Deutsche Bank AG (Registered) | | | 26,102 | | | | 208,168 | |
Deutsche Boerse AG | | | 2,638 | | | | 315,387 | |
Deutsche Lufthansa AG (Registered) | | | 3,133 | | | | 70,754 | |
Deutsche Post AG (Registered) | | | 13,398 | | | | 365,889 | |
Deutsche Telekom AG (Registered) | | | 45,082 | | | | 766,247 | |
Deutsche Wohnen SE | | | 4,719 | | | | 215,662 | |
E.ON SE | | | 30,205 | | | | 298,163 | |
Evonik Industries AG | | | 2,169 | | | | 54,141 | |
Fraport AG Frankfurt Airport Services Worldwide | | | 553 | | | | 39,577 | |
Fresenius Medical Care AG & Co. KGaA | | | 2,963 | | | | 192,065 | |
Fresenius SE & Co. KGaA | | | 5,667 | | | | 273,909 | |
GEA Group AG | | | 2,303 | | | | 59,292 | |
Hannover Rueck SE | | | 802 | | | | 108,086 | |
HeidelbergCement AG | | | 1,979 | | | | 121,308 | |
Henkel AG & Co. KGaA (Preference) | | | 1,382 | | | | 136,020 | |
HOCHTIEF AG | | | 256 | | | | 34,573 | |
HUGO BOSS AG | | | 842 | | | | 51,905 | |
Infineon Technologies AG | | | 15,530 | | | | 310,937 | |
Innogy SE(b) | | | 1,847 | | | | 78,553 | |
KION Group AG | | | 942 | | | | 47,904 | |
LANXESS AG | | | 1,156 | | | | 53,149 | |
Merck KGaA | | | 1,718 | | | | 176,838 | |
METRO AG | | | 2,394 | | | | 36,837 | |
| | |
| 6 | | 2018 BLACKROCK ANNUAL REPORTTO SHAREHOLDERS |
| | |
Schedule of Investments (continued) December 31, 2018 | | BlackRock International Index V.I. Fund (Percentages shown are based on Net Assets) |
| | | | | | | | |
| Security | | Shares | | | Value | |
|
| Germany (continued) | |
MTU Aero Engines AG | | | 691 | | | $ | 125,487 | |
Muenchener Rueckversicherungs-Gesellschaft AG in Muenchen (Registered) | | | 2,032 | | | | 443,177 | |
OSRAM Licht AG | | | 1,322 | | | | 57,532 | |
ProSiebenSat.1 Media SE | | | 3,098 | | | | 55,125 | |
Puma SE | | | 110 | | | | 53,816 | |
RWE AG | | | 6,890 | | | | 150,063 | |
SAP SE | | | 13,293 | | | | 1,319,326 | |
Siemens AG (Registered) | | | 10,347 | | | | 1,154,742 | |
Siemens Healthineers AG(b)(c) | | | 1,994 | | | | 83,323 | |
Symrise AG | | | 1,640 | | | | 121,513 | |
Telefonica Deutschland Holding AG | | | 9,887 | | | | 38,914 | |
thyssenkrupp AG | | | 5,794 | | | | 99,529 | |
TUI AG | | | 5,857 | | | | 84,181 | |
Uniper SE | | | 2,676 | | | | 69,029 | |
United Internet AG (Registered) | | | 1,635 | | | | 71,562 | |
Volkswagen AG | | | 432 | | | | 69,109 | |
Vonovia SE | | | 6,658 | | | | 300,135 | |
Wirecard AG | | | 1,606 | | | | 242,108 | |
Zalando SE(b)(c) | | | 1,484 | | | | 38,344 | |
| | | | | | | | |
| | | | | | | 13,889,229 | |
|
| Hong Kong— 3.4% | |
AIA Group Ltd. | | | 163,354 | | | | 1,356,951 | |
ASM Pacific Technology Ltd. | | | 4,000 | | | | 38,617 | |
Bank of East Asia Ltd. (The) | | | 16,825 | | | | 53,361 | |
BGP Holdings plc(d) | | | 253,848 | | | | — | |
CK Asset Holdings Ltd. | | | 34,659 | | | | 253,585 | |
CK Hutchison Holdings Ltd. | | | 36,659 | | | | 351,861 | |
CK Infrastructure Holdings Ltd. | | | 9,000 | | | | 68,109 | |
CLP Holdings Ltd. | | | 22,783 | | | | 257,468 | |
Dairy Farm International Holdings Ltd. | | | 4,500 | | | | 40,789 | |
Hang Lung Group Ltd. | | | 12,000 | | | | 30,596 | |
Hang Lung Properties Ltd. | | | 27,000 | | | | 51,320 | |
Hang Seng Bank Ltd. | | | 10,574 | | | | 236,871 | |
Henderson Land Development Co. Ltd. | | | 17,124 | | | | 85,227 | |
HK Electric Investments & HK Electric Investments Ltd.(a)(c) | | | 35,000 | | | | 35,276 | |
HKT Trust & HKT Ltd.(a) | | | 50,100 | | | | 72,171 | |
Hong Kong & China Gas Co. Ltd. | | | 127,804 | | | | 264,049 | |
Hong Kong Exchanges & Clearing Ltd. | | | 15,707 | | | | 454,067 | |
Hongkong Land Holdings Ltd. | | | 15,600 | | | | 98,345 | |
Hysan Development Co. Ltd. | | | 8,000 | | | | 38,043 | |
Jardine Matheson Holdings Ltd. | | | 3,100 | | | | 215,849 | |
Jardine Strategic Holdings Ltd. | | | 3,200 | | | | 117,328 | |
Kerry Properties Ltd. | | | 8,500 | | | | 29,011 | |
Link REIT | | | 28,500 | | | | 288,925 | |
Melco Resorts & Entertainment Ltd., ADR | | | 3,286 | | | | 57,899 | |
MTR Corp. Ltd. | | | 20,000 | | | | 105,257 | |
New World Development Co. Ltd. | | | 81,445 | | | | 107,570 | |
NWS Holdings Ltd. | | | 20,254 | | | | 41,589 | |
PCCW Ltd. | | | 56,000 | | | | 32,246 | |
Power Assets Holdings Ltd. | | | 18,500 | | | | 128,527 | |
Shangri-La Asia Ltd. | | | 16,960 | | | | 25,037 | |
Sino Land Co. Ltd. | | | 43,311 | | | | 74,204 | |
Sun Hung Kai Properties Ltd. | | | 22,000 | | | | 313,976 | |
Swire Pacific Ltd., Class A | | | 6,500 | | | | 68,627 | |
Swire Properties Ltd. | | | 15,600 | | | | 54,813 | |
Techtronic Industries Co. Ltd. | | | 18,500 | | | | 98,173 | |
WH Group Ltd.(c) | | | 117,000 | | | | 89,862 | |
Wharf Holdings Ltd. (The) | | | 15,953 | | | | 41,591 | |
Wharf Real Estate Investment Co. Ltd. | | | 15,953 | | | | 95,414 | |
Wheelock & Co. Ltd. | | | 11,000 | | | | 62,975 | |
Yue Yuen Industrial Holdings Ltd. | | | 10,000 | | | | 32,013 | |
| | | | | | | | |
| | | | | | | 5,867,592 | |
| | | | | | | | |
| Security | | Shares | | | Value | |
|
| Ireland— 0.6% | |
AerCap Holdings NV(b) | | | 1,663 | | | $ | 65,855 | |
AIB Group plc | | | 10,827 | | | | 45,654 | |
Bank of Ireland Group plc | | | 12,910 | | | | 71,802 | |
CRH plc | | | 11,469 | | | | 303,777 | |
James Hardie Industries plc, CDI | | | 5,870 | | | | 63,952 | |
Kerry Group plc, Class A | | | 2,109 | | | | 208,839 | |
Kingspan Group plc | | | 2,069 | | | | 88,693 | |
Paddy Power Betfair plc | | | 1,126 | | | | 92,437 | |
Ryanair Holdings plc(b) | | | 2,005 | | | | 24,601 | |
Smurfit Kappa Group plc | | | 2,996 | | | | 79,716 | |
| | | | | | | | |
| | | | | | | 1,045,326 | |
|
| Israel— 0.5% | |
Azrieli Group Ltd. | | | 564 | | | | 26,983 | |
Bank Hapoalim BM | | | 14,196 | | | | 89,778 | |
Bank LeumiLe-Israel BM | | | 20,033 | | | | 121,100 | |
Bezeq The Israeli Telecommunication Corp. Ltd. | | | 27,577 | | | | 26,910 | |
Check Point Software Technologies Ltd.(b) | | | 1,776 | | | | 182,306 | |
Elbit Systems Ltd. | | | 313 | | | | 35,929 | |
Israel Chemicals Ltd. | | | 9,360 | | | | 53,222 | |
Mizrahi Tefahot Bank Ltd. | | | 1,858 | | | | 31,380 | |
Nice Ltd.(b) | | | 814 | | | | 88,190 | |
Teva Pharmaceutical Industries Ltd., ADR | | | 12,892 | | | | 198,795 | |
Wix.com Ltd.(b) | | | 587 | | | | 53,029 | |
| | | | | | | | |
| | | | | | | 907,622 | |
|
| Italy— 2.0% | |
Assicurazioni Generali SpA | | | 16,150 | | | | 269,931 | |
Atlantia SpA | | | 6,588 | | | | 136,339 | |
Davide Campari-Milano SpA | | | 7,722 | | | | 65,393 | |
Enel SpA | | | 110,010 | | | | 637,755 | |
Eni SpA | | | 34,409 | | | | 543,566 | |
Ferrari NV | | | 1,630 | | | | 162,192 | |
Intesa Sanpaolo SpA | | | 201,309 | | | | 448,239 | |
Leonardo SpA | | | 5,381 | | | | 47,408 | |
Mediobanca Banca di Credito Finanziario SpA | | | 8,248 | | | | 69,790 | |
Moncler SpA | | | 2,379 | | | | 79,167 | |
Pirelli & C SpA(b)(c) | | | 5,318 | | | | 34,174 | |
Poste Italiane SpA(c) | | | 6,946 | | | | 55,698 | |
Prysmian SpA | | | 3,194 | | | | 62,146 | |
Recordati SpA | | | 1,390 | | | | 48,136 | |
Snam SpA | | | 29,981 | | | | 131,268 | |
Telecom Italia SpA(b) | | | 231,749 | | | | 122,369 | |
Terna Rete Elettrica Nazionale SpA | | | 18,707 | | | | 106,240 | |
UniCredit SpA | | | 27,282 | | | | 309,021 | |
| | | | | | | | |
| | | | | | | 3,328,832 | |
|
| Japan— 24.0% | |
ABC-Mart, Inc. | | | 400 | | | | 22,152 | |
Acom Co. Ltd. | | | 5,300 | | | | 17,241 | |
Aeon Co. Ltd. | | | 8,100 | | | | 158,323 | |
AEON Financial Service Co. Ltd. | | | 1,500 | | | | 26,611 | |
Aeon Mall Co. Ltd. | | | 1,400 | | | | 22,304 | |
AGC, Inc. | | | 2,500 | | | | 77,707 | |
Air Water, Inc. | | | 2,000 | | | | 30,143 | |
Aisin Seiki Co. Ltd. | | | 2,200 | | | | 75,627 | |
Ajinomoto Co., Inc. | | | 6,100 | | | | 108,391 | |
Alfresa Holdings Corp. | | | 2,500 | | | | 63,724 | |
Alps Electric Co. Ltd. | | | 2,500 | | | | 48,476 | |
Amada Holdings Co. Ltd. | | | 4,500 | | | | 40,396 | |
ANA Holdings, Inc. | | | 1,500 | | | | 53,849 | |
Aozora Bank Ltd. | | | 1,600 | | | | 47,688 | |
Asahi Group Holdings Ltd. | | | 4,800 | | | | 186,018 | |
Asahi Intecc Co. Ltd. | | | 1,300 | | | | 54,997 | |
Asahi Kasei Corp. | | | 16,800 | | | | 172,425 | |
Asics Corp. | | | 2,100 | | | | 26,671 | |
| | | | |
| SCHEDULE OF INVESTMENTS | | | 7 | |
| | |
Schedule of Investments (continued) December 31, 2018 | | BlackRock International Index V.I. Fund (Percentages shown are based on Net Assets) |
| | | | | | | | |
| Security | | Shares | | | Value | |
|
| Japan (continued) | |
Astellas Pharma, Inc. | | | 25,600 | | | $ | 327,082 | |
Bandai Namco Holdings, Inc. | | | 2,700 | | | | 121,228 | |
Bank of Kyoto Ltd. (The) | | | 700 | | | | 28,766 | |
Benesse Holdings, Inc. | | | 1,000 | | | | 25,438 | |
Bridgestone Corp. | | | 8,400 | | | | 322,273 | |
Brother Industries Ltd. | | | 3,000 | | | | 44,404 | |
Calbee, Inc. | | | 1,100 | | | | 34,358 | |
Canon, Inc. | | | 13,700 | | | | 376,965 | |
Casio Computer Co. Ltd. | | | 2,600 | | | | 30,826 | |
Central Japan Railway Co. | | | 2,000 | | | | 421,975 | |
Chiba Bank Ltd. (The) | | | 8,100 | | | | 45,121 | |
Chubu Electric Power Co., Inc. | | | 8,100 | | | | 115,096 | |
Chugai Pharmaceutical Co. Ltd. | | | 3,000 | | | | 173,998 | |
Chugoku Electric Power Co., Inc. (The) | | | 3,700 | | | | 48,084 | |
Coca-Cola Bottlers Japan Holdings, Inc. | | | 1,800 | | | | 53,678 | |
Concordia Financial Group Ltd. | | | 14,300 | | | | 54,642 | |
Credit Saison Co. Ltd. | | | 2,100 | | | | 24,604 | |
CyberAgent, Inc. | | | 1,300 | | | | 50,255 | |
Dai Nippon Printing Co. Ltd. | | | 3,200 | | | | 66,797 | |
Daicel Corp. | | | 3,500 | | | | 35,930 | |
Daifuku Co. Ltd. | | | 1,300 | | | | 58,943 | |
Dai-ichi Life Holdings, Inc. | | | 14,800 | | | | 229,839 | |
Daiichi Sankyo Co. Ltd. | | | 7,513 | | | | 240,309 | |
Daikin Industries Ltd. | | | 3,400 | | | | 361,269 | |
Daito Trust Construction Co. Ltd. | | | 1,000 | | | | 136,903 | |
Daiwa House Industry Co. Ltd. | | | 7,500 | | | | 239,238 | |
Daiwa House REIT Investment Corp. | | | 23 | | | | 51,523 | |
Daiwa Securities Group, Inc. | | | 21,500 | | | | 109,126 | |
DeNA Co. Ltd. | | | 1,400 | | | | 23,352 | |
Denso Corp. | | | 6,000 | | | | 265,606 | |
Dentsu, Inc. | | | 2,900 | | | | 129,516 | |
Disco Corp. | | | 400 | | | | 46,507 | |
Don Quijote Holdings Co. Ltd. | | | 1,600 | | | | 98,922 | |
East Japan Railway Co. | | | 4,100 | | | | 362,072 | |
Eisai Co. Ltd. | | | 3,400 | | | | 263,227 | |
Electric Power Development Co. Ltd. | | | 1,980 | | | | 46,985 | |
FamilyMart UNY Holdings Co. Ltd. | | | 800 | | | | 100,683 | |
FANUC Corp. | | | 2,600 | | | | 394,575 | |
Fast Retailing Co. Ltd. | | | 800 | | | | 408,593 | |
Fuji Electric Co. Ltd. | | | 1,600 | | | | 47,124 | |
FUJIFILM Holdings Corp. | | | 5,400 | | | | 209,328 | |
Fujitsu Ltd. | | | 2,600 | | | | 162,074 | |
Fukuoka Financial Group, Inc. | | | 1,900 | | | | 38,520 | |
Hakuhodo DY Holdings, Inc. | | | 3,100 | | | | 44,238 | |
Hamamatsu Photonics KK | | | 1,900 | | | | 63,674 | |
Hankyu Hanshin Holdings, Inc. | | | 3,000 | | | | 99,743 | |
Hikari Tsushin, Inc. | | | 300 | | | | 46,892 | |
Hino Motors Ltd. | | | 3,400 | | | | 32,016 | |
Hirose Electric Co. Ltd. | | | 435 | | | | 42,558 | |
Hisamitsu Pharmaceutical Co., Inc. | | | 800 | | | | 44,162 | |
Hitachi Chemical Co. Ltd. | | | 1,400 | | | | 21,061 | |
Hitachi Construction Machinery Co. Ltd. | | | 1,400 | | | | 32,762 | |
Hitachi High-Technologies Corp. | | | 900 | | | | 28,183 | |
Hitachi Ltd. | | | 13,200 | | | | 349,935 | |
Hitachi Metals Ltd. | | | 2,900 | | | | 30,162 | |
Honda Motor Co. Ltd. | | | 22,100 | | | | 582,226 | |
Hoshizaki Corp. | | | 700 | | | | 42,475 | |
Hoya Corp. | | | 5,100 | | | | 307,530 | |
Hulic Co. Ltd. | | | 4,000 | | | | 35,745 | |
Idemitsu Kosan Co. Ltd. | | | 1,800 | | | | 58,548 | |
IHI Corp. | | | 2,000 | | | | 55,083 | |
Iida Group Holdings Co. Ltd. | | | 2,000 | | | | 34,642 | |
Inpex Corp. | | | 13,600 | | | | 120,507 | |
Isetan Mitsukoshi Holdings Ltd. | | | 4,480 | | | | 49,498 | |
| | | | | | | | |
| Security | | Shares | | | Value | |
|
| Japan (continued) | |
Isuzu Motors Ltd. | | | 7,300 | | | $ | 102,398 | |
ITOCHU Corp. | | | 19,400 | | | | 329,466 | |
J Front Retailing Co. Ltd. | | | 3,100 | | | | 35,482 | |
Japan Airlines Co. Ltd. | | | 1,500 | | | | 53,162 | |
Japan Airport Terminal Co. Ltd. | | | 600 | | | | 20,742 | |
Japan Exchange Group, Inc. | | | 6,800 | | | | 109,683 | |
Japan Post Bank Co. Ltd. | | | 5,400 | | | | 59,453 | |
Japan Post Holdings Co. Ltd. | | | 21,800 | | | | 251,703 | |
Japan Prime Realty Investment Corp. | | | 11 | | | | 41,771 | |
Japan Real Estate Investment Corp. | | | 17 | | | | 95,449 | |
Japan Retail Fund Investment Corp. | | | 35 | | | | 69,845 | |
Japan Tobacco, Inc. | | | 15,000 | | | | 356,416 | |
JFE Holdings, Inc. | | | 6,500 | | | | 103,534 | |
JGC Corp. | | | 2,800 | | | | 39,408 | |
JSR Corp. | | | 2,600 | | | | 39,027 | |
JTEKT Corp. | | | 2,700 | | | | 29,861 | |
JXTG Holdings, Inc. | | | 44,550 | | | | 231,372 | |
Kajima Corp. | | | 6,000 | | | | 80,599 | |
Kakaku.com, Inc. | | | 1,800 | | | | 31,840 | |
Kamigumi Co. Ltd. | | | 1,400 | | | | 28,642 | |
Kaneka Corp. | | | 700 | | | | 25,069 | |
Kansai Electric Power Co., Inc. (The) | | | 9,400 | | | | 140,969 | |
Kansai Paint Co. Ltd. | | | 2,400 | | | | 46,098 | |
Kao Corp. | | | 6,600 | | | | 488,516 | |
Kawasaki Heavy Industries Ltd. | | | 1,900 | | | | 40,545 | |
KDDI Corp. | | | 24,000 | | | | 573,478 | |
Keihan Holdings Co. Ltd. | | | 1,300 | | | | 52,971 | |
Keikyu Corp. | | | 2,900 | | | | 47,390 | |
Keio Corp. | | | 1,400 | | | | 81,470 | |
Keisei Electric Railway Co. Ltd. | | | 1,700 | | | | 53,263 | |
Keyence Corp. | | | 1,328 | | | | 671,232 | |
Kikkoman Corp. | | | 1,900 | | | | 101,678 | |
Kintetsu Group Holdings Co. Ltd. | | | 2,300 | | | | 99,942 | |
Kirin Holdings Co. Ltd. | | | 11,300 | | | | 235,623 | |
Kobayashi Pharmaceutical Co. Ltd. | | | 700 | | | | 47,471 | |
Kobe Steel Ltd. | | | 4,100 | | | | 28,418 | |
Koito Manufacturing Co. Ltd. | | | 1,400 | | | | 72,231 | |
Komatsu Ltd. | | | 12,700 | | | | 272,922 | |
Konami Holdings Corp. | | | 1,200 | | | | 52,730 | |
Konica Minolta, Inc. | | | 6,000 | | | | 54,009 | |
Kose Corp. | | | 400 | | | | 62,831 | |
Kubota Corp. | | | 13,100 | | | | 186,200 | |
Kuraray Co. Ltd. | | | 4,200 | | | | 59,071 | |
Kurita Water Industries Ltd. | | | 1,300 | | | | 31,474 | |
Kyocera Corp. | | | 4,300 | | | | 214,936 | |
Kyowa Hakko Kirin Co. Ltd. | | | 3,400 | | | | 64,247 | |
Kyushu Electric Power Co., Inc. | | | 5,000 | | | | 59,538 | |
Kyushu Railway Co. | | | 2,100 | | | | 71,049 | |
Lawson, Inc. | | | 700 | | | | 44,278 | |
LINE Corp.(b) | | | 1,000 | | | | 34,153 | |
Lion Corp. | | | 3,000 | | | | 62,003 | |
LIXIL Group Corp. | | | 3,500 | | | | 43,390 | |
M3, Inc. | | | 5,600 | | | | 75,439 | |
Makita Corp. | | | 3,000 | | | | 106,548 | |
Marubeni Corp. | | | 20,800 | | | | 145,943 | |
Marui Group Co. Ltd. | | | 2,500 | | | | 48,450 | |
Maruichi Steel Tube Ltd. | | | 700 | | | | 21,959 | |
Mazda Motor Corp. | | | 7,600 | | | | 78,131 | |
McDonald’s Holdings Co. Japan Ltd. | | | 900 | | | | 38,230 | |
Mebuki Financial Group, Inc. | | | 10,980 | | | | 29,038 | |
Medipal Holdings Corp. | | | 2,300 | | | | 49,207 | |
MEIJI Holdings Co. Ltd. | | | 1,600 | | | | 130,396 | |
MINEBEA MITSUMI, Inc. | | | 5,100 | | | | 73,542 | |
MISUMI Group, Inc. | | | 3,800 | | | | 80,054 | |
| | |
| 8 | | 2018 BLACKROCK ANNUAL REPORTTO SHAREHOLDERS |
| | |
Schedule of Investments (continued) December 31, 2018 | | BlackRock International Index V.I. Fund (Percentages shown are based on Net Assets) |
| | | | | | | | |
| Security | | Shares | | | Value | |
|
| Japan (continued) | |
Mitsubishi Chemical Holdings Corp. | | | 17,000 | | | $ | 128,434 | |
Mitsubishi Corp. | | | 18,400 | | | | 504,465 | |
Mitsubishi Electric Corp. | | | 25,100 | | | | 276,793 | |
Mitsubishi Estate Co. Ltd. | | | 16,300 | | | | 256,456 | |
Mitsubishi Gas Chemical Co., Inc. | | | 2,200 | | | | 32,955 | |
Mitsubishi Heavy Industries Ltd. | | | 4,000 | | | | 143,529 | |
Mitsubishi Materials Corp. | | | 1,400 | | | | 36,891 | |
Mitsubishi Motors Corp. | | | 8,900 | | | | 48,467 | |
Mitsubishi Tanabe Pharma Corp. | | | 3,400 | | | | 49,081 | |
Mitsubishi UFJ Financial Group, Inc. | | | 158,060 | | | | 775,704 | |
Mitsubishi UFJ Lease & Finance Co. Ltd. | | | 5,400 | | | | 25,882 | |
Mitsui & Co. Ltd. | | | 22,600 | | | | 347,211 | |
Mitsui Chemicals, Inc. | | | 2,400 | | | | 54,183 | |
Mitsui Fudosan Co. Ltd. | | | 11,900 | | | | 264,322 | |
Mitsui OSK Lines Ltd. | | | 1,500 | | | | 32,460 | |
Mizuho Financial Group, Inc. | | | 326,400 | | | | 505,018 | |
MonotaRO Co. Ltd. | | | 1,700 | | | | 41,907 | |
MS&AD Insurance Group Holdings, Inc. | | | 6,300 | | | | 179,079 | |
Murata Manufacturing Co. Ltd. | | | 2,400 | | | | 323,400 | |
Nabtesco Corp. | | | 1,500 | | | | 32,476 | |
Nagoya Railroad Co. Ltd. | | | 2,400 | | | | 63,208 | |
NEC Corp. | | | 3,500 | | | | 104,069 | |
Nexon Co. Ltd.(b) | | | 5,900 | | | | 76,166 | |
NGK Insulators Ltd. | | | 3,500 | | | | 47,439 | |
NGK Spark Plug Co. Ltd. | | | 2,100 | | | | 41,569 | |
NH Foods Ltd. | | | 1,200 | | | | 45,110 | |
Nidec Corp. | | | 3,000 | | | | 339,441 | |
Nikon Corp. | | | 4,300 | | | | 64,049 | |
Nintendo Co. Ltd. | | | 1,500 | | | | 398,309 | |
Nippon Building Fund, Inc. | | | 18 | | | | 113,343 | |
Nippon Electric Glass Co. Ltd. | | | 1,100 | | | | 26,950 | |
Nippon Express Co. Ltd. | | | 1,000 | | | | 55,553 | |
Nippon Paint Holdings Co. Ltd. | | | 1,900 | | | | 64,736 | |
Nippon Prologis REIT, Inc. | | | 23 | | | | 48,541 | |
Nippon Steel & Sumitomo Metal Corp. | | | 10,100 | | | | 173,527 | |
Nippon Telegraph & Telephone Corp. | | | 9,500 | | | | 387,594 | |
Nippon Yusen KK | | | 2,000 | | | | 30,582 | |
Nissan Chemical Corp. | | | 1,700 | | | | 88,711 | |
Nissan Motor Co. Ltd. | | | 32,000 | | | | 255,978 | |
Nisshin Seifun Group, Inc. | | | 2,600 | | | | 53,551 | |
Nissin Foods Holdings Co. Ltd. | | | 800 | | | | 50,125 | |
Nitori Holdings Co. Ltd. | | | 1,100 | | | | 137,764 | |
Nitto Denko Corp. | | | 2,200 | | | | 110,340 | |
Nomura Holdings, Inc. | | | 46,000 | | | | 174,322 | |
Nomura Real Estate Holdings, Inc. | | | 1,700 | | | | 31,174 | |
Nomura Real Estate Master Fund, Inc. | | | 52 | | | | 68,417 | |
Nomura Research Institute Ltd. | | | 1,470 | | | | 54,512 | |
NSK Ltd. | | | 4,800 | | | | 41,183 | |
NTT Data Corp. | | | 8,400 | | | | 91,810 | |
NTT Docomo, Inc. | | | 18,000 | | | | 404,446 | |
Obayashi Corp. | | | 8,600 | | | | 77,872 | |
Obic Co. Ltd. | | | 900 | | | | 69,470 | |
Odakyu Electric Railway Co. Ltd. | | | 3,900 | | | | 85,763 | |
Oji Holdings Corp. | | | 11,600 | | | | 59,269 | |
Olympus Corp. | | | 3,900 | | | | 119,281 | |
Omron Corp. | | | 2,600 | | | | 94,255 | |
Ono Pharmaceutical Co. Ltd. | | | 5,100 | | | | 104,146 | |
Oracle Corp. | | | 500 | | | | 31,739 | |
Oriental Land Co. Ltd. | | | 2,700 | | | | 271,538 | |
ORIX Corp. | | | 18,300 | | | | 267,398 | |
Osaka Gas Co. Ltd. | | | 5,000 | | | | 91,210 | |
Otsuka Corp. | | | 1,400 | | | | 38,530 | |
Otsuka Holdings Co. Ltd. | | | 5,200 | | | | 212,494 | |
Panasonic Corp. | | | 30,300 | | | | 272,198 | |
| | | | | | | | |
| Security | | Shares | | | Value | |
|
| Japan (continued) | |
Park24 Co. Ltd. | | | 1,500 | | | $ | 33,032 | |
Persol Holdings Co. Ltd. | | | 2,400 | | | | 35,600 | |
Pigeon Corp. | | | 1,600 | | | | 68,244 | |
Pola Orbis Holdings, Inc. | | | 1,200 | | | | 32,338 | |
Rakuten, Inc. | | | 11,400 | | | | 76,478 | |
Recruit Holdings Co. Ltd. | | | 15,000 | | | | 362,381 | |
Renesas Electronics Corp.(b) | | | 11,100 | | | | 50,415 | |
Resona Holdings, Inc. | | | 27,800 | | | | 133,342 | |
Ricoh Co. Ltd. | | | 8,900 | | | | 86,970 | |
Rinnai Corp. | | | 400 | | | | 26,338 | |
Rohm Co. Ltd. | | | 1,300 | | | | 82,973 | |
Ryohin Keikaku Co. Ltd. | | | 300 | | | | 72,835 | |
Sankyo Co. Ltd. | | | 600 | | | | 22,818 | |
Santen Pharmaceutical Co. Ltd. | | | 4,900 | | | | 70,698 | |
SBI Holdings, Inc. | | | 2,945 | | | | 57,434 | |
Secom Co. Ltd. | | | 2,800 | | | | 232,262 | |
Sega Sammy Holdings, Inc. | | | 2,268 | | | | 31,618 | |
Seibu Holdings, Inc. | | | 3,000 | | | | 52,180 | |
Seiko Epson Corp. | | | 3,700 | | | | 51,677 | |
Sekisui Chemical Co. Ltd. | | | 4,900 | | | | 72,842 | |
Sekisui House Ltd. | | | 8,300 | | | | 121,886 | |
Seven & i Holdings Co. Ltd. | | | 10,340 | | | | 449,326 | |
Seven Bank Ltd. | | | 7,900 | | | | 22,552 | |
SG Holdings Co. Ltd. | | | 1,300 | | | | 33,803 | |
Sharp Corp. | | | 2,300 | | | | 23,027 | |
Shimadzu Corp. | | | 3,000 | | | | 59,160 | |
Shimamura Co. Ltd. | | | 300 | | | | 22,973 | |
Shimano, Inc. | | | 1,000 | | | | 140,967 | |
Shimizu Corp. | | | 7,300 | | | | 59,385 | |
Shin-Etsu Chemical Co. Ltd. | | | 5,000 | | | | 384,164 | |
Shinsei Bank Ltd. | | | 2,100 | | | | 24,965 | |
Shionogi & Co. Ltd. | | | 3,700 | | | | 211,179 | |
Shiseido Co. Ltd. | | | 5,100 | | | | 319,403 | |
Shizuoka Bank Ltd. (The) | | | 5,700 | | | | 44,432 | |
Showa Denko KK | | | 1,800 | | | | 53,450 | |
Showa Shell Sekiyu KK | | | 2,500 | | | | 34,635 | |
SMC Corp. | | | 800 | | | | 240,858 | |
SoftBank Group Corp. | | | 11,200 | | | | 733,591 | |
Sohgo Security Services Co. Ltd. | | | 900 | | | | 42,050 | |
Sompo Holdings, Inc. | | | 4,400 | | | | 149,468 | |
Sony Corp. | | | 17,200 | | | | 829,205 | |
Sony Financial Holdings, Inc. | | | 2,300 | | | | 42,864 | |
Stanley Electric Co. Ltd. | | | 1,800 | | | | 50,354 | |
Subaru Corp. | | | 8,200 | | | | 175,180 | |
SUMCO Corp. | | | 3,100 | | | | 34,525 | |
Sumitomo Chemical Co. Ltd. | | | 20,000 | | | | 96,854 | |
Sumitomo Corp. | | | 15,000 | | | | 212,832 | |
Sumitomo Dainippon Pharma Co. Ltd. | | | 2,100 | | | | 66,970 | |
Sumitomo Electric Industries Ltd. | | | 10,000 | | | | 132,433 | |
Sumitomo Heavy Industries Ltd. | | | 1,500 | | | | 44,477 | |
Sumitomo Metal Mining Co. Ltd. | | | 3,100 | | | | 83,016 | |
Sumitomo Mitsui Financial Group, Inc. | | | 17,900 | | | | 590,075 | |
Sumitomo Mitsui Trust Holdings, Inc. | | | 4,400 | | | | 160,235 | |
Sumitomo Realty & Development Co. Ltd. | | | 5,000 | | | | 183,043 | |
Sumitomo Rubber Industries Ltd. | | | 2,300 | | | | 27,078 | |
Sundrug Co. Ltd. | | | 1,000 | | | | 29,779 | |
Suntory Beverage & Food Ltd. | | | 1,800 | | | | 81,275 | |
Suzuken Co. Ltd. | | | 1,000 | | | | 50,923 | |
Suzuki Motor Corp. | | | 4,600 | | | | 231,893 | |
Sysmex Corp. | | | 2,400 | | | | 113,979 | |
T&D Holdings, Inc. | | | 7,400 | | | | 85,600 | |
Taiheiyo Cement Corp. | | | 1,600 | | | | 49,240 | |
Taisei Corp. | | | 3,100 | | | | 132,768 | |
Taisho Pharmaceutical Holdings Co. Ltd. | | | 500 | | | | 50,184 | |
| | | | |
| SCHEDULE OF INVESTMENTS | | | 9 | |
| | |
Schedule of Investments (continued) December 31, 2018 | | BlackRock International Index V.I. Fund (Percentages shown are based on Net Assets) |
| | | | | | | | |
| Security | | Shares | | | Value | |
|
| Japan (continued) | |
Taiyo Nippon Sanso Corp. | | | 1,700 | | | $ | 27,637 | |
Takashimaya Co. Ltd. | | | 1,900 | | | | 24,260 | |
Takeda Pharmaceutical Co. Ltd. | | | 9,800 | | | | 332,166 | |
TDK Corp. | | | 1,800 | | | | 126,010 | |
Teijin Ltd. | | | 2,400 | | | | 38,304 | |
Terumo Corp. | | | 4,200 | | | | 236,902 | |
THK Co. Ltd. | | | 1,600 | | | | 29,891 | |
Tobu Railway Co. Ltd. | | | 2,500 | | | | 67,501 | |
Toho Co. Ltd. | | | 1,500 | | | | 54,349 | |
Toho Gas Co. Ltd. | | | 1,000 | | | | 42,064 | |
Tohoku Electric Power Co., Inc. | | | 5,700 | | | | 75,046 | |
Tokio Marine Holdings, Inc. | | | 9,200 | | | | 437,080 | |
Tokyo Century Corp. | | | 600 | | | | 26,426 | |
Tokyo Electric Power Co. Holdings, Inc.(b) | | | 19,200 | | | | 114,049 | |
Tokyo Electron Ltd. | | | 2,100 | | | | 236,406 | |
Tokyo Gas Co. Ltd. | | | 5,200 | | | | 131,519 | |
Tokyu Corp. | | | 6,600 | | | | 107,850 | |
Tokyu Fudosan Holdings Corp. | | | 6,800 | | | | 33,517 | |
Toppan Printing Co. Ltd. | | | 3,300 | | | | 48,508 | |
Toray Industries, Inc. | | | 18,400 | | | | 130,090 | |
Toshiba Corp.(b) | | | 8,700 | | | | 245,661 | |
Tosoh Corp. | | | 3,500 | | | | 45,399 | |
TOTO Ltd. | | | 1,900 | | | | 65,721 | |
Toyo Seikan Group Holdings Ltd. | | | 2,000 | | | | 45,776 | |
Toyo Suisan Kaisha Ltd. | | | 1,200 | | | | 41,788 | |
Toyoda Gosei Co. Ltd. | | | 900 | | | | 17,718 | |
Toyota Industries Corp. | | | 2,100 | | | | 96,705 | |
Toyota Motor Corp. | | | 30,700 | | | | 1,777,118 | |
Toyota Tsusho Corp. | | | 2,800 | | | | 82,271 | |
Trend Micro, Inc. | | | 1,600 | | | | 86,457 | |
Tsuruha Holdings, Inc. | | | 500 | | | | 42,816 | |
Unicharm Corp. | | | 5,400 | | | | 174,647 | |
United Urban Investment Corp. | | | 39 | | | | 60,400 | |
USS Co. Ltd. | | | 2,900 | | | | 48,657 | |
Welcia Holdings Co. Ltd. | | | 600 | | | | 27,120 | |
West Japan Railway Co. | | | 2,200 | | | | 155,433 | |
Yahoo Japan Corp. | | | 37,900 | | | | 94,285 | |
Yakult Honsha Co. Ltd. | | | 1,500 | | | | 105,006 | |
Yamada Denki Co. Ltd. | | | 8,400 | | | | 40,343 | |
Yamaguchi Financial Group, Inc. | | | 2,600 | | | | 24,853 | |
Yamaha Corp. | | | 1,800 | | | | 76,571 | |
Yamaha Motor Co. Ltd. | | | 3,700 | | | | 72,238 | |
Yamato Holdings Co. Ltd. | | | 4,100 | | | | 112,408 | |
Yamazaki Baking Co. Ltd. | | | 1,600 | | | | 33,507 | |
Yaskawa Electric Corp. | | | 3,200 | | | | 78,221 | |
Yokogawa Electric Corp. | | | 3,000 | | | | 51,787 | |
Yokohama Rubber Co. Ltd. (The) | | | 1,600 | | | | 29,924 | |
ZOZO, Inc. | | | 2,700 | | | | 49,467 | |
| | | | | | | | |
| | | | | | | 40,862,920 | |
|
| Luxembourg— 0.3% | |
ArcelorMittal | | | 9,140 | | | | 189,202 | |
Eurofins Scientific SE | | | 152 | | | | 56,769 | |
RTL Group SA | | | 515 | | | | 27,599 | |
SES SA, FDR | | | 4,843 | | | | 92,725 | |
Tenaris SA | | | 6,279 | | | | 67,485 | |
| | | | | | | | |
| | | | | | | 433,780 | |
|
| Macau— 0.3% | |
Galaxy Entertainment Group Ltd. | | | 32,000 | | | | 202,133 | |
MGM China Holdings Ltd. | | | 12,800 | | | | 21,369 | |
Sands China Ltd. | | | 32,400 | | | | 141,297 | |
SJM Holdings Ltd. | | | 26,000 | | | | 24,157 | |
Wynn Macau Ltd. | | | 20,800 | | | | 45,279 | |
| | | | | | | | |
| | | | | | | 434,235 | |
| | | | | | | | |
| Security | | Shares | | | Value | |
|
| Mexico— 0.0% | |
Fresnillo plc | | | 2,939 | | | $ | 32,294 | |
| | | | | | | | |
|
| Netherlands— 4.6% | |
ABN AMRO Group NV, CVA(c) | | | 5,624 | | | | 132,343 | |
Aegon NV | | | 23,684 | | | | 110,927 | |
Akzo Nobel NV | | | 3,464 | | | | 278,970 | |
ASML Holding NV | | | 5,544 | | | | 868,521 | |
EXOR NV | | | 1,442 | | | | 78,282 | |
Heineken Holding NV | | | 1,532 | | | | 129,433 | |
Heineken NV | | | 3,549 | | | | 313,685 | |
ING Groep NV | | | 52,634 | | | | 566,163 | |
Koninklijke Ahold Delhaize NV | | | 16,577 | | | | 418,772 | |
Koninklijke DSM NV | | | 2,504 | | | | 203,139 | |
Koninklijke KPN NV | | | 44,704 | | | | 130,580 | |
Koninklijke Philips NV | | | 12,727 | | | | 446,202 | |
Koninklijke Vopak NV | | | 935 | | | | 42,401 | |
NN Group NV | | | 4,004 | | | | 159,193 | |
NXP Semiconductors NV | | | 4,685 | | | | 343,317 | |
Randstad NV | | | 1,584 | | | | 72,626 | |
Royal Dutch Shell plc, Class A | | | 61,902 | | | | 1,821,952 | |
Royal Dutch Shell plc, Class B | | | 50,373 | | | | 1,506,027 | |
Wolters Kluwer NV | | | 3,872 | | | | 227,702 | |
| | | | | | | | |
| | | | | | | 7,850,235 | |
|
| New Zealand— 0.2% | |
a2 Milk Co. Ltd.(b) | | | 9,707 | | | | 72,925 | |
Auckland International Airport Ltd. | | | 12,791 | | | | 61,735 | |
Fisher & Paykel Healthcare Corp. Ltd. | | | 7,597 | | | | 66,388 | |
Fletcher Building Ltd. | | | 11,346 | | | | 37,163 | |
Meridian Energy Ltd. | | | 17,039 | | | | 38,988 | |
Ryman Healthcare Ltd. | | | 5,318 | | | | 38,379 | |
Spark New Zealand Ltd. | | | 24,403 | | | | 68,070 | |
| | | | | | | | |
| | | | | | | 383,648 | |
|
| Norway— 0.7% | |
Aker BP ASA | | | 1,436 | | | | 36,206 | |
DNB ASA | | | 13,461 | | | | 216,071 | |
Equinor ASA | | | 15,885 | | | | 336,955 | |
Gjensidige Forsikring ASA | | | 2,659 | | | | 41,597 | |
Marine Harvest ASA | | | 5,540 | | | | 116,769 | |
Norsk Hydro ASA | | | 17,881 | | | | 81,020 | |
Orkla ASA | | | 10,838 | | | | 84,861 | |
Schibsted ASA, Class B | | | 1,303 | | | | 39,637 | |
Telenor ASA | | | 9,912 | | | | 192,494 | |
Yara International ASA | | | 2,361 | | | | 91,015 | |
| | | | | | | | |
| | | | | | | 1,236,625 | |
|
| Portugal— 0.2% | |
EDP — Energias de Portugal SA | | | 34,032 | | | | 119,054 | |
Galp Energia SGPS SA | | | 6,665 | | | | 104,946 | |
Jeronimo Martins SGPS SA | | | 3,347 | | | | 39,663 | |
| | | | | | | | |
| | | | | | | 263,663 | |
|
| Singapore— 1.3% | |
Ascendas Real Estate Investment Trust | | | 35,562 | | | | 67,112 | |
CapitaLand Commercial Trust | | | 34,838 | | | | 44,747 | |
CapitaLand Ltd. | | | 34,092 | | | | 77,744 | |
CapitaLand Mall Trust | | | 33,000 | | | | 54,724 | |
City Developments Ltd. | | | 5,431 | | | | 32,378 | |
ComfortDelGro Corp. Ltd. | | | 28,800 | | | | 45,491 | |
DBS Group Holdings Ltd. | | | 23,867 | | | | 415,043 | |
Genting Singapore Ltd. | | | 80,400 | | | | 57,552 | |
Golden Agri-Resources Ltd. | | | 85,302 | | | | 15,315 | |
Jardine Cycle & Carriage Ltd. | | | 1,283 | | | | 33,215 | |
Keppel Corp. Ltd. | | | 19,302 | | | | 83,794 | |
Oversea-Chinese Banking Corp. Ltd. | | | 41,835 | | | | 346,042 | |
SATS Ltd. | | | 9,000 | | | | 30,826 | |
| | |
| 10 | | 2018 BLACKROCK ANNUAL REPORTTO SHAREHOLDERS |
| | |
Schedule of Investments (continued) December 31, 2018 | | BlackRock International Index V.I. Fund (Percentages shown are based on Net Assets) |
| | | | | | | | |
| Security | | Shares | | | Value | |
|
| Singapore (continued) | |
Sembcorp Industries Ltd. | | | 13,100 | | | $ | 24,407 | |
Singapore Airlines Ltd. | | | 7,200 | | | | 49,741 | |
Singapore Exchange Ltd. | | | 10,700 | | | | 56,077 | |
Singapore Press Holdings Ltd. | | | 21,330 | | | | 36,757 | |
Singapore Technologies Engineering Ltd. | | | 20,781 | | | | 53,272 | |
Singapore Telecommunications Ltd. | | | 112,850 | | | | 242,880 | |
Suntec REIT | | | 28,300 | | | | 36,916 | |
United Overseas Bank Ltd. | | | 17,859 | | | | 323,069 | |
UOL Group Ltd. | | | 6,746 | | | | 30,680 | |
Venture Corp. Ltd. | | | 3,600 | | | | 36,960 | |
Wilmar International Ltd. | | | 25,500 | | | | 58,396 | |
| | | | | | | | |
| | | | | | | 2,253,138 | |
|
| South Africa— 0.2% | |
Anglo American plc | | | 14,035 | | | | 313,832 | |
Investec plc | | | 8,906 | | | | 50,067 | |
| | | | | | | | |
| | | | | | | 363,899 | |
|
| Spain— 3.0% | |
ACS Actividades de Construccion y Servicios SA | | | 3,419 | | | | 132,340 | |
Aena SME SA(c) | | | 954 | | | | 148,225 | |
Amadeus IT Group SA | | | 5,939 | | | | 413,221 | |
Banco Bilbao Vizcaya Argentaria SA | | | 90,188 | | | | 479,062 | |
Banco de Sabadell SA | | | 74,815 | | | | 85,605 | |
Banco Santander SA | | | 220,028 | | | | 999,146 | |
Bankia SA | | | 16,407 | | | | 48,004 | |
Bankinter SA | | | 8,963 | | | | 71,920 | |
CaixaBank SA | | | 47,717 | | | | 172,804 | |
Enagas SA | | | 3,015 | | | | 81,502 | |
Endesa SA | | | 4,223 | | | | 97,385 | |
Ferrovial SA | | | 6,590 | | | | 133,465 | |
Gas Natural SDG SA | | | 4,657 | | | | 118,804 | |
Grifols SA | | | 3,966 | | | | 104,115 | |
Iberdrola SA | | | 80,615 | | | | 647,329 | |
Industria de Diseno Textil SA | | | 14,821 | | | | 378,302 | |
Mapfre SA | | | 14,331 | | | | 38,062 | |
Red Electrica Corp. SA | | | 5,756 | | | | 128,360 | |
Repsol SA | | | 18,599 | | | | 299,017 | |
Siemens Gamesa Renewable Energy SA(b) | | | 3,170 | | | | 38,596 | |
Telefonica SA | | | 63,353 | | | | 533,268 | |
| | | | | | | | |
| | | | | | | 5,148,532 | |
|
| Sweden— 2.5% | |
Alfa Laval AB | | | 3,904 | | | | 83,925 | |
Assa Abloy AB, Class B | | | 13,812 | | | | 247,329 | |
Atlas Copco AB, Class A(b) | | | 9,266 | | | | 221,069 | |
Atlas Copco AB, Class B(b) | | | 5,188 | | | | 113,678 | |
Boliden AB(b) | | | 3,637 | | | | 78,810 | |
Electrolux AB | | | 3,199 | | | | 67,431 | |
Epiroc AB, Class A(b) | | | 8,928 | | | | 84,857 | |
Epiroc AB, Class B(b) | | | 5,188 | | | | 46,310 | |
Essity AB, Class B | | | 8,062 | | | | 198,176 | |
Hennes & Mauritz AB, Class B | | | 11,653 | | | | 165,718 | |
Hexagon AB, Class B | | | 3,437 | | | | 158,884 | |
Husqvarna AB, Class B | | | 5,551 | | | | 41,210 | |
ICA Gruppen AB | | | 1,070 | | | | 38,225 | |
Industrivarden AB, Class C | | | 2,221 | | | | 44,967 | |
Investor AB, Class B | | | 6,267 | | | | 266,312 | |
Kinnevik AB, Class B | | | 3,118 | | | | 75,454 | |
L E Lundbergforetagen AB, Class B | | | 1,010 | | | | 29,826 | |
Lundin Petroleum AB | | | 2,489 | | | | 62,161 | |
Sandvik AB | | | 15,561 | | | | 222,962 | |
Securitas AB, Class B | | | 4,163 | | | | 67,066 | |
Skandinaviska Enskilda Banken AB, Class A | | | 21,639 | | | | 210,350 | |
Skanska AB, Class B | | | 4,522 | | | | 72,104 | |
SKF AB, Class B | | | 5,029 | | | | 76,434 | |
| | | | | | | | |
| Security | | Shares | | | Value | |
|
| Sweden (continued) | |
Svenska Handelsbanken AB, Class A | | | 20,311 | | | $ | 225,974 | |
Swedbank AB, Class A | | | 12,441 | | | | 278,071 | |
Swedish Match AB | | | 2,339 | | | | 92,080 | |
Tele2 AB, Class B | | | 6,403 | | | | 81,663 | |
Telefonaktiebolaget LM Ericsson, Class B | | | 41,946 | | | | 371,305 | |
Telia Co. AB | | | 37,422 | | | | 178,012 | |
Volvo AB, Class B | | | 21,373 | | | | 279,859 | |
| | | | | | | | |
| | | | | | | 4,180,222 | |
|
| Switzerland— 9.0% | |
ABB Ltd. (Registered) | | | 24,927 | | | | 476,009 | |
Adecco Group AG (Registered) | | | 2,162 | | | | 101,619 | |
Baloise Holding AG (Registered) | | | 649 | | | | 89,601 | |
Barry Callebaut AG (Registered) | | | 29 | | | | 45,259 | |
Chocoladefabriken Lindt & Spruengli AG | | | 14 | | | | 86,994 | |
Chocoladefabriken Lindt & Spruengli AG (Registered) | | | 1 | | | | 74,575 | |
Cie Financiere Richemont SA (Registered) | | | 7,060 | | | | 455,283 | |
Clariant AG (Registered)(b) | | | 2,648 | | | | 48,834 | |
Coca-Cola HBC AG(b) | | | 2,691 | | | | 84,222 | |
Credit Suisse Group AG (Registered)(b) | | | 34,613 | | | | 378,379 | |
Dufry AG (Registered)(b) | | | 430 | | | | 40,946 | |
EMS-Chemie Holding AG (Registered) | | | 109 | | | | 51,897 | |
Geberit AG (Registered) | | | 492 | | | | 191,595 | |
Givaudan SA (Registered) | | | 123 | | | | 285,196 | |
Glencore plc(b) | | | 153,723 | | | | 571,552 | |
Julius Baer Group Ltd.(b) | | | 2,976 | | | | 106,054 | |
Kuehne + Nagel International AG (Registered) | | | 718 | | | | 92,426 | |
LafargeHolcim Ltd. (Registered)(b) | | | 6,658 | | | | 274,766 | |
Lonza Group AG (Registered)(b) | | | 1,019 | | | | 264,894 | |
Nestle SA (Registered) | | | 41,265 | | | | 3,349,182 | |
Novartis AG (Registered) | | | 29,324 | | | | 2,511,433 | |
Pargesa Holding SA | | | 513 | | | | 36,999 | |
Partners Group Holding AG | | | 231 | | | | 140,528 | |
Roche Holding AG | | | 9,503 | | | | 2,359,204 | |
Schindler Holding AG | | | 541 | | | | 107,417 | |
Schindler Holding AG (Registered) | | | 268 | | | | 52,089 | |
SGS SA (Registered) | | | 71 | | | | 159,823 | |
Sika AG (Registered) | | | 1,722 | | | | 218,735 | |
Sonova Holding AG (Registered) | | | 738 | | | | 121,361 | |
STMicroelectronics NV | | | 9,080 | | | | 128,696 | |
Straumann Holding AG (Registered) | | | 137 | | | | 86,524 | |
Swatch Group AG (The) | | | 410 | | | | 119,662 | |
Swatch Group AG (The) (Registered) | | | 742 | | | | 42,919 | |
Swiss Life Holding AG (Registered)(b) | | | 455 | | | | 175,616 | |
Swiss Prime Site AG (Registered) | | | 1,010 | | | | 81,811 | |
Swiss Re AG | | | 4,106 | | | | 377,753 | |
Swisscom AG (Registered) | | | 344 | | | | 164,424 | |
Temenos AG (Registered)(b) | | | 803 | | | | 96,491 | |
UBS Group AG (Registered)(b) | | | 52,134 | | | | 650,280 | |
Vifor Pharma AG | | | 605 | | | | 65,833 | |
Zurich Insurance Group AG(b) | | | 2,047 | | | | 610,188 | |
| | | | | | | | |
| | | | | | | 15,377,069 | |
|
| United Arab Emirates— 0.0% | |
NMC Health plc | | | 1,384 | | | | 48,303 | |
| | | | | | | | |
|
| United Kingdom— 14.1% | |
3i Group plc | | | 13,723 | | | | 135,408 | |
Admiral Group plc | | | 2,678 | | | | 69,879 | |
Ashtead Group plc | | | 6,516 | | | | 135,920 | |
Associated British Foods plc | | | 4,737 | | | | 123,463 | |
AstraZeneca plc | | | 17,017 | | | | 1,270,251 | |
Auto Trader Group plc(c) | | | 12,604 | | | | 73,146 | |
Aviva plc | | | 52,775 | | | | 252,581 | |
Babcock International Group plc | | | 3,361 | | | | 20,963 | |
BAE Systems plc | | | 43,651 | | | | 255,308 | |
| | | | |
| SCHEDULE OF INVESTMENTS | | | 11 | |
| | |
Schedule of Investments (continued) December 31, 2018 | | BlackRock International Index V.I. Fund (Percentages shown are based on Net Assets) |
| | | | | | | | |
| Security | | Shares | | | Value | |
|
| United Kingdom (continued) | |
Barclays plc | | | 231,717 | | | $ | 443,337 | |
Barratt Developments plc | | | 13,463 | | | | 79,415 | |
Berkeley Group Holdings plc | | | 1,695 | | | | 75,178 | |
BP plc | | | 269,838 | | | | 1,705,832 | |
British American Tobacco plc | | | 31,023 | | | | 987,122 | |
British Land Co. plc (The) | | | 12,415 | | | | 84,425 | |
BT Group plc | | | 112,599 | | | | 342,368 | |
Bunzl plc | | | 4,467 | | | | 134,898 | |
Burberry Group plc | | | 5,561 | | | | 122,114 | |
Centrica plc | | | 74,586 | | | | 128,659 | |
CNH Industrial NV | | | 14,332 | | | | 129,494 | |
Coca-Cola European Partners plc | | | 2,902 | | | | 133,057 | |
Compass Group plc | | | 21,505 | | | | 452,569 | |
ConvaTec Group plc(c) | | | 18,256 | | | | 32,337 | |
Croda International plc | | | 1,750 | | | | 104,512 | |
DCC plc | | | 1,188 | | | | 90,621 | |
Diageo plc | | | 33,285 | | | | 1,189,420 | |
Direct Line Insurance Group plc | | | 18,282 | | | | 74,315 | |
easyJet plc | | | 2,112 | | | | 29,760 | |
Experian plc | | | 12,591 | | | | 305,230 | |
Fiat Chrysler Automobiles NV(b) | | | 14,876 | | | | 214,488 | |
G4S plc | | | 20,630 | | | | 52,077 | |
GlaxoSmithKline plc | | | 67,079 | | | | 1,278,393 | |
GVC Holdings plc | | | 7,296 | | | | 62,636 | |
Hammerson plc | | | 10,560 | | | | 44,457 | |
Hargreaves Lansdown plc | | | 3,784 | | | | 89,246 | |
HSBC Holdings plc | | | 268,188 | | | | 2,212,481 | |
Imperial Brands plc | | | 12,962 | | | | 393,419 | |
Informa plc | | | 16,631 | | | | 133,492 | |
InterContinental Hotels Group plc | | | 2,408 | | | | 130,256 | |
International Consolidated Airlines Group SA | | | 8,141 | | | | 64,540 | |
Intertek Group plc | | | 2,146 | | | | 131,341 | |
ITV plc | | | 48,169 | | | | 76,669 | |
J Sainsbury plc | | | 23,366 | | | | 78,989 | |
John Wood Group plc | | | 9,011 | | | | 57,976 | |
Johnson Matthey plc | | | 2,573 | | | | 91,871 | |
Kingfisher plc | | | 28,521 | | | | 74,990 | |
Land Securities Group plc | | | 10,701 | | | | 109,876 | |
Legal & General Group plc | | | 82,057 | | | | 241,770 | |
Lloyds Banking Group plc | | | 958,314 | | | | 631,702 | |
London Stock Exchange Group plc | | | 4,328 | | | | 224,539 | |
Marks & Spencer Group plc | | | 21,603 | | | | 67,756 | |
Meggitt plc | | | 10,324 | | | | 62,017 | |
Melrose Industries plc | | | 64,402 | | | | 134,542 | |
Merlin Entertainments plc(c) | | | 9,513 | | | | 38,533 | |
Micro Focus International plc | | | 5,801 | | | | 101,626 | |
Mondi plc | | | 4,883 | | | | 101,702 | |
National Grid plc | | | 45,603 | | | | 446,149 | |
Next plc | | | 1,872 | | | | 95,316 | |
Pearson plc | | | 10,380 | | | | 124,351 | |
Persimmon plc | | | 4,139 | | | | 101,926 | |
Prudential plc | | | 35,056 | | | | 625,976 | |
Reckitt Benckiser Group plc | | | 9,053 | | | | 693,246 | |
RELX plc | | | 26,763 | | | | 551,864 | |
Rolls-Royce Holdings plc(b) | | | 23,013 | | | | 242,442 | |
Royal Bank of Scotland Group plc | | | 64,051 | | | | 177,681 | |
Royal Mail plc | | | 11,966 | | | | 41,533 | |
RSA Insurance Group plc | | | 13,648 | | | | 89,568 | |
Sage Group plc (The) | | | 14,406 | | | | 110,486 | |
Schroders plc | | | 1,653 | | | | 51,481 | |
Segro plc | | | 13,449 | | | | 100,964 | |
Severn Trent plc | | | 3,146 | | | | 72,926 | |
Smith & Nephew plc | | | 11,624 | | | | 217,586 | |
Smiths Group plc | | | 5,262 | | | | 91,606 | |
| | | | | | | | |
| Security | | Shares | | | Value | |
|
| United Kingdom (continued) | |
SSE plc | | | 13,551 | | | $ | 187,134 | |
St James’s Place plc | | | 7,035 | | | | 84,728 | |
Standard Chartered plc | | | 38,513 | | | | 299,310 | |
Standard Life Aberdeen plc | | | 31,196 | | | | 102,147 | |
Taylor Wimpey plc | | | 43,564 | | | | 75,752 | |
Tesco plc | | | 133,153 | | | | 322,918 | |
Unilever NV, CVA | | | 20,874 | | | | 1,130,792 | |
Unilever plc | | | 15,237 | | | | 799,985 | |
United Utilities Group plc | | | 9,066 | | | | 85,243 | |
Vodafone Group plc | | | 360,816 | | | | 701,531 | |
Weir Group plc (The) | | | 3,203 | | | | 53,039 | |
Whitbread plc | | | 2,441 | | | | 142,547 | |
Wm Morrison Supermarkets plc | | | 29,757 | | | | 80,896 | |
WPP plc | | | 17,448 | | | | 189,886 | |
| | | | | | | | |
| | | | | | | 23,973,975 | |
|
| United States— 0.7% | |
Carnival plc | | | 2,337 | | | | 112,227 | |
Ferguson plc | | | 3,204 | | | | 204,730 | |
QIAGEN NV(b) | | | 3,012 | | | | 102,922 | |
Shire plc | | | 12,362 | | | | 719,315 | |
| | | | | | | | |
| | | | | | | 1,139,194 | |
| | | | | | | | |
| |
Total Common Stocks— 98.3%
(Cost: $189,542,309) | | | | 167,655,908 | |
| | | | | | | | |
|
Preferred Securities— 0.5% | |
|
Preferred Stocks— 0.5% | |
|
| Germany— 0.5% | |
Bayerische Motoren Werke AG (Preference) | | | 733 | | | | 52,272 | |
Fuchs Petrolub SE (Preference) | | | 924 | | | | 38,200 | |
Henkel AG & Co. KGaA (Preference) | | | 2,452 | | | | 267,830 | |
Porsche Automobil Holding SE (Preference) | | | 2,036 | | | | 119,742 | |
Sartorius AG (Preference) | | | 473 | | | | 58,868 | |
Volkswagen AG (Preference) | | | 2,524 | | | | 402,466 | |
| | | | | | | | |
| | | | | | | 939,378 | |
|
| United Kingdom— 0.0% | |
Rolls-Royce Holdings plc (Preference)(b) | | | 1,058,598 | | | | 1,349 | |
| | | | | | | | |
| |
Total Preferred Stocks— 0.5%
(Cost: $717,502) | | | | 940,727 | |
| | | | | | | | |
|
Rights— 0.0% | |
|
| Spain— 0.0% | |
Repsol SA(b) | | | 18,599 | | | | 8,524 | |
| | | | | | | | |
| |
Total Rights— 0.0%
(Cost: $8,512) | | | | 8,524 | |
| | | | | | | | |
| |
Total Long-Term Investments— 98.8%
(Cost: $190,268,323) | | | | 168,605,159 | |
| | | | | | | | |
|
Short-Term Securities— 0.0% | |
BlackRock Liquidity Funds,T-Fund,
Institutional Class,
2.32%(e)(f) | | | 35,389 | | | | 35,389 | |
| | | | | | | | |
| |
Total Short-Term Securities— 0.0%
(Cost: $35,389) | | | | 35,389 | |
| | | | | | | | |
| |
Total Investments— 98.8%
(Cost: $190,303,712) | | | | 168,640,548 | |
| |
Other Assets Less Liabilities— 1.2% | | | | 1,988,594 | |
| | | | | |
| |
Net Assets— 100.0% | | | $ | 170,629,142 | |
| | | | | |
| | |
| 12 | | 2018 BLACKROCK ANNUAL REPORTTO SHAREHOLDERS |
| | |
Schedule of Investments (continued) December 31, 2018 | | BlackRock International Index V.I. Fund (Percentages shown are based on Net Assets) |
| (a) | A security contractually bound to one or more other securities to form a single saleable unit which cannot be sold separately. |
| (b) | Non-income producing security. |
| (c) | Security exempt from registration pursuant to Rule 144A under the Securities Act of 1933, as amended. These securities may be resold in transactions exempt from registration to qualified institutional investors. |
| (d) | Security is valued using significant unobservable inputs and is classified as Level 3 in the fair value hierarchy. |
| (e) | Annualized7-day yield as of period end. |
| (f) | During the year ended December 31, 2018, investments in issuers considered to be an affiliate of the Fund for purposes of Section 2(a)(3) of the Investment Company Act of 1940, as amended, were as follows: |
| | | | | | | | | | | | | | | | | | | | | | | | | | | | |
| Affiliate | | Shares
Held at
12/31/17 | | | Net
Activity | | | Shares
Held at
12/31/18 | | | Value at
12/31/18 | | | Income | | | Net
Realized
Gain (Loss) | | | Change in
Unrealized
Appreciation
(Depreciation) | |
BlackRock Liquidity Funds,T-Fund, Institutional Class | | | — | | | | 35,389 | | | | 35,389 | | | $ | 35,389 | | | $ | 278 | | | $ | — | | | $ | — | |
Derivative Financial Instruments Outstanding as of Period End
Futures Contracts
| | | | | | | | | | | | | | | | |
| Description | | Number of
Contracts | | | Expiration
Date | | | Notional
Amount (000) | | | Value/
Unrealized
Appreciation
(Depreciation) | |
Long Contracts | | | | | | | | | | | | | | | | |
Nikkei 225 Index | | | 4 | | | | 03/07/19 | | | $ | 364 | | | $ | (16,869 | ) |
EURO STOXX 50 Index | | | 20 | | | | 03/15/19 | | | | 681 | | | | (17,792 | ) |
FTSE 100 Index | | | 5 | | | | 03/15/19 | | | | 424 | | | | (5,539 | ) |
SPI 200 Index | | | 2 | | | | 03/21/19 | | | | 196 | | | | 4,921 | |
| | | | | | | | | | | | | | | | |
| | | | | | | | | | | | | | $ | (35,279 | ) |
| | | | | | | | | | | | | | | | |
Derivative Financial Instruments Categorized by Risk Exposure
As of period end, the fair values of derivative financial instruments located in the Statement of Assets and Liabilities were as follows:
| | | | | | | | | | | | | | | | | | | | | | | | | | | | |
| | | Commodity
Contracts | | | Credit
Contracts | | | Equity
Contracts | | | Foreign
Currency
Exchange
Contracts | | | Interest
Rate
Contracts | | | Other
Contracts | | | Total | |
Assets — Derivative Financial Instruments | | | | | | | | | | | | | | | | | | | | | | | | | |
Futures contracts | | | | | | | | | | | | | | | | | | | | | | | | | | | | |
Net unrealized appreciation(a) | | $ | — | | | $ | — | | | $ | 4,921 | | | $ | — | | | $ | — | | | $ | — | | | $ | 4,921 | |
| | | | | | | | | | | | | | | | | | | | | | | | | | | | |
| | | | | | |
Liabilities — Derivative Financial Instruments | | | | | | | | | | | | | | | | | | | | | | | | | |
Futures contracts | | | | | | | | | | | | | | | | | | | | | | | | | | | | |
Net unrealized depreciation(a) | | $ | — | | | $ | — | | | $ | 40,200 | | | $ | — | | | $ | — | | | $ | — | | | $ | 40,200 | |
| | | | | | | | | | | | | | | | | | | | | | | | | | | | |
| | (a) | Includes cumulative appreciation (depreciation) on futures contracts, if any, as reported in the Schedule of Investments. Only current day’s variation margin is reported within the Statement of Assets and Liabilities. | |
For the year ended December 31, 2018, the effect of derivative financial instruments in the Statement of Operations were as follows:
| | | | | | | | | | | | | | | | | | | | | | | | | | | | |
| | | Commodity
Contracts | | | Credit
Contracts | | | Equity
Contracts | | | Foreign
Currency
Exchange
Contracts | | | Interest
Rate
Contracts | | | Other
Contracts | | | Total | |
Net Realized Gain (Loss) from: | | | | | | | | | | | | | | | | | | | | | | | | | | | | |
Futures contracts | | $ | — | | | $ | — | | | $ | (20,965 | ) | | $ | — | | | $ | — | | | $ | — | | | $ | (20,965 | ) |
| | | | | | | | | | | | | | | | | | | | | | | | | | | | |
| | $ | — | | | $ | — | | | $ | (20,965 | ) | | $ | — | | | $ | — | | | $ | — | | | $ | (20,965 | ) |
| | | | | | | | | | | | | | | | | | | | | | | | | | | | |
| | | | | | | |
| Net Change in Unrealized Appreciation (Depreciation) on: | | | | | | | | | | | | | | | | | | | | | |
Futures contracts | | $ | — | | | $ | — | | | $ | (35,596 | ) | | $ | — | | | $ | — | | | $ | — | | | $ | (35,596 | ) |
| | | | | | | | | | | | | | | | | | | | | | | | | | | | |
| | | | |
| SCHEDULE OF INVESTMENTS | | | 13 | |
| | |
Schedule of Investments (continued) December 31, 2018 | | BlackRock International Index V.I. Fund |
Average Quarterly Balances of Outstanding Derivative Financial Instruments
| | | | |
Futures contracts: | | | | |
Average notional value of contracts — long | | $ | 2,299,195 | |
For more information about the Fund’s investment risks regarding derivative financial instruments, refer to the Notes to Financial Statements.
Fair Value Hierarchy as of Period End
Various inputs are used in determining the fair value of investments and derivative financial instruments. For information about the Fund’s policy regarding valuation of investments and derivative financial instruments, refer to the Notes to Financial Statements.
The following tables summarize the Fund’s investments and derivative financial instruments categorized in the disclosure hierarchy:
| | | | | | | | | | | | | | | | |
| | | Level 1 | | | Level 2 | | | Level 3 | | | Total | |
Assets: | | | | | | | | | | | | | | | | |
Investments: | | | | | | | | | | | | | | | | |
Long-Term Investments: | | | | | | | | | | | | | | | | |
Common Stocks: | | | | | | | | | | | | | | | | |
Australia | | $ | 126,922 | | | $ | 12,829,536 | | | $ | — | | | $ | 12,956,458 | |
Austria | | | — | | | | 397,655 | | | | — | | | | 397,655 | |
Belgium | | | — | | | | 1,602,207 | | | | — | | | | 1,602,207 | |
Chile | | | — | | | | 52,438 | | | | — | | | | 52,438 | |
China | | | 61,855 | | | | 243,271 | | | | — | | | | 305,126 | |
Colombia | | | — | | | | 55,619 | | | | — | | | | 55,619 | |
Denmark | | | — | | | | 2,961,921 | | | | — | | | | 2,961,921 | |
Finland | | | — | | | | 2,114,966 | | | | — | | | | 2,114,966 | |
France | | | 627,379 | | | | 17,561,806 | | | | — | | | | 18,189,185 | |
Germany | | | 132,369 | | | | 13,756,860 | | | | — | | | | 13,889,229 | |
Hong Kong | | | 57,899 | | | | 5,809,693 | | | | — | | | | 5,867,592 | |
Ireland | | | 158,292 | | | | 887,034 | | | | — | | | | 1,045,326 | |
Israel | | | 434,130 | | | | 473,492 | | | | — | | | | 907,622 | |
Italy | | | — | | | | 3,328,832 | | | | — | | | | 3,328,832 | |
Japan | | | — | | | | 40,862,920 | | | | — | | | | 40,862,920 | |
Luxembourg | | | — | | | | 433,780 | | | | — | | | | 433,780 | |
Macau | | | — | | | | 434,235 | | | | — | | | | 434,235 | |
Mexico | | | — | | | | 32,294 | | | | — | | | | 32,294 | |
Netherlands | | | 343,317 | | | | 7,506,918 | | | | — | | | | 7,850,235 | |
New Zealand | | | 37,163 | | | | 346,485 | | | | — | | | | 383,648 | |
Norway | | | — | | | | 1,236,625 | | | | — | | | | 1,236,625 | |
Portugal | | | — | | | | 263,663 | | | | — | | | | 263,663 | |
Singapore | | | — | | | | 2,253,138 | | | | — | | | | 2,253,138 | |
South Africa | | | — | | | | 363,899 | | | | — | | | | 363,899 | |
Spain | | | — | | | | 5,148,532 | | | | — | | | | 5,148,532 | |
Sweden | | | — | | | | 4,180,222 | | | | — | | | | 4,180,222 | |
Switzerland | | | 74,575 | | | | 15,302,494 | | | | — | | | | 15,377,069 | |
United Arab Emirates | | | — | | | | 48,303 | | | | — | | | | 48,303 | |
United Kingdom | | | 133,057 | | | | 23,840,918 | | | | — | | | | 23,973,975 | |
United States | | | — | | | | 1,139,194 | | | | — | | | | 1,139,194 | |
Preferred Securities | | | — | | | | 940,727 | | | | — | | | | 940,727 | |
Rights | | | 8,524 | | | | — | | | | — | | | | 8,524 | |
Short-Term Securities | | | 35,389 | | | | — | | | | — | | | | 35,389 | |
| | | | | | | | | | | | | | | | |
| | $ | 2,230,871 | | | $ | 166,409,677 | | | $ | — | | | $ | 168,640,548 | |
| | | | | | | | | | | | | | | | |
Derivative Financial Instruments(a) | | | | | | | | | | | | | | | | |
Assets: | | | | | | | | | | | | | | | | |
Equity contracts | | $ | 4,921 | | | $ | — | | | $ | — | | | $ | 4,921 | |
| | | | | | | | | | | | | | | | |
Liabilities: | | | | | | | | | | | | | | | | |
Equity contracts | | $ | (40,200 | ) | | $ | — | | | $ | — | | | $ | (40,200 | ) |
| | | | | | | | | | | | | | | | |
| | (a) | Derivative financial instruments are futures contracts, which are valued at the unrealized appreciation (depreciation) on the instrument. | |
During the year ended December 31, 2018, there were no transfers between levels.
See notes to financial statements.
| | |
| 14 | | 2018 BLACKROCK ANNUAL REPORTTO SHAREHOLDERS |
Statement of Assets and Liabilities
December 31, 2018
| | | | |
| | | BlackRock
International Index V.I.
Fund | |
| |
ASSETS | | | | |
Investments at value — unaffiliated (cost — $190,268,323) | | $ | 168,605,159 | |
Investments at value — affiliated (cost — $35,389) | | | 35,389 | |
Cash | | | 3,357 | |
Cash pledged for futures contracts | | | 92,479 | |
Foreign currency at value (cost — $814,607) | | | 822,375 | |
Receivables: | | | | |
Investments sold | | | 104,881 | |
Capital shares sold | | | 130,201 | |
Dividends — affiliated | | | 66 | |
Dividends — unaffiliated | | | 1,046,217 | |
From the Manager | | | 7,281 | |
Variation margin on futures contracts | | | 12,303 | |
Deferred offering costs | | | 29,077 | |
Prepaid expenses | | | 162 | |
| | | | |
Total assets | | | 170,888,947 | |
| | | | |
| |
LIABILITIES | | | | |
Payables: | | | | |
Capital shares redeemed | | | 79,918 | |
Custodian fees | | | 19,000 | |
Printing fees | | | 32,663 | |
Professional fees | | | 82,007 | |
Variation margin on futures contracts | | | 3,835 | |
Investment advisory fees | | | 2,837 | |
Directors’ and Officer’s fees | | | 4,998 | |
Other accrued expenses | | | 34,547 | |
| | | | |
Total liabilities | | | 259,805 | |
| | | | |
| |
NET ASSETS | | $ | 170,629,142 | |
| | | | |
| |
NET ASSETS CONSIST OF | | | | |
Paid-in capital | | $ | 193,590,893 | |
Accumulated loss | | | (22,961,751 | ) |
| | | | |
NET ASSETS | | $ | 170,629,142 | |
| | | | |
| |
NET ASSET VALUE | | | | |
Class I — Based on net assets of $170,629,142 and 21,377,191 shares outstanding, 100 million shares authorized, $0.10 par value | | $ | 7.98 | |
| | | | |
See notes to financial statements.
Statement of Operations
Year Ended December 31, 2018
| | | | |
| | | BlackRock
International Index V.I.
Fund | |
| |
INVESTMENT INCOME | | | | |
Dividends — affiliated | | $ | 278 | |
Dividends — unaffiliated | | | 10,293,566 | |
Foreign taxes withheld | | | (874,192 | ) |
| | | | |
Total investment income | | | 9,419,652 | |
| | | | |
| | | | |
| |
EXPENSES | | | | |
Investment advisory | | | 402,127 | |
Reorganization | | | 151,536 | |
Custodian | | | 101,456 | |
Professional | | | 60,848 | |
Printing | | | 56,770 | |
Licensing | | | 20,002 | |
Transfer agent | | | 16,787 | |
Directors and Officer | | | 14,790 | |
Accounting services | | | 9,412 | |
Offering | | | 6,204 | |
Registration | | | 5,445 | |
Miscellaneous | | | 49,063 | |
| | | | |
Total expenses | | | 894,440 | |
Less: | | | | |
Fees waived and/or reimbursed by the Manager or Predecessor Manager | | | (183,835 | ) |
Transfer agent fees waived and/or reimbursed | | | (15,533 | ) |
| | | | |
Total expenses after fees waived and/or reimbursed | | | 695,072 | |
| | | | |
Net investment income | | | 8,724,580 | |
| | | | |
| |
REALIZED AND UNREALIZED GAIN (LOSS) | | | | |
Net realized gain (loss) from: | | | | |
Investments — unaffiliated | | | 51,948,947 | |
Foreign currency transactions | | | 91,041 | |
Futures contracts | | | (20,965 | ) |
| | | | |
| | | 52,019,023 | |
| | | | |
Net change in unrealized appreciation (depreciation) on: | | | | |
Investments — unaffiliated | | | (88,912,218 | ) |
Foreign currency translations | | | (27,999 | ) |
Futures contracts | | | (35,596 | ) |
| | | | |
| | | (88,975,813 | ) |
| | | | |
Net realized and unrealized loss | | | (36,956,790 | ) |
| | | | |
NET DECREASE IN NET ASSETS RESULTING FROM OPERATIONS | | $ | (28,232,210 | ) |
| | | | |
See notes to financial statements.
| | |
| 16 | | 2018 BLACKROCK ANNUAL REPORTTO SHAREHOLDERS |
Statements of Changes in Net Assets
| | | | | | | | |
| | | BlackRock International Index V.I. Fund | |
| | | Year Ended December 31, | |
| | | 2018 | | | 2017 | |
| | |
INCREASE (DECREASE) IN NET ASSETS | | | | | | | | |
| | |
OPERATIONS | | | | | | | | |
Net investment income | | $ | 8,724,580 | | | $ | 8,329,518 | |
Net realized gain | | | 52,019,023 | | | | 4,812,052 | |
Net change in unrealized appreciation (depreciation) | | | (88,975,813 | ) | | | 55,954,078 | |
| | | | | | | | |
Net increase (decrease) in net assets resulting from operations | | | (28,232,210 | ) | | | 69,095,648 | |
| | | | | | | | |
| | |
DISTRIBUTIONS TO SHAREHOLDERS(a)(b) | | | | | | | | |
Decrease in net assets resulting from distributions to shareholders | | | (60,158,843 | ) | | | (12,750,402 | ) |
| | | | | | | | |
| | |
CAPITAL SHARE TRANSACTIONS | | | | | | | | |
Shares sold | | | 3,757,710 | | | | 2,738,444 | |
Shares issued in reinvestment of distributions | | | 60,158,359 | | | | 12,750,402 | |
Shares redeemed | | | (139,137,066 | ) | | | (13,121,822 | ) |
| | | | | | | | |
Net increase (decrease) in net assets derived from capital share transactions | | | (75,220,997 | ) | | | 2,367,024 | |
| | | | | | | | |
| | |
NET ASSETS(b) | | | | | | | | |
Total increase (decrease) in net assets | | | (163,612,050 | ) | | | 58,712,270 | |
Beginning of year | | | 334,241,192 | | | | 275,528,922 | |
| | | | | | | | |
End of year | | $ | 170,629,142 | | | $ | 334,241,192 | |
| | | | | | | | |
| (a) | Distributions for annual periods determined in accordance with U.S. federal income tax regulations. |
| (b) | Prior year distribution character information and (distributions in excess of) net investment income has been modified or removed to conform with current year RegulationS-X presentation changes. Refer to Note 12 for this prior year information. |
See notes to financial statements.
Financial Highlights
(For a share outstanding throughout each period)
| | | | | | | | | | | | | | | | | | | | |
| | | BlackRock International Index V.I. Fund(a) | |
| |
| | | Class I | |
| |
| | | Year Ended December 31, | |
| | | 2018 | | | 2017 | | | 2016 | | | 2015 | | | 2014 | |
| | | | | |
Net asset value, beginning of year | | $ | 14.28 | | | $ | 11.84 | | | $ | 12.21 | | | $ | 12.76 | | | $ | 14.01 | |
| | | | | | | | | | | | | | | | | | | | |
Net investment income(b) | | | 0.42 | | | | 0.36 | | | | 0.34 | | | | 0.31 | | | | 0.44 | |
Net realized and unrealized gain (loss) | | | (2.40 | ) | | | 2.65 | | | | (0.24 | ) | | | (0.45 | ) | | | (1.26 | ) |
| | | | | | | | | | | | | | | | | | | | |
Net increase (decrease) from investment operations | | | (1.98 | ) | | | 3.01 | | | | 0.10 | | | | (0.14 | ) | | | (0.82 | ) |
| | | | | | | | | | | | | | | | | | | | |
| | | | | |
| Distributions(c) | | | | | | | | | | | | | | | |
From net investment income | | | (0.64 | ) | | | (0.40 | ) | | | (0.35 | ) | | | (0.30 | ) | | | (0.43 | ) |
From net realized gain | | | (3.68 | ) | | | (0.17 | ) | | | (0.12 | ) | | | (0.11 | ) | | | — | |
| | | | | | | | | | | | | | | | | | | | |
Total distributions | | | (4.32 | ) | | | (0.57 | ) | | | (0.47 | ) | | | (0.41 | ) | | | (0.43 | ) |
| | | | | | | | | | | | | | | | | | | | |
| | | | | |
Net asset value, end of year | | $ | 7.98 | | | $ | 14.28 | | | $ | 11.84 | | | $ | 12.21 | | | $ | 12.76 | |
| | | | | | | | | | | | | | | | | | | | |
| | | | | |
Total Return(d) | | | | | | | | | | | | | | | | | | | | |
Based on net asset value | | | (13.70 | )% | | | 25.40 | % | | | 0.90 | % | | | (1.16 | )% | | | (5.88 | )% |
| | | | | | | | | | | | | | | | | | | | |
| | | | | |
Ratios to Average Net Assets | | | | | | | | | | | | | | | | | | | | |
Total expenses | | | 0.31 | %(e) | | | 0.26 | % | | | 0.42 | % | | | 0.68 | % | | | 0.64 | % |
| | | | | | | | | | | | | | | | | | | | |
Total expenses after fees waived and/or reimbursed | | | 0.24 | %(e) | | | 0.26 | %(f) | | | 0.42 | %(f) | | | 0.68 | %(f) | | | 0.64 | %(f) |
| | | | | | | | | | | | | | | | | | | | |
Net investment income | | | 3.00 | % | | | 2.69 | % | | | 2.83 | % | | | 2.31 | % | | | 3.12 | % |
| | | | | | | | | | | | | | | | | | | | |
| | | | | |
Supplemental Data | | | | | | | | | | | | | | | | | | | | |
Net assets, end of year (000) | | $ | 170,629 | | | $ | 334,241 | | | $ | 275,529 | | | $ | 280,934 | | | $ | 290,761 | |
| | | | | | | | | | | | | | | | | | | | |
Portfolio turnover rate | | | 4 | % | | | 4 | % | | | 3 | % | | | 3 | % | | | 3 | % |
| | | | | | | | | | | | | | | | | | | | |
| (a) | On October 29, 2018, the Fund acquired all of the assets and assumed certain stated liabilities of the International Equity Index Fund (the “Predecessor Fund”), a series of State Farm Variable Product Trust, through a tax-free reorganization (the “Reorganization”). The Predecessor Fund is the performance and accounting survivor of the Reorganization. |
| (b) | Based on average shares outstanding. |
| (c) | Distributions for annual periods determined in accordance with U.S. federal income tax regulations. |
| (d) | Where applicable, excludes insurance-related fees and expenses and assumes the reinvestment of distributions. |
| (e) | Includes reorganization costs associated with the Fund’s reorganization. Without these costs, total expenses and total expenses after fees waived and/or reimbursed would have been 0.27% and 0.24%, respectively. |
| (f) | The expense ratio includes the effect of expense reimbursements that are less than 0.01%. |
See notes to financial statements.
| | |
| 18 | | 2018 BLACKROCK ANNUAL REPORTTO SHAREHOLDERS |
Notes to Financial Statements
BlackRock Variable Series Funds, Inc. (the “Company”) is registered under the Investment Company Act of 1940, as amended (the “1940 Act”), as anopen-end management investment company. The Company is organized as a Maryland corporation that is comprised of 15 separate portfolios. The funds offer shares to insurance companies for their separate accounts to fund benefits under certain variable annuity and variable life insurance contracts. The financial statements presented are for BlackRock International Index V.I. Fund (the “Fund”). The Fund is classified as diversified.
The Fund, together with certain other registered investment companies advised by BlackRock Advisors, LLC (the “Manager”) or its affiliates, is included in a complex ofopen-end funds referred to as the Equity-Bond Complex.
Reorganization:On October 29, 2018, the International Equity Index Fund (the “Predecessor Fund”), a series of State Farm Variable Product Trust, reorganized into the Fund (the “Reorganization”) pursuant to an Agreement and Plan of Reorganization. The Reorganization was approved by shareholders of the Predecessor Fund.
The Predecessor Fund is the performance and accounting survivor of the Reorganization, meaning that the Fund assumed the performance and financial history of the Predecessor Fund upon completion of the Reorganization. The Reorganization wastax-free; accordingly, the Predecessor Fund’s shareholders became shareholders of the Fund without realizing any gain or loss for federal income tax purposes.
As a result, the Fund acquired all of the assets and assumed certain stated liabilities of the Predecessor Fund in exchange for an equal aggregate value of newly-issued shares of the Fund. Each shareholder of the Predecessor Fund received shares of the Fund in an amount equal to the aggregate net asset value (“NAV”) of such shareholder’s Predecessor Fund shares, as determined at the close of business on October 26, 2018.
The Reorganization was accomplished by atax-free exchange of shares of the Fund in the following amount and at the following conversion ratio:
| | | | | | | | | | | | |
| Predecessor Fund | | Shares Prior to
Reorganization | | | Conversion
Ratio | | | Shares Post-
Reorganization | |
International Equity Index Fund, a series of State Farm Variable Product Trust | | | 14,050,452 | | | | 1 | | | | 14,050,452 | |
For financial reporting purposes, assets received and shares issued by the Fund were recorded at fair value. However, the cost basis of the investments received from the Predecessor Fund were carried forward to align ongoing reporting of the Fund’s realized and unrealized gains and losses with amounts distributable to shareholders for tax purposes.
Prior to the Reorganization, the Fund had not yet commenced operations and had no assets or liabilities. The Predecessor Fund’s net assets, fair value and cost of investments prior to the Reorganization were as follows:
| | | | | | | | | | | | |
| Predecessor Fund | | Net Assets | | | Fair Value
of Investments | | | Cost of
Investments | |
International Equity Index Fund, a series of State Farm Variable Product Trust | | $ | 177,944,330 | | | $ | 174,789,237 | | | $ | 190,647,069 | |
Reorganization costs incurred by the Fund in connection with the Reorganization were expensed by the Fund. The Manager or Predecessor Manager reimbursed the Fund $151,536, which is included in fees waived and/or reimbursed by the Manager or Predecessor Manager in the Statement of Operations.
| 2. | SIGNIFICANT ACCOUNTING POLICIES |
The financial statements are prepared in conformity with accounting principles generally accepted in the United States of America (“U.S. GAAP”), which may require management to make estimates and assumptions that affect the reported amounts of assets and liabilities in the financial statements, disclosure of contingent assets and liabilities at the date of the financial statements and the reported amounts of increases and decreases in net assets from operations during the reporting period. Actual results could differ from those estimates. The Fund is considered an investment company under U.S. GAAP and follows the accounting and reporting guidance applicable to investment companies. Below is a summary of significant accounting policies:
Investment Transactions and Income Recognition: For financial reporting purposes, investment transactions are recorded on the dates the transactions are entered into (the “trade dates”). Realized gains and losses on investment transactions are determined on the identified cost basis. Dividend income is recorded on theex-dividend date. Dividends from foreign securities where theex-dividend date may have passed are subsequently recorded when the Fund is informed of theex-dividend date. Under the applicable foreign tax laws, a withholding tax at various rates may be imposed on capital gains, dividends and interest.
Foreign Currency Translation: The Fund’s books and records are maintained in U.S. dollars. Securities and other assets and liabilities denominated in foreign currencies are translated into U.S. dollars using exchange rates determined as of the close of trading on the New York Stock Exchange (“NYSE”). Purchases and sales of investments are recorded at the rates of exchange prevailing on the respective dates of such transactions. Generally, when the U.S. dollar rises in value against a foreign currency, the investments denominated in that currency will lose value; the opposite effect occurs if the U.S. dollar falls in relative value.
The Fund does not isolate the portion of the results of operations arising as a result of changes in the exchange rates from the changes in the market prices of investments held or sold for financial reporting purposes. Accordingly, the effects of changes in exchange rates on investments are not segregated in the Statement of Operations from the effects of changes in market prices of those investments, but are included as a component of net realized and unrealized gain (loss) from investments. The Fund reports realized currency gains (losses) on foreign currency related transactions as components of net realized gain (loss) for financial reporting purposes, whereas such components are generally treated as ordinary income for U.S. federal income tax purposes.
| | | | |
| NOTESTO FINANCIAL STATEMENTS | | | 19 | |
Notes to Financial Statements (continued)
Segregation and Collateralization: In cases where the Fund enters into certain investments (e.g., futures contracts) that would be treated as “senior securities” for 1940 Act purposes, the Fund may segregate or designate on its books and records cash or liquid assets having a market value at least equal to the amount of its future obligations under such investments. Doing so allows the investment to be excluded from treatment as a “senior security.” Furthermore, if required by an exchange or counterparty agreement, the Fund may be required to deliver/deposit cash and/or securities to/with an exchange, or broker-dealer or custodian as collateral for certain investments or obligations.
Offering Costs:Offering costs are amortized over a12- month period beginning with the commencement of operations of a class of shares.
Distributions:Distributions paid by the Fund are recorded on theex-dividend date. Distributions of capital gains are recorded on theex-dividend date and made at least annually. The character and timing of distributions are determined in accordance with U.S. federal income tax regulations, which may differ from U.S. GAAP.
Recent Accounting Standards:In August 2018, the Financial Accounting Standards Board issued Accounting Standards Update2018-13 “Changes to the Disclosure Requirements for Fair Value Measurement” which modifies disclosure requirements for fair value measurements. The guidance is effective for fiscal years beginning after December 15, 2019 and for interim periods within those fiscal years. Management is currently evaluating the impact of this guidance to the Fund.
Indemnifications:In the normal course of business, the Fund enters into contracts that contain a variety of representations that provide general indemnification. The Fund’s maximum exposure under these arrangements is unknown because it involves future potential claims against the Fund, which cannot be predicted with any certainty.
Other: Expenses directly related to the Fund are charged to the Fund. Other operating expenses shared by several funds, including other funds managed by the Manager, are prorated among those funds on the basis of relative net assets or other appropriate methods.
| 3. | INVESTMENT VALUATION AND FAIR VALUE MEASUREMENTS |
Investment Valuation Policies: The Fund’s investments are valued at fair value (also referred to as “market value” within the financial statements) as of the close of trading on the NYSE (generally 4:00 p.m., Eastern time). U.S. GAAP defines fair value as the price the Fund would receive to sell an asset or pay to transfer a liability in an orderly transaction between market participants at the measurement date. The Fund determines the fair values of its financial instruments using various independent dealers or pricing services under policies approved by the Board of Directors of the Company (the “Board”). The BlackRock Global Valuation Methodologies Committee (the “Global Valuation Committee”) is the committee formed by management to develop global pricing policies and procedures and to oversee the pricing function for all financial instruments.
Fair Value Inputs and Methodologies: The following methods and inputs are used to establish the fair value of the Fund’s assets and liabilities:
| | • | | Equity investments traded on a recognized securities exchange are valued at the official closing price each day, if available. For equity investments traded on more than one exchange, the official closing price on the exchange where the stock is primarily traded is used. Equity investments traded on a recognized exchange for which there were no sales on that day may be valued at the last available bid (long positions) or ask (short positions) price. |
| | • | | Generally, trading in foreign instruments is substantially completed each day at various times prior to the close of trading on the NYSE. Occasionally, events affecting the values of such instruments may occur between the foreign market close and the close of trading on the NYSE that may not be reflected in the computation of the Fund’s net assets. Each business day, the Fund uses a pricing service to assist with the valuation of certain foreign exchange-traded equity securities and foreign exchange-traded andover-the-counter (“OTC”) options (the “Systematic Fair Value Price”). Using current market factors, the Systematic Fair Value Price is designed to value such foreign securities and foreign options at fair value as of the close of trading on the NYSE, which follows the close of the local markets. |
| | • | | Investments inopen-end U.S. mutual funds are valued at NAV each business day. |
| | • | | Futures contracts traded on exchanges are valued at their last sale price. |
If events (e.g., a company announcement, market volatility or a natural disaster) occur that are expected to materially affect the value of such investments, or in the event that the application of these methods of valuation results in a price for an investment that is deemed not to be representative of the market value of such investment, or if a price is not available, the investment will be valued by the Global Valuation Committee, or its delegate, in accordance with a policy approved by the Board as reflecting fair value (“Fair Valued Investments”). The fair valuation approaches that may be used by the Global Valuation Committee will include market approach, income approach and cost approach. Valuation techniques such as discounted cash flow, use of market comparables and matrix pricing are types of valuation approaches and are typically used in determining fair value. When determining the price for Fair Valued Investments, the Global Valuation Committee, or its delegate, seeks to determine the price that the Fund might reasonably expect to receive or pay from the current sale or purchase of that asset or liability in anarm’s-length transaction. Fair value determinations shall be based upon all available factors that the Global Valuation Committee, or its delegate, deems relevant and consistent with the principles of fair value measurement.
The Global Valuation Committee, or its delegate, employs various methods for calibrating valuation approaches for investments where an active market does not exist, including regular due diligence of the Fund’s pricing vendors, regular reviews of key inputs and assumptions, transactional back-testing or disposition analysis to compare unrealized gains and losses to realized gains and losses, reviews of missing or stale prices and large movements in market values and reviews of any market related activity. The pricing of all Fair Valued Investments is subsequently reported to the Board or a committee thereof on a quarterly basis. As a result of the inherent uncertainty in valuation of these investments, the fair values may differ from the values that would have been used had an active market existed.
| | |
| 20 | | 2018 BLACKROCK ANNUAL REPORTTO SHAREHOLDERS |
Notes to Financial Statements (continued)
For investments in equity or debt issued by privately held companies or funds (“Private Company” or collectively, the “Private Companies”) and other Fair Valued Investments, the fair valuation approaches that are used by third party pricing services utilize one or a combination of, but not limited to, the following inputs.
| | |
| | | Standard Inputs Generally Considered By Third Party Pricing Services |
Market approach | | (i) recent market transactions, including subsequent rounds of financing, in the underlying investment or comparable issuers; (ii) recapitalizations and other transactions across the capital structure; and (iii) market multiples of comparable issuers. |
Income approach | | (i) future cash flows discounted to present and adjusted as appropriate for liquidity, credit, and/or market risks; (ii) quoted prices for similar investments or assets in active markets; and (iii) other risk factors, such as interest rates, yield curves, volatilities, prepayment speeds, loss severities, credit risks, recovery rates, liquidation amounts and/or default rates. |
Cost approach | | (i) audited or unaudited financial statements, investor communications and financial or operational metrics issued by the Private Company; (ii) changes in the valuation of relevant indices or publicly traded companies comparable to the Private Company; (iii) relevant news and other public sources; and (iv) known secondary market transactions in the Private Company’s interests and merger or acquisition activity in companies comparable to the Private Company. |
Investments in series of preferred stock issued by Private Companies are typically valued utilizing market approach in determining the enterprise value of the company. Such investments often contain rights and preferences that differ from other series of preferred and common stock of the same issuer. Valuation techniques such as an option pricing model (“OPM”), a probability weighted expected return model (“PWERM”) or a hybrid of those techniques are used in allocating enterprise value of the company, as deemed appropriate under the circumstances. The use of OPM and PWERM techniques involve a determination of the exit scenarios of the investment in order to appropriately allocate the enterprise value of the company among the various parts of its capital structure.
The Private Companies are not subject to the public company disclosure, timing, and reporting standards as other investments held by the Fund. Typically, the most recently available information by a Private Company is as of a date that is earlier than the date the Fund is calculating its NAV. This factor may result in a difference between the value of the investment and the price the Fund could receive upon the sale of the investment.
Fair Value Hierarchy: Various inputs are used in determining the fair value of investments and derivative financial instruments. These inputs to valuation techniques are categorized into a fair value hierarchy consisting of three broad levels for financial statement purposes as follows:
| | • | | Level 1 — Unadjusted price quotations in active markets/exchanges for identical assets or liabilities that the Fund has the ability to access |
| | • | | Level 2 — Other observable inputs (including, but not limited to, quoted prices for similar assets or liabilities in markets that are active, quoted prices for identical or similar assets or liabilities in markets that are not active, inputs other than quoted prices that are observable for the assets or liabilities (such as interest rates, yield curves, volatilities, prepayment speeds, loss severities, credit risks and default rates) or other market–corroborated inputs) |
| | • | | Level 3 — Unobservable inputs based on the best information available in the circumstances, to the extent observable inputs are not available (including the Fund’s own assumptions used in determining the fair value of investments and derivative financial instruments) |
The hierarchy gives the highest priority to unadjusted quoted prices in active markets for identical assets or liabilities (Level 1 measurements) and the lowest priority to unobservable inputs (Level 3 measurements). Accordingly, the degree of judgment exercised in determining fair value is greatest for instruments categorized in Level 3. The inputs used to measure fair value may fall into different levels of the fair value hierarchy. In such cases, for disclosure purposes, the fair value hierarchy classification is determined based on the lowest level input that is significant to the fair value measurement in its entirety. Investments classified within Level 3 have significant unobservable inputs used by the Global Valuation Committee in determining the price for Fair Valued Investments. Level 3 investments include equity or debt issued by Private Companies or funds. There may not be a secondary market, and/or there are a limited number of investors. Level 3 investments may also be adjusted to reflect illiquidity and/ornon-transferability, with the amount of such discount estimated by the Global Valuation Committee in the absence of market information.
Changes in valuation techniques may result in transfers into or out of an assigned level within the hierarchy. In accordance with the Fund’s policy, transfers between different levels of the fair value hierarchy are deemed to have occurred as of the beginning of the reporting period. The categorization of a value determined for investments and derivative financial instruments is based on the pricing transparency of the investments and derivative financial instruments and is not necessarily an indication of the risks associated with investing in those securities.
| 4. | SECURITIES AND OTHER INVESTMENTS |
Preferred Stocks:Preferred stock has a preference over common stock in liquidation (and generally in receiving dividends as well), but is subordinated to the liabilities of the issuer in all respects. As a general rule, the market value of preferred stock with a fixed dividend rate and no conversion element varies inversely with interest rates and perceived credit risk, while the market price of convertible preferred stock generally also reflects some element of conversion value. Because preferred stock is junior to debt securities and other obligations of the issuer, deterioration in the credit quality of the issuer will cause greater changes in the value of a preferred stock than in a more senior debt security with similar stated yield characteristics. Unlike interest payments on debt securities, preferred stock dividends are payable only if declared by the issuer’s board of directors. Preferred stock also may be subject to optional or mandatory redemption provisions.
| | | | |
| NOTESTO FINANCIAL STATEMENTS | | | 21 | |
Notes to Financial Statements (continued)
| 5. | DERIVATIVE FINANCIAL INSTRUMENTS |
The Fund engages in various portfolio investment strategies using derivative contracts both to increase the returns of the Fund and/or to manage its exposure to certain risks such as credit risk, equity risk, interest rate risk, foreign currency exchange rate risk, commodity price risk or other risks (e.g., inflation risk). Derivative financial instruments categorized by risk exposure are included in the Schedule of Investments. These contracts may be transacted on an exchange or OTC.
Futures Contracts:Futures contracts are purchased or sold to gain exposure to, or manage exposure to, changes in interest rates (interest rate risk) and changes in the value of equity securities (equity risk) or foreign currencies (foreign currency exchange rate risk).
Futures contracts are agreements between the Fund and a counterparty to buy or sell a specific quantity of an underlying instrument at a specified price and on a specified date. Depending on the terms of a contract, it is settled either through physical delivery of the underlying instrument on the settlement date or by payment of a cash amount on the settlement date. Upon entering into a futures contract, the Fund is required to deposit initial margin with the broker in the form of cash or securities in an amount that varies depending on a contract’s size and risk profile. The initial margin deposit must then be maintained at an established level over the life of the contract. Amounts pledged, which are considered restricted, are included in cash pledged for futures contracts in the Statement of Assets and Liabilities.
Securities deposited as initial margin are designated in the Schedule of Investments and cash deposited, if any, is shown as cash pledged for futures contracts in the Statement of Assets and Liabilities. Pursuant to the contract, the Fund agrees to receive from or pay to the broker an amount of cash equal to the daily fluctuation in market value of the contract (“variation margin”). Variation margin is recorded as unrealized appreciation (depreciation) and, if any, shown as variation margin receivable (or payable) on futures contracts in the Statement of Assets and Liabilities. When the contract is closed, a realized gain or loss is recorded in the Statement of Operations equal to the difference between the notional amount of the contract at the time it was opened and the notional amount at the time it was closed. The use of futures contracts involves the risk of an imperfect correlation in the movements in the price of futures contracts and interest, foreign currency exchange rates or underlying assets.
| 6. | INVESTMENT ADVISORY AGREEMENT AND OTHER TRANSACTIONS WITH AFFILIATES |
Investment Advisory: The Company, on behalf of the Fund, entered into an Investment Advisory Agreement with the Manager, the Fund’s investment adviser, an indirect, wholly-owned subsidiary of BlackRock, Inc. (“BlackRock”), to provide investment advisory and administrative services. The Manager is responsible for the management of the Fund’s portfolio and provides the personnel, facilities, equipment and certain other services necessary to the operations of the Fund.
For such services, the Fund paid the Manager a monthly fee at an annual rate equal to 0.08% of the average daily value of the Fund’s net assets for the period October 29, 2018 through December 31, 2018.
Prior to October 29, 2018, the Predecessor Fund paid State Farm Investment Management Corp. (“SFIMC” or “Predecessor Manager”), the investment adviser to the Predecessor Fund, an effective investment advisory fee of 0.15%.
SFIMC engaged BlackRock Fund Advisors (“BFA”) as the investment sub-adviser to provide day-to-day portfolio management for the Predecessor Fund. Sub-advisory fees for managing the portfolio were paid by SFIMC. No additional advisory fees were charged to the Predecessor Fund for the services of the sub-adviser.
For the period January 1, 2018 through October 26, 2018, BFA earned $116,396 of fees for sub-advisory services which is included in investment advisory in the Statement of Operations.
Prior to October 29, 2018, the Predecessor Fund did not pay any direct or indirect discount, commission or other compensation for transfer agent services provided by SFIMC or for distribution and underwriting services provided by State Farm VP Management Corp.
Transfer Agent: On behalf of the Fund, the Manager entered into agreements with insurance companies and other financial intermediaries (“Service Organizations”), some of which may be affiliates. Pursuant to these agreements, the Service Organizations provide the Fund with administrative, networking, recordkeeping, sub-transfer agency and shareholder services to sub-accounts they service. For these services, the Service Organizations receive an annual fee per shareholder account, which will vary depending on share class and/or net assets of Fund shareholders serviced by the Service Organizations. For the period October 29, 2018 to December 31, 2018, the Fund did not pay any amounts to affiliates in return for these services.
In addition, the Fund pays the transfer agent, which is not an affiliate, a fee for the issuance, transfer and redemption of shares and the opening and maintenance of shareholder accounts, which is included in transfer agent in the Statement of Operations.
Expense Limitations, Waivers and Reimbursements: With respect to the Fund, effective October 29, 2018, the Manager voluntarily agreed to waive its investment advisory fees by the amount of investment advisory fees the Fund pays to the Manager indirectly through its investment in affiliated money market funds (the “affiliated money market fund waiver”). The amount of waivers and/or reimbursements of fees and expenses made pursuant to the expense limitation described below will be reduced by the amount of the affiliated money market fund waiver. This amount is included in fees waived and/or reimbursed by the Manager or Predecessor Manager in the Statement of Operations. For the year ended December 31, 2018, the amount waived was $9.
Effective October 29, 2018, the Manager has contractually agreed to waive its investment advisory fee with respect to any portion of the Fund’s assets invested in affiliated equity and fixed-income mutual funds and affiliated exchange-traded funds that have a contractual management fee through April 30, 2021. The contractual agreement may be terminated upon 90 days’ notice by a majority of directors who are not “interested persons” of the Fund, as defined in the 1940 Act (“Independent Directors”) or by a vote of a majority of the outstanding voting securities of the Fund. For the year ended December 31, 2018, there were no fees waived by the Manager pursuant to this arrangement.
With respect to the Fund, effective October 29, 2018, the Manager has contractually agreed to waive and/or reimburse fees or expenses in order to limit expenses, excluding interest expense, dividend expense, acquired fund fees and expenses, and certain other fund expenses, which constitute extraordinary expenses not incurred in the ordinary course of the Fund’s business (“expense limitation”). The expense limitation as a percentage of average daily net assets is 0.27%. The Manager has agreed not to reduce or discontinue this contractual expense limitation through April 30, 2021, unless approved by the Board, including a majority of the Independent Directors, or by a vote of a majority of the outstanding voting securities of the Fund. For the year ended December 31, 2018, the fees waived and/or reimbursed by the Manager or Predecessor Manager were $32,290.
| | |
| 22 | | 2018 BLACKROCK ANNUAL REPORTTO SHAREHOLDERS |
Notes to Financial Statements (continued)
These amounts are shown as transfer agent fees waived and/or reimbursed in the Statement of Operations. For the year ended December 31, 2018, the fees waived and/or reimbursed were $15,533.
In addition, effective October 29, 2018, the Manager has contractually agreed to waive and/or reimburse fees or expenses in order to limit fees paid by the Fund for operational and recordkeeping services to 0.05% of average daily net assets. For the year ended December 31, 2018, there were no fees waived and/or reimbursed by the Manager pursuant to this arrangement.
With respect to the contractual expense limitation, if during the Fund’s fiscal year the operating expenses of a share class, that at any time during the prior two fiscal years received a waiver and/or reimbursement from the Manager, are less than the current expense limitation for that share class, the Manager is entitled to be reimbursed by such share class up to the lesser of: (a) the amount of fees waived and/or expenses reimbursed during those prior two fiscal years under the agreement and (b) an amount not to exceed either the current expense limitation of that share class or the expense limitation of the share class in effect at the time that the share class received the applicable waiver and/or reimbursement, provided that:
(1) the Fund, of which the share class is a part, has more than $50 million in assets for the fiscal year, and
(2) the Manager or an affiliate continues to serve as the Fund’s investment adviser or administrator.
This repayment applies only to the contractual expense limitation on net expenses and does not apply to the contractual investment advisory fee waiver or contractual operational and recordkeeping services waiver described above or any voluntary waivers that may be in effect from time to time.
On December 31, 2018, the fund level and class specific waivers and/or reimbursements subject to possible future recoupment under the expense limitation agreement are as follows:
| | | | |
| | | Expiring December 31, | |
| | | 2020 | |
Fund Level | | $ | 32,290 | |
Class I | | | 15,533 | |
Prior to October 29, 2018, SFIMC reimbursed expenses incurred by the Predecessor Fund (other than the investment advisory and management services fee and acquired fund fees) that exceeded 0.20% of the Predecessor Fund’s average daily net assets. Prior-year reimbursements and waivers are not subject to recoupment. For the period January 1, 2018, through October 26, 2018, there were no fees reimbursed by SFIMC pursuant to this agreement.
Interfund Lending: In accordance with an exemptive order (the “Order”) from the SEC, the Fund may participate in a joint lending and borrowing facility for temporary purposes (the “Interfund Lending Program”), subject to compliance with the terms and conditions of the Order, and to the extent permitted by the Fund’s investment policies and restrictions. The Fund is currently permitted to borrow and lend under the Interfund Lending Program.
A lending BlackRock fund may lend in aggregate up to 15% of its net assets, but may not lend more than 5% of its net assets to any one borrowing fund through the Interfund Lending Program. A borrowing BlackRock fund may not borrow through the Interfund Lending Program or from any other source more than 33 1/3% of its total assets (or any lower threshold provided for by the fund’s investment restrictions). If a borrowing BlackRock fund’s total outstanding borrowings exceed 10% of its total assets, each of its outstanding interfund loans will be subject to collateralization of at least 102% of the outstanding principal value of the loan. All interfund loans are for temporary or emergency purposes and the interest rate to be charged will be the average of the highest current overnight repurchase agreement rate available to a lending fund and the bank loan rate, as calculated according to a formula established by the Board.
During the year ended December 31, 2018, the Fund did not participate in the Interfund Lending Program.
Directors and Officers: Certain directors and/or officers of the Company are directors and/or officers of BlackRock or its affiliates. The Fund reimburses the Manager for a portion of the compensation paid to the Company’s Chief Compliance Officer, which is included in Directors and Officer in the Statement of Operations.
Other Transactions: The Fund may purchase securities from, or sell securities to, an affiliated fund provided the affiliation is due solely to having a common investment adviser, common officers, or common directors. For the year ended December 31, 2018, the purchase and sale transactions and any net realized gains (losses) with affiliated funds in compliance with Rule17a-7 under the 1940 Act were as follows:
| | | | |
Purchases | | $ | 148,238 | |
Sales | | | 66,382 | |
Net Realized Gain | | | 11,523 | |
For the year ended December 31, 2018, purchases and sales of investments, excluding short-term securities, were $12,000,747 and $138,624,825, respectively.
It is the Fund’s policy to comply with the requirements of the Internal Revenue Code of 1986, as amended, applicable to regulated investment companies, and to distribute substantially all of its taxable income to its shareholders. Therefore, no U.S. federal income tax provision is required.
| | | | |
| NOTESTO FINANCIAL STATEMENTS | | | 23 | |
Notes to Financial Statements (continued)
The Fund files U.S. federal and various state and local tax returns. No income tax returns are currently under examination. The statute of limitations on the Fund’s U.S. federal tax returns generally remains open for each of the four years ended December 31, 2018. The statutes of limitations on the Fund’s state and local tax returns may remain open for an additional year depending upon the jurisdiction.
Management has analyzed tax laws and regulations and their application to the Fund as of December 31, 2018, inclusive of the open tax return years, and does not believe there are any uncertain tax positions that require recognition of a tax liability in the Fund’s financial statements.
U.S. GAAP requires that certain components of net assets be adjusted to reflect permanent differences between financial and tax reporting. These reclassifications have no effect on net assets or net asset values per share. As of period end, the following permanent differences attributable to non-deductible expenses was reclassified to the following accounts:
| | | | |
Paid in capital | | $ | (6,204 | ) |
Accumulated earnings | | $ | 6,204 | |
The tax character of distributions paid was as follows:
| | | | | | | | |
| | | 12/31/18 | | | 12/31/17 | |
Ordinary income | | $ | 9,255,946 | | | $ | 9,117,495 | |
Long-term capital gains | | | 50,902,897 | | | | 3,632,907 | |
| | | | | | | | |
| | $ | 60,158,843 | | | $ | 12,750,402 | |
| | | | | | | | |
As of period end, the tax components of accumulated loss were as follows:
| | | | |
Net unrealized losses(a) | | $ | (22,833,320 | ) |
Qualified late-year losses(b) | | | (128,431 | ) |
| | | | |
| | $ | (22,961,751 | ) |
| | | | |
| | (a) | The difference between book-basis andtax-basisnet unrealized losses was attributable primarily to the tax deferral of losses on wash sales, the realization for tax purposes of unrealized gains on investments in passive foreign investment companies, the realization for tax purposes of unrealized gains/losses on certain futures contracts and the classification of investments. | |
| | (b) | The Fund has elected to defer certain qualified late-year losses and recognize such losses in the next taxable year. | |
As of December 31, 2018, gross unrealized appreciation and depreciation for investments and derivatives based on cost for U.S. federal income tax purposes were as follows:
| | | | |
Tax cost | | $ | 191,376,498 | |
| | | | |
Gross unrealized appreciation | | $ | 40,948,741 | |
Gross unrealized depreciation | | | (63,696,639 | ) |
| | | | |
Net unrealized depreciation | | $ | (22,747,898 | ) |
| | | | |
The Company, on behalf of the Fund, along with certain other funds managed by the Manager and its affiliates (“Participating Funds”), is a party to a364-day, $2.25 billion credit agreement with a group of lenders. Under this agreement, the Fund may borrow to fund shareholder redemptions. Excluding commitments designated for certain individual funds, the Participating Funds, including the Fund, can borrow up to an aggregate commitment amount of $1.75 billion at any time outstanding, subject to asset coverage and other limitations as specified in the agreement. The credit agreement has the following terms: a fee of 0.10% per annum on unused commitment amounts and interest at a rate equal to the higher of(a) one-month LIBOR (but, in any event, not less than 0.00%) on the date the loan is made plus 0.80% per annum or (b) the Fed Funds rate (but, in any event, not less than 0.00%) in effect from time to time plus 0.80% per annum on amounts borrowed. The agreement expires in April 2019 unless extended or renewed. Prior to April 19, 2018, the aggregate commitment amount was $2.1 billion and the fee was 0.12% per annum. Participating Funds paid an upfront commitment fee of 0.02% on the total commitment amounts, in addition to administration, legal and arrangement fees, which are included in miscellaneous expenses in the Statement of Operations. These fees were allocated among such funds based upon portions of the aggregate commitment available to them and relative net assets of Participating Funds. During the year ended December 31, 2018, the Fund did not borrow under the credit agreement.
In the normal course of business, the Fund invests in securities or other instruments and may enter into certain transactions, and such activities subject the Fund to various risks, including among others, fluctuations in the market (market risk) or failure of an issuer to meet all of its obligations. The value of securities or other instruments may also be affected by various factors, including, without limitation: (i) the general economy; (ii) the overall market as well as local, regional or global political and/or social instability; (iii) regulation, taxation or international tax treaties between various countries; or (iv) currency, interest rate and price fluctuations. The Fund’s prospectus provides details of the risks to which the Fund is subject.
Valuation Risk: The market values of equities, such as common stocks and preferred securities or equity related investments, such as futures and options, may decline due to general market conditions which are not specifically related to a particular company. They may also decline due to factors which affect a particular industry or industries. The Fund may invest in illiquid investments and may experience difficulty in selling those investments in a timely manner at the price that it believes the
| | |
| 24 | | 2018 BLACKROCK ANNUAL REPORTTO SHAREHOLDERS |
Notes to Financial Statements (continued)
investments are worth. Prices may fluctuate widely over short or extended periods in response to company, market or economic news. Markets also tend to move in cycles, with periods of rising and falling prices. This volatility may cause the Fund’s NAV to experience significant increases or decreases over short periods of time. If there is a general decline in the securities and other markets, the NAV of the Fund may lose value, regardless of the individual results of the securities and other instruments in which the Fund invests.
The price the Fund could receive upon the sale of any particular portfolio investment may differ from the Fund’s valuation of the investment, particularly for securities that trade in thin or volatile markets or that are valued using a fair valuation technique or a price provided by an independent pricing service. Changes to significant unobservable inputs and assumptions (i.e., publicly traded company multiples, growth rate, time to exit) due to the lack of observable inputs may significantly impact the resulting fair value and therefore the Fund’s results of operations. As a result, the price received upon the sale of an investment may be less than the value ascribed by the Fund, and the Fund could realize a greater than expected loss or lesser than expected gain upon the sale of the investment. The Fund’s ability to value its investments may also be impacted by technological issues and/or errors by pricing services or other third party service providers.
Counterparty Credit Risk: The Fund may be exposed to counterparty credit risk, or the risk that an entity may fail to or be unable to perform on its commitments related to unsettled or open transactions. The Fund manages counterparty credit risk by entering into transactions only with counterparties that the Manager believes have the financial resources to honor their obligations and by monitoring the financial stability of those counterparties. Financial assets, which potentially expose the Fund to market, issuer and counterparty credit risks, consist principally of financial instruments and receivables due from counterparties. The extent of the Fund’s exposure to market, issuer and counterparty credit risks with respect to these financial assets is approximately their value recorded in the Statement of Assets and Liabilities, less any collateral held by the Fund.
A derivative contract may suffer amark-to-market loss if the value of the contract decreases due to an unfavorable change in the market rates or values of the underlying instrument. Losses can also occur if the counterparty does not perform under the contract.
With exchange-traded futures, there is less counterparty credit risk to the Fund since the exchange or clearinghouse, as counterparty to such instruments, guarantees against a possible default. The clearinghouse stands between the buyer and the seller of the contract; therefore, credit risk is limited to failure of the clearinghouse. While offset rights may exist under applicable law, the Fund does not have a contractual right of offset against a clearing broker or clearinghouse in the event of a default (including the bankruptcy or insolvency). Additionally, credit risk exists in exchange-traded futures with respect to initial and variation margin that is held in a clearing broker’s customer accounts. While clearing brokers are required to segregate customer margin from their own assets, in the event that a clearing broker becomes insolvent or goes into bankruptcy and at that time there is a shortfall in the aggregate amount of margin held by the clearing broker for all its clients, typically the shortfall would be allocated on a pro rata basis across all the clearing broker’s customers, potentially resulting in losses to the Fund.
Concentration Risk:The Fund invests a significant portion of its assets in securities of issuers located in Europe or with significant exposure to European issuers or countries. The European financial markets have recently experienced volatility and adverse trends due to concerns about economic downturns in, or rising government debt levels of, several European countries. These events may spread to other countries in Europe and may affect the value and liquidity of certain of the Fund’s investments.
The United Kingdom is scheduled to withdraw from the European Union in March 2019, which may introduce significant new uncertainties and instability in the financial markets across Europe.
The Fund invests a significant portion of its assets in securities of issuers located in Asia or with significant exposure to Asian issuers or countries. The Asian financial markets have recently experienced volatility and adverse trends due to concerns in several Asian countries regarding monetary policy, government intervention in the markets, rising government debt levels or economic downturns. These events may spread to other countries in Asia and may affect the value and liquidity of certain of the Fund’s investments.
| 11. | CAPITAL SHARE TRANSACTIONS |
Transactions in capital shares were as follows:
| | | | | | | | | | | | | | | | |
| | | Year Ended 12/31/2018 (a) | | | Year Ended 12/31/2017 | |
| | | Shares | | | Amount | | | Shares | | | Amount | |
Class I | | | | | | | | | | | | | | | | |
Shares sold | | | 280,077 | | | $ | 3,757,710 | | | | 205,642 | | | $ | 2,738,444 | |
Shares issued in reinvestment of distributions | | | 7,541,790 | | | | 60,158,359 | | | | 894,765 | | | | 12,750,402 | |
Shares redeemed | | | (9,845,024 | ) | | | (139,137,066 | ) | | | (969,140 | ) | | | (13,121,822 | ) |
| | | | | | | | | | | | | | | | |
Net increase (decrease) | | | (2,023,157 | ) | | $ | (75,220,997 | ) | | | 131,267 | | | $ | 2,367,024 | |
| | | | | | | | | | | | | | | | |
| | (a) | Includes the activity of the Predecessor Fund prior to the Reorganization on October 29, 2018. Excludes the exchange of shares of the Predecessor Fund for shares of the Fund during the Reorganization. The Predecessor Fund is the performance and accounting survivor of the Reorganization. | |
As of December 31, 2018, BlackRock Financial Management, Inc., an affiliate of the Fund, owned 790 Class I Shares of BlackRock International Index V.I. Fund.
| 12. | REGULATIONS-X AMENDMENTS |
On August 17, 2018, the SEC adopted amendments to certain disclosure requirements in Securities Act ReleaseNo. 33-10532, Disclosure Update and Simplification. The Fund has adopted the amendments pertinent to RegulationS-X in this shareholder report. The amendments impacted certain disclosure presentation on the Statement of Assets and Liabilities, Statements of Changes in Net Assets and Notes to the Financial Statements.
| | | | |
| NOTESTO FINANCIAL STATEMENTS | | | 25 | |
Notes to Financial Statements (continued)
Prior year distribution information and (distributions in excess of) net investment income in the Statements of Changes in Net Assets has been modified to conform to the current year presentation in accordance with the RegulationS-X changes.
Distributions for the year ended December 31, 2017 were classified as follows:
| | | | | | | | |
| Share Class | | Net Investment Income | | | Net Realized Gain | |
Class I | | $ | (8,906,575 | ) | | $ | (3,843,827 | ) |
Distributions in excess of net investment income as of December 31, 2017 was $(2,271,240).
Management has evaluated the impact of all subsequent events on the Fund through the date the financial statements were issued and has determined that there were no subsequent events requiring adjustment or additional disclosure in the financial statements.
| | |
| 26 | | 2018 BLACKROCK ANNUAL REPORTTO SHAREHOLDERS |
Report of Independent Registered Public Accounting Firm
To the Shareholders of BlackRock International Index V.I. Fund and the Board of Directors of BlackRock Variable Series Funds, Inc.:
Opinion on the Financial Statements and Financial Highlights
We have audited the accompanying statement of assets and liabilities of BlackRock International Index V.I. Fund (formerly, International Equity Index Fund of State Farm Variable Product Trust) of BlackRock Variable Series Funds, Inc. (the “Fund”), including the schedule of investments, as of December 31, 2018, the related statements of operations, changes in net assets, and the financial highlights for the year then ended, and the related notes. In our opinion, the financial statements and financial highlights present fairly, in all material respects, the financial position of the Fund as of December 31, 2018, and the results of its operations, the changes in its net assets, and the financial highlights for the year then ended, in conformity with accounting principles generally accepted in the United States of America.
The statements of changes in net assets for the year ended December 31, 2017 and the financial highlights for each of the four years in the period ended December 31, 2017 of the Fund were audited by other auditors whose report dated February 23, 2018, expressed an unqualified opinion on those financial statements and financial highlights.
Basis for Opinion
These financial statements and financial highlights are the responsibility of the Fund’s management. Our responsibility is to express an opinion on the Fund’s financial statements and financial highlights based on our audit. We are a public accounting firm registered with the Public Company Accounting Oversight Board (United States) (PCAOB) and are required to be independent with respect to the Fund in accordance with the U.S. federal securities laws and the applicable rules and regulations of the Securities and Exchange Commission and the PCAOB.
We conducted our audit in accordance with the standards of the PCAOB. Those standards require that we plan and perform the audit to obtain reasonable assurance about whether the financial statements and financial highlights are free of material misstatement, whether due to error or fraud. The Fund is not required to have, nor were we engaged to perform, an audit of its internal control over financial reporting. As part of our audit we are required to obtain an understanding of internal control over financial reporting but not for the purpose of expressing an opinion on the effectiveness of the Fund’s internal control over financial reporting. Accordingly, we express no such opinion.
Our audit included performing procedures to assess the risks of material misstatement of the financial statements and financial highlights, whether due to error or fraud, and performing procedures that respond to those risks. Such procedures included examining, on a test basis, evidence regarding the amounts and disclosures in the financial statements and financial highlights. Our audit also included evaluating the accounting principles used and significant estimates made by management, as well as evaluating the overall presentation of the financial statements and financial highlights. Our procedures included confirmation of securities owned as of December 31, 2018, by correspondence with the custodian and brokers; when replies were not received from brokers, we performed other auditing procedures. We believe that our audit provides a reasonable basis for our opinion.
Deloitte & Touche LLP
Boston, Massachusetts
February 15, 2019
We have served as the auditor of one or more BlackRock investment companies since 1992.
| | | | |
| REPORT OF INDEPENDENT REGISTERED PUBLIC ACCOUNTING FIRM | | | 27 | |
Disclosure of Investment Advisory Agreement
The Board of Directors (the “Board,” the members of which are referred to as “Board Members”) of BlackRock Variable Series Funds, Inc. (the “Company”) met in person on November 14, 2017 (the “Meeting”) to consider the approval of the proposed investment advisory agreement (the “Advisory Agreement” or the “Agreement”) between the Company, on behalf of the BlackRock International Index V.I. Fund (the “International Fund”) and BlackRock Small Cap Index V.I. Fund (the “Small Cap Fund”) (each, a “Fund” and together, the “Funds”), and BlackRock Advisors, LLC (the “Manager” or “BlackRock”) as each Fund’s investment advisor. The Funds commenced operations in October 2018.
Activities and Composition of the Board
On the date of the Meeting, the Board consisted of eleven individuals, nine of whom were not “interested persons” of the Company as defined in the Investment Company Act of 1940, as amended (the “1940 Act”) (the “Independent Board Members”). The Board Members are responsible for the oversight of the operations of each Fund and perform the various duties imposed on the directors of investment companies by the 1940 Act. The Independent Board Members have retained independent legal counsel to assist them in connection with their duties. The Chair of the Board is an Independent Board Member. The Board has established five standing committees: an Audit Committee, a Governance and Nominating Committee, a Compliance Committee, a Performance Oversight Committee and an Executive Committee, each of which is chaired by an Independent Board Member and composed of Independent Board Members (except for the Performance Oversight Committee and the Executive Committee, each of which also has one interested Board Member).
The Agreement
Pursuant to the 1940 Act, the Board is required to consider the initial approval of the Agreement. The Board’s consideration of the Agreement is a deliberative process, during which the Board assessed, among other things, the nature, extent and quality of the services to be provided to each Fund by BlackRock, BlackRock’s personnel and affiliates, including (as applicable): investment management; accounting, administrative and shareholder services; oversight of each Fund’s service providers; marketing and promotional services; risk management and oversight; legal and compliance services; and ability to meet applicable legal and regulatory requirements.
Board Considerations in Approving the Agreement
The Approval Process: At the Meeting, the Board reviewed materials relating to its consideration of the Agreement. The Board considered all factors it believed relevant with respect to the Company and each Fund, including, among other factors: (a) the nature, extent and quality of the services to be provided by BlackRock; (b) the investment performance of BlackRock portfolio management; (c) the advisory fee and the estimated cost of the services and estimated profits to be realized by BlackRock and its affiliates from their relationship with each Fund; (d) the sharing of potential economies of scale; (e) potentialfall-out benefits to BlackRock and its affiliates as a result of BlackRock’s relationship with each Fund; and (g) other factors deemed relevant by the Board Members.
In determining whether to approve the Agreement, the Board met with the relevant investment advisory personnel from BlackRock and considered all information it deemed reasonably necessary to evaluate the terms of the Agreement. The Board received materials in advance of the Meeting relating to its consideration of the Agreement, including, among other things, (a) information independently compiled and prepared by Broadridge Financial Solutions, Inc. (“Broadridge”), based on either a Lipper classification or Morningstar category, regarding each Fund’s estimated fees and expenses as compared with a peer group of funds as determined by Broadridge (“Expense Peers”) and other metrics, as applicable; (b) information regarding BlackRock’s economic outlook for each Fund and its general investment outlook for the markets; (c) information regarding fees paid to service providers that are affiliates of BlackRock; and (d) information outlining the legal duties of the Board under the 1940 Act with respect to the consideration and approval of the Agreement. The Board also noted information received at prior Board meetings concerning compliance records and regulatory matters relating to BlackRock.
The Board also considered other matters it deemed important to the approval process, such as other payments to be made to BlackRock or its affiliates, securities lending and cash management, services related to the valuation and pricing of Fund portfolio holdings, and advice from independent legal counsel with respect to the review process and materials submitted for the Board’s review. The Board noted the willingness of BlackRock personnel to engage in open, candid discussions with the Board. The Board did not identify any particular information as determinative, and each Board Member may have attributed different weights to the various items considered.
A. Nature, Extent and Quality of the Services to be Provided by BlackRock
The Board, including the Independent Board Members, reviewed the nature, extent and quality of services to be provided by BlackRock, including the investment advisory services to be provided to each Fund. The Board received information concerning the investment philosophy and investment process to be used by BlackRock in managing each Fund, as well as a description of the capabilities, personnel and services of BlackRock. In connection with this review, the Board considered BlackRock’sin-house research capabilities as well as other resources available to its personnel. The Board considered the scope of the services to be provided by BlackRock to each Fund under the Agreement relative to services typically provided by third parties to other funds. The Board noted that the standard of care applicable under the Agreement was comparable to that found generally in investment company advisory agreements. The Board concluded that the scope of BlackRock’s services to be provided to each Fund was consistent with each Fund’s operational requirements, including, in addition to seeking to meet its investment objective, compliance with investment restrictions, tax and reporting requirements and related shareholder services.
The Board, including the Independent Board Members, also considered the quality of the administrative and othernon-investment advisory services to be provided by BlackRock and its affiliates to each Fund. The Board evaluated the procedures of BlackRock designed to fulfill its fiduciary duty to each Fund with respect to possible conflicts of interest, including BlackRock’s code of ethics (regulating the personal trading of BlackRock’s officers and employees), the procedures by which BlackRock allocates trades among its various investment advisory clients, the integrity of the systems in place to ensure compliance with the foregoing and the record of BlackRock in these matters. The Board also noted information received at prior Board meetings concerning the standards of BlackRock with respect to the execution of portfolio transactions.
| | |
| 28 | | 2018 BLACKROCK ANNUAL REPORTTO SHAREHOLDERS |
Disclosure of Investment Advisory Agreement (continued)
The Board, including the Independent Board Members, considered, among other factors, with respect to BlackRock: the number, education and experience of investment personnel generally and each Fund’s portfolio management team; BlackRock’s research capabilities; investments by portfolio managers in the funds they manage; portfolio trading capabilities; use of technology; commitment to compliance; credit analysis capabilities; risk analysis and oversight capabilities; and the approach to training and retaining portfolio managers and other research, advisory and management personnel. The Board also considered BlackRock’s overall risk management program, including the continued efforts of BlackRock and its affiliates to address cybersecurity risks and the role of BlackRock’s Risk & Quantitative Analysis Group. The Board engaged in a review of BlackRock’s compensation structure with respect to each Fund’s portfolio management team and BlackRock’s ability to attract and retain high-quality talent and create performance incentives. The Board also considered the business reputation of BlackRock and its financial resources and concluded that BlackRock would be able to meet any reasonably foreseeable obligation under the Agreement.
In addition to investment advisory services, the Board, including the Independent Board Members, considered the quality of the administrative and othernon-investment advisory services to be provided by BlackRock and its affiliates to each Fund. The Board noted that BlackRock and its affiliates will provide each Fund with certain administrative, shareholder and other services (in addition to any such services to be provided to each Fund by third parties) and officers and other personnel as are necessary for the operations of each Fund. In particular, the Board noted that BlackRock and its affiliates will provide each Fund with administrative services including, among others: (i) responsibility for disclosure documents, such as the prospectus, the summary prospectus (as applicable), the statement of additional information and periodic shareholder reports; (ii) oversight of daily accounting and pricing; (iii) responsibility for periodic filings with regulators; (iv) overseeing and coordinating the activities of other service providers including, among others, each Fund’s custodian, fund accountant, transfer agent, and auditor; (v) organizing Board meetings and preparing the materials for such Board meetings; (vi) providing legal and compliance support; (vii) furnishing analytical and other support to assist the Board in its consideration of strategic issues such as the merger, consolidation or repurposing of certainopen-end funds; and (viii) performing administrative functions necessary for the operation of each Fund, such as tax reporting, expense management, fulfilling regulatory filing requirements, overseeing each Fund’s distribution partners, and shareholder call center and other services. The Board reviewed the structure and duties of BlackRock’s fund administration, shareholder services, and legal & compliance departments and considered BlackRock’s policies and procedures for assuring compliance with applicable laws and regulations.
B. The Investment Performance of each Fund and BlackRock
The Board, including the Independent Board Members, previously received and considered information about BlackRock’s investment performance for other funds. The Board, however, could not consider the performance history of the Funds because the Funds were not yet organized and had not yet commenced operations as of the date of the Meeting.
C. Consideration of the Advisory/Management Fees and the Cost of the Services to be Provided and Estimated Profits to be Realized by BlackRock and its Affiliates from their Relationship with each Fund
In connection with the initial approval of the Agreement, the Board, including the Independent Board Members, reviewed each Fund’s proposed contractual management fee rate compared with those of its Expense Peers. The contractual management fee rate represents a combination of the advisory fee and any administrative fees, before taking into account any reimbursements or fee waivers. In addition, the Board, including the Independent Board Members, considered each Fund’s estimated total expense ratio, as well as its actual management fee rate, to those of its Expense Peers. The estimated total expense ratio represents a fund’s total net operating expenses, including any12b-1 or non12b-1 service fees. The estimated total expense ratio gives effect to any expense reimbursements or fee waivers that benefit a fund, and the actual management fee rate gives effect to any management fee reimbursements or waivers that benefit a fund. The Board considered the services provided and the fees charged by BlackRock and its affiliates to other types of clients with similar investment mandates, as applicable, including institutional accounts andsub-advised mutual funds (including mutual funds sponsored by third parties).
The Board noted that each Fund’s contractual management fee rate and actual management fee rate ranked in the first quartile, and that each Fund’s estimated total expense ratio ranked in the first quartile, relative to each Fund’s Expense Peers. The Board further noted that BlackRock and the Board have contractually agreed to a cap on each Fund’s total expenses as a percentage of each Fund’s average daily net assets. Additionally, the Board noted that BlackRock and the Board have contractually agreed to a cap on certain operational and recordkeeping fees for each of the Funds.
Following consideration of this information, the Board, including the Independent Board Members, concluded that the fees to be paid pursuant to the Agreement were fair and reasonable in light of the services provided.
As the Funds had not commenced operations as of the date of the Meeting, BlackRock was not able to provide the Board with specific information concerning the expected profits to be realized by BlackRock and its affiliates from their relationships with the Funds. BlackRock, however, will provide the Board with such information at future meetings.
D. Economies of Scale
The Board, including the Independent Board Members, considered the extent to which economies of scale might be realized as the assets of each Fund increase. The Board also noted the existence of fee waivers and/or expense caps, noting that any contractual fee waivers and expense caps would be approved by the Board.
E. Other Factors Deemed Relevant by the Board Members
The Board, including the Independent Board Members, also took into account other potential ancillary or“fall-out” benefits that BlackRock or its affiliates may derive from BlackRock’s respective relationships with each Fund, both tangible and intangible, such as BlackRock’s ability to leverage its investment professionals who manage other portfolios and risk management personnel, an increase in BlackRock’s profile in the investment advisory community, and the engagement of BlackRock’s affiliates as service providers to each Fund, including for administrative, distribution, securities lending and cash management services. The Board also considered BlackRock’s overall
| | | | |
| DISCLOSUREOF INVESTMENT ADVISORY AGREEMENT | | | 29 | |
Disclosure of Investment Advisory Agreement (continued)
operations and its efforts to expand the scale of, and improve the quality of, its operations. The Board also noted that, subject to applicable law, BlackRock may use and benefit from third party research obtained by soft dollars generated by certain registered fund transactions to assist in managing all or a number of its other client accounts.
The Board, including all of the Independent Board Members, concluded that these potential ancillary benefits that BlackRock and its affiliates could receive with regard to providing investment advisory and other services to each Fund were consistent with those generally available to other mutual fund sponsors.
The Board noted the competitive nature of theopen-end fund marketplace, and that shareholders would be able to redeem their Fund shares if they believe that each Fund’s fees and expenses are too high or if they are dissatisfied with the performance of each Fund.
Conclusion
The Board, including the Independent Board Members, approved the Advisory Agreement between the Manager and the Company, on behalf of each Fund, for atwo-year term beginning on the effective date of the Advisory Agreement. Based upon its evaluation of all of the aforementioned factors in their totality, as well as other information, the Board, including the Independent Board Members, was satisfied that the terms of the Agreement were fair and reasonable and in the best interest of each Fund and its shareholders. In arriving at its decision to approve the Agreement, the Board did not identify any single factor or group of factors asall-important or controlling, but considered all factors together, and different Board Members may have attributed different weights to the various factors considered. The Independent Board Members were also assisted by the advice of independent legal counsel in making this determination.
| | |
| 30 | | 2018 BLACKROCK ANNUAL REPORTTO SHAREHOLDERS |
Glossary of Terms Used in this Report
| | |
| Portfolio Abbreviations |
| |
| ADR | | American Depositary Receipt |
| |
| CDI | | Crest Depository Interests |
| |
| CVA | | Certification Van Aandelon (Dutch Certificate) |
| |
| FDR | | Fiduciary Depositary Receipt |
| |
| REIT | | Real Estate Investment Trust |
| |
| SDR | | Swedish Depositary Receipts |
| | | | |
| GLOSSARYOF TERMS USEDINTHIS REPORT | | | 31 | |
DECEMBER 31, 2018
| | |
ANNUAL REPORT | |  |
BlackRock Variable Series Funds, Inc.
| Ø | | BlackRock iShares® Dynamic Allocation V.I. Fund |
|
| Not FDIC Insured • May Lose Value • No Bank Guarantee |
| | |
| Fund Summary as of December 31, 2018 | | BlackRock iShares® Dynamic Allocation V.I. Fund |
Investment Objective
BlackRock iShares® Dynamic Allocation V.I. Fund’s (the “Fund”) investment objective is to seek to provide total return.
On November 14, 2017, the Board of Directors of the Company (the “Board”) and, on May 23, 2018, the Board of Trustees of State Farm Variable Product Trust each approved a reorganization of the State Farm Stock and Bond Balanced Fund (the “Target Fund”), with and into the Fund. At a special shareholder meeting on September 14, 2018, the shareholders of the Target Fund approved the reorganization, which was completed on October 29, 2018.
Portfolio Management Commentary
How did the Fund perform?
For the12-month period ended December 31, 2018, the Fund outperformed its blended benchmark, (60% MSCI All Country World Index / 40% Bloomberg Barclays U.S. Aggregate Bond Index).
What factors influenced performance?
The largest contributions to Fund performance came from exposure to the iShares Short Maturity Bond ETF and the iShares Intermediate-Term Corporate Bond ETF.
The largest detractors from Fund performance derived from exposure to the iShares Core MSCI EAFE ETF and the iShares Core S&P 500 ETF.
Describe recent portfolio activity.
During the12-month period, the Fund adopted a more defensive stance in terms of overall asset allocation, decreasing exposure to equities and increasing exposure to fixed income. The larger fixed income allocation funded increases in investment grade U.S. credit and shorter duration corporate bonds. The Fund also maintained an overweight to U.S. stocks, reducing exposures to developed market and emerging market stocks. The composition of the Fund’s U.S. equities allocation was reorganized, funding an increase in broad U.S. market exposure from small- andmid-cap exposures. In addition, the Fund sought exposure to global technology stocks, and decreased exposure to preferred and momentum-oriented stocks. Lastly, the Fund added to emerging market government bonds, and trimmed its holdings in agency bonds.
Describe portfolio positioning at period end.
At period end, the Fund maintained a slight overweight position to equities relative to the benchmark, but reduced from earlier in the year. The Fund’s top holdings included exposure to U.S. equities, short duration corporate bonds, and investment grade U.S. credit. Within equities, the Fund maintained broad exposure to U.S. large cap and momentum, with smaller allocations to value, growth and minimum volatility. Within fixed income, the Fund was underweight duration and overweight broader credit versus rates. In addition, the Fund ended the period with small allocations to U.S. Treasuries, emerging market equities and emerging market government bonds.
The views expressed reflect the opinions of BlackRock as of the date of this report and are subject to change based on changes in market, economic or other conditions.
These views are not intended to be a forecast of future events and are no guarantee of future results.
Portfolio Information
PORTFOLIO COMPOSITION
| | | | |
| Asset Type | | Percent of
Affiliated Investment
Companies | |
Equity Funds | | | 48 | % |
Fixed Income Funds | | | 34 | |
Short-Term Securities | | | 18 | |
| | |
| 2 | | 2018 BLACKROCK ANNUAL REPORTTO SHAREHOLDERS |
| | |
| Fund Summary as of December 31, 2018 (continued) | | BlackRock iShares® Dynamic Allocation V.I. Fund |
TOTAL RETURN BASED ON A $10,000 INVESTMENT
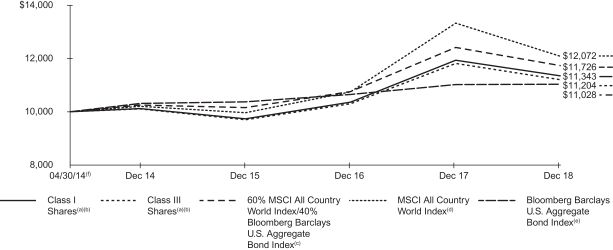
| (a) | Assuming transaction costs, if any, and other operating expenses, including investment advisory fees. Does not include insurance-related fees and expenses. |
| (b) | The Fund invests in a portfolio of underlying exchange-traded funds that seek to track equity, fixed income and alternative indices. |
| (c) | A customized weighted index comprised of 60% MSCI All Country World Index and 40% Bloomberg Barclays U.S. Aggregate Bond Index. |
| (d) | A free float-adjusted market capitalization weighted index that is designed to measure the equity market performance of developed and emerging markets. The MSCI All Country World Index consists of 46 country indexes comprising 23 developed and 23 emerging market country indexes. |
| (e) | A widely recognized unmanaged market-weighted index, comprised of investment-grade corporate bonds rated BBB or better, mortgages and U.S. Treasury and U.S. Government agency issues with at least one year to maturity. |
| (f) | Commencement of operations. |
Performance Summary for the Period Ended December 31, 2018
| | | | | | | | | | | | | | | | |
| | | | | | | | | Average Annual Total Returns | |
| | | 6-Month
Total Returns (b) | | | | | | 1 Year (b) | | | Since
Inception (b)(c) | |
Class I(a) | | | (4.94 | )% | | | | | | | (4.94 | )% | | | 2.73 | % |
Class III(a) | | | (5.10 | ) | | | | | | | (5.18 | ) | | | 2.46 | |
60% MSCI All Country World Index / 40% Bloomberg Barclays U.S. Aggregate Bond Index | | | (4.73 | ) | | | | | | | (5.52 | ) | | | 3.47 | |
MSCI All Country World Index | | | (9.02 | ) | | | | | | | (9.41 | ) | | | 4.12 | |
Bloomberg Barclays U.S. Aggregate Bond Index | | | 1.65 | | | | | | | | 0.01 | | | | 2.12 | |
| | (a) | Average annual and cumulative total returns are based on changes in net asset value for the periods shown, and assume reinvestment of all distributions at net asset value on theex-dividend date. Insurance-related fees and expenses are not reflected in these returns. | |
| | (b) | For a portion of the period, the Fund’s investment adviser waived a portion of its fee. Without such waiver, the Fund’s performance would have been lower. | |
| | (c) | The Fund commenced operations on April 30, 2014. | |
Past performance is not indicative of future results. Performance results do not reflect the deduction of taxes that a shareholder would pay on Fund distributions or the redemption of Fund shares.
Performance results may include adjustments made for financial reporting purposes in accordance with U.S. generally accepted accounting principles.
Expense Example
| | | | | | | | | | | | | | | | | | | | | | | | | | | | | | | | |
| | | Actual | | | | | | Hypothetical (a) | | | | |
| | | Beginning
Account Value
(07/01/18) | | | Ending
Account Value
(12/31/18) | | | Expenses
Paid During
the Period (b) | | | | | | Beginning
Account Value
(07/01/18) | | | Ending
Account Value
(12/31/18) | | | Expenses
Paid During
the Period (b) | | | Annualized
Expense
Ratio | |
Class I | | $ | 1,000.00 | | | $ | 950.60 | | | $ | 1.43 | | | | | | | $ | 1,000.00 | | | $ | 1,023.74 | | | $ | 1.48 | | | | 0.29 | % |
Class III | | | 1,000.00 | | | | 949.00 | | | | 3.24 | | | | | | | | 1,000.00 | | | | 1,021.88 | | | | 3.36 | | | | 0.66 | |
| | (a) | Hypothetical 5% annual return before expenses is calculated by prorating the number of days in the most recent fiscal half year divided by 365. | |
| | (b) | For each class of the Fund, expenses are equal to annualized expense ratio for the class, multiplied by the average account value over the period, multiplied by 184/365 (to reflect theone-half year period shown). | |
See “Disclosure of Expenses” on the following page for further information on how expenses were calculated.
| | |
| Disclosure of Expenses | | BlackRock iShares® Dynamic Allocation V.I. Fund |
Shareholders of the Fund may incur the following charges: (a) transactional expenses; and (b) operating expenses, including investment advisory fees, service and distribution fees, including12b-1 fees, acquired fund fees and expenses, and other fund expenses. The expense example on the previous page (which is based on a hypothetical investment of $1,000 invested on July 1, 2018 and held through December 31, 2018) is intended to assist shareholders both in calculating expenses based on an investment in the Fund and in comparing these expenses with similar costs of investing in other mutual funds.
The expense example provides information about actual account values and actual expenses. In order to estimate the expenses a shareholder paid during the period covered by this report, shareholders can divide their account value by $1,000 and then multiply the result by the number corresponding to their share class under the heading entitled “Expenses Paid During the Period.”
The expense example also provides information about hypothetical account values and hypothetical expenses based on the Fund’s actual expense ratio and an assumed rate of return of 5% per year before expenses. In order to assist shareholders in comparing the ongoing expenses of investing in the Fund and other funds, compare the 5% hypothetical example with the 5% hypothetical examples that appear in shareholder reports of other funds.
The expenses shown in the expense example are intended to highlight shareholders’ ongoing costs only and do not reflect transactional expenses, such as sales charges, if any. Therefore, the hypothetical example is useful in comparing ongoing expenses only, and will not help shareholders determine the relative total expenses of owning different funds. If these transactional expenses were included, shareholder expenses would have been higher.
| | |
| 4 | | 2018 BLACKROCK ANNUAL REPORTTO SHAREHOLDERS |
| | |
Consolidated Schedule of Investments December 31, 2018 | | BlackRock iShares® Dynamic Allocation V.I. Fund (Percentages shown are based on Net Assets) |
| | | | | | | | |
| Security | | Shares | | | Value | |
|
Affiliated Investment Companies — 121.3%(d) | |
| |
| Equity Funds — 58.4% | | | | |
iShares Core MSCI EAFE ETF | | | 190,016 | | | $ | 10,450,880 | |
iShares Core MSCI Emerging Markets ETF(a) | | | 81,513 | | | | 3,843,338 | |
iShares Core S&P 500 ETF(a) | | | 109,639 | | | | 27,586,269 | |
iShares Core S&PMid-Cap ETF(a) | | | 20,257 | | | | 3,363,877 | |
iShares Core S&PSmall-Cap ETF(a) | | | 31,125 | | | | 2,157,585 | |
iShares Edge MSCI Minimum Volatility USA
ETF(a) | | | 91,341 | | | | 4,786,268 | |
iShares Edge MSCI USA Momentum Factor
ETF(a) | | | 78,970 | | | | 7,915,163 | |
iShares Global Tech ETF | | | 45,208 | | | | 6,511,308 | |
iShares S&P 500 Growth ETF(a) | | | 14,822 | | | | 2,233,231 | |
iShares S&P 500 Value ETF(a) | | | 22,800 | | | | 2,305,992 | |
| | | | | | | | |
| | | | | | | 71,153,911 | |
| |
| Fixed Income Funds — 41.3% | | | | |
iShares iBoxx $ Investment Grade Corporate Bond ETF | | | 105,522 | | | | 11,904,992 | |
iShares Intermediate-Term Corporate Bond
ETF(a) | | | 175,713 | | | | 9,210,876 | |
iShares J.P. Morgan USD Emerging Markets Bond ETF | | | 62,919 | | | | 6,537,913 | |
iShares Short Maturity Bond ETF(a) | | | 370,419 | | | | 18,465,387 | |
| | | | | | | | |
| Security | | Shares | | | Value | |
| |
| Fixed Income Funds (continued) | | | | |
iShares U.S. Treasury Bond ETF(a) | | | 164,381 | | | $ | 4,051,992 | |
| | | | | | | | |
| | | | | | | 50,171,160 | |
|
| Short-Term Securities — 21.6%(b) | |
BlackRock Liquidity Funds,T-Fund, Institutional Class,
2.32% | | | 272,513 | | | | 272,513 | |
SL Liquidity Series, LLC, Money Market Series,
2.57%(c) | | | 26,024,369 | | | | 26,021,766 | |
| | | | | | | | |
| | | | | | | 26,294,279 | |
| |
Total Affiliated Investment Companies — 121.3%
(Cost: $157,476,510) | | | | 147,619,350 | |
| |
Liabilities in Excess of Other Assets — (21.3)% | | | | (25,936,341 | ) |
| | | | | |
| |
Net Assets — 100.0% | | | $ | 121,683,009 | |
| | | | | |
| (a) | Security, or a portion of the security, is on loan. |
| (b) | Annualized7-day yield as of period end. |
| (c) | Security was purchased with the cash collateral from loaned securities. |
| (d) | During the year ended December 31, 2018, investments in issuers considered to be affiliates of the Fund for the purposes of Section 2(a)(3) of the Investment Company Act of 1940, as amended, and/or related parties of the Fund were as follows: |
| | | | | | | | | | | | | | | | | | | | | | | | | | | | | | | | |
| Affiliated Persons and/or Related Parties | | Shares
Held at
12/31/17 | | | Shares
Purchased | | | Shares
Sold | | | Shares
Held at
12/31/18 | | | Value at
12/31/18 | | | Income | | | Net
Realized
Gain (Loss) (a) | | | Change in
Unrealized
Appreciation
(Depreciation) | |
BlackRock Liquidity Funds,T-Fund, Institutional Class | | | 57,845 | | | | 214,668 | (b) | | | — | | | | 272,513 | | | $ | 272,513 | | | $ | 1,577 | | | $ | — | | | $ | — | |
SL Liquidity Series, LLC, Money Market Series | | | 2,016,002 | | | | 24,008,367 | (b) | | | — | | | | 26,024,369 | | | | 26,021,766 | | | | 60,001 | (c) | | | (5,127 | ) | | | (846 | ) |
iShares1-3 Year Treasury Bond ETF | | | 23,797 | | | | 3,441 | | | | (27,238 | ) | | | — | | | | — | | | | 7,040 | | | | (32,501 | ) | | | 16,848 | |
iShares 20+ Year Treasury Bond ETF | | | — | | | | 5,600 | | | | (5,600 | ) | | | — | | | | — | | | | 4,471 | | | | 18,873 | | | | — | |
iShares Agency Bond ETF | | | 11,079 | | | | 300 | | | | (11,379 | ) | | | — | | | | — | | | | 5,711 | | | | (24,942 | ) | | | 220 | |
iShares Commodities Select Strategy ETF | | | 6,561 | | | | 600 | | | | (7,161 | ) | | | — | | | | — | | | | 2,930 | | | | 39,439 | | | | (16,904 | ) |
iShares Core MSCI EAFE ETF | | | — | | | | 203,181 | | | | (13,165 | ) | | | 190,016 | | | | 10,450,880 | | | | 187,273 | | | | (47,557 | ) | | | (863,834 | ) |
iShares Core MSCI Emerging Markets ETF | | | 50,350 | | | | 69,237 | | | | (38,074 | ) | | | 81,513 | | | | 3,843,338 | | | | 84,777 | | | | 297,238 | | | | (525,507 | ) |
iShares Core S&P 500 ETF | | | 15,804 | | | | 98,112 | | | | (4,277 | ) | | | 109,639 | | | | 27,586,269 | | | | 281,230 | | | | 310,289 | | | | (2,060,848 | ) |
iShares Core S&PMid-Cap ETF | | | 12,423 | | | | 18,803 | | | | (10,969 | ) | | | 20,257 | | | | 3,363,877 | | | | 33,384 | | | | 404,294 | | | | (713,878 | ) |
iShares Core S&PSmall-Cap ETF | | | 19,736 | | | | 24,727 | | | | (13,338 | ) | | | 31,125 | | | | 2,157,585 | | | | 19,023 | | | | 283,951 | | | | (488,953 | ) |
iShares Edge MSCI Minimum Volatility Global ETF | | | 8,397 | | | | 2,800 | | | | (11,197 | ) | | | — | | | | — | | | | 8,960 | | | | 147,889 | | | | (109,653 | ) |
iShares Edge MSCI Minimum Volatility USA ETF | | | 18,450 | | | | 78,476 | | | | (5,585 | ) | | | 91,341 | | | | 4,786,268 | | | | 47,510 | | | | 55,227 | | | | (154,615 | ) |
iShares Edge MSCI USA Momentum Factor ETF | | | 1,400 | | | | 88,042 | | | | (10,472 | ) | | | 78,970 | | | | 7,915,163 | | | | 47,269 | | | | 86,801 | | | | (435,990 | ) |
iShares Global Infrastructure ETF | | | 8,277 | | | | 300 | | | | (8,577 | ) | | | — | | | | — | | | | 4,923 | | | | 13,992 | | | | (37,044 | ) |
iShares Global Tech ETF | | | — | | | | 46,348 | | | | (1,140 | ) | | | 45,208 | | | | 6,511,308 | | | | 36,797 | | | | (14,311 | ) | | | (700,087 | ) |
iShares Gold Trust | | | 10,379 | | | | 1,450 | | | | (11,829 | ) | | | — | | | | — | | | | — | | | | 1,414 | | | | (8,039 | ) |
iShares iBoxx $ High Yield Corporate Bond ETF | | | 14,263 | | | | 600 | | | | (14,863 | ) | | | — | | | | — | | | | 15,356 | | | | (9,613 | ) | | | (13,820 | ) |
iShares iBoxx $ Investment Grade Corporate Bond ETF | | | 15,740 | | | | 96,524 | | | | (6,742 | ) | | | 105,522 | | | | 11,904,992 | | | | 161,087 | | | | 5,041 | | | | (169,353 | ) |
iShares Intermediate-Term Corporate Bond ETF | | | — | | | | 191,967 | | | | (16,254 | ) | | | 175,713 | | | | 9,210,876 | | | | 133,802 | | | | (4,394 | ) | | | (52,103 | ) |
iShares International Aggregate Bond ETF | | | — | | | | 1,600 | | | | (1,600 | ) | | | — | | | | — | | | | 935 | | | | (625 | ) | | | — | |
iShares J.P. Morgan USD Emerging Markets Bond ETF | | | 3,140 | | | | 61,034 | | | | (1,255 | ) | | | 62,919 | | | | 6,537,913 | | | | 170,612 | | | | (4,728 | ) | | | (172,884 | ) |
iShares MSCI Canada ETF | | | 21,075 | | | | 300 | | | | (21,375 | ) | | | — | | | | — | | | | — | | | | 46,125 | | | | (82,130 | ) |
iShares MSCI EAFE ETF | | | 56,073 | | | | 1,700 | | | | (57,773 | ) | | | — | | | | — | | | | — | | | | 657,197 | | | | (615,024 | ) |
iShares MSCI EAFESmall-Cap ETF | | | 13,600 | | | | 100 | | | | (13,700 | ) | | | — | | | | — | | | | — | | | | 157,760 | | | | (135,709 | ) |
iShares Short Maturity Bond ETF | | | — | | | | 381,298 | | | | (10,879 | ) | | | 370,419 | | | | 18,465,387 | | | | 139,371 | | | | (1,846 | ) | | | (96,893 | ) |
iShares Silver Trust | | | 4,905 | | | | 1,820 | | | | (6,725 | ) | | | — | | | | — | | | | — | | | | (11,338 | ) | | | (1,680 | ) |
iShares S&P 500 Growth ETF | | | — | | | | 15,435 | | | | (613 | ) | | | 14,822 | | | | 2,233,231 | | | | 11,122 | | | | 5,985 | | | | (128,074 | ) |
iShares S&P 500 Value ETF | | | — | | | | 23,420 | | | | (620 | ) | | | 22,800 | | | | 2,305,992 | | | | 24,516 | | | | (975 | ) | | | (159,529 | ) |
iShares U.S. Credit Bond ETF | | | 20,159 | | | | 1,099 | | | | (21,258 | ) | | | — | | | | — | | | | 18,141 | | | | (32,278 | ) | | | (61,398 | ) |
iShares U.S. Preferred Stock ETF | | | 13,613 | | | | 400 | | | | (14,013 | ) | | | — | | | | — | | | | 15,116 | | | | (15,181 | ) | | | (1,250 | ) |
iShares U.S. Real Estate ETF | | | 3,900 | | | | 2,400 | | | | (6,300 | ) | | | — | | | | — | | | | 11,129 | | | | 8,084 | | | | (6,792 | ) |
iShares U.S. Treasury Bond ETF | | | — | | | | 168,524 | | | | (4,143 | ) | | | 164,381 | | | | 4,051,992 | | | | 27,837 | | | | (568 | ) | | | 53,925 | |
| | | | | | | | | | | | | | | | | | | | | | | | | | | | | | | | |
Total | | | | | | | | | | | | | | | | | | $ | 147,619,350 | | | $ | 1,561,900 | | | $ | 2,333,615 | | | $ | (7,741,844 | ) |
| | | | | | | | | | | | | | | | | | | | | | | | | | | | | | | | |
| | (a) | Includes net capital gain distributions, if applicable. | |
| | (b) | Represents net shares purchased. | |
| | (c) | Represents securities lending income earned from the reinvestment of cash collateral from loaned securities, net of fees and collateral investment expenses, and other payments to and from borrowers of securities. | |
| | | | |
| CONSOLIDATED SCHEDULE OF INVESTMENTS | | | 5 | |
| | |
Consolidated Schedule of Investments (continued) December 31, 2018 | | BlackRock iShares® Dynamic Allocation V.I. Fund |
Fair Value Hierarchy as of Period End
Various inputs are used in determining the fair value of investments. For information about the Fund’s policy regarding valuation of investments, refer to the Notes to Consolidated Financial Statements.
The following table summarizes the Fund’s investments categorized in the disclosure hierarchy:
| | | | | | | | | | | | | | | | |
| | | Level 1 | | | Level 2 | | | Level 3 | | | Total | |
Assets: | | | | | | | | | | | | | | | | |
Investments: | | | | | | | | | | | | | | | | |
Affiliated Investment Companies | | $ | 121,325,071 | | | $ | — | | | $ | — | | | $ | 121,325,071 | |
Short-Term Securities | | | 272,513 | | | | — | | | | — | | | | 272,513 | |
| | | | | | | | | | | | | | | | |
| | $ | 121,597,584 | | | $ | — | | | $ | — | | | $ | 121,597,584 | |
| | | | | | | | | | | | | | | | |
Investments valued at NAV(a) | | | | | | | | | | | | | | | 26,021,766 | |
| | | | | | | | | | | | | | | | |
Total Investment | | | | | | | | | | | | | | $ | 147,619,350 | |
| | | | | | | | | | | | | | | | |
| | (a) | As of December 31, 2018, certain investments of the Fund were fair valued using NAV per share as no quoted market value is available and therefore have been excluded from the fair value hierarchy. | |
During the year ended December 31, 2018, there were no transfers between levels.
See notes to consolidated financial statements.
| | |
| 6 | | 2018 BLACKROCK ANNUAL REPORTTO SHAREHOLDERS |
Consolidated Statement of Assets and Liabilities
December 31, 2018
| | | | |
| | | BlackRock iShares®
Dynamic Allocation V.I. Fund | |
| |
ASSETS | | | | |
Investments at value — affiliated (including securities loaned at value of $25,634,487) (cost — $157,476,510) | | $ | 147,619,350 | |
Cash | | | 106 | |
Receivables: | | | | |
Securities lending income — affiliated | | | 5,643 | |
Capital shares sold | | | 194,057 | |
Dividends — affiliated | | | 340 | |
Dividends — unaffiliated | | | 38,254 | |
From the Manager | | | 1,161 | |
Prepaid expenses | | | 119 | |
| | | | |
Total assets | | | 147,859,030 | |
| | | | |
| |
LIABILITIES | | | | |
Cash collateral on securities loaned at value | | | 26,027,438 | |
Payables: | | | | |
Investments purchased | | | 69,991 | |
Accounting services fees | | | 9,664 | |
Capital shares redeemed | | | 4,273 | |
Printing fees | | | 18,568 | |
Distribution fees | | | 822 | |
Transfer agent fees | | | 24,810 | |
Board realignment and consolidation | | | 1,177 | |
Investment advisory fees | | | 2,758 | |
Directors’ and Officer’s fees | | | 5,084 | |
Other affiliates | | | 66 | |
Other accrued expenses | | | 11,370 | |
| | | | |
Total liabilities | | | 26,176,021 | |
| | | | |
| |
NET ASSETS | | $ | 121,683,009 | |
| | | | |
| |
NET ASSETS CONSIST OF | | | | |
Paid-in capital | | $ | 131,354,207 | |
Accumulated loss | | | (9,671,198 | ) |
| | | | |
NET ASSETS | | $ | 121,683,009 | |
| | | | |
| |
NET ASSET VALUE | | | | |
Class I — Based on net assets of $117,501,961 and 11,389,620 shares outstanding, 100 million shares authorized, $0.10 par value. | | $ | 10.32 | |
| | | | |
Class III — Based on net assets of $4,181,048 and 406,539 shares outstanding, 100 million shares authorized, $0.10 par value. | | $ | 10.28 | |
| | | | |
See notes to consolidated financial statements.
| | | | |
| CONSOLIDATED FINANCIAL STATEMENTS | | | 7 | |
Consolidated Statement of Operations
Year Ended December 31, 2018
| | | | |
| | | BlackRock iShares®
Dynamic Allocation V.I. Fund | |
| |
INVESTMENT INCOME | | | | |
Dividends — affiliated | | $ | 1,501,899 | |
Securities lending income — affiliated — net | | | 60,001 | |
| | | | |
Total investment income | | | 1,561,900 | |
| | | | |
| |
EXPENSES | | | | |
Reorganization | | | 118,371 | |
Transfer agent — class specific | | | 98,712 | |
Professional | | | 72,657 | |
Investment advisory | | | 70,875 | |
Accounting services | | | 50,451 | |
Printing | | | 25,746 | |
Directors and Officer | | | 18,210 | |
Distribution — class specific | | | 9,664 | |
Custodian | | | 8,045 | |
Transfer agent | | | 5,079 | |
Registration | | | 3,869 | |
Board realignment and consolidation | | | 1,195 | |
Miscellaneous | | | 6,212 | |
| | | | |
Total expenses | | | 489,086 | |
Less: | | | | |
Fees waived and/or reimbursed by the Manager | | | (203,677 | ) |
Transfer agent fees waived and/or reimbursed — class specific | | | (98,709 | ) |
| | | | |
Total expenses after fees waived and/or reimbursed | | | 186,700 | |
| | | | |
Net investment income | | | 1,375,200 | |
| | | | |
| |
REALIZED AND UNREALIZED GAIN (LOSS) | | | | |
Net realized gain from investments — affiliated | | | 2,333,615 | |
Net change in unrealized depreciation on investments — affiliated | | | (7,741,844 | ) |
| | | | |
Net realized and unrealized loss | | | (5,408,229 | ) |
| | | | |
NET DECREASE IN NET ASSETS RESULTING FROM OPERATIONS | | $ | (4,033,029 | ) |
| | | | |
See notes to consolidated financial statements.
| | |
| 8 | | 2018 BLACKROCK ANNUAL REPORTTO SHAREHOLDERS |
Consolidated Statements of Changes in Net Assets
| | | | | | | | |
| | | BlackRock iShares® Dynamic
Allocation V.I. Fund | |
| | | Year Ended December 31, | |
| | | 2018 | | | 2017 | |
| | |
INCREASE (DECREASE) IN NET ASSETS | | | | | | | | |
| | |
OPERATIONS | | | | | | | | |
Net investment income | | $ | 1,375,200 | | | $ | 518,378 | |
Net realized gain | | | 2,333,615 | | | | 379,198 | |
Net change in unrealized appreciation (depreciation) | | | (7,741,844 | ) | | | 2,493,939 | |
| | | | | | | | |
Net increase (decrease) in net assets resulting from operations | | | (4,033,029 | ) | | | 3,391,515 | |
| | | | | | | | |
| | |
DISTRIBUTIONS TO SHAREHOLDERS(a)(b) | | | | | | | | |
From net investment income and net realized gain: | | | | | | | | |
Class I | | | (2,881,352 | ) | | | (452,727 | ) |
Class III | | | (93,658 | ) | | | (56,728 | ) |
From return of capital: | | | | | | | | |
Class I | | | — | | | | (13,367 | ) |
Class III | | | — | | | | (3,178 | ) |
| | | | | | | | |
Decrease in net assets resulting from distributions to shareholders | | | (2,975,010 | ) | | | (526,000 | ) |
| | | | | | | | |
| | |
CAPITAL SHARE TRANSACTIONS | | | | | | | | |
Net increase in net assets derived from capital share transactions | | | 99,743,994 | | | | 6,142,899 | |
| | | | | | | | |
| | |
NET ASSETS(b) | | | | | | | | |
Total increase in net assets | | | 92,735,955 | | | | 9,008,414 | |
Beginning of year | | | 28,947,054 | | | | 19,938,640 | |
| | | | | | | | |
End of year | | $ | 121,683,009 | | | $ | 28,947,054 | |
| | | | | | | | |
| (a) | Distributions for annual periods determined in accordance with U.S. federal income tax regulations. |
| (b) | Prior year distribution character information and undistributed net investment income has been modified or removed to conform with current year RegulationS-X presentation changes. Refer to Note 11 for this prior year information. |
See notes to consolidated financial statements.
| | | | |
| CONSOLIDATED FINANCIAL STATEMENTS | | | 9 | |
Consolidated Financial Highlights
(For a share outstanding throughout each period)
| | | | | | | | | | | | | | | | | | | | | | | | |
| | | BlackRock iShares® Dynamic Allocation V.I. Fund | |
| |
| | | Class I | |
| | | Year Ended December 31, | | | | | | Period from
04/30/2014 (a) to 12/31/2014 | |
| | | 2018 | | | 2017 | | | 2016 | | | 2015 | | | | |
| | | | | | | |
Net asset value, beginning of period | | $ | 11.13 | | | $ | 9.85 | | | $ | 9.45 | | | $ | 10.02 | | | | | | | $ | 10.00 | |
| | | | | | | | | | | | | | | | | | | | | | | | |
Net investment income(b) | | | 0.33 | | | | 0.23 | | | | 0.22 | | | | 0.24 | | | | | | | | 0.20 | |
Net realized and unrealized gain (loss) | | | (0.88 | ) | | | 1.26 | | | | 0.39 | | | | (0.63 | ) | | | | | | | (0.07 | ) |
| | | | | | | | | | | | | | | | | | | | | | | | |
Net increase (decrease) from investment operations | | | (0.55 | ) | | | 1.49 | | | | 0.61 | | | | (0.39 | ) | | | | | | | 0.13 | |
| | | | | | | | | | | | | | | | | | | | | | | | |
| | | | | | |
| Distributions(c) | | | | | | | | | | | | | | | | | | |
From net investment income | | | (0.11 | ) | | | (0.20 | ) | | | (0.20 | ) | | | (0.17 | ) | | | | | | | (0.10 | ) |
From net realized gain | | | (0.15 | ) | | | — | | | | — | | | | — | | | | | | | | (0.01 | ) |
From return of capital | | | — | | | | (0.01 | ) | | | (0.01 | ) | | | (0.01 | ) | | | | | | | — | |
| | | | | | | | | | | | | | | | | | | | | | | | |
Total distributions | | | (0.26 | ) | | | (0.21 | ) | | | (0.21 | ) | | | (0.18 | ) | | | | | | | (0.11 | ) |
| | | | | | | | | | | | | | | | | | | | | | | | |
| | | | | | |
Net asset value, end of period | | $ | 10.32 | | | $ | 11.13 | | | $ | 9.85 | | | $ | 9.45 | | | | | | | $ | 10.02 | |
| | | | | | | | | | | | | | | | | | | | | | | | |
| | | | | | |
Total Return(d) | | | | | | | | | | | | | | | | | | | | | | | | |
Based on net asset value | | | (4.94 | )% | | | 15.11 | % | | | 6.49 | % | | | (3.88 | )% | | | | | | | 1.27 | %(e) |
| | | | | | | | | | | | | | | | | | | | | | | | |
| | | | | | |
Ratios to Average Net Assets(f) | | | | | | | | | | | | | | | | | | | | | | | | |
Total expenses | | | 1.00 | %(g) | | | 0.94 | % | | | 0.83 | % | | | 1.90 | % | | | | | | | 6.47 | %(h)(i) |
| | | | | | | | | | | | | | | | | | | | | | | | |
Total expenses after fees waived and/or reimbursed | | | 0.37 | %(g) | | | 0.53 | % | | | 0.53 | % | | | 0.64 | % | | | | | | | 0.75 | %(h) |
| | | | | | | | | | | | | | | | | | | | | | | | |
Net investment income | | | 3.01 | % | | | 2.14 | % | | | 2.27 | % | | | 2.41 | % | | | | | | | 2.85 | %(h) |
| | | | | | | | | | | | | | | | | | | | | | | | |
| | | | | | |
Supplemental Data | | | | | | | | | | | | | | | | | | | | | | | | |
Net assets, end of period (000) | | $ | 117,502 | | | $ | 25,332 | | | $ | 18,135 | | | $ | 14,636 | | | | | | | $ | 6,092 | |
| | | | | | | | | | | | | | | | | | | | | | | | |
Portfolio turnover rate | | | 54 | % | | | 48 | % | | | 54 | % | | | 54 | % | | | | | | | 25 | % |
| | | | | | | | | | | | | | | | | | | | | | | | |
| (a) | Commencement of operations. |
| (b) | Based on average shares outstanding. |
| (c) | Distributions for annual periods determined in accordance with U.S. federal income tax regulations. |
| (d) | Where applicable, excludes insurance-related fees and expenses and assumes the reinvestment of distributions. |
| (e) | Aggregate total return. |
| (f) | Excludes expenses incurred indirectly as a result of investments in underlying funds as follows: |
| | | | | | | | | | | | | | | | | | | | | | | | | | | | | | | | | | | | | | | | |
| | | Year Ended December 31, | | | | | | Period from
04/30/2014 (a) to 12/31/2014 | | | | |
| | | 2018 | | | | | | 2017 | | | | | | 2016 | | | | | | 2015 | | | | | | | |
Investments in underlying funds | | | 0.20 | % | | | | | | | 0.21 | % | | | | | | | 0.23 | % | | | | | | | 0.29 | % | | | | | | | 0.27 | % | | | | |
| | | | | | | | | | | | | | | | | | | | | | | | | | | | | | | | | | | | | | | | |
| (g) | Includes reorganization costs associated with the Fund’s reorganization. Without these costs, the total expenses and total expenses after fees waived and/or reimbursed would have been 0.76% and 0.37%, respectively. |
| (i) | Organization and/or offering costs were not annualized in the calculation of the expense ratios. If these expenses were annualized, the total expenses for Class I would have been 7.00%. |
See notes to consolidated financial statements.
| | |
| 10 | | 2018 BLACKROCK ANNUAL REPORTTO SHAREHOLDERS |
Consolidated Financial Highlights (continued)
(For a share outstanding throughout each period)
| | | | | | | | | | | | | | | | | | | | | | | | |
| | | BlackRock iShares® Dynamic Allocation V.I. Fund (continued) | |
| |
| | | Class III | |
| | | Year Ended December 31, | | | | | | Period from
04/30/2014 (a) to 12/31/2014 | |
| | | 2018 | | | 2017 | | | 2016 | | | 2015 | | | | |
| | | | | | | |
Net asset value, beginning of period | | $ | 11.09 | | | $ | 9.83 | | | $ | 9.44 | | | $ | 10.01 | | | | | | | $ | 10.00 | |
| | | | | | | | | | | | | | | | | | | | | | | | |
Net investment income(b) | | | 0.20 | | | | 0.21 | | | | 0.21 | | | | 0.26 | | | | | | | | 0.17 | |
Net realized and unrealized gain (loss) | | | (0.77 | ) | | | 1.24 | | | | 0.37 | | | | (0.66 | ) | | | | | | | (0.06 | ) |
| | | | | | | | | | | | | | | | | | | | | | | | |
Net increase (decrease) from investment operations | | | (0.57 | ) | | | 1.45 | | | | 0.58 | | | | (0.40 | ) | | | | | | | 0.11 | |
| | | | | | | | | | | | | | | | | | | | | | | | |
| | | | | | |
| Distributions(c) | | | | | | | | | | | | | | | | | | |
From net investment income | | | (0.09 | ) | | | (0.18 | ) | | | (0.18 | ) | | | (0.16 | ) | | | | | | | (0.09 | ) |
From net realized gain | | | (0.15 | ) | | | — | | | | — | | | | — | | | | | | | | (0.01 | ) |
From return of capital | | | — | | | | (0.01 | ) | | | (0.01 | ) | | | (0.01 | ) | | | | | | | — | |
| | | | | | | | | | | | | | | | | | | | | | | | |
Total distributions | | | (0.24 | ) | | | (0.19 | ) | | | (0.19 | ) | | | (0.17 | ) | | | | | | | (0.10 | ) |
| | | | | | | | | | | | | | | | | | | | | | | | |
| | | | | | |
Net asset value, end of period | | $ | 10.28 | | | $ | 11.09 | | | $ | 9.83 | | | $ | 9.44 | | | | | | | $ | 10.01 | |
| | | | | | | | | | | | | | | | | | | | | | | | |
| | | | | | |
Total Return(d) | | | | | | | | | | | | | | | | | | | | | | | | |
Based on net asset value | | | (5.18 | )% | | | 14.72 | % | | | 6.16 | % | | | (3.99 | )% | | | | | | | 1.05 | %(e) |
| | | | | | | | | | | | | | | | | | | | | | | | |
| | | | | | |
Ratios to Average Net Assets(f) | | | | | | | | | | | | | | | | | | | | | | | | |
Total expenses | | | 1.38 | %(g) | | | 1.25 | % | | | 1.02 | % | | | 1.87 | % | | | | | | | 8.32 | %(h)(i) |
| | | | | | | | | | | | | | | | | | | | | | | | |
Total expenses after fees waived and/or reimbursed | | | 0.72 | %(g) | | | 0.78 | % | | | 0.78 | % | | | 0.86 | % | | | | | | | 1.00 | %(h) |
| | | | | | | | | | | | | | | | | | | | | | | | |
Net investment income | | | 1.83 | % | | | 1.97 | % | | | 2.08 | % | | | 2.56 | % | | | | | | | 2.54 | %(h) |
| | | | | | | | | | | | | | | | | | | | | | | | |
| | | | | | |
Supplemental Data | | | | | | | | | | | | | | | | | | | | | | | | |
Net assets, end of period (000) | | $ | 4,181 | | | $ | 3,615 | | | $ | 1,804 | | | $ | 1,174 | | | | | | | $ | 20 | |
| | | | | | | | | | | | | | | | | | | | | | | | |
Portfolio turnover rate | | | 54 | % | | | 48 | % | | | 54 | % | | | 54 | % | | | | | | | 25 | % |
| | | | | | | | | | | | | | | | | | | | | | | | |
| (a) | Commencement of operations. |
| (b) | Based on average shares outstanding. |
| (c) | Distributions for annual periods determined in accordance with U.S. federal income tax regulations. |
| (d) | Where applicable, excludes insurance-related fees and expenses and assumes the reinvestment of distributions. |
| (e) | Aggregate total return. |
| (f) | Excludes expenses incurred indirectly as a result of investments in underlying funds as follows: |
| | | | | | | | | | | | | | | | | | | | | | | | | | | | | | | | | | | | | | | | |
| | | Year Ended December 31, | | | | | | Period from
04/30/2014 (a) to 12/31/2014 | | | | |
| | | 2018 | | | | | | 2017 | | | | | | 2016 | | | | | | 2015 | | | | | | | |
Investments in underlying funds | | | 0.20 | % | | | | | | | 0.21 | % | | | | | | | 0.23 | % | | | | | | | 0.29 | % | | | | | | | 0.27 | % | | | | |
| | | | | | | | | | | | | | | | | | | | | | | | | | | | | | | | | | | | | | | | |
| (g) | Includes reorganization costs associated with the Fund’s reorganization. Without these costs, the total expenses and total expenses after fees waived and/or reimbursed would have been 1.14% and 0.72%, respectively. |
| (i) | Organization and/or offering costs were not annualized in the calculation of the expense ratios. If these expenses were annualized, the total expenses for Class III would have been 9.13%. |
See notes to consolidated financial statements.
| | | | |
| CONSOLIDATED FINANCIAL HIGHLIGHTS | | | 11 | |
Notes to Consolidated Financial Statements
BlackRock Variable Series Funds, Inc. (the “Company”) is registered under the Investment Company Act of 1940, as amended (the “1940 Act”), as anopen-end management investment company. The Company is organized as a Maryland corporation that is comprised of 15 separate portfolios. The funds offer shares to insurance companies for their separate accounts to fund benefits under certain variable annuity and variable life insurance contracts. The consolidated financial statements presented are for BlackRock iShares@ Dynamic Allocation V.I. Fund (the “Fund”). The Fund is classified as diversified. Class I and Class III Shares have equal voting, dividend, liquidation and other rights, except that only shares of the respective classes are entitled to vote on matters concerning only that class. In addition, Class III Shares bear certain expenses related to the distribution of such shares.
The Fund, together with certain other registered investment companies advised by BlackRock Advisors, LLC (the “Manager”) or its affiliates, is included in a complex ofopen-end funds referred to as the Equity-Bond Complex.
Reorganization:The Board and the Board of Trustees of State Farm Variable Product Trust and shareholders of the Target Fund approved the reorganization of the Target Fund into the Fund. As a result, the Fund acquired substantially all of the assets and assumed substantially all of the liabilities of the Target Fund in exchange for an equal aggregate value of newly-issued Class I Shares of the Fund.
Each shareholder of the Target Fund received shares of the Fund in an amount equal to the aggregate net asset value (“NAV”) of such shareholder’s Target Fund shares, as determined at the close of business on October 26, 2018, less the costs of the Target Fund’s reorganization.
The reorganization was accomplished by atax-free exchange of shares of the Fund in the following amounts and at the following conversion ratio:
| | | | | | | | | | | | | | | | |
| Target Fund | | Shares Prior to
Reorganization | | | Conversion
Ratio | | | iShares® Dynamic
Allocation V.I. Fund
Share Class | | | Shares of iShares®
Dynamic Allocation
V.I. Fund | |
State Farm Stock and Bond Balanced Fund | | | 9,171,251 | | | | 0.94097697 | | | | Class I | | | | 8,629,936 | |
The Target Fund’s net assets and composition of net assets on October 26, 2018, the valuation date of the reorganization were as follows:
| | | | | | | | | | | | |
| Target Fund | | Net Assets | | | Paid-In
Capital | | | Accumulated
Loss | |
State Farm Stock and Bond Balanced Fund | | $ | 93,649,853 | | | $ | 98,897,788 | | | $ | (5,247,935 | ) |
For financial reporting purposes, assets received and shares issued by the Fund were recorded at fair value. However, the cost basis of the investments received from the Target Fund was carried forward to align ongoing reporting of the Fund’s realized and unrealized gains and losses with amounts distributable to shareholders for tax purposes.
The net assets of the Fund before the reorganization were $32,398,241. The aggregate net assets of the Fund immediately after the acquisition amounted to $126,048,094. The Target Fund’s fair value and cost of investments prior to the reorganization were as follows:
| | | | | | | | |
| Target Fund | | Fair Value
of Investments | | | Cost of
Investments | |
State Farm Stock and Bond Balanced Fund | | $ | 93,059,358 | | | $ | 98,307,293 | |
The purpose of the transaction was to combine the assets of the Target Fund with the assets of the Fund. The reorganization was a tax-free event and closed on October 29, 2018.
Assuming the acquisition had been completed on January 1, 2018, the beginning of the fiscal reporting period of the Fund, the pro forma results of operations for the year ended December 31, 2018, are as follows:
| | • | | Net investment income: $2,113,145 |
| | • | | Net realized and change in unrealized loss on investments: $(6,224,912) |
| | • | | Net decrease in net assets resulting from operations: $(4,111,767) |
Because the combined investment portfolios have been managed as a single integrated portfolio since the acquisition was completed, it is not practicable to separate the amounts of revenue and earnings of the Fund that have been included in the Fund’s Consolidated Statement of Operations since October 29, 2018.
Reorganization costs incurred by the Fund in connection with the reorganization were expensed by the Fund. The Manager reimbursed the Fund $116,751, which is included in fees waived and/or reimbursed by the Manager in the Consolidated Statement of Operations.
Basis of Consolidation:The accompanying consolidated financial statements of the Fund include the accounts of iShares@ Dynamic Allocation V.I. Fund (Cayman) (the “Subsidiary”), which is a wholly-owned subsidiary of the Fund and primarily invests in commodity-related instruments. The Subsidiary enables the Fund to hold these commodity-related instruments and satisfy regulated investment company tax requirements. The Fund may invest up to 25% of its total assets in the Subsidiary. The net
| | |
| 12 | | 2018 BLACKROCK ANNUAL REPORTTO SHAREHOLDERS |
Notes to Consolidated Financial Statements (continued)
assets of the Subsidiary as of period end were $0, which is 0.0% of the Fund’s consolidated net assets. Intercompany accounts and transactions, if any, have been eliminated. The Subsidiary is subject to the same investment policies and restrictions that apply to the Fund, except that the Subsidiary may invest without limitation in commodity-related instruments.
| 2. | SIGNIFICANT ACCOUNTING POLICIES |
The consolidated financial statements are prepared in conformity with accounting principles generally accepted in the United States of America (“U.S. GAAP”), which may require management to make estimates and assumptions that affect the reported amounts of assets and liabilities in the consolidated financial statements, disclosure of contingent assets and liabilities at the date of the consolidated financial statements and the reported amounts of increases and decreases in net assets from operations during the reporting period. Actual results could differ from those estimates. The Fund is considered an investment company under U.S. GAAP and follows the accounting and reporting guidance applicable to investment companies. Below is a summary of significant accounting policies:
Investment Transactions and Income Recognition: For financial reporting purposes, investment transactions are recorded on the dates the transactions are entered into (the “trade dates”). Realized gains and losses on investment transactions are determined on the identified cost basis. Dividend income is recorded on theex-dividend date. Dividends from foreign securities where theex-dividend date may have passed are subsequently recorded when the Fund is informed of theex-dividend date. Under the applicable foreign tax laws, a withholding tax at various rates may be imposed on capital gains, dividends and interest. Upon notification from issuers, a portion of the dividend income received from a real estate investment trust may be redesignated as a reduction of cost of the related investment and/or realized gain. Income, expenses and realized and unrealized gains and losses are allocated daily to each class based on its relative net assets.
Distributions: Distributions paid by the Fund are recorded on theex-dividend date. Distributions of capital gains are recorded on theex-dividend date and made at least annually. The character and timing of distributions are determined in accordance with U.S. federal income tax regulations, which may differ from U.S. GAAP.
Net income and realized gains from investments held by the Subsidiary are treated as ordinary income for tax purposes. If a net loss is realized by the Subsidiary in any taxable year, the loss will generally not be available to offset the Fund’s ordinary income and/or capital gains for that year.
Recent Accounting Standards: In August 2018, the Financial Accounting Standards Board issued Accounting Standards Update2018-13 “Changes to the Disclosure Requirements for Fair Value Measurement” which modifies disclosure requirements for fair value measurements. The guidance is effective for fiscal years beginning after December 15, 2019 and for interim periods within those fiscal years. Management is currently evaluating the impact of this guidance to the Fund.
Indemnifications:In the normal course of business, the Fund enters into contracts that contain a variety of representations that provide general indemnification. The Fund’s maximum exposure under these arrangements is unknown because it involves future potential claims against the Fund, which cannot be predicted with any certainty.
Other: Expenses directly related to the Fund or its classes are charged to the Fund or the applicable class. Other operating expenses shared by several funds, including other funds managed by the Manager, are prorated among those funds on the basis of relative net assets or other appropriate methods. Expenses directly related to the Fund and other shared expenses prorated to the Fund are allocated daily to each class based on its relative net assets or other appropriate methods.
| 3. | INVESTMENT VALUATION AND FAIR VALUE MEASUREMENTS |
Investment Valuation Policies: The Fund’s investments are valued at fair value (also referred to as “market value” within the consolidated financial statements) as of the close of trading on the New York Stock Exchange (“NYSE”) (generally 4:00 p.m., Eastern time). U.S. GAAP defines fair value as the price the Fund would receive to sell an asset or pay to transfer a liability in an orderly transaction between market participants at the measurement date. The Fund determines the fair values of its financial instruments using various independent dealers or pricing services under policies approved by the Board. The BlackRock Global Valuation Methodologies Committee (the “Global Valuation Committee”) is the committee formed by management to develop global pricing policies and procedures and to oversee the pricing function for all financial instruments.
Fair Value Inputs and Methodologies: The following methods and inputs are used to establish the fair value of the Fund’s assets and liabilities:
| | • | | Exchange-traded funds (“ETFs”) traded on a recognized securities exchange are valued at the official closing price each day, if available. For ETFs traded on more than one exchange, the official closing price on the exchange where the stock is primarily traded is used. ETFs traded on a recognized exchange for which there were no sales on that day may be valued at the last available bid (long positions) or ask (short positions) price. |
| | • | | Investments inopen-end U.S. mutual funds are valued at NAV each business day. |
| | • | | The Fund values its investment in SL Liquidity Series, LLC, Money Market Series (the “Money Market Series”) at fair value, which is ordinarily based upon its pro rata ownership in the underlying fund’s net assets. The Money Market Series seeks current income consistent with maintaining liquidity and preserving capital. Although the Money Market Series is not registered under the 1940 Act, its investments may follow the parameters of investments by a money market fund that is subject to Rule2a-7 under the 1940 Act. |
If events (e.g., a company announcement, market volatility or a natural disaster) occur that are expected to materially affect the value of such investments, or in the event that the application of these methods of valuation results in a price for an investment that is deemed not to be representative of the market value of such investment, or if a price is not available, the investment will be valued by the Global Valuation Committee, or its delegate, in accordance with a policy approved by the Board as reflecting fair value (“Fair Valued Investments”). The fair valuation approaches that may be used by the Global Valuation Committee will include market approach, income approach and cost approach. Valuation techniques such as discounted cash flow, use of market comparables and matrix pricing are types of valuation approaches and are typically used in determining fair value. When determining the price for Fair Valued Investments, the Global Valuation Committee, or its delegate, seeks to determine the price that the
| | | | |
| NOTESTO CONSOLIDATED FINANCIAL STATEMENTS | | | 13 | |
Notes to Consolidated Financial Statements (continued)
Fund might reasonably expect to receive or pay from the current sale or purchase of that asset or liability in anarm’s-length transaction. Fair value determinations shall be based upon all available factors that the Global Valuation Committee, or its delegate, deems relevant and consistent with the principles of fair value measurement. The pricing of all Fair Valued Investments is subsequently reported to the Board or a committee thereof on a quarterly basis.
Fair Value Hierarchy: Various inputs are used in determining the fair value of investments. These inputs to valuation techniques are categorized into a fair value hierarchy consisting of three broad levels for consolidated financial statement purposes as follows:
| | • | | Level 1 — Unadjusted price quotations in active markets/exchanges for identical assets or liabilities that the Fund has the ability to access |
| | • | | Level 2 — Other observable inputs (including, but not limited to, quoted prices for similar assets or liabilities in markets that are active, quoted prices for identical or similar assets or liabilities in markets that are not active, inputs other than quoted prices that are observable for the assets or liabilities (such as interest rates, yield curves, volatilities, prepayment speeds, loss severities, credit risks and default rates) or other market-corroborated inputs) |
| | • | | Level 3 — Unobservable inputs based on the best information available in the circumstances, to the extent observable inputs are not available (including the Fund’s own assumptions used in determining the fair value of investments) |
The hierarchy gives the highest priority to unadjusted quoted prices in active markets for identical assets or liabilities (Level 1 measurements) and the lowest priority to unobservable inputs (Level 3 measurements). Accordingly, the degree of judgment exercised in determining fair value is greatest for instruments categorized in Level 3. The inputs used to measure fair value may fall into different levels of the fair value hierarchy. In such cases, for disclosure purposes, the fair value hierarchy classification is determined based on the lowest level input that is significant to the fair value measurement in its entirety. Investments classified within Level 3 have significant unobservable inputs used by the Global Valuation Committee in determining the price for Fair Valued Investments. Level 3 investments include equity or debt issued by privately held companies or funds. There may not be a secondary market, and/or there are a limited number of investors. Level 3 investments may also be adjusted to reflect illiquidity and/ornon-transferability, with the amount of such discount estimated by the Global Valuation Committee in the absence of market information.
Changes in valuation techniques may result in transfers into or out of an assigned level within the hierarchy. In accordance with the Fund’s policy, transfers between different levels of the fair value hierarchy are deemed to have occurred as of the beginning of the reporting period. The categorization of a value determined for investments is based on the pricing transparency of the investments and is not necessarily an indication of the risks associated with investing in those securities.
As of December 31, 2018, certain investments of the Fund were valued using NAV per share as no quoted market value is available and therefore have been excluded from the fair value hierarchy.
| 4. | SECURITIES AND OTHER INVESTMENTS |
Securities Lending: The Fund may lend its securities to approved borrowers, such as brokers, dealers and other financial institutions. The borrower pledges and maintains with the Fund collateral consisting of cash, an irrevocable letter of credit issued by a bank, or securities issued or guaranteed by the U.S. Government. The initial collateral received by the Fund is required to have a value of at least 102% of the current value of the loaned securities for securities traded on U.S. exchanges and a value of at least 105% for all other securities. The collateral is maintained thereafter at a value equal to at least 100% of the current market value of the securities on loan. The market value of the loaned securities is determined at the close of each business day of the Fund and any additional required collateral is delivered to the Fund, or excess collateral returned by the Fund, on the next business day. During the term of the loan, the Fund is entitled to all distributions made on or in respect of the loaned securities, but does not receive interest income on securities received as collateral. Loans of securities are terminable at any time and the borrower, after notice, is required to return borrowed securities within the standard time period for settlement of securities transactions.
The market value of any securities on loan, all of which were classified as investment companies in the Fund’s Consolidated Schedule of Investments, and the value of any related collateral are shown separately in the Consolidated Statement of Assets and Liabilities as a component of investments at value — unaffiliated, and collateral on securities loaned at value, respectively. As of period end, any securities on loan were collateralized by cash and/or U.S. Government obligations. Cash collateral invested by the securities lending agent, BlackRock Investment Management, LLC (“BIM”), if any, is disclosed in the Consolidated Schedule of Investments.
Securities lending transactions are entered into by the Fund under Master Securities Lending Agreements (each, an “MSLA”), which provide the right, in the event of default (including bankruptcy or insolvency), for thenon-defaulting party to liquidate the collateral and calculate a net exposure to the defaulting party or request additional collateral. In the event that a borrower defaults, the Fund, as lender, would offset the market value of the collateral received against the market value of the securities loaned. When the value of the collateral is greater than that of the market value of the securities loaned, the lender is left with a net amount payable to the defaulting party. However, bankruptcy or insolvency laws of a particular jurisdiction may impose restrictions on or prohibitions against such a right of offset in the event of an MSLA counterparty’s bankruptcy or insolvency. Under the MSLA, absent an event of default, the borrower can resell orre-pledge the loaned securities, and the Fund can reinvest cash collateral received in connection with loaned securities. Upon an event of default, the parties’ obligations to return the securities or collateral to the other party are extinguished, and the parties can resell orre-pledge the loaned securities or the collateral received in connection with the loaned securities in order to satisfy the defaulting party’s net payment obligation for all transactions under the MSLA. The defaulting party remains liable for any deficiency.
As of period end, the following table is a summary of the Fund’s securities lending agreements by counterparty which are subject to offset under an MSLA:
| | | | | | | | | | | | |
| Counterparty | | Securities
Loaned at Value | | | Cash Collateral
Received (a) | | | Net
Amount | |
Deutsche Bank Securities Inc. | | $ | 687,652 | | | $ | (687,652 | ) | | $ | — | |
JP Morgan Securities LLC | | | 24,946,835 | | | | (24,946,835 | ) | | | — | |
| | | | | | | | | | | | |
| | $ | 25,634,487 | | | $ | (25,634,487 | ) | | $ | — | |
| | | | | | | | | | | | |
| | (a) | Cash collateral with a value of $ 26,027,438 has been received in connection with securities lending agreements. Collateral received in excess of the value of securities loaned from the individual counterparty, if any, is not shown for financial reporting purposes in the table above. | |
| | |
| 14 | | 2018 BLACKROCK ANNUAL REPORTTO SHAREHOLDERS |
Notes to Consolidated Financial Statements (continued)
The risks of securities lending include the risk that the borrower may not provide additional collateral when required or may not return the securities when due. To mitigate these risks, the Fund benefits from a borrower default indemnity provided by BIM. BIM’s indemnity allows for full replacement of the securities loaned if the collateral received does not cover the value on the securities loaned in the event of borrower default. The Fund could incur a loss if the value of an investment purchased with cash collateral falls below the market value of loaned securities or if the value of an investment purchased with cash collateral falls below the value of the original cash collateral received.
| 5. | INVESTMENT ADVISORY AGREEMENT AND OTHER TRANSACTIONS WITH AFFILIATES |
Investment Advisory: The Company, on behalf of the Fund, entered into an Investment Advisory Agreement with the Manager, the Fund’s investment adviser and an indirect, wholly-owned subsidiary of BlackRock, to provide investment advisory and administrative services. The Manager is responsible for the management of the Fund’s portfolio and provides the personnel, facilities, equipment and certain other services necessary to the operations of the Fund.
For such services, the Fund pays the Manager a monthly fee at an annual rate equal to the following percentages of the average daily value of the Fund’s net assets:
| | | | |
| Average Daily Net Assets | | Investment
Advisory Fees | |
First $1 Billion | | | 0.150 | % |
$1 Billion — $3 Billion | | | 0.140 | |
$3 Billion — $5 Billion | | | 0.135 | |
Greater than $5 Billion | | | 0.130 | |
The Manager provides investment management and other services to the Subsidiary. The Manager does not receive separate compensation from the Subsidiary for providing investment management or administrative services. However, the Fund pays the Manager based on the Fund’s net assets, which includes the assets of the Subsidiary.
Distribution Fees: The Company, on behalf of the Fund, entered into a Distribution Agreement and a Distribution Plan with BlackRock Investments, LLC (“BRIL”), an affiliate of the Manager. Pursuant to the Distribution Plan and in accordance with Rule12b-1 under the 1940 Act, the Fund pays BRIL ongoing distribution fees. The fees are accrued daily and paid monthly at an annual rate of 0.25% based upon the average daily net assets attributable to Class III.
BRIL and broker-dealers, pursuant tosub-agreements with BRIL, provide shareholder servicing and distribution services to the Fund. The ongoing service and/or distribution fee compensates BRIL and each broker-dealer for providing shareholder servicing and/or distribution related services to shareholders.
For the year ended December 31, 2018, the class specific distribution fees borne directly by Class III were $9,664.
Transfer Agent: On behalf of the Fund, the Manager entered into agreements with insurance companies and other financial intermediaries (“Service Organizations”), some of which may be affiliates. Pursuant to these agreements, the Service Organizations provide the Fund with administrative, networking, recordkeeping,sub-transfer agency and shareholder services tosub-accounts they service. For these services, the Service Organizations receive an annual fee per shareholder account, which will vary depending on share class and/or net assets of Fund shareholders serviced by the Service Organizations which is shown as transfer agent — class specific. For the year ended December 31, 2018, the Fund did not pay any amounts to affiliates in return for these services.
In addition, the Fund pays the transfer agent, which is not an affiliate, a fee for the issuance, transfer and redemption of shares and the opening and maintenance of shareholder accounts, which is included in transfer agent in the Consolidated Statement of Operations. For the year ended December 31, 2018, the following table shows the class specific transfer agent fees borne directly by each share class of the Fund:
| | | | | | | | |
| Class I | | | Class III | | Total | |
| $ | 90,392 | | | $8,320 | | $ | 98,712 | |
Expense Limitations, Waivers and Reimbursements: With respect to the Fund, the Manager voluntarily agreed to waive its investment advisory fees by the amount of investment advisory fees the Fund pays to the Manager indirectly through its investment in affiliated money market funds (the “affiliated money market fund waiver”). The amount of waivers and/or reimbursements of fees and expenses made pursuant to the expense limitation described below will be reduced by the amount of the affiliated money market fund waiver. This amount is included in fees waived and/or reimbursed by the Manager in the Consolidated Statement of Operations. For the year ended December 31, 2018, the amount waived was $82.
In addition, the Manager has contractually agreed to waive the management fee on assets estimated to be attributable to the Fund’s investments in other equity and fixed-income mutual funds managed by BlackRock or its affiliates, if any. For the year ended December 31, 2018, there were no fees waived by the manager.
For the year ended December 31, 2018, the Fund reimbursed the Manager $442 for certain accounting services, which is included in accounting services in the Consolidated Statement of Operations.
Effective October 29, 2018, with respect to the Fund, the Manager contractually agreed to waive and/or reimburse fees or expenses in order to limit expenses, excluding interest expense, dividend expense, tax expense, acquired fund fees and expenses, and certain other fund expenses, which constitute extraordinary expenses not incurred in the ordinary course of the Fund’s business (“expense limitation”). The expense limitations as a percentage of average daily net assets are as follows:
| | | | | | | | |
| Class I | | | | | Class III | |
| | 0.19% | | | | | | 0.44% | |
| | | | |
| NOTESTO CONSOLIDATED FINANCIAL STATEMENTS | | | 15 | |
Notes to Consolidated Financial Statements (continued)
The Manager has agreed not to reduce or discontinue this contractual expense limitation through April 30, 2021, unless approved by the Board, including a majority of the directors who are not “interested persons” of the Fund, as defined in the 1940 Act (“Independent Directors”), or by a vote of a majority of the outstanding voting securities of the Fund. For the year ended December 31, 2018, the Manager waived and/or reimbursed $86,844 which is included in fees waived and/or reimbursed by the Manager in the Consolidated Statement of Operations.
Prior to October 29, 2018, Class I and Class III expense limitations as a percentage of average daily net assets were 0.53% and 0.78%, respectively.
These amounts waived and/or reimbursed are shown as transfer agent fees waived and/or reimbursed — class specific in the Consolidated Statement of Operations. For the year ended December 31, 2018, class specific expense waivers and/or reimbursements were as follows:
| | | | | | | | | | | | |
| | | Class I | | | Class III | | | Total | |
Transfer agent fees waived and/or reimbursed | | $ | 90,389 | | | $ | 8,320 | | | $ | 98,709 | |
With respect to the contractual expense limitation, if during the Fund’s fiscal year the operating expenses of a share class, that at any time during the prior two fiscal years received a waiver and/or reimbursement from the Manager, are less than the current expense limitation for that share class, the Manager is entitled to be reimbursed by such share class up to the lesser of: (a) the amount of fees waived and/or expenses reimbursed during those prior two fiscal years under the agreement and (b) an amount not to exceed either the current expense limitation of that share class or the expense limitation of the share class in effect at the time that the share class received the applicable waiver and/or reimbursement, provided that:
(1) the Fund, of which the share class is a part, has more than $50 million in assets for the fiscal year, and
(2) the Manager or an affiliate continues to serve as the Fund’s investment adviser or administrator.
This repayment applies only to the contractual expense limitation on net expenses and does not apply to any voluntary waivers that may be in effect from time to time.
On December 31, 2018, the Fund level and class specific waivers and/or reimbursements subject to possible future recoupment under the expense limitation agreement were as follows:
| | | | | | | | |
| | | Expiring December 31, | |
| | | 2019 | | | 2020 | |
Fund Level | | $ | 79,451 | | | $ | 86,844 | |
Class I | | | 25,064 | | | | 90,389 | |
Class III | | | 3,305 | | | | 8,320 | |
The following Fund level and class specific waivers and/or reimbursements previously recorded by the Fund, which were subject to recoupment by the Manager, expired on December 31, 2018:
| | | | |
Fund Level | | $ | 21,999 | |
Class I | | | 29,259 | |
Class III | | | 2,053 | |
Securities Lending: The U.S. Securities and Exchange Commission (“SEC”) has issued an exemptive order which permits BIM, an affiliate of the Manager, to serve as securities lending agent for the Fund, subject to applicable conditions. As securities lending agent, BIM bears all operational costs directly related to securities lending. The Fund is responsible for expenses in connection with the investment of cash collateral received for securities on loan (the “collateral investment expenses”). The cash collateral is invested in a private investment company managed by the Manager or its affiliates. However, BIM has agreed to cap the collateral investment expenses of the private investment company to an annual rate of 0.04%. The investment adviser to the private investment company will not charge any advisory fees with respect to shares purchased by the Fund. The private investment company in which the cash collateral has been invested may, under certain circumstances, impose a liquidity fee of up to 2% of the value withdrawn or temporarily restrict withdrawals for up to 10 business days during a 90 day period, in the event that the private investment company’s weekly liquid assets fall below certain thresholds.
Securities lending income is equal to the total of income earned from the reinvestment of cash collateral, net of fees and other payments to and from borrowers of securities, and less the collateral investment expenses. The Fund retains a portion of securities lending income and remits a remaining portion to BIM as compensation for its services as securities lending agent.
Pursuant to a securities lending agreement, the Fund retains 80% of securities lending income, and this amount retained can never be less than 70% of the total of securities lending income plus the collateral investment expenses.
In addition, commencing the business day following the date that the aggregate securities lending income earned across the Equity-Bond Complex in a calendar year exceeds a specified threshold, the Fund, pursuant to the securities lending agreement, will retain for the remainder of that calendar year securities lending income in an amount equal to 85% of securities lending income, and this amount retained can never be less than 70% of the total of securities lending income plus the collateral investment expenses.
The share of securities lending income earned by the Fund is shown as securities lending income — affiliated — net in the Consolidated Statement of Operations. For the year ended December 31, 2018, the Fund paid BIM $12,881 for securities lending agent services.
| | |
| 16 | | 2018 BLACKROCK ANNUAL REPORTTO SHAREHOLDERS |
Notes to Consolidated Financial Statements (continued)
Interfund Lending: In accordance with an exemptive order (the “Order”) from the SEC, the Fund may participate in a joint lending and borrowing facility for temporary purposes (the “Interfund Lending Program”), subject to compliance with the terms and conditions of the Order, and to the extent permitted by the Fund’s investment policies and restrictions. The Fund is currently permitted to borrow and lend under the Interfund Lending Program.
A lending BlackRock fund may lend in aggregate up to 15% of its net assets, but may not lend more than 5% of its net assets to any one borrowing fund through the Interfund Lending Program. A borrowing BlackRock fund may not borrow through the Interfund Lending Program or from any other source more than 33 1/3% of its total assets (or any lower threshold provided for by the fund’s investment restrictions). If a borrowing BlackRock fund’s total outstanding borrowings exceed 10% of its total assets, each of its outstanding interfund loans will be subject to collateralization of at least 102% of the outstanding principal value of the loan. All interfund loans are for temporary or emergency purposes and the interest rate to be charged will be the average of the highest current overnight repurchase agreement rate available to a lending fund and the bank loan rate, as calculated according to a formula established by the Board.
During the year ended December 31, 2018, the Fund did not participate in the Interfund Lending Program.
Directors and Officers: Certain directors and/or officers of the Company are directors and/or officers of BlackRock or its affiliates. The Fund reimburses the Manager for a portion of the compensation paid to the Company’s Chief Compliance Officer, which is included in Directors and Officer in the Consolidated Statement of Operations.
For the year ended December 31, 2018, purchases and sales of investments, and excluding short-term securities, were $33,229,988 and $28,504,245, respectively.
It is the Fund’s policy to comply with the requirements of the Internal Revenue Code of 1986, as amended, applicable to regulated investment companies, and to distribute substantially all of its taxable income to its shareholders. Therefore, no U.S. federal income tax provision is required.
The Fund files U.S. federal and various state and local tax returns. No income tax returns are currently under examination. The statute of limitations on the Fund’s U.S. federal tax returns generally remains open for each of the four years ended December 31, 2018. The statutes of limitations on the Fund’s state and local tax returns may remain open for an additional year depending upon the jurisdiction.
Management has analyzed tax laws and regulations and their application to the Fund as of December 31, 2018, inclusive of the open tax return years, and does not believe there are any uncertain tax positions that require recognition of a tax liability in the Fund’s consolidated financial statements.
U.S. GAAP requires that certain components of net assets be adjusted to reflect permanent differences between financial and tax reporting. These reclassifications have no effect on net assets or net asset values per share. As of period end, the following permanent difference attributable to the characterization of income/losses from a wholly owned subsidiary was reclassified to the following accounts:
| | | | |
Paid-in capital | | $ | (9,924 | ) |
Accumulated earnings | | | 9,924 | |
The tax character of distributions paid was as follows:
| | | | | | | | |
| | | 12/31/18 | | | 12/31/17 | |
Ordinary income | | $ | 1,250,006 | | | $ | 509,455 | |
Long term capital gains | | | 1,725,004 | | | | — | |
Tax return of capital | | | — | | | | 16,545 | |
| | | | | | | | |
| | $ | 2,975,010 | | | $ | 526,000 | |
| | | | | | | | |
As of period end, the tax components of accumulated loss were as follows:
| | | | |
Undistributed ordinary income | | $ | 23,778 | |
Undistributed long-term capital gains | | | 130,939 | |
Net unrealized losses(a) | | | (9,825,915 | ) |
| | | | |
| | $ | (9,671,198 | ) |
| | | | |
| | (a) | The difference between book-basis andtax-basisnet unrealized losses was attributable primarily to the tax deferral of losses on wash sales and the timing and recognition of partnership income. | |
During the year ended December 31, 2018, the Fund utilized $458,729 of its capital loss carryforward.
As of December 31, 2018, gross unrealized appreciation and depreciation for investments based on cost for U.S. federal income tax purposes were as follows:
| | | | |
Tax cost | | $ | 157,563,080 | |
| | | | |
Gross unrealized appreciation | | $ | 73,594 | |
Gross unrealized depreciation | | | (10,017,324 | ) |
| | | | |
Net unrealized depreciation | | $ | (9,943,730 | ) |
| | | | |
| | | | |
| NOTESTO CONSOLIDATED FINANCIAL STATEMENTS | | | 17 | |
Notes to Consolidated Financial Statements (continued)
The Company, on behalf of the Fund, along with certain other funds managed by the Manager and its affiliates (“Participating Funds”), is a party to a364-day, $2.25 billion credit agreement with a group of lenders. Under this agreement, the Fund may borrow to fund shareholder redemptions. Excluding commitments designated for certain individual funds, the Participating Funds, including the Fund, can borrow up to an aggregate commitment amount of $1.75 billion at any time outstanding, subject to asset coverage and other limitations as specified in the agreement. The credit agreement has the following terms: a fee of 0.10% per annum on unused commitment amounts and interest at a rate equal to the higher of(a) one-month LIBOR (but, in any event, not less than 0.00%) on the date the loan is made plus 0.80% per annum or (b) the Fed Funds rate (but, in any event, not less than 0.00%) in effect from time to time plus 0.80% per annum on amounts borrowed. The agreement expires in April 2019 unless extended or renewed. Prior to April 19, 2018, the aggregate commitment amount was $2.1 billion and the fee was 0.12% per annum. Participating Funds paid an upfront commitment fee of 0.02% on the total commitment amounts, in addition to administration, legal and arrangement fees, which are included in miscellaneous expenses in the Consolidated Statement of Operations. These fees were allocated among such funds based upon portions of the aggregate commitment available to them and relative net assets of Participating Funds. During the year ended December 31, 2018, the Fund did not borrow under the credit agreement.
In the normal course of business, the Fund invests in securities or other instruments and may enter into certain transactions, and such activities subject the Fund to various risks, including among others, fluctuations in the market (market risk) or failure of an issuer to meet all of its obligations. The value of securities or other instruments may also be affected by various factors, including, without limitation: (i) the general economy; (ii) the overall market as well as local, regional or global political and/or social instability; (iii) regulation, taxation or international tax treaties between various countries; or (iv) currency, interest rate and price fluctuations. The Fund’s prospectus provides details of the risks to which the Fund is subject.
The Fund may be exposed to additional risks when reinvesting cash collateral in money market funds that do not seek to maintain a stable NAV per share of $1.00, which may be subject to redemption gates or liquidity fees under certain circumstances.
Counterparty Credit Risk: The Fund may be exposed to counterparty credit risk, or the risk that an entity may fail to or be unable to perform on its commitments related to unsettled or open transactions. The Fund manages counterparty credit risk by entering into transactions only with counterparties that the Manager believes have the financial resources to honor their obligations and by monitoring the financial stability of those counterparties. Financial assets, which potentially expose the Fund to market, issuer and counterparty credit risks, consist principally of financial instruments and receivables due from counterparties. The extent of the Fund’s exposure to market, issuer and counterparty credit risks with respect to these financial assets is approximately their value recorded in the Consolidated Statement of Assets and Liabilities, less any collateral held by the Fund.
| 10. | CAPITAL SHARE TRANSACTIONS |
Transactions in capital shares for each class were as follows:
| | | | | | | | | | | | | | | | |
| | | Year Ended
12/31/2018 | | | Year Ended
12/31/2017 | |
| | | Shares | | | Amount | | | Shares | | | Amount | |
Class I | | | | | | | | | | | | | | | | |
Shares sold | | | 766,813 | | | $ | 8,557,354 | | | | 583,027 | | | $ | 6,150,100 | |
Shares issued in reinvestment of distributions | | | 279,201 | | | | 2,881,352 | | | | 41,877 | | | | 466,094 | |
Shares issued in reorganization | | | 8,629,936 | | | | 93,649,853 | | | | — | | | | — | |
Shares redeemed | | | (563,155 | ) | | | (6,224,356 | ) | | | (189,522 | ) | | | (1,993,433 | ) |
| | | | | | | | | | | | | | | | |
Net increase | | | 9,112,795 | | | $ | 98,864,203 | | | | 435,382 | | | $ | 4,622,761 | |
| | | | | | | | | | | | | | | | |
| | | | |
Class III | | | | | | | | | | | | | | | | |
Shares sold | | | 173,313 | | | $ | 1,932,140 | | | | 176,888 | | | $ | 1,880,454 | |
Shares issued in reinvestment of distributions | | | 9,111 | | | | 93,658 | | | | 5,402 | | | | 59,907 | |
Shares redeemed | | | (101,732 | ) | | | (1,146,007 | ) | | | (39,950 | ) | | | (420,223 | ) |
| | | | | | | | | | | | | | | | |
Net increase | | | 80,692 | | | $ | 879,791 | | | | 142,340 | | | $ | 1,520,138 | |
| | | | | | | | | | | | | | | | |
Total Net Increase | | | 9,193,487 | | | $ | 99,743,994 | | | | 577,722 | | | $ | 6,142,899 | |
| | | | | | | | | | | | | | | | |
| 11. | REGULATIONS-X AMENDMENTS |
On August 17, 2018, the SEC adopted amendments to certain disclosure requirements in Securities Act ReleaseNo. 33-10532, Disclosure Update and Simplification. The Fund has adopted the amendments pertinent to RegulationS-X in this shareholder report. The amendments impacted certain disclosure presentation on the Consolidated Statement of Assets and Liabilities, Consolidated Statements of Changes in Net Assets and Notes to the Consolidated Financial Statements.
Prior year distribution information and undistributed net investment income in the Consolidated Statements of Changes in Net Assets has been modified to conform to the current year presentation in accordance with the RegulationS-X changes.
| | |
| 18 | | 2018 BLACKROCK ANNUAL REPORTTO SHAREHOLDERS |
Notes to Consolidated Financial Statements (continued)
Distributions for the year ended December 31, 2017 were classified as follows:
| | | | | | | | |
| Share Class | | Net Investment Income | | | Return of Capital | |
Class I | | $ | (452,727 | ) | | $ | (13,367 | ) |
Class III | | | (56,728 | ) | | | (3,178 | ) |
Undistributed net investment income as of December 31, 2017 was $16,399.
Management has evaluated the impact of all subsequent events on the Fund through the date the consolidated financial statements were issued and has determined that there were no subsequent events requiring adjustment or additional disclosure in the consolidated financial statements.
| | | | |
| NOTESTO CONSOLIDATED FINANCIAL STATEMENTS | | | 19 | |
Report of Independent Registered Public Accounting Firm
To the Shareholders of BlackRock iShares Dynamic Allocation V.I. Fund and the Board of Directors of BlackRock Variable Series Funds, Inc.:
Opinion on the Financial Statements and Financial Highlights
We have audited the accompanying consolidated statement of assets and liabilities of BlackRock iShares Dynamic Allocation V.I. Fund, of BlackRock Variable Series Funds, Inc. and subsidiary (the “Fund”), including the consolidated schedule of investments, as of December 31, 2018, the related consolidated statement of operations for the year then ended, the consolidated statements of changes in net assets for each of the two years in the period then ended, the consolidated financial highlights for each of the four years in the period then ended and for the period from April 30, 2014 (commencement of operations) through December 31, 2014, and the related notes. In our opinion, the financial statements and financial highlights present fairly, in all material respects, the financial position of the Fund as of December 31, 2018, and the results of its operations for the year then ended, the changes in its net assets for each of the two years in the period then ended, and the financial highlights for each of the four years in the period then ended and for the period from April 30, 2014 (commencement of operations) through December 31, 2014, in conformity with accounting principles generally accepted in the United States of America.
Basis for Opinion
These financial statements and financial highlights are the responsibility of the Fund’s management. Our responsibility is to express an opinion on the Fund’s financial statements and financial highlights based on our audits. We are a public accounting firm registered with the Public Company Accounting Oversight Board (United States) (PCAOB) and are required to be independent with respect to the Fund in accordance with the U.S. federal securities laws and the applicable rules and regulations of the Securities and Exchange Commission and the PCAOB.
We conducted our audits in accordance with the standards of the PCAOB. Those standards require that we plan and perform the audit to obtain reasonable assurance about whether the financial statements and financial highlights are free of material misstatement, whether due to error or fraud. The Fund is not required to have, nor were we engaged to perform, an audit of its internal control over financial reporting. As part of our audits we are required to obtain an understanding of internal control over financial reporting but not for the purpose of expressing an opinion on the effectiveness of the Fund’s internal control over financial reporting. Accordingly, we express no such opinion.
Our audits included performing procedures to assess the risks of material misstatement of the financial statements and financial highlights, whether due to error or fraud, and performing procedures that respond to those risks. Such procedures included examining, on a test basis, evidence regarding the amounts and disclosures in the financial statements and financial highlights. Our audits also included evaluating the accounting principles used and significant estimates made by management, as well as evaluating the overall presentation of the financial statements and financial highlights. Our procedures included confirmation of securities owned as of December 31, 2018, by correspondence with the custodian and brokers; when replies were not received from brokers, we performed other auditing procedures. We believe that our audits provide a reasonable basis for our opinion.
Deloitte & Touche LLP
Boston, Massachusetts
February 15, 2019
We have served as the auditor of one or more BlackRock investment companies since 1992.
| | |
| 20 | | 2018 BLACKROCK ANNUAL REPORTTO SHAREHOLDERS |
Glossary of Terms Used in this Report
| | |
Currency |
| |
| USD | | United States Dollar |
| | |
| Portfolio Abbreviations |
| |
| EAFE | | Europe, Australasia and Far East |
| |
| ETF | | Exchange-Traded Fund |
| |
| MSCI | | Morgan Stanley Capital International |
| |
| S&P | | Standard & Poor’s |
| | | | |
| GLOSSARYOF TERMS USEDINTHIS REPORT | | | 21 | |
DECEMBER 31, 2018
| | |
ANNUAL REPORT | |  |
BlackRock Variable Series Funds, Inc.
| Ø | | BlackRock Large Cap Focus Growth V.I. Fund |
|
| Not FDIC Insured • May Lose Value • No Bank Guarantee |
| | |
| Fund Summary as of December 31, 2018 | | BlackRock Large Cap Focus Growth V.I. Fund |
Investment Objective
BlackRock Large Cap Focus Growth V.I. Fund’s (the “Fund”) investment objective is to seek long-term capital growth.
Portfolio Management Commentary
How did the Fund perform?
For the 12-month period ended December 31, 2018, the Fund outperformed its benchmark, the Russell 1000® Growth Index.
What factors influenced performance?
On a sector basis, the largest contributor to relative performance was consumer discretionary where internet & direct marketing retail holdings had the most positive impact. Selection within hotels, restaurants & leisure and a lack of exposure to media also added value within the sector. Health care and industrials were additional sources of strength. Within health care, equipment & supplies and life sciences tools & services holdings drove gains, while positioning to machinery and zero exposure to air freight & logistics benefited performance in industrials.
The top individual contributors were Amazon.com Inc. and Netflix Inc. Amazon outperformed as the company delivered a series of strong earnings reports, with revenue acceleration in North America, International, Prime, Amazon Web Services (“AWS”) and advertising. In addition, Amazon’s operating margin expansion has been notable, driven by advertising, subscription services, AWS and shipping efficiencies. At period end, the Fund maintained its overweight position in Amazon. Netflix continued to outperform after a series of strong earnings reports. The company exceeded 23 million global net subscriber additions for 2017 and is on pace to exceed 28 million in 2018, ahead of our forecasts. Overall, the investment adviser’s thesis is playing out as the mutually reinforcing growth of content and subscribers is benefiting Netflix as it gains scale.
Conversely, communication services detracted from performance with entertainment holdings hindering results. Consumer staples and materials also weighed on performance. Selection within beverages was a drag in consumer staples, while an overweight to construction materials was a weakness in materials (at period end the Fund had zero exposure to construction materials).
The top detractors over the annual period were Tencent Holdings Ltd. and Constellation Brands Inc. Tencent underperformed amid U.S./China trade tensions, weakness in the Chinese stock market, regulatory uncertainty and questions around timing of game launches and monetization. In addition, data showed a modest decline in Tencent’s share of mobile user time spent. Constellation has underperformed on investor concerns over sales growth for its Mexican import beers and overall beer profit margin growth, as well over reinvestment risk in cannabis and hemp company Canopy Growth. Constellation announced a $4 billion investment in Canopy Growth during the second quarter.
Describe recent portfolio activity.
Due to a combination of portfolio trading activity, market movement and sector reclassifications during the 12-month period, the portfolio’s weighting in the communication services sector increased, particularly within entertainment and interactive media & services. Health care exposure also increased, namely within equipment & supplies. Exposure to information technology decreased, largely with respect to internet software & services. Consumer discretionary exposure, namely within specialty retail, declined as well.
Describe portfolio positioning at period end.
As of period end, the Fund’s largest overweight position relative to the Russell 1000® Growth Index was the health care sector, followed by communication services. Industrials was the largest sector underweight, followed by consumer staples.
The views expressed reflect the opinions of BlackRock as of the date of this report and are subject to change based on changes in market, economic or other conditions. These views are not intended to be a forecast of future events and are no guarantee of future results.
| | |
| 2 | | 2018 BLACKROCK ANNUAL REPORTTO SHAREHOLDERS |
| | |
| Fund Summary as of December 31, 2018 (continued) | | BlackRock Large Cap Focus Growth V.I. Fund |
TOTAL RETURN BASED ON A $10,000 INVESTMENT
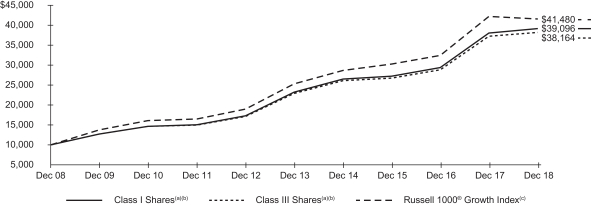
| (a) | Assuming transaction costs, if any, and other operating expenses, including investment advisory fees. Does not include insurance related fees and expenses. |
| (b) | Under normal circumstances, the Fund seeks to invest at least 80% of its net assets, plus the amount of any borrowings for investment purposes, in large cap equity securities and derivatives that have similar economic characteristics to such securities. The Fund’s total returns prior to June 12, 2017 are the returns of the Fund when it followed different investment strategies under the name “BlackRock Large Cap Growth V.I. Fund.” |
| (c) | An unmanaged index that measures the performance of the large cap growth segment of the U.S. equity universe and consists of those Russell 1000® securities with higherprice-to-book ratios and higher forecasted growth values. |
Performance Summary for the Period Ended December 31, 2018
| | | | | | | | | | | | | | | | | | | | |
| | | 6-Month | | | | | | Average Annual Total Returns | |
| | | Total Returns (b) | | | | | | 1 Year (b) | | | 5 Years (b) | | | 10 Years (b) | |
Class I(a) | | | (10.60 | )% | | | | | | | 3.01 | % | | | 11.05 | % | | | 14.61 | % |
Class III(a) | | | (10.72 | ) | | | | | | | 2.77 | | | | 10.78 | | | | 14.33 | |
Russell 1000® Growth Index | | | (8.17 | ) | | | | | | | (1.51 | ) | | | 10.40 | | | | 15.29 | |
| | (a) | Average annual and cumulative total returns are based on changes in net asset value for the periods shown, and assume reinvestment of all distributions at net asset value on theex-dividend date. Insurance-related fees and expenses are not reflected in these returns. The Fund’s total returns prior to June 12, 2017 are the returns of the Fund when it followed different investment strategies under the name “BlackRock Large Cap Growth V.I. Fund.” | |
| | (b) | For a portion of the period, the Fund’s investment adviser waived a portion of its fee. Without such waiver, the Fund’s performance would have been lower. | |
Past performance is not indicative of future results. Performance results do not reflect the deduction of taxes that a shareholder would pay on Fund distributions or the redemption of Fund shares.
Performance results may include adjustment made for financial reporting purposes in accordance with U.S. generally accepted accounting principles.
Expense Example
| | | | | | | | | | | | | | | | | | | | | | | | | | | | | | | | |
| | | Actual | | | | | | Hypothetical (a) | | | | |
| | | Beginning
Account Value
(07/01/18) | | | Ending
Account Value
(12/31/18) | | | Expenses
Paid During
the Period (b) | | | | | | Beginning
Account Value
(07/01/18) | | | Ending
Account Value
(12/31/18) | | | Expenses
Paid During
the Period (b) | | | Annualized
Expense
Ratio | |
Class I | | $ | 1,000.00 | | | $ | 894.00 | | | $ | 3.87 | | | | | | | $ | 1,000.00 | | | $ | 1,021.12 | | | $ | 4.13 | | | | 0.81 | % |
Class III | | | 1,000.00 | | | | 892.80 | | | | 5.06 | | | | | | | | 1,000.00 | | | | 1,019.86 | | | | 5.40 | | | | 1.06 | |
| | (a) | Hypothetical 5% annual return before expenses is calculated by prorating the number of days in the most recent fiscal half year divided by 365. | |
| | (b) | For each class of the Fund, expenses are equal to annualized expense ratio for the class, multiplied by the average account value over the period, multiplied by 184/365 (to reflect theone-half year period shown). | |
See “Disclosure of Expenses” on the following page for further information on how expenses were calculated.
| | |
| Fund Summary as of December 31, 2018 (continued) | | BlackRock Large Cap Focus Growth V.I. Fund |
SECTOR ALLOCATION
| | | | |
| Sector | | Percent of
Net Assets | |
Information Technology | | | 33 | % |
Health Care | | | 19 | |
Consumer Discretionary | | | 17 | |
Communication Services | | | 14 | |
Financials | | | 6 | |
Industrials | | | 5 | |
Real Estate | | | 2 | |
Consumer Staples | | | 2 | |
Short-Term Securities | | | 7 | |
Liabilities in Excess of Other Assets | | | (5 | ) |
For Fund compliance purposes, the Fund’s sector classifications refer to one or more of the sectorsub-classifications used by one or more widely recognized market indexes or ratings group indexes, and/or as defined by the investment adviser. These definitions may not apply for purposes of this report, which may combine sector sub classifications for reporting ease.
Disclosure of Expenses
Shareholders of the Fund may incur the following charges: (a) transactional expenses; and (b) operating expenses, including investment advisory fees, service and distribution fees, including12b-1 fees, acquired fund fees and expenses, and other fund expenses. The expense example on the previous page (which is based on a hypothetical investment of $1,000 invested on July 1, 2018 and held through December 31, 2018) is intended to assist shareholders both in calculating expenses based on an investment in the Fund and in comparing these expenses with similar costs of investing in other mutual funds.
The expense example provides information about actual account values and actual expenses. In order to estimate the expenses a shareholder paid during the period covered by this report, shareholders can divide their account value by $1,000 and then multiply the result by the number corresponding to their share class under the heading entitled “Expenses Paid During the Period.”
The expense example also provides information about hypothetical account values and hypothetical expenses based on the Fund’s actual expense ratio and an assumed rate of return of 5% per year before expenses. In order to assist shareholders in comparing the ongoing expenses of investing in the Fund and other funds, compare the 5% hypothetical example with the 5% hypothetical examples that appear in shareholder reports of other funds.
The expenses shown in the expense example are intended to highlight shareholders’ ongoing costs only and do not reflect any transactional expenses, such as sales charges, if any. Therefore, the hypothetical example is useful in comparing ongoing expenses only, and will not help shareholders determine the relative total expenses of owning different funds. If these transactional expenses were included, shareholder expenses would have been higher.
| | |
| 4 | | 2018 BLACKROCK ANNUAL REPORTTO SHAREHOLDERS |
| | |
Schedule of Investments December 31, 2018 | | BlackRock Large Cap Focus Growth V.I. Fund (Percentages shown are based on Net Assets) |
| | | | | | | | | | | | |
| Security | | | | | Shares | | | Value | |
|
Common Stocks — 98.2% | |
| |
| Automobiles — 0.9% | | | | |
Tesla, Inc.(a)(b) | | | | | | | 4,228 | | | $ | 1,407,078 | |
| | | | | | | | |
| |
| Beverages — 1.7% | | | | |
Constellation Brands, Inc., Class A | | | | | | | 16,720 | | | | 2,688,910 | |
| | | | | | | | |
| |
| Biotechnology — 1.4% | | | | |
Vertex Pharmaceuticals, Inc.(b) | | | | | | | 13,974 | | | | 2,315,632 | |
| | | | | | | | |
| |
| Capital Markets — 3.9% | | | | |
CME Group, Inc. | | | | | | | 14,503 | | | | 2,728,304 | |
S&P Global, Inc. | | | | | | | 20,957 | | | | 3,561,433 | |
| | | | | | | | |
| | | | | | | | | | | 6,289,737 | |
| |
| Diversified Financial Services — 2.4% | | | | |
Berkshire Hathaway, Inc., Class B(b) | | | | | | | 18,726 | | | | 3,823,475 | |
| | | | | | | | |
| |
| Entertainment — 5.4%(b) | | | | |
Electronic Arts, Inc. | | | | | | | 53,328 | | | | 4,208,112 | |
Netflix, Inc. | | | | | | | 17,256 | | | | 4,618,741 | |
| | | | | | | | |
| | | | | | | | | | | 8,826,853 | |
| |
| Equity Real Estate Investment Trusts (REITs) — 2.3% | | | | |
SBA Communications Corp.(b) | | | | | | | 22,962 | | | | 3,717,318 | |
| | | | | | | | |
| |
| Health Care Equipment & Supplies — 8.4% | | | | |
Align Technology, Inc.(b) | | | | | | | 12,732 | | | | 2,666,463 | |
Becton Dickinson and Co. | | | | | | | 18,339 | | | | 4,132,143 | |
Boston Scientific Corp.(b) | | | | | | | 112,641 | | | | 3,980,733 | |
Intuitive Surgical, Inc.(b) | | | | | | | 5,987 | | | | 2,867,294 | |
| | | | | | | | |
| | | | | | | | | | | 13,646,633 | |
| |
| Health Care Providers & Services — 5.6% | | | | |
Centene Corp.(b) | | | | | | | 19,224 | | | | 2,216,527 | |
UnitedHealth Group, Inc. | | | | | | | 27,549 | | | | 6,863,007 | |
| | | | | | | | |
| | | | | | | | | | | 9,079,534 | |
| |
| Hotels, Restaurants & Leisure — 1.2% | | | | |
Domino’s Pizza, Inc.(a) | | | | | | | 7,943 | | | | 1,969,785 | |
| | | | | | | | |
| |
| Interactive Media & Services — 8.6% | | | | |
Alphabet, Inc., Class A(b) | | | | | | | 6,127 | | | | 6,402,470 | |
Alphabet, Inc., Class C(b) | | | | | | | 74 | | | | 76,635 | |
Facebook, Inc., Class A(b) | | | | | | | 20,017 | | | | 2,624,028 | |
Tencent Holdings Ltd. | | | | | | | 119,746 | | | | 4,799,462 | |
| | | | | | | | |
| | | | | | | | | | | 13,902,595 | |
| |
| Internet & Direct Marketing Retail — 14.6% | | | | |
Amazon.com, Inc.(b) | | | | | | | 11,146 | | | | 16,740,958 | |
Booking Holdings, Inc.(b) | | | | | | | 2,326 | | | | 4,006,349 | |
MercadoLibre, Inc. | | | | | | | 9,845 | | | | 2,883,108 | |
| | | | | | | | |
| | | | | | | | | | | 23,630,415 | |
| |
| IT Services — 10.6% | | | | |
Mastercard, Inc., Class A | | | | | | | 29,792 | | | | 5,620,261 | |
PayPal Holdings, Inc.(b) | | | | | | | 40,343 | | | | 3,392,443 | |
Visa, Inc., Class A | | | | | | | 62,088 | | | | 8,191,890 | |
| | | | | | | | |
| | | | | | | | | | | 17,204,594 | |
| |
| Life Sciences Tools & Services — 1.9% | | | | |
Illumina, Inc.(b) | | | | | | | 10,029 | | | | 3,007,998 | |
| | | | | | | | |
| |
| Machinery — 1.0% | | | | |
Xylem, Inc. | | | | | | | 23,815 | | | | 1,588,937 | |
| | | | | | | | |
| |
| Pharmaceuticals — 1.3% | | | | |
Zoetis, Inc. | | | | | | | 24,553 | | | | 2,100,264 | |
| | | | | | | | |
| |
| Professional Services — 2.6% | | | | |
CoStar Group, Inc.(b) | | | | | | | 12,290 | | | | 4,145,909 | |
| | | | | | | | |
| | | | | | | | | | | | |
| Security | | | | | Shares | | | Value | |
| |
| Road & Rail — 1.8% | | | | |
Union Pacific Corp. | | | | | | | 21,561 | | | $ | 2,980,377 | |
| | | | | | | | |
| |
| Semiconductors & Semiconductor Equipment — 3.4% | | | | |
ASML Holding NV (Registered), NYRS(a) | | | | | | | 19,976 | | | | 3,108,665 | |
NVIDIA Corp. | | | | | | | 18,665 | | | | 2,491,778 | |
| | | | | | | | |
| | | | | | | | | | | 5,600,443 | |
| |
| Software — 18.3% | | | | |
Adobe, Inc.(b) | | | | | | | 17,912 | | | | 4,052,411 | |
Autodesk, Inc.(b) | | | | | | | 19,703 | | | | 2,534,003 | |
Intuit, Inc. | | | | | | | 19,785 | | | | 3,894,677 | |
Microsoft Corp. | | | | | | | 102,984 | | | | 10,460,085 | |
salesforce.com, Inc.(a)(b) | | | | | | | 44,356 | | | | 6,075,441 | |
ServiceNow, Inc.(a)(b) | | | | | | | 14,931 | | | | 2,658,465 | |
| | | | | | | | |
| | | | | | | | | | | 29,675,082 | |
| |
| Technology Hardware, Storage & Peripherals — 0.9% | | | | |
Apple, Inc. | | | | | | | 9,314 | | | | 1,469,190 | |
| | | | | | | | |
| |
Total Common Stocks — 98.2%
(Cost: $136,713,044) | | | | 159,070,759 | |
| | | | | | | | |
| |
Total Long-Term Investments — 98.2%
(Cost: $136,713,044) | | | | 159,070,759 | |
| | | | | | | | |
|
Short-Term Securities — 7.1% | |
|
| Money Market Funds — 7.1%(c)(f) | |
BlackRock Liquidity Funds,T-Fund, Institutional Class,
2.32% | | | | | | | 3,741,601 | | | | 3,741,601 | |
SL Liquidity Series, LLC, Money Market Series,
2.57%(d) | | | | | | | 7,770,691 | | | | 7,769,914 | |
| | | | | | | | |
| |
Total Money Market Funds — 7.1%
(Cost: $11,512,292) | | | | 11,511,515 | |
| | | | | | | | |
| | | |
| | | | | | Par
(000) | | | | |
|
| Time Deposits — 0.0% | |
Brown Brothers Harriman & Co.: | | | | | | | | | | | | |
0.83%, 01/02/19 | | | AUD | | | | — | (e) | | | 230 | |
1.52%, 01/02/19 | | | HKD | | | | 1 | | | | 90 | |
| | | | | | | | |
| |
Total Time Deposits — 0.0%
(Cost: $320) | | | | 320 | |
| | | | | | | | |
| |
Total Short-Term Securities — 7.1%
(Cost: $11,512,612) | | | | 11,511,835 | |
| | | | | | | | |
| |
Total Investments — 105.3%
(Cost: $148,225,656) | | | | 170,582,594 | |
| |
Liabilities in Excess of Other Assets — (5.3)% | | | | (8,517,100 | ) |
| | | | | | | | |
| |
Net Assets — 100.0% | | | $ | 162,065,494 | |
| | | | | | | | |
| (a) | Security, or a portion of the security, is on loan. |
| (b) | Non-income producing security. |
| (c) | Annualized7-day yield as of period end. |
| (d) | Security was purchased with the cash collateral from loaned securities. |
| (e) | Amount is less than $500. |
| | | | |
| SCHEDULE OF INVESTMENTS | | | 5 | |
| | |
Schedule of Investments (continued) December 31, 2018 | | BlackRock Large Cap Focus Growth V.I. Fund |
| (f) | During the year ended December 31, 2018, investments in issuers considered to be affiliates of the Fund for purposes of Section 2(a)(3) of the Investment Company Act of 1940, as amended, were as follows: |
| | | | | | | | | | | | | | | | | | | | | | | | | | | | |
| Affiliates | | Shares
Held at
12/31/17 | | | Net
Activity | | | Shares
Held at
12/31/18 | | | Value at
12/31/18 | | | Income | | | Net
Realized
Gain (Loss) (a) | | | Change in
Unrealized
Appreciation
(Depreciation) | |
BlackRock Liquidity Funds,T-Fund, Institutional Class | | | 82,464 | | | | 3,659,137 | | | | 3,741,601 | | | $ | 3,741,601 | | | $ | 42,698 | | | $ | — | | | $ | — | |
SL Liquidity Series, LLC, Money Market Series | | | 2,198,635 | | | | 5,572,056 | | | | 7,770,691 | | | | 7,769,914 | | | | 24,190 | (b) | | | (1,480 | ) | | | (777 | ) |
| | | | | | | | | | | | | | | | | | | | | | | | | | | | |
| | | | | | | | | | | | | | $ | 11,511,515 | | | $ | 66,888 | | | $ | (1,480 | ) | | $ | (777 | ) |
| | | | | | | | | | | | | | | | | | | | | | | | | | | | |
| | (a) | Includes net capital gain distributions, if applicable. | |
| | (b) | Represents securities lending income earned from the reinvestment of cash collateral from loaned securities, net of fees and collateral investment expenses, and other payments to and from borrowers of securities. | |
For Fund compliance purposes, the Fund’s industry classifications refer to one or more of the industrysub-classifications used by one or more widely recognized market indexes or ratings group indexes, and/or as defined by the investment advisor. These definitions may not apply for purposes of this report, which may combine such industrysub-classifications for reporting ease.
Fair Value Hierarchy as of Period End
Various inputs are used in determining the fair value of investments. For information about the Fund’s policy regarding valuation of investments, refer to the Notes to Financial Statements.
The following table summarizes the Fund’s investments categorized in the disclosure hierarchy:
| | | | | | | | | | | | | | | | |
| | | Level 1 | | | Level 2 | | | Level 3 | | | Total | |
Assets: | | | | | | | | | | | | | | | | |
Investments: | | | | | | | | | | | | | | | | |
Long-Term Investments | | | | | | | | | | | | | | | | |
Common Stocks: | | | | | | | | | | | | | | | | |
Automobiles | | $ | 1,407,078 | | | $ | — | | | $ | — | | | | 1,407,078 | |
Beverages | | | 2,688,910 | | | | — | | | | — | | | | 2,688,910 | |
Biotechnology | | | 2,315,632 | | | | — | | | | — | | | | 2,315,632 | |
Capital Markets | | | 6,289,737 | | | | — | | | | — | | | | 6,289,737 | |
Diversified Financial Services | | | 3,823,475 | | | | — | | | | — | | | | 3,823,475 | |
Entertainment | | | 8,826,853 | | | | — | | | | — | | | | 8,826,853 | |
Equity Real Estate Investment Trusts (REITs) | | | 3,717,318 | | | | — | | | | — | | | | 3,717,318 | |
Health Care Equipment & Supplies | | | 13,646,633 | | | | — | | | | — | | | | 13,646,633 | |
Health Care Providers & Services | | | 9,079,534 | | | | — | | | | — | | | | 9,079,534 | |
Hotels, Restaurants & Leisure | | | 1,969,785 | | | | — | | | | — | | | | 1,969,785 | |
Interactive Media & Services | | | 9,103,133 | | | | 4,799,462 | | | | — | | | | 13,902,595 | |
Internet & Direct Marketing Retail | | | 23,630,415 | | | | — | | | | — | | | | 23,630,415 | |
IT Services | | | 17,204,594 | | | | — | | | | — | | | | 17,204,594 | |
Life Sciences Tools & Services | | | 3,007,998 | | | | — | | | | — | | | | 3,007,998 | |
Machinery | | | 1,588,937 | | | | — | | | | — | | | | 1,588,937 | |
Pharmaceuticals | | | 2,100,264 | | | | — | | | | — | | | | 2,100,264 | |
Professional Services | | | 4,145,909 | | | | — | | | | — | | | | 4,145,909 | |
Road & Rail | | | 2,980,377 | | | | — | | | | — | | | | 2,980,377 | |
Semiconductors & Semiconductor Equipment | | | 5,600,443 | | | | — | | | | — | | | | 5,600,443 | |
Software | | | 29,675,082 | | | | — | | | | — | | | | 29,675,082 | |
Technology Hardware, Storage & Peripherals | | | 1,469,190 | | | | — | | | | — | | | | 1,469,190 | |
Short-Term Securities | | | | | | | | | | | | | | | | |
Money Market Funds | | | 3,741,601 | | | | — | | | | — | | | | 3,741,601 | |
Time Deposits | | | — | | | | 320 | | | | — | | | | 320 | |
| | | | | | | | | | | | | | | | |
Subtotal | | $ | 158,012,898 | | | $ | 4,799,782 | | | $ | — | | | $ | 162,812,680 | |
| | | | | | | | | | | | | | | | |
Investments valued at NAV(a) | | | | | | | | | | | | | | | 7,769,914 | |
| | | | | | | | | | | | | | | | |
Total Investments | | | | | | | | | | | | | | $ | 170,582,594 | |
| | | | | | | | | | | | | | | | |
| | (a) | As of December 31, 2018, certain investments of the Fund were fair valued using NAV per share as no quoted market value is available and therefore have been excluded from the fair value hierarchy. | |
During the year ended December 31, 2018, there were no transfers between levels.
See notes to financial statements.
| | |
| 6 | | 2018 BLACKROCK ANNUAL REPORTTO SHAREHOLDERS |
Statement of Assets and Liabilities
December 31, 2018
| | | | |
| | | BlackRock
Large Cap
Focus Growth
V.I. Fund | |
| |
ASSETS | | | | |
Investments at value — unaffiliated (including securities loaned at value of $7,654,931) (cost — $136,713,364) | | $ | 159,071,079 | |
Investments at value — affiliated (cost — $11,512,292) | | | 11,511,515 | |
Receivables: | | | | |
Investments sold | | | 1,902,180 | |
Securities lending income — affiliated | | | 1,435 | |
Capital shares sold | | | 86,094 | |
Dividends — affiliated | | | 5,575 | |
Dividends — unaffiliated | | | 25,135 | |
Prepaid expenses | | | 186 | |
| | | | |
Total assets | | | 172,603,199 | |
| | | | |
| |
LIABILITIES | | | | |
Cash collateral on securities loaned at value | | | 7,772,921 | |
Payables: | | | | |
Investments purchased | | | 2,197,176 | |
Capital shares redeemed | | | 213,992 | |
Distribution fees | | | 15,155 | |
Board realignment and consolidation | | | 7,800 | |
Investment advisory fees | | | 92,106 | |
Directors’ and Officer’s fees | | | 5,552 | |
Other affiliates | | | 384 | |
Other accrued expenses | | | 232,619 | |
| | | | |
Total liabilities | | | 10,537,705 | |
| | | | |
| |
NET ASSETS | | $ | 162,065,494 | |
| | | | |
| |
NET ASSETS CONSIST OF | | | | |
Paid-in capital | | $ | 138,951,741 | |
Accumulated earnings | | | 23,113,753 | |
| | | | |
NET ASSETS | | $ | 162,065,494 | |
| | | | |
| |
NET ASSET VALUE | | | | |
Class I — Based on net assets of $91,380,167 and 6,862,235 shares outstanding, 100 million shares authorized, $0.10 par value. | | $ | 13.32 | |
| | | | |
Class III — Based on net assets of $70,685,327 and 5,384,728 shares outstanding, 100 million shares authorized, $0.10 par value. | | $ | 13.13 | |
| | | | |
See notes to financial statements.
Statement of Operations
Year Ended December 31, 2018
| | | | |
| | | BlackRock
Large Cap
Focus Growth
V.I. Fund | |
| |
INVESTMENT INCOME | | | | |
Dividends — affiliated | | $ | 42,698 | |
Dividends — unaffiliated | | | 989,508 | |
Securities lending income — affiliated — net | | | 24,190 | |
Foreign taxes withheld | | | (366 | ) |
| | | | |
Total investment income | | | 1,056,030 | |
| | | | |
| |
EXPENSES | | | | |
Investment advisory | | | 1,149,721 | |
Transfer agent — class specific | | | 367,671 | |
Distribution — class specific | | | 179,321 | |
Professional | | | 70,242 | |
Accounting services | | | 50,037 | |
Directors and Officer | | | 19,396 | |
Printing | | | 15,294 | |
Board realignment and consolidation | | | 7,907 | |
Transfer agent | | | 5,000 | |
Custodian | | | 4,163 | |
Registration | | | 598 | |
Miscellaneous | | | 12,383 | |
| | | | |
Total expenses | | | 1,881,733 | |
Less: | | | | |
Fees waived and/or reimbursed by the Manager | | | (1,760 | ) |
Transfer agent fees waived and/or reimbursed — class specific | | | (243,856 | ) |
| | | | |
Total expenses after fees waived and/or reimbursed | | | 1,636,117 | |
| | | | |
Net investment loss | | | (580,087 | ) |
| | | | |
| |
REALIZED AND UNREALIZED GAIN (LOSS) | | | | |
Net realized gain (loss) from: | | | | |
Investments — affiliated | | | (1,480 | ) |
Investments — unaffiliated | | | 15,470,426 | |
Foreign currency transactions | | | (147 | ) |
| | | | |
| | | 15,468,799 | |
| | | | |
Net change in unrealized appreciation (depreciation) on: | | | | |
Investments — affiliated | | | (777 | ) |
Investments — unaffiliated | | | (11,921,848 | ) |
Foreign currency translations | | | (25 | ) |
| | | | |
| | | (11,922,650 | ) |
| | | | |
Net realized and unrealized gain | | | 3,546,149 | |
| | | | |
NET INCREASE IN NET ASSETS RESULTING FROM OPERATIONS | | $ | 2,966,062 | |
| | | | |
See notes to financial statements.
| | |
| 8 | | 2018 BLACKROCK ANNUAL REPORTTO SHAREHOLDERS |
Statements of Changes in Net Assets
| | | | | | | | |
| | | BlackRock Large Cap Focus
Growth V.I. Fund | |
| | | Year Ended December 31, | |
| | | 2018 | | | 2017 | |
| | |
INCREASE (DECREASE) IN NET ASSETS | | | | | | | | |
| | |
OPERATIONS | | | | | | | | |
Net investment income (loss) | | $ | (580,087 | ) | | $ | 24,367 | |
Net realized gain | | | 15,468,799 | | | | 27,208,552 | |
Net change in unrealized appreciation (depreciation) | | | (11,922,650 | ) | | | 9,233,119 | |
| | | | | | | | |
Net increase in net assets resulting from operations | | | 2,966,062 | | | | 36,466,038 | |
| | | | | | | | |
| | |
DISTRIBUTIONS TO SHAREHOLDERS(a)(b) | | | | | | | | |
Class I | | | (10,303,447 | ) | | | (16,392,533 | ) |
Class III | | | (7,856,717 | ) | | | (8,780,361 | ) |
| | | | | | | | |
Decrease in net assets resulting from distributions to shareholders | | | (18,160,164 | ) | | | (25,172,894 | ) |
| | | | | | | | |
| | |
CAPITAL SHARE TRANSACTIONS | | | | | | | | |
Net increase in net assets derived from capital share transactions | | | 22,131,719 | | | | 17,142,344 | |
| | | | | | | | |
| | |
NET ASSETS(b) | | | | | | | | |
Total increase in net assets | | | 6,937,617 | | | | 28,435,488 | |
Beginning of year | | | 155,127,877 | | | | 126,692,389 | |
| | | | | | | | |
End of year | | $ | 162,065,494 | | | $ | 155,127,877 | |
| | | | | | | | |
| (a) | Distributions for annual periods determined in accordance with U.S. federal income tax regulations. |
| (b) | Prior year distribution character information and undistributed net investment income has been modified or removed to conform with current year RegulationS-X presentation changes. Refer to Note 11 for this prior year information. |
See notes to financial statements.
Financial Highlights
(For a share outstanding throughout each period)
| | | | | | | | | | | | | | | | | | | | |
| | | BlackRock Large Cap Focus Growth V.I. Fund | |
| |
| | | Class I | |
| |
| | | Year Ended December 31, | |
| | | 2018 | | | 2017 | | | 2016 | | | 2015 | | | 2014 | |
| | | | | |
Net asset value, beginning of year | | $ | 14.51 | | | $ | 13.35 | | | $ | 13.59 | | | $ | 14.08 | | | $ | 14.22 | |
| | | | | | | | | | | | | | | | | | | | |
Net investment income (loss)(a) | | | (0.04 | ) | | | 0.02 | | | | 0.09 | | | | 0.08 | | | | 0.09 | |
Net realized and unrealized gain | | | 0.49 | | | | 3.92 | | | | 0.99 | | | | 0.31 | | | | 1.92 | |
| | | | | | | | | | | | | | | | | | | | |
Net increase from investment operations | | | 0.45 | | | | 3.94 | | | | 1.08 | | | | 0.39 | | | | 2.01 | |
| | | | | | | | | | | | | | | | | | | | |
| | | | | |
| Distributions(b) | | | | | | | | | | | | | | | |
From net investment income | | | — | | | | (0.01 | ) | | | (0.10 | ) | | | (0.09 | ) | | | (0.08 | ) |
From net realized gain | | | (1.64 | ) | | | (2.77 | ) | | | (1.22 | ) | | | (0.79 | ) | | | (2.07 | ) |
| | | | | | | | | | | | | | | | | | | | |
Total distributions | | | (1.64 | ) | | | (2.78 | ) | | | (1.32 | ) | | | (0.88 | ) | | | (2.15 | ) |
| | | | | | | | | | | | | | | | | | | | |
| | | | | |
Net asset value, end of year | | $ | 13.32 | | | $ | 14.51 | | | $ | 13.35 | | | $ | 13.59 | | | $ | 14.08 | |
| | | | | | | | | | | | | | | | | | | | |
| | | | | |
Total Return(c) | | | | | | | | | | | | | | | | | | | | |
Based on net asset value | | | 3.01 | % | | | 29.56 | % | | | 7.89 | % | | | 2.73 | % | | | 14.16 | % |
| | | | | | | | | | | | | | | | | | | | |
| | | | | |
Ratios to Average Net Assets(d) | | | | | | | | | | | | | | | | | | | | |
Total expenses | | | 0.96 | % | | | 1.01 | % | | | 0.96 | % | | | 0.95 | % | | | 0.96 | % |
| | | | | | | | | | | | | | | | | | | | |
Total expenses after fees waived and/or reimbursed | | | 0.82 | % | | | 0.89 | % | | | 0.84 | % | | | 0.82 | % | | | 0.83 | % |
| | | | | | | | | | | | | | | | | | | | |
Net investment income (loss) | | | (0.23 | )% | | | 0.10 | % | | | 0.68 | % | | | 0.59 | % | | | 0.57 | % |
| | | | | | | | | | | | | | | | | | | | |
| | | | | |
Supplemental Data | | | | | | | | | | | | | | | | | | | | |
Net assets, end of year (000) | | $ | 91,380 | | | $ | 100,308 | | | $ | 87,346 | | | $ | 98,485 | | | $ | 108,329 | |
| | | | | | | | | | | | | | | | | | | | |
Portfolio turnover rate | | | 63 | % | | | 95 | % | | | 37 | % | | | 35 | % | | | 51 | % |
| | | | | | | | | | | | | | | | | | | | |
| (a) | Based on average shares outstanding. |
| (b) | Distributions for annual periods determined in accordance with U.S. federal income tax regulations. |
| (c) | Where applicable, excludes insurance-related fees and expenses and assumes the reinvestment of distributions. |
| (d) | Excludes expenses incurred indirectly as a result of investments in underlying funds as follows: |
| | | | | | | | | | | | | | | | | | | | | | | | | | | | | | | | | | | | | | | | |
| | | Year Ended December 31, | |
| | | 2018 | | | | | | 2017 | | | | | | 2016 | | | | | | 2015 | | | | | | 2014 | | | | |
Investments in underlying funds | | | 0.01 | % | | | | | | | 0.01 | % | | | | | | | 0.01 | % | | | | | | | — | % | | | | | | | — | % | | | | |
| | | | | | | | | | | | | | | | | | | | | | | | | | | | | | | | | | | | | | | | |
See notes to financial statements.
| | |
| 10 | | 2018 BLACKROCK ANNUAL REPORTTO SHAREHOLDERS |
Financial Highlights (continued)
(For a share outstanding throughout each period)
| | | | | | | | | | | | | | | | | | | | |
| | | BlackRock Large Cap Focus Growth V.I. Fund (continued) | |
| |
| | | Class III | |
| |
| | | Year Ended December 31, | |
| | | 2018 | | | 2017 | | | 2016 | | | 2015 | | | 2014 | |
| | | | | |
Net asset value, beginning of year | | $ | 14.36 | | | $ | 13.24 | | | $ | 13.50 | | | $ | 13.99 | | | $ | 14.14 | |
| | | | | | | | | | | | | | | | | | | | |
Net investment income (loss)(a) | | | (0.08 | ) | | | (0.02 | ) | | | 0.06 | | | | 0.05 | | | | 0.05 | |
Net realized and unrealized gain | | | 0.49 | | | | 3.88 | | | | 0.96 | | | | 0.30 | | | | 1.92 | |
| | | | | | | | | | | | | | | | | | | | |
Net increase from investment operations | | | 0.41 | | | | 3.86 | | | | 1.02 | | | | 0.35 | | | | 1.97 | |
| | | | | | | | | | | | | | | | | | | | |
| | | | | |
| Distributions(b) | | | | | | | | | | | | | | | |
From net investment income | | | — | | | | (0.00 | )(c) | | | (0.06 | ) | | | (0.05 | ) | | | (0.05 | ) |
From net realized gain | | | (1.64 | ) | | | (2.74 | ) | | | (1.22 | ) | | | (0.79 | ) | | | (2.07 | ) |
| | | | | | | | | | | | | | | | | | | | |
Total distributions | | | (1.64 | ) | | | (2.74 | ) | | | (1.28 | ) | | | (0.84 | ) | | | (2.12 | ) |
| | | | | | | | | | | | | | | | | | | | |
| | | | | |
Net asset value, end of year | | $ | 13.13 | | | $ | 14.36 | | | $ | 13.24 | | | $ | 13.50 | | | $ | 13.99 | |
| | | | | | | | | | | | | | | | | | | | |
| | | | | |
Total Return(d) | | | | | | | | | | | | | | | | | | | | |
Based on net asset value | | | 2.77 | % | | | 29.23 | % | | | 7.54 | % | | | 2.51 | % | | | 13.96 | % |
| | | | | | | | | | | | | | | | | | | | |
| | | | | |
Ratios to Average Net Assets(e) | | | | | | | | | | | | | | | | | | | | |
Total expenses | | | 1.22 | % | | | 1.28 | % | | | 1.22 | % | | | 1.21 | % | | | 1.22 | % |
| | | | | | | | | | | | | | | | | | | | |
Total expenses after fees waived and/or reimbursed | | | 1.07 | % | | | 1.14 | % | | | 1.09 | % | | | 1.07 | % | | | 1.09 | % |
| | | | | | | | | | | | | | | | | | | | |
Net investment income (loss) | | | (0.48 | )% | | | (0.16 | )% | | | 0.42 | % | | | 0.35 | % | | | 0.32 | % |
| | | | | | | | | | | | | | | | | | | | |
| | | | | |
Supplemental Data | | | | | | | | | | | | | | | | | | | | |
Net assets, end of year (000) | | $ | 70,685 | | | $ | 54,820 | | | $ | 39,346 | | | $ | 37,818 | | | $ | 32,090 | |
| | | | | | | | | | | | | | | | | | | | |
Portfolio turnover rate | | | 63 | % | | | 95 | % | | | 37 | % | | | 35 | % | | | 51 | % |
| | | | | | | | | | | | | | | | | | | | |
| (a) | Based on average shares outstanding. |
| (b) | Distributions for annual periods determined in accordance with U.S. federal income tax regulations. |
| (c) | Amount is greater than $(0.005) per share. |
| (d) | Where applicable, excludes insurance-related fees and expenses and assumes the reinvestment of distributions. |
| (e) | Excludes expenses incurred indirectly as a result of investments in underlying funds as follows: |
| | | | | | | | | | | | | | | | | | | | | | | | | | | | | | | | | | | | | | | | |
| | | Year Ended December 31, | |
| | | 2018 | | | | | | 2017 | | | | | | 2016 | | | | | | 2015 | | | | | | 2014 | | | | |
Investments in underlying funds | | | 0.01 | % | | | | | | | 0.01 | % | | | | | | | 0.01 | % | | | | | | | — | % | | | | | | | — | % | | | | |
| | | | | | | | | | | | | | | | | | | | | | | | | | | | | | | | | | | | | | | | |
See notes to financial statements.
Notes to Financial Statements
BlackRock Variable Series Funds, Inc. (the “Company”) is registered under the Investment Company Act of 1940, as amended (the “1940 Act”), as anopen-end management investment company. The Company is organized as a Maryland corporation that is comprised of 15 separate portfolios. The funds offer shares to insurance companies for their separate accounts to fund benefits under certain variable annuity and variable life insurance contracts. The financial statements presented are for BlackRock Large Cap Focus Growth V.I. Fund (the “Fund”). The Fund is classified as diversified. Class I and Class III Shares have equal voting, dividend, liquidation and other rights, except that only shares of the respective classes are entitled to vote on matters concerning only that class. In addition, Class III Shares bear certain expenses related to the distribution of such shares.
The Fund, together with certain other registered investment companies advised by BlackRock Advisors, LLC (the “Manager”) or its affiliates, is included in a complex ofopen-end funds referred to as the Equity-Bond Complex.
| 2. | SIGNIFICANT ACCOUNTING POLICIES |
The financial statements are prepared in conformity with accounting principles generally accepted in the United States of America (“U.S. GAAP”), which may require management to make estimates and assumptions that affect the reported amounts of assets and liabilities in the financial statements, disclosure of contingent assets and liabilities at the date of the financial statements and the reported amounts of increases and decreases in net assets from operations during the reporting period. Actual results could differ from those estimates. The Fund is considered an investment company under U.S. GAAP and follows the accounting and reporting guidance applicable to investment companies. Below is a summary of significant accounting policies:
Investment Transactions and Income Recognition: For financial reporting purposes, investment transactions are recorded on the dates the transactions are entered into (the “trade dates”). Realized gains and losses on investment transactions are determined on the identified cost basis. Dividend income is recorded on theex-dividend date. Dividends from foreign securities where theex-dividend date may have passed are subsequently recorded when the Fund is informed of theex-dividend date. Under the applicable foreign tax laws, a withholding tax at various rates may be imposed on capital gains, dividends and interest. Income, expenses and realized and unrealized gains and losses are allocated daily to each class based on its relative net assets.
Foreign Currency Translation: The Fund’s books and records are maintained in U.S. dollars. Securities and other assets and liabilities denominated in foreign currencies are translated into U.S. dollars using exchange rates determined as of the close of trading on the New York Stock Exchange (“NYSE”). Purchases and sales of investments are recorded at the rates of exchange prevailing on the respective dates of such transactions. Generally, when the U.S. dollar rises in value against a foreign currency, the investments denominated in that currency will lose value; the opposite effect occurs if the U.S. dollar falls in relative value.
The Fund does not isolate the portion of the results of operations arising as a result of changes in the exchange rates from the changes in the market prices of investments held or sold for financial reporting purposes. Accordingly, the effects of changes in exchange rates on investments are not segregated in the Statement of Operations from the effects of changes in market prices of those investments, but are included as a component of net realized and unrealized gain (loss) from investments. The Fund reports realized currency gains (losses) on foreign currency related transactions as components of net realized gain (loss) for financial reporting purposes, whereas such components are generally treated as ordinary income for U.S. federal income tax purposes.
Distributions:Distributions paid by the Fund are recorded on theex-dividend date. Distributions of capital gains are recorded on theex-dividend date and made at least annually. The character and timing of distributions are determined in accordance with U.S. federal income tax regulations, which may differ from U.S. GAAP.
Recent Accounting Standards:In August 2018, the Financial Accounting Standards Board issued Accounting Standards Update2018-13 “Changes to the Disclosure Requirements for Fair Value Measurement” which modifies disclosure requirements for fair value measurements. The guidance is effective for fiscal years beginning after December 15, 2019 and for interim periods within those fiscal years. Management is currently evaluating the impact of this guidance to the Fund.
Indemnifications:In the normal course of business, the Fund enters into contracts that contain a variety of representations that provide general indemnification. The Fund’s maximum exposure under these arrangements is unknown because it involves future potential claims against the Fund, which cannot be predicted with any certainty.
Other: Expenses directly related to the Fund or its classes are charged to the Fund or the applicable class. Other operating expenses shared by several funds, including other funds managed by the Manager, are prorated among those funds on the basis of relative net assets or other appropriate methods. Expenses directly related to the Fund and other shared expenses prorated to the Fund are allocated daily to each class based on its relative net assets or other appropriate methods.
The Fund has an arrangement with its custodian whereby credits are earned on uninvested cash balances, which could be used to reduce custody fees and/or overdraft charges. The Fund may incur charges on certain uninvested cash balances and overdrafts, subject to certain conditions.
| 3. | INVESTMENT VALUATION AND FAIR VALUE MEASUREMENTS |
Investment Valuation Policies: The Fund’s investments are valued at fair value (also referred to as “market value” within the financial statements) as of the close of trading on the NYSE (generally 4:00 p.m., Eastern time). U.S. GAAP defines fair value as the price the Fund would receive to sell an asset or pay to transfer a liability in an orderly transaction between market participants at the measurement date. The Fund determines the fair values of its financial instruments using various independent dealers or pricing services under policies approved by the Board of Directors of the Company (the “Board”). The BlackRock Global Valuation Methodologies Committee (the “Global Valuation Committee”) is the committee formed by management to develop global pricing policies and procedures and to oversee the pricing function for all financial instruments.
| | |
| 12 | | 2018 BLACKROCK ANNUAL REPORTTO SHAREHOLDERS |
Notes to Financial Statements (continued)
Fair Value Inputs and Methodologies: The following methods and inputs are used to establish the fair value of the Fund’s assets and liabilities:
| | • | | Equity investments traded on a recognized securities exchange are valued at the official closing price each day, if available. For equity investments traded on more than one exchange, the official closing price on the exchange where the stock is primarily traded is used. Equity investments traded on a recognized exchange for which there were no sales on that day may be valued at the last available bid (long positions) or ask (short positions) price. |
| | • | | Investments inopen-end U.S. mutual funds are valued at net asset value (“NAV”) each business day. |
| | • | | The Fund values its investment in SL Liquidity Series, LLC, Money Market Series (the “Money Market Series”) at fair value, which is ordinarily based upon its pro rata ownership in the underlying fund’s net assets. The Money Market Series seeks current income consistent with maintaining liquidity and preserving capital. Although the Money Market Series is not registered under the 1940 Act, its investments may follow the parameters of investments by a money market fund that is subject to Rule2a-7 under the 1940 Act. |
If events (e.g., a company announcement, market volatility or a natural disaster) occur that are expected to materially affect the value of such investments, or in the event that the application of these methods of valuation results in a price for an investment that is deemed not to be representative of the market value of such investment, or if a price is not available, the investment will be valued by the Global Valuation Committee, or its delegate, in accordance with a policy approved by the Board as reflecting fair value (“Fair Valued Investments”). The fair valuation approaches that may be used by the Global Valuation Committee will include market approach, income approach and the cost approach. Valuation techniques such as discounted cash flow, use of market comparables and matrix pricing are types of valuation approaches and are typically used in determining fair value. When determining the price for Fair Valued Investments, the Global Valuation Committee, or its delegate, seeks to determine the price that the Fund might reasonably expect to receive or pay from the current sale or purchase of that asset or liability in anarm’s-length transaction. Fair value determinations shall be based upon all available factors that the Global Valuation Committee, or its delegate, deems relevant and consistent with the principles of fair value measurement. The pricing of all Fair Valued Investments is subsequently reported to the Board or a committee thereof on a quarterly basis.
Fair Value Hierarchy: Various inputs are used in determining the fair value of investments. These inputs to valuation techniques are categorized into a fair value hierarchy consisting of three broad levels for financial statement purposes as follows:
| | • | | Level 1 — Unadjusted price quotations in active markets/exchanges for identical assets or liabilities that the Fund has the ability to access |
| | • | | Level 2 — Other observable inputs (including, but not limited to, quoted prices for similar assets or liabilities in markets that are active, quoted prices for identical or similar assets or liabilities in markets that are not active, inputs other than quoted prices that are observable for the assets or liabilities (such as interest rates, yield curves, volatilities, prepayment speeds, loss severities, credit risks and default rates) or other market-corroborated inputs) |
| | • | | Level 3 — Unobservable inputs based on the best information available in the circumstances, to the extent observable inputs are not available (including the Fund’s own assumptions used in determining the fair value of investments) |
The hierarchy gives the highest priority to unadjusted quoted prices in active markets for identical assets or liabilities (Level 1 measurements) and the lowest priority to unobservable inputs (Level 3 measurements). Accordingly, the degree of judgment exercised in determining fair value is greatest for instruments categorized in Level 3. The inputs used to measure fair value may fall into different levels of the fair value hierarchy. In such cases, for disclosure purposes, the fair value hierarchy classification is determined based on the lowest level input that is significant to the fair value measurement in its entirety. Investments classified within Level 3 have significant unobservable inputs used by the Global Valuation Committee in determining the price for Fair Valued investments. Level 3 investments include equity or debt issued by privately held companies or funds. There may not be a secondary market, and/or there are a limited number of investors. Level 3 investments may also be adjusted to reflect illiquidity and/ornon-transferability, with the amount of such discount estimated by the Global Valuation Committee in the absence of market information.
Changes in valuation techniques may result in transfers into or out of an assigned level within the hierarchy. In accordance with the Fund’s policy, transfers between different levels of the fair value hierarchy are deemed to have occurred as of the beginning of the reporting period. The categorization of a value determined for investments is based on the pricing transparency of the investments and is not necessarily an indication of the risks associated with investing in those securities.
As of December 31, 2018, certain investments of the Fund were valued using NAV per share as no quoted market value is available and therefore have been excluded from the fair value hierarchy.
| 4. | SECURITIES AND OTHER INVESTMENTS |
Securities Lending: The Fund may lend its securities to approved borrowers, such as brokers, dealers and other financial institutions. The borrower pledges and maintains with the Fund collateral consisting of cash, an irrevocable letter of credit issued by a bank, or securities issued or guaranteed by the U.S. Government. The initial collateral received by the Fund is required to have a value of at least 102% of the current value of the loaned securities for securities traded on U.S. exchanges and a value of at least 105% for all other securities. The collateral is maintained thereafter at a value equal to at least 100% of the current market value of the securities on loan. The market value of the loaned securities is determined at the close of each business day of the Fund and any additional required collateral is delivered to the Fund, or excess collateral returned by the Fund, on the next business day. During the term of the loan, the Fund is entitled to all distributions made on or in respect of the loaned securities but does not receive interest income on securities received as collateral. Loans of securities are terminable at any time and the borrower, after notice, is required to return borrowed securities within the standard time period for settlement of securities transactions.
The market value of any securities on loan, all of which were classified as common stocks in the Fund’s Schedule of Investments, and the value of any related collateral are shown separately in the Statement of Assets and Liabilities as a component of investments at value — unaffiliated, and collateral on securities loaned at value, respectively. As of period end, any securities on loan were collateralized by cash and/or U.S. Government obligations. Cash collateral invested by the securities lending agent, BlackRock Investment Management, LLC (“BIM”), if any, is disclosed in the Schedule of Investments.
| | | | |
| NOTESTO FINANCIAL STATEMENTS | | | 13 | |
Notes to Financial Statements (continued)
Securities lending transactions are entered into by the Fund under Master Securities Lending Agreements (each, an “MSLA”), which provide the right, in the event of default (including bankruptcy or insolvency), for thenon-defaulting party to liquidate the collateral and calculate a net exposure to the defaulting party or request additional collateral. In the event that a borrower defaults, the Fund, as lender, would offset the market value of the collateral received against the market value of the securities loaned. When the value of the collateral is greater than that of the market value of the securities loaned, the lender is left with a net amount payable to the defaulting party. However, bankruptcy or insolvency laws of a particular jurisdiction may impose restrictions on or prohibitions against such a right of offset in the event of an MSLA counterparty’s bankruptcy or insolvency. Under the MSLA, absent an event of default, the borrower can resell orre-pledge the loaned securities, and the Fund can reinvest cash collateral received in connection with loaned securities. Upon an event of default, the parties’ obligations to return the securities or collateral to the other party are extinguished, and the parties can resell orre-pledge the loaned securities or the collateral received in connection with the loaned securities in order to satisfy the defaulting party’s net payment obligation for all transactions under the MSLA. The defaulting party remains liable for any deficiency.
As of period end, the following table is a summary of the Fund’s securities lending agreements by counterparty which are subject to offset under an MSLA:
| | | | | | | | | | | | |
| Counterparty | | Securities
Loaned at Value | | | Cash Collateral
Received (a) | | | Net
Amount | |
Citigroup Global Markets Inc. | | $ | 1,759,134 | | | $ | (1,759,134 | ) | | $ | — | |
Deutsche Bank Securities Inc. | | | 1,162,471 | | | | (1,162,471 | ) | | | — | |
JP Morgan Securities LLC | | | 3,739,281 | | | | (3,739,281 | ) | | | — | |
State Street Bank & Trust Co. | | | 13,639 | | | | (13,639 | ) | | | — | |
Toronto Dominion Bank | | | 980,406 | | | | (980,406 | ) | | | — | |
| | | | | | | | | | | | |
| | $ | 7,654,931 | | | $ | (7,654,931 | ) | | $ | — | |
| | | | | | | | | | | | |
| | (a) | Cash collateral with a value of $ 7,772,921 has been received in connection with securities lending agreements. Collateral received in excess of the value of securities loaned from the individual counterparty, if any, is not shown for financial reporting purposes in the table above. | |
The risks of securities lending include the risk that the borrower may not provide additional collateral when required or may not return the securities when due. To mitigate these risks, the Fund benefits from a borrower default indemnity provided by BIM. BIM’s indemnity allows for full replacement of the securities loaned if the collateral received does not cover the value on the securities loaned in the event of borrower default. The Fund could incur a loss if the value of an investment purchased with cash collateral falls below the market value of loaned securities or if the value of an investment purchased with cash collateral falls below the value of the original cash collateral received.
| 5. | INVESTMENT ADVISORY AGREEMENT AND OTHER TRANSACTIONS WITH AFFILIATES |
Investment Advisory: The Company, on behalf of the Fund, entered into an Investment Advisory Agreement with the Manager, the Fund’s investment adviser and an indirect, wholly-owned subsidiary of BlackRock, to provide investment advisory and administrative services. The Manager is responsible for the management of the Fund’s portfolio and provides the personnel, facilities, equipment and certain other services necessary to the operations of the Fund.
For such services, the Fund pays the Manager a monthly fee at an annual rate equal to the following percentages of the average daily value of the Fund’s net assets:
| | | | |
| Average Daily Net Assets | | Investment
Advisory Fees | |
First $1 Billion | | | 0.65 | % |
$1 Billion — $3 Billion | | | 0.61 | |
$3 Billion — $5 Billion | | | 0.59 | |
$5 Billion — $10 Billion | | | 0.57 | |
Greater than $10 Billion | | | 0.55 | |
Distribution Fees: The Company, on behalf of the Fund, entered into a Distribution Agreement and a Distribution Plan with BlackRock Investments, LLC (“BRIL”), an affiliate of the Manager. Pursuant to the Distribution Plan and in accordance with Rule12b-1 under the 1940 Act, the Fund pays BRIL ongoing distribution fees. The fees are accrued daily and paid monthly at an annual rate of 0.25% based upon the average daily net assets attributable to Class III.
BRIL and broker-dealers, pursuant tosub-agreements with BRIL, provide shareholder servicing and distribution services to the Fund. The ongoing service and/or distribution fee compensates BRIL and each broker-dealer for providing shareholder servicing and/or distribution related services to shareholders.
For the year ended December 31, 2018, the class specific distribution fees borne directly by Class III were $179,321.
Transfer Agent: On behalf of the Fund, the Manager entered into agreements with insurance companies and other financial intermediaries (“Service Organizations”), some of which may be affiliates. Pursuant to these agreements, the Service Organizations provide the Fund with administrative, networking, recordkeeping,sub-transfer agency and shareholder services tosub-accounts they service. For these services, the Service Organizations receive an annual fee per shareholder account, which will vary depending on share class and/or net assets of Fund shareholders serviced by the Service Organizations, which is shown as transfer agent — class specific. For the year ended December 31, 2018, the Fund did not pay any amounts to affiliates in return for these services.
In addition, the Fund pays the transfer agent, which is not an affiliate, a fee for the issuance, transfer and redemption of shares and the opening and maintenance of shareholder accounts, which is included in transfer agent in the Statement of Operations.
| | |
| 14 | | 2018 BLACKROCK ANNUAL REPORTTO SHAREHOLDERS |
Notes to Financial Statements (continued)
For the year ended December 31, 2018, the following table shows the class specific transfer agent fees borne directly by each share class of the Fund:
| | | | | | | | | | | | | | |
| Class I | | | | | Class III | | | | | Total | |
| $ | 216,942 | | | | | $ | 150,729 | | | | | $ | 367,671 | |
Expense Limitations, Waivers and Reimbursements:With respect to the Fund, the Manager voluntarily agreed to waive its investment advisory fees by the amount of investment advisory fees the Fund pays to the Manager indirectly through its investment in affiliated money market funds (the “affiliated money market fund waiver”). The amount of waivers and/or reimbursements of fees and expenses made pursuant to the expense limitation caps will be reduced by the amount of the affiliated money market fund waiver. This amount is shown as fees waived and/or reimbursed by the Manager in the Statement of Operations. For the year ended December 31, 2018, the amount waived was $1,760.
The Manager has contractually agreed to waive its investment advisory fee with respect to any portion of the Fund’s assets invested in affiliated equity and fixed-income mutual funds and affiliated exchange-traded funds that have a contractual management fee through April 30, 2019. The contractual agreement may be terminated upon 90 days’ notice by a majority of the directors who are not “interested persons” of the Fund, as defined in the 1940 Act (“Independent Directors”), or by a vote of a majority of the outstanding voting securities of the Fund. For the year ended December 31, 2018, there were no fees waived by the Manager pursuant to this arrangement.
For the year ended December 31, 2018, the Fund reimbursed the Manager $2,035 for certain accounting services, which is included in accounting services in the Statement of Operations.
The Manager has contractually agreed to reimburse transfer agent fees in order to limit such expenses to a percentage of average daily net assets as follows:
| | | | |
Class I | | | 0.07 | % |
Class III | | | 0.07 | |
The Manager has agreed not to reduce or discontinue this contractual expense limitation through April 30, 2019 unless approved by the Board, including a majority of the Independent Directors, or by a vote of a majority of the outstanding voting securities of the Fund.
These amounts waived and/or reimbursed are shown as transfer agent fees waived and/or reimbursed — class specific in the Statement of Operations. For the year ended December 31, 2018, class specific expense waivers and/or reimbursements are as follows:
| | | | | | | | | | | | |
| | | Class I | | | Class III | | | Total | |
Transfer Agent Fees Waived and/or Reimbursed | | $ | 143,337 | | | $ | 100,519 | | | $ | 243,856 | |
With respect to the Fund, the Manager contractually agreed to waive and/or reimburse fees or expenses in order to limit expenses, excluding interest expense, dividend expense, tax expense, acquired fund fees and expenses, and certain other fund expenses, which constitute extraordinary expenses not incurred in the ordinary course of the Fund’s business (“expense limitation”). The expense limitations as a percentage of average daily net assets are as follows:
| | | | | | | | | | | | | | | | |
| | | | Class I | | | | | | | Class III | | | |
| | | | | 1.25% | | | | | | | | | 1.50% | | | |
The Manager has agreed not to reduce or discontinue this contractual expense limitation through April 30, 2019, unless approved by the Board, including a majority of the Independent Directors, or by a vote of a majority of the outstanding voting securities of the Fund. For the year ended December 31, 2018, there were no fees waived and/or reimbursed by the Manager.
Securities Lending: The U.S. Securities and Exchange Commission (“SEC”) has issued an exemptive order which permits BIM, an affiliate of the Manager, to serve as securities lending agent for the Fund, subject to applicable conditions. As securities lending agent, BIM bears all operational costs directly related to securities lending. The Fund is responsible for expenses in connection with the investment of cash collateral received for securities on loan (the “collateral investment expenses”). The cash collateral is invested in a private investment company managed by the Manager or its affiliates. However, BIM has agreed to cap the collateral investment expenses of the private investment company to an annual rate of 0.04%. The investment adviser to the private investment company will not charge any advisory fees with respect to shares purchased by the Fund. The private investment company in which the cash collateral has been invested may, under certain circumstances, impose a liquidity fee of up to 2% of the value withdrawn or temporarily restrict withdrawals for up to 10 business days during a 90 day period, in the event that the private investment company’s weekly liquid assets fall below certain thresholds.
Securities lending income is equal to the total of income earned from the reinvestment of cash collateral, net of fees and other payments to and from borrowers of securities, and less the collateral investment expenses. The Fund retains a portion of securities lending income and remits a remaining portion to BIM as compensation for its services as securities lending agent.
Pursuant to a securities lending agreement, the Fund retains 71.5% of securities lending income, and this amount retained can never be less than 65% of the total of securities lending income plus the collateral investment expenses.
In addition, commencing the business day following the date that the aggregate securities lending income earned across the Equity-Bond Complex in a calendar year exceeds a specified threshold, the Fund, pursuant to the securities lending agreement, will retain for the remainder of that calendar year securities lending income in an amount equal to 75% of securities lending income, and this amount retained can never be less than 65% of the total of securities lending income plus the collateral investment expenses.
| | | | |
| NOTESTO FINANCIAL STATEMENTS | | | 15 | |
Notes to Financial Statements (continued)
The share of securities lending income earned by the Fund is shown as securities lending income — affiliated — net in the Statement of Operations. For the year ended December 31, 2018, the Fund paid BIM $9,137 for securities lending agent services.
Interfund Lending: In accordance with an exemptive order (the “Order”) from the SEC, the Fund may participate in a joint lending and borrowing facility for temporary purposes (the “Interfund Lending Program”), subject to compliance with the terms and conditions of the Order, and to the extent permitted by the Fund’s investment policies and restrictions. The Fund is currently permitted to borrow and lend under the Interfund Lending Program.
A lending BlackRock fund may lend in aggregate up to 15% of its net assets, but may not lend more than 5% of its net assets, to any one borrowing fund through the Interfund Lending Program. A borrowing BlackRock fund may not borrow through the Interfund Lending Program or from any other source more than 331⁄3% of its total assets (or any lower threshold provided for by the fund’s investment restrictions). If a borrowing BlackRock fund’s total outstanding borrowings exceed 10% of its total assets, each of its outstanding interfund loans will be subject to collateralization of at least 102% of the outstanding principal value of the loan. All interfund loans are for temporary or emergency purposes and the interest rate to be charged will be the average of the highest current overnight repurchase agreement rate available to a lending fund and the bank loan rate, as calculated according to a formula established by the Board.
During the year ended December 31, 2018, the Fund did not participate in the Interfund Lending Program.
Directors and Officers:Certain directors and/or officers of the Company are directors and/or officers of BlackRock or its affiliates. The Fund reimburses the Manager for a portion of the compensation paid to the Company’s Chief Compliance Officer, which is included in Directors and Officer in the Statement of Operations.
For the year ended December 31, 2018, purchases and sales of investments, excluding short-term securities, were $110,449,679 and $109,752,812, respectively.
It is the Fund’s policy to comply with the requirements of the Internal Revenue Code of 1986, as amended, applicable to regulated investment companies, and to distribute substantially all of its taxable income to its shareholders. Therefore, no U.S. federal income tax provision is required.
The Fund files U.S. federal and various state and local tax returns. No income tax returns are currently under examination. The statute of limitations on the Fund’s U.S. federal tax returns generally remains open for each of the four years ended December 31, 2018. The statutes of limitations on the Fund’s state and local tax returns may remain open for an additional year depending upon the jurisdiction.
Management has analyzed tax laws and regulations and their application to the Fund as of December 31, 2018, inclusive of the open tax return years, and does not believe that there are any uncertain tax positions that require recognition of a tax liability in the Fund’s financial statements.
U.S. GAAP requires that certain components of net assets be adjusted to reflect permanent differences between financial and tax reporting. These reclassifications have no effect on net assets or net asset values per share. As of period end, the following permanent differences attributable to net operating losses were reclassified to the following accounts:
| | | | |
Paid in capital | | $ | (617,029 | ) |
Accumulated earnings | | $ | 617,029 | |
The tax character of distributions paid was as follows:
| | | | | | | | |
| | | 12/31/18 | | | 12/31/17 | |
Ordinary income | | $ | 513,495 | | | $ | 2,327,022 | |
Long term capital gains | | | 17,646,669 | | | | 22,845,872 | |
| | | | | | | | |
| | $ | 18,160,164 | | | $ | 25,172,894 | |
| | | | | | | | |
As of period end, the tax components of accumulated earnings were as follows:
| | | | |
Undistributed long-term capital gains | | $ | 737,387 | |
Net unrealized gains(a) | | | 22,376,366 | |
| | | | |
| | $ | 23,113,753 | |
| | | | |
| | (a) | The difference between book-basis and tax-basis net unrealized gains was attributable primarily to the tax deferral of losses on wash sales and timing and recognition of partnership income. | |
As of December 31, 2018, gross unrealized appreciation and depreciation for investments based on cost for U.S. federal income tax purposes were as follows:
| | | | |
Tax cost | | $ | 148,260,086 | |
| | | | |
Gross unrealized appreciation | | $ | 27,466,004 | |
Gross unrealized depreciation | | | (5,143,496 | ) |
| | | | |
Net unrealized appreciation | | $ | 22,322,508 | |
| | | | |
| | |
| 16 | | 2018 BLACKROCK ANNUAL REPORTTO SHAREHOLDERS |
Notes to Financial Statements (continued)
The Company, on behalf of the Fund, along with certain other funds managed by the Manager and its affiliates (“Participating Funds”), is a party to a364-day, $2.25 billion credit agreement with a group of lenders. Under this agreement, the Fund may borrow to fund shareholder redemptions. Excluding commitments designated for certain individual funds, the Participating Funds, including the Fund, can borrow up to an aggregate commitment amount of $1.75 billion at any time outstanding, subject to asset coverage and other limitations as specified in the agreement. The credit agreement has the following terms: a fee of 0.10% per annum on unused commitment amounts and interest at a rate equal to the higher of(a) one-month LIBOR (but, in any event, not less than 0.00%) on the date the loan is made plus 0.80% per annum or (b) the Fed Funds rate (but, in any event, not less than 0.00%) in effect from time to time plus 0.80% per annum on amounts borrowed. The agreement expires in April 2019 unless extended or renewed. Prior to April 19, 2018, the aggregate commitment amount was $2.1 billion and the fee was 0.12% per annum. Participating Funds paid an upfront commitment fee of 0.02% on the total commitment amounts, in addition to administration, legal and arrangement fees, which are included in miscellaneous expenses in the Statement of Operations. These fees were allocated among such funds based upon portions of the aggregate commitment available to them and relative net assets of Participating Funds. During the year ended December 31, 2018, the Fund did not borrow under the credit agreement.
In the normal course of business, the Fund invests in securities or other instruments and may enter into certain transactions, and such activities subject the Fund to various risks, including among others, fluctuations in the market (market risk) or failure of an issuer to meet all of its obligations. The value of securities or other instruments may also be affected by various factors, including, without limitation: (i) the general economy; (ii) the overall market as well as local, regional or global political and/or social instability; (iii) regulation, taxation or international tax treaties between various countries; or (iv) currency, interest rate and price fluctuations. The Fund’s prospectus provides details of the risks to which the Fund is subject.
The Fund may be exposed to additional risks when reinvesting cash collateral in money market funds that do not seek to maintain a stable NAV per share of $1.00, which may be subject to redemption gates or liquidity fees under certain circumstances.
Valuation Risk: The market values of equities, such as common stocks and preferred securities or equity related investments, such as futures and options, may decline due to general market conditions which are not specifically related to a particular company. They may also decline due to factors which affect a particular industry or industries. The Fund may invest in illiquid investments and may experience difficulty in selling those investments in a timely manner at the price that it believes the investments are worth. Prices may fluctuate widely over short or extended periods in response to company, market or economic news. Markets also tend to move in cycles, with periods of rising and falling prices. This volatility may cause the Fund’s NAV to experience significant increases or decreases over short periods of time. If there is a general decline in the securities and other markets, the NAV of the Fund may lose value, regardless of the individual results of the securities and other instruments in which the Fund invests.
Counterparty Credit Risk: The Fund may be exposed to counterparty credit risk, or the risk that an entity may fail to or be unable to perform on its commitments related to unsettled or open transactions. The Fund manages counterparty credit risk by entering into transactions only with counterparties that the Manager believes have the financial resources to honor their obligations and by monitoring the financial stability of those counterparties. Financial assets, which potentially expose the Fund to market, issuer and counterparty credit risks, consist principally of financial instruments and receivables due from counterparties. The extent of the Fund’s exposure to market, issuer and counterparty credit risks with respect to these financial assets is approximately their value recorded in the Statement of Assets and Liabilities, less any collateral held by the Fund.
Concentration Risk: As of period end, the Fund invested a significant portion of its assets in securities in the information technology sector. Changes in economic conditions affecting such sector would have a greater impact on the Fund and could affect the value, income and/or liquidity of positions in such securities.
| 10. | CAPITAL SHARE TRANSACTIONS |
Transactions in capital shares for each class were as follows:
| | | | | | | | | | | | | | | | |
| | | Year Ended
12/31/2018 | | | Year Ended
12/31/2017 | |
| | | Shares | | | Amount | | | Shares | | | Amount | |
Class I | | | | | | | | | | | | | | | | |
Shares sold | | | 386,678 | | | $ | 6,168,160 | | | | 299,156 | | | $ | 4,606,186 | |
Shares issued in reinvestment of distributions | | | 755,113 | | | | 10,303,447 | | | | 1,121,874 | | | | 16,392,533 | |
Shares redeemed | | | (1,192,018 | ) | | | (19,141,189 | ) | | | (1,052,862 | ) | | | (16,192,812 | ) |
| | | | | | | | | | | | | | | | |
Net increase (decrease) | | | (50,227 | ) | | $ | (2,669,582 | ) | | | 368,168 | | | $ | 4,805,907 | |
| | | | | | | | | | | | | | | | |
| | | | |
Class III | | | | | | | | | | | | | | | | |
Shares sold | | | 2,379,648 | | | $ | 38,478,618 | | | | 722,465 | | | $ | 10,907,398 | |
Shares issued in reinvestment of distributions | | | 587,788 | | | | 7,856,717 | | | | 607,374 | | | | 8,780,361 | |
Shares redeemed | | | (1,399,440 | ) | | | (21,534,034 | ) | | | (485,328 | ) | | | (7,351,322 | ) |
| | | | | | | | | | | | | | | | |
Net increase | | | 1,567,996 | | | $ | 24,801,301 | | | | 844,511 | | | $ | 12,336,437 | |
| | | | | | | | | | | | | | | | |
Total Net Increase | | | 1,517,769 | | | $ | 22,131,719 | | | | 1,212,679 | | | $ | 17,142,344 | |
| | | | | | | | | | | | | | | | |
| | | | |
| NOTESTO FINANCIAL STATEMENTS | | | 17 | |
Notes to Financial Statements (continued)
| 11. | REGULATIONS-X AMENDMENTS |
On August 17, 2018, the SEC adopted amendments to certain disclosure requirements in Securities Act ReleaseNo. 33-10532, Disclosure Update and Simplification. The Fund has adopted the amendments pertinent to RegulationS-X in this shareholder report. The amendments impacted certain disclosure presentation on the Statement of Assets and Liabilities, Statements of Changes in Net Assets and Notes to the Financial Statements.
Prior year distribution information and undistributed net investment income in the Statements of Changes in Net Assets has been modified to conform to the current year presentation in accordance with the RegulationS-X changes.
Distributions for the year ended December 31, 2017 were classified as follows:
| | | | | | | | |
| Share Class | | Net Investment Income | | | Net Realized Gain | |
Class I | | $ | (39,574 | ) | | $ | (16,352,959 | ) |
Class III | | | (2,263 | ) | | | (8,778,098 | ) |
Undistributed net investment income as of December 31, 2017 was $17,082.
Management has evaluated the impact of all subsequent events on the Fund through the date the financial statements were issued and has determined that there were no subsequent events requiring adjustment or additional disclosure in the financial statements.
| | |
| 18 | | 2018 BLACKROCK ANNUAL REPORTTO SHAREHOLDERS |
Report of Independent Registered Public Accounting Firm
To the Shareholders of BlackRock Large Cap Focus Growth V.I. Fund and the Board of Directors of BlackRock Variable Series Funds, Inc.:
Opinion on the Financial Statements and Financial Highlights
We have audited the accompanying statement of assets and liabilities of BlackRock Large Cap Focus Growth V.I. Fund, of BlackRock Variable Series Funds, Inc. (the “Fund”), including the schedule of investments, as of December 31, 2018, the related statement of operations for the year then ended, the statements of changes in net assets for each of the two years in the period then ended, the financial highlights for each of the five years in the period then ended, and the related notes. In our opinion, the financial statements and financial highlights present fairly, in all material respects, the financial position of the Fund as of December 31, 2018, and the results of its operations for the year then ended, the changes in its net assets for each of the two years in the period then ended, and the financial highlights for each of the five years in the period then ended, in conformity with accounting principles generally accepted in the United States of America.
Basis for Opinion
These financial statements and financial highlights are the responsibility of the Fund’s management. Our responsibility is to express an opinion on the Fund’s financial statements and financial highlights based on our audits. We are a public accounting firm registered with the Public Company Accounting Oversight Board (United States) (PCAOB) and are required to be independent with respect to the Fund in accordance with the U.S. federal securities laws and the applicable rules and regulations of the Securities and Exchange Commission and the PCAOB.
We conducted our audits in accordance with the standards of the PCAOB. Those standards require that we plan and perform the audit to obtain reasonable assurance about whether the financial statements and financial highlights are free of material misstatement, whether due to error or fraud. The Fund is not required to have, nor were we engaged to perform, an audit of its internal control over financial reporting. As part of our audits we are required to obtain an understanding of internal control over financial reporting but not for the purpose of expressing an opinion on the effectiveness of the Fund’s internal control over financial reporting. Accordingly, we express no such opinion.
Our audits included performing procedures to assess the risks of material misstatement of the financial statements and financial highlights, whether due to error or fraud, and performing procedures that respond to those risks. Such procedures included examining, on a test basis, evidence regarding the amounts and disclosures in the financial statements and financial highlights. Our audits also included evaluating the accounting principles used and significant estimates made by management, as well as evaluating the overall presentation of the financial statements and financial highlights. Our procedures included confirmation of securities owned as of December 31, 2018, by correspondence with the custodian and brokers; when replies were not received from brokers, we performed other auditing procedures. We believe that our audits provide a reasonable basis for our opinion.
Deloitte & Touche LLP
Boston, Massachusetts
February 15, 2019
We have served as the auditor of one or more BlackRock investment companies since 1992.
| | | | |
| REPORTOF INDEPENDENT REGISTERED PUBLIC ACCOUNTING FIRM | | | 19 | |
Glossary of Terms Used in this Report
| | |
| Currency |
| |
| AUD | | Australian Dollar |
| |
| HKD | | Hong Kong Dollar |
| | |
| Portfolio Abbreviations |
| |
| NYRS | | New York Registered Shares |
| |
| S&P | | Standard & Poor’s |
| | |
| 20 | | 2018 BLACKROCK ANNUAL REPORTTO SHAREHOLDERS |
DECEMBER 31, 2018
| | |
ANNUAL REPORT | |  |
BlackRock Variable Series Funds, Inc.
| Ø | | BlackRock Managed Volatility V.I. Fund |
|
| Not FDIC Insured • May Lose Value • No Bank Guarantee |
| | |
| Fund Summary as of December 31, 2018 | | BlackRock Managed Volatility V.I. Fund |
Investment Objective
BlackRock Managed Volatility V.I. Fund’s (the “Fund”) investment objective is to seek a level of current income and degree of stability of principal not normally available from an investment solely in equity securities, as well as the opportunity for capital appreciation greater than is normally available from an investment solely in debt securities.
On November 15, 2017, the Board of Directors of BlackRock Variable Series Funds, Inc. (the “Company”) and, on December 1, 2017, the Board of Trustees of HIMCO VIT Portfolio Diversifier Fund (the “Target Fund”) approved a reorganization of the Target Fund into the Fund. At a special shareholder meeting on April 4, 2018, the shareholders of the Target Fund approved the reorganization, which was completed on April 23, 2018.
Portfolio Management Commentary
How did the Fund perform?
For the12-month period ended December 31, 2018, the Fund outperformed its blended benchmark (50% MSCI All Country World Index/50% FTSE World Government Bond Index (hedged into USD) and underperformed its performance benchmark, the ICE BofAML3-Month U.S. Treasury Bill Index.
What factors influenced performance?
Positive contributions were driven by a mix of relative value and directional positioning across countries. Positive returns were generated across fixed income, equity and currency allocations. The Fund’s cautious stance on the U.S. bond market contributed positively to performance, especially early in the period as domestic inflation strengthened, growth remained firm and the Fed maintained relatively hawkish rhetoric despite equity market volatility. A defensive view on domestic stocks also contributed as concerns over rising inflation and tightening monetary policy acted as a headwind to the U.S. equity market. Exposure to equities in Europe, Asia(ex-Japan) and emerging markets also added value. Later in the period, directional long positions in global developed market (“DM”) sovereign bond futures contributed positively. As global growth momentum slowed over the second half of the year, the majority of DM central banks had marginally dovish responses. This, coupled with the sharp equitysell-off in December, pushed global DM interest rates lower, benefiting the Fund’s long positions.
On the downside, exposure to European bonds dampened Fund returns late in the second quarter of 2018. Additionally, an allocation to Mexican bonds detracted from returns amid heightened concerns over the outcome of that country’s presidential election. An underweight position in the Japanese yen also weighed on returns as increased risk aversion in global markets and more hawkish comments from the Bank of Japan resulted in appreciation of the yen. As the period progressed, relative value fixed income positioning began to weigh on returns. Specifically, the Fund held a relative short position in Indian interest rates on expectations of higher inflation due to a weaker rupee and expanding monetary base. However, the Reserve Bank of India surprised the market by keeping interest rates unchanged, and rates subsequently rallied. The negative impact of the short Indian rate position was partially offset by a paired long in Mexican rates. On the equity side, a directional long position in Japanese equities weighed on returns in October and November before the position was cut in early December. Cross-sector equity positioning slightly detracted as well.
Describe recent portfolio activity.
The Fund began the period with a preference for stocks relative to bonds. Within equities, the Fund held notable long exposure to U.S. and Japanese stocks. Within fixed income, the Fund maintained a cautious stance on U.S. bonds. During the first half of the year, the Fund also added to emerging market stocks and bonds on attractive valuations, while trimming an overweight to European stocks and significantly reducing exposure to both European bonds and U.S. stocks. In the second half of the year, the Fund increased its long exposure to European stocks and moved from a net short position in European fixed income to a net long position. The Fund generally increased its stance with respect to duration and corresponding interest rate sensitivity into period end on expectations of weaker growth and moderate central bank policies.
Derivatives are used by the investment adviser as a means to manage and/or take outright views on interest rates, credit risk and/or foreign exchange positions in the Fund and to efficiently implement and manage risk. Derivatives comprise the majority of the Fund’s notional exposures. The strategies that employ these derivatives (primarily futures, forwards, and interest rate or total return swaps) vary in nature, but generally speaking, they seek to generate macro alpha by tactically allocating across major asset classes in line with the investment adviser’s macro outlook. During the period, the Fund’s use of derivatives as opposed to physical securities contributed positively to Fund performance.
The Fund held a relatively high allocation to cash backing derivative positions. Given derivatives’ ability to generate economic exposures for the Fund without the need to fully allocate cash, the Fund often had a high percentage exposure to cash throughout the period. The Fund’s cash exposures did not have a material impact on Fund performance.
Describe portfolio positioning at period end.
As of period end, the Fund was positioned net long in equities, net long in duration, and net long in the U.S. dollar. In equities, the Fund was long in Europe with underweights in North America and Asia(ex-Japan). The Fund maintained a slightly constructive view on emerging market equities. On the fixed income side, the Fund held a strong preference for Europe and Australia with generally bearish positions in emerging markets. In currencies, the Fund was positioned long in the U.S. dollar and Australian dollar with shorts in emerging markets and the euro.
The views expressed reflect the opinions of BlackRock as of the date of this report and are subject to change based on changes in market, economic or other conditions. These views are not intended to be a forecast of future events and are no guarantee of future results.
| | |
| 2 | | 2018 BLACKROCK ANNUAL REPORTTO SHAREHOLDERS |
| | |
| Fund Summary as of December 31, 2018 (continued) | | BlackRock Managed Volatility V.I. Fund |
TOTAL RETURN BASED ON A $10,000 INVESTMENT
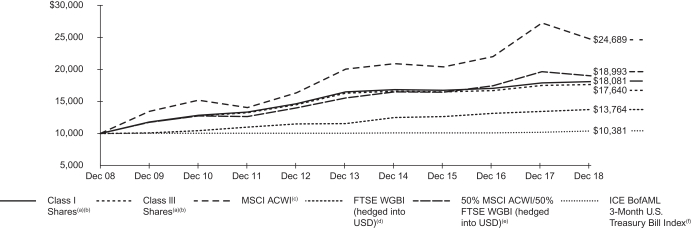
| (a) | Assuming transaction costs, if any, and other operating expenses, including investment advisory fees. Does not include insurance-related fees and expenses. |
| (b) | The Fund uses an asset allocation strategy, investing various percentages of its portfolio in three major categories: stocks, bonds and money market investments. The Fund’s total returns prior to January 22, 2013 are the returns of the Fund when it followed different investment strategies under the name “BlackRock Balanced Capital V.I. Fund”. |
| (c) | A free float-adjusted market capitalization weighted index that is designed to measure the equity market performance of developed and emerging markets. The MSCI All Country World Index consists of 46 country indexes comprising of 23 developed and 23 emerging market country indexes. |
| (d) | A market capitalization weighted bond index consisting of government bond markets of 23 countries, including the United States. |
| (e) | A customized weighted index comprised of the returns of 50% MSCI ACWI/50% FTSE WGBI (hedged into USD). |
| (f) | An unmanaged index that tracks 3-month U.S. Treasury securities. Effective June 2, 2014, the ICE BofAML 3-Month U.S. Treasury Bill Index was added to the performance benchmarks against which the Fund measures its performance. |
Performance Summary for the Period Ended December 31, 2018
| | | | | | | | | | | | | | | | | | | | | | | | | | | | |
| | | 6-Month
Total Returns (b) | | | | | | Average Annual Total Returns | |
| | | 1 Year (b) | | | | | | 5 Years (b) | | | | | | 10 Years (b) | |
Class I(a) | | | (0.15 | )% | | | | | | | 1.02 | % | | | | | | | 1.87 | % | | | | | | | 6.10 | % |
Class III(a) | | | (0.26 | ) | | | | | | | 0.80 | (c) | | | | | | | 1.62 | (c) | | | | | | | 5.84 | (c) |
50% MSCI ACWI/50% FTSE WGBI (hedged into USD) | | | (3.58 | ) | | | | | | | (3.32 | ) | | | | | | | 4.11 | | | | | | | | 6.63 | |
MSCI ACWI | | | (9.02 | ) | | | | | | | (9.41 | ) | | | | | | | 4.26 | | | | | | | | 9.46 | |
FTSE WGBI (hedged into USD) | | | 1.81 | | | | | | | | 2.60 | | | | | | | | 3.60 | | | | | | | | 3.25 | |
ICE BofAML 3-Month U.S. Treasury Bill Index | | | 1.06 | | | | | | | | 1.87 | | | | | | | | 0.63 | | | | | | | | 0.38 | |
| | (a) | Average annual and cumulative total returns are based on changes in net asset value for the periods shown, and assume reinvestment of all distributions at net asset value on the ex-dividend date. Insurance-related fees and expenses are not reflected in these returns. The Fund’s total returns prior to January 22, 2013 are the returns of the Fund when it followed different investment strategies under the name “BlackRock Balanced Capital V.I. Fund”. | |
| | (b) | For a portion of the period, the Fund’s investment adviser waived a portion of its fee. Without such waiver, the Fund’s performance would have been lower. | |
| | (c) | The returns for Class III Shares prior to February 14, 2018, the recommencement of operations of Class III Shares, are based upon the performance of the Fund’s Class I Shares, as adjusted to reflect the distribution (12b-1) fees applicable to Class III Shares. | |
Past performance is not indicative of future results. Performance results do not reflect the deduction of taxes that a shareholder would pay on Fund distributions or the redemption of Fund shares.
Performance results may include adjustments made for financial reporting purposes in accordance with U.S. generally accepted accounting principles.
Expense Example
| | | | | | | | | | | | | | | | | | | | | | | | | | | | | | | | |
| | | Actual | | | | | | Hypothetical (a) | | | | |
| | | Beginning
Account Value
(07/01/18) | | | Ending
Account Value
(12/31/18) | | | Expenses
Paid During
the Period (b) | | | | | | Beginning
Account Value
(07/01/18) | | | Ending
Account Value
(12/31/18) | | | Expenses
Paid During
the Period (b) | | | Annualized
Expense
Ratio | |
Class I | | $ | 1,000.00 | | | $ | 998.50 | | | $ | 2.97 | | | | | | | $ | 1,000.00 | | | $ | 1,022.23 | | | $ | 3.01 | | | | 0.59 | % |
Class III | | | 1,000.00 | | | | 997.40 | | | | 4.23 | | | | | | | | 1,000.00 | | | | 1,020.97 | | | | 4.28 | | | | 0.84 | |
| | (a) | Hypothetical 5% annual return before expenses is calculated by prorating the number of days in the most recent fiscal half year divided by 365. | |
| | (b) | For each class of the Fund, expenses are equal to annualized expense ratio for the class, multiplied by the average account value over the period, multiplied by 184/365 (to reflect the one-half year period shown). | |
See “Disclosure of Expenses” on page 5 for further information on how expenses were calculated.
| | |
| Fund Summary as of December 31, 2018 (continued) | | BlackRock Managed Volatility V.I. Fund |
Portfolio Information
PORTFOLIO COMPOSITION
| | | | |
| Asset Type | | Percent of
Total Investments (a) | |
Common Stocks | | | 71 | % |
U.S. Treasury Obligations | | | 29 | |
U.S. Government Sponsored Agency Obligations | | | — | (b) |
Preferred Stocks | | | — | (b) |
Corporate Bonds | | | — | (b) |
Rights | | | — | (b) |
Other Interests | | | — | (b) |
| | (a) | Total investments exclude short-term securities. | |
| | (b) | Representing less than 0.5% of the Fund’s total investments. | |
For Fund compliance purposes, the Fund’s sector classifications refer to one or more of the sector sub-classifications used by one or more widely recognized market indexes or rating group indexes, and/or as defined by the investment adviser. These definitions may not apply for purposes of this report, which may combine sector sub-classifications for reporting ease.
| | |
| 4 | | 2018 BLACKROCK ANNUAL REPORTTO SHAREHOLDERS |
| | |
| Disclosure of Expenses | | BlackRock Managed Volatility V.I. Fund |
Shareholders of the Fund may incur the following charges: (a) transactional expenses; and (b) operating expenses, including investment advisory fees, service and distribution fees, including 12b-1 fees, acquired fund fees and expenses, and other fund expenses. The expense example on the previous page (which is based on a hypothetical investment of $1,000 invested on July 1, 2018 and held through December 31, 2018) is intended to assist shareholders both in calculating expenses based on an investment in the Fund and in comparing these expenses with similar costs of investing in other mutual funds.
The expense example provides information about actual account values and actual expenses. In order to estimate the expenses a shareholder paid during the period covered by this report, shareholders can divide their account value by $1,000 and then multiply the result by the number corresponding to their share class under the heading entitled “Expenses Paid During the Period.”
The expense example also provides information about hypothetical account values and hypothetical expenses based on the Fund’s actual expense ratio and an assumed rate of return of 5% per year before expenses. In order to assist shareholders in comparing the ongoing expenses of investing in the Fund and other funds, compare the 5% hypothetical example with the 5% hypothetical examples that appear in shareholder reports of other funds.
The expenses shown in the expense example are intended to highlight shareholders’ ongoing costs only and do not reflect any transactional expenses, such as sales charges, if any. Therefore, the hypothetical example is useful in comparing ongoing expenses only, and will not help shareholders determine the relative total expenses of owning different funds. If these transactional expenses were included, shareholder expenses would have been higher.
Derivative Financial Instruments
The Fund may invest in various derivative financial instruments. These instruments are used to obtain exposure to a security, commodity, index, market, and/or other assets without owning or taking physical custody of securities, commodities and/or other referenced assets or to manage market, equity, credit, interest rate, foreign currency exchange rate, commodity and/or other risks. Derivative financial instruments may give rise to a form of economic leverage and involve risks, including the imperfect correlation between the value of a derivative financial instrument and the underlying asset, possible default of the counterparty to the transaction or illiquidity of the instrument. The Fund’s successful use of a derivative financial instrument depends on the investment adviser’s ability to predict pertinent market movements accurately, which cannot be assured. The use of these instruments may result in losses greater than if they had not been used, may limit the amount of appreciation the Fund can realize on an investment and/or may result in lower distributions paid to shareholders. The Fund’s investments in these instruments, if any, are discussed in detail in the Notes to Financial Statements.
| | | | |
| DISCLOSURE OF EXPENSES / DERIVATIVE FINANCIAL INSTRUMENTS | | | 5 | |
| | |
Schedule of Investments December 31, 2018 | | BlackRock Managed Volatility V.I. Fund (Percentages shown are based on Net Assets) |
| | | | | | | | |
| Security | | Shares | | | Value | |
|
Common Stocks— 55.3% | |
|
| Aerospace & Defense— 0.8% | |
Airbus SE | | | 1,299 | | | $ | 123,847 | |
BAE Systems plc | | | 28,041 | | | | 164,008 | |
Boeing Co. (The) | | | 1,224 | | | | 394,740 | |
Bombardier, Inc., Class B(a) | | | 12,346 | | | | 18,358 | |
CAE, Inc. | | | 12,582 | | | | 231,235 | |
Dassault Aviation SA | | | 302 | | | | 418,680 | |
Harris Corp. | | | 206 | | | | 27,738 | |
Huntington Ingalls Industries, Inc. | | | 549 | | | | 104,480 | |
Lockheed Martin Corp. | | | 223 | | | | 58,390 | |
Northrop Grumman Corp. | | | 353 | | | | 86,450 | |
Raytheon Co. | | | 640 | | | | 98,144 | |
Singapore Technologies Engineering Ltd. | | | 46,700 | | | | 119,715 | |
Spirit AeroSystems Holdings, Inc., Class A | | | 1,647 | | | | 118,732 | |
TransDigm Group, Inc.(a) | | | 40 | | | | 13,602 | |
| | | | | | | | |
| | | | | | | 1,978,119 | |
| | |
| Air Freight & Logistics —0.4% | | | | | | |
CH Robinson Worldwide, Inc. | | | 812 | | | | 68,281 | |
Expeditors International of Washington, Inc. | | | 8,921 | | | | 607,431 | |
United Parcel Service, Inc., Class B | | | 2,215 | | | | 216,029 | |
| | | | | | | | |
| | | | | | | 891,741 | |
| | |
| Airlines —0.5% | | | | | | |
American Airlines Group, Inc. | | | 5,691 | | | | 182,738 | |
Delta Air Lines, Inc. | | | 1,382 | | | | 68,962 | |
Deutsche Lufthansa AG (Registered) | | | 13,120 | | | | 296,296 | |
Southwest Airlines Co. | | | 7,934 | | | | 368,772 | |
United Continental Holdings, Inc.(a) | | | 4,127 | | | | 345,554 | |
| | | | | | | | |
| | | | | | | 1,262,322 | |
| | |
| Auto Components —0.0% | | | | | | |
Bridgestone Corp. | | | 2,100 | | | | 80,568 | |
| | | | | | | | |
| | |
| Automobiles —0.6% | | | | | | |
Bayerische Motoren Werke AG | | | 2,656 | | | | 215,415 | |
Daimler AG (Registered) | | | 4,597 | | | | 242,330 | |
Ferrari NV | | | 263 | | | | 26,170 | |
Fiat Chrysler Automobiles NV(a) | | | 8,071 | | | | 116,371 | |
Honda Motor Co. Ltd. | | | 1,500 | | | | 39,518 | |
Peugeot SA | | | 4,564 | | | | 97,340 | |
Subaru Corp. | | | 4,900 | | | | 104,680 | |
Suzuki Motor Corp. | | | 1,900 | | | | 95,782 | |
Toyota Motor Corp. | | | 5,900 | | | | 341,531 | |
Volkswagen AG | | | 521 | | | | 83,347 | |
| | | | | | | | |
| | | | | | | 1,362,484 | |
| | |
| Banks— 4.3% | | | | | | |
ABN AMRO Group NV, CVA(b) | | | 1,344 | | | | 31,627 | |
AIB Group plc | | | 43,771 | | | | 184,570 | |
Australia & New Zealand Banking Group Ltd. | | | 15,115 | | | | 261,167 | |
Banco Bilbao Vizcaya Argentaria SA | | | 84,469 | | | | 448,684 | |
Banco de Sabadell SA | | | 44,820 | | | | 51,284 | |
Banco Santander SA | | | 92,180 | | | | 418,589 | |
Bank Hapoalim BM | | | 775 | | | | 4,901 | |
Bank Leumi Le-Israel BM | | | 6,880 | | | | 41,590 | |
Bank of America Corp. | | | 37,699 | | | | 928,903 | |
Bank of Ireland Group plc | | | 43,888 | | | | 244,093 | |
Bankinter SA | | | 23,802 | | | | 190,990 | |
Barclays plc | | | 48,996 | | | | 93,743 | |
BB&T Corp. | | | 2,869 | | | | 124,285 | |
BOC Hong Kong Holdings Ltd. | | | 4,500 | | | | 16,703 | |
CaixaBank SA | | | 75,228 | | | | 272,433 | |
CIT Group, Inc. | | | 2,087 | | | | 79,870 | |
Citigroup, Inc. | | | 7,894 | | | | 410,962 | |
Citizens Financial Group, Inc. | | | 3,236 | | | | 96,206 | |
| | | | | | | | |
| Security | | Shares | | | Value | |
| | |
| Banks (continued) | | | | | | |
Commonwealth Bank of Australia | | | 6,493 | | | $ | 331,193 | |
DBS Group Holdings Ltd. | | | 7,100 | | | | 123,468 | |
Fifth Third Bancorp | | | 3,850 | | | | 90,591 | |
Hang Seng Bank Ltd. | | | 1,300 | | | | 29,122 | |
HSBC Holdings plc | | | 122,381 | | | | 1,009,611 | |
ING Groep NV | | | 25,935 | | | | 278,972 | |
JPMorgan Chase & Co. | | | 12,620 | | | | 1,231,964 | |
M&T Bank Corp. | | | 95 | | | | 13,597 | |
Mitsubishi UFJ Financial Group, Inc. | | | 32,200 | | | | 158,027 | |
Mizuho Financial Group, Inc. | | | 59,400 | | | | 91,906 | |
National Australia Bank Ltd. | | | 4,123 | | | | 69,965 | |
Nordea Bank AB | | | 11,014 | | | | 92,718 | |
Oversea-Chinese Banking Corp. Ltd. | | | 12,500 | | | | 103,395 | |
Regions Financial Corp. | | | 4,212 | | | | 56,357 | |
Royal Bank of Canada | | | 2,837 | | | | 194,176 | |
Royal Bank of Scotland Group plc | | | 55,018 | | | | 152,623 | |
Skandinaviska Enskilda Banken AB, Class A | | | 18,467 | | | | 179,516 | |
Standard Chartered plc | | | 27,481 | | | | 213,573 | |
Sumitomo Mitsui Financial Group, Inc. | | | 7,400 | | | | 243,941 | |
Sumitomo Mitsui Trust Holdings, Inc. | | | 100 | | | | 3,642 | |
SunTrust Banks, Inc. | | | 2,292 | | | | 115,608 | |
SVB Financial Group(a) | | | 108 | | | | 20,511 | |
Svenska Handelsbanken AB, Class A | | | 4,395 | | | | 48,897 | |
Swedbank AB, Class A | | | 7,667 | | | | 171,366 | |
Toronto-Dominion Bank (The) | | | 4,814 | | | | 239,290 | |
UniCredit SpA | | | 10,020 | | | | 113,496 | |
United Overseas Bank Ltd. | | | 5,400 | | | | 97,686 | |
US Bancorp | | | 6,633 | | | | 303,128 | |
Wells Fargo & Co. | | | 18,352 | | | | 845,660 | |
Westpac Banking Corp. | | | 12,931 | | | | 228,489 | |
| | | | | | | | |
| | | | | | | 10,753,088 | |
| | |
| Beverages —0.8% | | | | | | |
Asahi Group Holdings Ltd. | | | 300 | | | | 11,626 | |
Carlsberg A/S, Class B | | | 729 | | | | 77,550 | |
Coca-Cola Amatil Ltd. | | | 5,727 | | | | 33,031 | |
Coca-Cola Co. (The) | | | 176 | | | | 8,334 | |
Coca-Cola European Partners plc | | | 2,981 | | | | 136,679 | |
Constellation Brands, Inc., Class A | | | 72 | | | | 11,579 | |
Diageo plc | | | 8,101 | | | | 289,484 | |
Heineken Holding NV | | | 1,985 | | | | 167,706 | |
Heineken NV | | | 1,745 | | | | 154,235 | |
Kirin Holdings Co. Ltd. | | | 4,100 | | | | 85,491 | |
Molson Coors Brewing Co., Class B | | | 748 | | | | 42,008 | |
Monster Beverage Corp.(a) | | | 1,775 | | | | 87,365 | |
PepsiCo, Inc. | | | 4,362 | | | | 481,914 | |
Pernod Ricard SA | | | 1,539 | | | | 252,582 | |
Treasury Wine Estates Ltd. | | | 16,102 | | | | 167,908 | |
| | | | | | | | |
| | | | | | | 2,007,492 | |
|
| Biotechnology— 1.7% | |
AbbVie, Inc. | | | 8,715 | | | | 803,436 | |
Alexion Pharmaceuticals, Inc.(a) | | | 323 | | | | 31,447 | |
Alkermes plc(a) | | | 299 | | | | 8,823 | |
Amgen, Inc. | | | 4,524 | | | | 880,687 | |
BeiGene Ltd., ADR(a) | | | 218 | | | | 30,577 | |
Biogen, Inc.(a) | | | 1,279 | | | | 384,877 | |
Celgene Corp.(a) | | | 5,116 | | | | 327,884 | |
CSL Ltd. | | | 3,681 | | | | 480,805 | |
Genmab A/S(a) | | | 283 | | | | 46,531 | |
Gilead Sciences, Inc. | | | 7,618 | | | | 476,506 | |
Incyte Corp.(a) | | | 684 | | | | 43,495 | |
Regeneron Pharmaceuticals, Inc.(a) | | | 267 | | | | 99,724 | |
Shire plc | | | 3,981 | | | | 231,645 | |
United Therapeutics Corp.(a) | | | 702 | | | | 76,448 | |
| | |
| 6 | | 2018 BLACKROCK ANNUAL REPORTTO SHAREHOLDERS |
| | |
Schedule of Investments (continued) December 31, 2018 | | BlackRock Managed Volatility V.I. Fund (Percentages shown are based on Net Assets) |
| | | | | | | | |
| Security | | Shares | | | Value | |
|
| Biotechnology (continued) | |
Vertex Pharmaceuticals, Inc.(a) | | | 1,677 | | | $ | 277,896 | |
| | | | | | | | |
| | | | | | | 4,200,781 | |
| | |
| Capital Markets —1.0% | | | | | | |
Ameriprise Financial, Inc. | | | 2,317 | | | | 241,825 | |
Bank of New York Mellon Corp. (The) | | | 605 | | | | 28,477 | |
Brookfield Asset Management, Inc., Class A | | | 5,488 | | | | 210,322 | |
Charles Schwab Corp. (The) | | | 5,409 | | | | 224,636 | |
CME Group, Inc. | | | 1,550 | | | | 291,586 | |
Credit Suisse Group AG (Registered)(a) | | | 12,229 | | | | 133,684 | |
Deutsche Bank AG (Registered) | | | 7,278 | | | | 58,043 | |
E*TRADE Financial Corp.(a) | | | 1,806 | | | | 79,247 | |
Goldman Sachs Group, Inc. (The) | | | 1,009 | | | | 168,554 | |
Hargreaves Lansdown plc | | | 692 | | | | 16,321 | |
Hong Kong Exchanges & Clearing Ltd. | | | 4,700 | | | | 135,870 | |
Investec plc | | | 5,390 | | | | 30,301 | |
Macquarie Group Ltd. | | | 236 | | | | 18,077 | |
Moody’s Corp. | | | 183 | | | | 25,627 | |
Morgan Stanley | | | 5,042 | | | | 199,915 | |
MSCI, Inc. | | | 620 | | | | 91,407 | |
S&P Global, Inc. | | | 1,716 | | | | 291,617 | |
SEI Investments Co. | | | 369 | | | | 17,048 | |
Singapore Exchange Ltd. | | | 3,200 | | | | 16,771 | |
St James’s Place plc | | | 748 | | | | 9,009 | |
TD Ameritrade Holding Corp.(c) | | | 1,532 | | | | 75,007 | |
UBS Group AG (Registered)(a) | | | 11,405 | | | | 142,257 | |
| | | | | | | | |
| | | | | | | 2,505,601 | |
| | |
| Chemicals— 3.5% | | | | | | |
Air Water, Inc. | | | 10,700 | | | | 161,263 | |
Albemarle Corp.(c) | | | 4,331 | | | | 333,790 | |
Arkema SA | | | 964 | | | | 82,758 | |
Asahi Kasei Corp. | | | 20,800 | | | | 213,478 | |
Axalta Coating Systems Ltd.(a) | | | 2,076 | | | | 48,620 | |
BASF SE | | | 5,307 | | | | 369,652 | |
CF Industries Holdings, Inc. | | | 5,246 | | | | 228,253 | |
Chr Hansen Holding A/S | | | 631 | | | | 56,012 | |
Covestro AG(b) | | | 3,929 | | | | 194,582 | |
Daicel Corp. | | | 10,200 | | | | 104,709 | |
DowDuPont, Inc. | | | 16,889 | | | | 903,224 | |
Eastman Chemical Co. | | | 2,445 | | | | 178,754 | |
Ecolab, Inc. | | | 2,341 | | | | 344,946 | |
Evonik Industries AG | | | 13,140 | | | | 327,990 | |
FMC Corp. | | | 1,352 | | | | 99,994 | |
Hitachi Chemical Co. Ltd. | | | 2,000 | | | | 30,087 | |
Incitec Pivot Ltd. | | | 124,947 | | | | 288,819 | |
International Flavors & Fragrances, Inc. | | | 406 | | | | 54,235 | |
Israel Chemicals Ltd. | | | 1,107 | | | | 6,295 | |
JSR Corp. | | | 1,200 | | | | 18,013 | |
Kaneka Corp. | | | 3,200 | | | | 114,600 | |
Kansai Paint Co. Ltd. | | | 7,600 | | | | 145,976 | |
Kuraray Co. Ltd. | | | 2,300 | | | | 32,348 | |
Linde plc | | | 4,327 | | | | 675,185 | |
Methanex Corp. | | | 443 | | | | 21,306 | |
Mitsubishi Chemical Holdings Corp. | | | 34,000 | | | | 256,869 | |
Mitsubishi Gas Chemical Co., Inc. | | | 8,400 | | | | 125,829 | |
Mitsui Chemicals, Inc. | | | 8,300 | | | | 187,383 | |
Mosaic Co. (The) | | | 4,035 | | | | 117,862 | |
Nitto Denko Corp. | | | 300 | | | | 15,046 | |
Novozymes A/S, Class B | | | 3,706 | | | | 165,593 | |
Nutrien Ltd. | | | 12,952 | | | | 608,323 | |
Orica Ltd. | | | 1,329 | | | | 16,153 | |
PPG Industries, Inc. | | | 2,434 | | | | 248,828 | |
Sherwin-Williams Co. (The) | | | 1,547 | | | | 608,683 | |
Shin-Etsu Chemical Co. Ltd. | | | 3,300 | | | | 253,548 | |
| | | | | | | | |
| Security | | Shares | | | Value | |
| | |
| Chemicals (continued) | | | | | | |
Showa Denko KK | | | 3,600 | | | $ | 106,900 | |
Sumitomo Chemical Co. Ltd. | | | 26,600 | | | | 128,816 | |
Symrise AG | | | 498 | | | | 36,898 | |
Taiyo Nippon Sanso Corp. | | | 5,200 | | | | 84,536 | |
Teijin Ltd. | | | 10,800 | | | | 172,367 | |
Toray Industries, Inc. | | | 12,100 | | | | 85,548 | |
Tosoh Corp. | | | 13,800 | | | | 179,001 | |
Westlake Chemical Corp. | | | 263 | | | | 17,403 | |
Yara International ASA | | | 8,519 | | | | 328,402 | |
| | | | | | | | |
| | | | | | | 8,778,877 | |
| | |
| Commercial Services & Supplies —0.3% | | | | | | |
Cintas Corp. | | | 2,556 | | | | 429,382 | |
Copart, Inc.(a) | | | 3,895 | | | | 186,103 | |
ISS A/S | | | 2,755 | | | | 77,131 | |
Waste Management, Inc. | | | 742 | | | | 66,031 | |
| | | | | | | | |
| | | | | | | 758,647 | |
| | |
| Communications Equipment —0.2% | | | | | | |
Nokia OYJ | | | 22,882 | | | | 132,833 | |
Telefonaktiebolaget LM Ericsson, Class B | | | 29,189 | | | | 258,380 | |
| | | | | | | | |
| | | | | | | 391,213 | |
| | |
| Construction & Engineering —0.2% | | | | | | |
CIMIC Group Ltd. | | | 1,905 | | | | 58,255 | |
HOCHTIEF AG | | | 88 | | | | 11,884 | |
Kajima Corp. | | | 10,800 | | | | 145,077 | |
Obayashi Corp. | | | 6,600 | | | | 59,762 | |
Shimizu Corp. | | | 4,800 | | | | 39,048 | |
Taisei Corp. | | | 2,100 | | | | 89,940 | |
WSP Global, Inc. | | | 289 | | | | 12,420 | |
| | | | | | | | |
| | | | | | | 416,386 | |
| | |
| Construction Materials —0.3% | | | | | | |
Boral Ltd. | | | 40,723 | | | | 141,717 | |
CRH plc | | | 490 | | | | 12,978 | |
Fletcher Building Ltd. | | | 2,716 | | | | 8,896 | |
HeidelbergCement AG | | | 433 | | | | 26,542 | |
James Hardie Industries plc, CDI | | | 4,304 | | | | 46,891 | |
LafargeHolcim Ltd. (Registered)(a) | | | 7,702 | | | | 317,851 | |
Taiheiyo Cement Corp. | | | 3,000 | | | | 92,326 | |
| | | | | | | | |
| | | | | | | 647,201 | |
| | |
| Consumer Finance —0.5% | | | | | | |
Ally Financial, Inc. | | | 6,757 | | | | 153,114 | |
American Express Co. | | | 5,961 | | | | 568,202 | |
Capital One Financial Corp. | | | 2,927 | | | | 221,252 | |
Discover Financial Services | | | 2,972 | | | | 175,288 | |
Synchrony Financial | | | 6,130 | | | | 143,810 | |
| | | | | | | | |
| | | | | | | 1,261,666 | |
| | |
| Containers & Packaging —0.5% | | | | | | |
Amcor Ltd. | | | 34,770 | | | | 324,663 | |
CCL Industries, Inc., Class B | | | 1,665 | | | | 61,053 | |
International Paper Co. | | | 10,678 | | | | 430,964 | |
Packaging Corp. of America | | | 2,908 | | | | 242,702 | |
Sealed Air Corp. | | | 747 | | | | 26,026 | |
WestRock Co. | | | 1,442 | | | | 54,450 | |
| | | | | | | | |
| | | | | | | 1,139,858 | |
| | |
| Diversified Consumer Services —0.0% | | | | | | |
H&R Block, Inc. | | | 679 | | | | 17,226 | |
| | | | | | | | |
| | |
| Diversified Financial Services— 0.8% | | | | | | |
AXA Equitable Holdings, Inc. | | | 957 | | | | 15,915 | |
Berkshire Hathaway, Inc., Class B(a) | | | 4,934 | | | | 1,007,424 | |
EXOR NV | | | 287 | | | | 15,580 | |
Groupe Bruxelles Lambert SA | | | 3,378 | | | | 294,368 | |
| | | | |
| SCHEDULE OF INVESTMENTS | | | 7 | |
| | |
Schedule of Investments (continued) December 31, 2018 | | BlackRock Managed Volatility V.I. Fund (Percentages shown are based on Net Assets) |
| | | | | | | | |
| Security | | Shares | | | Value | |
|
| Diversified Financial Services (continued) | |
Investor AB, Class B | | | 1,227 | | | $ | 52,141 | |
L E Lundbergforetagen AB, Class B | | | 371 | | | | 10,956 | |
ORIX Corp. | | | 24,600 | | | | 359,453 | |
Standard Life Aberdeen plc | | | 9,414 | | | | 30,825 | |
Voya Financial, Inc. | | | 3,865 | | | | 155,141 | |
| | | | | | | | |
| | | | | | | 1,941,803 | |
| | |
| Electric Utilities —0.8% | | | | | | |
American Electric Power Co., Inc. | | | 2,027 | | | | 151,498 | |
Chubu Electric Power Co., Inc. | | | 7,900 | | | | 112,254 | |
CK Infrastructure Holdings Ltd. | | | 5,500 | | | | 41,622 | |
CLP Holdings Ltd. | | | 12,500 | | | | 141,261 | |
Duke Energy Corp. | | | 2,087 | | | | 180,108 | |
Edison International | | | 575 | | | | 32,643 | |
Electricite de France SA | | | 834 | | | | 13,200 | |
Entergy Corp. | | | 1,330 | | | | 114,473 | |
Eversource Energy | | | 77 | | | | 5,008 | |
Exelon Corp. | | | 4,330 | | | | 195,283 | |
FirstEnergy Corp. | | | 1,269 | | | | 47,651 | |
Fortum OYJ | | | 1,198 | | | | 26,224 | |
Kansai Electric Power Co., Inc. (The) | | | 11,000 | | | | 164,964 | |
Kyushu Electric Power Co., Inc. | | | 3,600 | | | | 42,868 | |
NextEra Energy, Inc. | | | 811 | | | | 140,968 | |
PG&E Corp.(a) | | | 1,780 | | | | 42,275 | |
Pinnacle West Capital Corp. | | | 174 | | | | 14,825 | |
Power Assets Holdings Ltd. | | | 8,000 | | | | 55,579 | |
PPL Corp. | | | 795 | | | | 22,522 | |
Southern Co. (The) | | | 2,666 | | | | 117,091 | |
Tohoku Electric Power Co., Inc. | | | 1,400 | | | | 18,432 | |
Tokyo Electric Power Co. Holdings, Inc.(a) | | | 16,400 | | | | 97,417 | |
Xcel Energy, Inc. | | | 1,582 | | | | 77,945 | |
| | | | | | | | |
| | | | | | | 1,856,111 | |
|
| Electronic Equipment, Instruments & Components —0.4% | |
Amphenol Corp., Class A | | | 1,515 | | | | 122,745 | |
CDW Corp. | | | 5,554 | | | | 450,152 | |
Hitachi Ltd. | | | 11,600 | | | | 307,519 | |
Keyence Corp. | | | 300 | | | | 151,634 | |
Kyocera Corp. | | | 500 | | | | 24,992 | |
| | | | | | | | |
| | | | | | | 1,057,042 | |
| | |
| Energy Equipment & Services —0.0% | | | | | | |
Halliburton Co. | | | 2,909 | | | | 77,321 | |
Tenaris SA | | | 2,981 | | | | 32,039 | |
| | | | | | | | |
| | | | | | | 109,360 | |
| | |
| Entertainment —0.5% | | | | | | |
Netflix, Inc.(a) | | | 1,492 | | | | 399,349 | |
Nintendo Co. Ltd. | | | 300 | | | | 79,662 | |
Twenty-First Century Fox, Inc., Class A | | | 3,170 | | | | 152,540 | |
Twenty-First Century Fox, Inc., Class B | | | 3,115 | | | | 148,835 | |
Viacom, Inc., Class B | | | 1,734 | | | | 44,564 | |
Walt Disney Co. (The) | | | 4,504 | | | | 493,863 | |
| | | | | | | | |
| | | | | | | 1,318,813 | |
|
| Equity Real Estate Investment Trusts (REITs)— 1.4% | |
American Tower Corp. | | | 443 | | | | 70,078 | |
Ascendas Real Estate Investment Trust | | | 43,300 | | | | 81,715 | |
AvalonBay Communities, Inc. | | | 989 | | | | 172,136 | |
Boston Properties, Inc. | | | 1,271 | | | | 143,051 | |
Brookfield Property REIT, Inc., Class A | | | 9,436 | | | | 151,920 | |
Camden Property Trust | | | 217 | | | | 19,107 | |
CapitaLand Commercial Trust | | | 32,300 | | | | 41,487 | |
CapitaLand Mall Trust | | | 41,700 | | | | 69,151 | |
Crown Castle International Corp. | | | 1,748 | | | | 189,885 | |
Duke Realty Corp. | | | 2,497 | | | | 64,672 | |
Equity Residential | | | 4,111 | | | | 271,367 | |
| | | | | | | | |
| Security | | Shares | | | Value | |
|
| Equity Real Estate Investment Trusts (REITs) (continued) | |
Essex Property Trust, Inc. | | | 177 | | | $ | 43,402 | |
Federal Realty Investment Trust | | | 40 | | | | 4,722 | |
H&R REIT | | | 3,356 | | | | 50,763 | |
HCP, Inc. | | | 5,281 | | | | 147,498 | |
Host Hotels & Resorts, Inc. | | | 10,847 | | | | 180,820 | |
Kimco Realty Corp. | | | 5,051 | | | | 73,997 | |
Liberty Property Trust | | | 1,290 | | | | 54,025 | |
Link REIT | | | 6,000 | | | | 60,826 | |
Macerich Co. (The) | | | 1,289 | | | | 55,788 | |
Public Storage | | | 2,015 | | | | 407,856 | |
SBA Communications Corp.(a) | | | 1,262 | | | | 204,305 | |
Simon Property Group, Inc. | | | 2,994 | | | | 502,962 | |
SL Green Realty Corp. | | | 1,599 | | | | 126,449 | |
UDR, Inc. | | | 1,404 | | | | 55,627 | |
Ventas, Inc. | | | 1,094 | | | | 64,098 | |
VEREIT, Inc. | | | 7,893 | | | | 56,435 | |
Vornado Realty Trust | | | 2,243 | | | | 139,133 | |
Weyerhaeuser Co. | | | 2,247 | | | | 49,119 | |
| | | | | | | | |
| | | | | | | 3,552,394 | |
| | |
| Food & Staples Retailing —0.0% | | | | | | |
Alimentation Couche-Tard, Inc., Class B | | | 1,714 | | | | 85,260 | |
Dairy Farm International Holdings Ltd. | | | 1,900 | | | | 17,222 | |
Koninklijke Ahold Delhaize NV | | | 399 | | | | 10,080 | |
| | | | | | | | |
| | | | | | | 112,562 | |
| | |
| Food Products —1.1% | | | | | | |
Barry Callebaut AG (Registered) | | | 47 | | | | 73,351 | |
Bunge Ltd. | | | 2,501 | | | | 133,654 | |
Campbell Soup Co. | | | 1,806 | | | | 59,580 | |
Chocoladefabriken Lindt & Spruengli AG | | | 6 | | | | 37,283 | |
Conagra Brands, Inc. | | | 5,078 | | | | 108,466 | |
Danone SA | | | 2,890 | | | | 203,695 | |
General Mills, Inc. | | | 4,835 | | | | 188,275 | |
Hershey Co. (The) | | | 430 | | | | 46,087 | |
Hormel Foods Corp. | | | 284 | | | | 12,121 | |
Ingredion, Inc. | | | 260 | | | | 23,764 | |
JM Smucker Co. (The) | | | 521 | | | | 48,708 | |
Kerry Group plc, Class A | | | 64 | | | | 6,338 | |
Kikkoman Corp. | | | 700 | | | | 37,460 | |
Lamb Weston Holdings, Inc. | | | 85 | | | | 6,253 | |
MEIJI Holdings Co. Ltd. | | | 100 | | | | 8,150 | |
Nestle SA (Registered) | | | 17,471 | | | | 1,417,995 | |
Saputo, Inc. | | | 2,919 | | | | 83,794 | |
Toyo Suisan Kaisha Ltd. | | | 100 | | | | 3,482 | |
Tyson Foods, Inc., Class A | | | 2,972 | | | | 158,705 | |
Yamazaki Baking Co. Ltd. | | | 1,900 | | | | 39,790 | |
| | | | | | | | |
| | | | | | | 2,696,951 | |
| | |
| Gas Utilities —0.2% | | | | | | |
Hong Kong & China Gas Co. Ltd. | | | 76,000 | | | | 157,020 | |
Osaka Gas Co. Ltd. | | | 600 | | | | 10,945 | |
Tokyo Gas Co. Ltd. | | | 5,800 | | | | 146,694 | |
UGI Corp. | | | 1,022 | | | | 54,524 | |
| | | | | | | | |
| | | | | | | 369,183 | |
| | |
| Health Care Equipment & Supplies —0.2% | | | | | | |
Abbott Laboratories | | | 1,866 | | | | 134,968 | |
Cochlear Ltd. | | | 166 | | | | 20,340 | |
Coloplast A/S, Class B | | | 185 | | | | 17,208 | |
Hoya Corp. | | | 3,700 | | | | 223,110 | |
Koninklijke Philips NV | | | 3,203 | | | | 112,295 | |
Olympus Corp. | | | 1,600 | | | | 48,936 | |
Siemens Healthineers AG(a)(b) | | | 75 | | | | 3,134 | |
Terumo Corp. | | | 400 | | | | 22,562 | |
| | | | | | | | |
| | | | | | | 582,553 | |
| | |
| 8 | | 2018 BLACKROCK ANNUAL REPORTTO SHAREHOLDERS |
| | |
Schedule of Investments (continued) December 31, 2018 | | BlackRock Managed Volatility V.I. Fund (Percentages shown are based on Net Assets) |
| | | | | | | | |
| Security | | Shares | | | Value | |
| | |
| Health Care Providers & Services —2.6% | | | | | | |
Alfresa Holdings Corp. | | | 700 | | | $ | 17,843 | |
AmerisourceBergen Corp. | | | 1,945 | | | | 144,708 | |
Anthem, Inc. | | | 1,038 | | | | 272,610 | |
Cardinal Health, Inc. | | | 2,314 | | | | 103,204 | |
Centene Corp.(a) | | | 822 | | | | 94,777 | |
CVS Health Corp. | | | 10,122 | | | | 663,193 | |
DaVita, Inc.(a) | | | 3,512 | | | | 180,728 | |
Fresenius SE & Co. KGaA | | | 101 | | | | 4,882 | |
Halfmoon Parent, Inc. | | | 4,705 | | | | 893,662 | |
HCA Healthcare, Inc. | | | 4,662 | | | | 580,186 | |
Henry Schein, Inc.(a) | | | 464 | | | | 36,433 | |
Humana, Inc. | | | 2,166 | | | | 620,516 | |
Laboratory Corp. of America Holdings(a) | | | 951 | | | | 120,168 | |
McKesson Corp. | | | 1,574 | | | | 173,880 | |
Quest Diagnostics, Inc. | | | 2,826 | | | | 235,321 | |
Ramsay Health Care Ltd. | | | 482 | | | | 19,606 | |
Ryman Healthcare Ltd. | | | 1,646 | | | | 11,879 | |
Sonic Healthcare Ltd. | | | 8,652 | | | | 134,972 | |
Suzuken Co. Ltd. | | | 1,400 | | | | 71,292 | |
UnitedHealth Group, Inc. | | | 7,287 | | | | 1,815,337 | |
Universal Health Services, Inc., Class B | | | 1,531 | | | | 178,453 | |
WellCare Health Plans, Inc.(a) | | | 200 | | | | 47,218 | |
| | | | | | | | |
| | | | | | | 6,420,868 | |
| | |
| Health Care Technology —0.0% | | | | | | |
Cerner Corp.(a) | | | 1,091 | | | | 57,212 | |
| | | | | | | | |
| | |
| Hotels, Restaurants & Leisure —1.6% | | | | | | |
Chipotle Mexican Grill, Inc.(a) | | | 621 | | | | 268,142 | |
Darden Restaurants, Inc. | | | 2,616 | | | | 261,234 | |
Domino’s Pizza, Inc. | | | 1,455 | | | | 360,825 | |
McDonald’s Corp. | | | 8,413 | | | | 1,493,896 | |
Paddy Power Betfair plc | | | 189 | | | | 15,516 | |
Star Group, Inc. (The)(a) | | | 1,338 | | | | 22,091 | |
Starbucks Corp. | | | 14,024 | | | | 903,146 | |
Yum! Brands, Inc. | | | 6,883 | | | | 632,685 | |
| | | | | | | | |
| | | | | | | 3,957,535 | |
| | |
| Household Durables —0.2% | | | | | | |
DR Horton, Inc. | | | 2,786 | | | | 96,563 | |
NVR, Inc.(a) | | | 57 | | | | 138,908 | |
PulteGroup, Inc. | | | 5,792 | | | | 150,534 | |
Sony Corp. | | | 3,100 | | | | 149,450 | |
Techtronic Industries Co. Ltd. | | | 1,500 | | | | 7,960 | |
| | | | | | | | |
| | | | | | | 543,415 | |
| | |
| Household Products —1.3% | | | | | | |
Church & Dwight Co., Inc. | | | 3,197 | | | | 210,235 | |
Clorox Co. (The) | | | 559 | | | | 86,164 | |
Colgate-Palmolive Co. | | | 3,981 | | | | 236,949 | |
Essity AB, Class B | | | 2,497 | | | | 61,380 | |
Henkel AG & Co. KGaA (Preference) | | | 2,290 | | | | 225,389 | |
Kimberly-Clark Corp. | | | 4,614 | | | | 525,719 | |
Lion Corp. | | | 3,100 | | | | 64,069 | |
Pigeon Corp. | | | 1,000 | | | | 42,653 | |
Procter & Gamble Co. (The) | | | 14,033 | | | | 1,289,913 | |
Reckitt Benckiser Group plc | | | 4,119 | | | | 315,418 | |
Unicharm Corp. | | | 1,600 | | | | 51,747 | |
| | | | | | | | |
| | | | | | | 3,109,636 | |
|
| Independent Power and Renewable Electricity Producers —0.0% | |
Electric Power Development Co. Ltd. | | | 2,100 | | | | 49,833 | |
NRG Energy, Inc. | | | 722 | | | | 28,591 | |
| | | | | | | | |
| | | | | | | 78,424 | |
| | |
| Industrial Conglomerates— 0.3% | | | | | | |
Jardine Matheson Holdings Ltd. | | | 2,600 | | | | 181,035 | |
| | | | | | | | |
| Security | | Shares | | | Value | |
| | |
| Industrial Conglomerates (continued) | | | | | | |
Jardine Strategic Holdings Ltd. | | | 4,900 | | | $ | 179,655 | |
Keppel Corp. Ltd. | | | 16,800 | | | | 72,932 | |
NWS Holdings Ltd. | | | 9,000 | | | | 18,480 | |
Sembcorp Industries Ltd. | | | 19,900 | | | | 37,076 | |
Siemens AG (Registered) | | | 2,270 | | | | 253,336 | |
Toshiba Corp.(a) | | | 4,100 | | | | 115,771 | |
| | | | | | | | |
| | | | | | | 858,285 | |
| | |
| Insurance —4.5% | | | | | | |
Admiral Group plc | | | 2,528 | | | | 65,965 | |
Aegon NV | | | 36,223 | | | | 169,656 | |
Ageas | | | 14,509 | | | | 653,132 | |
AIA Group Ltd. | | | 61,600 | | | | 511,700 | |
Alleghany Corp. | | | 20 | | | | 12,466 | |
Allianz SE (Registered) | | | 3,638 | | | | 731,076 | |
Allstate Corp. (The) | | | 5,295 | | | | 437,526 | |
American Financial Group, Inc. | | | 307 | | | | 27,793 | |
American International Group, Inc. | | | 8,976 | | | | 353,744 | |
Aon plc | | | 1,926 | | | | 279,963 | |
Arch Capital Group Ltd.(a)(c) | | | 5,059 | | | | 135,177 | |
Assurant, Inc. | | | 343 | | | | 30,678 | |
Athene Holding Ltd., Class A(a) | | | 5,417 | | | | 215,759 | |
Aviva plc | | | 59,366 | | | | 284,126 | |
AXA SA | | | 13,016 | | | | 280,910 | |
Brighthouse Financial, Inc.(a) | | | 432 | | | | 13,167 | |
Chubb Ltd. | | | 1,419 | | | | 183,306 | |
Cincinnati Financial Corp. | | | 146 | | | | 11,303 | |
Dai-ichi Life Holdings, Inc. | | | 8,500 | | | | 132,002 | |
Direct Line Insurance Group plc | | | 22,795 | | | | 92,660 | |
Everest Re Group Ltd. | | | 559 | | | | 121,728 | |
Fairfax Financial Holdings Ltd. | | | 181 | | | | 79,679 | |
Hannover Rueck SE | | | 956 | | | | 128,840 | |
Hartford Financial Services Group, Inc. (The) | | | 6,334 | | | | 281,546 | |
Insurance Australia Group Ltd. | | | 2,143 | | | | 10,570 | |
Japan Post Holdings Co. Ltd. | | | 2,700 | | | | 31,174 | |
Legal & General Group plc | | | 81,980 | | | | 241,543 | |
Lincoln National Corp. | | | 2,835 | | | | 145,464 | |
Loews Corp. | | | 5,213 | | | | 237,296 | |
Manulife Financial Corp. | | | 17,152 | | | | 243,359 | |
Mapfre SA | | | 12,340 | | | | 32,774 | |
Marsh & McLennan Cos., Inc. | | | 7,562 | | | | 603,070 | |
MetLife, Inc. | | | 12,111 | | | | 497,278 | |
MS&AD Insurance Group Holdings, Inc. | | | 6,500 | | | | 184,764 | |
Muenchener Rueckversicherungs-Gesellschaft AG (Registered) | | | 361 | | | | 78,734 | |
NN Group NV | | | 336 | | | | 13,359 | |
Principal Financial Group, Inc. | | | 4,143 | | | | 182,996 | |
Progressive Corp. (The)(c) | | | 7,480 | | | | 451,268 | |
Prudential Financial, Inc. | | | 1,674 | | | | 136,515 | |
Prudential plc | | | 19,336 | | | | 345,273 | |
QBE Insurance Group Ltd. | | | 54,713 | | | | 389,590 | |
Reinsurance Group of America, Inc. | | | 255 | | | | 35,759 | |
RenaissanceRe Holdings Ltd. | | | 533 | | | | 71,262 | |
Sompo Holdings, Inc. | | | 3,300 | | | | 112,101 | |
Sony Financial Holdings, Inc. | | | 1,400 | | | | 26,091 | |
Sun Life Financial, Inc. | | | 10,089 | | | | 334,699 | |
Swiss Re AG | | | 1,191 | | | | 109,572 | |
T&D Holdings, Inc. | | | 3,900 | | | | 45,113 | |
Tokio Marine Holdings, Inc. | | | 5,600 | | | | 266,049 | |
Torchmark Corp. | | | 1,175 | | | | 87,573 | |
Travelers Cos., Inc. (The) | | | 3,273 | | | | 391,942 | |
Unum Group | | | 7,106 | | | | 208,774 | |
Willis Towers Watson plc(c) | | | 913 | | | | 138,648 | |
Zurich Insurance Group AG(a) | | | 991 | | | | 295,406 | |
| | | | | | | | |
| | | | | | | 11,181,918 | |
| | | | |
| SCHEDULE OF INVESTMENTS | | | 9 | |
| | |
Schedule of Investments (continued) December 31, 2018 | | BlackRock Managed Volatility V.I. Fund (Percentages shown are based on Net Assets) |
| | | | | | | | |
| Security | | Shares | | | Value | |
| | |
| Interactive Media & Services —1.4%(a) | | | | | | |
Alphabet, Inc., Class A | | | 946 | | | $ | 988,532 | |
Alphabet, Inc., Class C | | | 1,300 | | | | 1,346,293 | |
Facebook, Inc., Class A | | | 7,943 | | | | 1,041,248 | |
IAC/InterActiveCorp | | | 126 | | | | 23,063 | |
TripAdvisor, Inc. | | | 524 | | | | 28,264 | |
Twitter, Inc. | | | 386 | | | | 11,094 | |
| | | | | | | | |
| | | | | | | 3,438,494 | |
| | |
| Internet & Direct Marketing Retail —1.0%(a) | | | | | | |
Amazon.com, Inc. | | | 1,489 | | | | 2,236,433 | |
Booking Holdings, Inc. | | | 161 | | | | 277,310 | |
eBay, Inc. | | | 1,537 | | | | 43,144 | |
Wayfair, Inc., Class A | | | 451 | | | | 40,626 | |
| | | | | | | | |
| | | | | | | 2,597,513 | |
| | |
| IT Services —1.4% | | | | | | |
Automatic Data Processing, Inc. | | | 2,943 | | | | 385,886 | |
Broadridge Financial Solutions, Inc. | | | 1,149 | | | | 110,591 | |
Cognizant Technology Solutions Corp., Class A | | | 680 | | | | 43,167 | |
Computershare Ltd. | | | 22,502 | | | | 272,708 | |
Fidelity National Information Services, Inc. | | | 3,000 | | | | 307,650 | |
Fiserv, Inc.(a) | | | 4,334 | | | | 318,506 | |
FleetCor Technologies, Inc.(a) | | | 128 | | | | 23,772 | |
Fujitsu Ltd. | | | 3,300 | | | | 205,709 | |
International Business Machines Corp. | | | 1,969 | | | | 223,816 | |
Jack Henry & Associates, Inc. | | | 845 | | | | 106,909 | |
Leidos Holdings, Inc. | | | 1,694 | | | | 89,308 | |
Mastercard, Inc., Class A | | | 1,117 | | | | 210,722 | |
Otsuka Corp. | | | 600 | | | | 16,513 | |
Paychex, Inc. | | | 4,366 | | | | 284,445 | |
PayPal Holdings, Inc.(a) | | | 3,734 | | | | 313,992 | |
Shopify, Inc., Class A(a) | | | 477 | | | | 65,963 | |
Square, Inc., Class A(a) | | | 97 | | | | 5,441 | |
Visa, Inc., Class A | | | 3,330 | | | | 439,360 | |
Wirecard AG | | | 302 | | | | 45,527 | |
| | | | | | | | |
| | | | | | | 3,469,985 | |
| | |
| Life Sciences Tools & Services —0.4% | | | | | | |
Agilent Technologies, Inc. | | | 1,839 | | | | 124,059 | |
Illumina, Inc.(a) | | | 678 | | | | 203,353 | |
Lonza Group AG (Registered)(a) | | | 46 | | | | 11,958 | |
Mettler-Toledo International, Inc.(a) | | | 233 | | | | 131,780 | |
QIAGEN NV(a) | | | 1,512 | | | | 51,666 | |
Thermo Fisher Scientific, Inc. | | | 1,868 | | | | 418,040 | |
Waters Corp.(a) | | | 694 | | | | 130,923 | |
| | | | | | | | |
| | | | | | | 1,071,779 | |
| | |
| Machinery —0.0% | | | | | | |
ANDRITZ AG | | | 745 | | | | 34,215 | |
| | | | | | | | |
| | |
| Media —0.5% | | | | | | |
CBS Corp. (Non-Voting), Class B | | | 3,544 | | | | 154,944 | |
Charter Communications, Inc., Class A(a) | | | 569 | | | | 162,148 | |
Comcast Corp., Class A | | | 18,263 | | | | 621,855 | |
Liberty Global plc, Class C(a) | | | 5,317 | | | | 109,743 | |
Liberty Media Corp.-Liberty SiriusXM, Class C(a) | | | 1,138 | | | | 42,083 | |
News Corp., Class A | | | 3,556 | | | | 40,360 | |
ProSiebenSat.1 Media SE | | | 707 | | | | 12,580 | |
SES SA, FDR | | | 806 | | | | 15,432 | |
Sirius XM Holdings, Inc. | | | 19,032 | | | | 108,673 | |
| | | | | | | | |
| | | | | | | 1,267,818 | |
| | |
| Metals & Mining— 0.8% | | | | | | |
Anglo American plc | | | 7,391 | | | | 165,268 | |
ArcelorMittal | | | 710 | | | | 14,697 | |
Barrick Gold Corp. | | | 14,936 | | | | 201,634 | |
BlueScope Steel Ltd. | | | 4,263 | | | | 32,885 | |
| | | | | | | | |
| Security | | Shares | | | Value | |
| | |
| Metals & Mining (continued) | | | | | | |
First Quantum Minerals Ltd. | | | 3,219 | | | $ | 26,031 | |
Freeport-McMoRan, Inc. | | | 4,280 | | | | 44,127 | |
Glencore plc(a) | | | 73,903 | | | | 274,776 | |
Kinross Gold Corp.(a) | | | 142,587 | | | | 459,554 | |
Nucor Corp. | | | 7,252 | | | | 375,726 | |
South32 Ltd. | | | 37,147 | | | | 88,366 | |
Steel Dynamics, Inc. | | | 7,842 | | | | 235,574 | |
Turquoise Hill Resources Ltd.(a) | | | 24,919 | | | | 41,069 | |
| | | | | | | | |
| | | | | | | 1,959,707 | |
| | |
| Multiline Retail —0.0% | | | | | | |
Wesfarmers Ltd. | | | 300 | | | | 6,816 | |
| | | | | | | | |
| | |
| Multi-Utilities —0.1% | | | | | | |
Ameren Corp. | | | 730 | | | | 47,618 | |
CMS Energy Corp. | | | 112 | | | | 5,561 | |
Consolidated Edison, Inc. | | | 412 | | | | 31,502 | |
Dominion Energy, Inc. | | | 631 | | | | 45,091 | |
DTE Energy Co. | | | 279 | | | | 30,774 | |
E.ON SE | | | 7,017 | | | | 69,267 | |
Public Service Enterprise Group, Inc. | | | 510 | | | | 26,545 | |
| | | | | | | | |
| | | | | | | 256,358 | |
|
| Oil, Gas & Consumable Fuels— 3.8% | |
Anadarko Petroleum Corp. | | | 3,323 | | | | 145,680 | |
BP plc | | | 109,168 | | | | 690,126 | |
Cabot Oil & Gas Corp. | | | 2,005 | | | | 44,812 | |
Canadian Natural Resources Ltd. | | | 10,440 | | | | 251,900 | |
Chevron Corp. | | | 7,748 | | | | 842,905 | |
ConocoPhillips | | | 3,126 | | | | 194,906 | |
Devon Energy Corp. | | | 6,524 | | | | 147,051 | |
Enbridge, Inc. | | | 5,138 | | | | 159,612 | |
Eni SpA | | | 21,370 | | | | 337,586 | |
EOG Resources, Inc. | | | 575 | | | | 50,146 | |
Equinor ASA | | | 5,941 | | | | 126,021 | |
Exxon Mobil Corp. | | | 13,768 | | | | 938,840 | |
Galp Energia SGPS SA | | | 38,768 | | | | 610,434 | |
Hess Corp. | | | 322 | | | | 13,041 | |
HollyFrontier Corp. | | | 848 | | | | 43,350 | |
Idemitsu Kosan Co. Ltd. | | | 3,000 | | | | 97,580 | |
JXTG Holdings, Inc. | | | 52,200 | | | | 271,102 | |
Marathon Oil Corp. | | | 1,778 | | | | 25,496 | |
Marathon Petroleum Corp. | | | 1,682 | | | | 99,255 | |
Neste OYJ | | | 2,512 | | | | 194,486 | |
Occidental Petroleum Corp. | | | 3,634 | | | | 223,055 | |
Oil Search Ltd. | | | 5,293 | | | | 26,661 | |
OMV AG | | | 1,414 | | | | 61,754 | |
Phillips 66 | | | 1,365 | | | | 117,595 | |
Repsol SA | | | 39,006 | | | | 627,102 | |
Royal Dutch Shell plc, Class A | | | 33,751 | | | | 993,388 | |
Royal Dutch Shell plc, Class B | | | 29,890 | | | | 893,636 | |
Showa Shell Sekiyu KK | | | 15,200 | | | | 210,583 | |
Suncor Energy, Inc. | | | 1,460 | | | | 40,778 | |
TOTAL SA | | | 14,109 | | | | 744,181 | |
TransCanada Corp. | | | 1,306 | | | | 46,636 | |
Valero Energy Corp. | | | 1,529 | | | | 114,629 | |
| | | | | | | | |
| | | | | | | 9,384,327 | |
| | |
| Paper & Forest Products —0.1% | | | | | | |
West Fraser Timber Co. Ltd. | | | 2,692 | | | | 132,983 | |
| | | | | | | | |
| | |
| Personal Products— 1.1% | | | | | | |
Beiersdorf AG | | | 1,836 | | | | 191,499 | |
Estee Lauder Cos., Inc. (The), Class A | | | 3,487 | | | | 453,659 | |
Kao Corp. | | | 4,200 | | | | 310,874 | |
Kobayashi Pharmaceutical Co. Ltd. | | | 400 | | | | 27,126 | |
Kose Corp. | | | 700 | | | | 109,955 | |
| | |
| 10 | | 2018 BLACKROCK ANNUAL REPORTTO SHAREHOLDERS |
| | |
Schedule of Investments (continued) December 31, 2018 | | BlackRock Managed Volatility V.I. Fund (Percentages shown are based on Net Assets) |
| | | | | | | | |
| Security | | Shares | | | Value | |
| | |
| Personal Products (continued) | | | | | | |
L’Oreal SA | | | 1,989 | | | $ | 455,132 | |
Pola Orbis Holdings, Inc. | | | 4,800 | | | | 129,351 | |
Shiseido Co. Ltd. | | | 3,500 | | | | 219,198 | |
Unilever NV, CVA | | | 8,039 | | | | 435,491 | |
Unilever plc | | | 5,484 | | | | 287,925 | |
| | | | | | | | |
| | | | | | | 2,620,210 | |
| | |
| Pharmaceuticals —4.4% | | | | | | |
Allergan plc | | | 1,667 | | | | 222,811 | |
Astellas Pharma, Inc. | | | 32,900 | | | | 420,351 | |
AstraZeneca plc | | | 5,161 | | | | 385,248 | |
Aurora Cannabis, Inc.(a) | | | 1,267 | | | | 6,292 | |
Bausch Health Cos., Inc.(a) | | | 3,846 | | | | 71,134 | |
Bayer AG (Registered) | | | 3,812 | | | | 265,120 | |
Bristol-Myers Squibb Co. | | | 9,422 | | | | 489,756 | |
Chugai Pharmaceutical Co. Ltd. | | | 2,400 | | | | 139,198 | |
Daiichi Sankyo Co. Ltd. | | | 4,500 | | | | 143,936 | |
Eisai Co. Ltd. | | | 1,900 | | | | 147,098 | |
Eli Lilly & Co. | | | 5,433 | | | | 628,707 | |
GlaxoSmithKline plc | | | 21,533 | | | | 410,376 | |
H Lundbeck A/S | | | 2,697 | | | | 118,703 | |
Hisamitsu Pharmaceutical Co., Inc. | | | 500 | | | | 27,601 | |
Johnson & Johnson | | | 10,474 | | | | 1,351,670 | |
Kyowa Hakko Kirin Co. Ltd. | | | 2,800 | | | | 52,909 | |
Merck & Co., Inc. | | | 12,839 | | | | 981,028 | |
Merck KGaA | | | 2,072 | | | | 213,276 | |
Mitsubishi Tanabe Pharma Corp. | | | 3,700 | | | | 53,412 | |
Mylan NV(a) | | | 854 | | | | 23,400 | |
Nektar Therapeutics(a) | | | 1,267 | | | | 41,646 | |
Novartis AG (Registered) | | | 3,970 | | | | 340,008 | |
Novo Nordisk A/S, Class B | | | 15,155 | | | | 696,025 | |
Ono Pharmaceutical Co. Ltd. | | | 2,500 | | | | 51,052 | |
Orion OYJ, Class B | | | 1,912 | | | | 66,516 | |
Otsuka Holdings Co. Ltd. | | | 2,900 | | | | 118,506 | |
Pfizer, Inc. | | | 25,675 | | | | 1,120,714 | |
Roche Holding AG | | | 1,629 | | | | 404,414 | |
Sanofi | | | 9,494 | | | | 823,604 | |
Santen Pharmaceutical Co. Ltd. | | | 1,000 | | | | 14,428 | |
Shionogi & Co. Ltd. | | | 5,000 | | | | 285,377 | |
Sumitomo Dainippon Pharma Co. Ltd. | | | 2,900 | | | | 92,482 | |
Taisho Pharmaceutical Holdings Co. Ltd. | | | 1,000 | | | | 100,368 | |
Takeda Pharmaceutical Co. Ltd. | | | 5,200 | | | | 176,251 | |
Teva Pharmaceutical Industries Ltd., ADR | | | 7,920 | | | | 122,126 | |
UCB SA | | | 1,496 | | | | 122,188 | |
Zoetis, Inc. | | | 1,618 | | | | 138,404 | |
| | | | | | | | |
| | | | | | | 10,866,135 | |
| | |
| Professional Services —0.6% | | | | | | |
CoStar Group, Inc.(a) | | | 347 | | | | 117,057 | |
Equifax, Inc. | | | 2,100 | | | | 195,573 | |
Nielsen Holdings plc | | | 4,731 | | | | 110,374 | |
Recruit Holdings Co. Ltd. | | | 2,600 | | | | 62,813 | |
Robert Half International, Inc. | | | 6,201 | | | | 354,697 | |
SGS SA (Registered) | | | 87 | | | | 195,839 | |
Thomson Reuters Corp. | | | 709 | | | | 34,240 | |
TransUnion | | | 3,487 | | | | 198,062 | |
Verisk Analytics, Inc.(a) | | | 2,879 | | | | 313,926 | |
| | | | | | | | |
| | | | | | | 1,582,581 | |
|
| Real Estate Management & Development— 0.2% | |
Aroundtown SA | | | 3,095 | | | | 25,676 | |
CapitaLand Ltd. | | | 48,600 | | | | 110,829 | |
City Developments Ltd. | | | 1,600 | | | | 9,539 | |
CK Asset Holdings Ltd. | | | 3,000 | | | | 21,950 | |
Daito Trust Construction Co. Ltd. | | | 500 | | | | 68,452 | |
Daiwa House Industry Co. Ltd. | | | 4,000 | | | | 127,594 | |
| | | | | | | | |
| Security | | Shares | | | Value | |
|
| Real Estate Management & Development (continued) | |
Hongkong Land Holdings Ltd. | | | 2,000 | | | $ | 12,608 | |
Mitsubishi Estate Co. Ltd. | | | 1,900 | | | | 29,893 | |
Sumitomo Realty & Development Co. Ltd. | | | 300 | | | | 10,982 | |
Sun Hung Kai Properties Ltd. | | | 3,500 | | | | 49,951 | |
Swiss Prime Site AG (Registered) | | | 653 | | | | 52,894 | |
| | | | | | | | |
| | | | | | | 520,368 | |
| | |
| Road & Rail —0.1% | | | | | | |
Canadian National Railway Co. | | | 1,694 | | | | 125,462 | |
Canadian Pacific Railway Ltd. | | | 123 | | | | 21,825 | |
| | | | | | | | |
| | | | | | | 147,287 | |
|
| Semiconductors & Semiconductor Equipment —0.6% | |
Broadcom, Inc. | | | 568 | | | | 144,431 | |
Infineon Technologies AG | | | 12,653 | | | | 253,334 | |
Intel Corp. | | | 11,887 | | | | 557,857 | |
NVIDIA Corp. | | | 456 | | | | 60,876 | |
NXP Semiconductors NV(a) | | | 621 | | | | 45,507 | |
QUALCOMM, Inc. | | | 1,818 | | | | 103,462 | |
Renesas Electronics Corp.(a) | | | 5,400 | | | | 24,527 | |
Rohm Co. Ltd. | | | 600 | | | | 38,295 | |
STMicroelectronics NV | | | 10,702 | | | | 151,686 | |
SUMCO Corp. | | | 3,900 | | | | 43,434 | |
Texas Instruments, Inc. | | | 1,004 | | | | 94,878 | |
| | | | | | | | |
| | | | | | | 1,518,287 | |
| | |
| Software —1.3% | | | | | | |
Adobe, Inc.(a) | | | 179 | | | | 40,497 | |
BlackBerry Ltd.(a) | | | 4,086 | | | | 29,062 | |
CDK Global, Inc. | | | 2,483 | | | | 118,886 | |
Citrix Systems, Inc.(a) | | | 549 | | | | 56,251 | |
Constellation Software, Inc. | | | 279 | | | | 178,587 | |
Intuit, Inc. | | | 1,817 | | | | 357,676 | |
Microsoft Corp. | | | 17,956 | | | | 1,823,792 | |
Open Text Corp. | | | 2,033 | | | | 66,268 | |
Oracle Corp. | | | 4,822 | | | | 217,713 | |
SAP SE | | | 2,861 | | | | 283,953 | |
Temenos AG (Registered)(a) | | | 741 | | | | 89,041 | |
| | | | | | | | |
| | | | | | | 3,261,726 | |
| | |
| Specialty Retail —2.3% | | | | | | |
Advance Auto Parts, Inc. | | | 281 | | | | 44,246 | |
AutoZone, Inc.(a) | | | 158 | | | | 132,458 | |
Best Buy Co., Inc. | | | 2,630 | | | | 139,285 | |
Burlington Stores, Inc.(a) | | | 2,073 | | | | 337,215 | |
Gap, Inc. (The) | | | 11,376 | | | | 293,046 | |
Hennes & Mauritz AB, Class B | | | 1,877 | | | | 26,693 | |
Home Depot, Inc. (The) | | | 5,468 | | | | 939,512 | |
L Brands, Inc. | | | 11,301 | | | | 290,097 | |
Lowe’s Cos., Inc. | | | 4,492 | | | | 414,881 | |
O’Reilly Automotive, Inc.(a) | | | 565 | | | | 194,546 | |
Ross Stores, Inc. | | | 7,118 | | | | 592,217 | |
Tiffany & Co. | | | 6,264 | | | | 504,315 | |
TJX Cos., Inc. (The) | | | 13,023 | | | | 582,649 | |
Tractor Supply Co. | | | 7,217 | | | | 602,186 | |
Ulta Beauty, Inc.(a) | | | 2,877 | | | | 704,405 | |
| | | | | | | | |
| | | | | | | 5,797,751 | |
|
| Technology Hardware, Storage & Peripherals— 2.1% | |
Apple, Inc. | | | 21,987 | | | | 3,468,229 | |
Brother Industries Ltd. | | | 3,700 | | | | 54,765 | |
Canon, Inc. | | | 3,400 | | | | 93,553 | |
Dell Technologies, Inc., Class C(a) | | | 1,745 | | | | 85,287 | |
FUJIFILM Holdings Corp. | | | 5,700 | | | | 220,958 | |
Hewlett Packard Enterprise Co. | | | 7,031 | | | | 92,880 | |
HP, Inc. | | | 9,357 | | | | 191,444 | |
Konica Minolta, Inc. | | | 5,800 | | | | 52,208 | |
| | | | |
| SCHEDULE OF INVESTMENTS | | | 11 | |
| | |
Schedule of Investments (continued) December 31, 2018 | | BlackRock Managed Volatility V.I. Fund (Percentages shown are based on Net Assets) |
| | | | | | | | |
| Security | | Shares | | | Value | |
|
| Technology Hardware, Storage & Peripherals (continued) | |
NEC Corp. | | | 1,800 | | | $ | 53,521 | |
NetApp, Inc. | | | 3,926 | | | | 234,265 | |
Ricoh Co. Ltd. | | | 7,400 | | | | 72,312 | |
Seagate Technology plc(c) | | | 7,802 | | | | 301,079 | |
Seiko Epson Corp. | | | 6,400 | | | | 89,387 | |
Western Digital Corp. | | | 2,761 | | | | 102,074 | |
Xerox Corp. | | | 3,240 | | | | 64,022 | |
| | | | | | | | |
| | | | | | | 5,175,984 | |
|
| Textiles, Apparel & Luxury Goods —0.7% | |
adidas AG | | | 1,302 | | | | 272,104 | |
Asics Corp. | | | 7,300 | | | | 92,715 | |
Gildan Activewear, Inc. | | | 11,628 | | | | 352,962 | |
HUGO BOSS AG | | | 1,025 | | | | 63,185 | |
Kering SA | | | 734 | | | | 343,856 | |
LVMH Moet Hennessy Louis Vuitton SE | | | 1,718 | | | | 502,989 | |
NIKE, Inc., Class B | | | 549 | | | | 40,703 | |
Pandora A/S | | | 1,240 | | | | 50,623 | |
Puma SE | | | 35 | | | | 17,123 | |
| | | | | | | | |
| | | | | | | 1,736,260 | |
| | |
| Tobacco —0.6% | | | | | | |
Altria Group, Inc. | | | 7,912 | | | | 390,773 | |
British American Tobacco plc | | | 8,641 | | | | 274,948 | |
Japan Tobacco, Inc. | | | 7,300 | | | | 173,456 | |
Philip Morris International, Inc. | | | 5,493 | | | | 366,713 | |
Swedish Match AB | | | 5,505 | | | | 216,718 | |
| | | | | | | | |
| | | | | | | 1,422,608 | |
|
| Trading Companies & Distributors —0.1% | |
Ashtead Group plc | | | 1,144 | | | | 23,863 | |
Ferguson plc | | | 1,048 | | | | 66,965 | |
Finning International, Inc. | | | 7,029 | | | | 122,539 | |
Marubeni Corp. | | | 1,600 | | | | 11,227 | |
| | | | | | | | |
| | | | | | | 224,594 | |
| | |
| Transportation Infrastructure —0.2% | | | | | | |
Transurban Group(d) | | | 45,040 | | | | 369,667 | |
| | | | | | | | |
| |
Total Common Stocks— 55.3%
(Cost: $149,296,836) | | | | 137,120,788 | |
| | | | | | | | |
| | |
| | | Par
(000) | | | | |
| | |
Corporate Bonds— 0.0% | | | | | | | | |
|
| Diversified Telecommunication Services— 0.0% | |
AT&T, Inc., 7.13%, 12/15/31 | | | USD 25 | | | | 27,399 | |
| | | | | | | | |
| |
Total Corporate Bonds— 0.0%
(Cost: $30,294) | | | | 27,399 | |
| | | | | | | | |
| | |
| | | Beneficial
Interest
(000) | | | | |
| | |
Other Interests— 0.0%(a)(e)(f)(g) | | | | | | | | |
| | |
| Capital Markets— 0.0% | | | | | | |
Lehman Brothers Holdings, Inc. | | | 25 | | | | — | |
| | | | | | | | |
| |
Total Other Interests— 0.0% | | | | — | |
| | | | | | | | |
| | |
| | | Shares | | | | |
|
| Preferred Stocks— 0.2% | |
| | |
Automobiles— 0.1% | | | | | | | | |
Bayerische Motoren Werke AG (Preference) | | | 992 | | | | 70,741 | |
Porsche Automobil Holding SE (Preference) | | | 1,657 | | | | 97,452 | |
| | | | | | | | |
| | |
| Security | | Shares | | | Value | |
|
| Preferred Stocks (continued) | |
Volkswagen AG (Preference) | | | 669 | | | $ | 106,676 | |
| | | | | | | | |
| | | | 274,869 | |
| | |
| Chemicals— 0.0% | | | | | | |
Fuchs Petrolub SE (Preference) | | | 2,367 | | | | 97,857 | |
| | | | | | | | |
|
| Health Care Equipment & Supplies— 0.0% | |
Sartorius AG (Preference) | | | 173 | | | | 21,531 | |
| | | | | | | | |
| | |
| Household Products— 0.1% | | | | | | |
Henkel AG & Co. KGaA (Preference) | | | 2,202 | | | | 240,522 | |
| | | | | | | | |
| |
Total Preferred Stocks— 0.2%
(Cost: $660,706) | | | | 634,779 | |
| | | | | | | | |
| | |
Rights— 0.0%(a) | | | | | | | | |
|
| Oil, Gas & Consumable Fuels —0.0% | |
Repsol SA | | | 39,006 | | | | 17,876 | |
| | | | | | | | |
| |
Total Rights— 0.0%
(Cost: $17,852) | | | | 17,876 | |
| | | | | | | | |
| | |
| | | Par
(000) | | | | |
|
U.S. Government Sponsored Agency Obligations — 0.3% | |
Federal Home Loan Mortgage Corp. Notes, 3.75%, 03/27/19 | | | USD 680 | | | | 682,097 | |
| | | | | | | | |
| |
Total U.S. Government Sponsored Agency Securities — 0.3%
(Cost: $683,597) | | | | 682,097 | |
| | | | | | | | |
|
U.S. Treasury Obligations— 22.6% | |
U.S. Treasury Bonds, 8.75%, 08/15/20 | | | 14,500 | | | | 15,908,653 | |
U.S. Treasury Notes: | | | | | | | | |
3.63%, 02/15/20 | | | 14,500 | | | | 14,657,461 | |
2.75%, 08/15/21 | | | 11,500 | | | | 11,577,715 | |
1.13%, 08/31/21 | | | 14,500 | | | | 13,995,898 | |
| | | | | | | | |
| |
Total U.S. Treasury Obligations— 22.6%
(Cost: $56,024,056) | | | | 56,139,727 | |
| | | | | | | | |
| |
Total Long-Term Investments— 78.4%
(Cost: $206,713,341) | | | | 194,622,666 | |
| | | | | | | | |
| | |
| | | Shares | | | | |
|
Short-Term Securities — 5.0%(h)(j) | |
BlackRock Liquidity Funds, T-Fund, Institutional Class, 2.32% | | | 11,969,958 | | | | 11,969,958 | |
SL Liquidity Series, LLC, Money Market Series, 2.57%(i) | | | 459,918 | | | | 459,872 | |
| | | | | | | | |
| |
Total Short-Term Securities — 5.0%
(Cost: $12,429,834) | | | | 12,429,830 | |
| | | | | | | | |
| |
Total Investments — 83.4%
(Cost: $219,143,175) | | | | 207,052,496 | |
| |
Other Assets Less Liabilities — 16.6% | | | | 41,097,428 | |
| | | | | | | | |
| |
Net Assets — 100.0% | | | $ | 248,149,924 | |
| | | | | | | | |
| (a) | Non-income producing security. |
| (b) | Security exempt from registration pursuant to Rule 144A under the Securities Act of 1933, as amended. These securities may be resold in transactions exempt from registration to qualified institutional investors. |
| (c) | Security, or a portion of the security, is on loan. |
| (d) | A security contractually bound to one or more other securities to form a single saleable unit which cannot be sold separately. |
| | |
| 12 | | 2018 BLACKROCK ANNUAL REPORTTO SHAREHOLDERS |
| | |
Schedule of Investments (continued) December 31, 2018 | | BlackRock Managed Volatility V.I. Fund |
| (e) | Other interests represent beneficial interests in liquidation trusts and other reorganizational or private entities. |
| (f) | Issuer filed for bankruptcy and/or is in default. |
| (g) | Security is valued using significant unobservable inputs and is classified as Level 3 in the fair value hierarchy. |
| (h) | Annualized 7-day yield as of period end. |
| (i) | Security was purchased with the cash collateral from loaned securities. |
| (j) | During the year ended December 31, 2018, investments in issuers considered to be affiliates of the Fund for purposes of Section 2(a)(3) of the Investment Company Act of 1940, as amended, and/or related parties of the Fund were as follows: |
| | | | | | | | | | | | | | | | | | | | | | | | | | | | | | | | |
| Affiliated Persons and/or Related Parties | | Par/ Shares
Held at
12/31/17 | | | Par/ Shares
Purchased | | | Par/ Shares
Sold | | | Par/ Shares
Held at
12/31/18 | | | Value at
12/31/18 | | | Income | | | Net
Realized
Gain (Loss) (a) | | | Change in
Unrealized
Appreciation
(Depreciation) | |
BlackRock Liquidity Funds, T-Fund, Institutional Class | | | 3,387,049 | | | | 8,582,909 | (b) | | | — | | | | 11,969,958 | | | $ | 11,969,958 | | | $ | 460,581 | | | $ | — | | | $ | — | |
SL Liquidity Series, LLC, Money Market Series | | | 1,935,844 | | | | — | | | | (1,475,926 | )(c) | | | 459,918 | | | | 459,872 | | | | 3,019 | (d) | | | (68 | ) | | | (4 | ) |
BlackRock, Inc. | | | — | | | | 105,000 | | | | (105,000 | ) | | | — | | | | — | | | | 102 | | | | (212 | ) | | | — | |
BlackRock, Inc. | | | — | | | | 378 | | | | (378 | ) | | | — | | | | — | | | | — | | | | 79,675 | | | | — | |
iShares 1-3 Year Credit Bond ETF | | | 15,923 | | | | — | | | | (15,923 | ) | | | — | | | | — | | | | 7,571 | | | | (29,567 | ) | | | 14,296 | |
iShares 3-7 Year Treasury Bond ETF | | | 6,491 | | | | — | | | | (6,491 | ) | | | — | | | | — | | | | 3,290 | | | | (25,574 | ) | | | 7,607 | |
iShares Core U.S. Aggregate Bond ETF | | | 17,278 | | | | — | | | | (17,278 | ) | | | — | | | | — | | | | 12,444 | | | | (85,240 | ) | | | 27,745 | |
iShares MSCI EAFE ETF | | | 21,263 | | | | — | | | | (21,263 | ) | | | — | | | | — | | | | — | | | | 131,855 | | | | (116,368 | ) |
PNC Financial Services Group, Inc. (The)(e) | | | — | | | | 1,442 | | | | (1,442 | ) | | | — | | | | N/A | | | | 1,082 | | | | 90,833 | | | | — | |
PNC Financial Services Group, Inc. (The)(e) | | | — | | | | 320,000 | | | | (320,000 | ) | | | — | | | | N/A | | | | 259 | | | | (2,665 | ) | | | — | |
| | | | | | | | | | | | | | | | | | | | | | | | | | | | | | | | |
| | | | | | | | | | | | | | | | | | $ | 12,429,830 | | | $ | 488,348 | | | $ | 159,037 | | | $ | (66,724 | ) |
| | | | | | | | | | | | | | | | | | | | | | | | | | | | | | | | |
| | (a) | Includes net capital gain distributions, if applicable. | |
| | (b) | Represents net shares purchased. | |
| | (c) | Represents net shares sold. | |
| | (d) | Represents securities lending income earned from the reinvestment of cash collateral from loaned securities, net of fees and collateral investment expenses, and other payments to and from borrowers of securities. | |
| | (e) | As of period end, the entity is no longer an affiliate of the Fund. | |
For Fund compliance purposes, the Fund’s industry classifications refer to one or more of the industry sub-classifications used by one or more widely recognized market indexes or ratings group indexes, and/or as defined by the investment adviser. These definitions may not apply for purposes of this report, which may combine such industry sub-classifications for reporting ease.
Derivative Financial Instruments Outstanding as of Period End
Futures Contracts
| | | | | | | | | | | | | | | | |
| Description | | Number of
Contracts | | | Expiration
Date | | | Notional
Amount (000) | | | Value/
Unrealized
Appreciation (Depreciation) | |
Long Contracts | | | | | | | | | | | | | | | | |
Amsterdam Exchange Index | | | 263 | | | | 01/18/19 | | | $ | 29,393 | | | $ | (1,193,142 | ) |
CAC 40 10 Euro Index | | | 105 | | | | 01/18/19 | | | | 5,689 | | | | (189,975 | ) |
Euro-BTP | | | 70 | | | | 03/07/19 | | | | 10,251 | | | | 371,044 | |
TOPIX Index | | | 58 | | | | 03/07/19 | | | | 7,903 | | | | (479,296 | ) |
Australia 10 Year Bond | | | 169 | | | | 03/15/19 | | | | 15,793 | | | | 191,398 | |
DAX Index | | | 66 | | | | 03/15/19 | | | | 19,966 | | | | (688,113 | ) |
FTSE 100 Index | | | 105 | | | | 03/15/19 | | | | 8,912 | | | | (224,631 | ) |
FTSE/MIB Index | | | 109 | | | | 03/15/19 | | | | 11,368 | | | | (449,422 | ) |
Canada 10 Year Bond | | | 692 | | | | 03/20/19 | | | | 69,327 | | | | 1,579,271 | |
U.S. Treasury 10 Year Note | | | 59 | | | | 03/20/19 | | | | 7,199 | | | | 91,619 | |
SPI 200 Index | | | 112 | | | | 03/21/19 | | | | 10,967 | | | | (102,552 | ) |
| | | | | | | | | | | | | | | | |
| | | | | | | | | | | | | | | (1,093,799 | ) |
| | | | | | | | | | | | | | | | |
| | | | |
| SCHEDULE OF INVESTMENTS | | | 13 | |
| | |
Schedule of Investments (continued) December 31, 2018 | | BlackRock Managed Volatility V.I. Fund |
Futures Contracts (continued)
| | | | | | | | | | | | | | | | |
| Description | | Number of
Contracts | | | Expiration
Date | | | Notional
Amount (000) | | | Value/
Unrealized
Appreciation (Depreciation) | |
Short Contracts | | | | | | | | | | | | | | | | |
IBEX 35 Index | | | 255 | | | | 01/18/19 | | | $ | 24,884 | | | $ | 1,110,273 | |
OMXS30 Index | | | 537 | | | | 01/18/19 | | | | 8,532 | | | | 449,272 | |
Hang Seng Index | | | 82 | | | | 01/30/19 | | | | 13,537 | | | | (91,278 | ) |
MSCI Singapore Index | | | 1,173 | | | | 01/30/19 | | | | 29,408 | | | | (58,095 | ) |
Euro-Bund | | | 31 | | | | 03/07/19 | | | | 5,809 | | | | (12,013 | ) |
S&P/TSX 60 Index | | | 45 | | | | 03/14/19 | | | | 5,652 | | | | 176,956 | |
MSCI EAFE E-Mini Index | | | 591 | | | | 03/15/19 | | | | 50,708 | | | | 1,759,259 | |
S&P 500 E-Mini Index | | | 715 | | | | 03/15/19 | | | | 89,561 | | | | 5,394,431 | |
Long Gilt | | | 151 | | | | 03/27/19 | | | | 23,706 | | | | 6,278 | |
| | | | | | | | | | | | | | | | |
| | | | | | | | | | | | | | | 8,735,083 | |
| | | | | | | | | | | | | | | | |
| | | | | | | | | | | | | | $ | 7,641,284 | |
| | | | | | | | | | | | | | | | |
Forward Foreign Currency Exchange Contracts
| | | | | | | | | | | | | | | | | | | | |
Currency
Purchased | | | Currency
Sold | | | Counterparty | | Settlement Date | | | Unrealized
Appreciation
(Depreciation) | |
| BRL | | | 19,126,000 | | | USD | | | 4,866,667 | | | JPMorgan Chase Bank NA | | | 03/20/19 | | | $ | 40,180 | |
| BRL | | | 21,174,000 | | | USD | | | 5,429,323 | | | UBS AG | | | 03/20/19 | | | | 2,946 | |
| CHF | | | 1,760,000 | | | USD | | | 1,794,232 | | | UBS AG | | | 03/20/19 | | | | 9,332 | |
| EUR | | | 9,439,000 | | | USD | | | 10,781,292 | | | JPMorgan Chase Bank NA | | | 03/20/19 | | | | 103,250 | |
| EUR | | | 10,983,115 | | | USD | | | 12,613,613 | | | UBS AG | | | 03/20/19 | | | | 51,518 | |
| INR | | | 892,440,000 | | | USD | | | 12,388,118 | | | BNP Paribas SA | | | 03/20/19 | | | | 337,310 | |
| JPY | | | 907,186,000 | | | USD | | | 8,090,254 | | | Morgan Stanley & Co. International plc | | | 03/20/19 | | | | 237,884 | |
| JPY | | | 67,064,000 | | | USD | | | 600,827 | | | UBS AG | | | 03/20/19 | | | | 14,833 | |
| KRW | | | 3,018,528,000 | | | USD | | | 2,697,301 | | | Goldman Sachs International | | | 03/20/19 | | | | 20,428 | |
| KRW | | | 6,718,906,000 | | | USD | | | 5,975,016 | | | JPMorgan Chase Bank NA | | | 03/20/19 | | | | 74,344 | |
| MXN | | | 79,157,000 | | | USD | | | 3,843,599 | | | Morgan Stanley & Co. International plc | | | 03/20/19 | | | | 136,676 | |
| MYR | | | 45,267,000 | | | USD | | | 10,825,541 | | | UBS AG | | | 03/20/19 | | | | 119,047 | |
| PLN | | | 21,719,000 | | | USD | | | 5,784,186 | | | UBS AG | | | 03/20/19 | | | | 29,788 | |
| THB | | | 175,568,000 | | | USD | | | 5,372,338 | | | Goldman Sachs International | | | 03/20/19 | | | | 30,838 | |
| USD | | | 2,549,755 | | | AUD | | | 3,548,000 | | | Morgan Stanley & Co. International plc | | | 03/20/19 | | | | 47,456 | |
| USD | | | 3,459,306 | | | AUD | | | 4,785,033 | | | UBS AG | | | 03/20/19 | | | | 84,565 | |
| USD | | | 6,658,354 | | | CAD | | | 8,906,000 | | | Morgan Stanley & Co. International plc | | | 03/20/19 | | | | 123,132 | |
| USD | | | 18,713,259 | | | CAD | | | 24,819,820 | | | UBS AG | | | 03/20/19 | | | | 500,480 | |
| USD | | | 353,140 | | | NOK | | | 3,035,000 | | | Morgan Stanley & Co. International plc | | | 03/20/19 | | | | 939 | |
| USD | | | 75,663 | | | NZD | | | 110,000 | | | UBS AG | | | 03/20/19 | | | | 1,732 | |
| USD | | | 273,152 | | | ZAR | | | 3,902,000 | | | UBS AG | | | 03/20/19 | | | | 4,421 | |
| | | | | | | | | | | | | | | | | | | | |
| | | | | | | | | | | | | | | | | | | 1,971,099 | |
| | | | | | | | | | | | | | | | | | | | |
| AUD | | | 7,068,000 | | | USD | | | 5,098,113 | | | JPMorgan Chase Bank NA | | | 03/20/19 | | | | (113,263 | ) |
| AUD | | | 15,452,565 | | | USD | | | 11,190,748 | | | UBS AG | | | 03/20/19 | | | | (292,512 | ) |
| CAD | | | 11,771,000 | | | USD | | | 8,814,673 | | | Morgan Stanley & Co. International plc | | | 03/20/19 | | | | (177,116 | ) |
| GBP | | | 3,240,000 | | | USD | | | 4,151,428 | | | UBS AG | | | 03/20/19 | | | | (6,348 | ) |
| NOK | | | 2,192,000 | | | USD | | | 259,465 | | | UBS AG | | | 03/20/19 | | | | (5,091 | ) |
| USD | | | 8,670,377 | | | CNY | | | 59,973,000 | | | Citibank NA | | | 03/20/19 | | | | (59,672 | ) |
| USD | | | 10,009,965 | | | CNY | | | 69,110,000 | | | Morgan Stanley & Co. International plc | | | 03/20/19 | | | | (50,124 | ) |
| USD | | | 5,626,428 | | | CNY | | | 38,918,000 | | | UBS AG | | | 03/20/19 | | | | (38,723 | ) |
| USD | | | 586,065 | | | CZK | | | 13,243,000 | | | UBS AG | | | 03/20/19 | | | | (4,832 | ) |
| USD | | | 109,514 | | | EUR | | | 96,000 | | | JPMorgan Chase Bank NA | | | 03/20/19 | | | | (1,188 | ) |
| USD | | | 26,204,627 | | | EUR | | | 22,791,251 | | | UBS AG | | | 03/20/19 | | | | (77,005 | ) |
| | |
| 14 | | 2018 BLACKROCK ANNUAL REPORTTO SHAREHOLDERS |
| | |
Schedule of Investments (continued) December 31, 2018 | | BlackRock Managed Volatility V.I. Fund |
Forward Foreign Currency Exchange Contracts (continued)
| | | | | | | | | | | | | | | | | | | | |
Currency
Purchased | | | Currency
Sold | | | Counterparty | | Settlement Date | | | Unrealized
Appreciation
(Depreciation) | |
| USD | | | 4,671,109 | | | GBP | | | 3,685,000 | | | Morgan Stanley & Co. International plc | | | 03/20/19 | | | $ | (43,280 | ) |
| USD | | | 103,887 | | | INR | | | 7,484,000 | | | BNP Paribas SA | | | 03/20/19 | | | | (2,829 | ) |
| USD | | | 5,452,177 | | | INR | | | 396,237,000 | | | Citibank NA | | | 03/20/19 | | | | (197,822 | ) |
| USD | | | 10,321,726 | | | JPY | | | 1,152,479,950 | | | UBS AG | | | 03/20/19 | | | | (258,257 | ) |
| USD | | | 3,808,357 | | | MXN | | | 77,740,000 | | | Morgan Stanley & Co. International plc | | | 03/20/19 | | | | (100,666 | ) |
| USD | | | 870,393 | | | MXN | | | 17,911,000 | | | UBS AG | | | 03/20/19 | | | | (30,232 | ) |
| USD | | | 7,912,781 | | | MYR | | | 32,947,000 | | | UBS AG | | | 03/20/19 | | | | (53,096 | ) |
| USD | | | 10,281,224 | | | PLN | | | 38,839,000 | | | Morgan Stanley & Co. International plc | | | 03/20/19 | | | | (115,615 | ) |
| USD | | | 358,732 | | | PLN | | | 1,347,000 | | | UBS AG | | | 03/20/19 | | | | (1,847 | ) |
| USD | | | 6,189,552 | | | SEK | | | 55,625,000 | | | Morgan Stanley & Co. International plc | | | 03/20/19 | | | | (125,275 | ) |
| USD | | | 1,924,558 | | | SEK | | | 17,220,000 | | | UBS AG | | | 03/20/19 | | | | (30,343 | ) |
| USD | | | 539,475 | | | SGD | | | 739,000 | | | Morgan Stanley & Co. International plc | | | 03/20/19 | | | | (3,680 | ) |
| USD | | | 222,488 | | | SGD | | | 304,000 | | | UBS AG | | | 03/20/19 | | | | (948 | ) |
| USD | | | 24,700,903 | | | THB | | | 808,097,000 | | | Goldman Sachs International | | | 03/20/19 | | | | (168,606 | ) |
| USD | | | 3,052,537 | | | ZAR | | | 44,361,000 | | | Morgan Stanley & Co. International plc | | | 03/20/19 | | | | (2,599 | ) |
| ZAR | | | 45,974,000 | | | USD | | | 3,171,189 | | | Morgan Stanley & Co. International plc | | | 03/20/19 | | | | (4,965 | ) |
| ZAR | | | 85,135,000 | | | USD | | | 5,959,710 | | | UBS AG | | | 03/20/19 | | | | (96,472 | ) |
| | | | | | | | | | | | | | | | | | | | |
| | | | | | | | | | | | | | | | | | | (2,062,406 | ) |
| | | | | | | | | | | | | | | | | | | | |
| | | Net Unrealized Depreciation | | | $ | (91,307 | ) |
| | | | | | | | | | | | | | | | | | | | |
Centrally Cleared Interest Rate Swaps
| | | | | | | | | | | | | | | | | | | | | | | | | | | | | | | | | | | | |
| Paid by the Fund | | Received by the Fund | | Effective
Date | | | Termination
Date | | | Notional
Amount (000) | | | Value | | | Upfront
Premium
Paid
(Received) | | | Unrealized
Appreciation
(Depreciation) | |
| Rate | | Frequency | | Rate | | | Frequency |
| 28 day MXIBTIIE | | Monthly | | | 9.04% | | | Monthly | | | 03/20/19 | (a) | | | 03/13/24 | | | | MXN | | | | 310,000 | | | $ | 279,090 | | | $ | — | | | $ | 279,090 | |
| 28 day MXIBTIIE | | Monthly | | | 8.93% | | | Monthly | | | 03/20/19 | (a) | | | 03/13/24 | | | | MXN | | | | 523,000 | | | | 353,113 | | | | — | | | | 353,113 | |
| 28 day MXIBTIIE | | Monthly | | | 8.75% | | | Monthly | | | 03/20/19 | (a) | | | 03/13/24 | | | | MXN | | | | 900,000 | | | | 285,306 | | | | — | | | | 285,306 | |
| 28 day MXIBTIIE | | Monthly | | | 8.66% | | | Monthly | | | 03/20/19 | (a) | | | 03/13/24 | | | | MXN | | | | 229,550 | | | | 28,137 | | | | — | | | | 28,137 | |
| 28 day MXIBTIIE | | Monthly | | | 8.97% | | | Monthly | | | 03/20/19 | (a) | | | 03/13/24 | | | | MXN | | | | 318,000 | | | | 243,991 | | | | — | | | | 243,991 | |
| 3.11% | | Semi-Annual | | | 3 month LIBOR | | | Quarterly | | | 03/20/19 | (a) | | | 03/19/24 | | | | USD | | | | 28,000 | | | | (701,425 | ) | | | — | | | | (701,425 | ) |
| 3.21% | | Semi-Annual | | | 3 month LIBOR | | | Quarterly | | | 03/20/19 | (a) | | | 03/19/24 | | | | USD | | | | 29,000 | | | | (859,170 | ) | | | 1,916 | | | | (861,086 | ) |
| 3.04% | | Semi-Annual | | | 3 month LIBOR | | | Quarterly | | | 03/20/19 | (a) | | | 03/19/24 | | | | USD | | | | 30,000 | | | | (650,674 | ) | | | (2,069 | ) | | | (648,605 | ) |
| 6 month LIBOR | | Semi-Annual | | | 1.52% | | | Semi-Annual | | | 03/20/19 | (a) | | | 03/20/24 | | | | GBP | | | | 32,000 | | | | 393,071 | | | | — | | | | 393,071 | |
| 6 month EURIBOR | | Semi-Annual | | | 0.59% | | | Annual | | | 03/20/19 | (a) | | | 03/20/24 | | | | EUR | | | | 63,000 | | | | 1,257,775 | | | | 5,998 | | | | 1,251,777 | |
| 6 month BBR | | Semi-Annual | | | 2.61% | | | Semi-Annual | | | 03/20/19 | (a) | | | 03/20/24 | | | | AUD | | | | 25,000 | | | | 307,008 | | | | — | | | | 307,008 | |
| 6 month BBR | | Semi-Annual | | | 2.58% | | | Semi-Annual | | | 03/20/19 | (a) | | | 03/20/24 | | | | AUD | | | | 49,500 | | | | 563,808 | | | | — | | | | 563,808 | |
| 6 month BBR | | Semi-Annual | | | 2.57% | | | Semi-Annual | | | 03/20/19 | (a) | | | 03/20/24 | | | | AUD | | | | 23,500 | | | | 258,369 | | | | — | | | | 258,369 | |
| 6 month EURIBOR | | Semi-Annual | | | 0.37% | | | Annual | | | 03/20/19 | (a) | | | 03/20/24 | | | | EUR | | | | 23,000 | | | | 168,824 | | | | — | | | | 168,824 | |
| 6 month LIBOR | | Semi-Annual | | | 1.38% | | | Semi-Annual | | | 03/20/19 | (a) | | | 03/20/24 | | | | GBP | | | | 13,000 | | | | 50,715 | | | | — | | | | 50,715 | |
| 2.48% | | Annual | | | 6 month WIBOR | | | Semi-Annual | | | 03/20/19 | (a) | | | 03/20/24 | | | | PLN | | | | 74,900 | | | | (306,773 | ) | | | — | | | | (306,773 | ) |
| 2.47% | | Annual | | | 6 month WIBOR | | | Semi-Annual | | | 03/20/19 | (a) | | | 03/20/24 | | | | PLN | | | | 139,100 | | | | (552,318 | ) | | | — | | | | (552,318 | ) |
| 3 month JIBAR | | Quarterly | | | 7.81% | | | Quarterly | | | 03/20/19 | (a) | | | 03/20/24 | | | | ZAR | | | | 1,000 | | | | 240 | | | | — | | | | 240 | |
| 2.48% | | Semi-Annual | | | 3 month BA | | | Semi-Annual | | | 03/20/19 | (a) | | | 03/20/24 | | | | CAD | | | | 36,000 | | | | (230,577 | ) | | | (3,810 | ) | | | (226,767 | ) |
| 6 month LIBOR | | Semi-Annual | | | 1.56% | | | Semi-Annual | | | 03/20/19 | (a) | | | 03/20/24 | | | | GBP | | | | 27,000 | | | | 403,779 | | | | 18,850 | | | | 384,929 | |
| 6 month BBR | | Semi-Annual | | | 2.61% | | | Semi-Annual | | | 03/20/19 | (a) | | | 03/20/24 | | | | AUD | | | | 48,000 | | | | 586,289 | | | | — | | | | 586,289 | |
| 2.59% | | Annual | | | 6 month WIBOR | | | Semi-Annual | | | 03/20/19 | (a) | | | 03/20/24 | | | | PLN | | | | 98,000 | | | | (527,072 | ) | | | — | | | | (527,072 | ) |
| 2.64% | | Annual | | | 6 month WIBOR | | | Semi-Annual | | | 03/20/19 | (a) | | | 03/20/24 | | | | PLN | | | | 98,000 | | | | (588,382 | ) | | | — | | | | (588,382 | ) |
| 6 month LIBOR | | Semi-Annual | | | 1.00% | | | Semi-Annual | | | 03/20/19 | (a) | | | 03/20/24 | | | | GBP | | | | 12,000 | | | | (233,212 | ) | | | (209,081 | ) | | | (24,131 | ) |
| 2.31% | | Annual | | | 6 month WIBOR | | | Semi-Annual | | | 03/20/19 | (a) | | | 03/20/24 | | | | PLN | | | | 68,000 | | | | (133,871 | ) | | | — | | | | (133,871 | ) |
| 6 month EURIBOR | | Semi-Annual | | | 0.32% | | | Annual | | | 03/20/19 | (a) | | | 03/20/24 | | | | EUR | | | | 25,000 | | | | 104,961 | | | | (8,089 | ) | | | 113,050 | |
| 3 month JIBAR | | Quarterly | | | 8.39% | | | Quarterly | | | 03/20/19 | (a) | | | 03/20/24 | | | | ZAR | | | | 1,018,000 | | | | 1,904,841 | | | | — | | | | 1,904,841 | |
| | | | | | | | | | | | | | | | | | | | | | | | | | | | | | | | | | | | |
| | | | | | | | | | | | | | | | | | | | | | | | | | $ | 2,405,843 | | | $ | (196,285 | ) | | $ | 2,602,128 | |
| | | | | | | | | | | | | | | | | | | | | | | | | | | | | | | | | | | | |
| | | | |
| SCHEDULE OF INVESTMENTS | | | 15 | |
| | |
Schedule of Investments (continued) December 31, 2018 | | BlackRock Managed Volatility V.I. Fund |
OTC Interest Rate Swaps
| | | | | | | | | | | | | | | | | | | | | | | | | | | | | | | | | | | | | | |
| Paid by the Fund | | Received by the Fund | | Counterparty | | Effective
Date | | | Termination
Date | | | Notional
Amount
(000) | | | Value | | | Upfront
Premium
Paid
(Received) | | | Unrealized
Appreciation
(Depreciation) | |
| Rate | | Frequency | | Rate | | | Frequency |
| 6.55% | | Semi-Annual | | | 1 day MIBOR | | | Semi-Annual | | Bank of America NA | | | 03/20/19 | (a) | | | 03/20/24 | | | | INR | | | | 502,405 | | | $ | (85,551 | ) | | $ | — | | | $ | (85,551 | ) |
| 3 month TWCPBA | | Quarterly | | | 1.11% | | | Quarterly | | Bank of America NA | | | 03/20/19 | (a) | | | 03/20/24 | | | | TWD | | | | 231,000 | | | | 86,328 | | | | — | | | | 86,328 | |
| 1.78% | | Quarterly | | | 3 month CD_KSDA | | | Quarterly | | Bank of America NA | | | 03/20/19 | (a) | | | 03/20/24 | | | | KRW | | | | 10,768,570 | | | | (5,451 | ) | | | — | | | | (5,451 | ) |
| 2.12% | | Quarterly | | | 3 month CD_KSDA | | | Quarterly | | Bank of America NA | | | 03/20/19 | (a) | | | 03/20/24 | | | | KRW | | | | 17,122,356 | | | | (258,795 | ) | | | — | | | | (258,795 | ) |
| 3 month TWCPBA | | Quarterly | | | 1.09% | | | Quarterly | | Bank of America NA | | | 03/20/19 | (a) | | | 03/20/24 | | | | TWD | | | | 262,000 | | | | 91,235 | | | | — | | | | 91,235 | |
| 6.60% | | Semi-Annual | | | 1 day MIBOR | | | Semi-Annual | | Bank of America NA | | | 03/20/19 | (a) | | | 03/20/24 | | | | INR | | | | 493,526 | | | | (99,576 | ) | | | — | | | | (99,576 | ) |
| 6.60% | | Semi-Annual | | | 1 day MIBOR | | | Semi-Annual | | Bank of America NA | | | 03/20/19 | (a) | | | 03/20/24 | | | | INR | | | | 1,221,123 | | | | (248,209 | ) | | | — | | | | (248,209 | ) |
| 3 month TWCPBA | | Quarterly | | | 1.09% | | | Quarterly | | Bank of America NA | | | 03/20/19 | (a) | | | 03/20/24 | | | | TWD | | | | 173,000 | | | | 59,140 | | | | — | | | | 59,140 | |
| 3 month TWCPBA | | Quarterly | | | 1.09% | | | Quarterly | | Bank of America NA | | | 03/20/19 | (a) | | | 03/20/24 | | | | TWD | | | | 173,000 | | | | 58,865 | | | | — | | | | 58,865 | |
| 6.54% | | Semi-Annual | | | 1 day MIBOR | | | Semi-Annual | | Bank of America NA | | | 03/20/19 | (a) | | | 03/20/24 | | | | INR | | | | 501,149 | | | | (83,834 | ) | | | — | | | | (83,834 | ) |
| 2.19% | | Quarterly | | | 3 month CD_KSDA | | | Quarterly | | Bank of America NA | | | 03/20/19 | (a) | | | 03/20/24 | | | | KRW | | | | 25,621,453 | | | | (466,483 | ) | | | — | | | | (466,483 | ) |
| 6 month THBFIX | | Semi-Annual | | | 2.37% | | | Semi-Annual | | Bank of America NA | | | 03/20/19 | (a) | | | 03/20/24 | | | | THB | | | | 549,640 | | | | 346,329 | | | | — | | | | 346,329 | |
| 3.41% | | Quarterly | | | 1 week CNREPOFI | | | Quarterly | | Bank of America NA | | | 03/20/19 | (a) | | | 03/20/24 | | | | CNY | | | | 60,872 | | | | (216,655 | ) | | | — | | | | (216,655 | ) |
| 3.46% | | Quarterly | | | 1 week CNREPOFI | | | Quarterly | | Bank of America NA | | | 03/20/19 | (a) | | | 03/20/24 | | | | CNY | | | | 93,015 | | | | (359,285 | ) | | | — | | | | (359,285 | ) |
| 7.57% | | Semi-Annual | | | 1 day MIBOR | | | Semi-Annual | | Bank of America NA | | | 03/20/19 | (a) | | | 03/20/24 | | | | INR | | | | 2,081,000 | | | | (1,630,985 | ) | | | — | | | | (1,630,985 | ) |
| 7.63% | | Semi-Annual | | | 1 day MIBOR | | | Semi-Annual | | Bank of America NA | | | 03/20/19 | (a) | | | 03/20/24 | | | | INR | | | | 346,840 | | | | (283,475 | ) | | | — | | | | (283,475 | ) |
| 7.64% | | Semi-Annual | | | 1 day MIBOR | | | Semi-Annual | | Bank of America NA | | | 03/20/19 | (a) | | | 03/20/24 | | | | INR | | | | 987,160 | | | | (815,095 | ) | | | — | | | | (815,095 | ) |
| 6 month THBFIX | | Semi-Annual | | | 2.36% | | | Semi-Annual | | BNP Paribas SA | | | 03/20/19 | (a) | | | 03/20/24 | | | | THB | | | | 381,607 | | | | 232,680 | | | | — | | | | 232,680 | |
| 1.78% | | Quarterly | | | 3 month CD_KSDA | | | Quarterly | | BNP Paribas SA | | | 03/20/19 | (a) | | | 03/20/24 | | | | KRW | | | | 10,768,570 | | | | (7,747 | ) | | | — | | | | (7,747 | ) |
| 2.20% | | Quarterly | | | 3 month CD_KSDA | | | Quarterly | | BNP Paribas SA | | | 03/20/19 | (a) | | | 03/20/24 | | | | KRW | | | | 25,753,392 | | | | (472,729 | ) | | | — | | | | (472,729 | ) |
| 1.79% | | Quarterly | | | 3 month CD_KSDA | | | Quarterly | | BNP Paribas SA | | | 03/20/19 | (a) | | | 03/20/24 | | | | KRW | | | | 11,112,500 | | | | (12,498 | ) | | | — | | | | (12,498 | ) |
| 3 month TWCPBA | | Quarterly | | | 0.98% | | | Quarterly | | BNP Paribas SA | | | 03/20/19 | (a) | | | 03/20/24 | | | | TWD | | | | 426,000 | | | | 73,693 | | | | — | | | | 73,693 | |
| 2.12% | | Quarterly | | | 3 month CD_KSDA | | | Quarterly | | BNP Paribas SA | | | 03/20/19 | (a) | | | 03/20/24 | | | | KRW | | | | 17,121,500 | | | | (260,243 | ) | | | — | | | | (260,243 | ) |
| 2.14% | | Quarterly | | | 3 month CD_KSDA | | | Quarterly | | BNP Paribas SA | | | 03/20/19 | (a) | | | 03/20/24 | | | | KRW | | | | 17,119,788 | | | | (269,709 | ) | | | — | | | | (269,709 | ) |
| 2.12% | | Quarterly | | | 3 month CD_KSDA | | | Quarterly | | BNP Paribas SA | | | 03/20/19 | (a) | | | 03/20/24 | | | | KRW | | | | 17,122,356 | | | | (255,144 | ) | | | — | | | | (255,144 | ) |
| 3 month KLIBOR | | Quarterly | | | 4.03% | | | Quarterly | | BNP Paribas SA | | | 03/20/19 | (a) | | | 03/20/24 | | | | MYR | | | | 49,140 | | | | 143,473 | | | | — | | | | 143,473 | |
| 2.03% | | Quarterly | | | 3 month CD_KSDA | | | Quarterly | | BNP Paribas SA | | | 03/20/19 | (a) | | | 03/20/24 | | | | KRW | | | | 25,448,800 | | | | (283,699 | ) | | | — | | | | (283,699 | ) |
| 6 month THBFIX | | Semi-Annual | | | 2.36% | | | Semi-Annual | | BNP Paribas SA | | | 03/20/19 | (a) | | | 03/20/24 | | | | THB | | | | 647,000 | | | | 401,088 | | | | — | | | | 401,088 | |
| 1.79% | | Quarterly | | | 3 month CD_KSDA | | | Quarterly | | Deutsche Bank AG | | | 03/20/19 | (a) | | | 03/20/24 | | | | KRW | | | | 8,796,860 | | | | (9,143 | ) | | | — | | | | (9,143 | ) |
| 7.29% | | Semi-Annual | | | 1 day MIBOR | | | Semi-Annual | | Deutsche Bank AG | | | 03/20/19 | (a) | | | 03/20/24 | | | | INR | | | | 854,820 | | | | (524,492 | ) | | | — | | | | (524,492 | ) |
| 6.66% | | Semi-Annual | | | 1 day MIBOR | | | Semi-Annual | | Deutsche Bank AG | | | 03/20/19 | (a) | | | 03/20/24 | | | | INR | | | | 1,116,560 | | | | (268,801 | ) | | | — | | | | (268,801 | ) |
| 2.05% | | Quarterly | | | 3 month CD_KSDA | | | Quarterly | | Deutsche Bank AG | | | 03/20/19 | (a) | | | 03/20/24 | | | | KRW | | | | 20,614,559 | | | | (246,373 | ) | | | — | | | | (246,373 | ) |
| 3 month KLIBOR | | Quarterly | | | 4.05% | | | Quarterly | | Goldman Sachs International | | | 03/20/19 | (a) | | | 03/20/24 | | | | MYR | | | | 41,860 | | | | 129,075 | | | | — | | | | 129,075 | |
| 6 month THBFIX | | Semi-Annual | | | 2.33% | | | Semi-Annual | | Goldman Sachs International | | | 03/20/19 | (a) | | | 03/20/24 | | | | THB | | | | 198,113 | | | | 113,305 | | | | — | | | | 113,305 | |
| 1.97% | | Quarterly | | | 3 month CD_KSDA | | | Quarterly | | Goldman Sachs International | | | 03/20/19 | (a) | | | 03/20/24 | | | | KRW | | | | 24,248,120 | | | | (214,466 | ) | | | — | | | | (214,466 | ) |
| 3 month KLIBOR | | Quarterly | | | 3.98% | | | Quarterly | | Goldman Sachs International | | | 03/20/19 | (a) | | | 03/20/24 | | | | MYR | | | | 28,000 | | | | 66,460 | | | | — | | | | 66,460 | |
| 6.59% | | Semi-Annual | | | 1 day MIBOR | | | Semi-Annual | | JPMorgan Chase Bank NA | | | 03/20/19 | (a) | | | 03/20/24 | | | | INR | | | | 493,526 | | | | (95,876 | ) | | | — | | | | (95,876 | ) |
| 6.59% | | Semi-Annual | | | 1 day MIBOR | | | Semi-Annual | | JPMorgan Chase Bank NA | | | 03/20/19 | (a) | | | 03/20/24 | | | | INR | | | | 1,090,288 | | | | (211,808 | ) | | | — | | | | (211,808 | ) |
| 6.55% | | Semi-Annual | | | 1 day MIBOR | | | Semi-Annual | | JPMorgan Chase Bank NA | | | 03/20/19 | (a) | | | 03/20/24 | | | | INR | | | | 508,481 | | | | (86,585 | ) | | | — | | | | (86,585 | ) |
| 6.57% | | Semi-Annual | | | 1 day MIBOR | | | Semi-Annual | | JPMorgan Chase Bank NA | | | 03/20/19 | (a) | | | 03/20/24 | | | | INR | | | | 640,943 | | | | (116,828 | ) | | | — | | | | (116,828 | ) |
| 7.29% | | Semi-Annual | | | 1 day MIBOR | | | Semi-Annual | | JPMorgan Chase Bank NA | | | 03/20/19 | (a) | | | 03/20/24 | | | | INR | | | | 728,180 | | | | (447,880 | ) | | | — | | | | (447,880 | ) |
| 6 month THBFIX | | Semi-Annual | | | 1.92% | | | Semi-Annual | | JPMorgan Chase Bank NA | | | 03/20/19 | (a) | | | 03/20/24 | | | | THB | | | | 49,500 | | | | (1,030 | ) | | | — | | | | (1,030 | ) |
| 6 month THBFIX | | Semi-Annual | | | 1.97% | | | Semi-Annual | | JPMorgan Chase Bank NA | | | 03/20/19 | (a) | | | 03/20/24 | | | | THB | | | | 286,500 | | | | 13,849 | | | | — | | | | 13,849 | |
| 3 month TWCPBA | | Quarterly | | | 1.11% | | | Quarterly | | JPMorgan Chase Bank NA | | | 03/20/19 | (a) | | | 03/20/24 | | | | TWD | | | | 231,000 | | | | 87,800 | | | | — | | | | 87,800 | |
| 1.79% | | Quarterly | | | 3 month CD_KSDA | | | Quarterly | | JPMorgan Chase Bank NA | | | 03/20/19 | (a) | | | 03/20/24 | | | | KRW | | | | 20,637,500 | | | | (23,650 | ) | | | — | | | | (23,650 | ) |
| 3 month TWCPBA | | Quarterly | | | 1.07% | | | Quarterly | | JPMorgan Chase Bank NA | | | 03/20/19 | (a) | | | 03/20/24 | | | | TWD | | | | 194,000 | | | | 62,147 | | | | — | | | | 62,147 | |
| 6 month THBFIX | | Semi-Annual | | | 2.37% | | | Semi-Annual | | JPMorgan Chase
Bank NA | | | 03/20/19 | (a) | | | 03/20/24 | | | | THB | | | | 309,526 | | | | 192,783 | | | | — | | | | 192,783 | |
| | | | | | | | | | | | | | | | | | | | | | | | | | | | | | | | | | | | | | |
| | | | | | | | | | | | | | | | | | | | | | | | | | | | $ | (6,203,845 | ) | | $ | — | | | $ | (6,203,845 | ) |
| | | | | | | | | | | | | | | | | | | | | | | | | | | | | | | | | | | | | | |
| | |
| 16 | | 2018 BLACKROCK ANNUAL REPORTTO SHAREHOLDERS |
| | |
Schedule of Investments (continued) December 31, 2018 | | BlackRock Managed Volatility V.I. Fund |
OTC Total Return Swaps
| | | | | | | | | | | | | | | | | | | | | | | | | | | | | | | | | | | | |
| Reference Entity | | Fixed Amount
Paid / (Received)
by the Fund (a) | | | Counterparty | | | Termination
Date | | | Notional
Amount (000) | | | Value | | | Upfront
Premium
Paid
(Received) | | | Unrealized
Appreciation
(Depreciation) | |
Taiwan Capitalization Weighted Stock Index Future January 2019 | | | TWD | | | | 251,500,004 | | | | Merrill Lynch International & Co. | | | | 01/16/19 | | | | TWD | | | | 251,500 | | | $ | (125,946 | ) | | $ | — | | | $ | (125,946 | ) |
Taiwan Capitalization Weighted Stock Index Future January 2019 | | | TWD | | | | 239,710,941 | | | | Merrill Lynch International & Co. | | | | 01/16/19 | | | | TWD | | | | 239,711 | | | | (120,042 | ) | | | — | | | | (120,042 | ) |
Taiwan Capitalization Weighted Stock Index Future January 2019 | | | TWD | | | | 74,664,064 | | | | Merrill Lynch International & Co. | | | | 01/16/19 | | | | TWD | | | | 74,664 | | | | (37,391 | ) | | | — | | | | (37,391 | ) |
KOSPI 200 Index Futures March 2019 | | | KRW | | | | 4,092,570,400 | | | | Merrill Lynch International & Co. | | | | 03/14/19 | | | | KRW | | | | 4,092,570 | | | | (5,372 | ) | | | — | | | | (5,372 | ) |
| | | | | | | | | | | | | | | | | | | | | | | | | | | | | | | | | | | | |
| | | | | | | | | | | | | | | | | | | | | | | | | | $ | (288,751 | ) | | $ | — | | | $ | (288,751 | ) |
| | | | | | | | | | | | | | | | | | | | | | | | | | | | | | | | | | | | |
| | (a) | At termination, the fixed amount paid (received) will be exchanged for the total return of the reference entity. | |
The following reference rates, and their values as of period end, are used for security descriptions:
| | | | | | |
| Reference Index | | | | Reference Rate | |
1 day MIBOR | | Mumbai Interbank Offered Rate | | | 6.65 | % |
1 week CNREPOFI | | 7 Day China Fixing Repo Rates | | | 2.55 | % |
28 day MXIBTIIE | | Mexico Interbank TIIE 28-Day | | | 8.41 | % |
3 month BA | | 3 month Canadian Bankers Acceptances | | | 2.24 | % |
3 month CD_KSDA | | Certificates of Deposit by the Korean Securities Dealers Association | | | 1.89 | % |
3 month JIBAR | | Johannesburg Interbank Average Rate | | | 7.15 | % |
3 month KLIBOR | | Kuala Lumpur Interbank Offered Rate | | | 3.65 | % |
3 month LIBOR | | London Interbank Offered Rate | | | 2.81 | % |
3 month TWCPBA | | Taiwan Secondary Markets Bills Rate | | | 0.67 | % |
6 month BBR | | Australian Bank Bill Rate | | | 2.22 | % |
6 month EURIBOR | | Euro Interbank Offered Rate | | | (0.24 | %) |
6 month LIBOR | | London Interbank Offered Rate | | | 2.88 | % |
6 month THBFIX | | 6 month Thai Baht Interest Rate Fixing | | | 1.74 | % |
6 month WIBOR | | Warsaw Interbank Offered Rate | | | 1.79 | % |
Balances Reported in the Statement of Assets and Liabilities for Centrally Cleared Swaps and OTC Swaps
| | | | | | | | | | | | | | | | |
| | | Swap
Premiums
Paid | | | Swap
Premiums
Received | | | Unrealized
Appreciation | | | Unrealized
Depreciation | |
Centrally Cleared Swaps(a) | | $ | 26,764 | | | $ | (223,049 | ) | | $ | 7,172,558 | | | $ | (4,570,430 | ) |
OTC Swaps | | | — | | | | — | | | | 2,158,250 | | | | (8,650,846 | ) |
| | (a) | Includes cumulative appreciation (depreciation) on centrally cleared swaps, as reported in the Schedule of Investments. Only current day’s variation margin is reported within the Statement of Assets and Liabilities and is net of any previously paid (received) swap premium amounts. | |
Derivative Financial Instruments Categorized by Risk Exposure
As of period end, the fair values of derivative financial instruments located in the Statement of Assets and Liabilities were as follows:
| | | | | | | | | | | | | | | | | | | | | | | | | | | | |
| | | Commodity
Contracts | | | Credit
Contracts | | | Equity
Contracts | | | Foreign
Currency
Exchange
Contracts | | | Interest
Rate
Contracts | | | Other
Contracts | | | Total | |
Assets — Derivative Financial Instruments | | | | | | | | | | | | | | | | | | | | | | | | | | | | |
Futures contracts | | | | | | | | | | | | | | | | | | | | | | | | | | | | |
Net unrealized appreciation(a) | | $ | — | | | $ | — | | | $ | 8,890,191 | | | $ | — | | | $ | 2,239,610 | | | $ | — | | | $ | 11,129,801 | |
Forward foreign currency exchange contracts | | | | | | | | | | | | | | | | | | | | | | | | | | | | |
Unrealized appreciation on forward foreign currency exchange contracts | | | — | | | | — | | | | — | | | | 1,971,099 | | | | — | | | | — | | | | 1,971,099 | |
Swaps — centrally cleared | | | | | | | | | | | | | | | | | | | | | | | | | | | | |
Net unrealized appreciation(a) | | | — | | | | — | | | | — | | | | — | | | | 7,172,558 | | | | — | | | | 7,172,558 | |
Swaps — OTC | | | | | | | | | | | | | | | | | | | | | | | | | | | | |
Unrealized appreciation on OTC swaps; Swap premiums paid | | | — | | | | — | | | | — | | | | — | | | | 2,158,250 | | | | — | | | | 2,158,250 | |
| | | | | | | | | | | | | | | | | | | | | | | | | | | | |
| | $ | — | | | $ | — | | | $ | 8,890,191 | | | $ | 1,971,099 | | | $ | 11,570,418 | | | $ | — | | | $ | 22,431,708 | |
| | | | | | | | | | | | | | | | | | | | | | | | | | | | |
| | | | |
| SCHEDULE OF INVESTMENTS | | | 17 | |
| | |
Schedule of Investments (continued) December 31, 2018 | | BlackRock Managed Volatility V.I. Fund |
Derivative Financial Instruments Categorized by Risk Exposure (continued)
| | | | | | | | | | | | | | | | | | | | | | | | | | | | |
| | | Commodity
Contracts | | | Credit
Contracts | | | Equity
Contracts | | | Foreign
Currency
Exchange
Contracts | | | Interest
Rate
Contracts | | | Other
Contracts | | | Total | |
Liabilities — Derivative Financial Instruments | | | | | | | | | | | | | | | | | | | | | | | | | | | | |
Futures contracts | | | | | | | | | | | | | | | | | | | | | | | | | | | | |
Net unrealized depreciation(a) | | $ | — | | | $ | — | | | $ | 3,476,504 | | | $ | — | | | $ | 12,013 | | | $ | — | | | $ | 3,488,517 | |
Forward foreign currency exchange contracts | | | | | | | | | | | | | | | | | | | | | | | | | | | | |
Unrealized depreciation on forward foreign currency exchange contracts | | | — | | | | — | | | | — | | | | 2,062,406 | | | | — | | | | — | | | | 2,062,406 | |
Swaps — centrally cleared | | | | | | | | | | | | | | | | | | | | | | | | | | | | |
Net unrealized depreciation(a) | | | — | | | | — | | | | — | | | | — | | | | 4,570,430 | | | | — | | | | 4,570,430 | |
Swaps — OTC | | | | | | | | | | | | | | | | | | | | | | | | | | | | |
Unrealized depreciation on OTC swaps; Swap premiums received | | | — | | | | — | | | | 288,751 | | | | — | | | | 8,362,095 | | | | — | | | | 8,650,846 | |
| | | | | | | | | | | | | | | | | | | | | | | | | | | | |
| | $ | — | | | $ | — | | | $ | 3,765,255 | | | $ | 2,062,406 | | | $ | 12,944,538 | | | $ | — | | | $ | 18,772,199 | |
| | | | | | | | | | | | | | | | | | | | | | | | | | | | |
| | (a) | Includes cumulative appreciation (depreciation) on futures contracts and centrally cleared swaps, if any, as reported in the Schedule of Investments. Only current day’s variation margin is reported within the Statement of Assets and Liabilities. | |
For the year ended December 31, 2018, the effect of derivative financial instruments in the Statement of Operations were as follows:
| | | | | | | | | | | | | | | | | | | | | | | | | | | | |
| | | Commodity
Contracts | | | Credit
Contracts | | | Equity
Contracts | | | Foreign
Currency
Exchange
Contracts | | | Interest
Rate
Contracts | | | Other
Contracts | | | Total | |
Net Realized Gain (Loss) from: | | | | | | | | | | | | | | | | | | | | | | | | | | | | |
Futures contracts | | $ | — | | | $ | — | | | $ | 10,103,810 | | | $ | — | | | $ | 3,391,179 | | | $ | — | | | $ | 13,494,989 | |
Forward foreign currency exchange contracts | | | — | | | | — | | | | — | | | | 1,358,731 | | | | — | | | | — | | | | 1,358,731 | |
Swaps | | | | | | | | | | | (34,416 | ) | | | | | | | (3,013,248 | ) | | | | | | | (3,047,664 | ) |
| | | | | | | | | | | | | | | | | | | | | | | | | | | | |
| | $ | — | | | $ | — | | | $ | 10,069,394 | | | $ | 1,358,731 | | | $ | 377,931 | | | $ | — | | | $ | 11,806,056 | |
| | | | | | | | | | | | | | | | | | | | | | | | | | | | |
| | | | | | | |
| Net Change in Unrealized Appreciation (Depreciation) on: | | | | | | | | | | | | | | | | | | | | | |
Futures contracts | | $ | — | | | $ | — | | | $ | 5,386,956 | | | $ | — | | | $ | 2,221,059 | | | $ | — | | | $ | 7,608,015 | |
Forward foreign currency exchange contracts | | | — | | | | — | | | | — | | | | (46,136 | ) | | | — | | | | — | | | | (46,136 | ) |
Swaps | | | — | | | | — | | | | (288,751 | ) | | | — | | | | (3,601,717 | ) | | | — | | | | (3,890,468 | ) |
| | | | | | | | | | | | | | | | | | | | | | | | | | | | |
| | $ | — | | | $ | — | | | $ | 5,098,205 | | | $ | (46,136 | ) | | $ | (1,380,658 | ) | | $ | — | | | $ | 3,671,411 | |
| | | | | | | | | | | | | | | | | | | | | | | | | | | | |
Average Quarterly Balances of Outstanding Derivative Financial Instruments
| | | | |
Futures contracts: | | | | |
Average notional value of contracts — long | | $ | 170,796,372 | |
Average notional value of contracts — short | | | 274,529,030 | |
Forward foreign currency exchange contracts: | | | | |
Average amounts purchased — in USD | | | 96,570,799 | |
Average amounts sold — in USD | | | 73,441,614 | |
Interest rate swaps: | | | | |
Average notional value — pays fixed rate | | | 480,571,722 | |
Average notional value — receives fixed rate | | | 463,979,783 | |
Total return swaps: | | | | |
Average notional value | | | 19,736,869 | |
For more information about the Fund’s investment risks regarding derivative financial instruments, refer to the Notes to Financial Statements.
| | |
| 18 | | 2018 BLACKROCK ANNUAL REPORTTO SHAREHOLDERS |
| | |
Schedule of Investments (continued) December 31, 2018 | | BlackRock Managed Volatility V.I. Fund |
Derivative Financial Instruments — Offsetting as of Period End
The Fund’s derivative assets and liabilities (by type) were as follows:
| | | | | | | | |
| | | Assets | | | Liabilities | |
Derivative Financial Instruments: | | | | | | | | |
Futures contracts | | $ | 1,100,342 | | | $ | 1,787,454 | |
Forward foreign currency exchange contracts | | | 1,971,099 | | | | 2,062,406 | |
Swaps — Centrally cleared | | | 1,097,301 | | | | — | |
Swaps — OTC(a) | | | 2,158,250 | | | | 8,650,846 | |
| | | | | | | | |
Total derivative assets and liabilities in the Statement of Assets and Liabilities | | $ | 6,326,992 | | | $ | 12,500,706 | |
Derivatives not subject to a Master Netting Agreement or similar agreement (“MNA”) | | | (2,197,643 | ) | | | (1,787,454 | ) |
| | | | | | | | |
Total derivative assets and liabilities subject to an MNA | | $ | 4,129,349 | | | $ | 10,713,252 | |
| | | | | | | | |
| | (a) | Includes unrealized appreciation (depreciation) on OTC swaps and swap premiums (paid/received) in the Statement of Assets and Liabilities. | |
The following tables present the Fund’s derivative assets and liabilities by counterparty net of amounts available for offset under an MNA and net of the related collateral received and pledged by the Fund:
| | | | | | | | | | | | | | | | | | | | |
| Counterparty | | Derivative
Assets
Subject to
an MNA by
Counterparty | | | Derivatives
Available
for Offset (a) | | | Non-cash
Collateral
Received | | | Cash
Collateral
Received | | | Net Amount
of Derivative
Assets | |
Bank of America NA | | $ | 641,897 | | | $ | (641,897 | ) | | $ | — | | | $ | — | | | $ | — | |
BNP Paribas SA | | | 1,188,244 | | | | (1,188,244 | ) | | | — | | | | — | | | | — | |
Goldman Sachs International | | | 360,106 | | | | (360,106 | ) | | | — | | | | — | | | | — | |
JPMorgan Chase Bank NA | | | 574,353 | | | | (574,353 | ) | | | — | | | | — | | | | — | |
Morgan Stanley & Co. International plc | | | 546,087 | | | | (546,087 | ) | | | — | | | | — | | | | — | |
UBS AG | | | 818,662 | | | | (818,662 | ) | | | — | | | | — | | | | — | |
| | | | | | | | | | | | | | | | | | | | |
| | $ | 4,129,349 | | | $ | (4,129,349 | ) | | $ | — | | | $ | — | | | $ | — | |
| | | | | | | | | | | | | | | | | | | | |
| | | | | | | | | | | | | | | | | | | | |
| Counterparty | | Derivative
Liabilities
Subject to
an MNA by
Counterparty | | | Derivatives
Available
for Offset (a) | | | Non-cash
Collateral
Pledged | | | Cash
Collateral
Pledged (b) | | | Net Amount
of Derivative
Liabilities (c)(d) | |
Bank of America NA | | $ | 4,553,394 | | | $ | (641,897 | ) | | $ | — | | | $ | (3,440,000 | ) | | $ | 471,497 | |
BNP Paribas SA | | | 1,564,598 | | | | (1,188,244 | ) | | | — | | | | (376,354 | ) | | | — | |
Citibank NA | | | 257,494 | | | | — | | | | — | | | | — | | | | 257,494 | |
Deutsche Bank AG | | | 1,048,809 | | | | — | | | | — | | | | — | | | | 1,048,809 | |
Goldman Sachs International | | | 383,072 | | | | (360,106 | ) | | | — | | | | (22,966 | ) | | | — | |
JPMorgan Chase Bank NA | | | 1,098,108 | | | | (574,353 | ) | | | — | | | | — | | | | 523,755 | |
Merrill Lynch International & Co. | | | 288,751 | | | | — | | | | — | | | | — | | | | 288,751 | |
Morgan Stanley & Co. International plc | | | 623,320 | | | | (546,087 | ) | | | — | | | | — | | | | 77,233 | |
UBS AG | | | 895,706 | | | | (818,662 | ) | | | — | | | | — | | | | 77,044 | |
| | | | | | | | | | | | | | | | | | | | |
| | $ | 10,713,252 | | | $ | (4,129,349 | ) | | $ | — | | | $ | (3,839,320 | ) | | $ | 2,744,583 | |
| | | | | | | | | | | | | | | | | | | | |
| | (a) | The amount of derivatives available for offset is limited to the amount of derivative assets and/or liabilities that are subject to an MNA. | |
| | (b) | Excess of collateral pledged to the individual counterparty is not shown for financial reporting purposes. | |
| | (c) | Net amount represents the net amount payable due to the counterparty in the event of default. | |
| | (d) | Net amount may also include forward foreign currency exchange contracts that are not required to be collateralized. | |
| | | | |
| SCHEDULE OF INVESTMENTS | | | 19 | |
| | |
Schedule of Investments (continued) December 31, 2018 | | BlackRock Managed Volatility V.I. Fund |
Fair Value Hierarchy as of Period End
Various inputs are used in determining the fair value of investments and derivative financial instruments. For information about the Fund’s policy regarding valuation of investments and derivative financial instruments, refer to the Notes to Financial Statements.
The following tables summarize the Fund’s investments and derivative financial instruments categorized in the disclosure hierarchy:
| | | | | | | | | | | | | | | | |
| | | Level 1 | | | Level 2 | | | Level 3 | | | Total | |
Assets: | | | | | | | | | | | | | | | | |
Investments: | | | | | | | | | | | | | | | | |
Long-Term Investments: | | | | | | | | | | | | | | | | |
Common Stocks: | | | | | | | | | | | | | | | | |
Aerospace & Defense | | $ | 1,570,549 | | | $ | 407,570 | | | $ | — | | | $ | 1,978,119 | |
Air Freight & Logistics | | | 891,741 | | | | — | | | | — | | | | 891,741 | |
Airlines | | | 966,026 | | | | 296,296 | | | | — | | | | 1,262,322 | |
Auto Components | | | — | | | | 80,568 | | | | — | | | | 80,568 | |
Automobiles | | | — | | | | 1,362,484 | | | | — | | | | 1,362,484 | |
Banks | | | 4,751,108 | | | | 6,001,980 | | | | — | | | | 10,753,088 | |
Beverages | | | 767,879 | | | | 1,239,613 | | | | — | | | | 2,007,492 | |
Biotechnology | | | 3,441,800 | | | | 758,981 | | | | — | | | | 4,200,781 | |
Capital Markets | | | 1,945,268 | | | | 560,333 | | | | — | | | | 2,505,601 | |
Chemicals | | | 4,489,406 | | | | 4,289,471 | | | | — | | | | 8,778,877 | |
Commercial Services & Supplies | | | 681,516 | | | | 77,131 | | | | — | | | | 758,647 | |
Communications Equipment | | | — | | | | 391,213 | | | | — | | | | 391,213 | |
Construction & Engineering | | | 12,420 | | | | 403,966 | | | | — | | | | 416,386 | |
Construction Materials | | | 8,896 | | | | 638,305 | | | | — | | | | 647,201 | |
Consumer Finance | | | 1,261,666 | | | | — | | | | — | | | | 1,261,666 | |
Containers & Packaging | | | 815,195 | | | | 324,663 | | | | — | | | | 1,139,858 | |
Diversified Consumer Services | | | 17,226 | | | | — | | | | — | | | | 17,226 | |
Diversified Financial Services | | | 1,178,480 | | | | 763,323 | | | | — | | | | 1,941,803 | |
Electric Utilities | | | 1,142,290 | | | | 713,821 | | | | — | | | | 1,856,111 | |
Electronic Equipment, Instruments & Components | | | 572,897 | | | | 484,145 | | | | — | | | | 1,057,042 | |
Energy Equipment & Services | | | 77,321 | | | | 32,039 | | | | — | | | | 109,360 | |
Entertainment | | | 1,239,151 | | | | 79,662 | | | | — | | | | 1,318,813 | |
Equity Real Estate Investment Trusts (REITs) | | | 3,299,215 | | | | 253,179 | | | | — | | | | 3,552,394 | |
Food & Staples Retailing | | | 85,260 | | | | 27,302 | | | | — | | | | 112,562 | |
Food Products | | | 869,407 | | | | 1,827,544 | | | | — | | | | 2,696,951 | |
Gas Utilities | | | 54,524 | | | | 314,659 | | | | — | | | | 369,183 | |
Health Care Equipment & Supplies | | | 134,968 | | | | 447,585 | | | | — | | | | 582,553 | |
Health Care Providers & Services | | | 6,160,394 | | | | 260,474 | | | | — | | | | 6,420,868 | |
Health Care Technology | | | 57,212 | | | | — | | | | — | | | | 57,212 | |
Hotels, Restaurants & Leisure | | | 3,957,535 | | | | — | | | | — | | | | 3,957,535 | |
Household Durables | | | 386,005 | | | | 157,410 | | | | — | | | | 543,415 | |
Household Products | | | 2,348,980 | | | | 760,656 | | | | — | | | | 3,109,636 | |
Independent Power and Renewable Electricity Producers | | | 28,591 | | | | 49,833 | | | | — | | | | 78,424 | |
Industrial Conglomerates | | | — | | | | 858,285 | | | | — | | | | 858,285 | |
Insurance | | | 5,949,738 | | | | 5,232,180 | | | | — | | | | 11,181,918 | |
Interactive Media & Services | | | 3,438,494 | | | | — | | | | — | | | | 3,438,494 | |
Internet & Direct Marketing Retail | | | 2,597,513 | | | | — | | | | — | | | | 2,597,513 | |
IT Services | | | 2,929,528 | | | | 540,457 | | | | — | | | | 3,469,985 | |
Life Sciences Tools & Services | | | 1,008,155 | | | | 63,624 | | | | — | | | | 1,071,779 | |
Machinery | | | — | | | | 34,215 | | | | — | | | | 34,215 | |
Media | | | 1,239,806 | | | | 28,012 | | | | — | | | | 1,267,818 | |
Metals & Mining | | | 1,383,715 | | | | 575,992 | | | | — | | | | 1,959,707 | |
Multiline Retail | | | — | | | | 6,816 | | | | — | | | | 6,816 | |
Multi-Utilities | | | 187,091 | | | | 69,267 | | | | — | | | | 256,358 | |
Oil, Gas & Consumable Fuels | | | 3,499,687 | | | | 5,884,640 | | | | — | | | | 9,384,327 | |
Paper & Forest Products | | | 132,983 | | | | — | | | | — | | | | 132,983 | |
Personal Products | | | 453,659 | | | | 2,166,551 | | | | — | | | | 2,620,210 | |
Pharmaceuticals | | | 5,197,688 | | | | 5,668,447 | | | | — | | | | 10,866,135 | |
Professional Services | | | 1,323,929 | | | | 258,652 | | | | — | | | | 1,582,581 | |
Real Estate Management & Development | | | — | | | | 520,368 | | | | — | | | | 520,368 | |
Road & Rail | | | 147,287 | | | | — | | | | — | | | | 147,287 | |
Semiconductors & Semiconductor Equipment | | | 1,007,011 | | | | 511,276 | | | | — | | | | 1,518,287 | |
Software | | | 2,888,732 | | | | 372,994 | | | | — | | | | 3,261,726 | |
Specialty Retail | | | 5,771,058 | | | | 26,693 | | | | — | | | | 5,797,751 | |
Technology Hardware, Storage & Peripherals | | | 4,539,280 | | | | 636,704 | | | | — | | | | 5,175,984 | |
| | |
| 20 | | 2018 BLACKROCK ANNUAL REPORTTO SHAREHOLDERS |
| | |
Schedule of Investments (continued) December 31, 2018 | | BlackRock Managed Volatility V.I. Fund |
Fair Value Hierarchy as of Period End (continued)
| | | | | | | | | | | | | | | | |
| | | Level 1 | | | Level 2 | | | Level 3 | | | Total | |
Textiles, Apparel & Luxury Goods | | $ | 410,788 | | | $ | 1,325,472 | | | $ | — | | | $ | 1,736,260 | |
Tobacco | | | 757,486 | | | | 665,122 | | | | — | | | | 1,422,608 | |
Trading Companies & Distributors | | | 122,539 | | | | 102,055 | | | | — | | | | 224,594 | |
Transportation Infrastructure | | | — | | | | 369,667 | | | | — | | | | 369,667 | |
Corporate Bonds(a) | | | — | | | | 27,399 | | | | — | | | | 27,399 | |
Preferred Securities(a) | | | — | | | | 634,779 | | | | — | | | | 634,779 | |
Rights | | | 17,876 | | | | — | | | | — | | | | 17,876 | |
U.S. Government Sponsored Agency Securities | | | — | | | | 682,097 | | | | — | | | | 682,097 | |
U.S. Treasury Obligations | | | — | | | | 56,139,727 | | | | — | | | | 56,139,727 | |
Short-Term Securities | | | 11,969,958 | | | | — | | | | — | | | | 11,969,958 | |
| | | | | | | | | | | | | | | | |
Subtotal | | $ | 100,186,927 | | | $ | 106,405,697 | | | $ | — | | | $ | 206,592,624 | |
| | | | | | | | | | | | | | | | |
Investments valued at NAV(b) | | | | | | | | | | | | | | | 459,872 | |
| | | | | | | | | | | | | | | | |
Total Investments | | | | | | | | | | | | | | $ | 207,052,496 | |
| | | | | | | | | | | | | | | | |
Derivative Financial Instruments(c) | | | | | | | | | | | | | | | | |
Assets: | | | | | | | | | | | | | | | | |
Equity contracts | | $ | 8,890,191 | | | $ | — | | | $ | — | | | $ | 8,890,191 | |
Foreign currency exchange contracts | | | — | | | | 1,971,099 | | | | — | | | | 1,971,099 | |
Interest rate contracts | | | 2,239,610 | | | | 9,330,808 | | | | — | | | | 11,570,418 | |
Liabilities: | | | | | | | | | | | | | | | | |
Equity contracts | | | (3,476,504 | ) | | | (288,751 | ) | | | — | | | | (3,765,255 | ) |
Foreign currency exchange contracts | | | — | | | | (2,062,406 | ) | | | — | | | | (2,062,406 | ) |
Interest rate contracts | | | (12,013 | ) | | | (12,932,525 | ) | | | — | | | | (12,944,538 | ) |
| | | | | | | | | | | | | | | | |
| | $ | 7,641,284 | | | $ | (3,981,775 | ) | | $ | — | | | $ | 3,659,509 | |
| | | | | | | | | | | | | | | | |
| | (a) | See above Schedule of Investments for values in each industry. | |
| | (b) | As of December 31, 2018, certain investments of the Fund were fair valued using NAV per share as no quoted market value is available and therefore have been excluded from the fair value hierarchy. | |
| | (c) | Derivative financial instruments are swaps, futures contracts and forward foreign currency exchange contracts. Swaps, futures contracts and forward foreign currency exchange contracts are valued at the unrealized appreciation (depreciation) on the instrument. | |
During the year ended December 31, 2018, there were no transfers between levels.
See notes to financial statements.
| | | | |
| SCHEDULE OF INVESTMENTS | | | 21 | |
Statement of Assets and Liabilities
December 31, 2018
| | | | |
| | | BlackRock Managed
Volatility V.I. Fund | |
| |
ASSETS | | | | |
Investments at value — unaffiliated (including securities loaned at value of $453,631) (cost — $206,713,341) | | $ | 194,622,666 | |
Investments at value — affiliated (cost — $12,429,834) | | | 12,429,830 | |
Cash | | | 1,300 | |
Cash pledged: | | | | |
Collateral — OTC derivatives | | | 4,490,000 | |
Futures contracts | | | 22,825,000 | |
Centrally cleared swaps | | | 7,038,000 | |
Foreign currency at value (cost — $13,765,056) | | | 13,818,114 | |
Receivables: | | | | |
Securities lending income — affiliated | | | 264 | |
Dividends — affiliated | | | 32,237 | |
Dividends — unaffiliated | | | 165,400 | |
Interest — unaffiliated | | | 858,259 | |
Variation margin on futures contracts | | | 1,100,342 | |
Variation margin on centrally cleared swaps | | | 1,097,301 | |
Unrealized appreciation on: | | | | |
Forward foreign currency exchange contracts | | | 1,971,099 | |
OTC swaps | | | 2,158,250 | |
Prepaid expenses | | | 282 | |
| | | | |
Total assets | | | 262,608,344 | |
| | | | |
| |
LIABILITIES | | | | |
Cash received as collateral for OTC derivatives | | | 1,160,000 | |
Cash collateral on securities loaned at value | | | 459,965 | |
Payables: | | | | |
Capital shares redeemed | | | 123,736 | |
Income dividend distributions | | | 166 | |
Distribution fees | | | 46,290 | |
Variation margin on futures contracts | | | 1,787,454 | |
Board realignment and consolidation | | | 2,070 | |
Investment advisory fees | | | 23,165 | |
Directors’ and Officer’s fees | | | 5,473 | |
Other affiliates | | | 685 | |
Other accrued expenses | | | 136,164 | |
Unrealized depreciation on: | | | | |
Forward foreign currency exchange contracts | | | 2,062,406 | |
OTC swaps | | | 8,650,846 | |
| | | | |
Total liabilities | | | 14,458,420 | |
| | | | |
| |
NET ASSETS | | $ | 248,149,924 | |
| | | | |
| |
NET ASSETS CONSIST OF | | | | |
Paid-in capital | | $ | 377,958,214 | |
Accumulated loss | | | (129,808,290 | ) |
| | | | |
NET ASSETS | | $ | 248,149,924 | |
| | | | |
| |
NET ASSET VALUE | | | | |
Class I — Based on net assets of $12,570,664 and 934,693 shares outstanding, 100 million shares authorized, $0.10 par value. | | $ | 13.45 | |
| | | | |
Class III — Based on net assets of $235,579,260 and 17,519,192 shares outstanding, 100 million shares authorized, $0.10 par value. | | $ | 13.45 | |
| | | | |
See notes to financial statements.
| | |
| 22 | | 2018 BLACKROCK ANNUAL REPORTTO SHAREHOLDERS |
Statement of Operations
Year Ended December 31, 2018
| | | | |
| | | BlackRock Managed
Volatility V.I. Fund | |
| |
INVESTMENT INCOME | | | | |
Dividends — affiliated | | $ | 484,967 | |
Dividends — unaffiliated | | | 2,598,357 | |
Interest — affiliated | | | 362 | |
Interest — unaffiliated | | | 945,695 | |
Securities lending income — affiliated — net | | | 3,019 | |
Foreign taxes withheld | | | (77,475 | ) |
| | | | |
Total investment income | | | 3,954,925 | |
| | | | |
| |
EXPENSES | | | | |
Investment advisory | | | 1,066,217 | |
Distribution — class specific | | | 451,080 | |
Professional | | | 145,248 | |
Accounting services | | | 87,010 | |
Custodian | | | 79,787 | |
Transfer agent — class specific | | | 43,950 | |
Directors and Officer | | | 16,520 | |
Printing | | | 12,598 | |
Registration | | | 9,074 | |
Offering | | | 6,781 | |
Transfer agent | | | 4,999 | |
Board realignment and consolidation | | | 2,237 | |
Miscellaneous | | | 15,323 | |
| | | | |
Total expenses | | | 1,940,824 | |
Less: | | | | |
Fees waived and/or reimbursed by the Manager | | | (291,066 | ) |
Transfer agent fees waived and/or reimbursed — class specific | | | (43,950 | ) |
| | | | |
Total expenses after fees waived and/or reimbursed | | | 1,605,808 | |
| | | | |
Net investment income | | | 2,349,117 | |
| | | | |
| |
REALIZED AND UNREALIZED GAIN (LOSS) | | | | |
Net realized gain (loss) from: | | | | |
Investments — affiliated | | | 159,037 | |
Investments — unaffiliated | | | 11,387,017 | |
Forward foreign currency exchange contracts | | | 1,358,731 | |
Foreign currency transactions | | | (67,620 | ) |
Futures contracts | | | 13,494,989 | |
Swaps . . . . . | | | (3,047,664 | ) |
| | | | |
| | | 23,284,490 | |
| | | | |
Net change in unrealized appreciation (depreciation) on: | | | | |
Investments — affiliated | | | (66,724 | ) |
Investments — unaffiliated | | | (28,192,508 | ) |
Forward foreign currency exchange contracts | | | (46,136 | ) |
Foreign currency translations | | | 69,759 | |
Futures contracts | | | 7,608,015 | |
Swaps . . . . . | | | (3,890,468 | ) |
| | | | |
| | | (24,518,062 | ) |
| | | | |
Net realized and unrealized loss | | | (1,233,572 | ) |
| | | | |
NET INCREASE IN NET ASSETS RESULTING FROM OPERATIONS | | $ | 1,115,545 | |
| | | | |
See notes to financial statements.
Statements of Changes in Net Assets
| | | | | | | | |
| | | BlackRock Managed
Volatility V.I. Fund | |
| | | Year Ended December 31, | |
| | | 2018 | | | 2017 | |
| | |
INCREASE (DECREASE) IN NET ASSETS | | | | | | | | |
| | |
OPERATIONS | | | | | | | | |
Net investment income | | $ | 2,349,117 | | | $ | 43,960 | |
Net realized gain | | | 23,284,490 | | | | 47,809 | |
Net change in unrealized appreciation (depreciation) | | | (24,518,062 | ) | | | 644,084 | |
| | | | | | | | |
Net increase in net assets resulting from operations | | | 1,115,545 | | | | 735,853 | |
| | | | | | | | |
| | |
DISTRIBUTIONS TO SHAREHOLDERS(a)(b) | | | | | | | | |
Class I | | | (363,124 | ) | | | (148,699 | ) |
Class III | | | (6,371,560 | ) | | | — | |
| | | | | | | | |
Decrease in net assets resulting from distributions to shareholders | | | (6,734,684 | ) | | | (148,699 | ) |
| | | | | | | | |
| | |
CAPITAL SHARE TRANSACTIONS | | | | | | | | |
Net increase (decrease) in net assets derived from capital share transactions | | | 239,233,033 | | | | (1,946,110 | ) |
| | | | | | | | |
| | |
NET ASSETS(b) | | | | | | | | |
Total increase (decrease) in net assets | | | 233,613,894 | | | | (1,358,956 | ) |
Beginning of year | | | 14,536,030 | | | | 15,894,986 | |
| | | | | | | | |
End of year | | $ | 248,149,924 | | | $ | 14,536,030 | |
| | | | | | | | |
| (a) | Distributions for annual periods determined in accordance with U.S. federal income tax regulations. |
| (b) | Prior year distribution character information and distributions in excess of net investment income has been modified or removed to conform with current year Regulation S-X presentation changes. Refer to Note 12 for this prior year information. |
See notes to financial statements.
| | |
| 24 | | 2018 BLACKROCK ANNUAL REPORTTO SHAREHOLDERS |
Financial Highlights
(For a share outstanding throughout each period)
| | | | | | | | | | | | | | | | | | | | |
| | | BlackRock Managed Volatility V.I. Fund | |
| |
| | | Class I | |
| |
| | | Year Ended December 31, | |
| | 2018 | | | 2017 | | | 2016 | | | 2015 | | | 2014 | |
| | | | | |
Net asset value, beginning of year | | $ | 13.71 | | | $ | 13.19 | | | $ | 13.08 | | | $ | 13.70 | | | $ | 14.41 | |
| | | | | | | | | | | | | | | | | | | | |
Net investment income (loss)(a) | | | 0.15 | | | | 0.04 | | | | 0.02 | (b) | | | (0.06 | ) | | | 0.04 | |
Net realized and unrealized gain (loss) | | | (0.01 | ) | | | 0.62 | | | | 0.20 | | | | (0.01 | ) | | | 0.29 | |
| | | | | | | | | | | | | | | | | | | | |
Net increase (decrease) from investment operations | | | 0.14 | | | | 0.66 | | | | 0.22 | | | | (0.07 | ) | | | 0.33 | |
| | | | | | | | | | | | | | | | | | | | |
| | | | | |
| Distributions(c) | | | | | | | | | | | | | | | |
From net investment income | | | (0.25 | ) | | | (0.05 | ) | | | (0.11 | ) | | | — | | | | — | |
From net realized gain | | | (0.15 | ) | | | (0.09 | ) | | | — | | | | (0.55 | ) | | | (1.04 | ) |
| | | | | | | | | | | | | | | | | | | | |
Total distributions | | | (0.40 | ) | | | (0.14 | ) | | | (0.11 | ) | | | (0.55 | ) | | | (1.04 | ) |
| | | | | | | | | | | | | | | | | | | | |
| | | | | |
Net asset value, end of year | | $ | 13.45 | | | $ | 13.71 | | | $ | 13.19 | | | $ | 13.08 | | | $ | 13.70 | |
| | | | | | | | | | | | | | | | | | | | |
| | | | | |
Total Return(d) | | | | | | | | | | | | | | | | | | | | |
Based on net asset value | | | 1.02 | % | | | 4.98 | % | | | 1.71 | %(e) | | | (0.57 | )% | | | 2.28 | % |
| | | | | | | | | | | | | | | | | | | | |
| | | | | |
Ratios to Average Net Assets(f) | | | | | | | | | | | | | | | | | | | | |
Total expenses | | | 1.21 | % | | | 1.48 | % | | | 1.39 | % | | | 1.47 | % | | | 1.60 | % |
| | | | | | | | | | | | | | | | | | | | |
Total expenses after fees waived and/or reimbursed | | | 0.71 | % | | | 0.89 | % | | | 0.94 | % | | | 1.00 | % | | | 1.07 | % |
| | | | | | | | | | | | | | | | | | | | |
Net investment income (loss) | | | 1.09 | % | | | 0.29 | % | | | 0.18 | %(b) | | | (0.46 | )% | | | 0.25 | % |
| | | | | | | | | | | | | | | | | | | | |
| | | | | |
Supplemental Data | | | | | | | | | | | | | | | | | | | | |
Net assets, end of year (000) | | $ | 12,571 | | | $ | 14,536 | | | $ | 15,895 | | | $ | 18,180 | | | $ | 21,283 | |
| | | | | | | | | | | | | | | | | | | | |
Portfolio turnover rate | | | 319 | % | | | 0 | % | | | 1 | % | | | 13 | % | | | 64 | % |
| | | | | | | | | | | | | | | | | | | | |
| (a) | Based on average shares outstanding. |
| (b) | Net investment income per share the ratio of net investment income to average net assets includes $0.02 per share and 0.19%, respectively, resulting from a one time payment from a third party administrator. |
| (c) | Distributions for annual periods determined in accordance with U.S. federal income tax regulations. |
| (d) | Where applicable, excludes insurance-related fees and expenses and assumes the reinvestments of distributions. |
| (e) | Includes reimbursements of out of pocket expenses from a third party administrator. Excluding this amount, the Fund’s total return is 1.48%. |
| (f) | Excludes expenses incurred indirectly as a result of investments in underlying funds as follows: |
| | | | | | | | | | | | | | | | | | | | | | | | | | | | | | | | | | | | | | | | |
| | | Year Ended December 31, | |
| | 2018 | | | | | | 2017 | | | | | | 2016 | | | | | | 2015 | | | | | | 2014 | | | | |
Investments in underlying funds | | | 0.03 | % | | | | | | | 0.23 | % | | | | | | | 0.25 | % | | | | | | | 0.23 | % | | | | | | | 0.23 | % | | | | |
| | | | | | | | | | | | | | | | | | | | | | | | | | | | | | | | | | | | | | | | |
See notes to financial statements.
Financial Highlights (continued)
(For a share outstanding throughout each period)
| | | | |
| | | BlackRock Managed
Volatility V.I. Fund (continued) | |
| |
| | | Class III | |
| | | Period from
02/14/2018(a) to
12/31/2018 | |
| | |
Net asset value, beginning of period | | $ | 13.70 | |
| | | | |
Net investment income(b) | | | 0.15 | |
Net realized and unrealized (loss) | | | (0.02 | ) |
| | | | |
Net increase from investment operations | | | 0.13 | |
| | | | |
| |
| Distributions(c) | | | |
From net investment income | | | (0.23 | ) |
From net realized gain | | | (0.15 | ) |
| | | | |
Total distributions | | | (0.38 | ) |
| | | | |
| |
Net asset value, end of period | | $ | 13.45 | |
| | | | |
| |
Total Return(d) | | | | |
Based on net asset value | | | 0.90 | %(e) |
| | | | |
| |
Ratios to Average Net Assets(f) | | | | |
Total expenses | | | 0.99 | %(g) |
| | | | |
Total expenses after fees waived and/or reimbursed | | | 0.84 | %(g) |
| | | | |
Net investment income | | | 1.22 | %(g) |
| | | | |
| |
Supplemental Data | | | | |
Net assets, end of period (000) | | $ | 235,579 | |
| | | | |
Portfolio turnover rate | | | 319 | %(h) |
| | | | |
| (a) | Recommencement of operations. |
| (b) | Based on average shares outstanding. |
| (c) | Distributions for annual periods determined in accordance with U.S. federal income tax regulations. |
| (d) | Where applicable, excludes insurance-related fees and expenses and assumes the reinvestments of distributions. |
| (e) | Aggregate total return. |
| (f) | Excludes expenses incurred indirectly as a result of investments in underlying funds as follows: |
| | | | |
| | | Period from
02/14/2018(a) to
12/31/2018 | |
Investments in underlying funds | | | 0.03 | % |
| | | | |
| (h) | Portfolio turnover rate is representative of the Fund for the entire year. |
See notes to financial statements.
| | |
| 26 | | 2018 BLACKROCK ANNUAL REPORTTO SHAREHOLDERS |
Notes to Financial Statements
BlackRock Variable Series Funds, Inc. (the “Company”) is registered under the Investment Company Act of 1940, as amended (the “1940 Act”), as an open-end management investment company. The Company is organized as a Maryland corporation that is comprised of 15 separate portfolios. The funds offer shares to insurance companies for their separate accounts to fund benefits under certain variable annuity and variable life insurance contracts. The financial statements presented are for BlackRock Managed Volatility V.I. Fund (the “Fund”). The Fund is classified as diversified. Class I and Class III Shares have identical voting, dividend, liquidation and other rights, except that only shares of the respective classes are entitled to vote on matters concerning only that class. In addition, Class III Shares bear certain expenses related to the distribution of such shares. Class III Shares recommenced operations on February 14, 2018.
The Fund, together with certain other registered investment companies advised by BlackRock Advisors, LLC (the “Manager”) or its affiliates, is included in a complex of open-end funds referred to as the Equity-Bond Complex.
REORGANIZATION
The Board, the Board of Trustees of HIMCO Variable Insurance Trust and shareholders of the Target Fund approved the reorganization of the Target Fund into the Fund. As a result, the Fund acquired substantially all of the assets and assumed substantially all of the liabilities of the Target Fund in exchange for an equal aggregate value of newly-issued Class III Shares of the Fund.
Each shareholder of the Target Fund received shares of the Fund in an amount equal to the aggregate net asset value (“NAV”) of such shareholder’s Target Fund shares, as determined at the close of business on April 20, 2018, less the costs of the Target Fund’s reorganization.
The reorganization was accomplished by a tax-free exchange of shares of the Fund in the following amount and at the following conversion ratio:
| | | | | | | | | | | | | | | | |
| Target Fund’s Share Class | | Shares Prior to
Reorganization | | | Conversion
Ratio | | | Managed Volatility V.I.
Fund’s Share Class | | | Shares of Managed
Volatility V.I. Fund | |
Class IB | | | 39,633,345 | | | | 0.49126053 | | | | Class III | | | | 19,470,298 | |
The Target Fund’s net assets and composition of net assets as of the close of business on April 20, 2018, the valuation date of the reorganization were as follows:
| | | | | | | | | | | | |
| Target Fund | | Net Assets | | | Paid-
In Capital | | | Accumulated
Loss | |
HIMCO VIT Portfolio Diversifier Fund | | $ | 268,343,917 | | | $ | 392,342,469 | | | $ | (123,998,552 | ) |
For financial reporting purposes, assets received and shares issued by the Fund were recorded at fair value. However, the cost basis of the investments received from the Target Fund was carried forward to align ongoing reporting of the Fund realized and unrealized gains and losses with amounts distributable to shareholders for tax purposes.
The net assets of the Fund before the acquisition were $13,676,731. The aggregate net assets of the Fund immediately after the acquisition amounted to $282,020,648. The Target Fund’s fair value and cost of investments prior to the reorganization were as follows:
| | | | | | | | |
| Target Fund | | Fair Value
of Investments | | | Cost of
Investments | |
HIMCO VIT Portfolio Diversifier Fund | | $ | 202,633,700 | | | $ | 186,254,411 | |
The purpose of the transaction was to combine the assets of the Target Fund with the assets of the Fund. The reorganization was a tax-free event and closed on April 23, 2018.
Assuming the acquisition had been completed on January 1, 2018, the beginning of the fiscal reporting period of the Fund, the pro forma results of operations for the year ended December 31, 2018, are as follows:
| | • | | Net investment income: $3,467,734 |
| | • | | Net realized and change in unrealized loss on investments: $(7,842,825) |
| | • | | Net decrease in net assets resulting from operations: $(4,375,091) |
Because the combined investment portfolios have been managed as a single integrated portfolio since the acquisition was completed, it is not practicable to separate the amounts of revenue and earnings of the Fund that have been included in the Fund’s Statement of Operations since April 23, 2018.
| 2. | SIGNIFICANT ACCOUNTING POLICIES |
The financial statements are prepared in conformity with accounting principles generally accepted in the United States of America (“U.S. GAAP”), which may require management to make estimates and assumptions that affect the reported amounts of assets and liabilities in the financial statements, disclosure of contingent assets and
| | | | |
| NOTESTO FINANCIAL STATEMENTS | | | 27 | |
Notes to Financial Statements (continued)
liabilities at the date of the financial statements and the reported amounts of increases and decreases in net assets from operations during the reporting period. Actual results could differ from those estimates. The Fund is considered an investment company under U.S. GAAP and follows the accounting and reporting guidance applicable to investment companies. Below is a summary of significant accounting policies:
Investment Transactions and Income Recognition: For financial reporting purposes, investment transactions are recorded on the dates the transactions are entered into (the “trade dates”). Realized gains and losses on investment transactions are determined on the identified cost basis. Dividend income is recorded on the ex-dividend date. Dividends from foreign securities where the ex-dividend date may have passed are subsequently recorded when the Fund is informed of the ex-dividend date. Under the applicable foreign tax laws, a withholding tax at various rates may be imposed on capital gains, dividends and interest. Interest income, including amortization and accretion of premiums and discounts on debt securities, is recognized on an accrual basis. Income, expenses and realized and unrealized gains and losses are allocated daily to each class based on its relative net assets.
Foreign Currency Translation: The Fund’s books and records are maintained in U.S. dollars. Securities and other assets and liabilities denominated in foreign currencies are translated into U.S. dollars using exchange rates determined as of the close of trading on the New York Stock Exchange (“NYSE”). Purchases and sales of investments are recorded at the rates of exchange prevailing on the respective dates of such transactions. Generally, when the U.S. dollar rises in value against a foreign currency, the investments denominated in that currency will lose value; the opposite effect occurs if the U.S. dollar falls in relative value.
The Fund does not isolate the portion of the results of operations arising as a result of changes in the exchange rates from the changes in the market prices of investments held or sold for financial reporting purposes. Accordingly, the effects of changes in exchange rates on investments are not segregated in the Statement of Operations from the effects of changes in market prices of those investments, but are included as a component of net realized and unrealized gain (loss) from investments. The Fund reports realized currency gains (losses) on foreign currency related transactions as components of net realized gain (loss) for financial reporting purposes, whereas such components are generally treated as ordinary income for U.S. federal income tax purposes.
Segregation and Collateralization: In cases where the Fund enters into certain investments (e.g., futures contracts, forward foreign currency exchange contracts and swaps) that would be treated as “senior securities” for 1940 Act purposes, the Fund may segregate or designate on its books and records cash or liquid assets having a market value at least equal to the amount of its future obligations under such investments. Doing so allows the investment to be excluded from treatment as a “senior security.” Furthermore, if required by an exchange or counterparty agreement, the Fund may be required to deliver/deposit cash and/or securities to/with an exchange, or broker-dealer or custodian as collateral for certain investments or obligations.
Offering Costs:Offering costs are amortized over a 12–month period beginning with the commencement of operations of a class of shares.
Distributions: Distributions paid by the Fund are recorded on the ex-dividend date. Distributions of capital gains are recorded on the ex-dividend date and made at least annually. The character and timing of distributions are determined in accordance with U.S. federal income tax regulations, which may differ from U.S. GAAP.
Recent Accounting Standards: In March 2017, the Financial Accounting Standards Board issued Accounting Standards Update “Premium Amortization of Purchased Callable Debt Securities” which amends the amortization period for certain purchased callable debt securities. Under the new guidance, the premium amortization of purchased callable debt securities that have explicit, non-contingent call features and are callable at fixed prices will be amortized to the earliest call date. The guidance will be applied on a modified retrospective basis and is effective for fiscal years, and their interim periods, beginning after December 15, 2018. Management is currently evaluating the impact of this guidance to the Fund.
In August 2018, the Financial Accounting Standards Board issued Accounting Standards Update 2018-13 “Changes to the Disclosure Requirements for Fair Value Measurement” which modifies disclosure requirements for fair value measurements. The guidance is effective for fiscal years beginning after December 15, 2019 and for interim periods within those fiscal years. Management is currently evaluating the impact of this guidance to the Fund.
Indemnifications: In the normal course of business, the Fund enters into contracts that contain a variety of representations that provide general indemnification. The Fund’s maximum exposure under these arrangements is unknown because it involves future potential claims against the Fund, which cannot be predicted with any certainty.
Other: Expenses directly related to the Fund or its classes are charged to the Fund or the applicable class. Other operating expenses shared by several funds, including other funds managed by the Manager, are prorated among those funds on the basis of relative net assets or other appropriate methods. Expenses directly related to the Fund and other shared expenses prorated to the Fund are allocated daily to each class based on its relative net assets or other appropriate methods.
| 3. | INVESTMENT VALUATION AND FAIR VALUE MEASUREMENTS |
Investment Valuation Policies: The Fund’s investments are valued at fair value (also referred to as “market value” within the financial statements) as of the close of trading on the NYSE (generally 4:00 p.m., Eastern time). U.S. GAAP defines fair value as the price the Fund would receive to sell an asset or pay to transfer a liability in an orderly transaction between market participants at the measurement date. The Fund determines the fair values of its financial instruments using various independent dealers or pricing services under policies approved by the Board. The BlackRock Global Valuation Methodologies Committee (the “Global Valuation Committee”) is the committee formed by management to develop global pricing policies and procedures and to oversee the pricing function for all financial instruments.
Fair Value Inputs and Methodologies: The following methods and inputs are used to establish the fair value of the Fund’s assets and liabilities:
| | • | | Equity investments traded on a recognized securities exchange are valued at the official closing price each day, if available. For equity investments traded on more than one exchange, the official closing price on the exchange where the stock is primarily traded is used. Equity investments traded on a recognized exchange for which there were no sales on that day may be valued at the last available bid (long positions) or ask (short positions) price. |
| | |
| 28 | | 2018 BLACKROCK ANNUAL REPORTTO SHAREHOLDERS |
Notes to Financial Statements (continued)
| | • | | Fixed-income securities for which market quotations are readily available are generally valued using the last available bid prices or current market quotations provided by independent dealers or third party pricing services. Floating rate loan interests are valued at the mean of the bid prices from one or more independent brokers or dealers as obtained from a third party pricing service. Pricing services generally value fixed income securities assuming orderly transactions of an institutional round lot size, but the Fund may hold or transact in such securities in smaller, odd lot sizes. Odd lots may trade at lower prices than institutional round lots. The pricing services may use matrix pricing or valuation models that utilize certain inputs and assumptions to derive values, including transaction data (e.g., recent representative bids and offers), credit quality information, perceived market movements, news, and other relevant information. Certain fixed-income securities, including asset-backed and mortgage related securities may be valued based on valuation models that consider the estimated cash flows of each tranche of the entity, establish a benchmark yield and develop an estimated tranche specific spread to the benchmark yield based on the unique attributes of the tranche. The amortized cost method of valuation may be used with respect to debt obligations with sixty days or less remaining to maturity unless the Manager determines such method does not represent fair value. |
Generally, trading in foreign instruments is substantially completed each day at various times prior to the close of trading on the NYSE. Occasionally, events affecting the values of such instruments may occur between the foreign market close and the close of trading on the NYSE that may not be reflected in the computation of the Fund’s net assets. Each business day, the Fund uses a pricing service to assist with the valuation of certain foreign exchange-traded equity securities and foreign exchange-traded over-the-counter (“OTC”) options (the “Systematic Fair Value Price”). Using current market factors, the Systematic Fair Value Price is designed to value such foreign securities and foreign options at fair value as of the close of trading on the NYSE, which follows the close of the local markets.
| | • | | Investments in open-end U.S. mutual funds are valued at NAV each business day. |
| | • | | The Fund values its investment in SL Liquidity Series, LLC, Money Market Series (the “Money Market Series”) at fair value, which is ordinarily based upon its pro rata ownership in the underlying fund’s net assets. The Money Market Series seeks current income consistent with maintaining liquidity and preserving capital. Although the Money Market Series is not registered under the 1940 Act, its investments may follow the parameters of investments by a money market fund that is subject to Rule 2a-7 under the 1940 Act. |
| | • | | Futures contracts traded on exchanges are valued at their last sale price. |
| | • | | Forward foreign currency exchange contracts are valued at the mean between the bid and ask prices and are determined as of the close of trading on the NYSE. Interpolated values are derived when the settlement date of the contract is an interim date for which quotations are not available. |
| | • | | Swap agreements are valued utilizing quotes received daily by the Fund’s pricing service or through brokers, which are derived using daily swap curves and models that incorporate a number of market data factors, such as discounted cash flows, trades and values of the underlying reference instruments. |
If events (e.g., a company announcement, market volatility or a natural disaster) occur that are expected to materially affect the value of such investments, or in the event that the application of these methods of valuation results in a price for an investment that is deemed not to be representative of the market value of such investment, or if a price is not available, the investment will be valued by the Global Valuation Committee, or its delegate, in accordance with a policy approved by the Board as reflecting fair value (“Fair Valued Investments”). The fair valuation approaches that may be used by the Global Valuation Committee will include market approach, income approach and cost approach. Valuation techniques such as discounted cash flow, use of market comparables and matrix pricing are types of valuation approaches and are typically used in determining fair value. When determining the price for Fair Valued Investments, the Global Valuation Committee, or its delegate, seeks to determine the price that the Fund might reasonably expect to receive or pay from the current sale or purchase of that asset or liability in an arm’s-length transaction. Fair value determinations shall be based upon all available factors that the Global Valuation Committee, or its delegate, deems relevant and consistent with the principles of fair value measurement. The pricing of all Fair Valued Investments is subsequently reported to the Board or a committee thereof on a quarterly basis.
Fair Value Hierarchy: Various inputs are used in determining the fair value of investments and derivative financial instruments. These inputs to valuation techniques are categorized into a fair value hierarchy consisting of three broad levels for financial statement purposes as follows:
| | • | | Level 1 — Unadjusted price quotations in active markets/exchanges for identical assets or liabilities that the Fund has the ability to access |
| | • | | Level 2 — Other observable inputs (including, but not limited to, quoted prices for similar assets or liabilities in markets that are active, quoted prices for identical or similar assets or liabilities in markets that are not active, inputs other than quoted prices that are observable for the assets or liabilities (such as interest rates, yield curves, volatilities, prepayment speeds, loss severities, credit risks and default rates) or other market–corroborated inputs) |
| | • | | Level 3 — Unobservable inputs based on the best information available in the circumstances, to the extent observable inputs are not available (including the Fund’s own assumptions used in determining the fair value of investments and derivative financial instruments) |
The hierarchy gives the highest priority to unadjusted quoted prices in active markets for identical assets or liabilities (Level 1 measurements) and the lowest priority to unobservable inputs (Level 3 measurements). Accordingly, the degree of judgment exercised in determining fair value is greatest for instruments categorized in Level 3. The inputs used to measure fair value may fall into different levels of the fair value hierarchy. In such cases, for disclosure purposes, the fair value hierarchy classification is determined based on the lowest level input that is significant to the fair value measurement in its entirety. Investments classified within Level 3 have significant unobservable inputs used by the Global Valuation Committee in determining the price for Fair Valued Investments. Level 3 investments include equity or debt issued by privately held companies or funds. There may not be a secondary market, and/or there are a limited number of investors. Level 3 investments may also be adjusted to reflect illiquidity and/or non-transferability, with the amount of such discount estimated by the Global Valuation Committee in the absence of market information.
Changes in valuation techniques may result in transfers into or out of an assigned level within the hierarchy. In accordance with the Fund’s policy, transfers between different levels of the fair value hierarchy are deemed to have occurred as of the beginning of the reporting period. The categorization of a value determined for investments and derivative financial instruments is based on the pricing transparency of the investments and derivative financial instruments and is not necessarily an indication of the risks associated with investing in those securities.
| | | | |
| NOTESTO FINANCIAL STATEMENTS | | | 29 | |
Notes to Financial Statements (continued)
As of December 31, 2018, certain investments of the Fund were valued using NAV per share as no quoted market value is available and therefore have been excluded from the fair value hierarchy.
| 4. | SECURITIES AND OTHER INVESTMENTS |
Preferred Stocks: Preferred stock has a preference over common stock in liquidation (and generally in receiving dividends as well), but is subordinated to the liabilities of the issuer in all respects. As a general rule, the market value of preferred stock with a fixed dividend rate and no conversion element varies inversely with interest rates and perceived credit risk, while the market price of convertible preferred stock generally also reflects some element of conversion value. Because preferred stock is junior to debt securities and other obligations of the issuer, deterioration in the credit quality of the issuer will cause greater changes in the value of a preferred stock than in a more senior debt security with similar stated yield characteristics. Unlike interest payments on debt securities, preferred stock dividends are payable only if declared by the issuer’s board of directors. Preferred stock also may be subject to optional or mandatory redemption provisions.
Multiple Class Pass-Through Securities:Multiple class pass-through securities, including collateralized mortgage obligations (“CMOs”) and commercial mortgage-backed securities may be issued by Ginnie Mae, U.S. Government agencies or instrumentalities or by trusts formed by private originators of, or investors in, mortgage loans. In general, CMOs are debt obligations of a legal entity that are collateralized by, a pool of residential or commercial mortgage loans or Mortgage Assets. The payments on these are used to make payments on the CMOs or multiple pass-through securities. Multiple class pass-through securities represent direct ownership interests in the Mortgage Assets. Classes of CMOs include interest only (“IOs”), principal only (“POs”), planned amortization classes and targeted amortization classes. IOs and POs are stripped mortgage-backed securities representing interests in a pool of mortgages, the cash flow from which has been separated into interest and principal components. IOs receive the interest portion of the cash flow while POs receive the principal portion. IOs and POs can be extremely volatile in response to changes in interest rates. As interest rates rise and fall, the value of IOs tends to move in the same direction as interest rates. POs perform best when prepayments on the underlying mortgages rise since this increases the rate at which the principal is returned and the yield to maturity on the PO. When payments on mortgages underlying a PO are slower than anticipated, the life of the PO is lengthened and the yield to maturity is reduced. If the underlying Mortgage Assets experience greater than anticipated prepayments of principal, a fund’s initial investment in the IOs may not fully recoup.
Securities Lending: The Fund may lend its securities to approved borrowers, such as brokers, dealers and other financial institutions. The borrower pledges and maintains with the Fund collateral consisting of cash, an irrevocable letter of credit issued by a bank, or securities issued or guaranteed by the U.S. Government. The initial collateral received by the Fund is required to have a value of at least 102% of the current value of the loaned securities for securities traded on U.S. exchanges and a value of at least 105% for all other securities. The collateral is maintained thereafter at a value equal to at least 100% of the current market value of the securities on loan. The market value of the loaned securities is determined at the close of each business day of the Fund and any additional required collateral is delivered to the Fund, or excess collateral returned by the Fund, on the next business day. During the term of the loan, the Fund is entitled to all distributions made on or in respect of the loaned securities, but does not receive interest income on securities received as collateral. Loans of securities are terminable at any time and the borrower, after notice, is required to return borrowed securities within the standard time period for settlement of securities transactions.
The market value of any securities on loan, all of which were classified as investment companies in the Fund’s Schedule of Investments, and the value of any related collateral are shown separately in the Statement of Assets and Liabilities as a component of investments at value-unaffiliated, and collateral on securities loaned at value, respectively. As of period end, any securities on loan were collateralized by cash and/or U.S. Government obligations. Cash collateral invested by the securities lending agent, BlackRock Investment Management, LLC (“BIM”), if any, is disclosed in the Schedule of Investments.
Securities lending transactions are entered into by the Fund under Master Securities Lending Agreements (each, an “MSLA”), which provide the right, in the event of default (including bankruptcy or insolvency), for the non-defaulting party to liquidate the collateral and calculate a net exposure to the defaulting party or request additional collateral. In the event that a borrower defaults, the Fund, as lender, would offset the market value of the collateral received against the market value of the securities loaned. When the value of the collateral is greater than that of the market value of the securities loaned, the lender is left with a net amount payable to the defaulting party. However, bankruptcy or insolvency laws of a particular jurisdiction may impose restrictions on or prohibitions against such a right of offset in the event of an MSLA counterparty’s bankruptcy or insolvency. Under the MSLA, absent an event of default, the borrower can resell or re-pledge the loaned securities, and the Fund can reinvest cash collateral received in connection with loaned securities. Upon an event of default, the parties’ obligations to return the securities or collateral to the other party are extinguished, and the parties can resell or re-pledge the loaned securities or the collateral received in connection with the loaned securities in order to satisfy the defaulting party’s net payment obligation for all transactions under the MSLA. The defaulting party remains liable for any deficiency.
As of period end, the following table is a summary of the Fund’s securities lending agreements by counterparty which are subject to offset under an MSLA:
| | | | | | | | | | | | |
| Counterparty | | Securities
Loaned at Value | | | Cash Collateral
Received (a) | | | Net
Amount | |
Citigroup Global Markets, Inc. | | $ | 453,631 | | | $ | (453,631 | ) | | $ | — | |
| | (a) | Cash collateral with a value of $459,965 has been received in connection with securities lending agreements. Collateral received in excess of the value of securities loaned from the individual counterparty, if any, is not shown for financial reporting purposes in the table above. | |
The risks of securities lending include the risk that the borrower may not provide additional collateral when required or may not return the securities when due. To mitigate these risks, the Fund benefits from a borrower default indemnity provided by BIM. BIM’s indemnity allows for full replacement of the securities loaned if the collateral received does not cover the value on the securities loaned in the event of borrower default. The Fund could incur a loss if the value of an investment purchased with cash collateral falls below the market value of loaned securities or if the value of an investment purchased with cash collateral falls below the value of the original cash collateral received.
| | |
| 30 | | 2018 BLACKROCK ANNUAL REPORTTO SHAREHOLDERS |
Notes to Financial Statements (continued)
| 5. | DERIVATIVE FINANCIAL INSTRUMENTS |
The Fund engages in various portfolio investment strategies using derivative contracts both to increase the returns of the Fund and/or to manage its exposure to certain risks such as credit risk, equity risk, interest rate risk, foreign currency exchange rate risk, commodity price risk or other risks (e.g., inflation risk). Derivative financial instruments categorized by risk exposure are included in the Schedule of Investments. These contracts may be transacted on an exchange or OTC.
Futures Contracts: Futures contracts are purchased or sold to gain exposure to, or manage exposure to changes in interest rates (interest rate risk) and changes in the value of equity securities (equity risk) or foreign currencies (foreign currency exchange rate risk).
Futures contracts are agreements between the Fund and a counterparty to buy or sell a specific quantity of an underlying instrument at a specified price and on a specified date. Depending on the terms of a contract, it is settled either through physical delivery of the underlying instrument on the settlement date or by payment of a cash amount on the settlement date. Upon entering into a futures contract, the Fund is required to deposit initial margin with the broker in the form of cash or securities in an amount that varies depending on a contract’s size and risk profile. The initial margin deposit must then be maintained at an established level over the life of the contract. Amounts pledged, which are considered restricted, are included in cash pledged for futures contracts in the Statement of Assets and Liabilities.
Securities deposited as initial margin are designated in the Schedule of Investments and cash deposited, if any, is shown as cash pledged for futures contracts in the Statement of Assets and Liabilities. Pursuant to the contract, the Fund agrees to receive from or pay to the broker an amount of cash equal to the daily fluctuation in market value of the contract (“variation margin”). Variation margin is recorded as unrealized appreciation (depreciation) and, if any, shown as variation margin receivable (or payable) on futures contracts in the Statement of Assets and Liabilities. When the contract is closed, a realized gain or loss is recorded in the Statement of Operations equal to the difference between the notional amount of the contract at the time it was opened and the notional amount at the time it was closed. The use of futures contracts involves the risk of an imperfect correlation in the movements in the price of futures contracts and interest, foreign currency exchange rates or underlying assets.
Forward Foreign Currency Exchange Contracts: The Fund enters into forward foreign currency exchange contracts to gain or reduce exposure, to foreign currencies (foreign currency exchange rate risk).
A forward foreign currency exchange contract is an agreement between two parties to buy and sell a currency at a set exchange rate on a specified date. These contracts help to manage the overall exposure to the currencies in which some of the investments held by the Fund are denominated and in some cases, may be used to obtain exposure to a particular market.
The contract is marked-to-market daily and the change in market value is recorded as unrealized appreciation (depreciation) in the Statement of Assets and Liabilities. When a contract is closed, a realized gain or loss is recorded in the Statement of Operations equal to the difference between the value at the time it was opened and the value at the time it was closed. Non-deliverable forward foreign currency exchange contracts are settled with the counterparty in cash without the delivery of foreign currency. The use of forward foreign currency exchange contracts involves the risk that the value of a forward foreign currency exchange contract changes unfavorably due to movements in the value of the referenced foreign currencies. Cash amounts pledged for forward foreign currency exchange contracts are considered restricted and are included in cash pledged as collateral for OTC derivatives on the Statement of Assets and Liabilities.
Swaps: Swap contracts are entered into to manage exposure to issuers, markets and securities. Such contracts are agreements between the Fund and a counterparty to make periodic net payments on a specified notional amount or a net payment upon termination. Swap agreements are privately negotiated in the OTC market and may be entered into as a bilateral contract (“OTC swaps”) or centrally cleared (“centrally cleared swaps”).
For OTC swaps, any upfront premiums paid and any upfront fees received are shown as swap premiums paid and swap premiums received, respectively, in the Statement of Assets and Liabilities and amortized over the term of the contract. The daily fluctuation in market value is recorded as unrealized appreciation (depreciation) on OTC Swaps in the Statement of Assets and Liabilities. Payments received or paid are recorded in the Statement of Operations as realized gains or losses, respectively. When an OTC swap is terminated, a realized gain or loss is recorded in the Statement of Operations equal to the difference between the proceeds from (or cost of) the closing transaction and the Fund’s basis in the contract, if any. Generally, the basis of the contract is the premium received or paid.
In a centrally cleared swap, immediately following execution of the swap contract, the swap contract is novated to a central counterparty (the “CCP”) and the Fund’s counterparty on the swap agreement becomes the CCP. The Fund is required to interface with the CCP through the broker. Upon entering into a centrally cleared swap, the Fund is required to deposit initial margin with the broker in the form of cash or securities in an amount that varies depending on the size and risk profile of the particular swap. Securities deposited as initial margin are designated in the Schedule of Investments and cash deposited is shown as cash pledged for centrally cleared swaps in the Statement of Assets and Liabilities. Amounts pledged, which are considered restricted cash, are included in cash pledged for centrally cleared swaps on the Statement of Assets and Liabilities. Pursuant to the contract, the Fund agrees to receive from or pay to the broker an amount of cash equal to the daily fluctuation in market value of the contract (“variation margin”). Variation margin is recorded as unrealized appreciation (depreciation) and shown as variation margin receivable (or payable) on centrally cleared swaps in the Statement of Assets and Liabilities. Payments received from (paid to) the counterparty, including at termination, are recorded as realized gains (losses) in the Statement of Operations.
| | • | | Total return swaps — Total return swaps are entered into to obtain exposure to a security or market without owning such security or investing directly in such market or to exchange the risk/return of one market (e.g., fixed-income) with another market (e.g., equity or commodity prices) (equity risk, commodity price risk and/or interest rate risk). |
Total return swaps are agreements in which there is an exchange of cash flows whereby one party commits to make payments based on the total return (distributions plus capital gains/losses) of an underlying instrument, or basket or underlying instruments, in exchange for fixed or floating rate interest payments. If the total return of the instrument(s) or index underlying the transaction exceeds or falls short of the offsetting fixed or floating interest rate obligation, the Fund receives payment from or makes a payment to the counterparty.
| | • | | Interest rate swaps — Interest rate swaps are entered into to gain or reduce exposure to interest rates or to manage duration, the yield curve or interest rate (interest rate risk). |
| | | | |
| NOTESTO FINANCIAL STATEMENTS | | | 31 | |
Notes to Financial Statements (continued)
Interest rate swaps are agreements in which one party pays a stream of interest payments, either fixed or floating, in exchange for another party’s stream of interest payments, either fixed or floating, on the same notional amount for a specified period of time. In more complex interest rate swaps, the notional principal amount may decline (or amortize) over time.
Swap transactions involve, to varying degrees, elements of interest rate, credit and market risk in excess of the amounts recognized in the Statement of Assets and Liabilities. Such risks involve the possibility that there will be no liquid market for these agreements, that the counterparty to the agreements may default on its obligation to perform or disagree as to the meaning of the contractual terms in the agreements, and that there may be unfavorable changes in interest rates and/or market values associated with these transactions.
Master Netting Arrangements: In order to define its contractual rights and to secure rights that will help it mitigate its counterparty risk, the Fund may enter into an International Swaps and Derivatives Association, Inc. Master Agreement (“ISDA Master Agreement”) or similar agreement with its counterparties. An ISDA Master Agreement is a bilateral agreement between the Fund and a counterparty that governs certain OTC derivatives and typically contains, among other things, collateral posting terms and netting provisions in the event of a default and/or termination event. Under an ISDA Master Agreement, the Fund may, under certain circumstances, offset with the counterparty certain derivative financial instruments’ payables and/or receivables with collateral held and/or posted and create one single net payment. The provisions of the ISDA Master Agreement typically permit a single net payment in the event of default including the bankruptcy or insolvency of the counterparty. Bankruptcy or insolvency laws of a particular jurisdiction may restrict or prohibit the right of offset in bankruptcy, insolvency or other events.
Collateral Requirements: For derivatives traded under an ISDA Master Agreement, the collateral requirements are typically calculated by netting the mark-to-market amount for each transaction under such agreement and comparing that amount to the value of any collateral currently pledged by the Fund and the counterparty.
Cash collateral that has been pledged to cover obligations of the Fund and cash collateral received from the counterparty, if any, is reported separately on the Statement of Assets and Liabilities as cash pledged as collateral and cash received as collateral, respectively. Non-cash collateral pledged by the Fund, if any, is noted in the Schedule of Investments. Generally, the amount of collateral due from or to a counterparty is subject to a certain minimum transfer amount threshold before a transfer is required, which is determined at the close of business of the Fund. Any additional required collateral is delivered to/pledged by the Fund on the next business day. Typically, the counterparty is not permitted to sell, re-pledge or use cash and non-cash collateral it receives. The Fund generally agrees not to use non-cash collateral that it receives but may, absent default or certain other circumstances defined in the underlying ISDA Master Agreement, be permitted to use cash collateral received. In such cases, interest may be paid pursuant to the collateral arrangement with the counterparty. To the extent amounts due to the Fund from its/ counterparties are not fully collateralized, it bears the risk of loss from counterparty non-performance. Likewise, to the extent the Fund has delivered collateral to a counterparty and stands ready to perform under the terms of its agreement with such counterparty, it bears the risk of loss from a counterparty in the amount of the value of the collateral in the event the counterparty fails to return such collateral. Based on the terms of agreements, collateral may not be required for all derivative contracts.
For financial reporting purposes, the Fund does not offset derivative assets and derivative liabilities that are subject to netting arrangements, if any, in the Statement of Assets and Liabilities.
| 6. | INVESTMENT ADVISORY AGREEMENT AND OTHER TRANSACTIONS WITH AFFILIATES |
Investment Advisory: The Company, on behalf of the Fund, entered into an Investment Advisory Agreement with the Manager, the Fund’s investment adviser and an indirect, wholly-owned subsidiary of BlackRock, to provide investment advisory and administrative services. The Manager is responsible for the management of the Fund’s portfolio and provides the personnel, facilities, equipment and certain other services necessary to the operations of the Fund.
For such services, the Fund pays the Manager a monthly fee at an annual rate equal to the following percentages of the average daily value of the Fund’s net assets:
| | | | |
| Average Daily Net Assets | | Investment
Advisory Fees | |
First $1 Billion | | | 0.55 | % |
$1 Billion — $3 Billion | | | 0.52 | |
$3 Billion — $5 Billion | | | 0.50 | |
$5 Billion — $10 Billion | | | 0.48 | |
Greater than $10 Billion | | | 0.47 | |
With respect to the Fund, the Manager entered into sub-advisory agreements with BlackRock International Limited (“BIL”), BlackRock Asset Management North Asia Limited (“BNA”) and BlackRock (Singapore) Limited (“BSL”), each an affiliate of the Manager. The Manager pays each of BIL, BNA and BSL, for services they provide, a monthly fee that is a percentage of the investment advisory fees paid by the Fund to the Manager.
Distribution Fees: The Company, on behalf of the Fund, entered into a Distribution Agreement and a Distribution Plan with BlackRock Investments, LLC (“BRIL”), an affiliate of the Manager. Pursuant to the Distribution Plan and in accordance with Rule 12b-1 under the 1940 Act, the Fund pays BRIL ongoing distribution fees. The fees are accrued daily and paid monthly at an annual rate of 0.25% based upon the average daily net assets attributable to Class III.
BRIL and broker-dealers, pursuant to sub-agreements with BRIL, provide shareholder servicing and distribution services to the Fund. The ongoing service and/or distribution fee compensates BRIL and each broker-dealer for providing shareholder servicing and/or distribution related services to shareholders.
For the year ended December 31, 2018, the class specific distribution fees borne directly by Class III were $451,080.
Transfer Agent: On behalf of the Fund, the Manager entered into agreements with insurance companies and other financial intermediaries (“Service Organizations”), some of which may be affiliates. Pursuant to these agreements, the Service Organizations provide the Fund with administrative, networking, recordkeeping, sub-transfer agency and shareholder services to sub-accounts they service. For these services, the Service Organizations receive an annual fee per shareholder account, which will
| | |
| 32 | | 2018 BLACKROCK ANNUAL REPORTTO SHAREHOLDERS |
Notes to Financial Statements (continued)
vary depending on share class and/or net assets of Fund shareholders serviced by the Service Organizations, which is shown as transfer agent — class specific. For the year ended December 31, 2018, the Fund did not pay any amounts to affiliates in return for these services.
In addition, the Fund pays the transfer agent, which is not an affiliate, a fee for the issuance, transfer and redemption of shares and the opening and maintenance of shareholder accounts, which is included in transfer agent in the Statement of Operations.
For the year ended December 31, 2018, the following table shows the class specific transfer agent fees borne directly by each share class of the Fund:
| | | | | | | | | | | | | | |
| Class I | | | | | Class III | | | | | Total | |
| $ | 26,690 | | | | | $ | 17,260 | | | | | $ | 43,950 | |
Expense Limitations, Waivers and Reimbursements:With respect to the Fund, the Manager voluntarily agreed to waive its investment advisory fees by the amount of investment advisory fees the Fund pays to the Manager indirectly through its investment in affiliated money market funds (the “affiliated money market fund waiver”). The amount of waivers and/or reimbursements of fees and expenses made pursuant to the expense limitation will be reduced by the amount of the affiliated money market fund waiver. This amount is included in fees waived and/or reimbursed by the Manager in the Statement of Operations. For the year ended December 31, 2018, the amount waived was $19,635.
The Manager has contractually agreed to waive its investment advisory fee with respect to any portion of the Fund’s assets invested in affiliated equity and fixed-income mutual funds and affiliated exchange-traded funds that have a contractual management fee through April 30, 2021. The contractual agreement may be terminated upon 90 days’ notice by a majority of the directors who are not “interested persons” of the Fund, as defined in the 1940 Act (“Independent Directors”), or by a vote of a majority of the outstanding voting securities of the Fund. This amount is included in fees waived and/or reimbursed by the Manager in the Statement of Operations. For the year ended December 31, 2018, the Fund waived $9,795 in investment advisory fees pursuant to this arrangement.
For the year ended December 31, 2018, the Fund reimbursed the Manager $2,259 for certain accounting services, which is included in accounting services in the Statement of Operations.
The Manager has contractually agreed to reimburse all transfer agent fees for Class I Shares and Class III Shares.
The Manager has agreed not to reduce or discontinue this contractual expense limitation through April 30, 2021, unless approved by the Board, including a majority of the Independent Directors, or by a vote of a majority of the outstanding voting securities of the Fund.
These amounts waived and/or reimbursed are shown as transfer agent fees waived and/or reimbursed — class specific in the Statement of Operations. For the year ended December 31, 2018, class specific expense waivers and/or reimbursements were as follows:
| | | | | | | | | | | | |
| | | Class I | | | Class III | | | Total | |
Transfer agent fees waived and/or reimbursed | | $ | 26,690 | | | $ | 17,260 | | | $ | 43,950 | |
With respect to the Fund, the Manager contractually agreed to waive and/or reimburse fees or expenses in order to limit expenses, excluding interest expense, dividend expense, tax expense, acquired fund fees and expenses, and certain other fund expenses, which constitute extraordinary expenses not incurred in the ordinary course of the Fund’s business (“expense limitation”). The expense limitations as a percentage of average daily net assets are as follows:
| | | | | | | | |
| | | Class I | | | | | Class III (a) |
| | | 0.59% | | | | | | 0.84% |
| | (a) | Class III recommenced operations on February 14, 2018. | |
Prior to April 23, 2018, Class I and Class III’s expense limitations as a percentage of average daily net assets were 1.00% and 1.25%, respectively.
The Manager has agreed not to reduce or discontinue this contractual expense limitation through April 30, 2021 unless approved by the Board, including a majority of the Independent Directors, or by a vote of a majority of the outstanding voting securities of the Fund. This amount is included in fees waived and/or reimbursed by the Manager in the Statement of Operations. For the year ended December 31, 2018, the amount waived and/or reimbursed was $261,636.
Securities Lending: The U.S. Securities and Exchange Commission (“SEC”) has issued an exemptive order which permits BIM, an affiliate of the Manager, to serve as securities lending agent for the Fund, subject to applicable conditions. As securities lending agent, BIM bears all operational costs directly related to securities lending. The Fund is responsible for expenses in connection with the investment of cash collateral received for securities on loan (the “collateral investment expenses”). The cash collateral is invested in a private investment company managed by the Manager or its affiliates. However, BIM has agreed to cap the collateral investment expenses of the private investment company to an annual rate of 0.04%. The investment adviser to the private investment company will not charge any advisory fees with respect to shares purchased by the Fund. The private investment company in which the cash collateral has been invested may, under certain circumstances, impose a liquidity fee of up to 2% of the value withdrawn or temporarily restrict withdrawals for up to 10 business days during a 90 day period, in the event that the private investment company’s weekly liquid assets fall below certain thresholds.
Securities lending income is equal to the total of income earned from the reinvestment of cash collateral, net of fees and other payments to and from borrowers of securities, and less the collateral investment expenses. The Fund retains a portion of securities lending income and remits a remaining portion to BIM as compensation for its services as securities lending agent.
Pursuant to a securities lending agreement, the Fund retains 80% of securities lending income, and this amount retained can never be less than 70% of the total of securities lending income plus the collateral investment expenses.
| | | | |
| NOTESTO FINANCIAL STATEMENTS | | | 33 | |
Notes to Financial Statements (continued)
In addition, commencing the business day following the date that the aggregate securities lending income earned across the Equity-Bond Complex in a calendar year exceeds a specified threshold, the Fund, pursuant to the securities lending agreement, will retain for the remainder of that calendar year securities lending income in an amount equal to 85% of securities lending income, and this amount retained can never be less than 70% of the total of securities lending income plus the collateral investment expenses.
The share of securities lending income earned by the Fund is shown as securities lending income — affiliated — net in the Statement of Operations. For the year ended December 31, 2018, the Fund paid BIM $639 for securities lending agent services.
lnterfund Lending: In accordance with an exemptive order (the “Order”) from the SEC, the Fund may participate in a joint lending and borrowing facility for temporary purposes (the “lnterfund Lending Program”), subject to compliance with the terms and conditions of the Order, and to the extent permitted by the Fund’s investment policies and restrictions. The Fund is currently permitted to borrow under the lnterfund Lending Program.
A lending BlackRock fund may lend in aggregate up to 15% of its net assets, but may not lend more than 5% of its net assets, to any one borrowing fund through the lnterfund Lending Program. A borrowing BlackRock fund may not borrow through the lnterfund Lending Program or from any other source more than 33 1/3% of its total assets (or any lower threshold provided for by the fund’s investment restrictions). If a borrowing BlackRock fund’s total outstanding borrowings exceed 10% of its total assets, each of its outstanding interfund loans will be subject to collateralization of at least 102% of the outstanding principal value of the loan. All interfund loans are for temporary or emergency purposes and the interest rate to be charged will be the average of the highest current overnight repurchase agreement rate available to a lending fund and the bank loan rate, as calculated according to a formula established by the Board.
During the year ended December 31, 2018, the Fund did not participate in the lnterfund Lending Program.
Directors and Officers: Certain directors and/or officers of the Company are directors and/or officers of BlackRock or its affiliates. The Fund reimburses the Manager for a portion of the compensation paid to the Company’s Chief Compliance Officer, which is included in Directors and Officer in the Statement of Operations.
For the year ended December 31, 2018, purchases and sales of investments, including paydowns and excluding short-term securities, were as follows:
| | | | | | | | |
| | | Purchases | | | Sales | |
Non-U.S Government Securities | | $ | 373,841,841 | | | $ | 382,742,327 | |
U.S Government Securities | | | 76,962,685 | | | | 68,777,949 | |
It is the Fund’s policy to comply with the requirements of the Internal Revenue Code of 1986, as amended, applicable to regulated investment companies, and to distribute substantially all of its taxable income to its shareholders. Therefore, no U.S. federal income tax provision is required.
The Fund files U.S. federal and various state and local tax returns. No income tax returns are currently under examination. The statute of limitations on the Fund’s U.S. federal tax returns generally remains open for each of the four years ended December 31, 2018. The statutes of limitations on the Fund’s state and local tax returns may remain open for an additional year depending upon the jurisdiction.
Management has analyzed tax laws and regulations and their application to the Fund as of December 31, 2018, inclusive of the open tax return years, and does not believe that there are any uncertain tax positions that require recognition of a tax liability in the Fund’s financial statements.
U.S. GAAP requires that certain components of net assets be adjusted to reflect permanent differences between financial and tax reporting. These reclassifications have no effect on net assets or net asset values per share. As of December 31, 2018, the following permanent differences, attributable tonon-deductible offering costs, were reclassified to the following accounts:
| | | | |
Paid-in capital | | $ | (6,781 | ) |
Accumulated earnings | | | 6,781 | |
The tax character of distributions paid was as follows:
| | | | | | | | |
| | | 12/31/2018 | | | 12/31/2017 | |
Ordinary income | | $ | 6,734,684 | | | $ | 93,042 | |
Long term capital gains | | | — | | | | 55,657 | |
| | | | | | | | |
| | $ | 6,734,684 | | | $ | 148,699 | |
| | | | | | | | |
As of December 31, 2018, the tax components of accumulated net earnings (losses) were as follows:
| | | | |
Undistributed ordinary income | | $ | 159,108 | |
Capital loss carryforward | | | (111,405,144 | ) |
Net unrealized losses(a) | | | (17,334,954 | ) |
Qualified late-year losses(b) | | | (1,227,300 | ) |
| | | | |
| | $ | (129,808,290 | ) |
| | | | |
| | |
| 34 | | 2018 BLACKROCK ANNUAL REPORTTO SHAREHOLDERS |
Notes to Financial Statements (continued)
| | (a) | The difference between book-basis and tax-basis net unrealized losses was attributable primarily to the tax deferral of losses on wash sales and straddles, the realization for tax purposes of unrealized gains/losses on certain futures and foreign currency exchange contracts, the realization for tax purposes of unrealized gains on investments in passive foreign investment companies, the timing and recognition of partnership income, and the classification of investments. | |
| | (b) | The Fund has elected to defer certain qualified late-year losses and recognize such losses in the next taxable year. | |
As of December 31, 2018, the Fund had a capital loss carryforward, with no expiration date, available to offset future realized capital gains of $111,405,144.
During the year ended December 31, 2018, the Fund utilized $6,083,346 of its capital loss carryforward.
As of December 31, 2018, gross unrealized appreciation and depreciation for investments and derivatives based on cost for U.S. federal income tax purposes were as follows:
| | | | |
Tax cost | | $ | 221,000,783 | |
| | | | |
Gross unrealized appreciation | | $ | 22,784,354 | |
Gross unrealized depreciation | | | (39,228,683 | ) |
| | | | |
Net unrealized depreciation | | $ | (16,444,329 | ) |
| | | | |
The Company, on behalf of the Fund, along with certain other funds managed by the Manager and its affiliates (“Participating Funds”), is a party to a 364-day, $2.25 billion credit agreement with a group of lenders. Under this agreement, the Fund may borrow to fund shareholder redemptions. Excluding commitments designated for certain individual funds, the Participating Funds, including the Fund, can borrow up to an aggregate commitment amount of $1.75 billion at any time outstanding, subject to asset coverage and other limitations as specified in the agreement. The credit agreement has the following terms: a fee of 0.10% per annum on unused commitment amounts and interest at a rate equal to the higher of (a) one-month LIBOR (but, in any event, not less than 0.00%) on the date the loan is made plus 0.80% per annum or (b) the Fed Funds rate (but, in any event, not less than 0.00%) in effect from time to time plus 0.80% per annum on amounts borrowed. The agreement expires in April 2019 unless extended or renewed. Prior to April 19, 2018, the aggregate commitment amount was $2.1 billion and the fee was 0.12% per annum. Participating Funds paid an upfront commitment fee of 0.02% on the total commitment amounts, in addition to administration, legal and arrangement fees, which are included in miscellaneous expenses in the Statement of Operations. These fees were allocated among such funds based upon portions of the aggregate commitment available to them and relative net assets of Participating Funds. During the year ended December 31, 2018, the Fund did not borrow under the credit agreement.
In the normal course of business, the Fund invests in securities or other instruments and may enter into certain transactions, and such activities subject the Fund to various risks, including among others, fluctuations in the market (market risk) or failure of an issuer to meet all of its obligations. The value of securities or other instruments may also be affected by various factors, including, without limitation: (i) the general economy; (ii) the overall market as well as local, regional or global political and/or social instability; (iii) regulation, taxation or international tax treaties between various countries; or (iv) currency, interest rate and price fluctuations. The Fund’s prospectus provides details of the risks to which the Fund is subject.
The Fund may be exposed to prepayment risk, which is the risk that borrowers may exercise their option to prepay principal earlier than scheduled during periods of declining interest rates, which would force the Fund to reinvest in lower yielding securities. The Fund may also be exposed to reinvestment risk, which is the risk that income from the Fund’s portfolio will decline if the Fund invests the proceeds from matured, traded or called fixed-income securities at market interest rates that are below the Fund portfolio’s current earnings rate.
The Fund may be exposed to additional risks when reinvesting cash collateral in money market funds that do not seek to maintain a stable NAV per share of $1.00, which may be subject to redemption gates or liquidity fees under certain circumstances.
Valuation Risk: The market values of equities, such as common stocks and preferred securities or equity related investments, such as futures and options, may decline due to general market conditions which are not specifically related to a particular company. They may also decline due to factors which affect a particular industry or industries. The Fund may invest in illiquid investments and may experience difficulty in selling those investments in a timely manner at the price that it believes the investments are worth. Prices may fluctuate widely over short or extended periods in response to company, market or economic news. Markets also tend to move in cycles, with periods of rising and falling prices. This volatility may cause the Fund’s NAV to experience significant increases or decreases over short periods of time. If there is a general decline in the securities and other markets, the NAV of the Fund may lose value, regardless of the individual results of the securities and other instruments in which the Fund invests.
Counterparty Credit Risk: The Fund may be exposed to counterparty credit risk, or the risk that an entity may fail to or be unable to perform on its commitments related to unsettled or open transactions. The Fund manages counterparty credit risk by entering into transactions only with counterparties that the Manager believes have the financial resources to honor their obligations and by monitoring the financial stability of those counterparties. Financial assets, which potentially expose the Fund to market, issuer and counterparty credit risks, consist principally of financial instruments and receivables due from counterparties. The extent of the Fund’s exposure to market, issuer and counterparty credit risks with respect to these financial assets is approximately their value recorded in the Statement of Assets and Liabilities, less any collateral held by the Fund.
A derivative contract may suffer a mark-to-market loss if the value of the contract decreases due to an unfavorable change in the market rates or values of the underlying instrument. Losses can also occur if the counterparty does not perform under the contract.
The Fund’s risk of loss from counterparty credit risk on OTC derivatives is generally limited to the aggregate unrealized gain less the value of any collateral held by the Fund.
| | | | |
| NOTESTO FINANCIAL STATEMENTS | | | 35 | |
Notes to Financial Statements (continued)
With exchange-traded futures and centrally cleared swaps, there is less counterparty credit risk to the Fund since the exchange or clearinghouse, as counterparty to such instruments, guarantees against a possible default. The clearinghouse stands between the buyer and the seller of the contract; therefore, credit risk is limited to failure of the clearinghouse. While offset rights may exist under applicable law, the Fund does not have a contractual right of offset against a clearing broker or clearinghouse in the event of a default (including the bankruptcy or insolvency). Additionally, credit risk exists in exchange-traded futures and centrally cleared swaps with respect to initial and variation margin that is held in a clearing broker’s customer accounts. While clearing brokers are required to segregate customer margin from their own assets, in the event that a clearing broker becomes insolvent or goes into bankruptcy and at that time there is a shortfall in the aggregate amount of margin held by the clearing broker for all its clients, typically the shortfall would be allocated on a pro rata basis across all the clearing broker’s customers, potentially resulting in losses to the Fund.
| 11. | CAPITAL SHARE TRANSACTIONS |
Transactions in capital shares were as follows:
| | | | | | | | | | | | | | | | |
| | | Year Ended
12/31/2018 (a) | | | Year Ended
12/31/2017 | |
| | | Shares | | | Amount | | | Shares | | | Amount | |
Class I | | | | | | | | | | | | | | | | |
Shares sold | | | 26,476 | | | $ | 367,264 | | | | 41,987 | | | $ | 563,708 | |
Shares issued in reinvestment of distributions | | | 26,995 | | | | 363,124 | | | | 10,985 | | | | 148,699 | |
Shares redeemed | | | (178,879 | ) | | | (2,476,164 | ) | | | (197,978 | ) | | | (2,658,517 | ) |
| | | | | | | | | | | | | | | | |
Net decrease | | | (125,408 | ) | | $ | (1,745,776 | ) | | | (145,006 | ) | | $ | (1,946,110 | ) |
| | | | | | | | | | | | | | | | |
| | | | |
Class III | | | | | | | | | | | | | | | | |
Shares sold | | | 725,363 | | | $ | 10,018,545 | | | | — | | | $ | — | |
Shares issued in reinvestment of distributions | | | 474,003 | | | | 6,371,288 | | | | — | | | | — | |
Shares issued in reorganization | | | 19,470,298 | | | | 268,343,917 | | | | — | | | | — | |
Shares redeemed | | | (3,150,472 | ) | | | (43,754,941 | ) | | | — | | | | — | |
| | | | | | | | | | | | | | | | |
Net increase | | | 17,519,192 | | | $ | 240,978,809 | | | | — | | | $ | — | |
| | | | | | | | | | | | | | | | |
Total Net Increase (Decrease) | | | 17,393,784 | | | $ | 239,233,033 | | | | (145,006 | ) | | $ | (1,946,110 | ) |
| | | | | | | | | | | | | | | | |
| | (a) | Period February 14, 2018 (recommencement of operations) to December 31, 2018 for Class III. | |
As of December 31, 2018, BlackRock Financial Management, Inc., an affiliate of the Fund, owned 730 Class III shares of BlackRock Managed Volatility V.I. Fund.
| 12. | REGULATION S-X AMENDMENTS |
On August 17, 2018, the SEC adopted amendments to certain disclosure requirements in Securities Act Release No. 33-10532, Disclosure Update and Simplification. The Fund has adopted the amendments pertinent to Regulation S-X in this shareholder report. The amendments impacted certain disclosure presentation on the Statement of Assets and Liabilities, Statements of Changes in Net Assets and Notes to the Financial Statements.
Prior year distribution information and distributions in excess of net investment income in the Statements of Changes in Net Assets has been modified to conform to the current year presentation in accordance with the Regulation S-X changes.
Distributions for the year ended December 31, 2017 were classified as follows:
| | | | | | | | |
| Share Class | | Net Investment Income | | | Net Realized Gain | |
Class I | | $ | (50,000 | ) | | $ | (98,699 | ) |
Distributions in excess of net investment income as of December 31, 2017 was $(31,377).
Management has evaluated the impact of all subsequent events on the Fund through the date the financial statements were issued and has determined that there were no subsequent events requiring adjustment or additional disclosure in the financial statements.
| | |
| 36 | | 2018 BLACKROCK ANNUAL REPORTTO SHAREHOLDERS |
Report of Independent Registered Public Accounting Firm
To the Shareholders of BlackRock Managed Volatility V.I. Fund and the Board of Directors of BlackRock Variable Series Funds, Inc.:
Opinion on the Financial Statements and Financial Highlights
We have audited the accompanying statement of assets and liabilities of BlackRock Managed Volatility V.I. Fund of BlackRock Variable Series Funds, Inc. (the “Fund”), including the schedule of investments, as of December 31, 2018, the related statement of operations for the year then ended, the statements of changes in net assets for each of the two years in the period then ended, the financial highlights for each of the five years in the period then ended, and the related notes. In our opinion, the financial statements and financial highlights present fairly, in all material respects, the financial position of the Fund as of December 31, 2018, and the results of its operations for the year then ended, the changes in its net assets for each of the two years in the period then ended, and the financial highlights for each of the five years in the period then ended, in conformity with accounting principles generally accepted in the United States of America.
Basis for Opinion
These financial statements and financial highlights are the responsibility of the Fund’s management. Our responsibility is to express an opinion on the Fund’s financial statements and financial highlights based on our audits. We are a public accounting firm registered with the Public Company Accounting Oversight Board (United States) (PCAOB) and are required to be independent with respect to the Fund in accordance with the U.S. federal securities laws and the applicable rules and regulations of the Securities and Exchange Commission and the PCAOB.
We conducted our audits in accordance with the standards of the PCAOB. Those standards require that we plan and perform the audit to obtain reasonable assurance about whether the financial statements and financial highlights are free of material misstatement, whether due to error or fraud. The Fund is not required to have, nor were we engaged to perform, an audit of its internal control over financial reporting. As part of our audits we are required to obtain an understanding of internal control over financial reporting but not for the purpose of expressing an opinion on the effectiveness of the Fund’s internal control over financial reporting. Accordingly, we express no such opinion.
Our audits included performing procedures to assess the risks of material misstatement of the financial statements and financial highlights, whether due to error or fraud, and performing procedures that respond to those risks. Such procedures included examining, on a test basis, evidence regarding the amounts and disclosures in the financial statements and financial highlights. Our audits also included evaluating the accounting principles used and significant estimates made by management, as well as evaluating the overall presentation of the financial statements and financial highlights. Our procedures included confirmation of securities owned as of December 31, 2018, by correspondence with the custodian and brokers; when replies were not received from brokers, we performed other auditing procedures. We believe that our audits provide a reasonable basis for our opinion.
Deloitte & Touche LLP
Boston, Massachusetts
February 15, 2019
We have served as the auditor of one or more BlackRock investment companies since 1992.
| | | | |
| REPORTOF INDEPENDENT REGISTERED PUBLIC ACCOUNTING FIRM | | | 37 | |
Glossary of Terms Used in this Report
| | |
| Currency |
| |
| AUD | | Australian Dollar |
| |
| BRL | | Brazilian Real |
| |
| CAD | | Canadian Dollar |
| |
| CHF | | Swiss Franc |
| |
| CNY | | Chinese Yuan |
| |
| CZK | | Czech Koruna |
| |
| EUR | | Euro |
| |
| GBP | | British Pound |
| |
| HKD | | Hong Kong Dollar |
| |
| INR | | Indian Rupee |
| |
| JPY | | Japanese Yen |
| |
| KRW | | South Korean Won |
| |
| MXN | | Mexican Peso |
| |
| MYR | | Malaysian Ringgit |
| |
| NOK | | Norwegian Krone |
| |
| NZD | | New Zealand Dollar |
| |
| PLN | | Polish Zloty |
| |
| SEK | | Swedish Krona |
| |
| SGD | | Singapore Dollar |
| |
| THB | | Thai Baht |
| |
| TWD | | New Taiwan Dollar |
| |
| USD | | United States Dollar |
| |
| ZAR | | South African Rand |
| | |
| Portfolio Abbreviations | | |
| |
| ADR | | American Depositary Receipt |
| |
| CDI | | Crest Depository Interests |
| |
| CVA | | Certification Van Aandelon (Dutch Certificate) |
| |
| ETF | | Exchange-Traded Fund |
| |
| FDR | | Fiduciary Depositary Receipt |
| |
| OTC | | Over-The-Counter |
| |
| REIT | | Real Estate Investment Trust |
| |
| S&P | | Standard & Poor’s |
| | |
| 38 | | 2018 BLACKROCK ANNUAL REPORTTO SHAREHOLDERS |
DECEMBER 31, 2018
| | |
ANNUAL REPORT | |  |
BlackRock Variable Series Funds, Inc.
| Ø | | BlackRock S&P 500 Index V.I. Fund |
|
| Not FDIC Insured • May Lose Value • No Bank Guarantee |
| | |
| Fund Summary as of December 31, 2018 | | BlackRock S&P 500 Index V.I. Fund |
Investment Objective
BlackRock S&P 500 Index V.I. Fund’s (the “Fund”) investment objective is to seek investment results that, before expenses, correspond to the aggregate price and yield performance of the Standard and Poor’s (“S&P”) 500® Index.
On November 15, 2017, the Board of Directors of the Company (the “Board”) and, on December 1, 2017, the Board of Trustees of HIMCO Variable Insurance Trust each approved a reorganization of the HIMCO VIT Index Fund (the “HIMCO Fund”), with and into the Fund. At a special shareholder meeting on April 4, 2018, the shareholders of the HIMCO Fund approved the HIMCO Reorganization, which was completed on April 23, 2018.
On November 14, 2017, the Board and, on May 23, 2018, the Board of Trustees of State Farm Variable Product Trust each approved a reorganization of the State Farm Large Cap Equity Index Fund (the “State Farm Fund”), with and into the Fund. At a special shareholder meeting on September 14, 2018, the shareholders of the State Farm Fund approved the State Farm reorganization, which was completed on October 29, 2018.
Portfolio Management Commentary
How did the Fund perform?
For the 12-month period ended December 31, 2018, the Fund’s Class I, Class II and Class III Shares returned (4.61)%, (4.74)% and (4.82)%, respectively, while the benchmark S&P 500® Index returned (4.38)%.
Returns for the Fund’s respective share classes differ from the benchmark index based on individual share-class expenses.
Describe the market environment.
In the beginning of the first quarter of 2018, the low volatility regime that helped global equity markets reach record highs in 2017 continued to support U.S. markets. Further fueled bytax-reform optimism, January saw markets rally, led higher by momentum and information technology names. However, as the first quarter progressed, a combination of economic over-heating concerns, the return of volatility, rising yields and the specter of trade wars weighed on markets.
From a sector standpoint, technology and consumer discretionary stocks outperformed, due to their impressive early-quarter runs. Although the first quarter was plagued with volatility, the defensive sectors of telecommunications and consumer staples were the worst performing in the S&P 500® Index.
Contrary to what the U.S. equity market’s lackluster performance would suggest, the U.S. economy remained healthy in the first quarter of 2018. This supported the Fed’s decision to increase interest rates in March and to revise higher their rate hike expectations for 2019.
Despite the fluid headlines and ongoing threats regarding the topic of U.S. protectionism in the second quarter of 2018, investors found confidence in strong U.S. economic data and earnings growth. On the macroeconomic front, the U.S. unemployment rate struck 3.8%, the lowest level since 1975. Economic reports throughout the second quarter of 2018 also indicated strong economic conditions. Additionally, the core personal consumption expenditure hit the Fed’s target rate of 2%, supporting their decision to raise rates in June. From a sector standpoint, energy outperformed as a prolonged period of higher crude oil prices increased the attractiveness of energy company shares.
In the third quarter of 2018, U.S. large cap equities reachedall-time highs as impressive economic growth and earnings results fueledrisk-on appetite and outweighed the specter of trade wars. Despite the announcement of tariffs on $505 billion of Chinese goods and China’s retaliatory measures, U.S. equity volatility was limited. Macroeconomic releases continued to showcase strength in both labor and economic conditions. The strength of the economy allowed the Fed to raise the target range of the benchmark federal funds rate from 2% to 2.25%.
In the fourth quarter of 2018, ten out of the eleven Global Industry Classification Standard equity sectors moved lower. The utilities sector (+1.36%) was the only sector to advance, as lower interest rates and a flight to safety throughout the fourth quarter benefited the traditionally defensive sector.
Conversely, the energy sector(-23.78%) trailed the market, as a decline in crude oil provided a headwind. However, it was the information technology sector(-17.34%) that deducted the most from the index’s overall total return(-3.6%), as lowered corporate earnings guidance weighed on investor sentiment.
More broadly, concerns over Fed policy, Sino-American trade tensions, and a potential slowdown in growth contributed to investor anxiety throughout the fourth quarter. The quarter began with Fed Chairman Powell’s comment that the U.S. Federal Funds rate was “a long way from neutral.” The hawkish comment drove a temporarysell-off in Treasuries. However, this was short lived as declines in energy prices and softness in portions of the U.S. economy contributed to a reduction in inflation expectations. This was accompanied by a broad basedrisk-off in December — which was the worst December performance on record since 1931 — and the10-year U.S. Treasury yield ended the quarter lower than its intra-quarter highs.
For theone-year period ended December 31, 2018, the largest negative returns for the S&P 500® Index in 2018 came from the energy(-18.08%), materials(-14.70%), and industrials(-13.29%) sectors. However, the health care (+6.41%), utilities (+4.11%), and information technology sectors (+3.37%) contributed positively to overall return.
Describe recent portfolio activity.
During the period, as changes were made to the composition of the S&P 500® Index, the Fund purchased and sold securities to maintain its objective of replicating the risks and return of the benchmark index.
Describe portfolio positioning at period end.
The Fund remains positioned to match the risk characteristics of its benchmark index, irrespective of the market’s future direction.
| | |
| 2 | | 2018 BLACKROCK ANNUAL REPORTTO SHAREHOLDERS |
| | |
| Fund Summary as of December 31, 2018 (continued) | | BlackRock S&P 500 Index V.I. Fund |
TOTAL RETURN BASED ON A $10,000 INVESTMENT
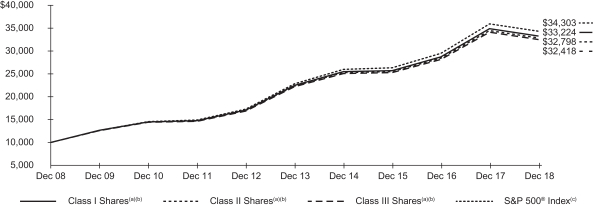
| (a) | Assuming transaction costs, if any, and other operating expenses, including investment advisory fees. Does not include insurance-related fees and expenses. The returns for Class III Shares prior to February 14, 2018, the recommencement of operations of Class III Shares, are based upon the performance of the Fund’s Class I Shares, as adjusted to reflect the distribution(12b-1) fees applicable to Class III Shares. |
| (b) | Under normal circumstances, the Fund invests at least 80% of its assets in the common stocks represented in the S&P 500® Index and in derivative instruments linked to the S&P 500® Index. |
| (c) | An unmanaged index that covers 500 leading companies and captures approximately 80% coverage of available market capitalization. |
Performance Summary for the Period Ended December 31, 2018
| | | | | | | | | | | | | | | | |
| | | | | | Average Annual Total Returns | |
| | | 6-Month
Total Returns (b) | | | 1 Year (b) | | | 5 Years (b) | | | 10 Years (b) | |
Class I(a) | | | (6.93 | )% | | | (4.61 | )% | | | 8.17 | % | | | 12.76 | % |
Class II(a) | | | (7.00 | ) | | | (4.74 | ) | | | 8.01 | | | | 12.61 | |
Class III(a) | | | (7.04 | ) | | | (4.82 | )(c) | | | 7.91 | (c) | | | 12.48 | (c) |
S&P 500® Index | | | (6.85 | ) | | | (4.38 | ) | | | 8.49 | | | | 13.12 | |
| | (a) | Average annual and cumulative total returns are based on changes in net asset value for the periods shown, and assume reinvestment of all distributions at net asset value on the ex-dividend date. Insurance-related fees and expenses are not reflected in these returns. | |
| | (b) | For a portion of the period, the Fund’s investment adviser waived a portion of its fee. Without such waiver, the Fund’s performance would have been lower. | |
| | (c) | The returns for Class III Shares prior to February 14, 2018, the recommencement of operations of Class III Shares, are based upon the performance of the Fund’s Class I Shares, as adjusted to reflect the distribution (12b-1) fees applicable to Class III Shares. | |
Past performance is not indicative of future results. Performance results do not reflect the deduction of taxes that a shareholder would pay on Fund distributions or the redemption of Fund shares.
Performance results may include adjustments made for financial reporting purposes in accordance with U.S. generally accepted accounting principles.
Expense Example
| | | | | | | | | | | | | | | | | | | | | | | | | | | | | | | | |
| | | Actual | | | | | | Hypothetical (a) | | | | |
| | | Beginning
Account Value
(07/01/18) | | | Ending
Account Value
(12/31/18) | | | Expenses
Paid During
the Period (b) | | | | | | Beginning
Account Value
(07/01/18) | | | Ending Account Value
(12/31/18) | | | Expenses
Paid During
the Period (b) | | | Annualized
Expense Ratio | |
Class I | | $ | 1,000.00 | | | $ | 930.70 | | | $ | 0.73 | | | | | | | $ | 1,000.00 | | | $ | 1,024.45 | | | $ | 0.77 | | | | 0.15 | % |
Class II | | | 1,000.00 | | | | 930.00 | | | | 1.46 | | | | | | | | 1,000.00 | | | | 1,023.69 | | | | 1.53 | | | | 0.30 | |
Class III | | | 1,000.00 | | | | 929.60 | | | | 1.75 | | | | | | | | 1,000.00 | | | | 1,023.39 | | | | 1.84 | | | | 0.36 | |
| | (a) | Hypothetical 5% annual return before expenses is calculated by prorating the number of days in the most recent fiscal half year divided by 365. | |
| | (b) | For each class of the Fund, expenses are equal to annualized expense ratio for the class, multiplied by the average account value over the period, multiplied by 184/365 (to reflect the one-half year period shown). | |
See “Disclosure of Expenses” on page 5 for further information on how expenses were calculated
| | |
| Fund Summary as of December 31, 2018 (continued) | | BlackRock S&P 500 Index V.I. Fund |
Portfolio Information
SECTOR ALLOCATION
| | | | |
| Sector | | Percent of
Net Assets | |
Information Technology | | | 20 | % |
Health Care | | | 16 | |
Financials | | | 13 | |
Communication Services | | | 10 | |
Consumer Discretionary | | | 10 | |
Industrials | | | 9 | |
Consumer Staples | | | 7 | |
Energy | | | 5 | |
Utilities | | | 3 | |
Real Estate | | | 3 | |
Materials | | | 3 | |
Short-Term Securities | | | 3 | |
Liabilities in Excess of Other Assets | | | (2 | ) |
For Fund compliance purposes, the Fund’s sector classifications refer to one or more of the sector sub-classifications used by one or more widely recognized market indexes or ratings group indexes, and/or as defined by the investment adviser. These definitions may not apply for purposes of this report, which may combine sector sub classifications for reporting ease.
| | |
| 4 | | 2018 BLACKROCK ANNUAL REPORTTO SHAREHOLDERS |
| | |
| Disclosure of Expenses | | BlackRock S&P 500 Index V.I. Fund |
Shareholders of the Fund may incur the following charges: (a) transactional expenses; and (b) operating expenses, including investment advisory fees, service and distribution fees, including 12b-1 fees, acquired fund fees and expenses, and other fund expenses. The expense example on the previous page (which is based on a hypothetical investment of $1,000 invested on July 1, 2018 and held through December 31, 2018) is intended to assist shareholders both in calculating expenses based on an investment in the Fund and in comparing these expenses with similar costs of investing in other mutual funds.
The expense example provides information about actual account values and actual expenses. In order to estimate the expenses a shareholder paid during the period covered by this report, shareholders can divide their account value by $1,000 and then multiply the result by the number corresponding to their share class under the heading entitled “Expenses Paid During the Period.”
The expense example also provides information about hypothetical account values and hypothetical expenses based on the Fund’s actual expense ratio and an assumed rate of return of 5% per year before expenses. In order to assist shareholders in comparing the ongoing expenses of investing in the Fund and other funds, compare the 5% hypothetical example with the 5% hypothetical examples that appear in shareholder reports of other funds.
The expenses shown in the expense example are intended to highlight shareholders’ ongoing costs only and do not reflect any transactional expenses, such as sales charges, if any. Therefore, the hypothetical example is useful in comparing ongoing expenses only, and will not help shareholders determine the relative total expenses of owning different funds. If these transactional expenses were included, shareholder expenses would have been higher.
Derivative Financial Instruments
The Fund may invest in various derivative financial instruments. These instruments are used to obtain exposure to a security, commodity, index, market, and/or other assets without owning or taking physical custody of securities, commodities and/or other referenced assets or to manage market, equity, credit, interest rate, foreign currency exchange rate, commodity and/or other risks. Derivative financial instruments may give rise to a form of economic leverage and involve risks, including the imperfect correlation between the value of a derivative financial instrument and the underlying asset, possible default of the counterparty to the transaction or illiquidity of the instrument. The Fund’s successful use of a derivative financial instrument depends on the investment adviser’s ability to predict pertinent market movements accurately, which cannot be assured. The use of these instruments may result in losses greater than if they had not been used, may limit the amount of appreciation the Fund can realize on an investment and/or may result in lower distributions paid to shareholders. The Fund’s investments in these instruments, if any, are discussed in detail in the Notes to Financial Statements.
| | | | |
| DISCLOSURE OF EXPENSES / DERIVATIVE FINANCIAL INSTRUMENTS | | | 5 | |
| | |
Schedule of Investments December 31, 2018 | | BlackRock S&P 500 Index V.I. Fund (Percentages shown are based on Net Assets) |
| | | | | | | | |
| Security | | Shares | | | Value | |
|
Common Stocks — 99.4% | |
|
Aerospace & Defense — 2.5% | |
Arconic, Inc.(a) | | | 35,588 | | | $ | 600,014 | |
Boeing Co. (The) | | | 43,297 | | | | 13,963,283 | |
General Dynamics Corp. | | | 22,830 | | | | 3,589,104 | |
Harris Corp. | | | 9,685 | | | | 1,304,085 | |
Huntington Ingalls Industries, Inc. | | | 3,495 | | | | 665,133 | |
L3 Technologies, Inc. | | | 6,426 | | | | 1,115,939 | |
Lockheed Martin Corp.(a) | | | 20,249 | | | | 5,301,998 | |
Northrop Grumman Corp. | | | 14,234 | | | | 3,485,907 | |
Raytheon Co.(a) | | | 23,265 | | | | 3,567,688 | |
Textron, Inc. | | | 20,100 | | | | 924,399 | |
TransDigm Group, Inc.(b) | | | 3,978 | | | | 1,352,759 | |
United Technologies Corp. | | | 66,571 | | | | 7,088,480 | |
| | | | | | | | |
| | | | | | | 42,958,789 | |
| | |
| Air Freight & Logistics — 0.6% | | | | | | |
CH Robinson Worldwide, Inc.(a) | | | 11,273 | | | | 947,947 | |
Expeditors International of Washington, Inc. | | | 14,246 | | | | 970,010 | |
FedEx Corp. | | | 19,944 | | | | 3,217,565 | |
United Parcel Service, Inc., Class B | | | 56,994 | | | | 5,558,625 | |
| | | | | | | | |
| | | | | | | 10,694,147 | |
| | |
| Airlines — 0.4% | | | | | | |
Alaska Air Group, Inc.(a) | | | 10,108 | | | | 615,072 | |
American Airlines Group, Inc.(a) | | | 33,399 | | | | 1,072,442 | |
Delta Air Lines, Inc. | | | 51,149 | | | | 2,552,335 | |
Southwest Airlines Co. | | | 41,777 | | | | 1,941,795 | |
United Continental Holdings, Inc.(a)(b) | | | 18,763 | | | | 1,571,026 | |
| | | | | | | | |
| | | | | | | 7,752,670 | |
| | |
| Auto Components — 0.1% | | | | | | |
Aptiv plc | | | 21,600 | | | | 1,329,912 | |
BorgWarner, Inc. | | | 17,495 | | | | 607,776 | |
Goodyear Tire & Rubber Co. (The) | | | 19,102 | | | | 389,872 | |
| | | | | | | | |
| | | | | | | 2,327,560 | |
| | |
| Automobiles — 0.4% | | | | | | |
Ford Motor Co. | | | 320,304 | | | | 2,450,326 | |
General Motors Co. | | | 107,609 | | | | 3,599,521 | |
Harley-Davidson, Inc.(a) | | | 13,462 | | | | 459,323 | |
| | | | | | | | |
| | | | | | | 6,509,170 | |
| | |
| Banks — 5.6% | | | | | | |
Bank of America Corp. | | | 748,257 | | | | 18,437,053 | |
BB&T Corp. | | | 63,176 | | | | 2,736,784 | |
Citigroup, Inc. | | | 200,209 | | | | 10,422,881 | |
Citizens Financial Group, Inc. | | | 38,360 | | | | 1,140,443 | |
Comerica, Inc. | | | 13,128 | | | | 901,762 | |
Fifth Third Bancorp | | | 53,748 | | | | 1,264,690 | |
First Republic Bank | | | 13,416 | | | | 1,165,850 | |
Huntington Bancshares, Inc.(a) | | | 87,025 | | | | 1,037,338 | |
JPMorgan Chase & Co. | | | 272,620 | | | | 26,613,164 | |
KeyCorp | | | 84,812 | | | | 1,253,521 | |
M&T Bank Corp. | | | 11,609 | | | | 1,661,596 | |
People’s United Financial, Inc. | | | 29,867 | | | | 430,981 | |
PNC Financial Services Group, Inc. (The)(a) | | | 37,828 | | | | 4,422,472 | |
Regions Financial Corp. | | | 84,758 | | | | 1,134,062 | |
SunTrust Banks, Inc. | | | 36,833 | | | | 1,857,857 | |
SVB Financial Group(b) | | | 4,302 | | | | 817,036 | |
US Bancorp | | | 124,540 | | | | 5,691,478 | |
Wells Fargo & Co. | | | 347,314 | | | | 16,004,229 | |
Zions Bancorp(a) | | | 15,468 | | | | 630,166 | |
| | | | | | | | |
| | | | | | | 97,623,363 | |
|
| Beverages — 1.9% | |
Brown-Forman Corp., Class B | | | 13,633 | | | | 648,658 | |
| | | | | | | | |
| Security | | Shares | | | Value | |
|
| Beverages (continued) | |
Coca-Cola Co. (The) | | | 313,760 | | | $ | 14,856,536 | |
Constellation Brands, Inc., Class A | | | 13,617 | | | | 2,189,886 | |
Molson Coors Brewing Co., Class B | | | 15,181 | | | | 852,565 | |
Monster Beverage Corp.(b) | | | 32,553 | | | | 1,602,259 | |
PepsiCo, Inc. | | | 115,836 | | | | 12,797,561 | |
| | | | | | | | |
| | | | | | | 32,947,465 | |
| | |
| Biotechnology — 2.6% | | | | | | |
AbbVie, Inc. | | | 123,317 | | | | 11,368,594 | |
Alexion Pharmaceuticals, Inc.(b) | | | 18,360 | | | | 1,787,530 | |
Amgen, Inc. | | | 52,240 | | | | 10,169,561 | |
Biogen, Inc.(b) | | | 16,518 | | | | 4,970,597 | |
Celgene Corp.(b) | | | 57,325 | | | | 3,673,959 | |
Gilead Sciences, Inc. | | | 106,081 | | | | 6,635,367 | |
Incyte Corp.(b) | | | 14,327 | | | | 911,054 | |
Regeneron Pharmaceuticals, Inc.(b) | | | 6,371 | | | | 2,379,568 | |
Vertex Pharmaceuticals, Inc.(b) | | | 20,951 | | | | 3,471,790 | |
| | | | | | | | |
| | | | | | | 45,368,020 | |
| | |
| Building Products — 0.3% | | | | | | |
Allegion plc | | | 7,793 | | | | 621,180 | |
AO Smith Corp. | | | 11,796 | | | | 503,689 | |
Fortune Brands Home & Security, Inc. | | | 11,776 | | | | 447,370 | |
Johnson Controls International plc | | | 75,755 | | | | 2,246,136 | |
Masco Corp. | | | 25,003 | | | | 731,088 | |
| | | | | | | | |
| | | | | | | 4,549,463 | |
| | |
| Capital Markets — 2.7% | | | | | | |
Affiliated Managers Group, Inc. | | | 4,216 | | | | 410,807 | |
Ameriprise Financial, Inc. | | | 11,350 | | | | 1,184,600 | |
Bank of New York Mellon Corp. (The) | | | 74,576 | | | | 3,510,292 | |
BlackRock, Inc.(e) | | | 9,976 | | | | 3,918,772 | |
Cboe Global Markets, Inc. | | | 9,258 | | | | 905,710 | |
Charles Schwab Corp. (The) | | | 98,223 | | | | 4,079,201 | |
CME Group, Inc. | | | 29,331 | | | | 5,517,748 | |
E*TRADE Financial Corp.(b) | | | 20,843 | | | | 914,591 | |
Franklin Resources, Inc.(a) | | | 24,397 | | | | 723,615 | |
Goldman Sachs Group, Inc. (The) | | | 28,360 | | | | 4,737,538 | |
Intercontinental Exchange, Inc. | | | 46,545 | | | | 3,506,235 | |
Invesco Ltd. | | | 34,489 | | | | 577,346 | |
Moody’s Corp. | | | 13,666 | | | | 1,913,787 | |
Morgan Stanley | | | 107,175 | | | | 4,249,489 | |
MSCI, Inc. | | | 7,217 | | | | 1,064,002 | |
Nasdaq, Inc.(a) | | | 9,406 | | | | 767,247 | |
Northern Trust Corp.(a) | | | 18,082 | | | | 1,511,474 | |
Raymond James Financial, Inc. | | | 10,572 | | | | 786,663 | |
S&P Global, Inc. | | | 20,569 | | | | 3,495,496 | |
State Street Corp.(a) | | | 31,111 | | | | 1,962,171 | |
T. Rowe Price Group, Inc.(a) | | | 19,729 | | | | 1,821,381 | |
| | | | | | | | |
| | | | | | | 47,558,165 | |
|
| Chemicals — 2.1% | |
Air Products & Chemicals, Inc. | | | 17,998 | | | | 2,880,580 | |
Albemarle Corp.(a) | | | 8,707 | | | | 671,049 | |
Celanese Corp. | | | 10,959 | | | | 985,981 | |
CF Industries Holdings, Inc. | | | 18,971 | | | | 825,428 | |
DowDuPont, Inc. | | | 188,084 | | | | 10,058,732 | |
Eastman Chemical Co. | | | 11,481 | | | | 839,376 | |
Ecolab, Inc. | | | 20,840 | | | | 3,070,774 | |
FMC Corp. | | | 11,024 | | | | 815,335 | |
International Flavors & Fragrances, Inc.(a) | | | 8,406 | | | | 1,128,674 | |
Linde plc | | | 45,176 | | | | 7,049,263 | |
LyondellBasell Industries NV, Class A | | | 25,699 | | | | 2,137,129 | |
Mosaic Co. (The) | | | 29,073 | | | | 849,222 | |
PPG Industries, Inc. | | | 19,666 | | | | 2,010,455 | |
Sherwin-Williams Co. (The) | | | 6,741 | | | | 2,652,314 | |
| | | | | | | | |
| | | | | | | 35,974,312 | |
| | |
| 6 | | 2018 BLACKROCK ANNUAL REPORTTO SHAREHOLDERS |
| | |
Schedule of Investments (continued) December 31, 2018 | | BlackRock S&P 500 Index V.I. Fund (Percentages shown are based on Net Assets) |
| | | | | | | | |
| Security | | Shares | | | Value | |
| | |
| Commercial Services & Supplies — 0.4% | | | | | | |
Cintas Corp. | | | 7,098 | | | $ | 1,192,393 | |
Copart, Inc.(b) | | | 17,083 | | | | 816,226 | |
Republic Services, Inc. | | | 17,828 | | | | 1,285,221 | |
Rollins, Inc.(a) | | | 12,330 | | | | 445,113 | |
Waste Management, Inc. | | | 32,156 | | | | 2,861,562 | |
| | | | | | | | |
| | | | | | | 6,600,515 | |
| | |
| Communications Equipment — 1.1% | | | | | | |
Arista Networks, Inc.(b) | | | 4,267 | | | | 899,057 | |
Cisco Systems, Inc. | | | 368,583 | | | | 15,970,702 | |
F5 Networks, Inc.(b) | | | 4,970 | | | | 805,289 | |
Juniper Networks, Inc. | | | 28,296 | | | | 761,445 | |
Motorola Solutions, Inc. | | | 13,406 | | | | 1,542,226 | |
| | | | | | | | |
| | | | | | | 19,978,719 | |
| | |
| Construction & Engineering — 0.1% | | | | | | |
Fluor Corp. | | | 11,830 | | | | 380,926 | |
Jacobs Engineering Group, Inc. | | | 9,560 | | | | 558,877 | |
Quanta Services, Inc.(b) | | | 11,428 | | | | 343,983 | |
| | | | | | | | |
| | | | | | | 1,283,786 | |
| | |
| Construction Materials — 0.1% | | | | | | |
Martin Marietta Materials, Inc.(a) | | | 5,141 | | | | 883,584 | |
Vulcan Materials Co. | | | 10,825 | | | | 1,069,510 | |
| | | | | | | | |
| | | | | | | 1,953,094 | |
| | |
| Consumer Finance — 0.6% | | | | | | |
American Express Co. | | | 57,427 | | | | 5,473,942 | |
Capital One Financial Corp. | | | 38,731 | | | | 2,927,676 | |
Discover Financial Services | | | 27,543 | | | | 1,624,486 | |
Synchrony Financial | | | 54,209 | | | | 1,271,743 | |
| | | | | | | | |
| | | | | | | 11,297,847 | |
| | |
| Containers & Packaging — 0.3% | | | | | | |
Avery Dennison Corp. | | | 7,112 | | | | 638,871 | |
Ball Corp. | | | 27,739 | | | | 1,275,439 | |
International Paper Co. | | | 33,205 | | | | 1,340,154 | |
Packaging Corp. of America | | | 7,746 | | | | 646,481 | |
Sealed Air Corp.(a) | | | 12,865 | | | | 448,217 | |
WestRock Co. | | | 20,786 | | | | 784,879 | |
| | | | | | | | |
| | | | | | | 5,134,041 | |
| | |
| Distributors — 0.1% | | | | | | |
Genuine Parts Co. | | | 12,007 | | | | 1,152,912 | |
LKQ Corp.(a)(b) | | | 26,087 | | | | 619,045 | |
| | | | | | | | |
| | | | | | | 1,771,957 | |
|
| Diversified Consumer Services — 0.0% | |
H&R Block, Inc. | | | 16,849 | | | | 427,459 | |
| | | | | | | | |
| | |
| Diversified Financial Services — 1.9% | | | | | | |
Berkshire Hathaway, Inc., Class B(b) | | | 159,556 | | | | 32,578,144 | |
Jefferies Financial Group, Inc. | | | 23,043 | | | | 400,026 | |
| | | | | | | | |
| | | | | | | 32,978,170 | |
| |
| Diversified Telecommunication Services — 2.1% | | | | |
AT&T, Inc. | | | 596,658 | | | | 17,028,619 | |
CenturyLink, Inc.(a) | | | 78,014 | | | | 1,181,912 | |
Verizon Communications, Inc.(a) | | | 338,747 | | | | 19,044,357 | |
| | | | | | | | |
| | | | | | | 37,254,888 | |
| | |
| Electric Utilities — 2.1% | | | | | | |
Alliant Energy Corp. | | | 19,342 | | | | 817,199 | |
American Electric Power Co., Inc. | | | 40,438 | | | | 3,022,336 | |
Duke Energy Corp. | | | 58,442 | | | | 5,043,545 | |
Edison International | | | 26,909 | | | | 1,527,624 | |
Entergy Corp. | | | 14,850 | | | | 1,278,139 | |
Evergy, Inc. | | | 21,598 | | | | 1,226,118 | |
Eversource Energy | | | 25,800 | | | | 1,678,032 | |
| | | | | | | | |
| Security | | Shares | | | Value | |
| | |
| Electric Utilities (continued) | | | | | | |
Exelon Corp. | | | 79,276 | | | $ | 3,575,348 | |
FirstEnergy Corp. | | | 39,832 | | | | 1,495,692 | |
NextEra Energy, Inc. | | | 39,182 | | | | 6,810,615 | |
PG&E Corp.(b) | | | 42,318 | | | | 1,005,053 | |
Pinnacle West Capital Corp. | | | 9,188 | | | | 782,818 | |
PPL Corp. | | | 59,043 | | | | 1,672,688 | |
Southern Co. (The) | | | 84,349 | | | | 3,704,608 | |
Xcel Energy, Inc. | | | 42,356 | | | | 2,086,880 | |
| | | | | | | | |
| | | | | | | 35,726,695 | |
| | |
| Electrical Equipment — 0.5% | | | | | | |
AMETEK, Inc. | | | 19,029 | | | | 1,288,264 | |
Eaton Corp. plc | | | 35,408 | | | | 2,431,113 | |
Emerson Electric Co. | | | 51,396 | | | | 3,070,911 | |
Rockwell Automation, Inc. | | | 9,894 | | | | 1,488,849 | |
| | | | | | | | |
| | | | | | | 8,279,137 | |
|
| Electronic Equipment, Instruments & Components — 0.5% | |
Amphenol Corp., Class A | | | 24,721 | | | | 2,002,895 | |
Corning, Inc. | | | 65,618 | | | | 1,982,320 | |
FLIR Systems, Inc. | | | 11,031 | | | | 480,290 | |
IPG Photonics Corp.(b) | | | 2,812 | | | | 318,571 | |
Keysight Technologies, Inc.(b) | | | 15,483 | | | | 961,185 | |
TE Connectivity Ltd.(a) | | | 28,122 | | | | 2,126,867 | |
| | | | | | | | |
| | | | | | | 7,872,128 | |
| | |
| Energy Equipment & Services — 0.5% | | | | | | |
Baker Hughes a GE Co. | | | 41,989 | | | | 902,763 | |
Halliburton Co. | | | 71,819 | | | | 1,908,949 | |
Helmerich & Payne, Inc. | | | 8,939 | | | | 428,536 | |
National Oilwell Varco, Inc.(a) | | | 30,887 | | | | 793,796 | |
Schlumberger Ltd. | | | 113,426 | | | | 4,092,410 | |
TechnipFMC plc | | | 34,439 | | | | 674,316 | |
| | | | | | | | |
| | | | | | | 8,800,770 | |
| | |
| Entertainment — 2.0% | | | | | | |
Activision Blizzard, Inc.(a) | | | 62,556 | | | | 2,913,233 | |
Electronic Arts, Inc.(b) | | | 24,769 | | | | 1,954,522 | |
Netflix, Inc.(b) | | | 35,726 | | | | 9,562,421 | |
Take-Two Interactive Software, Inc.(b) | | | 9,436 | | | | 971,342 | |
Twenty-First Century Fox, Inc., Class A | | | 86,630 | | | | 4,168,635 | |
Twenty-First Century Fox, Inc., Class B | | | 39,933 | | | | 1,907,999 | |
Viacom, Inc., Class B | | | 28,483 | | | | 732,013 | |
Walt Disney Co. (The) | | | 122,043 | | | | 13,382,015 | |
| | | | | | | | |
| | | | | | | 35,592,180 | |
| |
| Equity Real Estate Investment Trusts (REITs) — 2.9% | | | | |
Alexandria Real Estate Equities, Inc. | | | 8,713 | | | | 1,004,086 | |
American Tower Corp. | | | 36,089 | | | | 5,708,919 | |
Apartment Investment & Management Co., Class A | | | 12,760 | | | | 559,909 | |
AvalonBay Communities, Inc. | | | 11,332 | | | | 1,972,335 | |
Boston Properties, Inc. | | | 12,598 | | | | 1,417,905 | |
Crown Castle International Corp. | | | 34,063 | | | | 3,700,264 | |
Digital Realty Trust, Inc. | | | 16,853 | | | | 1,795,687 | |
Duke Realty Corp. | | | 29,031 | | | | 751,903 | |
Equinix, Inc. | | | 6,590 | | | | 2,323,370 | |
Equity Residential | | | 30,161 | | | | 1,990,928 | |
Essex Property Trust, Inc. | | | 5,451 | | | | 1,336,640 | |
Extra Space Storage, Inc. | | | 10,216 | | | | 924,344 | |
Federal Realty Investment Trust | | | 6,055 | | | | 714,732 | |
HCP, Inc. | | | 39,555 | | | | 1,104,771 | |
Host Hotels & Resorts, Inc. | | | 60,835 | | | | 1,014,119 | |
Iron Mountain, Inc. | | | 23,465 | | | | 760,501 | |
Kimco Realty Corp.(a) | | | 34,546 | | | | 506,099 | |
Macerich Co. (The) | | | 8,673 | | | | 375,367 | |
Mid-America Apartment Communities, Inc. | | | 9,170 | | | | 877,569 | |
Prologis, Inc. | | | 51,609 | | | | 3,030,481 | |
| | | | |
| SCHEDULE OF INVESTMENTS | | | 7 | |
| | |
Schedule of Investments (continued) December 31, 2018 | | BlackRock S&P 500 Index V.I. Fund (Percentages shown are based on Net Assets) |
| | | | | | | | |
| Security | | Shares | | | Value | |
| | |
| Equity Real Estate Investment Trusts (REITs) (continued) | | | | | | |
Public Storage | | | 12,293 | | | $ | 2,488,226 | |
Realty Income Corp. | | | 24,194 | | | | 1,525,190 | |
Regency Centers Corp. | | | 13,891 | | | | 815,124 | |
SBA Communications Corp.(b) | | | 9,316 | | | | 1,508,167 | |
Simon Property Group, Inc. | | | 25,356 | | | | 4,259,554 | |
SL Green Realty Corp. | | | 6,991 | | | | 552,848 | |
UDR, Inc. | | | 22,399 | | | | 887,448 | |
Ventas, Inc. | | | 29,132 | | | | 1,706,844 | |
Vornado Realty Trust | | | 14,331 | | | | 888,952 | |
Welltower, Inc.(a) | | | 30,796 | | | | 2,137,550 | |
Weyerhaeuser Co. | | | 61,086 | | | | 1,335,340 | |
| | | | | | | | |
| | | | | | | 49,975,172 | |
| | |
| Food & Staples Retailing — 1.6% | | | | | | |
Costco Wholesale Corp. | | | 35,925 | | | | 7,318,282 | |
Kroger Co. (The) | | | 65,421 | | | | 1,799,077 | |
Sysco Corp. | | | 39,026 | | | | 2,445,369 | |
Walgreens Boots Alliance, Inc. | | | 65,906 | | | | 4,503,357 | |
Walmart, Inc.(a) | | | 116,706 | | | | 10,871,164 | |
| | | | | | | | |
| | | | | | | 26,937,249 | |
| | |
| Food Products — 1.1% | | | | | | |
Archer-Daniels-Midland Co. | | | 45,962 | | | | 1,883,063 | |
Campbell Soup Co. | | | 15,794 | | | | 521,044 | |
Conagra Brands, Inc. | | | 39,811 | | | | 850,363 | |
General Mills, Inc. | | | 48,901 | | | | 1,904,205 | |
Hershey Co. (The) | | | 11,497 | | | | 1,232,248 | |
Hormel Foods Corp.(a) | | | 22,041 | | | | 940,710 | |
JM Smucker Co. (The)(a) | | | 9,375 | | | | 876,469 | |
Kellogg Co. | | | 20,531 | | | | 1,170,472 | |
Kraft Heinz Co. (The) | | | 50,973 | | | | 2,193,878 | |
Lamb Weston Holdings, Inc. | | | 12,020 | | | | 884,191 | |
McCormick & Co., Inc. (Non-Voting) | | | 9,983 | | | | 1,390,033 | |
Mondelez International, Inc., Class A | | | 119,187 | | | | 4,771,056 | |
Tyson Foods, Inc., Class A | | | 24,442 | | | | 1,305,203 | |
| | | | | | | | |
| | | | | | | 19,922,935 | |
|
| Health Care Equipment & Supplies — 3.4% | |
Abbott Laboratories | | | 143,954 | | | | 10,412,193 | |
ABIOMED, Inc.(b) | | | 3,692 | | | | 1,200,048 | |
Align Technology, Inc.(b) | | | 5,967 | | | | 1,249,669 | |
Baxter International, Inc. | | | 40,572 | | | | 2,670,449 | |
Becton Dickinson and Co. | | | 21,992 | | | | 4,955,237 | |
Boston Scientific Corp.(b) | | | 113,445 | | | | 4,009,146 | |
Cooper Cos., Inc. (The)(a) | | | 4,039 | | | | 1,027,925 | |
Danaher Corp. | | | 50,434 | | | | 5,200,754 | |
Dentsply Sirona, Inc. | | | 18,555 | | | | 690,432 | |
Edwards Lifesciences Corp.(b) | | | 17,199 | | | | 2,634,371 | |
Hologic, Inc.(b) | | | 22,086 | | | | 907,735 | |
IDEXX Laboratories, Inc.(b) | | | 7,070 | | | | 1,315,161 | |
Intuitive Surgical, Inc.(b) | | | 9,362 | | | | 4,483,649 | |
Medtronic plc | | | 110,104 | | | | 10,015,060 | |
ResMed, Inc. | | | 11,628 | | | | 1,324,080 | |
Stryker Corp. | | | 25,461 | | | | 3,991,012 | |
Varian Medical Systems, Inc.(b) | | | 7,470 | | | | 846,426 | |
Zimmer Biomet Holdings, Inc. | | | 16,806 | | | | 1,743,118 | |
| | | | | | | | |
| | | | | | | 58,676,465 | |
| | |
| Health Care Providers & Services — 3.2% | | | | | | |
AmerisourceBergen Corp.(a) | | | 12,857 | | | | 956,561 | |
Anthem, Inc. | | | 21,204 | | | | 5,568,806 | |
Cardinal Health, Inc. | | | 24,425 | | | | 1,089,355 | |
Centene Corp.(b) | | | 16,856 | | | | 1,943,497 | |
CVS Health Corp. | | | 105,792 | | | | 6,931,492 | |
DaVita, Inc.(b) | | | 10,342 | | | | 532,199 | |
Halfmoon Parent, Inc. | | | 31,244 | | | | 5,933,844 | |
| | | | | | | | |
| Security | | Shares | | | Value | |
| | |
| Health Care Providers & Services (continued) | | | | | | |
HCA Healthcare, Inc. | | | 22,007 | | | $ | 2,738,771 | |
Henry Schein, Inc.(b) | | | 12,476 | | | | 979,615 | |
Humana, Inc. | | | 11,247 | | | | 3,222,040 | |
Laboratory Corp. of America Holdings(b) | | | 8,272 | | | | 1,045,250 | |
McKesson Corp.(a) | | | 16,017 | | | | 1,769,398 | |
Quest Diagnostics, Inc. | | | 10,969 | | | | 913,389 | |
UnitedHealth Group, Inc. | | | 78,849 | | | | 19,642,863 | |
Universal Health Services, Inc., Class B | | | 7,082 | | | | 825,478 | |
WellCare Health Plans, Inc.(b) | | | 4,108 | | | | 969,858 | |
| | | | | | | | |
| | | | | | | 55,062,416 | |
| | |
| Health Care Technology — 0.1% | | | | | | |
Cerner Corp.(b) | | | 27,012 | | | | 1,416,509 | |
| | | | | | | | |
| | |
| Hotels, Restaurants & Leisure — 1.8% | | | | | | |
Carnival Corp. | | | 32,941 | | | | 1,623,991 | |
Chipotle Mexican Grill, Inc.(b) | | | 2,005 | | | | 865,739 | |
Darden Restaurants, Inc. | | | 10,283 | | | | 1,026,860 | |
Hilton Worldwide Holdings, Inc. | | | 24,114 | | | | 1,731,385 | |
Marriott International, Inc., Class A | | | 23,212 | | | | 2,519,895 | |
McDonald’s Corp. | | | 63,200 | | | | 11,222,424 | |
MGM Resorts International | | | 41,059 | | | | 996,091 | |
Norwegian Cruise Line Holdings Ltd.(b) | | | 18,034 | | | | 764,461 | |
Royal Caribbean Cruises Ltd. | | | 14,162 | | | | 1,384,902 | |
Starbucks Corp. | | | 101,891 | | | | 6,561,781 | |
Wynn Resorts Ltd. | | | 8,023 | | | | 793,555 | |
Yum! Brands, Inc. | | | 25,603 | | | | 2,353,428 | |
| | | | | | | | |
| | | | | | | 31,844,512 | |
|
| Household Durables — 0.3% | |
DR Horton, Inc. | | | 28,071 | | | | 972,941 | |
Garmin Ltd. | | | 10,121 | | | | 640,862 | |
Leggett & Platt, Inc.(a) | | | 10,692 | | | | 383,201 | |
Lennar Corp., Class A | | | 23,983 | | | | 938,934 | |
Mohawk Industries, Inc.(b) | | | 5,284 | | | | 618,017 | |
Newell Brands, Inc.(a) | | | 35,207 | | | | 654,498 | |
PulteGroup, Inc. | | | 20,895 | | | | 543,061 | |
Whirlpool Corp. | | | 5,231 | | | | 559,037 | |
| | | | | | | | |
| | | | | | | 5,310,551 | |
| | |
| Household Products — 1.7% | | | | | | |
Church & Dwight Co., Inc. | | | 20,146 | | | | 1,324,801 | |
Clorox Co. (The) | | | 10,465 | | | | 1,613,075 | |
Colgate-Palmolive Co. | | | 71,104 | | | | 4,232,110 | |
Kimberly-Clark Corp. | | | 28,390 | | | | 3,234,757 | |
Procter & Gamble Co. (The) | | | 204,248 | | | | 18,774,476 | |
| | | | | | | | |
| | | | | | | 29,179,219 | |
|
| Independent Power and Renewable Electricity Producers — 0.1% | |
AES Corp. | | | 53,692 | | | | 776,386 | |
NRG Energy, Inc. | | | 23,769 | | | | 941,253 | |
| | | | | | | | |
| | | | | | | 1,717,639 | |
| | |
| Industrial Conglomerates — 1.4% | | | | | | |
3M Co. | | | 47,736 | | | | 9,095,617 | |
General Electric Co. | | | 713,080 | | | | 5,398,016 | |
Honeywell International, Inc. | | | 60,690 | | | | 8,018,363 | |
Roper Technologies, Inc. | | | 8,479 | | | | 2,259,823 | |
| | | | | | | | |
| | | | | | | 24,771,819 | |
| | |
| Insurance — 2.4% | | | | | | |
Aflac, Inc. | | | 62,410 | | | | 2,843,400 | |
Allstate Corp. (The) | | | 28,254 | | | | 2,334,628 | |
American International Group, Inc. | | | 72,741 | | | | 2,866,723 | |
Aon plc | | | 19,831 | | | | 2,882,634 | |
Arthur J Gallagher & Co. | | | 15,056 | | | | 1,109,627 | |
Assurant, Inc. | | | 4,366 | | | | 390,495 | |
Brighthouse Financial, Inc.(b) | | | 10,046 | | | | 306,202 | |
| | |
| 8 | | 2018 BLACKROCK ANNUAL REPORTTO SHAREHOLDERS |
| | |
Schedule of Investments (continued) December 31, 2018 | | BlackRock S&P 500 Index V.I. Fund (Percentages shown are based on Net Assets) |
| | | | | | | | |
| Security | | Shares | | | Value | |
| | |
| Insurance (continued) | | | | | | |
Chubb Ltd. | | | 37,647 | | | $ | 4,863,239 | |
Cincinnati Financial Corp.(a) | | | 12,571 | | | | 973,247 | |
Everest Re Group Ltd. | | | 3,332 | | | | 725,576 | |
Hartford Financial Services Group, Inc. (The)(a) | | | 29,165 | | | | 1,296,384 | |
Lincoln National Corp. | | | 17,512 | | | | 898,541 | |
Loews Corp. | | | 22,667 | | | | 1,031,802 | |
Marsh & McLennan Cos., Inc. | | | 41,232 | | | | 3,288,252 | |
MetLife, Inc. | | | 80,902 | | | | 3,321,836 | |
Principal Financial Group, Inc.(a) | | | 21,891 | | | | 966,925 | |
Progressive Corp. (The) | | | 47,803 | | | | 2,883,955 | |
Prudential Financial, Inc. | | | 33,941 | | | | 2,767,889 | |
Torchmark Corp. | | | 8,413 | | | | 627,021 | |
Travelers Cos., Inc. (The) | | | 21,622 | | | | 2,589,235 | |
Unum Group | | | 17,933 | | | | 526,872 | |
Willis Towers Watson plc | | | 10,697 | | | | 1,624,446 | |
| | | | | | | | |
| | | | | | | 41,118,929 | |
| | |
| Interactive Media & Services — 4.6%(b) | | | | | | |
Alphabet, Inc., Class A | | | 24,498 | | | | 25,599,430 | |
Alphabet, Inc., Class C | | | 25,222 | | | | 26,120,155 | |
Facebook, Inc., Class A | | | 196,957 | | | | 25,819,093 | |
TripAdvisor, Inc. | | | 8,394 | | | | 452,772 | |
Twitter, Inc. | | | 58,848 | | | | 1,691,292 | |
| | | | | | | | |
| | | | | | | 79,682,742 | |
|
| Internet & Direct Marketing Retail — 3.5% | |
Amazon.com, Inc.(b) | | | 33,672 | | | | 50,574,334 | |
Booking Holdings, Inc.(b) | | | 3,798 | | | | 6,541,751 | |
eBay, Inc.(b) | | | 74,197 | | | | 2,082,710 | |
Expedia Group, Inc. | | | 9,712 | | | | 1,094,057 | |
| | | | | | | | |
| | | | | | | 60,292,852 | |
| | |
| IT Services — 4.8% | | | | | | |
Accenture plc, Class A | | | 52,259 | | | | 7,369,042 | |
Akamai Technologies, Inc.(b) | | | 13,309 | | | | 812,914 | |
Alliance Data Systems Corp. | | | 3,841 | | | | 576,457 | |
Automatic Data Processing, Inc. | | | 35,783 | | | | 4,691,867 | |
Broadridge Financial Solutions, Inc. | | | 9,493 | | | | 913,701 | |
Cognizant Technology Solutions Corp., Class A | | | 47,469 | | | | 3,013,332 | |
DXC Technology Co. | | | 23,103 | | | | 1,228,387 | |
Fidelity National Information Services, Inc. | | | 26,702 | | | | 2,738,290 | |
Fiserv, Inc.(b) | | | 32,667 | | | | 2,400,698 | |
FleetCor Technologies, Inc.(b) | | | 7,315 | | | | 1,358,542 | |
Gartner, Inc.(a)(b) | | | 7,446 | | | | 951,897 | |
Global Payments, Inc. | | | 12,989 | | | | 1,339,556 | |
International Business Machines Corp. | | | 74,504 | | | | 8,468,870 | |
Jack Henry & Associates, Inc. | | | 6,372 | | | | 806,185 | |
Mastercard, Inc., Class A(a) | | | 74,490 | | | | 14,052,538 | |
Paychex, Inc. | | | 26,239 | | | | 1,709,471 | |
PayPal Holdings, Inc.(a)(b) | | | 96,603 | | | | 8,123,346 | |
Total System Services, Inc. | | | 13,760 | | | | 1,118,550 | |
VeriSign, Inc.(b) | | | 8,704 | | | | 1,290,716 | |
Visa, Inc., Class A | | | 144,060 | | | | 19,007,276 | |
Western Union Co. (The) | | | 36,302 | | | | 619,312 | |
| | | | | | | | |
| | | | | | | 82,590,947 | |
| | |
| Leisure Products — 0.1%(a) | | | | | | |
Hasbro, Inc. | | | 9,541 | | | | 775,206 | |
Mattel, Inc.(b) | | | 29,551 | | | | 295,215 | |
| | | | | | | | |
| | | | | | | 1,070,421 | |
| | |
| Life Sciences Tools & Services — 1.0% | | | | | | |
Agilent Technologies, Inc. | | | 26,133 | | | | 1,762,932 | |
Illumina, Inc.(b) | | | 12,051 | | | | 3,614,456 | |
IQVIA Holdings, Inc.(b) | | | 12,989 | | | | 1,508,932 | |
Mettler-Toledo International, Inc.(b) | | | 2,053 | | | | 1,161,136 | |
PerkinElmer, Inc. | | | 9,119 | | | | 716,297 | |
| | | | | | | | |
| Security | | Shares | | | Value | |
| | |
| Life Sciences Tools & Services (continued) | | | | | | |
Thermo Fisher Scientific, Inc. | | | 32,996 | | | $ | 7,384,175 | |
Waters Corp.(b) | | | 6,210 | | | | 1,171,517 | |
| | | | | | | | |
| | | | | | | 17,319,445 | |
| | |
| Machinery — 1.5% | | | | | | |
Caterpillar, Inc. | | | 48,378 | | | | 6,147,392 | |
Cummins, Inc. | | | 12,110 | | | | 1,618,380 | |
Deere & Co. | | | 26,446 | | | | 3,944,950 | |
Dover Corp. | | | 11,997 | | | | 851,187 | |
Flowserve Corp.(a) | | | 10,379 | | | | 394,610 | |
Fortive Corp. | | | 24,093 | | | | 1,630,132 | |
Illinois Tool Works, Inc. | | | 25,025 | | | | 3,170,417 | |
Ingersoll-Rand plc | | | 20,153 | | | | 1,838,558 | |
PACCAR, Inc. | | | 28,647 | | | | 1,636,890 | |
Parker-Hannifin Corp. | | | 10,841 | | | | 1,616,827 | |
Pentair plc | | | 13,093 | | | | 494,653 | |
Snap-on, Inc. | | | 4,592 | | | | 667,172 | |
Stanley Black & Decker, Inc. | | | 12,384 | | | | 1,482,860 | |
Xylem, Inc. | | | 14,555 | | | | 971,110 | |
| | | | | | | | |
| | | | | | | 26,465,138 | |
|
| Media — 1.3% | |
CBS Corp. (Non-Voting), Class B | | | 27,924 | | | | 1,220,837 | |
Charter Communications, Inc., Class A(b) | | | 14,451 | | | | 4,118,101 | |
Comcast Corp., Class A | | | 372,199 | | | | 12,673,376 | |
Discovery, Inc., Class A(a)(b) | | | 13,205 | | | | 326,692 | |
Discovery, Inc., Class C(b) | | | 29,533 | | | | 681,621 | |
DISH Network Corp., Class A(b) | | | 19,097 | | | | 476,852 | |
Interpublic Group of Cos., Inc. (The) | | | 30,812 | | | | 635,652 | |
News Corp., Class A | | | 31,580 | | | | 358,433 | |
News Corp., Class B | | | 10,303 | | | | 119,000 | |
Omnicom Group, Inc. | | | 18,371 | | | | 1,345,492 | |
| | | | | | | | |
| | | | | | | 21,956,056 | |
| | |
| Metals & Mining — 0.2% | | | | | | |
Freeport-McMoRan, Inc. | | | 118,793 | | | | 1,224,756 | |
Newmont Mining Corp. | | | 43,204 | | | | 1,497,018 | |
Nucor Corp. | | | 25,737 | | | | 1,333,434 | |
| | | | | | | | |
| | | | | | | 4,055,208 | |
| | |
| Multiline Retail — 0.5% | | | | | | |
Dollar General Corp. | | | 21,551 | | | | 2,329,232 | |
Dollar Tree, Inc.(b) | | | 19,509 | | | | 1,762,053 | |
Kohl’s Corp. | | | 13,537 | | | | 898,044 | |
Macy’s, Inc. | | | 25,206 | | | | 750,635 | |
Nordstrom, Inc. | | | 9,328 | | | | 434,778 | |
Target Corp. | | | 42,780 | | | | 2,827,330 | |
| | | | | | | | |
| | | | | | | 9,002,072 | |
| | |
| Multi-Utilities — 1.1% | | | | | | |
Ameren Corp. | | | 20,028 | | | | 1,306,427 | |
CenterPoint Energy, Inc. | | | 41,088 | | | | 1,159,914 | |
CMS Energy Corp. | | | 23,305 | | | | 1,157,093 | |
Consolidated Edison, Inc. | | | 25,535 | | | | 1,952,406 | |
Dominion Energy, Inc. | | | 53,818 | | | | 3,845,834 | |
DTE Energy Co. | | | 14,914 | | | | 1,645,014 | |
NiSource, Inc. | | | 29,499 | | | | 747,800 | |
Public Service Enterprise Group, Inc. | | | 41,437 | | | | 2,156,796 | |
SCANA Corp. | | | 11,692 | | | | 558,644 | |
Sempra Energy(a) | | | 22,402 | | | | 2,423,672 | |
WEC Energy Group, Inc. | | | 25,867 | | | | 1,791,549 | |
| | | | | | | | |
| | | | | | | 18,745,149 | |
| | |
| Oil, Gas & Consumable Fuels — 4.8% | | | | | | |
Anadarko Petroleum Corp. | | | 41,120 | | | | 1,802,701 | |
Apache Corp. | | | 31,303 | | | | 821,704 | |
Cabot Oil & Gas Corp. | | | 35,849 | | | | 801,225 | |
| | | | |
| SCHEDULE OF INVESTMENTS | | | 9 | |
| | |
Schedule of Investments (continued) December 31, 2018 | | BlackRock S&P 500 Index V.I. Fund (Percentages shown are based on Net Assets) |
| | | | | | | | |
| Security | | Shares | | | Value | |
| | |
| Oil, Gas & Consumable Fuels (continued) | | | | | | |
Chevron Corp. | | | 156,647 | | | $ | 17,041,627 | |
Cimarex Energy Co. | | | 7,634 | | | | 470,636 | |
Concho Resources, Inc.(a)(b) | | | 16,403 | | | | 1,686,064 | |
ConocoPhillips | | | 94,380 | | | | 5,884,593 | |
Devon Energy Corp. | | | 38,383 | | | | 865,153 | |
Diamondback Energy, Inc. | | | 12,645 | | | | 1,172,191 | |
EOG Resources, Inc. | | | 47,541 | | | | 4,146,051 | |
Exxon Mobil Corp. | | | 347,092 | | | | 23,668,203 | |
Hess Corp.(a) | | | 20,401 | | | | 826,241 | |
HollyFrontier Corp. | | | 13,069 | | | | 668,087 | |
Kinder Morgan, Inc. | | | 156,220 | | | | 2,402,664 | |
Marathon Oil Corp.(a) | | | 68,149 | | | | 977,257 | |
Marathon Petroleum Corp. | | | 56,637 | | | | 3,342,149 | |
Newfield Exploration Co.(b) | | | 17,131 | | | | 251,140 | |
Noble Energy, Inc. | | | 39,334 | | | | 737,906 | |
Occidental Petroleum Corp. | | | 61,898 | | | | 3,799,299 | |
ONEOK, Inc. | | | 33,724 | | | | 1,819,410 | |
Phillips 66 | | | 34,610 | | | | 2,981,652 | |
Pioneer Natural Resources Co. | | | 13,975 | | | | 1,837,992 | |
Valero Energy Corp. | | | 34,683 | | | | 2,600,185 | |
Williams Cos., Inc. (The) | | | 99,127 | | | | 2,185,750 | |
| | | | | | | | |
| | | | | | | 82,789,880 | |
|
| Personal Products — 0.1% | |
Coty, Inc., Class A(a) | | | 38,088 | | | | 249,857 | |
Estee Lauder Cos., Inc. (The), Class A | | | 18,028 | | | | 2,345,443 | |
| | | | | | | | |
| | | | | | | 2,595,300 | |
| | |
| Pharmaceuticals — 5.2% | | | | | | |
Allergan plc | | | 26,006 | | | | 3,475,962 | |
Bristol-Myers Squibb Co. | | | 133,734 | | | | 6,951,493 | |
Eli Lilly & Co. | | | 77,291 | | | | 8,944,115 | |
Johnson & Johnson | | | 219,871 | | | | 28,374,353 | |
Merck & Co., Inc. | | | 213,181 | | | | 16,289,160 | |
Mylan NV(b) | | | 42,137 | | | | 1,154,554 | |
Nektar Therapeutics(b) | | | 14,017 | | | | 460,739 | |
Perrigo Co. plc(a) | | | 9,995 | | | | 387,306 | |
Pfizer, Inc. | | | 473,889 | | | | 20,685,255 | |
Zoetis, Inc. | | | 39,375 | | | | 3,368,137 | |
| | | | | | | | |
| | | | | | | 90,091,074 | |
| | |
| Professional Services — 0.3% | | | | | | |
Equifax, Inc. | | | 9,885 | | | | 920,590 | |
IHS Markit Ltd.(b) | | | 29,406 | | | | 1,410,606 | |
Nielsen Holdings plc | | | 29,161 | | | | 680,326 | |
Robert Half International, Inc. | | | 9,909 | | | | 566,795 | |
Verisk Analytics, Inc.(b) | | | 13,496 | | | | 1,471,604 | |
| | | | | | | | |
| | | | | | | 5,049,921 | |
| |
| Real Estate Management & Development — 0.1% | | | | |
CBRE Group, Inc., Class A(b) | | | 25,989 | | | | 1,040,599 | |
| | | | | | | | |
| | |
| Road & Rail — 1.0% | | | | | | |
CSX Corp. | | | 65,765 | | | | 4,085,979 | |
JB Hunt Transport Services, Inc. | | | 7,160 | | | | 666,166 | |
Kansas City Southern | | | 8,436 | | | | 805,216 | |
Norfolk Southern Corp. | | | 22,327 | | | | 3,338,780 | |
Union Pacific Corp. | | | 60,403 | | | | 8,349,507 | |
| | | | | | | | |
| | | | | | | 17,245,648 | |
| |
| Semiconductors & Semiconductor Equipment — 3.7% | | | | |
Advanced Micro Devices, Inc.(b) | | | 72,100 | | | | 1,330,966 | |
Analog Devices, Inc.(a) | | | 30,346 | | | | 2,604,597 | |
Applied Materials, Inc. | | | 80,809 | | | | 2,645,687 | |
Broadcom, Inc. | | | 33,895 | | | | 8,618,820 | |
Intel Corp. | | | 374,161 | | | | 17,559,376 | |
KLA-Tencor Corp. | | | 12,424 | | | | 1,111,824 | |
| | | | | | | | |
| Security | | Shares | | | Value | |
| |
| Semiconductors & Semiconductor Equipment (continued) | | | | |
Lam Research Corp. | | | 12,722 | | | $ | 1,732,355 | |
Maxim Integrated Products, Inc.(a) | | | 22,795 | | | | 1,159,126 | |
Microchip Technology, Inc.(a) | | | 19,389 | | | | 1,394,457 | |
Micron Technology, Inc.(b) | | | 91,827 | | | | 2,913,671 | |
NVIDIA Corp. | | | 50,008 | | | | 6,676,068 | |
Qorvo, Inc.(b) | | | 10,227 | | | | 621,086 | |
QUALCOMM, Inc. | | | 99,374 | | | | 5,655,374 | |
Skyworks Solutions, Inc. | | | 14,554 | | | | 975,409 | |
Texas Instruments, Inc. | | | 78,746 | | | | 7,441,497 | |
Xilinx, Inc. | | | 20,745 | | | | 1,766,851 | |
| | | | | | | | |
| | | | | | | 64,207,164 | |
|
| Software — 6.1% | |
Adobe, Inc.(b) | | | 40,018 | | | | 9,053,672 | |
ANSYS, Inc.(b) | | | 6,850 | | | | 979,139 | |
Autodesk, Inc.(b) | | | 17,945 | | | | 2,307,907 | |
Cadence Design Systems, Inc.(b) | | | 23,130 | | | | 1,005,692 | |
Citrix Systems, Inc.(b) | | | 10,496 | | | | 1,075,420 | |
Fortinet, Inc.(b) | | | 11,938 | | | | 840,793 | |
Intuit, Inc. | | | 21,277 | | | | 4,188,378 | |
Microsoft Corp. | | | 633,624 | | | | 64,357,190 | |
Oracle Corp. | | | 208,895 | | | | 9,431,609 | |
Red Hat, Inc.(b) | | | 14,466 | | | | 2,540,808 | |
salesforce.com, Inc.(b) | | | 62,715 | | | | 8,590,074 | |
Symantec Corp.(a) | | | 52,377 | | | | 989,663 | |
Synopsys, Inc.(b) | | | 12,112 | | | | 1,020,315 | |
| | | | | | | | |
| | | | | | | 106,380,660 | |
| | |
| Specialty Retail — 2.3% | | | | | | |
Advance Auto Parts, Inc. | | | 6,007 | | | | 945,862 | |
AutoZone, Inc.(b) | | | 2,067 | | | | 1,732,849 | |
Best Buy Co., Inc. | | | 19,193 | | | | 1,016,461 | |
CarMax, Inc.(b) | | | 14,239 | | | | 893,213 | |
Foot Locker, Inc. | | | 9,331 | | | | 496,409 | |
Gap, Inc. (The)(a) | | | 17,511 | | | | 451,084 | |
Home Depot, Inc. (The) | | | 92,600 | | | | 15,910,532 | |
L Brands, Inc. | | | 18,284 | | | | 469,350 | |
Lowe’s Cos., Inc. | | | 65,827 | | | | 6,079,782 | |
O’Reilly Automotive, Inc.(b) | | | 6,610 | | | | 2,276,021 | |
Ross Stores, Inc. | | | 30,609 | | | | 2,546,669 | |
Tiffany & Co. | | | 8,894 | | | | 716,056 | |
TJX Cos., Inc. (The) | | | 101,454 | | | | 4,539,052 | |
Tractor Supply Co.(a) | | | 10,007 | | | | 834,984 | |
Ulta Beauty, Inc.(b) | | | 4,598 | | | | 1,125,774 | |
| | | | | | | | |
| | | | | | | 40,034,098 | |
| |
| Technology Hardware, Storage & Peripherals — 3.8% | | | | |
Apple, Inc. | | | 369,581 | | | | 58,297,707 | |
Hewlett Packard Enterprise Co.(a) | | | 116,659 | | | | 1,541,065 | |
HP, Inc. | | | 130,186 | | | | 2,663,606 | |
NetApp, Inc. | | | 20,650 | | | | 1,232,186 | |
Seagate Technology plc(a) | | | 21,351 | | | | 823,935 | |
Western Digital Corp.(a) | | | 23,727 | | | | 877,187 | |
Xerox Corp. | | | 16,995 | | | | 335,821 | |
| | | | | | | | |
| | | | | | | 65,771,507 | |
| | |
| Textiles, Apparel & Luxury Goods — 0.7% | | | | | | |
Hanesbrands, Inc. | | | 30,369 | | | | 380,524 | |
Michael Kors Holdings Ltd.(b) | | | 12,316 | | | | 467,023 | |
NIKE, Inc., Class B(a) | | | 104,367 | | | | 7,737,769 | |
PVH Corp. | | | 6,209 | | | | 577,127 | |
Ralph Lauren Corp. | | | 4,473 | | | | 462,777 | |
Tapestry, Inc. | | | 23,758 | | | | 801,832 | |
Under Armour, Inc., Class A(a)(b) | | | 16,080 | | | | 284,133 | |
Under Armour, Inc., Class C(b) | | | 15,770 | | | | 255,001 | |
| | |
| 10 | | 2018 BLACKROCK ANNUAL REPORTTO SHAREHOLDERS |
| | |
Schedule of Investments (continued) December 31, 2018 | | BlackRock S&P 500 Index V.I. Fund (Percentages shown are based on Net Assets) |
| | | | | | | | |
| Security | | Shares | | | Value | |
| | |
| Textiles, Apparel & Luxury Goods (continued) | | | | | | |
VF Corp. | | | 26,591 | | | $ | 1,897,002 | |
| | | | | | | | |
| | | | | | | 12,863,188 | |
| | |
| Tobacco — 0.9% | | | | | | |
Altria Group, Inc. | | | 154,046 | | | | 7,608,332 | |
Philip Morris International, Inc. | | | 127,336 | | | | 8,500,951 | |
| | | | | | | | |
| | | | | | | 16,109,283 | |
| | |
| Trading Companies & Distributors — 0.2% | | | | | | |
Fastenal Co.(a) | | | 23,533 | | | | 1,230,541 | |
United Rentals, Inc.(b) | | | 6,649 | | | | 681,722 | |
WW Grainger, Inc.(a) | | | 3,740 | | | | 1,056,026 | |
| | | | | | | | |
| | | | | | | 2,968,289 | |
|
| Water Utilities — 0.1% | |
American Water Works Co., Inc. | | | 14,806 | | | | 1,343,941 | |
| | | | | | | | |
| |
Total Common Stocks — 99.4%
(Cost: $967,295,522) | | | | 1,724,818,507 | |
| | | | | | | | |
| |
Total Long-Term Investments — 99.4%
(Cost: $967,295,522) | | | | 1,724,818,507 | |
| | | | | | | | |
| | | | | | | | |
| Security | | Shares | | | Value | |
| |
| Short-Term Securities — 2.7%(c)(e) | | | | |
BlackRock Liquidity Funds, T-Fund, Institutional Class, 2.32% | | | 15,713,324 | | | $ | 15,713,324 | |
SL Liquidity Series, LLC, Money Market Series, 2.57%(d) | | | 31,575,620 | | | | 31,572,463 | |
| | | | | | | | |
| |
Total Short-Term Securities — 2.7%
(Cost: $47,286,759) | | | | 47,285,787 | |
| | | | | | | | |
| |
Total Investments — 102.1%
(Cost: $1,014,582,281) | | | | 1,772,104,294 | |
| |
Liabilities in Excess of Other Assets — (2.1)% | | | | (35,766,681 | ) |
| | | | | | | | |
| |
Net Assets — 100.0% | | | $ | 1,736,337,613 | |
| | | | | | | | |
| (a) | Security, or a portion of the security, is on loan. |
| (b) | Non-income producing security. |
| (c) | Annualized 7-day yield as of period end. |
| (d) | Security was purchased with the cash collateral from loaned securities. |
| (e) | During the year ended December 31, 2018, investments in issuers considered to be affiliates of the Fund for purposes of Section 2(a)(3) of the Investment Company Act of 1940, as amended and/or related parties of the fund, were as follows: |
| | | | | | | | | | | | | | | | | | | | | | | | | | | | | | | | |
| Affiliated Persons and/or Related Parties | | Shares
Held at
12/31/17 | | | Shares
Purchased | | | Shares Sold | | | Shares
Held at
12/31/18 | | | Value at
12/31/18 | | | Income | | | Net
Realized
Gain (Loss) (a) | | | Change in
Unrealized
Appreciation
(Depreciation) | |
BlackRock Liquidity Funds, T-Fund, Institutional Class | | | 2,592,667 | | | | 13,120,657 | (b) | | | — | | | | 15,713,324 | | | $ | 15,713,324 | | | $ | 164,153 | | | $ | — | | | $ | — | |
SL Liquidity Series, LLC, Money Market Series | | | 3,040,710 | | | | 28,534,910 | (b) | | | — | | | | 31,575,620 | | | | 31,572,463 | | | | 49,655 | (c) | | | 5,020 | | | | (972 | ) |
BlackRock, Inc. | | | 1,183 | | | | 9,369 | | | | (576 | ) | | | 9,976 | | | | 3,918,772 | | | | 75,949 | | | | 159,096 | | | | (447,959 | ) |
PNC Financial Services Group, Inc. (The)(d) | | | 4,559 | | | | 35,385 | | | | (2,116 | ) | | | 37,828 | | | | N/A | | | | 85,326 | | | | 152,304 | | | | (1,109,827 | ) |
| | | | | | | | | | | | | | | | | | | | | | | | | | | | | | | | |
| | | | | | | | | | | | | | | | | | $ | 51,204,559 | | | $ | 375,083 | | | $ | 316,420 | | | $ | (1,558,758 | ) |
| | | | | | | | | | | | | | | | | | | | | | | | | | | | | | | | |
| | (a) | Includes net capital gains distributions, if applicable. | |
| | (b) | Represents net shares purchased. | |
| | (c) | Represents securities lending income earned from the reinvestment of cash collateral from loaned securities, net of fees and collateral investment expenses, and other payments to and from borrowers of securities. | |
| | (d) | As of period end, the entity is no longer an affiliate of the Fund. | |
For Fund compliance purposes, the Fund’s industry classifications refer to one or more of the industry sub-classifications used by one or more widely recognized market indexes or ratings group indexes, and/or as defined by the investment adviser. These definitions may not apply for purposes of this report, which may combine such industry sub-classifications for reporting ease.
| | |
| Portfolio Abbreviation |
| |
| S&P | | Standard & Poor’s |
Derivative Financial Instruments Outstanding as of Period End
Futures Contracts
| | | | | | | | | | | | | | | | |
| Description | | Number of
Contracts | | | Expiration
Date | | | Notional
Amount (000) | | | Value/
Unrealized
Appreciation
(Depreciation) | |
Long Contracts | | | | | | | | | | | | | | | | |
S&P 500 E-Mini Index | | | 141 | | | | 03/15/19 | | | $ | 17,662 | | | $ | 173,170 | |
| | | | | | | | | | | | | | | | |
| | | | |
| SCHEDULE OF INVESTMENTS | | | 11 | |
| | |
Schedule of Investments (continued) December 31, 2018 | | BlackRock S&P 500 Index V.I. Fund |
Derivative Financial Instruments Categorized by Risk Exposure
As of period end, the fair values of derivative financial instruments located in the Statement of Assets and Liabilities were as follows:
| | | | | | | | | | | | | | | | | | | | | | | | | | | | |
| | | Commodity
Contracts | | | Credit
Contracts | | | Equity
Contracts | | | Foreign
Currency
Exchange
Contracts | | | Interest
Rate
Contracts | | | Other
Contracts | | | Total | |
Assets — Derivative Financial Instruments | | | | | | | | | | | | | | | | | | | | | | | | | | | | |
Futures contracts | | | | | | | | | | | | | | | | | | | | | | | | | | | | |
Net unrealized appreciation(a) | | $ | — | | | $ | — | | | $ | 173,170 | | | $ | — | | | $ | — | | | $ | — | | | $ | 173,170 | |
| | | | | | | | | | | | | | | | | | | | | | | | | | | | |
| | (a) | Includes cumulative appreciation on futures contracts, if any, as reported in the Schedule of Investments. Only current day’s variation margin is reported within the Statement of Assets and Liabilities. | |
For the year ended December 31, 2018, the effect of derivative financial instruments in the Statement of Operations were as follows:
| | | | | | | | | | | | | | | | | | | | | | | | | | | | |
| | | Commodity
Contracts | | | Credit
Contracts | | | Equity
Contracts | | | Foreign
Currency
Exchange
Contracts | | | Interest
Rate
Contracts | | | Other
Contracts | | | Total | |
Net Realized Gain (Loss) from: | | | | | | | | | | | | | | | | | | | | | | | | | | | | |
Futures contracts | | $ | — | | | $ | — | | | $ | (931,129 | ) | | $ | — | | | $ | — | | | $ | — | | | $ | (931,129 | ) |
| | | | | | | | | | | | | | | | | | | | | | | | | | | | |
Net Change in Unrealized Appreciation (Depreciation) on: | | | | | | | | | | | | | | | | | | | | | | | | | | | | |
Futures contracts | | $ | — | | | $ | — | | | $ | 176,825 | | | $ | — | | | $ | — | | | $ | — | | | $ | 176,825 | |
| | | | | | | | | | | | | | | | | | | | | | | | | | | | |
Average Quarterly Balances of Outstanding Derivative Financial Instruments
| | | | |
Futures contracts: | | | | |
Average notional value of contracts — long | | $ | 12,904,575 | |
For more information about the Fund’s investment risks regarding derivative financial instruments, refer to the Notes to Financial Statements.
Fair Value Hierarchy as of Period End
Various inputs are used in determining the fair value of investments and derivative financial instruments. For information about the Fund’s policy regarding valuation of investments and derivative financial instruments, refer to the Notes to Financial Statements.
The following table summarizes the Fund’s investments and derivative financial instruments categorized in the disclosure hierarchy:
| | | | | | | | | | | | | | | | |
| | | Level 1 | | | Level 2 | | | Level 3 | | | Total | |
Assets: | | | | | | | | | | | | | | | | |
Investments: | | | | | | | | | | | | | | | | |
Long-Term Investments | | | | | | | | | | | | | | | | |
Common Stocks(a) | | $ | 1,724,818,507 | | | $ | — | | | $ | — | | | $ | 1,724,818,507 | |
Short-Term Securities | | | 15,713,324 | | | | — | | | | — | | | | 15,713,324 | |
| | | | | | | | | | | | | | | | |
Subtotal | | $ | 1,740,531,831 | | | $ | — | | | $ | — | | | $ | 1,740,531,831 | |
| | | | | | | | | | | | | | | | |
Investments valued at NAV(b) | | | | | | | | | | | | | | $ | 31,572,463 | |
| | | | | | | | | | | | | | | | |
Total Investments | | | | | | | | | | | | | | $ | 1,772,104,294 | |
| | | | | | | | | | | | | | | | |
Derivative Financial Instruments(c) | | | | | | | | | | | | | | | | |
Assets: | | | | | | | | | | | | | | | | |
Equity contracts | | $ | 173,170 | | | $ | — | | | $ | — | | | $ | 173,170 | |
| | | | | | | | | | | | | | | | |
| | (a) | See above Schedule of Investments for values in each industry. | |
| | (b) | As of December 31, 2018, certain investments of the Fund were fair valued using NAV per share as no quoted market value is available and therefore have been excluded from the fair value hierarchy. | |
| | (c) | Derivative financial instruments are futures contracts, which are valued at the unrealized appreciation (depreciation) on the instrument. | |
During the year ended December 31, 2018, there were no transfers between levels.
See notes to financial statements.
| | |
| 12 | | 2018 BLACKROCK ANNUAL REPORTTO SHAREHOLDERS |
Statement of Assets and Liabilities
December 31, 2018
| | | | |
| | | BlackRock S&P 500
Index V.I. Fund | |
| |
ASSETS | | | | |
Investments at value — unaffiliated (including securities loaned at value of $31,110,553) (cost — $965,238,013) | | $ | 1,720,899,735 | |
Investments at value — affiliated (cost — $49,344,268) | | | 51,204,559 | |
Cash pledged for futures contracts | | | 879,000 | |
Receivables: | | | | |
Investments sold | | | 521,102 | |
Securities lending income — affiliated | | | 8,249 | |
Capital shares sold | | | 716,255 | |
Dividends — affiliated | | | 26,835 | |
Dividends — unaffiliated | | | 2,006,953 | |
From the Manager | | | 8,037 | |
Variation margin on futures contracts | | | 137,118 | |
Prepaid expenses | | | 11,914 | |
| | | | |
Total assets | | | 1,776,419,757 | |
| | | | |
| |
LIABILITIES | | | | |
Bank overdraft | | | 166,233 | |
Cash collateral on securities loaned at value | | | 31,569,774 | |
Payables: | | | | |
Investments purchased | | | 1,165,897 | |
Capital shares redeemed | | | 6,539,380 | |
Distribution fees | | | 64,143 | |
Board realignment and consolidation | | | 7,133 | |
Investment advisory fees | | | 56,036 | |
Directors’ and Officer’s fees | | | 9,296 | |
Other affiliates | | | 3,059 | |
Other accrued expenses | | | 501,193 | |
| | | | |
Total liabilities | | | 40,082,144 | |
| | | | |
| |
NET ASSETS | | $ | 1,736,337,613 | |
| | | | |
| |
NET ASSETS CONSIST OF | | | | |
Paid-in capital | | $ | 991,957,031 | |
Accumulated earnings | | | 744,380,582 | |
| | | | |
NET ASSETS | | $ | 1,736,337,613 | |
| | | | |
| |
NET ASSET VALUE | | | | |
Class I — Based on net assets of $1,412,399,695 and 68,891,822 shares outstanding, 100 million shares authorized, $0.10 par value | | $ | 20.50 | |
| | | | |
Class II — Based on net assets of $4,484,593 and 220,702 shares outstanding, 100 million shares authorized, $0.10 par value | | $ | 20.32 | |
| | | | |
Class III — Based on net assets of $319,453,325 and 15,723,188 shares outstanding, 100 million shares authorized, $0.10 par value | | $ | 20.32 | |
| | | | |
See notes to financial statements.
Statement of Operations
Year Ended December 31, 2018
| | | | |
| | | BlackRock S&P 500
Index V.I. Fund | |
| |
INVESTMENT INCOME | | | | |
Dividends — affiliated | | $ | 325,428 | |
Dividends — unaffiliated | | | 21,690,340 | |
Securities lending income — affiliated — net | | | 49,655 | |
| | | | |
Total investment income | | | 22,065,423 | |
| | | | |
| |
EXPENSES | | | | |
Investment advisory | | | 919,907 | |
Distribution — class specific | | | 652,011 | |
Transfer agent — class specific | | | 400,788 | |
Professional | | | 162,790 | |
Reorganization | | | 137,991 | |
Accounting services | | | 103,655 | |
Printing | | | 40,534 | |
Registration | | | 32,806 | |
Directors and Officer | | | 30,003 | |
Custodian | | | 28,035 | |
Offering | | | 17,331 | |
Board realignment and consolidation | | | 7,133 | |
Transfer agent | | | 6,753 | |
Miscellaneous | | | 46,551 | |
| | | | |
Total expenses | | | 2,586,288 | |
Less: | | | | |
Fees waived and/or reimbursed by the Manager | | | (237,529 | ) |
Transfer agent fees waived and/or reimbursed — class specific | | | (119,440 | ) |
| | | | |
Total expenses after fees waived and/or reimbursed | | | 2,229,319 | |
| | | | |
Net investment income | | | 19,836,104 | |
| | | | |
| |
REALIZED AND UNREALIZED GAIN (LOSS) | | | | |
Net realized gain (loss) from: | | | | |
Investments — affiliated | | | 316,420 | |
Investments — unaffiliated | | | 98,921,438 | |
Futures contracts | | | (931,129 | ) |
| | | | |
| | | 98,306,729 | |
| | | | |
Net change in unrealized appreciation (depreciation) on: | | | | |
Investments — affiliated | | | (1,558,758 | ) |
Investments — unaffiliated | | | (205,459,514 | ) |
Futures contracts | | | 176,825 | |
| | | | |
| | | (206,841,447 | ) |
| | | | |
Net realized and unrealized loss | | | (108,534,718 | ) |
| | | | |
NET DECREASE IN NET ASSETS RESULTING FROM OPERATIONS | | $ | (88,698,614 | ) |
| | | | |
See notes to financial statements.
| | |
| 14 | | 2018 BLACKROCK ANNUAL REPORTTO SHAREHOLDERS |
Statements of Changes in Net Assets
| | | | | | | | |
| | | BlackRock S&P 500 Index V.I. Fund | |
| | | Year Ended | |
| | 12/31/2018 | | | 12/31/2017 | |
| | |
INCREASE (DECREASE) IN NET ASSETS | | | | | | | | |
| | |
OPERATIONS | | | | | | | | |
Net investment income | | $ | 19,836,104 | | | $ | 3,577,169 | |
Net realized gain | | | 98,306,729 | | | | 10,983,785 | |
Net change in unrealized appreciation (depreciation) | | | (206,841,447 | ) | | | 26,662,306 | |
| | | | | | | | |
Net increase (decrease) in net assets resulting from operations | | | (88,698,614 | ) | | | 41,223,260 | |
| | | | | | | | |
| | |
DISTRIBUTIONS TO SHAREHOLDERS(a)(b) | | | | | | | | |
Class I | | | (80,579,932 | ) | | | (12,284,211 | ) |
Class II | | | (251,963 | ) | | | (184,677 | ) |
Class III | | | (18,332,689 | ) | | | — | |
| | | | | | | | |
Decrease in net assets resulting from distributions to shareholders | | | (99,164,584 | ) | | | (12,468,888 | ) |
| | | | | | | | |
| | |
CAPITAL SHARE TRANSACTIONS | | | | | | | | |
Net increase (decrease) in net assets derived from capital share transactions | | | 1,704,609,344 | | | | (6,721,848 | ) |
| | | | | | | | |
| | |
NET ASSETS(b) | | | | | | | | |
Total increase in net assets | | | 1,516,746,146 | | | | 22,032,524 | |
Beginning of year | | | 219,591,467 | | | | 197,558,943 | |
| | | | | | | | |
End of year | | $ | 1,736,337,613 | | | $ | 219,591,467 | |
| | | | | | | | |
| (a) | Distributions for annual periods determined in accordance with U.S. federal income tax regulations. |
| (b) | Prior year distribution character information and undistributed net investment income has been modified or removed to conform with current year RegulationS-X presentation changes. Refer to Note 12 for this prior year information. |
See notes to financial statements.
Financial Highlights
(For a share outstanding throughout each period)
| | | | | | | | | | | | | | | | | | | | |
| | | BlackRock S&P 500 Index V.I. Fund | |
| |
| | | Class I | |
| |
| | | Year Ended December 31, | |
| | | 2018 | | | 2017 | | | 2016 | | | 2015 | | | 2014 | |
| | | | | |
Net asset value, beginning of year | | $ | 22.82 | | | $ | 19.90 | | | $ | 19.08 | | | $ | 20.63 | | | $ | 19.43 | |
| | | | | | | | | | | | | | | | | | | | |
Net investment income(a) | | | 0.44 | | | | 0.37 | | | | 0.37 | | | | 0.37 | | | | 0.35 | |
Net realized and unrealized gain (loss) | | | (1.51 | ) | | | 3.91 | | | | 1.85 | | | | (0.14 | ) | | | 2.25 | |
| | | | | | | | | | | | | | | | | | | | |
Net increase (decrease) from investment operations | | | (1.07 | ) | | | 4.28 | | | | 2.22 | | | | 0.23 | | | | 2.60 | |
| | | | | | | | | | | | | | | | | | | | |
| | | | | |
| Distributions(b) | | | | | | | | | | | | | | | |
From net investment income | | | (0.25 | ) | | | (0.39 | ) | | | (0.38 | ) | | | (0.42 | ) | | | (0.36 | ) |
From net realized gain | | | (1.00 | ) | | | (0.97 | ) | | | (1.02 | ) | | | (1.36 | ) | | | (1.04 | ) |
| | | | | | | | | | | | | | | | | | | | |
Total distributions | | | (1.25 | ) | | | (1.36 | ) | | | (1.40 | ) | | | (1.78 | ) | | | (1.40 | ) |
| | | | | | | | | | | | | | | | | | | | |
| | | | | |
Net asset value, end of year | | $ | 20.50 | | | $ | 22.82 | | | $ | 19.90 | | | $ | 19.08 | | | $ | 20.63 | |
| | | | | | | | | | | | | | | | | | | | |
| | | | | |
Total Return(c) | | | | | | | | | | | | | | | | | | | | |
Based on net asset value | | | (4.61 | )% | | | 21.50 | % | | | 11.60 | % | | | 1.05 | % | | | 13.30 | % |
| | | | | | | | | | | | | | | | | | | | |
| | | | | |
Ratios to Average Net Assets | | | | | | | | | | | | | | | | | | | | |
Total expenses | | | 0.19 | %(d) | | | 0.46 | % | | | 0.46 | % | | | 0.46 | % | | | 0.46 | % |
| | | | | | | | | | | | | | | | | | | | |
Total expenses after fees waived and/or reimbursed | | | 0.16 | %(d) | | | 0.30 | % | | | 0.31 | % | | | 0.31 | % | | | 0.34 | % |
| | | | | | | | | | | | | | | | | | | | |
Net investment income | | | 1.88 | % | | | 1.68 | % | | | 1.87 | % | | | 1.76 | % | | | 1.70 | % |
| | | | | | | | | | | | | | | | | | | | |
| | | | | |
Supplemental Data | | | | | | | | | | | | | | | | | | | | |
Net assets, end of year (000) | | $ | 1,412,400 | | | $ | 216,251 | | | $ | 195,261 | | | $ | 187,048 | | | $ | 204,029 | |
| | | | | | | | | | | | | | | | | | | | |
Portfolio turnover rate | | | 5 | % | | | 3 | % | | | 4 | % | | | 4 | % | | | 3 | % |
| | | | | | | | | | | | | | | | | | | | |
| (a) | Based on average shares outstanding. |
| (b) | Distributions for annual periods determined in accordance with U.S. federal income tax regulations. |
| (c) | Where applicable, excludes insurance-related fees and expenses and assumes the reinvestment of distributions. |
| (d) | Includes reorganization costs associated with the Fund’s reorganization. Without these costs, total expenses and total expenses after fees waived and/or reimbursed would have been 0.18% and 0.15%, respectively. |
See notes to financial statements.
| | |
| 16 | | 2018 BLACKROCK ANNUAL REPORTTO SHAREHOLDERS |
Financial Highlights (continued)
(For a share outstanding throughout each period)
| | | | | | | | | | | | | | | | | | | | |
| | | BlackRock S&P 500 Index V.I. Fund (continued) | |
| |
| | | Class II | |
| |
| | | Year Ended December 31, | |
| | | 2018 | | | 2017 | | | 2016 | | | 2015 | | | 2014 | |
| | | | | |
Net asset value, beginning of year | | $ | 22.63 | | | $ | 19.75 | | | $ | 18.94 | | | $ | 20.49 | | | $ | 19.31 | |
| | | | | | | | | | | | | | | | | | | | |
Net investment income(a) | | | 0.38 | | | | 0.34 | | | | 0.33 | | | | 0.33 | | | | 0.32 | |
Net realized and unrealized gain (loss) | | | (1.47 | ) | | | 3.87 | | | | 1.85 | | | | (0.13 | ) | | | 2.22 | |
| | | | | | | | | | | | | | | | | | | | |
Net increase (decrease) from investment operations | | | (1.09 | ) | | | 4.21 | | | | 2.18 | | | | 0.20 | | | | 2.54 | |
| | | | | | | | | | | | | | | | | | | | |
| | | | | |
| Distributions(b) | | | | | | | | | | | | | | | |
From net investment income | | | (0.22 | ) | | | (0.36 | ) | | | (0.35 | ) | | | (0.39 | ) | | | (0.32 | ) |
From net realized gain | | | (1.00 | ) | | | (0.97 | ) | | | (1.02 | ) | | | (1.36 | ) | | | (1.04 | ) |
| | | | | | | | | | | | | | | | | | | | |
Total distributions | | | (1.22 | ) | | | (1.33 | ) | | | (1.37 | ) | | | (1.75 | ) | | | (1.36 | ) |
| | | | | | | | | | | | | | | | | | | | |
| | | | | |
Net asset value, end of year | | $ | 20.32 | | | $ | 22.63 | | | $ | 19.75 | | | $ | 18.94 | | | $ | 20.49 | |
| | | | | | | | | | | | | | | | | | | | |
| | | | | |
Total Return(c) | | | | | | | | | | | | | | | | | | | | |
Based on net asset value | | | (4.74 | )% | | | 21.31 | % | | | 11.47 | % | | | 0.89 | % | | | 13.11 | % |
| | | | | | | | | | | | | | | | | | | | |
| | | | | |
Ratios to Average Net Assets | | | | | | | | | | | | | | | | | | | | |
Total expenses | | | 0.40 | %(d) | | | 0.60 | % | | | 0.62 | % | | | 0.61 | % | | | 0.60 | % |
| | | | | | | | | | | | | | | | | | | | |
Total expenses after fees waived and/or reimbursed | | | 0.33 | %(d) | | | 0.45 | % | | | 0.46 | % | | | 0.46 | % | | | 0.48 | % |
| | | | | | | | | | | | | | | | | | | | |
Net investment income | | | 1.64 | % | | | 1.54 | % | | | 1.71 | % | | | 1.61 | % | | | 1.55 | % |
| | | | | | | | | | | | | | | | | | | | |
| | | | | |
Supplemental Data | | | | | | | | | | | | | | | | | | | | |
Net assets, end of year (000) | | $ | 4,485 | | | $ | 3,340 | | | $ | 2,298 | | | $ | 1,780 | | | $ | 1,962 | |
| | | | | | | | | | | | | | | | | | | | |
Portfolio turnover rate | | | 5 | % | | | 3 | % | | | 4 | % | | | 4 | % | | | 3 | % |
| | | | | | | | | | | | | | | | | | | | |
| (a) | Based on average shares outstanding. |
| (b) | Distributions for annual periods determined in accordance with U.S. federal income tax regulations. |
| (c) | Where applicable, excludes insurance-related fees and expenses and assumes the reinvestment of distributions. |
| (d) | Includes reorganization costs associated with the Fund’s reorganization. Without these costs, total expenses and total expenses after fees waived and/or reimbursed would have been 0.39% and 0.33%, respectively. |
See notes to financial statements.
Financial Highlights (continued)
(For a share outstanding throughout each period)
| | | | |
| | | BlackRock S&P 500
Index V.I. Fund
(continued) | |
| |
| | | Class III | |
| | | Period from
02/14/2018 (a) to 12/31/2018 | |
| |
Net asset value, beginning of period | | $ | 22.88 | |
| | | | |
Net investment income(b) | | | 0.34 | |
Net realized and unrealized (loss) | | | (1.69 | ) |
| | | | |
Net (decrease) from investment operations | | | (1.35 | ) |
| | | | |
| |
| Distributions(c) | | | |
From net investment income | | | (0.21 | ) |
From net realized gain | | | (1.00 | ) |
| | | | |
Total distributions | | | (1.21 | ) |
| | | | |
| |
Net asset value, end of period | | $ | 20.32 | |
| | | | |
| |
Total Return(d) | | | | |
Based on net asset value | | | (5.82 | )%(e) |
| | | | |
| |
Ratios to Average Net Assets | | | | |
Total expenses | | | 0.38 | %(f)(g) |
| | | | |
Total expenses after fees waived and/or reimbursed | | | 0.36 | %(f)(g) |
| | | | |
Net investment income | | | 1.64 | %(f) |
| | | | |
| |
Supplemental Data | | | | |
Net assets, end of period (000) | | $ | 319,453 | |
| | | | |
Portfolio turnover rate | | | 5 | %(h) |
| | | | |
| (a) | Recommencement of operations. |
| (b) | Based on average shares outstanding. |
| (c) | Distributions for annual periods determined in accordance with U.S. federal income tax regulations. |
| (d) | Where applicable, excludes insurance-related fees and expenses and assumes the reinvestment of distributions. |
| (e) | Aggregate total return. |
| (g) | Includes reorganization costs associated with the Fund’s reorganization. Without these costs, total expenses and total expenses after fees waived and/or reimbursed would have been 0.37% and 0.35%, respectively. |
| (h) | Portfolio turnover rate is representative of the fund for the entire year. |
See notes to financial statements.
| | |
| 18 | | 2018 BLACKROCK ANNUAL REPORTTO SHAREHOLDERS |
Notes to Financial Statements
BlackRock Variable Series Funds, Inc. (the “Company”) is registered under the Investment Company Act of 1940, as amended (the “1940 Act”), as anopen-end management investment company. The Company is organized as a Maryland corporation that is comprised of 15 separate portfolios. The funds offer shares to insurance companies for their separate accounts to fund benefits under certain variable annuity and variable life insurance contracts. The financial statements presented are for BlackRock S&P 500 Index V.I. Fund (the “Fund”). The Fund is classified as diversified. Class I, Class II and Class III Shares have equal voting, dividend, liquidation and other rights, except that only shares of the respective classes are entitled to vote on matters concerning only that class. In addition, Class II and Class III Shares bear certain expenses related to the distribution of such shares. Class III Shares recommenced operations on February 14, 2018.
The Fund, together with certain other registered investment companies advised by BlackRock Advisors, LLC (the “Manager”) or its affiliates, is included in a complex ofopen-end funds referred to as the Equity-Bond Complex.
Reorganizations
The Board, the Board of the HIMCO Variable Insurance Trust and shareholders of the HIMCO Fund approved the reorganization of the HIMCO Fund into the Fund. As a result, the Fund acquired substantially all of the assets and assumed substantially all of the liabilities of the HIMCO Fund in exchange for an equal aggregate value of newly-issued Class I and Class III Shares of the Fund.
Each shareholder of the HIMCO Fund received shares of the Fund in an amount equal to the aggregate net asset value (“NAV”) of such shareholder’s HIMCO Fund shares, as determined at the close of business on April 20, 2018, less the costs of the HIMCO Fund’s reorganization.
The HIMCO reorganization was accomplished by atax-free exchange of shares of the Fund in the following amounts and at the following conversion ratios:
| | | | | | | | | | | | | | | | |
| HIMCO Fund’s Share Class | | Shares Prior to
HIMCO Reorganization | | | Conversion
Ratio | | | S&P 500 Index V.I.
Fund’s Share Class | | | Shares of S&P 500
Index V.I. Fund | |
Class IA | | | 17,179,594 | | | | 1.83129659 | | | | Class I | | | | 31,460,932 | |
Class IB | | | 9,244,848 | | | | 1.81412014 | | | | Class III | | | | 16,771,265 | |
The HIMCO Fund’s net assets and composition of net assets as of the close of business on April 20, 2018, the valuation date of the HIMCO reorganization were as follows:
| | | | | | | | | | | | |
| HIMCO Fund | | Net Assets | | | Paid-In Capital | | | Accumulated earnings | |
HIMCO VIT Index Fund | | $ | 1,100,925,673 | | | $ | 552,473,484 | | | $ | 548,452,189 | |
For financial reporting purposes, assets received and shares issued by the Fund were recorded at fair value. However, the cost basis of the investments received from the HIMCO Fund was carried forward to align ongoing reporting of the Fund’s realized and unrealized gains and losses with amounts distributable to shareholders for tax purposes.
The net assets of the Fund before the HIMCO reorganization were $221,043,512. The aggregate net assets of the Fund immediately after the HIMCO reorganization amounted to $1,321,969,185. The HIMCO Fund’s fair value and cost of investments prior to the HIMCO reorganization were as follows:
| | | | | | | | |
| HIMCO Fund | | Fair Value
of Investments | | | Cost of
Investments | |
HIMCO VIT Index Fund | | $ | 1,091,642,970 | | | $ | 514,211,227 | |
The purpose of the transaction was to combine the assets of the HIMCO Fund with the assets of the Fund. The HIMCO reorganization was a tax-free event and closed on April 23, 2018.
Assuming the acquisition had been completed on January 1, 2018, the beginning of the fiscal reporting period of the Fund, the pro forma results of operations for the year ended December 31, 2018, are as follows:
| | • | | Net investment income: $25,009,801 |
| | • | | Net realized and change in unrealized loss on investments: $(108,025,468) |
| | • | | Net increase in net assets resulting from operations: $(83,015,667) |
Because the combined investment portfolios have been managed as a single integrated portfolio since the acquisition was completed, it is not practicable to separate the amounts of revenue and earnings of the Fund that have been included in the Fund’s Statement of Operations since April 23, 2018.
The Board, the Board of Trustees of State Farm Variable Product Trust and shareholders of the State Farm Fund approved the reorganization of the State Farm Fund into the Fund. As a result, the Fund acquired substantially all of the assets and assumed substantially all of the liabilities of the State Farm Fund in exchange for an equal aggregate value of newly-issued Class I Shares of the Fund.
Each shareholder of the State Farm Fund received shares of the Fund in an amount equal to the aggregate NAV of such shareholder’s State Farm Fund shares, as determined at the close of business on October 26, 2018, less the costs of the State Farm Fund’s reorganization.
| | | | |
| NOTESTO FINANCIAL STATEMENTS | | | 19 | |
Notes to Financial Statements (continued)
The State Farm reorganization was accomplished by atax-free exchange of shares of the Fund in the following amount and at the following conversion ratio:
| | | | | | | | | | | | | | | | |
| State Farm Fund | | Shares Prior to
State Farm
Reorganization | | | Conversion
Ratio | | | S&P 500 Index
V.I. Fund’s Share Class | | | Shares of
S&P 500 Index
V.I. Fund | |
State Farm Large Cap Equity Index Fund | | | 31,060,082 | | | | 0.87209818 | | | | Class I | | | | 27,087,441 | |
The State Farm Fund’s net assets and composition of net assets on October 26, 2018, the valuation date of the State Farm reorganization were as follows:
| | | | | | | | | | | | |
| State Farm Fund | | Net Assets | | | Paid-In Capital | | | Accumulated earnings | |
State Farm Large Cap Equity Index Fund | | $ | 622,154,676 | | | $ | 387,022,240 | | | $ | 235,132,436 | |
For financial reporting purposes, assets received and shares issued by the Fund were recorded at fair value. However, the cost basis of the investments received from the State Farm Fund was carried forward to align ongoing reporting of the Fund’s realized and unrealized gains and losses with amounts distributable to shareholders for tax purposes.
The net assets of the Fund before the State Farm reorganization were $1,244,306,961. The aggregate net assets of the Fund immediately after the State Farm reorganization amounted to $1,866,461,637. The State Farm Fund’s fair value and cost of investments prior to the reorganization were as follows:
| | | | | | | | |
| State Farm Fund | | Fair Value
of Investments | | | Cost of
Investments | |
State Farm Large Cap Equity Index Fund | | $ | 617,866,688 | | | $ | 382,357,766 | |
The purpose of the transaction was to combine the assets of the State Farm Fund with the assets of the Fund. The State Farm reorganization was a tax-free event and closed on October 29, 2018.
Assuming the acquisition had been completed on January 1, 2018, the beginning of the fiscal reporting period of the Fund, the pro forma results of operations for the year ended December 31, 2018, are as follows:
| | • | | Net investment income: $29,919,446 |
| | • | | Net realized and change in unrealized gain (loss) on investments: $(105,351,557) |
| | • | | Net increase in net assets resulting from operations: $(75,432,111) |
Because the combined investment portfolios have been managed as a single integrated portfolio since the acquisition was completed, it is not practicable to separate the amounts of revenue and earnings of the Fund that have been included in the Fund’s Statement of Operations since October 29, 2018.
State Farm Reorganization costs incurred by the Fund in connection with the State Farm Reorganization were expensed by the Fund. The Manager reimbursed the Fund $111,986, which is included in fees waived and/or reimbursed by the Manager in the Statement of Operations.
| 2. | SIGNIFICANT ACCOUNTING POLICIES |
The financial statements are prepared in conformity with accounting principles generally accepted in the United States of America (“U.S. GAAP”), which may require management to make estimates and assumptions that affect the reported amounts of assets and liabilities in the financial statements, disclosure of contingent assets and liabilities at the date of the financial statements and the reported amounts of increases and decreases in net assets from operations during the reporting period. Actual results could differ from those estimates. The Fund is considered an investment company under U.S. GAAP and follows the accounting and reporting guidance applicable to investment companies. Below is a summary of significant accounting policies:
Investment Transactions and Income Recognition: For financial reporting purposes, investment transactions are recorded on the dates the transactions are entered into (the “trade dates”). Realized gains and losses on investment transactions are determined on the identified cost basis. Dividend income is recorded on theex-dividend date. Dividends from foreign securities where theex-dividend date may have passed are subsequently recorded when the Fund is informed of theex-dividend date. Under the applicable foreign tax laws, a withholding tax at various rates may be imposed on capital gains, dividends and interest. Upon notification from issuers, some of the dividend income received from a real estate investment trust may be redesignated as a reduction of cost of the related investment and/or realized gain. Interest income, including amortization and accretion of premiums and discounts on debt security is recognized on an accrual basis. Income, expenses and realized and unrealized gains and losses are allocated daily to each class based on its relative net assets.
Foreign Currency Translation: The Fund’s books and records are maintained in U.S. dollars. Securities and other assets and liabilities denominated in foreign currencies are translated into U.S. dollars using exchange rates determined as of the close of trading on the New York Stock Exchange (“NYSE”). Purchases and sales of investments are recorded at the rates of exchange prevailing on the respective dates of such transactions. Generally, when the U.S. dollar rises in value against a foreign currency, the investments denominated in that currency will lose value; the opposite effect occurs if the U.S. dollar falls in relative value.
The Fund does not isolate the portion of the results of operations arising as a result of changes in the exchange rates from the changes in the market prices of investments held or sold for financial reporting purposes. Accordingly, the effects of changes in exchange rates on investments are not segregated in the Statement of Operations from
| | |
| 20 | | 2018 BLACKROCK ANNUAL REPORTTO SHAREHOLDERS |
Notes to Financial Statements (continued)
the effects of changes in market prices of those investments, but are included as a component of net realized and unrealized gain (loss) from investments. The Fund reports realized currency gains (losses) on foreign currency related transactions as components of net realized gain (loss) for financial reporting purposes, whereas such components are generally treated as ordinary income for U.S. federal income tax purposes.
Segregation and Collateralization: In cases where the Fund enters into certain investments (e.g., futures contracts) that would be treated as “senior securities” for 1940 Act purposes, the Fund may segregate or designate on its books and records cash or liquid assets having a market value at least equal to the amount of its future obligations under such investments. Doing so allows the investment to be excluded from treatment as a “senior security.” Furthermore, if required by an exchange or counterparty agreement, the Fund may be required to deliver/deposit cash and/or securities to/with an exchange, or broker-dealer or custodian as collateral for certain investments or obligations.
Distributions: Distributions paid by the Fund are recorded on theex-dividend date. Distributions of capital gains are recorded on the ex-dividend date and made at least annually. The character and timing of distributions are determined in accordance with U.S. federal income tax regulations, which may differ from U.S. GAAP.
Offering Costs:Offering costs are amortized over a12- month period beginning with the commencement of operations of a class of shares.
Recent Accounting Standards: In August 2018, the Financial Accounting Standards Board issued Accounting Standards Update2018-13 “Changes to the Disclosure Requirements for Fair Value Measurement” which modifies disclosure requirements for fair value measurements. The guidance is effective for fiscal years beginning after December 15, 2019 and for interim periods within those fiscal years. Management is currently evaluating the impact of this guidance to the Fund.
Indemnifications: In the normal course of business, the Fund enters into contracts that contain a variety of representations that provide general indemnification. The Fund’s maximum exposure under these arrangements is unknown because it involves future potential claims against the Fund, which cannot be predicted with any certainty.
Other: Expenses directly related to the Fund or its classes are charged to the Fund or the applicable class. Other operating expenses shared by several funds, including other funds managed by the Manager, are prorated among those funds on the basis of relative net assets or other appropriate methods. Expenses directly related to the Fund and other shared expenses prorated to the Fund are allocated daily to each class based on its relative net assets or other appropriate methods.
| 3. | INVESTMENT VALUATION AND FAIR VALUE MEASUREMENTS |
Investment Valuation Policies: The Fund’s investments are valued at fair value (also referred to as “market value” within the financial statements) as of the close of trading on the NYSE (generally 4:00 p.m., Eastern time). U.S. GAAP defines fair value as the price the Fund would receive to sell an asset or pay to transfer a liability in an orderly transaction between market participants at the measurement date. The Fund determines the fair values of its financial instruments using various independent dealers or pricing services under policies approved by the Board. The BlackRock Global Valuation Methodologies Committee (the “Global Valuation Committee”) is the committee formed by management to develop global pricing policies and procedures and to oversee the pricing function for all financial instruments.
Fair Value Inputs and Methodologies: The following methods and inputs are used to establish the fair value of the Fund’s assets and liabilities:
| | • | | Equity investments traded on a recognized securities exchange are valued at the official closing price each day, if available. For equity investments traded on more than one exchange, the official closing price on the exchange where the stock is primarily traded is used. Equity investments traded on a recognized exchange for which there were no sales on that day may be valued at the last available bid (long positions) or ask (short positions) price. |
| | • | | Investments inopen-end U.S. mutual funds are valued at NAV each business day. |
| | • | | The Fund values its investment in SL Liquidity Series, LLC, Money Market Series (the “Money Market Series”) at fair value, which is ordinarily based upon its pro rata ownership in the underlying fund’s net assets. The Money Market Series seeks current income consistent with maintaining liquidity and preserving capital. Although the Money Market Series is not registered under the 1940 Act, its investments may follow the parameters of investments by a money market fund that is subject to Rule2a-7 under the 1940 Act. |
| | • | | Futures contracts traded on exchanges are valued at their last sale price. |
If events (e.g., a company announcement, market volatility or a natural disaster) occur that are expected to materially affect the value of such investments, or in the event that the application of these methods of valuation results in a price for an investment that is deemed not to be representative of the market value of such investment, or if a price is not available, the investment will be valued by the Global Valuation Committee, or its delegate, in accordance with a policy approved by the Board as reflecting fair value (“Fair Valued Investments”). The fair valuation approaches that may be used by the Global Valuation Committee will include market approach, income approach and cost approach. Valuation techniques such as discounted cash flow, use of market comparables and matrix pricing are types of valuation approaches and are typically used in determining fair value. When determining the price for Fair Valued Investments, the Global Valuation Committee, or its delegate, seeks to determine the price that the Fund might reasonably expect to receive or pay from the current sale or purchase of that asset or liability in anarm’s-length transaction. Fair value determinations shall be based upon all available factors that the Global Valuation Committee, or its delegate, deems relevant and consistent with the principles of fair value measurement. The pricing of all Fair Valued Investments is subsequently reported to the Board or a committee thereof on a quarterly basis.
Fair Value Hierarchy: Various inputs are used in determining the fair value of investments and derivative financial instruments. These inputs to valuation techniques are categorized into a fair value hierarchy consisting of three broad levels for financial statement purposes as follows:
| | • | | Level 1 — Unadjusted price quotations in active markets/exchanges for identical assets or liabilities that the Fund has the ability to access |
| | • | | Level 2 — Other observable inputs (including, but not limited to, quoted prices for similar assets or liabilities in markets that are active, quoted prices for identical or similar assets or liabilities in markets that are not active, inputs other than quoted prices that are observable for the assets or liabilities (such as interest rates, yield curves, volatilities, prepayment speeds, loss severities, credit risks and default rates) or other market–corroborated inputs) |
| | | | |
| NOTESTO FINANCIAL STATEMENTS | | | 21 | |
Notes to Financial Statements (continued)
| | • | | Level 3 — Unobservable inputs based on the best information available in the circumstances, to the extent observable inputs are not available (including the Fund’s own assumptions used in determining the fair value of investments and derivative financial instruments) |
The hierarchy gives the highest priority to unadjusted quoted prices in active markets for identical assets or liabilities (Level 1 measurements) and the lowest priority to unobservable inputs (Level 3 measurements). Accordingly, the degree of judgment exercised in determining fair value is greatest for instruments categorized in Level 3. The inputs used to measure fair value may fall into different levels of the fair value hierarchy. In such cases, for disclosure purposes, the fair value hierarchy classification is determined based on the lowest level input that is significant to the fair value measurement in its entirety. Investments classified within Level 3 have significant unobservable inputs used by the Global Valuation Committee in determining the price for Fair Valued Investments. Level 3 investments include equity or debt issued by privately held companies or funds. There may not be a secondary market, and/or there are a limited number of investors. Level 3 investments may also be adjusted to reflect illiquidity and/ornon-transferability, with the amount of such discount estimated by the Global Valuation Committee in the absence of market information.
Changes in valuation techniques may result in transfers into or out of an assigned level within the hierarchy. In accordance with the Fund’s policy, transfers between different levels of the fair value hierarchy are deemed to have occurred as of the beginning of the reporting period. The categorization of a value determined for investments and derivative financial instruments is based on the pricing transparency of the investments and derivative financial instruments and is not necessarily an indication of the risks associated with investing in those securities.
As of December 31, 2018, certain investments of the Fund were valued using NAV per share as no quoted market value is available and therefore have been excluded from the fair value hierarchy.
| 4. | SECURITIES AND OTHER INVESTMENTS |
Securities Lending: The Fund may lend its securities to approved borrowers, such as brokers, dealers and other financial institutions. The borrower pledges and maintains with the Fund collateral consisting of cash, an irrevocable letter of credit issued by a bank, or securities issued or guaranteed by the U.S. Government. The initial collateral received by the Fund is required to have a value of at least 102% of the current value of the loaned securities for securities traded on U.S. exchanges and a value of at least 105% for all other securities. The collateral is maintained thereafter at a value equal to at least 100% of the current market value of the securities on loan. The market value of the loaned securities is determined at the close of each business day of the Fund and any additional required collateral is delivered to the Fund, or excess collateral returned by the Fund, on the next business day. During the term of the loan, the Fund is entitled to all distributions made on or in respect of the loaned securities, but does not receive interest income on securities received as collateral. Loans of securities are terminable at any time and the borrower, after notice, is required to return borrowed securities within the standard time period for settlement of securities transactions.
The market value of any securities on loan, all of which were classified as common stocks in the Fund’s Schedule of Investments, and the value of any related collateral are shown separately in the Statement of Assets and Liabilities as a component of investments at value — unaffiliated, and collateral on securities loaned at value, respectively. As of period end, any securities on loan were collateralized by cash and/or U.S. Government obligations. Cash collateral invested by the securities lending agent, BlackRock Investment Management, LLC (“BIM”), if any, is disclosed in the Schedule of Investments.
Securities lending transactions are entered into by the Fund under Master Securities Lending Agreements (each, an “MSLA”), which provide the right, in the event of default (including bankruptcy or insolvency), for thenon-defaulting party to liquidate the collateral and calculate a net exposure to the defaulting party or request additional collateral. In the event that a borrower defaults, the Fund, as lender, would offset the market value of the collateral received against the market value of the securities loaned. When the value of the collateral is greater than that of the market value of the securities loaned, the lender is left with a net amount payable to the defaulting party. However, bankruptcy or insolvency laws of a particular jurisdiction may impose restrictions on or prohibitions against such a right of offset in the event of an MSLA counterparty’s bankruptcy or insolvency. Under the MSLA, absent an event of default, the borrower can resell orre-pledge the loaned securities, and the Fund can reinvest cash collateral received in connection with loaned securities. Upon an event of default, the parties’ obligations to return the securities or collateral to the other party are extinguished, and the parties can resell orre-pledge the loaned securities or the collateral received in connection with the loaned securities in order to satisfy the defaulting party’s net payment obligation for all transactions under the MSLA. The defaulting party remains liable for any deficiency.
As of period end, the following table is a summary of the Fund’s securities lending agreements by counterparty which are subject to offset under an MSLA:
| | | | | | | | | | | | |
| Counterparty | | Securities
Loaned at Value | | | Cash Collateral
Received (a) | | | Net
Amount | |
Citigroup Global Markets Inc. | | $ | 7,747,927 | | | $ | (7,747,927 | ) | | $ | — | |
Credit Suisse Securities (USA) LLC | | | 3,302,880 | | | | (3,302,880 | ) | | | — | |
Deutsche Bank Securities Inc. | | | 2,232,615 | | | | (2,232,615 | ) | | | — | |
Fidelity Investments | | | 394,106 | | | | (394,106 | ) | | | — | |
Goldman Sachs & Co. | | | 114,885 | | | | (114,885 | ) | | | — | |
JP Morgan Securities LLC | | | 13,552,187 | | | | (13,552,187 | ) | | | — | |
State Street Bank & Trust Co. | | | 2,785,622 | | | | (2,785,622 | ) | | | — | |
Toronto Dominion Bank | | | 542,411 | | | | (542,411 | ) | | | — | |
UBS Securities LLC | | | 437,920 | | | | (437,920 | ) | | | — | |
| | | | | | | | | | | | |
| | $ | 31,110,553 | | | $ | (31,110,553 | ) | | $ | — | |
| | | | | | | | | | | | |
| | (a) | Cash collateral with a value of $31,569,774 has been received in connection with securities lending agreements. Collateral received in excess of the value of securities loaned from the individual counterparty, if any, is not shown for financial reporting purposes in the table above. | |
The risks of securities lending include the risk that the borrower may not provide additional collateral when required or may not return the securities when due. To mitigate these risks, the Fund benefits from a borrower default indemnity provided by BIM. BIM’s indemnity allows for full replacement of the securities loaned if the collateral received
| | |
| 22 | | 2018 BLACKROCK ANNUAL REPORTTO SHAREHOLDERS |
Notes to Financial Statements (continued)
does not cover the value on the securities loaned in the event of borrower default. The Fund could incur a loss if the value of an investment purchased with cash collateral falls below the market value of loaned securities or if the value of an investment purchased with cash collateral falls below the value of the original cash collateral received.
| 5. | DERIVATIVE FINANCIAL INSTRUMENTS |
The Fund engages in various portfolio investment strategies using derivative contracts both to increase the returns of the Fund and/or to manage its exposure to certain risks such as credit risk, equity risk, interest rate risk, foreign currency exchange rate risk, commodity price risk or other risks (e.g., inflation risk). Derivative financial instruments categorized by risk exposure are included in the Schedule of Investments. These contracts may be transacted on an exchange orover-the-counter (“OTC”).
Futures Contracts: Futures contracts are purchased or sold to gain exposure to, or manage exposure to, changes in interest rates (interest rate risk) and changes in the value of equity securities (equity risk) or foreign currencies (foreign currency exchange rate risk).
Futures contracts are agreements between the Fund and a counterparty to buy or sell a specific quantity of an underlying instrument at a specified price and on a specified date. Depending on the terms of a contract, it is settled either through physical delivery of the underlying instrument on the settlement date or by payment of a cash amount on the settlement date. Upon entering into a futures contract, the Fund is required to deposit initial margin with the broker in the form of cash or securities in an amount that varies depending on a contract’s size and risk profile. The initial margin deposit must then be maintained at an established level over the life of the contract. Amounts pledged, which are considered restricted, are included in cash pledged for futures contracts in the Statement of Assets and Liabilities.
Securities deposited as initial margin are designated in the Schedule of Investments and cash deposited, if any, is shown as cash pledged for futures contracts in the Statement of Assets and Liabilities. Pursuant to the contract, the Fund agrees to receive from or pay to the broker an amount of cash equal to the daily fluctuation in market value of the contract (“variation margin”). Variation margin is recorded as unrealized appreciation (depreciation) and, if any, shown as variation margin receivable (or payable) on futures contracts in the Statement of Assets and Liabilities. When the contract is closed, a realized gain or loss is recorded in the Statement of Operations equal to the difference between the notional amount of the contract at the time it was opened and the notional amount at the time it was closed. The use of futures contracts involves the risk of an imperfect correlation in the movements in the price of futures contracts and interest, foreign currency exchange rates or underlying assets.
| 6. | INVESTMENT ADVISORY AGREEMENT AND OTHER TRANSACTIONS WITH AFFILIATES |
Investment Advisory: The Company, on behalf of the Fund, entered into an Investment Advisory Agreement with the Manager, the Fund’s investment adviser and an indirect, wholly-owned subsidiary of BlackRock, to provide investment advisory and administrative services. The Manager is responsible for the management of the Fund’s portfolio and provides the personnel, facilities, equipment and certain other services necessary to the operations of the Fund.
For such services, the Fund pays the Manager a monthly fee at an annual rate equal to 0.07% of the average daily value of the Fund’s net assets.
Prior to April 23, 2018, this fee was 0.30% of the average daily value of the Fund’s net assets.
Distribution Fees: The Company, on behalf of the Fund, entered into a Distribution Agreement and a Distribution Plan with BlackRock Investments, LLC (“BRIL”), an affiliate of the Manager. Pursuant to the Distribution Plan and in accordance with Rule12b-1 under the 1940 Act, the Fund pays BRIL ongoing distribution fees. The fees are accrued daily and paid monthly at annual rates based upon the average daily net assets of the relevant share class of the Fund as follows:
| | | | | | | | | | | | | | | | | | | | |
| | | Class I | | | | | | Class II | | | | | | Class III | |
Distribution Fees | | | N/A | | | | | | | | 0.15 | % | | | | | | | 0.25 | % |
For the year ended December 31, 2018, the following table shows the class specific distribution fees borne directly by each share class of the Fund:
| | | | | | | | | | | | |
| | | Class II | | | Class III | | | Total | |
Distribution Fees | | $ | 6,138 | | | $ | 645,873 | | | $ | 652,011 | |
Transfer Agent: On behalf of the Fund, the Manager entered into agreements with insurance companies and other financial intermediaries (“Service Organizations”), some of which may be affiliates. Pursuant to these agreements, the Service Organizations provide the Fund with administrative, networking, recordkeeping,sub-transfer agency and shareholder services tosub-accounts they service. For these services, the Service Organizations receive an annual fee per shareholder account, which will vary depending on share class and/or net assets of Fund shareholders serviced by the Service Organizations, which is shown as transfer agent — class specific. For the year ended December 31, 2018, the Fund did not pay any amounts to affiliates in return for these services.
In addition, the Fund pays the transfer agent, which is not an affiliate, a fee for the issuance, transfer and redemption of shares and the opening and maintenance of shareholder accounts, which is included in transfer agent in the Statement of Operations.
For the year ended December 31, 2018, the following table shows the class specific transfer agent fees borne directly by each share class of the Fund:
| | | | | | | | | | | | | | | | | | | | |
| Class I | | | | | Class II | | | | | Class III | | | | | Total | |
| $ | 381,148 | | | | | $ | 2,253 | | | | | $ | 17,387 | | | | | $ | 400,788 | |
Expense Limitations, Waivers and Reimbursements:Effective April 23, 2018, the contractual advisory fee waiver of 0.10% is discontinued in conjunction with the reduced advisory fee from 0.30% to 0.07%. For the year ended December 31, 2018, the amount waived and/or reimbursed by the Manager pursuant to this contractual waiver was $68,657.
With respect to the Fund, the Manager voluntarily agreed to waive its investment advisory fees by the amount of investment advisory fees the Fund pays to the Manager indirectly through its investment in affiliated money market funds (the “affiliated money market fund waiver”). The amount of waivers and/or reimbursements of fees and
| | | | |
| NOTESTO FINANCIAL STATEMENTS | | | 23 | |
Notes to Financial Statements (continued)
expenses made pursuant to the expense limitation will be reduced by the amount of the affiliated money market fund waiver. This amount is included in fees waived and/or reimbursed by the Manager in the Statement of Operations. For the year ended December 31, 2018, the amount waived was $6,903.
The Manager has contractually agreed to waive its investment advisory fee with respect to any portion of the Fund’s assets invested in affiliated equity and fixed-income mutual funds and affiliated exchange-traded funds that have a contractual management fee through April 30, 2021. The contractual agreement may be terminated upon 90 days’ notice by a majority of directors who are not “interested persons” of the Fund, as defined in the 1940 Act (“Independent Directors”), or by a vote of a majority of the outstanding voting securities of the Fund. For the year ended December 31, 2018, there were no fees waived and/or reimbursed by the Manager.
For the year ended December 31, 2018, the Fund reimbursed the Manager $11,758 for certain accounting services, which is included in accounting services in the Statement of Operations.
The Fund has begun to incur expenses in connection with a proposed realignment and consolidation of the boards of directors of certain BlackRock-advised funds. The Manager has voluntarily agreed to reimburse the Fund for all or a portion of such expenses, which amounts are included in fees waived and/or reimbursed by the Manager in the Statement of Operations. For the year ended December 31, 2018, the amount reimbursed was $7,133.
The Manager has contractually agreed to reimburse transfer agent fees in order to limit such expenses to a percentage of average daily net assets as follows:
| | | | |
Class I | | | 0.05 | % |
Class II | | | 0.05 | |
Class III | | | 0.05 | |
The Manager has agreed not to reduce or discontinue this contractual expense limitation through April 30, 2021, unless approved by the Board, including a majority of the Independent Directors, or by a vote of a majority of the outstanding voting securities of the Fund.
Prior to April 23, 2018, the Manager reimbursed all transfer agent fees — class specific for Class I, Class II and Class III of the Fund.
These amounts waived and/or reimbursed are shown as transfer agent fees waived and/or reimbursed — class specific in the Statement of Operations. For the year ended December 31, 2018, class specific expense waivers and/or reimbursements were as follows:
| | | | | | | | | | | | | | | | |
| | | Class I | | | Class II | | | Class III | | | Total | |
Transfer Agent Fees Waived and/or Reimbursed | | $ | 54,123 | | | $ | 756 | | | $ | 4,282 | | | $ | 59,161 | |
With respect to the Fund, the Manager contractually agreed to waive and/or reimburse fees or expenses in order to limit expenses, excluding interest expense, dividend expense, acquired fund fees and expenses, and certain other fund expenses, which constitute extraordinary expenses not incurred in the ordinary course of the Fund’s business (“expense limitation”). The expense limitations as a percentage of average daily net assets are as follows:
| | | | | | | | | | | | | | |
| Class I | | | | | Class II | | | | | Class III (a) | |
| | 0.15% | | | | | | 0.30% | | | | | | 0.40% | |
| | (a) | Class III recommenced operations on February 14, 2018. | |
Prior to April 23, 2018, Class I, Class II and Class III expense limitations as a percentage of average daily net assets were 1.25%, 1.40% and 1.50%, respectively.
The Manager has agreed not to reduce or discontinue this contractual expense limitation through April 30, 2021, unless approved by the Board, including a majority of the Independent Directors, or by a vote of a majority of the outstanding voting securities of the Fund. For the year ended December 31, 2018, the Manager waived and/or reimbursed $42,850 and $60,279, which is included in fees waived and/or reimbursed by the Manager and transfer agent fees waived and/or reimbursed — class specific, respectively, in the Statement of Operations.
Securities Lending: The U.S. Securities and Exchange Commission (“SEC”) has issued an exemptive order which permits BIM, an affiliate of the Manager, to serve as securities lending agent for the Fund, subject to applicable conditions. As securities lending agent, BIM bears all operational costs directly related to securities lending. The Fund is responsible for expenses in connection with the investment of cash collateral received for securities on loan (the “collateral investment expenses”). The cash collateral is invested in a private investment company managed by the Manager or its affiliates. However, BIM has agreed to cap the collateral investment expenses of the private investment company to an annual rate of 0.04%. The investment adviser to the private investment company will not charge any advisory fees with respect to shares purchased by the Fund. The private investment company in which the cash collateral has been invested may, under certain circumstances, impose a liquidity fee of up to 2% of the value withdrawn or temporarily restrict withdrawals for up to 10 business days during a 90 day period, in the event that the private investment company’s weekly liquid assets fall below certain thresholds.
Securities lending income is equal to the total of income earned from the reinvestment of cash collateral, net of fees and other payments to and from borrowers of securities, and less the collateral investment expenses. The Fund retains a portion of securities lending income and remits a remaining portion to BIM as compensation for its services as securities lending agent.
Pursuant to a securities lending agreement, the Fund retains 71.5% of securities lending income, and this amount retained can never be less than 65% of the total of securities lending income plus the collateral investment expenses.
In addition, commencing the business day following the date that the aggregate securities lending income earned across the Equity-Bond Complex in a calendar year exceeds a specified threshold, the Fund, pursuant to the securities lending agreement, will retain for the remainder of that calendar year securities lending income in an amount equal to 75% of securities lending income, and this amount retained can never be less than 65% of the total of securities lending income plus the collateral investment expenses.
| | |
| 24 | | 2018 BLACKROCK ANNUAL REPORTTO SHAREHOLDERS |
Notes to Financial Statements (continued)
The share of securities lending income earned by the Fund is shown as securities lending income — affiliated — net in the Statement of Operations. For the year ended December 31, 2018, the Fund paid BIM $17,615 for securities lending agent services.
Interfund Lending: In accordance with an exemptive order (the “Order”) from the SEC, the Fund may participate in a joint lending and borrowing facility for temporary purposes (the “Interfund Lending Program”), subject to compliance with the terms and conditions of the Order, and to the extent permitted by the Fund’s investment policies and restrictions. The Fund is currently permitted to borrow under the Interfund Lending Program.
A lending BlackRock fund may lend in aggregate up to 15% of its net assets, but may not lend more than 5% of its net assets to any one borrowing fund through the Interfund Lending Program. A borrowing BlackRock fund may not borrow through the Interfund Lending Program or from any other source more than 33 1/3% of its total assets (or any lower threshold provided for by the fund’s investment restrictions). If a borrowing BlackRock fund’s total outstanding borrowings exceed 10% of its total assets, each of its outstanding interfund loans will be subject to collateralization of at least 102% of the outstanding principal value of the loan. All interfund loans are for temporary or emergency purposes and the interest rate to be charged will be the average of the highest current overnight repurchase agreement rate available to a lending fund and the bank loan rate, as calculated according to a formula established by the Board.
During the year ended December 31, 2018, the Fund did not participate in the Interfund Lending Program.
Directors and Officers: Certain directors and/or officers of the Company are directors and/or officers of BlackRock or its affiliates. The Fund reimburses the Manager for a portion of the compensation paid to the Company’s Chief Compliance Officer, which is included in Directors and Officer in the Statement of Operations.
Other Transactions: The Fund may purchase securities from, or sell securities to, an affiliated fund provided the affiliation is due solely to having a common investment adviser, common officers, or common directors. For the year ended December 31, 2018, the purchase and sale transactions and any net realized gains (losses) with affiliated funds in compliance with Rule17a-7 under the 1940 Act were as follows:
| | | | |
Purchases | | $ | 24,283,155 | |
Sales | | | 11,502,176 | |
Net Realized Gain | | | 3,762,432 | |
For the year ended December 31, 2018, purchases and sales of investments, excluding short-term securities, were $59,850,054 and $155,227,291, respectively.
It is the Fund’s policy to comply with the requirements of the Internal Revenue Code of 1986, as amended, applicable to regulated investment companies, and to distribute substantially all of its taxable income to its shareholders. Therefore, no U.S. federal income tax provision is required.
The Fund files U.S. federal and various state and local tax returns. No income tax returns are currently under examination. The statute of limitations on the Fund’s U.S. federal tax returns generally remains open for each of the four years ended December 31, 2018. The statutes of limitations on the Fund’s state and local tax returns may remain open for an additional year depending upon the jurisdiction.
Management has analyzed tax laws and regulations and their application to the Fund as of December 31, 2018, inclusive of the open tax return years, and does not believe there are any uncertain tax positions that require recognition of a tax liability in the Fund’s financial statements.
US GAAP requires that certain components of net assets be adjusted to reflect permanent differences between financial and tax reporting. These reclassifications have no effect on net assets or net asset values per share. As of period end, the following permanent difference attributable tonon-deductible expenses was reclassified to the following accounts:
| | | | |
Paid in capital | | $ | (17,331 | ) |
Accumulated earnings | | $ | 17,331 | |
The tax character of distributions paid was as follows:
| | | | | | | | |
| | | 12/31/18 | | | 12/31/17 | |
Ordinary income | | $ | 19,423,791 | | | $ | 3,811,505 | |
Long term capital gains | | | 79,740,793 | | | | 8,657,383 | |
| | | | | | | | |
| | $ | 99,164,584 | | | $ | 12,468,888 | |
| | | | | | | | |
As of period end, the tax components of accumulated net earnings were as follows:
| | | | |
Undistributed ordinary income | | $ | 313,990 | |
Undistributed long-term capital gains | | | 17,293,853 | |
Net unrealized gains(a) | | | 726,772,739 | |
| | | | |
| | $ | 744,380,582 | |
| | | | |
| | (a) | The difference between book-basis andtax-basisnet unrealized gains was attributable primarily to the tax deferral of losses on wash sales, the realization for tax purposes of unrealized gains/losses on certain futures contracts the timing and recognition of partnership income, and the classification of investments. | |
| | | | |
| NOTESTO FINANCIAL STATEMENTS | | | 25 | |
Notes to Financial Statements (continued)
As of December 31, 2018, gross unrealized appreciation and depreciation for investments and derivatives based on cost for U.S. federal income tax purposes were as follows:
| | | | |
Tax cost | | $ | 1,045,623,220 | |
| | | | |
Gross unrealized appreciation | | $ | 807,763,573 | |
Gross unrealized depreciation | | | (81,282,499 | ) |
| | | | |
Net unrealized appreciation | | $ | 726,481,074 | |
| | | | |
The Company, on behalf of the Fund, along with certain other funds managed by the Manager and its affiliates (“Participating Funds”), is a party to a364-day, $2.25 billion credit agreement with a group of lenders. Under this agreement, the Fund may borrow to fund shareholder redemptions. Excluding commitments designated for certain individual funds, the Participating Funds, including the Fund, can borrow up to an aggregate commitment amount of $1.75 billion at any time outstanding, subject to asset coverage and other limitations as specified in the agreement. The credit agreement has the following terms: a fee of 0.10% per annum on unused commitment amounts and interest at a rate equal to the higher of(a) one-month LIBOR (but, in any event, not less than 0.00%) on the date the loan is made plus 0.80% per annum or (b) the Fed Funds rate (but, in any event, not less than 0.00%) in effect from time to time plus 0.80% per annum on amounts borrowed. The agreement expires in April 2019 unless extended or renewed. Prior to April 19, 2018, the aggregate commitment amount was $2.1 billion and the fee was 0.12% per annum. Participating Funds paid an upfront commitment fee of 0.02% on the total commitment amounts, in addition to administration, legal and arrangement fees, which are included in miscellaneous expenses in the Statement of Operations. These fees were allocated among such funds based upon portions of the aggregate commitment available to them and relative net assets of Participating Funds. During the year ended December 31, 2018, the Fund did not borrow under the credit agreement.
In the normal course of business, the Fund invests in securities or other instruments and may enter into certain transactions, and such activities subject the Fund to various risks, including among others, fluctuations in the market (market risk) or failure of an issuer to meet all of its obligations. The value of securities or other instruments may also be affected by various factors, including, without limitation: (i) the general economy; (ii) the overall market as well as local, regional or global political and/or social instability; (iii) regulation, taxation or international tax treaties between various countries; or (iv) currency, interest rate and price fluctuations. The Fund’s prospectus provides details of the risks to which the Fund is subject.
The Fund may be exposed to additional risks when reinvesting cash collateral in money market funds that do not seek to maintain a stable NAV per share of $1.00 and which may be subject to redemption gates or liquidity fees under certain circumstances.
Valuation Risk: The market values of equities, such as common stocks and preferred securities or equity related investments, such as futures and options, may decline due to general market conditions which are not specifically related to a particular company. They may also decline due to factors which affect a particular industry or industries. The Fund may invest in illiquid investments and may experience difficulty in selling those investments in a timely manner at the price that it believes the investments are worth. Prices may fluctuate widely over short or extended periods in response to company, market or economic news. Markets also tend to move in cycles, with periods of rising and falling prices. This volatility may cause the Fund’s NAV to experience significant increases or decreases over short periods of time. If there is a general decline in the securities and other markets, the NAV of the Fund may lose value, regardless of the individual results of the securities and other instruments in which the Fund invests.
The price the Fund could receive upon the sale of any particular portfolio investment may differ from the Fund’s valuation of the investment, particularly for securities that trade in thin or volatile markets or that are valued using a fair valuation technique or a price provided by an independent pricing service. Changes to significant unobservable inputs and assumptions (i.e., publicly traded company multiples, growth rate, time to exit) due to the lack of observable inputs may significantly impact the resulting fair value and therefore the Fund’s results of operations. As a result, the price received upon the sale of an investment may be less than the value ascribed by the Fund, and the Fund could realize a greater than expected loss or lesser than expected gain upon the sale of the investment. The Fund’s ability to value its investments may also be impacted by technological issues and/or errors by pricing services or other third party service providers.
Counterparty Credit Risk: The Fund may be exposed to counterparty credit risk, or the risk that an entity may fail to or be unable to perform on its commitments related to unsettled or open transactions. The Fund manages counterparty credit risk by entering into transactions only with counterparties that the Manager believes have the financial resources to honor their obligations and by monitoring the financial stability of those counterparties. Financial assets, which potentially expose the Fund to market, issuer and counterparty credit risks, consist principally of financial instruments and receivables due from counterparties. The extent of the Fund’s exposure to market, issuer and counterparty credit risks with respect to these financial assets is approximately their value recorded in the Statement of Assets and Liabilities, less any collateral held by the Fund.
A derivative contract may suffer amark-to-market loss if the value of the contract decreases due to an unfavorable change in the market rates or values of the underlying instrument. Losses can also occur if the counterparty does not perform under the contract.
With exchange-traded futures, there is less counterparty credit risk to the Fund since the exchange or clearinghouse, as counterparty to such instruments, guarantees against a possible default. The clearinghouse stands between the buyer and the seller of the contract; therefore, credit risk is limited to failure of the clearinghouse. While offset rights may exist under applicable law, the Fund does not have a contractual right of offset against a clearing broker or clearinghouse in the event of a default (including the bankruptcy or insolvency). Additionally, credit risk exists in exchange-traded futures with respect to initial and variation margin that is held in a clearing broker’s customer accounts. While clearing brokers are required to segregate customer margin from their own assets, in the event that a clearing broker becomes insolvent or goes into bankruptcy and at that time there is a shortfall in the aggregate amount of margin held by the clearing broker for all its clients, typically the shortfall would be allocated on a pro rata basis across all the clearing broker’s customers, potentially resulting in losses to the Fund.
| | |
| 26 | | 2018 BLACKROCK ANNUAL REPORTTO SHAREHOLDERS |
Notes to Financial Statements (continued)
| 11. | CAPITAL SHARE TRANSACTIONS |
Transactions in capital shares for each class were as follows:
| | | | | | | | | | | | | | | | |
| | | Year Ended
12/31/2018(a) | | | Year Ended
12/31/2017 | |
| | | Shares | | | Amount | | | Shares | | | Amount | |
Class I | | | | | | | | | | | | | | | | |
Shares sold | | | 1,629,081 | | | $ | 38,154,514 | | | | 853,159 | | | $ | 18,530,628 | |
Shares issued in reinvestment of distributions | | | 3,984,526 | | | | 80,579,932 | | | | 537,342 | | | | 12,284,211 | |
Shares issued in reorganization | | | 58,548,373 | | | | 1,342,478,516 | | | | — | | | | — | |
Shares redeemed | | | (4,748,491 | ) | | | (111,807,406 | ) | | | (1,723,846 | ) | | | (38,229,011 | ) |
| | | | | | | | | | | | | | | | |
Net increase (decrease) | | | 59,413,489 | | | $ | 1,349,405,556 | | | | (333,345 | ) | | $ | (7,414,172 | ) |
| | | | | | | | | | | | | | | | |
| | | | |
Class II | | | | | | | | | | | | | | | | |
Shares sold | | | 104,448 | | | $ | 2,472,635 | | | | 133,824 | | | $ | 2,754,443 | |
Shares issued in reinvestment of distributions | | | 12,559 | | | | 251,963 | | | | 8,145 | | | | 184,677 | |
Shares redeemed | | | (43,947 | ) | | | (1,018,068 | ) | | | (110,703 | ) | | | (2,246,796 | ) |
| | | | | | | | | | | | | | | | |
Net increase | | | 73,060 | | | $ | 1,706,530 | | | | 31,266 | | | $ | 692,324 | |
| | | | | | | | | | | | | | | | |
| | | | |
Class III | | | | | | | | | | | | | | | | |
Shares sold | | | 749,247 | | | $ | 17,376,769 | | | | — | | | $ | — | |
Shares issued in reinvestment of distributions | | | 912,793 | | | | 18,332,584 | | | | — | | | | — | |
Shares issued in reorganization | | | 16,771,265 | | | | 380,601,833 | | | | — | | | | — | |
Shares redeemed | | | (2,710,117 | ) | | | (62,813,928 | ) | | | — | | | | — | |
| | | | | | | | | | | | | | | | |
Net increase | | | 15,723,188 | | | $ | 353,497,258 | | | | — | | | $ | — | |
| | | | | | | | | | | | | | | | |
Total Net Increase (Decrease) | | | 75,209,737 | | | $ | 1,704,609,344 | | | | (302,079 | ) | | $ | (6,721,848 | ) |
| | | | | | | | | | | | | | | | |
| | (a) | Period February 14, 2018 (recommencement of operations) to December 31, 2018 for Class III. | |
As of December 31, 2018, BlackRock Financial Management, Inc, an affiliate of the Fund, owned 437 Class III shares of BlackRock S&P 500 Index V.I. Fund.
| 12. | REGULATIONS-X AMENDMENTS |
On August 17, 2018, the SEC adopted amendments to certain disclosure requirements in Securities Act ReleaseNo. 33-10532, Disclosure Update and Simplification. The Fund has adopted the amendments pertinent to RegulationS-X in this shareholder report. The amendments impacted certain disclosure presentation on the Statement of Assets and Liabilities, Statements of Changes in Net Assets and Notes to the Financial Statements.
Prior year distribution information and undistributed net investment income in the Statements of Changes in Net Assets has been modified to conform to the current year presentation in accordance with the RegulationS-X changes.
Distributions for the year ended December 31, 2017 were classified as follows:
| | | | | | | | |
| Share Class | | Net Investment Income | | | Net Realized Gain | |
Class I | | $ | (3,518,974 | ) | | $ | (8,765,237 | ) |
Class II | | | (50,068 | ) | | | (134,609 | ) |
Undistributed net investment income as of December 31, 2017 was $15,576.
Management has evaluated the impact of all subsequent events on the Fund through the date the consolidated financial statements were issued and has determined that there were no subsequent events requiring adjustment or additional disclosure in the financial statements.
| | | | |
| NOTESTO FINANCIAL STATEMENTS | | | 27 | |
Report of Independent Registered Public Accounting Firm
To the Shareholders of BlackRock S&P 500 Index V.I. Fund and the Board of Directors of BlackRock Variable Series Funds, Inc.:
Opinion on the Financial Statements and Financial Highlights
We have audited the accompanying statement of assets and liabilities of BlackRock S&P 500 Index V.I. Fund of BlackRock Variable Series Funds, Inc. (the “Fund”), including the schedule of investments, as of December 31, 2018, the related statement of operations for the year then ended, the statements of changes in net assets for each of the two years in the period then ended, the financial highlights for each of the five years in the period then ended, and the related notes. In our opinion, the financial statements and financial highlights present fairly, in all material respects, the financial position of the Fund as of December 31, 2018, and the results of its operations for the year then ended, the changes in its net assets for each of the two years in the period then ended, and the financial highlights for each of the five years in the period then ended, in conformity with accounting principles generally accepted in the United States of America.
Basis for Opinion
These financial statements and financial highlights are the responsibility of the Fund’s management. Our responsibility is to express an opinion on the Fund’s financial statements and financial highlights based on our audits. We are a public accounting firm registered with the Public Company Accounting Oversight Board (United States) (PCAOB) and are required to be independent with respect to the Fund in accordance with the U.S. federal securities laws and the applicable rules and regulations of the Securities and Exchange Commission and the PCAOB.
We conducted our audits in accordance with the standards of the PCAOB. Those standards require that we plan and perform the audit to obtain reasonable assurance about whether the financial statements and financial highlights are free of material misstatement, whether due to error or fraud. The Fund is not required to have, nor were we engaged to perform, an audit of its internal control over financial reporting. As part of our audits we are required to obtain an understanding of internal control over financial reporting but not for the purpose of expressing an opinion on the effectiveness of the Fund’s internal control over financial reporting. Accordingly, we express no such opinion.
Our audits included performing procedures to assess the risks of material misstatement of the financial statements and financial highlights, whether due to error or fraud, and performing procedures that respond to those risks. Such procedures included examining, on a test basis, evidence regarding the amounts and disclosures in the financial statements and financial highlights. Our audits also included evaluating the accounting principles used and significant estimates made by management, as well as evaluating the overall presentation of the financial statements and financial highlights. Our procedures included confirmation of securities owned as of December 31, 2018, by correspondence with the custodian and brokers; when replies were not received from brokers, we performed other auditing procedures. We believe that our audits provide a reasonable basis for our opinion.
Deloitte & Touche LLP
Boston, Massachusetts
February 15, 2019
We have served as the auditor of one or more BlackRock investment companies since 1992.
| | |
| 28 | | 2018 BLACKROCK ANNUAL REPORTTO SHAREHOLDERS |
DECEMBER 31, 2018
| | |
ANNUAL REPORT | |  |
BlackRock Variable Series Funds, Inc.
| Ø | | BlackRock Small Cap Index V.I. Fund |
|
| Not FDIC Insured • May Lose Value • No Bank Guarantee |
| | |
| Fund Summary as of December 31, 2018 | | BlackRock Small Cap Index V.I. Fund |
Investment Objective
BlackRock Small Cap Index V.I. Fund’s (the “Fund”) investment objective is to seek to match the performance of Russell 2000® Index (the “Russell 2000” or the “Underlying Index”) as closely as possible before the deduction of Fund expenses.
On November 14, 2017, the Board of Directors of the Company (the “Board”) and, on May 23, 2018, the Board of Trustees of State Farm Variable Product Trust each approved a reorganization of the State Farm Small Cap Equity Index Fund (the “Predecessor Fund”), with and into the Fund. At a special shareholder meeting on September 14, 2018, the shareholders of the Predecessor Fund approved the reorganization, which was completed on October 29, 2018.
Portfolio Management Commentary
How did the Fund perform?
For the12-month period ended December 31, 2018, the Fund’s Class I Shares returned (11.25)%. The Russell 2000® Index returned (11.01)% for the same period. The Russell 2000® Index is a subset of the Russell 3000® Index representing approximately 10% of the total market capitalization of that index. It includes approximately 2000 of the smallest securities based on a combination of their market cap and current index membership.
Describe the market environment.
In the beginning of the first quarter of 2018, the low volatility regime that helped global equity markets reach record highs in 2017 continued to support U.S. markets. Further fueled bytax-reform optimism, January saw markets rally, led higher by momentum and information technology names. However, as the first quarter progressed, a combination of economic over-heating concerns, the return of volatility, rising yields and the specter of trade wars weighed on markets.
Contrary to what the U.S. equity market’s lackluster performance would suggest, the U.S. economy remained healthy in the first quarter of 2018. This supported the Fed’s decision to increase interest rates in March and to revise higher their rate hike expectations for 2019.
Despite the fluid headlines and ongoing threats regarding the topic of U.S. protectionism in the second quarter of 2018, investors found confidence in strong U.S. economic data and earnings growth. On the macroeconomic front, the U.S. unemployment rate struck 3.8%, the lowest level since 1975. Economic reports throughout the second quarter of 2018 also indicated strong economic conditions. Additionally, the core personal consumption expenditure hit the Fed’s target rate of 2%, supporting their decision to raise rates in June. From a sector standpoint, energy outperformed as a prolonged period of higher crude oil prices increased the attractiveness of energy company shares.
In the third quarter of 2018, U.S. large cap equities reachedall-time highs as impressive economic growth and earnings results fueledrisk-on appetite and outweighed the specter of trade wars. Despite the announcement of tariffs on $505 billion of Chinese goods and China’s retaliatory measures, U.S. equity volatility was limited. Macroeconomic releases continued to showcase strength in both labor and economic conditions. The strength of the economy allowed the Fed to raise the target range of the benchmark federal funds rate from 2% to 2.25%.
More broadly, concerns over Fed policy, Sino-American trade tensions, and a potential slowdown in growth contributed to investor anxiety throughout the fourth quarter of 2018. The quarter began with Fed Chairman Powell’s comment that the U.S. Federal Funds rate was “a long way from neutral.” The hawkish comment drove a temporarysell-off in Treasuries. However, this was short lived as declines in energy prices and softness in portions of the U.S. economy contributed to a reduction in inflation expectations. This was accompanied by a broad basedrisk-off in December — which was the worst December performance on record since 1931 — and the10-year U.S. Treasury yield ended the quarter lower than its intra-quarter highs.
Describe recent portfolio activity.
During the12-month period, as changes were made to the composition of the Russell 2000® Index, the Fund purchased and sold securities to maintain its objective of matching the performance of the Underlying Index.
Describe portfolio positioning at period end.
The Fund remains positioned to match the risk characteristics of the Underlying Index, irrespective of the market’s future direction.
The views expressed reflect the opinions of BlackRock as of the date of this report and are subject to change based on changes in market, economic or other conditions. These views are not intended to be a forecast of future events and are no guarantee of future results.
| | |
| 2 | | 2018 BLACKROCK ANNUAL REPORTTO SHAREHOLDERS |
| | |
| Fund Summary as of December 31, 2018 (continued) | | BlackRock Small Cap Index V.I. Fund |
TOTAL RETURN BASED ON A $10,000 INVESTMENT
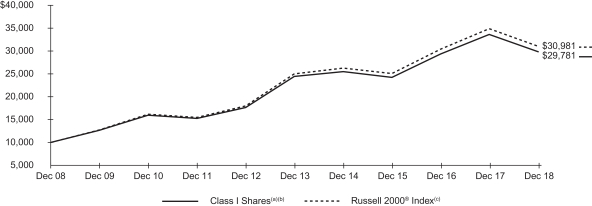
| (a) | Assuming transaction costs, if any, and other operating expenses, including investment advisory fees. Does not include insurance-related fees and expenses. |
| (b) | Under normal circumstances, the Fund will invest at least 90% of its assets in securities or other financial instruments that are components of or have economic characteristics similar to the securities included in the Russell 2000. |
| (c) | An unmanaged index that is a subset of the Russell 3000® Index representing approximately 10% of the total market capitalization of that index. It includes approximately 2000 of the smallest securities based on a combination of their market cap and current index membership. |
Performance Summary for the Period Ended December 31, 2018
| | | | | | | | | | | | | | | | | | | | | | | | | | | | |
| | | 6-Month
Total Returns (b) | | | | | | Average Annual Total Returns | |
| | | | | | 1 Year (b) | | | | | | 5 Years (b) | | | | | | 10 Years (b) | |
Class I(a) | | | (17.48 | )% | | | | | | | (11.25 | )% | | | | | | | 4.08 | % | | | | | | | 11.53 | % |
Russell 2000 Index | | | (17.35 | ) | | | | | | | (11.01 | ) | | | | | | | 4.41 | | | | | | | | 11.97 | |
| | (a) | Average annual and cumulative total returns are based on changes in net asset value (“NAV”) for the periods shown, and assume reinvestment of all distributions at NAV on the ex-dividend date. Insurance-related fees and expenses are not reflected in these returns. | |
| | (b) | For a portion of the period, the Fund’s investment adviser waived a portion of its fee. Without such waiver, the Fund’s performance would have been lower. | |
On October 29, 2018, the Fund acquired all of the assets and assumed certain stated liabilities of the Small Cap Equity Index Fund (the “Predecessor Fund”), a series of State Farm Variable Product Trust, through a tax-free reorganization (the “Reorganization”). The Predecessor Fund is the performance and accounting survivor of the Reorganization; accordingly, the Fund assumed the performance and financial history of the Predecessor Fund upon completion of the Reorganization.
Past performance is not indicative of future results. Performance results do not reflect the deduction of taxes that a shareholder would pay on Fund distributions or the redemption of Fund shares.
Performance results may include adjustments made for financial reporting purposes in accordance with U.S. generally accepted accounting principles.
Expense Example
| | | | | | | | | | | | | | | | | | | | | | | | | | | | | | | | |
| | | Actual | | | | | | Hypothetical(a) | | | | |
| | | Beginning
Account Value
(07/01/18) | | | Ending
Account Value
(12/31/18) | | | Expenses
Paid During
the Period (b) | | | | | | Beginning
Account Value
(07/01/18) | | | Ending
Account Value
(12/31/18) | | | Expenses
Paid During
the Period (b) | | | Annualized
Expense
Ratio | |
Class I | | $ | 1,000.00 | | | $ | 825.20 | | | $ | 1.06 | | | | | | | $ | 1,000.00 | | | $ | 1,024.05 | | | $ | 1.17 | | | | 0.23 | % |
| | (a) | Hypothetical 5% annual return before expenses is calculated by prorating the number of days in the most recent fiscal half year divided by 365. | |
| | (b) | Expenses are equal to the Fund’s annualized expense ratio, multiplied by the average account value over the period, multiplied by 184/365 (to reflect theone-half year period shown) | |
See “Disclosure of Expenses” on the following page for further information on how expenses were calculated.
| | |
| Fund Summary as of December 31, 2018 (continued) | | BlackRock Small Cap Index V.I. Fund |
Portfolio Information
SECTOR ALLOCATION
| | | | |
| Sector | | Percent of
Net Assets | |
Financials | | | 18 | % |
Health Care | | | 15 | |
Industrials | | | 14 | |
Information Technology | | | 14 | |
Consumer Discretionary | | | 12 | |
Real Estate | | | 7 | |
Materials | | | 4 | |
Utilities | | | 4 | |
Energy | | | 4 | |
Communication Services | | | 3 | |
Consumer Staples | | | 3 | |
Short-Term Securities | | | 2 | |
Other Assets | | | — | (a) |
| | (a) | Representing less than 0.5% of the Fund’s net assets. | |
For Fund compliance purposes, the Fund’s sector classifications refer to one or more of the sectorsub-classifications used by one or more widely recognized market indexes or ratings group indexes, and/or as defined by the investment adviser. These definitions may not apply for purposes of this report, which may combine sector sub classifications for reporting ease.
Disclosure of Expenses
Shareholders of the Fund may incur the following charges: (a) transactional expenses; and (b) operating expenses, including investment advisory fees, service and distribution fees, including12b-1 fees, acquired fund fees and expenses, and other fund expenses. The expense example shown on the previous page (which is based on a hypothetical investment of $1,000 invested on July 1, 2018 and held through December 31, 2018) is intended to assist shareholders both in calculating expenses based on an investment in the Fund and in comparing these expenses with similar costs of investing in other mutual funds.
The expense example provides information about actual account values and actual expenses. In order to estimate the expenses a shareholder paid during the period covered by this report, shareholders can divide their account value by $1,000 and then multiply the result by the number corresponding to their share class under the heading entitled “Expenses Paid During the Period.”
The expense example also provides information about hypothetical account values and hypothetical expenses based on the Fund’s actual expense ratio and an assumed rate of return of 5% per year before expenses. In order to assist shareholders in comparing the ongoing expenses of investing in the Fund and other funds, compare the 5% hypothetical example with the 5% hypothetical examples that appear in shareholder reports of other funds.
The expenses shown in the expense example are intended to highlight shareholders’ ongoing costs only and do not reflect any transactional expenses, such as sales charges, if any. Therefore, the hypothetical example is useful in comparing ongoing expenses only, and will not help shareholders determine the relative total expenses of owning different funds. If these transactional expenses were included, shareholder expenses would have been higher.
Derivative Financial Instruments
The Fund may invest in various derivative financial instruments. These instruments are used to obtain exposure to a security, commodity, index, market, and/or other assets without owning or taking physical custody of securities, commodities and/or other referenced assets or to manage market, equity, credit, interest rate, foreign currency exchange rate, commodity and/or other risks. Derivative financial instruments may give rise to a form of economic leverage and involve risks, including the imperfect correlation between the value of a derivative financial instrument and the underlying asset, possible default of the counterparty to the transaction or illiquidity of the instrument. The Fund’s successful use of a derivative financial instrument depends on the investment adviser’s ability to predict pertinent market movements accurately, which cannot be assured. The use of these instruments may result in losses greater than if they had not been used, may limit the amount of appreciation the Fund can realize on an investment and/or may result in lower distributions paid to shareholders. The Fund’s investments in these instruments, if any, are discussed in detail in the Notes to Financial Statements.
| | |
| 4 | | 2018 BLACKROCK ANNUAL REPORTTO SHAREHOLDERS |
| | |
Schedule of Investments December 31, 2018 | | BlackRock Small Cap Index V.I. Fund (Percentages shown are based on Net Assets) |
| | | | | | | | |
| Security | | Shares | | | Value | |
|
Common Stocks — 97.4% | |
| |
| Aerospace & Defense — 1.2% | | | | |
AAR Corp. | | | 4,315 | | | $ | 161,122 | |
Aerojet Rocketdyne Holdings, Inc.(a) | | | 9,489 | | | | 334,297 | |
Aerovironment, Inc.(a) | | | 2,816 | | | | 191,347 | |
Astronics Corp.(a) | | | 2,809 | | | | 85,534 | |
Axon Enterprise, Inc.(a) | | | 7,633 | | | | 333,944 | |
Cubic Corp. | | | 3,363 | | | | 180,728 | |
Ducommun, Inc.(a) | | | 1,390 | | | | 50,485 | |
Engility Holdings, Inc.(a) | | | 2,410 | | | | 68,589 | |
Esterline Technologies Corp.(a) | | | 3,475 | | | | 422,039 | |
KeyW Holding Corp. (The)(a) | | | 6,461 | | | | 43,224 | |
Kratos Defense & Security Solutions, Inc.(a) | | | 11,698 | | | | 164,825 | |
Maxar Technologies Ltd. | | | 7,523 | | | | 89,975 | |
Mercury Systems, Inc.(a) | | | 6,240 | | | | 295,090 | |
Moog, Inc., Class A | | | 4,262 | | | | 330,220 | |
National Presto Industries, Inc. | | | 659 | | | | 77,050 | |
Sparton Corp.(a) | | | 1,194 | | | | 21,719 | |
Triumph Group, Inc. | | | 6,473 | | | | 74,439 | |
Vectrus, Inc.(a) | | | 1,481 | | | | 31,960 | |
Wesco Aircraft Holdings, Inc.(a) | | | 7,195 | | | | 56,840 | |
| | | | | | | | |
| | | | | | | 3,013,427 | |
| |
| Air Freight & Logistics — 0.3% | | | | |
Air Transport Services Group, Inc.(a) | | | 7,752 | | | | 176,823 | |
Atlas Air Worldwide Holdings, Inc.(a) | | | 3,145 | | | | 132,688 | |
Echo Global Logistics, Inc.(a) | | | 3,715 | | | | 75,526 | |
Forward Air Corp. | | | 3,897 | | | | 213,750 | |
Hub Group, Inc., Class A(a) | | | 4,340 | | | | 160,884 | |
Radiant Logistics, Inc.(a) | | | 4,623 | | | | 19,648 | |
| | | | | | | | |
| | | | | | | 779,319 | |
| |
| Airlines — 0.5% | | | | |
Allegiant Travel Co. | | | 1,713 | | | | 171,677 | |
Hawaiian Holdings, Inc. | | | 6,210 | | | | 164,006 | |
Mesa Air Group, Inc.(a) | | | 1,597 | | | | 12,313 | |
SkyWest, Inc. | | | 6,766 | | | | 300,884 | |
Spirit Airlines, Inc.(a) | | | 9,114 | | | | 527,883 | |
| | | | | | | | |
| | | | | | | 1,176,763 | |
| |
| Auto Components — 1.0% | | | | |
American Axle & Manufacturing Holdings, Inc.(a) | | | 14,800 | | | | 164,280 | |
Cooper Tire & Rubber Co. | | | 6,737 | | | | 217,807 | |
Cooper-Standard Holdings, Inc.(a) | | | 2,353 | | | | 146,168 | |
Dana, Inc. | | | 19,425 | | | | 264,763 | |
Dorman Products, Inc.(a) | | | 3,567 | | | | 321,101 | |
Fox Factory Holding Corp.(a) | | | 4,791 | | | | 282,046 | |
Gentherm, Inc.(a) | | | 4,499 | | | | 179,870 | |
LCI Industries | | | 3,245 | | | | 216,766 | |
Modine Manufacturing Co.(a) | | | 6,578 | | | | 71,108 | |
Motorcar Parts of America, Inc.(a) | | | 2,527 | | | | 42,049 | |
Shiloh Industries, Inc.(a) | | | 2,418 | | | | 14,097 | |
Standard Motor Products, Inc. | | | 2,820 | | | | 136,573 | |
Stoneridge, Inc.(a) | | | 3,648 | | | | 89,923 | |
Superior Industries International, Inc. | | | 3,141 | | | | 15,108 | |
Tenneco, Inc., Class A | | | 6,755 | | | | 185,020 | |
Tower International, Inc. | | | 2,633 | | | | 62,666 | |
| | | | | | | | |
| | | | | | | 2,409,345 | |
| |
| Automobiles — 0.0% | | | | |
Winnebago Industries, Inc. | | | 4,108 | | | | 99,455 | |
| | | | | | | | |
| | |
| Banks — 9.4% | | | | | | |
1st Constitution Bancorp | | | 1,123 | | | | 22,381 | |
1st Source Corp. | | | 2,084 | | | | 84,069 | |
Access National Corp. | | | 2,020 | | | | 43,087 | |
ACNB Corp. | | | 927 | | | | 36,385 | |
| | | | | | | | |
| Security | | Shares | | | Value | |
| | |
| Banks (continued) | | | | | | |
Allegiance Bancshares, Inc.(a) | | | 1,563 | | | $ | 50,594 | |
Amalgamated Bank, Class A | | | 1,454 | | | | 28,353 | |
American National Bankshares, Inc. | | | 1,030 | | | | 30,189 | |
Ameris Bancorp | | | 5,629 | | | | 178,270 | |
Ames National Corp. | | | 1,036 | | | | 26,335 | |
Arrow Financial Corp. | | | 1,621 | | | | 51,904 | |
Atlantic Capital Bancshares, Inc.(a) | | | 3,388 | | | | 55,462 | |
Auburn National Bancorporation, Inc. | | | 372 | | | | 11,778 | |
Banc of California, Inc. | | | 5,714 | | | | 76,053 | |
BancFirst Corp. | | | 2,394 | | | | 119,461 | |
Bancorp, Inc. (The)(a) | | | 6,694 | | | | 53,284 | |
BancorpSouth Bank | | | 12,508 | | | | 326,959 | |
Bank of Commerce Holdings | | | 2,460 | | | | 26,962 | |
Bank of Marin Bancorp | | | 1,806 | | | | 74,479 | |
Bank of NT Butterfield & Son Ltd. (The) | | | 7,251 | | | | 227,319 | |
Bank of Princeton (The) | | | 507 | | | | 14,145 | |
Bankwell Financial Group, Inc. | | | 917 | | | | 26,327 | |
Banner Corp. | | | 4,257 | | | | 227,664 | |
Bar Harbor Bankshares | | | 2,025 | | | | 45,421 | |
Baycom Corp.(a) | | | 1,265 | | | | 29,209 | |
BCB Bancorp, Inc. | | | 1,943 | | | | 20,343 | |
Berkshire Hills Bancorp, Inc. | | | 5,408 | | | | 145,854 | |
Blue Hills Bancorp, Inc. | | | 3,054 | | | | 65,172 | |
Boston Private Financial Holdings, Inc. | | | 11,065 | | | | 116,957 | |
Bridge Bancorp, Inc. | | | 2,203 | | | | 56,154 | |
Brookline Bancorp, Inc. | | | 10,494 | | | | 145,027 | |
Bryn Mawr Bank Corp. | | | 2,648 | | | | 91,091 | |
Business First Bancshares, Inc. | | | 1,521 | | | | 36,854 | |
Byline Bancorp, Inc.(a) | | | 2,043 | | | | 34,036 | |
C&F Financial Corp. | | | 505 | | | | 26,871 | |
Cadence BanCorp | | | 9,606 | | | | 161,189 | |
Cambridge Bancorp | | | 419 | | | | 34,882 | |
Camden National Corp. | | | 2,044 | | | | 73,523 | |
Capital Bancorp, Inc.(a) | | | 578 | | | | 6,595 | |
Capital City Bank Group, Inc. | | | 1,346 | | | | 31,241 | |
Capstar Financial Holdings, Inc. | | | 807 | | | | 11,887 | |
Carolina Financial Corp. | | | 2,791 | | | | 82,586 | |
Cathay General Bancorp | | | 10,273 | | | | 344,454 | |
CB Financial Services, Inc. | | | 738 | | | | 18,288 | |
CBTX, Inc. | | | 2,475 | | | | 72,765 | |
CenterState Bank Corp. | | | 12,172 | | | | 256,099 | |
Central Pacific Financial Corp. | | | 3,817 | | | | 92,944 | |
Central Valley Community Bancorp | | | 1,361 | | | | 25,682 | |
Century Bancorp, Inc., Class A | | | 369 | | | | 24,992 | |
Chemical Financial Corp. | | | 9,475 | | | | 346,880 | |
Chemung Financial Corp. | | | 478 | | | | 19,746 | |
Citizens & Northern Corp. | | | 1,454 | | | | 38,429 | |
City Holding Co. | | | 1,993 | | | | 134,707 | |
Civista Bancshares, Inc. | | | 1,670 | | | | 29,091 | |
CNB Financial Corp. | | | 1,929 | | | | 44,271 | |
Coastal Financial Corp.(a) | | | 887 | | | | 13,509 | |
Codorus Valley Bancorp, Inc. | | | 727 | | | | 15,449 | |
Columbia Banking System, Inc. | | | 9,712 | | | | 352,448 | |
Community Bank System, Inc. | | | 6,671 | | | | 388,919 | |
Community Bankers Trust Corp.(a) | | | 2,249 | | | | 16,238 | |
Community Financial Corp. (The) | | | 631 | | | | 18,450 | |
Community Trust Bancorp, Inc. | | | 2,058 | | | | 81,517 | |
ConnectOne Bancorp, Inc. | | | 4,011 | | | | 74,083 | |
County Bancorp, Inc. | | | 714 | | | | 12,402 | |
Customers Bancorp, Inc.(a) | | | 3,896 | | | | 70,907 | |
CVB Financial Corp. | | | 14,863 | | | | 300,679 | |
Eagle Bancorp, Inc.(a) | | | 4,237 | | | | 206,384 | |
Enterprise Bancorp, Inc. | | | 1,279 | | | | 41,133 | |
Enterprise Financial Services Corp. | | | 3,022 | | | | 113,718 | |
| | | | |
| SCHEDULE OF INVESTMENTS | | | 5 | |
| | |
Schedule of Investments (continued) December 31, 2018 | | BlackRock Small Cap Index V.I. Fund (Percentages shown are based on Net Assets) |
| | | | | | | | |
| Security | | Shares | | | Value | |
| | |
| Banks (continued) | | | | | | |
Equity Bancshares, Inc., Class A(a) | | | 1,775 | | | $ | 62,569 | |
Esquire Financial Holdings, Inc.(a) | | | 828 | | | | 17,968 | |
Evans Bancorp, Inc. | | | 525 | | | | 17,068 | |
Farmers & Merchants Bancorp, Inc. | | | 1,151 | | | | 44,302 | |
Farmers National Banc Corp. | | | 3,365 | | | | 42,870 | |
FB Financial Corp. | | | 2,172 | | | | 76,063 | |
Fidelity D&D Bancorp, Inc. | | | 358 | | | | 22,976 | |
Fidelity Southern Corp. | | | 2,898 | | | | 75,406 | |
Financial Institutions, Inc. | | | 2,039 | | | | 52,402 | |
First Bancorp | | | 3,886 | | | | 126,917 | |
First BanCorp | | | 28,388 | | | | 244,137 | |
First Bancorp, Inc. | | | 1,269 | | | | 33,375 | |
First Bancshares, Inc. (The) | | | 1,644 | | | | 49,731 | |
First Bank | | | 2,179 | | | | 26,409 | |
First Busey Corp. | | | 5,806 | | | | 142,479 | |
First Business Financial Services, Inc. | | | 706 | | | | 13,774 | |
First Choice Bancorp | | | 1,078 | | | | 24,363 | |
First Commonwealth Financial Corp. | | | 13,259 | | | | 160,169 | |
First Community Bancshares, Inc. | | | 2,145 | | | | 67,525 | |
First Community Corp. | | | 1,128 | | | | 21,917 | |
First Financial Bancorp | | | 12,683 | | | | 300,841 | |
First Financial Bankshares, Inc. | | | 8,359 | | | | 482,231 | |
First Financial Corp. | | | 1,582 | | | | 63,517 | |
First Financial Northwest, Inc. | | | 1,367 | | | | 21,147 | |
First Foundation, Inc.(a) | | | 5,059 | | | | 65,059 | |
First Guaranty Bancshares, Inc. | | | 671 | | | | 15,574 | |
First Internet Bancorp | | | 1,295 | | | | 26,470 | |
First Interstate BancSystem, Inc., Class A | | | 4,369 | | | | 159,731 | |
First Merchants Corp. | | | 6,559 | | | | 224,777 | |
FirstMid-Illinois Bancshares, Inc. | | | 1,659 | | | | 52,955 | |
First Midwest Bancorp, Inc. | | | 13,607 | | | | 269,555 | |
First Northwest Bancorp | | | 1,103 | | | | 16,357 | |
First of Long Island Corp. (The) | | | 3,259 | | | | 65,017 | |
First Savings Financial Group, Inc. | | | 233 | | | | 12,102 | |
First United Corp. | | | 1,064 | | | | 16,939 | |
Flushing Financial Corp. | | | 3,641 | | | | 78,391 | |
Franklin Financial Network, Inc.(a) | | | 1,674 | | | | 44,143 | |
Fulton Financial Corp. | | | 22,888 | | | | 354,306 | |
German American Bancorp, Inc. | | | 2,794 | | | | 77,589 | |
Glacier Bancorp, Inc. | | | 11,278 | | | | 446,834 | |
Great Southern Bancorp, Inc. | | | 1,466 | | | | 67,480 | |
Great Western Bancorp, Inc. | | | 7,868 | | | | 245,875 | |
Green Bancorp, Inc. | | | 3,330 | | | | 57,076 | |
Guaranty Bancorp | | | 3,405 | | | | 70,654 | |
Guaranty Bancshares, Inc. | | | 856 | | | | 25,526 | |
Hancock Whitney Corp. | | | 11,305 | | | | 391,718 | |
Hanmi Financial Corp. | | | 4,239 | | | | 83,508 | |
HarborOne Bancorp, Inc.(a) | | | 2,088 | | | | 33,178 | |
Heartland Financial USA, Inc. | | | 3,900 | | | | 171,405 | |
Heritage Commerce Corp. | | | 5,306 | | | | 60,170 | |
Heritage Financial Corp. | | | 4,855 | | | | 144,291 | |
Hilltop Holdings, Inc. | | | 9,558 | | | | 170,419 | |
Home BancShares, Inc. | | | 21,163 | | | | 345,803 | |
HomeTrust Bancshares, Inc. | | | 2,326 | | | | 60,895 | |
Hope Bancorp, Inc. | | | 16,538 | | | | 196,141 | |
Horizon Bancorp, Inc. | | | 4,916 | | | | 77,574 | |
Howard Bancorp, Inc.(a) | | | 1,497 | | | | 21,407 | |
IBERIABANK Corp. | | | 7,139 | | | | 458,895 | |
Independent Bank Corp. | | | 6,531 | | | | 315,416 | |
Independent Bank Group, Inc. | | | 2,807 | | | | 128,476 | |
International Bancshares Corp. | | | 7,344 | | | | 252,634 | |
Investar Holding Corp. | | | 1,325 | | | | 32,860 | |
Investors Bancorp, Inc. | | | 30,791 | | | | 320,226 | |
Lakeland Bancorp, Inc. | | | 5,976 | | | | 88,505 | |
| | | | | | | | |
| Security | | Shares | | | Value | |
| | |
| Banks (continued) | | | | | | |
Lakeland Financial Corp. | | | 3,240 | | | $ | 130,118 | |
LCNB Corp. | | | 1,299 | | | | 19,680 | |
LegacyTexas Financial Group, Inc. | | | 6,317 | | | | 202,713 | |
Level One Bancorp, Inc. | | | 552 | | | | 12,381 | |
Live Oak Bancshares, Inc. | | | 3,380 | | | | 50,058 | |
Macatawa Bank Corp. | | | 3,277 | | | | 31,525 | |
MB Financial, Inc. | | | 11,029 | | | | 437,079 | |
MBT Financial Corp. | | | 1,859 | | | | 17,289 | |
Mercantile Bank Corp. | | | 2,155 | | | | 60,900 | |
Metropolitan Bank Holding Corp.(a) | | | 804 | | | | 24,803 | |
Mid Penn Bancorp, Inc. | | | 581 | | | | 13,375 | |
Middlefield Banc Corp. | | | 421 | | | | 17,863 | |
Midland States Bancorp, Inc. | | | 2,801 | | | | 62,574 | |
MidSouth Bancorp, Inc. | | | 2,223 | | | | 23,564 | |
MidWestOne Financial Group, Inc. | | | 1,481 | | | | 36,773 | |
MutualFirst Financial, Inc. | | | 727 | | | | 19,316 | |
MVB Financial Corp. | | | 1,269 | | | | 22,893 | |
National Bank Holdings Corp., Class A | | | 3,818 | | | | 117,862 | |
National Bankshares, Inc. | | | 802 | | | | 29,217 | |
National Commerce Corp.(a) | | | 2,367 | | | | 85,212 | |
NBT Bancorp, Inc. | | | 5,660 | | | | 195,779 | |
Nicolet Bankshares, Inc.(a) | | | 1,104 | | | | 53,875 | |
Northeast Bancorp | | | 860 | | | | 14,388 | |
Northrim BanCorp, Inc. | | | 807 | | | | 26,526 | |
Norwood Financial Corp. | | | 659 | | | | 21,747 | |
Oak Valley Bancorp | | | 869 | | | | 15,903 | |
OFG Bancorp | | | 5,752 | | | | 94,678 | |
Ohio Valley Banc Corp. | | | 644 | | | | 22,791 | |
Old Line Bancshares, Inc. | | | 2,081 | | | | 54,772 | |
Old National Bancorp | | | 20,071 | | | | 309,093 | |
Old Second Bancorp, Inc. | | | 3,856 | | | | 50,128 | |
Opus Bank | | | 2,618 | | | | 51,287 | |
Origin Bancorp, Inc. | | | 2,319 | | | | 79,032 | |
Orrstown Financial Services, Inc. | | | 1,094 | | | | 19,922 | |
Pacific City Financial Corp. | | | 1,353 | | | | 21,174 | |
Pacific Mercantile Bancorp(a) | | | 2,339 | | | | 16,724 | |
Pacific Premier Bancorp, Inc.(a) | | | 6,053 | | | | 154,473 | |
Park National Corp. | | | 1,824 | | | | 154,949 | |
Parke Bancorp, Inc. | | | 1,005 | | | | 18,809 | |
Peapack Gladstone Financial Corp. | | | 2,433 | | | | 61,263 | |
Penns Woods Bancorp, Inc. | | | 573 | | | | 23,058 | |
Peoples Bancorp of North Carolina, Inc. | | | 740 | | | | 18,100 | |
Peoples Bancorp, Inc. | | | 2,347 | | | | 70,645 | |
Peoples Financial Services Corp. | | | 912 | | | | 40,183 | |
People’s Utah Bancorp | | | 2,042 | | | | 61,566 | |
Preferred Bank | | | 1,851 | | | | 80,241 | |
Premier Financial Bancorp, Inc. | | | 1,798 | | | | 26,808 | |
QCR Holdings, Inc. | | | 1,736 | | | | 55,708 | |
RBB Bancorp | | | 1,796 | | | | 31,556 | |
Reliant Bancorp, Inc. | | | 1,213 | | | | 27,948 | |
Renasant Corp. | | | 6,401 | | | | 193,182 | |
Republic Bancorp, Inc., Class A | | | 1,275 | | | | 49,368 | |
Republic First Bancorp, Inc.(a) | | | 5,329 | | | | 31,814 | |
S&T Bancorp, Inc. | | | 4,572 | | | | 173,004 | |
Sandy Spring Bancorp, Inc. | | | 4,601 | | | | 144,195 | |
SB One Bancorp | | | 1,132 | | | | 23,138 | |
Seacoast Banking Corp. of Florida(a) | | | 6,106 | | | | 158,878 | |
Select Bancorp, Inc.(a) | | | 1,428 | | | | 17,679 | |
ServisFirst Bancshares, Inc. | | | 6,178 | | | | 196,893 | |
Shore Bancshares, Inc. | | | 1,949 | | | | 28,338 | |
Sierra Bancorp | | | 1,873 | | | | 45,008 | |
Simmons First National Corp., Class A | | | 12,022 | | | | 290,091 | |
SmartFinancial, Inc.(a) | | | 1,370 | | | | 25,030 | |
South State Corp. | | | 4,854 | | | | 290,997 | |
| | |
| 6 | | 2018 BLACKROCK ANNUAL REPORTTO SHAREHOLDERS |
| | |
Schedule of Investments (continued) December 31, 2018 | | BlackRock Small Cap Index V.I. Fund (Percentages shown are based on Net Assets) |
| | | | | | | | |
| Security | | Shares | | | Value | |
| | |
| Banks (continued) | | | | | | |
Southern First Bancshares, Inc.(a) | | | 846 | | | $ | 27,131 | |
Southern National Bancorp of Virginia, Inc. | | | 2,595 | | | | 34,306 | |
Southside Bancshares, Inc. | | | 4,412 | | | | 140,081 | |
Spirit of Texas Bancshares, Inc.(a) | | | 1,001 | | | | 22,803 | |
State Bank Financial Corp. | | | 5,010 | | | | 108,166 | |
Stock Yards Bancorp, Inc. | | | 2,861 | | | | 93,841 | |
Summit Financial Group, Inc. | | | 1,321 | | | | 25,509 | |
Tompkins Financial Corp. | | | 1,958 | | | | 146,870 | |
Towne Bank | | | 8,752 | | | | 209,610 | |
TriCo Bancshares | | | 3,389 | | | | 114,514 | |
TriState Capital Holdings, Inc.(a) | | | 3,258 | | | | 63,401 | |
Triumph Bancorp, Inc.(a) | | | 3,185 | | | | 94,595 | |
Trustmark Corp. | | | 8,378 | | | | 238,187 | |
UMB Financial Corp. | | | 6,021 | | | | 367,100 | |
Union Bankshares Corp. | | | 8,698 | | | | 245,545 | |
Union Bankshares, Inc. | | | 589 | | | | 28,125 | |
United Bankshares, Inc. | | | 13,275 | | | | 412,985 | |
United Community Banks, Inc. | | | 10,415 | | | | 223,506 | |
United Security Bancshares | | | 2,059 | | | | 19,725 | |
Unity Bancorp, Inc. | | | 1,215 | | | | 25,223 | |
Univest Corp. of Pennsylvania | | | 3,830 | | | | 82,613 | |
Valley National Bancorp | | | 42,865 | | | | 380,641 | |
Veritex Holdings, Inc.(a) | | | 3,086 | | | | 65,979 | |
Washington Trust Bancorp, Inc. | | | 1,999 | | | | 95,012 | |
WesBanco, Inc. | | | 6,941 | | | | 254,665 | |
West Bancorporation, Inc. | | | 2,109 | | | | 40,261 | |
Westamerica Bancorp | | | 3,422 | | | | 190,537 | |
| | | | | | | | |
| | | | | | | 22,803,490 | |
| |
| Beverages — 0.3% | | | | |
Boston Beer Co., Inc. (The), Class A(a) | | | 1,072 | | | | 258,180 | |
Castle Brands, Inc.(a) | | | 14,031 | | | | 11,933 | |
Celsius Holdings, Inc.(a) | | | 3,655 | | | | 12,683 | |
Coca-Cola Bottling Co. Consolidated | | | 624 | | | | 110,685 | |
Craft Brew Alliance, Inc.(a) | | | 1,925 | | | | 27,547 | |
MGP Ingredients, Inc. | | | 1,756 | | | | 100,180 | |
National Beverage Corp. | | | 1,562 | | | | 112,105 | |
Primo Water Corp.(a) | | | 4,353 | | | | 60,986 | |
| | | | | | | | |
| | | | | | | 694,299 | |
| |
| Biotechnology — 6.1%(a) | | | | |
Abeona Therapeutics, Inc. | | | 3,822 | | | | 27,289 | |
ACADIA Pharmaceuticals, Inc. | | | 13,068 | | | | 211,310 | |
Acceleron Pharma, Inc. | | | 5,138 | | | | 223,760 | |
Achaogen, Inc. | | | 5,460 | | | | 6,716 | |
Achillion Pharmaceuticals, Inc. | | | 18,054 | | | | 28,706 | |
Acorda Therapeutics, Inc. | | | 5,787 | | | | 90,161 | |
Adamas Pharmaceuticals, Inc. | | | 2,917 | | | | 24,911 | |
ADMA Biologics, Inc. | | | 3,050 | | | | 7,289 | |
Aduro Biotech, Inc. | | | 8,518 | | | | 22,487 | |
Adverum Biotechnologies, Inc. | | | 7,091 | | | | 22,337 | |
Aeglea BioTherapeutics, Inc. | | | 2,623 | | | | 19,646 | |
Agenus, Inc. | | | 12,282 | | | | 29,231 | |
AgeX Therapeutics, Inc. | | | 1,338 | | | | 4,001 | |
Aimmune Therapeutics, Inc. | | | 5,750 | | | | 137,540 | |
Akebia Therapeutics, Inc. | | | 11,391 | | | | 62,992 | |
Albireo Pharma, Inc. | | | 1,158 | | | | 28,406 | |
Alder Biopharmaceuticals, Inc. | | | 7,736 | | | | 79,294 | |
Aldeyra Therapeutics, Inc. | | | 2,564 | | | | 21,281 | |
Allakos, Inc. | | | 1,089 | | | | 56,922 | |
Allena Pharmaceuticals, Inc. | | | 1,874 | | | | 10,213 | |
Allogene Therapeutics, Inc. | | | 2,624 | | | | 70,664 | |
AMAG Pharmaceuticals, Inc. | | | 4,557 | | | | 69,221 | |
Amicus Therapeutics, Inc. | | | 25,134 | | | | 240,784 | |
AnaptysBio, Inc. | | | 2,735 | | | | 174,466 | |
| | | | | | | | |
| Security | | Shares | | | Value | |
| |
| Biotechnology (continued) | | | | |
Apellis Pharmaceuticals, Inc. | | | 4,795 | | | $ | 63,246 | |
Aptinyx, Inc. | | | 1,740 | | | | 28,780 | |
Arbutus Biopharma Corp. | | | 4,663 | | | | 17,859 | |
Arcus Biosciences, Inc. | | | 3,867 | | | | 41,648 | |
Ardelyx, Inc. | | | 5,362 | | | | 9,598 | |
Arena Pharmaceuticals, Inc. | | | 6,591 | | | | 256,719 | |
ArQule, Inc. | | | 14,398 | | | | 39,882 | |
Array BioPharma, Inc. | | | 27,072 | | | | 385,776 | |
Arrowhead Pharmaceuticals, Inc. | | | 11,557 | | | | 143,538 | |
Arsanis, Inc. | | | 688 | | | | 1,596 | |
Atara Biotherapeutics, Inc. | | | 5,569 | | | | 193,467 | |
Athenex, Inc. | | | 5,837 | | | | 74,072 | |
Athersys, Inc. | | | 16,463 | | | | 23,707 | |
Audentes Therapeutics, Inc. | | | 4,757 | | | | 101,419 | |
AVEO Pharmaceuticals, Inc. | | | 13,375 | | | | 21,400 | |
Avid Bioservices, Inc. | | | 6,678 | | | | 27,380 | |
Avrobio, Inc. | | | 763 | | | | 12,704 | |
Bellicum Pharmaceuticals, Inc. | | | 4,801 | | | | 14,019 | |
BioCryst Pharmaceuticals, Inc. | | | 14,488 | | | | 116,918 | |
Biohaven Pharmaceutical Holding Co. Ltd. | | | 3,773 | | | | 139,526 | |
BioSpecifics Technologies Corp. | | | 764 | | | | 46,298 | |
BioTime, Inc. | | | 13,380 | | | | 12,216 | |
Blueprint Medicines Corp. | | | 5,490 | | | | 295,966 | |
Calithera Biosciences, Inc. | | | 3,313 | | | | 13,285 | |
Calyxt, Inc. | | | 767 | | | | 7,946 | |
Cara Therapeutics, Inc. | | | 4,325 | | | | 56,225 | |
CareDx, Inc. | | | 4,720 | | | | 118,661 | |
CASI Pharmaceuticals, Inc. | | | 6,101 | | | | 24,526 | |
Catalyst Biosciences, Inc. | | | 1,915 | | | | 15,109 | |
Catalyst Pharmaceuticals, Inc. | | | 12,807 | | | | 24,589 | |
Celcuity, Inc. | | | 620 | | | | 14,874 | |
Cellular Biomedicine Group, Inc. | | | 1,644 | | | | 29,033 | |
ChemoCentryx, Inc. | | | 2,624 | | | | 28,628 | |
Chimerix, Inc. | | | 4,712 | | | | 12,110 | |
Clovis Oncology, Inc. | | | 6,322 | | | | 113,543 | |
Cohbar, Inc. | | | 3,582 | | | | 11,140 | |
Coherus Biosciences, Inc. | | | 6,892 | | | | 62,373 | |
Concert Pharmaceuticals, Inc. | | | 2,754 | | | | 34,563 | |
Corbus Pharmaceuticals Holdings, Inc. | | | 6,623 | | | | 38,678 | |
Corvus Pharmaceuticals, Inc. | | | 2,229 | | | | 8,180 | |
Crinetics Pharmaceuticals, Inc. | | | 868 | | | | 26,031 | |
CTI BioPharma Corp. | | | 8,191 | | | | 6,009 | |
Cue Biopharma, Inc. | | | 2,851 | | | | 13,400 | |
Cytokinetics, Inc. | | | 6,105 | | | | 38,584 | |
CytomX Therapeutics, Inc. | | | 5,910 | | | | 89,241 | |
Deciphera Pharmaceuticals, Inc. | | | 1,256 | | | | 26,363 | |
Denali Therapeutics, Inc. | | | 6,050 | | | | 124,993 | |
Dicerna Pharmaceuticals, Inc. | | | 6,914 | | | | 73,911 | |
Dynavax Technologies Corp. | | | 8,278 | | | | 75,744 | |
Eagle Pharmaceuticals, Inc. | | | 1,403 | | | | 56,527 | |
Editas Medicine, Inc. | | | 6,060 | | | | 137,865 | |
Eidos Therapeutics, Inc. | | | 1,097 | | | | 15,095 | |
Emergent BioSolutions, Inc. | | | 5,907 | | | | 350,167 | |
Enanta Pharmaceuticals, Inc. | | | 2,224 | | | | 157,526 | |
Epizyme, Inc. | | | 6,947 | | | | 42,793 | |
Equillium, Inc. | | | 675 | | | | 5,508 | |
Esperion Therapeutics, Inc. | | | 3,038 | | | | 139,748 | |
Evelo Biosciences, Inc. | | | 1,646 | | | | 21,414 | |
Fate Therapeutics, Inc. | | | 7,900 | | | | 101,357 | |
Fennec Pharmaceuticals, Inc. | | | 1,819 | | | | 11,605 | |
FibroGen, Inc. | | | 9,926 | | | | 459,375 | |
Five Prime Therapeutics, Inc. | | | 4,430 | | | | 41,199 | |
Flexion Therapeutics, Inc. | | | 4,460 | | | | 50,487 | |
Fortress Biotech, Inc. | | | 5,274 | | | | 4,536 | |
| | | | |
| SCHEDULE OF INVESTMENTS | | | 7 | |
| | |
Schedule of Investments (continued) December 31, 2018 | | BlackRock Small Cap Index V.I. Fund (Percentages shown are based on Net Assets) |
| | | | | | | | |
| Security | | Shares | | | Value | |
| |
| Biotechnology (continued) | | | | |
Forty Seven, Inc. | | | 911 | | | $ | 14,321 | |
G1 Therapeutics, Inc. | | | 3,024 | | | | 57,910 | |
Genomic Health, Inc. | | | 2,783 | | | | 179,253 | |
Geron Corp. | | | 22,429 | | | | 22,429 | |
Global Blood Therapeutics, Inc. | | | 6,634 | | | | 272,326 | |
GlycoMimetics, Inc. | | | 4,523 | | | | 42,833 | |
Gritstone Oncology, Inc. | | | 840 | | | | 12,978 | |
GTx, Inc. | | | 742 | | | | 579 | |
Halozyme Therapeutics, Inc. | | | 16,568 | | | | 242,390 | |
Heron Therapeutics, Inc. | | | 9,152 | | | | 237,403 | |
Homology Medicines, Inc. | | | 2,211 | | | | 49,438 | |
Idera Pharmaceuticals, Inc. | | | 2,969 | | | | 8,224 | |
Immune Design Corp. | | | 5,369 | | | | 6,980 | |
ImmunoGen, Inc. | | | 19,060 | | | | 91,488 | |
Immunomedics, Inc. | | | 19,275 | | | | 275,054 | |
Inovio Pharmaceuticals, Inc. | | | 10,948 | | | | 43,792 | |
Insmed, Inc. | | | 10,168 | | | | 133,404 | |
Insys Therapeutics, Inc. | | | 3,942 | | | | 13,797 | |
Intellia Therapeutics, Inc. | | | 4,411 | | | | 60,210 | |
Intercept Pharmaceuticals, Inc. | | | 2,908 | | | | 293,097 | |
Intrexon Corp. | | | 9,776 | | | | 63,935 | |
Invitae Corp. | | | 8,711 | | | | 96,344 | |
Iovance Biotherapeutics, Inc. | | | 13,740 | | | | 121,599 | |
Ironwood Pharmaceuticals, Inc. | | | 18,394 | | | | 190,562 | |
Jounce Therapeutics, Inc. | | | 2,248 | | | | 7,576 | |
Kadmon Holdings, Inc. | | | 12,712 | | | | 26,441 | |
Karyopharm Therapeutics, Inc. | | | 6,437 | | | | 60,315 | |
Kezar Life Sciences, Inc. | | | 790 | | | | 18,644 | |
Kindred Biosciences, Inc. | | | 4,119 | | | | 45,103 | |
Kiniksa Pharmaceuticals Ltd., Class A | | | 979 | | | | 27,500 | |
Kodiak Sciences, Inc. | | | 1,090 | | | | 7,739 | |
Kura Oncology, Inc. | | | 4,007 | | | | 56,258 | |
La Jolla Pharmaceutical Co. | | | 2,847 | | | | 26,847 | |
Lexicon Pharmaceuticals, Inc. | | | 5,737 | | | | 38,094 | |
Ligand Pharmaceuticals, Inc. | | | 2,778 | | | | 376,975 | |
LogicBio Therapeutics, Inc. | | | 830 | | | | 8,632 | |
Loxo Oncology, Inc. | | | 3,571 | | | | 500,190 | |
MacroGenics, Inc. | | | 5,205 | | | | 66,103 | |
Madrigal Pharmaceuticals, Inc. | | | 921 | | | | 103,815 | |
MannKind Corp. | | | 17,212 | | | | 18,245 | |
MediciNova, Inc. | | | 5,240 | | | | 42,811 | |
Mersana Therapeutics, Inc. | | | 2,099 | | | | 8,564 | |
Minerva Neurosciences, Inc. | | | 4,064 | | | | 27,391 | |
Miragen Therapeutics, Inc. | | | 4,150 | | | | 12,574 | |
Mirati Therapeutics, Inc. | | | 2,678 | | | | 113,601 | |
Molecular Templates, Inc. | | | 1,461 | | | | 5,902 | |
Momenta Pharmaceuticals, Inc. | | | 10,188 | | | | 112,475 | |
Mustang Bio, Inc. | | | 2,441 | | | | 7,177 | |
Myriad Genetics, Inc. | | | 9,141 | | | | 265,729 | |
NantKwest, Inc. | | | 4,937 | | | | 5,727 | |
Natera, Inc. | | | 4,371 | | | | 61,019 | |
NewLink Genetics Corp. | | | 4,970 | | | | 7,554 | |
Novavax, Inc. | | | 50,615 | | | | 93,132 | |
Nymox Pharmaceutical Corp. | | | 4,564 | | | | 5,979 | |
OPKO Health, Inc. | | | 42,711 | | | | 128,560 | |
Organovo Holdings, Inc. | | | 12,101 | | | | 11,582 | |
Ovid therapeutics, Inc. | | | 1,840 | | | | 4,453 | |
Palatin Technologies, Inc. | | | 28,574 | | | | 20,242 | |
PDL BioPharma, Inc. | | | 17,793 | | | | 51,600 | |
Pfenex, Inc. | | | 3,440 | | | | 10,974 | |
Pieris Pharmaceuticals, Inc. | | | 6,594 | | | | 17,540 | |
PolarityTE, Inc. | | | 1,393 | | | | 18,792 | |
Portola Pharmaceuticals, Inc. | | | 8,645 | | | | 168,750 | |
Principia Biopharma, Inc. | | | 689 | | | | 18,872 | |
| | | | | | | | |
| Security | | Shares | | | Value | |
| |
| Biotechnology (continued) | | | | |
Progenics Pharmaceuticals, Inc. | | | 10,680 | | | $ | 44,856 | |
Proteostasis Therapeutics, Inc. | | | 4,096 | | | | 13,271 | |
Prothena Corp. plc | | | 5,335 | | | | 54,950 | |
PTC Therapeutics, Inc. | | | 6,012 | | | | 206,332 | |
Puma Biotechnology, Inc. | | | 3,866 | | | | 78,673 | |
Ra Pharmaceuticals, Inc. | | | 1,710 | | | | 31,122 | |
Radius Health, Inc. | | | 5,373 | | | | 88,601 | |
Recro Pharma, Inc. | | | 2,169 | | | | 15,400 | |
REGENXBIO, Inc. | | | 4,205 | | | | 176,400 | |
Repligen Corp. | | | 5,190 | | | | 273,721 | |
Replimune Group, Inc. | | | 1,163 | | | | 11,630 | |
Retrophin, Inc. | | | 5,372 | | | | 121,568 | |
Rhythm Pharmaceuticals, Inc. | | | 2,021 | | | | 54,324 | |
Rigel Pharmaceuticals, Inc. | | | 22,292 | | | | 51,272 | |
Rocket Pharmaceuticals, Inc. | | | 2,771 | | | | 41,066 | |
Rubius Therapeutics, Inc. | | | 1,472 | | | | 23,670 | |
Sangamo Therapeutics, Inc. | | | 13,466 | | | | 154,590 | |
Savara, Inc. | | | 4,017 | | | | 30,409 | |
Scholar Rock Holding Corp. | | | 946 | | | | 21,730 | |
Selecta Biosciences, Inc. | | | 2,360 | | | | 6,278 | |
Seres Therapeutics, Inc. | | | 2,927 | | | | 13,230 | |
Solid Biosciences, Inc. | | | 1,618 | | | | 43,362 | |
Sorrento Therapeutics, Inc. | | | 14,516 | | | | 34,838 | |
Spark Therapeutics, Inc. | | | 4,176 | | | | 163,449 | |
Spectrum Pharmaceuticals, Inc. | | | 13,388 | | | | 117,145 | |
Spero Therapeutics, Inc. | | | 999 | | | | 6,144 | |
Spring Bank Pharmaceuticals, Inc. | | | 1,607 | | | | 16,697 | |
Stemline Therapeutics, Inc. | | | 3,754 | | | | 35,663 | |
Surface Oncology, Inc. | | | 1,176 | | | | 4,986 | |
Sutro Biopharma, Inc. | | | 719 | | | | 6,485 | |
Syndax Pharmaceuticals, Inc. | | | 2,072 | | | | 9,220 | |
Synergy Pharmaceuticals, Inc. | | | 33,003 | | | | 3,759 | |
Synlogic, Inc. | | | 1,715 | | | | 12,022 | |
Syros Pharmaceuticals, Inc. | | | 3,105 | | | | 17,295 | |
T2 Biosystems, Inc. | | | 4,091 | | | | 12,314 | |
TG Therapeutics, Inc. | | | 7,636 | | | | 31,308 | |
Tocagen, Inc. | | | 2,703 | | | | 22,192 | |
Translate Bio, Inc. | | | 1,447 | | | | 10,852 | |
Twist Bioscience Corp. | | | 580 | | | | 13,392 | |
Tyme Technologies, Inc. | | | 13,196 | | | | 48,693 | |
Ultragenyx Pharmaceutical, Inc. | | | 6,243 | | | | 271,446 | |
UNITY Biotechnology, Inc. | | | 3,184 | | | | 51,772 | |
Unum Therapeutics, Inc. | | | 2,001 | | | | 8,804 | |
Vanda Pharmaceuticals, Inc. | | | 6,818 | | | | 178,154 | |
Veracyte, Inc. | | | 3,799 | | | | 47,791 | |
Verastem, Inc. | | | 9,123 | | | | 30,653 | |
Vericel Corp. | | | 5,705 | | | | 99,267 | |
Viking Therapeutics, Inc. | | | 7,718 | | | | 59,043 | |
Vital Therapies, Inc. | | | 4,896 | | | | 912 | |
Voyager Therapeutics, Inc. | | | 2,848 | | | | 26,771 | |
Xencor, Inc. | | | 6,136 | | | | 221,878 | |
XOMA Corp. | | | 1,034 | | | | 13,080 | |
Y-mAbs Therapeutics, Inc. | | | 775 | | | | 15,763 | |
Zafgen, Inc. | | | 3,975 | | | | 19,676 | |
ZIOPHARM Oncology, Inc. | | | 17,470 | | | �� | 32,669 | |
| | | | | | | | |
| | | | | | | 14,760,713 | |
| |
| Building Products — 1.2% | | | | |
AAON, Inc. | | | 5,480 | | | | 192,129 | |
Advanced Drainage Systems, Inc. | | | 4,807 | | | | 116,570 | |
American Woodmark Corp.(a) | | | 1,876 | | | | 104,456 | |
Apogee Enterprises, Inc. | | | 3,676 | | | | 109,729 | |
Armstrong Flooring, Inc.(a) | | | 2,814 | | | | 33,318 | |
Builders FirstSource, Inc.(a) | | | 15,008 | | | | 163,737 | |
Caesarstone Ltd. | | | 3,044 | | | | 41,337 | |
| | |
| 8 | | 2018 BLACKROCK ANNUAL REPORTTO SHAREHOLDERS |
| | |
Schedule of Investments (continued) December 31, 2018 | | BlackRock Small Cap Index V.I. Fund (Percentages shown are based on Net Assets) |
| | | | | | | | |
| Security | | Shares | | | Value | |
| |
| Building Products (continued) | | | | |
Continental Building Products, Inc.(a) | | | 4,936 | | | $ | 125,621 | |
CSW Industrials, Inc.(a) | | | 2,063 | | | | 99,746 | |
Gibraltar Industries, Inc.(a) | | | 4,240 | | | | 150,902 | |
Griffon Corp. | | | 4,596 | | | | 48,028 | |
Insteel Industries, Inc. | | | 2,420 | | | | 58,758 | |
JELD-WEN Holding, Inc.(a) | | | 9,181 | | | | 130,462 | |
Masonite International Corp.(a) | | | 3,212 | | | | 143,994 | |
NCI Building Systems, Inc.(a) | | | 5,660 | | | | 41,035 | |
Patrick Industries, Inc.(a) | | | 3,163 | | | | 93,656 | |
PGT Innovations, Inc.(a) | | | 7,035 | | | | 111,505 | |
Quanex Building Products Corp. | | | 4,636 | | | | 63,003 | |
Simpson Manufacturing Co., Inc. | | | 5,504 | | | | 297,932 | |
Trex Co., Inc.(a) | | | 7,851 | | | | 466,035 | |
Universal Forest Products, Inc. | | | 7,963 | | | | 206,719 | |
| | | | | | | | |
| | | | | | | 2,798,672 | |
| |
| Capital Markets — 1.3% | | | | |
Arlington Asset Investment Corp., Class A | | | 3,742 | | | | 27,092 | |
Artisan Partners Asset Management, Inc., Class A | | | 6,381 | | | | 141,084 | |
Ashford, Inc. | | | 131 | | | | 6,799 | |
Associated Capital Group, Inc., Class A | | | 197 | | | | 6,940 | |
B. Riley Financial, Inc. | | | 2,716 | | | | 38,567 | |
Blucora, Inc.(a) | | | 6,320 | | | | 168,365 | |
BrightSphere Investment Group plc | | | 10,686 | | | | 114,127 | |
Cohen & Steers, Inc. | | | 2,963 | | | | 101,690 | |
Cowen, Inc.(a) | | | 3,561 | | | | 47,504 | |
Diamond Hill Investment Group, Inc. | | | 433 | | | | 64,712 | |
Donnelley Financial Solutions, Inc.(a) | | | 4,471 | | | | 62,728 | |
Federated Investors, Inc., Class B | | | 12,863 | | | | 341,513 | |
Focus Financial Partners, Inc., Class A(a) | | | 2,499 | | | | 65,799 | |
GAIN Capital Holdings, Inc. | | | 3,963 | | | | 24,412 | |
Greenhill & Co., Inc. | | | 2,253 | | | | 54,973 | |
Hamilton Lane, Inc., Class A | | | 1,981 | | | | 73,297 | |
Houlihan Lokey, Inc. | | | 4,435 | | | | 163,208 | |
INTL. FCStone, Inc.(a) | | | 2,037 | | | | 74,513 | |
Investment Technology Group, Inc. | | | 4,328 | | | | 130,879 | |
Ladenburg Thalmann Financial Services, Inc. | | | 13,284 | | | | 30,952 | |
Moelis & Co., Class A | | | 5,922 | | | | 203,598 | |
Oppenheimer Holdings, Inc., Class A | | | 1,284 | | | | 32,806 | |
Piper Jaffray Cos. | | | 1,702 | | | | 112,060 | |
PJT Partners, Inc., Class A | | | 2,648 | | | | 102,636 | |
Pzena Investment Management, Inc., Class A | | | 2,576 | | | | 22,282 | |
Safeguard Scientifics, Inc.(a) | | | 2,163 | | | | 18,645 | |
Siebert Financial Corp.(a) | | | 1,073 | | | | 15,516 | |
Silvercrest Asset Management Group, Inc., Class A | | | 794 | | | | 10,505 | |
Stifel Financial Corp. | | | 9,217 | | | | 381,768 | |
Value Line, Inc. | | | 315 | | | | 8,193 | |
Virtus Investment Partners, Inc. | | | 921 | | | | 73,155 | |
Waddell & Reed Financial, Inc., Class A | | | 10,329 | | | | 186,748 | |
Westwood Holdings Group, Inc. | | | 1,082 | | | | 36,788 | |
WisdomTree Investments, Inc. | | | 15,530 | | | | 103,275 | |
| | | | | | | | |
| | | | | | | 3,047,129 | |
| |
| Chemicals — 1.8% | | | | |
Advanced Emissions Solutions, Inc. | | | 685 | | | | 7,227 | |
AdvanSix, Inc.(a) | | | 4,079 | | | | 99,283 | |
AgroFresh Solutions, Inc.(a) | | | 3,507 | | | | 13,292 | |
American Vanguard Corp. | | | 3,869 | | | | 58,770 | |
Amyris, Inc.(a) | | | 3,882 | | | | 12,966 | |
Balchem Corp. | | | 4,259 | | | | 333,693 | |
Chase Corp. | | | 962 | | | | 96,248 | |
Ferro Corp.(a) | | | 10,196 | | | | 159,873 | |
Flotek Industries, Inc.(a) | | | 9,338 | | | | 10,178 | |
FutureFuel Corp. | | | 3,429 | | | | 54,384 | |
GCP Applied Technologies, Inc.(a) | | | 9,550 | | | | 234,452 | |
| | | | | | | | |
| Security | | Shares | | | Value | |
| |
| Chemicals (continued) | | | | |
Hawkins, Inc. | | | 1,286 | | | $ | 52,662 | |
HB Fuller Co. | | | 6,726 | | | | 286,998 | |
Ingevity Corp.(a) | | | 5,631 | | | | 471,258 | |
Innophos Holdings, Inc. | | | 2,585 | | | | 63,410 | |
Innospec, Inc. | | | 3,218 | | | | 198,744 | |
Intrepid Potash, Inc.(a) | | | 12,511 | | | | 32,529 | |
Koppers Holdings, Inc.(a) | | | 2,735 | | | | 46,604 | |
Kraton Corp.(a) | | | 4,116 | | | | 89,893 | |
Kronos Worldwide, Inc. | | | 2,830 | | | | 32,602 | |
LSB Industries, Inc.(a) | | | 2,515 | | | | 13,883 | |
Marrone Bio Innovations, Inc.(a) | | | 8,606 | | | | 12,651 | |
Minerals Technologies, Inc. | | | 4,700 | | | | 241,298 | |
OMNOVA Solutions, Inc.(a) | | | 5,813 | | | | 42,609 | |
PolyOne Corp. | | | 10,606 | | | | 303,332 | |
PQ Group Holdings, Inc.(a) | | | 4,859 | | | | 71,962 | |
Quaker Chemical Corp. | | | 1,734 | | | | 308,149 | |
Rayonier Advanced Materials, Inc. | | | 6,728 | | | | 71,653 | |
Sensient Technologies Corp. | | | 5,651 | | | | 315,608 | |
Stepan Co. | | | 2,692 | | | | 199,208 | |
Trecora Resources(a) | | | 2,581 | | | | 20,132 | |
Tredegar Corp. | | | 3,437 | | | | 54,511 | |
Trinseo SA | | | 5,690 | | | | 260,488 | |
Tronox Ltd., Class A | | | 12,434 | | | | 96,736 | |
Valhi, Inc. | | | 4,603 | | | | 8,884 | |
| | | | | | | | |
| | | | | | | 4,376,170 | |
| |
| Commercial Services & Supplies — 2.5% | | | | |
ABM Industries, Inc. | | | 8,788 | | | | 282,183 | |
ACCO Brands Corp. | | | 13,745 | | | �� | 93,191 | |
Advanced Disposal Services, Inc.(a) | | | 9,624 | | | | 230,399 | |
Brady Corp., Class A | | | 6,234 | | | | 270,930 | |
BrightView Holdings, Inc.(a) | | | 3,277 | | | | 33,458 | |
Brink’s Co. (The) | | | 6,677 | | | | 431,668 | |
Casella Waste Systems, Inc., Class A(a) | | | 5,293 | | | | 150,798 | |
CECO Environmental Corp.(a) | | | 3,524 | | | | 23,787 | |
Cimpress NV(a) | | | 2,925 | | | | 302,503 | |
Covanta Holding Corp. | | | 15,614 | | | | 209,540 | |
Deluxe Corp. | | | 5,793 | | | | 222,683 | |
Ennis, Inc. | | | 3,378 | | | | 65,026 | |
Essendant, Inc. | | | 4,882 | | | | 61,416 | |
Healthcare Services Group, Inc. | | | 9,839 | | | | 395,331 | |
Heritage-Crystal Clean, Inc.(a) | | | 1,914 | | | | 44,041 | |
Herman Miller, Inc. | | | 7,899 | | | | 238,945 | |
HNI Corp. | | | 5,765 | | | | 204,254 | |
Interface, Inc. | | | 7,844 | | | | 111,777 | |
Kimball International, Inc., Class B | | | 4,802 | | | | 68,140 | |
Knoll, Inc. | | | 6,430 | | | | 105,966 | |
LSC Communications, Inc. | | | 4,353 | | | | 30,471 | |
Matthews International Corp., Class A | | | 4,144 | | | | 168,329 | |
McGrath RentCorp | | | 3,201 | | | | 164,787 | |
Mobile Mini, Inc. | | | 5,901 | | | | 187,357 | |
MSA Safety, Inc. | | | 4,528 | | | | 426,855 | |
Multi-Color Corp. | | | 1,842 | | | | 64,636 | |
NL Industries, Inc.(a) | | | 1,105 | | | | 3,878 | |
PICO Holdings, Inc.(a) | | | 2,314 | | | | 21,150 | |
Pitney Bowes, Inc. | | | 24,989 | | | | 147,685 | |
Quad/Graphics, Inc. | | | 4,149 | | | | 51,116 | |
RR Donnelley & Sons Co. | | | 9,380 | | | | 37,145 | |
SP Plus Corp.(a) | | | 3,006 | | | | 88,797 | |
Steelcase, Inc., Class A | | | 11,268 | | | | 167,104 | |
Team, Inc.(a) | | | 3,929 | | | | 57,560 | |
Tetra Tech, Inc. | | | 7,361 | | | | 381,079 | |
UniFirst Corp. | | | 2,026 | | | | 289,860 | |
US Ecology, Inc. | | | 2,910 | | | | 183,272 | |
Viad Corp. | | | 2,703 | | | | 135,393 | |
| | | | |
| SCHEDULE OF INVESTMENTS | | | 9 | |
| | |
Schedule of Investments (continued) December 31, 2018 | | BlackRock Small Cap Index V.I. Fund (Percentages shown are based on Net Assets) |
| | | | | | | | |
| Security | | Shares | | | Value | |
| |
| Commercial Services & Supplies (continued) | | | | |
VSE Corp. | | | 1,151 | | | $ | 34,426 | |
| | | | | | | | |
| | | | | | | 6,186,936 | |
| |
| Communications Equipment — 1.6% | | | | |
Acacia Communications, Inc.(a) | | | 3,634 | | | | 138,092 | |
ADTRAN, Inc. | | | 6,361 | | | | 68,317 | |
Aerohive Networks, Inc.(a) | | | 5,096 | | | | 16,613 | |
Applied Optoelectronics, Inc.(a) | | | 2,492 | | | | 38,452 | |
CalAmp Corp.(a) | | | 4,560 | | | | 59,326 | |
Calix, Inc.(a) | | | 5,782 | | | | 56,375 | |
Casa Systems, Inc.(a) | | | 3,595 | | | | 47,202 | |
Ciena Corp.(a) | | | 18,645 | | | | 632,252 | |
Clearfield, Inc.(a) | | | 1,205 | | | | 11,954 | |
Comtech Telecommunications Corp. | | | 3,053 | | | | 74,310 | |
DASAN Zhone Solutions, Inc.(a) | | | 917 | | | | 12,756 | |
Digi International, Inc.(a) | | | 3,277 | | | | 33,065 | |
Extreme Networks, Inc.(a) | | | 15,241 | | | | 92,970 | |
Finisar Corp.(a) | | | 15,584 | | | | 336,614 | |
Harmonic, Inc.(a) | | | 10,793 | | | | 50,943 | |
Infinera Corp.(a) | | | 20,030 | | | | 79,920 | |
InterDigital, Inc. | | | 4,596 | | | | 305,312 | |
KVH Industries, Inc.(a) | | | 1,815 | | | | 18,676 | |
Lumentum Holdings, Inc.(a) | | | 9,747 | | | | 409,471 | |
NETGEAR, Inc.(a) | | | 4,149 | | | | 215,872 | |
NetScout Systems, Inc.(a) | | | 9,737 | | | | 230,085 | |
Plantronics, Inc. | | | 4,404 | | | | 145,772 | |
Quantenna Communications, Inc.(a) | | | 4,485 | | | | 64,360 | |
Ribbon Communications, Inc.(a) | | | 6,644 | | | | 32,024 | |
ViaSat, Inc.(a) | | | 7,353 | | | | 433,459 | |
Viavi Solutions, Inc.(a) | | | 30,194 | | | | 303,450 | |
| | | | | | | | |
| | | | | | | 3,907,642 | |
| |
| Construction & Engineering — 1.0% | | | | |
Aegion Corp.(a) | | | 4,260 | | | | 69,523 | |
Ameresco, Inc., Class A(a) | | | 2,301 | | | | 32,444 | |
Argan, Inc. | | | 1,944 | | | | 73,561 | |
Comfort Systems USA, Inc. | | | 4,866 | | | | 212,547 | |
Dycom Industries, Inc.(a) | | | 4,011 | | | | 216,754 | |
EMCOR Group, Inc. | | | 7,352 | | | | 438,841 | |
Granite Construction, Inc. | | | 5,838 | | | | 235,155 | |
Great Lakes Dredge & Dock Corp.(a) | | | 7,081 | | | | 46,876 | |
HC2 Holdings, Inc.(a) | | | 5,263 | | | | 13,894 | |
IES Holdings, Inc.(a) | | | 1,246 | | | | 19,375 | |
Infrastructure and Energy Alternatives, Inc.(a) | | | 2,738 | | | | 22,424 | |
KBR, Inc. | | | 18,732 | | | | 284,352 | |
MasTec, Inc.(a) | | | 8,043 | | | | 326,224 | |
MYR Group, Inc.(a) | | | 2,137 | | | | 60,199 | |
Northwest Pipe Co.(a) | | | 973 | | | | 22,661 | |
NV5 Global, Inc.(a) | | | 1,245 | | | | 75,385 | |
Orion Group Holdings, Inc.(a) | | | 3,358 | | | | 14,406 | |
Primoris Services Corp. | | | 5,552 | | | | 106,210 | |
Sterling Construction Co., Inc.(a) | | | 3,409 | | | | 37,124 | |
Tutor Perini Corp.(a) | | | 4,970 | | | | 79,371 | |
Willscot Corp.(a) | | | 4,737 | | | | 44,623 | |
| | | | | | | | |
| | | | | | | 2,431,949 | |
| |
| Construction Materials — 0.1% | | | | |
Forterra, Inc.(a) | | | 2,002 | | | | 7,527 | |
Summit Materials, Inc., Class A(a) | | | 14,892 | | | | 184,661 | |
United States Lime & Minerals, Inc. | | | 211 | | | | 14,981 | |
US Concrete, Inc.(a) | | | 2,136 | | | | 75,358 | |
| | | | | | | | |
| | | | | | | 282,527 | |
| |
| Consumer Finance — 0.7% | | | | |
Curo Group Holdings Corp.(a) | | | 1,533 | | | | 14,548 | |
Elevate Credit, Inc.(a) | | | 3,330 | | | | 14,918 | |
| | | | | | | | |
| Security | | Shares | | | Value | |
| |
| Consumer Finance (continued) | | | | |
Encore Capital Group, Inc.(a) | | | 3,454 | | | $ | 81,169 | |
Enova International, Inc.(a) | | | 4,420 | | | | 86,013 | |
EZCORP, Inc., Class A(a) | | | 6,650 | | | | 51,405 | |
FirstCash, Inc. | | | 5,772 | | | | 417,604 | |
Green Dot Corp., Class A(a) | | | 6,249 | | | | 496,920 | |
LendingClub Corp.(a) | | | 41,984 | | | | 110,418 | |
Nelnet, Inc., Class A | | | 2,471 | | | | 129,332 | |
PRA Group, Inc.(a) | | | 5,926 | | | | 144,417 | |
Regional Management Corp.(a) | | | 1,370 | | | | 32,949 | |
World Acceptance Corp.(a) | | | 816 | | | | 83,444 | |
| | | | | | | | |
| | | | | | | 1,663,137 | |
| |
| Containers & Packaging — 0.1% | | | | |
Greif, Inc., Class A | | | 3,397 | | | | 126,063 | |
Greif, Inc., Class B | | | 740 | | | | 32,856 | |
Myers Industries, Inc. | | | 4,675 | | | | 70,639 | |
UFP Technologies, Inc.(a) | | | 582 | | | | 17,483 | |
| | | | | | | | |
| | | | | | | 247,041 | |
| |
| Distributors — 0.1% | | | | |
Core-Mark Holding Co., Inc. | | | 6,062 | | | | 140,942 | |
Funko, Inc., Class A(a) | | | 1,362 | | | | 17,910 | |
Weyco Group, Inc. | | | 783 | | | | 22,840 | |
| | | | | | | | |
| | | | | | | 181,692 | |
| |
| Diversified Consumer Services — 0.9% | | | | |
Adtalem Global Education, Inc.(a) | | | 7,616 | | | | 360,389 | |
American Public Education, Inc.(a) | | | 2,128 | | | | 60,563 | |
Career Education Corp.(a) | | | 9,025 | | | | 103,065 | |
Carriage Services, Inc. | | | 2,465 | | | | 38,207 | |
Chegg, Inc.(a) | | | 14,400 | | | | 409,248 | |
Houghton Mifflin Harcourt Co.(a) | | | 13,742 | | | | 121,754 | |
K12, Inc.(a) | | | 4,888 | | | | 121,174 | |
Laureate Education, Inc., Class A(a) | | | 11,978 | | | | 182,545 | |
Regis Corp.(a) | | | 4,701 | | | | 79,682 | |
Sotheby’s(a) | | | 4,414 | | | | 175,412 | |
Strategic Education, Inc. | | | 2,775 | | | | 314,741 | |
Weight Watchers International, Inc.(a) | | | 5,118 | | | | 197,299 | |
| | | | | | | | |
| | | | | | | 2,164,079 | |
| |
| Diversified Financial Services — 0.2% | | | | |
Banco Latinoamericano de Comercio Exterior SA, Class E | | | 4,064 | | | | 70,307 | |
Cannae Holdings, Inc.(a) | | | 9,156 | | | | 156,751 | |
FGL Holdings(a) | | | 18,831 | | | | 125,414 | |
Marlin Business Services Corp. | | | 926 | | | | 20,678 | |
On Deck Capital, Inc.(a) | | | 6,433 | | | | 37,955 | |
| | | | | | | | |
| | | | | | | 411,105 | |
| |
| Diversified Telecommunication Services — 0.5% | | | | |
ATN International, Inc. | | | 1,387 | | | | 99,212 | |
Cincinnati Bell, Inc.(a) | | | 6,091 | | | | 47,388 | |
Cogent Communications Holdings, Inc. | | | 5,562 | | | | 251,458 | |
Consolidated Communications Holdings, Inc. | | | 9,318 | | | | 92,062 | |
Frontier Communications Corp. | | | 13,854 | | | | 32,973 | |
Intelsat SA(a) | | | 7,398 | | | | 158,243 | |
Iridium Communications, Inc.(a) | | | 12,748 | | | | 235,201 | |
Ooma, Inc.(a) | | | 2,141 | | | | 29,717 | |
ORBCOMM, Inc.(a) | | | 9,715 | | | | 80,246 | |
pdvWireless, Inc.(a) | | | 1,167 | | | | 43,634 | |
Vonage Holdings Corp.(a) | | | 29,366 | | | | 256,365 | |
Windstream Holdings, Inc.(a) | | | 4,969 | | | | 10,385 | |
| | | | | | | | |
| | | | | | | 1,336,884 | |
| |
| Electric Utilities — 1.2% | | | | |
ALLETE, Inc. | | | 6,843 | | | | 521,573 | |
El Paso Electric Co. | | | 5,378 | | | | 269,599 | |
IDACORP, Inc. | | | 6,631 | | | | 617,081 | |
| | |
| 10 | | 2018 BLACKROCK ANNUAL REPORTTO SHAREHOLDERS |
| | |
Schedule of Investments (continued) December 31, 2018 | | BlackRock Small Cap Index V.I. Fund (Percentages shown are based on Net Assets) |
| | | | | | | | |
| Security | | Shares | | | Value | |
| |
| Electric Utilities (continued) | | | | |
MGE Energy, Inc. | | | 4,637 | | | $ | 278,035 | |
Otter Tail Corp. | | | 5,233 | | | | 259,766 | |
PNM Resources, Inc. | | | 10,573 | | | | 434,445 | |
Portland General Electric Co. | | | 11,690 | | | | 535,986 | |
Spark Energy, Inc., Class A | | | 1,626 | | | | 12,081 | |
| | | | | | | | |
| | | | | | | 2,928,566 | |
| |
| Electrical Equipment — 0.7% | | | | |
Allied Motion Technologies, Inc. | | | 928 | | | | 41,472 | |
Atkore International Group, Inc.(a) | | | 5,182 | | | | 102,811 | |
AZZ, Inc. | | | 3,438 | | | | 138,758 | |
Babcock & Wilcox Enterprises, Inc.(a) | | | 5,219 | | | | 2,037 | |
Encore Wire Corp. | | | 2,704 | | | | 135,687 | |
Energous Corp.(a) | | | 2,722 | | | | 15,760 | |
EnerSys | | | 5,594 | | | | 434,150 | |
Enphase Energy, Inc.(a) | | | 11,487 | | | | 54,334 | |
FuelCell Energy, Inc.(a) | | | 12,967 | | | | 7,138 | |
Generac Holdings, Inc.(a) | | | 8,055 | | | | 400,334 | |
Plug Power, Inc.(a) | | | 27,322 | | | | 33,879 | |
Powell Industries, Inc. | | | 1,149 | | | | 28,736 | |
Preformed Line Products Co. | | | 463 | | | | 25,118 | |
Sunrun, Inc.(a) | | | 12,837 | | | | 139,795 | |
Thermon Group Holdings, Inc.(a) | | | 4,303 | | | | 87,265 | |
TPI Composites, Inc.(a) | | | 1,934 | | | | 47,538 | |
Vicor Corp.(a) | | | 2,319 | | | | 87,635 | |
Vivint Solar, Inc.(a) | | | 4,915 | | | | 18,726 | |
| | | | | | | | |
| | | | | | | 1,801,173 | |
|
| Electronic Equipment, Instruments & Components — 2.4% | |
Anixter International, Inc.(a) | | | 3,914 | | | | 212,569 | |
Arlo Technologies, Inc.(a) | | | 1,873 | | | | 18,693 | |
AVX Corp. | | | 6,197 | | | | 94,504 | |
Badger Meter, Inc. | | | 3,793 | | | | 186,654 | |
Bel Fuse, Inc., Class B | | | 1,475 | | | | 27,170 | |
Belden, Inc. | | | 5,367 | | | | 224,180 | |
Benchmark Electronics, Inc. | | | 5,514 | | | | 116,787 | |
Control4 Corp.(a) | | | 3,455 | | | | 60,808 | |
CTS Corp. | | | 4,344 | | | | 112,466 | |
Daktronics, Inc. | | | 4,775 | | | | 35,335 | |
Electro Scientific Industries, Inc.(a) | | | 4,290 | | | | 128,528 | |
ePlus, Inc.(a) | | | 1,777 | | | | 126,469 | |
Fabrinet(a) | | | 4,787 | | | | 245,621 | |
FARO Technologies, Inc.(a) | | | 2,232 | | | | 90,708 | |
Fitbit, Inc., Class A(a) | | | 27,994 | | | | 139,130 | |
II-VI, Inc.(a) | | | 8,209 | | | | 266,464 | |
Insight Enterprises, Inc.(a) | | | 4,666 | | | | 190,140 | |
Iteris, Inc.(a) | | | 3,745 | | | | 13,969 | |
Itron, Inc.(a) | | | 4,502 | | | | 212,900 | |
KEMET Corp. | | | 7,492 | | | | 131,410 | |
Kimball Electronics, Inc.(a) | | | 3,440 | | | | 53,286 | |
Knowles Corp.(a) | | | 11,603 | | | | 154,436 | |
Maxwell Technologies, Inc.(a) | | | 5,060 | | | | 10,474 | |
Mesa Laboratories, Inc. | | | 447 | | | | 93,150 | |
Methode Electronics, Inc. | | | 4,786 | | | | 111,466 | |
MTS Systems Corp. | | | 2,373 | | | | 95,229 | |
Napco Security Technologies, Inc.(a) | | | 1,375 | | | | 21,656 | |
nLight, Inc.(a) | | | 2,856 | | | | 50,780 | |
Novanta, Inc.(a) | | | 4,349 | | | | 273,987 | |
OSI Systems, Inc.(a) | | | 2,231 | | | | 163,532 | |
PAR Technology Corp.(a) | | | 1,351 | | | | 29,384 | |
Park Electrochemical Corp. | | | 2,399 | | | | 43,350 | |
PC Connection, Inc. | | | 1,532 | | | | 45,546 | |
Plexus Corp.(a) | | | 3,899 | | | | 199,161 | |
Rogers Corp.(a) | | | 2,438 | | | | 241,508 | |
Sanmina Corp.(a) | | | 9,003 | | | | 216,612 | |
| | | | | | | | |
| Security | | Shares | | | Value | |
|
| Electronic Equipment, Instruments & Components (continued) | |
ScanSource, Inc.(a) | | | 3,345 | | | $ | 115,001 | |
SYNNEX Corp. | | | 5,522 | | | | 446,398 | |
Tech Data Corp.(a) | | | 5,078 | | | | 415,431 | |
TTM Technologies, Inc.(a) | | | 12,459 | | | | 121,226 | |
Vishay Intertechnology, Inc. | | | 17,600 | | | | 316,976 | |
Vishay Precision Group, Inc.(a) | | | 1,373 | | | | 41,506 | |
| | | | | | | | |
| | | | | | | 5,894,600 | |
| |
| Energy Equipment & Services — 1.2% | | | | |
Archrock, Inc. | | | 16,889 | | | | 126,499 | |
Basic Energy Services, Inc.(a) | | | 2,825 | | | | 10,848 | |
Bristow Group, Inc.(a) | | | 4,368 | | | | 10,614 | |
C&J Energy Services, Inc.(a) | | | 8,566 | | | | 115,641 | |
Cactus, Inc., Class A(a) | | | 5,045 | | | | 138,283 | |
CARBO Ceramics, Inc.(a) | | | 2,993 | | | | 10,416 | |
Covia Holdings Corp.(a) | | | 4,017 | | | | 13,738 | |
Dawson Geophysical Co.(a) | | | 3,303 | | | | 11,164 | |
Diamond Offshore Drilling, Inc.(a) | | | 8,606 | | | | 81,241 | |
Dril-Quip, Inc.(a) | | | 4,324 | | | | 129,850 | |
Era Group, Inc.(a) | | | 2,446 | | | | 21,378 | |
Exterran Corp.(a) | | | 4,303 | | | | 76,163 | |
Forum Energy Technologies, Inc.(a) | | | 10,760 | | | | 44,439 | |
Frank’s International NV(a) | | | 9,722 | | | | 50,749 | |
FTS International, Inc.(a) | | | 4,077 | | | | 28,987 | |
Helix Energy Solutions Group, Inc.(a) | | | 18,686 | | | | 101,091 | |
Independence Contract Drilling, Inc.(a) | | | 4,876 | | | | 15,213 | |
ION Geophysical Corp.(a) | | | 1,706 | | | | 8,837 | |
Keane Group, Inc.(a) | | | 7,147 | | | | 58,462 | |
Key Energy Services, Inc.(a) | | | 1,659 | | | | 3,434 | |
KLX Energy Services Holdings, Inc.(a) | | | 2,671 | | | | 62,635 | |
Liberty Oilfield Services, Inc., Class A(a) | | | 5,882 | | | | 76,172 | |
Mammoth Energy Services, Inc. | | | 1,616 | | | | 29,056 | |
Matrix Service Co.(a) | | | 3,515 | | | | 63,059 | |
McDermott International, Inc.(a) | | | 23,828 | | | | 155,835 | |
Natural Gas Services Group, Inc.(a) | | | 1,654 | | | | 27,192 | |
NCS Multistage Holdings, Inc.(a) | | | 1,349 | | | | 6,866 | |
Newpark Resources, Inc.(a) | | | 11,838 | | | | 81,327 | |
Nine Energy Service, Inc.(a) | | | 1,942 | | | | 43,773 | |
Noble Corp. plc(a) | | | 32,761 | | | | 85,834 | |
Oceaneering International, Inc.(a) | | | 13,131 | | | | 158,885 | |
Oil States International, Inc.(a) | | | 7,918 | | | | 113,069 | |
PHI, Inc.(Non-Voting)(a) | | | 2,033 | | | | 3,761 | |
Pioneer Energy Services Corp.(a) | | | 8,780 | | | | 10,799 | |
Profire Energy, Inc.(a) | | | 3,741 | | | | 5,424 | |
ProPetro Holding Corp.(a) | | | 9,414 | | | | 115,981 | |
Quintana Energy Services, Inc.(a) | | | 958 | | | | 3,315 | |
RigNet, Inc.(a) | | | 2,020 | | | | 25,533 | |
Rowan Cos. plc, Class A(a) | | | 16,928 | | | | 142,026 | |
SEACOR Holdings, Inc.(a) | | | 2,273 | | | | 84,101 | |
SEACOR Marine Holdings, Inc.(a) | | | 2,193 | | | | 25,790 | |
Select Energy Services, Inc., Class A(a) | | | 5,996 | | | | 37,895 | |
Smart Sand, Inc.(a) | | | 3,545 | | | | 7,870 | |
Solaris Oilfield Infrastructure, Inc., Class A | | | 3,457 | | | | 41,795 | |
Superior Energy Services, Inc.(a) | | | 20,368 | | | | 68,233 | |
TETRA Technologies, Inc.(a) | | | 16,166 | | | | 27,159 | |
Tidewater, Inc.(a) | | | 3,825 | | | | 73,172 | |
Unit Corp.(a) | | | 6,950 | | | | 99,246 | |
US Silica Holdings, Inc. | | | 10,400 | | | | 105,872 | |
| | | | | | | | |
| | | | | | | 2,838,722 | |
| |
| Entertainment — 0.6% | | | | |
AMC Entertainment Holdings, Inc., Class A | | | 6,901 | | | | 84,744 | |
Eros International plc(a) | | | 4,749 | | | | 39,369 | |
Glu Mobile, Inc.(a) | | | 14,816 | | | | 119,565 | |
IMAX Corp.(a) | | | 7,122 | | | | 133,965 | |
| | | | |
| SCHEDULE OF INVESTMENTS | | | 11 | |
| | |
Schedule of Investments (continued) December 31, 2018 | | BlackRock Small Cap Index V.I. Fund (Percentages shown are based on Net Assets) |
| | | | | | | | |
| Security | | Shares | | | Value | |
| |
| Entertainment (continued) | | | | |
Liberty Media Corp-Liberty Braves, Class A(a) | | | 1,017 | | | $ | 25,364 | |
Liberty Media Corp-Liberty Braves, Class C(a) | | | 4,734 | | | | 117,829 | |
LiveXLive Media, Inc.(a) | | | 3,650 | | | | 18,068 | |
Marcus Corp. (The) | | | 2,561 | | | | 101,160 | |
Pandora Media, Inc.(a) | | | 34,016 | | | | 275,189 | |
Reading International, Inc., Class A(a) | | | 2,052 | | | | 29,836 | |
Rosetta Stone, Inc.(a) | | | 2,617 | | | | 42,919 | |
World Wrestling Entertainment, Inc., Class A | | | 5,714 | | | | 426,950 | |
| | | | | | | | |
| | | | | | | 1,414,958 | |
| |
| Equity Real Estate Investment Trusts (REITs) — 6.5% | | | | |
Acadia Realty Trust | | | 10,699 | | | | 254,208 | |
Agree Realty Corp. | | | 4,386 | | | | 259,300 | |
Alexander & Baldwin, Inc.(a) | | | 9,070 | | | | 166,707 | |
Alexander’s, Inc. | | | 283 | | | | 86,241 | |
American Assets Trust, Inc. | | | 5,112 | | | | 205,349 | |
Americold Realty Trust | | | 11,463 | | | | 292,765 | |
Armada Hoffler Properties, Inc. | | | 6,459 | | | | 90,814 | |
Ashford Hospitality Trust, Inc. | | | 11,284 | | | | 45,136 | |
Bluerock Residential Growth REIT, Inc. | | | 2,866 | | | | 25,851 | |
Braemar Hotels & Resorts, Inc. | | | 3,885 | | | | 34,693 | |
BRT Apartments Corp. | | | 1,299 | | | | 14,861 | |
CareTrust REIT, Inc. | | | 10,674 | | | | 197,042 | |
CatchMark Timber Trust, Inc., Class A | | | 6,522 | | | | 46,306 | |
CBL & Associates Properties, Inc. | | | 22,490 | | | | 43,181 | |
Cedar Realty Trust, Inc. | | | 11,410 | | | | 35,827 | |
Chatham Lodging Trust | | | 6,008 | | | | 106,221 | |
Chesapeake Lodging Trust | | | 7,879 | | | | 191,854 | |
City Office REIT, Inc. | | | 4,712 | | | | 48,298 | |
Clipper Realty, Inc. | | | 1,689 | | | | 22,075 | |
Community Healthcare Trust, Inc. | | | 2,314 | | | | 66,713 | |
CoreCivic, Inc. | | | 15,775 | | | | 281,268 | |
CorEnergy Infrastructure Trust, Inc. | | | 1,576 | | | | 52,134 | |
CorePoint Lodging, Inc. | | | 5,495 | | | | 67,314 | |
Cousins Properties, Inc. | | | 55,854 | | | | 441,247 | |
DiamondRock Hospitality Co. | | | 27,535 | | | | 250,018 | |
Easterly Government Properties, Inc. | | | 8,040 | | | | 126,067 | |
EastGroup Properties, Inc. | | | 4,672 | | | | 428,563 | |
Farmland Partners, Inc. | | | 3,891 | | | | 17,665 | |
First Industrial Realty Trust, Inc. | | | 16,544 | | | | 477,460 | |
Four Corners Property Trust, Inc. | | | 8,997 | | | | 235,721 | |
Franklin Street Properties Corp. | | | 13,847 | | | | 86,267 | |
Front Yard Residential Corp. | | | 6,550 | | | | 57,182 | |
GEO Group, Inc. (The) | | | 15,962 | | | | 314,451 | |
Getty Realty Corp. | | | 4,350 | | | | 127,934 | |
Gladstone Commercial Corp. | | | 3,734 | | | | 66,913 | |
Gladstone Land Corp. | | | 1,281 | | | | 14,706 | |
Global Medical REIT, Inc. | | | 2,205 | | | | 19,603 | |
Global Net Lease, Inc. | | | 9,535 | | | | 168,007 | |
Government Properties Income Trust | | | 13,004 | | | | 89,338 | |
Hannon Armstrong Sustainable Infrastructure Capital, Inc. | | | 6,858 | | | | 130,645 | |
Healthcare Realty Trust, Inc. | | | 16,469 | | | | 468,378 | |
Hersha Hospitality Trust | | | 4,729 | | | | 82,947 | |
Independence Realty Trust, Inc. | | | 11,585 | | | | 106,350 | |
Industrial Logistics Properties Trust | | | 8,582 | | | | 168,807 | |
InfraREIT, Inc. | | | 5,872 | | | | 123,429 | |
Innovative Industrial Properties, Inc. | | | 811 | | | | 36,811 | |
Investors Real Estate Trust | | | 1,593 | | | | 78,159 | |
iStar, Inc. | | | 8,643 | | | | 79,256 | |
Jernigan Capital, Inc. | | | 2,400 | | | | 47,568 | |
Kite Realty Group Trust | | | 10,990 | | | | 154,849 | |
Lexington Realty Trust | | | 26,927 | | | | 221,071 | |
LTC Properties, Inc. | | | 5,225 | | | | 217,778 | |
Mack-Cali Realty Corp. | | | 12,017 | | | | 235,413 | |
MedEquities Realty Trust, Inc. | | | 3,754 | | | | 25,677 | |
| | | | | | | | |
| Security | | Shares | | | Value | |
|
| Equity Real Estate Investment Trusts (REITs) (continued) | |
Monmouth Real Estate Investment Corp. | | | 10,904 | | | $ | 135,210 | |
National Health Investors, Inc. | | | 5,431 | | | | 410,258 | |
National Storage Affiliates Trust | | | 7,519 | | | | 198,953 | |
New Senior Investment Group, Inc. | | | 9,678 | | | | 39,873 | |
NexPoint Residential Trust, Inc. | | | 2,444 | | | | 85,662 | |
NorthStar Realty Europe Corp. | | | 5,933 | | | | 86,266 | |
One Liberty Properties, Inc. | | | 1,988 | | | | 48,149 | |
Pebblebrook Hotel Trust | | | 18,026 | | | | 510,316 | |
Pennsylvania REIT | | | 9,137 | | | | 54,274 | |
Physicians Realty Trust | | | 24,262 | | | | 388,920 | |
Piedmont Office Realty Trust, Inc., Class A | | | 17,020 | | | | 290,021 | |
PotlatchDeltic Corp. | | | 8,850 | | | | 280,014 | |
Preferred Apartment Communities, Inc., Class A | | | 5,305 | | | | 74,588 | |
PS Business Parks, Inc. | | | 2,644 | | | | 346,364 | |
QTS Realty Trust, Inc., Class A | | | 6,767 | | | | 250,717 | |
Ramco-Gershenson Properties Trust | | | 10,536 | | | | 125,905 | |
Retail Opportunity Investments Corp. | | | 14,755 | | | | 234,309 | |
Rexford Industrial Realty, Inc. | | | 12,058 | | | | 355,349 | |
RLJ Lodging Trust | | | 23,096 | | | | 378,774 | |
Ryman Hospitality Properties, Inc. | | | 5,941 | | | | 396,205 | |
Sabra Health Care REIT, Inc. | | | 23,630 | | | | 389,422 | |
Safety Income & Growth, Inc. | | | 872 | | | | 16,402 | |
Saul Centers, Inc. | | | 1,567 | | | | 73,994 | |
Select Income REIT | | | 11,745 | | | | 86,443 | |
Seritage Growth Properties, Class A | | | 4,338 | | | | 140,248 | |
Spirit MTA REIT | | | 5,716 | | | | 40,755 | |
STAG Industrial, Inc. | | | 12,421 | | | | 309,035 | |
Summit Hotel Properties, Inc. | | | 13,734 | | | | 133,632 | |
Sunstone Hotel Investors, Inc. | | | 30,311 | | | | 394,346 | |
Tanger Factory Outlet Centers, Inc. | | | 12,206 | | | | 246,805 | |
Terreno Realty Corp. | | | 7,619 | | | | 267,960 | |
Tier REIT, Inc. | | | 6,713 | | | | 138,489 | |
UMH Properties, Inc. | | | 4,411 | | | | 52,226 | |
Universal Health Realty Income Trust | | | 1,702 | | | | 104,452 | |
Urban Edge Properties | | | 14,530 | | | | 241,489 | |
Urstadt Biddle Properties, Inc., Class A | | | 3,926 | | | | 75,458 | |
Washington Prime Group, Inc. | | | 24,825 | | | | 120,650 | |
Washington REIT | | | 10,467 | | | | 240,741 | |
Whitestone REIT | | | 5,069 | | | | 62,146 | |
Xenia Hotels & Resorts, Inc. | | | 14,966 | | | | 257,415 | |
| | | | | | | | |
| | | | | | | 15,814,673 | |
| |
| Food & Staples Retailing — 0.6% | | | | |
Andersons, Inc. (The) | | | 3,613 | | | | 107,993 | |
BJ’s Wholesale Club Holdings, Inc.(a) | | | 9,415 | | | | 208,636 | |
Chefs’ Warehouse, Inc. (The)(a) | | | 2,887 | | | | 92,326 | |
Ingles Markets, Inc., Class A | | | 1,873 | | | | 50,983 | |
Natural Grocers by Vitamin Cottage, Inc.(a) | | | 1,090 | | | | 16,710 | |
Performance Food Group Co.(a) | | | 13,528 | | | | 436,549 | |
PriceSmart, Inc. | | | 2,937 | | | | 173,577 | |
Rite Aid Corp.(a) | | | 139,772 | | | | 99,000 | |
Smart & Final Stores, Inc.(a) | | | 2,571 | | | | 12,187 | |
SpartanNash Co. | | | 4,730 | | | | 81,261 | |
United Natural Foods, Inc.(a) | | | 6,695 | | | | 70,900 | |
Village Super Market, Inc., Class A | | | 1,016 | | | | 27,168 | |
Weis Markets, Inc. | | | 1,268 | | | | 60,585 | |
| | | | | | | | |
| | | | | | | 1,437,875 | |
| |
| Food Products — 1.2% | | | | |
Alico, Inc. | | | 327 | | | | 9,647 | |
B&G Foods, Inc. | | | 8,728 | | | | 252,326 | |
Calavo Growers, Inc. | | | 2,106 | | | | 153,654 | |
Cal-Maine Foods, Inc. | | | 4,143 | | | | 175,249 | |
Darling Ingredients, Inc.(a) | | | 21,768 | | | | 418,816 | |
Dean Foods Co. | | | 12,114 | | | | 46,154 | |
| | |
| 12 | | 2018 BLACKROCK ANNUAL REPORTTO SHAREHOLDERS |
| | |
Schedule of Investments (continued) December 31, 2018 | | BlackRock Small Cap Index V.I. Fund (Percentages shown are based on Net Assets) |
| | | | | | | | |
| Security | | Shares | | | Value | |
| |
| Food Products (continued) | | | | |
Farmer Brothers Co.(a) | | | 1,208 | | | $ | 28,183 | |
Fresh Del Monte Produce, Inc. | | | 4,041 | | | | 114,239 | |
Freshpet, Inc.(a) | | | 3,485 | | | | 112,078 | |
Hostess Brands, Inc.(a) | | | 13,109 | | | | 143,412 | |
J&J Snack Foods Corp. | | | 1,996 | | | | 288,602 | |
John B Sanfilippo & Son, Inc. | | | 1,140 | | | | 63,452 | |
Lancaster Colony Corp. | | | 2,509 | | | | 443,742 | |
Landec Corp.(a) | | | 3,600 | | | | 42,624 | |
Limoneira Co. | | | 1,952 | | | | 38,162 | |
Sanderson Farms, Inc. | | | 2,712 | | | | 269,274 | |
Schuman, Inc., CVR(a)(b) | | | 4,294 | | | | 8,202 | |
Seneca Foods Corp., Class A(a) | | | 860 | | | | 24,269 | |
Simply Good Foods Co. (The)(a) | | | 8,008 | | | | 151,351 | |
Tootsie Roll Industries, Inc. | | | 2,172 | | | | 72,545 | |
| | | | | | | | |
| | | | | | | 2,855,981 | |
| |
| Gas Utilities — 1.1% | | | | |
Chesapeake Utilities Corp. | | | 2,101 | | | | 170,811 | |
New Jersey Resources Corp. | | | 11,585 | | | | 529,087 | |
Northwest Natural Holding Co. | | | 3,802 | | | | 229,869 | |
ONE Gas, Inc. | | | 6,836 | | | | 544,146 | |
RGC Resources, Inc. | | | 909 | | | | 27,234 | |
South Jersey Industries, Inc. | | | 11,396 | | | | 316,809 | |
Southwest Gas Holdings, Inc. | | | 6,373 | | | | 487,534 | |
Spire, Inc. | | | 6,450 | | | | 477,816 | |
| | | | | | | | |
| | | | | | | 2,783,306 | |
| |
| Health Care Equipment & Supplies — 3.6% | | | | |
Accuray, Inc.(a) | | | 10,460 | | | | 35,669 | |
AngioDynamics, Inc.(a) | | | 4,838 | | | | 97,389 | |
Anika Therapeutics, Inc.(a) | | | 1,892 | | | | 63,590 | |
Antares Pharma, Inc.(a) | | | 19,168 | | | | 52,137 | |
AtriCure, Inc.(a) | | | 4,699 | | | | 143,789 | |
Atrion Corp. | | | 189 | | | | 140,064 | |
Avanos Medical, Inc.(a) | | | 6,225 | | | | 278,818 | |
AxoGen, Inc.(a) | | | 4,502 | | | | 91,976 | |
Axonics Modulation Technologies, Inc.(a) | | | 821 | | | | 12,405 | |
Cardiovascular Systems, Inc.(a) | | | 4,311 | | | | 122,820 | |
Cerus Corp.(a) | | | 17,622 | | | | 89,344 | |
CONMED Corp. | | | 3,349 | | | | 215,006 | |
CryoLife, Inc.(a) | | | 4,723 | | | | 134,039 | |
CryoPort, Inc.(a) | | | 3,179 | | | | 35,064 | |
Cutera, Inc.(a) | | | 1,750 | | | | 29,785 | |
CytoSorbents Corp.(a) | | | 3,801 | | | | 30,712 | |
ElectroCore, Inc.(a) | | | 865 | | | | 5,415 | |
Endologix, Inc.(a) | | | 13,356 | | | | 9,563 | |
FONAR Corp.(a) | | | 988 | | | | 19,997 | |
GenMark Diagnostics, Inc.(a) | | | 6,775 | | | | 32,926 | |
Glaukos Corp.(a) | | | 4,498 | | | | 252,653 | |
Globus Medical, Inc., Class A(a) | | | 9,655 | | | | 417,868 | |
Haemonetics Corp.(a) | | | 6,729 | | | | 673,236 | |
Helius Medical Technologies, Inc.(a) | | | 2,208 | | | | 20,225 | |
Heska Corp.(a) | | | 884 | | | | 76,112 | |
Inogen, Inc.(a) | | | 2,342 | | | | 290,806 | |
Integer Holdings Corp.(a) | | | 4,132 | | | | 315,106 | |
IntriCon Corp.(a) | | | 957 | | | | 25,246 | |
Invacare Corp. | | | 4,375 | | | | 18,813 | |
iRadimed Corp.(a) | | | 560 | | | | 13,698 | |
iRhythm Technologies, Inc.(a) | | | 3,202 | | | | 222,475 | |
Lantheus Holdings, Inc.(a) | | | 4,932 | | | | 77,186 | |
LeMaitre Vascular, Inc. | | | 2,092 | | | | 49,455 | |
LivaNova plc(a) | | | 6,357 | | | | 581,475 | |
Meridian Bioscience, Inc. | | | 5,517 | | | | 95,775 | |
Merit Medical Systems, Inc.(a) | | | 7,078 | | | | 395,023 | |
Natus Medical, Inc.(a) | | | 4,280 | | | | 145,648 | |
| | | | | | | | |
| Security | | Shares | | | Value | |
| |
| Health Care Equipment & Supplies (continued) | | | | |
Neogen Corp.(a) | | | 6,677 | | | $ | 380,589 | |
Neuronetics, Inc.(a) | | | 983 | | | | 19,021 | |
Nevro Corp.(a) | | | 3,865 | | | | 150,310 | |
Novocure Ltd.(a) | | | 9,771 | | | | 327,133 | |
NuVasive, Inc.(a) | | | 6,828 | | | | 338,396 | |
Nuvectra Corp.(a) | | | 2,233 | | | | 36,487 | |
NxStage Medical, Inc.(a) | | | 8,611 | | | | 246,447 | |
OraSure Technologies, Inc.(a) | | | 7,990 | | | | 93,323 | |
Orthofix Medical, Inc.(a) | | | 2,322 | | | | 121,882 | |
OrthoPediatrics Corp.(a) | | | 821 | | | | 28,636 | |
Oxford Immunotec Global plc(a) | | | 3,370 | | | | 43,069 | |
Pulse Biosciences, Inc.(a) | | | 1,231 | | | | 14,107 | |
Quidel Corp.(a) | | | 4,539 | | | | 221,594 | |
Rockwell Medical, Inc.(a) | | | 5,557 | | | | 12,559 | |
RTI Surgical, Inc.(a) | | | 7,485 | | | | 27,695 | |
SeaSpine Holdings Corp.(a) | | | 1,822 | | | | 33,233 | |
Senseonics Holdings, Inc.(a) | | | 11,315 | | | | 29,306 | |
SI-BONE, Inc.(a) | | | 981 | | | | 20,493 | |
Sientra, Inc.(a) | | | 3,081 | | | | 39,160 | |
STAAR Surgical Co.(a) | | | 5,837 | | | | 186,259 | |
Surmodics, Inc.(a) | | | 1,722 | | | | 81,382 | |
Tactile Systems Technology, Inc.(a) | | | 2,334 | | | | 106,314 | |
Tandem Diabetes Care, Inc.(a) | | | 6,770 | | | | 257,057 | |
TransEnterix, Inc.(a) | | | 21,215 | | | | 47,946 | |
Utah Medical Products, Inc. | | | 456 | | | | 37,884 | |
Varex Imaging Corp.(a) | | | 5,069 | | | | 120,034 | |
ViewRay, Inc.(a) | | | 8,006 | | | | 48,596 | |
Wright Medical Group NV(a) | | | 16,511 | | | | 449,429 | |
| | | | | | | | |
| | | | | | | 8,829,649 | |
| |
| Health Care Providers & Services — 1.9% | | | | |
AAC Holdings, Inc.(a) | | | 2,368 | | | | 3,315 | |
Addus HomeCare Corp.(a) | | | 1,256 | | | | 85,257 | |
Amedisys, Inc.(a) | | | 3,551 | | | | 415,858 | |
American Renal Associates Holdings, Inc.(a) | | | 1,636 | | | | 18,847 | |
AMN Healthcare Services, Inc.(a) | | | 6,021 | | | | 341,150 | |
Apollo Medical Holdings, Inc.(a) | | | 509 | | | | 10,104 | |
BioScrip, Inc.(a) | | | 16,802 | | | | 59,983 | |
BioTelemetry, Inc.(a) | | | 4,310 | | | | 257,393 | |
Brookdale Senior Living, Inc.(a) | | | 24,828 | | | | 166,348 | |
Capital Senior Living Corp.(a) | | | 2,932 | | | | 19,938 | |
Civitas Solutions, Inc.(a) | | | 1,450 | | | | 25,389 | |
Community Health Systems, Inc.(a) | | | 10,916 | | | | 30,783 | |
CorVel Corp.(a) | | | 1,206 | | | | 74,434 | |
Cross Country Healthcare, Inc.(a) | | | 4,593 | | | | 33,667 | |
Diplomat Pharmacy, Inc.(a) | | | 7,537 | | | | 101,448 | |
Ensign Group, Inc. (The) | | | 6,545 | | | | 253,881 | |
Genesis Healthcare, Inc.(a) | | | 8,928 | | | | 10,535 | |
Guardant Health, Inc.(a) | | | 1,819 | | | | 68,376 | |
HealthEquity, Inc.(a) | | | 7,190 | | | | 428,883 | |
LHC Group, Inc.(a) | | | 3,915 | | | | 367,540 | |
Magellan Health, Inc.(a) | | | 3,269 | | | | 185,973 | |
National HealthCare Corp. | | | 1,611 | | | | 126,383 | |
National Research Corp. | | | 1,465 | | | | 55,875 | |
Owens & Minor, Inc. | | | 8,111 | | | | 51,343 | |
Patterson Cos., Inc. | | | 10,889 | | | | 214,078 | |
PetIQ, Inc.(a) | | | 2,023 | | | | 47,480 | |
Providence Service Corp. (The)(a) | | | 1,481 | | | | 88,890 | |
Quorum Health Corp.(a) | | | 4,554 | | | | 13,161 | |
R1 RCM, Inc.(a) | | | 13,668 | | | | 108,661 | |
RadNet, Inc.(a) | | | 5,263 | | | | 53,525 | |
Select Medical Holdings Corp.(a) | | | 14,398 | | | | 221,009 | |
Surgery Partners, Inc.(a) | | | 2,431 | | | | 23,799 | |
Tenet Healthcare Corp.(a) | | | 11,115 | | | | 190,511 | |
Tivity Health, Inc.(a) | | | 5,310 | | | | 131,741 | |
| | | | |
| SCHEDULE OF INVESTMENTS | | | 13 | |
| | |
Schedule of Investments (continued) December 31, 2018 | | BlackRock Small Cap Index V.I. Fund (Percentages shown are based on Net Assets) |
| | | | | | | | |
| Security | | Shares | | | Value | |
| |
| Health Care Providers & Services (continued) | | | | |
Triple-S Management Corp., Class B(a) | | | 2,933 | | | $ | 51,005 | |
US Physical Therapy, Inc. | | | 1,655 | | | | 169,389 | |
Vapotherm, Inc.(a) | | | 498 | | | | 9,935 | |
| | | | | | | | |
| | | | | | | 4,515,887 | |
| |
| Health Care Technology — 1.1% | | | | |
Allscripts Healthcare Solutions, Inc.(a) | | | 23,142 | | | | 223,089 | |
Castlight Health, Inc., Class B(a) | | | 8,716 | | | | 18,914 | |
Computer Programs & Systems, Inc. | | | 1,438 | | | | 36,094 | |
Evolent Health, Inc., Class A(a) | | | 9,051 | | | | 180,567 | |
HealthStream, Inc. | | | 3,440 | | | | 83,076 | |
HMS Holdings Corp.(a) | | | 11,004 | | | | 309,542 | |
Inovalon Holdings, Inc., Class A(a) | | | 9,148 | | | | 129,719 | |
Inspire Medical Systems, Inc.(a) | | | 1,531 | | | | 64,685 | |
Medidata Solutions, Inc.(a) | | | 7,523 | | | | 507,201 | |
NantHealth, Inc.(a) | | | 2,817 | | | | 1,533 | |
NextGen Healthcare Information Systems LLC(a) | | | 7,059 | | | | 106,944 | |
Omnicell, Inc.(a) | | | 5,144 | | | | 315,018 | |
Simulations Plus, Inc. | | | 1,344 | | | | 26,746 | |
Tabula Rasa HealthCare, Inc.(a) | | | 2,325 | | | | 148,242 | |
Teladoc Health, Inc.(a) | | | 8,899 | | | | 441,123 | |
Vocera Communications, Inc.(a) | | | 3,957 | | | | 155,708 | |
| | | | | | | | |
| | | | | | | 2,748,201 | |
| |
| Hotels, Restaurants & Leisure — 2.9% | | | | |
BBX Capital Corp. | | | 8,715 | | | | 49,937 | |
Belmond Ltd., Class A(a) | | | 11,898 | | | | 297,807 | |
Biglari Holdings, Inc., Class A(a) | | | 15 | | | | 8,815 | |
BJ’s Restaurants, Inc. | | | 2,745 | | | | 138,815 | |
Bloomin’ Brands, Inc. | | | 11,128 | | | | 199,080 | |
Bluegreen Vacations Corp. | | | 1,041 | | | | 13,460 | |
Bojangles’, Inc.(a) | | | 2,077 | | | | 33,398 | |
Boyd Gaming Corp. | | | 10,937 | | | | 227,271 | |
Brinker International, Inc. | | | 5,036 | | | | 221,483 | |
Carrols Restaurant Group, Inc.(a) | | | 4,613 | | | | 45,392 | |
Century Casinos, Inc.(a) | | | 3,588 | | | | 26,515 | |
Cheesecake Factory, Inc. (The) | | | 5,485 | | | | 238,652 | |
Churchill Downs, Inc. | | | 1,565 | | | | 381,766 | |
Chuy’s Holdings, Inc.(a) | | | 2,223 | | | | 39,436 | |
Cracker Barrel Old Country Store, Inc. | | | 2,557 | | | | 408,762 | |
Dave & Buster’s Entertainment, Inc. | | | 5,292 | | | | 235,811 | |
Del Frisco’s Restaurant Group, Inc.(a) | | | 3,871 | | | | 27,678 | |
Del Taco Restaurants, Inc.(a) | | | 3,868 | | | | 38,641 | |
Denny’s Corp.(a) | | | 8,234 | | | | 133,473 | |
Dine Brands Global, Inc. | | | 2,225 | | | | 149,831 | |
Drive Shack, Inc.(a) | | | 8,029 | | | | 31,474 | |
El Pollo Loco Holdings, Inc.(a) | | | 2,493 | | | | 37,819 | |
Eldorado Resorts, Inc.(a) | | | 8,745 | | | | 316,656 | |
Empire Resorts, Inc.(a) | | | 502 | | | | 5,085 | |
Fiesta Restaurant Group, Inc.(a) | | | 3,154 | | | | 48,919 | |
Golden Entertainment, Inc.(a) | | | 2,413 | | | | 38,656 | |
Habit Restaurants, Inc. (The), Class A(a) | | | 2,656 | | | | 27,888 | |
International Speedway Corp., Class A | | | 3,217 | | | | 141,098 | |
J Alexander’s Holdings, Inc.(a) | | | 1,396 | | | | 11,489 | |
Jack in the Box, Inc. | | | 3,611 | | | | 280,322 | |
Lindblad Expeditions Holdings, Inc.(a) | | | 2,560 | | | | 34,458 | |
Marriott Vacations Worldwide Corp. | | | 5,168 | | | | 364,396 | |
Monarch Casino & Resort, Inc.(a) | | | 1,502 | | | | 57,286 | |
Nathan’s Famous, Inc. | | | 366 | | | | 24,321 | |
Noodles & Co.(a) | | | 1,864 | | | | 13,029 | |
OBH, Inc.(a) | | | 101 | | | | 11,472 | |
Papa John’s International, Inc. | | | 2,949 | | | | 117,400 | |
Penn National Gaming, Inc.(a) | | | 14,319 | | | | 269,627 | |
Planet Fitness, Inc., Class A(a) | | | 11,578 | | | | 620,812 | |
PlayAGS, Inc.(a) | | | 2,917 | | | | 67,091 | |
| | | | | | | | |
| Security | | Shares | | | Value | |
| |
| Hotels, Restaurants & Leisure (continued) | | | | |
Potbelly Corp.(a) | | | 3,040 | | | $ | 24,472 | |
RCI Hospitality Holdings, Inc. | | | 1,101 | | | | 24,585 | |
Red Lion Hotels Corp.(a) | | | 1,917 | | | | 15,719 | |
Red Robin Gourmet Burgers, Inc.(a) | | | 1,725 | | | | 46,092 | |
Red Rock Resorts, Inc., Class A | | | 9,232 | | | | 187,502 | |
Ruth’s Hospitality Group, Inc. | | | 3,835 | | | | 87,170 | |
Scientific Games Corp., Class A(a) | | | 7,299 | | | | 130,506 | |
SeaWorld Entertainment, Inc.(a) | | | 7,292 | | | | 161,080 | |
Shake Shack, Inc., Class A(a) | | | 3,274 | | | | 148,705 | |
Speedway Motorsports, Inc. | | | 1,307 | | | | 21,265 | |
Texas Roadhouse, Inc. | | | 8,888 | | | | 530,614 | |
Town Sports International Holdings, Inc.(a) | | | 2,279 | | | | 14,586 | |
Wingstop, Inc. | | | 3,857 | | | | 247,581 | |
| | | | | | | | |
| | | | | | | 7,075,198 | |
| |
| Household Durables — 1.5% | | | | |
Bassett Furniture Industries, Inc. | | | 1,195 | | | | 23,948 | |
Beazer Homes USA, Inc.(a) | | | 4,174 | | | | 39,569 | |
Cavco Industries, Inc.(a) | | | 1,136 | | | | 148,112 | |
Century Communities, Inc.(a) | | | 3,474 | | | | 59,961 | |
Ethan Allen Interiors, Inc. | | | 3,176 | | | | 55,866 | |
Flexsteel Industries, Inc. | | | 891 | | | | 19,673 | |
GoPro, Inc., Class A(a) | | | 14,999 | | | | 63,596 | |
Green Brick Partners, Inc.(a) | | | 2,967 | | | | 21,481 | |
Hamilton Beach Brands Holding Co., Class A | | | 1,018 | | | | 23,882 | |
Helen of Troy Ltd.(a) | | | 3,517 | | | | 461,360 | |
Hooker Furniture Corp. | | | 1,537 | | | | 40,485 | |
Hovnanian Enterprises, Inc., Class A(a) | | | 13,660 | | | | 9,342 | |
Installed Building Products, Inc.(a) | | | 2,917 | | | | 98,274 | |
iRobot Corp.(a) | | | 3,544 | | | | 296,775 | |
KB Home | | | 11,411 | | | | 217,950 | |
La-Z-Boy, Inc. | | | 6,200 | | | | 171,802 | |
LGI Homes, Inc.(a) | | | 2,456 | | | | 111,060 | |
Lifetime Brands, Inc. | | | 1,738 | | | | 17,432 | |
Lovesac Co. (The)(a) | | | 847 | | | | 19,430 | |
M/I Homes, Inc.(a) | | | 3,678 | | | | 77,312 | |
MDC Holdings, Inc. | | | 6,021 | | | | 169,250 | |
Meritage Homes Corp.(a) | | | 4,800 | | | | 176,256 | |
New Home Co., Inc. (The)(a) | | | 2,045 | | | | 10,695 | |
Purple Innovation, Inc.(a) | | | 885 | | | | 5,213 | |
Roku, Inc.(a) | | | 5,755 | | | | 176,333 | |
Skyline Champion Corp. | | | 3,832 | | | | 56,292 | |
Sonos, Inc.(a) | | | 2,457 | | | | 24,128 | |
Taylor Morrison Home Corp., Class A(a) | | | 15,333 | | | | 243,795 | |
TopBuild Corp.(a) | | | 4,710 | | | | 211,950 | |
TRI Pointe Group, Inc.(a) | | | 17,901 | | | | 195,658 | |
Tupperware Brands Corp. | | | 6,306 | | | | 199,080 | |
Turtle Beach Corp.(a) | | | 1,254 | | | | 17,895 | |
Universal Electronics, Inc.(a) | | | 1,789 | | | | 45,226 | |
Vuzix Corp.(a) | | | 3,746 | | | | 18,018 | |
William Lyon Homes, Class A(a) | | | 4,242 | | | | 45,347 | |
ZAGG, Inc.(a) | | | 3,629 | | | | 35,492 | |
| | | | | | | | |
| | | | | | | 3,607,938 | |
| |
| Household Products — 0.2% | | | | |
Central Garden & Pet Co.(a) | | | 1,274 | | | | 43,890 | |
Central Garden & Pet Co., Class A(a) | | | 5,377 | | | | 168,031 | |
Oil-Dri Corp. of America | | | 585 | | | | 15,502 | |
WD-40 Co. | | | 1,812 | | | | 332,067 | |
| | | | | | | | |
| | | | | | | 559,490 | |
|
| Independent Power and Renewable Electricity Producers — 0.3% | |
Atlantic Power Corp.(a) | | | 15,883 | | | | 34,466 | |
Clearway Energy, Inc. | | | 13,867 | | | | 237,679 | |
Ormat Technologies, Inc. | | | 5,287 | | | | 276,510 | |
Pattern Energy Group, Inc., Class A | | | 10,741 | | | | 199,998 | |
| | |
| 14 | | 2018 BLACKROCK ANNUAL REPORTTO SHAREHOLDERS |
| | |
Schedule of Investments (continued) December 31, 2018 | | BlackRock Small Cap Index V.I. Fund (Percentages shown are based on Net Assets) |
| | | | | | | | |
| Security | | Shares | | | Value | |
|
| Independent Power and Renewable Electricity Producers (continued) | |
TerraForm Power, Inc., Class A | | | 9,713 | | | $ | 108,980 | |
| | | | | | | | |
| | | | | | | 857,633 | |
| |
| Industrial Conglomerates — 0.1% | | | | |
Raven Industries, Inc. | | | 4,761 | | | | 172,301 | |
| | | | | | | | |
| |
| Insurance — 2.8% | | | | |
Ambac Financial Group, Inc.(a) | | | 6,015 | | | | 103,699 | |
American Equity Investment Life Holding Co. | | | 11,897 | | | | 332,402 | |
AMERISAFE, Inc. | | | 2,537 | | | | 143,823 | |
Argo Group International Holdings Ltd. | | | 4,305 | | | | 289,511 | |
Citizens, Inc.(a) | | | 6,570 | | | | 49,406 | |
CNO Financial Group, Inc. | | | 21,825 | | | | 324,756 | |
Crawford & Co., Class B | | | 1,060 | | | | 9,540 | |
Donegal Group, Inc., Class A | | | 1,325 | | | | 18,080 | |
eHealth, Inc.(a) | | | 2,491 | | | | 95,704 | |
EMC Insurance Group, Inc. | | | 1,156 | | | | 36,819 | |
Employers Holdings, Inc. | | | 4,281 | | | | 179,674 | |
Enstar Group Ltd.(a) | | | 1,599 | | | | 267,944 | |
FBL Financial Group, Inc., Class A | | | 1,313 | | | | 86,198 | |
FedNat Holding Co. | | | 1,367 | | | | 27,231 | |
Genworth Financial, Inc., Class A(a) | | | 66,959 | | | | 312,029 | |
Global Indemnity Ltd. | | | 1,088 | | | | 39,418 | |
Goosehead Insurance, Inc., Class A(a) | | | 1,220 | | | | 32,074 | |
Greenlight Capital Re Ltd., Class A(a) | | | 3,963 | | | | 34,161 | |
Hallmark Financial Services, Inc.(a) | | | 1,538 | | | | 16,441 | |
HCI Group, Inc. | | | 877 | | | | 44,560 | |
Health Insurance Innovations, Inc., Class A(a) | | | 1,696 | | | | 45,334 | |
Heritage Insurance Holdings, Inc. | | | 2,640 | | | | 38,861 | |
Horace Mann Educators Corp. | | | 5,465 | | | | 204,664 | |
Independence Holding Co. | | | 533 | | | | 18,762 | |
Investors Title Co. | | | 168 | | | | 29,682 | |
James River Group Holdings Ltd. | | | 3,445 | | | | 125,880 | |
Kemper Corp. | | | 7,003 | | | | 464,859 | |
Kingstone Cos., Inc. | | | 1,471 | | | | 26,022 | |
Kinsale Capital Group, Inc. | | | 2,592 | | | | 144,011 | |
Maiden Holdings Ltd. | | | 10,151 | | | | 16,749 | |
MBIA, Inc.(a) | | | 11,754 | | | | 104,846 | |
National General Holdings Corp. | | | 8,492 | | | | 205,591 | |
National Western Life Group, Inc., Class A | | | 303 | | | | 91,112 | |
Navigators Group, Inc. (The) | | | 2,751 | | | | 191,167 | |
NI Holdings, Inc.(a) | | | 1,086 | | | | 17,083 | |
Primerica, Inc. | | | 5,566 | | | | 543,854 | |
ProAssurance Corp. | | | 7,051 | | | | 285,989 | |
Protective Insurance Corp., Class B | | | 1,131 | | | | 18,831 | |
RLI Corp. | | | 5,209 | | | | 359,369 | |
Safety Insurance Group, Inc. | | | 1,948 | | | | 159,366 | |
Selective Insurance Group, Inc. | | | 7,709 | | | | 469,786 | |
State Auto Financial Corp. | | | 2,218 | | | | 75,501 | |
Stewart Information Services Corp. | | | 3,108 | | | | 128,671 | |
Third Point Reinsurance Ltd.(a) | | | 8,914 | | | | 85,931 | |
Tiptree, Inc. | | | 3,208 | | | | 17,933 | |
Trupanion, Inc.(a) | | | 3,346 | | | | 85,189 | |
United Fire Group, Inc. | | | 2,793 | | | | 154,872 | |
United Insurance Holdings Corp. | | | 2,729 | | | | 45,356 | |
Universal Insurance Holdings, Inc. | | | 4,202 | | | | 159,340 | |
| | | | | | | | |
| | | | | | | 6,758,081 | |
| |
| Interactive Media & Services — 0.5%(a) | | | | |
Care.com, Inc. | | | 2,614 | | | | 50,476 | |
Cargurus, Inc. | | | 6,644 | | | | 224,102 | |
Cars.com, Inc. | | | 8,957 | | | | 192,575 | |
Liberty TripAdvisor Holdings, Inc., Class A | | | 9,645 | | | | 153,259 | |
Meet Group, Inc. (The) | | | 8,941 | | | | 41,397 | |
QuinStreet, Inc. | | | 5,750 | | | | 93,323 | |
Travelzoo | | | 766 | | | | 7,530 | |
| | | | | | | | |
| Security | | Shares | | | Value | |
| |
| Interactive Media & Services (continued) | | | | |
TrueCar, Inc. | | | 12,283 | | | $ | 111,284 | |
Yelp, Inc. | | | 10,772 | | | | 376,912 | |
| | | | | | | | |
| | | | | | | 1,250,858 | |
| | |
| Internet & Direct Marketing Retail — 1.0% | | | | | | |
1-800-Flowers.com, Inc., Class A(a) | | | 3,304 | | | | 40,408 | |
Duluth Holdings, Inc., Class B(a) | | | 992 | | | | 25,028 | |
Etsy, Inc.(a) | | | 15,709 | | | | 747,277 | |
Gaia, Inc.(a) | | | 1,765 | | | | 18,286 | |
Groupon, Inc.(a) | | | 58,566 | | | | 187,411 | |
Lands’ End, Inc.(a) | | | 1,541 | | | | 21,898 | |
Leaf Group Ltd.(a) | | | 2,590 | | | | 17,742 | |
Liberty Expedia Holdings, Inc., Class A(a) | | | 7,235 | | | | 282,961 | |
Liquidity Services, Inc.(a) | | | 3,193 | | | | 19,701 | |
Nutrisystem, Inc. | | | 3,918 | | | | 171,922 | |
Overstock.com, Inc.(a) | | | 2,752 | | | | 37,372 | |
PetMed Express, Inc. | | | 2,650 | | | | 61,639 | |
Quotient Technology, Inc.(a) | | | 10,590 | | | | 113,101 | |
Remark Holdings, Inc.(a) | | | 4,410 | | | | 5,336 | |
Shutterfly, Inc.(a) | | | 4,386 | | | | 176,580 | |
Shutterstock, Inc. | | | 2,498 | | | | 89,953 | |
Stamps.com, Inc.(a) | | | 2,335 | | | | 363,419 | |
| | | | | | | | |
| | | | | | | 2,380,034 | |
| |
| IT Services — 2.0% | | | | |
Brightcove, Inc.(a) | | | 4,472 | | | | 31,483 | |
CACI International, Inc., Class A(a) | | | 3,174 | | | | 457,151 | |
Carbonite, Inc.(a) | | | 4,167 | | | | 105,258 | |
Cardtronics plc, Class A(a) | | | 5,269 | | | | 136,994 | |
Cass Information Systems, Inc. | | | 1,904 | | | | 100,781 | |
ConvergeOne Holdings, Inc. | | | 3,935 | | | | 48,715 | |
CSG Systems International, Inc. | | | 4,413 | | | | 140,201 | |
Endurance International Group Holdings, Inc.(a) | | | 9,321 | | | | 61,985 | |
Everi Holdings, Inc.(a) | | | 8,662 | | | | 44,609 | |
EVERTEC, Inc. | | | 8,093 | | | | 232,269 | |
Evo Payments, Inc., Class A(a) | | | 2,917 | | | | 71,962 | |
Exela Technologies, Inc.(a) | | | 6,071 | | | | 23,616 | |
ExlService Holdings, Inc.(a) | | | 4,433 | | | | 233,264 | |
GTT Communications, Inc.(a) | | | 5,635 | | | | 133,324 | |
Hackett Group, Inc. (The) | | | 3,187 | | | | 51,024 | |
I3 Verticals, Inc., Class A(a) | | | 1,168 | | | | 28,149 | |
Information Services Group, Inc.(a) | | | 5,071 | | | | 21,501 | |
Internap Corp.(a) | | | 2,478 | | | | 10,284 | |
Limelight Networks, Inc.(a) | | | 14,509 | | | | 33,951 | |
LiveRamp Holdings, Inc.(a) | | | 10,208 | | | | 394,335 | |
ManTech International Corp., Class A | | | 3,514 | | | | 183,765 | |
MAXIMUS, Inc. | | | 8,318 | | | | 541,419 | |
MoneyGram International, Inc.(a) | | | 4,673 | | | | 9,346 | |
NIC, Inc. | | | 8,547 | | | | 106,667 | |
Perficient, Inc.(a) | | | 3,793 | | | | 84,432 | |
Perspecta, Inc. | | | 19,081 | | | | 328,575 | |
PFSweb, Inc.(a) | | | 2,384 | | | | 12,230 | |
Presidio, Inc. | | | 4,762 | | | | 62,144 | |
PRGX Global, Inc.(a) | | | 2,445 | | | | 23,154 | |
Science Applications International Corp. | | | 5,627 | | | | 358,440 | |
ServiceSource International, Inc.(a) | | | 8,665 | | | | 9,358 | |
Sykes Enterprises, Inc.(a) | | | 5,252 | | | | 129,882 | |
Travelport Worldwide Ltd. | | | 16,667 | | | | 260,339 | |
TTEC Holdings, Inc. | | | 1,879 | | | | 53,683 | |
Tucows, Inc., Class A(a) | | | 1,263 | | | | 75,856 | |
Unisys Corp.(a) | | | 6,703 | | | | 77,956 | |
Virtusa Corp.(a) | | | 3,775 | | | | 160,777 | |
| | | | | | | | |
| | | | | | | 4,838,879 | |
| |
| Leisure Products — 0.4% | | | | |
Acushnet Holdings Corp. | | | 4,596 | | | | 96,838 | |
American Outdoor Brands Corp.(a) | | | 7,134 | | | | 91,743 | |
| | | | |
| SCHEDULE OF INVESTMENTS | | | 15 | |
| | |
Schedule of Investments (continued) December 31, 2018 | | BlackRock Small Cap Index V.I. Fund (Percentages shown are based on Net Assets) |
| | | | | | | | |
| Security | | Shares | | | Value | |
| |
| Leisure Products (continued) | | | | |
Callaway Golf Co. | | | 12,480 | | | $ | 190,944 | |
Clarus Corp. | | | 2,481 | | | | 25,108 | |
Escalade, Inc. | | | 1,657 | | | | 18,973 | |
Johnson Outdoors, Inc., Class A | | | 647 | | | | 38,005 | |
Malibu Boats, Inc., Class A(a) | | | 2,718 | | | | 94,586 | |
Marine Products Corp. | | | 921 | | | | 15,574 | |
MCBC Holdings, Inc.(a) | | | 2,448 | | | | 45,778 | |
Nautilus, Inc.(a) | | | 3,825 | | | | 41,692 | |
Sturm Ruger & Co., Inc. | | | 2,233 | | | | 118,840 | |
Vista Outdoor, Inc.(a) | | | 7,581 | | | | 86,044 | |
YETI Holdings, Inc.(a) | | | 1,878 | | | | 27,870 | |
| | | | | | | | |
| | | | | | | 891,995 | |
| |
| Life Sciences Tools & Services — 0.5% | | | | |
Accelerate Diagnostics, Inc.(a) | | | 3,461 | | | | 39,801 | |
Cambrex Corp.(a) | | | 4,370 | | | | 165,011 | |
ChromaDex Corp.(a) | | | 6,178 | | | | 21,191 | |
Codexis, Inc.(a) | | | 6,761 | | | | 112,909 | |
Enzo Biochem, Inc.(a) | | | 5,170 | | | | 14,373 | |
Fluidigm Corp.(a) | | | 2,929 | | | | 25,248 | |
Harvard Bioscience, Inc.(a) | | | 5,161 | | | | 16,412 | |
Luminex Corp. | | | 5,506 | | | | 127,244 | |
Medpace Holdings, Inc.(a) | | | 2,886 | | | | 152,756 | |
NanoString Technologies, Inc.(a) | | | 3,450 | | | | 51,163 | |
NeoGenomics, Inc.(a) | | | 8,428 | | | | 106,277 | |
Pacific Biosciences of California, Inc.(a) | | | 17,866 | | | | 132,208 | |
Quanterix Corp.(a) | | | 1,281 | | | | 23,455 | |
Syneos Health, Inc.(a) | | | 8,235 | | | | 324,047 | |
| | | | | | | | |
| | | | | | | 1,312,095 | |
| |
| Machinery — 3.6% | | | | |
Actuant Corp., Class A | | | 8,096 | | | | 169,935 | |
Alamo Group, Inc. | | | 1,279 | | | | 98,892 | |
Albany International Corp., Class A | | | 3,813 | | | | 238,046 | |
Altra Industrial Motion Corp. | | | 7,968 | | | | 200,395 | |
Astec Industries, Inc. | | | 3,042 | | | | 91,838 | |
Barnes Group, Inc. | | | 6,348 | | | | 340,380 | |
Blue Bird Corp.(a) | | | 1,933 | | | | 35,161 | |
Briggs & Stratton Corp. | | | 5,511 | | | | 72,084 | |
Chart Industries, Inc.(a) | | | 4,091 | | | | 266,038 | |
CIRCOR International, Inc.(a) | | | 2,159 | | | | 45,987 | |
Columbus McKinnon Corp. | | | 2,965 | | | | 89,365 | |
Commercial Vehicle Group, Inc.(a) | | | 3,913 | | | | 22,304 | |
DMC Global, Inc. | | | 1,896 | | | | 66,588 | |
Douglas Dynamics, Inc. | | | 2,949 | | | | 105,840 | |
Eastern Co. (The) | | | 893 | | | | 21,593 | |
Energy Recovery, Inc.(a) | | | 4,540 | | | | 30,554 | |
EnPro Industries, Inc. | | | 2,750 | | | | 165,275 | |
ESCO Technologies, Inc. | | | 3,381 | | | | 222,977 | |
Evoqua Water Technologies Corp.(a) | | | 10,052 | | | | 96,499 | |
Federal Signal Corp. | | | 7,890 | | | | 157,011 | |
Franklin Electric Co., Inc. | | | 6,160 | | | | 264,141 | |
FreightCar America, Inc.(a) | | | 1,439 | | | | 9,627 | |
Gencor Industries, Inc.(a) | | | 1,255 | | | | 13,767 | |
Global Brass & Copper Holdings, Inc. | | | 2,889 | | | | 72,658 | |
Gorman-Rupp Co. (The) | | | 2,343 | | | | 75,937 | |
Graham Corp. | | | 1,423 | | | | 32,501 | |
Greenbrier Cos., Inc. (The) | | | 4,203 | | | | 166,187 | |
Harsco Corp.(a) | | | 10,688 | | | | 212,264 | |
Hillenbrand, Inc. | | | 8,338 | | | | 316,260 | |
Hurco Cos., Inc. | | | 746 | | | | 26,632 | |
Hyster-Yale Materials Handling, Inc. | | | 1,377 | | | | 85,319 | |
John Bean Technologies Corp. | | | 4,158 | | | | 298,586 | |
Kadant, Inc. | | | 1,452 | | | | 118,280 | |
Kennametal, Inc. | | | 10,820 | | | | 360,090 | |
| | | | | | | | |
| Security | | Shares | | | Value | |
| |
| Machinery (continued) | | | | |
LB Foster Co., Class A(a) | | | 1,317 | | | $ | 20,940 | |
Lindsay Corp. | | | 1,425 | | | | 137,156 | |
Lydall, Inc.(a) | | | 2,247 | | | | 45,637 | |
Manitex International, Inc.(a) | | | 2,276 | | | | 12,928 | |
Manitowoc Co., Inc. (The)(a) | | | 4,691 | | | | 69,286 | |
Meritor, Inc.(a) | | | 10,393 | | | | 175,746 | |
Milacron Holdings Corp.(a) | | | 9,209 | | | | 109,495 | |
Miller Industries, Inc. | | | 1,464 | | | | 39,528 | |
Mueller Industries, Inc. | | | 7,529 | | | | 175,877 | |
Mueller Water Products, Inc., Class A | | | 20,543 | | | | 186,941 | |
Navistar International Corp.(a) | | | 6,534 | | | | 169,557 | |
NN, Inc. | | | 4,895 | | | | 32,845 | |
Omega Flex, Inc. | | | 370 | | | | 20,006 | |
Park-Ohio Holdings Corp. | | | 1,153 | | | | 35,386 | |
Proto Labs, Inc.(a) | | | 3,599 | | | | 405,931 | |
RBC Bearings, Inc.(a) | | | 3,173 | | | | 415,980 | |
REV Group, Inc. | | | 3,979 | | | | 29,882 | |
Rexnord Corp.(a) | | | 13,884 | | | | 318,638 | |
Spartan Motors, Inc. | | | 4,530 | | | | 32,752 | |
SPX Corp.(a) | | | 5,718 | | | | 160,161 | |
SPX FLOW, Inc.(a) | | | 5,598 | | | | 170,291 | |
Standex International Corp. | | | 1,691 | | | | 113,601 | |
Sun Hydraulics Corp. | | | 3,796 | | | | 125,989 | |
Tennant Co. | | | 2,371 | | | | 123,553 | |
Titan International, Inc. | | | 6,671 | | | | 31,087 | |
TriMas Corp.(a) | | | 6,087 | | | | 166,114 | |
Twin Disc, Inc.(a) | | | 1,346 | | | | 19,853 | |
Wabash National Corp. | | | 7,510 | | | | 98,231 | |
Watts Water Technologies, Inc., Class A | | | 3,690 | | | | 238,116 | |
Woodward, Inc. | | | 6,904 | | | | 512,898 | |
| | | | | | | | |
| | | | | | | 8,783,416 | |
| |
| Marine — 0.1% | | | | |
Costamare, Inc. | | | 6,059 | | | | 26,599 | |
Eagle Bulk Shipping, Inc.(a) | | | 5,652 | | | | 26,056 | |
Genco Shipping & Trading Ltd.(a) | | | 1,183 | | | | 9,334 | |
Matson, Inc. | | | 5,626 | | | | 180,144 | |
Safe Bulkers, Inc.(a) | | | 7,634 | | | | 13,589 | |
Scorpio Bulkers, Inc. | | | 7,727 | | | | 42,730 | |
| | | | | | | | |
| | | | | | | 298,452 | |
| |
| Media — 1.4% | | | | |
Beasley Broadcast Group, Inc., Class A | | | 779 | | | | 2,921 | |
Boston Omaha Corp., Class A(a) | | | 807 | | | | 18,884 | |
Cardlytics, Inc.(a) | | | 772 | | | | 8,361 | |
Central European Media Enterprises Ltd., Class A(a) | | | 10,652 | | | | 29,612 | |
Clear Channel Outdoor Holdings, Inc., Class A | | | 4,190 | | | | 21,746 | |
Daily Journal Corp.(a) | | | 144 | | | | 33,696 | |
Emerald Expositions Events, Inc. | | | 3,293 | | | | 40,636 | |
Entercom Communications Corp., Class A | | | 17,002 | | | | 97,081 | |
Entravision Communications Corp., Class A | | | 8,032 | | | | 23,373 | |
EW Scripps Co. (The), Class A | | | 6,057 | | | | 95,277 | |
Fluent, Inc.(a) | | | 5,182 | | | | 18,655 | |
Gannett Co., Inc. | | | 15,045 | | | | 128,334 | |
Gray Television, Inc.(a) | | | 10,610 | | | | 156,391 | |
Hemisphere Media Group, Inc.(a) | | | 2,547 | | | | 30,920 | |
Liberty Latin America Ltd., Class A(a) | | | 5,770 | | | | 83,550 | |
Liberty Latin America Ltd., Class C(a) | | | 15,100 | | | | 220,007 | |
Loral Space & Communications, Inc.(a) | | | 1,705 | | | | 63,511 | |
MDC Partners, Inc., Class A(a) | | | 7,197 | | | | 18,784 | |
Meredith Corp. | | | 5,238 | | | | 272,062 | |
MSG Networks, Inc., Class A(a) | | | 7,859 | | | | 185,158 | |
National CineMedia, Inc. | | | 10,245 | | | | 66,388 | |
New Media Investment Group, Inc. | | | 7,919 | | | | 91,623 | |
New York Times Co. (The), Class A | | | 17,448 | | | | 388,916 | |
| | |
| 16 | | 2018 BLACKROCK ANNUAL REPORTTO SHAREHOLDERS |
| | |
Schedule of Investments (continued) December 31, 2018 | | BlackRock Small Cap Index V.I. Fund (Percentages shown are based on Net Assets) |
| | | | | | | | |
| Security | | Shares | | | Value | |
| |
| Media (continued) | | | | |
Nexstar Media Group, Inc., Class A | | | 5,811 | | | $ | 456,977 | |
Saga Communications, Inc., Class A | | | 599 | | | | 19,905 | |
Scholastic Corp. | | | 3,740 | | | | 150,572 | |
Sinclair Broadcast Group, Inc., Class A | | | 8,626 | | | | 227,209 | |
TechTarget, Inc.(a) | | | 2,698 | | | | 32,943 | |
TEGNA, Inc. | | | 28,796 | | | | 313,012 | |
Tribune Publishing Co.(a) | | | 2,161 | | | | 24,506 | |
WideOpenWest, Inc.(a) | | | 3,932 | | | | 28,035 | |
| | | | | | | | |
| | | | | | | 3,349,045 | |
| |
| Metals & Mining — 1.2% | | | | |
AK Steel Holding Corp.(a) | | | 41,835 | | | | 94,129 | |
Allegheny Technologies, Inc.(a) | | | 16,674 | | | | 362,993 | |
Carpenter Technology Corp. | | | 6,195 | | | | 220,604 | |
Century Aluminum Co.(a) | | | 6,633 | | | | 48,487 | |
Cleveland-Cliffs, Inc.(a) | | | 39,545 | | | | 304,101 | |
Coeur Mining, Inc.(a) | | | 24,633 | | | | 110,109 | |
Commercial Metals Co. | | | 15,466 | | | | 247,765 | |
Compass Minerals International, Inc. | | | 4,526 | | | | 188,689 | |
Gold Resource Corp. | | | 6,157 | | | | 24,628 | |
Haynes International, Inc. | | | 1,648 | | | | 43,507 | |
Hecla Mining Co. | | | 60,193 | | | | 142,055 | |
Kaiser Aluminum Corp. | | | 1,992 | | | | 177,866 | |
Livent Corp.(a) | | | 2,230 | | | | 30,774 | |
Materion Corp. | | | 2,672 | | | | 120,213 | |
Olympic Steel, Inc. | | | 1,022 | | | | 14,584 | |
Ramaco Resources, Inc.(a) | | | 928 | | | | 4,594 | |
Ryerson Holding Corp.(a) | | | 2,354 | | | | 14,924 | |
Schnitzer Steel Industries, Inc., Class A | | | 3,479 | | | | 74,972 | |
SunCoke Energy, Inc.(a) | | | 8,629 | | | | 73,778 | |
Synalloy Corp. | | | 1,286 | | | | 21,335 | |
Tahoe Resources, Inc.(a) | | | 41,247 | | | | 150,552 | |
TimkenSteel Corp.(a) | | | 5,311 | | | | 46,418 | |
Universal Stainless & Alloy Products, Inc.(a) | | | 1,112 | | | | 18,026 | |
Warrior Met Coal, Inc. | | | 5,735 | | | | 138,271 | |
Worthington Industries, Inc. | | | 5,577 | | | | 194,303 | |
| | | | | | | | |
| | | | | | | 2,867,677 | |
| |
| Mortgage Real Estate Investment Trusts (REITs) — 1.1% | | | | |
AG Mortgage Investment Trust, Inc. | | | 3,731 | | | | 59,435 | |
Anworth Mortgage Asset Corp. | | | 12,933 | | | | 52,249 | |
Apollo Commercial Real Estate Finance, Inc. | | | 16,380 | | | | 272,891 | |
Arbor Realty Trust, Inc. | | | 7,864 | | | | 79,190 | |
Ares Commercial Real Estate Corp. | | | 3,558 | | | | 46,396 | |
ARMOUR Residential REIT, Inc. | | | 5,526 | | | | 113,283 | |
Blackstone Mortgage Trust, Inc., Class A | | | 14,850 | | | | 473,121 | |
Capstead Mortgage Corp. | | | 12,221 | | | | 81,514 | |
Cherry Hill Mortgage Investment Corp. | | | 2,191 | | | | 38,430 | |
Colony Credit Real Estate, Inc. | | | 11,153 | | | | 176,106 | |
Dynex Capital, Inc. | | | 7,751 | | | | 44,336 | |
Exantas Capital Corp. | | | 4,032 | | | | 40,401 | |
Granite Point Mortgage Trust, Inc. | | | 5,699 | | | | 102,753 | |
Great Ajax Corp. | | | 2,117 | | | | 25,510 | |
Invesco Mortgage Capital, Inc. | | | 14,923 | | | | 216,085 | |
KKR Real Estate Finance Trust, Inc. | | | 2,532 | | | | 48,488 | |
Ladder Capital Corp. | | | 11,995 | | | | 185,563 | |
New York Mortgage Trust, Inc. | | | 19,676 | | | | 115,892 | |
Orchid Island Capital, Inc. | | | 6,950 | | | | 44,410 | |
PennyMac Mortgage Investment Trust | | | 7,959 | | | | 148,197 | |
Ready Capital Corp. | | | 2,193 | | | | 30,329 | |
Redwood Trust, Inc. | | | 10,915 | | | | 164,489 | |
TPG RE Finance Trust, Inc. | | | 4,668 | | | | 85,331 | |
Western Asset Mortgage Capital Corp. | | | 5,372 | | | | 44,802 | |
| | | | | | | | |
| | | | | | | 2,689,201 | |
| | | | | | | | |
| Security | | Shares | | | Value | |
| |
| Multiline Retail — 0.3% | | | | |
Big Lots, Inc. | | | 5,334 | | | $ | 154,259 | |
Dillard’s, Inc., Class A | | | 1,546 | | | | 93,239 | |
JC Penney Co., Inc.(a) | | | 41,696 | | | | 43,364 | |
Ollie’s Bargain Outlet Holdings, Inc.(a) | | | 6,602 | | | | 439,099 | |
| | | | | | | | |
| | | | | | | 729,961 | |
| |
| Multi-Utilities — 0.5% | | | | |
Avista Corp. | | | 8,706 | | | | 369,831 | |
Black Hills Corp. | | | 7,116 | | | | 446,742 | |
NorthWestern Corp. | | | 6,713 | | | | 399,021 | |
Unitil Corp. | | | 1,933 | | | | 97,887 | |
| | | | | | | | |
| | | | | | | 1,313,481 | |
| |
| Oil, Gas & Consumable Fuels — 2.3% | | | | |
Abraxas Petroleum Corp.(a) | | | 20,376 | | | | 22,210 | |
Adams Resources & Energy, Inc. | | | 325 | | | | 12,581 | |
Alta Mesa Resources, Inc., Class A(a) | | | 13,047 | | | | 13,047 | |
Approach Resources, Inc.(a) | | | 6,960 | | | | 6,069 | |
Arch Coal, Inc., Class A | | | 2,188 | | | | 181,582 | |
Ardmore Shipping Corp.(a) | | | 4,945 | | | | 23,093 | |
Berry Petroleum Corp. | | | 1,549 | | | | 13,554 | |
Bonanza Creek Energy, Inc.(a) | | | 2,503 | | | | 51,737 | |
California Resources Corp.(a) | | | 6,001 | | | | 102,257 | |
Callon Petroleum Co.(a) | | | 30,327 | | | | 196,822 | |
Carrizo Oil & Gas, Inc.(a) | | | 11,610 | | | | 131,077 | |
Clean Energy Fuels Corp.(a) | | | 18,219 | | | | 31,337 | |
Cloud Peak Energy, Inc.(a) | | | 7,969 | | | | 2,919 | |
CONSOL Energy, Inc.(a) | | | 3,730 | | | | 118,278 | |
CVR Energy, Inc. | | | 2,305 | | | | 79,476 | |
Delek US Holdings, Inc. | | | 10,456 | | | | 339,925 | |
Denbury Resources, Inc.(a) | | | 61,047 | | | | 104,390 | |
DHT Holdings, Inc. | | | 12,204 | | | | 47,840 | |
Dorian LPG Ltd.(a) | | | 3,080 | | | | 17,956 | |
Earthstone Energy, Inc., Class A(a) | | | 2,843 | | | | 12,850 | |
Eclipse Resources Corp.(a) | | | 14,180 | | | | 14,889 | |
Energy Fuels, Inc.(a) | | | 11,654 | | | | 33,214 | |
EP Energy Corp., Class A(a) | | | 6,343 | | | | 4,440 | |
Evolution Petroleum Corp. | | | 3,310 | | | | 22,574 | |
Frontline Ltd.(a) | | | 10,214 | | | | 56,483 | |
GasLog Ltd. | | | 5,410 | | | | 89,049 | |
Golar LNG Ltd. | | | 12,565 | | | | 273,414 | |
Goodrich Petroleum Corp.(a) | | | 1,356 | | | | 18,306 | |
Green Plains, Inc. | | | 5,233 | | | | 68,605 | |
Gulfport Energy Corp.(a) | | | 23,199 | | | | 151,953 | |
Halcon Resources Corp.(a) | | | 17,721 | | | | 30,126 | |
Hallador Energy Co. | | | 2,493 | | | | 12,640 | |
HighPoint Resources Corp.(a) | | | 14,441 | | | | 35,958 | |
International Seaways, Inc.(a) | | | 2,888 | | | | 48,634 | |
Isramco, Inc.(a) | | | 61 | | | | 7,229 | |
Jagged Peak Energy, Inc.(a) | | | 8,525 | | | | 77,748 | |
Laredo Petroleum, Inc.(a) | | | 20,657 | | | | 74,778 | |
Lilis Energy, Inc.(a) | | | 6,885 | | | | 9,432 | |
Matador Resources Co.(a) | | | 13,996 | | | | 217,358 | |
Midstates Petroleum Co., Inc.(a) | | | 2,475 | | | | 18,587 | |
NACCO Industries, Inc., Class A | | | 369 | | | | 12,509 | |
NextDecade Corp.(a) | | | 1,214 | | | | 6,556 | |
Nordic American Tankers Ltd. | | | 16,520 | | | | 33,040 | |
Northern Oil and Gas, Inc.(a) | | | 25,823 | | | | 58,360 | |
Oasis Petroleum, Inc.(a) | | | 35,789 | | | | 197,913 | |
Overseas Shipholding Group, Inc., Class A(a) | | | 9,123 | | | | 15,144 | |
Panhandle Oil and Gas, Inc., Class A | | | 2,093 | | | | 32,442 | |
Par Pacific Holdings, Inc.(a) | | | 4,130 | | | | 58,563 | |
PDC Energy, Inc.(a) | | | 8,802 | | | | 261,948 | |
Peabody Energy Corp. | | | 10,403 | | | | 317,083 | |
Penn Virginia Corp.(a) | | | 1,648 | | | | 89,091 | |
| | | | |
| SCHEDULE OF INVESTMENTS | | | 17 | |
| | |
Schedule of Investments (continued) December 31, 2018 | | BlackRock Small Cap Index V.I. Fund (Percentages shown are based on Net Assets) |
| | | | | | | | |
| Security | | Shares | | | Value | |
| |
| Oil, Gas & Consumable Fuels (continued) | | | | |
Renewable Energy Group, Inc.(a) | | | 4,902 | | | $ | 125,981 | |
Resolute Energy Corp.(a) | | | 2,900 | | | | 84,042 | |
REX American Resources Corp.(a) | | | 756 | | | | 51,491 | |
Ring Energy, Inc.(a) | | | 7,602 | | | | 38,618 | |
Sanchez Energy Corp.(a) | | | 8,564 | | | | 2,312 | |
SandRidge Energy, Inc.(a) | | | 3,997 | | | | 30,417 | |
Scorpio Tankers, Inc. | | | 57,383 | | | | 100,994 | |
SemGroup Corp., Class A | | | 10,507 | | | | 144,787 | |
Ship Finance International Ltd. | | | 9,683 | | | | 101,962 | |
SilverBow Resources, Inc.(a) | | | 792 | | | | 18,723 | |
Southwestern Energy Co.(a) | | | 78,311 | | | | 267,041 | |
SRC Energy, Inc.(a) | | | 32,129 | | | | 151,006 | |
Talos Energy, Inc.(a) | | | 2,676 | | | | 43,672 | |
Teekay Corp. | | | 9,099 | | | | 30,391 | |
Teekay Tankers Ltd., Class A | | | 22,004 | | | | 20,420 | |
Tellurian, Inc.(a) | | | 11,306 | | | | 78,577 | |
Ultra Petroleum Corp.(a) | | | 14,328 | | | | 10,891 | |
Uranium Energy Corp.(a) | | | 20,527 | | | | 25,659 | |
W&T Offshore, Inc.(a) | | | 12,348 | | | | 50,874 | |
WildHorse Resource Development Corp.(a) | | | 3,625 | | | | 51,149 | |
World Fuel Services Corp. | | | 8,898 | | | | 190,506 | |
Zion Oil & Gas, Inc.(a) | | | 8,539 | | | | 3,564 | |
| | | | | | | | |
| | | | | | | 5,480,143 | |
| |
| Paper & Forest Products — 0.4% | | | | |
Boise Cascade Co. | | | 5,163 | | | | 123,137 | |
Clearwater Paper Corp.(a) | | | 2,145 | | | | 52,274 | |
Louisiana-Pacific Corp. | | | 18,139 | | | | 403,049 | |
Neenah, Inc. | | | 2,215 | | | | 130,508 | |
PH Glatfelter Co. | | | 5,770 | | | | 56,315 | |
Schweitzer-Mauduit International, Inc. | | | 4,080 | | | | 102,204 | |
Verso Corp., Class A(a) | | | 4,578 | | | | 102,547 | |
| | | | | | | | |
| | | | | | | 970,034 | |
| |
| Personal Products — 0.4% | | | | |
Edgewell Personal Care Co.(a) | | | 7,167 | | | | 267,688 | |
elf Beauty, Inc.(a) | | | 2,958 | | | | 25,616 | |
Inter Parfums, Inc. | | | 2,311 | | | | 151,532 | |
Medifast, Inc. | | | 1,552 | | | | 194,031 | |
Natural Health Trends Corp. | | | 841 | | | | 15,550 | |
Nature’s Sunshine Products, Inc.(a) | | | 635 | | | | 5,175 | |
Revlon, Inc., Class A(a) | | | 1,015 | | | | 25,568 | |
USANA Health Sciences, Inc.(a) | | | 1,682 | | | | 198,022 | |
| | | | | | | | |
| | | | | | | 883,182 | |
| |
| Pharmaceuticals — 1.9% | | | | |
Aclaris Therapeutics, Inc.(a) | | | 4,586 | | | | 33,891 | |
Aerie Pharmaceuticals, Inc.(a) | | | 4,723 | | | | 170,500 | |
Akcea Therapeutics, Inc.(a) | | | 1,693 | | | | 51,027 | |
Akorn, Inc.(a) | | | 12,399 | | | | 42,033 | |
Amneal Pharmaceuticals, Inc.(a) | | | 11,541 | | | | 156,150 | |
Amphastar Pharmaceuticals, Inc.(a) | | | 4,721 | | | | 93,948 | |
Ampio Pharmaceuticals, Inc.(a) | | | 12,735 | | | | 5,028 | |
ANI Pharmaceuticals, Inc.(a) | | | 1,045 | | | | 47,046 | |
Aquestive Therapeutics, Inc.(a) | | | 785 | | | | 4,945 | |
Aratana Therapeutics, Inc.(a) | | | 6,581 | | | | 40,342 | |
Arvinas, Inc.(a) | | | 821 | | | | 10,550 | |
Assembly Biosciences, Inc.(a) | | | 2,791 | | | | 63,132 | |
Assertio Therapeutics, Inc.(a) | | | 6,607 | | | | 23,851 | |
Clearside Biomedical, Inc.(a) | | | 4,517 | | | | 4,833 | |
Collegium Pharmaceutical, Inc.(a) | | | 3,896 | | | | 66,894 | |
Corcept Therapeutics, Inc.(a) | | | 12,970 | | | | 173,279 | |
Corium International, Inc., CVR(a) | | | 3,221 | | | | 580 | |
Cymabay Therapeutics, Inc.(a) | | | 7,824 | | | | 61,575 | |
Dermira, Inc.(a) | | | 4,525 | | | | 32,535 | |
Dova Pharmaceuticals, Inc.(a) | | | 1,449 | | | | 10,983 | |
| | | | | | | | |
| Security | | Shares | | | Value | |
| |
| Pharmaceuticals (continued) | | | | |
Durect Corp.(a) | | | 17,057 | | | $ | 8,240 | |
Eloxx Pharmaceuticals, Inc.(a) | | | 2,875 | | | | 34,529 | |
Endo International plc(a) | | | 29,752 | | | | 217,190 | |
Evolus, Inc.(a) | | | 1,430 | | | | 17,017 | |
Horizon Pharma plc(a) | | | 21,956 | | | | 429,020 | |
Innovate Biopharmaceuticals, Inc.(a) | | | 2,975 | | | | 6,872 | |
Innoviva, Inc.(a) | | | 9,153 | | | | 159,720 | |
Intersect ENT, Inc.(a) | | | 3,975 | | | | 112,016 | |
Intra-Cellular Therapies, Inc.(a) | | | 5,947 | | | | 67,736 | |
Kala Pharmaceuticals, Inc.(a) | | | 1,535 | | | | 7,506 | |
Lannett Co., Inc.(a) | | | 4,575 | | | | 22,692 | |
Liquidia Technologies, Inc.(a) | | | 751 | | | | 16,267 | |
Mallinckrodt plc(a) | | | 10,930 | | | | 172,694 | |
Marinus Pharmaceuticals, Inc.(a) | | | 4,783 | | | | 13,727 | |
Medicines Co. (The)(a) | | | 9,140 | | | | 174,940 | |
Melinta Therapeutics, Inc.(a) | | | 3,241 | | | | 2,569 | |
Menlo Therapeutics, Inc.(a) | | | 995 | | | | 4,099 | |
MyoKardia, Inc.(a) | | | 4,517 | | | | 220,701 | |
Neos Therapeutics, Inc.(a) | | | 4,198 | | | | 6,927 | |
Ocular Therapeutix, Inc.(a) | | | 3,929 | | | | 15,637 | |
Odonate Therapeutics, Inc.(a) | | | 1,000 | | | | 14,080 | |
Omeros Corp.(a) | | | 6,084 | | | | 67,776 | |
Optinose, Inc.(a) | | | 2,599 | | | | 16,114 | |
Osmotica Pharmaceuticals plc(a) | | | 920 | | | | 7,130 | |
Pacira Pharmaceuticals, Inc.(a) | | | 5,298 | | | | 227,920 | |
Paratek Pharmaceuticals, Inc.(a) | | | 4,042 | | | | 20,735 | |
Phibro Animal Health Corp., Class A | | | 2,650 | | | | 85,224 | |
Prestige Brands Holdings, Inc.(a) | | | 6,909 | | | | 213,350 | |
Reata Pharmaceuticals, Inc., Class A(a) | | | 2,483 | | | | 139,296 | |
resTORbio, Inc.(a) | | | 962 | | | | 8,292 | |
Revance Therapeutics, Inc.(a) | | | 4,357 | | | | 87,706 | |
scPharmaceuticals, Inc.(a) | | | 1,083 | | | | 4,072 | |
Sienna Biopharmaceuticals, Inc.(a) | | | 2,341 | | | | 5,431 | |
SIGA Technologies, Inc.(a) | | | 6,893 | | | | 54,455 | |
Supernus Pharmaceuticals, Inc.(a) | | | 6,502 | | | | 215,996 | |
Teligent, Inc.(a) | | | 6,748 | | | | 9,245 | |
Tetraphase Pharmaceuticals, Inc.(a) | | | 8,084 | | | | 9,135 | |
TherapeuticsMD, Inc.(a) | | | 24,257 | | | | 92,419 | |
Theravance Biopharma, Inc.(a) | | | 5,690 | | | | 145,607 | |
Tricida, Inc.(a) | | | 1,534 | | | | 36,172 | |
Verrica Pharmaceuticals, Inc.(a) | | | 870 | | | | 7,091 | |
WaVe Life Sciences Ltd.(a) | | | 2,340 | | | | 98,374 | |
Xeris Pharmaceuticals, Inc.(a) | | | 1,029 | | | | 17,493 | |
Zogenix, Inc.(a) | | | 5,573 | | | | 203,192 | |
Zomedica Pharmaceuticals Corp.(a) | | | 4,780 | | | | 5,879 | |
| | | | | | | | |
| | | | | | | 4,595,405 | |
| |
| Professional Services — 1.5% | | | | |
Acacia Research Corp.(a) | | | 5,266 | | | | 15,693 | |
ASGN, Inc.(a) | | | 6,739 | | | | 367,276 | |
Barrett Business Services, Inc. | | | 932 | | | | 53,357 | |
BG Staffing, Inc. | | | 1,131 | | | | 23,355 | |
CBIZ, Inc.(a) | | | 6,852 | | | | 134,984 | |
CRA International, Inc. | | | 1,043 | | | | 44,380 | |
Exponent, Inc. | | | 6,853 | | | | 347,516 | |
Forrester Research, Inc. | | | 1,362 | | | | 60,881 | |
Franklin Covey Co.(a) | | | 1,117 | | | | 24,943 | |
FTI Consulting, Inc.(a) | | | 5,046 | | | | 336,265 | |
GP Strategies Corp.(a) | | | 1,543 | | | | 19,457 | |
Heidrick & Struggles International, Inc. | | | 2,480 | | | | 77,351 | |
Huron Consulting Group, Inc.(a) | | | 2,936 | | | | 150,646 | |
ICF International, Inc. | | | 2,401 | | | | 155,537 | |
InnerWorkings, Inc.(a) | | | 5,175 | | | | 19,355 | |
Insperity, Inc. | | | 5,090 | | | | 475,202 | |
Kelly Services, Inc., Class A | | | 4,153 | | | | 85,053 | |
| | |
| 18 | | 2018 BLACKROCK ANNUAL REPORTTO SHAREHOLDERS |
| | |
Schedule of Investments (continued) December 31, 2018 | | BlackRock Small Cap Index V.I. Fund (Percentages shown are based on Net Assets) |
| | | | | | | | |
| Security | | Shares | | | Value | |
| |
| Professional Services (continued) | | | | |
Kforce, Inc. | | | 3,061 | | | $ | 94,646 | |
Korn/Ferry International | | | 7,624 | | | | 301,453 | |
Mistras Group, Inc.(a) | | | 2,325 | | | | 33,434 | |
Navigant Consulting, Inc. | | | 5,418 | | | | 130,303 | |
Resources Connection, Inc. | | | 3,958 | | | | 56,204 | |
TriNet Group, Inc.(a) | | | 5,793 | | | | 243,016 | |
TrueBlue, Inc.(a) | | | 5,348 | | | | 118,993 | |
Upwork, Inc.(a) | | | 1,303 | | | | 23,597 | |
WageWorks, Inc.(a) | | | 5,269 | | | | 143,106 | |
Willdan Group, Inc.(a) | | | 1,172 | | | | 40,997 | |
| | | | | | | | |
| | | | | | | 3,577,000 | |
| |
| Real Estate Management & Development — 0.6% | | | | |
Altisource Portfolio Solutions SA(a) | | | 1,184 | | | | 26,628 | |
Consolidated-Tomoka Land Co. | | | 457 | | | | 23,992 | |
Cushman & Wakefield plc(a) | | | 6,031 | | | | 87,269 | |
Essential Properties Realty Trust, Inc. | | | 4,727 | | | | 65,422 | |
Forestar Group, Inc.(a) | | | 1,390 | | | | 19,252 | |
FRP Holdings, Inc.(a) | | | 876 | | | | 40,305 | |
Griffin Industrial Realty, Inc. | | | 166 | | | | 5,295 | |
HFF, Inc., Class A | | | 4,986 | | | | 165,336 | |
Kennedy-Wilson Holdings, Inc. | | | 16,641 | | | | 302,367 | |
Marcus & Millichap, Inc.(a) | | | 2,582 | | | | 88,640 | |
Maui Land & Pineapple Co., Inc.(a) | | | 1,072 | | | | 10,634 | |
Newmark Group, Inc., Class A | | | 19,826 | | | | 159,005 | |
RE/MAX Holdings, Inc., Class A | | | 2,368 | | | | 72,816 | |
Redfin Corp.(a) | | | 10,515 | | | | 151,416 | |
RMR Group, Inc. (The), Class A | | | 935 | | | | 49,630 | |
St Joe Co. (The)(a) | | | 4,678 | | | | 61,609 | |
Stratus Properties, Inc.(a) | | | 638 | | | | 15,299 | |
Tejon Ranch Co.(a) | | | 2,793 | | | | 46,308 | |
Transcontinental Realty Investors, Inc.(a) | | | 242 | | | | 6,853 | |
Trinity Place Holdings, Inc.(a) | | | 1,862 | | | | 8,081 | |
| | | | | | | | |
| | | | | | | 1,406,157 | |
| |
| Road & Rail — 0.5% | | | | |
ArcBest Corp. | | | 3,409 | | | | 116,792 | |
Avis Budget Group, Inc.(a) | | | 8,866 | | | | 199,308 | |
Covenant Transportation Group, Inc., Class A(a) | | | 1,638 | | | | 31,450 | |
Daseke, Inc.(a) | | | 5,272 | | | | 19,401 | |
Heartland Express, Inc. | | | 6,208 | | | | 113,606 | |
Hertz Global Holdings, Inc.(a) | | | 7,281 | | | | 99,386 | |
Marten Transport Ltd. | | | 5,193 | | | | 84,075 | |
PAM Transportation Services, Inc.(a) | | | 341 | | | | 13,439 | |
Saia, Inc.(a) | | | 3,404 | | | | 190,011 | |
Universal Logistics Holdings, Inc. | | | 980 | | | | 17,728 | |
US Xpress Enterprises, Inc., Class A(a) | | | 2,495 | | | | 13,997 | |
USA Truck, Inc.(a) | | | 1,261 | | | | 18,877 | |
Werner Enterprises, Inc. | | | 5,814 | | | | 171,746 | |
YRC Worldwide, Inc.(a) | | | 4,269 | | | | 13,447 | |
| | | | | | | | |
| | | | | | | 1,103,263 | |
| |
| Semiconductors & Semiconductor Equipment — 2.7% | | | | |
ACM Research, Inc., Class A(a) | | | 1,284 | | | | 13,970 | |
Adesto Technologies Corp.(a) | | | 2,873 | | | | 12,641 | |
Advanced Energy Industries, Inc.(a) | | | 4,761 | | | | 204,390 | |
Alpha & Omega Semiconductor Ltd.(a) | | | 2,486 | | | | 25,332 | |
Ambarella, Inc.(a) | | | 3,992 | | | | 139,640 | |
Amkor Technology, Inc.(a) | | | 13,591 | | | | 89,157 | |
Aquantia Corp.(a) | | | 2,609 | | | | 22,881 | |
Axcelis Technologies, Inc.(a) | | | 4,256 | | | | 75,757 | |
AXT, Inc.(a) | | | 4,613 | | | | 20,067 | |
Brooks Automation, Inc. | | | 9,230 | | | | 241,641 | |
Cabot Microelectronics Corp. | | | 3,772 | | | | 359,660 | |
CEVA, Inc.(a) | | | 2,930 | | | | 64,724 | |
Cirrus Logic, Inc.(a) | | | 7,635 | | | | 253,329 | |
| | | | | | | | |
| Security | | Shares | | | Value | |
| |
| Semiconductors & Semiconductor Equipment (continued) | | | | |
Cohu, Inc. | | | 5,261 | | | $ | 84,544 | |
Cree, Inc.(a) | | | 13,150 | | | | 562,491 | |
Diodes, Inc.(a) | | | 5,335 | | | | 172,107 | |
Entegris, Inc. | | | 18,853 | | | | 525,905 | |
FormFactor, Inc.(a) | | | 9,820 | | | | 138,364 | |
Ichor Holdings Ltd.(a) | | | 3,191 | | | | 52,013 | |
Impinj, Inc.(a) | | | 2,157 | | | | 31,384 | |
Inphi Corp.(a) | | | 5,768 | | | | 185,441 | |
Integrated Device Technology, Inc.(a) | | | 17,018 | | | | 824,181 | |
Kopin Corp.(a) | | | 9,119 | | | | 9,110 | |
Lattice Semiconductor Corp.(a) | | | 15,549 | | | | 107,599 | |
MACOM Technology Solutions Holdings, Inc.(a) | | | 6,018 | | | | 87,321 | |
MaxLinear, Inc.(a) | | | 8,302 | | | | 146,115 | |
Nanometrics, Inc.(a) | | | 3,026 | | | | 82,701 | |
NeoPhotonics Corp.(a) | | | 5,049 | | | | 32,718 | |
NVE Corp. | | | 634 | | | | 55,500 | |
PDF Solutions, Inc.(a) | | | 3,267 | | | | 27,541 | |
Photronics, Inc.(a) | | | 9,016 | | | | 87,275 | |
Power Integrations, Inc. | | | 3,804 | | | | 231,968 | |
Rambus, Inc.(a) | | | 14,154 | | | | 108,561 | |
Rudolph Technologies, Inc.(a) | | | 4,184 | | | | 85,647 | |
Semtech Corp.(a) | | | 8,643 | | | | 396,454 | |
Silicon Laboratories, Inc.(a) | | | 5,703 | | | | 449,454 | |
SMART Global Holdings, Inc.(a) | | | 1,322 | | | | 39,263 | |
SunPower Corp.(a) | | | 8,181 | | | | 40,660 | |
Synaptics, Inc.(a) | | | 4,429 | | | | 164,803 | |
Ultra Clean Holdings, Inc.(a) | | | 5,104 | | | | 43,231 | |
Veeco Instruments, Inc.(a) | | | 6,420 | | | | 47,572 | |
Xperi Corp. | | | 6,505 | | | | 119,627 | |
| | | | | | | | |
| | | | | | | 6,462,739 | |
| | |
| Software — 5.3% | | | | | | |
8x8, Inc.(a) | | | 12,215 | | | | 220,359 | |
A10 Networks, Inc.(a) | | | 6,329 | | | | 39,493 | |
ACI Worldwide, Inc.(a) | | | 15,239 | | | | 421,663 | |
Agilysys, Inc.(a) | | | 1,822 | | | | 26,127 | |
Alarm.com Holdings, Inc.(a) | | | 4,092 | | | | 212,252 | |
Altair Engineering, Inc., Class A(a) | | | 3,172 | | | | 87,484 | |
Alteryx, Inc., Class A(a) | | | 3,884 | | | | 230,981 | |
Amber Road, Inc.(a) | | | 2,860 | | | | 23,538 | |
American Software, Inc., Class A | | | 3,796 | | | | 39,668 | |
Anaplan, Inc.(a) | | | 2,308 | | | | 61,254 | |
Appfolio, Inc., Class A(a) | | | 2,013 | | | | 119,210 | |
Apptio, Inc., Class A(a) | | | 4,570 | | | | 173,477 | |
Asure Software, Inc.(a) | | | 1,580 | | | | 8,026 | |
Avalara, Inc.(a) | | | 1,108 | | | | 34,514 | |
Avaya Holdings Corp.(a) | | | 13,905 | | | | 202,457 | |
Benefitfocus, Inc.(a) | | | 2,977 | | | | 136,108 | |
Blackbaud, Inc. | | | 6,409 | | | | 403,126 | |
Blackline, Inc.(a) | | | 4,774 | | | | 195,495 | |
Bottomline Technologies DE, Inc.(a) | | | 5,497 | | | | 263,856 | |
Box, Inc., Class A(a) | | | 16,389 | | | | 276,646 | |
Carbon Black, Inc.(a) | | | 4,830 | | | | 64,819 | |
ChannelAdvisor Corp.(a) | | | 3,104 | | | | 35,230 | |
Cision Ltd.(a) | | | 8,204 | | | | 95,987 | |
Cloudera, Inc.(a) | | | 13,727 | | | | 151,821 | |
CommVault Systems, Inc.(a) | | | 5,221 | | | | 308,509 | |
Cornerstone OnDemand, Inc.(a) | | | 7,223 | | | | 364,256 | |
Coupa Software, Inc.(a) | | | 7,183 | | | | 451,523 | |
Digimarc Corp.(a) | | | 1,625 | | | | 23,562 | |
Domo, Inc., Class B(a) | | | 1,025 | | | | 20,121 | |
Ebix, Inc. | | | 3,196 | | | | 136,022 | |
eGain Corp.(a) | | | 2,825 | | | | 18,560 | |
Ellie Mae, Inc.(a) | | | 4,539 | | | | 285,185 | |
Envestnet, Inc.(a) | | | 5,867 | | | | 288,598 | |
| | | | |
| SCHEDULE OF INVESTMENTS | | | 19 | |
| | |
Schedule of Investments (continued) December 31, 2018 | | BlackRock Small Cap Index V.I. Fund (Percentages shown are based on Net Assets) |
| | | | | | | | |
| Security | | Shares | | | Value | |
| | |
| Software (continued) | | | | | | |
Everbridge, Inc.(a) | | | 3,564 | | | $ | 202,293 | |
Five9, Inc.(a) | | | 7,616 | | | | 332,972 | |
ForeScout Technologies, Inc.(a) | | | 3,989 | | | | 103,674 | |
Fusion Connect, Inc.(a) | | | 3,294 | | | | 5,534 | |
Hortonworks, Inc.(a) | | | 9,378 | | | | 135,231 | |
HubSpot, Inc.(a) | | | 4,872 | | | | 612,557 | |
Imperva, Inc.(a) | | | 4,627 | | | | 257,678 | |
Instructure, Inc.(a) | | | 4,219 | | | | 158,255 | |
j2 Global, Inc. | | | 6,222 | | | | 431,682 | |
LivePerson, Inc.(a) | | | 7,700 | | | | 145,222 | |
Majesco(a) | | | 949 | | | | 6,728 | |
MicroStrategy, Inc., Class A(a) | | | 1,261 | | | | 161,093 | |
MINDBODY, Inc., Class A(a) | | | 5,787 | | | | 210,647 | |
Mitek Systems, Inc.(a) | | | 4,222 | | | | 45,640 | |
MobileIron, Inc.(a) | | | 9,510 | | | | 43,651 | |
Model N, Inc.(a) | | | 3,426 | | | | 45,326 | |
Monotype Imaging Holdings, Inc. | | | 5,502 | | | | 85,391 | |
New Relic, Inc.(a) | | | 5,887 | | | | 476,670 | |
OneSpan, Inc.(a) | | | 4,185 | | | | 54,196 | |
Park City Group, Inc.(a) | | | 2,134 | | | | 12,740 | |
Paylocity Holding Corp.(a) | | | 3,848 | | | | 231,688 | |
Progress Software Corp. | | | 5,802 | | | | 205,913 | |
PROS Holdings, Inc.(a) | | | 4,132 | | | | 129,745 | |
Q2 Holdings, Inc.(a) | | | 4,863 | | | | 240,962 | |
QAD, Inc., Class A | | | 1,364 | | | | 53,646 | |
Qualys, Inc.(a) | | | 4,478 | | | | 334,686 | |
Rapid7, Inc.(a) | | | 4,850 | | | | 151,126 | |
Rimini Street, Inc.(a) | | | 1,362 | | | | 7,014 | |
SailPoint Technologies Holding, Inc.(a) | | | 9,065 | | | | 212,937 | |
SecureWorks Corp., Class A(a) | | | 805 | | | | 13,596 | |
SendGrid, Inc.(a) | | | 3,839 | | | | 165,730 | |
ShotSpotter, Inc.(a) | | | 974 | | | | 30,369 | |
SPS Commerce, Inc.(a) | | | 2,242 | | | | 184,696 | |
SVMK, Inc.(a) | | | 1,816 | | | | 22,282 | |
Telaria, Inc.(a) | | | 6,978 | | | | 19,050 | |
Telenav, Inc.(a) | | | 4,426 | | | | 17,970 | |
Tenable Holdings, Inc.(a) | | | 1,672 | | | | 37,102 | |
TiVo Corp. | | | 16,037 | | | | 150,908 | |
Trade Desk, Inc. (The), Class A(a) | | | 4,382 | | | | 508,575 | |
Upland Software, Inc.(a) | | | 2,088 | | | | 56,752 | |
Varonis Systems, Inc.(a) | | | 3,749 | | | | 198,322 | |
Verint Systems, Inc.(a) | | | 8,456 | | | | 357,773 | |
Veritone, Inc.(a) | | | 1,146 | | | | 4,355 | |
VirnetX Holding Corp.(a) | | | 8,291 | | | | 19,898 | |
Workiva, Inc.(a) | | | 3,782 | | | | 135,736 | |
Yext, Inc.(a) | | | 10,781 | | | | 160,098 | |
Zix Corp.(a) | | | 7,316 | | | | 41,921 | |
Zscaler, Inc.(a) | | | 7,986 | | | | 313,131 | |
| | | | | | | | |
| | | | | | | 12,953,088 | |
| |
| Specialty Retail — 2.9% | | | | |
Aaron’s, Inc. | | | 9,195 | | | | 386,650 | |
Abercrombie & Fitch Co., Class A | | | 8,643 | | | | 173,292 | |
American Eagle Outfitters, Inc. | | | 21,424 | | | | 414,126 | |
America’sCar-Mart, Inc.(a) | | | 794 | | | | 57,525 | |
Asbury Automotive Group, Inc.(a) | | | 2,493 | | | | 166,183 | |
Ascena Retail Group, Inc.(a) | | | 23,254 | | | | 58,368 | |
At Home Group, Inc.(a) | | | 5,871 | | | | 109,553 | |
Barnes & Noble Education, Inc.(a) | | | 4,763 | | | | 19,100 | |
Barnes & Noble, Inc. | | | 7,917 | | | | 56,132 | |
Bed Bath & Beyond, Inc. | | | 17,862 | | | | 202,198 | |
Big 5 Sporting Goods Corp. | | | 3,207 | | | | 8,306 | |
Boot Barn Holdings, Inc.(a) | | | 3,674 | | | | 62,568 | |
Buckle, Inc. (The) | | | 3,825 | | | | 73,976 | |
Caleres, Inc. | | | 5,590 | | | | 155,570 | |
| | | | | | | | |
| Security | | Shares | | | Value | |
| |
| Specialty Retail (continued) | | | | |
Camping World Holdings, Inc., Class A | | | 4,304 | | | $ | 49,367 | |
Carvana Co.(a) | | | 4,300 | | | | 140,653 | |
Cato Corp. (The), Class A | | | 2,996 | | | | 42,753 | |
Chico’s FAS, Inc. | | | 16,976 | | | | 95,405 | |
Children’s Place, Inc. (The) | | | 2,056 | | | | 185,225 | |
Citi Trends, Inc. | | | 1,638 | | | | 33,399 | |
Conn’s, Inc.(a) | | | 2,609 | | | | 49,206 | |
Container Store Group, Inc. (The)(a) | | | 1,695 | | | | 8,085 | |
DSW, Inc., Class A | | | 9,122 | | | | 225,313 | |
Express, Inc.(a) | | | 9,666 | | | | 49,393 | |
Five Below, Inc.(a) | | | 7,150 | | | | 731,588 | |
Francesca’s Holdings Corp.(a) | | | 3,745 | | | | 3,636 | |
GameStop Corp., Class A | | | 13,315 | | | | 168,035 | |
Genesco, Inc.(a) | | | 2,581 | | | | 114,338 | |
GNC Holdings, Inc., Class A(a) | | | 10,811 | | | | 25,622 | |
Group 1 Automotive, Inc. | | | 2,293 | | | | 120,887 | |
Guess?, Inc. | | | 7,648 | | | | 158,849 | |
Haverty Furniture Cos., Inc. | | | 2,509 | | | | 47,119 | |
Hibbett Sports, Inc.(a) | | | 2,507 | | | | 35,850 | |
Hudson Ltd., Class A(a) | | | 5,283 | | | | 90,603 | |
J. Jill, Inc.(a) | | | 2,734 | | | | 14,572 | |
Kirkland’s, Inc.(a) | | | 1,703 | | | | 16,230 | |
Lithia Motors, Inc., Class A | | | 2,828 | | | | 215,861 | |
Lumber Liquidators Holdings, Inc.(a) | | | 3,779 | | | | 35,976 | |
MarineMax, Inc.(a) | | | 2,532 | | | | 46,361 | |
Monro, Inc. | | | 4,228 | | | | 290,675 | |
Murphy USA, Inc.(a) | | | 3,995 | | | | 306,177 | |
National Vision Holdings, Inc.(a) | | | 7,877 | | | | 221,895 | |
New York & Co., Inc.(a) | | | 4,547 | | | | 12,868 | |
Office Depot, Inc. | | | 70,614 | | | | 182,184 | |
Party City Holdco, Inc.(a) | | | 7,527 | | | | 75,119 | |
Pier 1 Imports, Inc. | | | 13,599 | | | | 4,159 | |
Rent-A-Center, Inc.(a) | | | 5,892 | | | | 95,391 | |
RH(a) | | | 2,618 | | | | 313,689 | |
Sally Beauty Holdings, Inc.(a) | | | 16,008 | | | | 272,936 | |
Shoe Carnival, Inc. | | | 1,364 | | | | 45,708 | |
Signet Jewelers Ltd. | | | 6,755 | | | | 214,606 | |
Sleep Number Corp.(a) | | | 4,161 | | | | 132,029 | |
Sonic Automotive, Inc., Class A | | | 3,164 | | | | 43,537 | |
Sportsman’s Warehouse Holdings, Inc.(a) | | | 4,205 | | | | 18,418 | |
Tailored Brands, Inc. | | | 6,597 | | | | 89,983 | |
Tile Shop Holdings, Inc. | | | 4,709 | | | | 25,805 | |
Tilly’s, Inc., Class A | | | 2,457 | | | | 26,683 | |
Winmark Corp. | | | 311 | | | | 49,449 | |
Zumiez, Inc.(a) | | | 2,465 | | | | 47,254 | |
| | | | | | | | |
| | | | | | | 7,116,438 | |
|
| Technology Hardware, Storage & Peripherals — 0.3% | |
3D Systems Corp.(a) | | | 14,499 | | | | 147,455 | |
Avid Technology, Inc.(a) | | | 3,792 | | | | 18,012 | |
Cray, Inc.(a) | | | 5,368 | | | | 115,895 | |
Diebold Nixdorf, Inc. | | | 10,128 | | | | 25,219 | |
Eastman Kodak Co.(a) | | | 2,849 | | | | 7,265 | |
Electronics For Imaging, Inc.(a) | | | 5,519 | | | | 136,871 | |
Immersion Corp.(a) | | | 3,092 | | | | 27,704 | |
Stratasys Ltd.(a) | | | 6,728 | | | | 121,171 | |
USA Technologies, Inc.(a) | | | 7,063 | | | | 27,475 | |
| | | | | | | | |
| | | | | | | 627,067 | |
| |
| Textiles, Apparel & Luxury Goods — 0.9% | | | | |
Crocs, Inc.(a) | | | 8,661 | | | | 225,013 | |
Culp, Inc. | | | 1,410 | | | | 26,649 | |
Deckers Outdoor Corp.(a) | | | 3,808 | | | | 487,233 | |
Fossil Group, Inc.(a) | | | 6,059 | | | | 95,308 | |
G-III Apparel Group Ltd.(a) | | | 5,774 | | | | 161,037 | |
| | |
| 20 | | 2018 BLACKROCK ANNUAL REPORTTO SHAREHOLDERS |
| | |
Schedule of Investments (continued) December 31, 2018 | | BlackRock Small Cap Index V.I. Fund (Percentages shown are based on Net Assets) |
| | | | | | | | |
| Security | | Shares | | | Value | |
| |
| Textiles, Apparel & Luxury Goods (continued) | | | | |
Movado Group, Inc. | | | 2,089 | | | $ | 66,054 | |
Oxford Industries, Inc. | | | 2,223 | | | | 157,922 | |
Rocky Brands, Inc. | | | 742 | | | | 19,292 | |
Steven Madden Ltd. | | | 11,569 | | | | 350,078 | |
Superior Group of Cos., Inc. | | | 1,315 | | | | 23,210 | |
Unifi, Inc.(a) | | | 2,074 | | | | 47,370 | |
Vera Bradley, Inc.(a) | | | 3,000 | | | | 25,710 | |
Wolverine World Wide, Inc. | | | 12,264 | | | | 391,099 | |
| | | | | | | | |
| | | | | | | 2,075,975 | |
| |
| Thrifts & Mortgage Finance — 2.3% | | | | |
Axos Financial, Inc.(a) | | | 7,860 | | | | 197,915 | |
BankFinancial Corp. | | | 1,581 | | | | 23,636 | |
Beneficial Bancorp, Inc. | | | 9,062 | | | | 129,496 | |
Bridgewater Bancshares, Inc.(a) | | | 1,922 | | | | 20,277 | |
BSB Bancorp, Inc.(a) | | | 1,030 | | | | 28,902 | |
Capitol Federal Financial, Inc. | | | 17,112 | | | | 218,520 | |
Columbia Financial, Inc.(a) | | | 6,597 | | | | 100,868 | |
Dime Community Bancshares, Inc. | | | 4,308 | | | | 73,150 | |
Entegra Financial Corp.(a) | | | 1,049 | | | | 21,767 | |
ESSA Bancorp, Inc. | | | 1,222 | | | | 19,075 | |
Essent Group Ltd.(a) | | | 12,756 | | | | 436,000 | |
Federal Agricultural Mortgage Corp., Class C | | | 1,192 | | | | 72,044 | |
First Defiance Financial Corp. | | | 2,648 | | | | 64,902 | |
Flagstar Bancorp, Inc.(a) | | | 3,924 | | | | 103,594 | |
FS Bancorp, Inc. | | | 493 | | | | 21,140 | |
Greene County Bancorp, Inc. | | | 388 | | | | 12,075 | |
Hingham Institution for Savings | | | 156 | | | | 30,847 | |
Home Bancorp, Inc. | | | 1,018 | | | | 36,037 | |
HomeStreet, Inc.(a) | | | 3,310 | | | | 70,271 | |
Impac Mortgage Holdings, Inc.(a) | | | 1,386 | | | | 5,239 | |
Kearny Financial Corp. | | | 11,117 | | | | 142,520 | |
LendingTree, Inc.(a) | | | 1,058 | | | | 232,305 | |
Luther Burbank Corp. | | | 2,629 | | | | 23,714 | |
Malvern Bancorp, Inc.(a) | | | 1,026 | | | | 20,243 | |
Merchants Bancorp | | | 2,139 | | | | 42,694 | |
Meridian Bancorp, Inc. | | | 6,383 | | | | 91,405 | |
Meta Financial Group, Inc. | | | 3,708 | | | | 71,898 | |
MGIC Investment Corp.(a) | | | 48,047 | | | | 502,572 | |
Mr Cooper Group, Inc.(a) | | | 9,637 | | | | 112,464 | |
NMI Holdings, Inc., Class A(a) | | | 8,265 | | | | 147,530 | |
Northfield Bancorp, Inc. | | | 5,768 | | | | 78,156 | |
Northwest Bancshares, Inc. | | | 12,707 | | | | 215,257 | |
OceanFirst Financial Corp. | | | 6,307 | | | | 141,971 | |
Ocwen Financial Corp.(a) | | | 15,605 | | | | 20,911 | |
OP Bancorp(a) | | | 1,864 | | | | 16,534 | |
Oritani Financial Corp. | | | 5,330 | | | | 78,617 | |
PCSB Financial Corp. | | | 2,088 | | | | 40,841 | |
PDL Community Bancorp(a) | | | 1,335 | | | | 17,008 | |
PennyMac Financial Services, Inc. | | | 2,351 | | | | 49,982 | |
Provident Bancorp, Inc.(a) | | | 658 | | | | 14,265 | |
Provident Financial Services, Inc. | | | 8,238 | | | | 198,783 | |
Prudential Bancorp, Inc. | | | 1,270 | | | | 22,352 | |
Radian Group, Inc. | | | 28,697 | | | | 469,483 | |
Riverview Bancorp, Inc. | | | 3,056 | | | | 22,248 | |
SI Financial Group, Inc. | | | 1,654 | | | | 21,055 | |
Southern Missouri Bancorp, Inc. | | | 872 | | | | 29,561 | |
Sterling Bancorp, Inc. | | | 2,960 | | | | 20,572 | |
Territorial Bancorp, Inc. | | | 922 | | | | 23,954 | |
Timberland Bancorp, Inc. | | | 982 | | | | 21,899 | |
TrustCo Bank Corp. | | | 12,433 | | | | 85,290 | |
United Community Financial Corp. | | | 6,439 | | | | 56,985 | |
United Financial Bancorp, Inc. | | | 6,735 | | | | 99,004 | |
Walker & Dunlop, Inc. | | | 3,675 | | | | 158,944 | |
Washington Federal, Inc. | | | 11,090 | | | | 296,214 | |
Waterstone Financial, Inc. | | | 3,350 | | | | 56,146 | |
| | | | | | | | |
| Security | | Shares | | | Value | |
| |
| Thrifts & Mortgage Finance (continued) | | | | |
Western New England Bancorp, Inc. | | | 3,480 | | | $ | 34,939 | |
WSFS Financial Corp. | | | 4,004 | | | | 151,792 | |
| | | | | | | | |
| | | | | | | 5,515,863 | |
| | |
| Tobacco — 0.2% | | | | | | |
22nd Century Group, Inc.(a) | | | 14,966 | | | | 37,265 | |
Pyxus International, Inc.(a) | | | 953 | | | | 11,303 | |
Turning Point Brands, Inc. | | | 976 | | | | 26,567 | |
Universal Corp. | | | 3,281 | | | | 177,666 | |
Vector Group Ltd. | | | 13,602 | | | | 132,347 | |
| | | | | | | | |
| | | | | | | 385,148 | |
| |
| Trading Companies & Distributors — 1.2% | | | | |
Aircastle Ltd. | | | 6,453 | | | | 111,250 | |
Applied Industrial Technologies, Inc. | | | 5,068 | | | | 273,368 | |
Beacon Roofing Supply, Inc.(a) | | | 9,055 | | | | 287,225 | |
BlueLinx Holdings, Inc.(a) | | | 1,118 | | | | 27,626 | |
BMC Stock Holdings, Inc.(a) | | | 8,952 | | | | 138,577 | |
CAI International, Inc.(a) | | | 2,260 | | | | 52,500 | |
DXP Enterprises, Inc.(a) | | | 2,114 | | | | 58,854 | |
EVI Industries, Inc. | | | 557 | | | | 18,576 | |
Foundation Building Materials, Inc.(a) | | | 1,782 | | | | 14,808 | |
GATX Corp. | | | 4,992 | | | | 353,484 | |
General Finance Corp.(a) | | | 1,474 | | | | 14,902 | |
GMS, Inc.(a) | | | 4,325 | | | | 64,270 | |
H&E Equipment Services, Inc. | | | 4,225 | | | | 86,275 | |
Herc Holdings, Inc.(a) | | | 3,189 | | | | 82,882 | |
Kaman Corp. | | | 3,667 | | | | 205,682 | |
Lawson Products, Inc.(a) | | | 1,004 | | | | 31,726 | |
MRC Global, Inc.(a) | | | 11,161 | | | | 136,499 | |
Nexeo Solutions, Inc.(a) | | | 4,348 | | | | 37,349 | |
NOW, Inc.(a) | | | 14,327 | | | | 166,766 | |
Rush Enterprises, Inc., Class A | | | 3,991 | | | | 137,609 | |
Rush Enterprises, Inc., Class B | | | 483 | | | | 17,195 | |
SiteOne Landscape Supply, Inc.(a) | | | 5,304 | | | | 293,152 | |
Systemax, Inc. | | | 1,623 | | | | 38,773 | |
Textainer Group Holdings Ltd.(a) | | | 3,621 | | | | 36,065 | |
Titan Machinery, Inc.(a) | | | 2,475 | | | | 32,546 | |
Triton International Ltd. | | | 6,552 | | | | 203,571 | |
Veritiv Corp.(a) | | | 1,528 | | | | 38,154 | |
Willis Lease Finance Corp.(a) | | | 459 | | | | 15,881 | |
| | | | | | | | |
| | | | | | | 2,975,565 | |
| |
| Water Utilities — 0.5% | | | | |
American States Water Co. | | | 4,860 | | | | 325,814 | |
AquaVenture Holdings Ltd.(a) | | | 1,279 | | | | 24,160 | |
Artesian Resources Corp., Class A | | | 936 | | | | 32,638 | |
Cadiz, Inc.(a) | | | 3,363 | | | | 34,639 | |
California Water Service Group | | | 6,378 | | | | 303,976 | |
Connecticut Water Service, Inc. | | | 1,600 | | | | 106,992 | |
Consolidated Water Co. Ltd. | | | 1,787 | | | | 20,836 | |
Global Water Resources, Inc. | | | 1,267 | | | | 12,847 | |
Middlesex Water Co. | | | 2,114 | | | | 112,782 | |
Pure Cycle Corp.(a) | | | 2,648 | | | | 26,295 | |
SJW Group | | | 2,288 | | | | 127,259 | |
York Water Co. (The) | | | 1,710 | | | | 54,823 | |
| | | | | | | | |
| | | | | | | 1,183,061 | |
| |
| Wireless Telecommunication Services — 0.2% | | | | |
Boingo Wireless, Inc.(a) | | | 5,448 | | | | 112,065 | |
Gogo, Inc.(a) | | | 7,458 | | | | 22,299 | |
NII Holdings, Inc.(a) | | | 11,793 | | | | 52,007 | |
Shenandoah Telecommunications Co. | | | 6,200 | | | | 274,350 | |
Spok Holdings, Inc. | | | 2,221 | | | | 29,451 | |
| | | | | | | | |
| | | | | | | 490,172 | |
| | | | | | | | |
| |
Total Common Stocks — 97.4%
(Cost: $220,208,668) | | | | 236,171,400 | |
| | | | | |
| | | | |
| SCHEDULE OF INVESTMENTS | | | 21 | |
| | |
Schedule of Investments (continued) December 31, 2018 | | BlackRock Small Cap Index V.I. Fund (Percentages shown are based on Net Assets) |
| | | | | | | | |
| Security | | Shares | | | Value | |
|
Investment Companies — 0.0% | |
Ferroglobe Representation & Warranty Insurance Trust — Beneficial Interest Units(b) | | | 10,979 | | | $ | — | |
| | | | | | | | |
| |
Total Investment Companies — 0.0%
(Cost: $—) | | | | — | |
| | | | | |
| |
Total Long-Term Investments — 97.4%
(Cost: $220,208,668) | | | | 236,171,400 | |
| | | | | |
|
Short-Term Securities — 2.3%(c) | |
BlackRock Liquidity Funds,T-Fund, Institutional Class,
2.32%(d) | | | 5,505,930 | | | | 5,505,930 | |
JPMorgan US Treasury Plus Money Market Fund, Agency Class, 2.24% | | | 58 | | | | 58 | |
| | | | | | | | |
| |
Total Short-Term Securities — 2.3%
(Cost: $5,505,988) | | | | 5,505,988 | |
| | | | | |
| |
Total Investments — 99.7%
(Cost: $225,714,656) | | | | 241,677,388 | |
| |
Other Assets Less Liabilities — 0.3% | | | | 622,317 | |
| | | | | |
| |
Net Assets — 100.0% | | | $ | 242,299,705 | |
| | | | | |
| (a) | Non-income producing security. |
| (b) | Security is valued using significant unobservable inputs and is classified as Level 3 in the fair value hierarchy. |
| (c) | Annualized7-day yield as of period end. |
| (d) | During the year ended December 31, 2018, investments in issuers considered to be an affiliate of the Fund for purposes of Section 2(a)(3) of the Investment Company Act of 1940, as amended, were as follows: |
| | | | | | | | | | | | | | | | | | | | | | | | | | | | |
| Affiliate | | Shares
Held at
12/31/17 | | | Net
Activity | | | Shares
Held at
12/31/18 | | | Value at
12/31/18 | | | Income | | | Net
Realized
Gain (Loss)(a) | | | Change in
Unrealized
Appreciation
(Depreciation) | |
BlackRock Liquidity Funds,T-Fund, Institutional Class | | | — | | | | 5,505,930 | | | | 5,505,930 | | | $ | 5,505,930 | | | $ | 22,616 | | | $ | — | | | $ | — | |
| | | | | | | | | | | | | | | | | | | | | | | | | | | | |
| | (a) | Includes net capital gain distributions, if applicable. | |
For Fund compliance purposes, the Fund’s industry classifications refer to one or more of the industrysub-classifications used by one or more widely recognized market indexes or ratings group indexes, and/or as defined by the investment advisor. These definitions may not apply for purposes of this report, which may combine such industrysub-classifications for reporting ease.
Derivative Financial Instruments Outstanding as of Period End
Futures Contracts
| | | | | | | | | | | | | | | | |
| Description | | Number of
Contracts | | | Expiration
Date | | | Notional
Amount (000) | | | Value/
Unrealized
Appreciation
(Depreciation) | |
Long Contracts | | | | | | | | | | | | | | | | |
Russell 2000E-Mini Index | | | 93 | | | | 03/15/19 | | | $ | 6,273 | | | $ | (199,145 | ) |
| | | | | | | | | | | | | | | | |
| | |
| 22 | | 2018 BLACKROCK ANNUAL REPORTTO SHAREHOLDERS |
| | |
Schedule of Investments (continued) December 31, 2018 | | BlackRock Small Cap Index V.I. Fund |
Derivative Financial Instruments Categorized by Risk Exposure
As of period end, the fair values of derivative financial instruments located in the Statement of Assets and Liabilities were as follows:
| | | | | | | | | | | | | | | | | | | | | | | | | | | | |
| | | Commodity
Contracts | | | Credit
Contracts | | | Equity
Contracts | | | Foreign
Currency
Exchange
Contracts | | | Interest
Rate
Contracts | | | Other
Contracts | | | Total | |
Liabilities — Derivative Financial Instruments | | | | | | | | | | | | | | | | | | | | | | | | | | | | |
Futures contracts | | | | | | | | | | | | | | | | | | | | | | | | | | | | |
Net unrealized depreciation(a) | | $ | — | | | $ | — | | | $ | 199,145 | | | $ | — | | | $ | — | | | $ | — | | | $ | 199,145 | |
| | | | | | | | | | | | | | | | | | | | | | | | | | | | |
| | (a) | Includes cumulative depreciation on futures contracts, if any, as reported in the Schedule of Investments. Only current day’s variation margin is reported within the Statement of Assets and Liabilities. | |
For the year ended December 31, 2018, the effect of derivative financial instruments in the Statement of Operations were as follows:
| | | | | | | | | | | | | | | | | | | | | | | | | | | | |
| | | Commodity
Contracts | | | Credit
Contracts | | | Equity
Contracts | | | Foreign
Currency
Exchange
Contracts | | | Interest
Rate
Contracts | | | Other
Contracts | | | Total | |
Net Realized Gain (Loss) from: | | | | | | | | | | | | | | | | | | | | | | | | | | | | |
Futures contracts | | $ | — | | | $ | — | | | $ | (652,193 | ) | | $ | — | | | $ | — | | | $ | — | | | $ | (652,193 | ) |
| | | | | | | | | | | | | | | | | | | | | | | | | | | | |
| | | | | | | |
| Net Change in Unrealized Appreciation (Depreciation) on: | | | | | | | | | | | | | | | | | | | | | |
Futures contracts | | $ | — | | | $ | — | | | $ | (227,515 | ) | | $ | — | | | $ | — | | | $ | — | | | $ | (227,515 | ) |
| | | | | | | | | | | | | | | | | | | | | | | | | | | | |
Average Quarterly Balances of Outstanding Derivative Financial Instruments
| | | | |
Futures contracts: | | | | |
Average notional value of contracts — long | | $ | 4,916,540 | |
For more information about the Fund’s investment risks regarding derivative financial instruments, refer to the Notes to Financial Statements.
Fair Value Hierarchy as of Period End
Various inputs are used in determining the fair value of investments and derivative financial instruments. For information about the Fund’s policy regarding valuation of investments and derivative financial instruments, refer to the Notes to Financial Statements.
The following tables summarize the Fund’s investments and derivative financial instruments categorized in the disclosure hierarchy:
| | | | | | | | | | | | | | | | |
| | | Level 1 | | | Level 2 | | | Level 3 | | | Total | |
Assets: | | | | | | | | | | | | | | | | |
Investments: | | | | | | | | | | | | | | | | |
Long-Term Investments | | | | | | | | | | | | | | | | |
Common Stocks: | | | | | | | | | | | | | | | | |
Aerospace & Defense | | $ | 3,013,427 | | | $ | — | | | $ | — | | | $ | 3,013,427 | |
Air Freight & Logistics | | | 779,319 | | | | — | | | | — | | | | 779,319 | |
Airlines | | | 1,176,763 | | | | — | | | | — | | | | 1,176,763 | |
Auto Components | | | 2,409,345 | | | | — | | | | — | | | | 2,409,345 | |
Automobiles | | | 99,455 | | | | — | | | | — | | | | 99,455 | |
Banks | | | 22,803,490 | | | | — | | | | — | | | | 22,803,490 | |
Beverages | | | 694,299 | | | | — | | | | — | | | | 694,299 | |
Biotechnology | | | 14,760,713 | | | | — | | | | — | | | | 14,760,713 | |
Building Products | | | 2,798,672 | | | | — | | | | — | | | | 2,798,672 | |
Capital Markets | | | 3,047,129 | | | | — | | | | — | | | | 3,047,129 | |
Chemicals | | | 4,376,170 | | | | — | | | | — | | | | 4,376,170 | |
Commercial Services & Supplies | | | 6,186,936 | | | | — | | | | — | | | | 6,186,936 | |
Communications Equipment | | | 3,907,642 | | | | — | | | | — | | | | 3,907,642 | |
Construction & Engineering | | | 2,431,949 | | | | — | | | | — | | | | 2,431,949 | |
Construction Materials | | | 282,527 | | | | — | | | | — | | | | 282,527 | |
Consumer Finance | | | 1,663,137 | | | | — | | | | — | | | | 1,663,137 | |
Containers & Packaging | | | 247,041 | | | | — | | | | — | | | | 247,041 | |
Distributors | | | 181,692 | | | | — | | | | — | | | | 181,692 | |
Diversified Consumer Services | | | 2,164,079 | | | | — | | | | — | | | | 2,164,079 | |
Diversified Financial Services | | | 411,105 | | | | — | | | | — | | | | 411,105 | |
| | | | |
| SCHEDULE OF INVESTMENTS | | | 23 | |
| | |
Schedule of Investments (continued) December 31, 2018 | | BlackRock Small Cap Index V.I. Fund |
Fair Value Hierarchy as of Period End (continued)
| | | | | | | | | | | | | | | | |
| | | Level 1 | | | Level 2 | | | Level 3 | | | Total | |
Diversified Telecommunication Services | | $ | 1,336,884 | | | $ | — | | | $ | — | | | $ | 1,336,884 | |
Electric Utilities | | | 2,928,566 | | | | — | | | | — | | | | 2,928,566 | |
Electrical Equipment | | | 1,801,173 | | | | — | | | | — | | | | 1,801,173 | |
Electronic Equipment, Instruments & Components | | | 5,894,600 | | | | — | | | | — | | | | 5,894,600 | |
Energy Equipment & Services | | | 2,838,722 | | | | — | | | | — | | | | 2,838,722 | |
Entertainment | | | 1,414,958 | | | | — | | | | — | | | | 1,414,958 | |
Equity Real Estate Investment Trusts (REITs) | | | 15,814,673 | | | | — | | | | — | | | | 15,814,673 | |
Food & Staples Retailing | | | 1,437,875 | | | | — | | | | — | | | | 1,437,875 | |
Food Products | | | 2,847,779 | | | | — | | | | 8,202 | | | | 2,855,981 | |
Gas Utilities | | | 2,783,306 | | | | — | | | | — | | | | 2,783,306 | |
Health Care Equipment & Supplies | | | 8,829,649 | | | | — | | | | — | | | | 8,829,649 | |
Health Care Providers & Services | | | 4,515,887 | | | | — | | | | — | | | | 4,515,887 | |
Health Care Technology | | | 2,748,201 | | | | — | | | | — | | | | 2,748,201 | |
Hotels, Restaurants & Leisure | | | 7,075,198 | | | | — | | | | — | | | | 7,075,198 | |
Household Durables | | | 3,607,938 | | | | — | | | | — | | | | 3,607,938 | |
Household Products | | | 559,490 | | | | — | | | | — | | | | 559,490 | |
Independent Power and Renewable Electricity Producers | | | 857,633 | | | | — | | | | — | | | | 857,633 | |
Industrial Conglomerates | | | 172,301 | | | | — | | | | — | | | | 172,301 | |
Insurance | | | 6,758,081 | | | | — | | | | — | | | | 6,758,081 | |
Interactive Media & Services | | | 1,250,858 | | | | — | | | | — | | | | 1,250,858 | |
Internet & Direct Marketing Retail | | | 2,380,034 | | | | — | | | | — | | | | 2,380,034 | |
IT Services | | | 4,838,879 | | | | — | | | | — | | | | 4,838,879 | |
Leisure Products | | | 891,995 | | | | — | | | | — | | | | 891,995 | |
Life Sciences Tools & Services | | | 1,312,095 | | | | — | | | | — | | | | 1,312,095 | |
Machinery | | | 8,783,416 | | | | — | | | | — | | | | 8,783,416 | |
Marine | | | 298,452 | | | | — | | | | — | | | | 298,452 | |
Media | | | 3,349,045 | | | | — | | | | — | | | | 3,349,045 | |
Metals & Mining | | | 2,867,677 | | | | — | | | | — | | | | 2,867,677 | |
Mortgage Real Estate Investment Trusts (REITs) | | | 2,689,201 | | | | — | | | | — | | | | 2,689,201 | |
Multiline Retail | | | 729,961 | | | | — | | | | — | | | | 729,961 | |
Multi-Utilities | | | 1,313,481 | | | | — | | | | — | | | | 1,313,481 | |
Oil, Gas & Consumable Fuels | | | 5,480,143 | | | | — | | | | — | | | | 5,480,143 | |
Paper & Forest Products | | | 970,034 | | | | — | | | | — | | | | 970,034 | |
Personal Products | | | 883,182 | | | | — | | | | — | | | | 883,182 | |
Pharmaceuticals | | | 4,594,825 | | | | 580 | | | | — | | | | 4,595,405 | |
Professional Services | | | 3,577,000 | | | | — | | | | — | | | | 3,577,000 | |
Real Estate Management & Development | | | 1,406,157 | | | | — | | | | — | | | | 1,406,157 | |
Road & Rail | | | 1,103,263 | | | | — | | | | — | | | | 1,103,263 | |
Semiconductors & Semiconductor Equipment | | | 6,462,739 | | | | — | | | | — | | | | 6,462,739 | |
Software | | | 12,953,088 | | | | — | | | | — | | | | 12,953,088 | |
Specialty Retail | | | 7,116,438 | | | | — | | | | — | | | | 7,116,438 | |
Technology Hardware, Storage & Peripherals | | | 627,067 | | | | — | | | | — | | | | 627,067 | |
Textiles, Apparel & Luxury Goods | | | 2,075,975 | | | | — | | | | — | | | | 2,075,975 | |
Thrifts & Mortgage Finance | | | 5,515,863 | | | | — | | | | — | | | | 5,515,863 | |
Tobacco | | | 385,148 | | | | — | | | | — | | | | 385,148 | |
Trading Companies & Distributors | | | 2,975,565 | | | | — | | | | — | | | | 2,975,565 | |
Water Utilities | | | 1,183,061 | | | | — | | | | — | | | | 1,183,061 | |
Wireless Telecommunication Services | | | 490,172 | | | | — | | | | — | | | | 490,172 | |
Short-Term Securities | | | 5,505,988 | | | | — | | | | — | | | | 5,505,988 | |
| | | | | | | | | | | | | | | | |
| | $ | 241,668,606 | | | $ | 580 | | | $ | 8,202 | | | $ | 241,677,388 | |
| | | | | | | | | | | | | | | | |
Derivative Financial Instruments(a) | | | | | | | | | | | | | | | | |
Liabilities: | | | | | | | | | | | | | | | | |
Equity contracts | | $ | (199,145 | ) | | $ | — | | | $ | — | | | $ | (199,145 | ) |
| | | | | | | | | | | | | | | | |
| | (a) | Derivative financial instruments are futures contracts. Futures contracts are valued at the unrealized appreciation (depreciation) on the instrument. | |
During the year ended December 31, 2018, there were no transfers between levels.
See notes to financial statements.
| | |
| 24 | | 2018 BLACKROCK ANNUAL REPORTTO SHAREHOLDERS |
Statement of Assets and Liabilities
December 31, 2018
| | | | |
| | | BlackRock Small Cap
Index V.I. Fund | |
| |
ASSETS | | | | |
Investments at value — unaffiliated (cost — $220,208,726) | | $ | 236,171,458 | |
Investments at value — affiliated (cost — $5,505,930) | | | 5,505,930 | |
Cash pledged for futures contracts | | | 330,000 | |
Receivables: | | | | |
Investments sold | | | 189,159 | |
Capital shares sold | | | 152,021 | |
Dividends — affiliated | | | 10,720 | |
Dividends — unaffiliated | | | 341,778 | |
From the Manager | | | 4,234 | |
Variation margin on futures contracts | | | 36,353 | |
Deferred offering cost | | | 27,309 | |
Prepaid expenses | | | 245 | |
| | | | |
Total assets | | | 242,769,207 | |
| | | | |
| |
LIABILITIES | | | | |
Bank overdraft | | | 15,597 | |
Payables: | | | | |
Investments purchased | | | 38,939 | |
Pricing fees | | | 99,817 | |
Capital shares redeemed | | | 145,317 | |
Printing fees | | | 35,075 | |
Professional fees | | | 53,460 | |
Investment advisory fees | | | 33,166 | |
Directors’ and Officer’s fees | | | 5,191 | |
Other accrued expenses | | | 42,940 | |
| | | | |
Total liabilities | | | 469,502 | |
| | | | |
| |
NET ASSETS | | $ | 242,299,705 | |
| | | | |
| |
NET ASSETS CONSIST OF | | | | |
Paid-in capital | | $ | 226,076,259 | |
Accumulated earnings | | | 16,223,446 | |
| | | | |
NET ASSETS | | $ | 242,299,705 | |
| | | | |
Class I — Based on net assets of $242,299,705 and 25,230,797 shares outstanding, 100 million shares number of shares authorized, par value $0.10 per share | | $ | 9.60 | |
| | | | |
See notes to financial statements.
Statement of Operations
Year Ended December 31, 2018
| | | | |
| | | BlackRock Small Cap
Index V.I. Fund | |
| |
INVESTMENT INCOME | | | | |
Dividends — affiliated | | $ | 22,616 | |
Dividends — unaffiliated | | | 4,572,938 | |
Interest — unaffiliated | | | 58,509 | |
Foreign taxes withheld | | | (1,323 | ) |
| | | | |
Total investment income | | | 4,652,740 | |
| | | | |
| |
EXPENSES | | | | |
Investment advisory | | | 418,524 | |
Reorganization | | | 160,359 | |
License | | | 154,900 | |
Professional | | | 63,736 | |
Printing | | | 56,482 | |
Custodian | | | 36,995 | |
Transfer agent | | | 24,389 | |
Directors and Officer | | | 14,125 | |
Accounting services | | | 10,169 | |
Registration | | | 6,736 | |
Offering | | | 5,826 | |
Miscellaneous | | | 54,154 | |
| | | | |
Total expenses | | | 1,006,395 | |
Less: | | | | |
Fees waived and/or reimbursed by the Manager or Predecessor Manager | | | (218,538 | ) |
Transfer agent fees waived and/or reimbursed | | | (23,136 | ) |
| | | | |
Total expenses after fees waived and/or reimbursed | | | 764,721 | |
| | | | |
Net investment income | | | 3,888,019 | |
| | | | |
| |
REALIZED AND UNREALIZED GAIN (LOSS) | | | | |
Net realized gain (loss) from: | | | | |
Investments — unaffiliated | | | 57,418,437 | |
Futures contracts | | | (652,193 | ) |
| | | | |
| | | 56,766,244 | |
| | | | |
Net change in unrealized appreciation (depreciation) on: | | | | |
Investments — unaffiliated | | | (84,616,728 | ) |
Futures contracts | | | (227,515 | ) |
| | | | |
| | | (84,844,243 | ) |
| | | | |
Net realized and unrealized loss | | | (28,077,999 | ) |
| | | | |
NET DECREASE IN NET ASSETS RESULTING FROM OPERATIONS | | $ | (24,189,980 | ) |
| | | | |
See notes to financial statements.
| | |
| 26 | | 2018 BLACKROCK ANNUAL REPORTTO SHAREHOLDERS |
Statements of Changes in Net Assets
| | | | | | | | |
| | | BlackRock Small Cap
Index V.I. Fund | |
| | | Year Ended December 31, | |
| | | 2018 | | | 2017 | |
| | |
INCREASE (DECREASE) IN NET ASSETS | | | | | | | | |
| | |
OPERATIONS | | | | | | | | |
Net investment income | | $ | 3,888,019 | | | $ | 3,561,877 | |
Net realized gain | | | 56,766,244 | | | | 19,364,819 | |
Net change in unrealized appreciation (depreciation) | | | (84,844,243 | ) | | | 21,040,994 | |
| | | | | | | | |
Net increase (decrease) in net assets resulting from operations | | | (24,189,980 | ) | | | 43,967,690 | |
| | | | | | | | |
| | |
DISTRIBUTIONS TO SHAREHOLDERS(a)(b) | | | | | | | | |
Decrease in net assets resulting from distributions to shareholders | | | (62,190,705 | ) | | | (22,853,721 | ) |
| | | | | | | | |
| | |
CAPITAL SHARE TRANSACTIONS | | | | | | | | |
Shares sold | | | 3,317,952 | | | | 2,037,902 | |
Shares issued in reinvestment of distributions | | | 62,190,568 | | | | 22,853,721 | |
Shares redeemed | | | (77,181,228 | ) | | | (20,927,858 | ) |
| | | | | | | | |
Net increase (decrease) in net assets derived from capital share transactions | | | (11,672,708 | ) | | | 3,963,765 | |
| | | | | | | | |
| | |
NET ASSETS(b) | | | | | | | | |
Total increase (decrease) in net assets | | | (98,053,393 | ) | | | 25,077,734 | |
Beginning of year | | | 340,353,098 | | | | 315,275,364 | |
| | | | | | | | |
End of year | | $ | 242,299,705 | | | $ | 340,353,098 | |
| | | | | | | | |
| (a) | Distributions for annual periods determined in accordance with U.S. federal income tax regulations. |
| (b) | Prior year distribution character information and undistributed net investment income has been modified or removed to conform with current year RegulationS-X presentation changes. Refer to Note 11 for this prior year information. |
See notes to financial statements.
Financial Highlights
(For a share outstanding throughout each period)
| | | | | | | | | | | | | | | | | | | | |
| | | BlackRock Small Cap Index V.I. Fund(a) | |
| |
| | | Class I | |
| |
| | | Year Ended December 31, | |
| | | 2018 | | | 2017 | | | 2016 | | | 2015 | | | 2014 | |
| | | | | |
Net asset value, beginning of year | | $ | 14.57 | | | $ | 13.63 | | | $ | 11.78 | | | $ | 13.46 | | | $ | 13.99 | |
| | | | | | | | | | | | | | | | | | | | |
Net investment income(b) | | | 0.18 | | | | 0.16 | | | | 0.15 | | | | 0.11 | | | | 0.11 | |
Net realized and unrealized gain (loss) | | | (1.86 | ) | | | 1.83 | | | | 2.33 | | | | (0.74 | ) | | | 0.51 | |
| | | | | | | | | | | | | | | | | | | | |
Net increase (decrease) from investment operations | | | (1.68 | ) | | | 1.99 | | | | 2.48 | | | | (0.63 | ) | | | 0.62 | |
| | | | | | | | | | | | | | | | | | | | |
| | | | | |
| Distributions(c) | | | | | | | | | | | | | | | |
From net investment income | | | (0.19 | ) | | | (0.16 | ) | | | (0.16 | ) | | | (0.12 | ) | | | (0.11 | ) |
From net realized gain | | | (3.10 | ) | | | (0.89 | ) | | | (0.47 | ) | | | (0.93 | ) | | | (1.04 | ) |
| | | | | | | | | | | | | | | | | | | | |
Total distributions | | | (3.29 | ) | | | (1.05 | ) | | | (0.63 | ) | | | (1.05 | ) | | | (1.15 | ) |
| | | | | | | | | | | | | | | | | | | | |
| | | | | |
Net asset value, end of year | | $ | 9.60 | | | $ | 14.57 | | | $ | 13.63 | | | $ | 11.78 | | | $ | 13.46 | |
| | | | | | | | | | | | | | | | | | | | |
| | | | | |
Total Return(d) | | | | | | | | | | | | | | | | | | | | |
Based on net asset value | | | (11.25 | )% | | | 14.55 | % | | | 20.96 | % | | | (4.86 | )% | | | 4.37 | % |
| | | | | | | | | | | | | | | | | | | | |
| | | | | |
Ratios to Average Net Assets | | | | | | | | | | | | | | | | | | | | |
Total expenses | | | 0.30 | %(e) | | | 0.23 | % | | | 0.31 | % | | | 0.50 | % | | | 0.49 | % |
| | | | | | | | | | | | | | | | | | | | |
Total expenses after fees waived and/or reimbursed | | | 0.23 | %(e) | | | 0.22 | % | | | 0.30 | % | | | 0.49 | % | | | 0.48 | % |
| | | | | | | | | | | | | | | | | | | | |
Net investment income | | | 1.17 | % | | | 1.11 | % | | | 1.23 | % | | | 0.84 | % | | | 0.76 | % |
| | | | | | | | | | | | | | | | | | | | |
| | | | | |
Supplemental Data | | | | | | | | | | | | | | | | | | | | |
Net assets, end of year (000) | | $ | 242,300 | | | $ | 340,353 | | | $ | 315,275 | | | $ | 276,199 | | | $ | 306,195 | |
| | | | | | | | | | | | | | | | | | | | |
Portfolio turnover rate | | | 17 | % | | | 12 | % | | | 15 | % | | | 14 | % | | | 15 | % |
| | | | | | | | | | | | | | | | | | | | |
| (a) | On October 29, 2018, the Fund acquired all of the assets and assumed certain stated liabilities of the Small Cap Equity Index Fund (the “Predecessor Fund”), a series of State Farm Variable Product Trust, through a tax-free reorganization (the “Reorganization”). The Predecessor Fund is the performance and accounting survivor of the Reorganization. |
| (b) | Based on average shares outstanding. |
| (c) | Distributions for annual periods determined in accordance with U.S. federal income tax regulations. |
| (d) | Where applicable, excludes insurance-related fees and expenses and assumes the reinvestment of distributions. |
| (e) | Includes reorganization costs associated with the Fund’s reorganization. Without these costs, total expenses and total expenses after fees waived and/or reimbursed would have been 0.27% and 0.23%, respectively. |
See notes to financial statements.
| | |
| 28 | | 2018 BLACKROCK ANNUAL REPORTTO SHAREHOLDERS |
Notes to Financial Statements
BlackRock Variable Series Funds, Inc. (the “Company”) is registered under the Investment Company Act of 1940, as amended (the “1940 Act”), as anopen-end management investment company. The Company is organized as a Maryland corporation that is comprised of 15 separate portfolios. The funds offer shares to insurance companies for their separate accounts to fund benefits under certain variable annuity and variable life insurance contracts. The financial statements presented are for BlackRock Small Cap Index V.I. Fund (the “Fund”). The Fund is classified as diversified.
The Fund, together with certain other registered investment companies advised by BlackRock Advisors, LLC (the “Manager”) or its affiliates, is included in a complex ofopen-end funds referred to as the Equity-Bond Complex.
Reorganization: On October 29, 2018, the Small Cap Equity Index Fund (the “Predecessor Fund”), a series of State Farm Variable Product Trust, reorganized into the Fund (the “Reorganization”) pursuant to an Agreement and Plan of Reorganization. The Reorganization closed immediately before the opening of business on October 29, 2018 and was approved by shareholders of the Predecessor Fund.
The Predecessor Fund is the performance and accounting survivor of the Reorganization; accordingly, Fund assumed the performance and financial history of the Predecessor Fund upon completion of the Reorganization. The Reorganization was tax-free, meaning that the Predecessor Fund’s shareholders became shareholders of the Fund without realizing any gain or loss for federal income tax purposes.
As a result, the Fund acquired all of the assets and assumed certain stated liabilities of the Predecessor Fund in exchange for an equal aggregate value of newly-issued shares of the Fund. Each shareholder of the Predecessor Fund received shares of the Fund in an amount equal to the aggregate net asset value (“NAV”) of such shareholder’s Predecessor Fund shares, as determined at the close of business on October 26, 2018.
The Reorganization was accomplished by atax-free exchange of shares of the Fund in the following amount and at the following conversion ratio:
| | | | | | | | | | | | |
| Predecessor Fund | | Shares Prior to
Reorganization | | | Conversion
Ratio | | | Shares
Post-Reorganization | |
Small Cap Equity Index Fund, a series of State Farm Variable Product Trust | | | 19,044,278 | | | | 1 | | | | 19,044,278 | |
For financial reporting purposes, assets received and shares issued by the Fund were recorded at fair value. However, the cost basis of the investments received from the Predecessor Fund were carried forward to align ongoing reporting of the Fund’s realized and unrealized gains and losses with amounts distributable to shareholders for tax purposes.
Prior to the Reorganization, the Fund had not yet commenced operations and had no assets or liabilities. The Predecessor Fund’s net assets, fair value and cost of investments prior to the Reorganization were as follows:
| | | | | | | | | | | | |
Predecessor Fund | | Net Assets | | | Fair Value
of Investments | | | Cost of
Investments | |
Small Cap Equity Index Fund, a series of State Farm Variable Product Trust | | $ | 268,225,204 | | | $ | 262,372,806 | | | $ | 221,728,024 | |
Reorganization costs incurred by the Fund in connection with the Reorganization were expensed by the Fund. The Manager or Predecessor Manager reimbursed the Fund $160,359, which is included in fees waived and/or reimbursed by the Manager or Predecessor Manager in the Statement of Operations.
| 2. | SIGNIFICANT ACCOUNTING POLICIES |
The financial statements are prepared in conformity with accounting principles generally accepted in the United States of America (“U.S. GAAP”), which may require management to make estimates and assumptions that affect the reported amounts of assets and liabilities in the financial statements, disclosure of contingent assets and liabilities at the date of the financial statements and the reported amounts of increases and decreases in net assets from operations during the reporting period. Actual results could differ from those estimates. The Fund is considered an investment company under U.S. GAAP and follows the accounting and reporting guidance applicable to investment companies. Below is a summary of significant accounting policies:
Investment Transactions and Income Recognition: For financial reporting purposes, investment transactions are recorded on the dates the transactions are entered into (the “trade dates”). Realized gains and losses on investment transactions are determined on the identified cost basis. Dividend income is recorded on theex-dividend date. Dividends from foreign securities where theex-dividend date may have passed are subsequently recorded when the Fund is informed of theex-dividend date. Under the applicable foreign tax laws, a withholding tax at various rates may be imposed on capital gains, dividends and interest. Interest income, including amortization and accretion of premiums and discounts on debt security is recognized on an accrual basis.
Foreign Currency Translation: The Fund’s books and records are maintained in U.S. dollars. Securities and other assets and liabilities denominated in foreign currencies are translated into U.S. dollars using exchange rates determined as of the close of trading on the New York Stock Exchange (“NYSE”). Purchases and sales of investments are recorded at the rates of exchange prevailing on the respective dates of such transactions. Generally, when the U.S. dollar rises in value against a foreign currency, the investments denominated in that currency will lose value; the opposite effect occurs if the U.S. dollar falls in relative value.
The Fund does not isolate the portion of the results of operations arising as a result of changes in the exchange rates from the changes in the market prices of investments held or sold for financial reporting purposes. Accordingly, the effects of changes in exchange rates on investments are not segregated in the Statement of Operations from
| | | | |
| NOTESTO FINANCIAL STATEMENTS | | | 29 | |
Notes to Financial Statements (continued)
the effects of changes in market prices of those investments, but are included as a component of net realized and unrealized gain (loss) from investments. The Fund reports realized currency gains (losses) on foreign currency related transactions as components of net realized gain (loss) for financial reporting purposes, whereas such components are generally treated as ordinary income for U.S. federal income tax purposes.
Segregation and Collateralization: In cases where the Fund enters into certain investments (e.g., futures contracts) that would be treated as “senior securities” for 1940 Act purposes, the Fund may segregate or designate on its books and records cash or liquid assets having a market value at least equal to the amount of its future obligations under such investments. Doing so allows the investment to be excluded from treatment as a “senior security.” Furthermore, if required by an exchange or counterparty agreement, the Fund may be required to deliver/deposit cash and/or securities to/with an exchange, or broker-dealer or custodian as collateral for certain investments or obligations.
Offering Costs:Offering costs are amortized over a12- month period beginning with the commencement of operations of a class of shares.
Distributions: Distributions paid by the Fund are recorded on theex-dividend date. Distributions of capital gains are recorded on the ex-dividend date and made at least annually. The character and timing of distributions are determined in accordance with U.S. federal income tax regulations, which may differ from U.S. GAAP.
Recent Accounting Standards: In August 2018, the Financial Accounting Standards Board issued Accounting Standards Update2018-13 “Changes to the Disclosure Requirements for Fair Value Measurement” which modifies disclosure requirements for fair value measurements. The guidance is effective for fiscal years beginning after December 15, 2019 and for interim periods within those fiscal years. Management is currently evaluating the impact of this guidance to the Fund.
Indemnifications: In the normal course of business, the Fund enters into contracts that contain a variety of representations that provide general indemnification. The Fund’s maximum exposure under these arrangements is unknown because it involves future potential claims against the Fund, which cannot be predicted with any certainty.
Other: Expenses directly related to the Fund are charged to the Fund. Other operating expenses shared by several funds, including other funds managed by the Manager, are prorated among those funds on the basis of relative net assets or other appropriate methods.
| 3. | INVESTMENT VALUATION AND FAIR VALUE MEASUREMENTS |
Investment Valuation Policies: The Fund’s investments are valued at fair value (also referred to as “market value” within the financial statements) as of the close of trading on the NYSE (generally 4:00 p.m., Eastern time). U.S. GAAP defines fair value as the price the Fund would receive to sell an asset or pay to transfer a liability in an orderly transaction between market participants at the measurement date. The Fund determines the fair values of its financial instruments using various independent dealers or pricing services under policies approved by the Board of Directors of the Company (the “Board”). The BlackRock Global Valuation Methodologies Committee (the “Global Valuation Committee”) is the committee formed by management to develop global pricing policies and procedures and to oversee the pricing function for all financial instruments.
Fair Value Inputs and Methodologies: The following methods and inputs are used to establish the fair value of the Fund’s assets and liabilities:
| | • | | Equity investments traded on a recognized securities exchange are valued at the official closing price each day, if available. For equity investments traded on more than one exchange, the official closing price on the exchange where the stock is primarily traded is used. Equity investments traded on a recognized exchange for which there were no sales on that day may be valued at the last available bid (long positions) or ask (short positions) price. |
| | • | | Generally, trading in foreign instruments is substantially completed each day at various times prior to the close of trading on the NYSE. Occasionally, events affecting the values of such instruments may occur between the foreign market close and the close of trading on the NYSE that may not be reflected in the computation of the Fund’s net assets. Each business day, the Fund uses a pricing service to assist with the valuation of certain foreign exchange-traded equity securities and foreign exchange-traded and over-the-counter (“OTC”) options (the “Systematic Fair Value Price”). Using current market factors, the Systematic Fair Value Price is designed to value such foreign securities and foreign options at fair value as of the close of trading on the NYSE, which follows the close of the local markets. |
| | • | | Investments inopen-end U.S. mutual funds are valued at NAV each business day. |
| | • | | Futures contracts traded on exchanges are valued at their last sale price. |
If events (e.g., a company announcement, market volatility or a natural disaster) occur that are expected to materially affect the value of such investments, or in the event that the application of these methods of valuation results in a price for an investment that is deemed not to be representative of the market value of such investment, or if a price is not available, the investment will be valued by the Global Valuation Committee, or its delegate, in accordance with a policy approved by the Board as reflecting fair value (“Fair Valued Investments”). The fair valuation approaches that may be used by the Global Valuation Committee will include market approach, income approach and cost approach. Valuation techniques such as discounted cash flow, use of market comparables and matrix pricing are types of valuation approaches and are typically used in determining fair value. When determining the price for Fair Valued Investments, the Global Valuation Committee, or its delegate, seeks to determine the price that the Fund might reasonably expect to receive or pay from the current sale or purchase of that asset or liability in an arm’s-length transaction. Fair value determinations shall be based upon all available factors that the Global Valuation Committee, or its delegate, deems relevant and consistent with the principles of fair value measurement.
The Global Valuation Committee, or its delegate, employs various methods for calibrating valuation approaches for investments where an active market does not exist, including regular due diligence of the Fund’s pricing vendors, regular reviews of key inputs and assumptions, transactional back-testing or disposition analysis to compare
unrealized gains and losses to realized gains and losses, reviews of missing or stale prices and large movements in market values and reviews of any market related
| | |
| 30 | | 2018 BLACKROCK ANNUAL REPORTTO SHAREHOLDERS |
Notes to Financial Statements (continued)
activity. The pricing of all Fair Valued Investments is subsequently reported to the Board or a committee thereof on a quarterly basis. As a result of the inherent uncertainty in valuation of these investments, the fair values may differ from the values that would have been used had an active market existed.
For investments in equity or debt issued by privately held companies or funds (“Private Company” or collectively, the “Private Companies”) and other Fair Valued Investments, the fair valuation approaches that are used by third party pricing services utilize one or a combination of, but not limited to, the following inputs.
| | |
| | | Standard Inputs Generally Considered By Third Party Pricing Services |
Market approach | | (i) recentmarket transactions, including subsequent rounds of financing, in the underlying investment or comparable issuers; (ii) recapitalizations and other transactions across the capital structure; and (iii) market multiples of comparable issuers. |
Income approach | | (i) future cash flows discounted to present and adjusted as appropriate for liquidity, credit, and/or market risks; (ii) quoted prices for similar investments or assets in active markets; and (iii) other risk factors, such as interest rates, yield curves, volatilities, prepayment speeds, loss severities, credit risks, recovery rates, liquidation amounts and/or default rates. |
Cost approach | | (i) audited or unaudited financial statements, investor communications and financial or operational metrics issued by the Private Company; (ii) changes in the valuation of relevant indices or publicly traded companies comparable to the Private Company; (iii) relevant news and other public sources; and (iv) known secondary market transactions in the Private Company’s interests and merger or acquisition activity in companies comparable to the Private Company. |
Investments in series of preferred stock issued by Private Companies are typically valued utilizing market approach in determining the enterprise value of the company. Such investments often contain rights and preferences that differ from other series of preferred and common stock of the same issuer. Valuation techniques such as an option pricing model (“OPM”), a probability weighted expected return model (“PWERM”) or a hybrid of those techniques are used in allocating enterprise value of the company, as deemed appropriate under the circumstances. The use of OPM and PWERM techniques involve a determination of the exit scenarios of the investment in order to appropriately allocate the enterprise value of the company among the various parts of its capital structure.
The Private Companies are not subject to the public company disclosure, timing, and reporting standards as other investments held by the Fund. Typically, the most recently available information by a Private Company is as of a date that is earlier than the date the Fund is calculating its NAV. This factor may result in a difference between the value of the investment and the price the Fund could receive upon the sale of the investment.
Fair Value Hierarchy: Various inputs are used in determining the fair value of investments and derivative financial instruments. These inputs to valuation techniques are categorized into a fair value hierarchy consisting of three broad levels for financial statement purposes as follows:
| | • | | Level 1 — Unadjusted price quotations in active markets/exchanges for identical assets or liabilities that the Fund has the ability to access |
| | • | | Level 2 — Other observable inputs (including, but not limited to, quoted prices for similar assets or liabilities in markets that are active, quoted prices for identical or similar assets or liabilities in markets that are not active, inputs other than quoted prices that are observable for the assets or liabilities (such as interest rates, yield curves, volatilities, prepayment speeds, loss severities, credit risks and default rates) or other market–corroborated inputs) |
| | • | | Level 3 — Unobservable inputs based on the best information available in the circumstances, to the extent observable inputs are not available (including the Fund’s own assumptions used in determining the fair value of investments and derivative financial instruments) |
The hierarchy gives the highest priority to unadjusted quoted prices in active markets for identical assets or liabilities (Level 1 measurements) and the lowest priority to unobservable inputs (Level 3 measurements). Accordingly, the degree of judgment exercised in determining fair value is greatest for instruments categorized in Level 3. The inputs used to measure fair value may fall into different levels of the fair value hierarchy. In such cases, for disclosure purposes, the fair value hierarchy classification is determined based on the lowest level input that is significant to the fair value measurement in its entirety. Investments classified within Level 3 have significant unobservable inputs used by the Global Valuation Committee in determining the price for Fair Valued Investments. Level 3 investments include equity or debt issued by Private Companies or funds. There may not be a secondary market, and/or there are a limited number of investors. Level 3 investments may also be adjusted to reflect illiquidity and/ornon-transferability, with the amount of such discount estimated by the Global Valuation Committee in the absence of market information.
Changes in valuation techniques may result in transfers into or out of an assigned level within the hierarchy. In accordance with the Fund’s policy, transfers between different levels of the fair value hierarchy are deemed to have occurred as of the beginning of the reporting period. The categorization of a value determined for investments and derivative financial instruments is based on the pricing transparency of the investments and derivative financial instruments and is not necessarily an indication of the risks associated with investing in those securities.
| 4. | DERIVATIVE FINANCIAL INSTRUMENTS |
The Fund engages in various portfolio investment strategies using derivative contracts both to increase the returns of the Fund and/or to manage its exposure to certain risks such as credit risk, equity risk, interest rate risk, foreign currency exchange rate risk, commodity price risk or other risks (e.g., inflation risk). Derivative financial instruments categorized by risk exposure are included in the Schedule of Investments. These contracts may be transacted on an exchange or OTC.
Futures Contracts: Futures contracts are purchased or sold to gain exposure to, or manage exposure to, changes in interest rates (interest rate risk) and changes in the value of equity securities (equity risk) or foreign currencies (foreign currency exchange rate risk).
| | | | |
| NOTESTO FINANCIAL STATEMENTS | | | 31 | |
Notes to Financial Statements (continued)
Futures contracts are agreements between the Fund and a counterparty to buy or sell a specific quantity of an underlying instrument at a specified price and on a specified date. Depending on the terms of a contract, it is settled either through physical delivery of the underlying instrument on the settlement date or by payment of a cash amount on the settlement date. Upon entering into a futures contract, the Fund is required to deposit initial margin with the broker in the form of cash or securities in an amount that varies depending on a contract’s size and risk profile. The initial margin deposit must then be maintained at an established level over the life of the contract. Amounts pledged, which are considered restricted, are included in cash pledged for futures contracts in the Statement of Assets and Liabilities.
Securities deposited as initial margin are designated in the Schedule of Investments and cash deposited, if any, is shown as cash pledged for futures contracts in the Statement of Assets and Liabilities. Pursuant to the contract, the Funds agrees to receive from or pay to the broker an amount of cash equal to the daily fluctuation in market value of the contract (“variation margin”). Variation margin is recorded as unrealized appreciation (depreciation) and, if any, shown as variation margin receivable (or payable) on futures contracts in the Statement of Assets and Liabilities. When the contract is closed, a realized gain or loss is recorded in the Statement of Operations equal to the difference between the notional amount of the contract at the time it was opened and the notional amount at the time it was closed. The use of futures contracts involves the risk of an imperfect correlation in the movements in the price of futures contracts and interest, foreign currency exchange rates or underlying assets.
| 5. | INVESTMENT ADVISORY AGREEMENT AND OTHER TRANSACTIONS WITH AFFILIATES |
Investment Advisory: The Company, on behalf of the Fund, entered into an Investment Advisory Agreement with the Manager, the Fund’s investment adviser, an indirect, wholly-owned subsidiary of BlackRock, to provide investment advisory and administrative services. The Manager is responsible for the management of the Fund’s portfolio and provides the personnel, facilities, equipment and certain other services necessary to the operations of the Fund.
For such services, the Fund paid the Manager a monthly fee at an annual rate equal to 0.08% of the average daily value of the Fund’s net assets for the period October 28, 2018 through December 31, 2018.
Prior to October 29, 2018, the Predecessor Fund paid State Farm Investment Management Corp. (“SFIMC” or “Predecessor Manager”), the investment adviser to the Predecessor Fund, an effective investment advisory fee of 0.13%.
SFIMC engaged BlackRock Fund Advisors (“BFA”) as the investment sub-adviser to provide day-to-day portfolio management for the Predecessor Fund. Sub-advisory fees for managing the portfolio were paid by SFIMC. No additional advisory fees were charged to the Predecessor Fund for the services of the sub-adviser.
For the period January 1, 2018 through October 26, 2018, BFA earned $94,925 of fees for sub-advisory services which is included in Investment advisory in the Statement of Operations.
Prior to October 29, 2018, the Predecessor Fund did not pay any direct or indirect discount, commission or other compensation for transfer agent services provided by SFIMC or for distribution and underwriting services provided by State Farm VP Management Corp.
Transfer Agent: On behalf of the Fund, the Manager entered into agreements with insurance companies and other financial intermediaries (“Service Organizations”), some of which may be affiliates. Pursuant to these agreements, the Service Organizations provide the Fund with administrative, networking, recordkeeping,sub-transfer agency and shareholder services tosub-accounts they service. For these services, the Service Organizations receive an annual fee per shareholder account, which will vary depending on share class and/or net assets of Fund shareholders serviced by the Service Organizations, which is shown as transfer agent — class specific. For the period October 29, 2018 to December 31, 2018, the Fund did not pay any amounts to affiliates in return for these services.
In addition, the Fund pays the transfer agent, which is not an affiliate, a fee for the issuance, transfer and redemption of shares and the opening and maintenance of shareholder accounts, which is included in transfer agent in the Statement of Operations. For the period October 29, 2018 to December 31, 2018, the Fund had no class specific transfer agent fees.
Expense Limitations, Waivers and Reimbursements:With respect to the Fund, effective October 29, 2018, the Manager voluntarily agreed to waive its investment advisory fees by the amount of investment advisory fees the Fund pays to the Manager indirectly through its investment in affiliated money market funds (the “affiliated money market fund waiver”). The amount of waivers and/or reimbursements of fees and expenses made pursuant to the expense limitation described below will be reduced by the amount of the affiliated money market fund waiver. This amount is included in fees waived and/or reimbursed by the Manager or Predecessor Manager in the Statement of Operations. For the year ended December 31, 2018, the amount waived was $695.
Effective October 29, 2018, the Manager has contractually agreed to waive its investment advisory fee with respect to any portion of the Fund’s assets invested in affiliated equity and fixed-income mutual funds and affiliated exchange-traded funds that have a contractual management fee through April 30, 2021. The contractual agreement may be terminated upon 90 days’ notice by a majority of directors who are not “interested persons” of the Fund, as defined in the 1940 Act (“Independent Directors”) or by a vote of a majority of the outstanding voting securities of the Fund. For the year ended December 31, 2018, there were no fees waived by the Manager.
With respect to the Fund, effective October 29, 2018, the Manager has contractually agreed to waive and/or reimburse fees or expenses in order to limit expenses, excluding interest expense, dividend expense, acquired fund fees and expenses, and certain other fund expenses, which constitute extraordinary expenses not incurred in the ordinary course of the Fund’s business (“expense limitation”). The expense limitation as a percentage of average daily net assets is 0.22%. The Manager has agreed not to reduce or discontinue this contractual expense limitation through April 30, 2021, unless approved by the Board, including a majority of the Independent Directors, or by a vote of a majority of the outstanding voting securities of the Fund. For the year ended December 31, 2018, the fees waived and/or reimbursed by the Manager was $23,988. These amounts are shown as transfer agent fees waived and/or reimbursed in the Statement of Operations. For the year ended December 31, 2018, the fees waived and/or reimbursed were $23,136.
In addition, effective October 29, 2018, the Manager has contractually agreed to waive and/or reimburse fees or expenses in order to limit fees paid by the Fund for operational and recordkeeping services to 0.05% of average daily net assets. These amounts are shown as transfer agent fees waived and/or reimbursed in the Statement of Operations. For the year ended December 31, 2018, there were no fees waived and/or reimbursed pursuant to this arrangement.
| | |
| 32 | | 2018 BLACKROCK ANNUAL REPORTTO SHAREHOLDERS |
Notes to Financial Statements (continued)
With respect to the contractual expense limitation, if during the Fund’s fiscal year the operating expenses of a share class, that at any time during the prior two fiscal years received a waiver and/or reimbursement from the Manager, are less than the current expense limitation for that share class, the Manager is entitled to be reimbursed by such share class up to the lesser of: (a) the amount of fees waived and/or expenses reimbursed during those prior two fiscal years under the agreement and (b) an amount not to exceed either the current expense limitation of that share class or the expense limitation of the share class in effect at the time that the share class received the applicable waiver and/or reimbursement, provided that:
(1) the Fund, of which the share class is a part, has more than $50 million in assets for the fiscal year, and
(2) the Manager or an affiliate continues to serve as the Fund’s investment adviser or administrator.
This repayment applies only to the contractual expense limitation on net expenses and does not apply to the contractual investment advisory fee waiver or contractual operational and recordkeeping services waiver described above or any voluntary waivers that may be in effect from time to time.
On December 31, 2018, the fund level and class specific waivers and/or reimbursements subject to possible future recoupment under the expense limitation agreement are as follows:
| | | | |
| | | Expiring December 31 | |
| | | 2020 | |
Fund level | | $ | 23,988 | |
Class I | | | 23,136 | |
Prior to October 26, 2018, SFIMC reimbursed expenses incurred by the Predecessor Fund (other than the investment advisory and management services fee, acquired fund fees and expenses and custody fees) that exceeded 0.10% of the Predecessor Fund’s average daily net assets. SFIMC also reimbursed all custody fees. Prior-year reimbursements and waivers are not subject to recoupment. For the period January 1, 2018 through October 26, 2018, the amount waived was $33,496, which is included in fees waived and/or reimbursed by the Manager or Predecessor Manager in the Statement of Operations.
Interfund Lending: In accordance with an exemptive order (the “Order”) from the SEC, the Fund may participate in a joint lending and borrowing facility for temporary purposes (the “Interfund Lending Program”), subject to compliance with the terms and conditions of the Order, and to the extent permitted by the Fund’s investment policies and restrictions. The Fund is currently permitted to borrow and lend under the Interfund Lending Program.
A lending BlackRock fund may lend in aggregate up to 15% of its net assets, but may not lend more than 5% of its net assets to any one borrowing fund through the Interfund Lending Program. A borrowing BlackRock fund may not borrow through the Interfund Lending Program or from any other source more than 331⁄3% of its total assets (or any lower threshold provided for by the fund’s investment restrictions). If a borrowing BlackRock fund’s total outstanding borrowings exceed 10% of its total assets, each of its outstanding interfund loans will be subject to collateralization of at least 102% of the outstanding principal value of the loan. All interfund loans are for temporary or emergency purposes and the interest rate to be charged will be the average of the highest current overnight repurchase agreement rate available to a lending fund and the bank loan rate, as calculated according to a formula established by the Board.
During the year ended December 31, 2018, the Fund did not participate in the Interfund Lending Program.
Directors and Officers: Certain directors and/or officers of the Company are directors and/or officers of BlackRock or its affiliates. The Fund reimburses the Manager for a portion of the compensation paid to the Company’s Chief Compliance Officer, which is included in Directors and Officer in the Statement of Operations.
Other Transactions: The Fund may purchase securities from, or sell securities to, an affiliated fund provided the affiliation is due solely to having a common investment adviser, common officers, or common directors. For the year ended December 31, 2018, the purchase and sale transactions and any net realized gains (losses) with an affiliated fund in compliance with Rule17a-7 under the 1940 Act were as follows:
| | | | |
Purchases | | $ | 6,529 | |
Sales | | | 12,753 | |
Net Realized Loss | | | (1,146 | ) |
For the year ended December 31, 2018, purchases and sales of investments, excluding short-term securities, were $53,697,959 and $124,854,643, respectively.
It is the Fund’s policy to comply with the requirements of the Internal Revenue Code of 1986, as amended, applicable to regulated investment companies, and to distribute substantially all of its taxable income to its shareholders. Therefore, no U.S. federal income tax provision is required.
The Fund files U.S. federal and various state and local tax returns. No income tax returns are currently under examination. The statute of limitations on the Fund’s U.S. federal tax returns generally remains open for each of the four years ended December 31, 2018. The statutes of limitations on the Fund’s state and local tax returns may remain open for an additional year depending upon the jurisdiction.
Management has analyzed tax laws and regulations and their application to the Fund as of December 31, 2018, inclusive of the open tax return years, and does not believe there are any uncertain tax positions that require recognition of a tax liability in the Fund’s financial statements.
| | | | |
| NOTESTO FINANCIAL STATEMENTS | | | 33 | |
Notes to Financial Statements (continued)
US GAAP requires that certain components of net assets be adjusted to reflect permanent differences between financial and tax reporting. These reclassifications have no effect on net assets or net asset values per share. As of period end, the following permanent difference attributable to non-deductible expenses was reclassified to the following accounts:
| | | | |
Paid in capital | | $ | (5,826 | ) |
Accumulated earnings | | $ | 5,826 | |
The tax character of distributions paid was as follows:
| | | | | | | | |
| | | 12/31/18 | | | 12/31/17 | |
Ordinary income | | $ | 6,107,960 | | | $ | 5,409,376 | |
Long term capital gains | | | 56,082,745 | | | | 17,444,345 | |
| | | | | | | | |
| | $ | 62,190,705 | | | $ | 22,853,721 | |
| | | | | | | | |
As of period end, the tax components of accumulated net earnings were as follows:
| | | | |
Undistributed ordinary income | | $ | 181,471 | |
Undistributed long-term capital gains | | | 202,849 | |
Net unrealized gains(a) | | | 15,839,126 | |
| | | | |
| | $ | 16,223,446 | |
| | | | |
| | (a) | The difference between book-basis and tax-basis net unrealized gains was attributable primarily to the tax deferral of losses on wash sales, the realization for tax purposes of unrealized gains on investments in passive foreign investment companies, the realization for tax purposes of unrealized gains/losses on certain futures contracts and the classification of investments. | |
As of December 31, 2018, gross unrealized appreciation and depreciation for investments and derivatives based on cost for U.S. federal income tax purposes were as follows:
| | | | |
Tax cost | | $ | 225,838,261 | |
| | | | |
Gross unrealized appreciation | | $ | 65,514,156 | |
Gross unrealized depreciation | | | (49,675,030 | ) |
| | | | |
Net unrealized appreciation | | $ | 15,839,126 | |
| | | | |
The Company, on behalf of the Fund, along with certain other funds managed by the Manager and its affiliates (“Participating Funds”), is a party to a364-day, $2.25 billion credit agreement with a group of lenders. Under this agreement, the Fund may borrow to fund shareholder redemptions. Excluding commitments designated for certain individual funds, the Participating Funds, including the Fund, can borrow up to an aggregate commitment amount of $1.75 billion at any time outstanding, subject to asset coverage and other limitations as specified in the agreement. The credit agreement has the following terms: a fee of 0.10% per annum on unused commitment amounts and interest at a rate equal to the higher of(a) one-month LIBOR (but, in any event, not less than 0.00%) on the date the loan is made plus 0.80% per annum or (b) the Fed Funds rate (but, in any event, not less than 0.00%) in effect from time to time plus 0.80% per annum on amounts borrowed. The agreement expires in April 2019 unless extended or renewed. Prior to April 19, 2018, the aggregate commitment amount was $2.1 billion and the fee was 0.12% per annum. Participating Funds paid an upfront commitment fee of 0.02% on the total commitment amounts, in addition to administration, legal and arrangement fees, which are included in miscellaneous expenses in the Statement of Operations. These fees were allocated among such funds based upon portions of the aggregate commitment available to them and relative net assets of Participating Funds. During the year ended December 31, 2018, the Fund did not borrow under the credit agreement.
In the normal course of business, the Fund invests in securities or other instruments and may enter into certain transactions, and such activities subject the Fund to various risks, including among others, fluctuations in the market (market risk) or failure of an issuer to meet all of its obligations. The value of securities or other instruments may also be affected by various factors, including, without limitation: (i) the general economy; (ii) the overall market as well as local, regional or global political and/or social instability; (iii) regulation, taxation or international tax treaties between various countries; or (iv) currency, interest rate and price fluctuations. The Fund’s prospectus provides details of the risks to which the Fund is subject.
Valuation Risk: The market values of equities, such as common stocks and preferred securities or equity related investments, such as futures and options, may decline due to general market conditions which are not specifically related to a particular company. They may also decline due to factors which affect a particular industry or industries. The Fund may invest in illiquid investments and may experience difficulty in selling those investments in a timely manner at the price that it believes the investments are worth. Prices may fluctuate widely over short or extended periods in response to company, market or economic news. Markets also tend to move in cycles, with periods of rising and falling prices. This volatility may cause the Fund’s NAV to experience significant increases or decreases over short periods of time. If there is a general decline in the securities and other markets, the NAV of the Fund may lose value, regardless of the individual results of the securities and other instruments in which the Fund invests.
| | |
| 34 | | 2018 BLACKROCK ANNUAL REPORTTO SHAREHOLDERS |
Notes to Financial Statements (continued)
The price the Fund could receive upon the sale of any particular portfolio investment may differ from the Fund’s valuation of the investment, particularly for securities that trade in thin or volatile markets or that are valued using a fair valuation technique or a price provided by an independent pricing service. Changes to significant unobservable inputs and assumptions (i.e., publicly traded company multiples, growth rate, time to exit) due to the lack of observable inputs may significantly impact the resulting fair value and therefore the Fund’s results of operations. As a result, the price received upon the sale of an investment may be less than the value ascribed by the Fund, and the Fund could realize a greater than expected loss or lesser than expected gain upon the sale of the investment. The Fund’s ability to value its investments may also be impacted by technological issues and/or errors by pricing services or other third party service providers.
Counterparty Credit Risk: The Fund may be exposed to counterparty credit risk, or the risk that an entity may fail to or be unable to perform on its commitments related to unsettled or open transactions. The Fund manages counterparty credit risk by entering into transactions only with counterparties that the Manager believes have the financial resources to honor their obligations and by monitoring the financial stability of those counterparties. Financial assets, which potentially expose the Fund to market, issuer and counterparty credit risks, consist principally of financial instruments and receivables due from counterparties. The extent of the Fund’s exposure to market, issuer and counterparty credit risks with respect to these financial assets is approximately their value recorded in the Statement of Assets and Liabilities, less any collateral held by the Fund.
A derivative contract may suffer amark-to-market loss if the value of the contract decreases due to an unfavorable change in the market rates or values of the underlying instrument. Losses can also occur if the counterparty does not perform under the contract.
With exchange-traded futures, there is less counterparty credit risk to the Fund since the exchange or clearinghouse, as counterparty to such instruments, guarantees against a possible default. The clearinghouse stands between the buyer and the seller of the contract; therefore, credit risk is limited to failure of the clearinghouse. While offset rights may exist under applicable law, the Fund does not have a contractual right of offset against a clearing broker or clearinghouse in the event of a default (including the bankruptcy or insolvency). Additionally, credit risk exists in exchange-traded futures with respect to initial and variation margin that is held in a clearing broker’s customer accounts. While clearing brokers are required to segregate customer margin from their own assets, in the event that a clearing broker becomes insolvent or goes into bankruptcy and at that time there is a shortfall in the aggregate amount of margin held by the clearing broker for all its clients, typically the shortfall would be allocated on a pro rata basis across all the clearing broker’s customers, potentially resulting in losses to the Fund.
| 10. | CAPITAL SHARE TRANSACTIONS |
Transactions in capital shares were as follows:
| | | | | | | | | | | | | | | | |
| | | Year Ended
12/31/2018 (a) | | | Year Ended
12/31/2017 | |
| | | Shares | | | Amount | | | Shares | | | Amount | |
Class I | | | | | | | | | | | | | | | | |
Shares sold | | | 226,594 | | | $ | 3,317,952 | | | | 141,872 | | | $ | 2,037,902 | |
Shares issued in reinvestment of distributions | | | 6,509,197 | | | | 62,190,568 | | | | 1,561,047 | | | | 22,853,721 | |
Shares redeemed | | | (4,870,048 | ) | | | (77,181,228 | ) | | | (1,463,353 | ) | | | (20,927,858 | ) |
| | | | | | | | | | | | | | | | |
Net increase (decrease) | | | 1,865,743 | | | $ | (11,672,708 | ) | | | 239,566 | | | $ | 3,963,765 | |
| | | | | | | | | | | | | | | | |
| | (a) | Includes the activity of the Predecessor Fund prior to the Reorganization on October 29, 2018. Excludes the exchange of shares of the Predecessor Fund for shares of the Fund during the Reorganization. The Predecessor Fund is the performance and accounting survivor of the Reorganization. | |
As of December 31, 2018, BlackRock Financial Management, Inc., an affiliate of the Fund, owned 710 Class I Shares of BlackRock Small Cap Index V.I. Fund.
| 11. | REGULATIONS-X AMENDMENTS |
On August 17, 2018, the SEC adopted amendments to certain disclosure requirements in Securities Act ReleaseNo. 33-10532, Disclosure Update and Simplification. The Fund has adopted the amendments pertinent to RegulationS-X in this shareholder report. The amendments impacted certain disclosure presentation on the Statement of Assets and Liabilities, Statements of Changes in Net Assets and Notes to the Financial Statements.
Prior year distribution information and undistributed net investment income in the Statements of Changes in Net Assets has been modified to conform to the current year presentation in accordance with the RegulationS-X changes.
Distributions for the year ended December 31, 2017 were classified as follows:
| | | | | | | | | | | | | | |
| Share Class | | | | | Net Investment Income | | | | | Net Realized Gain | |
| | Class I | | | | | | (3,509,680 | ) | | | | | (19,344,041 | ) |
Undistributed net investment income as of December 31, 2017 was $867.
Management has evaluated the impact of all subsequent events on the Fund through the date the financial statements were issued and has determined that there were no subsequent events requiring adjustment or additional disclosure in the financial statements.
| | | | |
| NOTESTO FINANCIAL STATEMENTS | | | 35 | |
Report of Independent Registered Public Accounting Firm
To the Shareholders of BlackRock Small Cap Index V.I. Fund and the Board of Directors of BlackRock Variable Series Funds, Inc.:
Opinion on the Financial Statements and Financial Highlights
We have audited the accompanying statement of assets and liabilities of BlackRock Small Cap Index V.I. Fund (formerly, Small Cap Equity Index Fund of State Farm Variable Product Trust) of BlackRock Variable Series Funds, Inc. (the “Fund”), including the schedule of investments, as of December 31, 2018, the related statements of operations, changes in net assets, and the financial highlights for the year then ended, and the related notes. In our opinion, the financial statements and financial highlights present fairly, in all material respects, the financial position of the Fund as of December 31, 2018, and the results of its operations, the changes in its net assets, and the financial highlights for the year then ended, in conformity with accounting principles generally accepted in the United States of America.
The statements of changes in net assets for the year ended December 31, 2017 and the financial highlights for each of the four years in the period ended December 31, 2017 of the Fund were audited by other auditors whose report dated February 23, 2018, expressed an unqualified opinion on those financial statements and financial highlights.
Basis for Opinion
These financial statements and financial highlights are the responsibility of the Fund’s management. Our responsibility is to express an opinion on the Fund’s financial statements and financial highlights based on our audit. We are a public accounting firm registered with the Public Company Accounting Oversight Board (United States) (PCAOB) and are required to be independent with respect to the Fund in accordance with the U.S. federal securities laws and the applicable rules and regulations of the Securities and Exchange Commission and the PCAOB.
We conducted our audit in accordance with the standards of the PCAOB. Those standards require that we plan and perform the audit to obtain reasonable assurance about whether the financial statements and financial highlights are free of material misstatement, whether due to error or fraud. The Fund is not required to have, nor were we engaged to perform, an audit of its internal control over financial reporting. As part of our audit we are required to obtain an understanding of internal control over financial reporting but not for the purpose of expressing an opinion on the effectiveness of the Fund’s internal control over financial reporting. Accordingly, we express no such opinion.
Our audit included performing procedures to assess the risks of material misstatement of the financial statements and financial highlights, whether due to error or fraud, and performing procedures that respond to those risks. Such procedures included examining, on a test basis, evidence regarding the amounts and disclosures in the financial statements and financial highlights. Our audit also included evaluating the accounting principles used and significant estimates made by management, as well as evaluating the overall presentation of the financial statements and financial highlights. Our procedures included confirmation of securities owned as of December 31, 2018, by correspondence with the custodian and brokers; when replies were not received from brokers, we performed other auditing procedures. We believe that our audit provides a reasonable basis for our opinion.
Deloitte & Touche LLP
Boston, Massachusetts
February 15, 2019
We have served as the auditor of one or more BlackRock investment companies since 1992.
| | |
| 36 | | 2018 BLACKROCK ANNUAL REPORTTO SHAREHOLDERS |
Disclosure of Investment Advisory Agreement
The Board of Directors (the “Board,” the members of which are referred to as “Board Members”) of BlackRock Variable Series Funds, Inc. (the “Company”) met in person on November 14, 2017 (the “Meeting”) to consider the approval of the proposed investment advisory agreement (the “Advisory Agreement” or the “Agreement”) between the Company, on behalf of the BlackRock International Index V.I. Fund (the “International Fund”) and BlackRock Small Cap Index V.I. Fund (the “Small Cap Fund”) (each, a “Fund” and together, the “Funds”), and BlackRock Advisors, LLC (the “Manager” or “BlackRock”) as each Fund’s investment advisor. The Funds commenced operations in October 2018.
Activities and Composition of the Board
On the date of the Meeting, the Board consisted of eleven individuals, nine of whom were not “interested persons” of the Company as defined in the Investment Company Act of 1940, as amended (the “1940 Act”) (the “Independent Board Members”). The Board Members are responsible for the oversight of the operations of each Fund and perform the various duties imposed on the directors of investment companies by the 1940 Act. The Independent Board Members have retained independent legal counsel to assist them in connection with their duties. The Chair of the Board is an Independent Board Member. The Board has established five standing committees: an Audit Committee, a Governance and Nominating Committee, a Compliance Committee, a Performance Oversight Committee and an Executive Committee, each of which is chaired by an Independent Board Member and composed of Independent Board Members (except for the Performance Oversight Committee and the Executive Committee, each of which also has one interested Board Member).
The Agreement
Pursuant to the 1940 Act, the Board is required to consider the initial approval of the Agreement. The Board’s consideration of the Agreement is a deliberative process, during which the Board assessed, among other things, the nature, extent and quality of the services to be provided to each Fund by BlackRock, BlackRock’s personnel and affiliates, including (as applicable): investment management; accounting, administrative and shareholder services; oversight of each Fund’s service providers; marketing and promotional services; risk management and oversight; legal and compliance services; and ability to meet applicable legal and regulatory requirements.
Board Considerations in Approving the Agreement
The Approval Process: At the Meeting, the Board reviewed materials relating to its consideration of the Agreement. The Board considered all factors it believed relevant with respect to the Company and each Fund, including, among other factors: (a) the nature, extent and quality of the services to be provided by BlackRock; (b) the investment performance of BlackRock portfolio management; (c) the advisory fee and the estimated cost of the services and estimated profits to be realized by BlackRock and its affiliates from their relationship with each Fund; (d) the sharing of potential economies of scale; (e) potentialfall-out benefits to BlackRock and its affiliates as a result of BlackRock’s relationship with each Fund; and (g) other factors deemed relevant by the Board Members.
In determining whether to approve the Agreement, the Board met with the relevant investment advisory personnel from BlackRock and considered all information it deemed reasonably necessary to evaluate the terms of the Agreement. The Board received materials in advance of the Meeting relating to its consideration of the Agreement, including, among other things, (a) information independently compiled and prepared by Broadridge Financial Solutions, Inc. (“Broadridge”), based on either a Lipper classification or Morningstar category, regarding each Fund’s estimated fees and expenses as compared with a peer group of funds as determined by Broadridge (“Expense Peers”) and other metrics, as applicable; (b) information regarding BlackRock’s economic outlook for each Fund and its general investment outlook for the markets; (c) information regarding fees paid to service providers that are affiliates of BlackRock; and (d) information outlining the legal duties of the Board under the 1940 Act with respect to the consideration and approval of the Agreement. The Board also noted information received at prior Board meetings concerning compliance records and regulatory matters relating to BlackRock.
The Board also considered other matters it deemed important to the approval process, such as other payments to be made to BlackRock or its affiliates, securities lending and cash management, services related to the valuation and pricing of Fund portfolio holdings, and advice from independent legal counsel with respect to the review process and materials submitted for the Board’s review. The Board noted the willingness of BlackRock personnel to engage in open, candid discussions with the Board. The Board did not identify any particular information as determinative, and each Board Member may have attributed different weights to the various items considered.
A. Nature, Extent and Quality of the Services to be Provided by BlackRock: The Board, including the Independent Board Members, reviewed the nature, extent and quality of services to be provided by BlackRock, including the investment advisory services to be provided to each Fund. The Board received information concerning the investment philosophy and investment process to be used by BlackRock in managing each Fund, as well as a description of the capabilities, personnel and services of BlackRock. In connection with this review, the Board considered BlackRock’sin-house research capabilities as well as other resources available to its personnel. The Board considered the scope of the services to be provided by BlackRock to each Fund under the Agreement relative to services typically provided by third parties to other funds. The Board noted that the standard of care applicable under the Agreement was comparable to that found generally in investment company advisory agreements. The Board concluded that the scope of BlackRock’s services to be provided to each Fund was consistent with each Fund’s operational requirements, including, in addition to seeking to meet its investment objective, compliance with investment restrictions, tax and reporting requirements and related shareholder services.
The Board, including the Independent Board Members, also considered the quality of the administrative and othernon-investment advisory services to be provided by BlackRock and its affiliates to each Fund. The Board evaluated the procedures of BlackRock designed to fulfill its fiduciary duty to each Fund with respect to possible conflicts of interest, including BlackRock’s code of ethics (regulating the personal trading of BlackRock’s officers and employees), the procedures by which BlackRock allocates trades among its various investment advisory clients, the integrity of the systems in place to ensure compliance with the foregoing and the record of BlackRock in these matters. The Board also noted information received at prior Board meetings concerning the standards of BlackRock with respect to the execution of portfolio transactions.
The Board, including the Independent Board Members, considered, among other factors, with respect to BlackRock: the number, education and experience of investment personnel generally and each Fund’s portfolio management team; BlackRock’s research capabilities; investments by portfolio managers in the funds they manage;
| | | | |
| DISCLOSUREOF INVESTMENT ADVISORY AGREEMENT | | | 37 | |
Disclosure of Investment Advisory Agreement (continued)
portfolio trading capabilities; use of technology; commitment to compliance; credit analysis capabilities; risk analysis and oversight capabilities; and the approach to training and retaining portfolio managers and other research, advisory and management personnel. The Board also considered BlackRock’s overall risk management program, including the continued efforts of BlackRock and its affiliates to address cybersecurity risks and the role of BlackRock’s Risk & Quantitative Analysis Group. The Board engaged in a review of BlackRock’s compensation structure with respect to each Fund’s portfolio management team and BlackRock’s ability to attract and retain high-quality talent and create performance incentives. The Board also considered the business reputation of BlackRock and its financial resources and concluded that BlackRock would be able to meet any reasonably foreseeable obligation under the Agreement.
In addition to investment advisory services, the Board, including the Independent Board Members, considered the quality of the administrative and othernon-investment advisory services to be provided by BlackRock and its affiliates to each Fund. The Board noted that BlackRock and its affiliates will provide each Fund with certain administrative, shareholder and other services (in addition to any such services to be provided to each Fund by third parties) and officers and other personnel as are necessary for the operations of each Fund. In particular, the Board noted that BlackRock and its affiliates will provide each Fund with administrative services including, among others: (i) responsibility for disclosure documents, such as the prospectus, the summary prospectus (as applicable), the statement of additional information and periodic shareholder reports; (ii) oversight of daily accounting and pricing; (iii) responsibility for periodic filings with regulators; (iv) overseeing and coordinating the activities of other service providers including, among others, each Fund’s custodian, fund accountant, transfer agent, and auditor; (v) organizing Board meetings and preparing the materials for such Board meetings; (vi) providing legal and compliance support; (vii) furnishing analytical and other support to assist the Board in its consideration of strategic issues such as the merger, consolidation or repurposing of certainopen-end funds; and (viii) performing administrative functions necessary for the operation of each Fund, such as tax reporting, expense management, fulfilling regulatory filing requirements, overseeing each Fund’s distribution partners, and shareholder call center and other services. The Board reviewed the structure and duties of BlackRock’s fund administration, shareholder services, and legal & compliance departments and considered BlackRock’s policies and procedures for assuring compliance with applicable laws and regulations.
B. The Investment Performance of each Fund and BlackRock: The Board, including the Independent Board Members, previously received and considered information about BlackRock’s investment performance for other funds. The Board, however, could not consider the performance history of the Funds because the Funds were not yet organized and had not yet commenced operations as of the date of the Meeting.
C. Consideration of the Advisory/Management Fees and the Cost of the Services to be Provided and Estimated Profits to be Realized by BlackRock and its Affiliates from their Relationship with each Fund: In connection with the initial approval of the Agreement, the Board, including the Independent Board Members, reviewed each Fund’s proposed contractual management fee rate compared with those of its Expense Peers. The contractual management fee rate represents a combination of the advisory fee and any administrative fees, before taking into account any reimbursements or fee waivers. In addition, the Board, including the Independent Board Members, considered each Fund’s estimated total expense ratio, as well as its actual management fee rate, to those of its Expense Peers. The estimated total expense ratio represents a fund’s total net operating expenses, including any12b-1 or non12b-1 service fees. The estimated total expense ratio gives effect to any expense reimbursements or fee waivers that benefit a fund, and the actual management fee rate gives effect to any management fee reimbursements or waivers that benefit a fund. The Board considered the services provided and the fees charged by BlackRock and its affiliates to other types of clients with similar investment mandates, as applicable, including institutional accounts andsub-advised mutual funds (including mutual funds sponsored by third parties).
The Board noted that each Fund’s contractual management fee rate and actual management fee rate ranked in the first quartile, and that each Fund’s estimated total expense ratio ranked in the first quartile, relative to each Fund’s Expense Peers. The Board further noted that BlackRock and the Board have contractually agreed to a cap on each Fund’s total expenses as a percentage of each Fund’s average daily net assets. Additionally, the Board noted that BlackRock and the Board have contractually agreed to a cap on certain operational and recordkeeping fees for each of the Funds.
Following consideration of this information, the Board, including the Independent Board Members, concluded that the fees to be paid pursuant to the Agreement were fair and reasonable in light of the services provided.
As the Funds had not commenced operations as of the date of the Meeting, BlackRock was not able to provide the Board with specific information concerning the expected profits to be realized by BlackRock and its affiliates from their relationships with the Funds. BlackRock, however, will provide the Board with such information at future meetings.
D. Economies of Scale: The Board, including the Independent Board Members, considered the extent to which economies of scale might be realized as the assets of each Fund increase. The Board also noted the existence of fee waivers and/or expense caps, noting that any contractual fee waivers and expense caps would be approved by the Board.
E. Other Factors Deemed Relevant by the Board Members: The Board, including the Independent Board Members, also took into account other potential ancillary or“fall-out” benefits that BlackRock or its affiliates may derive from BlackRock’s respective relationships with each Fund, both tangible and intangible, such as BlackRock’s ability to leverage its investment professionals who manage other portfolios and risk management personnel, an increase in BlackRock’s profile in the investment advisory community, and the engagement of BlackRock’s affiliates as service providers to each Fund, including for administrative, distribution, securities lending and cash management services. The Board also considered BlackRock’s overall operations and its efforts to expand the scale of, and improve the quality of, its operations. The Board also noted that, subject to applicable law, BlackRock may use and benefit from third party research obtained by soft dollars generated by certain registered fund transactions to assist in managing all or a number of its other client accounts.
The Board, including all of the Independent Board Members, concluded that these potential ancillary benefits that BlackRock and its affiliates could receive with regard to providing investment advisory and other services to each Fund were consistent with those generally available to other mutual fund sponsors.
The Board noted the competitive nature of theopen-end fund marketplace, and that shareholders would be able to redeem their Fund shares if they believe that each Fund’s fees and expenses are too high or if they are dissatisfied with the performance of each Fund.
| | |
| 38 | | 2018 BLACKROCK ANNUAL REPORTTO SHAREHOLDERS |
Disclosure of Investment Advisory Agreement (continued)
Conclusion
The Board, including the Independent Board Members, approved the Advisory Agreement between the Manager and the Company, on behalf of each Fund, for atwo-year term beginning on the effective date of the Advisory Agreement. Based upon its evaluation of all of the aforementioned factors in their totality, as well as other information, the Board, including the Independent Board Members, was satisfied that the terms of the Agreement were fair and reasonable and in the best interest of each Fund and its shareholders. In arriving at its decision to approve the Agreement, the Board did not identify any single factor or group of factors asall-important or controlling, but considered all factors together, and different Board Members may have attributed different weights to the various factors considered. The Independent Board Members were also assisted by the advice of independent legal counsel in making this determination.
| | | | |
| DISCLOSUREOF INVESTMENT ADVISORY AGREEMENT | | | 39 | |
Glossary of Terms Used in this Report
| | |
| Currency |
| |
| USD | | United States Dollar |
| | |
| Portfolio Abbreviations |
| |
| CLO | | Collateralized Loan Obligation |
| |
| REIT | | Real Estate Investment Trust |
| | |
| 40 | | 2018 BLACKROCK ANNUAL REPORTTO SHAREHOLDERS |
Director and Officer Information
| | | | | | | | |
| Independent Directors (a) |
| | | | | |
Name Year of Birth (b) | | Position(s) Held
(Length of Service) (c) | | Principal Occupation(s) During Past Five Years | | Number of BlackRock-Advised
Registered Investment Companies
(“RICs”) Consisting of
Investment Portfolios
(“Portfolios”) Overseen | | Public Company and
Other Investment
Company Directorships
Held During
Past Five Years |
Robert M. Hernandez 1944 | | Chair of the Board and Director (Since 2007) | | Director, Vice Chairman and Chief Financial Officer of USX Corporation (energy and steel business) from 1991 to 2001; Director andnon-executive Chairman, RTI International Metals, Inc. from 1990 to 2015; Director, TE Connectivity (electronics) from 2006 to 2012. | | 32 RICs consisting of 95 Portfolios | | Chubb Limited (insurance company); Eastman Chemical Company |
James H. Bodurtha 1944 | | Director (Since 2007) | | Director, The China Business Group, Inc. (consulting and investing firm) from 1996 to 2013 and Executive Vice President thereof from 1996 to 2003; Chairman of the Board, Berkshire Holding Corporation since 1980; Director, ICI Mutual since 2010. | | 32 RICs consisting of 95 Portfolios | | None |
Bruce R. Bond 1946 | | Director (Since 2007) | | Board Member, Amsphere Limited (software) since 2018; Trustee and Member of the Governance Committee, State Street Research Mutual Funds from 1997 to 2005; Board Member of Governance, Audit and Finance Committee, Avaya Inc. (computer equipment) from 2003 to 2007. | | 32 RICs consisting of 95 Portfolios | | None |
Honorable Stuart E. Eizenstat 1943 | | Director (Since 2007) | | Senior Counsel of Covington and Burling LLP (law firm) since 2016; Head of International Practice thereof since 2001, and Partner thereof from 2001 to 2016; Advisory Board Member, OCP S.A. (phosphates) since 2010; International Advisory Board Member, The Coca-Cola Company from 2002 to 2011; Advisory Board Member, Veracity Worldwide, LLC (risk management) from 2007 to 2012; Member of the International Advisory Board, GML Ltd. (energy) since 2003; Board of Directors, Ferroglobe (silicon metals) since 2016. | | 32 RICs consisting of 95 Portfolios | | Alcatel-Lucent (telecommunications); Global Specialty Metallurgical; UPS Corporation (delivery service) |
Henry Gabbay 1947 | | Director (Since 2007) | | Board Member, Equity-Liquidity andClosed-End Fund Boards from 2007 through 2014; Consultant, BlackRock, Inc. from 2007 to 2008; Managing Director, BlackRock, Inc. from 1989 to 2007; Chief Administrative Officer, BlackRock Advisors, LLC from 1998 to 2007; President of BlackRock Funds and BlackRock Allocation Target Shares (formerly, BlackRock Bond Allocation Target Shares) from 2005 to 2007 and Treasurer of certainclosed-end funds in the BlackRock fund complex from 1989 to 2006. | | 32 RICs consisting of 95 Portfolios | | None |
Lena G. Goldberg 1949 | | Director (Since 2016) | | Senior Lecturer, Harvard Business School since 2008; Director, Charles Stark Draper Laboratory, Inc. since 2013; FMR LLC/Fidelity Investments (financial services) from 1996 to 2008, serving in various senior roles including Executive Vice President — Strategic Corporate Initiatives and Executive Vice President and General Counsel; Partner, Sullivan & Worcester LLP from 1985 to 1996 and Associate thereof from 1979 to 1985. | | 32 RICs consisting of 95 Portfolios | | None |
| | | | |
| DIRECTORAND OFFICER INFORMATION | | | | |
Director and Officer Information (continued)
| | | | | | | | |
| Independent Directors (a)(continued) |
| | | | | |
Name Year of Birth (b) | | Position(s) Held
(Length of Service) (c) | | Principal Occupation(s) During Past Five Years | | Number of BlackRock-Advised
Registered Investment Companies
(“RICs”) Consisting of
Investment Portfolios
(“Portfolios”) Overseen | | Public Company and
Other Investment
Company Directorships
Held During
Past Five Years |
Henry R. Keizer 1956 | | Director (Since 2016) | | Director, Park Indemnity Ltd. (captive insurer) since 2010; Director, MUFG Americas Holdings Corporation and MUFG Union Bank, N.A. (financial and bank holding company) from 2014 to 2016; Director, American Institute of Certified Public Accountants from 2009 to 2011; Director, KPMG LLP (audit, tax and advisory services) from 2004 to 2005 and 2010 to 2012; Director, KPMG International in 2012, Deputy Chairman and Chief Operating Officer thereof from 2010 to 2012 and U.S. Vice Chairman of Audit thereof from 2005 to 2010; Global Head of Audit, KPMGI (consortium of KPMG firms) from 2006 to 2010; Director, YMCA of Greater New York from 2006 to 2010. | | 32 RICs consisting of 95 Portfolios | | Hertz Global Holdings (car rental); Montpelier Re Holdings, Ltd. (publicly held property and casual reinsurance) from 2013 until 2015; Sealed Air Corp. (packaging); WABCO (commercial vehicle safety systems) |
John F O’Brien 1943 | | Director (Since 2007) | | Trustee, Woods Hole Oceanographic Institute since 2003 and Chairman thereof from 2009 to 2015;Co-Founder and Managing Director, Board Leaders LLC (director education) since 2005. | | 32 RICs consisting of 95 Portfolios | | Cabot Corporation (chemicals); LKQ Corporation (auto parts manufacturing); TJX Companies, Inc. (retailer) |
Donald C. Opatrny 1952 | | Director (Since 2015) | | Trustee, Vice Chair, Member of the Executive Committee and Chair of the Investment Committee, Cornell University since 2004; President, Trustee and Member of the Investment Committee, The Aldrich Contemporary Art Museum from 2007 to 2014; Member of the Board and Investment Committee, University School from 2007 to 2018; Member of the Investment Committee, Mellon Foundation from 2009 to 2015; Trustee, Artstor (a Mellon Foundation affiliate) from 2010 to 2015; President and Trustee, the Center for the Arts, Jackson Hole from 2011 to 2018; Director, Athena Capital Advisors LLC (investment management firm) since 2013; Trustee and Chair of the Investment Committee, Community Foundation of Jackson Hole since 2014; Member of Affordable Housing Supply Board of Jackson, Wyoming since 2017; Member, Investment Funds Committee, State of Wyoming since 2017; Trustee, Phoenix Art Museum since 2018. | | 32 RICs consisting of 95 Portfolios | | None |
|
| Interested Directors (a)(d) |
| | | | | |
Name
Year of Birth (b) | | Position(s) Held
(Length of Service) (c) | | Principal Occupation(s) During Past Five Years | | Number of BlackRock-Advised
Registered Investment Companies
(“RICs”) Consisting of
Investment Portfolios
(“Portfolios”) Overseen | | Public Company and
Other Investment
Company Directorships
Held During
Past Five Years |
Robert Fairbairn 1965 | | Director (Since 2015) | | Senior Managing Director of BlackRock, Inc. since 2010; oversees BlackRock’s Strategic Partner Program and Strategic Product Management Group; Member of BlackRock’s Global Executive and Global Operating Committees;Co-Chair of BlackRock’s Human Capital Committee; Member of the Board of Managers of BlackRock Investments, LLC since 2011; Global Head of BlackRock’s Retail and iShares® businesses from 2012 to 2016. | | 127 RICs consisting of 304 Portfolios | | None |
| | |
| | 2018 BLACKROCK ANNUAL REPORTTO SHAREHOLDERS |
Director and Officer Information (continued)
| | | | | | | | |
| Interested Directors (a)(d)(continued) |
| | | | | |
Name
Year of Birth (b) | | Position(s) Held
(Length of Service) (c) | | Principal Occupation(s) During Past Five Years | | Number of BlackRock-Advised
Registered Investment Companies
(“RICs”) Consisting of
Investment Portfolios
(“Portfolios”) Overseen | | Public Company and
Other Investment
Company Directorships
Held During
Past Five Years |
John M. Perlowski 1964 | | Director (Since 2015) and President and Chief Executive Officer (Since 2010) | | Managing Director of BlackRock, Inc. since 2009; Head of BlackRock Global Accounting and Product Services since 2009; Advisory Director of Family Resource Network (charitable foundation) since 2009. | | 127 RICs consisting of 304 Portfolios | | None |
(a) The address of each Director is c/o BlackRock, Inc., 55 East 52nd Street, New York, NY 10055. |
(b) Each Independent Director holds office until his or her successor is duly elected and qualifies or until his or her earlier death, resignation, retirement or removal as provided by the Company’sby-laws or charter or statute, or until December 31 of the year in which he or she turns 75. The Board may determine to extend the terms of Independent Directors on acase-by-case basis, as appropriate. Interested Directors serve until their successor is duly elected and qualifies or until their earlier death, resignation, retirement or removal as provided by the Company’sby-laws or statute, or until December 31 of the year in which they turn 72. |
(c) Following the combination of Merrill Lynch Investment Managers, L.P. (“MLIM”) and BlackRock, Inc. in September 2006, the various legacy MLIM and legacy BlackRock fund boards were realigned and consolidated into three new fund boards in 2007. As a result, although the chart shows certain Independent Directors as joining the Company’s board in 2007, those Directors first became members of the boards of other legacy MLIM or legacy BlackRock funds as follows: James H. Bodurtha, 1995; Bruce R. Bond, 2005; Honorable Stuart E. Eizenstat, 2001; Robert M. Hernandez, 1996; and John F. O’Brien, 2005. For BlackRock Total Return V.I. Fund, BlackRock High Yield V.I Fund, and BlackRock U.S. Government Bond V.I Fund, Length of Service includes service as director of the Predecessor/Target Funds. |
(d) Mr. Fairbairn and Mr. Perlowski are both “interested persons,” as defined in the 1940 Act, of the Company based on their positions with BlackRock, Inc. and its affiliates. Mr. Fairbairn and Mr. Perlowski are also board members of the BlackRockClosed-End Complex and the BlackRock Equity-Liquidity Complex. |
| | | | |
| DIRECTORAND OFFICER INFORMATION | | | | |
Director and Officer Information (continued)
| | | | |
| Officers Who Are Not Directors (a) |
| | | |
Name
Year of Birth (b) | | Position(s) Held (Length of Service) | | Principal Occupation(s) During Past Five Years |
Jennifer McGovern 1977 | | Vice President (Since 2014) | | Managing Director of BlackRock, Inc. since 2016; Director of BlackRock, Inc. from 2011 to 2015; Head of Product Structure and Oversight for BlackRock’s U.S. Wealth Advisory Group since 2013. |
Neal J. Andrews 1966 | | Chief Financial Officer (Since 2007) | | Managing Director of BlackRock, Inc. since 2006. |
Jay M. Fife 1970 | | Treasurer (Since 2007) | | Managing Director of BlackRock, Inc. since 2007. |
Charles Park 1967 | | Chief Compliance Officer (Since 2014) | | Anti-Money Laundering Compliance Officer for the BlackRock-advised Funds in the Equity-Bond Complex, the Equity-Liquidity Complex and theClosed-End Complex from 2014 to 2015; Chief Compliance Officer of BlackRock Advisors, LLC and the BlackRock-advised Funds in the Equity-Bond Complex, the Equity-Liquidity Complex and theClosed-End Complex since 2014; Principal of and Chief Compliance Officer for iShares® Delaware Trust Sponsor LLC since 2012 and BlackRock Fund Advisors (“BFA”) since 2006; Chief Compliance Officer for theBFA-advised iShares® exchange traded funds since 2006; Chief Compliance Officer for BlackRock Asset Management International Inc. since 2012. |
John MacKessy 1972 | | Anti-Money Laundering Compliance Officer (Since 2018) | | Director of BlackRock, Inc. since 2017; Global Head of Anti-Money Laundering at BlackRock, Inc. since 2017; Director of AML Monitoring and Investigations Group of Citibank from 2015 to 2017; Global Anti-Money Laundering and Economic Sanctions Officer for MasterCard from 2011 to 2015. |
Benjamin Archibald 1975 | | Secretary (Since 2012) | | Managing Director of BlackRock, Inc. since 2014; Director of BlackRock, Inc. from 2010 to 2013; Secretary of the iShares® exchange traded funds since 2015; Secretary of the BlackRock-advised mutual funds since 2012. |
(a) The address of each Officer is c/o BlackRock, Inc., 55 East 52nd Street, New York, NY 10055. |
(b) Officers of the Company serve at the pleasure of the Board. |
Further information about the Company’s Directors and Officers is available in the Company’s Statement of Additional Information, which can be obtained without charge by calling(800)-441-7762.
At a special meeting of shareholders held on November 21, 2018, each Fund’s shareholders elected Directors who took office on January 1, 2019. For BlackRock Variable Series Funds, Inc., the newly elected Directors include seven former Directors and eight individuals who served as directors/trustees of the funds in the BlackRock Equity-Liquidity Complex. For BlackRock Variable Series Funds II, Inc., the newly elected Directors include three former Directors and eight individuals who served as directors/trustees of the funds in the BlackRockClosed-End Complex. Information regarding the individuals who began serving as Directors effective January 1, 2019 can be found in the proxy statement for the special meeting of shareholders, which is available on the SEC’s EDGAR Database at http://www.sec.gov.
Investment Adviser and Administrator
BlackRock Advisors, LLC
Wilmington, DE 19809
Accounting Agent
JPMorgan Chase Bank, N.A.
New York, NY 10179
Transfer Agent
BNY Mellon Investment Servicing (US) Inc.
Wilmington, DE 19809
Custodians
JPMorgan Chase Bank, N.A.(c)
New York, NY 10179
Brown Brothers Harriman & Co.(d)
Boston, MA 02109
Sub-Advisers
BlackRock International Limited(a)
Edinburgh, Scotland EH3 8BL
BlackRock Asset Management
North Asia Limited(b)
Hong Kong
BlackRock (Singapore) Limited(b)
079912 Singapore
Independent Registered Public Accounting Firm
Deloitte & Touche LLP
Boston, MA 02116
Distributor
BlackRock Investments, LLC
New York, NY 10022
Legal Counsel
Willkie Farr & Gallagher LLP
New York, NY 10019
Address of the Funds
100 Bellevue Parkway
Wilmington, DE 19809
| (a) | For BlackRock International V.I. Fund and BlackRock Managed Volatility V.I Fund. |
| (b) | For BlackRock Managed Volatility V.I. Fund. |
| (c) | For all Funds except BlackRock Global Allocation V.I. Fund, BlackRock International V.I. Fund and BlackRock Large Cap Focus Growth V.I. Fund. |
| (d) | For BlackRock Global Allocation V.I. Fund, BlackRock International V.I. Fund and BlackRock Large Cap Focus Growth V.I. Fund. |
| | |
| | 2018 BLACKROCK ANNUAL REPORTTO SHAREHOLDERS |
Additional Information
Proxy Results
BlackRock Variable Series Funds, Inc.
A Special Meeting of Shareholders was held on November 21, 2018 for shareholders of record on September 24, 2018, to elect a Board of Directors of the Funds. The newly elected Directors took office effective January 1, 2019.
Shareholders approved the Directors* of BlackRock Variable Series Funds, Inc. with voting results as follows:
| | | | | | | | | | | | |
| | | Votes For | | | Votes Against | | | Votes Abstained | |
Bruce R. Bond | | | 853,415,418 | | | | 20,821,487 | | | | 54,328,090 | |
Susan J. Carter | | | 859,039,119 | | | | 17,819,914 | | | | 51,705,962 | |
Collette Chilton | | | 856,423,656 | | | | 20,742,083 | | | | 51,399,256 | |
Neil A. Cotty | | | 852,591,474 | | | | 20,690,305 | | | | 55,283,216 | |
Robert Fairbairn | | | 852,542,660 | | | | 20,795,311 | | | | 55,227,025 | |
Lena G. Goldberg | | | 854,847,802 | | | | 21,644,125 | | | | 52,073,069 | |
Robert M. Hernandez | | | 850,400,415 | | | | 23,756,329 | | | | 54,408,250 | |
Henry R. Keizer | | | 852,907,817 | | | | 20,662,329 | | | | 54,994,850 | |
Cynthia A. Montgomery | | | 858,485,209 | | | | 18,681,453 | | | | 51,398,333 | |
Donald C. Opatrny | | | 852,092,270 | | | | 20,950,922 | | | | 55,521,803 | |
John M. Perlowski | | | 853,364,573 | | | | 20,553,365 | | | | 54,647,057 | |
Joseph P. Platt | | | 852,037,460 | | | | 22,003,638 | | | | 54,523,898 | |
Mark Stalnecker | | | 853,005,625 | | | | 20,799,654 | | | | 54,759,717 | |
Kenneth L. Urish | | | 851,983,013 | | | | 21,087,065 | | | | 55,494,917 | |
Claire A. Walton | | | 858,718,970 | | | | 18,461,950 | | | | 51,384,075 | |
| | * | Denotes Company-wide proposal and voting results. | |
The above Directors, referred to as the BlackRock Multi-Asset Board, have also been elected to serve as directors for other BlackRock-advised equity, multi-asset, index and money market funds.
BlackRock Variable Series Funds II, Inc.
A Special Meeting of Shareholders was held on November 21, 2018 for shareholders of record on September 24, 2018, to elect a Board of Directors of the Funds. The newly elected Directors took office effective January 1, 2019.
Shareholders approved the Directors* of BlackRock Variable Series Funds II, Inc. with voting results as follows:
| | | | | | | | | | | | |
| | | Votes For | | | Votes Against | | | Votes Abstained | |
Michael J. Castellano | | | 59,887,070 | | | | 1,387,922 | | | | 4,893,829 | |
Richard E. Cavanagh | | | 59,649,768 | | | | 1,455,828 | | | | 5,063,225 | |
Cynthia L. Egan | | | 59,918,319 | | | | 1,345,231 | | | | 4,905,271 | |
Frank J. Fabozzi | | | 59,851,485 | | | | 1,328,783 | | | | 4,988,553 | |
Robert Fairbairn | | | 59,950,088 | | | | 1,221,911 | | | | 4,996,822 | |
Henry Gabbay | | | 59,979,137 | | | | 1,094,954 | | | | 5,094,730 | |
R. Glenn Hubbard | | | 60,054,180 | | | | 1,149,136 | | | | 4,965,505 | |
W. Carl Kester | | | 59,878,572 | | | | 1,214,536 | | | | 5,075,713 | |
Catherine A. Lynch | | | 60,029,677 | | | | 1,220,289 | | | | 4,918,855 | |
John M. Perlowski | | | 60,044,864 | | | | 1,136,151 | | | | 4,987,806 | |
Karen P. Robards | | | 60,316,551 | | | | 1,000,326 | | | | 4,851,944 | |
| | * | Denotes Company-wide proposal and voting results. | |
The above Directors, referred to as the BlackRock Fixed-Income Board, have also been elected to serve as directors for other BlackRock-advised non-index fixed-income mutual funds and all of the BlackRock-advised closed-end funds.
General Information
Householding
The Funds will mail only one copy of shareholder documents, including prospectuses, annual and semi-annual reports and proxy statements, to shareholders with multiple accounts at the same address. This practice is commonly called “householding” and is intended to reduce expenses and eliminate duplicate mailings of shareholder documents. Mailings of your shareholder documents may be householded indefinitely unless you instruct us otherwise. If you do not want the mailing of these documents to be combined with those for other members of your household, please call the Funds at (800)441-7762.
Additional Information (continued)
Availability of Quarterly Schedule of Investments
The Funds file their complete schedule of portfolio holdings with the SEC for the first and third quarters of each fiscal year on FormN-Q. The Funds’ FormsN-Q are available on the SEC’s website at http://www.sec.gov. The Funds’ FormsN-Q may also be obtained upon request and without charge by calling (800)441-7762.
Availability of Proxy Voting Policies and Procedures
A description of the policies and procedures that the Funds use to determine how to vote proxies relating to portfolio securities is available upon request and without charge (1) by calling (800)441-7762; (2) athttp://www.blackrock.com/prospectus/insurance; and (3) on the SEC’s website at http://www.sec.gov.
Availability of Proxy Voting Record
Information about how the Funds voted proxies relating to securities held in the Funds’ portfolios during the most recent12-month period ended June 30 is available upon request and without charge (1) athttp://www.blackrock.com/prospectus/insurance or by calling (800)441-7762 and (2) on the SEC’s website at http://www.sec.gov.
BlackRock’s Mutual Fund Family
BlackRock offers a diverse lineup ofopen-end mutual funds crossing all investment styles and managed by experts in equity, fixed-income andtax-exempt investing. Visithttp://www.blackrock.com for more information.
Shareholder Privileges
Account Information
Call us at (800)441-7762 from 8:00 AM to 6:00 PM ET on any business day to get information about your account balances, recent transactions and share prices. You can also reach us on the Web athttp://www.blackrock.com.
Automatic Investment Plans
Investor Class shareholders who want to invest regularly can arrange to have $50 or more automatically deducted from their checking or savings account and invested in any of the BlackRock funds.
Systematic Withdrawal Plans
Investor Class shareholders can establish a systematic withdrawal plan and receive periodic payments of $50 or more from their BlackRock funds, as long as their account balance is at least $10,000.
Retirement Plans
Shareholders may make investments in conjunction with Traditional, Rollover, Roth, Coverdell, Simple IRAs, SEP IRAs and 403(b) Plans.
BlackRock Privacy Principles
BlackRock is committed to maintaining the privacy of its current and former fund investors and individual clients (collectively, “Clients”) and to safe-guarding theirnon-public personal information. The following information is provided to help you understand what personal information BlackRock collects, how we protect that information and why in certain cases we share such information with select parties.
If you are located in a jurisdiction where specific laws, rules or regulations require BlackRock to provide you with additional or different privacy-related rights beyond what is set forth below, then BlackRock will comply with those specific laws, rules or regulations.
BlackRock obtains or verifies personalnon-public information from and about you from different sources, including the following: (i) information we receive from you or, if applicable, your financial intermediary, on applications, forms or other documents; (ii) information about your transactions with us, our affiliates, or others; (iii) information we receive from a consumer reporting agency; and (iv) from visits to our websites.
BlackRock does not sell or disclose tonon-affiliated third parties anynon-public personal information about its Clients, except as permitted by law or as is necessary to respond to regulatory requests or to service Client accounts. Thesenon-affiliated third parties are required to protect the confidentiality and security of this information and to use it only for its intended purpose.
We may share information with our affiliates to service your account or to provide you with information about other BlackRock products or services that may be of interest to you. In addition, BlackRock restricts access tonon-public personal information about its Clients to those BlackRock employees with a legitimate business need for the information. BlackRock maintains physical, electronic and procedural safeguards that are designed to protect thenon-public personal information of its Clients, including procedures relating to the proper storage and disposal of such information.
| | |
| | 2018 BLACKROCK ANNUAL REPORTTO SHAREHOLDERS |
This report is only for distribution to shareholders of the Funds of BlackRock Variable Series Funds, Inc. Past performance results shown in this report should not be considered a representation of future performance. Investment return and principal value of non-money market fund shares will fluctuate so that shares, when redeemed, may be worth more or less than their original cost. An investment in the BlackRock Government Money Market V.I. Fund is not insured or guaranteed by the Federal Deposit Insurance Corporation or any other government agency. Although the money market fund seeks to preserve the value of your investment at $1.00 per share, it is possible to lose money by investing in money market funds. Statements and other information herein are as dated and are subject to change.

| | |
| VS-12/18-AR | |  |
| Item 2 – | Code of Ethics – The registrant (or the “Fund”) has adopted a code of ethics, as of the end of the period covered by this report, applicable to the registrant’s principal executive officer, principal financial officer, principal accounting officer or controller, or persons performing similar functions. During the period covered by this report, the code of ethics was amended to update certain information and to make othernon-material changes. During the period covered by this report, there have been no waivers granted under the code of ethics. The registrant undertakes to provide a copy of the code of ethics to any person upon request, without charge, who calls1-800-441-7762. |
| Item 3 – | Audit Committee Financial Expert – The registrant’s board of directors (the “board of directors”), has determined that (i) the registrant has the following audit committee financial experts serving on its audit committee and (ii) each audit committee financial expert is independent: |
Robert M. Hernandez
Henry R. Keizer
Bruce R. Bond
Under applicable securities laws, a person determined to be an audit committee financial expert will not be deemed an “expert” for any purpose, including without limitation for the purposes of Section 11 of the Securities Act of 1933, as a result of being designated or identified as an audit committee financial expert. The designation or identification of a person as an audit committee financial expert does not impose on such person any duties, obligations, or liabilities greater than the duties, obligations, and liabilities imposed on such person as a member of the audit committee and board of directors in the absence of such designation or identification.
| Item 4 – | Principal Accountant Fees and Services |
The following table presents fees billed by Deloitte & Touche LLP (“D&T”) in each of the last two fiscal years for the services rendered to the Fund:
| | | | | | | | | | | | | | | | |
| | | (a) Audit Fees | | (b) Audit-Related Fees1 | | (c) Tax Fees2 | | (d) All Other Fees |
| Entity Name | | Current
Fiscal Year
End | | Previous
Fiscal Year
End | | Current
Fiscal Year
End | | Previous
Fiscal Year
End | | Current
Fiscal Year
End | | Previous
Fiscal Year
End | | Current
Fiscal Year
End | | Previous
Fiscal Year
End |
BlackRock Advantage Large Cap Core V.I. Fund | | $30,294 | | $30,286 | | $38 | | $4,000 | | $13,100 | | $13,107 | | $0 | | $0 |
BlackRock Advantage Large Cap Value V.I. Fund | | $22,032 | | $22,024 | | $38 | | $4,000 | | $13,100 | | $13,107 | | $0 | | $0 |
| BlackRock Advantage U.S. Total Market V.I. Fund | | $27,234 | | $27,226 | | $0 | | $4,000 | | $13,100 | | $13,107 | | $0 | | $0 |
| BlackRock Basic Value V.I. Fund | | $37,536 | | $37,528 | | $0 | | $0 | | $13,100 | | $13,107 | | $0 | | $0 |
| BlackRock Capital Appreciation V.I. Fund | | $24,684 | | $24,701 | | $0 | | $0 | | $13,100 | | $13,107 | | $0 | | $0 |
| BlackRock Equity Dividend V.I. Fund | | $19,584 | | $19,627 | | $0 | | $0 | | $8,200 | | $8,160 | | $0 | | $0 |
2
| | | | | | | | | | | | | | | | |
| BlackRock Global Allocation V.I. Fund | | $51,306 | | $51,332 | | $0 | | $0 | | $20,000 | | $20,000 | | $0 | | $0 |
| BlackRock Government Money Market V.I. Fund | | $26,520 | | $24,302 | | $0 | | $0 | | $9,800 | | $9,792 | | $0 | | $0 |
| BlackRock International V.I. Fund | | $30,090 | | $30,107 | | $38 | | $0 | | $14,100 | | $14,127 | | $0 | | $0 |
| BlackRock International Index V.I. Fund | | $30,294 | | $0 | | $0 | | $0 | | $14,100 | | $0 | | $0 | | $0 |
| BlackRock iShares Dynamic Allocation V.I. Fund | | $20,400 | | $29,006 | | $38 | | $0 | | $13,900 | | $13,850 | | $0 | | $0 |
| BlackRock Large Cap Focus Growth V.I. Fund | | $22,032 | | $22,024 | | $38 | | $4,000 | | $13,100 | | $13,107 | | $0 | | $0 |
| BlackRock Managed Volatility V.I. Fund | | $34,680 | | $29,427 | | $0 | | $0 | | $9,000 | | $8,976 | | $0 | | $0 |
| BlackRock S&P 500 Index V.I. Fund | | $30,294 | | $30,286 | | $4,000 | | $0 | | $13,100 | | $13,107 | | $0 | | $0 |
| BlackRock Small Cap Index V.I. Fund | | $27,540 | | $0 | | $0 | | $0 | | $13,100 | | $0 | | $0 | | $0 |
The following table presents fees billed by D&T that were required to be approved by the registrant’s audit committee (the “Committee”) for services that relate directly to the operations or financial reporting of the Fund and that are rendered on behalf of BlackRock Advisors, LLC (the “Investment Adviser” or “BlackRock”) and entities controlling, controlled by, or under common control with BlackRock (not including anysub-adviser whose role is primarily portfolio management and is subcontracted with or overseen by another investment adviser) that provide ongoing services to the Fund (“Affiliated Service Providers”):
| | | | |
| | | Current Fiscal Year End | | Previous Fiscal Year End |
| (b) Audit-Related Fees1 | | $0 | | $0 |
| (c) Tax Fees2 | | $0 | | $0 |
| (d) All Other Fees3 | | $2,274,000 | | $2,129,000 |
1 The nature of the services includes assurance and related services reasonably related to the performance of the audit or review of financial statements not included in Audit Fees, including accounting consultations, agreed-upon procedure reports, attestation reports, comfort letters,out-of-pocket expenses and internal control reviews not required by regulators.
2 The nature of the services includes tax compliance and/or tax preparation, including services relating to the filing or amendment of federal, state or local income tax returns, regulated investment company qualification reviews, taxable income and tax distribution calculations.
3Non-audit fees of $2,274,000 and $2,129,000 for the current fiscal year and previous fiscal year, respectively, were paid to the Fund’s principal accountant in their entirety by BlackRock, in connection with services provided to the Affiliated Service Providers of the Fund and of certain other funds sponsored and advised by BlackRock or its affiliates for a service organization review and an accounting research tool subscription. These amounts represent aggregate fees paid by BlackRock and were not allocated on a per fund basis.
(e)(1) Audit CommitteePre-Approval Policies and Procedures:
The Committee has adopted policies and procedures with regard to thepre-approval of services. Audit, audit-related and tax compliance services provided to the registrant on an annual basis require specificpre-approval by the Committee. The Committee also must approve other non-audit services provided to the registrant and thosenon-audit services provided to the Investment Adviser and Affiliated Service Providers that relate directly to the operations and the financial reporting of the registrant. Certain of thesenon-audit services that the Committee believes are (a)
3
consistent with the SEC’s auditor independence rules and (b) routine and recurring services that will not impair the independence of the independent accountants may be approved by the Committee without consideration on a specificcase-by-case basis (“generalpre-approval”). The term of any generalpre-approval is 12 months from the date of thepre-approval, unless the Committee provides for a different period. Tax or othernon-audit services provided to the registrant which have a direct impact on the operations or financial reporting of the registrant will only be deemedpre-approved provided that any individual project does not exceed $10,000 attributable to the registrant or $50,000 per project. For this purpose, multiple projects will be aggregated to determine if they exceed the previously mentioned cost levels.
Any proposed services exceeding thepre-approved cost levels will require specificpre-approval by the Committee, as will any other services not subject to generalpre-approval (e.g., unanticipated but permissible services). The Committee is informed of each service approved subject to generalpre-approval at the next regularly scheduledin-person board meeting. At this meeting, an analysis of such services is presented to the Committee for ratification. The Committee may delegate to the Committee Chairman the authority to approve the provision of and fees for any specific engagement of permittednon-audit services, including services exceedingpre-approved cost levels.
(e)(2) None of the services described in each of Items 4(b) through (d) were approved by the Committee pursuant to the de minimis exception in paragraph (c)(7)(i)(C) of Rule2-01 of RegulationS-X.
(f) Not Applicable
(g) The aggregatenon-audit fees, defined as the sum of the fees shown under “Audit-Related Fees,” “Tax Fees” and “All Other Fees,” paid to the accountant for services rendered by the accountant to the registrant, the Investment Adviser and the Affiliated Service Providers were:
| | | | |
| Entity Name | | Current Fiscal Year End | | Previous Fiscal Year
End |
| BlackRock Advantage Large Cap Core V.I. Fund | | $13,138 | | $17,107 |
| BlackRock Advantage Large Cap Growth V.I. Fund | | $13,138 | | $17,107 |
| BlackRock Advantage U.S. Total Market V.I. Fund | | $13,100 | | $17,107 |
| BlackRock Basic Value V.I. Fund | | $13,100 | | $13,107 |
| BlackRock Capital Appreciation V.I. Fund | | $13,100 | | $13,107 |
| BlackRock Equity Dividend V.I. Fund | | $8,200 | | $8,160 |
| BlackRock Global Allocation V.I. Fund | | $20,000 | | $20,000 |
| BlackRock Government Money Market V.I. Fund | | $9,800 | | $9,792 |
| BlackRock International V.I. Fund | | $14,138 | | $14,127 |
| BlackRock International Index V.I. Fund | | $14,100 | | $0 |
| BlackRock iShares Dynamic Allocation V.I. Fund | | $13,938 | | $13,850 |
4
| | | | |
| BlackRock Large Cap Focus Growth V.I. Fund | | $13,138 | | $17,107 |
| BlackRock Managed Volatility V.I. Fund | | $9,000 | | $8,976 |
| BlackRock S&P 500 Index V.I. Fund | | $17,100 | | $13,107 |
| BlackRock Small Cap Index V.I. Fund | | $13,100 | | $0 |
Additionally, the amounts billed by D&T in connection with services provided to the Affiliated Service Providers of the Fund and of other funds sponsored and advised by BlackRock or its affiliates during the current and previous fiscal years for a service organization review and an accounting research tool subscription were:
| | |
Current Fiscal Year End | | Previous Fiscal Year End |
$2,274,000 | | $2,129,000 |
These amounts represent aggregate fees paid by BlackRock and were not allocated on a per fund basis.
(h) The Committee has considered and determined that the provision ofnon-audit services that were rendered to the Investment Adviser and the Affiliated Service Providers that were notpre-approved pursuant to paragraph
(c)(7)(ii) of Rule2-01 of RegulationS-X is compatible with maintaining the principal accountant’s independence.
| Item 5 – | Audit Committee of Listed Registrants – Not Applicable |
(a) The registrant’s Schedule of Investments is included as part of the Report to Stockholders filed under Item 1 of this Form.
(b) Not Applicable due to no such divestments during the semi-annual period covered since the previous FormN-CSR filing.
| Item 7 – | Disclosure of Proxy Voting Policies and Procedures forClosed-End Management Investment Companies – Not Applicable |
| Item 8 – | Portfolio Managers ofClosed-End Management Investment Companies – Not Applicable |
| Item 9 – | Purchases of Equity Securities byClosed-End Management Investment Company and Affiliated Purchasers – Not Applicable |
| Item 10 – | Submission of Matters to a Vote of Security Holders – There have been no material changes to these procedures. |
| Item 11 – | Controls and Procedures |
(a) The registrant’s principal executive and principal financial officers, or persons performing similar functions, have concluded that the registrant’s disclosure controls and procedures (as defined
5
in Rule30a-3(c) under the Investment Company Act of 1940, as amended (the “1940 Act”)) are effective as of a date within 90 days of the filing of this report based on the evaluation of these controls and procedures required by Rule30a-3(b) under the 1940 Act and Rule 15d-15(b) under the Securities Exchange Act of 1934, as amended.
(b) There were no changes in the registrant’s internal control over financial reporting (as defined in Rule30a-3(d) under the 1940 Act) that occurred during the second fiscal quarter of the period covered by this report that have materially affected, or are reasonably likely to materially affect, the registrant’s internal control over financial reporting.
| Item 12 – | Disclosure of Securities Lending Activities forClosed-End Management Investment Companies – Not Applicable to the registrant. |
| Item 13 – | Exhibits attached hereto |
(a)(1) Code of Ethics – See Item 2
(a)(2) Certifications – Attached hereto
(a)(3) Not Applicable
(a)(4) Not Applicable
(b) Certifications – Attached hereto
6
Pursuant to the requirements of the Securities Exchange Act of 1934 and the Investment Company Act of 1940, the registrant has duly caused this report to be signed on its behalf by the undersigned, thereunto duly authorized.
| | |
| BlackRock Variable Series Funds, Inc. |
| |
| By: | | /s/ John M. Perlowski |
| | John M. Perlowski Chief Executive Officer (principal executive officer) of BlackRock Variable Series Funds, Inc. |
Date: February 28, 2019
Pursuant to the requirements of the Securities Exchange Act of 1934 and the Investment Company Act of 1940, this report has been signed below by the following persons on behalf of the registrant and in the capacities and on the dates indicated.
| | |
| By: | | /s/ John M. Perlowski |
| | John M. Perlowski Chief Executive Officer (principal executive officer) of BlackRock Variable Series Funds, Inc. |
Date: February 28, 2019
| | |
| By: | | /s/ Neal J. Andrews |
| | Neal J. Andrews Chief Financial Officer (principal financial officer) of BlackRock Variable Series Funds, Inc. |
Date: February 28, 2019
7