UNITED STATES
SECURITIES AND EXCHANGE COMMISSION
Washington, D.C. 20549
FORM N-CSR
CERTIFIED SHAREHOLDER REPORT OF REGISTERED
MANAGEMENT INVESTMENT COMPANIES
Investment Company Act file number 811-3320
Fidelity Colchester Street Trust
(Exact name of registrant as specified in charter)
82 Devonshire St., Boston, Massachusetts 02109
(Address of principal executive offices) (Zip code)
Scott C. Goebel, Secretary
82 Devonshire St.
Boston, Massachusetts 02109
(Name and address of agent for service)
Registrant's telephone number, including area code: 617-563-7000
Date of fiscal year end: | March 31 |
| |
Date of reporting period: | September 30, 2011 |
Item 1. Reports to Stockholders
Fidelity ®
Institutional
Money Market
Funds
Semiannual Report
September 30, 2011
Contents
Fund Goals:
Treasury Only Portfolio seeks as high a level of current income as is consistent with the security of principal and liquidity.
Treasury Portfolio, Government Portfolio, Prime Money Market Portfolio, and Money Market Portfolio seek to obtain as high a level of current income as is consistent with the preservation of principal and liquidity within the limitations prescribed for the fund.
Tax-Exempt Portfolio seeks to obtain as high a level of interest income exempt from federal income tax as is consistent with liquidity and stability of principal.
To view a fund's proxy voting guidelines and proxy voting record for the 12-month period ended June 30, visit http://www.fidelity.com/proxyvotingresults or visit the Securities and Exchange Commission's (SEC) web site at http://www.sec.gov. You may also call 1-877-297-2952, or for Class F, call 1-800-835-5092, to request a free copy of the proxy voting guidelines.
Standard & Poor's, S&P and S&P 500 are registered service marks of The McGraw-Hill Companies, Inc. and have been licensed for use by Fidelity Distributors Corporation.
Other third party marks appearing herein are the property of their respective owners.
All other marks appearing herein are registered or unregistered trademarks or service marks of FMR LLC or an affiliated company.
Investments in the funds are neither insured nor guaranteed by the U.S. Government, and there can be no assurance that the funds will maintain a stable $1.00 share price.
This report and the financial statements contained herein are submitted for the general information of the shareholders of the funds. This report is not authorized for distribution to prospective investors in the funds unless preceded or accompanied by an effective prospectus.
A fund files its complete schedule of portfolio holdings with the SEC for the first and third quarters of each fiscal year on Form N-Q. Forms N-Q are available on the SEC's web site at http://www.sec.gov. A fund's Forms N-Q may be reviewed and copied at the SEC's Public Reference Room in Washington, DC. Information regarding the operation of the SEC's Public Reference Room may be obtained by calling 1-800-SEC-0330. For a complete list of a fund's portfolio holdings, view the most recent holdings listing, semiannual report, or annual report on Fidelity's web site at http://www.fidelity.com, http://www.advisor.fidelity.com, or http://www.401k.com, as applicable.
NOT FDIC INSURED • MAY LOSE VALUE • NO BANK GUARANTEE
Neither the funds nor Fidelity Distributors Corporation is a bank.
Semiannual Report
As a shareholder of a Fund, you incur two types of costs: (1) transaction costs, and (2) ongoing costs, including management fees, distribution and/or service (12b-1) fees and other Fund expenses. This Example is intended to help you understand your ongoing costs (in dollars) of investing in the Funds and to compare these costs with the ongoing costs of investing in other mutual funds.
The Example is based on an investment of $1,000 invested at the beginning of the period and held for the entire period (April 1, 2011 to September 30, 2011).
Actual Expenses
The first line of the accompanying table for each class of each fund provides information about actual account values and actual expenses. You may use the information in this line, together with the amount you invested, to estimate the expenses that you paid over the period. Simply divide your account value by $1,000.00 (for example, an $8,600 account value divided by $1,000.00 = 8.6), then multiply the result by the number in the first line for a class of the fund under the heading entitled "Expenses Paid During Period" to estimate the expenses you paid on your account during this period. A small balance maintenance fee of $12.00 that is charged once a year may apply for certain accounts with a value of less than $2,000. This fee is not included in the table below. If it was, the estimate of expenses you paid during the period would be higher, and your ending account value lower, by this amount. In addition, each Fund, as a shareholder in the underlying Fidelity Central Funds, will indirectly bear its pro-rata share of the fees and expenses incurred by the underlying Fidelity Central Funds. These fees and expenses are not included in the Fund's annualized expense ratio used to calculate the expense estimate in the table below.
Hypothetical Example for Comparison Purposes
The second line of the accompanying table for each class of each fund provides information about hypothetical account values and hypothetical expenses based on a Class' actual expense ratio and an assumed rate of return of 5% per year before expenses, which is not the Class' actual return. The hypothetical account values and expenses may not be used to estimate the actual ending account balance or expenses you paid for the period. You may use this information to compare the ongoing costs of investing in the Fund and other funds. To do so, compare this 5% hypothetical example with the 5% hypothetical examples that appear in the shareholder reports of the other funds. A small balance maintenance fee of $12.00 that is charged once a year may apply for certain accounts with a value of less than $2,000. This fee is not included in the table below. If it was, the estimate of expenses you paid during the period would be higher, and your ending account value lower, by this amount. In addition, each Fund, as a shareholder in the underlying Fidelity Central Funds, will indirectly bear its pro-rata share of the fees and expenses incurred by the underlying Fidelity Central Funds. These fees and expenses are not included in the Fund's annualized expense ratio used to calculate the expense estimate in the table below.
Please note that the expenses shown in the table are meant to highlight your ongoing costs only and do not reflect any transaction costs. Therefore, the second line of the table is useful in comparing ongoing costs only, and will not help you determine the relative total costs of owning different funds.
| Annualized Expense Ratio | Beginning
Account Value
April 1, 2011 | Ending
Account Value
September 30, 2011 | Expenses Paid
During Period*
April 1, 2011 to
September 30, 2011 |
Treasury Only Portfolio | | | | |
Class I | .07% | | | |
Actual | | $ 1,000.00 | $ 1,000.10 | $ .35 ** |
Hypothetical A | | $ 1,000.00 | $ 1,024.65 | $ .35 ** |
Class II | .08% | | | |
Actual | | $ 1,000.00 | $ 1,000.10 | $ .40 ** |
Hypothetical A | | $ 1,000.00 | $ 1,024.60 | $ .40 ** |
Class III | .08% | | | |
Actual | | $ 1,000.00 | $ 1,000.10 | $ .40 ** |
Hypothetical A | | $ 1,000.00 | $ 1,024.60 | $ .40 ** |
Class IV | .09% | | | |
Actual | | $ 1,000.00 | $ 1,000.10 | $ .45 ** |
Hypothetical A | | $ 1,000.00 | $ 1,024.55 | $ .46 ** |
Select Class | .08% | | | |
Actual | | $ 1,000.00 | $ 1,000.10 | $ .40 ** |
Hypothetical A | | $ 1,000.00 | $ 1,024.60 | $ .40 ** |
Treasury Portfolio | | | | |
Class I | .11% | | | |
Actual | | $ 1,000.00 | $ 1,000.10 | $ .55 ** |
Hypothetical A | | $ 1,000.00 | $ 1,024.45 | $ .56 ** |
Class II | .11% | | | |
Actual | | $ 1,000.00 | $ 1,000.10 | $ .55 ** |
Hypothetical A | | $ 1,000.00 | $ 1,024.45 | $ .56 ** |
| Annualized Expense Ratio | Beginning
Account Value
April 1, 2011 | Ending
Account Value
September 30, 2011 | Expenses Paid
During Period*
April 1, 2011 to
September 30, 2011 |
Class III | .11% | | | |
Actual | | $ 1,000.00 | $ 1,000.10 | $ .55 ** |
Hypothetical A | | $ 1,000.00 | $ 1,024.45 | $ .56 ** |
Class IV | .11% | | | |
Actual | | $ 1,000.00 | $ 1,000.10 | $ .55 ** |
Hypothetical A | | $ 1,000.00 | $ 1,024.45 | $ .56 ** |
Select Class | .11% | | | |
Actual | | $ 1,000.00 | $ 1,000.10 | $ .55 ** |
Hypothetical A | | $ 1,000.00 | $ 1,024.45 | $ .56 ** |
Government Portfolio | | | | |
Class I | .16% | | | |
Actual | | $ 1,000.00 | $ 1,000.10 | $ .80 ** |
Hypothetical A | | $ 1,000.00 | $ 1,024.20 | $ .81 ** |
Class II | .16% | | | |
Actual | | $ 1,000.00 | $ 1,000.10 | $ .80 ** |
Hypothetical A | | $ 1,000.00 | $ 1,024.20 | $ .81 ** |
Class III | .16% | | | |
Actual | | $ 1,000.00 | $ 1,000.10 | $ .80 ** |
Hypothetical A | | $ 1,000.00 | $ 1,024.20 | $ .81 ** |
Select Class | .16% | | | |
Actual | | $ 1,000.00 | $ 1,000.10 | $ .80 ** |
Hypothetical A | | $ 1,000.00 | $ 1,024.20 | $ .81 ** |
Prime Money Market Portfolio | | | | |
Class I | .20% | | | |
Actual | | $ 1,000.00 | $ 1,000.50 | $ 1.00 |
Hypothetical A | | $ 1,000.00 | $ 1,024.00 | $ 1.01 |
Class II | .28% | | | |
Actual | | $ 1,000.00 | $ 1,000.10 | $ 1.40 ** |
Hypothetical A | | $ 1,000.00 | $ 1,023.60 | $ 1.42 ** |
Class III | .28% | | | |
Actual | | $ 1,000.00 | $ 1,000.10 | $ 1.40 ** |
Hypothetical A | | $ 1,000.00 | $ 1,023.60 | $ 1.42 ** |
Class IV | .28% | | | |
Actual | | $ 1,000.00 | $ 1,000.10 | $ 1.40 ** |
Hypothetical A | | $ 1,000.00 | $ 1,023.60 | $ 1.42 ** |
Select Class | .25% | | | |
Actual | | $ 1,000.00 | $ 1,000.20 | $ 1.25 |
Hypothetical A | | $ 1,000.00 | $ 1,023.75 | $ 1.26 |
Institutional Class | .14% | | | |
Actual | | $ 1,000.00 | $ 1,000.80 | $ .70 |
Hypothetical A | | $ 1,000.00 | $ 1,024.30 | $ .71 |
Money Market Portfolio | | | | |
Class I | .18% | | | |
Actual | | $ 1,000.00 | $ 1,000.70 | $ .90 |
Hypothetical A | | $ 1,000.00 | $ 1,024.10 | $ .91 |
Class II | .31% | | | |
Actual | | $ 1,000.00 | $ 1,000.10 | $ 1.55 |
Hypothetical A | | $ 1,000.00 | $ 1,023.45 | $ 1.57 |
| Annualized Expense Ratio | Beginning
Account Value
April 1, 2011 | Ending
Account Value
September 30, 2011 | Expenses Paid
During Period*
April 1, 2011 to
September 30, 2011 |
Class III | .31% | | | |
Actual | | $ 1,000.00 | $ 1,000.10 | $ 1.55 ** |
Hypothetical A | | $ 1,000.00 | $ 1,023.45 | $ 1.57 ** |
Select Class | .23% | | | |
Actual | | $ 1,000.00 | $ 1,000.50 | $ 1.15 |
Hypothetical A | | $ 1,000.00 | $ 1,023.85 | $ 1.16 |
Class F | .14% | | | |
Actual | | $ 1,000.00 | $ 1,000.90 | $ .70 |
Hypothetical A | | $ 1,000.00 | $ 1,024.30 | $ .71 |
Institutional Class | .14% | | | |
Actual | | $ 1,000.00 | $ 1,000.90 | $ .70 |
Hypothetical A | | $ 1,000.00 | $ 1,024.30 | $ .71 |
Tax-Exempt Portfolio | | | | |
Class I | .17% | | | |
Actual | | $ 1,000.00 | $ 1,000.10 | $ .85 ** |
Hypothetical A | | $ 1,000.00 | $ 1,024.15 | $ .86 ** |
Class II | .18% | | | |
Actual | | $ 1,000.00 | $ 1,000.10 | $ .90 ** |
Hypothetical A | | $ 1,000.00 | $ 1,024.10 | $ .91 ** |
Class III | .18% | | | |
Actual | | $ 1,000.00 | $ 1,000.10 | $ .90 ** |
Hypothetical A | | $ 1,000.00 | $ 1,024.10 | $ .91 ** |
Select Class | .18% | | | |
Actual | | $ 1,000.00 | $ 1,000.10 | $ .90 ** |
Hypothetical A | | $ 1,000.00 | $ 1,024.10 | $ .91 ** |
A 5% return per year before expenses
* Expenses are equal to each Class' annualized expense ratio, multiplied by the average account value over the period, multiplied by 183/ 366 (to reflect the one-half year period).
** If certain fees were not voluntarily waived by FMR or its affiliates during the period, the annualized expense ratio and the expenses paid in the actual and hypothetical examples above would have been as follows:
Treasury Only Portfolio | Annualized Expense Ratio | Expenses Paid |
Class I | .21% | �� |
Actual | | $ 1.05 |
Hypothetical A | | $ 1.06 |
Class II | .36% | |
Actual | | $ 1.80 |
Hypothetical A | | $ 1.82 |
Class III | .47% | |
Actual | | $ 2.35 |
Hypothetical A | | $ 2.38 |
Class IV | .72% | |
Actual | | $ 3.59 |
Hypothetical A | | $ 3.64 |
Select Class | .27% | |
Actual | | $ 1.35 |
Hypothetical A | | $ 1.37 |
Treasury Portfolio | Annualized Expense Ratio | Expenses Paid |
Class I | .21% | |
Actual | | $ 1.05 |
Hypothetical A | | $ 1.06 |
Class II | .36% | |
Actual | | $ 1.80 |
Hypothetical A | | $ 1.82 |
Class III | .46% | |
Actual | | $ 2.30 |
Hypothetical A | | $ 2.33 |
Class IV | .71% | |
Actual | | $ 3.54 |
Hypothetical A | | $ 3.59 |
Select Class | .26% | |
Actual | | $ 1.30 |
Hypothetical A | | $ 1.32 |
Government Portfolio | | |
Class I | .21% | |
Actual | | $ 1.05 |
Hypothetical A | | $ 1.06 |
Class II | .36% | |
Actual | | $ 1.80 |
Hypothetical A | | $ 1.82 |
Class III | .46% | |
Actual | | $ 2.30 |
Hypothetical A | | $ 2.33 |
Select Class | .26% | |
Actual | | $ 1.30 |
Hypothetical A | | $ 1.32 |
Prime Money Market Portfolio | | |
Class II | .35% | |
Actual | | $ 1.75 |
Hypothetical A | | $ 1.77 |
Class III | .45% | |
Actual | | $ 2.25 |
Hypothetical A | | $ 2.28 |
Class IV | .70% | |
Actual | | $ 3.50 |
Hypothetical A | | $ 3.54 |
Money Market Portfolio | | |
Class III | .43% | |
Actual | | $ 2.15 |
Hypothetical A | | $ 2.17 |
Tax-Exempt Portfolio | Annualized Expense Ratio | Expenses Paid |
Class I | .22% | |
Actual | | $ 1.10 |
Hypothetical A | | $ 1.11 |
Class II | .35% | |
Actual | | $ 1.75 |
Hypothetical A | | $ 1.77 |
Class III | .45% | |
Actual | | $ 2.25 |
Hypothetical A | | $ 2.28 |
Select Class | .25% | |
Actual | | $ 1.25 |
Hypothetical A | | $ 1.26 |
A 5% return per year before expenses
Semiannual Report
Treasury Only Portfolio
Investment Changes (Unaudited)
Effective Maturity Diversification |
Days | % of fund's
investments
9/30/11 | % of fund's
investments
3/31/11 | % of fund's
investments
9/30/10 |
1 - 7 | 14.6 | 8.0 | 12.1 |
8 - 30 | 33.6 | 26.3 | 37.7 |
31 - 60 | 16.5 | 22.6 | 28.1 |
61 - 90 | 15.8 | 21.1 | 10.3 |
91 - 180 | 15.5 | 18.8 | 7.7 |
> 180 | 4.0 | 3.2 | 4.1 |
Effective maturity is determined in accordance with the requirements of Rule 2a-7 under the Investment Company Act of 1940. |
Weighted Average Maturity |
| 9/30/11 | 3/31/11 | 9/30/10 |
Treasury Only Portfolio | 52 Days | 58 Days | 52 Days |
All Taxable Money Market Funds Average* | 39 Days | 45 Days | 44 Days |
This is a weighted average of all the maturities of the securities held in a fund. Weighted Average Maturity (WAM) can be used as a measure of sensitivity to interest rate changes and markets changes. Generally, the longer the maturity, the greater the sensitivity to such changes. WAM is based on the dollar-weighted average length of time until principal payments must be paid. Depending on the types of securities held in a fund, certain maturity shortening devices (e.g., demand features, interest rate resets, and call options) may be taken into account when calculating the WAM. |
Weighted Average Life |
| 9/30/11 | 3/31/11 | 9/30/10 |
Treasury Only Portfolio | 52 Days | 58 Days | 52 Days |
Weighted Average Life (WAL) is the weighted average of the life of the securities held in a fund or portfolio and can be used as a measure of sensitivity to changes in liquidity and/or credit risk. Generally, the higher the value, the greater the sensitivity. WAL is based on the dollar-weighted average length of time until principal payments must be paid, taking into account any call options exercised by the issuer and any permissible maturity shortening features other than interest rate resets. The difference between WAM and WAL is that WAM takes into account interest rate resets and WAL does not. WAL for money market funds is not the same as WAL of a mortgage- or asset-backed security. |
Asset Allocation (% of fund's net assets) |
As of September 30, 2011 | As of March 31, 2011 |
 | U.S. Treasury
Obligations 100.4% | | | U.S. Treasury
Obligations 99.9% | |
 | Net Other Assets** (0.4)% | |  | Net Other Assets 0.1% | |
 | | | | | |

* Source: iMoneyNet, Inc.
** Net Other Assets are not included in the pie chart.
Semiannual Report
Treasury Only Portfolio
Investments September 30, 2011 (Unaudited)
Showing Percentage of Net Assets
U.S. Treasury Obligations - 100.4% |
| | Yield (a) | Principal Amount (000s) | Value (000s) |
U.S. Treasury Bills - 75.4% |
| 10/6/11 to 2/16/12 | 0.00 to 0.12% | $ 6,913,809 | $ 6,913,572 |
U.S. Treasury Notes - 25.0% |
| 10/31/11 to 6/30/12 | 0.01 to 0.32 | 2,281,000 | 2,286,350 |
TOTAL INVESTMENT PORTFOLIO - 100.4% (Cost $9,199,922) | 9,199,922 |
NET OTHER ASSETS (LIABILITIES) - (0.4)% | (36,576) |
NET ASSETS - 100% | $ 9,163,346 |
Legend |
(a) Yield represents either the annualized yield at the date of purchase, or the stated coupon rate, or, for floating and adjustable rate securities, the rate at period end. |
Other Information |
The date shown for securities represents the date when principal payments must be paid, taking into account any call options exercised by the issuer and any permissible maturity shortening features other than interest rate resets. |
All investments are categorized as Level 2 under the Fair Value Hierarchy. The inputs or methodology used for valuing securities may not be an indication of the risk associated with investing in those securities. For more information on valuation inputs, please refer to the Security Valuation section in the accompanying Notes to Financial Statements. |
See accompanying notes which are an integral part of the financial statements.
Semiannual Report
Treasury Only Portfolio
Financial Statements
Statement of Assets and Liabilities
Amounts in thousands (except per-share amounts) | September 30, 2011 (Unaudited) |
| | |
Assets | | |
Investment in securities, at value - See accompanying schedule: Unaffiliated issuers (cost $9,199,922) | | $ 9,199,922 |
Receivable for fund shares sold | | 5,906 |
Interest receivable | | 7,769 |
Other receivables | | 14 |
Total assets | | 9,213,611 |
| | |
Liabilities | | |
Payable for investments purchased | $ 44,781 | |
Payable for fund shares redeemed | 5,199 | |
Distributions payable | 17 | |
Accrued management fee | 163 | |
Other affiliated payables | 60 | |
Other payables and accrued expenses | 45 | |
Total liabilities | | 50,265 |
| | |
Net Assets | | $ 9,163,346 |
Net Assets consist of: | | |
Paid in capital | | $ 9,163,312 |
Distributions in excess of net investment income | | (1) |
Accumulated undistributed net realized gain (loss) on investments | | 35 |
Net Assets | | $ 9,163,346 |
| | |
Class I:
Net Asset Value, offering price and redemption price per share ($8,047,655 ÷ 8,046,529 shares) | | $ 1.00 |
| | |
Class II:
Net Asset Value, offering price and redemption price per share ($564,124 ÷ 564,179 shares) | | $ 1.00 |
| | |
Class III:
Net Asset Value, offering price and redemption price per share ($340,528 ÷ 340,457 shares) | | $ 1.00 |
| | |
Class IV:
Net Asset Value, offering price and redemption price per share ($17,571 ÷ 17,570 shares) | | $ 1.00 |
| | |
Select Class:
Net Asset Value, offering price and redemption price per share ($193,468 ÷ 193,479 shares) | | $ 1.00 |
Statement of Operations
Amounts in thousands | Six months ended September 30, 2011 (Unaudited) |
| | |
Investment Income | | |
Interest | | $ 3,220 |
| | |
Expenses | | |
Management fee | $ 5,427 | |
Transfer agent fees | 2,347 | |
Distribution and service plan fees | 942 | |
Accounting fees and expenses | 322 | |
Custodian fees and expenses | 42 | |
Independent trustees' compensation | 13 | |
Registration fees | 93 | |
Audit | 23 | |
Legal | 13 | |
Miscellaneous | 39 | |
Total expenses before reductions | 9,261 | |
Expense reductions | (6,428) | 2,833 |
Net investment income (loss) | | 387 |
Realized and Unrealized Gain (Loss) Net realized gain (loss) on: | | |
Investment securities: | | |
Unaffiliated issuers | | 35 |
Net increase in net assets resulting from operations | | $ 422 |
See accompanying notes which are an integral part of the financial statements.
Semiannual Report
Treasury Only Portfolio
Financial Statements - continued
Statement of Changes in Net Assets
Amounts in thousands | Six months ended September 30, 2011 (Unaudited) | Year ended
March 31,
2011 |
Increase (Decrease) in Net Assets | | |
Operations | | |
Net investment income (loss) | $ 387 | $ 856 |
Net realized gain (loss) | 35 | 101 |
Net increase in net assets resulting from operations | 422 | 957 |
Distributions to shareholders from net investment income | (388) | (854) |
Distributions to shareholders from net realized gain | - | (245) |
Total distributions | (388) | (1,099) |
Share transactions - net increase (decrease) | 1,765,360 | (2,775,464) |
Total increase (decrease) in net assets | 1,765,394 | (2,775,606) |
| | |
Net Assets | | |
Beginning of period | 7,397,952 | 10,173,558 |
End of period (including distributions in excess of net investment income of $1 and $0, respectively) | $ 9,163,346 | $ 7,397,952 |
Financial Highlights - Class I
| Six months ended
September 30, 2011 | Years ended March 31, |
| (Unaudited) | 2011 | 2010 | 2009 | 2008 | 2007 |
Selected Per-Share Data | | | | | | |
Net asset value, beginning of period | $ 1.00 | $ 1.00 | $ 1.00 | $ 1.00 | $ 1.00 | $ 1.00 |
Income from Investment Operations | | | | | | |
Net investment income (loss) | - E | - E | .001 | .010 | .040 | .048 |
Net realized and unrealized gain (loss) E | - | - | - | - | - | - |
Total from investment operations | - E | - E | .001 | .010 | .040 | .048 |
Distributions from net investment income | - E | - E | (.001) | (.010) | (.040) | (.048) |
Distributions from net realized gain | - | - E | - E | - | - | - |
Total distributions | - E | - E | (.001) | (.010) | (.040) | (.048) |
Net asset value, end of period | $ 1.00 | $ 1.00 | $ 1.00 | $ 1.00 | $ 1.00 | $ 1.00 |
Total Return B,C | .01% | .01% | .09% | 1.05% | 4.03% | 4.87% |
Ratios to Average Net Assets D | | | | | | |
Expenses before reductions | .21% A | .21% | .21% | .24% | .24% | .24% |
Expenses net of fee waivers, if any | .07% A | .18% | .20% | .23% | .20% | .20% |
Expenses net of all reductions | .07% A | .18% | .20% | .23% | .20% | .20% |
Net investment income (loss) | .01% A | .01% | .10% | .81% | 3.48% | 4.78% |
Supplemental Data | | | | | | |
Net assets, end of period (in millions) | $ 8,048 | $ 6,149 | $ 8,371 | $ 15,535 | $ 6,775 | $ 1,425 |
A Annualized
B Total returns for periods of less than one year are not annualized.
C Total returns would have been lower if certain expenses had not been reduced during the applicable periods shown.
D Expense ratios reflect operating expenses of the class. Expenses before reductions do not reflect amounts reimbursed or waived or reductions from expense offset arrangements and do not represent the amount paid by the class during periods when reimbursements, waivers or reductions occur. Expenses net of fee waivers reflect expenses after reimbursement and waivers but prior to reductions from expense offset arrangements. Expenses net of all reductions represent the net expenses paid by the class.
E Amount represents less than $.001 per share.
See accompanying notes which are an integral part of the financial statements.
Semiannual Report
Financial Highlights - Class II
| Six months ended
September 30, 2011 | Years ended March 31, |
| (Unaudited) | 2011 | 2010 | 2009 | 2008 | 2007 |
Selected Per-Share Data | | | | | | |
Net asset value, beginning of period | $ 1.00 | $ 1.00 | $ 1.00 | $ 1.00 | $ 1.00 | $ 1.00 |
Income from Investment Operations | | | | | | |
Net investment income (loss) | - E | - E | - E | .009 | .038 | .046 |
Net realized and unrealized gain (loss) E | - | - | - | - | - | - |
Total from investment operations | - E | - E | - E | .009 | .038 | .046 |
Distributions from net investment income | - E | - E | - E | (.009) | (.038) | (.046) |
Distributions from net realized gain | - | - E | - E | - | - | - |
Total distributions | - E | - E | - E | (.009) | (.038) | (.046) |
Net asset value, end of period | $ 1.00 | $ 1.00 | $ 1.00 | $ 1.00 | $ 1.00 | $ 1.00 |
Total Return B,C | .01% | .01% | .03% | .89% | 3.88% | 4.71% |
Ratios to Average Net Assets D | | | | | | |
Expenses before reductions | .36% A | .36% | .36% | .39% | .39% | .39% |
Expenses net of fee waivers, if any | .08% A | .17% | .27% | .38% | .35% | .35% |
Expenses net of all reductions | .08% A | .17% | .27% | .38% | .35% | .35% |
Net investment income (loss) | .01% A | .01% | .03% | .66% | 3.58% | 4.63% |
Supplemental Data | | | | | | |
Net assets, end of period (in millions) | $ 564 | $ 585 | $ 649 | $ 906 | $ 514 | $ 210 |
A Annualized
B Total returns for periods of less than one year are not annualized.
C Total returns would have been lower if certain expenses had not been reduced during the applicable periods shown.
D Expense ratios reflect operating expenses of the class. Expenses before reductions do not reflect amounts reimbursed or waived or reductions from expense offset arrangements and do not represent the amount paid by the class during periods when reimbursements, waivers or reductions occur. Expenses net of fee waivers reflect expenses after reimbursement and waivers but prior to reductions from expense offset arrangements. Expenses net of all reductions represent the net expenses paid by the class.
E Amount represents less than $.001 per share.
Financial Highlights - Class III
| Six months ended
September 30, 2011 | Years ended March 31, |
| (Unaudited) | 2011 | 2010 | 2009 | 2008 | 2007 |
Selected Per-Share Data | | | | | | |
Net asset value, beginning of period | $ 1.00 | $ 1.00 | $ 1.00 | $ 1.00 | $ 1.00 | $ 1.00 |
Income from Investment Operations | | | | | | |
Net investment income (loss) | - E | - E | - E | .008 | .037 | .045 |
Net realized and unrealized gain (loss) E | - | - | - | - | - | - |
Total from investment operations | - E | -E | -E | .008 | .037 | .045 |
Distributions from net investment income | - E | - E | - E | (.008) | (.037) | (.045) |
Distributions from net realized gain | - | - E | - E | - | - | - |
Total distributions | -E | - E | - E | (.008) | (.037) | (.045) |
Net asset value, end of period | $ 1.00 | $ 1.00 | $ 1.00 | $ 1.00 | $ 1.00 | $ 1.00 |
Total Return B,C | .01% | .01% | .01% | .80% | 3.77% | 4.61% |
Ratios to Average Net Assets D | | | | | | |
Expenses before reductions | .47% A | .46% | .46% | .49% | .49% | .49% |
Expenses net of fee waivers, if any | .08% A | .18% | .28% | .47% | .45% | .45% |
Expenses net of all reductions | .08% A | .18% | .28% | .47% | .45% | .45% |
Net investment income (loss) | .01% A | .01% | .02% | .57% | 3.46% | 4.53% |
Supplemental Data | | | | | | |
Net assets, end of period (in millions) | $ 341 | $ 392 | $ 615 | $ 835 | $ 514 | $ 187 |
A Annualized
B Total returns for periods of less than one year are not annualized.
C Total returns would have been lower if certain expenses had not been reduced during the applicable periods shown.
D Expense ratios reflect operating expenses of the class. Expenses before reductions do not reflect amounts reimbursed or waived or reductions from expense offset arrangements and do not represent the amount paid by the class during periods when reimbursements, waivers or reductions occur. Expenses net of fee waivers reflect expenses after reimbursement and waivers but prior to reductions from expense offset arrangements. Expenses net of all reductions represent the net expenses paid by the class.
E Amount represents less than $.001 per share.
See accompanying notes which are an integral part of the financial statements.
Semiannual Report
Financial Highlights - Class IV
| Six months ended
September 30, 2011 | Years ended March 31, |
| (Unaudited) | 2011 | 2010 | 2009 | 2008 D |
Selected Per-Share Data | | | | | |
Net asset value, beginning of period | $ 1.00 | $ 1.00 | $ 1.00 | $ 1.00 | $ 1.00 |
Income from Investment Operations | | | | | |
Net investment income (loss) | - F | - F | - F | .006 | .007 |
Net realized and unrealized gain (loss) F | - | - | - | - | - |
Total from investment operations | - F | - F | - F | .006 | .007 |
Distributions from net investment income | - F | - F | - F | (.006) | (.007) |
Distributions from net realized gain | - | - F | - F | - | - |
Total distributions | - F | - F | - F | (.006) | (.007) |
Net asset value, end of period | $ 1.00 | $ 1.00 | $ 1.00 | $ 1.00 | $ 1.00 |
Total Return B,C | .01% | .01% | .01% | .60% | .71% |
Ratios to Average Net Assets E | | | | | |
Expenses before reductions | .72% A | .71% | .72% | .74% | .77% A |
Expenses net of fee waivers, if any | .09% A | .17% | .30% | .65% | .70% A |
Expenses net of all reductions | .09% A | .17% | .30% | .65% | .70% A |
Net investment income (loss) | .01% A | .01% | .01% | .39% | 1.70% A |
Supplemental Data | | | | | |
Net assets, end of period (in millions) | $ 18 | $ 62 | $ 60 | $ 140 | $ 39 |
A Annualized
B Total returns for periods of less than one year are not annualized.
C Total returns would have been lower if certain expenses had not been reduced during the applicable periods shown.
D For the period December 12, 2007 (commencement of sale of shares) to March 31, 2008.
E Expense ratios reflect operating expenses of the class. Expenses before reductions do not reflect amounts reimbursed or waived or reductions from expense offset arrangements and do not represent the amount paid by the class during periods when reimbursements, waivers or reductions occur. Expense ratios before reductions for start-up periods may not be representative of longer-term operating periods. Expenses net of fee waivers reflect expenses after reimbursement and waivers but prior to reductions from expense offset arrangements. Expenses net of all reductions represent the net expenses paid by the class.
F Amount represents less than $.001 per share.
Financial Highlights - Select Class
| Six months ended
September 30, 2011 | Years ended March 31, |
| (Unaudited) | 2011 | 2010 | 2009 | 2008 | 2007 |
Selected Per-Share Data | | | | | | |
Net asset value, beginning of period | $ 1.00 | $ 1.00 | $ 1.00 | $ 1.00 | $ 1.00 | $ 1.00 |
Income from Investment Operations | | | | | | |
Net investment income (loss) | - E | - E | .001 | .010 | .039 | .047 |
Net realized and unrealized gain (loss) E | - | - | - | - | - | - |
Total from investment operations | - E | - E | .001 | .010 | .039 | .047 |
Distributions from net investment income | - E | - E | (.001) | (.010) | (.039) | (.047) |
Distributions from net realized gain | - | - E | - E | - | - | - |
Total distributions | - E | - E | (.001) | (.010) | (.039) | (.047) |
Net asset value, end of period | $ 1.00 | $ 1.00 | $ 1.00 | $ 1.00 | $ 1.00 | $ 1.00 |
Total Return B,C | .01% | .01% | .07% | .99% | 3.98% | 4.81% |
Ratios to Average Net Assets D | | | | | | |
Expenses before reductions | .27% A | .26% | .26% | .29% | .29% | .29% |
Expenses net of fee waivers, if any | .08% A | .18% | .23% | .28% | .25% | .25% |
Expenses net of all reductions | .08% A | .18% | .23% | .28% | .25% | .25% |
Net investment income (loss) | .01% A | .01% | .07% | .76% | 3.50% | 4.73% |
Supplemental Data | | | | | | |
Net assets, end of period (in millions) | $ 193 | $ 209 | $ 478 | $ 763 | $ 174 | $ 17 |
A Annualized
B Total returns for periods of less than one year are not annualized.
C Total returns would have been lower if certain expenses had not been reduced during the applicable periods shown.
D Expense ratios reflect operating expenses of the class. Expenses before reductions do not reflect amounts reimbursed or waived or reductions from expense offset arrangements and do not represent the amount paid by the class during periods when reimbursements, waivers or reductions occur. Expenses net of fee waivers reflect expenses after reimbursement and waivers but prior to reductions from expense offset arrangements. Expenses net of all reductions represent the net expenses paid by the class.
E Amount represents less than $.001 per share.
See accompanying notes which are an integral part of the financial statements.
Semiannual Report
Treasury Portfolio
Investment Changes (Unaudited)
Effective Maturity Diversification |
Days | % of fund's investments 9/30/11 | % of fund's investments 3/31/11 | % of fund's
investments
9/30/10 |
1 - 7 | 77.8 | 63.0 | 71.2 |
8 - 30 | 0.6 | 5.1 | 0.0 |
31 - 60 | 3.6 | 1.3 | 2.1 |
61 - 90 | 5.0 | 2.4 | 2.4 |
91 - 180 | 7.2 | 14.7 | 12.1 |
> 180 | 5.8 | 13.5 | 12.2 |
Effective maturity is determined in accordance with the requirements of Rule 2a-7 under the Investment Company Act of 1940. |
Weighted Average Maturity |
| 9/30/11 | 3/31/11 | 9/30/10 |
Treasury Portfolio | 30 Days | 51 Days | 54 Days |
All Taxable Money Market Funds Average* | 39 Days | 45 Days | 44 Days |
This is a weighted average of all the maturities of the securities held in a fund. Weighted Average Maturity (WAM) can be used as a measure of sensitivity to interest rate changes and markets changes. Generally, the longer the maturity, the greater the sensitivity to such changes. WAM is based on the dollar-weighted average length of time until principal payments must be paid. Depending on the types of securities held in a fund, certain maturity shortening devices (e.g., demand features, interest rate resets, and call options) may be taken into account when calculating the WAM. |
Weighted Average Life |
| 9/30/11 | 3/31/11 | 9/30/10 |
Treasury Portfolio | 30 Days | 51 Days | 54 Days |
Weighted Average Life (WAL) is the weighted average of the life of the securities held in a fund or portfolio and can be used as a measure of sensitivity to changes in liquidity and/or credit risk. Generally, the higher the value, the greater the sensitivity. WAL is based on the dollar-weighted average length of time until principal payments must be paid, taking into account any call options exercised by the issuer and any permissible maturity shortening features other than interest rate resets. The difference between WAM and WAL is that WAM takes into account interest rate resets and WAL does not. WAL for money market funds is not the same as WAL of a mortgage- or asset-backed security. |
Asset Allocation (% of fund's net assets) |
As of September 30, 2011 | As of March 31, 2011 |
| U.S. Treasury
Obligations 22.2% | | | U.S. Treasury
Obligations 37.0% | |
 | Repurchase
Agreements 77.7% | | | Repurchase
Agreements 62.9% | |
| Net Other Assets 0.1% | | | Net Other Assets 0.1% | |

* Source: iMoneyNet, Inc.
Semiannual Report
Treasury Portfolio
Investments September 30, 2011 (Unaudited)
Showing Percentage of Net Assets
U.S. Treasury Obligations - 22.2% |
| | Yield (a) | Principal Amount (000s) | Value (000s) |
U.S. Treasury Bills - 4.3% |
| 10/20/11 to 3/8/12 | 0.06 to 0.30% | $ 758,000 | $ 757,780 |
U.S. Treasury Notes - 17.9% |
| 10/31/11 to 7/15/12 | 0.11 to 0.32 | 3,148,000 | 3,159,265 |
TOTAL U.S. TREASURY OBLIGATIONS | 3,917,045 |
Repurchase Agreements - 77.7% |
| Maturity Amount (000s) | | |
In a joint trading account at: | | | |
0.04% dated 9/30/11 due 10/3/11 (Collateralized by (U.S. Treasury Obligations)) # | $ 404,367 | | 404,366 |
0.05% dated 9/30/11 due 10/3/11 (Collateralized by (U.S. Treasury Obligations)) # | 11,365,499 | | 11,365,450 |
With: | | | |
Citigroup Global Capital Markets, Inc. at 0.04%, dated 9/29/11 due 10/6/11 (Collateralized by U.S. Treasury Obligations valued at $794,313,833, 0% - 7.63%, 2/2/12 - 11/15/40) | 778,006 | | 778,000 |
Deutsche Bank Securities, Inc. at 0.14%, dated 8/3/11 due 10/7/11 (Collateralized by U.S. Treasury Obligations valued at $394,885,288, 0% - 8.75%, 10/27/11 - 11/15/39) | 387,135 | | 387,000 |
Morgan Stanley & Co., Inc. at: | | | |
0.09%, dated 8/16/11 due 10/7/11 (Collateralized by U.S. Treasury Obligations valued at $403,732,420, 0% - 7.25%, 10/6/11 - 8/15/39) | 395,075 | | 395,000 |
0.11%, dated 8/12/11 due 10/7/11 (Collateralized by U.S. Treasury Obligations valued at $403,839,748, 0.5% - 5.5%, 1/31/12 - 8/15/41) | 395,115 | | 395,000 |
TOTAL REPURCHASE AGREEMENTS | 13,724,816 |
TOTAL INVESTMENT PORTFOLIO - 99.9% (Cost $17,641,861) | | 17,641,861 |
NET OTHER ASSETS (LIABILITIES) - 0.1% | | 9,883 |
NET ASSETS - 100% | $ 17,651,744 |
Legend |
(a) Yield represents either the annualized yield at the date of purchase, or the stated coupon rate, or, for floating and adjustable rate securities, the rate at period end. |
# Additional information on each counterparty to the repurchase agreement is as follows: |
Repurchase Agreement / Counterparty | Value
(Amounts in
thousands) |
$404,366,000 due 10/03/11 at 0.04% |
Barclays Capital, Inc. | $ 112,957 |
HSBC Securities (USA), Inc. | 212,359 |
Merrill Lynch, Pierce, Fenner & Smith, Inc. | 79,050 |
| $ 404,366 |
$11,365,450,000 due 10/03/11 at 0.05% |
Barclays Capital, Inc. | $ 2,878,123 |
Commerz Markets LLC | 382,312 |
Credit Agricole Securities (USA), Inc. | 3,058,497 |
Credit Suisse Securities (USA) LLC | 2,293,872 |
RBS Securities, Inc. | 1,911,560 |
UBS Securities LLC | 764,624 |
Wells Fargo Securities LLC | 76,462 |
| $ 11,365,450 |
Other Information |
The date shown for securities represents the date when principal payments must be paid, taking into account any call options exercised by the issuer and any permissible maturity shortening features other than interest rate resets. |
All investments are categorized as Level 2 under the Fair Value Hierarchy. The inputs or methodology used for valuing securities may not be an indication of the risk associated with investing in those securities. For more information on valuation inputs, please refer to the Security Valuation section in the accompanying Notes to Financial Statements. |
See accompanying notes which are an integral part of the financial statements.
Semiannual Report
Treasury Portfolio
Financial Statements
Statement of Assets and Liabilities
Amounts in thousands (except per-share amounts) | September 30, 2011 (Unaudited) |
| | |
Assets | | |
Investment in securities, at value (including repurchase agreements of $13,724,816) - See accompanying schedule: Unaffiliated issuers (cost $17,641,861) | | $ 17,641,861 |
Receivable for fund shares sold | | 59,912 |
Interest receivable | | 10,497 |
Other receivables | | 105 |
Total assets | | 17,712,375 |
| | |
Liabilities | | |
Payable for investments purchased | $ 59,029 | |
Payable for fund shares redeemed | 48 | |
Distributions payable | 78 | |
Accrued management fee | 1,224 | |
Distribution and service plan fees payable | 2 | |
Other affiliated payables | 101 | |
Other payables and accrued expenses | 149 | |
Total liabilities | | 60,631 |
| | |
Net Assets | | $ 17,651,744 |
Net Assets consist of: | | |
Paid in capital | | $ 17,651,760 |
Distributions in excess of net investment income | | (15) |
Accumulated undistributed net realized gain (loss) on investments | | (1) |
Net Assets | | $ 17,651,744 |
| | |
Class I:
Net Asset Value, offering price and redemption price per share ($13,114,560 ÷ 13,111,132 shares) | | $ 1.00 |
| | |
Class II:
Net Asset Value, offering price and redemption price per share ($117,907 ÷ 117,842 shares) | | $ 1.00 |
| | |
Class III:
Net Asset Value, offering price and redemption price per share ($3,606,428 ÷ 3,606,338 shares) | | $ 1.00 |
| | |
Class IV:
Net Asset Value, offering price and redemption price per share ($401,055 ÷ 400,967 shares) | | $ 1.00 |
| | |
Select Class:
Net Asset Value, offering price and redemption price per share ($411,794 ÷ 411,741 shares) | | $ 1.00 |
Statement of Operations
Amounts in thousands | Six months ended September 30, 2011 (Unaudited) |
| | |
Investment Income | | |
Interest | | $ 8,222 |
| | |
Expenses | | |
Management fee | $ 9,934 | |
Transfer agent fees | 4,275 | |
Distribution and service plan fees | 5,336 | |
Accounting fees and expenses | 495 | |
Custodian fees and expenses | 25 | |
Independent trustees' compensation | 24 | |
Registration fees | 72 | |
Audit | 28 | |
Legal | 23 | |
Miscellaneous | 57 | |
Total expenses before reductions | 20,269 | |
Expense reductions | (12,746) | 7,523 |
Net investment income (loss) | | 699 |
Realized and Unrealized Gain (Loss) Net realized gain (loss) on: | | |
Investment securities: | | |
Unaffiliated issuers | | 2 |
Net increase in net assets resulting from operations | | $ 701 |
See accompanying notes which are an integral part of the financial statements.
Semiannual Report
Statement of Changes in Net Assets
Amounts in thousands | Six months ended September 30, 2011 (Unaudited) | Year ended
March 31,
2011 |
Increase (Decrease) in Net Assets | | |
Operations | | |
Net investment income (loss) | $ 699 | $ 2,585 |
Net realized gain (loss) | 2 | 25 |
Net increase in net assets resulting from operations | 701 | 2,610 |
Distributions to shareholders from net investment income | (714) | (2,569) |
Share transactions - net increase (decrease) | 4,287,051 | (212,937) |
Total increase (decrease) in net assets | 4,287,038 | (212,896) |
| | |
Net Assets | | |
Beginning of period | 13,364,706 | 13,577,602 |
End of period (including distributions in excess of net investment income of $15 and $0, respectively) | $ 17,651,744 | $ 13,364,706 |
Financial Highlights - Class I
| Six months ended
September 30, 2011 | Years ended March 31, |
| (Unaudited) | 2011 | 2010 | 2009 | 2008 | 2007 |
Selected Per-Share Data | | | | | | |
Net asset value, beginning of period | $ 1.00 | $ 1.00 | $ 1.00 | $ 1.00 | $ 1.00 | $ 1.00 |
Income from Investment Operations | | | | | | |
Net investment income (loss) | - E | - E | .001 | .011 | .041 | .050 |
Net realized and unrealized gain (loss) E | - | - | - | - | - | - |
Total from investment operations | - E | - E | .001 | .011 | .041 | .050 |
Distributions from net investment income | - E | - E | (.001) | (.011) | (.041) | (.050) |
Distributions from net realized gain | - | - | - E | - | - | - |
Total distributions | - E | - E | (.001) | (.011) | (.041) | (.050) |
Net asset value, end of period | $ 1.00 | $ 1.00 | $ 1.00 | $ 1.00 | $ 1.00 | $ 1.00 |
Total Return B,C | .01% | .03% | .10% | 1.11% | 4.20% | 5.11% |
Ratios to Average Net Assets D | | | | | | |
Expenses before reductions | .21% A | .21% | .21% | .23% | .22% | .23% |
Expenses net of fee waivers, if any | .11% A | .20% | .21% | .22% | .20% | .20% |
Expenses net of all reductions | .11% A | .20% | .21% | .22% | .20% | .20% |
Net investment income (loss) | .01% A | .03% | .11% | 1.04% | 3.71% | 5.01% |
Supplemental Data | | | | | | |
Net assets, end of period (in millions) | $ 13,115 | $ 8,784 | $ 8,650 | $ 16,236 | $ 15,037 | $ 5,491 |
A Annualized
B Total returns for periods of less than one year are not annualized.
C Total returns would have been lower if certain expenses had not been reduced during the applicable periods shown.
D Expense ratios reflect operating expenses of the class. Expenses before reductions do not reflect amounts reimbursed or waived or reductions from expense offset arrangements and do not represent the amount paid by the class during periods when reimbursements, waivers or reductions occur. Expenses net of fee waivers reflect expenses after reimbursement and waivers but prior to reductions from expense offset arrangements. Expenses net of all reductions represent the net expenses paid by the class.
E Amount represents less than $.001 per share.
See accompanying notes which are an integral part of the financial statements.
Semiannual Report
Financial Highlights - Class II
| Six months ended
September 30, 2011 | Years ended March 31, |
September 30, | (Unaudited) | 2011 | 2010 | 2009 | 2008 | 2007 |
Selected Per-Share Data | | | | | | |
Net asset value, beginning of period | $ 1.00 | $ 1.00 | $ 1.00 | $ 1.00 | $ 1.00 | $ 1.00 |
Income from Investment Operations | | | | | | |
Net investment income (loss) | - E | - E | - E | .010 | .040 | .048 |
Net realized and unrealized gain (loss) E | - | - | - | - | - | - |
Total from investment operations | - E | - E | - E | .010 | .040 | .048 |
Distributions from net investment income | - E | - E | - E | (.010) | (.040) | (.048) |
Distributions from net realized gain | - | - | - E | - | - | - |
Total distributions | - E | - E | - E | (.010) | (.040) | (.048) |
Net asset value, end of period | $ 1.00 | $ 1.00 | $ 1.00 | $ 1.00 | $ 1.00 | $ 1.00 |
Total Return B,C | .01% | .01% | .03% | .96% | 4.04% | 4.96% |
Ratios to Average Net Assets D | | | | | | |
Expenses before reductions | .36% A | .36% | .36% | .38% | .37% | .39% |
Expenses net of fee waivers, if any | .11% A | .22% | .29% | .36% | .35% | .35% |
Expenses net of all reductions | .11% A | .22% | .29% | .36% | .35% | .35% |
Net investment income (loss) | .01% A | .01% | .03% | .90% | 3.90% | 4.86% |
Supplemental Data | | | | | | |
Net assets, end of period (in millions) | $ 118 | $ 155 | $ 164 | $ 407 | $ 305 | $ 355 |
A Annualized
B Total returns for periods of less than one year are not annualized.
C Total returns would have been lower if certain expenses had not been reduced during the applicable periods shown.
D Expense ratios reflect operating expenses of the class. Expenses before reductions do not reflect amounts reimbursed or waived or reductions from expense offset arrangements and do not represent the amount paid by the class during periods when reimbursements, waivers or reductions occur. Expenses net of fee waivers reflect expenses after reimbursement and waivers but prior to reductions from expense offset arrangements. Expenses net of all reductions represent the net expenses paid by the class.
E Amount represents less than $.001 per share.
Financial Highlights - Class III
| Six months ended
September 30, 2011 | Years ended March 31, |
| (Unaudited) | 2011 | 2010 | 2009 | 2008 | 2007 |
Selected Per-Share Data | | | | | | |
Net asset value, beginning of period | $ 1.00 | $ 1.00 | $ 1.00 | $ 1.00 | $ 1.00 | $ 1.00 |
Income from Investment Operations | | | | | | |
Net investment income (loss) | - E | - E | - E | .009 | .039 | .047 |
Net realized and unrealized gain (loss) E | - | - | - | - | - | - |
Total from investment operations | - E | - E | - E | .009 | .039 | .047 |
Distributions from net investment income | - E | - E | - E | (.009) | (.039) | (.047) |
Distributions from net realized gain | - | - | - E | - | - | - |
Total distributions | - E | - E | - E | (.009) | (.039) | (.047) |
Net asset value, end of period | $ 1.00 | $ 1.00 | $ 1.00 | $ 1.00 | $ 1.00 | $ 1.00 |
Total Return B,C | .01% | .01% | .01% | .87% | 3.94% | 4.85% |
Ratios to Average Net Assets D | | | | | | |
Expenses before reductions | .46% A | .46% | .46% | .48% | .47% | .48% |
Expenses net of fee waivers, if any | .11% A | .22% | .30% | .46% | .45% | .45% |
Expenses net of all reductions | .11% A | .22% | .30% | .46% | .45% | .45% |
Net investment income (loss) | .01% A | .01% | .02% | .80% | 3.74% | 4.76% |
Supplemental Data | | | | | | |
Net assets, end of period (in millions) | $ 3,606 | $ 3,768 | $ 3,907 | $ 5,051 | $ 5,329 | $ 3,663 |
A Annualized
B Total returns for periods of less than one year are not annualized.
C Total returns would have been lower if certain expenses had not been reduced during the applicable periods shown.
D Expense ratios reflect operating expenses of the class. Expenses before reductions do not reflect amounts reimbursed or waived or reductions from expense offset arrangements and do not represent the amount paid by the class during periods when reimbursements, waivers or reductions occur. Expenses net of fee waivers reflect expenses after reimbursement and waivers but prior to reductions from expense offset arrangements. Expenses net of all reductions represent the net expenses paid by the class.
E Amount represents less than $.001 per share.
See accompanying notes which are an integral part of the financial statements.
Semiannual Report
Financial Highlights - Class IV
| Six months ended
September 30, 2011 | Years ended March 31, |
| (Unaudited) | 2011 | 2010 | 2009 | 2008 D |
Selected Per-Share Data | | | | | |
Net asset value, beginning of period | $ 1.00 | $ 1.00 | $ 1.00 | $ 1.00 | $ 1.00 |
Income from Investment Operations | | | | | |
Net investment income (loss) | - F | - F | - F | .007 | .007 |
Net realized and unrealized gain (loss) F | - | - | - | - | - |
Total from investment operations | - F | - F | - F | .007 | .007 |
Distributions from net investment income | - F | - F | - F | (.007) | (.007) |
Distributions from net realized gain | - | - | - F | - | - |
Total distributions | - F | - F | - F | (.007) | (.007) |
Net asset value, end of period | $ 1.00 | $ 1.00 | $ 1.00 | $ 1.00 | $ 1.00 |
Total Return B,C | .01% | .01% | .01% | .71% | .68% |
Ratios to Average Net Assets E | | | | | |
Expenses before reductions | .71% A | .71% | .71% | .73% | .72% A |
Expenses net of fee waivers, if any | .11% A | .22% | .30% | .62% | .70% A |
Expenses net of all reductions | .11% A | .22% | .30% | .62% | .70% A |
Net investment income (loss) | .01% A | .01% | .03% | .64% | 2.19% A |
Supplemental Data | | | | | |
Net assets, end of period (000 omitted) | $ 401,055 | $ 304,950 | $ 492,495 | $ 453,724 | $ 117 |
A Annualized
B Total returns for periods of less than one year are not annualized.
C Total returns would have been lower if certain expenses had not been reduced during the applicable periods shown.
D For the period December 12, 2007 (commencement of sale of shares) to March 31, 2008.
E Expense ratios reflect operating expenses of the class. Expenses before reductions do not reflect amounts reimbursed or waived or reductions from expense offset arrangements and do not represent the amount paid by the class during periods when reimbursements, waivers or reductions occur. Expense ratios before reductions for start-up periods may not be representative of longer-term operating periods. Expenses net of fee waivers reflect expenses after reimbursement and waivers but prior to reductions from expense offset arrangements. Expenses net of all reductions represent the net expenses paid by the class.
F Amount represents less than $.001 per share.
Financial Highlights - Select Class
| Six months ended
September 30, 2011 | Years ended March 31, |
| (Unaudited) | 2011 | 2010 | 2009 | 2008 | 2007 |
Selected Per-Share Data | | | | | | |
Net asset value, beginning of period | $ 1.00 | $ 1.00 | $ 1.00 | $ 1.00 | $ 1.00 | $ 1.00 |
Income from Investment Operations | | | | | | |
Net investment income (loss) | - E | - E | .001 | .011 | .041 | .049 |
Net realized and unrealized gain (loss) E | - | - | - | - | - | - |
Total from investment operations | - E | - E | .001 | .011 | .041 | .049 |
Distributions from net investment income | - E | - E | (.001) | (.011) | (.041) | (.049) |
Distributions from net realized gain | - | - | - E | - | - | - |
Total distributions | - E | - E | (.001) | (.011) | (.041) | (.049) |
Net asset value, end of period | $ 1.00 | $ 1.00 | $ 1.00 | $ 1.00 | $ 1.00 | $ 1.00 |
Total Return B,C | .01% | .01% | .07% | 1.06% | 4.15% | 5.06% |
Ratios to Average Net Assets D | | | | | | |
Expenses before reductions | .26% A | .26% | .26% | .28% | .27% | .28% |
Expenses net of fee waivers, if any | .11% A | .22% | .24% | .27% | .25% | .25% |
Expenses net of all reductions | .11% A | .22% | .24% | .27% | .25% | .25% |
Net investment income (loss) | .01% A | .01% | .08% | .99% | 3.95% | 4.96% |
Supplemental Data | | | | | | |
Net assets, end of period (in millions) | $ 412 | $ 352 | $ 365 | $ 882 | $ 513 | $ 296 |
A Annualized
B Total returns for periods of less than one year are not annualized.
C Total returns would have been lower if certain expenses had not been reduced during the applicable periods shown.
D Expense ratios reflect operating expenses of the class. Expenses before reductions do not reflect amounts reimbursed or waived or reductions from expense offset arrangements and do not represent the amount paid by the class during periods when reimbursements, waivers or reductions occur. Expenses net of fee waivers reflect expenses after reimbursement and waivers but prior to reductions from expense offset arrangements. Expenses net of all reductions represent the net expenses paid by the class.
E Amount represents less than $.001 per share.
See accompanying notes which are an integral part of the financial statements.
Semiannual Report
Government Portfolio
Investment Changes (Unaudited)
Effective Maturity Diversification |
Days | % of fund's investments 9/30/11 | % of fund's investments 3/31/11 | % of fund's
investments
9/30/10 |
1 - 7 | 55.8 | 57.7 | 59.8 |
8 - 30 | 5.0 | 10.3 | 10.5 |
31 - 60 | 10.5 | 9.5 | 13.6 |
61 - 90 | 12.8 | 1.8 | 0.0 |
91 - 180 | 9.1 | 9.6 | 5.0 |
> 180 | 6.8 | 11.1 | 11.1 |
Effective maturity is determined in accordance with the requirements of Rule 2a-7 under the Investment Company Act of 1940. |
Weighted Average Maturity |
| 9/30/11 | 3/31/11 | 9/30/10 |
Government Portfolio | 49 Days | 48 Days | 48 Days |
All Taxable Money Market Funds Average* | 39 Days | 45 Days | 44 Days |
This is a weighted average of all the maturities of the securities held in a fund. Weighted Average Maturity (WAM) can be used as a measure of sensitivity to interest rate changes and markets changes. Generally, the longer the maturity, the greater the sensitivity to such changes. WAM is based on the dollar-weighted average length of time until principal payments must be paid. Depending on the types of securities held in a fund, certain maturity shortening devices (e.g., demand features, interest rate resets, and call options) may be taken into account when calculating the WAM. |
Weighted Average Life |
| 9/30/11 | 3/31/11 | 9/30/10 |
Government Portfolio | 63 Days | 88 Days | 112 Days |
Weighted Average Life (WAL) is the weighted average of the life of the securities held in a fund or portfolio and can be used as a measure of sensitivity to changes in liquidity and/or credit risk. Generally, the higher the value, the greater the sensitivity. WAL is based on the dollar-weighted average length of time until principal payments must be paid, taking into account any call options exercised by the issuer and any permissible maturity shortening features other than interest rate resets. The difference between WAM and WAL is that WAM takes into account interest rate resets and WAL does not. WAL for money market funds is not the same as WAL of a mortgage- or asset-backed security. |
Asset Allocation (% of fund's net assets) |
As of September 30, 2011 | As of March 31, 2011 |
| Federal Agency Issues 42.0% | | | Federal Agency Issues 43.9% | |
 | U.S. Treasury Obligations 6.2% | | | U.S. Treasury Obligations 5.4% | |
 | Repurchase Agreements 52.9% | | | Repurchase Agreements 50.6% | |
 | Net Other Assets** (1.1)% | | | Net Other Assets 0.1% | |

* Source: iMoneyNet, Inc.
** Net Other Assets are not included in the pie chart.
Semiannual Report
Government Portfolio
Investments September 30, 2011 (Unaudited)
Showing Percentage of Net Assets
Federal Agencies - 42.0% |
| | Yield (a) | Principal Amount (000s) | Value (000s) |
Fannie Mae Mortgage pass-thru certificates - 9.5% |
| 10/19/11 to 9/17/12 | 0.09 to 0.26% (b) | $ 3,441,230 | $ 3,442,694 |
Federal Farm Credit Bank - 0.2% |
| 11/29/12 | 0.19 (b) | 73,000 | 72,979 |
Federal Home Loan Bank - 24.1% |
| 10/12/11 to 11/15/12 | 0.07 to 0.41 (b) | 8,710,270 | 8,710,109 |
Freddie Mac - 8.2% |
| 10/4/11 to 11/2/12 | 0.09 to 0.35 (b) | 2,972,236 | 2,976,105 |
TOTAL FEDERAL AGENCIES | 15,201,887 |
U.S. Treasury Obligations - 6.2% |
|
U.S. Treasury Bills - 3.8% |
| 11/3/11 to 3/8/12 | 0.06 to 0.12 (c) | 1,378,000 | 1,377,705 |
U.S. Treasury Notes - 2.4% |
| 12/15/11 to 8/15/12 | 0.07 to 0.33 | 875,000 | 882,221 |
TOTAL U.S. TREASURY OBLIGATIONS | 2,259,926 |
Repurchase Agreements - 52.9% |
| Maturity Amount (000s) | | |
In a joint trading account at: | | | |
0.09% dated 9/30/11 due 10/3/11 (Collateralized by (U.S. Treasury Obligations)) # | $ 16,772,197 | | 16,772,067 |
0.09% dated 9/30/11 due 10/3/11 (Collateralized by (U.S. Treasury Obligations)) # | 740,394 | | 740,388 |
With: | | | |
Barclays Capital, Inc. at 0.15%, dated 7/27/11 due 10/7/11 (Collateralized by U.S. Treasury Obligations valued at $103,049,286, 3.13% - 4%, 5/15/21 - 2/16/26) | 101,038 | | 101,000 |
Citibank NA at: | | | |
0.08%, dated 9/28/11 due 10/5/11 (Collateralized by U.S. Treasury Obligations valued at $167,281,957, 2.75% - 3.5%, 2/15/18 - 2/15/19) | 164,003 | | 164,000 |
0.12%, dated 9/27/11 due 10/4/11 (Collateralized by U.S. Government Obligations valued at $170,343,408, 3.5% - 4.5%, 1/1/25 - 3/1/41) | 167,004 | | 167,000 |
|
| Maturity Amount (000s) | | Value (000s) |
Deutsche Bank Securities, Inc. at: | | | |
0.19%, dated 8/17/11 due 10/7/11 (Collateralized by U.S. Government Obligations valued at $107,229,195, 4% - 7%, 4/1/32 - 8/1/41) | $ 105,067 | | $ 105,000 |
0.23%, dated 8/3/11 due 10/7/11 (Collateralized by U.S. Government Obligations valued at $90,898,734, 0.56% - 7%, 7/1/23 - 6/20/60) | 89,051 | | 89,000 |
Goldman Sachs & Co. at 0.1%, dated 9/28/11 due 10/5/11 (Collateralized by U.S. Government Obligations valued at $111,181,545, 4% - 6.5%, 6/15/26 - 9/15/41) | 109,002 | | 109,000 |
ING Financial Markets LLC at: | | | |
0.17%, dated 8/9/11 due 10/7/11 (Collateralized by U.S. Government Obligations valued at $46,936,108, 0.63% - 6%, 4/15/22 - 9/1/41) | 46,020 | | 46,000 |
0.18%, dated 8/11/11 due 10/7/11 (Collateralized by U.S. Government Obligations valued at $59,175,050, 0.63% - 6.04%, 4/1/20 - 6/1/41) | 58,023 | | 58,000 |
0.19%, dated: | | | |
7/13/11 due 10/7/11 (Collateralized by U.S. Government Obligations valued at $416,024,541, 0.63% - 6.5%, 8/25/17 - 1/1/48) | 404,390 | | 404,000 |
7/15/11 due 10/7/11 (Collateralized by U.S. Government Obligations valued at $207,150,256, 0.63% - 6.39%, 6/5/18 - 9/1/41) | 203,199 | | 203,000 |
0.2%, dated 4/4/11 due 10/7/11 (Collateralized by U.S. Government Obligations valued at $54,115,781, 0.63% - 4%, 6/12/13 - 2/1/36) | 53,062 | | 53,000 |
0.23%, dated 8/4/11 due 10/7/11 (Collateralized by U.S. Government Obligations valued at $45,921,716, 0.63% - 6%, 4/15/22 - 9/1/41) | 45,052 | | 45,000 |
Repurchase Agreements - continued |
| Maturity Amount (000s) | | Value (000s) |
With: - continued | | | |
RBC Capital Markets Corp. at 0.16%, dated 8/26/11 due 10/7/11 (Collateralized by U.S. Government Obligations valued at $66,956,952, 0.61% - 7.5%, 1/1/22 - 10/25/41) | $ 65,036 | | $ 65,000 |
Wells Fargo Securities, LLC at 0.2%, dated 4/20/11 due 10/7/11 (Collateralized by U.S. Government Obligations valued at $47,998,417, 3.5% - 4%, 9/1/26 - 9/1/31) | 47,048 | | 47,000 |
TOTAL REPURCHASE AGREEMENTS | 19,168,455 |
TOTAL INVESTMENT PORTFOLIO - 101.1% (Cost $36,630,268) | | 36,630,268 |
NET OTHER ASSETS (LIABILITIES) - (1.1)% | (388,272) |
NET ASSETS - 100% | $ 36,241,996 |
Legend |
(a) Yield represents either the annualized yield at the date of purchase, or the stated coupon rate, or, for floating and adjustable rate securities, the rate at period end. |
(b) Coupon rates for floating and adjustable rate securities reflect the rates in effect at period end. |
(c) Security or a portion of the security was pledged to cover reverse repurchase agreements. At the period end, the value of securities pledged amounted to $362,976,000. The principal amount of the outstanding reverse repurchase agreement is $363,109,000. |
# Additional information on each counterparty to the repurchase agreement is as follows: |
Repurchase Agreement / Counterparty | Value
(Amounts in
thousands) |
$16,772,067,000 due 10/03/11 at 0.09% |
BNP Paribas Securities Corp. | $ 1,195,221 |
Bank of America NA | 4,387,330 |
Barclays Capital, Inc. | 1,590,408 |
Citibank NA | 1,425,883 |
Credit Agricole Securities (USA), Inc. | 438,733 |
Deutsche Bank Securities, Inc. | 1,645,249 |
HSBC Securities (USA), Inc. | 1,548,728 |
ING Financial Markets LLC | 350,987 |
J.P. Morgan Securities, Inc. | 1,096,833 |
Merrill Lynch, Pierce, Fenner & Smith, Inc. | 657,725 |
Morgan Stanley & Co., Inc. | 65,810 |
RBC Capital Markets Corp. | 767,783 |
RBS Securities, Inc. | 219,367 |
UBS Securities LLC | 219,367 |
Wells Fargo Securities LLC | 1,162,643 |
| $ 16,772,067 |
$740,388,000 due 10/03/11 at 0.09% |
Barclays Capital, Inc. | $ 408,163 |
Merrill Lynch, Pierce, Fenner & Smith, Inc. | 66,445 |
RBC Capital Markets Corp. | 75,937 |
UBS Securities LLC | 189,843 |
| $ 740,388 |
Other Information |
The date shown for securities represents the date when principal payments must be paid, taking into account any call options exercised by the issuer and any permissible maturity shortening features other than interest rate resets. |
All investments are categorized as Level 2 under the Fair Value Hierarchy. The inputs or methodology used for valuing securities may not be an indication of the risk associated with investing in those securities. For more information on valuation inputs, please refer to the Security Valuation section in the accompanying Notes to Financial Statements. |
Income Tax Information |
At March 31, 2011, the Fund had a capital loss carryforward of approximately $2,306,000 all of which will expire in fiscal 2019. Capital loss carryforwards are only available to offset future capital gains of the Fund to the extent provided by regulations and may be limited. |
See accompanying notes which are an integral part of the financial statements.
Semiannual Report
Government Portfolio
Financial Statements
Statement of Assets and Liabilities
Amounts in thousands (except per-share amounts) | September 30, 2011 (Unaudited) |
| | |
Assets | | |
Investment in securities, at value (including repurchase agreements of $19,168,455) - See accompanying schedule: Unaffiliated issuers (cost $36,630,268) | | $ 36,630,268 |
Receivable for fund shares sold | | 41,402 |
Interest receivable | | 13,760 |
Other receivables | | 336 |
Total assets | | 36,685,766 |
| | |
Liabilities | | |
Payable for investments purchased | $ 72,135 | |
Payable for fund shares redeemed | 3,737 | |
Distributions payable | 172 | |
Accrued management fee | 4,041 | |
Payable for reverse repurchase agreement | 363,106 | |
Other affiliated payables | 146 | |
Other payables and accrued expenses | 433 | |
Total liabilities | | 443,770 |
| | |
Net Assets | | $ 36,241,996 |
Net Assets consist of: | | |
Paid in capital | | $ 36,244,486 |
Distributions in excess of net investment income | | (187) |
Accumulated undistributed net realized gain (loss) on investments | | (2,303) |
Net Assets | | $ 36,241,996 |
| | |
Class I:
Net Asset Value, offering price and redemption price per share ($32,788,422 ÷ 32,780,471 shares) | | $ 1.00 |
| | |
Class II:
Net Asset Value, offering price and redemption price per share ($989,600 ÷ 989,217 shares) | | $ 1.00 |
| | |
Class III:
Net Asset Value, offering price and redemption price per share ($1,981,067 ÷ 1,980,420 shares) | | $ 1.00 |
| | |
Select Class:
Net Asset Value, offering price and redemption price per share ($482,907 ÷ 482,910 shares) | | $ 1.00 |
Statement of Operations
Amounts in thousands | Six months ended September 30, 2011 (Unaudited) |
| | |
Investment Income | | |
Interest | | $ 27,738 |
| | |
Expenses | | |
Management fee | $ 22,954 | |
Transfer agent fees | 9,877 | |
Distribution and service plan fees | 3,156 | |
Accounting fees and expenses | 791 | |
Custodian fees and expenses | 93 | |
Independent trustees' compensation | 56 | |
Registration fees | 79 | |
Audit | 32 | |
Legal | 55 | |
Miscellaneous | 166 | |
Total expenses before reductions | 37,259 | |
Expense reductions | (11,185) | 26,074 |
Net investment income (loss) | | 1,664 |
Realized and Unrealized Gain (Loss) Net realized gain (loss) on: | | |
Investment securities: | | |
Unaffiliated issuers | | 3 |
Net increase in net assets resulting from operations | | $ 1,667 |
See accompanying notes which are an integral part of the financial statements.
Semiannual Report
Statement of Changes in Net Assets
Amounts in thousands | Six months ended September 30, 2011 (Unaudited) | Year ended
March 31,
2011 |
Increase (Decrease) in Net Assets | | |
Operations | | |
Net investment income (loss) | $ 1,664 | $ 16,186 |
Net realized gain (loss) | 3 | (2,304) |
Net increase in net assets resulting from operations | 1,667 | 13,882 |
Distributions to shareholders from net investment income | (1,666) | (16,201) |
Distributions to shareholders from net realized gain | - | (976) |
Total distributions | (1,666) | (17,177) |
Share transactions - net increase (decrease) | 3,338,443 | (16,132,135) |
Total increase (decrease) in net assets | 3,338,444 | (16,135,430) |
| | |
Net Assets | | |
Beginning of period | 32,903,552 | 49,038,982 |
End of period (including distributions in excess of net investment income of $187 and distributions in excess of net investment income of $185, respectively) | $ 36,241,996 | $ 32,903,552 |
Financial Highlights - Class I
| Six months ended
September 30, 2011 | Years ended March 31, |
| (Unaudited) | 2011 | 2010 | 2009 | 2008 | 2007 |
Selected Per-Share Data | | | | | | |
Net asset value, beginning of period | $ 1.00 | $ 1.00 | $ 1.00 | $ 1.00 | $ 1.00 | $ 1.00 |
Income from Investment Operations | | | | | | |
Net investment income (loss) | - E | - E | .002 | .017 | .046 | .050 |
Net realized and unrealized gain (loss) | - E | - E | - | - | - | - |
Total from investment operations | - E | - E | .002 | .017 | .046 | .050 |
Distributions from net investment income | - E | - E | (.002) | (.017) | (.046) | (.050) |
Distributions from net realized gain | - | - E | - | - | - | - |
Total distributions | - E | - E | (.002) | (.017) | (.046) | (.050) |
Net asset value, end of period | $ 1.00 | $ 1.00 | $ 1.00 | $ 1.00 | $ 1.00 | $ 1.00 |
Total Return B,C | .01% | .05% | .17% | 1.70% | 4.74% | 5.15% |
Ratios to Average Net Assets D | | | | | | |
Expenses before reductions | .21% A | .21% | .21% | .23% | .22% | .23% |
Expenses net of fee waivers, if any | .16% A | .21% | .21% | .23% | .20% | .20% |
Expenses net of all reductions | .16% A | .21% | .21% | .23% | .20% | .20% |
Net investment income (loss) | .01% A | .05% | .18% | 1.44% | 4.39% | 5.04% |
Supplemental Data | | | | | | |
Net assets, end of period (in millions) | $ 32,788 | $ 29,687 | $ 45,414 | $ 54,931 | $ 18,583 | $ 5,711 |
A Annualized
B Total returns for periods of less than one year are not annualized.
C Total returns would have been lower if certain expenses had not been reduced during the applicable periods shown.
D Expense ratios reflect operating expenses of the class. Expenses before reductions do not reflect amounts reimbursed or waived or reductions from expense offset arrangements and do not represent the amount paid by the class during periods when reimbursements, waivers or reductions occur. Expenses net of fee waivers reflect expenses after reimbursement and waivers but prior to reductions from expense offset arrangements. Expenses net of all reductions represent the net expenses paid by the class.
E Amount represents less than $.001 per share.
See accompanying notes which are an integral part of the financial statements.
Semiannual Report
Financial Highlights - Class II
| Six months ended
September 30, 2011 | Years ended March 31, |
| (Unaudited) | 2011 | 2010 | 2009 | 2008 | 2007 |
Selected Per-Share Data | | | | | | |
Net asset value, beginning of period | $ 1.00 | $ 1.00 | $ 1.00 | $ 1.00 | $ 1.00 | $ 1.00 |
Income from Investment Operations | | | | | | |
Net investment income (loss) | - E | - E | .001 | .015 | .045 | .049 |
Net realized and unrealized gain (loss) | - E | - E | - | - | - | - |
Total from investment operations | - E | - E | .001 | .015 | .045 | .049 |
Distributions from net investment income | - E | - E | (.001) | (.015) | (.045) | (.049) |
Distributions from net realized gain | - | - E | - | - | - | - |
Total distributions | - E | - E | (.001) | (.015) | (.045) | (.049) |
Net asset value, end of period | $ 1.00 | $ 1.00 | $ 1.00 | $ 1.00 | $ 1.00 | $ 1.00 |
Total Return B,C | .01% | .01% | .08% | 1.55% | 4.59% | 5.00% |
Ratios to Average Net Assets D | | | | | | |
Expenses before reductions | .36% A | .36% | .36% | .38% | .38% | .39% |
Expenses net of fee waivers, if any | .16% A | .25% | .31% | .38% | .35% | .35% |
Expenses net of all reductions | .16% A | .25% | .31% | .38% | .35% | .35% |
Net investment income (loss) | .01% A | .01% | .07% | 1.29% | 4.32% | 4.89% |
Supplemental Data | | | | | | |
Net assets, end of period (in millions) | $ 990 | $ 807 | $ 1,413 | $ 1,936 | $ 1,342 | $ 536 |
A Annualized
B Total returns for periods of less than one year are not annualized.
C Total returns would have been lower if certain expenses had not been reduced during the applicable periods shown.
D Expense ratios reflect operating expenses of the class. Expenses before reductions do not reflect amounts reimbursed or waived or reductions from expense offset arrangements and do not represent the amount paid by the class during periods when reimbursements, waivers or reductions occur. Expenses net of fee waivers reflect expenses after reimbursement and waivers but prior to reductions from expense offset arrangements. Expenses net of all reductions represent the net expenses paid by the class.
E Amount represents less than $.001 per share.
Financial Highlights - Class III
| Six months ended
September 30, 2011 | Years ended March 31, |
| (Unaudited) | 2011 | 2010 | 2009 | 2008 | 2007 |
Selected Per-Share Data | | | | | | |
Net asset value, beginning of period | $ 1.00 | $ 1.00 | $ 1.00 | $ 1.00 | $ 1.00 | $ 1.00 |
Income from Investment Operations | | | | | | |
Net investment income (loss) | - E | - E | - E | .014 | .044 | .048 |
Net realized and unrealized gain (loss) | - E | - E | - | - | - | - |
Total from investment operations | - E | - E | - E | .014 | .044 | .048 |
Distributions from net investment income | - E | - E | - E | (.014) | (.044) | (.048) |
Distributions from net realized gain | - | - E | - | - | - | - |
Total distributions | - E | - E | - E | (.014) | (.044) | (.048) |
Net asset value, end of period | $ 1.00 | $ 1.00 | $ 1.00 | $ 1.00 | $ 1.00 | $ 1.00 |
Total Return B,C | .01% | .01% | .04% | 1.44% | 4.48% | 4.89% |
Ratios to Average Net Assets D | | | | | | |
Expenses before reductions | .46% A | .46% | .46% | .49% | .48% | .48% |
Expenses net of fee waivers, if any | .16% A | .25% | .35% | .48% | .45% | .45% |
Expenses net of all reductions | .16% A | .25% | .35% | .48% | .45% | .45% |
Net investment income (loss) | .01% A | .01% | .03% | 1.19% | 4.27% | 4.79% |
Supplemental Data | | | | | | |
Net assets, end of period (in millions) | $ 1,981 | $ 2,050 | $ 1,910 | $ 3,031 | $ 1,763 | $ 814 |
A Annualized
B Total returns for periods of less than one year are not annualized.
C Total returns would have been lower if certain expenses had not been reduced during the applicable periods shown.
D Expense ratios reflect operating expenses of the class. Expenses before reductions do not reflect amounts reimbursed or waived or reductions from expense offset arrangements and do not represent the amount paid by the class during periods when reimbursements, waivers or reductions occur. Expenses net of fee waivers reflect expenses after reimbursement and waivers but prior to reductions from expense offset arrangements. Expenses net of all reductions represent the net expenses paid by the class.
E Amount represents less than $.001 per share.
See accompanying notes which are an integral part of the financial statements.
Semiannual Report
Financial Highlights - Select Class
| Six months ended
September 30, 2011 | Years ended March 31, |
| (Unaudited) | 2011 | 2010 | 2009 | 2008 | 2007 |
Selected Per-Share Data | | | | | | |
Net asset value, beginning of period | $ 1.00 | $ 1.00 | $ 1.00 | $ 1.00 | $ 1.00 | $ 1.00 |
Income from Investment Operations | | | | | | |
Net investment income (loss) | - E | - E | .001 | .016 | .046 | .050 |
Net realized and unrealized gain (loss) | - E | - E | - | - | - | - |
Total from investment operations | - E | - E | .001 | .016 | .046 | .050 |
Distributions from net investment income | - E | - E | (.001) | (.016) | (.046) | (.050) |
Distributions from net realized gain | - | - E | - | - | - | - |
Total distributions | - E | - E | (.001) | (.016) | (.046) | (.050) |
Net asset value, end of period | $ 1.00 | $ 1.00 | $ 1.00 | $ 1.00 | $ 1.00 | $ 1.00 |
Total Return B,C | .01% | .02% | .13% | 1.65% | 4.69% | 5.10% |
Ratios to Average Net Assets D | | | | | | |
Expenses before reductions | .26% A | .26% | .26% | .28% | .27% | .28% |
Expenses net of fee waivers, if any | .16% A | .24% | .25% | .28% | .25% | .25% |
Expenses net of all reductions | .16% A | .24% | .25% | .28% | .25% | .25% |
Net investment income (loss) | .01% A | .01% | .13% | 1.39% | 4.30% | 4.99% |
Supplemental Data | | | | | | |
Net assets, end of period (in millions) | $ 483 | $ 360 | $ 302 | $ 612 | $ 266 | $ 45 |
A Annualized
B Total returns for periods of less than one year are not annualized.
C Total returns would have been lower if certain expenses had not been reduced during the applicable periods shown.
D Expense ratios reflect operating expenses of the class. Expenses before reductions do not reflect amounts reimbursed or waived or reductions from expense offset arrangements and do not represent the amount paid by the class during periods when reimbursements, waivers or reductions occur. Expenses net of fee waivers reflect expenses after reimbursement and waivers but prior to reductions from expense offset arrangements. Expenses net of all reductions represent the net expenses paid by the class.
E Amount represents less than $.001 per share.
See accompanying notes which are an integral part of the financial statements.
Semiannual Report
Prime Money Market Portfolio
Investment Changes (Unaudited)
Effective Maturity Diversification |
Days | % of fund's investments 9/30/11 | % of fund's investments 3/31/11 | % of fund's
investments
9/30/10 |
1 - 7 | 42.6 | 32.2 | 29.0 |
8 - 30 | 15.7 | 24.8 | 23.6 |
31 - 60 | 20.1 | 15.8 | 14.9 |
61 - 90 | 7.6 | 6.6 | 15.2 |
91 - 180 | 9.7 | 13.8 | 14.2 |
> 180 | 4.3 | 6.8 | 3.1 |
Effective maturity is determined in accordance with the requirements of Rule 2a-7 under the Investment Company Act of 1940. |
Weighted Average Maturity |
| 9/30/11 | 3/31/11 | 9/30/10 |
Prime Money Market Portfolio | 41 Days | 50 Days | 51 Days |
All Taxable Money Market Funds Average* | 39 Days | 45 Days | 44 Days |
This is a weighted average of all the maturities of the securities held in a fund. Weighted Average Maturity (WAM) can be used as a measure of sensitivity to interest rate changes and markets changes. Generally, the longer the maturity, the greater the sensitivity to such changes. WAM is based on the dollar-weighted average length of time until principal payments must be paid. Depending on the types of securities held in a fund, certain maturity shortening devices (e.g., demand features, interest rate resets, and call options) may be taken into account when calculating the WAM. |
Weighted Average Life |
| 9/30/11 | 3/31/11 | 9/30/10 |
Prime Money Market Portfolio | 83 Days | 107 Days | 81 Days |
Weighted Average Life (WAL) is the weighted average of the life of the securities held in a fund or portfolio and can be used as a measure of sensitivity to changes in liquidity and/or credit risk. Generally, the higher the value, the greater the sensitivity. WAL is based on the dollar-weighted average length of time until principal payments must be paid, taking into account any call options exercised by the issuer and any permissible maturity shortening features other than interest rate resets. The difference between WAM and WAL is that WAM takes into account interest rate resets and WAL does not. WAL for money market funds is not the same as WAL of a mortgage- or asset-backed security. |
Asset Allocation (% of fund's net assets) |
As of September 30, 2011 | As of March 31, 2011 |
| Corporate Bonds 0.1% | | | Corporate Bonds 0.1% | |
| Commercial Paper 10.1% | | | Commercial Paper 18.5% | |
 | Bank CDs, BAs, TDs,
and Notes 47.6% | | | Bank CDs, BAs, TDs,
and Notes 45.0% | |
| Government Securities† 16.1% | | | Government Securities† 16.4% | |
 | Repurchase Agreements 28.8% | | | Repurchase Agreements 20.1% | |
 | Net Other Assets** (2.7)% | | | Net Other Assets** (0.1)% | |

* Source: iMoneyNet, Inc.
** Net Other Assets are not included in the pie chart.
† Includes Federal Financing Bank Supported Student Loan Short-Term Notes.
Semiannual Report
Prime Money Market Portfolio
Investments September 30, 2011 (Unaudited)
Showing Percentage of Net Assets
Corporate Bonds - 0.1% |
| | Yield (a) | Principal Amount (000s) | Value (000s) |
Florida Timber Finance III LLC Taxable, LOC Wells Fargo Bank NA |
| 10/7/11 | 0.22% (d) | $ 25,155 | $ 25,155 |
LP Pinewood SPV LLC Taxable, LOC Wells Fargo Bank NA |
| 10/7/11 | 0.22 (d) | 37,000 | 37,000 |
TOTAL CORPORATE BONDS | 62,155 |
Certificates of Deposit - 39.0% |
|
Domestic Certificates Of Deposit - 0.4% |
Branch Banking & Trust Co. |
| 11/17/11 to 12/5/11 | 0.24 to 0.27 | 203,000 | 203,000 |
London Branch, Eurodollar, Foreign Banks - 5.2% |
ABN AMRO Bank NV |
| 11/3/11 | 0.36 | 356,000 | 356,001 |
Australia & New Zealand Banking Group Ltd. |
| 12/13/11 | 0.30 | 66,000 | 66,000 |
Commonwealth Bank of Australia |
| 12/12/11 | 0.30 | 190,000 | 190,000 |
Credit Agricole SA |
| 10/5/11 | 0.36 | 481,000 | 481,000 |
HSBC Bank PLC |
| 12/28/11 to 5/10/12 | 0.30 to 0.55 | 1,294,000 | 1,294,000 |
National Australia Bank Ltd. |
| 12/1/11 | 0.30 | 500,000 | 500,000 |
| | 2,887,001 |
New York Branch, Yankee Dollar, Foreign Banks - 33.4% |
Bank of Montreal |
| 11/22/11 to 10/5/12 | 0.30 to 0.33 (d) | 511,000 | 511,000 |
Bank of Montreal Chicago CD Program |
| 9/26/12 | 0.38 (d) | 194,000 | 194,000 |
Bank of Nova Scotia |
| 11/1/11 to 10/11/12 | 0.25 to 0.44 (d) | 1,869,000 | 1,869,000 |
Bank of Tokyo-Mitsubishi |
| 11/3/11 to 11/30/11 | 0.28 to 0.32 | 575,000 | 575,000 |
BNP Paribas New York Branch |
| 11/2/11 to 11/7/11 | 0.44 to 0.45 | 1,225,000 | 1,225,000 |
BNP Paribas SA |
| 11/28/11 to 12/12/11 | 0.46 to 0.63 (d) | 825,000 | 825,014 |
Canadian Imperial Bank of Commerce New York Branch |
| 10/4/11 to 10/16/12 | 0.30 to 0.46 (d) | 2,393,000 | 2,393,164 |
Credit Suisse |
| 10/25/11 | 0.28 (d) | 449,000 | 449,000 |
|
| | Yield (a) | Principal Amount (000s) | Value (000s) |
Credit Suisse New York Branch |
| 11/14/11 to 12/28/11 | 0.30 to 0.37% | $ 1,100,000 | $ 1,100,000 |
Deutsche Bank |
| 10/4/11 | 0.31 (d) | 700,000 | 700,000 |
Deutsche Bank AG New York Branch |
| 10/14/11 to 10/17/11 | 0.30 | 311,000 | 311,000 |
Mitsubishi UFJ Trust & Banking Corp. |
| 10/3/11 to 10/27/11 | 0.28 to 0.30 | 606,000 | 606,002 |
Mizuho Corporate Bank Ltd. |
| 10/5/11 to 10/7/11 | 0.18 | 611,000 | 611,000 |
National Bank Canada |
| 11/4/11 to 7/6/12 | 0.33 to 0.37 (d) | 833,000 | 833,000 |
Rabobank Nederland New York Branch |
| 3/12/12 to 6/8/12 | 0.28 to 0.35 (d) | 2,083,000 | 2,083,000 |
Royal Bank of Canada |
| 10/1/12 | 0.59 (d) | 190,000 | 190,000 |
Skandinaviska Enskilda Banken |
| 10/6/11 | 0.26 | 95,000 | 95,000 |
Sumitomo Mitsui Banking Corp. |
| 10/3/11 to 10/12/11 | 0.18 to 0.20 | 2,497,000 | 2,497,000 |
Sumitomo Trust & Banking Co. Ltd. |
| 10/3/11 to 10/4/11 | 0.19 to 0.20 | 388,000 | 388,000 |
Svenska Handelsbanken |
| 11/3/11 | 0.30 | 393,000 | 393,002 |
Toronto-Dominion Bank New York Branch |
| 1/12/12 | 0.31 (d) | 195,000 | 195,000 |
UBS AG |
| 11/21/11 | 0.35 | 250,000 | 250,000 |
| | 18,293,182 |
TOTAL CERTIFICATES OF DEPOSIT | 21,383,183 |
Commercial Paper - 10.1% |
|
ASB Finance Ltd. |
| 2/3/12 | 0.37 (d) | 150,000 | 149,997 |
Barclays Bank PLC/Barclays US CCP Funding LLC |
| 10/11/11 to 10/18/11 | 0.27 | 193,000 | 192,982 |
Caisse d'Amort de la Dette Societe |
| 10/11/11 to 5/25/12 | 0.24 to 0.31 (b)(d) | 1,621,000 | 1,620,606 |
Commonwealth Bank of Australia |
| 10/28/11 to 12/15/11 | 0.30 to 0.35 (d) | 500,000 | 499,862 |
DnB NOR Bank ASA |
| 11/8/11 to 11/17/11 | 0.30 | 762,000 | 761,724 |
Commercial Paper - continued |
| | Yield (a) | Principal Amount (000s) | Value (000s) |
Gotham Funding Corp. (Liquidity Facility Bank of Tokyo-Mitsubishi UFJ Ltd.) |
| 10/12/11 to 10/18/11 | 0.25 to 0.26% | $ 94,000 | $ 93,992 |
Northern Pines Funding LLC |
| 12/1/11 | 0.37 (d) | 123,000 | 123,000 |
Royal Bank of Canada |
| 11/23/11 | 0.30 | 463,000 | 462,796 |
Skandinaviska Enskilda Banken AB |
| 10/6/11 | 0.30 | 368,000 | 367,985 |
Svenska Handelsbanken, Inc. |
| 11/3/11 to 12/28/11 | 0.30 to 0.33 | 260,000 | 259,830 |
Swedbank AB |
| 10/24/11 to 10/26/11 | 0.38 | 226,000 | 225,942 |
Texas Instruments, Inc. |
| 12/6/11 to 12/12/11 | 0.20 | 81,000 | 80,969 |
Total Capital Canada Ltd. |
| 12/15/11 | 0.42 | 113,000 | 112,901 |
UBS Finance, Inc. |
| 11/23/11 | 0.35 | 60,000 | 59,969 |
Westpac Banking Corp. |
| 10/7/11 to 4/10/12 | 0.31 to 0.39 (d) | 523,000 | 523,000 |
TOTAL COMMERCIAL PAPER | 5,535,555 |
U.S. Government and Government Agency Obligations - 0.5% |
|
Other Government Related - 0.5% |
Straight-A Funding LLC (Liquidity Facility Federal Financing Bank) |
| 11/3/11 | 0.65 (c) | 250,000 | 249,865 |
Federal Agencies - 0.7% |
|
Federal Home Loan Bank - 0.7% |
| 8/30/12 to 10/10/12 | 0.25 to 0.41 | 354,000 | 353,982 |
U.S. Treasury Obligations - 14.9% |
|
U.S. Treasury Bills - 6.2% |
| 11/3/11 to 3/8/12 | 0.07 to 0.31 | 3,360,700 | 3,359,347 |
U.S. Treasury Notes - 8.7% |
| 10/31/11 to 10/15/12 | 0.13 to 0.33 | 4,753,500 | 4,775,895 |
TOTAL U.S. TREASURY OBLIGATIONS | 8,135,242 |
Master Notes - 0.7% |
|
Royal Bank of Scotland PLC |
| 10/17/11 | 0.73 (d)(g) | 380,000 | 380,000 |
Medium-Term Notes - 6.0% |
| | Yield (a) | Principal Amount (000s) | Value (000s) |
Commonwealth Bank of Australia |
| 2/10/12 | 0.31% (b)(d) | $ 236,000 | $ 236,000 |
Metropolitan Life Insurance Co. |
| 12/29/11 | 0.58 (d)(g) | 30,000 | 30,000 |
Royal Bank of Canada |
| 10/1/12 to 10/15/12 | 0.30 to 0.69 (b)(d) | 841,000 | 841,000 |
| 10/5/12 | 0.27 (d) | 714,000 | 713,777 |
Westpac Banking Corp. |
| 4/2/12 to 6/14/12 | 0.29 to 0.32 (b)(d) | 1,484,000 | 1,484,000 |
TOTAL MEDIUM-TERM NOTES | 3,304,777 |
Municipal Securities - 1.9% |
|
Arizona Health Facilities Auth. Rev. (Catholic Healthcare West Proj.) Series 2008 A, LOC JPMorgan Chase Bank, VRDN |
| 10/7/11 | 0.13 (d) | 27,100 | 27,100 |
Bay Area Toll Auth. San Francisco Bay Toll Bridge Rev. Participating VRDN Series EGL 06 83 Class A, (Liquidity Facility Citibank NA) |
| 10/7/11 | 0.16 (d)(f) | 35,600 | 35,600 |
California Health Facilities Fing. Auth. Rev. (St. Joseph Health Sys. Proj.) Series 2011 D, LOC Wells Fargo Bank NA, VRDN |
| 10/7/11 | 0.13 (d) | 52,300 | 52,300 |
California Hsg. Fin. Agcy. Rev. (Home Mtg. Prog.) Series 2005 B1, (Liquidity Facility Fannie Mae) (Liquidity Facility Freddie Mac), VRDN |
| 10/7/11 | 0.12 (d)(e) | 8,355 | 8,355 |
California Hsg. Fin. Agcy. Rev. (Multifamily Hsg. Prog.) Series 2001 G, (Liquidity Facility Fannie Mae) (Liquidity Facility Freddie Mac), VRDN |
| 10/7/11 | 0.14 (d)(e) | 25,965 | 25,965 |
California Hsg. Fin. Agcy. Rev. (Multifamily Hsg. Prog.) Series III 2001 E, (Liquidity Facility Fannie Mae) (Liquidity Facility Freddie Mac), VRDN |
| 10/7/11 | 0.14 (d)(e) | 19,200 | 19,200 |
California Hsg. Fin. Agcy. Rev. Series 2000 A, (Liquidity Facility Fannie Mae) (Liquidity Facility Freddie Mac), VRDN |
| 10/7/11 | 0.15 (d)(e) | 31,780 | 31,780 |
California Poll. Cont. Fing. Auth. Solid Waste Disp. Rev. (Recology, Inc. Proj.) Series 2010 A, LOC Bank of America NA, VRDN |
| 10/7/11 | 0.23 (d) | 20,495 | 20,495 |
California Statewide Cmntys. Dev. Auth. Multi-family Hsg. Rev. (Canyon Creek Apts. Proj.) Series 1995 C, LOC Fannie Mae, VRDN |
| 10/7/11 | 0.15 (d)(e) | 38,800 | 38,800 |
California Statewide Cmntys. Dev. Auth. Multi-family Hsg. Rev. (Heritage Park Apts. Proj.) Series 2008 C, LOC Freddie Mac, VRDN |
| 10/7/11 | 0.15 (d)(e) | 9,000 | 9,000 |
California Statewide Cmntys. Dev. Auth. Multi-family Hsg. Rev. (Vineyard Creek Apts. Proj.) Series 2003 W, LOC Fannie Mae, VRDN |
| 10/7/11 | 0.15 (d)(e) | 19,500 | 19,500 |
Chula Vista Multi-Family Hsg. Rev. (Teresina Apts. Proj.) Series 2006 A, LOC Fannie Mae, VRDN |
| 10/7/11 | 0.14 (d)(e) | 18,970 | 18,970 |
Municipal Securities - continued |
| | Yield (a) | Principal Amount (000s) | Value (000s) |
Clark County McCarran Int'l. Arpt. Passenger Facility Charge Rev. Series 2010 F2, LOC Union Bank of California, VRDN |
| 10/7/11 | 0.16% (d) | $ 20,000 | $ 20,000 |
Cobb County Kennestone Hosp. Auth. Rev. (WellStar Health Sys. Proj.) Series 2005 A, LOC Bank of America NA, VRDN |
| 10/7/11 | 0.26 (d) | 10,000 | 10,000 |
Contra Costa County Multi-family Hsg. Rev. (Park Regency Proj.) Series 2003 F, LOC Fannie Mae, VRDN |
| 10/7/11 | 0.14 (d)(e) | 12,800 | 12,800 |
Hamilton County Hosp. Facilities Rev. (Children's Hosp. Med. Ctr. Proj.) Series 1997 A, LOC PNC Bank NA, VRDN |
| 10/7/11 | 0.16 (d) | 10,600 | 10,600 |
Idaho Health Facilities Auth. Rev. (St. Luke's Health Sys. Proj.) Series 2009 B, LOC BMO Harris Bank NA, VRDN |
| 10/7/11 | 0.15 (d) | 18,000 | 18,000 |
Illinois Edl. Facilities Auth. Revs. (Field Museum of Natural History Proj.) Series 2000, LOC JPMorgan Chase Bank, VRDN |
| 10/7/11 | 0.14 (d) | 11,200 | 11,200 |
Illinois Fin. Auth. Poll. Cont. Rev. (Commonwealth Edison Co. Proj.) Series 2008 F, LOC JPMorgan Chase Bank, VRDN |
| 10/7/11 | 0.13 (d) | 10,100 | 10,100 |
Indiana Dev. Fin. Auth. Solid Waste Disp. Rev. (Waste Mgmt., Inc. Proj.) Series 2002 A, LOC JPMorgan Chase Bank, VRDN |
| 10/7/11 | 0.21 (d)(e) | 25,000 | 25,000 |
Indiana Fin. Auth. Health Sys. Rev. (Sisters of Saint Francis Health Svcs., Inc. Obligated Group Proj.) Series 2008 D, LOC Bank of America NA, VRDN |
| 10/7/11 | 0.13 (d) | 11,500 | 11,500 |
Kentucky Muni. Pwr. Agcy. Pwr. Sys. Rev. Participating VRDN Series Solar 07 107, (Liquidity Facility U.S. Bank NA, Minnesota) |
| 10/7/11 | 0.14 (d)(f) | 20,595 | 20,595 |
Nassau Health Care Corp. Rev. Series 2009 D1, LOC JPMorgan Chase Bank, VRDN |
| 10/7/11 | 0.12 (d) | 22,660 | 22,660 |
New York City Hsg. Dev. Corp. Multi-family Rental Hsg. Rev. (Morris Avenue Apts. Proj.) Series A, LOC Fannie Mae, VRDN |
| 10/7/11 | 0.14 (d)(e) | 39,400 | 39,400 |
New York City Hsg. Dev. Corp. Multi-family Rental Hsg. Rev. (One Columbus Place Dev. Proj.) Series A, LOC Fannie Mae, VRDN |
| 10/7/11 | 0.14 (d)(e) | 17,500 | 17,500 |
New York City Hsg. Dev. Corp. Multi-family Rental Hsg. Rev. (Two Gold Street Proj.) Series 2006 A, LOC Fannie Mae, VRDN |
| 10/7/11 | 0.14 (d) | 33,000 | 33,000 |
New York Dorm. Auth. Revs. (Univ. of Rochester Proj.) Series 2003 C, LOC JPMorgan Chase Bank, VRDN |
| 10/7/11 | 0.14 (d) | 8,600 | 8,600 |
New York Hsg. Fin. Agcy. Rev. (150 East 44th Street Hsg. Proj.) Series 2000 A, LOC Fannie Mae, VRDN |
| 10/7/11 | 0.15 (d)(e) | 20,800 | 20,800 |
New York Hsg. Fin. Agcy. Rev. (360 West 43rd Street Hsg. Proj.) Series A, LOC Fannie Mae, VRDN |
| 10/7/11 | 0.14 (d)(e) | 18,800 | 18,800 |
|
| | Yield (a) | Principal Amount (000s) | Value (000s) |
New York Hsg. Fin. Agcy. Rev. (600 West 42nd Street Hsg. Proj.) Series 2007 A, LOC Bank of New York, New York, VRDN |
| 10/7/11 | 0.16% (d)(e) | $ 41,800 | $ 41,800 |
New York Hsg. Fin. Agcy. Rev. (Kew Garden Hills Apts. Hsg. Proj.) Series 2003 A, LOC Fannie Mae, VRDN |
| 10/7/11 | 0.14 (d)(e) | 21,800 | 21,800 |
New York Hsg. Fin. Agcy. Rev. (Tower 31 Hsg. Proj.) Series 2005 A, LOC Freddie Mac, VRDN |
| 10/7/11 | 0.14 (d)(e) | 31,800 | 31,800 |
New York Hsg. Fin. Agcy. Rev. (Union Square South Proj.) Series 1996 A, LOC Fannie Mae, VRDN |
| 10/7/11 | 0.14 (d)(e) | 26,300 | 26,300 |
New York Hsg. Fin. Agcy. Rev. Series 2010 A, LOC Bank of America NA, VRDN |
| 10/7/11 | 0.16 (d) | 5,000 | 5,000 |
North Texas Tollway Auth. Rev. Series 2009 D, LOC JPMorgan Chase Bank, VRDN |
| 10/7/11 | 0.14 (d) | 28,000 | 28,000 |
Northwest Texas Independent School District Participating VRDN Series Solar 06 47, (Liquidity Facility U.S. Bank NA, Minnesota) |
| 10/7/11 | 0.14 (d)(f) | 14,365 | 14,365 |
Philadelphia Arpt. Rev. Series 2005 C, LOC TD Banknorth, NA, VRDN |
| 10/7/11 | 0.13 (d)(e) | 29,775 | 29,775 |
Phoenix Indl. Dev. Auth. Multi-family Hsg. Rev. (Paradise Lakes Apt. Proj.) Series 2007 A, LOC Wells Fargo Bank NA, VRDN |
| 10/7/11 | 0.14 (d) | 10,125 | 10,125 |
Pinellas County Health Facilities Auth. Rev. (BayCare Health Sys. Proj.) Series 2009 A2, LOC Northern Trust Co., VRDN |
| 10/7/11 | 0.14 (d) | 10,000 | 10,000 |
Saint Joseph County Hosp. Auth. Health Sys. Rev. (Memorial Health Sys. Proj.) Series 2008 B, LOC JPMorgan Chase Bank, VRDN |
| 10/7/11 | 0.15 (d) | 37,265 | 37,265 |
San Francisco City & County Arpts. Commission Int'l. Arpt. Rev. Series 2010 A2, LOC JPMorgan Chase Bank, VRDN |
| 10/7/11 | 0.14 (d)(e) | 25,000 | 25,000 |
South Miami Health Facilities Auth. Hosp. Rev. Participating VRDN Series BA 07 1025, (Liquidity Facility Bank of America NA) |
| 10/7/11 | 0.22 (d)(f) | 10,000 | 10,000 |
Southern California Pub. Pwr. Auth. Rev. (Magnolia Pwr. Proj.) Series 2009-1, LOC KBC Bank NV, VRDN |
| 10/7/11 | 0.28 (d) | 13,170 | 13,170 |
Stockton Pub. Fing. Auth. Wtr. Rev. (Delta Wtr. Supply Proj.) Series 2010 A, LOC Union Bank of California, VRDN |
| 10/7/11 | 0.14 (d) | 12,900 | 12,900 |
Travis County Health Facilities Dev. (Longhorn Village Proj.) Series 2008 B, LOC Bank of Scotland PLC, VRDN |
| 10/7/11 | 0.15 (d) | 16,900 | 16,900 |
Triborough Bridge & Tunnel Auth. Revs. Series 2002 F, (Liquidity Facility Royal Bank of Scotland NV), VRDN |
| 10/7/11 | 0.13 (d) | 70,925 | 70,925 |
Municipal Securities - continued |
| | Yield (a) | Principal Amount (000s) | Value (000s) |
Triborough Bridge & Tunnel Auth. Revs. Series 2005 B3, (Liquidity Facility Bank of America NA), VRDN |
| 10/7/11 | 0.20% (d) | $ 10,000 | $ 10,000 |
Washington Econ. Dev. Fin. Auth. Solid Waste Disp. Rev. (Waste Mgmt., Inc. Proj.) Series E, LOC JPMorgan Chase Bank, VRDN |
| 10/7/11 | 0.21 (d)(e) | 20,000 | 20,000 |
| TOTAL MUNICIPAL SECURITIES | 1,052,745 |
Repurchase Agreements - 28.8% |
| Maturity Amount (000s) | | |
In a joint trading account at: | | | |
0.04% dated 9/30/11 due 10/3/11 (Collateralized by U.S. Treasury Obligations) # | $ 300,001 | | 300,000 |
0.09% dated 9/30/11 due 10/3/11 (Collateralized by U.S. Treasury Obligations) # | 8,914,477 | | 8,914,408 |
0.09% dated 9/30/11 due 10/3/11 (Collateralized by U.S. Treasury Obligations) # | 234,617 | | 234,615 |
With: | | | |
Barclays Capital, Inc. at: | | | |
0.15%, dated 7/27/11 due 10/7/11 (Collateralized by U.S. Government Obligations valued at $177,530,288, 0% - 6%, 10/15/19 - 8/20/41) | 174,066 | | 174,000 |
0.2%, dated 9/30/11 due 10/3/11 (Collateralized by Corporate Obligations valued at $191,103,186, 0% - 6.5%, 1/15/12 - 12/1/22) | 182,003 | | 182,000 |
0.32%, dated: | | | |
9/27/11 due 10/4/11 (Collateralized by Equity Securities valued at $52,922,825) | 49,003 | | 49,000 |
9/29/11 due 10/6/11 (Collateralized by Equity Securities valued at $41,041,459) | 38,002 | | 38,000 |
0.33%, dated 9/30/11 due 10/3/11 (Collateralized by U.S. Government Obligations valued at $103,002,833, 2.5% - 7.5%, 8/25/23 - 5/16/41) | 100,003 | | 100,000 |
0.38%, dated 9/30/11 due 10/3/11 (Collateralized by Equity Securities valued at $1,393,244,120) | 1,290,041 | | 1,290,000 |
0.43%, dated 9/6/11 due 10/6/11 (Collateralized by Mortgage Loan Obligations valued at $83,181,191, .36% - 8.97%, 4/25/33 - 4/25/47) | 77,028 | | 77,000 |
|
| Maturity Amount (000s) | | Value (000s) |
0.53%, dated 9/30/11 due 10/3/11 (Collateralized by Corporate Obligations valued at $50,299,706, 0.88% - 5.25%, 2/15/14 - 10/1/14) | $ 47,002 | | $ 47,000 |
0.6%, dated 9/8/11 due 10/13/11 (Collateralized by Corporate Obligations valued at $203,972,755, 0.14% - 9.35%, 1/21/15 - 6/11/50) | 189,110 | | 189,000 |
1%, dated: | | | |
10/13/10 due 10/11/11 (Collateralized by Corporate Obligations valued at $155,692,853, 0% - 7.25%, 2/16/12 - 1/1/49) | 144,442 | | 143,000 |
8/8/11 due 10/7/11 (Collateralized by Mortgage Loan Obligations valued at $214,560,170, 0% - 8.2%, 7/28/15 - 12/20/54) | 199,332 | | 199,000 |
Citibank NA at: | | | |
0.08%, dated 9/28/11 due 10/5/11 (Collateralized by U.S. Treasury Obligations valued at $258,062,957, 0.75% - 3.5%, 9/15/13 - 5/15/20) | 253,004 | | 253,000 |
0.12%, dated 9/27/11 due 10/4/11 (Collateralized by U.S. Government Obligations valued at $264,185,284, 4% - 6.5%, 6/1/23 - 11/1/47) | 259,006 | | 259,000 |
Credit Suisse Securities (USA) LLC at: | | | |
0.21%, dated 9/30/11 due 10/3/11 (Collateralized by Equity Securities valued at $947,192,052) | 877,015 | | 877,000 |
0.34%, dated 7/14/11 due 10/7/11 (Collateralized by Equity Securities valued at $226,975,588) | 210,179 | | 210,000 |
0.6%, dated 9/9/11 due 10/12/11 (Collateralized by Equity Securities valued at $39,915,618) | 38,021 | | 38,000 |
0.67%, dated: | | | |
9/12/11 due: | | | |
10/21/11 (Collateralized by Mortgage Loan Obligations valued at $51,201,827, .63% - 6.27%, 11/25/14 - 12/12/49) | 48,035 | | 48,000 |
10/31/11 (Collateralized by Mortgage Loan Obligations valued at $50,416,947, 5.46% - 5.98%, 2/15/40 - 8/10/45) | 48,044 | | 48,000 |
9/16/11 due 10/27/11 (Collateralized by Mortgage Loan Obligations valued at $108,552,278, 0% - 6.97%, 6/12/17 - 8/25/47) | 98,075 | | 98,000 |
Repurchase Agreements - continued |
| Maturity Amount (000s) | | Value (000s) |
With: - continued | | | |
Deutsche Bank Securities, Inc. at: | | | |
0.19%, dated 8/17/11 due 10/7/11 (Collateralized by U.S. Government Obligations valued at $171,402,507, 2.38% - 7%, 2/1/26 - 11/1/40) | $ 168,106 | | $ 168,000 |
0.23%, dated 8/3/11 due 10/7/11 (Collateralized by U.S. Government Obligations valued at $172,118,634, 0.85% - 7.5%, 10/15/18 - 2/20/60) | 168,097 | | 168,000 |
Goldman Sachs & Co. at: | | | |
0.1%, dated 9/28/11 due 10/5/11 (Collateralized by U.S. Government Obligations valued at $172,382,394, 4% - 6%, 9/15/38 - 7/20/41) | 169,003 | | 169,000 |
0.2%, dated 9/28/11 due 10/5/11 (Collateralized by U.S. Government Obligations valued at $394,750,966, 4% - 6%, 12/1/32 - 8/1/41) | 387,015 | | 387,000 |
0.25%, dated 9/30/11 due 10/7/11 (Collateralized by U.S. Government Obligations valued at $147,903,081, 4.5% - 5.5%, 9/1/38 - 2/1/41) | 145,007 | | 145,000 |
ING Financial Markets LLC at: | | | |
0.17%, dated 8/9/11 due 10/7/11 (Collateralized by U.S. Government Obligations valued at $89,800,631, 0.63% - 5.5%, 6/25/24 - 6/1/41) | 88,037 | | 88,000 |
0.2%, dated 4/4/11 due 10/7/11 (Collateralized by U.S. Government Obligations valued at $115,437,364, 0.63% - 6.49%, 7/1/14 - 9/1/41) | 113,132 | | 113,000 |
0.23%, dated 8/4/11 due 10/7/11 (Collateralized by U.S. Government Obligations valued at $87,790,786, 0.63% - 5.5%, 10/1/18 - 9/1/41) | 86,099 | | 86,000 |
RBS Securities, Inc. at 0.53%, dated 9/30/11 due 10/7/11 (Collateralized by U.S. Government Obligations valued at $434,914,687, .38% - 11.95%, 10/20/11 - 11/18/50) | 406,042 | | 406,000 |
Royal Bank of Scotland PLC at 0.53%, dated 9/30/11 due 10/7/11 (Collateralized by Corporate Obligations valued at $205,971,138, 0% - 11.88%, 4/22/13 - 1/15/53) | 194,020 | | 194,000 |
|
| Maturity Amount (000s) | | Value (000s) |
Wells Fargo Securities, LLC at 0.2%, dated 4/20/11 due 10/7/11 (Collateralized by U.S. Government Obligations valued at $108,251,749, 3.5% - 4%, 9/1/26 - 9/1/31) | $ 106,108 | | $ 106,000 |
TOTAL REPURCHASE AGREEMENTS | 15,798,023 |
TOTAL INVESTMENT PORTFOLIO - 102.7% (Cost $56,255,527) | | 56,255,527 |
NET OTHER ASSETS (LIABILITIES) - (2.7)% | | (1,457,561) |
NET ASSETS - 100% | $ 54,797,966 |
Security Type Abbreviations |
VRDN | - | VARIABLE RATE DEMAND NOTE (A debt instrument that is payable upon demand, either daily, weekly or monthly) |
Legend |
(a) Yield represents either the annualized yield at the date of purchase, or the stated coupon rate, or, for floating and adjustable rate securities, the rate at period end. |
(b) Security exempt from registration under Rule 144A of the Securities Act of 1933. These securities may be resold in transactions exempt from registration, normally to qualified institutional buyers. At the end of the period, the value of these securities amounted to $4,181,606,000 or 7.6% of net assets. |
(c) The Federal Financing Bank, an instrumentality of the U.S. Government acting under the supervision of the Secretary of the Treasury (FFB), has entered into a Liquidity Loan Agreement with Straight-A Funding LLC (Issuer), pursuant to which the FFB has committed, subject to certain conditions, to provide financing to the Issuer to cover any payment deficiencies in respect of notes on their legal final maturity dates. At the end of the period, these securities amounted to $249,865,000, or 0.5% of net assets. |
(d) Coupon rates for floating and adjustable rate securities reflect the rates in effect at period end. |
(e) Private activity obligations whose interest is subject to the federal alternative minimum tax for individuals. |
(f) Provides evidence of ownership in one or more underlying municipal bonds. |
(g) Restricted securities - Investment in securities not registered under the Securities Act of 1933 (excluding 144A issues). At the end of the period, the value of restricted securities (excluding 144A issues) amounted to $410,000,000 or 0.7% of net assets. |
Additional information on each restricted holding is as follows: |
Security | Acquisition Date | Cost
(000s) |
Metropolitan Life Insurance Co. 0.58%, 12/29/11 | 3/26/02 | $ 30,000 |
Royal Bank of Scotland PLC 0.73%, 10/17/11 | 9/16/11 | $ 380,000 |
# Additional information on each counterparty to the repurchase agreement is as follows: |
Repurchase Agreement / Counterparty | Value
(Amounts in thousands) |
$300,000,000 due 10/03/11 at 0.04% |
Barclays Capital, Inc. | $ 83,803 |
HSBC Securities (USA), Inc. | 157,550 |
Merrill Lynch, Pierce, Fenner & Smith, Inc. | 58,647 |
| $ 300,000 |
$8,914,408,000 due 10/03/11 at 0.09% |
BNP Paribas Securities Corp. | $ 635,264 |
Bank of America NA | 2,331,883 |
Barclays Capital, Inc. | 845,307 |
Citibank NA | 757,861 |
Credit Agricole Securities (USA), Inc. | 233,188 |
Deutsche Bank Securities, Inc. | 874,455 |
HSBC Securities (USA), Inc. | 823,154 |
ING Financial Markets LLC | 186,550 |
J.P. Morgan Securities, Inc. | 582,970 |
Merrill Lynch, Pierce, Fenner & Smith, Inc. | 349,583 |
Morgan Stanley & Co., Inc. | 34,978 |
RBC Capital Markets Corp. | 408,079 |
RBS Securities, Inc. | 116,594 |
UBS Securities LLC | 116,594 |
Wells Fargo Securities LLC | 617,948 |
| $ 8,914,408 |
$234,615,000 due 10/03/11 at 0.09% |
Barclays Capital, Inc. | $ 129,339 |
Merrill Lynch, Pierce, Fenner & Smith, Inc. | 21,055 |
RBC Capital Markets Corp. | 24,063 |
UBS Securities LLC | 60,158 |
| $ 234,615 |
Other Information |
The date shown for securities represents the date when principal payments must be paid, taking into account any call options exercised by the issuer and any permissible maturity shortening features other than interest rate resets. |
All investments are categorized as Level 2 under the Fair Value Hierarchy. The inputs or methodology used for valuing securities may not be an indication of the risk associated with investing in those securities. For more information on valuation inputs, please refer to the Security Valuation section in the accompanying Notes to Financial Statements. |
See accompanying notes which are an integral part of the financial statements.
Semiannual Report
Prime Money Market Portfolio
Financial Statements
Statement of Assets and Liabilities
Amounts in thousands (except per-share amounts) | September 30, 2011 (Unaudited) |
Assets | | |
Investment in securities, at value (including repurchase agreements of $15,798,023) - See accompanying schedule: Unaffiliated issuers (cost $56,255,527) | | $ 56,255,527 |
Receivable for fund shares sold | | 1,109 |
Interest receivable | | 37,323 |
Receivable from investment adviser for expense reductions | | 1,393 |
Other receivables | | 193 |
Total assets | | 56,295,545 |
| | |
Liabilities | | |
Payable for investments purchased | $ 1,444,823 | |
Payable for fund shares redeemed | 41,488 | |
Distributions payable | 1,927 | |
Accrued management fee | 6,660 | |
Distribution and service plan fees payable | 225 | |
Other affiliated payables | 2,069 | |
Other payables and accrued expenses | 387 | |
Total liabilities | | 1,497,579 |
| | |
Net Assets | | $ 54,797,966 |
Net Assets consist of: | | |
Paid in capital | | $ 54,795,864 |
Distributions in excess of net investment income | | (4) |
Accumulated undistributed net realized gain (loss) on investments | | 2,106 |
Net Assets | | $ 54,797,966 |
| | |
Class I:
Net Asset Value, offering price and redemption price per share ($13,020,747 ÷ 13,018,625 shares) | | $ 1.00 |
| | |
Class II:
Net Asset Value, offering price and redemption price per share ($668,773 ÷ 668,405 shares) | | $ 1.00 |
| | |
Class III:
Net Asset Value, offering price and redemption price per share ($1,670,914 ÷ 1,670,928 shares) | | $ 1.00 |
| | |
Class IV:
Net Asset Value, offering price and redemption price per share ($131,423 ÷ 131,406 shares) | | $ 1.00 |
| | |
Select Class:
Net Asset Value, offering price and redemption price per share ($1,474,502 ÷ 1,474,271 shares) | | $ 1.00 |
| | |
Institutional Class:
Net Asset Value, offering price and redemption price per share ($37,831,607 ÷ 37,825,267 shares) | | $ 1.00 |
Statement of Operations
Amounts in thousands | Six months ended September 30, 2011 (Unaudited) |
| | |
Investment Income | | |
Interest | | $ 98,476 |
| | |
Expenses | | |
Management fee | $ 47,009 | |
Transfer agent fees | 13,635 | |
Distribution and service plan fees | 3,612 | |
Accounting fees and expenses | 1,117 | |
Custodian fees and expenses | 289 | |
Independent trustees' compensation | 121 | |
Registration fees | 147 | |
Audit | 23 | |
Legal | 126 | |
Miscellaneous | 288 | |
Total expenses before reductions | 66,367 | |
Expense reductions | (10,888) | 55,479 |
Net investment income (loss) | | 42,997 |
Realized and Unrealized Gain (Loss) Net realized gain (loss) on: | | |
Investment securities: | | |
Unaffiliated issuers | | 2,106 |
Net increase in net assets resulting from operations | | $ 45,103 |
See accompanying notes which are an integral part of the financial statements.
Semiannual Report
Prime Money Market Portfolio
Financial Statements - continued
Statement of Changes in Net Assets
Amounts in thousands | Six months ended September 30, 2011 (Unaudited) | Year ended
March 31,
2011 |
Increase (Decrease) in Net Assets | | |
Operations | | |
Net investment income (loss) | $ 42,997 | $ 149,932 |
Net realized gain (loss) | 2,106 | 1,710 |
Net increase in net assets resulting
from operations | 45,103 | 151,642 |
Distributions to shareholders from net investment income | (43,001) | (149,918) |
Share transactions - net increase (decrease) | (16,047,463) | (1,908,509) |
Total increase (decrease) in net assets | (16,045,361) | (1,906,785) |
| | |
Net Assets | | |
Beginning of period | 70,843,327 | 72,750,112 |
End of period (including distributions in excess of net investment income of $4 and $0, respectively) | $ 54,797,966 | $ 70,843,327 |
Financial Highlights - Class I
| Six months ended September 30, 2011 | Years ended March 31, |
| (Unaudited) | 2011 | 2010 | 2009 | 2008 | 2007 |
Selected Per-Share Data | | | | | | |
Net asset value, beginning of period | $ 1.00 | $ 1.00 | $ 1.00 | $ 1.00 | $ 1.00 | $ 1.00 |
Income from Investment Operations | | | | | | |
Net investment income (loss) | - E | .002 | .003 | .022 | .049 | .051 |
Distributions from net investment income | - E | (.002) | (.003) | (.022) | (.049) | (.051) |
Net asset value, end of period | $ 1.00 | $ 1.00 | $ 1.00 | $ 1.00 | $ 1.00 | $ 1.00 |
Total Return B, C | .05% | .19% | .33% | 2.23% | 4.96% | 5.22% |
Ratios to Average Net Assets D | | | | | | |
Expenses before reductions | .21% A | .21% | .22% | .23% | .22% | .23% |
Expenses net of fee waivers, if any | .20% A | .20% | .21% | .22% | .20% | .20% |
Expenses net of all reductions | .20% A | .20% | .21% | .22% | .20% | .20% |
Net investment income (loss) | .09% A | .19% | .29% | 2.14% | 4.84% | 5.09% |
Supplemental Data | | | | | | |
Net assets, end of period (in millions) | $ 13,021 | $ 21,761 | $ 30,823 | $ 11,953 | $ 7,810 | $ 9,075 |
A Annualized
B Total returns for periods of less than one year are not annualized.
C Total returns would have been lower if certain expenses had not been reduced during the applicable periods shown.
D Expense ratios reflect operating expenses of the class. Expenses before reductions do not reflect amounts reimbursed or waived or reductions from expense offset arrangements and do not represent the amount paid by the class during periods when reimbursements, waivers or reductions occur. Expenses net of fee waivers reflect expenses after reimbursement and waivers but prior to reductions from expense offset arrangements. Expenses net of all reductions represent the net expenses paid by the class.
E Amount represents less than $.001 per share.
See accompanying notes which are an integral part of the financial statements.
Semiannual Report
Financial Highlights -Class II
| Six months ended September 30, 2011 | Years ended March 31, |
| (Unaudited) | 2011 | 2010 | 2009 | 2008 | 2007 |
Selected Per-Share Data | | | | | | |
Net asset value, beginning of period | $ 1.00 | $ 1.00 | $ 1.00 | $ 1.00 | $ 1.00 | $ 1.00 |
Income from Investment Operations | | | | | | |
Net investment income (loss) | - E | - E | .002 | .021 | .047 | .049 |
Distributions from net investment income | - E | - E | (.002) | (.021) | (.047) | (.049) |
Net asset value, end of period | $ 1.00 | $ 1.00 | $ 1.00 | $ 1.00 | $ 1.00 | $ 1.00 |
Total Return B, C | .01% | .04% | .19% | 2.08% | 4.81% | 5.06% |
Ratios to Average Net Assets D | | | | | | |
Expenses before reductions | .36% A | .36% | .37% | .38% | .37% | .38% |
Expenses net of fee waivers, if any | .28% A | .35% | .35% | .37% | .35% | .35% |
Expenses net of all reductions | .28% A | .35% | .35% | .37% | .35% | .35% |
Net investment income (loss) | .01% A | .04% | .14% | 1.99% | 4.72% | 4.94% |
Supplemental Data | | | | | | |
Net assets, end of period (in millions) | $ 669 | $ 776 | $ 959 | $ 1,475 | $ 1,363 | $ 1,152 |
A Annualized
B Total returns for periods of less than one year are not annualized.
C Total returns would have been lower if certain expenses had not been reduced during the applicable periods shown.
D Expense ratios reflect operating expenses of the class. Expenses before reductions do not reflect amounts reimbursed or waived or reductions from expense offset arrangements and do not represent the amount paid by the class during periods when reimbursements, waivers or reductions occur. Expenses net of fee waivers reflect expenses after reimbursement and waivers but prior to reductions from expense offset arrangements. Expenses net of all reductions represent the net expenses paid by the class.
E Amount represents less than $.001 per share.
Financial Highlights -Class III
| Six months ended September 30, 2011 | Years ended March 31, |
| (Unaudited) | 2011 | 2010 | 2009 | 2008 | 2007 |
Selected Per-Share Data | | | | | | |
Net asset value, beginning of period | $ 1.00 | $ 1.00 | $ 1.00 | $ 1.00 | $ 1.00 | $ 1.00 |
Income from Investment Operations | | | | | | |
Net investment income (loss) | - E | - E | .001 | .020 | .046 | .048 |
Distributions from net investment income | - E | - E | (.001) | (.020) | (.046) | (.048) |
Net asset value, end of period | $ 1.00 | $ 1.00 | $ 1.00 | $ 1.00 | $ 1.00 | $ 1.00 |
Total Return B, C | .01% | .01% | .13% | 1.98% | 4.70% | 4.96% |
Ratios to Average Net Assets D | | | | | | |
Expenses before reductions | .46% A | .46% | .47% | .48% | .47% | .48% |
Expenses net of fee waivers, if any | .28% A | .38% | .42% | .47% | .45% | .45% |
Expenses net of all reductions | .28% A | .38% | .42% | .47% | .45% | .45% |
Net investment income (loss) | .01% A | .01% | .07% | 1.89% | 4.60% | 4.84% |
Supplemental Data | | | | | | |
Net assets, end of period (in millions) | $ 1,671 | $ 2,732 | $ 2,851 | $ 3,539 | $ 2,911 | $ 3,053 |
A Annualized
B Total returns for periods of less than one year are not annualized.
C Total returns would have been lower if certain expenses had not been reduced during the applicable periods shown.
D Expense ratios reflect operating expenses of the class. Expenses before reductions do not reflect amounts reimbursed or waived or reductions from expense offset arrangements and do not represent the amount paid by the class during periods when reimbursements, waivers or reductions occur. Expenses net of fee waivers reflect expenses after reimbursement and waivers but prior to reductions from expense offset arrangements. Expenses net of all reductions represent the net expenses paid by the class.
E Amount represents less than $.001 per share.
See accompanying notes which are an integral part of the financial statements.
Semiannual Report
Financial Highlights -Class IV
| Six months ended September 30, 2011 | Years ended March 31, |
| (Unaudited) | 2011 | 2010 | 2009 | 2008 E |
Selected Per-Share Data | | | | | |
Net asset value, beginning of period | $ 1.00 | $ 1.00 | $ 1.00 | $ 1.00 | $ 1.00 |
Income from Investment Operations | | | | | |
Net investment income (loss) | - G | - G | - G | .017 | .011 |
Distributions from net investment income | - G | - G | - G | (.017) | (.011) |
Net asset value, end of period | $ 1.00 | $ 1.00 | $ 1.00 | $ 1.00 | $ 1.00 |
Total Return B, C | .01% | .01% | .04% | 1.72% | 1.10% |
Ratios to Average Net Assets F | | | | | |
Expenses before reductions | .71% A | .71% | .72% | .73% | .73% A |
Expenses net of fee waivers, if any | .28% A | .38% | .49% | .72% | .70% A |
Expenses net of all reductions | .28% A | .38% | .49% | .72% | .70% A |
Net investment income (loss) | .01% A | .01% | -% D | 1.64% | 3.54% A |
Supplemental Data | | | | | |
Net assets, end of period (in millions) | $ 131 | $ 190 | $ 272 | $ 67 | $ 1 |
A Annualized
B Total returns for periods of less than one year are not annualized.
C Total returns would have been lower if certain expenses had not been reduced during the applicable periods shown.
D Amount represents less than .01%.
E For the period December 12, 2007 (commencement of sale of shares) to March 31, 2008.
F Expense ratios reflect operating expenses of the class. Expenses before reductions do not reflect amounts reimbursed or waived or reductions from expense offset arrangements and do not represent the amount paid by the class during periods when reimbursements, waivers or reductions occur. Expense ratios before reductions for start-up periods may not be representative of longer-term operating periods. Expenses net of fee waivers reflect expenses after reimbursement and waivers but prior to reductions from expense offset arrangements. Expenses net of all reductions represent the net expenses paid by the class.
G Amount represents less than $.001 per share.
Financial Highlights -Select Class
| Six months ended September 30, 2011 | Years ended March 31, |
| (Unaudited) | 2011 | 2010 | 2009 | 2008 | 2007 |
Selected Per-Share Data | | | | | | |
Net asset value, beginning of period | $ 1.00 | $ 1.00 | $ 1.00 | $ 1.00 | $ 1.00 | $ 1.00 |
Income from Investment Operations | | | | | | |
Net investment income (loss) | - E | .001 | .003 | .022 | .048 | .050 |
Distributions from net investment income | - E | (.001) | (.003) | (.022) | (.048) | (.050) |
Net asset value, end of period | $ 1.00 | $ 1.00 | $ 1.00 | $ 1.00 | $ 1.00 | $ 1.00 |
Total Return B, C | .02% | .14% | .28% | 2.18% | 4.91% | 5.17% |
Ratios to Average Net Assets D | | | | | | |
Expenses before reductions | .26% A | .26% | .27% | .28% | .27% | .28% |
Expenses net of fee waivers, if any | .25% A | .25% | .26% | .27% | .25% | .25% |
Expenses net of all reductions | .25% A | .25% | .26% | .27% | .25% | .25% |
Net investment income (loss) | .04% A | .14% | .24% | 2.09% | 4.76% | 5.04% |
Supplemental Data | | | | | | |
Net assets, end of period (in millions) | $ 1,475 | $ 1,272 | $ 752 | $ 600 | $ 501 | $ 381 |
A Annualized
B Total returns for periods of less than one year are not annualized.
C Total returns would have been lower if certain expenses had not been reduced during the applicable periods shown.
D Expense ratios reflect operating expenses of the class. Expenses before reductions do not reflect amounts reimbursed or waived or reductions from expense offset arrangements and do not represent the amount paid by the class during periods when reimbursements, waivers or reductions occur. Expenses net of fee waivers reflect expenses after reimbursement and waivers but prior to reductions from expense offset arrangements. Expenses net of all reductions represent the net expenses paid by the class.
E Amount represents less than $.001 per share.
See accompanying notes which are an integral part of the financial statements.
Semiannual Report
Financial Highlights -Institutional Class
| Six months ended September 30, 2011 | Years ended March 31, |
| (Unaudited) | 2011 | 2010 | 2009 | 2008 D |
Selected Per-Share Data | | | | | |
Net asset value, beginning of period | $ 1.00 | $ 1.00 | $ 1.00 | $ 1.00 | $ 1.00 |
Income from Investment Operations | | | | | |
Net investment income (loss) | .001 | .003 | .004 | .023 | .013 |
Distributions from net investment income | (.001) | (.003) | (.004) | (.023) | (.013) |
Net asset value, end of period | $ 1.00 | $ 1.00 | $ 1.00 | $ 1.00 | $ 1.00 |
Total Return B, C | .08% | .25% | .39% | 2.29% | 1.27% |
Ratios to Average Net Assets E | | | | | |
Expenses before reductions | .18% A | .18% | .19% | .20% | .19% A |
Expenses net of fee waivers, if any | .14% A | .14% | .15% | .16% | .14% A |
Expenses net of all reductions | .14% A | .14% | .15% | .16% | .14% A |
Net investment income (loss) | .15% A | .25% | .35% | 2.20% | 4.02% A |
Supplemental Data | | | | | |
Net assets, end of period (in millions) | $ 37,832 | $ 44,113 | $ 37,092 | $ 12,523 | $ 7,174 |
A Annualized
B Total returns for periods of less than one year are not annualized.
C Total returns would have been lower if certain expenses had not been reduced during the applicable periods shown.
D For the period December 12, 2007 (commencement of sale of shares) to March 31, 2008.
E Expense ratios reflect operating expenses of the class. Expenses before reductions do not reflect amounts reimbursed or waived or reductions from expense offset arrangements and do not represent the amount paid by the class during periods when reimbursements, waivers or reductions occur. Expense ratios before reductions for start-up periods may not be representative of longer-term operating periods. Expenses net of fee waivers reflect expenses after reimbursement and waivers but prior to reductions from expense offset arrangements. Expenses net of all reductions represent the net expenses paid by the class.
See accompanying notes which are an integral part of the financial statements.
Semiannual Report
Money Market Portfolio
Investment Changes (Unaudited)
Effective Maturity Diversification |
Days | % of fund's investments 9/30/11 | % of fund's investments 3/31/11 | % of fund's investments 9/30/10 |
1 - 7 | 40.8 | 32.1 | 28.0 |
8 - 30 | 17.5 | 24.0 | 25.6 |
31 - 60 | 20.8 | 18.0 | 14.0 |
61 - 90 | 10.5 | 6.4 | 17.6 |
91 - 180 | 6.6 | 14.0 | 12.0 |
> 180 | 3.8 | 5.5 | 2.8 |
Effective maturity is determined in accordance with the requirements of Rule 2a-7 under the Investment Company Act of 1940. |
Weighted Average Maturity |
| 9/30/11 | 3/31/11 | 9/30/10 |
Money Market Portfolio | 41 Days | 48 Days | 49 Days |
All Taxable Money Market Funds Average * | 39 Days | 45 Days | 44 Days |
This is a weighted average of all the maturities of the securities held in a fund. Weighted Average Maturity (WAM) can be used as a measure of sensitivity to interest rate changes and markets changes. Generally, the longer the maturity, the greater the sensitivity to such changes. WAM is based on the dollar-weighted average length of time until principal payments must be paid. Depending on the types of securities held in a fund, certain maturity shortening devices (e.g., demand features, interest rate resets, and call options) may be taken into account when calculating the WAM. |
Weighted Average Life |
| 9/30/11 | 3/31/11 | 9/30/10 |
Money Market Portfolio | 79 Days | 92 Days | 82 Days |
Weighted Average Life (WAL) is the weighted average of the life of the securities held in a fund or portfolio and can be used as a measure of sensitivity to changes in liquidity and/or credit risk. Generally, the higher the value, the greater the sensitivity. WAL is based on the dollar-weighted average length of time until principal payments must be paid, taking into account any call options exercised by the issuer and any permissible maturity shortening features other than interest rate resets. The difference between WAM and WAL is that WAM takes into account interest rate resets and WAL does not. WAL for money market funds is not the same as WAL of a mortgage- or asset-backed security. |
Asset Allocation (% of fund's net assets) |
As of September 30, 2011 | As of March 31, 2011 |
| Corporate Bonds 0.1% | | | Corporate Bonds 0.1% | |
 | Commercial Paper 9.7% | | | Commercial Paper 20.0% | |
 | Bank CDs, BAs, TDs,
and Notes 56.2% | | | Bank CDs, BAs, TDs,
and Notes 51.0% | |
| Government Securities † 10.7% | | | Government Securities † 6.4% | |
 | Repurchase Agreements 26.2% | | | Repurchase Agreements 23.7% | |
| Net Other Assets** (2.9)% | | | Net Other Assets** (1.2)% | |

* Source: iMoneyNet, Inc.
** Net Other Assets are not included in the pie chart.
† Includes Federal Financing Bank Supported Student Loan Short-Term Notes
Semiannual Report
Money Market Portfolio
Investments September 30, 2011 (Unaudited)
Showing Percentage of Net Assets
Corporate Bonds - 0.1% |
| | Yield (a) | Principal Amount (000s) | Value (000s) |
LP Pinewood SPV LLC Taxable, LOC Wells Fargo Bank NA |
| 10/7/11 | 0.22% (d) | $ 67,000 | $ 67,000 |
Certificates of Deposit - 48.2% |
|
Domestic Certificates Of Deposit - 0.3% |
Branch Banking & Trust Co. |
| 11/17/11 to 12/5/11 | 0.24 to 0.27 | 215,000 | 215,000 |
London Branch, Eurodollar, Foreign Banks - 8.8% |
ABN AMRO Bank NV |
| 10/3/11 to 11/3/11 | 0.32 to 0.36 | 918,000 | 918,001 |
Australia & New Zealand Banking Group Ltd. |
| 11/30/11 | 0.25 | 144,000 | 144,000 |
Commonwealth Bank of Australia |
| 10/21/11 to 12/13/11 | 0.20 to 0.30 | 1,310,000 | 1,310,001 |
Credit Agricole SA |
| 10/5/11 | 0.36 | 406,000 | 406,000 |
HSBC Bank PLC |
| 12/28/11 to 5/3/12 | 0.30 to 0.55 | 938,000 | 938,000 |
National Australia Bank Ltd. |
| 11/8/11 to 12/1/11 | 0.25 to 0.30 | 1,774,000 | 1,774,000 |
| | 5,490,002 |
New York Branch, Yankee Dollar, Foreign Banks - 39.1% |
Bank of Tokyo-Mitsubishi UFJ Ltd. |
| 12/6/11 to 12/7/11 | 0.32 | 1,299,000 | 1,299,000 |
Bank of Montreal |
| 10/20/11 to 10/5/12 | 0.19 to 0.33 (d) | 850,500 | 850,500 |
Bank of Montreal Chicago CD Program |
| 9/26/12 | 0.38 (d) | 209,000 | 209,000 |
Bank of Nova Scotia |
| 11/18/11 to 10/11/12 | 0.25 to 0.44 (d) | 2,306,000 | 2,306,000 |
Bank of Tokyo-Mitsubishi |
| 11/2/11 to 11/29/11 | 0.28 to 0.32 | 1,222,000 | 1,222,000 |
BNP Paribas New York Branch |
| 11/2/11 to 11/7/11 | 0.44 to 0.45 | 1,111,000 | 1,111,000 |
BNP Paribas SA |
| 11/18/11 to 12/12/11 | 0.42 to 0.63 (d) | 1,165,000 | 1,165,013 |
Canadian Imperial Bank of Commerce New York Branch |
| 10/4/11 to 10/16/12 | 0.30 to 0.50 (d) | 2,497,000 | 2,497,000 |
Credit Suisse New York Branch |
| 10/25/11 to 12/28/11 | 0.24 to 0.37 | 1,644,000 | 1,644,008 |
Deutsche Bank |
| 10/4/11 | 0.31 (d) | 1,000,000 | 1,000,000 |
|
| | Yield (a) | Principal Amount (000s) | Value (000s) |
Deutsche Bank AG New York Branch |
| 10/5/11 | 0.20% | $ 610,000 | $ 610,000 |
DnB NOR Bank ASA |
| 11/18/11 | 0.30 | 519,000 | 519,000 |
Mitsubishi UFJ Trust & Banking Corp. |
| 10/3/11 to 10/14/11 | 0.28 to 0.30 | 191,000 | 191,000 |
Mizuho Corporate Bank Ltd. |
| 10/5/11 to 10/7/11 | 0.18 | 667,000 | 667,000 |
National Bank Canada |
| 11/4/11 to 7/6/12 | 0.33 to 0.37 (d) | 780,000 | 780,000 |
Rabobank Nederland New York Branch |
| 10/21/11 to 6/8/12 | 0.20 to 0.35 (d) | 2,441,000 | 2,441,000 |
Royal Bank of Canada |
| 10/1/12 | 0.59 (d) | 383,000 | 383,000 |
Skandinaviska Enskilda Banken |
| 10/6/11 | 0.26 | 106,000 | 106,000 |
Sumitomo Mitsui Banking Corp. |
| 10/3/11 to 10/12/11 | 0.18 to 0.20 | 2,716,000 | 2,716,000 |
Sumitomo Trust & Banking Co. Ltd. |
| 10/3/11 to 10/4/11 | 0.19 to 0.20 | 418,000 | 418,000 |
Svenska Handelsbanken |
| 11/3/11 | 0.30 | 425,000 | 425,002 |
Toronto-Dominion Bank New York Branch |
| 11/15/11 to 1/12/12 | 0.25 to 0.31 (d) | 439,000 | 439,000 |
UBS AG |
| 10/28/11 to 11/23/11 | 0.22 to 0.35 | 1,304,000 | 1,304,000 |
| | 24,302,523 |
TOTAL CERTIFICATES OF DEPOSIT | 30,007,525 |
Commercial Paper - 9.7% |
|
ASB Finance Ltd. |
| 2/1/12 | 0.37 (d) | 150,000 | 149,997 |
Barclays Bank PLC/Barclays US CCP Funding LLC |
| 10/4/11 to 10/31/11 | 0.27 | 437,000 | 436,935 |
Caisse d'Amort de la Dette Societe |
| 10/11/11 to 5/25/12 | 0.24 to 0.31 (b)(d) | 1,433,000 | 1,432,652 |
Commonwealth Bank of Australia |
| 10/6/11 to 11/21/11 | 0.20 to 0.35 (d) | 731,875 | 731,862 |
Danske Corp. |
| 10/6/11 | 0.25 | 157,000 | 156,995 |
DnB NOR Bank ASA |
| 11/22/11 | 0.30 | 129,000 | 128,944 |
Commercial Paper - continued |
| | Yield (a) | Principal Amount (000s) | Value (000s) |
Gotham Funding Corp. (Liquidity Facility Bank of Tokyo-Mitsubishi UFJ Ltd.) |
| 10/12/11 to 10/18/11 | 0.25 to 0.26% | $ 107,000 | $ 106,990 |
Nordea North America, Inc. |
| 10/18/11 | 0.21 | 354,000 | 353,966 |
Northern Pines Funding LLC |
| 12/1/11 | 0.37 (d) | 104,000 | 104,000 |
Royal Bank of Canada |
| 11/23/11 | 0.30 | 456,000 | 455,799 |
Skandinaviska Enskilda Banken AB |
| 10/6/11 to 10/7/11 | 0.30 | 312,000 | 311,985 |
Svenska Handelsbanken, Inc. |
| 11/21/11 to 12/28/11 | 0.30 to 0.33 | 421,000 | 420,745 |
Swedbank AB |
| 10/26/11 to 10/28/11 | 0.38 | 243,000 | 242,934 |
Texas Instruments, Inc. |
| 12/6/11 to 12/12/11 | 0.20 | 81,000 | 80,969 |
Total Capital Canada Ltd. |
| 12/15/11 | 0.42 | 104,000 | 103,909 |
Westpac Banking Corp. |
| 10/7/11 to 4/10/12 | 0.31 to 0.39 (d) | 822,000 | 822,000 |
TOTAL COMMERCIAL PAPER | 6,040,682 |
U.S. Government and Government Agency Obligations - 1.2% |
|
Other Government Related - 1.2% |
Straight-A Funding LLC (Liquidity Facility Federal Financing Bank) |
| 10/14/11 to 11/3/11 | 0.65 (c) | 741,000 | 740,634 |
Federal Agencies - 3.5% |
|
Fannie Mae - 1.0% |
| 4/2/12 | 0.20 | 610,000 | 609,376 |
Federal Home Loan Bank - 2.5% |
| 2/6/12 to 8/30/12 | 0.17 to 0.41 | 1,563,000 | 1,562,993 |
TOTAL FEDERAL AGENCIES | 2,172,369 |
U.S. Treasury Obligations - 6.0% |
| | Yield (a) | Principal Amount (000s) | Value (000s) |
U.S. Treasury Bills - 1.5% |
| 11/3/11 to 2/9/12 | 0.12 to 0.30% | $ 954,000 | $ 953,405 |
U.S. Treasury Notes - 4.5% |
| 10/31/11 to 10/15/12 | 0.15 to 0.32 | 2,759,000 | 2,772,636 |
TOTAL U.S. TREASURY OBLIGATIONS | 3,726,041 |
Master Notes - 0.7% |
|
Royal Bank of Scotland PLC |
| 10/17/11 | 0.73 (d)(g) | 421,000 | 421,000 |
Medium-Term Notes - 5.6% |
|
Commonwealth Bank of Australia |
| 2/10/12 | 0.31 (b)(d) | 207,000 | 207,000 |
Metropolitan Life Insurance Co. |
| 12/29/11 | 0.58 (d)(g) | 65,000 | 65,000 |
Royal Bank of Canada |
| 10/1/12 to 10/15/12 | 0.30 to
0.69 (b)(d) | 1,005,000 | 1,005,000 |
| 10/5/12 | 0.27 (d) | 630,000 | 629,803 |
Westpac Banking Corp. |
| 4/2/12 to 6/14/12 | 0.29 to 0.32 (b)(d) | 1,583,000 | 1,583,000 |
TOTAL MEDIUM-TERM NOTES | 3,489,803 |
Municipal Securities - 1.7% |
|
ABAG Fin. Auth. for Nonprofit Corps. Rev. (Sharp HealthCare Proj.) Series 2009 A, LOC Bank of America NA, VRDN |
| 10/7/11 | 0.16 (d) | 8,500 | 8,500 |
Allen County Hosp. Facilities Rev. (Catholic Healthcare Partners Proj.) Series 2010 D, LOC JPMorgan Chase Bank, VRDN |
| 10/7/11 | 0.14 (d) | 23,000 | 23,000 |
Anaheim Hsg. Auth. Multi-family Hsg. Rev. (Park Vista Apt. Proj.) Series 2000 D, LOC Freddie Mac, VRDN |
| 10/7/11 | 0.14 (d)(e) | 14,580 | 14,580 |
California Hsg. Fin. Agcy. Rev. (Home Mtg. Prog.) Series 2005 A, (Liquidity Facility Fannie Mae) (Liquidity Facility Freddie Mac), VRDN |
| 10/7/11 | 0.14 (d)(e) | 23,700 | 23,700 |
District of Columbia Rev. (Washington Drama Society, Inc. Proj.) Series 2008, LOC JPMorgan Chase Bank, VRDN |
| 10/7/11 | 0.15 (d) | 37,065 | 37,065 |
Fredericksburg Econ. Dev. Auth. (Eagle Village I Proj.) Series 2009 A, LOC Bank of America NA, VRDN |
| 10/7/11 | 0.26 (d) | 70,730 | 70,730 |
Highlands County Health Facilities Auth. Rev. (Adventist Health Sys./Sunbelt, Inc. Prog.) Series 2007 A1, VRDN |
| 10/7/11 | 0.12 (d) | 5,000 | 5,000 |
Municipal Securities - continued |
| | Yield (a) | Principal Amount (000s) | Value (000s) |
Highlands County Health Facilities Auth. Rev. (Adventist Health Sys./Sunbelt Obligated Group Proj.) Series 2005 H, LOC U.S. Bank NA, Minnesota, VRDN |
| 10/7/11 | 0.13% (d) | $ 24,725 | $ 24,725 |
Humble Independent School District Participating VRDN Series Solar 06 20, (Liquidity Facility U.S. Bank NA, Minnesota) |
| 10/7/11 | 0.15 (d)(f) | 14,740 | 14,740 |
Illinois Fin. Auth. Rev. (Children's Memorial Hosp. Proj.) Series 2008 C, LOC JPMorgan Chase Bank, VRDN |
| 10/7/11 | 0.14 (d) | 34,100 | 34,100 |
Illinois Fin. Auth. Rev. (Little Co. of Mary Hosp. Proj.) Series 2008 A, LOC JPMorgan Chase Bank, VRDN |
| 10/7/11 | 0.17 (d) | 44,470 | 44,470 |
Illinois Fin. Auth. Rev. (Rockford Mem. Hosp. Proj.) LOC JPMorgan Chase Bank, VRDN |
| 10/7/11 | 0.17 (d) | 40,600 | 40,600 |
Indiana Fin. Auth. Health Sys. Rev. (Sisters of Saint Francis Health Svcs., Inc. Obligated Group Proj.) Series 2008 B, LOC JPMorgan Chase Bank, VRDN |
| 10/7/11 | 0.14 (d) | 10,900 | 10,900 |
Indiana Health & Edl. Facilities Fing. Auth. Rev. Participating VRDN Series Solar 07 63, (Liquidity Facility U.S. Bank NA, Minnesota) |
| 10/7/11 | 0.14 (d)(f) | 15,195 | 15,195 |
Louisiana Pub. Facilities Auth. Hosp. Rev. (Franciscan Missionaries of Our Lady Health Sys. Proj.) Series 2005 B, LOC JPMorgan Chase Bank, VRDN |
| 10/7/11 | 0.14 (d) | 25,000 | 25,000 |
Louisiana Pub. Facilities Auth. Rev. (CommCare Corp. Proj.) Series 2008 B, LOC JPMorgan Chase Bank, VRDN |
| 10/7/11 | 0.15 (d) | 14,900 | 14,900 |
Massachusetts Bay Trans. Auth. Sales Tax Rev. Participating VRDN Series PT 4368, (Liquidity Facility Wells Fargo & Co.) |
| 10/7/11 | 0.14 (d)(f) | 10,060 | 10,060 |
Missouri Health & Edl. Facilities Auth. Health Facilities Rev. (SSM Health Care Sys. Proj.) Series 2005 A1, LOC Bank of America NA, VRDN |
| 10/7/11 | 0.17 (d) | 9,100 | 9,100 |
Moffat County Poll. Cont. Rev. (Tri-State Generation and Transmission Assoc., Inc. Proj.) Series 2009, LOC Bank of America NA, VRDN |
| 10/7/11 | 0.18 (d) | 11,175 | 11,175 |
Monroe County Dev. Auth. Poll. Cont. Rev. (Oglethorpe Pwr. Corp. Proj.) Series 2009 B, LOC JPMorgan Chase Bank, VRDN |
| 10/7/11 | 0.13 (d) | 12,000 | 12,000 |
New York City Hsg. Dev. Corp. Multi-family Rental Hsg. Rev. (255 West 9th Street Proj.) Series 2001 A, LOC Fannie Mae, VRDN |
| 10/7/11 | 0.14 (d)(e) | 58,235 | 58,235 |
New York City Hsg. Dev. Corp. Multi-family Rental Hsg. Rev. (West 43rd Street Proj.) Series 1999 A, LOC Fannie Mae, VRDN |
| 10/7/11 | 0.14 (d)(e) | 24,200 | 24,200 |
New York Hsg. Fin. Agcy. Rev. (240 East 39th Street Hsg. Proj.) Series 1997 A, LOC Fannie Mae, VRDN |
| 10/7/11 | 0.14 (d)(e) | 62,700 | 62,700 |
|
| | Yield (a) | Principal Amount (000s) | Value (000s) |
New York Hsg. Fin. Agcy. Rev. (29 Flatbush Ave. Hsg. Proj.) Series 2010 A, LOC Bank of America NA, VRDN |
| 10/7/11 | 0.17% (d) | $ 30,000 | $ 30,000 |
New York Hsg. Fin. Agcy. Rev. (360 West 43rd Street Hsg. Proj.) Series A, LOC Fannie Mae, VRDN |
| 10/7/11 | 0.14 (d)(e) | 9,900 | 9,900 |
New York Hsg. Fin. Agcy. Rev. (Clinton Green South Hsg. Proj.) Series 2005 A, LOC Freddie Mac, VRDN |
| 10/7/11 | 0.14 (d)(e) | 13,000 | 13,000 |
New York Hsg. Fin. Agcy. Rev. (East 39th Street Hsg. Proj.) Series 1999 A, LOC Fannie Mae, VRDN |
| 10/7/11 | 0.14 (d)(e) | 33,700 | 33,700 |
New York Hsg. Fin. Agcy. Rev. (Normandie Court II Hsg. Proj.) Series 1999 A, LOC Freddie Mac, VRDN |
| 10/7/11 | 0.14 (d)(e) | 29,870 | 29,870 |
New York Metropolitan Trans. Auth. Dedicated Tax Fund Rev. Series 2008 A2, LOC Bank of Tokyo-Mitsubishi, VRDN |
| 10/7/11 | 0.10 (d) | 30,755 | 30,755 |
Ohio Air Quality Dev. Auth. Rev. (Dayton Pwr. & Lt. Co. Proj.) Series 2008 B, LOC JPMorgan Chase Bank, VRDN |
| 10/7/11 | 0.13 (d)(e) | 20,200 | 20,200 |
Pennsylvania Higher Edl. Facilities Auth. Rev. (Thomas Jefferson Univ. Proj.) Series 2008 A, LOC JPMorgan Chase Bank, VRDN |
| 10/7/11 | 0.12 (d) | 18,040 | 18,040 |
Pennsylvania Hsg. Fin. Agcy. Single Family Mtg. Rev. Series 2004 84D, (Liquidity Facility Fannie Mae) (Liquidity Facility Freddie Mac), VRDN |
| 10/7/11 | 0.13 (d)(e) | 18,450 | 18,450 |
Pennsylvania Hsg. Fin. Agcy. Single Family Mtg. Rev. Series 2004 86C, (Liquidity Facility Fannie Mae) (Liquidity Facility Freddie Mac), VRDN |
| 10/7/11 | 0.13 (d)(e) | 16,640 | 16,640 |
Pennsylvania Hsg. Fin. Agcy. Single Family Mtg. Rev. Series 2005-89, (Liquidity Facility Fannie Mae) (Liquidity Facility Freddie Mac), VRDN |
| 10/7/11 | 0.13 (d)(e) | 10,000 | 10,000 |
Pennsylvania Hsg. Fin. Agcy. Single Family Mtg. Rev. Series 2005-91B, (Liquidity Facility Fannie Mae) (Liquidity Facility Freddie Mac), VRDN |
| 10/7/11 | 0.13 (d)(e) | 21,350 | 21,350 |
Saint Joseph County Hosp. Auth. Health Sys. Rev. (Memorial Health Sys. Proj.) Series 2008 A, LOC JPMorgan Chase Bank, VRDN |
| 10/7/11 | 0.15 (d) | 19,205 | 19,205 |
San Diego Hsg. Auth. Multi-family Hsg. Rev. (Villa Nueva Apts. Proj.) Series 2007 F, LOC Freddie Mac, VRDN |
| 10/7/11 | 0.15 (d)(e) | 37,500 | 37,500 |
San Francisco City & County Arpts. Commission Int'l. Arpt. Rev. Series 2010 A3, LOC JPMorgan Chase Bank, VRDN |
| 10/7/11 | 0.14 (d)(e) | 14,000 | 14,000 |
Simi Valley Multi-family Hsg. Rev. (Parker Ranch Proj.) Series A, LOC Fannie Mae, VRDN |
| 10/7/11 | 0.16 (d)(e) | 17,500 | 17,500 |
Tarrant County Cultural Ed. Facilities Fin. Corp. Hosp. Rev. (Scott and White Memorial Hosp. and Scott, Sherwood and Brindley Foundation Proj.) Series 2008 1, LOC Wells Fargo Bank NA, VRDN |
| 10/7/11 | 0.13 (d) | 27,220 | 27,220 |
Municipal Securities - continued |
| | Yield (a) | Principal Amount (000s) | Value (000s) |
Tarrant County Cultural Ed. Facilities Fin. Corp. Rev. (Christus Health Proj.) Series 2008 C2, LOC Bank of America NA, VRDN |
| 10/7/11 | 0.18% (d) | $ 17,550 | $ 17,550 |
Texas Gen. Oblig. (Veterans Land Proj.) Series A, VRDN |
| 10/7/11 | 0.14 (d)(e) | 23,140 | 23,140 |
Univ. of California Revs. Participating VRDN Putters 3668Z, (Liquidity Facility JPMorgan Chase Bank) |
| 10/7/11 | 0.16 (d)(f) | 10,000 | 10,000 |
Univ. of Colorado Hosp. Auth. Rev. Series A, LOC Wells Fargo Bank NA, VRDN |
| 10/7/11 | 0.12 (d) | 23,000 | 23,000 |
Univ. of Texas Board of Regents Sys. Rev. Participating VRDN Series BBT 08 25, (Liquidity Facility Branch Banking & Trust Co.) |
| 10/7/11 | 0.15 (d)(f) | 10,085 | 10,085 |
| TOTAL MUNICIPAL SECURITIES | 1,045,780 |
Repurchase Agreements - 26.2% |
| Maturity Amount (000s) | | |
In a joint trading account at: | | | |
0.09% dated 9/30/11 due 10/3/11 (Collateralized by U.S. Treasury Obligations) # | $ 7,231,730 | | 7,231,674 |
0.09% dated 9/30/11 due 10/3/11 (Collateralized by U.S. Treasury Obligations) # | 68,713 | | 68,712 |
With: | | | |
Barclays Capital, Inc. at: | | | |
0.15%, dated 7/27/11 due 10/7/11 (Collateralized by U.S. Government Obligations valued at $190,794,137, 0% - 6.22%, 10/15/19 - 1/20/61) | 187,071 | | 187,000 |
0.32%, dated: | | | |
9/27/11 due 10/4/11 (Collateralized by Equity Securities valued at $57,243,055) | 53,003 | | 53,000 |
9/29/11 due 10/6/11 (Collateralized by Equity Securities valued at $45,361,614) | 42,003 | | 42,000 |
0.43%, dated 9/6/11 due 10/6/11 (Collateralized by Mortgage Loan Obligations valued at $92,907,568, 0.39% - 10.76%, 8/25/11 - 9/25/21) | 86,031 | | 86,000 |
0.6%, dated 9/8/11 due 10/13/11 (Collateralized by Mortgage Loan Obligations valued at $234,273,687, 0.36% - 10.76%, 2/25/28 - 9/25/46) | 217,127 | | 217,000 |
|
| Maturity Amount (000s) | | Value (000s) |
1%, dated: | | | |
10/13/10 due 10/11/11 (Collateralized by Corporate Obligations valued at $148,559,332, 0.5% - 6%, 12/15/11 - 5/15/41) | $ 138,381 | | $ 137,000 |
8/8/11 due 10/7/11 (Collateralized by Mortgage Loan Obligations valued at $223,291,007, 0.32% - 8.31%, 3/15/12 - 2/10/51) | 208,347 | | 208,000 |
Citibank NA at: | | | |
0.08%, dated 9/28/11 due 10/5/11 (Collateralized by U.S. Treasury Obligations valued at $281,523,187, 0.63% - 4.13%, 8/31/12 - 6/30/41) | 276,004 | | 276,000 |
0.12%, dated 9/27/11 due 10/4/11 (Collateralized by U.S. Government Obligations valued at $286,625,733, 3.5% - 6.5%, 1/1/25 - 9/1/41) | 281,007 | | 281,000 |
Citigroup Global Markets, Inc. at: | | | |
0.28%, dated 9/30/11 due 10/3/11 (Collateralized by Corporate Obligations valued at $102,002,383, 1.63% - 7%, 11/15/11 - 6/15/25) | 100,002 | | 100,000 |
0.48%, dated 9/30/11 due 10/3/11 (Collateralized by Corporate Obligations valued at $107,131,187, 0% - 12%, 12/20/11 - 3/4/53) | 100,004 | | 100,000 |
Credit Suisse Securities (USA) LLC at: | | | |
0.21%, dated 9/30/11 due 10/3/11 (Collateralized by Equity Securities valued at $265,689,020) | 246,004 | | 246,000 |
0.34%, dated 7/14/11 due 10/7/11 (Collateralized by Equity Securities valued at $228,056,444) | 211,179 | | 211,000 |
0.6%, dated 9/9/11 due 10/12/11 (Collateralized by Corporate Obligations valued at $45,169,103, 4.95% - 6.9%, 8/15/13 - 3/1/19) | 43,024 | | 43,000 |
0.67%, dated: | | | |
9/12/11 due: | | | |
10/21/11 (Collateralized by Mortgage Loan Obligations valued at $58,339,548, .22% - 7.0%, 12/25/27 - 1/25/47) | 54,039 | | 54,000 |
10/31/11 (Collateralized by Mortgage Loan Obligations valued at $57,686,472, 0.0% - 8.92%, 8/18/13 - 4/15/49) | 54,049 | | 54,000 |
Repurchase Agreements - continued |
| Maturity Amount (000s) | | Value (000s) |
With: - continued | | | |
Credit Suisse Securities (USA) LLC at: - continued | | | |
9/16/11 due 10/27/11 (Collateralized by Mortgage Loan Obligations valued at $113,429,594, .44% - 6.97%, 5/25/21 - 8/25/47) | $ 105,080 | | $ 105,000 |
Deutsche Bank Securities, Inc. at: | | | |
0.19%, dated 8/17/11 due 10/7/11 (Collateralized by U.S. Government Obligations valued at $188,746,808, 3.5% - 7%, 10/1/25 - 5/1/41) | 185,117 | | 185,000 |
0.23%, dated 8/3/11 due 10/7/11 (Collateralized by U.S. Government Obligations valued at $195,381,488, 0.66% - 7%, 11/1/20 - 8/20/61) | 190,109 | | 190,000 |
Goldman Sachs & Co. at: | | | |
0.1%, dated 9/28/11 due 10/5/11 (Collateralized by U.S. Government Obligations valued at $187,682,607, 4.5% - 6%, 12/15/36 - 5/15/40) | 184,004 | | 184,000 |
0.2%, dated 9/28/11 due 10/5/11 (Collateralized by U.S. Government Obligations valued at $430,451,958, 3.5% - 6.0%, 10/1/25 - 8/1/41) | 422,016 | | 422,000 |
0.25%, dated 9/30/11 due 10/7/11 (Collateralized by U.S. Government Obligations valued at $162,183,379, 4.5% - 5.5%, 7/1/31 - 2/1/41) | 159,008 | | 159,000 |
0.17%, dated 8/9/11 due 10/7/11 (Collateralized by U.S. Government Obligations valued at $93,877,850, 0.63% - 6.12%, 6/5/18 - 3/1/38) | 92,039 | | 92,000 |
0.18%, dated 8/11/11 due 10/7/11 (Collateralized by U.S. Government Obligations valued at $113,322,390, 0.63% - 6%, 10/15/24 - 9/1/41) | 111,045 | | 111,000 |
0.2%, dated 4/4/11 due 10/7/11 (Collateralized by U.S. Government Obligations valued at $109,264,652, 0.63% - 6.04%, 11/1/21 - 6/1/41) | 107,125 | | 107,000 |
0.23%, dated 8/4/11 due 10/7/11 (Collateralized by U.S. Government Obligations valued at $97,976,632, 0.63% - 6.21%, 6/5/18 - 10/1/44) | 96,110 | | 96,000 |
Repurchase Agreements - continued |
| Maturity Amount (000s) | | Value (000s) |
0.48%, dated 9/30/11 due 10/3/11 (Collateralized by Equity Securities valued at $1,064,145,176) | $ 979,039 | | $ 979,000 |
0.5%, dated 7/25/11 due 10/24/11 (Collateralized by Equity Securities valued at $397,113,893) | 365,461 | | 365,000 |
0.65%, dated 4/26/11 due 10/24/11 (Collateralized by Equity Securities valued at $83,934,420) | 77,252 | | 77,000 |
0.69%, dated 7/27/11 due 1/23/12 (Collateralized by Equity Securities valued at $319,969,618) | 295,014 | | 294,000 |
J.P. Morgan Securities, Inc. at: | | | |
0.16%, dated 9/30/11 due 10/3/11 (Collateralized by U.S. Government Obligations valued at $1,356,601,811, 3.5% - 6%, 6/1/14 - 10/1/41) | 1,330,018 | | 1,330,000 |
0.75%, dated 9/28/11 due 3/26/12 (Collateralized by Mortgage Loan Obligations valued at $106,925,031, .43% - 6.75%, 2/25/34 - 12/20/46) | 99,371 | | 99,000 |
Merrill Lynch, Pierce, Fenner & Smith at: | | | |
0.23%, dated 9/30/11 due 10/3/11 (Collateralized by Equity Securities valued at $185,763,561) | 172,003 | | 172,000 |
0.48%, dated 9/30/11 due 10/3/11 (Collateralized by Corporate Obligations valued at $227,985,417, 0% - 8%, 6/15/12 - 12/15/37) | 210,008 | | 210,000 |
0.58%, dated 9/30/11 due 10/3/11 (Collateralized by Corporate Obligations valued at $356,417,226, 0% - 10.96%, 11/8/12 - 3/4/53) | 330,016 | | 330,000 |
RBC Capital Markets Corp. at: | | | |
0.16%, dated 8/26/11 due 10/7/11 (Collateralized by U.S. Government Obligations valued at $117,689,201, 0.63% - 10%, 1/1/16 - 8/25/41) | 115,064 | | 115,000 |
0.17%, dated 7/28/11 due 10/7/11 (Collateralized by U.S. Government Obligations valued at $71,490,368, 3.63% - 6%, 10/1/11 - 8/1/41) | 70,031 | | 70,000 |
RBS Securities, Inc. at 0.53%, dated 9/30/11 due 10/7/11 (Collateralized by U.S. Corporate Obligations valued at $480,600,257, 0.28% - 9.50%, 10/25/12 - 3/20/50) | 445,046 | | 445,000 |
Repurchase Agreements - continued |
| Maturity Amount (000s) | | Value (000s) |
With: - continued | | | |
Royal Bank of Scotland PLC at 0.53%, dated 9/30/11 due 10/7/11 (Collateralized by Corporate Obligations valued at $225,741,673, 0.0% - 5.92%, 1/26/12 - 2/10/51) | $ 212,022 | | $ 212,000 |
UBS Securities LLC at: | | | |
0.38%, dated 7/7/11 due 10/5/11 (Collateralized by Corporate Obligations valued at $79,739,173, 1.5% - 6.5%, 5/1/13 - 6/15/38) | 74,070 | | 74,000 |
0.42%, dated: | | | |
8/24/11 due 10/7/11 (Collateralized by Corporate Obligations valued at $59,877,931, 3.8% - 6.45%, 1/1/12 - 3/15/37) | 57,060 | | 57,000 |
8/25/11 due 10/7/11 (Collateralized by Corporate Obligations valued at $76,714,890, 4.5% - 11.88%, 11/15/13 - 2/15/36) | 71,075 | | 71,000 |
Wells Fargo Securities, LLC at: | | | |
0.2%, dated 4/20/11 due 10/7/11 (Collateralized by U.S. Government Obligations valued at $102,124,292, 3.5% - 4%, 9/1/26 - 9/1/31) | 100,102 | | 100,000 |
0.35%, dated 7/11/11 due 10/7/11 (Collateralized by Corporate Obligations valued at $79,743,643, 0% - 9.85%, 2/6/12 - 9/25/43) | 76,068 | | 76,000 |
TOTAL REPURCHASE AGREEMENTS | 16,322,386 |
TOTAL INVESTMENT PORTFOLIO - 102.9% (Cost $64,033,220) | | 64,033,220 |
NET OTHER ASSETS (LIABILITIES) - (2.9)% | | (1,812,446) |
NET ASSETS - 100% | $ 62,220,774 |
Security Type Abbreviations |
VRDN | - | VARIABLE RATE DEMAND NOTE (A debt instrument that is payable upon demand, either daily, weekly or monthly) |
Legend |
(a) Yield represents either the annualized yield at the date of purchase, or the stated coupon rate, or, for floating and adjustable rate securities, the rate at period end. |
(b) Security exempt from registration under Rule 144A of the Securities Act of 1933. These securities may be resold in transactions exempt from registration, normally to qualified institutional buyers. At the end of the period, the value of these securities amounted to $4,227,652,000 or 6.8% of net assets. |
(c) The Federal Financing Bank, an instrumentality of the U.S. Government acting under the supervision of the Secretary of the Treasury (FFB), has entered into a Liquidity Loan Agreement with Straight-A Funding LLC (Issuer), pursuant to which the FFB has committed, subject to certain conditions, to provide financing to the Issuer to cover any payment deficiencies in respect of notes on their legal final maturity dates. At the end of the period, these securities amounted to $740,634,000, or 1.2% of net assets. |
(d) Coupon rates for floating and adjustable rate securities reflect the rates in effect at period end. |
(e) Private activity obligations whose interest is subject to the federal alternative minimum tax for individuals. |
(f) Provides evidence of ownership in one or more underlying municipal bonds. |
(g) Restricted securities - Investment in securities not registered under the Securities Act of 1933 (excluding 144A issues). At the end of the period, the value of restricted securities (excluding 144A issues) amounted to $486,000,000 or 0.8% of net assets. |
Additional information on each restricted holding is as follows: |
Security | Acquisition Date | Cost
(000s) |
Metropolitan Life Insurance Co. 0.58%, 12/29/11 | 3/26/02 | $ 65,000 |
Royal Bank of Scotland PLC 0.73%, 10/17/11 | 9/16/11 | $ 421,000 |
# Additional information on each counterparty to the repurchase agreement is as follows: |
Repurchase Agreement / Counterparty | Value
(Amounts in thousands) |
$7,231,674,000 due 10/03/11 at 0.09% |
BNP Paribas Securities Corp. | $ 515,348 |
Bank of America NA | 1,891,702 |
Barclays Capital, Inc. | 685,742 |
Citibank NA | 614,803 |
Credit Agricole Securities (USA), Inc. | 189,170 |
Deutsche Bank Securities, Inc. | 709,388 |
HSBC Securities (USA), Inc. | 667,771 |
ING Financial Markets LLC | 151,336 |
J.P. Morgan Securities, Inc. | 472,925 |
Merrill Lynch, Pierce, Fenner & Smith, Inc. | 283,594 |
Morgan Stanley & Co., Inc. | 28,376 |
RBC Capital Markets Corp. | 331,048 |
RBS Securities, Inc. | 94,585 |
UBS Securities LLC | 94,585 |
Wells Fargo Securities LLC | 501,301 |
| $ 7,231,674 |
$68,712,000 due 10/03/11 at 0.09% |
Barclays Capital, Inc. | $ 37,881 |
Merrill Lynch, Pierce, Fenner & Smith, Inc. | 6,166 |
RBC Capital Markets Corp. | 7,047 |
UBS Securities LLC | 17,618 |
| $ 68,712 |
Other Information |
The date shown for securities represents the date when principal payments must be paid, taking into account any call options exercised by the issuer and any permissible maturity shortening features other than interest rate resets. |
All investments are categorized as Level 2 under the Fair Value Hierarchy. The inputs or methodology used for valuing securities may not be an indication of the risk associated with investing in those securities. For more information on valuation inputs, please refer to the Security Valuation section in the accompanying Notes to Financial Statements. |
See accompanying notes which are an integral part of the financial statements.
Semiannual Report
Money Market Portfolio
Financial Statements
Statement of Assets and Liabilities
Amounts in thousands (except per-share amounts) | September 30, 2011 (Unaudited) |
Assets | | |
Investment in securities, at value (including repurchase agreements of $16,322,386) - See accompanying schedule: Unaffiliated issuers (cost $64,033,220) | | $ 64,033,220 |
Receivable for fund shares sold | | 89,697 |
Interest receivable | | 34,439 |
Receivable from investment adviser for expense reductions | | 1,804 |
Other receivables | | 593 |
Total assets | | 64,159,753 |
| | |
Liabilities | | |
Payable for investments purchased | $ 1,870,031 | |
Payable for fund shares redeemed | 56,455 | |
Distributions payable | 1,627 | |
Accrued management fee | 7,333 | |
Distribution and service plan fees payable | 246 | |
Other affiliated payables | 2,498 | |
Other payables and accrued expenses | 789 | |
Total liabilities | | 1,938,979 |
| | |
Net Assets | | $ 62,220,774 |
Net Assets consist of: | | |
Paid in capital | | $ 62,220,303 |
Distributions in excess of net investment income | | (11) |
Accumulated undistributed net realized gain (loss) on investments | | 482 |
Net Assets | | $ 62,220,774 |
| | |
Class I:
Net Asset Value, offering price and redemption price per share ($27,057,449 ÷ 27,049,675 shares) | | $ 1.00 |
| | |
Class II:
Net Asset Value, offering price and redemption price per share ($234,446 ÷ 234,405 shares) | | $ 1.00 |
| | |
Class III:
Net Asset Value, offering price and redemption price per share ($2,434,721 ÷ 2,435,412 shares) | | $ 1.00 |
| | |
Select Class:
Net Asset Value, offering price and redemption price per share ($680,387 ÷ 680,229 shares) | | $ 1.00 |
| | |
| | |
Class F:
Net Asset Value, offering price and redemption price per share ($1,054,067 ÷ 1,054,053 shares) | | $ 1.00 |
| | |
Institutional Class:
Net Asset Value, offering price and redemption price per share ($30,759,704 ÷ 30,750,684 shares) | | $ 1.00 |
Statement of Operations
Amounts in thousands | Six months ended September 30, 2011 (Unaudited) |
| | |
Investment Income | | |
Interest | | $ 105,995 |
| | |
Expenses | | |
Management fee | $ 45,793 | |
Transfer agent fees | 14,886 | |
Distribution and service plan fees | 3,681 | |
Accounting fees and expenses | 1,101 | |
Custodian fees and expenses | 280 | |
Independent trustees' compensation | 115 | |
Registration fees | 255 | |
Audit | 23 | |
Legal | 115 | |
Miscellaneous | 285 | |
Total expenses before reductions | 66,534 | |
Expense reductions | (11,686) | 54,848 |
Net investment income (loss) | | 51,147 |
Realized and Unrealized Gain (Loss) Net realized gain (loss) on: | | |
Investment securities: | | |
Unaffiliated issuers | | 482 |
Net increase in net assets resulting from operations | | $ 51,629 |
See accompanying notes which are an integral part of the financial statements.
Semiannual Report
Statement of Changes in Net Assets
Amounts in thousands | Six months ended September 30, 2011 (Unaudited) | Year ended
March 31,
2011 |
Increase (Decrease) in Net Assets | | |
Operations | | |
Net investment income (loss) | $ 51,147 | $ 158,317 |
Net realized gain (loss) | 482 | 659 |
Net increase in net assets resulting
from operations | 51,629 | 158,976 |
Distributions to shareholders from net investment income | (51,158) | (158,301) |
Share transactions - net increase (decrease) | (4,560,330) | 2,348,365 |
Total increase (decrease) in net assets | (4,559,859) | 2,349,040 |
| | |
Net Assets | | |
Beginning of period | 66,780,633 | 64,431,593 |
End of period (including distributions in excess of net investment income of $11 and $0, respectively) | $ 62,220,774 | $ 66,780,633 |
Financial Highlights - Class I
| Six months ended September 30, 2011 | Years ended March 31, |
| (Unaudited) | 2011 | 2010 | 2009 | 2008 | 2007 |
Selected Per-Share Data | | | | | | |
Net asset value, beginning of period | $ 1.00 | $ 1.00 | $ 1.00 | $ 1.00 | $ 1.00 | $ 1.00 |
Income from Investment Operations | | | | | | |
Net investment income (loss) | .001 | .002 | .005 | .023 | .049 | .051 |
Distributions from net investment income | (.001) | (.002) | (.005) | (.023) | (.049) | (.051) |
Net asset value, end of period | $ 1.00 | $ 1.00 | $ 1.00 | $ 1.00 | $ 1.00 | $ 1.00 |
Total Return B, C | .07% | .23% | .47% | 2.37% | 5.01% | 5.24% |
Ratios to Average Net Assets D | | | | | | |
Expenses before reductions | .21% A | .21% | .22% | .23% | .22% | .23% |
Expenses net of fee waivers, if any | .18% A | .18% | .19% | .20% | .18% | .18% |
Expenses net of all reductions | .18% A | .18% | .19% | .20% | .18% | .18% |
Net investment income (loss) | .14% A | .23% | .45% | 2.31% | 4.91% | 5.14% |
Supplemental Data | | | | | | |
Net assets, end of period (in millions) | $ 27,057 | $ 31,063 | $ 34,386 | $ 35,613 | $ 28,573 | $ 28,969 |
A Annualized
B Total returns for periods of less than one year are not annualized.
C Total returns would have been lower if certain expenses had not been reduced during the applicable periods shown.
D Expense ratios reflect operating expenses of the class. Expenses before reductions do not reflect amounts reimbursed or waived or reductions from expense offset arrangements and do not represent the amount paid by the class during periods when reimbursements, waivers or reductions occur. Expenses net of fee waivers reflect expenses after reimbursement and waivers but prior to reductions from expense offset arrangements. Expenses net of all reductions represent the net expenses paid by the class.
See accompanying notes which are an integral part of the financial statements.
Semiannual Report
Financial Highlights - Class II
| Six months ended September 30, 2011 | Years ended March 31, |
| (Unaudited) | 2011 | 2010 | 2009 | 2008 | 2007 |
Selected Per-Share Data | | | | | | |
Net asset value, beginning of period | $ 1.00 | $ 1.00 | $ 1.00 | $ 1.00 | $ 1.00 | $ 1.00 |
Income from Investment Operations | | | | | | |
Net investment income (loss) | .001 | .001 | .003 | .022 | .047 | .050 |
Distributions from net investment income | (.001) | (.001) | (.003) | (.022) | (.047) | (.050) |
Net asset value, end of period | $ 1.00 | $ 1.00 | $ 1.00 | $ 1.00 | $ 1.00 | $ 1.00 |
Total Return B, C | .01% | .08% | .31% | 2.21% | 4.85% | 5.08% |
Ratios to Average Net Assets D | | | | | | |
Expenses before reductions | .36% A | .36% | .37% | .38% | .37% | .38% |
Expenses net of fee waivers, if any | .31% A | .33% | .34% | .35% | .33% | .33% |
Expenses net of all reductions | .31% A | .33% | .34% | .35% | .33% | .33% |
Net investment income (loss) | .01% A | .08% | .30% | 2.16% | 4.70% | 4.99% |
Supplemental Data | | | | | | |
Net assets, end of period (in millions) | $ 234 | $ 420 | $ 835 | $ 680 | $ 699 | $ 637 |
A Annualized
B Total returns for periods of less than one year are not annualized.
C Total returns would have been lower if certain expenses had not been reduced during the applicable periods shown.
D Expense ratios reflect operating expenses of the class. Expenses before reductions do not reflect amounts reimbursed or waived or reductions from expense offset arrangements and do not represent the amount paid by the class during periods when reimbursements, waivers or reductions occur. Expenses net of fee waivers reflect expenses after reimbursement and waivers but prior to reductions from expense offset arrangements. Expenses net of all reductions represent the net expenses paid by the class.
Financial Highlights - Class III
| Six months ended September 30, 2011 | Years ended March 31, |
| (Unaudited) | 2011 | 2010 | 2009 | 2008 | 2007 |
Selected Per-Share Data | | | | | | |
Net asset value, beginning of period | $ 1.00 | $ 1.00 | $ 1.00 | $ 1.00 | $ 1.00 | $ 1.00 |
Income from Investment Operations | | | | | | |
Net investment income (loss) | - E | - E | .002 | .021 | .046 | .049 |
Distributions from net investment income | - E | - E | (.002) | (.021) | (.046) | (.049) |
Net asset value, end of period | $ 1.00 | $ 1.00 | $ 1.00 | $ 1.00 | $ 1.00 | $ 1.00 |
Total Return B, C | .01% | .01% | .22% | 2.11% | 4.74% | 4.98% |
Ratios to Average Net Assets D | | | | | | |
Expenses before reductions | .46% A | .46% | .47% | .48% | .47% | .48% |
Expenses net of fee waivers, if any | .31% A | .40% | .44% | .45% | .43% | .43% |
Expenses net of all reductions | .31% A | .40% | .44% | .45% | .43% | .43% |
Net investment income (loss) | .01% A | .01% | .21% | 2.06% | 4.49% | 4.89% |
Supplemental Data | | | | | | |
Net assets, end of period (in millions) | $ 2,435 | $ 3,524 | $ 3,766 | $ 4,184 | $ 5,256 | $ 1,701 |
A Annualized
B Total returns for periods of less than one year are not annualized.
C Total returns would have been lower if certain expenses had not been reduced during the applicable periods shown.
D Expense ratios reflect operating expenses of the class. Expenses before reductions do not reflect amounts reimbursed or waived or reductions from expense offset arrangements and do not represent the amount paid by the class during periods when reimbursements, waivers or reductions occur. Expenses net of fee waivers reflect expenses after reimbursement and waivers but prior to reductions from expense offset arrangements. Expenses net of all reductions represent the net expenses paid by the class.
E Amount represents less than $.001 per share.
See accompanying notes which are an integral part of the financial statements.
Semiannual Report
Financial Highlights - Select Class
| Six months ended September 30, 2011 | Years ended March 31, |
| (Unaudited) | 2011 | 2010 | 2009 | 2008 | 2007 |
Selected Per-Share Data | | | | | | |
Net asset value, beginning of period | $ 1.00 | $ 1.00 | $ 1.00 | $ 1.00 | $ 1.00 | $ 1.00 |
Income from Investment Operations | | | | | | |
Net investment income (loss) | - E | .002 | .004 | .023 | .048 | .051 |
Distributions from net investment income | - E | (.002) | (.004) | (.023) | (.048) | (.051) |
Net asset value, end of period | $ 1.00 | $ 1.00 | $ 1.00 | $ 1.00 | $ 1.00 | $ 1.00 |
Total Return B, C | .05% | .18% | .42% | 2.31% | 4.96% | 5.19% |
Ratios to Average Net Assets D | | | | | | |
Expenses before reductions | .26% A | .26% | .27% | .28% | .27% | .28% |
Expenses net of fee waivers, if any | .23% A | .23% | .24% | .25% | .23% | .23% |
Expenses net of all reductions | .23% A | .23% | .24% | .25% | .23% | .23% |
Net investment income (loss) | .09% A | .18% | .40% | 2.25% | 4.60% | 5.08% |
Supplemental Data | | | | | | |
Net assets, end of period (in millions) | $ 680 | $ 2,161 | $ 622 | $ 619 | $ 1,626 | $ 470 |
A Annualized
B Total returns for periods of less than one year are not annualized.
C Total returns would have been lower if certain expenses had not been reduced during the applicable periods shown.
D Expense ratios reflect operating expenses of the class. Expenses before reductions do not reflect amounts reimbursed or waived or reductions from expense offset arrangements and do not represent the amount paid by the class during periods when reimbursements, waivers or reductions occur. Expenses net of fee waivers reflect expenses after reimbursement and waivers but prior to reductions from expense offset arrangements. Expenses net of all reductions represent the net expenses paid by the class.
E Amount represents less than $.001 per share.
Financial Highlights - Class F
| Six months ended September 30, 2011 | Years ended March 31, |
| (Unaudited) | 2011 | 2010 D |
Selected Per-Share Data | | | |
Net asset value, beginning of period | $ 1.00 | $ 1.00 | $ 1.00 |
Income from Investment Operations | | | |
Net investment income (loss) | .001 | .003 | .003 |
Distributions from net investment income | (.001) | (.003) | (.003) |
Net asset value, end of period | $ 1.00 | $ 1.00 | $ 1.00 |
Total Return B, C | .09% | .27% | .29% |
Ratios to Average Net Assets E | | | |
Expenses before reductions | .15% A | .15% | .16% A |
Expenses net of fee waivers, if any | .14% A | .14% | .15% A |
Expenses net of all reductions | .14% A | .14% | .15% A |
Net investment income (loss) | .18% A | .27% | .26% A |
Supplemental Data | | | |
Net assets, end of period (in millions) | $ 1,054 | $ 822 | $ 149 |
A Annualized
B Total returns for periods of less than one year are not annualized.
C Total returns would have been lower if certain expenses had not been reduced during the applicable periods shown.
D For the period June 26, 2009 (commencement of sale of shares) to March 31, 2010.
E Expense ratios reflect operating expenses of the class. Expenses before reductions do not reflect amounts reimbursed or waived or reductions from expense offset arrangements and do not represent the amount paid by the class during periods when reimbursements, waivers or reductions occur. Expense ratios before reductions for start-up periods may not be representative of longer-term operating periods. Expenses net of fee waivers reflect expenses after reimbursement and waivers but prior to reductions from expense offset arrangements. Expenses net of all reductions represent the net expenses paid by the class.
See accompanying notes which are an integral part of the financial statements.
Semiannual Report
Financial Highlights -Institutional Class
| Six months ended September 30, 2011 | Years ended March 31, |
| (Unaudited) | 2011 | 2010 | 2009 | 2008 D |
Selected Per-Share Data | | | | | |
Net asset value, beginning of period | $ 1.00 | $ 1.00 | $ 1.00 | $ 1.00 | $ 1.00 |
Income from Investment Operations | | | | | |
Net investment income (loss) | .001 | .003 | .005 | .024 | .013 |
Distributions from net investment income | (.001) | (.003) | (.005) | (.024) | (.013) |
Net asset value, end of period | $ 1.00 | $ 1.00 | $ 1.00 | $ 1.00 | $ 1.00 |
Total Return B, C | .09% | .27% | .51% | 2.41% | 1.29% |
Ratios to Average Net Assets E | | | | | |
Expenses before reductions | .18% A | .18% | .19% | .20% | .19% A |
Expenses net of fee waivers, if any | .14% A | .14% | .15% | .16% | .14% A |
Expenses net of all reductions | .14% A | .14% | .15% | .16% | .14% A |
Net investment income (loss) | .18% A | .27% | .49% | 2.35% | 4.03% A |
Supplemental Data | | | | | |
Net assets, end of period (in millions) | $ 30,760 | $ 28,790 | $ 24,674 | $ 15,526 | $ 11,578 |
A Annualized
B Total returns for periods of less than one year are not annualized.
C Total returns would have been lower if certain expenses had not been reduced during the applicable periods shown.
D For the period December 12, 2007 (commencement of sale of shares) to March 31, 2008.
E Expense ratios reflect operating expenses of the class. Expenses before reductions do not reflect amounts reimbursed or waived or reductions from expense offset arrangements and do not represent the amount paid by the class during periods when reimbursements, waivers or reductions occur. Expense ratios before reductions for start-up periods may not be representative of longer-term operating periods. Expenses net of fee waivers reflect expenses after reimbursement and waivers but prior to reductions from expense offset arrangements. Expenses net of all reductions represent the net expenses paid by the class.
See accompanying notes which are an integral part of the financial statements.
Semiannual Report
Tax-Exempt Portfolio
Investment Changes (Unaudited)
Effective Maturity Diversification |
Days | % of fund's investments 9/30/11 | % of fund's investments 3/31/11 | % of fund's
investments
9/30/10 |
1 - 7 | 87.3 | 83.2 | 83.4 |
8 - 30 | 1.8 | 2.2 | 4.8 |
31 - 60 | 1.6 | 2.0 | 3.0 |
61 - 90 | 2.3 | 4.5 | 3.4 |
91 - 180 | 3.0 | 6.3 | 2.7 |
> 180 | 4.0 | 1.8 | 2.7 |
Effective maturity is determined in accordance with the requirements of Rule 2a-7 under the Investment Company Act of 1940. |
Weighted Average Maturity |
| 9/30/11 | 3/31/11 | 9/30/10 |
Tax-Exempt Portfolio | 22 Days | 21 Days | 20 Days |
All Tax-Free Money Market Funds Average* | 33 Days | 27 Days | 33 Days |
This is a weighted average of all the maturities of the securities held in a fund. Weighted Average Maturity (WAM) can be used as a measure of sensitivity to interest rate changes and markets changes. Generally, the longer the maturity, the greater the sensitivity to such changes. WAM is based on the dollar-weighted average length of time until principal payments must be paid. Depending on the types of securities held in a fund, certain maturity shortening devices (e.g., demand features, interest rate resets, and call options) may be taken into account when calculating the WAM. |
Weighted Average Life |
| 9/30/11 | 3/31/11 | 9/30/10 |
Tax-Exempt Portfolio | 22 Days | 21 Days | 20 Days |
Weighted Average Life (WAL) is the weighted average of the life of the securities held in a fund or portfolio and can be used as a measure of sensitivity to changes in liquidity and/or credit risk. Generally, the higher the value, the greater the sensitivity. WAL is based on the dollar-weighted average length of time until principal payments must be paid, taking into account any call options exercised by the issuer and any permissible maturity shortening features other than interest rate resets. The difference between WAM and WAL is that WAM takes into account interest rate resets and WAL does not. WAL for money market funds is not the same as WAL of a mortgage- or asset-backed security. |
Asset Allocation (% of fund's net assets) |
As of September 30, 2011 | As of March 31, 2011 |
| Variable Rate Demand
Notes (VRDNs) 73.4% | | | Variable Rate Demand
Notes (VRDNs) 71.2% | |
| Commercial Paper
(including CP Mode) 13.7% | | | Commercial Paper
(including CP Mode) 12.9% | |
| Tender Notes and Bonds 1.1% | | | Tender Notes and Bonds 1.1% | |
 | Municipal Notes 1.5% | | | Municipal Notes 3.6% | |
| Municipal Bonds 2.6% | | | Municipal Bonds 2.7% | |
| Tax-Free Cash Central 7.1% | | | Tax-Free Cash Central 8.7% | |
| Net Other Assets 0.6% | |  | Net Other Assets** (0.2)% | |

* Source: iMoneyNet, Inc.
** Net Other Assets are not included in the pie chart.
Semiannual Report
Tax-Exempt Portfolio
Investments September 30, 2011 (Unaudited)
Showing Percentage of Net Assets
Municipal Securities - 99.4% |
| Principal Amount (000s) | | Value (000s) |
Alabama - 1.4% |
Columbia Indl. Dev. Board Poll. Cont. Rev. (Alabama Pwr. Co. Proj.): | | | |
Series 1995 C, 0.24% 10/3/11, VRDN (b) | $ 8,000 | | $ 8,000 |
Series 1995 E, 0.17% 10/3/11, VRDN (b) | 6,700 | | 6,700 |
Daphne-Villa Mercy Spl. Care Facilities Fing. Auth. Rev. (Mercy Med. Proj.) Series 1997, 0.26% 10/7/11, LOC Bank of America NA, VRDN (b) | 7,100 | | 7,100 |
Mobile Indl. Dev. Board Dock & Wharf Rev. (Holnam, Inc. Proj.) Series 1999 B, 0.15% 10/7/11, LOC Wells Fargo Bank NA, VRDN (b) | 1,800 | | 1,800 |
Mobile Indl. Dev. Board Poll. Cont. Rev. (Alabama Pwr. Co. Barry Plant Proj.) Series 2009, 0.16% 10/3/11, VRDN (b) | 1,000 | | 1,000 |
Pell City Spl. Care Facilities Rev. (Noland Health Svcs., Inc. Proj.) Series 2009 A, 0.16% 10/7/11, LOC U.S. Bank NA, Minnesota, VRDN (b) | 10,350 | | 10,350 |
Univ. of Alabama at Birmingham Hosp. Rev. Participating VRDN Series Solar 07 108, 0.15% 10/7/11 (Liquidity Facility U.S. Bank NA, Minnesota) (b)(e) | 15,975 | | 15,975 |
| | 50,925 |
Alaska - 0.1% |
Valdez Marine Term. Rev. (Phillips Trans. Alaska, Inc. Proj.) Series 1994 C, 0.2% 10/7/11 (ConocoPhillips Guaranteed), VRDN (b) | 4,500 | | 4,500 |
Arizona - 1.3% |
Arizona Health Facilities Auth. Rev. (Catholic Healthcare West Proj.) Series 2009 F, 0.14% 10/7/11, LOC Citibank NA, VRDN (b) | 14,000 | | 14,000 |
Phoenix Civic Impt. Corp. Series 2009, 0.14% 10/5/11, LOC Bank of America NA, CP | 16,200 | | 16,200 |
Phoenix Civic Impt. Corp. Wtr. Sys. Rev. Participating VRDN Series Putters 3458, 0.16% 10/7/11 (Liquidity Facility JPMorgan Chase Bank) (b)(e) | 3,000 | | 3,000 |
Phoenix Indl. Dev. Auth. Multi-family Hsg. Rev. (Paradise Lakes Apt. Proj.) Series 2007 A, 0.14% 10/7/11, LOC Wells Fargo Bank NA, VRDN (b) | 2,000 | | 2,000 |
Pima County Indl. Dev. Auth. Indl. Rev. (Tucson Elec. Pwr. Co. Proj.) Series 1982 A, 0.16% 10/7/11, LOC Wells Fargo Bank NA, VRDN (b) | 4,000 | | 4,000 |
|
| Principal Amount (000s) | | Value (000s) |
Salt River Proj. Agricultural Impt. & Pwr. District Elec. Sys. Rev. Participating VRDN: | | | |
Series Putters 3307, 0.16% 10/7/11 (Liquidity Facility JPMorgan Chase Bank) (b)(e) | $ 6,600 | | $ 6,600 |
Series Putters 3708Z, 0.16% 10/7/11 (Liquidity Facility JPMorgan Chase Bank) (b)(e) | 2,000 | | 2,000 |
Tempe Indl. Dev. Auth. Rev. (ASUF Brickyard Proj.) Series 2004 A, 0.36% 10/7/11, LOC Bank of America NA, VRDN (b) | 1,000 | | 1,000 |
| | 48,800 |
Arkansas - 0.6% |
Boone Co. Hosp. Rev. (North Arkansas Reg'l. Med. Ctr. Proj.) Series 2006, 0.26% 10/7/11, LOC Bank of America NA, VRDN (b) | 22,065 | | 22,065 |
California - 3.7% |
ABAG Fin. Auth. for Nonprofit Corps. Rev. (Sharp HealthCare Proj.) Series 2009 C, 0.13% 10/7/11, LOC Citibank NA, VRDN (b) | 5,400 | | 5,400 |
Acalanes Union High School District Participating VRDN Series WF11 85Z, 0.16% 10/7/11 (Liquidity Facility Wells Fargo Bank NA) (b)(e) | 10,155 | | 10,155 |
California Edl. Facilities Auth. Rev. Participating VRDN Series DB 373, 0.18% 10/7/11 (Liquidity Facility Deutsche Bank AG) (b)(e) | 1,422 | | 1,422 |
California Gen. Oblig.: | | | |
Series 2004 A1, 0.11% 10/3/11, LOC Citibank NA, LOC California Teachers Retirement Sys., VRDN (b) | 9,800 | | 9,800 |
Series 2004 A5, 0.13% 10/3/11, LOC Citibank NA, LOC California Teachers Retirement Sys., VRDN (b) | 15,450 | | 15,450 |
Series 2004 A6, 0.14% 10/7/11, LOC Citibank NA, LOC California Teachers Retirement Sys., VRDN (b) | 3,150 | | 3,150 |
Series 2004 B4, 0.14% 10/7/11, LOC Citibank NA, VRDN (b) | 8,000 | | 8,000 |
Series 2005 B5, 0.15% 10/7/11, LOC Barclays Bank PLC, VRDN (b) | 4,000 | | 4,000 |
California Health Facilities Fing. Auth. Rev.: | | | |
(Children's Hosp. of Orange County Proj.): | | | |
Series 2009 C, 0.14% 10/7/11, LOC U.S. Bank NA, Minnesota, VRDN (b) | 2,000 | | 2,000 |
Series 2009 D, 0.14% 10/7/11, LOC U.S. Bank NA, Minnesota, VRDN (b) | 2,150 | | 2,150 |
Municipal Securities - continued |
| Principal Amount (000s) | | Value (000s) |
California - continued |
California Health Facilities Fing. Auth. Rev.: - continued | | | |
(St. Joseph Health Sys. Proj.) Series 2011 A, 0.13% 10/7/11, LOC Union Bank of California, VRDN (b) | $ 1,000 | | $ 1,000 |
California Hsg. Fin. Agcy. Rev. (Multifamily Hsg. Prog.): | | | |
Series 2000 D, 0.13% 10/7/11 (Liquidity Facility Fannie Mae) (Liquidity Facility Freddie Mac), VRDN (b) | 3,955 | | 3,955 |
Series 2002 B, 0.13% 10/7/11 (Liquidity Facility Fannie Mae) (Liquidity Facility Freddie Mac), VRDN (b) | 4,640 | | 4,640 |
California Infrastructure & Econ. Dev. Bank Rev. (Pacific Gas and Elec. Co. Proj.) Series 2009 C, 0.12% 10/3/11, LOC Sumitomo Mitsui Banking Corp., VRDN (b) | 3,900 | | 3,900 |
California Statewide Cmntys. Dev. Auth. Gas Supply Rev. Series 2010, 0.15% 10/7/11 (Liquidity Facility Royal Bank of Canada), VRDN (b) | 7,500 | | 7,500 |
Los Angeles Cmnty. Redev. Agcy. Multi-family Hsg. Rev. (Promenade Towers Proj.) Series 2000, 0.13% 10/7/11, LOC Freddie Mac, VRDN (b) | 1,760 | | 1,760 |
Los Angeles Gen. Oblig.: | | | |
Bonds Series Putters 3930, 0.16%, tender 10/20/11 (Liquidity Facility JPMorgan Chase & Co.) (b)(e)(f) | 6,400 | | 6,400 |
Participating VRDN Series Putters 3931, 0.15% 10/3/11 (Liquidity Facility JPMorgan Chase & Co.) (b)(e) | 5,000 | | 5,000 |
Orange County Apt. Dev. Rev. (Aliso Creek Proj.) Series 1992 B, 0.12% 10/7/11, LOC Freddie Mac, VRDN (b) | 2,400 | | 2,400 |
Orange County Sanitation District Rev. BAN Series 2010 B, 2% 11/23/11 | 11,400 | | 11,427 |
Orange County Wtr. District Rev. Ctfs. of Prtn. Series 2003 A, 0.13% 10/7/11, LOC Citibank NA, VRDN (b) | 7,000 | | 7,000 |
Richmond Wastewtr. Rev. Series 2008 A, 0.15% 10/7/11, LOC Union Bank of California, VRDN (b) | 2,000 | | 2,000 |
Sacramento Suburban Wtr. District Ctfs. of Prtn. Series 2009 A, 0.13% 10/7/11, LOC Sumitomo Mitsui Banking Corp., VRDN (b) | 5,000 | | 5,000 |
San Bernardino County Gen. Oblig. TRAN Series A, 2% 6/29/12 | 5,800 | | 5,874 |
|
| Principal Amount (000s) | | Value (000s) |
Southern California Pub. Pwr. Auth. Rev. (Palo Verde Proj.) Series 2008 A, 0.13% 10/7/11, LOC Citibank NA, VRDN (b) | $ 8,000 | | $ 8,000 |
Univ. of California Revs. Series A, 0.14% 10/17/11, CP | 1,370 | | 1,370 |
| | 138,753 |
Colorado - 2.7% |
Colorado Health Facilities Auth. Rev.: | | | |
(Catholic Health Initiatives Proj.) Series 2004 B1, 0.35% 10/7/11 (Liquidity Facility Bayerische Landesbank Girozentrale), VRDN (b) | 6,545 | | 6,545 |
(NCMC, Inc. Proj.) Series 2009 A, 0.15% 10/3/11, LOC Wells Fargo Bank NA, VRDN (b) | 15,120 | | 15,120 |
Participating VRDN Series BA 08 1090, 0.22% 10/7/11 (Liquidity Facility Bank of America NA) (b)(e) | 5,375 | | 5,375 |
Colorado Reg'l. Trans. District Sales Tax Rev. Participating VRDN: | | | |
Series EGL 07 0039, 0.16% 10/7/11 (Liquidity Facility Citibank NA) (b)(e) | 16,000 | | 16,000 |
Series EGL 07 0040, 0.16% 10/7/11 (Liquidity Facility Citibank NA) (b)(e) | 11,700 | | 11,700 |
Series ROC II R 12312, 0.16% 10/7/11 (Liquidity Facility Citibank NA) (b)(e) | 6,000 | | 6,000 |
Denver City & County Wtr. Participating VRDN Series PZ 232, 0.17% 10/7/11 (Liquidity Facility Wells Fargo & Co.) (b)(e) | 16,010 | | 16,010 |
Denver Urban Renewal Auth. Tax Increment Rev.: | | | |
Series 2008 A1, 0.16% 10/7/11, LOC U.S. Bank NA, Minnesota, VRDN (b) | 14,460 | | 14,460 |
Series 2008 A2, 0.16% 10/7/11, LOC U.S. Bank NA, Minnesota, VRDN (b) | 9,420 | | 9,420 |
| | 100,630 |
Connecticut - 0.2% |
Connecticut Health & Edl. Facilities Auth. Rev.: | | | |
(Greater Hartford YMCA Proj.) Series 2008 B, 0.21% 10/3/11, LOC Bank of America NA, VRDN (b) | 1,000 | | 1,000 |
(Masonicare Corp. Proj.) Series D, 0.15% 10/3/11, LOC Wells Fargo Bank NA, VRDN (b) | 2,400 | | 2,400 |
Participating VRDN Series Putters 3363, 0.16% 10/7/11 (Liquidity Facility JPMorgan Chase Bank) (b)(e) | 2,800 | | 2,800 |
| | 6,200 |
Municipal Securities - continued |
| Principal Amount (000s) | | Value (000s) |
Delaware - 1.4% |
Delaware Health Facilities Auth. Rev.: | | | |
(Bayhealth Med. Ctr. Proj.) Series 2009 C, 0.15% 10/3/11, LOC Wells Fargo Bank NA, VRDN (b) | $ 36,125 | | $ 36,125 |
(Beebe Med. Ctr. Proj.) 0.18% 10/7/11, LOC PNC Bank NA, VRDN (b) | 12,805 | | 12,805 |
Wilmington Adjustable Rate Demand Rev. (Delaware Art Museum, Inc. Proj.) 0.15% 10/7/11, LOC Wells Fargo Bank NA, VRDN (b) | 4,200 | | 4,200 |
| | 53,130 |
District Of Columbia - 1.4% |
District of Columbia Income Tax Rev. Participating VRDN Series Putters 3354, 0.16% 10/7/11 (Liquidity Facility JPMorgan Chase Bank) (b)(e) | 7,155 | | 7,155 |
District of Columbia Rev.: | | | |
(American Psychological Assoc. Proj.) Series 2003, 0.36% 10/7/11, LOC Bank of America NA, VRDN (b) | 2,100 | | 2,100 |
(Defenders of Wildlife Proj.) 0.36% 10/7/11, LOC Bank of America NA, VRDN (b) | 5,905 | | 5,905 |
(Friends Legal Svcs. Corp. Proj.) 0.36% 10/7/11, LOC Bank of America NA, VRDN (b) | 10,290 | | 10,290 |
(The Phillips Collection Issue Proj.) Series 2003, 0.46% 10/7/11, LOC Bank of America NA, VRDN (b) | 2,675 | | 2,675 |
(The Washington Ctr. for Internships and Academic Seminars Proj.) Series 2009, 0.15% 10/7/11, LOC Branch Banking & Trust Co., VRDN (b) | 4,000 | | 4,000 |
Bonds (American Nat'l. Red Cross Proj.) Series 2000, 0.15% tender 10/6/11, LOC JPMorgan Chase Bank, CP mode | 6,600 | | 6,600 |
District of Columbia Univ. Rev. (American Univ. Proj.) Series 2006 A, 0.23% 10/7/11, LOC Bank of America NA, VRDN (b) | 11,700 | | 11,700 |
| | 50,425 |
Florida - 9.9% |
Local Govt. Fin. Comm Series 2011 A1, 0.14% 10/3/11, LOC JPMorgan Chase Bank, CP | 8,500 | | 8,500 |
Alachua County Health Facilities Auth. Continuing Care Retirement Cmnty. Rev. (Oak Hammock at The Univ. of Florida, Inc. Proj.) Series A, 0.16% 10/3/11, LOC Bank of Scotland PLC, VRDN (b) | 2,230 | | 2,230 |
Cape Coral Wtr. & Swr. Rev. Participating VRDN Series Solar 07 60, 0.17% 10/7/11 (Liquidity Facility U.S. Bank NA, Minnesota) (b)(e) | 20,395 | | 20,395 |
|
| Principal Amount (000s) | | Value (000s) |
Collier County Indl. Dev. Auth. (Cmnty. School of Naples Proj.) 0.36% 10/7/11, LOC Bank of America NA, VRDN (b) | $ 13,680 | | $ 13,680 |
Florida Board of Ed. Pub. Ed. Cap. Outlay Participating VRDN: | | | |
Series EGL 07 48, 0.15% 10/7/11 (Liquidity Facility Citibank NA) (b)(e) | 21,445 | | 21,445 |
Series ROC II R 817, 0.15% 10/7/11 (Liquidity Facility Citibank NA) (b)(e) | 10,005 | | 10,005 |
Florida Dept. of Envir. Protection Rev. Bonds Series 2001 A, 5.5% 7/1/12 | 1,000 | | 1,038 |
Florida Dept. of Trans. Tpk. Rev. Participating VRDN Series Solar 07 30, 0.15% 10/7/11 (Liquidity Facility U.S. Bank NA, Minnesota) (b)(e) | 15,010 | | 15,010 |
Florida Gen. Oblig. Participating VRDN Series PZ 130, 0.17% 10/7/11 (Liquidity Facility Wells Fargo & Co.) (b)(e) | 7,070 | | 7,070 |
Florida Hsg. Fin. Corp. Multi-family Mtg. Rev. (Victoria Park Apts. Proj.) Series 2002 J, 0.16% 10/7/11, LOC Fannie Mae, VRDN (b) | 1,050 | | 1,050 |
Florida Hurricane Catastrophe Fund Fin. Corp. Rev. Bonds Series 2006 A, 5.25% 7/1/12 | 13,340 | | 13,835 |
Florida Local Govt. Fin. Commission Auth. Rev. Series 2006 A, 0.14% 10/5/11, LOC Wells Fargo Bank NA, CP | 3,839 | | 3,839 |
Highlands County Health Facilities Auth. Rev.: | | | |
(Adventist Health Sys./Sunbelt, Inc. Prog.) Series 2007 A1, 0.12% 10/7/11, VRDN (b) | 1,000 | | 1,000 |
(Adventist Health Sys./Sunbelt Obligated Group Proj.) Series 2005 H, 0.13% 10/7/11, LOC U.S. Bank NA, Minnesota, VRDN (b) | 14,700 | | 14,700 |
Participating VRDN Series MS 3251, 0.17% 10/7/11 (Liquidity Facility Morgan Stanley Bank, West Valley City Utah) (b)(e) | 5,625 | | 5,625 |
Jacksonville Health Facilities Auth. Hosp. Rev. (Baptist Med. Ctr. Proj.) Series 2001, 0.15% 10/3/11, LOC Wells Fargo Bank NA, VRDN (b) | 12,490 | | 12,490 |
Miami-Dade County Gen. Oblig. Bonds Series 2011 C, 2% 10/1/11 | 5,685 | | 5,685 |
Nassau County Poll. Cont. Rev. (Rayonier Proj.) 0.36% 10/7/11, LOC Bank of America NA, VRDN (b) | 11,910 | | 11,910 |
Orange County Health Facilities Auth. Rev. (The Nemours Foundation Proj.) Series 2009 C2, 0.14% 10/7/11, VRDN (b) | 11,810 | | 11,810 |
Municipal Securities - continued |
| Principal Amount (000s) | | Value (000s) |
Florida - continued |
Orange County Indl. Dev. Auth. Indl. Dev. Rev. (Central Florida YMCA Proj.) Series 2002 A, 0.23% 10/7/11, LOC Bank of America NA, VRDN (b) | $ 3,245 | | $ 3,245 |
Palm Beach County Edl. Facilities Auth. (Lynn Univ. Proj.) Series 2001, 0.26% 10/7/11, LOC Bank of America NA, VRDN (b) | 7,565 | | 7,565 |
Palm Beach County Pub. Impt. Rev. Participating VRDN Series BBT 08 53, 0.15% 10/7/11 (Liquidity Facility Branch Banking & Trust Co.) (b)(e) | 8,600 | | 8,600 |
Palm Beach County Rev.: | | | |
(Benjamin Private School Proj.) 0.36% 10/7/11, LOC Bank of America NA, VRDN (b) | 3,840 | | 3,840 |
(Raymond F. Kravis Ctr. Proj.) Series 2002, 0.15% 10/7/11, LOC Northern Trust Co., VRDN (b) | 1,900 | | 1,900 |
(Saint Andrew's School of Boca Raton, Inc. Proj.) Series 2007, 0.26% 10/7/11, LOC Bank of America NA, VRDN (b) | 18,940 | | 18,940 |
(The Norton Gallery and School of Arts, Inc. Proj.) Series 2000, 0.19% 10/7/11, LOC Bank of America NA, VRDN (b) | 2,200 | | 2,200 |
Palm Beach County Wtr. & Swr. Rev. Participating VRDN Series Putters 2622, 0.16% 10/7/11 (Liquidity Facility JPMorgan Chase Bank) (b)(e) | 1,775 | | 1,775 |
Pasco County School Board Ctfs. of Prtn. Series 2008 C, 0.23% 10/7/11, LOC Bank of America NA, VRDN (b) | 20,405 | | 20,405 |
Pinellas County Swr. Rev. Participating VRDN Series Putters 2917 Z, 0.18% 10/7/11 (Liquidity Facility JPMorgan Chase Bank) (b)(e) | 3,000 | | 3,000 |
Pinellas County Health Facilities Auth. Rev. (BayCare Health Sys. Proj.) Series 2009 A3, 0.15% 10/7/11, LOC Wells Fargo Bank NA, VRDN (b) | 15,975 | | 15,975 |
Polk County School Board Ctfs. of Prtn. (Master Lease Prog.): | | | |
Series 2009 A, 0.15% 10/3/11, LOC Wells Fargo Bank NA, VRDN (b) | 9,970 | | 9,970 |
Series 2009 B, 0.15% 10/3/11, LOC Wells Fargo Bank NA, VRDN (b) | 29,980 | | 29,980 |
South Florida Wtr. Mgmt. District Ctfs. of Prtn. Participating VRDN Series ROC II R 12313, 0.16% 10/7/11 (Liquidity Facility Citibank NA) (b)(e) | 13,090 | | 13,090 |
South Miami Health Facilities Auth. Hosp. Rev. Participating VRDN: | | | |
Series BA 07 1025, 0.22% 10/7/11 (Liquidity Facility Bank of America NA) (b)(e) | 6,575 | | 6,575 |
|
| Principal Amount (000s) | | Value (000s) |
Series BA 07 1030, 0.22% 10/7/11 (Liquidity Facility Bank of America NA) (b)(e) | $ 1,011 | | $ 1,011 |
Sunshine State Govt. Fing. Commission Rev. Series 2011 C, 0.16% 10/7/11, LOC JPMorgan Chase Bank, VRDN (b) | 4,600 | | 4,600 |
Univ. of North Florida Parking Sys. Rev. Series 1998, 0.2% 10/3/11, LOC Wells Fargo Bank NA, VRDN (b) | 2,100 | | 2,100 |
Volusia County Hsg. Fin. Auth. Multi-family Hsg. Rev. (Fisherman's Landing Apts. Proj.) 0.16% 10/7/11, LOC Fannie Mae, VRDN (b) | 3,315 | | 3,315 |
Volusia County School Board Ctfs. of Prtn. Participating VRDN Series Solar 06 8, 0.15% 10/7/11 (Liquidity Facility U.S. Bank NA, Minnesota) (b)(e) | 20,815 | | 20,815 |
Winter Haven Util. Sys. Impt. & Rfdg. Rev. Participating VRDN Series Solar 06 54, 0.15% 10/7/11 (Liquidity Facility U.S. Bank NA, Minnesota) (b)(e) | 8,020 | | 8,020 |
| | 368,238 |
Georgia - 1.3% |
Atlanta Arpt. Rev. Series 2010 A2, 0.19% 11/9/11, LOC JPMorgan Chase Bank, CP | 2,375 | | 2,375 |
DeKalb County Hsg. Auth. Multi-family Hsg. Rev. (Timber Trace Apts. Proj.) Series 2003, 0.15% 10/7/11, LOC Freddie Mac, VRDN (b) | 1,500 | | 1,500 |
Fulton County Dev. Auth. (Mount Vernon Presbyterian School Proj.) Series 2005, 0.15% 10/7/11, LOC Branch Banking & Trust Co., VRDN (b) | 2,700 | | 2,700 |
Fulton County Hosp. Auth. Rev. (Northside Hosp. Proj.) Series 2003 B, 0.15% 10/3/11, LOC Wells Fargo Bank NA, VRDN (b) | 7,790 | | 7,790 |
Georgia Gen. Oblig.: | | | |
Bonds: | | | |
Series 1998 D, 5.25% 10/1/11 | 1,700 | | 1,700 |
Series 2007 B, 5% 4/1/12 | 1,000 | | 1,024 |
Series 2011 A, 3% 7/1/12 | 3,000 | | 3,062 |
Participating VRDN Series 85TP, 0.15% 10/7/11 (Liquidity Facility Wells Fargo & Co.) (b)(e) | 200 | | 200 |
Glynn-Brunswick Memorial Hosp. Auth. Rev. (Southeast Georgia Health Sys. Proj.) Series 2008 B, 0.15% 10/7/11, LOC Branch Banking & Trust Co., VRDN (b) | 12,380 | | 12,380 |
Municipal Securities - continued |
| Principal Amount (000s) | | Value (000s) |
Georgia - continued |
Main Street Natural Gas, Inc. Georgia Gas Proj. Rev. Series 2010 A, 0.16% 10/7/11 (Liquidity Facility Royal Bank of Canada), VRDN (b) | $ 12,490 | | $ 12,490 |
Thomasville Hosp. Auth. Rev. (Archbold Memorial Hosp. Proj.) Series 2009 B, 0.15% 10/7/11, LOC Branch Banking & Trust Co., VRDN (b) | 3,510 | | 3,510 |
| | 48,731 |
Hawaii - 0.6% |
Hawaii Gen. Oblig. Participating VRDN Series ROC II R 11021 PB, 0.19% 10/7/11 (Liquidity Facility Deutsche Postbank AG) (b)(e) | 20,295 | | 20,295 |
Illinois - 6.6% |
Chicago Board of Ed.: | | | |
Series 2009 A2, 0.14% 10/7/11, LOC Northern Trust Co., VRDN (b) | 5,900 | | 5,900 |
Series 2009 B, 0.14% 10/3/11, LOC U.S. Bank NA, Minnesota, VRDN (b) | 11,140 | | 11,140 |
Chicago Gen. Oblig. Participating VRDN Series Solar 06 38, 0.15% 10/7/11 (Liquidity Facility U.S. Bank NA, Minnesota) (b)(e) | 7,815 | | 7,815 |
Chicago Wastewtr. Transmission Rev. Series 2008 C1, 0.13% 10/3/11, LOC BMO Harris Bank NA, VRDN (b) | 4,115 | | 4,115 |
Chicago Wtr. Rev.: | | | |
Series 2004 A1, 0.18% 10/7/11, LOC California Pub. Employees Retirement Sys., VRDN (b) | 19,720 | | 19,720 |
Series 2004 A2, 0.18% 10/7/11, LOC California Pub. Employees Retirement Sys., VRDN (b) | 19,625 | | 19,625 |
DuPage County Rev. (Morton Arboretum Proj.) 0.23% 10/7/11, LOC Bank of America NA, VRDN (b) | 24,050 | | 24,050 |
Illinois Edl. Facilities Auth. Revs. Participating VRDN Series ROC II R 12278, 0.15% 10/7/11 (Liquidity Facility Citibank NA) (b)(e) | 5,195 | | 5,195 |
Illinois Fin. Auth. Poll. Cont. Rev. (Commonwealth Edison Co. Proj.) Series 2008 E, 0.15% 10/7/11, LOC JPMorgan Chase Bank, VRDN (b) | 14,305 | | 14,305 |
Illinois Fin. Auth. Rev.: | | | |
(Alexian Brothers Health Sys. Proj.) Series 2004, 0.17% 10/7/11, LOC JPMorgan Chase Bank, VRDN (b) | 1,400 | | 1,400 |
(Concordia Univ. Proj.) Series 2009, 0.17% 10/7/11, LOC Fed. Home Ln. Bank Chicago, VRDN (b) | 14,800 | | 14,800 |
(Museum of Science & Industry Proj.) Series 2009 C, 0.16% 10/7/11, LOC PNC Bank NA, VRDN (b) | 9,670 | | 9,670 |
|
| Principal Amount (000s) | | Value (000s) |
(North Central College Proj.) Series 2008, 0.26% 10/7/11, LOC Bank of America NA, VRDN (b) | $ 8,500 | | $ 8,500 |
(Provena Health Proj.) Series 2009 C, 0.15% 10/7/11, LOC JPMorgan Chase Bank, VRDN (b) | 1,300 | | 1,300 |
(The Univ. of Chicago Med. Ctr. Proj.) Series 2010 B, 0.12% 10/3/11, LOC Wells Fargo Bank NA, VRDN (b) | 10,210 | | 10,210 |
Participating VRDN: | | | |
Series BC 11 16B, 0.17% 10/7/11 (Liquidity Facility Barclays Bank PLC) (a)(b)(e) | 3,950 | | 3,950 |
Series DB 601, 0.18% 10/7/11 (Liquidity Facility Deutsche Bank AG) (b)(e) | 10,195 | | 10,195 |
Series EGL 06 115, 0.15% 10/7/11 (Liquidity Facility Citibank NA) (b)(e) | 13,615 | | 13,615 |
Series Putters 3174, 0.16% 10/7/11 (Liquidity Facility JPMorgan Chase Bank) (b)(e) | 1,130 | | 1,130 |
Series Putters 3378, 0.16% 10/7/11 (Liquidity Facility JPMorgan Chase Bank) (b)(e) | 3,795 | | 3,795 |
Series Putters 3379, 0.16% 10/7/11 (Liquidity Facility JPMorgan Chase Bank) (b)(e) | 4,995 | | 4,995 |
Series 2011 B, 0.12% 10/3/11, LOC Wells Fargo Bank NA, VRDN (b) | 4,000 | | 4,000 |
Illinois Hsg. Dev. Auth. Multi-family Hsg. Rev. (Lakeshore Plaza Proj.) Series 2008 B, 0.15% 10/7/11, LOC JPMorgan Chase Bank, VRDN (b) | 14,935 | | 14,935 |
Illinois Toll Hwy. Auth. Toll Hwy. Rev. Series 2007 A 1B, 0.13% 10/7/11, LOC PNC Bank NA, VRDN (b) | 5,000 | | 5,000 |
Lake County Multi-family Hsg. Rev. (Whispering Oaks Apts. Proj.) Series 2008, 0.13% 10/7/11, LOC Freddie Mac, VRDN (b) | 16,250 | | 16,250 |
Metropolitan Pier & Exposition Participating VRDN Series MS 3216, 0.16% 10/7/11 (Liquidity Facility Morgan Stanley Bank, West Valley City Utah) (b)(e) | 10,000 | | 10,000 |
Yorkville Svc. Area 2004-106 Tax (MPI Grande Reserve Proj.) 0.46% 10/7/11, LOC Bank of America NA, VRDN (b) | 1,622 | | 1,622 |
| | 247,232 |
Indiana - 1.7% |
Indiana Dev. Fin. Auth. Envir. Rev. Series 2005, 0.15% 10/7/11, LOC Royal Bank of Scotland PLC, VRDN (b) | 12,000 | | 12,000 |
Municipal Securities - continued |
| Principal Amount (000s) | | Value (000s) |
Indiana - continued |
Indiana Fin. Auth. Health Sys. Rev. Participating VRDN Series 3654 Z, 0.16% 10/7/11 (Liquidity Facility JPMorgan Chase Bank) (b)(e) | $ 12,290 | | $ 12,290 |
Indiana Fin. Auth. Hosp. Rev. (Cmnty. Health Network Proj.) Series 2009 A, 0.23% 10/7/11, LOC Bank of America NA, VRDN (b) | 5,000 | | 5,000 |
Indiana Fin. Auth. Rev. (Ascension Health Proj.) Series 2008 E8, 0.13% 10/7/11, VRDN (b) | 1,000 | | 1,000 |
Indiana Health Facilities Fing. Auth. Hosp. Rev. (Cmnty. Hospitals Proj.): | | | |
Series 1997 A, 0.15% 10/7/11, LOC JPMorgan Chase Bank, VRDN (b) | 7,000 | | 7,000 |
Series 1997 B, 0.15% 10/7/11, LOC JPMorgan Chase Bank, VRDN (b) | 15,000 | | 15,000 |
Indiana Health Facility Fing. Auth. Rev. Bonds (Ascension Health Subordinate Cr. Proj.) Series A2, 3.75%, tender 2/1/12 (b) | 2,000 | | 2,023 |
Marshall County Econ. Dev. Rev. (Culver Edl. Foundation Prog.) Series 2000, 0.16% 10/7/11, LOC Northern Trust Co., VRDN (b) | 8,300 | | 8,300 |
| | 62,613 |
Iowa - 0.2% |
Iowa Fin. Auth. Wellness Facilities Rev. (Cmnty. Y of Marshalltown Proj.) Series 2001, 0.23% 10/7/11, LOC Bank of America NA, VRDN (b) | 7,475 | | 7,475 |
Kansas - 0.6% |
Kansas Dept. of Trans. Hwy. Rev. Participating VRDN Series BBT 08 51, 0.15% 10/7/11 (Liquidity Facility Branch Banking & Trust Co.) (b)(e) | 6,300 | | 6,300 |
Wichita Gen. Oblig.: | | | |
BAN Series 246, 0.375% 8/10/12 | 6,900 | | 6,905 |
Participating VRDN Series Putters 3951, 0.15% 10/3/11 (Liquidity Facility JPMorgan Chase & Co.) (b)(e) | 9,000 | | 9,000 |
| | 22,205 |
Louisiana - 1.1% |
East Baton Rouge Parish Indl. Dev. Board Rev. (Stupp Bros., Inc. Proj.) Series 2008, 0.36% 10/7/11, LOC Bank of America NA, VRDN (b) | 4,985 | | 4,985 |
Louisiana Gas & Fuel Tax Rev. Participating VRDN Series ROC II R 11948, 0.16% 10/7/11 (Liquidity Facility Citibank NA) (b)(e) | 6,665 | | 6,665 |
|
| Principal Amount (000s) | | Value (000s) |
Louisiana Offshore Term. Auth. Deepwater Port Rev. (LOOP LLC Proj.) Series 2003 B, 0.15% 10/7/11, LOC JPMorgan Chase Bank, VRDN (b) | $ 2,900 | | $ 2,900 |
Louisiana Pub. Facilities Auth. Rev.: | | | |
(Air Products & Chemicals, Inc. Proj.): | | | |
Series 2004, 0.11% 10/7/11, VRDN (b) | 3,350 | | 3,350 |
0.11% 10/3/11, VRDN (b) | 3,780 | | 3,780 |
0.11% 10/3/11, VRDN (b) | 10,415 | | 10,415 |
(C-Port LLC Proj.) Series 2008, 0.26% 10/7/11, LOC Bank of America NA, VRDN (b) | 4,000 | | 4,000 |
St. James Parish Gen. Oblig. (NuStar Logistics LP Proj.) Series 2010 B, 0.16% 10/7/11, LOC JPMorgan Chase Bank, VRDN (b) | 5,400 | | 5,400 |
| | 41,495 |
Maine - 0.4% |
Maine Health & Higher Ed. Facilities Auth. Rev. Participating VRDN Series Solar 06 122, 0.15% 10/7/11 (Liquidity Facility U.S. Bank NA, Minnesota) (b)(e) | 14,890 | | 14,890 |
Maryland - 1.4% |
Anne Arundel County Gen. Oblig. Bonds Series 2011, 3% 4/1/12 | 6,290 | | 6,372 |
Baltimore County Econ. Dev. Rev. (The Bais Yaakov School for Girls Proj.) Series 2003, 0.41% 10/7/11, LOC Bank of America NA, VRDN (b) | 5,180 | | 5,180 |
Baltimore County Gen. Oblig. Series 2011: | | | |
0.15% 10/4/11 (Liquidity Facility Mizuho Corporate Bank Ltd.), CP | 6,100 | | 6,100 |
0.15% 10/11/11 (Liquidity Facility Mizuho Corporate Bank Ltd.), CP | 5,100 | | 5,100 |
0.16% 11/2/11 (Liquidity Facility Mizuho Corporate Bank Ltd.), CP | 4,100 | | 4,100 |
0.18% 12/5/11 (Liquidity Facility Mizuho Corporate Bank Ltd.), CP | 5,100 | | 5,100 |
Maryland Cmnty. Dev. Administration Multi-family Dev. Rev. (Avalon Lea Apt. Proj.) Series 1997, 0.17% 10/7/11, LOC Fannie Mae, VRDN (b) | 1,800 | | 1,800 |
Maryland Health & Higher Edl. Facilities Auth. Rev. Participating VRDN Series BBT 08 46, 0.15% 10/7/11 (Liquidity Facility Branch Banking & Trust Co.) (b)(e) | 3,825 | | 3,825 |
Maryland Trans. Auth. Trans. Facility Projects Rev. Participating VRDN Series ROC II R 11437, 0.17% 10/7/11 (Liquidity Facility Citibank NA) (b)(e) | 7,785 | | 7,785 |
Municipal Securities - continued |
| Principal Amount (000s) | | Value (000s) |
Maryland - continued |
Montgomery County Econ. Dev. Rev. (Georgetown Preparatory School, Inc. Proj.) Series 2005, 0.23% 10/7/11, LOC Bank of America NA, VRDN (b) | $ 6,850 | | $ 6,850 |
Montgomery County Hsg. Opportunity Commission Single Family Mtg. Rev. Series 2002 C, 0.16% 10/7/11 (Liquidity Facility Fannie Mae) (Liquidity Facility Freddie Mac), VRDN (b) | 1,300 | | 1,300 |
| | 53,512 |
Massachusetts - 4.2% |
Massachusetts Gen. Oblig. Participating VRDN: | | | |
Series Clipper 07 39, 0.19% 10/7/11 (Liquidity Facility State Street Bank & Trust Co., Boston) (b)(e) | 5,675 | | 5,675 |
Series Clipper 07 41, 0.19% 10/7/11 (Liquidity Facility State Street Bank & Trust Co., Boston) (b)(e) | 131,350 | | 131,350 |
Massachusetts Health & Edl. Facilities Auth. Rev. Participating VRDN Series ROC II R 11824, 0.16% 10/7/11 (Liquidity Facility Citibank NA) (b)(e) | 2,000 | | 2,000 |
Massachusetts School Bldg. Auth. Dedicated Sales Tax Rev. Participating VRDN: | | | |
Series EGL 07 0031, 0.16% 10/7/11 (Liquidity Facility Citibank NA) (b)(e) | 10,000 | | 10,000 |
Series EGL 07 0092, 0.16% 10/7/11 (Liquidity Facility Citibank NA) (b)(e) | 5,000 | | 5,000 |
Massachusetts Wtr. Resources Auth. Wtr. & Swr. Rev. Participating VRDN Series EGL 06 0054, 0.16% 10/7/11 (Liquidity Facility Citibank NA) (b)(e) | 3,000 | | 3,000 |
| | 157,025 |
Michigan - 1.2% |
Chelsea Econ. Dev. Corp. Ltd. Oblig. Rev. (Silver Maples of Chelsea Proj.) 0.17% 10/7/11, LOC Comerica Bank, VRDN (b) | 5,485 | | 5,485 |
Detroit Econ. Dev. Corp. Rev. (Michigan Opera Theatre Proj.) Series 1999, 0.25% 10/7/11, LOC JPMorgan Chase Bank, VRDN (b) | 900 | | 900 |
Grand Traverse County Hosp. Series 2011 B, 0.17% 10/7/11, LOC JPMorgan Chase Bank, VRDN (b) | 4,325 | | 4,325 |
Michigan Fin. Auth. Rev. RAN Series 2011 C3, 2% 8/20/12, LOC Bank of Nova Scotia New York Branch | 7,400 | | 7,511 |
Michigan Higher Ed. Rev. (Univ. of Detroit Mercy Proj.) Series 2007, 0.14% 10/3/11, LOC JPMorgan Chase Bank, VRDN (b) | 500 | | 500 |
|
| Principal Amount (000s) | | Value (000s) |
Michigan Hosp. Fin. Auth. Rev. Bonds: | | | |
(Ascension Health Sr. Cr. Group Proj.) Series 2010 F: | | | |
0.25%, tender 4/27/12 (b) | $ 11,200 | | $ 11,200 |
0.25%, tender 4/27/12 (b) | 5,140 | | 5,140 |
(Trinity Health Sys. Proj.) Series 2008 C, 0.14% tender 10/11/11, CP mode | 2,700 | | 2,700 |
Ottawa County Wtr. Supply Sys. Rev. Participating VRDN Series Putters 3360, 0.18% 10/7/11 (Liquidity Facility JPMorgan Chase Bank) (b)(e) | 6,620 | | 6,620 |
| | 44,381 |
Minnesota - 1.0% |
Bloomington Sr. Hsg. Rev. (Presbyterian Homes Proj.) Series 2008, 0.18% 10/7/11, LOC Freddie Mac, VRDN (b) | 4,075 | | 4,075 |
Minneapolis Gen. Oblig. Bonds Series 2011, 3% 12/1/11 | 4,800 | | 4,821 |
Minnetonka Multi-family Hsg. Rev. (Cliffs at Ridgedale Proj.) Series 1995, 0.16% 10/7/11, LOC Fannie Mae, VRDN (b) | 21,550 | | 21,550 |
St. Paul City Port Auth. District Heating Rev. Series 2009 5O, 0.3% 10/7/11, LOC Deutsche Bank AG, VRDN (b) | 7,635 | | 7,635 |
| | 38,081 |
Missouri - 1.5% |
Cape Girardeau County Indl. Dev. Auth. (St. Francis Med. Ctr. Proj.) Series 2009 B, 0.2% 10/7/11, LOC Wells Fargo Bank NA, VRDN (b) | 1,600 | | 1,600 |
Missouri Health & Edl. Facilities Auth. Edl. Facilities Rev.: | | | |
(Saint Louis Univ. Proj.): | | | |
Series 2008 A1, 0.13% 10/3/11, LOC Wells Fargo Bank NA, VRDN (b) | 2,200 | | 2,200 |
Series 2008 A2, 0.12% 10/3/11, LOC Wells Fargo Bank NA, VRDN (b) | 13,240 | | 13,240 |
Participating VRDN: | | | |
Series EGL 07 0001, 0.16% 10/7/11 (Liquidity Facility Citibank NA) (b)(e) | 8,000 | | 8,000 |
Series PT 4624, 0.16% 10/7/11 (Liquidity Facility Deutsche Postbank AG) (b)(e) | 11,065 | | 11,065 |
Municipal Securities - continued |
| Principal Amount (000s) | | Value (000s) |
Missouri - continued |
Missouri Health & Edl. Facilities Auth. Rev. (Ascension Health Cr. Group Proj.) Series 2003 C2, 0.13% 10/7/11, VRDN (b) | $ 8,000 | | $ 8,000 |
Missouri Highways & Trans. Commission State Road Rev. Series 2005 B, 0.15% 10/7/11, LOC State Street Bank & Trust Co., Boston, VRDN (b) | 11,400 | | 11,400 |
| | 55,505 |
Nebraska - 2.4% |
Central Plains Energy Proj. Rev. (Nebraska Gas Proj.) Series 2009, 0.16% 10/7/11 (Liquidity Facility Royal Bank of Canada), VRDN (b) | 16,000 | | 16,000 |
Nebraska Pub. Pwr. District Rev. Series A, 0.15% 10/6/11, CP | 17,000 | | 17,000 |
Nebraska Pub. Pwr. Generation Agcy. Rev. Participating VRDN Series Solar 07 20, 0.15% 10/7/11 (Liquidity Facility U.S. Bank NA, Minnesota) (b)(e) | 31,990 | | 31,990 |
Omaha Pub. Pwr. District Elec. Rev. Series A: | | | |
0.14% 10/20/11, CP | 7,300 | | 7,300 |
0.15% 11/8/11, CP | 3,500 | | 3,500 |
0.16% 10/18/11, CP | 15,000 | | 15,000 |
| | 90,790 |
Nevada - 0.7% |
Clark County McCarran Int'l. Arpt. Passenger Facility Charge Rev. Series 2010 F2, 0.16% 10/7/11, LOC Union Bank of California, VRDN (b) | 11,000 | | 11,000 |
Las Vegas Valley Wtr. District Wtr. Impt. Gen. Oblig. Participating VRDN Series Solar 06 93, 0.14% 10/7/11 (Liquidity Facility U.S. Bank NA, Minnesota) (b)(e) | 13,860 | | 13,860 |
| | 24,860 |
New Mexico - 0.9% |
New Mexico Muni. Energy Acquisition Auth. Gas Supply Rev. Series 2009, 0.16% 10/7/11 (Liquidity Facility Royal Bank of Canada), VRDN (b) | 30,200 | | 30,200 |
Univ. of New Mexico Univ. Revs. Participating VRDN Series ROC II R 11961, 0.16% 10/7/11 (Liquidity Facility Citibank NA) (b)(e) | 3,000 | | 3,000 |
| | 33,200 |
New York - 2.7% |
New York City Gen. Oblig.: | | | |
Participating VRDN Series Putters 2951, 0.16% 10/7/11 (Liquidity Facility JPMorgan Chase Bank) (b)(e) | 1,400 | | 1,400 |
|
| Principal Amount (000s) | | Value (000s) |
Series 2006 I5, 0.15% 10/3/11, LOC California Pub. Employees Retirement Sys., VRDN (b) | $ 2,000 | | $ 2,000 |
New York City Muni. Wtr. Fin. Auth. Wtr. & Swr. Sys. Rev.: | | | |
Participating VRDN Series EGL 07 116, 0.16% 10/7/11 (Liquidity Facility Citibank NA) (b)(e) | 19,800 | | 19,800 |
Series 2006 AA1, 0.15% 10/3/11 (Liquidity Facility California Teachers Retirement Sys.) (Liquidity Facility State Street Bank & Trust Co., Boston), VRDN (b) | 5,590 | | 5,590 |
Series 8, 0.19% 6/25/12, CP | 2,500 | | 2,500 |
New York City Transitional Fin. Auth. Rev.: | | | |
Participating VRDN Series WF 11-21C, 0.17% 10/7/11 (Liquidity Facility Wells Fargo Bank NA) (b)(e) | 1,000 | | 1,000 |
Series C, 0.12% 10/3/11 (Liquidity Facility Morgan Stanley Bank, West Valley City Utah), VRDN (b) | 7,000 | | 7,000 |
New York Dorm. Auth. Personal Income Tax Rev. Participating VRDN Series Putters 3698 Z, 0.16% 10/7/11 (Liquidity Facility JPMorgan Chase Bank) (b)(e) | 2,225 | | 2,225 |
New York Dorm. Auth. Revs. Participating VRDN Series EGL 07 0003, 0.16% 10/7/11 (Liquidity Facility Citibank NA) (b)(e) | 15,560 | | 15,560 |
New York Envir. Facilities Corp. Clean Wtr. & Drinking Wtr. Participating VRDN Series Putters 3376, 0.16% 10/7/11 (Liquidity Facility JPMorgan Chase Bank) (b)(e) | 4,425 | | 4,425 |
New York Envir. Facilities Corp. State Personal Income Tax Rev. Participating VRDN Series Putters 2666, 0.16% 10/7/11 (Liquidity Facility JPMorgan Chase Bank) (b)(e) | 3,185 | | 3,185 |
New York Hsg. Fin. Agcy. Rev. (600 West 42nd St. Hsg. Proj.) Series 2009 A, 0.13% 10/7/11, LOC Bank of New York, New York, VRDN (b) | 6,623 | | 6,623 |
New York Pwr. Auth. Series 2, 0.18% 12/7/11, CP | 22,810 | | 22,810 |
New York Urban Dev. Corp. Rev. Participating VRDN Series Putters 2283, 0.16% 10/7/11 (Liquidity Facility Deutsche Bank AG New York Branch) (b)(e) | 7,090 | | 7,090 |
| | 101,208 |
New York & New Jersey - 0.0% |
Port Auth. of New York & New Jersey Participating VRDN Series Putters 1546, 0.16% 10/7/11 (Liquidity Facility JPMorgan Chase Bank) (b)(e) | 1,405 | | 1,405 |
Municipal Securities - continued |
| Principal Amount (000s) | | Value (000s) |
North Carolina - 2.2% |
Board of Governors of the Univ. of North Carolina Series D, 0.14% 10/4/11, CP | $ 2,000 | | $ 2,000 |
Charlotte Wtr. & Swr. Sys. Rev. Participating VRDN Series ROC II R 11906, 0.15% 10/7/11 (Liquidity Facility Citibank NA) (b)(e) | 2,750 | | 2,750 |
Charlotte-Mecklenburg Hosp. Auth. Health Care Sys. Rev. Series 2007 H, 0.1% 10/3/11, LOC Wells Fargo Bank NA, VRDN (b) | 6,150 | | 6,150 |
North Carolina Cap. Facilities Fin. Agcy. Edl. Facilities Rev.: | | | |
(Campbell Univ. Proj.) Series 2009, 0.15% 10/7/11, LOC Branch Banking & Trust Co., VRDN (b) | 1,465 | | 1,465 |
(Greensboro College Proj.) 0.21% 10/7/11, LOC Bank of America NA, VRDN (b) | 5,610 | | 5,610 |
North Carolina Cap. Facilities Fin. Agcy. Rev.: | | | |
Participating VRDN: | | | |
Series EGL 06 0139, 0.16% 10/7/11 (Liquidity Facility Citibank NA) (b)(e) | 1,900 | | 1,900 |
Series EGL 07 0015, 0.16% 10/7/11 (Liquidity Facility Citibank NA) (b)(e) | 10,890 | | 10,890 |
Series EGL 7053004 Class A, 0.16% 10/7/11 (Liquidity Facility Citibank NA) (b)(e) | 13,105 | | 13,105 |
Series 2001 A1, 0.15% 12/7/11, CP | 3,537 | | 3,537 |
North Carolina Cap. Impt. Ltd. Participating VRDN Series BBT 08 52, 0.15% 10/7/11 (Liquidity Facility Branch Banking & Trust Co.) (b)(e) | 3,530 | | 3,530 |
North Carolina Gen. Oblig. Bonds Series 2005 B, 5% 4/1/12 | 1,700 | | 1,741 |
North Carolina Med. Care Commission Health Care Facilities Rev. (WakeMed Proj.): | | | |
Series 2009 B, 0.15% 10/7/11, LOC Wells Fargo Bank NA, VRDN (b) | 1,000 | | 1,000 |
Series 2009 C, 0.15% 10/7/11, LOC Wells Fargo Bank NA, VRDN (b) | 6,400 | | 6,400 |
Orange Wtr. & Swr. Auth. Series 2004 B, 0.12% 10/7/11 (Liquidity Facility Wells Fargo Bank NA), VRDN (b) | 2,000 | | 2,000 |
Piedmont Triad Arpt. Auth. Series 2008 A, 0.12% 10/7/11, LOC Branch Banking & Trust Co., VRDN (b) | 11,050 | | 11,050 |
|
| Principal Amount (000s) | | Value (000s) |
Raleigh Combined Enterprise Sys. Rev. Participating VRDN Series EGL 07 0010, 0.16% 10/7/11 (Liquidity Facility Citibank NA) (b)(e) | $ 4,950 | | $ 4,950 |
Univ. of North Carolina at Chapel Hill Rev. Participating VRDN Series EGL 05 3014 Class A, 0.16% 10/7/11 (Liquidity Facility Citibank NA) (b)(e) | 2,100 | | 2,100 |
| | 80,178 |
Ohio - 3.4% |
Columbus Gen. Oblig. Participating VRDN Series Clipper 08 2, 0.16% 10/7/11 (Liquidity Facility State Street Bank & Trust Co., Boston) (b)(e) | 11,985 | | 11,985 |
Columbus Swr. Sys. Rev. Participating VRDN Series BBT 08 5, 0.15% 10/7/11 (Liquidity Facility Branch Banking & Trust Co.) (b)(e) | 5,230 | | 5,230 |
Franklin County Hosp. Rev. Bonds (U.S. Health Corp. of Columbus Proj.) Series 2011 B, 2%, tender 7/2/12 (b) | 5,100 | | 5,164 |
Hamilton County Hosp. Facilities Rev. (Children's Hosp. Med. Ctr. Proj.) Series 2000, 0.16% 10/7/11, LOC JPMorgan Chase Bank, VRDN (b) | 1,115 | | 1,115 |
Lake County Hosp. Facilities Rev. (Lake Hosp. Sys., Inc. Proj.) Series 2002, 0.22% 10/7/11, LOC JPMorgan Chase Bank, VRDN (b) | 7,200 | | 7,200 |
Ohio Gen. Oblig.: | | | |
(Infrastructure Impt. Proj.) Series 2003 B, 0.12% 10/7/11, VRDN (b) | 2,225 | | 2,225 |
Bonds Series H, 5% 5/1/12 | 2,000 | | 2,053 |
0.12% 10/7/11, VRDN (b) | 5,000 | | 5,000 |
Ohio Higher Edl. Facility Commission Rev.: | | | |
(Cleveland Clinic Foundation Proj.) Series 2008 B4, 0.12% 10/3/11, VRDN (b) | 20,100 | | 20,100 |
Bonds: | | | |
(Cleveland Clinic Foundation Proj.): | | | |
Series 2008 B5: | | | |
0.25% tender 2/8/12, CP mode | 13,450 | | 13,450 |
0.28% tender 5/4/12, CP mode | 5,000 | | 5,000 |
Series 2008 B6: | | | |
0.25% tender 12/7/11, CP mode | 9,200 | | 9,200 |
0.27% tender 3/7/12, CP mode | 15,000 | | 15,000 |
Municipal Securities - continued |
| Principal Amount (000s) | | Value (000s) |
Ohio - continued |
Ohio Wtr. Dev. Auth. Poll. Cont. Facilities Rev.: | | | |
(First Energy Nuclear Generation Corp. Proj.) Series 2006 B, 0.15% 10/3/11, LOC Wells Fargo Bank NA, VRDN (b) | $ 21,204 | | $ 21,204 |
(FirstEnergy Corp. Proj.) Series 2006 A, 0.09% 10/3/11, LOC UBS AG, VRDN (b) | 3,000 | | 3,000 |
| | 126,926 |
Oregon - 0.9% |
Clackamas County Hosp. Facility Auth. Bonds (Providence Health Sys. Proj.): | | | |
Series 2003 D: | | | |
0.14% tender 10/17/11, CP mode | 13,000 | | 13,000 |
0.2% tender 10/4/11, CP mode | 12,500 | | 12,500 |
Series F, 0.2% tender 1/9/12, CP mode | 5,000 | | 5,000 |
Oregon Health and Science Univ. Spl. Rev. Series 2009 B1, 0.15% 10/7/11, LOC U.S. Bank NA, Minnesota, VRDN (b) | 1,900 | | 1,900 |
| | 32,400 |
Pennsylvania - 2.4% |
Allegheny County Higher Ed. Bldg. Auth. Univ. Rev. (Point Park Univ. Proj.) Series 2008 C, 0.16% 10/7/11, LOC PNC Bank NA, VRDN (b) | 6,570 | | 6,570 |
Allegheny County Hosp. Dev. Auth. Rev. (Jefferson Reg'l. Med. Ctr. Proj.) Series 2008 A, 0.16% 10/7/11, LOC PNC Bank NA, VRDN (b) | 1,670 | | 1,670 |
Allegheny County Indl. Dev. Auth. Rev. (Zoological Society of Pittsburgh Proj.) Series 1999 B, 0.16% 10/7/11, LOC PNC Bank NA, VRDN (b) | 2,200 | | 2,200 |
Allegheny County Port Auth. Spl. Rev. Bonds 2% 3/1/12 | 2,760 | | 2,774 |
Bucks County Indl. Dev. Auth. Hosp. Rev. (Grand View Hosp. Proj.) Series 2008 A, 0.12% 10/7/11, LOC PNC Bank NA, VRDN (b) | 2,000 | | 2,000 |
Clearfield County Indl. Dev. Auth. Rev. (Dubois Area Catholic School Proj.) 0.16% 10/7/11, LOC PNC Bank NA, VRDN (b) | 900 | | 900 |
Erie County Hosp. Auth. Rev. (Saint Vincent Health Ctr. Proj.) Series 2010 B, 0.16% 10/7/11, LOC Manufacturers & Traders Trust Co., VRDN (b) | 3,500 | | 3,500 |
Haverford Township School District Series 2009, 0.16% 10/7/11, LOC TD Banknorth, NA, VRDN (b) | 965 | | 965 |
|
| Principal Amount (000s) | | Value (000s) |
Lancaster County Hosp. Auth. Health Ctr. Rev. (Masonic Homes Proj.) Series 2008 D, 0.15% 10/3/11, LOC JPMorgan Chase Bank, VRDN (b) | $ 1,715 | | $ 1,715 |
Montgomery County Higher Ed. & Health Auth. Rev. (William Penn Charter School Proj.) Series 2001, 0.16% 10/7/11, LOC PNC Bank NA, VRDN (b) | 5,375 | | 5,375 |
Montgomery County Redev. Auth. Multi-family Hsg. Rev.: | | | |
(Brookside Manor Apts. Proj.) Series 2001 A, 0.16% 10/7/11, LOC Fannie Mae, VRDN (b) | 9,170 | | 9,170 |
(Kingswood Apts. Proj.) Series 2001 A, 0.16% 10/7/11, LOC Fannie Mae, VRDN (b) | 10,725 | | 10,725 |
Pennsylvania Gen. Oblig. Participating VRDN Series ROC II R 11505, 0.16% 10/7/11 (Liquidity Facility Citibank NA) (b)(e) | 4,510 | | 4,510 |
Pennsylvania Higher Edl. Facilities Auth. Rev.: | | | |
(Keystone College Proj.) Series 2001 H5, 0.16% 10/7/11, LOC PNC Bank NA, VRDN (b) | 3,300 | | 3,300 |
(King's College Proj.) Series 2002 J3, 0.16% 10/7/11, LOC PNC Bank NA, VRDN (b) | 1,315 | | 1,315 |
Participating VRDN Series WF 11 26C, 0.17% 10/7/11 (Liquidity Facility Wells Fargo Bank NA) (b)(e) | 2,000 | | 2,000 |
Philadelphia Auth. for Indl. Dev. Rev. (New Courtland Elder Svcs. Proj.) Series 2003, 0.11% 10/3/11, LOC PNC Bank NA, VRDN (b) | 5,490 | | 5,490 |
Pittsburgh Wtr. & Swr. Auth. Wtr. & Swr. Sys. Rev. Series 2008 B2, 0.12% 10/7/11, LOC PNC Bank NA, VRDN (b) | 9,700 | | 9,700 |
Schuylkill County Indl. Dev. Auth. Resource Recovery Rev. (Integrys Energy Group, Inc. Proj.) 0.15% 10/7/11, LOC JPMorgan Chase Bank, VRDN (b) | 4,800 | | 4,800 |
Somerset County Gen. Oblig.: | | | |
Series 2009 A, 0.16% 10/7/11, LOC PNC Bank NA, VRDN (b) | 3,445 | | 3,445 |
Series 2009 C, 0.16% 10/7/11, LOC PNC Bank NA, VRDN (b) | 1,200 | | 1,200 |
Westmoreland County Indl. Dev. Auth. Rev. (Excela Health Proj.) Series 2010 B, 0.16% 10/7/11, LOC PNC Bank NA, VRDN (b) | 5,175 | | 5,175 |
Wilkes Barre Gen. Oblig. Series 2004 B, 0.16% 10/7/11, LOC PNC Bank NA, VRDN (b) | 2,010 | | 2,010 |
| | 90,509 |
Municipal Securities - continued |
| Principal Amount (000s) | | Value (000s) |
Rhode Island - 0.1% |
Rhode Island Health and Edl. Bldg. Corp. Higher Ed. Facility Rev. (New England Institute of Technology Proj.) Series 2008, 0.13% 10/7/11, LOC TD Banknorth, NA, VRDN (b) | $ 4,870 | | $ 4,870 |
South Carolina - 1.8% |
Charleston County Hosp. Facilities (Care Alliance Health Svcs. Proj.) Series 2004 B2, 0.15% 10/3/11, LOC Wells Fargo Bank NA, VRDN (b) | 4,500 | | 4,500 |
Greenville County School District Bonds Series 2011, 1.5% 6/1/12 | 7,950 | | 8,017 |
Horry County School District Participating VRDN Series ROC II R 754 PB, 0.19% 10/7/11 (Liquidity Facility Deutsche Postbank AG) (b)(e) | 5,530 | | 5,530 |
Piedmont Muni. Pwr. Agcy. Elec. Rev.: | | | |
Series 2011 C, 0.12% 10/7/11, LOC TD Banknorth, NA, VRDN (b) | 1,600 | | 1,600 |
Series 2011B, 0.13% 10/7/11, LOC U.S. Bank NA, Minnesota, VRDN (b) | 8,250 | | 8,250 |
South Carolina Edl. Facilities Auth. for Private Nonprofit Institutions of Higher Learning Edl. Facilities Rev.: | | | |
(Claflin Univ. Proj.) 0.23% 10/7/11, LOC Bank of America NA, VRDN (b) | 8,269 | | 8,269 |
(Converse College Proj.) Series 2009, 0.15% 10/7/11, LOC Wells Fargo Bank NA, VRDN (b) | 2,000 | | 2,000 |
(Newberry College Proj.) Series 2008, 0.15% 10/7/11, LOC Branch Banking & Trust Co., VRDN (b) | 11,995 | | 11,995 |
South Carolina Jobs-Econ. Dev. Auth. (The Reg'l. Med. Ctr. of Orangeburg and Calhoun Counties Proj.) Series 2009, 0.15% 10/7/11, LOC Branch Banking & Trust Co., VRDN (b) | 2,565 | | 2,565 |
South Carolina Pub. Svc. Auth. Rev.: | | | |
Bonds Series 2002 D, 5.25% 1/1/12 | 1,000 | | 1,012 |
Participating VRDN Series ROC II R 11426, 0.17% 10/7/11 (Liquidity Facility Citibank NA) (b)(e) | 3,810 | | 3,810 |
Series 2010 A: | | | |
0.17% 11/10/11, CP | 6,100 | | 6,100 |
0.17% 12/12/11, CP | 3,390 | | 3,390 |
| | 67,038 |
Tennessee - 2.1% |
Blount County Pub. Bldg. Auth.: | | | |
(Local Govt. Pub. Impt. Proj.): | | | |
Series 2009 E8A, 0.15% 10/7/11, LOC Branch Banking & Trust Co., VRDN (b) | 1,400 | | 1,400 |
Series 2009 E9A, 0.15% 10/7/11, LOC Branch Banking & Trust Co., VRDN (b) | 8,335 | | 8,335 |
|
| Principal Amount (000s) | | Value (000s) |
Series E7A, 0.15% 10/7/11, LOC Branch Banking & Trust Co., VRDN (b) | $ 5,270 | | $ 5,270 |
Clarksville Pub. Bldg. Auth. Rev. (Tennessee Muni. Bond Fund Proj.) Series 1994, 0.36% 10/7/11, LOC Bank of America NA, VRDN (b) | 4,500 | | 4,500 |
Knox County Health Edl. & Hsg. Facilities Board Hosp. Facilities Rev. (Catholic Healthcare Partners Proj.) Series 2008 A, 0.13% 10/7/11, LOC U.S. Bank NA, Minnesota, VRDN (b) | 2,300 | | 2,300 |
Memphis Health, Edl. & Hsg. Facilities Board (Watergrove Apts. Proj.) Series 2004, 0.16% 10/7/11, LOC Freddie Mac, VRDN (b) | 18,170 | | 18,170 |
Metropolitan Govt. Nashville & Davidson County Indl. Dev. Board Rev. (Nashville Symphony Hall Proj.) Series 2004, 0.23% 10/7/11, LOC Bank of America NA, VRDN (b) | 24,715 | | 24,715 |
Montgomery County Pub. Bldg. Auth. Pooled Fing. Rev. (Tennessee County Ln. Pool Prog.) Series 1999, 0.33% 10/7/11, LOC Bank of America NA, VRDN (b) | 8,500 | | 8,500 |
Nashville and Davidson County Metropolitan Govt. Gen. Oblig. Participating VRDN Series Clipper 06 4, 0.19% 10/7/11 (Liquidity Facility State Street Bank & Trust Co., Boston) (b)(e) | 5,000 | | 5,000 |
| | 78,190 |
Texas - 15.2% |
Alamo Cmnty. College District Participating VRDN Series Solar 06 42, 0.15% 10/7/11 (Liquidity Facility U.S. Bank NA, Minnesota) (b)(e) | 10,215 | | 10,215 |
Austin Elec. Util. Sys. Rev.: | | | |
Participating VRDN Series Solar 06 91, 0.15% 10/7/11 (Liquidity Facility U.S. Bank NA, Minnesota) (b)(e) | 10,165 | | 10,165 |
Series A: | | | |
0.16% 10/6/11, LOC JPMorgan Chase Bank, LOC State Street Bank & Trust Co., Boston, CP | 20,500 | | 20,500 |
0.18% 10/4/11, LOC JPMorgan Chase Bank, LOC State Street Bank & Trust Co., Boston, CP | 3,090 | | 3,090 |
Beaumont Independent School District Participating VRDN Series Putters 3225, 0.19% 10/7/11 (Liquidity Facility JPMorgan Chase Bank) (b)(e) | 11,115 | | 11,115 |
Brownsville Util. Sys. Rev. Series A, 0.22% 12/15/11, LOC State Street Bank & Trust Co., Boston, CP | 7,500 | | 7,500 |
Municipal Securities - continued |
| Principal Amount (000s) | | Value (000s) |
Texas - continued |
Dallas Wtr. & Swr. Sys. Rev. Participating VRDN Series Solar 06 60, 0.15% 10/7/11 (Liquidity Facility U.S. Bank NA, Minnesota) (b)(e) | $ 19,175 | | $ 19,175 |
Dallas Wtrwks. & Swr. Sys. Rev. Participating VRDN: | | | |
Series Putters 3227, 0.16% 10/7/11 (Liquidity Facility JPMorgan Chase Bank) (b)(e) | 15,005 | | 15,005 |
Series Putters 3742, 0.16% 10/7/11 (Liquidity Facility JPMorgan Chase Bank) (b)(e) | 5,000 | | 5,000 |
Denton Independent School District Participating VRDN Series DB 513, 0.18% 10/7/11 (Liquidity Facility Deutsche Bank AG) (b)(e) | 31,100 | | 31,100 |
Friendswood Independent School District Participating VRDN Series Putters 3221, 0.19% 10/7/11 (Liquidity Facility JPMorgan Chase Bank) (b)(e) | 8,185 | | 8,185 |
Goose Creek Consolidated Independent School District Participating VRDN Series PZ 219, 0.17% 10/7/11 (Liquidity Facility Wells Fargo & Co.) (b)(e) | 10,385 | | 10,385 |
Gulf Coast Waste Disp. Auth. Envir. Facilities Rev. (Air Products Proj.) Series 2005, 0.13% 10/7/11 (Air Products & Chemicals, Inc. Guaranteed), VRDN (b) | 2,100 | | 2,100 |
Harris County Gen. Oblig.: | | | |
Bonds Series 2011 A, 2%, tender 8/15/12 (b) | 4,400 | | 4,466 |
Participating VRDN: | | | |
Series Clipper 07 46, 0.19% 10/7/11 (Liquidity Facility State Street Bank & Trust Co., Boston) (b)(e) | 40,000 | | 40,000 |
Series ROC II R 718 PB, 0.2% 10/7/11 (Liquidity Facility Deutsche Postbank AG) (b)(e) | 9,690 | | 9,690 |
Series A1, 0.17% 1/17/12 (Liquidity Facility State Street Bank & Trust Co., Boston), CP | 6,550 | | 6,550 |
Series B, 0.22% 10/5/11 (Liquidity Facility Bank of America NA), CP | 2,800 | | 2,800 |
TAN Series 2011, 1.5% 2/29/12 | 5,100 | | 5,128 |
Harris County Metropolitan Trans. Auth.: | | | |
Series A1, 0.15% 10/5/11 (Liquidity Facility JPMorgan Chase Bank), CP | 29,050 | | 29,050 |
Series A3: | | | |
0.22% 10/25/11 (Liquidity Facility State Street Bank & Trust Co., Boston), CP | 5,000 | | 5,000 |
0.23% 12/8/11 (Liquidity Facility State Street Bank & Trust Co., Boston), CP | 5,000 | | 5,000 |
|
| Principal Amount (000s) | | Value (000s) |
Houston Gen. Oblig. Series A, 0.2% 10/7/11, LOC Union Bank of California, CP | $ 3,700 | | $ 3,700 |
Houston Higher Ed. Fin. Corp. Higher Ed. Rev.: | | | |
Participating VRDN Series ROC II R 11860, 0.16% 10/7/11 (Liquidity Facility Citibank NA) (b)(e) | 6,000 | | 6,000 |
Series A: | | | |
0.22% 1/12/12, CP | 5,000 | | 5,000 |
0.22% 1/12/12, CP | 1,000 | | 1,000 |
Houston Util. Sys. Rev.: | | | |
Bonds Series 2010 C, 2% 11/15/11 | 3,500 | | 3,507 |
Participating VRDN: | | | |
Series ROC II R 11411, 0.16% 10/7/11 (Liquidity Facility Citibank NA) (b)(e) | 10,000 | | 10,000 |
Series ROC II R 11885X, 0.16% 10/7/11 (Liquidity Facility Citibank NA) (b)(e) | 5,180 | | 5,180 |
Judson Independent School District Participating VRDN Series DB 423, 0.18% 10/7/11 (Liquidity Facility Deutsche Bank AG) (b)(e) | 12,745 | | 12,745 |
Klein Independent School District Participating VRDN Series WF 11 51 C, 0.17% 10/7/11 (Liquidity Facility Wells Fargo Bank NA) (b)(e) | 5,000 | | 5,000 |
Lower Colorado River Auth. Rev. 0.18% 10/6/11, LOC JPMorgan Chase Bank, LOC State Street Bank & Trust Co., Boston, CP | 11,200 | | 11,200 |
Lubbock Health Facilities Dev. Corp. Rev. Bonds (St. Joseph Health Sys. Proj.) Series 2008 B, 5% 7/1/12 | 10,960 | | 11,332 |
Medina Valley Independent School District Participating VRDN Series ROC II R 11969, 0.16% 10/7/11 (Liquidity Facility Citibank NA) (b)(e) | 2,040 | | 2,040 |
North Central Texas Health Facilities Dev. Corp. Participating VRDN Series WF 09 33C, 0.17% 10/7/11 (Liquidity Facility Wells Fargo & Co.) (b)(e) | 7,200 | | 7,200 |
North East Texas Independent School District Participating VRDN Series MS 3277 X, 0.17% 10/7/11 (Liquidity Facility Morgan Stanley Bank, West Valley City Utah) (b)(e) | 5,000 | | 5,000 |
North Texas Muni. Wtr. District Wtr. Sys. Rev. Participating VRDN: | | | |
Series BA 08 1174, 0.22% 10/7/11 (Liquidity Facility Bank of America NA) (b)(e) | 5,460 | | 5,460 |
Series ROC II R 593 PB, 0.19% 10/7/11 (Liquidity Facility Deutsche Postbank AG) (b)(e) | 16,810 | | 16,810 |
Municipal Securities - continued |
| Principal Amount (000s) | | Value (000s) |
Texas - continued |
North Texas Tollway Auth. Rev. Series 2011 A, 0.15% 10/7/11, LOC Morgan Stanley Bank, West Valley City Utah, VRDN (b) | $ 8,500 | | $ 8,500 |
Port Arthur Navigation District Envir. Facilities Rev.: | | | |
(Motiva Enterprises LLC Proj.) Series 2010 B, 0.14% 10/3/11, VRDN (b) | 13,000 | | 13,000 |
Series 2010 D, 0.14% 10/3/11, VRDN (b) | 15,200 | | 15,200 |
Red River Ed. Fin. Corp. Ed. Rev. (Texas Christian Univ. Proj.) Series 2000, 0.12% 10/7/11, VRDN (b) | 1,000 | | 1,000 |
San Antonio Elec. & Gas Sys. Rev. Participating VRDN: | | | |
Series BBT 08 26, 0.15% 10/7/11 (Liquidity Facility Branch Banking & Trust Co.) (b)(e) | 5,320 | | 5,320 |
Series Putters 3688Z, 0.16% 10/7/11 (Liquidity Facility JPMorgan Chase Bank) (b)(e) | 4,605 | | 4,605 |
San Antonio Hotel Occupancy Tax Rev. Series 2008, 0.15% 10/7/11, LOC Wells Fargo Bank NA, VRDN (b) | 5,620 | | 5,620 |
San Antonio Wtr. Sys. Rev.: | | | |
Participating VRDN Series EGL 06 5, 0.16% 10/7/11 (Liquidity Facility Citibank NA) (b)(e) | 3,000 | | 3,000 |
Series 2001 A, 0.22% 10/7/11, CP | 12,400 | | 12,400 |
Sherman Higher Ed. Fin. Corp. (Austin College Proj.) Series 1997, 0.26% 10/7/11, LOC Bank of America NA, VRDN (b) | 12,900 | | 12,900 |
Spring Branch Independent School District Participating VRDN Series Putters 3377, 0.16% 10/7/11 (Liquidity Facility JPMorgan Chase Bank) (b)(e) | 4,500 | | 4,500 |
Spring Independent School District Participating VRDN Series DB 603, 0.18% 10/7/11 (Liquidity Facility Deutsche Bank AG) (b)(e) | 3,800 | | 3,800 |
Tarrant County Cultural Ed. Facilities Fin. Corp. Hosp. Rev.: | | | |
(Methodist Hospitals of Dallas Proj.) Series 2008, 0.18% 10/3/11, LOC JPMorgan Chase Bank, VRDN (b) | 1,765 | | 1,765 |
Bonds (Baylor Health Care Sys. Proj.) Series 2011 B, 0.29%, tender 4/27/12 (b) | 6,200 | | 6,200 |
Tarrant County Health Facilities Dev. Corp. Rev. (Carter Blood Care Proj.) Series 1998, 0.15% 10/7/11, LOC JPMorgan Chase Bank, VRDN (b) | 5,840 | | 5,840 |
|
| Principal Amount (000s) | | Value (000s) |
Texas A&M Univ. Rev.: | | | |
Participating VRDN: | | | |
Series BC 10 39W, 0.17% 10/7/11 (Liquidity Facility Barclays Bank PLC) (b)(e) | $ 1,580 | | $ 1,580 |
Series ROC II R 11804, 0.16% 10/7/11 (Liquidity Facility Citibank NA) (b)(e) | 4,000 | | 4,000 |
0.17% 10/7/11 (Liquidity Facility Wells Fargo Bank NA) (a)(b)(e) | 4,575 | | 4,575 |
Series 1993 B, 0.13% 10/5/11, CP | 5,025 | | 5,025 |
Texas Gen. Oblig.: | | | |
Bonds Series 2008 A, 5% 10/1/11 | 3,000 | | 3,000 |
Participating VRDN: | | | |
Series Putters 3480, 0.16% 10/7/11 (Liquidity Facility JPMorgan Chase Bank) (b)(e) | 7,495 | | 7,495 |
Series Solar 06 57, 0.15% 10/7/11 (Liquidity Facility U.S. Bank NA, Minnesota) (b)(e) | 10,165 | | 10,165 |
Texas Pub. Fin. Auth. Rev. Series 2003, 0.15% 10/7/11, CP | 4,000 | | 4,000 |
Univ. of Texas Board of Regents Sys. Rev. Series 2002 A: | | | |
0.12% 10/4/11 (Liquidity Facility Univ. of Texas Invt. Mgmt. Co.), CP | 2,900 | | 2,900 |
0.13% 10/12/11 (Liquidity Facility Univ. of Texas Invt. Mgmt. Co.), CP | 5,100 | | 5,100 |
0.14% 10/24/11 (Liquidity Facility Univ. of Texas Invt. Mgmt. Co.), CP | 5,750 | | 5,750 |
0.16% 11/7/11 (Liquidity Facility Univ. of Texas Invt. Mgmt. Co.), CP | 11,600 | | 11,600 |
0.16% 12/6/11 (Liquidity Facility Univ. of Texas Invt. Mgmt. Co.), CP | 14,000 | | 14,000 |
Upper Trinity Reg'l. Wtr. District Series A, 0.16% 10/5/11, LOC Bank of America NA, CP | 10,000 | | 10,000 |
| | 565,233 |
Utah - 1.9% |
Emery County Poll. Cont. Rev. (PacifiCorp Proj.) Series 1994, 0.15% 10/7/11, LOC Wells Fargo Bank NA, VRDN (b) | 7,790 | | 7,790 |
Intermountain Pwr. Agcy. Pwr. Supply Rev.: | | | |
Series 1997 B1, 0.17% 1/19/12 (Liquidity Facility Bank of Nova Scotia), CP | 4,600 | | 4,600 |
Series 1997 B2, 0.25% 11/9/11 (Liquidity Facility Bank of Nova Scotia), CP | 18,490 | | 18,490 |
Series 1997 B3, 0.17% 1/19/12 (Liquidity Facility JPMorgan Chase Bank), CP | 3,700 | | 3,700 |
Series 1998 B4, 0.15% 10/3/11 (Liquidity Facility JPMorgan Chase Bank), CP | 9,760 | | 9,760 |
Municipal Securities - continued |
| Principal Amount (000s) | | Value (000s) |
Utah - continued |
Riverton Hosp. Rev. Participating VRDN: | | | |
Series Putters 1762, 0.15% 10/3/11 (Liquidity Facility JPMorgan Chase & Co.) (b)(e) | $ 14,000 | | $ 14,000 |
Series WF 11 35C, 0.17% 10/7/11 (Liquidity Facility Wells Fargo Bank NA) (b)(e) | 5,530 | | 5,530 |
Utah State Board of Regents Rev. Participating VRDN Series Solar 06 140, 0.15% 10/7/11 (Liquidity Facility U.S. Bank NA, Minnesota) (b)(e) | 4,800 | | 4,800 |
Utah Transit Auth. Sales Tax Rev. Participating VRDN Series PT 4606, 0.2% 10/7/11 (Liquidity Facility Deutsche Postbank AG) (b)(e) | 2,325 | | 2,325 |
| | 70,995 |
Virginia - 2.0% |
Albemarle County Econ. Dev. Auth. Hosp. Rev. (Martha Jefferson Hosp. Proj.) Series 2008 D, 0.15% 10/3/11, LOC Wells Fargo Bank NA, VRDN (b) | 8,140 | | 8,140 |
Albemarle Econ. Dev. Auth. Health Svcs. Rev. (The Univ. of Virginia Health Svcs. Foundation Proj.) Series 2009, 0.2% 10/3/11, LOC Bank of America NA, VRDN (b) | 4,000 | | 4,000 |
Fairfax County Indl. Dev. Auth. (Inova Health Sys. Proj.) Series A1, 0.13% 10/7/11 (Liquidity Facility TD Banknorth, NA), VRDN (b) | 2,100 | | 2,100 |
Loudoun County Indl. Dev. Auth. (Loudoun Country Day School, Inc. Proj.) Series 2008, 0.11% 10/7/11, LOC PNC Bank NA, VRDN (b) | 2,000 | | 2,000 |
Montgomery County Indl. Dev. Auth. Rev. (Virginia Tech Foundation Proj.) Series 2005, 0.2% 10/3/11, LOC Bank of America NA, VRDN (b) | 7,000 | | 7,000 |
Newport News Indl. Dev. Auth. (CNU Warwick LLC Student Apts. Proj.) 0.28% 10/7/11, LOC Bank of America NA, VRDN (b) | 8,050 | | 8,050 |
Norfolk Econ. Dev. Auth. Rev. Series 1997, 0.17% 1/17/12, CP | 15,000 | | 15,000 |
Univ. of Virginia Gen. Rev.: | | | |
Participating VRDN Series BBT 08 30, 0.15% 10/7/11 (Liquidity Facility Branch Banking & Trust Co.) (b)(e) | 7,515 | | 7,515 |
Series 2003 A, 0.19% 12/7/11, CP | 7,000 | | 7,000 |
Virginia College Bldg. Auth. Edl. Facilities Rev. Bonds 4% 2/1/12 | 2,000 | | 2,024 |
Virginia Commonwealth Trans. Board Rev. Bonds (Trans. Cap. Projects) Seroes 2010 A1, 5% 5/15/12 | 1,320 | | 1,359 |
|
| Principal Amount (000s) | | Value (000s) |
Virginia Commonwealth Univ. Health Sys. Auth. Series 2008 A, 0.13% 10/3/11, LOC Branch Banking & Trust Co., VRDN (b) | $ 6,810 | | $ 6,810 |
Virginia Small Bus. Fing. (Children's Hosp. of The King's Daughters, Inc. Proj.) Series 2006, 0.25% 10/7/11, LOC Bank of America NA, VRDN (b) | 2,000 | | 2,000 |
| | 72,998 |
Washington - 5.6% |
Central Puget Sound Reg'l. Trans. Auth. Sales & Use Tax Rev. Participating VRDN: | | | |
Series BBT 08 34, 0.15% 10/7/11 (Liquidity Facility Branch Banking & Trust Co.) (b)(e) | 3,045 | | 3,045 |
Series Putters 2866, 0.16% 10/7/11 (Liquidity Facility JPMorgan Chase Bank) (b)(e) | 7,280 | | 7,280 |
Energy Northwest Elec. Rev. Bonds: | | | |
(#1 Proj.) Series 2008 D, 5% 7/1/12 | 1,000 | | 1,035 |
Series 2008 D, 5% 7/1/12 | 3,850 | | 3,986 |
King County Gen. Oblig. Participating VRDN Series BC 10 66W, 0.17% 10/7/11 (Liquidity Facility Barclays Bank PLC) (b)(e) | 2,500 | | 2,500 |
NJB Properties Lease Rev. Participating VRDN Series Solar 07 106, 0.15% 10/7/11 (Liquidity Facility U.S. Bank NA, Minnesota) (b)(e) | 3,350 | | 3,350 |
Univ. of Washington Univ. Revs. Participating VRDN: | | | |
Series Solar 07 75, 0.15% 10/7/11 (Liquidity Facility U.S. Bank NA, Minnesota) (b)(e) | 38,245 | | 38,245 |
Series Solar 07 94, 0.15% 10/7/11 (Liquidity Facility U.S. Bank NA, Minnesota) (b)(e) | 18,304 | | 18,304 |
Washington Econ. Dev. Fin. Auth. Econ. Dev. Rev. (Puget Sound Blood Ctr. Proj.) Series 2008 D, 0.15% 10/7/11, LOC Wells Fargo Bank NA, VRDN (b) | 7,175 | | 7,175 |
Washington Gen. Oblig. Participating VRDN: | | | |
Series Clipper 05 39, 0.21% 10/7/11 (Liquidity Facility State Street Bank & Trust Co., Boston) (b)(e) | 37,230 | | 37,230 |
Series GS 06 7T, 0.15% 10/7/11 (Liquidity Facility Wells Fargo & Co.) (b)(e) | 24,615 | | 24,615 |
Series Putters 3054, 0.16% 10/7/11 (Liquidity Facility JPMorgan Chase Bank) (b)(e) | 3,035 | | 3,035 |
Series Putters 3539, 0.16% 10/7/11 (Liquidity Facility JPMorgan Chase Bank) (b)(e) | 4,330 | | 4,330 |
Municipal Securities - continued |
| Principal Amount (000s) | | Value (000s) |
Washington - continued |
Washington Health Care Facilities Auth. Rev.: | | | |
(Children's Hosp. Reg'l. Med. Ctr. Proj.) Series 2008 A, 0.26% 10/7/11, LOC Bank of America NA, VRDN (b) | $ 17,235 | | $ 17,235 |
(MultiCare Health Sys. Proj.) Series 2009 B, 0.12% 10/7/11, LOC Wells Fargo Bank NA, VRDN (b) | 3,250 | | 3,250 |
(Southwest Washington Med. Ctr.) Series 2008 A, 0.16% 10/7/11, LOC Union Bank of California, VRDN (b) | 5,500 | | 5,500 |
Participating VRDN Series Putters 3403V, 0.16% 10/7/11 (Liquidity Facility JPMorgan Chase Bank) (b)(e) | 7,995 | | 7,995 |
Washington Hsg. Fin. Commission Nonprofit Rev. (YMCA of Pierce and Kitsap Countries Proj.) Series 2010 B, 0.15% 10/7/11, LOC Wells Fargo Bank NA, VRDN (b) | 10,165 | | 10,165 |
Washington Pub. Pwr. Supply Sys. Nuclear Proj. #2 Rev. Bonds: | | | |
Series 1992 A, 6.3% 7/1/12 (Bonneville Pwr. Administration Guaranteed) | 3,100 | | 3,239 |
5.4% 7/1/12 (Bonneville Pwr. Administration Guaranteed) | 7,300 | | 7,579 |
| | 209,093 |
West Virginia - 0.2% |
West Virginia Econ. Dev. Auth. Solid Waste Disp. Facilities Rev. (Appalachian Pwr. Co. - Amos Proj.) Series 2009 B, 0.14% 10/7/11, LOC Sumitomo Mitsui Banking Corp., VRDN (b) | 8,300 | | 8,300 |
Wisconsin - 3.3% |
Appleton Redev. Auth. Rev. (Fox Cities Performing Arts Ctr. Proj.) Series 2001 B, 0.15% 10/7/11, LOC JPMorgan Chase Bank, VRDN (b) | 17,300 | | 17,300 |
Wisconsin Ctr. District Tax Rev. Series 2001 A, 0.15% 10/7/11, LOC U.S. Bank NA, Minnesota, VRDN (b) | 2,000 | | 2,000 |
Wisconsin Gen. Oblig.: | | | |
Bonds Series C, 5% 5/1/12 | 2,820 | | 2,895 |
Series 2006 A, 0.17% 1/19/12 (Liquidity Facility State Street Bank & Trust Co., Boston) (Liquidity Facility California Teachers Retirement Sys.), CP | 4,000 | | 4,000 |
TAN 2% 6/15/12 | 17,800 | | 18,022 |
|
| Principal Amount (000s) | | Value (000s) |
Wisconsin Health & Edl. Facilities Auth. Rev.: | | | |
(Froedtert & Cmnty. Health, Inc. Proj.) Series 2009 B, 0.12% 10/3/11, LOC U.S. Bank NA, Minnesota, VRDN (b) | $ 16,085 | | $ 16,085 |
Bonds: | | | |
(Alexian Brothers Health Sys. Proj.) 0.2% tender 1/9/12, LOC JPMorgan Chase Bank, CP mode | 5,700 | | 5,700 |
(Ministry Health Care Proj.) Series A, 0.14% tender 10/5/11, LOC U.S. Bank NA, Minnesota, CP mode | 11,500 | | 11,500 |
Wisconsin Hsg. and Econ. Dev. Auth. Multifamily Hsg. Rev. Series 2006 A, 0.16% 10/7/11 (Liquidity Facility Fannie Mae) (Liquidity Facility Freddie Mac), VRDN (b) | 5,145 | | 5,145 |
Wisconsin Trans. Rev.: | | | |
Series 1997 A, 0.31% 10/6/11 (Liquidity Facility State Street Bank & Trust Co., Boston) (Liquidity Facility California Teachers Retirement Sys.), CP | 18,000 | | 18,000 |
Series 2006 A: | | | |
0.17% 1/17/12 (Liquidity Facility State Street Bank & Trust Co., Boston) (Liquidity Facility California Teachers Retirement Sys.), CP | 16,474 | | 16,475 |
0.17% 1/19/12 (Liquidity Facility State Street Bank & Trust Co., Boston) (Liquidity Facility California Teachers Retirement Sys.), CP | 1,500 | | 1,500 |
0.19% 12/7/11 (Liquidity Facility State Street Bank & Trust Co., Boston) (Liquidity Facility California Teachers Retirement Sys.), CP | 2,440 | | 2,440 |
| | 121,062 |
| Shares | | |
Other - 7.1% |
Fidelity Tax-Free Cash Central Fund, 0.14% (c)(d) | 265,809,000 | | 265,809 |
TOTAL INVESTMENT PORTFOLIO - 99.4% (Cost $3,702,170) | | 3,702,170 |
NET OTHER ASSETS (LIABILITIES) - 0.6% | | 23,371 |
NET ASSETS - 100% | $ 3,725,541 |
Security Type Abbreviations |
BAN | - | BOND ANTICIPATION NOTE |
CP | - | COMMERCIAL PAPER |
RAN | - | REVENUE ANTICIPATION NOTE |
TAN | - | TAX ANTICIPATION NOTE |
TRAN | - | TAX AND REVENUE ANTICIPATION NOTE |
VRDN | - | VARIABLE RATE DEMAND NOTE (A debt instrument that is payable upon demand, either daily, weekly or monthly) |
Legend |
(a) Security exempt from registration under Rule 144A of the Securities Act of 1933. These securities may be resold in transactions exempt from registration, normally to qualified institutional buyers. At the end of the period, the value of these securities amounted to $8,525,000 or 0.2% of net assets. |
(b) Coupon rates for floating and adjustable rate securities reflect the rates in effect at period end. |
(c) Information in this report regarding holdings by state and security types does not reflect the holdings of the Fidelity Tax-Free Cash Central Fund. |
(d) Affiliated fund that is available only to investment companies and other accounts managed by Fidelity Investments. The rate quoted is the annualized seven-day yield of the fund at period end. A complete unaudited listing of the fund's holdings as of its most recent quarter end is available upon request. In addition, each Fidelity Central Fund's financial statements are available on the SEC's website or upon request. |
(e) Provides evidence of ownership in one or more underlying municipal bonds. |
(f) Restricted securities - Investment in securities not registered under the Securities Act of 1933 (excluding 144A issues). At the end of the period, the value of restricted securities (excluding 144A issues) amounted to $6,400,000 or 0.2% of net assets. |
Additional information on each restricted holding is as follows: |
Security | Acquisition Date | Cost (000s) |
Los Angeles Gen. Oblig. Bonds Series Putters 3930, 0.16%, tender 10/20/11 (Liquidity Facility JPMorgan Chase & Co.) | 7/20/11 | $ 6,400 |
Affiliated Central Funds |
Information regarding fiscal year to date income earned by the Fund from investments in Fidelity Central Funds is as follows: |
Fund | Income earned
(Amounts in thousands) |
Fidelity Tax-Free Cash Central Fund | $ 141 |
Other Information |
The date shown for securities represents the date when principal payments must be paid, taking into account any call options exercised by the issuer and any permissible maturity shortening features other than interest rate resets. |
All investments are categorized as Level 2 under the Fair Value Hierarchy. The inputs or methodology used for valuing securities may not be an indication of the risk associated with investing in those securities. For more information on valuation inputs, please refer to the Security Valuation section in the accompanying Notes to Financial Statements. |
See accompanying notes which are an integral part of the financial statements.
Semiannual Report
Tax-Exempt Portfolio
Financial Statements
Statement of Assets and Liabilities
Amounts in thousands (except per-share amounts) | September 30, 2011 (Unaudited) |
| | |
Assets | | |
Investment in securities, at value - See accompanying schedule: Unaffiliated issuers (cost $3,436,361) | $ 3,436,361 | |
Fidelity Central Funds (cost $265,809) | 265,809 | |
Total Investments (cost $3,702,170) | | $ 3,702,170 |
Cash | | 21,665 |
Receivable for investments sold | | 5,000 |
Receivable for fund shares sold | | 2,909 |
Interest receivable | | 2,367 |
Distributions receivable from Fidelity Central Funds | | 19 |
Receivable from investment adviser for expense reductions | | 5 |
Other receivables | | 39 |
Total assets | | 3,734,174 |
| | |
Liabilities | | |
Payable for investments purchased | $ 5,001 | |
Payable for fund shares redeemed | 2,867 | |
Distributions payable | 12 | |
Accrued management fee | 425 | |
Other affiliated payables | 256 | |
Other payables and accrued expenses | 72 | |
Total liabilities | | 8,633 |
| | |
Net Assets | | $ 3,725,541 |
Net Assets consist of: | | |
Paid in capital | | $ 3,725,343 |
Distributions in excess of net investment income | | (1) |
Accumulated undistributed net realized gain (loss) on investments | | 199 |
Net Assets | | $ 3,725,541 |
| | |
Class I:
Net Asset Value, offering price and redemption price per share ($3,499,260 ÷ 3,496,798 shares) | | $ 1.00 |
| | |
Class II:
Net Asset Value, offering price and redemption price per share ($16,593 ÷ 16,582 shares) | | $ 1.00 |
| | |
Class III:
Net Asset Value, offering price and redemption price per share ($177,154 ÷ 177,034 shares) | | $ 1.00 |
| | |
Select Class:
Net Asset Value, offering price and redemption price per share ($32,534 ÷ 32,506 shares) | | $ 1.00 |
Statement of Operations
Amounts in thousands | Six months ended September 30, 2011 (Unaudited) |
| | |
Investment Income | | |
Interest | | $ 3,481 |
Income from Fidelity Central Funds | | 141 |
Total income | | 3,622 |
| | |
Expenses | | |
Management fee | $ 2,670 | |
Transfer agent fees | 1,152 | |
Distribution and service plan fees | 265 | |
Accounting fees and expenses | 168 | |
Custodian fees and expenses | 24 | |
Independent trustees' compensation | 7 | |
Registration fees | 48 | |
Audit | 20 | |
Legal | 7 | |
Miscellaneous | 22 | |
Total expenses before reductions | 4,383 | |
Expense reductions | (1,120) | 3,263 |
Net investment income (loss) | | 359 |
Realized and Unrealized Gain (Loss) Net realized gain (loss) on: | | |
Investment securities: | | |
Unaffiliated issuers | | 64 |
Net increase in net assets resulting from operations | | $ 423 |
See accompanying notes which are an integral part of the financial statements.
Semiannual Report
Statement of Changes in Net Assets
Amounts in thousands | Six months ended September 30, 2011 (Unaudited) | Year ended
March 31,
2011 |
Increase (Decrease) in Net Assets | | |
Operations | | |
Net investment income (loss) | $ 359 | $ 3,903 |
Net realized gain (loss) | 64 | 40 |
Net increase in net assets resulting from operations | 423 | 3,943 |
Distributions to shareholders from net investment income | (360) | (3,906) |
Distributions to shareholders from net realized gain | - | (147) |
Total distributions | (360) | (4,053) |
Share transactions - net increase (decrease) | (382,167) | (971,972) |
Total increase (decrease) in net assets | (382,104) | (972,082) |
| | |
Net Assets | | |
Beginning of period | 4,107,645 | 5,079,727 |
End of period (including distributions in excess of net investment income of $1 and $0, respectively) | $ 3,725,541 | $ 4,107,645 |
Financial Highlights - Class I
| Six months ended
September 30, 2011 | Years ended March 31, |
| (Unaudited) | 2011 | 2010 | 2009 | 2008 | 2007 |
Selected Per-Share Data | | | | | | |
Net asset value, beginning of period | $ 1.00 | $ 1.00 | $ 1.00 | $ 1.00 | $ 1.00 | $ 1.00 |
Income from Investment Operations | | | | | | |
Net investment income (loss) | - F | .001 | .001 | .015 | .033 | .034 |
Net realized and unrealized gain (loss) F | - | - | - | - | - | - |
Total from investment operations | - F | .001 | .001 | .015 | .033 | .034 |
Distributions from net investment income | - F | (.001) | (.001) | (.015) | (.033) | (.034) |
Distributions from net realized gain | - | - F | - F | - F | - F | - |
Total distributions | - F | (.001) | (.001) | (.015) | (.033) | (.034) |
Net asset value, end of period | $ 1.00 | $ 1.00 | $ 1.00 | $ 1.00 | $ 1.00 | $ 1.00 |
Total Return B,C | .01% | .09% | .15% | 1.50% | 3.33% | 3.44% |
Ratios to Average Net Assets D,E | | | | | | |
Expenses before reductions | .22% A | .22% | .25% | .24% | .23% | .23% |
Expenses net of fee waivers, if any | .17% A | .22% | .23% | .22% | .20% | .20% |
Expenses net of all reductions | .17% A | .22% | .23% | .20% | .17% | .18% |
Net investment income (loss) | .02% A | .09% | .16% | 1.55% | 3.27% | 3.39% |
Supplemental Data | | | | | | |
Net assets, end of period (in millions) | $ 3,499 | $ 3,814 | $ 4,828 | $ 7,738 | $ 10,463 | $ 8,976 |
A Annualized
B Total returns for periods of less than one year are not annualized.
C Total returns would have been lower if certain expenses had not been reduced during the applicable periods shown.
D Fees and expenses of any underlying Fidelity Central Funds are not included in the Fund's expense ratio. The Fund indirectly bears its proportionate share of the expenses of any underlying Fidelity Central Funds.
E Expense ratios reflect operating expenses of the class. Expenses before reductions do not reflect amounts reimbursed or waived or reductions from expense offset arrangements and do not represent the amount paid by the class during periods when reimbursements, waivers or reductions occur. Expenses net of fee waivers reflect expenses after reimbursement and waivers but prior to reductions from expense offset arrangements. Expenses net of all reductions represent the net expenses paid by the class.
F Amount represents less than $.001 per share.
See accompanying notes which are an integral part of the financial statements.
Semiannual Report
Financial Highlights - Class II
| Six months ended
September 30, 2011 | Years ended March 31, |
| (Unaudited) | 2011 | 2010 | 2009 | 2008 | 2007 |
Selected Per-Share Data | | | | | | |
Net asset value, beginning of period | $ 1.00 | $ 1.00 | $ 1.00 | $ 1.00 | $ 1.00 | $ 1.00 |
Income from Investment Operations | | | | | | |
Net investment income (loss) | - F | - F | .001 | .013 | .031 | .032 |
Net realized and unrealized gain (loss) F | - | - | - | - | - | - |
Total from investment operations | - F | - F | .001 | .013 | .031 | .032 |
Distributions from net investment income | - F | - F | (.001) | (.013) | (.031) | (.032) |
Distributions from net realized gain | - | - F | - F | - F | - F | - |
Total distributions | - F | - F | (.001) | (.013) | (.031) | (.032) |
Net asset value, end of period | $ 1.00 | $ 1.00 | $ 1.00 | $ 1.00 | $ 1.00 | $ 1.00 |
Total Return B,C | .01% | .01% | .05% | 1.35% | 3.18% | 3.29% |
Ratios to Average Net Assets D,E | | | | | | |
Expenses before reductions | .37% A | .37% | .40% | .39% | .38% | .38% |
Expenses net of fee waivers, if any | .18% A | .29% | .34% | .37% | .35% | .35% |
Expenses net of all reductions | .18% A | .29% | .34% | .35% | .32% | .32% |
Net investment income (loss) | .01% A | .01% | .06% | 1.40% | 3.12% | 3.24% |
Supplemental Data | | | | | | |
Net assets, end of period (in millions) | $ 17 | $ 22 | $ 26 | $ 54 | $ 111 | $ 116 |
A Annualized
B Total returns for periods of less than one year are not annualized.
C Total returns would have been lower if certain expenses had not been reduced during the applicable periods shown.
D Fees and expenses of any underlying Fidelity Central Funds are not included in the Fund's expense ratio. The Fund indirectly bears its proportionate share of the expenses of any underlying Fidelity Central Funds.
E Expense ratios reflect operating expenses of the class. Expenses before reductions do not reflect amounts reimbursed or waived or reductions from expense offset arrangements and do not represent the amount paid by the class during periods when reimbursements, waivers or reductions occur. Expenses net of fee waivers reflect expenses after reimbursement and waivers but prior to reductions from expense offset arrangements. Expenses net of all reductions represent the net expenses paid by the class.
F Amount represents less than $.001 per share.
Financial Highlights - Class III
| Six months ended
September 30, 2011 | Years ended March 31, |
| (Unaudited) | 2011 | 2010 | 2009 | 2008 | 2007 |
Selected Per-Share Data | | | | | | |
Net asset value, beginning of period | $ 1.00 | $ 1.00 | $ 1.00 | $ 1.00 | $ 1.00 | $ 1.00 |
Income from Investment Operations | | | | | | |
Net investment income (loss) | - F | - F | - F | .012 | .030 | .031 |
Net realized and unrealized gain (loss) F | - | - | - | - | - | - |
Total from investment operations | - F | - F | - F | .012 | .030 | .031 |
Distributions from net investment income | - F | - F | - F | (.012) | (.030) | (.031) |
Distributions from net realized gain | - | - F | - F | - F | - F | - |
Total distributions | - F | - F | - F | (.012) | (.030) | (.031) |
Net asset value, end of period | $ 1.00 | $ 1.00 | $ 1.00 | $ 1.00 | $ 1.00 | $ 1.00 |
Total Return B,C | .01% | .01% | .03% | 1.25% | 3.07% | 3.18% |
Ratios to Average Net Assets D,E | | | | | | |
Expenses before reductions | .47% A | .47% | .50% | .49% | .48% | .48% |
Expenses net of fee waivers, if any | .18% A | .29% | .37% | .47% | .45% | .45% |
Expenses net of all reductions | .18% A | .29% | .37% | .45% | .42% | .42% |
Net investment income (loss) | .01% A | .01% | .02% | 1.30% | 3.02% | 3.14% |
Supplemental Data | | | | | | |
Net assets, end of period (in millions) | $ 177 | $ 198 | $ 166 | $ 272 | $ 459 | $ 360 |
A Annualized
B Total returns for periods of less than one year are not annualized.
C Total returns would have been lower if certain expenses had not been reduced during the applicable periods shown.
D Fees and expenses of any underlying Fidelity Central Funds are not included in the Fund's expense ratio. The Fund indirectly bears its proportionate share of the expenses of any underlying Fidelity Central Funds.
E Expense ratios reflect operating expenses of the class. Expenses before reductions do not reflect amounts reimbursed or waived or reductions from expense offset arrangements and do not represent the amount paid by the class during periods when reimbursements, waivers or reductions occur. Expenses net of fee waivers reflect expenses after reimbursement and waivers but prior to reductions from expense offset arrangements. Expenses net of all reductions represent the net expenses paid by the class.
F Amount represents less than $.001 per share.
See accompanying notes which are an integral part of the financial statements.
Semiannual Report
Financial Highlights - Select Class
| Six months ended
September 30, 2011 | Years ended March 31, |
| (Unaudited) | 2011 | 2010 | 2009 | 2008 | 2007 |
Selected Per-Share Data | | | | | | |
Net asset value, beginning of period | $ 1.00 | $ 1.00 | $ 1.00 | $ 1.00 | $ 1.00 | $ 1.00 |
Income from Investment Operations | | | | | | |
Net investment income (loss) | - F | .001 | .001 | .014 | .032 | .033 |
Net realized and unrealized gain (loss) F | - | - | - | - | - | - |
Total from investment operations | - F | .001 | .001 | .014 | .032 | .033 |
Distributions from net investment income | - F | (.001) | (.001) | (.014) | (.032) | (.033) |
Distributions from net realized gain | - | - F | - F | - F | - F | - |
Total distributions | - F | (.001) | (.001) | (.014) | (.032) | (.033) |
Net asset value, end of period | $ 1.00 | $ 1.00 | $ 1.00 | $ 1.00 | $ 1.00 | $ 1.00 |
Total Return B,C | .01% | .06% | .11% | 1.45% | 3.28% | 3.39% |
Ratios to Average Net Assets D,E | | | | | | |
Expenses before reductions | .27% A | .27% | .30% | .29% | .28% | .29% |
Expenses net of fee waivers, if any | .18% A | .25% | .28% | .27% | .25% | .25% |
Expenses net of all reductions | .18% A | .25% | .28% | .25% | .22% | .23% |
Net investment income (loss) | .01% A | .05% | .12% | 1.50% | 3.22% | 3.34% |
Supplemental Data | | | | | | |
Net assets, end of period (in millions) | $ 33 | $ 73 | $ 60 | $ 48 | $ 92 | $ 85 |
A Annualized
B Total returns for periods of less than one year are not annualized.
C Total returns would have been lower if certain expenses had not been reduced during the applicable periods shown.
D Fees and expenses of any underlying Fidelity Central Funds are not included in the Fund's expense ratio. The Fund indirectly bears its proportionate share of the expenses of any underlying Fidelity Central Funds.
E Expense ratios reflect operating expenses of the class. Expenses before reductions do not reflect amounts reimbursed or waived or reductions from expense offset arrangements and do not represent the amount paid by the class during periods when reimbursements, waivers or reductions occur. Expenses net of fee waivers reflect expenses after reimbursement and waivers but prior to reductions from expense offset arrangements. Expenses net of all reductions represent the net expenses paid by the class.
F Amount represents less than $.001 per share.
See accompanying notes which are an integral part of the financial statements.
Semiannual Report
Notes to Financial Statements
For the period ended September 30, 2011 (Unaudited)
(Amounts in thousands except percentages)
1. Organization.
Treasury Only Portfolio, Treasury Portfolio, Government Portfolio, Prime Money Market Portfolio, Money Market Portfolio and Tax-Exempt Portfolio (the Funds) are funds of Fidelity Colchester Street Trust (the Trust). Each Fund is authorized to issue an unlimited number of shares. The Trust is registered under the Investment Company Act of 1940, as amended (the 1940 Act), as an open-end management investment company organized as a Delaware statutory trust. Each Fund offers Class I, Class II, Class III and Select Class shares. Treasury Only Portfolio and Treasury Portfolio also offer Class IV shares. Prime Money Market Portfolio also offers Class IV and Institutional Class. Money Market Portfolio also offers Class F and Institutional Class. All classes have equal rights as to assets and voting privileges. Prime Money Market Portfolio and Money Market Portfolio offer conversion privileges between classes within each fund to eligible shareholders of the existing classes of shares. Class F shares of the Fund are only available for purchase by mutual funds for which Fidelity Management & Research Company (FMR) or an affiliate serves as investment manager. Each class has exclusive voting rights with respect to matters that affect that class. Investment income, realized and unrealized capital gains and losses, the common expenses of the Fund, and certain fund-level expense reductions, if any, are allocated on a pro-rata basis to each class based on the relative net assets of each class to the total net assets of each Fund. Each class differs with respect to transfer agent and distribution and service plan fees incurred. Certain expense reductions may also differ by class.
2. Investments in Fidelity Central Funds.
The Funds may invest in Fidelity Central Funds, which are open-end investment companies available only to other investment companies and accounts managed by FMR and its affiliates. The Funds' Schedules of Investments list each of the Fidelity Central Funds held as of period end, if any, as an investment of each Fund, but does not include the underlying holdings of each Fidelity Central Fund. As an Investing Fund, the Funds indirectly bear their proportionate share of the expenses of the underlying Fidelity Central Funds.
The Money Market Central Funds seek preservation of capital and current income and are managed by Fidelity Investments Money Management, Inc. (FIMM), an affiliate of FMR.
A complete unaudited list of holdings for each Fidelity Central Fund is available upon request or at the Securities and Exchange Commission (the SEC) web site at www.sec.gov. In addition, the financial statements of the Fidelity Central Funds are available on the SEC web site or upon request.
3. Significant Accounting Policies.
The financial statements have been prepared in conformity with accounting principles generally accepted in the United States of America (GAAP), which require management to make certain estimates and assumptions at the date of the financial statements. Actual results could differ from those estimates. Subsequent events, if any, through the date that the financial statements were issued have been evaluated in the preparation of the financial statements. The following summarizes the significant accounting policies of the Funds:
Security Valuation. Each Fund categorizes the inputs to valuation techniques used to value their investments into a disclosure hierarchy consisting of three levels as shown below:
Level 1 - quoted prices in active markets for identical investments
Level 2 - other significant observable inputs (including quoted prices for similar investments, interest rates, prepayment speeds, etc.)
Level 3 - unobservable inputs (including the Fund's own assumptions based on the best information available)
As permitted by compliance with certain conditions under Rule 2a-7 of the 1940 Act, securities are valued at amortized cost, which approximates fair value, and are categorized as Level 2 in the hierarchy.
Investment Transactions and Income. Security transactions, including the Funds' investment activity in the Fidelity Central Funds, are accounted for as of trade date. Gains and losses on securities sold are determined on the basis of identified cost. Interest income and distributions from the Fidelity Central Funds are accrued as earned. Interest income includes coupon interest and amortization of premium and accretion of discount on debt securities.
Expenses. Expenses directly attributable to a fund are charged to that fund. Expenses attributable to more than one fund are allocated among the respective funds on the basis of relative net assets or other appropriate methods. Expense estimates are accrued in the period to which they relate and adjustments are made when actual amounts are known.
Deferred Trustee Compensation. Under a Deferred Compensation Plan (the Plan) for Government Portfolio and Money Market Portfolio, independent Trustees may elect to defer receipt of a portion of their annual compensation. Deferred amounts are invested in a cross-section of Fidelity funds, are marked-to-market and remain in the Fund until distributed in accordance with the Plan. The investment of deferred amounts and the offsetting payable to the Trustees are included in the accompanying Statement of Assets and Liabilities.
Semiannual Report
Notes to Financial Statements (Unaudited) - continued
(Amounts in thousands except percentages)
3. Significant Accounting Policies - continued
Income Tax Information and Distributions to Shareholders. Each year, each Fund intends to qualify as a regulated investment company, including distributing substantially all of its taxable income and realized gains under Subchapter M of the Internal Revenue Code and filing its U.S. federal tax return. As a result, no provision for income taxes is required. A fund's federal tax return is subject to examination by the Internal Revenue Service (IRS) for a period of three years.
Dividends are declared and recorded daily and paid monthly from net investment income. Distributions from realized gains, if any, are declared and recorded on the ex-dividend date. Income dividends and capital gain distributions are declared separately for each class. Income and capital gain distributions are determined in accordance with income tax regulations, which may differ from GAAP.
Capital accounts within the financial statements are adjusted for permanent book-tax differences. These adjustments have no impact on net assets or the results of operations. Temporary book-tax differences will reverse in a subsequent period.
Book-tax differences are primarily due to deferred trustees compensation, capital loss carryforwards and losses deferred due to wash sales and excise tax regulations.
The Tax-Exempt Portfolio purchases municipal securities whose interest, in the opinion of the issuer, is free from federal income tax. There is no assurance that the IRS will agree with this opinion. In the event the IRS determines that the issuer does not comply with relevant tax requirements, interest payments from a security could become federally taxable, possibly retroactively to the date the security was issued.
The federal tax cost of investment securities and unrealized appreciation (depreciation) as of period end were as follows for each Fund:
| Tax cost | Gross unrealized appreciation | Gross unrealized depreciation | Net unrealized appreciation
(depreciation)
on securities and
other investments |
Treasury Only Portfolio: | $ 9,199,922 | $ - | $ - | $ - |
Treasury Portfolio: | 17,641,861 | - | - | - |
Government Portfolio: | 36,630,268 | - | - | - |
Prime Money Market Portfolio: | 56,255,527 | - | - | - |
Money Market Portfolio: | 64,033,220 | - | - | - |
Tax-Exempt Portfolio: | 3,702,170 | - | - | - |
Under the recently enacted Regulated Investment Company Modernization Act of 2010 (the Act), The Funds will be permitted to carry forward capital losses incurred in taxable years beginning after December 22, 2010 for an unlimited period. However, any losses incurred during those future taxable years will be required to be utilized prior to any losses incurred in pre-enactment taxable years, which generally expire after eight years from when they are incurred. Additionally, post-enactment capital losses that are carried forward will retain their character as either short-term or long-term capital losses rather than being considered all short-term as under previous law. The Funds' first fiscal year end subject to the Act will be March 31, 2012.
4. Operating Policies.
Repurchase Agreements. FMR has received an Exemptive Order from the SEC which permits the Funds and other affiliated entities of FMR to transfer uninvested cash balances into joint trading accounts which are then invested in repurchase agreements. The Funds may also invest directly with institutions in repurchase agreements. Repurchase agreements are collateralized by government or non-government securities. Upon settlement date, collateral is held in segregated accounts with custodian banks and may be obtained in the event of a default of the counterparty. Each applicable Fund monitors, on a daily basis, the value of the collateral to ensure it is at least equal to the principal amount of the repurchase agreement (including accrued interest). In the event of a default by the counterparty, realization of the collateral proceeds could be delayed, during which time the value of the collateral may decline.
Reverse Repurchase Agreements. To enhance their yield, the Funds may enter into reverse repurchase agreements whereby a fund transfers securities to a counterparty who then agrees to transfer them back to the applicable fund at a future date and agreed upon price, reflecting a rate of interest below market rate. Securities sold under a reverse repurchase agreement, are recorded as a liability in each applicable fund's accompanying Statement of Assets and Liabilities. A fund receives cash proceeds, which are invested in other securities, and agrees to repay the proceeds plus any accrued interest in return for the same securities transferred. A fund continues to receive interest payments on the transferred securities during the term of the reverse repurchase agreement. During the period that a reverse repurchase agreement is outstanding each applicable fund identifies cash and liquid securities as segregated in its custodian records with a value at least equal to its obligation under the agreement. If the counterparty defaults on its obligation, because of insolvency or other reasons, the Fund could experience delays and costs in recovering the security or in gaining access to the collateral. Information regarding reverse repurchase agreements open at period end is included at the end of Fund's Schedule of Investments.
Semiannual Report
4. Operating Policies - continued
Restricted Securities. The Funds may invest in securities that are subject to legal or contractual restrictions on resale. These securities generally may be resold in transactions exempt from registration or to the public if the securities are registered. Disposal of these securities may involve time-consuming negotiations and expense, and prompt sale at an acceptable price may be difficult. Information regarding restricted securities is included at the end of each applicable Fund's Schedule of Investments.
5. Fees and Other Transactions with Affiliates.
Management Fee. FMR and its affiliates provide the Funds with investment management related services for which the Funds pay a monthly management fee that is based on an annual rate of .14% of average net assets.
Distribution and Service Plan Fees. In accordance with Rule 12b-1 of the 1940 Act, the Funds have adopted separate Distribution and Service Plans for each class of shares. Class II, Class III and Select Class of each Fund pays Fidelity Distributors Corporation (FDC), an affiliate of FMR, a Service fee based on an annual percentage of each class' average net assets. Class IV of Treasury Only Portfolio, Treasury Portfolio and Prime Money Market Portfolio pays FDC separate Distribution and Service Fees, each of which is based on an annual percentage of each class' average net assets. FDC may pay financial intermediaries for selling shares of the Funds and providing shareholder support services. For the period, the Distribution and Service fee rates, total fees and amounts retained by FDC were as follows:
| Distribution Fee | Service Fee |
Class II | .00% | .15% |
Class III | .00% | .25% |
Class IV | .25% | .25% |
Select Class | .00% | .05% |
| Total Fees | Retained by FDC |
Treasury Only Portfolio:
Class II | $ 430 | $ - |
Class III | 388 | - |
Class IV | 76 | - |
Select Class | 48 | - |
| $ 942 | $ - |
Treasury Portfolio:
Class II | $ 116 | $ - |
Class III | 4,196 | - |
Class IV | 909 | - |
Select Class | 115 | - |
| $ 5,336 | $ - |
Government Portfolio:
Class II | $ 672 | $ - |
Class III | 2,378 | - |
Select Class | 106 | - |
| $ 3,156 | $ - |
Prime Money Market Portfolio:
Class II | $ 534 | $ - |
Class III | 2,354 | - |
Class IV | 400 | - |
Select Class | 324 | - |
| $ 3,612 | $ - |
Money Market Portfolio:
Class II | $ 243 | $ - |
Class III | 3,164 | - |
Select Class | 274 | - |
| $ 3,681 | $ - |
Tax-Exempt Portfolio:
Class II | $ 17 | $ -* |
Class III | 235 | - |
Select Class | 13 | - |
| $ 265 | $ -* |
* Amount represents three hundred thirty seven dollars.
During the period, FMR or its affiliates waived a portion of these fees.
Semiannual Report
Notes to Financial Statements (Unaudited) - continued
(Amounts in thousands except percentages)
5. Fees and Other Transactions with Affiliates - continued
Transfer Agent Fees. Fidelity Investments Institutional Operations Company, Inc. (FIIOC), an affiliate of FMR, is the transfer, dividend disbursing and shareholder servicing agent for the Funds except for Tax-Exempt Portfolio. Citibank, N.A. (Citibank) is the custodian, transfer and servicing agent for Tax-Exempt Portfolio. Citibank has entered into a sub-arrangement with FIIOC to perform the activities associated with the transfer agency and shareholder servicing functions for Tax-Exempt Portfolio. FIIOC receives asset-based fees with respect to each account. FIIOC pays for typesetting, printing and mailing of all shareholder reports, except proxy statements. Each class, with the exception of Institutional Class and Class F, pays a transfer agent fee equal to an annual rate of .06% of average net assets. Institutional Class pays a transfer agent fee equal to an annual rate of .03% of average net assets. FIIOC receives no fees for providing transfer agency services to Class F. For the period, transfer agent fees for each class were as follows:
Treasury Only Portfolio - Class I | $ 2,011 |
Treasury Only Portfolio- Class II | 173 |
Treasury Only Portfolio- Class III | 96 |
Treasury Only Portfolio - Class IV | 9 |
Treasury Only Portfolio - Select Class | 58 |
| $ 2,347 |
Treasury Portfolio - Class I | $ 2,970 |
Treasury Portfolio - Class II | 47 |
Treasury Portfolio - Class III | 1,010 |
Treasury Portfolio - Class IV | 109 |
Treasury Portfolio - Select Class | 139 |
| $ 4,275 |
Government Portfolio - Class I | $ 8,901 |
Government Portfolio - Class II | 270 |
Government Portfolio - Class III | 575 |
Government Portfolio - Select Class | 131 |
| $ 9,877 |
Prime Money Market Portfolio - Class I | $ 5,814 |
Prime Money Market Portfolio - Class II | 217 |
Prime Money Market Portfolio - Class III | 571 |
Prime Money Market Portfolio - Class IV | 50 |
Prime Money Market Portfolio - Select Class | 392 |
Prime Money Market Portfolio - Institutional Class | 6,591 |
| $ 13,635 |
Money Market Portfolio - Class I | $ 9,164 |
Money Market Portfolio - Class II | 99 |
Money Market Portfolio - Class III | 763 |
Money Market Portfolio - Select Class | 330 |
Money Market Portfolio - Institutional Class | 4,530 |
| $ 14,886 |
Tax-Exempt Portfolio - Class I | $ 1,071 |
Tax-Exempt Portfolio - Class II | 7 |
Tax-Exempt Portfolio - Class III | 58 |
Tax-Exempt Portfolio - Select Class | 16 |
| $ 1,152 |
During the period, FMR or its affiliates waived a portion of these fees.
Accounting Fees. Fidelity Service Company, Inc. (FSC), an affiliate of FMR, maintains the accounting records for the Funds except for Tax-Exempt Portfolio. Citibank has entered into a sub-arrangement with FSC to maintain Tax-Exempt Portfolio's accounting records. The fee is based on the level of average net assets for the month.
Semiannual Report
6. Expense Reductions.
FMR voluntarily agreed to reimburse funds to the extent annual operating expenses exceeded certain levels of average net assets as noted in the table below. Some expenses, for example interest expense, are excluded from this reimbursement.
The following classes of each applicable Fund were in reimbursement during the period:
| Expense
Limitations | Reimbursement
from adviser |
Prime Money Market Portfolio | | |
Class I | .20% | $ 635 |
Class II | .35% | 28 |
Class III | .45% | 60 |
Class IV | .70% | 6 |
Select Class | .25% | 43 |
Institutional Class | .14% | 7,955 |
Money Market Portfolio | | |
Class I | .18% | $ 4,089 |
Class II | .33% | 44 |
Class III | .43% | 344 |
Select Class | .23% | 146 |
Class F | .14% | 31 |
Institutional Class | .14% | 5,543 |
Tax-Exempt Portfolio | | |
Class II | .35% | $ 2 |
Class III | .45% | 17 |
Select Class | .25% | 4 |
Additionally, FMR or its affiliates voluntarily agreed to waive certain fees in order to maintain a minimum annualized yield of .01%. Such arrangements may be discontinued by FMR at any time. For the period, the amount of the waiver for each class was as follows:
Treasury Only Portfolio | |
Class I | $ 4,706 |
Class II | 827 |
Class III | 600 |
Class IV | 94 |
Select Class | 179 |
Treasury Portfolio | |
Class I | $ 5,179 |
Class II | 196 |
Class III | 5,919 |
Class IV | 1,100 |
Select Class | 352 |
Government Portfolio | |
Class I | $ 7,243 |
Class II | 892 |
Class III | 2,831 |
Select Class | 219 |
Prime Money Market Portfolio | |
Class II | $ 244 |
Class III | 1,577 |
Class IV | 334 |
Select Class | 5 |
Money Market Portfolio | |
Class II | $ 33 |
Class III | 1,456 |
Semiannual Report
Notes to Financial Statements (Unaudited) - continued
(Amounts in thousands except percentages)
6. Expense Reductions - continued
Tax-Exempt Portfolio | |
Class I | $ 796 |
Class II | 20 |
Class III | 253 |
Select Class | 19 |
In addition, through arrangements with each applicable Fund's custodian, credits realized as a result of uninvested cash balances were used to reduce each Fund's expenses. All of the applicable expense reductions are noted in the table below.
| Custody
expense
reduction |
| |
Treasury Only Portfolio | $ 22 |
Prime Money Market Portfolio | 1 |
Tax-Exempt Portfolio | 9 |
7. Distributions to Shareholders.
Distributions to shareholders of each class were as follows:
| Six months ended
September 30, 2011 | Year ended
March 31, 2011 |
From net investment income | | |
Treasury Only Portfolio - Class I | $ 332 | $ 710 |
Treasury Only Portfolio - Class II | 29 | 63 |
Treasury Only Portfolio - Class III | 16 | 47 |
Treasury Only Portfolio - Class IV | 2 | 6 |
Treasury Only Portfolio - Select Class | 9 | 28 |
Total | $ 388 | $ 854 |
Treasury Portfolio - Class I | $ 497 | $ 2,096 |
Treasury Portfolio - Class II | 8 | 17 |
Treasury Portfolio - Class III | 168 | 388 |
Treasury Portfolio - Class IV | 18 | 30 |
Treasury Portfolio - Select Class | 23 | 38 |
Total | $ 714 | $ 2,569 |
Government Portfolio - Class I | $ 1,505 | $ 15,825 |
Government Portfolio - Class II | 45 | 98 |
Government Portfolio - Class III | 95 | 208 |
Government Portfolio - Select Class | 21 | 70 |
Total | $ 1,666 | $ 16,201 |
Prime Money Market Portfolio - Class I | $ 9,146 | $ 49,946 |
Prime Money Market Portfolio - Class II | 36 | 392 |
Prime Money Market Portfolio - Class III | 95 | 254 |
Prime Money Market Portfolio - Class IV | 8 | 20 |
Prime Money Market Portfolio - Select Class | 271 | 1,195 |
Prime Money Market Portfolio - Institutional Class | 33,445 | 98,111 |
Total | $ 43,001 | $ 149,918 |
Money Market Portfolio - Class I | $ 22,016 | $ 79,474 |
Money Market Portfolio - Class II | 32 | 503 |
Money Market Portfolio - Class III | 127 | 497 |
Money Market Portfolio - Select Class | 562 | 1,043 |
Money Market Portfolio - Class F | 853 | 1,190 |
Money Market Portfolio - Institutional Class | 27,568 | 75,594 |
Total | $ 51,158 | $ 158,301 |
Semiannual Report
7. Distributions to Shareholders - continued
| Six months ended
September 30, 2011 | Year ended
March 31, 2011 |
Tax-Exempt Portfolio - Class I | $ 347 | $ 3,849 |
Tax Exempt Portfolio - Class II | 1 | 2 |
Tax Exempt Portfolio - Class III | 9 | 20 |
Tax Exempt Portfolio - Select Class | 3 | 35 |
Total | $ 360 | $ 3,906 |
| | |
From net realized gain | | |
Treasury Only Portfolio - Class I | $ - | $ 202 |
Treasury Only Portfolio - Class II | - | 21 |
Treasury Only Portfolio - Class III | - | 12 |
Treasury Only Portfolio - Class IV | - | 2 |
Treasury Only Portfolio - Select Class | - | 8 |
Total | $ - | $ 245 |
Government Portfolio - Class I | $ - | $ 875 |
Government Portfolio - Class II | - | 24 |
Government Portfolio - Class III | - | 62 |
Government Portfolio - Select Class | - | 15 |
Total | $ - | $ 976 |
Tax-Exempt Portfolio - Class I | $ - | $ 139 |
Tax Exempt Portfolio - Class II | - | 1 |
Tax Exempt Portfolio - Class III | - | 5 |
Tax Exempt Portfolio - Select Class | - | 2 |
Total | $ - | $ 147 |
8. Share Transactions.
Transactions for each class of shares at a $1.00 per share were as follows:
| Six months ended
September 30, 2011 | Year ended
March 31, 2011 |
Treasury Only Portfolio - Class I Shares sold | 7,481,614 | 9,325,356 |
Reinvestment of distributions | 269 | 753 |
Shares redeemed | (5,583,663) | (11,547,791) |
Net increase (decrease) | 1,898,220 | (2,221,682) |
Treasury Only Portfolio - Class II Shares sold | 625,271 | 1,267,446 |
Reinvestment of distributions | 12 | 36 |
Shares redeemed | (646,460) | (1,331,000) |
Net increase (decrease) | (21,177) | (63,518) |
Treasury Only Portfolio - Class III Shares sold | 641,236 | 1,906,451 |
Reinvestment of distributions | 7 | 30 |
Shares redeemed | (692,330) | (2,129,824) |
Net increase (decrease) | (51,087) | (223,343) |
Treasury Only Portfolio - Class IV Shares sold | 53,781 | 94,822 |
Reinvestment of distributions | 2 | 8 |
Shares redeemed | (98,701) | (92,410) |
Net increase (decrease) | (44,918) | 2,420 |
Treasury Only Portfolio - Select Class Shares sold | 464,089 | 938,799 |
Reinvestment of distributions | 7 | 29 |
Shares redeemed | (479,774) | (1,208,169) |
Net increase (decrease) | (15,678) | (269,341) |
Semiannual Report
Notes to Financial Statements (Unaudited) - continued
(Amounts in thousands except percentages)
8. Share Transactions - continued
| Six months ended
September 30, 2011 | Year ended
March 31, 2011 |
Treasury Portfolio - Class I Shares sold | 30,439,764 | 30,159,804 |
Reinvestment of distributions | 263 | 1,182 |
Shares redeemed | (26,109,942) | (30,026,808) |
Net increase (decrease) | 4,330,085 | 134,178 |
Treasury Portfolio - Class II Shares sold | 945,249 | 1,387,389 |
Reinvestment of distributions | 2 | 5 |
Shares redeemed | (982,451) | (1,395,982) |
Net increase (decrease) | (37,200) | (8,588) |
Treasury Portfolio - Class III Shares sold | 6,372,388 | 13,151,252 |
Reinvestment of distributions | 28 | 62 |
Shares redeemed | (6,534,152) | (13,289,612) |
Net increase (decrease) | (161,736) | (138,298) |
Treasury Portfolio - Class IV Shares sold | 468,258 | 852,681 |
Reinvestment of distributions | - | - |
Shares redeemed | (372,149) | (1,040,182) |
Net increase (decrease) | 96,109 | (187,501) |
Treasury Portfolio - Select Class Shares sold | 855,028 | 1,342,798 |
Reinvestment of distributions | 11 | 25 |
Shares redeemed | (795,246) | (1,355,551) |
Net increase (decrease) | 59,793 | (12,728) |
Government Portfolio - Class I Shares sold | 124,079,402 | 275,569,247 |
Reinvestment of distributions | 707 | 7,778 |
Shares redeemed | (120,978,230) | (291,301,004) |
Net increase (decrease) | 3,101,879 | (15,723,979) |
Government Portfolio - Class II Shares sold | 2,063,504 | 32,387,366 |
Reinvestment of distributions | 15 | 47 |
Shares redeemed | (1,880,827) | (32,993,501) |
Net increase (decrease) | 182,692 | (606,088) |
Government Portfolio - Class III Shares sold | 3,422,106 | 10,260,061 |
Reinvestment of distributions | 21 | 78 |
Shares redeemed | (3,491,214) | (10,120,411) |
Net increase (decrease) | (69,087) | 139,728 |
Government Portfolio - Select Class Shares sold | 8,079,417 | 2,433,017 |
Reinvestment of distributions | 17 | 60 |
Shares redeemed | (7,956,475) | (2,374,873) |
Net increase (decrease) | 122,959 | 58,204 |
Prime Money Market Portfolio - Class I Shares sold | 56,245,867 | 121,991,182 |
Reinvestment of distributions | 2,919 | 15,993 |
Shares redeemed | (64,988,507) | (131,069,568) |
Net increase (decrease) | (8,739,721) | (9,062,393) |
Semiannual Report
8. Share Transactions - continued
| Six months ended
September 30, 2011 | Year ended
March 31, 2011 |
Prime Money Market Portfolio - Class II Shares sold | 3,013,396 | 4,959,880 |
Reinvestment of distributions | 19 | 223 |
Shares redeemed | (3,120,948) | (5,143,074) |
Net increase (decrease) | (107,533) | (182,971) |
Prime Money Market Portfolio - Class III Shares sold | 3,445,158 | 11,890,436 |
Reinvestment of distributions | 33 | 87 |
Shares redeemed | (4,506,295) | (12,010,007) |
Net increase (decrease) | (1,061,104) | (119,484) |
Prime Money Market Portfolio - Class IV Shares sold | 390,473 | 926,637 |
Reinvestment of distributions | 6 | 18 |
Shares redeemed | (448,625) | (1,009,268) |
Net increase (decrease) | (58,146) | (82,613) |
Prime Money Market Portfolio - Select Class Shares sold | 11,877,058 | 36,008,539 |
Reinvestment of distributions | 196 | 949 |
Shares redeemed | (11,674,808) | (35,489,685) |
Net increase (decrease) | 202,446 | 519,803 |
Prime Money Market Portfolio - Institutional Class Shares sold | 229,851,712 | 412,304,054 |
Reinvestment of distributions | 19,641 | 61,224 |
Shares redeemed | (236,154,758) | (405,346,129) |
Net increase (decrease) | (6,283,405) | 7,019,149 |
Money Market Portfolio - Class I Shares sold | 57,417,380 | 129,654,262 |
Reinvestment of distributions | 16,181 | 56,221 |
Shares redeemed | (61,438,576) | (133,032,330) |
Net increase (decrease) | (4,005,015) | (3,321,847) |
Money Market Portfolio - Class II Shares sold | 407,880 | 2,109,859 |
Reinvestment of distributions | 29 | 370 |
Shares redeemed | (593,862) | (2,525,235) |
Net increase (decrease) | (185,953) | (415,006) |
Money Market Portfolio - Class III Shares sold | 8,649,717 | 19,592,821 |
Reinvestment of distributions | 67 | 227 |
Shares redeemed | (9,739,441) | (19,835,254) |
Net increase (decrease) | (1,089,657) | (242,206) |
Money Market Portfolio - Select Class Shares sold | 5,359,819 | 9,007,280 |
Reinvestment of distributions | 123 | 672 |
Shares redeemed | (6,840,159) | (7,468,913) |
Net increase (decrease) | (1,480,217) | 1,539,039 |
Money Market Portfolio - Class F Shares sold | 317,228 | 741,144 |
Reinvestment of distributions | 853 | 1,190 |
Shares redeemed | (85,626) | (69,774) |
Net increase (decrease) | 232,455 | 672,560 |
Semiannual Report
Notes to Financial Statements (Unaudited) - continued
(Amounts in thousands except percentages)
8. Share Transactions - continued
| Six months ended
September 30, 2011 | Year ended
March 31, 2011 |
Money Market Portfolio - Institutional Class Shares sold | 89,141,291 | 154,730,887 |
Reinvestment of distributions | 20,630 | 61,838 |
Shares redeemed | (87,193,864) | (150,676,900) |
Net increase (decrease) | 1,968,057 | 4,115,825 |
Tax-Exempt Portfolio - Class I Shares sold | 2,965,763 | 7,263,950 |
Reinvestment of distributions | 219 | 2,550 |
Shares redeemed | (3,280,782) | (8,280,573) |
Net increase (decrease) | (314,800) | (1,014,073) |
Tax-Exempt Portfolio - Class II Shares sold | 12,770 | 17,896 |
Reinvestment of distributions | 1 | 3 |
Shares redeemed | (18,091) | (22,093) |
Net increase (decrease) | (5,320) | (4,194) |
Tax-Exempt Portfolio - Class III Shares sold | 650,617 | 1,370,264 |
Reinvestment of distributions | 3 | 12 |
Shares redeemed | (671,879) | (1,337,626) |
Net increase (decrease) | (21,259) | 32,650 |
Tax-Exempt Portfolio - Select Class Shares sold | 22,245 | 75,375 |
Reinvestment of distributions | 3 | 30 |
Shares redeemed | (63,036) | (61,760) |
Net increase (decrease) | (40,788) | 13,645 |
9. Other.
The Funds' organizational documents provide former and current trustees and officers with a limited indemnification against liabilities arising in connection with the performance of their duties to the Funds. In the normal course of business, the Funds may also enter into contracts that provide general indemnifications. The Funds' maximum exposure under these arrangements is unknown as this would be dependent on future claims that may be made against the Funds. The risk of material loss from such claims is considered remote.
Semiannual Report
Board Approval of Investment Advisory Contracts and Management Fees
FIMM Funds: Treasury Only Portfolio / Treasury Portfolio / Government Portfolio / Prime Money Market Portfolio / Money Market Portfolio / Tax-Exempt Portfolio
Each year, the Board of Trustees, including the Independent Trustees (together, the Board), votes on the renewal of the management contract and sub-advisory agreements (together, the Advisory Contracts) for each fund. The Board, assisted by the advice of fund counsel and Independent Trustees' counsel, requests and considers a broad range of information relevant to the renewal of the Advisory Contracts throughout the year.
The Board meets regularly and considers at each of its meetings factors that are relevant to its annual consideration of the renewal of each fund's Advisory Contracts, including the services and support provided to each fund and its shareholders. The Board has established three standing committees, Operations, Audit, and Nominating and Governance, each composed of Independent Trustees with varying backgrounds, to which the Board has assigned specific subject matter responsibilities in order to enhance effective decision-making by the Board. The Operations Committee, of which all of the Independent Trustees are members, meets regularly throughout the year and, among other matters, considers matters specifically related to the annual consideration of the renewal of each fund's Advisory Contracts. The Board, acting directly and through its Committees, requests and receives information concerning the annual consideration of the renewal of each fund's Advisory Contracts. The Board also meets as needed to consider matters specifically related to the Board's annual consideration of the renewal of Advisory Contracts. Members of the Board may also meet with trustees of other Fidelity funds through ad hoc joint committees to discuss certain matters relevant to the Fidelity funds.
At its September 2011 meeting, the Board of Trustees, including the Independent Trustees, unanimously determined to renew each fund's Advisory Contracts. In reaching its determination, the Board considered all factors it believed relevant, including (i) the nature, extent, and quality of the services to be provided to each fund and its shareholders (including the investment performance of each fund); (ii) the competitiveness of each fund's management fee and total expense ratio; (iii) the total costs of the services to be provided by and the profits to be realized by Fidelity from its relationship with each fund; (iv) the extent to which economies of scale would be realized as each fund grows; and (v) whether fee levels reflect these economies of scale, if any, for the benefit of fund shareholders.
In considering whether to renew the Advisory Contracts for each fund, the Board reached a determination, with the assistance of fund counsel and Independent Trustees' counsel and through the exercise of its business judgment, that the renewal of the Advisory Contracts is in the best interests of each fund and its shareholders and that the compensation payable under the Advisory Contracts is fair and reasonable. The Board's decision to renew the Advisory Contracts was not based on any single factor, but rather was based on a comprehensive consideration of all the information provided to the Board at its meetings throughout the year. The Board, in reaching its determination to renew the Advisory Contracts, is aware that shareholders in each fund have a broad range of investment choices available to them, including a wide choice among mutual funds offered by Fidelity's competitors, and that each fund's shareholders, who have the opportunity to review and weigh the disclosure provided by the fund in its prospectus and other public disclosures, have chosen to invest in that fund, managed by Fidelity.
Nature, Extent, and Quality of Services Provided. The Board considered the staffing within the investment adviser, FMR, and the sub-advisers (together, the Investment Advisers), including the backgrounds of the funds' investment personnel and the funds' investment objectives and disciplines. The Independent Trustees also had discussions with senior management of Fidelity's investment operations and investment groups. The Board considered the structure of the portfolio manager compensation program and whether this structure provides appropriate incentives to act in the best interests of each fund.
Resources Dedicated to Investment Management and Support Services. The Board reviewed the general qualifications and capabilities of the Investment Advisers' investment staff, including its size, education, experience, and resources, as well as the Investment Advisers' approach to recruiting, managing, and compensating investment personnel. The Board also noted that FMR has devoted increased resources to non-U.S. offices. The Board noted that Fidelity's analysts have extensive resources, tools and capabilities which allow them to conduct sophisticated quantitative and fundamental analysis, as well as credit analysis of issuers, counterparties and enhancers. The Board also believes that Fidelity's investment professionals have sufficient access to global information and data so as to provide competitive investment results over time, and that those professionals also have access to sophisticated tools which permit them to assess portfolio construction and risk and performance attribution characteristics continuously, as well as to transmit new information and research conclusions rapidly around the world. Additionally, in its deliberations, the Board considered the Investment Advisers' trading capabilities and resources which are an integral part of the investment management process.
Shareholder and Administrative Services. The Board considered (i) the nature, extent, quality, and cost of advisory, administrative, and shareholder services performed by the Investment Advisers and their affiliates under the Advisory Contracts and under separate agreements covering transfer agency and pricing and bookkeeping services for each fund; (ii) the nature and extent of the investment adviser's supervision of third party service providers, principally custodians and subcustodians; and (iii) the resources devoted to, and the record of compliance with, each fund's compliance policies and procedures.
The Board noted that the growth of fund assets over time across the complex allows Fidelity to reinvest in the development of services designed to enhance the value or convenience of the Fidelity funds as investment vehicles. These services include 24-hour access to account information and market information through telephone representatives and over the Internet, investor education materials and asset allocation tools, and the expanded availability of Fidelity Investor Centers, with 35 new branches opening since 2010.
Semiannual Report
Investment in a Large Fund Family. The Board considered the benefits to shareholders of investing in a Fidelity fund, including the benefits of investing in a fund that is part of a large family of funds offering a variety of investment disciplines and providing a large variety of mutual fund investor services. The Board noted that Fidelity had taken, or had made recommendations that resulted in the Fidelity funds taking, a number of actions over the previous year that benefited particular funds, including (i) continuing to dedicate additional resources to investment research and support of the senior management team that oversees asset management; (ii) rationalizing product lines through the mergers of six funds into other funds; (iii) continuing to migrate the Freedom Funds to dedicated lower cost underlying funds; (iv) obtaining shareholder approval to broaden the investment strategies for Fidelity Consumer Finance Portfolio, Fidelity Emerging Asia Fund, and Fidelity Environment and Alternative Energy Portfolio; (v) contractually agreeing to reduce the management fees and impose other expense limitations on Spartan 500 Index Fund and U.S. Bond Index Fund in connection with launching new institutional classes of these funds; (vi) changing the name, primary and supplemental benchmarks, and investment policies of Fidelity Global Strategies Fund to support the fund's flexible investment mandate and global orientation; and (vii) reducing the transfer agency account fee rates on certain accounts.
Investment Performance. The Board considered whether each fund has operated in accordance with its investment objective, as well as its record of compliance with its investment restrictions. It also reviewed each fund's absolute investment performance for each class, as well as each fund's relative investment performance for each class measured over multiple periods against a peer group of mutual funds deemed appropriate by Fidelity and reviewed by the Board. For each fund, the following charts considered by the Board show, over the one-, three-, and five-year periods ended December 31, 2010, the cumulative total returns of Class I and Class III of the fund and a range of cumulative total returns of a peer group of mutual funds identified by Lipper Inc. as having an investment objective similar to that of the fund. The returns of Class I and Class III show the performance of the highest and lowest performing classes, respectively (based on five-year performance). The box within each chart shows the 25th percentile return (bottom of box) and the 75th percentile return (top of box) of the peer group. Returns shown above the box are in the first quartile and returns shown below the box are in the fourth quartile. The percentage beaten numbers noted below each chart correspond to the percentile box and represent the percentage of funds in the peer group whose performance was equal to or lower than that of the class indicated.
Treasury Only Portfolio
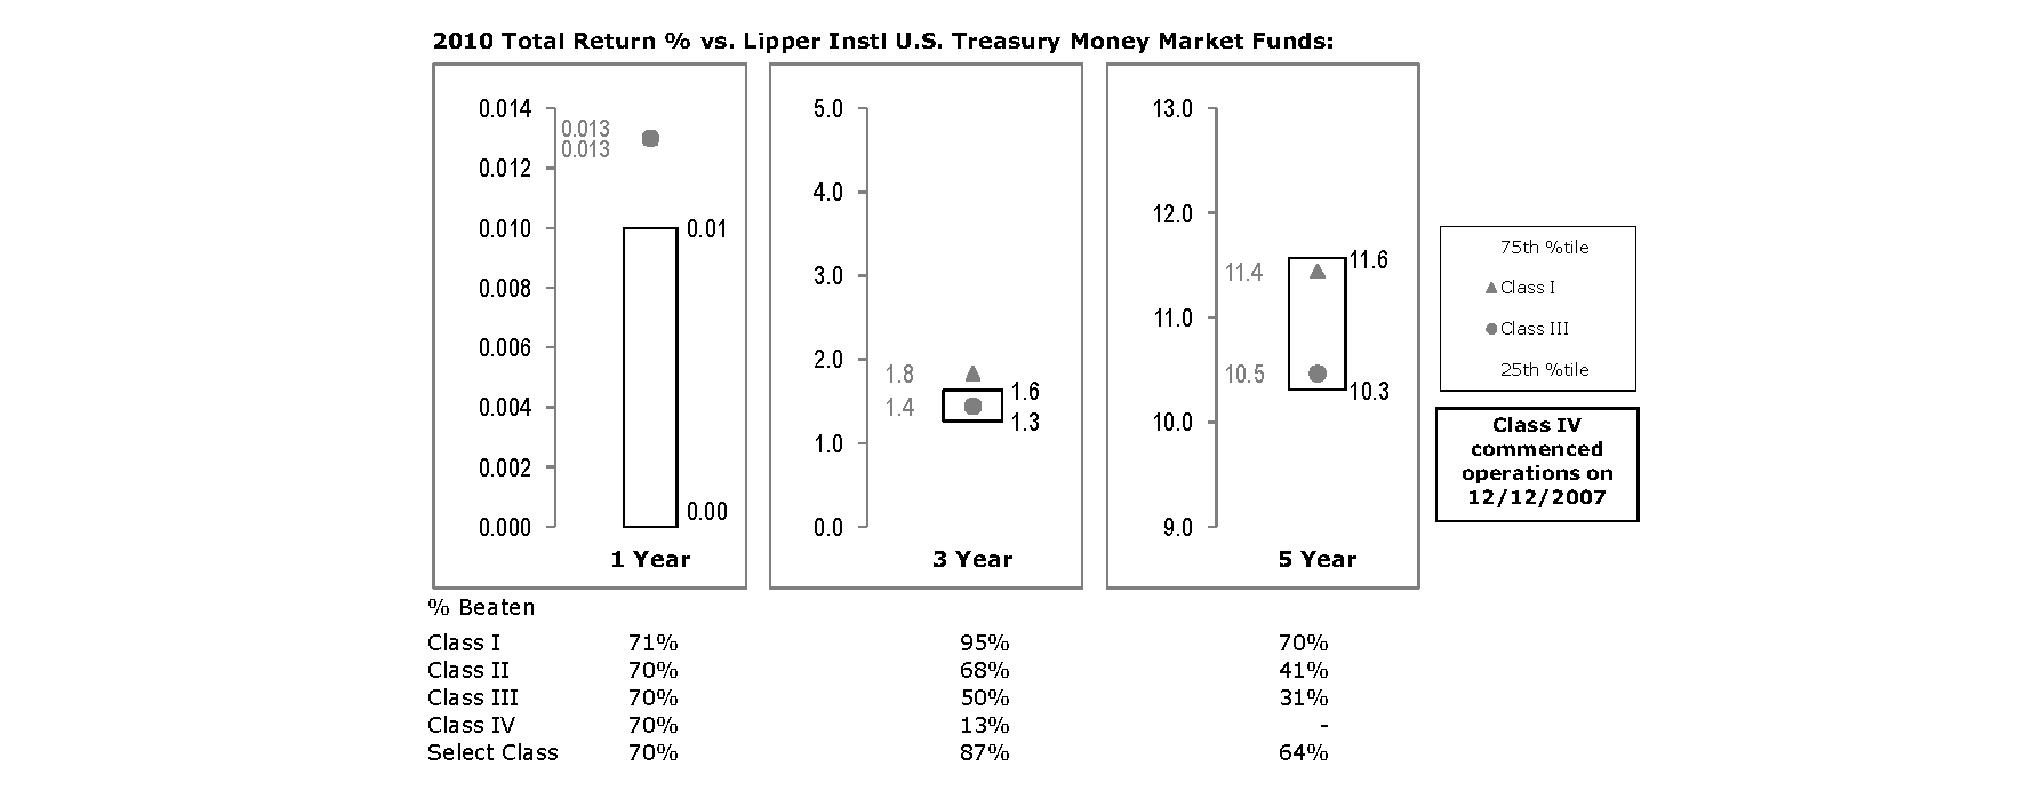
The Board reviewed the fund's relative investment performance against its peer group and noted that the performance of Class I of the fund was in the second quartile for the one- and five-year periods and the first quartile for the three-year period. The Board considered that the variations in performance among the fund's classes reflect the variations in class expenses, which result in lower performance for higher expense classes. The Board also reviewed the fund's performance since inception as well as performance in the current year.
Semiannual Report
Board Approval of Investment Advisory Contracts and Management Fees - continued
Treasury Portfolio
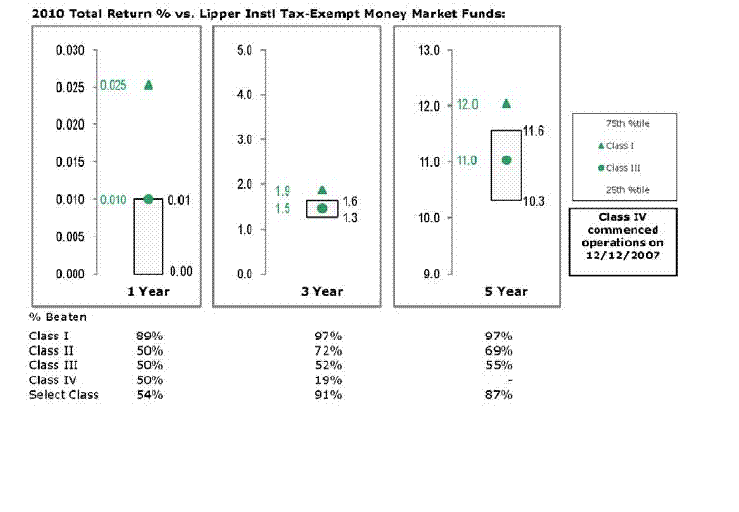
The Board reviewed the fund's relative investment performance against its peer group and noted that the performance of Class I of the fund was in the first quartile for all the periods shown. The Board considered that the variations in performance among the fund's classes reflect the variations in class expenses, which result in lower performance for higher expense classes. The Board also reviewed the fund's performance since inception as well as performance in the current year.
Government Portfolio
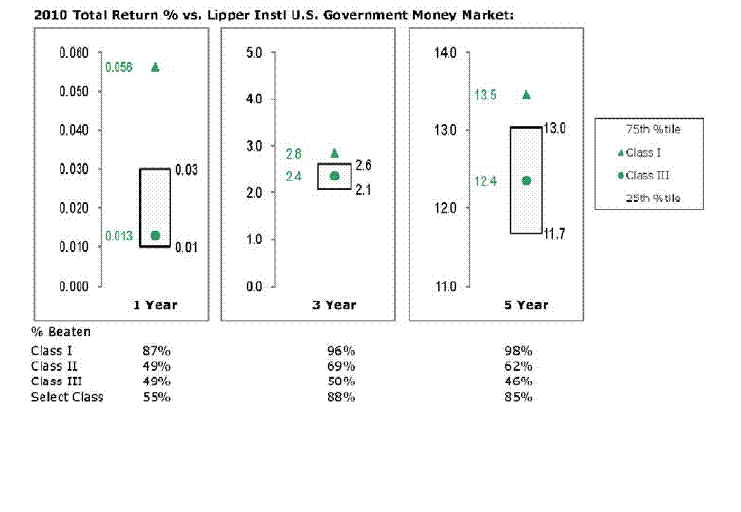
The Board reviewed the fund's relative investment performance against its peer group and noted that the performance of Class I of the fund was in the first quartile for all the periods shown. The Board considered that the variations in performance among the fund's classes reflect the variations in class expenses, which result in lower performance for higher expense classes. The Board also reviewed the fund's performance since inception as well as performance in the current year.
Semiannual Report
Prime Money Market Portfolio
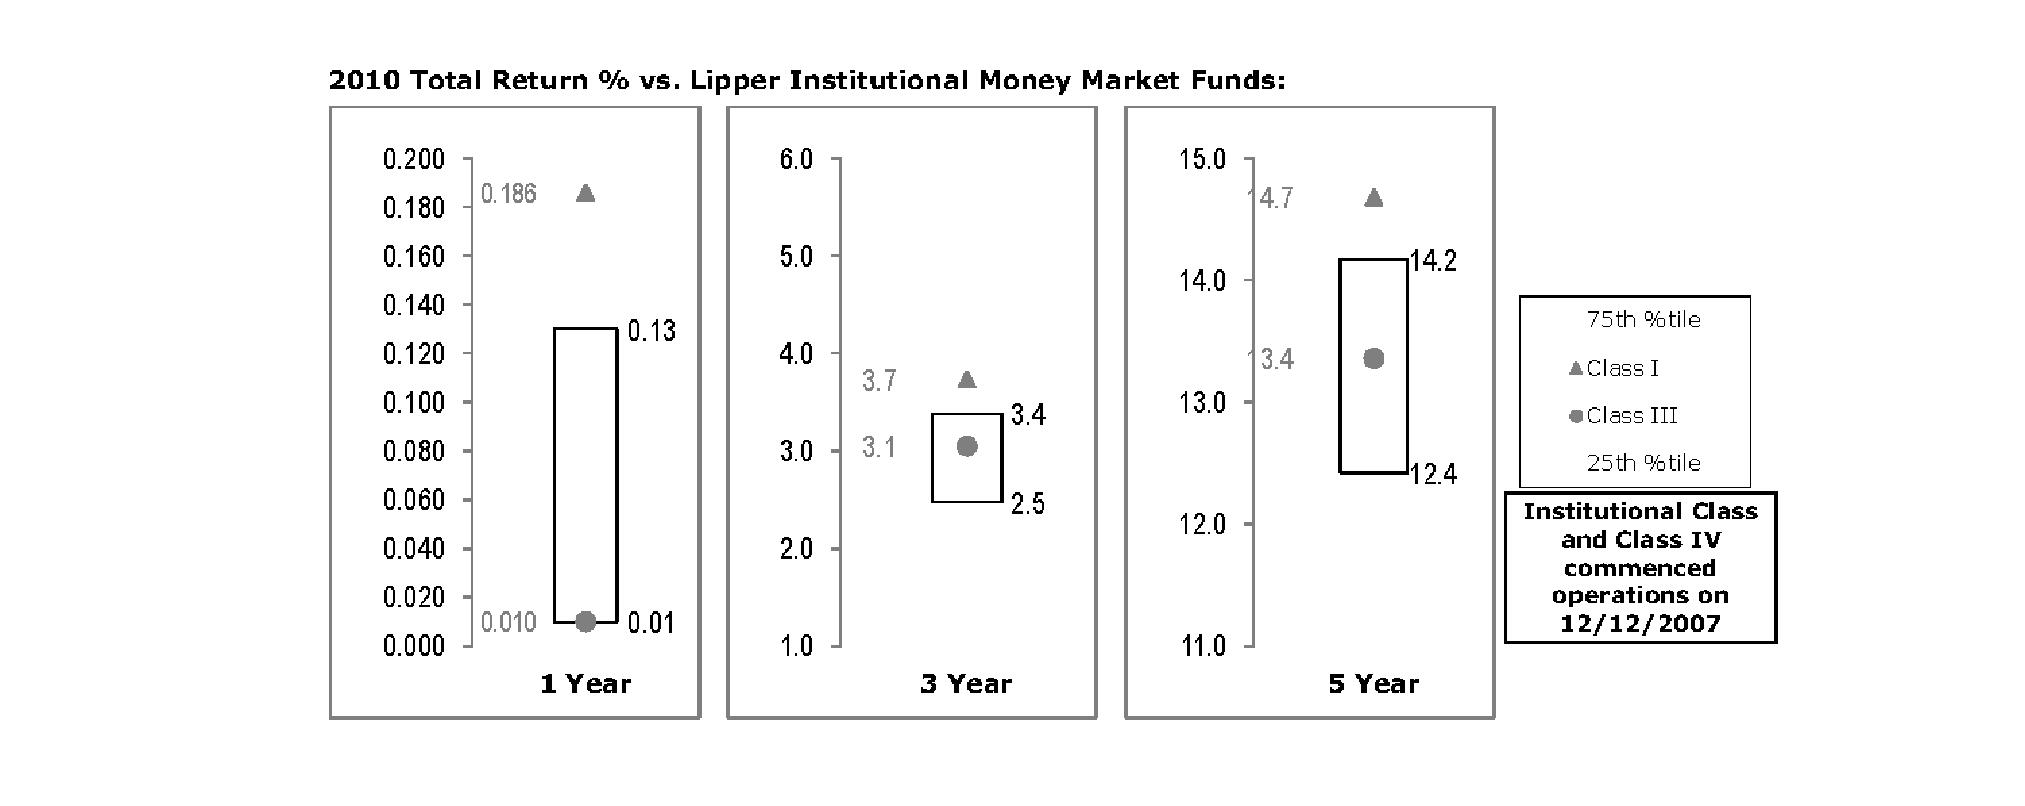
The Board reviewed the fund's relative investment performance against its peer group and noted that the performance of Class I of the fund was in the first quartile for all the periods shown. The Board considered that the variations in performance among the fund's classes reflect the variations in class expenses, which result in lower performance for higher expense classes. The Board also reviewed the fund's performance since inception as well as performance in the current year.
Money Market Portfolio
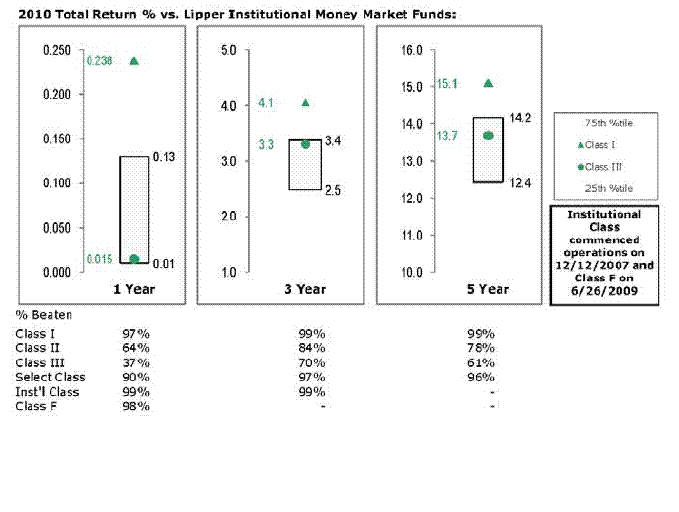
The Board reviewed the fund's relative investment performance against its peer group and noted that the performance of Class I of the fund was in the first quartile for all the periods shown. The Board considered that the variations in performance among the fund's classes reflect the variations in class expenses, which result in lower performance for higher expense classes. The Board also reviewed the fund's performance since inception as well as performance in the current year.
Semiannual Report
Board Approval of Investment Advisory Contracts and Management Fees - continued
Tax-Exempt Portfolio
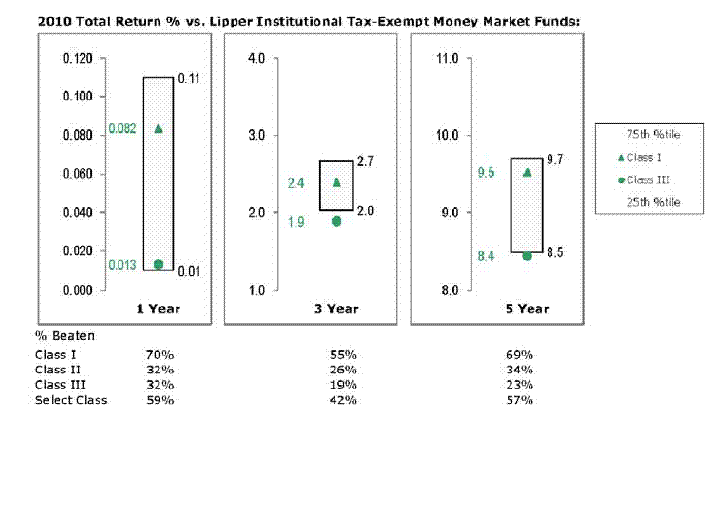
The Board reviewed the fund's relative investment performance against its peer group and noted that the performance of Class I of the fund was in the second quartile for all the periods shown. The Board considered that the variations in performance among the fund's classes reflect the variations in class expenses, which result in lower performance for higher expense classes. The Board also reviewed the fund's performance since inception as well as performance in the current year.
Based on its review, the Board concluded that the nature, extent, and quality of services provided to each fund under the Advisory Contracts should benefit each fund's shareholders.
Competitiveness of Management Fee and Total Expense Ratio. The Board considered each fund's management fee and total expense ratio compared to "mapped groups" of competitive funds and classes. Fidelity creates "mapped groups" by combining similar Lipper investment objective categories that have comparable management fee characteristics. Combining Lipper investment objective categories aids the Board's management fee and total expense ratio comparisons by broadening the competitive group used for comparison and by reducing the number of universes to which various Fidelity funds are compared.
Management Fee. The Board considered two proprietary management fee comparisons for the 12-month periods shown in the charts below. The group of Lipper funds used by the Board for management fee comparisons is referred to below as the "Total Mapped Group" and, for the reasons explained above, is broader than the Lipper peer group used by the Board for performance comparisons. The Total Mapped Group comparison focuses on a fund's standing relative to the total universe of comparable funds available to investors in terms of gross management fees before expense reimbursements or caps. "TMG %" represents the percentage of funds in the Total Mapped Group that had management fees that were lower than a fund's. For example, a TMG % of 10% means that 90% of the funds in the Total Mapped Group had higher management fees than a fund. The "Asset-Size Peer Group" (ASPG) comparison focuses on a fund's standing relative to non-Fidelity funds similar in size to the fund within the Total Mapped Group. The ASPG represents at least 15% of the funds in the Total Mapped Group with comparable asset size and management fee characteristics, subject to a minimum of 50 funds (or all funds in the Total Mapped Group if fewer than 50). Additional information, such as the ASPG quartile in which a fund's management fee ranked, is also included in the charts and considered by the Board.
Semiannual Report
Treasury Only Portfolio
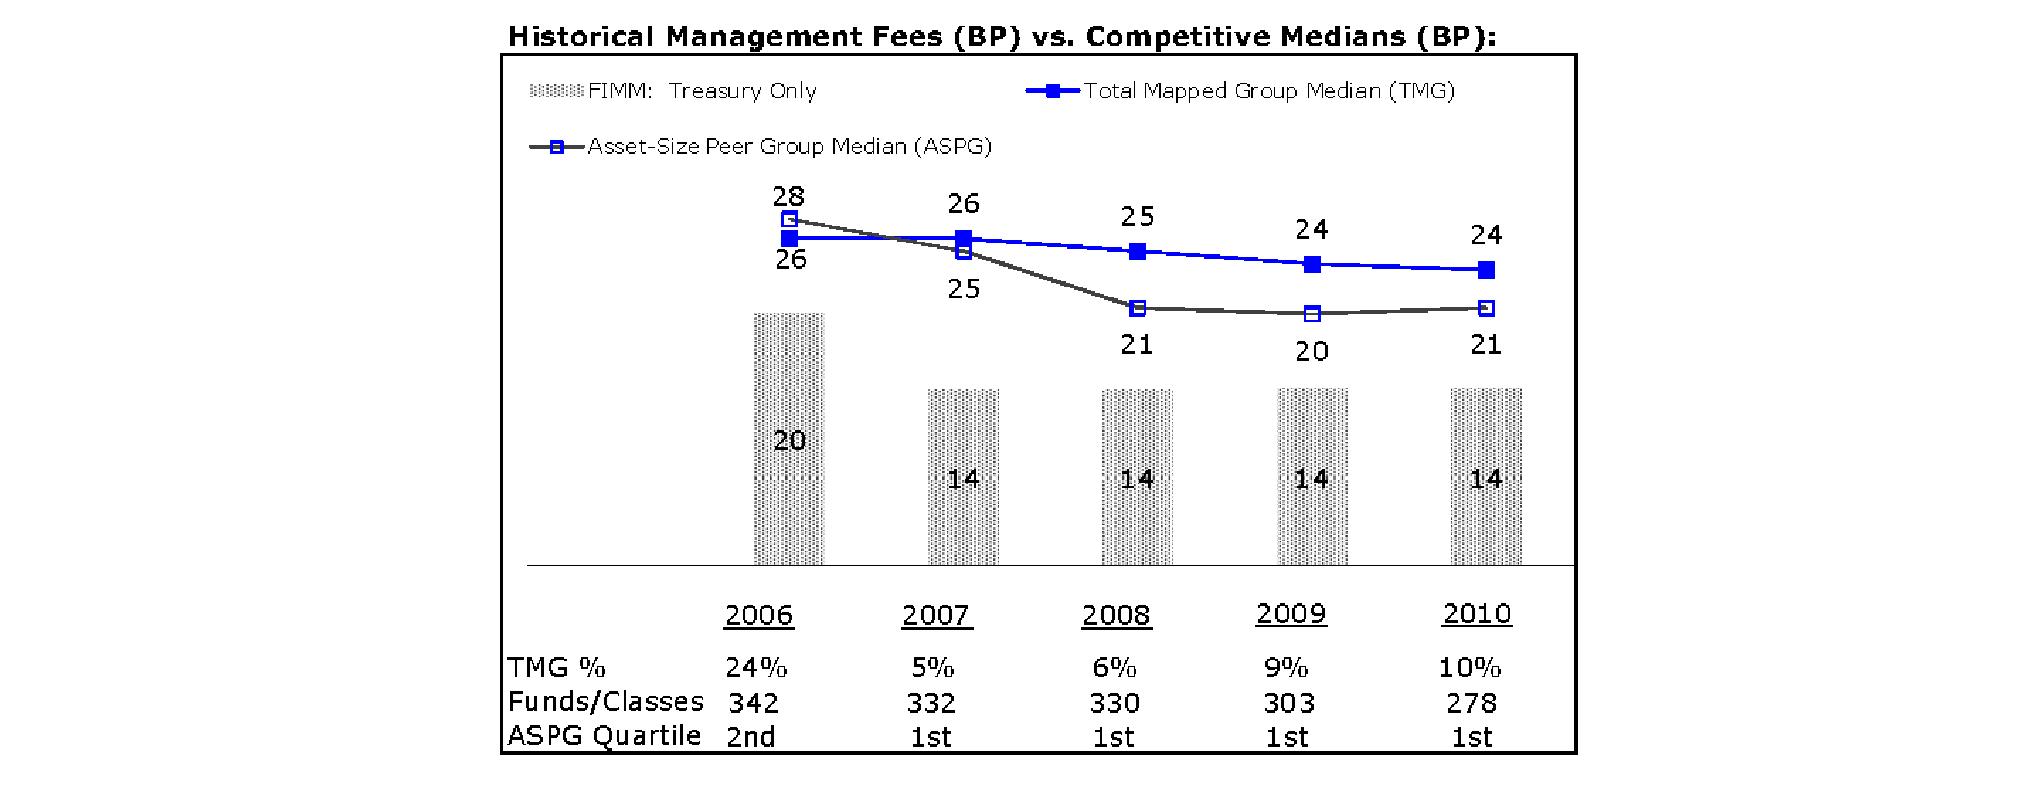
Treasury Portfolio
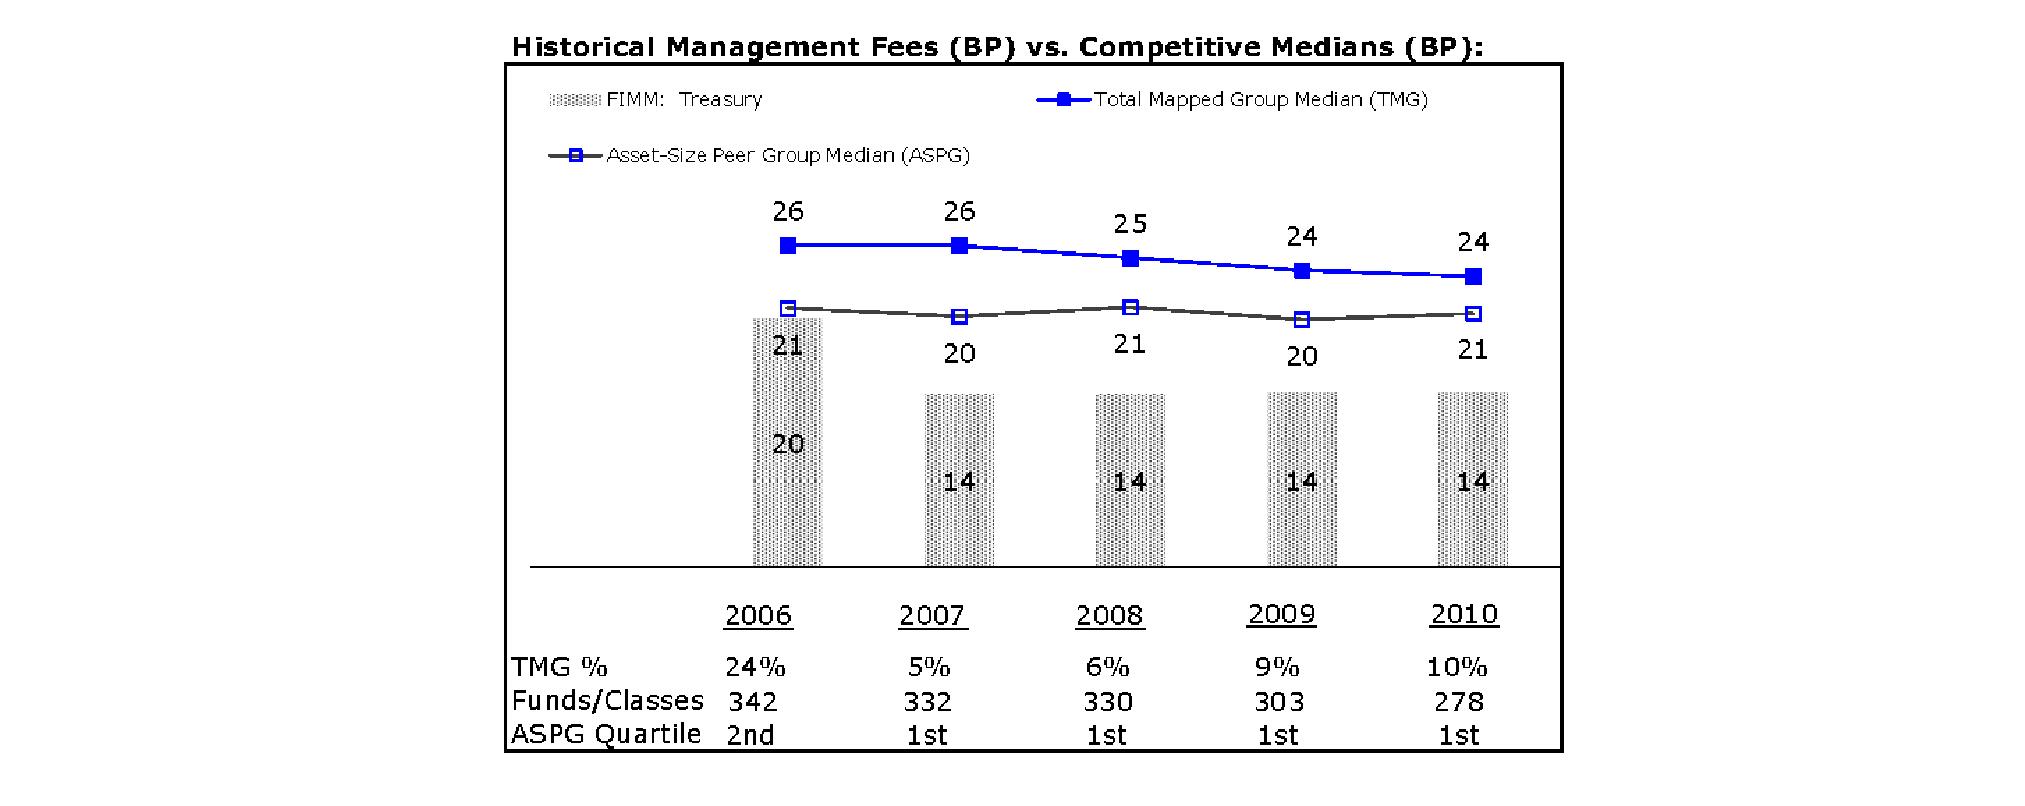
Semiannual Report
Board Approval of Investment Advisory Contracts and Management Fees - continued
Government Portfolio
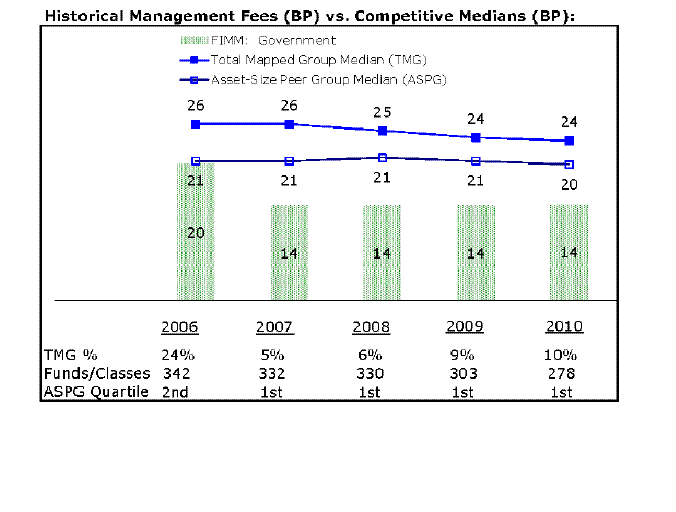
Prime Money Market Portfolio
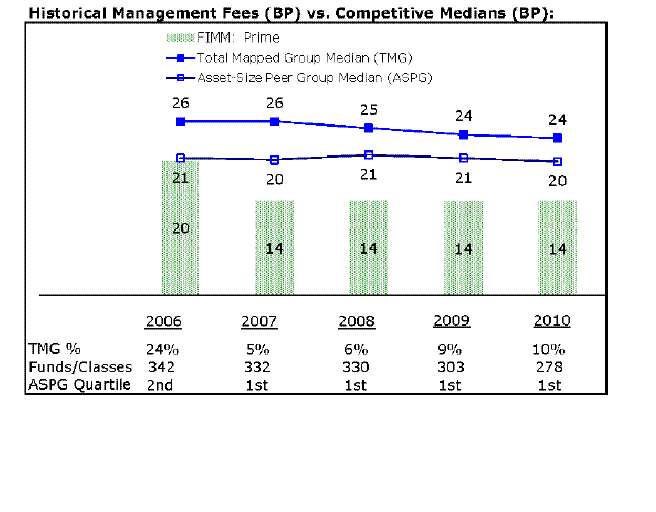
Semiannual Report
Money Market Portfolio
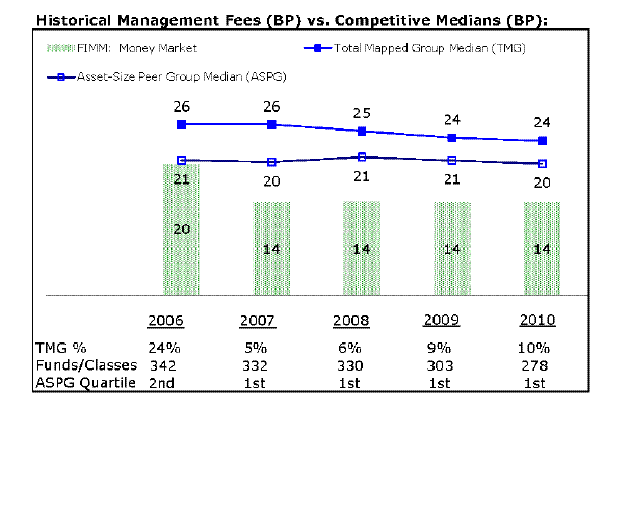
Tax-Exempt Portfolio
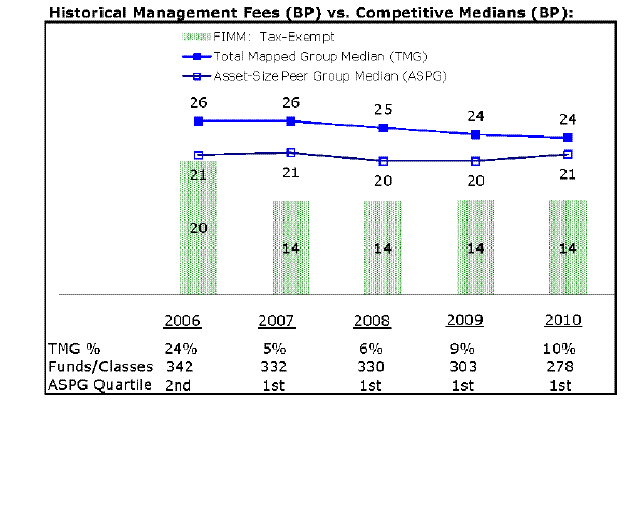
The Board noted that each fund's management fee ranked below the median of its Total Mapped Group and below the median of its ASPG for 2010.
Furthermore, the Board considered that it had approved an amended and restated management contract for each fund (effective December 1, 2007) that lowered each fund's management fee from 20 basis points to 14 basis points. The Board considered that the charts reflect each fund's lower management fee for 2007, as if the lower fee were in effect for the entire year.
Based on its review, the Board concluded that each fund's management fee is fair and reasonable in light of the services that the fund receives and the other factors considered.
Total Expense Ratio. In its review of the total expense ratio of each class of each fund, the Board considered the fund's management fee as well as other fund or class expenses, as applicable, such as transfer agent fees, pricing and bookkeeping fees, fund-paid 12b-1 fees, and custodial, legal, and audit fees. The Board also noted the effects of any waivers and reimbursements on fees and expenses. As part of its review, the Board also considered the current and historical total expense ratios of each class of each fund compared to competitive fund median expenses. Each class of each fund is compared to those funds and classes in the Total Mapped Group (used by the Board for management fee comparisons) that have a similar sales load structure.
Semiannual Report
Board Approval of Investment Advisory Contracts and Management Fees - continued
The Board considered that it had approved changes (effective December 1, 2007) in the contractual arrangements for each fund that set the "class level" transfer agent fee at a fixed rate of 3 basis points for Institutional Class and at a fixed rate of 6 basis points for all other classes. The Board recognized that, although the new fixed transfer agent fee rate for Class I, Class II, Class III and Select Class of each fund is higher than its previous rate, each class's total expense ratio, before any waivers or reimbursements, is lower because of the 6 basis point reduction in each fund's management fee.
The Board noted that each fund offers multiple classes, each of which has a different 12b-1 fee structure, and that the multiple structures are intended to offer a range of pricing options for the intermediary market. The Board also noted that the total expense ratios of the classes of each fund vary primarily by the level of their 12b-1 fees, although differences in transfer agent fees may also cause expenses to vary from class to class.
The Board noted that the total expense ratio of each class of each of Treasury Only Portfolio and Treasury Portfolio ranked below its competitive median for 2010.
The Board noted that the total expense ratio of Class I of each of Government Portfolio and Tax-Exempt Portfolio ranked below its competitive median for 2010 and the total expense ratio of each of Class II, Class III, and Select Class ranked above its competitive median for 2010.
The Board noted that the total expense ratio of each of Class I and Institutional Class of Prime Money Market Portfolio ranked below its competitive median for 2010 and the total expense ratio of each of Class II, Class III, Class IV, and Select Class ranked above its competitive median for 2010.
The Board noted that the total expense ratio of each of Class I, Institutional Class, and Class F of Money Market Portfolio ranked below its competitive median for 2010, the total expense ratio of Select Class ranked equal to its competitive median for 2010, and the total expense ratio of each of Class II and Class III ranked above its competitive median for 2010.
The Board considered that various factors, including 12b-1 fees and relatively higher other expenses in the case of small fund size, can affect total expense ratios. The Board considered that Fidelity has been voluntarily waiving part or all of the 12b-1 fees, transfer agent fees, and/or management fees to maintain a minimum yield, and also noted that Fidelity retains the ability to be repaid in certain circumstances.
Fees Charged to Other Fidelity Clients. The Board also considered Fidelity fee structures and other information with respect to clients of FMR and its affiliates, such as other mutual funds advised or subadvised by FMR or its affiliates, pension plan clients, and other institutional clients. In March 2010, the Board created an ad hoc joint committee with the board of other Fidelity funds (the Committee) to review and compare Fidelity's institutional investment advisory business with its business of providing services to the Fidelity funds, including the differences in services provided, fees charged, and costs incurred, as well as competition in their respective marketplaces.
Based on its review of total expense ratios and fees charged to other Fidelity clients, the Board concluded that the total expense ratio of each class of each fund was reasonable, although in some cases above the median of the universe presented for comparison, in light of the services that the fund and its shareholders receive and the other factors considered, including the findings of the Committee.
Costs of the Services and Profitability. The Board considered the revenues earned and the expenses incurred by Fidelity in conducting the business of developing, marketing, distributing, managing, administering and servicing each fund and its shareholders. The Board also considered the level of Fidelity's profits in respect of all the Fidelity funds.
On an annual basis, FMR presents to the Board Fidelity's profitability for each fund. Fidelity calculates the profitability for each fund, as well as aggregate profitability for groups of Fidelity funds and all Fidelity funds, using a series of detailed revenue and cost allocation methodologies which originate with the books and records of Fidelity on which Fidelity's audited financial statements are based. The Audit Committee of the Board reviews any significant changes from the prior year's methodologies.
PricewaterhouseCoopers LLP (PwC), independent registered public accounting firm and auditor to Fidelity and certain Fidelity funds, has been engaged annually by the Board as part of the Board's assessment of Fidelity's profitability analysis. PwC's engagement includes the review and assessment of Fidelity's methodologies used in determining the revenues and expenses attributable to Fidelity's mutual fund business, and completion of agreed-upon procedures surrounding the mathematical accuracy of fund profitability and its conformity to allocation methodologies. After considering PwC's reports issued under the engagement and information provided by Fidelity, the Board concluded that while other allocation methods may also be reasonable, Fidelity's profitability methodologies are reasonable in all material respects.
The Board also reviewed Fidelity's non-fund businesses and fall-out benefits related to the mutual fund business as well as cases where Fidelity's affiliates may benefit from or be related to the funds' business.
The Board considered the costs of the services provided by and the profits realized by Fidelity in connection with the operation of each fund and was satisfied that the profitability was not excessive in the circumstances.
Economies of Scale. The Board considered whether there have been economies of scale in respect of the management of the Fidelity funds, whether the Fidelity funds (including each fund) have appropriately benefited from any such economies of scale, and whether there is potential for realization of any further economies of scale. The Board considered the extent to which each fund will benefit from economies of scale through increased services to the fund, through waivers or reimbursements, or through fee or expense reductions. The Board also noted that in 2009, it and the board of other Fidelity funds created an ad hoc committee (the Economies of Scale Committee) to analyze whether FMR attains economies of scale in respect of the management and servicing of the Fidelity funds, whether the Fidelity funds have appropriately benefited from such economies of scale, and whether there is potential for realization of any further economies of scale.
Semiannual Report
The Board concluded, taking into account the analysis of the Economies of Scale Committee, that any potential economies of scale are being appropriately shared between fund shareholders and Fidelity.
Additional Information Requested by the Board. In order to develop fully the factual basis for consideration of the Fidelity funds' Advisory Contracts, the Board requested and received additional information on certain topics, including: (i) Fidelity's fund profitability methodology, profitability trends for certain funds, and the impact of certain factors on fund profitability results; (ii) portfolio manager changes that have occurred during the past year and the amount of the investment that each portfolio manager has made in the Fidelity fund(s) that he or she manages; (iii) Fidelity's compensation structure for portfolio managers, research analysts, and other key personnel, including its effects on fund profitability, the rationale for the compensation structure, and the extent to which current market conditions have affected retention and recruitment; (iv) the compensation paid to fund sub-advisers on behalf of the Fidelity funds; (v) Fidelity's fee structures and rationale for recommending different fees among different categories of funds and classes, as well as Fidelity's voluntary waiver of its fees to maintain minimum yields for certain money market funds and classes; (vi) the reasons why certain expenses affect various funds and classes differently; (vii) Fidelity's transfer agent fees, expenses, and services and how the benefits of decreased costs and new efficiencies can be shared across all of the Fidelity funds; (viii) the reasons for and consequences of changes to certain product lines compared to competitors; (ix) the allocation of and historical trends in Fidelity's realization of fall-out benefits; and (x) explanations regarding the relative total expense ratios of certain funds and classes, total expense competitive trends, and actions that might be taken by FMR to reduce total expense ratios for certain funds and classes or to achieve further economies of scale.
Based on its evaluation of all of the conclusions noted above, and after considering all factors it believed relevant, the Board ultimately concluded that the advisory fee structures are fair and reasonable, and that each fund's Advisory Contracts should be renewed.
Semiannual Report
Semiannual Report
Investment Adviser
Fidelity Management & Research Company
Boston, MA
Investment Sub-Advisers
Fidelity Investments Money Management, Inc.
Fidelity Management & Research (U.K.) Inc.
Fidelity Management & Research (Hong Kong) Limited
Fidelity Management & Research (Japan) Inc.
General Distributor
Fidelity Distributors Corporation
Boston, MA
Transfer and Service Agents
Fidelity Investments Institutional Operations Company, Inc.
Boston, MA
Citibank, N.A.
New York, NY
Tax-Exempt Portfolio
Fidelity Service Company, Inc.
Boston, MA
Treasury Only Portfolio, Treasury Portfolio,
Government Portfolio, Prime Money Market
Portfolio, and Money Market Portfolio
Custodians
The Bank of New York Mellon
New York, NY
Treasury Only Portfolio, Treasury Portfolio,
Government Portfolio, Prime Money Market
Portfolio, and Money Market Portfolio
Citibank, N.A.
New York, NY
Tax-Exempt Portfolio
IMM-SANN-1111
1.537280.114

Item 2. Code of Ethics
Not applicable.
Item 3. Audit Committee Financial Expert
Not applicable.
Item 4. Principal Accountant Fees and Services
Not applicable.
Item 5. Audit Committee of Listed Registrants
Not applicable.
Item 6. Investments
(a) Not applicable.
(b) Not applicable
Item 7. Disclosure of Proxy Voting Policies and Procedures for Closed-End Management Investment Companies
Not applicable.
Item 8. Portfolio Managers of Closed-End Management Investment Companies
Not applicable.
Item 9. Purchase of Equity Securities by Closed-End Management Investment Company and Affiliated Purchasers
Not applicable.
Item 10. Submission of Matters to a Vote of Security Holders
There were no material changes to the procedures by which shareholders may recommend nominees to the Fidelity Colchester Street Trust's Board of Trustees.
Item 11. Controls and Procedures
(a)(i) The President and Treasurer and the Chief Financial Officer have concluded that the Fidelity Colchester Street Trust's (the "Trust") disclosure controls and procedures (as defined in Rule 30a-3(c) under the Investment Company Act) provide reasonable assurances that material information relating to the Trust is made known to them by the appropriate persons, based on their evaluation of these controls and procedures as of a date within 90 days of the filing date of this report.
(a)(ii) There was no change in the Trust's internal control over financial reporting (as defined in Rule 30a-3(d) under the Investment Company Act) that occurred during the second fiscal quarter of the period covered by this report that has materially affected, or is reasonably likely to materially affect, the Trust's internal control over financial reporting.
Item 12. Exhibits
(a) | (1) | Not applicable. |
(a) | (2) | Certification pursuant to Rule 30a-2(a) under the Investment Company Act of 1940 (17 CFR 270.30a-2(a)) is filed and attached hereto as Exhibit 99.CERT. |
(a) | (3) | Not applicable. |
(b) | | Certification pursuant to Rule 30a-2(b) under the Investment Company Act of 1940 (17 CFR 270.30a-2(b)) is furnished and attached hereto as Exhibit 99.906CERT. |
SIGNATURES
Pursuant to the requirements of the Securities Exchange Act of 1934 and the Investment Company Act of 1940, the registrant has duly caused this report to be signed on its behalf by the undersigned, thereunto duly authorized.
Fidelity Colchester Street Trust
By: | /s/ John R. Hebble |
| John R. Hebble |
| President and Treasurer |
| |
Date: | November 30, 2011 |
Pursuant to the requirements of the Securities Exchange Act of 1934 and the Investment Company Act of 1940, this report has been signed below by the following persons on behalf of the registrant and in the capacities and on the dates indicated.
By: | /s/ John R. Hebble |
| John R. Hebble |
| President and Treasurer |
| |
Date: | November 30, 2011 |
By: | /s/ Christine Reynolds |
| Christine Reynolds |
| Chief Financial Officer |
| |
Date: | November 30, 2011 |