UNITED STATES
SECURITIES AND EXCHANGE COMMISSION
Washington, D.C. 20549
FORM N-CSR
CERTIFIED SHAREHOLDER REPORT OF REGISTERED
MANAGEMENT INVESTMENT COMPANIES
Investment Company Act file number 811-3320
Fidelity Colchester Street Trust
(Exact name of registrant as specified in charter)
245 Summer St., Boston, Massachusetts 02210
(Address of principal executive offices) (Zip code)
Scott C. Goebel, Secretary
245 Summer St.
Boston, Massachusetts 02210
(Name and address of agent for service)
Registrant's telephone number, including area code: 617-563-7000
Date of fiscal year end: | March 31 |
| |
Date of reporting period: | September 30, 2014 |
Item 1. Reports to Stockholders
Fidelity ®
Institutional
Money Market
Funds
Treasury Only Portfolio
Treasury Portfolio
Government Portfolio
Prime Money Market Portfolio
Money Market Portfolio
Tax-Exempt Portfolio
Semiannual Report
September 30, 2014
(Fidelity Cover Art)
Contents
Fund Goals:
Treasury Only Portfolio seeks as high a level of current income as is consistent with the security of principal and liquidity.
Treasury Portfolio, Government Portfolio, Prime Money Market Portfolio, and Money Market Portfolio seek to obtain as high a level of current income as is consistent with the preservation of principal and liquidity within the limitations prescribed for the fund.
Tax-Exempt Portfolio seeks to obtain as high a level of interest income exempt from federal income tax as is consistent with liquidity and stability of principal.
To view a fund's proxy voting guidelines and proxy voting record for the 12-month period ended June 30, visit http://www.fidelity.com/proxyvotingresults or visit the Securities and Exchange Commission's (SEC) web site at http://www.sec.gov. You may also call 1-877-297-2952 or, for Class F, call 1-800-835-5092, to request a free copy of the proxy voting guidelines.
Other third-party marks appearing herein are the property of their respective owners.
All other marks appearing herein are registered or unregistered trademarks or service marks of FMR LLC or an affiliated company. © 2014 FMR LLC. All rights reserved.
Investments in the funds are neither insured nor guaranteed by the U.S. Government, and there can be no assurance that the funds will maintain a stable $1.00 share price.
This report and the financial statements contained herein are submitted for the general information of the shareholders of the funds. This report is not authorized for distribution to prospective investors in the funds unless preceded or accompanied by an effective prospectus.
A fund files its complete schedule of portfolio holdings with the SEC for the first and third quarters of each fiscal year on Form N-Q. Forms N-Q are available on the SEC's web site at http://www.sec.gov. A fund's Forms N-Q may be reviewed and copied at the SEC's Public Reference Room in Washington, DC. Information regarding the operation of the SEC's Public Reference Room may be obtained by calling 1-800-SEC-0330. For a complete list of a fund's portfolio holdings, view the most recent holdings listing, semiannual report, or annual report on Fidelity's web site at http://www.fidelity.com, http://www.advisor.fidelity.com, or http://www.401k.com, as applicable.
NOT FDIC INSURED • MAY LOSE VALUE • NO BANK GUARANTEE
Neither the funds nor Fidelity Distributors Corporation is a bank.
Semiannual Report
As a shareholder of a Fund, you incur two types of costs: (1) transaction costs, and (2) ongoing costs, including management fees, distribution and/or service (12b-1) fees and other Fund expenses. This Example is intended to help you understand your ongoing costs (in dollars) of investing in the Funds and to compare these costs with the ongoing costs of investing in other mutual funds.
The actual expense Example is based on an investment of $1,000 at the beginning of the period and held for the entire period (April 1, 2014 to September 30, 2014) for all classes of each fund, except for Institutional Class for Treasury Only Portfolio, Treasury Portfolio and Government Portfolio which is based on an investment of $1,000 at the beginning of the period and held for the period May 14, 2014 to September 30, 2014. The hypothetical expense Example is based on an investment of $1,000 invested for one-half year period (April 1, 2014 to September 30, 2014).
Actual Expenses
The first line of the accompanying table for each class of each fund provides information about actual account values and actual expenses. You may use the information in this line, together with the amount you invested, to estimate the expenses that you paid over the period. Simply divide your account value by $1,000.00 (for example, an $8,600 account value divided by $1,000.00 = 8.6), then multiply the result by the number in the first line for a class of the fund under the heading entitled "Expenses Paid During Period" to estimate the expenses you paid on your account during this period. In addition, each Fund, as a shareholder in the underlying Fidelity Central Funds, will indirectly bear its pro-rata share of the fees and expenses incurred by the underlying Fidelity Central Funds. These fees and expenses are not included in the Fund's annualized expense ratio used to calculate the expense estimate in the table below.
Hypothetical Example for Comparison Purposes
The second line of the accompanying table for each class of each fund provides information about hypothetical account values and hypothetical expenses based on a Class' actual expense ratio and an assumed rate of return of 5% per year before expenses, which is not the Class' actual return. The hypothetical account values and expenses may not be used to estimate the actual ending account balance or expenses you paid for the period. You may use this information to compare the ongoing costs of investing in the Fund and other funds. To do so, compare this 5% hypothetical example with the 5% hypothetical examples that appear in the shareholder reports of the other funds. In addition, each Fund, as a shareholder in the underlying Fidelity Central Funds, will indirectly bear its pro-rata share of the fees and expenses incurred by the underlying Fidelity Central Funds. These fees and expenses are not included in the Fund's annualized expense ratio used to calculate the expense estimate in the table below.
Please note that the expenses shown in the table are meant to highlight your ongoing costs only and do not reflect any transaction costs. Therefore, the second line of the table is useful in comparing ongoing costs only, and will not help you determine the relative total costs of owning different funds.
| Annualized
Expense Ratio B | Beginning
Account Value | Ending
Account Value
September 30, 2014 | Expenses Paid
During Period |
Treasury Only Portfolio | | | | |
Class I | .05% | | | |
Actual | | $ 1,000.00 | $ 1,000.10 | $ .25 C |
HypotheticalA | | $ 1,000.00 | $ 1,024.82 | $ .25 D |
Class II | .05% | | | |
Actual | | $ 1,000.00 | $ 1,000.10 | $ .25 C |
HypotheticalA | | $ 1,000.00 | $ 1,024.82 | $ .25 D |
Class III | .05% | | | |
Actual | | $ 1,000.00 | $ 1,000.10 | $ .25 C |
HypotheticalA | | $ 1,000.00 | $ 1,024.82 | $ .25 D |
Class IV | .04% | | | |
Actual | | $ 1,000.00 | $ 1,000.10 | $ .20 C |
HypotheticalA | | $ 1,000.00 | $ 1,024.87 | $ .20 D |
Select Class | .05% | | | |
Actual | | $ 1,000.00 | $ 1,000.10 | $ .25 C |
HypotheticalA | | $ 1,000.00 | $ 1,024.82 | $ .25 D |
Institutional Class | .04% | | | |
Actual | | $ 1,000.00 | $ 1,000.04 | $ .15 * |
HypotheticalA | | $ 1,000.00 | $ 1,024.87 | $ .20 D |
Treasury Portfolio | | | | |
Class I | .07% | | | |
Actual | | $ 1,000.00 | $ 1,000.10 | $ .35 C |
HypotheticalA | | $ 1,000.00 | $ 1,024.72 | $ .36 D |
Class II | .07% | | | |
Actual | | $ 1,000.00 | $ 1,000.10 | $ .35 C |
HypotheticalA | | $ 1,000.00 | $ 1,024.72 | $ .36 D |
| Annualized
Expense Ratio B | Beginning
Account Value | Ending
Account Value
September 30, 2014 | Expenses Paid
During Period |
Treasury Portfolio - continued | | | | |
Class III | .07% | | | |
Actual | | $ 1,000.00 | $ 1,000.10 | $ .35 C |
HypotheticalA | | $ 1,000.00 | $ 1,024.72 | $ .36 D |
Class IV | .07% | | | |
Actual | | $ 1,000.00 | $ 1,000.10 | $ .35 C |
HypotheticalA | | $ 1,000.00 | $ 1,024.72 | $ .36 D |
Select Class | .07% | | | |
Actual | | $ 1,000.00 | $ 1,000.10 | $ .35 C |
HypotheticalA | | $ 1,000.00 | $ 1,024.72 | $ .36 D |
Institutional Class | .06% | | | |
Actual | | $ 1,000.00 | $ 1,000.04 | $ .23 * |
HypotheticalA | | $ 1,000.00 | $ 1,024.77 | $ .30 D |
Government Portfolio | | | | |
Class I | .10% | | | |
Actual | | $ 1,000.00 | $ 1,000.10 | $ .50 C |
HypotheticalA | | $ 1,000.00 | $ 1,024.57 | $ .51 D |
Class II | .10% | | | |
Actual | | $ 1,000.00 | $ 1,000.10 | $ .50 C |
HypotheticalA | | $ 1,000.00 | $ 1,024.57 | $ .51 D |
Class III | .10% | | | |
Actual | | $ 1,000.00 | $ 1,000.10 | $ .50 C |
HypotheticalA | | $ 1,000.00 | $ 1,024.57 | $ .51 D |
Select Class | .10% | | | |
Actual | | $ 1,000.00 | $ 1,000.10 | $ .50 C |
HypotheticalA | | $ 1,000.00 | $ 1,024.57 | $ .51 D |
Institutional Class | .10% | | | |
Actual | | $ 1,000.00 | $ 1,000.04 | $ .38 * |
HypotheticalA | | $ 1,000.00 | $ 1,024.57 | $ .51 D |
Prime Money Market Portfolio | | | | |
Class I | .19% | | | |
Actual | | $ 1,000.00 | $ 1,000.10 | $ .95 C |
HypotheticalA | | $ 1,000.00 | $ 1,024.12 | $ .96 D |
Class II | .19% | | | |
Actual | | $ 1,000.00 | $ 1,000.10 | $ .95 C |
HypotheticalA | | $ 1,000.00 | $ 1,024.12 | $ .96 D |
Class III | .19% | | | |
Actual | | $ 1,000.00 | $ 1,000.10 | $ .95 C |
HypotheticalA | | $ 1,000.00 | $ 1,024.12 | $ .96 D |
Class IV | .19% | | | |
Actual | | $ 1,000.00 | $ 1,000.10 | $ .95 C |
HypotheticalA | | $ 1,000.00 | $ 1,024.12 | $ .96 D |
Select Class | .19% | | | |
Actual | | $ 1,000.00 | $ 1,000.10 | $ .95 C |
HypotheticalA | | $ 1,000.00 | $ 1,024.12 | $ .96 D |
Institutional Class | .14% | | | |
Actual | | $ 1,000.00 | $ 1,000.30 | $ .70 C |
HypotheticalA | | $ 1,000.00 | $ 1,024.37 | $ .71 D |
| Annualized
Expense Ratio B | Beginning
Account Value | Ending
Account Value
September 30, 2014 | Expenses Paid
During Period |
Money Market Portfolio | | | | |
Class I | .18% | | | |
Actual | | $ 1,000.00 | $ 1,000.20 | $ .90 C |
HypotheticalA | | $ 1,000.00 | $ 1,024.17 | $ .91 D |
Class II | .21% | | | |
Actual | | $ 1,000.00 | $ 1,000.10 | $ 1.05 C |
HypotheticalA | | $ 1,000.00 | $ 1,024.02 | $ 1.07 D |
Class III | .21% | | | |
Actual | | $ 1,000.00 | $ 1,000.10 | $ 1.05 C |
HypotheticalA | | $ 1,000.00 | $ 1,024.02 | $ 1.07 D |
Select Class | .21% | | | |
Actual | | $ 1,000.00 | $ 1,000.10 | $ 1.05 C |
HypotheticalA | | $ 1,000.00 | $ 1,024.02 | $ 1.07 D |
Class F | .14% | | | |
Actual | | $ 1,000.00 | $ 1,000.40 | $ .70 C |
HypotheticalA | | $ 1,000.00 | $ 1,024.37 | $ .71 D |
Institutional Class | .14% | | | |
Actual | | $ 1,000.00 | $ 1,000.40 | $ .70 C |
HypotheticalA | | $ 1,000.00 | $ 1,024.37 | $ .71 D |
Tax-Exempt Portfolio | | | | |
Class I | .08% | | | |
Actual | | $ 1,000.00 | $ 1,000.10 | $ .40 C |
HypotheticalA | | $ 1,000.00 | $ 1,024.67 | $ .41 D |
Class II | .08% | | | |
Actual | | $ 1,000.00 | $ 1,000.10 | $ .40 C |
HypotheticalA | | $ 1,000.00 | $ 1,024.67 | $ .41 D |
Class III | .08% | | | |
Actual | | $ 1,000.00 | $ 1,000.10 | $ .40 C |
HypotheticalA | | $ 1,000.00 | $ 1,024.67 | $ .41 D |
Select Class | .08% | | | |
Actual | | $ 1,000.00 | $ 1,000.10 | $ .40 C |
HypotheticalA | | $ 1,000.00 | $ 1,024.67 | $ .41 D |
A 5% return per year before expenses
B Annualized expense ratio reflects expenses net of applicable fee waivers.
C Actual expenses are equal to the Class' annualized expense ratio, multiplied by the average account value over the period, multiplied by 183/365 (to reflect the one-half year period).
D Hypothetical expenses are equal to the Class' annualized expense ratio, multiplied by the average value over the period, multiplied by 183/365 (to reflect the one-half year period).
* Actual expenses are equal to the Class' annualized expense ratio, multiplied by the average account value over the period, multiplied by 140/365 (to reflect the period May 14, 2014 to September 30, 2014).
Semiannual Report
Treasury Only Portfolio
Investment Changes/Performance (Unaudited)
Effective Maturity Diversification |
Days | % of fund's investments 9/30/14 | % of fund's investments 3/31/14 | % of fund's
investments
9/30/13 |
1 - 7 | 8.0 | 1.6 | 1.7 |
8 - 30 | 20.6 | 28.2 | 19.1 |
31 - 60 | 28.3 | 28.6 | 35.7 |
61 - 90 | 21.6 | 19.3 | 28.8 |
91 - 180 | 21.5 | 22.3 | 13.9 |
> 180 | 0.0 | 0.0 | 0.8 |
Effective maturity is determined in accordance with the requirements of Rule 2a-7 under the Investment Company Act of 1940. |
Weighted Average Maturity |
| 9/30/14 | 3/31/14 | 9/30/13 |
Treasury Only Portfolio | 56 Days | 57 Days | 57 Days |
All Taxable Money Market Funds Average* | 45 Days | 46 Days | 48 Days |
This is a weighted average of all the maturities of the securities held in a fund. Weighted Average Maturity (WAM) can be used as a measure of sensitivity to interest rate changes and market changes. Generally, the longer the maturity, the greater the sensitivity to such changes. WAM is based on the dollar-weighted average length of time until principal payments must be paid. Depending on the types of securities held in a fund, certain maturity shortening devices (e.g., demand features, interest rate resets, and call options) may be taken into account when calculating the WAM. |
Weighted Average Life |
| 9/30/14 | 3/31/14 | 9/30/13 |
Treasury Only Portfolio | 91 Days | 67 Days | 57 Days |
Weighted Average Life (WAL) is the weighted average of the life of the securities held in a fund or portfolio and can be used as a measure of sensitivity to changes in liquidity and/or credit risk. Generally, the higher the value, the greater the sensitivity. WAL is based on the dollar-weighted average length of time until principal payments must be paid, taking into account any call options exercised by the issuer and any permissible maturity shortening features other than interest rate resets. The difference between WAM and WAL is that WAM takes into account interest rate resets and WAL does not. WAL for money market funds is not the same as WAL of a mortgage- or asset-backed security. |
Asset Allocation (% of fund's net assets) |
As of September 30, 2014 | As of March 31, 2014 |
 | Treasury Debt 102.4% | | | Treasury Debt 103.0% | |
 | Net Other Assets (Liabilities)** (2.4)% | | | Net Other Assets (Liabilities)** (3.0)% | |

Current and Historical Seven-Day Yields |
| 9/30/14 | 6/30/14 | 3/31/14 | 12/31/14 | 9/30/13 |
| | | | | |
Class I | 0.01% | 0.01% | 0.01% | 0.01% | 0.01% |
| | | | | |
Class II | 0.01% | 0.01% | 0.01% | 0.01% | 0.01% |
| | | | | |
Class III | 0.01% | 0.01% | 0.01% | 0.01% | 0.01% |
| | | | | |
Class IV | 0.01% | 0.01% | 0.01% | 0.01% | 0.01% |
| | | | | |
Select Class | 0.01% | 0.01% | 0.01% | 0.01% | 0.01% |
| | | | | |
Institutional Class | 0.01% | 0.01% | N/A | N/A | N/A |
Yield refers to the income paid by the fund over a given period. Yields for money market funds are usually for seven-day periods, as they are here, though they are expressed as annual percentage rates. Past performance is no guarantee of future results. Yield will vary and it's possible to lose money investing in the Fund. A portion of the Fund's expenses was reimbursed and/or waived. Absent such reimbursements and/or waivers the yield for the period ending September 30, 2014, the most recent period shown in the table, would have been -0.17% for Class I, -0.32% for Class II, -0.43% for Class III, -0.70% for Class IV, -0.22% for Select Class and -0.15% for Institutional Class.
* Source: iMoneyNet, Inc.
** Net Other Assets (Liabilities) are not included in the pie chart.
Semiannual Report
Treasury Only Portfolio
Investments September 30, 2014 (Unaudited)
Showing Percentage of Net Assets
Treasury Debt - 102.4% |
| | Yield (a) | Principal Amount (000s) | Value (000s) |
U.S. Treasury Obligations - 102.4% |
U.S. Treasury Bills |
| 10/2/14 to 3/5/15 | 0.02 to 0.05% | $ 4,307,580 | $ 4,307,406 |
U.S. Treasury Notes |
| 10/15/14 to 4/30/16 | 0.03 to 0.08 (b) | 7,010,348 | 7,024,588 |
TOTAL INVESTMENT PORTFOLIO - 102.4% (Cost $11,331,994) | 11,331,994 |
NET OTHER ASSETS (LIABILITIES) - (2.4)% | | (266,279) |
NET ASSETS - 100% | $ 11,065,715 |
Legend |
(a) Yield represents either the annualized yield at the date of purchase, or the stated coupon rate, or, for floating and adjustable rate securities, the rate at period end. |
(b) Coupon rates for floating and adjustable rate securities reflect the rates in effect at period end. |
Other Information |
The date shown for securities represents the date when principal payments must be paid, taking into account any call options exercised by the issuer and any permissible maturity shortening features other than interest rate resets. |
All investments are categorized as Level 2 under the Fair Value Hierarchy. The inputs or methodology used for valuing securities may not be an indication of the risk associated with investing in those securities. For more information on valuation inputs, please refer to the Security Valuation section in the accompanying Notes to Financial Statements. |
See accompanying notes which are an integral part of the financial statements.
Semiannual Report
Treasury Only Portfolio
Financial Statements
Statement of Assets and Liabilities
Amounts in thousands (except per-share amounts) September 30, 2014
(Unaudited) |
| | |
Assets | | |
Investment in securities, at value - See accompanying schedule: Unaffiliated issuers (cost $11,331,994) | | $ 11,331,994 |
Receivable for fund shares sold | | 7,248 |
Interest receivable | | 29,876 |
Receivable from investment adviser for expense reductions | | 140 |
Total assets | | 11,369,258 |
| | |
Liabilities | | |
Payable for investments purchased | $ 299,995 | |
Payable for fund shares redeemed | 3,014 | |
Distributions payable | 23 | |
Accrued management fee | 359 | |
Other affiliated payables | 70 | |
Other payables and accrued expenses | 82 | |
Total liabilities | | 303,543 |
| | |
Net Assets | | $ 11,065,715 |
Net Assets consist of: | | |
Paid in capital | | $ 11,065,480 |
Accumulated undistributed net realized gain (loss) on investments | | 235 |
Net Assets | | $ 11,065,715 |
| | |
Class I:
Net Asset Value, offering price and redemption price per share ($9,545,824 ÷ 9,544,498 shares) | | $ 1.00 |
| | |
Class II:
Net Asset Value, offering price and redemption price per share ($360,403 ÷ 360,442 shares) | | $ 1.00 |
| | |
Class III:
Net Asset Value, offering price and redemption price per share ($607,018 ÷ 606,889 shares) | | $ 1.00 |
| | |
Class IV:
Net Asset Value, offering price and redemption price per share ($145,774 ÷ 145,767 shares) | | $ 1.00 |
| | |
| | |
Select Class:
Net Asset Value, offering price and redemption price per share ($344,057 ÷ 344,059 shares) | | $ 1.00 |
| | |
Institutional Class:
Net Asset Value, offering price and redemption price per share ($62,639 ÷ 62,638 shares) | | $ 1.00 |
Statement of Operations
Amounts in thousands Six months ended September 30, 2014
(Unaudited) |
| | |
Investment Income | | |
Interest | | $ 3,072 |
| | |
Expenses | | |
Management fee | $ 7,489 | |
Transfer agent fees | 3,224 | |
Distribution and service plan fees | 1,214 | |
Accounting fees and expenses | 424 | |
Custodian fees and expenses | 63 | |
Independent trustees' compensation | 24 | |
Registration fees | 76 | |
Audit | 28 | |
Legal | 11 | |
Miscellaneous | 42 | |
Total expenses before reductions | 12,595 | |
Expense reductions | (10,060) | 2,535 |
Net investment income (loss) | | 537 |
Realized and Unrealized Gain (Loss) Net realized gain (loss) on: | | |
Investment securities: | | |
Unaffiliated issuers | | 61 |
Net increase in net assets resulting from operations | | $ 598 |
See accompanying notes which are an integral part of the financial statements.
Semiannual Report
Treasury Only Portfolio
Financial Statements - continued
Statement of Changes in Net Assets
Amounts in thousands | Six months ended
September 30, 2014
(Unaudited) | Year ended
March 31,
2014 |
Increase (Decrease) in Net Assets | | |
Operations | | |
Net investment income (loss) | $ 537 | $ 1,141 |
Net realized gain (loss) | 61 | 33 |
Net increase in net assets resulting from operations | 598 | 1,174 |
Distributions to shareholders from net investment income | (537) | (1,140) |
Share transactions - net increase (decrease) | 189,971 | 451,298 |
Total increase (decrease) in net assets | 190,032 | 451,332 |
| | |
Net Assets | | |
Beginning of period | 10,875,683 | 10,424,351 |
End of period | $ 11,065,715 | $ 10,875,683 |
Financial Highlights - Class I
| Six months ended
September 30, 2014 | Years ended March 31, |
| (Unaudited) | 2014 | 2013 | 2012 | 2011 | 2010 |
Selected Per-Share Data | | | | | | |
Net asset value, beginning of period | $ 1.00 | $ 1.00 | $ 1.00 | $ 1.00 | $ 1.00 | $ 1.00 |
Income from Investment Operations | | | | | | |
Net investment income (loss) | - E | - E | - E | - E | - E | .001 |
Net realized and unrealized gain (loss) E | - | - | - | - | - | - |
Total from investment operations | - E | - E | - E | - E | - E | .001 |
Distributions from net investment income | - E | - E | - E | - E | - E | (.001) |
Distributions from net realized gain | - | - | - | - | - E | - E |
Total distributions | - E | - E | - E | - E | - E | (.001) |
Net asset value, end of period | $ 1.00 | $ 1.00 | $ 1.00 | $ 1.00 | $ 1.00 | $ 1.00 |
Total Return B, C | .01% | .01% | .01% | .01% | .01% | .09% |
Ratios to Average Net Assets D | | | | | | |
Expenses before reductions | .21% A | .21% | .21% | .21% | .21% | .21% |
Expenses net of fee waivers, if any | .05% A | .06% | .10% | .06% | .18% | .20% |
Expenses net of all reductions | .05% A | .06% | .10% | .06% | .18% | .20% |
Net investment income (loss) | .01% A | .01% | .01% | .01% | .01% | .10% |
Supplemental Data | | | | | | |
Net assets, end of period (in millions) | $ 9,546 | $ 9,795 | $ 9,431 | $ 8,064 | $ 6,149 | $ 8,371 |
A Annualized
B Total returns for periods of less than one year are not annualized.
C Total returns would have been lower if certain expenses had not been reduced during the applicable periods shown.
D Expense ratios reflect operating expenses of the class. Expenses before reductions do not reflect amounts reimbursed or waived or reductions from expense offset arrangements and do not represent the amount paid by the class during periods when reimbursements, waivers or reductions occur. Expenses net of fee waivers reflect expenses after reimbursement and waivers but prior to reductions from expense offset arrangements. Expenses net of all reductions represent the net expenses paid by the class.
E Amount represents less than $.001 per share.
See accompanying notes which are an integral part of the financial statements.
Semiannual Report
Financial Highlights - Class II
| Six months ended
September 30, 2014 | Years ended March 31, |
| (Unaudited) | 2014 | 2013 | 2012 | 2011 | 2010 |
Selected Per-Share Data | | | | | | |
Net asset value, beginning of period | $ 1.00 | $ 1.00 | $ 1.00 | $ 1.00 | $ 1.00 | $ 1.00 |
Income from Investment Operations | | | | | | |
Net investment income (loss) E | - | - | - | - | - | - |
Net realized and unrealized gain (loss) E | - | - | - | - | - | - |
Total from investment operations E | - | - | - | - | - | - |
Distributions from net investment income E | - | - | - | - | - | - |
Distributions from net realized gain | - | - | - | - | - E | - E |
Total distributions E | - | - | - | - | - | - |
Net asset value, end of period | $ 1.00 | $ 1.00 | $ 1.00 | $ 1.00 | $ 1.00 | $ 1.00 |
Total ReturnB, C | .01% | .01% | .01% | .01% | .01% | .03% |
Ratios to Average Net Assets D | | | | | | |
Expenses before reductions | .36% A | .36% | .36% | .36% | .36% | .36% |
Expenses net of fee waivers, if any | .05% A | .06% | .10% | .06% | .17% | .27% |
Expenses net of all reductions | .05% A | .06% | .10% | .06% | .17% | .27% |
Net investment income (loss) | .01% A | .01% | .01% | .01% | .01% | .03% |
Supplemental Data | | | | | | |
Net assets, end of period (in millions) | $ 360 | $ 359 | $ 354 | $ 499 | $ 585 | $ 649 |
A Annualized
B Total returns for periods of less than one year are not annualized.
C Total returns would have been lower if certain expenses had not been reduced during the applicable periods shown.
D Expense ratios reflect operating expenses of the class. Expenses before reductions do not reflect amounts reimbursed or waived or reductions from expense offset arrangements and do not represent the amount paid by the class during periods when reimbursements, waivers or reductions occur. Expenses net of fee waivers reflect expenses after reimbursement and waivers but prior to reductions from expense offset arrangements. Expenses net of all reductions represent the net expenses paid by the class.
E Amount represents less than $.001 per share.
Financial Highlights - Class III
| Six months ended
September 30, 2014 | Years ended March 31, |
| (Unaudited) | 2014 | 2013 | 2012 | 2011 | 2010 |
Selected Per-Share Data | | | | | | |
Net asset value, beginning of period | $ 1.00 | $ 1.00 | $ 1.00 | $ 1.00 | $ 1.00 | $ 1.00 |
Income from Investment Operations | | | | | | |
Net investment income (loss) E | - | - | - | - | - | - |
Net realized and unrealized gain (loss) E | - | - | - | - | - | - |
Total from investment operations E | - | - | - | - | - | - |
Distributions from net investment income E | - | - | - | - | - | - |
Distributions from net realized gain | - | - | - | - | - E | - E |
Total distributions E | - | - | - | - | - | - |
Net asset value, end of period | $ 1.00 | $ 1.00 | $ 1.00 | $ 1.00 | $ 1.00 | $ 1.00 |
Total ReturnB, C | .01% | .01% | .01% | .01% | .01% | .01% |
Ratios to Average Net Assets D | | | | | | |
Expenses before reductions | .46% A | .46% | .46% | .46% | .46% | .46% |
Expenses net of fee waivers, if any | .05% A | .06% | .10% | .06% | .18% | .28% |
Expenses net of all reductions | .05% A | .06% | .10% | .06% | .18% | .28% |
Net investment income (loss) | .01% A | .01% | .01% | .01% | .01% | .02% |
Supplemental Data | | | | | | |
Net assets, end of period (in millions) | $ 607 | $ 487 | $ 408 | $ 408 | $ 392 | $ 615 |
A Annualized
B Total returns for periods of less than one year are not annualized.
C Total returns would have been lower if certain expenses had not been reduced during the applicable periods shown.
D Expense ratios reflect operating expenses of the class. Expenses before reductions do not reflect amounts reimbursed or waived or reductions from expense offset arrangements and do not represent the amount paid by the class during periods when reimbursements, waivers or reductions occur. Expenses net of fee waivers reflect expenses after reimbursement and waivers but prior to reductions from expense offset arrangements. Expenses net of all reductions represent the net expenses paid by the class.
E Amount represents less than $.001 per share.
See accompanying notes which are an integral part of the financial statements.
Semiannual Report
Financial Highlights - Class IV
| Six months ended
September 30, 2014 | Years ended March 31, |
| (Unaudited) | 2014 | 2013 | 2012 | 2011 | 2010 |
Selected Per-Share Data | | | | | | |
Net asset value, beginning of period | $ 1.00 | $ 1.00 | $ 1.00 | $ 1.00 | $ 1.00 | $ 1.00 |
Income from Investment Operations | | | | | | |
Net investment income (loss) E | - | - | - | - | - | - |
Net realized and unrealized gain (loss) E | - | - | - | - | - | - |
Total from investment operations E | - | - | - | - | - | - |
Distributions from net investment income E | - | - | - | - | - | - |
Distributions from net realized gain | - | - | - | - | - E | - E |
Total distributions E | - | - | - | - | - | - |
Net asset value, end of period | $ 1.00 | $ 1.00 | $ 1.00 | $ 1.00 | $ 1.00 | $ 1.00 |
Total ReturnB, C | .01% | .01% | .01% | .01% | .01% | .01% |
Ratios to Average Net Assets D | | | | | | |
Expenses before reductions | .72% A | .71% | .71% | .72% | .71% | .72% |
Expenses net of fee waivers, if any | .04% A | .06% | .10% | .07% | .17% | .30% |
Expenses net of all reductions | .04% A | .06% | .10% | .07% | .17% | .30% |
Net investment income (loss) | .01% A | .01% | .01% | .01% | .01% | .01% |
Supplemental Data | | | | | | |
Net assets, end of period (in millions) | $ 146 | $ 18 | $ 22 | $ 25 | $ 62 | $ 60 |
A Annualized
B Total returns for periods of less than one year are not annualized.
C Total returns would have been lower if certain expenses had not been reduced during the applicable periods shown.
D Expense ratios reflect operating expenses of the class. Expenses before reductions do not reflect amounts reimbursed or waived or reductions from expense offset arrangements and do not represent the amount paid by the class during periods when reimbursements, waivers or reductions occur. Expenses net of fee waivers reflect expenses after reimbursement and waivers but prior to reductions from expense offset arrangements. Expenses net of all reductions represent the net expenses paid by the class.
E Amount represents less than $.001 per share.
Financial Highlights - Select Class
| Six months ended
September 30, 2014 | Years ended March 31, |
| (Unaudited) | 2014 | 2013 | 2012 | 2011 | 2010 |
Selected Per-Share Data | | | | | | |
Net asset value, beginning of period | $ 1.00 | $ 1.00 | $ 1.00 | $ 1.00 | $ 1.00 | $ 1.00 |
Income from Investment Operations | | | | | | |
Net investment income (loss) | - E | - E | - E | - E | - E | .001 |
Net realized and unrealized gain (loss) E | - | - | - | - | - | - |
Total from investment operations | - E | - E | - E | - E | - E | .001 |
Distributions from net investment income | - E | - E | - E | - E | - E | (.001) |
Distributions from net realized gain | - | - | - | - | - E | - E |
Total distributions | - E | - E | - E | - E | - E | (.001) |
Net asset value, end of period | $ 1.00 | $ 1.00 | $ 1.00 | $ 1.00 | $ 1.00 | $ 1.00 |
Total ReturnB, C | .01% | .01% | .01% | .01% | .01% | .07% |
Ratios to Average Net Assets D | | | | | | |
Expenses before reductions | .26% A | .26% | .26% | .26% | .26% | .26% |
Expenses net of fee waivers, if any | .05% A | .06% | .10% | .06% | .18% | .23% |
Expenses net of all reductions | .05% A | .06% | .10% | .06% | .18% | .23% |
Net investment income (loss) | .01% A | .01% | .01% | .01% | .01% | .07% |
Supplemental Data | | | | | | |
Net assets, end of period (in millions) | $ 344 | $ 215 | $ 210 | $ 269 | $ 209 | $ 478 |
A Annualized
B Total returns for periods of less than one year are not annualized.
C Total returns would have been lower if certain expenses had not been reduced during the applicable periods shown.
D Expense ratios reflect operating expenses of the class. Expenses before reductions do not reflect amounts reimbursed or waived or reductions from expense offset arrangements and do not represent the amount paid by the class during periods when reimbursements, waivers or reductions occur. Expenses net of fee waivers reflect expenses after reimbursement and waivers but prior to reductions from expense offset arrangements. Expenses net of all reductions represent the net expenses paid by the class.
E Amount represents less than $.001 per share.
See accompanying notes which are an integral part of the financial statements.
Semiannual Report
Financial Highlights - Institutional Class
| Period ended
September 30,
2014 D |
Selected Per-Share Data | (Unaudited) |
Net asset value, beginning of period | $ 1.00 |
Income from Investment Operations | |
Net investment income (loss) F | - |
Distributions from net investment income F | - |
Net asset value, end of period | $ 1.00 |
Total ReturnB, C | .00% |
Ratios to Average Net Assets E | |
Expenses before reductions | .18% A |
Expenses net of fee waivers, if any | .04% A |
Expenses net of all reductions | .04% A |
Net investment income (loss) | .02% A |
Supplemental Data | |
Net assets, end of period (in millions) | $ 63 |
A Annualized
B Total returns for periods of less than one year are not annualized.
C Total returns would have been lower if certain expenses had not been reduced during the applicable periods shown.
D For the period May 14, 2014 (commencement of sale of shares) to September 30, 2014.
E Expense ratios reflect operating expenses of the class. Expenses before reductions do not reflect amounts reimbursed or waived or reductions from expense offset arrangements and do not represent the amount paid by the class during periods when reimbursements, waivers or reductions occur. Expense ratios before reductions for start-up periods may not be representative of longer-term operating periods. Expenses net of fee waivers reflect expenses after reimbursement and waivers but prior to reductions from expense offset arrangements. Expenses net of all reductions represent the net expenses paid by the class.
F Amount represents less than $.001 per share.
See accompanying notes which are an integral part of the financial statements.
Semiannual Report
Treasury Portfolio
Investment Changes/Performance (Unaudited)
Effective Maturity Diversification |
Days | % of fund's investments 9/30/14 | % of fund's investments 3/31/14 | % of fund's
investments
9/30/13 |
1 - 7 | 78.4 | 45.9 | 63.0 |
8 - 30 | 2.3 | 15.2 | 5.2 |
31 - 60 | 1.6 | 13.5 | 4.2 |
61 - 90 | 3.2 | 3.0 | 6.2 |
91 - 180 | 8.1 | 14.7 | 12.5 |
> 180 | 6.4 | 7.7 | 8.9 |
Effective maturity is determined in accordance with the requirements of Rule 2a-7 under the Investment Company Act of 1940. |
Weighted Average Maturity |
| 9/30/14 | 3/31/14 | 9/30/13 |
Treasury Portfolio | 31 Days | 53 Days | 45 Days |
All Taxable Money Market Funds Average* | 45 Days | 46 Days | 48 Days |
This is a weighted average of all the maturities of the securities held in a fund. Weighted Average Maturity (WAM) can be used as a measure of sensitivity to interest rate changes and market changes. Generally, the longer the maturity, the greater the sensitivity to such changes. WAM is based on the dollar-weighted average length of time until principal payments must be paid. Depending on the types of securities held in a fund, certain maturity shortening devices (e.g., demand features, interest rate resets, and call options) may be taken into account when calculating the WAM. |
Weighted Average Life |
| 9/30/14 | 3/31/14 | 9/30/13 |
Treasury Portfolio | 54 Days | 59 Days | 45 Days |
Weighted Average Life (WAL) is the weighted average of the life of the securities held in a fund or portfolio and can be used as a measure of sensitivity to changes in liquidity and/or credit risk. Generally, the higher the value, the greater the sensitivity. WAL is based on the dollar-weighted average length of time until principal payments must be paid, taking into account any call options exercised by the issuer and any permissible maturity shortening features other than interest rate resets. The difference between WAM and WAL is that WAM takes into account interest rate resets and WAL does not. WAL for money market funds is not the same as WAL of a mortgage- or asset-backed security. |
Asset Allocation (% of fund's net assets) |
As of September 30, 2014 | As of March 31, 2014 |
| Treasury Debt 22.6% | | | Treasury Debt 53.1% | |
 | Repurchase
Agreements 77.3% | | | Repurchase
Agreements 46.8% | |
 | Net Other Assets (Liabilities) 0.1% | | | Net Other Assets (Liabilities) 0.1% | |

Current and Historical Seven-Day Yields |
| 9/30/14 | 6/30/14 | 3/31/14 | 12/31/13 | 9/30/13 |
| | | | | |
Class I | 0.01% | 0.01% | 0.01% | 0.01% | 0.01% |
| | | | | |
Class II | 0.01% | 0.01% | 0.01% | 0.01% | 0.01% |
| | | | | |
Class III | 0.01% | 0.01% | 0.01% | 0.01% | 0.01% |
| | | | | |
Class IV | 0.01% | 0.01% | 0.01% | 0.01% | 0.01% |
| | | | | |
Select Class | 0.01% | 0.01% | 0.01% | 0.01% | 0.01% |
| | | | | |
Institutional Class | 0.01% | 0.01% | N/A | N/A | N/A |
Yield refers to the income paid by the fund over a given period. Yields for money market funds are usually for seven-day periods, as they are here, though they are expressed as annual percentage rates. Past performance is no guarantee of future results. Yield will vary and it's possible to lose money investing in the Fund. A portion of the Fund's expenses was reimbursed and/or waived. Absent such reimbursements and/or waivers the yield for the period ending September 30, 2014, the most recent period shown in the table, would have been -0.16% for Class I, -0.31% for Class II, -0.41% for Class III, -0.66% for Class IV, -0.21% for Select Class and -0.12% for Institutional Class.
* Source: iMoneyNet, Inc.
Semiannual Report
Treasury Portfolio
Investments September 30, 2014 (Unaudited)
Showing Percentage of Net Assets
Treasury Debt - 22.6% |
| | Yield (a) | Principal Amount (000s) | Value (000s) |
U.S. Treasury Obligations - 22.6% |
U.S. Treasury Bills |
| 2/19/15 to 8/20/15 | 0.06 to 0.13% | $ 378,330 | $ 378,126 |
U.S. Treasury Notes |
| 10/31/14 to 7/31/16 | 0.06 to 0.18 (b) | 3,157,104 | 3,170,138 |
TOTAL TREASURY DEBT (Cost $3,548,264) |
3,548,264
|
Treasury Repurchase Agreement - 77.3% |
| Maturity Amount (000s) | | |
In a joint trading account: | | | |
at 0.01% dated 9/30/14 due 10/1/14 (Collateralized by U.S. Treasury Obligations) # | $ 2,591,051 | | 2,591,050 |
at 0.01% dated 9/30/14 due 10/1/14 (Collateralized by U.S. Treasury Obligations) # | 704,162 | | 704,162 |
With: | | | |
Barclays Capital, Inc. at: | | | |
0.06%, dated 9/17/14 due 10/7/14 (Collateralized by U.S. Treasury Obligations valued at $1,105,032,010, 0% - 6.5%, 10/30/14 - 2/15/41) | 1,083,054 | | 1,083,000 |
0.08%, dated 8/20/14 due 10/7/14 (Collateralized by U.S. Treasury Obligations valued at $147,981,333, 0% - 6.13%, 11/20/14 - 5/15/41) | 145,020 | | 145,000 |
0.09%, dated 8/4/14 due 10/6/14 (Collateralized by U.S. Treasury Obligations valued at $179,546,034, 0.25% - 3.38%, 8/15/15 - 11/15/19) | 176,028 | | 176,000 |
BNP Paribas Securities Corp. at: | | | |
0.06%, dated 9/10/14 due 10/7/14 (Collateralized by U.S. Treasury Obligations valued at $366,247,608, 0% - 9.88%, 10/31/14 - 8/15/43) | 359,035 | | 359,000 |
0.07%, dated 7/29/14 due 10/1/14 (Collateralized by U.S. Treasury Obligations valued at $364,186,034, 0.13% - 6.88%, 12/31/14 - 2/15/40) | 357,044 | | 357,000 |
|
| Maturity Amount (000s) | | Value (000s) |
Federal Reserve Bank of New York at 0%, dated 9/30/14 due 10/1/14 (Collateralized by U.S. Treasury Obligations valued at $6,207,000,087, 3%, 5/15/42) | $ 6,207,000 | | $ 6,207,000 |
Wells Fargo Securities, LLC at: | | | |
0.08%, dated 7/29/14 due 10/27/14 (Collateralized by U.S. Treasury Obligations valued at $364,461,365, 0.08% - 4.38%, 11/30/15 - 5/15/41) | 357,071 | | 357,000 |
0.1%, dated 9/11/14 due 2/9/15 (Collateralized by U.S. Treasury Obligations valued at $146,896,065, 0.25% - 0.38%, 7/15/15 - 3/31/16) | 144,060 | | 144,000 |
TOTAL TREASURY REPURCHASE AGREEMENT (Cost $12,123,212) |
12,123,212
|
TOTAL INVESTMENT PORTFOLIO - 99.9% (Cost $15,671,476) | | 15,671,476 |
NET OTHER ASSETS (LIABILITIES) - 0.1% | | 9,271 |
NET ASSETS - 100% | $ 15,680,747 |
Legend |
(a) Yield represents either the annualized yield at the date of purchase, or the stated coupon rate, or, for floating and adjustable rate securities, the rate at period end. |
(b) Coupon rates for floating and adjustable rate securities reflect the rates in effect at period end. |
# Additional information on each counterparty to the repurchase agreement is as follows: |
Repurchase Agreement / Counterparty | Value
(Amounts in thousands) |
$2,591,050,000 due 10/01/14 at 0.01% |
Credit Agricole CIB New York Branch | $ 2,307,116 |
Wells Fargo Securities LLC | 283,934 |
| $ 2,591,050 |
$704,162,000 due 10/01/14 at 0.01% |
BNP Paribas Securities Corp. | $ 427,051 |
Barclays Capital, Inc. | 118,120 |
Merrill Lynch, Pierce, Fenner & Smith, Inc. | 158,991 |
| $ 704,162 |
Other Information |
The date shown for securities represents the date when principal payments must be paid, taking into account any call options exercised by the issuer and any permissible maturity shortening features other than interest rate resets. |
All investments are categorized as Level 2 under the Fair Value Hierarchy. The inputs or methodology used for valuing securities may not be an indication of the risk associated with investing in those securities. For more information on valuation inputs, please refer to the Security Valuation section in the accompanying Notes to Financial Statements. |
See accompanying notes which are an integral part of the financial statements.
Semiannual Report
Treasury Portfolio
Financial Statements
Statement of Assets and Liabilities
Amounts in thousands (except per-share amounts) September 30, 2014
(Unaudited) |
| | |
Assets | | |
Investment in securities, at value (including repurchase agreements of $12,123,212) - See accompanying schedule: Unaffiliated issuers (cost $15,671,476) | | $ 15,671,476 |
Receivable for fund shares sold | | 43 |
Interest receivable | | 10,030 |
Receivable from investment adviser for expense reductions | | 176 |
Other receivables | | 162 |
Total assets | | 15,681,887 |
| | |
Liabilities | | |
Payable for fund shares redeemed | $ 38 | |
Distributions payable | 66 | |
Accrued management fee | 728 | |
Other affiliated payables | 88 | |
Other payables and accrued expenses | 220 | |
Total liabilities | | 1,140 |
| | |
Net Assets | | $ 15,680,747 |
Net Assets consist of: | | |
Paid in capital | | $ 15,680,706 |
Accumulated undistributed net realized gain (loss) on investments | | 41 |
Net Assets | | $ 15,680,747 |
| | |
Class I:
Net Asset Value, offering price and redemption price per share ($10,983,660 ÷ 10,980,551 shares) | | $ 1.00 |
| | |
Class II:
Net Asset Value, offering price and redemption price per share ($114,391 ÷ 114,563 shares) | | $ 1.00 |
| | |
Class III:
Net Asset Value, offering price and redemption price per share ($3,435,738 ÷ 3,434,745 shares) | | $ 1.00 |
| | |
Class IV:
Net Asset Value, offering price and redemption price per share ($521,704 ÷ 521,468 shares) | | $ 1.00 |
| | |
Select Class:
Net Asset Value, offering price and redemption price per share ($189,128 ÷ 189,104 shares) | | $ 1.00 |
| | |
Institutional Class:
Net Asset Value, offering price and redemption price per share ($436,126 ÷ 436,107 shares) | | $ 1.00 |
Statement of Operations
Amounts in thousands Six months ended September 30, 2014
(Unaudited) |
| | |
Investment Income | | |
Interest | | $ 5,144 |
| | |
Expenses | | |
Management fee | $ 9,551 | |
Transfer agent fees | 4,096 | |
Distribution and service plan fees | 5,056 | |
Accounting fees and expenses | 484 | |
Custodian fees and expenses | 12 | |
Independent trustees' compensation | 30 | |
Registration fees | 80 | |
Audit | 30 | |
Legal | 13 | |
Miscellaneous | 51 | |
Total expenses before reductions | 19,403 | |
Expense reductions | (14,942) | 4,461 |
Net investment income (loss) | | 683 |
Realized and Unrealized Gain (Loss) Net realized gain (loss) on: | | |
Investment securities: | | |
Unaffiliated issuers | | 41 |
Net increase in net assets resulting from operations | | $ 724 |
See accompanying notes which are an integral part of the financial statements.
Semiannual Report
Statement of Changes in Net Assets
Amounts in thousands | Six months ended
September 30, 2014
(Unaudited) | Year ended
March 31,
2014 |
Increase (Decrease) in Net Assets | | |
Operations | | |
Net investment income (loss) | $ 683 | $ 1,374 |
Net realized gain (loss) | 41 | 48 |
Net increase in net assets resulting from operations | 724 | 1,422 |
Distributions to shareholders from net investment income | (683) | (1,370) |
Share transactions - net increase (decrease) | 2,328,793 | (308,930) |
Total increase (decrease) in net assets | 2,328,834 | (308,878) |
| | |
Net Assets | | |
Beginning of period | 13,351,913 | 13,660,791 |
End of period | $ 15,680,747 | $ 13,351,913 |
Financial Highlights - Class I
| Six months ended
September 30, 2014 | Years ended March 31, |
| (Unaudited) | 2014 | 2013 | 2012 | 2011 | 2010 |
Selected Per-Share Data | | | | | | |
Net asset value, beginning of period | $ 1.00 | $ 1.00 | $ 1.00 | $ 1.00 | $ 1.00 | $ 1.00 |
Income from Investment Operations | | | | | | |
Net investment income (loss) | - E | - E | - E | - E | - E | .001 |
Net realized and unrealized gain (loss) E | - | - | - | - | - | - |
Total from investment operations | - E | - E | - E | - E | - E | .001 |
Distributions from net investment income | - E | - E | - E | - E | - E | (.001) |
Distributions from net realized gain | - | - | - | - | - | - E |
Total distributions | - E | - E | - E | - E | - E | (.001) |
Net asset value, end of period | $ 1.00 | $ 1.00 | $ 1.00 | $ 1.00 | $ 1.00 | $ 1.00 |
Total Return B, C | .01% | .01% | .01% | .01% | .03% | .10% |
Ratios to Average Net Assets D | | | | | | |
Expenses before reductions | .21% A | .21% | .21% | .21% | .21% | .21% |
Expenses net of fee waivers, if any | .07% A | .08% | .16% | .10% | .20% | .21% |
Expenses net of all reductions | .07% A | .08% | .16% | .10% | .20% | .21% |
Net investment income (loss) | .01% A | .01% | .01% | .01% | .03% | .11% |
Supplemental Data | | | | | | |
Net assets, end of period (in millions) | $ 10,984 | $ 9,736 | $ 9,964 | $ 11,712 | $ 8,784 | $ 8,650 |
A Annualized
B Total returns for periods of less than one year are not annualized.
C Total returns would have been lower if certain expenses had not been reduced during the applicable periods shown.
D Expense ratios reflect operating expenses of the class. Expenses before reductions do not reflect amounts reimbursed or waived or reductions from expense offset arrangements and do not represent the amount paid by the class during periods when reimbursements, waivers or reductions occur. Expenses net of fee waivers reflect expenses after reimbursement and waivers but prior to reductions from expense offset arrangements. Expenses net of all reductions represent the net expenses paid by the class.
E Amount represents less than $.001 per share.
See accompanying notes which are an integral part of the financial statements.
Semiannual Report
Financial Highlights - Class II
| Six months ended
September 30, 2014 | Years ended March 31, |
| (Unaudited) | 2014 | 2013 | 2012 | 2011 | 2010 |
Selected Per-Share Data | | | | | | |
Net asset value, beginning of period | $ 1.00 | $ 1.00 | $ 1.00 | $ 1.00 | $ 1.00 | $ 1.00 |
Income from Investment Operations | | | | | | |
Net investment income (loss) E | - | - | - | - | - | - |
Net realized and unrealized gain (loss) E | - | - | - | - | - | - |
Total from investment operations E | - | - | - | - | - | - |
Distributions from net investment income E | - | - | - | - | - | - |
Distributions from net realized gain | - | - | - | - | - | - E |
Total distributions E | - | - | - | - | - | - |
Net asset value, end of period | $ 1.00 | $ 1.00 | $ 1.00 | $ 1.00 | $ 1.00 | $ 1.00 |
Total Return B, C | .01% | .01% | .01% | .01% | .01% | .03% |
Ratios to Average Net Assets D | | | | | | |
Expenses before reductions | .36% A | .36% | .36% | .36% | .36% | .36% |
Expenses net of fee waivers, if any | .07% A | .08% | .16% | .10% | .22% | .29% |
Expenses net of all reductions | .07% A | .08% | .16% | .10% | .22% | .29% |
Net investment income (loss) | .01% A | .01% | .01% | .01% | .01% | .03% |
Supplemental Data | | | | | | |
Net assets, end of period (in millions) | $ 114 | $ 133 | $ 127 | $ 80 | $ 155 | $ 164 |
A Annualized
B Total returns for periods of less than one year are not annualized.
C Total returns would have been lower if certain expenses had not been reduced during the applicable periods shown.
D Expense ratios reflect operating expenses of the class. Expenses before reductions do not reflect amounts reimbursed or waived or reductions from expense offset arrangements and do not represent the amount paid by the class during periods when reimbursements, waivers or reductions occur. Expenses net of fee waivers reflect expenses after reimbursement and waivers but prior to reductions from expense offset arrangements. Expenses net of all reductions represent the net expenses paid by the class.
E Amount represents less than $.001 per share.
Financial Highlights - Class III
| Six months ended
September 30, 2014 | Years ended March 31, |
| (Unaudited) | 2014 | 2013 | 2012 | 2011 | 2010 |
Selected Per-Share Data | | | | | | |
Net asset value, beginning of period | $ 1.00 | $ 1.00 | $ 1.00 | $ 1.00 | $ 1.00 | $ 1.00 |
Income from Investment Operations | | | | | | |
Net investment income (loss) E | - | - | - | - | - | - |
Net realized and unrealized gain (loss) E | - | - | - | - | - | - |
Total from investment operations E | - | - | - | - | - | - |
Distributions from net investment income E | - | - | - | - | - | - |
Distributions from net realized gain | - | - | - | - | - | - E |
Total distributions E | - | - | - | - | - | - |
Net asset value, end of period | $ 1.00 | $ 1.00 | $ 1.00 | $ 1.00 | $ 1.00 | $ 1.00 |
Total Return B, C | .01% | .01% | .01% | .01% | .01% | .01% |
Ratios to Average Net Assets D | | | | | | |
Expenses before reductions | .46% A | .46% | .46% | .46% | .46% | .46% |
Expenses net of fee waivers, if any | .07% A | .08% | .16% | .10% | .22% | .30% |
Expenses net of all reductions | .07% A | .08% | .16% | .10% | .22% | .30% |
Net investment income (loss) | .01% A | .01% | .01% | .01% | .01% | .02% |
Supplemental Data | | | | | | |
Net assets, end of period (in millions) | $ 3,436 | $ 2,654 | $ 2,844 | $ 3,108 | $ 3,768 | $ 3,907 |
A Annualized
B Total returns for periods of less than one year are not annualized.
C Total returns would have been lower if certain expenses had not been reduced during the applicable periods shown.
D Expense ratios reflect operating expenses of the class. Expenses before reductions do not reflect amounts reimbursed or waived or reductions from expense offset arrangements and do not represent the amount paid by the class during periods when reimbursements, waivers or reductions occur. Expenses net of fee waivers reflect expenses after reimbursement and waivers but prior to reductions from expense offset arrangements. Expenses net of all reductions represent the net expenses paid by the class.
E Amount represents less than $.001 per share.
See accompanying notes which are an integral part of the financial statements.
Semiannual Report
Financial Highlights - Class IV
| Six months ended
September 30, 2014 | Years ended March 31, |
| (Unaudited) | 2014 | 2013 | 2012 | 2011 | 2010 |
Selected Per-Share Data | | | | | | |
Net asset value, beginning of period | $ 1.00 | $ 1.00 | $ 1.00 | $ 1.00 | $ 1.00 | $ 1.00 |
Income from Investment Operations | | | | | | |
Net investment income (loss) E | - | - | - | - | - | - |
Net realized and unrealized gain (loss) E | - | - | - | - | - | - |
Total from investment operations E | - | - | - | - | - | - |
Distributions from net investment income E | - | - | - | - | - | - |
Distributions from net realized gain | - | - | - | - | - | - E |
Total distributions E | - | - | - | - | - | - |
Net asset value, end of period | $ 1.00 | $ 1.00 | $ 1.00 | $ 1.00 | $ 1.00 | $ 1.00 |
Total Return B, C | .01% | .01% | .01% | .01% | .01% | .01% |
Ratios to Average Net Assets D | | | | | | |
Expenses before reductions | .71% A | .71% | .71% | .71% | .71% | .71% |
Expenses net of fee waivers, if any | .07% A | .08% | .16% | .10% | .22% | .30% |
Expenses net of all reductions | .07% A | .08% | .16% | .10% | .22% | .30% |
Net investment income (loss) | .01% A | .01% | .01% | .01% | .01% | .03% |
Supplemental Data | | | | | | |
Net assets, end of period (in millions) | $ 522 | $ 591 | $ 527 | $ 484 | $ 305 | $ 492 |
A Annualized
B Total returns for periods of less than one year are not annualized.
C Total returns would have been lower if certain expenses had not been reduced during the applicable periods shown.
D Expense ratios reflect operating expenses of the class. Expenses before reductions do not reflect amounts reimbursed or waived or reductions from expense offset arrangements and do not represent the amount paid by the class during periods when reimbursements, waivers or reductions occur. Expenses net of fee waivers reflect expenses after reimbursement and waivers but prior to reductions from expense offset arrangements. Expenses net of all reductions represent the net expenses paid by the class.
E Amount represents less than $.001 per share.
Financial Highlights - Select Class
| Six months ended
September 30, 2014 | Years ended March 31, |
| (Unaudited) | 2014 | 2013 | 2012 | 2011 | 2010 |
Selected Per-Share Data | | | | | | |
Net asset value, beginning of period | $ 1.00 | $ 1.00 | $ 1.00 | $ 1.00 | $ 1.00 | $ 1.00 |
Income from Investment Operations | | | | | | |
Net investment income (loss) | - E | - E | - E | - E | - E | .001 |
Net realized and unrealized gain (loss) E | - | - | - | - | - | - |
Total from investment operations | - E | - E | - E | - E | - E | .001 |
Distributions from net investment income | - E | - E | - E | - E | - E | (.001) |
Distributions from net realized gain | - | - | - | - | - | - E |
Total distributions | - E | - E | - E | - E | - E | (.001) |
Net asset value, end of period | $ 1.00 | $ 1.00 | $ 1.00 | $ 1.00 | $ 1.00 | $ 1.00 |
Total ReturnB, C | .01% | .01% | .01% | .01% | .01% | .07% |
Ratios to Average Net AssetsD | | | | | | |
Expenses before reductions | .26% A | .26% | .26% | .26% | .26% | .26% |
Expenses net of fee waivers, if any | .07% A | .08% | .16% | .10% | .22% | .24% |
Expenses net of all reductions | .07% A | .08% | .16% | .10% | .22% | .24% |
Net investment income (loss) | .01% A | .01% | .01% | .01% | .01% | .08% |
Supplemental Data | | | | | | |
Net assets, end of period (in millions) | $ 189 | $ 238 | $ 198 | $ 259 | $ 352 | $ 365 |
A Annualized
B Total returns for periods of less than one year are not annualized.
C Total returns would have been lower if certain expenses had not been reduced during the applicable periods shown.
D Expense ratios reflect operating expenses of the class. Expenses before reductions do not reflect amounts reimbursed or waived or reductions from expense offset arrangements and do not represent the amount paid by the class during periods when reimbursements, waivers or reductions occur. Expenses net of fee waivers reflect expenses after reimbursement and waivers but prior to reductions from expense offset arrangements. Expenses net of all reductions represent the net expenses paid by the class.
E Amount represents less than $.001 per share.
See accompanying notes which are an integral part of the financial statements.
Semiannual Report
Financial Highlights - Institutional Class
| Period ended
September 30, 2014 D |
| (Unaudited) |
Selected Per-Share Data | |
Net asset value, beginning of period | $ 1.00 |
Income from Investment Operations | |
Net investment income (loss) F | - |
Distributions from net investment income F | - |
Net asset value, end of period | $ 1.00 |
Total ReturnB, C | .00% |
Ratios to Average Net Assets E | |
Expenses before reductions | .18% A |
Expenses net of fee waivers, if any | .06% A |
Expenses net of all reductions | .06% A |
Net investment income (loss) | .01% A |
Supplemental Data | |
Net assets, end of period (in millions) | $ 436 |
A Annualized
B Total returns for periods of less than one year are not annualized.
C Total returns would have been lower if certain expenses had not been reduced during the applicable periods shown.
D For the period May 14, 2014 (commencement of sale of shares) to September 30, 2014.
E Expense ratios reflect operating expenses of the class. Expenses before reductions do not reflect amounts reimbursed or waived or reductions from expense offset arrangements and do not represent the amount paid by the class during periods when reimbursements, waivers or reductions occur. Expense ratios before reductions for start-up periods may not be representative of longer-term operating periods. Expenses net of fee waivers reflect expenses after reimbursement and waivers but prior to reductions from expense offset arrangements. Expenses net of all reductions represent the net expenses paid by the class.
F Amount represents less than $.001 per share.
See accompanying notes which are an integral part of the financial statements.
Semiannual Report
Government Portfolio
Investment Changes/Performance (Unaudited)
Effective Maturity Diversification |
Days | % of fund's investments 9/30/14 | % of fund's investments 3/31/14 | % of fund's investments 9/30/13 |
1 - 7 | 55.1 | 43.1 | 51.3 |
8 - 30 | 14.2 | 17.2 | 11.9 |
31 - 60 | 7.8 | 6.8 | 12.8 |
61 - 90 | 5.1 | 11.9 | 3.8 |
91 - 180 | 7.8 | 14.2 | 12.7 |
> 180 | 10.0 | 6.8 | 7.5 |
Effective maturity is determined in accordance with the requirements of Rule 2a-7 under the Investment Company Act of 1940. |
Weighted Average Maturity |
| 9/30/14 | 3/31/14 | 9/30/13 |
Government Portfolio | 49 Days | 55 Days | 50 Days |
All Taxable Money Market Funds Average* | 45 Days | 46 Days | 48 Days |
This is a weighted average of all the maturities of the securities held in a fund. Weighted Average Maturity (WAM) can be used as a measure of sensitivity to interest rate changes and market changes. Generally, the longer the maturity, the greater the sensitivity to such changes. WAM is based on the dollar-weighted average length of time until principal payments must be paid. Depending on the types of securities held in a fund, certain maturity shortening devices (e.g., demand features, interest rate resets, and call options) may be taken into account when calculating the WAM. |
Weighted Average Life |
| 9/30/14 | 3/31/14 | 9/30/13 |
Government Portfolio | 91 Days | 112 Days | 96 Days |
Weighted Average Life (WAL) is the weighted average of the life of the securities held in a fund or portfolio and can be used as a measure of sensitivity to changes in liquidity and/or credit risk. Generally, the higher the value, the greater the sensitivity. WAL is based on the dollar-weighted average length of time until principal payments must be paid, taking into account any call options exercised by the issuer and any permissible maturity shortening features other than interest rate resets. The difference between WAM and WAL is that WAM takes into account interest rate resets and WAL does not. WAL for money market funds is not the same as WAL of a mortgage- or asset-backed security. |
Asset Allocation (% of fund's net assets) |
As of September 30, 2014 | As of March 31, 2014 |
| Treasury Debt 1.3% | | | Treasury Debt 12.1% | |
 | Government
Agency Debt 39.9% | | | Government
Agency Debt 42.9% | |
 | Repurchase
Agreements 55.9% | | | Repurchase
Agreements 44.6% | |
| Net Other Assets (Liabilities) 2.9% | | | Net Other Assets (Liabilities) 0.4% | |

Current and Historical Seven-Day Yields |
| 9/30/14 | 6/30/14 | 3/31/14 | 12/31/14 | 9/30/13 |
| | | | | |
Class I | 0.01% | 0.01% | 0.01% | 0.01% | 0.01% |
| | | | | |
Class II | 0.01% | 0.01% | 0.01% | 0.01% | 0.01% |
| | | | | |
Class III | 0.01% | 0.01% | 0.01% | 0.01% | 0.01% |
| | | | | |
Select Class | 0.01% | 0.01% | 0.01% | 0.01% | 0.01% |
| | | | | |
Institutional Class | 0.01% | 0.01% | N/A | N/A | N/A |
Yield refers to the income paid by the fund over a given period. Yields for money market funds are usually for seven-day periods, as they are here, though they are expressed as annual percentage rates. Past performance is no guarantee of future results. Yield will vary and it's possible to lose money investing in the Fund. A portion of the Fund's expenses was reimbursed and/or waived. Absent such reimbursements and/or waivers the yield for the period ending September 30, 2014, the most recent period shown in the table, would have been -0.11% for Class I, -0.27% for Class II, -0.37% for Class III, -0.17% for Select Class and -0.08% for Institutional Class.
* Source: iMoneyNet, Inc.
Semiannual Report
Government Portfolio
Investments September 30, 2014 (Unaudited)
Showing Percentage of Net Assets
Treasury Debt - 1.3% |
| | Yield (a) | Principal Amount (000s) | Value (000s) |
U.S. Treasury Obligations - 1.3% |
U.S. Treasury Notes |
| 11/15/14 to 1/31/16 (Cost $345,860) | 0.06 to 0.16% (b) | $ 345,000 | $ 345,860 |
Government Agency Debt - 39.9% |
|
Federal Agencies - 39.9% |
Fannie Mae |
| 12/19/14 to 10/22/15 | 0.09 to 0.23 (b) | 937,478 | 939,525 |
Federal Farm Credit Bank |
| 10/1/14 to 9/19/16 | 0.14 to 0.15 (b) | 714,900 | 714,871 |
Federal Home Loan Bank |
| 10/16/14 to 12/11/15 | 0.07 to 0.25 (b) | 7,902,730 | 7,902,178 |
Freddie Mac |
| 11/25/14 to 7/17/15 | 0.10 to 0.20 (b) | 852,202 | 855,544 |
TOTAL GOVERNMENT AGENCY DEBT (Cost $10,412,118) |
10,412,118
|
Government Agency Repurchase Agreement - 36.9% |
| Maturity Amount (000s) | | |
In a joint trading account: | | | |
at 0.01% dated 9/30/14 due 10/1/14 (Collateralized by U.S. Government Obligations) # | $ 1,694,953 | | 1,694,952 |
at 0.01% dated 9/30/14 due 10/1/14 (Collateralized by U.S. Government Obligations) # | 317,173 | | 317,173 |
With: | | | |
BNP Paribas Securities Corp. at: | | | |
0.05%, dated 9/18/14 due 10/7/14 (Collateralized by U.S. Government Obligations valued at $563,640,602, 1.63% - 6%, 6/1/18 - 7/20/44) | 552,570 | | 552,545 |
0.06%, dated 9/9/14 due 10/7/14 (Collateralized by U.S. Government Obligations valued at $612,692,059, 0% - 7.5%, 5/15/15 - 10/1/46) | 599,888 | | 599,858 |
Citibank NA at: | | | |
0.03%, dated 9/30/14 due 10/7/14 (Collateralized by U.S. Treasury Obligations valued at $139,288,304, 0.1% - 2.75%, 1/31/15 - 11/15/23) | 136,558 | | 136,557 |
0.04%, dated 9/30/14 due 10/7/14 (Collateralized by U.S. Government Obligations valued at $835,746,202, 1.38% - 11.5%, 3/1/15 - 10/15/49) | 819,348 | | 819,342 |
|
| Maturity Amount (000s) | | Value (000s) |
ING Financial Markets LLC at: | | | |
0.08%, dated 9/26/14 due 10/7/14 (Collateralized by U.S. Government Obligations valued at $416,848,724, 3.5% - 4%, 11/1/25 - 10/1/43) | $ 408,725 | | $ 408,671 |
0.09%, dated: | | | |
8/6/14 due 10/6/14 (Collateralized by U.S. Government Obligations valued at $343,860,212, 1.63% - 7.5%, 12/1/24 - 6/1/44) | 337,120 | | 337,069 |
8/12/14 due 10/7/14 (Collateralized by U.S. Government Obligations valued at $254,218,153, 3% - 7%, 8/1/26 - 4/1/43) | 249,237 | | 249,200 |
8/19/14 due 10/7/14 (Collateralized by U.S. Government Obligations valued at $170,414,408, 3.5% - 4.5%, 10/1/25 - 8/1/42) | 167,081 | | 167,055 |
Morgan Stanley & Co., Inc. at 0.05%, dated 9/29/14 due 10/6/14 (Collateralized by U.S. Government Obligations valued at $172,380,479, 2% - 5.5%, 9/1/17 - 7/1/44) | 169,002 | | 169,000 |
RBC Capital Markets Corp. at: | | | |
0.07%, dated 9/16/14 due 10/7/14 (Collateralized by U.S. Government Obligations valued at $447,664,547, 1.32% - 9.5%, 9/1/17 - 2/15/54) | 438,771 | | 438,745 |
0.09%, dated 9/2/14 due 10/7/14 (Collateralized by U.S. Government Obligations valued at $571,780,023, 0.55% - 7%, 4/20/16 - 2/15/54) | 560,354 | | 560,271 |
0.1%, dated: | | | |
9/5/14 due 10/7/14 (Collateralized by U.S. Government Obligations valued at $566,056,063, 0.5% - 9.5%, 7/15/16 - 2/15/54) | 554,945 | | 554,806 |
9/15/14 due 10/7/14 (Collateralized by U.S. Government Obligations valued at $420,306,471, 0.5% - 9.3%, 9/15/18 - 2/15/54) | 411,413 | | 411,309 |
Wells Fargo Securities, LLC at: | | | |
0.05%, dated 9/24/14 due 10/1/14 (Collateralized by U.S. Government Obligations valued at $668,992,660, ..41% - 6%, 4/1/15 - 11/16/52) | 654,388 | | 654,382 |
0.06%, dated 9/26/14 due 10/3/14 (Collateralized by U.S. Government Obligations valued at $277,898,256, 2.5% - 5.5%, 4/1/29 - 8/1/44) | 272,450 | | 272,447 |
Government Agency Repurchase Agreement - continued |
| Maturity Amount (000s) | | Value (000s) |
With: - continued | | | |
Wells Fargo Securities, LLC at: - continued | | | |
0.13%, dated: | | | |
8/6/14 due: | | | |
11/6/14 (Collateralized by U.S. Government Obligations valued at $343,878,665, 2.5% - 5.5%, 9/1/24 - 10/1/44) | $ 337,180 | | $ 337,069 |
11/7/14 (Collateralized by U.S. Government Obligations valued at $387,296,478, 0.45% - 6%, 8/1/24 - 9/25/44) | 379,328 | | 379,202 |
8/13/14 due 11/13/14 (Collateralized by U.S. Government Obligations valued at $561,653,488, 0% - 5.5%, 6/1/17 - 10/1/44) | 550,183 | | 550,000 |
TOTAL GOVERNMENT AGENCY REPURCHASE AGREEMENT (Cost $9,609,653) |
9,609,653
|
Treasury Repurchase Agreement - 19.0% |
| | | |
With Federal Reserve Bank of New York at 0%, dated 9/30/14 due 10/1/14 (Collateralized by U.S. Treasury Obligations valued at $4,965,000,005, 3.13%, 2/15/42) (Cost $4,965,000) | 4,965,000 | |
4,965,000
|
TOTAL INVESTMENT PORTFOLIO - 97.1% (Cost $25,332,631) | | 25,332,631 |
NET OTHER ASSETS (LIABILITIES) - 2.9% | | 753,468 |
NET ASSETS - 100% | $ 26,086,099 |
Legend |
(a) Yield represents either the annualized yield at the date of purchase, or the stated coupon rate, or, for floating and adjustable rate securities, the rate at period end. |
(b) Coupon rates for floating and adjustable rate securities reflect the rates in effect at period end. |
# Additional information on each counterparty to the repurchase agreement is as follows: |
Repurchase Agreement / Counterparty | Value
(Amounts in thousands) |
$1,694,952,000 due 10/01/14 at 0.01% |
BNP Paribas Securities Corp. | $ 214,728 |
Bank of America NA | 267,345 |
Citibank NA | 227,837 |
Credit Agricole CIB New York Branch | 82,906 |
Credit Suisse Securities (USA) LLC | 51,176 |
HSBC Securities (USA), Inc. | 318,726 |
ING Financial Markets LLC | 97,235 |
J.P. Morgan Securities, Inc. | 153,529 |
Merrill Lynch, Pierce, Fenner & Smith, Inc. | 32,753 |
Societe Generale | 61,412 |
Wells Fargo Securities LLC | 187,305 |
| $ 1,694,952 |
$317,173,000 due 10/01/14 at 0.01% |
BNP Paribas Securities Corp. | $ 104,219 |
Barclays Capital, Inc. | 27,777 |
Citibank NA | 86,802 |
J.P. Morgan Securities, Inc. | 57,868 |
Merrill Lynch, Pierce, Fenner & Smith, Inc. | 40,507 |
| $ 317,173 |
Other Information |
The date shown for securities represents the date when principal payments must be paid, taking into account any call options exercised by the issuer and any permissible maturity shortening features other than interest rate resets. |
All investments are categorized as Level 2 under the Fair Value Hierarchy. The inputs or methodology used for valuing securities may not be an indication of the risk associated with investing in those securities. For more information on valuation inputs, please refer to the Security Valuation section in the accompanying Notes to Financial Statements. |
See accompanying notes which are an integral part of the financial statements.
Semiannual Report
Government Portfolio
Financial Statements
Statement of Assets and Liabilities
Amounts in thousands (except per-share amounts) September 30, 2014
(Unaudited) |
| | |
Assets | | |
Investment in securities, at value (including repurchase agreements of $14,574,653) - See accompanying schedule: Unaffiliated issuers (cost $25,332,631) | | $ 25,332,631 |
Cash | | 748,660 |
Receivable for fund shares sold | | 1,179 |
Interest receivable | | 7,169 |
Receivable from investment adviser for expense reductions | | 259 |
Other receivables | | 471 |
Total assets | | 26,090,369 |
| | |
Liabilities | | |
Payable for fund shares redeemed | $ 1,376 | |
Distributions payable | 110 | |
Accrued management fee | 2,074 | |
Voluntary deferred trustee fee | 472 | |
Other affiliated payables | 128 | |
Other payables and accrued expenses | 110 | |
Total liabilities | | 4,270 |
| | |
Net Assets | | $ 26,086,099 |
Net Assets consist of: | | |
Paid in capital | | $ 26,087,746 |
Distributions in excess of net investment income | | (675) |
Accumulated undistributed net realized gain (loss) on investments | | (972) |
Net Assets | | $ 26,086,099 |
| | |
Class I:
Net Asset Value, offering price and redemption price per share ($22,330,776 ÷ 22,322,092 shares) | | $ 1.00 |
| | |
Class II:
Net Asset Value, offering price and redemption price per share ($708,841 ÷ 708,769 shares) | | $ 1.00 |
| | |
Class III:
Net Asset Value, offering price and redemption price per share ($2,343,058 ÷ 2,341,686 shares) | | $ 1.00 |
| | |
Select Class:
Net Asset Value, offering price and redemption price per share ($346,879 ÷ 346,754 shares) | | $ 1.00 |
| | |
Institutional Class:
Net Asset Value, offering price and redemption price per share ($356,545 ÷ 356,485 shares) | | $ 1.00 |
Statement of Operations
Amounts in thousands Six months ended September 30, 2014
(Unaudited) |
| | |
Investment Income | | |
Interest | | $ 14,032 |
| | |
Expenses | | |
Management fee | $ 17,875 | |
Transfer agent fees | 7,663 | |
Distribution and service plan fees | 3,305 | |
Accounting fees and expenses | 720 | |
Custodian fees and expenses | 90 | |
Independent trustees' compensation | 57 | |
Registration fees | 113 | |
Audit | 38 | |
Legal | 26 | |
Miscellaneous | 90 | |
Total expenses before reductions | 29,977 | |
Expense reductions | (17,226) | 12,751 |
Net investment income (loss) | | 1,281 |
Realized and Unrealized Gain (Loss) Net realized gain (loss) on: | | |
Investment securities: | | |
Unaffiliated issuers | | 218 |
Net increase in net assets resulting from operations | | $ 1,499 |
See accompanying notes which are an integral part of the financial statements.
Semiannual Report
Statement of Changes in Net Assets
Amounts in thousands | Six months ended
September 30, 2014
(Unaudited) | Year ended
March 31,
2014 |
Increase (Decrease) in Net Assets | | |
Operations | | |
Net investment income (loss) | $ 1,281 | $ 2,582 |
Net realized gain (loss) | 218 | 238 |
Net increase in net assets resulting from operations | 1,499 | 2,820 |
Distributions to shareholders from net investment income | (1,281) | (2,575) |
Share transactions - net increase (decrease) | 516,408 | 970,704 |
Total increase (decrease) in net assets | 516,626 | 970,949 |
| | |
Net Assets | | |
Beginning of period | 25,569,473 | 24,598,524 |
End of period (including distributions in excess of net investment income of $675 and distributions in excess of net investment income of $675, respectively) | $ 26,086,099 | $ 25,569,473 |
Financial Highlights - Class I
| Six months ended
September 30, 2014 | Years ended March 31, |
| (Unaudited) | 2014 | 2013 | 2012 | 2011 | 2010 |
Selected Per-Share Data | | | | | | |
Net asset value, beginning of period | $ 1.00 | $ 1.00 | $ 1.00 | $ 1.00 | $ 1.00 | $ 1.00 |
Income from Investment Operations | | | | | | |
Net investment income (loss) | - E | - E | - E | - E | - E | .002 |
Net realized and unrealized gain (loss) E | - | - | - | - | - | - |
Total from investment operations | - E | - E | - E | - E | - E | .002 |
Distributions from net investment income | - E | - E | - E | - E | - E | (.002) |
Distributions from net realized gain | - | - | - | - | - E | - |
Total distributions | - E | - E | - E | - E | - E | (.002) |
Net asset value, end of period | $ 1.00 | $ 1.00 | $ 1.00 | $ 1.00 | $ 1.00 | $ 1.00 |
Total Return B, C | .01% | .01% | .01% | .01% | .05% | .17% |
Ratios to Average Net Assets D | | | | | | |
Expenses before reductions | .21% A | .21% | .21% | .21% | .21% | .21% |
Expenses net of fee waivers, if any | .10% A | .11% | .18% | .15% | .21% | .21% |
Expenses net of all reductions | .10% A | .11% | .18% | .15% | .21% | .21% |
Net investment income (loss) | .01% A | .01% | .01% | .01% | .05% | .18% |
Supplemental Data | | | | | | |
Net assets, end of period (in millions) | $ 22,331 | $ 22,569 | $ 21,579 | $ 24,822 | $ 29,687 | $ 45,414 |
A Annualized
B Total returns for periods of less than one year are not annualized.
C Total returns would have been lower if certain expenses had not been reduced during the applicable periods shown.
D Expense ratios reflect operating expenses of the class. Expenses before reductions do not reflect amounts reimbursed or waived or reductions from expense offset arrangements and do not represent the amount paid by the class during periods when reimbursements, waivers or reductions occur. Expenses net of fee waivers reflect expenses after reimbursement and waivers but prior to reductions from expense offset arrangements. Expenses net of all reductions represent the net expenses paid by the class.
E Amount represents less than $.001 per share.
See accompanying notes which are an integral part of the financial statements.
Semiannual Report
Financial Highlights - Class II
| Six months ended
September 30, 2014 | Years ended March 31, |
| (Unaudited) | 2014 | 2013 | 2012 | 2011 | 2010 |
Selected Per-Share Data | | | | | | |
Net asset value, beginning of period | $ 1.00 | $ 1.00 | $ 1.00 | $ 1.00 | $ 1.00 | $ 1.00 |
Income from Investment Operations | | | | | | |
Net investment income (loss) | - E | - E | - E | - E | - E | .001 |
Net realized and unrealized gain (loss) E | - | - | - | - | - | - |
Total from investment operations | - E | - E | - E | - E | - E | .001 |
Distributions from net investment income | - E | - E | - E | - E | - E | (.001) |
Distributions from net realized gain | - | - | - | - | - E | - |
Total distributions | - E | - E | - E | - E | - E | (.001) |
Net asset value, end of period | $ 1.00 | $ 1.00 | $ 1.00 | $ 1.00 | $ 1.00 | $ 1.00 |
Total Return B, C | .01% | .01% | .01% | .01% | .01% | .08% |
Ratios to Average Net Assets D | | | | | | |
Expenses before reductions | .36% A | .36% | .36% | .36% | .36% | .36% |
Expenses net of fee waivers, if any | .10% A | .11% | .18% | .15% | .25% | .31% |
Expenses net of all reductions | .10% A | .11% | .18% | .15% | .25% | .31% |
Net investment income (loss) | .01% A | .01% | .01% | .01% | .01% | .07% |
Supplemental Data | | | | | | |
Net assets, end of period (in millions) | $ 709 | $ 356 | $ 642 | $ 827 | $ 807 | $ 1,413 |
A Annualized
B Total returns for periods of less than one year are not annualized.
C Total returns would have been lower if certain expenses had not been reduced during the applicable periods shown.
D Expense ratios reflect operating expenses of the class. Expenses before reductions do not reflect amounts reimbursed or waived or reductions from expense offset arrangements and do not represent the amount paid by the class during periods when reimbursements, waivers or reductions occur. Expenses net of fee waivers reflect expenses after reimbursement and waivers but prior to reductions from expense offset arrangements. Expenses net of all reductions represent the net expenses paid by the class.
E Amount represents less than $.001 per share.
Financial Highlights - Class III
| Six months ended
September 30, 2014 | Years ended March 31, |
| (Unaudited) | 2014 | 2013 | 2012 | 2011 | 2010 |
Selected Per-Share Data | | | | | | |
Net asset value, beginning of period | $ 1.00 | $ 1.00 | $ 1.00 | $ 1.00 | $ 1.00 | $ 1.00 |
Income from Investment Operations | | | | | | |
Net investment income (loss) E | - | - | - | - | - | - |
Net realized and unrealized gain (loss) E | - | - | - | - | - | - |
Total from investment operations E | - | - | - | - | - | - |
Distributions from net investment income E | - | - | - | - | - | - |
Distributions from net realized gain | - | - | - | - | - E | - |
Total distributions E | - | - | - | - | - | - |
Net asset value, end of period | $ 1.00 | $ 1.00 | $ 1.00 | $ 1.00 | $ 1.00 | $ 1.00 |
Total Return B, C | .01% | .01% | .01% | .01% | .01% | .04% |
Ratios to Average Net Assets D | | | | | | |
Expenses before reductions | .46% A | .46% | .46% | .46% | .46% | .46% |
Expenses net of fee waivers, if any | .10% A | .11% | .18% | .15% | .25% | .35% |
Expenses net of all reductions | .10% A | .11% | .18% | .15% | .25% | .35% |
Net investment income (loss) | .01% A | .01% | .01% | .01% | .01% | .03% |
Supplemental Data | | | | | | |
Net assets, end of period (in millions) | $ 2,343 | $ 2,266 | $ 1,709 | $ 2,027 | $ 2,050 | $ 1,910 |
A Annualized
B Total returns for periods of less than one year are not annualized.
C Total returns would have been lower if certain expenses had not been reduced during the applicable periods shown.
D Expense ratios reflect operating expenses of the class. Expenses before reductions do not reflect amounts reimbursed or waived or reductions from expense offset arrangements and do not represent the amount paid by the class during periods when reimbursements, waivers or reductions occur. Expenses net of fee waivers reflect expenses after reimbursement and waivers but prior to reductions from expense offset arrangements. Expenses net of all reductions represent the net expenses paid by the class.
E Amount represents less than $.001 per share.
See accompanying notes which are an integral part of the financial statements.
Semiannual Report
Financial Highlights - Select Class
| Six months ended
September 30, 2014 | Years ended March 31, |
| (Unaudited) | 2014 | 2013 | 2012 | 2011 | 2010 |
Selected Per-Share Data | | | | | | |
Net asset value, beginning of period | $ 1.00 | $ 1.00 | $ 1.00 | $ 1.00 | $ 1.00 | $ 1.00 |
Income from Investment Operations | | | | | | |
Net investment income (loss) | - E | - E | - E | - E | - E | .001 |
Net realized and unrealized gain (loss) E | - | - | - | - | - | - |
Total from investment operations | - E | - E | - E | - E | - E | .001 |
Distributions from net investment income | - E | - E | - E | - E | - E | (.001) |
Distributions from net realized gain | - | - | - | - | - E | - |
Total distributions | - E | - E | - E | - E | - E | (.001) |
Net asset value, end of period | $ 1.00 | $ 1.00 | $ 1.00 | $ 1.00 | $ 1.00 | $ 1.00 |
Total Return B, C | .01% | .01% | .01% | .01% | .02% | .13% |
Ratios to Average Net Assets D | | | | | | |
Expenses before reductions | .26% A | .26% | .26% | .26% | .26% | .26% |
Expenses net of fee waivers, if any | .10% A | .11% | .18% | .15% | .24% | .25% |
Expenses net of all reductions | .10% A | .11% | .18% | .15% | .24% | .25% |
Net investment income (loss) | .01% A | .01% | .01% | .01% | .01% | .13% |
Supplemental Data | | | | | | |
Net assets, end of period (in millions) | $ 347 | $ 378 | $ 669 | $ 519 | $ 360 | $ 302 |
A Annualized
B Total returns for periods of less than one year are not annualized.
C Total returns would have been lower if certain expenses had not been reduced during the applicable periods shown.
D Expense ratios reflect operating expenses of the class. Expenses before reductions do not reflect amounts reimbursed or waived or reductions from expense offset arrangements and do not represent the amount paid by the class during periods when reimbursements, waivers or reductions occur. Expenses net of fee waivers reflect expenses after reimbursement and waivers but prior to reductions from expense offset arrangements. Expenses net of all reductions represent the net expenses paid by the class.
E Amount represents less than $.001 per share.
Financial Highlights - Institutional Class
| Period ended
September 30, 2014 D |
| (Unaudited) |
Selected Per-Share Data | |
Net asset value, beginning of period | $ 1.00 |
Income from Investment Operations | |
Net investment income (loss) F | - |
Distributions from net investment income F | - |
Net asset value, end of period | $ 1.00 |
Total Return B, C | .00% |
Ratios to Average Net Assets E | |
Expenses before reductions | .18% A |
Expenses net of fee waivers, if any | .10% A |
Expenses net of all reductions | .10% A |
Net investment income (loss) | .01% A |
Supplemental Data | |
Net assets, end of period (in millions) | $ 357 |
A Annualized
B Total returns for periods of less than one year are not annualized.
C Total returns would have been lower if certain expenses had not been reduced during the applicable periods shown.
D For the period May 14, 2014 (commencement of sale of shares) to September 30, 2014.
E Expense ratios reflect operating expenses of the class. Expenses before reductions do not reflect amounts reimbursed or waived or reductions from expense offset arrangements and do not represent the amount paid by the class during periods when reimbursements, waivers or reductions occur. Expense ratios before reductions for start-up periods may not be representative of longer-term operating periods. Expenses net of fee waivers reflect expenses after reimbursement and waivers but prior to reductions from expense offset arrangements. Expenses net of all reductions represent the net expenses paid by the class.
F Amount represents less than $.001 per share.
See accompanying notes which are an integral part of the financial statements.
Semiannual Report
Prime Money Market Portfolio
Investment Changes/Performance (Unaudited)
Effective Maturity Diversification |
Days | % of fund's investments 9/30/14 | % of fund's investments 3/31/14 | % of fund's investments 9/30/13 |
1 - 7 | 45.6 | 25.3 | 34.3 |
8 - 30 | 17.0 | 22.5 | 20.2 |
31 - 60 | 10.9 | 12.9 | 10.3 |
61 - 90 | 11.5 | 15.1 | 12.2 |
91 - 180 | 8.4 | 20.7 | 18.3 |
> 180 | 6.6 | 3.5 | 4.7 |
Effective maturity is determined in accordance with the requirements of Rule 2a-7 under the Investment Company Act of 1940. |
Weighted Average Maturity |
| 9/30/14 | 3/31/14 | 9/30/13 |
Prime Money Market Portfolio | 46 Days | 56 Days | 49 Days |
All Taxable Money Market Funds Average* | 45 Days | 46 Days | 48 Days |
This is a weighted average of all the maturities of the securities held in a fund. Weighted Average Maturity (WAM) can be used as a measure of sensitivity to interest rate changes and market changes. Generally, the longer the maturity, the greater the sensitivity to such changes. WAM is based on the dollar-weighted average length of time until principal payments must be paid. Depending on the types of securities held in a fund, certain maturity shortening devices (e.g., demand features, interest rate resets, and call options) may be taken into account when calculating the WAM. |
Weighted Average Life |
| 9/30/14 | 3/31/14 | 9/30/13 |
Prime Money Market Portfolio | 77 Days | 92 Days | 89 Days |
Weighted Average Life (WAL) is the weighted average of the life of the securities held in a fund or portfolio and can be used as a measure of sensitivity to changes in liquidity and/or credit risk. Generally, the higher the value, the greater the sensitivity. WAL is based on the dollar-weighted average length of time until principal payments must be paid, taking into account any call options exercised by the issuer and any permissible maturity shortening features other than interest rate resets. The difference between WAM and WAL is that WAM takes into account interest rate resets and WAL does not. WAL for money market funds is not the same as WAL of a mortgage- or asset-backed security. |
Asset Allocation (% of fund's net assets) |
As of September 30, 2014 | As of March 31, 2014 |
| Certificates of
Deposit 38.7% | | | Certificates of
Deposit 36.2% | |
 | Commercial Paper 3.8% | | | Commercial Paper 9.1% | |
 | Variable Rate
Demand Notes
(VRDNs) 0.3% | | | Variable Rate
Demand Notes
(VRDNs) 0.4% | |
| Other Notes 1.2% | | | Other Notes 1.1% | |
 | Treasury Debt 5.3% | | | Treasury Debt 19.9% | |
| Government
Agency Debt 5.7% | | | Government
Agency Debt 4.2% | |
 | Other Municipal
Debt 0.0% | |  | Other Municipal
Debt 0.5% | |
| Other Instruments 5.4% | | | Other Instruments 1.8% | |
 | Repurchase
Agreements 38.0% | |  | Repurchase
Agreements 23.7% | |
 | Net Other Assets (Liabilities) 1.6% | | | Net Other Assets (Liabilities) 3.1% | |

* Source: iMoneyNet, Inc.
Semiannual Report
Current and Historical Seven-Day Yields |
| 9/30/14 | 6/30/14 | 3/31/14 | 12/31/13 | 9/30/13 |
| | | | | |
Class I | 0.01% | 0.01% | 0.01% | 0.01% | 0.01% |
| | | | | |
Class II | 0.01% | 0.01% | 0.01% | 0.01% | 0.01% |
| | | | | |
Class III | 0.01% | 0.01% | 0.01% | 0.01% | 0.01% |
| | | | | |
Class IV | 0.01% | 0.01% | 0.01% | 0.01% | 0.01% |
| | | | | |
Select Class | 0.01% | 0.01% | 0.01% | 0.01% | 0.01% |
| | | | | |
Institutional Class | 0.05% | 0.06% | 0.06% | 0.04% | 0.05% |
Yield refers to the income paid by the fund over a given period. Yields for money market funds are usually for seven-day periods, as they are here, though they are expressed as annual percentage rates. Past performance is no guarantee of future results. Yield will vary and it's possible to lose money investing in the Fund. A portion of the Fund's expenses was reimbursed and/or waived. Absent such reimbursements and/or waivers the yield for the period ending September 30, 2014, the most recent period shown in the table, would have been -0.03% for Class I, -0.18% for Class II, -0.28% for Class III, -0.53% for Class IV, -0.08% for Select Class and 0.01% for Institutional Class.
Semiannual Report
Prime Money Market Portfolio
Investments September 30, 2014 (Unaudited)
Showing Percentage of Net Assets
Certificate of Deposit - 38.7% |
| | Yield (a) | Principal Amount (000s) | Value (000s) |
Domestic Certificates Of Deposit - 1.0% |
Citibank NA |
| 12/16/14 | 0.23% | $ 109,000 | $ 109,000 |
Wells Fargo Bank NA |
| 12/5/14 | 0.21 (c) | 235,000 | 235,000 |
| | 344,000 |
London Branch, Eurodollar, Foreign Banks - 1.9% |
Commonwealth Bank of Australia |
| 12/22/14 | 0.22 | 70,000 | 70,000 |
National Australia Bank Ltd. |
| 1/5/15 to 3/10/15 | 0.22 to 0.25 (c) | 575,000 | 575,000 |
| | 645,000 |
New York Branch, Yankee Dollar, Foreign Banks - 35.8% |
Bank of Montreal Chicago CD Program |
| 11/13/14 to 6/12/15 | 0.18 to 0.24 (c) | 1,011,000 | 1,011,000 |
Bank of Nova Scotia |
| 10/3/14 to 5/29/15 | 0.21 to 0.31 (c) | 1,603,000 | 1,603,000 |
Bank of Tokyo-Mitsubishi UFJ Ltd. |
| 12/1/14 to 4/2/15 | 0.25 | 1,346,000 | 1,346,000 |
Canadian Imperial Bank of Commerce |
| 2/27/15 to 6/12/15 | 0.24 to 0.30 (c) | 895,000 | 895,000 |
Credit Suisse AG |
| 11/10/14 to 1/12/15 | 0.25 to 0.29 | 536,000 | 536,000 |
Mizuho Corporate Bank Ltd. |
| 10/10/14 to 1/9/15 | 0.25 | 792,000 | 792,000 |
Natexis Banques Populaires New York Branch |
| 10/31/14 to 1/5/15 | 0.26 | 1,841,000 | 1,841,000 |
Rabobank Nederland New York Branch |
| 1/5/15 | 0.21 (c) | 155,000 | 155,000 |
Royal Bank of Canada |
| 4/9/15 | 0.23 (c) | 143,000 | 143,000 |
Sumitomo Mitsui Banking Corp. |
| 11/28/14 to 3/16/15 | 0.22 to 0.33 (c) | 1,865,000 | 1,865,000 |
Sumitomo Mitsui Trust Banking Ltd. |
| 10/24/14 to 1/22/15 | 0.24 | 633,000 | 633,000 |
Toronto-Dominion Bank |
| 10/10/14 to 6/16/15 | 0.21 to 0.30 (c) | 464,000 | 464,000 |
UBS AG |
| 12/23/14 to 3/5/15 | 0.26 to 0.27 (c) | 1,056,000 | 1,056,000 |
| | 12,340,000 |
TOTAL CERTIFICATE OF DEPOSIT (Cost $13,329,000) |
13,329,000
|
Financial Company Commercial Paper - 3.8% |
| | Yield (a) | Principal Amount (000s) | Value (000s) |
Bank of Nova Scotia |
| 5/22/15 | 0.28% | $ 170,000 | $ 169,692 |
Commonwealth Bank of Australia |
| 2/23/15 | 0.22 (c) | 50,000 | 50,000 |
DNB Bank ASA |
| 3/18/15 | 0.25 | 70,000 | 69,918 |
General Electric Capital Corp. |
| 11/10/14 | 0.20 | 171,000 | 170,962 |
JPMorgan Securities LLC |
| 4/27/15 | 0.25 (c) | 380,000 | 380,000 |
Swedbank AB |
| 1/12/15 to 1/28/15 | 0.25 | 185,000 | 184,857 |
Toronto Dominion Holdings (U.S.A.) |
| 10/3/14 | 0.25 | 151,000 | 150,998 |
Toyota Motor Credit Corp. |
| 3/25/15 | 0.25 | 117,000 | 116,858 |
TOTAL FINANCIAL COMPANY COMMERCIAL PAPER (Cost $1,293,285) |
1,293,285
|
Treasury Debt - 5.3% |
|
U.S. Treasury Obligations - 5.3% |
U.S. Treasury Bills |
| 3/5/15 to 8/20/15 | 0.11 to 0.13 | 656,030 | 655,502 |
U.S. Treasury Notes |
| 10/31/14 to 3/15/15 | 0.08 to 0.17 | 1,177,850 | 1,182,095 |
TOTAL TREASURY DEBT (Cost $1,837,597) |
1,837,597
|
Other Note - 1.2% |
|
Medium-Term Notes - 1.2% |
Svenska Handelsbanken AB |
| 2/27/15 to 3/13/15 (Cost $432,000) | 0.28 to 0.30 (b)(c) | 432,000 |
432,000
|
Variable Rate Demand Note - 0.3% |
|
Delaware - 0.1% |
LP Pinewood SPV LLC Taxable, LOC Wells Fargo Bank NA, VRDN |
| 10/7/14 | 0.15 (c) | 37,000 | 37,000 |
Florida - 0.1% |
Florida Timber Fin. III LLC Taxable, LOC Wells Fargo Bank NA, VRDN |
| 10/7/14 | 0.15 (c) | 25,155 | 25,155 |
Indiana - 0.1% |
Indiana Dev. Fin. Auth. Solid Waste Disp. Rev. (Waste Mgmt., Inc. Proj.) Series 2002 A, LOC JPMorgan Chase Bank, VRDN |
| 10/7/14 | 0.06 (c)(d) | 25,000 | 25,000 |
Variable Rate Demand Note - continued |
| | Yield (a) | Principal Amount (000s) | Value (000s) |
Washington - 0.0% |
Washington Econ. Dev. Fin. Auth. Solid Waste Disp. Rev. (Waste Mgmt., Inc. Proj.) Series E, LOC JPMorgan Chase Bank, VRDN |
| 10/7/14 | 0.06% (c)(d) | $ 20,000 | $ 20,000 |
TOTAL VARIABLE RATE DEMAND NOTE (Cost $107,155) |
107,155
|
Government Agency Debt - 5.7% |
|
Federal Agencies - 5.7% |
Federal Home Loan Bank |
| 10/17/14 to 10/2/15 | 0.07 to 0.25 | 1,604,750 | 1,604,663 |
Freddie Mac |
| 7/16/15 to 7/17/15 | 0.14 (c) | 351,000 | 350,972 |
TOTAL GOVERNMENT AGENCY DEBT (Cost $1,955,635) |
1,955,635
|
Other Instrument - 5.4% |
|
Time Deposits - 5.4% |
Bank of Tokyo-Mitsub New York Br(TD) |
| 10/1/14 | 0.09 | 521,000 | 521,000 |
Credit Agricole CIB |
| 10/1/14 | 0.06 | 445,000 | 445,000 |
ING Bank NV |
| 10/7/14 | 0.11 | 104,000 | 104,000 |
Skandinaviska Enskilda Banken AB |
| 10/1/14 | 0.06 | 749,000 | 749,000 |
Swedbank AB |
| 10/1/14 | 0.01 | 46,000 | 46,000 |
TOTAL OTHER INSTRUMENT (Cost $1,865,000) |
1,865,000
|
Government Agency Repurchase Agreement - 9.5% |
| Maturity Amount (000s) | | |
In a joint trading account at: | | | |
0.01% dated 9/30/14 due 10/1/14 (Collateralized by U.S. Government Obligations) # | $ 2,780,733 | | 2,780,732 |
0.01% dated 9/30/14 due 10/1/14 (Collateralized by U.S. Government Obligations) # | 226,106 | | 226,106 |
With Morgan Stanley & Co., Inc. at 0.05%, dated 9/29/14 due 10/6/14 (Collateralized by U.S. Government Obligations valued at $256,020,711, 1.35% - 10%, 4/1/15 - 12/1/44) | 251,002 | | 251,000 |
TOTAL GOVERNMENT AGENCY REPURCHASE AGREEMENT (Cost $3,257,838) |
3,257,838
|
Treasury Repurchase Agreement - 21.6% |
| Maturity Amount (000s) | | Value (000s) |
With Federal Reserve Bank of New York at 0%, dated 9/30/14 due 10/1/14 (Collateralized by U.S. Treasury Obligations valued at $7,448,000,091, 3.63% - 3.88%, 5/15/18 - 2/15/21) (Cost $7,448,000) | $ 7,448,000 | | $ 7,448,000 |
Other Repurchase Agreement - 6.9% |
| | | |
Other Repurchase Agreement - 6.9% |
With: | | | |
Credit Suisse Securities (U.S.A.) LLC at: | | | |
0.14%, dated 9/30/14 due 10/7/14 (Collateralized by U.S. Government Obligations valued at $14,421,916, 3%, 6/15/42) | 14,000 | | 14,000 |
0.36%, dated 9/30/14 due: | | | |
10/1/14 (Collateralized by Corporate Obligations valued at $50,763,858, 5.65% - 11.63%, 11/15/15 - 10/15/36) | 47,000 | | 47,000 |
10/7/14 (Collateralized by Corporate Obligations valued at $52,921,693, 8.5% - 11%, 10/1/21 - 9/15/22) | 49,003 | | 49,000 |
0.41%, dated 9/24/14 due 10/1/14 (Collateralized by Corporate Obligations valued at $113,412,350, 0.36% - 5.95%, 1/20/25 - 2/10/51) | 108,009 | | 108,000 |
0.42%, dated 9/25/14 due 10/2/14 (Collateralized by Corporate Obligations valued at $113,412,639, 0.14% - 6.37%, 1/15/25 - 9/15/65) | 108,009 | | 108,000 |
0.65%, dated: | | | |
8/5/14 due 11/3/14 (Collateralized by Corporate Obligations valued at $37,842,053, 6.35% - 11.75%, 3/15/16 - 10/1/20) | 35,057 | | 35,000 |
8/28/14 due: | | | |
10/9/14 (Collateralized by Corporate Obligations valued at $75,648,351, 0%, 11/01/47) | 72,055 | | 72,000 |
10/31/14 (Collateralized by Corporate Obligations valued at $92,459,552, 0.57% - 0.91%, 10/15/17 - 5/26/26) | 88,102 | | 88,000 |
Other Repurchase Agreement - continued |
| Maturity Amount (000s) | | Value (000s) |
Other Repurchase Agreement - continued |
With: - continued | | | |
Credit Suisse Securities (U.S.A.) LLC at: - continued | | | |
11/13/14 (Collateralized by Corporate Obligations valued at $305,822,269, 0.23% - 5.5%, 4/15/32 - 1/25/43) | $ 283,393 | | $ 283,000 |
11/18/14 (Collateralized by Mortgage Loan Obligations valued at $365,383,791, 0% - 6.55%, 9/25/17 - 2/25/47) | 344,509 | | 344,000 |
J.P. Morgan Clearing Corp. at: | | | |
0.59%, dated 6/13/14 due 10/14/14 (Collateralized by Corporate Obligations valued at $113,247,331, 0.25% - 4%, 8/15/18 - 11/15/29) | 104,210 | | 104,000 |
0.63%, dated: | | | |
6/19/14 due 12/29/14 (Collateralized by Corporate Obligations valued at $81,670,380, 2.5% - 3.5%, 12/15/17 - 2/15/40) | 75,276 | | 75,000 |
8/27/14 due 12/29/14 (Collateralized by Corporate Obligations valued at $79,397,188, 0.16% - 6.5%, 4/1/19 - 6/15/21) | 73,194 | | 73,000 |
0.64%, dated 4/8/14 due 10/6/14 (Collateralized by Corporate Obligations valued at $83,958,473, 1.75% - 4%, 12/15/15 - 11/15/40) | 77,248 | | 77,000 |
J.P. Morgan Securities, Inc. at: | | | |
0.13%, dated 9/30/14 due 10/1/14 (Collateralized by U.S. Government Obligations valued at $30,903,613, 0.46% - 6.05%, 10/7/14 - 9/16/44) | 30,000 | | 30,000 |
0.2%, dated 9/24/14 due 10/1/14 (Collateralized by U.S. Government Obligations valued at $74,165,630, 1.31% - 7.28%, 11/20/34 - 9/20/44) | 72,003 | | 72,000 |
0.59%, dated 6/4/14 due 12/19/14 (Collateralized by Corporate Obligations valued at $23,149,630, 0.8% - 6.3%, 12/1/15 - 1/15/38) | 22,071 | | 22,000 |
0.61%, dated 6/4/14 due 12/19/14 (Collateralized by Mortgage Loan Obligations valued at $151,502,469, 0.23% - 6.25%, 7/15/19 - 8/12/48) | 140,470 | | 140,000 |
0.62%, dated 7/10/14 due 11/7/14 (Collateralized by Mortgage Loan Obligations valued at $105,990,288, 0.21% - 1.41%, 3/25/35 - 5/25/46) | 98,203 | | 98,000 |
|
| Maturity Amount (000s) | | Value (000s) |
0.63%, dated: | | | |
6/18/14 due 12/29/14 (Collateralized by Mortgage Loan Obligations valued at $134,163,810, 0.28% - 6.24%, 4/25/35 - 12/10/49) | $ 124,516 | | $ 124,000 |
7/16/14 due 12/29/14 (Collateralized by Mortgage Loan Obligations valued at $50,828,388, 0.36%, 6/25/37) | 47,173 | | 47,000 |
8/15/14 due 12/29/14 (Collateralized by Corporate Obligations valued at $199,078,725, 5.63% - 11%, 5/1/18 - 3/1/23) | 183,490 | | 183,000 |
0.65%, dated 9/11/14 due 12/29/14 (Collateralized by Mortgage Loan Obligations valued at $22,690,503, 2.56% - 5.75%, 11/25/35 - 4/25/37) | 21,080 | | 21,000 |
RBC Capital Markets Co. at: | | | |
0.19%, dated 9/30/14 due 10/7/14 (Collateralized by U.S. Government Obligations valued at $43,185,233, 0% - 8.46%, 10/25/19 - 9/25/44) | 42,003 | | 42,000 |
0.29%, dated 9/23/14 due 10/7/14 (Collateralized by U.S. Government Obligations valued at $51,475,199, 0% - 8.46%, 7/25/20 - 9/25/44) | 50,037 | | 50,000 |
0.38%, dated 9/30/14 due 10/7/14 (Collateralized by Corporate Obligations valued at $45,360,479, 3.38% - 10.75%, 2/1/16 - 3/15/42) | 42,006 | | 42,000 |
0.4%, dated 9/23/14 due 10/7/14 (Collateralized by Mortgage Loan Obligations valued at $15,058,792, 0.28% - 6.25%, 11/15/26 - 2/15/51) | 14,002 | | 14,000 |
TOTAL OTHER REPURCHASE AGREEMENT (Cost $2,362,000) |
2,362,000
|
TOTAL INVESTMENT PORTFOLIO - 98.4% (Cost $33,887,510) | 33,887,510 |
NET OTHER ASSETS (LIABILITIES) - 1.6% | | 538,030 |
NET ASSETS - 100% | $ 34,425,540 |
Security Type Abbreviations |
VRDN | - | VARIABLE RATE DEMAND NOTE (A debt instrument that is payable upon demand, either daily, weekly or monthly) |
Legend |
(a) Yield represents either the annualized yield at the date of purchase, or the stated coupon rate, or, for floating and adjustable rate securities, the rate at period end. |
(b) Security exempt from registration under Rule 144A of the Securities Act of 1933. These securities may be resold in transactions exempt from registration, normally to qualified institutional buyers. At the end of the period, the value of these securities amounted to $432,000,000 or 1.3% of net assets. |
(c) Coupon rates for floating and adjustable rate securities reflect the rates in effect at period end. |
(d) Private activity obligations whose interest is subject to the federal alternative minimum tax for individuals. |
# Additional information on each counterparty to the repurchase agreement is as follows: |
Repurchase Agreement / Counterparty | Value
(Amounts in thousands) |
$2,780,732,000 due 10/01/14 at 0.01% |
BNP Paribas Securities Corp. | $ 352,281 |
Bank of America NA | 438,605 |
Citibank NA | 373,789 |
Credit Agricole CIB New York Branch | 136,015 |
Credit Suisse Securities (USA) LLC | 83,960 |
HSBC Securities (USA), Inc. | 522,901 |
ING Financial Markets LLC | 159,523 |
J.P. Morgan Securities, Inc. | 251,879 |
Merrill Lynch, Pierce, Fenner & Smith, Inc. | 53,734 |
Societe Generale | 100,752 |
Wells Fargo Securities LLC | 307,293 |
| $ 2,780,732 |
$226,106,000 due 10/01/14 at 0.01% |
BNP Paribas Securities Corp. | $ 74,296 |
Barclays Capital, Inc. | 19,801 |
Citibank NA | 61,879 |
J.P. Morgan Securities, Inc. | 41,253 |
Merrill Lynch, Pierce, Fenner & Smith, Inc. | 28,877 |
| $ 226,106 |
Other Information |
The date shown for securities represents the date when principal payments must be paid, taking into account any call options exercised by the issuer and any permissible maturity shortening features other than interest rate resets. |
All investments are categorized as Level 2 under the Fair Value Hierarchy. The inputs or methodology used for valuing securities may not be an indication of the risk associated with investing in those securities. For more information on valuation inputs, please refer to the Security Valuation section in the accompanying Notes to Financial Statements. |
See accompanying notes which are an integral part of the financial statements.
Semiannual Report
Prime Money Market Portfolio
Financial Statements
Statement of Assets and Liabilities
Amounts in thousands (except per-share amounts) September 30, 2014
(Unaudited) |
| | |
Assets | | |
Investment in securities, at value (including repurchase agreements of $13,067,838) - See accompanying schedule: Unaffiliated issuers (cost $33,887,510) | | $ 33,887,510 |
Cash | | 523,138 |
Receivable for fund shares sold | | 1,698 |
Interest receivable | | 18,686 |
Receivable from investment adviser for expense reductions | | 1,011 |
Other receivables | | 324 |
Total assets | | 34,432,367 |
| | |
Liabilities | | |
Payable for fund shares redeemed | $ 310 | |
Distributions payable | 501 | |
Transfer agent fee payable | 1,042 | |
Accrued management fee | 4,280 | |
Other affiliated payables | 139 | |
Other payables and accrued expenses | 555 | |
Total liabilities | | 6,827 |
| | |
Net Assets | | $ 34,425,540 |
Net Assets consist of: | | |
Paid in capital | | $ 34,424,696 |
Accumulated undistributed net realized gain (loss) on investments | | 844 |
Net Assets | | $ 34,425,540 |
| | |
Class I:
Net Asset Value, offering price and redemption price per share ($6,232,969 ÷ 6,230,789 shares) | | $ 1.00 |
| | |
Class II:
Net Asset Value, offering price and redemption price per share ($654,847 ÷ 654,579 shares) | | $ 1.00 |
| | |
Class III:
Net Asset Value, offering price and redemption price per share ($1,186,087 ÷ 1,185,846 shares) | | $ 1.00 |
| | |
Class IV:
Net Asset Value, offering price and redemption price per share ($204,229 ÷ 204,156 shares) | | $ 1.00 |
| | |
Select Class:
Net Asset Value, offering price and redemption price per share ($741,823 ÷ 741,575 shares) | | $ 1.00 |
| | |
Institutional Class:
Net Asset Value, offering price and redemption price per share ($25,405,585 ÷ 25,396,884 shares) | | $ 1.00 |
Statement of Operations
Amounts in thousands Six months ended September 30, 2014
(Unaudited) |
| | |
Investment Income | | |
Interest | | $ 37,690 |
| | |
Expenses | | |
Management fee | $ 26,495 | |
Transfer agent fees | 7,225 | |
Distribution and service plan fees | 2,854 | |
Accounting fees and expenses | 838 | |
Custodian fees and expenses | 172 | |
Independent trustees' compensation | 84 | |
Registration fees | 115 | |
Audit | 37 | |
Legal | 37 | |
Miscellaneous | 169 | |
Total expenses before reductions | 38,026 | |
Expense reductions | (9,019) | 29,007 |
Net investment income (loss) | | 8,683 |
Realized and Unrealized Gain (Loss) Net realized gain (loss) on: | | |
Investment securities: | | |
Unaffiliated issuers | | 553 |
Net increase in net assets resulting from operations | | $ 9,236 |
See accompanying notes which are an integral part of the financial statements.
Semiannual Report
Prime Money Market Portfolio
Financial Statements - continued
Statement of Changes in Net Assets
Amounts in thousands | Six months ended
September 30, 2014
(Unaudited) | Year ended
March 31,
2014 |
Increase (Decrease) in Net Assets | | |
Operations | | |
Net investment income (loss) | $ 8,683 | $ 20,977 |
Net realized gain (loss) | 553 | 561 |
Net increase in net assets resulting from operations | 9,236 | 21,538 |
Distributions to shareholders from net investment income | (8,683) | (20,979) |
Share transactions - net increase (decrease) | (3,946,394) | (6,678,780) |
Total increase (decrease) in net assets | (3,945,841) | (6,678,221) |
| | |
Net Assets | | |
Beginning of period | 38,371,381 | 45,049,602 |
End of period | $ 34,425,540 | $ 38,371,381 |
Financial Highlights - Class I
| Six months ended
September 30, 2014 | Years ended March 31, |
| (Unaudited) | 2014 | 2013 | 2012 | 2011 | 2010 |
Selected Per-Share Data | | | | | | |
Net asset value, beginning of period | $ 1.00 | $ 1.00 | $ 1.00 | $ 1.00 | $ 1.00 | $ 1.00 |
Income from Investment Operations | | | | | | |
Net investment income (loss) | - E | - E | .001 | .001 | .002 | .003 |
Distributions from net investment income | - E | - E | (.001) | (.001) | (.002) | (.003) |
Net asset value, end of period | $ 1.00 | $ 1.00 | $ 1.00 | $ 1.00 | $ 1.00 | $ 1.00 |
Total ReturnB, C | .01% | .02% | .09% | .10% | .19% | .33% |
Ratios to Average Net Assets D | | | | | | |
Expenses before reductions | .21% A | .21% | .21% | .21% | .21% | .22% |
Expenses net of fee waivers, if any | .19% A | .19% | .20% | .20% | .20% | .21% |
Expenses net of all reductions | .19% A | .19% | .20% | .20% | .20% | .21% |
Net investment income (loss) | .01% A | .02% | .09% | .10% | .19% | .29% |
Supplemental Data | | | | | | |
Net assets, end of period (in millions) | $ 6,233 | $ 7,816 | $ 10,332 | $ 15,149 | $ 21,761 | $ 30,823 |
A Annualized
B Total returns for periods of less than one year are not annualized.
C Total returns would have been lower if certain expenses had not been reduced during the applicable periods shown.
D Expense ratios reflect operating expenses of the class. Expenses before reductions do not reflect amounts reimbursed or waived or reductions from expense offset arrangements and do not represent the amount paid by the class during periods when reimbursements, waivers or reductions occur. Expenses net of fee waivers reflect expenses after reimbursement and waivers but prior to reductions from expense offset arrangements. Expenses net of all reductions represent the net expenses paid by the class.
E Amount represents less than $.001 per share.
See accompanying notes which are an integral part of the financial statements.
Semiannual Report
Financial Highlights - Class II
| Six months ended
September 30, 2014 | Years ended March 31, |
| (Unaudited) | 2014 | 2013 | 2012 | 2011 | 2010 |
Selected Per-Share Data | | | | | | |
Net asset value, beginning of period | $ 1.00 | $ 1.00 | $ 1.00 | $ 1.00 | $ 1.00 | $ 1.00 |
Income from Investment Operations | | | | | | |
Net investment income (loss) | - E | - E | - E | - E | - E | .002 |
Distributions from net investment income | - E | - E | - E | - E | - E | (.002) |
Net asset value, end of period | $ 1.00 | $ 1.00 | $ 1.00 | $ 1.00 | $ 1.00 | $ 1.00 |
Total Return B, C | .01% | .01% | .01% | .01% | .04% | .19% |
Ratios to Average Net Assets D | | | | | | |
Expenses before reductions | .36% A | .36% | .36% | .36% | .36% | .37% |
Expenses net of fee waivers, if any | .19% A | .19% | .28% | .29% | .35% | .35% |
Expenses net of all reductions | .19% A | .19% | .28% | .29% | .35% | .35% |
Net investment income (loss) | .01% A | .01% | .01% | .01% | .04% | .14% |
Supplemental Data | | | | | | |
Net assets, end of period (in millions) | $ 655 | $ 419 | $ 487 | $ 828 | $ 776 | $ 959 |
A Annualized
B Total returns for periods of less than one year are not annualized.
C Total returns would have been lower if certain expenses had not been reduced during the applicable periods shown.
D Expense ratios reflect operating expenses of the class. Expenses before reductions do not reflect amounts reimbursed or waived or reductions from expense offset arrangements and do not represent the amount paid by the class during periods when reimbursements, waivers or reductions occur. Expenses net of fee waivers reflect expenses after reimbursement and waivers but prior to reductions from expense offset arrangements. Expenses net of all reductions represent the net expenses paid by the class.
E Amount represents less than $.001 per share.
Financial Highlights - Class III
| Six months ended September 30, 2014 | Years ended March 31, |
| (Unaudited) | 2014 | 2013 | 2012 | 2011 | 2010 |
Selected Per-Share Data | | | | | | |
Net asset value, beginning of period | $ 1.00 | $ 1.00 | $ 1.00 | $ 1.00 | $ 1.00 | $ 1.00 |
Income from Investment Operations | | | | | | |
Net investment income (loss) | - E | - E | - E | - E | - E | .001 |
Distributions from net investment income | - E | - E | - E | - E | - E | (.001) |
Net asset value, end of period | $ 1.00 | $ 1.00 | $ 1.00 | $ 1.00 | $ 1.00 | $ 1.00 |
Total ReturnB, C | .01% | .01% | .01% | .01% | .01% | .13% |
Ratios to Average Net Assets D | | | | | | |
Expenses before reductions | .46%A | .46% | .46% | .46% | .46% | .47% |
Expenses net of fee waivers, if any | .19%A | .19% | .28% | .29% | .38% | .42% |
Expenses net of all reductions | .19%A | .19% | .28% | .29% | .38% | .42% |
Net investment income (loss) | .01%A | .01% | .01% | .01% | .01% | .07% |
Supplemental Data | | | | | | |
Net assets, end of period (in millions) | $ 1,186 | $ 1,967 | $ 1,790 | $ 1,543 | $ 2,732 | $ 2,851 |
A Annualized
B Total returns for periods of less than one year are not annualized.
C Total returns would have been lower if certain expenses had not been reduced during the applicable periods shown.
D Expense ratios reflect operating expenses of the class. Expenses before reductions do not reflect amounts reimbursed or waived or reductions from expense offset arrangements and do not represent the amount paid by the class during periods when reimbursements, waivers or reductions occur. Expenses net of fee waivers reflect expenses after reimbursement and waivers but prior to reductions from expense offset arrangements. Expenses net of all reductions represent the net expenses paid by the class.
E Amount represents less than $.001 per share.
See accompanying notes which are an integral part of the financial statements.
Semiannual Report
Financial Highlights - Class IV
| Six months ended
September 30, 2014 | Years ended March 31, |
| (Unaudited) | 2014 | 2013 | 2012 | 2011 | 2010 |
Selected Per-Share Data | | | | | | |
Net asset value, beginning of period | $ 1.00 | $ 1.00 | $ 1.00 | $ 1.00 | $ 1.00 | $ 1.00 |
Income from Investment Operations | | | | | | |
Net investment income (loss) F | - | - | - | - | - | - |
Distributions from net investment income F | - | - | - | - | - | - |
Net asset value, end of period | $ 1.00 | $ 1.00 | $ 1.00 | $ 1.00 | $ 1.00 | $ 1.00 |
Total ReturnB, C | .01% | .01% | .01% | .01% | .01% | .04% |
Ratios to Average Net Assets E | | | | | | |
Expenses before reductions | .71% A | .71% | .71% | .71% | .71% | .72% |
Expenses net of fee waivers, if any | .19% A | .18% | .29% | .29% | .38% | .49% |
Expenses net of all reductions | .19% A | .18% | .29% | .29% | .38% | .49% |
Net investment income (loss) | .01% A | .02% | -% D | .01% | .01% | -% D |
Supplemental Data | | | | | | |
Net assets, end of period (in millions) | $ 204 | $ 100 | $ 37 | $ 65 | $ 190 | $ 272 |
A Annualized
B Total returns for periods of less than one year are not annualized.
C Total returns would have been lower if certain expenses had not been reduced during the applicable periods shown.
D Amount represents less than .01%.
E Expense ratios reflect operating expenses of the class. Expenses before reductions do not reflect amounts reimbursed or waived or reductions from expense offset arrangements and do not represent the amount paid by the class during periods when reimbursements, waivers or reductions occur. Expenses net of fee waivers reflect expenses after reimbursement and waivers but prior to reductions from expense offset arrangements. Expenses net of all reductions represent the net expenses paid by the class.
F Amount represents less than $.001 per share.
Financial Highlights - Select Class
| Six months ended
September 30, 2014 | Years ended March 31, |
| (Unaudited) | 2014 | 2013 | 2012 | 2011 | 2010 |
Selected Per-Share Data | | | | | | |
Net asset value, beginning of period | $ 1.00 | $ 1.00 | $ 1.00 | $ 1.00 | $ 1.00 | $ 1.00 |
Income from Investment Operations | | | | | | |
Net investment income (loss) | - E | - E | - E | .001 | .001 | .003 |
Distributions from net investment income | - E | - E | - E | (.001) | (.001) | (.003) |
Net asset value, end of period | $ 1.00 | $ 1.00 | $ 1.00 | $ 1.00 | $ 1.00 | $ 1.00 |
Total ReturnB, C | .01% | .01% | .05% | .05% | .14% | .28% |
Ratios to Average Net Assets D | | | | | | |
Expenses before reductions | .26% A | .26% | .26% | .26% | .26% | .27% |
Expenses net of fee waivers, if any | .19% A | .19% | .25% | .25% | .25% | .26% |
Expenses net of all reductions | .19% A | .19% | .25% | .25% | .25% | .26% |
Net investment income (loss) | .01% A | .01% | .05% | .05% | .14% | .24% |
Supplemental Data | | | | | | |
Net assets, end of period (in millions) | $ 742 | $ 1,173 | $ 1,724 | $ 1,207 | $ 1,272 | $ 752 |
A Annualized
B Total returns for periods of less than one year are not annualized.
C Total returns would have been lower if certain expenses had not been reduced during the applicable periods shown.
D Expense ratios reflect operating expenses of the class. Expenses before reductions do not reflect amounts reimbursed or waived or reductions from expense offset arrangements and do not represent the amount paid by the class during periods when reimbursements, waivers or reductions occur. Expenses net of fee waivers reflect expenses after reimbursement and waivers but prior to reductions from expense offset arrangements. Expenses net of all reductions represent the net expenses paid by the class.
E Amount represents less than $.001 per share.
See accompanying notes which are an integral part of the financial statements.
Semiannual Report
Financial Highlights - Institutional Class
| Six months ended
September 30, 2014 | Years ended March 31, |
| (Unaudited) | 2014 | 2013 | 2012 | 2011 | 2010 |
Selected Per-Share Data | | | | | | |
Net asset value, beginning of period | $ 1.00 | $ 1.00 | $ 1.00 | $ 1.00 | $ 1.00 | $ 1.00 |
Income from Investment Operations | | | | | | |
Net investment income (loss) | - E | .001 | .002 | .002 | .003 | .004 |
Distributions from net investment income | - E | (.001) | (.002) | (.002) | (.003) | (.004) |
Net asset value, end of period | $ 1.00 | $ 1.00 | $ 1.00 | $ 1.00 | $ 1.00 | $ 1.00 |
Total ReturnB, C | .03% | .06% | .15% | .16% | .25% | .39% |
Ratios to Average Net Assets D | | | | | | |
Expenses before reductions | .18% A | .18% | .18% | .18% | .18% | .19% |
Expenses net of fee waivers, if any | .14% A | .14% | .14% | .14% | .14% | .15% |
Expenses net of all reductions | .14% A | .14% | .14% | .14% | .14% | .15% |
Net investment income (loss) | .06% A | .06% | .15% | .16% | .25% | .35% |
Supplemental Data | | | | | | |
Net assets, end of period (in millions) | $ 25,406 | $ 26,896 | $ 30,681 | $ 34,433 | $ 44,113 | $ 37,092 |
A Annualized
B Total returns for periods of less than one year are not annualized.
C Total returns would have been lower if certain expenses had not been reduced during the applicable periods shown.
D Expense ratios reflect operating expenses of the class. Expenses before reductions do not reflect amounts reimbursed or waived or reductions from expense offset arrangements and do not represent the amount paid by the class during periods when reimbursements, waivers or reductions occur. Expenses net of fee waivers reflect expenses after reimbursement and waivers but prior to reductions from expense offset arrangements. Expenses net of all reductions represent the net expenses paid by the class.
E Amount represents less than $.001 per share.
See accompanying notes which are an integral part of the financial statements.
Semiannual Report
Money Market Portfolio
Investment Changes/Performance (Unaudited)
Effective Maturity Diversification |
Days | % of fund's investments 9/30/14 | % of fund's investments 3/31/14 | % of fund's investments 9/30/13 |
1 - 7 | 39.3 | 26.1 | 33.9 |
8 - 30 | 19.3 | 18.2 | 18.9 |
31 - 60 | 10.3 | 17.6 | 13.8 |
61 - 90 | 13.4 | 12.1 | 16.6 |
91 - 180 | 11.3 | 21.0 | 12.2 |
> 180 | 6.4 | 5.0 | 4.6 |
Effective maturity is determined in accordance with the requirements of Rule 2a-7 under the Investment Company Act of 1940. |
Weighted Average Maturity |
| 9/30/14 | 3/31/14 | 9/30/13 |
Money Market Portfolio | 50 Days | 57 Days | 51 Days |
All Taxable Money Market Funds Average* | 45 Days | 46 Days | 48 Days |
This is a weighted average of all the maturities of the securities held in a fund. Weighted Average Maturity (WAM) can be used as a measure of sensitivity to interest rate changes and market changes. Generally, the longer the maturity, the greater the sensitivity to such changes. WAM is based on the dollar-weighted average length of time until principal payments must be paid. Depending on the types of securities held in a fund, certain maturity shortening devices (e.g., demand features, interest rate resets, and call options) may be taken into account when calculating the WAM. |
Weighted Average Life |
| 9/30/14 | 3/31/14 | 9/30/13 |
Money Market Portfolio | 80 Days | 80 Days | 85 Days |
Weighted Average Life (WAL) is the weighted average of the life of the securities held in a fund or portfolio and can be used as a measure of sensitivity to changes in liquidity and/or credit risk. Generally, the higher the value, the greater the sensitivity. WAL is based on the dollar-weighted average length of time until principal payments must be paid, taking into account any call options exercised by the issuer and any permissible maturity shortening features other than interest rate resets. The difference between WAM and WAL is that WAM takes into account interest rate resets and WAL does not. WAL for money market funds is not the same as WAL of a mortgage- or asset-backed security. |
Asset Allocation (% of fund's net assets) |
As of September 30, 2014 | As of March 31, 2014 |
| Certificates of
Deposit 47.6% | | | Certificates of
Deposit 49.9% | |
| Commercial Paper 3.6% | | | Commercial Paper 9.0% | |
| Variable Rate
Demand Notes
(VRDNs) 0.1% | | | Variable Rate
Demand Notes
(VRDNs) 0.1% | |
| Other Notes 0.9% | | | Other Notes 0.9% | |
| Treasury Debt 3.3% | | | Treasury Debt 9.8% | |
| Government
Agency Debt 8.7% | | | Government
Agency Debt 3.5% | |
| Other Municipal
Debt 0.0% | | | Other Municipal
Debt 0.5% | |
| Other Instruments 4.0% | | | Other Instruments 1.8% | |
| Repurchase
Agreements 29.9% | | | Repurchase
Agreements 23.6% | |
| Net Other Assets (Liabilities) 1.9% | | | Net Other Assets (Liabilities) 0.9% | |

Semiannual Report
Current and Historical Seven-Day Yields |
| 9/30/14 | 6/30/14 | 3/31/14 | 12/31/13 | 9/30/13 |
| | | | | |
Class I | 0.04% | 0.05% | 0.05% | 0.03% | 0.04% |
| | | | | |
Class II | 0.01% | 0.01% | 0.01% | 0.01% | 0.01% |
| | | | | |
Class III | 0.01% | 0.01% | 0.01% | 0.01% | 0.01% |
| | | | | |
Select Class | 0.01% | 0.01% | 0.01% | 0.01% | 0.01% |
| | | | | |
Class F | 0.08% | 0.09% | 0.09% | 0.07% | 0.08% |
| | | | | |
Institutional Class | 0.08% | 0.09% | 0.09% | 0.07% | 0.08% |
Yield refers to the income paid by the fund over a given period. Yields for money market funds are usually for seven-day periods, as they are here, though they are expressed as annual percentage rates. Past performance is no guarantee of future results. Yield will vary and it's possible to lose money investing in the Fund. A portion of the Fund's expenses was reimbursed and/or waived. Absent such reimbursements and/or waivers the yield for the period ending September 30, 2014, the most recent period shown in the table, would have been 0.01% for Class I, -0.14% for Class II, -0.24% for Class III, -0.04% for Select Class, 0.07% for Class F and 0.04% for Institutional Class.
* Source: iMoneyNet, Inc.
Semiannual Report
Money Market Portfolio
Investments September 30, 2014 (Unaudited)
Showing Percentage of Net Assets
Certificate of Deposit - 47.6% |
| | Yield (a) | Principal Amount (000s) | Value (000s) |
Domestic Certificates Of Deposit - 5.3% |
BMO Harris Bank NA |
| 10/17/14 | 0.20% | $ 100,000 | $ 100,000 |
Citibank NA |
| 10/3/14 to 12/17/14 | 0.21 to 0.23 | 1,909,000 | 1,909,000 |
Wells Fargo Bank NA |
| 11/4/14 to 3/16/15 | 0.20 to 0.23 (c) | 1,459,000 | 1,459,000 |
| | 3,468,000 |
London Branch, Eurodollar, Foreign Banks - 3.0% |
Commonwealth Bank of Australia |
| 12/22/14 | 0.22 | 126,000 | 126,000 |
National Australia Bank Ltd. |
| 10/24/14 to 3/10/15 | 0.20 to 0.25 (c) | 1,834,000 | 1,834,000 |
| | 1,960,000 |
New York Branch, Yankee Dollar, Foreign Banks - 39.3% |
Bank of Montreal Chicago CD Program |
| 11/26/14 to 6/12/15 | 0.18 to 0.24 (c) | 1,042,000 | 1,042,000 |
Bank of Nova Scotia |
| 10/3/14 to 5/29/15 | 0.21 to 0.31 (c) | 2,622,000 | 2,622,000 |
Bank of Tokyo-Mitsubishi UFJ Ltd. |
| 11/21/14 to 4/1/15 | 0.25 | 3,234,000 | 3,234,000 |
Canadian Imperial Bank of Commerce |
| 2/27/15 to 6/12/15 | 0.24 to 0.30 (c) | 1,207,000 | 1,207,000 |
Credit Agricole CIB |
| 12/29/14 | 0.24 | 642,000 | 642,000 |
Credit Suisse AG |
| 11/3/14 to 1/12/15 | 0.25 to 0.31 (c) | 1,426,000 | 1,426,000 |
Mizuho Corporate Bank Ltd. |
| 10/10/14 to 1/23/15 | 0.25 | 2,959,000 | 2,959,000 |
Natexis Banques Populaires New York Branch |
| 10/2/14 to 1/5/15 | 0.12 to 0.26 | 3,221,000 | 3,221,000 |
Rabobank Nederland New York Branch |
| 1/5/15 | 0.21 (c) | 269,000 | 269,000 |
Royal Bank of Canada |
| 4/9/15 to 6/26/15 | 0.22 to 0.23 (c) | 420,000 | 420,000 |
Sumitomo Mitsui Banking Corp. |
| 10/10/14 to 3/16/15 | 0.22 to 0.33 (c) | 3,264,200 | 3,264,200 |
Sumitomo Mitsui Trust Banking Ltd. |
| 10/24/14 to 1/22/15 | 0.24 | 1,714,000 | 1,714,000 |
Swedbank AB |
| 12/8/14 to 12/9/14 | 0.25 | 654,000 | 654,000 |
Toronto-Dominion Bank |
| 10/10/14 to 7/2/15 | 0.23 to 0.31 (c) | 1,052,000 | 1,052,000 |
|
| | Yield (a) | Principal Amount (000s) | Value (000s) |
UBS AG |
| 12/23/14 to 3/5/15 | 0.26 to 0.27% (c) | $ 1,841,000 | $ 1,841,000 |
| | 25,567,200 |
TOTAL CERTIFICATE OF DEPOSIT (Cost $30,995,200) |
30,995,200
|
Financial Company Commercial Paper - 3.6% |
|
Bank of Nova Scotia |
| 5/22/15 | 0.28 | 291,000 | 290,473 |
Commonwealth Bank of Australia |
| 2/23/15 | 0.22 (c) | 85,000 | 85,000 |
DNB Bank ASA |
| 3/18/15 | 0.25 | 125,000 | 124,854 |
General Electric Capital Corp. |
| 11/3/14 | 0.20 | 186,000 | 185,966 |
JPMorgan Securities LLC |
| 4/22/15 to 4/27/15 | 0.25 (c) | 536,000 | 536,000 |
Skandinaviska Enskilda Banken AB |
| 12/30/14 | 0.22 | 363,000 | 362,800 |
Swedbank AB |
| 1/13/15 to 1/29/15 | 0.25 | 529,000 | 528,589 |
Toronto Dominion Holdings (U.S.A.) |
| 2/3/15 | 0.24 | 4,000 | 3,997 |
Toyota Motor Credit Corp. |
| 3/25/15 to 3/27/15 | 0.25 | 210,000 | 209,742 |
TOTAL FINANCIAL COMPANY COMMERCIAL PAPER (Cost $2,327,421) |
2,327,421
|
Treasury Debt - 3.3% |
|
U.S. Treasury Obligations - 3.3% |
U.S. Treasury Bills |
| 10/16/14 | 0.14 | 280,000 | 279,983 |
U.S. Treasury Notes |
| 10/31/14 to 11/30/14 | 0.08 to 0.17 | 1,833,725 | 1,840,249 |
TOTAL TREASURY DEBT (Cost $2,120,232) |
2,120,232
|
Other Note - 0.9% |
|
Medium-Term Notes - 0.9% |
Svenska Handelsbanken AB |
| 3/13/15 to 3/27/15 (Cost $618,000) | 0.28 to 0.30 (b)(c) | 618,000 |
618,000
|
Variable Rate Demand Note - 0.1% |
| | Yield (a) | Principal Amount (000s) | Value (000s) |
Delaware - 0.1% |
LP Pinewood SPV LLC Taxable, LOC Wells Fargo Bank NA, VRDN |
| 10/7/14 (Cost $67,000) | 0.15% (c) | $ 67,000 | $ 67,000 |
Government Agency Debt - 8.7% |
|
Federal Agencies - 8.7% |
Federal Home Loan Bank |
| 10/1/14 to 10/2/15 | 0.07 to 0.25 (c) | 5,032,540 | 5,032,311 |
Freddie Mac |
| 7/16/15 to 7/17/15 | 0.14 (c) | 638,000 | 637,949 |
TOTAL GOVERNMENT AGENCY DEBT (Cost $5,670,260) |
5,670,260
|
Other Instrument - 4.0% |
|
Corporate Bonds - 0.4% |
International Bank Reconstruction & Development |
| 10/28/15 | 0.30 | 234,000 | 234,000 |
Time Deposits - 3.6% |
Credit Agricole CIB |
| 10/1/14 | 0.06 | 802,000 | 802,000 |
ING Bank NV |
| 10/7/14 | 0.11 | 188,000 | 188,000 |
Skandinaviska Enskilda Banken AB |
| 10/1/14 | 0.06 | 1,289,000 | 1,289,000 |
Swedbank AB |
| 10/1/14 | 0.01 | 84,000 | 84,000 |
| | 2,363,000 |
TOTAL OTHER INSTRUMENT (Cost $2,597,000) |
2,597,000
|
Government Agency Repurchase Agreement - 6.4% |
| Maturity Amount (000s) | | |
In a joint trading account at: | | | |
0.01% dated 9/30/14 due 10/1/14 (Collateralized by U.S. Government Obligations) # | $ 3,098,652 | | 3,098,651 |
0.01% dated 9/30/14 due 10/1/14 (Collateralized by U.S. Government Obligations) # | 654,974 | | 654,974 |
With Morgan Stanley & Co., Inc. at 0.05%, dated 9/29/14 due 10/6/14 (Collateralized by U.S. Government Obligations valued at $445,741,238, 2.1% - 9%, 11/1/14 - 7/1/43) | 437,004 | | 437,000 |
TOTAL GOVERNMENT AGENCY REPURCHASE AGREEMENT (Cost $4,190,625) |
4,190,625
|
Treasury Repurchase Agreement - 14.6% |
| Maturity Amount (000s) | | Value (000s) |
With Federal Reserve Bank of New York at 0%, dated 9/30/14 due 10/1/14 (Collateralized by U.S. Treasury Obligations valued at $9,516,000,037, 2.5% - 4.5%, 8/15/23 - 5/15/38) (Cost $9,516,000) | $ 9,516,000 | | $ 9,516,000 |
Other Repurchase Agreement - 8.9% |
| | | |
Other Repurchase Agreement - 8.9% |
With: | | | |
BNP Paribas Securities Corp. at: | | | |
0.23%, dated 9/12/14 due 10/7/14 (Collateralized by Corporate Obligations valued at $50,406,118, 0% - 8.75%, 9/19/16 - 3/15/45) | 48,010 | | 48,000 |
0.28%, dated 9/30/14 due 10/1/14 (Collateralized by U.S. Government Obligations valued at $306,633,526, 3% - 5.95%, 5/20/41 - 9/20/44) | 300,002 | | 300,000 |
0.41%, dated 9/10/14 due 10/7/14 (Collateralized by Corporate Obligations valued at $17,284,133, 2.63% - 9.75%, 7/10/17 - 6/26/24) | 16,005 | | 16,000 |
Citigroup Global Markets, Inc. at: | | | |
0.78%, dated 7/15/14 due 10/15/14 (Collateralized by Corporate Obligations valued at $25,963,806, 0% - 3.75%, 3/15/18 - 12/15/43) | 24,048 | | 24,000 |
1%, dated 8/15/14 due 2/2/15 (Collateralized by Corporate Obligations valued at $173,025,600, 0% - 9.34%, 12/22/14 - 1/15/49) | 160,933 | | 160,000 |
Credit Suisse Securities (U.S.A.) LLC at: | | | |
0.14%, dated 9/30/14 due 10/7/14 (Collateralized by U.S. Government Obligations valued at $25,751,253, 0% - 5.5%, 11/15/32 - 1/15/43) | 25,001 | | 25,000 |
0.36%, dated 9/30/14 due: | | | |
10/1/14 (Collateralized by Corporate Obligations valued at $183,600,525, 0.24% - 8.85%, 11/15/25 - 2/15/51) | 170,002 | | 170,000 |
10/7/14 (Collateralized by Corporate Obligations valued at $92,403,593, 0.35% - 1.67%, 8/21/17 - 12/20/54) | 88,006 | | 88,000 |
0.41%, dated 9/24/14 due 10/1/14 (Collateralized by Corporate Obligations valued at $201,974,528, 0.26% - 1.65%, 8/25/32 - 4/25/47) | 187,015 | | 187,000 |
Other Repurchase Agreement - continued |
| Maturity Amount (000s) | | Value (000s) |
Other Repurchase Agreement - continued |
With: - continued | | | |
Credit Suisse Securities (U.S.A.) LLC at: - continued | | | |
0.42%, dated 9/25/14 due 10/2/14 (Collateralized by Corporate Obligations valued at $201,972,436, 0.2% - 8.4%, 12/2/30 - 4/25/47) | $ 187,015 | | $ 187,000 |
0.65%, dated: | | | |
8/5/14 due 11/3/14 (Collateralized by Corporate Obligations valued at $68,322,464, 0%, 11/1/47) | 65,106 | | 65,000 |
8/7/14 due 11/5/14 (Collateralized by Corporate Obligations valued at $290,805,749, 0.21% - 6.13%, 2/25/33 - 3/25/47) | 269,437 | | 269,000 |
8/28/14 due: | | | |
10/9/14 (Collateralized by Corporate Obligations valued at $133,564,811, 0% - 5.82%, 5/15/25 - 12/25/48) | 127,096 | | 127,000 |
10/31/14 (Collateralized by Corporate Obligations valued at $166,420,437, 0.29% - 9.68%, 7/2/26 - 10/15/48) | 154,178 | | 154,000 |
11/13/14 (Collateralized by Corporate Obligations valued at $66,189,506, 0% - 5.9%, 2/10/17 - 11/1/47) | 63,088 | | 63,000 |
ING Financial Markets LLC at 0.26%, dated 9/30/14 due 10/1/14 (Collateralized by Corporate Obligations valued at $68,959,281, 1.5% - 9.75%, 12/1/14 - 5/15/67) | 65,000 | | 65,000 |
J.P. Morgan Clearing Corp. at: | | | |
0.59%, dated 6/13/14 due 10/14/14 (Collateralized by Corporate Obligations valued at $47,912,307, 2.25%, 5/1/32) | 44,089 | | 44,000 |
0.63%, dated: | | | |
6/19/14 due 12/29/14 (Collateralized by Corporate Obligations valued at $123,049,665, 1.75% - 5%, 5/15/15 - 5/1/32) | 113,415 | | 113,000 |
8/27/14 due 12/29/14 (Collateralized by Corporate Obligations valued at $137,040,574, 1.5% - 4%, 7/15/18 - 5/1/32) | 126,335 | | 126,000 |
|
| Maturity Amount (000s) | | Value (000s) |
0.64%, dated 4/8/14 due 10/6/14 (Collateralized by Corporate Obligations valued at $148,289,535, 1% - 7.5%, 11/15/14 - 10/15/38) | $ 136,438 | | $ 136,000 |
J.P. Morgan Securities, Inc. at: | | | |
0.2%, dated 9/24/14 due 10/1/14 (Collateralized by U.S. Government Obligations valued at $127,724,650, 0.11% - 13.27%, 9/25/19 - 8/25/44) | 124,005 | | 124,000 |
0.59%, dated 6/4/14 due 12/19/14 (Collateralized by Corporate Obligations valued at $39,979,985, 1.68% - 8.38%, 1/15/16 - 6/15/45) | 38,123 | | 38,000 |
0.61%, dated 6/4/14 due 12/19/14 (Collateralized by Mortgage Loan Obligations valued at $258,636,562, 0% - 50%, 8/25/21 - 2/15/51) | 239,802 | | 239,000 |
0.62%, dated 7/10/14 due 11/7/14 (Collateralized by Mortgage Loan Obligations valued at $182,779,879, 2.47% - 6.25%, 5/25/35 - 2/15/51) | 169,349 | | 169,000 |
0.63%, dated: | | | |
6/18/14 due 12/29/14 (Collateralized by Mortgage Loan Obligations valued at $317,015,943, 0.18% - 7%, 1/25/19 - 2/10/51) | 294,220 | | 293,000 |
7/16/14 due 12/29/14 (Collateralized by Mortgage Loan Obligations valued at $31,363,306, 2.51% - 6.25%, 12/25/35 - 3/12/51) | 29,107 | | 29,000 |
8/15/14 due 12/29/14 (Collateralized by Corporate Obligations valued at $282,310,412, 4.75% - 12.5%, 3/31/16 - 12/29/49) | 261,699 | | 261,000 |
Merrill Lynch, Pierce, Fenner & Smith at: | | | |
0.23%, dated 9/25/14 due 10/2/14 (Collateralized by U.S. Government Obligations valued at $323,558,068, 0.45% - 5.85%, 5/16/33 - 8/20/64) | 316,014 | | 316,000 |
0.5%, dated 9/30/14 due 10/1/14 (Collateralized by Corporate Obligations valued at $487,958,572, 0% - 8.5%, 10/1/14 - 3/15/63) | 469,007 | | 469,000 |
0.78%, dated: | | | |
9/4/14 due 12/3/14 (Collateralized by Equity Securities valued at $161,014,152) | 149,291 | | 149,000 |
Other Repurchase Agreement - continued |
| Maturity Amount (000s) | | Value (000s) |
Other Repurchase Agreement - continued |
With: - continued | | | |
Merrill Lynch, Pierce, Fenner & Smith at: - continued | | | |
0.78%, dated: - continued | | | |
9/10/14 due 12/9/14 (Collateralized by Equity Securities valued at $255,933,337) | $ 237,462 | | $ 237,000 |
9/11/14 due 12/9/14 (Collateralized by Equity Securities valued at $115,610,101) | 107,206 | | 107,000 |
0.85%, dated 8/28/14 due 10/31/14 (Collateralized by Corporate Obligations valued at $400,547,330, 0% - 49.45%, 10/1/14 - 3/30/67) | 371,561 | | 371,000 |
RBC Capital Markets Co. at: | | | |
0.19%, dated 9/30/14 due 10/7/14 (Collateralized by U.S. Government Obligations valued at $78,147,034, 0% - 11.59%, 12/1/17 - 9/25/44) | 76,006 | | 76,000 |
0.29%, dated 9/23/14 due 10/7/14 (Collateralized by U.S. Government Obligations valued at $90,565,187, 0% - 8.59%, 3/25/22 - 9/20/44) | 88,065 | | 88,000 |
0.38%, dated 9/30/14 due 10/7/14 (Collateralized by Corporate Obligations valued at $82,080,867, 3.38% - 12.5%, 11/10/14 - 6/24/44) | 76,011 | | 76,000 |
0.4%, dated 9/23/14 due 10/7/14 (Collateralized by Mortgage Loan Obligations valued at $26,943,675, 0.28% - 6.25%, 11/15/26 - 2/15/51) | 25,004 | | 25,000 |
UBS Securities LLC at 0.43%, dated 7/8/14 due 10/7/14 (Collateralized by Corporate Obligations valued at $141,627,924, 0% - 7.88%, 10/15/14 - 9/1/42) | 131,144 | | 131,000 |
|
| Maturity Amount (000s) | | Value (000s) |
Wells Fargo Securities, LLC at: | | | |
0.35%, dated 9/30/14 due 10/7/14 (Collateralized by Equity Securities valued at $34,560,346) | $ 32,002 | | $ 32,000 |
0.4%, dated 9/26/14 due 10/3/14 (Collateralized by Corporate Obligations valued at $136,840,262, 0% - 11%, 10/16/14 - 10/1/77) | 127,010 | | 127,000 |
0.75%, dated 7/29/14 due 10/29/14 (Collateralized by Corporate Obligations valued at $88,678,080, 0% - 8.25%, 3/15/15 - 12/1/40) | 82,157 | | 82,000 |
TOTAL OTHER REPURCHASE AGREEMENT (Cost $5,806,000) |
5,806,000
|
TOTAL INVESTMENT PORTFOLIO - 98.1% (Cost $63,907,738) | | 63,907,738 |
NET OTHER ASSETS (LIABILITIES) - 1.9% | | 1,260,215 |
NET ASSETS - 100% | $ 65,167,953 |
Security Type Abbreviations |
VRDN | - | VARIABLE RATE DEMAND NOTE (A debt instrument that is payable upon demand, either daily, weekly or monthly) |
Legend |
(a) Yield represents either the annualized yield at the date of purchase, or the stated coupon rate, or, for floating and adjustable rate securities, the rate at period end. |
(b) Security exempt from registration under Rule 144A of the Securities Act of 1933. These securities may be resold in transactions exempt from registration, normally to qualified institutional buyers. At the end of the period, the value of these securities amounted to $618,000,000 or 0.9% of net assets. |
(c) Coupon rates for floating and adjustable rate securities reflect the rates in effect at period end. |
# Additional information on each counterparty to the repurchase agreement is as follows: |
Repurchase Agreement / Counterparty | Value
(Amounts in thousands) |
$3,098,651,000 due 10/01/14 at 0.01% |
BNP Paribas Securities Corp. | $ 392,558 |
Bank of America NA | 488,751 |
Citibank NA | 416,524 |
Credit Agricole CIB New York Branch | 151,565 |
Credit Suisse Securities (USA) LLC | 93,559 |
HSBC Securities (USA), Inc. | 582,684 |
ING Financial Markets LLC | 177,762 |
J.P. Morgan Securities, Inc. | 280,676 |
Merrill Lynch, Pierce, Fenner & Smith, Inc. | 59,878 |
Societe Generale | 112,271 |
Wells Fargo Securities LLC | 342,423 |
| $ 3,098,651 |
$654,974,000 due 10/01/14 at 0.01% |
BNP Paribas Securities Corp. | $ 215,218 |
Barclays Capital, Inc. | 57,360 |
Citibank NA | 179,248 |
J.P. Morgan Securities, Inc. | 119,499 |
Merrill Lynch, Pierce, Fenner & Smith, Inc. | 83,649 |
| $ 654,974 |
Other Information |
The date shown for securities represents the date when principal payments must be paid, taking into account any call options exercised by the issuer and any permissible maturity shortening features other than interest rate resets. |
All investments are categorized as Level 2 under the Fair Value Hierarchy. The inputs or methodology used for valuing securities may not be an indication of the risk associated with investing in those securities. For more information on valuation inputs, please refer to the Security Valuation section in the accompanying Notes to Financial Statements. |
See accompanying notes which are an integral part of the financial statements.
Semiannual Report
Money Market Portfolio
Financial Statements
Statement of Assets and Liabilities
Amounts in thousands (except per-share amounts) September 30, 2014
(Unaudited) |
| | |
Assets | | |
Investment in securities, at value (including repurchase agreements of $19,512,625) - See accompanying schedule: Unaffiliated issuers (cost $63,907,738) | | $ 63,907,738 |
Cash | | 1,467,330 |
Receivable for fund shares sold | | 84,912 |
Interest receivable | | 34,349 |
Receivable from investment adviser for expense reductions | | 1,821 |
Other receivables | | 843 |
Total assets | | 65,496,993 |
| | |
Liabilities | | |
Payable for investments purchased | $ 233,999 | |
Payable for fund shares redeemed | 82,792 | |
Distributions payable | 930 | |
Accrued management fee | 7,655 | |
Distribution and service plan fees payable | 66 | |
Other affiliated payables | 2,417 | |
Other payables and accrued expenses | 1,181 | |
Total liabilities | | 329,040 |
| | |
Net Assets | | $ 65,167,953 |
Net Assets consist of: | | |
Paid in capital | | $ 65,167,350 |
Undistributed net investment income | | 1 |
Accumulated undistributed net realized gain (loss) on investments | | 602 |
Net Assets | | $ 65,167,953 |
| | |
Class I:
Net Asset Value, offering price and redemption price per share ($23,117,556 ÷ 23,115,188 shares) | | $ 1.00 |
| | |
Class II:
Net Asset Value, offering price and redemption price per share ($109,100 ÷ 109,158 shares) | | $ 1.00 |
| | |
Class III:
Net Asset Value, offering price and redemption price per share ($1,421,874 ÷ 1,422,540 shares) | | $ 1.00 |
| | |
Select Class:
Net Asset Value, offering price and redemption price per share ($365,604 ÷ 365,736 shares) | | $ 1.00 |
| | |
Class F:
Net Asset Value, offering price and redemption price per share ($2,052,285 ÷ 2,051,724 shares) | | $ 1.00 |
| | |
Institutional Class:
Net Asset Value, offering price and redemption price per share ($38,101,534 ÷ 38,085,198 shares) | | $ 1.00 |
Statement of Operations
Amounts in thousands Six months ended September 30, 2014
(Unaudited) |
| | |
Investment Income | | |
Interest | | $ 74,535 |
| | |
Expenses | | |
Management fee | $ 46,301 | |
Transfer agent fees | 13,380 | |
Distribution and service plan fees | 2,186 | |
Accounting fees and expenses | 1,107 | |
Custodian fees and expenses | 250 | |
Independent trustees' compensation | 147 | |
Registration fees | 145 | |
Audit | 30 | |
Legal | 66 | |
Miscellaneous | 250 | |
Total expenses before reductions | 63,862 | |
Expense reductions | (12,094) | 51,768 |
Net investment income (loss) | | 22,767 |
Realized and Unrealized Gain (Loss) Net realized gain (loss) on: | | |
Investment securities: | | |
Unaffiliated issuers | | 220 |
Net increase in net assets resulting from operations | | $ 22,987 |
See accompanying notes which are an integral part of the financial statements.
Semiannual Report
Money Market Portfolio
Financial Statements - continued
Statement of Changes in Net Assets
Amounts in thousands | Six months ended
September 30, 2014
(Unaudited) | Year ended
March 31,
2014 |
Increase (Decrease) in Net Assets | | |
Operations | | |
Net investment income (loss) | $ 22,767 | $ 55,504 |
Net realized gain (loss) | 220 | 1,000 |
Net increase in net assets resulting from operations | 22,987 | 56,504 |
Distributions to shareholders from net investment income | (22,766) | (55,503) |
Share transactions - net increase (decrease) | (2,137,025) | 179,766 |
Total increase (decrease) in net assets | (2,136,804) | 180,767 |
| | |
Net Assets | | |
Beginning of period | 67,304,757 | 67,123,990 |
End of period (including undistributed net investment income of $1 and $0, respectively) | $ 65,167,953 | $ 67,304,757 |
Financial Highlights - Class I
| Six months ended
September 30, 2014 | Years ended March 31, |
| (Unaudited) | 2014 | 2013 | 2012 | 2011 | 2010 |
Selected Per-Share Data | | | | | | |
Net asset value, beginning of period | $ 1.00 | $ 1.00 | $ 1.00 | $ 1.00 | $ 1.00 | $ 1.00 |
Income from Investment Operations | | | | | | |
Net investment income (loss) | - E | .001 | .002 | .002 | .002 | .005 |
Distributions from net investment income | - E | (.001) | (.002) | (.002) | (.002) | (.005) |
Net asset value, end of period | $ 1.00 | $ 1.00 | $ 1.00 | $ 1.00 | $ 1.00 | $ 1.00 |
Total Return B, C | .02% | .06% | .16% | .17% | .23% | .47% |
Ratios to Average Net Assets D | | | | | | |
Expenses before reductions | .21% A | .21% | .21% | .21% | .21% | .22% |
Expenses net of fee waivers, if any | .18% A | .18% | .18% | .18% | .18% | .19% |
Expenses net of all reductions | .18% A | .18% | .18% | .18% | .18% | .19% |
Net investment income (loss) | .04% A | .06% | .16% | .16% | .23% | .45% |
Supplemental Data | | | | | | |
Net assets, end of period (in millions) | $ 23,118 | $ 22,712 | $ 24,416 | $ 24,209 | $ 31,063 | $ 34,386 |
A Annualized
B Total returns for periods of less than one year are not annualized.
C Total returns would have been lower if certain expenses had not been reduced during the applicable periods shown.
D Expense ratios reflect operating expenses of the class. Expenses before reductions do not reflect amounts reimbursed or waived or reductions from expense offset arrangements and do not represent the amount paid by the class during periods when reimbursements, waivers or reductions occur. Expenses net of fee waivers reflect expenses after reimbursement and waivers but prior to reductions from expense offset arrangements. Expenses net of all reductions represent the net expenses paid by the class.
E Amount represents less than $.001 per share.
See accompanying notes which are an integral part of the financial statements.
Semiannual Report
Financial Highlights - Class II
| Six months ended
September 30, 2014 | Years ended March 31, |
| (Unaudited) | 2014 | 2013 | 2012 | 2011 | 2010 |
Selected Per-Share Data | | | | | | |
Net asset value, beginning of period | $ 1.00 | $ 1.00 | $ 1.00 | $ 1.00 | $ 1.00 | $ 1.00 |
Income from Investment Operations | | | | | | |
Net investment income (loss) | - E | - E | - E | - E | .001 | .003 |
Distributions from net investment income | - E | - E | - E | - E | (.001) | (.003) |
Net asset value, end of period | $ 1.00 | $ 1.00 | $ 1.00 | $ 1.00 | $ 1.00 | $ 1.00 |
Total ReturnB, C | .01% | .01% | .02% | .03% | .08% | .31% |
Ratios to Average Net Assets D | | | | | | |
Expenses before reductions | .35% A | .36% | .36% | .36% | .36% | .37% |
Expenses net of fee waivers, if any | .21% A | .23% | .32% | .32% | .33% | .34% |
Expenses net of all reductions | .21% A | .23% | .32% | .32% | .33% | .34% |
Net investment income (loss) | .01% A | .01% | .02% | .03% | .08% | .30% |
Supplemental Data | | | | | | |
Net assets, end of period (in millions) | $ 109 | $ 150 | $ 165 | $ 207 | $ 420 | $ 835 |
A Annualized
B Total returns for periods of less than one year are not annualized.
C Total returns would have been lower if certain expenses had not been reduced during the applicable periods shown.
D Expense ratios reflect operating expenses of the class. Expenses before reductions do not reflect amounts reimbursed or waived or reductions from expense offset arrangements and do not represent the amount paid by the class during periods when reimbursements, waivers or reductions occur. Expenses net of fee waivers reflect expenses after reimbursement and waivers but prior to reductions from expense offset arrangements. Expenses net of all reductions represent the net expenses paid by the class.
E Amount represents less than $.001 per share.
Financial Highlights - Class III
| Six months ended
September 30, 2014 | Years ended March 31, |
| (Unaudited) | 2014 | 2013 | 2012 | 2011 | 2010 |
Selected Per-Share Data | | | | | | |
Net asset value, beginning of period | $ 1.00 | $ 1.00 | $ 1.00 | $ 1.00 | $ 1.00 | $ 1.00 |
Income from Investment Operations | | | | | | |
Net investment income (loss) | - E | - E | - E | - E | - E | .002 |
Distributions from net investment income | - E | - E | - E | - E | - E | (.002) |
Net asset value, end of period | $ 1.00 | $ 1.00 | $ 1.00 | $ 1.00 | $ 1.00 | $ 1.00 |
Total ReturnB, C | .01% | .01% | .01% | .01% | .01% | .22% |
Ratios to Average Net Assets D | | | | | | |
Expenses before reductions | .45% A | .46% | .46% | .46% | .46% | .47% |
Expenses net of fee waivers, if any | .21% A | .23% | .33% | .33% | .40% | .44% |
Expenses net of all reductions | .21% A | .23% | .33% | .33% | .40% | .44% |
Net investment income (loss) | .01% A | .01% | .01% | .01% | .01% | .21% |
Supplemental Data | | | | | | |
Net assets, end of period (in millions) | $ 1,422 | $ 1,834 | $ 2,086 | $ 2,398 | $ 3,524 | $ 3,766 |
A Annualized
B Total returns for periods of less than one year are not annualized.
C Total returns would have been lower if certain expenses had not been reduced during the applicable periods shown.
D Expense ratios reflect operating expenses of the class. Expenses before reductions do not reflect amounts reimbursed or waived or reductions from expense offset arrangements and do not represent the amount paid by the class during periods when reimbursements, waivers or reductions occur. Expenses net of fee waivers reflect expenses after reimbursement and waivers but prior to reductions from expense offset arrangements. Expenses net of all reductions represent the net expenses paid by the class.
E Amount represents less than $.001 per share.
See accompanying notes which are an integral part of the financial statements.
Semiannual Report
Financial Highlights - Select Class
| Six months ended
September 30, 2014 | Years ended March 31, |
| (Unaudited) | 2014 | 2013 | 2012 | 2011 | 2010 |
Selected Per-Share Data | | | | | | |
Net asset value, beginning of period | $ 1.00 | $ 1.00 | $ 1.00 | $ 1.00 | $ 1.00 | $ 1.00 |
Income from Investment Operations | | | | | | |
Net investment income (loss) | - E | - E | .001 | .001 | .002 | .004 |
Distributions from net investment income | - E | - E | (.001) | (.001) | (.002) | (.004) |
Net asset value, end of period | $ 1.00 | $ 1.00 | $ 1.00 | $ 1.00 | $ 1.00 | $ 1.00 |
Total Return B, C | .01% | .02% | .11% | .11% | .18% | .42% |
Ratios to Average Net Assets D | | | | | | |
Expenses before reductions | .26% A | .26% | .26% | .26% | .26% | .27% |
Expenses net of fee waivers, if any | .21% A | .22% | .23% | .23% | .23% | .24% |
Expenses net of all reductions | .21% A | .22% | .23% | .23% | .23% | .24% |
Net investment income (loss) | .01% A | .02% | .11% | .11% | .18% | .40% |
Supplemental Data | | | | | | |
Net assets, end of period (in millions) | $ 366 | $ 331 | $ 389 | $ 577 | $ 2,161 | $ 622 |
A Annualized
B Total returns for periods of less than one year are not annualized.
C Total returns would have been lower if certain expenses had not been reduced during the applicable periods shown.
D Expense ratios reflect operating expenses of the class. Expenses before reductions do not reflect amounts reimbursed or waived or reductions from expense offset arrangements and do not represent the amount paid by the class during periods when reimbursements, waivers or reductions occur. Expenses net of fee waivers reflect expenses after reimbursement and waivers but prior to reductions from expense offset arrangements. Expenses net of all reductions represent the net expenses paid by the class.
E Amount represents less than $.001 per share.
Financial Highlights - Class F
| Six months ended
September 30, 2014 | Years ended March 31, |
| (Unaudited) | 2014 | 2013 | 2012 | 2011 | 2010 D |
Selected Per-Share Data | | | | | | |
Net asset value, beginning of period | $ 1.00 | $ 1.00 | $ 1.00 | $ 1.00 | $ 1.00 | $ 1.00 |
Income from Investment Operations | | | | | | |
Net investment income (loss) | - F | .001 | .002 | .002 | .003 | .003 |
Distributions from net investment income | - F | (.001) | (.002) | (.002) | (.003) | (.003) |
Net asset value, end of period | $ 1.00 | $ 1.00 | $ 1.00 | $ 1.00 | $ 1.00 | $ 1.00 |
Total Return B, C | .04% | .10% | .20% | .21% | .27% | .29% |
Ratios to Average Net Assets E | | | | | | |
Expenses before reductions | .15% A | .15% | .15% | .15% | .15% | .16% A |
Expenses net of fee waivers, if any | .14% A | .14% | .14% | .14% | .14% | .15% A |
Expenses net of all reductions | .14% A | .14% | .14% | .14% | .14% | .15% A |
Net investment income (loss) | .08% A | .10% | .20% | .20% | .27% | .26% A |
Supplemental Data | | | | | | |
Net assets, end of period (in millions) | $ 2,052 | $ 2,135 | $ 2,244 | $ 1,547 | $ 822 | $ 149 |
A Annualized
B Total returns for periods of less than one year are not annualized.
C Total returns would have been lower if certain expenses had not been reduced during the applicable periods shown.
D For the period June 26, 2009 (commencement of sale of shares) to March 31, 2010.
E Expense ratios reflect operating expenses of the class. Expenses before reductions do not reflect amounts reimbursed or waived or reductions from expense offset arrangements and do not represent the amount paid by the class during periods when reimbursements, waivers or reductions occur. Expenses net of fee waivers reflect expenses after reimbursement and waivers but prior to reductions from expense offset arrangements. Expenses net of all reductions represent the net expenses paid by the class.
F Amount represents less than $.001 per share.
See accompanying notes which are an integral part of the financial statements.
Semiannual Report
Financial Highlights - Institutional Class
| Six months ended
September 30, 2014 | Years ended March 31, |
| (Unaudited) | 2014 | 2013 | 2012 | 2011 | 2010 |
Selected Per-Share Data | | | | | | |
Net asset value, beginning of period | $ 1.00 | $ 1.00 | $ 1.00 | $ 1.00 | $ 1.00 | $ 1.00 |
Income from Investment Operations | | | | | | |
Net investment income (loss) | - E | .001 | .002 | .002 | .003 | .005 |
Distributions from net investment income | - E | (.001) | (.002) | (.002) | (.003) | (.005) |
Net asset value, end of period | $ 1.00 | $ 1.00 | $ 1.00 | $ 1.00 | $ 1.00 | $ 1.00 |
Total Return B, C | .04% | .10% | .20% | .21% | .27% | .51% |
Ratios to Average Net Assets D | | | | | | |
Expenses before reductions | .18% A | .18% | .18% | .18% | .18% | .19% |
Expenses net of fee waivers, if any | .14% A | .14% | .14% | .14% | .14% | .15% |
Expenses net of all reductions | .14% A | .14% | .14% | .14% | .14% | .15% |
Net investment income (loss) | .08% A | .10% | .20% | .20% | .27% | .49% |
Supplemental Data | | | | | | |
Net assets, end of period (in millions) | $ 38,102 | $ 40,143 | $ 37,824 | $ 32,286 | $ 28,790 | $ 24,674 |
A Annualized
B Total returns for periods of less than one year are not annualized.
C Total returns would have been lower if certain expenses had not been reduced during the applicable periods shown.
D Expense ratios reflect operating expenses of the class. Expenses before reductions do not reflect amounts reimbursed or waived or reductions from expense offset arrangements and do not represent the amount paid by the class during periods when reimbursements, waivers or reductions occur. Expenses net of fee waivers reflect expenses after reimbursement and waivers but prior to reductions from expense offset arrangements. Expenses net of all reductions represent the net expenses paid by the class.
E Amount represents less than $.001 per share.
See accompanying notes which are an integral part of the financial statements.
Semiannual Report
Tax-Exempt Portfolio
Investment Changes/Performance (Unaudited)
Effective Maturity Diversification |
Days | % of fund's investments 9/30/14 | % of fund's investments 3/31/14 | % of fund's investments 9/30/13 |
1 - 7 | 74.9 | 67.5 | 66.6 |
8 - 30 | 1.5 | 3.6 | 4.0 |
31 - 60 | 3.5 | 8.8 | 3.5 |
61 - 90 | 5.1 | 7.0 | 5.5 |
91 - 180 | 1.4 | 10.2 | 6.5 |
> 180 | 13.6 | 2.9 | 13.9 |
Effective maturity is determined in accordance with the requirements of Rule 2a-7 under the Investment Company Act of 1940. |
Weighted Average Maturity |
| 9/30/14 | 3/31/14 | 9/30/13 |
Tax-Exempt Portfolio | 47 Days | 32 Days | 57 Days |
All Tax-Free Money Market Funds Average* | 42 Days | 31 Days | 42 Days |
This is a weighted average of all the maturities of the securities held in a fund. Weighted Average Maturity (WAM) can be used as a measure of sensitivity to interest rate changes and market changes. Generally, the longer the maturity, the greater the sensitivity to such changes. WAM is based on the dollar-weighted average length of time until principal payments must be paid. Depending on the types of securities held in a fund, certain maturity shortening devices (e.g., demand features, interest rate resets, and call options) may be taken into account when calculating the WAM. |
Weighted Average Life |
| 9/30/14 | 3/31/14 | 9/30/13 |
Tax-Exempt Portfolio | 47 Days | 32 Days | 58 Days |
Weighted Average Life (WAL) is the weighted average of the life of the securities held in a fund or portfolio and can be used as a measure of sensitivity to changes in liquidity and/or credit risk. Generally, the higher the value, the greater the sensitivity. WAL is based on the dollar-weighted average length of time until principal payments must be paid, taking into account any call options exercised by the issuer and any permissible maturity shortening features other than interest rate resets. The difference between WAM and WAL is that WAM takes into account interest rate resets and WAL does not. WAL for money market funds is not the same as WAL of a mortgage- or asset-backed security. |
Asset Allocation (% of fund's net assets) |
As of September 30, 2014 | As of March 31, 2014 |
| Variable Rate
Demand Notes
(VRDNs) 63.4% | | | Variable Rate
Demand Notes
(VRDNs) 60.4% | |
| Other Municipal
Debt 27.7% | | | Other Municipal
Debt 36.4% | |
| Investment
Companies 5.3% | | | Investment
Companies 2.9% | |
| Net Other Assets
(Liabilities) 3.6% | | | Net Other Assets
(Liabilities) 0.3% | |

Current and Historical Seven-Day Yields |
| 9/30/14 | 6/30/14 | 3/31/14 | 12/31/13 | 9/30/13 |
| | | | | |
Class I | 0.01% | 0.01% | 0.01% | 0.01% | 0.01% |
| | | | | |
Class II | 0.01% | 0.01% | 0.01% | 0.01% | 0.01% |
| | | | | |
Class III | 0.01% | 0.01% | 0.01% | 0.01% | 0.01% |
| | | | | |
Select Class | 0.01% | 0.01% | 0.01% | 0.01% | 0.01% |
Yield refers to the income paid by the fund over a given period. Yields for money market funds are usually for seven-day periods, as they are here, though they are expressed as annual percentage rates. Past performance is no guarantee of future results. Yield will vary and it's possible to lose money investing in the Fund. A portion of the Fund's expenses was reimbursed and/or waived. Absent such reimbursements and/or waivers the yield for the period ending September 30, 2014, the most recent period shown in the table, would have been -0.15% for Class I, -0.31% for Class II, -0.42% for Class III and -0.21% for Select Class.
* Source: iMoneyNet, Inc.
Semiannual Report
Tax-Exempt Portfolio
Investments September 30, 2014 (Unaudited)
Showing Percentage of Net Assets
Variable Rate Demand Note - 63.4% |
| Principal Amount (000s) | | Value (000s) |
Alabama - 1.6% |
Columbia Indl. Dev. Board Poll. Cont. Rev. (Alabama Pwr. Co. Proj.): | | | |
Series 1995 A, 0.03% 10/1/14, VRDN (b) | $ 3,800 | | $ 3,800 |
Series 1995 B, 0.01% 10/1/14, VRDN (b) | 2,500 | | 2,500 |
Series 1995 C, 0.07% 10/1/14, VRDN (b) | 4,700 | | 4,700 |
Series 1995 D, 0.05% 10/1/14, VRDN (b) | 2,180 | | 2,180 |
Series 1995 E, 0.05% 10/1/14, VRDN (b) | 2,000 | | 2,000 |
Eutaw Indl. Dev. Board Poll. Cont. Rev. (Alabama Pwr. Co. Proj.) 0.01% 10/1/14, VRDN (b) | 1,800 | | 1,800 |
Mobile Indl. Dev. Board Exempt Facilities Rev. Series 1997, 0.05% 10/7/14 (Kimberly-Clark Corp. Guaranteed), VRDN (b) | 14,750 | | 14,750 |
Mobile Indl. Dev. Board Solid Waste Disp. Rev. (Alabama Pwr. Co. Barry Plant Proj.) Second Series 2009, 0.04% 10/2/14, VRDN (b) | 1,400 | | 1,400 |
Wilsonville Indl. Dev. Board Poll. Cont. Rev. (Alabama Pwr. Co. Proj.) Series D, 0.03% 10/1/14, VRDN (b) | 5,300 | | 5,300 |
| | 38,430 |
Alaska - 0.3% |
Alaska Indl. Dev. & Export Auth. Rev.: | | | |
(Greater Fairbanks Cmnty. Hosp. Foundation Proj.) Series 2009 A, 0.04% 10/7/14, LOC Mufg Union Bank NA, VRDN (b) | 1,500 | | 1,500 |
(Greater Fairbanks Hosp. Proj.) Series 2009 B, 0.04% 10/7/14, LOC U.S. Bank NA, Cincinnati, VRDN (b) | 6,000 | | 6,000 |
| | 7,500 |
Arizona - 1.0% |
Arizona Board of Regents Arizona State Univ. Rev. Series 2008 A, 0.04% 10/7/14, LOC JPMorgan Chase Bank, VRDN (b) | 1,800 | | 1,800 |
Arizona Health Facilities Auth. Rev.: | | | |
(Banner Health Sys. Proj.) Series 2008 E, 0.04% 10/7/14, LOC Bank of America NA, VRDN (b) | 2,400 | | 2,400 |
(Catholic Healthcare West Proj.): | | | |
Series 2005 B, 0.06% 10/7/14, LOC JPMorgan Chase Bank, VRDN (b) | 1,500 | | 1,500 |
Series 2008 B, 0.05% 10/7/14, LOC PNC Bank NA, VRDN (b) | 2,200 | | 2,200 |
|
| Principal Amount (000s) | | Value (000s) |
Maricopa County Indl. Dev. Auth. Rev. (Valley of the Sun YMCA Proj.) Series 2008, 0.07% 10/7/14, LOC U.S. Bank NA, Cincinnati, VRDN (b) | $ 1,300 | | $ 1,300 |
Phoenix Civic Impt. Corp. Wtr. Sys. Rev. Participating VRDN Series Putters 3458, 0.05% 10/7/14 (Liquidity Facility JPMorgan Chase Bank) (b)(e) | 3,000 | | 3,000 |
Salt River Proj. Agricultural Impt. & Pwr. District Elec. Sys. Rev. Participating VRDN: | | | |
Series EGL 06 14 Class A, 0.04% 10/7/14 (Liquidity Facility Citibank NA) (b)(e) | 1,100 | | 1,100 |
Series Putters 3307, 0.05% 10/7/14 (Liquidity Facility JPMorgan Chase Bank) (b)(e) | 3,600 | | 3,600 |
Series ROC II R 11980 X, 0.04% 10/7/14 (Liquidity Facility Citibank NA) (b)(e) | 3,030 | | 3,030 |
Tucson Indl. Dev. Auth. Multi-family Hsg. Rev. (Family Hsg. Resources Proj.) Series 2002 A, 0.05% 10/7/14, LOC Fannie Mae, VRDN (b) | 2,150 | | 2,150 |
Yavapai County Indl. Dev. Auth. (Northern Arizona Healthcare Sys. Proj.) Series 2008 B, 0.04% 10/7/14, LOC Wells Fargo Bank NA, VRDN (b) | 1,300 | | 1,300 |
| | 23,380 |
Arkansas - 0.3% |
Fort Smith Gen. Oblig. (Mitsubishi Pwr. Systems Americas Proj.) Series 2010, 0.07% 10/7/14, LOC Bank of Tokyo-Mitsubishi UFJ Ltd., VRDN (b) | 6,000 | | 6,000 |
California - 2.4% |
California Gen. Oblig.: | | | |
Series 2003 C3, 0.04% 10/7/14, LOC U.S. Bank NA, Cincinnati, VRDN (b) | 1,600 | | 1,600 |
Series 2004 A10, 0.04% 10/7/14, LOC Citibank NA, VRDN (b) | 21,900 | | 21,900 |
California Health Facilities Fing. Auth. Rev. (Catholic Healthcare West Proj.) Series 2005 H, 0.04% 10/7/14, LOC Sumitomo Mitsui Banking Corp., VRDN (b) | 17,500 | | 17,500 |
Los Angeles Cmnty. College District Participating VRDN: | | | |
Series MS 3096, 0.07% 10/7/14 (Liquidity Facility Deutsche Bank AG New York Branch) (b)(e) | 8,500 | | 8,500 |
Series RBC O 4, 0.04% 10/7/14 (Liquidity Facility Royal Bank of Canada) (b)(e) | 2,000 | | 2,000 |
Variable Rate Demand Note - continued |
| Principal Amount (000s) | | Value (000s) |
California - continued |
Los Angeles Hbr. Dept. Rev. Participating VRDN Series WF 10 40C, 0.05% 10/7/14 (Liquidity Facility Wells Fargo Bank NA) (b)(e) | $ 1,400 | | $ 1,400 |
Rancho Wtr. District Fing. Auth. Rev. Participating VRDN Series BA 08 3024X, 0.09% 10/7/14 (Liquidity Facility Bank of America NA) (b)(e) | 4,980 | | 4,980 |
| | 57,880 |
Colorado - 2.0% |
Colorado Reg'l. Trans. District Sales Tax Rev. Participating VRDN: | | | |
Series EGL 14 0020, 0.04% 10/7/14 (Liquidity Facility Citibank NA) (b)(e) | 11,700 | | 11,700 |
Series EGL 14 0021, 0.04% 10/7/14 (Liquidity Facility Citibank NA) (b)(e) | 16,000 | | 16,000 |
Colorado Univ. Co. Hosp. Auth. Rev. Series 2011 A, 0.05% 10/7/14, LOC Wells Fargo Bank NA, VRDN (b) | 1,400 | | 1,400 |
Denver City & County Wtr. Participating VRDN Series PZ 232, 0.06% 10/7/14 (Liquidity Facility Wells Fargo & Co.) (b)(e) | 16,230 | | 16,230 |
Univ. of Colorado Enterprise Sys. Rev. Participating VRDN Series RBC O 70, 0.04% 10/7/14 (Liquidity Facility Royal Bank of Canada) (b)(e) | 1,800 | | 1,800 |
| | 47,130 |
Connecticut - 0.2% |
Connecticut Health & Edl. Facilities Auth. Rev.: | | | |
Participating VRDN Series Putters 3363, 0.05% 10/7/14 (Liquidity Facility JPMorgan Chase Bank) (b)(e) | 2,315 | | 2,315 |
Series 2014 D, 0.05% 10/7/14, LOC Bank of America NA, VRDN (b) | 2,000 | | 2,000 |
| | 4,315 |
District Of Columbia - 0.9% |
District of Columbia Hsg. Fin. Agcy. Multi-family Hsg. Rev. (Pentacle Apts. Proj.) Series 2008, 0.055% 10/7/14, LOC Freddie Mac, VRDN (b) | 3,515 | | 3,515 |
District of Columbia Income Tax Rev. Participating VRDN Series Putters 3354, 0.05% 10/7/14 (Liquidity Facility JPMorgan Chase Bank) (b)(e) | 7,155 | | 7,155 |
District of Columbia Rev.: | | | |
(American Psychological Assoc. Proj.) Series 2003, 0.09% 10/7/14, LOC Bank of America NA, VRDN (b) | 1,470 | | 1,470 |
(Medlantic/Helix Proj.) Series 1998 A Tranche III, 0.05% 10/7/14, LOC PNC Bank NA, VRDN (b) | 1,870 | | 1,870 |
|
| Principal Amount (000s) | | Value (000s) |
(Washington Drama Society, Inc. Proj.) Series 2008, 0.05% 10/7/14, LOC JPMorgan Chase Bank, VRDN (b) | $ 2,200 | | $ 2,200 |
District of Columbia Univ. Rev. (American Univ. Proj.) Series 2003, 0.04% 10/7/14, LOC Wells Fargo Bank NA, VRDN (b) | 5,600 | | 5,600 |
| | 21,810 |
Florida - 3.1% |
Florida Dept. of Trans. Tpk. Rev. Participating VRDN Series Solar 07 30, 0.04% 10/7/14 (Liquidity Facility U.S. Bank NA, Cincinnati) (b)(e) | 2,500 | | 2,500 |
Florida Gen. Oblig. Participating VRDN Series PZ 130, 0.06% 10/7/14 (Liquidity Facility Wells Fargo & Co.) (b)(e) | 7,255 | | 7,255 |
Highlands County Health Facilities Auth. Rev. Participating VRDN Series MS 3251, 0.05% 10/7/14 (Liquidity Facility Morgan Stanley Bank, West Valley City Utah) (b)(e) | 5,625 | | 5,625 |
Jacksonville Hsg. Fin. Auth. Multi-family Hsg. Rev. (Augustine Apts. Proj.) 0.05% 10/7/14, LOC Fannie Mae, VRDN (b) | 1,700 | | 1,700 |
Miami-Dade County Series 2014 A, 0.04% 10/7/14, LOC Bank of Tokyo-Mitsubishi UFJ Ltd., VRDN (b) | 3,600 | | 3,600 |
North Broward Hosp. District Rev. Series 2005 A: | | | |
0.04% 10/7/14, LOC Wells Fargo Bank NA, VRDN (b) | 26,400 | | 26,400 |
0.04% 10/7/14, LOC Wells Fargo Bank NA, VRDN (b) | 4,000 | | 4,000 |
Orange County Indl. Dev. Auth. Indl. Dev. Rev. (Central Florida YMCA Proj.) Series 2002 A, 0.06% 10/7/14, LOC Bank of America NA, VRDN (b) | 2,400 | | 2,400 |
Palm Beach County Pub. Impt. Rev. Participating VRDN Series BBT 08 53, 0.04% 10/7/14 (Liquidity Facility Branch Banking & Trust Co.) (b)(e) | 8,600 | | 8,600 |
Palm Beach County Rev.: | | | |
(Hospice of Palm Beach Proj.) Series 2001, 0.05% 10/7/14, LOC Northern Trust Co., VRDN (b) | 1,000 | | 1,000 |
(The Norton Gallery and School of Arts, Inc. Proj.) Series 2000, 0.05% 10/7/14, LOC Bank of America NA, VRDN (b) | 3,300 | | 3,300 |
Pinellas County Health Facilities Auth. Rev. (BayCare Health Sys. Proj.) Series 2009 A3, 0.05% 10/7/14, LOC Wells Fargo Bank NA, VRDN (b) | 6,000 | | 6,000 |
| | 72,380 |
Variable Rate Demand Note - continued |
| Principal Amount (000s) | | Value (000s) |
Georgia - 1.0% |
Athens-Clarke County Unified Govt. Dev. Auth. Rev. (Univ. of Georgia Athletic Assoc. Proj.): | | | |
Series 2003, 0.02% 10/1/14, LOC Wells Fargo Bank NA, VRDN (b) | $ 1,765 | | $ 1,765 |
Series 2005 B, 0.02% 10/1/14, LOC Wells Fargo Bank NA, VRDN (b) | 1,345 | | 1,345 |
Fulton County Dev. Auth. (Mount Vernon Presbyterian School Proj.) Series 2005, 0.05% 10/7/14, LOC Branch Banking & Trust Co., VRDN (b) | 2,500 | | 2,500 |
Georgia Gen. Oblig. Participating VRDN Series 85TP, 0.04% 10/7/14 (Liquidity Facility Wells Fargo & Co.) (b)(e) | 6,620 | | 6,620 |
Glynn-Brunswick Memorial Hosp. Auth. Rev. (Southeast Georgia Health Sys. Proj.) Series 2008 B, 0.05% 10/7/14, LOC Branch Banking & Trust Co., VRDN (b) | 12,370 | | 12,370 |
| | 24,600 |
Illinois - 5.2% |
Chicago Gen. Oblig.: | | | |
Series 2003 B1, 0.05% 10/7/14, LOC JPMorgan Chase Bank, VRDN (b) | 3,800 | | 3,800 |
Series 2005 D2, 0.03% 10/1/14, LOC Northern Trust Co., VRDN (b) | 2,200 | | 2,200 |
Series 2007 E, 0.03% 10/1/14, LOC Barclays Bank PLC, VRDN (b) | 17,000 | | 17,000 |
Series 2007 F, 0.03% 10/1/14, LOC JPMorgan Chase Bank, VRDN (b) | 10,400 | | 10,400 |
Chicago Wtr. Rev.: | | | |
Series 2004 A1, 0.1% 10/7/14, LOC California Pub. Employees Retirement Sys., VRDN (b) | 21,075 | | 21,075 |
Series 2004 A2, 0.1% 10/7/14, LOC California Pub. Employees Retirement Sys., VRDN (b) | 20,265 | | 20,265 |
Illinois Fin. Auth. Rev.: | | | |
(Little Co. of Mary Hosp. Proj.) Series 2008 B, 0.04% 10/7/14, LOC JPMorgan Chase Bank, VRDN (b) | 3,620 | | 3,620 |
(Northwest Cmnty. Hosp. Proj.): | | | |
Series 2008 B, 0.05% 10/7/14, LOC JPMorgan Chase Bank, VRDN (b) | 1,065 | | 1,065 |
Series 2008 C, 0.05% 10/7/14, LOC JPMorgan Chase Bank, VRDN (b) | 5,865 | | 5,865 |
(OSF Healthcare Sys. Proj.) Series 2009 C, 0.05% 10/7/14, LOC Wells Fargo Bank NA, VRDN (b) | 3,700 | | 3,700 |
(Spertus Institute of Jewish Studies Proj.) 0.05% 10/7/14, LOC Northern Trust Co., VRDN (b) | 8,900 | | 8,900 |
|
| Principal Amount (000s) | | Value (000s) |
Participating VRDN: | | | |
Series BC 11 16B, 0.06% 10/7/14 (Liquidity Facility Barclays Bank PLC) (a)(b)(e) | $ 3,950 | | $ 3,950 |
Series Putters 3378, 0.05% 10/7/14 (Liquidity Facility JPMorgan Chase Bank) (b)(e) | 3,795 | | 3,795 |
Series Putters 3379, 0.05% 10/7/14 (Liquidity Facility JPMorgan Chase Bank) (b)(e) | 4,995 | | 4,995 |
Series 2011 B, 0.01% 10/1/14, LOC Wells Fargo Bank NA, VRDN (b) | 1,850 | | 1,850 |
Series 2012 G, 0.04% 10/7/14, LOC Bank of Montreal Chicago CD Prog., VRDN (b) | 1,500 | | 1,500 |
Illinois Gen. Oblig. Series 2003 B3, 0.03% 10/7/14, LOC Wells Fargo Bank NA, VRDN (b) | 2,800 | | 2,800 |
Illinois Health Facilities Auth. Rev. (Herman M. Finch Univ. of Health Sciences/The Chicago Med. School Proj.) Series 2003, 0.05% 10/7/14, LOC JPMorgan Chase Bank, VRDN (b) | 1,400 | | 1,400 |
Illinois Sales Tax Rev. Participating VRDN Series MS 3283 X, 0.04% 10/7/14 (Liquidity Facility Cr. Suisse AG) (b)(e) | 4,500 | | 4,500 |
| | 122,680 |
Indiana - 2.1% |
Indiana Fin. Auth. Health Sys. Rev. (Sisters of Saint Francis Health Svcs., Inc. Obligated Group Proj.): | | | |
Series 2008 F, 0.04% 10/7/14, LOC Bank of New York, New York, VRDN (b) | 1,600 | | 1,600 |
Series 2008 J, 0.04% 10/7/14, LOC Wells Fargo Bank NA, VRDN (b) | 4,700 | | 4,700 |
Indiana Fin. Auth. Hosp. Rev.: | | | |
(Cmnty. Health Network Proj.) Series 2009 A, 0.04% 10/7/14, LOC Wells Fargo Bank NA, VRDN (b) | 13,215 | | 13,215 |
(Indiana Univ. Health Obligated Group Proj.): | | | |
Series 2011 D, 0.04% 10/7/14, LOC Northern Trust Co., VRDN (b) | 3,400 | | 3,400 |
Series 2011 E, 0.04% 10/7/14, LOC Bank of America NA, VRDN (b) | 13,700 | | 13,700 |
(Parkview Health Sys. Oblig. Group Proj.) Series 2009 B, 0.04% 10/7/14, LOC Wells Fargo Bank NA, VRDN (b) | 12,045 | | 12,045 |
| | 48,660 |
Variable Rate Demand Note - continued |
| Principal Amount (000s) | | Value (000s) |
Kansas - 0.3% |
Kansas Dept. of Trans. Hwy. Rev. Participating VRDN Series BBT 08 51, 0.04% 10/7/14 (Liquidity Facility Branch Banking & Trust Co.) (b)(e) | $ 6,300 | | $ 6,300 |
Kansas Dev. Fin. Auth. Health Facilities Rev. (KU Health Sys. Proj.) Series 2011 J, 0.04% 10/1/14, LOC U.S. Bank NA, Cincinnati, VRDN (b) | 1,600 | | 1,600 |
| | 7,900 |
Kentucky - 0.8% |
Louisville & Jefferson County: | | | |
Series 2011 B, 0.03% 10/1/14, LOC JPMorgan Chase Bank, VRDN (b) | 1,900 | | 1,900 |
Series 2013 C, 0.04% 10/7/14, LOC PNC Bank NA, VRDN (b) | 16,000 | | 16,000 |
| | 17,900 |
Louisiana - 0.9% |
Louisiana Offshore Term. Auth. Deepwater Port Rev. (LOOP LLC Proj.) Series 2003 A, 0.04% 10/1/14, LOC JPMorgan Chase Bank, VRDN (b) | 3,500 | | 3,500 |
Louisiana Pub. Facilities Auth. Rev.: | | | |
(Air Products & Chemicals, Inc. Proj.): | | | |
Series 2005, 0.01% 10/1/14, VRDN (b) | 2,600 | | 2,600 |
Series 2008 B, 0.01% 10/1/14, VRDN (b) | 5,600 | | 5,600 |
(C-Port LLC Proj.) Series 2008, 0.07% 10/7/14, LOC Bank of America NA, VRDN (b) | 2,350 | | 2,350 |
Saint James Parish Gen. Oblig. (NuStar Logistics, L.P. Proj.): | | | |
Series 2010 A, 0.05% 10/7/14, LOC Bank of Tokyo-Mitsubishi UFJ Ltd., VRDN (b) | 2,600 | | 2,600 |
Series 2010 B, 0.05% 10/7/14, LOC Bank of Tokyo-Mitsubishi UFJ Ltd., VRDN (b) | 3,900 | | 3,900 |
| | 20,550 |
Maryland - 0.8% |
Maryland Health & Higher Edl. Facilities Auth. Rev.: | | | |
(Adventist Healthcare Proj.) Series 2005 A, 0.05% 10/7/14, LOC Mufg Union Bank NA, VRDN (b) | 2,000 | | 2,000 |
(Anne Arundel Health Sys. Proj.) Series 2009 B, 0.06% 10/7/14, LOC Bank of America NA, VRDN (b) | 1,600 | | 1,600 |
|
| Principal Amount (000s) | | Value (000s) |
Participating VRDN Series Putters 4424, 0.05% 10/7/14 (Liquidity Facility JPMorgan Chase Bank) (b)(e) | $ 7,310 | | $ 7,310 |
Maryland Trans. Auth. Trans. Facility Projects Rev. Participating VRDN Series ROC II R 11437, 0.05% 10/7/14 (Liquidity Facility Citibank NA) (b)(e) | 7,785 | | 7,785 |
| | 18,695 |
Massachusetts - 3.3% |
Massachusetts Gen. Oblig. Participating VRDN Series Clipper 07 41, 0.07% 10/7/14 (Liquidity Facility State Street Bank & Trust Co., Boston) (b)(e) | 61,850 | | 61,850 |
Massachusetts School Bldg. Auth. Dedicated Sales Tax Rev. Participating VRDN: | | | |
Series EGL 07 0031, 0.04% 10/7/14 (Liquidity Facility Citibank NA) (b)(e) | 10,000 | | 10,000 |
Series EGL 14 0012, 0.04% 10/7/14 (Liquidity Facility Citibank NA) (b)(e) | 5,000 | | 5,000 |
Series MS 30911, 0.05% 10/7/14 (Liquidity Facility Morgan Stanley Bank, West Valley City Utah) (b)(e) | 2,630 | | 2,630 |
| | 79,480 |
Michigan - 1.4% |
Kent Hosp. Fin. Auth. Hosp. Facilities Rev. (Metropolitan Hosp. Proj.) Series 2012, 0.05% 10/7/14, LOC Bank of America NA, VRDN (b) | 21,900 | | 21,900 |
Michigan Bldg. Auth. Rev. Participating VRDN Series EGL 14 0028, 0.05% 10/7/14 (Liquidity Facility Citibank NA) (b)(e) | 3,000 | | 3,000 |
Michigan Fin. Auth. Rev. Participating VRDN Series Putters 4286, 0.05% 10/7/14 (Liquidity Facility JPMorgan Chase Bank) (b)(e) | 2,000 | | 2,000 |
Ottawa County Wtr. Supply Sys. Rev. Participating VRDN Series Putters 3360, 0.06% 10/7/14 (Liquidity Facility JPMorgan Chase Bank) (b)(e) | 6,620 | | 6,620 |
| | 33,520 |
Mississippi - 0.5% |
Mississippi Bus. Fin. Corp. Indl. Dev. Rev. (New Process Steel, L.P. Proj.) Series 2010, 0.05% 10/7/14, LOC Wells Fargo Bank NA, VRDN (b) | 2,400 | | 2,400 |
Mississippi Dev. Bank Spl. Oblig. (Harrison County Proj.) Series 2008 A2, 0.06% 10/7/14, LOC Bank of America NA, VRDN (b) | 10,150 | | 10,150 |
| | 12,550 |
Missouri - 0.9% |
Missouri Health & Edl. Facilities Series 2013 B, 0.06% 10/1/14, LOC Bank of America NA, VRDN (b) | 5,285 | | 5,285 |
Variable Rate Demand Note - continued |
| Principal Amount (000s) | | Value (000s) |
Missouri - continued |
Missouri Health & Edl. Facilities Auth. Edl. Facilities Rev. (Saint Louis Univ. Proj.): | | | |
Series 2008 A1, 0.03% 10/1/14, LOC Wells Fargo Bank NA, VRDN (b) | $ 1,290 | | $ 1,290 |
Series 2008 B1, 0.03% 10/1/14, LOC Barclays Bank PLC, VRDN (b) | 2,535 | | 2,535 |
Missouri Health & Edl. Facilities Auth. Rev. (Ascension Health Proj.) Series 2003 C3, 0.04% 10/7/14, VRDN (b) | 9,900 | | 9,900 |
Missouri Highways & Trans. Commission State Road Rev. Series 2005 B, 0.04% 10/7/14, LOC State Street Bank & Trust Co., Boston, VRDN (b) | 3,010 | | 3,010 |
| | 22,020 |
Nevada - 1.9% |
Clark County Arpt. Rev.: | | | |
Series 2008 D 2B, 0.04% 10/7/14, LOC Royal Bank of Canada, VRDN (b) | 23,000 | | 23,000 |
Series 2008 D3, 0.05% 10/7/14, LOC Bank of America NA, VRDN (b) | 3,200 | | 3,200 |
Clark County Fuel Tax Participating VRDN Series ROC II R 11507, 0.04% 10/7/14 (Liquidity Facility Citibank NA) (b)(e) | 5,345 | | 5,345 |
Las Vegas Valley Wtr. District Wtr. Impt. Gen. Oblig. Participating VRDN Series Solar 06 93, 0.04% 10/7/14 (Liquidity Facility U.S. Bank NA, Cincinnati) (b)(e) | 12,670 | | 12,670 |
| | 44,215 |
New York - 12.5% |
Barclays Bank PLC Participating VRDN Series BC 11 11B, 0.05% 10/7/14 (Liquidity Facility Barclays Bank PLC) (b)(e) | 6,240 | | 6,240 |
Nassau Health Care Corp. Rev.: | | | |
Series 2009 B2, 0.04% 10/7/14, LOC TD Banknorth, NA, VRDN (b) | 2,000 | | 2,000 |
Series 2009 D1, 0.04% 10/7/14, LOC JPMorgan Chase Bank, VRDN (b) | 1,300 | | 1,300 |
New York City Gen. Oblig.: | | | |
Series 2006 E2, 0.05% 10/1/14, LOC Bank of America NA, VRDN (b) | 13,000 | | 13,000 |
Series 2006 I7, 0.05% 10/7/14, LOC Bank of America NA, VRDN (b) | 4,600 | | 4,600 |
Series 2008 J10, 0.03% 10/7/14 (Liquidity Facility Bank of Tokyo-Mitsubishi UFJ Ltd.), VRDN (b) | 1,600 | | 1,600 |
Series 2008 J6, 0.05% 10/1/14, LOC Landesbank Hessen-Thuringen, VRDN (b) | 9,500 | | 9,500 |
|
| Principal Amount (000s) | | Value (000s) |
Series 2011 A4, 0.04% 10/7/14, LOC Bank of Tokyo-Mitsubishi UFJ Ltd., VRDN (b) | $ 2,500 | | $ 2,500 |
Series 2012 G6, 0.02% 10/1/14 (Liquidity Facility Mizuho Corporate Bank Ltd.), VRDN (b) | 14,100 | | 14,100 |
Series 2013 F3, 0.05% 10/1/14 (Liquidity Facility Bank of America NA), VRDN (b) | 3,000 | | 3,000 |
Series 2014 D3, 0.03% 10/1/14 (Liquidity Facility JPMorgan Chase Bank), VRDN (b) | 2,000 | | 2,000 |
Series D5, 0.03% 10/1/14, LOC PNC Bank NA, VRDN (b) | 8,500 | | 8,500 |
Series H2, 0.03% 10/1/14 (Liquidity Facility JPMorgan Chase Bank), VRDN (b) | 15,000 | | 15,000 |
New York City Hsg. Dev. Corp. Multi-family Mtg. Rev.: | | | |
(245 East 124th Street Proj.) Series 2008 A, 0.04% 10/7/14, LOC Freddie Mac, VRDN (b) | 1,300 | | 1,300 |
Series 2013 A, 0.04% 10/7/14, LOC Wells Fargo Bank NA, VRDN (b) | 4,000 | | 4,000 |
New York City Muni. Wtr. Fin. Auth. Wtr. & Swr. Sys. Rev.: | | | |
Participating VRDN: | | | |
Series EGL 14 0043, 0.04% 10/7/14 (Liquidity Facility Citibank NA) (b)(e) | 19,800 | | 19,800 |
Series ROC II R 11916, 0.05% 10/7/14 (Liquidity Facility Citibank NA) (b)(e) | 1,240 | | 1,240 |
Series 2008 BB2, 0.05% 10/1/14 (Liquidity Facility Bank of America NA), VRDN (b) | 54,750 | | 54,750 |
Series 2009 BB2, 0.05% 10/1/14 (Liquidity Facility Landesbank Hessen-Thuringen), VRDN (b) | 4,400 | | 4,400 |
Series 2014 AA, 0.03% 10/1/14 (Liquidity Facility Mizuho Corporate Bank Ltd.), VRDN (b) | 17,700 | | 17,700 |
Series FF, 0.05% 10/1/14 (Liquidity Facility Bank of America NA), VRDN (b) | 10,000 | | 10,000 |
New York City Transitional Fin. Auth. Rev.: | | | |
Participating VRDN: | | | |
Series ROC II R 11902, 0.05% 10/7/14 (Liquidity Facility Citibank NA) (b)(e) | 3,800 | | 3,800 |
Series ROC II R 14022, 0.05% 10/7/14 (Liquidity Facility Citibank NA) (b)(e) | 2,185 | | 2,185 |
Series 2001 A, 0.05% 10/7/14 (Liquidity Facility JPMorgan Chase Bank), VRDN (b) | 1,500 | | 1,500 |
Variable Rate Demand Note - continued |
| Principal Amount (000s) | | Value (000s) |
New York - continued |
New York City Transitional Fin. Auth. Rev.: - continued | | | |
Series 2003 1D, 0.04% 10/1/14 (Liquidity Facility Landesbank Hessen-Thuringen), VRDN (b) | $ 10,530 | | $ 10,530 |
Series 2013 C4, 0.03% 10/1/14 (Liquidity Facility JPMorgan Chase Bank), VRDN (b) | 7,985 | | 7,985 |
Series 2013 C5, 0.03% 10/7/14 (Liquidity Facility Sumitomo Mitsui Banking Corp.), VRDN (b) | 1,800 | | 1,800 |
Series 2015 A3, 0.03% 10/1/14 (Liquidity Facility Mizuho Corporate Bank Ltd.), VRDN (b) | 1,900 | | 1,900 |
New York City Trust Cultural Resources Rev.: | | | |
(Lincoln Ctr. for the Performing Arts, Inc. Proj.) Series 2008 A1, 0.04% 10/1/14, LOC JPMorgan Chase Bank, VRDN (b) | 8,000 | | 8,000 |
(The New York Botanical Garden Proj.) Series 2009 A, 0.04% 10/7/14, LOC JPMorgan Chase Bank, VRDN (b) | 1,900 | | 1,900 |
New York Dorm. Auth. Revs. (City Univ. Proj.) Series 2008 D, 0.03% 10/7/14, LOC TD Banknorth, NA, VRDN (b) | 1,500 | | 1,500 |
New York Envir. Facilities Corp. Clean Wtr. & Drinking Wtr. Participating VRDN Series Putters 3376, 0.05% 10/7/14 (Liquidity Facility JPMorgan Chase Bank) (b)(e) | 4,425 | | 4,425 |
New York Envir. Facilities Corp. State Personal Income Tax Rev. Participating VRDN Series Putters 2666, 0.05% 10/7/14 (Liquidity Facility JPMorgan Chase Bank) (b)(e) | 3,185 | | 3,185 |
New York Hsg. Fin. Agcy. Rev.: | | | |
(10 Barclay Street Hsg. Proj.) Series 2004 A, 0.05% 10/7/14, LOC Fannie Mae, VRDN (b) | 1,400 | | 1,400 |
(29 Flatbush Ave. Hsg. Proj.) Series 2010 A, 0.04% 10/7/14, LOC Bank of America NA, VRDN (b) | 2,700 | | 2,700 |
(316 11th Ave Hsg. Proj.) Series 2009 A, 0.04% 10/7/14, LOC Fannie Mae, VRDN (b) | 6,000 | | 6,000 |
(44th Street Dev. LLC Proj.) Series 2011 A1, 0.04% 10/7/14, LOC Wells Fargo Bank NA, VRDN (b) | 9,000 | | 9,000 |
(505 West 37th Street Proj.) Series 2009 A, 0.04% 10/1/14, LOC Landesbank Hessen-Thuringen, VRDN (b) | 1,400 | | 1,400 |
(Taconic West 17th St. Proj.) Series 2009 A, 0.05% 10/7/14, LOC Fannie Mae, VRDN (b) | 3,210 | | 3,210 |
|
| Principal Amount (000s) | | Value (000s) |
Series 2011 A2, 0.04% 10/7/14, LOC Wells Fargo Bank NA, VRDN (b) | $ 1,000 | | $ 1,000 |
Series 2012 A1, 0.05% 10/7/14, LOC Wells Fargo Bank NA, VRDN (b) | 2,500 | | 2,500 |
Series 2013 A, 0.03% 10/1/14, LOC PNC Bank NA, VRDN (b) | 4,675 | | 4,675 |
Series 2014 A2, 0.04% 10/7/14, LOC Manufacturers & Traders Trust Co., VRDN (b) | 7,700 | | 7,700 |
Series A, 0.05% 10/7/14, LOC Freddie Mac, VRDN (b) | 2,550 | | 2,550 |
New York Hsg. Fin. Svc. Contract Rev. Series 2003 L, 0.05% 10/7/14, LOC Bank of America NA, VRDN (b) | 3,800 | | 3,800 |
New York Thruway Auth. Second Gen. Hwy. & Bridge Trust Fund Participating VRDN Series ROC II R 11997, 0.05% 10/7/14 (Liquidity Facility Citibank NA) (b)(e) | 2,000 | | 2,000 |
Onondaga County Indl. Dev. Auth. Civic Facility Rev. (Syracuse Research Corp. Facility Proj.) Series 2008 B, 0.04% 10/7/14, LOC JPMorgan Chase Bank, VRDN (b) | 3,900 | | 3,900 |
| | 297,075 |
North Carolina - 2.3% |
Charlotte Wtr. & Swr. Sys. Rev.: | | | |
Participating VRDN Series ROC II R 11906, 0.04% 10/7/14 (Liquidity Facility Citibank NA) (b)(e) | 2,720 | | 2,720 |
Series 2002 B, 0.04% 10/7/14 (Liquidity Facility Wells Fargo Bank NA), VRDN (b) | 1,210 | | 1,210 |
Greensboro Combined Enterprise Sys. Rev. Series 2014 A, 0.05% 10/7/14 (Liquidity Facility Bank of America NA), VRDN (b) | 1,200 | | 1,200 |
North Carolina Cap. Facilities Fin. Agcy. Edl. Facilities Rev.: | | | |
(Greensboro College Proj.) 0.06% 10/7/14, LOC Bank of America NA, VRDN (b) | 3,290 | | 3,290 |
(High Point Univ. Rev.) Series 2006, 0.05% 10/7/14, LOC Branch Banking & Trust Co., VRDN (b) | 3,610 | | 3,610 |
North Carolina Cap. Facilities Fin. Agcy. Rev. Participating VRDN: | | | |
Series EGL 06 0139, 0.04% 10/7/14 (Liquidity Facility Citibank NA) (b)(e) | 1,900 | | 1,900 |
Series EGL 14 0017, 0.04% 10/7/14 (Liquidity Facility Citibank NA) (b)(e) | 10,890 | | 10,890 |
Series EGL 7053004 Class A, 0.04% 10/7/14 (Liquidity Facility Citibank NA) (b)(e) | 13,105 | | 13,105 |
Variable Rate Demand Note - continued |
| Principal Amount (000s) | | Value (000s) |
North Carolina - continued |
North Carolina Med. Care Commission Hosp. Rev. (CaroMont Health Proj.) Series 2003 A, 0.05% 10/7/14, LOC Wells Fargo Bank NA, VRDN (b) | $ 2,700 | | $ 2,700 |
Parson County Indl. Facilities and Poll. Cont. Fing. Auth. (CertainTeed Gypsum NC, Inc. Proj.) Series 2010, 0.05% 10/7/14, LOC Cr. Industriel et Commercial, VRDN (b) | 3,920 | | 3,920 |
Piedmont Triad Arpt. Auth. Series 2008 A, 0.05% 10/7/14, LOC Branch Banking & Trust Co., VRDN (b) | 1,000 | | 1,000 |
Raleigh Combined Enterprise Sys. Rev. Participating VRDN Series EGL 07 0010, 0.04% 10/7/14 (Liquidity Facility Citibank NA) (b)(e) | 4,950 | | 4,950 |
Univ. of North Carolina at Chapel Hill Rev. Participating VRDN Series EGL 05 3014 Class A, 0.05% 10/7/14 (Liquidity Facility Citibank NA) (b)(e) | 2,100 | | 2,100 |
Wake County Gen. Oblig. Series 2003 C, 0.04% 10/7/14 (Liquidity Facility Wells Fargo Bank NA), VRDN (b) | 1,000 | | 1,000 |
| | 53,595 |
Ohio - 1.1% |
Akron Bath Copley Hosp. District Rev. (Akron Gen. Health Systems Proj.) Series 2008, 0.06% 10/7/14, LOC JPMorgan Chase Bank, VRDN (b) | 9,800 | | 9,800 |
Columbus Swr. Sys. Rev. Participating VRDN Series BBT 08 5, 0.04% 10/7/14 (Liquidity Facility Branch Banking & Trust Co.) (b)(e) | 5,180 | | 5,180 |
Middletown Hosp. Facilities Rev. Series 2008 A, 0.04% 10/7/14, LOC PNC Bank NA, VRDN (b) | 1,000 | | 1,000 |
Ohio State Univ. Gen. Receipts: | | | |
Series 2001, 0.03% 10/7/14, VRDN (b) | 9,000 | | 9,000 |
Series 2010 E, 0.04% 10/7/14, VRDN (b) | 1,700 | | 1,700 |
| | 26,680 |
Oregon - 1.5% |
Clackamas County Hosp. Facility Auth. (Legacy Health Sys. Proj.) Series 2008 B, 0.04% 10/7/14, LOC U.S. Bank NA, Cincinnati, VRDN (b) | 24,950 | | 24,950 |
|
| Principal Amount (000s) | | Value (000s) |
Oregon Gen. Oblig. Participating VRDN Series ROC II R 11949, 0.05% 10/7/14 (Liquidity Facility Citibank NA) (b)(e) | $ 3,000 | | $ 3,000 |
Salem Hosp. Facility Auth. Rev. (Salem Hosp. Proj.) Series 2008 B, 0.05% 10/7/14, LOC U.S. Bank NA, Cincinnati, VRDN (b) | 8,500 | | 8,500 |
| | 36,450 |
Pennsylvania - 1.6% |
Bucks County Indl. Dev. Auth. Hosp. Rev. (Grand View Hosp. Proj.) Series 2008 A, 0.03% 10/7/14, LOC TD Banknorth, NA, VRDN (b) | 2,000 | | 2,000 |
Cap. Region Wtr. Swr. Rev. Series 2014 B, 0.04% 10/7/14, LOC Manufacturers & Traders Trust Co., VRDN (b) | 1,200 | | 1,200 |
Chester County Health & Ed. Auth. Rev. 0.04% 10/7/14, LOC Manufacturers & Traders Trust Co., VRDN (b) | 7,180 | | 7,180 |
Indiana County Hosp. Auth. Series 2014 B, 0.05% 10/7/14, LOC PNC Bank NA, VRDN (b) | 3,400 | | 3,400 |
Pennsylvania Gen. Oblig. Participating VRDN Series ROC II R 11505, 0.04% 10/7/14 (Liquidity Facility Citibank NA) (b)(e) | 4,510 | | 4,510 |
Pennsylvania Higher Edl. Facilities Auth. College & Univ. Revs. (St. Josephs Univ. Proj.) Series 2008 A, 0.05% 10/7/14, LOC TD Banknorth, NA, VRDN (b) | 3,000 | | 3,000 |
Philadelphia Gas Works Rev. (1998 Gen. Ordinance Proj.) Eighth Series B, 0.04% 10/7/14, LOC Wells Fargo Bank NA, VRDN (b) | 17,000 | | 17,000 |
| | 38,290 |
Rhode Island - 0.4% |
Narragansett Bay Commission Wastewtr. Sys. Rev. Series 2008 A, 0.05% 10/7/14, LOC U.S. Bank NA, Cincinnati, VRDN (b) | 1,900 | | 1,900 |
Rhode Island Health and Edl. Bldg. Corp. Higher Ed. Facility Rev.: | | | |
(Bryant Univ. Proj.) Series 2008, 0.05% 10/7/14, LOC TD Banknorth, NA, VRDN (b) | 1,160 | | 1,160 |
(New England Institute of Technology Proj.) Series 2008, 0.03% 10/7/14, LOC TD Banknorth, NA, VRDN (b) | 5,455 | | 5,455 |
| | 8,515 |
South Carolina - 0.2% |
Greenville Hosp. Sys. Facilities Rev. Series 2008 B, 0.04% 10/7/14, LOC U.S. Bank NA, Cincinnati, VRDN (b) | 5,295 | | 5,295 |
Variable Rate Demand Note - continued |
| Principal Amount (000s) | | Value (000s) |
Tennessee - 0.9% |
Blount County Pub. Bldg. Auth. (Local Govt. Pub. Impt. Proj.) Series 2009 E8A, 0.05% 10/7/14, LOC Branch Banking & Trust Co., VRDN (b) | $ 1,400 | | $ 1,400 |
Clarksville Pub. Bldg. Auth. Rev. (Tennessee Muni. Bond Fund Proj.): | | | |
Series 1994, 0.07% 10/7/14, LOC Bank of America NA, VRDN (b) | 2,280 | | 2,280 |
Series 2005, 0.07% 10/1/14, LOC Bank of America NA, VRDN (b) | 1,200 | | 1,200 |
Johnson City Health & Edl. Hosp. Rev. (Mountain States Health Alliance Proj.): | | | |
Series 2011 A, 0.04% 10/7/14, LOC U.S. Bank NA, Cincinnati, VRDN (b) | 1,900 | | 1,900 |
Series 2011 B, 0.04% 10/7/14, LOC PNC Bank NA, VRDN (b) | 15,700 | | 15,700 |
| | 22,480 |
Texas - 6.8% |
Austin Wtr. & Wastewtr. Sys. Rev. Participating VRDN Series ROC II R 11992, 0.05% 10/7/14 (Liquidity Facility Citibank NA) (b)(e) | 3,440 | | 3,440 |
Dallas Wtr. & Swr. Sys. Rev. Participating VRDN Series Solar 06 60, 0.04% 10/7/14 (Liquidity Facility U.S. Bank NA, Cincinnati) (b)(e) | 18,930 | | 18,930 |
Dallas Wtrwks. & Swr. Sys. Rev. Participating VRDN: | | | |
Series Putters 3227, 0.05% 10/7/14 (Liquidity Facility JPMorgan Chase Bank) (b)(e) | 2,995 | | 2,995 |
Series Putters 3742, 0.05% 10/7/14 (Liquidity Facility JPMorgan Chase Bank) (b)(e) | 5,000 | | 5,000 |
Friendswood Independent School District Participating VRDN Series Putters 3221, 0.05% 10/7/14 (Liquidity Facility JPMorgan Chase Bank) (b)(e) | 1,295 | | 1,295 |
Goose Creek Consolidated Independent School District Participating VRDN Series PZ 219, 0.06% 10/7/14 (Liquidity Facility Wells Fargo & Co.) (b)(e) | 10,574 | | 10,574 |
Harris County Gen. Oblig. Participating VRDN Series Clipper 07 46, 0.07% 10/7/14 (Liquidity Facility State Street Bank & Trust Co., Boston) (b)(e) | 40,000 | | 40,000 |
Houston Higher Ed. Fin. Corp. Higher Ed. Rev. Participating VRDN Series ROC II R 11860, 0.04% 10/7/14 (Liquidity Facility Citibank NA) (b)(e) | 6,000 | | 6,000 |
Houston Util. Sys. Rev. Participating VRDN: | | | |
Series ROC II R 11411, 0.04% 10/7/14 (Liquidity Facility Citibank NA) (b)(e) | 10,000 | | 10,000 |
|
| Principal Amount (000s) | | Value (000s) |
Series ROC II R 11885X, 0.06% 10/7/14 (Liquidity Facility Citibank NA) (b)(e) | $ 5,180 | | $ 5,180 |
Judson Independent School District Participating VRDN Series DB 423, 0.11% 10/7/14 (Liquidity Facility Deutsche Bank AG) (b)(e) | 1,335 | | 1,335 |
Lamar Consolidated Independent School District Participating VRDN Series DB 512, 0.06% 10/7/14 (Liquidity Facility Deutsche Bank AG) (b)(e) | 1,000 | | 1,000 |
Leander Independent School District Participating VRDN Series BC 10 28W, 0.06% 10/7/14 (Liquidity Facility Barclays Bank PLC) (b)(e) | 7,200 | | 7,200 |
Lovejoy Independent School District Participating VRDN Series DB 514, 0.07% 10/7/14 (Liquidity Facility Deutsche Bank AG) (b)(e) | 910 | | 910 |
Medina Valley Texas Independent School District Participating VRDN Series ROC II R 11969, 0.04% 10/7/14 (Liquidity Facility Citibank NA) (b)(e) | 2,040 | | 2,040 |
North East Texas Independent School District Participating VRDN Series MS 3277 X, 0.04% 10/7/14 (Liquidity Facility Cr. Suisse AG) (b)(e) | 5,000 | | 5,000 |
Northside Independent School District Participating VRDN Series ROC II R 11965, 0.04% 10/7/14 (Liquidity Facility Citibank NA) (b)(e) | 2,000 | | 2,000 |
Port Arthur Navigation District Indl. Dev. Corp. Exempt Facilities Rev. (Total Petrochemicals and Refining U.S.A., Inc. Proj.) Series 2012 A, 0.05% 10/7/14 (Total SA Guaranteed), VRDN (b) | 4,100 | | 4,100 |
Tarrant County Cultural Ed. Facilities Fin. Corp. Rev. (Christus Health Proj.) Series 2008 C1, 0.04% 10/7/14, LOC PNC Bank NA, VRDN (b) | 8,235 | | 8,235 |
Texas A&M Univ. Rev. Participating VRDN Series BC 10 39W, 0.06% 10/7/14 (Liquidity Facility Barclays Bank PLC) (b)(e) | 1,580 | | 1,580 |
Texas City Indl. Dev. Corp. (NRG Energy, Inc. Proj.) Series 2012, 0.06% 10/7/14, LOC Bank of America NA, VRDN (b) | 600 | | 600 |
Texas Dept. of Hsg. & Cmnty. Affairs Multi-family Hsg. Rev. Series 2003, 0.04% 10/7/14, LOC Freddie Mac, VRDN (b) | 1,300 | | 1,300 |
Texas Gen. Oblig. Series 2012 A, 0.04% 10/7/14 (Liquidity Facility State Street Bank & Trust Co., Boston), VRDN (b) | 22,900 | | 22,900 |
| | 161,614 |
Variable Rate Demand Note - continued |
| Principal Amount (000s) | | Value (000s) |
Virginia - 1.5% |
Albemarle County Indl. Dev. Auth. 0.05% 10/7/14, LOC Wells Fargo Bank NA, VRDN (b) | $ 2,795 | | $ 2,795 |
Albemarle Econ. Dev. Auth. Health Svcs. Rev. (The Univ. of Virginia Health Svcs. Foundation Proj.) Series 2009, 0.05% 10/1/14, LOC Bank of America NA, VRDN (b) | 1,605 | | 1,605 |
Fairfax County Indl. Dev. Auth. Participating VRDN Series MS 3285, 0.05% 10/7/14 (Liquidity Facility Morgan Stanley Bank, West Valley City Utah) (b)(e) | 5,510 | | 5,510 |
Fauquier County Indl. Dev. Auth. Rev. (Highland School Proj.) Series 2008, 0.05% 10/7/14, LOC Branch Banking & Trust Co., VRDN (b) | 3,350 | | 3,350 |
Hanover County Econ. Dev. Auth. Rev. (Bon Secours Health Sys. Proj.): | | | |
Series 2008 D1, 0.05% 10/7/14, LOC Bank of New York, New York, VRDN (b) | 2,300 | | 2,300 |
Series 2008 D2, 0.04% 10/7/14, LOC U.S. Bank NA, Cincinnati, VRDN (b) | 6,800 | | 6,800 |
Loudoun County Indl. Dev. Auth. (Howard Hughes Med. Institute Proj.) Series 2003 D, 0.03% 10/7/14, VRDN (b) | 11,090 | | 11,090 |
Virginia Resources Auth. Clean Wtr. Rev. Participating VRDN Series BBT 08 48, 0.04% 10/7/14 (Liquidity Facility Branch Banking & Trust Co.) (b)(e) | 2,840 | | 2,840 |
| | 36,290 |
Washington - 3.6% |
Central Puget Sound Reg'l. Trans. Auth. Sales & Use Tax Rev. Participating VRDN Series Putters 2866, 0.05% 10/7/14 (Liquidity Facility JPMorgan Chase Bank) (b)(e) | 7,280 | | 7,280 |
Eclipse Fdg. Trust Custody Rpt. Various States Participating VRDN Series Solar 07 106, 0.04% 10/7/14 (Liquidity Facility U.S. Bank NA, Cincinnati) (b)(e) | 3,310 | | 3,310 |
King County Gen. Oblig. Participating VRDN Series BC 10 66W, 0.06% 10/7/14 (Liquidity Facility Barclays Bank PLC) (b)(e) | 2,500 | | 2,500 |
Univ. of Washington Univ. Revs. Participating VRDN Series Solar 07 94, 0.04% 10/7/14 (Liquidity Facility U.S. Bank NA, Cincinnati) (b)(e) | 18,304 | | 18,304 |
|
| Principal Amount (000s) | | Value (000s) |
Washington Gen. Oblig. Participating VRDN: | | | |
Series Clipper 05 39, 0.04% 10/7/14 (Liquidity Facility State Street Bank & Trust Co., Boston) (b)(e) | $ 7,430 | | $ 7,430 |
Series GS 06 7T, 0.04% 10/7/14 (Liquidity Facility Wells Fargo & Co.) (b)(e) | 24,220 | | 24,220 |
Series Putters 3539, 0.05% 10/7/14 (Liquidity Facility JPMorgan Chase Bank) (b)(e) | 4,330 | | 4,330 |
Washington Hsg. Fin. Commission Multi-family Hsg. Rev.: | | | |
(Affinity at Olympia Apts. Proj.) Series 2012 A, 0.07% 10/7/14, LOC Fed. Home Ln. Bank, San Francisco, VRDN (b) | 6,250 | | 6,250 |
(Discovery Heights Apt. Proj.) Series 2010, 0.03% 10/7/14, LOC Freddie Mac, VRDN (b) | 1,000 | | 1,000 |
(Reserve at Renton Apts. Proj.) Series 2014, 0.06% 10/7/14, LOC Fed. Home Ln. Bank, San Francisco, VRDN (b) | 4,000 | | 4,000 |
(The Cambridge Apts. Proj.) Series 2009, 0.05% 10/7/14, LOC Fannie Mae, VRDN (b) | 1,200 | | 1,200 |
(Willow Tree Grove Apts. Proj.) Series 2011, 0.03% 10/7/14, LOC Freddie Mac, VRDN (b) | 4,800 | | 4,800 |
| | 84,624 |
Wisconsin - 0.1% |
Wisconsin Health & Edl. Facilities Auth. Rev. (Oakwood Village Proj.) Series 2005, 0.06% 10/7/14, LOC BMO Harris Bank NA, VRDN (b) | 2,200 | | 2,200 |
TOTAL VARIABLE RATE DEMAND NOTE (Cost $1,504,703) |
1,504,703
|
Other Municipal Debt - 27.7% |
| | | |
Alabama - 0.1% |
Alabama Pub. School & College Auth. Rev. Bonds Series 2007, 3.5% 12/1/14 | 2,000 | | 2,011 |
Alaska - 0.2% |
Anchorage Gen. Oblig.: | | | |
Series A, 0.09% 11/6/14, LOC Wells Fargo Bank NA, CP | 500 | | 500 |
Series A1, 0.09% 11/6/14, LOC Wells Fargo Bank NA, CP | 600 | | 600 |
Series B1, 0.08% 11/5/14, LOC JPMorgan Chase Bank, CP | 2,600 | | 2,600 |
Series C1, 0.08% 11/5/14, LOC Bank of Tokyo-Mitsubishi UFJ Ltd., CP | 1,100 | | 1,100 |
| | 4,800 |
Other Municipal Debt - continued |
| Principal Amount (000s) | | Value (000s) |
Arizona - 0.6% |
Phoenix Civic Impt. Corp. Series 2011 B1, 0.08% 10/1/14, LOC Barclays Bank PLC, CP | $ 4,500 | | $ 4,500 |
Phoenix Civic Impt. Corp. Wastewtr. Sys. Rev.: | | | |
Series 2012 A, 0.09% 11/18/14, LOC Royal Bank of Canada, CP | 2,300 | | 2,300 |
Series 2012 B, 0.13% 12/10/14, LOC Wells Fargo Bank NA, CP | 6,400 | | 6,400 |
Salt River Proj. Agricultural Impt. & Pwr. District Elec. Sys. Rev. Series C, 0.07% 11/19/14, CP | 1,200 | | 1,200 |
| | 14,400 |
California - 5.2% |
California Gen. Oblig.: | | | |
RAN 1.5% 6/22/15 | 74,215 | | 74,953 |
Series A3, 0.07% 11/5/14, LOC JPMorgan Chase Bank, LOC California Pub. Employees Retirement Sys., CP | 1,300 | | 1,300 |
Los Angeles County Gen. Oblig. TRAN 1.5% 6/30/15 | 11,900 | | 12,022 |
Los Angeles Dept. of Wtr. & Pwr. Rev.: | | | |
0.08% 12/4/14 (Liquidity Facility Wells Fargo Bank NA), CP | 1,000 | | 1,000 |
0.1% 12/22/14 (Liquidity Facility Wells Fargo Bank NA), CP | 800 | | 800 |
Los Angeles Gen. Oblig. TRAN 1.5% 6/25/15 | 28,500 | | 28,789 |
Sacramento Muni. Util. District Elec. Rev. Series L1, 0.08% 12/4/14, LOC Barclays Bank PLC, CP | 2,300 | | 2,300 |
San Bernardino County Gen. Oblig. TRAN 2% 6/30/15 | 1,500 | | 1,521 |
| | 122,685 |
Colorado - 0.5% |
Colorado Ed. Ln. Prog. TRAN Series 2014 A, 1% 6/29/15 | 8,100 | | 8,153 |
Colorado Gen. Fdg. Rev. TRAN Series A, 1.5% 6/26/15 | 3,800 | | 3,839 |
| | 11,992 |
Connecticut - 0.4% |
Connecticut Gen. Oblig. Bonds: | | | |
(Econ. Recovery Proj.) Series 2009 A, 5% 1/1/15 | 1,800 | | 1,822 |
Series 2014 C: | | | |
1% 12/15/14 | 1,200 | | 1,202 |
2% 6/15/15 | 3,700 | | 3,749 |
Univ. of Connecticut Gen. Oblig. Bonds Series 2014 A, 2% 2/15/15 | 1,800 | | 1,813 |
| | 8,586 |
|
| Principal Amount (000s) | | Value (000s) |
District Of Columbia - 0.4% |
District of Columbia Rev. Bonds Series 2000, 0.08% tender 12/4/14, LOC JPMorgan Chase Bank, CP mode | $ 5,000 | | $ 5,000 |
Metropolitan Washington Arpts. Auth. Dulles Toll Road Rev. Series 1, 0.09% 12/5/14, LOC JPMorgan Chase Bank, CP | 2,900 | | 2,900 |
Metropolitan Washington DC Arpts. Auth. Sys. Rev. Series 2 A1, 0.08% 10/2/14, LOC Sumitomo Mitsui Banking Corp., CP | 1,100 | | 1,100 |
| | 9,000 |
Florida - 1.4% |
Alachua County Health Facilities Auth. Health Facilities Rev. Bonds (Shands Teaching Hosp. & Clinics, Inc. Proj.) Series 2008 A, 0.08% tender 10/17/14, LOC Bank of America NA, CP mode | 1,700 | | 1,700 |
Florida Board of Ed. Pub. Ed. Cap. Outlay Bonds: | | | |
Series 2009 D, 5% 6/1/15 | 1,630 | | 1,683 |
Series 2011 A, 5% 6/1/15 | 5,710 | | 5,895 |
Florida Local Govt. Fin. Cmnty. Series 2011 A1: | | | |
0.08% 10/3/14, LOC JPMorgan Chase Bank, CP | 1,500 | | 1,500 |
0.08% 11/5/14, LOC JPMorgan Chase Bank, CP | 2,300 | | 2,300 |
Hillsborough County Cap. Impt. Prog. Rev. Series A: | | | |
0.07% 10/9/14, LOC Bank of Tokyo-Mitsubishi UFJ Ltd., CP | 1,138 | | 1,138 |
0.09% 10/30/14, LOC Bank of Tokyo-Mitsubishi UFJ Ltd., CP | 1,400 | | 1,400 |
0.1% 12/4/14, LOC Bank of Tokyo-Mitsubishi UFJ Ltd., CP | 1,700 | | 1,700 |
0.11% 11/20/14, LOC Bank of Tokyo-Mitsubishi UFJ Ltd., CP | 1,600 | | 1,600 |
Jacksonville Elec. Auth. Elec. Sys. Rev.: | | | |
Bonds Series 2013 A, 5% 10/1/15 | 1,020 | | 1,069 |
Series C1, 0.08% 12/2/14, CP | 2,200 | | 2,200 |
Jacksonville Gen. Oblig. Series 2004 A, 0.09% 12/1/14, LOC Barclays Bank PLC, CP | 1,300 | | 1,300 |
JEA Saint Johns River Pwr. Park Sys. Rev. Bonds: | | | |
Series 23 Issue 2, 5% 10/1/14 | 3,600 | | 3,600 |
Series 25 Issue 2, 4% 10/1/14 | 2,800 | | 2,800 |
Polk County Indl. Dev. Auth. Health Sys. Rev. Bonds Series 2014 A1, 0.12%, tender 4/28/15 (b) | 1,600 | | 1,600 |
Tampa Health Sys. Rev. Bonds Series 2012 B, 0.12%, tender 4/28/15 (b) | 1,900 | | 1,900 |
| | 33,385 |
Other Municipal Debt - continued |
| Principal Amount (000s) | | Value (000s) |
Georgia - 0.6% |
Cobb County Gen. Obligations TAN 0.5% 11/28/14 | $ 2,900 | | $ 2,902 |
Georgia Gen. Oblig. Bonds: | | | |
Series 1996 B, 4.8% 4/1/15 | 1,500 | | 1,535 |
Series 2011 I, 4% 11/1/14 | 1,000 | | 1,003 |
Series 2014 A, 5% 2/1/15 | 2,000 | | 2,033 |
Georgia Muni. Elec. Auth. Pwr. Rev.: | | | |
Bonds (Gen. Resolution Proj.) Series 1985A, 0.09% tender 12/9/14, LOC Barclays Bank PLC, CP mode | 1,200 | | 1,200 |
Series B: | | | |
0.07% 10/2/14, LOC TD Banknorth, NA, CP | 2,400 | | 2,400 |
0.07% 10/6/14, LOC PNC Bank NA, CP | 2,913 | | 2,913 |
| | 13,986 |
Idaho - 0.0% |
Idaho Gen. Oblig. TAN 2% 6/30/15 | 1,000 | | 1,014 |
Illinois - 0.8% |
Chicago O'Hare Int'l. Arpt. Rev. Series 2011 B2, 0.11% 11/5/14, LOC Wells Fargo Bank NA, CP | 4,723 | | 4,723 |
Illinois Fin. Auth. Ed. Rev.: | | | |
Series L, 0.08% 10/16/14, LOC PNC Bank NA, CP | 2,000 | | 2,000 |
0.09% 1/14/15, LOC PNC Bank NA, CP | 2,000 | | 2,000 |
Illinois Fin. Auth. Rev. Bonds: | | | |
(Advocate Health Care Proj.) Series 2008 C B3, 0.13%, tender 7/16/15 (b) | 5,000 | | 5,000 |
(Hosp. Sister Svcs. Proj.): | | | |
Series 2012 H: | | | |
0.09% tender 11/5/14, CP mode | 1,300 | | 1,300 |
0.09% tender 12/3/14, CP mode | 1,600 | | 1,600 |
Series 2012 I, 0.08% tender 10/2/14, CP mode | 1,300 | | 1,300 |
Illinois Unemployment Ins. Fund Bldg. Receipts Bonds Series 2012 A, 5% 6/15/15 | 2,000 | | 2,069 |
| | 19,992 |
Indiana - 0.6% |
Indiana Fin. Auth. Rev. Bonds (Trinity Health Sys. Proj.) Series 2008 D2: | | | |
0.07% tender 10/1/14, CP mode | 7,700 | | 7,700 |
0.09% tender 12/1/14, CP mode | 2,800 | | 2,800 |
Indianapolis Gas Util. Sys. Rev. 0.08% 12/4/14, LOC JPMorgan Chase Bank, CP | 2,700 | | 2,700 |
| | 13,200 |
|
| Principal Amount (000s) | | Value (000s) |
Kansas - 0.2% |
Wichita Gen. Oblig. BAN Series 258, 0.5% 10/15/14 | $ 4,600 | | $ 4,600 |
Maryland - 0.7% |
Baltimore County Gen. Oblig.: | | | |
0.07% 11/4/14 (Liquidity Facility Mizuho Corporate Bank Ltd.), CP | 2,600 | | 2,600 |
0.08% 10/3/14 (Liquidity Facility Mizuho Corporate Bank Ltd.), CP | 1,850 | | 1,850 |
0.08% 10/3/14 (Liquidity Facility Mizuho Corporate Bank Ltd.), CP | 2,600 | | 2,600 |
0.08% 12/4/14 (Liquidity Facility Mizuho Corporate Bank Ltd.), CP | 3,500 | | 3,500 |
Maryland Gen. Oblig. Bonds Series 2014 C, 5% 8/1/15 | 600 | | 624 |
Montgomery County Gen. Oblig. Bonds: | | | |
Series 2012 A, 5% 11/1/14 | 3,000 | | 3,012 |
Series 2013 MD, 0.08%, tender 12/1/14 (b) | 2,500 | | 2,500 |
| | 16,686 |
Massachusetts - 0.2% |
Massachusetts Gen. Oblig. RAN Series 2014 A, 1.5% 4/23/15 | 5,100 | | 5,140 |
Michigan - 1.1% |
Michigan Bldg. Auth. Rev. Series 6, 0.07% 10/9/14, LOC State Street Bank & Trust Co., Boston, LOC U.S. Bank NA, Cincinnati, CP | 3,200 | | 3,200 |
Michigan Hosp. Fin. Auth. Rev. Bonds: | | | |
(Ascension Health Sr. Cr. Group Proj.) Series 2010 F: | | | |
0.1%, tender 4/28/15 (b) | 9,700 | | 9,700 |
0.1%, tender 4/28/15 (b) | 4,490 | | 4,490 |
(Trinity Health Sys. Proj.) Series 2008 C: | | | |
0.07% tender 10/16/14, CP mode | 1,300 | | 1,300 |
0.07% tender 11/4/14, CP mode | 940 | | 940 |
0.07% tender 11/4/14, CP mode | 1,900 | | 1,900 |
0.08% tender 11/5/14, CP mode | 2,200 | | 2,200 |
0.09% tender 12/3/14, CP mode | 1,300 | | 1,300 |
Univ. of Michigan Rev. Series J1, 0.08% 11/6/14, CP | 1,200 | | 1,200 |
| | 26,230 |
Minnesota - 0.2% |
Univ. of Minnesota Gen. Oblig.: | | | |
Bonds Series 2011 A, 5% 12/1/14 | 2,250 | | 2,268 |
Series 2007 B, 0.08% 12/4/14, CP | 1,100 | | 1,100 |
Univ. of Minnesota Rev. Series 2005 A, 0.08% 11/5/14, CP | 1,900 | | 1,900 |
| | 5,268 |
Other Municipal Debt - continued |
| Principal Amount (000s) | | Value (000s) |
Missouri - 0.0% |
Missouri Health & Edl. Facilities Bonds (BJC Health Sys. Proj.) Series 2013 C, 0.11%, tender 4/28/15 (b) | $ 1,200 | | $ 1,200 |
Nebraska - 0.6% |
Nebraska Pub. Pwr. District Rev. Series A: | | | |
0.08% 11/6/14, CP | 1,300 | | 1,300 |
0.08% 12/4/14, CP | 1,300 | | 1,300 |
0.08% 12/10/14, CP | 1,300 | | 1,300 |
0.09% 11/13/14, CP | 1,300 | | 1,300 |
Omaha Pub. Pwr. District Elec. Rev.: | | | |
Bonds Series 2011 A, 4% 2/1/15 | 1,000 | | 1,013 |
Series A: | | | |
0.1% 11/17/14, CP | 800 | | 800 |
0.11% 11/5/14, CP | 7,000 | | 7,000 |
0.11% 12/17/14, CP | 1,370 | | 1,370 |
| | 15,383 |
Nevada - 0.3% |
Clark County School District Bonds: | | | |
Series 2006 B, 5% 6/15/15 | 1,100 | | 1,137 |
Series 2013 B, 5% 6/15/15 | 1,000 | | 1,034 |
Nevada Unemployment Compensation Fund Spl. Rev. Bonds Series 2013, 4% 6/1/15 | 1,350 | | 1,385 |
Truckee Meadows Wtr. Auth. Wtr. Rev.: | | | |
Series 2006 A, 0.1% 10/9/14, LOC Bank of Tokyo-Mitsubishi UFJ Ltd., CP | 1,100 | | 1,100 |
Series 2006 B, 0.1% 12/1/14, LOC Bank of Tokyo-Mitsubishi UFJ Ltd., CP | 1,800 | | 1,800 |
| | 6,456 |
New Jersey - 0.1% |
Hoboken Gen. Oblig. BAN Series 2014 A, 1% 3/18/15 | 1,100 | | 1,104 |
Passaic County Gen. Oblig. BAN Series 2013 A, 1.25% 12/19/14 | 1,300 | | 1,303 |
| | 2,407 |
New Mexico - 0.0% |
New Mexico Gen. Oblig. Bonds 5% 3/1/15 | 1,250 | | 1,275 |
New York - 0.3% |
New York City Gen. Oblig. Bonds Series 1994 A5, 5% 8/1/15 | 2,000 | | 2,081 |
New York Metropolitan Trans. Auth. Rev.: | | | |
Series 2B, 0.08% 11/6/14, LOC Barclays Bank PLC, CP | 4,100 | | 4,100 |
Series 2D, 0.1% 12/8/14, LOC Citibank NA, CP | 1,300 | | 1,300 |
| | 7,481 |
|
| Principal Amount (000s) | | Value (000s) |
North Carolina - 0.2% |
North Carolina Gen. Oblig. Bonds Series 2007 A, 5% 3/1/15 | $ 1,200 | | $ 1,224 |
Wake County Gen. Oblig. Bonds: | | | |
Series 2007, 5% 3/1/15 | 3,500 | | 3,571 |
Series 2009 C, 5% 3/1/15 | 1,000 | | 1,020 |
| | 5,815 |
Ohio - 1.3% |
Franklin County Rev. Bonds Series 2013 OH, 0.11%, tender 4/28/15 (b) | 5,000 | | 5,000 |
Ohio Higher Edl. Facility Commission Rev. Bonds (The Cleveland Clinic Foundation Proj.): | | | |
Series 2008 B5, 0.1% tender 2/4/15, CP mode | 1,800 | | 1,800 |
Series 2008 B6: | | | |
0.1% tender 10/6/14, CP mode | 15,000 | | 15,000 |
0.1% tender 10/29/14, CP mode | 9,200 | | 9,200 |
0.1% tender 3/5/15, CP mode | 1,100 | | 1,100 |
| | 32,100 |
Oklahoma - 0.1% |
Oklahoma City Wtr. Utils. Trust Wtr. and Swr. Rev. Series A: | | | |
0.06% 10/3/14, LOC State Street Bank & Trust Co., Boston, CP | 1,600 | | 1,600 |
0.09% 12/8/14, LOC State Street Bank & Trust Co., Boston, CP | 1,200 | | 1,200 |
| | 2,800 |
Oregon - 0.6% |
Oregon Facilities Auth. Rev. Bonds Series 2013 C, 0.09%, tender 10/1/14 (b) | 1,400 | | 1,400 |
Oregon Gen. Oblig. TAN Series 2014 A, 2% 6/15/15 | 13,280 | | 13,455 |
| | 14,855 |
Pennsylvania - 0.2% |
Univ. of Pittsburgh Commonwealth Sys. of Higher Ed.: | | | |
BAN Series 2014, 2% 7/22/15 | 1,000 | | 1,015 |
Bonds (Univ. Cap. Proj.) Series 2005 C, 0.09% tender 11/4/14, CP mode | 2,900 | | 2,900 |
| | 3,915 |
South Carolina - 0.1% |
Greenville County School District Bonds Series 2014 C, 1% 6/1/15 | 1,400 | | 1,408 |
South Carolina Gen. Oblig. Bonds Series 2010 A, 4% 6/1/15 | 450 | | 461 |
| | 1,869 |
Tennessee - 0.3% |
Memphis Elec. Sys. Rev. Bonds 5% 12/1/14 | 6,075 | | 6,124 |
Other Municipal Debt - continued |
| Principal Amount (000s) | | Value (000s) |
Texas - 7.8% |
Austin Elec. Util. Sys. Rev. Series A, 0.08% 12/4/14, LOC Bank of Tokyo-Mitsubishi UFJ Ltd., CP | $ 3,700 | | $ 3,700 |
Dallas Wtrwks. & Swr. Sys. Rev. Bonds Series 2013, 2% 10/1/14 | 1,440 | | 1,440 |
Harris County Gen. Oblig.: | | | |
Series A1, 0.1% 12/1/14 (Liquidity Facility State Street Bank & Trust Co., Boston), CP | 1,800 | | 1,800 |
0.1% 3/18/15 (Liquidity Facility JPMorgan Chase Bank), CP | 1,500 | | 1,500 |
Harris County Metropolitan Trans. Auth.: | | | |
Series A1: | | | |
0.08% 12/4/14 (Liquidity Facility JPMorgan Chase Bank), CP | 4,800 | | 4,800 |
0.13% 12/11/14 (Liquidity Facility JPMorgan Chase Bank), CP | 15,250 | | 15,250 |
Series A3: | | | |
0.13% 12/11/14 (Liquidity Facility State Street Bank & Trust Co., Boston), CP | 5,000 | | 5,000 |
0.14% 12/10/14 (Liquidity Facility State Street Bank & Trust Co., Boston), CP | 5,000 | | 5,000 |
Lower Colorado River Auth. Rev.: | | | |
Series A: | | | |
0.09% 10/7/14, LOC JPMorgan Chase Bank, CP | 1,100 | | 1,100 |
0.09% 11/4/14, LOC JPMorgan Chase Bank, CP | 1,700 | | 1,700 |
0.08% 10/3/14, LOC JPMorgan Chase Bank, LOC State Street Bank & Trust Co., Boston, CP | 3,500 | | 3,500 |
0.09% 12/3/14, LOC JPMorgan Chase Bank, LOC State Street Bank & Trust Co., Boston, CP | 800 | | 800 |
0.09% 12/3/14, LOC JPMorgan Chase Bank, LOC State Street Bank & Trust Co., Boston, CP | 900 | | 900 |
0.1% 10/7/14, LOC JPMorgan Chase Bank, LOC State Street Bank & Trust Co., Boston, CP | 900 | | 900 |
0.1% 12/1/14, LOC JPMorgan Chase Bank, LOC State Street Bank & Trust Co., Boston, CP | 1,500 | | 1,500 |
North Texas Tollway Auth. Rev. Bonds Series 2009 D: | | | |
0.07% tender 11/6/14, LOC JPMorgan Chase Bank, CP mode | 1,700 | | 1,700 |
0.07% tender 11/7/14, LOC JPMorgan Chase Bank, CP mode | 2,500 | | 2,500 |
San Antonio Wtr. Sys. Rev. Bonds Series 2013 E, 4% 5/15/15 | 2,650 | | 2,714 |
|
| Principal Amount (000s) | | Value (000s) |
Tarrant County Cultural Ed. Facilities Fin. Corp. Hosp. Rev. Bonds (Baylor Health Care Sys. Proj.): | | | |
Series 2011 B, 0.17%, tender 4/28/15 (b) | $ 6,200 | | $ 6,200 |
Series 2013 B, 0.13%, tender 4/28/15 (b) | 900 | | 900 |
Texas A&M Univ. Rev. Series 1993 B: | | | |
0.08% 10/6/14, CP | 1,504 | | 1,504 |
0.09% 12/8/14, CP | 1,500 | | 1,500 |
0.1% 12/8/14, CP | 1,893 | | 1,893 |
Texas Gen. Oblig.: | | | |
Bonds: | | | |
Series 2009 E, 5% 8/1/15 | 1,000 | | 1,040 |
Series 2010 B, 5% 10/1/14 | 820 | | 820 |
Series 2013, 2% 10/1/14 | 3,810 | | 3,810 |
TRAN Series 2014, 1.5% 8/31/15 | 75,200 | | 76,138 |
Texas Muni. Pwr. Agcy. Rev. Series 2005: | | | |
0.09% 11/6/14, LOC Barclays Bank PLC, CP | 1,300 | | 1,300 |
0.09% 12/9/14, LOC Barclays Bank PLC, CP | 2,400 | | 2,400 |
Texas Pub. Fin. Auth. Rev. Bonds Series 2010 A, 5% 7/1/15 | 1,870 | | 1,938 |
Univ. of Texas Board of Regents Sys. Rev. Series 2002 A: | | | |
0.07% 10/1/14 (Liquidity Facility Univ. of Texas Invt. Mgmt. Co.), CP | 1,100 | | 1,100 |
0.07% 10/6/14 (Liquidity Facility Univ. of Texas Invt. Mgmt. Co.), CP | 1,100 | | 1,100 |
0.07% 10/15/14 (Liquidity Facility Univ. of Texas Invt. Mgmt. Co.), CP | 1,300 | | 1,300 |
0.07% 10/16/14 (Liquidity Facility Univ. of Texas Invt. Mgmt. Co.), CP | 1,200 | | 1,200 |
0.08% 10/9/14 (Liquidity Facility Univ. of Texas Invt. Mgmt. Co.), CP | 1,400 | | 1,400 |
0.08% 11/3/14 (Liquidity Facility Univ. of Texas Invt. Mgmt. Co.), CP | 1,300 | | 1,300 |
0.08% 11/4/14 (Liquidity Facility Univ. of Texas Invt. Mgmt. Co.), CP | 1,300 | | 1,300 |
0.08% 11/4/14 (Liquidity Facility Univ. of Texas Invt. Mgmt. Co.), CP | 1,292 | | 1,292 |
0.08% 11/5/14 (Liquidity Facility Univ. of Texas Invt. Mgmt. Co.), CP | 8,500 | | 8,500 |
0.08% 11/6/14 (Liquidity Facility Univ. of Texas Invt. Mgmt. Co.), CP | 900 | | 900 |
0.08% 12/3/14 (Liquidity Facility Univ. of Texas Invt. Mgmt. Co.), CP | 1,450 | | 1,450 |
0.08% 12/3/14 (Liquidity Facility Univ. of Texas Invt. Mgmt. Co.), CP | 1,200 | | 1,200 |
0.09% 12/5/14 (Liquidity Facility Univ. of Texas Invt. Mgmt. Co.), CP | 1,100 | | 1,100 |
0.09% 1/22/15 (Liquidity Facility Univ. of Texas Invt. Mgmt. Co.), CP | 1,300 | | 1,300 |
0.09% 2/2/15 (Liquidity Facility Univ. of Texas Invt. Mgmt. Co.), CP | 1,400 | | 1,400 |
Other Municipal Debt - continued |
| Principal Amount (000s) | | Value (000s) |
Texas - continued |
Univ. of Texas Board of Regents Sys. Rev. Series 2002 A: - continued | | | |
0.09% 2/3/15 (Liquidity Facility Univ. of Texas Invt. Mgmt. Co.), CP | $ 1,000 | | $ 1,000 |
0.09% 2/4/15 (Liquidity Facility Univ. of Texas Invt. Mgmt. Co.), CP | 1,400 | | 1,400 |
0.09% 2/5/15 (Liquidity Facility Univ. of Texas Invt. Mgmt. Co.), CP | 1,400 | | 1,400 |
| | 184,889 |
Utah - 0.3% |
Intermountain Pwr. Agcy. Pwr. Supply Rev. Series 2013 B1, 0.11% 11/7/14 (Liquidity Facility JPMorgan Chase Bank), CP | 900 | | 900 |
Riverton Hosp. Rev. Bonds Series WF 11 35C, 0.11%, tender 10/16/14 (Liquidity Facility Wells Fargo Bank NA) (b)(e)(f) | 5,530 | | 5,530 |
| | 6,430 |
Virginia - 0.3% |
Fairfax County Indl. Dev. Auth. Bonds (Inova Health Sys. Proj.) Series 2012 C, 0.12%, tender 4/28/15 (b) | 2,800 | | 2,800 |
Norfolk Econ. Dev. Auth. Rev. Series 1997, 0.08% 11/17/14, CP | 2,100 | | 2,100 |
Virginia Pub. Bldg. Auth. Pub. Facilities Rev. Bonds Series 2014 C, 5% 8/1/15 | 1,100 | | 1,145 |
| | 6,045 |
Washington - 0.7% |
Energy Northwest Elec. Rev. Bonds: | | | |
(Proj. #3) Series 2007 A: | | | |
5% 7/1/15 | 4,940 | | 5,119 |
5% 7/1/15 | 500 | | 518 |
Series 2007 C, 5% 7/1/15 | 2,695 | | 2,793 |
5% 7/1/15 | 2,100 | | 2,177 |
Seattle Muni. Lt. & Pwr. Rev. Bonds Series 2010 B, 5% 2/1/15 | 1,000 | | 1,018 |
Washington Gen. Oblig. Bonds: | | | |
Series 2010 A, 5% 1/1/15 | 1,925 | | 1,948 |
Series WF 11-16C, 0.11%, tender 10/2/14 (Liquidity Facility Wells Fargo Bank NA) (b)(e)(f) | 1,300 | | 1,300 |
Washington Health Care Facilities Auth. Rev. Bonds Series 2013 B1, 0.19%, tender 4/28/15 (b) | 1,500 | | 1,500 |
| | 16,373 |
Wisconsin - 1.3% |
Milwaukee Gen. Oblig.: | | | |
Bonds Series 2014 N2, 5% 4/1/15 | 1,415 | | 1,449 |
RAN Series 2014 RI, 1% 12/23/14 | 2,000 | | 2,004 |
|
| Principal Amount (000s) | | Value (000s) |
Wisconsin Gen. Oblig.: | | | |
Series 2005 A, 0.08% 11/17/14 (Liquidity Facility Bank of New York, New York), CP | $ 1,100 | | $ 1,100 |
Series 2013 A: | | | |
0.07% 10/3/14 (Liquidity Facility Bank of New York, New York), CP | 1,600 | | 1,600 |
0.08% 12/8/14 (Liquidity Facility Bank of New York, New York), CP | 1,300 | | 1,300 |
Wisconsin Health & Edl. Facilities Bonds: | | | |
Series 2013 B, 0.1%, tender 4/28/15 (b) | 1,220 | | 1,220 |
Series 2014 B1, 0.12%, tender 4/28/15 (b) | 1,300 | | 1,300 |
Wisconsin Health & Edl. Facilities Auth. Rev. Bonds Series 2012 J, 0.09% tender 10/7/14, CP mode | 900 | | 900 |
Wisconsin Trans. Rev.: | | | |
Series 1997 A, 0.09% 10/6/14 (Liquidity Facility State Street Bank & Trust Co., Boston) (Liquidity Facility California Teachers Retirement Sys.), CP | 13,489 | | 13,489 |
Series 2006 A: | | | |
0.09% 10/6/14 (Liquidity Facility State Street Bank & Trust Co., Boston) (Liquidity Facility California Teachers Retirement Sys.), CP | 1,710 | | 1,710 |
0.1% 12/1/14 (Liquidity Facility State Street Bank & Trust Co., Boston) (Liquidity Facility California Teachers Retirement Sys.), CP | 1,900 | | 1,900 |
Series 2013 A, 0.09% 12/8/14 (Liquidity Facility State Street Bank & Trust Co., Boston) (Liquidity Facility California Teachers Retirement Sys.), CP | 1,900 | | 1,900 |
| | 29,872 |
TOTAL OTHER MUNICIPAL DEBT (Cost $658,264) |
658,264
|
Investment Company - 5.3% |
| Shares | | |
Fidelity Tax-Free Cash Central Fund, 0.04% (c)(d) (Cost $125,138) | 125,138,000 | |
125,138
|
TOTAL INVESTMENT PORTFOLIO - 96.4% (Cost $2,288,105) | | 2,288,105 |
NET OTHER ASSETS (LIABILITIES) - 3.6% | | 85,181 |
NET ASSETS - 100% | $ 2,373,286 |
Security Type Abbreviations |
BAN | - | BOND ANTICIPATION NOTE |
CP | - | COMMERCIAL PAPER |
RAN | - | REVENUE ANTICIPATION NOTE |
TAN | - | TAX ANTICIPATION NOTE |
TRAN | - | TAX AND REVENUE ANTICIPATION NOTE |
VRDN | - | VARIABLE RATE DEMAND NOTE (A debt instrument that is payable upon demand, either daily, weekly or monthly) |
Legend |
(a) Security exempt from registration under Rule 144A of the Securities Act of 1933. These securities may be resold in transactions exempt from registration, normally to qualified institutional buyers. At the end of the period, the value of these securities amounted to $3,950,000 or 0.2% of net assets. |
(b) Coupon rates for floating and adjustable rate securities reflect the rates in effect at period end. |
(c) Information in this report regarding holdings by state and security types does not reflect the holdings of the Fidelity Tax-Free Cash Central Fund. |
(d) Affiliated fund that is available only to investment companies and other accounts managed by Fidelity Investments. The rate quoted is the annualized seven-day yield of the fund at period end. A complete unaudited listing of the fund's holdings as of its most recent quarter end is available upon request. In addition, each Fidelity Central Fund's financial statements are available on the SEC's website or upon request. |
(e) Provides evidence of ownership in one or more underlying municipal bonds. |
(f) Restricted securities - Investment in securities not registered under the Securities Act of 1933 (excluding 144A issues). At the end of the period, the value of restricted securities (excluding 144A issues) amounted to $6,830,000 or 0.3% of net assets. |
Additional information on each restricted holding is as follows: |
Security | Acquisition Date | Cost (000s) |
Riverton Hosp. Rev. Bonds Series WF 11 35C, 0.11%, tender 10/16/14 (Liquidity Facility Wells Fargo Bank NA) | 3/24/11 | $ 5,530 |
Washington Gen. Oblig. Bonds Series WF 11-16C, 0.11%, tender 10/2/14 (Liquidity Facility Wells Fargo Bank NA) | 5/9/13 | $ 1,300 |
Affiliated Central Funds |
Information regarding fiscal year to date income earned by the Fund from investments in Fidelity Central Funds is as follows: |
Fund | Income earned
(Amounts in thousands) |
Fidelity Tax-Free Cash Central Fund | $ 18 |
Other Information |
The date shown for securities represents the date when principal payments must be paid, taking into account any call options exercised by the issuer and any permissible maturity shortening features other than interest rate resets. |
All investments are categorized as Level 2 under the Fair Value Hierarchy. The inputs or methodology used for valuing securities may not be an indication of the risk associated with investing in those securities. For more information on valuation inputs, please refer to the Security Valuation section in the accompanying Notes to Financial Statements. |
See accompanying notes which are an integral part of the financial statements.
Semiannual Report
Tax-Exempt Portfolio
Financial Statements
Statement of Assets and Liabilities
Amounts in thousands (except per-share amounts) September 30, 2014
(Unaudited) |
| | |
Assets | | |
Investment in securities, at value - See accompanying schedule: Unaffiliated issuers (cost $2,162,967) | $ 2,162,967 | |
Fidelity Central Funds (cost $125,138) | 125,138 | |
Total Investments (cost $2,288,105) | | $ 2,288,105 |
Cash | | 85,702 |
Receivable for fund shares sold | | 109 |
Interest receivable | | 1,735 |
Distributions receivable from Fidelity Central Funds | | 4 |
Receivable from investment adviser for expense reductions | | 5 |
Other receivables | | 41 |
Total assets | | 2,375,701 |
| | |
Liabilities | | |
Payable for investments purchased | $ 2,000 | |
Payable for fund shares redeemed | 99 | |
Distributions payable | 9 | |
Accrued management fee | 76 | |
Other affiliated payables | 149 | |
Other payables and accrued expenses | 82 | |
Total liabilities | | 2,415 |
| | |
Net Assets | | $ 2,373,286 |
Net Assets consist of: | | |
Paid in capital | | $ 2,372,578 |
Accumulated undistributed net realized gain (loss) on investments | | 708 |
Net Assets | | $ 2,373,286 |
| | |
Class I:
Net Asset Value, offering price and redemption price per share ($2,139,769 ÷ 2,136,378 shares) | | $ 1.00 |
| | |
Class II:
Net Asset Value, offering price and redemption price per share ($11,842 ÷ 11,825 shares) | | $ 1.00 |
| | |
Class III:
Net Asset Value, offering price and redemption price per share ($215,258 ÷ 214,919 shares) | | $ 1.00 |
| | |
Select Class:
Net Asset Value, offering price and redemption price per share ($6,417 ÷ 6,405 shares) | | $ 1.00 |
Statement of Operations
Amounts in thousands Six months ended September 30, 2014
(Unaudited) |
| | |
Investment Income | | |
Interest | | $ 971 |
Income from Fidelity Central Funds | | 18 |
Total income | | 989 |
| | |
Expenses | | |
Management fee | $ 1,608 | |
Transfer agent fees | 696 | |
Distribution and service plan fees | 322 | |
Accounting fees and expenses | 109 | |
Custodian fees and expenses | 16 | |
Independent trustees' compensation | 5 | |
Registration fees | 52 | |
Audit | 19 | |
Legal | 2 | |
Miscellaneous | 11 | |
Total expenses before reductions | 2,840 | |
Expense reductions | (1,966) | 874 |
Net investment income (loss) | | 115 |
Realized and Unrealized Gain (Loss) Net realized gain (loss) on: | | |
Investment securities: | | |
Unaffiliated issuers | | 708 |
Net increase in net assets resulting from operations | | $ 823 |
See accompanying notes which are an integral part of the financial statements.
Semiannual Report
Statement of Changes in Net Assets
Amounts in thousands | Six months ended
September 30, 2014
(Unaudited) | Year ended
March 31,
2014 |
Increase (Decrease) in Net Assets | | |
Operations | | |
Net investment income (loss) | $ 115 | $ 251 |
Net realized gain (loss) | 708 | 262 |
Net increase in net assets resulting from operations | 823 | 513 |
Distributions to shareholders from net investment income | (115) | (251) |
Distributions to shareholders from net realized gain | - | (250) |
Total distributions | (115) | (501) |
Share transactions - net increase (decrease) | 23,770 | (337,140) |
Total increase (decrease) in net assets | 24,478 | (337,128) |
| | |
Net Assets | | |
Beginning of period | 2,348,808 | 2,685,936 |
End of period | $ 2,373,286 | $ 2,348,808 |
Financial Highlights - Class I
| Six months ended
September 30, 2014 | Years ended March 31, |
| (Unaudited) | 2014 | 2013 | 2012 | 2011 | 2010 |
Selected Per-Share Data | | | | | | |
Net asset value, beginning of period | $ 1.00 | $ 1.00 | $ 1.00 | $ 1.00 | $ 1.00 | $ 1.00 |
Income from Investment Operations | | | | | | |
Net investment income (loss) | - F | - F | - F | - F | .001 | .001 |
Net realized and unrealized gain (loss) F | - | - | - | - | - | - |
Total from investment operations | - F | - F | - F | - F | .001 | .001 |
Distributions from net investment income | - F | - F | - F | - F | (.001) | (.001) |
Distributions from net realized gain | - | - F | - | - | - F | - F |
Total distributions | - F | - F | - F | - F | (.001) | (.001) |
Net asset value, end of period | $ 1.00 | $ 1.00 | $ 1.00 | $ 1.00 | $ 1.00 | $ 1.00 |
Total ReturnB, C | .01% | .02% | .01% | .01% | .09% | .15% |
Ratios to Average Net Assets D, E | | | | | | |
Expenses before reductions | .22% A | .22% | .22% | .22% | .22% | .25% |
Expenses net of fee waivers, if any | .08% A | .11% | .18% | .16% | .22% | .23% |
Expenses net of all reductions | .08% A | .10% | .17% | .15% | .22% | .23% |
Net investment income (loss) | .01% A | .01% | .01% | .01% | .09% | .16% |
Supplemental Data | | | | | | |
Net assets, end of period (in millions) | $ 2,140 | $ 2,055 | $ 2,342 | $ 3,160 | $ 3,814 | $ 4,828 |
A Annualized
B Total returns for periods of less than one year are not annualized.
C Total returns would have been lower if certain expenses had not been reduced during the applicable periods shown.
D Fees and expenses of any underlying Fidelity Central Funds are not included in the Fund's expense ratio. The Fund indirectly bears its proportionate share of the expenses of any underlying Fidelity Central Funds.
E Expense ratios reflect operating expenses of the class. Expenses before reductions do not reflect amounts reimbursed or waived or reductions from expense offset arrangements and do not represent the amount paid by the class during periods when reimbursements, waivers or reductions occur. Expenses net of fee waivers reflect expenses after reimbursement and waivers but prior to reductions from expense offset arrangements. Expenses net of all reductions represent the net expenses paid by the class.
F Amount represents less than $.001 per share.
See accompanying notes which are an integral part of the financial statements.
Semiannual Report
Financial Highlights - Class II
| Six months ended
September 30, 2014 | Years ended March 31, |
| (Unaudited) | 2014 | 2013 | 2012 | 2011 | 2010 |
Selected Per-Share Data | | | | | | |
Net asset value, beginning of period | $ 1.00 | $ 1.00 | $ 1.00 | $ 1.00 | $ 1.00 | $ 1.00 |
Income from Investment Operations | | | | | | |
Net investment income (loss) | - F | - F | - F | - F | - F | .001 |
Net realized and unrealized gain (loss) F | - | - | - | - | - | - |
Total from investment operations | - F | - F | - F | - F | - F | .001 |
Distributions from net investment income | - F | - F | - F | - F | - F | (.001) |
Distributions from net realized gain | - | - F | - | - | - F | - F |
Total distributions | - F | - F | - F | - F | - F | (.001) |
Net asset value, end of period | $ 1.00 | $ 1.00 | $ 1.00 | $ 1.00 | $ 1.00 | $ 1.00 |
Total ReturnB, C | .01% | .02% | .01% | .01% | .01% | .05% |
Ratios to Average Net Assets D, E | | | | | | |
Expenses before reductions | .37% A | .37% | .37% | .37% | .37% | .40% |
Expenses net of fee waivers, if any | .08% A | .11% | .17% | .15% | .29% | .34% |
Expenses net of all reductions | .08% A | .10% | .17% | .15% | .29% | .34% |
Net investment income (loss) | .01% A | .01% | .01% | .01% | .01% | .06% |
Supplemental Data | | | | | | |
Net assets, end of period (in millions) | $ 12 | $ 12 | $ 12 | $ 15 | $ 22 | $ 26 |
A Annualized
B Total returns for periods of less than one year are not annualized.
C Total returns would have been lower if certain expenses had not been reduced during the applicable periods shown.
D Fees and expenses of any underlying Fidelity Central Funds are not included in the Fund's expense ratio. The Fund indirectly bears its proportionate share of the expenses of any underlying Fidelity Central Funds.
E Expense ratios reflect operating expenses of the class. Expenses before reductions do not reflect amounts reimbursed or waived or reductions from expense offset arrangements and do not represent the amount paid by the class during periods when reimbursements, waivers or reductions occur. Expenses net of fee waivers reflect expenses after reimbursement and waivers but prior to reductions from expense offset arrangements. Expenses net of all reductions represent the net expenses paid by the class.
F Amount represents less than $.001 per share.
Financial Highlights - Class III
| Six months ended
September 30, 2014 | Years ended March 31, |
| (Unaudited) | 2014 | 2013 | 2012 | 2011 | 2010 |
Selected Per-Share Data | | | | | | |
Net asset value, beginning of period | $ 1.00 | $ 1.00 | $ 1.00 | $ 1.00 | $ 1.00 | $ 1.00 |
Income from Investment Operations | | | | | | |
Net investment income (loss) F | - | - | - | - | - | - |
Net realized and unrealized gain (loss) F | - | - | - | - | - | - |
Total from investment operations F | - | - | - | - | - | - |
Distributions from net investment income F | - | - | - | - | - | - |
Distributions from net realized gain | - | - F | - | - | - F | - F |
Total distributions F | - | - | - | - | - | - |
Net asset value, end of period | $ 1.00 | $ 1.00 | $ 1.00 | $ 1.00 | $ 1.00 | $ 1.00 |
Total ReturnB, C | .01% | .02% | .01% | .01% | .01% | .03% |
Ratios to Average Net Assets D, E | | | | | | |
Expenses before reductions | .47% A | .47% | .47% | .47% | .47% | .50% |
Expenses net of fee waivers, if any | .08% A | .11% | .17% | .16% | .29% | .37% |
Expenses net of all reductions | .08% A | .10% | .17% | .16% | .29% | .37% |
Net investment income (loss) | .01% A | .01% | .01% | .01% | .01% | .02% |
Supplemental Data | | | | | | |
Net assets, end of period (in millions) | $ 215 | $ 275 | $ 323 | $ 240 | $ 198 | $ 166 |
A Annualized
B Total returns for periods of less than one year are not annualized.
C Total returns would have been lower if certain expenses had not been reduced during the applicable periods shown.
D Fees and expenses of any underlying Fidelity Central Funds are not included in the Fund's expense ratio. The Fund indirectly bears its proportionate share of the expenses of any underlying Fidelity Central Funds.
E Expense ratios reflect operating expenses of the class. Expenses before reductions do not reflect amounts reimbursed or waived or reductions from expense offset arrangements and do not represent the amount paid by the class during periods when reimbursements, waivers or reductions occur. Expenses net of fee waivers reflect expenses after reimbursement and waivers but prior to reductions from expense offset arrangements. Expenses net of all reductions represent the net expenses paid by the class.
F Amount represents less than $.001 per share.
See accompanying notes which are an integral part of the financial statements.
Semiannual Report
Financial Highlights - Select Class
| Six months ended
September 30, 2014 | Years ended March 31, |
| (Unaudited) | 2014 | 2013 | 2012 | 2011 | 2010 |
Selected Per-Share Data | | | | | | |
Net asset value, beginning of period | $ 1.00 | $ 1.00 | $ 1.00 | $ 1.00 | $ 1.00 | $ 1.00 |
Income from Investment Operations | | | | | | |
Net investment income (loss) | - F | - F | - F | - F | .001 | .001 |
Net realized and unrealized gain (loss) F | - | - | - | - | - | - |
Total from investment operations | - F | - F | - F | - F | .001 | .001 |
Distributions from net investment income | - F | - F | - F | - F | (.001) | (.001) |
Distributions from net realized gain | - | - F | - | - | - F | - F |
Total distributions | - F | - F | - F | - F | (.001) | (.001) |
Net asset value, end of period | $ 1.00 | $ 1.00 | $ 1.00 | $ 1.00 | $ 1.00 | $ 1.00 |
Total Return B, C | .01% | .02% | .01% | .01% | .06% | .11% |
Ratios to Average Net Assets D, E | | | | | | |
Expenses before reductions | .27% A | .27% | .27% | .27% | .27% | .30% |
Expenses net of fee waivers, if any | .08% A | .11% | .18% | .17% | .25% | .28% |
Expenses net of all reductions | .08% A | .11% | .18% | .17% | .25% | .28% |
Net investment income (loss) | .01% A | .01% | .01% | .01% | .05% | .12% |
Supplemental Data | | | | | | |
Net assets, end of period (in millions) | $ 6 | $ 7 | $ 8 | $ 15 | $ 73 | $ 60 |
A Annualized
B Total returns for periods of less than one year are not annualized.
C Total returns would have been lower if certain expenses had not been reduced during the applicable periods shown.
D Fees and expenses of any underlying Fidelity Central Funds are not included in the Fund's expense ratio. The Fund indirectly bears its proportionate share of the expenses of any underlying Fidelity Central Funds.
E Expense ratios reflect operating expenses of the class. Expenses before reductions do not reflect amounts reimbursed or waived or reductions from expense offset arrangements and do not represent the amount paid by the class during periods when reimbursements, waivers or reductions occur. Expenses net of fee waivers reflect expenses after reimbursement and waivers but prior to reductions from expense offset arrangements. Expenses net of all reductions represent the net expenses paid by the class.
F Amount represents less than $.001 per share.
See accompanying notes which are an integral part of the financial statements.
Semiannual Report
Notes to Financial Statements
For the period ended September 30, 2014 (Unaudited)
(Amounts in thousands except percentages)
1. Organization.
Treasury Only Portfolio, Treasury Portfolio, Government Portfolio, Prime Money Market Portfolio, Money Market Portfolio and Tax-Exempt Portfolio (the Funds) are funds of Fidelity Colchester Street Trust (the Trust). Each Fund is authorized to issue an unlimited number of shares. The Trust is registered under the Investment Company Act of 1940, as amended (the 1940 Act), as an open-end management investment company organized as a Delaware statutory trust. Each Fund offers Class I, Class II, Class III and Select Class shares. Prime Money Market Portfolio, Treasury Only Portfolio and Treasury Portfolio also offer Class IV and Institutional Class shares. Government Portfolio also offers Institutional Class shares. Money Market Portfolio also offers Class F and Institutional Class shares. Treasury Only Portfolio, Treasury Portfolio and Government Portfolio commenced sale of Institutional Class shares on May 14, 2014. All classes have equal rights as to assets and voting privileges. Each Fund except for Tax-Exempt Portfolio offers conversion privileges from Class I to Institutional Class for eligible shareholders. Class F shares of Money Market Portfolio are only available for purchase by mutual funds for which Fidelity Management & Research Company (FMR) or an affiliate serves as investment manager. Each class has exclusive voting rights with respect to matters that affect that class.
2. Investments in Fidelity Central Funds.
The Funds may invest in Fidelity Central Funds, which are open-end investment companies generally available only to other investment companies and accounts managed by the investment adviser and its affiliates. The Funds' Schedules of Investments list each of the Fidelity Central Funds held as of period end, if any, as an investment of each Fund, but do not include the underlying holdings of each Fidelity Central Fund. As an Investing Fund, each Fund indirectly bears its proportionate share of the expenses of the underlying Fidelity Central Funds.
The Money Market Central Funds seek preservation of capital and current income and are managed by Fidelity Investments Money Management, Inc. (FIMM), an affiliate of the investment adviser. Annualized expenses of the Money Market Central Funds as of their most recent shareholder report date are less than .01%.
A complete unaudited list of holdings for each Fidelity Central Fund is available upon request or at the Securities and Exchange Commission (the SEC) website at www.sec.gov. In addition, the financial statements of the Fidelity Central Funds are available on the SEC website or upon request.
3. Significant Accounting Policies.
The financial statements have been prepared in conformity with accounting principles generally accepted in the United States of America (GAAP), which require management to make certain estimates and assumptions at the date of the financial statements. Actual results could differ from those estimates. Subsequent events, if any, through the date that the financial statements were issued have been evaluated in the preparation of the financial statements. The following summarizes the significant accounting policies of the Funds:
Security Valuation. Each Fund categorizes the inputs to valuation techniques used to value its investments into a disclosure hierarchy consisting of three levels as shown below:
Level 1 - quoted prices in active markets for identical investments
Level 2 - other significant observable inputs (including quoted prices for similar investments, interest rates, prepayment speeds, etc.)
Level 3 - unobservable inputs (including the Fund's own assumptions based on the best information available)
As permitted by compliance with certain conditions under Rule 2a-7 of the 1940 Act, securities are valued at amortized cost, which approximates fair value. The amortized cost of an instrument is determined by valuing it at its original cost and thereafter amortizing any discount or premium from its face value at a constant rate until maturity. Securities held by a money market fund are generally high quality and liquid; however, they are reflected as Level 2 because the inputs used to determine fair value are not quoted prices in an active market.
Investment Transactions and Income. Security transactions, including the Funds' investment activity in the Fidelity Central Funds, are accounted for as of trade date. Gains and losses on securities sold are determined on the basis of identified cost. Income and capital gain distributions from Fidelity Central Funds, if any, are recorded on the ex-dividend date. Interest income is accrued as earned and includes coupon interest and amortization of premium and accretion of discount on debt securities as applicable. The principal amount on inflation-indexed securities is periodically adjusted to the rate of inflation and interest is accrued based on the principal amount. The adjustments to principal due to inflation are reflected as increases or decreases to Interest in the accompanying Statement of Operations.
Class Allocations and Expenses. Investment income, realized and unrealized capital gains and losses, common expenses of each Fund, and certain fund-level expense reductions, if any, are allocated daily on a pro-rata basis to each class based on the relative net assets of each class to the total net assets of each Fund. Each class differs with respect to transfer agent and distribution and service plan fees incurred. Certain expense reductions may also differ by class. For the reporting period, the allocated portion of income and expenses to each class as a percent of its average net assets may vary
Semiannual Report
Notes to Financial Statements (Unaudited) - continued
(Amounts in thousands except percentages)
3. Significant Accounting Policies - continued
Class Allocations and Expenses - continued
due to the timing of recording these transactions in relation to fluctuating net assets of the classes. Expenses directly attributable to a fund are charged to that fund. Expenses attributable to more than one fund are allocated among the respective funds on the basis of relative net assets or other appropriate methods. Expense estimates are accrued in the period to which they relate and adjustments are made when actual amounts are known.
Deferred Trustee Compensation. Under a Deferred Compensation Plan (the Plan) for Treasury Portfolio, Government Portfolio, Prime Money Market Portfolio, Money Market Portfolio and Tax-Exempt Portfolio, independent Trustees may elect to defer receipt of a portion of their annual compensation. Deferred amounts are invested in a cross-section of Fidelity funds, are marked-to-market and remain in the Fund until distributed in accordance with the Plan. The investment of deferred amounts and the offsetting payable to the Trustees are included in the accompanying Statement of Assets and Liabilities.
Income Tax Information and Distributions to Shareholders. Each year, each Fund intends to qualify as a regulated investment company under Subchapter M of the Internal Revenue Code, including distributing substantially all of its taxable income and realized gains. As a result, no provision for U.S. Federal income taxes is required. Each Fund files a U.S. federal tax return, in addition to state and local tax returns as required. Each Fund's federal income tax returns are subject to examination by the Internal Revenue Service (IRS) for a period of three fiscal years after they are filed. State and local tax returns may be subject to examination for an additional fiscal year depending on the jurisdiction.
Dividends are declared and recorded daily and paid monthly from net investment income. Distributions from realized gains, if any, are declared and recorded on the ex-dividend date. Income dividends and capital gain distributions are declared separately for each class. Income and capital gain distributions are determined in accordance with income tax regulations, which may differ from GAAP.
Capital accounts within the financial statements are adjusted for permanent book-tax differences. These adjustments have no impact on net assets or the results of operations. Capital accounts are not adjusted for temporary book-tax differences which will reverse in a subsequent period.
Book-tax differences are primarily due to deferred trustees compensation, capital loss carryforwards and losses deferred due to wash sales.
The Tax-Exempt Portfolio purchases municipal securities whose interest, in the opinion of the issuer, is free from federal income tax. There is no assurance that the IRS will agree with this opinion. In the event the IRS determines that the issuer does not comply with relevant tax requirements, interest payments from a security could become federally taxable, possibly retroactively to the date the security was issued.
The federal tax cost of investment securities and unrealized appreciation (depreciation) as of period end were as follows for each Fund:
| Tax cost | Gross unrealized
appreciation | Gross unrealized
depreciation | Net unrealized
appreciation
(depreciation) on
securities |
Treasury Only Portfolio | $ 11,331,994 | $ - | $ - | $ - |
Treasury Portfolio | 15,671,476 | - | - | - |
Government Portfolio | 25,332,631 | - | - | - |
Prime Money Market Portfolio | 33,887,510 | - | - | - |
Money Market Portfolio | 63,907,738 | - | - | - |
Tax-Exempt Portfolio | 2,288,105 | - | - | - |
Capital loss carryforwards are only available to offset future capital gains of the Funds to the extent provided by regulations and may be limited. Under the Regulated Investment Company Modernization Act of 2010 (the Act), the Funds are permitted to carry forward capital losses incurred in taxable years beginning after December 22, 2010 for an unlimited period and such capital losses are required to be used prior to any losses that expire. The capital loss carryforward information presented below, including any applicable limitation, is estimated as of prior fiscal period end and is subject to adjustment.
| Fiscal year
of expiration |
| 2019 |
Government Portfolio | $ (1,187) |
Repurchase Agreements. Pursuant to an Exemptive Order issued by the SEC, the Funds along with other registered investment companies having management contracts with FMR, or other affiliated entities of FMR, are permitted to transfer uninvested cash balances into joint trading accounts which are then invested in repurchase agreements. The Funds may also invest directly with institutions in repurchase agreements. Repurchase agreements may be collateralized by government or non-government securities. Upon settlement date, collateral is held in segregated accounts with
Semiannual Report
3. Significant Accounting Policies - continued
Repurchase Agreements - continued
custodian banks and may be obtained in the event of a default of the counterparty. Each applicable Fund monitors, on a daily basis, the value of the collateral to ensure it is at least equal to the principal amount of the repurchase agreement (including accrued interest). In the event of a default by the counterparty, realization of the collateral proceeds could be delayed, during which time the value of the collateral may decline.
Reverse Repurchase Agreements. To enhance their yield, the Funds may enter into reverse repurchase transactions under master repurchase agreements whereby the Fund sells securities to a counterparty in return for cash and agrees to repurchase those securities at a future date and agreed upon price. During the period that reverse repurchase transactions are outstanding, each applicable fund identifies the securities as pledged in its records with an initial value at least equal to its principal obligation under the agreement. The cash proceeds received by the Funds may be invested in other securities. To the extent cash proceeds received from the counterparty exceed the value of the securities sold, the counterparty may request additional collateral from the Fund. If the counterparty defaults on its obligation, because of insolvency or other reasons, the Fund could experience delays and costs in recovering the securities sold. Information regarding securities sold under a reverse repurchase agreement, if any, is included at the end of each applicable Fund's Schedule of Investments and the cash proceeds are recorded as a liability in each applicable fund's accompanying Statement of Assets and Liabilities. The Fund continues to receive interest and dividend payments on the securities sold during the term of the reverse repurchase agreement. At period end, there were no reverse repurchase agreements outstanding.
Restricted Securities. The Funds may invest in securities that are subject to legal or contractual restrictions on resale. These securities generally may be resold in transactions exempt from registration or to the public if the securities are registered. Disposal of these securities may involve time-consuming negotiations and expense, and prompt sale at an acceptable price may be difficult. Information regarding restricted securities is included at the end of each applicable Fund's Schedule of Investments.
4. Fees and Other Transactions with Affiliates.
Management Fee. Fidelity Management & Research Company (the investment adviser) and its affiliates provide the Funds with investment management related services for which the Funds pay a monthly management fee that is based on an annual rate of .14% of average net assets.
Distribution and Service Plan Fees. In accordance with Rule 12b-1 of the 1940 Act, the Funds have adopted separate Distribution and Service Plans for each class of shares. Class II, Class III and Select Class of each Fund pays Fidelity Distributors Corporation (FDC), an affiliate of the investment adviser, a Service fee based on an annual percentage of each class' average net assets. Class IV of Treasury Only Portfolio, Treasury Portfolio and Prime Money Market Portfolio pays FDC separate Distribution and Service Fees, each of which is based on an annual percentage of each class' average net assets. FDC may pay financial intermediaries for selling shares of the Funds and providing shareholder support services. For the period, the Distribution and Service fee rates, total fees and amounts retained by FDC were as follows:
| Distribution
Fee | Service
Fee |
Class II | .00% | .15% |
Class III | .00% | .25% |
Class IV | .25% | .25% |
Select Class | .00% | .05% |
| Total Fees | Retained
by FDC |
Treasury Only Portfolio: Class II | $ 261 | $ - |
Class III | 739 | - |
Class IV | 139 | - |
Select Class | 75 | - |
| $ 1,214 | $ - |
Treasury Portfolio: Class II | $ 66 | $ - |
Class III | 3,669 | - |
Class IV | 1,267 | - |
Select Class | 54 | - |
| $ 5,056 | $ - |
Semiannual Report
Notes to Financial Statements (Unaudited) - continued
(Amounts in thousands except percentages)
4. Fees and Other Transactions with Affiliates - continued
Distribution and Service Plan Fees - continued
| Total Fees | Retained
by FDC |
Government Portfolio: Class II | $ 409 | $ - |
Class III | 2,802 | - |
Select Class | 94 | - |
| $ 3,305 | $ - |
Prime Money Market Portfolio: Class II | $ 376 | $ - |
Class III | 1,916 | - |
Class IV | 319 | - |
Select Class | 243 | - |
| $ 2,854 | $ - |
Money Market Portfolio: Class II | $ 100 | $ -* |
Class III | 1,994 | - |
Select Class | 92 | 44 |
| $ 2,186 | $ 44 |
Tax-Exempt Portfolio: Class II | $ 9 | $ - |
Class III | 311 | - |
Select Class | 2 | - |
| $ 322 | $ - |
* Amount represents three hundred sixty three dollars.
During the period, the investment adviser or its affiliates waived a portion of these fees.
Transfer Agent Fees. Fidelity Investments Institutional Operations Company, Inc. (FIIOC), an affiliate of the investment adviser, is the transfer, dividend disbursing and shareholder servicing agent for the Funds except for Tax-Exempt Portfolio. Citibank, N.A. (Citibank) is the custodian, transfer and servicing agent for Tax-Exempt Portfolio. Citibank has entered into a sub-arrangement with FIIOC to perform the activities associated with the transfer agency and shareholder servicing functions for Tax-Exempt Portfolio. FIIOC receives asset-based fees with respect to each account. FIIOC pays for typesetting, printing and mailing of all shareholder reports, except proxy statements. Each class, with the exception of Institutional Class, pays a transfer agent fee equal to an annual rate of .06% of average net assets. Institutional Class pays a transfer agent fee equal to an annual rate of .03% of average net assets. FIIOC receives no fees for providing transfer agency services to Class F. The transfer agent fee for each class of Tax-Exempt Portfolio is paid to Citibank. For the period, transfer agent fees for each class were as follows:
Treasury Only Portfolio - Class I | $ 2,826 |
Treasury Only Portfolio - Class II | 106 |
Treasury Only Portfolio - Class III | 179 |
Treasury Only Portfolio - Class IV | 17 |
Treasury Only Portfolio - Select Class | 91 |
Treasury Only Portfolio - Institutional Class | 5 |
| $ 3,224 |
Treasury Portfolio - Class I | $ 2,952 |
Treasury Portfolio - Class II | 27 |
Treasury Portfolio - Class III | 885 |
Treasury Portfolio - Class IV | 153 |
Treasury Portfolio - Select Class | 65 |
Treasury Portfolio - Institutional Class | 14 |
| $ 4,096 |
Government Portfolio - Class I | $ 6,681 |
Government Portfolio - Class II | 164 |
Government Portfolio - Class III | 676 |
Government Portfolio - Select Class | 114 |
Government Portfolio - Institutional Class | 28 |
| $ 7,663 |
Semiannual Report
4. Fees and Other Transactions with Affiliates - continued
Transfer Agent Fees - continued
Prime Money Market Portfolio - Class I | $ 2,077 |
Prime Money Market Portfolio - Class II | 152 |
Prime Money Market Portfolio - Class III | 463 |
Prime Money Market Portfolio - Class IV | 39 |
Prime Money Market Portfolio - Select Class | 295 |
Prime Money Market Portfolio - Institutional Class | 4,199 |
| $ 7,225 |
Money Market Portfolio - Class I | $ 6,838 |
Money Market Portfolio - Class II | 41 |
Money Market Portfolio - Class III | 481 |
Money Market Portfolio - Select Class | 111 |
Money Market Portfolio - Institutional Class | 5,909 |
| $ 13,380 |
Tax-Exempt Portfolio - Class I | $ 614 |
Tax-Exempt Portfolio - Class II | 4 |
Tax-Exempt Portfolio - Class III | 76 |
Tax-Exempt Portfolio - Select Class | 2 |
| $ 696 |
During the period, the investment adviser or its affiliates waived a portion of these fees.
Accounting Fees. Fidelity Service Company, Inc. (FSC), an affiliate of the investment adviser, maintains the accounting records for the Funds except for Tax-Exempt Portfolio. Citibank has entered into a sub-arrangement with FSC to maintain Tax-Exempt Portfolio's accounting records. The fee is based on the level of average net assets for each month. The fee for Tax-Exempt Portfolio is paid to Citibank.
5. Expense Reductions.
The investment adviser voluntarily agreed to reimburse funds to the extent annual operating expenses exceeded certain levels of average net assets as noted in the table below. Some expenses, for example interest expense, are excluded from this reimbursement.
The following classes of each applicable Fund were in reimbursement during the period:
| Expense
Limitations | Reimbursement |
Treasury Only Portfolio | | |
Class I | .20% | $ 431 |
Class II | .35% | 15 |
Class III | .45% | 28 |
Class IV | .70% | 4 |
Select Class | .25% | 16 |
Institutional Class | .14% | 7 |
Treasury Portfolio | | |
Class I | .20% | $ 384 |
Class II | .35% | 4 |
Class III | .45% | 107 |
Class IV | .70% | 14 |
Select Class | .25% | 8 |
Institutional Class | .14% | 19 |
Government Portfolio | | |
Class I | .20% | $ 744 |
Class II | .35% | 18 |
Class III | .45% | 67 |
Select Class | .25% | 13 |
Institutional Class | .14% | 36 |
Semiannual Report
Notes to Financial Statements (Unaudited) - continued
(Amounts in thousands except percentages)
5. Expense Reductions - continued
| Expense
Limitations | Reimbursement |
Prime Money Market Portfolio | | |
Class I | .20% | $ 251 |
Class II | .35% | 18 |
Class III | .45% | 51 |
Class IV | .70% | 4 |
Select Class | .25% | 38 |
Institutional Class | .14% | 5,216 |
Money Market Portfolio | | |
Class I | .18% | $ 2,916 |
Class II | .33% | 17 |
Class III | .43% | 198 |
Select Class | .23% | 47 |
Class F | .14% | 60 |
Institutional Class | .14% | 7,016 |
Tax-Exempt Portfolio | | |
Class II | .35% | $ 1 |
Class III | .45% | 24 |
Select Class | .25% | 1 |
Additionally, the investment adviser or its affiliates voluntarily agreed to waive certain fees in order to maintain a minimum annualized yield of .01%. Such arrangements may be discontinued by the investment adviser at any time. For the period, the amount of the waiver for each class was as follows:
Treasury Only Portfolio | |
Class I | $ 7,309 |
Class II | 535 |
Class III | 1,201 |
Class IV | 308 |
Select Class | 181 |
Institutional Class | 16 |
Treasury Portfolio | |
Class I | $ 6,723 |
Class II | 126 |
Class III | 5,697 |
Class IV | 1,619 |
Select Class | 202 |
Institutional Class | 36 |
Government Portfolio | |
Class I | $ 11,365 |
Class II | 691 |
Class III | 3,959 |
Select Class | 286 |
Institutional Class | 40 |
Prime Money Market Portfolio | |
Class I | $ 393 |
Class II | 407 |
Class III | 2,009 |
Class IV | 329 |
Select Class | 298 |
Money Market Portfolio | |
Class II | $ 78 |
Class III | 1,724 |
Select Class | 28 |
Tax-Exempt Portfolio | |
Class I | $ 1,446 |
Class II | 16 |
Class III | 466 |
Select Class | 6 |
Semiannual Report
5. Expense Reductions - continued
In addition, through arrangements with each applicable Fund's custodian, credits realized as a result of uninvested cash balances were used to reduce each Fund's expenses. All of the applicable expense reductions are noted in the table below.
| Custody expense
reduction |
Treasury Only Portfolio | $ 9 |
Treasury Portfolio | 3 |
Government Portfolio | 7 |
Prime Money Market Portfolio | 5 |
Money Market Portfolio | 10 |
Tax-Exempt Portfolio | 6 |
6. Distributions to Shareholders.
Distributions to shareholders of each class were as follows:
| Six months ended
September 30,
2014 | Year ended
March 31,
2014 |
Treasury Only Portfolio A | | |
From net investment income | | |
Class I | $ 469 | $ 1,042 |
Class II | 18 | 36 |
Class III | 30 | 40 |
Class IV | 3 | 2 |
Select Class | 15 | 20 |
Institutional Class | 2 | - |
Total | $ 537 | $ 1,140 |
Treasury Portfolio A | | |
From net investment income | | |
Class I | $ 490 | $ 1,013 |
Class II | 4 | 9 |
Class III | 148 | 275 |
Class IV | 25 | 49 |
Select Class | 11 | 24 |
Institutional Class | 5 | - |
Total | $ 683 | $ 1,370 |
Government Portfolio A | | |
From net investment income | | |
Class I | $ 1,114 | $ 2,302 |
Class II | 27 | 40 |
Class III | 112 | 187 |
Select Class | 19 | 46 |
Institutional Class | 9 | - |
Total | $ 1,281 | $ 2,575 |
Prime Money Market Portfolio | | |
From net investment income | | |
Class I | $ 346 | $ 1,330 |
Class II | 25 | 47 |
Class III | 77 | 221 |
Class IV | 6 | 6 |
Select Class | 49 | 163 |
Institutional Class | 8,180 | 19,212 |
Total | $ 8,683 | $ 20,979 |
Semiannual Report
Notes to Financial Statements (Unaudited) - continued
(Amounts in thousands except percentages)
6. Distributions to Shareholders - continued
| Six months ended
September 30,
2014 | Year ended
March 31,
2014 |
Money Market Portfolio | | |
From net investment income | | |
Class I | $ 5,105 | $ 14,309 |
Class II | 7 | 18 |
Class III | 80 | 227 |
Select Class | 18 | 63 |
Class F | 892 | 2,257 |
Institutional Class | 16,664 | 38,629 |
Total | $ 22,766 | $ 55,503 |
Tax-Exempt Portfolio | | |
From net investment income | | |
Class I | $ 102 | $ 221 |
Class II | 1 | 1 |
Class III | 12 | 28 |
Select Class | - B | 1 |
Total | $ 115 | $ 251 |
From net realized gain | | |
Class I | $ - | $ 222 |
Class II | - | 1 |
Class III | - | 26 |
Select Class | - | 1 |
Total | $ - | $ 250 |
A Distributions for Institutional Class are for the period May 14, 2014 (commencement of sale of shares) to September 30, 2014.
B Amount represents three hundred thirty-two dollars.
7. Share Transactions.
Share transactions for each class of shares at a $1.00 per share were as follows and may contain automatic conversions between classes or exchanges between funds:
| Six months ended
September 30,
2014 | Year ended
March 31,
2014 |
Treasury Only Portfolio A | | |
Class I Shares sold | 10,265,905 | 24,513,309 |
Reinvestment of distributions | 348 | 728 |
Shares redeemed | (10,515,796) | (24,149,458) |
Net increase (decrease) | (249,543) | 364,579 |
Class II Shares sold | 235,755 | 552,697 |
Reinvestment of distributions | 8 | 20 |
Shares redeemed | (234,732) | (546,875) |
Net increase (decrease) | 1,031 | 5,842 |
Class III Shares sold | 1,687,770 | 1,861,802 |
Reinvestment of distributions | 8 | 14 |
Shares redeemed | (1,568,056) | (1,782,997) |
Net increase (decrease) | 119,722 | 78,819 |
Class IV Shares sold | 197,723 | 84,558 |
Reinvestment of distributions | 3 | 2 |
Shares redeemed | (70,364) | (87,845) |
Net increase (decrease) | 127,362 | (3,285) |
Semiannual Report
7. Share Transactions - continued
| Six months ended
September 30,
2014 | Year ended
March 31,
2014 |
Treasury Only Portfolio A - continued | | |
Select Class Shares sold | 901,398 | 1,200,234 |
Reinvestment of distributions | 13 | 17 |
Shares redeemed | (772,650) | (1,194,908) |
Net increase (decrease) | 128,761 | 5,343 |
Institutional Class Shares sold | 108,404 | - |
Reinvestment of distributions | 2 | - |
Shares redeemed | (45,768) | - |
Net increase (decrease) | 62,638 | - |
Treasury Portfolio A | | |
Class I Shares sold | 29,564,335 | 56,798,646 |
Reinvestment of distributions | 254 | 493 |
Shares redeemed | (28,316,186) | (57,027,837) |
Net increase (decrease) | 1,248,403 | (228,698) |
Class II Shares sold | 685,010 | 1,411,658 |
Reinvestment of distributions | 1 | 3 |
Shares redeemed | (703,586) | (1,405,038) |
Net increase (decrease) | (18,575) | 6,623 |
Class III Shares sold | 8,112,800 | 14,091,001 |
Reinvestment of distributions | 17 | 37 |
Shares redeemed | (7,331,507) | (14,281,777) |
Net increase (decrease) | 781,310 | (190,739) |
Class IV Shares sold | 469,456 | 836,663 |
Shares redeemed | (538,595) | (773,322) |
Net increase (decrease) | (69,139) | 63,341 |
Select Class Shares sold | 184,695 | 699,148 |
Reinvestment of distributions | 6 | 11 |
Shares redeemed | (234,014) | (658,616) |
Net increase (decrease) | (49,313) | 40,543 |
Institutional Class Shares sold | 468,102 | - |
Reinvestment of distributions | 5 | - |
Shares redeemed | (32,000) | - |
Net increase (decrease) | 436,107 | - |
Government Portfolio A | | |
Class I Shares sold | 78,687,464 | 209,862,111 |
Reinvestment of distributions | 573 | 1,119 |
Shares redeemed | (78,926,256) | (208,873,085) |
Net increase (decrease) | (238,219) | 990,145 |
Class II Shares sold | 5,235,045 | 11,181,265 |
Reinvestment of distributions | 7 | 14 |
Shares redeemed | (4,882,428) | (11,466,827) |
Net increase (decrease) | 352,624 | (285,548) |
Semiannual Report
Notes to Financial Statements (Unaudited) - continued
(Amounts in thousands except percentages)
7. Share Transactions - continued
| Six months ended
September 30,
2014 | Year ended
March 31,
2014 |
Government Portfolio A - continued | | |
Class III Shares sold | 3,642,133 | 6,540,066 |
Reinvestment of distributions | 26 | 32 |
Shares redeemed | (3,565,144) | (5,983,828) |
Net increase (decrease) | 77,015 | 556,270 |
Select Class Shares sold | 518,634 | 1,389,405 |
Reinvestment of distributions | 11 | 35 |
Shares redeemed | (550,142) | (1,679,603) |
Net increase (decrease) | (31,497) | (290,163) |
Institutional Class Shares sold | 528,100 | - |
Reinvestment of distributions | 9 | - |
Shares redeemed | (171,624) | - |
Net increase (decrease) | 356,485 | - |
Prime Money Market Portfolio | | |
Class I Shares sold | 20,292,399 | 48,461,171 |
Reinvestment of distributions | 107 | 445 |
Shares redeemed | (21,875,836) | (50,976,847) |
Net increase (decrease) | (1,583,330) | (2,515,231) |
Class II Shares sold | 1,440,341 | 2,447,579 |
Reinvestment of distributions | 9 | 25 |
Shares redeemed | (1,204,901) | (2,514,929) |
Net increase (decrease) | 235,449 | (67,325) |
Class III Shares sold | 2,806,415 | 6,058,144 |
Reinvestment of distributions | 14 | 30 |
Shares redeemed | (3,586,974) | (5,881,307) |
Net increase (decrease) | (780,545) | 176,867 |
Class IV Shares sold | 202,334 | 306,810 |
Reinvestment of distributions | 6 | 4 |
Shares redeemed | (98,470) | (243,064) |
Net increase (decrease) | 103,870 | 63,750 |
Select Class Shares sold | 1,585,704 | 8,619,365 |
Reinvestment of distributions | 18 | 61 |
Shares redeemed | (2,016,669) | (9,170,685) |
Net increase (decrease) | (430,947) | (551,259) |
Institutional Class Shares sold | 213,081,421 | 419,265,240 |
Reinvestment of distributions | 5,006 | 12,336 |
Shares redeemed | (214,577,318) | (423,063,158) |
Net increase (decrease) | (1,490,891) | (3,785,582) |
Money Market Portfolio | | |
Class I Shares sold | 49,848,417 | 78,151,555 |
Reinvestment of distributions | 3,612 | 10,402 |
Shares redeemed | (49,441,874) | (79,866,608) |
Net increase (decrease) | 410,155 | (1,704,651) |
Semiannual Report
7. Share Transactions - continued
| Six months ended
September 30,
2014 | Year ended
March 31,
2014 |
Money Market Portfolio - continued | | |
Class II Shares sold | 536,562 | 1,059,440 |
Reinvestment of distributions | 5 | 14 |
Shares redeemed | (577,614) | (1,073,750) |
Net increase (decrease) | (41,047) | (14,296) |
Class III Shares sold | 3,549,275 | 14,051,941 |
Reinvestment of distributions | 35 | 94 |
Shares redeemed | (3,961,362) | (14,303,766) |
Net increase (decrease) | (412,052) | (251,731) |
Select Class Shares sold | 631,081 | 836,512 |
Reinvestment of distributions | 6 | 22 |
Shares redeemed | (596,099) | (895,118) |
Net increase (decrease) | 34,988 | (58,584) |
Class F Shares sold | 286,051 | 563,133 |
Reinvestment of distributions | 884 | 2,257 |
Shares redeemed | (369,999) | (674,872) |
Net increase (decrease) | (83,064) | (109,482) |
Institutional Class Shares sold | 115,717,734 | 213,762,027 |
Reinvestment of distributions | 12,250 | 28,552 |
Shares redeemed | (117,775,989) | (211,472,069) |
Net increase (decrease) | (2,046,005) | 2,318,510 |
Tax-Exempt Portfolio | | |
Class I Shares sold | 2,002,492 | 3,372,864 |
Reinvestment of distributions | 57 | 257 |
Shares redeemed | (1,918,198) | (3,660,725) |
Net increase (decrease) | 84,351 | (287,604) |
Class II Shares sold | 155 | 2,890 |
Reinvestment of distributions | 1 | 2 |
Shares redeemed | (166) | (2,938) |
Net increase (decrease) | (10) | (46) |
Class III Shares sold | 686,861 | 1,634,781 |
Reinvestment of distributions | 4 | 18 |
Shares redeemed | (746,594) | (1,683,244) |
Net increase (decrease) | (59,729) | (48,445) |
Select Class Shares sold | 19,189 | 37,983 |
Reinvestment of distributions | - B | - C |
Shares redeemed | (20,031) | (39,028) |
Net increase (decrease) | (842) | (1,045) |
A Share transactions for Institutional Class are for the period May 14, 2014 (commencement of sale of shares) to September 30, 2014.
B Amount represents one hundred two shares.
C Amount represents four hundred sixty-nine shares.
Semiannual Report
Notes to Financial Statements (Unaudited) - continued
(Amounts in thousands except percentages)
8. Other.
The Funds' organizational documents provide former and current trustees and officers with a limited indemnification against liabilities arising in connection with the performance of their duties to the Funds. In the normal course of business, the Funds may also enter into contracts that provide general indemnifications. The Funds' maximum exposure under these arrangements is unknown as this would be dependent on future claims that may be made against the Funds. The risk of material loss from such claims is considered remote.
At the end of the period, the investment adviser or its affiliates were the owners of record of more than 10% of the total outstanding shares of the Government Portfolio.
Semiannual Report
Board Approval of Investment Advisory Contracts and Management Fees
FIMM Funds: Treasury Only Portfolio / Treasury Portfolio / Government Portfolio / Prime Money Market Portfolio / Money Market Portfolio / Tax-Exempt Portfolio
Each year, the Board of Trustees, including the Independent Trustees (together, the Board), votes on the renewal of the management contract with Fidelity Management & Research Company (FMR) and the sub-advisory agreements (together, the Advisory Contracts) for each fund. The Board, assisted by the advice of fund counsel and Independent Trustees' counsel, requests and considers a broad range of information relevant to the renewal of the Advisory Contracts throughout the year.
The Board meets regularly and, at each of its meetings, covers an extensive agenda of topics and materials and considers factors that are relevant to its annual consideration of the renewal of each fund's Advisory Contracts, including the services and support provided to each fund and its shareholders. The Board has established four standing committees (Committees) - Operations, Audit, Fair Valuation, and Governance and Nominating - each composed of and chaired by Independent Trustees with varying backgrounds, to which the Board has assigned specific subject matter responsibilities in order to enhance effective decision-making by the Board. The Operations Committee, of which all of the Independent Trustees are members, meets regularly throughout the year and considers, among other matters, information specifically related to the annual consideration of the renewal of each fund's Advisory Contracts. The Board, acting directly and through its Committees, requests and receives information concerning the annual consideration of the renewal of each fund's Advisory Contracts. The Board also meets as needed to consider matters specifically related to the Board's annual consideration of the renewal of the Advisory Contracts. Members of the Board may also meet with trustees of other Fidelity funds through ad hoc joint committees to discuss certain matters relevant to the Fidelity funds.
At its September 2014 meeting, the Board, including the Independent Trustees, unanimously determined to renew each fund's Advisory Contracts. In reaching its determination, the Board considered all factors it believed relevant, including (i) the nature, extent, and quality of the services to be provided to each fund and its shareholders (including the investment performance of each fund); (ii) the competitiveness of each fund's management fee and total expense ratio relative to peer funds; (iii) the total costs of the services to be provided by and the profits to be realized by Fidelity from its relationship with each fund; (iv) the extent to which economies of scale exist and would be realized as each fund grows; and (v) whether fee levels reflect these economies of scale, if any, for the benefit of fund shareholders. In connection with separate internal corporate reorganizations involving Fidelity Management & Research (U.K.) Inc. (FMR U.K.) and Fidelity Management & Research (Japan) Inc. (FMR Japan), the Board approved certain non-material amendments to the funds' sub-advisory agreements with FMR U.K. and FMR Japan to reflect that, after these reorganizations, FMR Investment Management (UK) Limited and Fidelity Management & Research (Japan) Limited will carry on the business of FMR U.K. and FMR Japan, respectively. The Board noted that no changes to the portfolio managers or to the foreign research or investment advisory services provided to the funds were expected in connection with either reorganization and that the same personnel and resources would continue to be available to the funds at the new entities.
In considering whether to renew the Advisory Contracts for each fund, the Board reached a determination, with the assistance of fund counsel and Independent Trustees' counsel and through the exercise of its business judgment, that the renewal of the Advisory Contracts was in the best interests of each fund and its shareholders and that the compensation payable under the Advisory Contracts was fair and reasonable. The Board's decision to renew the Advisory Contracts was not based on any single factor, but rather was based on a comprehensive consideration of all the information provided to the Board at its meetings throughout the year. The Board, in reaching its determination to renew the Advisory Contracts, was aware that shareholders of each fund have a broad range of investment choices available to them, including a wide choice among funds offered by Fidelity's competitors, and that each fund's shareholders, who have the opportunity to review and weigh the disclosure provided by the fund in its prospectus and other public disclosures, have chosen to invest in that fund, which is part of the Fidelity family of funds.
Nature, Extent, and Quality of Services Provided. The Board considered Fidelity's staffing as it relates to the funds, including the backgrounds of investment personnel of Fidelity, and also considered the funds' investment objectives, strategies, and related investment philosophies. The Independent Trustees also had discussions with senior management of Fidelity's investment operations and investment groups. The Board considered the structure of the portfolio manager compensation program and whether this structure provides appropriate incentives to act in the best interests of each fund. Additionally, the Board considered the portfolio managers' investments, if any, in the funds that they manage.
Resources Dedicated to Investment Management and Support Services. The Board reviewed the general qualifications and capabilities of Fidelity's investment staff, including its size, education, experience, and resources, as well as Fidelity's approach to recruiting, training, managing, and compensating investment personnel. The Board noted that Fidelity has continued to increase the resources devoted to non-U.S. offices, including expansion of Fidelity's global investment organization. The Board also noted that Fidelity's analysts have extensive resources, tools and capabilities that allow them to conduct sophisticated quantitative and fundamental analysis, as well as credit analysis of issuers, counterparties and guarantors. Further, the Board believes that Fidelity's investment professionals have sufficient access to global information and data so as to provide competitive investment results over time, and that those professionals also have access to sophisticated tools that permit them to assess portfolio construction and risk and performance attribution characteristics continuously, as well as to transmit new information and research conclusions rapidly around the world. Additionally, in its deliberations, the Board considered Fidelity's trading, risk management, and compliance capabilities and resources, which are integral parts of the investment management process.
Semiannual Report
Board Approval of Investment Advisory Contracts and Management Fees - continued
Shareholder and Administrative Services. The Board considered (i) the nature, extent, quality, and cost of advisory, administrative, and shareholder services performed by FMR, the sub-advisers (together with FMR, the Investment Advisers), and their affiliates under the Advisory Contracts and under separate agreements covering transfer agency and pricing and bookkeeping services for each fund; (ii) the nature and extent of the supervision of third party service providers, principally custodians and subcustodians; and (iii) the resources devoted to, and the record of compliance with, each fund's compliance policies and procedures.
The Board noted that the growth of fund assets over time across the complex allows Fidelity to reinvest in the development of services designed to enhance the value or convenience of the Fidelity funds as investment vehicles. These services include 24-hour access to account information and market information through telephone representatives and over the Internet, investor education materials and asset allocation tools, and the expanded availability of Fidelity Investor Centers.
Investment in a Large Fund Family. The Board considered the benefits to shareholders of investing in a Fidelity fund, including the benefits of investing in a fund that is part of a large family of funds offering a variety of investment disciplines and providing a large variety of mutual fund investor services. The Board noted that Fidelity had taken, or had made recommendations that resulted in the Fidelity funds taking, a number of actions over the previous year that benefited particular funds, including (i) continuing to dedicate additional resources to investment research and to the support of the senior management team that oversees asset management; (ii) persisting in efforts to enhance Fidelity's global research capabilities; (iii) launching new funds and making other enhancements to meet client needs for income-oriented solutions; (iv) reducing fund expenses for certain index funds; (v) continuing to launch dedicated lower cost underlying funds to meet portfolio construction needs related to expanding underlying fund options for Fidelity funds of funds, specifically for the Freedom Fund product lines; (vi) rationalizing product lines and gaining increased efficiencies through fund mergers; (vii) launching sector-based exchange-traded funds and establishing a new Fidelity adviser, Fidelity SelectCo, LLC, to manage sector-based funds and products; (viii) continuing to develop, acquire, and implement systems and technology to improve security and services to the funds and to increase efficiency; (ix) modifying the eligibility criteria for certain share classes to increase their marketability to a portion of the defined contribution plan market; (x) waiving redemption fees for certain qualified fund-of-fund and wrap programs and certain retirement plan transactions; and (xi) launching new Institutional Class shares of certain money market funds to attract and retain assets and to fill a gap in money market fund offerings.
Investment Performance. The Board considered whether each fund has operated in accordance with its investment objective, as well as its record of compliance with its investment restrictions and its performance history.
The Board took into account discussions with the Investment Advisers about fund investment performance that occur at Board meetings throughout the year. In this regard the Board noted that as part of regularly scheduled fund reviews and other reports to the Board on fund performance, the Board periodically considers annualized return information for each fund for different time periods, measured against a peer group of funds with similar objectives ("peer group"). In its evaluation of fund investment performance at meetings throughout the year, the Board gave particular attention to information indicating underperformance of certain Fidelity funds for specific time periods and the Investment Advisers' explanations for such underperformance.
In addition to reviewing absolute and relative fund performance, the Independent Trustees periodically consider the appropriateness of fund performance metrics in evaluating the results achieved. In general, the Independent Trustees believe that fund performance should be evaluated based on gross performance (before fees and expenses but after transaction costs) compared to appropriate peer groups, over appropriate time periods that may include full market cycles, taking into account relevant factors including the following: general market conditions; expectations for interest rate levels and credit conditions; issuer-specific information including credit quality; tactical opportunities for investment; the fund's market value NAV over time and its resilience under various stressed conditions; and fund cash flows and other factors.
The Board recognizes that in interest rate environments where many competitors waive fees to maintain a minimum yield, relative money market fund performance on a net basis (after fees and expenses) may not be particularly meaningful due to miniscule performance differences among competitor funds. Depending on the circumstances, the Independent Trustees may be satisfied with a fund's performance notwithstanding that it lags its peer group for certain periods.
The Independent Trustees recognize that shareholders evaluate performance on a net basis over their own holding periods, for which one-, three-, and five-year periods are often used as a proxy. For this reason, the performance information reviewed by the Board also included net cumulative calendar year total return information for each fund and an appropriate peer group for the most recent one-, three-, and five-year periods.
Based on its review, the Board concluded that the nature, extent, and quality of services provided to each fund under the Advisory Contracts should benefit each fund's shareholders.
Competitiveness of Management Fee and Total Expense Ratio. The Board considered each fund's management fee and total expense ratio compared to "mapped groups" of competitive funds and classes. Fidelity creates "mapped groups" by combining similar Lipper investment objective categories that have comparable investment mandates. Combining Lipper investment objective categories aids the Board's management fee and total expense ratio comparisons by broadening the competitive group used for comparison and by reducing the number of universes to which various Fidelity funds are compared.
Semiannual Report
Management Fee. The Board considered two proprietary management fee comparisons for the 12-month periods shown in the charts below. The group of Lipper funds used by the Board for management fee comparisons is referred to below as the "Total Mapped Group" and, for the reasons explained above, is broader than the Lipper peer group used by the Board for performance comparisons. The Total Mapped Group comparison focuses on a fund's standing in terms of gross management fees before expense reimbursements or caps relative to the total universe of funds with comparable investment mandates, regardless of whether their management fee structures also are comparable. Funds with comparable investment mandates offer exposure to similar types of securities. Funds with comparable management fee structures have similar management fee contractual arrangements (e.g., flat rate charged for advisory services, all-inclusive fee rate, etc.). "TMG %" represents the percentage of funds in the Total Mapped Group that had management fees that were lower than a fund's. For example, a hypothetical TMG % of 20% would mean that 80% of the funds in the Total Mapped Group had higher, and 20% had lower, management fees than a fund. The funds' actual TMG %s are in the charts below. The "Asset-Size Peer Group" (ASPG) comparison focuses on a fund's standing relative to a subset of non-Fidelity funds within the Total Mapped Group that are similar in size and management fee structure. For example, if a fund is in the first quartile of the ASPG, the fund's management fee ranks in the least expensive or lowest 25% of funds in the ASPG. The ASPG represents at least 15% of the funds in the Total Mapped Group with comparable asset size and management fee structures, subject to a minimum of 50 funds (or all funds in the Total Mapped Group if fewer than 50). Additional information, such as the ASPG quartile in which a fund's management fee rate ranked, is also included in the charts and considered by the Board.
Treasury Only Portfolio
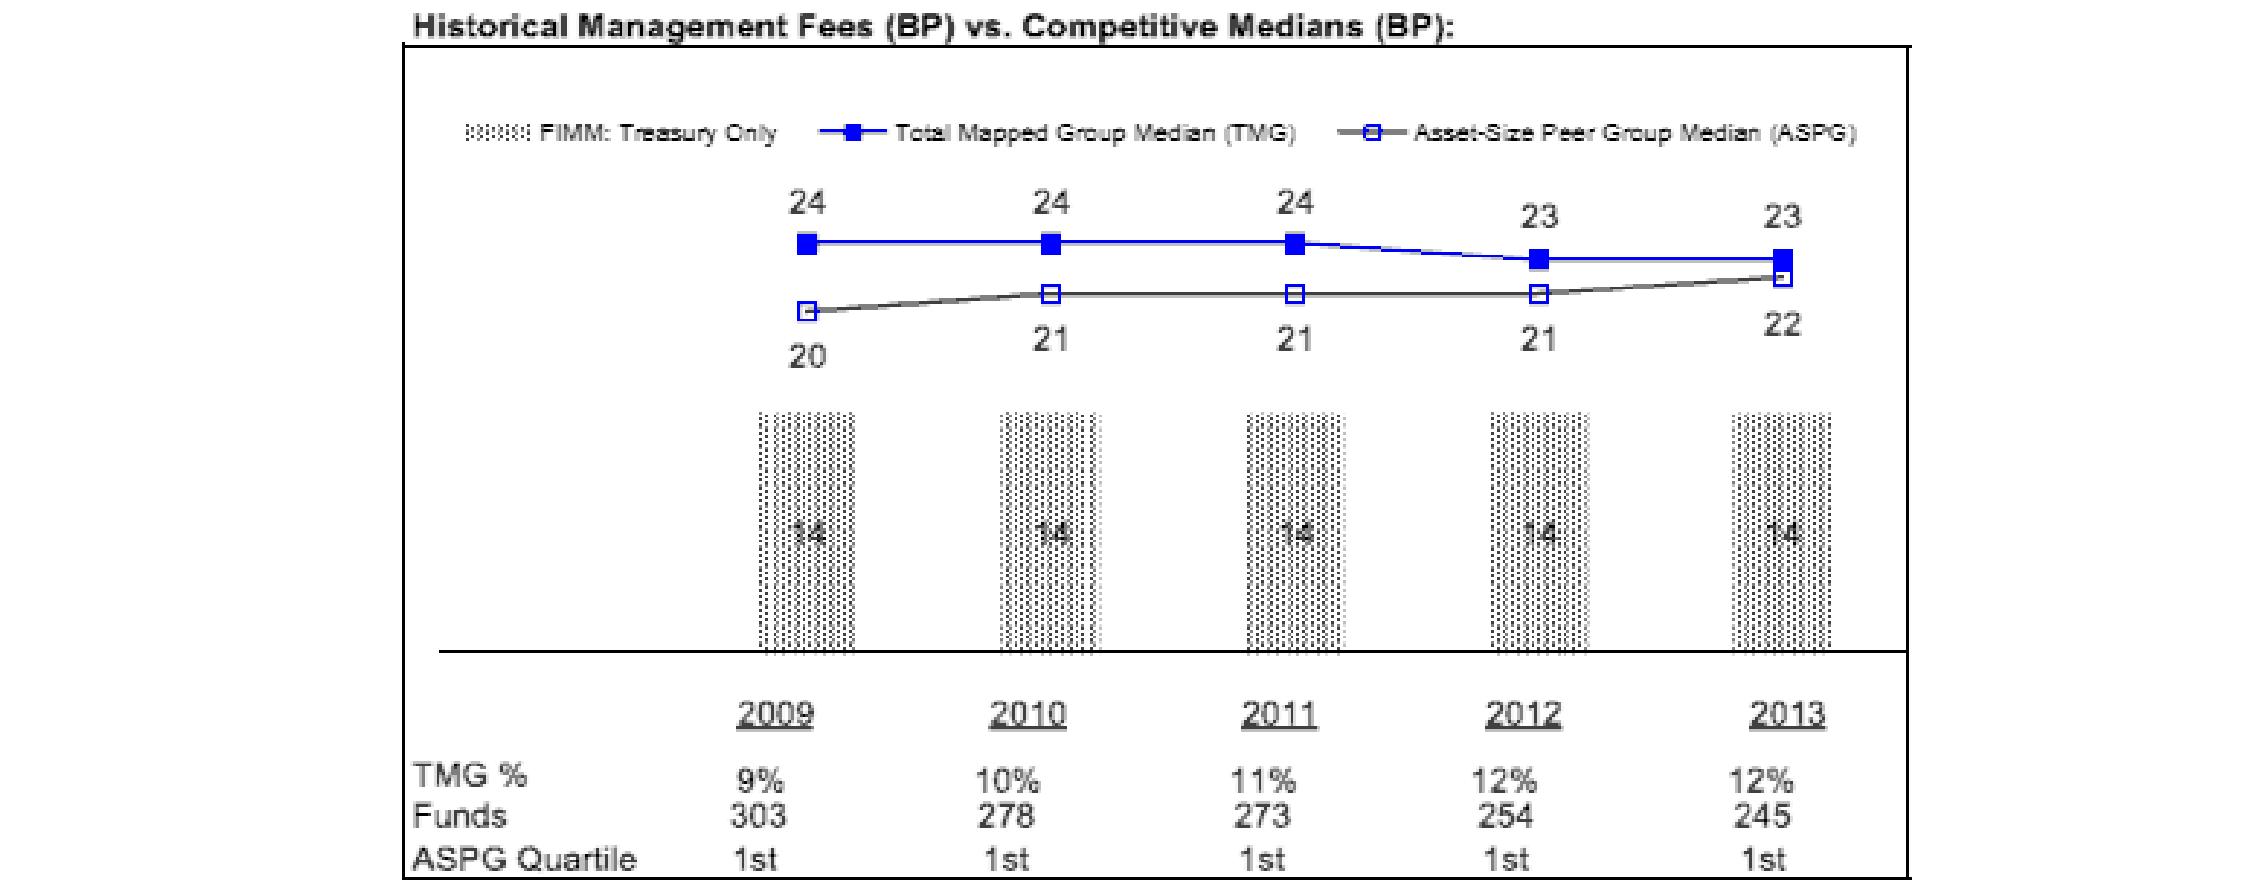
Semiannual Report
Board Approval of Investment Advisory Contracts and Management Fees - continued
Treasury Portfolio
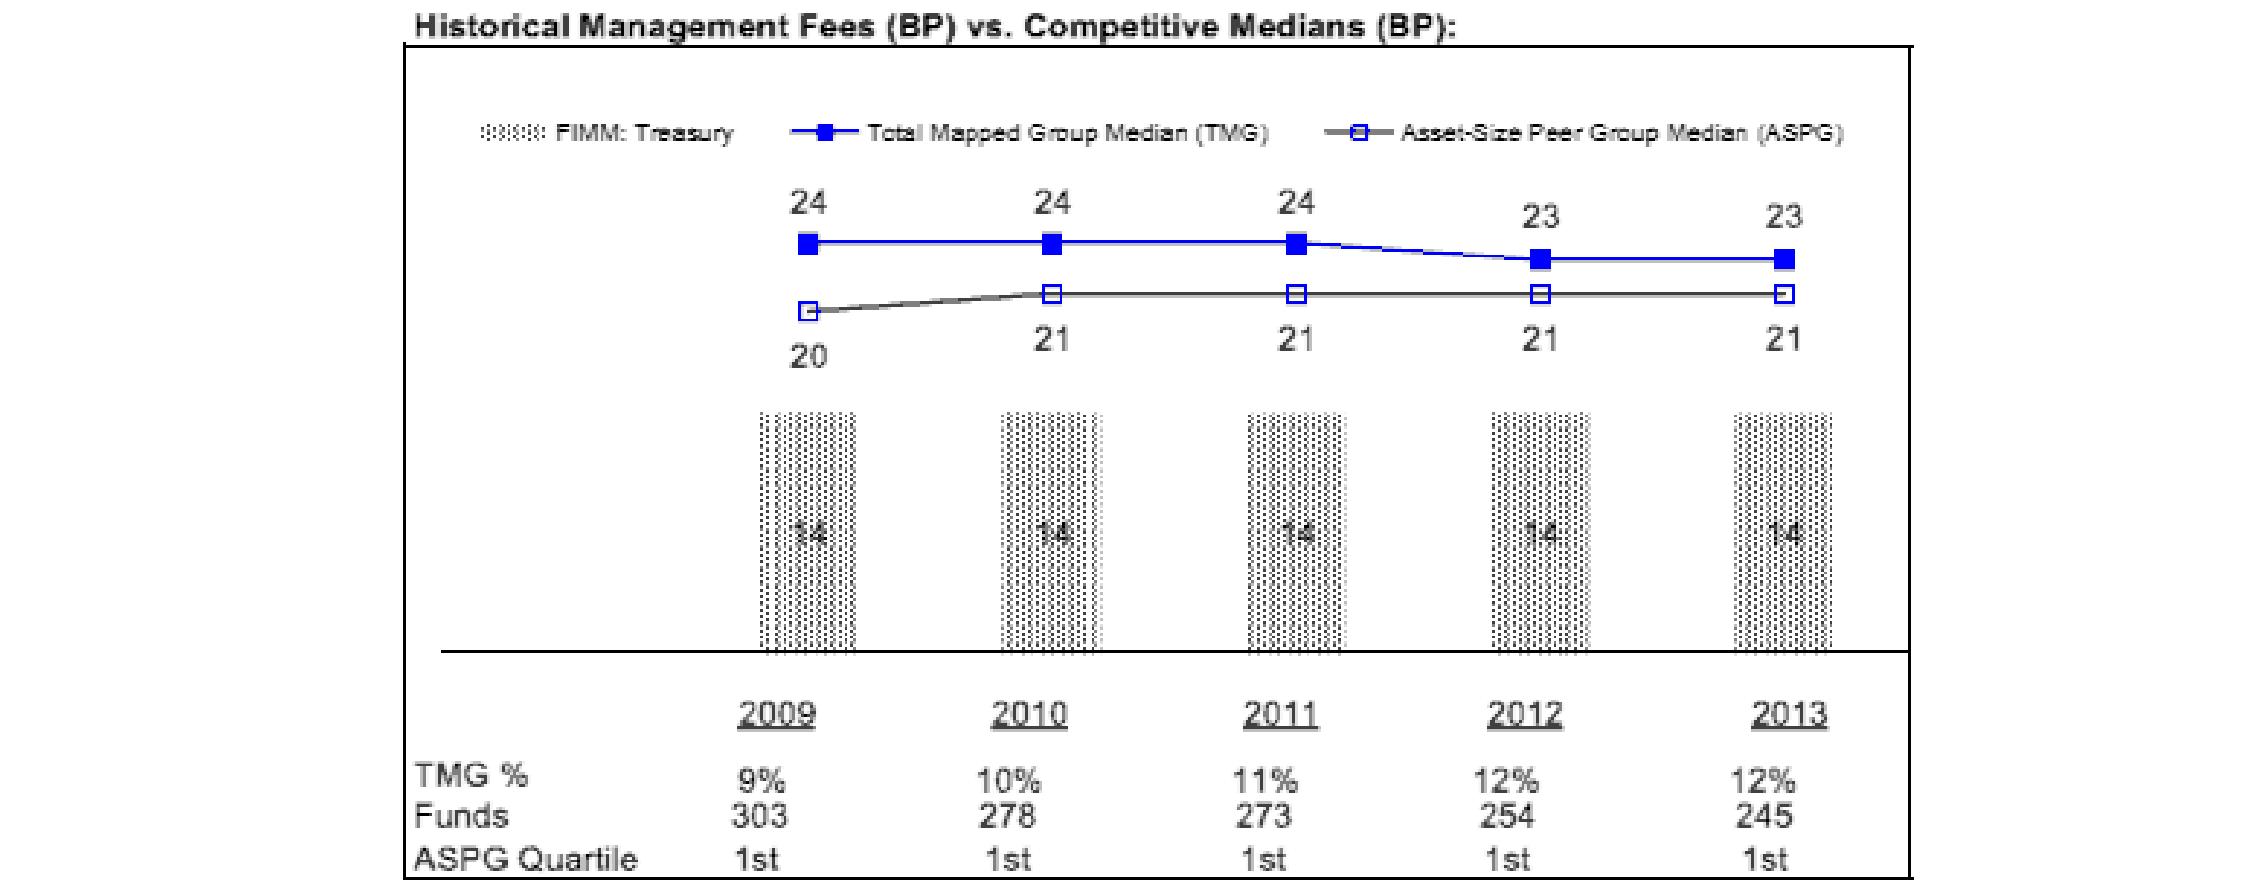
Government Portfolio
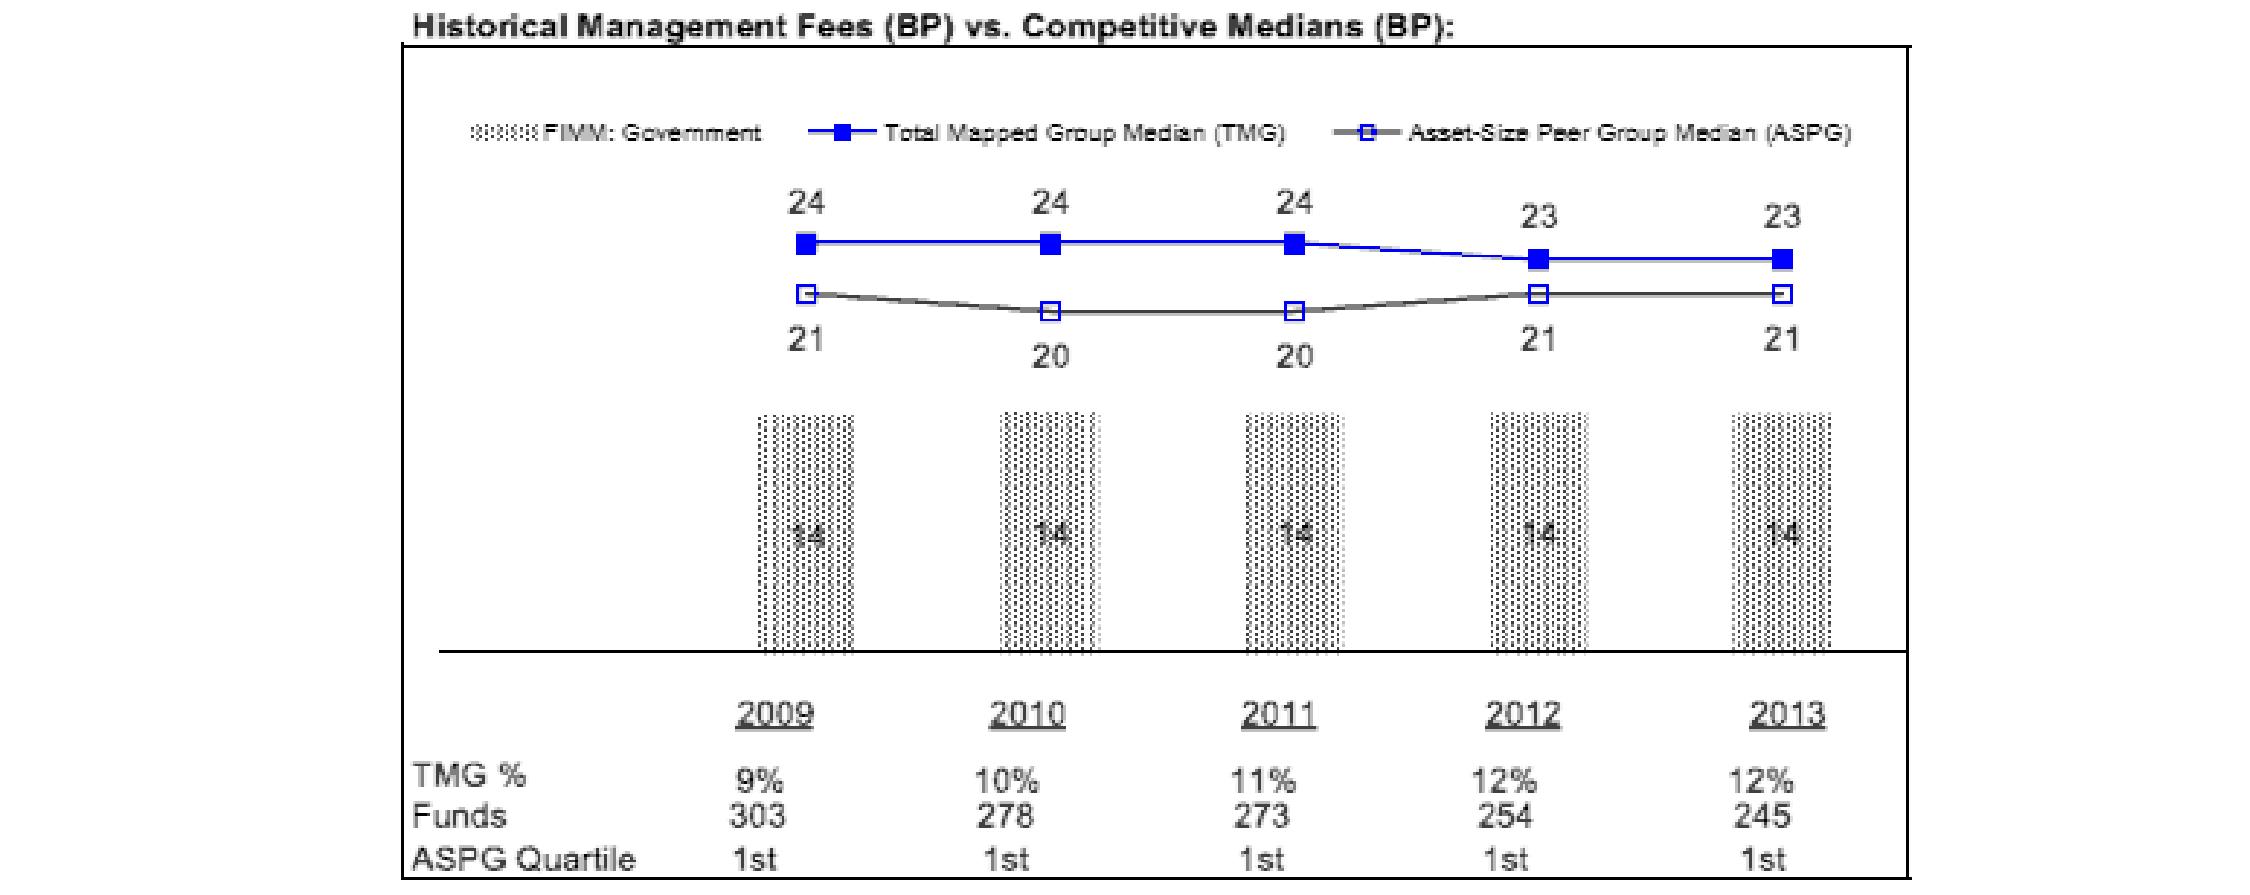
Semiannual Report
Prime Money Market Portfolio
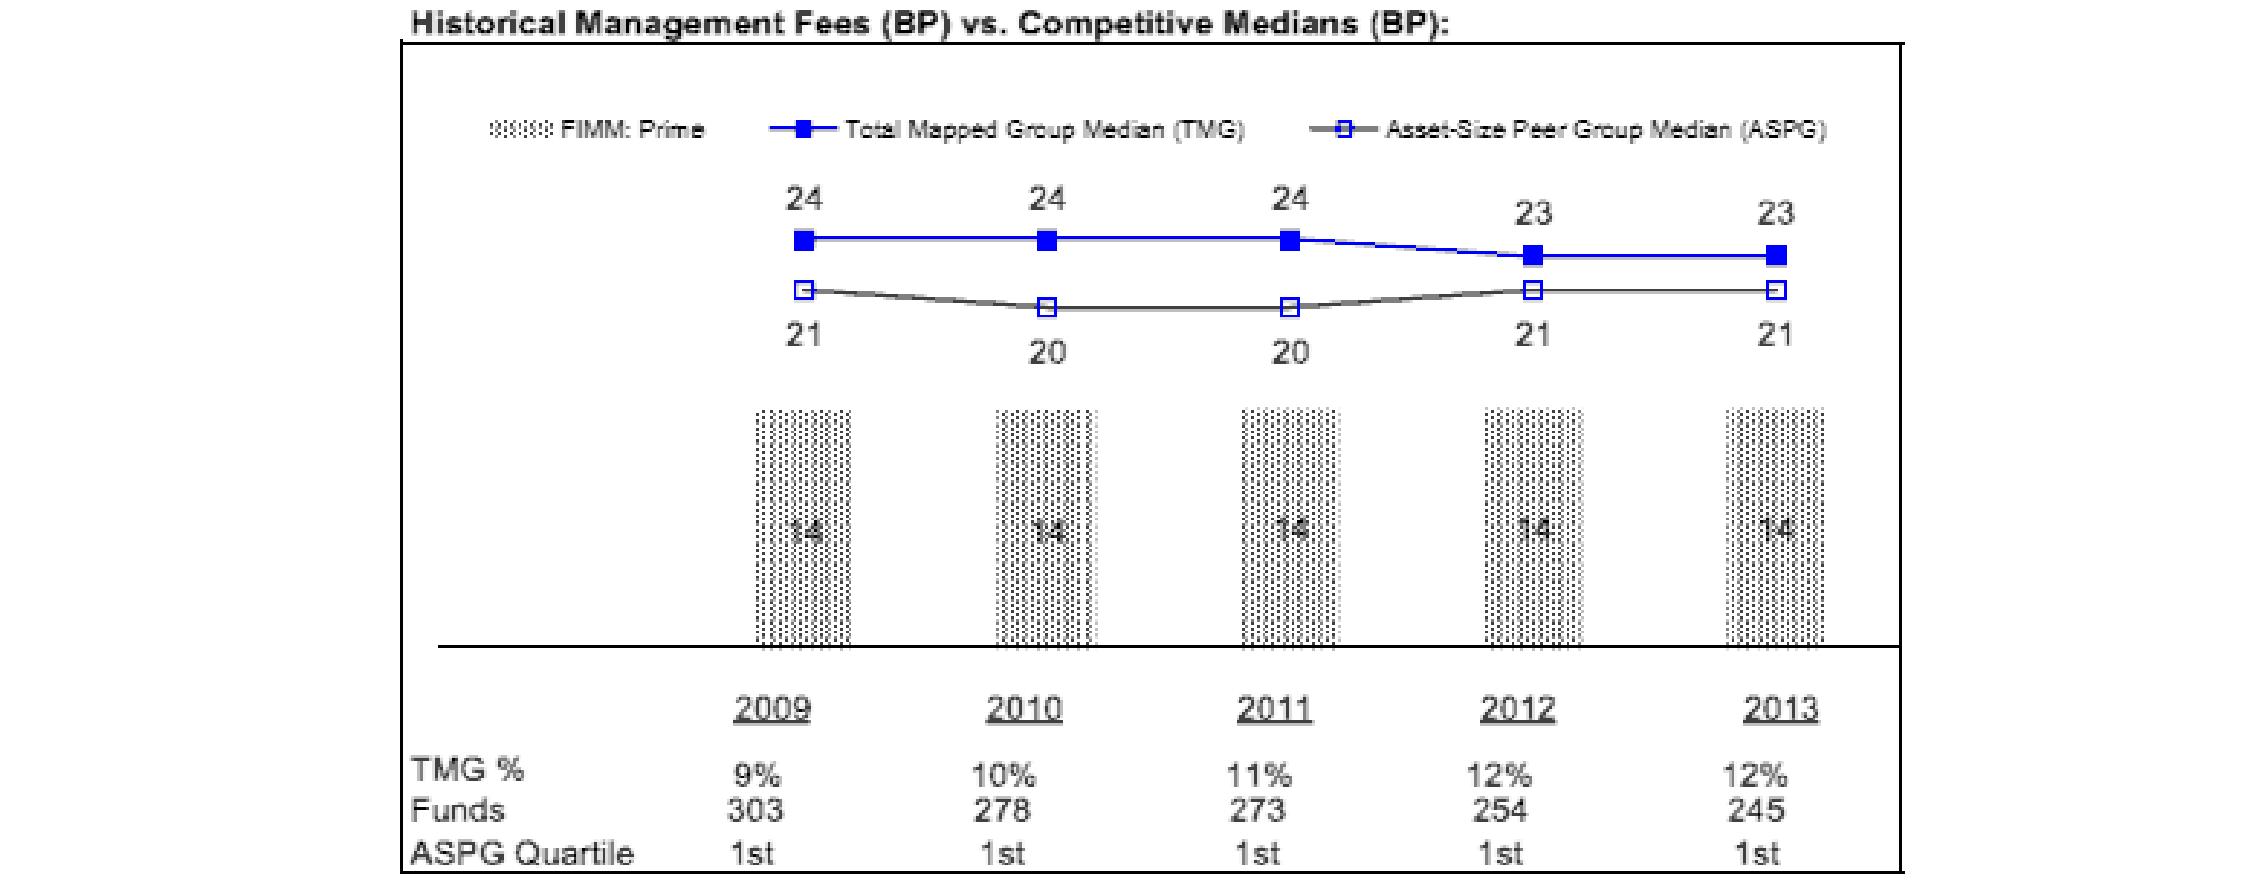
Money Market Portfolio
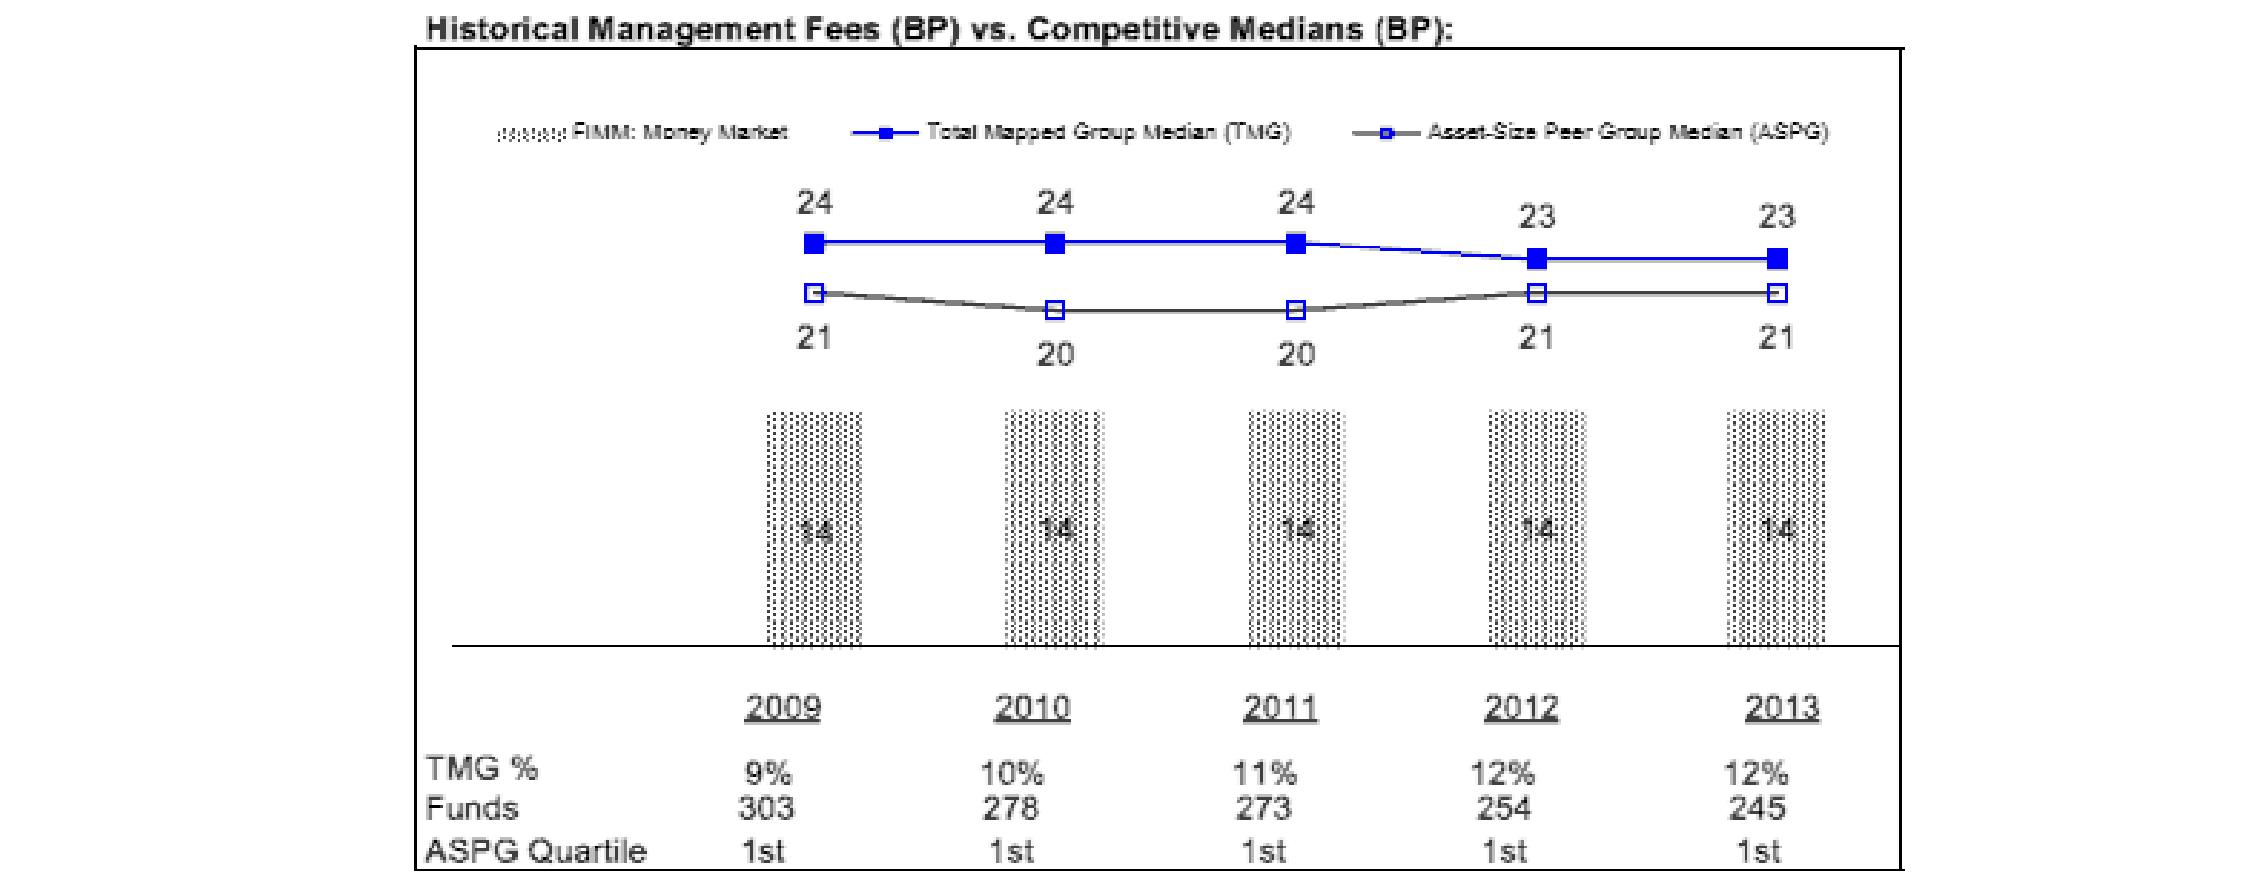
Semiannual Report
Board Approval of Investment Advisory Contracts and Management Fees - continued
Tax-Exempt Portfolio
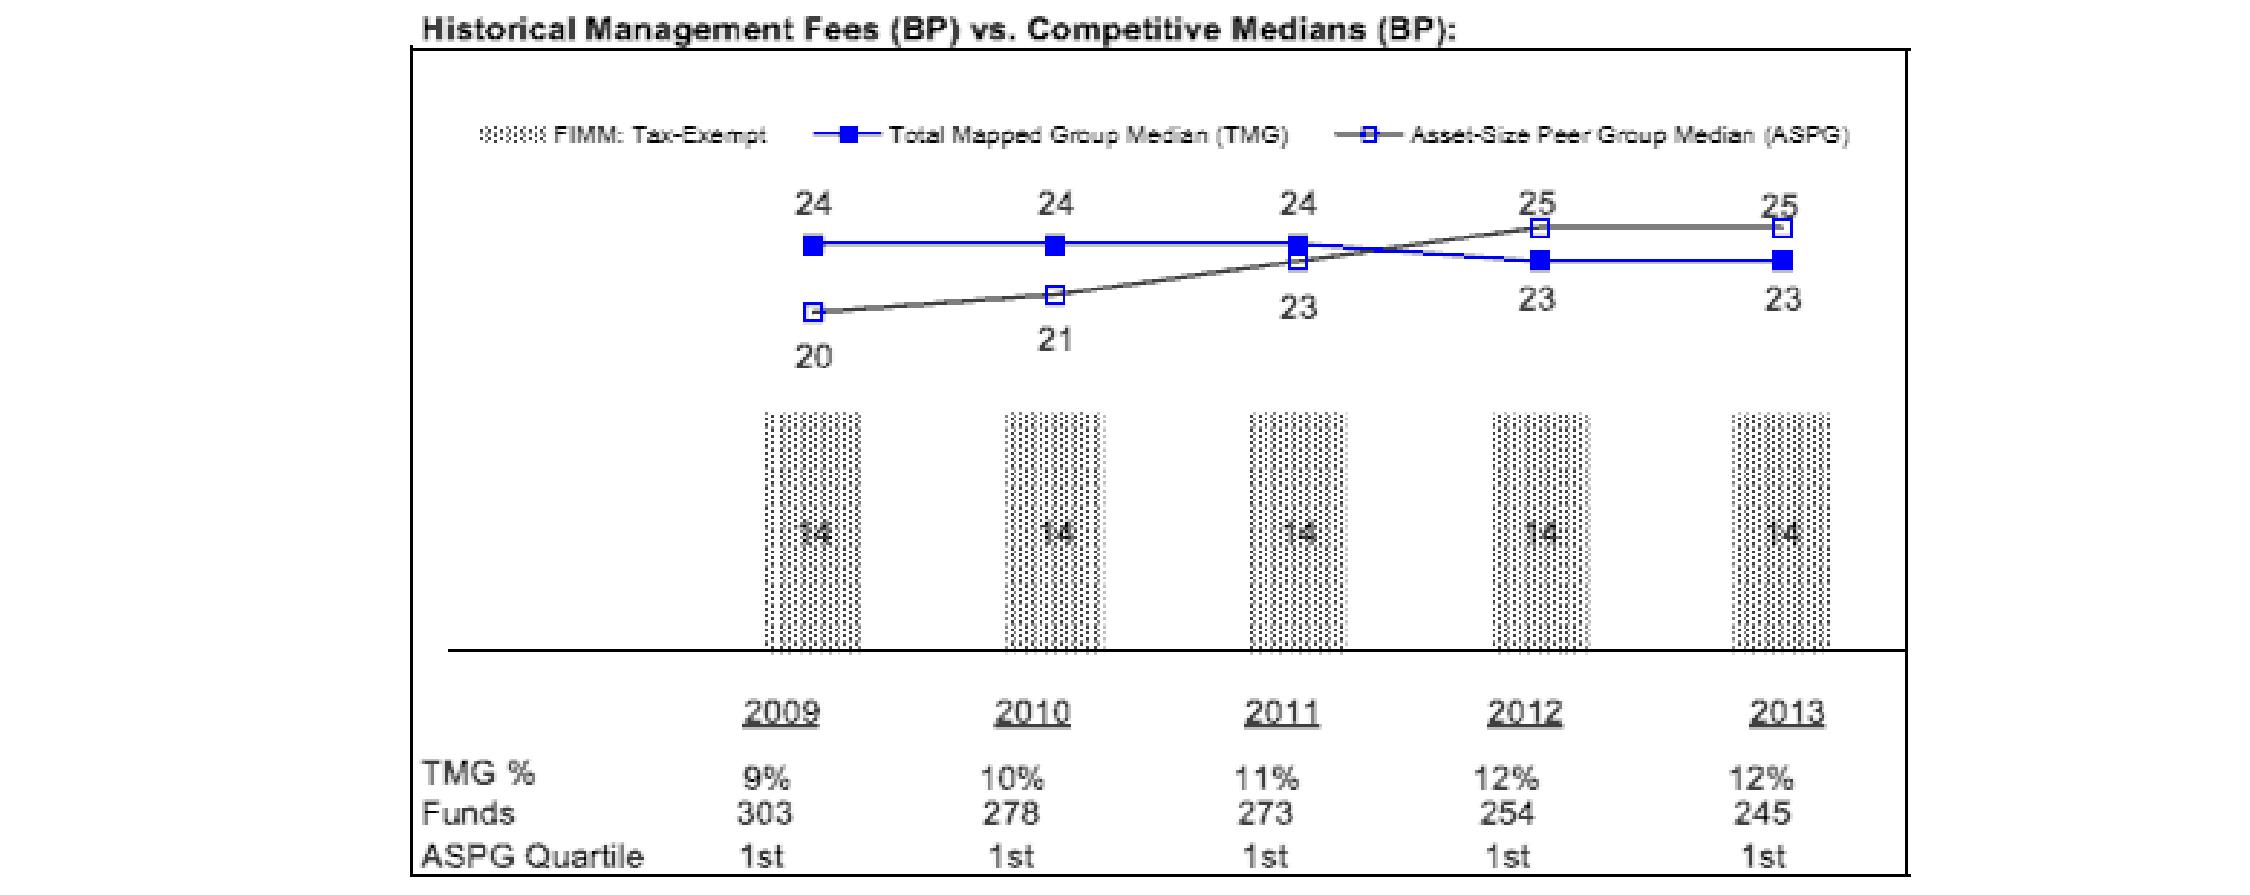
The Board noted that each fund's management fee rate ranked below the median of its Total Mapped Group and below the median of its ASPG for 2013.
Based on its review, the Board concluded that each fund's management fee is fair and reasonable in light of the services that the fund receives and the other factors considered.
Total Expense Ratio. In its review of the total expense ratio of each class of each fund, the Board considered the fund's management fee as well as other fund or class expenses, as applicable, such as transfer agent fees, pricing and bookkeeping fees, fund-paid 12b-1 fees, and custodial, legal, and audit fees. The Board also noted that Fidelity may agree to waive fees and expenses from time to time, and the extent to which, if any, it has done so for the funds. As part of its review, the Board also considered the current and historical total expense ratios of each class of each fund compared to competitive fund median expenses. Each class of each fund is compared to those funds and classes in the Total Mapped Group (used by the Board for management fee comparisons) that have a similar sales load structure.
The Board noted that the total expense ratio of each class of each of Treasury Only Portfolio, Treasury Portfolio, Government Portfolio, and Tax-Exempt Portfolio ranked below its competitive median for 2013.
The Board noted that the total expense ratio of Institutional Class of Prime Money Market Portfolio ranked below its competitive median for 2013 and the total expense ratio of each of Class I, Class II, Class III, Class IV, and Select Class ranked above its competitive median for 2013.
The Board noted that the total expense ratio of each of Institutional Class and Class F of Money Market Portfolio ranked below its competitive median for 2013 and the total expense ratio of each of Class I, Class II, Class III, and Select Class ranked above its competitive median for 2013.
The Board considered that, in general, various factors can affect total expense ratios. The Board noted that each fund offers multiple classes, each of which has a different 12b-1 fee structure, and that the multiple structures are intended to offer a range of pricing options for the intermediary market. The Board also noted that the total expense ratios of the classes of each fund vary primarily by the level of their 12b-1 fees, although differences in transfer agent fees may also cause expenses to vary from class to class.
The Board considered that, for certain classes, Fidelity has been voluntarily waiving part or all of the 12b-1 fees, transfer agent fees, and/or management fees to maintain a minimum yield, and also noted that Fidelity retains the ability to be repaid in certain circumstances.
Fees Charged to Other Fidelity Clients. The Board also considered Fidelity fee structures and other information with respect to clients of Fidelity, such as other funds advised or subadvised by Fidelity, pension plan clients, and other institutional clients. The Board noted the findings of the 2013 ad hoc joint committee (created with the board of other Fidelity funds), which reviewed and compared Fidelity's institutional investment advisory business with its business of providing services to the Fidelity funds, including the differences in services provided, fees charged, and costs incurred, as well as competition in their respective marketplaces.
Based on its review of total expense ratios and fees charged to other Fidelity clients, the Board concluded that the total expense ratio of each class of each fund was reasonable, although in some cases above the median of the universe presented for comparison, in light of the services that the fund and its shareholders receive and the other factors considered.
Semiannual Report
Costs of the Services and Profitability. The Board considered the revenues earned and the expenses incurred by Fidelity in conducting the business of developing, marketing, distributing, managing, administering and servicing each fund and servicing each fund's shareholders. The Board also considered the level of Fidelity's profits in respect of all the Fidelity funds.
On an annual basis, Fidelity presents to the Board information about the profitability of its relationship with each fund. Fidelity calculates profitability information for each fund, as well as aggregate profitability information for groups of Fidelity funds and all Fidelity funds, using a series of detailed revenue and cost allocation methodologies which originate with the books and records of Fidelity on which Fidelity's audited financial statements are based. The Audit Committee of the Board reviews any significant changes from the prior year's methodologies.
PricewaterhouseCoopers LLP (PwC), independent registered public accounting firm and auditor to Fidelity and certain Fidelity funds, has been engaged annually by the Board as part of the Board's assessment of Fidelity's profitability analysis. PwC's engagement includes the review and assessment of the methodologies used by Fidelity in determining the revenues and expenses attributable to Fidelity's mutual fund business, and completion of agreed-upon procedures in respect of the mathematical accuracy of fund profitability and its conformity to established allocation methodologies. After considering PwC's reports issued under the engagement and information provided by Fidelity, the Board concluded that while other allocation methods may also be reasonable, Fidelity's profitability methodologies are reasonable in all material respects.
The Board also reviewed Fidelity's non-fund businesses and fall-out benefits related to the mutual fund business as well as cases where Fidelity's affiliates may benefit from or be related to the funds' business.
The Board considered the costs of the services provided by and the profits realized by Fidelity in connection with the operation of each fund and was satisfied that the profitability was not excessive.
Economies of Scale. The Board considered whether there have been economies of scale in respect of the management of the Fidelity funds, whether the Fidelity funds (including each fund) have appropriately benefited from any such economies of scale, and whether there is potential for realization of any further economies of scale. The Board considered the extent to which each fund will benefit from economies of scale as assets grow through increased services to the fund, through waivers or reimbursements, or through fee or expense ratio reductions. The Board also noted that in 2013, it and the boards of other Fidelity funds created an ad hoc committee (the Economies of Scale Committee) to analyze whether Fidelity attains economies of scale in respect of the management and servicing of the Fidelity funds, whether the Fidelity funds have appropriately benefited from such economies of scale, and whether there is potential for realization of any further economies of scale.
The Board concluded, taking into account the analysis of the Economies of Scale Committee, that economies of scale, if any, are being appropriately shared between fund shareholders and Fidelity.
Additional Information Requested by the Board. In order to develop fully the factual basis for consideration of the Fidelity funds' Advisory Contracts, the Board requested and received additional information on certain topics, including: (i) Fidelity's fund profitability methodology, profitability trends for certain funds, and the impact of certain factors on fund profitability results; (ii) portfolio manager changes that have occurred during the past year and the amount of the investment that each portfolio manager has made in the Fidelity fund(s) that he or she manages; (iii) Fidelity's compensation structure for portfolio managers, research analysts, and other key personnel, including its effects on fund profitability, the rationale for the compensation structure, and the extent to which current market conditions have affected retention and recruitment; (iv) the arrangements with and compensation paid to certain fund sub-advisers on behalf of the Fidelity funds; (v) Fidelity's fee structures, including the group fee structure and definition of group assets, and the rationale for recommending different fees among different categories of funds and classes; (vi) Fidelity's voluntary waiver of its fees to maintain minimum yields for certain money market funds and classes as well as contractual waivers in place for certain funds; (vii) the methodology with respect to competitive fund data and peer group classifications; (viii) Fidelity's transfer agent fee, expense, and service structures for different funds and classes, and the impact of the increased use of omnibus accounts; and (ix) explanations regarding the relative total expense ratios of certain funds and classes, total expense competitive trends and methodologies for total expense competitive comparisons, and actions that might be taken by Fidelity to reduce total expense ratios for certain funds and classes or to achieve further economies of scale.
Based on its evaluation of all of the conclusions noted above, and after considering all factors it believed relevant, the Board ultimately concluded that the advisory fee structures are fair and reasonable, and that each fund's Advisory Contracts should be renewed.
Semiannual Report
Semiannual Report
Investment Adviser
Fidelity Management & Research Company
Boston, MA
Investment Sub-Advisers
Fidelity Investments Money Management, Inc.
Fidelity Management & Research (U.K.) Inc.
Fidelity Management & Research (Hong Kong) Limited
Fidelity Management & Research (Japan) Inc.
General Distributor
Fidelity Distributors Corporation
Smithfield, RI
Transfer and Service Agents
Fidelity Investments Institutional Operations Company, Inc.
Boston, MA
Citibank, N.A.
New York, NY
Tax-Exempt Portfolio
Fidelity Service Company, Inc.
Boston, MA
Treasury Only Portfolio, Treasury Portfolio,
Government Portfolio, Prime Money Market
Portfolio, and Money Market Portfolio
Custodians
The Bank of New York Mellon
New York, NY
Treasury Only Portfolio, Treasury Portfolio,
Government Portfolio, Prime Money Market
Portfolio, and Money Market Portfolio
Citibank, N.A.
New York, NY
Tax-Exempt Portfolio
(Fidelity Investment logo)(registered trademark)
Corporate Headquarters
245 Summer St., Boston, MA 02210
www.fidelity.com
IMM-SANN-1114
1.537280.117
Item 2. Code of Ethics
Not applicable.
Item 3. Audit Committee Financial Expert
Not applicable.
Item 4. Principal Accountant Fees and Services
Not applicable.
Item 5. Audit Committee of Listed Registrants
Not applicable.
Item 6. Investments
(a) Not applicable.
(b) Not applicable
Item 7. Disclosure of Proxy Voting Policies and Procedures for Closed-End Management Investment Companies
Not applicable.
Item 8. Portfolio Managers of Closed-End Management Investment Companies
Not applicable.
Item 9. Purchase of Equity Securities by Closed-End Management Investment Company and Affiliated Purchasers
Not applicable.
Item 10. Submission of Matters to a Vote of Security Holders
There were no material changes to the procedures by which shareholders may recommend nominees to the Fidelity Colchester Street Trust's Board of Trustees.
Item 11. Controls and Procedures
(a)(i) The President and Treasurer and the Chief Financial Officer have concluded that the Fidelity Colchester Street Trust's (the "Trust") disclosure controls and procedures (as defined in Rule 30a-3(c) under the Investment Company Act) provide reasonable assurances that material information relating to the Trust is made known to them by the appropriate persons, based on their evaluation of these controls and procedures as of a date within 90 days of the filing date of this report.
(a)(ii) There was no change in the Trust's internal control over financial reporting (as defined in Rule 30a-3(d) under the Investment Company Act) that occurred during the second fiscal quarter of the period covered by this report that has materially affected, or is reasonably likely to materially affect, the Trust's internal control over financial reporting.
Item 12. Exhibits
(a) | (1) | Not applicable. |
(a) | (2) | Certification pursuant to Rule 30a-2(a) under the Investment Company Act of 1940 (17 CFR 270.30a-2(a)) is filed and attached hereto as Exhibit 99.CERT. |
(a) | (3) | Not applicable. |
(b) | | Certification pursuant to Rule 30a-2(b) under the Investment Company Act of 1940 (17 CFR 270.30a-2(b)) is furnished and attached hereto as Exhibit 99.906CERT. |
SIGNATURES
Pursuant to the requirements of the Securities Exchange Act of 1934 and the Investment Company Act of 1940, the registrant has duly caused this report to be signed on its behalf by the undersigned, thereunto duly authorized.
Fidelity Colchester Street Trust
By: | /s/Stephanie J. Dorsey |
| Stephanie J. Dorsey |
| President and Treasurer |
| |
Date: | November 20, 2014 |
Pursuant to the requirements of the Securities Exchange Act of 1934 and the Investment Company Act of 1940, this report has been signed below by the following persons on behalf of the registrant and in the capacities and on the dates indicated.
By: | /s/Stephanie J. Dorsey |
| Stephanie J. Dorsey |
| President and Treasurer |
| |
Date: | November 20, 2014 |
By: | /s/Howard J. Galligan III |
| Howard J. Galligan III |
| Chief Financial Officer |
| |
Date: | November 20, 2014 |