UNITED STATES
SECURITIES AND EXCHANGE COMMISSION
Washington, D.C. 20549
FORM N-CSR
CERTIFIED SHAREHOLDER REPORT OF REGISTERED
MANAGEMENT INVESTMENT COMPANIES
Investment Company Act file number 811-3320
Fidelity Colchester Street Trust
(Exact name of registrant as specified in charter)
245 Summer St., Boston, MA 02210
(Address of principal executive offices) (Zip code)
Marc Bryant, Secretary
245 Summer St.
Boston, Massachusetts 02210
(Name and address of agent for service)
Registrant's telephone number, including area code:
617-563-7000
Date of fiscal year end: | March 31 |
Date of reporting period: | September 30, 2016 |
Item 1.
Reports to Stockholders
Fidelity® Investments Money Market Funds Treasury Only Portfolio Treasury Portfolio Government Portfolio Money Market Portfolio Prime Money Market Portfolio Prime Reserves Portfolio Tax-Exempt Portfolio Semi-Annual Report September 30, 2016 |
 |
Contents
Board Approval of Investment Advisory Contracts and Management Fees |
To view a fund's proxy voting guidelines and proxy voting record for the 12-month period ended June 30, visit http://www.fidelity.com/proxyvotingresults or visit the Securities and Exchange Commission's (SEC) web site at http://www.sec.gov.
You may also call 1-877-297-2952 to request a free copy of the proxy voting guidelines.
Standard & Poor's, S&P and S&P 500 are registered service marks of The McGraw-Hill Companies, Inc. and have been licensed for use by Fidelity Distributors Corporation.
Other third-party marks appearing herein are the property of their respective owners.
All other marks appearing herein are registered or unregistered trademarks or service marks of FMR LLC or an affiliated company. © 2016 FMR LLC. All rights reserved.
Fund Goals:
Treasury Only Portfolio seeks as high a level of current income as is consistent with the security of principal and liquidity.
Treasury Portfolio, Government Portfolio, Money Market Portfolio, Prime Money Market Portfolio and Prime Reserves Portfolio seek to obtain as high a level of current income as is consistent with the preservation of principal and liquidity within the limitations prescribed for the fund.
Tax-Exempt Portfolio seeks to obtain as high a level of interest income exempt from federal income tax as is consistent with liquidity and stability of principal.
This report and the financial statements contained herein are submitted for the general information of the shareholders of the Funds. This report is not authorized for distribution to prospective investors in the Funds unless preceded or accompanied by an effective prospectus.
A fund files its complete schedule of portfolio holdings with the SEC for the first and third quarters of each fiscal year on Form N-Q. Forms N-Q are available on the SEC’s web site at http://www.sec.gov. A fund's Forms N-Q may be reviewed and copied at the SEC’s Public Reference Room in Washington, DC. Information regarding the operation of the SEC's Public Reference Room may be obtained by calling 1-800-SEC-0330.
For a complete list of a fund's portfolio holdings, view the most recent holdings listing, semiannual report, or annual report on Fidelity's web site at http://www.fidelity.com, http://www.institutional.fidelity.com, or http://www.401k.com, as applicable.
Investments in the funds are neither insured nor guaranteed by the U.S. Government, and there can be no assurance that the funds will maintain a stable $1.00 share price.
NOT FDIC INSURED •MAY LOSE VALUE •NO BANK GUARANTEE
Neither the Funds nor Fidelity Distributors Corporation is a bank.
Treasury Only Portfolio
Investment Summary/Performance (Unaudited)
Effective Maturity Diversification
| Days | % of fund's investments 9/30/16 | % of fund's investments 3/31/16 | % of fund's investments 9/30/15 |
| 1 - 7 | 16.8 | 20.6 | 22.7 |
| 8 - 30 | 16.1 | 20.3 | 29.9 |
| 31 - 60 | 23.8 | 16.0 | 11.7 |
| 61 - 90 | 30.6 | 20.8 | 1.5 |
| 91 - 180 | 11.7 | 21.0 | 34.2 |
| > 180 | 1.0 | 1.3 | 0.0 |
Effective maturity is determined in accordance with the requirements of Rule 2a-7 under the Investment Company Act of 1940.
Asset Allocation (% of fund's net assets)
| As of September 30, 2016 | ||
| U.S. Treasury Debt | 99.9% | |
| Net Other Assets (Liabilities) | 0.1% | |

| As of March 31, 2016 | ||
| U.S. Treasury Debt | 99.9% | |
| Net Other Assets (Liabilities) | 0.1% | |

Current And Historical 7-Day Yields
| 9/30/16 | 6/30/16 | 3/31/16 | 12/31/15 | 9/30/15 | |
| Class I | 0.17% | 0.16% | 0.17% | 0.04% | 0.01% |
| Class II | 0.02% | 0.01% | 0.02% | 0.01% | 0.01% |
| Class III | 0.01% | 0.01% | 0.01% | 0.01% | 0.01% |
| Class IV | 0.01% | 0.01% | 0.01% | 0.01% | 0.01% |
| Select Class | 0.12% | 0.11% | 0.12% | 0.01% | 0.01% |
| Institutional Class | 0.21% | 0.20% | 0.21% | 0.08% | 0.01% |
Yield refers to the income paid by the Fund over a given period. Yields for money market funds are usually for seven-day periods, as they are here, though they are expressed as annual percentage rates. Past performance is no guarantee of future results. Yield will vary and it's possible to lose money investing in the Fund. A portion of the Fund's expenses was reimbursed and/or waived. Absent such reimbursements and/or waivers the yield for the period ending September 30, 2016, the most recent period shown in the table, would have been 0.13% for Class I, -0.02% for Class II, -0.13% for Class III, -0.38% for Class IV, 0.08% for Select Class and 0.16% for Institutional Class.
Percentages shown as 0.0% may reflect amounts less than 0.05%.
Treasury Only Portfolio
Investments September 30, 2016 (Unaudited)
Showing Percentage of Net Assets
| U.S. Treasury Debt - 99.9% | ||||
| Yield(a) | Principal Amount (000s) | Value (000s) | ||
| U.S. Treasury Obligations - 99.9% | ||||
| U.S. Treasury Bills | ||||
| 10/13/16 to 3/30/17 | 0.16 to 0.54% | $9,505,929 | $9,499,876 | |
| U.S. Treasury Bonds | ||||
| 11/15/16 | 0.34 to 0.48 | 161,000 | 161,826 | |
| U.S. Treasury Notes | ||||
| 10/15/16 to 1/31/18 | 0.30 to 0.52 (b) | 3,970,731 | 3,974,277 | |
| TOTAL U.S. TREASURY DEBT | ||||
| (Cost $13,635,979) | 13,635,979 | |||
| TOTAL INVESTMENT PORTFOLIO - 99.9% | ||||
| (Cost $13,635,979) | 13,635,979 | |||
| NET OTHER ASSETS (LIABILITIES) - 0.1% | 15,265 | |||
| NET ASSETS - 100% | $13,651,244 |
The date shown for securities represents the date when principal payments must be paid, taking into account any call options exercised by the issuer and any permissible maturity shortening features other than interest rate resets.
Legend
(a) Yield represents either the annualized yield at the date of purchase, or the stated coupon rate, or, for floating and adjustable rate securities, the rate at period end.
(b) Coupon rates for floating and adjustable rate securities reflect the rates in effect at period end.
Investment Valuation
All investments are categorized as Level 2 under the Fair Value Hierarchy. The inputs or methodology used for valuing securities may not be an indication of the risk associated with investing in those securities. For more information on valuation inputs please refer to the Investment Valuation section in the accompanying Notes to Financial Statements.
See accompanying notes which are an integral part of the financial statements.
Treasury Only Portfolio
Financial Statements
Statement of Assets and Liabilities
| Amounts in thousands (except per-share amounts) | September 30, 2016 (Unaudited) | |
| Assets | ||
| Investment in securities, at value — See accompanying schedule: Unaffiliated issuers (cost $13,635,979) | $13,635,979 | |
| Receivable for fund shares sold | 14,623 | |
| Interest receivable | 14,916 | |
| Prepaid expenses | 36 | |
| Receivable from investment adviser for expense reductions | 425 | |
| Total assets | 13,665,979 | |
| Liabilities | ||
| Payable for fund shares redeemed | $11,487 | |
| Distributions payable | 777 | |
| Accrued management fee | 1,561 | |
| Distribution and service plan fees payable | 166 | |
| Other affiliated payables | 664 | |
| Other payables and accrued expenses | 80 | |
| Total liabilities | 14,735 | |
| Net Assets | $13,651,244 | |
| Net Assets consist of: | ||
| Paid in capital | $13,651,095 | |
| Undistributed net investment income | 1 | |
| Accumulated undistributed net realized gain (loss) on investments | 148 | |
| Net Assets | $13,651,244 | |
| Class I: | ||
| Net Asset Value, offering price and redemption price per share ($8,668,092 ÷ 8,666,860 shares) | $1.00 | |
| Class II: | ||
| Net Asset Value, offering price and redemption price per share ($230,526 ÷ 230,542 shares) | $1.00 | |
| Class III: | ||
| Net Asset Value, offering price and redemption price per share ($1,000,532 ÷ 1,000,252 shares) | $1.00 | |
| Class IV: | ||
| Net Asset Value, offering price and redemption price per share ($47,557 ÷ 47,551 shares) | $1.00 | |
| Select Class: | ||
| Net Asset Value, offering price and redemption price per share ($161,788 ÷ 161,787 shares) | $1.00 | |
| Institutional Class: | ||
| Net Asset Value, offering price and redemption price per share ($3,542,749 ÷ 3,542,644 shares) | $1.00 |
See accompanying notes which are an integral part of the financial statements.
Statement of Operations
| Amounts in thousands | Six months ended September 30, 2016 (Unaudited) | |
| Investment Income | ||
| Interest | $23,050 | |
| Expenses | ||
| Management fee | $9,307 | |
| Transfer agent fees | 3,564 | |
| Distribution and service plan fees | 1,553 | |
| Accounting fees and expenses | 477 | |
| Custodian fees and expenses | 74 | |
| Independent trustees' fees and expenses | 30 | |
| Registration fees | 189 | |
| Audit | 22 | |
| Legal | 18 | |
| Miscellaneous | 44 | |
| Total expenses before reductions | 15,278 | |
| Expense reductions | (2,893) | 12,385 |
| Net investment income (loss) | 10,665 | |
| Realized and Unrealized Gain (Loss) | ||
| Net realized gain (loss) on: | ||
| Investment securities: | ||
| Unaffiliated issuers | 103 | |
| Total net realized gain (loss) | 103 | |
| Net increase in net assets resulting from operations | $10,768 |
See accompanying notes which are an integral part of the financial statements.
Statement of Changes in Net Assets
| Amounts in thousands | Six months ended September 30, 2016 (Unaudited) | Year ended March 31, 2016 |
| Increase (Decrease) in Net Assets | ||
| Operations | ||
| Net investment income (loss) | $10,665 | $5,396 |
| Net realized gain (loss) | 103 | 75 |
| Net increase in net assets resulting from operations | 10,768 | 5,471 |
| Distributions to shareholders from net investment income | (10,712) | (4,615) |
| Share transactions - net increase (decrease) | 28,449 | 2,840,666 |
| Total increase (decrease) in net assets | 28,505 | 2,841,522 |
| Net Assets | ||
| Beginning of period | 13,622,739 | 10,781,217 |
| End of period | $13,651,244 | $13,622,739 |
| Other Information | ||
| Undistributed net investment income end of period | $1 | $48 |
See accompanying notes which are an integral part of the financial statements.
Financial Highlights — Treasury Only Portfolio Class I
| Six months ended (Unaudited) September 30, | Years ended March 31, | |||||
| 2016 | 2016 | 2015 | 2014 | 2013 | 2012 | |
| Selected Per–Share Data | ||||||
| Net asset value, beginning of period | $1.00 | $1.00 | $1.00 | $1.00 | $1.00 | $1.00 |
| Income from Investment Operations | ||||||
| Net investment income (loss) | .001 | –A | –A | –A | –A | –A |
| Net realized and unrealized gain (loss)A | – | – | – | – | – | – |
| Total from investment operations | .001 | –A | –A | –A | –A | –A |
| Distributions from net investment income | (.001) | –A | –A | –A | –A | –A |
| Total distributions | (.001) | –A | –A | –A | –A | –A |
| Net asset value, end of period | $1.00 | $1.00 | $1.00 | $1.00 | $1.00 | $1.00 |
| Total ReturnB,C | .08% | .04% | .01% | .01% | .01% | .01% |
| Ratios to Average Net AssetsD | ||||||
| Expenses before reductions | .21%E | .21% | .21% | .21% | .21% | .21% |
| Expenses net of fee waivers, if any | .18%E | .11% | .05% | .06% | .10% | .06% |
| Expenses net of all reductions | .18%E | .11% | .05% | .06% | .10% | .06% |
| Net investment income (loss) | .17%E | .05% | - %F | .01% | .01% | .01% |
| Supplemental Data | ||||||
| Net assets, end of period (in millions) | $8,668 | $10,035 | $9,402 | $9,795 | $9,431 | $8,064 |
A Amount represents less than $.0005 per share.
B Total returns for periods of less than one year are not annualized.
C Total returns would have been lower if certain expenses had not been reduced during the applicable periods shown.
D Expense ratios reflect operating expenses of the class. Expenses before reductions do not reflect amounts reimbursed or waived or reductions from expense offset arrangements and do not represent the amount paid by the class during periods when reimbursements, waivers or reductions occur. Expenses net of fee waivers reflect expenses after reimbursement and waivers but prior to reductions from expense offset arrangements. Expenses net of all reductions represent the net expenses paid by the class.
E Annualized
F Amount represents less than .005%.
See accompanying notes which are an integral part of the financial statements.
Financial Highlights — Treasury Only Portfolio Class II
| Six months ended (Unaudited) September 30, | Years ended March 31, | |||||
| 2016 | 2016 | 2015 | 2014 | 2013 | 2012 | |
| Selected Per–Share Data | ||||||
| Net asset value, beginning of period | $1.00 | $1.00 | $1.00 | $1.00 | $1.00 | $1.00 |
| Income from Investment Operations | ||||||
| Net investment income (loss)A | – | – | – | – | – | – |
| Net realized and unrealized gain (loss)A | – | – | – | – | – | – |
| Total from investment operationsA | – | – | – | – | – | – |
| Distributions from net investment incomeA | – | – | – | – | – | – |
| Total distributionsA | – | – | – | – | – | – |
| Net asset value, end of period | $1.00 | $1.00 | $1.00 | $1.00 | $1.00 | $1.00 |
| Total ReturnB,C | .01% | .01% | .01% | .01% | .01% | .01% |
| Ratios to Average Net AssetsD | ||||||
| Expenses before reductions | .36%E | .36% | .36% | .36% | .36% | .36% |
| Expenses net of fee waivers, if any | .33%E | .13% | .05% | .06% | .10% | .06% |
| Expenses net of all reductions | .33%E | .13% | .05% | .06% | .10% | .06% |
| Net investment income (loss) | .02%E | .03% | - %F | .01% | .01% | .01% |
| Supplemental Data | ||||||
| Net assets, end of period (in millions) | $231 | $307 | $310 | $359 | $354 | $499 |
A Amount represents less than $.0005 per share.
B Total returns for periods of less than one year are not annualized.
C Total returns would have been lower if certain expenses had not been reduced during the applicable periods shown.
D Expense ratios reflect operating expenses of the class. Expenses before reductions do not reflect amounts reimbursed or waived or reductions from expense offset arrangements and do not represent the amount paid by the class during periods when reimbursements, waivers or reductions occur. Expenses net of fee waivers reflect expenses after reimbursement and waivers but prior to reductions from expense offset arrangements. Expenses net of all reductions represent the net expenses paid by the class.
E Annualized
F Amount represents less than .005%.
See accompanying notes which are an integral part of the financial statements.
Financial Highlights — Treasury Only Portfolio Class III
| Six months ended (Unaudited) September 30, | Years ended March 31, | |||||
| 2016 | 2016 | 2015 | 2014 | 2013 | 2012 | |
| Selected Per–Share Data | ||||||
| Net asset value, beginning of period | $1.00 | $1.00 | $1.00 | $1.00 | $1.00 | $1.00 |
| Income from Investment Operations | ||||||
| Net investment income (loss)A | – | – | – | – | – | – |
| Net realized and unrealized gain (loss)A | – | – | – | – | – | – |
| Total from investment operationsA | – | – | – | – | – | – |
| Distributions from net investment incomeA | – | – | – | – | – | – |
| Total distributionsA | – | – | – | – | – | – |
| Net asset value, end of period | $1.00 | $1.00 | $1.00 | $1.00 | $1.00 | $1.00 |
| Total ReturnB,C | .01% | .01% | .01% | .01% | .01% | .01% |
| Ratios to Average Net AssetsD | ||||||
| Expenses before reductions | .46%E | .46% | .46% | .46% | .46% | .46% |
| Expenses net of fee waivers, if any | .34%E | .15% | .05% | .06% | .10% | .06% |
| Expenses net of all reductions | .34%E | .15% | .05% | .06% | .10% | .06% |
| Net investment income (loss) | .01%E | .01% | - %F | .01% | .01% | .01% |
| Supplemental Data | ||||||
| Net assets, end of period (in millions) | $1,001 | $831 | $635 | $487 | $408 | $408 |
A Amount represents less than $.0005 per share.
B Total returns for periods of less than one year are not annualized.
C Total returns would have been lower if certain expenses had not been reduced during the applicable periods shown.
D Expense ratios reflect operating expenses of the class. Expenses before reductions do not reflect amounts reimbursed or waived or reductions from expense offset arrangements and do not represent the amount paid by the class during periods when reimbursements, waivers or reductions occur. Expenses net of fee waivers reflect expenses after reimbursement and waivers but prior to reductions from expense offset arrangements. Expenses net of all reductions represent the net expenses paid by the class.
E Annualized
F Amount represents less than .005%.
See accompanying notes which are an integral part of the financial statements.
Financial Highlights — Treasury Only Portfolio Class IV
| Six months ended (Unaudited) September 30, | Years ended March 31, | |||||
| 2016 | 2016 | 2015 | 2014 | 2013 | 2012 | |
| Selected Per–Share Data | ||||||
| Net asset value, beginning of period | $1.00 | $1.00 | $1.00 | $1.00 | $1.00 | $1.00 |
| Income from Investment Operations | ||||||
| Net investment income (loss)A | – | – | – | – | – | – |
| Net realized and unrealized gain (loss)A | – | – | – | – | – | – |
| Total from investment operationsA | – | – | – | – | – | – |
| Distributions from net investment incomeA | – | – | – | – | – | – |
| Total distributionsA | – | – | – | – | – | – |
| Net asset value, end of period | $1.00 | $1.00 | $1.00 | $1.00 | $1.00 | $1.00 |
| Total ReturnB,C | .01% | .01% | .01% | .01% | .01% | .01% |
| Ratios to Average Net AssetsD | ||||||
| Expenses before reductions | .72%E | .71% | .71% | .71% | .71% | .72% |
| Expenses net of fee waivers, if any | .32%E | .14% | .04% | .06% | .10% | .07% |
| Expenses net of all reductions | .32%E | .14% | .04% | .06% | .10% | .07% |
| Net investment income (loss) | .02%E | .02% | .01% | .01% | .01% | .01% |
| Supplemental Data | ||||||
| Net assets, end of period (in millions) | $48 | $338 | $114 | $18 | $22 | $25 |
A Amount represents less than $.0005 per share.
B Total returns for periods of less than one year are not annualized.
C Total returns would have been lower if certain expenses had not been reduced during the applicable periods shown.
D Expense ratios reflect operating expenses of the class. Expenses before reductions do not reflect amounts reimbursed or waived or reductions from expense offset arrangements and do not represent the amount paid by the class during periods when reimbursements, waivers or reductions occur. Expenses net of fee waivers reflect expenses after reimbursement and waivers but prior to reductions from expense offset arrangements. Expenses net of all reductions represent the net expenses paid by the class.
E Annualized
See accompanying notes which are an integral part of the financial statements.
Financial Highlights — Treasury Only Portfolio Select Class
| Six months ended (Unaudited) September 30, | Years ended March 31, | |||||
| 2016 | 2016 | 2015 | 2014 | 2013 | 2012 | |
| Selected Per–Share Data | ||||||
| Net asset value, beginning of period | $1.00 | $1.00 | $1.00 | $1.00 | $1.00 | $1.00 |
| Income from Investment Operations | ||||||
| Net investment income (loss) | .001 | –A | –A | –A | –A | –A |
| Net realized and unrealized gain (loss)A | – | – | – | – | – | – |
| Total from investment operations | .001 | –A | –A | –A | –A | –A |
| Distributions from net investment income | (.001) | –A | –A | –A | –A | –A |
| Total distributions | (.001) | –A | –A | –A | –A | –A |
| Net asset value, end of period | $1.00 | $1.00 | $1.00 | $1.00 | $1.00 | $1.00 |
| Total ReturnB,C | .06% | .03% | .01% | .01% | .01% | .01% |
| Ratios to Average Net AssetsD | ||||||
| Expenses before reductions | .26%E | .27% | .26% | .26% | .26% | .26% |
| Expenses net of fee waivers, if any | .23%E | .12% | .05% | .06% | .10% | .06% |
| Expenses net of all reductions | .23%E | .12% | .05% | .06% | .10% | .06% |
| Net investment income (loss) | .12%E | .04% | - %F | .01% | .01% | .01% |
| Supplemental Data | ||||||
| Net assets, end of period (in millions) | $162 | $180 | $194 | $215 | $210 | $269 |
A Amount represents less than $.0005 per share.
B Total returns for periods of less than one year are not annualized.
C Total returns would have been lower if certain expenses had not been reduced during the applicable periods shown.
D Expense ratios reflect operating expenses of the class. Expenses before reductions do not reflect amounts reimbursed or waived or reductions from expense offset arrangements and do not represent the amount paid by the class during periods when reimbursements, waivers or reductions occur. Expenses net of fee waivers reflect expenses after reimbursement and waivers but prior to reductions from expense offset arrangements. Expenses net of all reductions represent the net expenses paid by the class.
E Annualized
F Amount represents less than .005%.
See accompanying notes which are an integral part of the financial statements.
Financial Highlights — Treasury Only Portfolio Institutional Class
| Six months ended (Unaudited) September 30, | Years ended March 31, | ||
| 2016 | 2016 | 2015 A | |
| Selected Per–Share Data | |||
| Net asset value, beginning of period | $1.00 | $1.00 | $1.00 |
| Income from Investment Operations | |||
| Net investment income (loss) | .001 | .001 | –B |
| Net realized and unrealized gain (loss)B | – | – | – |
| Total from investment operations | .001 | .001 | –B |
| Distributions from net investment income | (.001) | (.001) | –B |
| Total distributions | (.001) | (.001) | –B |
| Net asset value, end of period | $1.00 | $1.00 | $1.00 |
| Total ReturnC,D | .10% | .05% | .01% |
| Ratios to Average Net AssetsE | |||
| Expenses before reductions | .18%F | .18% | .19%F |
| Expenses net of fee waivers, if any | .14%F | .12% | .04%F |
| Expenses net of all reductions | .14%F | .12% | .04%F |
| Net investment income (loss) | .21%F | .04% | - %F,G |
| Supplemental Data | |||
| Net assets, end of period (in millions) | $3,543 | $1,932 | $126 |
A For the period May 14, 2014 (commencement of sale of shares) to March 31, 2015.
B Amount represents less than $.0005 per share.
C Total returns for periods of less than one year are not annualized.
D Total returns would have been lower if certain expenses had not been reduced during the applicable periods shown.
E Expense ratios reflect operating expenses of the class. Expenses before reductions do not reflect amounts reimbursed or waived or reductions from expense offset arrangements and do not represent the amount paid by the class during periods when reimbursements, waivers or reductions occur. Expense ratios before reductions for start-up periods may not be representative of longer-term operating periods. Expenses net of fee waivers reflect expenses after reimbursement and waivers but prior to reductions from expense offset arrangements. Expenses net of all reductions represent the net expenses paid by the class.
F Annualized
G Amount represents less than .005%.
See accompanying notes which are an integral part of the financial statements.
Treasury Portfolio
Investment Summary/Performance (Unaudited)
Effective Maturity Diversification
| Days | % of fund's investments 9/30/16 | % of fund's investments 3/31/16 | % of fund's investments 9/30/15 |
| 1 - 7 | 50.5 | 42.1 | 73.9 |
| 8 - 30 | 7.5 | 13.1 | 2.1 |
| 31 - 60 | 12.6 | 10.2 | 3.0 |
| 61 - 90 | 12.7 | 11.5 | 0.5 |
| 91 - 180 | 12.9 | 20.7 | 11.4 |
| > 180 | 3.8 | 2.4 | 9.1 |
Effective maturity is determined in accordance with the requirements of Rule 2a-7 under the Investment Company Act of 1940.
Asset Allocation (% of fund's net assets)
| As of September 30, 2016 | ||
| U.S. Treasury Debt | 61.6% | |
| Repurchase Agreements | 38.7% | |
| Net Other Assets (Liabilities)* | (0.3)% | |

* Net Other Assets (Liabilities) are not included in the pie chart
| As of March 31, 2016 | ||
| U.S. Treasury Debt | 73.8% | |
| Repurchase Agreements | 26.0% | |
| Net Other Assets (Liabilities) | 0.2% | |

Current And Historical 7-Day Yields
| 9/30/16 | 6/30/16 | 3/31/16 | 12/31/15 | 9/30/15 | |
| Class I | 0.20% | 0.20% | 0.19% | 0.11% | 0.01% |
| Class II | 0.05% | 0.05% | 0.04% | 0.01% | 0.01% |
| Class III | 0.01% | 0.01% | 0.01% | 0.01% | 0.01% |
| Class IV | 0.01% | 0.01% | 0.01% | 0.01% | 0.01% |
| Select Class | 0.15% | 0.15% | 0.14% | 0.06% | 0.01% |
| Institutional Class | 0.24% | 0.24% | 0.23% | 0.15% | 0.01% |
Yield refers to the income paid by the Fund over a given period. Yields for money market funds are usually for seven-day periods, as they are here, though they are expressed as annual percentage rates. Past performance is no guarantee of future results. Yield will vary and it's possible to lose money investing in the Fund. A portion of the Fund's expenses was reimbursed and/or waived. Absent such reimbursements and/or waivers the yield for the period ending September 30, 2016, the most recent period shown in the table, would have been 0.16% for Class I, 0.01% for Class II, -0.08% for Class III, -0.34% for Class IV, 0.12% for Select Class and 0.20% for Institutional Class.
Treasury Portfolio
Investments September 30, 2016 (Unaudited)
Showing Percentage of Net Assets
| U.S. Treasury Debt - 61.6% | ||||
| Yield(a) | Principal Amount (000s) | Value (000s) | ||
| U.S. Treasury Obligations - 61.6% | ||||
| U.S. Treasury Bills | ||||
| 10/13/16 to 3/30/17 | 0.29 to 0.54% | $5,904,000 | $5,898,955 | |
| U.S. Treasury Bonds | ||||
| 11/15/16 | 0.37 to 0.47 | 132,000 | 133,143 | |
| U.S. Treasury Notes | ||||
| 10/15/16 to 7/31/18 | 0.28 to 0.54 (b) | 8,012,054 | 8,023,775 | |
| TOTAL U.S. TREASURY DEBT | ||||
| (Cost $14,055,873) | 14,055,873 |
| U.S. Treasury Repurchase Agreement - 38.7% | |||
| Maturity Amount (000s) | Value (000s) | ||
| In a joint trading account at: | |||
| 0.47% dated 9/30/16 due 10/3/16 (Collateralized by U.S. Treasury Obligations) # | $653,816 | $653,791 | |
| 0.48% dated 9/30/16 due 10/3/16 (Collateralized by U.S. Treasury Obligations) # | 660,771 | 660,744 | |
| With: | |||
| Barclays Capital, Inc. at 0.47%, dated 9/30/16 due 10/3/16 (Collateralized by U.S. Treasury Obligations valued at $44,881,856, 0.00% - 6.13%, 11/10/16 - 8/15/29) | 44,002 | 44,000 | |
| BNP Paribas, S.A. at: | |||
| 0.36%, dated: | |||
| 8/15/16 due 10/7/16 (Collateralized by U.S. Treasury Obligations valued at $50,004,534, 0.00% - 2.75%, 11/10/16 - 11/15/23) | 49,045 | 49,000 | |
| 9/22/16 due 11/21/16 (Collateralized by U.S. Treasury Obligations valued at $56,223,597, 0.63% - 6.25%, 5/31/17 - 8/15/42) | 55,033 | 55,000 | |
| 0.37%, dated: | |||
| 8/26/16 due 10/7/16 (Collateralized by U.S. Treasury Obligations valued at $119,386,699, 0.00% - 5.50%, 11/10/16 - 8/15/28) | 117,105 | 117,000 | |
| 8/29/16 due 10/7/16 (Collateralized by U.S. Treasury Obligations valued at $178,564,278, 0.00% - 6.00%, 11/10/16 - 2/15/26) | 175,153 | 175,000 | |
| 9/7/16 due 10/7/16 (Collateralized by U.S. Treasury Obligations valued at $59,339,068, 0.00% - 6.75%, 11/03/16 - 8/15/45) | 58,036 | 58,000 | |
| 0.4%, dated 9/2/16 due 12/1/16 (Collateralized by U.S. Treasury Obligations valued at $153,881,107, 0.00% - 6.75%, 11/10/16 - 2/15/43) | 150,150 | 150,000 | |
| Deutsche Bank Securities, Inc. at 0.55%, dated 9/30/16 due 10/3/16 (Collateralized by U.S. Treasury Obligations valued at $56,102,625, 0.75% - 2.63%, 6/30/17 - 4/30/18) | 55,003 | 55,000 | |
| Federal Reserve Bank of New York at 0.25%, dated 9/30/16 due 10/3/16 (Collateralized by U.S. Treasury Obligations valued at $5,119,106,646, 1.38% - 3.13%, 5/31/21 - 2/15/43) | 5,119,107 | 5,119,000 | |
| ING Financial Markets LLC at 0.34%, dated 8/24/16 due 10/18/16 (Collateralized by U.S. Treasury Obligations valued at $181,128,504, 0.50% - 4.50%, 2/15/17 - 8/15/46) | 177,092 | 177,000 | |
| Mizuho Securities U.S.A., Inc. at 0.53%, dated 9/30/16 due 10/3/16 (Collateralized by U.S. Treasury Obligations valued at $57,320,369, 1.75%, 12/31/20) | 56,002 | 56,000 | |
| Prudential Insurance Co. of America at 0.53%, dated 9/30/16 due 10/3/16 (Collateralized by U.S. Treasury Obligations valued at $107,695,958, 1.00%, 3/31/17 - 9/30/19) | 105,671 | 105,666 | |
| RBC Capital Markets Corp. at 0.34%, dated: | |||
| 8/29/16 due 10/7/16 (Collateralized by U.S. Treasury Obligations valued at $184,352,175, 0.00% - 8.75%, 11/10/16 - 11/15/45) | 180,090 | 180,000 | |
| 9/6/16 due 10/7/16 (Collateralized by U.S. Treasury Obligations valued at $21,426,503, 0.75% - 8.75%, 11/15/16 - 2/15/44) | 21,012 | 21,000 | |
| 9/28/16 due 10/7/16 (Collateralized by U.S. Treasury Obligations valued at $30,886,983, 0.63% - 9.00%, 5/15/17 - 11/15/44) | 30,018 | 30,000 | |
| RBS Securities, Inc. at 0.48%, dated 9/30/16 due 10/3/16 (Collateralized by U.S. Treasury Obligations valued at $45,980,573, 0.88% - 5.00%, 8/15/17 - 5/15/37) | 45,002 | 45,000 | |
| Royal Bank of Canada at: | |||
| 0.35%, dated 9/26/16 due 10/3/16 (Collateralized by U.S. Treasury Obligations valued at $26,617,275, 0.88%, 6/15/19) | 26,002 | 26,000 | |
| 0.42%, dated: | |||
| 9/27/16 due 10/4/16 (Collateralized by U.S. Treasury Obligations valued at $74,424,769, 0.75% - 2.25%, 9/30/18 - 3/31/21) | 73,006 | 73,000 | |
| 9/28/16 due 10/5/16 (Collateralized by U.S. Treasury Obligations valued at $127,115,464, 1.38%, 10/31/20 - 5/31/21) | 124,010 | 124,000 | |
| 0.43%, dated: | |||
| 9/29/16 due 10/6/16 (Collateralized by U.S. Treasury Obligations valued at $40,089,395, 1.88%, 10/31/17) | 39,003 | 39,000 | |
| 9/30/16 due 10/7/16 (Collateralized by U.S. Treasury Obligations valued at $25,567,526, 1.50%, 1/31/22) | 25,002 | 25,000 | |
| 0.5%, dated 9/30/16 due 10/3/16 (Collateralized by U.S. Treasury Obligations valued at $3,071,525, 1.38%, 6/30/23) | 3,000 | 3,000 | |
| 0.54%, dated 9/30/16 due 10/3/16 (Collateralized by U.S. Treasury Obligations valued at $138,752,966, 0.63% - 1.38%, 6/30/18 - 9/30/20) | 136,006 | 136,000 | |
| Sumitomo Mitsui Trust Bank Ltd. at 0.48%, dated: | |||
| 8/30/16 due 10/4/16 (Collateralized by U.S. Treasury Obligations valued at $56,508,945, 3.00% - 3.88%, 2/28/17 - 5/15/18) | 54,710 | 54,684 | |
| 8/31/16 due 10/5/16 (Collateralized by U.S. Treasury Obligations valued at $19,722,909, 2.50%, 5/15/24) | 19,124 | 19,115 | |
| 9/7/16 due 10/7/16 (Collateralized by U.S. Treasury Obligations valued at $19,328,000, 2.25%, 11/15/24) | 18,793 | 18,784 | |
| 9/9/16 due 10/7/16 (Collateralized by U.S. Treasury Obligations valued at $57,547,631, 2.13% - 3.75%, 11/15/18 - 8/31/20) | 55,874 | 55,848 | |
| 9/13/16 due 10/7/16 (Collateralized by U.S. Treasury Obligations valued at $83,504,424, 2.25% - 2.63%, 8/15/20 - 11/15/24) | 81,286 | 81,248 | |
| 9/14/16 due 10/7/16 (Collateralized by U.S. Treasury Obligations valued at $62,785,306, 2.38%, 8/15/24) | 61,357 | 61,328 | |
| 9/16/16 due 10/7/16 (Collateralized by U.S. Treasury Obligations valued at $101,892,275, 2.25% - 3.75%, 11/15/18 - 11/15/24) | 98,878 | 98,832 | |
| 9/20/16 due 10/7/16 (Collateralized by U.S. Treasury Obligations valued at $93,243,263, 2.25% - 3.25%, 3/31/17 - 11/15/24) | 91,509 | 91,466 | |
| 9/27/16 due 10/7/16 (Collateralized by U.S. Treasury Obligations valued at $63,073,715, 2.63% - 3.75%, 11/15/18 - 8/15/20) | 61,181 | 61,153 | |
| 10/4/16 due 10/7/16(c) | 52,583 | 52,558 | |
| 10/5/16 due 10/7/16(c) | 18,666 | 18,657 | |
| Wells Fargo Securities LLC at 0.41%, dated: | |||
| 9/2/16 due 12/1/16 (Collateralized by U.S. Treasury Obligations valued at $20,407,227, 0.75% - 0.88%, 1/31/18 - 4/15/18) | 20,021 | 20,000 | |
| 9/7/16 due 12/6/16 (Collateralized by U.S. Treasury Obligations valued at $26,527,945, 0.88%, 7/15/18) | 26,027 | 26,000 | |
| TOTAL U.S. TREASURY REPURCHASE AGREEMENT | |||
| (Cost $8,836,874) | 8,836,874 | ||
| TOTAL INVESTMENT PORTFOLIO - 100.3% | |||
| (Cost $22,892,747) | 22,892,747 | ||
| NET OTHER ASSETS (LIABILITIES) - (0.3)% | (72,660) | ||
| NET ASSETS - 100% | $22,820,087 |
The date shown for securities represents the date when principal payments must be paid, taking into account any call options exercised by the issuer and any permissible maturity shortening features other than interest rate resets.
Legend
(a) Yield represents either the annualized yield at the date of purchase, or the stated coupon rate, or, for floating and adjustable rate securities, the rate at period end.
(b) Coupon rates for floating and adjustable rate securities reflect the rates in effect at period end.
(c) Represents a forward settling transaction and therefore no collateral securities had been allocated as of period end. The agreement contemplated the delivery of U.S. Treasury Obligations as collateral on settlement date.
Investment Valuation
All investments are categorized as Level 2 under the Fair Value Hierarchy. The inputs or methodology used for valuing securities may not be an indication of the risk associated with investing in those securities. For more information on valuation inputs please refer to the Investment Valuation section in the accompanying Notes to Financial Statements.
Other Information
# Additional information on each counterparty to the repurchase agreement is as follows:
| Repurchase Agreement / Counterparty | Value(000s) |
| $653,791,000 due 10/03/16 at 0.47% | |
| BNP Paribas, S.A. | $14,000 |
| Bank of Nova Scotia | 200,000 |
| Citibank NA | 63,000 |
| Credit Agricole CIB New York Branch | 17,000 |
| HSBC Securities (USA), Inc. | 281,791 |
| Merrill Lynch, Pierce, Fenner & Smith, Inc. | 23,000 |
| Wells Fargo Securities LLC | 55,000 |
| $653,791 | |
| $660,744,000 due 10/03/16 at 0.48% | |
| BNP Paribas, S.A. | 568,954 |
| Credit Agricole CIB New York Branch | 91,790 |
| $660,744 |
See accompanying notes which are an integral part of the financial statements.
Treasury Portfolio
Financial Statements
Statement of Assets and Liabilities
| Amounts in thousands (except per-share amounts) | September 30, 2016 (Unaudited) | |
| Assets | ||
| Investment in securities, at value (including repurchase agreements of $8,836,874) — See accompanying schedule: Unaffiliated issuers (cost $22,892,747) | $22,892,747 | |
| Receivable for fund shares sold | 830 | |
| Interest receivable | 24,834 | |
| Prepaid expenses | 53 | |
| Receivable from investment adviser for expense reductions | 578 | |
| Other receivables | 164 | |
| Total assets | 22,919,206 | |
| Liabilities | ||
| Payable to custodian bank | $1,003 | |
| Payable for investments purchased | 91,660 | |
| Payable for fund shares redeemed | 894 | |
| Distributions payable | 1,438 | |
| Accrued management fee | 2,292 | |
| Distribution and service plan fees payable | 613 | |
| Other affiliated payables | 972 | |
| Other payables and accrued expenses | 247 | |
| Total liabilities | 99,119 | |
| Net Assets | $22,820,087 | |
| Net Assets consist of: | ||
| Paid in capital | $22,819,992 | |
| Undistributed net investment income | 1 | |
| Accumulated undistributed net realized gain (loss) on investments | 94 | |
| Net Assets | $22,820,087 | |
| Class I: | ||
| Net Asset Value, offering price and redemption price per share ($12,504,284 ÷ 12,500,087 shares) | $1.00 | |
| Class II: | ||
| Net Asset Value, offering price and redemption price per share ($272,988 ÷ 272,810 shares) | $1.00 | |
| Class III: | ||
| Net Asset Value, offering price and redemption price per share ($2,725,421 ÷ 2,725,246 shares) | $1.00 | |
| Class IV: | ||
| Net Asset Value, offering price and redemption price per share ($878,195 ÷ 877,960 shares) | $1.00 | |
| Select Class: | ||
| Net Asset Value, offering price and redemption price per share ($331,490 ÷ 331,418 shares) | $1.00 | |
| Institutional Class: | ||
| Net Asset Value, offering price and redemption price per share ($6,107,709 ÷ 6,107,922 shares) | $1.00 |
See accompanying notes which are an integral part of the financial statements.
Statement of Operations
| Amounts in thousands | Six months ended September 30, 2016 (Unaudited) | |
| Investment Income | ||
| Interest | $34,684 | |
| Expenses | ||
| Management fee | $12,972 | |
| Transfer agent fees | 4,993 | |
| Distribution and service plan fees | 5,539 | |
| Accounting fees and expenses | 584 | |
| Custodian fees and expenses | 101 | |
| Independent trustees' fees and expenses | 40 | |
| Registration fees | 130 | |
| Audit | 26 | |
| Legal | 23 | |
| Miscellaneous | 53 | |
| Total expenses before reductions | 24,461 | |
| Expense reductions | (5,070) | 19,391 |
| Net investment income (loss) | 15,293 | |
| Realized and Unrealized Gain (Loss) | ||
| Net realized gain (loss) on: | ||
| Investment securities: | ||
| Unaffiliated issuers | 94 | |
| Total net realized gain (loss) | 94 | |
| Net increase in net assets resulting from operations | $15,387 |
See accompanying notes which are an integral part of the financial statements.
Statement of Changes in Net Assets
| Amounts in thousands | Six months ended September 30, 2016 (Unaudited) | Year ended March 31, 2016 |
| Increase (Decrease) in Net Assets | ||
| Operations | ||
| Net investment income (loss) | $15,293 | $7,513 |
| Net realized gain (loss) | 94 | 279 |
| Net increase in net assets resulting from operations | 15,387 | 7,792 |
| Distributions to shareholders from net investment income | (15,413) | (6,744) |
| Share transactions - net increase (decrease) | 5,364,561 | 1,276,158 |
| Total increase (decrease) in net assets | 5,364,535 | 1,277,206 |
| Net Assets | ||
| Beginning of period | 17,455,552 | 16,178,346 |
| End of period | $22,820,087 | $17,455,552 |
| Other Information | ||
| Undistributed net investment income end of period | $1 | $121 |
See accompanying notes which are an integral part of the financial statements.
Financial Highlights — Treasury Portfolio Class I
| Six months ended (Unaudited) September 30, | Years ended March 31, | |||||
| 2016 | 2016 | 2015 | 2014 | 2013 | 2012 | |
| Selected Per–Share Data | ||||||
| Net asset value, beginning of period | $1.00 | $1.00 | $1.00 | $1.00 | $1.00 | $1.00 |
| Income from Investment Operations | ||||||
| Net investment income (loss) | .001 | .001 | –A | –A | –A | –A |
| Net realized and unrealized gain (loss)A | – | – | – | – | – | – |
| Total from investment operations | .001 | .001 | –A | –A | –A | –A |
| Distributions from net investment income | (.001) | (.001) | –A | –A | –A | –A |
| Total distributions | (.001) | (.001) | –A | –A | –A | –A |
| Net asset value, end of period | $1.00 | $1.00 | $1.00 | $1.00 | $1.00 | $1.00 |
| Total ReturnB,C | .10% | .05% | .01% | .01% | .01% | .01% |
| Ratios to Average Net AssetsD | ||||||
| Expenses before reductions | .21%E | .21% | .21% | .21% | .21% | .21% |
| Expenses net of fee waivers, if any | .18%E | .13% | .07% | .08% | .16% | .10% |
| Expenses net of all reductions | .18%E | .13% | .07% | .08% | .16% | .10% |
| Net investment income (loss) | .19%E | .05% | .01% | .01% | .01% | .01% |
| Supplemental Data | ||||||
| Net assets, end of period (in millions) | $12,504 | $9,639 | $11,727 | $9,736 | $9,964 | $11,712 |
A Amount represents less than $.0005 per share.
B Total returns for periods of less than one year are not annualized.
C Total returns would have been lower if certain expenses had not been reduced during the applicable periods shown.
D Expense ratios reflect operating expenses of the class. Expenses before reductions do not reflect amounts reimbursed or waived or reductions from expense offset arrangements and do not represent the amount paid by the class during periods when reimbursements, waivers or reductions occur. Expenses net of fee waivers reflect expenses after reimbursement and waivers but prior to reductions from expense offset arrangements. Expenses net of all reductions represent the net expenses paid by the class.
E Annualized
See accompanying notes which are an integral part of the financial statements.
Financial Highlights — Treasury Portfolio Class II
| Six months ended (Unaudited) September 30, | Years ended March 31, | |||||
| 2016 | 2016 | 2015 | 2014 | 2013 | 2012 | |
| Selected Per–Share Data | ||||||
| Net asset value, beginning of period | $1.00 | $1.00 | $1.00 | $1.00 | $1.00 | $1.00 |
| Income from Investment Operations | ||||||
| Net investment income (loss)A | – | – | – | – | – | – |
| Net realized and unrealized gain (loss)A | – | – | – | – | – | – |
| Total from investment operationsA | – | – | – | – | – | – |
| Distributions from net investment incomeA | – | – | – | – | – | – |
| Total distributionsA | – | – | – | – | – | – |
| Net asset value, end of period | $1.00 | $1.00 | $1.00 | $1.00 | $1.00 | $1.00 |
| Total ReturnB,C | .02% | .01% | .01% | .01% | .01% | .01% |
| Ratios to Average Net AssetsD | ||||||
| Expenses before reductions | .36%E | .36% | .36% | .36% | .36% | .36% |
| Expenses net of fee waivers, if any | .33%E | .22% | .07% | .08% | .16% | .10% |
| Expenses net of all reductions | .33%E | .22% | .07% | .08% | .16% | .10% |
| Net investment income (loss) | .04%E | .01% | .01% | .01% | .01% | .01% |
| Supplemental Data | ||||||
| Net assets, end of period (in millions) | $273 | $557 | $70 | $133 | $127 | $80 |
A Amount represents less than $.0005 per share.
B Total returns for periods of less than one year are not annualized.
C Total returns would have been lower if certain expenses had not been reduced during the applicable periods shown.
D Expense ratios reflect operating expenses of the class. Expenses before reductions do not reflect amounts reimbursed or waived or reductions from expense offset arrangements and do not represent the amount paid by the class during periods when reimbursements, waivers or reductions occur. Expenses net of fee waivers reflect expenses after reimbursement and waivers but prior to reductions from expense offset arrangements. Expenses net of all reductions represent the net expenses paid by the class.
E Annualized
See accompanying notes which are an integral part of the financial statements.
Financial Highlights — Treasury Portfolio Class III
| Six months ended (Unaudited) September 30, | Years ended March 31, | |||||
| 2016 | 2016 | 2015 | 2014 | 2013 | 2012 | |
| Selected Per–Share Data | ||||||
| Net asset value, beginning of period | $1.00 | $1.00 | $1.00 | $1.00 | $1.00 | $1.00 |
| Income from Investment Operations | ||||||
| Net investment income (loss)A | – | – | – | – | – | – |
| Net realized and unrealized gain (loss)A | – | – | – | – | – | – |
| Total from investment operationsA | – | – | – | – | – | – |
| Distributions from net investment incomeA | – | – | – | – | – | – |
| Total distributionsA | – | – | – | – | – | – |
| Net asset value, end of period | $1.00 | $1.00 | $1.00 | $1.00 | $1.00 | $1.00 |
| Total ReturnB,C | .01% | .01% | .01% | .01% | .01% | .01% |
| Ratios to Average Net AssetsD | ||||||
| Expenses before reductions | .46%E | .46% | .46% | .46% | .46% | .46% |
| Expenses net of fee waivers, if any | .36%E | .17% | .07% | .08% | .16% | .10% |
| Expenses net of all reductions | .36%E | .17% | .07% | .08% | .16% | .10% |
| Net investment income (loss) | .01%E | .02% | .01% | .01% | .01% | .01% |
| Supplemental Data | ||||||
| Net assets, end of period (in millions) | $2,725 | $2,862 | $2,866 | $2,654 | $2,844 | $3,108 |
A Amount represents less than $.0005 per share.
B Total returns for periods of less than one year are not annualized.
C Total returns would have been lower if certain expenses had not been reduced during the applicable periods shown.
D Expense ratios reflect operating expenses of the class. Expenses before reductions do not reflect amounts reimbursed or waived or reductions from expense offset arrangements and do not represent the amount paid by the class during periods when reimbursements, waivers or reductions occur. Expenses net of fee waivers reflect expenses after reimbursement and waivers but prior to reductions from expense offset arrangements. Expenses net of all reductions represent the net expenses paid by the class.
E Annualized
See accompanying notes which are an integral part of the financial statements.
Financial Highlights — Treasury Portfolio Class IV
| Six months ended (Unaudited) September 30, | Years ended March 31, | |||||
| 2016 | 2016 | 2015 | 2014 | 2013 | 2012 | |
| Selected Per–Share Data | ||||||
| Net asset value, beginning of period | $1.00 | $1.00 | $1.00 | $1.00 | $1.00 | $1.00 |
| Income from Investment Operations | ||||||
| Net investment income (loss)A | – | – | – | – | – | – |
| Net realized and unrealized gain (loss)A | – | – | – | – | – | – |
| Total from investment operationsA | – | – | – | – | – | – |
| Distributions from net investment incomeA | – | – | – | – | – | – |
| Total distributionsA | – | – | – | – | – | – |
| Net asset value, end of period | $1.00 | $1.00 | $1.00 | $1.00 | $1.00 | $1.00 |
| Total ReturnB,C | .01% | .01% | .01% | .01% | .01% | .01% |
| Ratios to Average Net AssetsD | ||||||
| Expenses before reductions | .71%E | .71% | .71% | .71% | .71% | .71% |
| Expenses net of fee waivers, if any | .36%E | .18% | .07% | .08% | .16% | .10% |
| Expenses net of all reductions | .36%E | .18% | .07% | .08% | .16% | .10% |
| Net investment income (loss) | .01%E | .01% | .01% | .01% | .01% | .01% |
| Supplemental Data | ||||||
| Net assets, end of period (in millions) | $878 | $905 | $621 | $591 | $527 | $484 |
A Amount represents less than $.0005 per share.
B Total returns for periods of less than one year are not annualized.
C Total returns would have been lower if certain expenses had not been reduced during the applicable periods shown.
D Expense ratios reflect operating expenses of the class. Expenses before reductions do not reflect amounts reimbursed or waived or reductions from expense offset arrangements and do not represent the amount paid by the class during periods when reimbursements, waivers or reductions occur. Expenses net of fee waivers reflect expenses after reimbursement and waivers but prior to reductions from expense offset arrangements. Expenses net of all reductions represent the net expenses paid by the class.
E Annualized
See accompanying notes which are an integral part of the financial statements.
Financial Highlights — Treasury Portfolio Select Class
| Six months ended (Unaudited) September 30, | Years ended March 31, | |||||
| 2016 | 2016 | 2015 | 2014 | 2013 | 2012 | |
| Selected Per–Share Data | ||||||
| Net asset value, beginning of period | $1.00 | $1.00 | $1.00 | $1.00 | $1.00 | $1.00 |
| Income from Investment Operations | ||||||
| Net investment income (loss) | .001 | –A | –A | –A | –A | –A |
| Net realized and unrealized gain (loss)A | – | – | – | – | – | – |
| Total from investment operations | .001 | –A | –A | –A | –A | –A |
| Distributions from net investment income | (.001) | –A | –A | –A | –A | –A |
| Total distributions | (.001) | –A | –A | –A | –A | –A |
| Net asset value, end of period | $1.00 | $1.00 | $1.00 | $1.00 | $1.00 | $1.00 |
| Total ReturnB,C | .07% | .04% | .01% | .01% | .01% | .01% |
| Ratios to Average Net AssetsD | ||||||
| Expenses before reductions | .26%E | .26% | .26% | .26% | .26% | .26% |
| Expenses net of fee waivers, if any | .23%E | .15% | .07% | .08% | .16% | .10% |
| Expenses net of all reductions | .23%E | .15% | .07% | .08% | .16% | .10% |
| Net investment income (loss) | .14%E | .04% | .01% | .01% | .01% | .01% |
| Supplemental Data | ||||||
| Net assets, end of period (in millions) | $331 | $287 | $225 | $238 | $198 | $259 |
A Amount represents less than $.0005 per share.
B Total returns for periods of less than one year are not annualized.
C Total returns would have been lower if certain expenses had not been reduced during the applicable periods shown.
D Expense ratios reflect operating expenses of the class. Expenses before reductions do not reflect amounts reimbursed or waived or reductions from expense offset arrangements and do not represent the amount paid by the class during periods when reimbursements, waivers or reductions occur. Expenses net of fee waivers reflect expenses after reimbursement and waivers but prior to reductions from expense offset arrangements. Expenses net of all reductions represent the net expenses paid by the class.
E Annualized
See accompanying notes which are an integral part of the financial statements.
Financial Highlights — Treasury Portfolio Institutional Class
| Six months ended (Unaudited) September 30, | Years ended March 31, | ||
| 2016 | 2016 | 2015 A | |
| Selected Per–Share Data | |||
| Net asset value, beginning of period | $1.00 | $1.00 | $1.00 |
| Income from Investment Operations | |||
| Net investment income (loss) | .001 | .001 | –B |
| Net realized and unrealized gain (loss)B | – | – | – |
| Total from investment operations | .001 | .001 | –B |
| Distributions from net investment income | (.001) | (.001) | –B |
| Total distributions | (.001) | (.001) | –B |
| Net asset value, end of period | $1.00 | $1.00 | $1.00 |
| Total ReturnC,D | .12% | .07% | .01% |
| Ratios to Average Net AssetsE | |||
| Expenses before reductions | .18%F | .18% | .18%F |
| Expenses net of fee waivers, if any | .14%F | .13% | .07%F |
| Expenses net of all reductions | .14%F | .13% | .07%F |
| Net investment income (loss) | .23%F | .11% | - %F,G |
| Supplemental Data | |||
| Net assets, end of period (in millions) | $6,108 | $3,205 | $669 |
A For the period May 14, 2014 (commencement of sale of shares) to March 31, 2015.
B Amount represents less than $.0005 per share.
C Total returns for periods of less than one year are not annualized.
D Total returns would have been lower if certain expenses had not been reduced during the applicable periods shown.
E Expense ratios reflect operating expenses of the class. Expenses before reductions do not reflect amounts reimbursed or waived or reductions from expense offset arrangements and do not represent the amount paid by the class during periods when reimbursements, waivers or reductions occur. Expense ratios before reductions for start-up periods may not be representative of longer-term operating periods. Expenses net of fee waivers reflect expenses after reimbursement and waivers but prior to reductions from expense offset arrangements. Expenses net of all reductions represent the net expenses paid by the class.
F Annualized
G Amount represents less than .005%.
See accompanying notes which are an integral part of the financial statements.
Government Portfolio
Investment Summary/Performance (Unaudited)
Effective Maturity Diversification
| Days | % of fund's investments 9/30/16 | % of fund's investments 3/31/16 | % of fund's investments 9/30/15 |
| 1 - 7 | 35.5 | 36.0 | 52.5 |
| 8 - 30 | 12.7 | 22.3 | 17.9 |
| 31 - 60 | 19.3 | 9.1 | 8.8 |
| 61 - 90 | 16.8 | 16.4 | 5.8 |
| 91 - 180 | 13.8 | 14.2 | 13.7 |
| >180 | 1.9 | 2.0 | 1.3 |
Effective maturity is determined in accordance with the requirements of Rule 2a-7 under the Investment Company Act of 1940.
Asset Allocation (% of fund's net assets)
| As of September 30, 2016 | ||
| U.S. Treasury Debt | 19.1% | |
| U.S. Government Agency Debt | 45.8% | |
| Repurchase Agreements | 35.1% | |

| As of March 31, 2016 | ||
| U.S. Treasury Debt | 24.7% | |
| U.S. Government Agency Debt | 47.9% | |
| Repurchase Agreements | 28.9% | |
| Net Other Assets (Liabilities)* | (1.5)% | |

* Net Other Assets (Liabilities) are not included in the pie chart
Current And Historical 7-Day Yields
| 9/30/16 | 6/30/16 | 3/31/16 | 12/31/15 | 9/30/15 | |
| Class I | 0.27% | 0.26% | 0.23% | 0.12% | 0.01% |
| Class II | 0.12% | 0.11% | 0.08% | 0.01% | 0.01% |
| Class III | 0.02% | 0.02% | 0.01% | 0.01% | 0.01% |
| Select Class | 0.22% | 0.21% | 0.18% | 0.07% | 0.01% |
| Institutional Class | 0.31% | 0.30% | 0.27% | 0.16% | 0.02% |
Yield refers to the income paid by the Fund over a given period. Yields for money market funds are usually for seven-day periods, as they are here, though they are expressed as annual percentage rates. Past performance is no guarantee of future results. Yield will vary and it's possible to lose money investing in the Fund. A portion of the Fund's expenses was reimbursed and/or waived. Absent such reimbursements and/or waivers the yield for the period ending September 30, 2016, the most recent period shown in the table, would have been 0.24% for Class I, 0.09% for Class II, -0.01% for Class III, 0.19% for Select Class and 0.27% for Institutional Class.
Government Portfolio
Investments September 30, 2016 (Unaudited)
Showing Percentage of Net Assets
| U.S. Treasury Debt - 19.1% | ||||
| Yield(a) | Principal Amount (000s) | Value (000s) | ||
| U.S. Treasury Obligations - 19.1% | ||||
| U.S. Treasury Bills | ||||
| 10/13/16 to 3/30/17 | 0.29 to 0.54% | $11,603,250 | $11,590,049 | |
| U.S. Treasury Bonds | ||||
| 11/15/16 | 0.37 | 125,000 | 126,086 | |
| U.S. Treasury Notes | ||||
| 10/31/16 to 3/31/17 | 0.28 to 0.54 (b) | 6,223,000 | 6,253,232 | |
| TOTAL U.S. TREASURY DEBT | ||||
| (Cost $17,969,367) | 17,969,367 | |||
| U.S. Government Agency Debt - 45.8% | ||||
| Federal Agencies - 45.8% | ||||
| Fannie Mae | ||||
| 10/6/16 to 1/11/18 | 0.40 to 0.63 (b) | 5,584,287 | 5,579,408 | |
| Federal Farm Credit Bank | ||||
| 10/3/16 to 11/13/17 | 0.44 to 0.75 (b) | 3,082,100 | 3,081,699 | |
| Federal Home Loan Bank | ||||
| 10/4/16 to 3/12/18 | 0.29 to 0.79 (b)(c) | 30,078,410 | 30,072,508 | |
| Freddie Mac | ||||
| 10/14/16 to 1/12/18 | 0.34 to 0.78 (b) | 4,431,734 | 4,429,748 | |
| TOTAL U.S. GOVERNMENT AGENCY DEBT | ||||
| (Cost $43,163,363) | 43,163,363 |
| U.S. Government Agency Repurchase Agreement - 10.9% | |||
| Maturity Amount (000s) | Value (000s) | ||
| In a joint trading account at: | |||
| 0.49% dated 9/30/16 due 10/3/16 (Collateralized by U.S. Government Obligations) # | $241,299 | $241,289 | |
| 0.52% dated 9/30/16 due 10/3/16 (Collateralized by U.S. Government Obligations) # | 5,561,888 | 5,561,649 | |
| With: | |||
| BNP Paribas, S.A. at 0.38%, dated 9/7/16 due 10/7/16 (Collateralized by U.S. Government Obligations valued at $63,406,993, 1.01% - 7.50%, 6/01/25 - 6/15/46) | 62,040 | 62,000 | |
| Citibank NA at: | |||
| 0.4%, dated 9/27/16 due 10/4/16 (Collateralized by U.S. Treasury Obligations valued at $69,872,300, 0.13% - 8.13%, 4/15/17 - 2/15/24) | 68,005 | 68,000 | |
| 0.42%, dated 9/27/16 due 10/4/16 (Collateralized by U.S. Treasury Obligations valued at $415,399,992, 0.00% - 7.00%, 6/01/17 - 7/15/45) | 407,033 | 407,000 | |
| Deutsche Bank Securities, Inc. at 0.57%, dated 9/30/16 due 10/3/16 (Collateralized by U.S. Treasury Obligations valued at $128,756,157, 3.63%, 8/15/43) | 125,006 | 125,000 | |
| ING Financial Markets LLC at: | |||
| 0.38%, dated 8/3/16 due 10/3/16 (Collateralized by U.S. Government Obligations valued at $37,765,241, 3.50% - 4.00%, 8/01/26 - 8/01/42) | 37,024 | 37,000 | |
| 0.4%, dated 8/26/16 due 11/1/16 (Collateralized by U.S. Government Obligations valued at $64,286,445, 3.50% - 4.50%, 11/01/26 - 8/01/45) | 63,047 | 63,000 | |
| 0.41%, dated: | |||
| 8/23/16 due 11/4/16: | |||
| (Collateralized by U.S. Government Obligations valued at $125,514,823, 3.00% - 4.50%, 1/01/29 - 9/01/42) | 123,126 | 123,000 | |
| (Collateralized by U.S. Government Obligations valued at $101,024,830, 3.00% - 5.00%, 9/01/29 - 4/01/43) | 99,101 | 99,000 | |
| 8/24/16 due 11/4/16: | |||
| (Collateralized by U.S. Government Obligations valued at $153,064,477, 3.50%, 1/01/46) | 150,154 | 150,000 | |
| (Collateralized by U.S. Government Obligations valued at $143,883,105, 3.50%, 1/01/46) | 141,146 | 141,000 | |
| 8/30/16 due 11/4/16 (Collateralized by U.S. Government Obligations valued at $125,505,167, 3.50% - 5.00%, 7/01/25 - 12/01/45) | 123,126 | 123,000 | |
| 9/1/16 due 11/4/16 (Collateralized by U.S. Government Obligations valued at $156,113,836, 3.50%, 1/01/46) | 153,159 | 153,000 | |
| 9/7/16 due 11/4/16 (Collateralized by U.S. Government Obligations valued at $126,515,104, 3.00% - 5.00%, 12/01/24 - 11/01/43) | 124,127 | 124,000 | |
| Merrill Lynch, Pierce, Fenner & Smith at 0.36%, dated 8/17/16 due 10/7/16 (Collateralized by U.S. Government Obligations valued at $368,393,064, 2.48% - 4.00%, 2/01/28 - 9/01/46) | 361,220 | 361,000 | |
| Mitsubishi UFJ Securities (U.S.A.), Inc. at: | |||
| 0.39%, dated: | |||
| 9/6/16 due 11/7/16 (Collateralized by U.S. Government Obligations valued at $78,562,973, 2.50% - 4.50%, 1/01/26 - 9/01/46) | 77,052 | 77,000 | |
| 9/7/16 due 11/8/16 (Collateralized by U.S. Government Obligations valued at $101,008,443, 2.11% - 5.61%, 1/01/19 - 9/01/46) | 99,066 | 99,000 | |
| 9/8/16 due: | |||
| 11/10/16 (Collateralized by U.S. Government Obligations valued at $115,291,216, 2.02% - 5.83%, 1/01/23 - 8/01/48) | 113,077 | 113,000 | |
| 11/15/16 (Collateralized by U.S. Government Obligations valued at $103,047,901, 2.20% - 5.71%, 1/01/26 - 10/01/46) | 101,074 | 101,000 | |
| 9/13/16 due 11/16/16 (Collateralized by U.S. Government Obligations valued at $65,294,144, 2.00% - 4.50%, 2/01/21 - 10/01/46) | 64,044 | 64,000 | |
| 9/22/16 due 11/21/16 (Collateralized by U.S. Government Obligations valued at $109,153,006, 2.36% - 6.00%, 4/01/25 - 9/01/46) | 107,070 | 107,000 | |
| 9/26/16 due 11/22/16 (Collateralized by U.S. Government Obligations valued at $150,971,448, 2.15% - 6.00%, 12/01/20 - 10/01/46) | 148,091 | 148,000 | |
| 9/28/16 due 11/28/16 (Collateralized by U.S. Government Obligations valued at $111,186,023, 2.06% - 4.50%, 3/01/24 - 10/01/46) | 109,072 | 109,000 | |
| 0.44%, dated 9/20/16 due 12/19/16 (Collateralized by U.S. Government Obligations valued at $66,310,535, 2.31% - 4.50%, 5/01/28 - 10/01/46) | 65,072 | 65,000 | |
| Mizuho Securities U.S.A., Inc. at 0.5%, dated 8/8/16 due 10/7/16 (Collateralized by U.S. Government Obligations valued at $122,665,333, 2.50% - 6.50%, 7/25/44 - 7/25/46) | 119,150 | 119,000 | |
| RBC Capital Markets Corp. at: | |||
| 0.35%, dated 8/3/16 due 10/3/16 (Collateralized by U.S. Government Obligations valued at $125,534,406, 2.23% - 5.00%, 8/01/25 - 10/01/46) | 123,073 | 123,000 | |
| 0.36%, dated: | |||
| 8/30/16 due 10/7/16 (Collateralized by U.S. Government Obligations valued at $51,017,399, 2.31% - 6.00%, 3/15/25 - 6/01/46) | 50,028 | 50,000 | |
| 9/6/16 due 10/7/16 (Collateralized by U.S. Government Obligations valued at $104,087,793, 1.50% - 5.50%, 12/01/19 - 9/01/46) | 102,064 | 102,000 | |
| 0.37%, dated: | |||
| 9/13/16 due 10/7/16 (Collateralized by U.S. Government Obligations valued at $78,559,698, 1.50% - 6.08%, 7/01/26 - 9/01/46) | 77,046 | 77,000 | |
| 9/15/16 due 10/7/16 (Collateralized by U.S. Government Obligations valued at $65,292,078, 2.42% - 5.00%, 2/01/20 - 9/01/46) | 64,039 | 64,000 | |
| 9/16/16 due 10/7/16 (Collateralized by U.S. Government Obligations valued at $105,078,376, 2.36% - 8.00%, 12/25/22 - 9/20/46) | 103,064 | 103,000 | |
| 9/19/16 due 10/7/16 (Collateralized by U.S. Government Obligations valued at $65,290,357, 2.39% - 6.00%, 2/01/26 - 7/01/46) | 64,039 | 64,000 | |
| 9/20/16 due 10/7/16 (Collateralized by U.S. Government Obligations valued at $70,389,840, 2.50% - 5.00%, 6/01/28 - 7/01/46) | 69,044 | 69,000 | |
| Wells Fargo Securities, LLC at: | |||
| 0.41%, dated 9/9/16 due 11/8/16 (Collateralized by U.S. Government Obligations valued at $52,544,358, 1.75% - 3.00%, 4/15/23 - 2/15/43) | 51,035 | 51,000 | |
| 0.42%, dated 9/7/16 due 12/6/16 (Collateralized by U.S. Government Obligations valued at $253,660,818, 2.50% - 4.00%, 11/16/43 - 9/20/46) | 248,260 | 248,000 | |
| 0.43%, dated 9/27/16 due 10/4/16 (Collateralized by U.S. Government Obligations valued at $419,240,044, 0.77% - 5.50%, 12/25/17 - 3/25/55) | 407,034 | 407,000 | |
| 0.48%, dated 9/29/16 due 10/6/16 (Collateralized by U.S. Government Obligations valued at $72,103,846, 1.75%, 4/15/23) | 70,007 | 70,000 | |
| TOTAL U.S. GOVERNMENT AGENCY REPURCHASE AGREEMENT | |||
| (Cost $10,268,938) | 10,268,938 | ||
| U.S. Treasury Repurchase Agreement - 24.2% | |||
| With: | |||
| Barclays Capital, Inc. at 0.47%, dated 9/30/16 due 10/3/16 (Collateralized by U.S. Treasury Obligations valued at $183,607,282, 0.00% - 3.50%, 12/08/16 - 6/30/22) | 180,007 | 180,000 | |
| BNP Paribas, S.A. at: | |||
| 0.36%, dated: | |||
| 8/15/16 due 10/7/16 (Collateralized by U.S. Treasury Obligations valued at $189,970,062, 0.00% - 4.38%, 11/10/16 - 5/15/41) | 186,169 | 186,000 | |
| 9/22/16 due 11/21/16 (Collateralized by U.S. Treasury Obligations valued at $247,480,718, 0.00% - 6.13%, 11/10/16 - 5/15/44) | 242,145 | 242,000 | |
| 0.37%, dated: | |||
| 8/26/16 due 10/7/16 (Collateralized by U.S. Treasury Obligations valued at $460,802,061, 0.00% - 4.38%, 11/10/16 - 5/15/41) | 451,403 | 451,000 | |
| 8/29/16 due 10/7/16 (Collateralized by U.S. Treasury Obligations valued at $695,579,664, 0.00% - 5.25%, 11/10/16 - 8/15/45) | 676,591 | 676,000 | |
| 9/7/16 due 10/7/16 (Collateralized by U.S. Treasury Obligations valued at $227,821,874, 0.00% - 3.50%, 11/10/16 - 2/15/43) | 223,140 | 223,000 | |
| 0.4%, dated 9/2/16 due 12/1/16 (Collateralized by U.S. Treasury Obligations valued at $583,867,153, 0.00% - 6.00%, 11/10/16 - 5/15/45) | 571,571 | 571,000 | |
| Deutsche Bank Securities, Inc. at 0.55%, dated 9/30/16 due 10/3/16 (Collateralized by U.S. Treasury Obligations valued at $230,530,631, 2.25%, 11/15/25) | 226,010 | 226,000 | |
| Federal Reserve Bank of New York at 0.25%, dated 9/30/16 due 10/3/16 (Collateralized by U.S. Treasury Obligations valued at $15,507,323,132, 1.63% - 3.63%, 5/15/19 - 8/15/43) | 15,507,323 | 15,507,000 | |
| Mizuho Securities U.S.A., Inc. at 0.53%, dated 9/30/16 due 10/3/16 (Collateralized by U.S. Treasury Obligations valued at $234,711,890, 1.38%, 2/29/20) | 230,010 | 230,000 | |
| Prudential Insurance Co. of America at 0.53%, dated 9/30/16 due 10/3/16 (Collateralized by U.S. Treasury Obligations valued at $443,649,041, 1.00% - 8.13%, 7/31/19 - 2/15/31) | 433,629 | 433,610 | |
| RBC Capital Markets Corp. at 0.34%, dated: | |||
| 9/6/16 due 10/7/16 (Collateralized by U.S. Treasury Obligations valued at $80,845,531, 0.00% - 8.00%, 10/20/16 - 8/15/44) | 79,046 | 79,000 | |
| 9/28/16 due 10/7/16 (Collateralized by U.S. Treasury Obligations valued at $124,496,510, 0.00% - 9.00%, 10/15/16 - 2/15/46) | 122,071 | 122,000 | |
| RBS Securities, Inc. at 0.48%, dated 9/30/16 due 10/3/16 (Collateralized by U.S. Treasury Obligations valued at $190,763,643, 0.50% - 3.38%, 1/31/17 - 5/15/43) | 187,007 | 187,000 | |
| Royal Bank of Canada at: | |||
| 0.35%, dated 9/26/16 due 10/3/16 (Collateralized by U.S. Treasury Obligations valued at $110,674,678, 1.25% - 1.63%, 1/31/22 - 5/15/26) | 108,007 | 108,000 | |
| 0.42%, dated: | |||
| 9/27/16 due 10/4/16 (Collateralized by U.S. Treasury Obligations valued at $306,532,354, 1.88% - 2.25%, 10/31/17 - 3/31/21) | 299,024 | 299,000 | |
| 9/28/16 due 10/5/16 (Collateralized by U.S. Treasury Obligations valued at $523,202,116, 0.88% - 2.13%, 7/31/19 - 8/31/20) | 512,042 | 512,000 | |
| 0.43%, dated: | |||
| 9/29/16 due 10/6/16 (Collateralized by U.S. Treasury Obligations valued at $163,766,441, 1.63%, 7/31/20) | 160,013 | 160,000 | |
| 9/30/16 due 10/7/16 (Collateralized by U.S. Treasury Obligations valued at $107,383,200, 1.50%, 1/31/22) | 105,009 | 105,000 | |
| 0.5%, dated 9/30/16 due 10/3/16 (Collateralized by U.S. Treasury Obligations valued at $13,309,271, 1.38%, 6/30/23) | 13,001 | 13,000 | |
| 0.54%, dated 9/30/16 due 10/3/16 (Collateralized by U.S. Treasury Obligations valued at $573,148,049, 1.50% - 2.13%, 5/31/22 - 8/15/26) | 558,025 | 558,000 | |
| Sumitomo Mitsui Trust Bank Ltd. at 0.48%, dated: | |||
| 8/30/16 due 10/4/16 (Collateralized by U.S. Treasury Obligations valued at $215,762,597, 0.88% - 3.00%, 12/31/16 - 2/28/17) | 211,049 | 210,951 | |
| 8/31/16 due 10/5/16 (Collateralized by U.S. Treasury Obligations valued at $75,856,921, 2.50%, 5/15/24) | 73,695 | 73,661 | |
| 9/7/16 due 10/7/16 (Collateralized by U.S. Treasury Obligations valued at $74,489,656, 2.25%, 11/15/24) | 72,427 | 72,393 | |
| 9/9/16 due 10/7/16 (Collateralized by U.S. Treasury Obligations valued at $217,756,702, 2.13%, 8/31/20) | 213,023 | 212,924 | |
| 9/13/16 due 10/7/16 (Collateralized by U.S. Treasury Obligations valued at $180,795,859, 2.63% - 3.75%, 11/15/18 - 8/15/20) | 175,082 | 175,000 | |
| 9/16/16 due 10/7/16 (Collateralized by U.S. Treasury Obligations valued at $155,090,953, 3.75%, 11/15/18) | 150,070 | 150,000 | |
| 9/20/16 due 10/7/16 (Collateralized by U.S. Treasury Obligations valued at $153,018,365, 0.88% - 3.25%, 12/31/16 - 3/31/17) | 150,070 | 150,000 | |
| 9/27/16 due 10/7/16 (Collateralized by U.S. Treasury Obligations valued at $209,856,990, 2.63%, 8/15/20) | 205,096 | 205,000 | |
| 10/4/16 due 10/7/16(d) | 215,124 | 215,024 | |
| 10/5/16 due 10/7/16(d) | 76,619 | 76,583 | |
| Wells Fargo Securities LLC at 0.41%, dated: | |||
| 9/2/16 due 12/1/16 (Collateralized by U.S. Treasury Obligations valued at $75,506,660, 1.00% - 1.38%, 10/31/16 - 6/30/23) | 74,076 | 74,000 | |
| 9/7/16 due 12/6/16 (Collateralized by U.S. Treasury Obligations valued at $103,050,538, 0.88%, 5/15/17) | 101,104 | 101,000 | |
| TOTAL U.S. TREASURY REPURCHASE AGREEMENT | |||
| (Cost $22,785,146) | 22,785,146 | ||
| TOTAL INVESTMENT PORTFOLIO - 100.0% | |||
| (Cost $94,186,814) | 94,186,814 | ||
| NET OTHER ASSETS (LIABILITIES) - 0.0% | (36,869) | ||
| NET ASSETS - 100% | $94,149,945 |
The date shown for securities represents the date when principal payments must be paid, taking into account any call options exercised by the issuer and any permissible maturity shortening features other than interest rate resets.
Legend
(a) Yield represents either the annualized yield at the date of purchase, or the stated coupon rate, or, for floating and adjustable rate securities, the rate at period end.
(b) Coupon rates for floating and adjustable rate securities reflect the rates in effect at period end.
(c) Security or a portion of the security purchased on a delayed delivery or when-issued basis.
(d) Represents a forward settling transaction and therefore no collateral securities had been allocated as of period end. The agreement contemplated the delivery of U.S. Treasury Obligations as collateral on settlement date.
Investment Valuation
All investments are categorized as Level 2 under the Fair Value Hierarchy. The inputs or methodology used for valuing securities may not be an indication of the risk associated with investing in those securities. For more information on valuation inputs please refer to the Investment Valuation section in the accompanying Notes to Financial Statements.
Other Information
# Additional information on each counterparty to the repurchase agreement is as follows:
| Repurchase Agreement / Counterparty | Value(000s) |
| $241,289,000 due 10/03/16 at 0.49% | |
| BNP Paribas, S.A. | $89,697 |
| Bank of America NA | 2,852 |
| Credit Agricole CIB New York Branch | 33,763 |
| HSBC Securities (USA), Inc. | 57,035 |
| ING Financial Markets LLC | 11,407 |
| Merrill Lynch, Pierce, Fenner & Smith, Inc. | 18,019 |
| Societe Generale | 28,516 |
| $241,289 | |
| $5,561,649,000 due 10/03/16 at 0.52% | |
| BNP Paribas, S.A. | 208,399 |
| Bank of America NA | 1,029,063 |
| Citibank NA | 797,086 |
| Credit Agricole CIB New York Branch | 145,271 |
| HSBC Securities (USA), Inc. | 885,612 |
| J.P. Morgan Securities, Inc. | 23,578 |
| Merrill Lynch, Pierce, Fenner & Smith, Inc. | 197,750 |
| Mizuho Securities USA, Inc. | 438,093 |
| Wells Fargo Securities LLC | 1,836,797 |
| $5,561,649 |
See accompanying notes which are an integral part of the financial statements.
Government Portfolio
Financial Statements
Statement of Assets and Liabilities
| Amounts in thousands (except per-share amounts) | September 30, 2016 (Unaudited) | |
| Assets | ||
| Investment in securities, at value (including repurchase agreements of $33,054,084) — See accompanying schedule: Unaffiliated issuers (cost $94,186,814) | $94,186,814 | |
| Cash | 125 | |
| Receivable for fund shares sold | 353,280 | |
| Interest receivable | 51,200 | |
| Prepaid expenses | 171 | |
| Receivable from investment adviser for expense reductions | 2,225 | |
| Other receivables | 462 | |
| Total assets | 94,594,277 | |
| Liabilities | ||
| Payable for investments purchased | ||
| Regular delivery | $291,731 | |
| Delayed delivery | 43,000 | |
| Payable for fund shares redeemed | 87,265 | |
| Distributions payable | 8,678 | |
| Accrued management fee | 9,305 | |
| Distribution and service plan fees payable | 654 | |
| Other affiliated payables | 3,072 | |
| Other payables and accrued expenses | 627 | |
| Total liabilities | 444,332 | |
| Net Assets | $94,149,945 | |
| Net Assets consist of: | ||
| Paid in capital | $94,151,103 | |
| Distributions in excess of net investment income | (630) | |
| Accumulated undistributed net realized gain (loss) on investments | (528) | |
| Net Assets | $94,149,945 | |
| Class I: | ||
| Net Asset Value, offering price and redemption price per share ($32,493,407 ÷ 32,481,919 shares) | $1.00 | |
| Class II: | ||
| Net Asset Value, offering price and redemption price per share ($925,594 ÷ 925,144 shares) | $1.00 | |
| Class III: | ||
| Net Asset Value, offering price and redemption price per share ($2,836,988 ÷ 2,835,670 shares) | $1.00 | |
| Select Class: | ||
| Net Asset Value, offering price and redemption price per share ($628,961 ÷ 628,876 shares) | $1.00 | |
| Institutional Class: | ||
| Net Asset Value, offering price and redemption price per share ($57,264,995 ÷ 57,267,585 shares) | $1.00 |
See accompanying notes which are an integral part of the financial statements.
Statement of Operations
| Amounts in thousands | Six months ended September 30, 2016 (Unaudited) | |
| Investment Income | ||
| Interest | $128,352 | |
| Expenses | ||
| Management fee | $41,497 | |
| Transfer agent fees | 13,267 | |
| Distribution and service plan fees | 3,411 | |
| Accounting fees and expenses | 1,043 | |
| Custodian fees and expenses | 220 | |
| Independent trustees' fees and expenses | 118 | |
| Registration fees | 373 | |
| Audit | 26 | |
| Legal | 60 | |
| Miscellaneous | 126 | |
| Total expenses before reductions | 60,141 | |
| Expense reductions | (9,410) | 50,731 |
| Net investment income (loss) | 77,621 | |
| Realized and Unrealized Gain (Loss) | ||
| Net realized gain (loss) on: | ||
| Investment securities: | ||
| Unaffiliated issuers | 276 | |
| Total net realized gain (loss) | 276 | |
| Net increase in net assets resulting from operations | $77,897 |
See accompanying notes which are an integral part of the financial statements.
Statement of Changes in Net Assets
| Amounts in thousands | Six months ended September 30, 2016 (Unaudited) | Year ended March 31, 2016 |
| Increase (Decrease) in Net Assets | ||
| Operations | ||
| Net investment income (loss) | $77,621 | $21,681 |
| Net realized gain (loss) | 276 | 145 |
| Net increase in net assets resulting from operations | 77,897 | 21,826 |
| Distributions to shareholders from net investment income | (77,854) | (20,503) |
| Share transactions - net increase (decrease) | 50,094,160 | 19,868,899 |
| Total increase (decrease) in net assets | 50,094,203 | 19,870,222 |
| Net Assets | ||
| Beginning of period | 44,055,742 | 24,185,520 |
| End of period | $94,149,945 | $44,055,742 |
| Other Information | ||
| Distributions in excess of net investment income end of period | $(630) | $(397) |
See accompanying notes which are an integral part of the financial statements.
Financial Highlights — Government Portfolio Class I
| Six months ended (Unaudited) September 30, | Years ended March 31, | |||||
| 2016 | 2016 | 2015 | 2014 | 2013 | 2012 | |
| Selected Per–Share Data | ||||||
| Net asset value, beginning of period | $1.00 | $1.00 | $1.00 | $1.00 | $1.00 | $1.00 |
| Income from Investment Operations | ||||||
| Net investment income (loss) | .001 | .001 | –A | –A | –A | –A |
| Net realized and unrealized gain (loss)A | – | – | – | – | – | – |
| Total from investment operations | .001 | .001 | –A | –A | –A | –A |
| Distributions from net investment income | (.001) | (.001) | –A | –A | –A | –A |
| Total distributions | (.001) | (.001) | –A | –A | –A | –A |
| Net asset value, end of period | $1.00 | $1.00 | $1.00 | $1.00 | $1.00 | $1.00 |
| Total ReturnB,C | .13% | .06% | .01% | .01% | .01% | .01% |
| Ratios to Average Net AssetsD | ||||||
| Expenses before reductions | .21%E | .21% | .21% | .21% | .21% | .21% |
| Expenses net of fee waivers, if any | .18%E | .16% | .11% | .11% | .18% | .15% |
| Expenses net of all reductions | .18%E | .16% | .11% | .11% | .18% | .15% |
| Net investment income (loss) | .25%E | .08% | .01% | .01% | .01% | .01% |
| Supplemental Data | ||||||
| Net assets, end of period (in millions) | $32,493 | $22,047 | $19,333 | $22,569 | $21,579 | $24,822 |
A Amount represents less than $.0005 per share.
B Total returns for periods of less than one year are not annualized.
C Total returns would have been lower if certain expenses had not been reduced during the applicable periods shown.
D Expense ratios reflect operating expenses of the class. Expenses before reductions do not reflect amounts reimbursed or waived or reductions from expense offset arrangements and do not represent the amount paid by the class during periods when reimbursements, waivers or reductions occur. Expenses net of fee waivers reflect expenses after reimbursement and waivers but prior to reductions from expense offset arrangements. Expenses net of all reductions represent the net expenses paid by the class.
E Annualized
See accompanying notes which are an integral part of the financial statements.
Financial Highlights — Government Portfolio Class II
| Six months ended (Unaudited) September 30, | Years ended March 31, | |||||
| 2016 | 2016 | 2015 | 2014 | 2013 | 2012 | |
| Selected Per–Share Data | ||||||
| Net asset value, beginning of period | $1.00 | $1.00 | $1.00 | $1.00 | $1.00 | $1.00 |
| Income from Investment Operations | ||||||
| Net investment income (loss) | .001 | –A | –A | –A | –A | –A |
| Net realized and unrealized gain (loss)A | – | – | – | – | – | – |
| Total from investment operations | .001 | –A | –A | –A | –A | –A |
| Distributions from net investment income | (.001) | –A | –A | –A | –A | –A |
| Total distributions | (.001) | –A | –A | –A | –A | –A |
| Net asset value, end of period | $1.00 | $1.00 | $1.00 | $1.00 | $1.00 | $1.00 |
| Total ReturnB,C | .05% | .02% | .01% | .01% | .01% | .01% |
| Ratios to Average Net AssetsD | ||||||
| Expenses before reductions | .36%E | .36% | .36% | .36% | .36% | .36% |
| Expenses net of fee waivers, if any | .33%E | .20% | .11% | .11% | .18% | .15% |
| Expenses net of all reductions | .33%E | .20% | .11% | .11% | .18% | .15% |
| Net investment income (loss) | .10%E | .04% | .01% | .01% | .01% | .01% |
| Supplemental Data | ||||||
| Net assets, end of period (in millions) | $926 | $485 | $539 | $356 | $642 | $827 |
A Amount represents less than $.0005 per share.
B Total returns for periods of less than one year are not annualized.
C Total returns would have been lower if certain expenses had not been reduced during the applicable periods shown.
D Expense ratios reflect operating expenses of the class. Expenses before reductions do not reflect amounts reimbursed or waived or reductions from expense offset arrangements and do not represent the amount paid by the class during periods when reimbursements, waivers or reductions occur. Expenses net of fee waivers reflect expenses after reimbursement and waivers but prior to reductions from expense offset arrangements. Expenses net of all reductions represent the net expenses paid by the class.
E Annualized
See accompanying notes which are an integral part of the financial statements.
Financial Highlights — Government Portfolio Class III
| Six months ended (Unaudited) September 30, | Years ended March 31, | |||||
| 2016 | 2016 | 2015 | 2014 | 2013 | 2012 | |
| Selected Per–Share Data | ||||||
| Net asset value, beginning of period | $1.00 | $1.00 | $1.00 | $1.00 | $1.00 | $1.00 |
| Income from Investment Operations | ||||||
| Net investment income (loss)A | – | – | – | – | – | – |
| Net realized and unrealized gain (loss)A | – | – | – | – | – | – |
| Total from investment operationsA | – | – | – | – | – | – |
| Distributions from net investment incomeA | – | – | – | – | – | – |
| Total distributionsA | – | – | – | – | – | – |
| Net asset value, end of period | $1.00 | $1.00 | $1.00 | $1.00 | $1.00 | $1.00 |
| Total ReturnB,C | .01% | .01% | .01% | .01% | .01% | .01% |
| Ratios to Average Net AssetsD | ||||||
| Expenses before reductions | .46%E | .46% | .46% | .46% | .46% | .46% |
| Expenses net of fee waivers, if any | .42%E | .21% | .11% | .11% | .18% | .15% |
| Expenses net of all reductions | .42%E | .21% | .11% | .11% | .18% | .15% |
| Net investment income (loss) | .01%E | .03% | .01% | .01% | .01% | .01% |
| Supplemental Data | ||||||
| Net assets, end of period (in millions) | $2,837 | $1,957 | $2,120 | $2,266 | $1,709 | $2,027 |
A Amount represents less than $.0005 per share.
B Total returns for periods of less than one year are not annualized.
C Total returns would have been lower if certain expenses had not been reduced during the applicable periods shown.
D Expense ratios reflect operating expenses of the class. Expenses before reductions do not reflect amounts reimbursed or waived or reductions from expense offset arrangements and do not represent the amount paid by the class during periods when reimbursements, waivers or reductions occur. Expenses net of fee waivers reflect expenses after reimbursement and waivers but prior to reductions from expense offset arrangements. Expenses net of all reductions represent the net expenses paid by the class.
E Annualized
See accompanying notes which are an integral part of the financial statements.
Financial Highlights — Government Portfolio Select Class
| Six months ended (Unaudited) September 30, | Years ended March 31, | |||||
| 2016 | 2016 | 2015 | 2014 | 2013 | 2012 | |
| Selected Per–Share Data | ||||||
| Net asset value, beginning of period | $1.00 | $1.00 | $1.00 | $1.00 | $1.00 | $1.00 |
| Income from Investment Operations | ||||||
| Net investment income (loss) | .001 | –A | –A | –A | –A | –A |
| Net realized and unrealized gain (loss)A | – | – | – | – | – | – |
| Total from investment operations | .001 | –A | –A | –A | –A | –A |
| Distributions from net investment income | (.001) | –A | –A | –A | –A | –A |
| Total distributions | (.001) | –A | –A | –A | –A | –A |
| Net asset value, end of period | $1.00 | $1.00 | $1.00 | $1.00 | $1.00 | $1.00 |
| Total ReturnB,C | .10% | .05% | .01% | .01% | .01% | .01% |
| Ratios to Average Net AssetsD | ||||||
| Expenses before reductions | .26%E | .26% | .26% | .26% | .26% | .26% |
| Expenses net of fee waivers, if any | .23%E | .17% | .11% | .11% | .18% | .15% |
| Expenses net of all reductions | .23%E | .17% | .11% | .11% | .18% | .15% |
| Net investment income (loss) | .20%E | .07% | - %F | .01% | .01% | .01% |
| Supplemental Data | ||||||
| Net assets, end of period (in millions) | $629 | $286 | $686 | $378 | $669 | $519 |
A Amount represents less than $.0005 per share.
B Total returns for periods of less than one year are not annualized.
C Total returns would have been lower if certain expenses had not been reduced during the applicable periods shown.
D Expense ratios reflect operating expenses of the class. Expenses before reductions do not reflect amounts reimbursed or waived or reductions from expense offset arrangements and do not represent the amount paid by the class during periods when reimbursements, waivers or reductions occur. Expenses net of fee waivers reflect expenses after reimbursement and waivers but prior to reductions from expense offset arrangements. Expenses net of all reductions represent the net expenses paid by the class.
E Annualized
F Amount represents less than .005%.
See accompanying notes which are an integral part of the financial statements.
Financial Highlights — Government Portfolio Institutional Class
| Six months ended (Unaudited) September 30, | Years ended March 31, | ||
| 2016 | 2016 | 2015 A | |
| Selected Per–Share Data | |||
| Net asset value, beginning of period | $1.00 | $1.00 | $1.00 |
| Income from Investment Operations | |||
| Net investment income (loss) | .001 | .001 | –B |
| Net realized and unrealized gain (loss)B | – | – | – |
| Total from investment operations | .001 | .001 | –B |
| Distributions from net investment income | (.001) | (.001) | –B |
| Total distributions | (.001) | (.001) | –B |
| Net asset value, end of period | $1.00 | $1.00 | $1.00 |
| Total ReturnC,D | .15% | .08% | .01% |
| Ratios to Average Net AssetsE | |||
| Expenses before reductions | .18%F | .18% | .18%F |
| Expenses net of fee waivers, if any | .14%F | .14% | .11%F |
| Expenses net of all reductions | .14%F | .14% | .11%F |
| Net investment income (loss) | .29%F | .10% | - %F,G |
| Supplemental Data | |||
| Net assets, end of period (in millions) | $57,265 | $19,281 | $1,508 |
A For the period May 14, 2014 (commencement of sale of shares) to March 31, 2015.
B Amount represents less than $.0005 per share.
C Total returns for periods of less than one year are not annualized.
D Total returns would have been lower if certain expenses had not been reduced during the applicable periods shown.
E Expense ratios reflect operating expenses of the class. Expenses before reductions do not reflect amounts reimbursed or waived or reductions from expense offset arrangements and do not represent the amount paid by the class during periods when reimbursements, waivers or reductions occur. Expense ratios before reductions for start-up periods may not be representative of longer-term operating periods. Expenses net of fee waivers reflect expenses after reimbursement and waivers but prior to reductions from expense offset arrangements. Expenses net of all reductions represent the net expenses paid by the class.
F Annualized
G Amount represents less than .005%.
See accompanying notes which are an integral part of the financial statements.
Money Market Portfolio
Investment Summary/Performance (Unaudited)
Effective Maturity Diversification
| Days | % of fund's investments 9/30/16 | % of fund's investments 3/31/16 | % of fund's investments 9/30/15 |
| 1 - 7 | 65.9 | 59.9 | 45.2 |
| 8 - 30 | 19.9 | 16.1 | 21.8 |
| 31 - 60 | 9.4 | 16.0 | 9.8 |
| 61 - 90 | 3.9 | 6.0 | 15.6 |
| 91 - 180 | 0.9 | 2.0 | 7.6 |
Effective maturity is determined in accordance with the requirements of Rule 2a-7 under the Investment Company Act of 1940.
Asset Allocation (% of fund's net assets)
| As of September 30, 2016 | ||
| Certificates of Deposit | 28.1% | |
| Commercial Paper | 19.2% | |
| Variable Rate Demand Notes (VRDNs) | 7.5% | |
| U.S. Treasury Debt | 4.1% | |
| U.S. Government Agency Debt | 3.6% | |
| Non-Negotiable Time Deposit | 11.8% | |
| Other Instruments | 1.5% | |
| Repurchase Agreements | 29.6% | |
| Net Other Assets (Liabilities)* | (5.4)% | |
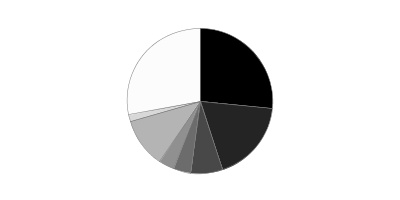
* Net Other Assets (Liabilities) are not included in the pie chart
| As of March 31, 2016 | ||
| Certificates of Deposit | 34.6% | |
| Commercial Paper | 8.9% | |
| Variable Rate Demand Notes (VRDNs) | 0.1% | |
| U.S. Treasury Debt | 4.6% | |
| U.S. Government Agency Debt | 1.3% | |
| Non-Negotiable Time Deposit | 19.0% | |
| Repurchase Agreements | 30.9% | |
| Net Other Assets (Liabilities) | 0.6% | |

Current And Historical 7-Day Yields
| 9/30/16 | 6/30/16 | 3/31/16 | 12/31/15 | 9/30/15 | |
| Class I | 0.55% | 0.42% | 0.35% | 0.28% | 0.13% |
| Class II | 0.40% | 0.27% | 0.20% | 0.13% | 0.01% |
| Class III | 0.30% | 0.17% | 0.10% | 0.04% | 0.01% |
| Select Class | 0.50% | 0.37% | 0.30% | 0.23% | 0.08% |
| Institutional Class | 0.59% | 0.46% | 0.39% | 0.32% | 0.17% |
Yield refers to the income paid by the Fund over a given period. Yields for money market funds are usually for seven-day periods, as they are here, though they are expressed as annual percentage rates. Past performance is no guarantee of future results. Yield will vary and it's possible to lose money investing in the Fund. A portion of the Fund's expenses was reimbursed and/or waived. Absent such reimbursements and/or waivers the yield for the period ending September 30, 2016, the most recent period shown in the table, would have been 0.51% for Class I, 0.36% for Class II, 0.26% for Class III, 0.46% for Select Class and 0.54% for Institutional Class.
Money Market Portfolio
Investments September 30, 2016 (Unaudited)
Showing Percentage of Net Assets
| Certificate of Deposit - 28.1% | ||||
| Yield(a) | Principal Amount (000s) | Value (000s) | ||
| Domestic Certificates Of Deposit - 3.7% | ||||
| State Street Bank & Trust Co. | ||||
| 11/28/16 | 0.91% | $114,000 | $114,000 | |
| Wells Fargo Bank NA | ||||
| 10/13/16 to 3/23/17 | 0.87 to 1.10 (b) | 479,000 | 479,001 | |
| 593,001 | ||||
| London Branch, Eurodollar, Foreign Banks - 0.9% | ||||
| Mizuho Bank Ltd. London Branch | ||||
| 10/13/16 | 0.82 | 150,000 | 150,000 | |
| New York Branch, Yankee Dollar, Foreign Banks - 23.5% | ||||
| Bank of Montreal Chicago | ||||
| 10/5/16 to 2/1/17 | 0.69 to 1.07 (b) | 358,000 | 358,000 | |
| Bank of Nova Scotia | ||||
| 11/21/16 to 2/17/17 | 0.94 to 1.03 (b) | 405,000 | 405,000 | |
| Bayerische Landesbank | ||||
| 10/3/16 to 10/11/16 | 0.75 | 248,500 | 248,500 | |
| BNP Paribas New York Branch | ||||
| 10/31/16 | 0.92 | 102,000 | 102,000 | |
| Canadian Imperial Bank of Commerce | ||||
| 12/12/16 to 1/23/17 | 0.92 to 1.00 (b) | 600,000 | 600,000 | |
| Credit Suisse AG | ||||
| 10/3/16 | 0.83 | 150,000 | 150,000 | |
| Landesbank Baden-Wuerttemberg New York Branch | ||||
| 10/3/16 to 10/5/16 | 0.45 | 327,000 | 327,000 | |
| Mizuho Corporate Bank Ltd. | ||||
| 10/3/16 to 10/13/16 | 0.75 to 0.85 | 300,000 | 300,000 | |
| Royal Bank of Canada | ||||
| 11/7/16 to 1/23/17 | 0.89 to 1.10 (b) | 200,000 | 200,000 | |
| Sumitomo Mitsui Banking Corp. | ||||
| 10/11/16 to 10/24/16 | 0.75 to 0.85 | 281,000 | 281,000 | |
| Toronto-Dominion Bank New York Branch | ||||
| 2/1/17 to 3/23/17 | 0.97 to 1.18 (b) | 250,000 | 250,000 | |
| UBS AG | ||||
| 11/7/16 to 3/13/17 | 0.88 to 1.16 (b) | 515,000 | 515,000 | |
| 3,736,500 | ||||
| TOTAL CERTIFICATE OF DEPOSIT | ||||
| (Cost $4,479,501) | 4,479,501 | |||
| Financial Company Commercial Paper - 13.0% | ||||
| Bank of Nova Scotia | ||||
| 12/5/16 | 0.93 (b) | 150,000 | 150,000 | |
| Barclays Bank PLC/Barclays U.S. CCP Funding LLC | ||||
| 10/4/16 to 10/13/16 | 0.60 to 0.80 | 190,000 | 189,965 | |
| Bayerische Landesbank | ||||
| 10/5/16 to 10/6/16 | 0.47 | 218,000 | 217,987 | |
| BPCE SA | ||||
| 10/3/16 to 12/21/16 | 0.70 to 1.01 | 556,000 | 555,440 | |
| Commonwealth Bank of Australia | ||||
| 2/8/17 | 0.97 (b) | 200,000 | 200,000 | |
| Credit Agricole CIB | ||||
| 12/1/16 | 0.98 | 105,000 | 104,826 | |
| Landesbank Baden-Wurttemberg | ||||
| 10/4/16 | 0.45 to 0.48 | 506,000 | 505,981 | |
| Toyota Motor Credit Corp. | ||||
| 11/8/16 to 11/9/16 | 0.88(b) | 150,000 | 150,000 | |
| TOTAL FINANCIAL COMPANY COMMERCIAL PAPER | ||||
| (Cost $2,074,199) | 2,074,199 | |||
| Asset Backed Commercial Paper - 3.9% | ||||
| Atlantic Asset Securitization Corp. (Credit Agricole CIB Guaranteed) | ||||
| 11/15/16 | 1.00 | 90,000 | 89,888 | |
| 11/8/16 | 1.00 | 150,000 | 149,842 | |
| 12/13/16 | 1.00 | 89,000 | 88,820 | |
| Gotham Funding Corp. (Liquidity Facility Bank of Tokyo-Mitsubishi UFJ Ltd.) | ||||
| 12/13/16 | 1.00 | 44,600 | 44,510 | |
| 12/14/16 | 1.00 | 105,400 | 105,183 | |
| 12/19/16 | 1.03 | 58,000 | 57,869 | |
| 12/20/16 | 1.03 | 77,874 | 77,696 | |
| 12/20/16 | 1.03 | 14,000 | 13,968 | |
| TOTAL ASSET BACKED COMMERCIAL PAPER | ||||
| (Cost $627,776) | 627,776 | |||
| Non-Financial Company Commercial Paper - 2.3% | ||||
| BAT International Finance PLC | ||||
| 10/4/16 | 0.70 | 21,950 | 21,949 | |
| Eversource Energy | ||||
| 10/4/16 | 0.63 | 59,000 | 58,997 | |
| Florida Power & Light Co. | ||||
| 10/6/16 | 0.54 | 60,000 | 59,996 | |
| Sempra Global | ||||
| 10/31/16 | 0.98 | 97,000 | 96,921 | |
| UnitedHealth Group, Inc. | ||||
| 10/3/16 | 0.54 | 126,000 | 125,996 | |
| TOTAL NON-FINANCIAL COMPANY COMMERCIAL PAPER | ||||
| (Cost $363,859) | 363,859 | |||
| U.S. Treasury Debt - 4.1% | ||||
| U.S. Treasury Obligations - 4.1% | ||||
| U.S. Treasury Notes | ||||
| 10/31/17 to 4/30/18 | ||||
| (Cost $659,957) | 0.42 to 0.52 (b) | 660,000 | 659,957 | |
| Other Instrument - 1.5% | ||||
| Master Notes - 1.5% | ||||
| Toyota Motor Credit Corp. | ||||
| 10/7/16 | ||||
| (Cost $240,000) | 0.87 (b) | 240,000 | 240,000 | |
| Variable Rate Demand Note - 7.5% | ||||
| Alabama - 0.1% | ||||
| Tuscaloosa County Indl. Dev. Gulf Opportunity (Hunt Refining Proj.) Series 2011 A, 0.85% 10/7/16, LOC JPMorgan Chase Bank, VRDN | ||||
| 10/7/16 | 0.85 (b)(c) | 18,200 | 18,200 | |
| Arizona - 0.3% | ||||
| Arizona Health Facilities Auth. Rev. (Catholic Healthcare West Proj.) Series 2008 B, 0.88% 10/7/16, LOC Barclays Bank PLC, VRDN | ||||
| 10/7/16 | 0.88 (b) | 42,600 | 42,600 | |
| California - 1.1% | ||||
| California Edl. Facilities Auth. Rev. (Univ. of San Francisco Proj.) Series 2005 B, 0.82% 10/7/16, LOC JPMorgan Chase Bank, VRDN | ||||
| 10/7/16 | 0.82 (b) | 17,600 | 17,600 | |
| Los Angeles Dept. of Wtr. & Pwr. Rev. Series 2001 B1, 0.83% 10/7/16 (Liquidity Facility Barclays Bank PLC), VRDN | ||||
| 10/7/16 | 0.83 (b) | 34,400 | 34,400 | |
| Riverside Ctfs. of Prtn. (Riverside Renaissance Proj.) Series 2008, 0.88% 10/7/16, LOC Bank of America NA, VRDN | ||||
| 10/7/16 | 0.88 (b) | 37,280 | 37,280 | |
| San Francisco City & County Arpts. Commission Int'l. Arpt. Rev. Series 2010 A1, 0.86% 10/7/16, LOC Bank of America NA, VRDN | ||||
| 10/7/16 | 0.86 (b)(d) | 82,440 | 82,440 | |
| 171,720 | ||||
| Delaware - 0.4% | ||||
| LP Pinewood SPV LLC Taxable, LOC Wells Fargo Bank NA, VRDN | ||||
| 10/7/16 | 0.65 (b) | 67,000 | 67,000 | |
| Georgia - 0.1% | ||||
| Burke County Indl. Dev. Auth. Poll. Cont. Rev. (Georgia Pwr. Co. Plant Vogtle Proj.) Series 2012, 0.97% 10/3/16, VRDN | ||||
| 10/3/16 | 0.97 (b)(d) | 11,900 | 11,900 | |
| Illinois - 0.4% | ||||
| Illinois Fin. Auth. Rev. (The Univ. of Chicago Med. Ctr. Proj.) Series 2010 A, 0.84% 10/3/16, LOC Bank of America NA, VRDN | ||||
| 10/3/16 | 0.84 (b) | 46,250 | 46,250 | |
| Univ. of Illinois Rev. Series 2008, 0.85% 10/7/16, LOC Wells Fargo Bank NA, VRDN | ||||
| 10/7/16 | 0.85 (b) | 22,080 | 22,080 | |
| 68,330 | ||||
| Minnesota - 0.2% | ||||
| Hennepin County Gen. Oblig. Series 2013 C, 0.84% 10/7/16 (Liquidity Facility U.S. Bank NA, Cincinnati), VRDN | ||||
| 10/7/16 | 0.84 (b) | 30,275 | 30,275 | |
| Nevada - 0.5% | ||||
| Clark County Arpt. Rev. Series 2008 D3, 0.84% 10/7/16, LOC Bank of America NA, VRDN | ||||
| 10/7/16 | 0.84 (b) | 72,125 | 72,125 | |
| New Jersey - 0.2% | ||||
| New Jersey Hsg. & Mtg. Fin. Agcy. Multi-family Rev. Series 2013 5, 0.88% 10/7/16, LOC Citibank NA, VRDN | ||||
| 10/7/16 | 0.88 (b)(d) | 36,570 | 36,570 | |
| New Mexico - 0.2% | ||||
| New Mexico Fin. Auth. Trans. Rev. Series 2008 B1, 0.86% 10/7/16, LOC State Street Bank & Trust Co., Boston, VRDN | ||||
| 10/7/16 | 0.86 (b) | 29,760 | 29,760 | |
| New York - 3.2% | ||||
| New York City Muni. Wtr. Fin. Auth. Wtr. & Swr. Sys. Rev. Series 2008 B1, 0.86% 10/7/16 (Liquidity Facility Royal Bank of Canada), VRDN | ||||
| 10/7/16 | 0.86 (b) | 57,900 | 57,900 | |
| New York City Muni. Wtr. Fin. Auth. Wtr. & Swr. Sys. Rev. Series 2008 BB2, 0.85% 10/3/16 (Liquidity Facility Bank of America NA), VRDN | ||||
| 10/3/16 | 0.85 (b) | 47,010 | 47,010 | |
| New York City Muni. Wtr. Fin. Auth. Wtr. & Swr. Sys. Rev. Series 2008 BB3, 0.86% 10/7/16 (Liquidity Facility Royal Bank of Canada), VRDN | ||||
| 10/7/16 | 0.86 (b) | 62,000 | 62,000 | |
| New York City Muni. Wtr. Fin. Auth. Wtr. & Swr. Sys. Rev. Series 2011 DD-3B, 0.88% 10/3/16 (Liquidity Facility State Street Bank & Trust Co., Boston), VRDN | ||||
| 10/3/16 | 0.88 (b) | 34,670 | 34,670 | |
| New York City Transitional Fin. Auth. Rev. Series 2003 A4, 0.87% 10/3/16 (Liquidity Facility TD Banknorth, NA), VRDN | ||||
| 10/3/16 | 0.87 (b) | 34,450 | 34,450 | |
| New York City Transitional Fin. Auth. Rev. Series 2015 A3, 0.91% 10/3/16 (Liquidity Facility Mizuho Corporate Bank Ltd.), VRDN | ||||
| 10/3/16 | 0.91 (b) | 60,000 | 60,000 | |
| New York Hsg. Fin. Agcy. Rev. (350 West 43rd Street Hsg. Proj.) Series 2002 A, 0.89% 10/3/16, LOC Landesbank Hessen-Thuringen, VRDN | ||||
| 10/3/16 | 0.89 (b)(d) | 49,000 | 49,000 | |
| New York Hsg. Fin. Agcy. Rev. (455 West 37th Street Hsg. Proj.) Series A, 0.89% 10/3/16, LOC Landesbank Hessen-Thuringen, VRDN | ||||
| 10/3/16 | 0.89 (b)(d) | 66,460 | 66,460 | |
| New York Local Govt. Assistance Corp. Series 2008 B, 0.85% 10/7/16 (Liquidity Facility JPMorgan Chase Bank), VRDN | ||||
| 10/7/16 | 0.85 (b) | 39,000 | 39,000 | |
| New York Metropolitan Trans. Auth. Dedicated Tax Fund Rev. Series 2016, 0.84% 10/7/16, LOC Bank of Tokyo-Mitsubishi UFJ Ltd., VRDN | ||||
| 10/7/16 | 0.84 (b) | 65,000 | 65,000 | |
| 515,490 | ||||
| Ohio - 0.2% | ||||
| Middletown Hosp. Facilities Rev. Series 2008 B, 0.87% 10/7/16, LOC PNC Bank NA, VRDN | ||||
| 10/7/16 | 0.87 (b) | 32,360 | 32,360 | |
| Oregon - 0.3% | ||||
| Clackamas County Hosp. Facility Auth. (Legacy Health Sys. Proj.) Series 2008 C, 0.83% 10/7/16, LOC U.S. Bank NA, Cincinnati, VRDN | ||||
| 10/7/16 | 0.83 (b) | 40,600 | 40,600 | |
| Texas - 0.3% | ||||
| Riesel Indl. Dev. Corp. (Sandy Creek Energy Assoc. Proj.) 0.87% 10/7/16, LOC BNP Paribas SA, VRDN | ||||
| 10/7/16 | 0.87 (b)(d) | 50,000 | 50,000 | |
| TOTAL VARIABLE RATE DEMAND NOTE | ||||
| (Cost $1,186,930) | 1,186,930 | |||
| U.S. Government Agency Debt - 3.6% | ||||
| Federal Agencies - 3.6% | ||||
| Fannie Mae | ||||
| 1/26/17 | 0.54 (b) | 210,000 | 209,993 | |
| Freddie Mac | ||||
| 4/20/17 | 0.54 (b) | 358,000 | 357,970 | |
| TOTAL U.S. GOVERNMENT AGENCY DEBT | ||||
| (Cost $567,963) | 567,963 | |||
| Non-Negotiable Time Deposit - 11.8% | ||||
| Time Deposits - 11.8% | ||||
| Bank of Montreal London Branch | ||||
| 10/6/16 | 0.45 | 480,000 | 480,000 | |
| Barclays Bank PLC | ||||
| 10/3/16 | 0.45 | 649,000 | 649,000 | |
| BNP Paribas | ||||
| 10/3/16 | 0.30 | 300,000 | 300,000 | |
| Citizens Bank NA | ||||
| 10/3/16 | 0.47 | 350,000 | 350,000 | |
| Credit Agricole CIB | ||||
| 10/3/16 | 0.30 | 100,000 | 100,000 | |
| TOTAL NON-NEGOTIABLE TIME DEPOSIT | ||||
| (Cost $1,879,000) | 1,879,000 |
| U.S. Government Agency Repurchase Agreement - 5.3% | |||
| Maturity Amount (000s) | Value (000s) | ||
| In a joint trading account at: | |||
| 0.49% dated 9/30/16 due 10/3/16 (Collateralized by U.S. Government Obligations) # | $34,650 | $34,649 | |
| 0.52% dated 9/30/16 due 10/3/16 (Collateralized by U.S. Government Obligations) # | 783,553 | 783,519 | |
| With Deutsche Bank Securities, Inc. at 0.57%, dated 9/30/16 due 10/3/16 (Collateralized by U.S. Treasury Obligations valued at $23,461,155, 1.63%, 2/15/26) | 23,001 | 23,000 | |
| TOTAL U.S. GOVERNMENT AGENCY REPURCHASE AGREEMENT | |||
| (Cost $841,168) | 841,168 | ||
| U.S. Treasury Repurchase Agreement - 2.8% | |||
| With: | |||
| Barclays Capital, Inc. at 0.47%, dated 9/30/16 due 10/3/16 (Collateralized by U.S. Treasury Obligations valued at $33,661,353, 0.36% - 1.38%, 12/15/16 - 9/30/20) | 33,001 | 33,000 | |
| Deutsche Bank Securities, Inc. at 0.55%, dated 9/30/16 due 10/3/16 (Collateralized by U.S. Treasury Obligations valued at $41,821,995, 1.63% - 2.13%, 5/15/25 - 2/15/26) | 41,002 | 41,000 | |
| Mizuho Securities U.S.A., Inc. at 0.53%, dated 9/30/16 due 10/3/16 (Collateralized by U.S. Treasury Obligations valued at $42,860,211, 1.38%, 2/29/20) | 42,002 | 42,000 | |
| Nomura Securities International, Inc. at 0.5%, dated 9/30/16 due 10/3/16 (Collateralized by U.S. Treasury Obligations valued at $199,098,378, 1.75%, 1/31/23) | 194,008 | 194,000 | |
| RBS Securities, Inc. at 0.48%, dated 9/30/16 due 10/3/16 (Collateralized by U.S. Treasury Obligations valued at $34,766,000, 0.88% - 3.13%, 5/31/18 - 2/15/43) | 34,001 | 34,000 | |
| Royal Bank of Canada at 0.54%, dated 9/30/16 due 10/3/16 (Collateralized by U.S. Treasury Obligations valued at $105,711,282, 1.88%, 5/31/22) | 103,005 | 103,000 | |
| TOTAL U.S. TREASURY REPURCHASE AGREEMENT | |||
| (Cost $447,000) | 447,000 | ||
| Other Repurchase Agreement - 21.5% | |||
| Other Repurchase Agreement - 21.5% | |||
| With: | |||
| Citigroup Global Markets, Inc. at: | |||
| 0.43%, dated 9/30/16 due 10/3/16 (Collateralized by Equity Securities valued at $271,089,756) | 251,009 | 251,000 | |
| 0.6%, dated 9/28/16 due 10/5/16 (Collateralized by Equity Securities valued at $170,654,221) | 158,018 | 158,000 | |
| 0.75%, dated: | |||
| 9/27/16 due 10/4/16 (Collateralized by Corporate Obligations valued at $39,964,996, 1.30% - 7.02%, 10/15/29 - 2/15/46) | 37,005 | 37,000 | |
| 9/29/16 due 10/6/16 (Collateralized by Mortgage Loan Obligations valued at $45,066,645, 0.00% - 6.35%, 11/14/39 - 4/10/49) | 42,006 | 42,000 | |
| 1.7%, dated 8/11/16 due 11/16/16 (Collateralized by Corporate Obligations valued at $84,450,834, 0.78% - 1.44%, 9/25/35 - 11/19/51) | 78,357 | 78,000 | |
| Credit Suisse Securities (U.S.A.) LLC at: | |||
| 0.6%, dated 9/30/16 due 10/6/16 (Collateralized by Mortgage Loan Obligations valued at $41,401,923, 6.00%, 12/25/65) | 36,004 | 36,000 | |
| 0.65%, dated 9/29/16 due 10/6/16 (Collateralized by Mortgage Loan Obligations valued at $181,703,293, 0.38% - 6.00%, 4/26/37 - 12/25/65) | 158,020 | 158,000 | |
| HSBC Securities, Inc. at 0.43%, dated 9/30/16 due 10/3/16 (Collateralized by Corporate Obligations valued at $94,500,056, 1.80% - 7.00%, 5/05/17 - 6/15/48) | 90,003 | 90,000 | |
| ING Financial Markets LLC at: | |||
| 0.55%, dated 9/30/16 due 10/3/16: | |||
| (Collateralized by Equity Securities valued at $115,565,298) | 107,005 | 107,000 | |
| (Collateralized by Equity Securities valued at $55,082,525) | 51,002 | 51,000 | |
| (Collateralized by Equity Securities valued at $50,762,329) | 47,002 | 47,000 | |
| 0.63%, dated 9/30/16 due 10/3/16 (Collateralized by Corporate Obligations valued at $58,320,827, 3.93% - 11.00%, 4/15/19 - 4/15/22) | 54,003 | 54,000 | |
| J.P. Morgan Clearing Corp. at: | |||
| 0.66%, dated 9/22/16 due 10/7/16 (Collateralized by Equity Securities valued at $217,427,175) | 200,117 | 200,000 | |
| 1.37%, dated 9/22/16 due 10/31/16 (Collateralized by Corporate Obligations valued at $150,051,467, 0.75% - 4.00%, 3/15/18 - 10/01/44)(b)(e) | 138,205 | 138,000 | |
| J.P. Morgan Securities, LLC at: | |||
| 0.57%, dated 9/29/16 due 10/6/16 (Collateralized by U.S. Government Obligations valued at $390,380,243, 0.12% - 16.50%, 6/25/21 - 8/16/55) | 379,042 | 379,000 | |
| 1.37%, dated 5/18/16 due 11/14/16 (Collateralized by Mortgage Loan Obligations valued at $135,672,370, 0.50% - 6.92%, 1/25/34 - 11/25/57)(b)(e) | 125,859 | 125,000 | |
| Merrill Lynch, Pierce, Fenner & Smith at 0.55%, dated: | |||
| 9/29/16 due 10/6/16 (Collateralized by U.S. Government Obligations valued at $351,921,505, 3.00% - 4.00%, 1/01/46 - 8/01/46) | 345,037 | 345,000 | |
| 9/30/16 due 10/3/16 (Collateralized by Equity Securities valued at $71,283,298) | 66,003 | 66,000 | |
| Mitsubishi UFJ Securities (U.S.A.), Inc. at 0.71%, dated: | |||
| 9/15/16 due 10/3/16 (Collateralized by Corporate Obligations valued at $20,527,285, 1.25% - 7.88%, 6/15/18 - 3/1/26) | 19,007 | 19,000 | |
| 9/28/16 due 10/7/16 (Collateralized by Corporate Obligations valued at $19,439,214, 0.00% - 5.88%, 7/15/17 - 5/15/41) | 18,005 | 18,000 | |
| Mizuho Securities U.S.A., Inc. at: | |||
| 0.63%, dated: | |||
| 9/20/16 due 10/4/16 (Collateralized by Equity Securities valued at $28,086,436) | 26,006 | 26,000 | |
| 9/21/16 due 10/5/16 (Collateralized by Equity Securities valued at $23,765,006) | 22,005 | 22,000 | |
| 9/22/16 due 10/6/16 (Collateralized by Equity Securities valued at $63,732,279) | 59,014 | 59,000 | |
| 9/23/16 due 10/7/16 (Collateralized by Equity Securities valued at $25,924,560) | 24,006 | 24,000 | |
| 9/26/16 due 10/7/16 (Collateralized by Equity Securities valued at $89,650,999) | 83,022 | 83,000 | |
| 9/27/16 due 10/7/16 (Collateralized by Equity Securities valued at $25,922,741) | 24,006 | 24,000 | |
| 9/28/16 due 10/7/16 (Collateralized by Equity Securities valued at $50,764,448) | 47,012 | 47,000 | |
| 9/30/16 due 10/7/16 (Collateralized by Equity Securities valued at $59,403,127) | 55,013 | 55,000 | |
| 0.8%, dated 9/22/16 due 10/6/16 (Collateralized by U.S. Government Obligations valued at $14,311,630, 1.25% - 4.00%, 8/17/21 - 7/16/28) | 14,004 | 14,000 | |
| 1.65%, dated 7/18/16 due 10/17/16 (Collateralized by U.S. Government Obligations valued at $36,177,227, 1.76% - 5.68%, 7/25/45 - 4/15/46) | 35,146 | 35,000 | |
| RBC Capital Markets Co. at: | |||
| 0.75%, dated 7/22/16 due 10/7/16 (Collateralized by U.S. Government Obligations valued at $77,259,056, 0.00% - 6.17%, 6/01/31 - 4/01/46) | 75,141 | 75,000 | |
| 0.99%, dated 9/26/16 due 10/7/16 (Collateralized by Municipal Bond Obligations valued at $90,414,917, 4.00% - 5.00%, 7/01/37 - 7/01/44) | 86,208 | 86,000 | |
| SG Americas Securities, LLC at 0.75%, dated: | |||
| 9/27/16 due 10/4/16 (Collateralized by Corporate Obligations valued at $63,582,245, 1.34% - 8.00%, 11/09/17 - 6/05/2115) | 59,009 | 59,000 | |
| 9/28/16 due 10/5/16 (Collateralized by Corporate Obligations valued at $64,441,379, 4.20% - 12.00%, 6/01/20 - 12/15/44) | 60,009 | 60,000 | |
| Wells Fargo Securities LLC at: | |||
| 0.48%, dated 9/30/16 due 10/3/16: | |||
| (Collateralized by Corporate Obligations valued at $4,320,439, 1.63% - 8.25%, 5/15/18 - 12/01/40) | 4,000 | 4,000 | |
| (Collateralized by Corporate Obligations valued at $139,325,573, 0.00% - 6.51%, 4/06/30 - 4/07/52) | 129,005 | 129,000 | |
| 0.55%, dated 9/30/16 due 10/7/16 (Collateralized by Corporate Obligations valued at $58,393,937, 0.01% - 7.50%, 1/15/17 - 5/15/77) | 56,006 | 56,000 | |
| 0.6%, dated: | |||
| 9/27/16 due 10/4/16 (Collateralized by Equity Securities valued at $68,046,816) | 63,007 | 63,000 | |
| 9/30/16 due: | |||
| 10/3/16 (Collateralized by Corporate Obligations valued at $1,050,053, 3.75% - 4.40%, 3/15/19 - 5/19/26) | 1,000 | 1,000 | |
| 10/7/16 (Collateralized by Corporate Obligations valued at $115,566,605, 5.63% - 12.13%, 12/15/16 - 2/01/23) | 107,012 | 107,000 | |
| TOTAL OTHER REPURCHASE AGREEMENT | |||
| (Cost $3,428,000) | 3,428,000 | ||
| TOTAL INVESTMENT PORTFOLIO - 105.4% | |||
| (Cost $16,795,353) | 16,795,353 | ||
| NET OTHER ASSETS (LIABILITIES) - (5.4)% | (856,837) | ||
| NET ASSETS - 100% | $15,938,516 |
Security Type Abbreviations
VRDN – VARIABLE RATE DEMAND NOTE (A debt instrument that is payable upon demand, either daily, weekly or monthly)
The date shown for securities represents the date when principal payments must be paid, taking into account any call options exercised by the issuer and any permissible maturity shortening features other than interest rate resets.
Legend
(a) Yield represents either the annualized yield at the date of purchase, or the stated coupon rate, or, for floating and adjustable rate securities, the rate at period end.
(b) Coupon rates for floating and adjustable rate securities reflect the rates in effect at period end.
(c) Security exempt from registration under Rule 144A of the Securities Act of 1933. These securities may be resold in transactions exempt from registration, normally to qualified institutional buyers. At the end of the period, the value of these securities amounted to $18,200,000 or 0.1% of net assets.
(d) Private activity obligations whose interest is subject to the federal alternative minimum tax for individuals.
(e) The maturity amount is based on the rate at period end.
Investment Valuation
All investments are categorized as Level 2 under the Fair Value Hierarchy. The inputs or methodology used for valuing securities may not be an indication of the risk associated with investing in those securities. For more information on valuation inputs please refer to the Investment Valuation section in the accompanying Notes to Financial Statements.
Other Information
# Additional information on each counterparty to the repurchase agreement is as follows:
| Repurchase Agreement / Counterparty | Value(000s) |
| $34,649,000 due 10/03/16 at 0.49% | |
| BNP Paribas, S.A. | $12,881 |
| Bank of America NA | 409 |
| Credit Agricole CIB New York Branch | 4,848 |
| HSBC Securities (USA), Inc. | 8,190 |
| ING Financial Markets LLC | 1,638 |
| Merrill Lynch, Pierce, Fenner & Smith, Inc. | 2,588 |
| Societe Generale | 4,095 |
| $34,649 | |
| $783,519,000 due 10/03/16 at 0.52% | |
| BNP Paribas, S.A. | 29,409 |
| BNY Mellon Capital Markets LLC | 15,983 |
| Bank of America NA | 145,020 |
| Citibank NA | 31,167 |
| Credit Agricole CIB New York Branch | 20,512 |
| HSBC Securities (USA), Inc. | 108,659 |
| J.P. Morgan Securities, Inc. | 110,230 |
| Merrill Lynch, Pierce, Fenner & Smith, Inc. | 14,491 |
| Mizuho Securities USA, Inc. | 35,909 |
| Societe Generale | 13,319 |
| Wells Fargo Bank, NA | 30,634 |
| Wells Fargo Securities LLC | 228,186 |
| $783,519 |
See accompanying notes which are an integral part of the financial statements.
Money Market Portfolio
Financial Statements
Statement of Assets and Liabilities
| Amounts in thousands (except per-share amounts) | September 30, 2016 (Unaudited) | |
| Assets | ||
| Investment in securities, at value (including repurchase agreements of $4,716,168) — See accompanying schedule: Unaffiliated issuers (cost $16,795,353) | $16,795,353 | |
| Cash | 2 | |
| Receivable for fund shares sold | 109,170 | |
| Interest receivable | 9,069 | |
| Prepaid expenses | 58 | |
| Receivable from investment adviser for expense reductions | 608 | |
| Other receivables | 813 | |
| Total assets | 16,915,073 | |
| Liabilities | ||
| Payable for investments purchased | $34,467 | |
| Payable for fund shares redeemed | 937,193 | |
| Distributions payable | 973 | |
| Accrued management fee | 2,091 | |
| Distribution and service plan fees payable | 32 | |
| Other affiliated payables | 728 | |
| Other payables and accrued expenses | 1,073 | |
| Total liabilities | 976,557 | |
| Net Assets | $15,938,516 | |
| Net Assets consist of: | ||
| Paid in capital | $15,938,471 | |
| Undistributed net investment income | 18 | |
| Accumulated undistributed net realized gain (loss) on investments | 27 | |
| Net Assets | $15,938,516 | |
| Class I: | ||
| Net Asset Value, offering price and redemption price per share ($6,584,501 ÷ 6,576,691 shares) | $1.00 | |
| Class II: | ||
| Net Asset Value, offering price and redemption price per share ($33,383 ÷ 33,347 shares) | $1.00 | |
| Class III: | ||
| Net Asset Value, offering price and redemption price per share ($131,014 ÷ 130,937 shares) | $1.00 | |
| Select Class: | ||
| Net Asset Value, offering price and redemption price per share ($10,171 ÷ 10,160 shares) | $1.00 | |
| Institutional Class: | ||
| Net Asset Value, offering price and redemption price per share ($9,179,447 ÷ 9,167,717 shares) | $1.00 |
See accompanying notes which are an integral part of the financial statements.
Statement of Operations
| Amounts in thousands | Six months ended September 30, 2016 (Unaudited) | |
| Investment Income | ||
| Interest (including $4 from affiliated interfund lending) | $80,636 | |
| Expenses | ||
| Management fee | $19,507 | |
| Transfer agent fees | 6,031 | |
| Distribution and service plan fees | 960 | |
| Accounting fees and expenses | 713 | |
| Custodian fees and expenses | 176 | |
| Independent trustees' fees and expenses | 76 | |
| Registration fees | 160 | |
| Audit | 25 | |
| Legal | 56 | |
| Miscellaneous | 224 | |
| Total expenses before reductions | 27,928 | |
| Expense reductions | (4,824) | 23,104 |
| Net investment income (loss) | 57,532 | |
| Realized and Unrealized Gain (Loss) | ||
| Net realized gain (loss) on: | ||
| Investment securities: | ||
| Unaffiliated issuers | 27 | |
| Total net realized gain (loss) | 27 | |
| Net increase in net assets resulting from operations | $57,559 |
See accompanying notes which are an integral part of the financial statements.
Statement of Changes in Net Assets
| Amounts in thousands | Six months ended September 30, 2016 (Unaudited) | Year ended March 31, 2016 |
| Increase (Decrease) in Net Assets | ||
| Operations | ||
| Net investment income (loss) | $57,532 | $123,642 |
| Net realized gain (loss) | 27 | 655 |
| Net increase in net assets resulting from operations | 57,559 | 124,297 |
| Distributions to shareholders from net investment income | (57,794) | (122,767) |
| Share transactions - net increase (decrease) | (29,568,468) | (17,083,145) |
| Total increase (decrease) in net assets | (29,568,703) | (17,081,615) |
| Net Assets | ||
| Beginning of period | 45,507,219 | 62,588,834 |
| End of period | $15,938,516 | $45,507,219 |
| Other Information | ||
| Undistributed net investment income end of period | $18 | $280 |
See accompanying notes which are an integral part of the financial statements.
Financial Highlights — Money Market Portfolio Class I
| Six months ended (Unaudited) September 30, | Years ended March 31, | |||||
| 2016 | 2016 | 2015 | 2014 | 2013 | 2012 | |
| Selected Per–Share Data | ||||||
| Net asset value, beginning of period | $1.00 | $1.00 | $1.00 | $1.00 | $1.00 | $1.00 |
| Income from Investment Operations | ||||||
| Net investment income (loss) | .002 | .002 | .001 | .001 | .002 | .002 |
| Net realized and unrealized gain (loss)A | – | – | – | – | – | – |
| Total from investment operations | .002 | .002 | .001 | .001 | .002 | .002 |
| Distributions from net investment income | (.002) | (.002) | (.001) | (.001) | (.002) | (.002) |
| Total distributions | (.002) | (.002) | (.001) | (.001) | (.002) | (.002) |
| Net asset value, end of period | $1.00 | $1.00 | $1.00 | $1.00 | $1.00 | $1.00 |
| Total ReturnB,C | .21% | .18% | .06% | .06% | .16% | .17% |
| Ratios to Average Net AssetsD | ||||||
| Expenses before reductions | .21%E | .21% | .21% | .21% | .21% | .21% |
| Expenses net of fee waivers, if any | .18%E | .18% | .18% | .18% | .18% | .18% |
| Expenses net of all reductions | .18%E | .18% | .18% | .18% | .18% | .18% |
| Net investment income (loss) | .40%E | .17% | .05% | .06% | .16% | .16% |
| Supplemental Data | ||||||
| Net assets, end of period (in millions) | $6,585 | $19,911 | $21,651 | $22,712 | $24,416 | $24,209 |
A Amount represents less than $.0005 per share.
B Total returns for periods of less than one year are not annualized.
C Total returns would have been lower if certain expenses had not been reduced during the applicable periods shown.
D Expense ratios reflect operating expenses of the class. Expenses before reductions do not reflect amounts reimbursed or waived or reductions from expense offset arrangements and do not represent the amount paid by the class during periods when reimbursements, waivers or reductions occur. Expenses net of fee waivers reflect expenses after reimbursement and waivers but prior to reductions from expense offset arrangements. Expenses net of all reductions represent the net expenses paid by the class.
E Annualized
See accompanying notes which are an integral part of the financial statements.
Financial Highlights — Money Market Portfolio Class II
| Six months ended (Unaudited) September 30, | Years ended March 31, | |||||
| 2016 | 2016 | 2015 | 2014 | 2013 | 2012 | |
| Selected Per–Share Data | ||||||
| Net asset value, beginning of period | $1.00 | $1.00 | $1.00 | $1.00 | $1.00 | $1.00 |
| Income from Investment Operations | ||||||
| Net investment income (loss) | .001 | .001 | –A | –A | –A | –A |
| Net realized and unrealized gain (loss)A | – | – | – | – | – | – |
| Total from investment operations | .001 | .001 | –A | –A | –A | –A |
| Distributions from net investment income | (.001) | (.001) | –A | –A | –A | –A |
| Total distributions | (.001) | (.001) | –A | –A | –A | –A |
| Net asset value, end of period | $1.00 | $1.00 | $1.00 | $1.00 | $1.00 | $1.00 |
| Total ReturnB,C | .14% | .06% | .01% | .01% | .02% | .03% |
| Ratios to Average Net AssetsD | ||||||
| Expenses before reductions | .36%E | .36% | .36% | .36% | .36% | .36% |
| Expenses net of fee waivers, if any | .33%E | .30% | .22% | .23% | .32% | .32% |
| Expenses net of all reductions | .33%E | .30% | .22% | .23% | .32% | .32% |
| Net investment income (loss) | .25%E | .06% | .01% | .01% | .02% | .03% |
| Supplemental Data | ||||||
| Net assets, end of period (in millions) | $33 | $76 | $95 | $150 | $165 | $207 |
A Amount represents less than $.0005 per share.
B Total returns for periods of less than one year are not annualized.
C Total returns would have been lower if certain expenses had not been reduced during the applicable periods shown.
D Expense ratios reflect operating expenses of the class. Expenses before reductions do not reflect amounts reimbursed or waived or reductions from expense offset arrangements and do not represent the amount paid by the class during periods when reimbursements, waivers or reductions occur. Expenses net of fee waivers reflect expenses after reimbursement and waivers but prior to reductions from expense offset arrangements. Expenses net of all reductions represent the net expenses paid by the class.
E Annualized
See accompanying notes which are an integral part of the financial statements.
Financial Highlights — Money Market Portfolio Class III
| Six months ended (Unaudited) September 30, | Years ended March 31, | |||||
| 2016 | 2016 | 2015 | 2014 | 2013 | 2012 | |
| Selected Per–Share Data | ||||||
| Net asset value, beginning of period | $1.00 | $1.00 | $1.00 | $1.00 | $1.00 | $1.00 |
| Income from Investment Operations | ||||||
| Net investment income (loss) | .001 | –A | –A | –A | –A | –A |
| Net realized and unrealized gain (loss)A | – | – | – | – | – | – |
| Total from investment operations | .001 | –A | –A | –A | –A | –A |
| Distributions from net investment income | (.001) | –A | –A | –A | –A | –A |
| Total distributions | (.001) | –A | –A | –A | –A | –A |
| Net asset value, end of period | $1.00 | $1.00 | $1.00 | $1.00 | $1.00 | $1.00 |
| Total ReturnB,C | .09% | .03% | .01% | .01% | .01% | .01% |
| Ratios to Average Net AssetsD | ||||||
| Expenses before reductions | .46%E | .46% | .46% | .46% | .46% | .46% |
| Expenses net of fee waivers, if any | .43%E | .32% | .23% | .23% | .33% | .33% |
| Expenses net of all reductions | .43%E | .32% | .23% | .23% | .33% | .33% |
| Net investment income (loss) | .15%E | .03% | .01% | .01% | .01% | .01% |
| Supplemental Data | ||||||
| Net assets, end of period (in millions) | $131 | $1,129 | $1,454 | $1,834 | $2,086 | $2,398 |
A Amount represents less than $.0005 per share.
B Total returns for periods of less than one year are not annualized.
C Total returns would have been lower if certain expenses had not been reduced during the applicable periods shown.
D Expense ratios reflect operating expenses of the class. Expenses before reductions do not reflect amounts reimbursed or waived or reductions from expense offset arrangements and do not represent the amount paid by the class during periods when reimbursements, waivers or reductions occur. Expenses net of fee waivers reflect expenses after reimbursement and waivers but prior to reductions from expense offset arrangements. Expenses net of all reductions represent the net expenses paid by the class.
E Annualized
See accompanying notes which are an integral part of the financial statements.
Financial Highlights — Money Market Portfolio Select Class
| Six months ended (Unaudited) September 30, | Years ended March 31, | |||||
| 2016 | 2016 | 2015 | 2014 | 2013 | 2012 | |
| Selected Per–Share Data | ||||||
| Net asset value, beginning of period | $1.00 | $1.00 | $1.00 | $1.00 | $1.00 | $1.00 |
| Income from Investment Operations | ||||||
| Net investment income (loss) | .002 | .001 | –A | –A | .001 | .001 |
| Net realized and unrealized gain (loss)A | – | – | – | – | – | – |
| Total from investment operations | .002 | .001 | –A | –A | .001 | .001 |
| Distributions from net investment income | (.002) | (.001) | –A | –A | (.001) | (.001) |
| Total distributions | (.002) | (.001) | –A | –A | (.001) | (.001) |
| Net asset value, end of period | $1.00 | $1.00 | $1.00 | $1.00 | $1.00 | $1.00 |
| Total ReturnB,C | .19% | .13% | .02% | .02% | .11% | .11% |
| Ratios to Average Net AssetsD | ||||||
| Expenses before reductions | .26%E | .26% | .26% | .26% | .26% | .26% |
| Expenses net of fee waivers, if any | .23%E | .23% | .22% | .22% | .23% | .23% |
| Expenses net of all reductions | .23%E | .23% | .22% | .22% | .23% | .23% |
| Net investment income (loss) | .35%E | .12% | .01% | .02% | .11% | .11% |
| Supplemental Data | ||||||
| Net assets, end of period (in millions) | $10 | $224 | $407 | $331 | $389 | $577 |
A Amount represents less than $.0005 per share.
B Total returns for periods of less than one year are not annualized.
C Total returns would have been lower if certain expenses had not been reduced during the applicable periods shown.
D Expense ratios reflect operating expenses of the class. Expenses before reductions do not reflect amounts reimbursed or waived or reductions from expense offset arrangements and do not represent the amount paid by the class during periods when reimbursements, waivers or reductions occur. Expenses net of fee waivers reflect expenses after reimbursement and waivers but prior to reductions from expense offset arrangements. Expenses net of all reductions represent the net expenses paid by the class.
E Annualized
See accompanying notes which are an integral part of the financial statements.
See accompanying notes which are an integral part of the financial statements.
Financial Highlights — Money Market Portfolio Institutional Class
| Six months ended (Unaudited) September 30, | Years ended March 31, | |||||
| 2016 | 2016 | 2015 | 2014 | 2013 | 2012 | |
| Selected Per–Share Data | ||||||
| Net asset value, beginning of period | $1.00 | $1.00 | $1.00 | $1.00 | $1.00 | $1.00 |
| Income from Investment Operations | ||||||
| Net investment income (loss) | .002 | .002 | .001 | .001 | .002 | .002 |
| Net realized and unrealized gain (loss)A | – | – | – | – | – | – |
| Total from investment operations | .002 | .002 | .001 | .001 | .002 | .002 |
| Distributions from net investment income | (.002) | (.002) | (.001) | (.001) | (.002) | (.002) |
| Total distributions | (.002) | (.002) | (.001) | (.001) | (.002) | (.002) |
| Net asset value, end of period | $1.00 | $1.00 | $1.00 | $1.00 | $1.00 | $1.00 |
| Total ReturnB,C | .23% | .22% | .10% | .10% | .20% | .21% |
| Ratios to Average Net AssetsD | ||||||
| Expenses before reductions | .18%E | .18% | .18% | .18% | .18% | .18% |
| Expenses net of fee waivers, if any | .14%E | .14% | .14% | .14% | .14% | .14% |
| Expenses net of all reductions | .14%E | .14% | .14% | .14% | .14% | .14% |
| Net investment income (loss) | .44%E | .21% | .09% | .10% | .20% | .20% |
| Supplemental Data | ||||||
| Net assets, end of period (in millions) | $9,179 | $21,863 | $36,919 | $40,143 | $37,824 | $32,286 |
A Amount represents less than $.0005 per share.
B Total returns for periods of less than one year are not annualized.
C Total returns would have been lower if certain expenses had not been reduced during the applicable periods shown.
D Expense ratios reflect operating expenses of the class. Expenses before reductions do not reflect amounts reimbursed or waived or reductions from expense offset arrangements and do not represent the amount paid by the class during periods when reimbursements, waivers or reductions occur. Expenses net of fee waivers reflect expenses after reimbursement and waivers but prior to reductions from expense offset arrangements. Expenses net of all reductions represent the net expenses paid by the class.
E Annualized
See accompanying notes which are an integral part of the financial statements.
Prime Money Market Portfolio
Investment Summary/Performance (Unaudited)
Effective Maturity Diversification
| Days | % of fund's investments 9/30/16 | % of fund's investments 3/31/16 | % of fund's investments 9/30/15 |
| 1 - 7 | 78.7 | 47.8 | 55.5 |
| 8 - 30 | 9.9 | 13.8 | 17.9 |
| 31 - 60 | 10.0 | 8.8 | 6.0 |
| 61 - 90 | 0.0 | 15.0 | 12.6 |
| 91 - 180 | 1.4 | 14.6 | 8.0 |
Effective maturity is determined in accordance with the requirements of Rule 2a-7 under the Investment Company Act of 1940.
Asset Allocation (% of fund's net assets)
| As of September 30, 2016 | ||
| Certificates of Deposit | 16.8% | |
| Commercial Paper | 5.1% | |
| Variable Rate Demand Notes (VRDNs) | 0.4% | |
| U.S. Treasury Debt | 4.0% | |
| U.S. Government Agency Debt | 4.3% | |
| Non-Negotiable Time Deposit | 13.5% | |
| Other Instruments | 2.6% | |
| Repurchase Agreements | 53.3% | |

| As of March 31, 2016 | ||
| Certificates of Deposit | 42.3% | |
| Commercial Paper | 6.3% | |
| Variable Rate Demand Notes (VRDNs) | 0.1% | |
| U.S. Treasury Debt | 5.3% | |
| U.S. Government Agency Debt | 2.8% | |
| Non-Negotiable Time Deposit | 17.3% | |
| Repurchase Agreements | 26.5% | |
| Net Other Assets (Liabilities)* | (0.6)% | |

* Net Other Assets (Liabilities) are not included in the pie chart
Current And Historical 7-Day Yields
| 9/30/16 | 6/30/16 | 3/31/16 | 12/31/15 | 9/30/15 | |
| Class I | 0.40% | 0.44% | 0.39% | 0.28% | 0.10% |
| Class II | 0.25% | 0.29% | 0.24% | 0.13% | 0.01% |
| Class III | 0.15% | 0.19% | 0.14% | 0.03% | 0.01% |
| Class IV | 0.01% | 0.01% | 0.01% | 0.01% | 0.01% |
| Select Class | 0.35% | 0.39% | 0.34% | 0.23% | 0.05% |
| Institutional Class | 0.44% | 0.48% | 0.43% | 0.32% | 0.14% |
Yield refers to the income paid by the Fund over a given period. Yields for money market funds are usually for seven-day periods, as they are here, though they are expressed as annual percentage rates. Past performance is no guarantee of future results. Yield will vary and it's possible to lose money investing in the Fund. A portion of the Fund's expenses was reimbursed and/or waived. Absent such reimbursements and/or waivers the yield for the period ending September 30, 2016, the most recent period shown in the table, would have been 0.36% for Class I, 0.21% for Class II, 0.10% for Class III, -0.06% for Class IV, 0.30% for Select Class and 0.39% for Institutional Class.
Percentages shown as 0.0% may reflect amounts less than 0.05%.
Prime Money Market Portfolio
Investments September 30, 2016
Showing Percentage of Net Assets
| Certificate of Deposit - 16.8% | ||||
| Yield(a) | Principal Amount (000s) | Value (000s) | ||
| Domestic Certificates Of Deposit - 2.9% | ||||
| State Street Bank & Trust Co. | ||||
| 11/28/16 | 0.91% | $159,000 | $159,000 | |
| Wells Fargo Bank NA | ||||
| 11/1/16 | 0.91 | 250,000 | 250,000 | |
| 409,000 | ||||
| New York Branch, Yankee Dollar, Foreign Banks - 13.9% | ||||
| Bank of Montreal Chicago | ||||
| 11/10/16 | 0.87 (b) | 118,000 | 118,000 | |
| Bank of Nova Scotia | ||||
| 11/21/16 to 1/3/17 | 0.94 to 0.95 (b) | 475,000 | 475,000 | |
| Canadian Imperial Bank of Commerce | ||||
| 12/12/16 to 1/20/17 | 0.92 to 0.97 (b) | 600,000 | 600,000 | |
| Toronto-Dominion Bank New York Branch | ||||
| 2/1/17 | 0.97 (b) | 200,000 | 200,000 | |
| UBS AG | ||||
| 11/7/16 to 1/10/17 | 0.88 to 1.05 (b) | 550,000 | 550,000 | |
| 1,943,000 | ||||
| TOTAL CERTIFICATE OF DEPOSIT | ||||
| (Cost $2,352,000) | 2,352,000 | |||
| Financial Company Commercial Paper - 5.1% | ||||
| Bank of Nova Scotia | ||||
| 12/5/16 | 0.93 (b) | 265,000 | 265,000 | |
| National Australia Bank Ltd. | ||||
| 10/3/16 | 0.65 | 250,000 | 249,991 | |
| Toyota Motor Credit Corp. | ||||
| 11/8/16 | 0.88 (b) | 200,000 | 200,000 | |
| TOTAL FINANCIAL COMPANY COMMERCIAL PAPER | ||||
| (Cost $714,991) | 714,991 | |||
| U.S. Treasury Debt - 4.0% | ||||
| U.S. Treasury Obligations - 4.0% | ||||
| U.S. Treasury Notes | ||||
| 10/31/17 to 4/30/18 | ||||
| (Cost $559,892) | 0.42 to 0.44 (b) | 560,000 | 559,892 | |
| Other Instrument - 2.6% | ||||
| Master Notes - 2.6% | ||||
| Toyota Motor Credit Corp. | ||||
| 10/7/16 | ||||
| (Cost $360,000) | 0.87 (b) | 360,000 | 360,000 | |
| Variable Rate Demand Note - 0.4% | ||||
| Delaware - 0.2% | ||||
| LP Pinewood SPV LLC Taxable, LOC Wells Fargo Bank NA, VRDN | ||||
| 10/7/16 | 0.65 (b) | 37,000 | 37,000 | |
| Florida - 0.2% | ||||
| Florida Timber Fin. III LLC Taxable 10/7/16, LOC Wells Fargo Bank NA, VRDN | ||||
| 10/7/16 | 0.65 (b) | 25,155 | 25,155 | |
| TOTAL VARIABLE RATE DEMAND NOTE | ||||
| (Cost $62,155) | 62,155 | |||
| U.S. Government Agency Debt - 4.3% | ||||
| Federal Agencies - 4.3% | ||||
| Federal Home Loan Bank | ||||
| 2/3/17 | 0.62 (b) | 370,000 | 369,940 | |
| Freddie Mac | ||||
| 4/20/17 | 0.54 (b) | 242,000 | 241,980 | |
| TOTAL U.S. GOVERNMENT AGENCY DEBT | ||||
| (Cost $611,920) | 611,920 | |||
| Non-Negotiable Time Deposit - 13.5% | ||||
| Time Deposits - 13.5% | ||||
| BNP Paribas | ||||
| 10/3/16 | 0.30 | 1,000,000 | 1,000,000 | |
| Credit Agricole CIB | ||||
| 10/3/16 | 0.30 | 900,000 | 900,000 | |
| TOTAL NON-NEGOTIABLE TIME DEPOSIT | ||||
| (Cost $1,900,000) | 1,900,000 |
| U.S. Government Agency Repurchase Agreement - 25.5% | |||
| Maturity Amount (000s) | Value (000s) | ||
| In a joint trading account at: | |||
| 0.49% dated 9/30/16 due 10/3/16 (Collateralized by U.S. Government Obligations) # | $1,794,756 | $1,794,682 | |
| 0.52% dated 9/30/16 due 10/3/16 (Collateralized by U.S. Government Obligations) # | 1,750,818 | 1,750,743 | |
| With Deutsche Bank Securities, Inc. at 0.57%, dated 9/30/16 due 10/3/16 (Collateralized by U.S. Treasury Obligations valued at $28,561,450, 1.63%, 2/15/26) | 28,001 | 28,000 | |
| TOTAL U.S. GOVERNMENT AGENCY REPURCHASE AGREEMENT | |||
| (Cost $3,573,425) | 3,573,425 | ||
| U.S. Treasury Repurchase Agreement - 1.9% | |||
| With: | |||
| Barclays Capital, Inc. at 0.47%, dated 9/30/16 due 10/3/16 (Collateralized by U.S. Treasury Obligations valued at $40,801,599, 0.00% - 1.75%, 12/08/16 - 5/31/23) | 40,002 | 40,000 | |
| Deutsche Bank Securities, Inc. at 0.55%, dated 9/30/16 due 10/3/16 (Collateralized by U.S. Treasury Obligations valued at $51,002,426, 2.13%, 5/15/25) | 50,002 | 50,000 | |
| Mizuho Securities U.S.A., Inc. at 0.53%, dated 9/30/16 due 10/3/16 (Collateralized by U.S. Treasury Obligations valued at $52,046,358, 1.38%, 2/29/20) | 51,002 | 51,000 | |
| Royal Bank of Canada at 0.54%, dated 9/30/16 due 10/3/16 (Collateralized by U.S. Treasury Obligations valued at $125,739,672, 0.63% - 1.63%, 6/30/18 - 6/30/20) | 123,006 | 123,000 | |
| TOTAL U.S. TREASURY REPURCHASE AGREEMENT | |||
| (Cost $264,000) | 264,000 | ||
| Other Repurchase Agreement - 25.9% | |||
| Other Repurchase Agreement - 25.9% | |||
| With: | |||
| Citigroup Global Markets, Inc. at: | |||
| 0.43%, dated 9/30/16 due 10/3/16 (Collateralized by Equity Securities valued at $325,091,692) | 301,011 | 301,000 | |
| 0.75%, dated: | |||
| 9/27/16 due 10/4/16 (Collateralized by Corporate Obligations valued at $71,288,910, 0.78% - 5.06%, 9/25/35 - 12/26/50) | 66,010 | 66,000 | |
| 9/29/16 due 10/6/16 (Collateralized by Corporate Obligations valued at $62,645,220, 0.84% - 5.60%, 11/25/36 - 7/03/50) | 58,008 | 58,000 | |
| Credit Suisse Securities (U.S.A.) LLC at 0.6%, dated 9/30/16 due 10/6/16 (Collateralized by Mortgage Loan Obligations valued at $49,451,614, 3.88% - 6.00%, 9/27/31 - 12/25/65) | 43,004 | 43,000 | |
| HSBC Securities, Inc. at 0.43%, dated 9/30/16 due 10/3/16 (Collateralized by Corporate Obligations valued at $112,352,372, 1.25% - 9.25%, 3/22/17 - 10/19/75) | 107,004 | 107,000 | |
| ING Financial Markets LLC at: | |||
| 0.55%, dated 9/30/16 due 10/3/16 (Collateralized by Equity Securities valued at $139,326,413) | 129,006 | 129,000 | |
| 0.63%, dated 9/30/16 due 10/3/16 (Collateralized by Corporate Obligations valued at $70,202,090, 5.75% - 14.00%, 2/01/21 - 6/01/23) | 65,003 | 65,000 | |
| J.P. Morgan Securities, LLC at 1.37%, dated 5/18/16 due 11/14/16 (Collateralized by Mortgage Loan Obligations valued at $454,815,977, 0.00% - 107.07%, 12/15/27 - 6/25/56) (b)(c) | 421,879 | 419,000 | |
| Mitsubishi UFJ Securities (U.S.A.), Inc. at 0.71%, dated: | |||
| 9/15/16 due 10/3/16 (Collateralized by Equity Securities valued at $48,617,301) | 45,016 | 45,000 | |
| 9/28/16 due 10/7/16 (Collateralized by Corporate Obligations valued at $33,457,732, 0.25% - 5.50%, 10/02/17 - 2/01/33) | 31,009 | 31,000 | |
| Mizuho Securities U.S.A., Inc. at: | |||
| 0.41%, dated 9/30/16 due 10/3/16 (Collateralized by U.S. Government Obligations valued at $510,018,473, 2.00% - 9.50%, 2/01/29 - 12/01/32) | 500,017 | 500,000 | |
| 0.63%, dated: | |||
| 9/20/16 due 10/4/16 (Collateralized by Equity Securities valued at $64,814,765) | 60,015 | 60,000 | |
| 9/21/16 due 10/5/16 (Collateralized by Equity Securities valued at $70,214,768) | 65,016 | 65,000 | |
| 9/22/16 due 10/6/16 (Collateralized by Equity Securities valued at $174,993,687) | 162,040 | 162,000 | |
| 9/28/16 due 10/7/16 (Collateralized by Equity Securities valued at $108,009,585) | 100,026 | 100,000 | |
| 9/30/16 due 10/7/16 (Collateralized by Equity Securities valued at $95,045,011) | 88,022 | 88,000 | |
| 0.8%, dated 9/22/16 due 10/6/16 (Collateralized by U.S. Government Obligations valued at $28,566,982, 0.85% - 7.50%, 9/30/17 - 11/01/34) | 28,009 | 28,000 | |
| RBC Capital Markets Co. at: | |||
| 0.75%, dated 7/22/16 due 10/7/16 (Collateralized by U.S. Government Obligations valued at $245,193,134, 0.00% - 7.00%, 5/25/23 - 8/15/46) | 238,446 | 238,000 | |
| 0.99%, dated 9/26/16 due 10/7/16 (Collateralized by Municipal Bond Obligations valued at $172,442,170, 5.00%, 8/01/30 - 12/01/44) | 164,397 | 164,000 | |
| SG Americas Securities, LLC at 0.75%, dated: | |||
| 9/27/16 due 10/4/16 (Collateralized by Corporate Obligations valued at $113,951,106, 0.75% - 12.00%, 8/18/17 - 4/01/47) | 106,015 | 106,000 | |
| 9/28/16 due 10/5/16 (Collateralized by Corporate Obligations valued at $111,376,467, 1.50% - 10.00%, 2/23/18 - 4/01/47) | 104,015 | 104,000 | |
| Wells Fargo Securities LLC at: | |||
| 0.43%, dated 9/30/16 due 10/3/16 (Collateralized by Equity Securities valued at $132,844,768) | 123,004 | 123,000 | |
| 0.48%, dated 9/30/16 due 10/3/16: | |||
| (Collateralized by Corporate Obligations valued at $303,492,163, 0.25% - 8.25%, 3/01/17 - 12/01/40) | 281,011 | 281,000 | |
| (Collateralized by Corporate Obligations valued at $166,326,653, 0.00% - 6.25%, 11/01/17 - 8/15/56) | 154,006 | 154,000 | |
| 0.55%, dated 9/30/16 due 10/7/16 (Collateralized by Corporate Obligations valued at $67,323,086, 0.00% - 1.88%, 10/03/16 - 9/20/21) | 66,007 | 66,000 | |
| 0.6%, dated 9/30/16 due 10/7/16 (Collateralized by Corporate Obligations valued at $135,315,975, 0.00% - 8.88%, 10/07/16 - 12/15/53) | 129,015 | 129,000 | |
| TOTAL OTHER REPURCHASE AGREEMENT | |||
| (Cost $3,632,000) | 3,632,000 | ||
| TOTAL INVESTMENT PORTFOLIO - 100.0% | |||
| (Cost $14,030,383) | 14,030,383 | ||
| NET OTHER ASSETS (LIABILITIES) - 0.0% | (2,090) | ||
| NET ASSETS - 100% | $14,028,293 |
Security Type Abbreviations
VRDN – VARIABLE RATE DEMAND NOTE (A debt instrument that is payable upon demand, either daily, weekly or monthly)
The date shown for securities represents the date when principal payments must be paid, taking into account any call options exercised by the issuer and any permissible maturity shortening features other than interest rate resets.
Legend
(a) Yield represents either the annualized yield at the date of purchase, or the stated coupon rate, or, for floating and adjustable rate securities, the rate at period end.
(b) Coupon rates for floating and adjustable rate securities reflect the rates in effect at period end.
(c) The maturity amount is based on the rate at period end.
Investment Valuation
All investments are categorized as Level 2 under the Fair Value Hierarchy. The inputs or methodology used for valuing securities may not be an indication of the risk associated with investing in those securities. For more information on valuation inputs please refer to the Investment Valuation section in the accompanying Notes to Financial Statements.
Other Information
# Additional information on each counterparty to the repurchase agreement is as follows:
| Repurchase Agreement / Counterparty | Value(000s) |
| $1,794,682,000 due 10/03/16 at 0.49% | |
| BNP Paribas, S.A. | $667,154 |
| Bank of America NA | 21,210 |
| Credit Agricole CIB New York Branch | 251,129 |
| HSBC Securities (USA), Inc. | 424,219 |
| ING Financial Markets LLC | 84,841 |
| Merrill Lynch, Pierce, Fenner & Smith, Inc. | 134,027 |
| Societe Generale | 212,102 |
| $1,794,682 | |
| $1,750,743,000 due 10/03/16 at 0.52% | |
| BNP Paribas, S.A. | 65,601 |
| Bank of America NA | 323,937 |
| Citibank NA | 250,914 |
| Credit Agricole CIB New York Branch | 45,729 |
| HSBC Securities (USA), Inc. | 278,780 |
| J.P. Morgan Securities, Inc. | 7,422 |
| Merrill Lynch, Pierce, Fenner & Smith, Inc. | 62,250 |
| Mizuho Securities USA, Inc. | 137,907 |
| Wells Fargo Securities LLC | 578,203 |
| $1,750,743 |
See accompanying notes which are an integral part of the financial statements.
Prime Money Market Portfolio
Financial Statements
Statement of Assets and Liabilities
| Amounts in thousands (except per-share amounts) | September 30, 2016 | |
| Assets | ||
| Investment in securities, at value (including repurchase agreements of $7,469,425) — See accompanying schedule: Unaffiliated issuers (cost $14,030,383) | $14,030,383 | |
| Interest receivable | 7,733 | |
| Prepaid expenses | 177 | |
| Receivable from investment adviser for expense reductions | 1,309 | |
| Other receivables | 384 | |
| Total assets | 14,039,986 | |
| Liabilities | ||
| Payable for fund shares redeemed | $262 | |
| Distributions payable | 4,528 | |
| Accrued management fee | 4,596 | |
| Transfer agent fee payable | 1,183 | |
| Distribution and service plan fees payable | 212 | |
| Other affiliated payables | 141 | |
| Other payables and accrued expenses | 771 | |
| Total liabilities | 11,693 | |
| Net Assets | $14,028,293 | |
| Net Assets consist of: | ||
| Paid in capital | $14,038,612 | |
| Distributions in excess of net investment income | (5) | |
| Accumulated undistributed net realized gain (loss) on investments | (10,314) | |
| Net Assets | $14,028,293 | |
| Class I: | ||
| Net Asset Value, offering price and redemption price per share ($2,551,106 ÷ 2,550,405 shares) | $1.00 | |
| Class II: | ||
| Net Asset Value, offering price and redemption price per share ($170,657 ÷ 170,628 shares) | $1.00 | |
| Class III: | ||
| Net Asset Value, offering price and redemption price per share ($254,526 ÷ 254,473 shares) | $1.00 | |
| Class IV: | ||
| Net Asset Value, offering price and redemption price per share ($21 ÷ 21 shares) | $1.00 | |
| Select Class: | ||
| Net Asset Value, offering price and redemption price per share ($40,982 ÷ 40,969 shares) | $1.00 | |
| Institutional Class: | ||
| Net Asset Value, offering price and redemption price per share ($11,011,001 ÷ 11,009,114 shares) | $1.00 |
See accompanying notes which are an integral part of the financial statements.
Statement of Operations
| Amounts in thousands | Six months ended September 30, 2016 | |
| Investment Income | ||
| Interest | $168,046 | |
| Expenses | ||
| Management fee | $40,330 | |
| Transfer agent fees | 10,326 | |
| Distribution and service plan fees | 1,735 | |
| Accounting fees and expenses | 1,026 | |
| Custodian fees and expenses | 407 | |
| Independent trustees' fees and expenses | 136 | |
| Registration fees | 116 | |
| Audit | 30 | |
| Legal | 82 | |
| Miscellaneous | 164 | |
| Total expenses before reductions | 54,352 | |
| Expense reductions | (9,944) | 44,408 |
| Net investment income (loss) | 123,638 | |
| Realized and Unrealized Gain (Loss) | ||
| Net realized gain (loss) on: | ||
| Investment securities: | ||
| Unaffiliated issuers | 36 | |
| Total net realized gain (loss) | 36 | |
| Net increase in net assets resulting from operations | $123,674 |
See accompanying notes which are an integral part of the financial statements.
Statement of Changes in Net Assets
| Amounts in thousands | Six months ended September 30, 2016 | Year ended March 31, 2016 |
| Increase (Decrease) in Net Assets | ||
| Operations | ||
| Net investment income (loss) | $123,638 | $102,537 |
| Net realized gain (loss) | 36 | 894 |
| Net increase in net assets resulting from operations | 123,674 | 103,431 |
| Distributions to shareholders from net investment income | (123,979) | (101,456) |
| Distributions to shareholders from net realized gain | (10,350) | – |
| Total distributions | (134,329) | (101,456) |
| Share transactions - net increase (decrease) | (44,180,422) | 16,711,766 |
| Total increase (decrease) in net assets | (44,191,077) | 16,713,741 |
| Net Assets | ||
| Beginning of period | 58,219,370 | 41,505,629 |
| End of period | $14,028,293 | $58,219,370 |
| Other Information | ||
| Undistributed net investment income end of period | $– | $336 |
| Distributions in excess of net investment income end of period | $(5) | $– |
See accompanying notes which are an integral part of the financial statements.
Financial Highlights — Prime Money Market Portfolio Class I
| Six months ended September 30, | Years ended March 31, | |||||
| 2016 | 2016 | 2015 | 2014 | 2013 | 2012 | |
| Selected Per–Share Data | ||||||
| Net asset value, beginning of period | $1.00 | $1.00 | $1.00 | $1.00 | $1.00 | $1.00 |
| Income from Investment Operations | ||||||
| Net investment income (loss) | .002 | .002 | –A | –A | .001 | .001 |
| Net realized and unrealized gain (loss)A | – | – | – | – | – | – |
| Total from investment operations | .002 | .002 | –A | –A | .001 | .001 |
| Distributions from net investment income | (.002) | (.002) | –A | –A | (.001) | (.001) |
| Distributions from net realized gain | –A | – | – | – | – | – |
| Total distributions | (.002) | (.002) | –A | –A | (.001) | (.001) |
| Net asset value, end of period | $1.00 | $1.00 | $1.00 | $1.00 | $1.00 | $1.00 |
| Total ReturnB,C | .22% | .17% | .01% | .02% | .09% | .10% |
| Ratios to Average Net AssetsD | ||||||
| Expenses before reductions | .21%E | .21% | .21% | .21% | .21% | .21% |
| Expenses net of fee waivers, if any | .18%E | .18% | .19% | .19% | .20% | .20% |
| Expenses net of all reductions | .18%E | .18% | .19% | .19% | .20% | .20% |
| Net investment income (loss) | .40%E | .18% | .01% | .02% | .09% | .10% |
| Supplemental Data | ||||||
| Net assets, end of period (in millions) | $2,551 | $9,638 | $6,236 | $7,816 | $10,332 | $15,149 |
A Amount represents less than $.0005 per share.
B Total returns for periods of less than one year are not annualized.
C Total returns would have been lower if certain expenses had not been reduced during the applicable periods shown.
D Expense ratios reflect operating expenses of the class. Expenses before reductions do not reflect amounts reimbursed or waived or reductions from expense offset arrangements and do not represent the amount paid by the class during periods when reimbursements, waivers or reductions occur. Expenses net of fee waivers reflect expenses after reimbursement and waivers but prior to reductions from expense offset arrangements. Expenses net of all reductions represent the net expenses paid by the class.
E Annualized
See accompanying notes which are an integral part of the financial statements.
Financial Highlights — Prime Money Market Portfolio Class II
| Six months ended September 30, | Years ended March 31, | |||||
| 2016 | 2016 | 2015 | 2014 | 2013 | 2012 | |
| Selected Per–Share Data | ||||||
| Net asset value, beginning of period | $1.00 | $1.00 | $1.00 | $1.00 | $1.00 | $1.00 |
| Income from Investment Operations | ||||||
| Net investment income (loss) | .001 | .001 | –A | –A | –A | –A |
| Net realized and unrealized gain (loss) A | – | – | – | – | – | – |
| Total from investment operations | .001 | .001 | –A | –A | –A | –A |
| Distributions from net investment income | (.001) | (.001) | –A | –A | –A | –A |
| Distributions from net realized gain | –A | – | – | – | – | – |
| Total distributions | (.001) | (.001) | –A | –A | –A | –A |
| Net asset value, end of period | $1.00 | $1.00 | $1.00 | $1.00 | $1.00 | $1.00 |
| Total ReturnB,C | .16% | .06% | .01% | .01% | .01% | .01% |
| Ratios to Average Net AssetsD | ||||||
| Expenses before reductions | .36%E | .36% | .36% | .36% | .36% | .36% |
| Expenses net of fee waivers, if any | .33%E | .28% | .20% | .19% | .28% | .29% |
| Expenses net of all reductions | .33%E | .28% | .20% | .19% | .28% | .29% |
| Net investment income (loss) | .25%E | .09% | .01% | .01% | .01% | .01% |
| Supplemental Data | ||||||
| Net assets, end of period (in millions) | $171 | $245 | $454 | $419 | $487 | $828 |
A Amount represents less than $.0005 per share.
B Total returns for periods of less than one year are not annualized.
C Total returns would have been lower if certain expenses had not been reduced during the applicable periods shown.
D Expense ratios reflect operating expenses of the class. Expenses before reductions do not reflect amounts reimbursed or waived or reductions from expense offset arrangements and do not represent the amount paid by the class during periods when reimbursements, waivers or reductions occur. Expenses net of fee waivers reflect expenses after reimbursement and waivers but prior to reductions from expense offset arrangements. Expenses net of all reductions represent the net expenses paid by the class.
E Annualized
See accompanying notes which are an integral part of the financial statements.
Financial Highlights — Prime Money Market Portfolio Class III
| Six months ended September 30, | Years ended March 31, | |||||
| 2016 | 2016 | 2015 | 2014 | 2013 | 2012 | |
| Selected Per–Share Data | ||||||
| Net asset value, beginning of period | $1.00 | $1.00 | $1.00 | $1.00 | $1.00 | $1.00 |
| Income from Investment Operations | ||||||
| Net investment income (loss) | .001 | –A | –A | –A | –A | –A |
| Net realized and unrealized gain (loss)A | – | – | – | – | – | – |
| Total from investment operations | .001 | –A | –A | –A | –A | –A |
| Distributions from net investment income | (.001) | –A | –A | –A | –A | –A |
| Distributions from net realized gain | –A | – | – | – | – | – |
| Total distributions | (.001) | –A | –A | –A | –A | –A |
| Net asset value, end of period | $1.00 | $1.00 | $1.00 | $1.00 | $1.00 | $1.00 |
| Total ReturnB,C | .09% | .04% | .01% | .01% | .01% | .01% |
| Ratios to Average Net AssetsD | ||||||
| Expenses before reductions | .45%E | .46% | .46% | .46% | .46% | .46% |
| Expenses net of fee waivers, if any | .43%E | .31% | .20% | .19% | .28% | .29% |
| Expenses net of all reductions | .43%E | .31% | .20% | .19% | .28% | .29% |
| Net investment income (loss) | .15%E | .06% | .01% | .01% | .01% | .01% |
| Supplemental Data | ||||||
| Net assets, end of period (in millions) | $255 | $894 | $1,011 | $1,967 | $1,790 | $1,543 |
A Amount represents less than $.0005 per share.
B Total returns for periods of less than one year are not annualized.
C Total returns would have been lower if certain expenses had not been reduced during the applicable periods shown.
D Expense ratios reflect operating expenses of the class. Expenses before reductions do not reflect amounts reimbursed or waived or reductions from expense offset arrangements and do not represent the amount paid by the class during periods when reimbursements, waivers or reductions occur. Expenses net of fee waivers reflect expenses after reimbursement and waivers but prior to reductions from expense offset arrangements. Expenses net of all reductions represent the net expenses paid by the class.
E Annualized
See accompanying notes which are an integral part of the financial statements.
Financial Highlights — Prime Money Market Portfolio Class IV
| Six months ended September 30, | Years ended March 31, | |||||
| 2016 | 2016 | 2015 | 2014 | 2013 | 2012 | |
| Selected Per–Share Data | ||||||
| Net asset value, beginning of period | $1.00 | $1.00 | $1.00 | $1.00 | $1.00 | $1.00 |
| Income from Investment Operations | ||||||
| Net investment income (loss)A | – | – | – | – | – | – |
| Net realized and unrealized gain (loss)A | – | – | – | – | – | – |
| Total from investment operationsA | – | – | – | – | – | – |
| Distributions from net investment incomeA | – | – | – | – | – | – |
| Total distributionsA | – | – | – | – | – | – |
| Net asset value, end of period | $1.00 | $1.00 | $1.00 | $1.00 | $1.00 | $1.00 |
| Total ReturnB,C | .01% | .01% | .01% | .01% | .01% | .01% |
| Ratios to Average Net AssetsD | ||||||
| Expenses before reductions | .70%E | .71% | .71% | .71% | .71% | .71% |
| Expenses net of fee waivers, if any | .58%E | .33% | .20% | .18% | .29% | .29% |
| Expenses net of all reductions | .58%E | .33% | .20% | .18% | .29% | .29% |
| Net investment income (loss) | - %E,F | .03% | .01% | .02% | - %F | .01% |
| Supplemental Data | ||||||
| Net assets, end of period (in millions) | $– | $184 | $207 | $100 | $37 | $65 |
A Amount represents less than $.0005 per share.
B Total returns for periods of less than one year are not annualized.
C Total returns would have been lower if certain expenses had not been reduced during the applicable periods shown.
D Expense ratios reflect operating expenses of the class. Expenses before reductions do not reflect amounts reimbursed or waived or reductions from expense offset arrangements and do not represent the amount paid by the class during periods when reimbursements, waivers or reductions occur. Expenses net of fee waivers reflect expenses after reimbursement and waivers but prior to reductions from expense offset arrangements. Expenses net of all reductions represent the net expenses paid by the class.
E Annualized
F Amount represents less than .005%.
See accompanying notes which are an integral part of the financial statements.
Financial Highlights — Prime Money Market Portfolio Select Class
| Six months ended September 30, | Years ended March 31, | |||||
| 2016 | 2016 | 2015 | 2014 | 2013 | 2012 | |
| Selected Per–Share Data | ||||||
| Net asset value, beginning of period | $1.00 | $1.00 | $1.00 | $1.00 | $1.00 | $1.00 |
| Income from Investment Operations | ||||||
| Net investment income (loss) | .002 | .001 | –A | –A | –A | .001 |
| Net realized and unrealized gain (loss)A | – | – | – | – | – | – |
| Total from investment operations | .002 | .001 | –A | –A | –A | .001 |
| Distributions from net investment income | (.002) | (.001) | –A | –A | –A | (.001) |
| Distributions from net realized gain | –A | – | – | – | – | – |
| Total distributions | (.002) | (.001) | –A | –A | –A | (.001) |
| Net asset value, end of period | $1.00 | $1.00 | $1.00 | $1.00 | $1.00 | $1.00 |
| Total ReturnB,C | .18% | .12% | .01% | .01% | .05% | .05% |
| Ratios to Average Net AssetsD | ||||||
| Expenses before reductions | .26%E | .26% | .26% | .26% | .26% | .26% |
| Expenses net of fee waivers, if any | .23%E | .23% | .20% | .19% | .25% | .25% |
| Expenses net of all reductions | .23%E | .23% | .20% | .19% | .25% | .25% |
| Net investment income (loss) | .35%E | .13% | .01% | .01% | .05% | .05% |
| Supplemental Data | ||||||
| Net assets, end of period (in millions) | $41 | $771 | $1,068 | $1,173 | $1,724 | $1,207 |
A Amount represents less than $.0005 per share.
B Total returns for periods of less than one year are not annualized.
C Total returns would have been lower if certain expenses had not been reduced during the applicable periods shown.
D Expense ratios reflect operating expenses of the class. Expenses before reductions do not reflect amounts reimbursed or waived or reductions from expense offset arrangements and do not represent the amount paid by the class during periods when reimbursements, waivers or reductions occur. Expenses net of fee waivers reflect expenses after reimbursement and waivers but prior to reductions from expense offset arrangements. Expenses net of all reductions represent the net expenses paid by the class.
E Annualized
See accompanying notes which are an integral part of the financial statements.
Financial Highlights — Prime Money Market Portfolio Institutional Class
| Six months ended September 30, | Years ended March 31, | |||||
| 2016 | 2016 | 2015 | 2014 | 2013 | 2012 | |
| Selected Per–Share Data | ||||||
| Net asset value, beginning of period | $1.00 | $1.00 | $1.00 | $1.00 | $1.00 | $1.00 |
| Income from Investment Operations | ||||||
| Net investment income (loss) | .002 | .002 | .001 | .001 | .002 | .002 |
| Net realized and unrealized gain (loss)A | – | – | – | – | – | – |
| Total from investment operations | .002 | .002 | .001 | .001 | .002 | .002 |
| Distributions from net investment income | (.002) | (.002) | (.001) | (.001) | (.002) | (.002) |
| Distributions from net realized gain | –A | – | – | – | – | – |
| Total distributions | (.002) | (.002) | (.001) | (.001) | (.002) | (.002) |
| Net asset value, end of period | $1.00 | $1.00 | $1.00 | $1.00 | $1.00 | $1.00 |
| Total ReturnB,C | .24% | .21% | .07% | .06% | .15% | .16% |
| Ratios to Average Net AssetsD | ||||||
| Expenses before reductions | .18%E | .18% | .18% | .18% | .18% | .18% |
| Expenses net of fee waivers, if any | .14%E | .14% | .14% | .14% | .14% | .14% |
| Expenses net of all reductions | .14%E | .14% | .14% | .14% | .14% | .14% |
| Net investment income (loss) | .44%E | .22% | .07% | .06% | .15% | .16% |
| Supplemental Data | ||||||
| Net assets, end of period (in millions) | $11,011 | $46,487 | $32,529 | $26,896 | $30,681 | $34,433 |
A Amount represents less than $.0005 per share.
B Total returns for periods of less than one year are not annualized.
C Total returns would have been lower if certain expenses had not been reduced during the applicable periods shown.
D Expense ratios reflect operating expenses of the class. Expenses before reductions do not reflect amounts reimbursed or waived or reductions from expense offset arrangements and do not represent the amount paid by the class during periods when reimbursements, waivers or reductions occur. Expenses net of fee waivers reflect expenses after reimbursement and waivers but prior to reductions from expense offset arrangements. Expenses net of all reductions represent the net expenses paid by the class.
E Annualized
See accompanying notes which are an integral part of the financial statements.
Prime Reserves Portfolio
Investment Summary/Performance (Unaudited)
Effective Maturity Diversification
| Days | % of fund's investments 9/30/16 |
| 1 - 7 | 79.2 |
| 8 - 30 | 7.1 |
| 31 - 60 | 6.5 |
| 61 - 90 | 7.2 |
Effective maturity is determined in accordance with the requirements of Rule 2a-7 under the Investment Company Act of 1940.
Asset Allocation (% of fund's net assets)
| As of September 30, 2016 | ||
| Certificates of Deposit | 14.0% | |
| Commercial Paper | 39.4% | |
| Variable Rate Demand Notes (VRDNs) | 7.9% | |
| Non-Negotiable Time Deposit | 3.3% | |
| Repurchase Agreements | 31.1% | |
| Net Other Assets (Liabilities) | 4.3% | |

Current And Historical 7-Day Yields
| 9/30/16 | 6/30/16 | |
| Class I | 0.44% | 0.33% |
| Class II | 0.29% | 0.18% |
| Class III | 0.19% | 0.08% |
| Select Class | 0.39% | 0.28% |
| Institutional Class | 0.48% | 0.37% |
Yield refers to the income paid by the Fund over a given period. Yields for money market funds are usually for seven-day periods, as they are here, though they are expressed as annual percentage rates. Past performance is no guarantee of future results. Yield will vary and it's possible to lose money investing in the Fund. A portion of the Fund's expenses was reimbursed and/or waived. Absent such reimbursements and/or waivers the yield for the period ending September 30, 2016, the most recent period shown in the table, would have been 0.21% for Class I, 0.06% for Class II, -0.04% for Class III, 0.16% for Select Class and 0.24% for Institutional Class.
Prime Reserves Portfolio
Investments September 30, 2016 (Unaudited)
Showing Percentage of Net Assets
| Certificate of Deposit - 14.0% | ||||
| Yield(a) | Principal Amount (000s) | Value (000s) | ||
| New York Branch, Yankee Dollar, Foreign Banks - 14.0% | ||||
| Bank of Montreal Chicago | ||||
| 10/3/16 to 12/21/16 | 0.43 to 0.90 % | $23,000 | $22,998 | |
| BNP Paribas New York Branch | ||||
| 10/31/16 | 0.92 | 5,000 | 5,000 | |
| Landesbank Baden-Wuerttemberg New York Branch | ||||
| 10/3/16 to 10/6/16 | 0.45 | 12,000 | 12,000 | |
| Mitsubishi UFJ Trust & Banking Corp. | ||||
| 11/10/16 | 0.95 | 5,000 | 5,000 | |
| Mizuho Corporate Bank Ltd. | ||||
| 10/20/16 | 0.90 | 5,000 | 5,000 | |
| Sumitomo Mitsui Banking Corp. | ||||
| 10/3/16 to 10/6/16 | 0.43 | 17,000 | 17,000 | |
| TOTAL CERTIFICATE OF DEPOSIT | ||||
| (Cost $66,998) | 66,998 | |||
| Financial Company Commercial Paper - 21.1% | ||||
| ABN AMRO Funding U.S.A. LLC | ||||
| 11/3/16 to 12/2/16 | 0.80 to 0.89 | 10,000 | 9,989 | |
| Barclays Bank PLC/Barclays U.S. CCP Funding LLC | ||||
| 10/4/16 to 10/13/16 | 0.60 to 0.80 | 6,000 | 5,999 | |
| Bayerische Landesbank | ||||
| 10/4/16 to 10/6/16 | 0.47 | 13,000 | 12,999 | |
| BPCE SA | ||||
| 10/31/16 to 12/21/16 | 0.91 to 1.00 | 10,000 | 9,985 | |
| Caisse centrale Desjardins | ||||
| 12/15/16 | 0.90 | 5,000 | 4,991 | |
| Credit Agricole CIB | ||||
| 10/6/16 | 0.42 | 20,000 | 19,999 | |
| Landesbank Baden-Wurttemberg | ||||
| 10/4/16 to 10/5/16 | 0.48 | 10,000 | 10,000 | |
| Sumitomo Mitsui Banking Corp. | ||||
| 10/18/16 | 0.85 | 5,000 | 4,998 | |
| Sumitomo Trust & Banking Co. Ltd. | ||||
| 10/3/16 | 0.42 | 22,000 | 21,999 | |
| TOTAL FINANCIAL COMPANY COMMERCIAL PAPER | ||||
| (Cost $100,959) | 100,959 | |||
| Asset Backed Commercial Paper - 16.5% | ||||
| Atlantic Asset Securitization Corp. (Credit Agricole CIB Guaranteed) | ||||
| 10/11/16 | 0.72 | 5,000 | 4,999 | |
| 10/3/16 | 0.45 | 1,500 | 1,500 | |
| 10/3/16 | 0.45 | 1,750 | 1,750 | |
| 10/6/16 | 0.43 | 6,000 | 6,000 | |
| 11/1/16 | 0.90 | 5,000 | 4,996 | |
| 12/13/16 | 1.00 | 3,000 | 2,994 | |
| Autobahn Funding Co. LLC (Liquidity Facility DZ BANK AG) | ||||
| 10/6/16 | 0.41 | 20,000 | 19,999 | |
| Gotham Funding Corp. (Liquidity Facility Bank of Tokyo-Mitsubishi UFJ Ltd.) | ||||
| 10/4/16 | 0.47 | 15,000 | 14,999 | |
| 12/14/16 | 1.00 | 5,000 | 4,990 | |
| Manhattan Asset Funding Co. LLC (Liquidity Facility Sumitomo Mitsui Banking Corp.) | ||||
| 10/11/16 | 0.63 | 5,000 | 4,999 | |
| 10/11/16 | 0.48 | 3,000 | 3,000 | |
| 10/20/16 | 0.90 | 5,000 | 4,998 | |
| 10/4/16 | 0.45 | 2,000 | 2,000 | |
| Sheffield Receivables Corp. (Barclays Bank PLC Guaranteed) | ||||
| 10/3/16 | 0.50 | 2,000 | 2,000 | |
| TOTAL ASSET BACKED COMMERCIAL PAPER | ||||
| (Cost $79,224) | 79,224 | |||
| Non-Financial Company Commercial Paper - 1.8% | ||||
| BAT International Finance PLC | ||||
| 10/4/16 | 0.70 | 1,000 | 1,000 | |
| Eversource Energy | ||||
| 10/4/16 | 0.63 | 2,000 | 2,000 | |
| Florida Power & Light Co. | ||||
| 10/6/16 | 0.54 | 2,000 | 2,000 | |
| Sempra Global | ||||
| 10/13/16 | 0.92 | 500 | 500 | |
| UnitedHealth Group, Inc. | ||||
| 10/3/16 | 0.54 | 3,000 | 3,000 | |
| TOTAL NON-FINANCIAL COMPANY COMMERCIAL PAPER | ||||
| (Cost $8,500) | 8,500 | |||
| Variable Rate Demand Note - 7.9% | ||||
| Connecticut - 0.4% | ||||
| Connecticut Hsg. Fin. Auth. Series 2013 B6, 0.88% 10/7/16 (Liquidity Facility Bank of Tokyo-Mitsubishi UFJ Ltd.), VRDN | ||||
| 10/7/16 | 0.88 (b) | 1,700 | 1,700 | |
| Georgia - 1.4% | ||||
| Heard County Dev. Auth. Poll. Cont. Rev. Series 2007, 0.88% 10/3/16, VRDN | ||||
| 10/3/16 | 0.88 (b)(c) | 6,900 | 6,900 | |
| Louisiana - 0.4% | ||||
| Louisiana Pub. Facilities Auth. Rev. (River View Villas Proj.) Series 2006, 0.9% 10/7/16, LOC Freddie Mac, VRDN | ||||
| 10/7/16 | 0.90 (b) | 2,000 | 2,000 | |
| Maryland - 0.5% | ||||
| Maryland Cmnty. Dev. Administration Dept. of Hsg. & Cmnty. Dev. (Parlane Apts. Proj.) Series 2001 C, 0.86% 10/7/16, LOC Fannie Mae, VRDN | ||||
| 10/7/16 | 0.86 (b)(c) | 2,475 | 2,475 | |
| New York - 3.1% | ||||
| New York City Muni. Wtr. Fin. Auth. Wtr. & Swr. Sys. Rev. Series 2008 B1, 0.86% 10/7/16 (Liquidity Facility Sumitomo Mitsui Banking Corp.), VRDN | ||||
| 10/7/16 | 0.86 (b) | 1,000 | 1,000 | |
| New York City Muni. Wtr. Fin. Auth. Wtr. & Swr. Sys. Rev. Series 2008 BB3, 0.86% 10/7/16 (Liquidity Facility Royal Bank of Canada), VRDN | ||||
| 10/7/16 | 0.86 (b) | 4,000 | 4,000 | |
| New York City Transitional Fin. Auth. Rev. Series 2001 A, 0.88% 10/7/16 (Liquidity Facility JPMorgan Chase Bank), VRDN | ||||
| 10/7/16 | 0.88 (b) | 2,200 | 2,200 | |
| New York Hsg. Fin. Agcy. Rev. (350 West 43rd Street Hsg. Proj.) Series 2002 A, 0.89% 10/3/16, LOC Landesbank Hessen-Thuringen, VRDN | ||||
| 10/3/16 | 0.89 (b)(c) | 2,500 | 2,500 | |
| New York Hsg. Fin. Agcy. Rev. Series 2010 A, 0.88% 10/7/16, LOC Landesbank Hessen-Thuringen, VRDN | ||||
| 10/7/16 | 0.88 (b) | 3,000 | 3,000 | |
| New York Hsg. Fin. Agcy. Rev. Series 2014 A, 0.88% 10/7/16, LOC Manufacturers & Traders Trust Co., VRDN | ||||
| 10/7/16 | 0.88 (b) | 1,950 | 1,950 | |
| 14,650 | ||||
| Ohio - 1.4% | ||||
| Hamilton County Hosp. Facilities Rev. (Children's Hosp. Med. Ctr. Proj.) Series 2002 I, 0.84% 10/7/16, LOC U.S. Bank NA, Cincinnati, VRDN | ||||
| 10/7/16 | 0.84 (b) | 6,815 | 6,815 | |
| Texas - 0.4% | ||||
| Tarrant County Cultural Ed. Facilities Fin. Corp. Rev. (Christus Health Proj.) Series 2008 C1, 0.86% 10/7/16, LOC Sumitomo Mitsui Banking Corp., VRDN | ||||
| 10/7/16 | 0.86 (b) | 1,995 | 1,995 | |
| Virginia - 0.3% | ||||
| King George County Indl. Dev. Auth. Exempt Facilities Rev. (Birchwood Pwr. Partners Proj.) Series 1994 A, 0.83% 10/3/16, LOC Mizuho Corporate Bank Ltd., VRDN | ||||
| 10/3/16 | 0.83 (b)(c) | 1,300 | 1,300 | |
| TOTAL VARIABLE RATE DEMAND NOTE | ||||
| (Cost $37,835) | 37,835 | |||
| Non-Negotiable Time Deposit - 3.3% | ||||
| Time Deposits - 3.3% | ||||
| Barclays Bank PLC | ||||
| 10/3/16 | ||||
| (Cost $16,000) | 0.45 | 16,000 | 16,000 |
| U.S. Government Agency Repurchase Agreement - 4.8% | |||
| Maturity Amount (000s) | Value (000s) | ||
| In a joint trading account at 0.52% dated 9/30/16 due 10/3/16 (Collateralized by U.S. Government Obligations) # | $21,999 | $21,998 | |
| With Deutsche Bank Securities, Inc. at 0.57%, dated 9/30/16 due 10/3/16 (Collateralized by U.S. Treasury Obligations valued at $1,020,059, 1.63%, 2/15/26) | 1,000 | 1,000 | |
| TOTAL U.S. GOVERNMENT AGENCY REPURCHASE AGREEMENT | |||
| (Cost $22,998) | 22,998 | ||
| U.S. Treasury Repurchase Agreement - 2.5% | |||
| With: | |||
| Barclays Capital, Inc. at 0.47%, dated 9/30/16 due 10/3/16 (Collateralized by U.S. Treasury Obligations valued at $1,020,056, 1.38% - 2.75%, 12/31/17 - 2/29/20) | 1,000 | 1,000 | |
| Deutsche Bank Securities, Inc. at 0.55%, dated 9/30/16 due 10/3/16 (Collateralized by U.S. Treasury Obligations valued at $1,020,059, 1.63%, 2/15/26) | 1,000 | 1,000 | |
| Mizuho Securities U.S.A., Inc. at 0.53%, dated 9/30/16 due 10/3/16 (Collateralized by U.S. Treasury Obligations valued at $1,026,993, 1.75%, 1/31/23) | 1,000 | 1,000 | |
| Nomura Securities International, Inc. at 0.5%, dated 9/30/16 due 10/3/16 (Collateralized by U.S. Treasury Obligations valued at $5,119,242, 1.50%, 2/28/23) | 5,000 | 5,000 | |
| RBS Securities, Inc. at 0.48%, dated 9/30/16 due 10/3/16 (Collateralized by U.S. Treasury Obligations valued at $1,031,119, 4.25%, 5/15/39) | 1,000 | 1,000 | |
| Royal Bank of Canada at 0.54%, dated 9/30/16 due 10/3/16 (Collateralized by U.S. Treasury Obligations valued at $3,077,781, 1.38%, 10/31/20) | 3,000 | 3,000 | |
| TOTAL U.S. TREASURY REPURCHASE AGREEMENT | |||
| (Cost $12,000) | 12,000 | ||
| Other Repurchase Agreement - 23.8% | |||
| Other Repurchase Agreement - 23.8% | |||
| With: | |||
| Citigroup Global Markets, Inc. at: | |||
| 0.43%, dated 9/30/16 due 10/3/16 (Collateralized by Equity Securities valued at $7,560,300) | 7,000 | 7,000 | |
| 0.6%, dated 9/28/16 due 10/5/16 (Collateralized by Equity Securities valued at $4,320,403) | 4,000 | 4,000 | |
| 0.75%, dated: | |||
| 9/27/16 due 10/4/16 (Collateralized by Corporate Obligations valued at $1,080,135, 2.29%, 3/09/45) | 1,000 | 1,000 | |
| 9/29/16 due 10/6/16 (Collateralized by Corporate Obligations valued at $1,080,090, 2.29%, 3/09/45) | 1,000 | 1,000 | |
| Credit Suisse Securities (U.S.A.) LLC at: | |||
| 0.6%, dated 9/30/16 due 10/6/16 (Collateralized by Mortgage Loan Obligations valued at $1,152,772, 6%, 12/25/65) | 1,000 | 1,000 | |
| 0.65%, dated 9/29/16 due 10/6/16 (Collateralized by Mortgage Loan Obligations valued at $4,600,214, 6.00%, 12/25/65) | 4,001 | 4,000 | |
| Deutsche Bank Securities, Inc. at 0.75%, dated 9/27/16 due 10/4/16 (Collateralized by Municipal Bond Obligations valued at $6,300,788, 4.13%, 7/01/38) | 6,001 | 6,000 | |
| HSBC Securities, Inc. at 0.43%, dated 9/30/16 due 10/3/16 (Collateralized by Corporate Obligations valued at $2,100,262, 2.65% - 4.95%, 2/01/22 - 10/13/45) | 2,000 | 2,000 | |
| ING Financial Markets LLC at: | |||
| 0.55%, dated 9/30/16 due 10/3/16: | |||
| (Collateralized by Equity Securities valued at $1,080,066) | 1,000 | 1,000 | |
| (Collateralized by Equity Securities valued at $1,080,052) | 1,000 | 1,000 | |
| (Collateralized by Equity Securities valued at $3,240,152) | 3,000 | 3,000 | |
| 0.63%, dated 9/30/16 due 10/3/16 (Collateralized by Corporate Obligations valued at $1,084,397, 7.88%, 2/01/21) | 1,000 | 1,000 | |
| J.P. Morgan Clearing Corp. at: | |||
| 0.66%, dated 9/22/16 due 10/7/16 (Collateralized by Equity Securities valued at $5,435,682) | 5,003 | 5,000 | |
| 1.37%, dated 9/22/16 due 10/31/16 (Collateralized by Corporate Obligations valued at $1,087,998, 0.25% - 4.50%, 11/15/17 - 3/01/19)(b)(d) | 1,001 | 1,000 | |
| J.P. Morgan Securities, LLC at 0.57%, dated 9/29/16 due 10/6/16 (Collateralized by U.S. Government Obligations valued at $16,321,318, 3.50%, 2/01/45) | 16,002 | 16,000 | |
| Merrill Lynch, Pierce, Fenner & Smith at 0.55%, dated: | |||
| 9/29/16 due 10/6/16 (Collateralized by U.S. Government Obligations valued at $9,270,567, 0.59% - 5.91%, 11/15/37 - 10/20/64) | 9,001 | 9,000 | |
| 9/30/16 due 10/3/16 (Collateralized by Equity Securities valued at $2,160,105) | 2,000 | 2,000 | |
| Mitsubishi UFJ Securities (U.S.A.), Inc. at 0.71%, dated: | |||
| 9/15/16 due 10/3/16 (Collateralized by Corporate Obligations valued at $1,080,384, 2.00% - 4.75%, 4/15/19 - 12/15/26) | 1,000 | 1,000 | |
| 9/28/16 due 10/7/16 (Collateralized by Corporate Obligations valued at $1,080,107, 1.00% - 5.50%, 6/15/18 - 12/15/35) | 1,000 | 1,000 | |
| Mizuho Securities U.S.A., Inc. at: | |||
| 0.63%, dated: | |||
| 9/20/16 due 10/4/16 (Collateralized by Equity Securities valued at $1,080,255) | 1,000 | 1,000 | |
| 9/21/16 due 10/5/16 (Collateralized by Equity Securities valued at $1,080,261) | 1,000 | 1,000 | |
| 9/22/16 due 10/6/16 (Collateralized by Equity Securities valued at $2,160,436) | 2,000 | 2,000 | |
| 9/23/16 due 10/7/16 (Collateralized by Equity Securities valued at $2,160,392) | 2,000 | 2,000 | |
| 9/26/16 due 10/7/16 (Collateralized by Equity Securities valued at $3,240,399) | 3,001 | 3,000 | |
| 9/27/16 due 10/7/16 (Collateralized by Equity Securities valued at $1,080,133) | 1,000 | 1,000 | |
| 9/30/16 due 10/7/16 (Collateralized by Equity Securities valued at $2,160,135) | 2,000 | 2,000 | |
| 0.8%, dated 9/22/16 due 10/6/16 (Collateralized by U.S. Government Obligations valued at $1,020,882, 1.88% - 2.14%, 10/06/20 - 12/28/20) | 1,000 | 1,000 | |
| 1.65%, dated 8/1/16 due 10/31/16 (Collateralized by U.S. Government Obligations valued at $2,065,948, 5.37% - 5.94%, 12/25/41 - 1/15/42) | 2,008 | 2,000 | |
| 1.75%, dated 8/2/16 due 11/1/16 (Collateralized by U.S. Government Obligations valued at $2,066,209, 5.37% - 5.48%, 12/25/41) | 2,009 | 2,000 | |
| RBC Capital Markets Co. at: | |||
| 0.75%, dated 7/22/16 due 10/7/16 (Collateralized by U.S. Government Obligations valued at $2,063,133, 4.00% - 6.19%, 4/15/39 - 6/15/44) | 2,004 | 2,000 | |
| 0.99%, dated 9/26/16 due 10/7/16 (Collateralized by Municipal Bond Obligations valued at $2,301,478, 4.00%, 7/01/37) | 2,005 | 2,000 | |
| SG Americas Securities, LLC at 0.75%, dated: | |||
| 9/27/16 due 10/4/16 (Collateralized by Corporate Obligations valued at $2,101,076, 2.35%, 3/05/20) | 2,000 | 2,000 | |
| 9/28/16 due 10/5/16 (Collateralized by Corporate Obligations valued at $2,101,073, 2.35% - 4.20%, 3/05/20 - 12/15/44) | 2,000 | 2,000 | |
| Wells Fargo Securities LLC at: | |||
| 0.43%, dated 9/30/16 due 10/3/16 (Collateralized by Equity Securities valued at $4,320,198) | 4,000 | 4,000 | |
| 0.48%, dated 9/30/16 due 10/3/16: | |||
| (Collateralized by Equity Securities valued at $6,480,267) | 6,000 | 6,000 | |
| (Collateralized by Mortgage Loan Obligations valued at $4,320,173, 0.77% - 2.96%, 10/25/34 - 6/25/46) | 4,000 | 4,000 | |
| 0.55%, dated 9/30/16 due 10/7/16 (Collateralized by Corporate Obligations valued at $2,100,610, 2.50% - 3.38%, 3/05/18 - 9/17/20) | 2,000 | 2,000 | |
| 0.6%, dated: | |||
| 9/27/16 due 10/4/16 (Collateralized by Equity Securities valued at $2,160,216) | 2,000 | 2,000 | |
| 9/30/16 due: | |||
| 10/3/16 (Collateralized by Equity Securities valued at $1,080,070) | 1,000 | 1,000 | |
| 10/07/16(Collateralized by Corporate Obligations valued at $3,150,158, 3.40%, 10/01/46) | 3,000 | 3,000 | |
| TOTAL OTHER REPURCHASE AGREEMENT | |||
| (Cost $114,000) | 114,000 | ||
| TOTAL INVESTMENT PORTFOLIO - 95.7% | |||
| (Cost $458,514) | 458,514 | ||
| NET OTHER ASSETS (LIABILITIES) - 4.3% | 20,733 | ||
| NET ASSETS - 100% | $479,247 |
Security Type Abbreviations
CP – COMMERCIAL PAPER
VRDN – VARIABLE RATE DEMAND NOTE (A debt instrument that is payable upon demand, either daily, weekly or monthly)
The date shown for securities represents the date when principal payments must be paid, taking into account any call options exercised by the issuer and any permissible maturity shortening features other than interest rate resets.
Legend
(a) Yield represents either the annualized yield at the date of purchase, or the stated coupon rate, or, for floating and adjustable rate securities, the rate at period end.
(b) Coupon rates for floating and adjustable rate securities reflect the rates in effect at period end.
(c) Private activity obligations whose interest is subject to the federal alternative minimum tax for individuals.
(d) The maturity amount is based on the rate at period end.
Investment Valuation
All investments are categorized as Level 2 under the Fair Value Hierarchy. The inputs or methodology used for valuing securities may not be an indication of the risk associated with investing in those securities. For more information on valuation inputs please refer to the Investment Valuation section in the accompanying Notes to Financial Statements.
Other Information
# Additional information on each counterparty to the repurchase agreement is as follows:
| Repurchase Agreement / Counterparty | Value(000s) |
| $21,998,000 due 10/03/16 at 0.52% | |
| BNP Paribas, S.A. | $826 |
| BNY Mellon Capital Markets LLC | 449 |
| Bank of America NA | 4,072 |
| Citibank NA | 875 |
| Credit Agricole CIB New York Branch | 576 |
| HSBC Securities (USA), Inc. | 3,051 |
| J.P. Morgan Securities, Inc. | 3,095 |
| Merrill Lynch, Pierce, Fenner & Smith, Inc. | 407 |
| Mizuho Securities USA, Inc. | 1,008 |
| Societe Generale | 374 |
| Wells Fargo Bank, NA | 860 |
| Wells Fargo Securities LLC | 6,405 |
| $21,998 |
See accompanying notes which are an integral part of the financial statements.
Prime Reserves Portfolio
Financial Statements
Statement of Assets and Liabilities
| Amounts in thousands (except per-share amounts) | September 30, 2016 (Unaudited) | |
| Assets | ||
| Investment in securities, at value (including repurchase agreements of $148,998) — See accompanying schedule: Unaffiliated issuers (cost $458,514) | $458,514 | |
| Receivable for fund shares sold | 20,949 | |
| Interest receivable | 75 | |
| Prepaid expenses | 1 | |
| Receivable from investment adviser for expense reductions | 67 | |
| Total assets | 479,606 | |
| Liabilities | ||
| Payable for fund shares redeemed | $187 | |
| Distributions payable | 9 | |
| Accrued management fee | 57 | |
| Custody fees payable | 43 | |
| Registration fees payable | 28 | |
| Other affiliated payables | 21 | |
| Other payables and accrued expenses | 14 | |
| Total liabilities | 359 | |
| Net Assets | $479,247 | |
| Net Assets consist of: | ||
| Paid in capital | $479,247 | |
| Net Assets | $479,247 | |
| Class I: | ||
| Net Asset Value, offering price and redemption price per share ($104,070 ÷ 104,070 shares) | $1.00 | |
| Class II: | ||
| Net Asset Value, offering price and redemption price per share ($1,001 ÷ 1,001 shares) | $1.00 | |
| Class III: | ||
| Net Asset Value, offering price and redemption price per share ($1,000 ÷ 1,000 shares) | $1.00 | |
| Select Class: | ||
| Net Asset Value, offering price and redemption price per share ($1,001 ÷ 1,001 shares) | $1.00 | |
| Institutional Class: | ||
| Net Asset Value, offering price and redemption price per share ($372,175 ÷ 372,175 shares) | $1.00 |
See accompanying notes which are an integral part of the financial statements.
Statement of Operations
| Amounts in thousands | For the period June 2, 2016 (commencement of operations) to September 30, 2016 (Unaudited) | |
| Investment Income | ||
| Interest (including $5 from affiliated interfund lending) | $542 | |
| Expenses | ||
| Management fee | $136 | |
| Transfer agent fees | 33 | |
| Distribution and service plan fees | 1 | |
| Accounting fees and expenses | 15 | |
| Custodian fees and expenses | 45 | |
| Registration fees | 85 | |
| Audit | 16 | |
| Miscellaneous | 3 | |
| Total expenses before reductions | 334 | |
| Expense reductions | (191) | 143 |
| Net investment income (loss) | 399 | |
| Net increase in net assets resulting from operations | $399 |
See accompanying notes which are an integral part of the financial statements.
Statement of Changes in Net Assets
| Amounts in thousands | For the period June 2, 2016 (commencement of operations) to September 30, 2016 (Unaudited) |
| Increase (Decrease) in Net Assets | |
| Operations | |
| Net investment income (loss) | $399 |
| Net increase in net assets resulting from operations | 399 |
| Distributions to shareholders from net investment income | (399) |
| Share transactions - net increase (decrease) | 479,247 |
| Total increase (decrease) in net assets | 479,247 |
| Net Assets | |
| Beginning of period | – |
| End of period | $479,247 |
See accompanying notes which are an integral part of the financial statements.
Financial Highlights — Prime Reserves Portfolio Class I
| Period ended (Unaudited) September 30, | |
| 2016 A | |
| Selected Per–Share Data | |
| Net asset value, beginning of period | $1.00 |
| Income from Investment Operations | |
| Net investment income (loss) | .001 |
| Net realized and unrealized gain (loss) | – |
| Total from investment operations | .001 |
| Distributions from net investment income | (.001) |
| Total distributions | (.001) |
| Net asset value, end of period | $1.00 |
| Total ReturnB,C | .12% |
| Ratios to Average Net AssetsD | |
| Expenses before reductions | .36%E |
| Expenses net of fee waivers, if any | .18%E |
| Expenses net of all reductions | .18%E |
| Net investment income (loss) | .38%E |
| Supplemental Data | |
| Net assets, end of period (in millions) | $104 |
A For the period June 2, 2016 (commencement of operations) to September 30, 2016.
B Total returns for periods of less than one year are not annualized.
C Total returns would have been lower if certain expenses had not been reduced during the applicable periods shown.
D Expense ratios reflect operating expenses of the class. Expenses before reductions do not reflect amounts reimbursed or waived or reductions from expense offset arrangements and do not represent the amount paid by the class during periods when reimbursements, waivers or reductions occur. Expense ratios before reductions for start-up periods may not be representative of longer-term operating periods. Expenses net of fee waivers reflect expenses after reimbursement and waivers but prior to reductions from expense offset arrangements. Expenses net of all reductions represent the net expenses paid by the class.
E Annualized
See accompanying notes which are an integral part of the financial statements.
Financial Highlights — Prime Reserves Portfolio Class II
| Period ended (Unaudited) September 30, | |
| 2016 A | |
| Selected Per–Share Data | |
| Net asset value, beginning of period | $1.00 |
| Income from Investment Operations | |
| Net investment income (loss) | .001 |
| Net realized and unrealized gain (loss) | – |
| Total from investment operations | .001 |
| Distributions from net investment income | (.001) |
| Total distributions | (.001) |
| Net asset value, end of period | $1.00 |
| Total ReturnB,C | .07% |
| Ratios to Average Net AssetsD | |
| Expenses before reductions | .81%E |
| Expenses net of fee waivers, if any | .33%E |
| Expenses net of all reductions | .33%E |
| Net investment income (loss) | .23%E |
| Supplemental Data | |
| Net assets, end of period (in millions) | $1 |
A For the period June 2, 2016 (commencement of operations) to September 30, 2016.
B Total returns for periods of less than one year are not annualized.
C Total returns would have been lower if certain expenses had not been reduced during the applicable periods shown.
D Expense ratios reflect operating expenses of the class. Expenses before reductions do not reflect amounts reimbursed or waived or reductions from expense offset arrangements and do not represent the amount paid by the class during periods when reimbursements, waivers or reductions occur. Expense ratios before reductions for start-up periods may not be representative of longer-term operating periods. Expenses net of fee waivers reflect expenses after reimbursement and waivers but prior to reductions from expense offset arrangements. Expenses net of all reductions represent the net expenses paid by the class.
E Annualized
See accompanying notes which are an integral part of the financial statements.
Financial Highlights — Prime Reserves Portfolio Class III
| Period ended (Unaudited) September 30, | |
| 2016 A | |
| Selected Per–Share Data | |
| Net asset value, beginning of period | $1.00 |
| Income from Investment Operations | |
| Net investment income (loss)B | – |
| Net realized and unrealized gain (loss) | – |
| Total from investment operationsB | – |
| Distributions from net investment incomeB | – |
| Total distributionsB | – |
| Net asset value, end of period | $1.00 |
| Total ReturnC,D | .03% |
| Ratios to Average Net AssetsE | |
| Expenses before reductions | .91%F |
| Expenses net of fee waivers, if any | .43%F |
| Expenses net of all reductions | .43%F |
| Net investment income (loss) | .13%F |
| Supplemental Data | |
| Net assets, end of period (in millions) | $1 |
A For the period June 2, 2016 (commencement of operations) to September 30, 2016.
B Amount represents less than $.0005 per share.
C Total returns for periods of less than one year are not annualized.
D Total returns would have been lower if certain expenses had not been reduced during the applicable periods shown.
E Expense ratios reflect operating expenses of the class. Expenses before reductions do not reflect amounts reimbursed or waived or reductions from expense offset arrangements and do not represent the amount paid by the class during periods when reimbursements, waivers or reductions occur. Expense ratios before reductions for start-up periods may not be representative of longer-term operating periods. Expenses net of fee waivers reflect expenses after reimbursement and waivers but prior to reductions from expense offset arrangements. Expenses net of all reductions represent the net expenses paid by the class.
F Annualized
See accompanying notes which are an integral part of the financial statements.
Financial Highlights — Prime Reserves Portfolio Select Class
| Period ended (Unaudited) September 30, | |
| 2016 A | |
| Selected Per–Share Data | |
| Net asset value, beginning of period | $1.00 |
| Income from Investment Operations | |
| Net investment income (loss) | .001 |
| Net realized and unrealized gain (loss) | – |
| Total from investment operations | .001 |
| Distributions from net investment income | (.001) |
| Total distributions | (.001) |
| Net asset value, end of period | $1.00 |
| Total ReturnB,C | .10% |
| Ratios to Average Net AssetsD | |
| Expenses before reductions | .71%E |
| Expenses net of fee waivers, if any | .23%E |
| Expenses net of all reductions | .23%E |
| Net investment income (loss) | .33%E |
| Supplemental Data | |
| Net assets, end of period (in millions) | $1 |
A For the period June 2, 2016 (commencement of operations) to September 30, 2016.
B Total returns for periods of less than one year are not annualized.
C Total returns would have been lower if certain expenses had not been reduced during the applicable periods shown.
D Expense ratios reflect operating expenses of the class. Expenses before reductions do not reflect amounts reimbursed or waived or reductions from expense offset arrangements and do not represent the amount paid by the class during periods when reimbursements, waivers or reductions occur. Expense ratios before reductions for start-up periods may not be representative of longer-term operating periods. Expenses net of fee waivers reflect expenses after reimbursement and waivers but prior to reductions from expense offset arrangements. Expenses net of all reductions represent the net expenses paid by the class.
E Annualized
See accompanying notes which are an integral part of the financial statements.
Financial Highlights — Prime Reserves Portfolio Institutional Class
| Period ended (Unaudited) September 30, | |
| 2016 A | |
| Selected Per–Share Data | |
| Net asset value, beginning of period | $1.00 |
| Income from Investment Operations | |
| Net investment income (loss) | .001 |
| Net realized and unrealized gain (loss) | – |
| Total from investment operations | .001 |
| Distributions from net investment income | (.001) |
| Total distributions | (.001) |
| Net asset value, end of period | $1.00 |
| Total ReturnB,C | .13% |
| Ratios to Average Net AssetsD | |
| Expenses before reductions | .34%E |
| Expenses net of fee waivers, if any | .14%E |
| Expenses net of all reductions | .14%E |
| Net investment income (loss) | .42%E |
| Supplemental Data | |
| Net assets, end of period (in millions) | $372 |
A For the period June 2, 2016 (commencement of operations) to September 30, 2016.
B Total returns for periods of less than one year are not annualized.
C Total returns would have been lower if certain expenses had not been reduced during the applicable periods shown.
D Expense ratios reflect operating expenses of the class. Expenses before reductions do not reflect amounts reimbursed or waived or reductions from expense offset arrangements and do not represent the amount paid by the class during periods when reimbursements, waivers or reductions occur. Expense ratios before reductions for start-up periods may not be representative of longer-term operating periods. Expenses net of fee waivers reflect expenses after reimbursement and waivers but prior to reductions from expense offset arrangements. Expenses net of all reductions represent the net expenses paid by the class.
E Annualized
See accompanying notes which are an integral part of the financial statements.
Tax-Exempt Portfolio
Investment Summary/Performance (Unaudited)
Effective Maturity Diversification
| Days | % of fund's investments 9/30/16 | % of fund's investments 3/31/16 | % of fund's investments 9/30/15 |
| 1 - 7 | 76.3 | 75.4 | 77.8 |
| 8 - 30 | 1.8 | 1.4 | 2.2 |
| 31 - 60 | 4.5 | 3.6 | 3.4 |
| 61 - 90 | 3.7 | 3.3 | 1.8 |
| 91 - 180 | 2.0 | 9.8 | 2.9 |
| > 180 | 11.7 | 6.5 | 11.9 |
Effective maturity is determined in accordance with the requirements of Rule 2a-7 under the Investment Company Act of 1940.
Asset Allocation (% of fund's net assets)
| As of September 30, 2016 | ||
| Variable Rate Demand Notes (VRDNs) | 30.5% | |
| Tender Option Bond | 21.9% | |
| Other Municipal Security | 26.0% | |
| Investment Companies | 20.4% | |
| Net Other Assets (Liabilities) | 1.2% | |
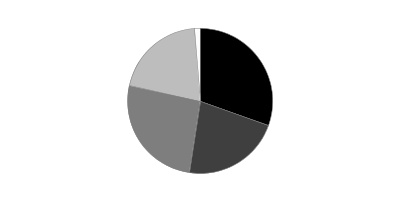
| As of March 31, 2016 | ||
| Variable Rate Demand Notes (VRDNs) | 44.2% | |
| Tender Option Bond | 13.1% | |
| Other Municipal Security | 28.3% | |
| Investment Companies | 12.3% | |
| Net Other Assets (Liabilities) | 2.1% | |
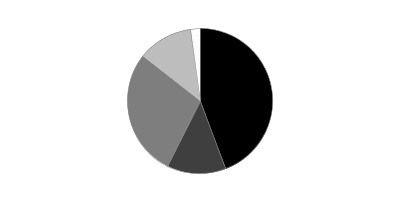
Current And Historical 7-Day Yields
| 9/30/16 | 6/30/16 | 03/31/16 | 12/31/15 | 09/30/15 | |
| Class I | 0.63% | 0.30% | 0.13% | 0.01% | 0.01% |
| Class II | 0.48% | 0.15% | 0.01% | 0.01% | 0.01% |
| Class III | 0.38% | 0.05% | 0.01% | 0.01% | 0.01% |
| Select Class | 0.58% | 0.24% | 0.08% | 0.01% | 0.01% |
Yield refers to the income paid by the Fund over a given period. Yields for money market funds are usually for seven-day periods, as they are here, though they are expressed as annual percentage rates. Past performance is no guarantee of future results. Yield will vary and it's possible to lose money investing in the Fund. A portion of the Fund's expenses was reimbursed and/or waived. Absent such reimbursements and/or waivers the yield for the period ending September 30, 2016, the most recent period shown in the table, would have been 0.59% for Class I, 0.44% for Class II, 0.34% for Class III and 0.54% for Select Class.
Tax-Exempt Portfolio
Investments September 30, 2016 (Unaudited)
Showing Percentage of Net Assets
| Variable Rate Demand Note - 30.5% | |||
| Principal Amount (000s) | Value (000s) | ||
| Alabama - 1.6% | |||
| Mobile Downtown Redev. Auth. Gulf Opportunity Zone Series 2011 B, 0.91% 10/7/16, LOC Wells Fargo Bank NA, VRDN (a)(b) | $10,455 | $10,455 | |
| Mobile Indl. Dev. Board Poll. Cont. Rev. (Alabama Pwr. Co. Barry Plant Proj.) Series 2007 C, 0.92% 10/7/16, VRDN (a) | 1,250 | 1,250 | |
| Univ. of Alabama at Birmingham Hosp. Rev. Series 2012 B, 0.84% 10/7/16, LOC Bank of America NA, VRDN (a) | 9,000 | 9,000 | |
| 20,705 | |||
| Alaska - 0.2% | |||
| Valdez Marine Term. Rev. (Phillips Trans. Alaska, Inc. Proj.) Series 1994 C, 0.91% 10/7/16, VRDN (a) | 2,200 | 2,200 | |
| California - 0.1% | |||
| California Poll. Cont. Fing. Auth. Ctfs. of Prtn. (Pacific Gas & Elec. Co. Proj.) Series 1996 C, 0.92% 10/3/16, LOC Mizuho Corporate Bank Ltd., VRDN (a) | 1,300 | 1,300 | |
| Colorado - 0.2% | |||
| Colorado Health Facilities Auth. Rev. (Boulder Cmnty. Hosp. Proj.) Series 2000, 0.82% 10/7/16, LOC JPMorgan Chase Bank, VRDN (a) | 2,520 | 2,520 | |
| Connecticut - 2.2% | |||
| Connecticut Gen. Oblig. Series 2016 C, 0.88% 10/7/16 (Liquidity Facility Bank of America NA), VRDN (a) | 3,650 | 3,650 | |
| Connecticut Health & Edl. Facilities Auth. Rev. Series 2014 D, 0.83% 10/7/16, LOC Bank of America NA, VRDN (a) | 10,900 | 10,900 | |
| Connecticut Hsg. Fin. Auth.: | |||
| Series 2011 C1, 0.9% 10/7/16 (Liquidity Facility Barclays Bank PLC), VRDN (a) | 10,235 | 10,235 | |
| Series 2011 E3, 0.88% 10/7/16 (Liquidity Facility Bank of Tokyo-Mitsubishi UFJ Ltd.), VRDN (a) | 1,650 | 1,650 | |
| Series E 3, 0.86% 10/7/16 (Liquidity Facility Landesbank Hessen-Thuringen), VRDN (a) | 1,000 | 1,000 | |
| 27,435 | |||
| Delaware - 0.0% | |||
| Delaware Econ. Dev. Auth. Rev. (Delmarva Pwr. & Lt. Co. Proj.): | |||
| Series 1993 C, 1% 10/7/16, VRDN (a) | 300 | 300 | |
| Series 1999 A, 0.87% 10/7/16, VRDN (a) | 300 | 300 | |
| 600 | |||
| District Of Columbia - 0.9% | |||
| District of Columbia Hsg. Fin. Agcy. Multi-family Hsg. Rev.: | |||
| (Park 7 at Minnesota Benning Proj.) Series 2012, 0.89% 10/7/16, LOC Freddie Mac, VRDN (a) | 2,000 | 2,000 | |
| (Pentacle Apts. Proj.) Series 2008, 0.91% 10/7/16, LOC Freddie Mac, VRDN (a) | 3,150 | 3,150 | |
| District of Columbia Rev.: | |||
| (American Psychological Assoc. Proj.) Series 2003, 0.9% 10/7/16, LOC Bank of America NA, VRDN (a) | 1,235 | 1,235 | |
| (Washington Drama Society, Inc. Proj.) Series 2008, 0.9% 10/7/16, LOC JPMorgan Chase Bank, VRDN (a) | 1,200 | 1,200 | |
| District of Columbia Univ. Rev. (American Univ. Proj.) Series 2006 A, 0.86% 10/7/16, LOC Royal Bank of Canada, VRDN (a) | 3,600 | 3,600 | |
| 11,185 | |||
| Florida - 0.6% | |||
| North Broward Hosp. District Rev. Series 2005 A, 0.83% 10/7/16, LOC Wells Fargo Bank NA, VRDN (a) | 7,700 | 7,700 | |
| Georgia - 1.2% | |||
| Bartow County Dev. Auth. Poll. Cont. Rev. (Georgia Pwr. Co. Plant Bowen Proj.) First Series 2009, 0.92% 10/7/16, VRDN (a) | 1,400 | 1,400 | |
| Burke County Indl. Dev. Auth. Poll. Cont. Rev.: | |||
| (Georgia Pwr. Co. Plant Vogtle Proj.) Eighth Series 1994, 0.9% 10/3/16, VRDN (a) | 3,100 | 3,100 | |
| (Oglethorpe Pwr. Corp. Proj.): | |||
| Series 2010 A, 0.83% 10/7/16, LOC Bank of America NA, VRDN (a) | 2,600 | 2,600 | |
| Series 2010 B, 0.83% 10/7/16, LOC Bank of America NA, VRDN (a) | 1,605 | 1,605 | |
| Monroe County Dev. Auth. Poll. Cont. Rev. (Oglethorpe Pwr. Corp. Proj.) Series 2009 B, 0.87% 10/7/16, LOC JPMorgan Chase Bank, VRDN (a) | 2,300 | 2,300 | |
| Paulding County Hosp. Auth. Rev. Series 2012 B, 0.88% 10/7/16, LOC Northern Trust Co., VRDN (a) | 3,900 | 3,900 | |
| 14,905 | |||
| Illinois - 3.0% | |||
| Chicago O'Hare Int'l. Arpt. Rev. Series 2005 D, 0.87% 10/7/16, LOC Barclays Bank PLC, VRDN (a) | 1,400 | 1,400 | |
| Illinois Fin. Auth. Rev.: | |||
| (Chicago Historical Society Proj.) Series 2006, 0.86% 10/7/16, LOC Northern Trust Co., VRDN(a) | 7,100 | 7,100 | |
| (Little Co. of Mary Hosp. Proj.) Series 2008 A, 0.9% 10/7/16, LOC Barclays Bank PLC, VRDN (a) | 4,120 | 4,120 | |
| (The Carle Foundation Proj.) Series 2009 C, 0.88% 10/7/16, LOC Northern Trust Co., VRDN (a) | 3,200 | 3,200 | |
| Series 2009 A, 0.88% 10/7/16, LOC BMO Harris Bank NA, VRDN (a) | 10,815 | 10,815 | |
| Illinois Gen. Oblig. Series 2003 B, 0.88% 10/7/16, LOC JPMorgan Chase Bank, VRDN (a) | 1,300 | 1,300 | |
| Illinois Toll Hwy. Auth. Toll Hwy. Rev. Series 2007 A-2A, 0.89% 10/7/16, LOC Bank of Tokyo-Mitsubishi UFJ Ltd., VRDN (a) | 3,400 | 3,400 | |
| Lake County Multi-family Hsg. Rev. (Whispering Oaks Apts. Proj.) Series 2008, 0.91% 10/7/16, LOC Freddie Mac, VRDN (a) | 6,000 | 6,000 | |
| 37,335 | |||
| Indiana - 0.6% | |||
| Indiana Fin. Auth. Health Sys. Rev. (Sisters of Saint Francis Health Svcs., Inc. Obligated Group Proj.) Series 2008 J, 0.83% 10/7/16, LOC Wells Fargo Bank NA, VRDN (a) | 7,780 | 7,780 | |
| Iowa - 2.8% | |||
| Iowa Fin. Auth. Poll. Cont. Facility Rev.: | |||
| (MidAmerican Energy Proj.) Series 2008 B, 0.85% 10/7/16, VRDN (a) | 21,800 | 21,800 | |
| (Midamerican Energy Proj.) Series 2016 A, 0.85% 10/7/16, VRDN (a) | 900 | 900 | |
| Iowa Higher Ed. Ln. Auth. Rev. (Loras College Proj.) Series 2000, 0.93% 10/3/16, LOC Bank of America NA, VRDN (a) | 12,450 | 12,450 | |
| 35,150 | |||
| Louisiana - 1.7% | |||
| East Baton Rouge Parish Pub. Impt. Sales Tax Rev. Series 2008 A, 0.83% 10/7/16, LOC JPMorgan Chase Bank, VRDN (a) | 11,135 | 11,135 | |
| Louisiana Pub. Facilities Auth. Rev. (C-Port LLC Proj.) Series 2008, 0.93% 10/7/16, LOC Bank of America NA, VRDN (a) | 1,410 | 1,410 | |
| Saint James Parish Gen. Oblig. (NuStar Logistics, L.P. Proj.): | |||
| Series 2010 B, 0.89% 10/7/16, LOC Bank of Tokyo-Mitsubishi UFJ Ltd., VRDN (a) | 3,200 | 3,200 | |
| Series 2010, 0.89% 10/7/16, LOC Mizuho Bank Ltd., VRDN (a) | 1,200 | 1,200 | |
| Series 2011, 0.86% 10/7/16, LOC Bank of Nova Scotia, VRDN (a) | 5,000 | 5,000 | |
| 21,945 | |||
| Maryland - 0.4% | |||
| Maryland Health & Higher Edl. Facilities Auth. Rev. (Adventist Healthcare Proj.) Series 2005 A, 0.87% 10/7/16, LOC MUFG Union Bank NA, VRDN (a) | 5,600 | 5,600 | |
| Michigan - 1.7% | |||
| Kent Hosp. Fin. Auth. Hosp. Facilities Rev. (Metropolitan Hosp. Proj.) Series 2012, 0.83% 10/7/16, LOC Bank of America NA, VRDN (a) | 20,840 | 20,840 | |
| Mississippi - 0.8% | |||
| Mississippi Dev. Bank Spl. Oblig. (Harrison County Proj.) Series 2008 A2, 0.9% 10/7/16, LOC Bank of America NA, VRDN (a) | 10,150 | 10,150 | |
| Nevada - 0.5% | |||
| Clark County Indl. Dev. Rev. (Southwest Gas Corp. Proj.) Series 2009 A, 0.86% 10/7/16, LOC Bank of America NA, VRDN (a) | 5,750 | 5,750 | |
| New York - 5.4% | |||
| Nassau Health Care Corp. Rev. Series 2009 D1, 0.85% 10/7/16, LOC JPMorgan Chase Bank, VRDN (a) | 3,755 | 3,755 | |
| New York City Gen. Oblig. Series 2006 I8, 0.91% 10/3/16 (Liquidity Facility State Street Bank & Trust Co., Boston), VRDN (a) | 10,000 | 10,000 | |
| New York City Muni. Wtr. Fin. Auth. Wtr. & Swr. Sys. Rev.: | |||
| Series 2008 B1, 0.86% 10/7/16 (Liquidity Facility Royal Bank of Canada), VRDN (a) | 6,000 | 6,000 | |
| Series 2014 AA, 0.91% 10/3/16 (Liquidity Facility Bank of Montreal Chicago), VRDN (a) | 10,000 | 10,000 | |
| Series F2, 0.88% 10/7/16 (Liquidity Facility JPMorgan Chase Bank), VRDN(a) | 1,300 | 1,300 | |
| New York City Transitional Fin. Auth. Rev.: | |||
| Series 2003 1A, 0.86% 10/7/16 (Liquidity Facility Landesbank Hessen-Thuringen), VRDN (a) | 1,600 | 1,600 | |
| Series 2003 A2, 0.95% 10/3/16 (Liquidity Facility Bank of Tokyo-Mitsubishi UFJ Ltd.), VRDN (a) | 3,000 | 3,000 | |
| New York Hsg. Fin. Agcy. Rev.: | |||
| (Tribeca Green Hsg. Proj.) Series 2003 A, 0.84% 10/7/16, LOC Landesbank Hessen-Thuringen, VRDN (a) | 1,700 | 1,700 | |
| Series 2010 A, 0.87% 10/7/16, LOC Landesbank Hessen-Thuringen, VRDN (a) | 2,000 | 2,000 | |
| Series 2013 A, 0.84% 10/7/16, LOC Wells Fargo Bank NA, VRDN (a) | 4,800 | 4,800 | |
| Series 2013 A1, 0.8% 10/7/16, LOC Manufacturers & Traders Trust Co., VRDN (a) | 17,600 | 17,600 | |
| Yonkers Indl. Dev. Agcy. Civic Facility Rev. (Consumers Union of United States, Inc. Proj.) Series 2005, 0.84% 10/7/16, LOC JPMorgan Chase Bank, VRDN (a) | 6,200 | 6,200 | |
| 67,955 | |||
| North Carolina - 0.6% | |||
| Greensboro Combined Enterprise Sys. Rev. Series 2014 A, 0.88% 10/7/16 (Liquidity Facility Bank of America NA), VRDN (a) | 1,030 | 1,030 | |
| North Carolina Med. Care Commission Hosp. Rev. (CaroMont Health Proj.) Series 2003 A, 0.82% 10/7/16, LOC Wells Fargo Bank NA, VRDN (a) | 1,500 | 1,500 | |
| Parson County Indl. Facilities and Poll. Cont. Fing. Auth. (CertainTeed Gypsum NC, Inc. Proj.) Series 2010, 0.91% 10/7/16, LOC Cr. Industriel et Commercial, VRDN (a) | 2,700 | 2,700 | |
| Piedmont Triad Arpt. Auth. Series 2008 A, 0.91% 10/7/16, LOC Branch Banking & Trust Co., VRDN (a) | 2,595 | 2,595 | |
| 7,825 | |||
| Ohio - 0.4% | |||
| Franklin County Hosp. Rev. Series 2009 B, 0.88% 10/7/16 (Liquidity Facility Barclays Bank PLC), VRDN (a) | 1,100 | 1,100 | |
| Ohio Air Quality Dev. Auth. Rev. (TimkenSteel Proj.) Series 2003, 0.84% 10/7/16, LOC JPMorgan Chase Bank, VRDN (a) | 3,500 | 3,500 | |
| 4,600 | |||
| Oklahoma - 0.1% | |||
| Univ. Hospitals Trust Rev. Series 2005 A, 0.84% 10/7/16, LOC Bank of America NA, VRDN (a) | 1,300 | 1,300 | |
| Pennsylvania - 0.8% | |||
| Indiana County Hosp. Auth. Series 2014 B, 0.91% 10/7/16, LOC PNC Bank NA, VRDN (a) | 3,400 | 3,400 | |
| Lancaster Indl. Dev. Auth. Rev.: | |||
| (Mennonite Home Proj.) 0.94% 10/7/16, LOC Manufacturers & Traders Trust Co., VRDN (a) | 900 | 900 | |
| (Willow Valley Retirement Proj.) Series 2009 B, 0.89% 10/7/16, LOC PNC Bank NA, VRDN (a) | 455 | 455 | |
| Washington County Hosp. Auth. Rev. (Monongahela Valley Hosp. Proj.): | |||
| Series 2011 A, 0.88% 10/7/16, LOC PNC Bank NA, VRDN (a) | 2,540 | 2,540 | |
| Series 2011 B, 0.88% 10/7/16, LOC PNC Bank NA, VRDN (a) | 3,395 | 3,395 | |
| 10,690 | |||
| Tennessee - 1.6% | |||
| Clarksville Pub. Bldg. Auth. Rev. (Tennessee Muni. Bond Fund Proj.): | |||
| Series 1994, 0.92% 10/7/16, LOC Bank of America NA, VRDN (a) | 1,845 | 1,845 | |
| Series 2001, 0.92% 10/3/16, LOC Bank of America NA, VRDN (a) | 17,960 | 17,960 | |
| 19,805 | |||
| Texas - 1.9% | |||
| Dallas Performing Arts Cultural Facilities Corp. Cultural Facility Rev.: | |||
| (Dallas Ctr. for the Performing Arts Foundation, Inc. Proj.) Series 2008 B, 0.86% 10/7/16, LOC JPMorgan Chase Bank, VRDN (a) | 2,600 | 2,600 | |
| (Dallas Ctr. For The Performing Arts Foundation, Inc. Proj.) Series 2008 A, 0.88% 10/7/16, LOC Bank of America NA, VRDN (a) | 6,745 | 6,745 | |
| Harris County Health Facilities Dev. Corp. Rev. (Saint Dominic Village Proj.) Series 2000, 0.91% 10/7/16, LOC JPMorgan Chase Bank, VRDN (a) | 5,425 | 5,425 | |
| Port Arthur Navigation District Envir. Facilities Rev. (Motiva Enterprises LLC Proj.): | |||
| Series 2009 B, 0.94% 10/3/16, VRDN (a) | 1,800 | 1,800 | |
| Series 2010 C, 0.94% 10/3/16, VRDN (a) | 300 | 300 | |
| Port Arthur Navigation District Indl. Dev. Corp. Exempt Facilities Rev.: | |||
| (Air Products Proj.) Series 2012, 0.98% 10/7/16 (Total SA Guaranteed), VRDN (a) | 900 | 900 | |
| (Total Petrochemicals & Refining U.S.A., Inc. Proj.) Series 2012 B, 0.98% 10/7/16 (Total SA Guaranteed), VRDN (a) | 900 | 900 | |
| (Total Petrochemicals and Refining U.S.A., Inc. Proj.) Series 2012 A, 0.98% 10/7/16 (Total SA Guaranteed), VRDN (a) | 4,100 | 4,100 | |
| Tarrant County Cultural Ed. Facilities Fin. Corp. Hosp. Rev. (Methodist Hospitals of Dallas Proj.) Series 2008, 0.88% 10/7/16, LOC JPMorgan Chase Bank, VRDN (a) | 1,750 | 1,750 | |
| 24,520 | |||
| Washington - 1.0% | |||
| King County Swr. Rev. Series 2001 A, 0.87% 10/7/16, LOC Landesbank Hessen-Thuringen, VRDN (a) | 5,900 | 5,900 | |
| Washington Hsg. Fin. Commission Multi-family Hsg. Rev. (Reserve at Renton Apts. Proj.) Series 2014, 0.87% 10/7/16, LOC Fed. Home Ln. Bank, San Francisco, VRDN (a) | 6,700 | 6,700 | |
| 12,600 | |||
| West Virginia - 0.1% | |||
| West Virginia Hosp. Fin. Auth. Hosp. Rev. (Cabell Huntington Hosp. Proj.) Series 2008 B, 0.95% 10/7/16, LOC Branch Banking & Trust Co., VRDN (a) | 900 | 900 | |
| Wyoming - 0.1% | |||
| Converse County Poll. Cont. Rev. (PacifiCorp Proj.) Series 1994, 0.88% 10/7/16, VRDN (a) | 1,400 | 1,400 | |
| TOTAL VARIABLE RATE DEMAND NOTE | |||
| (Cost $384,695) | 384,695 | ||
| Tender Option Bond - 21.9% | |||
| Alabama - 0.3% | |||
| Alabama Spl. Care Facilities Fing. Auth. Birmingham Rev. Participating VRDN Series 16 ZM0206, 0.87% 10/7/16 (Liquidity Facility Morgan Stanley Bank, West Valley City Utah) (a)(c) | 4,000 | 4,000 | |
| Arizona - 0.5% | |||
| Phoenix Civic Impt. Corp. Wtr. Sys. Rev. Participating VRDN Series Putters 3458, 0.87% 10/7/16 (Liquidity Facility JPMorgan Chase Bank) (a)(c) | 3,000 | 3,000 | |
| Salt River Proj. Agricultural Impt. & Pwr. District Elec. Sys. Rev. Participating VRDN Series 16 XM 02 45, 0.87% 10/7/16 (Liquidity Facility JPMorgan Chase Bank) (a)(c) | 3,605 | 3,605 | |
| 6,605 | |||
| California - 0.5% | |||
| Los Angeles Hbr. Dept. Rev. Bonds Series WF 10 40C, 1.04%, tender 12/1/16 (Liquidity Facility Wells Fargo Bank NA) (a)(c)(d) | 1,400 | 1,400 | |
| Rancho Wtr. District Fing. Auth. Rev. Participating VRDN Series 16 ZF0342, 0.91% 10/7/16 (Liquidity Facility Bank of America NA) (a)(c) | 4,980 | 4,980 | |
| 6,380 | |||
| Colorado - 0.9% | |||
| Colorado Health Facilities Auth. Rev. Participating VRDN Series ZF 04 17, 0.99% 10/7/16 (Liquidity Facility JPMorgan Chase Bank) (a)(c) | 200 | 200 | |
| Colorado Reg'l. Trans. District Sales Tax Rev. Participating VRDN: | |||
| Series EGL 16 0004, 0.88% 10/7/16 (Liquidity Facility Citibank NA) (a)(c) | 4,900 | 4,900 | |
| Series Floaters 16 XF1031, 1.01% 10/7/16 (Liquidity Facility Deutsche Bank AG New York Branch) (a)(c) | 700 | 700 | |
| Univ. of Colorado Enterprise Sys. Rev.: | |||
| Bonds Series RBC E 55, 1.04%, tender 2/1/17 (Liquidity Facility Royal Bank of Canada) (a)(c)(d) | 3,200 | 3,200 | |
| Participating VRDN Series XM 03 05, 0.88% 10/7/16 (Liquidity Facility Royal Bank of Canada) (a)(c) | 1,800 | 1,800 | |
| 10,800 | |||
| Connecticut - 0.0% | |||
| Connecticut Health & Edl. Facilities Auth. Rev. Participating VRDN Series 15 XF0091, 0.87% 10/7/16 (Liquidity Facility JPMorgan Chase Bank) (a)(c) | 390 | 390 | |
| District Of Columbia - 0.6% | |||
| District of Columbia Income Tax Rev. Participating VRDN: | |||
| Series Putters 3354, 0.87% 10/7/16 (Liquidity Facility JPMorgan Chase Bank) (a)(c) | 7,155 | 7,155 | |
| Series XF 23 41, 0.95% 10/7/16 (Liquidity Facility Barclays Bank PLC) (a)(c) | 300 | 300 | |
| 7,455 | |||
| Florida - 0.7% | |||
| Central Florida Expressway Bonds Series RBC E 62, 1.04%, tender 2/1/17 (Liquidity Facility Royal Bank of Canada) (a)(c)(d) | 2,695 | 2,695 | |
| Highlands County Health Facilities Auth. Rev. Participating VRDN Series MS 3251, 0.87% 10/7/16 (Liquidity Facility Morgan Stanley Bank, West Valley City Utah) (a)(c) | 5,625 | 5,625 | |
| 8,320 | |||
| Georgia - 0.6% | |||
| Private Colleges & Univs. Auth. Rev. Emory Univ. Participating VRDN Series Floaters 16 XF0517, 0.88% 10/7/16 (Liquidity Facility Royal Bank of Canada) (a)(c) | 7,500 | 7,500 | |
| Illinois - 1.5% | |||
| City of Chicago Gen. Oblig. Bonds Participating VRDN Series XF 23 42, 1.09% 10/7/16 (Liquidity Facility Barclays Bank PLC) (a)(c) | 100 | 100 | |
| Illinois Fin. Auth. Rev. Participating VRDN: | |||
| Series Putters 0022, 0.87% 10/7/16 (Liquidity Facility JPMorgan Chase Bank) (a)(c) | 3,795 | 3,795 | |
| Series Putters 3379, 0.87% 10/7/16 (Liquidity Facility JPMorgan Chase Bank) (a)(c) | 4,995 | 4,995 | |
| Illinois Toll Hwy. Auth. Toll Hwy. Rev. Participating VRDN: | |||
| Series 15 XF0277, 0.92% 10/7/16 (Liquidity Facility JPMorgan Chase Bank) (a)(c) | 1,500 | 1,500 | |
| Series 15 XF2202, 0.88% 10/7/16 (Liquidity Facility Citibank NA) (a)(c) | 1,150 | 1,150 | |
| Series 15 XM 0078, 0.9% 10/7/16 (Liquidity Facility Royal Bank of Canada) (a)(c) | 5,180 | 5,180 | |
| Series Floaters XM 03 94, 0.87% 10/7/16 (Liquidity Facility Morgan Stanley Bank, West Valley City Utah) (a)(c) | 1,200 | 1,200 | |
| The County of Cook Participating VRDN Series XF 23 13, 0.99% 10/7/16 (Liquidity Facility Barclays Bank PLC) (a)(c) | 300 | 300 | |
| Will Cnty. Gen. Oblig. Participating VRDN Series Floaters ZF 05 11, 0.9% 10/7/16 (Liquidity Facility Toronto-Dominion Bank) (a)(c) | 500 | 500 | |
| 18,720 | |||
| Indiana - 0.4% | |||
| Indiana Health & Edl. Facilities Fing. Auth. Rev. Bonds Series 16 E71, 1.04%, tender 12/1/16 (Liquidity Facility Royal Bank of Canada) (a)(c)(d) | 5,400 | 5,400 | |
| Kentucky - 0.3% | |||
| Kentucky Muni. Pwr. Agcy. Pwr. Sys. Rev. Participating VRDN Series Solar 07 107, 0.88% 10/7/16 (Liquidity Facility U.S. Bank NA, Cincinnati) (a)(c) | 3,100 | 3,100 | |
| Louisiana - 0.7% | |||
| Louisiana Gas & Fuel Tax Rev. Participating VRDN Series EGL 14 0049, 0.89% 10/7/16 (Liquidity Facility Citibank NA) (a)(c) | 8,500 | 8,500 | |
| Massachusetts - 0.3% | |||
| Massachusetts Gen. Oblig. Participating VRDN Series Clipper 07 41, 0.88% 10/7/16 (Liquidity Facility State Street Bank & Trust Co., Boston) (a)(c) | 1,300 | 1,300 | |
| Massachusetts School Bldg. Auth. Dedicated Sales Tax Rev. Participating VRDN Series MS 30911, 0.87% 10/7/16 (Liquidity Facility Morgan Stanley Bank, West Valley City Utah) (a)(c) | 2,630 | 2,630 | |
| 3,930 | |||
| Michigan - 0.7% | |||
| Michigan Bldg. Auth. Rev. Participating VRDN Series Floaters XM 03 92, 0.87% 10/7/16 (Liquidity Facility Morgan Stanley Bank, West Valley City Utah) (a)(c) | 600 | 600 | |
| Michigan Fin. Auth. Rev. Participating VRDN Series 15 XF0126, 0.87% 10/7/16 (Liquidity Facility JPMorgan Chase Bank) (a)(c) | 2,000 | 2,000 | |
| Ottawa County Wtr. Supply Sys. Rev. Participating VRDN Series 15 XF0113, 0.89% 10/7/16 (Liquidity Facility JPMorgan Chase Bank) (a)(c) | 6,625 | 6,625 | |
| 9,225 | |||
| Minnesota - 0.1% | |||
| Minnesota Gen. Oblig. Participating VRDN Series Clipper 09 59, 0.88% 10/7/16 (Liquidity Facility State Street Bank & Trust Co., Boston) (a)(c) | 1,100 | 1,100 | |
| Nevada - 0.7% | |||
| Clark County Fuel Tax Participating VRDN: | |||
| ROC II R 11836, 0.88% 10/7/16 (Liquidity Facility Citibank NA) (a)(c) | 3,450 | 3,450 | |
| Series ROC II R 11507, 0.88% 10/7/16 (Liquidity Facility Citibank NA) (a)(c) | 5,345 | 5,345 | |
| 8,795 | |||
| New Jersey - 0.0% | |||
| New Jersey St Transn Trust Fund Auth. Participating VRDN Series Floaters 16 XF1059, 1.03% 10/7/16 (Liquidity Facility Deutsche Bank AG New York Branch) (a)(c) | 300 | 300 | |
| New York - 2.8% | |||
| New York City Gen. Oblig. Participating VRDN Series 15 ZF0198, 0.87% 10/7/16 (Liquidity Facility JPMorgan Chase Bank) (a)(c) | 3,690 | 3,690 | |
| New York City Muni. Wtr. Fin. Auth. Wtr. & Swr. Sys. Rev. Participating VRDN: | |||
| Series EGL 14 0043, 0.88% 10/7/16 (Liquidity Facility Citibank NA) (a)(c) | 14,800 | 14,800 | |
| Series ROC II R 11916, 0.88% 10/7/16 (Liquidity Facility Citibank NA) (a)(c) | 1,235 | 1,235 | |
| New York City Transitional Fin. Auth. Rev. Participating VRDN: | |||
| Series ROC II R 11902, 0.88% 10/7/16 (Liquidity Facility Citibank NA) (a)(c) | 3,800 | 3,800 | |
| Series ROC II R 14022, 0.88% 10/7/16 (Liquidity Facility Citibank NA) (a)(c) | 2,185 | 2,185 | |
| New York Envir. Facilities Corp. Clean Wtr. & Drinking Wtr. Participating VRDN Series 16 XM0215, 0.87% 10/7/16 (Liquidity Facility JPMorgan Chase Bank) (a)(c) | 4,425 | 4,425 | |
| New York Envir. Facilities Corp. State Personal Income Tax Rev. Participating VRDN Series 15 XF0086, 0.87% 10/7/16 (Liquidity Facility JPMorgan Chase Bank) (a)(c) | 3,185 | 3,185 | |
| New York Thruway Auth. Second Gen. Hwy. & Bridge Trust Fund Participating VRDN Series ROC II R 11997, 0.88% 10/7/16 (Liquidity Facility Citibank NA) (a)(c) | 2,000 | 2,000 | |
| 35,320 | |||
| North Carolina - 1.7% | |||
| Charlotte Wtr. & Swr. Sys. Rev. Participating VRDN Series ROC II R 11906, 0.88% 10/7/16 (Liquidity Facility Citibank NA) (a)(c) | 2,700 | 2,700 | |
| North Carolina Cap. Facilities Fin. Agcy. Rev. Participating VRDN: | |||
| Series 15 XF0095, 0.87% 10/7/16 (Liquidity Facility JPMorgan Chase Bank) (a)(c) | 3,090 | 3,090 | |
| Series EGL 14 0051, 0.88% 10/7/16 (Liquidity Facility Citibank NA) (a)(c) | 8,800 | 8,800 | |
| Series EGL 14 0052, 0.88% 10/7/16 (Liquidity Facility Citibank NA) (a)(c) | 2,850 | 2,850 | |
| Series MS 15 ZM0105, 0.87% 10/7/16 (Liquidity Facility Morgan Stanley Bank, West Valley City Utah) (a)(c) | 2,185 | 2,185 | |
| North Carolina Gen. Oblig. Participating VRDN Series 15 XF0140, 0.87% 10/7/16 (Liquidity Facility JPMorgan Chase Bank) (a)(c) | 1,000 | 1,000 | |
| North Carolina Ltd. Oblig. Participating VRDN Series ROC 14089, 0.88% 10/7/16 (Liquidity Facility Citibank NA) (a)(c) | 1,000 | 1,000 | |
| 21,625 | |||
| Oregon - 0.2% | |||
| Oregon Gen. Oblig. Participating VRDN Series ROC II R 11949, 0.88% 10/7/16 (Liquidity Facility Citibank NA) (a)(c) | 3,000 | 3,000 | |
| Pennsylvania - 0.6% | |||
| Pennsylvania Health & Edl. Facilities Fing. Auth. Rev. Bonds Series E72, 1.04%, tender 12/1/16 (Liquidity Facility Royal Bank of Canada) (a)(c)(d) | 5,100 | 5,100 | |
| Univ. of Pittsburgh Med. Ctr. Bonds Series RBC E53, 1.04%, tender 1/3/17 (Liquidity Facility Royal Bank of Canada) (a)(c)(d) | 2,400 | 2,400 | |
| 7,500 | |||
| South Carolina - 0.5% | |||
| South Carolina Pub. Svc. Auth. Rev. Participating VRDN Series Floaters XM 03 84, 0.96% 10/7/16 (Liquidity Facility JPMorgan Chase Bank) (a)(c) | 2,470 | 2,470 | |
| South Carolina St. Pub. Svc. Auth. Rev. Participating VRDN Series XG 0046, 0.93% 10/7/16 (Liquidity Facility Toronto-Dominion Bank) (a)(c) | 3,800 | 3,800 | |
| 6,270 | |||
| Tennessee - 0.2% | |||
| Rutherford County Health & Edl. Facilities Board Rev. Participating VRDN Series 2014 ZF0208, 0.94% 10/7/16 (Liquidity Facility JPMorgan Chase Bank) (a)(c) | 2,500 | 2,500 | |
| Texas - 4.2% | |||
| Austin Wtr. & Wastewtr. Sys. Rev. Participating VRDN Series ROC II R 11992, 0.88% 10/7/16 (Liquidity Facility Citibank NA) (a)(c) | 3,390 | 3,390 | |
| City of Dallas Wtrwks. & Swr. Sys. Rev. Participating VRDN Series XM 02 88, 0.87% 10/7/16 (Liquidity Facility JPMorgan Chase Bank) (a)(c) | 5,000 | 5,000 | |
| Dallas Wtrwks. & Swr. Sys. Rev. Participating VRDN: | |||
| Series Clipper 09 52, 0.88% 10/7/16 (Liquidity Facility State Street Bank & Trust Co., Boston) (a)(c) | 800 | 800 | |
| Series Putters 3227, 0.87% 10/7/16 (Liquidity Facility JPMorgan Chase Bank) (a)(c) | 2,995 | 2,995 | |
| Friendswood Independent School District Participating VRDN Series 16 XM 02 40, 0.87% 10/7/16 (Liquidity Facility JPMorgan Chase Bank) (a)(c) | 1,300 | 1,300 | |
| Harris County Gen. Oblig. Participating VRDN Series Clipper 07 46, 0.89% 10/7/16 (Liquidity Facility State Street Bank & Trust Co., Boston) (a)(c) | 40,000 | 40,000 | |
| 53,485 | |||
| Utah - 0.6% | |||
| Riverton Hosp. Rev.: | |||
| Bonds Series WF 11 35C, 1.04%, tender 11/3/16 (Liquidity Facility Wells Fargo Bank NA) (a)(c)(d) | 5,530 | 5,530 | |
| Participating VRDN Series RBC ZF 0274, 0.9% 10/7/16 (Liquidity Facility Royal Bank of Canada) (a)(c) | 1,400 | 1,400 | |
| 6,930 | |||
| Vermont - 0.2% | |||
| Vermont Edl. and Health Buildings Fing. Agcy. Participating VRDN Series XF 23 61, 0.94% 10/7/16 (Liquidity Facility Barclays Bank PLC) (a)(c) | 2,850 | 2,850 | |
| Washington - 2.0% | |||
| Central Puget Sound Reg'l. Trans. Auth. Sales & Use Tax Rev. Participating VRDN Series 15 XF2158, 0.88% 10/7/16 (Liquidity Facility Citibank NA) (a)(c) | 2,885 | 2,885 | |
| King County Swr. Rev. Participating VRDN Series Floater 3090, 0.87% 10/7/16 (Liquidity Facility Cr. Suisse AG) (a)(c) | 7,361 | 7,361 | |
| Seattle Muni. Lt. & Pwr. Rev. Bonds Series WF 11-18C, 1.04%, tender 11/10/16 (Liquidity Facility Wells Fargo Bank NA) (a)(c)(d) | 600 | 600 | |
| Univ. of Washington Univ. Revs. Participating VRDN Series Solar 07 75, 0.87% 10/7/16 (Liquidity Facility U.S. Bank NA, Cincinnati) (a)(c) | 1,400 | 1,400 | |
| Washington Gen. Oblig.: | |||
| Bonds Series WF 11-16C, 1.04%, tender 11/17/16 (Liquidity Facility Wells Fargo Bank NA) (a)(c)(d) | 2,500 | 2,500 | |
| Participating VRDN: | |||
| Series 15 ZM0121, 0.88% 10/7/16 (Liquidity Facility Royal Bank of Canada) (a)(c) | 1,250 | 1,250 | |
| Series 16 XM0219, 0.87% 10/7/16 (Liquidity Facility JPMorgan Chase Bank) (a)(c) | 4,335 | 4,335 | |
| Washington Health Care Facilities Auth. Rev. Participating VRDN Series 15 XF0132, 0.87% 10/7/16 (Liquidity Facility JPMorgan Chase Bank) (a)(c) | 4,625 | 4,625 | |
| 24,956 | |||
| Wisconsin - 0.1% | |||
| Wisconsin Gen. Oblig. Participating VRDN: | |||
| Series Clipper 09 36, 0.88% 10/7/16 (Liquidity Facility State Street Bank & Trust Co., Boston) (a)(c) | 1,000 | 1,000 | |
| Series Clipper 09 53, 0.88% 10/7/16 (Liquidity Facility State Street Bank & Trust Co., Boston) (a)(c) | 800 | 800 | |
| 1,800 | |||
| TOTAL TENDER OPTION BOND | |||
| (Cost $276,756) | 276,756 | ||
| Other Municipal Security - 26.0% | |||
| Arizona - 0.1% | |||
| Salt River Proj. Agricultural Impt. & Pwr. District Elec. Sys. Rev. Series C: | |||
| 0.73% 11/7/16, CP | 800 | 800 | |
| 0.74% 11/7/16, CP | 800 | 800 | |
| 1,600 | |||
| California - 2.7% | |||
| California Statewide Cmntys. Dev. Auth. Gas Supply Rev. Bonds: | |||
| Series 2010 A, 0.95%, tender 1/3/17 (Liquidity Facility Royal Bank of Canada) (a) | 5,900 | 5,900 | |
| Series 2010 B, 0.95%, tender 1/3/17 (Liquidity Facility Royal Bank of Canada) (a) | 2,560 | 2,560 | |
| Los Angeles County Gen. Oblig. TRAN Series 2016, 3% 6/30/17 | 3,100 | 3,153 | |
| Los Angeles Dept. of Wtr. & Pwr. Rev. 0.48% 10/13/16 (Liquidity Facility Royal Bank of Canada), CP | 1,800 | 1,800 | |
| Los Angeles Gen. Oblig. TRAN Series 2016, 3% 6/29/17 | 12,800 | 13,019 | |
| Riverside County Gen. Oblig. TRAN Series 2016, 3% 6/30/17 | 7,200 | 7,324 | |
| 33,756 | |||
| Colorado - 0.8% | |||
| Colorado Univ. Co. Hosp. Auth. Rev. Bonds: | |||
| Series 2015 A, 1.09%, tender 4/28/17 (a) | 4,800 | 4,800 | |
| Series 2015 C, 1.09%, tender 4/28/17 (a) | 5,200 | 5,200 | |
| 10,000 | |||
| Connecticut - 0.6% | |||
| Connecticut Gen. Oblig. Bonds Series 2016 A, 3% 3/15/17 | 900 | 910 | |
| Enfield Gen. Oblig. BAN Series 2016, 2% 8/9/17 | 1,600 | 1,617 | |
| South Windsor Gen. Oblig. BAN 2% 2/16/17 | 5,085 | 5,110 | |
| 7,637 | |||
| District Of Columbia - 0.5% | |||
| Metropolitan Washington Arpts. Auth. Dulles Toll Road Rev. Series 1: | |||
| 0.53% 11/14/16, LOC JPMorgan Chase Bank, CP | 2,300 | 2,300 | |
| 0.72% 10/4/16, LOC JPMorgan Chase Bank, CP | 1,300 | 1,300 | |
| 0.73% 10/6/16, LOC JPMorgan Chase Bank, CP | 1,800 | 1,800 | |
| 0.78% 12/7/16, LOC JPMorgan Chase Bank, CP | 900 | 900 | |
| 6,300 | |||
| Florida - 2.8% | |||
| Florida Local Govt. Fin. Cmnty. Series 11A1: | |||
| 0.5% 10/5/16, LOC JPMorgan Chase Bank, CP | 2,300 | 2,300 | |
| 0.75% 11/3/16, LOC JPMorgan Chase Bank, CP | 2,600 | 2,600 | |
| Hillsborough County Cap. Impt. Prog. Rev. Series A, 0.52% 10/27/16, LOC Bank of Tokyo-Mitsubishi UFJ Ltd., CP | 2,300 | 2,300 | |
| Jacksonville Gen. Oblig. Series 04A, 0.78% 12/6/16, LOC Bank of America NA, CP | 1,000 | 1,000 | |
| Miami-Dade County School District TAN Series 2016, 5% 2/23/17 | 3,300 | 3,355 | |
| Miami-Dade County Wtr. & Swr. Rev.: | |||
| Series A1, 0.55% 10/5/16, LOC Barclays Bank PLC, CP | 1,800 | 1,800 | |
| Series B1, 0.52% 10/6/16, LOC Sumitomo Mitsui Banking Corp., CP | 1,200 | 1,200 | |
| Orlando Utils. Commission Util. Sys. Rev. Bonds Series 2011 A, 1.09%, tender 4/28/17 (a) | 10,300 | 10,300 | |
| Polk County Indl. Dev. Auth. Health Sys. Rev. Bonds: | |||
| Series 2014 A, 1.14%, tender 4/28/17 (a) | 1,000 | 1,000 | |
| Series 2014 A1, 1.09%, tender 4/28/17 (a) | 3,800 | 3,800 | |
| Tampa Health Sys. Rev. Bonds Series 2012 B, 1.14%, tender 4/28/17 (a) | 5,300 | 5,300 | |
| 34,955 | |||
| Georgia - 1.0% | |||
| Atlanta Wtr. & Wastewtr. Rev. Series 15A1, 0.58% 1/9/17, LOC PNC Bank NA, CP | 600 | 600 | |
| Georgia Muni. Elec. Auth. Pwr. Rev.: | |||
| Bonds Series 85A, 0.74% tender 10/6/16, LOC Barclays Bank PLC, CP mode | 1,050 | 1,050 | |
| Series B, 0.74% 10/21/16, LOC PNC Bank NA, CP | 2,000 | 2,000 | |
| Main Street Natural Gas, Inc. Georgia Gas Proj. Rev. Bonds: | |||
| Series 2010 A1, 0.95%, tender 12/1/16 (Liquidity Facility Royal Bank of Canada) (a) | 3,700 | 3,700 | |
| Series 2010 A2, 0.96%, tender 12/1/16 (Liquidity Facility Royal Bank of Canada) (a) | 5,480 | 5,480 | |
| 12,830 | |||
| Hawaii - 0.2% | |||
| Honolulu City & County Gen. Oblig. Series B1, 0.75% 11/3/16, LOC Sumitomo Mitsui Banking Corp., CP | 2,000 | 2,000 | |
| Idaho - 0.6% | |||
| Idaho Gen. Oblig. TAN Series 2016, 2% 6/30/17 | 5,700 | 5,754 | |
| Idaho Health Facilities Auth. Hosp. Rev. Bonds Series 2013 ID, 0.7%, tender 12/1/16 (a) | 1,400 | 1,400 | |
| 7,154 | |||
| Illinois - 0.8% | |||
| Illinois Fin. Auth. Ed. Rev. Series LOY, 0.5% 10/4/16, LOC PNC Bank NA, CP | 1,100 | 1,100 | |
| Illinois Fin. Auth. Rev. Bonds: | |||
| (Advocate Health Care Network Proj.) Series 2011 B, 1.14%, tender 4/28/17 (a) | 600 | 600 | |
| Series 12H, 0.75% tender 12/2/16, CP mode | 1,800 | 1,800 | |
| Series 12I: | |||
| 0.5% tender 10/5/16, CP mode | 2,300 | 2,300 | |
| 0.75% tender 11/3/16, CP mode | 1,200 | 1,200 | |
| 0.8% tender 1/6/17, CP mode | 1,200 | 1,200 | |
| 0.85% tender 11/16/16, CP mode | 700 | 700 | |
| Series 2016 D, 4% 2/15/17 | 1,000 | 1,012 | |
| 9,912 | |||
| Indiana - 0.4% | |||
| Indiana Fin. Auth. Rev. Bonds Series D2, 0.74% tender 11/9/16, CP mode | 3,400 | 3,400 | |
| Indianapolis Gas Util. Sys. Rev. Series 2016: | |||
| 0.76% 11/9/16, LOC JPMorgan Chase Bank, CP | 1,100 | 1,100 | |
| 0.82% 10/12/16, LOC JPMorgan Chase Bank, CP | 1,200 | 1,200 | |
| 5,700 | |||
| Kentucky - 0.0% | |||
| Jefferson County Poll. Cont. Rev. Bonds Series 01A, 0.8% tender 10/5/16, CP mode | 500 | 500 | |
| Maryland - 0.6% | |||
| Baltimore County Gen. Oblig.: | |||
| Series 2016, 0.75% 12/2/16 (Liquidity Facility Mizuho Bank Ltd.), CP | 2,800 | 2,800 | |
| 0.5% 10/3/16 (Liquidity Facility Mizuho Bank Ltd.), CP | 3,700 | 3,700 | |
| Montgomery County Gen. Oblig. Bonds Series 2013 MD, 0.7%, tender 12/1/16 (a) | 1,500 | 1,500 | |
| 8,000 | |||
| Massachusetts - 0.9% | |||
| Massachusetts Gen. Oblig. RAN Series 2016 C 2% 6/26/17 | 6,000 | 6,058 | |
| Massachusetts Health & Edl. Facilities Auth. Rev. Series 2016, 0.74% 11/1/16, CP | 600 | 600 | |
| Massachusetts Indl. Fin. Agcy. Poll. Cont. Rev. Bonds: | |||
| (New England Pwr. Co. Proj.) Series 93A, 1.08% tender 11/10/16, CP mode | 1,700 | 1,700 | |
| Series 92: | |||
| 1.03% tender 11/8/16, CP mode | 100 | 100 | |
| 1.05% tender 11/9/16, CP mode | 600 | 600 | |
| Series 93B, 0.95% tender 10/12/16, CP mode | 800 | 800 | |
| Massachusetts School Bldg. Auth. Dedicated Sales Tax Rev. Series B, 0.74% 11/2/16, LOC Citibank NA, CP | 1,500 | 1,500 | |
| 11,358 | |||
| Michigan - 2.6% | |||
| Michigan Bldg. Auth. Rev. Series 7, 0.94% 12/8/16, LOC State Street Bank & Trust Co., Boston, LOC U.S. Bank NA, Cincinnati, CP | 1,400 | 1,400 | |
| Michigan Fin. Auth. Rev. Bonds Series 2013 M1, 0.7%, tender 12/1/16 (a) | 1,900 | 1,900 | |
| Michigan Hosp. Fin. Auth. Rev. Bonds (Ascension Health Sr. Cr. Group Proj.) Series 2010 F: | |||
| 1.11%, tender 4/28/17 (a) | 12,000 | 12,000 | |
| 1.11%, tender 4/28/17 (a) | 6,590 | 6,590 | |
| 1.11%, tender 4/28/17 (a) | 6,720 | 6,719 | |
| Univ. of Michigan Rev.: | |||
| Series K1: | |||
| 0.74% 11/7/16, CP | 1,600 | 1,600 | |
| 0.74% 11/16/16, CP | 1,200 | 1,200 | |
| Series K2, 0.9% 6/26/17, CP | 1,200 | 1,200 | |
| 32,609 | |||
| Minnesota - 0.1% | |||
| Univ. of Minnesota Gen. Oblig. Series 07C, 0.74% 11/3/16, CP | 1,200 | 1,200 | |
| Missouri - 0.6% | |||
| Curators of the Univ. of Missouri Series A: | |||
| 0.45% 10/3/16, CP | 900 | 900 | |
| 0.67% 10/5/16, CP | 1,100 | 1,100 | |
| 0.78% 12/5/16, CP | 1,600 | 1,600 | |
| 0.86% 11/18/16, CP | 1,700 | 1,700 | |
| 0.86% 12/1/16, CP | 900 | 900 | |
| Saint Louis Gen. Fund Rev. TRAN Series 2016, 2% 6/1/17 | 1,300 | 1,310 | |
| 7,510 | |||
| Nebraska - 0.3% | |||
| Nebraska Pub. Pwr. District Rev. Series A: | |||
| 0.7% 10/4/16, CP | 1,100 | 1,100 | |
| 0.76% 11/1/16, CP | 1,100 | 1,100 | |
| Omaha Pub. Pwr. District Elec. Rev. Series A: | |||
| 0.59% 11/16/16, CP | 700 | 700 | |
| 0.7% 10/4/16, CP | 700 | 700 | |
| 3,600 | |||
| Nevada - 0.2% | |||
| Truckee Meadows Wtr. Auth. Wtr. Rev.: | |||
| Series 06A: | |||
| 0.79% 12/14/16, LOC Bank of Tokyo-Mitsubishi UFJ Ltd., CP | 1,000 | 1,000 | |
| 0.8% 12/8/16, LOC Bank of Tokyo-Mitsubishi UFJ Ltd., CP | 900 | 900 | |
| Series 06B, 0.76% 11/2/16, LOC Bank of Tokyo-Mitsubishi UFJ Ltd., CP | 1,000 | 1,000 | |
| 2,900 | |||
| New Hampshire - 0.1% | |||
| New Hampshire Bus. Fin. Auth. Poll. Cont. Rev. Bonds Series 90B, 1.08% tender 10/25/16, CP mode | 1,000 | 1,000 | |
| New Jersey - 1.7% | |||
| Burlington County Bridge Commission Lease Rev. BAN Series 2016 B, 2% 4/26/17 | 800 | 805 | |
| Burlington County Gen. Oblig. BAN Series 2016 A, 2% 5/16/17 | 3,000 | 3,024 | |
| Hoboken Gen. Oblig. BAN Series A, 2.25% 3/14/17 | 1,700 | 1,712 | |
| Hudson County Gen. Oblig. BAN Series 2015, 2% 12/16/16 | 3,700 | 3,711 | |
| Middlesex County Gen. Oblig. BAN 2% 6/15/17 | 1,800 | 1,816 | |
| North Brunswick Township Gen. Oblig. BAN Series A, 2% 7/27/17 | 1,600 | 1,617 | |
| Union County Gen. Oblig. BAN Series 2016, 2% 6/23/17 | 4,400 | 4,443 | |
| Woodbridge Township Gen. Oblig. BAN Series 2016: | |||
| 2% 8/18/17 | 1,900 | 1,922 | |
| 3% 8/18/17 | 2,200 | 2,245 | |
| 21,295 | |||
| New York - 0.9% | |||
| Bay Shore Union Free School District TAN Series 2016, 2% 6/23/17 | 1,800 | 1,813 | |
| Bayport-Blue Point Union Free School District TAN Series 2016, 2% 6/27/17 (e) | 500 | 504 | |
| Harborfields Central School District Greenlawn TAN 1.5% 6/23/17 | 500 | 503 | |
| Islip Union Free School District TAN Series 2016, 2% 6/23/17 (e) | 1,000 | 1,007 | |
| Lockport City School District BAN Series 2016, 2% 8/4/17 | 900 | 910 | |
| New York City Muni. Wtr. Fin. Auth. Wtr. & Swr. Sys. Rev. Series 1: | |||
| 0.73% 10/6/16, CP | 800 | 800 | |
| 0.73% 10/6/16, CP | 900 | 900 | |
| New York Pwr. Auth. Series 2, 0.5% 10/6/16, CP | 1,977 | 1,977 | |
| Rochester Gen. Oblig. BAN: | |||
| Series 2016 II, 2% 8/4/17 | 1,500 | 1,517 | |
| Series 2016 III, 1.25% 3/1/17 | 700 | 702 | |
| Tonawanda Town BAN Series 2016, 2% 8/31/17 | 700 | 705 | |
| 11,338 | |||
| New York And New Jersey - 0.0% | |||
| Port Auth. of New York & New Jersey Series B, 0.84% 12/13/16, CP | 500 | 500 | |
| North Carolina - 0.2% | |||
| Mecklenburg County Gen. Oblig. Bonds Series 2009 D, 1.09%, tender 10/12/16 (a) | 2,000 | 2,000 | |
| Ohio - 1.0% | |||
| Franklin County Rev. Bonds Series 2013 OH, 0.7%, tender 12/1/16 (a) | 2,100 | 2,100 | |
| Lucas County Gen. Oblig. BAN Series 2016, 2% 7/12/17 | 700 | 707 | |
| Ohio Higher Edl. Facility Commission Rev. Bonds: | |||
| Series 08B5: | |||
| 0.53% tender 10/26/16, CP mode | 2,300 | 2,300 | |
| 0.9% tender 1/4/17, CP mode | 2,050 | 2,050 | |
| Series 08B6: | |||
| 0.8% tender 12/6/16, CP mode | 1,400 | 1,400 | |
| 0.82% tender 12/14/16, CP mode | 1,800 | 1,800 | |
| Series 2016: | |||
| 0.5% tender 10/18/16, CP mode | 700 | 700 | |
| 0.5% tender 10/18/16, CP mode | 1,100 | 1,100 | |
| Ohio State Univ. Gen. Receipts Rev. Bonds Series 03C, 0.49% tender 10/6/16, CP mode | 500 | 500 | |
| 12,657 | |||
| Oklahoma - 0.4% | |||
| Oklahoma City Wtr. Utils. Trust Wtr. and Swr. Rev. Series A: | |||
| 0.75% 11/1/16 (Liquidity Facility State Street Bank & Trust Co., Boston), CP | 2,500 | 2,500 | |
| 0.88% 11/1/16 (Liquidity Facility State Street Bank & Trust Co., Boston), CP | 1,000 | 1,000 | |
| Oklahoma Dev. Fin. Auth. Health Sys. Rev. Bonds Series 2015 B, 1.19%, tender 4/28/17 (a) | 1,750 | 1,750 | |
| 5,250 | |||
| Pennsylvania - 0.1% | |||
| Philadelphia Gas Works Rev. Series 2, 0.98% 10/31/16, LOC PNC Bank NA, CP | 900 | 900 | |
| Univ. of Pittsburgh Commonwealth Sys. of Higher Ed. Bonds Series 05B, 0.74% tender 11/1/16, CP mode | 600 | 600 | |
| 1,500 | |||
| Tennessee - 0.3% | |||
| Nashville and Davidson County Metropolitan Govt. Health & Edl. Facilities Board Rev. Bonds Series 2001 B1, 1.11%, tender 4/28/17 (a) | 3,800 | 3,800 | |
| Texas - 4.3% | |||
| Austin Elec. Util. Sys. Rev. Series A, 0.48% 10/6/16, LOC Bank of Tokyo-Mitsubishi UFJ Ltd., CP | 1,300 | 1,300 | |
| Brownsville Util. Sys. Rev. Series A, 0.6% 10/28/16, LOC Bank of Montreal Chicago, CP | 300 | 300 | |
| Harris County Cultural Ed. Facilities Fin. Corp. Rev. Bonds: | |||
| (Texas Children's Hosp. Proj.) Series 2015 2, 1.04%, tender 4/28/17 (a) | 2,900 | 2,900 | |
| Series 16B1, 0.48% tender 10/5/16, CP mode | 2,200 | 2,200 | |
| Series 16B2, 0.57% tender 12/5/16, CP mode | 2,100 | 2,100 | |
| Series 16B3, 0.74% tender 11/3/16, CP mode | 1,800 | 1,800 | |
| Harris County Metropolitan Trans. Auth.: | |||
| Series A1: | |||
| 0.5% 10/6/16 (Liquidity Facility JPMorgan Chase Bank), CP | 1,400 | 1,400 | |
| 0.52% 10/18/16 (Liquidity Facility JPMorgan Chase Bank), CP | 1,600 | 1,600 | |
| 0.75% 11/4/16 (Liquidity Facility JPMorgan Chase Bank), CP | 1,300 | 1,300 | |
| Series A3, 0.52% 10/18/16 (Liquidity Facility State Street Bank & Trust Co., Boston), CP | 4,500 | 4,500 | |
| Houston Gen. Oblig. TRAN Series 2016, 2% 6/30/17 | 3,200 | 3,232 | |
| Lower Colorado River Auth. Rev. Series A: | |||
| 0.47% 10/6/16, LOC JPMorgan Chase Bank, CP | 1,600 | 1,600 | |
| 0.49% 11/4/16, LOC JPMorgan Chase Bank, CP | 1,200 | 1,200 | |
| 0.57% 12/5/16, LOC JPMorgan Chase Bank, CP | 1,300 | 1,300 | |
| 0.92% 10/5/16, LOC JPMorgan Chase Bank, CP | 1,273 | 1,273 | |
| Tarrant County Cultural Ed. Facilities Fin. Corp. Hosp. Rev. Bonds (Baylor Health Care Sys. Proj.): | |||
| Series 2011 B, 1.14%, tender 4/28/17 (a) | 8,400 | 8,400 | |
| Series 2013 B, 1.14%, tender 4/28/17 (a) | 2,400 | 2,400 | |
| Texas A&M Univ. Rev. Series B, 0.52% 11/3/16, CP | 1,200 | 1,200 | |
| Texas Muni. Pwr. Agcy. Rev. Series 05, 0.55% 10/3/16, LOC Barclays Bank PLC, CP | 4,200 | 4,200 | |
| Univ. of Texas Board of Regents Sys. Rev. Series A: | |||
| 0.46% 10/3/16 (Liquidity Facility Univ. of Texas Invt. Mgmt. Co.), CP | 700 | 700 | |
| 0.46% 10/5/16 (Liquidity Facility Univ. of Texas Invt. Mgmt. Co.), CP | 954 | 954 | |
| 0.46% 10/6/16 (Liquidity Facility Univ. of Texas Invt. Mgmt. Co.), CP | 800 | 800 | |
| 0.52% 10/4/16 (Liquidity Facility Univ. of Texas Invt. Mgmt. Co.), CP | 800 | 800 | |
| 0.58% 11/9/16 (Liquidity Facility Univ. of Texas Invt. Mgmt. Co.), CP | 1,200 | 1,200 | |
| 0.8% 12/2/16 (Liquidity Facility Univ. of Texas Invt. Mgmt. Co.), CP | 3,000 | 3,000 | |
| Univ. of Texas Permanent Univ. Fund Rev. Series A, 0.52% 11/15/16, CP | 1,600 | 1,600 | |
| Upper Trinity Reg'l. Wtr. District Series 2016, 0.74% 11/3/16, LOC Bank of America NA, CP | 1,300 | 1,300 | |
| 54,559 | |||
| Vermont - 0.3% | |||
| Vermont Econ. Dev. Auth. Rev. Series B, 0.78% 11/22/16, LOC JPMorgan Chase Bank, CP | 3,500 | 3,500 | |
| Virginia - 0.1% | |||
| Virginia Commonwealth Trans. Board Rev. Bonds (Northern Virginia Trans. District Prog.) Series 2012 A, 5% 5/15/17 | 1,005 | 1,032 | |
| Washington - 0.1% | |||
| Univ. of Washington Univ. Revs. Series 8, 0.54% 12/1/16, CP | 1,100 | 1,100 | |
| Wisconsin - 0.7% | |||
| Wisconsin Gen. Oblig.: | |||
| Series 06A, 0.5% 10/4/16 (Liquidity Facility BMO Harris Bank NA), CP | 1,700 | 1,700 | |
| Series 13A, 0.74% 11/4/16 (Liquidity Facility BMO Harris Bank NA), CP | 1,300 | 1,300 | |
| Wisconsin Health & Edl. Facilities Bonds Series 2013 B, 1.11%, tender 4/28/17 (a) | 3,340 | 3,340 | |
| Wisconsin Trans. Rev.: | |||
| Series 13A: | |||
| 0.46% 10/6/16 (Liquidity Facility State Street Bank & Trust Co., Boston), CP | 1,300 | 1,300 | |
| 0.51% 10/11/16 (Liquidity Facility State Street Bank & Trust Co., Boston), CP | 600 | 600 | |
| Series 97A, 0.75% 11/7/16 (Liquidity Facility State Street Bank & Trust Co., Boston), CP | 799 | 799 | |
| 9,039 | |||
| TOTAL OTHER MUNICIPAL SECURITY | |||
| (Cost $328,091) | 328,091 | ||
| Shares (000s) | Value (000s) | ||
| Investment Company - 20.4% | |||
| Fidelity Tax-Free Cash Central Fund, 0.79% (f)(g) | |||
| (Cost $257,975) | 257,975 | 257,975 | |
| TOTAL INVESTMENT PORTFOLIO - 98.8% | |||
| (Cost $1,247,517) | 1,247,517 | ||
| NET OTHER ASSETS (LIABILITIES) - 1.2% | 15,185 | ||
| NET ASSETS - 100% | $1,262,702 |
Security Type Abbreviations
BAN – BOND ANTICIPATION NOTE
CP – COMMERCIAL PAPER
RAN – REVENUE ANTICIPATION NOTE
TAN – TAX ANTICIPATION NOTE
TRAN – TAX AND REVENUE ANTICIPATION NOTE
VRDN – VARIABLE RATE DEMAND NOTE (A debt instrument that is payable upon demand, either daily, weekly or monthly)
The date shown for securities represents the date when principal payments must be paid, taking into account any call options exercised by the issuer and any permissible maturity shortening features other than interest rate resets.
Legend
(a) Coupon rates for floating and adjustable rate securities reflect the rates in effect at period end.
(b) Security exempt from registration under Rule 144A of the Securities Act of 1933. These securities may be resold in transactions exempt from registration, normally to qualified institutional buyers. At the end of the period, the value of these securities amounted to $10,455,000 or 0.8% of net assets.
(c) Provides evidence of ownership in one or more underlying municipal bonds.
(d) Restricted securities - Investment in securities not registered under the Securities Act of 1933 (excluding 144A issues). At the end of the period, the value of restricted securities (excluding 144A issues) amounted to $28,825,000 or 2.3% of net assets.
(e) Security or a portion of the security purchased on a delayed delivery or when-issued basis.
(f) Information in this report regarding holdings by state and security types does not reflect the holdings of the Fidelity Tax-Free Cash Central Fund.
(g) Affiliated fund that is available only to investment companies and other accounts managed by Fidelity Investments. The rate quoted is the annualized seven-day yield of the fund at period end. A complete unaudited listing of the fund's holdings as of its most recent quarter end is available upon request. In addition, each Fidelity Central Fund's financial statements are available on the SEC's website or upon request.
Additional information on each restricted holding is as follows:
| Security | Acquisition Date | Cost (000s) |
| Central Florida Expressway Bonds Series RBC E 62, 1.04%, tender 2/1/17 (Liquidity Facility Royal Bank of Canada) | 8/1/16 | $2,695 |
| Indiana Health & Edl. Facilities Fing. Auth. Rev. Bonds Series 16 E71, 1.04%, tender 12/1/16 (Liquidity Facility Royal Bank of Canada) | 6/1/16 - 9/1/16 | $5,400 |
| Los Angeles Hbr. Dept. Rev. Bonds Series WF 10 40C, 1.04%, tender 12/1/16 (Liquidity Facility Wells Fargo Bank NA) | 3/22/12 | $1,400 |
| Pennsylvania Health & Edl. Facilities Fing. Auth. Rev. Bonds Series E72, 1.04%, tender 12/1/16 (Liquidity Facility Royal Bank of Canada) | 6/1/16 - 9/1/16 | $5,100 |
| Riverton Hosp. Rev. Bonds Series WF 11 35C, 1.04%, tender 11/3/16 (Liquidity Facility Wells Fargo Bank NA) | 3/24/11 | $5,530 |
| Seattle Muni. Lt. & Pwr. Rev. Bonds Series WF 11-18C, 1.04%, tender 11/10/16 (Liquidity Facility Wells Fargo Bank NA) | 2/11/16 | $600 |
| Univ. of Colorado Enterprise Sys. Rev. Bonds Series RBC E 55, 1.04%, tender 2/1/17 (Liquidity Facility Royal Bank of Canada) | 5/26/16 - 8/1/16 | $3,200 |
| Univ. of Pittsburgh Med. Ctr. Bonds Series RBC E53, 1.04%, tender 1/3/17 (Liquidity Facility Royal Bank of Canada) | 7/1/16 | $2,400 |
| Washington Gen. Oblig. Bonds Series WF 11-16C, 1.04%, tender 11/17/16 (Liquidity Facility Wells Fargo Bank NA) | 5/9/13 - 2/18/16 | $2,500 |
Affiliated Central Funds
Information regarding fiscal year to date income earned by the Fund from investments in Fidelity Central Funds is as follows:
| Fund | Income earned |
| (Amounts in thousands) | |
| Fidelity Tax-Free Cash Central Fund | $430 |
| Total | $430 |
Investment Valuation
All investments are categorized as Level 2 under the Fair Value Hierarchy. The inputs or methodology used for valuing securities may not be an indication of the risk associated with investing in those securities. For more information on valuation inputs please refer to the Investment Valuation section in the accompanying Notes to Financial Statements.
See accompanying notes which are an integral part of the financial statements.
Tax-Exempt Portfolio
Financial Statements
Statement of Assets and Liabilities
| Amounts in thousands (except per-share amounts) | September 30, 2016 (Unaudited) | |
| Assets | ||
| Investment in securities, at value — See accompanying schedule: Unaffiliated issuers (cost $989,542) | $989,542 | |
| Fidelity Central Funds (cost $257,975) | 257,975 | |
| Total Investments (cost $1,247,517) | $1,247,517 | |
| Cash | 61 | |
| Receivable for investments sold | 22,678 | |
| Receivable for fund shares sold | 4,093 | |
| Interest receivable | 1,432 | |
| Distributions receivable from Fidelity Central Funds | 104 | |
| Prepaid expenses | 3 | |
| Receivable from investment adviser for expense reductions | 38 | |
| Other receivables | 53 | |
| Total assets | 1,275,979 | |
| Liabilities | ||
| Payable for investments purchased | ||
| Regular delivery | $4,290 | |
| Delayed delivery | 1,511 | |
| Payable for fund shares redeemed | 7,106 | |
| Distributions payable | 89 | |
| Accrued management fee | 134 | |
| Distribution and service plan fees payable | 3 | |
| Other affiliated payables | 70 | |
| Other payables and accrued expenses | 74 | |
| Total liabilities | 13,277 | |
| Net Assets | $1,262,702 | |
| Net Assets consist of: | ||
| Paid in capital | $1,263,754 | |
| Distributions in excess of net investment income | (2) | |
| Accumulated undistributed net realized gain (loss) on investments | (1,050) | |
| Net Assets | $1,262,702 | |
| Class I: | ||
| Net Asset Value, offering price and redemption price per share ($1,255,978 ÷ 1,254,787 shares) | $1.00 | |
| Class II: | ||
| Net Asset Value, offering price and redemption price per share ($381 ÷ 380 shares) | $1.00 | |
| Class III: | ||
| Net Asset Value, offering price and redemption price per share ($6,205 ÷ 6,200 shares) | $1.00 | |
| Select Class: | ||
| Net Asset Value, offering price and redemption price per share ($138 ÷ 138 shares) | $1.00 |
See accompanying notes which are an integral part of the financial statements.
Statement of Operations
| Amounts in thousands | Six months ended September 30, 2016 (Unaudited) | |
| Investment Income | ||
| Interest | $2,738 | |
| Income from Fidelity Central Funds | 430 | |
| Total income | 3,168 | |
| Expenses | ||
| Management fee | $917 | |
| Transfer agent fees | 393 | |
| Distribution and service plan fees | 83 | |
| Accounting fees and expenses | 71 | |
| Custodian fees and expenses | 6 | |
| Independent trustees' fees and expenses | 3 | |
| Registration fees | 55 | |
| Audit | 22 | |
| Legal | 2 | |
| Miscellaneous | 3 | |
| Total expenses before reductions | 1,555 | |
| Expense reductions | (309) | 1,246 |
| Net investment income (loss) | 1,922 | |
| Realized and Unrealized Gain (Loss) | ||
| Net realized gain (loss) on: | ||
| Investment securities: | ||
| Unaffiliated issuers | (10) | |
| Total net realized gain (loss) | (10) | |
| Net increase in net assets resulting from operations | $1,912 |
See accompanying notes which are an integral part of the financial statements.
Statement of Changes in Net Assets
| Amounts in thousands | Six months ended September 30, 2016 (Unaudited) | Year ended March 31, 2016 |
| Increase (Decrease) in Net Assets | ||
| Operations | ||
| Net investment income (loss) | $1,922 | $287 |
| Net realized gain (loss) | (10) | 459 |
| Net increase in net assets resulting from operations | 1,912 | 746 |
| Distributions to shareholders from net investment income | (1,924) | (287) |
| Distributions to shareholders from net realized gain | (1,040) | (1,814) |
| Total distributions | (2,964) | (2,101) |
| Share transactions - net increase (decrease) | (385,091) | (817,108) |
| Total increase (decrease) in net assets | (386,143) | (818,463) |
| Net Assets | ||
| Beginning of period | 1,648,845 | 2,467,308 |
| End of period | $1,262,702 | $1,648,845 |
| Other Information | ||
| Distributions in excess of net investment income end of period | $(2) | $– |
See accompanying notes which are an integral part of the financial statements.
Financial Highlights — Tax-Exempt Portfolio Class I
| Six months ended (Unaudited) September 30, | Years ended March 31, | |||||
| 2016 | 2016 | 2015 | 2014 | 2013 | 2012 | |
| Selected Per–Share Data | ||||||
| Net asset value, beginning of period | $1.00 | $1.00 | $1.00 | $1.00 | $1.00 | $1.00 |
| Income from Investment Operations | ||||||
| Net investment income (loss) | .002 | –A | –A | –A | –A | –A |
| Net realized and unrealized gain (loss) | –A | .001 | –A | –A | –A | –A |
| Total from investment operations | .002 | .001 | –A | –A | –A | –A |
| Distributions from net investment income | (.002) | –A | –A | –A | –A | –A |
| Distributions from net realized gain | (.001) | (.001) | –A | –A | – | – |
| Total distributions | (.002)B | (.001) | –A | –A | –A | –A |
| Net asset value, end of period | $1.00 | $1.00 | $1.00 | $1.00 | $1.00 | $1.00 |
| Total ReturnC,D | .23% | .08% | .03% | .02% | .01% | .01% |
| Ratios to Average Net AssetsE,F | ||||||
| Expenses before reductions | .22%G | .22% | .22% | .22% | .22% | .22% |
| Expenses net of fee waivers, if any | .18%G | .05% | .06% | .11% | .18% | .16% |
| Expenses net of all reductions | .18%G | .05% | .06% | .10% | .17% | .15% |
| Net investment income (loss) | .30%G | .01% | .01% | .01% | .01% | .01% |
| Supplemental Data | ||||||
| Net assets, end of period (in millions) | $1,256 | $1,429 | $2,166 | $2,055 | $2,342 | $3,160 |
A Amount represents less than $.0005 per share.
B Total distributions of $.002 per share is comprised of distributions from net investment income of $.0016 and distributions from net realized gain of $.0007 per share.
C Total returns for periods of less than one year are not annualized.
D Total returns would have been lower if certain expenses had not been reduced during the applicable periods shown.
E Fees and expenses of any underlying Fidelity Central Funds are not included in the Fund's expense ratio. The Fund indirectly bears its proportionate share of the expenses of any underlying Fidelity Central Funds.
F Expense ratios reflect operating expenses of the class. Expenses before reductions do not reflect amounts reimbursed or waived or reductions from expense offset arrangements and do not represent the amount paid by the class during periods when reimbursements, waivers or reductions occur. Expenses net of fee waivers reflect expenses after reimbursement and waivers but prior to reductions from expense offset arrangements. Expenses net of all reductions represent the net expenses paid by the class.
G Annualized
See accompanying notes which are an integral part of the financial statements.
Financial Highlights — Tax-Exempt Portfolio Class II
| Six months ended (Unaudited) September 30, | Years ended March 31, | |||||
| 2016 | 2016 | 2015 | 2014 | 2013 | 2012 | |
| Selected Per–Share Data | ||||||
| Net asset value, beginning of period | $1.00 | $1.00 | $1.00 | $1.00 | $1.00 | $1.00 |
| Income from Investment Operations | ||||||
| Net investment income (loss) | .001 | –A | –A | –A | –A | –A |
| Net realized and unrealized gain (loss) | .001B | .001 | –A | –A | –A | –A |
| Total from investment operations | .002 | .001 | –A | –A | –A | –A |
| Distributions from net investment income | (.001) | –A | –A | –A | –A | –A |
| Distributions from net realized gain | (.001) | (.001) | –A | –A | – | – |
| Total distributions | (.002) | (.001) | –A | –A | –A | –A |
| Net asset value, end of period | $1.00 | $1.00 | $1.00 | $1.00 | $1.00 | $1.00 |
| Total ReturnC,D | .15% | .08% | .03% | .02% | .01% | .01% |
| Ratios to Average Net AssetsE,F | ||||||
| Expenses before reductions | .37%G | .37% | .37% | .37% | .37% | .37% |
| Expenses net of fee waivers, if any | .33%G | .06% | .06% | .11% | .17% | .15% |
| Expenses net of all reductions | .33%G | .05% | .06% | .10% | .17% | .15% |
| Net investment income (loss) | .15%G | .01% | .01% | .01% | .01% | .01% |
| Supplemental Data | ||||||
| Net assets, end of period (in millions) | $– | $1 | $12 | $12 | $12 | $15 |
A Amount represents less than $.0005 per share.
B The amount shown for a share outstanding does not correspond with the aggregate net gain (loss) on investments for the period due to the timing of sales and repurchases of shares in relation to fluctuating market values of the investments of the Fund.
C Total returns for periods of less than one year are not annualized.
D Total returns would have been lower if certain expenses had not been reduced during the applicable periods shown.
E Fees and expenses of any underlying Fidelity Central Funds are not included in the Fund's expense ratio. The Fund indirectly bears its proportionate share of the expenses of any underlying Fidelity Central Funds.
F Expense ratios reflect operating expenses of the class. Expenses before reductions do not reflect amounts reimbursed or waived or reductions from expense offset arrangements and do not represent the amount paid by the class during periods when reimbursements, waivers or reductions occur. Expenses net of fee waivers reflect expenses after reimbursement and waivers but prior to reductions from expense offset arrangements. Expenses net of all reductions represent the net expenses paid by the class.
G Annualized
See accompanying notes which are an integral part of the financial statements.
Financial Highlights — Tax-Exempt Portfolio Class III
| Six months ended (Unaudited) September 30, | Years ended March 31, | |||||
| 2016 | 2016 | 2015 | 2014 | 2013 | 2012 | |
| Selected Per–Share Data | ||||||
| Net asset value, beginning of period | $1.00 | $1.00 | $1.00 | $1.00 | $1.00 | $1.00 |
| Income from Investment Operations | ||||||
| Net investment income (loss) A | – | – | – | – | – | – |
| Net realized and unrealized gain (loss) | .001B | .001 | –A | –A | –A | –A |
| Total from investment operations | .001 | .001 | –A | –A | –A | –A |
| Distributions from net investment incomeA | – | – | – | – | – | – |
| Distributions from net realized gain | (.001) | (.001) | –A | –A | – | – |
| Total distributions | (.001) | (.001) | –A | –A | –A | –A |
| Net asset value, end of period | $1.00 | $1.00 | $1.00 | $1.00 | $1.00 | $1.00 |
| Total ReturnC,D | .11% | .08% | .03% | .02% | .01% | .01% |
| Ratios to Average Net AssetsE,F | ||||||
| Expenses before reductions | .47%G | .47% | .47% | .47% | .47% | .47% |
| Expenses net of fee waivers, if any | .39%G | .06% | .06% | .11% | .17% | .16% |
| Expenses net of all reductions | .39%G | .06% | .06% | .10% | .17% | .16% |
| Net investment income (loss) | .09%G | .01% | .01% | .01% | .01% | .01% |
| Supplemental Data | ||||||
| Net assets, end of period (in millions) | $6 | $215 | $285 | $275 | $323 | $240 |
A Amount represents less than $.0005 per share.
B The amount shown for a share outstanding does not correspond with the aggregate net gain (loss) on investments for the period due to the timing of sales and repurchases of shares in relation to fluctuating market values of the investments of the Fund.
C Total returns for periods of less than one year are not annualized.
D Total returns would have been lower if certain expenses had not been reduced during the applicable periods shown.
E Fees and expenses of any underlying Fidelity Central Funds are not included in the Fund's expense ratio. The Fund indirectly bears its proportionate share of the expenses of any underlying Fidelity Central Funds.
F Expense ratios reflect operating expenses of the class. Expenses before reductions do not reflect amounts reimbursed or waived or reductions from expense offset arrangements and do not represent the amount paid by the class during periods when reimbursements, waivers or reductions occur. Expenses net of fee waivers reflect expenses after reimbursement and waivers but prior to reductions from expense offset arrangements. Expenses net of all reductions represent the net expenses paid by the class.
G Annualized
See accompanying notes which are an integral part of the financial statements.
Financial Highlights — Tax-Exempt Portfolio Select Class
| Six months ended (Unaudited) September 30, | Years ended March 31, | |||||
| 2016 | 2016 | 2015 | 2014 | 2013 | 2012 | |
| Selected Per–Share Data | ||||||
| Net asset value, beginning of period | $1.00 | $1.00 | $1.00 | $1.00 | $1.00 | $1.00 |
| Income from Investment Operations | ||||||
| Net investment income (loss) | .001 | –A | –A | –A | –A | –A |
| Net realized and unrealized gain (loss) | .001B | .001 | –A | –A | –A | –A |
| Total from investment operations | .002 | .001 | –A | –A | –A | –A |
| Distributions from net investment income | (.001) | –A | –A | –A | –A | –A |
| Distributions from net realized gain | (.001) | (.001) | –A | –A | – | – |
| Total distributions | (.002) | (.001) | –A | –A | –A | –A |
| Net asset value, end of period | $1.00 | $1.00 | $1.00 | $1.00 | $1.00 | $1.00 |
| Total ReturnC,D | .20% | .08% | .03% | .02% | .01% | .01% |
| Ratios to Average Net AssetsE,F | ||||||
| Expenses before reductions | .27%G | .27% | .27% | .27% | .27% | .27% |
| Expenses net of fee waivers, if any | .23%G | .06% | .06% | .11% | .18% | .17% |
| Expenses net of all reductions | .23%G | .06% | .06% | .11% | .18% | .17% |
| Net investment income (loss) | .25%G | .01% | .01% | .01% | .01% | .01% |
| Supplemental Data | ||||||
| Net assets, end of period (in millions) | $– | $4 | $4 | $7 | $8 | $15 |
A Amount represents less than $.0005 per share.
B The amount shown for a share outstanding does not correspond with the aggregate net gain (loss) on investments for the period due to the timing of sales and repurchases of shares in relation to fluctuating market values of the investments of the Fund.
C Total returns for periods of less than one year are not annualized.
D Total returns would have been lower if certain expenses had not been reduced during the applicable periods shown.
E Fees and expenses of any underlying Fidelity Central Funds are not included in the Fund's expense ratio. The Fund indirectly bears its proportionate share of the expenses of any underlying Fidelity Central Funds.
F Expense ratios reflect operating expenses of the class. Expenses before reductions do not reflect amounts reimbursed or waived or reductions from expense offset arrangements and do not represent the amount paid by the class during periods when reimbursements, waivers or reductions occur. Expenses net of fee waivers reflect expenses after reimbursement and waivers but prior to reductions from expense offset arrangements. Expenses net of all reductions represent the net expenses paid by the class.
G Annualized
See accompanying notes which are an integral part of the financial statements.
Notes to Financial Statements (Unaudited)
For the period ended September 30, 2016
(Amounts in thousands except percentages)
1. Organization.
Treasury Only Portfolio, Treasury Portfolio, Government Portfolio, Money Market Portfolio, Prime Money Market Portfolio, Prime Reserves Portfolio and Tax-Exempt Portfolio (the Funds) are funds of Fidelity Colchester Street Trust (the Trust). Each Fund is authorized to issue an unlimited number of shares. The Trust is registered under the Investment Company Act of 1940, as amended (the 1940 Act), as an open-end management investment company organized as a Delaware statutory trust. Each Fund offers Class I, Class II, Class III and Select Class shares. Prime Money Market Portfolio, Treasury Only Portfolio and Treasury Portfolio also offer Class IV and Institutional Class shares. Government Portfolio, Money Market Portfolio and Prime Reserves Portfolio also offer Institutional Class shares. All classes have equal rights as to assets and voting privileges. Each Fund except for Tax-Exempt Portfolio offers conversion privileges from Class I to Institutional Class for eligible shareholders. Effective January 1, 2016, shares of the Money Market Portfolio and Tax-Exempt Portfolio are only available for purchase by retail shareholders. Each class has exclusive voting rights with respect to matters that affect that class.
Money Market Portfolio offered Class F shares during the period June 26, 2009 through May 20, 2016 and all outstanding shares were redeemed by May 20, 2016. All current fiscal period dollar and share amounts for Money Market Portfolio Class F presented in the Notes to Financial Statements are for the period April 1, 2016 to May 20, 2016.
In accordance with amendments to Rule 2a-7 of the 1940 Act, Prime Money Market Portfolio and Prime Reserves Portfolio have each been designated an institutional money market fund, and effective October 3, 2016 the value of their shares are calculated to four decimal places that fluctuates based upon changes in the value of their investments.
2. Investments in Fidelity Central Funds.
The Funds may invest in Fidelity Central Funds, which are open-end investment companies generally available only to other investment companies and accounts managed by the investment adviser and its affiliates. The Funds' Schedules of Investments list each of the Fidelity Central Funds held as of period end, if any, as an investment of each Fund, but do not include the underlying holdings of each Fidelity Central Fund. As an Investing Fund, each Fund indirectly bears its proportionate share of the expenses of the underlying Fidelity Central Funds.
The Money Market Central Funds seek preservation of capital and current income and are managed by Fidelity Investments Money Management, Inc. (FIMM), an affiliate of the investment adviser. Annualized expenses of the Money Market Central Funds as of their most recent shareholder report date are less than .005%.
A complete unaudited list of holdings for each Fidelity Central Fund is available upon request or at the Securities and Exchange Commission (the SEC) website at www.sec.gov. In addition, the financial statements of the Fidelity Central Funds, which are not covered by the Funds' Report of Independent Registered Public Accounting Firm, are available on the SEC website or upon request.
3. Significant Accounting Policies.
The financial statements have been prepared in conformity with accounting principles generally accepted in the United States of America (GAAP), which require management to make certain estimates and assumptions at the date of the financial statements. Actual results could differ from those estimates. Subsequent events, if any, through the date that the financial statements were issued have been evaluated in the preparation of the financial statements. The following summarizes the significant accounting policies of the Funds:
Investment Valuation. Each Fund categorizes the inputs to valuation techniques used to value its investments into a disclosure hierarchy consisting of three levels as shown below:
- Level 1 – quoted prices in active markets for identical investments
- Level 2 – other significant observable inputs (including quoted prices for similar investments, interest rates, prepayment speeds, etc.)
- Level 3 – unobservable inputs (including the Fund's own assumptions based on the best information available)
As permitted by compliance with certain conditions under Rule 2a-7 of the 1940 Act, securities are valued at amortized cost, which approximates fair value. The amortized cost of an instrument is determined by valuing it at its original cost and thereafter amortizing any discount or premium from its face value at a constant rate until maturity. Securities held by a money market fund are generally high quality and liquid; however, they are reflected as Level 2 because the inputs used to determine fair value are not quoted prices in an active market.
Investment Transactions and Income. Security transactions, including the Funds' investment activity in the Fidelity Central Funds, are accounted for as of trade date. Gains and losses on securities sold are determined on the basis of identified cost. Income and capital gain distributions from Fidelity Central Funds, if any, are recorded on the ex-dividend date. Interest income is accrued as earned and includes coupon interest and amortization of premium and accretion of discount on debt securities as applicable. The principal amount on inflation-indexed securities is periodically adjusted to the rate of inflation and interest is accrued based on the principal amount. The adjustments to principal due to inflation are reflected as increases or decreases to Interest in the accompanying Statement of Operations.
Class Allocations and Expenses. Investment income, realized and unrealized capital gains and losses, common expenses of each Fund, and certain fund-level expense reductions, if any, are allocated daily on a pro-rata basis to each class based on the relative net assets of each class to the total net assets of each Fund. Each class differs with respect to transfer agent and distribution and service plan fees incurred. Certain expense reductions may also differ by class. For the reporting period, the allocated portion of income and expenses to each class as a percent of its average net assets may vary due to the timing of recording these transactions in relation to fluctuating net assets of the classes. Expenses directly attributable to a fund are charged to that fund. Expenses attributable to more than one fund are allocated among the respective funds on the basis of relative net assets or other appropriate methods. Expense estimates are accrued in the period to which they relate and adjustments are made when actual amounts are known.
Deferred Trustee Compensation. Under a Deferred Compensation Plan (the Plan) for Treasury Portfolio, Government Portfolio, Money Market Portfolio, Prime Money Market Portfolio and Tax-Exempt Portfolio, independent Trustees may elect to defer receipt of a portion of their annual compensation. Deferred amounts are invested in a cross-section of Fidelity funds, are marked-to-market and remain in the Fund until distributed in accordance with the Plan. The investment of deferred amounts and the offsetting payable to the Trustees are included in the accompanying Statement of Assets and Liabilities.
Income Tax Information and Distributions to Shareholders. Each year, each Fund intends to qualify as a regulated investment company under Subchapter M of the Internal Revenue Code, including distributing substantially all of its taxable income and realized gains. As a result, no provision for U.S. Federal income taxes is required. Each Fund files a U.S. federal tax return, in addition to state and local tax returns as required. Each Fund's federal income tax returns are subject to examination by the Internal Revenue Service (IRS) for a period of three fiscal years after they are filed. State and local tax returns may be subject to examination for an additional fiscal year depending on the jurisdiction.
Dividends are declared and recorded daily and paid monthly from net investment income. Distributions from realized gains, if any, are declared and recorded on the ex-dividend date. Income dividends and capital gain distributions are declared separately for each class. Income and capital gain distributions are determined in accordance with income tax regulations, which may differ from GAAP.
Capital accounts within the financial statements are adjusted for permanent book-tax differences. These adjustments have no impact on net assets or the results of operations. Capital accounts are not adjusted for temporary book-tax differences which will reverse in a subsequent period.
Book-tax differences are primarily due to deferred trustees compensation, capital loss carryforwards and losses deferred due to wash sales and excise tax regulations.
The Tax-Exempt Portfolio purchases municipal securities whose interest, in the opinion of the issuer, is free from federal income tax. There is no assurance that the IRS will agree with this opinion. In the event the IRS determines that the issuer does not comply with relevant tax requirements, interest payments from a security could become federally taxable, possibly retroactively to the date the security was issued.
The federal tax cost of investment securities and unrealized appreciation (depreciation) as of period end were as follows for each Fund:
| Tax cost | Gross unrealized appreciation | Gross unrealized depreciation | Net unrealized appreciation (depreciation) on securities | |
| Treasury Only Portfolio | $13,635,979 | $– | $– | $– |
| Treasury Portfolio | 22,892,747 | – | – | – |
| Government Portfolio | 94,186,814 | – | – | – |
| Money Market Portfolio | 16,795,353 | – | – | – |
| Prime Money Market Portfolio | 14,030,383 | – | – | – |
| Prime Reserve Portfolio | 458,514 | – | – | – |
| Tax-Exempt Portfolio | 1,247,517 | – | – | – |
Capital loss carryforwards are only available to offset future capital gains of the Funds to the extent provided by regulations and may be limited. Under the Regulated Investment Company Modernization Act of 2010 (the Act), the Funds are permitted to carry forward capital losses incurred in taxable years beginning after December 22, 2010 for an unlimited period and such capital losses are required to be used prior to any losses that expire. The capital loss carryforward information presented below, including any applicable limitation, is estimated as of prior fiscal period end and is subject to adjustment.
| Fiscal year of expiration 2019 | |
| Government Portfolio | $(804) |
Repurchase Agreements. Pursuant to an Exemptive Order issued by the Securities and Exchange Commission (the SEC), the Funds along with other registered investment companies having management contracts with Fidelity Management and Research Company (FMR), an affiliate of SelectCo, or other affiliated entities of FMR, are permitted to transfer uninvested cash balances into joint trading accounts which are then invested in repurchase agreements. The Funds may also invest directly with institutions in repurchase agreements. For Treasury Only Portfolio, Treasury Portfolio and Government Portfolio, repurchase agreements may be collateralized by cash or government securities. For Money Market Portfolio, Prime Money Market Portfolio, Prime Reserves Portfolio and Tax-Exempt Portfolio, repurchase agreements may be collateralized by government or non-government securities. Upon settlement date, collateral is held in segregated accounts with custodian banks and may be obtained in the event of a default of the counterparty. Each applicable Fund monitors, on a daily basis, the value of the collateral to ensure it is at least equal to the principal amount of the repurchase agreement (including accrued interest). In the event of a default by the counterparty, realization of the collateral proceeds could be delayed, during which time the value of the collateral may decline.
Reverse Repurchase Agreements. To enhance their yield, the Funds may enter into reverse repurchase transactions under master repurchase agreements whereby the Fund sells securities to a counterparty in return for cash and agrees to repurchase those securities at a future date and agreed upon price. During the period that reverse repurchase transactions are outstanding, each applicable fund identifies the securities as pledged in its records with an initial value at least equal to its principal obligation under the agreement. The cash proceeds received by the Funds may be invested in other securities. To the extent cash proceeds received from the counterparty exceed the value of the securities sold, the counterparty may request additional collateral from the Fund. If the counterparty defaults on its obligation, because of insolvency or other reasons, the Fund could experience delays and costs in recovering the securities sold. Information regarding securities sold under a reverse repurchase agreement, if any, is included at the end of each applicable Fund's Schedule of Investments and the cash proceeds are recorded as a liability in each applicable fund's accompanying Statement of Assets and Liabilities. The Fund continues to receive interest and dividend payments on the securities sold during the term of the reverse repurchase agreement. At period end, there were no reverse repurchase agreements outstanding.
Delayed Delivery Transactions and When-Issued Securities. During the period, certain Funds transacted in securities on a delayed delivery or when-issued basis. Payment and delivery may take place after the customary settlement period for that security. The price of the underlying securities and the date when the securities will be delivered and paid for are fixed at the time the transaction is negotiated. The securities purchased on a delayed delivery or when-issued basis are identified as such in each applicable Fund's Schedule of Investments. The certain Funds may receive compensation for interest forgone in the purchase of a delayed delivery or when-issued security. With respect to purchase commitments, each applicable Fund identifies securities as segregated in its records with a value at least equal to the amount of the commitment. Losses may arise due to changes in the value of the underlying securities or if the counterparty does not perform under the contract's terms, or if the issuer does not issue the securities due to political, economic, or other factors.
Restricted Securities. The Funds may invest in securities that are subject to legal or contractual restrictions on resale. These securities generally may be resold in transactions exempt from registration or to the public if the securities are registered. Disposal of these securities may involve time-consuming negotiations and expense, and prompt sale at an acceptable price may be difficult. Information regarding restricted securities is included at the end of each applicable Fund's Schedule of Investments.
4. Fees and Other Transactions with Affiliates.
Management Fee. Fidelity Management & Research Company (the investment adviser) and its affiliates provide the Funds with investment management related services for which the Funds pay a monthly management fee that is based on an annual rate of .14% of average net assets.
Distribution and Service Plan Fees. In accordance with Rule 12b-1 of the 1940 Act, the Funds have adopted separate Distribution and Service Plans for each class of shares. Class II, Class III and Select Class of each Fund pays Fidelity Distributors Corporation (FDC), an affiliate of the investment adviser, a Service fee based on an annual percentage of each class' average net assets. Class IV of Treasury Only Portfolio, Treasury Portfolio and Prime Money Market Portfolio pays FDC separate Distribution and Service Fees, each of which is based on an annual percentage of each class' average net assets. FDC may pay financial intermediaries for selling shares of the Funds and providing shareholder support services. For the period, the Distribution and Service fee rates, total fees and amounts retained by FDC were as follows:
| Distribution Fee | Service Fee | |
| Class II | .00% | .15% |
| Class III | .00% | .25% |
| Class IV | .25% | .25% |
| Select Class | .00% | .05% |
| Total Fees | Retained by FDC | |
| Treasury Only Portfolio: | ||
| Class II | $205 | $11 |
| Class III | 1,000 | 263 |
| Class IV | 303 | 6 |
| Select Class | 45 | 20 |
| $1,553 | $300 | |
| Treasury Portfolio: | ||
| Class II | $250 | $19 |
| Class III | 3,227 | 762 |
| Class IV | 1,990 | – |
| Select Class | 72 | 5 |
| $5,539 | $786 | |
| Government Portfolio: | ||
| Class II | $573 | $256 |
| Class III | 2,747 | 906 |
| Select Class | 91 | 4 |
| $3,411 | $1,166 | |
| Money Market Portfolio: | ||
| Class II | $43 | $5 |
| Class III | 893 | 2 |
| Select Class | 24 | 19 |
| $960 | $26 | |
| Prime Money Market Portfolio: | ||
| Class II | $232 | $81 |
| Class III | 962 | 87 |
| Class IV | 262 | – |
| Select Class | 279 | 5 |
| $1,735 | $173 | |
| Prime Reserves Portfolio: | ||
| Class II | $–(a) | $–(a) |
| Class III | 1 | 1 |
| Select Class | –(a) | –(a) |
| $1 | $1 | |
| Tax-Exempt Portfolio: | ||
| Class II | $–(a) | $–(a) |
| Class III | 83 | 4 |
| Select Class | –(a) | –(a) |
| $83 | $4 |
(a) In the amount of less than five hundred dollars.
During the period, the investment adviser or its affiliates waived a portion of these fees.
Transfer Agent Fees. Fidelity Investments Institutional Operations Company, Inc. (FIIOC), an affiliate of the investment adviser, is the transfer, dividend disbursing and shareholder servicing agent for the Funds. FIIOC receives asset-based fees with respect to each account. FIIOC pays for typesetting, printing and mailing of all shareholder reports, except proxy statements. Each class, with the exception of Institutional Class, pays a transfer agent fee equal to an annual rate of .06% of class-level average net assets. Institutional Class pays a transfer agent fee equal to an annual rate of .03% of class-level average net assets. FIIOC receives no fees for providing transfer agency services to Class F. For the period, transfer agent fees for each class were as follows:
| Treasury Only Portfolio | |
| Class I | $2,727 |
| Class II | 82 |
| Class III | 240 |
| Class IV | 36 |
| Select Class | 54 |
| Institutional Class | 425 |
| $3,564 | |
| Treasury Portfolio | |
| Class I | $3,226 |
| Class II | 100 |
| Class III | 774 |
| Class IV | 239 |
| Select Class | 87 |
| Institutional Class | 567 |
| $4,993 | |
| Government Portfolio | |
| Class I | $7,753 |
| Class II | 229 |
| Class III | 659 |
| Select Class | 109 |
| Institutional Class | 4,517 |
| $13,267 | |
| Money Market Portfolio | |
| Class I | $3,607 |
| Class II | 17 |
| Class III | 214 |
| Select Class | 28 |
| Class F | – |
| Institutional Class | 2,165 |
| $6,031 | |
| Prime Money Market Portfolio | |
| Class I | $2,677 |
| Class II | 93 |
| Class III | 231 |
| Class IV | 31 |
| Select Class | 335 |
| Institutional Class | 6,959 |
| $10,326 | |
| Prime Reserves Portfolio | |
| Class I | $8 |
| Class II | –(a) |
| Class III | –(a) |
| Select Class | –(a) |
| Institutional Class | 25 |
| $33 | |
| Tax-Exempt Portfolio | |
| Class I | $373 |
| Class II | –(a) |
| Class III | 20 |
| Select Class | –(a) |
| $393 |
(a) In the amount of less than five hundred dollars.
Accounting Fees. Fidelity Service Company, Inc. (FSC), an affiliate of the investment adviser, maintains each Fund's accounting records. The fee is based on the level of average net assets for each month.
Interfund Lending Program. Pursuant to an Exemptive Order issued by the SEC, the Funds, along with other registered investment companies having management contracts with FMR or other affiliated entities of FMR, may participate in an interfund lending program. This program provides an alternative credit facility allowing the funds to borrow from, or lend money to, other participating affiliated funds. At period end, there were no interfund loans outstanding. Each applicable fund's activity in this program during the period for which loans were outstanding was as follows:
| Borrower or Lender | Average Loan Balance | Weighted Average Interest Rate | |
| Money Market Portfolio | Lender | $12,315 | .59% |
| Prime Reserves Portfolio | Lender | 8,612 | .59% |
Interfund Trades. The Funds may purchase from or sell securities to other Fidelity Funds under procedures adopted by the Board. The procedures have been designed to ensure these interfund trades are executed in accordance with Rule 17a-7 of the 1940 Act.
Other. During the period, the investment adviser reimbursed the Funds for certain losses as follows:
| Amount | |
| Government Portfolio | $1 |
| Prime Money Market Portfolio | 18 |
5. Expense Reductions.
The investment adviser contractually agreed to reimburse funds to the extent annual operating expenses exceeded certain levels of average net assets as noted in the table below. This reimbursement will remain in place through May 31, 2017. Some expenses, for example interest expense, are excluded from this reimbursement.
The following classes of each applicable Fund were in reimbursement during the period:
| Expense Limitations | Reimbursement | |
| Treasury Only Portfolio | ||
| Class I | .18% | $1,480 |
| Class II | .33% | 44 |
| Class III | .43% | 129 |
| Class IV | .68% | 29 |
| Select Class | .23% | 30 |
| Institutional Class | .14% | 596 |
| Treasury Portfolio | ||
| Class I | .18% | $1,608 |
| Class II | .33% | 54 |
| Class III | .43% | 380 |
| Class IV | .68% | 117 |
| Select Class | .23% | 43 |
| Institutional Class | .14% | 756 |
| Government Portfolio | ||
| Class I | .18% | $3,395 |
| Class II | .33% | 99 |
| Class III | .43% | 283 |
| Select Class | .23% | 48 |
| Institutional Class | .14% | 5,470 |
| Money Market Portfolio | ||
| Class I | .18% | $1,790 |
| Class II | .33% | 8 |
| Class III | .43% | 106 |
| Select Class | .23% | 14 |
| Class F | .14% | 20 |
| Institutional Class | .14% | 2,885 |
| Prime Money Market Portfolio | ||
| Class I | .18% | $1,174 |
| Class II | .33% | 41 |
| Class III | .43% | 95 |
| Class IV | .68% | 12 |
| Select Class | .23% | 143 |
| Institutional Class | .14% | 8,425 |
| Prime Reserves Portfolio | ||
| Class I | .18% | $24 |
| Class II | .33% | 2 |
| Class III | .43% | 2 |
| Select Class | .23% | 2 |
| Institutional Class | .14% | 161 |
| Tax-Exempt Portfolio | ||
| Class I | .18% | $275 |
| Class II | .33% | –(a) |
| Class III | .43% | 15 |
| Select Class | .23% | –(a) |
(a) In the amount of less than five hundred dollars.
Additionally, the investment adviser or its affiliates voluntarily agreed to waive certain fees in order to maintain a minimum annualized yield of .01%. Such arrangements may be discontinued by the investment adviser at any time. For the period, the amount of the waiver for each class was as follows:
| Treasury Only Portfolio | |
| Class II | $3 |
| Class III | 371 |
| Class IV | 209 |
| Treasury Portfolio | |
| Class III | 853 |
| Class IV | 1,259 |
| Government Portfolio | |
| Class III | 115 |
| Prime Money Market Portfolio | |
| Class IV | 53 |
| Prime Reserves Portfolio | |
| Class III | –(a) |
| Tax-Exempt Portfolio | |
| Class III | 13 |
(a) In the amount of less than five hundred dollars.
In addition, through arrangements with each applicable Fund's custodian, credits realized as a result of certain uninvested cash balances were used to reduce each Fund's expenses. All of the applicable expense reductions are noted in the table below.
| Custody expense reduction | |
| Treasury Only Portfolio | $2 |
| Treasury Portfolio | – |
| Government Portfolio | – |
| Money Market Portfolio | 1 |
| Prime Money Market Portfolio | 1 |
| Prime Reserves Portfolio | – |
| Tax-Exempt Portfolio | 6 |
6. Distributions to Shareholders.
Distributions to shareholders of each class were as follows:
| Six months ended September 30, 2016 | Year ended March 31, 2016 | |
| Treasury Only Portfolio | ||
| From net investment income | ||
| Class I | $7,587 | $3,944 |
| Class II | 25 | 33 |
| Class III | 40 | 69 |
| Class IV | 6 | 33 |
| Select Class | 104 | 39 |
| Institutional Class | 2,950 | 497 |
| Total | $10,712 | $4,615 |
| Treasury Portfolio | ||
| From net investment income | ||
| Class I | $10,482 | $5,136 |
| Class II | 70 | 64 |
| Class III | 129 | 271 |
| Class IV | 40 | 69 |
| Select Class | 210 | 87 |
| Institutional Class | 4,482 | 1,117 |
| Total | $15,413 | $6,744 |
| Government Portfolio | ||
| From net investment income | ||
| Class I | $32,719 | $13,726 |
| Class II | 394 | 81 |
| Class III | 133 | 189 |
| Select Class | 370 | 117 |
| Institutional Class | 44,238 | 6,390 |
| Total | $77,854 | $20,503 |
| Money Market Portfolio | ||
| From net investment income | ||
| Class I | $23,820 | $39,384 |
| Class II | 74 | 59 |
| Class III | 407 | 437 |
| Select Class | 143 | 412 |
| Class F | 1,013 | 5,349 |
| Institutional Class | 32,337 | 77,126 |
| Total | $57,794 | $122,767 |
| Prime Money Market Portfolio | ||
| From net investment income | ||
| Class I | $17,953 | $17,794 |
| Class II | 383 | 178 |
| Class III | 592 | 324 |
| Class IV | 5 | 19 |
| Select Class | 1,982 | 1,387 |
| Institutional Class | 103,064 | 81,754 |
| Total | $123,979 | $101,456 |
| From net realized gain | ||
| Class I | $1,803 | $– |
| Class II | 141 | – |
| Class III | 148 | – |
| Select Class | 20 | – |
| Institutional Class | 8,238 | – |
| Total | $10,350 | $– |
| Prime Reserves Portfolio(a) | ||
| From net investment income | ||
| Class I | $51 | $– |
| Class II | 1 | – |
| Select Class | 1 | – |
| Institutional Class | 346 | – |
| Total | $399 | $– |
| Tax-Exempt Portfolio | ||
| From net investment income | ||
| Class I | $1,914 | $256 |
| Class II | –(b) | 1 |
| Class III | 9 | 30 |
| Select Class | 1 | – |
| Total | $1,924 | $287 |
| From net realized gain | ||
| Class I | $980 | $1,590 |
| Class II | –(b) | 6 |
| Class III | 60 | 215 |
| Select Class | –(b) | 3 |
| Total | $1,040 | $1,814 |
(a) Distributions are for the period June 2, 2016 (commencement of operations) to September 30, 2016.
(b) In the amount of less than five hundred dollars.
7. Share Transactions.
Share transactions for each class of shares at a $1.00 per share were as follows and may contain automatic conversions between classes or exchanges between affiliated funds:
| Six months ended September 30, 2016 | Year ended March 31, 2016 | |
| Treasury Only Portfolio | ||
| Class I | ||
| Shares sold | 8,022,415 | 23,930,981 |
| Reinvestment of distributions | 5,024 | 2,493 |
| Shares redeemed | (9,394,420) | (23,300,949) |
| Net increase (decrease) | (1,366,981) | 632,525 |
| Class II | ||
| Shares sold | 174,496 | 468,539 |
| Reinvestment of distributions | 13 | 16 |
| Shares redeemed | (251,387) | (471,381) |
| Net increase (decrease) | (76,878) | (2,826) |
| Class III | ||
| Shares sold | 2,488,665 | 3,609,622 |
| Reinvestment of distributions | 14 | 22 |
| Shares redeemed | (2,319,012) | (3,413,941) |
| Net increase (decrease) | 169,667 | 195,703 |
| Class IV | ||
| Shares sold | 58,913 | 575,857 |
| Reinvestment of distributions | 6 | 33 |
| Shares redeemed | (349,263) | (351,664) |
| Net increase (decrease) | (290,344) | 224,226 |
| Select Class | ||
| Shares sold | 574,370 | 1,886,187 |
| Reinvestment of distributions | 59 | 33 |
| Shares redeemed | (592,503) | (1,900,313) |
| Net increase (decrease) | (18,074) | (14,093) |
| Institutional Class | ||
| Shares sold | 3,685,503 | 2,583,114 |
| Reinvestment of distributions | 1,280 | 334 |
| Shares redeemed | (2,075,724) | (778,317) |
| Net increase (decrease) | 1,611,059 | 1,805,131 |
| Treasury Portfolio | ||
| Class I | ||
| Shares sold | 39,242,371 | 77,692,489 |
| Reinvestment of distributions | 3,335 | 2,220 |
| Shares redeemed | (36,381,944) | (79,782,544) |
| Net increase (decrease) | 2,863,762 | (2,087,835) |
| Class II | ||
| Shares sold | 1,863,425 | 3,132,744 |
| Reinvestment of distributions | 2 | 1 |
| Shares redeemed | (2,147,525) | (2,646,421) |
| Net increase (decrease) | (284,098) | 486,324 |
| Class III | ||
| Shares sold | 4,143,281 | 8,969,249 |
| Reinvestment of distributions | 21 | 35 |
| Shares redeemed | (4,278,787) | (8,974,000) |
| Net increase (decrease) | (135,485) | (4,716) |
| Class IV | ||
| Shares sold | 502,129 | 1,359,716 |
| Reinvestment of distributions | –(a) | – |
| Shares redeemed | (529,129) | (1,075,523) |
| Net increase (decrease) | (27,000) | 284,193 |
| Select Class | ||
| Shares sold | 807,580 | 1,469,924 |
| Reinvestment of distributions | 58 | 49 |
| Shares redeemed | (763,254) | (1,407,519) |
| Net increase (decrease) | 44,384 | 62,454 |
| Institutional Class | ||
| Shares sold | 14,762,699 | 8,440,821 |
| Reinvestment of distributions | 3,616 | 954 |
| Shares redeemed | (11,863,317) | (5,906,037) |
| Net increase (decrease) | 2,902,998 | 2,535,738 |
| Government Portfolio | ||
| Class I | ||
| Shares sold | 88,904,072 | 140,405,028 |
| Reinvestment of distributions | 9,064 | 5,103 |
| Shares redeemed | (78,468,982) | (137,697,131) |
| Net increase (decrease) | 10,444,154 | 2,713,000 |
| Class II | ||
| Shares sold | 2,875,457 | 7,709,478 |
| Reinvestment of distributions | 45 | 22 |
| Shares redeemed | (2,435,369) | (7,763,586) |
| Net increase (decrease) | 440,133 | (54,086) |
| Class III | ||
| Shares sold | 3,637,138 | 5,143,852 |
| Reinvestment of distributions | 39 | 43 |
| Shares redeemed | (2,757,728) | (5,306,134) |
| Net increase (decrease) | 879,449 | (162,239) |
| Select Class | ||
| Shares sold | 1,140,213 | 1,343,910 |
| Reinvestment of distributions | 147 | 74 |
| Shares redeemed | (797,278) | (1,744,490) |
| Net increase (decrease) | 343,082 | (400,506) |
| Institutional Class | ||
| Shares sold | 141,404,423 | 109,287,709 |
| Reinvestment of distributions | 31,872 | 4,948 |
| Shares redeemed | (103,448,953) | (91,519,927) |
| Net increase (decrease) | 37,987,342 | 17,772,730 |
| Money Market Portfolio | ||
| Class I | ||
| Shares sold | 7,509,199 | 98,348,331 |
| Reinvestment of distributions | 18,051 | 28,391 |
| Shares redeemed | (20,856,902) | (100,118,863) |
| Net increase (decrease) | (13,329,652) | (1,742,141) |
| Class II | ||
| Shares sold | 87,697 | 952,260 |
| Reinvestment of distributions | 61 | 45 |
| Shares redeemed | (130,367) | (971,326) |
| Net increase (decrease) | (42,609) | (19,021) |
| Class III | ||
| Shares sold | 1,216,005 | 8,694,671 |
| Reinvestment of distributions | 145 | 134 |
| Shares redeemed | (2,214,374) | (9,019,943) |
| Net increase (decrease) | (998,224) | (325,138) |
| Select Class | ||
| Shares sold | 218,264 | 888,733 |
| Reinvestment of distributions | 30 | 77 |
| Shares redeemed | (431,871) | (1,071,857) |
| Net increase (decrease) | (213,577) | (183,047) |
| Class F | ||
| Shares sold | 129,619 | 1,731,609 |
| Reinvestment of distributions | 713 | 5,349 |
| Shares redeemed | (2,434,015) | (1,496,721) |
| Net increase (decrease) | (2,303,683) | 240,237 |
| Institutional Class | ||
| Shares sold | 17,183,145 | 194,088,843 |
| Reinvestment of distributions | 26,817 | 54,657 |
| Shares redeemed | (29,890,685) | (209,197,535) |
| Net increase (decrease) | (12,680,723) | (15,054,035) |
| Prime Money Market Portfolio | ||
| Class I | ||
| Shares sold | 70,640,777 | 117,973,183 |
| Reinvestment of distributions | 6,769 | 6,449 |
| Shares redeemed | (77,733,115) | (114,578,138) |
| Net increase (decrease) | (7,085,569) | 3,401,494 |
| Class II | ||
| Shares sold | 3,614,058 | 1,906,686 |
| Reinvestment of distributions | 53 | 32 |
| Shares redeemed | (3,688,345) | (2,115,257) |
| Net increase (decrease) | (74,234) | (208,539) |
| Class III | ||
| Shares sold | 2,620,678 | 5,517,790 |
| Reinvestment of distributions | 120 | 62 |
| Shares redeemed | (3,260,596) | (5,634,833) |
| Net increase (decrease) | (639,798) | (116,981) |
| Class IV | ||
| Shares sold | 39,312 | 136,156 |
| Reinvestment of distributions | 5 | 19 |
| Shares redeemed | (223,046) | (159,570) |
| Net increase (decrease) | (183,729) | (23,395) |
| Select Class | ||
| Shares sold | 3,813,116 | 6,946,481 |
| Reinvestment of distributions | 885 | 587 |
| Shares redeemed | (4,543,461) | (7,244,431) |
| Net increase (decrease) | (729,460) | (297,363) |
| Institutional Class | ||
| Shares sold | 204,610,033 | 505,615,310 |
| Reinvestment of distributions | 59,654 | 48,811 |
| Shares redeemed | (240,137,319) | (491,707,571) |
| Net increase (decrease) | (35,467,632) | 13,956,550 |
| Prime Reserves Portfolio(b) | ||
| Class I | ||
| Shares sold | 153,878 | – |
| Reinvestment of distributions | 39 | – |
| Shares redeemed | (49,847) | – |
| Net increase (decrease) | 104,070 | – |
| Class II | ||
| Shares sold | 1,000 | – |
| Reinvestment of distributions | 1 | – |
| Shares redeemed | – | – |
| Net increase (decrease) | 1,001 | – |
| Class III | ||
| Shares sold | 1,000 | – |
| Reinvestment of distributions | –(a) | – |
| Shares redeemed | – | – |
| Net increase (decrease) | 1,000 | – |
| Select Class | ||
| Shares sold | 1,000 | – |
| Reinvestment of distributions | 1 | – |
| Shares redeemed | – | – |
| Net increase (decrease) | 1,001 | – |
| Institutional Class | ||
| Shares sold | 848,535 | – |
| Reinvestment of distributions | 331 | – |
| Shares redeemed | (476,691) | – |
| Net increase (decrease) | 372,175 | – |
| Tax-Exempt Portfolio | ||
| Class I | ||
| Shares sold | 956,654 | 3,853,663 |
| Reinvestment of distributions | 1,859 | 864 |
| Shares redeemed | (1,130,642) | (4,589,991) |
| Net increase (decrease) | (172,129) | (735,464) |
| Class II | ||
| Shares sold | 67 | 398 |
| Reinvestment of distributions | 1 | 7 |
| Shares redeemed | (447) | (12,033) |
| Net increase (decrease) | (379) | (11,628) |
| Class III | ||
| Shares sold | 109,285 | 2,845,086 |
| Reinvestment of distributions | 29 | 74 |
| Shares redeemed | (318,199) | (2,914,558) |
| Net increase (decrease) | (208,885) | (69,398) |
| Select Class | ||
| Shares sold | 2,064 | 30,765 |
| Reinvestment of distributions | –(a) | 1 |
| Shares redeemed | (5,762) | (31,384) |
| Net increase (decrease) | (3,698) | (618) |
(a) In the amount of less than five hundred shares.
(b) Share transactions are for the period June 2, 2016 (commencement of operations) to September 30, 2016.
8. Other.
The Funds' organizational documents provide former and current trustees and officers with a limited indemnification against liabilities arising in connection with the performance of their duties to the Funds. In the normal course of business, the Funds may also enter into contracts that provide general indemnifications. The Funds' maximum exposure under these arrangements is unknown as this would be dependent on future claims that may be made against the Funds. The risk of material loss from such claims is considered remote.
Shareholder Expense Example
As a shareholder of a Fund, you incur two types of costs: (1) transaction costs and (2) ongoing costs, including management fees, distribution and/or service (12b-1) fees and other Fund expenses. This Example is intended to help you understand your ongoing costs (in dollars) of investing in the Funds and to compare these costs with the ongoing costs of investing in other mutual funds.
The actual expense Example is based on an investment of $1,000 invested at the beginning of the period and held for the entire period (April 1, 2016 to September 30, 2016), except for Prime Reserves Portfolio. For Prime Reserves Portfolio, the actual expense Example is based on an investment of $1,000 invested at the beginning of the period and held for the entire period (June 2, 2016 to September 30, 2016). The hypothetical expense Example is based on an investment of $1,000 invested for the one-half year period (April 1, 2016 to September 30, 2016).
Actual Expenses
The first line of the accompanying table for each class of each fund provides information about actual account values and actual expenses. You may use the information in this line, together with the amount you invested, to estimate the expenses that you paid over the period. Simply divide your account value by $1,000.00 (for example, an $8,600 account value divided by $1,000.00 = 8.6), then multiply the result by the number in the first line for a class of the fund under the heading entitled "Expenses Paid During Period" to estimate the expenses you paid on your account during this period. In addition, each Fund, as a shareholder in the underlying Fidelity Central Funds, will indirectly bear its pro-rata share of the fees and expenses incurred by the underlying Fidelity Central Funds. These fees and expenses are not included in the Fund's annualized expense ratio used to calculate the expense estimate in the table below.
Hypothetical Example for Comparison Purposes
The second line of the accompanying table for each class of each fund provides information about hypothetical account values and hypothetical expenses based on a Class' actual expense ratio and an assumed rate of return of 5% per year before expenses, which is not the Class' actual return. The hypothetical account values and expenses may not be used to estimate the actual ending account balance or expenses you paid for the period. You may use this information to compare the ongoing costs of investing in the Fund and other funds. To do so, compare this 5% hypothetical example with the 5% hypothetical examples that appear in the shareholder reports of the other funds. In addition, each Fund, as a shareholder in the underlying Fidelity Central Funds, will indirectly bear its pro-rata share of the fees and expenses incurred by the underlying Fidelity Central Funds. These fees and expenses are not included in the Fund's annualized expense ratio used to calculate the expense estimate in the table below.
Please note that the expenses shown in the table are meant to highlight your ongoing costs only and do not reflect any transaction costs. Therefore, the second line of the table is useful in comparing ongoing costs only, and will not help you determine the relative total costs of owning different funds.
| Annualized Expense Ratio-A | Beginning Account Value | Ending Account Value September 30, 2016 | Expenses Paid During Period | |
| Treasury Only Portfolio | ||||
| Class I | .18% | |||
| Actual | $1,000.00 | $1,000.80 | $.90-B | |
| Hypothetical-C | $1,000.00 | $1,024.17 | $.91-B | |
| Class II | .33% | |||
| Actual | $1,000.00 | $1,000.10 | $1.65-B | |
| Hypothetical-C | $1,000.00 | $1,023.41 | $1.67-B | |
| Class III | .34% | |||
| Actual | $1,000.00 | $1,000.10 | $1.70-B | |
| Hypothetical-C | $1,000.00 | $1,023.36 | $1.72-B | |
| Class IV | .32% | |||
| Actual | $1,000.00 | $1,000.10 | $1.60-B | |
| Hypothetical-C | $1,000.00 | $1,023.46 | $1.62-B | |
| Select Class | .23% | |||
| Actual | $1,000.00 | $1,000.60 | $1.15-B | |
| Hypothetical-C | $1,000.00 | $1,023.92 | $1.17-B | |
| Institutional Class | .14% | |||
| Actual | $1,000.00 | $1,001.00 | $.70-B | |
| Hypothetical-C | $1,000.00 | $1,024.37 | $.71-B | |
| Treasury Portfolio | ||||
| Class I | .18% | |||
| Actual | $1,000.00 | $1,001.00 | $.90-B | |
| Hypothetical-C | $1,000.00 | $1,024.17 | $.91-B | |
| Class II | .33% | |||
| Actual | $1,000.00 | $1,000.20 | $1.65-B | |
| Hypothetical-C | $1,000.00 | $1,023.41 | $1.67-B | |
| Class III | .36% | |||
| Actual | $1,000.00 | $1,000.10 | $1.81-B | |
| Hypothetical-C | $1,000.00 | $1,023.26 | $1.83-B | |
| Class IV | .36% | |||
| Actual | $1,000.00 | $1,000.10 | $1.81-B | |
| Hypothetical-C | $1,000.00 | $1,023.26 | $1.83-B | |
| Select Class | .23% | |||
| Actual | $1,000.00 | $1,000.70 | $1.15-B | |
| Hypothetical-C | $1,000.00 | $1,023.92 | $1.17-B | |
| Institutional Class | .14% | |||
| Actual | $1,000.00 | $1,001.20 | $.70-B | |
| Hypothetical-C | $1,000.00 | $1,024.37 | $.71-B | |
| Government Portfolio | ||||
| Class I | .18% | |||
| Actual | $1,000.00 | $1,001.30 | $.90-B | |
| Hypothetical-C | $1,000.00 | $1,024.17 | $.91-B | |
| Class II | .33% | |||
| Actual | $1,000.00 | $1,000.50 | $1.65-B | |
| Hypothetical-C | $1,000.00 | $1,023.41 | $1.67-B | |
| Class III | .42% | |||
| Actual | $1,000.00 | $1,000.10 | $2.11-B | |
| Hypothetical-C | $1,000.00 | $1,022.96 | $2.13-B | |
| Select Class | .23% | |||
| Actual | $1,000.00 | $1,001.00 | $1.15-B | |
| Hypothetical-C | $1,000.00 | $1,023.92 | $1.17-B | |
| Institutional Class | .14% | |||
| Actual | $1,000.00 | $1,001.50 | $.70-B | |
| Hypothetical-C | $1,000.00 | $1,024.37 | $.71-B | |
| Money Market Portfolio | ||||
| Class I | .18% | |||
| Actual | $1,000.00 | $1,002.10 | $.90-B | |
| Hypothetical-C | $1,000.00 | $1,024.17 | $.91-B | |
| Class II | .33% | |||
| Actual | $1,000.00 | $1,001.40 | $1.66-B | |
| Hypothetical-C | $1,000.00 | $1,023.41 | $1.67-B | |
| Class III | .43% | |||
| Actual | $1,000.00 | $1,000.90 | $2.16-B | |
| Hypothetical-C | $1,000.00 | $1,022.91 | $2.18-B | |
| Select Class | .23% | |||
| Actual | $1,000.00 | $1,001.90 | $1.15-B | |
| Hypothetical-C | $1,000.00 | $1,023.92 | $1.17-B | |
| Institutional Class | .14% | |||
| Actual | $1,000.00 | $1,002.30 | $.70-B | |
| Hypothetical-C | $1,000.00 | $1,024.37 | $.71-B | |
| Prime Money Market Portfolio | ||||
| Class I | .18% | |||
| Actual | $1,000.00 | $1,002.20 | $.90-B | |
| Hypothetical-C | $1,000.00 | $1,024.17 | $.91-B | |
| Class II | .33% | |||
| Actual | $1,000.00 | $1,001.60 | $1.66-B | |
| Hypothetical-C | $1,000.00 | $1,023.41 | $1.67-B | |
| Class III | .43% | |||
| Actual | $1,000.00 | $1,000.90 | $2.16-B | |
| Hypothetical-C | $1,000.00 | $1,022.91 | $2.18-B | |
| Class IV | .58% | |||
| Actual | $1,000.00 | $1,000.10 | $2.91-B | |
| Hypothetical-C | $1,000.00 | $1,022.16 | $2.94-B | |
| Select Class | .23% | |||
| Actual | $1,000.00 | $1,001.80 | $1.15-B | |
| Hypothetical-C | $1,000.00 | $1,023.92 | $1.17-B | |
| Institutional Class | .14% | |||
| Actual | $1,000.00 | $1,002.40 | $.70-B | |
| Hypothetical-C | $1,000.00 | $1,024.37 | $.71-B | |
| Prime Reserves Portfolio | ||||
| Class I | .18% | |||
| Actual | $1,000.00 | $1,001.20 | $.60-D | |
| Hypothetical-C | $1,000.00 | $1,024.17 | $.91-B | |
| Class II | .33% | |||
| Actual | $1,000.00 | $1,000.70 | $1.09-D | |
| Hypothetical-C | $1,000.00 | $1,023.41 | $1.67-B | |
| Class III | .43% | |||
| Actual | $1,000.00 | $1,000.30 | $1.43-D | |
| Hypothetical-C | $1,000.00 | $1,022.91 | $2.18-B | |
| Select Class | .23% | |||
| Actual | $1,000.00 | $1,001.00 | $.76-D | |
| Hypothetical-C | $1,000.00 | $1,023.92 | $1.17-B | |
| Institutional Class | .14% | |||
| Actual | $1,000.00 | $1,001.30 | $.46-D | |
| Hypothetical-C | $1,000.00 | $1,024.37 | $.71-B | |
| Tax-Exempt Portfolio | ||||
| Class I | .18% | |||
| Actual | $1,000.00 | $1,002.30 | $.90-B | |
| Hypothetical-C | $1,000.00 | $1,024.17 | $.91-B | |
| Class II | .33% | |||
| Actual | $1,000.00 | $1,001.50 | $1.66-B | |
| Hypothetical-C | $1,000.00 | $1,023.41 | $1.67-B | |
| Class III | .39% | |||
| Actual | $1,000.00 | $1,001.10 | $1.96-B | |
| Hypothetical-C | $1,000.00 | $1,023.11 | $1.98-B | |
| Select Class | .23% | |||
| Actual | $1,000.00 | $1,002.00 | $1.15-B | |
| Hypothetical-C | $1,000.00 | $1,023.92 | $1.17-B | |
A Annualized expense ratio reflects expenses net of applicable fee waivers.
B Expenses are equal to each Class' annualized expense ratio, multiplied by the average account value over the period, multiplied by 183/365 (to reflect the one-half year period).
C 5% return per year before expenses
D Actual expenses are equal to each Class' annualized expense ratio, multiplied by the average account value over the period, multiplied by 121/365 (to reflect the period June 2, 2016 to September 30, 2016).
Board Approval of Investment Advisory Contracts and Management Fees
FIMM Funds: Government Portfolio / Money Market Portfolio / Prime Money Market Portfolio / Tax-Exempt Portfolio / Treasury Portfolio / Treasury Only Portfolio
Each year, the Board of Trustees, including the Independent Trustees (together, the Board), votes on the renewal of the management contract with Fidelity Management & Research Company (FMR) and the sub-advisory agreements (together, the Advisory Contracts) for each fund. The Board, assisted by the advice of fund counsel and Independent Trustees' counsel, requests and considers a broad range of information relevant to the renewal of the Advisory Contracts throughout the year.
The Board meets regularly and, at each of its meetings, covers an extensive agenda of topics and materials and considers factors that are relevant to its annual consideration of the renewal of each fund's Advisory Contracts, including the services and support provided to each fund and its shareholders. The Board has established four standing committees (Committees) — Operations, Audit, Fair Valuation, and Governance and Nominating — each composed of and chaired by Independent Trustees with varying backgrounds, to which the Board has assigned specific subject matter responsibilities in order to enhance effective decision-making by the Board. The Operations Committee, of which all of the Independent Trustees are members, meets regularly throughout the year and considers, among other matters, information specifically related to the annual consideration of the renewal of each fund's Advisory Contracts. The Board, acting directly and through its Committees, requests and receives information concerning the annual consideration of the renewal of each fund's Advisory Contracts. The Board also meets as needed to consider matters specifically related to the Board's annual consideration of the renewal of the Advisory Contracts. Members of the Board may also meet with trustees of other Fidelity funds through ad hoc joint committees to discuss certain matters relevant to all of the Fidelity funds.
At its September 2016 meeting, the Board unanimously determined to renew each fund's Advisory Contracts. In reaching its determination, the Board considered all factors it believed relevant, including (i) the nature, extent, and quality of the services to be provided to each fund and its shareholders (including the investment performance of each fund); (ii) the competitiveness of each fund's management fee and total expense ratio relative to peer funds; (iii) the total costs of the services to be provided by and the profits to be realized by Fidelity from its relationships with each fund; and (iv) the extent to which, if any, economies of scale exist and would be realized as each fund grows, and whether any economies of scale are appropriately shared with fund shareholders.
In considering whether to renew the Advisory Contracts for each fund, the Board reached a determination, with the assistance of fund counsel and Independent Trustees' counsel and through the exercise of its business judgment, that the renewal of the Advisory Contracts was in the best interests of each fund and its shareholders and that the compensation payable under the Advisory Contracts was fair and reasonable. The Board's decision to renew the Advisory Contracts was not based on any single factor, but rather was based on a comprehensive consideration of all the information provided to the Board at its meetings throughout the year. The Board, in reaching its determination to renew the Advisory Contracts, was aware that shareholders of each fund have a broad range of investment choices available to them, including a wide choice among funds offered by Fidelity's competitors, and that each fund's shareholders, who have the opportunity to review and weigh the disclosure provided by the fund in its prospectus and other public disclosures, have chosen to invest in that fund, which is part of the Fidelity family of funds.
Nature, Extent, and Quality of Services Provided. The Board considered Fidelity's staffing as it relates to the funds, including the backgrounds of investment personnel of Fidelity, and also considered the funds' investment objectives, strategies, and related investment philosophies. The Independent Trustees also had discussions with senior management of Fidelity's investment operations and investment groups. The Board considered the structure of the investment personnel compensation program and whether this structure provides appropriate incentives to act in the best interests of each fund. Additionally, the Board considered the portfolio managers' investments, if any, in the funds that they manage.Resources Dedicated to Investment Management and Support Services. The Board reviewed the general qualifications and capabilities of Fidelity's investment staff, including its size, education, experience, and resources, as well as Fidelity's approach to recruiting, managing, and compensating investment personnel. The Board noted that Fidelity has continued to increase the resources devoted to non-U.S. offices, including expansion of Fidelity's global investment organization. The Board also noted that Fidelity's analysts have extensive resources, tools and capabilities that allow them to conduct sophisticated quantitative and fundamental analysis, as well as credit analysis of issuers, counterparties and guarantors. Further, the Board considered that Fidelity's investment professionals have sufficient access to global information and data so as to provide competitive investment results over time, and that those professionals also have access to sophisticated tools that permit them to assess portfolio construction and risk and performance attribution characteristics continuously, as well as to transmit new information and research conclusions rapidly around the world. Additionally, in its deliberations, the Board considered Fidelity's trading, risk management, compliance, and technology and operations capabilities and resources, which are integral parts of the investment management process.Shareholder and Administrative Services. The Board considered (i) the nature, extent, quality, and cost of advisory, administrative, and shareholder services performed by FMR, the sub-advisers (together with FMR, the Investment Advisers), and their affiliates under the Advisory Contracts and under separate agreements covering transfer agency and pricing and bookkeeping services for each fund; (ii) the nature and extent of the supervision of third party service providers, principally custodians, subcustodians, and pricing vendors; and (iii) the resources devoted to, and the record of compliance with, each fund's compliance policies and procedures.The Board noted that the growth of fund assets over time across the complex allows Fidelity to reinvest in the development of services designed to enhance the value or convenience of the Fidelity funds as investment vehicles. These services include 24-hour access to account information and market information through telephone representatives and over the Internet, investor education materials and asset allocation tools, and the expanded availability of Fidelity Investor Centers.Investment in a Large Fund Family. The Board considered the benefits to shareholders of investing in a Fidelity fund, including the benefits of investing in a fund that is part of a large family of funds offering a variety of investment disciplines and providing a large variety of mutual fund investor services. The Board noted that Fidelity had taken, or had made recommendations that resulted in the Fidelity funds taking, a number of actions over the previous year that benefited particular funds, including: (i) continuing to dedicate additional resources to investment research and to the support of the senior management team that oversees asset management; (ii) continuing efforts to enhance Fidelity's global research capabilities; (iii) launching new funds and making other enhancements to meet client needs; (iv) broadening eligibility requirements for certain lower-priced share classes of, and streamlining the fee structure for, certain existing equity index funds; (v) lowering expense caps for certain existing funds and classes to reduce expenses paid by shareholders; (vi) eliminating redemption fees for certain variable insurance product funds and classes; (vii) continuing to launch dedicated lower cost underlying funds to meet portfolio construction needs related to expanding underlying fund options for Fidelity funds of funds, specifically for the Freedom Fund product lines; (viii) launching a lower cost share class for use by the Freedom Index Fund product line; (ix) rationalizing product lines and gaining increased efficiencies through fund mergers and share class consolidations; (x) continuing to develop, acquire and implement systems and technology to improve services to the funds and shareholders, strengthen information security, and increase efficiency; (xi) implementing investment enhancements to further strengthen Fidelity's target date product line to increase investors' probability of success in achieving their goals; (xii) accelerating the conversion of all remaining Class B shares to Class A shares, which have a lower expense structure; and (xiii) implementing changes to Fidelity's money market fund product line in response to recent regulatory reforms.Investment Performance. The Board considered whether each fund has operated in accordance with its investment objective, as well as its record of compliance with its investment restrictions and its performance history.The Board took into account discussions with representatives of the Investment Advisers about fund investment performance that occur at Board meetings throughout the year. In this regard the Board noted that as part of regularly scheduled fund reviews and other reports to the Board on fund performance, the Board considers annualized return information for each fund for different time periods, measured against a peer group of funds with similar objectives ("peer group").In addition to reviewing absolute and relative fund performance, the Independent Trustees periodically consider the appropriateness of fund performance metrics in evaluating the results achieved. In general, the Independent Trustees believe that fund performance should be evaluated based on gross performance (before fees and expenses but after transaction costs) compared to the gross performance of appropriate peer groups, over appropriate time periods that may include full market cycles, taking into account relevant factors including the following: general market conditions; expectations for interest rate levels and credit conditions; issuer-specific information including credit quality; the fund's market value NAV over time and its resilience under various stressed conditions; and fund cash flows and other factors.The Board recognizes that in interest rate environments where many competitors waive fees to maintain a minimum yield, relative money market fund performance on a net basis (after fees and expenses) may not be particularly meaningful due to miniscule performance differences among competitor funds. Depending on the circumstances, the Independent Trustees may be satisfied with a fund's performance notwithstanding that it lags its peer group for certain periods.The Independent Trustees recognize that shareholders evaluate performance on a net basis over their own holding periods, for which one-, three-, and five-year periods are often used as a proxy. For this reason, the performance information reviewed by the Board also included net cumulative calendar year total return information for each fund and an appropriate peer group for the most recent one-, three-, and five-year periods.Based on its review, the Board concluded that the nature, extent, and quality of services provided to each fund under the Advisory Contracts should continue to benefit the shareholders of each fund.Competitiveness of Management Fee and Total Expense Ratio. The Board considered each fund's management fee and total expense ratio compared to "mapped groups" of competitive funds and classes created for the purpose of facilitating the Trustees' competitive analysis of management fees and total expenses. Fidelity creates "mapped groups" by combining similar Lipper investment objective categories that have comparable investment mandates. Combining Lipper investment objective categories aids the Board's management fee and total expense ratio comparisons by broadening the competitive group used for comparison.Management Fee. The Board considered two proprietary management fee comparisons for the 12-month periods shown in basis points (BP) in the charts below. The group of Lipper funds used by the Board for management fee comparisons is referred to below as the "Total Mapped Group" and, for the reasons explained above, is broader than the Lipper peer group used by the Board for performance comparisons. The Total Mapped Group comparison focuses on a fund's standing in terms of gross management fees before expense reimbursements or caps relative to the total universe of funds with comparable investment mandates, regardless of whether their management fee structures also are comparable. Funds with comparable investment mandates offer exposure to similar types of securities. Funds with comparable management fee structures have similar management fee contractual arrangements (e.g., flat rate charged for advisory services, all-inclusive fee rate, etc.). "TMG %" represents the percentage of funds in the Total Mapped Group that had management fees that were lower than a fund's. For example, a hypothetical TMG % of 20% would mean that 80% of the funds in the Total Mapped Group had higher, and 20% had lower, management fees than a fund. The funds' actual TMG %s and the number of funds in the Total Mapped Group are in the charts below. The "Asset-Size Peer Group" (ASPG) comparison focuses on a fund's standing relative to a subset of non-Fidelity funds within the Total Mapped Group that are similar in size and management fee structure. For example, if a fund is in the first quartile of the ASPG, the fund's management fee ranks in the least expensive or lowest 25% of funds in the ASPG. The ASPG represents at least 15% of the funds in the Total Mapped Group with comparable asset size and management fee structures, subject to a minimum of 50 funds (or all funds in the Total Mapped Group if fewer than 50). Additional information, such as the ASPG quartile in which a fund's management fee rate ranked, is also included in the charts and considered by the Board.Government Portfolio

Money Market Portfolio
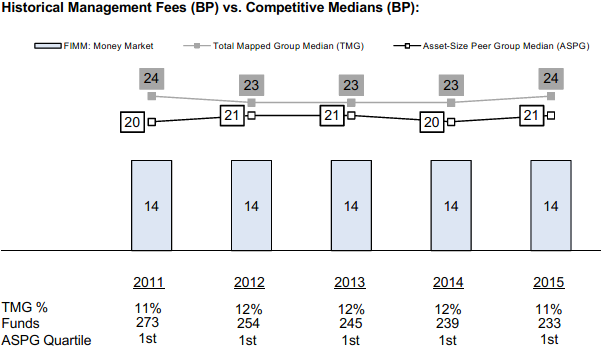
Prime Money Market Portfolio

Tax-Exempt Portfolio

Treasury Portfolio
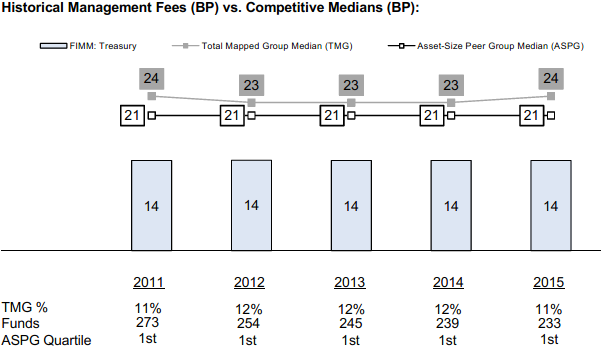
Treasury Only Portfolio

Board Approval of Investment Advisory Contracts and Management Fees
Prime Reserves Portfolio
On March 10, 2016, the Board of Trustees, including the Independent Trustees (together, the Board), voted to approve the management contract with Fidelity Management & Research Company (FMR) and the sub-advisory agreements (together, the Advisory Contracts) for the fund. The Board, assisted by the advice of fund counsel and Independent Trustees' counsel, considered a broad range of information.Nature, Extent, and Quality of Services Provided. The Board considered Fidelity's staffing as it relates to the fund, including the backgrounds of investment personnel of Fidelity, and also considered the fund's investment objective, strategies, and related investment philosophy. The Board considered the structure of the portfolio manager compensation program and whether this structure provides appropriate incentives to act in the best interests of the fund.Resources Dedicated to Investment Management and Support Services. The Board reviewed the general qualifications and capabilities of Fidelity's investment staff, including its size, education, experience, and resources, as well as Fidelity's approach to recruiting, training, managing, and compensating investment personnel. The Board noted that Fidelity has continued to increase the resources devoted to non-U.S. offices, including expansion of Fidelity's global investment organization. The Board also noted that Fidelity's analysts have extensive resources, tools and capabilities that allow them to conduct sophisticated quantitative and fundamental analysis, as well as credit analysis of issuers, counterparties and guarantors. Further, the Board considered that Fidelity's investment professionals have sufficient access to global information and data so as to provide competitive investment results over time, and that those professionals also have access to sophisticated tools that permit them to assess portfolio construction and risk and performance attribution characteristics continuously, as well as to transmit new information and research conclusions rapidly around the world. Additionally, in its deliberations, the Board considered Fidelity's trading, risk management, compliance, and technology and operations capabilities and resources, which are integral parts of the investment management process.Shareholder and Administrative Services. The Board considered the nature, extent, quality, and cost of advisory, administrative, and shareholder services to be performed by FMR, the sub-advisers (together with FMR, the Investment Advisers), and their affiliates under the Advisory Contracts and under separate agreements covering transfer agency and pricing and bookkeeping services for the fund. The Board also considered the nature and extent of the supervision of third party service providers, principally custodians, subcustodians, and pricing vendors.The Board noted that the growth of fund assets over time across the complex allows Fidelity to reinvest in the development of services designed to enhance the value or convenience of the Fidelity funds as investment vehicles. These services include 24-hour access to account information and market information through telephone representatives and over the Internet, investor education materials and asset allocation tools, and the expanded availability of Fidelity Investor Centers.Investment Performance. The fund is a new fund and therefore had no historical performance for the Board to review at the time it approved the fund's Advisory Contracts. The Board considered the Investment Advisers' strength in fundamental, research-driven security selection, which the Board is familiar with through its supervision of other Fidelity funds, including an existing fund with the same investment objective as the fund and the same portfolio management team that will provide services to the fund.Based on its review, the Board concluded that the nature, extent, and quality of services to be provided to the fund under the Advisory Contracts should benefit the shareholders of the fund.Competitiveness of Management Fee and Total Expense Ratio. The Board considered the fund's proposed management fee and the projected total expense ratio of each class of the fund in reviewing the Advisory Contracts. The Board noted that the fund's proposed management fee rate is lower than the median fee rate of funds with similar Lipper investment objective categories and comparable investment mandates, regardless of whether their management fee structures are comparable. The Board also considered that the projected total expense ratio each class of the fund, except Class III, is below the median of those funds and classes used by the Board for management fee comparisons that have a similar sales load structure, excluding the effect of fee waivers. The Board noted that the projected total expense ratio of Class III is slightly above median, primarily as a result of a higher 12b-1 fee as compared to other funds/classes in the Institutional peer group.The Board also noted that FMR had contractually agreed to reimburse each class of the fund through May 31, 2018 to the extent total operating expenses (excluding interest, certain taxes, certain securities lending costs, brokerage commissions, extraordinary expenses, and acquired fund fees and expenses, if any), as a percentage of average net assets of each class exceed a certain limit.The Board considered the total expense ratio of the fund after the effect of the contractual expense cap arrangements.Based on its review, the Board concluded that the management fee and the projected total expense ratio of each class of the fund were reasonable in light of the services that the fund and its shareholders will receive and the other factors considered.Costs of the Services and Profitability. The fund is a new fund and therefore no revenue, cost, or profitability data was available for the Board to review in respect of the fund at the time it approved the Advisory Contracts. In connection with its future renewal of the fund's Advisory Contracts, the Board will consider the revenues earned and the expenses incurred by Fidelity in conducting the business of developing, marketing, distributing, managing, administering and servicing the fund and servicing the fund's shareholders.Economies of Scale. The Board will consider economies of scale when there is operating experience to permit assessment thereof. It noted that, notwithstanding the entrepreneurial risk associated with a new fund, the management fee was at a level normally associated, by comparison with competitors, with very high fund net assets, and Fidelity asserted to the Board that the level of the fee anticipated economies of scale at lower asset levels even before, if ever, economies of scale are achieved. The Board also noted that the fund and its shareholders would have access to the very considerable number and variety of services available through Fidelity and its affiliates.Based on its evaluation of all of the conclusions noted above, and after considering all factors it believed relevant, the Board concluded that the advisory fee structures are fair and reasonable, and that the fund's Advisory Contracts should be approved.![]()
IMM-SANN-1116
1.537280.119
Item 2.
Code of Ethics
Not applicable.
Item 3.
Audit Committee Financial Expert
Not applicable.
Item 4.
Principal Accountant Fees and Services
Not applicable.
Item 5.
Audit Committee of Listed Registrants
Not applicable.
Item 6.
Investments
(a)
Not applicable.
(b)
Not applicable
Item 7.
Disclosure of Proxy Voting Policies and Procedures for Closed-End Management Investment Companies
Not applicable.
Item 8.
Portfolio Managers of Closed-End Management Investment Companies
Not applicable.
Item 9.
Purchase of Equity Securities by Closed-End Management Investment Company and Affiliated Purchasers
Not applicable.
Item 10.
Submission of Matters to a Vote of Security Holders
There were no material changes to the procedures by which shareholders may recommend nominees to the Fidelity Colchester Street Trust’s Board of Trustees.
Item 11.
Controls and Procedures
(a)(i) The President and Treasurer and the Chief Financial Officer have concluded that the Fidelity Colchester Street Trust’s (the “Trust”) disclosure controls and procedures (as defined in Rule 30a-3(c) under the Investment Company Act) provide reasonable assurances that material information relating to the Trust is made known to them by the appropriate persons, based on their evaluation of these controls and procedures as of a date within 90 days of the filing date of this report.
(a)(ii) There was no change in the Trust’s internal control over financial reporting (as defined in Rule 30a-3(d) under the Investment Company Act) that occurred during the second fiscal quarter of the period covered by this report that has materially affected, or is reasonably likely to materially affect, the Trust’s internal control over financial reporting.
Item 12.
Exhibits
(a) | (1) | Not applicable. |
(a) | (2) | Certification pursuant to Rule 30a-2(a) under the Investment Company Act of 1940 (17 CFR 270.30a-2(a)) is filed and attached hereto as Exhibit 99.CERT. |
(a) | (3) | Not applicable. |
(b) | Certification pursuant to Rule 30a-2(b) under the Investment Company Act of 1940 (17 CFR 270.30a-2(b)) is furnished and attached hereto as Exhibit 99.906CERT. |
SIGNATURES
Pursuant to the requirements of the Securities Exchange Act of 1934 and the Investment Company Act of 1940, the registrant has duly caused this report to be signed on its behalf by the undersigned, thereunto duly authorized.
Fidelity Colchester Street Trust
By: | /s/Stephanie J. Dorsey |
Stephanie J. Dorsey | |
President and Treasurer | |
Date: | December 5, 2016 |
Pursuant to the requirements of the Securities Exchange Act of 1934 and the Investment Company Act of 1940, this report has been signed below by the following persons on behalf of the registrant and in the capacities and on the dates indicated.
By: | /s/Stephanie J. Dorsey |
Stephanie J. Dorsey | |
President and Treasurer | |
Date: | December 5, 2016 |
By: | /s/Howard J. Galligan III |
Howard J. Galligan III | |
Chief Financial Officer | |
Date: | December 5, 2016 |