Fidelity® Investments Money Market Funds Treasury Only Portfolio
Treasury Portfolio
Government Portfolio
Money Market Portfolio
Prime Money Market Portfolio
Prime Reserves Portfolio
Tax-Exempt Portfolio
Semi-Annual Report September 30, 2017 |
 |
Contents
To view a fund's proxy voting guidelines and proxy voting record for the 12-month period ended June 30, visit http://www.fidelity.com/proxyvotingresults or visit the Securities and Exchange Commission's (SEC) web site at http://www.sec.gov.
You may also call 1-877-297-2952 to request a free copy of the proxy voting guidelines.
Standard & Poor's, S&P and S&P 500 are registered service marks of The McGraw-Hill Companies, Inc. and have been licensed for use by Fidelity Distributors Corporation.
Other third-party marks appearing herein are the property of their respective owners.
All other marks appearing herein are registered or unregistered trademarks or service marks of FMR LLC or an affiliated company. © 2017 FMR LLC. All rights reserved.
This report and the financial statements contained herein are submitted for the general information of the shareholders of the Funds. This report is not authorized for distribution to prospective investors in the Funds unless preceded or accompanied by an effective prospectus.
A fund files its complete schedule of portfolio holdings with the SEC for the first and third quarters of each fiscal year on Form N-Q. Forms N-Q are available on the SEC’s web site at http://www.sec.gov. A fund's Forms N-Q may be reviewed and copied at the SEC’s Public Reference Room in Washington, DC. Information regarding the operation of the SEC's Public Reference Room may be obtained by calling 1-800-SEC-0330.
For a complete list of a fund's portfolio holdings, view the most recent holdings listing, semiannual report, or annual report on Fidelity's web site at http://www.fidelity.com, http://www.institutional.fidelity.com, or http://www.401k.com, as applicable.
NOT FDIC INSURED •MAY LOSE VALUE •NO BANK GUARANTEE
Neither the Funds nor Fidelity Distributors Corporation is a bank.
Treasury Only Portfolio
Investment Summary/Performance (Unaudited)
Effective Maturity Diversification
| Days | % of fund's investments 9/30/17 | % of fund's investments 3/31/17 | % of fund's investments 9/30/16 |
| 1 - 7 | 22.6 | 14.4 | 16.8 |
| 8 - 30 | 4.5 | 30.2 | 16.1 |
| 31 - 60 | 30.2 | 24.6 | 23.8 |
| 61 - 90 | 34.7 | 19.0 | 30.6 |
| 91 - 180 | 8.0 | 10.2 | 11.7 |
| > 180 | 0.0 | 1.6 | 1.0 |
Effective maturity is determined in accordance with the requirements of Rule 2a-7 under the Investment Company Act of 1940.
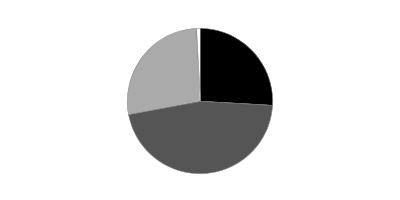
Asset Allocation (% of fund's net assets)
| As of September 30, 2017 |
| | U.S. Treasury Debt | 100.0% |

| As of March 31, 2017 |
| | U.S. Treasury Debt | 100.1% |
| | Net Other Assets (Liabilities)* | (0.1)% |

* Net Other Assets (Liabilities) are not included in the pie chart
Current And Historical 7-Day Yields
| | 9/30/17 | 6/30/17 | 3/31/17 | 12/31/16 | 9/30/16 |
| Class I | 0.89% | 0.78% | 0.47% | 0.31% | 0.17% |
| Class II | 0.74% | 0.63% | 0.32% | 0.16% | 0.02% |
| Class III | 0.64% | 0.53% | 0.22% | 0.06% | 0.01% |
| Class IV | 0.39% | 0.28% | 0.01% | 0.01% | 0.01% |
| Select Class | 0.84% | 0.73% | 0.42% | 0.26% | 0.12% |
| Institutional Class | 0.93% | 0.82% | 0.51% | 0.35% | 0.21% |
Yield refers to the income paid by the Fund over a given period. Yields for money market funds are usually for seven-day periods, as they are here, though they are expressed as annual percentage rates. Past performance is no guarantee of future results. Yield will vary and it's possible to lose money investing in the Fund. A portion of the Fund's expenses was reimbursed and/or waived. Absent such reimbursements and/or waivers the yield for the period ending September 30, 2017, the most recent period shown in the table, would have been 0.86% for Class I, 0.70% for Class II, 0.60% for Class III, 0.35% for Class IV, 0.81% for Select Class and 0.89% for Institutional Class.
Percentages shown as 0.0% may reflect amounts less than 0.05%.
Treasury Only Portfolio
Investments September 30, 2017 (Unaudited)
Showing Percentage of Net Assets
| U.S. Treasury Debt - 100.0% | | | | |
| | | Yield(a) | Principal Amount (000s) | Value (000s) |
| U.S. Treasury Obligations - 100.0% | | | | |
| U.S. Treasury Bills | | | | |
| 10/5/17 to 2/15/18 | | 0.96 to 1.14 % | $9,703,929 | $9,686,386 |
| U.S. Treasury Notes | | | | |
| 10/31/17 to 7/31/19 | | 0.74 to 1.32 (b) | 3,520,041 | 3,521,534 |
| TOTAL U.S. TREASURY DEBT | | | | |
| (Cost $13,207,920) | | | | 13,207,920 |
| TOTAL INVESTMENT IN SECURITIES - 100.0% | | | | |
| (Cost $13,207,920) | | | | 13,207,920 |
| NET OTHER ASSETS (LIABILITIES) - 0.0% | | | | 5,067 |
| NET ASSETS - 100% | | | | $13,212,987 |
The date shown for securities represents the date when principal payments must be paid, taking into account any call options exercised by the issuer and any permissible maturity shortening features other than interest rate resets.
Legend
(a) Yield represents either the annualized yield at the date of purchase, or the stated coupon rate, or, for floating and adjustable rate securities, the rate at period end.
(b) Coupon rates for floating and adjustable rate securities reflect the rates in effect at period end.
Investment Valuation
All investments are categorized as Level 2 under the Fair Value Hierarchy. The inputs or methodology used for valuing securities may not be an indication of the risk associated with investing in those securities. For more information on valuation inputs please refer to the Investment Valuation section in the accompanying Notes to Financial Statements.
See accompanying notes which are an integral part of the financial statements.
Treasury Only Portfolio
Financial Statements
Statement of Assets and Liabilities
| Amounts in thousands (except per-share amounts) | | September 30, 2017 (Unaudited) |
| Assets | | |
Investment in securities, at value — See accompanying schedule:
Unaffiliated issuers (cost $13,207,920) | | $13,207,920 |
| Cash | | 1 |
| Receivable for fund shares sold | | 11,188 |
| Interest receivable | | 9,102 |
| Prepaid expenses | | 32 |
| Receivable from investment adviser for expense reductions | | 401 |
| Total assets | | 13,228,644 |
| Liabilities | | |
| Payable for fund shares redeemed | $9,218 | |
| Distributions payable | 3,943 | |
| Accrued management fee | 1,555 | |
| Distribution and service plan fees payable | 248 | |
| Other affiliated payables | 622 | |
| Other payables and accrued expenses | 71 | |
| Total liabilities | | 15,657 |
| Net Assets | | $13,212,987 |
| Net Assets consist of: | | |
| Paid in capital | | $13,213,013 |
| Distributions in excess of net investment income | | (4) |
| Accumulated undistributed net realized gain (loss) on investments | | (22) |
| Net Assets | | $13,212,987 |
| Class I: | | |
| Net Asset Value, offering price and redemption price per share ($6,980,558 ÷ 6,979,422 shares) | | $1.00 |
| Class II: | | |
| Net Asset Value, offering price and redemption price per share ($215,974 ÷ 215,990 shares) | | $1.00 |
| Class III: | | |
| Net Asset Value, offering price and redemption price per share ($896,925 ÷ 896,663 shares) | | $1.00 |
| Class IV: | | |
| Net Asset Value, offering price and redemption price per share ($35,548 ÷ 35,542 shares) | | $1.00 |
| Select Class: | | |
| Net Asset Value, offering price and redemption price per share ($153,744 ÷ 153,744 shares) | | $1.00 |
| Institutional Class: | | |
| Net Asset Value, offering price and redemption price per share ($4,930,238 ÷ 4,930,047 shares) | | $1.00 |
See accompanying notes which are an integral part of the financial statements.
Statement of Operations
| Amounts in thousands | | Six months ended September 30, 2017 (Unaudited) |
| Investment Income | | |
| Interest | | $59,703 |
| Expenses | | |
| Management fee | $9,188 | |
| Transfer agent fees | 3,241 | |
| Distribution and service plan fees | 1,477 | |
| Accounting fees and expenses | 474 | |
| Custodian fees and expenses | 75 | |
| Independent trustees' fees and expenses | 24 | |
| Registration fees | 79 | |
| Audit | 22 | |
| Legal | 11 | |
| Miscellaneous | 39 | |
| Total expenses before reductions | 14,630 | |
| Expense reductions | (2,245) | 12,385 |
| Net investment income (loss) | | 47,318 |
| Realized and Unrealized Gain (Loss) | | |
| Net realized gain (loss) on: | | |
| Investment securities: | | |
| Unaffiliated issuers | | (19) |
| Total net realized gain (loss) | | (19) |
| Net increase in net assets resulting from operations | | $47,299 |
See accompanying notes which are an integral part of the financial statements.
Statement of Changes in Net Assets
| Amounts in thousands | Six months ended September 30, 2017 (Unaudited) | Year ended March 31, 2017 |
| Increase (Decrease) in Net Assets | | |
| Operations | | |
| Net investment income (loss) | $47,318 | $31,360 |
| Net realized gain (loss) | (19) | 93 |
| Net increase in net assets resulting from operations | 47,299 | 31,453 |
| Distributions to shareholders from net investment income | (47,508) | (31,217) |
| Share transactions - net increase (decrease) | (524,650) | 114,871 |
| Total increase (decrease) in net assets | (524,859) | 115,107 |
| Net Assets | | |
| Beginning of period | 13,737,846 | 13,622,739 |
| End of period | $13,212,987 | $13,737,846 |
| Other Information | | |
| Undistributed net investment income end of period | $– | $186 |
| Distributions in excess of net investment income end of period | $(4) | $– |
See accompanying notes which are an integral part of the financial statements.
Financial Highlights
Treasury Only Portfolio Class I
| | Six months ended (Unaudited) September 30, | Years ended March 31, | | | | |
| | 2017 | 2017 | 2016 | 2015 | 2014 | 2013 |
| Selected Per–Share Data | | | | | | |
| Net asset value, beginning of period | $1.00 | $1.00 | $1.00 | $1.00 | $1.00 | $1.00 |
| Income from Investment Operations | | | | | | |
| Net investment income (loss) | .004 | .002 | –A | –A | –A | –A |
| Net realized and unrealized gain (loss)A | – | – | – | – | – | – |
| Total from investment operations | .004 | .002 | –A | –A | –A | –A |
| Distributions from net investment income | (.004) | (.002) | –A | –A | –A | –A |
| Total distributions | (.004) | (.002) | –A | –A | –A | –A |
| Net asset value, end of period | $1.00 | $1.00 | $1.00 | $1.00 | $1.00 | $1.00 |
| Total ReturnB,C | .37% | .23% | .04% | .01% | .01% | .01% |
| Ratios to Average Net AssetsD | | | | | | |
| Expenses before reductions | .21%E | .21% | .21% | .21% | .21% | .21% |
| Expenses net of fee waivers, if any | .18%E | .18% | .11% | .05% | .06% | .10% |
| Expenses net of all reductions | .18%E | .18% | .11% | .05% | .06% | .10% |
| Net investment income (loss) | .73%E | .24% | .05% | - %F | .01% | .01% |
| Supplemental Data | | | | | | |
| Net assets, end of period (in millions) | $6,981 | $7,638 | $10,035 | $9,402 | $9,795 | $9,431 |
A Amount represents less than $.0005 per share.
B Total returns for periods of less than one year are not annualized.
C Total returns would have been lower if certain expenses had not been reduced during the applicable periods shown.
D Expense ratios reflect operating expenses of the class. Expenses before reductions do not reflect amounts reimbursed or waived or reductions from expense offset arrangements and do not represent the amount paid by the class during periods when reimbursements, waivers or reductions occur. Expenses net of fee waivers reflect expenses after reimbursement and waivers but prior to reductions from expense offset arrangements. Expenses net of all reductions represent the net expenses paid by the class.
E Annualized
F Amount represents less than .005%.
See accompanying notes which are an integral part of the financial statements.
Treasury Only Portfolio Class II
| | Six months ended (Unaudited) September 30, | Years ended March 31, | | | | |
| | 2017 | 2017 | 2016 | 2015 | 2014 | 2013 |
| Selected Per–Share Data | | | | | | |
| Net asset value, beginning of period | $1.00 | $1.00 | $1.00 | $1.00 | $1.00 | $1.00 |
| Income from Investment Operations | | | | | | |
| Net investment income (loss) | .003 | .001 | –A | –A | –A | –A |
| Net realized and unrealized gain (loss)A | – | – | – | – | – | – |
| Total from investment operations | .003 | .001 | –A | –A | –A | –A |
| Distributions from net investment income | (.003) | (.001) | –A | –A | –A | –A |
| Total distributions | (.003) | (.001) | –A | –A | –A | –A |
| Net asset value, end of period | $1.00 | $1.00 | $1.00 | $1.00 | $1.00 | $1.00 |
| Total ReturnB,C | .29% | .09% | .01% | .01% | .01% | .01% |
| Ratios to Average Net AssetsD | | | | | | |
| Expenses before reductions | .36%E | .36% | .36% | .36% | .36% | .36% |
| Expenses net of fee waivers, if any | .33%E | .33% | .13% | .05% | .06% | .10% |
| Expenses net of all reductions | .33%E | .33% | .13% | .05% | .06% | .10% |
| Net investment income (loss) | .58%E | .09% | .03% | - %F | .01% | .01% |
| Supplemental Data | | | | | | |
| Net assets, end of period (in millions) | $216 | $159 | $307 | $310 | $359 | $354 |
A Amount represents less than $.0005 per share.
B Total returns for periods of less than one year are not annualized.
C Total returns would have been lower if certain expenses had not been reduced during the applicable periods shown.
D Expense ratios reflect operating expenses of the class. Expenses before reductions do not reflect amounts reimbursed or waived or reductions from expense offset arrangements and do not represent the amount paid by the class during periods when reimbursements, waivers or reductions occur. Expenses net of fee waivers reflect expenses after reimbursement and waivers but prior to reductions from expense offset arrangements. Expenses net of all reductions represent the net expenses paid by the class.
E Annualized
F Amount represents less than .005%.
See accompanying notes which are an integral part of the financial statements.
Treasury Only Portfolio Class III
| | Six months ended (Unaudited) September 30, | Years ended March 31, | | | | |
| | 2017 | 2017 | 2016 | 2015 | 2014 | 2013 |
| Selected Per–Share Data | | | | | | |
| Net asset value, beginning of period | $1.00 | $1.00 | $1.00 | $1.00 | $1.00 | $1.00 |
| Income from Investment Operations | | | | | | |
| Net investment income (loss) | .002 | –A | –A | –A | –A | –A |
| Net realized and unrealized gain (loss)A | – | – | – | – | – | – |
| Total from investment operations | .002 | –A | –A | –A | –A | –A |
| Distributions from net investment income | (.002) | –A | –A | –A | –A | –A |
| Total distributions | (.002) | –A | –A | –A | –A | –A |
| Net asset value, end of period | $1.00 | $1.00 | $1.00 | $1.00 | $1.00 | $1.00 |
| Total ReturnB,C | .24% | .04% | .01% | .01% | .01% | .01% |
| Ratios to Average Net AssetsD | | | | | | |
| Expenses before reductions | .46%E | .46% | .46% | .46% | .46% | .46% |
| Expenses net of fee waivers, if any | .43%E | .38% | .15% | .05% | .06% | .10% |
| Expenses net of all reductions | .43%E | .38% | .15% | .05% | .06% | .10% |
| Net investment income (loss) | .48%E | .04% | .01% | - %F | .01% | .01% |
| Supplemental Data | | | | | | |
| Net assets, end of period (in millions) | $897 | $921 | $831 | $635 | $487 | $408 |
A Amount represents less than $.0005 per share.
B Total returns for periods of less than one year are not annualized.
C Total returns would have been lower if certain expenses had not been reduced during the applicable periods shown.
D Expense ratios reflect operating expenses of the class. Expenses before reductions do not reflect amounts reimbursed or waived or reductions from expense offset arrangements and do not represent the amount paid by the class during periods when reimbursements, waivers or reductions occur. Expenses net of fee waivers reflect expenses after reimbursement and waivers but prior to reductions from expense offset arrangements. Expenses net of all reductions represent the net expenses paid by the class.
E Annualized
F Amount represents less than .005%.
See accompanying notes which are an integral part of the financial statements.
Treasury Only Portfolio Class IV
| | Six months ended (Unaudited) September 30, | Years ended March 31, | | | | |
| | 2017 | 2017 | 2016 | 2015 | 2014 | 2013 |
| Selected Per–Share Data | | | | | | |
| Net asset value, beginning of period | $1.00 | $1.00 | $1.00 | $1.00 | $1.00 | $1.00 |
| Income from Investment Operations | | | | | | |
| Net investment income (loss) | .001 | –A | –A | –A | –A | –A |
| Net realized and unrealized gain (loss)A | – | – | – | – | – | – |
| Total from investment operations | .001 | –A | –A | –A | –A | –A |
| Distributions from net investment income | (.001) | –A | –A | –A | –A | –A |
| Total distributions | (.001) | –A | –A | –A | –A | –A |
| Net asset value, end of period | $1.00 | $1.00 | $1.00 | $1.00 | $1.00 | $1.00 |
| Total ReturnB,C | .12% | .01% | .01% | .01% | .01% | .01% |
| Ratios to Average Net AssetsD | | | | | | |
| Expenses before reductions | .71%E | .72% | .71% | .71% | .71% | .71% |
| Expenses net of fee waivers, if any | .68%E | .37% | .14% | .04% | .06% | .10% |
| Expenses net of all reductions | .68%E | .37% | .14% | .04% | .06% | .10% |
| Net investment income (loss) | .23%E | .05% | .02% | .01% | .01% | .01% |
| Supplemental Data | | | | | | |
| Net assets, end of period (in millions) | $36 | $32 | $338 | $114 | $18 | $22 |
A Amount represents less than $.0005 per share.
B Total returns for periods of less than one year are not annualized.
C Total returns would have been lower if certain expenses had not been reduced during the applicable periods shown.
D Expense ratios reflect operating expenses of the class. Expenses before reductions do not reflect amounts reimbursed or waived or reductions from expense offset arrangements and do not represent the amount paid by the class during periods when reimbursements, waivers or reductions occur. Expenses net of fee waivers reflect expenses after reimbursement and waivers but prior to reductions from expense offset arrangements. Expenses net of all reductions represent the net expenses paid by the class.
E Annualized
See accompanying notes which are an integral part of the financial statements.
Treasury Only Portfolio Select Class
| | Six months ended (Unaudited) September 30, | Years ended March 31, | | | | |
| | 2017 | 2017 | 2016 | 2015 | 2014 | 2013 |
| Selected Per–Share Data | | | | | | |
| Net asset value, beginning of period | $1.00 | $1.00 | $1.00 | $1.00 | $1.00 | $1.00 |
| Income from Investment Operations | | | | | | |
| Net investment income (loss) | .003 | .002 | –A | –A | –A | –A |
| Net realized and unrealized gain (loss)A | – | – | – | – | – | – |
| Total from investment operations | .003 | .002 | –A | –A | –A | –A |
| Distributions from net investment income | (.003) | (.002) | –A | –A | –A | –A |
| Total distributions | (.003) | (.002) | –A | –A | –A | –A |
| Net asset value, end of period | $1.00 | $1.00 | $1.00 | $1.00 | $1.00 | $1.00 |
| Total ReturnB,C | .34% | .18% | .03% | .01% | .01% | .01% |
| Ratios to Average Net AssetsD | | | | | | |
| Expenses before reductions | .26%E | .26% | .27% | .26% | .26% | .26% |
| Expenses net of fee waivers, if any | .23%E | .23% | .12% | .05% | .06% | .10% |
| Expenses net of all reductions | .23%E | .23% | .12% | .05% | .06% | .10% |
| Net investment income (loss) | .68%E | .19% | .04% | - %F | .01% | .01% |
| Supplemental Data | | | | | | |
| Net assets, end of period (in millions) | $154 | $94 | $180 | $194 | $215 | $210 |
A Amount represents less than $.0005 per share.
B Total returns for periods of less than one year are not annualized.
C Total returns would have been lower if certain expenses had not been reduced during the applicable periods shown.
D Expense ratios reflect operating expenses of the class. Expenses before reductions do not reflect amounts reimbursed or waived or reductions from expense offset arrangements and do not represent the amount paid by the class during periods when reimbursements, waivers or reductions occur. Expenses net of fee waivers reflect expenses after reimbursement and waivers but prior to reductions from expense offset arrangements. Expenses net of all reductions represent the net expenses paid by the class.
E Annualized
F Amount represents less than .005%.
See accompanying notes which are an integral part of the financial statements.
Treasury Only Portfolio Institutional Class
| | Six months ended (Unaudited) September 30, | Years ended March 31, | | |
| | 2017 | 2017 | 2016 | 2015 A |
| Selected Per–Share Data | | | | |
| Net asset value, beginning of period | $1.00 | $1.00 | $1.00 | $1.00 |
| Income from Investment Operations | | | | |
| Net investment income (loss) | .004 | .003 | .001 | –B |
| Net realized and unrealized gain (loss)B | – | – | – | – |
| Total from investment operations | .004 | .003 | .001 | –B |
| Distributions from net investment income | (.004) | (.003) | (.001) | –B |
| Total distributions | (.004) | (.003) | (.001) | –B |
| Net asset value, end of period | $1.00 | $1.00 | $1.00 | $1.00 |
| Total ReturnC,D | .39% | .27% | .05% | .01% |
| Ratios to Average Net AssetsE | | | | |
| Expenses before reductions | .18%F | .18% | .18% | .19%F |
| Expenses net of fee waivers, if any | .14%F | .14% | .12% | .04%F |
| Expenses net of all reductions | .14%F | .14% | .12% | .04%F |
| Net investment income (loss) | .77%F | .28% | .04% | - %F,G |
| Supplemental Data | | | | |
| Net assets, end of period (in millions) | $4,930 | $4,894 | $1,932 | $126 |
A For the period May 14, 2014 (commencement of sale of shares) to March 31, 2015.
B Amount represents less than $.0005 per share.
C Total returns for periods of less than one year are not annualized.
D Total returns would have been lower if certain expenses had not been reduced during the applicable periods shown.
E Expense ratios reflect operating expenses of the class. Expenses before reductions do not reflect amounts reimbursed or waived or reductions from expense offset arrangements and do not represent the amount paid by the class during periods when reimbursements, waivers or reductions occur. Expense ratios before reductions for start-up periods may not be representative of longer-term operating periods. Expenses net of fee waivers reflect expenses after reimbursement and waivers but prior to reductions from expense offset arrangements. Expenses net of all reductions represent the net expenses paid by the class.
F Annualized
G Amount represents less than .005%.
See accompanying notes which are an integral part of the financial statements.
Treasury Portfolio
Investment Summary/Performance (Unaudited)
Effective Maturity Diversification
| Days | % of fund's investments 9/30/17 | % of fund's investments 3/31/17 | % of fund's investments 9/30/16 |
| 1 - 7 | 55.0 | 52.3 | 50.5 |
| 8 - 30 | 0.2 | 16.1 | 7.5 |
| 31 - 60 | 13.4 | 7.4 | 12.6 |
| 61 - 90 | 19.6 | 7.5 | 12.7 |
| 91 - 180 | 11.8 | 12.9 | 12.9 |
| > 180 | 0.0 | 3.8 | 3.8 |
Effective maturity is determined in accordance with the requirements of Rule 2a-7 under the Investment Company Act of 1940.
Asset Allocation (% of fund's net assets)
| As of September 30, 2017 |
| | U.S. Treasury Debt | 51.1% |
| | Repurchase Agreements | 46.7% |
| | Net Other Assets (Liabilities) | 2.2% |

| As of March 31, 2017 |
| | U.S. Treasury Debt | 60.5% |
| | Repurchase Agreements | 39.0% |
| | Net Other Assets (Liabilities) | 0.5% |

Current And Historical 7-Day Yields
| | 9/30/17 | 6/30/17 | 3/31/17 | 12/31/16 | 9/30/16 |
| Class I | 0.91% | 0.83% | 0.55% | 0.35% | 0.20% |
| Class II | 0.76% | 0.68% | 0.40% | 0.20% | 0.05% |
| Class III | 0.66% | 0.58% | 0.30% | 0.10% | 0.01% |
| Class IV | 0.41% | 0.33% | 0.05% | 0.01% | 0.01% |
| Select Class | 0.86% | 0.78% | 0.50% | 0.30% | 0.15% |
| Institutional Class | 0.95% | 0.87% | 0.59% | 0.39% | 0.24% |
Yield refers to the income paid by the Fund over a given period. Yields for money market funds are usually for seven-day periods, as they are here, though they are expressed as annual percentage rates. Past performance is no guarantee of future results. Yield will vary and it's possible to lose money investing in the Fund. A portion of the Fund's expenses was reimbursed and/or waived. Absent such reimbursements and/or waivers the yield for the period ending September 30, 2017, the most recent period shown in the table, would have been 0.87% for Class I, 0.71% for Class II, 0.61% for Class III, 0.36% for Class IV, 0.82% for Select Class and 0.90% for Institutional Class.
Percentages shown as 0.0% may reflect amounts less than 0.05%.
Treasury Portfolio
Investments September 30, 2017 (Unaudited)
Showing Percentage of Net Assets
| U.S. Treasury Debt - 51.1% | | | | |
| | | Yield(a) | Principal Amount (000s) | Value (000s) |
| U.S. Treasury Obligations - 51.1% | | | | |
| U.S. Treasury Bills | | | | |
| 11/2/17 to 3/8/18 | | 1.02 to 1.15 % | $6,025,400 | $6,010,548 |
| U.S. Treasury Notes | | | | |
| 10/31/17 to 7/31/19 | | 0.74 to 1.32 (b) | 6,899,441 | 6,901,485 |
| TOTAL U.S. TREASURY DEBT | | | | |
| (Cost $12,912,033) | | | | 12,912,033 |
| U.S. Treasury Repurchase Agreement - 46.7% | | | |
| | | Maturity Amount (000s) | Value (000s) |
| In a joint trading account at 1.05% dated 9/29/17 due 10/2/17 (Collateralized by U.S. Treasury Obligations) # | | $1,102,032 | $1,101,936 |
| With: | | | |
| Barclays Capital, Inc. at 1.06%, dated 9/29/17 due 10/2/17 (Collateralized by U.S. Treasury Obligations valued at $32,642,977, 0.63% - 3.75%, 9/30/17 - 2/15/26) | | 32,003 | 32,000 |
| BMO Capital Markets Corp. at: | | | |
| 1.06%, dated 9/27/17 due 10/6/17 (Collateralized by U.S. Treasury Obligations valued at $32,058,389, 2.00%, 2/15/22) | | 31,072 | 31,000 |
| 1.07%, dated 8/29/17 due 10/6/17 (Collateralized by U.S. Treasury Obligations valued at $15,408,279, 2.50%, 8/15/23) | | 15,042 | 15,000 |
| BMO Harris Bank NA at: | | | |
| 1.06%, dated: | | | |
| 7/7/17 due 10/6/17 (Collateralized by U.S. Treasury Obligations valued at $26,972,770, 1.00%, 5/15/18) | | 26,070 | 26,000 |
| 7/13/17 due 10/5/17 (Collateralized by U.S. Treasury Obligations valued at $27,625,584, 0.75% - 3.38%, 10/31/17 - 8/15/47) | | 27,067 | 27,000 |
| 7/25/17 due 10/6/17 (Collateralized by U.S. Treasury Obligations valued at $29,910,821, 2.75%, 11/15/23) | | 29,066 | 29,000 |
| 8/3/17 due 10/6/17 (Collateralized by U.S. Treasury Obligations valued at $28,983,625, 1.38%, 6/30/18) | | 28,073 | 28,000 |
| 8/9/17 due 10/6/17 (Collateralized by U.S. Treasury Obligations valued at $47,126,931, 0.88% - 3.63%, 1/31/18 - 8/15/47) | | 46,126 | 46,000 |
| 8/10/17 due 10/6/17 (Collateralized by U.S. Treasury Obligations valued at $31,811,875, 1.38% - 3.63%, 1/31/18 - 8/15/47) | | 31,082 | 31,000 |
| 8/17/17 due 10/6/17 (Collateralized by U.S. Treasury Obligations valued at $32,866,081, 3.63%, 2/15/20) | | 32,084 | 32,000 |
| 1.07%, dated: | | | |
| 7/25/17 due 10/6/17 (Collateralized by U.S. Treasury Obligations valued at $30,038,752, 2.00% - 3.13%, 11/15/26 - 2/15/43) | | 29,073 | 29,000 |
| 7/26/17 due 10/6/17: | | | |
| (Collateralized by U.S. Treasury Obligations valued at $29,744,271, 2.00%, 2/15/22) | | 29,073 | 29,000 |
| (Collateralized by U.S. Treasury Obligations valued at $14,341,317, 0.75% - 3.63%, 12/31/17 - 8/15/47) | | 14,037 | 14,000 |
| 7/27/17 due 10/6/17 (Collateralized by U.S. Treasury Obligations valued at $14,432,234, 0.75% - 3.63%, 10/31/17 - 2/15/47) | | 14,038 | 14,000 |
| 7/28/17 due 10/6/17 (Collateralized by U.S. Treasury Obligations valued at $29,886,108, 2.50%, 5/15/24) | | 29,076 | 29,000 |
| 9/1/17 due 10/6/17 (Collateralized by U.S. Treasury Obligations valued at $16,366,004, 2.00% - 2.25%, 12/31/23 - 8/15/25) | | 16,049 | 16,000 |
| 9/14/17 due 10/6/17 (Collateralized by U.S. Treasury Obligations valued at $20,609,326, 2.00%, 2/15/22) | | 20,054 | 20,000 |
| 1.08%, dated 8/4/17 due 10/6/17 (Collateralized by U.S. Treasury Obligations valued at $17,379,952, 0.00% - 3.63%, 11/16/17 - 8/15/47) | | 17,053 | 17,000 |
| BNP Paribas, S.A. at: | | | |
| 1.08%, dated: | | | |
| 7/18/17 due 10/6/17 (Collateralized by U.S. Treasury Obligations valued at $28,625,207, 0.00% - 6.25%, 10/12/17 - 8/15/45) | | 28,076 | 28,000 |
| 8/7/17 due 10/6/17 (Collateralized by U.S. Treasury Obligations valued at $57,215,995, 0.00% - 7.88%, 10/12/17 - 8/15/40) | | 56,153 | 56,000 |
| 8/8/17 due 10/6/17 (Collateralized by U.S. Treasury Obligations valued at $63,344,370, 0.00% - 3.88%, 10/12/17 - 11/15/45) | | 62,169 | 62,000 |
| 8/11/17 due 10/6/17 (Collateralized by U.S. Treasury Obligations valued at $126,708,639, 0.00% - 6.25%, 10/12/17 - 2/15/45) | | 124,339 | 124,000 |
| 1.09%, dated: | | | |
| 8/25/17 due 10/6/17 (Collateralized by U.S. Treasury Obligations valued at $64,408,498, 0.00% - 4.75%, 10/12/17 - 8/15/44) | | 63,179 | 63,000 |
| 8/30/17 due 10/6/17 (Collateralized by U.S. Treasury Obligations valued at $73,513,380, 0.00% - 2.38%, 10/12/17 - 8/15/24) | | 72,201 | 72,000 |
| 8/31/17 due 10/6/17 (Collateralized by U.S. Treasury Obligations valued at $66,863,521, 1.24% - 4.75%, 8/31/18 - 11/15/46) | | 65,181 | 65,000 |
| 9/5/17 due 10/6/17 (Collateralized by U.S. Treasury Obligations valued at $50,502,338, 2.00% - 4.63%, 2/15/23 - 11/15/43) | | 49,135 | 49,000 |
| 9/7/17 due 10/6/17 (Collateralized by U.S. Treasury Obligations valued at $65,833,031, 2.00% - 2.88%, 11/15/26 - 8/15/45) | | 64,176 | 64,000 |
| 9/11/17 due 10/6/17 (Collateralized by U.S. Treasury Obligations valued at $132,908,977, 1.50% - 6.25%, 8/31/18 - 11/15/43) | | 129,355 | 129,000 |
| 9/13/17 due 10/6/17 (Collateralized by U.S. Treasury Obligations valued at $137,779,223, 0.00% - 2.75%, 10/12/17 - 11/15/23) | | 135,376 | 135,000 |
| 9/15/17 due 10/6/17 (Collateralized by U.S. Treasury Obligations valued at $134,709,362, 0.00% - 7.63%, 10/12/17 - 2/15/45) | | 132,364 | 132,000 |
| 1.1%, dated: | | | |
| 7/18/17 due 10/6/17 (Collateralized by U.S. Treasury Obligations valued at $28,627,106, 0.00% - 8.75%, 10/12/17 - 5/15/46) | | 28,096 | 28,000 |
| 8/14/17 due 10/6/17 (Collateralized by U.S. Treasury Obligations valued at $191,025,596, 0.00% - 9.13%, 11/2/17 - 11/15/44) | | 187,686 | 187,000 |
| 8/15/17 due 10/6/17 (Collateralized by U.S. Treasury Obligations valued at $64,460,208, 0.00% - 3.88%, 10/12/17 - 8/15/44) | | 63,231 | 63,000 |
| 9/20/17 due 10/6/17 (Collateralized by U.S. Treasury Obligations valued at $101,017,665, 0.00% - 7.50%, 10/12/17 - 11/15/46) | | 99,269 | 99,000 |
| 9/21/17 due 10/6/17 (Collateralized by U.S. Treasury Obligations valued at $74,789,882, 1.13% - 8.75%, 10/31/18 - 2/15/46) | | 73,203 | 73,000 |
| 1.11%, dated: | | | |
| 8/28/17 due 11/28/17 (Collateralized by U.S. Treasury Obligations valued at $31,958,465, 1.50% - 3.75%, 8/31/18 - 2/15/46) | | 31,088 | 31,000 |
| 8/30/17 due 11/30/17 (Collateralized by U.S. Treasury Obligations valued at $265,775,159, 0.00% - 4.38%, 10/12/17 - 11/15/46) | | 259,735 | 259,000 |
| 1.12%, dated: | | | |
| 6/27/17 due 10/6/17 (Collateralized by U.S. Treasury Obligations valued at $28,646,692, 0.00% - 8.75%, 11/30/17 - 11/15/44) | | 28,105 | 28,000 |
| 7/24/17 due 11/9/17 (Collateralized by U.S. Treasury Obligations valued at $29,645,027, 0.00% - 6.88%, 10/12/17 - 8/15/44) | | 29,097 | 29,000 |
| 7/25/17 due 11/9/17 (Collateralized by U.S. Treasury Obligations valued at $29,643,513, 0.00% - 3.88%, 10/12/17 - 8/15/46) | | 29,097 | 29,000 |
| 1.13%, dated 6/29/17 due 10/6/17 (Collateralized by U.S. Treasury Obligations valued at $26,649,516, 0.00% - 6.13%, 10/12/17 - 2/15/46) | | 26,098 | 26,000 |
| 1.14%, dated 7/6/17 due 10/6/17 (Collateralized by U.S. Treasury Obligations valued at $55,590,831, 0.00% - 6.88%, 10/12/17 - 2/15/47) | | 54,205 | 54,000 |
| Credit AG at 1.05%, dated 9/29/17 due 10/6/17 (Collateralized by U.S. Treasury Obligations valued at $32,642,949, 2.00%, 9/30/20) | | 32,007 | 32,000 |
| Deutsche Bank AG at 1.06%, dated 9/29/17 due 10/2/17 (Collateralized by U.S. Treasury Obligations valued at $98,959,324, 1.13% - 5.50%, 2/28/19 - 5/15/44) | | 97,009 | 97,000 |
| Deutsche Bank Securities, Inc. at 1.06%, dated 9/29/17 due 10/2/17 (Collateralized by U.S. Treasury Obligations valued at $52,024,643, 0.00% - 2.63%, 11/15/17 - 12/31/22) | | 51,005 | 51,000 |
| Federal Reserve Bank of New York at 1%, dated 9/29/17 due 10/2/17 (Collateralized by U.S. Treasury Obligations valued at $6,051,504,336, 8.75%, 8/15/20) | | 6,051,504 | 6,051,000 |
| Goldman Sachs & Co. at 1.06%, dated 9/29/17 due 10/6/17 (Collateralized by U.S. Treasury Obligations valued at $32,656,631, 0.00% - 2.75%, 11/9/17 - 8/15/42) | | 32,007 | 32,000 |
| ING Financial Markets LLC at 1.03%, dated 9/29/17 due 10/2/17 (Collateralized by U.S. Treasury Obligations valued at $51,328,361, 1.63%, 5/31/23) | | 49,004 | 49,000 |
| Lloyds Bank PLC at 1.16%, dated: | | | |
| 8/16/17 due 11/16/17 (Collateralized by U.S. Treasury Obligations valued at $25,608,448, 1.38%, 6/30/18) | | 25,074 | 25,000 |
| 8/24/17 due 11/22/17 (Collateralized by U.S. Treasury Obligations valued at $30,795,334, 2.13% - 6.13%, 12/31/21 - 11/15/27) | | 30,087 | 30,000 |
| 8/31/17 due 11/29/17 (Collateralized by U.S. Treasury Obligations valued at $33,696,975, 1.50%, 8/31/18) | | 33,096 | 33,000 |
| 9/12/17 due 12/14/17 (Collateralized by U.S. Treasury Obligations valued at $66,640,288, 2.25% - 6.13%, 11/15/23 - 11/15/27) | | 65,195 | 65,000 |
| 9/14/17 due 12/15/17 (Collateralized by U.S. Treasury Obligations valued at $68,729,365, 2.13% - 6.13%, 12/31/21 - 11/15/27) | | 67,199 | 67,000 |
| Mitsubishi UFJ Securities (U.S.A.), Inc. at: | | | |
| 1.04%, dated 9/28/17 due 10/5/17 (Collateralized by U.S. Treasury Obligations valued at $31,623,667, 1.50% - 7.13%, 4/15/20 - 11/15/46) | | 31,006 | 31,000 |
| 1.05%, dated 9/18/17 due 10/6/17 (Collateralized by U.S. Treasury Obligations valued at $16,375,758, 0.00% - 3.00%, 9/13/18 - 5/15/45) | | 16,014 | 16,000 |
| MUFG Securities EMEA PLC at: | | | |
| 1.07%, dated: | | | |
| 9/15/17 due 10/6/17 (Collateralized by U.S. Treasury Obligations valued at $103,912,150, 2.63%, 11/15/20) | | 101,093 | 101,000 |
| 9/22/17 due 10/6/17 (Collateralized by U.S. Treasury Obligations valued at $49,219,515, 2.13% - 2.63%, 11/15/20 - 5/15/25) | | 48,026 | 48,000 |
| 10/2/17 due 10/6/17(c) | | 13,005 | 13,000 |
| 1.09%, dated: | | | |
| 9/7/17 due 10/6/17 (Collateralized by U.S. Treasury Obligations valued at $16,484,512, 2.00% - 2.63%, 11/15/20 - 11/15/25) | | 16,019 | 16,000 |
| 9/12/17 due 10/6/17 (Collateralized by U.S. Treasury Obligations valued at $32,747,672, 2.00% - 2.63%, 8/15/20 - 11/15/25) | | 32,034 | 32,000 |
| 1.1%, dated: | | | |
| 8/28/17 due 10/6/17 (Collateralized by U.S. Treasury Obligations valued at $12,366,059, 1.50%, 3/31/23) | | 12,034 | 12,000 |
| 8/29/17 due 10/6/17: | | | |
| (Collateralized by U.S. Treasury Obligations valued at $16,653,677, 2.13% - 3.00%, 5/15/25 - 11/15/45) | | 16,021 | 16,000 |
| (Collateralized by U.S. Treasury Obligations valued at $6,243,913, 2.88%, 11/15/46) | | 6,008 | 6,000 |
| (Collateralized by U.S. Treasury Obligations valued at $1,033,211, 1.75%, 3/31/22) | | 1,001 | 1,000 |
| 9/25/17 due 10/13/17 (Collateralized by U.S. Treasury Obligations valued at $16,336,381, 1.63%, 5/15/26) | | 16,009 | 16,000 |
| 9/29/17 due 10/2/17 (Collateralized by U.S. Treasury Obligations valued at $10,240,527, 1.50%, 8/15/26) | | 10,001 | 10,000 |
| 1.11%, dated: | | | |
| 9/6/17 due: | | | |
| 10/2/17 (Collateralized by U.S. Treasury Obligations valued at $7,286,822, 3.00%, 5/15/45) | | 7,006 | 7,000 |
| 10/20/17 (Collateralized by U.S. Treasury Obligations valued at $7,246,029, 1.25% - 2.25%, 3/31/19 - 11/15/25) | | 7,009 | 7,000 |
| 9/7/17 due 10/17/17 (Collateralized by U.S. Treasury Obligations valued at $16,392,120, 2.63%, 8/15/20 - 11/15/20) | | 16,020 | 16,000 |
| Natixis SA at 1.04%, dated 9/28/17 due 10/5/17 (Collateralized by U.S. Treasury Obligations valued at $63,312,820, 1.00% - 4.75%, 5/15/18 - 2/15/41) | | 62,013 | 62,000 |
| Nomura Securities International, Inc. at 1.06%, dated 9/29/17 due 10/2/17 (Collateralized by U.S. Treasury Obligations valued at $366,224,085, 0.00% - 9.13%, 2/8/18 - 8/15/46) | | 357,032 | 357,000 |
| Norinchukin Bank at: | | | |
| 1.16%, dated: | | | |
| 8/14/17 due 11/6/17 (Collateralized by U.S. Treasury Obligations valued at $16,346,705, 2.13%, 8/31/20) | | 16,043 | 16,000 |
| 8/21/17 due 11/9/17 (Collateralized by U.S. Treasury Obligations valued at $15,319,634, 2.13%, 8/31/20) | | 15,039 | 15,000 |
| 8/23/17 due 11/15/17 (Collateralized by U.S. Treasury Obligations valued at $15,319,634, 2.13%, 8/31/20) | | 15,041 | 15,000 |
| 8/30/17 due 11/22/17 (Collateralized by U.S. Treasury Obligations valued at $33,695,059, 2.13%, 8/31/20) | | 33,089 | 33,000 |
| 8/31/17 due 11/21/17 (Collateralized by U.S. Treasury Obligations valued at $178,671,530, 3.63%, 8/15/19) | | 175,462 | 175,000 |
| 9/25/17 due 12/1/17 (Collateralized by U.S. Treasury Obligations valued at $16,326,367, 2.13%, 8/31/20) | | 16,035 | 16,000 |
| 1.17%, dated 7/26/17 due 10/26/17 (Collateralized by U.S. Treasury Obligations valued at $14,312,900, 2.13%, 8/31/20) | | 14,042 | 14,000 |
| 1.2%, dated 6/29/17 due 10/3/17 (Collateralized by U.S. Treasury Obligations valued at $13,301,082, 2.13%, 8/31/20) | | 13,042 | 13,000 |
| Prudential Insurance Co. of America at 1.08%, dated 9/29/17 due 10/2/17 (Collateralized by U.S. Treasury Obligations valued at $156,029,413, 1.00% - 8.75%, 8/15/18 - 2/15/36) | | 152,003 | 151,989 |
| RBC Capital Markets Corp. at 1.08%, dated 8/3/17 due 10/6/17 (Collateralized by U.S. Treasury Obligations valued at $7,192,470, 0.75% - 5.38%, 11/30/17 - 2/15/47) | | 7,019 | 7,000 |
| RBC Dominion Securities at: | | | |
| 1.04%, dated: | | | |
| 9/12/17 due 10/6/17 (Collateralized by U.S. Treasury Obligations valued at $18,370,652, 1.38%, 1/31/21) | | 18,015 | 18,000 |
| 9/13/17 due 10/6/17: | | | |
| (Collateralized by U.S. Treasury Obligations valued at $34,699,049, 2.13%, 5/15/25) | | 34,028 | 34,000 |
| (Collateralized by U.S. Treasury Obligations valued at $34,699,049, 2.13%, 5/15/25) | | 34,029 | 34,000 |
| (Collateralized by U.S. Treasury Obligations valued at $34,699,049, 2.13%, 5/15/25) | | 34,023 | 34,000 |
| 1.05%, dated 9/13/17 due 10/6/17: | | | |
| (Collateralized by U.S. Treasury Obligations valued at $34,699,250, 2.13%, 5/15/25) | | 34,033 | 34,000 |
| (Collateralized by U.S. Treasury Obligations valued at $34,699,250, 2.13%, 5/15/25) | | 34,034 | 34,000 |
| 1.07%, dated: | | | |
| 7/20/17 due 10/6/17 (Collateralized by U.S. Treasury Obligations valued at $28,622,867, 1.38%, 1/31/21) | | 28,079 | 28,000 |
| 7/24/17 due 10/6/17 (Collateralized by U.S. Treasury Obligations valued at $29,641,639, 2.13%, 5/15/25) | | 29,082 | 29,000 |
| 9/7/17 due 10/6/17 (Collateralized by U.S. Treasury Obligations valued at $32,664,275, 2.13%, 5/15/25) | | 32,087 | 32,000 |
| 1.08%, dated 7/25/17 due 10/6/17 (Collateralized by U.S. Treasury Obligations valued at $29,641,246, 1.38% - 2.13%, 1/31/21 - 5/15/25) | | 29,085 | 29,000 |
| RBS Securities, Inc. at 1.06%, dated 9/29/17 due 10/2/17 (Collateralized by U.S. Treasury Obligations valued at $6,121,855, 1.13% - 2.75%, 1/31/19 - 2/15/24) | | 6,001 | 6,000 |
| Societe Generale at: | | | |
| 1.09%, dated: | | | |
| 7/5/17 due 10/5/17 (Collateralized by U.S. Treasury Obligations valued at $55,481,462, 0.00% - 4.50%, 10/12/17 - 11/15/44) | | 54,150 | 54,000 |
| 7/6/17 due 10/6/17 (Collateralized by U.S. Treasury Obligations valued at $55,553,431, 1.25% - 3.63%, 10/31/18 - 5/15/46) | | 54,150 | 54,000 |
| 7/13/17 due 10/6/17 (Collateralized by U.S. Treasury Obligations valued at $56,755,362, 0.00% - 8.75%, 10/12/17 - 5/15/46) | | 55,150 | 55,000 |
| 1.1%, dated 8/18/17 due 11/20/17 (Collateralized by U.S. Treasury Obligations valued at $55,164,666, 0.00% - 3.63%, 10/12/17 - 11/15/46) | | 54,155 | 54,000 |
| Sumitomo Mitsui Trust Bank Ltd. at 1.16%, dated: | | | |
| 8/23/17 due 10/4/17 (Collateralized by U.S. Treasury Obligations valued at $17,520,165, 2.50% - 4.25%, 11/15/17 - 5/15/24) | | 17,023 | 17,000 |
| 8/30/17 due 10/5/17 (Collateralized by U.S. Treasury Obligations valued at $7,208,454, 2.50% - 4.25%, 11/15/17 - 5/15/24) | | 7,008 | 7,000 |
| 9/6/17 due 10/6/17 (Collateralized by U.S. Treasury Obligations valued at $7,201,262, 2.25% - 4.25%, 11/15/17 - 11/15/24) | | 7,009 | 7,000 |
| 9/13/17 due 10/6/17 (Collateralized by U.S. Treasury Obligations valued at $7,161,280, 2.38% - 4.25%, 11/15/17 - 8/15/24) | | 7,009 | 7,000 |
| 10/4/17 due 10/6/17(c) | | 7,009 | 7,000 |
| TD Securities (U.S.A.) at 1.06%, dated 9/29/17 due 10/2/17 (Collateralized by U.S. Treasury Obligations valued at $30,602,703, 2.13%, 2/29/24) | | 30,003 | 30,000 |
| TOTAL U.S. TREASURY REPURCHASE AGREEMENT | | | |
| (Cost $11,810,925) | | | 11,810,925 |
| TOTAL INVESTMENT IN SECURITIES - 97.8% | | | |
| (Cost $24,722,958) | | | 24,722,958 |
| NET OTHER ASSETS (LIABILITIES) - 2.2% | | | 567,005 |
| NET ASSETS - 100% | | | $25,289,963 |
The date shown for securities represents the date when principal payments must be paid, taking into account any call options exercised by the issuer and any permissible maturity shortening features other than interest rate resets.
Legend
(a) Yield represents either the annualized yield at the date of purchase, or the stated coupon rate, or, for floating and adjustable rate securities, the rate at period end.
(b) Coupon rates for floating and adjustable rate securities reflect the rates in effect at period end.
(c) Represents a forward settling transaction and therefore no collateral securities had been allocated as of period end. The agreement contemplated the delivery of U.S. Treasury Obligations as collateral on settlement date.
Investment Valuation
All investments are categorized as Level 2 under the Fair Value Hierarchy. The inputs or methodology used for valuing securities may not be an indication of the risk associated with investing in those securities. For more information on valuation inputs please refer to the Investment Valuation section in the accompanying Notes to Financial Statements.
Other Information
# Additional information on each counterparty to the repurchase agreement is as follows:
| Repurchase Agreement / Counterparty | Value (000s) |
| $1,101,936,000 due 10/02/17 at 1.05% | |
| Bank of Nova Scotia | $526,589 |
| HSBC Securities (USA), Inc. | 474,367 |
| Merrill Lynch, Pierce, Fenner & Smith, Inc. | 41,580 |
| RBC Dominion Securities, Inc. | 59,400 |
| | $1,101,936 |
See accompanying notes which are an integral part of the financial statements.
Treasury Portfolio
Financial Statements
Statement of Assets and Liabilities
| Amounts in thousands (except per-share amounts) | | September 30, 2017 (Unaudited) |
| Assets | | |
Investment in securities, at value (including repurchase agreements of $11,810,925) — See accompanying schedule:
Unaffiliated issuers (cost $24,722,958) | | $24,722,958 |
| Receivable for investments sold | | 577,746 |
| Receivable for fund shares sold | | 92 |
| Interest receivable | | 30,756 |
| Prepaid expenses | | 49 |
| Receivable from investment adviser for expense reductions | | 724 |
| Other receivables | | 209 |
| Total assets | | 25,332,534 |
| Liabilities | | |
| Payable for investments purchased | $27,021 | |
| Payable for fund shares redeemed | 1,272 | |
| Distributions payable | 9,066 | |
| Accrued management fee | 2,824 | |
| Distribution and service plan fees payable | 1,059 | |
| Other affiliated payables | 1,054 | |
| Other payables and accrued expenses | 275 | |
| Total liabilities | | 42,571 |
| Net Assets | | $25,289,963 |
| Net Assets consist of: | | |
| Paid in capital | | $25,289,977 |
| Undistributed net investment income | | 12 |
| Accumulated undistributed net realized gain (loss) on investments | | (26) |
| Net Assets | | $25,289,963 |
| Class I: | | |
| Net Asset Value, offering price and redemption price per share ($8,416,645 ÷ 8,413,652 shares) | | $1.00 |
| Class II: | | |
| Net Asset Value, offering price and redemption price per share ($1,393,951 ÷ 1,392,998 shares) | | $1.00 |
| Class III: | | |
| Net Asset Value, offering price and redemption price per share ($2,653,845 ÷ 2,653,576 shares) | | $1.00 |
| Class IV: | | |
| Net Asset Value, offering price and redemption price per share ($805,001 ÷ 804,763 shares) | | $1.00 |
| Select Class: | | |
| Net Asset Value, offering price and redemption price per share ($268,625 ÷ 268,566 shares) | | $1.00 |
| Institutional Class: | | |
| Net Asset Value, offering price and redemption price per share ($11,751,896 ÷ 11,751,670 shares) | | $1.00 |
See accompanying notes which are an integral part of the financial statements.
Statement of Operations
| Amounts in thousands | | Six months ended September 30, 2017 (Unaudited) |
| Investment Income | | |
| Interest | | $98,680 |
| Expenses | | |
| Management fee | $14,473 | |
| Transfer agent fees | 5,033 | |
| Distribution and service plan fees | 5,875 | |
| Accounting fees and expenses | 628 | |
| Custodian fees and expenses | 67 | |
| Independent trustees' fees and expenses | 36 | |
| Registration fees | 130 | |
| Audit | 25 | |
| Legal | 16 | |
| Miscellaneous | 63 | |
| Total expenses before reductions | 26,346 | |
| Expense reductions | (3,372) | 22,974 |
| Net investment income (loss) | | 75,706 |
| Realized and Unrealized Gain (Loss) | | |
| Net realized gain (loss) on: | | |
| Investment securities: | | |
| Unaffiliated issuers | | (18) |
| Total net realized gain (loss) | | (18) |
| Net increase in net assets resulting from operations | | $75,688 |
See accompanying notes which are an integral part of the financial statements.
Statement of Changes in Net Assets
| Amounts in thousands | Six months ended September 30, 2017 (Unaudited) | Year ended March 31, 2017 |
| Increase (Decrease) in Net Assets | | |
| Operations | | |
| Net investment income (loss) | $75,706 | $46,904 |
| Net realized gain (loss) | (18) | 192 |
| Net increase in net assets resulting from operations | 75,688 | 47,096 |
| Distributions to shareholders from net investment income | (76,214) | (46,502) |
| Share transactions - net increase (decrease) | 6,341,681 | 1,492,662 |
| Total increase (decrease) in net assets | 6,341,155 | 1,493,256 |
| Net Assets | | |
| Beginning of period | 18,948,808 | 17,455,552 |
| End of period | $25,289,963 | $18,948,808 |
| Other Information | | |
| Undistributed net investment income end of period | $12 | $520 |
See accompanying notes which are an integral part of the financial statements.
Financial Highlights
Treasury Portfolio Class I
| | Six months ended (Unaudited) September 30, | Years ended March 31, | | | | |
| | 2017 | 2017 | 2016 | 2015 | 2014 | 2013 |
| Selected Per–Share Data | | | | | | |
| Net asset value, beginning of period | $1.00 | $1.00 | $1.00 | $1.00 | $1.00 | $1.00 |
| Income from Investment Operations | | | | | | |
| Net investment income (loss) | .004 | .003 | .001 | –A | –A | –A |
| Net realized and unrealized gain (loss)A | – | – | – | – | – | – |
| Total from investment operations | .004 | .003 | .001 | –A | –A | –A |
| Distributions from net investment income | (.004) | (.003) | (.001) | –A | –A | –A |
| Total distributions | (.004) | (.003) | (.001) | –A | –A | –A |
| Net asset value, end of period | $1.00 | $1.00 | $1.00 | $1.00 | $1.00 | $1.00 |
| Total ReturnB,C | .39% | .27% | .05% | .01% | .01% | .01% |
| Ratios to Average Net AssetsD | | | | | | |
| Expenses before reductions | .21%E | .21% | .21% | .21% | .21% | .21% |
| Expenses net of fee waivers, if any | .18%E | .18% | .13% | .07% | .08% | .16% |
| Expenses net of all reductions | .18%E | .18% | .13% | .07% | .08% | .16% |
| Net investment income (loss) | .77%E | .27% | .05% | .01% | .01% | .01% |
| Supplemental Data | | | | | | |
| Net assets, end of period (in millions) | $8,417 | $8,308 | $9,639 | $11,727 | $9,736 | $9,964 |
A Amount represents less than $.0005 per share.
B Total returns for periods of less than one year are not annualized.
C Total returns would have been lower if certain expenses had not been reduced during the applicable periods shown.
D Expense ratios reflect operating expenses of the class. Expenses before reductions do not reflect amounts reimbursed or waived or reductions from expense offset arrangements and do not represent the amount paid by the class during periods when reimbursements, waivers or reductions occur. Expenses net of fee waivers reflect expenses after reimbursement and waivers but prior to reductions from expense offset arrangements. Expenses net of all reductions represent the net expenses paid by the class.
E Annualized
See accompanying notes which are an integral part of the financial statements.
Treasury Portfolio Class II
| | Six months ended (Unaudited) September 30, | Years ended March 31, | | | | |
| | 2017 | 2017 | 2016 | 2015 | 2014 | 2013 |
| Selected Per–Share Data | | | | | | |
| Net asset value, beginning of period | $1.00 | $1.00 | $1.00 | $1.00 | $1.00 | $1.00 |
| Income from Investment Operations | | | | | | |
| Net investment income (loss) | .003 | .001 | –A | –A | –A | –A |
| Net realized and unrealized gain (loss)A | – | – | – | – | – | – |
| Total from investment operations | .003 | .001 | –A | –A | –A | –A |
| Distributions from net investment income | (.003) | (.001) | –A | –A | –A | –A |
| Total distributions | (.003) | (.001) | –A | –A | –A | –A |
| Net asset value, end of period | $1.00 | $1.00 | $1.00 | $1.00 | $1.00 | $1.00 |
| Total ReturnB,C | .31% | .12% | .01% | .01% | .01% | .01% |
| Ratios to Average Net AssetsD | | | | | | |
| Expenses before reductions | .36%E | .36% | .36% | .36% | .36% | .36% |
| Expenses net of fee waivers, if any | .33%E | .33% | .22% | .07% | .08% | .16% |
| Expenses net of all reductions | .33%E | .33% | .22% | .07% | .08% | .16% |
| Net investment income (loss) | .62%E | .12% | .01% | .01% | .01% | .01% |
| Supplemental Data | | | | | | |
| Net assets, end of period (in millions) | $1,394 | $363 | $557 | $70 | $133 | $127 |
A Amount represents less than $.0005 per share.
B Total returns for periods of less than one year are not annualized.
C Total returns would have been lower if certain expenses had not been reduced during the applicable periods shown.
D Expense ratios reflect operating expenses of the class. Expenses before reductions do not reflect amounts reimbursed or waived or reductions from expense offset arrangements and do not represent the amount paid by the class during periods when reimbursements, waivers or reductions occur. Expenses net of fee waivers reflect expenses after reimbursement and waivers but prior to reductions from expense offset arrangements. Expenses net of all reductions represent the net expenses paid by the class.
E Annualized
See accompanying notes which are an integral part of the financial statements.
Treasury Portfolio Class III
| | Six months ended (Unaudited) September 30, | Years ended March 31, | | | | |
| | 2017 | 2017 | 2016 | 2015 | 2014 | 2013 |
| Selected Per–Share Data | | | | | | |
| Net asset value, beginning of period | $1.00 | $1.00 | $1.00 | $1.00 | $1.00 | $1.00 |
| Income from Investment Operations | | | | | | |
| Net investment income (loss) | .003 | .001 | –A | –A | –A | –A |
| Net realized and unrealized gain (loss)A | – | – | – | – | – | – |
| Total from investment operations | .003 | .001 | –A | –A | –A | –A |
| Distributions from net investment income | (.003) | (.001) | –A | –A | –A | –A |
| Total distributions | (.003) | (.001) | –A | –A | –A | –A |
| Net asset value, end of period | $1.00 | $1.00 | $1.00 | $1.00 | $1.00 | $1.00 |
| Total ReturnB,C | .26% | .05% | .01% | .01% | .01% | .01% |
| Ratios to Average Net AssetsD | | | | | | |
| Expenses before reductions | .46%E | .46% | .46% | .46% | .46% | .46% |
| Expenses net of fee waivers, if any | .43%E | .39% | .17% | .07% | .08% | .16% |
| Expenses net of all reductions | .43%E | .39% | .17% | .07% | .08% | .16% |
| Net investment income (loss) | .52%E | .06% | .02% | .01% | .01% | .01% |
| Supplemental Data | | | | | | |
| Net assets, end of period (in millions) | $2,654 | $2,563 | $2,862 | $2,866 | $2,654 | $2,844 |
A Amount represents less than $.0005 per share.
B Total returns for periods of less than one year are not annualized.
C Total returns would have been lower if certain expenses had not been reduced during the applicable periods shown.
D Expense ratios reflect operating expenses of the class. Expenses before reductions do not reflect amounts reimbursed or waived or reductions from expense offset arrangements and do not represent the amount paid by the class during periods when reimbursements, waivers or reductions occur. Expenses net of fee waivers reflect expenses after reimbursement and waivers but prior to reductions from expense offset arrangements. Expenses net of all reductions represent the net expenses paid by the class.
E Annualized
See accompanying notes which are an integral part of the financial statements.
Treasury Portfolio Class IV
| | Six months ended (Unaudited) September 30, | Years ended March 31, | | | | |
| | 2017 | 2017 | 2016 | 2015 | 2014 | 2013 |
| Selected Per–Share Data | | | | | | |
| Net asset value, beginning of period | $1.00 | $1.00 | $1.00 | $1.00 | $1.00 | $1.00 |
| Income from Investment Operations | | | | | | |
| Net investment income (loss) | .001 | –A | –A | –A | –A | –A |
| Net realized and unrealized gain (loss)A | – | – | – | – | – | – |
| Total from investment operations | .001 | –A | –A | –A | –A | –A |
| Distributions from net investment income | (.001) | –A | –A | –A | –A | –A |
| Total distributions | (.001) | –A | –A | –A | –A | –A |
| Net asset value, end of period | $1.00 | $1.00 | $1.00 | $1.00 | $1.00 | $1.00 |
| Total ReturnB,C | .14% | .01% | .01% | .01% | .01% | .01% |
| Ratios to Average Net AssetsD | | | | | | |
| Expenses before reductions | .71%E | .71% | .71% | .71% | .71% | .71% |
| Expenses net of fee waivers, if any | .68%E | .43% | .18% | .07% | .08% | .16% |
| Expenses net of all reductions | .68%E | .43% | .18% | .07% | .08% | .16% |
| Net investment income (loss) | .27%E | .02% | .01% | .01% | .01% | .01% |
| Supplemental Data | | | | | | |
| Net assets, end of period (in millions) | $805 | $793 | $905 | $621 | $591 | $527 |
A Amount represents less than $.0005 per share.
B Total returns for periods of less than one year are not annualized.
C Total returns would have been lower if certain expenses had not been reduced during the applicable periods shown.
D Expense ratios reflect operating expenses of the class. Expenses before reductions do not reflect amounts reimbursed or waived or reductions from expense offset arrangements and do not represent the amount paid by the class during periods when reimbursements, waivers or reductions occur. Expenses net of fee waivers reflect expenses after reimbursement and waivers but prior to reductions from expense offset arrangements. Expenses net of all reductions represent the net expenses paid by the class.
E Annualized
See accompanying notes which are an integral part of the financial statements.
Treasury Portfolio Select Class
| | Six months ended (Unaudited) September 30, | Years ended March 31, | | | | |
| | 2017 | 2017 | 2016 | 2015 | 2014 | 2013 |
| Selected Per–Share Data | | | | | | |
| Net asset value, beginning of period | $1.00 | $1.00 | $1.00 | $1.00 | $1.00 | $1.00 |
| Income from Investment Operations | | | | | | |
| Net investment income (loss) | .004 | .002 | –A | –A | –A | –A |
| Net realized and unrealized gain (loss)A | – | – | – | – | – | – |
| Total from investment operations | .004 | .002 | –A | –A | –A | –A |
| Distributions from net investment income | (.004) | (.002) | –A | –A | –A | –A |
| Total distributions | (.004) | (.002) | –A | –A | –A | –A |
| Net asset value, end of period | $1.00 | $1.00 | $1.00 | $1.00 | $1.00 | $1.00 |
| Total ReturnB,C | .36% | .22% | .04% | .01% | .01% | .01% |
| Ratios to Average Net AssetsD | | | | | | |
| Expenses before reductions | .26%E | .26% | .26% | .26% | .26% | .26% |
| Expenses net of fee waivers, if any | .23%E | .23% | .15% | .07% | .08% | .16% |
| Expenses net of all reductions | .23%E | .23% | .15% | .07% | .08% | .16% |
| Net investment income (loss) | .72%E | .22% | .04% | .01% | .01% | .01% |
| Supplemental Data | | | | | | |
| Net assets, end of period (in millions) | $269 | $276 | $287 | $225 | $238 | $198 |
A Amount represents less than $.0005 per share.
B Total returns for periods of less than one year are not annualized.
C Total returns would have been lower if certain expenses had not been reduced during the applicable periods shown.
D Expense ratios reflect operating expenses of the class. Expenses before reductions do not reflect amounts reimbursed or waived or reductions from expense offset arrangements and do not represent the amount paid by the class during periods when reimbursements, waivers or reductions occur. Expenses net of fee waivers reflect expenses after reimbursement and waivers but prior to reductions from expense offset arrangements. Expenses net of all reductions represent the net expenses paid by the class.
E Annualized
See accompanying notes which are an integral part of the financial statements.
Treasury Portfolio Institutional Class
| | Six months ended (Unaudited) September 30, | Years ended March 31, | | |
| | 2017 | 2017 | 2016 | 2015 A |
| Selected Per–Share Data | | | | |
| Net asset value, beginning of period | $1.00 | $1.00 | $1.00 | $1.00 |
| Income from Investment Operations | | | | |
| Net investment income (loss) | .004 | .003 | .001 | –B |
| Net realized and unrealized gain (loss)B | – | – | – | – |
| Total from investment operations | .004 | .003 | .001 | –B |
| Distributions from net investment income | (.004) | (.003) | (.001) | –B |
| Total distributions | (.004) | (.003) | (.001) | –B |
| Net asset value, end of period | $1.00 | $1.00 | $1.00 | $1.00 |
| Total ReturnC,D | .41% | .31% | .07% | .01% |
| Ratios to Average Net AssetsE | | | | |
| Expenses before reductions | .18%F | .18% | .18% | .18%F |
| Expenses net of fee waivers, if any | .14%F | .14% | .13% | .07%F |
| Expenses net of all reductions | .14%F | .14% | .13% | .07%F |
| Net investment income (loss) | .81%F | .31% | .11% | - %F,G |
| Supplemental Data | | | | |
| Net assets, end of period (in millions) | $11,752 | $6,645 | $3,205 | $669 |
A For the period May 14, 2014 (commencement of sale of shares) to March 31, 2015.
B Amount represents less than $.0005 per share.
C Total returns for periods of less than one year are not annualized.
D Total returns would have been lower if certain expenses had not been reduced during the applicable periods shown.
E Expense ratios reflect operating expenses of the class. Expenses before reductions do not reflect amounts reimbursed or waived or reductions from expense offset arrangements and do not represent the amount paid by the class during periods when reimbursements, waivers or reductions occur. Expense ratios before reductions for start-up periods may not be representative of longer-term operating periods. Expenses net of fee waivers reflect expenses after reimbursement and waivers but prior to reductions from expense offset arrangements. Expenses net of all reductions represent the net expenses paid by the class.
F Annualized
G Amount represents less than .005%.
See accompanying notes which are an integral part of the financial statements.
Government Portfolio
Investment Summary/Performance (Unaudited)
Effective Maturity Diversification
| Days | % of fund's investments 9/30/17 | % of fund's investments 3/31/17 | % of fund's investments 9/30/16 |
| 1 - 7 | 39.8 | 30.6 | 35.5 |
| 8 - 30 | 24.2 | 24.5 | 12.7 |
| 31 - 60 | 12.7 | 15.8 | 19.3 |
| 61 - 90 | 16.3 | 18.1 | 16.8 |
| 91 - 180 | 7.0 | 8.6 | 13.8 |
| > 180 | 0.0 | 2.4 | 1.9 |
Effective maturity is determined in accordance with the requirements of Rule 2a-7 under the Investment Company Act of 1940.
Asset Allocation (% of fund's net assets)
| As of September 30, 2017 |
| | U.S. Treasury Debt | 17.3% |
| | U.S. Government Agency Debt | 48.8% |
| | Repurchase Agreements | 34.1% |
| | Net Other Assets (Liabilities)* | (0.2)% |

* Net Other Assets (Liabilities) are not included in the pie chart
| As of March 31, 2017 |
| | U.S. Treasury Debt | 25.9% |
| | U.S. Government Agency Debt | 46.1% |
| | Repurchase Agreements | 27.3% |
| | Variable Rate Demand Notes (VRDNs) | 0.7% |
Current And Historical 7-Day Yields
| | 9/30/17 | 6/30/17 | 3/31/17 | 12/31/16 | 9/30/16 |
| Class I | 0.91% | 0.81% | 0.56% | 0.39% | 0.27% |
| Class II | 0.76% | 0.66% | 0.41% | 0.24% | 0.12% |
| Class III | 0.66% | 0.56% | 0.31% | 0.14% | 0.02% |
| Select Class | 0.86% | 0.76% | 0.51% | 0.34% | 0.22% |
| Institutional Class | 0.95% | 0.85% | 0.60% | 0.43% | 0.31% |
Yield refers to the income paid by the Fund over a given period. Yields for money market funds are usually for seven-day periods, as they are here, though they are expressed as annual percentage rates. Past performance is no guarantee of future results. Yield will vary and it's possible to lose money investing in the Fund. A portion of the Fund's expenses was reimbursed and/or waived. Absent such reimbursements and/or waivers the yield for the period ending September 30, 2017, the most recent period shown in the table, would have been 0.88% for Class I, 0.73% for Class II, 0.63% for Class III, 0.83% for Select Class and 0.91% for Institutional Class.
Percentages shown as 0.0% may reflect amounts less than 0.05%.
Government Portfolio
Investments September 30, 2017 (Unaudited)
Showing Percentage of Net Assets
| U.S. Treasury Debt - 17.3% | | | | |
| | | Yield(a) | Principal Amount (000s) | Value (000s) |
| U.S. Treasury Obligations - 17.3% | | | | |
| U.S. Treasury Bills | | | | |
| 11/2/17 to 3/8/18 | | 1.02 to 1.15 % | $10,216,488 | $10,191,281 |
| U.S. Treasury Notes | | | | |
| 10/31/17 to 7/31/19 | | 0.74 to 1.19 (b) | 6,752,000 | 6,756,078 |
| TOTAL U.S. TREASURY DEBT | | | | |
| (Cost $16,947,359) | | | | 16,947,359 |
|
| U.S. Government Agency Debt - 48.8% | | | | |
| Federal Agencies - 48.8% | | | | |
| Fannie Mae | | | | |
| 10/5/17 to 1/11/18 | | 1.02 to 1.28 (b) | 3,243,915 | 3,239,948 |
| Federal Farm Credit Bank | | | | |
| 10/16/17 to 6/26/19 | | 1.01 to 1.29 (b) | 3,495,500 | 3,495,626 |
| Federal Home Loan Bank | | | | |
| 10/2/17 to 12/27/18 | | 0.91 to 1.31 (b) | 35,945,300 | 35,937,110 |
| Freddie Mac | | | | |
| 11/13/17 to 6/28/18 | | 0.97 to 1.30 (b) | 5,040,717 | 5,038,329 |
| TOTAL U.S. GOVERNMENT AGENCY DEBT | | | | |
| (Cost $47,711,013) | | | | 47,711,013 |
| U.S. Government Agency Repurchase Agreement - 15.8% | | | |
| | | Maturity Amount (000s) | Value (000s) |
| In a joint trading account at: | | | |
| 1.05% dated 9/29/17 due 10/2/17 (Collateralized by U.S. Government Obligations) # | | $1,305,702 | $1,305,588 |
| 1.07% dated 9/29/17 due 10/2/17 (Collateralized by U.S. Government Obligations) # | | 4,802,365 | 4,801,937 |
| With: | | | |
| BNP Paribas, S.A. at: | | | |
| 1.1%, dated: | | | |
| 8/22/17 due 10/6/17 (Collateralized by U.S. Treasury Obligations valued at $77,150,767, 0.00% - 7.63%, 10/12/17 - 6/20/47) | | 75,206 | 75,000 |
| 8/25/17 due 10/6/17 (Collateralized by U.S. Treasury Obligations valued at $77,255,543, 0.00% - 4.50%, 10/12/17 - 8/20/47) | | 75,215 | 75,000 |
| 1.11%, dated 8/31/17 due 10/6/17 (Collateralized by U.S. Treasury Obligations valued at $306,708,368, 0.00% - 8.75%, 10/12/17 - 1/20/47) | | 299,848 | 299,000 |
| 1.12%, dated 8/15/17 due 10/6/17 (Collateralized by U.S. Treasury Obligations valued at $311,376,280, 0.00% - 7.63%, 10/12/17 - 2/15/47) | | 303,027 | 301,900 |
| 1.13%, dated 6/27/17 due 10/6/17 (Collateralized by U.S. Treasury Obligations valued at $75,178,364, 0.00% - 7.00%, 10/12/17 - 8/20/47) | | 73,275 | 73,000 |
| Citibank NA at: | | | |
| 1.02%, dated 9/26/17 due 10/3/17 (Collateralized by U.S. Treasury Obligations valued at $73,562,522, 0.38% - 10.00%, 11/30/17 - 7/1/47) | | 72,014 | 72,000 |
| 1.03%, dated 9/26/17 due 10/3/17 (Collateralized by U.S. Treasury Obligations valued at $443,129,418, 0.00% - 9.50%, 10/12/17 - 4/1/56) | | 433,087 | 433,000 |
| ING Financial Markets LLC at: | | | |
| 1.09%, dated: | | | |
| 8/2/17 due 10/30/17 (Collateralized by U.S. Government Obligations valued at $179,836,657, 4.00%, 11/20/45 - 5/20/47) | | 176,474 | 176,000 |
| 8/3/17 due 11/1/17 (Collateralized by U.S. Government Obligations valued at $150,199,559, 4.00%, 8/20/45) | | 147,401 | 147,000 |
| 8/4/17 due 11/2/17 (Collateralized by U.S. Government Obligations valued at $89,918,282, 2.13% - 6.75%, 4/24/26 - 3/15/31) | | 88,240 | 88,000 |
| 8/7/17 due 11/3/17 (Collateralized by U.S. Government Obligations valued at $168,570,370, 4.00%, 11/20/45 - 2/20/46) | | 165,440 | 165,000 |
| 8/14/17 due 11/3/17 (Collateralized by U.S. Government Obligations valued at $154,234,565, 4.00%, 8/20/45 - 2/20/46) | | 151,416 | 151,000 |
| 8/15/17 due 11/3/17 (Collateralized by U.S. Government Obligations valued at $92,950,480, 1.38% - 3.75%, 1/28/19 - 4/24/26) | | 91,251 | 91,000 |
| 1.1%, dated 9/28/17 due 11/2/17 (Collateralized by U.S. Government Obligations valued at $73,443,440, 0.88% - 2.38%, 10/26/17 - 5/15/27) | | 72,077 | 72,000 |
| Merrill Lynch, Pierce, Fenner & Smith at 1.06%, dated 8/11/17 due 10/6/17 (Collateralized by U.S. Government Obligations valued at $458,681,219, 2.87% - 4.00%, 3/1/30 - 10/1/47) | | 449,806 | 449,000 |
| Mitsubishi UFJ Securities (U.S.A.), Inc. at: | | | |
| 1.07%, dated: | | | |
| 9/28/17 due 10/5/17 (Collateralized by U.S. Government Obligations valued at $146,897,462, 0.00% - 5.00%, 2/1/18 - 8/20/67) | | 144,030 | 144,000 |
| 9/29/17 due 10/2/17 (Collateralized by U.S. Government Obligations valued at $138,732,369, 2.33% - 4.90%, 8/1/19 - 10/1/47) | | 136,012 | 136,000 |
| 1.1%, dated: | | | |
| 9/5/17 due 11/6/17 (Collateralized by U.S. Government Obligations valued at $258,272,899, 2.00% - 5.75%, 1/1/19 - 6/20/67) | | 253,479 | 253,000 |
| 9/6/17 due 11/7/17 (Collateralized by U.S. Government Obligations valued at $212,328,550, 0.00% - 6.50%, 9/13/18 - 9/1/47) | | 208,394 | 208,000 |
| 9/7/17 due 11/8/17 (Collateralized by U.S. Government Obligations valued at $76,558,438, 2.17% - 5.37%, 11/1/21 - 9/1/47) | | 75,142 | 75,000 |
| 9/13/17 due 11/14/17 (Collateralized by U.S. Government Obligations valued at $199,015,473, 2.24% - 5.82%, 9/1/18 - 8/20/67) | | 195,369 | 195,000 |
| 9/21/17 due 11/20/17 (Collateralized by U.S. Government Obligations valued at $196,926,167, 2.70% - 4.50%, 6/1/24 - 6/1/47) | | 193,354 | 193,000 |
| 9/26/17 due 11/27/17 (Collateralized by U.S. Government Obligations valued at $162,209,733, 2.30% - 5.96%, 11/1/21 - 9/1/47) | | 159,301 | 159,000 |
| Natixis SA at 1.05%, dated 9/28/17 due 10/5/17 (Collateralized by U.S. Treasury Obligations valued at $148,198,740, 0.13% - 4.00%, 1/31/20 - 2/1/44) | | 144,029 | 144,000 |
| Nomura Securities International, Inc. at 1.08%, dated 9/29/17 due 10/2/17 (Collateralized by U.S. Government Obligations valued at $1,526,057,333, 2.00% - 10.50%, 11/1/17 - 12/20/60) | | 1,496,135 | 1,496,000 |
| RBC Capital Markets Corp. at: | | | |
| 1.09%, dated: | | | |
| 7/21/17 due 10/19/17 (Collateralized by U.S. Government Obligations valued at $147,204,646, 2.50% - 8.00%, 11/1/17 - 9/20/47) | | 144,392 | 144,000 |
| 8/10/17 due 11/8/17 (Collateralized by U.S. Government Obligations valued at $197,178,868, 1.48% - 4.50%, 11/1/26 - 9/20/47) | | 193,526 | 193,000 |
| 8/14/17 due 11/13/17 (Collateralized by U.S. Government Obligations valued at $108,280,975, 2.50% - 5.00%, 2/1/24 - 9/1/47) | | 106,292 | 106,000 |
| 1.1%, dated 7/6/17 due: | | | |
| 10/3/17 (Collateralized by U.S. Government Obligations valued at $80,802,158, 2.50% - 5.50%, 10/1/23 - 9/20/47) | | 79,215 | 79,000 |
| 10/4/17 (Collateralized by U.S. Government Obligations valued at $147,310,926, 1.13% - 8.00%, 12/1/17 - 9/20/47) | | 144,396 | 144,000 |
| RBC Dominion Securities at: | | | |
| 1.05%, dated 9/21/17 due 10/3/17 (Collateralized by U.S. Government Obligations valued at $151,008,433, 3.50%, 4/20/46) | | 148,052 | 148,000 |
| 1.07%, dated: | | | |
| 7/7/17 due 10/5/17 (Collateralized by U.S. Government Obligations valued at $146,237,170, 3.50%, 4/20/46) | | 143,383 | 143,000 |
| 7/10/17 due 10/6/17 (Collateralized by U.S. Government Obligations valued at $147,246,711, 3.50%, 3/20/47) | | 144,394 | 144,000 |
| 7/11/17 due 10/6/17 (Collateralized by U.S. Government Obligations valued at $70,553,624, 3.50%, 5/20/47) | | 69,189 | 69,000 |
| 7/19/17 due 10/6/17 (Collateralized by U.S. Government Obligations valued at $146,185,147, 3.00% - 3.50%, 4/20/46 - 7/20/46) | | 143,395 | 143,000 |
| 1.08%, dated: | | | |
| 7/13/17 due 10/6/17 (Collateralized by U.S. Government Obligations valued at $148,259,397, 3.50%, 4/20/46 - 3/20/47) | | 145,422 | 145,000 |
| 7/17/17 due 10/6/17 (Collateralized by U.S. Government Obligations valued at $146,196,937, 3.50%, 4/20/46) | | 143,403 | 143,000 |
| 7/20/17 due 10/6/17 (Collateralized by U.S. Government Obligations valued at $147,206,074, 3.50%, 4/20/46 - 3/20/47) | | 144,415 | 144,000 |
| 7/21/17 due 10/6/17: | | | |
| (Collateralized by U.S. Government Obligations valued at $147,201,668, 3.50%, 3/20/47) | | 144,415 | 144,000 |
| (Collateralized by U.S. Government Obligations valued at $147,201,667, 3.50%, 4/20/46) | | 144,419 | 144,000 |
| 1.09%, dated 7/24/17 due 10/6/17 (Collateralized by U.S. Government Obligations valued at $148,213,467, 3.50%, 3/20/47) | | 145,430 | 145,000 |
| RBC Financial Group at: | | | |
| 1.07%, dated 8/14/17 due 10/6/17 (Collateralized by U.S. Government Obligations valued at $78,185,607, 2.31% - 6.50%, 3/1/27 - 9/20/47) | | 76,142 | 76,000 |
| 1.09%, dated: | | | |
| 8/14/17 due 10/6/17 (Collateralized by U.S. Government Obligations valued at $78,382,913, 3.00% - 6.50%, 8/1/26 - 9/20/47) | | 76,212 | 76,000 |
| 8/15/17 due 10/6/17 (Collateralized by U.S. Government Obligations valued at $155,276,564, 1.50% - 4.50%, 1/1/27 - 7/1/47) | | 152,423 | 152,000 |
| 8/16/17 due 10/6/17 (Collateralized by U.S. Government Obligations valued at $107,252,409, 3.13% - 5.00%, 1/1/26 - 8/20/47) | | 105,292 | 105,000 |
| 1.1%, dated 9/11/17 due 10/6/17 (Collateralized by U.S. Government Obligations valued at $152,077,521, 2.50% - 6.50%, 1/1/26 - 9/20/47) | | 149,414 | 149,000 |
| Societe Generale at: | | | |
| 1.07%, dated 9/29/17 due 10/2/17 (Collateralized by U.S. Treasury Obligations valued at $301,659,986, 0.13% - 6.75%, 4/15/19 - 8/15/44) | | 293,026 | 293,000 |
| 1.08%, dated: | | | |
| 9/26/17 due 10/6/17 (Collateralized by U.S. Treasury Obligations valued at $575,473,094, 0.13% - 1.75%, 3/31/19 - 1/31/23) | | 563,524 | 563,000 |
| 9/28/17 due 10/6/17 (Collateralized by U.S. Treasury Obligations valued at $105,072,817, 0.63% - 1.00%, 2/28/18 - 1/15/24) | | 103,099 | 103,000 |
| TOTAL U.S. GOVERNMENT AGENCY REPURCHASE AGREEMENT | | | |
| (Cost $15,473,425) | | | 15,473,425 |
|
| U.S. Treasury Repurchase Agreement - 18.3% | | | |
| With: | | | |
| Barclays Capital, Inc. at 1.06%, dated 9/29/17 due 10/2/17 (Collateralized by U.S. Treasury Obligations valued at $130,571,625, 0.63% - 3.13%, 11/30/17 - 2/15/26) | | 128,011 | 128,000 |
| BMO Capital Markets Corp. at: | | | |
| 1.06%, dated 9/27/17 due 10/6/17 (Collateralized by U.S. Treasury Obligations valued at $132,639,056, 3.63%, 2/15/20) | | 129,300 | 129,000 |
| 1.07%, dated 8/29/17 due 10/6/17 (Collateralized by U.S. Treasury Obligations valued at $69,608,127, 1.50% - 3.88%, 5/15/18 - 11/15/26) | | 68,190 | 68,000 |
| BMO Harris Bank NA at: | | | |
| 1.06%, dated: | | | |
| 7/7/17 due 10/6/17 (Collateralized by U.S. Treasury Obligations valued at $134,468,754, 1.00% - 2.50%, 5/15/18 - 2/29/24) | | 131,351 | 131,000 |
| 7/13/17 due 10/5/17 (Collateralized by U.S. Treasury Obligations valued at $134,192,057, 0.88% - 3.75%, 12/31/17 - 8/15/47) | | 131,324 | 131,000 |
| 7/25/17 due 10/6/17 (Collateralized by U.S. Treasury Obligations valued at $136,353,001, 2.75%, 11/15/23) | | 132,299 | 132,000 |
| 8/3/17 due 10/6/17 (Collateralized by U.S. Treasury Obligations valued at $137,869,400, 1.00% - 1.38%, 5/31/18 - 6/30/18) | | 134,351 | 134,000 |
| 8/9/17 due 10/6/17 (Collateralized by U.S. Treasury Obligations valued at $207,721,773, 0.88% - 3.63%, 1/31/18 - 8/15/47) | | 203,556 | 203,000 |
| 8/10/17 due 10/6/17 (Collateralized by U.S. Treasury Obligations valued at $138,588,593, 0.63% - 3.63%, 10/31/17 - 8/15/47) | | 135,358 | 135,000 |
| 8/17/17 due 10/6/17 (Collateralized by U.S. Treasury Obligations valued at $139,701,580, 2.00% - 3.88%, 2/15/20 - 8/15/40) | | 135,354 | 135,000 |
| 1.07%, dated: | | | |
| 7/25/17 due 10/6/17 (Collateralized by U.S. Treasury Obligations valued at $135,293,451, 2.13% - 3.88%, 5/15/18 - 12/31/23) | | 132,333 | 132,000 |
| 7/26/17 due 10/6/17: | | | |
| (Collateralized by U.S. Treasury Obligations valued at $137,016,024, 2.88%, 8/15/45 - 11/15/46) | | 132,333 | 132,000 |
| (Collateralized by U.S. Treasury Obligations valued at $67,629,438, 0.63% - 3.63%, 12/31/17 - 8/15/47) | | 66,177 | 66,000 |
| 7/27/17 due 10/6/17 (Collateralized by U.S. Treasury Obligations valued at $67,503,387, 0.88% - 3.63%, 1/31/18 - 8/15/47) | | 66,179 | 66,000 |
| 7/28/17 due 10/6/17 (Collateralized by U.S. Treasury Obligations valued at $137,301,059, 1.75%, 10/31/18) | | 133,348 | 133,000 |
| 9/1/17 due 10/6/17 (Collateralized by U.S. Treasury Obligations valued at $69,194,286, 2.00% - 3.88%, 5/15/18 - 11/15/26) | | 67,203 | 67,000 |
| 9/14/17 due 10/6/17 (Collateralized by U.S. Treasury Obligations valued at $81,920,806, 2.00%, 2/15/22) | | 80,216 | 80,000 |
| 1.08%, dated 8/4/17 due 10/6/17 (Collateralized by U.S. Treasury Obligations valued at $82,176,632, 0.00% - 3.63%, 12/31/17 - 8/15/47) | | 80,247 | 80,000 |
| BNP Paribas, S.A. at: | | | |
| 1.08%, dated: | | | |
| 7/18/17 due 10/6/17 (Collateralized by U.S. Treasury Obligations valued at $133,000,102, 0.00% - 8.75%, 10/12/17 - 8/15/44) | | 130,351 | 130,000 |
| 8/7/17 due 10/6/17 (Collateralized by U.S. Treasury Obligations valued at $271,910,389, 0.00% - 3.00%, 10/12/17 - 11/15/44) | | 266,726 | 266,000 |
| 8/8/17 due 10/6/17 (Collateralized by U.S. Treasury Obligations valued at $276,474,356, 0.00% - 6.25%, 1/4/18 - 8/15/45) | | 270,737 | 270,000 |
| 8/11/17 due 10/6/17 (Collateralized by U.S. Treasury Obligations valued at $550,329,012, 0.00% - 8.88%, 10/12/17 - 2/15/46) | | 539,469 | 538,000 |
| 1.09%, dated: | | | |
| 8/25/17 due 10/6/17 (Collateralized by U.S. Treasury Obligations valued at $277,011,291, 0.00% - 4.38%, 10/12/17 - 8/15/42) | | 270,768 | 270,000 |
| 8/30/17 due 10/6/17 (Collateralized by U.S. Treasury Obligations valued at $298,137,606, 0.00% - 8.75%, 10/12/17 - 11/15/26) | | 292,813 | 292,000 |
| 8/31/17 due 10/6/17 (Collateralized by U.S. Treasury Obligations valued at $275,386,977, 0.00% - 8.75%, 1/4/18 - 2/15/46) | | 269,749 | 269,000 |
| 9/5/17 due 10/6/17 (Collateralized by U.S. Treasury Obligations valued at $205,650,843, 0.00% - 4.25%, 10/12/17 - 2/15/46) | | 201,554 | 201,000 |
| 9/7/17 due 10/6/17 (Collateralized by U.S. Treasury Obligations valued at $273,566,966, 0.00% - 3.13%, 10/12/17 - 5/15/46) | | 268,738 | 268,000 |
| 9/11/17 due 10/6/17 (Collateralized by U.S. Treasury Obligations valued at $549,353,795, 0.00% - 8.75%, 10/12/17 - 5/15/44) | | 538,480 | 537,000 |
| 9/13/17 due 10/6/17 (Collateralized by U.S. Treasury Obligations valued at $544,355,631, 0.00% - 6.25%, 10/12/17 - 2/15/46) | | 533,482 | 532,000 |
| 9/15/17 due 10/6/17 (Collateralized by U.S. Treasury Obligations valued at $544,646,832, 0.00% - 9.13%, 10/12/17 - 5/15/47) | | 533,466 | 532,000 |
| 1.1%, dated: | | | |
| 7/18/17 due 10/6/17 (Collateralized by U.S. Treasury Obligations valued at $133,446,594, 0.00% - 4.38%, 10/12/17 - 8/15/44) | | 130,445 | 130,000 |
| 8/14/17 due 10/6/17 (Collateralized by U.S. Treasury Obligations valued at $829,795,554, 0.00% - 9.13%, 10/12/17 - 5/15/44) | | 812,970 | 810,000 |
| 8/15/17 due 10/6/17 (Collateralized by U.S. Treasury Obligations valued at $278,051,387, 0.00% - 4.38%, 10/12/17 - 8/15/45) | | 272,997 | 272,000 |
| 9/20/17 due 10/6/17 (Collateralized by U.S. Treasury Obligations valued at $405,327,751, 0.00% - 8.50%, 10/12/17 - 11/15/46) | | 396,074 | 395,000 |
| 9/21/17 due 10/6/17 (Collateralized by U.S. Treasury Obligations valued at $302,036,429, 0.00% - 9.13%, 10/12/17 - 11/15/42) | | 296,823 | 296,000 |
| 1.11%, dated 8/28/17 due 11/28/17 (Collateralized by U.S. Treasury Obligations valued at $138,869,789, 0.00% - 3.88%, 10/12/17 - 11/15/42) | | 136,386 | 136,000 |
| 1.12%, dated: | | | |
| 6/27/17 due 10/6/17 (Collateralized by U.S. Treasury Obligations valued at $135,050,206, 0.00% - 8.75%, 1/4/18 - 11/15/46) | | 132,493 | 132,000 |
| 7/24/17 due 11/9/17 (Collateralized by U.S. Treasury Obligations valued at $134,183,688, 1.21% - 3.75%, 1/31/19 - 2/15/47) | | 130,437 | 130,000 |
| 7/25/17 due 11/9/17 (Collateralized by U.S. Treasury Obligations valued at $134,929,112, 0.00% - 6.00%, 10/12/17 - 8/15/46) | | 132,439 | 132,000 |
| 1.13%, dated 6/29/17 due 10/6/17 (Collateralized by U.S. Treasury Obligations valued at $135,130,302, 0.00% - 6.13%, 10/12/17 - 2/15/45) | | 132,497 | 132,000 |
| 1.14%, dated 7/6/17 due 10/6/17 (Collateralized by U.S. Treasury Obligations valued at $271,614,702, 1.50% - 6.88%, 8/31/18 - 5/15/46) | | 265,003 | 264,000 |
| Credit AG at 1.05%, dated 9/29/17 due 10/6/17 (Collateralized by U.S. Treasury Obligations valued at $131,591,553, 2.00% - 5.38%, 2/15/25 - 2/15/31) | | 129,026 | 129,000 |
| Deutsche Bank AG at 1.06%, dated 9/29/17 due 10/2/17 (Collateralized by U.S. Treasury Obligations valued at $397,144,996, 1.00% - 4.38%, 5/15/18 - 2/15/46) | | 388,034 | 388,000 |
| Deutsche Bank Securities, Inc. at 1.06%, dated 9/29/17 due 10/2/17 (Collateralized by U.S. Treasury Obligations valued at $208,230,427, 0.00% - 8.13%, 9/30/17 - 5/15/47) | | 204,018 | 204,000 |
| Federal Reserve Bank of New York at 1%, dated 9/29/17 due 10/2/17 (Collateralized by U.S. Treasury Obligations valued at $1,415,118,020, 8.00%, 11/15/21) | | 1,415,118 | 1,415,000 |
| Goldman Sachs & Co. at 1.06%, dated 9/29/17 due 10/6/17 (Collateralized by U.S. Treasury Obligations valued at $130,697,677, 0.00% - 3.00%, 3/29/18 - 5/15/45) | | 127,026 | 127,000 |
| ING Financial Markets LLC at 1.03%, dated 9/29/17 due 10/2/17 (Collateralized by U.S. Treasury Obligations valued at $203,262,291, 1.63%, 5/31/23) | | 198,017 | 198,000 |
| Lloyds Bank PLC at 1.16%, dated: | | | |
| 8/16/17 due 11/16/17 (Collateralized by U.S. Treasury Obligations valued at $112,876,577, 6.00% - 7.50%, 11/15/24 - 11/15/27) | | 109,323 | 109,000 |
| 8/24/17 due 11/22/17 (Collateralized by U.S. Treasury Obligations valued at $138,577,737, 2.13% - 6.13%, 12/31/21 - 11/15/27) | | 135,392 | 135,000 |
| 8/31/17 due 11/29/17 (Collateralized by U.S. Treasury Obligations valued at $136,309,572, 1.13% - 6.13%, 1/15/19 - 11/15/27) | | 133,386 | 133,000 |
| 9/12/17 due 12/14/17 (Collateralized by U.S. Treasury Obligations valued at $273,599,166, 2.25% - 6.13%, 11/15/23 - 11/15/27) | | 267,800 | 267,000 |
| 9/14/17 due 12/15/17 (Collateralized by U.S. Treasury Obligations valued at $272,514,839, 2.63% - 7.63%, 8/15/20 - 11/15/27) | | 266,789 | 266,000 |
| Mitsubishi UFJ Securities (U.S.A.), Inc. at: | | | |
| 1.04%, dated 9/28/17 due 10/5/17 (Collateralized by U.S. Treasury Obligations valued at $133,732,071, 1.00% - 6.25%, 11/30/18 - 2/15/47) | | 131,026 | 131,000 |
| 1.05%, dated 9/18/17 due 10/6/17 (Collateralized by U.S. Treasury Obligations valued at $67,393,451, 0.00% - 5.00%, 1/15/18 - 2/15/45) | | 66,058 | 66,000 |
| MUFG Securities EMEA PLC at: | | | |
| 1.07%, dated: | | | |
| 9/15/17 due 10/6/17 (Collateralized by U.S. Treasury Obligations valued at $410,587,908, 2.63%, 11/15/20) | | 399,368 | 399,000 |
| 9/22/17 due 10/6/17 (Collateralized by U.S. Treasury Obligations valued at $194,597,396, 2.00% - 2.63%, 11/15/20 - 5/15/46) | | 189,101 | 189,000 |
| 10/2/17 due 10/6/17(c) | | 52,022 | 52,000 |
| 1.09%, dated: | | | |
| 9/7/17 due 10/6/17 (Collateralized by U.S. Treasury Obligations valued at $69,210,602, 2.00% - 8.50%, 2/15/20 - 2/15/45) | | 67,081 | 67,000 |
| 9/12/17 due 10/6/17 (Collateralized by U.S. Treasury Obligations valued at $137,547,297, 1.38% - 2.88%, 6/30/18 - 8/15/45) | | 134,142 | 134,000 |
| 1.1%, dated: | | | |
| 8/28/17 due 10/6/17 (Collateralized by U.S. Treasury Obligations valued at $55,552,234, 1.25% - 2.25%, 3/31/20 - 3/31/23) | | 54,152 | 54,000 |
| 8/29/17 due 10/6/17: | | | |
| (Collateralized by U.S. Treasury Obligations valued at $69,965,895, 2.00% - 3.00%, 2/15/23 - 5/15/46) | | 67,787 | 67,700 |
| (Collateralized by U.S. Treasury Obligations valued at $28,105,529, 2.63% - 2.88%, 11/15/20 - 11/15/46) | | 27,035 | 27,000 |
| (Collateralized by U.S. Treasury Obligations valued at $5,784,967, 1.75%, 3/31/22) | | 5,608 | 5,600 |
| 9/25/17 due 10/13/17 (Collateralized by U.S. Treasury Obligations valued at $67,799,069, 1.63% - 2.63%, 11/15/20 - 5/15/26) | | 66,036 | 66,000 |
| 9/29/17 due 10/2/17 (Collateralized by U.S. Treasury Obligations valued at $43,007,768, 1.50%, 8/15/26) | | 42,004 | 42,000 |
| 1.11%, dated: | | | |
| 9/6/17 due: | | | |
| 10/2/17 (Collateralized by U.S. Treasury Obligations valued at $27,600,468, 2.50% - 8.50%, 2/15/20 - 5/15/46) | | 26,521 | 26,500 |
| 10/20/17 (Collateralized by U.S. Treasury Obligations valued at $29,884,185, 2.00% - 2.25%, 2/15/23 - 11/15/25) | | 29,039 | 29,000 |
| 9/7/17 due 10/17/17 (Collateralized by U.S. Treasury Obligations valued at $68,635,731, 2.50% - 2.63%, 8/15/20 - 2/15/45) | | 67,083 | 67,000 |
| Natixis SA at 1.04%, dated 9/28/17 due 10/5/17 (Collateralized by U.S. Treasury Obligations valued at $265,501,442, 1.00% - 3.00%, 5/15/18 - 11/15/44) | | 260,053 | 260,000 |
| Norinchukin Bank at: | | | |
| 1.16%, dated: | | | |
| 8/14/17 due 11/6/17 (Collateralized by U.S. Treasury Obligations valued at $69,467,711, 1.63%, 7/31/19) | | 68,184 | 68,000 |
| 8/21/17 due 11/9/17 (Collateralized by U.S. Treasury Obligations valued at $69,447,590, 1.63%, 7/31/19) | | 68,175 | 68,000 |
| 8/23/17 due 11/15/17 (Collateralized by U.S. Treasury Obligations valued at $68,422,032, 1.63% - 2.00%, 7/31/19 - 11/15/26) | | 67,181 | 67,000 |
| 8/30/17 due 11/22/17 (Collateralized by U.S. Treasury Obligations valued at $135,794,388, 1.00% - 3.63%, 8/15/19 - 9/30/19) | | 133,360 | 133,000 |
| 8/31/17 due 11/21/17 (Collateralized by U.S. Treasury Obligations valued at $68,405,142, 2.00%, 11/15/26) | | 67,177 | 67,000 |
| 9/25/17 due 12/1/17 (Collateralized by U.S. Treasury Obligations valued at $66,310,956, 2.00%, 11/15/26) | | 65,140 | 65,000 |
| 1.17%, dated 7/26/17 due 10/26/17 (Collateralized by U.S. Treasury Obligations valued at $67,466,199, 2.00%, 11/15/26) | | 66,197 | 66,000 |
| 1.2%, dated 6/29/17 due 10/3/17 (Collateralized by U.S. Treasury Obligations valued at $67,530,106, 2.00%, 11/15/26) | | 66,211 | 66,000 |
| Prudential Insurance Co. of America at 1.08%, dated 9/29/17 due 10/2/17 (Collateralized by U.S. Treasury Obligations valued at $644,457,040, 1.00% - 8.75%, 7/31/19 - 2/15/31) | | 627,866 | 627,809 |
| RBC Capital Markets Corp. at 1.08%, dated 8/3/17 due 10/6/17 (Collateralized by U.S. Treasury Obligations valued at $33,900,707, 0.00% - 6.00%, 10/31/17 - 2/15/47) | | 33,089 | 33,000 |
| RBC Dominion Securities at: | | | |
| 1.04%, dated: | | | |
| 9/12/17 due 10/6/17 (Collateralized by U.S. Treasury Obligations valued at $70,420,749, 2.13%, 5/15/25) | | 69,058 | 69,000 |
| 9/13/17 due 10/6/17: | | | |
| (Collateralized by U.S. Treasury Obligations valued at $135,734,536, 1.38%, 2/15/20) | | 133,111 | 133,000 |
| (Collateralized by U.S. Treasury Obligations valued at $135,734,536, 1.38%, 2/15/20) | | 133,115 | 133,000 |
| (Collateralized by U.S. Treasury Obligations valued at $136,755,100, 2.25%, 11/15/25) | | 134,089 | 134,000 |
| 1.05%, dated 9/13/17 due 10/6/17: | | | |
| (Collateralized by U.S. Treasury Obligations valued at $135,735,275, 1.38% - 2.25%, 2/15/20 - 11/15/25) | | 133,128 | 133,000 |
| (Collateralized by U.S. Treasury Obligations valued at $135,735,199, 1.38% - 2.00%, 2/15/20 - 10/31/21) | | 133,132 | 133,000 |
| 1.07%, dated: | | | |
| 7/20/17 due 10/6/17 (Collateralized by U.S. Treasury Obligations valued at $132,891,679, 2.00%, 10/31/21) | | 130,367 | 130,000 |
| 7/24/17 due 10/6/17 (Collateralized by U.S. Treasury Obligations valued at $134,920,161, 2.00%, 10/31/21), | | 132,373 | 132,000 |
| 9/7/17 due 10/6/17 (Collateralized by U.S. Treasury Obligations valued at $138,823,149, 2.25%, 11/15/25) | | 136,368 | 136,000 |
| 1.08%, dated 7/25/17 due 10/6/17 (Collateralized by U.S. Treasury Obligations valued at $134,918,738, 2.00%, 10/31/21) | | 132,388 | 132,000 |
| RBS Securities, Inc. at 1.06%, dated 9/29/17 due 10/2/17 (Collateralized by U.S. Treasury Obligations valued at $26,522,063, 1.13% - 1.75%, 2/28/19 - 11/30/21) | | 26,002 | 26,000 |
| Societe Generale at: | | | |
| 1.09%, dated: | | | |
| 7/5/17 due 10/5/17 (Collateralized by U.S. Treasury Obligations valued at $266,477,718, 0.00% - 8.50%, 10/12/17 - 8/15/46) | | 260,724 | 260,000 |
| 7/6/17 due 10/6/17 (Collateralized by U.S. Treasury Obligations valued at $266,674,640, 0.00% - 6.50%, 11/9/17 - 11/15/44) | | 260,724 | 260,000 |
| 7/13/17 due 10/6/17 (Collateralized by U.S. Treasury Obligations valued at $267,358,608, 0.00% - 8.75%, 10/12/17 - 2/15/47) | | 260,508 | 259,800 |
| 1.1%, dated 8/18/17 due 11/20/17 (Collateralized by U.S. Treasury Obligations valued at $239,028,611, 0.00% - 8.75%, 10/12/17 - 8/15/46) | | 233,669 | 233,000 |
| Sumitomo Mitsui Trust Bank Ltd. at 1.16%, dated: | | | |
| 8/23/17 due 10/4/17 (Collateralized by U.S. Treasury Obligations valued at $77,166,741, 2.50% - 4.25%, 11/15/17 - 5/15/24) | | 74,976 | 74,875 |
| 8/30/17 due 10/5/17 (Collateralized by U.S. Treasury Obligations valued at $28,851,129, 2.50% - 4.25%, 11/15/17 - 5/15/24) | | 28,032 | 28,000 |
| 9/6/17 due 10/6/17 (Collateralized by U.S. Treasury Obligations valued at $27,984,037, 2.25% - 4.25%, 11/15/17 - 11/15/24) | | 27,224 | 27,188 |
| 9/13/17 due 10/6/17 (Collateralized by U.S. Treasury Obligations valued at $28,656,339, 2.38% - 4.25%, 11/15/17 - 8/15/24) | | 28,038 | 28,000 |
| 10/4/17 due 10/6/17(c) | | 27,037 | 27,000 |
| TD Securities (U.S.A.) at 1.06%, dated 9/29/17 due 10/2/17 (Collateralized by U.S. Treasury Obligations valued at $124,451,038, 1.75%, 6/30/22 - 1/31/23) | | 122,011 | 122,000 |
| TOTAL U.S. TREASURY REPURCHASE AGREEMENT | | | |
| (Cost $17,941,472) | | | 17,941,472 |
| TOTAL INVESTMENT IN SECURITIES - 100.2% | | | |
| (Cost $98,073,269) | | | 98,073,269 |
| NET OTHER ASSETS (LIABILITIES) - (0.2)% | | | (151,990) |
| NET ASSETS - 100% | | | $97,921,279 |
The date shown for securities represents the date when principal payments must be paid, taking into account any call options exercised by the issuer and any permissible maturity shortening features other than interest rate resets.
Legend
(a) Yield represents either the annualized yield at the date of purchase, or the stated coupon rate, or, for floating and adjustable rate securities, the rate at period end.
(b) Coupon rates for floating and adjustable rate securities reflect the rates in effect at period end.
(c) Represents a forward settling transaction and therefore no collateral securities had been allocated as of period end. The agreement contemplated the delivery of U.S. Treasury Obligations as collateral on settlement date.
Investment Valuation
All investments are categorized as Level 2 under the Fair Value Hierarchy. The inputs or methodology used for valuing securities may not be an indication of the risk associated with investing in those securities. For more information on valuation inputs please refer to the Investment Valuation section in the accompanying Notes to Financial Statements.
Other Information
# Additional information on each counterparty to the repurchase agreement is as follows:
| Repurchase Agreement / Counterparty | Value (000s) |
| $1,305,588,000 due 10/02/17 at 1.05% | |
| Bank of Nova Scotia | $169,850 |
| HSBC Securities (USA), Inc. | 714,557 |
| Merrill Lynch, Pierce, Fenner & Smith, Inc. | 112,431 |
| RBC Dominion Securities, Inc. | 159,653 |
| Wells Fargo Securities LLC | 149,097 |
| | $1,305,588 |
| $4,801,937,000 due 10/02/17 at 1.07% | |
| BNP Paribas, S.A. | 303,953 |
| Bank of America NA | 1,739,730 |
| Citibank NA | 180,972 |
| Credit Agricole CIB New York Branch | 157,976 |
| Mizuho Securities USA, Inc. | 354,945 |
| RBC Dominion Securities, Inc. | 296,635 |
| Wells Fargo Securities LLC | 1,767,726 |
| | $4,801,937 |
See accompanying notes which are an integral part of the financial statements.
Government Portfolio
Financial Statements
Statement of Assets and Liabilities
| Amounts in thousands (except per-share amounts) | | September 30, 2017 (Unaudited) |
| Assets | | |
Investment in securities, at value (including repurchase agreements of $33,414,897) — See accompanying schedule:
Unaffiliated issuers (cost $98,073,269) | | $98,073,269 |
| Cash | | 1 |
| Receivable for investments sold | | 24,225 |
| Receivable for fund shares sold | | 115,208 |
| Interest receivable | | 83,182 |
| Prepaid expenses | | 229 |
| Receivable from investment adviser for expense reductions | | 2,738 |
| Other receivables | | 653 |
| Total assets | | 98,299,505 |
| Liabilities | | |
| Payable for investments purchased | $262,964 | |
| Payable for fund shares redeemed | 62,603 | |
| Distributions payable | 35,824 | |
| Accrued management fee | 11,547 | |
| Distribution and service plan fees payable | 782 | |
| Other affiliated payables | 3,616 | |
| Other payables and accrued expenses | 890 | |
| Total liabilities | | 378,226 |
| Net Assets | | $97,921,279 |
| Net Assets consist of: | | |
| Paid in capital | | $97,922,399 |
| Distributions in excess of net investment income | | (655) |
| Accumulated undistributed net realized gain (loss) on investments | | (465) |
| Net Assets | | $97,921,279 |
| Class I: | | |
| Net Asset Value, offering price and redemption price per share ($29,968,966 ÷ 29,958,117 shares) | | $1.00 |
| Class II: | | |
| Net Asset Value, offering price and redemption price per share ($559,121 ÷ 558,840 shares) | | $1.00 |
| Class III: | | |
| Net Asset Value, offering price and redemption price per share ($3,282,217 ÷ 3,280,644 shares) | | $1.00 |
| Select Class: | | |
| Net Asset Value, offering price and redemption price per share ($808,283 ÷ 808,162 shares) | | $1.00 |
| Institutional Class: | | |
| Net Asset Value, offering price and redemption price per share ($63,302,692 ÷ 63,304,727 shares) | | $1.00 |
See accompanying notes which are an integral part of the financial statements.
Statement of Operations
| Amounts in thousands | | Six months ended September 30, 2017 (Unaudited) |
| Investment Income | | |
| Interest | | $454,200 |
| Expenses | | |
| Management fee | $67,111 | |
| Transfer agent fees | 19,860 | |
| Distribution and service plan fees | 4,545 | |
| Accounting fees and expenses | 1,390 | |
| Custodian fees and expenses | 348 | |
| Independent trustees' fees and expenses | 174 | |
| Registration fees | 219 | |
| Audit | 26 | |
| Legal | 79 | |
| Miscellaneous | 216 | |
| Total expenses before reductions | 93,968 | |
| Expense reductions | (14,752) | 79,216 |
| Net investment income (loss) | | 374,984 |
| Realized and Unrealized Gain (Loss) | | |
| Net realized gain (loss) on: | | |
| Investment securities: | | |
| Unaffiliated issuers | | (233) |
| Total net realized gain (loss) | | (233) |
| Net increase in net assets resulting from operations | | $374,751 |
See accompanying notes which are an integral part of the financial statements.
Statement of Changes in Net Assets
| Amounts in thousands | Six months ended September 30, 2017 (Unaudited) | Year ended March 31, 2017 |
| Increase (Decrease) in Net Assets | | |
| Operations | | |
| Net investment income (loss) | $374,984 | $275,109 |
| Net realized gain (loss) | (233) | 572 |
| Net increase in net assets resulting from operations | 374,751 | 275,681 |
| Distributions to shareholders from net investment income | (377,144) | (273,207) |
| Share transactions - net increase (decrease) | 3,527,384 | 50,338,072 |
| Total increase (decrease) in net assets | 3,524,991 | 50,340,546 |
| Net Assets | | |
| Beginning of period | 94,396,288 | 44,055,742 |
| End of period | $97,921,279 | $94,396,288 |
| Other Information | | |
| Undistributed net investment income end of period | $– | $1,505 |
| Distributions in excess of net investment income end of period | $(655) | $– |
See accompanying notes which are an integral part of the financial statements.
Financial Highlights
Government Portfolio Class I
| | Six months ended (Unaudited) September 30, | Years ended March 31, | | | | |
| | 2017 | 2017 | 2016 | 2015 | 2014 | 2013 |
| Selected Per–Share Data | | | | | | |
| Net asset value, beginning of period | $1.00 | $1.00 | $1.00 | $1.00 | $1.00 | $1.00 |
| Income from Investment Operations | | | | | | |
| Net investment income (loss) | .004 | .003 | .001 | –A | –A | –A |
| Net realized and unrealized gain (loss)A | – | – | – | – | – | – |
| Total from investment operations | .004 | .003 | .001 | –A | –A | –A |
| Distributions from net investment income | (.004) | (.003) | (.001) | –A | –A | –A |
| Total distributions | (.004) | (.003) | (.001) | –A | –A | –A |
| Net asset value, end of period | $1.00 | $1.00 | $1.00 | $1.00 | $1.00 | $1.00 |
| Total ReturnB,C | .39% | .31% | .06% | .01% | .01% | .01% |
| Ratios to Average Net AssetsD | | | | | | |
| Expenses before reductions | .20%E | .21% | .21% | .21% | .21% | .21% |
| Expenses net of fee waivers, if any | .18%E | .18% | .16% | .11% | .11% | .18% |
| Expenses net of all reductions | .18%E | .18% | .16% | .11% | .11% | .18% |
| Net investment income (loss) | .76%E | .33% | .08% | .01% | .01% | .01% |
| Supplemental Data | | | | | | |
| Net assets, end of period (in millions) | $29,969 | $31,498 | $22,047 | $19,333 | $22,569 | $21,579 |
A Amount represents less than $.0005 per share.
B Total returns for periods of less than one year are not annualized.
C Total returns would have been lower if certain expenses had not been reduced during the applicable periods shown.
D Expense ratios reflect operating expenses of the class. Expenses before reductions do not reflect amounts reimbursed or waived or reductions from expense offset arrangements and do not represent the amount paid by the class during periods when reimbursements, waivers or reductions occur. Expenses net of fee waivers reflect expenses after reimbursement and waivers but prior to reductions from expense offset arrangements. Expenses net of all reductions represent the net expenses paid by the class.
E Annualized
See accompanying notes which are an integral part of the financial statements.
Government Portfolio Class II
| | Six months ended (Unaudited) September 30, | Years ended March 31, | | | | |
| | 2017 | 2017 | 2016 | 2015 | 2014 | 2013 |
| Selected Per–Share Data | | | | | | |
| Net asset value, beginning of period | $1.00 | $1.00 | $1.00 | $1.00 | $1.00 | $1.00 |
| Income from Investment Operations | | | | | | |
| Net investment income (loss) | .003 | .002 | –A | –A | –A | –A |
| Net realized and unrealized gain (loss)A | – | – | – | – | – | – |
| Total from investment operations | .003 | .002 | –A | –A | –A | –A |
| Distributions from net investment income | (.003) | (.002) | –A | –A | –A | –A |
| Total distributions | (.003) | (.002) | –A | –A | –A | –A |
| Net asset value, end of period | $1.00 | $1.00 | $1.00 | $1.00 | $1.00 | $1.00 |
| Total ReturnB,C | .31% | .16% | .02% | .01% | .01% | .01% |
| Ratios to Average Net AssetsD | | | | | | |
| Expenses before reductions | .35%E | .36% | .36% | .36% | .36% | .36% |
| Expenses net of fee waivers, if any | .33%E | .33% | .20% | .11% | .11% | .18% |
| Expenses net of all reductions | .33%E | .33% | .20% | .11% | .11% | .18% |
| Net investment income (loss) | .61%E | .18% | .04% | .01% | .01% | .01% |
| Supplemental Data | | | | | | |
| Net assets, end of period (in millions) | $559 | $909 | $485 | $539 | $356 | $642 |
A Amount represents less than $.0005 per share.
B Total returns for periods of less than one year are not annualized.
C Total returns would have been lower if certain expenses had not been reduced during the applicable periods shown.
D Expense ratios reflect operating expenses of the class. Expenses before reductions do not reflect amounts reimbursed or waived or reductions from expense offset arrangements and do not represent the amount paid by the class during periods when reimbursements, waivers or reductions occur. Expenses net of fee waivers reflect expenses after reimbursement and waivers but prior to reductions from expense offset arrangements. Expenses net of all reductions represent the net expenses paid by the class.
E Annualized
See accompanying notes which are an integral part of the financial statements.
Government Portfolio Class III
| | Six months ended (Unaudited) September 30, | Years ended March 31, | | | | |
| | 2017 | 2017 | 2016 | 2015 | 2014 | 2013 |
| Selected Per–Share Data | | | | | | |
| Net asset value, beginning of period | $1.00 | $1.00 | $1.00 | $1.00 | $1.00 | $1.00 |
| Income from Investment Operations | | | | | | |
| Net investment income (loss) | .003 | .001 | –A | –A | –A | –A |
| Net realized and unrealized gain (loss)A | – | – | – | – | – | – |
| Total from investment operations | .003 | .001 | –A | –A | –A | –A |
| Distributions from net investment income | (.003) | (.001) | –A | –A | –A | –A |
| Total distributions | (.003) | (.001) | –A | –A | –A | –A |
| Net asset value, end of period | $1.00 | $1.00 | $1.00 | $1.00 | $1.00 | $1.00 |
| Total ReturnB,C | .26% | .07% | .01% | .01% | .01% | .01% |
| Ratios to Average Net AssetsD | | | | | | |
| Expenses before reductions | .45%E | .46% | .46% | .46% | .46% | .46% |
| Expenses net of fee waivers, if any | .43%E | .43% | .21% | .11% | .11% | .18% |
| Expenses net of all reductions | .43%E | .43% | .21% | .11% | .11% | .18% |
| Net investment income (loss) | .51%E | .09% | .03% | .01% | .01% | .01% |
| Supplemental Data | | | | | | |
| Net assets, end of period (in millions) | $3,282 | $3,038 | $1,957 | $2,120 | $2,266 | $1,709 |
A Amount represents less than $.0005 per share.
B Total returns for periods of less than one year are not annualized.
C Total returns would have been lower if certain expenses had not been reduced during the applicable periods shown.
D Expense ratios reflect operating expenses of the class. Expenses before reductions do not reflect amounts reimbursed or waived or reductions from expense offset arrangements and do not represent the amount paid by the class during periods when reimbursements, waivers or reductions occur. Expenses net of fee waivers reflect expenses after reimbursement and waivers but prior to reductions from expense offset arrangements. Expenses net of all reductions represent the net expenses paid by the class.
E Annualized
See accompanying notes which are an integral part of the financial statements.
Government Portfolio Select Class
| | Six months ended (Unaudited) September 30, | Years ended March 31, | | | | |
| | 2017 | 2017 | 2016 | 2015 | 2014 | 2013 |
| Selected Per–Share Data | | | | | | |
| Net asset value, beginning of period | $1.00 | $1.00 | $1.00 | $1.00 | $1.00 | $1.00 |
| Income from Investment Operations | | | | | | |
| Net investment income (loss) | .004 | .003 | –A | –A | –A | –A |
| Net realized and unrealized gain (loss)A | – | – | – | – | – | – |
| Total from investment operations | .004 | .003 | –A | –A | –A | –A |
| Distributions from net investment income | (.004) | (.003) | –A | –A | –A | –A |
| Total distributions | (.004) | (.003) | –A | –A | –A | –A |
| Net asset value, end of period | $1.00 | $1.00 | $1.00 | $1.00 | $1.00 | $1.00 |
| Total ReturnB,C | .36% | .26% | .05% | .01% | .01% | .01% |
| Ratios to Average Net AssetsD | | | | | | |
| Expenses before reductions | .25%E | .26% | .26% | .26% | .26% | .26% |
| Expenses net of fee waivers, if any | .23%E | .23% | .17% | .11% | .11% | .18% |
| Expenses net of all reductions | .23%E | .23% | .17% | .11% | .11% | .18% |
| Net investment income (loss) | .71%E | .28% | .07% | - %F | .01% | .01% |
| Supplemental Data | | | | | | |
| Net assets, end of period (in millions) | $808 | $641 | $286 | $686 | $378 | $669 |
A Amount represents less than $.0005 per share.
B Total returns for periods of less than one year are not annualized.
C Total returns would have been lower if certain expenses had not been reduced during the applicable periods shown.
D Expense ratios reflect operating expenses of the class. Expenses before reductions do not reflect amounts reimbursed or waived or reductions from expense offset arrangements and do not represent the amount paid by the class during periods when reimbursements, waivers or reductions occur. Expenses net of fee waivers reflect expenses after reimbursement and waivers but prior to reductions from expense offset arrangements. Expenses net of all reductions represent the net expenses paid by the class.
E Annualized
F Amount represents less than .005%.
See accompanying notes which are an integral part of the financial statements.
Government Portfolio Institutional Class
| | Six months ended (Unaudited) September 30, | Years ended March 31, | | |
| | 2017 | 2017 | 2016 | 2015 A |
| Selected Per–Share Data | | | | |
| Net asset value, beginning of period | $1.00 | $1.00 | $1.00 | $1.00 |
| Income from Investment Operations | | | | |
| Net investment income (loss) | .004 | .004 | .001 | –B |
| Net realized and unrealized gain (loss)B | – | – | – | – |
| Total from investment operations | .004 | .004 | .001 | –B |
| Distributions from net investment income | (.004) | (.004) | (.001) | –B |
| Total distributions | (.004) | (.004) | (.001) | –B |
| Net asset value, end of period | $1.00 | $1.00 | $1.00 | $1.00 |
| Total ReturnC,D | .41% | .35% | .08% | .01% |
| Ratios to Average Net AssetsE | | | | |
| Expenses before reductions | .17%F | .18% | .18% | .18%F |
| Expenses net of fee waivers, if any | .14%F | .14% | .14% | .11%F |
| Expenses net of all reductions | .14%F | .14% | .14% | .11%F |
| Net investment income (loss) | .80%F | .37% | .10% | - %F,G |
| Supplemental Data | | | | |
| Net assets, end of period (in millions) | $63,303 | $58,310 | $19,281 | $1,508 |
A For the period May 14, 2014 (commencement of sale of shares) to March 31, 2015.
B Amount represents less than $.0005 per share.
C Total returns for periods of less than one year are not annualized.
D Total returns would have been lower if certain expenses had not been reduced during the applicable periods shown.
E Expense ratios reflect operating expenses of the class. Expenses before reductions do not reflect amounts reimbursed or waived or reductions from expense offset arrangements and do not represent the amount paid by the class during periods when reimbursements, waivers or reductions occur. Expense ratios before reductions for start-up periods may not be representative of longer-term operating periods. Expenses net of fee waivers reflect expenses after reimbursement and waivers but prior to reductions from expense offset arrangements. Expenses net of all reductions represent the net expenses paid by the class.
F Annualized
G Amount represents less than .005%.
See accompanying notes which are an integral part of the financial statements.
Money Market Portfolio
Investment Summary/Performance (Unaudited)
Effective Maturity Diversification
| Days | % of fund's investments 9/30/17 | % of fund's investments 3/31/17 | % of fund's investments 9/30/16 |
| 1 - 7 | 51.6 | 50.1 | 65.9 |
| 8 - 30 | 28.1 | 23.8 | 19.9 |
| 31 - 60 | 10.0 | 13.5 | 9.4 |
| 61 - 90 | 5.5 | 11.9 | 3.9 |
| 91 - 180 | 4.8 | 0.7 | 0.9 |
Effective maturity is determined in accordance with the requirements of Rule 2a-7 under the Investment Company Act of 1940.
Asset Allocation (% of fund's net assets)
| As of September 30, 2017 |
| | Certificates of Deposit | 39.8% |
| | Commercial Paper | 33.0% |
| | U.S. Treasury Debt | 3.4% |
| | Non-Negotiable Time Deposit | 8.2% |
| | Other Instruments | 1.6% |
| | Repurchase Agreements | 14.5% |
| | Net Other Assets (Liabilities)* | (0.5)% |

* Net Other Assets (Liabilities) are not included in the pie chart
| As of March 31, 2017 |
| | Certificates of Deposit | 37.3% |
| | Commercial Paper | 31.2% |
| | U.S. Treasury Debt | 4.3% |
| | Non-Negotiable Time Deposit | 4.5% |
| | Other Instruments | 2.0% |
| | Repurchase Agreements | 20.2% |
| | Net Other Assets (Liabilities) | 0.5% |
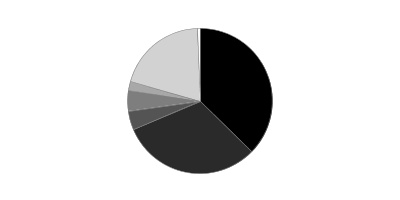
Current And Historical 7-Day Yields
| | 9/30/17 | 6/30/17 | 3/31/17 | 12/31/16 | 9/30/16 |
| Class I | 1.23% | 1.19% | 1.02% | 0.86% | 0.55% |
| Class II | 1.08% | 1.04% | 0.87% | 0.71% | 0.40% |
| Class III | 0.98% | 0.94% | 0.77% | 0.61% | 0.30% |
| Select Class | 1.18% | 1.14% | 0.97% | 0.81% | 0.50% |
| Institutional Class | 1.27% | 1.23% | 1.06% | 0.90% | 0.59% |
Yield refers to the income paid by the Fund over a given period. Yields for money market funds are usually for seven-day periods, as they are here, though they are expressed as annual percentage rates. Past performance is no guarantee of future results. Yield will vary and it's possible to lose money investing in the Fund. A portion of the Fund's expenses was reimbursed and/or waived. Absent such reimbursements and/or waivers the yield for the period ending September 30, 2017, the most recent period shown in the table, would have been 1.20% for Class I, 1.04% for Class II, 0.94% for Class III, 1.15% for Select Class and 1.23% for Institutional Class.
Money Market Portfolio
Investments September 30, 2017 (Unaudited)
Showing Percentage of Net Assets
| Certificate of Deposit - 39.8% | | | | |
| | | Yield(a) | Principal Amount (000s) | Value (000s) |
| Domestic Certificates Of Deposit - 3.6% | | | | |
| Citibank NA | | | | |
| 10/4/17 | | 1.32 % | $258,000 | $258,000 |
| Wells Fargo Bank NA | | | | |
| 12/20/17 to 4/25/18 | | 1.37 to 1.42 (b)(c) | 557,000 | 557,000 |
| | | | | 815,000 |
| London Branch, Eurodollar, Foreign Banks - 9.0% | | | | |
| ABN AMRO Bank NV | | | | |
| 12/1/17 to 1/5/18 | | 1.40 to 1.46 | 476,000 | 476,000 |
| Mizuho Bank Ltd. London Branch | | | | |
| 10/3/17 to 12/7/17 | | 1.37 to 1.40 | 707,000 | 706,187 |
| Sumitomo Mitsui Trust Bank Ltd. London Branch | | | | |
| 10/3/17 to 12/15/17 | | 1.34 to 1.40 | 832,000 | 832,000 |
| | | | | 2,014,187 |
| New York Branch, Yankee Dollar, Foreign Banks - 27.2% | | | | |
| Bank of Montreal | | | | |
| 10/2/17 to 6/21/18 | | 1.32 to 1.72 (b) | 1,029,000 | 1,029,000 |
| Bank of Nova Scotia | | | | |
| 4/10/18 to 6/7/18 | | 1.40 to 1.42 (b)(c) | 519,000 | 519,000 |
| BNP Paribas New York Branch | | | | |
| 12/4/17 | | 1.36 | 200,000 | 200,000 |
| Canadian Imperial Bank of Commerce | | | | |
| 12/18/17 to 5/22/18 | | 1.41 to 1.72 (b)(c) | 349,000 | 349,121 |
| KBC Bank NV | | | | |
| 11/24/17 to 11/30/17 | | 1.34 to 1.34 | 663,000 | 663,000 |
Landesbank Baden-
Wuerttemberg New York Branch | | | | |
| 10/2/17 to 10/4/17 | | 1.23 to 1.23 | 672,000 | 672,000 |
| Mitsubishi UFJ Trust & Banking Corp. | | | | |
| 10/5/17 to 1/30/18 | | 1.38 to 1.40 (b)(c) | 803,800 | 803,800 |
| Royal Bank of Canada | | | | |
| 10/24/17 to 6/20/18 | | 1.38 to 1.70 (b)(c) | 633,000 | 633,000 |
| Sumitomo Mitsui Banking Corp. | | | | |
| 12/4/17 to 1/26/18 | | 1.35 to 1.39 (b)(c) | 858,000 | 858,000 |
| Sumitomo Mitsui Trust Bank Ltd. | | | | |
| 12/4/17 | | 1.35 (b)(c) | 58,000 | 58,000 |
| Toronto-Dominion Bank New York Branch | | | | |
| 10/27/17 to 11/1/17 | | 1.47 to 1.68 (b)(c) | 332,000 | 332,000 |
| | | | | 6,116,921 |
| TOTAL CERTIFICATE OF DEPOSIT | | | | |
| (Cost $8,946,108) | | | | 8,946,108 |
|
| Financial Company Commercial Paper - 27.9% | | | | |
| Bank of Nova Scotia | | | | |
| 6/1/18 | | 1.42 (b)(c) | 208,000 | 208,000 |
| Barclays Bank PLC/Barclays U.S. CCP Funding LLC | | | | |
| 10/3/17 to 12/22/17 | | 1.30 to 1.48 (d) | 674,000 | 672,633 |
| Bayerische Landesbank | | | | |
| 10/2/17 to 10/6/17 | | 1.24 to 1.24 | 1,121,000 | 1,120,884 |
| BNP Paribas Dublin Branch | | | | |
| 10/3/17 | | 1.17 | 399,000 | 398,974 |
| BPCE SA | | | | |
| 10/2/17 to 11/6/17 | | 1.34 to 1.41 | 828,000 | 827,732 |
| Caisse d'Amort de la Dette Sociale | | | | |
| 10/3/17 to 10/4/17 | | 1.33 to 1.34 (d) | 393,000 | 392,960 |
| Canadian Imperial Bank of Commerce | | | | |
| 10/13/17 to 4/20/18 | | 1.38 to 1.72 (b)(c) | 639,000 | 639,000 |
| J.P. Morgan Securities, LLC | | | | |
| 1/8/18 to 4/9/18 | | 1.39 to 1.41 (b)(c) | 599,000 | 599,000 |
| Mitsubishi UFJ Trust & Banking Corp. | | | | |
| 10/6/17 to 1/17/18 | | 1.22 to 1.41 | 277,000 | 276,095 |
| Ontario Teachers' Finance Trust | | | | |
| 10/6/17 | | 1.45 (b)(c) | 81,000 | 81,000 |
| UBS AG London Branch | | | | |
| 3/2/18 to 4/3/18 | | 1.43 to 1.44 (b) | 1,062,000 | 1,062,000 |
| TOTAL FINANCIAL COMPANY COMMERCIAL PAPER | | | | |
| (Cost $6,278,278) | | | | 6,278,278 |
|
| Asset Backed Commercial Paper - 3.4% | | | | |
| Atlantic Asset Securitization Corp. (Credit Agricole CIB Guaranteed) | | | | |
| | | | | |
| 1/25/18 | | 1.42 | 96,000 | 95,564 |
| 10/11/17 | | 1.35 | 150,000 | 149,944 |
| 10/12/17 | | 1.35 | 35,000 | 34,986 |
| 2/1/18 | | 1.43 | 66,000 | 65,680 |
| Gotham Funding Corp. (Liquidity Facility Bank of Tokyo-Mitsubishi UFJ Ltd.) | | | | |
| | | | | |
| 1/25/18 | | 1.42 | 144,000 | 143,346 |
| 1/26/18 | | 1.43 | 47,000 | 46,783 |
| 1/26/18 | | 1.43 | 77,000 | 76,645 |
| Manhattan Asset Funding Co. LLC (Liquidity Facility Sumitomo Mitsui Banking Corp.) | | | | |
| | | | | |
| 10/31/17 | | 1.34 | 27,000 | 26,970 |
| 11/1/17 | | | 25,000 | 24,971 |
| Sheffield Receivables Corp. (Barclays Bank PLC Guaranteed) | | | | |
| 10/6/17 | | 1.20 | 89,000 | 88,985 |
| TOTAL ASSET BACKED COMMERCIAL PAPER | | | | |
| (Cost $753,874) | | | | 753,874 |
|
| Non-Financial Company Commercial Paper - 1.7% | | | | |
| Bell Canada | | | | |
| 10/10/17 to 11/20/17 | | 1.45 to 1.45 | 122,150 | 122,004 |
| Dominion Resources, Inc. | | | | |
| 11/2/17 to 11/14/17 | | 1.44 to 1.45 | 108,325 | 108,164 |
| Duke Energy Corp. | | | | |
| 10/3/17 | | 1.44 | 12,450 | 12,449 |
| Rogers Communications, Inc. | | | | |
| 10/25/17 | | 1.47 | 19,000 | 18,981 |
| 10/25/17 | | 1.45 | 27,000 | 26,974 |
| 11/1/17 | | 1.45 | 11,000 | 10,986 |
| 11/1/17 | | 1.45 | 11,000 | 10,986 |
| Sempra Global | | | | |
| 10/4/17 to 11/13/17 | | 1.44 to 1.46 | 63,700 | 63,625 |
| TOTAL NON-FINANCIAL COMPANY COMMERCIAL PAPER | | | | |
| (Cost $374,169) | | | | 374,169 |
|
| U.S. Treasury Debt - 3.4% | | | | |
| U.S. Treasury Obligations - 3.4% | | | | |
| U.S. Treasury Notes | | | | |
| 10/31/17 to 10/31/18 | | | | |
| (Cost $769,011) | | 1.22 to 1.32 (b)(c) | 769,000 | 769,011 |
|
| Other Instrument - 1.6% | | | | |
| Master Notes - 1.6% | | | | |
| Toyota Motor Credit Corp. | | | | |
| 10/6/17 | | | | |
| (Cost $361,000) | | 1.55 (b)(c) | 361,000 | 361,000 |
|
| Non-Negotiable Time Deposit - 8.2% | | | | |
| Time Deposits - 8.2% | | | | |
| Barclays Bank PLC | | | | |
| 10/3/17 to 10/4/17 | | 1.24 to 1.24 | 456,000 | 456,000 |
| BNP Paribas | | | | |
| 10/6/17 | | 1.17 | 450,000 | 450,000 |
| Credit Agricole CIB | | | | |
| 10/2/17 to 10/6/17 | | 1.08 to 1.23 | 640,000 | 640,000 |
| Natixis SA | | | | |
| 10/2/17 | | 1.08 | 293,000 | 293,000 |
| TOTAL NON-NEGOTIABLE TIME DEPOSIT | | | | |
| (Cost $1,839,000) | | | | 1,839,000 |
| U.S. Government Agency Repurchase Agreement - 0.0% | | | |
| | | Maturity Amount (000s) | Value (000s) |
| In a joint trading account at 1.05% dated 9/29/17 due 10/2/17 (Collateralized by U.S. Government Obligations) # | | | $ |
| (Cost $607) | | 607 | 607 |
|
| U.S. Treasury Repurchase Agreement - 2.0% | | | |
| With Commerz Markets LLC at 1.11%, dated 9/29/17 due 10/2/17 (Collateralized by U.S. Treasury Obligations valued at $456,964,355, 0.00%, 1/25/18 - 3/8/18) | | | |
| (Cost $448,000) | | 448,041 | 448,000 |
|
| Other Repurchase Agreement - 12.5% | | | |
| Other Repurchase Agreement - 12.5% | | | |
| With: | | | |
| BNP Paribas at 1.29%, dated 9/29/17 due 10/2/17 (Collateralized by Corporate Obligations valued at $43,054,628, 3.38% - 8.88%, 11/15/18 - 3/30/67) | | 41,004 | 41,000 |
| Citigroup Global Markets, Inc. at: | | | |
| 1.36%, dated 9/29/17 due 10/2/17 (Collateralized by Equity Securities valued at $306,754,769) | | 284,032 | 284,000 |
| 2.13%, dated: | | | |
| 8/21/17 due 11/20/17 (Collateralized by Mortgage Loan Obligations valued at $126,313,110, 0.00% - 8.50%, 8/1/19 - 9/17/58) | | 120,646 | 120,000 |
| 8/28/17 due 11/27/17 (Collateralized by Mortgage Loan Obligations valued at $54,111,825, 3.25% - 6.34%, 7/15/30 - 8/12/47) | | 50,269 | 50,000 |
| Credit Suisse Securities (U.S.A.) LLC at 1.36%, dated 9/28/17 due 10/5/17 (Collateralized by Mortgage Loan Obligations valued at $46,505,464, 0.00% - 6.48%, 5/25/34 - 10/15/48) | | 41,011 | 41,000 |
| HSBC Securities, Inc. at 1.36%, dated 9/29/17 due 10/2/17 (Collateralized by Corporate Obligations valued at $64,050,159, 2.33% - 7.11%, 9/15/20 - 9/19/47) | | 61,007 | 61,000 |
| ING Financial Markets LLC at: | | | |
| 1.36%, dated 9/29/17 due 10/2/17 (Collateralized by Equity Securities valued at $54,006,190) | | 50,006 | 50,000 |
| 1.44%, dated 9/29/17 due 10/2/17 (Collateralized by Corporate Obligations valued at $14,043,761, 3.45% - 7.75%, 3/15/20 - 1/15/28) | | 13,002 | 13,000 |
| J.P. Morgan Securities, LLC at: | | | |
| 1.28%, dated 9/29/17 due 10/2/17 (Collateralized by U.S. Government Obligations valued at $124,630,117, 0.00% - 6.00%, 10/10/17 - 12/16/53) | | 121,013 | 121,000 |
| 1.36%, dated 9/28/17 due 10/5/17 (Collateralized by U.S. Government Obligations valued at $207,042,082, 0.00% - 7.26%, 4/25/22 - 10/16/58) | | 201,053 | 201,000 |
| 1.51%, dated 9/29/17 due 10/6/17 (Collateralized by Mortgage Loan Obligations valued at $88,063,533, 1.42% - 27.67%, 4/1/19 - 2/10/51) | | 81,109 | 81,000 |
| Merrill Lynch, Pierce, Fenner & Smith at: | | | |
| 1.36%, dated 9/27/17 due 10/4/17 (Collateralized by U.S. Government Obligations valued at $269,330,864, 3.00% - 3.50%, 7/1/41 - 1/1/47) | | 264,070 | 264,000 |
| 1.43%, dated 9/27/17 due 10/6/17 (Collateralized by Equity Securities valued at $86,417,176) | | 80,044 | 80,000 |
| 2.3%, dated 8/15/17 due 11/13/17 (Collateralized by Equity Securities valued at $509,461,701) | | 479,743 | 477,000 |
| Mitsubishi UFJ Securities (U.S.A.), Inc. at 1.46%, dated 9/26/17 due 10/3/17 (Collateralized by Corporate Obligations valued at $44,290,776, 0.38% - 5.50%, 7/1/18 - 9/30/46) | | 41,012 | 41,000 |
| Mizuho Securities U.S.A., Inc. at: | | | |
| 1.34%, dated 9/29/17 due 10/2/17 (Collateralized by Corporate Obligations valued at $64,054,224, 1.39% - 7.90%, 11/9/17 - 7/1/57) | | 61,007 | 61,000 |
| 1.46%, dated: | | | |
| 9/20/17 due 10/4/17 (Collateralized by Equity Securities valued at $64,831,548) | | 60,034 | 60,000 |
| 9/28/17 due 10/6/17 (Collateralized by Equity Securities valued at $65,890,706) | | 61,035 | 61,000 |
| 9/29/17 due 10/6/17 (Collateralized by Equity Securities valued at $65,888,017) | | 61,035 | 61,000 |
| 1.51%, dated 9/22/17 due 10/6/17 (Collateralized by Corporate Obligations valued at $20,505,812, 0.00% - 2.13%, 11/30/17 - 1/18/22) | | 20,012 | 20,000 |
| 2.22%, dated 9/13/17 due 12/12/17 (Collateralized by Corporate Obligations valued at $42,140,678, 0.00% - 6.00%, 12/7/18 - 11/15/45) | | 40,222 | 40,000 |
| Societe Generale at: | | | |
| 1.29%, dated 9/29/17 due 10/2/17 (Collateralized by Corporate Obligations valued at $170,119,212, 0.00% - 5.13%, 11/28/17 - 8/1/27) | | 162,017 | 162,000 |
| 1.44%, dated 9/29/17 due 10/2/17 (Collateralized by Corporate Obligations valued at $130,398,747, 2.33% - 12.50%, 1/15/19 - 11/15/95) | | 121,015 | 121,000 |
| 1.56%, dated: | | | |
| 9/1/17 due 10/2/17 (Collateralized by Corporate Obligations valued at $43,257,564, 2.13% - 10.75%, 3/1/19 - 10/1/37)(b)(c)(e) | | 40,054 | 40,000 |
| 10/2/17 due 11/2/17(b)(c)(e)(f) | | 41,055 | 41,000 |
| Wells Fargo Securities, LLC at: | | | |
| 1.31%, dated 9/29/17 due 10/2/17 (Collateralized by Corporate Obligations valued at $41,825,357, 1.63% - 1.75%, 9/11/18 - 7/16/20) | | 41,004 | 41,000 |
| 1.36%, dated 9/28/17 due 10/5/17 (Collateralized by Corporate Obligations valued at $62,230,174, 0.88% - 2.50%, 4/10/18 - 8/10/27) | | 61,016 | 61,000 |
| 1.41%, dated 9/28/17 due 10/5/17 (Collateralized by Corporate Obligations valued at $126,907,959, 0.00% - 11.25%, 10/2/17 - 8/15/54) | | 122,033 | 122,000 |
| TOTAL OTHER REPURCHASE AGREEMENT | | | |
| (Cost $2,816,000) | | | 2,816,000 |
| TOTAL INVESTMENT IN SECURITIES - 100.5% | | | |
| (Cost $22,586,047) | | | 22,586,047 |
| NET OTHER ASSETS (LIABILITIES) - (0.5)% | | | (105,572) |
| NET ASSETS - 100% | | | $22,480,475 |
The date shown for securities represents the date when principal payments must be paid, taking into account any call options exercised by the issuer and any permissible maturity shortening features other than interest rate resets.
Legend
(a) Yield represents either the annualized yield at the date of purchase, or the stated coupon rate, or, for floating and adjustable rate securities, the rate at period end.
(b) Coupon rates for floating and adjustable rate securities reflect the rates in effect at period end.
(c) Coupon is indexed to a floating interest rate which may be multiplied by a specified factor and/or subject to caps or floors.
(d) Security exempt from registration under Rule 144A of the Securities Act of 1933. These securities may be resold in transactions exempt from registration, normally to qualified institutional buyers. At the end of the period, the value of these securities amounted to $1,065,593,000 or 4.7% of net assets.
(e) The maturity amount is based on the rate at period end.
(f) Represents a forward settling transaction and therefore no collateral securities had been allocated as of period end. The agreement contemplated the delivery of Corporate Obligations as collateral on settlement date.
Investment Valuation
All investments are categorized as Level 2 under the Fair Value Hierarchy. The inputs or methodology used for valuing securities may not be an indication of the risk associated with investing in those securities. For more information on valuation inputs please refer to the Investment Valuation section in the accompanying Notes to Financial Statements.
Other Information
# Additional information on each counterparty to the repurchase agreement is as follows:
| Repurchase Agreement / Counterparty | Value (000s) |
| $607,000 due 10/02/17 at 1.05% | |
| Bank of Nova Scotia | $79 |
| HSBC Securities (USA), Inc. | 333 |
| Merrill Lynch, Pierce, Fenner & Smith, Inc. | 52 |
| RBC Dominion Securities, Inc. | 74 |
| Wells Fargo Securities LLC | 69 |
| | $607 |
See accompanying notes which are an integral part of the financial statements.
Money Market Portfolio
Financial Statements
Statement of Assets and Liabilities
| Amounts in thousands (except per-share amounts) | | September 30, 2017 (Unaudited) |
| Assets | | |
Investment in securities, at value (including repurchase agreements of $3,264,607) — See accompanying schedule:
Unaffiliated issuers (cost $22,586,047) | | $22,586,047 |
| Cash | | 1 |
| Receivable for fund shares sold | | 98,323 |
| Interest receivable | | 15,293 |
| Prepaid expenses | | 48 |
| Receivable from investment adviser for expense reductions | | 681 |
| Other receivables | | 901 |
| Total assets | | 22,701,294 |
| Liabilities | | |
| Payable for investments purchased | $145,000 | |
| Payable for fund shares redeemed | 68,671 | |
| Distributions payable | 2,629 | |
| Accrued management fee | 2,557 | |
| Distribution and service plan fees payable | 23 | |
| Other affiliated payables | 919 | |
| Other payables and accrued expenses | 1,020 | |
| Total liabilities | | 220,819 |
| Net Assets | | $22,480,475 |
| Net Assets consist of: | | |
| Paid in capital | | $22,480,476 |
| Distributions in excess of net investment income | | (2) |
| Accumulated undistributed net realized gain (loss) on investments | | 1 |
| Net Assets | | $22,480,475 |
| Class I: | | |
| Net Asset Value, offering price and redemption price per share ($10,548,046 ÷ 10,538,499 shares) | | $1.00 |
| Class II: | | |
| Net Asset Value, offering price and redemption price per share ($24,995 ÷ 24,974 shares) | | $1.00 |
| Class III: | | |
| Net Asset Value, offering price and redemption price per share ($91,766 ÷ 91,736 shares) | | $1.00 |
| Select Class: | | |
| Net Asset Value, offering price and redemption price per share ($15,548 ÷ 15,536 shares) | | $1.00 |
| Institutional Class: | | |
| Net Asset Value, offering price and redemption price per share ($11,800,120 ÷ 11,789,474 shares) | | $1.00 |
See accompanying notes which are an integral part of the financial statements.
Statement of Operations
| Amounts in thousands | | Six months ended September 30, 2017 (Unaudited) |
| Investment Income | | |
| Interest (including $36 from affiliated interfund lending) | | $130,431 |
| Expenses | | |
| Management fee | $13,694 | |
| Transfer agent fees | 4,285 | |
| Distribution and service plan fees | 129 | |
| Accounting fees and expenses | 606 | |
| Custodian fees and expenses | 132 | |
| Independent trustees' fees and expenses | 34 | |
| Registration fees | 197 | |
| Audit | 25 | |
| Legal | 13 | |
| Miscellaneous | 88 | |
| Total expenses before reductions | 19,203 | |
| Expense reductions | (3,552) | 15,651 |
| Net investment income (loss) | | 114,780 |
| Realized and Unrealized Gain (Loss) | | |
| Net realized gain (loss) on: | | |
| Investment securities: | | |
| Unaffiliated issuers | | 1 |
| Total net realized gain (loss) | | 1 |
| Net increase in net assets resulting from operations | | $114,781 |
See accompanying notes which are an integral part of the financial statements.
Statement of Changes in Net Assets
| Amounts in thousands | Six months ended September 30, 2017 (Unaudited) | Year ended March 31, 2017 |
| Increase (Decrease) in Net Assets | | |
| Operations | | |
| Net investment income (loss) | $114,780 | $125,902 |
| Net realized gain (loss) | 1 | 616 |
| Net increase in net assets resulting from operations | 114,781 | 126,518 |
| Distributions to shareholders from net investment income | (114,782) | (126,160) |
| Share transactions - net increase (decrease) | 4,688,357 | (27,715,458) |
| Total increase (decrease) in net assets | 4,688,356 | (27,715,100) |
| Net Assets | | |
| Beginning of period | 17,792,119 | 45,507,219 |
| End of period | $22,480,475 | $17,792,119 |
| Other Information | | |
| Distributions in excess of net investment income end of period | $(2) | $– |
See accompanying notes which are an integral part of the financial statements.
Financial Highlights
Money Market Portfolio Class I
| | Six months ended (Unaudited) September 30, | Years ended March 31, | | | | |
| | 2017 | 2017 | 2016 | 2015 | 2014 | 2013 |
| Selected Per–Share Data | | | | | | |
| Net asset value, beginning of period | $1.00 | $1.00 | $1.00 | $1.00 | $1.00 | $1.00 |
| Income from Investment Operations | | | | | | |
| Net investment income (loss) | .006 | .006 | .002 | .001 | .001 | .002 |
| Net realized and unrealized gain (loss)A | – | – | – | – | – | – |
| Total from investment operations | .006 | .006 | .002 | .001 | .001 | .002 |
| Distributions from net investment income | (.006) | (.006) | (.002) | (.001) | (.001) | (.002) |
| Total distributions | (.006) | (.006) | (.002) | (.001) | (.001) | (.002) |
| Net asset value, end of period | $1.00 | $1.00 | $1.00 | $1.00 | $1.00 | $1.00 |
| Total ReturnB,C | .58% | .63% | .18% | .06% | .06% | .16% |
| Ratios to Average Net AssetsD | | | | | | |
| Expenses before reductions | .21%E | .21% | .21% | .21% | .21% | .21% |
| Expenses net of fee waivers, if any | .18%E | .18% | .18% | .18% | .18% | .18% |
| Expenses net of all reductions | .18%E | .18% | .18% | .18% | .18% | .18% |
| Net investment income (loss) | 1.15%E | .56% | .17% | .05% | .06% | .16% |
| Supplemental Data | | | | | | |
| Net assets, end of period (in millions) | $10,548 | $7,631 | $19,911 | $21,651 | $22,712 | $24,416 |
A Amount represents less than $.0005 per share.
B Total returns for periods of less than one year are not annualized.
C Total returns would have been lower if certain expenses had not been reduced during the applicable periods shown.
D Expense ratios reflect operating expenses of the class. Expenses before reductions do not reflect amounts reimbursed or waived or reductions from expense offset arrangements and do not represent the amount paid by the class during periods when reimbursements, waivers or reductions occur. Expenses net of fee waivers reflect expenses after reimbursement and waivers but prior to reductions from expense offset arrangements. Expenses net of all reductions represent the net expenses paid by the class.
E Annualized
See accompanying notes which are an integral part of the financial statements.
Money Market Portfolio Class II
| | Six months ended (Unaudited) September 30, | Years ended March 31, | | | | |
| | 2017 | 2017 | 2016 | 2015 | 2014 | 2013 |
| Selected Per–Share Data | | | | | | |
| Net asset value, beginning of period | $1.00 | $1.00 | $1.00 | $1.00 | $1.00 | $1.00 |
| Income from Investment Operations | | | | | | |
| Net investment income (loss) | .005 | .005 | .001 | –A | –A | –A |
| Net realized and unrealized gain (loss)A | – | – | – | – | – | – |
| Total from investment operations | .005 | .005 | .001 | –A | –A | –A |
| Distributions from net investment income | (.005) | (.005) | (.001) | –A | –A | –A |
| Total distributions | (.005) | (.005) | (.001) | –A | –A | –A |
| Net asset value, end of period | $1.00 | $1.00 | $1.00 | $1.00 | $1.00 | $1.00 |
| Total ReturnB,C | .50% | .48% | .06% | .01% | .01% | .02% |
| Ratios to Average Net AssetsD | | | | | | |
| Expenses before reductions | .36%E | .36% | .36% | .36% | .36% | .36% |
| Expenses net of fee waivers, if any | .33%E | .33% | .30% | .22% | .23% | .32% |
| Expenses net of all reductions | .33%E | .33% | .30% | .22% | .23% | .32% |
| Net investment income (loss) | 1.00%E | .41% | .06% | .01% | .01% | .02% |
| Supplemental Data | | | | | | |
| Net assets, end of period (in millions) | $25 | $14 | $76 | $95 | $150 | $165 |
A Amount represents less than $.0005 per share.
B Total returns for periods of less than one year are not annualized.
C Total returns would have been lower if certain expenses had not been reduced during the applicable periods shown.
D Expense ratios reflect operating expenses of the class. Expenses before reductions do not reflect amounts reimbursed or waived or reductions from expense offset arrangements and do not represent the amount paid by the class during periods when reimbursements, waivers or reductions occur. Expenses net of fee waivers reflect expenses after reimbursement and waivers but prior to reductions from expense offset arrangements. Expenses net of all reductions represent the net expenses paid by the class.
E Annualized
See accompanying notes which are an integral part of the financial statements.
Money Market Portfolio Class III
| | Six months ended (Unaudited) September 30, | Years ended March 31, | | | | |
| | 2017 | 2017 | 2016 | 2015 | 2014 | 2013 |
| Selected Per–Share Data | | | | | | |
| Net asset value, beginning of period | $1.00 | $1.00 | $1.00 | $1.00 | $1.00 | $1.00 |
| Income from Investment Operations | | | | | | |
| Net investment income (loss) | .004 | .004 | –A | –A | –A | –A |
| Net realized and unrealized gain (loss)A | – | – | – | – | – | – |
| Total from investment operations | .004 | .004 | –A | –A | –A | –A |
| Distributions from net investment income | (.004) | (.004) | –A | –A | –A | –A |
| Total distributions | (.004) | (.004) | –A | –A | –A | –A |
| Net asset value, end of period | $1.00 | $1.00 | $1.00 | $1.00 | $1.00 | $1.00 |
| Total ReturnB,C | .45% | .38% | .03% | .01% | .01% | .01% |
| Ratios to Average Net AssetsD | | | | | | |
| Expenses before reductions | .46%E | .46% | .46% | .46% | .46% | .46% |
| Expenses net of fee waivers, if any | .43%E | .43% | .32% | .23% | .23% | .33% |
| Expenses net of all reductions | .43%E | .43% | .32% | .23% | .23% | .33% |
| Net investment income (loss) | .90%E | .31% | .03% | .01% | .01% | .01% |
| Supplemental Data | | | | | | |
| Net assets, end of period (in millions) | $92 | $91 | $1,129 | $1,454 | $1,834 | $2,086 |
A Amount represents less than $.0005 per share.
B Total returns for periods of less than one year are not annualized.
C Total returns would have been lower if certain expenses had not been reduced during the applicable periods shown.
D Expense ratios reflect operating expenses of the class. Expenses before reductions do not reflect amounts reimbursed or waived or reductions from expense offset arrangements and do not represent the amount paid by the class during periods when reimbursements, waivers or reductions occur. Expenses net of fee waivers reflect expenses after reimbursement and waivers but prior to reductions from expense offset arrangements. Expenses net of all reductions represent the net expenses paid by the class.
E Annualized
See accompanying notes which are an integral part of the financial statements.
Money Market Portfolio Select Class
| | Six months ended (Unaudited) September 30, | Years ended March 31, | | | | |
| | 2017 | 2017 | 2016 | 2015 | 2014 | 2013 |
| Selected Per–Share Data | | | | | | |
| Net asset value, beginning of period | $1.00 | $1.00 | $1.00 | $1.00 | $1.00 | $1.00 |
| Income from Investment Operations | | | | | | |
| Net investment income (loss) | .005 | .006 | .001 | –A | –A | .001 |
| Net realized and unrealized gain (loss)A | – | – | – | – | – | – |
| Total from investment operations | .005 | .006 | .001 | –A | –A | .001 |
| Distributions from net investment income | (.005) | (.006) | (.001) | –A | –A | (.001) |
| Total distributions | (.005) | (.006) | (.001) | –A | –A | (.001) |
| Net asset value, end of period | $1.00 | $1.00 | $1.00 | $1.00 | $1.00 | $1.00 |
| Total ReturnB,C | .55% | .58% | .13% | .02% | .02% | .11% |
| Ratios to Average Net AssetsD | | | | | | |
| Expenses before reductions | .26%E | .26% | .26% | .26% | .26% | .26% |
| Expenses net of fee waivers, if any | .23%E | .23% | .23% | .22% | .22% | .23% |
| Expenses net of all reductions | .23%E | .23% | .23% | .22% | .22% | .23% |
| Net investment income (loss) | 1.10%E | .51% | .12% | .01% | .02% | .11% |
| Supplemental Data | | | | | | |
| Net assets, end of period (in millions) | $16 | $12 | $224 | $407 | $331 | $389 |
A Amount represents less than $.0005 per share.
B Total returns for periods of less than one year are not annualized.
C Total returns would have been lower if certain expenses had not been reduced during the applicable periods shown.
D Expense ratios reflect operating expenses of the class. Expenses before reductions do not reflect amounts reimbursed or waived or reductions from expense offset arrangements and do not represent the amount paid by the class during periods when reimbursements, waivers or reductions occur. Expenses net of fee waivers reflect expenses after reimbursement and waivers but prior to reductions from expense offset arrangements. Expenses net of all reductions represent the net expenses paid by the class.
E Annualized
See accompanying notes which are an integral part of the financial statements.
Money Market Portfolio Institutional Class
| | Six months ended (Unaudited) September 30, | Years ended March 31, | | | | |
| | 2017 | 2017 | 2016 | 2015 | 2014 | 2013 |
| Selected Per–Share Data | | | | | | |
| Net asset value, beginning of period | $1.00 | $1.00 | $1.00 | $1.00 | $1.00 | $1.00 |
| Income from Investment Operations | | | | | | |
| Net investment income (loss) | .006 | .007 | .002 | .001 | .001 | .002 |
| Net realized and unrealized gain (loss)A | – | – | – | – | – | – |
| Total from investment operations | .006 | .007 | .002 | .001 | .001 | .002 |
| Distributions from net investment income | (.006) | (.007) | (.002) | (.001) | (.001) | (.002) |
| Total distributions | (.006) | (.007) | (.002) | (.001) | (.001) | (.002) |
| Net asset value, end of period | $1.00 | $1.00 | $1.00 | $1.00 | $1.00 | $1.00 |
| Total ReturnB,C | .60% | .67% | .22% | .10% | .10% | .20% |
| Ratios to Average Net AssetsD | | | | | | |
| Expenses before reductions | .18%E | .18% | .18% | .18% | .18% | .18% |
| Expenses net of fee waivers, if any | .14%E | .14% | .14% | .14% | .14% | .14% |
| Expenses net of all reductions | .14%E | .14% | .14% | .14% | .14% | .14% |
| Net investment income (loss) | 1.19%E | .60% | .21% | .09% | .10% | .20% |
| Supplemental Data | | | | | | |
| Net assets, end of period (in millions) | $11,800 | $10,043 | $21,863 | $36,919 | $40,143 | $37,824 |
A Amount represents less than $.0005 per share.
B Total returns for periods of less than one year are not annualized.
C Total returns would have been lower if certain expenses had not been reduced during the applicable periods shown.
D Expense ratios reflect operating expenses of the class. Expenses before reductions do not reflect amounts reimbursed or waived or reductions from expense offset arrangements and do not represent the amount paid by the class during periods when reimbursements, waivers or reductions occur. Expenses net of fee waivers reflect expenses after reimbursement and waivers but prior to reductions from expense offset arrangements. Expenses net of all reductions represent the net expenses paid by the class.
E Annualized
See accompanying notes which are an integral part of the financial statements.
Prime Money Market Portfolio
Investment Summary/Performance (Unaudited)
Effective Maturity Diversification
| Days | % of fund's investments 9/30/17 | % of fund's investments 3/31/17 | % of fund's investments 9/30/16 |
| 1 - 7 | 65.8 | 64.1 | 78.7 |
| 8 - 30 | 21.7 | 15.8 | 9.9 |
| 31 - 60 | 7.9 | 11.0 | 10.0 |
| 61 - 90 | 2.6 | 9.1 | 0.0 |
| 91 - 180 | 2.0 | 0.0 | 1.4 |
Effective maturity is determined in accordance with the requirements of Rule 2a-7 under the Investment Company Act of 1940.
Asset Allocation (% of fund's net assets)
| As of September 30, 2017 |
| | Certificates of Deposit | 30.0% |
| | Commercial Paper | 21.4% |
| | Variable Rate Demand Notes (VRDNs) | 0.2% |
| | U.S. Treasury Debt | 3.0% |
| | Non-Negotiable Time Deposit | 30.9% |
| | Other Instruments | 1.7% |
| | Repurchase Agreements | 12.6% |
| | Net Other Assets (Liabilities) | 0.2% |
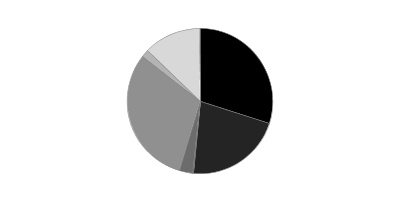
| As of March 31, 2017 |
| | Certificates of Deposit | 26.9% |
| | Commercial Paper | 19.5% |
| | Variable Rate Demand Notes (VRDNs) | 0.2% |
| | U.S. Treasury Debt | 6.4% |
| | Non-Negotiable Time Deposit | 19.0% |
| | Other Instruments | 2.2% |
| | Repurchase Agreements | 25.8% |
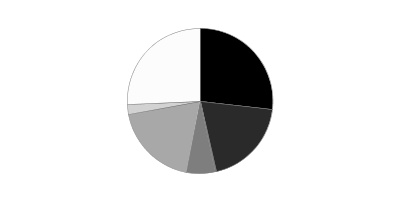
Current And Historical 7-Day Yields
| | 9/30/17 | 6/30/17 | 3/31/17 | 12/31/16 | 9/30/16 |
| Class I | 1.18% | 1.14% | 0.95% | 0.79% | 0.40% |
| Class II | 1.03% | 0.99% | 0.80% | 0.64% | 0.25% |
| Class III | 0.93% | 0.89% | 0.70% | 0.54% | 0.15% |
| Class IV | 0.65% | 0.66% | 0.46% | 0.23% | 0.01% |
| Select Class | 1.13% | 1.09% | 0.90% | 0.74% | 0.35% |
| Institutional Class | 1.22% | 1.18% | 0.99% | 0.83% | 0.44% |
Yield refers to the income paid by the Fund over a given period. Yields for money market funds are usually for seven-day periods, as they are here, though they are expressed as annual percentage rates. Past performance is no guarantee of future results. Yield will vary and it's possible to lose money investing in the Fund. A portion of the Fund's expenses was reimbursed and/or waived. Absent such reimbursements and/or waivers the yield for the period ending September 30, 2017, the most recent period shown in the table, would have been 1.14% for Class I, 0.99% for Class II, 0.89% for Class III, 0.58% for Class IV, 1.09% for Select Class and 1.17% for Institutional Class.
Percentages shown as 0.0% may reflect amounts less than 0.05%.
Prime Money Market Portfolio
Investments September 30, 2017
Showing Percentage of Net Assets
| Certificate of Deposit - 30.0% | | | | |
| | | Yield(a) | Principal Amount (000s) | Value (000s) |
| Domestic Certificates Of Deposit - 3.9% | | | | |
| Citibank NA | | | | |
| 10/4/17 | | 1.32 % | $161,000 | $161,004 |
| Wells Fargo Bank NA | | | | |
| 12/20/17 to 4/25/18 | | 1.37 to 1.42 (b)(c) | 352,000 | 352,073 |
| | | | | 513,077 |
| London Branch, Eurodollar, Foreign Banks - 6.6% | | | | |
| ABN AMRO Bank NV | | | | |
| 12/1/17 to 1/5/18 | | 1.40 to 1.46 | 299,000 | 299,030 |
| Mizuho Bank Ltd. London Branch | | | | |
| 11/13/17 to 12/11/17 | | 1.38 to 1.40 | 281,000 | 280,636 |
| Sumitomo Mitsui Trust Bank Ltd. London Branch | | | | |
| 10/10/17 to 11/27/17 | | 1.38 to 1.40 | 304,000 | 304,038 |
| | | | | 883,704 |
| New York Branch, Yankee Dollar, Foreign Banks - 19.5% | | | | |
| Bank of Montreal | | | | |
| 10/2/17 to 6/21/18 | | 1.32 to 1.72 (b) | 579,500 | 579,572 |
| Bank of Nova Scotia | | | | |
| 4/10/18 to 6/7/18 | | 1.40 to 1.42 (b)(c) | 415,000 | 415,023 |
| Canadian Imperial Bank of Commerce | | | | |
| 2/2/18 to 5/22/18 | | 1.43 to 1.72 (b)(c) | 203,000 | 203,124 |
| KBC Bank NV | | | | |
| 11/24/17 to 11/30/17 | | 1.34 to 1.34 | 385,000 | 385,051 |
| Mitsubishi UFJ Trust & Banking Corp. | | | | |
| 10/5/17 to 1/30/18 | | 1.38 to 1.40 (b)(c) | 325,500 | 325,547 |
| Royal Bank of Canada | | | | |
| 10/24/17 to 6/20/18 | | 1.38 to 1.70 (b)(c) | 337,000 | 337,037 |
| Sumitomo Mitsui Banking Corp. | | | | |
| 12/4/17 to 1/19/18 | | 1.35 to 1.39 (b)(c) | 225,000 | 225,016 |
| Sumitomo Mitsui Trust Bank Ltd. | | | | |
| 12/4/17 | | 1.35 (b)(c) | 38,000 | 38,004 |
| Toronto-Dominion Bank New York Branch | | | | |
| 11/1/17 | | 1.68 (b)(c) | 90,000 | 90,039 |
| | | | | 2,598,413 |
| TOTAL CERTIFICATE OF DEPOSIT | | | | |
| (Cost $3,994,677) | | | | 3,995,194 |
|
| Financial Company Commercial Paper - 18.8% | | | | |
| BNP Paribas Dublin Branch | | | | |
| 10/3/17 | | 1.17 | 237,918 | 237,888 |
| BPCE SA | | | | |
| 10/2/17 to 11/6/17 | | 1.34 to 1.41 | 503,000 | 502,758 |
| Canadian Imperial Bank of Commerce | | | | |
| 12/18/17 to 4/20/18 | | 1.38 to 1.49 (b)(c) | 256,000 | 256,067 |
| Federation des caisses Desjardin | | | | |
| 10/2/17 | | 1.11 | 79,000 | 78,993 |
| J.P. Morgan Securities, LLC | | | | |
| 12/21/17 to 4/9/18 | | 1.39 to 1.41 (b)(c) | 338,000 | 338,092 |
| Mitsubishi UFJ Trust & Banking Corp. | | | | |
| 10/6/17 | | 1.22 | 58,000 | 57,986 |
| Societe Generale | | | | |
| 10/2/17 | | 1.08 | 395,000 | 394,964 |
| UBS AG London Branch | | | | |
| 3/2/18 to 4/3/18 | | 1.43 to 1.44 (b) | 631,000 | 631,141 |
| TOTAL FINANCIAL COMPANY COMMERCIAL PAPER | | | | |
| (Cost $2,497,638) | | | | 2,497,889 |
|
| Asset Backed Commercial Paper - 1.2% | | | | |
| Gotham Funding Corp. (Liquidity Facility Bank of Tokyo-Mitsubishi UFJ Ltd.) | | | | |
| 10/5/17 | | | | |
| (Cost $157,977) | | 1.33 | 158,000 | 157,970 |
|
| Non-Financial Company Commercial Paper - 1.4% | | | | |
| Archer Daniels Midland Co. | | | | |
| 10/2/17 | | | | |
| (Cost $188,994) | | 1.10 to 1.12 | 189,000 | 188,982 |
|
| U.S. Treasury Debt - 3.0% | | | | |
| U.S. Treasury Obligations - 3.0% | | | | |
| U.S. Treasury Notes | | | | |
| 10/31/17 to 10/31/18 | | | | |
| (Cost $404,992) | | 1.22 to 1.24 (b)(c) | 405,000 | 405,386 |
|
| Other Instrument - 1.7% | | | | |
| Master Notes - 1.7% | | | | |
| Toyota Motor Credit Corp. | | | | |
| 10/6/17 | | | | |
| (Cost $221,000) | | 1.55 (b)(c) | 221,000 | 221,000 |
|
| Variable Rate Demand Note - 0.2% | | | | |
| Florida - 0.2% | | | | |
| Florida Timber Fin. III LLC Taxable 10/6/17, LOC Wells Fargo Bank NA, VRDN | | | | |
| 10/6/17 | | | | |
| (Cost $25,155) | | 1.23 (b) | 25,155 | 25,155 |
|
| Non-Negotiable Time Deposit - 30.9% | | | | |
| Time Deposits - 30.9% | | | | |
| Australia & New Zealand Banking Group Ltd. | | | | |
| 10/2/17 | | 1.07 | 600,000 | 600,000 |
| BNP Paribas | | | | |
| 10/6/17 | | 1.17 | 350,000 | 349,999 |
| Credit Agricole CIB | | | | |
| 10/2/17 to 10/6/17 | | 1.08 to 1.23 | 592,432 | 592,432 |
| Credit Industriel et Commercial | | | | |
| 10/2/17 | | 1.06 | 295,700 | 295,700 |
| DNB Bank ASA | | | | |
| 10/2/17 | | 1.05 | 589,000 | 589,000 |
| Natixis SA | | | | |
| 10/2/17 | | 1.08 | 100,000 | 100,000 |
| Nordea Bank AB | | | | |
| 10/2/17 | | 1.05 | 600,000 | 600,000 |
| Royal Bank of Canada | | | | |
| 10/2/17 | | 1.06 | 323,000 | 323,000 |
| Skandinaviska Enskilda Banken AB | | | | |
| 10/2/17 | | 1.06 | 660,000 | 660,000 |
| TOTAL NON-NEGOTIABLE TIME DEPOSIT | | | | |
| (Cost $4,110,132) | | | | 4,110,131 |
| U.S. Government Agency Repurchase Agreement - 1.4% | | | |
| | | Maturity Amount (000s) | Value (000s) |
| In a joint trading account at: | | | |
| 1.05% dated 9/29/17 due 10/2/17 (Collateralized by U.S. Government Obligations) # | | $172,111 | $172,096 |
| 1.07% dated 9/29/17 due 10/2/17 (Collateralized by U.S. Government Obligations) # | | 744 | 744 |
| With Mitsubishi UFJ Securities (U.S.A.), Inc. at 1.07%, dated 9/29/17 due 10/2/17 (Collateralized by U.S. Government Obligations valued at $18,361,637, 3.00% - 4.50%, 9/20/41 - 5/20/47) | | 18,002 | 18,000 |
| TOTAL U.S. GOVERNMENT AGENCY REPURCHASE AGREEMENT | | | |
| (Cost $190,840) | | | 190,840 |
|
| U.S. Treasury Repurchase Agreement - 0.3% | | | |
| With: | | | |
| ING Financial Markets LLC at 1.03%, dated 9/29/17 due 10/2/17 (Collateralized by U.S. Treasury Obligations valued at $27,816,724, 1.50%, 3/31/23) | | 27,002 | 27,000 |
| TD Securities (U.S.A.) at 1.06%, dated 9/29/17 due 10/2/17 (Collateralized by U.S. Treasury Obligations valued at $16,321,522, 2.13%, 2/29/24) | | 16,001 | 16,000 |
| TOTAL U.S. TREASURY REPURCHASE AGREEMENT | | | |
| (Cost $43,000) | | | 43,000 |
|
| Other Repurchase Agreement - 10.9% | | | |
| Other Repurchase Agreement - 10.9% | | | |
| With: | | | |
| BNP Paribas at 1.29%, dated 9/29/17 due 10/2/17 (Collateralized by Corporate Obligations valued at $25,202,275, 2.59% - 9.25%, 1/31/19 - 4/8/68) | | 24,003 | 24,000 |
| Citigroup Global Markets, Inc. at: | | | |
| 1.36%, dated 9/29/17 due 10/2/17 (Collateralized by U.S. Treasury Obligations valued at $173,750,964, 0.00% - 3.75%, 10/15/29 - 8/15/41) | | 167,019 | 167,000 |
| 2.13%, dated: | | | |
| 8/21/17 due 11/20/17 (Collateralized by Mortgage Loan Obligations valued at $80,345,745, 2.36% - 5.98%, 11/15/29 - 6/30/53) | | 75,404 | 74,998 |
| 8/28/17 due 11/27/17 (Collateralized by Mortgage Loan Obligations valued at $34,631,568, 4.34% - 4.38%, 7/17/34 - 9/15/34) | | 32,172 | 31,999 |
| Credit Suisse Securities (U.S.A.) LLC at 1.36%, dated 9/28/17 due 10/5/17 (Collateralized by Mortgage Loan Obligations valued at $25,922,324, 1.52%, 5/25/47) | | 24,006 | 24,000 |
| HSBC Securities, Inc. at 1.36%, dated 9/29/17 due 10/2/17 (Collateralized by Corporate Obligations valued at $37,802,087, 1.65% - 5.50%, 1/15/18 - 3/9/49) | | 36,004 | 36,000 |
| J.P. Morgan Securities, LLC at: | | | |
| 1.28%, dated 9/29/17 due 10/2/17 (Collateralized by U.S. Government Obligations valued at $73,895,183, 0.31% - 4.96%, 5/15/20 - 12/16/53) | | 72,008 | 72,000 |
| 1.36%, dated 9/28/17 due 10/5/17 (Collateralized by U.S. Government Obligations valued at $121,501,743, 0.12% - 7.00%, 7/25/22 - 10/16/59) | | 118,031 | 118,001 |
| 1.51%, dated 9/29/17 due 10/6/17 (Collateralized by Mortgage Loan Obligations valued at $51,843,636, 0.00% - 38.09%, 8/15/30 - 9/25/57) | | 48,064 | 48,000 |
| Merrill Lynch, Pierce, Fenner & Smith at 2.3%, dated 8/15/17 due 11/13/17 (Collateralized by Equity Securities valued at $326,076,938) | | 302,731 | 300,984 |
| Mitsubishi UFJ Securities (U.S.A.), Inc. at 1.46%, dated 9/26/17 due 10/3/17 (Collateralized by Corporate Obligations valued at $25,918,251, 0.38% - 8.00%, 3/1/18 - 8/1/39) | | 24,007 | 24,000 |
| Mizuho Securities U.S.A., Inc. at: | | | |
| 1.34%, dated 9/29/17 due 10/2/17 (Collateralized by Corporate Obligations valued at $37,804,221, 1.54% - 7.50%, 10/15/18 - 12/8/41) | | 36,004 | 36,000 |
| 1.46%, dated: | | | |
| 9/20/17 due 10/4/17 (Collateralized by Equity Securities valued at $39,979,453) | | 37,021 | 37,000 |
| 9/28/17 due 10/6/17 (Collateralized by Equity Securities valued at $38,886,310) | | 36,020 | 36,000 |
| 9/29/17 due 10/6/17 (Collateralized by Equity Securities valued at $38,884,744) | | 36,020 | 36,000 |
| 1.51%, dated 9/22/17 due 10/6/17 (Collateralized by Corporate Obligations valued at $12,245,135, 1.14% - 2.13%, 9/7/18 - 1/18/22) | | 12,007 | 12,000 |
| 2.22%, dated 9/13/17 due 12/12/17 (Collateralized by Corporate Obligations valued at $26,669,361, 1.92% - 6.25%, 7/31/18 - 10/15/27) | | 25,139 | 24,998 |
| Societe Generale at: | | | |
| 1.29%, dated 9/29/17 due 10/2/17 (Collateralized by Corporate Obligations valued at $100,810,837, 0.00% - 4.63%, 11/13/17 - 4/15/65) | | 96,010 | 96,000 |
| 1.44%, dated 9/29/17 due 10/2/17 (Collateralized by Corporate Obligations valued at $77,649,470, 0.00% - 11.50%, 11/28/17 - 2/15/41) | | 72,009 | 72,000 |
| 1.56%, dated: | | | |
| 9/1/17 due 10/2/17 (Collateralized by Corporate Obligations valued at $26,758,401, 0.00% - 10.00%, 11/28/17 - 10/15/43) (b)(c)(d) | | 25,395 | 25,000 |
| 10/2/17 due 11/2/17(b)(c)(d)(e) | | 24,380 | 23,999 |
| Wells Fargo Securities, LLC at: | | | |
| 1.31%, dated 9/29/17 due 10/2/17 (Collateralized by Corporate Obligations valued at $24,482,673, 1.30% - 2.50%, 9/30/17 - 7/29/25) | | 24,003 | 24,000 |
| 1.36%, dated 9/28/17 due 10/5/17 (Collateralized by Corporate Obligations valued at $36,725,646, 1.50% - 2.00%, 9/28/18 - 2/16/22) | | 36,010 | 36,000 |
| 1.41%, dated 9/28/17 due 10/5/17 (Collateralized by Corporate Obligations valued at $75,612,745, 4.38% - 10.38%, 11/1/18 - 5/15/64) | | 72,020 | 72,001 |
| TOTAL OTHER REPURCHASE AGREEMENT | | | |
| (Cost $1,452,000) | | | 1,451,980 |
| TOTAL INVESTMENT IN SECURITIES - 99.8% | | | |
| (Cost $13,286,405) | | | 13,287,527 |
| NET OTHER ASSETS (LIABILITIES) - 0.2% | | | 29,134 |
| NET ASSETS - 100% | | | $13,316,661 |
Security Type Abbreviations
VRDN – VARIABLE RATE DEMAND NOTE (A debt instrument that is payable upon demand, either daily, weekly or monthly)
The date shown for securities represents the date when principal payments must be paid, taking into account any call options exercised by the issuer and any permissible maturity shortening features other than interest rate resets.
Legend
(a) Yield represents either the annualized yield at the date of purchase, or the stated coupon rate, or, for floating and adjustable rate securities, the rate at period end.
(b) Coupon rates for floating and adjustable rate securities reflect the rates in effect at period end.
(c) Coupon is indexed to a floating interest rate which may be multiplied by a specified factor and/or subject to caps or floors.
(d) The maturity amount is based on the rate at period end.
(e) Represents a forward settling transaction and therefore no collateral securities had been allocated as of period end. The agreement contemplated the delivery of Corporate Obligations as collateral on settlement date.
Investment Valuation
All investments are categorized as Level 2 under the Fair Value Hierarchy. The inputs or methodology used for valuing securities may not be an indication of the risk associated with investing in those securities. For more information on valuation inputs please refer to the Investment Valuation section in the accompanying Notes to Financial Statements.
Other Information
# Additional information on each counterparty to the repurchase agreement is as follows:
| Repurchase Agreement / Counterparty | Value (000s) |
| $172,096,000 due 10/02/17 at 1.05% | |
| Bank of Nova Scotia | $22,389 |
| HSBC Securities (USA), Inc. | 94,189 |
| Merrill Lynch, Pierce, Fenner & Smith, Inc. | 14,820 |
| RBC Dominion Securities, Inc. | 21,045 |
| Wells Fargo Securities LLC | 19,653 |
| | $172,096 |
| $744,000 due 10/02/17 at 1.07% | |
| BNP Paribas, S.A. | 47 |
| Bank of America NA | 270 |
| Citibank NA | 28 |
| Credit Agricole CIB New York Branch | 24 |
| Mizuho Securities USA, Inc. | 55 |
| RBC Dominion Securities, Inc. | 46 |
| Wells Fargo Securities LLC | 274 |
| | $744 |
See accompanying notes which are an integral part of the financial statements.
Prime Money Market Portfolio
Financial Statements
Statement of Assets and Liabilities
| Amounts in thousands (except per-share amounts) | | September 30, 2017 (Unaudited) |
| Assets | | |
Investment in securities, at value (including repurchase agreements of $1,685,820) — See accompanying schedule:
Unaffiliated issuers (cost $13,286,405) | | $13,287,527 |
| Cash | | 1 |
| Receivable for investments sold | | 50,003 |
| Interest receivable | | 8,093 |
| Prepaid expenses | | 30 |
| Receivable from investment adviser for expense reductions | | 428 |
| Other receivables | | 556 |
| Total assets | | 13,346,638 |
| Liabilities | | |
| Payable for investments purchased | $24,000 | |
| Payable for fund shares redeemed | 1 | |
| Distributions payable | 3,461 | |
| Accrued management fee | 1,549 | |
| Distribution and service plan fees payable | 9 | |
| Other affiliated payables | 437 | |
| Other payables and accrued expenses | 520 | |
| Total liabilities | | 29,977 |
| Net Assets | | $13,316,661 |
| Net Assets consist of: | | |
| Paid in capital | | $13,315,014 |
| Distributions in excess of net investment income | | (6) |
| Accumulated undistributed net realized gain (loss) on investments | | 531 |
| Net unrealized appreciation (depreciation) on investments | | 1,122 |
| Net Assets | | $13,316,661 |
| Class I: | | |
| Net Asset Value, offering price and redemption price per share ($727,784.06 ÷ 727,444.204 shares) | | $1.0005 |
| Class II: | | |
| Net Asset Value, offering price and redemption price per share ($51,623.60 ÷ 51,604.887 shares) | | $1.0004 |
| Class III: | | |
| Net Asset Value, offering price and redemption price per share ($9,436.85 ÷ 9,433.056 shares) | | $1.0004 |
| Class IV: | | |
| Net Asset Value, offering price and redemption price per share ($20.10 ÷ 20.077 shares) | | $1.0011 |
| Select Class: | | |
| Net Asset Value, offering price and redemption price per share ($19,642.50 ÷ 19,632.194 shares) | | $1.0005 |
| Institutional Class: | | |
| Net Asset Value, offering price and redemption price per share ($12,508,154.08 ÷ 12,503,655.268 shares) | | $1.0004 |
See accompanying notes which are an integral part of the financial statements.
Statement of Operations
| Amounts in thousands | | Six months ended September 30, 2017 (Unaudited) |
| Investment Income | | |
| Interest | | $75,700 |
| Expenses | | |
| Management fee | $8,288 | |
| Transfer agent fees | 1,957 | |
| Distribution and service plan fees | 44 | |
| Accounting fees and expenses | 447 | |
| Custodian fees and expenses | 99 | |
| Independent trustees' fees and expenses | 21 | |
| Registration fees | 94 | |
| Audit | 25 | |
| Legal | 9 | |
| Miscellaneous | 137 | |
| Total expenses before reductions | 11,121 | |
| Expense reductions | (2,532) | 8,589 |
| Net investment income (loss) | | 67,111 |
| Realized and Unrealized Gain (Loss) | | |
| Net realized gain (loss) on: | | |
| Investment securities: | | |
| Unaffiliated issuers | | 531 |
| Total net realized gain (loss) | | 531 |
| Change in net unrealized appreciation (depreciation) on investment securities | | (1,182) |
| Net increase in net assets resulting from operations | | $66,460 |
See accompanying notes which are an integral part of the financial statements.
Statement of Changes in Net Assets
| Amounts in thousands | Six months ended September 30, 2017 (Unaudited) | Year ended March 31, 2017 |
| Increase (Decrease) in Net Assets | | |
| Operations | | |
| Net investment income (loss) | $67,111 | $160,265 |
| Net realized gain (loss) | 531 | 825 |
| Change in net unrealized appreciation (depreciation) | (1,182) | 2,304 |
| Net increase in net assets resulting from operations | 66,460 | 163,394 |
| Distributions to shareholders from net investment income | (67,117) | (160,593) |
| Distributions to shareholders from net realized gain | – | (10,360) |
| Total distributions | (67,117) | (170,953) |
| Share transactions - net increase (decrease) | 3,041,844 | (47,936,337) |
| Total increase (decrease) in net assets | 3,041,187 | (47,943,896) |
| Net Assets | | |
| Beginning of period | 10,275,474 | 58,219,370 |
| End of period | $13,316,661 | $10,275,474 |
| Other Information | | |
| Distributions in excess of net investment income end of period | $(6) | $– |
See accompanying notes which are an integral part of the financial statements.
Financial Highlights
Prime Money Market Portfolio Class I
| | Six months ended (Unaudited) September 30, | Years ended March 31, | | | | |
| | 2017 | 2017 A | 2016 | 2015 | 2014 | 2013 |
| Selected Per–Share Data | | | | | | |
| Net asset value, beginning of period | $1.0005 | $1.0000 | $1.00 | $1.00 | $1.00 | $1.00 |
| Income from Investment Operations | | | | | | |
| Net investment income (loss) | .0055 | .0056 | .002 | –B | –B | .001 |
| Net realized and unrealized gain (loss) | –B | .0007 | –B | –B | –B | –B |
| Total from investment operations | .0055 | .0063 | .002 | –B | –B | .001 |
| Distributions from net investment income | (.0055) | (.0056) | (.002) | –B | –B | (.001) |
| Distributions from net realized gain | – | (.0002) | – | – | – | – |
| Total distributions | (.0055) | (.0058) | (.002) | –B | –B | (.001) |
| Net asset value, end of period | $1.0005 | $1.0005 | $1.00 | $1.00 | $1.00 | $1.00 |
| Total ReturnC,D | .55% | .64% | .17% | .01% | .02% | .09% |
| Ratios to Average Net AssetsE | | | | | | |
| Expenses before reductions | .21%F | .21% | .21% | .21% | .21% | .21% |
| Expenses net of fee waivers, if any | .18%F | .18% | .18% | .19% | .19% | .20% |
| Expenses net of all reductions | .18%F | .18% | .18% | .19% | .19% | .20% |
| Net investment income (loss) | 1.10%F | .45% | .18% | .01% | .02% | .09% |
| Supplemental Data | | | | | | |
| Net assets, end of period (in millions) | $728 | $866 | $9,638 | $6,236 | $7,816 | $10,332 |
A Beginning October 3, 2016 the Fund began selling and redeeming class shares based upon the market-based value of the securities held rounded to the fourth decimal place; a "floating"net asset value.
B Amount represents less than $.00005 or $.0005 per share.
C Total returns for periods of less than one year are not annualized.
D Total returns would have been lower if certain expenses had not been reduced during the applicable periods shown.
E Expense ratios reflect operating expenses of the class. Expenses before reductions do not reflect amounts reimbursed or waived or reductions from expense offset arrangements and do not represent the amount paid by the class during periods when reimbursements, waivers or reductions occur. Expenses net of fee waivers reflect expenses after reimbursement and waivers but prior to reductions from expense offset arrangements. Expenses net of all reductions represent the net expenses paid by the class.
F Annualized
See accompanying notes which are an integral part of the financial statements.
Prime Money Market Portfolio Class II
| | Six months ended (Unaudited) September 30, | Years ended March 31, | | | | |
| | 2017 | 2017 A | 2016 | 2015 | 2014 | 2013 |
| Selected Per–Share Data | | | | | | |
| Net asset value, beginning of period | $1.0004 | $1.0000 | $1.00 | $1.00 | $1.00 | $1.00 |
| Income from Investment Operations | | | | | | |
| Net investment income (loss) | .0047 | .0041 | .001 | –B | –B | –B |
| Net realized and unrealized gain (loss) | –B | .0008 | –B | –B | –B | –B |
| Total from investment operations | .0047 | .0049 | .001 | –B | –B | –B |
| Distributions from net investment income | (.0047) | (.0041) | (.001) | –B | –B | –B |
| Distributions from net realized gain | – | (.0004) | – | – | – | – |
| Total distributions | (.0047) | (.0045) | (.001) | –B | –B | –B |
| Net asset value, end of period | $1.0004 | $1.0004 | $1.00 | $1.00 | $1.00 | $1.00 |
| Total ReturnC,D | .47% | .49% | .06% | .01% | .01% | .01% |
| Ratios to Average Net AssetsE | | | | | | |
| Expenses before reductions | .36%F | .36% | .36% | .36% | .36% | .36% |
| Expenses net of fee waivers, if any | .33%F | .33% | .28% | .20% | .19% | .28% |
| Expenses net of all reductions | .33%F | .33% | .28% | .20% | .19% | .28% |
| Net investment income (loss) | .95%F | .30% | .09% | .01% | .01% | .01% |
| Supplemental Data | | | | | | |
| Net assets, end of period (in millions) | $52 | $28 | $245 | $454 | $419 | $487 |
A Beginning October 3, 2016 the Fund began selling and redeeming class shares based upon the market-based value of the securities held rounded to the fourth decimal place; a "floating"net asset value.
B Amount represents less than $.00005 or $.0005 per share.
C Total returns for periods of less than one year are not annualized.
D Total returns would have been lower if certain expenses had not been reduced during the applicable periods shown.
E Expense ratios reflect operating expenses of the class. Expenses before reductions do not reflect amounts reimbursed or waived or reductions from expense offset arrangements and do not represent the amount paid by the class during periods when reimbursements, waivers or reductions occur. Expenses net of fee waivers reflect expenses after reimbursement and waivers but prior to reductions from expense offset arrangements. Expenses net of all reductions represent the net expenses paid by the class.
F Annualized
See accompanying notes which are an integral part of the financial statements.
Prime Money Market Portfolio Class III
| | Six months ended (Unaudited) September 30, | Years ended March 31, | | | | |
| | 2017 | 2017 A | 2016 | 2015 | 2014 | 2013 |
| Selected Per–Share Data | | | | | | |
| Net asset value, beginning of period | $1.0004 | $1.0000 | $1.00 | $1.00 | $1.00 | $1.00 |
| Income from Investment Operations | | | | | | |
| Net investment income (loss) | .0042 | .0031 | –B | –B | –B | –B |
| Net realized and unrealized gain (loss) | –B | .0006 | –B | –B | –B | –B |
| Total from investment operations | .0042 | .0037 | –B | –B | –B | –B |
| Distributions from net investment income | (.0042) | (.0031) | –B | –B | –B | –B |
| Distributions from net realized gain | – | (.0002) | – | – | – | – |
| Total distributions | (.0042) | (.0033) | –B | –B | –B | –B |
| Net asset value, end of period | $1.0004 | $1.0004 | $1.00 | $1.00 | $1.00 | $1.00 |
| Total ReturnC,D | .42% | .37% | .04% | .01% | .01% | .01% |
| Ratios to Average Net AssetsE | | | | | | |
| Expenses before reductions | .46%F | .45% | .46% | .46% | .46% | .46% |
| Expenses net of fee waivers, if any | .43%F | .43% | .31% | .20% | .19% | .28% |
| Expenses net of all reductions | .43%F | .43% | .31% | .20% | .19% | .28% |
| Net investment income (loss) | .85%F | .20% | .06% | .01% | .01% | .01% |
| Supplemental Data | | | | | | |
| Net assets, end of period (in millions) | $9 | $8 | $894 | $1,011 | $1,967 | $1,790 |
A Beginning October 3, 2016 the Fund began selling and redeeming class shares based upon the market-based value of the securities held rounded to the fourth decimal place; a "floating"net asset value.
B Amount represents less than $.00005 or $.0005 per share.
C Total returns for periods of less than one year are not annualized.
D Total returns would have been lower if certain expenses had not been reduced during the applicable periods shown.
E Expense ratios reflect operating expenses of the class. Expenses before reductions do not reflect amounts reimbursed or waived or reductions from expense offset arrangements and do not represent the amount paid by the class during periods when reimbursements, waivers or reductions occur. Expenses net of fee waivers reflect expenses after reimbursement and waivers but prior to reductions from expense offset arrangements. Expenses net of all reductions represent the net expenses paid by the class.
F Annualized
See accompanying notes which are an integral part of the financial statements.
Prime Money Market Portfolio Class IV
| | Six months ended (Unaudited) September 30, | Years ended March 31, | | | | |
| | 2017 | 2017 A | 2016 | 2015 | 2014 | 2013 |
| Selected Per–Share Data | | | | | | |
| Net asset value, beginning of period | $1.0012 | $1.0000 | $1.00 | $1.00 | $1.00 | $1.00 |
| Income from Investment Operations | | | | | | |
| Net investment income (loss) | .0029 | .0009 | –B | –B | –B | –B |
| Net realized and unrealized gain (loss) | (.0001) | .0012 | –B | –B | –B | –B |
| Total from investment operations | .0028 | .0021 | –B | –B | –B | –B |
| Distributions from net investment income | (.0029) | (.0009) | –B | –B | –B | –B |
| Total distributions | (.0029) | (.0009) | –B | –B | –B | –B |
| Net asset value, end of period | $1.0011 | $1.0012 | $1.00 | $1.00 | $1.00 | $1.00 |
| Total ReturnC,D | .28% | .21% | .01% | .01% | .01% | .01% |
| Ratios to Average Net AssetsE | | | | | | |
| Expenses before reductions | .72%F | .70% | .71% | .71% | .71% | .71% |
| Expenses net of fee waivers, if any | .68%F | .58% | .33% | .20% | .18% | .29% |
| Expenses net of all reductions | .68%F | .58% | .33% | .20% | .18% | .29% |
| Net investment income (loss) | .60%F | .05% | .03% | .01% | .02% | - %G |
| Supplemental Data | | | | | | |
| Net assets, end of period (in millions) | $– | $– | $184 | $207 | $100 | $37 |
A Beginning October 3, 2016 the Fund began selling and redeeming class shares based upon the market-based value of the securities held rounded to the fourth decimal place; a "floating"net asset value.
B Amount represents less than $.0005 per share.
C Total returns for periods of less than one year are not annualized.
D Total returns would have been lower if certain expenses had not been reduced during the applicable periods shown.
E Expense ratios reflect operating expenses of the class. Expenses before reductions do not reflect amounts reimbursed or waived or reductions from expense offset arrangements and do not represent the amount paid by the class during periods when reimbursements, waivers or reductions occur. Expenses net of fee waivers reflect expenses after reimbursement and waivers but prior to reductions from expense offset arrangements. Expenses net of all reductions represent the net expenses paid by the class.
F Annualized
G Amount represents less than .005%.
See accompanying notes which are an integral part of the financial statements.
Prime Money Market Portfolio Select Class
| | Six months ended (Unaudited) September 30, | Years ended March 31, | | | | |
| | 2017 | 2017 A | 2016 | 2015 | 2014 | 2013 |
| Selected Per–Share Data | | | | | | |
| Net asset value, beginning of period | $1.0006 | $1.0000 | $1.00 | $1.00 | $1.00 | $1.00 |
| Income from Investment Operations | | | | | | |
| Net investment income (loss) | .0052 | .0051 | .001 | –B | –B | –B |
| Net realized and unrealized gain (loss) | (.0001) | .0007 | –B | –B | –B | –B |
| Total from investment operations | .0051 | .0058 | .001 | –B | –B | –B |
| Distributions from net investment income | (.0052) | (.0051) | (.001) | –B | –B | –B |
| Distributions from net realized gain | – | –B | – | – | – | – |
| Total distributions | (.0052) | (.0052)C | (.001) | –B | –B | –B |
| Net asset value, end of period | $1.0005 | $1.0006 | $1.00 | $1.00 | $1.00 | $1.00 |
| Total ReturnD,E | .51% | .58% | .12% | .01% | .01% | .05% |
| Ratios to Average Net AssetsF | | | | | | |
| Expenses before reductions | .26%G | .26% | .26% | .26% | .26% | .26% |
| Expenses net of fee waivers, if any | .23%G | .23% | .23% | .20% | .19% | .25% |
| Expenses net of all reductions | .23%G | .23% | .23% | .20% | .19% | .25% |
| Net investment income (loss) | 1.05%G | .40% | .13% | .01% | .01% | .05% |
| Supplemental Data | | | | | | |
| Net assets, end of period (in millions) | $20 | $28 | $771 | $1,068 | $1,173 | $1,724 |
A Beginning October 3, 2016 the Fund began selling and redeeming class shares based upon the market-based value of the securities held rounded to the fourth decimal place; a "floating"net asset value.
B Amount represents less than $.00005 or $.0005 per share.
C Total distributions of $.0052 per share is comprised of distributions from net investment income of $.00514 and distributions from net realized gain of $.00002 per share.
D Total returns for periods of less than one year are not annualized.
E Total returns would have been lower if certain expenses had not been reduced during the applicable periods shown.
F Expense ratios reflect operating expenses of the class. Expenses before reductions do not reflect amounts reimbursed or waived or reductions from expense offset arrangements and do not represent the amount paid by the class during periods when reimbursements, waivers or reductions occur. Expenses net of fee waivers reflect expenses after reimbursement and waivers but prior to reductions from expense offset arrangements. Expenses net of all reductions represent the net expenses paid by the class.
G Annualized
See accompanying notes which are an integral part of the financial statements.
Prime Money Market Portfolio Institutional Class
| | Six months ended (Unaudited) September 30, | Years ended March 31, | | | | |
| | 2017 | 2017 A | 2016 | 2015 | 2014 | 2013 |
| Selected Per–Share Data | | | | | | |
| Net asset value, beginning of period | $1.0004 | $1.0000 | $1.00 | $1.00 | $1.00 | $1.00 |
| Income from Investment Operations | | | | | | |
| Net investment income (loss) | .0057 | .0060 | .002 | .001 | .001 | .002 |
| Net realized and unrealized gain (loss) | –B | .0006 | –B | –B | –B | –B |
| Total from investment operations | .0057 | .0066 | .002 | .001 | .001 | .002 |
| Distributions from net investment income | (.0057) | (.0060) | (.002) | (.001) | (.001) | (.002) |
| Distributions from net realized gain | – | (.0002) | – | – | – | – |
| Total distributions | (.0057) | (.0062) | (.002) | (.001) | (.001) | (.002) |
| Net asset value, end of period | $1.0004 | $1.0004 | $1.00 | $1.00 | $1.00 | $1.00 |
| Total ReturnC,D | .57% | .66% | .21% | .07% | .06% | .15% |
| Ratios to Average Net AssetsE | | | | | | |
| Expenses before reductions | .18%F | .18% | .18% | .18% | .18% | .18% |
| Expenses net of fee waivers, if any | .14%F | .14% | .14% | .14% | .14% | .14% |
| Expenses net of all reductions | .14%F | .14% | .14% | .14% | .14% | .14% |
| Net investment income (loss) | 1.14%F | .49% | .22% | .07% | .06% | .15% |
| Supplemental Data | | | | | | |
| Net assets, end of period (in millions) | $12,508 | $9,346 | $46,487 | $32,529 | $26,896 | $30,681 |
A Beginning October 3, 2016 the Fund began selling and redeeming class shares based upon the market-based value of the securities held rounded to the fourth decimal place; a "floating"net asset value.
B Amount represents less than $.00005 or $.0005 per share.
C Total returns for periods of less than one year are not annualized.
D Total returns would have been lower if certain expenses had not been reduced during the applicable periods shown.
E Expense ratios reflect operating expenses of the class. Expenses before reductions do not reflect amounts reimbursed or waived or reductions from expense offset arrangements and do not represent the amount paid by the class during periods when reimbursements, waivers or reductions occur. Expenses net of fee waivers reflect expenses after reimbursement and waivers but prior to reductions from expense offset arrangements. Expenses net of all reductions represent the net expenses paid by the class.
F Annualized
See accompanying notes which are an integral part of the financial statements.
Prime Reserves Portfolio
Investment Summary/Performance (Unaudited)
Effective Maturity Diversification
| Days | % of fund's investments 9/30/17 | % of fund's investments 3/31/17 | % of fund's investments 9/30/16 |
| 1 - 7 | 61.1 | 60.8 | 79.2 |
| 8 - 30 | 19.5 | 15.7 | 7.1 |
| 31 - 60 | 10.0 | 11.7 | 6.5 |
| 61 - 90 | 5.4 | 11.1 | 7.2 |
| 91 - 180 | 4.0 | 0.7 | 0.0 |
Effective maturity is determined in accordance with the requirements of Rule 2a-7 under the Investment Company Act of 1940.
Asset Allocation (% of fund's net assets)
| As of September 30, 2017 |
| | Certificates of Deposit | 31.1% |
| | Commercial Paper | 36.5% |
| | Non-Negotiable Time Deposit | 13.1% |
| | Other Instruments | 1.0% |
| | Repurchase Agreements | 19.3% |
| | Net Other Assets (Liabilities)* | (1.0)% |

* Net Other Assets (Liabilities) are not included in the pie chart
| As of March 31, 2017 |
| | Certificates of Deposit | 26.0% |
| | Commercial Paper | 34.2% |
| | Non-Negotiable Time Deposit | 8.5% |
| | Other Instruments | 1.9% |
| | Other Municipal Security | 0.4% |
| | Repurchase Agreements | 23.0% |
| | Net Other Assets (Liabilities) | 6.0% |
Current And Historical 7-Day Yields
| | 9/30/17 | 6/30/17 | 3/31/17 | 12/31/16 | 9/30/16 |
| Class I | 1.18% | 1.15% | 0.96% | 0.75% | 0.44% |
| Class II | 1.03% | 1.00% | 0.81% | 0.60% | 0.29% |
| Class III | 0.93% | 0.90% | 0.71% | 0.50% | 0.19% |
| Select Class | 1.13% | 1.10% | 0.91% | 0.70% | 0.39% |
| Institutional Class | 1.22% | 1.19% | 1.00% | 0.79% | 0.48% |
Yield refers to the income paid by the Fund over a given period. Yields for money market funds are usually for seven-day periods, as they are here, though they are expressed as annual percentage rates. Past performance is no guarantee of future results. Yield will vary and it's possible to lose money investing in the Fund. A portion of the Fund's expenses was reimbursed and/or waived. Absent such reimbursements and/or waivers the yield for the period ending September 30, 2017, the most recent period shown in the table, would have been 1.14% for Class I, 0.99% for Class II, 0.89% for Class III, 1.09% for Select Class and 1.17% for Institutional Class.
Percentages shown as 0.0% may reflect amounts less than 0.05%.
Prime Reserves Portfolio
Investments September 30, 2017 (Unaudited)
Showing Percentage of Net Assets
| Certificate of Deposit - 31.1% | | | | |
| | | Yield(a) | Principal Amount (000s) | Value (000s) |
| Domestic Certificates Of Deposit - 3.1% | | | | |
| BMO Harris Bank NA | | | | |
| 10/17/17 | | 1.40 % | $16,000 | $16,001 |
| Citibank NA | | | | |
| 10/4/17 | | 1.32 | 29,000 | 29,001 |
| Wells Fargo Bank NA | | | | |
| 12/20/17 to 4/20/18 | | 1.37 to 1.41 (b)(c) | 44,000 | 44,008 |
| | | | | 89,010 |
| London Branch, Eurodollar, Foreign Banks - 7.6% | | | | |
| ABN AMRO Bank NV | | | | |
| 12/1/17 to 1/5/18 | | 1.40 to 1.46 | 48,000 | 48,005 |
| Mizuho Bank Ltd. London Branch | | | | |
| 11/13/17 to 12/11/17 | | 1.38 to 1.40 | 76,000 | 75,882 |
| Sumitomo Mitsui Trust Bank Ltd. London Branch | | | | |
| 10/3/17 to 12/15/17 | | 1.34 to 1.40 | 98,000 | 98,011 |
| | | | | 221,898 |
| New York Branch, Yankee Dollar, Foreign Banks - 20.4% | | | | |
| Bank of Montreal | | | | |
| 11/1/17 to 5/4/18 | | 1.40 to 1.47 (b)(c) | 59,000 | 59,010 |
| Bank of Nova Scotia | | | | |
| 4/10/18 to 6/7/18 | | 1.40 to 1.42 (b)(c) | 75,000 | 75,004 |
| BNP Paribas New York Branch | | | | |
| 12/4/17 | | 1.36 | 25,000 | 25,007 |
| Canadian Imperial Bank of Commerce | | | | |
| 2/2/18 to 5/22/18 | | 1.41 to 1.72 (b)(c) | 60,000 | 60,025 |
| KBC Bank NV | | | | |
| 10/10/17 to 11/30/17 | | 1.34 to 1.35 | 78,500 | 78,509 |
Landesbank Baden-
Wuerttemberg New York Branch | | | | |
| 10/2/17 to 10/4/17 | | 1.23 to 1.23 | 85,000 | 85,000 |
| Mitsubishi UFJ Trust & Banking Corp. | | | | |
| 10/5/17 to 1/22/18 | | 1.38 to 1.40 (b)(c) | 69,000 | 69,011 |
| Royal Bank of Canada | | | | |
| 3/28/18 to 6/20/18 | | 1.38 to 1.41 (b)(c) | 47,000 | 47,001 |
| Sumitomo Mitsui Banking Corp. | | | | |
| 12/4/17 to 1/26/18 | | 1.35 to 1.39 (b)(c) | 78,000 | 78,004 |
| Sumitomo Mitsui Trust Bank Ltd. | | | | |
| 12/4/17 | | 1.35 (b)(c) | 7,000 | 7,001 |
| Toronto-Dominion Bank New York Branch | | | | |
| 11/1/17 | | 1.68 (b)(c) | 10,000 | 10,004 |
| | | | | 593,576 |
| TOTAL CERTIFICATE OF DEPOSIT | | | | |
| (Cost $904,385) | | | | 904,484 |
|
| Financial Company Commercial Paper - 29.2% | | | | |
| Barclays Bank PLC/Barclays U.S. CCP Funding LLC | | | | |
| 10/3/17 to 12/22/17 | | 1.30 to 1.48 (d) | 84,000 | 83,844 |
| Bayerische Landesbank | | | | |
| 10/2/17 to 10/6/17 | | 1.24 to 1.24 | 143,800 | 143,775 |
| BNP Paribas Dublin Branch | | | | |
| 10/3/17 | | 1.17 | 50,000 | 49,994 |
| BPCE SA | | | | |
| 10/2/17 to 11/6/17 | | 1.34 to 1.41 | 79,000 | 78,973 |
| Caisse d'Amort de la Dette Sociale | | | | |
| 10/3/17 to 10/4/17 | | 1.18 to 1.34 (d) | 37,000 | 36,995 |
| Canadian Imperial Bank of Commerce | | | | |
| 10/13/17 to 4/20/18 | | 1.38 to 1.72 (b)(c) | 45,000 | 45,007 |
| Federation des caisses Desjardin | | | | |
| 10/2/17 to 10/4/17 | | 1.11 to 1.18 | 32,000 | 31,998 |
| J.P. Morgan Securities, LLC | | | | |
| 10/2/17 to 4/9/18 | | 1.33 to 1.41 (b) | 82,000 | 82,014 |
Landesbank Baden-
Wurttemberg | | | | |
| 10/2/17 | | 1.10 | 60,000 | 59,994 |
| Mitsubishi UFJ Trust & Banking Corp. | | | | |
| 10/6/17 to 1/17/18 | | 1.22 to 1.41 | 38,000 | 37,897 |
| Societe Generale | | | | |
| 10/2/17 | | 1.08 | 98,000 | 97,991 |
| UBS AG London Branch | | | | |
| 3/2/18 to 4/3/18 | | 1.43 to 1.44 (b) | 100,000 | 100,023 |
| TOTAL FINANCIAL COMPANY COMMERCIAL PAPER | | | | |
| (Cost $848,470) | | | | 848,505 |
|
| Asset Backed Commercial Paper - 2.3% | | | | |
| Atlantic Asset Securitization Corp. (Credit Agricole CIB Guaranteed) | | | | |
| | | | | |
| 1/25/18 | | 1.42 | 12,000 | 11,945 |
| 2/1/18 | | 1.43 | 9,000 | 8,957 |
| Gotham Funding Corp. (Liquidity Facility Bank of Tokyo-Mitsubishi UFJ Ltd.) | | | | |
| | | | | |
| 1/25/18 | | 1.42 | 18,000 | 17,918 |
| 1/26/18 | | 1.43 | 6,000 | 5,972 |
| 1/26/18 | | 1.43 | 10,000 | 9,954 |
| Sheffield Receivables Corp. (Barclays Bank PLC Guaranteed) | | | | |
| 10/6/17 | | 1.20 | 12,000 | 11,998 |
| TOTAL ASSET BACKED COMMERCIAL PAPER | | | | |
| (Cost $66,743) | | | | 66,744 |
|
| Non-Financial Company Commercial Paper - 5.0% | | | | |
| Archer Daniels Midland Co. | | | | |
| 10/2/17 | | 1.10 to 1.12 | 43,000 | 42,996 |
| Bell Canada | | | | |
| 10/10/17 to 11/20/17 | | 1.45 to 1.46 | 25,000 | 24,961 |
| Dominion Resources, Inc. | | | | |
| 11/1/17 to 11/14/17 | | 1.44 to 1.45 | 19,000 | 18,970 |
| Duke Energy Corp. | | | | |
| 10/3/17 | | 1.44 | 2,000 | 2,000 |
| Florida Power & Light Co. | | | | |
| 10/2/17 | | 1.16 | 11,000 | 10,999 |
| Rogers Communications, Inc. | | | | |
| 10/25/17 | | 1.47 | 2,000 | 1,998 |
| 10/25/17 | | 1.47 | 5,500 | 5,494 |
| 10/25/17 | | 1.45 | 3,000 | 2,997 |
| 11/1/17 | | 1.45 | 1,000 | 999 |
| 11/1/17 | | 1.45 | 1,000 | 999 |
| Sempra Global | | | | |
| 10/4/17 to 11/13/17 | | 1.44 to 1.46 | 17,500 | 17,478 |
| South Carolina Public Service Authority Rev., LOC U.S. Bank NA, Cincinnati | | | | |
| 11/7/17 | | 1.38 | 15,000 | 14,999 |
| TOTAL NON-FINANCIAL COMPANY COMMERCIAL PAPER | | | | |
| (Cost $144,898) | | | | 144,890 |
|
| Other Instrument - 1.0% | | | | |
| Master Notes - 1.0% | | | | |
| Toyota Motor Credit Corp. | | | | |
| 10/6/17 | | | | |
| (Cost $28,000) | | 1.55 (b)(c) | 28,000 | 28,000 |
|
| Non-Negotiable Time Deposit - 13.1% | | | | |
| Time Deposits - 13.1% | | | | |
| Barclays Bank PLC | | | | |
| 10/3/17 to 10/4/17 | | 1.24 to 1.24 | 60,000 | 60,000 |
| BNP Paribas | | | | |
| 10/4/17 to 10/6/17 | | 1.17 to 1.17 | 63,000 | 63,000 |
| Credit Agricole CIB | | | | |
| 10/2/17 to 10/6/17 | | 1.08 to 1.23 | 130,000 | 130,000 |
| Natixis SA | | | | |
| 10/2/17 | | 1.08 | 66,000 | 66,000 |
| Skandinaviska Enskilda Banken AB | | | | |
| 10/2/17 | | 1.06 | 61,000 | 61,000 |
| TOTAL NON-NEGOTIABLE TIME DEPOSIT | | | | |
| (Cost $380,000) | | | | 380,000 |
| U.S. Government Agency Repurchase Agreement - 4.4% | | | |
| | | Maturity Amount (000s) | Value (000s) |
| In a joint trading account at 1.07% dated 9/29/17 due 10/2/17 (Collateralized by U.S. Government Obligations) # | | $123,632 | $123,621 |
| With Mitsubishi UFJ Securities (U.S.A.), Inc. at 1.07%, dated 9/29/17 due 10/2/17 (Collateralized by U.S. Government Obligations valued at $4,080,364, 1.38% - 4.50%, 8/31/23 - 9/20/41) | | 4,000 | 4,000 |
| TOTAL U.S. GOVERNMENT AGENCY REPURCHASE AGREEMENT | | | |
| (Cost $127,621) | | | 127,621 |
|
| U.S. Treasury Repurchase Agreement - 2.8% | | | |
| With: | | | |
| Barclays Capital, Inc. at 1.06%, dated 9/29/17 due 10/2/17 (Collateralized by U.S. Treasury Obligations valued at $4,120,444, 0.00% - 3.75%, 3/29/18 - 11/15/43) | | 4,000 | 4,000 |
| Commerz Markets LLC at 1.11%, dated 9/29/17 due 10/2/17 (Collateralized by U.S. Treasury Obligations valued at $59,163,681, 2.50%, 8/15/23) | | 58,005 | 58,000 |
| Deutsche Bank AG at 1.06%, dated 9/29/17 due 10/2/17 (Collateralized by U.S. Treasury Obligations valued at $11,221,083, 2.25%, 1/31/24) | | 11,001 | 11,000 |
| Deutsche Bank Securities, Inc. at 1.06%, dated 9/29/17 due 10/2/17 (Collateralized by U.S. Treasury Obligations valued at $6,120,580, 1.50% - 3.13%, 8/15/20 - 5/15/21) | | 6,001 | 6,000 |
| TD Securities (U.S.A.) at 1.06%, dated 9/29/17 due 10/2/17 (Collateralized by U.S. Treasury Obligations valued at $4,080,381, 2.13%, 2/29/24) | | 4,000 | 4,000 |
| TOTAL U.S. TREASURY REPURCHASE AGREEMENT | | | |
| (Cost $83,000) | | | 83,000 |
|
| Other Repurchase Agreement - 12.1% | | | |
| Other Repurchase Agreement - 12.1% | | | |
| With: | | | |
| BNP Paribas at 1.29%, dated 9/29/17 due 10/2/17 (Collateralized by Corporate Obligations valued at $5,250,564, 3.00% - 6.50%, 2/24/21 - 10/31/46) | | 5,001 | 5,000 |
| Citigroup Global Markets, Inc. at: | | | |
| 1.36%, dated 9/29/17 due 10/2/17 (Collateralized by U.S. Treasury Obligations valued at $37,744,280, 2.00%, 2/15/25) | | 37,004 | 37,000 |
| 2.13%, dated: | | | |
| 8/21/17 due 11/20/17 (Collateralized by Mortgage Loan Obligations valued at $15,157,574, 4.53%, 2/15/30) | | 14,075 | 14,000 |
| 8/28/17 due 11/27/17 (Collateralized by Corporate Obligations valued at $6,493,466, 6.20% - 8.50%, 12/21/21 - 1/1/49) | | 6,032 | 6,000 |
| Credit Suisse Securities (U.S.A.) LLC at 1.36%, dated 9/28/17 due 10/5/17 (Collateralized by Corporate Obligations valued at $5,354,212, 2.02% - 3.48%, 9/15/23 - 2/25/34) | | 5,001 | 5,000 |
| HSBC Securities, Inc. at 1.36%, dated 9/29/17 due 10/2/17 (Collateralized by Corporate Obligations valued at $8,403,190, 3.65% - 5.45%, 2/1/26 - 3/1/47) | | 8,001 | 8,000 |
| ING Financial Markets LLC at 1.44%, dated 9/29/17 due 10/2/17 (Collateralized by Corporate Obligations valued at $2,160,025, 6.85%, 6/1/34) | | 2,000 | 2,000 |
| J.P. Morgan Securities, LLC at: | | | |
| 1.28%, dated 9/29/17 due 10/2/17 (Collateralized by U.S. Government Obligations valued at $16,480,598, 0.34% - 5.81%, 7/25/19 - 12/16/53) | | 16,002 | 16,000 |
| 1.36%, dated 9/28/17 due 10/5/17 (Collateralized by U.S. Government Obligations valued at $26,522,769, 3.00%, 9/1/32) | | 26,007 | 26,000 |
| 1.51%, dated 9/29/17 due 10/6/17 (Collateralized by Mortgage Loan Obligations valued at $10,804,080, 5.00%, 9/25/57) | | 10,013 | 10,000 |
| Merrill Lynch, Pierce, Fenner & Smith at: | | | |
| 1.36%, dated 9/27/17 due 10/4/17 (Collateralized by U.S. Government Obligations valued at $34,686,551, 2.50%, 5/1/30) | | 34,009 | 34,000 |
| 1.43%, dated 9/27/17 due 10/6/17 (Collateralized by U.S. Treasury Obligations valued at $10,302,137, 0.13%, 1/15/23) | | 10,006 | 10,000 |
| 2.3%, dated 8/15/17 due 11/13/17 (Collateralized by Equity Securities valued at $63,915,448) | | 59,339 | 58,997 |
| Mitsubishi UFJ Securities (U.S.A.), Inc. at 1.46%, dated 9/26/17 due 10/3/17 (Collateralized by Corporate Obligations valued at $5,401,533, 0.00% - 5.50%, 3/1/18 - 12/15/43) | | 5,001 | 5,000 |
| Mizuho Securities U.S.A., Inc. at: | | | |
| 1.34%, dated 9/29/17 due 10/2/17 (Collateralized by Corporate Obligations valued at $8,401,943, 1.50% - 5.45%, 11/9/17 - 12/1/44) | | 8,001 | 8,000 |
| 1.46%, dated: | | | |
| 9/20/17 due 10/4/17 (Collateralized by Equity Securities valued at $8,644,227) | | 8,005 | 8,000 |
| 9/28/17 due 10/6/17 (Collateralized by Equity Securities valued at $8,641,430) | | 8,005 | 8,000 |
| 9/29/17 due 10/6/17 (Collateralized by Equity Securities valued at $8,641,119) | | 8,005 | 8,000 |
| 1.51%, dated 9/22/17 due 10/6/17 (Collateralized by Mortgage Loan Obligations valued at $3,061,284, 1.14%, 9/7/18) | | 3,002 | 3,000 |
| 2.22%, dated 9/13/17 due 12/12/17 (Collateralized by Corporate Obligations valued at $5,256,152, 2.10% - 4.63%, 6/12/20 - 11/1/22) | | 5,028 | 5,000 |
| Societe Generale at: | | | |
| 1.29%, dated 9/29/17 due 10/2/17 (Collateralized by Corporate Obligations valued at $22,053,405, 0.00% - 8.50%, 11/28/17 - 4/1/77) | | 21,002 | 21,000 |
| 1.44%, dated 9/29/17 due 10/2/17 (Collateralized by Corporate Obligations valued at $17,186,615, 1.99% - 10.50%, 2/13/18 - 4/10/47) | | 16,002 | 16,000 |
| 1.56%, dated: | | | |
| 9/1/17 due 10/2/17 (Collateralized by Corporate Obligations valued at $5,407,407, 5.25% - 12.50%, 1/15/19 - 11/15/43)(b)(c)(e) | | 5,079 | 5,000 |
| 10/2/17 due 11/2/17(b)(c)(e)(f) | | 5,079 | 5,000 |
| Wells Fargo Securities, LLC at: | | | |
| 1.31%, dated 9/29/17 due 10/2/17 (Collateralized by Corporate Obligations valued at $5,100,557, 1.75%, 7/13/20) | | 5,001 | 5,000 |
| 1.36%, dated 9/28/17 due 10/5/17 (Collateralized by Corporate Obligations valued at $8,161,233, 1.05% - 4.25%, 9/10/18 - 3/3/25) | | 8,002 | 8,000 |
| 1.41%, dated 9/28/17 due 10/5/17 (Collateralized by Corporate Obligations valued at $16,802,988, 4.80% - 9.75%, 1/31/22 - 12/15/46) | | 16,004 | 16,000 |
| TOTAL OTHER REPURCHASE AGREEMENT | | | |
| (Cost $353,001) | | | 352,997 |
| TOTAL INVESTMENT IN SECURITIES - 101.0% | | | |
| (Cost $2,936,118) | | | 2,936,241 |
| NET OTHER ASSETS (LIABILITIES) - (1.0)% | | | (27,843) |
| NET ASSETS - 100% | | | $2,908,398 |
The date shown for securities represents the date when principal payments must be paid, taking into account any call options exercised by the issuer and any permissible maturity shortening features other than interest rate resets.
Legend
(a) Yield represents either the annualized yield at the date of purchase, or the stated coupon rate, or, for floating and adjustable rate securities, the rate at period end.
(b) Coupon rates for floating and adjustable rate securities reflect the rates in effect at period end.
(c) Coupon is indexed to a floating interest rate which may be multiplied by a specified factor and/or subject to caps or floors.
(d) Security exempt from registration under Rule 144A of the Securities Act of 1933. These securities may be resold in transactions exempt from registration, normally to qualified institutional buyers. At the end of the period, the value of these securities amounted to $120,839,000 or 4.2% of net assets.
(e) The maturity amount is based on the rate at period end.
(f) Represents a forward settling transaction and therefore no collateral securities had been allocated as of period end. The agreement contemplated the delivery of Corporate Obligations as collateral on settlement date.
Investment Valuation
All investments are categorized as Level 2 under the Fair Value Hierarchy. The inputs or methodology used for valuing securities may not be an indication of the risk associated with investing in those securities. For more information on valuation inputs please refer to the Investment Valuation section in the accompanying Notes to Financial Statements.
Other Information
# Additional information on each counterparty to the repurchase agreement is as follows:
| Repurchase Agreement / Counterparty | Value (000s) |
| $123,621,000 due 10/02/17 at 1.07% | |
| BNP Paribas, S.A. | $8,966 |
| BNY Mellon Capital Markets LLC | 413 |
| Bank of America NA | 19,485 |
| Bank of Nova Scotia | 1,614 |
| Citibank NA | 12,888 |
| Credit Agricole CIB New York Branch | 4,021 |
| ING Financial Markets LLC | 1,238 |
| J.P. Morgan Securities, Inc. | 17,338 |
| Merrill Lynch, Pierce, Fenner & Smith, Inc. | 5,367 |
| Mizuho Securities USA, Inc. | 11,930 |
| RBC Dominion Securities, Inc. | 2,770 |
| Wells Fargo Securities LLC | 37,591 |
| | $123,621 |
See accompanying notes which are an integral part of the financial statements.
Prime Reserves Portfolio
Financial Statements
Statement of Assets and Liabilities
| Amounts in thousands (except per-share amounts) | | September 30, 2017 (Unaudited) |
| Assets | | |
Investment in securities, at value (including repurchase agreements of $563,618) — See accompanying schedule:
Unaffiliated issuers (cost $2,936,118) | | $2,936,241 |
| Cash | | 1 |
| Receivable for investments sold | | 8 |
| Receivable for fund shares sold | | 8,813 |
| Interest receivable | | 1,464 |
| Prepaid expenses | | 6 |
| Receivable from investment adviser for expense reductions | | 103 |
| Other receivables | | 63 |
| Total assets | | 2,946,699 |
| Liabilities | | |
| Payable for investments purchased | $18,000 | |
| Payable for fund shares redeemed | 19,065 | |
| Distributions payable | 744 | |
| Accrued management fee | 324 | |
| Distribution and service plan fees payable | 1 | |
| Other affiliated payables | 119 | |
| Other payables and accrued expenses | 48 | |
| Total liabilities | | 38,301 |
| Net Assets | | $2,908,398 |
| Net Assets consist of: | | |
| Paid in capital | | $2,908,207 |
| Accumulated undistributed net realized gain (loss) on investments | | 68 |
| Net unrealized appreciation (depreciation) on investments | | 123 |
| Net Assets | | $2,908,398 |
| Class I: | | |
| Net Asset Value, offering price and redemption price per share ($1,171,806.8 ÷ 1,171,564.0 shares) | | $1.0002 |
| Class II: | | |
| Net Asset Value, offering price and redemption price per share ($1,007.6 ÷ 1,007.4 shares) | | $1.0002 |
| Class III: | | |
| Net Asset Value, offering price and redemption price per share ($2,601.9 ÷ 2,601.3 shares) | | $1.0002 |
| Select Class: | | |
| Net Asset Value, offering price and redemption price per share ($2,689.8 ÷ 2,689.2 shares) | | $1.0002 |
| Institutional Class: | | |
| Net Asset Value, offering price and redemption price per share ($1,730,291.7 ÷ 1,729,920.6 shares) | | $1.0002 |
See accompanying notes which are an integral part of the financial statements.
Statement of Operations
| Amounts in thousands | | Six months ended September 30, 2017 (Unaudited) |
| Investment Income | | |
| Interest (including $40 from affiliated interfund lending) | | $14,143 |
| Expenses | | |
| Management fee | $1,531 | |
| Transfer agent fees | 460 | |
| Distribution and service plan fees | 3 | |
| Accounting fees and expenses | 105 | |
| Custodian fees and expenses | 36 | |
| Independent trustees' fees and expenses | 4 | |
| Registration fees | 132 | |
| Audit | 22 | |
| Total expenses before reductions | 2,293 | |
| Expense reductions | (581) | 1,712 |
| Net investment income (loss) | | 12,431 |
| Realized and Unrealized Gain (Loss) | | |
| Net realized gain (loss) on: | | |
| Investment securities: | | |
| Unaffiliated issuers | | 67 |
| Total net realized gain (loss) | | 67 |
| Change in net unrealized appreciation (depreciation) on investment securities | | (11) |
| Net increase in net assets resulting from operations | | $12,487 |
See accompanying notes which are an integral part of the financial statements.
Statement of Changes in Net Assets
| Amounts in thousands | Six months ended September 30, 2017 (Unaudited) | For the period
June 2, 2016 (commencement of operations) to March 31, 2017 |
| Increase (Decrease) in Net Assets | | |
| Operations | | |
| Net investment income (loss) | $12,431 | $3,795 |
| Net realized gain (loss) | 67 | 1 |
| Change in net unrealized appreciation (depreciation) | (11) | 134 |
| Net increase in net assets resulting from operations | 12,487 | 3,930 |
| Distributions to shareholders from net investment income | (12,431) | (3,795) |
| Share transactions - net increase (decrease) | 1,400,273 | 1,507,934 |
| Total increase (decrease) in net assets | 1,400,329 | 1,508,069 |
| Net Assets | | |
| Beginning of period | 1,508,069 | – |
| End of period | $2,908,398 | $1,508,069 |
See accompanying notes which are an integral part of the financial statements.
Financial Highlights
Prime Reserves Portfolio Class I
| | Six months ended (Unaudited) September 30, | Years ended March 31, |
| | 2017 | 2017 A,B |
| Selected Per–Share Data | | |
| Net asset value, beginning of period | $1.0002 | $1.0000 |
| Income from Investment Operations | | |
| Net investment income (loss) | .0055 | .0047 |
| Net realized and unrealized gain (loss) | –C | .0002 |
| Total from investment operations | .0055 | .0049 |
| Distributions from net investment income | (.0055) | (.0047) |
| Total distributions | (.0055) | (.0047) |
| Net asset value, end of period | $1.0002 | $1.0002 |
| Total ReturnD,E | .55% | .49% |
| Ratios to Average Net AssetsF | | |
| Expenses before reductions | .23%G | .25%G |
| Expenses net of fee waivers, if any | .18%G | .18%G |
| Expenses net of all reductions | .18%G | .18%G |
| Net investment income (loss) | 1.11%G | .68%G |
| Supplemental Data | | |
| Net assets, end of period (in millions) | $1,172 | $540 |
A For the period June 2, 2016 (commencement of operations) to March 31, 2017.
B Beginning October 3, 2016 the Fund began selling and redeeming class shares based upon the market-based value of the securities held rounded to the fourth decimal place; a "floating"net asset value.
C Amount represents less than $.00005 per share.
D Total returns for periods of less than one year are not annualized.
E Total returns would have been lower if certain expenses had not been reduced during the applicable periods shown.
F Expense ratios reflect operating expenses of the class. Expenses before reductions do not reflect amounts reimbursed or waived or reductions from expense offset arrangements and do not represent the amount paid by the class during periods when reimbursements, waivers or reductions occur. Expense ratios before reductions for start-up periods may not be representative of longer-term operating periods. Expenses net of fee waivers reflect expenses after reimbursement and waivers but prior to reductions from expense offset arrangements. Expenses net of all reductions represent the net expenses paid by the class.
G Annualized
See accompanying notes which are an integral part of the financial statements.
Prime Reserves Portfolio Class II
| | Six months ended (Unaudited) September 30, | Years ended March 31, |
| | 2017 | 2017 A,B |
| Selected Per–Share Data | | |
| Net asset value, beginning of period | $1.0002 | $1.0000 |
| Income from Investment Operations | | |
| Net investment income (loss) | .0047 | .0034 |
| Net realized and unrealized gain (loss) | –C | .0002 |
| Total from investment operations | .0047 | .0036 |
| Distributions from net investment income | (.0047) | (.0034) |
| Total distributions | (.0047) | (.0034) |
| Net asset value, end of period | $1.0002 | $1.0002 |
| Total ReturnD,E | .48% | .36% |
| Ratios to Average Net AssetsF | | |
| Expenses before reductions | .38%G | .56%G |
| Expenses net of fee waivers, if any | .33%G | .33%G |
| Expenses net of all reductions | .33%G | .33%G |
| Net investment income (loss) | .96%G | .53%G |
| Supplemental Data | | |
| Net assets, end of period (in millions) | $1 | $1 |
A For the period June 2, 2016 (commencement of operations) to March 31, 2017.
B Beginning October 3, 2016 the Fund began selling and redeeming class shares based upon the market-based value of the securities held rounded to the fourth decimal place; a "floating"net asset value.
C Amount represents less than $.00005 per share.
D Total returns for periods of less than one year are not annualized.
E Total returns would have been lower if certain expenses had not been reduced during the applicable periods shown.
F Expense ratios reflect operating expenses of the class. Expenses before reductions do not reflect amounts reimbursed or waived or reductions from expense offset arrangements and do not represent the amount paid by the class during periods when reimbursements, waivers or reductions occur. Expense ratios before reductions for start-up periods may not be representative of longer-term operating periods. Expenses net of fee waivers reflect expenses after reimbursement and waivers but prior to reductions from expense offset arrangements. Expenses net of all reductions represent the net expenses paid by the class.
G Annualized
See accompanying notes which are an integral part of the financial statements.
Prime Reserves Portfolio Class III
| | Six months ended (Unaudited) September 30, | Years ended March 31, |
| | 2017 | 2017 A,B |
| Selected Per–Share Data | | |
| Net asset value, beginning of period | $1.0002 | $1.0000 |
| Income from Investment Operations | | |
| Net investment income (loss) | .0042 | .0026 |
| Net realized and unrealized gain (loss) | –C | .0002 |
| Total from investment operations | .0042 | .0028 |
| Distributions from net investment income | (.0042) | (.0026) |
| Total distributions | (.0042) | (.0026) |
| Net asset value, end of period | $1.0002 | $1.0002 |
| Total ReturnD,E | .42% | .28% |
| Ratios to Average Net AssetsF | | |
| Expenses before reductions | .48%G | .66%G |
| Expenses net of fee waivers, if any | .43%G | .43%G |
| Expenses net of all reductions | .43%G | .43%G |
| Net investment income (loss) | .86%G | .43%G |
| Supplemental Data | | |
| Net assets, end of period (in millions) | $3 | $1 |
A For the period June 2, 2016 (commencement of operations) to March 31, 2017.
B Beginning October 3, 2016 the Fund began selling and redeeming class shares based upon the market-based value of the securities held rounded to the fourth decimal place; a "floating"net asset value.
C Amount represents less than $.00005 per share.
D Total returns for periods of less than one year are not annualized.
E Total returns would have been lower if certain expenses had not been reduced during the applicable periods shown.
F Expense ratios reflect operating expenses of the class. Expenses before reductions do not reflect amounts reimbursed or waived or reductions from expense offset arrangements and do not represent the amount paid by the class during periods when reimbursements, waivers or reductions occur. Expense ratios before reductions for start-up periods may not be representative of longer-term operating periods. Expenses net of fee waivers reflect expenses after reimbursement and waivers but prior to reductions from expense offset arrangements. Expenses net of all reductions represent the net expenses paid by the class.
G Annualized
See accompanying notes which are an integral part of the financial statements.
Prime Reserves Portfolio Select Class
| | Six months ended (Unaudited) September 30, | Years ended March 31, |
| | 2017 | 2017 A,B |
| Selected Per–Share Data | | |
| Net asset value, beginning of period | $1.0002 | $1.0000 |
| Income from Investment Operations | | |
| Net investment income (loss) | .0052 | .0043 |
| Net realized and unrealized gain (loss) | –C | .0002 |
| Total from investment operations | .0052 | .0045 |
| Distributions from net investment income | (.0052) | (.0043) |
| Total distributions | (.0052) | (.0043) |
| Net asset value, end of period | $1.0002 | $1.0002 |
| Total ReturnD,E | .53% | .45% |
| Ratios to Average Net AssetsF | | |
| Expenses before reductions | .28%G | .45%G |
| Expenses net of fee waivers, if any | .23%G | .23%G |
| Expenses net of all reductions | .23%G | .23%G |
| Net investment income (loss) | 1.06%G | .63%G |
| Supplemental Data | | |
| Net assets, end of period (in millions) | $3 | $1 |
A For the period June 2, 2016 (commencement of operations) to March 31, 2017.
B Beginning October 3, 2016 the Fund began selling and redeeming class shares based upon the market-based value of the securities held rounded to the fourth decimal place; a "floating"net asset value.
C Amount represents less than $.00005 per share.
D Total returns for periods of less than one year are not annualized.
E Total returns would have been lower if certain expenses had not been reduced during the applicable periods shown.
F Expense ratios reflect operating expenses of the class. Expenses before reductions do not reflect amounts reimbursed or waived or reductions from expense offset arrangements and do not represent the amount paid by the class during periods when reimbursements, waivers or reductions occur. Expense ratios before reductions for start-up periods may not be representative of longer-term operating periods. Expenses net of fee waivers reflect expenses after reimbursement and waivers but prior to reductions from expense offset arrangements. Expenses net of all reductions represent the net expenses paid by the class.
G Annualized
See accompanying notes which are an integral part of the financial statements.
Prime Reserves Portfolio Institutional Class
| | Six months ended (Unaudited) September 30, | Years ended March 31, |
| | 2017 | 2017 A,B |
| Selected Per–Share Data | | |
| Net asset value, beginning of period | $1.0002 | $1.0000 |
| Income from Investment Operations | | |
| Net investment income (loss) | .0057 | .0050 |
| Net realized and unrealized gain (loss) | –C | .0002 |
| Total from investment operations | .0057 | .0052 |
| Distributions from net investment income | (.0057) | (.0050) |
| Total distributions | (.0057) | (.0050) |
| Net asset value, end of period | $1.0002 | $1.0002 |
| Total ReturnD,E | .57% | .52% |
| Ratios to Average Net AssetsF | | |
| Expenses before reductions | .20%G | .24%G |
| Expenses net of fee waivers, if any | .14%G | .14%G |
| Expenses net of all reductions | .14%G | .14%G |
| Net investment income (loss) | 1.15%G | .72%G |
| Supplemental Data | | |
| Net assets, end of period (in millions) | $1,730 | $965 |
A For the period June 2, 2016 (commencement of operations) to March 31, 2017.
B Beginning October 3, 2016 the Fund began selling and redeeming class shares based upon the market-based value of the securities held rounded to the fourth decimal place; a "floating"net asset value.
C Amount represents less than $.00005 per share.
D Total returns for periods of less than one year are not annualized.
E Total returns would have been lower if certain expenses had not been reduced during the applicable periods shown.
F Expense ratios reflect operating expenses of the class. Expenses before reductions do not reflect amounts reimbursed or waived or reductions from expense offset arrangements and do not represent the amount paid by the class during periods when reimbursements, waivers or reductions occur. Expense ratios before reductions for start-up periods may not be representative of longer-term operating periods. Expenses net of fee waivers reflect expenses after reimbursement and waivers but prior to reductions from expense offset arrangements. Expenses net of all reductions represent the net expenses paid by the class.
G Annualized
See accompanying notes which are an integral part of the financial statements.
Tax-Exempt Portfolio
Investment Summary/Performance (Unaudited)
Effective Maturity Diversification
| Days | % of fund's investments 9/30/17 | % of fund's investments 3/31/17 | % of fund's investments 9/30/16 |
| 1 - 7 | 79.3 | 80.8 | 76.3 |
| 8 - 30 | 0.9 | 2.3 | 1.8 |
| 31 - 60 | 6.1 | 3.6 | 4.5 |
| 61 - 90 | 6.1 | 5.7 | 3.7 |
| 91 - 180 | 2.8 | 3.7 | 2.0 |
| > 180 | 4.8 | 3.9 | 11.7 |
Effective maturity is determined in accordance with the requirements of Rule 2a-7 under the Investment Company Act of 1940.
Asset Allocation (% of fund's net assets)
| As of September 30, 2017 |
| | Variable Rate Demand Notes (VRDNs) | 38.2% |
| | Tender Option Bond | 29.0% |
| | Other Municipal Security | 25.8% |
| | Investment Companies | 6.3% |
| | Net Other Assets (Liabilities) | 0.7% |

| As of March 31, 2017 |
| | Variable Rate Demand Notes (VRDNs) | 53.0% |
| | Tender Option Bond | 15.4% |
| | Other Municipal Security | 22.8% |
| | Investment Companies | 7.2% |
| | Net Other Assets (Liabilities) | 1.6% |

Current And Historical 7-Day Yields
| | 9/30/17 | 6/30/17 | 3/31/17 | 12/31/16 | 9/30/16 |
| Class I | 0.76% | 0.74% | 0.70% | 0.59% | 0.63% |
| Class II | 0.61% | 0.59% | 0.55% | 0.44% | 0.48% |
| Class III | 0.51% | 0.49% | 0.45% | 0.34% | 0.38% |
| Select Class | 0.71% | 0.69% | 0.65% | 0.54% | 0.58% |
Yield refers to the income paid by the Fund over a given period. Yields for money market funds are usually for seven-day periods, as they are here, though they are expressed as annual percentage rates. Past performance is no guarantee of future results. Yield will vary and it's possible to lose money investing in the Fund. A portion of the Fund's expenses was reimbursed and/or waived. Absent such reimbursements and/or waivers the yield for the period ending September 30, 2017, the most recent period shown in the table, would have been 0.73% for Class I, 0.58% for Class II, 0.48% for Class III and 0.68% for Select Class.
Tax-Exempt Portfolio
Investments September 30, 2017 (Unaudited)
Showing Percentage of Net Assets
| Variable Rate Demand Note - 38.2% | | | |
| | | Principal Amount (000s) | Value (000s) |
| Alabama - 1.2% | | | |
| Columbia Indl. Dev. Board Poll. Cont. Rev. (Alabama Pwr. Co. Proj.): | | | |
| Series 2014 A, 1.02% 10/2/17, VRDN (a) | | $7,775 | $7,775 |
| Series 2014 B, 1.02% 10/2/17, VRDN (a) | | 8,875 | 8,875 |
| Eutaw Indl. Dev. Board Poll. Cont. Rev. (Alabama Pwr. Co. Proj.) 1.02% 10/2/17, VRDN (a) | | 3,900 | 3,900 |
| Mobile Downtown Redev. Auth. Gulf Opportunity Zone Series 2011 B, 0.98% 10/6/17, LOC Wells Fargo Bank NA, VRDN (a)(b) | | 155 | 155 |
| Mobile Indl. Dev. Board Poll. Cont. Rev. (Alabama Pwr. Co. Barry Plant Proj.): | | | |
| Series 2007 C, 1.08% 10/6/17, VRDN (a) | | 6,450 | 6,450 |
| Series 2009, 1.02% 10/2/17, VRDN (a) | | 3,600 | 3,600 |
| Tuscaloosa County Indl. Dev. Gulf Opportunity (Hunt Refining Proj.) Series 2011 I, 0.97% 10/6/17, LOC Bank of Nova Scotia, VRDN (a)(b) | | 1,600 | 1,600 |
| West Jefferson Indl. Dev. Series 2008, 1.08% 10/6/17, VRDN (a) | | 4,800 | 4,800 |
| | | | 37,155 |
| Alaska - 1.9% | | | |
| Valdez Marine Term. Rev.: | | | |
| (ConocoPhillips Proj.) Series 1994 A, 1.03% 10/6/17, VRDN (a) | | 19,900 | 19,900 |
| (Phillips Trans. Alaska, Inc. Proj.): | | | |
| Series 1994 B, 1.05% 10/6/17, VRDN (a) | | 33,100 | 33,100 |
| Series 2002, 1.03% 10/6/17, VRDN (a) | | 6,400 | 6,400 |
| | | | 59,400 |
| Arizona - 0.8% | | | |
| Arizona Health Facilities Auth. Rev. (Catholic Healthcare West Proj.) Series 2009 F, 1.02% 10/6/17, LOC Mizuho Corporate Bank Ltd., VRDN (a) | | 14,100 | 14,100 |
| FHLMC Phoenix Indl. Dev. Auth. Multi-family Hsg. Rev. (Del Mar Terrace Apts. Proj.) Series 1999 A, 0.95% 10/6/17, LOC Freddie Mac, VRDN (a) | | 9,700 | 9,700 |
| | | | 23,800 |
| Colorado - 0.5% | | | |
| Colorado Health Facilities Auth. Rev. (Boulder Cmnty. Hosp. Proj.) Series 2000, 0.96% 10/6/17, LOC JPMorgan Chase Bank, VRDN (a) | | 15,140 | 15,140 |
| Connecticut - 2.1% | | | |
| Connecticut Gen. Oblig. Series 2016 C, 1.05% 10/6/17 (Liquidity Facility Bank of America NA), VRDN (a) | | 38,255 | 38,255 |
| Connecticut Health & Edl. Facilities Auth. Rev. Series 2011 B, 1% 10/6/17, LOC Bank of America NA, VRDN (a) | | 28,085 | 28,085 |
| | | | 66,340 |
| Delaware - 0.1% | | | |
| Delaware Econ. Dev. Auth. Rev. (Delmarva Pwr. & Lt. Co. Proj.): | | | |
| Series 1993 C, 1.15% 10/6/17, VRDN (a) | | 300 | 300 |
| Series 1999 A, 1.01% 10/6/17, VRDN (a) | | 1,900 | 1,900 |
| | | | 2,200 |
| District Of Columbia - 1.3% | | | |
| District of Columbia Rev.: | | | |
| (American Psychological Assoc. Proj.) Series 2003, 1.05% 10/6/17, LOC Bank of America NA, VRDN (a) | | 1,150 | 1,150 |
| (Washington Drama Society, Inc. Proj.) Series 2008, 0.99% 10/6/17, LOC JPMorgan Chase Bank, VRDN (a) | | 27,595 | 27,595 |
| FHLMC District of Columbia Hsg. Fin. Agcy. Multi-family Hsg. Rev.: | | | |
| (Park 7 at Minnesota Benning Proj.) Series 2012, 1% 10/6/17, LOC Freddie Mac, VRDN (a) | | 9,000 | 9,000 |
| (Pentacle Apts. Proj.) Series 2008, 0.98% 10/6/17, LOC Freddie Mac, VRDN (a) | | 3,050 | 3,050 |
| | | | 40,795 |
| Florida - 1.4% | | | |
| Jacksonville Poll. Cont. Rev. (Florida Pwr. & Lt. Co. Proj.) Series 1995, 0.99% 10/2/17, VRDN (a) | | 8,100 | 8,100 |
| Martin County Poll. Cont. Rev. (Florida Pwr. & Lt. Co. Proj.) Series 2000, 0.99% 10/2/17, VRDN (a) | | 9,700 | 9,700 |
| Orange County Health Facilities Auth. Rev. (Orlando Reg'l. Health Care Sys. Proj.) Series 2008 E, 0.93% 10/6/17, LOC Branch Banking & Trust Co., VRDN (a) | | 23,600 | 23,600 |
| FHLMC Pinellas County Hsg. Fin. Auth. (Booker Creek Apts. Proj.) Series 2009, 0.96% 10/6/17, LOC Freddie Mac, VRDN (a) | | 2,450 | 2,450 |
| FNMA Florida Hsg. Fin. Corp. Multi-family Mtg. Rev. (Mariner's Cay Apts. Proj.) Series 2008 M, 0.96% 10/6/17, LOC Fannie Mae, VRDN (a) | | 1,245 | 1,245 |
| | | | 45,095 |
| Georgia - 2.8% | | | |
| Burke County Indl. Dev. Auth. Poll. Cont. Rev.: | | | |
| (Georgia Pwr. Co. Plant Vogtle Proj.): | | | |
| Eighth Series 1994, 1.05% 10/2/17, VRDN (a) | | 1,300 | 1,300 |
| First Series 2009, 1.04% 10/2/17, VRDN (a) | | 6,425 | 6,425 |
| Second Series 1995, 1.04% 10/2/17, VRDN (a) | | 8,600 | 8,600 |
| (Oglethorpe Pwr. Corp. Proj.): | | | |
| Series 2010 A, 0.99% 10/6/17, LOC Bank of America NA, VRDN (a) | | 12,860 | 12,860 |
| Series 2010 B, 0.99% 10/6/17, LOC Bank of America NA, VRDN (a) | | 7,205 | 7,205 |
| Effingham County Indl. Dev. Auth. Poll Cont. 1.06% 10/2/17, VRDN (a) | | 6,370 | 6,370 |
| Georgia Muni. Elec. Auth. Pwr. Rev. (Proj. One) Series 2008 B, 0.94% 10/6/17, LOC Bank of Tokyo-Mitsubishi UFJ Ltd., VRDN (a) | | 7,390 | 7,390 |
| Monroe County Dev. Auth. Poll. Cont. Rev. (Georgia Pwr. Co. Plant Scherer Proj.): | | | |
| Series 1997, 1.04% 10/2/17, VRDN (a) | | 9,000 | 9,000 |
| Series 2008, 1.04% 10/2/17, VRDN (a) | | 28,040 | 28,040 |
| | | | 87,190 |
| Illinois - 5.7% | | | |
| Chicago O'Hare Int'l. Arpt. Rev. Series 2005 D, 1% 10/6/17, LOC Barclays Bank PLC, VRDN (a) | | 35,600 | 35,600 |
| Illinois Dev. Fin. Auth. Rev. (Var-Sinai Cmnty. Inst Proj.) Series 1997, 1% 10/6/17, LOC JPMorgan Chase Bank, VRDN (a) | | 5,000 | 5,000 |
| Illinois Fin. Auth. Rev. (Edward Hosp. Obligated Group Proj.): | | | |
| Series 2008 B2, 1% 10/6/17, LOC JPMorgan Chase Bank, VRDN (a) | | 14,700 | 14,700 |
| Series 2008 C, 1% 10/6/17, LOC JPMorgan Chase Bank, VRDN (a) | | 7,260 | 7,260 |
| Illinois Toll Hwy. Auth. Toll Hwy. Rev.: | | | |
| Series 2007 A 2B, 1% 10/6/17, LOC PNC Bank NA, VRDN (a) | | 26,300 | 26,300 |
| Series 2007 A 2C, 1% 10/6/17, LOC Landesbank Hessen-Thuringen, VRDN (a) | | 16,400 | 16,400 |
| Series 2007 A-2A, 1% 10/6/17, LOC Bank of Tokyo-Mitsubishi UFJ Ltd., VRDN (a) | | 21,140 | 21,140 |
| Series 2007 A1, 1% 10/6/17, LOC Landesbank Hessen-Thuringen, VRDN (a) | | 37,100 | 37,100 |
| FHLMC: | | | |
| Illinois Fin. Auth. Rev. (Trinity Int'l. Univ. Proj.) Series 2009, 0.95% 10/6/17, LOC Fed. Home Ln. Bank Chicago, VRDN (a) | | 195 | 195 |
| Lake County Multi-family Hsg. Rev. (Whispering Oaks Apts. Proj.) Series 2008, 1% 10/6/17, LOC Freddie Mac, VRDN (a) | | 12,500 | 12,500 |
| | | | 176,195 |
| Indiana - 0.8% | | | |
| Indiana Dev. Fin. Auth. Econ. (Archer-Daniels-Midland Co. Proj.) Series 2012, 1% 10/6/17 (Archer Daniels Midland Co. Guaranteed), VRDN (a) | | 16,440 | 16,440 |
| Indiana Dev. Fin. Auth. Envir. Rev. (Duke Energy Indiana, Inc. Proj.) Series 2009 A3, 1% 10/6/17, LOC Mizuho Bank Ltd., VRDN (a) | | 5,735 | 5,735 |
| Lawrenceburg Poll. Cont. Rev. (Indiana Michigan Pwr. Co. Proj.): | | | |
| Series H, 1.08% 10/6/17, VRDN (a) | | 1,200 | 1,200 |
| Series I, 1.08% 10/6/17, VRDN (a) | | 500 | 500 |
| | | | 23,875 |
| Iowa - 2.6% | | | |
| Iowa Fin. Auth. Health Facilities Rev. Series 2013 B2, 0.99% 10/6/17, LOC MUFG Union Bank NA, VRDN (a) | | 7,995 | 7,995 |
| Iowa Fin. Auth. Midwestern (Archer-Daniels-Midland Co. Proj.) Series 2012, 1% 10/6/17 (Archer Daniels Midland Co. Guaranteed), VRDN (a) | | 30,000 | 30,000 |
| Iowa Fin. Auth. Midwestern Disaster Area Econ. Dev. Series 2012 A, 0.97% 10/6/17, VRDN (a) | | 13,800 | 13,800 |
| Iowa Fin. Auth. Poll. Cont. Facility Rev. (MidAmerican Energy Proj.) Series 2008 B, 0.96% 10/6/17, VRDN (a) | | 29,600 | 29,600 |
| | | | 81,395 |
| Louisiana - 2.9% | | | |
| East Baton Rouge Parish Pub. Impt. Sales Tax Rev. Series 2008 A, 1% 10/6/17, LOC JPMorgan Chase Bank, VRDN (a) | | 10,540 | 10,540 |
| Louisiana Pub. Facilities Auth. Gulf Opportunity Zone Rev. (Celtic Mgmt. Corp. Proj.) Series 2008, 0.99% 10/6/17, LOC JPMorgan Chase Bank, VRDN (a) | | 4,200 | 4,200 |
| Louisiana Pub. Facilities Auth. Rev.: | | | |
| (C-Port LLC Proj.) Series 2008, 1.04% 10/6/17, LOC Bank of America NA, VRDN (a) | | 535 | 535 |
| (Christus Health Proj.) Series 2008 B, 0.94% 10/6/17, VRDN (a) | | 6,200 | 6,200 |
| Saint James Parish Gen. Oblig.: | | | |
| (Nucor Steel Louisiana LLC Proj.): | | | |
| Series 2010 A1, 1.05% 10/6/17, VRDN (a) | | 2,300 | 2,300 |
| Series 2010 B1, 1.05% 10/6/17, VRDN (a) | | 9,600 | 9,600 |
| (NuStar Logistics, L.P. Proj.): | | | |
| Series 2010 A, 0.97% 10/6/17, LOC Bank of Tokyo-Mitsubishi UFJ Ltd., VRDN (a) | | 15,700 | 15,700 |
| Series 2010 B, 0.97% 10/6/17, LOC Bank of Tokyo-Mitsubishi UFJ Ltd., VRDN (a) | | 24,200 | 24,200 |
| Series 2010, 0.97% 10/6/17, LOC Mizuho Bank Ltd., VRDN (a) | | 6,600 | 6,600 |
| FHLMC Louisiana Pub. Facilities Auth. Rev. (River View Villas Proj.) Series 2006, 0.96% 10/6/17, LOC Freddie Mac, VRDN (a) | | 11,200 | 11,200 |
| | | | 91,075 |
| Maine - 0.8% | | | |
| Maine Health & Higher Ed. Facilities Auth. Rev. Series 2008 A, 0.99% 10/6/17, LOC JPMorgan Chase Bank, VRDN (a) | | 25,000 | 25,000 |
| Mississippi - 0.5% | | | |
| Mississippi Dev. Bank Spl. Oblig. (Harrison County Proj.) Series 2008 A2, 1.02% 10/6/17, LOC Bank of America NA, VRDN (a) | | 15,550 | 15,550 |
| Nevada - 0.8% | | | |
| Reno Cap. Impt. Rev. Series 2005 A, 1% 10/6/17, LOC Bank of America NA, VRDN (a) | | 25,045 | 25,045 |
| New Jersey - 0.1% | | | |
| New Jersey Hsg. & Mtg. Fin. Agcy. Multi-family Rev. Series 2008 B, 0.95% 10/6/17, LOC Bank of America NA, VRDN (a) | | 2,570 | 2,570 |
| New York - 2.3% | | | |
| New York Hsg. Fin. Agcy. Rev.: | | | |
| Series 2010 A: | | | |
| 1.02% 10/6/17, LOC Landesbank Hessen-Thuringen, VRDN (a) | | 2,000 | 2,000 |
| 1.02% 10/6/17, LOC Landesbank Hessen-Thuringen, VRDN (a) | | 1,900 | 1,900 |
| Series 2013 A, 0.99% 10/6/17, LOC Wells Fargo Bank NA, VRDN (a) | | 25,500 | 25,500 |
| Series 2015 A, 1% 10/6/17, LOC Landesbank Hessen-Thuringen, VRDN (a) | | 31,300 | 31,300 |
| FNMA New York Hsg. Fin. Agcy. Rev. Series 2009 A, 0.91% 10/6/17, LOC Fannie Mae, VRDN (a) | | 10,975 | 10,975 |
| | | | 71,675 |
| North Carolina - 2.5% | | | |
| North Carolina Med. Care Commission Health Care Facilities Rev. (Cape Fear Valley Health Sys. Proj.): | | | |
| Series 2008 A1, 0.93% 10/6/17, LOC Branch Banking & Trust Co., VRDN (a) | | 21,640 | 21,640 |
| Series 2008 A2, 0.93% 10/6/17, LOC Branch Banking & Trust Co., VRDN (a) | | 22,100 | 22,100 |
| Parson County Indl. Facilities and Poll. Cont. Fing. Auth. (CertainTeed Gypsum NC, Inc. Proj.) Series 2010, 1.05% 10/6/17, LOC Cr. Industriel et Commercial, VRDN (a) | | 34,050 | 34,050 |
| | | | 77,790 |
| Ohio - 1.2% | | | |
| Allen County Hosp. Facilities Rev. Series 2012 B, 1.01% 10/6/17, VRDN (a) | | 38,600 | 38,600 |
| Oklahoma - 0.5% | | | |
| Univ. Hospitals Trust Rev. Series 2005 A, 1% 10/6/17, LOC Bank of America NA, VRDN (a) | | 14,905 | 14,905 |
| Pennsylvania - 0.4% | | | |
| Bucks County Indl. Dev. Auth. Hosp. Rev. (Grand View Hosp. Proj.) Series 2008 A, 0.94% 10/6/17, LOC TD Banknorth, NA, VRDN (a) | | 8,890 | 8,890 |
| Erie County Hosp. Auth. Rev. (Saint Vincent Health Ctr. Proj.) Series 2010 B, 0.99% 10/6/17, LOC Manufacturers & Traders Trust Co., VRDN (a) | | 2,000 | 2,000 |
| Lancaster Indl. Dev. Auth. Rev. (Mennonite Home Proj.) 1.04% 10/6/17, LOC Manufacturers & Traders Trust Co., VRDN (a) | | 505 | 505 |
| | | | 11,395 |
| Tennessee - 1.1% | | | |
| Clarksville Pub. Bldg. Auth. Rev. (Tennessee Muni. Bond Fund Proj.): | | | |
| Series 1994, 1.04% 10/6/17, LOC Bank of America NA, VRDN (a) | | 1,425 | 1,425 |
| Series 2003, 1.02% 10/2/17, LOC Bank of America NA, VRDN (a) | | 4,580 | 4,580 |
| Series 2005, 1.02% 10/2/17, LOC Bank of America NA, VRDN (a) | | 8,700 | 8,700 |
| Montgomery County Pub. Bldg. Auth. Pooled Fing. Rev.: | | | |
| (Tennessee County Ln. Pool Prog.): | | | |
| Series 1999, 1.04% 10/6/17, LOC Bank of America NA, VRDN (a) | | 4,720 | 4,720 |
| Series 2004, 1.02% 10/2/17, LOC Bank of America NA, VRDN (a) | | 4,900 | 4,900 |
| Series 2006, 1.02% 10/2/17, LOC Bank of America NA, VRDN (a) | | 5,000 | 5,000 |
| Series 2008, 1.02% 10/2/17, LOC Bank of America NA, VRDN (a) | | 6,300 | 6,300 |
| | | | 35,625 |
| Texas - 1.3% | | | |
| Harris County Health Facilities Dev. Corp. Rev. (Saint Dominic Village Proj.) Series 2000, 0.97% 10/6/17, LOC JPMorgan Chase Bank, VRDN (a) | | 4,925 | 4,925 |
| Harris County Hosp. District Rev. Series 2010, 1% 10/6/17, LOC JPMorgan Chase Bank, VRDN (a) | | 1,980 | 1,980 |
| Houston Arpt. Sys. Rev. Series 2010, 0.96% 10/6/17, LOC Barclays Bank PLC, VRDN (a) | | 22,335 | 22,335 |
| Port Arthur Navigation District Exempt Facilities (Var-Total Petrochemicals Proj.) Series 2009, 1% 10/6/17 (Total SA Guaranteed), VRDN (a) | | 400 | 400 |
| Port Arthur Navigation District Indl. Dev. Corp. Exempt Facilities Rev.: | | | |
| (Air Products Proj.): | | | |
| Series 2005, 0.98% 10/2/17 (Air Products & Chemicals, Inc. Guaranteed), VRDN (a) | | 5,500 | 5,500 |
| Series 2012, 1% 10/6/17 (Total SA Guaranteed), VRDN (a) | | 1,600 | 1,600 |
| (Total Petrochemicals & Refining U.S.A., Inc. Proj.) Series 2012 B, 1% 10/6/17 (Total SA Guaranteed), VRDN (a) | | 900 | 900 |
| (Total Petrochemicals and Refining U.S.A., Inc. Proj.) Series 2012 A, 1% 10/6/17 (Total SA Guaranteed), VRDN (a) | | 4,100 | 4,100 |
| | | | 41,740 |
| Virginia - 0.0% | | | |
| Newport News Indl. Dev. Auth. (CNU Warwick LLC Student Apts. Proj.) 1.06% 10/6/17, LOC Bank of America NA, VRDN (a) | | 500 | 500 |
| Washington - 2.0% | | | |
| King County Swr. Rev.: | | | |
| Series 2001 A, 0.98% 10/6/17, LOC Landesbank Hessen-Thuringen, VRDN (a) | | 11,825 | 11,825 |
| Series 2001 B, 0.95% 10/6/17, LOC Landesbank Hessen-Thuringen, VRDN (a) | | 2,100 | 2,100 |
| FHLMC Washington Hsg. Fin. Commission Multi-family Hsg. Rev.: | | | |
| (Discovery Heights Apt. Proj.) Series 2010, 1% 10/6/17, LOC Freddie Mac, VRDN (a) | | 12,215 | 12,215 |
| (Interurban Sr. Living Apts. Proj.) Series 2012, 0.96% 10/6/17, LOC Freddie Mac, VRDN (a) | | 5,495 | 5,495 |
| (Reserve at Renton Apts. Proj.) Series 2014, 0.96% 10/6/17, LOC Fed. Home Ln. Bank, San Francisco, VRDN (a) | | 21,000 | 21,000 |
| (Reserve at SeaTac Apts. Proj.) Series 2015, 0.96% 10/6/17, LOC Fed. Home Ln. Bank, San Francisco, VRDN (a) | | 5,500 | 5,500 |
| (Willow Tree Grove Apts. Proj.) Series 2011, 1% 10/6/17, LOC Freddie Mac, VRDN (a) | | 2,900 | 2,900 |
| | | | 61,035 |
| West Virginia - 0.5% | | | |
| West Virginia Hosp. Fin. Auth. Hosp. Rev. (Cabell Huntington Hosp. Proj.) Series 2008 B, 0.96% 10/6/17, LOC Branch Banking & Trust Co., VRDN (a) | | 14,400 | 14,400 |
| Wyoming - 0.1% | | | |
| Converse County Poll. Cont. Rev. (PacifiCorp Proj.) Series 1994, 1.07% 10/6/17, VRDN (a) | | 1,400 | 1,400 |
| Lincoln County Poll. Cont. Rev. (PacifiCorp Proj.) Series 1994, 1.06% 10/6/17, VRDN (a) | | 600 | 600 |
| | | | 2,000 |
| TOTAL VARIABLE RATE DEMAND NOTE | | | |
| (Cost $1,187,485) | | | 1,187,485 |
|
| Tender Option Bond - 29.0% | | | |
| Alabama - 0.2% | | | |
| Alabama Spl. Care Facilities Fing. Auth. Birmingham Rev. Participating VRDN Series 16 ZM0206, 0.97% 10/6/17 (Liquidity Facility Morgan Stanley Bank, West Valley City Utah) (a)(c) | | 6,975 | 6,975 |
| Arizona - 1.4% | | | |
| Arizona Tourism & Sports Auth. Tax Rev. Participating VRDN Series Floaters E85, 0.97% 10/6/17 (Liquidity Facility Royal Bank of Canada) (a)(c) | | 15,700 | 15,700 |
| Maricopa County Indl. Dev. Auth. Rev. Participating VRDN: | | | |
| Series Floaters XF 05 19, 0.96% 10/6/17 (Liquidity Facility JPMorgan Chase Bank) (a)(c) | | 4,000 | 4,000 |
| Series Floaters YX 10 32, 0.97% 10/6/17 (Liquidity Facility Barclays Bank PLC) (a)(c) | | 3,230 | 3,230 |
| Mesa Util. Sys. Rev. Bonds Series Solar 17 0026, SIFMA Municipal Swap Index + 0.050% 0.99%, tender 10/5/17 (Liquidity Facility U.S. Bank NA, Cincinnati) (a)(c)(d) | | 1,125 | 1,125 |
| Phoenix Civic Impt. Corp. Wtr. Sys. Rev. Participating VRDN Series Floaters XM 04 20, 0.96% 10/6/17 (Liquidity Facility JPMorgan Chase Bank) (a)(c) | | 6,000 | 6,000 |
| Rowan Univ. Participating VRDN Series 2016 XF 2337, 0.98% 10/6/17 (Liquidity Facility Barclays Bank PLC) (a)(c) | | 1,420 | 1,420 |
| Salt River Proj. Agricultural Impt. & Pwr. District Elec. Sys. Rev.: | | | |
| Bonds Series 2016 22, SIFMA Municipal Swap Index + 0.050% 0.99%, tender 10/5/17 (Liquidity Facility U.S. Bank NA, Cincinnati) (a)(c)(d) | | 1,195 | 1,195 |
| Participating VRDN: | | | |
| Series 16 XM 02 45, 0.96% 10/6/17 (Liquidity Facility JPMorgan Chase Bank) (a)(c) | | 10,000 | 10,000 |
| Series Floaters XM 04 47, 0.97% 10/6/17 (Liquidity Facility Barclays Bank PLC) (a)(c) | | 1,000 | 1,000 |
| | | | 43,670 |
| California - 0.3% | | | |
| Dignity Health Participating VRDN Series 17 04, 0.99% 10/6/17 (Liquidity Facility Barclays Bank PLC) (a)(c) | | 1,790 | 1,790 |
| Los Angeles Hbr. Dept. Rev. Bonds Series WF 10 40C, SIFMA Municipal Swap Index + 0.280% 1.22%, tender 3/1/18 (Liquidity Facility Wells Fargo Bank NA) (a)(c)(d)(e) | | 1,400 | 1,400 |
| Rancho Wtr. District Fing. Auth. Rev. Participating VRDN Series 16 ZF0342, 0.98% 10/6/17 (Liquidity Facility Bank of America NA) (a)(c) | | 4,980 | 4,980 |
| | | | 8,170 |
| Colorado - 1.0% | | | |
| Children's Hosp. Assoc., Co. Participating VRDN Series Floaters XF 23 05, 0.98% 10/6/17 (Liquidity Facility Barclays Bank PLC) (a)(c) | | 800 | 800 |
| Colorado Health Facilities Auth. Rev. Participating VRDN: | | | |
| Series Floaters XF 22 41, 1.14% 10/6/17 (Liquidity Facility Citibank NA) (a)(c) | | 600 | 600 |
| Series ZF 04 17, 1.09% 10/6/17 (Liquidity Facility JPMorgan Chase Bank) (a)(c) | | 300 | 300 |
| Colorado Reg'l. Trans. District Sales Tax Rev. Participating VRDN Series Floaters 16 XF1031, 0.99% 10/6/17 (Liquidity Facility Deutsche Bank AG New York Branch) (a)(c) | | 2,500 | 2,500 |
| Colorado Univ. Co. Hosp. Auth. Rev. Participating VRDN Series EGL 17 0002, 0.98% 10/6/17 (Liquidity Facility Citibank NA) (a)(c) | | 4,900 | 4,900 |
| Denver City & County Arpt. Rev. Participating VRDN Series Floaters XF 10 36, 1% 10/6/17 (Liquidity Facility Deutsche Bank AG New York Branch) (a)(c) | | 400 | 400 |
| Denver City & County Board Wtr. Rev. Bonds Series Solar 17 0032, SIFMA Municipal Swap Index + 0.150% 1.09%, tender 11/30/17 (Liquidity Facility U.S. Bank NA, Cincinnati) (a)(c)(d) | | 900 | 900 |
| Denver City & County Wastewtr. Dept. of Pub. Works Bonds Series 2016 12, SIFMA Municipal Swap Index + 0.050% 0.99%, tender 10/5/17 (Liquidity Facility U.S. Bank NA, Cincinnati) (a)(c)(d) | | 1,295 | 1,295 |
| Univ. of Colorado Enterprise Sys. Rev. Participating VRDN: | | | |
| Series RBC E 55, SIFMA Municipal Swap Index + 0.030% 0.97% 10/6/17 (Liquidity Facility Royal Bank of Canada) (a)(c)(d) | | 17,550 | 17,550 |
| Series XM 03 05, 0.97% 10/6/17 (Liquidity Facility Royal Bank of Canada) (a)(c) | | 1,800 | 1,800 |
| | | | 31,045 |
| Connecticut - 1.0% | | | |
| Connecticut Gen. Oblig. Participating VRDN: | | | |
| Series Floaters 014, 1.12% 11/10/17 (Liquidity Facility Barclays Bank PLC) (a)(b)(c) | | 5,000 | 5,000 |
| Series Floaters 016, 0.99% 10/2/17 (Liquidity Facility Barclays Bank PLC) (a)(c) | | 25,350 | 25,350 |
| | | | 30,350 |
| District Of Columbia - 0.5% | | | |
| Children's Nat'l. Med. Ctr., Participating VRDN Series 2015 XF 1047, 1.01% 10/6/17 (Liquidity Facility Deutsche Bank AG New York Branch) (a)(c) | | 1,200 | 1,200 |
| District of Columbia Gen. Oblig. Participating VRDN Series Floaters YX 10 39, 0.96% 10/6/17 (Liquidity Facility Barclays Bank PLC) (a)(c) | | 6,655 | 6,655 |
| District of Columbia Income Tax Rev. Participating VRDN: | | | |
| Series Floaters XM 04 12, 0.96% 10/6/17 (Liquidity Facility JPMorgan Chase Bank) (a)(c) | | 7,755 | 7,755 |
| Series XF 23 41, 0.98% 10/6/17 (Liquidity Facility Barclays Bank PLC) (a)(c) | | 300 | 300 |
| Eclipse Fdg. Trust Various States Bonds Series Solar 2017 35, SIFMA Municipal Swap Index + 0.150% 1.09%, tender 11/30/17 (Liquidity Facility U.S. Bank NA, Cincinnati) (a)(c)(d) | | 525 | 525 |
| | | | 16,435 |
| Florida - 1.2% | | | |
| Brooks Health Sys. Participating VRDN Series XG 0064, 1% 10/6/17 (Liquidity Facility Deutsche Bank AG New York Branch) (a)(c) | | 2,500 | 2,500 |
| Central Florida Expressway Bonds Series RBC E 62, SIFMA Municipal Swap Index + 0.170% 1.11%, tender 2/1/18 (Liquidity Facility Royal Bank of Canada) (a)(c)(d)(e) | | 6,595 | 6,595 |
| Eclipse Fdg. Trust Various States Bonds: | | | |
| Series 2017: | | | |
| 1.09%, tender 12/14/17 (Liquidity Facility U.S. Bank NA, Cincinnati) (a)(c) | | 800 | 800 |
| 1.09%, tender 12/21/17 (Liquidity Facility U.S. Bank NA, Cincinnati) (a)(c) | | 600 | 600 |
| Series Solar 2017 37, SIFMA Municipal Swap Index + 0.050% 0.99%, tender 10/5/17 (Liquidity Facility U.S. Bank NA, Cincinnati) (a)(c)(d) | | 600 | 600 |
| Florida Dept. of Trans. Tpk. Rev. Bonds Series Solar 17 02, SIFMA Municipal Swap Index + 0.050% 0.99%, tender 10/5/17 (Liquidity Facility U.S. Bank NA, Cincinnati) (a)(c)(d) | | 2,795 | 2,795 |
| Florida Gen. Oblig. Bonds Series Solar 042, SIFMA Municipal Swap Index + 0.050% 0.99%, tender 10/5/17 (Liquidity Facility U.S. Bank NA, Cincinnati) (a)(c)(d) | | 2,000 | 2,000 |
| Miami-Dade County Aviation Rev. Participating VRDN Series XG 00 65 1% 10/6/17 (Liquidity Facility Deutsche Bank AG New York Branch) (a)(c) | | 1,400 | 1,400 |
| Miami-Dade County Expressway Auth. Participating VRDN Series XG 00 99, 1% 10/6/17 (Liquidity Facility Deutsche Bank AG New York Branch) (a)(c) | | 1,300 | 1,300 |
| Miami-Dade County Gen. Oblig. Participating VRDN Series XM 04 70, 0.96% 10/6/17 (Liquidity Facility JPMorgan Chase Bank) (a)(c) | | 7,930 | 7,930 |
| Palm Beach County School Board Ctfs. of Prtn. Participating VRDN Series 2017 01, 0.98% 10/6/17 (Liquidity Facility Citibank NA) (a)(c) | | 1,100 | 1,100 |
| Palm Beach County Solid Waste Auth. Rev. Participating VRDN Series ROC II 14003, 0.97% 10/6/17 (Liquidity Facility Citibank NA) (a)(c) | | 1,670 | 1,670 |
| RBC Muni. Products, Inc. Trust Bonds Series E70, SIFMA Municipal Swap Index + 0.170% 1.11%, tender 2/1/18 (Liquidity Facility Royal Bank of Canada) (a)(c)(d)(e) | | 1,900 | 1,900 |
| Tampa Health Sys. Rev. Participating VRDN Series 16 XF2214, 0.97% 10/6/17 (Liquidity Facility Citibank NA) (a)(c) | | 4,800 | 4,800 |
| | | | 35,990 |
| Georgia - 0.5% | | | |
| Clarke County Hosp. Auth. Participating VRDN Series 2017 ZF 2413, 0.99% 10/6/17 (Liquidity Facility Barclays Bank PLC) (a)(c) | | 900 | 900 |
| Fulton County Gen. Oblig. Bonds Series 2017 07, SIFMA Municipal Swap Index + 0.050% 0.99%, tender 10/5/17 (Liquidity Facility U.S. Bank NA, Cincinnati) (a)(c)(d) | | 1,295 | 1,295 |
| Metropolitan Atlanta Rapid Transit Auth. Sales Tax Rev. Bonds Series Solar 0047, 1.09%, tender 11/16/17 (Liquidity Facility U.S. Bank NA, Cincinnati) (a)(c) | | 1,700 | 1,700 |
| Private Colleges & Univs. Auth. Rev. Participating VRDN Series Floaters ZM 01 52, 0.97% 10/6/17 (Liquidity Facility Morgan Stanley Bank, West Valley City Utah) (a)(c) | | 3,735 | 3,735 |
| Private Colleges & Univs. Auth. Rev. Emory Univ. Participating VRDN Series Floaters 16 XF0517, 0.98% 10/6/17 (Liquidity Facility Royal Bank of Canada) (a)(c) | | 7,500 | 7,500 |
| | | | 15,130 |
| Hawaii - 0.0% | | | |
| Hawaii Gen. Oblig. Bonds Series Solar 17 0031, SIFMA Municipal Swap Index + 0.050% 0.99%, tender 10/5/17 (Liquidity Facility U.S. Bank NA, Cincinnati) (a)(c)(d) | | 1,000 | 1,000 |
| Honolulu City & County Gen. Oblig. Bonds Series 2016, SIFMA Municipal Swap Index + 0.050% 0.99%, tender 10/5/17 (Liquidity Facility U.S. Bank NA, Cincinnati) (a)(c)(d) | | 605 | 605 |
| | | | 1,605 |
| Illinois - 3.0% | | | |
| Chicago Transit Auth. Participating VRDN Series Floaters XM 04 50, 0.98% 10/6/17 (Liquidity Facility Barclays Bank PLC) (a)(c) | | 4,435 | 4,435 |
| City of Chicago Gen. Oblig. Bonds Participating VRDN Series XF 23 42, 1.14% 10/6/17 (Liquidity Facility Barclays Bank PLC) (a)(c) | | 100 | 100 |
| Illinois Fin. Auth. Rev. Participating VRDN: | | | |
| Series 15 XM0050, 0.97% 10/6/17 (Liquidity Facility Citibank NA) (a)(c) | | 3,500 | 3,500 |
| Series 17 XM 0492, 0.96% 10/6/17 (Liquidity Facility JPMorgan Chase Bank) (a)(c) | | 5,250 | 5,250 |
| Series Floaters XF 25 00, 1% 10/6/17 (Liquidity Facility Citibank NA) (a)(c) | | 1,400 | 1,400 |
| Series Floaters XG 01 22, 0.96% 10/6/17 (Liquidity Facility Barclays Bank PLC) (a)(c) | | 7,335 | 7,335 |
| Series Floaters XM 05 19, 0.96% 10/6/17 (Liquidity Facility JPMorgan Chase Bank) (a)(c) | | 5,000 | 5,000 |
| Series Putters 0022, 0.96% 10/6/17 (Liquidity Facility JPMorgan Chase Bank) (a)(c) | | 3,795 | 3,795 |
| Series XF 23 38, 0.98% 10/6/17 (Liquidity Facility Barclays Bank PLC) (a)(c) | | 2,975 | 2,975 |
| Series ZF 04 78, 0.96% 10/6/17 (Liquidity Facility JPMorgan Chase Bank) (a)(c) | | 5,925 | 5,925 |
| Illinois Gen. Oblig. Participating VRDN Series Floaters E97, 1% 10/6/17 (Liquidity Facility Royal Bank of Canada) (a)(c) | | 8,600 | 8,600 |
| Illinois Sales Tax Rev. Participating VRDN Series XF 24 06, 0.98% 10/6/17 (Liquidity Facility Barclays Bank PLC) (a)(c) | | 700 | 700 |
| Illinois Toll Hwy. Auth. Toll Hwy. Rev. Participating VRDN: | | | |
| Series 15 XF0277, 1.02% 10/6/17 (Liquidity Facility JPMorgan Chase Bank) (a)(c) | | 1,500 | 1,500 |
| Series 15 XF2202, 0.97% 10/6/17 (Liquidity Facility Citibank NA) (a)(c) | | 1,150 | 1,150 |
| Series 15 XM 0078, 0.99% 10/6/17 (Liquidity Facility Royal Bank of Canada) (a)(c) | | 5,180 | 5,180 |
| Series Floaters E100, 0.97% 10/6/17 (Liquidity Facility Royal Bank of Canada) (a)(c) | | 21,500 | 21,500 |
| Series Floaters XL 00 41, 0.97% 10/6/17 (Liquidity Facility Morgan Stanley Bank, West Valley City Utah) (a)(c) | | 10,040 | 10,040 |
| Series XF 23 98, 0.97% 10/6/17 (Liquidity Facility Citibank NA) (a)(c) | | 2,780 | 2,780 |
| Series ZF 24 04, 0.97% 10/6/17 (Liquidity Facility Citibank NA) (a)(c) | | 1,635 | 1,635 |
| The County of Cook Participating VRDN Series XF 23 13, 0.98% 10/6/17 (Liquidity Facility Barclays Bank PLC) (a)(c) | | 300 | 300 |
| Will Cnty. Gen. Oblig. Participating VRDN Series Floaters ZF 05 11, 1% 10/6/17 (Liquidity Facility Toronto-Dominion Bank) (a)(c) | | 500 | 500 |
| | | | 93,600 |
| Indiana - 0.2% | | | |
| Hamilton County HealthCare Facilities Rev. Participating VRDN Series XF 10 26, 1.01% 10/6/17 (Liquidity Facility Deutsche Bank AG New York Branch) (a)(c) | | 2,000 | 2,000 |
| Indiana Health & Edl. Facilities Fing. Auth. Rev. Bonds Series 16 E71, SIFMA Municipal Swap Index + 0.550% 1.11%, tender 12/1/17 (Liquidity Facility Royal Bank of Canada) (a)(c)(d)(e) | | 5,400 | 5,400 |
| | | | 7,400 |
| Kansas - 0.0% | | | |
| Univ. of Kansas Hosp. Auth. Health Facilities Rev. Participating VRDN Series XF 10 51, 0.99% 10/6/17 (Liquidity Facility Deutsche Bank AG New York Branch) (a)(c) | | 1,200 | 1,200 |
| Kentucky - 0.4% | | | |
| Kentucky Econ. Dev. Fin. Auth. Participating VRDN Series Floaters XF 24 85, 0.97% 10/6/17 (Liquidity Facility Citibank NA) (a)(c) | | 11,400 | 11,400 |
| Kentucky Econ. Dev. Fin. Auth. Hosp. Rev. Participating VRDN Series Floaters XG 01 23, 0.98% 10/6/17 (Liquidity Facility Barclays Bank PLC) (a)(c) | | 1,100 | 1,100 |
| | | | 12,500 |
| Louisiana - 0.6% | | | |
| Louisiana Gas & Fuel Tax Rev. Participating VRDN: | | | |
| Series EGL 14 0049, 0.99% 10/6/17 (Liquidity Facility Citibank NA) (a)(c) | | 10,100 | 10,100 |
| Series Floaters XF 24 91, 0.97% 10/6/17 (Liquidity Facility Citibank NA) (a)(c) | | 3,400 | 3,400 |
| Series Floaters XG 01 50, 0.97% 10/6/17 (Liquidity Facility Citibank NA) (a)(c) | | 2,200 | 2,200 |
| Louisiana Local Govt. Envir. Facilities Participating VRDN Series 2016 XF 2336, 0.98% 10/6/17 (Liquidity Facility Barclays Bank PLC) (a)(c) | | 1,860 | 1,860 |
| | | | 17,560 |
| Maryland - 0.1% | | | |
| Baltimore County Gen. Oblig. Bonds Series Solar 17 22, SIFMA Municipal Swap Index + 0.050% 0.99%, tender 10/5/17 (Liquidity Facility U.S. Bank NA, Cincinnati) (a)(c)(d) | | 1,290 | 1,290 |
| Maryland Health & Higher Ed. Facilities Auth. Rev. Participating VRDN Series XF 10 21, 1.02% 10/6/17 (Liquidity Facility Deutsche Bank AG New York Branch) (a)(c) | | 2,000 | 2,000 |
| | | | 3,290 |
| Massachusetts - 0.2% | | | |
| Massachusetts Gen. Oblig. Bonds: | | | |
| Series Clipper 09 67, SIFMA Municipal Swap Index + 0.050% 0.99%, tender 10/5/17 (Liquidity Facility State Street Bank & Trust Co., Boston) (a)(c)(d) | | 6,200 | 6,200 |
| Series Clipper 09 69, SIFMA Municipal Swap Index + 0.200% 1.14%, tender 12/7/17 (Liquidity Facility State Street Bank & Trust Co., Boston) (a)(c)(d)(e) | | 1,175 | 1,175 |
| | | | 7,375 |
| Michigan - 0.3% | | | |
| Eastern Michigan Univ. Revs. Participating VRDN Series Floaters 17 012, 1.01% 10/6/17 (Liquidity Facility Barclays Bank PLC) (a)(c) | | 6,200 | 6,200 |
| Michigan Bldg. Auth. Rev. Participating VRDN Series Floaters XM 03 92, 0.97% 10/6/17 (Liquidity Facility Morgan Stanley Bank, West Valley City Utah) (a)(c) | | 300 | 300 |
| Michigan Fin. Auth. Rev. Participating VRDN: | | | |
| Series 15 XF0126, 0.96% 10/6/17 (Liquidity Facility JPMorgan Chase Bank) (a)(c) | | 3,000 | 3,000 |
| Series RBC 2016 ZM0131, 0.97% 10/6/17 (Liquidity Facility Royal Bank of Canada) (a)(c) | | 1,000 | 1,000 |
| | | | 10,500 |
| Minnesota - 0.1% | | | |
| Minnesota State Gen. Fdg. Rev. Participating VRDN Series 15 ZF0175, 0.96% 10/6/17 (Liquidity Facility JPMorgan Chase Bank) (a)(c) | | 3,335 | 3,335 |
| Missouri - 0.2% | | | |
| Missouri St Hefa Edl. Facilities Rev. Participating VRDN Series Floaters 17 010, 1.01% 10/6/17 (Liquidity Facility Barclays Bank PLC) (a)(c) | | 4,800 | 4,800 |
| Montana - 0.3% | | | |
| Missoula Mont Wtr. Sys. Rev. Participating VRDN Series Floaters 011, 1.12% 11/10/17 (Liquidity Facility Barclays Bank PLC) (a)(b)(c) | | 8,900 | 8,900 |
| Nebraska - 0.1% | | | |
| Douglas County School District #1 Bonds Series 2016 27, SIFMA Municipal Swap Index + 0.150% 1.09%, tender 12/28/17 (Liquidity Facility U.S. Bank NA, Cincinnati) (a)(c)(d) | | 2,200 | 2,200 |
| Omaha Pub. Pwr. District Elec. Rev. Participating VRDN Series Floaters XX 10 04, 0.99% 10/6/17 (Liquidity Facility Barclays Bank PLC) (a)(c) | | 600 | 600 |
| | | | 2,800 |
| Nevada - 0.7% | | | |
| Clark County Fuel Tax: | | | |
| Bonds Series Solar 17 25, SIFMA Municipal Swap Index + 0.150% 1.09%, tender 12/21/17 (Liquidity Facility U.S. Bank NA, Cincinnati) (a)(c)(d) | | 995 | 995 |
| Participating VRDN ROC II R 11836, 0.97% 10/6/17 (Liquidity Facility Citibank NA) (a)(c) | | 3,450 | 3,450 |
| Clark County Wtr. Reclamation District Participating VRDN: | | | |
| Series 16 ZF0446, 0.96% 10/6/17 (Liquidity Facility JPMorgan Chase Bank) (a)(c) | | 11,965 | 11,965 |
| Series ZF 04 79, 0.96% 10/6/17 (Liquidity Facility JPMorgan Chase Bank) (a)(c) | | 4,600 | 4,600 |
| | | | 21,010 |
| New Jersey - 3.7% | | | |
| New Jersey Econ. Dev. Auth. Lease Rev. Participating VRDN Series Floaters E102, 0.97% 10/6/17 (Liquidity Facility Royal Bank of Canada) (a)(c) | | 15,695 | 15,695 |
| New Jersey Gen. Oblig. Participating VRDN Series Floaters E 103, 0.97% 10/6/17 (Liquidity Facility Royal Bank of Canada) (a)(c) | | 98,400 | 98,400 |
| New Jersey St. Trans. Trust Fund Auth. Participating VRDN Series Floaters 16 XF1059, 1.11% 10/6/17 (Liquidity Facility Deutsche Bank AG New York Branch) (a)(c) | | 300 | 300 |
| | | | 114,395 |
| New York - 2.8% | | | |
| New York City Gen. Oblig. Participating VRDN Series 15 ZF0198, 0.96% 10/6/17 (Liquidity Facility JPMorgan Chase Bank) (a)(c) | | 3,690 | 3,690 |
| New York City Muni. Wtr. Fin. Auth. Wtr. & Swr. Sys. Rev. Participating VRDN: | | | |
| Series Floaters ZF 05 31, 0.96% 10/6/17 (Liquidity Facility JPMorgan Chase Bank) (a)(c) | | 13,030 | 13,030 |
| Series Putters 15 XM0002, 0.96% 10/6/17 (Liquidity Facility JPMorgan Chase Bank) (a)(c) | | 9,520 | 9,520 |
| New York City Transitional Fin. Auth. Rev. Participating VRDN: | | | |
| Series ROC II R 11902, 0.96% 10/6/17 (Liquidity Facility Citibank NA) (a)(c) | | 3,800 | 3,800 |
| Series ROC II R 14022, 0.96% 10/6/17 (Liquidity Facility Citibank NA) (a)(c) | | 2,185 | 2,185 |
| New York Dorm. Auth. Personal Income Tax Rev. Participating VRDN: | | | |
| Series 15 XF1030, 0.96% 10/6/17 (Liquidity Facility Deutsche Bank AG New York Branch) (a)(c) | | 6,100 | 6,100 |
| Series Floaters XF 05 25, 0.96% 10/6/17 (Liquidity Facility JPMorgan Chase Bank) (a)(c) | | 15,320 | 15,320 |
| New York Dorm. Auth. Revs. Participating VRDN Series XF 0291, 0.96% 10/6/17 (Liquidity Facility JPMorgan Chase Bank) (a)(c) | | 15,000 | 15,000 |
| New York Envir. Facilities Corp. Clean Wtr. & Drinking Wtr. Participating VRDN Series 16 XM0215, 0.96% 10/6/17 (Liquidity Facility JPMorgan Chase Bank) (a)(c) | | 4,425 | 4,425 |
| New York Envir. Facilities Corp. State Personal Income Tax Rev. Participating VRDN Series 15 XF0086, 0.96% 10/6/17 (Liquidity Facility JPMorgan Chase Bank) (a)(c) | | 3,185 | 3,185 |
| New York Sales Tax Asset Receivables Corp. Participating VRDN Series 2015 ZF0209, 0.96% 10/6/17 (Liquidity Facility JPMorgan Chase Bank) (a)(c) | | 5,250 | 5,250 |
| New York Thruway Auth. Second Gen. Hwy. & Bridge Trust Fund Participating VRDN Series ROC II R 11997, 0.96% 10/6/17 (Liquidity Facility Citibank NA) (a)(c) | | 2,000 | 2,000 |
| Triborough Bridge & Tunnel Auth. Revs. Participating VRDN Series XM 04 76, 0.96% 10/6/17 (Liquidity Facility JPMorgan Chase Bank) (a)(c) | | 2,195 | 2,195 |
| | | | 85,700 |
| North Carolina - 1.2% | | | |
| Charlotte Gen. Oblig. Participating VRDN Series Floaters XL 00 47, 0.97% 10/6/17 (Liquidity Facility Bank of America NA) (a)(c) | | 1,000 | 1,000 |
| Charlotte Int'l. Arpt. Rev. Participating VRDN Series Floaters ZM 05 34, 0.97% 10/6/17 (Liquidity Facility Wells Fargo Bank NA) (a)(c) | | 2,900 | 2,900 |
| Greensboro Combined Enterprise Sys. Rev. Bonds Series Solar 0045, SIFMA Municipal Swap Index + 0.050% 0.99%, tender 10/5/17 (Liquidity Facility U.S. Bank NA, Cincinnati) (a)(c)(d) | | 700 | 700 |
| North Carolina Cap. Facilities Fin. Agcy. Rev. Participating VRDN: | | | |
| Series 15 XF2167, 0.97% 10/6/17 (Liquidity Facility Citibank NA) (a)(c) | | 4,800 | 4,800 |
| Series 16 XF 0290, 0.96% 10/6/17 (Liquidity Facility JPMorgan Chase Bank) (a)(c) | | 1,255 | 1,255 |
| Series EGL 14 0050, 0.98% 10/6/17 (Liquidity Facility Citibank NA) (a)(c) | | 2,000 | 2,000 |
| Series EGL 14 0051, 0.98% 10/6/17 (Liquidity Facility Citibank NA) (a)(c) | | 9,500 | 9,500 |
| Series EGL 14 0052, 0.98% 10/6/17 (Liquidity Facility Citibank NA) (a)(c) | | 2,850 | 2,850 |
| Series MS 15 ZM0105, 0.97% 10/6/17 (Liquidity Facility Morgan Stanley Bank, West Valley City Utah) (a)(c) | | 2,185 | 2,185 |
| Series XM 02 82, 0.96% 10/6/17 (Liquidity Facility JPMorgan Chase Bank) (a)(c) | | 1,505 | 1,505 |
| North Carolina Gen. Oblig. Participating VRDN Series 15 XF0140, 0.96% 10/6/17 (Liquidity Facility JPMorgan Chase Bank) (a)(c) | | 1,000 | 1,000 |
| North Carolina Ltd. Oblig. Participating VRDN Series ROC 14089, 0.96% 10/6/17 (Liquidity Facility Citibank NA) (a)(c) | | 1,000 | 1,000 |
| North Carolina Med. Care Commission Participating VRDN Series XM 02 98, 0.97% 10/6/17 (Liquidity Facility Royal Bank of Canada) (a)(c) | | 4,765 | 4,765 |
| North Carolina Med. Care Commission Health Care Facilities Rev. Participating VRDN Series Floaters XM 04 44, 0.97% 10/6/17 (Liquidity Facility Barclays Bank PLC) (a)(c) | | 2,000 | 2,000 |
| Raleigh Combined Enterprise Sys. Rev. Bonds Series 2016 13, SIFMA Municipal Swap Index + 0.050% 0.99%, tender 10/5/17 (Liquidity Facility U.S. Bank NA, Cincinnati) (a)(c)(d) | | 595 | 595 |
| | | | 38,055 |
| Ohio - 0.7% | | | |
| Hamilton County HealthCare Facilities Rev. Participating VRDN Series XF 10 50, 1% 10/6/17 (Liquidity Facility Deutsche Bank AG New York Branch) (a)(c) | | 400 | 400 |
| Lucas County Gen. Oblig. Bonds Series 2016 26, SIFMA Municipal Swap Index + 0.150% 1.09%, tender 12/28/17 (Liquidity Facility U.S. Bank NA, Cincinnati) (a)(c)(d) | | 700 | 700 |
| Middletown Hosp. Facilities Rev. Participating VRDN Series Floaters 00 31 44, 1.12% 11/10/17 (Liquidity Facility Barclays Bank PLC) (a)(b)(c) | | 1,900 | 1,900 |
| Ohio Higher Edl. Facility Commission Rev. Participating VRDN Series 2017, 1.12% 11/10/17 (Liquidity Facility Barclays Bank PLC) (a)(b)(c) | | 1,000 | 1,000 |
| Ohio Hosp. Facilities Rev. Participating VRDN Series 2015 XF0105, 0.96% 10/6/17 (Liquidity Facility JPMorgan Chase Bank) (a)(c) | | 16,900 | 16,900 |
| | | | 20,900 |
| Oklahoma - 0.0% | | | |
| Oklahoma St Wtr. Resources Board Rev. Fund Bonds Series 2016, SIFMA Municipal Swap Index + 0.050% 0.99%, tender 10/5/17 (Liquidity Facility U.S. Bank NA, Cincinnati) (a)(c)(d) | | 595 | 595 |
| Oregon - 0.2% | | | |
| Clackamas County School District #7J Bonds Series Solar 0053, SIFMA Municipal Swap Index + 0.050% 0.99%, tender 10/5/17 (Liquidity Facility U.S. Bank NA, Cincinnati) (a)(c)(d) | | 1,800 | 1,800 |
| Oregon Gen. Oblig. Participating VRDN Series ROC II R 11949, 0.97% 10/6/17 (Liquidity Facility Citibank NA) (a)(c) | | 3,000 | 3,000 |
| Portland Wtr. Sys. Rev. Bonds Series 2016 24, SIFMA Municipal Swap Index + 0.150% 1.09%, tender 12/7/17 (Liquidity Facility U.S. Bank NA, Cincinnati) (a)(c)(d) | | 890 | 890 |
| | | | 5,690 |
| Pennsylvania - 1.7% | | | |
| Geisinger Auth. Health Sys. Rev. Participating VRDN: | | | |
| Series 15 ZF0174, 0.96% 10/6/17 (Liquidity Facility JPMorgan Chase Bank) (a)(c) | | 1,000 | 1,000 |
| Series Putters 0047, 0.96% 10/6/17 (Liquidity Facility JPMorgan Chase Bank) (a)(c) | | 1,000 | 1,000 |
| Pennsylvania Health & Edl. Facilities Fing. Auth. Rev. Bonds Series E72, SIFMA Municipal Swap Index + 0.750% 1.11%, tender 12/1/17 (Liquidity Facility Royal Bank of Canada) (a)(c)(d)(e) | | 10,900 | 10,900 |
| Pennsylvania Higher Edl. Facilities Auth. Rev. Bonds Series WF 11 26C, SIFMA Municipal Swap Index + 0.280% 1.22%, tender 2/8/18 (Liquidity Facility Wells Fargo Bank NA) (a)(c)(d)(e) | | 1,500 | 1,500 |
| Pennsylvania Tpk. Commission Tpk. Rev. Participating VRDN Series Floaters E 101, 0.97% 10/6/17 (Liquidity Facility Royal Bank of Canada) (a)(c) | | 30,500 | 30,500 |
| Philadelphia Auth. For Indl. Dev. Participating VRDN: | | | |
| Series 15 ZF0167, 0.96% 10/6/17 (Liquidity Facility JPMorgan Chase Bank) (a)(c) | | 2,750 | 2,750 |
| Series Putters 14 XM0005, 0.96% 10/6/17 (Liquidity Facility JPMorgan Chase Bank) (a)(b)(c) | | 1,000 | 1,000 |
| Univ. of Pittsburgh Med. Ctr. Bonds Series RBC E53, SIFMA Municipal Swap Index + 0.200% 1.12%, tender 10/2/17 (Liquidity Facility Royal Bank of Canada) (a)(c)(d)(e) | | 3,560 | 3,560 |
| | | | 52,210 |
| South Carolina - 0.4% | | | |
| Berkeley County School District Bonds Series Solar 17 0030, SIFMA Municipal Swap Index + 0.150% 1.09%, tender 11/16/17 (Liquidity Facility U.S. Bank NA, Cincinnati) (a)(c)(d) | | 600 | 600 |
| Columbia Wtrwks. & Swr. Rev. Bonds Series 2016 21, SIFMA Municipal Swap Index + 0.050% 0.99%, tender 10/5/17 (Liquidity Facility U.S. Bank NA, Cincinnati) (a)(c)(d) | | 1,000 | 1,000 |
| Lancaster County School District Bonds Series Solar 17 21, SIFMA Municipal Swap Index + 0.150% 1.09%, tender 12/7/17 (Liquidity Facility U.S. Bank NA, Cincinnati) (a)(c)(d) | | 595 | 595 |
| South Carolina Pub. Svc. Auth. Rev. Participating VRDN: | | | |
| Series 2017 XF 2425, 0.98% 10/6/17 (Liquidity Facility Barclays Bank PLC) (a)(c) | | 6,750 | 6,750 |
| Series Floaters XG 01 49, 0.98% 10/6/17 (Liquidity Facility Barclays Bank PLC) (a)(c) | | 2,400 | 2,400 |
| | | | 11,345 |
| Tennessee - 0.1% | | | |
| Nashville and Davidson County Metropolitan Govt. Health & Edl. Facilities Board Rev. Participating VRDN Series Floaters XG 01 45, 0.98% 10/6/17 (Liquidity Facility Barclays Bank PLC) (a)(c) | | 1,100 | 1,100 |
| Rutherford County Health & Edl. Facilities Board Rev. Participating VRDN Series 2014 ZF0208, 1.04% 10/6/17 (Liquidity Facility JPMorgan Chase Bank) (a)(c) | | 2,500 | 2,500 |
| | | | 3,600 |
| Texas - 2.9% | | | |
| City of Dallas Wtrwks. & Swr. Sys. Rev. Participating VRDN Series XM 02 88, 0.96% 10/6/17 (Liquidity Facility JPMorgan Chase Bank) (a)(c) | | 5,000 | 5,000 |
| Conroe Independent School District Bonds Series 2016 15, SIFMA Municipal Swap Index + 0.050% 0.99%, tender 10/5/17 (Liquidity Facility U.S. Bank NA, Cincinnati) (a)(c)(d) | | 1,290 | 1,290 |
| Cypress-Fairbanks Independent School District Bonds Series 2016 7, SIFMA Municipal Swap Index + 0.050% 0.99%, tender 10/5/17 (Liquidity Facility U.S. Bank NA, Cincinnati) (a)(c)(d) | | 790 | 790 |
| Dallas Wtrwks. & Swr. Sys. Rev. Participating VRDN Series 15 XF008, 0.96% 10/1/17 (Liquidity Facility JPMorgan Chase Bank) (a)(c) | | 5,355 | 5,355 |
| Harris County Gen. Oblig. Bonds Series Clipper 09 73, SIFMA Municipal Swap Index + 0.050% 0.99%, tender 10/5/17 (Liquidity Facility State Street Bank & Trust Co., Boston) (a)(c)(d) | | 36,800 | 36,800 |
| Harris County Health Facilities Dev. Corp. Rev. Participating VRDN Sewries 16 ZF0312, 0.96% 10/6/17 (Liquidity Facility JPMorgan Chase Bank) (a)(c) | | 10,485 | 10,485 |
| Harris County Metropolitan Trans. Auth. Participating VRDN Series 16 ZM0164, 0.97% 10/6/17 (Liquidity Facility Royal Bank of Canada) (a)(c) | | 4,000 | 4,000 |
| Hays Consolidated Independent School District Bonds Series Solar 0050, SIFMA Municipal Swap Index + 0.050% 0.99%, tender 10/5/17 (Liquidity Facility U.S. Bank NA, Cincinnati) (a)(c)(d) | | 780 | 780 |
| Lower Colorado River Auth. Rev. Participating VRDN Series Floaters E 98, 0.97% 10/6/17 (Liquidity Facility Royal Bank of Canada) (a)(c) | | 1,200 | 1,200 |
| New Caney Independent School District Participating VRDN Series Floaters 05 69, 0.96% 10/6/17 (Liquidity Facility JPMorgan Chase Bank) (a)(c) | | 3,700 | 3,700 |
| North Texas Muni. Wtr. District Wtr. Sys. Rev. Bonds Series 2016 14, SIFMA Municipal Swap Index + 0.050% 0.99%, tender 10/5/17 (Liquidity Facility U.S. Bank NA, Cincinnati) (a)(c)(d) | | 1,285 | 1,285 |
| Pflugerville Independent School District Participating VRDN Series 2017, 0.97% 10/6/17 (Liquidity Facility Royal Bank of Canada) (a)(c) | | 2,500 | 2,500 |
| San Antonio Pub. Facilities Corp. Lease Rev. Participating VRDN Series 16 ZF 0456, 0.97% 10/6/17 (Liquidity Facility State Street Bank & Trust Co., Boston) (a)(c) | | 7,465 | 7,465 |
| Tarrant County Cultural Ed. Facilities Fin. Corp. Rev. Participating VRDN Series Floaters XM 04 02, 0.97% 10/6/17 (Liquidity Facility Morgan Stanley Bank, West Valley City Utah) (a)(c) | | 2,100 | 2,100 |
| Texas Gen. Oblig. Participating VRDN Series Floaters XM 04 04, 0.97% 10/6/17 (Liquidity Facility Wells Fargo Bank NA) (a)(c) | | 7,500 | 7,500 |
| Texas State Univ. Sys. Fing. Rev. Participating VRDN Series 16 ZF 0307, 1.04% 10/6/17 (Liquidity Facility JPMorgan Chase Bank) (a)(c) | | 700 | 700 |
| | | | 90,950 |
| Utah - 0.3% | | | |
| Riverton Hosp. Rev.: | | | |
| Bonds Series WF 11 35C, SIFMA Municipal Swap Index + 0.280% 1.22%, tender 1/25/18 (Liquidity Facility Wells Fargo Bank NA) (a)(c)(d)(e) | | 5,530 | 5,530 |
| Participating VRDN Series RBC ZF 0274, 0.99% 10/6/17 (Liquidity Facility Royal Bank of Canada) (a)(c) | | 1,400 | 1,400 |
| Utah Transit Auth. Sales Tax Rev. Participating VRDN Series 2017, 0.97% 10/6/17 (Liquidity Facility Barclays Bank PLC) (a)(c) | | 2,660 | 2,660 |
| | | | 9,590 |
| Vermont - 0.1% | | | |
| Vermont Edl. and Health Buildings Fing. Agcy. Participating VRDN Series XF 23 61, 0.98% 10/6/17 (Liquidity Facility Barclays Bank PLC) (a)(c) | | 2,850 | 2,850 |
| Virginia - 1.1% | | | |
| Fairfax County Indl. Dev. Auth. Participating VRDN Series 15 ZF0166, 0.96% 10/6/17 (Liquidity Facility JPMorgan Chase Bank) (a)(c) | | 7,500 | 7,500 |
| Loudoun County Gen. Oblig. Bonds Series Solar 2017 38, SIFMA Municipal Swap Index + 0.050% 0.99%, tender 10/5/17 (Liquidity Facility U.S. Bank NA, Cincinnati) (a)(c)(d) | | 700 | 700 |
| Lynchburg Econ. Dev. Participating VRDN Series Floaters XG 01 47, 0.98% 10/6/17 (Liquidity Facility Barclays Bank PLC) (a)(c) | | 1,315 | 1,315 |
| Suffolk Econ. Dev. Auth. Hosp. Facilities Rev. Participating VRDN Series EGL 17 0005, 0.98% 10/6/17 (Liquidity Facility Citibank NA) (a)(c) | | 17,900 | 17,900 |
| Univ. of Virginia Gen. Rev.: | | | |
| Bonds Series Solar 17 17, SIFMA Municipal Swap Index + 0.150% 1.09%, tender 11/30/17 (Liquidity Facility U.S. Bank NA, Cincinnati) (a)(c)(d) | | 600 | 600 |
| Participating VRDN Series 15 ZF0173, 0.96% 10/6/17 (Liquidity Facility JPMorgan Chase Bank) (a)(c) | | 5,000 | 5,000 |
| Virginia Gen. Oblig. Bonds Series 2016 11, SIFMA Municipal Swap Index + 0.050% 0.99%, tender 10/5/17 (Liquidity Facility U.S. Bank NA, Cincinnati) (a)(c)(d) | | 495 | 495 |
| | | | 33,510 |
| Washington - 1.2% | | | |
| Central Puget Sound Reg'l. Trans. Auth. Sales & Use Tax Rev. Participating VRDN Series 15 XF2158, 0.97% 10/6/17 (Liquidity Facility Citibank NA) (a)(c) | | 2,885 | 2,885 |
| Eclipse Fdg. Trust Various States Bonds Series 2017, 1.09%, tender 12/28/17 (Liquidity Facility U.S. Bank NA, Cincinnati) (a)(c) | | 1,700 | 1,700 |
| King County Swr. Rev. Participating VRDN: | | | |
| Series EGL 14 0047, 0.98% 10/6/17 (Liquidity Facility Citibank NA) (a)(c) | | 1,000 | 1,000 |
| Series ROC II R 11962, 0.97% 10/6/17 (Liquidity Facility Citibank NA) (a)(c) | | 2,200 | 2,200 |
| Pierce County School District #10 Tacoma Participating VRDN Series Floaters XM 05 24, 0.97% 10/6/17 (Liquidity Facility Citibank NA) (a)(c) | | 2,538 | 2,538 |
| Seattle Muni. Lt. & Pwr. Rev. Bonds: | | | |
| Series Solar 17 19, SIFMA Municipal Swap Index + 0.150% 1.09%, tender 11/30/17 (Liquidity Facility U.S. Bank NA, Cincinnati) (a)(c)(d) | | 600 | 600 |
| Series WF 11-18C, SIFMA Municipal Swap Index + 0.280% 1.22%, tender 2/8/18 (Liquidity Facility Wells Fargo Bank NA) (a)(c)(d)(e) | | 600 | 600 |
| Seattle Wtr. Sys. Rev. Bonds Series Solar 17 5, SIFMA Municipal Swap Index + 0.150% 1.09%, tender 10/26/17 (Liquidity Facility U.S. Bank NA, Cincinnati) (a)(c)(d) | | 1,190 | 1,190 |
| Washington Gen. Oblig.: | | | |
| Bonds Series WF 11-16C, SIFMA Municipal Swap Index + 0.280% 1.22%, tender 2/15/18 (Liquidity Facility Wells Fargo Bank NA) (a)(c)(d)(e) | | 2,500 | 2,500 |
| Participating VRDN: | | | |
| Series 15 ZM0121, 0.97% 10/6/17 (Liquidity Facility Royal Bank of Canada) (a)(c) | | 1,250 | 1,250 |
| Series 16 XM0219, 0.96% 10/6/17 (Liquidity Facility JPMorgan Chase Bank) (a)(c) | | 4,335 | 4,335 |
| 0.96% 10/6/17 (Liquidity Facility JPMorgan Chase Bank) (a)(c) | | 2,250 | 2,250 |
| Washington Health Care Facilities Auth. Rev. Participating VRDN: | | | |
| Series 15 XF0132, 0.96% 10/6/17 (Liquidity Facility JPMorgan Chase Bank) (a)(c) | | 4,625 | 4,625 |
| Series 15 XF0148, 0.97% 10/6/17 (Liquidity Facility Bank of America NA) (a)(c) | | 7,485 | 7,485 |
| Washington State Motor Vehicle Fuel Tax Auth. Gen. Oblig. Participating VRDN Series XL 00 39, 0.96% 10/6/17 (Liquidity Facility JPMorgan Chase Bank) (a)(c) | | 2,530 | 2,530 |
| | | | 37,688 |
| Wisconsin - 0.3% | | | |
| Eclipse Fdg. Trust Various States Bonds Series Solar 2017 36, SIFMA Municipal Swap Index + 0.150% 1.09%, tender 12/14/17 (Liquidity Facility U.S. Bank NA, Cincinnati) (a)(c)(d) | | 700 | 700 |
| Wisconsin Gen. Oblig. Participating VRDN: | | | |
| Series Clipper 09 36, SIFMA Municipal Swap Index + 0.200% 1.14% 12/7/17 (Liquidity Facility State Street Bank & Trust Co., Boston) (a)(c)(d)(e) | | 1,455 | 1,455 |
| Series Clipper 09 53, SIFMA Municipal Swap Index + 0.200% 1.14% 12/7/17 (Liquidity Facility State Street Bank & Trust Co., Boston) (a)(c)(d)(e) | | 800 | 800 |
| Wisconsin Health & Edl. Facilities Participating VRDN: | | | |
| Series Floaters XG 00 72, 1.01% 10/6/17 (Liquidity Facility Deutsche Bank AG New York Branch) (a)(c) | | 700 | 700 |
| Series XM 04 79, 0.97% 10/6/17 (Liquidity Facility Morgan Stanley Bank, West Valley City Utah) (a)(c) | | 4,500 | 4,500 |
| | | | 8,155 |
| TOTAL TENDER OPTION BOND | | | |
| (Cost $898,873) | | | 898,873 |
|
| Other Municipal Security - 25.8% | | | |
| Alabama - 0.7% | | | |
| Huntsville Health Care Auth. Rev. Series 2017: | | | |
| 0.86% 11/2/17, CP | | 5,300 | 5,300 |
| 0.93% 12/1/17, CP | | 11,000 | 11,000 |
| 0.93% 12/11/17, CP | | 5,000 | 5,000 |
| | | | 21,300 |
| Arizona - 0.3% | | | |
| Arizona Health Facilities Auth. Rev. Bonds (Banner Health Sys. Proj.) Series 2008 D, 5.5% 1/1/18 (Pre-Refunded to 1/1/18 @ 100) | | 1,425 | 1,441 |
| Salt River Proj. Agricultural Impt. & Pwr. District Elec. Sys. Rev. Series C, 0.86% 12/4/17, CP | | 6,500 | 6,500 |
| | | | 7,941 |
| California - 0.5% | | | |
| California Statewide Cmntys. Dev. Auth. Gas Supply Rev. Bonds: | | | |
| Series 2010 A, SIFMA Municipal Swap Index + 0.100% 1.04%, tender 1/2/18 (Liquidity Facility Royal Bank of Canada) (a)(d) | | 5,900 | 5,900 |
| Series 2010 B, SIFMA Municipal Swap Index + 0.100% 1.04%, tender 1/2/18 (Liquidity Facility Royal Bank of Canada) (a)(d) | | 2,510 | 2,510 |
| Los Angeles Dept. of Wtr. & Pwr. Rev. Series 2017, 0.99% 1/23/18 (Liquidity Facility Royal Bank of Canada), CP | | 8,400 | 8,400 |
| | | | 16,810 |
| Colorado - 0.5% | | | |
| Colorado Ed. Ln. Prog. TRAN Series 2017, 4% 6/28/18 | | 15,000 | 15,328 |
| Connecticut - 0.5% | | | |
| Bethel Gen. Oblig. BAN Series 2017, 1.25% 10/17/17 | | 1,155 | 1,155 |
| Brookfield Gen. Oblig. BAN Series B, 2% 11/16/17 | | 5,800 | 5,807 |
| Connecticut Gen. Oblig. Bonds: | | | |
| Series 2013 A, 1.01% 1/1/18 (a) | | 600 | 600 |
| Series 2016 G, 4% 11/1/17 | | 3,500 | 3,508 |
| Connecticut Health & Edl. Facilities Auth. Rev. Bonds Series S2, 0.89% tender 10/2/17, CP mode | | 4,200 | 4,200 |
| East Haddam Gen. Oblig. BAN Series 2017, 2.25% 3/8/18 | | 600 | 603 |
| | | | 15,873 |
| District Of Columbia - 0.4% | | | |
| Metropolitan Washington Arpts. Auth. Dulles Toll Road Rev. Series 1: | | | |
| 0.88% 1/4/18, LOC JPMorgan Chase Bank, CP | | 2,800 | 2,800 |
| 0.9% 11/20/17, LOC JPMorgan Chase Bank, CP | | 3,600 | 3,600 |
| 0.91% 12/21/17, LOC JPMorgan Chase Bank, CP | | 4,800 | 4,800 |
| | | | 11,200 |
| Florida - 2.2% | | | |
| Broward County School District TAN Series 2017, 2% 6/15/18 | | 10,800 | 10,878 |
| Florida Local Govt. Fin. Cmnty.: | | | |
| Series 11A1: | | | |
| 0.85% 11/3/17, LOC JPMorgan Chase Bank, CP | | 23,500 | 23,500 |
| 0.9% 10/3/17, LOC JPMorgan Chase Bank, CP | | 2,300 | 2,300 |
| Series A-1, 0.96% 11/3/17, LOC JPMorgan Chase Bank, CP | | 2,500 | 2,500 |
| Miami-Dade County Wtr. & Swr. Rev. Series A1: | | | |
| 0.89% 11/7/17, LOC Barclays Bank PLC, CP | | 12,300 | 12,300 |
| 0.9% 11/16/17, LOC Barclays Bank PLC, CP | | 8,000 | 8,000 |
| Polk County Indl. Dev. Auth. Health Sys. Rev. Bonds: | | | |
| Series 2014 A, SIFMA Municipal Swap Index + 0.300% 1.24%, tender 4/27/18 (a)(d) | | 1,000 | 1,000 |
| Series 2014 A1, SIFMA Municipal Swap Index + 0.250% 1.19%, tender 4/27/18 (a)(d) | | 3,800 | 3,800 |
| Tampa Health Sys. Rev. Bonds Series 2012 B, SIFMA Municipal Swap Index + 0.300% 1.24%, tender 4/27/18 (a)(d) | | 5,300 | 5,300 |
| | | | 69,578 |
| Georgia - 1.5% | | | |
| Atlanta Arpt. Rev.: | | | |
| Series D-1: | | | |
| 1.01% 10/3/17, LOC Bank of America NA, CP | | 3,100 | 3,100 |
| 1.05% 10/3/17, LOC Bank of America NA, CP | | 900 | 900 |
| Series D-3: | | | |
| 1.01% 10/3/17, LOC Bank of America NA, CP | | 623 | 623 |
| 1.1% 10/3/17, LOC Bank of America NA, CP | | 100 | 100 |
| Series E-1: | | | |
| 1.01% 10/3/17, LOC Bank of Tokyo-Mitsubishi UFJ Ltd., CP | | 1,600 | 1,600 |
| 1.05% 10/3/17, LOC Bank of Tokyo-Mitsubishi UFJ Ltd., CP | | 500 | 500 |
| Series E-3: | | | |
| 1.01% 10/3/17, LOC Bank of Tokyo-Mitsubishi UFJ Ltd., CP | | 300 | 300 |
| 1.02% 10/4/17, LOC Bank of Tokyo-Mitsubishi UFJ Ltd., CP | | 300 | 300 |
| 1.02% 10/4/17, LOC Bank of Tokyo-Mitsubishi UFJ Ltd., CP | | 1,600 | 1,600 |
| Atlanta Wtr. & Wastewtr. Rev. Series A: | | | |
| 1% 10/2/17, LOC PNC Bank NA, CP | | 7,105 | 7,105 |
| 1% 10/3/17, LOC Wells Fargo Bank NA, CP | | 700 | 700 |
| Georgia Muni. Elec. Auth. Pwr. Rev.: | | | |
| Bonds (Auth. Gen. Resolution Projs.) Series 85A, 0.91% tender 11/6/17, LOC Barclays Bank PLC, CP mode | | 3,700 | 3,700 |
| Series B, 0.87% 11/6/17, LOC PNC Bank NA, CP | | 7,200 | 7,200 |
| Main Street Natural Gas, Inc. Georgia Gas Proj. Rev. Bonds: | | | |
| Series 2010 A1, SIFMA Municipal Swap Index + 0.100% 1.04%, tender 12/1/17 (Liquidity Facility Royal Bank of Canada) (a)(d) | | 9,300 | 9,300 |
| Series 2010 A2, SIFMA Municipal Swap Index + 0.100% 1.04%, tender 12/1/17 (Liquidity Facility Royal Bank of Canada) (a)(d) | | 10,730 | 10,730 |
| | | | 47,758 |
| Idaho - 0.2% | | | |
| Idaho Health Facilities Auth. Hosp. Rev. Bonds Series 2013 ID, 0.85%, tender 12/1/17 (a) | | 6,500 | 6,500 |
| Illinois - 2.3% | | | |
| Chicago O'Hare Int'l. Arpt. Rev.: | | | |
| Bonds Series 2008 A, 5% 1/1/18 (Pre-Refunded to 1/1/18 @ 100) | | 3,100 | 3,130 |
| Series 16B2, 0.9% 12/14/17, LOC Bank of Tokyo-Mitsubishi UFJ Ltd., CP | | 700 | 700 |
| Illinois Fin. Auth. Ed. Rev. Series LOY, 0.87% 10/2/17, LOC PNC Bank NA, CP | | 34,040 | 34,040 |
| Illinois Fin. Auth. Rev. Bonds: | | | |
| (Advocate Health Care Network Proj.) Series 2011 B, SIFMA Municipal Swap Index + 0.300% 1.24%, tender 4/27/18 (a)(d) | | 600 | 600 |
| Series 12H: | | | |
| 0.89% tender 12/11/17, CP mode | | 5,700 | 5,700 |
| 0.9% tender 12/1/17, CP mode | | 10,000 | 10,000 |
| 0.91% tender 2/2/18, CP mode | | 2,400 | 2,400 |
| Series 12I: | | | |
| 0.9% tender 11/13/17, CP mode | | 4,760 | 4,760 |
| 0.93% tender 1/3/18, CP mode | | 10,000 | 10,000 |
| | | | 71,330 |
| Indiana - 0.3% | | | |
| Indianapolis Gas Util. Sys. Rev. Series 2017, 0.9% 12/6/17, LOC JPMorgan Chase Bank, CP | | 8,200 | 8,200 |
| Kansas - 0.2% | | | |
| Wyandotte County/Kansas City Unified Govt. Gen. Oblig. BAN Series 2017-I, 1.5% 3/1/18 | | 5,100 | 5,100 |
| Kentucky - 0.1% | | | |
| Jefferson County Poll. Cont. Rev. Bonds Series 2001 A, 0.93% tender 10/3/17, CP mode | | 2,100 | 2,100 |
| Maryland - 0.3% | | | |
| Montgomery County Gen. Oblig. Bonds Series 2013 MD, 0.85%, tender 12/1/17 (a) | | 9,605 | 9,605 |
| Massachusetts - 0.8% | | | |
| Massachusetts Gen. Oblig. Bonds Series B, 0.005% x SIFMA Municipal Swap Index 1.42% 2/1/18 (a)(b)(d) | | 8,000 | 8,000 |
| Massachusetts Indl. Fin. Agcy. Poll. Cont. Rev. Bonds: | | | |
| ( New England Pwr. Co. Proj.) Series B, 1.15% tender 11/9/17, CP mode | | 2,400 | 2,400 |
| (New England Pwr. Co. Proj.): | | | |
| Series 1992, 1% tender 10/6/17, CP mode | | 6,070 | 6,070 |
| Series 1993 A, 1% tender 10/20/17, CP mode | | 2,200 | 2,200 |
| Series 93B, 1% tender 10/26/17, CP mode | | 4,200 | 4,200 |
| Massachusetts School Bldg. Auth. Dedicated Sales Tax Rev. Series C, 0.86% 12/1/17, LOC Barclays Bank PLC, CP | | 1,500 | 1,500 |
| | | | 24,370 |
| Michigan - 0.7% | | | |
| Kent Hosp. Fin. Auth. Hosp. Facilities Rev. Bonds Series 2011 A, 5% 11/15/17 | | 1,200 | 1,206 |
| Michigan Fin. Auth. Rev. Bonds Series 2013 M1, 0.85%, tender 12/1/17 (a) | | 9,200 | 9,200 |
| Michigan Hosp. Fin. Auth. Rev. Bonds Series C, 0.86% tender 12/1/17, CP mode | | 1,100 | 1,100 |
| Univ. of Michigan Rev.: | | | |
| Series K1: | | | |
| 0.84% 10/5/17, CP | | 3,355 | 3,355 |
| 0.86% 11/3/17, CP | | 3,100 | 3,100 |
| Series K2: | | | |
| 0.87% 6/4/18, CP | | 845 | 845 |
| 0.89% 5/1/18, CP | | 3,600 | 3,600 |
| | | | 22,406 |
| Minnesota - 0.2% | | | |
| Univ. of Minnesota Gen. Oblig.: | | | |
| Series 07 C, 0.84% 11/2/17, CP | | 4,200 | 4,200 |
| Series 07B, 0.87% 12/6/17, CP | | 2,800 | 2,800 |
| | | | 7,000 |
| Missouri - 0.1% | | | |
| Curators of the Univ. of Missouri Series A: | | | |
| 0.86% 12/6/17, CP | | 1,500 | 1,500 |
| 0.89% 11/3/17, CP | | 2,000 | 2,000 |
| | | | 3,500 |
| Montana - 0.0% | | | |
| Montana Board of Invt. Bonds Series 2013, 1.2%, tender 3/1/18 (a) | | 1,300 | 1,300 |
| Nebraska - 0.7% | | | |
| Omaha Pub. Pwr. District Elec. Rev.: | | | |
| Series 2017 A, 0.85% 11/3/17, CP | | 2,300 | 2,300 |
| Series A: | | | |
| 0.89% 1/3/18, CP | | 2,500 | 2,500 |
| 0.9% 10/3/17, CP | | 2,200 | 2,200 |
| 0.9% 11/2/17, CP | | 1,600 | 1,600 |
| 0.91% 12/1/17, CP | | 3,500 | 3,500 |
| 0.91% 12/5/17, CP | | 5,600 | 5,600 |
| 0.92% 12/4/17, CP | | 4,800 | 4,800 |
| | | | 22,500 |
| Nevada - 0.2% | | | |
| Truckee Meadows Wtr. Auth. Wtr. Rev. Series 06A: | | | |
| 0.86% 12/1/17, LOC Bank of Tokyo-Mitsubishi UFJ Ltd., CP | | 3,400 | 3,400 |
| 0.88% 1/3/18, LOC Bank of Tokyo-Mitsubishi UFJ Ltd., CP | | 2,600 | 2,600 |
| | | | 6,000 |
| New Hampshire - 0.1% | | | |
| New Hampshire Health & Ed. Facilities Auth. Rev. Bonds Series 2007, 5% 10/1/17 (Pre-Refunded to 10/1/17 @ 100) | | 2,890 | 2,890 |
| New Jersey - 0.4% | | | |
| Englewood Gen. Oblig. BAN Series 2017, 2.5% 4/4/18 | | 1,900 | 1,912 |
| Hudson County Gen. Oblig. BAN Series 2016, 2.5% 12/14/17 | | 2,100 | 2,105 |
| New Jersey Econ. Dev. Auth. Rev. Bonds 5% 12/15/17 (Escrowed to Maturity) | | 4,018 | 4,049 |
| Paramus BAN Series 2017, 2% 2/16/18 | | 2,400 | 2,408 |
| Passaic County Gen. Oblig. BAN Series 2016 A, 2% 12/11/17 | | 2,500 | 2,504 |
| | | | 12,978 |
| New York - 0.7% | | | |
| New York City Transitional Fin. Auth. Rev. Bonds Series 2011 E, 5% 11/1/17 | | 2,000 | 2,007 |
| New York City Trust For Cultural Bonds Series 2014 B1, SIFMA Municipal Swap Index + 0.040% 0.98%, tender 4/9/18 (a)(d) | | 2,100 | 2,100 |
| New York Pwr. Auth. Series 2, 0.98% 10/11/17, CP | | 2,400 | 2,400 |
| Riverhead Central School District TAN Series 2017, 2% 6/27/18 | | 9,800 | 9,875 |
| Sachem Central School District of Holbrook TAN Series 2017, 2% 6/28/18 | | 5,000 | 5,037 |
| | | | 21,419 |
| Ohio - 1.4% | | | |
| American Muni. Pwr. BAN Series 2016, 2% 10/19/17 | | 385 | 385 |
| Delaware Gen. Oblig. BAN Series 2017, 2% 4/12/18 | | 700 | 703 |
| Franklin County Rev. Bonds Series 2013 OH, SIFMA Municipal Swap Index + 0.000% 0.85%, tender 12/1/17 (a)(d) | | 15,300 | 15,300 |
| Huber Heights BAN Series 2016, 2.75% 12/12/17 | | 1,611 | 1,615 |
| North Ridgeville Gen. Oblig. BAN Series 2017, 2% 6/18/18 | | 800 | 805 |
| Ohio Higher Edl. Facility Commission Rev. Bonds: | | | |
| ( the Cleveland Clinic Foundation Proj.) Series B-5, 0.96% tender 12/11/17, CP mode | | 1,000 | 1,000 |
| Series 08B5, 0.94% tender 10/5/17, CP mode | | 16,000 | 16,000 |
| Series 08B6, 0.85% tender 11/9/17, CP mode | | 5,200 | 5,200 |
| Ohio State Univ. Gen. Receipts Rev. Bonds Series 03C, 0.89% tender 12/6/17, CP mode | | 2,000 | 2,000 |
| | | | 43,008 |
| Oklahoma - 0.1% | | | |
| Oklahoma City Wtr. Utils. Trust Wtr. and Swr. Rev. Series A, 0.86% 12/4/17 (Liquidity Facility State Street Bank & Trust Co., Boston), CP | | 1,000 | 1,000 |
| Oklahoma Dev. Fin. Auth. Health Sys. Rev. Bonds Series 2015 B, SIFMA Municipal Swap Index + 0.350% 1.29%, tender 4/27/18 (a)(d) | | 1,705 | 1,705 |
| | | | 2,705 |
| Tennessee - 0.8% | | | |
| Metropolitan Govt. Nashville & Davidson County Wtr. & Swr. Sys. Rev. Series A: | | | |
| 0.87% 10/26/17, LOC Bank of Tokyo-Mitsubishi UFJ Ltd., CP | | 2,400 | 2,400 |
| 0.93% 11/14/17, LOC Bank of Tokyo-Mitsubishi UFJ Ltd., CP | | 4,100 | 4,100 |
| 0.97% 11/6/17, LOC Bank of Tokyo-Mitsubishi UFJ Ltd., CP | | 4,000 | 4,000 |
| Nashville and Davidson County Metropolitan Govt. Gen. Oblig.: | | | |
| Series B-2, 0.98% 1/4/18 (Liquidity Facility JPMorgan Chase Bank), CP | | 2,100 | 2,100 |
| Series B1: | | | |
| 0.87% 12/5/17 (Liquidity Facility JPMorgan Chase Bank), CP | | 4,100 | 4,100 |
| 0.9% 11/2/17 (Liquidity Facility JPMorgan Chase Bank), CP | | 7,500 | 7,500 |
| | | | 24,200 |
| Texas - 7.7% | | | |
| Austin Elec. Util. Sys. Rev. Series A: | | | |
| 0.84% 10/3/17, LOC Bank of Tokyo-Mitsubishi UFJ Ltd., CP | | 2,550 | 2,550 |
| 0.85% 10/5/17, LOC Bank of Tokyo-Mitsubishi UFJ Ltd., CP | | 6,200 | 6,200 |
| Board of Regents of The Texas A&M Univ. Sys. Permanent Univ. Fund Series A, 0.9% 10/31/17, CP | | 1,200 | 1,200 |
| Fort Bend Independent School District Series 2017: | | | |
| 0.86% 10/6/17 (Liquidity Facility JPMorgan Chase Bank), CP | | 1,000 | 1,000 |
| 0.96% 10/6/17 (Liquidity Facility JPMorgan Chase Bank), CP | | 2,500 | 2,500 |
| Harris County Cultural Ed. Facilities Fin. Corp. Rev. Bonds: | | | |
| (Texas Children's Hosp. Proj.) Series 2015 2, 0.002% x SIFMA Municipal Swap Index 1.14%, tender 4/27/18 (a)(d) | | 2,900 | 2,900 |
| Series 16B1, 0.95% tender 10/4/17, CP mode | | 19,300 | 19,300 |
| Series 16B2, 0.89% tender 11/2/17, CP mode | | 20,100 | 20,100 |
| Series 16B3, 0.87% tender 12/5/17, CP mode | | 6,700 | 6,700 |
| Harris County Gen. Oblig.: | | | |
| Series 2017, 0.89% 10/5/17 (Liquidity Facility JPMorgan Chase Bank), CP | | 900 | 900 |
| Series A1, 0.86% 10/5/17 (Liquidity Facility State Street Bank & Trust Co., Boston), CP | | 3,200 | 3,200 |
| Series D, 0.85% 10/5/17 (Liquidity Facility JPMorgan Chase Bank), CP | | 10,300 | 10,300 |
| Harris County Metropolitan Trans. Auth.: | | | |
| Series A1: | | | |
| 0.91% 11/14/17 (Liquidity Facility JPMorgan Chase Bank), CP | | 1,300 | 1,300 |
| 0.97% 10/10/17 (Liquidity Facility JPMorgan Chase Bank), CP | | 4,650 | 4,650 |
| 1% 10/4/17 (Liquidity Facility JPMorgan Chase Bank), CP | | 4,400 | 4,400 |
| 1% 1/30/18 (Liquidity Facility JPMorgan Chase Bank), CP | | 4,200 | 4,200 |
| Series A3: | | | |
| 0.9% 11/14/17 (Liquidity Facility State Street Bank & Trust Co., Boston), CP | | 1,500 | 1,500 |
| 0.97% 10/10/17 (Liquidity Facility State Street Bank & Trust Co., Boston), CP | | 2,000 | 2,000 |
| Houston Gen. Oblig. Series E1: | | | |
| 0.86% 10/31/17, LOC Citibank NA, CP | | 800 | 800 |
| 0.93% 10/31/17, LOC Citibank NA, CP | | 1,600 | 1,600 |
| 0.95% 11/9/17, LOC Citibank NA, CP | | 800 | 800 |
| Lower Colorado River Auth. Rev.: | | | |
| Series 2017: | | | |
| 0.85% 11/2/17, LOC JPMorgan Chase Bank, LOC State Street Bank & Trust Co., Boston, CP | | 2,473 | 2,473 |
| 0.91% 2/2/18, LOC JPMorgan Chase Bank, LOC State Street Bank & Trust Co., Boston, CP | | 2,400 | 2,400 |
| Series B: | | | |
| 0.85% 11/3/17, LOC State Street Bank & Trust Co., Boston, CP | | 1,117 | 1,117 |
| 0.87% 10/2/17, LOC State Street Bank & Trust Co., Boston, CP | | 8,489 | 8,489 |
| 0.91% 2/2/18, LOC State Street Bank & Trust Co., Boston, CP | | 4,900 | 4,900 |
| North Texas Tollway Auth. Rev. Bonds 5.75% 1/1/18 (Pre-Refunded to 1/1/18 @ 100) | | 2,130 | 2,155 |
| Tarrant County Cultural Ed. Facilities Fin. Corp. Hosp. Rev. Bonds (Baylor Health Care Sys. Proj.): | | | |
| Series 2011 B, BMA Municipal Swap Index + 0.300% 1.24%, tender 4/27/18 (a)(d) | | 8,400 | 8,400 |
| Series 2013 B, SIFMA Municipal Swap Index + 0.300% 1.24%, tender 4/27/18 (a)(d) | | 2,400 | 2,400 |
| Texas A&M Univ. Rev. Series B, 0.95% 10/3/17, CP | | 7,300 | 7,300 |
| Texas Gen. Oblig. TRAN Series 2017, 4% 8/30/18 | | 72,350 | 74,357 |
| Texas Muni. Pwr. Agcy. Rev. Series 05: | | | |
| 0.87% 10/17/17, LOC Barclays Bank PLC, CP | | 1,300 | 1,300 |
| 0.88% 10/17/17, LOC Barclays Bank PLC, CP | | 1,800 | 1,800 |
| Univ. of Texas Board of Regents Sys. Rev.: | | | |
| Series A: | | | |
| 0.86% 11/1/17 (Liquidity Facility Univ. of Texas Invt. Mgmt. Co.), CP | | 7,700 | 7,700 |
| 0.97% 10/11/17 (Liquidity Facility Univ. of Texas Invt. Mgmt. Co.), CP | | 3,800 | 3,800 |
| 1.03% 10/2/17 (Liquidity Facility Univ. of Texas Invt. Mgmt. Co.), CP | | 3,800 | 3,800 |
| Univ. of Texas Permanent Univ. Fund Rev. Series A, 0.9% 12/12/17, CP | | 4,100 | 4,100 |
| Upper Trinity Reg'l. Wtr. District Series 2017, 0.93% 12/1/17, LOC Bank of America NA, CP | | 4,000 | 4,000 |
| | | | 238,591 |
| Virginia - 0.3% | | | |
| Norfolk Econ. Dev. Auth. Rev. Series 2017, 0.9% 12/6/17, CP | | 1,900 | 1,900 |
| Univ. of Virginia Gen. Rev. Series 2017 A, 0.91% 11/7/17, CP | | 7,600 | 7,600 |
| | | | 9,500 |
| Washington - 0.4% | | | |
| Univ. of Washington Univ. Revs. Series 8: | | | |
| 0.87% 12/11/17, CP | | 4,100 | 4,100 |
| 0.9% 2/20/18, CP | | 7,500 | 7,500 |
| | | | 11,600 |
| Wisconsin - 1.2% | | | |
| Wisconsin Gen. Oblig.: | | | |
| Series 06A, 0.85% 11/2/17 (Liquidity Facility BMO Harris Bank NA), CP | | 4,336 | 4,336 |
| Series 16A, 0.95% 10/4/17 (Liquidity Facility BMO Harris Bank NA), CP | | 32,000 | 32,000 |
| Wisconsin Trans. Rev. Series 13A, 0.97% 10/4/17 (Liquidity Facility State Street Bank & Trust Co., Boston), CP | | 2,000 | 2,000 |
| | | | 38,336 |
| TOTAL OTHER MUNICIPAL SECURITY | | | |
| (Cost $800,926) | | | 800,926 |
| | | Shares (000s) | Value (000s) |
|
| Investment Company - 6.3% | | | |
| Fidelity Tax-Free Cash Central Fund, 0.96% (f)(g) | | | |
| (Cost $196,756) | | 196,740 | $196,756 |
| TOTAL INVESTMENT IN SECURITIES - 99.3% | | | |
| (Cost $3,084,040) | | | 3,084,040 |
| NET OTHER ASSETS (LIABILITIES) - 0.7% | | | 21,415 |
| NET ASSETS - 100% | | | $3,105,455 |
Security Type Abbreviations
BAN – BOND ANTICIPATION NOTE
CP – COMMERCIAL PAPER
TAN – TAX ANTICIPATION NOTE
TRAN – TAX AND REVENUE ANTICIPATION NOTE
VRDN – VARIABLE RATE DEMAND NOTE (A debt instrument that is payable upon demand, either daily, weekly or monthly)
The date shown for securities represents the date when principal payments must be paid, taking into account any call options exercised by the issuer and any permissible maturity shortening features other than interest rate resets.
Legend
(a) Coupon rates for floating and adjustable rate securities reflect the rates in effect at period end.
(b) Security exempt from registration under Rule 144A of the Securities Act of 1933. These securities may be resold in transactions exempt from registration, normally to qualified institutional buyers. At the end of the period, the value of these securities amounted to $27,555,000 or 0.9% of net assets.
(c) Provides evidence of ownership in one or more underlying municipal bonds.
(d) Coupon is indexed to a floating interest rate which may be multiplied by a specified factor and/or subject to caps or floors.
(e) Restricted securities - Investment in securities not registered under the Securities Act of 1933 (excluding 144A issues). At the end of the period, the value of restricted securities (excluding 144A issues) amounted to $43,315,000 or 1.4% of net assets.
(f) Information in this report regarding holdings by state and security types does not reflect the holdings of the Fidelity Tax-Free Cash Central Fund.
(g) Affiliated fund that is available only to investment companies and other accounts managed by Fidelity Investments. The rate quoted is the annualized seven-day yield of the fund at period end. A complete unaudited listing of the fund's holdings as of its most recent quarter end is available upon request. In addition, each Fidelity Central Fund's financial statements are available on the SEC's website or upon request.
Additional information on each restricted holding is as follows:
| Security | Acquisition Date | Cost (000s) |
| Central Florida Expressway Bonds Series RBC E 62, SIFMA Municipal Swap Index + 0.170% 1.11%, tender 2/1/18 (Liquidity Facility Royal Bank of Canada) | 8/1/16 - 8/1/17 | $6,595 |
| Indiana Health & Edl. Facilities Fing. Auth. Rev. Bonds Series 16 E71, 1.11%, tender 12/1/17 (Liquidity Facility Royal Bank of Canada) | 6/1/16 - 9/1/16 | $5,400 |
| Los Angeles Hbr. Dept. Rev. Bonds Series WF 10 40C, SIFMA Municipal Swap Index + 0.280% 1.22%, tender 3/1/18 (Liquidity Facility Wells Fargo Bank NA) | 3/22/12 | $1,400 |
| Massachusetts Gen. Oblig. Bonds Series Clipper 09 69, SIFMA Municipal Swap Index + 0.200% 1.14%, tender 12/7/17 (Liquidity Facility State Street Bank & Trust Co., Boston) | 9/28/16 | $1,175 |
| Pennsylvania Health & Edl. Facilities Fing. Auth. Rev. Bonds Series E72, SIFMA Municipal Swap Index + 0.750% 1.11%, tender 12/1/17 (Liquidity Facility Royal Bank of Canada) | 6/1/16 - 9/1/17 | $10,900 |
| Pennsylvania Higher Edl. Facilities Auth. Rev. Bonds Series WF 11 26C, SIFMA Municipal Swap Index + 0.280% 1.22%, tender 2/8/18 (Liquidity Facility Wells Fargo Bank NA) | 11/10/16 | $1,500 |
| RBC Muni. Products, Inc. Trust Bonds Series E70, SIFMA Municipal Swap Index + 0.170% 1.11%, tender 2/1/18 (Liquidity Facility Royal Bank of Canada) | 11/1/16 - 8/1/17 | $1,900 |
| Riverton Hosp. Rev. Bonds Series WF 11 35C, SIFMA Municipal Swap Index + 0.280% 1.22%, tender 1/25/18 (Liquidity Facility Wells Fargo Bank NA) | 3/24/11 | $5,530 |
| Seattle Muni. Lt. & Pwr. Rev. Bonds Series WF 11-18C, SIFMA Municipal Swap Index + 0.280% 1.22%, tender 2/8/18 (Liquidity Facility Wells Fargo Bank NA) | 2/11/16 | $600 |
| Univ. of Pittsburgh Med. Ctr. Bonds Series RBC E53, 1.12%, tender 10/5/17 (Liquidity Facility Royal Bank of Canada) | 7/1/16 - 9/11/17 | $3,560 |
| Washington Gen. Oblig. Bonds Series WF 11-16C, SIFMA Municipal Swap Index + 0.280% 1.22%, tender 2/15/18 (Liquidity Facility Wells Fargo Bank NA) | 5/9/13 - 2/18/16 | $2,500 |
| Wisconsin Gen. Oblig. Participating VRDN Series Clipper 09 36, 1.14% 12/7/17 (Liquidity Facility State Street Bank & Trust Co., Boston) | 9/15/16 - 6/1/17 | $1,455 |
| Wisconsin Gen. Oblig. Participating VRDN Series Clipper 09 53, 1.14% 10/5/17 (Liquidity Facility State Street Bank & Trust Co., Boston) | 9/12/16 | $800 |
Affiliated Central Funds
Information regarding fiscal year to date income earned by the Fund from investments in Fidelity Central Funds is as follows:
| Fund | Income earned |
| | (Amounts in thousands) |
| Fidelity Tax-Free Cash Central Fund | $599 |
| Total | $599 |
Investment Valuation
All investments are categorized as Level 2 under the Fair Value Hierarchy. The inputs or methodology used for valuing securities may not be an indication of the risk associated with investing in those securities. For more information on valuation inputs please refer to the Investment Valuation section in the accompanying Notes to Financial Statements.
See accompanying notes which are an integral part of the financial statements.
Tax-Exempt Portfolio
Financial Statements
Statement of Assets and Liabilities
| Amounts in thousands (except per-share amounts) | | September 30, 2017 (Unaudited) |
| Assets | | |
Investment in securities, at value — See accompanying schedule:
Unaffiliated issuers (cost $2,887,284) | $2,887,284 | |
| Fidelity Central Funds (cost $196,756) | 196,756 | |
| Total Investment in Securities (cost $3,084,040) | | $3,084,040 |
| Cash | | 47 |
| Receivable for investments sold | | 51,031 |
| Receivable for fund shares sold | | 40,641 |
| Interest receivable | | 4,322 |
| Distributions receivable from Fidelity Central Funds | | 113 |
| Prepaid expenses | | 7 |
| Receivable from investment adviser for expense reductions | | 93 |
| Other receivables | | 56 |
| Total assets | | 3,180,350 |
| Liabilities | | |
| Payable for investments purchased | $59,295 | |
| Payable for fund shares redeemed | 14,493 | |
| Distributions payable | 493 | |
| Accrued management fee | 351 | |
| Distribution and service plan fees payable | 1 | |
| Other affiliated payables | 175 | |
| Other payables and accrued expenses | 87 | |
| Total liabilities | | 74,895 |
| Net Assets | | $3,105,455 |
| Net Assets consist of: | | |
| Paid in capital | | $3,105,356 |
| Accumulated undistributed net realized gain (loss) on investments | | 99 |
| Net Assets | | $3,105,455 |
| Class I: | | |
| Net Asset Value, offering price and redemption price per share ($3,098,453 ÷ 3,097,146 shares) | | $1.00 |
| Class II: | | |
| Net Asset Value, offering price and redemption price per share ($383 ÷ 382 shares) | | $1.00 |
| Class III: | | |
| Net Asset Value, offering price and redemption price per share ($5,478 ÷ 5,478 shares) | | $1.00 |
| Select Class: | | |
| Net Asset Value, offering price and redemption price per share ($1,141 ÷ 1,140 shares) | | $1.00 |
See accompanying notes which are an integral part of the financial statements.
Statement of Operations
| Amounts in thousands | | Six months ended September 30, 2017 (Unaudited) |
| Investment Income | | |
| Interest | | $11,325 |
| Income from Fidelity Central Funds | | 599 |
| Total income | | 11,924 |
| Expenses | | |
| Management fee | $1,902 | |
| Transfer agent fees | 815 | |
| Distribution and service plan fees | 7 | |
| Accounting fees and expenses | 125 | |
| Custodian fees and expenses | 12 | |
| Independent trustees' fees and expenses | 5 | |
| Registration fees | 91 | |
| Audit | 21 | |
| Legal | 2 | |
| Miscellaneous | 7 | |
| Total expenses before reductions | 2,987 | |
| Expense reductions | (527) | 2,460 |
| Net investment income (loss) | | 9,464 |
| Realized and Unrealized Gain (Loss) | | |
| Net realized gain (loss) on: | | |
| Investment securities: | | |
| Unaffiliated issuers | 105 | |
| Fidelity Central Funds | 8 | |
| Total net realized gain (loss) | | 113 |
| Net increase in net assets resulting from operations | | $9,577 |
See accompanying notes which are an integral part of the financial statements.
Statement of Changes in Net Assets
| Amounts in thousands | Six months ended September 30, 2017 (Unaudited) | Year ended March 31, 2017 |
| Increase (Decrease) in Net Assets | | |
| Operations | | |
| Net investment income (loss) | $9,464 | $7,112 |
| Net realized gain (loss) | 113 | (14) |
| Net increase in net assets resulting from operations | 9,577 | 7,098 |
| Distributions to shareholders from net investment income | (9,462) | (7,113) |
| Distributions to shareholders from net realized gain | – | (1,040) |
| Total distributions | (9,462) | (8,153) |
| Share transactions - net increase (decrease) | 837,592 | 619,958 |
| Total increase (decrease) in net assets | 837,707 | 618,903 |
| Net Assets | | |
| Beginning of period | 2,267,748 | 1,648,845 |
| End of period | $3,105,455 | $2,267,748 |
| Other Information | | |
| Distributions in excess of net investment income end of period | $– | $(2) |
See accompanying notes which are an integral part of the financial statements.
Financial Highlights
Tax-Exempt Portfolio Class I
| | Six months ended (Unaudited) September 30, | Years ended March 31, | | | | |
| | 2017 | 2017 | 2016 | 2015 | 2014 | 2013 |
| Selected Per–Share Data | | | | | | |
| Net asset value, beginning of period | $1.00 | $1.00 | $1.00 | $1.00 | $1.00 | $1.00 |
| Income from Investment Operations | | | | | | |
| Net investment income (loss) | .003 | .004 | –A | –A | –A | –A |
| Net realized and unrealized gain (loss) | –A | .001B | .001 | –A | –A | –A |
| Total from investment operations | .003 | .005 | .001 | –A | –A | –A |
| Distributions from net investment income | (.003) | (.004) | –A | –A | –A | –A |
| Distributions from net realized gain | – | (.001) | (.001) | –A | –A | – |
| Total distributions | (.003) | (.005) | (.001) | –A | –A | –A |
| Net asset value, end of period | $1.00 | $1.00 | $1.00 | $1.00 | $1.00 | $1.00 |
| Total ReturnC,D | .35% | .50% | .08% | .03% | .02% | .01% |
| Ratios to Average Net AssetsE,F | | | | | | |
| Expenses before reductions | .22%G | .22% | .22% | .22% | .22% | .22% |
| Expenses net of fee waivers, if any | .18%G | .18% | .05% | .06% | .11% | .18% |
| Expenses net of all reductions | .18%G | .18% | .05% | .06% | .10% | .17% |
| Net investment income (loss) | .69%G | .44% | .01% | .01% | .01% | .01% |
| Supplemental Data | | | | | | |
| Net assets, end of period (in millions) | $3,098 | $2,262 | $1,429 | $2,166 | $2,055 | $2,342 |
A Amount represents less than $.0005 per share.
B The amount shown for a share outstanding does not correspond with the aggregate net gain (loss) on investments for the period due to the timing of sales and repurchases of shares in relation to fluctuating market values of the investments of the Fund.
C Total returns for periods of less than one year are not annualized.
D Total returns would have been lower if certain expenses had not been reduced during the applicable periods shown.
E Fees and expenses of any underlying Fidelity Central Funds are not included in the Fund's expense ratio. The Fund indirectly bears its proportionate share of the expenses of any underlying Fidelity Central Funds.
F Expense ratios reflect operating expenses of the class. Expenses before reductions do not reflect amounts reimbursed or waived or reductions from expense offset arrangements and do not represent the amount paid by the class during periods when reimbursements, waivers or reductions occur. Expenses net of fee waivers reflect expenses after reimbursement and waivers but prior to reductions from expense offset arrangements. Expenses net of all reductions represent the net expenses paid by the class.
G Annualized
See accompanying notes which are an integral part of the financial statements.
Tax-Exempt Portfolio Class II
| | Six months ended (Unaudited) September 30, | Years ended March 31, | | | | |
| | 2017 | 2017 | 2016 | 2015 | 2014 | 2013 |
| Selected Per–Share Data | | | | | | |
| Net asset value, beginning of period | $1.00 | $1.00 | $1.00 | $1.00 | $1.00 | $1.00 |
| Income from Investment Operations | | | | | | |
| Net investment income (loss) | .003 | .003 | –A | –A | –A | –A |
| Net realized and unrealized gain (loss) | –A | –A | .001 | –A | –A | –A |
| Total from investment operations | .003 | .003 | .001 | –A | –A | –A |
| Distributions from net investment income | (.003) | (.003) | –A | –A | –A | –A |
| Distributions from net realized gain | – | (.001) | (.001) | –A | –A | – |
| Total distributions | (.003) | (.003)B | (.001) | –A | –A | –A |
| Net asset value, end of period | $1.00 | $1.00 | $1.00 | $1.00 | $1.00 | $1.00 |
| Total ReturnC,D | .27% | .35% | .08% | .03% | .02% | .01% |
| Ratios to Average Net AssetsE,F | | | | | | |
| Expenses before reductions | .37%G | .37% | .37% | .37% | .37% | .37% |
| Expenses net of fee waivers, if any | .33%G | .33% | .06% | .06% | .11% | .17% |
| Expenses net of all reductions | .33%G | .33% | .05% | .06% | .10% | .17% |
| Net investment income (loss) | .55%G | .29% | .01% | .01% | .01% | .01% |
| Supplemental Data | | | | | | |
| Net assets, end of period (in millions) | $– | $– | $1 | $12 | $12 | $12 |
A Amount represents less than $.0005 per share.
B Total distributions of $.003 per share is comprised of distributions from net investment income of $.0027 and distributions from net realized gain of $.0007 per share.
C Total returns for periods of less than one year are not annualized.
D Total returns would have been lower if certain expenses had not been reduced during the applicable periods shown.
E Fees and expenses of any underlying Fidelity Central Funds are not included in the Fund's expense ratio. The Fund indirectly bears its proportionate share of the expenses of any underlying Fidelity Central Funds.
F Expense ratios reflect operating expenses of the class. Expenses before reductions do not reflect amounts reimbursed or waived or reductions from expense offset arrangements and do not represent the amount paid by the class during periods when reimbursements, waivers or reductions occur. Expenses net of fee waivers reflect expenses after reimbursement and waivers but prior to reductions from expense offset arrangements. Expenses net of all reductions represent the net expenses paid by the class.
G Annualized
See accompanying notes which are an integral part of the financial statements.
Tax-Exempt Portfolio Class III
| | Six months ended (Unaudited) September 30, | Years ended March 31, | | | | |
| | 2017 | 2017 | 2016 | 2015 | 2014 | 2013 |
| Selected Per–Share Data | | | | | | |
| Net asset value, beginning of period | $1.00 | $1.00 | $1.00 | $1.00 | $1.00 | $1.00 |
| Income from Investment Operations | | | | | | |
| Net investment income (loss) | .002 | .002 | –A | –A | –A | –A |
| Net realized and unrealized gain (loss) | –A | .001B | .001 | –A | –A | –A |
| Total from investment operations | .002 | .003 | .001 | –A | –A | –A |
| Distributions from net investment income | (.002) | (.002) | –A | –A | –A | –A |
| Distributions from net realized gain | – | (.001) | (.001) | –A | –A | – |
| Total distributions | (.002) | (.003) | (.001) | –A | –A | –A |
| Net asset value, end of period | $1.00 | $1.00 | $1.00 | $1.00 | $1.00 | $1.00 |
| Total ReturnC,D | .22% | .25% | .08% | .03% | .02% | .01% |
| Ratios to Average Net AssetsE,F | | | | | | |
| Expenses before reductions | .46%G | .47% | .47% | .47% | .47% | .47% |
| Expenses net of fee waivers, if any | .43%G | .39% | .06% | .06% | .11% | .17% |
| Expenses net of all reductions | .43%G | .39% | .06% | .06% | .10% | .17% |
| Net investment income (loss) | .45%G | .23% | .01% | .01% | .01% | .01% |
| Supplemental Data | | | | | | |
| Net assets, end of period (in millions) | $5 | $5 | $215 | $285 | $275 | $323 |
A Amount represents less than $.0005 per share.
B The amount shown for a share outstanding does not correspond with the aggregate net gain (loss) on investments for the period due to the timing of sales and repurchases of shares in relation to fluctuating market values of the investments of the Fund.
C Total returns for periods of less than one year are not annualized.
D Total returns would have been lower if certain expenses had not been reduced during the applicable periods shown.
E Fees and expenses of any underlying Fidelity Central Funds are not included in the Fund's expense ratio. The Fund indirectly bears its proportionate share of the expenses of any underlying Fidelity Central Funds.
F Expense ratios reflect operating expenses of the class. Expenses before reductions do not reflect amounts reimbursed or waived or reductions from expense offset arrangements and do not represent the amount paid by the class during periods when reimbursements, waivers or reductions occur. Expenses net of fee waivers reflect expenses after reimbursement and waivers but prior to reductions from expense offset arrangements. Expenses net of all reductions represent the net expenses paid by the class.
G Annualized
See accompanying notes which are an integral part of the financial statements.
Tax-Exempt Portfolio Select Class
| | Six months ended (Unaudited) September 30, | Years ended March 31, | | | | |
| | 2017 | 2017 | 2016 | 2015 | 2014 | 2013 |
| Selected Per–Share Data | | | | | | |
| Net asset value, beginning of period | $1.00 | $1.00 | $1.00 | $1.00 | $1.00 | $1.00 |
| Income from Investment Operations | | | | | | |
| Net investment income (loss) | .003 | .004 | –A | –A | –A | –A |
| Net realized and unrealized gain (loss) | –A | –A | .001 | –A | –A | –A |
| Total from investment operations | .003 | .004 | .001 | –A | –A | –A |
| Distributions from net investment income | (.003) | (.004) | –A | –A | –A | –A |
| Distributions from net realized gain | – | (.001) | (.001) | –A | –A | – |
| Total distributions | (.003) | (.004)B | (.001) | –A | –A | –A |
| Net asset value, end of period | $1.00 | $1.00 | $1.00 | $1.00 | $1.00 | $1.00 |
| Total ReturnC,D | .32% | .44% | .08% | .03% | .02% | .01% |
| Ratios to Average Net AssetsE,F | | | | | | |
| Expenses before reductions | .27%G | .27% | .27% | .27% | .27% | .27% |
| Expenses net of fee waivers, if any | .23%G | .23% | .06% | .06% | .11% | .18% |
| Expenses net of all reductions | .23%G | .23% | .06% | .06% | .11% | .18% |
| Net investment income (loss) | .64%G | .39% | .01% | .01% | .01% | .01% |
| Supplemental Data | | | | | | |
| Net assets, end of period (in millions) | $1 | $– | $4 | $4 | $7 | $8 |
A Amount represents less than $.0005 per share.
B Total distributions of $.004 per share is comprised of distributions from net investment income of $.0037 and distributions from net realized gain of $.0007 per share.
C Total returns for periods of less than one year are not annualized.
D Total returns would have been lower if certain expenses had not been reduced during the applicable periods shown.
E Fees and expenses of any underlying Fidelity Central Funds are not included in the Fund's expense ratio. The Fund indirectly bears its proportionate share of the expenses of any underlying Fidelity Central Funds.
F Expense ratios reflect operating expenses of the class. Expenses before reductions do not reflect amounts reimbursed or waived or reductions from expense offset arrangements and do not represent the amount paid by the class during periods when reimbursements, waivers or reductions occur. Expenses net of fee waivers reflect expenses after reimbursement and waivers but prior to reductions from expense offset arrangements. Expenses net of all reductions represent the net expenses paid by the class.
G Annualized
See accompanying notes which are an integral part of the financial statements.
Notes to Financial Statements (Unaudited)
For the period ended September 30, 2017
(Amounts in thousands except percentages)
1. Organization.
Treasury Only Portfolio, Treasury Portfolio, Government Portfolio, Money Market Portfolio, Prime Money Market Portfolio, Prime Reserves Portfolio and Tax-Exempt Portfolio (the Funds) are funds of Fidelity Colchester Street Trust (the Trust). Each Fund is authorized to issue an unlimited number of shares. The Trust is registered under the Investment Company Act of 1940, as amended (the 1940 Act), as an open-end management investment company organized as a Delaware statutory trust. Each Fund offers Class I, Class II, Class III and Select Class shares. Prime Money Market Portfolio, Treasury Only Portfolio and Treasury Portfolio also offer Class IV and Institutional Class shares. Government Portfolio, Money Market Portfolio and Prime Reserves Portfolio also offer Institutional Class shares. Shares of Money Market Portfolio and Tax-Exempt Portfolio are only available for purchase by retail shareholders. All classes have equal rights as to assets and voting privileges. Each class has exclusive voting rights with respect to matters that affect that class. Each Fund except for Tax-Exempt Portfolio offers conversion privileges from Class I to Institutional Class for eligible shareholders.
In accordance with amendments to Rule 2a-7 of the 1940 Act, Prime Money Market Portfolio and Prime Reserves Portfolio (the Institutional Funds) have each been designated an institutional money market fund, and the value of their shares are calculated to four decimal places that fluctuates based upon changes in the value of their investments.
Money Market Portfolio offered Class F shares during the period June 26, 2009 through May 20, 2016 and all outstanding shares were redeemed by May 20, 2016. All prior fiscal period dollar and share amounts for Money Market Portfolio Class F presented in the Notes to Financial Statements are for the period April 1, 2016 to May 20, 2016.
2. Investments in Fidelity Central Funds.
The Funds may invest in Fidelity Central Funds, which are open-end investment companies generally available only to other investment companies and accounts managed by the investment adviser and its affiliates. The Funds' Schedules of Investments list each of the Fidelity Central Funds held as of period end, if any, as an investment of each Fund, but do not include the underlying holdings of each Fidelity Central Fund. As an Investing Fund, each Fund indirectly bears its proportionate share of the expenses of the underlying Fidelity Central Funds.
The Money Market Central Funds seek preservation of capital and current income and are managed by Fidelity Investments Money Management, Inc. (FIMM), an affiliate of the investment adviser. Annualized expenses of the Money Market Central Funds as of their most recent shareholder report date are less than .005%.
A complete unaudited list of holdings for each Fidelity Central Fund is available upon request or at the Securities and Exchange Commission (the SEC) website at www.sec.gov. In addition, the financial statements of the Fidelity Central Funds are available on the SEC website or upon request.
3. Significant Accounting Policies.
Each Fund is an investment company and applies the accounting and reporting guidance of the Financial Accounting Standards Board (FASB) Accounting Standards Codification Topic 946 Financial Services – Investments Companies. The financial statements have been prepared in conformity with accounting principles generally accepted in the United States of America (GAAP), which require management to make certain estimates and assumptions at the date of the financial statements. Actual results could differ from those estimates. Subsequent events, if any, through the date that the financial statements were issued have been evaluated in the preparation of the financial statements. The following summarizes the significant accounting policies of the Funds:
Investment Valuation. Investments are valued as of 4:00 p.m. Eastern time on the last calendar day of the period. The Board of Trustees (the Board) has delegated the day to day responsibility for the valuation of each Institutional Fund's investments to the Fair Value Committee (the Committee) established by the Institutional Funds' investment adviser. In accordance with valuation policies and procedures approved by the Board, each Institutional Fund attempts to obtain prices from one or more third party pricing vendors or brokers to value its investments. When current market prices, quotations or currency exchange rates are not readily available or reliable, investments will be fair valued in good faith by the Committee, in accordance with procedures adopted by the Board. Factors used in determining fair value vary by investment type and may include market or investment specific events, changes in interest rates and credit quality. The frequency with which these procedures are used cannot be predicted and they may be utilized to a significant extent. The Committee oversees the Institutional Funds' valuation policies and procedures and reports to the Board on the Committee's activities and fair value determinations. The Board monitors the appropriateness of the procedures used in valuing each Institutional Fund's investments and ratifies the fair value determinations of the Committee.
Each Fund categorizes the inputs to valuation techniques used to value its investments into a disclosure hierarchy consisting of three levels as shown below:
- Level 1 – quoted prices in active markets for identical investments
- Level 2 – other significant observable inputs (including quoted prices for similar investments, interest rates, prepayment speeds, etc.)
- Level 3 – unobservable inputs (including the Fund's own assumptions based on the best information available)
Valuation techniques used to value each Institutional Fund's investments by major category are as follows:
Debt securities, including restricted securities, are valued based on evaluated prices received from third party pricing vendors or from brokers who make markets in such securities. Municipal securities, U.S. government and government agency obligations, commercial paper, certificates of deposit and other short-term securities are valued by pricing vendors who utilize matrix pricing which considers yield or price of bonds of comparable quality, coupon, maturity and type or by broker-supplied prices. When independent prices are unavailable or unreliable, debt securities may be valued utilizing pricing methodologies which consider similar factors that would be used by third party pricing vendors. Debt securities are generally categorized as Level 2 in the hierarchy but may be Level 3 depending on the circumstances. Short-term securities with remaining maturities of sixty days or less may be valued at amortized cost, which approximates fair value, and are categorized as Level 2 in the hierarchy.
For Treasury Only Portfolio, Treasury Portfolio, Government Portfolio, Money Market Portfolio and Tax-Exempt Portfolio as permitted by compliance with certain conditions under Rule 2a-7 of the 1940 Act, securities are valued at amortized cost, which approximates fair value. The amortized cost of an instrument is determined by valuing it at its original cost and thereafter amortizing any discount or premium from its face value at a constant rate until maturity.
Securities held by a money market fund are generally high quality and liquid; however, they are reflected as Level 2 because the inputs used to determine fair value are not quoted prices in an active market.
Investment Transactions and Income. Security transactions, including the Funds' investment activity in the Fidelity Central Funds, are accounted for as of trade date. Gains and losses on securities sold are determined on the basis of identified cost. Income and capital gain distributions from Fidelity Central Funds, if any, are recorded on the ex-dividend date. Interest income is accrued as earned and includes coupon interest and amortization of premium and accretion of discount on debt securities as applicable. The principal amount on inflation-indexed securities is periodically adjusted to the rate of inflation and interest is accrued based on the principal amount. The adjustments to principal due to inflation are reflected as increases or decreases to Interest in the accompanying Statement of Operations.
Class Allocations and Expenses. Investment income, realized and unrealized capital gains and losses, common expenses of each Fund, and certain fund-level expense reductions, if any, are allocated daily on a pro-rata basis to each class based on the relative net assets of each class to the total net assets of each Fund. Each class differs with respect to transfer agent and distribution and service plan fees incurred. Certain expense reductions may also differ by class. For the reporting period, the allocated portion of income and expenses to each class as a percent of its average net assets may vary due to the timing of recording these transactions in relation to fluctuating net assets of the classes. Expenses directly attributable to a fund are charged to that fund. Expenses attributable to more than one fund are allocated among the respective funds on the basis of relative net assets or other appropriate methods. Expense estimates are accrued in the period to which they relate and adjustments are made when actual amounts are known.
Deferred Trustee Compensation. Under a Deferred Compensation Plan (the Plan) for Treasury Portfolio, Government Portfolio, Money Market Portfolio, Prime Money Market Portfolio and Tax-Exempt Portfolio, independent Trustees may elect to defer receipt of a portion of their annual compensation. Deferred amounts are invested in a cross-section of Fidelity funds, are marked-to-market and remain in the Fund until distributed in accordance with the Plan. The investment of deferred amounts and the offsetting payable to the Trustees are included in the accompanying Statement of Assets and Liabilities.
Income Tax Information and Distributions to Shareholders. Each year, each Fund intends to qualify as a regulated investment company under Subchapter M of the Internal Revenue Code, including distributing substantially all of its taxable income and realized gains. As a result, no provision for U.S. Federal income taxes is required. Each Fund files a U.S. federal tax return, in addition to state and local tax returns as required. Each Fund's federal income tax returns are subject to examination by the Internal Revenue Service (IRS) for a period of three fiscal years after they are filed. State and local tax returns may be subject to examination for an additional fiscal year depending on the jurisdiction.
Dividends are declared and recorded daily and paid monthly from net investment income. Distributions from realized gains, if any, are declared and recorded on the ex-dividend date. Income dividends and capital gain distributions are declared separately for each class. Income and capital gain distributions are determined in accordance with income tax regulations, which may differ from GAAP.
Capital accounts within the financial statements are adjusted for permanent book-tax differences. These adjustments have no impact on net assets or the results of operations. Capital accounts are not adjusted for temporary book-tax differences which will reverse in a subsequent period.
Book-tax differences are primarily due to deferred trustees compensation, capital loss carryforwards and losses deferred due to wash sales.
The Tax-Exempt Portfolio purchases municipal securities whose interest, in the opinion of the issuer, is free from federal income tax. There is no assurance that the IRS will agree with this opinion. In the event the IRS determines that the issuer does not comply with relevant tax requirements, interest payments from a security could become federally taxable, possibly retroactively to the date the security was issued.
As of period end, the cost and unrealized appreciation (depreciation) in securities for federal income tax purposes were as follows for each Fund:
| | Tax cost | Gross unrealized appreciation | Gross unrealized depreciation | Net unrealized appreciation (depreciation) |
| Treasury Only Portfolio | $13,207,920 | $– | $– | $– |
| Treasury Portfolio | 24,722,958 | – | – | – |
| Government Portfolio | 98,073,269 | – | – | – |
| Money Market Portfolio | 22,586,047 | – | – | – |
| Prime Money Market Portfolio | 13,286,405 | 1,242 | (120) | 1,122 |
| Prime Reserves Portfolio | 2,936,118 | 168 | (45) | 123 |
| Tax-Exempt Portfolio | 3,084,040 | – | – | – |
Capital loss carryforwards are only available to offset future capital gains of the Funds to the extent provided by regulations and may be limited. Under the Regulated Investment Company Modernization Act of 2010 (the Act), the Funds are permitted to carry forward capital losses incurred in taxable years beginning after December 22, 2010 for an unlimited period and such capital losses are required to be used prior to any losses that expire. The capital loss carryforward information presented below, including any applicable limitation, is estimated as of prior fiscal period end and is subject to adjustment.
| | Fiscal year
of expiration |
| | 2019 |
| Government Portfolio | $(118) |
| | No expiration
Short-term |
| Tax-Exempt Portfolio | $(15) |
Repurchase Agreements. Pursuant to an Exemptive Order issued by the Securities and Exchange Commission (the SEC), the Funds along with other registered investment companies having management contracts with Fidelity Management and Research Company (FMR), an affiliate of SelectCo, or other affiliated entities of FMR, are permitted to transfer uninvested cash balances into joint trading accounts which are then invested in repurchase agreements. The Funds may also invest directly with institutions in repurchase agreements. For Treasury Only Portfolio, Treasury Portfolio and Government Portfolio, repurchase agreements may be collateralized by cash or government securities. For Prime Money Market Portfolio, Money Market Portfolio, Prime Reserves Portfolio and Tax-Exempt Portfolio, repurchase agreements may be collateralized by government or non-government securities. Upon settlement date, collateral is held in segregated accounts with custodian banks and may be obtained in the event of a default of the counterparty. Each applicable Fund monitors, on a daily basis, the value of the collateral to ensure it is at least equal to the principal amount of the repurchase agreement (including accrued interest). In the event of a default by the counterparty, realization of the collateral proceeds could be delayed, during which time the value of the collateral may decline.
Reverse Repurchase Agreements. To enhance their yield, the Funds may enter into reverse repurchase transactions under master repurchase agreements whereby the Fund sells securities to a counterparty in return for cash and agrees to repurchase those securities at a future date and agreed upon price. During the period that reverse repurchase transactions are outstanding, each applicable fund identifies the securities as pledged in its records with an initial value at least equal to its principal obligation under the agreement. The cash proceeds received by the Funds may be invested in other securities. To the extent cash proceeds received from the counterparty exceed the value of the securities sold, the counterparty may request additional collateral from the Fund. If the counterparty defaults on its obligation, because of insolvency or other reasons, the Fund could experience delays and costs in recovering the securities sold. Information regarding securities sold under a reverse repurchase agreement, if any, is included at the end of each applicable Fund's Schedule of Investments and the cash proceeds are recorded as a liability in each applicable fund's accompanying Statement of Assets and Liabilities. The Fund continues to receive interest and dividend payments on the securities sold during the term of the reverse repurchase agreement. At period end, there were no reverse repurchase agreements outstanding.
Restricted Securities. The Funds may invest in securities that are subject to legal or contractual restrictions on resale. These securities generally may be resold in transactions exempt from registration or to the public if the securities are registered. Disposal of these securities may involve time-consuming negotiations and expense, and prompt sale at an acceptable price may be difficult. Information regarding restricted securities is included at the end of each applicable Fund's Schedule of Investments.
4. Fees and Other Transactions with Affiliates.
Management Fee. Fidelity Management & Research Company (the investment adviser) and its affiliates provide the Funds with investment management related services for which the Funds pay a monthly management fee that is based on an annual rate of .14% of average net assets.
Distribution and Service Plan Fees. In accordance with Rule 12b-1 of the 1940 Act, the Funds have adopted separate Distribution and Service Plans for each class of shares. Class II, Class III and Select Class of each Fund pays Fidelity Distributors Corporation (FDC), an affiliate of the investment adviser, a Service fee based on an annual percentage of each class' average net assets. Class IV of Treasury Only Portfolio, Treasury Portfolio and Prime Money Market Portfolio pays FDC separate Distribution and Service Fees, each of which is based on an annual percentage of each class' average net assets. FDC may pay financial intermediaries for selling shares of the Funds and providing shareholder support services. For the period, the Distribution and Service fee rates, total fees and amounts retained by FDC were as follows:
| | Distribution
Fee | Service
Fee |
| Class II | .00% | .15% |
| Class III | .00% | .25% |
| Class IV | .25% | .25% |
| Select Class | .00% | .05% |
| | Total Fees | Retained
by FDC |
| Treasury Only Portfolio: | | |
| Class II | $154 | $37 |
| Class III | 1,196 | 461 |
| Class IV | 89 | – |
| Select Class | 38 | 21 |
| | $1,477 | $519 |
Treasury Portfolio:
| | |
| Class II | $676 | $44 |
| Class III | 3,212 | 1,195 |
| Class IV | 1,924 | – |
| Select Class | 63 | 12 |
| | $5,875 | $1,251 |
Government Portfolio:
| | |
| Class II | $548 | $427 |
| Class III | 3,816 | 1,229 |
| Select Class | 181 | 5 |
| | $4,545 | $1,661 |
Money Market Portfolio:
| | |
| Class II | $14 | $–(a) |
| Class III | 111 | – |
| Select Class | 4 | –(a) |
| | $129 | $–(a) |
Prime Money Market Portfolio:
| | |
| Class II | $28 | $8 |
| Class III | 11 | 1 |
| Class IV | –(a) | –(a) |
| Select Class | 5 | 1 |
| | $44 | $10 |
Prime Reserves Portfolio:
| | |
| Class II | $1 | $1 |
| Class III | 1 | 1 |
| Select Class | 1 | 1 |
| | $3 | $3 |
Tax-Exempt Portfolio:
| | |
| Class II | $–(a) | $–(a) |
| Class III | 7 | – |
| Select Class | –(a) | –(a) |
| | $7 | $–(a) |
(a) In the amount of less than five hundred dollars.
Transfer Agent Fees. Fidelity Investments Institutional Operations Company, Inc. (FIIOC), an affiliate of the investment adviser, is the transfer, dividend disbursing and shareholder servicing agent for the Funds. FIIOC receives asset-based fees with respect to each account. FIIOC pays for typesetting, printing and mailing of all shareholder reports, except proxy statements. Each class, with the exception of Institutional Class, pays a transfer agent fee equal to an annual rate of .06% of class-level average net assets. Institutional Class pays a transfer agent fee equal to an annual rate of .03% of class-level average net assets. For the period, transfer agent fees for each class were as follows:
| Treasury Only Portfolio | |
| Class I | $2,140 |
| Class II | 61 |
| Class III | 287 |
| Class IV | 11 |
| Select ClassIV | 45 |
| Institutional ClassIV | 697 |
| | $3,241 |
| Treasury Portfolio | |
| Class I | $2,514 |
| Class II | 271 |
| Class III | 771 |
| Class IV | 231 |
| Select ClassIV | 76 |
| Institutional ClassIV | 1,170 |
| | $5,033 |
| Government Portfolio | |
| Class I | $9,605 |
| Class II | 219 |
| Class III | 916 |
| Select Class | 218 |
| Institutional Class | 8,902 |
| | $19,860 |
| Money Market Portfolio | |
| Class I | $2,664 |
| Class II | 6 |
| Class III | 27 |
| Select Class | 4 |
| Institutional Class | 1,584 |
| | $4,285 |
| Prime Money Market Portfolio | |
| Class I | $342 |
| Class II | 11 |
| Class III | 3 |
| Class IV | –(a) |
| Select Class | 6 |
| Institutional Class | 1,595 |
| | $1,957 |
| Prime Reserves Portfolio | |
| Class I | $263 |
| Class II | –(a) |
| Class III | –(a) |
| Select Class | 1 |
| Institutional Class | 196 |
| | $460 |
| Tax-Exempt Portfolio | |
| Class I | $813 |
| Class II | –(a) |
| Class III | 2 |
| Select Class | –(a) |
| | $815 |
(a) In the amount of less than five hundred dollars.
Accounting Fees. Fidelity Service Company, Inc. (FSC), an affiliate of the investment adviser, maintains each Fund's accounting records. The fee is based on the level of average net assets for each month.
Interfund Lending Program. Pursuant to an Exemptive Order issued by the Securities and Exchange Commission (the SEC), the Funds, along with other registered investment companies having management contracts with Fidelity Management & Research Company (FMR) or other affiliated entities of FMR, may participate in an interfund lending program. This program provides an alternative credit facility allowing the funds to borrow from, or lend money to, other participating affiliated funds. At period end, there were no interfund loans outstanding. Each applicable fund's activity in this program during the period for which loans were outstanding was as follows:
| | | Average Loan Balance | Weighted Average Interest Rate |
| Money Market Portfolio | Lender | 16,618 | 1.14% |
| Prime Reserves Portfolio | Lender | 15,452 | 1.19% |
Interfund Trades. The Funds may purchase from or sell securities to other Fidelity Funds under procedures adopted by the Board. The procedures have been designed to ensure these interfund trades are executed in accordance with Rule 17a-7 of the 1940 Act.
Other. During the period, the investment adviser reimbursed the Funds for certain losses as follows:
| | Amount |
| Treasury Portfolio | $1 |
| Money Market Portfolio | 9 |
| Prime Money Market Portfolio | 7 |
| Prime Reserves Porfolio | 1 |
5. Expense Reductions.
The investment adviser contractually agreed to reimburse funds to the extent annual operating expenses exceeded certain levels of average net assets as noted in the table below. This reimbursement will remain in place through May 31, 2018. Some expenses, for example interest expense, are excluded from this reimbursement.
The following classes of each applicable Fund were in reimbursement during the period:
| | Expense
Limitations | Reimbursement |
| Treasury Only Portfolio | | |
| Class I | .18% | $1,096 |
| Class II | .33% | 31 |
| Class III | .43% | 143 |
| Class IV | .68% | 5 |
| Select Class | .23% | 23 |
| Institutional Class | .14% | 944 |
| Treasury Portfolio | | |
| Class I | .18% | $1,221 |
| Class II | .33% | 127 |
| Class III | .43% | 362 |
| Class IV | .68% | 104 |
| Select Class | .23% | 36 |
| Institutional Class | .14% | 1,516 |
| Government Portfolio | | |
| Class I | .18% | $3,922 |
| Class II | .33% | 87 |
| Class III | .43% | 374 |
| Select Class | .23% | 90 |
| Institutional Class | .14% | 10,266 |
| Money Market Portfolio | | |
| Class I | .18% | $1,367 |
| Class II | .33% | 3 |
| Class III | .43% | 14 |
| Select Class | .23% | 2 |
| Institutional Class | .14% | 2,160 |
| Prime Money Market Portfolio | | |
| Class I | .18% | $195 |
| Class II | .33% | 6 |
| Class III | .43% | 1 |
| Class IV | .68% | –(a) |
| Select Class | .23% | 4 |
| Institutional Class | .14% | 2,326 |
| Prime Reserves Portfolio | | |
| Class I | .18% | $206 |
| Class II | .33% | –(a) |
| Class III | .43% | –(a) |
| Select Class | .23% | 1 |
| Institutional Class | .14% | 374 |
| Tax-Exempt Portfolio | | |
| Class I | .18% | $523 |
| Class II | .33% | –(a) |
| Class III | .43% | 1 |
| Select Class | .23% | 1 |
(a) In the amount of less than five hundred dollars.
In addition, through arrangements with each applicable Fund's custodian, credits realized as a result of certain uninvested cash balances were used to reduce each Fund's expenses. All of the applicable expense reductions are noted in the table below.
| | Custody
expense
reduction |
| Treasury Only Portfolio | $3 |
| Treasury Portfolio | 6 |
| Government Portfolio | 13 |
| Money Market Portfolio | 6 |
| Prime Money Market Portfolio | – |
| Prime Reserves Portfolio | –(a) |
| Tax-Exempt Portfolio | 2 |
(a) In the amount of less than five hundred dollars.
6. Distributions to Shareholders.
Distributions to shareholders of each class were as follows:
| | Six months ended
September 30, 2017 | Year ended
March 31, 2017 |
| Treasury Only Portfolio | | |
| From net investment income | | |
| Class I | $25,967 | $19,836 |
| Class II | 615 | 161 |
| Class III | 2,319 | 399 |
| Class IV | 42 | 8 |
| Select Class | 530 | 257 |
| Institutional Class | 18,035 | 10,556 |
| Total | $47,508 | $31,217 |
| Treasury Portfolio | | |
| From net investment income | | |
| Class I | $32,100 | $27,548 |
| Class II | 3,012 | 432 |
| Class III | 6,706 | 1,362 |
| Class IV | 1,028 | 90 |
| Select Class | 912 | 648 |
| Institutional Class | 32,456 | 16,422 |
| Total | $76,214 | $46,502 |
| Government Portfolio | | |
| From net investment income | | |
| Class I | $122,600 | $97,048 |
| Class II | 2,194 | 1,324 |
| Class III | 7,948 | 1,908 |
| Select Class | 2,642 | 1,728 |
| Institutional Class | 241,760 | 171,199 |
| Total | $377,144 | $273,207 |
| Money Market Portfolio | | |
| From net investment income | | |
| Class I | $51,286 | $51,603 |
| Class II | 93 | 128 |
| Class III | 401 | 681 |
| Select Class | 81 | 175 |
| Class F | – | 1,013 |
| Institutional Class | 62,921 | 72,560 |
| Total | $114,782 | $126,160 |
| Prime Money Market Portfolio | | |
| From net investment income | | |
| Class I | $6,255 | $21,114 |
| Class II | 174 | 500 |
| Class III | 38 | 628 |
| Class IV | – | 5 |
| Select Class | 107 | 2,111 |
| Institutional Class | 60,543 | 136,235 |
| Total | $67,117 | $160,593 |
| From net realized gain | | |
| Class I | $– | $1,805 |
| Class II | – | 141 |
| Class III | – | 148 |
| Select Class | – | 20 |
| Institutional Class | – | 8,246 |
| Total | $– | $10,360 |
| Prime Reserves Portfolio | | |
| From net investment income | | |
| Class I | $4,867 | $1,214(a) |
| Class II | 5 | 3(a) |
| Class III | 5 | 3(a) |
| Select Class | 12 | 4(a) |
| Institutional Class | 7,542 | 2,571(a) |
| Total | $12,431 | $3,795(a) |
| Tax-Exempt Portfolio | | |
| From net investment income | | |
| Class I | $9,447 | $7,094 |
| Class II | 1 | 1 |
| Class III | 12 | 17 |
| Select Class | 2 | 1 |
| Total | $9,462 | $7,113 |
| From net realized gain | | |
| Class I | $– | $980 |
| Class II | – | –(b) |
| Class III | – | 60 |
| Select Class | – | –(b) |
| Total | $– | $1,040 |
(a) Distributions are for the period June 2, 2016 (commencement of operations) to March 31, 2017.
(b) In the amount of less than five hundred dollars.
7. Share Transactions.
Share Transactions for each class of shares at a $1.00 per share were as follows and may contain automatic conversions between classes or exchanges between affiliated funds:
| | Shares | Shares | Dollars | Dollars |
| | Six months ended September 30, 2017 | Year ended
March 31, 2017 | Six months ended
September 30, 2017 | Year ended
March 31, 2017 |
| Treasury Only Portfolio | | | | |
| Class I | | | | |
| Shares sold | 5,764,576 | 15,240,325 | $5,764,576 | $15,240,325 |
| Reinvestment of distributions | 16,679 | 12,773 | 16,679 | 12,773 |
| Shares redeemed | (6,438,080) | (17,650,692) | (6,438,080) | (17,650,692) |
| Net increase (decrease) | (656,825) | (2,397,594) | $(656,825) | $(2,397,594) |
| Class II | | | | |
| Shares sold | 231,669 | 297,056 | $231,669 | $297,056 |
| Reinvestment of distributions | 210 | 85 | 210 | 85 |
| Shares redeemed | (174,795) | (445,655) | (174,795) | (445,655) |
| Net increase (decrease) | 57,084 | (148,514) | $57,084 | $(148,514) |
| Class III | | | | |
| Shares sold | 2,052,588 | 4,840,544 | $2,052,588 | $4,840,544 |
| Reinvestment of distributions | 1,091 | 184 | 1,091 | 184 |
| Shares redeemed | (2,078,098) | (4,750,231) | (2,078,098) | (4,750,231) |
| Net increase (decrease) | (24,419) | 90,497 | $(24,419) | $90,497 |
| Class IV | | | | |
| Shares sold | 73,343 | 125,268 | $73,343 | $125,268 |
| Reinvestment of distributions | 42 | 8 | 42 | 8 |
| Shares redeemed | (70,079) | (430,935) | (70,079) | (430,935) |
| Net increase (decrease) | 3,306 | (305,659) | $3,306 | $(305,659) |
| Select Class | | | | |
| Shares sold | 510,624 | 1,280,315 | $510,624 | $1,280,315 |
| Reinvestment of distributions | 215 | 145 | 215 | 145 |
| Shares redeemed | (450,623) | (1,366,793) | (450,623) | (1,366,793) |
| Net increase (decrease) | 60,216 | (86,333) | $60,216 | $(86,333) |
| Institutional Class | | | | |
| Shares sold | 5,437,644 | 9,635,535 | $5,437,644 | $9,635,535 |
| Reinvestment of distributions | 10,105 | 5,228 | 10,105 | 5,228 |
| Shares redeemed | (5,411,761) | (6,678,289) | (5,411,761) | (6,678,289) |
| Net increase (decrease) | 35,988 | 2,962,474 | $35,988 | $2,962,474 |
| Treasury Portfolio | | | | |
| Class I | | | | |
| Shares sold | 34,258,180 | 80,854,303 | $34,258,180 | $80,854,303 |
| Reinvestment of distributions | 10,704 | 8,190 | 10,704 | 8,190 |
| Shares redeemed | (34,159,510) | (82,194,540) | (34,159,510) | (82,194,540) |
| Net increase (decrease) | 109,374 | (1,332,047) | $109,374 | $(1,332,047) |
| Class II | | | | |
| Shares sold | 1,884,460 | 2,878,086 | $1,884,460 | $2,878,086 |
| Reinvestment of distributions | 26 | 13 | 26 | 13 |
| Shares redeemed | (854,623) | (3,071,872) | (854,623) | (3,071,872) |
| Net increase (decrease) | 1,029,863 | (193,773) | $1,029,863 | $(193,773) |
| Class III | | | | |
| Shares sold | 4,484,980 | 8,729,467 | $4,484,980 | $8,729,467 |
| Reinvestment of distributions | 841 | 184 | 841 | 184 |
| Shares redeemed | (4,394,856) | (9,027,771) | (4,394,856) | (9,027,771) |
| Net increase (decrease) | 90,965 | (298,120) | $90,965 | $(298,120) |
| Class IV | | | | |
| Shares sold | 849,277 | 931,051 | $849,277 | $931,051 |
| Reinvestment of distributions | 35 | –(a) | 35 | –(b) |
| Shares redeemed | (837,715) | (1,042,845) | (837,715) | (1,042,845) |
| Net increase (decrease) | 11,597 | (111,794) | $11,597 | $(111,794) |
| Select Class | | | | |
| Shares sold | 707,713 | 1,653,663 | $707,713 | $1,653,663 |
| Reinvestment of distributions | 164 | 177 | 164 | 177 |
| Shares redeemed | (715,137) | (1,665,048) | (715,137) | (1,665,048) |
| Net increase (decrease) | (7,260) | (11,208) | $(7,260) | $(11,208) |
| Institutional Class | | | | |
| Shares sold | 48,121,217 | 47,643,870 | $48,121,217 | $47,643,870 |
| Reinvestment of distributions | 23,097 | 12,675 | 23,097 | 12,675 |
| Shares redeemed | (43,037,172) | (44,216,941) | (43,037,172) | (44,216,941) |
| Net increase (decrease) | 5,107,142 | 3,439,604 | $5,107,142 | $3,439,604 |
| Government Portfolio | | | | |
| Class I | | | | |
| Shares sold | 119,142,903 | 216,719,320 | $119,142,903 | $216,719,320 |
| Reinvestment of distributions | 37,142 | 26,560 | 37,142 | 26,560 |
| Shares redeemed | (120,707,907) | (207,297,666) | (120,707,907) | (207,297,666) |
| Net increase (decrease) | (1,527,862) | 9,448,214 | $(1,527,862) | $9,448,214 |
| Class II | | | | |
| Shares sold | 3,249,290 | 6,254,053 | $3,249,290 | $6,254,053 |
| Reinvestment of distributions | 186 | 126 | 186 | 126 |
| Shares redeemed | (3,599,504) | (5,830,322) | (3,599,504) | (5,830,322) |
| Net increase (decrease) | (350,028) | 423,857 | $(350,028) | $423,857 |
| Class III | | | | |
| Shares sold | 3,799,743 | 7,571,865 | $3,799,743 | $7,571,865 |
| Reinvestment of distributions | 2,716 | 728 | 2,716 | 728 |
| Shares redeemed | (3,558,179) | (6,492,450) | (3,558,179) | (6,492,450) |
| Net increase (decrease) | 244,280 | 1,080,143 | $244,280 | $1,080,143 |
| Select Class | | | | |
| Shares sold | 1,851,401 | 3,163,969 | $1,851,401 | $3,163,969 |
| Reinvestment of distributions | 2,237 | 1,025 | 2,237 | 1,025 |
| Shares redeemed | (1,686,628) | (2,809,636) | (1,686,628) | (2,809,636) |
| Net increase (decrease) | 167,010 | 355,358 | $167,010 | $355,358 |
| Institutional Class | | | | |
| Shares sold | 243,022,395 | 418,317,187 | $243,022,395 | $418,317,187 |
| Reinvestment of distributions | 155,324 | 113,432 | 155,324 | 113,432 |
| Shares redeemed | (238,183,735) | (379,400,119) | (238,183,735) | (379,400,119) |
| Net increase (decrease) | 4,993,984 | 39,030,500 | $4,993,984 | $39,030,500 |
| Money Market Portfolio | | | | |
| Class I | | | | |
| Shares sold | 6,555,087 | 11,251,590 | $6,555,087 | $11,251,590 |
| Reinvestment of distributions | 44,720 | 42,256 | 44,720 | 42,256 |
| Shares redeemed | (3,683,351) | (23,578,146) | (3,683,351) | (23,578,146) |
| Net increase (decrease) | 2,916,456 | (12,284,300) | $2,916,456 | $(12,284,300) |
| Class II | | | | |
| Shares sold | 26,353 | 99,339 | $26,353 | $99,339 |
| Reinvestment of distributions | 93 | 115 | 93 | 115 |
| Shares redeemed | (15,827) | (161,055) | (15,827) | (161,055) |
| Net increase (decrease) | 10,619 | (61,601) | $10,619 | $(61,601) |
| Class III | | | | |
| Shares sold | 41,047 | 1,252,013 | $41,047 | $1,252,013 |
| Reinvestment of distributions | 400 | 419 | 400 | 419 |
| Shares redeemed | (41,057) | (2,290,247) | (41,057) | (2,290,247) |
| Net increase (decrease) | 390 | (1,037,815) | $390 | $(1,037,815) |
| Select Class | | | | |
| Shares sold | 3,901 | 224,289 | $3,901 | $224,289 |
| Reinvestment of distributions | 81 | 62 | 81 | 62 |
| Shares redeemed | (591) | (435,943) | (591) | (435,943) |
| Net increase (decrease) | 3,391 | (211,592) | $3,391 | $(211,592) |
| Class F | | | | |
| Shares sold | – | 129,619 | $– | $129,619 |
| Reinvestment of distributions | – | 713 | – | 713 |
| Shares redeemed | – | (2,434,015) | – | (2,434,015) |
| Net increase (decrease) | – | (2,303,683) | $– | $(2,303,683) |
| Institutional Class | | | | |
| Shares sold | 6,568,119 | 25,232,850 | $6,568,119 | $25,232,850 |
| Reinvestment of distributions | 56,099 | 61,995 | 56,099 | 61,995 |
| Shares redeemed | (4,866,717) | (37,111,312) | (4,866,717) | (37,111,312) |
| Net increase (decrease) | 1,757,501 | (11,816,467) | $1,757,501 | $(11,816,467) |
| Prime Money Market Portfolio | | | | |
| Class I | | | | |
| Shares sold | 2,734,696 | 74,144,867 | $2,736,060 | $74,146,617 |
| Reinvestment of distributions | 2,855 | 8,804 | 2,857 | 8,805 |
| Shares redeemed | (2,875,636) | (82,924,114) | (2,877,066) | (82,926,664) |
| Net increase (decrease) | (138,085) | (8,770,443) | $(138,149) | $(8,771,242) |
| Class II | | | | |
| Shares sold | 74,680 | 3,641,037 | $74,710 | $3,641,047 |
| Reinvestment of distributions | 138 | 126 | 138 | 126 |
| Shares redeemed | (50,969) | (3,858,268) | (50,990) | (3,858,336) |
| Net increase (decrease) | 23,849 | (217,105) | $23,858 | $(217,163) |
| Class III | | | | |
| Shares sold | 3,462 | 2,637,729 | $3,464 | $2,637,736 |
| Reinvestment of distributions | 36 | 136 | 36 | 136 |
| Shares redeemed | (2,268) | (3,523,935) | (2,269) | (3,524,041) |
| Net increase (decrease) | 1,230 | (886,070) | $1,231 | $(886,169) |
| Class IV | | | | |
| Shares sold | – | 39,312 | $– | $39,312 |
| Reinvestment of distributions | – | 5 | – | 5 |
| Shares redeemed | – | (223,046) | – | (223,046) |
| Net increase (decrease) | – | (183,729) | $– | $(183,729) |
| Select Class | | | | |
| Shares sold | 5,134 | 3,823,277 | $5,137 | $3,823,282 |
| Reinvestment of distributions | 106 | 1,007 | 106 | 1,007 |
| Shares redeemed | (13,155) | (4,567,165) | (13,162) | (4,567,177) |
| Net increase (decrease) | (7,915) | (742,881) | $(7,919) | $(742,888) |
| Institutional Class | | | | |
| Shares sold | 31,745,487 | 236,441,408 | $31,758,002 | $236,454,059 |
| Reinvestment of distributions | 44,689 | 84,139 | 44,707 | 84,149 |
| Shares redeemed | (28,628,598) | (273,660,217) | (28,639,886) | (273,673,354) |
| Net increase (decrease) | 3,161,578 | (37,134,670) | $3,162,823 | $(37,135,146) |
| Prime Reserves Portfolio | | | | |
| Class I | | | | |
| Shares sold | 1,020,569 | 694,526(c) | $1,020,771 | $694,596(c) |
| Reinvestment of distributions | 3,224 | 744(c) | 3,225 | 744(c) |
| Shares redeemed | (391,737) | (155,762)(c) | (391,815) | (155,776)(c) |
| Net increase (decrease) | 632,056 | 539,508(c) | $632,181 | $539,564(c) |
| Class II | | | | |
| Shares sold | – | 1,000(c) | $– | $1,000(c) |
| Reinvestment of distributions | 4 | 3(c) | 4 | 3(c) |
| Net increase (decrease) | 4 | 1,003(c) | $4 | $1,003(c) |
| Class III | | | | |
| Shares sold | 1,594 | 1,000(c) | $1,594 | $1,000(c) |
| Reinvestment of distributions | 5 | 3(c) | 5 | 3(c) |
| Shares redeemed | – | –(a),(c) | – | –(b),(c) |
| Net increase (decrease) | 1,599 | 1,003(c) | $1,599 | $1,003(c) |
| Select Class | | | | |
| Shares sold | 1,607 | 1,443(c) | $1,608 | $1,443(c) |
| Reinvestment of distributions | 11 | 4(c) | 11 | 4(c) |
| Shares redeemed | (376) | –(c) | (376) | –(c) |
| Net increase (decrease) | 1,242 | 1,447(c) | $1,243 | $1,447(c) |
| Institutional Class | | | | |
| Shares sold | 1,526,209 | 1,676,735(c) | $1,526,513 | $1,676,859(c) |
| Reinvestment of distributions | 5,950 | 2,323(c) | 5,951 | 2,324(c) |
| Shares redeemed | (767,065) | (714,231)(c) | (767,218) | (714,266)(c) |
| Net increase (decrease) | 765,094 | 964,827(c) | $765,246 | $964,917(c) |
| Tax-Exempt Portfolio | | | | |
| Class I | | | | |
| Shares sold | 2,072,242 | 2,969,785 | $2,072,242 | $2,969,785 |
| Reinvestment of distributions | 7,048 | 5,765 | 7,048 | 5,765 |
| Shares redeemed | (1,243,389) | (2,141,221) | (1,243,389) | (2,141,221) |
| Net increase (decrease) | 835,901 | 834,329 | $835,901 | $834,329 |
| Class II | | | | |
| Shares sold | – | 67 | $– | $67 |
| Reinvestment of distributions | 1 | 2 | 1 | 2 |
| Shares redeemed | – | (447) | – | (447) |
| Net increase (decrease) | 1 | (378) | $1 | $(378) |
| Class III | | | | |
| Shares sold | 17,499 | 115,337 | $17,499 | $115,337 |
| Reinvestment of distributions | 7 | 33 | 7 | 33 |
| Shares redeemed | (16,818) | (325,665) | (16,818) | (325,665) |
| Net increase (decrease) | 688 | (210,295) | $688 | $(210,295) |
| Select Class | | | | |
| Shares sold | 1,000 | 2,063 | $1,000 | $2,063 |
| Reinvestment of distributions | 2 | 1 | 2 | 1 |
| Shares redeemed | – | (5,762) | – | (5,762) |
| Net increase (decrease) | 1,002 | (3,698) | $1,002 | $(3,698) |
(a) In the amount of less than five hundred shares.
(b) In the amount of less than five hundred dollars.
(c) For the period June 2, 2016 (commencement of operations) to March 31, 2017.
8. Other.
The Funds' organizational documents provide former and current trustees and officers with a limited indemnification against liabilities arising in connection with the performance of their duties to the Funds. In the normal course of business, the Funds may also enter into contracts that provide general indemnifications. The Funds' maximum exposure under these arrangements is unknown as this would be dependent on future claims that may be made against the Funds. The risk of material loss from such claims is considered remote.
Shareholder Expense Example
As a shareholder of the Fund, you incur two types of costs: (1) transaction costs and (2) ongoing costs, including management fees, distribution and/or service (12b-1) fees and other Fund expenses. This Example is intended to help you understand your ongoing costs (in dollars) of investing in the Fund and to compare these costs with the ongoing costs of investing in other mutual funds.
The Example is based on an investment of $1,000 invested at the beginning of the period and held for the entire period (April 1, 2017 to September 30, 2017).
Actual Expenses
The first line of the accompanying table for each Class of each fund provides information about actual account values and actual expenses. You may use the information in this line, together with the amount you invested, to estimate the expenses that you paid over the period. Simply divide your account value by $1,000.00 (for example, an $8,600 account value divided by $1,000.00 = 8.6), then multiply the result by the number in the first line for a Class of the fund under the heading entitled "Expenses Paid During Period" to estimate the expenses you paid on your account during this period. In addition, each Fund, as a shareholder in the underlying Fidelity Central Funds, will indirectly bear its pro-rata share of the fees and expenses incurred by the underlying Fidelity Central Funds. These fees and expenses are not included in the Fund's annualized expense ratio used to calculate the expense estimate in the table below.
Hypothetical Example for Comparison Purposes
The second line of the accompanying table for each Class of each fund provides information about hypothetical account values and hypothetical expenses based on a Class' actual expense ratio and an assumed rate of return of 5% per year before expenses, which is not the Class' actual return. The hypothetical account values and expenses may not be used to estimate the actual ending account balance or expenses you paid for the period. You may use this information to compare the ongoing costs of investing in the Fund and other funds. To do so, compare this 5% hypothetical example with the 5% hypothetical examples that appear in the shareholder reports of the other funds. In addition, each Fund, as a shareholder in the underlying Fidelity Central Funds, will indirectly bear its pro-rata share of the fees and expenses incurred by the underlying Fidelity Central Funds. These fees and expenses are not included in the Fund's annualized expense ratio used to calculate the expense estimate in the table below.
Please note that the expenses shown in the table are meant to highlight your ongoing costs only and do not reflect any transaction costs. Therefore, the second line of the table is useful in comparing ongoing costs only, and will not help you determine the relative total costs of owning different funds.
| | Annualized Expense RatioA | Beginning
Account Value
April 1, 2017 | Ending
Account Value
September 30, 2017 | Expenses Paid
During Period-B
April 1, 2017
to September 30, 2017 |
| Treasury Only Portfolio | | | | |
| Class I | .18% | | | |
| Actual | | $1,000.00 | $1,003.70 | $.90 |
| Hypothetical-C | | $1,000.00 | $1,024.17 | $.91 |
| Class II | .33% | | | |
| Actual | | $1,000.00 | $1,002.90 | $1.66 |
| Hypothetical-C | | $1,000.00 | $1,023.41 | $1.67 |
| Class III | .43% | | | |
| Actual | | $1,000.00 | $1,002.40 | $2.16 |
| Hypothetical-C | | $1,000.00 | $1,022.91 | $2.18 |
| Class IV | .68% | | | |
| Actual | | $1,000.00 | $1,001.20 | $3.41 |
| Hypothetical-C | | $1,000.00 | $1,021.66 | $3.45 |
| Select Class | .23% | | | |
| Actual | | $1,000.00 | $1,003.40 | $1.16 |
| Hypothetical-C | | $1,000.00 | $1,023.92 | $1.17 |
| Institutional Class | .14% | | | |
| Actual | | $1,000.00 | $1,003.90 | $.70 |
| Hypothetical-C | | $1,000.00 | $1,024.37 | $.71 |
| Treasury Portfolio | | | | |
| Class I | .18% | | | |
| Actual | | $1,000.00 | $1,003.90 | $.90 |
| Hypothetical-C | | $1,000.00 | $1,024.17 | $.91 |
| Class II | .33% | | | |
| Actual | | $1,000.00 | $1,003.10 | $1.66 |
| Hypothetical-C | | $1,000.00 | $1,023.41 | $1.67 |
| Class III | .43% | | | |
| Actual | | $1,000.00 | $1,002.60 | $2.16 |
| Hypothetical-C | | $1,000.00 | $1,022.91 | $2.18 |
| Class IV | .68% | | | |
| Actual | | $1,000.00 | $1,001.40 | $3.41 |
| Hypothetical-C | | $1,000.00 | $1,021.66 | $3.45 |
| Select Class | .23% | | | |
| Actual | | $1,000.00 | $1,003.60 | $1.16 |
| Hypothetical-C | | $1,000.00 | $1,023.92 | $1.17 |
| Institutional Class | .14% | | | |
| Actual | | $1,000.00 | $1,004.10 | $.70 |
| Hypothetical-C | | $1,000.00 | $1,024.37 | $.71 |
| Government Portfolio | | | | |
| Class I | .18% | | | |
| Actual | | $1,000.00 | $1,003.90 | $.90 |
| Hypothetical-C | | $1,000.00 | $1,024.17 | $.91 |
| Class II | .33% | | | |
| Actual | | $1,000.00 | $1,003.10 | $1.66 |
| Hypothetical-C | | $1,000.00 | $1,023.41 | $1.67 |
| Class III | .43% | | | |
| Actual | | $1,000.00 | $1,002.60 | $2.16 |
| Hypothetical-C | | $1,000.00 | $1,022.91 | $2.18 |
| Select Class | .23% | | | |
| Actual | | $1,000.00 | $1,003.60 | $1.16 |
| Hypothetical-C | | $1,000.00 | $1,023.92 | $1.17 |
| Institutional Class | .14% | | | |
| Actual | | $1,000.00 | $1,004.10 | $.70 |
| Hypothetical-C | | $1,000.00 | $1,024.37 | $.71 |
| Money Market Portfolio | | | | |
| Class I | .18% | | | |
| Actual | | $1,000.00 | $1,005.80 | $.91 |
| Hypothetical-C | | $1,000.00 | $1,024.17 | $.91 |
| Class II | .33% | | | |
| Actual | | $1,000.00 | $1,005.00 | $1.66 |
| Hypothetical-C | | $1,000.00 | $1,023.41 | $1.67 |
| Class III | .43% | | | |
| Actual | | $1,000.00 | $1,004.50 | $2.16 |
| Hypothetical-C | | $1,000.00 | $1,022.91 | $2.18 |
| Select Class | .23% | | | |
| Actual | | $1,000.00 | $1,005.50 | $1.16 |
| Hypothetical-C | | $1,000.00 | $1,023.92 | $1.17 |
| Institutional Class | .14% | | | |
| Actual | | $1,000.00 | $1,006.00 | $.70 |
| Hypothetical-C | | $1,000.00 | $1,024.37 | $.71 |
| Prime Money Market Portfolio | | | | |
| Class I | .18% | | | |
| Actual | | $1,000.00 | $1,005.50 | $.90 |
| Hypothetical-C | | $1,000.00 | $1,024.17 | $.91 |
| Class II | .33% | | | |
| Actual | | $1,000.00 | $1,004.70 | $1.66 |
| Hypothetical-C | | $1,000.00 | $1,023.41 | $1.67 |
| Class III | .43% | | | |
| Actual | | $1,000.00 | $1,004.20 | $2.16 |
| Hypothetical-C | | $1,000.00 | $1,022.91 | $2.18 |
| Class IV | .68% | | | |
| Actual | | $1,000.00 | $1,002.80 | $3.41 |
| Hypothetical-C | | $1,000.00 | $1,021.66 | $3.45 |
| Select Class | .23% | | | |
| Actual | | $1,000.00 | $1,005.10 | $1.16 |
| Hypothetical-C | | $1,000.00 | $1,023.92 | $1.17 |
| Institutional Class | .14% | | | |
| Actual | | $1,000.00 | $1,005.70 | $.70 |
| Hypothetical-C | | $1,000.00 | $1,024.37 | $.71 |
| Prime Reserves Portfolio | | | | |
| Class I | .18% | | | |
| Actual | | $1,000.00 | $1,005.50 | $.90 |
| Hypothetical-C | | $1,000.00 | $1,024.17 | $.91 |
| Class II | .33% | | | |
| Actual | | $1,000.00 | $1,004.80 | $1.66 |
| Hypothetical-C | | $1,000.00 | $1,023.41 | $1.67 |
| Class III | .43% | | | |
| Actual | | $1,000.00 | $1,004.20 | $2.16 |
| Hypothetical-C | | $1,000.00 | $1,022.91 | $2.18 |
| Select Class | .23% | | | |
| Actual | | $1,000.00 | $1,005.30 | $1.16 |
| Hypothetical-C | | $1,000.00 | $1,023.92 | $1.17 |
| Institutional Class | .14% | | | |
| Actual | | $1,000.00 | $1,005.70 | $.70 |
| Hypothetical-C | | $1,000.00 | $1,024.37 | $.71 |
| Tax-Exempt Portfolio | | | | |
| Class I | .18% | | | |
| Actual | | $1,000.00 | $1,003.50 | $.90 |
| Hypothetical-C | | $1,000.00 | $1,024.17 | $.91 |
| Class II | .33% | | | |
| Actual | | $1,000.00 | $1,002.70 | $1.66 |
| Hypothetical-C | | $1,000.00 | $1,023.41 | $1.67 |
| Class III | .43% | | | |
| Actual | | $1,000.00 | $1,002.20 | $2.16 |
| Hypothetical-C | | $1,000.00 | $1,022.91 | $2.18 |
| Select Class | .23% | | | |
| Actual | | $1,000.00 | $1,003.20 | $1.15 |
| Hypothetical-C | | $1,000.00 | $1,023.92 | $1.17 |
A Annualized expense ratio reflects expenses net of applicable fee waivers.
B Expenses are equal to each Class' annualized expense ratio, multiplied by the average account value over the period, multiplied by 183/ 365 (to reflect the one-half year period).
C 5% return per year before expenses
Board Approval of Investment Advisory Contracts and Management Fees
FIMM Funds: Government Portfolio / Money Market Portfolio / Prime Money Market Portfolio / Prime Reserves Portfolio / Tax-Exempt Portfolio / Treasury Portfolio / Treasury Only Portfolio
Each year, the Board of Trustees, including the Independent Trustees (together, the Board), votes on the renewal of the management contract with Fidelity Management & Research Company (FMR) and the sub-advisory agreements (together, the Advisory Contracts) for each fund. FMR and the sub-advisers are referred to herein as the Investment Advisers. The Board, assisted by the advice of fund counsel and Independent Trustees' counsel, requests and considers a broad range of information relevant to the renewal of the Advisory Contracts throughout the year.
The Board meets regularly and, at each of its meetings, covers an extensive agenda of topics and materials and considers factors that are relevant to its annual consideration of the renewal of each fund's Advisory Contracts, including the services and support provided to each fund and its shareholders. The Board has established four standing committees (Committees) — Operations, Audit, Fair Valuation, and Governance and Nominating — each composed of and chaired by Independent Trustees with varying backgrounds, to which the Board has assigned specific subject matter responsibilities in order to enhance effective decision-making by the Board. The Operations Committee, of which all of the Independent Trustees are members, meets regularly throughout the year and considers, among other matters, information specifically related to the annual consideration of the renewal of each fund's Advisory Contracts. The Board, acting directly and through its Committees, requests and receives information concerning the annual consideration of the renewal of each fund's Advisory Contracts. The Board also meets as needed to review matters specifically related to the Board's annual consideration of the renewal of the Advisory Contracts. Members of the Board may also meet with trustees of other Fidelity funds through ad hoc joint committees to discuss certain matters relevant to all of the Fidelity funds.
At its September 2017 meeting, the Board unanimously determined to renew each fund's Advisory Contracts. In reaching its determination, the Board considered all factors it believed relevant, including (i) the nature, extent, and quality of the services to be provided to each fund and its shareholders (including the investment performance of each fund); (ii) the competitiveness of each fund's management fee and total expense ratio relative to peer funds; (iii) the total costs of the services to be provided by and the profits to be realized by Fidelity from its relationships with each fund; and (iv) the extent to which, if any, economies of scale exist and would be realized as each fund grows, and whether any economies of scale are appropriately shared with fund shareholders.
In considering whether to renew the Advisory Contracts for each fund, the Board reached a determination, with the assistance of fund counsel and Independent Trustees' counsel and through the exercise of its business judgment, that the renewal of the Advisory Contracts was in the best interests of each fund and its shareholders and that the compensation payable under the Advisory Contracts was fair and reasonable. The Board's decision to renew the Advisory Contracts was not based on any single factor, but rather was based on a comprehensive consideration of all the information provided to the Board at its meetings throughout the year. The Board, in reaching its determination to renew the Advisory Contracts, was aware that shareholders of each fund have a broad range of investment choices available to them, including a wide choice among funds offered by Fidelity's competitors, and that each fund's shareholders, who have the opportunity to review and weigh the disclosure provided by the fund in its prospectus and other public disclosures, have chosen to invest in that fund, which is part of the Fidelity family of funds.
Nature, Extent, and Quality of Services Provided. The Board considered Fidelity's staffing as it relates to the funds, including the backgrounds of investment personnel of Fidelity, and also considered the funds' investment objectives, strategies, and related investment philosophies. The Independent Trustees also had discussions with senior management of Fidelity's investment operations and investment groups. The Board considered the structure of the investment personnel compensation program and whether this structure provides appropriate incentives to act in the best interests of each fund. Additionally, the Board considered the portfolio managers' investments, if any, in the funds that they manage.
Resources Dedicated to Investment Management and Support Services. The Board reviewed the general qualifications and capabilities of Fidelity's investment staff, including its size, education, experience, and resources, as well as Fidelity's approach to recruiting, managing, and compensating investment personnel. The Board noted that Fidelity has continued to increase the resources devoted to non-U.S. offices, including expansion of Fidelity's global investment organization. The Board also noted that Fidelity's analysts have extensive resources, tools and capabilities that allow them to conduct sophisticated quantitative and fundamental analysis, as well as credit analysis of issuers, counterparties and guarantors. Further, the Board considered that Fidelity's investment professionals have sufficient access to global information and data so as to provide competitive investment results over time, and that those professionals also have access to sophisticated tools that permit them to assess portfolio construction and risk and performance attribution characteristics continuously, as well as to transmit new information and research conclusions rapidly around the world. Additionally, in its deliberations, the Board considered Fidelity's trading, risk management, compliance, and technology and operations capabilities and resources, which are integral parts of the investment management process.
Shareholder and Administrative Services. The Board considered (i) the nature, extent, quality, and cost of advisory, administrative, and shareholder services performed by the Investment Advisers and their affiliates under the Advisory Contracts and under separate agreements covering transfer agency and pricing and bookkeeping services for each fund; (ii) the nature and extent of the supervision of third party service providers, principally custodians, subcustodians, and pricing vendors; and (iii) the resources devoted to, and the record of compliance with, each fund's compliance policies and procedures.
The Board noted that the growth of fund assets over time across the complex allows Fidelity to reinvest in the development of services designed to enhance the value or convenience of the Fidelity funds as investment vehicles. These services include 24-hour access to account information and market information through telephone representatives and over the Internet, investor education materials and asset allocation tools, and the expanded availability of Fidelity Investor Centers.
Investment in a Large Fund Family. The Board considered the benefits to shareholders of investing in a Fidelity fund, including the benefits of investing in a fund that is part of a large family of funds offering a variety of investment disciplines and providing a large variety of mutual fund investor services. The Board noted that Fidelity had taken, or had made recommendations that resulted in the Fidelity funds taking, a number of actions over the previous year that benefited particular funds, including: (i) continuing to dedicate additional resources to Fidelity's investment research process, which includes meetings with management of issuers in which the funds invest, and to the support of the senior management team that oversees asset management; (ii) continuing efforts to enhance Fidelity's global research capabilities; (iii) launching new funds and making other enhancements to meet client needs; (iv) launching new share classes of existing funds; (v) eliminating purchase minimums and broadening eligibility requirements for certain lower-priced share classes; (vi) reducing management fees and total expenses for certain growth equity funds and index funds; (vii) lowering expense caps for certain existing funds and classes to reduce expenses borne by shareholders; (viii) eliminating short-term redemption fees for certain funds; (ix) introducing a new pricing structure for certain funds of funds that is expected to reduce overall expenses paid by shareholders; (x) rationalizing product lines and gaining increased efficiencies through proposals for fund mergers and share class consolidations; (xi) continuing to develop, acquire and implement systems and technology to improve services to the funds and shareholders, strengthen information security, and increase efficiency; and (xii) implementing enhancements to further strengthen Fidelity's product line to increase investors' probability of success in achieving their investment goals, including retirement income goals.
Investment Performance. The Board considered whether each fund has operated in accordance with its investment objective, as well as its record of compliance with its investment restrictions and its performance history. As Prime Reserves Portfolio recently commenced operations, the Board did not believe that it was appropriate to assign significant weight to its limited investment performance. The Board noted that there were portfolio management changes for Government Portfolio, Prime Money Market Portfolio, Prime Reserves Portfolio, Tax-Exempt Portfolio, Treasury Portfolio, and Treasury Only Portfolio in March 2017.
The Board took into account discussions with representatives of the Investment Advisers about fund investment performance that occur at Board meetings throughout the year. In this regard the Board noted that as part of regularly scheduled fund reviews and other reports to the Board on fund performance, the Board considers annualized return information for each fund for different time periods, measured against a peer group of funds with similar objectives ("peer group").
In addition to reviewing absolute and relative fund performance, the Independent Trustees periodically consider the appropriateness of fund performance metrics in evaluating the results achieved. In general, the Independent Trustees believe that fund performance should be evaluated based on gross performance (before fees and expenses but after transaction costs) compared to the gross performance of appropriate peer groups, over appropriate time periods that may include full market cycles, taking into account relevant factors including the following: general market conditions; expectations for interest rate levels and credit conditions; issuer-specific information including credit quality; the fund's market value NAV over time and its resilience under various stressed conditions; and fund cash flows and other factors.
The Board recognizes that in interest rate environments where many competitors waive fees to maintain a minimum yield, relative money market fund performance on a net basis (after fees and expenses) may not be particularly meaningful due to miniscule performance differences among competitor funds. Depending on the circumstances, the Independent Trustees may be satisfied with a fund's performance notwithstanding that it lags its peer group for certain periods.
The Independent Trustees recognize that shareholders evaluate performance on a net basis over their own holding periods, for which one-, three-, and five-year periods are often used as a proxy. For this reason, the performance information reviewed by the Board also included net cumulative calendar year total return information for each fund (except Prime Reserves Portfolio) and an appropriate peer group for the most recent one-, three-, and five-year periods.
Based on its review, the Board concluded that the nature, extent, and quality of services provided to each fund under the Advisory Contracts should continue to benefit the shareholders of each fund.
Competitiveness of Management Fee and Total Expense Ratio. The Board considered each fund's management fee and total expense ratio compared to "mapped groups" of competitive funds and classes created for the purpose of facilitating the Trustees' competitive analysis of management fees and total expenses. Fidelity creates "mapped groups" by combining similar Lipper investment objective categories that have comparable investment mandates. Combining Lipper investment objective categories aids the Board's management fee and total expense ratio comparisons by broadening the competitive group used for comparison.
Management Fee. The Board considered two proprietary management fee comparisons for the 12-month (or shorter) periods shown in basis points (BP) in the charts below. The group of Lipper funds used by the Board for management fee comparisons is referred to below as the "Total Mapped Group" and, for the reasons explained above, is broader than the Lipper peer group used by the Board for performance comparisons. The Total Mapped Group comparison focuses on a fund's standing in terms of gross management fees before expense reimbursements or caps relative to the total universe of funds with comparable investment mandates, regardless of whether their management fee structures also are comparable. Funds with comparable investment mandates offer exposure to similar types of securities. Funds with comparable management fee structures have similar management fee contractual arrangements (
e.g., flat rate charged for advisory services, all-inclusive fee rate,
etc.). "TMG %" represents the percentage of funds in the Total Mapped Group that had management fees that were lower than a fund's. For example, a hypothetical TMG % of 20% would mean that 80% of the funds in the Total Mapped Group had higher, and 20% had lower, management fees than a fund. The funds' actual TMG %s and the number of funds in the Total Mapped Group are in the charts below. The "Asset-Size Peer Group" (ASPG) comparison focuses on a fund's standing relative to a subset of non-Fidelity funds within the Total Mapped Group that are similar in size and management fee structure. For example, if a fund is in the first quartile of the ASPG, the fund's management fee ranks in the least expensive or lowest 25% of funds in the ASPG. The ASPG represents at least 15% of the funds in the Total Mapped Group with comparable asset size and management fee structures, subject to a minimum of 50 funds (or all funds in the Total Mapped Group if fewer than 50). Additional information, such as the ASPG quartile in which a fund's management fee rate ranked, is also included in the charts and considered by the Board.
Government Portfolio
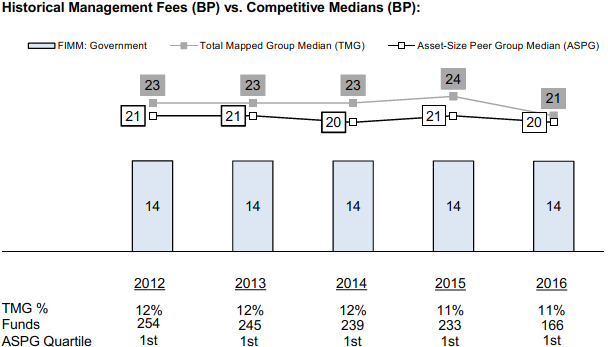
Money Market Portfolio
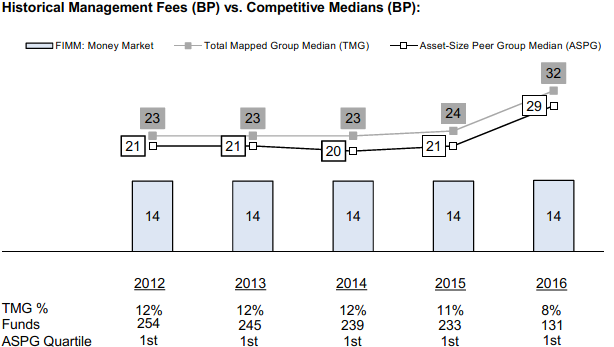
Prime Money Market Portfolio

Prime Reserves Portfolio
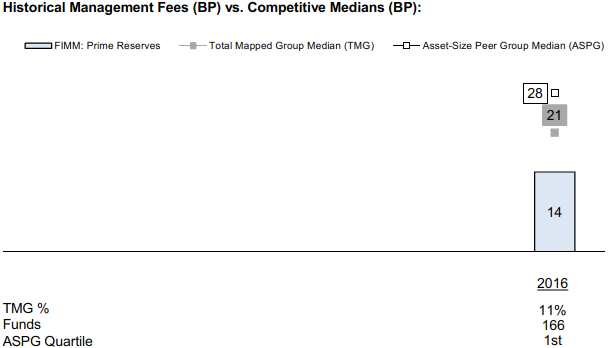
Tax-Exempt Portfolio

Treasury Portfolio

Treasury Only Portfolio
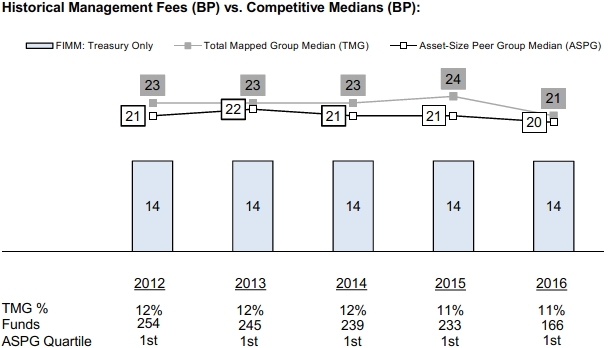
The Board noted that each fund's management fee rate ranked below the median of its Total Mapped Group and below the median of its ASPG for 2016. For each of Money Market Portfolio and Tax-Exempt Portfolio, the Board noted that the comparisons for 2015 reflect a new Total Mapped Group in light of changes to the fund's shareholder eligibility.
The Board noted that it and the boards of other Fidelity funds formed an ad hoc Committee on Group Fee, which meets periodically, to conduct an in-depth review of the "group fee" component of the management fee of funds with such management fee structures. The Committee's focus included the mechanics of the group fee, the competitive landscape of group fee structures, Fidelity funds with no group fee component (such as the funds) and investment products not included in group fee assets. The Board also considered that, for funds subject to the group fee, FMR agreed to voluntarily waive fees over a specified period of time in amounts designed to account for assets converted from certain funds to certain collective investment trusts.
Based on its review, the Board concluded that each fund's management fee is fair and reasonable in light of the services that the fund receives and the other factors considered.
Total Expense Ratio. In its review of the total expense ratio of each class of each fund, the Board considered the fund's management fee rate as well as other fund or class expenses, as applicable, such as transfer agent fees, pricing and bookkeeping fees, fund-paid 12b-1 fees, and custodial, legal, and audit fees. The Board also noted that Fidelity may agree to waive fees and expenses from time to time, and the extent to which, if any, it has done so for each fund. As part of its review, the Board also considered the current and historical total expense ratios of each class of each fund compared to competitive fund median expenses. Each class of each fund is compared to those funds and classes in the Total Mapped Group (used by the Board for management fee comparisons) that have a similar sales load structure.
The Board noted that the total expense ratio of each of Class I, Class II, and Select Class of Tax-Exempt Portfolio ranked below the competitive median for 2016 and the total expense ratio of Class III ranked above the competitive median for 2016.
The Board noted that the total expense ratio of each of Class I and Institutional Class of Money Market Portfolio ranked below the competitive median for 2016, the total expense ratio of Select Class ranked equal to the competitive median for 2016, and the total expense ratio of each of Class II and Class III ranked above the competitive median for 2016.
The Board noted that the total expense ratio of each of Class I and Institutional Class of each of Government Portfolio and Prime Reserves Portfolio ranked below the competitive median for 2016 and the total expense ratio of each of Class II, Class III, and Select Class ranked above the competitive median for 2016.
The Board noted that the total expense ratio of each of Class I and Institutional Class of each of Prime Money Market Portfolio, Treasury Portfolio, and Treasury Only Portfolio ranked below the competitive median for 2016 and the total expense ratio of each of Class II, Class III, Class IV, and Select Class ranked above the competitive median for 2016.
The Board considered that, in general, various factors can affect total expense ratios. The Board noted that each fund offers multiple classes, each of which has a different 12b-1 fee structure, and that the multiple structures are intended to offer a range of pricing options for the intermediary market. The Board also noted that the total expense ratios of the classes of each fund vary primarily by the level of their 12b-1 fees, although differences in transfer agent fees may also cause expenses to vary from class to class.
The Board considered that, for certain classes, Fidelity has been voluntarily waiving part or all of the 12b-1 fees, transfer agent fees, and/or management fees to maintain a minimum yield. The total expense ratio of the classes noted above ranked above the competitive median for 2016 because the advisers of many competitor funds waived fees or reimbursed expenses to a greater extent than Fidelity in order to maintain a minimum yield, which caused the expense medians of such competitor funds to be lower than they would otherwise be (Class I, Class II, Institutional Class, and Select Class) and due to the class's 12b-1 fee (Class III and Class IV). Excluding fee waivers (and, for Class III and Class IV, 12b-1 fees), the total expense ratio of each class of each fund ranked below the median.
The Board further considered that FMR has contractually agreed to reimburse each class of each fund to the extent that total operating expenses (excluding interest, certain taxes, certain securities lending costs, brokerage commissions, fees and expenses of the Independent Trustees, proxy and shareholder meeting expenses, extraordinary expenses, and acquired fund fees and expenses, if any), as a percentage of their respective average net assets, exceed the following rates: Class I: 0.18%; Class II: 0.33%; Class III: 0.43%; Class IV: 0.68%; Institutional Class: 0.14%; and Select Class: 0.23%, each through May 31, 2018.
Fees Charged to Other Fidelity Clients. The Board also considered Fidelity fee structures and other information with respect to clients of Fidelity, such as other funds advised or subadvised by Fidelity, pension plan clients, and other institutional clients with similar mandates. The Board noted that an ad hoc joint committee created by it and the boards of other Fidelity funds periodically reviews and compares Fidelity's institutional investment advisory business with its business of providing services to the Fidelity funds, including the differences in services provided, fees charged, and costs incurred, as well as competition in their respective marketplaces.
Based on its review of total expense ratios and fees charged to other Fidelity clients, the Board concluded that, although some classes were above the median of the universe presented for comparison, the total expense ratio of each class of each fund was reasonable in light of the services that the fund and its shareholders receive and the other factors considered.
Costs of the Services and Profitability. The Board considered the revenues earned and the expenses incurred by Fidelity in conducting the business of developing, marketing, distributing, managing, administering and servicing each fund and servicing each fund's shareholders. The Board also considered the level of Fidelity's profits in respect of all the Fidelity funds.
On an annual basis, Fidelity presents to the Board information about the profitability of its relationships with each fund. Fidelity calculates profitability information for each fund, as well as aggregate profitability information for groups of Fidelity funds and all Fidelity funds, using a series of detailed revenue and cost allocation methodologies which originate with the books and records of Fidelity on which Fidelity's audited financial statements are based. The Audit Committee of the Board reviews any significant changes from the prior year's methodologies.
PricewaterhouseCoopers LLP (PwC), independent registered public accounting firm and auditor to Fidelity and certain Fidelity funds, has been engaged annually by the Board as part of the Board's assessment of Fidelity's profitability analysis. PwC's engagement includes the review and assessment of the methodologies used by Fidelity in determining the revenues and expenses attributable to Fidelity's mutual fund business, and completion of agreed-upon procedures in respect of the mathematical accuracy of the fund profitability information and its conformity to established allocation methodologies. After considering PwC's reports issued under the engagement and information provided by Fidelity, the Board concluded that while other allocation methods may also be reasonable, Fidelity's profitability methodologies are reasonable in all material respects.
The Board also reviewed Fidelity's non-fund businesses and potential fall-out benefits related to the mutual fund business as well as cases where Fidelity's affiliates may benefit from or be related to the funds' business.
The Board considered the costs of the services provided by and the profits realized by Fidelity in connection with the operation of each fund and was satisfied that the profitability was not excessive.
Economies of Scale. The Board considered whether there have been economies of scale in respect of the management of the Fidelity funds, whether the Fidelity funds (including each fund) have appropriately benefited from any such economies of scale, and whether there is potential for realization of any further economies of scale. The Board considered the extent to which each fund will benefit from economies of scale as assets grow through increased services to the fund, through waivers or reimbursements, or through fee or expense ratio reductions. The Board also noted that a committee (the Economies of Scale Committee) created by it and the boards of other Fidelity funds periodically analyzes whether Fidelity attains economies of scale in respect of the management and servicing of the Fidelity funds, whether the Fidelity funds have appropriately benefited from such economies of scale, and whether there is potential for realization of any further economies of scale.
The Board concluded, taking into account the analysis of the Economies of Scale Committee, that economies of scale, if any, are being appropriately shared between fund shareholders and Fidelity.
Additional Information Requested by the Board. In order to develop fully the factual basis for consideration of the Fidelity funds' advisory contracts, the Board requested and received additional information on certain topics, including: (i) Fidelity's fund profitability methodology, profitability trends for certain funds, and the impact of certain factors on fund profitability results; (ii) portfolio manager changes that have occurred during the past year and the amount of the investment that each portfolio manager has made in the Fidelity fund(s) that he or she manages; (iii) Fidelity's compensation structure for portfolio managers, research analysts, and other key personnel, including its effects on fund profitability, the rationale for the compensation structure, and the extent to which current market conditions have affected retention and recruitment; (iv) the arrangements with and compensation paid to certain fund sub-advisers on behalf of the Fidelity funds; (v) the terms of Fidelity's contractual and voluntary expense cap and waiver arrangements with the funds; (vi) the methodology with respect to competitive fund data and peer group classifications; (vii) Fidelity's transfer agent fee, expense, and service structures for different funds and classes relative to competitive trends, and the impact of the increased use of omnibus accounts; (viii) Fidelity's long-term expectations for its offerings in the workplace investing channel; (ix) new developments in the retail and institutional marketplaces and the competitive positioning of the funds relative to other investment products and services; (x) the approach to considering "fall-out" benefits; (xi) the impact of money market reform on Fidelity's money market funds, including with respect to costs and profitability; (xii) the funds' share class structures and distribution channels, including the impact of the Department of Labor's new fiduciary rule on the funds' distribution arrangements; and (xiii) explanations regarding the relative total expense ratios of certain funds and classes, total expense competitive trends and methodologies for total expense competitive comparisons, and actions that might be taken by Fidelity to reduce total expense ratios for certain classes. In addition, the Board considered its discussions with Fidelity throughout the year regarding enhanced information security initiatives and the funds' fair valuation policies.
Based on its evaluation of all of the conclusions noted above, and after considering all factors it believed relevant, the Board concluded that the advisory fee structures are fair and reasonable, and that each fund's Advisory Contracts should be renewed.

IMM-SANN-1117
1.537280.120