| UNITED STATES |
SECURITIES AND EXCHANGE COMMISSION |
Washington, D.C. 20549 |
FORM N-CSR |
| CERTIFIED SHAREHOLDER REPORT OF |
| REGISTERED MANAGEMENT INVESTMENT COMPANIES |
Investment Company Act file number 811-3327 |
|
| MFS SERIES TRUST XIII |
|
| (Exact name of registrant as specified in charter) |
500 Boylston Street, Boston, Massachusetts 02116 |
|
| (Address of principal executive offices) (Zip code) |
Susan S. Newton |
| Massachusetts Financial Services Company |
| 500 Boylston Street |
| Boston, Massachusetts 02116 |
|
| (Name and address of agents for service) |
| Registrant’s telephone number, including area code: (617) 954-5000 |
|
Date of fiscal year end: February 28 |
|
Date of reporting period: February 28, 2006 |
|
ITEM 1. REPORTS TO STOCKHOLDERS.

LETTER FROM THE CEO

Dear Shareholders,
It has been said that change is the only constant in life. As investors have seen, that theme is still accurate today as we recently have experienced shifting economic cycles because of natural disasters and political instability around the globe.
Markets worldwide have fluctuated in the past year as devastating hurricanes had a dramatic effect on the international economy, particularly on oil prices. We witnessed political unrest in the Middle East, highlighted by instability in Iraq, and in Africa, the usually stable Nigeria also experienced violence. As a result, energy prices have bounced up and down, with crude oil prices at one point topping a record $70 per barrel.
Such cycles are not uncommon and in fact have almost become the norm in our everyday lives. What does all of this mean to you as an investor? In times like these, it helps to know that you’re working with a seasoned investment professional who has experience to guide you through difficult times. At MFS®, we believe our investment management team has the knowledge and confidence to navigate through difficult cycles and at the same time see through adversity to find investment opportunities for our clients and shareholders.
Our investment management process, honed over 80 years, combines a unique concept of teamwork with our unwavering focus on the long term. We firmly believe that the best way to realize long-term financial goals – be it a college education, a comfortable retirement, or a secure family legacy – is to follow a three-pronged approach that focuses on longer time horizons. Allocate holdings across the major asset classes – including stocks, bonds, and cash. Diversify within each class to take advantage of different market segments and investing styles. Rebalance assets regularly to maintain a desired asset allocation. Of course, these strategies cannot guarantee a profit or protect against a loss. This long-term approach requires diligence and patience, two traits that in our experience are essential to capitalizing on the many opportunities the financial markets can offer – through both up and down economic cycles.
Respectfully,

Robert J. Manning
Chief Executive Officer and Chief Investment Officer
MFS Investment Management®
April 17, 2006
The opinions expressed in this letter are those of MFS, and no forecasts can be guaranteed.
ANNUAL REPORT 1
PORTFOLIO COMPOSITION
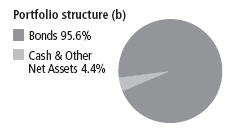
| Fixed income market sectors (b) | | |
| Mortgage-Backed Securities | | 48.6% |
|
| U.S. Government Agencies | | 36.2% |
|
| U.S. Treasury Securities | | 10.8% |
|
| Cash & Other Net Assets | | 4.4% |
|
| Credit quality of bonds (r) | | |
| AAA | | 99.2% |
|
| Not Rated | | 0.8% |
|
| Portfolio facts | | |
| Average Duration (d) | | 4.3 |
|
| Average Life (m) | | 6.9 yrs. |
|
| Average Maturity (m) | | 14.9 yrs. |
|
| Average Credit Quality of | | |
| Rated Securities (a) | | AAA |
|
| Average Short Term Credit Quality | | A-1 |
|
| (b) | | For purposes of this graphical presentation, the bond component includes both accrued interest amounts |
| | | and the equivalent exposure from any derivative holdings, if applicable. |
| (r) | | Each security is assigned a rating from Moody’s Investors Service. If not rated by Moody’s, the rating will |
| | | be that assigned by Standard & Poor’s. Likewise, if not assigned a rating by Standard & Poor’s, it will be |
| | | based on the rating assigned by Fitch, Inc. For those portfolios that hold a security which is not rated by |
| | | any of the three agencies, the security is considered Not Rated. Holdings in U.S. Treasuries and |
| | | government agency mortgage-backed securities, if any, are included in the ‘‘AAA’’-rating category. |
| | | Percentages are based on the total market value of investments as of 2/28/06. |
| (m) | | The average maturity shown is calculated using the final stated maturity on the portfolio’s holdings |
| | | without taking into account any holdings which have been pre-refunded to an earlier date or which |
| | | have a mandatory put date prior to the stated maturity. The average life shown takes into account these |
| | | earlier dates. |
| (a) | | The average credit quality of rated securities is based upon a market weighted average of portfolio |
| | | holdings that are rated by public rating agencies. |
| (d) | | Duration is a measure of how much a bond’s price is likely to fluctuate with general changes in interest |
| | | rates, e.g., if rates rise 1.00%, a bond with a 5-year duration is likely to lose about 5.00% of its value. |
| Percentages are based on net assets as of 2/28/06, unless otherwise noted. |
| The portfolio is actively managed, and current holdings may be different. |
|
2 ANNUAL REPORT |
MANAGEMENT REVIEW
Summary of Results
For the twelve months ended February 28, 2006, Class A shares of the MFS Government Securities Fund provided a total return of 2.28%, not including sales charges. In comparison, the fund’s benchmark, the Lehman Brothers U.S. Government/Mortgage Bond Index, provided a return of 3.04%.
Detractors from performance
The fund’s investments in some lower-yielding issues, relative to the benchmark, detracted from performance. Our underweighted positions in 30-year mortgage-backed securities, which outperformed comparable maturity U.S. Treasuries during the period, also hurt returns. The fund’s overweighted positions in agency securities also held back investment results, as those securities underperformed the overall index over the period.
Contributors to performance
Toward the end of the period, the portfolio’s long duration(d) stance, relative to the benchmark, contributed to performance as long-term interest rates declined.
Respectfully,
Peter Vaream
Portfolio Manager
Note to Shareholders: Effective April 1, 2006, Geoffrey Schechter replaced Peter Vaream as portfolio manager of the fund.
| (d) Duration is a measure of a portfolio’s sensitivity to changes in interest rates. |
The views expressed in this report are those of the portfolio manager only through the end of the period of the report as stated on the cover and do not necessarily reflect the views of MFS or any other person in the MFS organization. These views are subject to change at any time based on market and other conditions, and MFS disclaims any responsibility to update such views. These views may not be relied upon as investment advice or an indication of trading intent on behalf of any MFS portfolio. References to specific securities are not recommendations of such securities, and may not be representative of any MFS portfolio’s current or future investments.
The portfolio is actively managed, and current holdings may be different.
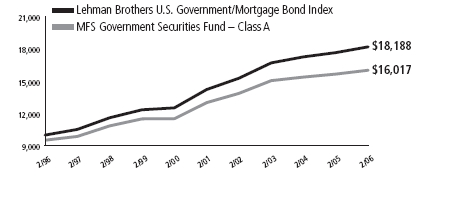
PERFORMANCE SUMMARY THROUGH 2/28/06
The following chart illustrates the historical performance of the fund’s Class A shares in comparison to its benchmark. Performance results include the deduction of the maximum applicable sales charge and reflect the percentage change in net asset value, including reinvestment of dividends and capital gains distributions. The performance of other share classes will be greater than or less than that of the class depicted below. Benchmark comparisons are unmanaged; do not reflect sales charges, commissions or expenses; and cannot be invested in directly. (See Notes to Performance Summary.)
Performance data shown represents past performance and is no guarantee of future results. Investment return and principal value fluctuate so your shares, when sold, may be worth more or less than the original cost; current performance may be lower or higher than quoted. For most recent month-end performance, please visit mfs.com. (For the most recent month-end performance for Class I shares call 1-888-808-6374.) The performance shown does not reflect the deduction of taxes, if any, that a shareholder would pay on fund distributions or the redemption of fund shares.
Growth of a hypothetical $10,000 investment
4 ANNUAL REPORT
Performance summary – continued
Total returns through 2/28/06
Average annual without sales charge
| Share class | | Class inception date | | 1-yr | | 5-yr | | 10-yr |
|
| A | | 7/25/84 | | 2.28% | | 4.25% | | 5.33% |
|
| B | | 8/30/93 | | 1.52% | | 3.56% | | 4.64% |
|
| C | | 4/01/96 | | 1.52% | | 3.56% | | 4.64% |
|
| I | | 1/02/97 | | 2.54% | | 4.59% | | 5.66% |
|
| R | | 12/31/02 | | 2.03% | | 4.12% | | 5.27% |
|
| R1 | | 4/01/05 | | 1.37% | | 3.53% | | 4.62% |
|
| R2 | | 4/01/05 | | 1.67% | | 3.59% | | 4.65% |
|
| R3 | | 10/31/03 | | 1.82% | | 3.71% | | 4.71% |
|
| R4 | | 4/01/05 | | 2.25% | | 4.24% | | 5.33% |
|
| R5 | | 4/01/05 | | 2.42% | | 4.27% | | 5.35% |
|
| 529A | | 7/31/02 | | 1.92% | | 4.02% | | 5.22% |
|
| 529B | | 7/31/02 | | 1.26% | | 3.38% | | 4.55% |
|
| 529C | | 7/31/02 | | 1.27% | | 3.38% | | 4.55% |
| Average annual | | | | | | |
| Comparative benchmarks | | | | | | |
|
| Average general U.S. government bond fund (l) | | 2.03% | | 4.10% | | 5.15% |
|
| Lehman Brothers U.S. Government/ | | | | | | |
| Mortgage Bond Index (s) | | 3.04% | | 5.04% | | 6.16% |
| Average annual with sales charge | | | | | | |
| Share class | | | | | | |
|
| A | | -2.58% | | 3.24% | | 4.82% |
| With Initial Sales Charge (4.75%) | | | | | | |
|
| B | | −2.41% | | 3.22% | | 4.64% |
| With CDSC (Declining over six years | | | | | | |
| from 4% to 0%) | | | | | | |
|
| C | | 0.54% | | 3.56% | | 4.64% |
| With CDSC (1% for 12 months) (c) | | | | | | |
|
| 529A | | −2.92% | | 3.01% | | 4.71% |
| With Initial Sales Charge (4.75%) | | | | | | |
|
| 529B | | −2.66% | | 3.04% | | 4.55% |
| With CDSC (Declining over six years | | | | | | |
| from 4% to 0%) | | | | | | |
|
| 529C | | 0.29% | | 3.38% | | 4.55% |
| With CDSC (1% for 12 months) (c) | | | | | | |
|
| Class I, R, R1, R2, R3, R4, and R5 shares do not have a sales charge. Please see Notes to Performance |
| Summary for more details. |
| CDSC – Contingent Deferred Sales Charge. |
| (c) | | Assuming redemption within one year from the end of the prior month of purchase. |
| (l) | | Source: Lipper Inc., an independent firm that reports mutual fund performance. |
| (s) | | Source: FactSet Research Systems, Inc. |
|
| | | ANNUAL REPORT 5 |
Performance summary – continued
Index Definition
Lehman Brothers U.S. Government/Mortgage Bond Index – measures debt issued by the U.S. Government as well as mortgage-backed pass-through securities of Ginnie Mae (GNMA), Fannie Mae (FNMA), and Freddie Mac (FHLMC).
It is not possible to invest directly in an index.
Notes to Performance Summary
Class R shares are available only to existing Class R shareholders. Class I shares are only available to certain eligible investors, and Class R1, R2, R3, R4, and R5 shares are only available to certain retirement plans. Class 529 shares are only available in conjunction with qualified tuition programs, such as the MFS 529 Savings Plan. There also is an additional annual fee, which is detailed in the program description, on qualified tuition programs. If this fee was reflected, the performance for Class 529 shares would have been lower. This annual fee is waived for Oregon residents and for those accounts with assets of $25,000 or more.
Performance for Classes I, R, R4, R5, and 529A shares includes the performance of the fund’s Class A shares for periods prior to their offering. Performance for Classes C, R1, R2, R3, 529B and 529C shares includes the performance of the fund’s Class B shares for periods prior to their offering. This blended class performance has been adjusted to take into account differences in sales loads, if any, applicable to these share classes, but has not been adjusted to take into account differences in class specific operating expenses (such as Rule 12b-1 fees). Compared to performance these share classes would have experienced had they been offered for the entire period, the use of blended performance generally results in higher performance for share classes with higher operating expenses than the share class to which it is blended, and lower performance for share classes with lower operating expenses than the share class to which it is blended.
Performance results reflect any applicable expense subsidies and waivers in effect during the periods shown. Without such subsidies and waivers the fund’s performance results would be less favorable. Please see the prospectus and financial statements for complete details.
6 ANNUAL REPORT
EXPENSE TABLE
Fund Expenses Borne by the Shareholders During the Period, September 1, 2005 through February 28, 2006.
As a shareholder of the fund, you incur two types of costs: (1) transaction costs, including sales charges (loads) on certain purchase or redemption payments and redemption fees on certain exchanges and redemptions, and (2) ongoing costs, including management fees; distribution and service (12b-1) fees; and other trust expenses. This example is intended to help you understand your ongoing costs (in dollars) of investing in the fund and to compare these costs with the ongoing costs of investing in other mutual funds.
The example is based on an investment of $1,000 invested at the beginning of the period and held for the entire period September 1, 2005 through February 28, 2006.
Actual Expenses
The first line for each share class in the following table provides information about actual account values and actual expenses. You may use the information in this line, together with the amount you invested, to estimate the expenses that you paid over the period. Simply divide your account value by $1,000 (for example, an $8,600 account value divided by $1,000 = 8.6), then multiply the result by the number in the first line under the heading entitled ‘‘Expenses Paid During Period’’ to estimate the expenses you paid on your account during this period.
Hypothetical Example for Comparison Purposes
The second line for each share class in the following table provides information about hypothetical account values and hypothetical expenses based on the fund’s actual expense ratio and an assumed rate of return of 5% per year before expenses, which is not the fund’s actual return. The hypothetical account values and expenses may not be used to estimate the actual ending account balance or expenses you paid for the period. You may use this information to compare the ongoing costs of investing in the fund and other funds. To do so, compare this 5% hypothetical example with the 5% hypothetical examples that appear in the shareholder reports of the other funds.
Please note that the expenses shown in the table are meant to highlight your ongoing costs only and do not reflect any transactional costs, such as sales charges (loads) or redemption fees. Therefore, the second line for each share class in the table is useful in comparing ongoing costs only, and will not help you determine the relative total costs of owning different funds. In addition, if these transactional costs were included, your costs would have been higher.
ANNUAL REPORT 7
| Expense table – continued | | | | |
| |
| | | | | Expenses |
| | Annualized | Beginning | Ending | Paid During |
| Share | | Expense | Account Value | Account Value | Period (p) |
| Class | | Ratio | 9/01/05 | 2/28/06 | 9/01/05-2/28/06 |
|
| A | Actual | 0.81% | $1,000.00 | $996.20 | $4.01 |
|
| Hypothetical (h) | 0.81% | $1,000.00 | $1,020.78 | $4.06 |
|
| B | Actual | 1.58% | $1,000.00 | $992.40 | $7.81 |
|
| Hypothetical (h) | 1.58% | $1,000.00 | $1,016.96 | $7.90 |
|
| C | Actual | 1.58% | $1,000.00 | $992.50 | $7.81 |
|
| Hypothetical (h) | 1.58% | $1,000.00 | $1,016.96 | $7.90 |
|
| I | Actual | 0.55% | $1,000.00 | $997.40 | $2.72 |
|
| Hypothetical (h) | 0.55% | $1,000.00 | $1,022.07 | $2.76 |
|
| R | Actual | 1.07% | $1,000.00 | $996.00 | $5.30 |
|
| Hypothetical (h) | 1.07% | $1,000.00 | $1,019.49 | $5.36 |
|
| R1 | Actual | 1.67% | $1,000.00 | $991.90 | $8.25 |
|
| Hypothetical (h) | 1.67% | $1,000.00 | $1,016.51 | $8.35 |
|
| R2 | Actual | 1.33% | $1,000.00 | $993.60 | $6.57 |
|
| Hypothetical (h) | 1.33% | $1,000.00 | $1,018.20 | $6.66 |
|
| R3 | Actual | 1.22% | $1,000.00 | $995.10 | $6.04 |
|
| Hypothetical (h) | 1.22% | $1,000.00 | $1,018.74 | $6.11 |
|
| R4 | Actual | 0.96% | $1,000.00 | $996.50 | $4.75 |
|
| Hypothetical (h) | 0.96% | $1,000.00 | $1,020.03 | $4.81 |
|
| R5 | Actual | 0.66% | $1,000.00 | $997.00 | $3.27 |
|
| Hypothetical (h) | 0.66% | $1,000.00 | $1,021.52 | $3.31 |
|
| 529A | Actual | 1.17% | $1,000.00 | $995.50 | $5.79 |
|
| Hypothetical (h) | 1.17% | $1,000.00 | $1,018.99 | $5.86 |
|
| 529B | Actual | 1.82% | $1,000.00 | $992.20 | $8.99 |
|
| Hypothetical (h) | 1.82% | $1,000.00 | $1,015.77 | $9.10 |
|
| 529C | Actual | 1.83% | $1,000.00 | $992.30 | $9.04 |
|
| Hypothetical (h) | 1.83% | $1,000.00 | $1,015.72 | $9.15 |
|
| (h) | | 5% class return per year before expenses. |
| (p) | | Expenses paid is equal to each class’ annualized expense ratio, as shown above, multiplied by the average |
| | account value over the period, multiplied by the number of days in the period, divided by the number of |
| | days in the year. Expenses paid do not include any applicable sales charges (loads) or redemption fees. If |
| | these transaction costs had been included, your costs would have been higher. |
Effective October 1, 2005 the fund’s Class R1, Class R2, and Class R3 retirement plan administration and
services fee was reduced (as described in Note 3 of the Notes to the Financial Statements). Had this fee
reduction been in effect through the entire six month period, the annualized expense ratio would have been
1.65%, 1.30%, and 1.21% for Class R1, Class R2, and Class R3, respectively, and the actual expenses paid
during the period would have been approximately $8.15, $6.43, and $5.99 for Class R1, Class R2, and
Class R3, respectively. |
|
|
|
|
|
| | |
| | 8 ANNUAL REPORT |
| PORTFOLIO OF INVESTMENTS – 2/28/06 | | | | | | |
| The Portfolio of Investments is a complete list of all securities owned by your fund. | | | |
| It is categorized by broad-based asset classes. | | | | | | |
| Bonds - 97.8% | | | | | | | | |
|
| Issuer | | | | | | | Shares/Par | | | Value ($) |
|
| Agency - Other - 6.5% | | | | | | |
|
| Financing Corp., 10.7%, 2017 | | $ | 14,360,000 | | $ | 21,483,063 |
| Financing Corp., STRIPS, 0%, 2017 | | | 18,780,000 | | | 10,552,257 |
| Financing Corp., 9.4%, 2018 | | | 11,750,000 | | | 16,343,580 |
| Financing Corp., 9.8%, 2018 | | | 14,975,000 | | | 21,415,523 |
| Financing Corp., 10.35%, 2018 | | | 15,165,000 | | | 22,573,042 |
| |
|
| | | | | | | | | | $ | 92,367,465 |
|
| Mortgage Backed - 48.5% | | | | | | |
|
| Fannie Mae, 4.374%, 2013 | | $ | 2,746,118 | | $ | 2,615,473 |
| Fannie Mae, 4.45%, 2014 | | | 3,199,316 | | | 3,052,622 |
| Fannie Mae, 4.5%, 2019 | | | 62,935,011 | | | 61,234,167 |
| Fannie Mae, 4.518%, 2014 | | | 2,463,815 | | | 2,361,078 |
| Fannie Mae, 4.56%, 2015 | | | 2,413,022 | | | 2,309,838 |
| Fannie Mae, 4.6%, 2014 | | | 1,869,842 | | | 1,799,811 |
| Fannie Mae, 4.62%, 2015 | | | 3,448,673 | | | 3,315,877 |
| Fannie Mae, 4.65%, 2013 | | | 3,666,366 | | | 3,570,236 |
| Fannie Mae, 4.665%,2015 | | | 1,628,057 | | | 1,569,409 |
| Fannie Mae, 4.667%, 2014 | | | 9,429,878 | | | 9,120,162 |
| Fannie Mae, 4.69%, 2015 | | | 1,326,978 | | | 1,281,500 |
| Fannie Mae, 4.7%, 2015 | | | 1,867,583 | | | 1,804,383 |
| Fannie Mae, 4.73%, 2012 | | | 2,866,908 | | | 2,788,142 |
| Fannie Mae, 4.74%, 2015 | | | 1,810,000 | | | 1,752,112 |
| Fannie Mae, 4.77%, 2014 | | | 1,612,890 | | | 1,566,415 |
| Fannie Mae, 4.771%, 2014 | | | 7,790,960 | | | 7,590,028 |
| Fannie Mae, 4.785%, 2012 | | | 928,863 | | | 906,909 |
| Fannie Mae, 4.79%, 2012 | | | 11,265,251 | | | 11,060,061 |
| Fannie Mae, 4.8%, 2013 | | | 1,321,399 | | | 1,289,650 |
| Fannie Mae, 4.815%, 2015 | | | 1,968,000 | | | 1,914,024 |
| Fannie Mae, 4.82%, 2014 - 2015 | | | 6,715,767 | | | 6,538,848 |
| Fannie Mae, 4.845%, 2013 | | | 3,885,776 | | | 3,798,373 |
| Fannie Mae, 4.847%, 2014 | | | 10,542,778 | | | 10,306,444 |
| Fannie Mae, 4.85%, 2015 | | | 1,481,135 | | | 1,445,344 |
| Fannie Mae, 4.87%, 2015 | | | 1,414,504 | | | 1,382,206 |
| Fannie Mae, 4.88%, 2020 | | | 1,438,405 | | | 1,424,252 |
| Fannie Mae, 4.89%, 2015 | | | 1,308,931 | | | 1,280,723 |
| Fannie Mae, 4.92%, 2014 | | | 1,561,260 | | | 1,542,720 |
| Fannie Mae, 4.925%, 2015 | | | 5,211,200 | | | 5,116,354 |
| Fannie Mae, 4.996%, 2017 | | | 5,078,975 | | | 5,011,176 |
| Fannie Mae, 5%, 2013 - 2027 | | | 48,440,429 | | | 47,929,018 |
|
| | | | | | | | ANNUAL REPORT 9 |
| Portfolio of Investments – continued | | | | | | |
| Issuer | | | Shares/Par | | | Value ($) |
|
| Bonds - continued | | | | | | |
|
| Mortgage Backed - continued | | | | | | |
|
| Fannie Mae, 5.06%, 2013 | | $ | 1,552,169 | | $ | 1,534,208 |
| Fannie Mae, 5.1%, 2014 | | | 2,024,628 | | | 2,005,672 |
| Fannie Mae, 5.5%, 2017 - 2035 | | | 232,005,076 | | | 230,696,253 |
| Fannie Mae, 6%, 2016 - 2034 | | | 63,106,185 | | | 63,883,123 |
| Fannie Mae, 6.5%, 2016 - 2034 | | | 31,296,527 | | | 32,127,325 |
| Fannie Mae, 7.029%, 2007 | | | 1,268,541 | | | 1,287,718 |
| Fannie Mae, 7.5%, 2024 - 2031 | | | 848,757 | | | 889,650 |
| Freddie Mac, 3.108%, 2035 | | | 316,094 | | | 314,801 |
| Freddie Mac, 4.375%, 2015 | | | 10,023,332 | | | 9,759,186 |
| Freddie Mac, 4.5%, 2013 - 2015 | | | 9,061,525 | | | 8,961,746 |
| Freddie Mac, 5%, 2024 - 2025 | | | 14,101,011 | | | 14,016,657 |
| Freddie Mac, 5.5%, 2033 - 2035 | | | 50,576,725 | | | 50,189,734 |
| Freddie Mac, 6%, 2017 - 2035 | | | 21,263,236 | | | 21,518,511 |
| Freddie Mac, 6.5%, 2016 - 2029 | | | 3,427,586 | | | 3,516,220 |
| Ginnie Mae, 5.5%, 2033 - 2034 | | | 35,139,559 | | | 35,251,144 |
| |
|
| | | | | | $ | 684,629,303 |
|
| U.S. Government Agencies - 29.2% | | | | | | |
|
| Aid to Egypt, 4.45%, 2015 | | $ | 7,118,000 | | $ | 6,897,342 |
| Aid to Israel, 0%, 2021 | | | 9,036,000 | | | 4,161,964 |
| Aid to Israel, 0%, 2024 | | | 14,262,000 | | | 5,764,722 |
| Aid to Israel, 5.5%, 2023 | | | 16,567,000 | | | 17,721,024 |
| Empresa Energetica Cornito Ltd., 6.07%, 2010 | | | 7,239,000 | | | 7,380,088 |
| Fannie Mae, 3.125%, 2007 | | | 35,000,000 | | | 33,941,810 |
| Fannie Mae, 4.25%, 2007 | | | 30,000,000 | | | 29,682,870 |
| Fannie Mae, 4.5%, 2008 | | | 15,000,000 | | | 14,845,995 |
| Fannie Mae, 5.5%, 2011 | | | 77,391,000 | | | 79,196,377 |
| Federal Home Loan Bank, 4.625%, 2008 | | | 35,755,000 | | | 35,570,504 |
| Freddie Mac, 4.2%, 2007 | | | 16,665,000 | | | 16,462,087 |
| Freddie Mac, 4.875%, 2009 - 2013 | | | 23,401,000 | | | 23,365,707 |
| Freddie Mac, 5.05%, 2015 | | | 13,957,000 | | | 13,800,151 |
| Overseas Private Investment Corp., 0%, 2007 | | | 6,924,301 | | | 7,045,477 |
| Small Business Administration, 4.34%, 2024 | | | 4,259,192 | | | 4,039,779 |
| Small Business Administration, 4.72%, 2024 | | | 7,518,744 | | | 7,300,403 |
| Small Business Administration, 4.76%, 2025 | | | 8,532,000 | | | 8,268,513 |
| Small Business Administration, 4.77%, 2024 | | | 6,371,429 | | | 6,206,306 |
| Small Business Administration, 4.86%, 2024 - 2025 | | | 9,782,728 | | | 9,562,010 |
| Small Business Administration, 4.87%, 2024 | | | 5,741,967 | | | 5,615,427 |
| Small Business Administration, 4.88%, 2024 | | | 3,616,084 | | | 3,539,864 |
| Small Business Administration, 4.89%, 2023 | | | 7,386,070 | | | 7,250,691 |
| Small Business Administration, 4.98%, 2023 | | | 2,850,548 | | | 2,813,864 |
|
| 10 ANNUAL REPORT | | | | | | |
| Portfolio of Investments – continued | | | | | | |
| Issuer | | | | | Shares/Par | | | Value ($) |
|
| Bonds - continued | | | | | | | | |
|
| U.S. Government Agencies - continued | | | | | | |
|
| Small Business Administration, 4.99%, 2024 | | | | $ | 5,220,367 | | $ | 5,148,359 |
| Small Business Administration, 5.11%, 2025 | | | | | 5,166,024 | | | 5,124,652 |
| Small Business Administration, 5.18%, 2024 | | | | | 7,264,699 | | | 7,247,824 |
| Small Business Administration, 5.19%, 2024 | | | | | 4,610,210 | | | 4,600,503 |
| Small Business Administration, 5.52%, 2024 | | | | | 4,402,781 | | | 4,467,045 |
| Small Business Administration, 6.07%, 2022 | | | | | 3,643,251 | | | 3,771,678 |
| Small Business Administration, 6.34%, 2021 | | | | | 4,233,808 | | | 4,417,066 |
| Small Business Administration, 6.35%, 2021 | | | | | 3,564,384 | | | 3,718,475 |
| Small Business Administration, 6.44%, 2021 | | | | | 3,676,826 | | | 3,844,353 |
| Small Business Administration, 6.625%, 2021 | | | 3,690,308 | | | 3,900,376 |
| Small Business Administration, 8.625%, 2011 | | | 168,985 | | | 176,891 |
| Small Business Administration, 8.8%, 2011 | | | 190,121 | | | 199,203 |
| Small Business Administration, 9.05%, 2009 | | | | | 48,834 | | | 50,613 |
| Small Business Administration, 9.1%, 2009 | | | 37,876 | | | 39,064 |
| Small Business Administration, 9.25%, 2010 | | | | | 83,374 | | | 87,412 |
| Small Business Administration, 9.3%, 2010 | | | 159,097 | | | 167,049 |
| Small Business Administration, 9.5%, 2010 | | | 127,215 | | | 133,032 |
| Small Business Administration, 9.65%, 2010 | | | | | 190,974 | | | 200,335 |
| Small Business Administration, 9.7%, 2010 | | | 91,470 | | | 96,116 |
| Small Business Administration, 9.9%, 2008 | | | 35,201 | | | 36,302 |
| Small Business Administration, 10.05%, 2008 - 2009 | | | 17,996 | | | 18,751 |
| U.S. Department of Housing & Urban Development, 6.36%, 2016 | | | 7,000,000 | | | 7,391,762 |
| U.S. Department of Housing & Urban Development, 6.59%, 2016 | | | 6,599,000 | | | 6,785,554 |
| |
|
| | | | | | | | $ | 412,055,390 |
|
| U.S. Treasury Obligations - 13.6% | | | | | | |
|
| U.S. Treasury Bonds, 6.875%, 2025 | | | | $ | 1,307,000 | | $ | 1,667,753 |
| U.S. Treasury Bonds, 6%, 2026 | | | | | 20,408,000 | | | 23,853,442 |
| U.S. Treasury Bonds, 5.25%, 2028 | | | | | 1,139,000 | | | 1,231,455 |
| U.S. Treasury Bonds, 6.25%, 2030 | | | | | 6,166,000 | | | 7,595,501 |
| U.S. Treasury Bonds, 5.375%, 2031 | | | | | 363,000 | | | 404,079 |
| U.S. Treasury Bonds, 4.5%, 2036 | | | | | 23,636,000 | | | 23,623,071 |
| U.S. Treasury Notes, 5.5%, 2008 | | | | | 16,147,000 | | | 16,400,556 |
| U.S. Treasury Notes, 5.625%, 2008 | | | | | 8,178,000 | | | 8,339,009 |
| U.S. Treasury Notes, 6%, 2009 | | | | | 4,566,000 | | | 4,761,662 |
| U.S. Treasury Notes, 6.5%, 2010 | | | | | 87,502,000 | | | 93,295,595 |
| U.S. Treasury Notes, TIPS, 3.875%, 2009 | | | 9,956,610 | | | 10,534,173 |
| |
|
| | | | | | | | $ | 191,706,296 |
|
| Total Bonds (Identified Cost, $1,392,963,193) | | | | | $1,380,758,454 |
|
| | | | | | ANNUAL REPORT 11 |
| Portfolio of Investments – continued | | | | | | | | | |
| Call Option Purchased - 0% | | | | | | | | | |
|
| | | | | | | Number | | | |
| Issue/Expiration/Strike Price | | | | | | of Contracts | | | Value ($) |
|
| U.S. Treasury Notes 10yr Futures - May 2006 @ $109 | | | | | | | |
| (Premium Paid, $381,845) | | | | | | 277 | | $ | 112,531 |
|
| Put Option Purchased - 0% | | | | | | | | | |
|
| U.S. Treasury Notes 10yr Futures - May 2006 @ $109 | | | | | | | |
| (Premium Paid, $277,970) | | | | | | 277 | | $ | 415,500 |
|
| Repurchase Agreements - 1.6% | | | | | | | | | |
|
| Issuer | | | | | | Shares/Par | | | |
|
| Goldman Sachs, 4.55%, dated 2/28/06, due 3/01/06, total to be | | | | | |
| received $22,894,893 (secured by various U.S. Treasury and | | | | | |
| Federal Agency obligations in a jointly traded account) | | | | $ 22,892,000 | | $ | 22,892,000 |
| Morgan Stanley, 4.56%, dated 2/28/06, due 3/01/06, total to be | | | | | |
| received $234,030 (secured by various U.S. Treasury and Federal | | | | | |
| Agency obligations in a jointly traded account) | | | | | | 234,000 | | | 234,000 |
|
| Total Repurchase Agreements, at Cost | | | | | | | | $ | 23,126,000 |
|
| Total Investments (Identified Cost, $1,416,749,008) | | | | | | $ | 1,404,412,485 |
|
| Other Assets, Less Liabilities - 0.6% | | | | | | | | | 8,305,771 |
|
| Net Assets - 100.0% | | | | | | | | $ | 1,412,718,256 |
|
| Futures contracts outstanding at February 28, 2006: | | | | | |
| | | | | | | | | | Unrealized |
| | | | | | | Expiration | | | Appreciation |
| | | Contracts | | Value | | Date | | (Depreciation) |
|
| U.S. Treasury Bond (Short) | | 224 | | $25,333,000 | | June 2006 | | | $(42,565) |
| U.S. Treasury Note 5 yr (Long) | | 175 | | 18,407,813 | | June 2006 | | | 29,466 |
| U.S. Treasury Note 10 yr (Short) | | 219 | | 23,631,469 | | June 2006 | | | (53,806) |
|
| | | | | | | | | | $(66,905) |
| At February 28, 2006, the fund had sufficient cash and/or securities to cover any commitments under |
| these derivative contracts. |
The following abbreviations are used in the Portfolio of Investments and are defined: |
| STRIPS | | Separate Trading of Registered Interest and Principal of Securities |
| TIPS | | Treasury Inflation Protected Security |
See Notes to Financial Statements |
|
12 ANNUAL REPORT |
| FINANCIAL STATEMENTS | Statement of Assets and Liabilities | |
This statement represents your fund’s balance sheet, which details the assets | |
| and liabilities composing the total value of the fund. | | | |
| At 2/28/06 | | | |
| Assets | | | |
|
| Investments, at value (identified cost, $1,416,749,008) | | $1,404,412,485 | |
| Cash | | 79,617 | |
| Receivable for fund shares sold | | 1,967,266 | |
| Interest receivable | | 10,997,408 | |
| Receivable from investment adviser | | 39,692 | |
| Other assets | | 8,580 | |
|
| Total assets | | | $1,417,505,048 |
|
| Liabilities | | | |
|
| Distributions payable | | $939,666 | |
| Payable for daily variation margin on open futures contracts | | 156,283 | |
| Payable for fund shares reacquired | | 3,129,750 | |
| Payable to affiliates | | | |
| Management fee | | 10,883 | |
| Shareholder servicing costs | | 148,127 | |
| Distribution and service fees | | 11,569 | |
| Administrative services fee | | 365 | |
| Program manager fees | | 9 | |
| Retirement plan administration and services fees | | 16 | |
| Payable for independent trustees’ compensation | | 133,829 | |
| Accrued expenses and other liabilities | | 256,295 | |
|
| Total liabilities | | | $4,786,792 |
|
| Net assets | | | $1,412,718,256 |
|
| Net assets consist of: | | | |
|
| Paid-in capital | | $1,495,410,586 | |
| Unrealized appreciation (depreciation) on investments and | | | |
| translation of assets and liabilities in foreign currencies | | (12,403,428) | |
| Accumulated net realized gain (loss) on investments | | (70,748,246) | |
| Undistributed net investment income | | 459,344 | |
|
| Net assets | | | $1,412,718,256 |
|
| Shares of beneficial interest outstanding | | | 149,151,339 |
|
| | | ANNUAL REPORT 13 |
| Statement of Assets and Liabilities – continued | | | | |
| Class A shares | | | | |
|
| Net assets | | $826,000,642 | | |
| Shares outstanding | | 87,189,948 | | |
|
| Net asset value per share | | | | $9.47 |
|
| Offering price per share (100/95.25 x net asset value | | | | |
| per share) | | | | $9.94 |
|
| Class B shares | | | | |
|
| Net assets | | $175,207,254 | | |
| Shares outstanding | | 18,522,176 | | |
|
| Net asset value and offering price per share | | | | $9.46 |
|
| Class C shares | | | | |
|
| Net assets | | $35,768,002 | | |
| Shares outstanding | | 3,765,353 | | |
|
| Net asset value and offering price per share | | | | $9.50 |
|
| Class I shares | | | | |
|
| Net assets | | $359,623,175 | | |
| Shares outstanding | | 37,971,209 | | |
|
| Net asset value, offering price, and redemption price per share | | | | $9.47 |
|
| Class R shares | | | | |
|
| Net assets | | $11,750,624 | | |
| Shares outstanding | | 1,241,290 | | |
|
| Net asset value, offering price, and redemption price per share | | | | $9.47 |
|
| Class R1 shares | | | | |
|
| Net assets | | $191,680 | | |
| Shares outstanding | | 20,252 | | |
|
| Net asset value, offering price, and redemption price per share | | | | $9.46 |
|
| Class R2 shares | | | | |
|
| Net assets | | $358,471 | | |
| Shares outstanding | | 37,874 | | |
|
| Net asset value, offering price, and redemption price per share | | | | $9.46 |
|
| Class R3 shares | | | | |
|
| Net assets | | $1,391,764 | | |
| Shares outstanding | | 147,017 | | |
|
| Net asset value, offering price, and redemption price per share | | | | $9.47 |
|
| Class R4 shares | | | | |
|
| Net assets | | $1,304,948 | | |
| Shares outstanding | | 137,704 | | |
|
| Net asset value, offering price, and redemption price per share | | | | $9.48 |
|
| 14 ANNUAL REPORT | | | | |
| Statement of Assets and Liabilities – continued | | |
| Class R5 shares | | |
|
| Net assets | $51,417 | |
| Shares outstanding | 5,428 | |
|
| Net asset value, offering price, and redemption price per share | | $9.47 |
|
| Class 529A shares | | |
|
| Net assets | $400,540 | |
| Shares outstanding | 42,360 | |
|
| Net asset value per share | | $9.46 |
|
| Offering price per share (100/95.25 x net asset value | | |
| per share) | | $9.93 |
|
| Class 529B shares | | |
|
| Net assets | $434,533 | |
| Shares outstanding | 45,957 | |
|
| Net asset value and offering price per share | | $9.46 |
|
| Class 529C shares | | |
|
| Net assets | $235,206 | |
| Shares outstanding | 24,771 | |
|
| Net asset value and offering price per share | | $9.50 |
|
| On sales of $100,000 or more, the offering price of Class A and Class 529A shares is reduced. A contingent |
| deferred sales charge may be imposed on redemptions of Class A, Class B, Class C, Class 529B and Class |
| 529C shares. | | |
See Notes to Financial Statements | | |
|
| | | ANNUAL REPORT 15 |
| FINANCIAL STATEMENTS | Statement of Operations | | | | |
| This statement describes how much your fund earned in investment income and accrued in | | |
| expenses. It also describes any gains and/or losses generated by fund operations. | | |
| Year ended 2/28/06 | | | | |
| Net investment income | | | | |
|
| Interest income | | | | $70,931,046 |
|
| Expenses | | | | |
| Management fee | | $5,871,859 | | |
| Distribution and service fees | | 4,762,940 | | |
| Program manager fees | | 2,759 | | |
| Shareholder servicing costs | | 2,594,623 | | |
| Administrative services fee | | 179,477 | | |
| Retirement plan administration and services fees | | 4,469 | | |
| Independent trustees’ compensation | | 46,722 | | |
| Custodian fee | | 368,761 | | |
| Shareholder communications | | 190,186 | | |
| Auditing fees | | 52,747 | | |
| Legal fees | | 37,976 | | |
| Registration fees | | 203,899 | | |
| Miscellaneous | | 88,550 | | |
|
| Total expenses | | | | $14,404,968 |
|
| Fees paid indirectly | | (71,526) | | |
| Reduction of expenses by investment adviser | | (1,522,724) | | |
|
| Net expenses | | | | $12,810,718 |
|
| Net investment income | | | | $58,120,328 |
|
| Realized and unrealized gain (loss) on investments | | | | |
|
| Realized gain (loss) (identified cost basis) | | | | |
| Investment transactions | | $(5,599,756) | | |
| Futures contracts | | 721,520 | | |
|
| Net realized gain (loss) on investments | | | | $(4,878,236) |
|
| Change in unrealized appreciation (depreciation) | | | | |
| Investments | | $(20,739,315) | | |
| Futures contracts | | (368,468) | | |
|
| Net unrealized gain (loss) on investments | | | | $(21,107,783) |
|
| Net realized and unrealized gain (loss) on investments | | | | $(25,986,019) |
|
| Change in net assets from operations | | | | $32,134,309 |
|
| See Notes to Financial Statements | | | | |
|
16 ANNUAL REPORT | | | | |
| FINANCIAL STATEMENTS | Statements of Changes in Net Assets | | |
These statements describe the increases and/or decreases in net assets resulting | | |
| from operations, any distributions, and any shareholder transactions. | | | | |
Years ended 2/28 | | 2006 | | 2005 |
| Change in net assets | | | | |
|
| From operations | | | | |
|
| Net investment income | | $58,120,328 | | $48,264,077 |
| Net realized gain (loss) on investments | | (4,878,236) | | 9,975,483 |
| Net unrealized gain (loss) on investments | | (21,107,783) | | (35,099,066) |
|
| Change in net assets from operations | | $32,134,309 | | $23,140,494 |
|
| Distributions declared to shareholders | | | | |
|
| From net investment income | | | | |
| Class A | | $(36,730,768) | | $(30,710,051) |
| Class B | | (6,947,250) | | (7,063,974) |
| Class C | | (1,420,773) | | (1,577,976) |
| Class I | | (13,967,234) | | (9,120,541) |
| Class R | | (436,665) | | (250,685) |
| Class R1 | | (4,121) | | — |
| Class R2 | | (6,328) | | — |
| Class R3 | | (35,810) | | (5,374) |
| Class R4 | | (22,606) | | — |
| Class R5 | | (2,004) | | — |
| Class 529A | | (15,171) | | (11,688) |
| Class 529B | | (13,373) | | (12,638) |
| Class 529C | | (8,730) | | (8,125) |
|
| Total distributions declared to shareholders | | $(59,610,833) | | $(48,761,052) |
|
| Change in net assets from fund share transactions | | $(61,115,105) | | $228,335,829 |
|
| Redemption fees | | $3,132 | | $4,544 |
|
| Total change in net assets | | $(88,588,497) | | $202,719,815 |
|
| Net assets | | | | |
|
| At beginning of period | | 1,501,306,753 | | 1,298,586,938 |
| At end of period (including undistributed net | | | | |
| investment income of $459,344 and accumulated | | | | |
| distributions in excess of net investment income of | | | | |
| $3,760,665, respectively) | | $1,412,718,256 | | $1,501,306,753 |
|
| See Notes to Financial Statements | | | | |
|
| | | | | ANNUAL REPORT 17 |
| FINANCIAL STATEMENTS | Financial Highlights | | | | | | | | |
The financial highlights table is intended to help you understand the fund’s financial performance for the past |
| 5 years (or life of a particular share class, if shorter). Certain information reflects financial results for a single |
| fund share. The total returns in the table represent the rate by which an investor would have earned (or lost) |
| on an investment in the fund share class (assuming reinvestment of all distributions) held for the entire period. |
| This information has been audited by the fund’s independent registered public accounting firm, whose report, |
| together with the fund’s financial statements, are included in this report. | | | | | | |
Class A | | | | | | | | | | |
| | | Years ended 2/28 and 29 |
| | | 2006 | | 2005(j) | | 2004 | | 2003 | | 2002 |
| Net asset value, beginning of period | | $9.65 | | $9.84 | | $10.03 | | $9.73 | | $9.71 |
|
| Income (loss) from investment operations | | | | | | | | | | |
|
| Net investment income (d) | | $0.39 | | $0.36 | | $0.29 | | $0.39 | | $0.50 |
| Net realized and unrealized gain (loss) on | | | | | | | | | | |
| investments and foreign currency | | (0.17) | | (0.19) | | (0.08) | | 0.42 | | 0.12 |
|
| Total from investment operations | | $0.22 | | $0.17 | | $0.21 | | $0.81 | | $0.62 |
|
| Less distributions declared to shareholders | | | | | | | | |
|
| From net investment income | | $(0.40) | | $(0.36) | | $(0.40) | | $(0.51) | | $(0.60) |
|
| Net asset value, end of period | | $9.47 | | $9.65 | | $9.84 | | $10.03 | | $9.73 |
|
| Total return (%) (t)(r) | | 2.28 | | 1.81 | | 2.19 | | 8.54 | | 6.59 |
|
| Ratios (%) (to average net assets) | | | | | | | | | | |
| and Supplemental data: | | | | | | | | | | |
|
| Expenses before expense reductions (f) | | 0.90 | | 0.93 | | 1.00 | | 0.98 | | 1.01 |
| Expenses after expense reductions (f) | | 0.80 | | 0.83 | | 0.95 | | 0.93 | | 0.96 |
| Net investment income | | 4.03 | | 3.75 | | 2.94 | | 3.97 | | 5.16 |
| Portfolio turnover | | 73 | | 126 | | 143 | | 134 | | 116 |
| Net assets at end of period | | | | | | | | | | |
| (000 Omitted) | | $826,001 | | $932,879 | | $803,974 | | $927,886 | | $622,606 |
|
See Notes to Financial Statements | | | | | | | | | | |
|
18 ANNUAL REPORT | | | | | | | | | | |
| Financial Highlights – continued | | | | | | | | | | |
Class B | | | | | | | | | | |
| | | Years ended 2/28 and 29 |
| | | 2006 | | 2005(j) | | 2004 | | 2003 | | 2002 |
| Net asset value, beginning of period | | $9.64 | | $9.83 | | $10.02 | | $9.72 | | $9.69 |
|
| Income (loss) from investment operations | | | | | | | | | | |
|
| Net investment income (d) | | $0.31 | | $0.29 | | $0.24 | | $0.33 | | $0.44 |
| Net realized and unrealized gain (loss) on | | | | | | | | | | |
| investments and foreign currency | | (0.16) | | (0.18) | | (0.09) | | 0.41 | | 0.12 |
|
| Total from investment operations | | $0.15 | | $0.11 | | $0.15 | | $0.74 | | $0.56 |
|
| Less distributions declared to shareholders | | | | | | | | |
|
| From net investment income | | $(0.33) | | $(0.30) | | $(0.34) | | $(0.44) | | $(0.53) |
|
| Net asset value, end of period | | $9.46 | | $9.64 | | $9.83 | | $10.02 | | $9.72 |
|
| Total return (%) (t)(r) | | 1.52 | | 1.12 | | 1.53 | | 7.84 | | 5.98 |
|
| Ratios (%) (to average net assets) | | | | | | | | | | |
| and Supplemental data: | | | | | | | | | | |
|
| Expenses before expense reductions (f) | | 1.65 | | 1.62 | | 1.64 | | 1.63 | | 1.66 |
| Expenses after expense reductions (f) | | 1.55 | | 1.52 | | 1.59 | | 1.58 | | 1.61 |
| Net investment income | | 3.27 | | 3.03 | | 2.42 | | 3.32 | | 4.52 |
| Portfolio turnover | | 73 | | 126 | | 143 | | 134 | | 116 |
| Net assets at end of period | | | | | | | | | | |
| (000 Omitted) | | $175,207 | | $233,734 | | $255,512 | | $408,553 | | $263,964 |
|
| See Notes to Financial Statements | | | | | | | | | | |
|
| | | | | | | | | ANNUAL REPORT 19 |
| Financial Highlights – continued | | | | | | | | | | |
Class C | | | | | | | | | | |
| | | Years ended 2/28 and 29 |
| | | 2006 | | 2005(j) | | 2004 | | 2003 | | 2002 |
| Net asset value, beginning of period | | $9.68 | | $9.87 | | $10.06 | | $9.76 | | $9.73 |
|
| Income (loss) from investment operations | | | | | | | | | | |
|
| Net investment income (d) | | $0.32 | | $0.29 | | $0.25 | | $0.33 | | $0.44 |
| Net realized and unrealized gain (loss) on | | | | | | | | | | |
| investments and foreign currency | | (0.17) | | (0.18) | | (0.10) | | 0.41 | | 0.12 |
|
| Total from investment operations | | $0.15 | | $0.11 | | $0.15 | | $0.74 | | $0.56 |
|
| Less distributions declared to shareholders | | | | | | | | | | |
|
| From net investment income | | $(0.33) | | $(0.30) | | $(0.34) | | $(0.44) | | $(0.53) |
|
| Net asset value, end of period | | $9.50 | | $9.68 | | $9.87 | | $10.06 | | $9.76 |
|
| Total return (%) (t)(r) | | 1.52 | | 1.13 | | 1.54 | | 7.81 | | 5.97 |
|
| Ratios (%) (to average net assets) | | | | | | | | | | |
| and Supplemental data: | | | | | | | | | | |
|
| Expenses before expense reductions (f) | | 1.65 | | 1.62 | | 1.64 | | 1.63 | | 1.66 |
| Expenses after expense reductions (f) | | 1.55 | | 1.52 | | 1.59 | | 1.58�� | | 1.61 |
| Net investment income | | 3.27 | | 2.95 | | 2.47 | | 3.32 | | 4.51 |
| Portfolio turnover | | 73 | | 126 | | 143 | | 134 | | 116 |
| Net assets at end of period | | | | | | | | | | |
| (000 Omitted) | | $35,768 | | $44,692 | | $63,609 | | $110,096 | | $81,397 |
|
| See Notes to Financial Statements | | | | | | | | | | |
|
20 ANNUAL REPORT | | | | | | | | | | |
| Financial Highlights – continued | | | | | | | | | | |
Class I | | | | | | | | | | |
| | | Years ended 2/28 and 29 |
| | | 2006 | | 2005(j) | | 2004 | | 2003 | | 2002 |
| Net asset value, beginning of period | | $9.65 | | $9.84 | | $10.03 | | $9.73 | | $9.71 |
|
| Income (loss) from investment operations | | | | | | | | |
|
| Net investment income (d) | | $0.41 | | $0.39 | | $0.25 | | $0.33 | | $0.53 |
| Net realized and unrealized gain (loss) | | | | | | | | | | |
| on investments and foreign currency | | (0.17) | | (0.19) | | (0.00) | (g)(w) | 0.51 | | 0.13 |
|
| Total from investment operations | | $0.24 | | $0.20 | | $0.25 | | $0.84 | | $0.66 |
|
| Less distributions declared to shareholders | | | | | | | | |
|
| From net investment income | | $(0.42) | | $(0.39) | | $(0.44) | | $(0.54) | | $(0.64) |
|
| Net asset value, end of period | | $9.47 | | $9.65 | | $9.84 | | $10.03 | | $9.73 |
|
| Total return (%) (r) | | 2.54 | | 2.14 | | 2.55 | | 8.92 | | 6.99 |
|
| Ratios (%) (to average net assets) | | | | | | | | | | |
| and Supplemental data: | | | | | | | | | | |
|
| Expenses before expense reductions (f) | | 0.65 | | 0.60 | | 0.67 | | 0.63 | | 0.66 |
| Expenses after expense reductions (f) | | 0.55 | | 0.50 | | 0.62 | | 0.58 | | 0.61 |
| Net investment income | | 4.34 | | 4.09 | | 2.57 | | 3.64 | | 5.49 |
| Portfolio turnover | | 73 | | 126 | | 143 | | 134 | | 116 |
| Net assets at end of period | | | | | | | | | | |
| (000 Omitted) | | $359,623 | | $279,080 | | $168,124 | | $33,682 | | $1,797 |
|
| See Notes to Financial Statements | | | | | | | | | | |
|
| | | | | | | | | ANNUAL REPORT 21 |
| Financial Highlights – continued | | | | | | | | | |
Class R | | | | | | | | | |
| | | Years ended 2/28 and 29 | |
| | | 2006 | | 2005(j) | | 2004 | | 2003(i) | |
| Net asset value, beginning of period | | $9.65 | | $9.84 | | $10.03 | | $10.03 | |
| |
| Income (loss) from investment operations | | | | | | | | | |
| |
| Net investment income (d) | | $0.36 | | $0.34 | | $0.18 | | $0.16 | |
| Net realized and unrealized gain (loss) on investments | | | | | | | | | |
| and foreign currency | | (0.17) | | (0.18) | | 0.02 | (g) | (0.08) | |
| |
| Total from investment operations | | $0.19 | | $0.16 | | $0.20 | | $0.08 | |
| |
| Less distributions declared to shareholders | | | | | | | | | |
| |
| From net investment income | | $(0.37) | | $(0.35) | | $(0.39) | | $(0.08) | |
| |
| Net asset value, end of period | | $9.47 | | $9.65 | | $9.84 | | $10.03 | |
| |
| Total return (%) (r) | | 2.03 | | 1.63 | | 2.05 | | 0.78 | (n) |
| |
| Ratios (%) (to average net assets) | | | | | | | | | |
| and Supplemental data: | | | | | | | | | |
| |
| Expenses before expense reductions (f) | | 1.15 | | 1.11 | | 1.19 | | 1.13 | (a) |
| Expenses after expense reductions (f) | | 1.05 | | 1.01 | | 1.14 | | 1.08 | (a) |
| Net investment income | | 3.76 | | 3.64 | | 1.87 | | 3.04 | (a) |
| Portfolio turnover | | 73 | | 126 | | 143 | | 134 | |
| Net assets at end of period (000 Omitted) | | $11,751 | | $9,411 | | $6,188 | | $79 | |
| |
| | | Class R1 | | Class R2 | |
| | | Year ended | | Year ended | |
| | | 2/28/06(i) | | 2/28/06(i) | |
| Net asset value, beginning of period | | $9.57 | | $9.57 | |
| |
| Income (loss) from investment operations | | | | | |
| |
| Net investment income (d) | | $0.29 | | $0.31 | |
| Net realized and unrealized gain (loss) on investments and | | | | | |
| foreign currency | | (0.12) | (g) | (0.11) | (g) |
| |
| Total from investment operations | | $0.17 | | $0.20 | |
| |
| Less distributions declared to shareholders | | | | | |
| |
| From net investment income | | $(0.28) | | $(0.31) | |
| |
| Net asset value, end of period | | $9.46 | | $9.46 | |
| |
| Total return (%) (r) | | 1.82 | (n) | 2.13 | (n) |
| |
| Ratios (%) (to average net assets) | | | | | |
| and Supplemental data: | | | | | |
| |
| Expenses before expense reductions (f) | | 1.85 | (a) | 1.55 | (a) |
| Expenses after expense reductions (f) | | 1.68 | (a) | 1.34 | (a) |
| Net investment income | | 3.25 | (a) | 3.60 | (a) |
| Portfolio turnover | | 73 | | 73 | |
| Net assets at end of period (000 Omitted) | | $192 | | $358 | |
| |
| See Notes to Financial Statements | | | | | |
| |
22 ANNUAL REPORT | | | | | |
| Financial Highlights – continued | | | | | | | |
Class R3 | | | | | | | |
| | | Years ended 2/28 and 29 | |
| | | 2006 | | 2005(j) | | 2004(i) | |
| Net asset value, beginning of period | | $9.65 | | $9.84 | | $9.69 | |
| |
| Income (loss) from investment operations | | | | | | | |
| |
| Net investment income (d) | | $0.35 | | $0.38 | | $0.02 | |
| Net realized and unrealized gain (loss) on investments and | | | | | | | |
| foreign currency | | (0.18) | | (0.25) | | 0.23 | (g) |
| |
| Total from investment operations | | $0.17 | | $0.13 | | $0.25 | |
| |
| Less distributions declared to shareholders | | | | | | | |
| |
| From net investment income | | $(0.35) | | $(0.32) | | $(0.10) | |
| |
| Net asset value, end of period | | $9.47 | | $9.65 | | $9.84 | |
| |
| Total return (%) (r) | | 1.82 | | 1.38 | | 2.58 | (n) |
| |
| Ratios (%) (to average net assets) | | | | | | | |
| and Supplemental data: | | | | | | | |
| |
| Expenses before expense reductions (f) | | 1.40 | | 1.36 | | 1.42 | (a) |
| Expenses after expense reductions (f) | | 1.24 | | 1.26 | | 1.37 | (a) |
| Net investment income | | 3.64 | | 3.99 | | 0.72 | (a) |
| Portfolio turnover | | 73 | | 126 | | 143 | |
| Net assets at end of period (000 Omitted) | | $1,392 | | $422 | | $41 | |
| |
| | | Class R4 | | Class R5 | |
| | | Year ended | | Year ended | |
| | | 2/28/06(i) | | 2/28/06(i) | |
| Net asset value, beginning of period | | $9.58 | | $9.58 | |
| |
| Income (loss) from investment operations | | | | | |
| |
| Net investment income (d) | | $0.36 | | $0.37 | |
| Net realized and unrealized gain (loss) on investments and | | | | | |
| foreign currency | | (0.11) | (g) | (0.10) | (g) |
| |
| Total from investment operations | | $0.25 | | $0.27 | |
| |
| Less distributions declared to shareholders | | | | | |
| |
| From net investment income | | $(0.35) | | $(0.38) | |
| |
| Net asset value, end of period | | $9.48 | | $9.47 | |
| |
| Total return (%) (r) | | 2.64 | (n) | 2.81 | (n) |
| |
| Ratios (%) (to average net assets) | | | | | |
| and Supplemental data: | | | | | |
| |
| Expenses before expense reductions (f) | | 1.05 | (a) | 0.75 | (a) |
| Expenses after expense reductions (f) | | 0.95 | (a) | 0.65 | (a) |
| Net investment income | | 4.02 | (a) | 4.20 | (a) |
| Portfolio turnover | | 73 | | 73 | |
| Net assets at end of period (000 Omitted) | | $1,305 | | $51 | |
| |
| See Notes to Financial Statements | | | | | |
| |
| | | ANNUAL REPORT 23 | |
| Financial Highlights – continued | | | | | | | | | |
Class 529A | | | | | | | | | |
| | | Years ended 2/28 and 29 | |
| | | 2006 | | 2005(j) | | 2004 | | 2003(i) | |
| Net asset value, beginning of period | | $9.64 | | $9.83 | | $10.02 | | $9.81 | |
| |
| Income (loss) from investment operations | | | | | | | | | |
| |
| Net investment income (d) | | $0.35 | | $0.33 | | $0.26 | | $0.28 | |
| Net realized and unrealized gain (loss) on investments | | | | | | | | | |
| and foreign currency | | (0.17) | | (0.18) | | (0.07) | | 0.20 | |
| |
| Total from investment operations | | $0.18 | | $0.15 | | $0.19 | | $0.48 | |
| |
| Less distributions declared to shareholders | | | | | | | | | |
| |
| From net investment income | | $(0.36) | | $(0.34) | | $(0.38) | | $(0.27) | |
| |
| Net asset value, end of period | | $9.46 | | $9.64 | | $9.83 | | $10.02 | |
| |
| Total return (%) (t)(r) | | 1.92 | | 1.53 | | 1.94 | | 4.97 | (n) |
| |
| Ratios (%) (to average net assets) | | | | | | | | | |
| and Supplemental data: | | | | | | | | | |
| |
| Expenses before expense reductions (f) | | 1.25 | | 1.21 | | 1.25 | | 1.23 | (a) |
| Expenses after expense reductions (f) | | 1.15 | | 1.11 | | 1.20 | | 1.18 | (a) |
| Net investment income | | 3.68 | | 3.47 | | 2.69 | | 3.05 | (a) |
| Portfolio turnover | | 73 | | 126 | | 143 | | 134 | |
| Net assets at end of period (000 Omitted) | | $401 | | $388 | | $332 | | $312 | |
| |
| Class 529B | | | | | | | | | |
| | | Years ended 2/28 and 29 | | | |
| |
| |
| | | 2006 | | 2005(j) | | 2004 | | 2003(i) | |
| Net asset value, beginning of period | | $9.64 | | $9.82 | | $10.01 | | $9.80 | |
| |
| Income (loss) from investment operations | | | | | | | | | |
| |
| Net investment income (d) | | $0.29 | | $0.26 | | $0.20 | | $0.24 | |
| Net realized and unrealized gain (loss) on investments | | | | | | | | | |
| and foreign currency | | (0.17) | | (0.17) | | (0.08) | | 0.21 | |
| |
| Total from investment operations | | $0.12 | | $0.09 | | $0.12 | | $0.45 | |
| |
| Less distributions declared to shareholders | | | | | | | | | |
| |
| From net investment income | | $(0.30) | | $(0.27) | | $(0.31) | | $(0.24) | |
| |
| Net asset value, end of period | | $9.46 | | $9.64 | | $9.82 | | $10.01 | |
| |
| Total return (%) (t)(r) | | 1.26 | | 0.97 | | 1.27 | | 4.58 | (n) |
| |
| Ratios (%) (to average net assets) | | | | | | | | | |
| and Supplemental data: | | | | | | | | | |
| |
| Expenses before expense reductions (f) | | 1.90 | | 1.87 | | 1.90 | | 1.88 | (a) |
| Expenses after expense reductions (f) | | 1.80 | | 1.77 | | 1.85 | | 1.83 | (a) |
| Net investment income | | 3.03 | | 2.71 | | 2.07 | | 2.53 | (a) |
| Portfolio turnover | | 73 | | 126 | | 143 | | 134 | |
| Net assets at end of period (000 Omitted) | | $435 | | $404 | | $524 | | $522 | |
| |
| See Notes to Financial Statements | | | | | | | | | |
| |
24 ANNUAL REPORT | | | | | | | | | |
| Financial Highlights – continued | | | | | | | | | |
Class 529C | | | | | | | | | |
| | | Years ended 2/28 and 29 | |
| | | 2006 | | 2005(j) | | 2004 | | 2003(i) | |
| Net asset value, beginning of period | | $9.68 | | $9.87 | | $10.06 | | $9.84 | |
| |
| Income (loss) from investment operations | | | | | | | | | |
| |
| Net investment income (d) | | $0.29 | | $0.26 | | $0.22 | | $0.20 | |
| Net realized and unrealized gain (loss) on investments | | | | | | | | | |
| and foreign currency | | (0.17) | | (0.18) | | (0.10) | | 0.26 | |
| |
| Total from investment operations | | $0.12 | | $0.08 | | $0.12 | | $0.46 | |
| |
| Less distributions declared to shareholders | | | | | | | | | |
| |
| From net investment income | | $(0.30) | | $(0.27) | | $(0.31) | | $(0.24) | |
| |
| Net asset value, end of period | | $9.50 | | $9.68 | | $9.87 | | $10.06 | |
| |
| Total return (%) (t)(r) | | 1.27 | | 0.88 | | 1.28 | | 4.66 | (n) |
| |
| Ratios (%) (to average net assets) | | | | | | | | | |
| and Supplemental data: | | | | | | | | | |
| |
| Expenses before expense reductions (f) | | 1.90 | | 1.86 | | 1.89 | | 1.88 | (a) |
| Expenses after expense reductions (f) | | 1.80 | | 1.76 | | 1.84 | | 1.83 | (a) |
| Net investment income | | 3.01 | | 2.76 | | 2.15 | | 2.37 | (a) |
| Portfolio turnover | | 73 | | 126 | | 143 | | 134 | |
| Net assets at end of period (000 Omitted) | | $235 | | $297 | | $283 | | $383 | |
| |
| Any redemption fees charged by the fund during the 2004 and 2005 fiscal years resulted in a per share |
| impact of less than $0.01. |
(a) | | Annualized. |
| (n) | | Not annualized. |
| (d) | | Per share data are based on average shares outstanding. |
| (f) | | Ratios do not reflect reductions from fees paid indirectly. |
| (g) | | The per share amount is not in accordance with the net realized and unrealized gain/loss for the period |
| | | because of the timing of sales of fund shares and the amount of per share realized and unrealized gains |
| | | and losses at such time. |
| (i) | | For the period from the class’ inception, December 31, 2002 (Class R), July 31, 2002 (Classes 529A, 529B, |
| | | and 529C), October 31, 2003 (Class R3) and April 1, 2005 (Classes R1, R2, R4, and R5) through the |
| | | stated period end. |
| (r) | | Certain expenses have been reduced without which performance would have been lower. |
| (t) | | Total returns do not include any applicable sales charges. |
| (w) Per share amount was less than $0.01. |
|
| | | ANNUAL REPORT 25 |
| Financial Highlights – continued |
(j) | | Due to a revision, certain amounts for the year ended February 28, 2005 have been changed from what |
| | | was previously reported. The impact of the revision was an increase to the ratio of net investment income |
| | | to average net assets and a corresponding decrease to the ratio of expenses to average net assets. |
| | | Additionally, the revision resulted in rounding the net asset value for certain classes up to the next cent, |
| | | increasing total return for these classes. As a result of these revised net asset values, no shareholder |
| | | accounts were materially effected. The impact for each share class is summarized as follows: |
| | | | | | Increase in Net | | |
| | Increase in Net | | | | Asset Value | | |
| | Investment | | Decrease in | | per Share | | Increase to |
| Share Class | Income Ratio | | Expense Ratio | | (Rounded) | | Total Return |
| Class A | 0.04% | | 0.04% | | N/A | | N/A |
| Class B | 0.03% | | 0.03% | | N/A | | N/A |
| Class C | 0.03% | | 0.03% | | N/A | | N/A |
| Class I | 0.05% | | 0.05% | | $0.01 | | 0.11% |
| Class R | 0.05% | | 0.05% | | $0.01 | | 0.10% |
| Class R3 | 0.10% | | 0.10% | | $0.01 | | 0.11% |
| Class 529A | 0.04% | | 0.04% | | $0.01 | | 0.11% |
| Class 529B | 0.03% | | 0.03% | | $0.01 | | 0.10% |
| Class 529C | 0.04% | | 0.04% | | $0.01 | | 0.10% |
See Notes to Financial Statements | | | | | | |
|
26 ANNUAL REPORT | | | | | | | |
NOTES TO FINANCIAL STATEMENTS
(1) Business and Organization
MFS Government Securities Fund (the fund) is a series of MFS Series Trust XIII (formerly known as MFS Government Securities Fund) (the trust). The trust is organized as a Massachusetts business trust and is registered under the Investment Company Act of 1940, as amended, as an open-end management investment company.
(2) Significant Accounting Policies
General – The preparation of financial statements in conformity with U.S. generally accepted accounting principles requires management to make estimates and assumptions that affect the reported amounts of assets and liabilities, and disclosure of contingent assets and liabilities at the date of the financial statements and the reported amounts of revenues and expenses during the reporting period. Actual results could differ from those estimates.
Investment Valuations – Debt instruments (other than short-term instruments), including restricted debt instruments, are generally valued at an evaluated bid price as reported by an independent pricing service. Values of debt instruments obtained from pricing services can utilize both dealer-supplied valuations and electronic data processing techniques which take into account factors such as institutional-size trading in similar groups of securities, yield, quality, coupon rate, maturity, type of issue, trading characteristics and other market data. Short-term instruments with a maturity at issuance of 365 days or less are generally valued at amortized cost, which approximates market value. Futures contracts are generally valued at settlement price as reported by an independent pricing service on the exchange on which they are primarily traded. For futures contracts in which there were no sales during the day, futures contracts are generally valued at the last quoted bid price as reported by an independent pricing service on the exchange on which they are primarily traded. Securities and other assets generally valued on the basis of information from an independent pricing service may also be valued on the basis of information from brokers and dealers. When pricing-service information or market quotations are not readily available, securities are priced at fair value as determined under the direction of the Board of Trustees.
Repurchase Agreements – The fund may enter into repurchase agreements with institutions that the fund’s investment adviser has determined are creditworthy. Each repurchase agreement is recorded at cost. The fund requires that the securities collateral in a repurchase transaction be transferred to the custodian in a manner sufficient to enable the fund to obtain those securities in the event of a default under the repurchase agreement. The fund monitors, on a daily basis, the value of the collateral to ensure that its value, including accrued interest, is greater than amounts owed to the fund under each such repurchase agreement. The fund, along with other affiliated entities of Massachusetts Financial Services Company (MFS), may utilize a joint trading account for the purpose of entering into one or more repurchase agreements.
Inflation-Adjusted Debt Securities – The fund invests in inflation-adjusted debt securities issued by the U.S. Treasury. The fund may also invest in
ANNUAL REPORT 27
Notes to Financial Statements – continued
inflation-adjusted debt securities issued by U.S. Government agencies and instrumentalities other than the U.S. Treasury and by other entities such as U.S. and foreign corporations and foreign governments. The principal value of these debt securities is adjusted by references to changes in the Consumer Price Index or another general price or wage index. These debt securities typically pay a fixed rate of interest, but this fixed rate is applied to the inflation-adjusted principal amount. The principal paid at maturity of the debt security is typically equal to the inflation-adjusted principal amount, or the security’s original par value, whichever is greater. Other types of inflation-adjusted securities may use other methods to adjust for other measures of inflation.
Derivative Risk – The fund may invest in derivatives for hedging or non-hedging purposes. While hedging can reduce or eliminate losses, it can also reduce or eliminate gains. When the fund uses derivatives as an investment to gain market exposure, or for hedging purposes, gains and losses from derivative instruments may be substantially greater than the derivative’s original cost. Derivative instruments include purchased options and futures contracts.
Futures Contracts – The fund may enter into futures contracts for the delayed delivery of securities or currency, or contracts based on financial indices at a fixed price on a future date. In entering such contracts, the fund is required to deposit with the broker either in cash or securities an amount equal to a certain percentage of the contract amount. Subsequent payments are made or received by the fund each day, depending on the daily fluctuations in the value of the contract, and are recorded for financial statement purposes as unrealized gains or losses by the fund. Upon entering into such contracts, the fund bears the risk of interest or exchange rates or securities prices moving unexpectedly, in which case, the fund may not achieve the anticipated benefits of the futures contracts and may realize a loss.
Short Term Fees – For purchases made on or after July 1, 2004 and before April 1, 2005, the fund charged a 2% redemption fee (which was retained by the fund) on proceeds from Class A, Class B, Class C, and Class I shares redeemed or exchanged within 5 business days following their acquisition (either by purchase or exchange). Effective April 1, 2005, the fund no longer charges a redemption fee. See the fund’s prospectus for details. Any redemption fees charged are accounted for as an addition to paid-in capital.
Investment Transactions and Income – Investment transactions are recorded on the trade date. Some securities may be purchased on a ‘‘when-issued’’ or ‘‘forward delivery’’ basis, which means that the securities will be delivered to the fund at a future date, usually beyond customary settlement time. Interest income is recorded on the accrual basis. All premium and discount is amortized or accreted for financial statement purposes in accordance with U.S. generally accepted accounting principles. All discount is accreted for tax reporting purposes as required by federal income tax regulations.
The fund may enter into ‘‘TBA’’ (to be announced) purchase commitments to purchase securities for a fixed unit price at a future date. Although the unit price has been established, the principal value has not been finalized.
28 ANNUAL REPORT
Notes to Financial Statements – continued
However, the principal amount of the commitments will not fluctuate more than 0.01% . The fund holds, and maintains until settlement date, cash or high-grade debt obligations in an amount sufficient to meet the purchase price, or the fund may enter into offsetting contracts for the forward sale of other securities it owns. Income on the securities will not be earned until settlement date. TBA purchase commitments may be considered securities in themselves, and involve a risk of loss if the value of the security to be purchased declines prior to settlement date, which is in addition to the risk of decline in the value of the fund’s other assets. Unsettled TBA purchase commitments are valued at the current market value of the underlying securities.
The fund may enter into ‘‘TBA’’ (to be announced) sale commitments to hedge its portfolio positions or to sell mortgage-backed securities it owns under delayed delivery arrangements. Proceeds of TBA sale commitments are not received until the contractual settlement date. During the time a TBA sale commitment is outstanding, equivalent deliverable securities, or an offsetting TBA purchase commitment deliverable on or before the sale commitment date, are held as ‘‘cover’’ for the transaction.
Fees Paid Indirectly – The fund’s custody fee is reduced according to an arrangement that measures the value of cash deposited with the custodian by the fund. This amount, for the year ended February 28, 2006, is shown as a reduction of total expenses on the Statement of Operations.
Tax Matters and Distributions – The fund intends to continue to qualify as a regulated investment company, as defined under Subchapter M of the Internal Revenue Code, and to distribute all of its taxable income, including realized capital gains. Accordingly, no provision for federal income tax is required in the financial statements. Foreign taxes, if any, have been accrued by the fund in the accompanying financial statements.
Distributions to shareholders are recorded on the ex-dividend date. Income and capital gain distributions are determined in accordance with income tax regulations, which may differ from generally accepted accounting principles. Certain capital accounts in the financial statements are periodically adjusted for permanent differences in order to reflect their tax character. These adjustments have no impact on net assets or net asset value per share. Temporary differences which arise from recognizing certain items of income, expense, gain or loss in different periods for financial statement and tax purposes will reverse at some time in the future. Distributions in excess of net investment income or net realized gains are temporary overdistributions for financial statement purposes resulting from differences in the recognition or classification of income for financial statement and tax purposes.
Book/tax differences primarily relate to expiration of capital loss carryforwards and amortization and accretion of debt securities.
ANNUAL REPORT 29
Notes to Financial Statements – continued
The tax character of distributions declared to shareholders is as follows:
| | | February 28, 2006 | | February 28, 2005 |
| Ordinary income (including | | | | |
| any short-term capital gains) | | $59,610,833 | | $48,761,052 |
The federal tax cost and the tax basis components of distributable earnings were as follows:
| As of February 28, 2006 | | |
| Cost of investments | | $1,425,783,993 |
|
| Gross appreciation | | $6,235,589 |
| Gross depreciation | | (27,607,097) |
|
| Net unrealized appreciation (depreciation) | | $(21,371,508) |
| Undistributed ordinary income | | $5,576,677 |
| Capital loss carryforwards | | (59,308,939) |
| Post-October capital loss deferral | | (2,471,227) |
| Other temporary differences | | (5,117,333) |
As of February 28, 2006, the fund had available capital loss carryforwards to offset future realized gains. Such losses expire as follows:
| February 28, 2007 | | $(5,253,445) |
| February 29, 2008 | | (15,270,459) |
| February 28, 2009 | | (3,477,230) |
| February 28, 2011 | | (11,527,172) |
| February 29, 2012 | | (5,729,829) |
| February 28, 2013 | | (11,095,767) |
| February 28, 2014 | | (6,955,037) |
|
| Total | | | | | | $(59,308,939) |
The availability of a portion of the capital loss carryforwards, which were acquired on November 19, 2004, in connection with the MFS Government Mortgage Fund merger, may be limited in a given year.
Multiple Classes of Shares of Beneficial Interest – The fund offers multiple classes of shares, which differ in their respective distribution and service fees. All shareholders bear the common expenses of the fund based on the value of settled shares outstanding of each class, without distinction between share classes. Dividends are declared separately for each class. Differences in per share dividend rates are generally due to differences in separate class expenses. Class B and Class 529B shares will convert to Class A and Class 529A shares, respectively, approximately eight years after purchase.
Other – Due to a revision to miscellaneous expenses, certain amounts on the Statement of Changes in Net Assets and Financial Highlights for the year ended February 28, 2005, have been changed from what was previously reported. The impact of the revision was to reduce expenses related to this item and thereby increase net investment income, changes in net assets from operations and net assets at end of period for the year ended February 28, 2005, by $521,341.
30 ANNUAL REPORT
Notes to Financial Statements – continued
(3) Transactions with Affiliates
Investment Adviser – The fund has an investment advisory agreement with Massachusetts Financial Services Company (MFS) to provide overall investment advisory and administrative services, and general office facilities. The management fee is computed daily and paid monthly at an annual rate of 0.40% of the fund’s average daily net assets.
As part of a settlement agreement with the New York Attorney General concerning market timing and related matters, MFS has agreed to reduce the management fee to 0.30% of the fund’s average daily net assets for the period March 1, 2004 through February 28, 2009. For the year ended February 28, 2006, this waiver amounted to $1,474,287 and is reflected as a reduction of total expenses in the Statement of Operations.
The management fee incurred for the year ended February 28, 2006 was equivalent to an annual effective rate of 0.30% of the fund’s average daily net assets.
The investment adviser has contractually agreed to pay a portion of the fund’s operating expenses, exclusive of management, distribution and service, retirement plan administration and services, program manager, and certain other fees and expenses, such that operating expenses do not exceed 0.25% annually of the fund’s average daily net assets. This contractual fee arrangement will continue until July 1, 2006. For the year ended February 28, 2006, this reduction amounted to $39,692 and is reflected as a reduction of total expenses in the Statement of Operations.
Distributor – MFS Fund Distributors, Inc. (MFD), a wholly owned subsidiary of MFS, as distributor, received $52,767 and $249 for the year ended February 28, 2006, as its portion of the initial sales charge on sales of Class A and Class 529A shares of the fund, respectively.
The Board of Trustees has adopted a distribution plan for certain class shares pursuant to Rule 12b-1 of the Investment Company Act of 1940.
The fund’s distribution plan provides that the fund will pay MFD for services provided by MFD and financial intermediaries in connection with the distribution and servicing of certain share classes. One component of the plan is a distribution fee paid to MFD and another component of the plan is a service fee paid to MFD. MFD may subsequently pay all, or a portion, of the distribution and/or service fees to financial intermediaries.
ANNUAL REPORT 31
| Notes to Financial Statements – continued | | | | | | |
Distribution Fee Plan Table: | | | | | | | | |
| | | | | | | Total | | Annual | | Distribution |
| | | Distribution | | Service | | Distribution | | Effective | | and Service |
| | | Fee Rate | | Fee Rate | | Plan(1) | | Rate(2) | | Fee |
| Class A | | 0.10% | | 0.25% | | 0.35% | | 0.25% | | $2,217,901 |
| Class B | | 0.75% | | 0.25% | | 1.00% | | 1.00% | | 2,052,972 |
| Class C | | 0.75% | | 0.25% | | 1.00% | | 1.00% | | 419,810 |
| Class R | | 0.25% | | 0.25% | | 0.50% | | 0.50% | | 55,930 |
| Class R1 | | 0.50% | | 0.25% | | 0.75% | | 0.75% | | 929 |
| Class R2 | | 0.25% | | 0.25% | | 0.50% | | 0.50% | | 848 |
| Class R3 | | 0.25% | | 0.25% | | 0.50% | | 0.50% | | 4,749 |
| Class R4 | | — | | 0.25% | | 0.25% | | 0.25% | | 1,362 |
| Class 529A | | 0.25% | | 0.25% | | 0.50% | | 0.35% | | 1,398 |
| Class 529B | | 0.75% | | 0.25% | | 1.00% | | 1.00% | | 4,248 |
| Class 529C | | 0.75% | | 0.25% | | 1.00% | | 1.00% | | 2,793 |
|
| Total Distribution and Service Fees | | | | | | | | $4,762,940 |
| (1) | In accordance with the distribution plan for certain classes, the fund pays distribution and/or service fees up to these annual percentage rates of each class’ average daily net assets. |
| (2) | The annual effective rates represent actual fees incurred under the distribution plan for the year ended February 28, 2006 based on each class’ average daily net assets. Payment of the 0.10% annual Class A distribution fee is not yet implemented and will commence on such date as the fund’s Board of Trustees may determine. 0.10% of the Class 529A distribution fee is currently being paid by the fund. Payment of the remaining 0.15% of the Class 529A distribution fee is not yet implemented and will commence on such date as the fund’s Board of Trustees may determine. |
Certain Class A, Class C and Class 529C shares are subject to a contingent deferred sales charge in the event of a shareholder redemption within 12 months of purchase. Class B and Class 529B shares are subject to a contingent deferred sales charge in the event of a shareholder redemption within six years of purchase. All contingent deferred sales charges are paid to MFD and during the year ended February 28, 2006, were as follows:
| | | Amount |
| Class A | | $21,378 |
| Class B | | $434,033 |
| Class C | | $3,192 |
| Class 529B | | $50 |
| Class 529C | | $— |
The fund has entered into and may from time to time enter into contracts with program managers and other parties which administer the tuition programs through which an investment in the fund’s 529 share classes is made. The fund has entered into an agreement with MFD pursuant to which MFD receives an annual fee of up to 0.35% from the fund based solely upon the value of the fund’s 529 share classes attributable to tuition programs to which MFD, or a third party which contracts with MFD, provides administrative services. The current fee has been established at 0.25% annually of average net assets of the fund’s 529 share classes. The fee may only be increased with the approval of the Board of Trustees who oversees the fund. The services provided by MFD, or a third party with which MFD contracts, include recordkeeping and tax reporting and account services, as well as services designed to maintain the program’s compliance with the
32 ANNUAL REPORT
Notes to Financial Statements – continued
Internal Revenue Code and other regulatory requirements. Program manager fees for the year ended February 28, 2006, were as follows:
| | | | | Amount |
| Class 529A | | | | $999 |
| Class 529B | | | | $1,062 |
| Class 529C | | | | $698 |
|
| Total Program Manager Fees | | $2,759 |
Shareholder Servicing Agent – The fund pays a portion of shareholder servicing costs to MFS Service Center, Inc. (MFSC), a wholly-owned subsidiary of MFS. MFSC receives a fee from the fund, for its services as shareholder servicing agent, set periodically under the supervision of the fund’s Board of Trustees. For the year ended February 28, 2006, the fee was $1,560,159 which equated to 0.1064% annually of the fund’s average daily net assets. MFSC also receives payment from the fund for out-of-pocket and sub-accounting expenses paid by MFSC on behalf of the fund. For the year ended February 28, 2006, these costs amounted to $665,100.
Administrator – MFS provides certain financial, legal, shareholder communications, compliance, and other administrative services to certain funds for which MFS acts as investment adviser. Under an administrative services agreement, the funds may partially reimburse MFS the costs incurred to provide these services, subject to review and approval by the Board of Trustees. Each fund is charged a fixed amount plus a fee based on calendar year average net assets. Effective July 1, 2005, the fund’s annual fixed amount is $10,000.
The administrative services fee incurred for the year ended February 28, 2006 was equivalent to an annual effective rate of 0.0122% of the fund’s average daily net assets.
In addition to the administrative services provided by MFS to the fund as described above, MFS is responsible for providing certain retirement plan administration and services with respect to certain shares. These services include various administrative, recordkeeping, and communication/educational services with respect to the retirement plans which invest in these shares, and may be provided directly by MFS or by a third party. MFS may subsequently pay all, or a portion, of the retirement plan administration and services fee to affiliated or unaffiliated third parties. For the year ended February 28, 2006, the fund paid MFS an annual retirement plan
ANNUAL REPORT 33
Notes to Financial Statements – continued
administration and services fee up to the following annual percentage rates of each class’ average daily net assets:
| | | | | Annual | | |
| | | Fee | | Effective | | Total |
| | | Rate | | Rate(1) | | Amount |
| Class R1 | | 0.45% | | 0.38% | | $557 |
| Class R2 | | 0.40% | | 0.29% | | 677 |
| Class R3 | | 0.25% | | 0.19% | | 2,371 |
| Class R4 | | 0.15% | | 0.15% | | 817 |
| Class R5 | | 0.10% | | 0.10% | | 47 |
|
| Total Retirement Plan Administration and Services Fees | | $4,469 |
| (1) | Effective October 1, 2005, MFS has contractually agreed to waive a portion of the retirement plan administration and services fee equal to 0.10% for Class R1 shares, 0.15% for Class R2 shares, and 0.10% for Class R3 shares. This agreement will continue until at least September 30, 2007. For the year ended February 28, 2006, this waiver amounted to $835 and is reflected as a reduction of total expenses in the Statement of Operations. |
Trustees’ and Officers’ Compensation – The fund pays compensation to Independent Trustees in the form of a retainer, attendance fees, and additional compensation to Board and Committee chairpersons. The fund does not pay compensation directly to Trustees who are officers of the investment adviser, or to officers of the fund, all of whom receive remuneration for their services to the fund from MFS. Certain officers and Trustees of the fund are officers or directors of MFS, MFD, and MFSC. The fund has an unfunded, defined benefit plan for retired Independent Trustees which resulted in a pension expense of $12,336. The fund also has an unfunded retirement benefit deferral plan for certain current Independent Trustees which resulted in an expense of $1,904. Both amounts are included in Independent trustees’ compensation for the year ended February 28, 2006. The deferred liability for retirement benefits payable to retired Trustees and certain current Trustees amounted to $51,236 and $79,822 respectively, at February 28, 2006, and is included in payable for independent trustees’ compensation.
Other – This fund and certain other MFS funds (the funds) have entered into a services agreement (the Agreement) which provides for payment of fees by the funds to Tarantino LLC in return for the provision of services of an Independent Chief Compliance Officer (ICCO) for the funds. The ICCO is an officer of the funds and the sole member of Tarantino LLC. The funds can terminate the Agreement with Tarantino LLC at any time under the terms of the Agreement. For the year ended February 28, 2006, the fee paid to Tarantino LLC was $9,615. MFS has agreed to reimburse the fund for a portion of the payments made by the funds to Tarantino LLC in the amount of $7,910 which is shown as a reduction of total expenses in the Statement of Operations. Additionally, MFS has agreed to bear all expenses associated with office space, other administrative support, and supplies provided to the ICCO.
34 ANNUAL REPORT
Notes to Financial Statements – continued
(4) Portfolio Securities
Purchases and sales of investments, other than purchased option transactions and short-term obligations, were as follows:
| | | Purchases | | Sales |
| U.S. government securities | | $992,966,647 | | $1,005,651,372 |
|
| Investments (non-U.S. government securities) | | $43,084,477 | | $32,880,986 |
|
(5) Shares of Beneficial Interest
The fund’s Declaration of Trust permits the Trustees to issue an unlimited number of full and fractional shares of beneficial interest. Transactions in fund shares were as follows:
| | | | | Year ended 2/28/06(i) | | Year ended 2/28/05 |
| | | | | Shares | | Amount | | Shares | | Amount |
| Shares sold | | | | | | | | |
| Class A | | 10,611,681 | | $101,911,884 | | 16,308,514 | | $158,080,874 |
| Class B | | 1,753,090 | | 16,845,100 | | 2,350,771 | | 22,878,329 |
| Class C | | 956,545 | | 9,240,885 | | 599,402 | | 5,839,934 |
| Class I | | 7,664,900 | | 73,401,210 | | 11,066,890 | | 107,326,816 |
| Class R | | 565,418 | | 5,426,802 | | 639,146 | | 6,203,334 |
| Class | | R1 | | 29,826 | | 286,568 | | — | | — |
| Class | | R2 | | 37,327 | | 356,858 | | — | | — |
| Class | | R3 | | 153,972 | | 1,475,492 | | 78,487 | | 763,365 |
| Class | | R4 | | 158,071 | | 1,517,633 | | — | | — |
| Class | | R5 | | 5,219 | | 50,000 | | — | | — |
| Class | | 529A | | 5,299 | | 50,939 | | 11,540 | | 111,687 |
| Class | | 529B | | 3,450 | | 33,038 | | 1,825 | | 17,703 |
| Class | | 529C | | 2,987 | | 28,608 | | 8,504 | | 83,637 |
|
| | | | | 21,947,785 | | $210,625,017 | | 31,065,079 | | $301,305,679 |
| Shares issued in connection with | | | | | | | | |
| acquisition of MFS Government | | | | | | | | |
| Mortgage Fund | | | | | | | | |
| Class A | | | | | | 43,483,744 | | $422,661,943 |
| Class B | | | | | | 5,217,434 | | 50,661,281 |
|
| | | | | | | 48,701,178 | | $473,323,224 |
| Shares issued to shareholders in | | | | | | | | |
| reinvestment of distributions | | | | | | | | |
| Class A | | 2,780,579 | | $26,662,325 | | 2,742,230 | | $26,585,292 |
| Class B | | 583,318 | | 5,586,303 | | 623,908 | | 6,040,560 |
| Class C | | 115,199 | | 1,108,064 | | 132,437 | | 1,287,771 |
| Class I | | 1,458,711 | | 13,966,752 | | 989,445 | | 9,583,025 |
| Class R | | 42,681 | | 408,808 | | 26,173 | | 253,587 |
| Class R1 | | 420 | | 4,004 | | — | | — |
| Class R2 | | 665 | | 6,326 | | — | | — |
|
| | | | | | |
ANNUAL REPORT 35 |
| Notes to Financial Statements – continued | | | | | | |
| | | | Year ended 2/28/06(i) | | Year ended 2/28/05 |
| | | | Shares | | Amount | | Shares | | Amount |
| Shares issued to shareholders in | | | | | | | | |
| reinvestment of distributions | | | | | | | | |
| Class R3 | | | 3,685 | | $35,165 | | 556 | | $5,380 |
| Class R4 | | | 2,366 | | 22,498 | | — | | — |
| Class R5 | | | 209 | | 2,004 | | — | | — |
| Class 529A | | | 1,584 | | 15,157 | | 1,285 | | 12,435 |
| Class 529B | | | 1,398 | | 13,369 | | 1,401 | | 13,549 |
| Class 529C | | | 905 | | 8,703 | | 890 | | 8,649 |
|
| | | | 4,991,720 | | $47,839,478 | | 4,518,325 | | $43,790,248 |
| Shares reacquired | | | | | | | | |
| Class A | | (22,830,344) | | $(218,822,611) | | (47,574,507) | | $(463,184,495) |
| Class B | | (8,058,578) | | (77,182,632) | | (9,941,512) | | (96,185,082) |
| Class C | | (1,922,572) | | (18,495,932) | | (2,559,242) | | (24,892,501) |
| Class I | | (85,757) | | (823,643) | | (215,330) | | (2,076,073) |
| Class R | | (342,272) | | (3,275,075) | | (318,931) | | (3,087,488) |
| Class R1 | | | (9,994) | | (95,027) | | — | | — |
| Class R2 | | | (118) | | (1,126) | | — | | — |
| Class R3 | | | (54,407) | | (520,088) | | (39,439) | | (382,182) |
| Class R4 | | | (22,733) | | (215,873) | | — | | — |
| Class R5 | | | — | | — | | — | | — |
| Class 529A | | | (4,795) | | (45,919) | | (6,347) | | (61,446) |
| Class 529B | | | (799) | | (7,708) | | (14,658) | | (141,070) |
| Class 529C | | | (9,788) | | (93,966) | | (7,381) | | (72,985) |
|
| | | | (33,342,157) | | $(319,579,600) | | (60,677,347) | | $(590,083,322) |
| Net change | | | | | | | | |
| Class A | | (9,438,084) | | $(90,248,402) | | 14,959,981 | | $144,143,614 |
| Class B | | (5,722,170) | | (54,751,229) | | (1,749,399) | | (16,604,912) |
| Class C | | (850,828) | | (8,146,983) | | (1,827,403) | | (17,764,796) |
| Class I | | 9,037,854 | | 86,544,319 | | 11,841,005 | | 114,833,768 |
| Class R | | 265,827 | | 2,560,535 | | 346,388 | | 3,369,433 |
| Class R1 | | | 20,252 | | 195,545 | | — | | — |
| Class R2 | | | 37,874 | | 362,058 | | — | | — |
| Class R3 | | | 103,250 | | 990,569 | | 39,604 | | 386,563 |
| Class R4 | | | 137,704 | | 1,324,258 | | — | | — |
| Class R5 | | | 5,428 | | 52,004 | | — | | — |
| Class 529A | | | 2,088 | | 20,177 | | 6,478 | | 62,676 |
| Class 529B | | | 4,049 | | 38,699 | | (11,432) | | (109,818) |
| Class 529C | | | (5,896) | | (56,655) | | 2,013 | | 19,301 |
|
| | | | (6,402,652) | | $(61,115,105) | | 23,607,235 | | $228,335,829 |
| (i) For the period from the class’ inception, April 1, 2005 (Classes R1, R2, R4, and R5) through the stated period end. |
| | | | | | | | |
|
| 36 ANNUAL REPORT | | | | | | | | |
Notes to Financial Statements – continued
The fund is one of several mutual funds in which the MFS fund-of-funds may invest. The MFS fund-of-funds do not invest in the underlying MFS funds for the purpose of exercising management or control. At the end of the period, the MFS Conservative Allocation Fund, the MFS Moderate Allocation Fund, and the MFS Growth Allocation Fund, were the owners of record of approximately 4%, 13%, and 7%, respectively, of the value of outstanding voting shares. In addition, the MFS Lifetime Retirement Income Fund, the MFS Lifetime 2010 Fund, the MFS Lifetime 2020 Fund, and the MFS Lifetime 2030 Fund were all the owners of record of less than 1% of the value of outstanding voting shares.
(6) Line of Credit
The fund and other affiliated funds participate in a $1 billion unsecured line of credit provided by a syndication of banks under a credit agreement. Borrowings may be made for temporary financing needs. Interest is charged to each fund, based on its borrowings, at a rate equal to the Federal Reserve funds rate plus 0.35% . In addition, a commitment fee, based on the average daily, unused portion of the line of credit, is allocated among the participating funds at the end of each calendar quarter. The commitment fee allocated to the fund for the year ended February 28, 2006 was $9,498 and is included in miscellaneous expense on the Statement of Operations. The fund had no significant borrowings during the year ended February 28, 2006.
(7) Acquisitions
At close of business on November 19, 2004, the fund acquired all of the assets and liabilities of the MFS Government Mortgage Fund. The acquisition was accomplished by a tax-free exchange of 48,701,178 shares of the fund (valued at $473,323,224) for all of the assets and liabilities of the MFS Government Mortgage Fund. MFS Government Mortgage Fund then converted all of its outstanding shares for the shares of the fund and distributed those shares to its shareholders. MFS Government Mortgage Fund’s net assets on that date were $473,323,224, including $3,693,881 of unrealized appreciation, $157,151 of accumulated distributions in excess of net investment income, and $31,781,771 of accumulated net realized loss on investments. These assets were combined with those of the fund. The aggregate net assets of the fund after the acquisition were $1,217,628,851.
ANNUAL REPORT 37
REPORT OF INDEPENDENT REGISTERED PUBLIC ACCOUNTING FIRM
To the Trustees and the Shareholders of MFS Government Securities Fund:
We have audited the accompanying statement of assets and liabilities, including the portfolio of investments, of MFS Government Securities Fund (the ‘‘Fund’’) (a series of MFS Series Trust XIII), as of February 28, 2006, and the related statement of operations for the year then ended, the statements of changes in net assets for each of the two years in the period then ended, and the financial highlights for each of the five years in the period then ended. These financial statements and financial highlights are the responsibility of the Fund’s management. Our responsibility is to express an opinion on these financial statements and financial highlights based on our audits.
We conducted our audits in accordance with the standards of the Public Company Accounting Oversight Board (United States). Those standards require that we plan and perform the audit to obtain reasonable assurance about whether the financial statements and financial highlights are free of material misstatement. The Fund is not required to have, nor were we engaged to perform, an audit of its internal control over financial reporting. Our audits included consideration of internal control over financial reporting as a basis for designing audit procedures that are appropriate in the circumstances, but not for the purpose of expressing an opinion on the effectiveness of the Fund’s internal control over financial reporting. Accordingly, we express no such opinion. An audit also includes examining, on a test basis, evidence supporting the amounts and disclosures in the financial statements, assessing the accounting principles used and significant estimates made by management, as well as evaluating the overall financial statement presentation. Our procedures included confirmation of securities owned as of February 28, 2006, by correspondence with the custodian. We believe that our audits provide a reasonable basis for our opinion.
In our opinion, such financial statements and financial highlights present fairly, in all material respects, the financial position of MFS Government Securities Fund as of February 28, 2006, the results of its operations for the year then ended, the changes in its net assets for each of the two years in the period then ended, and its financial highlights for each of the five years in the period then ended, in conformity with accounting principles generally accepted in the United States of America.
DELOITTE & TOUCHE LLP
Boston, Massachusetts
April 24, 2006
38 ANNUAL REPORT
| TRUSTEES AND OFFICERS — IDENTIFICATION AND BACKGROUND |
The Trustees and officers of the Trust, as of April 1, 2006, are listed below, together with their principal occupations during the past five years. (Their
titles may have varied during that period.) The address of each Trustee and officer is 500 Boylston Street, Boston, Massachusetts 02116. |
|
|
|
| | | | | | |
Principal Occupations During |
| | | Position(s) Held | | Trustee/Officer | | the Past Five Years & |
| Name, Date of Birth | | with Fund | | Since(1) | | Other Directorships(2) |
|
| INTERESTED TRUSTEES | | | | | | |
| Robert J. Manning(3) | | Trustee | | February 2004 | | Massachusetts Financial Services |
| (born 10/20/63) | | | | | | Company, Chief Executive |
| | | | | | | Officer, President, Chief |
| | | | | | | Investment Officer and Director |
| Robert C. Pozen(3) | | Trustee | | February 2004 | | Massachusetts Financial Services |
| (born 08/08/46) | | | | | | Company, Chairman (since |
| | | | | | | February 2004); Secretary of |
| | | | | | | Economic Affairs, The |
| | | | | | | Commonwealth of Massachusetts |
| | | | | | | (January 2002 to December 2002); |
| | | | | | | Fidelity Investments, Vice |
| | | | | | | Chairman (June 2000 to |
| | | | | | | December 2001); Fidelity |
| | | | | | | Management & Research |
| | | | | | | Company (investment adviser), |
| | | | | | | President (March 1997 to July |
| | | | | | | 2001); Bell Canada Enterprises |
| | | | | | | (telecommunications), Director; |
| | | | | | | Medtronic, Inc. (medical |
| | | | | | | technology), Director; Telesat |
| | | | | | | (satellite communications), |
| | | | | | | Director |
| INDEPENDENT TRUSTEES | | | | | | |
| J. Atwood Ives | | Trustee and | | February 1992 | | Private investor; Eastern |
| (born 05/01/36) | | Chair of | | | | Enterprises (diversified services |
| | | Trustees | | | | company), Chairman, Trustee and |
| | | | | | | Chief Executive Officer (until |
| | | | | | | November 2000) |
| Robert E. Butler(4) | | Trustee | | January 2006 | | Consultant – regulatory and |
| (born 11/29/41) | | | | | | compliance matters (since July |
| | | | | | | 2002); PricewaterhouseCoopers |
| | | | | | | LLP (professional services firm), |
| | | | | | | Partner (November 2000 until |
| | | | | | | June 2002) |
| Lawrence H. Cohn, M.D. | | Trustee | | August 1993 | | Brigham and Women’s Hospital, |
| (born 03/11/37) | | | | | | Senior Cardiac Surgeon, Chief of |
| | | | | | | Cardiac Surgery (until 2005); |
| | | | | | | Harvard Medical School, Professor |
| | | | | | | of Surgery; Brigham and Women’s |
| | | | | | | Hospital Physicians’ Organization, |
| | | | | | | Chair (2000 to 2004) |
|
| | | | | | |
ANNUAL REPORT 39 |
| | | | | | | Principal Occupations During |
| | | Position(s) Held | | Trustee/Officer | | the Past Five Years & |
| Name, Date of Birth | | with Fund | | Since(1) | | Other Directorships(2) |
|
| David H. Gunning | | Trustee | | January 2004 | | Cleveland-Cliffs Inc. (mining |
| (born 05/30/42) | | | | | | products and service provider), |
| | | | | | | Vice Chairman/Director (since |
| | | | | | | April 2001); Encinitos Ventures |
| | | | | | | (private investment company), |
| | | | | | | Principal (1997 to April 2001); |
| | | | | | | Lincoln Electric Holdings, Inc. |
| | | | | | | (welding equipment |
| | | | | | | manufacturer), Director |
| William R. Gutow | | Trustee | | December 1993 | | Private investor and real estate |
| (born 09/27/41) | | | | | | consultant; Capitol Entertainment |
| | | | | | | Management Company (video |
| | | | | | | franchise), Vice Chairman |
| Michael Hegarty | | Trustee | | December 2004 | | Retired; AXA Financial (financial |
| (born 12/21/44) | | | | | | services and insurance), Vice |
| | | | | | | Chairman and Chief Operating |
| | | | | | | Officer (until May 2001); The |
| | | | | | | Equitable Life Assurance Society |
| | | | | | | (insurance), President and Chief |
| | | | | | | Operating Officer (until May 2001) |
| Lawrence T. Perera | | Trustee | | July 1981 | | Hemenway & Barnes (attorneys), |
| (born 06/23/35) | | | | | | Partner |
| J. Dale Sherratt | | Trustee | | August 1993 | | Insight Resources, Inc. |
| (born 09/23/38) | | | | | | (acquisition planning specialists), |
| | | | | | | President; Wellfleet Investments |
| | | | | | | (investor in health care |
| | | | | | | companies), Managing General |
| | | | | | | Partner (since 1993); Cambridge |
| | | | | | | Nutraceuticals (professional |
| | | | | | | nutritional products), Chief |
| | | | | | | Executive Officer (until May 2001) |
| Laurie J. Thomsen | | Trustee | | March 2005 | | Private investor; Prism Venture |
| (born 08/05/57) | | | | | | Partners (venture capital), Co- |
| | | | | | | founder and General Partner |
| | | | | | | (until June 2004); St. Paul |
| | | | | | | Travelers Companies (commercial |
| | | | | | | property liability insurance), |
| | | | | | | Director |
| Robert W. Uek | | Trustee | | January 2006 | | Retired (since 1999); |
| (born 05/18/41) | | | | | | PricewaterhouseCoopers LLP |
| | | | | | | (professional services firm), |
| | | | | | | Partner (until 1999); Consultant |
| | | | | | | to investment company industry |
| | | | | | | (since 2000); TT International |
| | | | | | | Funds (mutual fund complex), |
| | | | | | | Trustee (2000 until 2005); |
| | | | | | | Hillview Investment Trust II |
| | | | | | | Funds (mutual fund complex), |
| | | | | | | Trustee (2000 until 2005) |
|
40 ANNUAL REPORT | | | | | | |
| | | | | | | Principal Occupations During |
| | | Position(s) Held | | Trustee/Officer | | the Past Five Years & |
| Name, Date of Birth | | with Fund | | Since(1) | | Other Directorships(2) |
|
| OFFICERS | | | | | | |
| Maria F. Dwyer(3) | | President | | November 2005 | | Massachusetts Financial Services |
| (born 12/01/58) | | | | | | Company, Executive Vice |
| | | | | | | President and Chief Regulatory |
| | | | | | | Officer (since March 2004); |
| | | | | | | Fidelity Management & Research |
| | | | | | | Company, Vice President (prior |
| | | | | | | to March 2004); Fidelity Group of |
| | | | | | | Funds, President and Treasurer |
| | | | | | | (prior to March 2004) |
| Tracy Atkinson(3) | | Treasurer | | September 2005 | | Massachusetts Financial Services |
| (born 12/30/64) | | | | | | Company, Senior Vice President |
| | | | | | | (since September 2004); |
| | | | | | | PricewaterhouseCoopers LLP, |
| | | | | | | Partner (prior to September 2004) |
| Christopher R. Bohane(3) | | Assistant | | July 2005 | | Massachusetts Financial Services |
| (born 1/18/74) | | Secretary and | | | | Company, Vice President and |
| | | Assistant | | | | Senior Counsel (since April |
| | | Clerk | | | | 2003); Kirkpatrick & Lockhart |
| | | | | | | LLP (law firm), Associate (prior |
| | | | | | | to April 2003); Nvest Services |
| | | | | | | Company, Assistant Vice |
| | | | | | | President and Associate Counsel |
| | | | | | | (prior to January 2001) |
| Ethan D. Corey(3) | | Assistant | | July 2005 | | Massachusetts Financial Services |
| (born 11/21/63) | | Secretary and | | | | Company, Special Counsel (since |
| | | Assistant | | | | December 2004); Dechert LLP |
| | | Clerk | | | | (law firm), Counsel (prior to |
| | | | | | | December 2004) |
| David L. DiLorenzo(3) | | Assistant | | July 2005 | | Massachusetts Financial Services |
| (born 8/10/68) | | Treasurer | | | | Company, Vice President (since |
| | | | | | | June 2005); JP Morgan Investor |
| | | | | | | Services, Vice President (January |
| | | | | | | 2001 to June 2005); State Street |
| | | | | | | Bank, Vice President and |
| | | | | | | Corporate Audit Manager (prior |
| | | | | | | to January 2001) |
| Timothy M. Fagan(3) | | Assistant | | September 2005 | | Massachusetts Financial Services |
| (born 7/10/68) | | Secretary and | | | | Company, Vice President and |
| | | Assistant | | | | Senior Counsel (since September |
| | | Clerk | | | | 2005); John Hancock Advisers, |
| | | | | | | LLC, Vice President and Chief |
| | | | | | | Compliance Officer (September |
| | | | | | | 2004 to August 2005), Senior |
| �� | | | | | | Attorney (prior to September |
| | | | | | | 2004); John Hancock Group of |
| | | | | | | Funds, Vice President and Chief |
| | | | | | | Compliance Officer (September |
| | | | | | | 2004 to December 2004) |
|
| | | | | | |
ANNUAL REPORT 41 |
| | | | | | | Principal Occupations During |
| | | Position(s) Held | | Trustee/Officer | | the Past Five Years & |
| Name, Date of Birth | | with Fund | | Since(1) | | Other Directorships(2) |
|
| Mark D. Fischer(3) | | Assistant | | July 2005 | | Massachusetts Financial Services |
| (born 10/27/70) | | Treasurer | | | | Company, Vice President (since |
| | | | | | | May 2005); JP Morgan Investment |
| | | | | | | Management Company, Vice |
| | | | | | | President (prior to May 2005) |
| Ellen Moynihan(3) | | Assistant | | April 1997 | | Massachusetts Financial Services |
| (born 11/13/57) | | Treasurer | | | | Company, Senior Vice President |
| Susan S. Newton(3) | | Assistant | | May 2005 | | Massachusetts Financial Services |
| (born 03/07/50) | | Secretary and | | | | Company, Senior Vice President |
| | | Assistant | | | | and Associate General Counsel |
| | | Clerk | | | | (since April 2005); John Hancock |
| | | | | | | Advisers, LLC, Senior Vice |
| | | | | | | President, Secretary and Chief |
| | | | | | | Legal Officer (prior to April |
| | | | | | | 2005); John Hancock Group of |
| | | | | | | Funds, Senior Vice President, |
| | | | | | | Secretary and Chief Legal Officer |
| | | | | | | (prior to April 2005) |
| Susan A. Pereira(3) | | Assistant | | July 2005 | | Massachusetts Financial Services |
| (born 11/05/70) | | Secretary and | | | | Company, Vice President and |
| | | Assistant | | | | Senior Counsel (since June 2004); |
| | | Clerk | | | | Bingham McCutchen LLP (law |
| | | | | | | firm), Associate (January 2001 to |
| | | | | | | June 2004); Preti, Flaherty, |
| | | | | | | Beliveau, Pachios & Haley, LLC, |
| | | | | | | Associate (prior to January 2001) |
| Mark N. Polebaum(3) | | Secretary and | | January 2006 | | Massachusetts Financial Services |
| (born 05/01/52) | | Clerk | | | | Company, Executive Vice |
| | | | | | | President, General Counsel and |
| | | | | | | Secretary (since January 2006); |
| | | | | | | Wilmer Cutler Pickering Hale |
| | | | | | | and Dorr LLP (law firm), Partner |
| | | | | | | (prior to January 2006) |
| Frank L. Tarantino | | Independent | | June 2004 | | Tarantino LLC (provider of |
| (born 03/07/44) | | Chief | | | | compliance services), Principal |
| | | Compliance | | | | (since June 2004); CRA Business |
| | | Officer | | | | Strategies Group (consulting |
| | | | | | | services), Executive Vice |
| | | | | | | President (April 2003 to June |
| | | | | | | 2004); David L. Babson & Co. |
| | | | | | | (investment adviser), Managing |
| | | | | | | Director, Chief Administrative |
| | | | | | | Officer and Director (February |
| | | | | | | 1997 to March 2003) |
|
42 ANNUAL REPORT | | | | | | |
| | | | | | | Principal Occupations During |
| | | Position(s) Held | | Trustee/Officer | | the Past Five Years & |
| Name, Date of Birth | | with Fund | | Since(1) | | Other Directorships(2) |
|
| James O. Yost(3) | | Assistant | | September 1990 | | Massachusetts Financial Services |
| (born 06/12/60) | | Treasurer | | | | Company, Senior Vice President |
| 1 | Date first appointed to serve as Trustee/officer of an MFS fund. Each Trustee has served continuously since appointment unless indicated otherwise. |
| |
| 2 | Directorships or trusteeships of companies required to report to the Securities and Exchange Commission (i.e., ‘‘public companies’’). |
| |
| 3 | ‘‘Interested person’’ of the Trust within the meaning of the Investment Company Act of 1940 (referred to as the 1940 Act), which is the principal federal law governing investment companies like the fund, as a result of position with MFS. The address of MFS is 500 Boylston Street, Boston, Massachusetts 02116. |
| |
| 4 | In 2004 and 2005, Mr. Butler provided consulting services to the independent compliance consultant retained by MFS pursuant to its settlement with the SEC concerning market timing and related matters. The terms of that settlement required that compensation and expenses related to the independent compliance consultant be borne exclusively by MFS and, therefore, MFS paid Mr. Butler for the services he rendered to the independent compliance consultant. In 2004 and 2005, MFS paid Mr. Butler a total of $351,119.29. |
| |
Each Trustee and officer holds office until his or her successor is chosen and qualified or until his or her earlier death, resignation, retirement or removal. Messrs. Butler, Ives, Sherratt and Uek and Ms. Thomsen are members of the Trust’s Audit Committee.
Each of the Trust’s Trustees and officers holds comparable positions with certain other funds of which MFS or a subsidiary is the investment adviser or distributor, and, in the case of the officers, with certain affiliates of MFS. As of December 31, 2005, each Trustee served as a board member of 98 funds within the MFS Family of Funds.
The Trust held a shareholders’ meeting in 2005, and will hold a shareholders’ meeting at least once every five years thereafter, to elect Trustees.
The Statement of Additional Information contains further information about the Trustees and is available without charge upon request by calling 1-800-225-2606.
Investment Adviser | | Custodian |
| Massachusetts Financial Services Company | | State Street Bank and Trust Company |
| 500 Boylston Street, Boston, MA 02116-3741 | | 225 Franklin Street, Boston, MA 02110 |
Distributor | | Independent Registered Public Accounting Firm |
| MFS Fund Distributors, Inc. | | Deloitte & Touche LLP |
| 500 Boylston Street, Boston, MA 02116-3741 | | 200 Berkeley Street, Boston, MA 02116 |
Portfolio Manager | | |
| Geoffrey Schechter | | |
|
| | | ANNUAL REPORT 43 |
BOARD REVIEW OF INVESTMENT ADVISORY AGREEMENT
A discussion regarding the Board’s most recent review and renewal of the Fund’s investment advisory agreement is available by clicking on the fund’s name under ‘‘Select a fund’’ on the MFS Web site (mfs.com).
PROXY VOTING POLICIES AND INFORMATION
A general description of the MFS funds’ proxy voting policies and procedures is available without charge, upon request, by calling 1-800-225-2606, by visiting the Proxy Voting section of mfs.com or by visiting the SEC’s Web site at http://www.sec.gov.
Information regarding how the fund voted proxies relating to portfolio securities during the most recent twelve-month period ended June 30 is available without charge by visiting the Proxy Voting section of mfs.com or by visiting the SEC’s Web site at http://www.sec.gov.
QUARTERLY PORTFOLIO DISCLOSURE
The fund will file a complete schedule of portfolio holdings with the Securities and Exchange Commission (the Commission) for the first and third quarters of each fiscal year on Form N-Q. The fund’s Form N-Q may be reviewed and copied at the:
Public Reference Room
Securities and Exchange Commission
Washington, D.C. 20549-0102
Information on the operation of the Public Reference Room may be obtained by calling the Commission at 1-800-SEC-0330. The fund’s Form N-Q is available on the EDGAR database on the Commission’s Internet Web site at http://www.sec.gov, and copies of this information may be obtained, upon payment of a duplicating fee, by electronic request at the following e-mail address: publicinfo@sec.gov or by writing the Public Reference Section at the above address.
A shareholder can also obtain the quarterly portfolio holdings report at mfs.com.
FEDERAL TAX INFORMATION (unaudited)
The fund will notify shareholders of amounts for use in preparing 2006 income tax forms in January 2007.
44 ANNUAL REPORT
ITEM 2. CODE OF ETHICS.
The Registrant has adopted a Code of Ethics pursuant to Section 406 of the Sarbanes-Oxley Act and as defined in Form N-CSR that applies to the Registrant’s principal executive officer and principal financial and accounting officer. The Registrant has not amended any provision in its Code of Ethics (the “Code”) that relates to an element of the Codes definitions enumerated in paragraph (b) of Item 2 of this Form N-CSR.
ITEM 3. AUDIT COMMITTEE FINANCIAL EXPERT.
Messrs. Robert E. Butler, J. Atwood Ives and Robert W. Uek and Ms. Laurie J. Thomsen, members of the Audit Committee, have been determined by the Board of Trustees in their reasonable business judgment to meet the definition of “audit committee financial expert” as such term is defined in Form N-CSR. In addition, Messrs. Butler, Ives and Uek and Ms. Thomsen are “independent” members of the Audit Committee (as such term has been defined by the Securities and Exchange Commission in regulations implementing Section 407 of the Sarbanes-Oxley Act of 2002). The Securities and Exchange Commission has stated that the designation of a person as an audit committee financial expert pursuant to this Item 3 on the Form N-CSR does not impose on such a person any duties, obligations or liability that are greater than the duties, obligations or liability imposed on such person as a member of the Audit Committee and the Board of Trustees in the absence of such designation or identification.
ITEM 4. PRINCIPAL ACCOUNTANT FEES AND SERVICES.
Items 4(a) through 4(d) and 4(g):
ITEM 4. PRINCIPAL ACCOUNTANT FEES AND SERVICES.
Items 4(a) through 4(d) and 4(g):
The Board of Trustees has appointed Deloitte & Touche LLP (“Deloitte”) to serve as independent accountants to the Registrant (the “Fund”). The tables below set forth the audit fees billed to the Fund as well as fees for non-audit services provided to the Fund and/or to the Fund’s investment adviser, Massachusetts Financial Services Company (“MFS”) and to various entities either controlling, controlled by, or under common control with MFS that provide ongoing services to the Fund (“MFS Related Entities”).
For the fiscal years ended February 28, 2006 and 2005, audit fees billed to the Fund by Deloitte were as follows:
| | | Audit Fees |
| Fees billed by Deloitte: | | 2006 | | 2005 |
| MFS Government Securities Fund | | $40,270 | | $39,070 |
For the fiscal years ended February 28, 2006 and 2005, fees billed by Deloitte for audit-related, tax and other services provided to the Fund and for audit-related, tax and other services provided to MFS and MFS Related Entities were as follows:
| | | Audit-Related Fees1 | | Tax Fees2 | | All Other Fees3 |
| Fees billed by Deloitte: | | 2006 | | 2005 | | 2006 | | 2005 | | 2006 | | 2005 |
| To MFS Government | | $0 | | $0 | | $10,350 | | $10,350 | | $0 | | $0 |
| Securities Fund | | | | | | | | | | | | |
| To MFS and MFS Related | | $741,371 | | $1,146,170 | | $0 | | $62,000 | | $373,825 | | $602,500 |
| Entities of MFS | | | | | | | | | | | | |
| Government Securities | | | | | | | | | | | | |
| Fund* | | | | | | | | | | | | |
| Aggregate fees for non-audit | | | | | | | | | | | | |
| services: | | | | | | | | | | | | |
| | | 2006 | | | | 2005 | | | | | | |
| To MFS Government | | $1,242,052 | | | | $1,856,710 | | | | | | |
| Securities Fund, MFS and | | | | | | | | | | | | |
| MFS Related Entities# | | | | | | | | | | | | |
* This amount reflects the fees billed to MFS and MFS Related Entities for non-audit services relating directly to the operations and
financial reporting of the Fund (portions of which services also related to the operations and financial reporting of other funds within
the MFS Funds complex). |
|
|
|
# This amount reflects the aggregate fees billed by Deloitte for non-audit services rendered to the Funds and for non-audit services
rendered to MFS and the MFS Related Entities. |
|
1 The fees included under “Audit-Related Fees” are fees related to assurance and related services that are reasonably related to the
performance of the audit or review of financial statements, but not reported under ‘‘Audit Fees,’’ including accounting consultations,
agreed-upon procedure reports, attestation reports, comfort letters and internal control reviews. |
|
|
|
|
2 The fees included under “Tax Fees” are fees associated with tax compliance, tax advice and tax planning, including services relating
to the filing or amendment of federal, state or local income tax returns, regulated investment company qualification reviews and tax
distribution and analysis. |
|
|
|
3 The fees included under “All Other Fees” are fees for products and services provided by Deloitte other than those reported under
“Audit Fees,” “Audit-Related Fees” and “Tax Fees,” including fees for services related to sales tax refunds, consultation on
internal cost allocations, consultation on allocation of monies pursuant to an administrative proceeding regarding disclosure
of brokerage allocation practices in connection with fund sales, and analysis of certain portfolio holdings versus investment styles. |
|
|
|
|
|
Item 4(e)(1):
Set forth below are the policies and procedures established by the Audit Committee of the Board of Trustees relating to the pre-approval of audit and non-audit related services: To the extent required by applicable law, pre-approval by the Audit Committee of the Board is needed for all audit and permissible non-audit services rendered to the Funds and all permissible non-audit services rendered to MFS or MFS Related Entities if the services relate directly to the operations and financial reporting of the Registrant. Pre-approval is currently on an engagement-by-engagement basis. In the event pre-approval of such services is necessary between regular meetings of the Audit Committee and it is not practical to wait to seek pre-approval at the next regular meeting of the Audit Committee, pre-approval of such services may be referred to the Chair of the Audit Committee for approval; provided that the Chair may not pre-approve any individual engagement for such services exceeding $50,000 or multiple engagements for such services in the aggregate exceeding $100,000 between such regular meetings of the Audit Committee. Any engagement pre-approved by the Chair between regular meetings of the Audit Committee shall be presented for ratification by the entire Audit Committee at its next regularly scheduled meeting.
Item 4(e)(2):
None, or 0%, of the services relating to the Audit-Related Fees, Tax Fees and All Other Fees paid by the Fund and MFS and MFS Related Entities relating directly to the operations and financial reporting of the Registrant disclosed above were approved by the audit committee pursuant to paragraphs (c)(7)(i)(C) of Rule 2-01 of Regulation S-X (which permits audit committee approval after the start of the engagement with respect to services other than audit, review or attest services, if certain conditions are satisfied).
Item 4(f): Not applicable.
Item 4(h): The Registrant’s Audit Committee has considered whether the provision by a Registrant’s independent registered public accounting firm of non-audit services to MFS and MFS Related Entities that were not pre-approved by the Committee (because such services did not relate directly to the operations and financial reporting of the Registrant) was compatible with maintaining the independence of the independent registered public accounting firm as the Registrant’s principal auditors.
ITEM 5. AUDIT COMMITTEE OF LISTED REGISTRANTS.
Not applicable to the Registrant.
ITEM 6. SCHEDULE OF INVESTMENTS
A schedule of investments of the Registrant is included as part of the report to shareholders of such series under Item 1 of this Form N-CSR.
ITEM 7. DISCLOSURE OF PROXY VOTING POLICIES AND PROCEDURES FOR CLOSED-END MANAGEMENT INVESTMENT COMPANIES.
Not applicable to the Registrant.
ITEM 8. PORTFOLIO MANAGERS OF CLOSED-END MANAGEMENT INVESTMENT COMPANIES.
Not applicable to the Registrant.
ITEM 9. PURCHASES OF EQUITY SECURITIES BY CLOSED-END MANAGEMENT INVESTMENT COMPANY AND AFFILIATED PURCHASERS.
Not applicable to the Registrant.
ITEM 10. SUBMISSION OF MATTERS TO A VOTE OF SECURITY HOLDERS.
There were no material changes to the procedures by which shareholders may send recommendations to the Board for nominees to the
Registrant’s Board since the Registrant last provided disclosure as to such procedures in response to the requirements of Item 7(d)(2)(ii)(G)
of Schedule 14A or this Item.
ITEM 11. CONTROLS AND PROCEDURES.
| (a) | Based upon their evaluation of the effectiveness of the registrant’s disclosure controls and procedures (as defined in Rule 30a-3(c) under the Investment Company Act of 1940 (the “Act”)) as conducted within 90 days of the filing date of this Form N-CSR, the registrant’s principal financial officer and principal executive officer have concluded that those disclosure controls and procedures provide reasonable assurance that the material information required to be disclosed by the registrant on this report is recorded, processed, summarized and reported within the time periods specified in the Securities and Exchange Commission’s rules and forms. |
| |
| (b) | There were no changes in the registrant’s internal controls over financial reporting (as defined in Rule 30a-3(d) under the Act) that occurred during the second fiscal quarter of the period covered by the report that have materially affected, or are reasonably likely to materially affect, the registrant’s internal control over financial reporting. |
| |
ITEM 12. EXHIBITS.
| (a) | File the exhibits listed below as part of this Form. Letter or number the exhibits in the sequence indicated. |
| |
| | (1) | Any code of ethics, or amendment thereto, that is the subject of the disclosure required by Item 2, to the extent that the registrant intends to satisfy the Item 2 requirements through filing of an exhibit: Code of Ethics attached hereto. |
| |
| | (2) A separate certification for each principal executive officer and principal financial
officer of the registrant as required by Rule 30a-2 under the Act (17 CFR 270.30a-2): Attached hereto. |
| |
| (b) | If the report is filed under Section 13(a) or 15(d) of the Exchange Act, provide the certifications required by Rule 30a-2(b) under the Act (17 CFR 270.30a-2(b)), Rule 13a-14(b) or Rule 15d-14(b) under the Exchange Act (17 CFR 240.13a-14(b) or 240.15d-14(b)) and Section 1350 of Chapter 63 of Title 18 of the United States Code (18 U.S.C. 1350) as an exhibit. A certification furnished pursuant to this paragraph will not be deemed “filed” for the purposes of Section 18 of the Exchange Act (15 U.S.C. 78r), or otherwise subject to the liability of that section. Such certification will not be deemed to be incorporated by reference into any filing under the Securities Act of 1933 or the Exchange Act, except to the extent that the registrant specifically incorporates it by reference: Attached hereto. |
| |
| |
| |
Notice
A copy of the Amended and Restated Declaration of Trust of the Registrant is on file with the Secretary of State of the Commonwealth of Massachusetts and notice is hereby given that this instrument is executed on behalf of the Registrant by an officer of the Registrant as an officer and not individually and the obligations of or arising out of this instrument are not binding upon any of the Trustees or shareholders individually, but are binding only upon the assets and property of the respective constituent series of the Registrant.
SIGNATURES
Pursuant to the requirements of the Securities Exchange Act of 1934 and the Investment Company Act of 1940, the registrant has duly caused this report to be signed on its behalf by the undersigned, thereunto duly authorized.
| (Registrant) | MFS GOVERNMENT SECURITIES FUND |
| |
| By (Signature and Title)* | MARIA F. DWYER |
| | Maria F. Dwyer, President |
| Date: April 24, 2006 | |
Pursuant to the requirements of the Securities Exchange Act of 1934 and the Investment Company Act of 1940, this report has been signed below by the following persons on behalf of the registrant and in the capacities and on the dates indicated.
| By (Signature and Title)* | MARIA F. DWYER |
| | Maria F. Dwyer, President (Principal Executive Officer) |
| Date: April 24, 2006 | |
By (Signature and Title)* | TRACY ATKINSON |
| | Tracy Atkinson, Treasurer (Principal Financial Officer and |
| | Accounting Officer) |
| Date: April 24, 2006 | |
| |
* Print name and title of each signing officer under his or her signature. |